Pico Scale User Manual
User Manual:
Open the PDF directly: View PDF ![]() .
.
Page Count: 80
- 1 Introduction
- 2 Product safety
- 3 PICOSCALE fundamentals
- 4 Basic Concepts
- 5 PicoScale hardware
- 6 Setup and installation
- 7 PicoScale Control GUI
- 8 Concluding Remarks
PICOSCALE
USER MANUAL
www.smaract.com

Copyright © 2018 SmarAct GmbH
Specifications are subject to change without notice. All rights reserved. Reproduction of images,
tables or diagrams prohibited.
The information given in this document was carefully checked by our team and is constantly up-
dated. Nevertheless, it is not possible to fully exclude the presence of errors. In order to always
get the latest information, please contact our technical sales team.
SmarAct GmbH, Schuette-Lanz-Strasse 9, D-26135 Oldenburg
Phone: +49 (0) 441 - 800879-0, Telefax: +49 (0) 441 - 800879-21
Internet: www.smaract.com, E-Mail: info@smaract.com
Document Version: 2.1.4
2
PicoScale User Manual

TABLE OF CONTENTS
1 Introduction ................................................................................................................................. 6
1.1 Preface ................................................................................................................................. 6
1.2 Technical support ................................................................................................................ 6
1.3 Signal words and symbols in this manual.......................................................................... 7
1.3.1 Signal words ............................................................................................................. 7
1.3.2 Symbols .................................................................................................................... 8
2 Product safety ............................................................................................................................. 9
2.1 Optical safety ....................................................................................................................... 9
2.2 Electrical safety .................................................................................................................... 10
2.3 Safety precautions............................................................................................................... 11
2.4 Compliance .......................................................................................................................... 12
2.4.1 CDRH/EN60825-1 ..................................................................................................... 12
2.4.2 Low voltage directive ............................................................................................... 12
2.4.3 EMC directive............................................................................................................ 12
2.4.4 RoHS directive .......................................................................................................... 13
2.4.5 Declaration of Conformity ....................................................................................... 14
2.5 Intended use........................................................................................................................ 15
2.6 Unpacking ............................................................................................................................ 15
2.7 Disposal of old equipment.................................................................................................. 15
3PICOSCALE fundamentals ......................................................................................................... 16
3.1 General setup and basic components................................................................................ 16
3.2 Measurement principle....................................................................................................... 17
3.2.1 Michelson interferometer........................................................................................ 17
3.2.2 Sinusoidal phase modulation.................................................................................. 18
3.2.3 Working range.......................................................................................................... 19
3.3 Traceability........................................................................................................................... 19
3.4 Environmental compensation............................................................................................. 19
3.4.1 Dead path................................................................................................................. 20
4 Basic Concepts ........................................................................................................................... 21
4.1 Modular architecture........................................................................................................... 21
4.1.1 Advanced trigger...................................................................................................... 21
4.1.2 Stream generator..................................................................................................... 21
4.1.3 Digital and analog GPIO, AquadB............................................................................ 23
4.1.4 Clock Generator ....................................................................................................... 23
4.1.5 Signal Generator ...................................................................................................... 23
4.1.6 Calculation System................................................................................................... 23
4.1.7 Counters ................................................................................................................... 23
4.1.8 Environmental Module ............................................................................................ 24
3
PicoScale User Manual

TABLE OF CONTENTS
4.2 Data sources ........................................................................................................................ 24
4.3 Signal flow............................................................................................................................ 25
4.4 Adjustment auto function ................................................................................................... 26
4.5 Events................................................................................................................................... 26
4.6 System filters ....................................................................................................................... 26
4.7 Streaming aggregation........................................................................................................ 27
4.8 Network discovery protocol................................................................................................ 27
5 PicoScale hardware .................................................................................................................... 29
5.1 PICOSCALE controller ........................................................................................................ 29
5.2 Interfaces ............................................................................................................................. 31
5.2.1 Environmental Module interface ............................................................................ 31
5.2.2 Optical outputs......................................................................................................... 32
5.2.3 Power connection .................................................................................................... 32
5.2.4 USB slave interface .................................................................................................. 33
5.2.5 Ethernet interface .................................................................................................... 33
5.2.6 USB master interface............................................................................................... 33
5.2.7 SmarAct Sensor Interface (SI).................................................................................. 33
5.2.8 SmarAct High Speed Sensor Interface (HSI)........................................................... 33
5.2.9 GPIO and Digital Differential Interface ................................................................... 33
5.3 Breakout-Box ....................................................................................................................... 35
5.3.1 Differential Digital Interface DDI............................................................................. 36
5.3.2 BOB digital GPIOs..................................................................................................... 38
5.3.3 BOB analog GPIOs ................................................................................................... 39
5.4 Sensor heads ....................................................................................................................... 40
5.5 Environmental Module........................................................................................................ 41
6 Setup and installation................................................................................................................. 42
6.1 System checklist .................................................................................................................. 42
6.2 Unpack the system .............................................................................................................. 43
6.3 Cabling ................................................................................................................................. 43
6.4 System power up................................................................................................................. 45
6.5 PICOSCALE software and APIinstallation......................................................................... 46
6.6 Firmware updates................................................................................................................ 46
6.6.1 Performing a PICOSCALE firmware update .......................................................... 47
6.6.2 System diagnostics data .......................................................................................... 47
7 PicoScale Control GUI ................................................................................................................ 49
7.1 Configuration of the PicoScale............................................................................................ 50
7.1.1 Connecting to the controller ................................................................................... 50
7.1.2 General settings ....................................................................................................... 50
7.1.3 Status........................................................................................................................ 51
7.2 Adjustment .......................................................................................................................... 53
7.3 Advanced Trigger................................................................................................................. 55
7.3.1 Trigger Source configuration ................................................................................... 56
7.3.2 Trigger configuration ............................................................................................... 60
7.4 Interfaces ............................................................................................................................. 63
7.4.1 Digital IO interface configuration ............................................................................ 63
7.4.2 Digital Differential Interface (DDI) configuration.................................................... 64
4
PicoScale User Manual

TABLE OF CONTENTS
7.4.3 DAC interface configuration .................................................................................... 66
7.5 Modules ............................................................................................................................... 67
7.5.1 Clock Generator ....................................................................................................... 67
7.5.2 Arbitrary Signal Generator....................................................................................... 68
7.5.3 Calculation System................................................................................................... 69
7.5.4 Counter..................................................................................................................... 70
7.6 Streaming Monitor .............................................................................................................. 71
7.6.1 Configure data receiver layout ................................................................................ 71
7.6.2 Setting up a data receiver........................................................................................ 72
7.6.3 Manipulate the data................................................................................................. 73
7.6.4 Configure the data stream ...................................................................................... 73
7.6.5 PicoScale Data Reader ............................................................................................. 74
7.7 Environmental Monitor ....................................................................................................... 76
7.8 Configuration Manager ....................................................................................................... 77
7.9 Property Dialog.................................................................................................................... 78
8 Concluding Remarks .................................................................................................................. 79
5
PicoScale User Manual

1INTRODUCTION
Congratulations on your purchase of the SmarAct PICOSCALE interferometer! You have acquired
a powerful tool for displacement measurements with picometer resolution. We are convinced
that the innovative features will make working with the PICOSCALE a pleasant and remarkable
experience.
1.1 Preface
This manual contains user information for the SmarAct PICOSCALE system, which includes a
control box, various sensor heads, a Breakout-Box and an Environmental Module.
NOTICE
Read this manual carefully before operating the PICOSCALE for the first time.
Special attention should be given to the material in chapter 2 "Product Safety",
which describes the secure handling of the PICOSCALE system.
1.2 Technical support
Should you experience any difficulties with your PICOSCALE system or need any technical in-
formation, please visit our web site: www.picoscale.com. Additional support can be obtained by
contacting our technical support at PicoScaleSupport@smaract.com or by phone at +49 441 800 879
0. When communicating with our Technical Support, the Support Engineer responding to your
request will require the model and the serial number.
6
PicoScale User Manual

1 INTRODUCTION
1.3 Signal words and symbols in this manual
This manual may contain sections in which particular hazards are defined or special attention is
drawn to particular conditions. These sections are indicated with signal words according to ANSI
Z-535.6 and safety symbols (pictorial hazard alerts) in accordance with ANSIZ-535.3 and ISO 7010.
1.3.1 Signal words
Four signal words are used in this documentation: DANGER,WARNING,CAUTION and NOTICE.
The signal words DANGER,WARNING and CAUTION designate the degree or level of hazard when
there is a risk of injury:
DANGER
Indicates a hazardous situation that, if not avoided, will result in death or serious injury.
Do not proceed beyond a DANGER notice until the indicated conditions are fully understood
and met. This signal word is to be limited to the most extreme situations.
WARNING
Indicates a hazardous situation that, if not avoided, could result in death or serious in-
jury. Do not proceed beyond a WARNING notice until the indicated conditions are fully
understood and met.
CAUTION
Indicates a hazardous situation that, if not avoided, could result in minor or moderate
injury. Do not proceed beyond a CAUTION notice until the indicated conditions are fully
understood and met.
The signal word NOTICE is used when there is a risk of property damage:
NOTICE
Indicates information considered important, but not hazard-related.
Messages relating to hazards that could result in both personal injury and property damage are
considered safety messages and not property damage messages.
7
PicoScale User Manual
1 INTRODUCTION
1.3.2 Symbols
The signal words DANGER,WARNING and CAUTION are always emphasized with a safety symbol
that indicated a special hazard, regardless of the hazard level:
This symbol is intended to alert the operator to the presence of important oper-
ating and maintenance instructions.
This symbol is intended to alert the operator to the danger of exposure to haz-
ardous visible and invisible laser radiation.
This symbol is intended to alert the operator to the presence of dangerous volt-
ages within the product enclosure that may be of sufficient magnitude to consti-
tute a risk of electrical shock.
8
PicoScale User Manual

2PRODUCT SAFETY
2.1 Optical safety
Because of its special properties, laser light poses safety hazards not associated with light from
conventional sources. The safe use of the lasers require that all laser users, and everyone near
the laser system, are aware of the danger involved. The safe use of the laser depends upon
the user being familiar with the instrument and the properties of coherent, intense beams of
light.
CAUTION
The PICOSCALE Controller contains an infrared diode laser with an output of
less than 0.2 mW at 1520 nm - 1580 nm (less than 0.3 mW for V1.4 and less than
0.6 mW for V1.4-HP) and red diode laser with an output power of less than 0.6
mW at 650 nm (no red laser for V1.4-HP).
Although the PicoScale is a Class Iproduct due to the low output power, it is
a good practice not to stare directly into the laser beam. Never use optical
instruments to observe the beam, this can cause serious eye damage.
Always use the PicoScale as intended by this manual!
9
PicoScale User Manual
2 PRODUCT SAFETY
2.2 Electrical safety
The SmarAct PICOSCALE controller contains hazardous voltages. Do not disassemble the en-
closure. There are no user-serviceable components inside. All units are designed to operate as
assembled. Warranty will be voided if the enclosure is disassembled.
WARNING
High voltage inside. To avoid electrical shock before powering the unit, make
sure that the protective conductor of the 3-conductor power cord is correctly
connected to the protective earth contact of the socket outlet. Improper ground-
ing can cause electric shock resulting in severe injury or even death.
WARNING
Shock warning. Do not operate without cover installed. Do not stick any mate-
rial through the ventilation holes. Do not operate under wet/damp conditions.
WARNING
Observe all terminal ratings. To avoid damage, fire or shock hazard, observe
all ratings marked on the PicoScale Controller or documented in the manual.
NOTICE
High electrostatic charges readily accumulate in the human body and equipment
and can easily discharge without detection. Although the electronics features
have impressive input protection, permanent damage may occur on devices
subjected to high-energy electrostatic discharges. Therefore, proper ESD pre-
cautions are recommended to avoid performance degradation.
The most common ESD damage occurs while handling the device during instal-
lation or use. Take the necessary measures to protect the system from ESD, e.g.
by wearing a wrist strap.
Dry air and carpet can create an even higher potential for ESD. Precautions or
shielding need to be taken for demonstrations or trade show exhibitions.
10
PicoScale User Manual

2 PRODUCT SAFETY
2.3 Safety precautions
NOTICE
End of life handling. The equipment contains substances that could be harm-
ful to the environment or human health. In order to avoid release of such sub-
stances into the environment, we encourage you to recycle this product in an
appropriate system that will ensure that most of the materials are reused or
recycled appropriately. Please contact your local authorities for disposal or recy-
cling information.
NOTICE
Provide proper ventilation. In order to prevent overheat events, system fail-
ure and damage the ventilation holes of the PicoScale Controller must not be
covered. Do not stack several PICOSCALE Controllers.
NOTICE
Always clean fiber prior connection! Prior to connecting an interferometer
head, make sure to clean both the fiber connector and the fiber receptacle with
suitable fiber cleaners. This is necessary to achieve the optimal signal quality
and avoid permanent damage to the fiber end surfaces.
For further information, please refer to the information presented in section 6.3.
NOTICE
Handle with care! The sensor heads and the optical fibers are small high-
precision parts and subject to damage under rough handling. Please make sure
to treat the fibers carefully and do not bend them too tightly; the minimum bend-
ing radius of 30 mm should always be respected. Be sure that the interferome-
ter heads are not torn or sheared offthe fibers. The PICOSCALE control system
contains sensitive optics and electronics. Make sure to use the original PicoScale
case for transport.
11
PicoScale User Manual

2 PRODUCT SAFETY
2.4 Compliance
The PICOSCALE laser interferometer and its accessory products have been certified in coopera-
tion with an independent testing lab to be in compliance with the environmental and safety direc-
tives listed in the following chapters.
2.4.1 CDRH/EN60825-1
The PICOSCALE laser interferometer system complies with all of the requirements of EN60825-1.
It further complies with 21 CFR 1040.10 except for deviations pursuant to Laser Notice No. 50,
dated June 24, 2007.
The following table lists PICOSCALE part or model numbers, and their corresponding CDRH ac-
cession numbers.
Table 2.1: PICOSCALE CDRH Accession Numbers
Part/Model number Accession Number Part/Model number Accession Number
PS-CTRL-V1.1-TAB (*) 1711061-000 PS-CTRL-V1.3-RACK (*) 1711061-000
PS-CTRL-V1.2-TAB (*) 1711061-000 PS-CTRL-V1.4-RACK 1711252-000
PS-CTRL-V1.3-TAB (*) 1711061-000 PS-CTRL-V1.4-TAB-HP 1810594-000
PS-CTRL-V1.4-TAB 1711252-000 PS-CTRL-V1.4-RACK-HP 1810594-000
(*) Discontinued
2.4.2 Low voltage directive
The PICOSCALE laser interferometer complies with the basic requirements of the Low Voltage
Directive 2014/35/EU.
Compliance with this directive has been verified by application of the following harmonized stan-
dards:
•EN 61010-1:2010:
Safety Requirements - Part 1: General requirements
•EN 60825-1:2014:
Safety of laser products - Part 1: Equipment classification and requirements (compare 2.4.1)
2.4.3 EMC directive
The PICOSCALE laser interferometer complies with the basic requirements of the EMC Directive
2014/30/EU.
Compliance with this directive has been verified by application of the following harmonized stan-
dards:
12
PicoScale User Manual

2 PRODUCT SAFETY
•EN 61326-1:2013:
EMC requirements - Part 1: General requirements
•EN 55011:2011:
Radio-frequency disturbance characteristics - Limits and methods of measurement
According to EN 61326-1:2013 the following test specifications have been used:
•EN 61000-4-2:2009 - Electrostatic discharge immunity test
•EN 61000-4-3:2010 -Radiated, radio-frequency, electromagnetic field immunity test
•EN 61000-4-4:2010 - Electrical fast transient/burst immunity test
•EN 61000-4-5:2006 - Surge immunity test
•EN 61000-4-11:2004 - Voltage dips, short interruptions and voltage variations immunity tests
2.4.4 RoHS directive
The PICOSCALE laser interferometer complies with the basic requirements of the RoHS Directive
2011/65/EU.
Compliance with this directive has been verified by application of the following harmonized stan-
dards:
•EN 50581:2012:
Technical documentation with respect to the restriction of hazardous substances
13
PicoScale User Manual

2 PRODUCT SAFETY
2.4.5 Declaration of Conformity
Declaration of
Conformity
according to DIN EN ISO/IEC 17050-1:2010
Manufacturer: SmarAct GmbH
Manufacturer’s Address: Schütte-Lanz-Strasse 9
26135 Oldenburg, Germany
The manufacturer hereby declares that the product and its related accessory
Product Name: PicoScale
Model Numbers: PS-CTRL-V1.1-TAB, PS-CTRL-V1.2-TAB, PS-CTRL-V1.3-TAB,
PS-CTRL-V1.4-TAB, PS-CTRL-V1.3-RACK, PS-CTRL-V1.4-RACK
Product Options: all
complies with the following European directives:
2014/35/EU: Low Voltage Directive
2014/30/EU: EMC Directive
2011/65/EU: RoHS Directive
The applied standards certifying the conformity are listed below:
Electromagnetic Emission: DIN EN 61326-1:2013
DIN EN 55011:2011, Groupe 1, Class B 1
Electromagnetic Immunity: DIN EN 61000-4-2:2009/DIN EN 61326-1:2013 (DIN EN 61000-6-2)
DIN EN 61000-4-3:2010/DIN EN 61326-1:2013 (DIN EN 61000-6-1)
DIN EN 61000-4-4:2010/DIN EN 61326-1:2013 (DIN EN 61000-6-2)
DIN EN 61000-4-5:2006/DIN EN 61326-1:2013 (DIN EN 61000-6-2)
DIN EN 61000-4-11:2004/DIN EN 61326-1:2013 (DIN EN 61000-6-2)
Safety (Low Voltage Directive): EN 61010-1:2001
Environmental Affairs: EN 50581:2012
Articles manufactured on or after the Date of Issue of the Declaration of Confirmity do not contain
any of the restricted substances in concentrations/applications not permitted by the RoHS
Directive.
July 25, 2016
Oldenburg, Germany
Axel Kortschack
Managing Director
1with active PS-BOB-V1.0-TAB the emission Class is A
14
PicoScale User Manual
2 PRODUCT SAFETY
2.5 Intended use
The PICOSCALE Controller is intended to be used in indoor locations with constant temperatures
inside the specified range (see table 2.2). Temperature fluctuations can have influence on laser
stability and measurement results and should be kept small (e.g., avoid exposure to direct sun-
light).
Table 2.2: Operation conditions for PICOSCALE Controller
General Conditions
Power supply 90-246 VAC @ 47-63 Hz
Input current 0.5 ARMS @ 230 VAC
Environment Pollution degree 2; Indoor location
Environmental temperature 15 °C - 30 °C
Environmental humidity 5% to 80% RH, non-condensing
Storage temperature 0 °C - 50 °C
2.6 Unpacking
Before unpacking the PICOSCALE Controller please refer to chapter 6 of this manual.
2.7 Disposal of old equipment
According to the EU directive 2012/19/EU, as of August, 13, 2012, electrical and electronic equip-
ment may not be disposed in the member states of the European Union with other waste.
SmarAct GmbH respects the manufacturer’s prod-
uct responsibility and will take care of environmen-
tally correct disposal of old SmarAct products free of
charge. To dispose old SmarAct equipment, you can
return it to SmarAct to the following address postage-
free:
SmarAct GmbH
Schütte-Lanz-Strasse 9
26135 Oldenburg, Germany
15
PicoScale User Manual
3 PICOSCALE FUNDAMENTALS
The PICOSCALE is a powerful system for optical and non-invasive displacement and vibration
measurements. The three channel system is based on a miniaturized Michelson interferometer.
The system features powerful interfaces and flexible software modules. Due to useful accessories
the system can be adapted to specific needs. The PICOSCALE GUI allows to operate the system
out of the box. In summary, these versatile characteristics make the PICOSCALE a very powerful
tool for every lab!
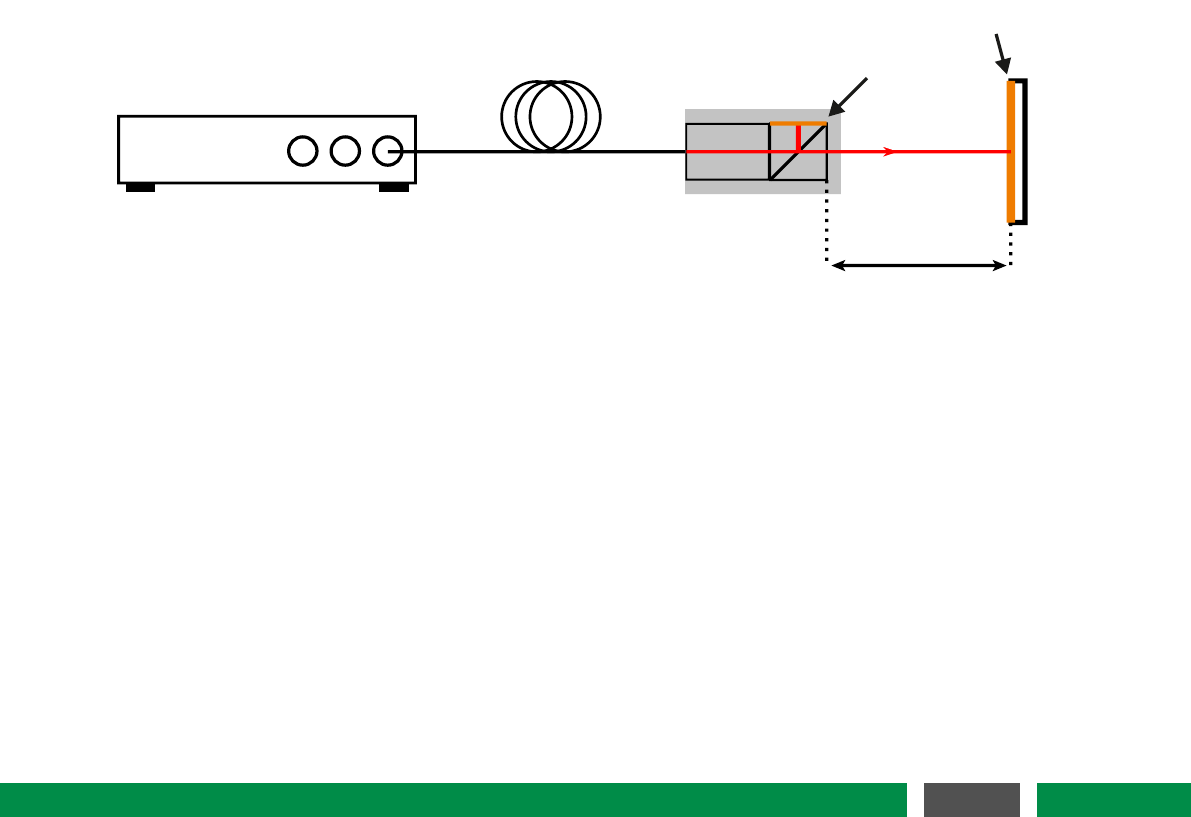
3.1 General setup and basic components
Each PICOSCALE measurement setup requires a few basic components. The PICOSCALE con-
troller is the core component. In the controller, coherent light is generated by a laser diode. A
fiber network distributes the laser light into three output channels.
Sensor head
Reference
mirror
Target mirror
Working distance
Optical fiber
PICOSCALE
Figure 3.1: Basic setup of a PICOSCALE displacement measurement. Miniaturized sensor heads
are connected to the PICOSCALE controller via optical fibers. The system measures
the displacements of a target mirror relative to the sensor head.
Up to three sensor heads can be connected to the controller via optical FC/APC-terminated fibers.
Within the sensor head, the laser light is divided into a reference and a measurement beam by
a beam splitter, being the central component of a Michelson interferometer. In standard sensor
heads one side of the miniaturized beam splitter cube is coated with a reflective coating, which acts
as reference mirror. The measurement beam exits the head and is reflected by the measurement
target, which can be a mirror, a piece of glass or almost any other technological relevant surface.
Both, the reflected reference and measurement beam interfere in the center of the beam splitter
cube and the combined light is guided back to the controller. Due to advanced signal processing
methods, based on lock-in detection and fast FPGA based evaluation algorithms, the PICOSCALE
is able to measure target mirror displacements with single picometer resolution and sample rates
of up to 10 MHz.
16
PicoScale User Manual
3PICOSCALE FUNDAMENTALS
3.2 Measurement principle
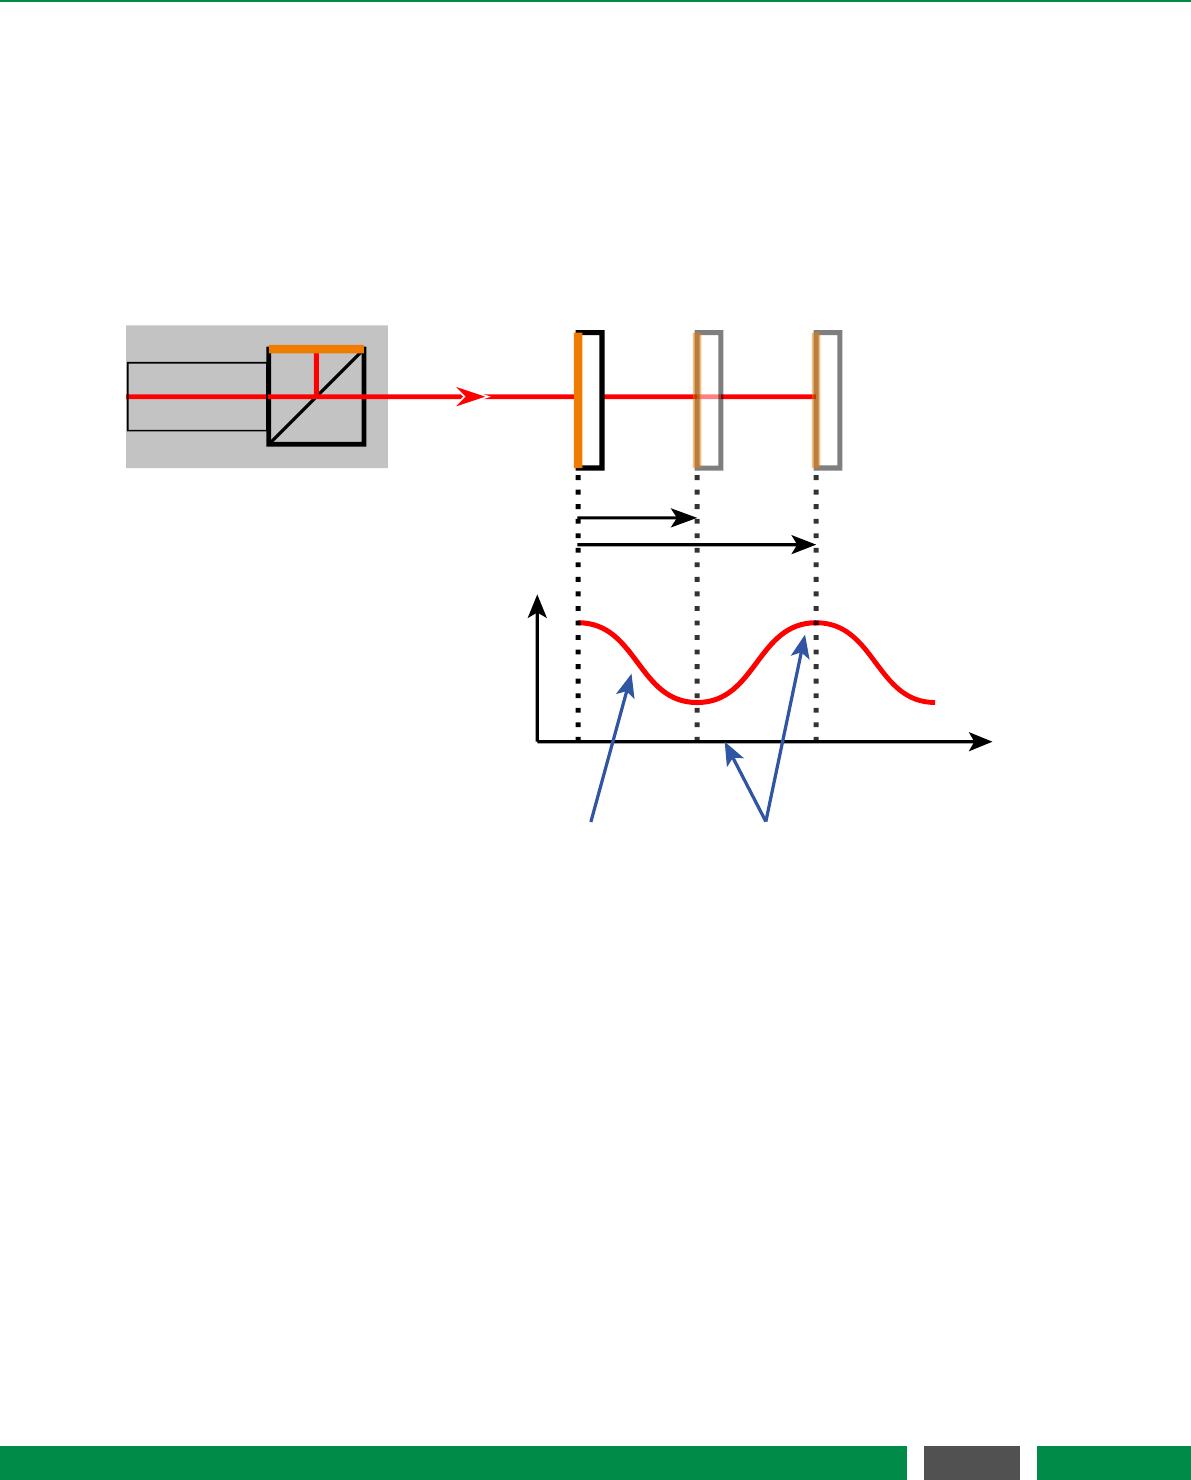
3.2.1 Michelson interferometer
The PICOSCALE displacement sensor is based on a Michelson interferometer with an extremely
compact and stable reference arm. .
λ/4 λ/2
Interferometer
signal
Displacement
0
vanishing
sensitivity
high
sensitivity
Sensor head
Target
mirror
Figure 3.2: Measurement principle of a Michelson interferometer. Constructive and destructive
interference occur due to a displacement of the target mirror. To circumvent these
blind spots the PICOSCALE utilizes sinusoidal phase modulation, see section 3.2.2.
The interferometer is driven by a laser, which is a coherent light source, that is required if a
Michelson interferometer is operated with (very) unequal arm lengths as it is the case for the
PICOSCALE. At a beam splitter, the light is divided into two parts. One part is reflected at a fixed
reference mirror and guided back to the beam splitter. The other part of the light hits the target
mirror. This light is also reflected while picking up a relative phase with respect to the reference
beam. Inside the beam splitter, both reflected beams interfere and the coherent superposition is
recorded by a photo detector.
In the PICOSCALE system, the beam splitter is located in the sensor head, whereas the light
source, a stabilized, distributed-feedback (DFB) laser diode and the photo detector are located in
the controller housing. The wavelength of the laser is around 1550 nm. Inside the controller, a
fiber network distributes the laser light to three independent measurement channels. The output
power of each channel is around 150 µW.
17
PicoScale User Manual
3PICOSCALE FUNDAMENTALS
The integration of the miniaturized beam splitter into the sensor head ensures that changes in the
fiber length, possibly caused by temperature gradients, do not affect the measurement.
In a Michelson interferometer, two light beams interfere with each other. Due to path length
differences in the measurement and the reference arm of the interferometer, constructive and
destructive interference occur. In case of constructive interference, the recorded interferometer
signal is high, while at destructive interference the recorded signal is low. A displacement of the
target mirror causes a change in the relative optical path lengths and thus in the phase difference
of target and reference beam, compare figure 3.2. As a result, the intensity measured by the photo
diode is changed. This intensity change in turn is used to infer positions and displacements with
high accuracy.
In standard interferometry, the interference signal is sinusoidally dependent on the phase differ-
ence between the reference and probe beam. This phase difference depends on the target mirror
position. Thus, during constant movement, the resulting intensity signal is a sinusoid, similar to
the signal shown in figure 3.2. Due to the symmetry of the sinusoid, it is not possible to determine
the movement direction at every working point. Furthermore, the sensitivity (change in signal in-
tensity due to change in target position) is not constant during movement. Thus, for long range
and high-resolution position measurements, the standard Michelson interferometry is not ideally
suited.
The PICOSCALE uses sinusoidal phase modulation of the laser beam to overcome these disadvan-
tages and provides high accuracy and resolution of position measurements as well as information
on the direction of the moving object mirror!
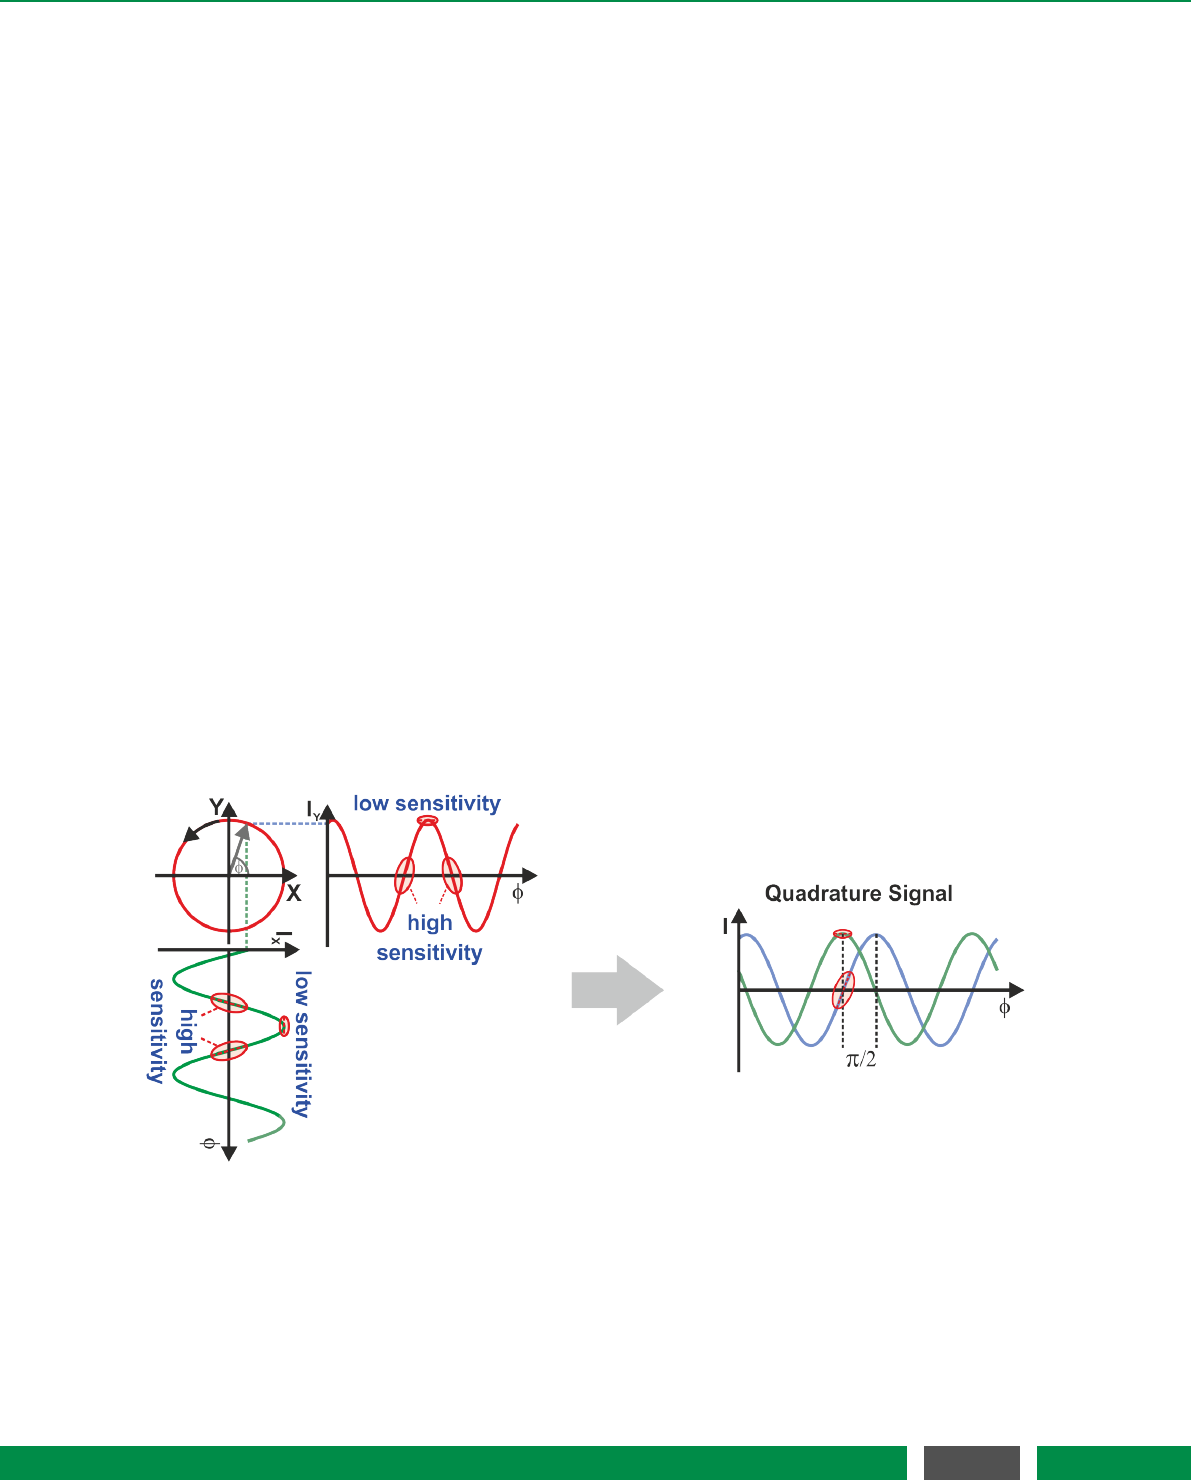
3.2.2 Sinusoidal phase modulation
Figure 3.3: Quadrature signal detection: points of low sensitivity in one signal are compensated by
high sensitivity in the quadrature signal.
Thus, sinusoidally modulating the wavelength of the laser light can overcome the aforementioned
disadvantages. This wavelength modulation is initiated by modulating the injection current of
the used distributed feedback (DFB) laser diode. The modulation of the wavelength produces
a sinusoidally phase modulated (SPM) interference signal. Due to appropriate demodulation, it
18
PicoScale User Manual

3PICOSCALE FUNDAMENTALS
becomes possible to extract the quadrature signal, which is a two dimensional signal, dependent
on the target mirror position, depicted in figure 3.3. The two extracted sinusoidal signals are
phase-shifted by 90 degrees and thus are in quadrature. The X and Y components are shown in
figure 3.3, left. Constant movement of the target mirror produces a circle in a two dimensional
representation. The right part of the figure shows both signal components simultaneously and
it can be seen that any blind spot in one signal is compensated by a high sensitivity point in the
other. Thus, the sensitivity is maintained high during movement.
Furthermore, the phase relationship between the two components allows to unambiguously in-
fer the movement direction. While an increasing relative position of the target mirror leads to
a counter-clockwise rotation of the X-Y vector, a decreasing position leads to a clockwise rota-
tion. Thus, sinusoidal phase modulation interferometry is perfectly suited for high-resolution,
long-range position measurements.
3.2.3 Working range
During the initial adjustment phase it is required to define a so-called working range. This is the
region where the target mirror is expected to be during the measurement. The setting of the
working range is mapped to internally stored configuration values and an appropriate setting sub-
sequently leads to highest accuracy and performance of the PICOSCALE position measurements.
3.3 Traceability
Although the DFB laser has a very high spectral purity, spectral width below 10 pm, the emitted
wavelength is not constant due to unavoidable thermal drifts. Since the measured target position
is directly dependent on the emitted wavelength, a feedback system stabilizing the wavelength of
the DFB laser is mandatory. In order to stabilize the temperature of the laser diode, it is equipped
with a thermo-electric cooler (TEC). Besides stabilizing the temperature, the TEC element can be
used to actively control and tune the temperature and thus the emitted wavelength. The wave-
length is locked to an absorption line of a gas absorption cell, according to the standards NIST
SRM 2517a or SRM 2519a. This reference cell is filled either with acetylene or hydrogen cyanide
and allows to determine the wavelength of the laser within a range of lower than ±1 pm. The gas
absorption cells are extremely insensitive to environmental parameters like temperature, humid-
ity, pressure and also on electro-magnetic fields. Thus, these cells offer a persistent and reliable
wavelength standard to stabilize the wavelength of the DFB laser diode.
The gas absorption cell is integrated in the PICOSCALE controller housing. One part of the mod-
ulated laser light is guided through the reference cell and the transmitted signal is recorded and
evaluated. A feedback loop controls the laser chip temperature such that the wavelength is con-
tinuously kept at an absorption line.
3.4 Environmental compensation
When the interferometer is used in a vacuum environment, no environmental compensation is
necessary. When the interferometer system is operated in ambient conditions, variations in the
19
PicoScale User Manual
3PICOSCALE FUNDAMENTALS
refractive index of the air can significantly influence interferometric position measurements. The
refractive index of air may change due to fluctuations in temperature, pressure and humidity
(TPH). If the refractive index increases, the optical path length of the laser light increases propor-
tionally. This effect would pretend a movement of the object mirror even if the geometrical path
did not change. To compensate a variation of the refractive index, it is necessary to measure the
atmospheric conditions such as air temperature, pressure and humidity. Based on these values,
the National Institute of Standards and Technology (NIST) suggests a formalism based on a set
of modified Edlén equations to calculate the refractive index of air1. The PICOSCALE follows the
suggested formalism to calculate the refractive index and thus to correct the position data.
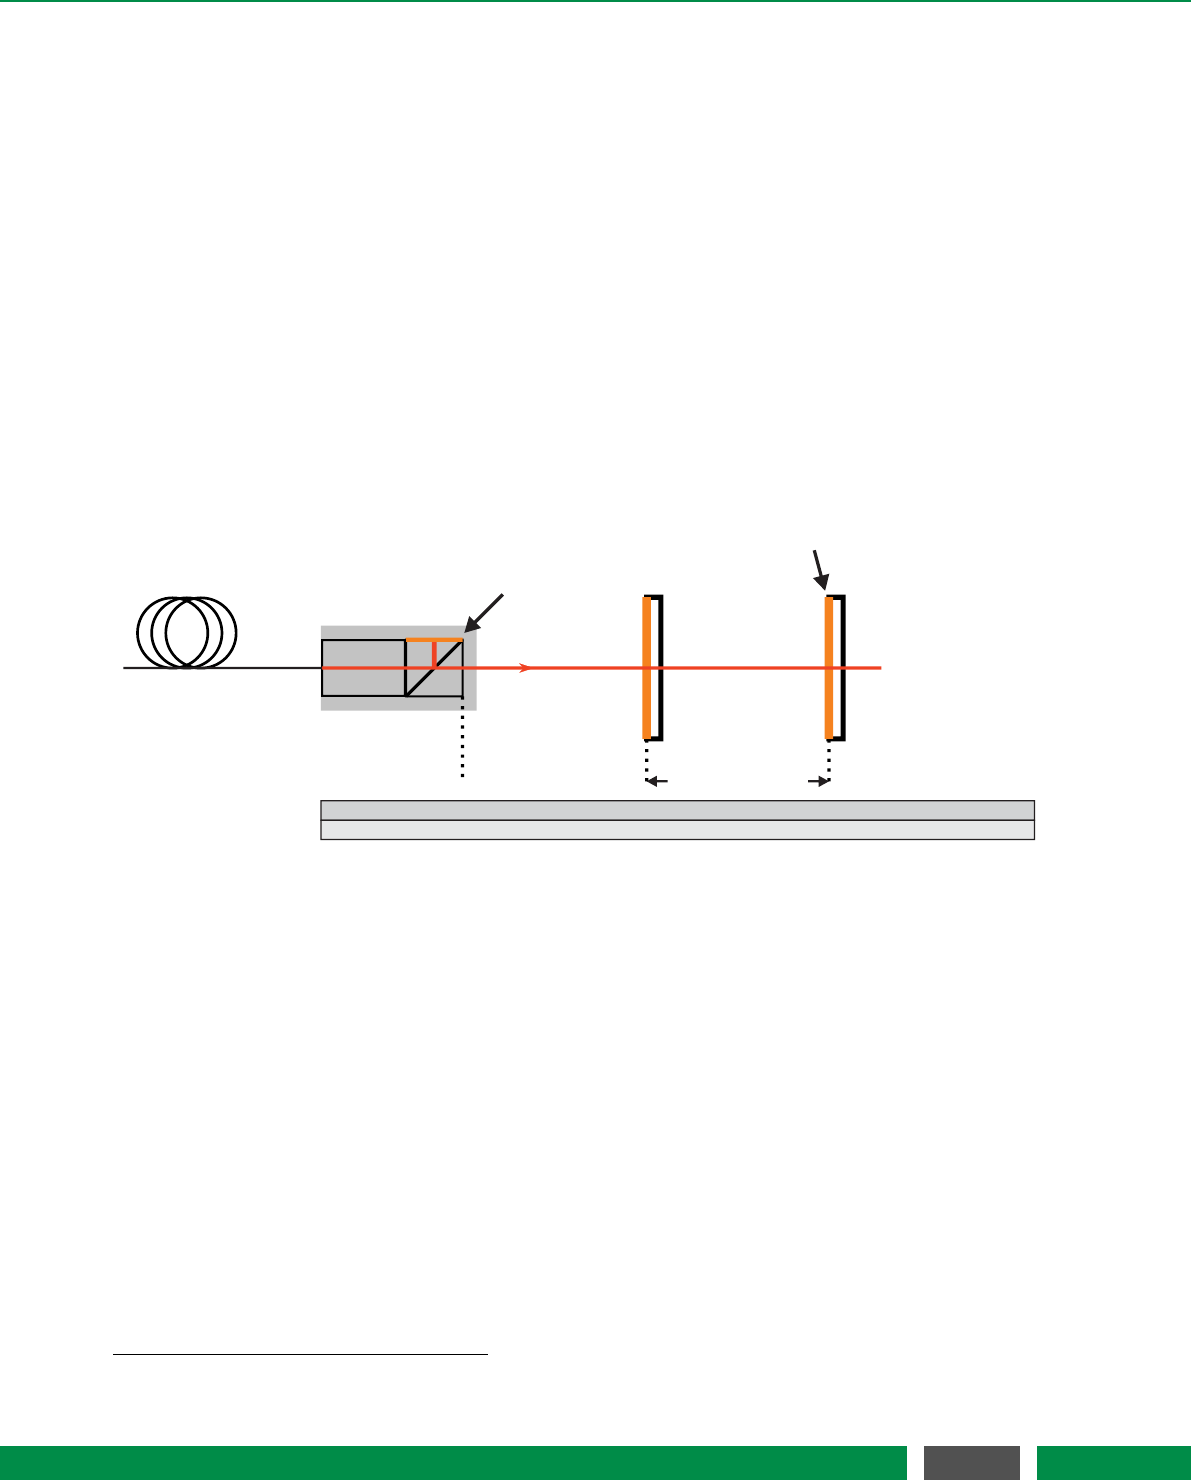
3.4.1 Dead path
The dead path is the distance between the absolute and relative zero position of the PICOSCALE
system. As figure 3.4 highlights, the absolute zero position is at the surface of the beam splitter
cube. The relative zero position can be defined freely. The system measures any position change
Sensor head
Reference
mirror
Target mirror
Optical fiber
absolute Position
relative Position
0
-D
D
0
D+X
X
Figure 3.4: The dead path is the distance between the absolute zero position, at the front face of
the beam splitter cube and the freely defined relative zero position.
relative to this internal zero position. When the measurement is done in ambient environment,
the changes in the refractive index cause a measurable change in the PICOSCALE position signal.
Based on the recorded environmental parameters the system calculates a correction factor to
compensate this virtual drift. The PICOSCALE measures the absolute distance between sensor
head and target mirror during the initial adjustment phase. When the absolute measurement
is done, the controller automatically zeros the internal position value, such that the measured
absolute distance is equal to the dead path. The measured dead path is stored automatically in
the system and can be accessed with appropriate properties. Furthermore, each time the internal
position value is set, the dead path is updated automatically, if the environmental compensation
is active.
1http://emtoolbox.nist.gov/Wavelength/Documentation.asp#EdlenorCiddor
20
PicoScale User Manual

4BASIC CONCEPTS
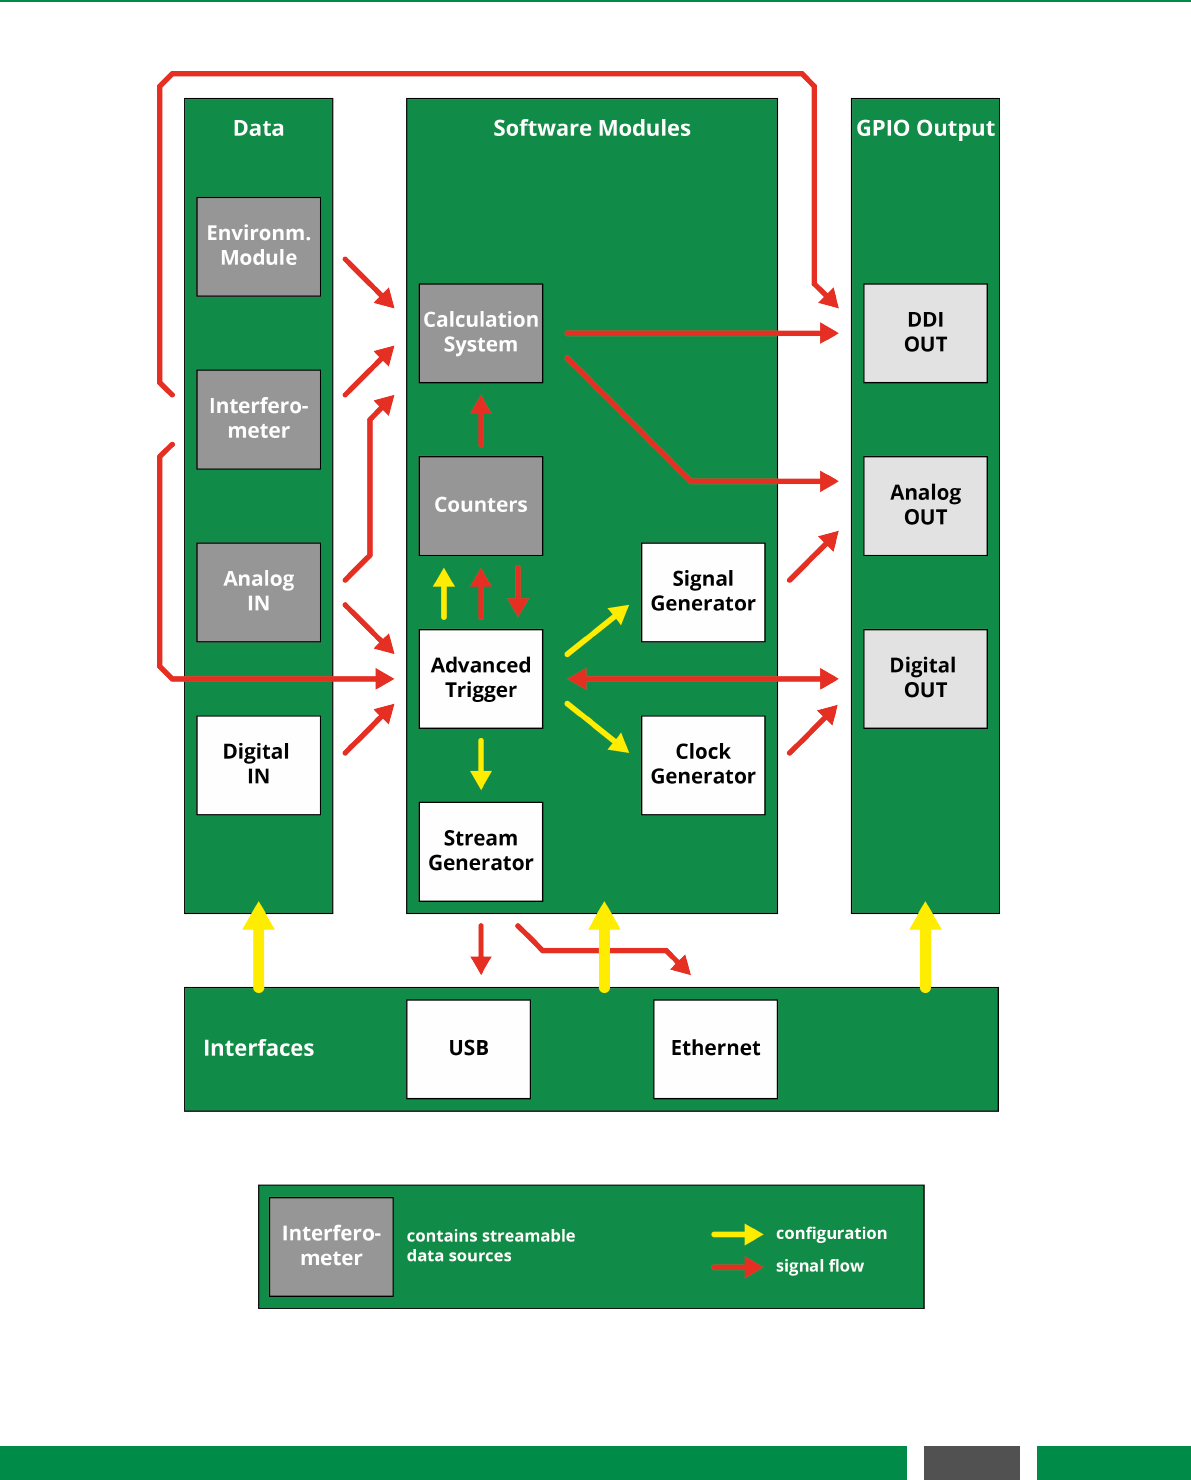
4.1 Modular architecture
The PICOSCALE is set up in a modular architecture to allow for highest possible flexibility, un-
derstandability and efficient maintenance. Each module has inputs and/or outputs that can be
configured by the user. The inputs may be outputs from other modules while the outputs can
either be directly linked to interfaces like the PICOSCALE Breakout-Box (BOB) or set up as input
for subsequent modules. This very open architecture allows you to set up sophisticated networks.
The PICOSCALE modules and their possible dependencies are depicted in figure 4.1. The func-
tionality of the modules can be summarized as follows.
4.1.1 Advanced trigger
The Advanced Trigger module is a versatile tool that allows control of a variety of other modules.
Within this module, triggers can be configured that can be used as start or stop events for other
modules (Clock Generator, Counters, Signal Generator, Stream Generator) or they can be directly
displayed through the GPIO interface. Several data sources can be used within the Advanced Trig-
ger module to configure the respective events. Beyond others, position data, data increments or
external data (through the GPIO interface) can be used to configure trigger sources. Furthermore,
trigger sources can be linked with logical operations to allow for sophisticated trigger configura-
tions. A detailed description of the Advanced Trigger functions can be found in section 7.3.
4.1.2 Stream generator
The data transfer between the PICOSCALE controller and the user PC is called streaming. A so-
phisticated aggregation, compression and decompression protocol ensures highest possible data
rate of up to 480 Mbit/s so that position data, which is a 48 bit data source, can transferred with a
10 MHz rate.
The Stream Generator is the fundamental software module that handles PICOSCALE data
sources. Within this module you can configure the data stream to your PC (USB or Ethernet)
and set up the appropriate data rate as well as appropriate digital low-pass filters to avoid alias-
ing or unnecessary oversampling. The Stream Generator is connected to the trigger module so
that triggered data streaming can be set up. All functions of the stream generator can be con-
veniently be accessed via the PICOSCALE GUI. For example, start and stop trigger events can be
chosen and the number of frames to be acquired can be defined. Details on the Stream Generator
configuration can be found in section 7.6.4.
21
PicoScale User Manual
4 BASIC CONCEPTS
Figure 4.1: Overview of all PICOSCALE modules and their possible dependencies.
22
PicoScale User Manual

4 BASIC CONCEPTS
4.1.3 Digital and analog GPIO, AquadB
The general purpose input/output (GPIO) interface contains analog-to-digital (ADC) as well as
digital-to-analog converters (DAC) to digitize external signals and output data, respectively. For
example, it can output signals from the Clock Generator, Signal Generator, Calculation System
and the Advanced Trigger module. On the other hand, external signals can be interfaced with the
PICOSCALE. Thus, the GPIO interface allows to synchronize external devices with the PICOSCALE
and vice versa.
In combination with the Signal Generator module or Stream Generator module, function genera-
tor and oscilloscope functionality can be realized. Please refer to section 7.4.1 for details.
4.1.4 Clock Generator
The Clock Generator module can provide up to two clocks with user defined frequency and phase.
Both clocks can be synchronized. Each clock generator may run in a direct mode or it may be
started and stopped by user defined trigger events. Each clock can be used in the GPIO interface
for both digital and analog processing. A detailed description of the Clock Generator module can
be found in section 7.5.1.
4.1.5 Signal Generator
In the Signal Generator module pre-defined shapes (sine, square, sawtooth) with user defined
amplitude, offset, phase and frequency can be configured that may then be used within the GPIO
interface. Furthermore, custom signal shapes can be uploaded to the module. A detailed descrip-
tion of the Signal Generator module can be found in section 7.5.2.
4.1.6 Calculation System
The Calculation System allows real-time processing of position data, GPIO data or environmental
data, for example. In total, three calculation systems can be configured and their output can either
be streamed or used in the GPIO interface. A detailed description can be found in section 7.5.3.
4.1.7 Counters
The Counter module allows to count either internal clocks (e.g., to use them as a timer) or trigger
events. This can be done either directly, or the counter can be started and stopped by triggers. In
total, two counters can be configured that may either be displayed in the Stream Monitor or they
may be used as source for trigger events. A detailed description of the counters is given in section
7.5.4.
23
PicoScale User Manual

4 BASIC CONCEPTS
4.1.8 Environmental Module
The Environmental Module is an accessory that records temperature, humidity and the pressure
of the surrounding of the PICOSCALE. These data influence the refractive index of the air. By
tracking the environmental data the position data calculated by the PICOSCALE can be corrected
for the respective fluctuations.
4.2 Data sources
Data sources are the basic data elements that provide data of any digital form over time. Position
of the target mirror, environmental temperature or GPIO data are data sources, for example. Data
sources that are related to each other are bundled into a channel.
The values of data sources may be retrieved from the device by streaming or polling them to the
user PC. The user may select a sub set of all available data sources and let the device stream the
values of these data sources over a period of time. An overview of all available data sources is
given in table 4.1.
Table 4.1: Overview of all streamable data sources. The data sources that are provided by the
modules are bundled into channel 1.
Channel 1 Channel 2 Channel 3
Position Position Position
Velocity Velocity Velocity
Acceleration Acceleration Acceleration
S(ω)raw S(ω)raw S(ω)raw
S(2ω)raw S(2ω)raw S(2ω)raw
S(ω)S(ω)S(ω)
S(2ω)S(2ω)S(2ω)
Counter 1&2
Env. module temperature
Env. module humidity
Env. module pressure
GPIO ADC 1-3
Calculation System 1-3
24
PicoScale User Manual
4 BASIC CONCEPTS
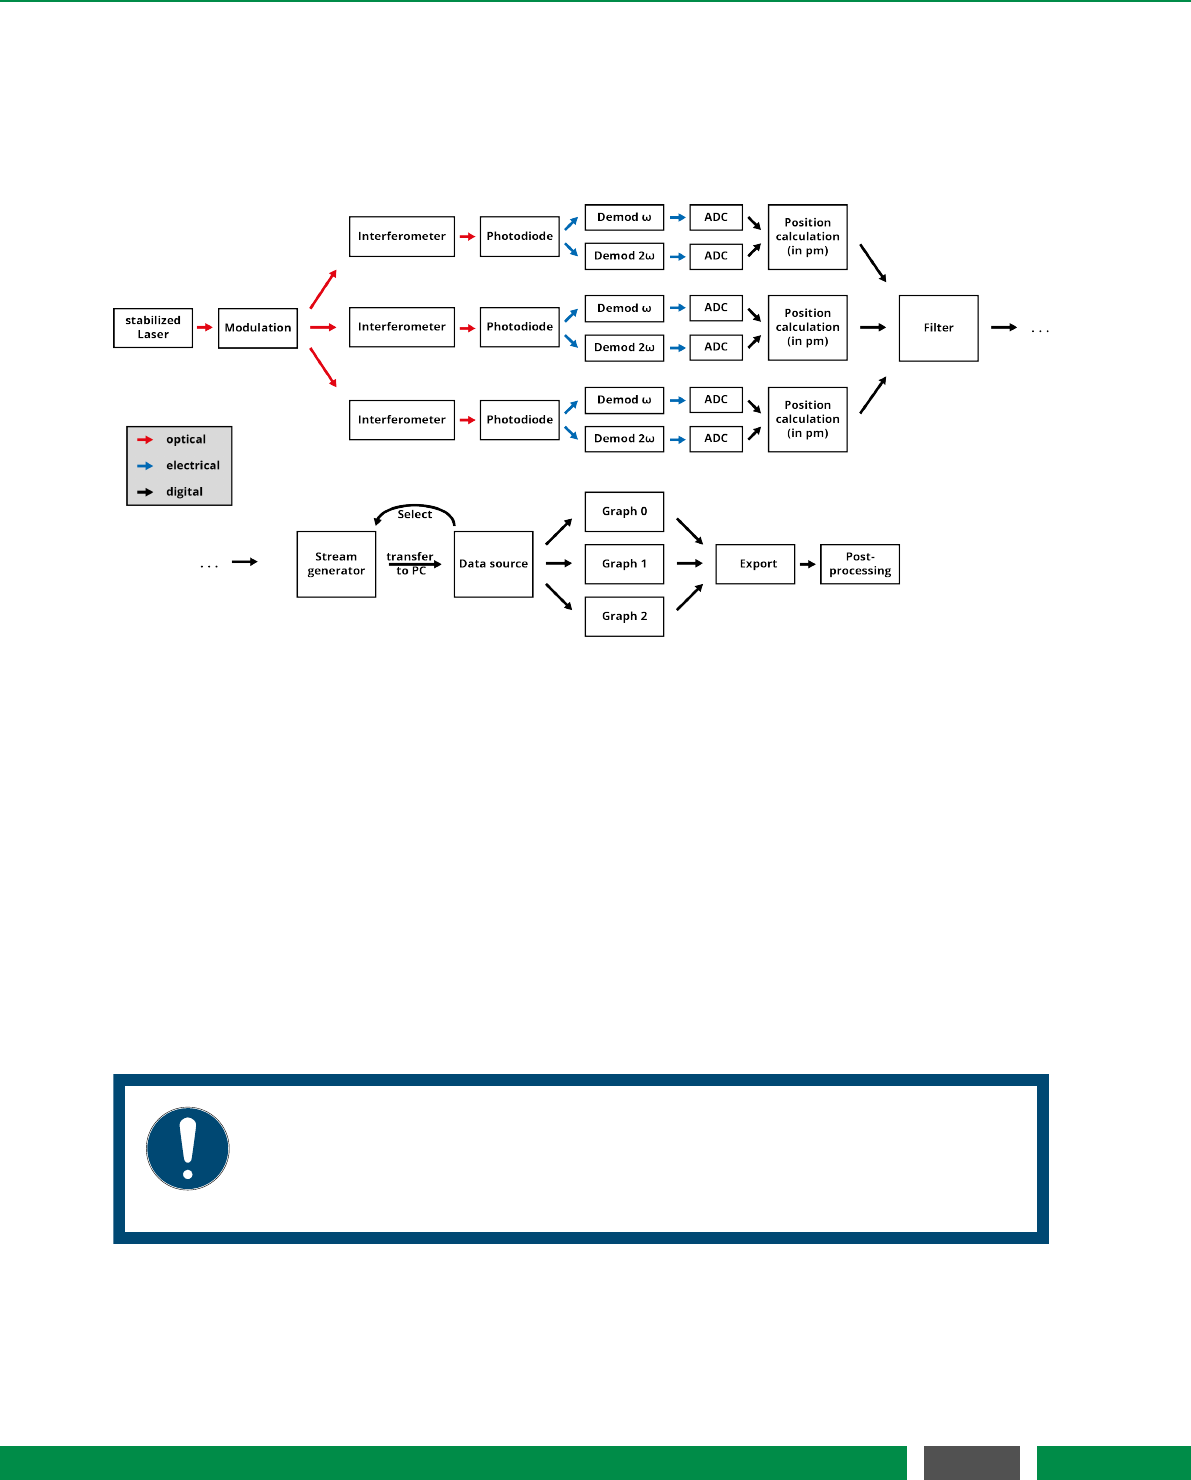
4.3 Signal flow
The PICOSCALE signals can be divided into three categories: optical signals, analog electrical
signals and digital signals. The basic and simplified signal flow is shown in figure 4.2.
Figure 4.2: Signal flow in the PICOSCALE.
At the beginning, an optical signal (light) is generated by a wavelength stabilized DFB laser diode.
The infra-red light is phase modulated with a frequency of ω=30 MHz and sent to the three sensor
heads. The interferometric signals generated in the sensor heads are detected by photo detectors
and converted into electronic signals.
The individual photo-electric signals are demodulated by both the modulation frequency and its
second harmonic (60 MHz). The resulting demodulation signals are digitized by analog-to-digital
converters (ADCs).
The digital signals are used to perform the position calculation. After appropriate filtering, the data
stream is configured and the data are transferred to the user PC. You can select the desired data
sources and display them in graphs. Finally, the data can be exported to csv-files to be available
for data post-processing.
NOTICE
The position values, generated in the FPGA, have a resolution of 1 pm. Thus, all
internal modules, especially the Advanced Trigger System and the Calculation
System, process integer numbers with the unit picometer.
25
PicoScale User Manual

4 BASIC CONCEPTS
4.4 Adjustment auto function
In the PICOSCALE auto functions are complex configuration processes that, once triggered, au-
tomatically perform a sequence of internal routines to optimize the system performance. The
adjustment auto function performs certain procedures to achieve high accuracy of position data
and must be run once before measurement. It has three states:
•Disabled
By default the auto function is disabled.
•Manual Adjustment
In this state you have to adjust the targets that reflect the laser back into the sensor head
in order to get the highest possible signal quality. Once satisfied, the user must start the
automatic adjustment routine to complete the adjustment.
•Automatic Adjustment
In this state the device performs internal signal optimization routines to improve the accu-
racy of the position data. After this procedure, the activated channels will generate valid
position data and you can start measuring.
4.5 Events
In some situations events might occur that require further attention or reactions by the user.
To avoid that the status of the device has to be permanently checked, the PICOSCALE offers a
notification system that you may configure to your needs. By default, the most important alerts
are enabled.
For example, a beam interrupt event is produced if the probe beam is disturbed such that the
signal quality has fallen below a certain level. If at some point the signal quality is sufficiently high
again, a beam restored event is sent. This information is important as you have to check if the
position data are still valid. Within the Advanced Trigger module, this event can be used as trigger
source which can be forwarded to a GPIO pin, for example. This way, you may react to unforeseen
incidents in the experimental setup and stop moving parts, for example.
4.6 System filters
Most PICOSCALE data sources are subject to low pass filtering before they are provided to other
internal modules. Compared to depricated PICOSCALE firmware versions1, this has the advan-
tage that the following modules can operate with filtered data:
•Calculation System. Data are filtered before they can be processed in the module
•Advanced Trigger. Triggers can be set up to react on filtered data
•Digital Differential Interface. Filtered data can be output via the AquadB or SD protocol
1In previous firmwares – older than 1.4.3 – the filters were implemented in the stream generator module. Therefore, only
data that were actually streamed via USB or Ethernet were subject to low pass filtering. If data sources were used within
the Calculation System, Trigger System etc or output via AquadB interface, the data were suffering increased noise.
26
PicoScale User Manual
4 BASIC CONCEPTS
NOTICE
When the data are streamed via USB or Ethernet, filter rate and frame rate have
to be matched. This is important as an inappropriate sample rate may lead to
oversampling or aliasing. In the PICOSCALE GUI, potential aliasing is indicated
by a small warning sign and the frame rate can easily be adapted to the filter.
NOTICE
When SmarAct’s motion controller MCS2 is connected, the filter rate is fixed to
39.06 kHz to match the MCS2’s sample rate and thus to avoid aliasing.
4.7 Streaming aggregation
When data sources are streamed to the PICOSCALE via USB or Ethernet, the PICOSCALE usually
bundles a certain amount of data before it sends them. This so-called aggregation decreases the
communication overhead significantly. If data are streamed with a specific frame rate, the PICO-
SCALE automatically uses a convenient aggregation size. This aggregation size is roughly set to
provide about 20 data packages per second. The protocol works most efficient if the aggregation
size is a power of 2, i.e.
Aggregation =2n,n∈N
However, if an external clock is used as frame rate, the PICOSCALE cannot know the precise frame
rate and thus also an aggregation size cannot be estimated. The user has to set the desired aggre-
gation manually. In the following table please find an overview on the frame rates and respective
aggregation size the PICOSCALE uses for direct streaming (i.e., an internal clock is used as frame
rate), which may serve as and rule-of-thumb to set the aggregation.
4.8 Network discovery protocol
The PICOSCALE network discovery protocol enables to list all available PICOSCALEs in your local
network. Within the PICOSCALE GUIyou may then easily select the appropriate device without
typing in the IP address after every startup of the PICOSCALE or restart of the GUI. See chapter 7
for usage of the protocol with the GUI.
27
PicoScale User Manual

4 BASIC CONCEPTS
Table 4.2: PICOSCALE frame rates and corresponding aggregation sizes.
Frame rate Aggregation
10 / 5 / 2.5 / 1.25 MHz 1024
625 / 312.5 / 156.25 / 78.13 / 39.06 kHz 1024
19.53 kHz 512
9.77 kHz 256
4.88 kHz 128
2.44 kHz 64
1.22 kHz 32
610 Hz 16
305 Hz 8
152 Hz 4
76 Hz 2
38 / 19 / 9 / 4 / 2 / 1 Hz 1
28
PicoScale User Manual
5PICOSCALE HARDWARE
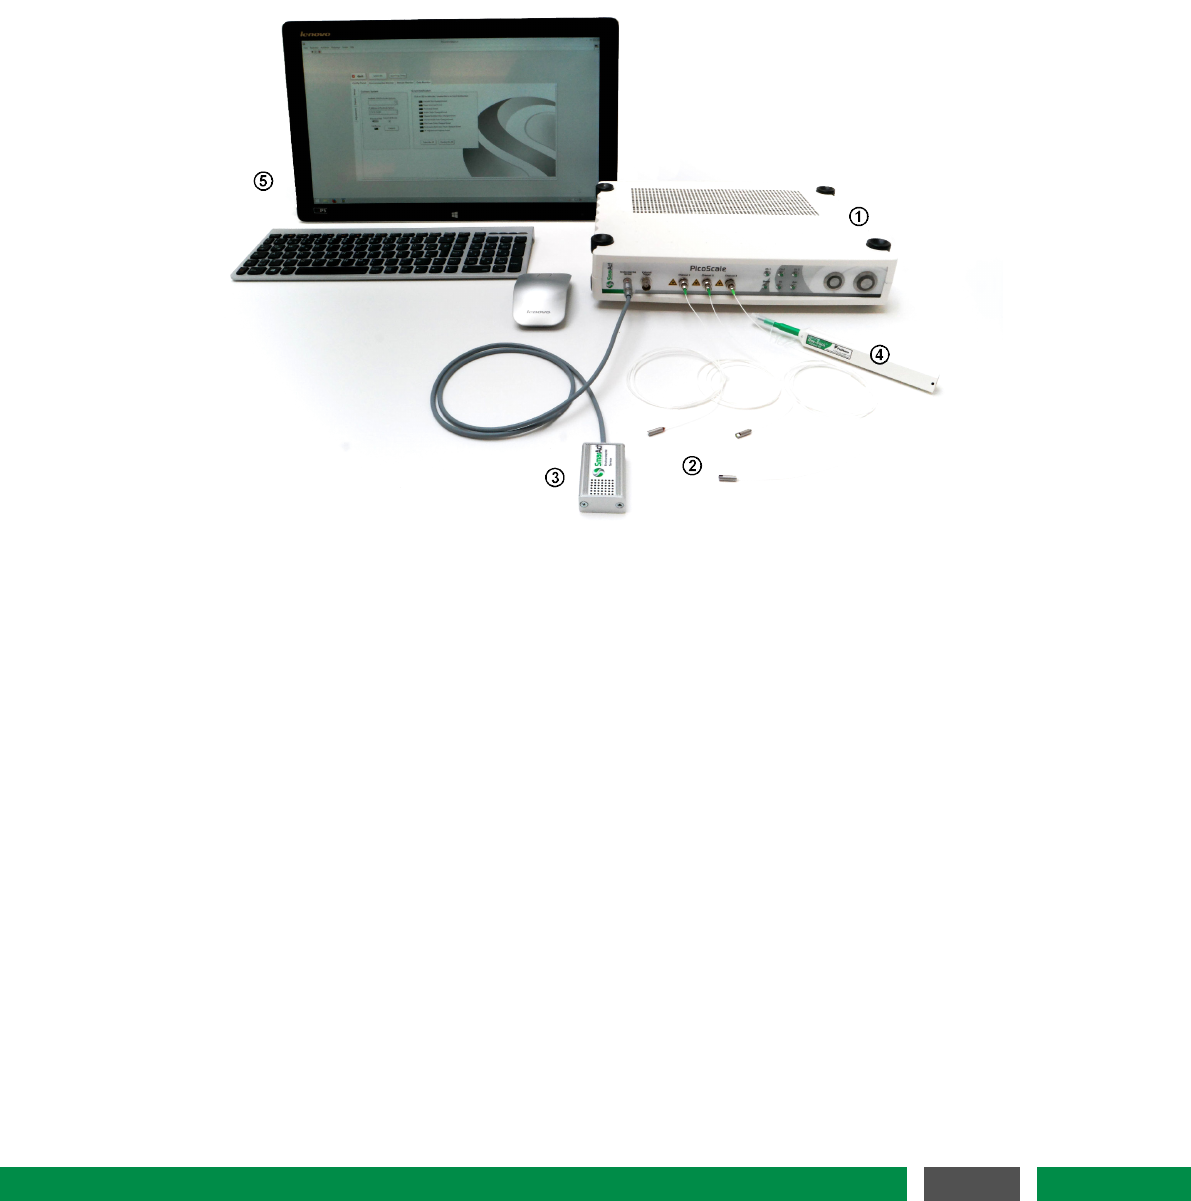
Figure 5.1: Basic accessory, consisting of (1) PICOSCALE Controller, (2) sensor heads, (3) Environ-
mental Module, (4) One-Click cleaner and (5) User PC.
This chapter provides an introduction to the PICOSCALE Hardware. The basic accessories are
shown in figure 5.1. The main component is the PICOSCALE Controller. It is available as a table-
top version (1) and a 19" rack version. Up to three measurement heads (2) and an environmental
module (3) can be connected to the controller. Typically each PICOSCALE system is shipped with
some additional accessory (4) like a One-Click cleaner pen, head adapters, mirror mounts, etc.
Finally, a PC (5) is required. It is not part of the PICOSCALE system and must be provided by the
user.
5.1 PICOSCALE controller
The PICOSCALE Controller contains the laser source, various optics and detection electronics. It
furthermore holds the position calculation unit, which is a hybrid system with a high performance
FPGA and an embedded PC. This combination guarantees maximum flexibility and highest perfor-
mance.
29
PicoScale User Manual
5 PICOSCALE HARDWARE
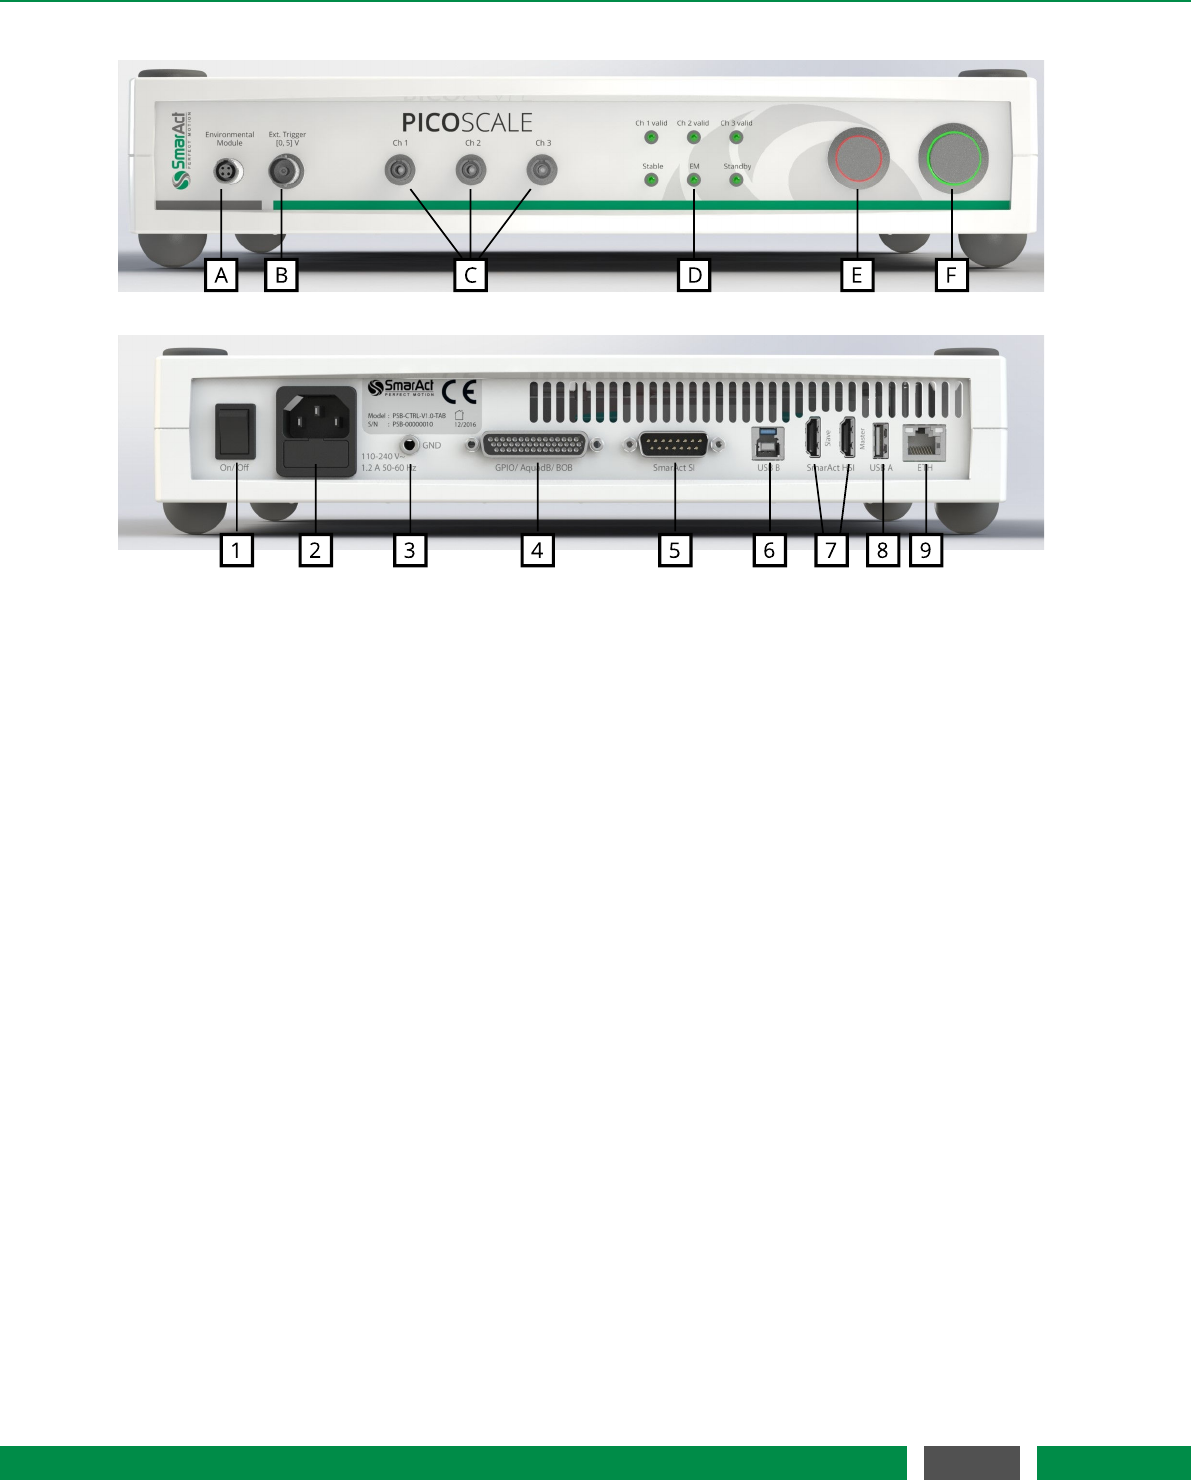
Figure 5.2: (top) Front side of the PICOSCALE Controller with different connectors for the (A) envi-
ronmental module, (B) external trigger connector, (C) sensor heads, (D) status LEDs, (E)
pilot laser and (F) power button. (bottom) Back side of the PICOSCALE Controller with
the (1) main power switch, (2) power connector (fuse included), (3) ground connector,
(4) GPIO and AquadB connector, (5) SmarAct sensor interface, (6) USB slave interface,
(7) SmarAct high-speed sensor interface, (8) USB master interfaces and (9) Ethernet
connector.
Figure 5.2 shows the front and back side of the PICOSCALE Controller. The front side exhibits
inputs for the environmental module (A), external trigger signals (B) and up to three measurement
heads (C). The environmental sensor is connected to the PICOSCALE simply by plugging the mod-
ule connector into the connector at the PICOSCALE housing. Red marks on the connector and
socket indicate the correct orientation.
The external trigger input is a BNC connector with an input range of [0,5] V. Internally, this trigger
input has a pull-up resistor (10 kΩ). Thus, the external trigger is always logically high when nothing
is connected to the input.
The optical inputs/outputs for up to three measurement heads are FC/APC connectors. It is impor-
tant, that only FC/APC connectors are used. Since these connectors have an 8◦-angled end face,
the orientation is crucial. Thus, the male connectors have keys, while the receptacles have corre-
sponding slots. It is mandatory to clean both, male and female connectors, with an appropriate
fiber cleaner (see chapter 6.3 for further information).
The status LED panel (D) offers a convenient overview of the system state. At the top, three LEDs
indicate the channel valid status. A channel becomes valid after the PICOSCALE sensor head
adjustment and the corresponding automated optimization routines have been successful. At the
bottom, the first LED indicates if the system is stable, which means that the wavelength of the
laser is actively stabilized. The PICOSCALE is ready for a measurement, if the desired channels
are valid and the system is stable. The next LED marks, if an active connection to an environmental
30
PicoScale User Manual

5 PICOSCALE HARDWARE
module is established. The last LED indicates if the device is in standby mode. On the right hand
side of the front panel there is the pilot laser button (E) and the power button (F). Once the system
has fully booted, pressing the pilot laser button activates the red adjustment lasers of all three
channels. Active pilot lasers are indicated by the red LEDs integrated into the button. The power
button turns the system on (if it is in standby mode) or off. The two front panel buttons are also
used to update the controller firmware, see chapter 6.6.1.
On the left side of the back panel there is the main power switch (1). When the main power is
turned on, the device is in standby mode and can be started with the power button at the front
panel. Next to the main power switch, there is the power connector (2) with integrated fuse. The
allowed input voltage range is [90,246] VAC with a maximum current of 0.5 ARMS and an AC fre-
quency between [47,63] Hz. The power input is protected with a 2.5 A slow blow fuse. For very
sensitive measurement setups, the PICOSCALE offers a PE socket (3) to reference connected de-
vices to the same ground potential. The GPIO and the AquadB interface (4) are available via a
D-Sub 44HD connector. For convenient access to all GPIOs and the DDIinterface, a Breakout-Box
(BOB) is available as accessory for the PICOSCALE Controller, which is connected via the 44 pin
connector. The PICOSCALE offers two bidirectional, high-level interfaces, USB and Ethernet. For
USB connection, the user PC is connected to the USB slave interface (6), for Ethernet correspond-
ingly to the Ethernet jack (8). Additionally, two integrated USB master interfaces are connected to
the embedded PC. Via these interfaces a software update can be installed, for example.
Besides the main, high-level interfaces, the PICOSCALE offers two low-level interfaces. The Smar-
Act SI(5) and SmarAct HSI(7) allow direct access of other SmarAct products to the PICOSCALE
data sources.
5.2 Interfaces
To work with the PICOSCALE Controller the system has to be connected to a PC. Therefore, a
USB 2.0 slave and a GBit Ethernet interface can be used. Both interfaces can be used at the same
time so that up to two users can connect to the system via Ethernet and USB. This allows that
data can be read out from several terminals at the same time. However, to prevent unintentional
reconfiguration, only one user has full access and the ability to configure the system.
The PICOSCALE offers a multitude of analog as well as digital interfaces to input or extract data
to and from the device, respectively. This guarantees a seamless integration in laboratory setups
with great flexibility that goes far beyond interferometric position measurements.
5.2.1 Environmental Module interface
The Environmental Module is connected to the PICOSCALE Controller with a four wire interface.
The communication to the PICOSCALE Controller is realized by a UART protocol, and the power
supply of the Environmental Module is also provided by this interface.
31
PicoScale User Manual
5 PICOSCALE HARDWARE
5.2.2 Optical outputs
CAUTION
Laser outputs. The PICOSCALE Controller contains an infrared diode laser with
an output of less than 0.2 mW at 1520 nm - 1580 nm and a red diode laser with
an output power of less than 0.6 mW at 650 nm. Do not stare into the beam and
ensure the laser light is always appropriately guided.
The PICOSCALE Controller has three optical outputs at the front panel of the chassis. Directly
after start up, the infrared measurement laser is enabled. This laser source has an output power
of maximum 0.2 mW per channel at a wavelength of 1520 nm - 1580 nm.
To improve the adjustment of the interferometer heads the PICOSCALE Controller provides the
possibility to switch on a red pilot laser with the pilot laser button on the front panel. The pilot
laser has a output power of max. 0.6 mW per channel at a wavelength of 650 nm. It has no
influence on the measurement of the PICOSCALE Controller.
5.2.3 Power connection
Connect the PICOSCALE Controller only with the provided IEC power cord and properly estab-
lished protective earth. After connecting the power cord use the main power switch to set the
system into standby mode. Finally press the power button on the front panel to start the system.
Change the main fuse
The PICOSCALE Controller is protected with a 2.5 A glass tube fuse with a slow blow timing be-
haviour. To prevent permanent damage or fire, the fuse must only be replaced with an equivalent
fuse if required (e.g. ESKA No. 522.500). The dimension of the glass tube is 20 x 5 mm.
WARNING
To prevent electrical shock, remove the power cord from the PICOSCALE Con-
troller before replacing the fuse.
To change the fuse, remove the power cord and open the fuse holder (see figure 5.2). There are
slots for two fuses. The first slot contains the active fuse, in the second slot a fuse for replacement
is included. Remove the damaged fuse and replace it with a slow blow 2.5 A glass tube fuse with
the dimension of 20 x 5 mm.
32
PicoScale User Manual
5 PICOSCALE HARDWARE
5.2.4 USB slave interface
The USB slave interface is one of the main bidirectional communication interfaces of the PICO-
SCALE Controller. It provides a USB 2.0 high speed connection with data-rates of up to 480 Mbits/s.
5.2.5 Ethernet interface
The Ethernet interface is the second main bidirectional communication interface of the PICO-
SCALE Controller. The interface is configured via the embedded PC and is able to provide GBit
Ethernet. To use the full performance of the PICOSCALE Controller, a GBit Ethernet connection is
required.
5.2.6 USB master interface
The USB master interface is connected to the embedded PC. Via this interface software updates
can be installed, for example (see chapter 6.6.1 for more information).
5.2.7 SmarAct Sensor Interface (SI)
NOTICE
The SmarAct sensor interface is sensitive to electrostatic discharge. Please use
wrist straps when using this interface.
The SmarAct SIinterfaces the PICOSCALE Controller with other SmarAct products, e.g. the Mod-
ular Control System 2 (MCS2). In this configuration the PICOSCALE Controller may act as sensor
module for the motion system.
5.2.8 SmarAct High Speed Sensor Interface (HSI)
The SmarAct HSIis an optional interface to connect other SmarAct systems with the PICOSCALE
Controller. This interface has the advantage that data can be transceived with data-rates up to
6.5 Gbit /s. This allows to perform very fast data processing with high resolution.
5.2.9 GPIO and Digital Differential Interface
The D-Sub 44HD connector provides several interfaces including analog and digital GPIOs as well
as Digital Differential Interfaces (DDI) for all three channels. Each DDIchannel can either act as an
AquadB or a serial interface. These additional interfaces make the PICOSCALE Controller a very
versatile laboratory measurement instrument as it provides the functionality of signal generators,
trigger systems, signal trackers and position measuring sensor in one device. This integration
33
PicoScale User Manual

5 PICOSCALE HARDWARE
in one device also has the advantage that different data sources are synchronized and can be
handled with a single tool.
For easy access to the signals we recommend to use the PICOSCALE Breakout-Box which is de-
scribed in chapter 5.3. It includes additional buffering of analog and digital IOs and splits the
D-Sub 44HD connector to BNC connectors. However, for direct access via the D-Sub 44HD con-
nector, please contact SmarAct for information on the pin assignments.
34
PicoScale User Manual
5 PICOSCALE HARDWARE
5.3 Breakout-Box
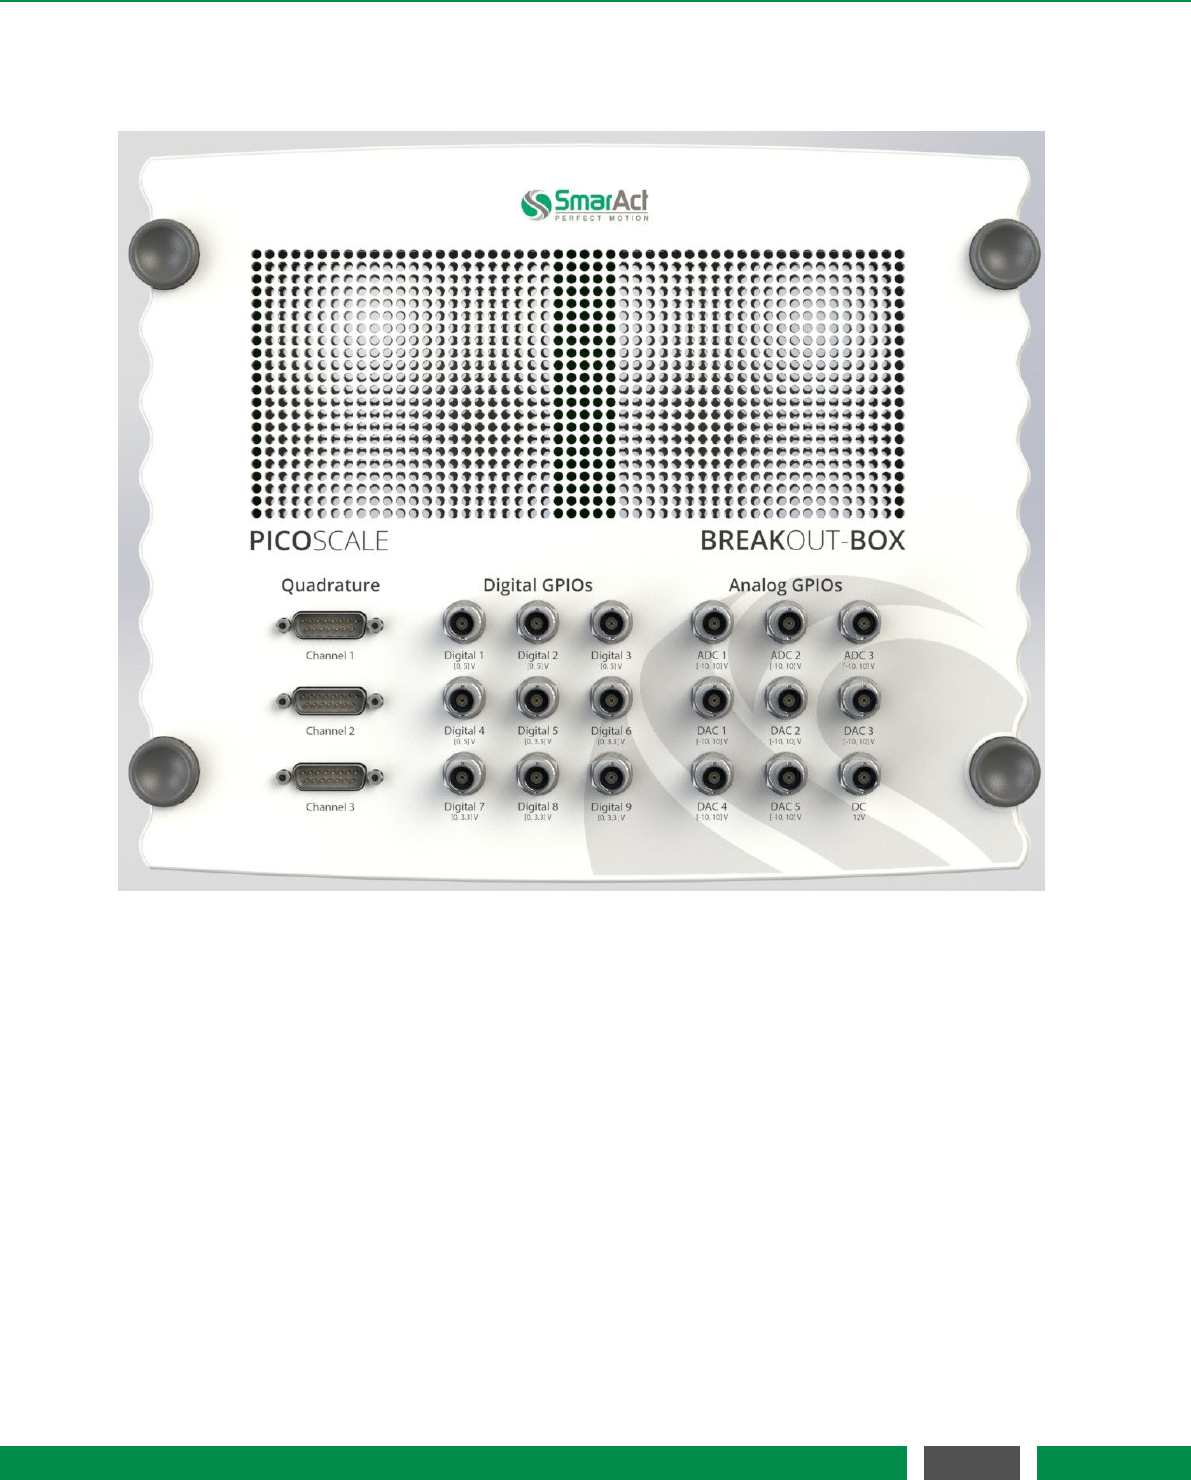
Figure 5.3: Breakout-Box connectors overview.
The PICOSCALE Breakout-Box (BOB) provides simple and convenient access to the great variety of
signals at the DSub 44HD connector. The chassis of the Breakout-Box is the same as the chassis of
the PICOSCALE Controller and BOB can be stacked on top of a PICOSCALE Controller. Ventilation
holes of the PICOSCALE Controller are passed on to the Breakout-Box, so that heated air can
disappear freely. Do not cover the holes to prevent overheating of the PICOSCALE Controller!
The connectors on the top of the Breakout-Box are placed in three groups. AquadB outputs are
placed on the left hand side, digital GPIOs can be found in the center and analog GPIO pins are on
the right hand side (see figure 5.3). Analog and digital GPIOs can be connected via BNC connectors
while the AquadB signals are mapped to DSub 15 connectors.
35
PicoScale User Manual

5 PICOSCALE HARDWARE
5.3.1 Differential Digital Interface DDI
The Differential Digital Interface (DDI) provides two differential digital signals, which can be used
for different digital protocols, e.g. AquadB and Serial Data. With the Breakout-Box the signals are
distributed to three DSub 15 connectors, one per channel. The pin assignment is shown in figure
5.4 and specified in table 5.1.
8
7
6
5
4
3
2
1
15
14
13
12
11
10
9
Figure 5.4: Pin assignment of the DSub 15 connector.
Table 5.1 –Pin assignment of DSub 15 AquadB connectors
Signal Direction AquadB serial data
1 Out A positive CLOCK positive
2 Out B positive DATA positive
3 - 7 - not connected -
8 - System Ground System Ground
9 Out A negative CLOCK negative
10 Out B negative DATA negative
11 - 15 - not connected -
Shielding - System Ground System Ground
The output levels of the specific DDIpins are illustrated in figure 5.5. Main performance parame-
ters are listed in 5.2.
1
3.5
V
t
AquadB.X_P
AquadB.X_N
Figure 5.5: Output level of the specific pins of the AquadB connector, where the Xis to be replaced
by the individual channel number and quadrature (A or B). The indices Pand Ndenote
the positive and negative part of a differential AquadB pair.
36
PicoScale User Manual
5 PICOSCALE HARDWARE
Table 5.2: Main performance data DDI
Parameter Typical Value Unit Comment
VODiff 0 - 5 V Differential output voltage
VIHDiff 0.2 V Differential high-level input voltage
VILDiff -0.2 V Differential low-level input voltage
fmax 5 MHz Max. frequency per differential pair
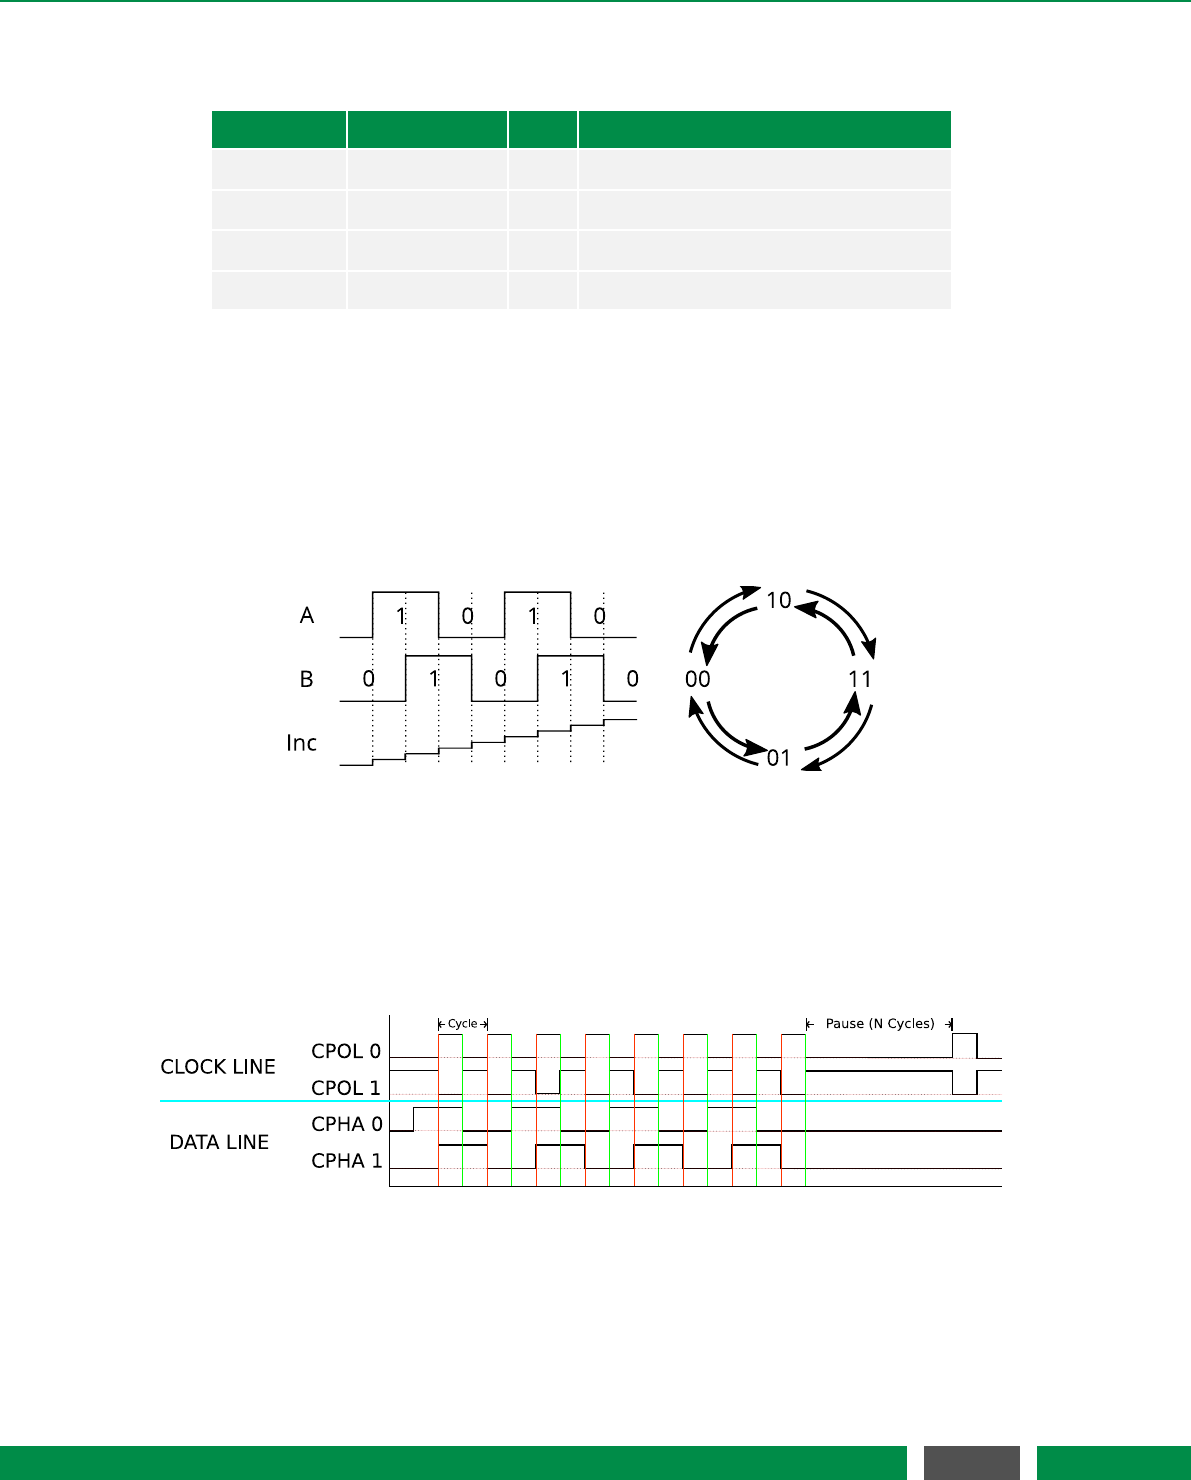
BOB AquadB
Industry standard AquadB receivers are often able to receive differential quadrature signals as
provided by the PICOSCALE Controller. In figure 5.6 the AquadB signals are shown schematically.
With the signals A and B four states can be encoded, each state indicates a position increment. So
the maximal increment frequency is 4 times the maximum differential pair frequency, in this case
20 MHz.
Figure 5.6: Scheme of the differential A and B signal and the according position increment of the
Quadrature interface.
The direction of the position change is given by the order of the cases.
BOB Serial Data
Figure 5.7: Clock and data cyles on the serial interface. The CLOCK LINE can either have a negative
zero level or a positive zero level. The DATA LINE can either be written with rising or the
falling edge of the clock.
Each of the three DSub 15 connectors can be configured to act as a serial data output. Infigure
5.7 the options are illustrated. The upper part of the figure shows the options of the clock line and
37
PicoScale User Manual

5 PICOSCALE HARDWARE
the lower part shows the options of the data line.
• (CPOL 0): The CLOCK LINE has a negative zero level .
• (CPOL 1): The CLOCK LINE has a positive zero level.
• (CPHA 0): The DATA LINE is written with the beginning of each clock cycle.
• (CPHA 1): The DATA LINE is written at the center of each clock cycle.
Furthermore, you can choose the data idle polarity.
5.3.2 BOB digital GPIOs
The digital GPIOs are buffered on the Breakout-Box. The signals labelled with Digital1 - Digital4
have a 5 V high level, while the Digital5-Digital9 signals have a 3.3 V high level. All digital GPIOs
are matched with a 50 Ωserial resistor. The direction of the buffers is automatically set with the
direction of the digital GPIOs within the PICOSCALE Controller. Main performance parameters
are listed in table 5.3 (for the Digital 1-4 signals) and table 5.4 (for the Digital 5-9 signals).
Table 5.3: Main performance data BOB Digital 1-4 GPIO Buffer
Parameter Typical Value Unit Comment
VO0 - 5 V Digital 1-4 output voltage
VIH3.5 V High-level input voltage
VIL1.5 V Low-level input voltage
rising/falling edge ≦50 ns
Table 5.4: Main performance data BOB Digital 5-9 GPIO Buffer
Parameter Typical Value Unit Comment
VO0 - 3.3 V Digital 5-9 output voltage
VIH2 V High-level input voltage
VIL0.8 V Low-level input voltage
rising/falling edge ≦50 ns
Due to the limited bandwidth it is recommended to use the digital GPIOs with a maximum fre-
quency of 1 MHz. Using higher frequencies may cause asymmetries in the duty cycle of the signal.
Depending on the cable connected to the BNC connector the digital GPIOs can over-/undershoot
with up to 1 V. The best signal form can be achieved in a 50 Ωenvironment and with short connec-
tions.
38
PicoScale User Manual

5 PICOSCALE HARDWARE
5.3.3 BOB analog GPIOs
The Breakout-Box buffers and normalizes the analog GPIOs to single ended signals with an ampli-
tude of ±10 V.
At the input ADC1 the single ended ±10 V signal is converted to a differential signal with an ampli-
tude equivalent to a full scale modulation of the ADC. Due to component tolerances, offsets and
gains can vary slightly so that ±10 V is not exactly equivalent to the ADC’s resolution. For an ex-
act mapping of voltage to ADC resolution it is recommended to do a calibration of the ADC input.
The input impedance of the ADC1 input is approx. 2.4 kΩ. The inputs ADC2 and ADC3 input are
converted a differential signal. Again, it is recommended to do a calibration to get an exact map-
ping from voltage to ADC resolution. The input impedance is approx. 34 kΩ. For a performance
overview see table 5.5 and 5.6.
Table 5.5: Main performance data of ADC1
Parameter Typical Value Unit
Full-scale input voltage ±10 V
Sample-rate 10 MS /s
Resolution 16 Bit
Bandwidth f1dB 2-2.5 MHz
Table 5.6: Main performance data of ADC2 and ADC3
Parameter Typical Value Unit
Full-scale input voltage ±10 V
Sample-rate 100 kS /s
Resolution 16 Bit
Bandwidth f1dB 35-45 kHz
The Breakout-Box converts the differential DAC1 signal from the PICOSCALE Controller to a single
ended ±10 V output signal. The output can drive currents up to 35 mA and a capacitive load up to
33 pF. DAC2-DAC5 are the PICOSCALE DAC signals normalized to ±10 V.If a single DAC channel
is connected, it can drive currents up to ±30 mA and a capacitive load of up to 200 pF. With more
channels connected, the maximum current reduces correspondingly. For a performance overview
see table 5.7 and 5.8.
39
PicoScale User Manual
5 PICOSCALE HARDWARE
Table 5.7: Main performance data of DAC1
Parameter Typical Value Unit
Full-scale output voltage ±10 V
Sample-rate 10 MS /s
Resolution 12 Bit
Bandwidth f1dB 2-2.5 MHz
Table 5.8: Main performance data of DAC2-5
Parameter Typical Value Unit
Full-scale output voltage ±10 V
Sample-rate 200 kS /s
Resolution 16 Bit
Bandwidth f1dB 130-170 kHz
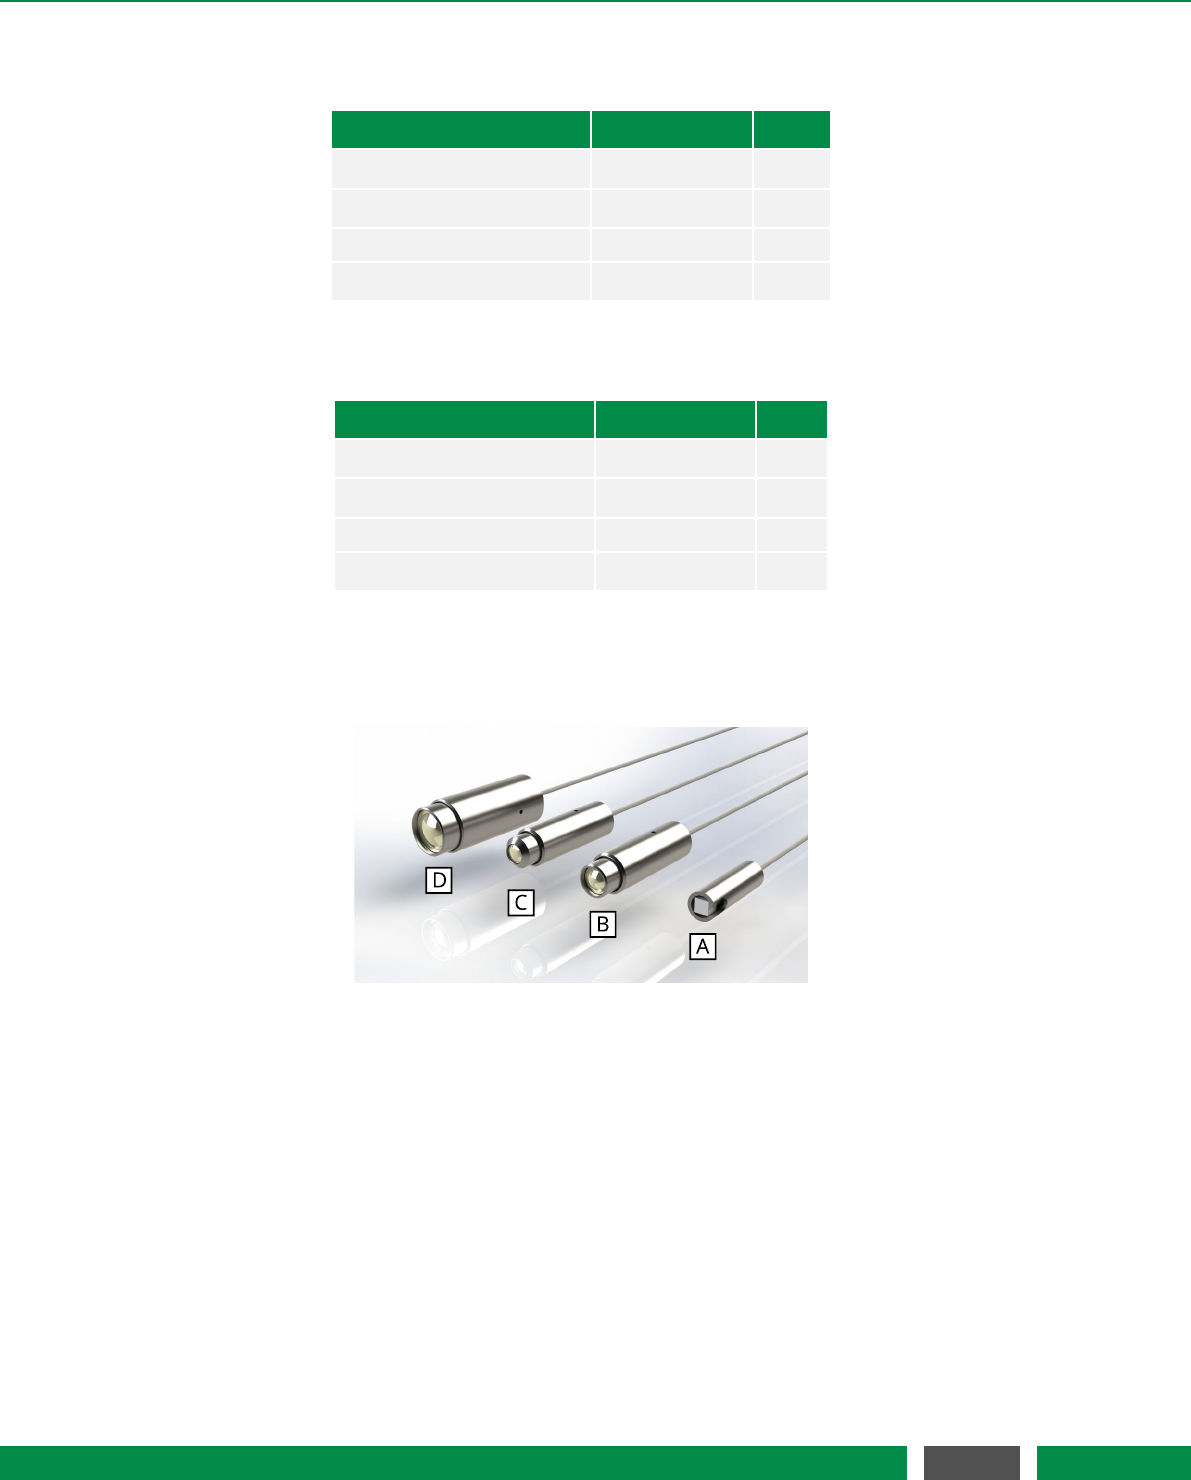
5.4 Sensor heads
Figure 5.8: Selection of PICOSCALE sensor heads: (A) PS-SH-C01, (B) PS-SH-F01, (C) PS-SH-C03, (D)
PS-SH-C02.
The PICOSCALE interferometer sensor heads are based on an optical fiber, a fiber ferrule, a colli-
mator and a beam splitter cube. The optical fiber (single mode, minimum bending radius 10 mm)
is terminated with a 8◦ferrule. The angle is introduced to suppress parasitic interferences. A gra-
dient index (GRIN) lens (also with 8◦angle) is glued to the ferrule and used to collimate the laser
beam. The key component is the beam splitter cube. The beam is split into two parts. One part is
guided to the reference mirror that is coated to one of the surfaces of the cube. The other part is
guided to the target. Given proper alignment, the probe beam interferes with the reference beam
in the beam splitter cube. The interfering light is guided through the optical fiber back into the
PICOSCALE Controller, where it is detected by a photo detector and the interference pattern is
evaluated.
40
PicoScale User Manual
5 PICOSCALE HARDWARE
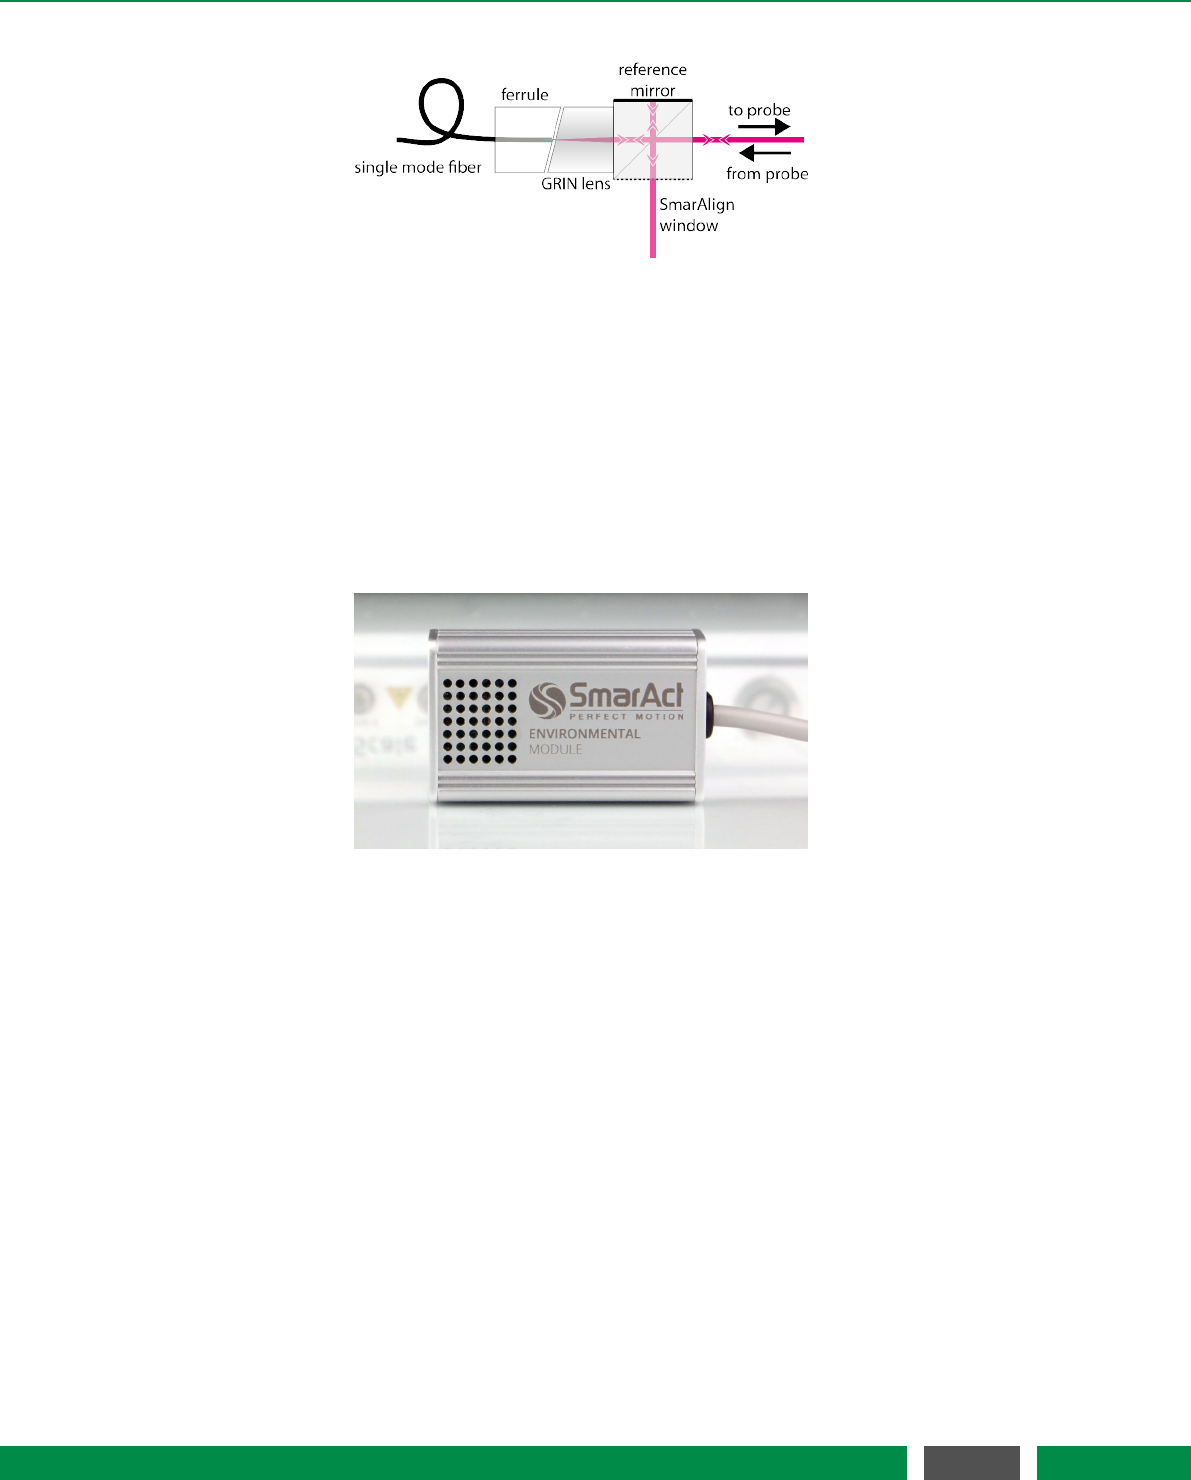
Figure 5.9: Setup of a PICOSCALE sensor head.
The open port of the beam splitter cube is the SmarAlign window. In specific sensor heads (for
example sensor head type C01) it can be used as a monitor to superimpose the beams reflected
from the reference and target mirror, respectively, using the visible pilot laser beam that is dif-
fusely scattered at this surface. All standard components are mounted in a titanium sleeve.
5.5 Environmental Module
Figure 5.10: Environmental Module
To measure the environmental parameters (temperature, pressure, humidity), an environmental
module can be connected to the PICOSCALE Controller. Since the measurement of the environ-
mental conditions is most meaningful close to the sensor head, the environmental module has a
small chassis to make it possible to place it in close vicinity of the heads. The environmental mod-
ule is contained in an aluminum housing as small as 32x50x16 mm³. A microprocessor collects the
data of the individual sensors and sends them to the FPGA for further processing. The measure-
ment bandwidth is 1 Hz which is sufficient to detect variations in the environmental conditions.
The accuracy of the environmental module is:
•temperature: ±200 mK
•pressure: ±2 mbar
•relative humidity: ±2%
These measurement uncertainties result in a position accuracy of typically <1 ppm.
41
PicoScale User Manual

6SETUP AND INSTALLATION
The following chapter describes the installation of a PICOSCALE system. Since many of the PICO-
SCALE components are fragile, please read and follow the information in this chapter carefully!
6.1 System checklist
If any cartons have been damaged, contact the shipper or SmarAct sales team at once. The ship-
ping boxes for a standard PICOSCALE interferometer should contain the following equipment
and documentation:
Table 6.1 –Components of a PICOSCALE System
Transport Case Image Dimension and Weight Content
Height x Width x Depth: (1) PICOSCALE Controller
15cm x 45cm x 40cm (2) USB Cable
Weight: (3) Power Cable
5.94kg (4) One-Click Cleaner Pen
(5) User Manual
(6) Software CD
Height x Width x Depth: (7) Sensor Head
4cm x 16cm x 15cm (8) Data sheet
Weight:
0.20kg
Continued on next page
42
PicoScale User Manual
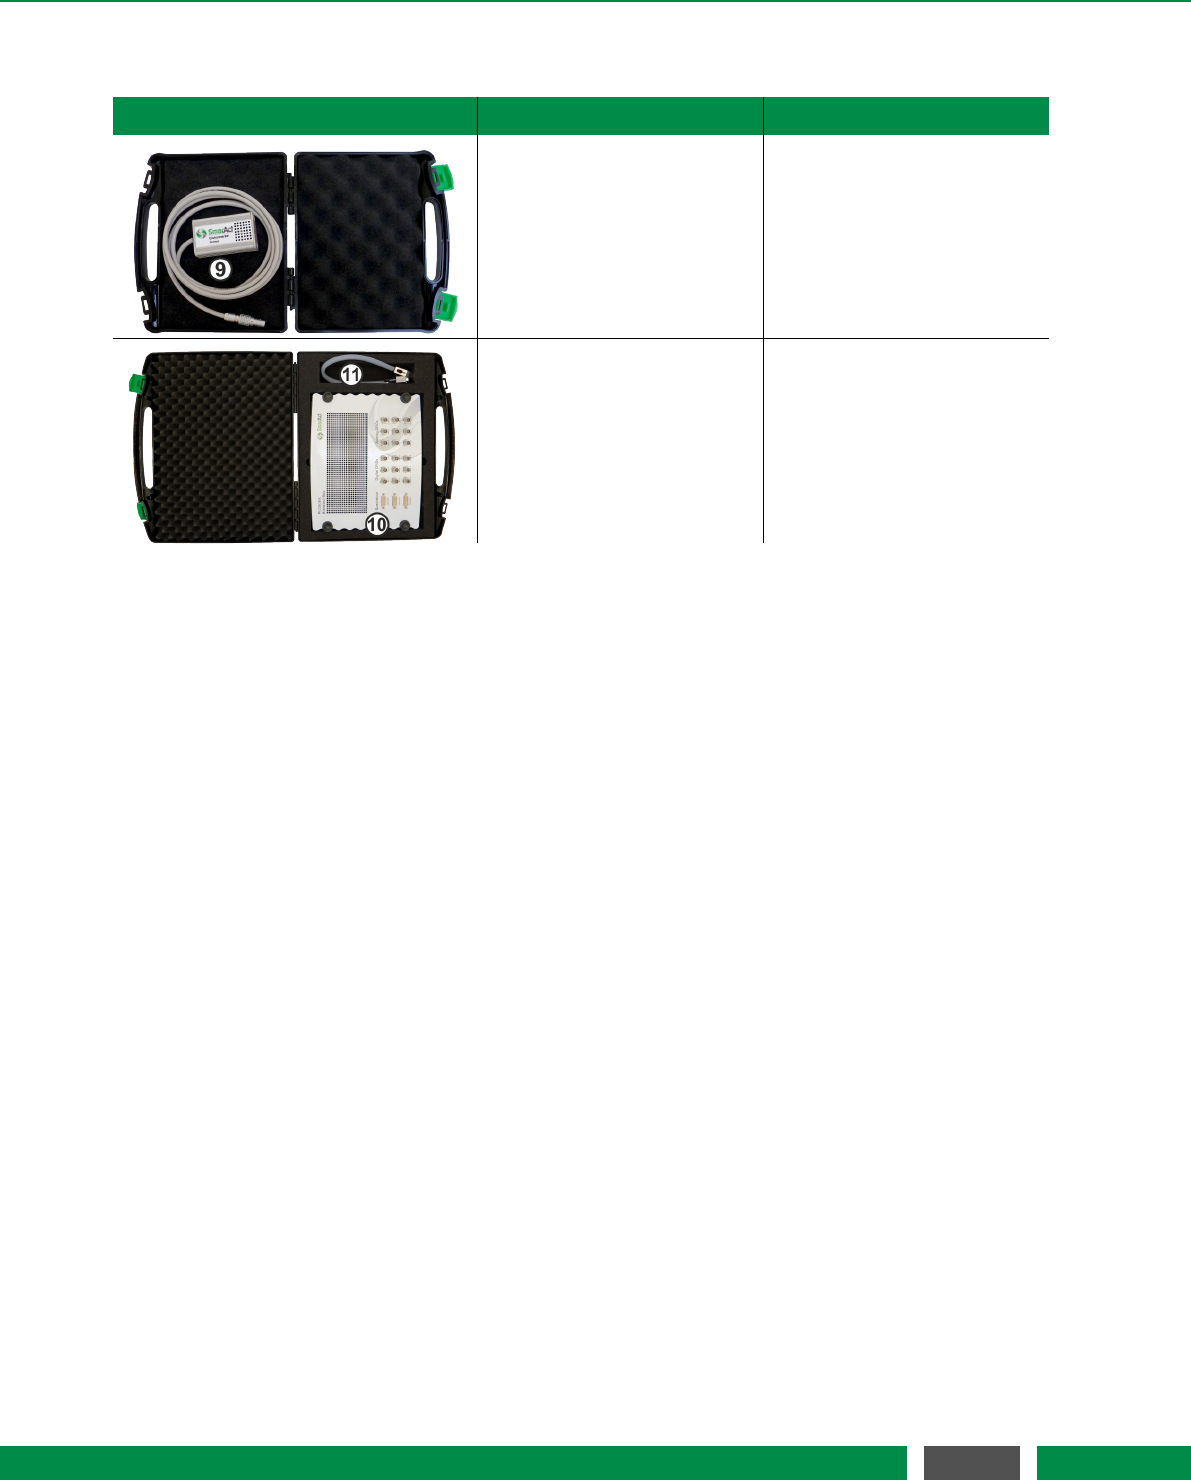
6 SETUP AND INSTALLATION
Table 6.1 – Continued from previous page
Transport Case Image Dimension and Weight Content
Height x Width x Depth: (9) Environmental Module
4cm x 16cm x 15cm (optional)
Weight:
0.3kg
Height x Width x Depth: (10) Breakout-Box
15cm x 45cm x 40cm (optional)
Weight: (11) BOB Cable
4.62kg (optional)
In case you have bought an in-vacuum system, there should be additional components like fiber
feed-throughs and fiber patch cords. A complete list of all PICOSCALE components and accessory
can be found on the SmarAct web page.
6.2 Unpack the system
1. Unpack the PICOSCALE system in an area that is clean and dry. Be very careful, especially
with fragile optical and vacuum components.
2. Check each shipping container to be sure you have removed all transport cases and addi-
tional items. Do not discard the reusable shipping containers until it is certain that all items
have been removed. It is recommended to keep the shipping containers in case you must
return any equipment to SmarAct.
3. Open each transport case and unpack the system components.
4. You are now ready to set up the system in the desired location.
6.3 Cabling
For the first time installation, the PICOSCALE has to be connected via USB to the measurement
PC. Note, that the PC is not part of the system and has to be supplied by the customer separately.
Connect the included USB cable to the USB slave interface at the back side of the PICOSCALE
Controller (figure 5.2, No. 6) and to the desired USB port at the user PC. After that, connect the
power supply cable to the power connector at the back side of the controller (figure 5.2, No. 2).
43
PicoScale User Manual
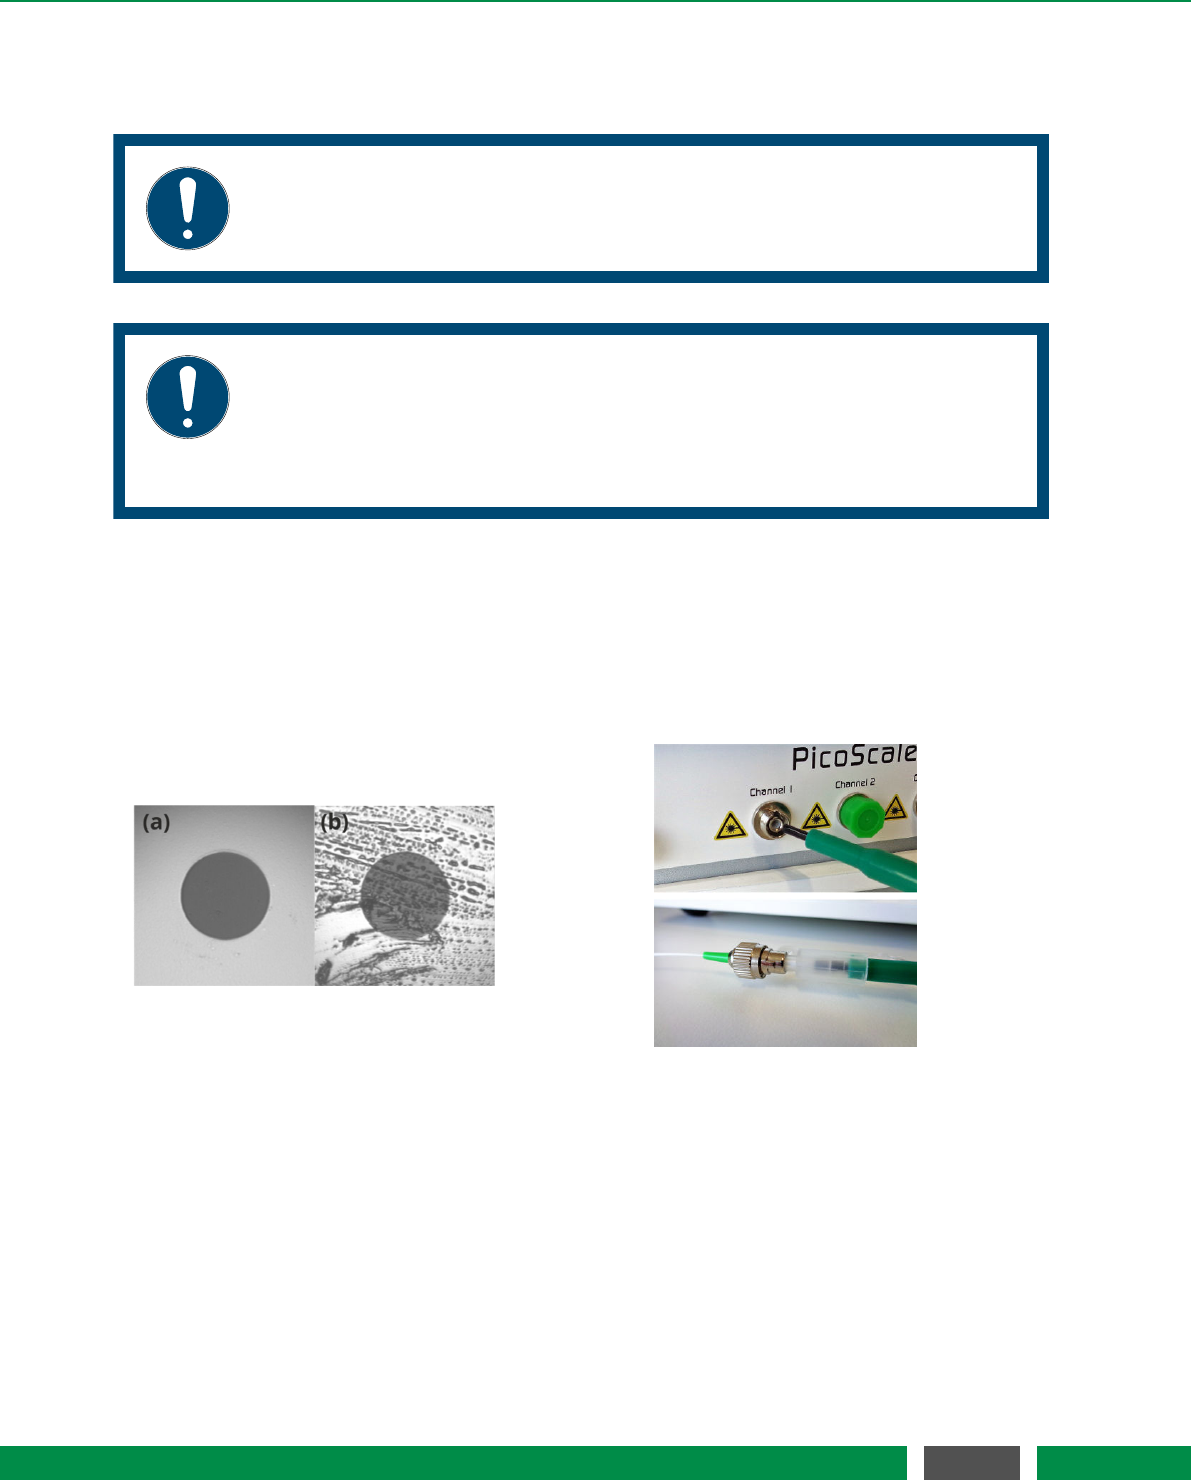
6 SETUP AND INSTALLATION
Next, connect the measurement heads to the corresponding adapters at the front side of the
PICOSCALE (figure 5.2, No. 4).
NOTICE
Glass fiber cables are very fragile and sensitive to bending. Please always respect
a minimum bending radius of 30 mm, unless otherwise specified.
NOTICE
Please note, that dirt attached to the fiber end-face can significantly lower the
system’s performance or even destroy the fiber connector. In this case, the
PICOSCALE and/or the corresponding sensor head has to be sent back to Smar-
Act to get repaired.
To ensure optimal signal quality and also to prevent damage of the fiber surfaces, it is very impor-
tant to clean all connectors first. This can be done using the One-Click cleaner pen which is part
of our shipment, cf. figure 6.1. Open the plastic cap and push the plastic tube onto the glass fiber
end piece until you hear a click. To clean the connectors on the PICOSCALE Controller or vacuum
feedthroughs, remove the plastic tube on top of the fiber optic cleaner and then repeat the same
process.
Figure 6.1: (left) Closeups of a clean (a) and dirty (b) fiber endface. Cleaning of the connectors and
sockets using the One-Click pen is illustrated on the right hand side.
Figure 6.1 (a) shows a close-up of a clean end-face, while image (b) shows dirt accumulated on
the end-face. On the right hand side cleaning of the fiber using the One-Click pen is illustrated.
For a detailed description of the One-Click pen please refer to the brief application note delivered
together with the tool.
When the fiber surfaces have been cleaned, gently plug the fiber connectors into the correspond-
ing sockets. The key of the connectors must slide into the matching slot in the socket (fig. 6.2).
Then fasten the connectors by turning the coupling ring.
44
PicoScale User Manual
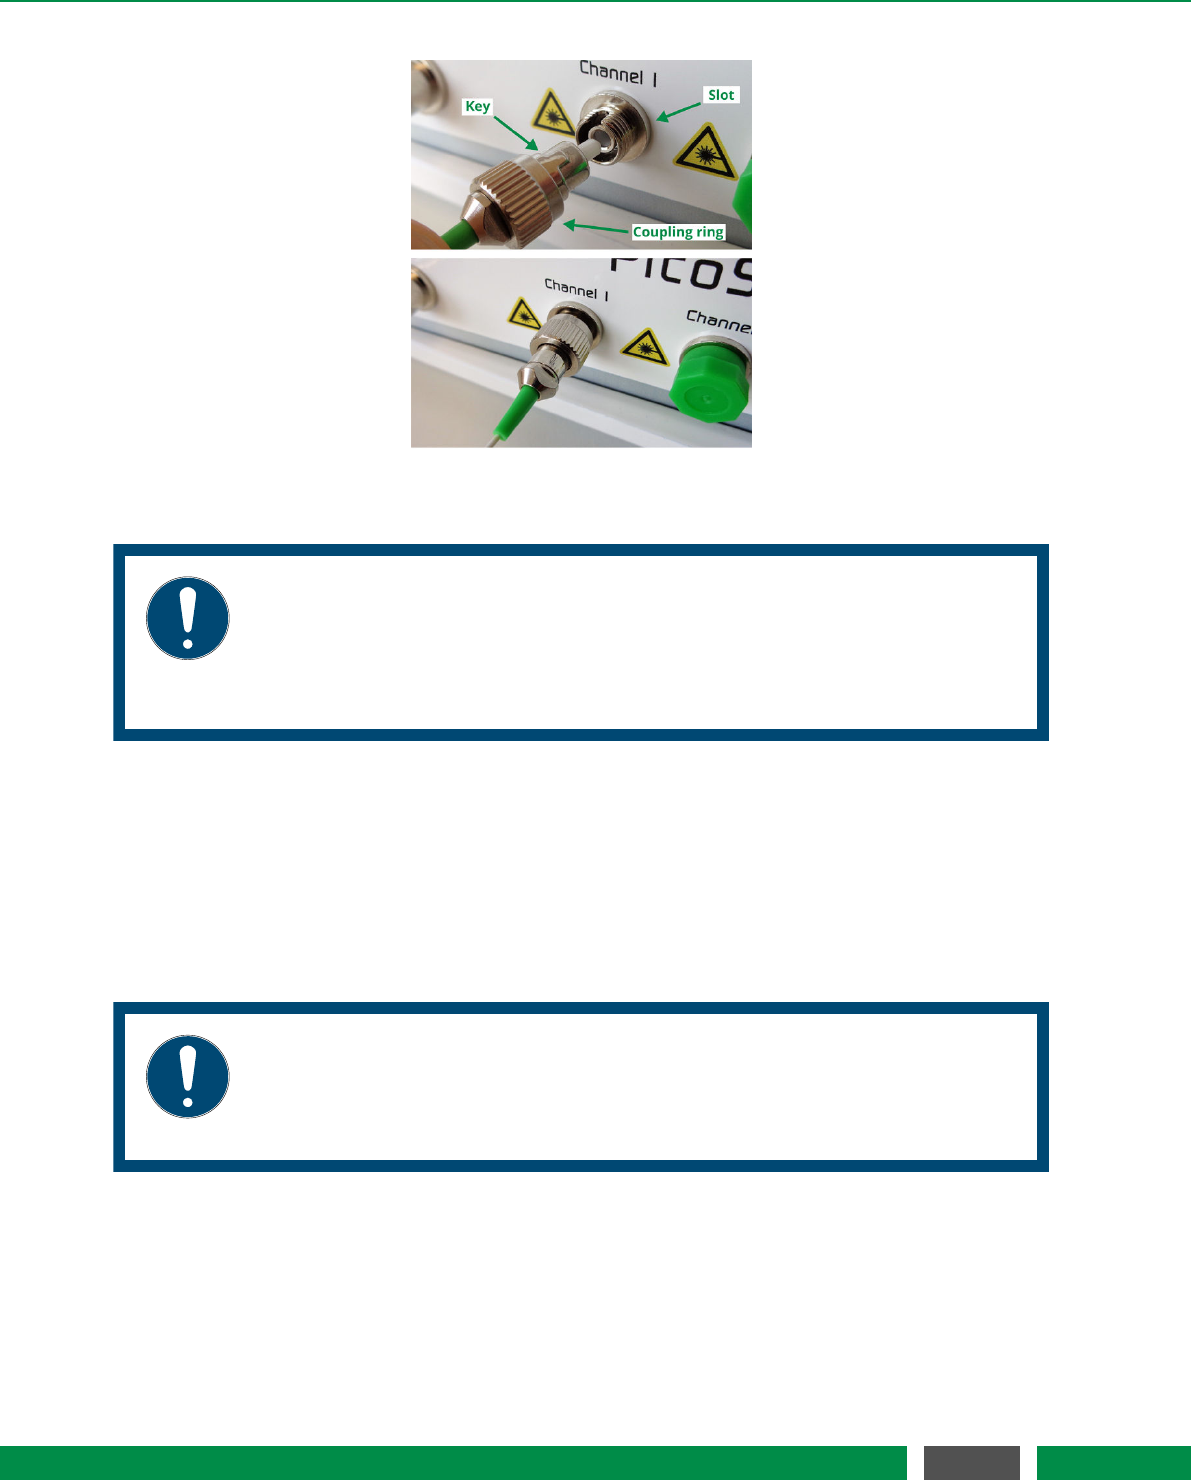
6 SETUP AND INSTALLATION
Figure 6.2: Connection of sensor head.
NOTICE
The PICOSCALE fiber network consists of FC/APC connectors. Do not plug any
other optical connector types to the system or its subcomponents. This may
cause significant damage to the optical system and dramatically drops the sys-
tem performance.
If purchased, connect the environmental module to the system front panel (figure 5.2, No. 1). A
red line and dot printed to the plug and connector mark the correct orientation. Place the sensor
as close as possible to the measurement head(s), to ensure that the sensor measures the local
environmental parameters, thus, reducing compensation errors.
The Breakout-Box (BOB) is connected using the included cable to the back panel of the PICO-
SCALE housing. Although the Breakout-Box is hot pluggable, it is recommended to connect BOB
before the system is switched on.
NOTICE
The included BOB cable is quite sensitive to bending, thus respect a minimum
bending radius of 50 mm. Please handle the large cable connectors with care
and ensure that no pins are bent prior plugging.
6.4 System power up
Connect the power cable and press the main power switch on the back side (figure 5.2, No. 1). Now
the standby LED at the front panel should be on, indicating an active power connection (figure 5.2,
45
PicoScale User Manual

6 SETUP AND INSTALLATION
No. 4). Press the power button at the right-hand-side of the front panel to power up the system
(figure 5.2, No. 6). A green LED ring should now illuminate the power button. The status LEDs start
blinking, indicating the boot sequence of the embedded controllers. After a few seconds, the LED
blinking stops and the system is ready to use.
With the Pilot Laser button (figure 5.2, No. 5) at the front panel, an additional red laser can be
activated, which is very helpful during the alignment of the sensor heads.
6.5 PICOSCALE software and API installation
The PICOSCALE Software provides you with a graphical user interface (GUI) as well as an applica-
tion programming interface (API). For proper operation of the software Windows 7 or later should
be used.
The minimum requirement regarding the cpu is an Intel Core-i5 processor of the fourth generation
or similiar and 4 GB of RAM. Recommended is an Intel Core-i7 processor of the fourth generation
or similiar with at least 3GHz and 8 GB of RAM.
To install the PICOSCALE software and API, open the included software CD and start the installer
program PicoScale_Installer_<version>.exe. At first, the installer dialogue presents some
important information about software and APIchanges. After confirming these information, you
can select a destination folder (default: C:\SmarAct\). Lastly, you can select which components
should be installed. After the installer is finished the PICOSCALE software and documentation
can be found in the PICOSCALE folder in the destination path.
To uninstall the PICOSCALE software navigate to the Uninstall folder in the PICOSCALE main
folder. Execute the program unins000.exe. After the program is finished, the complete PICO-
SCALE software is removed from the system.
6.6 Firmware updates
SmarAct will release firmware updates for the PICOSCALE from time to time. Firmware updates
usually contain updated software that fixes bugs, improves the system performance or adds new
features. Some firmware updates can be skipped, because later updates contain all the content
of earlier updates. However, some firmware version updates are required before later versions
can be installed. This holds for relatively old firmware versions. For example, if your PICOSCALE
has firmware version 1.0.5 installed, and you want to install version 1.1.7, you must first update
to version 1.1.0 and then to 1.1.7. The following firmware versions have to be installed before
updates to more recent versions are possible:
•picoscale-1.1.0_2015-12-18_160315.fw (contains PICOSCALE firmware version 1.1.0)
•picoscale-2.0.0_2017-09-22_093253.fw (contains PICOSCALE firmware version 2.0.0)
46
PicoScale User Manual

6 SETUP AND INSTALLATION
6.6.1 Performing a PICOSCALE firmware update
Firmware updates are files named like "picoscale-1.0.1__2015-12-01_160436.fw". The file
must be copied to a USB memory stick, which has to be plugged into one of the PICOSCALE
USB ports. For reducing problems, the stick should be empty (possibly freshly formatted) before
copying the new firmware to it.
Before starting the update process, the PICOSCALE has to be switched off. Hold the pilot laser
button and switch the device on, by pushing the power button. Do not release the pilot laser
button until it starts blinking, which indicates that the device is in the update or reconfiguration
mode.
NOTICE
It is important that the update process is NOT INTERRUPTED by switching off
the power supply. Otherwise the device may become unresponsive and must be
sent in for repair!
The update process may take a few minutes (5-15). When it has finished, the device will be in its
normal operation mode and the pilot laser button should have stopped blinking.
NOTICE
In rare cases the update procedure does not finish after a few minutes. This
problem may occur when updating PICOSCALE Controllers with an installed
firmware version older than v1.1. If the pilot laser button does still blink af-
ter 30 minutes, please switch the device offand on. The device will continue its
firmware update. During this phase, as described above, it must not be switched
off. Now, the update should finish after a few minutes.
Some firmware updates may also require an update of the programming interface libraries (SDK)
and the software tools for the PICOSCALE.
6.6.2 System diagnostics data
The PICOSCALE interferometer allows saving system diagnostics data (to a USB stick) for analysis
of problems. To save diagnostics data, start the device and plug in a USB memory stick. Wait until
it has booted and entered the normal operation mode. Hold the pilot laser button until it starts
blinking (this should happen after at most 10 to 15 seconds).
NOTICE
It is important, that the device is in normal operation mode, before the pilot
laser button is pressed!
47
PicoScale User Manual

6 SETUP AND INSTALLATION
When the blinking has stopped, you may unplug the memory stick. On the stick you will find two
files: "system.log" and "sysdiag_<uptime>_<bootcount>.dump".
"system.log" is a text file that contains a list of important system activities, like successful or failed
firmware updates. It may also include information about the reason why a system operation like
afirmware installation has failed. The "system.log" can additionally be downloaded from the
device using the PICOSCALE Control GUI, see chapter 7.
The "sysdiag_<uptime>_<bootcount>.dump"file contains status data in a binary format that can
be sent to SmarAct for a detailed problem analysis.
48
PicoScale User Manual
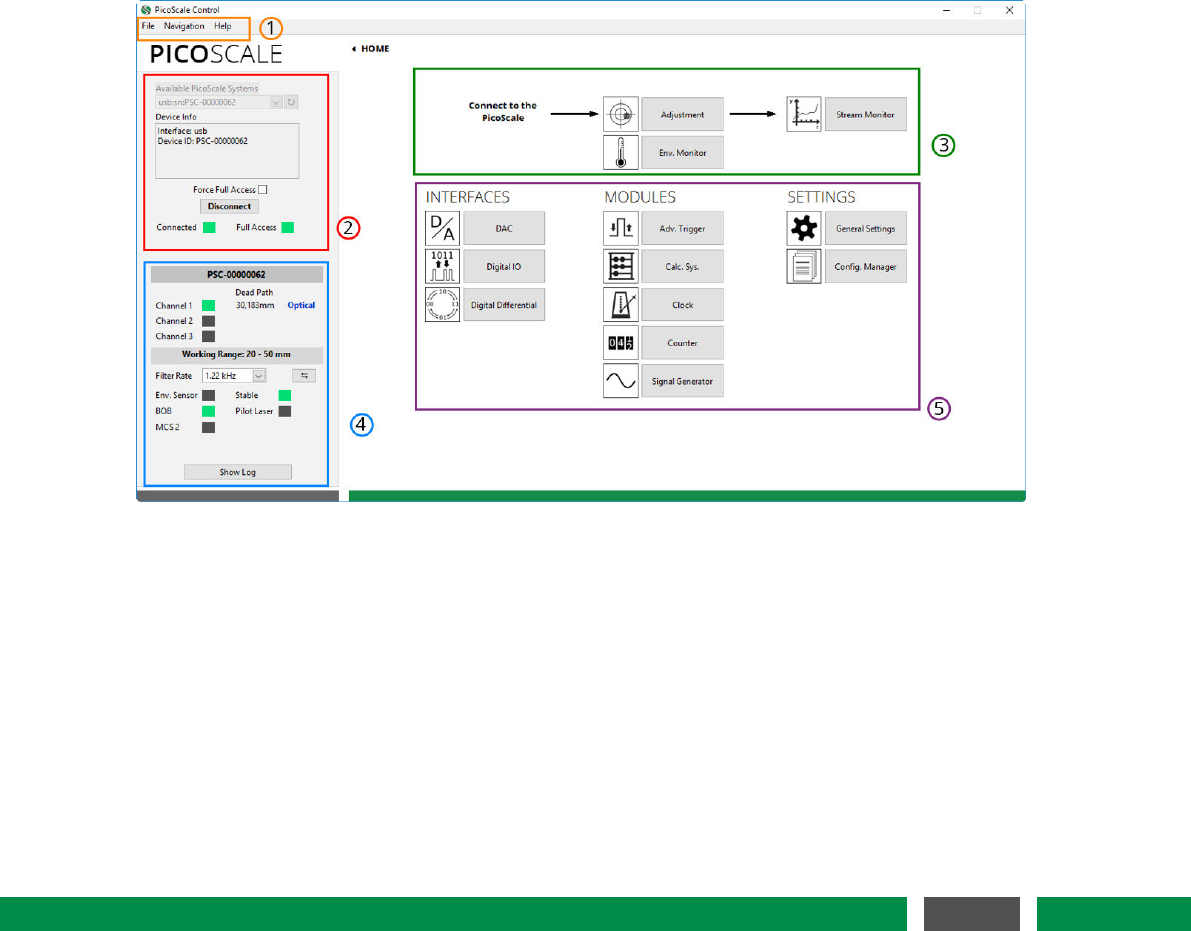
7PICOSCALE CONTROL GUI
The PICOSCALE can be controlled with the LabVIEW based graphical user interface (GUI). It con-
tains all main functions to connect to a PICOSCALE system, to adjust it, read the device’s status,
configure all installed modules and, of course, read and process the data source values generated
by the device.
In this chapter the GUIfeatures are presented. First, it is shown how to connect to the device
via different interfaces (USB and Ethernet) and read its status. Furthermore, the GUIexhibits an
adjustment panel, which guarantees a quick and easy adjustment of the PICOSCALE system with
user friendly auto-functions. Position data as well as other data sources can be displayed in the
the Stream Monitor.
Figure 7.1: PICOSCALE GUIoverview. (1) Menu (2) Connect to PICOSCALE (3) Adjustment, Envi-
ronmental Monitor and Stream Monitor (4) PICOSCALE Status (5) Interfaces, Modules
and Settings.
After the program is started you can see the HOME panel as shown in figure 7.1. All parts of
the GUIcan be reached from the HOME panel either by clicking on the corresponding buttons or
with the menu (1). All available PICOSCALEs are listed in (2). After connecting to the system the
adjustment and data streaming (3) as well as the PICOSCALE status (4) are available. All interfaces,
modules and the general settings can be centrally reached (5).
49
PicoScale User Manual
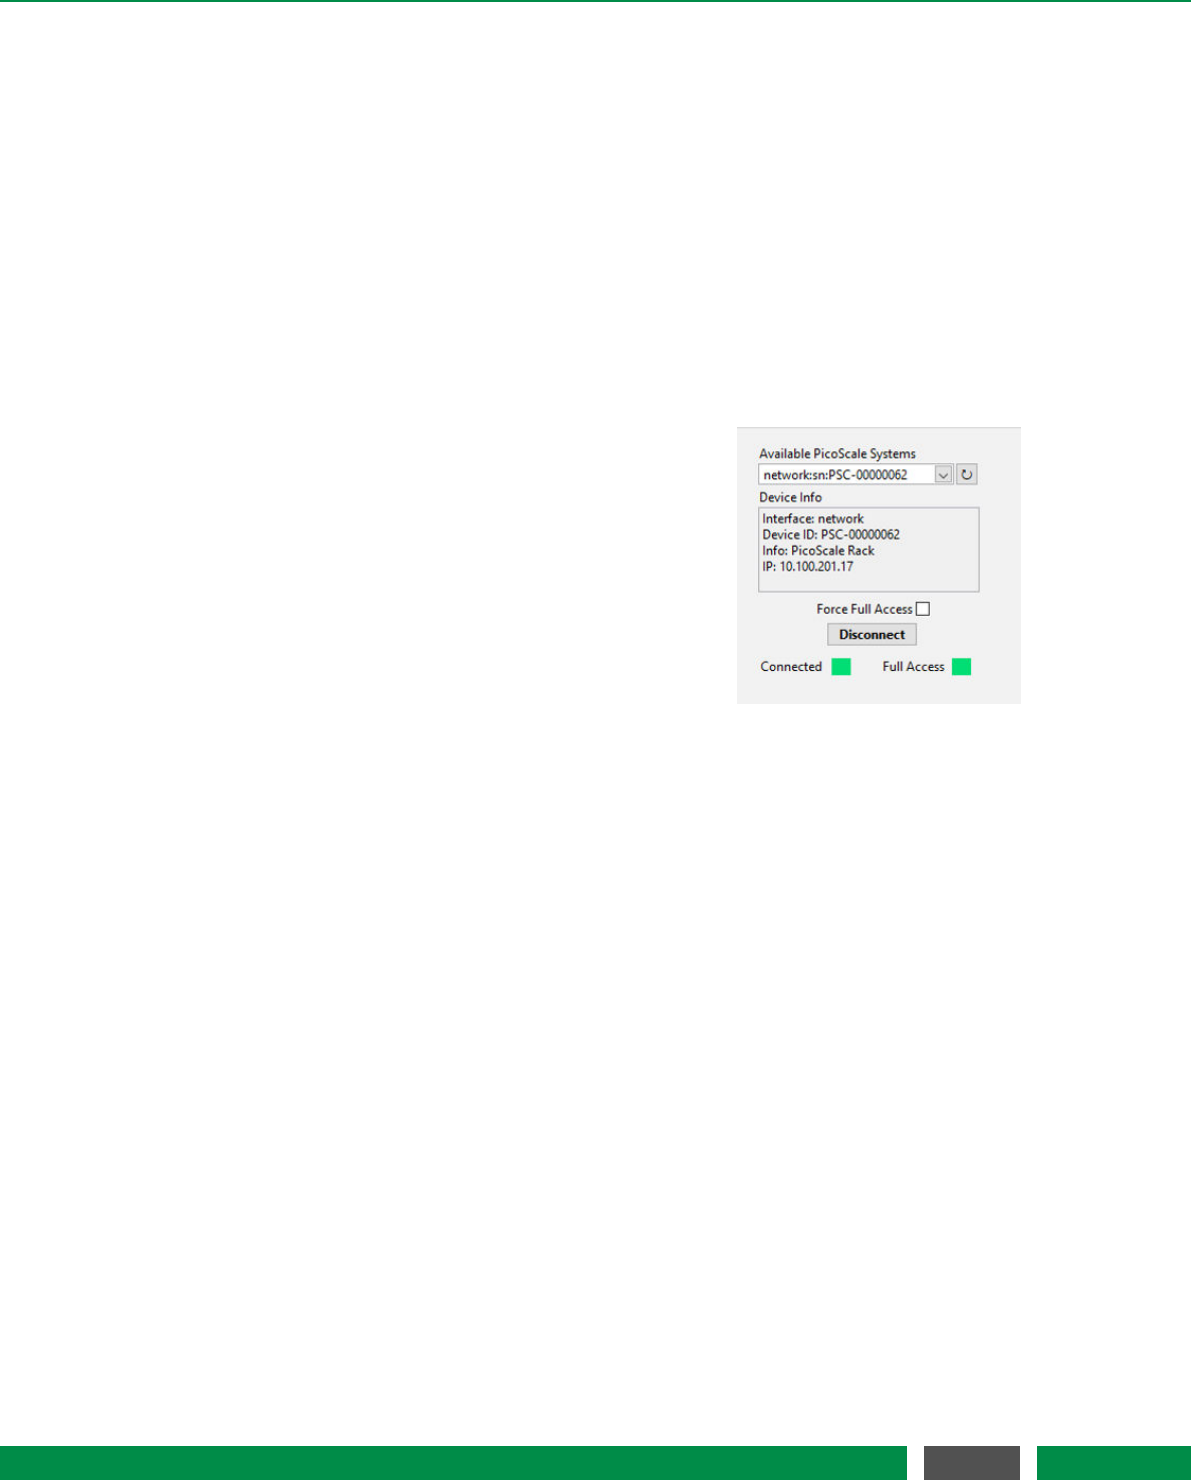
7 PICOSCALE CONTROL GUI
7.1 Configuration of the PicoScale
When starting the GUI, the HOME panel seen in figure 7.1 is opened. All elements of the GUIcan
be reached from here.
7.1.1 Connecting to the controller
The PICOSCALE is a multi-user system and up to two users can be connected to the same instru-
ment. Therefore, the device offers two interfaces, USB and Ethernet. When more than one user
is connected to the instrument, the PICOSCALE requires one main user (full-access connection)
who can control the system and change properties, for example. The other user can only extract
data from the device.
Figure 7.2: Connect System menu.
You can connect to a PICOSCALE Controller in the Connect
System menu, shown in figure 7.2. When the GUIis started,
all PICOSCALE devices are listed with their ID-strings in the
Available PicoScale Systems menu. You can refresh the list
at any time with the reload button next to the drop-down
menu. The Device Info shows additional information on the
device like Device ID,Info about the system and IP address
of an Ethernet interface. Below this field, you can check
whether a full-access connection should be forced. If the
Force Full Access check box is marked, all potentially exist-
ing full-access connections of other users are ignored and
a full-access connection is established. When this box is
unchecked, the GUIchecks if a full-access connection is al-
ready set up. If not, it establishes a full-access connection, if yes, the PICOSCALE GUIconnects
with limited access. The Full Access LED indicates if a full-access connection is established.
7.1.2 General settings
The basic setup of the system is located under General Settings in the Home panel. The PICO-
SCALE device generates user notifications, so-called Events. You can track these events to validate
received data or check the experimental setup, for example. In the Event Notification menu you
can subscribe or unsubscribe to events. It is located on the left side in figure 7.3. Especially if
high streaming rates (close to 10 MHz) are used, it is recommended to unsubscribe from all un-
necessary events in order to guarantee optimal performance of the PICOSCALE GUI. Subscribing
or unsubscribing to a specific event can be done by clicking on the appropriate check box in the
Event Notification menu. Furthermore, two buttons are available to subscribe or unsubscribe to
all events. After connecting to a PICOSCALE Controller, the GUIsubscribes to all events auto-
matically. Note that higher level events, such as streaming events, cannot be unsubscribed. For
detailed information on the event system, please refer to the PICOSCALE Programmer’s Guide.
The Network Configuration menu at the center of figure 7.3 allows to define the Ethernet configu-
ration used by the PICOSCALE system. If you use the Ethernet connection for the first time, we
recommended to connect the PICOSCALE Controller via USB, set up the desired Ethernet config-
uration and reconnect to the PICOSCALE Controller via Ethernet.
50
PicoScale User Manual
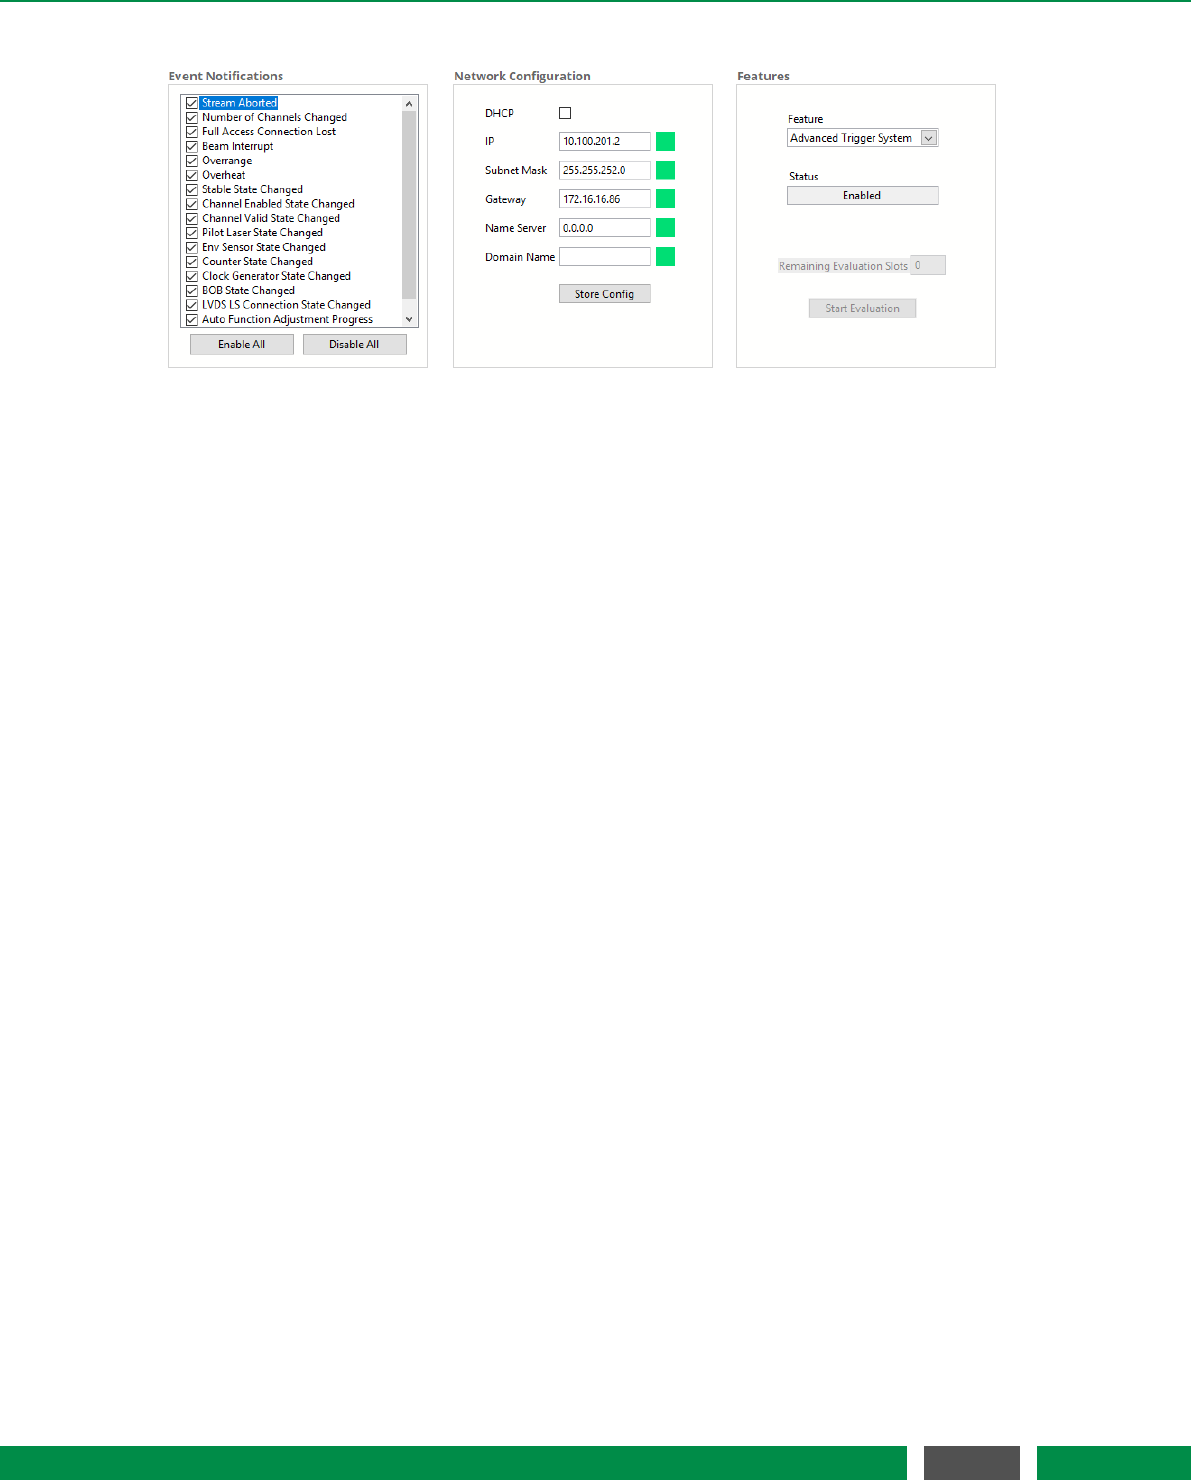
7 PICOSCALE CONTROL GUI
Figure 7.3: General Settings: (left) Configuration menu for Event Notification. (center) Network Con-
figuration. (right) Features Configuration.
You may activate the Dynamic Host Configuration Protocol (DHCP) if your server supports au-
tomatic assignment of IP addresses. If activated, the other fields are deactivated and have no
meaning. If DHCP is deactivated, a static IP Address, as well as other Ethernet properties like Sub-
net Mask,Gateway,Name Server and Domain Name can be configured in the appropriate panels.
Once all properties are defined, the configuration can be transmitted to the system by clicking on
the Store Config button. During transmission, the PICOSCALE checks the entered values, and if all
values are valid (indicated by the green LEDs), the desired configuration is activated.
The PICOSCALE offers chargeable firmware upgrades, such as the Advanced Trigger System, the
Signal Generators and the Calculation System.In the Features menu at the right hand side of figure
7.3, the available features are displayed in the Feature drop-down menu.
All chargeable features can be evaluated for a certain time. Generally, 10 time slots are available
and can be activated individually. Each time slot allows to evaluate the selected feature for 8
hours. The remaining evaluation time slots are displayed in the Remaining Evaluation Slots fields.
By clicking the Start Evaluation button, a new time slot is started.
If you decide to upgrade your system with the feature, please contact SmarAct. You will receive a
firmware upgrade and the feature time is set to infinity automatically.
7.1.3 Status
The PicoScale status is located in the lower left part of the GUIand displays the current status of the
system. The red box (4) in figure 7.1 illustrates the location. The active channels are marked with
a green rectangle. The value Dead Path besides the active channels is calculated during the ad-
justment process and indicates the absolute distance between the measurement head and object
mirror.
The working range of the system is displayed below the channel indicator. If the target leaves
this range a new adjustment might be necessary. The Filter Rate describes a low pass filter that is
applied to position and ADC data and can be adjusted with the drop-down list. It can be switched
to the corresponding Cut-off Frequency using the button on the right side. The filter is implemented
in the FPGA and determines the system bandwidth.
51
PicoScale User Manual
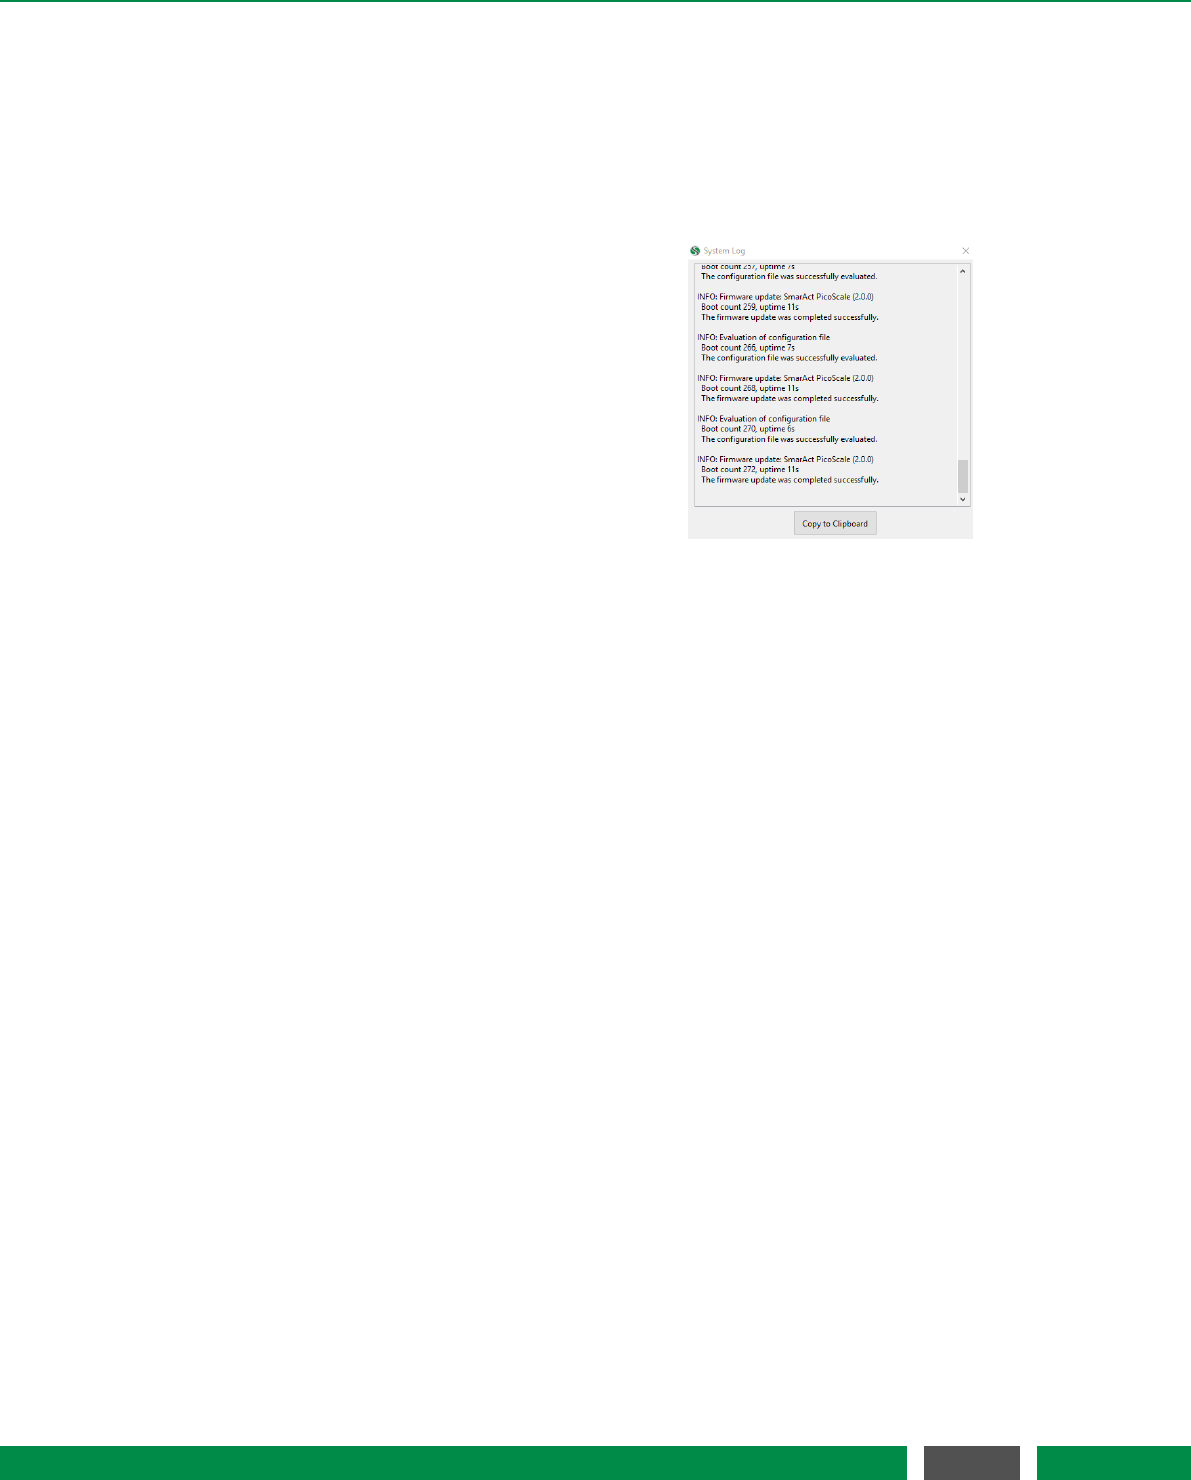
7 PICOSCALE CONTROL GUI
When the system recognizes optional components like the environment sensor, the Breakout-Box
and the MCS2, the rectangle besides the components is green. With the button Show Log the log
of the GUIcan be displayed. It shows log entries in case of system start-ups and displays error
codes. Each log entry is formatted with a date and time string and a clear text message. If the
last log entry was a system error message the Show Log button has red borders. The Clear button
deletes all log entries of the GUI.
Figure 7.4: System log of the PICOSCALE
controller
All fields in the PicoScale status are updated auto-
matically after connecting to a PICOSCALE sys-
tem. The system information is important for all
service requests.
The System Log of the PICOSCALE controller
shown in figure 7.4 is located in the menu bar un-
der Help.It contains a list of important system
activities like the activation of optional software
modules. It may also include information about
the reason why a system operation like a firmware
installation (cf. section 6.6.2) has failed. The infor-
mation can be relevant for service requests and
can easily be copied to the clipboard using the but-
ton Copy to Clipboard.
52
PicoScale User Manual
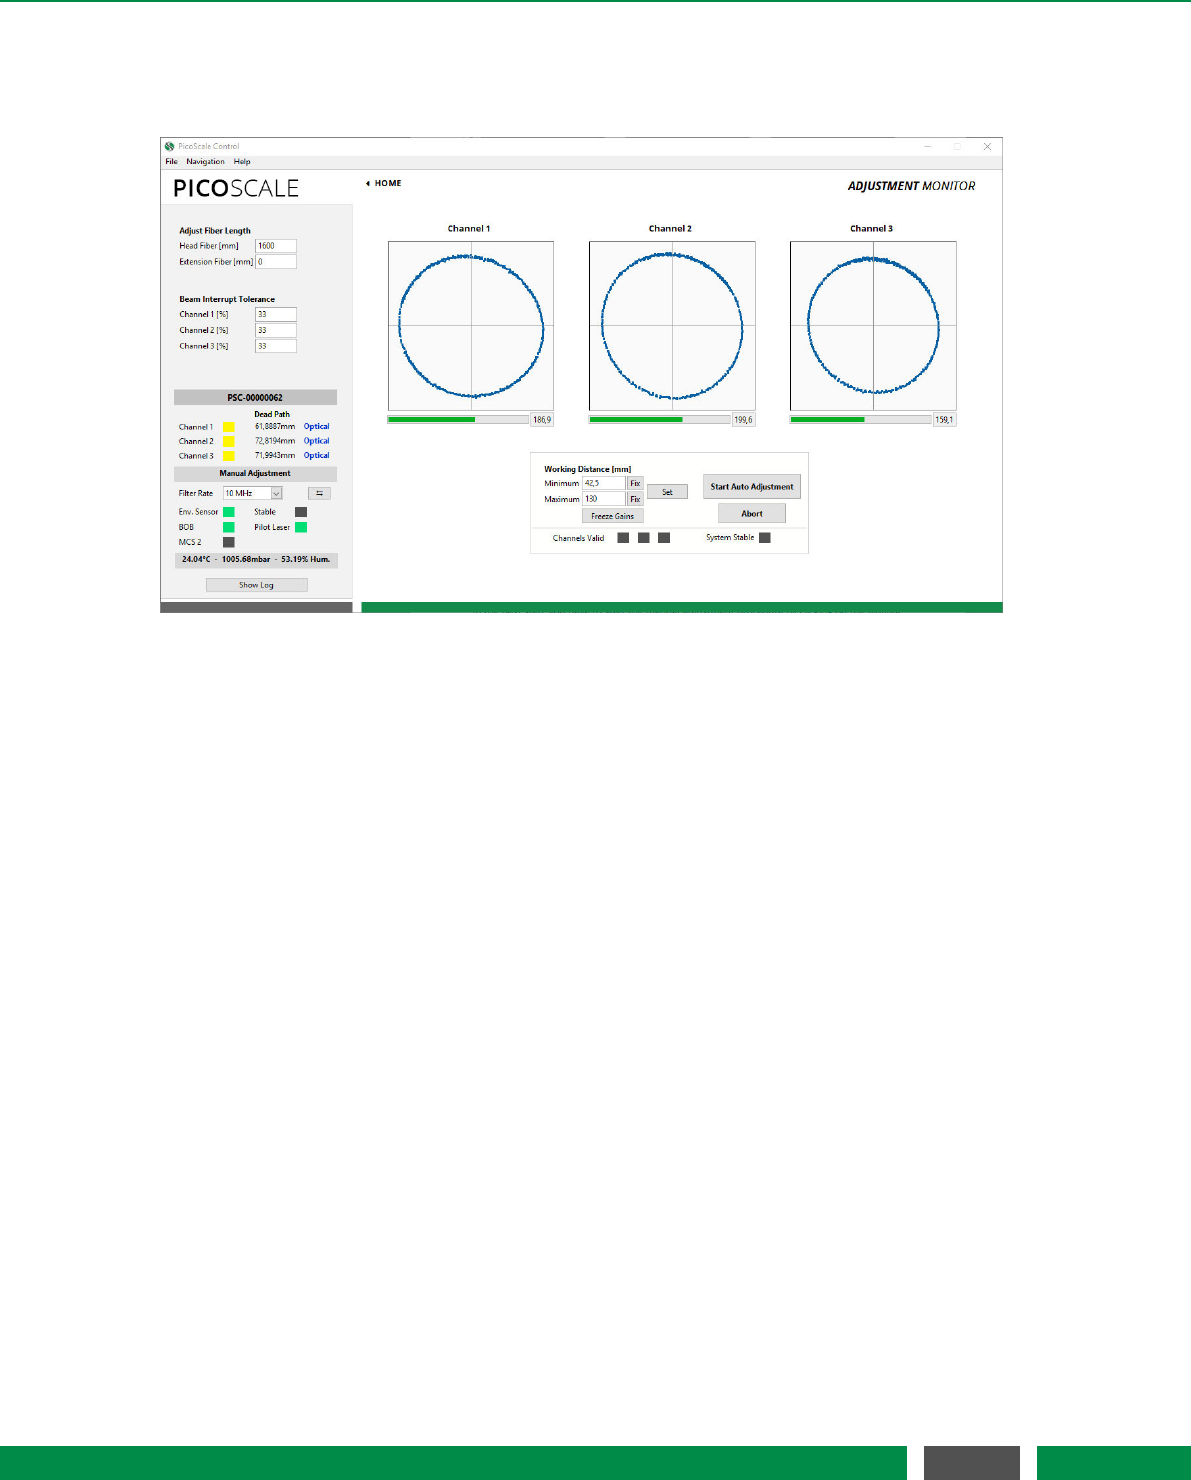
7 PICOSCALE CONTROL GUI
7.2 Adjustment
Figure 7.5: PICOSCALE Adjustment Panel.
The three input channels of the PICOSCALE can be configured in the Adjustment Monitor. The goal
of the adjustment is to align the interferometer heads in front of the target mirrors and optimize
the signal quality. Furthermore, internal subsystems of the PICOSCALE device are optimized
to achieve highest possible resolution and accuracy of position measurements. Note that a full-
access connection has to be established to perform the adjustment procedure. Each channel can
be enabled and disabled with the corresponding check box below the graphs before the manual
adjustment is started. With the drop-down menu besides each check box the connected head type
can be configured. The head type is written on the housing of each head and in the corresponding
data sheet. For older heads, please use the standard head type C01.
On the upper left side of the GUIin figure 7.5 the fiber length can be changed. A standard sensor
head is delivered with a fiber length of about 1600 mm. If additional extension fibers are used
the length should be inserted in the field Extension fiber [mm]. Furthermore, the beam interrupt
tolerance can be set: The PICOSCALE generates so-called beam interrupt events when the signal
quality drops below a certain threshold. The PICOSCALE can be made more tolerant to these
events by increasing the value of the beam interrupt tolerance (default: 33%). A value of 100%
means that no beam interrupt events are produced any more.
Channel enabling/disabling and configuration of the head type must be done before the adjust-
ment process is initiated, the beam interrupt tolerance can be set at any point.
The manual adjustment procedure is started by clicking on the Start Manual Adjustment button.
Figure 7.5 shows the Adjustment Monitor with one Lissajous graph for each channel after the man-
ual adjustment is started. Enter the expected working range (which influences the modulation
amplitude) and confirm it by clicking Set. The more precise you enter the expected working range,
the higher the accuracy of your measurement will be.
53
PicoScale User Manual

7 PICOSCALE CONTROL GUI
Then you have to align sensor head and target mirror with respect to each other. To rate and
optimize the alignment, use the Lissajous graph and the signal quality bar.
NOTICE
The absolute number of the signal quality has no meaning. It is just a temporary
indicator which helps you to optimize the current alignment. It is dependent on
many factors so that it cannot be used for comparison with previous alignments
with slightly different settings (working range, different channels, etc.).
When the sensor head is tilted relative to the target mirror, the shape (diameter and thickness) of
the Lissajous figure as well as the signal quality change. However, during this alignment the signal
amplification is actively adjusted, so that the signal amplitudes cover the whole ADC range. A
very sensitive way to optimize the orientation of the measurement heads is to "freeze" the analog
gains, by pressing the Freeze Gains button. In this case, the diameter of the corresponding Lissajous
figure changes due to tilting of the sensor heads and should be maximized. (If, during this process,
the Lissajous figure size exceeds the display, simply "unfreeze" and freeze the gains again.)
After the manual adjustment is done, start the automatic adjustment by clicking the Start Auto Ad-
justment button. During this phase, the channel electronics (gains, demodulation phases, etc.), as
well as the internal signal processing algorithms are optimized automatically. A Progress bar indi-
cates the status of the auto adjustment. The Results panel summarizes the results of the individual
subroutines of the adjustment process. To guarantee optimal performance, the enabled channels
should be valid and the system must be stable. The adjustment process can be aborted at any
time, simply by deactivating the Manual Adjust or the Auto Adjust buttons.
Figure 7.6: Results of the Auto Adjustment routine. All channels are valid and the laser is stable.
The label Optical indicated that optical pathlengths are measures, i.e. environmental
compensation is not active.
54
PicoScale User Manual
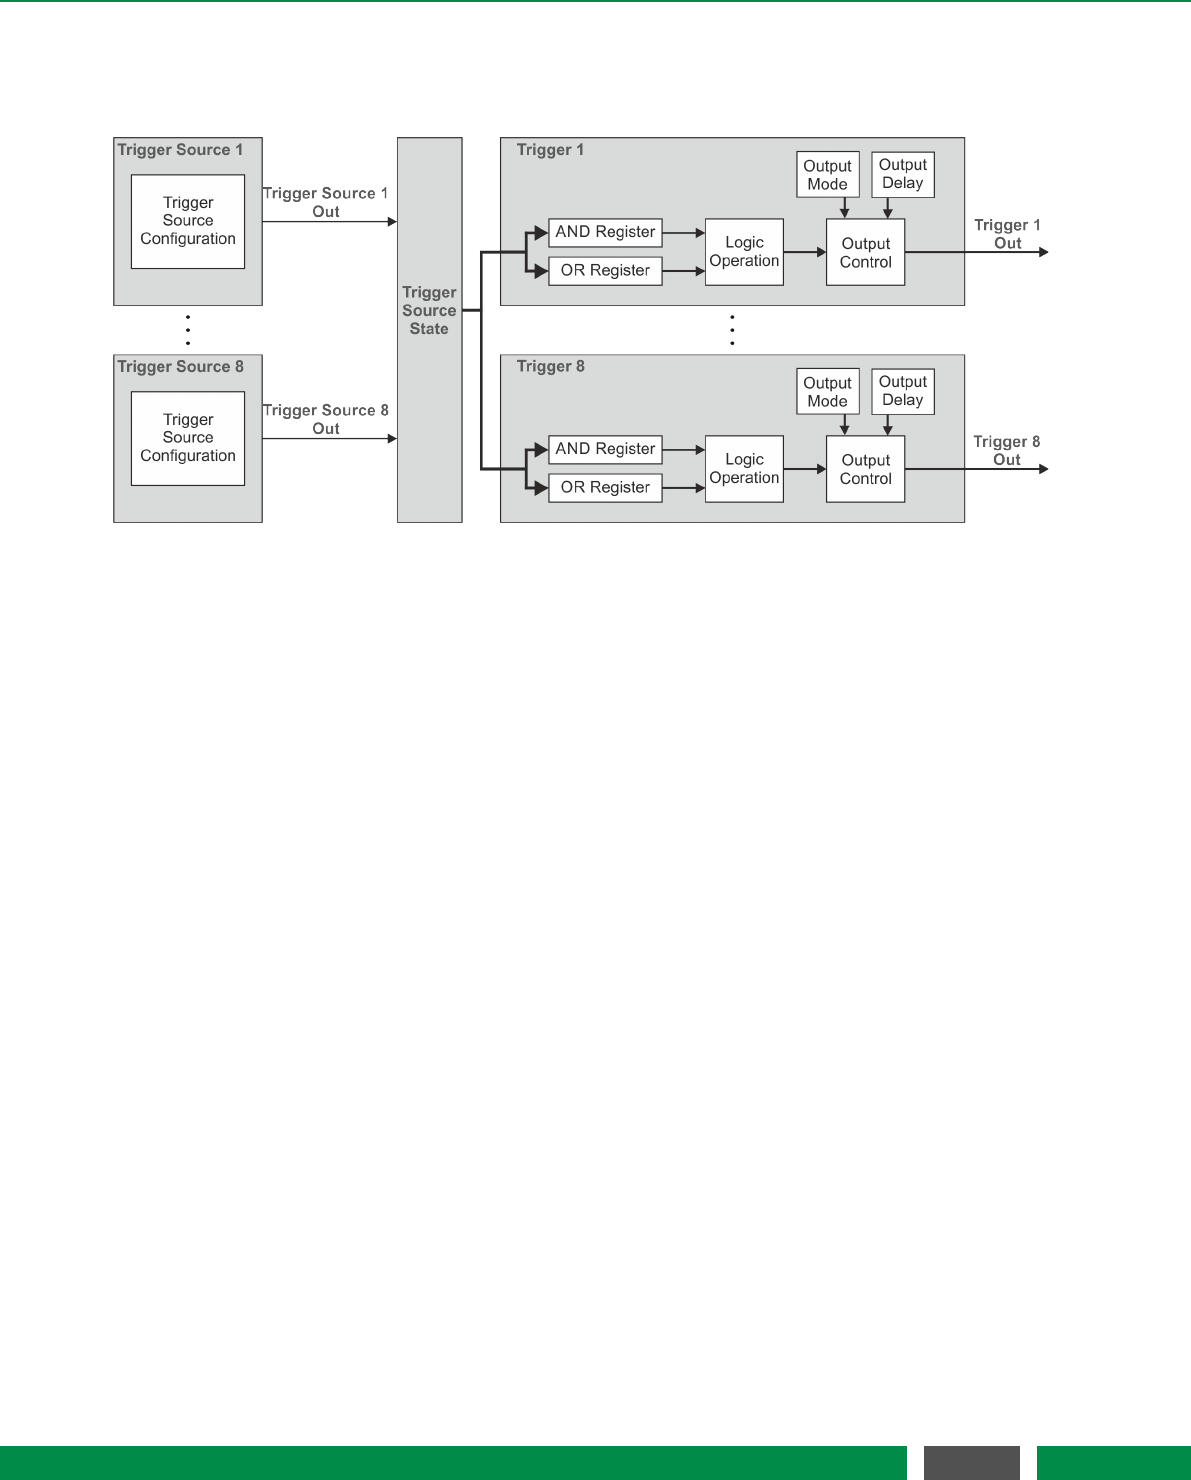
7 PICOSCALE CONTROL GUI
7.3 Advanced Trigger
Figure 7.7: Block Diagram of the PICOSCALE Trigger System.
The Advanced Trigger System can be purchased as an additional feature for the PICOSCALE system
which allows to synchronize internal and external processes. Figure 7.7 shows the block diagram
of the Advanced Trigger System. The system offers eight trigger sources (left side) which can be log-
ically combined to up to eight actual trigger output signals (right side). These signals may be used
by other internal sub systems or can be output by the GPIO interface to control and/or synchronize
external devices.
Each individual trigger source has an output signal, which can be logically HIGH or LOW. All trigger
source signals are stored in a trigger source state register to which all eight triggers have access.
Each trigger can combine several trigger sources by logical operations (AND, OR, etc.) which allows
to define very complex trigger logics. Additionally, the trigger signal can be delayed or debounced
to produce stable and reliable output signals that can be logically HIGH or LOW. The following sub
systems can use trigger signals:
•Stream Generator, see section 7.6
–start / stop / pause the data stream
–define the rate at which the data frames are generated
•Digital IO Interface, see section 7.4.1
–output trigger signals as TTL or CMOS signals
•Clock Generators, see section 7.5.1
–start / stop a clock generator
•Counters, see section 7.5.4
–start / stop / increment a counter
The advanced trigger system can be configured in the Advanced Trigger System panel of the PICO-
SCALE Control GUI.
55
PicoScale User Manual

7 PICOSCALE CONTROL GUI
7.3.1 Trigger Source configuration
Figure 7.8: Trigger Source Configuration; highlighted by green boxes
A trigger source is a basic component in the FPGA, which may be configured to listen to specific
events and react in a specific way. The configuration of a trigger source can be controlled within
the Advanced Trigger System panel. This enables access to specific properties, which are explained
in detail in the Programmer’s Guide. The table on the right part of figure 7.8 presents the values
of the corresponding trigger source configuration properties, thus, providing an overview of all
enabled trigger sources.
In the center of figure 7.8 you can select one of the eight available trigger sources. You can then
select the desired trigger source Event. This is the signal to which the trigger source listens to. The
meaning of the other fields depends on the chosen Event. The GUIdisables unnecessary fields
and updates the names of the controls.
Trigger Event None
The first Event is None. This event disables a trigger source and its output will remain in the logical
LOW state. All other register fields are not used and have no meaning.
Trigger Event Software
The Software event performs a state change of the trigger source when a software event is re-
ceived. To generate a software event, the APIoffers a special trigger source property Software
Trigger, which can be addressed using the Property Dialog (see section 7.9). For this event, the
Index 0 register holds the Software Trigger ID, a number that is compared to the trigger ID given
by the software event. On a match the trigger source switches to the state given by the property
value.
56
PicoScale User Manual
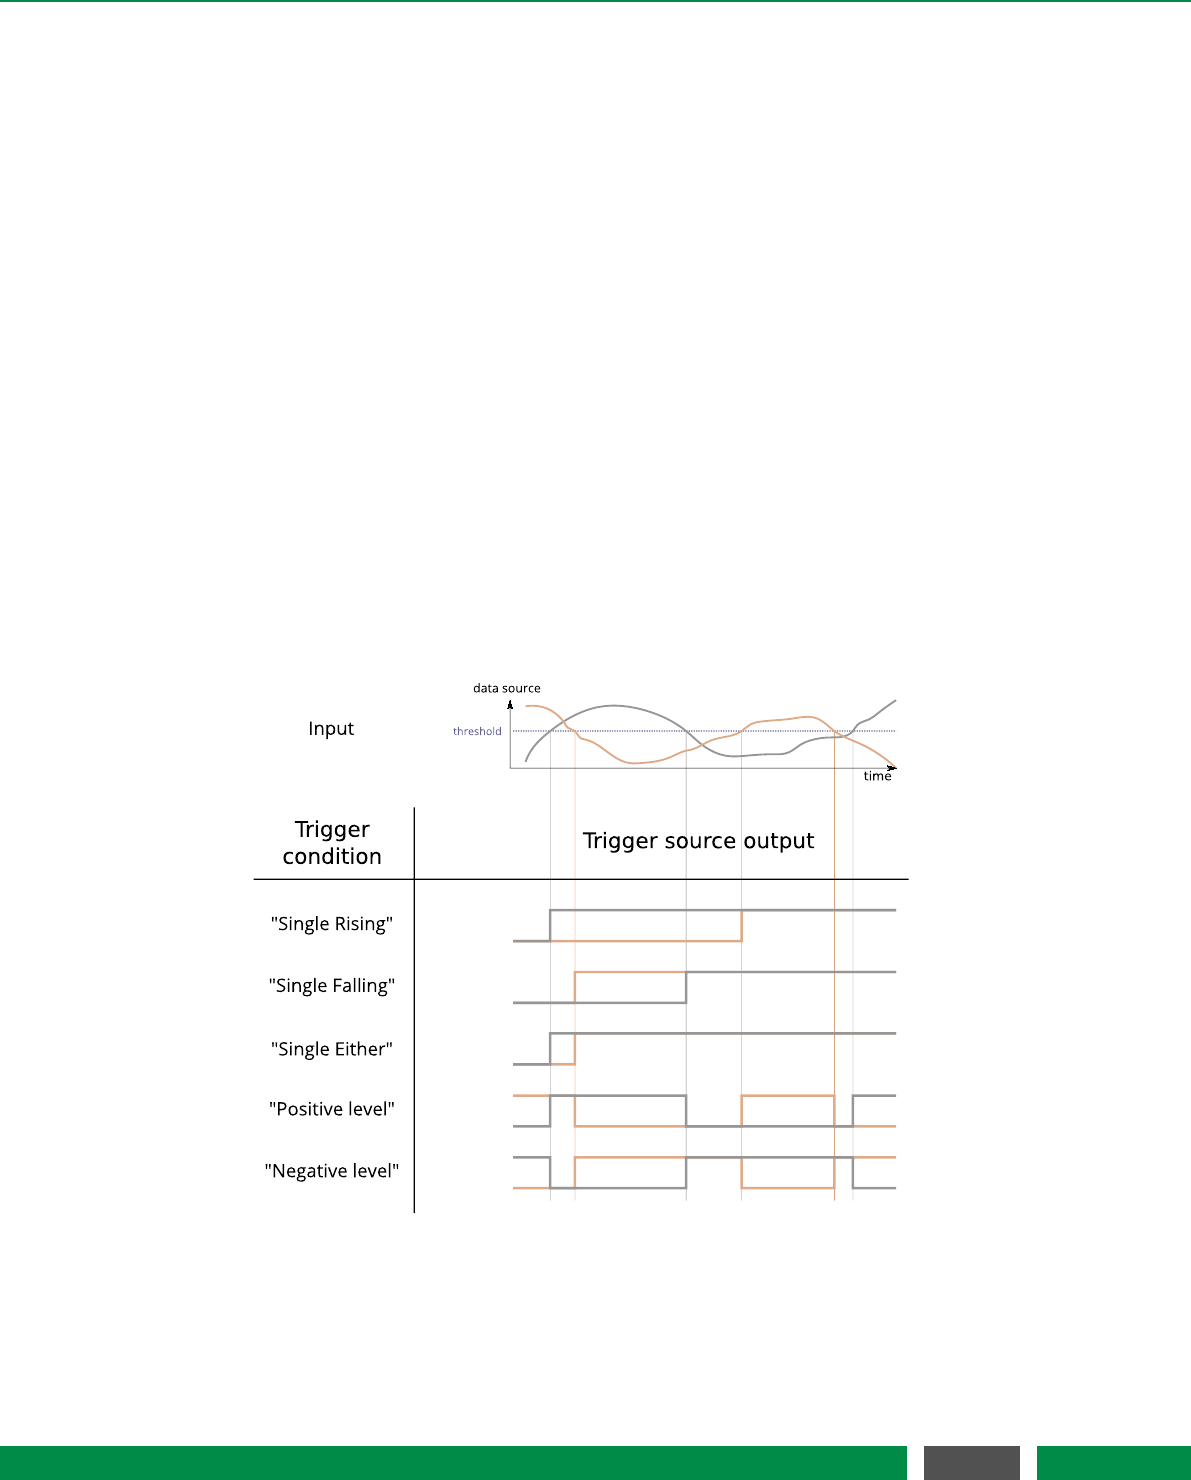
7 PICOSCALE CONTROL GUI
Trigger Event Data Source Value
The Data Source Value event performs a state change of the trigger source output when a data
source value passes a certain threshold or enters a certain range. Please note that not all data
sources are available. The possible data sources are restricted to position, Calculation System
outputs, ADCs and counters. The Condition menu allows to define how the selected data source
value and the configured threshold(s) are evaluated. The following conditions are available which
are illustrated in figure 7.9 and 7.10:
•Single Rising/Single Falling: The trigger source output is HIGH when the selected data source
value passes the Threshold from below/above. Once the trigger source is in a logically high
state, it stays high until reset.
•Single Either: The trigger source output is HIGH when the selected data source value passes
the Threshold from below or above. Once the trigger source is in a logically high state, it stays
high until reset.
•Positive/Negative Level: The trigger source is HIGH when the data source value is above the
Threshold and is LOW when the data source value is below the Threshold. For the negative
level it is vice versa.
•Positive/Negative Range: The trigger source is HIGH when the data source value is inside the
range defined by the Lower and Upper Threshold and LOW otherwise. For the negative range
it is high when the data source value is outside the specified range.
Figure 7.9: Summary of trigger conditions. Two traces of a data source are shown (position, for
example) with a user defined threshold. The trigger conditions single rising, single falling,
single either, positive level and negative level are illustrated.
57
PicoScale User Manual
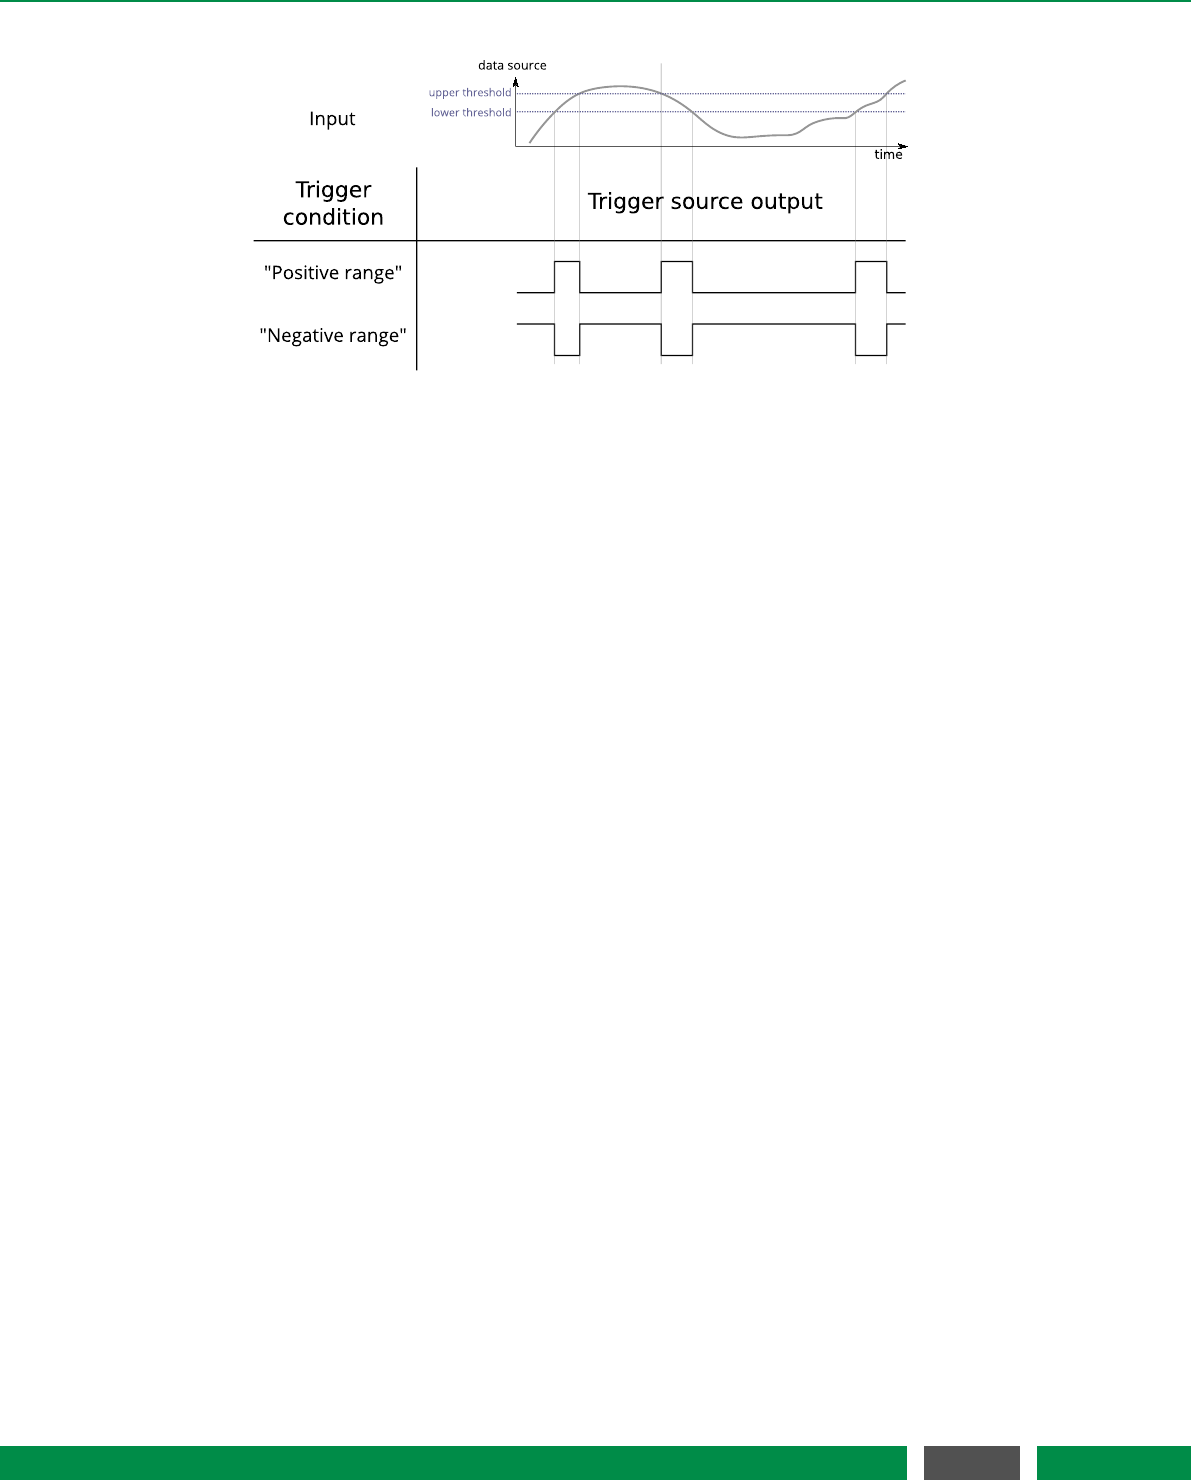
7 PICOSCALE CONTROL GUI
Figure 7.10: Summary of trigger conditions. The trigger conditions positive range and negative range
are illustrated, which both require an upper and lower threshold to define the appro-
priate range.
The next field Data Source allows for selecting the desired data source. With the last two fields the
Thresholds for the selected condition can be defined.
Trigger Event Data Source Increment
The Data Source Increment event generates positive pulses (a state change from LOW to HIGH
and back again) on the trigger source output whenever a certain increment of a data source value
is detected. A start Threshold can be defined and after the data source passes this value, the
threshold register is incremented by the defined Increment value. Please note, that not all data
sources are available. The Condition menu allows to define how the selected data source value and
the configured threshold/increment tuple are compared to each other. The following conditions
are available:
•Single Rising/Single Falling: A pulse is generated when the selected data source value passes
the Threshold from below/above. When this happens the Threshold is incremented or decre-
mented by the Increment value.
The next two fields, Channel and Source, allow for selecting the desired data source. Finally, you
can define the start Threshold and the Increment.
Trigger Event GPIO Trigger
The GPIO Trigger event listens to a specific GPIO input pin. To use a GPIO pin as trigger input
signal, the corresponding pin has to be defined as input, cf. section 7.4. The Condition menu
allows to define how the trigger source reacts on the selected input pin. The following conditions
are available:
•Single Rising/Single Falling: The trigger source output is HIGH when a rising/falling edge is
detected on the selected input pin. Once the trigger source is in a logically high state, it stays
high until reset.
58
PicoScale User Manual

7 PICOSCALE CONTROL GUI
•Single Either: The trigger source output is HIGH when a rising or a falling edge is detected on
the selected input pin. Once the trigger source is in a logically high state, it stays high until
reset.
•Positive Level,Negative Level: The level or the inverted level of the selected input pin is for-
warded to the trigger source output. In this case the state of the trigger source depends on
the level of the input pin.
The next field Channel allows for selecting the desired input pin. The pin labels are in accordance
with the pin labels of the PICOSCALE Breakout-Box (BOB).
Trigger Event External Trigger
The Event External Trigger listens to the external trigger pin that is on the front panel of the PICO-
SCALE Controller housing. The Condition menu allows to define how the trigger source reacts on
the External trigger input pin. The following conditions are available:
•Single Rising/Single Falling: The trigger source output is HIGH when a rising/falling edge is
detected on the input pin. Once the trigger source is in a logically high state, it stays high
until reset.
•Single Either: The trigger source output is HIGH when a rising or a falling edge is detected on
the input pin. Once the trigger source is in a logically high state, it stays high until reset.
•Positive Level,Negative Level: The level or the inverted level of the input pin is forwarded to
the trigger source output, respectively. In this case the state of the trigger source depends
on the level of the input pin.
All other fields are not used and have no meaning.
Trigger Event Internal Event
The last Event,Internal Event, reacts to signals that are generated when internal events occur, for
example a Beam interrupt event. The Condition menu defines how the trigger source reacts on the
selected event signal. The following conditions are available:
•Single Rising/Single Single Falling: The trigger source output is HIGH when a rising/falling is
detected on the input pin. Once the trigger source is in a logically high state, it stays high
until reset.
•Single Either: The trigger source output is HIGH when a rising or a falling edge is detected on
the input pin. Once the trigger source is in a logically high state, it stays high until reset.
•Positive Level,Negative Level: The level or the inverted level of the input pin is forwarded to
the trigger source output, respectively. In this case the state of the trigger source depends
on the level of the input pin.
The next two fields, Event and Channel, allow for selecting the desired internal event and the cor-
responding channel. All other fields are not used and have no meaning.
59
PicoScale User Manual
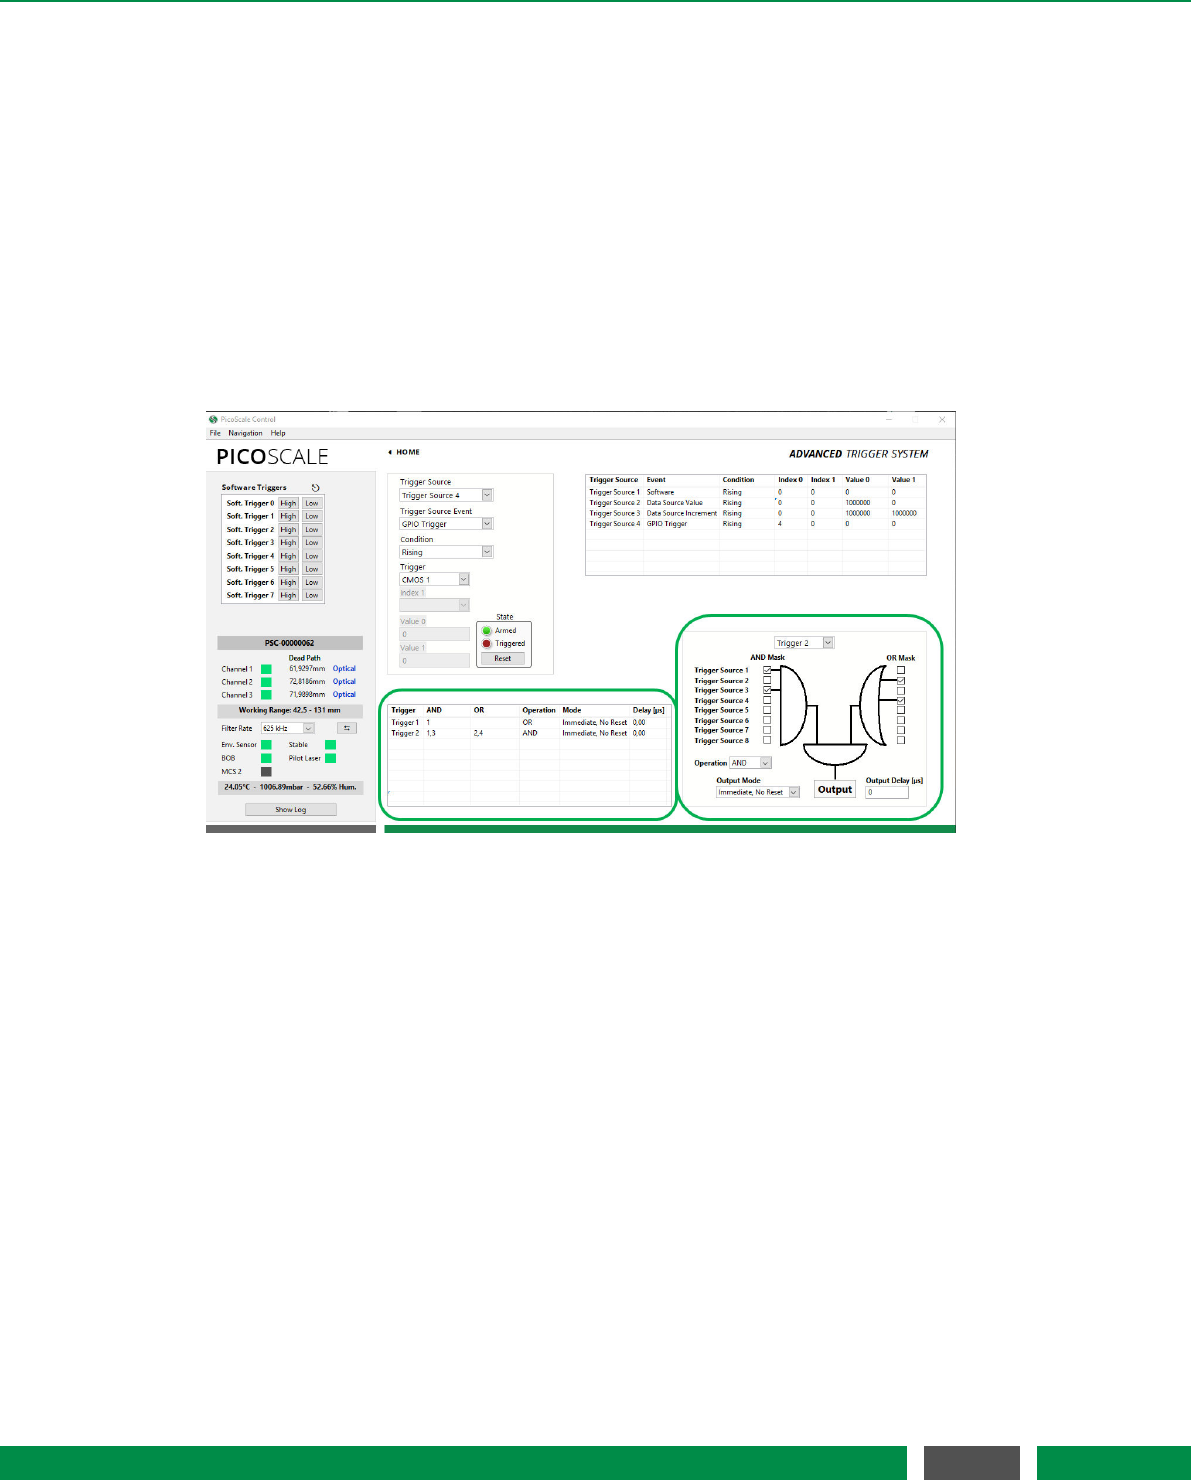
7 PICOSCALE CONTROL GUI
Trigger Reset
The two LEDs indicate the State of the trigger source. As explained above, the trigger source re-
mains HIGH when the selected condition is Rising,Falling or Either until it is reset. This means that
the trigger source is inactive and ignores further input changes. In this case the State LEDs show
Triggered.If the trigger source is ready and active, the LEDs show Armed.
If the trigger source is in the (inactive) Triggered state, the button Reset switches the trigger source
to logically LOW and activates the trigger again. The State LEDs will switch to Armed.
7.3.2 Trigger configuration
Figure 7.11: Trigger Configuration; highlighted by green boxes
Triggers logically combine the outputs of one or more trigger sources to generate an actual trigger
output signal. Each trigger has a set of registers, like AND Mask,OR Mask,Logic Operation, as well
as Output Mode and Output Delay. The PICOSCALE GUIallows to configure these registers. The
Trigger Index drop-down menu in the lower right corner of figure 7.11 allows to select a trigger.
For the trigger configuration, an AND Mask and an OR Mask are available, where you can combine
all trigger sources with logical ANDs or ORs, respectively. The outputs of these two masks are
logically connected by another Logic Operation, to form the trigger output signal. The following
Logic Operations are available:
•Disabled Deactivates the selected trigger. The GUIautomatically removes the trigger from
the Active Trigger Configuration tabular.
•OR: The output becomes LOW if both inputs are LOW. In all other cases, the output is HIGH.
•NOR or NOT OR The output becomes HIGH if both inputs are LOW. In all other cases, the
output is LOW.
•AND The output becomes HIGH if both inputs are HIGH. In all other cases, the output is LOW.
60
PicoScale User Manual

7 PICOSCALE CONTROL GUI
•NAND or NOT AND The output becomes LOW if both inputs are HIGH. In all other cases, the
output is HIGH.
•XOR The output becomes LOW if both inputs are simultaneously HIGH or simultaneously
LOW. In all other cases, the output is HIGH.
•NXOR or NOT XOR The output becomes HIGH if both inputs are simultaneously HIGH or
simultaneously LOW. In all other cases, the output is LOW.
NOTICE
If you simply want to pipe through a trigger source as a trigger output signal,
select the corresponding trigger source in the AND Mask, do not select anything
in the OR Mask (so that its output is always LOW) and combine the two masks by
an OR operation in the Logic Operation.
Finally, you have to configure the Output Mode and Output Delay of your trigger signal. Some trigger
sources simply create short pulses or the trigger condition may be subject to high frequency state
changes. In order to debounce or widen the pulses you can select an appropriate Output Mode
as well as an Output Delay. The PICOSCALE offers four different Output Modes, which are also
illustrated in figure 7.12:
•Immediate No Reset: In this mode the output control logic forwards a change of the trigger
state immediately and the state is kept stable for the configured delay.
•Immediate Reset: In this mode the output control logic forwards a change of the trigger
state immediately and the state is kept stable for the configured delay. A state change during
this delay resets the delay counter.
•Delayed No Reset: In this mode the output control logic starts a delay counter when the
trigger state changes. State changes during this delay are ignored. At the end of the delay
the current state is forwarded.
•Delayed Reset: In this mode the output control logic starts a delay counter when the trigger
state changes. State changes during this delay are ignored, but cause the delay counter to
be reset. At the end of the delay the current state is forwarded.
Note that the output mode only takes effect when a non-zero output delay is configured. When
the output delay is set to zero (default), the resulting trigger signal is identical to the input signal.
The output modes are divided into two categories, Immediate and Delayed.Immediate performs a
state change of the trigger output immediately after a state change of the input signal is recorded.
Delayed on the other hand keeps the current trigger state and waits for a certain time until the
trigger output reacts on an input signal state change.
The subcategories Reset and No Reset determine how the entered Output Delay is taken into ac-
count by the trigger system. Once a state change of the input signal is recorded, a delay counter is
started. In the No Reset case this counter runs independently of the input signal, thus deactivating
the trigger output for a fixed time. In case of Reset, the delay counter is restarted every time the
input signal changes its state. Thus, this mode guarantees that the trigger output remains in its
current state until the input signal is stable for the defined Output Delay time.
61
PicoScale User Manual

7 PICOSCALE CONTROL GUI
Input
Immediate No Reset
Immediate Reset
(a)
Delayed No Reset
Delayed Reset
(b)
10
10
10
10
10
10
10
10
Figure 7.12: Trigger Output Control Behavior (output delay = 10). The input traces are the result
of the configured logic operation of the trigger and the eight traces below show the
resulting trigger signal for the four output modes. The first input trace (a) shows some
short pulses (e.g. a steady low level with some noise) while the second trace (b) shows
a noisy transition of the input signal from low to high (similar to a trace of a mechanical
button when pressed).
In the middle of figure 7.11 the Active Trigger Configuration table provides an overview of the con-
figured triggers. In this table the first column displays the name of the active triggers. The next
two columns show the state of the eight AND and OR masks. The last three columns display the
chosen logic Operation, the output Mode and the output Delay.
62
PicoScale User Manual

7 PICOSCALE CONTROL GUI
7.4 Interfaces
The Interfaces panel allows to configure the GPIO interface of the PICOSCALE system. It groups
the Digital IO,AquadB and the Digital-to-Analog (DAC) sub-panels.
7.4.1 Digital IO interface configuration
Figure 7.13: Configuration Menu of the Digital IOInterface.
The PICOSCALE offers nine digital IO pins, which are directly connected to the FPGA controller.
The IO pins Digital 1 to Digital 4 are TTL ports and Digital 5 to Digital 9 are CMOS ports. They have a
voltage range of 0 to 3.3 V1. Each pin can be configured as input or as output pin and is accessible
via the D-Sub 44HD connector at the system back side or more conveniently via the Breakout-Box
(BOB). When the Digital 1 to Digital 4 pins are accessed via the Breakout-Box (BOB), their voltage
range is raised to 0 to 5V.
Figure 7.13 shows the Digital IO Interface Configuration panel. Each pin can be configured individu-
ally. Digital 1 to Digital 3 are configured as Output ports, Digital 4 to Digital 9 are Input ports in this
figure.
The arrangement of the individual menus is equal to the pin arrangement of the PICOSCALE
Breakout-Box. Each pin configuration has a drop-down menu in the bottom right corner, with
which the direction of the corresponding pin can be configured. The triangle in front of each LED
indicates whether the pin is configured as input or output.
On the left hand side of each panel three drop-down menus are available:
•Constant Level The output can be set to either logically HIGH or LOW.
1In PICOSCALE Controllers with the product codes PSC-CTRL-V1.0-TAB and PSC-CTRL-V1.1-TAB the signals GPIO.TTL*
have a 5V TTL level
63
PicoScale User Manual
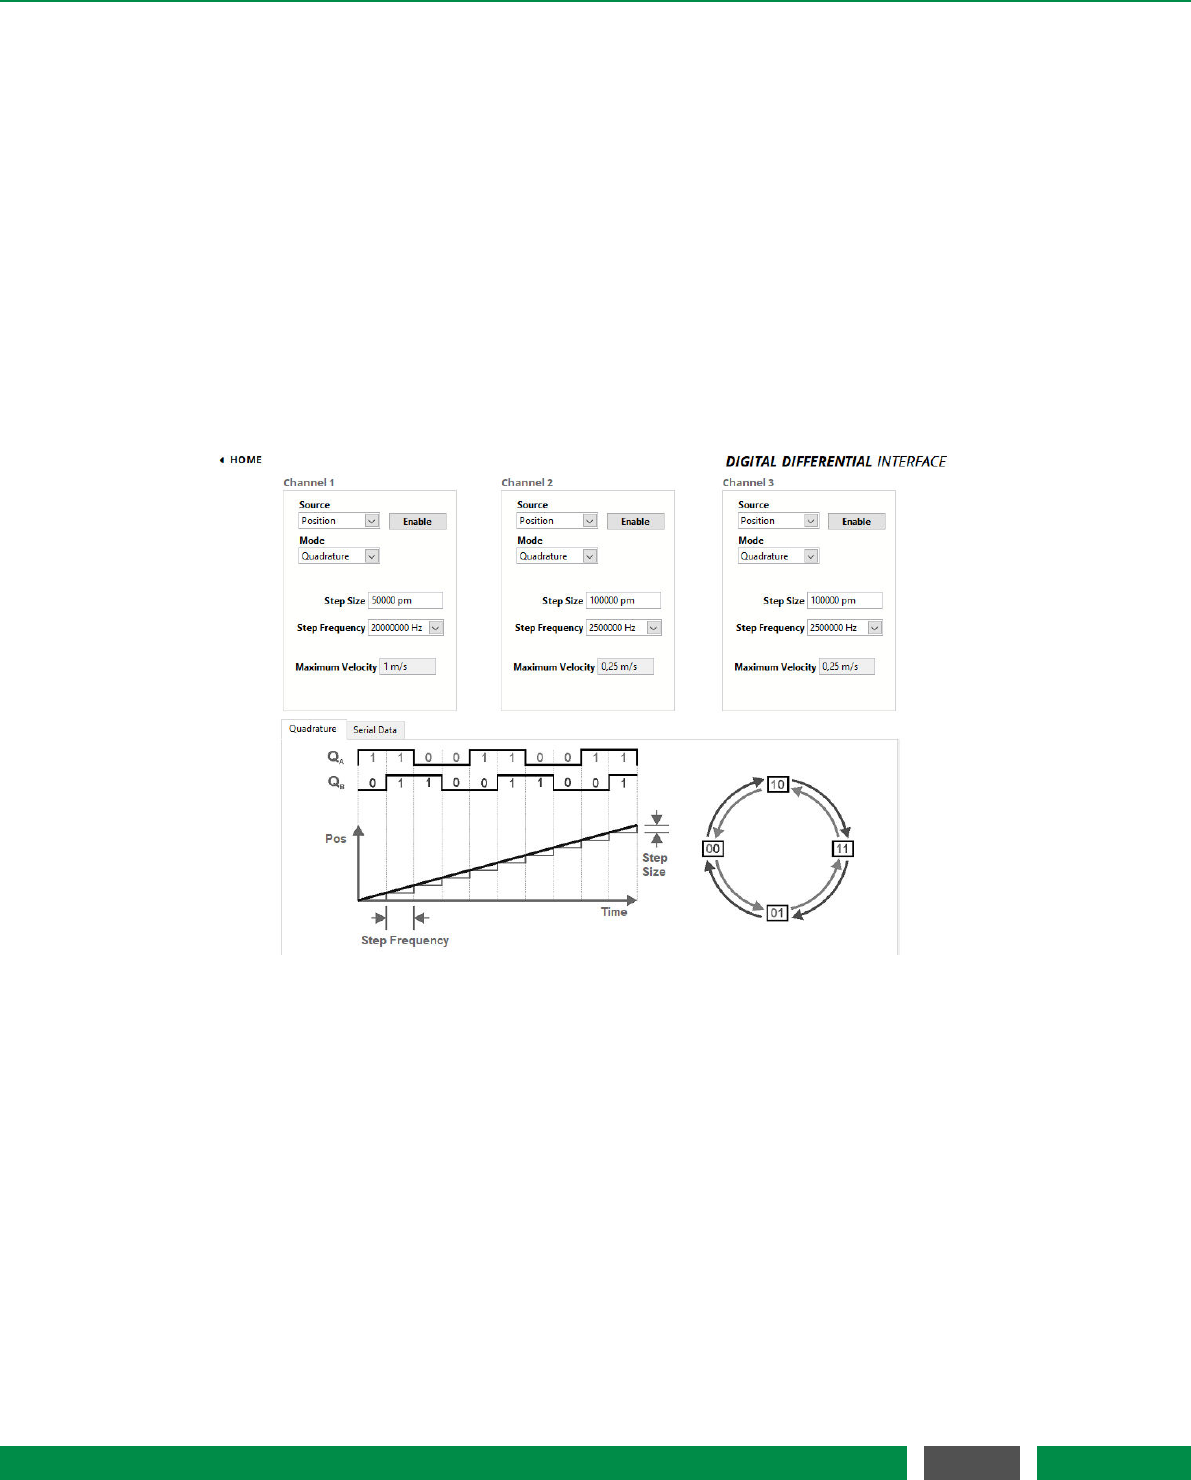
7 PICOSCALE CONTROL GUI
•Trigger Index A trigger (that has been defined in the Advanced Trigger module) controls the
output of the pin. In the drop-down menu the respective trigger index can be chosen.
•Clock Gen. Index A clock as defined in the Clock Generators configuration controls the out-
put. In the corresponding menu it’s index can be chosen.
The switch to the right hand side of the three menus finally defines, if the configured manual state,
the trigger or the clock generator output controls the pin. Note, that the mentioned options are
pin output options and only have effect, if the pin is configured as output pin. If a pin is configured
as output, e.g. Digital 1, the switch is connected to the triangle. While if a pin is configured as input,
e.g. Digital 4, the drop-down menus are not visible.
7.4.2 Digital Differential Interface (DDI) configuration
Figure 7.14: Configuration Menu of the Quadrature Interface.
The PICOSCALE offers three DDIoutputs, which are accessible via the D-Sub 44HD connector at
the system’s back plane or more conveniently via the Breakout-Box (BOB). Each of these outputs
can be configured as a Quadrature (AquadB) or a Serial Data interface.
The source of each channel can be chosen by the Source drop-down list. Available are the options
Position, which provides position data, and CalcSys that maps the output of the calculation system.
In the top right corner of each menu, an Enable button allows to activate the output.
With the drop-down list Mode the Quadrature or the Serial Data option is selected.
Below the configuration panels the principle of data representation is explained and the relevant
properties are defined. Note, that since the PICOSCALE only measures relative position changes,
no AquadB index signal is available.
64
PicoScale User Manual

7 PICOSCALE CONTROL GUI
Quadrature output (AquadB)
For each quadrature output a configuration menu is available. It allows the configuration of the
following paramters:
•Step Size The step size is entered in picometer (pm). Values between 1 pm and 1 cm are
accepted.
•Step Frequency. The drop-down menu allows to change the step frequency of the quadra-
ture interface with preset values ranging from 100kHz up to 20MHz.
The maximum target velocity is calculated by the PICOSCALE according to the configuration of
the AquadB channel and displayed underneath the Step Frequency field.
Serial data output (SD)
For each serial data output the configuration menu allows the configuration of the following pa-
rameters:
•Clock Frequency defines the data rate of the serial signal in Hz. It can be configured from
100kHz up to 10MHz.
•Clock Pause Delay defines a delay between two data words and is counted in clock cycles.
•Data Idle Priority defines the idle state of the data lines. It can be either low or high.
•Clock Mode defines the clock and data modes as described in chapter 5.3.1.
•Bitwidth defines the Bitwidth of a data word and the Shift.
65
PicoScale User Manual
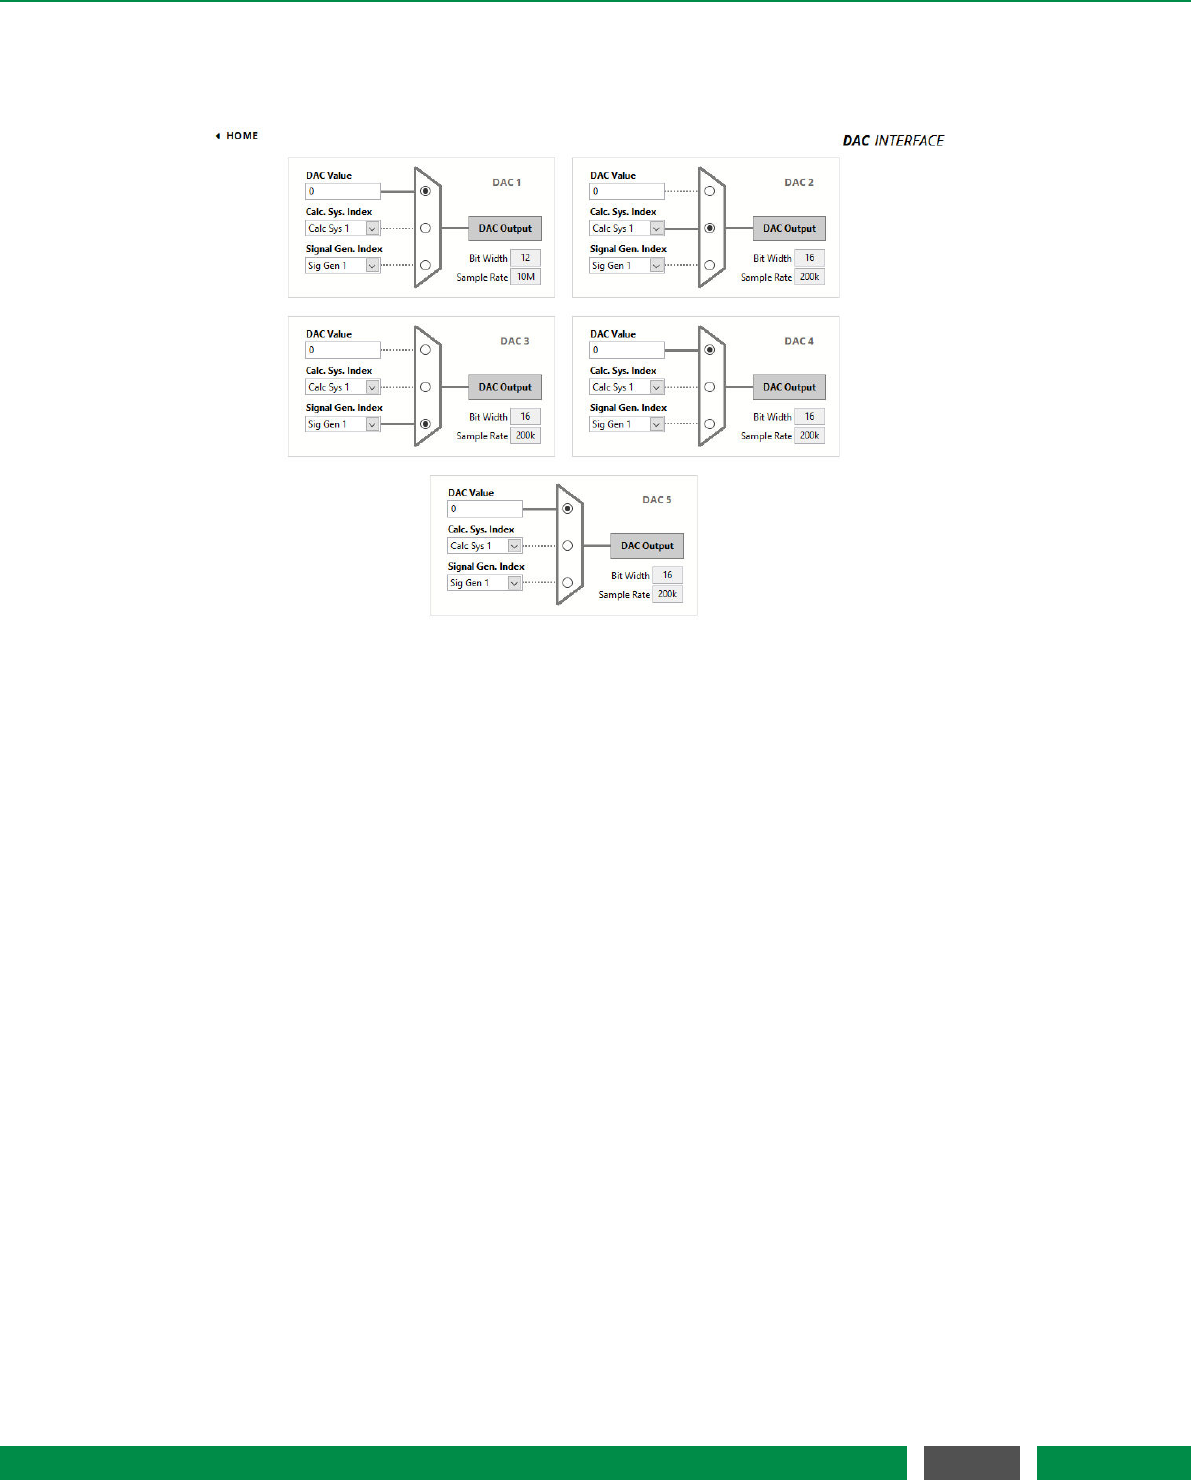
7 PICOSCALE CONTROL GUI
7.4.3 DAC interface configuration
Figure 7.15: Configuration Menu of the DAC Interface.
The PICOSCALE offers five DAC outputs that can be configured in the DAC Interface panel. DAC
1 is a fast 10 MHz output channel with 12 bit resolution, DAC 2–5 have 16 bit resolution but their
sample rate is limited to 200 kHz. The corresponding bit widths and sample rates are displayed in
the bottom right corner of each configuration panel.
Each DAC interface can be controlled by one of the following options, that can be selected via the
switch next to the drop-down menus:
•DAC Value A constant output with the specified value is generated. The range is [-1,1]
(float64) corresponding to a ±10 Volt output.
•Calc Sys Index Select The result of the specified calculation system is mapped to the DAC.
•Sig Gen Index Select The signal generator with the specified index is mapped to the DAC.
66
PicoScale User Manual
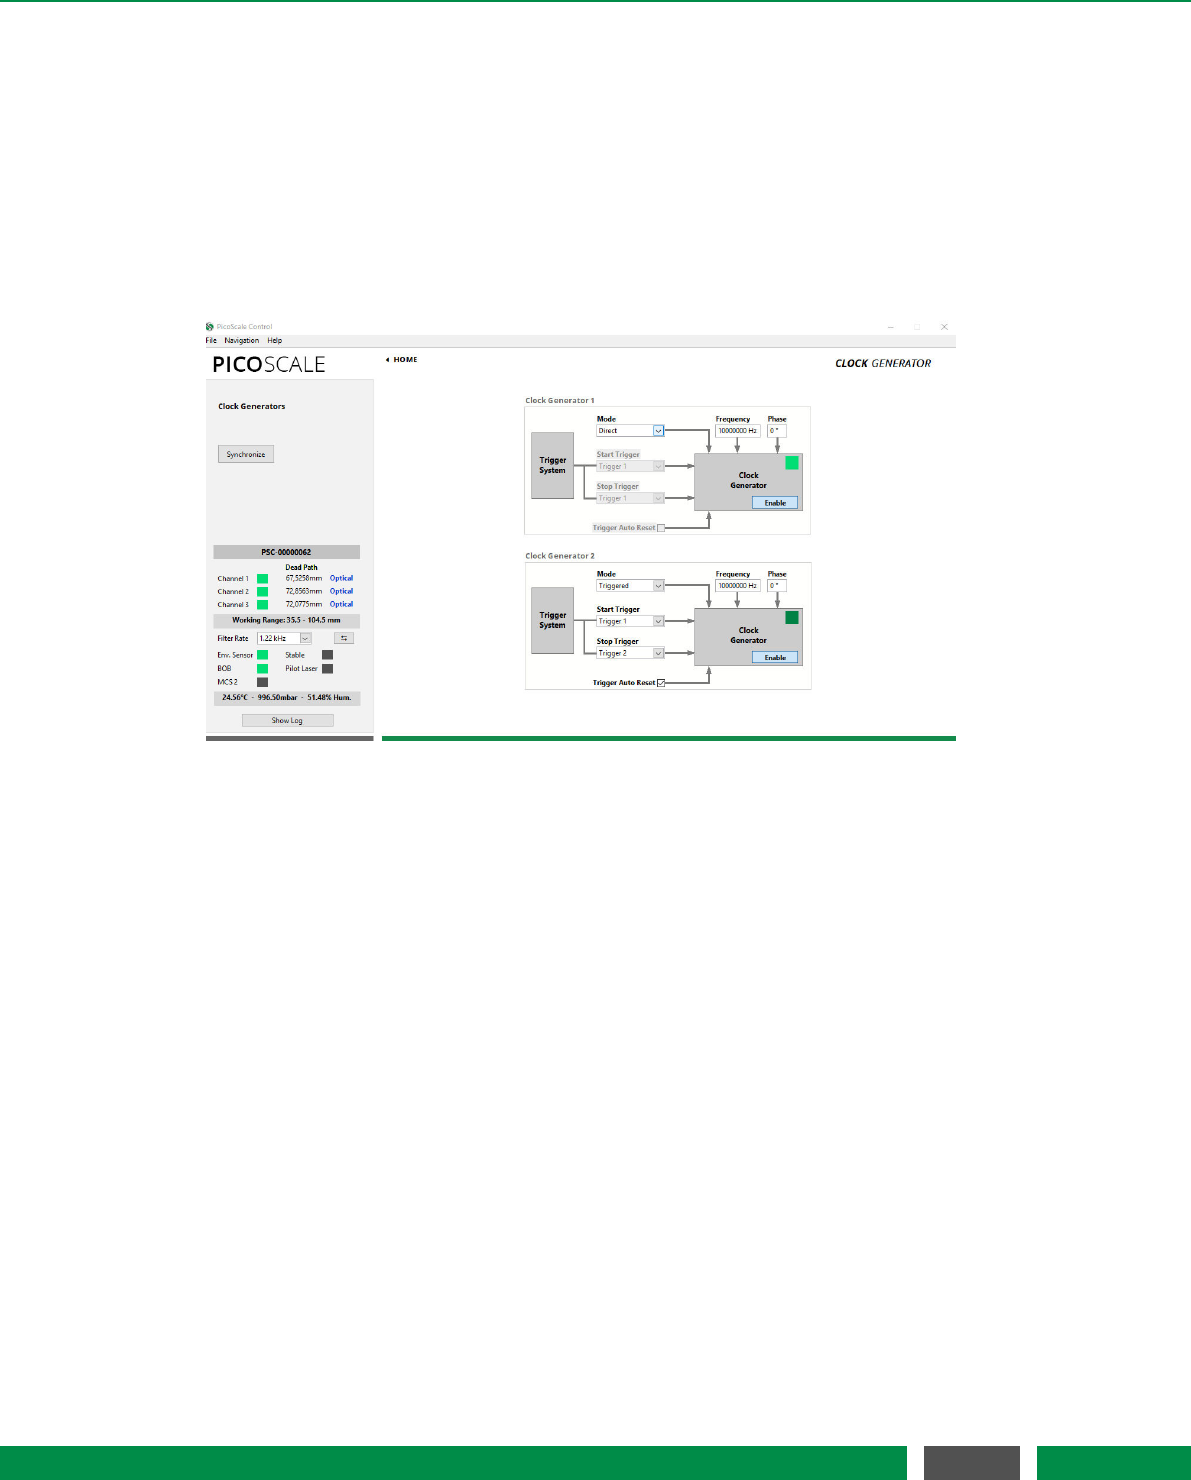
7 PICOSCALE CONTROL GUI
7.5 Modules
The PICOSCALE modules add much more versatility to your applications. These modules are the
Clock Generator module, the Arbitrary Signal Generator module, the Calculation System module and
the Counter module.
7.5.1 Clock Generator
Figure 7.16: Configuration Menu of the Clock Generators.
The PICOSCALE offers two digital clock generators, which can output frequencies from 1 Hz to
10 MHz. A clock generator can be used to simply output a clock via one of the GPIO pins, or it
can be used inside the advanced trigger system to synchronize internal data sources with external
processes, for example. In these applications, the PICOSCALE generates the master clock.
All clock generators are derived from the same master clock and can thus be synchronized. As
depicted in figure 7.16, each clock generator can be configured by a Frequency and a Phase Shift.
Enabling of each clock generator is done by the Enable button in the center of the each Clock Gen-
erator. Both generators can be synchronized to each other with a defined phase shift by clicking
the Synchronize button on the left side of the window.
Continuous output of a configured clock is realized in the Direct mode of the clock generator.
However, when you want to control external devices by the PICOSCALE or vice versa, it is helpful
to start and/or stop the clock generators once appropriate trigger conditions are given. For this,
the Mode of the clock generator must be set to Triggered and the the corresponding start and stop
trigger indices defined (cf. figure 7.16). The start and stop triggers are selected in the two drop-
down menus on the left side of each clock generator configuration panel. The triggers can be
configured in the respective menu of the Advanced Trigger panel. If the Auto Reset Mode is enabled,
the clock generator will listen for another start trigger after receiving a stop trigger. Otherwise the
clock generator can only be restarted by disabling and enabling it again manually. The auto reset
mode has no meaning in the direct clock generator mode.
67
PicoScale User Manual
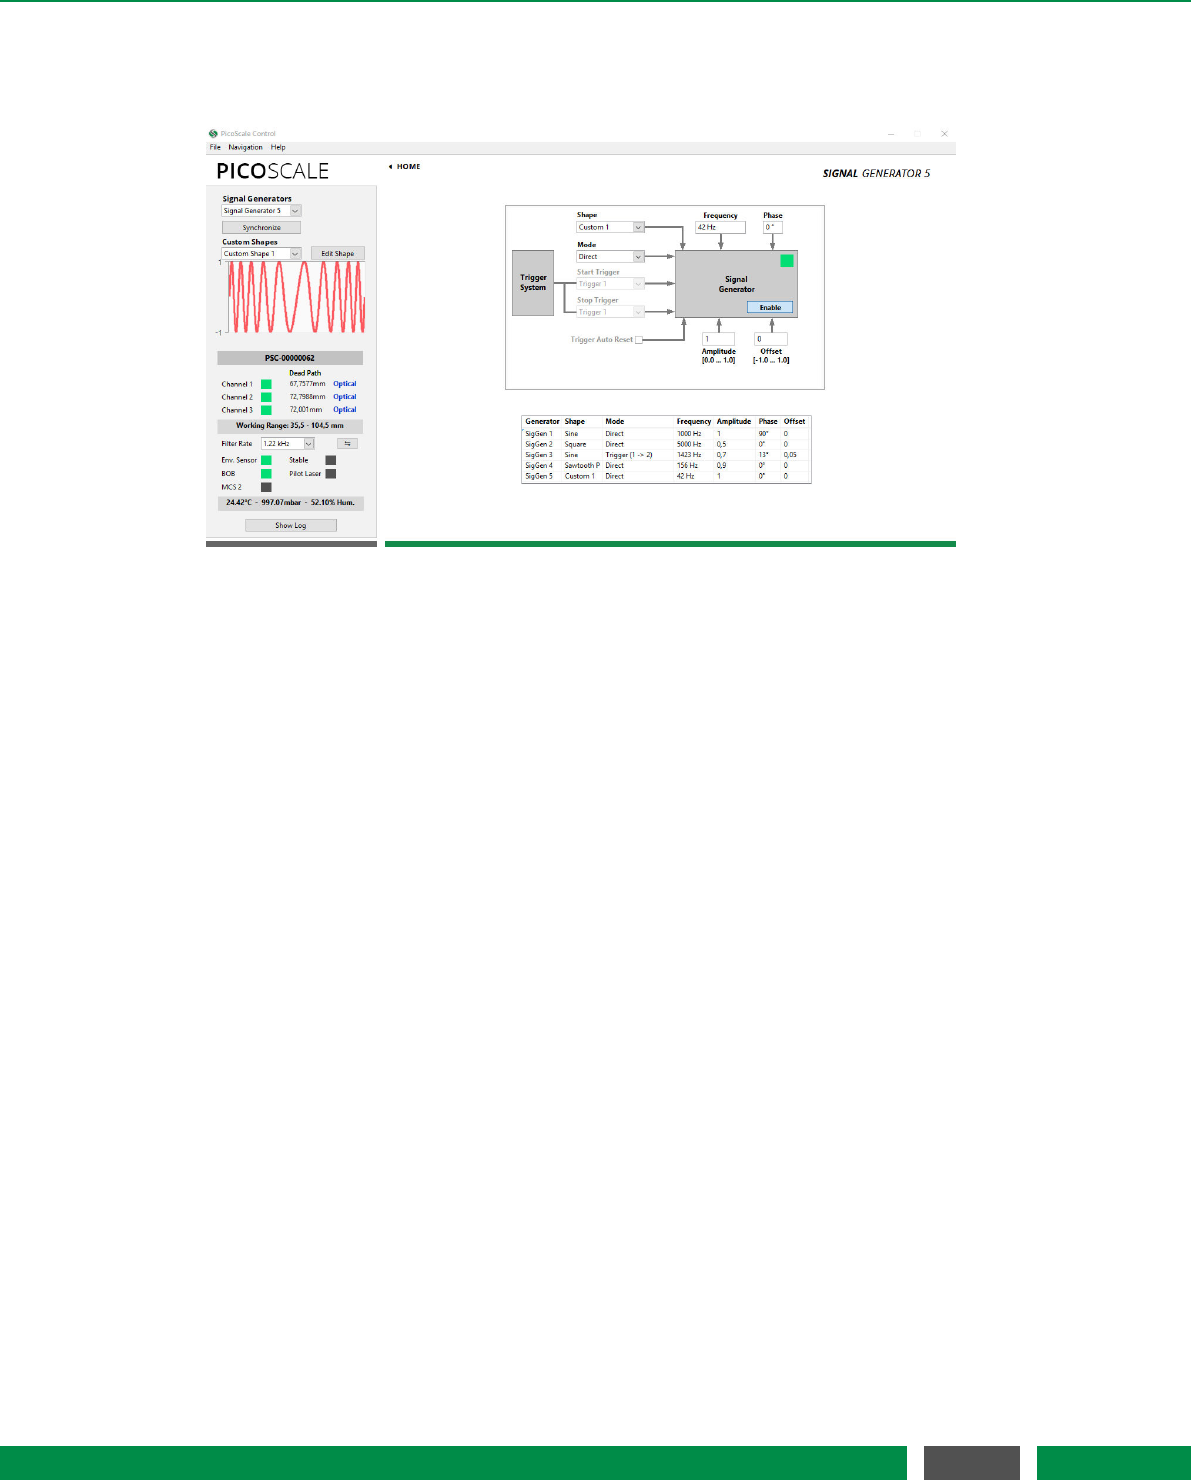
7 PICOSCALE CONTROL GUI
7.5.2 Arbitrary Signal Generator
Figure 7.17: Configuration Menu of the Arbitrary Signal Generators. In this example a frequency
modulation was uploaded as customized signal shape.
The PICOSCALE offers basic signal generator functionality with sine, square and sawtooth shapes.
Additionally, custom shapes can be uploaded as CSV files. In the configuration panel, see fig.
7.17, you can configure up to five signals (corresponding to five DAC interfaces). For each signal
generator you can choose sine, square, sawtooth (P: slow positive ramp, N: slow negative ramp)
or custom shapes in the Shape drop-down menu.
The frequency of the signals can be chosen between 1 mHz and 2.5 MHz. Note, that only DAC1
has a high 10 MHz sample rate and may be used to output fast signals. DAC2–DAC5 are limited to
200 kHz sample rate. The amplitude can be set in a range between 0 and 1 and the offset of the
signal can individually be set in a range between -1 and 1, where -1 corresponds to −10 V and 1
to 10 V. For example, a square signal with values between 0 and 5 Volt (i.e. TTL standard) can be
generated with the setting: shape Square, amplitude 0.25, offset 0.25.
When more than one signal generator is used, the signals can be synchronized with each other by
clicking the Synchronize button in the upper left part of the Signal Generator panel.
In the Custom Shapes panel, up to five custom shapes can be uploaded from CSV files. The files
must consist of 212=4096 float numbers (double, 64 bit) which represent the amplitude of the
signal at each point. Thus the numbers have to be in the range [-1,1]. (Decimal sign is "." and
the individual entries have to be separated by a line break.) The shape of the uploaded signal
is displayed in the graph. The Edit Shape button opens the Custom Shape Editor which allows to
define a custom signal shape by entering a formula or by uploading it from a CSV file.
68
PicoScale User Manual

7 PICOSCALE CONTROL GUI
7.5.3 Calculation System
Figure 7.18: Configuration Menu of the Calculation System.
Within the Calculation System you can perform basic calculations with data sources. Up to eight
calculation systems can be configured with the Calculation Systems drop-down menu in the upper
left part of the window.. First, you can define up to four operands (1.1–1.4). Each operand can
be a constant, a position/velocity/acceleration value from one of the three PICOSCALE channels,
an ADC value, a data source value from the environmental module (temperature, pressure or
humidity), signal generator outputs or a counter value. Then, you can sum up the four channels
or the minimum or maximum value can be calculated as defined in the grey Operator 1 box. If, for
instance, a subtraction is required, the Negate Output button can be activated in order to multiply
an operand by -1 before performing the summation. The exact same operations can be performed
with a second branch of data by defining operands 2.1–2.4 and Operator 2.In the third stage, the
results of Operator 1 and Operator 2 can be processed with Operator 3, resulting in a Calc Sys
Result.Operator 3 allows summation, subtraction, multiplication, division or Max/Min operation.
Alternatively, the inputs of Operator 3 can be set to a float constant or the Calc Sys Result of another
calculation system.
In the exemplary operation as shown in figure 7.18 the calculation is set up to give
Calc Sys Result =Position 1 −Position 2
12000000000 .
By default, the result is simply forwarded to the 64 bit Calc Sys Output. However, it is possible to
map the result to a specific value defined by a lookup-table (LUT). Note that in this case, the cal-
culation system result has to be in the range of [-1,1]. Results outside this range will be truncated.
The lookup-table needs to have 12 bit resolution (and thus has a length of 212=4096 points). The
result is interpolated based on those 4096 points to again give a 64 bit resolution. User defined
LUTs can be uploaded as CSV files in the Custom Shapes panel. (Decimal sign is "." and the 4096
individual entries have to be separated by a line break.) Once a calculation system is configured,
it can be stored in configuration slots for later usage by using the Module Configurations button.
69
PicoScale User Manual

7 PICOSCALE CONTROL GUI
7.5.4 Counter
Figure 7.19: Configuration Menu of the Counters.
The PICOSCALE offers two Counters that may be used as a timer (counting FPGA clock cycles) or
as an event counter of trigger events, see fig. 7.19. The counter trigger index can be set to one of
the eight trigger indices that can be configured within the Advanced Trigger module. If the Counter
Mode is set to Direct, the Counter simply counts when it is activated by the Enable CNT button in
the Counter Control panel. The Synchronize button in the upper left of the window enables both
counters simultaneously.
In the Triggered counter mode the counting starts in case of a Start Trigger event and stops in case
of a Stop Trigger event. Both can be selected on the left hand side of the configuration panel. In
the selection of the Trigger Reset Mode, there are three options:
•Disabled Counting starts at the pre-defined Start Value at a Start Trigger event and stops at
aStop Trigger event. Restart of the counter can only be done by disabling and enabling the
counter.
•Enabled Counting starts at the pre-defined Start Value at a Start Trigger event and stops at a
Stop Trigger event. Another Start Trigger event, starts counting again from the counter value
stored from the preceding counting period.
•Reset Value Counting starts at the predefined Start Value at a Start Trigger event and stops
at a Stop Trigger event. Another Start Trigger event, starts the counting again from the Start
Value, thus resets the preceding value.
The LED in the Counter panel indicates if a counter is currently running (LED green), off(LED off) or
armed (LED yellow). An armed counter means that the counter is waiting for a start trigger event.
The Reset Value button resets the counter to the corresponding start value.
70
PicoScale User Manual
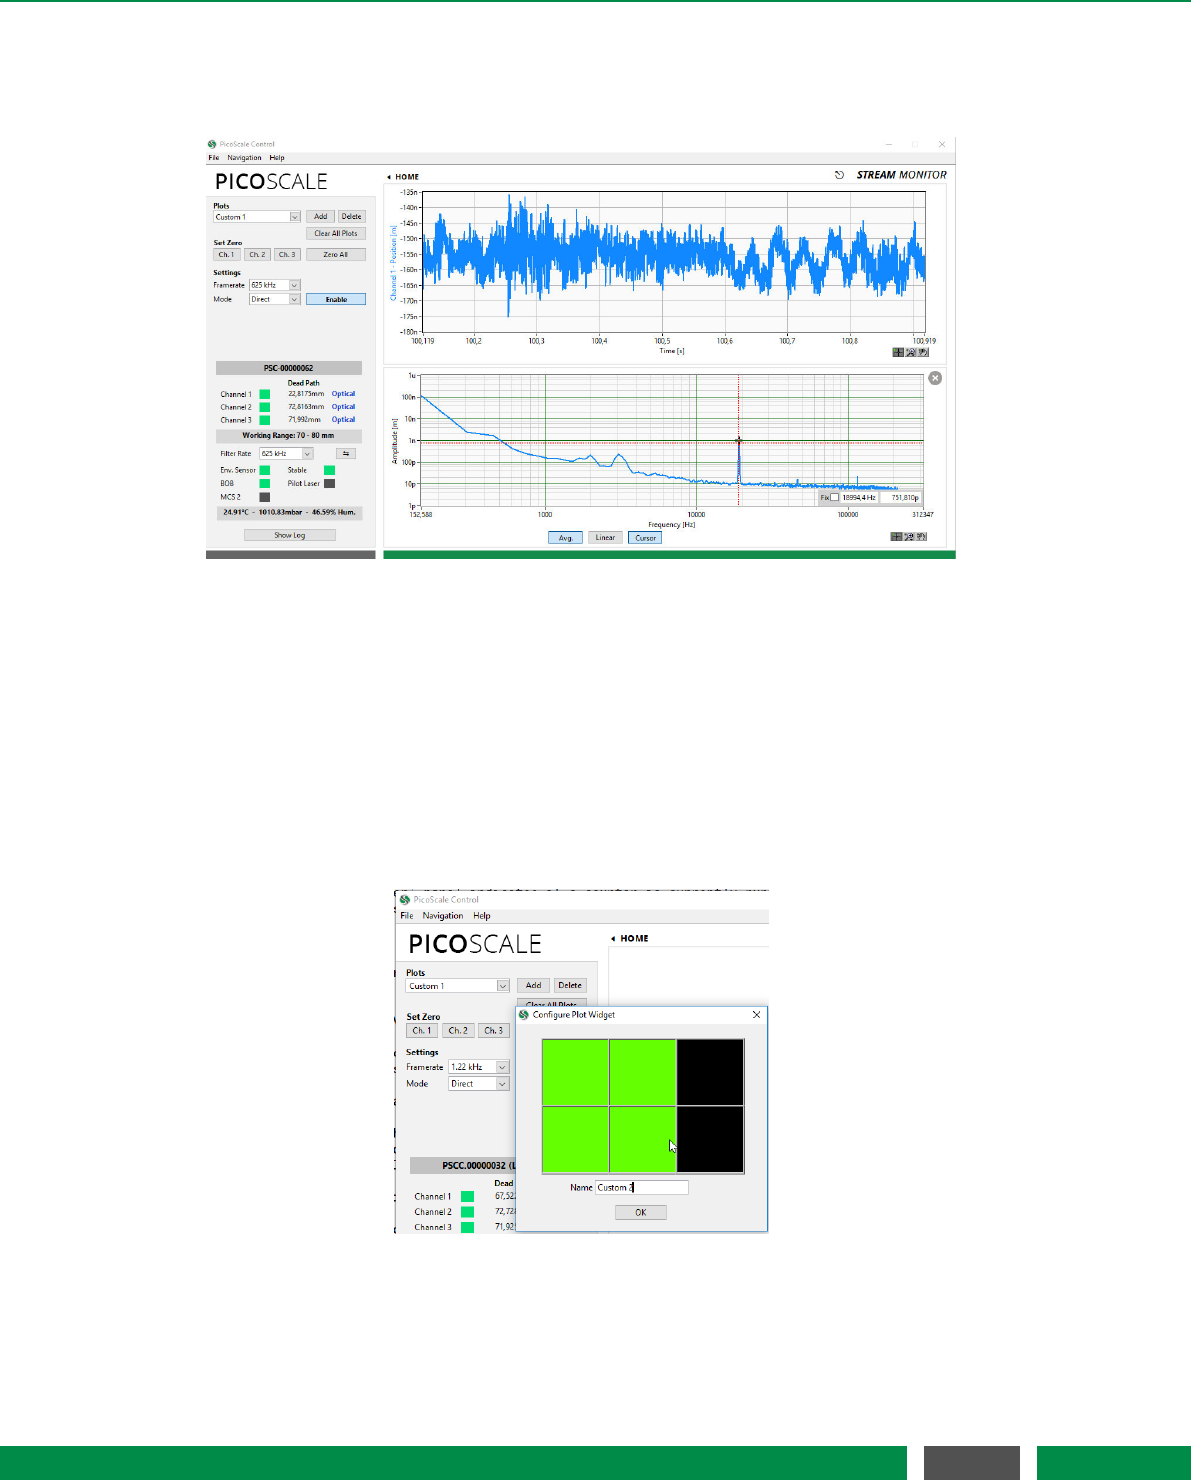
7 PICOSCALE CONTROL GUI
7.6 Streaming Monitor
Figure 7.20: Stream View Panel with two active streams.
For continuous data extraction from the PICOSCALE system, data frames can be configured and
afterwards streamed to the user PC. In the PICOSCALE GUIthe streaming interface can be con-
trolled and used within the Stream Monitor panel. Each panel can be undocked using the small
symbol next to the "STREAMMONITOR" headline so that you may move it to a different screen, for
example.
7.6.1 Configure data receiver layout
Figure 7.21: Setting up a new data receiver layout.
PICOSCALE Control allows to define a great variety of different plot layouts. When clicking the
Add button a new windows opens up and by sweeping over the desired pattern you can define a
71
PicoScale User Manual

7 PICOSCALE CONTROL GUI
new panel. The more tiles you select, the smaller the individual plots will be as the pattern will be
scaled to the window. You may also want to name the new panel appropriately.
7.6.2 Setting up a data receiver
Each empty plot panel contains a Configure button that opens a Receiver Settings window shown in
figure 7.22.
Figure 7.22: Plot configuration.
The drop-down menu Receiver Type allows to select the different data streams that can be pro-
cessed and displayed. There are several types of data output possible:
•Timeplot A single plot window is shown plotting the data source(s) on the y axis over time
on the x axis.
•Timeplot (Stacked) Several timeplots (one per data source) are stacked over each other.
•XY Graph The XY graph requires two inputs. The first stream is used for the x axis and the
second stream for the y axis. A Lissajous figure can be plotted using the data sources Sw
and S2w.
•Numeric A numeric output of the data stream.
•FFT (Power Spectrum) The power spectrum (PS) of one data source is calculated. You may
change to linear scaling (taking the square-root) of the power spectrum to display the am-
plitude spectrum (AS). Changing between PS and AS can be done be right-clicking into the
plot and selecting the appropriate scaling in the Spectrum Scaling selector. Units: If you, for
example, calculate the PS of a position data source, the unit will be m2.If you calculate the
AS of a position data source, the unit will be m.
•FFT (Power Spectral Density) The power spectral density (PSD) of one data source is cal-
culated, which is the power spectrum scaled by the noise equivalent bandwidth. The user
may change to linear scaling (taking the square-root) of the power spectral to display the
amplitude spectral density (ASD). Changing between PS and AS can be done be right-clicking
into the plot and selecting the appropriate scaling in the Spectrum Scaling selector. Units: If
you, for example, calculate the PSD of a position data source, the unit will be m2/Hz.If you
calculate the ASD of a position data source, the unit will be m/sqrtHz.
72
PicoScale User Manual

7 PICOSCALE CONTROL GUI
•File The data stream is directed to a file. The data are stored in binary format but using the
included Data Reader you can convert them to *.csv files, see section 7.6.5. A header file is
stored as well containing information on frame rate and a time stamp. If you stop and start
the stream several times, this information is also stored in this file and you can isolate the
data block later.
The white text box in the middle of the Receiver Settings window shows the active data sources
for this plot. Sources can be added and deleted using the appropriate buttons. The drop-down
menus below the text box allow to select the different channels and data types.
The available data sources have different data types which are summarized in table 7.1.
Data source Data type Size [bit]
Position int48 48
Velocity int64 64
Acceleration int64 64
Sw Raw uint16 16
S2w Raw uint16 16
Sw uint16 16
S2w uint16 16
Counter 1–2 uint48 48
Env Sensor Temperature int32 32
Env Sensor Humidity int32 32
Env Sensor Pressure int32 32
GPIO ADC1–3 uint16 16
Calculation System 1–3float32 32
Table 7.1: Overview of all data sources and their respective data types and sizes.
After selecting the Receiver Type and adding one or more data sources, the plot window is con-
figured using the Apply button. A plot is closed using the cross in the upper right corner of the
window.
7.6.3 Manipulate the data
The Clear all Plots button allows to clear the history of all active time plots simultaneously. For
most applications it is useful to zero the interferometer positions. This is achieved by clicking the
Set Zero Ch1,Ch2 and Ch3 buttons. To zero all channels simultaneously the Zero All button is used.
7.6.4 Configure the data stream
In the Settings region the Frame Rate drop-down menu changes the streaming frame rate to opti-
mize the data visualization corresponding to the experimental needs. You may choose data rates
73
PicoScale User Manual
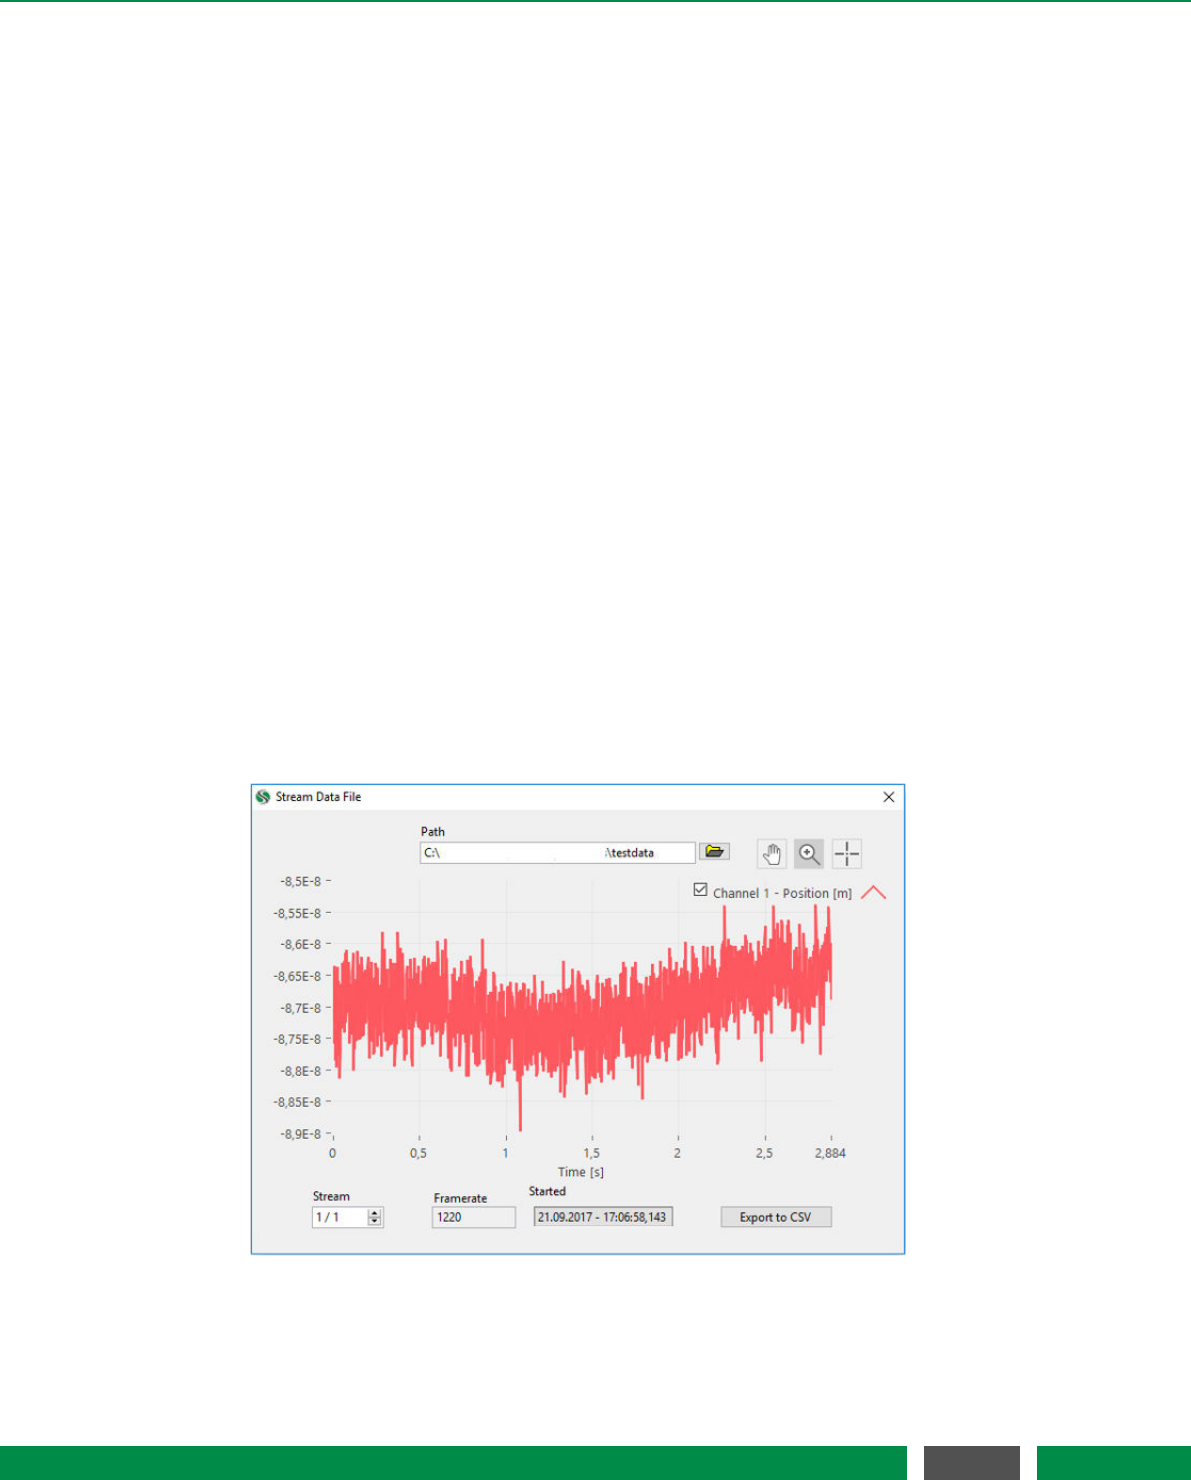
7 PICOSCALE CONTROL GUI
ranging from about 1 Hz to 10 MHz. The possible frame rates are dependent on the selected data
sources and the performance of your PC and network. Depending on the active data sources the
system automatically determines the maximum frame rate and corrects the displayed value in the
Frame Rate menu. You can also select triggers as frame rates so that you can use external clocks
for data sampling.
The Mode menu allows either Direct or Triggered streaming. In case of Triggered streaming the
Start and Stop triggers can be selected. After the stream is stopped by a corresponding trigger,
the stream generator in the PICOSCALE FPGA still sends a certain amount of data frames, speci-
fied by the Post Frame Count value. After receiving a stop trigger the stream generator is disabled
and needs to be enabled again, if further stream data should be recorded. Thus after receiving a
stop trigger, a subsequent start trigger event does not activate the data stream again. However,
sometimes this is necessary. With the Reset on Stop function the stream generator can be auto-
matically reactivated/armed, after a stop trigger was received and the corresponding post frames
were acquired.
The streaming is started and stopped with the Enable button.
With the drop-down menu Filter Rate, in the PICOSCALE status window, a low-pass filter can be
selected, used to filter the data inside the FPGA before transmitting it. The button to the right
side of the Filter Rate changes the drop-down menu to the corresponding Cutoff Frequency. The
Filter Rate and Frame Rate options should be set carefully to avoid aliasing. The system indicates
potential aliasing by a red logo on-top of the Frame Rate menu. By clicking on this logo, the Frame
Rate is automatically adjusted to meet the Filter Rate.
7.6.5 PicoScale Data Reader
Figure 7.23: PICOSCALE Data Reader. A data file has been loaded and the data are shown. Im-
portant information on frame rate and a time stamp are also given.
74
PicoScale User Manual

7 PICOSCALE CONTROL GUI
The data reader can process the files you have streamed to your hard disk. As the data are stored
in binary format you may want to convert them to human-readable CSV files. Therefore, navigate
to the Data Reader via File →Read Stream Data File. Here, you can select the desired header file
which contains the necessary information on frame rates etc. By clicking the Export to CSV button
you can store the data in a human-readable file that can be used for further data processing.
75
PicoScale User Manual
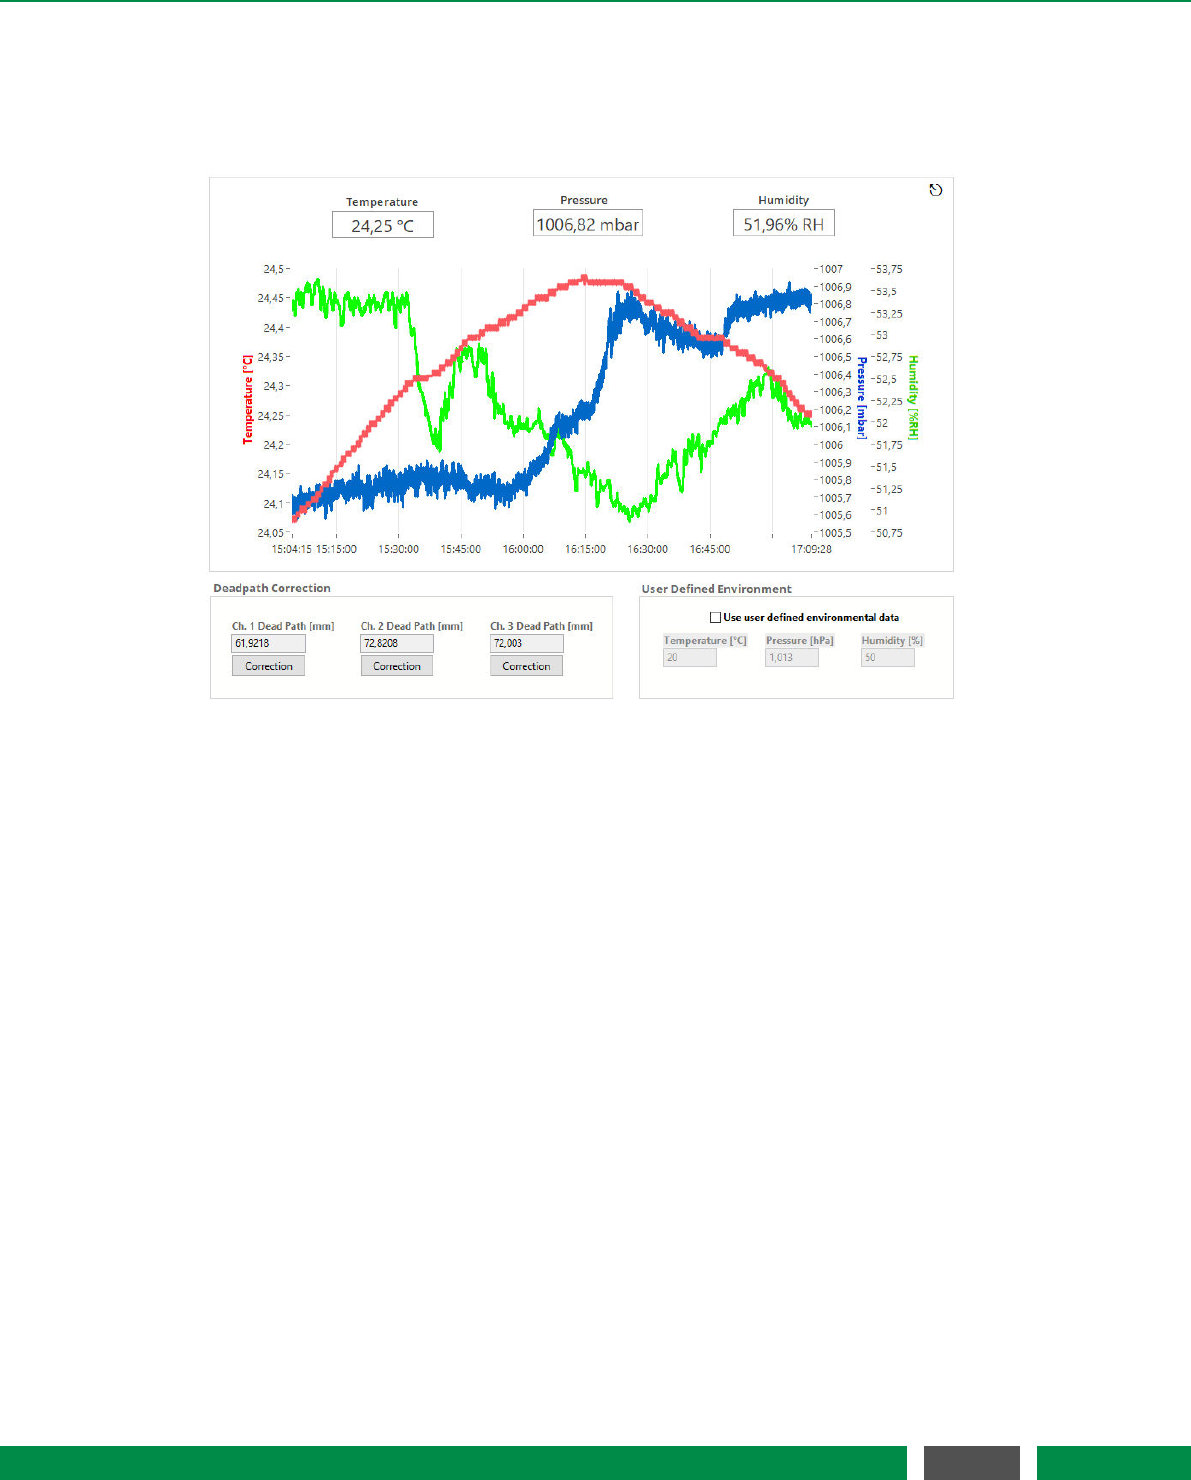
7 PICOSCALE CONTROL GUI
7.7 Environmental Monitor
Figure 7.24: Environmental Monitor.
The Environmental Monitor displays the temperature, humidity and pressure. When an environ-
mental module is connected to the PICOSCALE and the GUIsubscribes to the corresponding
event, temperature, humidity and pressure are recorded automatically. The influence on the mea-
surement can be corrected using the Deadpath Correction for the individual channels.
In the center of the display you find the environmental values plotted over time. Above the plot
the current values are shown. The environmental module records data with approximately one
Hertz sampling frequency and each plot can hold 24 hours of measurement data.
On the lower left hand side, the Dead Path Correction can be activated. During adjustment the
PICOSCALE roughly determines the absolute distance between target mirror and sensor head
and automatically determines the current dead path. The Channel Dead Path [mm] panels show
the dead paths (in millimeters) of the active channels.
Only when the dead path correction is enabled, variations of the refractive index are taken into
account and used for correction of position data. The dead paths can also be updated manually
when you enter a new value and enable the dead path correction for the specified channel.
When user defined environmental parameters are inserted on the lower right side of the window
a new adjustment described in chapter 7.2 will be necessary if you want to switch back to standard
dead path correction. For further details on dead path correction, please refer to section 3.4.
76
PicoScale User Manual
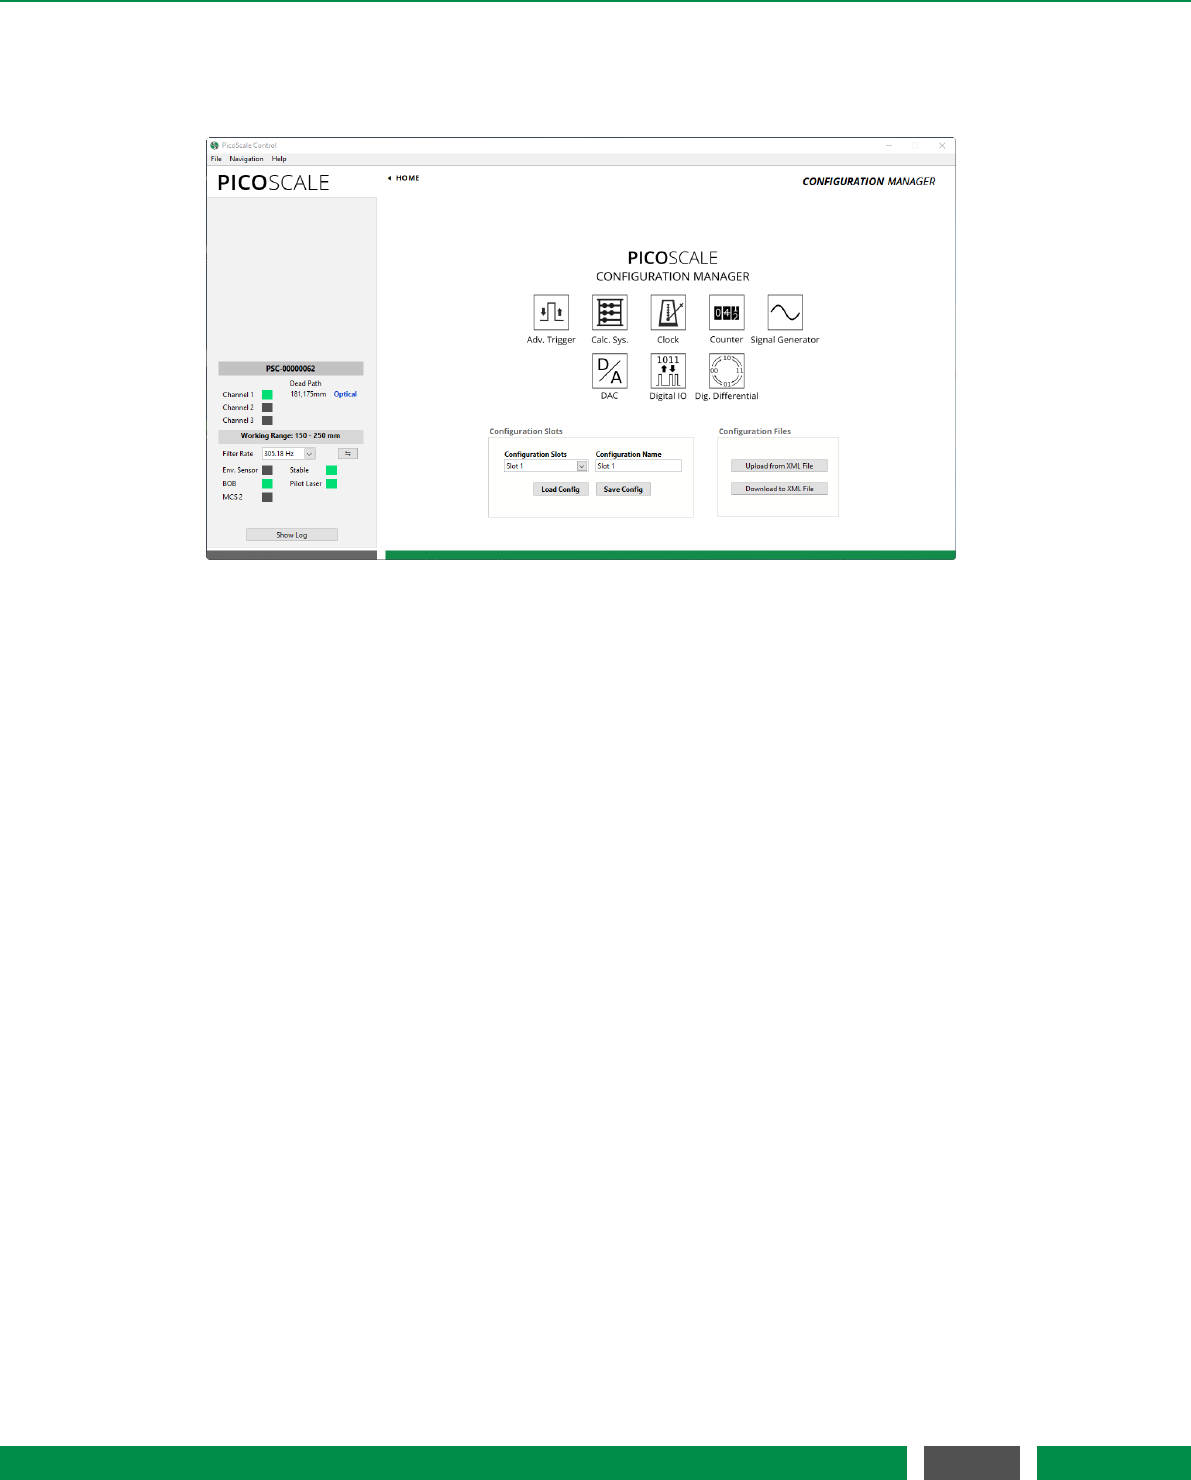
7 PICOSCALE CONTROL GUI
7.8 Configuration Manager
Figure 7.25: Configuration Manager. The current settings can be stored in so-called configuration
slots. Each configuration slot can also be down- and uploaded to *.XML files.
The PICOSCALE allows to store specific configuration settings to provide an easy and efficient way
to proceed your measurements after a restart of the system. Therefore, there are eight configura-
tion slots available, that can be named freely. Each configuration slot contains the settings of the
following modules:
•Advanced Trigger
•Calculation System, including look-up tables
•Clock Generator (*)
•Counter (*)
•Signal Generator, including custom shapes (*)
•Digital-to-analog converters
•Digital IO interface
•Digital Differential interface
(*) The outputs of these modules are disabled when the corresponding settings are loaded and
need to be enabled when needed. This prevents unintended signal output.
Once you have configured your system, you may store the settings in a configuration slot which
can optionally be renamed. The configuration slots are stored in the PICOSCALE internally. Ad-
ditionally, you may download the active configuration (independently of the actual slots) to an
*.XML file. This file can be uploaded and several PICOSCALE controllers can thus be configured
the same way.
77
PicoScale User Manual
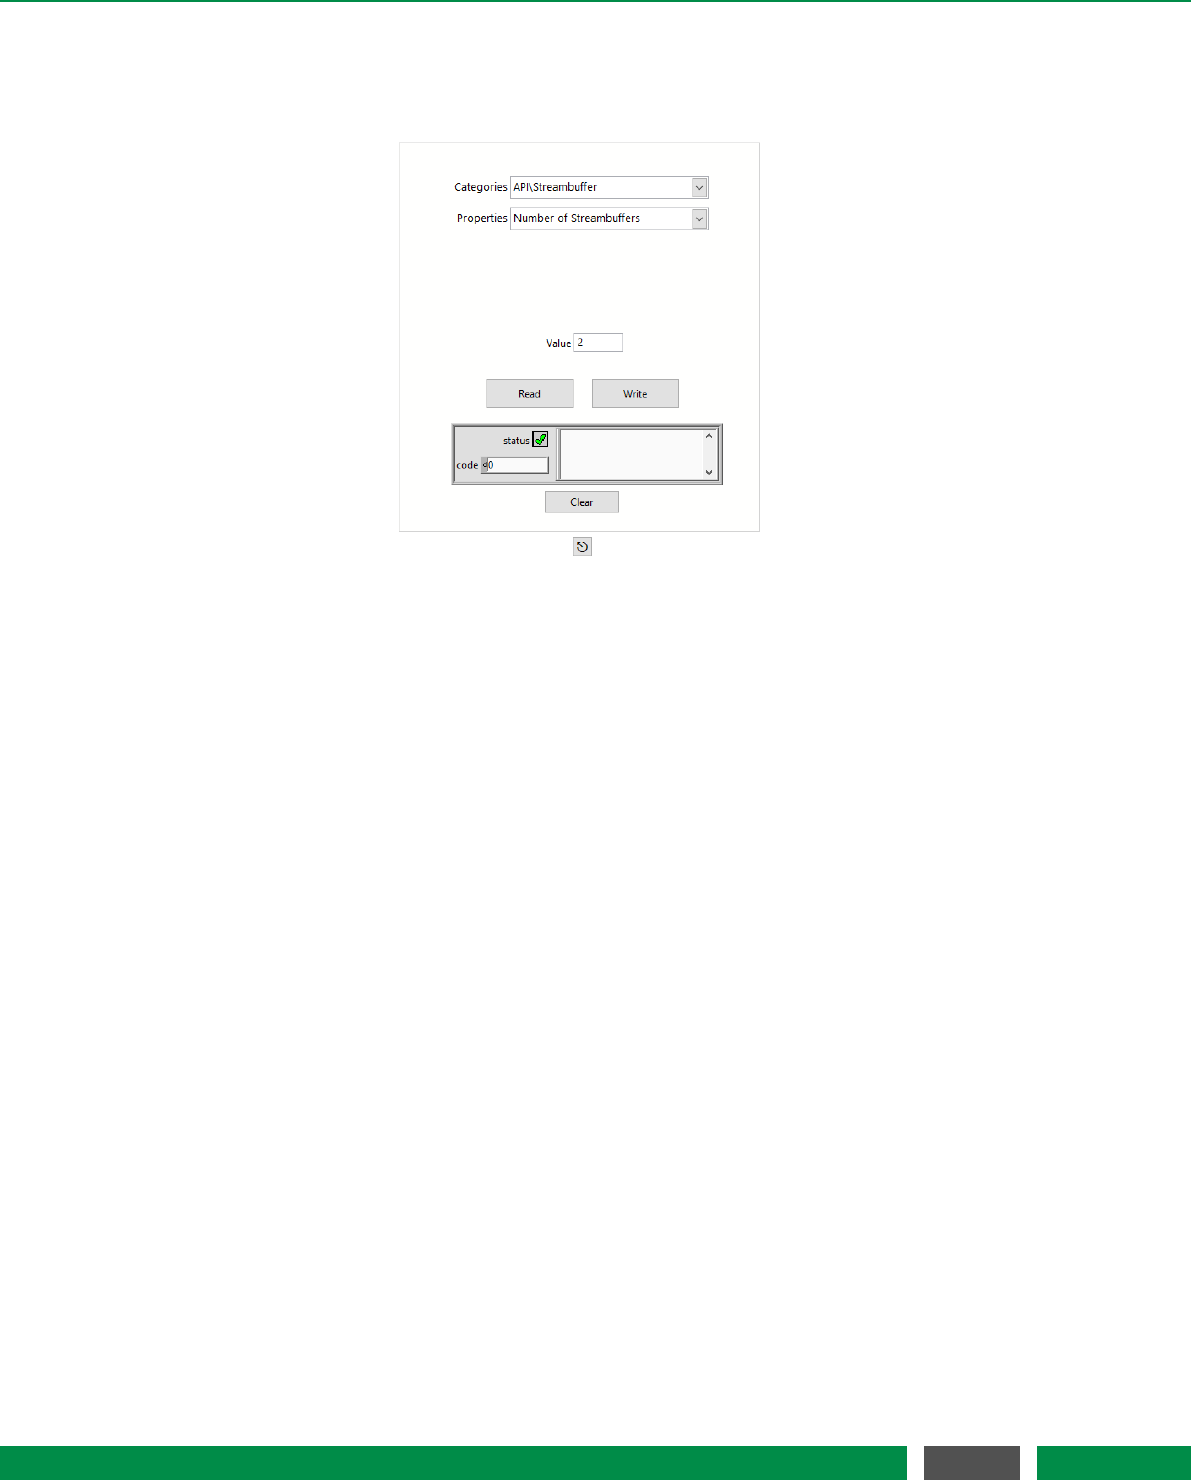
7 PICOSCALE CONTROL GUI
7.9 Property Dialog
Figure 7.26: Properties dialog box.
Properties are configuration values that define the behaviour of the device. The dialog can be
reached over the menu Navigation,Settings and Properties. Each property has a data type and
an access mode. Some properties may be read and written, while others are read only or (in
rare cases) write only. Within the Property Dialog, you can read or write these properties. For a
detailed description of the properties, please refer to the PICOSCALE Programmer’s Guide. Please
note that changing properties without due consideration may have significant consequences in
the performance of the PICOSCALE.
78
PicoScale User Manual
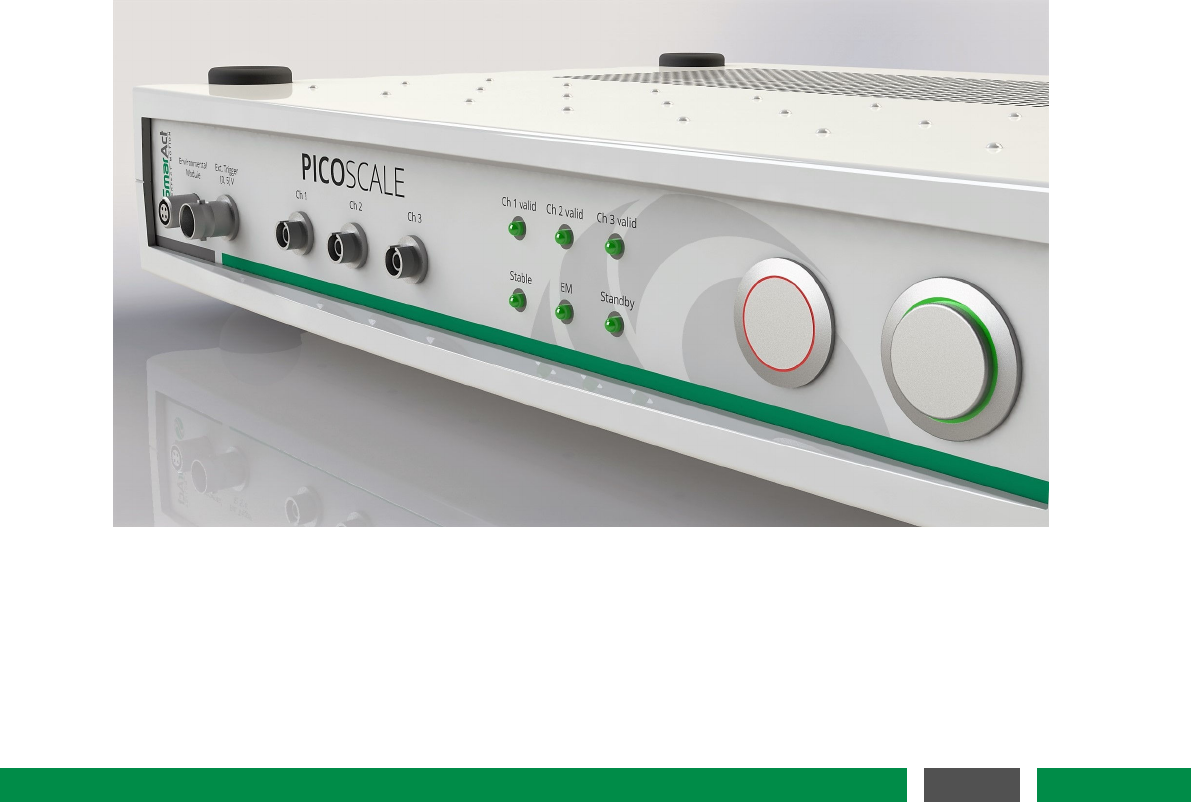
8CONCLUDING REMARKS
In this manual the basic operation principles, hardware and software of a PICOSCALE system are
introduced. You should now be able to work efficiently with the PICOSCALE to perform position
measurements with high accuracy. However, the PICOSCALE functionality goes far beyond mea-
suring positions only. You may use it as a signal generator, timing module in your laboratory, data
acquisition, perform basic calculations with high speed and many others. A selection of possible
applications as well as summaries of key performances you can find in the application notes on
SmarAct’s homepage or on request. SmarAct will constantly add more and more application notes
so it is worth checking the homepage regularly. You will also find an overview of convenient acces-
sories there. However, if you do not find solutions for your application directly there, please do
not hesitate to contact us. We will be very happy to help and try to find a solution for your precise
measurement or implementation issue as quickly as possible.
We are convinced that the great versatility of the PICOSCALE offers great potential for many high
precision metrology environments. Enjoy your PICOSCALE!
79
PicoScale User Manual

Sales partner / Contacts
Headquarters
SmarAct GmbH
Schuette-Lanz-Strasse 9
26135 Oldenburg
Germany
T: +49 441 – 800 87 90
Email: info-de@smaract.com
www.smaract.com
France
SmarAct GmbH
Schuette-Lanz-Strasse 9
26135 Oldenburg
Germany
T: +49 441 – 80 08 79 956
Email: info-fr@smaract.com
www.smaract.com
Israel
Trico Israel Ltd.
P.O.Box 6172
46150 Herzeliya
Israel
T: +972 9 – 950 60 74
Email: info-il@smaract.com
www.trico.co.il
Japan
Physix Technology Inc.
Ichikawa-Business-Plaza
4-2-5 Minami-yawata,
Ichikawa-shi
272-0023 Chiba
Japan
T/F: +81 47 –370 86 00
Email: info-jp@smaract.com
www.physix-tech.com
South Korea
SEUM Tronics
# 801, 1, Gasan digital 1-ro
Geumcheon-gu
Seoul, 08594,
Korea
T: +82 2 868 –10 02
Email: info-kr@smaract.com
www.seumtronics.com
USA
SmarAct Inc.
2140 Shattuck Ave. Suite 1103
Berkeley, CA 94704
United States of America
T: +1 415 –766 9006
Email: info-us@smaract.com
www.smaract.com
80
PicoScale User Manual
