Point85 OEE User Guide
User Manual:
Open the PDF directly: View PDF ![]() .
.
Page Count: 79
- Overview
- Designer Application
- Collector Application
- Monitor Application
- Operator Application
- Testing Applications
- Database
- Installation
- Project Structure
- Contributing Technology
- References
Point85
Overall Equipment Effectiveness Applications User GuideOverall Equipment Effectiveness Applications User GuideOverall Equipment Effectiveness Applications User Guide
Version 1.2Version 1.2Version 1.2
Kent Randall
November 30, 2018
2
Table of Contents
Overview..................................................................................................................................................... 4
OEE Calculations.................................................................................................................................... 5
Architecture........................................................................................................................................... 6
Technologies.......................................................................................................................................... 6
Designer Application................................................................................................................................... 7
Plant Entity Editor.................................................................................................................................. 7
The About button shows an informational dialog:........................................................................... 8
Entity Hierarchy................................................................................................................................ 8
Equipment Processed Materials....................................................................................................... 9
Equipment Data Collection Events ................................................................................................. 10
Material Editor..................................................................................................................................... 11
Reason Editor ...................................................................................................................................... 13
Unit of Measure (UOM)....................................................................................................................... 15
Description ..................................................................................................................................... 15
Editor.............................................................................................................................................. 16
Converter........................................................................................................................................ 19
Work Schedule..................................................................................................................................... 19
Description ..................................................................................................................................... 19
Editor.............................................................................................................................................. 20
Shifts.......................................................................................................................................... 21
Rotations................................................................................................................................... 22
Teams........................................................................................................................................ 24
Non-working Periods................................................................................................................. 24
Import Schedule........................................................................................................................ 25
Scripting............................................................................................................................................... 26
Description ................................................................................................................................ 26
Editor......................................................................................................................................... 29
Custom Scripting ....................................................................................................................... 31
Data Collector Editor ........................................................................................................................... 31
Data Source Editors ............................................................................................................................. 32
OPC UA Data Source....................................................................................................................... 33
Browser ..................................................................................................................................... 33
Trending .................................................................................................................................... 34
OPC DA Data Source....................................................................................................................... 36
Browser ..................................................................................................................................... 36
Trending .................................................................................................................................... 38
HTTP Data Source........................................................................................................................... 38
Definition................................................................................................................................... 38
Java Client Example................................................................................................................... 39
Database Trigger Example......................................................................................................... 40
3
iOS/Android Example ................................................................................................................ 42
Trending .................................................................................................................................... 43
Messaging Data Source .................................................................................................................. 44
Definition................................................................................................................................... 44
Trending .................................................................................................................................... 45
Database Table Data Source........................................................................................................... 47
Definition................................................................................................................................... 47
DB_EVENT Table Schema .......................................................................................................... 48
Trending .................................................................................................................................... 49
Dashboard ........................................................................................................................................... 49
Events............................................................................................................................................. 51
Availability Editor ...................................................................................................................... 52
Setup Editor............................................................................................................................... 53
Time Losses .................................................................................................................................... 53
First-Level Pareto Chart.................................................................................................................. 54
Second-Level Pareto Charts............................................................................................................ 55
Collector Application ................................................................................................................................ 56
Monitor Application.................................................................................................................................. 56
Dashboard ........................................................................................................................................... 57
Collector Notifications ......................................................................................................................... 57
Collector Status.................................................................................................................................... 58
Operator Application ................................................................................................................................ 59
User Interface...................................................................................................................................... 60
Web Service......................................................................................................................................... 63
Testing Applications.................................................................................................................................. 64
Collector User Interface....................................................................................................................... 64
HTTP and Messaging............................................................................................................................ 65
HTTP ............................................................................................................................................... 66
Messaging....................................................................................................................................... 66
Database................................................................................................................................................... 66
Design Schema..................................................................................................................................... 66
COLLECTOR Table ........................................................................................................................... 66
DATA_SOURCE Table...................................................................................................................... 67
EVENT_RESOLVER Table ................................................................................................................. 68
PLANT_ENTITY Table ...................................................................................................................... 68
MATERIAL Table ............................................................................................................................. 69
NON_WORKING_PERIOD Table...................................................................................................... 69
REASON Table................................................................................................................................. 69
ROTATION Table............................................................................................................................. 70
ROTATION_SEGMENT Table ........................................................................................................... 70
SHIFT Table..................................................................................................................................... 70
TEAM Table .................................................................................................................................... 70
UOM Table ..................................................................................................................................... 71
WORK_SCHEDULE Table................................................................................................................. 71
4
Execution Schema................................................................................................................................ 72
OEE_EVENT Table........................................................................................................................... 72
Installation................................................................................................................................................ 72
JavaFX Applications.............................................................................................................................. 72
Data Collector...................................................................................................................................... 74
Operator Web Application................................................................................................................... 74
Project Structure....................................................................................................................................... 74
OEE-Domain......................................................................................................................................... 75
OEE-Designer....................................................................................................................................... 75
OEE-Collector....................................................................................................................................... 76
OEE-Operations ................................................................................................................................... 76
Building................................................................................................................................................ 77
Contributing Technology .......................................................................................................................... 77
References................................................................................................................................................ 78
OOOVERVIEWVERVIEWVERVIEW
The Point85 Overall Equipment Effectiveness (OEE) applications enable:
collection of equipment data from multiple sources to support OEE calculations ,
resolution of a collected data value into an availability reason or produced material quantity
to provide input to the performance, availability and quality components of OEE
calculation of the OEE key performance indicator (KPI) for the equipment using an optional
work schedule for defining the scheduled production time
monitoring of equipment availability, performance and quality events
Sources of equipment availability, performance and quality event data include:
Manual: web browser-based data entry
OPC DA: classic OLE for Process Control (OPC) Data Acquisition (DA)
OPC UA: OLE for Process Control Unified Architecture (UA)
HTTP: invocation of a web service via an HTTP request
Messaging: an equipment event message received via a RabbitMQ message broker
Database Interface Table: a pre-defined table for inserting OEE events
The Point85 applications supporting OEE are:
Designer: a GUI application for defining the plant equipment, data sources, event resolution
scripts, manufacturing work schedule, availability reasons, produced materials and units of
measure for data collectors. The designer also includes a dashboard and trending
capabilities.

5
Collector: a Windows service or Unix deamon to collect the equipment event data and store
it in a relational database
Monitor: a GUI application with a dashboard to view the current equipment OEE and status
Operator: a web-application for manual entry of equipment events
In addition, two GUI test applications assist in the development of an OEE solution:
HTTP requester and RabbitMQ message publisher
Front end for a data collector
Please send comments and suggestions to point85.llc@gmail.com.
OEE COEE COEE CALCULATIONSALCULATIONSALCULATIONS
OEE is the product of equipment availability, performance and quality each expressed as a percentage.
The time-loss model is used to accumulate time in loss categories (or “no loss” if the equipment is
running normally). See [Kennedy] for details. A data source provides an input value to a data collector’s
resolver JavaScript function that maps that input value to an output value (reason or production count).
For availability and performance, the output value is a reason that is assigned to one of the following
loss categories:
Value Adding: the “no loss” or “running OK” category.
Not Scheduled: this is non-working time. Non-working periods (e.g. holidays) typically are planned
in the work schedule that is assigned to equipment.
Unscheduled: working time when the equipment is not scheduled for normal production (e.g. an
R&D or laboratory test run).
Planned Downtime: working time when the equipment is not scheduled for normal production but
the activity is intended to support production (e.g. planned preventive maintenance).
Unplanned Downtime: working time when the equipment is not available due to an unexpected
fault (e.g. motor failure or jam).
Setup: working time when the equipment is being changed over in order to run new material.
Stoppages: minor or short periods of time when the equipment is not producing as expected (such
as a blocked or starved condition).
Reduced Speed: the equipment is producing, but not at its design speed or ideal run rate.
For quality or yield, the data source provides a production count in the good, reject/rework or startup &
yield categories in the defined units of measure for the material being produced.

6
AAARCHITECTURERCHITECTURERCHITECTURE
The OEE applications can be grouped by design-time and run-time. The design-time Designer
application is used to define the plant equipment, data sources, event resolution scripts, manufacturing
work schedule, availability reasons, produced materials and units of measure for data collectors. The
designer also includes a dashboard and trending capabilities.
An automated run-time data collector receives an input value from an OPC DA, OPC UA, HTTP,
messaging or database source and executes a JavaScript resolver on this input to calculate an output
value. The output value is a reason (mapped to an OEE loss category) for an availability event, a new
production count (good, reject/rework or startup) for performance and quality events or a material/job
change event (a job is also known as an order, lot or batch). For the case of a custom event, the output
value is ignored. The event data is stored in a relational database where it is available for OEE
calculations. Both Microsoft SQL Server and Oracle are currently supported.
A web-based manual data collector records the OEE events based on information entered by an
operator. Similar to the automated collector, this data is also stored in the relational database.
If the system is configured for messaging, the event data is also sent to a RabbitMQ message broker to
which a run-time monitor application can subscribe. A monitor displays a dashboard for viewing
equipment OEE events. It also displays collector notifications and status information as messages are
received.
TTTECHNOLOGIESECHNOLOGIESECHNOLOGIES
Technologies used for the OEE applications are:
Java 8 programing language and JavaFX for the GUIs
JavaScript for resolving an input value into an output value based on an OEE event. The Nashorn
script engine included in the Java 8 JVM is used.
Vaadin and Tomcat for the web application
j-Interop and OpenSCADA utgard for the OPC DA client
Eclipse Milo for the OPC UA client
Hibernate with a Hikari connection pool and JPA interface for persisting data to a relational database
NanoHTTPD for the embedded HTTP server
RabbitMQ and Erlang for the messaging middle-ware
Google Gson for message and HTTP request serialization into a JSON string and deserialization
Please see the Contributing Technologies section below for additional details.
7
DDDESIGNERESIGNERESIGNER A A APPLICATIONPPLICATIONPPLICATION
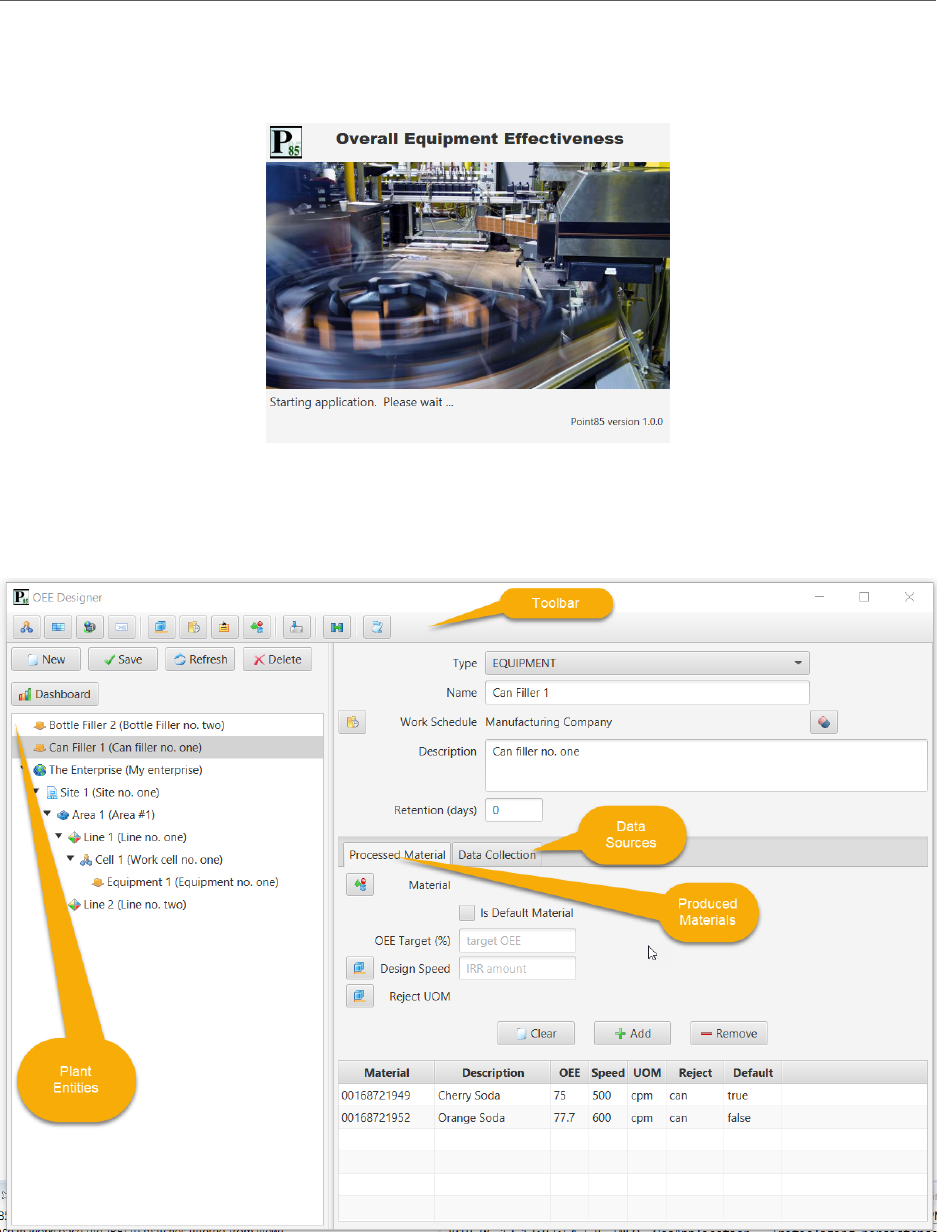
The Designer application is used to define all aspects of an OEE solution. It is launched from a shell
script. A splash screen is first displayed during the time the database connection is being established
and plant entity objects are being created.
PPPLANTLANTLANT E E ENTITYNTITYNTITY E E EDITORDITORDITOR
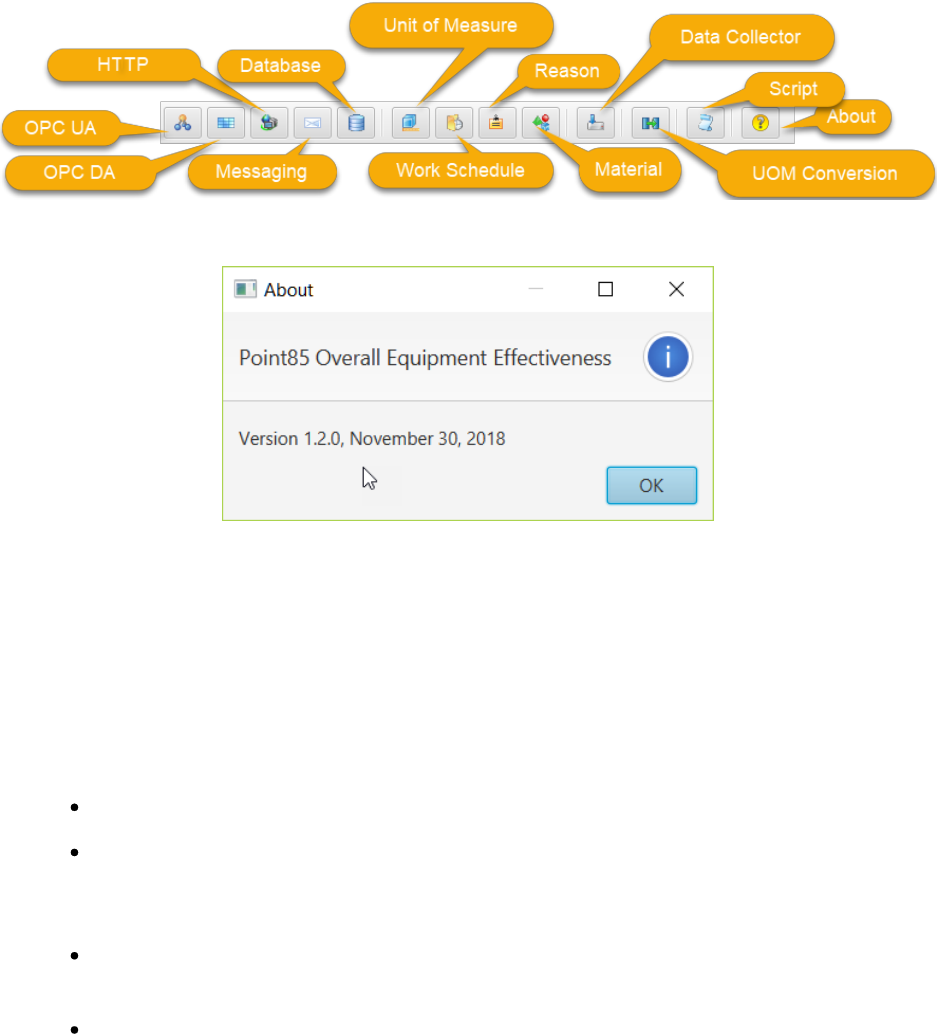
Upon launch of the Designer, the plant entity editor is displayed, for example:
8
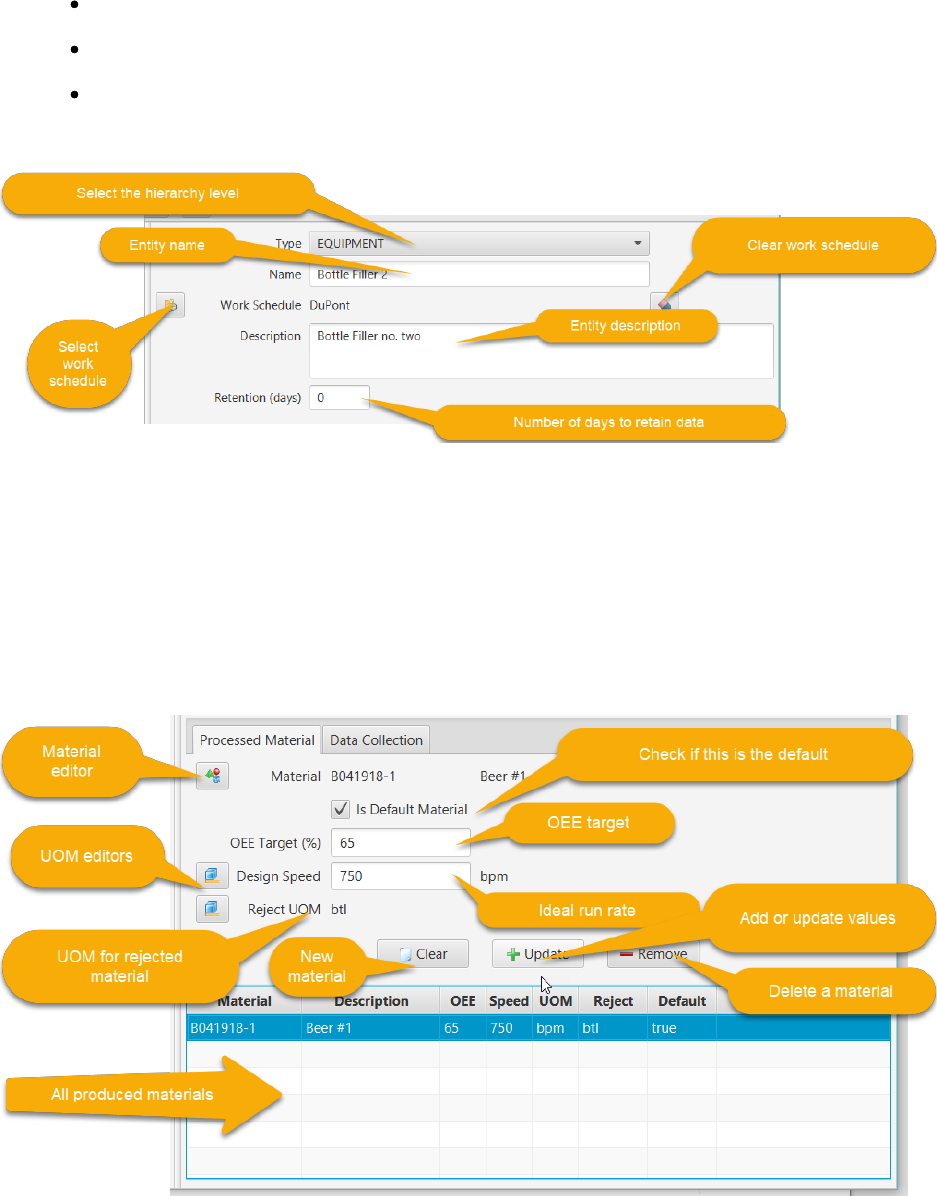
Toolbar
The toolbar buttons that launch other editors or applications (as discussed below) are:
The About button shows an informational dialog:The About button shows an informational dialog:The About button shows an informational dialog:
Entity HierarchyEntity HierarchyEntity Hierarchy
To begin, the plant entity physical model on the left side of the editor would typically be defined first.
This is the ISA-95 organizational hierarchy of Enterprise -> Site -> Area -> Production Line -> Work Cell ->
Equipment and is closely related to the process industry ISA 88 unit/machine model. Only equipment
can have OEE calculations, but higher level entities can have an associated work schedule and data
retention period that apply to equipment contained below them.
The physical model editor buttons are:
New: clear the editor to begin defining a new entity
Save: save the selected entity to the database. The parent entity (if any) must be selected
first. If a parent is selected, the child must be created of the proper type (e.g. Equipment if
the parent is a Work Cell).
Refresh: refresh the selected entity from the database to synchronize the editor with the
entity’s saved state
Delete: delete the selected entity and any children from the database
The Dashboard button displays the OEE dashboard for the selected equipment entity. The dashboard is
discussed below.
The physical model has a context menu accessed by right-clicking in the left-hand pane. The menu items
are:
9
Save All Entities: save all entities in the hierarchy to the database
Refresh All Entities: restore all entities in the hierarchy from their state in the database
Clear Selected Entity: de-select the entity so that no entity is selected
The entity’s attributes are displayed and edited in the upper right-hand corner of the editor:
The work schedule and data retention days apply to that entity and to all children below it. For
example, a work schedule could be defined for each Site or Area within a plant and have it apply to the
contained equipment. A retention of 90 days means that any event records older than 90 days for that
equipment will be deleted from the database when a new availability event is recorded.
Equipment Processed MaterialsEquipment Processed MaterialsEquipment Processed Materials
Equipment can produce many different materials. This one-to-many relationship is defined in the
Processed Material tab:
The editor actions are:

10
Clear: clear the editor controls in order to define a new processed material. The Add/Update
button text will change to “Add”.
Add: After defining the properties of a new material, clicking this button will add it to the list of
materials
Update: after selecting an existing processed material, the current values will be moved into the
editing controls. Make the necessary edits, then click this button to apply the changes to the list.
Remove: after selecting an existing processed material, click this button to remove it from the list.
Note that after making changes to the list of processed materials, the plant entity must be saved to the
database by clicking the Save button. An unsaved entity will be marked as such.
The material editor is accessed by clicking on the material button in this tab. The produced material is
then selected in the editor and the dialog closed. The unit of measure editor for the design speed and
rejects is accessed in a similar fashion.
Equipment Data Collection EventsEquipment Data Collection EventsEquipment Data Collection Events
Equipment can have many different sources of availability and production events. This one-to-many
relationship is defined in the Data Collection tab:
The editor actions are:
Clear: clear the editor controls in order to define a new resolver. The Add/Update button text will
change to “Add”.
Add: After defining the properties of the resolver, clicking this button will add it to the list
Update: after selecting an existing resolver, the current values will be moved into the editing
controls. Make the necessary edits, then click this button to apply the changes to the list.
Remove: after selecting an existing resolver, click this button to remove it from the list.

11
Watch: after selecting a resolver, click this button to launch a dialog to observe execution of the
resolver script when a new input value arrives. The output resolution is not saved to the database.
The dialogs are discussed below under the individual data source editors.
Note that after making changes to the list of event resolvers, the plant entity can be saved to the
database by clicking the Save button.
A data collector host is a Windows process or Unix daemon that interfaces to one or more data sources
to collect data for OEE calculations. A previously defined data collector for this event can be selected in
the dropdown, or the editor can be launched by clicking the editor button. This editor is discussed
below.
The event type is selected in the next dropdown:
AVAILABILITY - availability
PROD_GOOD - good production
PROD_REJECT - reject/rework production
PROD_STARTUP - setup & yield production
MATL_CHANGE - material change
JOB_CHANGE - job/order change
CUSTOM - application defined
The data source type (OPC DA, OPC UA, HTTP or messaging) is selected in the next dropdown.
The data source editor is launched by clicking on the button next to the source id field. For an OPC DA
source, a tag is selected in the browser. For OPC UA a node is selected. For HTTP, the HTTP data
collector’s embedded server is selected (in this case, the source id will be automatically created). For a
messaging source, the RabbitMQ broker is selected (in this case too, the source id will be automatically
created).
MMMATERIALATERIALATERIAL E E EDITORDITORDITOR
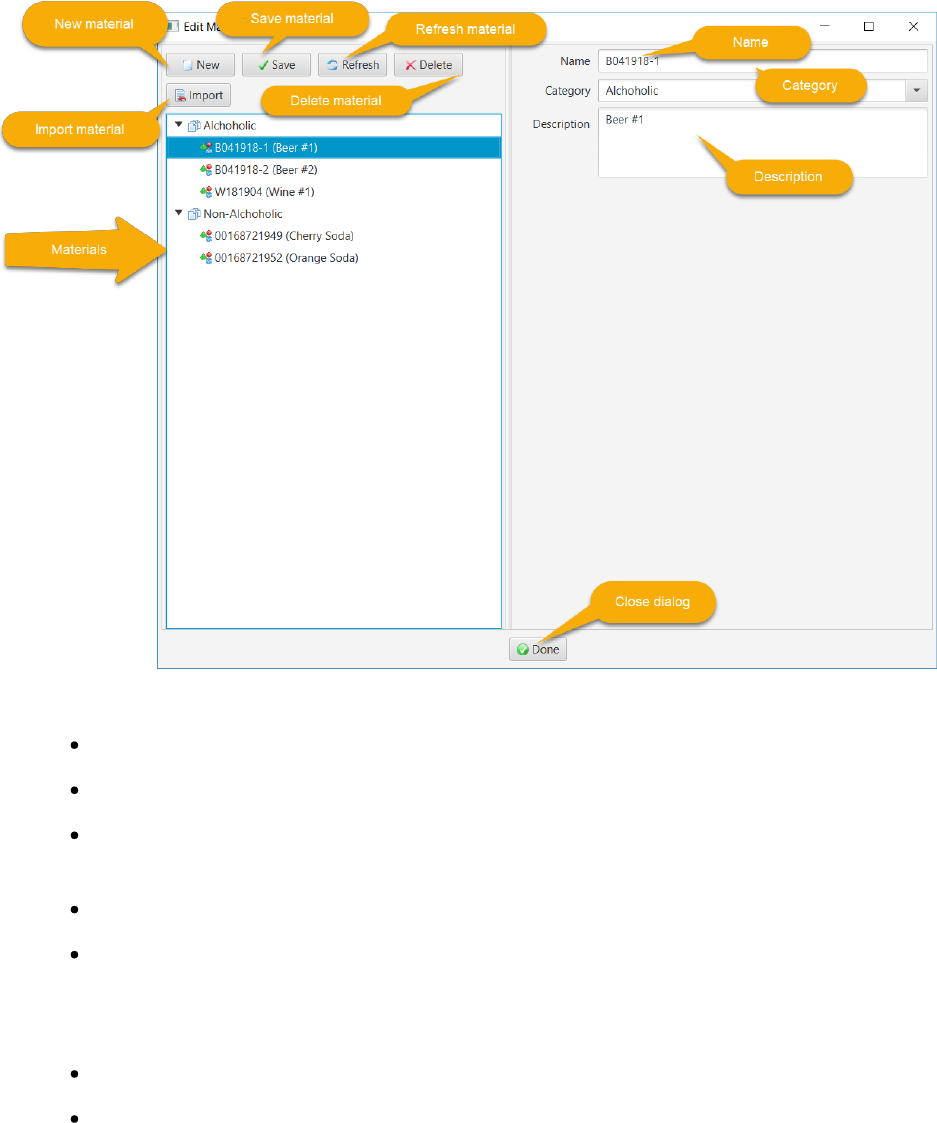
Materials produced by equipment are defined in this editor. For example:
12
The material editor buttons are:
New: clear the editor to begin defining a new material
Save: save the selected material to the database.
Refresh: refresh the selected material from the database to synchronize the editor with the
material’s saved state
Delete: delete the selected material from the database
Import: Import materials from a comma-separated value (CSV) file
The material editor has a context menu accessed by right-clicking in the left-hand pane. The menu
items are:
Save All Material: save all materials to the database
Refresh All Material: restore all materials from their state in the database
The material category provides a convenient way to organize different material.

13
Clicking the Import button launches a dialog to choose a text file with a comma-separated lines for each
material. The format is “name, description, category”. The “materials.csv” file is included in the project
as a example. For example:
B041918-1, Beer #1, Alcoholic
B041918-2, Beer #2, Alcoholic
W181904, Wine #1, Alcoholic
00168721952, Orange Soda, Non-Alcoholic
00168721949, Cherry Soda, Non-Alcoholic
RRREASONEASONEASON E E EDITORDITORDITOR
Availability and performance reasons are defined in this editor. For example:
The reason editor buttons are:
New: clear the editor to begin defining a new reason
Save: save the selected reason to the database.
Refresh: refresh the selected reason from the database to synchronize the editor with the
reason’s saved state

14
Delete: delete the selected reason from the database
Import: Import reasons from a file
When saving a reason, if a parent reason is selected after creating the new reason, you will be asked to
confirm that the new reason is a child of this parent. This hierarchy provides a way to organize the
reasons. If a reason is used to determine an availability or performance event, it must have a loss
category. Any reason with a loss category can be used in an OEE availability event.
The reason editor has a context menu accessed by right-clicking in the left-hand pane. The menu items
are:
Save All Reasons: save all reasons to the database
Refresh All Reasons: restore all reasons from their state in the database
Clear Selected Reason: unselect the selected reason so that no reason is selected
Clicking the Import button launches a dialog to choose a text file with comma-separated lines for each
reason. The “reasons.csv” file is included in the project as a example. The format is “name, description,
loss category, parent reason”. For example:
Running, Normal production state, NO_LOSS
Setups, Setup reasons, ,
Setup1, Setup reason #1, SETUP, Setups
Setup2, Setup reason #2, SETUP, Setups
Planned Downtimes, Planned downtime reasons, ,
Planned1, Downtime reason #1, PLANNED_DOWNTIME, Planned Downtimes
Planned2, Downtime reason #2, PLANNED_DOWNTIME, Planned Downtimes
Unplanned Downtimes, Unplanned downtime reasons, ,
Unplanned1, Unplanned downtime reason #1, UNPLANNED_DOWNTIME, Unplanned Downtimes
Unplanned2, Unplanned downtime reason #2, UNPLANNED_DOWNTIME, Unplanned Downtimes
Short Stops, Minor stoppage reasons, ,
Minor1, Minor stoppage reason #1, MINOR_STOPPAGES, Short Stops
Minor2, Minor stoppage reason #2, MINOR_STOPPAGES, Short Stops
The loss category name must match the TimeLoss.java enum name:
NO_LOSS
NOT_SCHEDULED
UNSCHEDULED
PLANNED_DOWNTIME
SETUP
UNPLANNED_DOWNTIME
MINOR_STOPPAGES

15
REDUCED_SPEED
REJECT_REWORK
STARTUP_YIELD
UUUNITNITNIT OFOFOF M M MEASUREEASUREEASURE (UOM) (UOM) (UOM)
DescriptionDescriptionDescription
Good, reject/rework and setup/yield production quantities must have a unit of measure. The
equipment’s design speed (a.k.a. ideal run rate) must be a quotient UOM, i.e. rate. The reject/rework
units must also be specified. These units of measure are used in OEE calculations when the input and
output UOMs differ. For example, a case packer might accept “can” as the input and reject UOM, but
output a “case” of 12 cans.
A measurement system is a collection of units of measure where each pair has a linear relationship, i.e.
y = ax + b where 'x' is the abscissa unit to be converted, 'y' (the ordinate) is the converted unit, 'a' is the
scaling factor and 'b' is the offset. In the absence of a defined conversion, a unit will always have a
conversion to itself where a = 1 and b = 0. A bridge unit conversion is defined to convert between the
fundamental SI and International customary units of mass (i.e. kilogram to pound mass), length (i.e.
metre to foot) and temperature (i.e. Kelvin to Rankine). These three bridge conversions permit unit of
measure conversions between the two systems. A custom unit can define any bridge conversion such as
a bottle to US fluid ounces or litres if needed.
A simple unit, for example a metre, is defined as a scalar UOM. A special scalar unit of measure is unity
or dimensionless "1".
A unit of measure that is the product of two other units is defined as a product UOM. An example is a
Joule which is a Newton·metre.
A unit of measure that is the quotient of two other units is defined as a quotient UOM. An example is a
velocity, e.g. metre/second.
A unit of measure that has an exponent on a base unit is defined as a power UOM. An example is area in
metre^2. Note that an exponent of 0 is unity, and an exponent of 1 is the base (root) unit itself. An
exponent of 2 is a product unit where the multiplier and multiplicand are the base unit. A power of -1 is
a quotient unit of measure where the dividend is 1 and the divisor is the base unit.
Units are classified by type, e.g. length, mass, time and temperature. Only units of the same type can be
converted to one another. System pre-defined units of measure are also enumerated, e.g. kilogram,
Newton, metre, etc. Custom units (e.g. a 1 litre bottle) do not have a pre-defined type or enumeration
and are referred to by a unique base symbol.
All units have a base symbol that is the most reduced form of the unit. For example, a Newton is
kilogram·metre/second^2. The base symbol is used in the measurement system to register each unit
and to discern the result of arithmetic operations on quantities. For example, dividing a quantity of
Newton·metres by a quantity of metres results in a quantity of Newtons.
16
A quantity is an decimal amount together with a unit of measure. When arithmetic operations are
performed on quantities, the original units can be transformed. For example, multiplying a length
quantity in metres by a force quantity in Newtons results in a quantity of energy in Joules (or Newton-
metres).
The unit of measure code is available as a standalone Java project at https://github.com/point85/caliper
and as a C# project at https://github.com/point85/CaliperSharp.
EditorEditorEditor
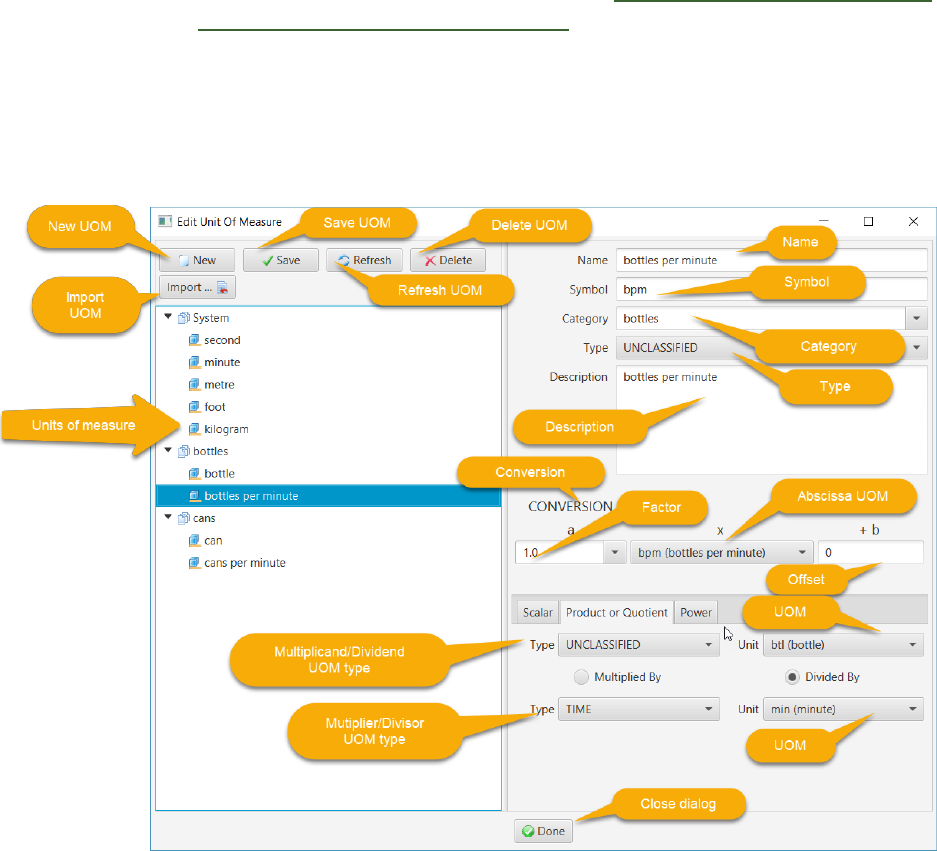
Units of measure are defined in the editor shown below. In this example, a quotient (rate) UOM
“bottles per minute” has been created. The dividend is a scalar unit of “bottle” that was previously
created. The divisor is a system time unit of “minute”.
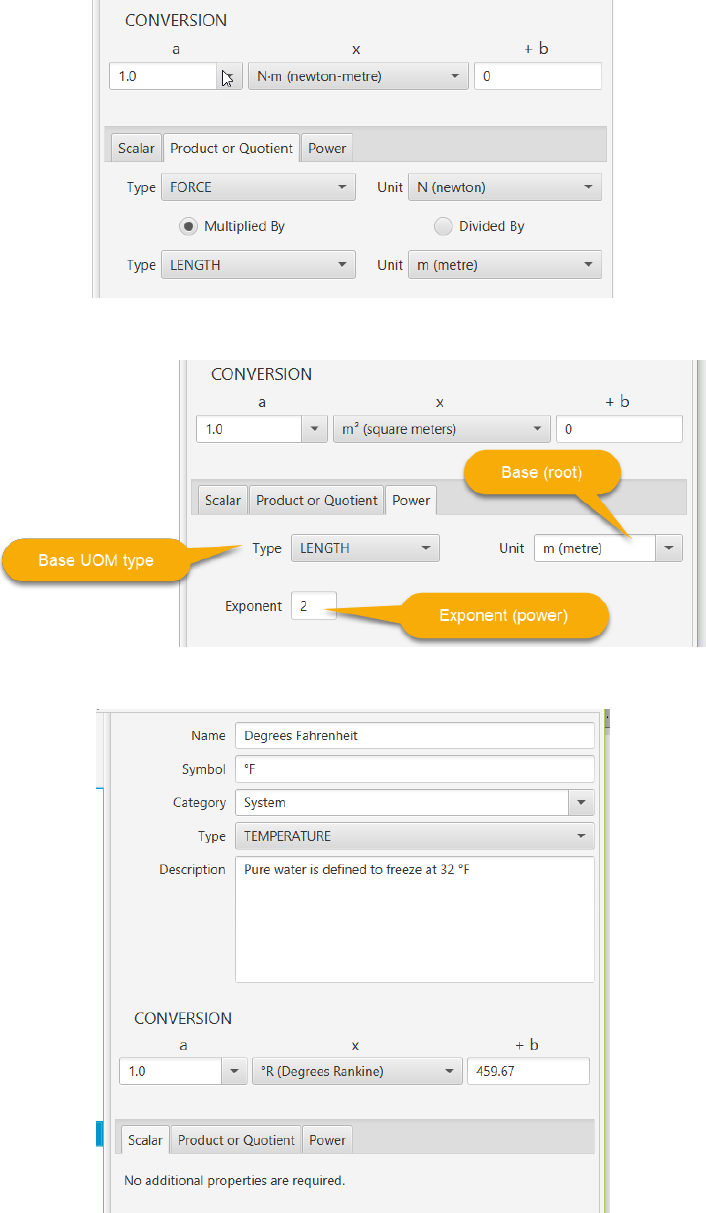
The UOM of measure editor is a general purpose editor and thus supports creation of quotient, product
and power units as well as scalar ones (e.g. bottle, can, minute). For example, a Newton-metre is a
system-defined product UOM created by importing it (as described below):
17
As a second example, square metres is a power UOM, again created by importing it:
Temperature in Fahrenheit is an example where the unit has a defined offset from Rankine units:
The UOM editor buttons are:

18
New: clear the editor to begin defining a new UOM
Save: save the selected UOM to the database.
Refresh: refresh the selected UOM from the database to synchronize the editor with the
UOM’s saved state
Delete: delete the selected UOM from the database
Import: Import a system UOM from pre-defined choices
When creating a UOM, a category needs to be specified. The category provides a way to group related
units. The “System” category is reserved for the pre-defined UOMs such as metre.
A UOM must also have a type. All units with the same type can be converted between each other. For
packaging units like “can” or “bottle” the UNCLASSIFIED type should be chosen. Whether or not a
conversion between units in this category makes sense is determined by application logic, since there is
no physical basis for such units.
A large number of system-defined types and the corresponding UOMs are included:
dimension-less "1": UNITY
fundamental physical: LENGTH, MASS, TIME, ELECTRIC_CURRENT, TEMPERATURE,
SUBSTANCE_AMOUNT, LUMINOSITY
other physical: AREA, VOLUME, DENSITY, VELOCITY, VOLUMETRIC_FLOW, MASS_FLOW,
FREQUENCY, ACCELERATION, FORCE, PRESSURE, ENERGY, POWER, ELECTRIC_CHARGE,
ELECTROMOTIVE_FORCE, ELECTRIC_RESISTANCE, ELECTRIC_CAPACITANCE,
ELECTRIC_PERMITTIVITY, ELECTRIC_FIELD_STRENGTH, MAGNETIC_FLUX,
MAGNETIC_FLUX_DENSITY, ELECTRIC_INDUCTANCE, ELECTRIC_CONDUCTANCE,
LUMINOUS_FLUX, ILLUMINANCE, RADIATION_DOSE_ABSORBED,
RADIATION_DOSE_EFFECTIVE, RADIATION_DOSE_RATE, RADIOACTIVITY,
CATALYTIC_ACTIVITY, DYNAMIC_VISCOSITY, KINEMATIC_VISCOSITY, RECIPROCAL_LENGTH,
PLANE_ANGLE, SOLID_ANGLE, INTENSITY, TIME_SQUARED, MOLAR_CONCENTRATION,
IRRADIANCE
computer science
currency
The UOM editor has a context menu accessed by right-clicking in the left-hand pane. The menu items
are:
Save All Units of Measure: save all UOMs to the database
Refresh All Units of Measure: restore all UOMs from their state in the database
Clicking the Import button launches a dialog to choose the system-defined type and then the UOM of
interest. For example to import the customary UOM of pound-mass:

19
Click “OK” to import the unit or “Cancel” to cancel out. Note that importing a UOM will import that
UOM and all referenced units.
ConverterConverterConverter
This utility is launched from the toolbar. It is used to convert from one UOM to another UOM of the
same type (e.g. length to length). For example, 1 kilometre (1000 metre) is 3,280.8 feet:
First, choose the unit type (e.g. LENGTH), the enter the “from” amount (1), “from” factor if desired (kilo)
and “from” unit (metre). Then, select the “to” factor (if any) and “to” unit (foot). Click the Convert
button to display the answer of 3,280.8 feet.
WWWORKORKORK S S SCHEDULECHEDULECHEDULE
DescriptionDescriptionDescription
The time equipment is scheduled for production is defined by a work schedule. The work schedule is
attached to the equipment itself or to any node in the hierarchy above it. The search starts at the
equipment with the availability event and moves up the hierarchy until a schedule is found. Therefore a
work schedule could be defined for area or site and apply to all equipment below it.
A work schedule consists of one or more teams who rotate through a sequence of shift and off-shift
periods of time. Breaks during shifts can be defined as well as non-working periods of time (e.g.
holidays and scheduled maintenance periods) that are applicable to the entire work schedule.

20
A work schedule is defined with a name and description. Zero or more non-working periods can be
defined. A non-working period has a defined starting date and time of day and duration. For example,
the New Year's Day holiday starting at midnight for 24 hours, or three consecutive days for preventive
maintenance of manufacturing equipment starting at the end of the night shift.
A shift is defined with a name, description, starting time of day and duration. An off-shift period is
associated with a shift. Shifts can be overlapped (typically when a hand-off of duties is important). A
rotation is a sequence of shifts and off-shift days. An instance of a shift has a starting date and time of
day and has an associated shift definition.
A team/crew is defined with a name and description. It has a rotation with a starting date. The starting
date shift will have an instance with that date and a starting time of day as defined by the shift. The
same rotation can be shared between more than one team, but with different starting times.
A rotation is a sequence of working periods (segments). Each segment starts with a shift and specifies
the number of days on-shift and off-shift. A work schedule can have more than one rotation.
A non-working period is a duration of time where no production teams are working. For example, a
holiday or a period of time when a plant is shutdown for preventative maintenance. A non-working
period starts at a defined day and time of day and continues for the specified duration of time.
A shift instance is the duration of time from a specified date and time of day and continues for the
duration of the associated shift. A team works this shift instance.
After a work schedule is defined, the working time for all shifts can be computed for a defined time
interval. This duration of time is the maximum available productive time and is the input to the
calculation of Overall Equipment Effectiveness (OEE). Time accumulated in the various loss categories
subtracts from this total time to finally arrive at the value adding time. The shift when an OEE event
occurs will be also recorded in the database.
The work schedule code is available as a standalone Java project at https://github.com/point85/Shift
and as a C# project at https://github.com/point85/ShiftSharp.
EditorEditorEditor
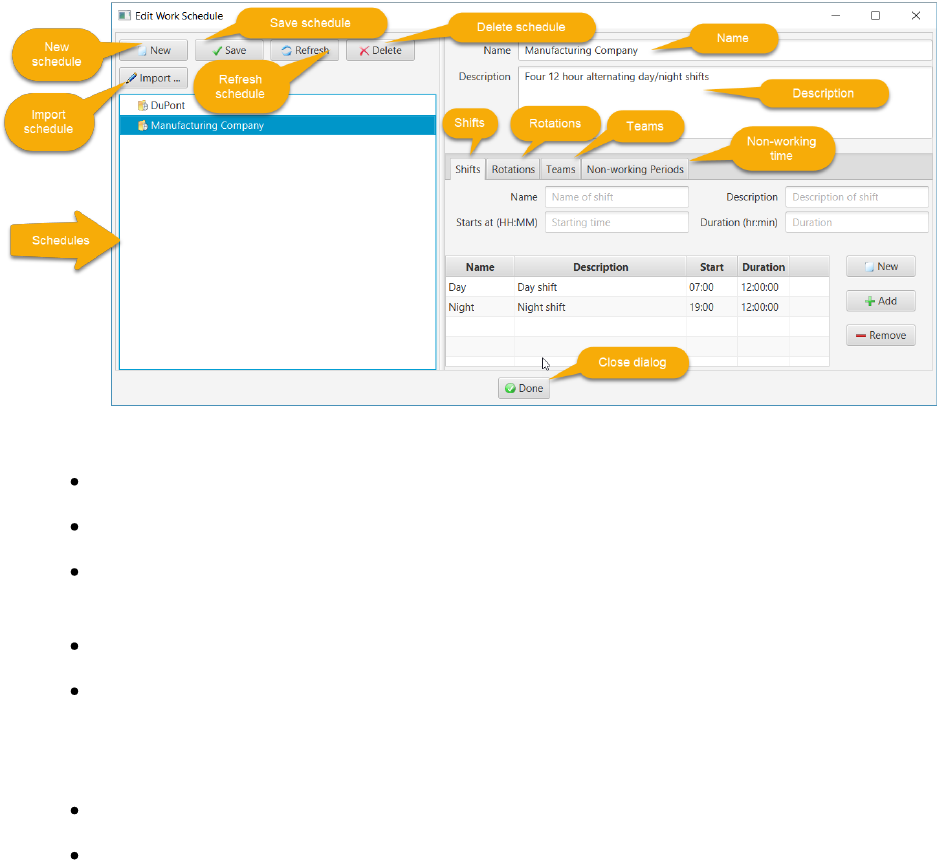
For the work schedule editor shown below, the Manufacturing Company schedule has been selected:
21
The work schedule editor buttons are:
New: clear the editor to begin defining a new schedule
Save: save the selected schedule to the database.
Refresh: refresh the selected schedule from the database to synchronize the editor with the
schedule’s saved state
Delete: delete the selected schedule from the database
Import: import a schedule from pre-defined templates
The work schedule editor has a context menu accessed by right-clicking in the left-hand pane. The
menu items are:
Save All Schedules: save all schedules to the database
Refresh All Schedules: restore all schedules from their state in the database
ShiftsShiftsShifts
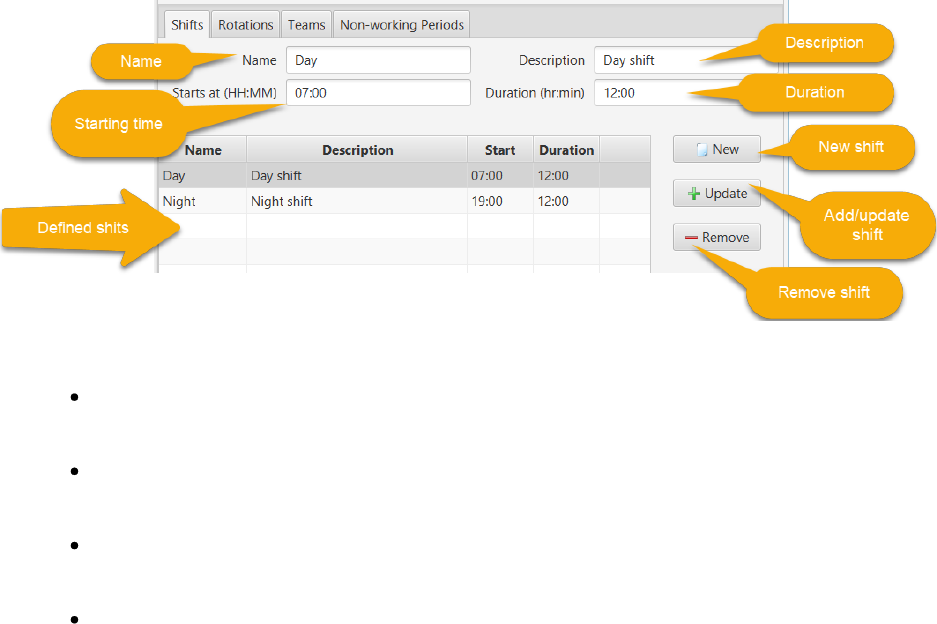
The “Shifts” tab is used to define shifts:
22
The editor actions are:
New: clear the editor controls in order to define a new shift. The Add/Update button text
will change to “Add”.
Add: After defining the properties of a new shift, clicking this button will add it to the list of
shifts
Update: after selecting an existing shift, the current values will be moved into the editing
controls. Make the necessary edits, then click this button to apply the changes to the list.
Remove: after selecting an existing shift, click this button to remove it from the list.
The starting time of day is entered in 24-hour format (hours:minutes from 00:00 to 23:59). The shift
duration is entered as hours:minutes between 00:00 and 24:00. Note that after making changes to the
list of shifts, the work schedule must be saved to the database by clicking the Save button.
RotationsRotationsRotations
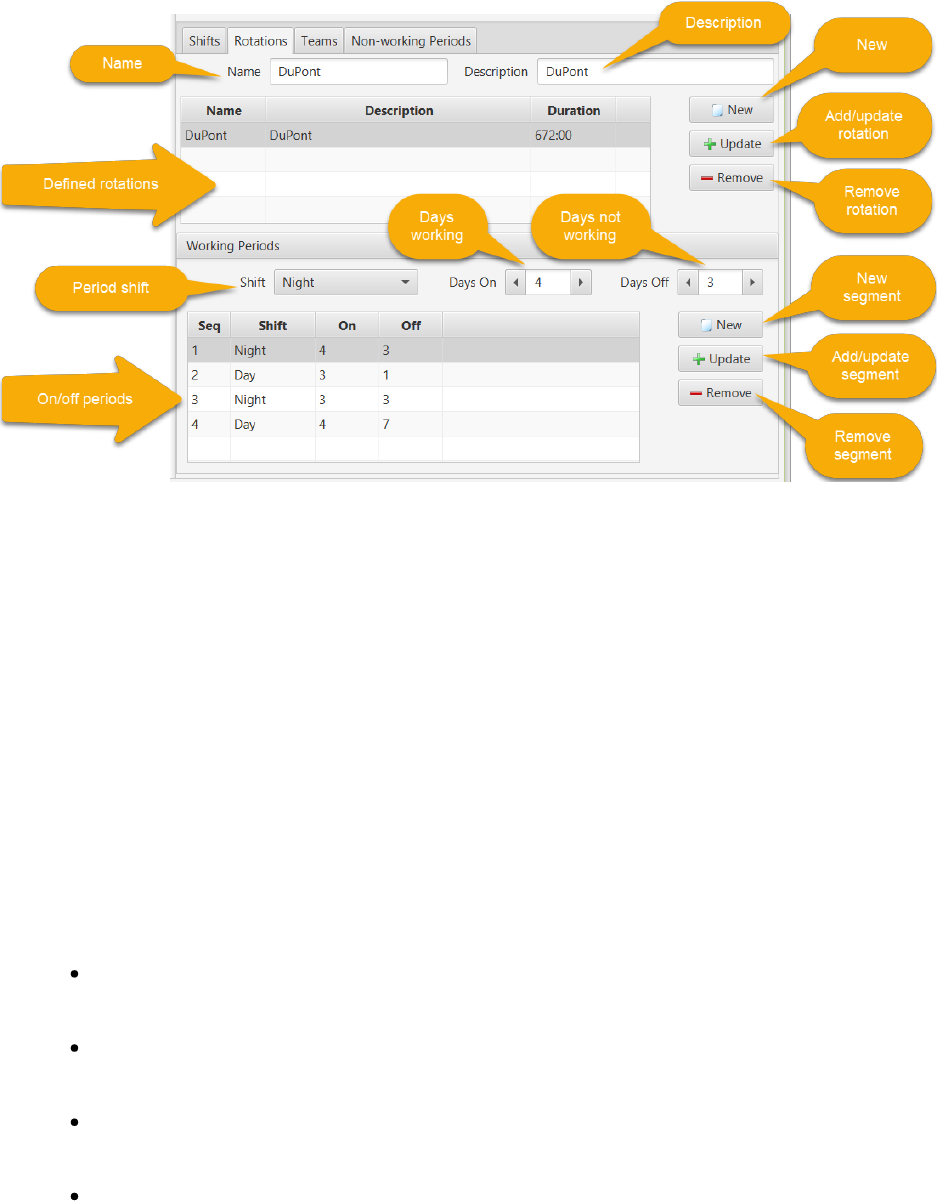
The “Rotations” tab is used to define rotations:
23
In this example, the DuPont 12-hour rotating shift schedule uses 4 teams (crews) and 2 twelve-hour
shifts to provide 24/7 coverage. It consists of a 4-week cycle where each team works 4 consecutive night
shifts, followed by 3 days off duty, works 3 consecutive day shifts, followed by 1 day off duty, works 3
consecutive night shifts, followed by 3 days off duty, work 4 consecutive day shift, then have 7
consecutive days off duty. Personnel works an average 42 hours per week.
This DuPont example has one long rotation of 672 hours (28 days or 4 weeks) consisting of 4 segments
in this sequence:
1. Night shift, 4 days on followed by 3 days off
2. Day shift, 3 days on followed by 1 day off
3. Night shift, 3 days on followed by 3 days off
4. Day shift, 4 days on followed by 7 days off
The editor actions for rotations are:
New: clear the editor controls in order to define a new rotation. The Add/Update button
text will change to “Add”.
Add: After defining the properties of a new rotation, clicking this button will add it to the list
of rotations
Update: after selecting an existing rotation, the current values will be moved into the editing
controls. Make the necessary edits, then click this button to apply the changes to the list.
Remove: after selecting an existing rotation, click this button to remove it from the list.
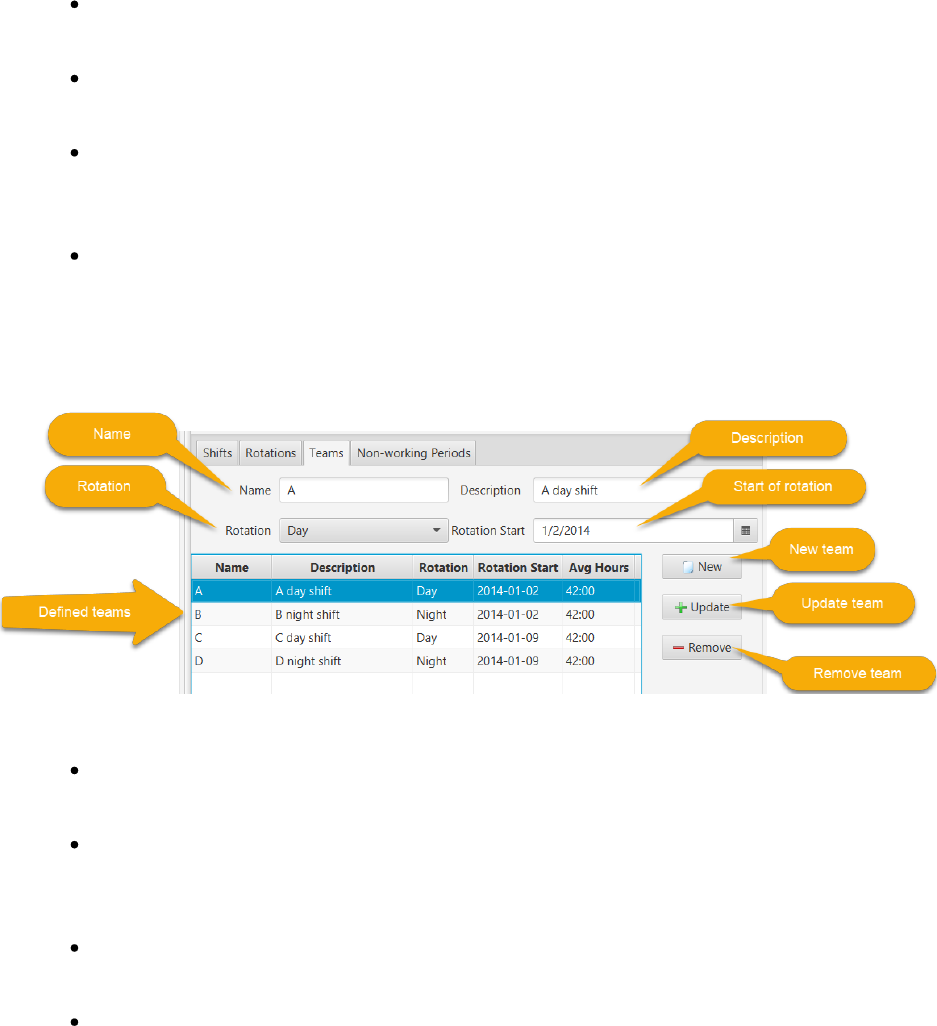
The editor actions for rotation segments are:
24
New: clear the editor controls in order to define a new rotation segment. The Add/Update
button text will change to “Add”.
Add: After defining the properties of a new rotation segment, clicking this button will add it
to the list of rotation segments
Update: after selecting an existing rotation segment, the current values will be moved into
the editing controls. Make the necessary edits, then click this button to apply the changes
to the list.
Remove: after selecting an existing rotation segment, click this button to remove it from the
list.
TeamsTeamsTeams
The “Teams” tab is used to define teams (crews):
The editor actions for teams are:
New: clear the editor controls in order to define a new team. The Add/Update button text
will change to “Add”.
Add: After defining the properties of a new team, clicking this button will add it to the list of
teams. The average working hours will be displayed in the last column, e.g. 42 hours and 0
minutes in this example.
Update: after selecting an existing team, the current values will be moved into the editing
controls. Make the necessary edits, then click this button to apply the changes to the list.
Remove: after selecting an existing team, click this button to remove it from the list.
Non-working PeriodsNon-working PeriodsNon-working Periods
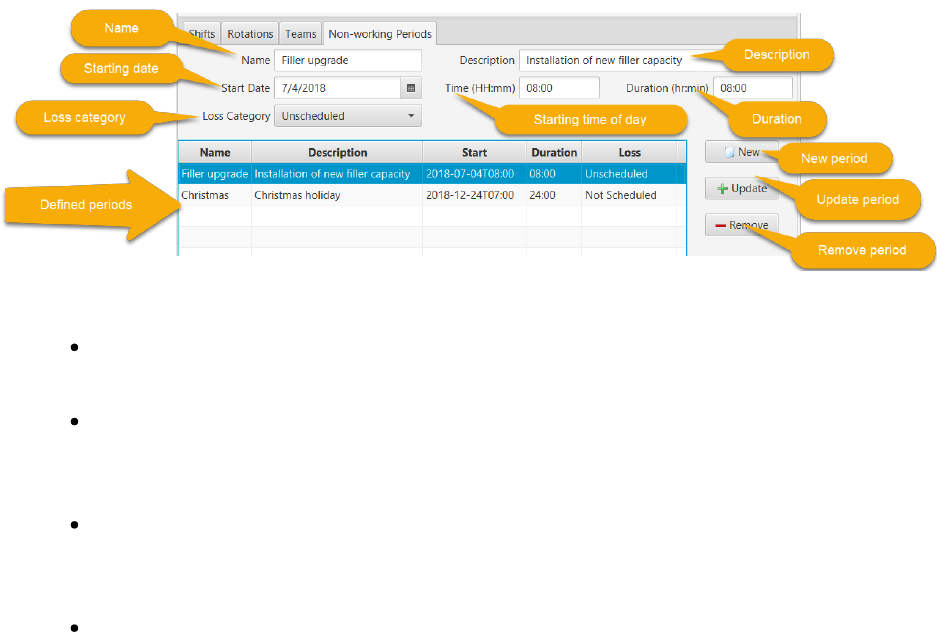
The “Non-working Periods” tab is used to define intervals of time on an exception basis where no
production will take place, for example holidays and planned maintenance outages:
25
The editor actions for teams are:
New: clear the editor controls in order to define a new non-working period. The
Add/Update button text will change to “Add”.
Add: After defining the properties of a new non-working period, clicking this button will add
it to the list of periods. The loss category is one of two choices (1) Not Scheduled (e.g.
holiday), or (2) Unscheduled (special event).
Update: after selecting an existing non-working period, the current values will be moved
into the editing controls. Make the necessary edits, then click this button to apply the
changes to the list.
Remove: after selecting an existing non-working period, click this button to remove it from
the list.
Import ScheduleImport ScheduleImport Schedule
Click the Import button to launch a dialog to choose a pre-defined work schedule (similar to a desired
one) and then save it to the database for further editing:
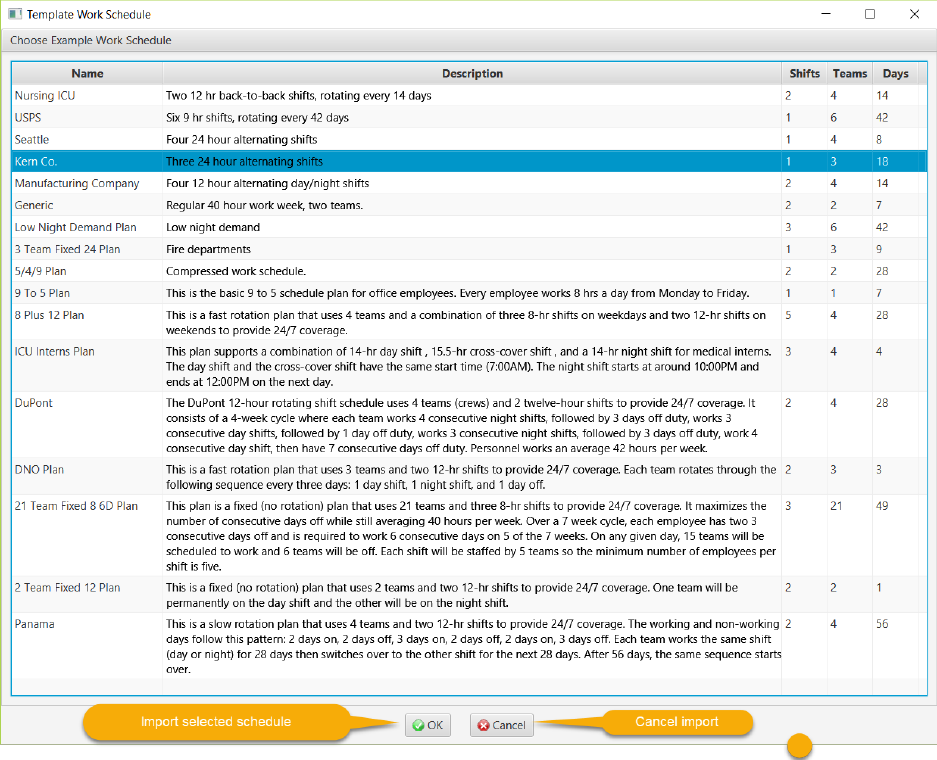
26
SSSCRIPTINGCRIPTINGCRIPTING
DescriptionDescriptionDescription
A JavaScript function must defined for each equipment resolver. This script is executed by the Java 8
Nashorn script engine. It accepts an input value from an OPC DA, OPC UA, HTTP or messaging data
source event and returns a value matching the type of the resolver (e.g. availability, production count,
material or job change). The script editor is used to write and test the body of this function.
An availability script outputs the name of a Reason (which is associated with an OEE loss category). A
good, reject or startup production script outputs a count in the unit of measure defined for that
equipment. A good production amount has the dividend UOM of the design speed, whereas a reject or
startup production amount has the defined reject UOM. A material change script outputs the name of a
defined material. A job change script outputs the name of a job/order. In order to perform OEE
calculations, the material must be defined as the first event before the time period of interest.
The script has three input arguments:

27
1. OeeContext context: an instance of the OeeContext class containing information about the
script execution environment (see below for details)
2. Object value: the input value
3. EventResolver resolver: the event resolver. The resolver’s last value can be used in rollover
calculations for production counts. The equipment for the executing script is also available
as a resolver attribute.
The OeeContext class has these primary public “getter” methods (note that domain javadocs are
available in the “docs” folder in the domain_docs.zip file):
getLogger(): Get an instance of an org.slf4j.Logger. The logging output(s) is configured in
the log4j.properties file
getMaterial(Equipment equipment): Get the material currently being processed on this
equipment. The equipment object is obtained from resolver.getEquipment()
getJob(Equipment equipment): Get the job currently being run on this equipment. The
equipment object is obtained from resolver.getEquipment()
getQualityReason(Equipment equipment): Get the reason assigned to the rejects and
rework or startup and yield production event.
getOpcDaClients(): Get the collection of DaOpcClient objects. A client object can then be
used for reading and writing tags, e.g. readSynch()/writeSynch()
getOpcUaClients(): Get the collection of UaOpcClient objects. A client object can then be
used for reading and writing nodes, e.g. readSynch()/writeSynch()
getMessagingClient()s: Get the collection of MessagingClient objects A client object can
then be used to send a message to the “Point85” exchange on a RabbitMQ broker, e.g.
publish()
The JavaScript below shows examples of calling these methods:
// logger
var logger = context.getLogger()
// equipment
var eq = EventResolver()
// log info
logger.info("Material: " + context.getMaterial(eq))
logger.info("Job: " + context.getJob(eq))
logger.info("Source id: " + resolver.getSourceId())
logger.info("Last value: " + resolver.getLastValue())
28
logger.info("Last timestamp: " + resolver.getLastTimestamp())
logger.info(context.toString())
// send RMQ message
var CollectorNotificationMessage =
Java.type("org.point85.domain.messaging.CollectorNotificationMessage")
var routingKey = Java.type("org.point85.domain.messaging.RoutingKey").NOTIFICATION_MESSAGE
var severity = Java.type("org.point85.domain.messaging.NotificationSeverity").INFO
var msg = new CollectorNotificationMessage("localhost", "192.168.0.8")
msg.setText("This is a notification")
msg.setSeverity(severity)
context.getMessagingClient().publish(msg, routingKey, 30)
// OPC DA read integer value
var variant = context.getOpcDaClient().readSynch("Saw-toothed Waves.Int2")
logger.info("Value: " + variant.getValueAsNumber())
// OPC DA write integer value
var OpcDaVariant = Java.type("org.point85.domain.opc.da.OpcDaVariant")
var variant = new OpcDaVariant(100)
context.getOpcDaClient().writeSynch("Data Type Examples.16 Bit Device.K Registers.Short1",
variant)
// OPC UA read current server time
var NodeId = Java.type("org.eclipse.milo.opcua.stack.core.types.builtin.NodeId")
var nodeId = new NodeId(0, 2258)
var dataValue = context.getOpcUaClient().readSynch(nodeId)
logger.info(dataValue.getValue().getValue())
// OPC UA write integer value
var NodeId = Java.type("org.eclipse.milo.opcua.stack.core.types.builtin.NodeId")
var Variant = Java.type("org.eclipse.milo.opcua.stack.core.types.builtin.Variant")
var nodeId = new NodeId(3, "Int32DataItem")
var value = new Variant(100)
code = context.getOpcUaClient().writeSynch(nodeId, value)
if (code.isBad()) {
logger.error("Write failed, code = " + code.getValue())
29
}
// database query
var service = Java.type("org.point85.domain.persistence.PersistenceService").instance()
var sql = "Select top 10 EVENT_TYPE, JOB from OEE_EVENT order by START_TIME desc"
var rows = service.getEntityManager().createNativeQuery(sql).getResultList()
for (i = 0; i < rows.size(); i++) {
var row = rows.get(i)
logger.info("Type: " + row[0] + ", Job: " + row[1])
}
// set a reject and rework reason named “002” for this production event
context.setQualityReason(resolver.getEquipment(), "002");
return value;
The default script for availability, material and job is to simply return the input value (passthrough):
return value;
However, the default script for a production count provides for a rollover of the counting sensor:
var ROLLOVER = 0;
var lastValue = resolver.getLastValue();
var delta = value - lastValue;
if (value < lastValue) {
delta += ROLLOVER;
}
return delta;
The variable “ROLLOVER” must be defined for the sensor. If the last value of the count is greater than
the current value, then the counter must have rolled over at the ROLLOVER value to zero in this
example.
EditorEditorEditor
The script editor dialog is launched either by (1) selecting an equipment resolver in the list in the “Data
Collection” tab of the equipment entity and then clicking the editor button or (2) clicking a button on
the toolbar. If the editor is launched from the toolbar, functionality will be limited since the resolver
input argument to the script will be null.
The editor looks like:
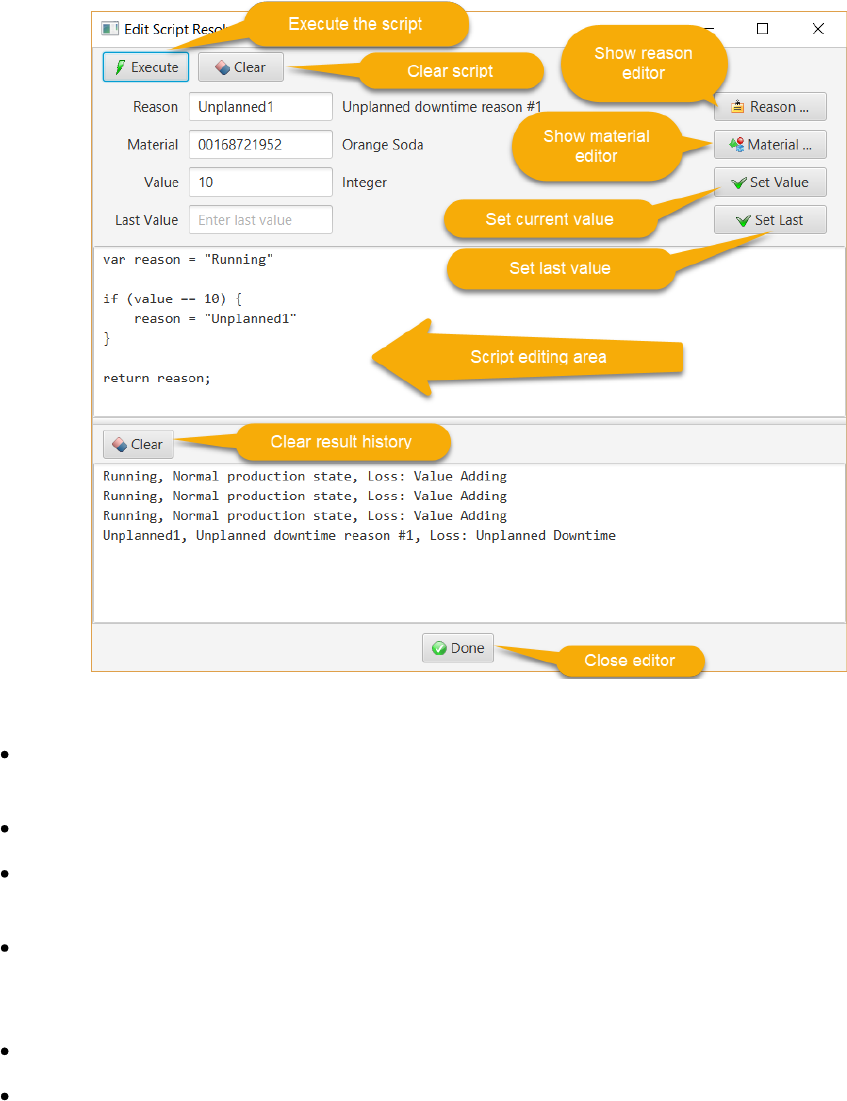
30
The editor actions are:
Execute: execute the script. The returned object’s toString() method will be called and the result
displayed in the execution history in the bottom pane.
Clear: clear the script editor or history
Reason...: Display the reason editor to create or update a reason and choose an existing reason.
The name is displayed in the text field where it is available for cutting and pasting into the script.
Material...: Display the material editor to create or update a material and choose an existing
material. The name is displayed in the text field where it is available for cutting and pasting into the
script.
Set Value: Set the value in the text field as the input value to the script before it is executed.
Set Last: Set the value in the text field as the previous input value to the script before it is executed.
Depending upon the type of resolver, the script area initially will be populated by a default script.
Availability, material change and job change scripts pass the input value through to the output:
return value;
whereas a production count script provides a variable called “ROLLOVER” as a place-holder to take into
account the case where a counter can output a lower value than a previous value:
31
var ROLLOVER = 0;
var lastValue = resolver.getLastValue();
var delta = value - lastValue;
if (value < lastValue) {
delta += ROLLOVER;
}
return delta;
Custom ScriptingCustom ScriptingCustom Scripting
A resolver script can be used for general purpose (non-OEE) data collection by choosing the “CUSTOM”
type. In this case, the input value to the script is used in the logic as required by a custom application.
The output value (if any) is ignored.
For example, suppose that a custom database table (TEST_CUSTOM) has been created with three
columns (string, integer and float values). When the input string (value) is received, a record is inserted
into this table by making use of the PersistenceService singleton’s executeUpdate() method:
var PersistenceService = Java.type('org.point85.domain.persistence.PersistenceService');
var sql = "insert into dbo.TEST_CUSTOM (A_STRING, AN_INT, A_FLOAT) values ('" + value + "', 1,
0.0)";
var result = PersistenceService.instance().executeUpdate(sql);
For a second example, the executeQuery() method of PersistenceService returns a JSON list of all
records in this table:
var PersistenceService = Java.type('org.point85.domain.persistence.PersistenceService');
var sql = "select * from dbo.TEST_CUSTOM";
var json = PersistenceService.instance().executeQuery(sql);
print(json);
DDDATAATAATA C C COLLECTOROLLECTOROLLECTOR E E EDITORDITORDITOR
The collector for receiving data from data sources and resolving them to OEE events is defined in this
editor. For example:

32
The state is one of DEV (under development and cannot be used), READY (released for use) or
RUNNING (in use). All ready or running collectors will be started to collect data.
The data collector editor buttons are:
New: clear the editor to begin defining a new collector
Save: save the selected reason to the database.
Delete: delete the selected reason from the database
DDDATAATAATA S S SOURCEOURCEOURCE E E EDITORSDITORSDITORS
The data source editors define where a non-manual input value to a resolver script can come from. The
supported sources are:
OPC DA: classic OLE for Process Control (OPC) Data Acquisition
OPC UA: OLE for Process Control Unified Architecture (UA)
HTTP: invocation of an HTTP POST request with the data in the request body
Messaging: an event message received via a RabbitMQ message broker with the data as the
message payload
Database: an event record inserted into the DB_EVENT table
33
OPC UA Data SourceOPC UA Data SourceOPC UA Data Source
BrowserBrowserBrowser
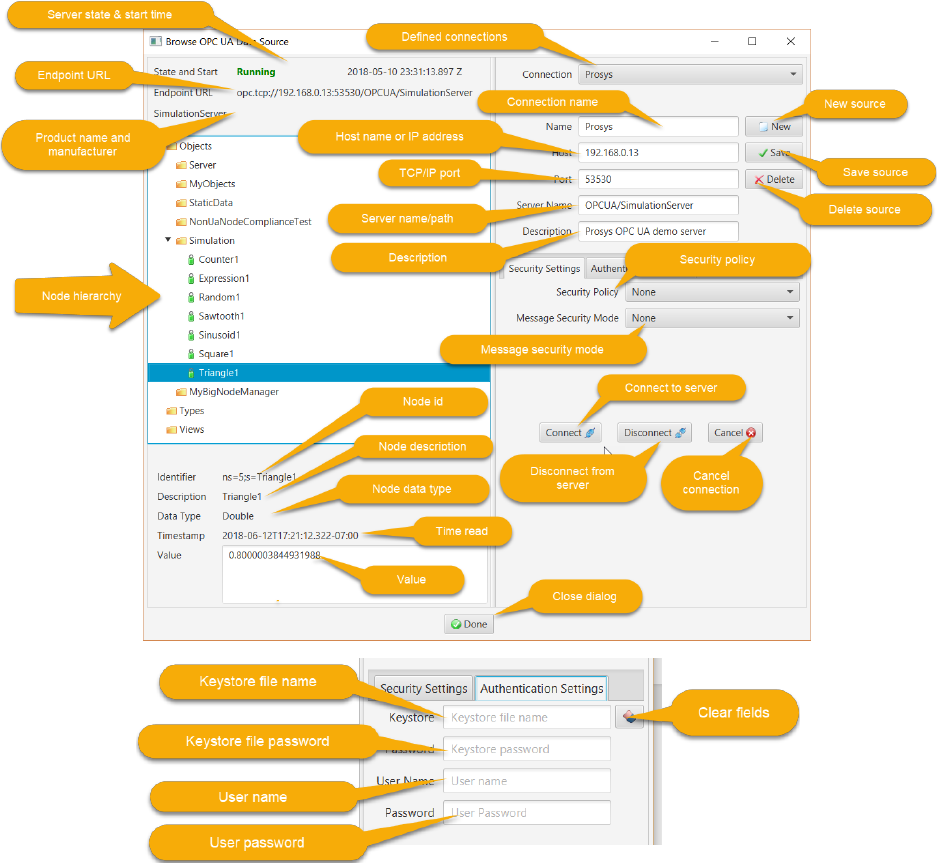
The OPC UA data source browser dialog is launched from the toolbar or from the Data Collection tab
after an equipment object with an OPC UA source has been selected in the physical model. It is used to
browse to the node providing the input value. This dialog looks like:
In this example, the browser is anonymously connected to the Prosys demo server running on a host at
192.168.0.13 IP address on port 53530 with a server name/path of OPCUA/SimulationServer.
If a secure connection is desired for a server, under the Security Settings tab, the Security Policy can be
chosen from None, Basic128Rsa15, Basic256, Basic256Sha256, Aes128_Sha256_RsaOaep or
Aes256_Sha256_RsaPss. The Message Security Mode can be chosen from None, Sign or Sign & Encrypt.
Under the Authentication Settings tab, the Java keystore file name can be specified in the Keystore text
field and its password in the Password text field. The keystore file must be placed in the config/security

34
folder. The user name and user password text fields can be used to specify the user name and password
for user authentication. The button to the right of the keystore file name clears out these security
settings.
The actions for an OPC UA data source are:
New: clear the editing controls to define a new data source
Save: save the data source to the database
Delete: delete the data source from the database
The actions for establishing a connection are:
Connect: connect to the data source
Disconnect: disconnect from the data source
Cancel: cancel an unsuccessful connection attempt
After a connection is established, the server namespace can be browsed. Selection of a node will display
the current value and information about it below the tree view. In this example, the node namespace is
5 with a string id of “Triangle1”.
Clicking the Done button will assign the selected node as the script resolver’s input source.
TrendingTrendingTrending
Suppose that an OPC UA event resolver executes an availability script for a Unified Automation OPC UA
demo server. An availability script must output a reason. For this node (triangle trend for a double
value), the publishing interval is every 5 seconds. The script outputs a reason based on the input value:
var reason = 'Running';
if (value < 0.0)
{
reason = 'Unplanned1';
}
return reason;
By clicking the Watch button for this resolver, the execution of the script can be observed:
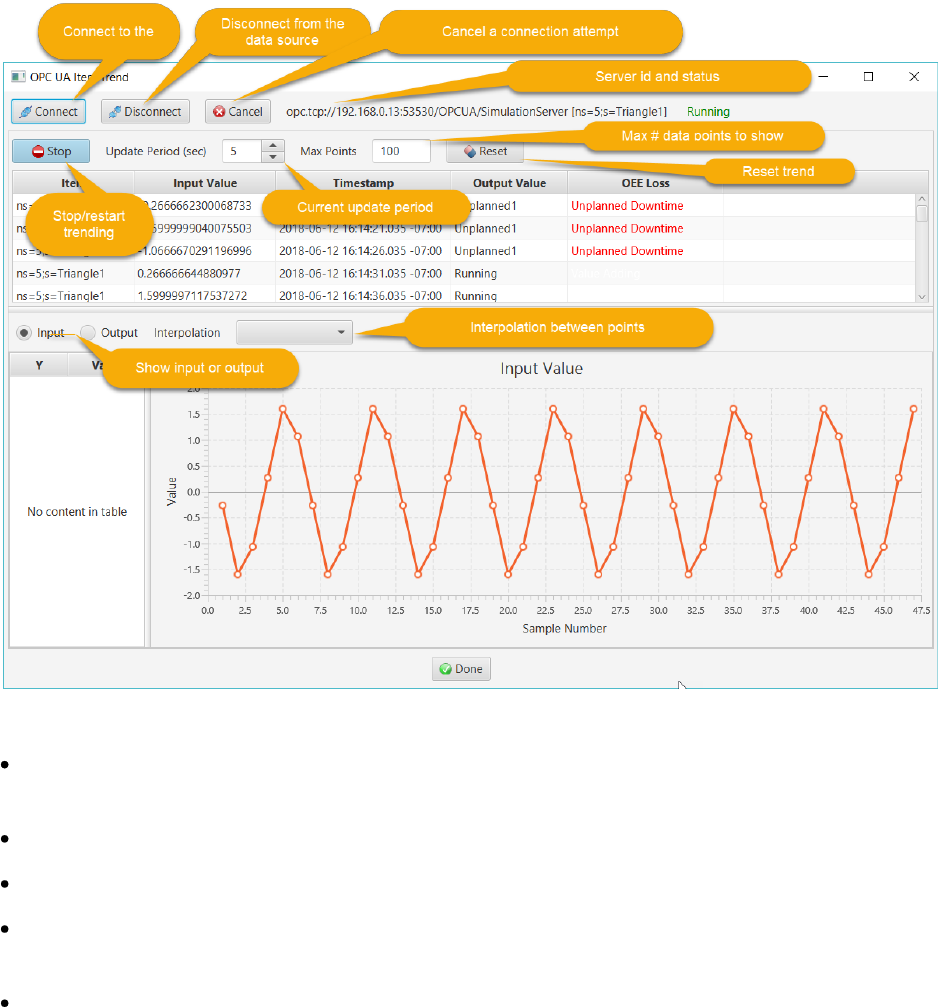
35
The actions are:
Connect: connect to the OPC UA data source. After a successful connection, the server id and node
ids are displayed along with the server status (Running in this case).
Disconnect: disconnect from the data source
Cancel: abort an unsuccessful connection attempt
Stop/Start: The trending can be paused by clicking this button. The text will change to Start. The
trend can be restarted by clicking it again.
Reset: Restart trending after changing either the update period or number of points to display.
The table shows the item id, input value, timestamp and output value. If the output is an availability
reason, the time loss category is displayed (Unplanned Downtime in this case).
The current update period and number of data points to display on the X axis is displayed. These values
can be changed when the trend is stopped and take effect after it is reset and restarted.
If Output is selected for the trend, the chart looks like:
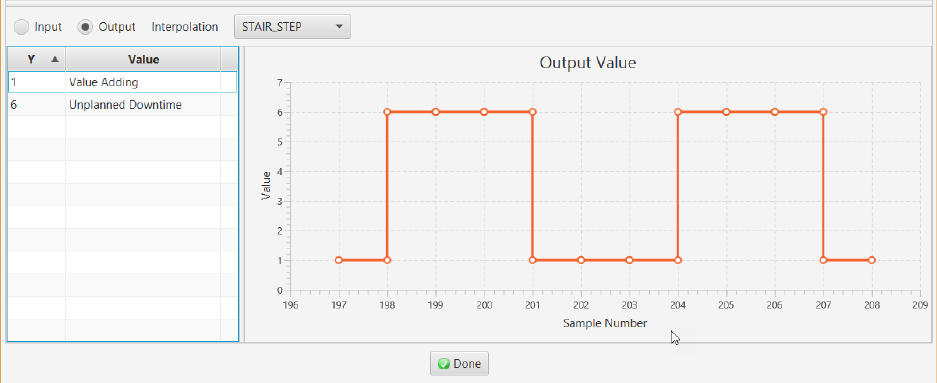
36
Since the output is a reason, the values are discrete and thus a stair step interpolation is desired (the
screen capture above displays a linear interpolation). The table on the left shows an integral value for
the Y axis and the corresponding discrete value. Linear interpolation applies to continuous values such
as integer or floating point data.
OPC DA Data SourceOPC DA Data SourceOPC DA Data Source
BrowserBrowserBrowser
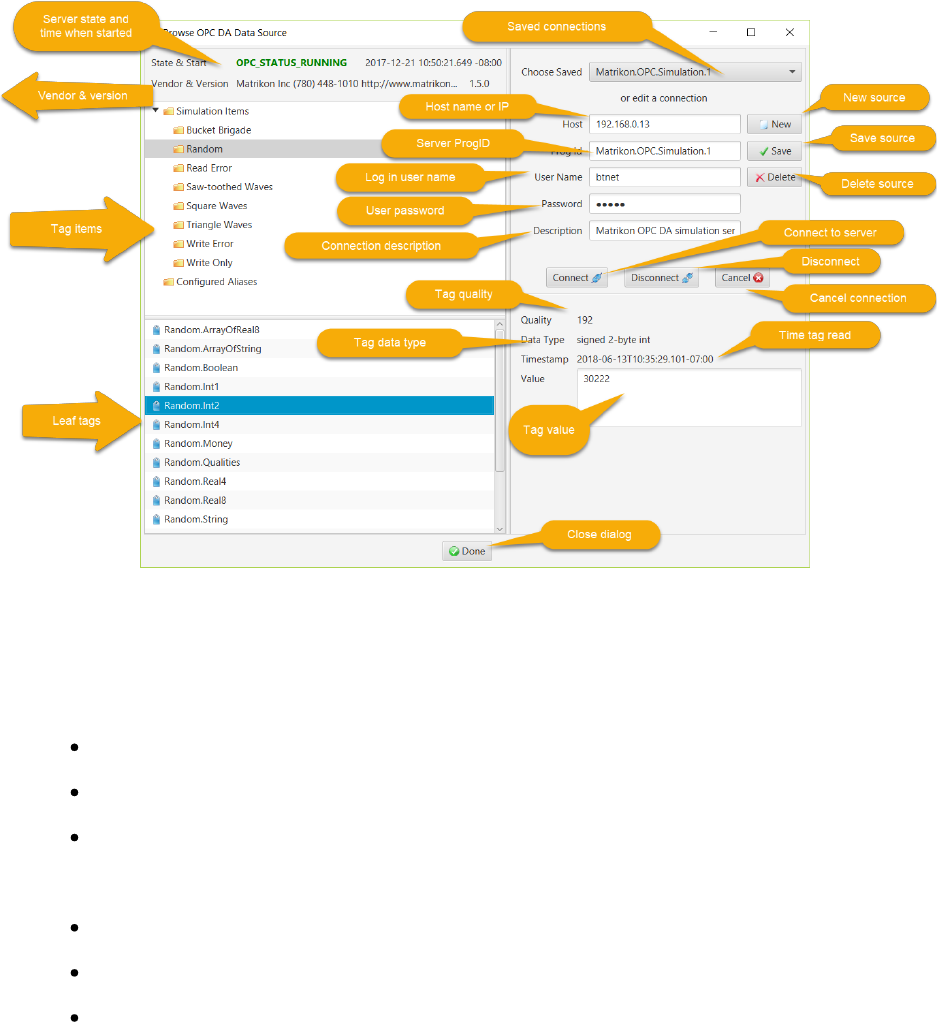
The OPC DA data source browser dialog is launched from the toolbar or from the Data Collection tab
after an equipment object with an OPC DA data source has been selected in the physical model. It is
used to browse to the tag providing the input value. This dialog looks like:
37
In this example, the browser is connected to the Matrikon OPC simulation server on host 192.168.0.13
with a ProgID of Matrikon.OPC.Simulation.1 and the “btnet” user and password (note that the user
name can include a Windows domain name).
The actions for an OPC DA data source browser are:
New: clear the editing controls to define a new data source
Save: save the data source to the database
Delete: delete the data source from the database
The actions for establishing a connection are:
Connect: connect to the data source
Disconnect: disconnect from the data source
Cancel: cancel an unsuccessful connection attempt
After a connection is established, the server tags can be browsed. Selection of a parent item of a leaf
tag will display the children below the tree view. Selecting a leaf tag will display the tag’s current value
and information about it to the right of the tree view.
Clicking the Done button will assign the selected tag as the OPC DA script resolver’s input source.
38
TrendingTrendingTrending
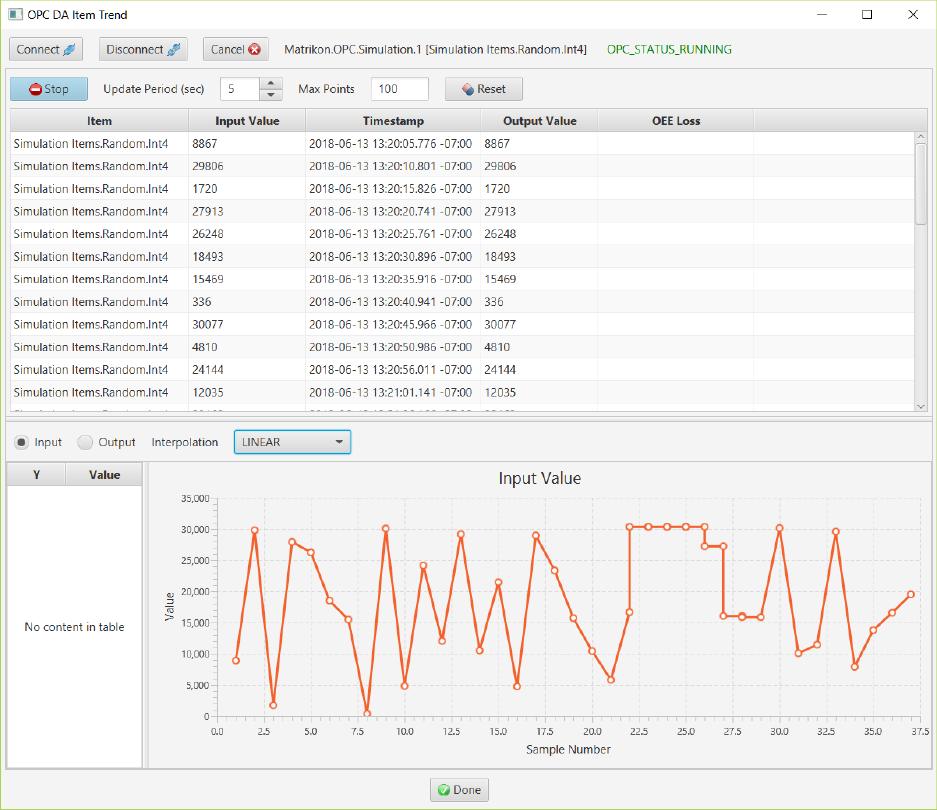
By clicking the Watch button for an OPC DA resolver, the execution of the script can be observed. A
trend chart for an OPC DA source for a 4-byte integer good production count with a pass-through
resolver script of:
return value;
looks like:
HTTP Data SourceHTTP Data SourceHTTP Data Source
DefinitionDefinitionDefinition
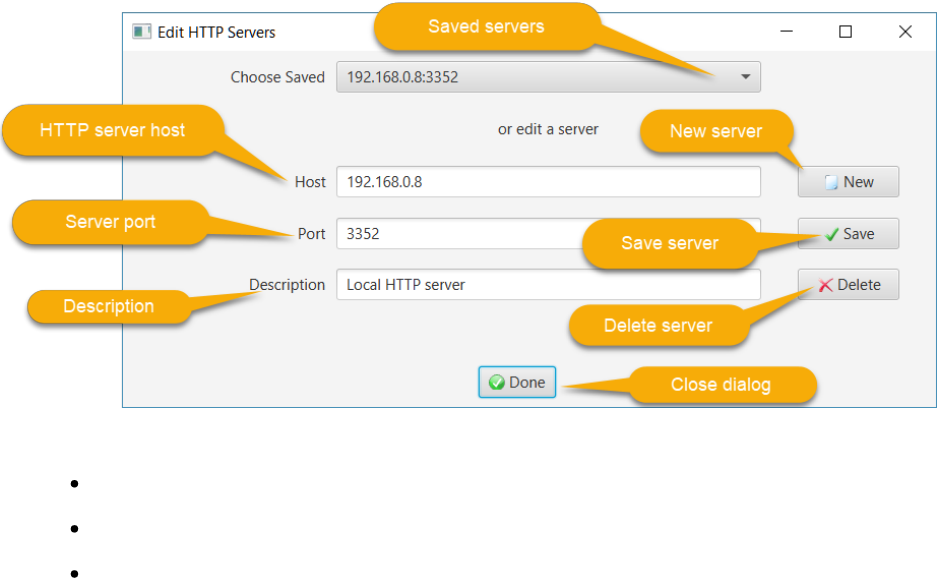
The HTTP data source definition dialog is launched from the toolbar or from the Data Collection tab after
an equipment object with an HTTP source has been selected in the physical model. It is used to define
the host and port for the NanoHTTPD embedded HTTP server in the data collector.
39
This dialog looks like:
The actions for an HTTP data source are:
New: clear the editing controls to define a new data source
Save: save the data source to the database
Delete: delete the data source from the database
Clicking the Done button will assign the HTTP server as the script resolver’s input source.
When the data collector is started on the specified host (192.168.0.8 in this example), it will listen to the
specified port (3352) ready to receive POST requests.
The POST request has the EquipmentEventRequestDto JSON serialized DTO (Data Transfer Object) as a
body (sourceId, value and timestamp fields). This request is for an availability, production of material,
setup or job change event.
The HTTP server responds with the corresponding EquipmentEventResponseDto JSON body (status and
errorText fields).
Java Client ExampleJava Client ExampleJava Client Example
An HTTP Java client can post an equipment event request. For example to loop-back test in the HTTP
trend dialog executes this code:
@FXML
private void onLoopbackTest() {
HttpURLConnection conn = null;
try {
// get the HTTP data source
EventResolver eventResolver = trendChartController.getEventResolver();
HttpSource dataSource = (HttpSource) eventResolver.getDataSource();
// build the URL for an equipment event
URL url = new URL(
"http://" + dataSource.getHost() + ":" + dataSource.getPort() + '/' +
OeeHttpServer.EVENT_EP);
// create a connection for a JSON POST request
40
conn = (HttpURLConnection) url.openConnection();
conn.setDoOutput(true);
conn.setRequestMethod("POST");
conn.setRequestProperty("Content-Type", "application/json");
// the value to send (must match the configured resolver)
String value = tfLoopbackValue.getText();
// timestamp when sent
String timestamp = DomainUtils.offsetDateTimeToString(OffsetDateTime.now());
// create the data transfer event object
EquipmentEventRequestDto dto = new EquipmentEventRequestDto(eventResolver.getSourceId(),
value, timestamp);
// serialize the body
Gson gson = new Gson();
String payload = gson.toJson(dto);
// make the request
OutputStream os = conn.getOutputStream();
os.write(payload.getBytes());
os.flush();
if (logger.isInfoEnabled()) {
logger.info("Posted equipment event request to URL " + url + " with value " + value);
}
// check the response code
int codeGroup = conn.getResponseCode() / 100;
if (codeGroup != 2) {
String msg = "Post failed, error code : " + conn.getResponseCode() + "\nEquipment
event response ...";
BufferedReader br = new BufferedReader(new
InputStreamReader((conn.getInputStream())));
String output;
while ((output = br.readLine()) != null) {
msg += "\n" + output;
}
throw new Exception(msg);
}
} catch (Exception e) {
AppUtils.showErrorDialog(e);
} finally {
conn.disconnect();
}
}
Database Trigger ExampleDatabase Trigger ExampleDatabase Trigger Example
For another example, a database table insertion trigger can be used to asynchronously post equipment
event messages to an HTTP collector. For example, SQL Server supports creating a stored procedure in
C#. This procedure can then be executed in a trigger. The C# codes makes the HTTP request and
receives the response. For simplicity, the values inserted into an EQUIPMENT_EVENT table row will be
input to the stored procedure and then posted to the HTTP collector at the specified URL.
The EQUIPMENT_EVENT data table is created as:
CREATE TABLE [dbo].[EQUIPMENT_EVENT] (
[Id] INT NOT NULL,
[SOURCE_ID] NVARCHAR (64) NOT NULL,
[VALUE] NVARCHAR (32) NOT NULL,
[EVENT_TIME] DATETIMEOFFSET (3) NOT NULL
);
41
Suppose that a pass-through availability script resolver with source id = "e1.avail" and data value = "r1"
has been created. "r1" is a reason with a loss category. When the following row is inserted into the
EQUIPMENT_EVENT table, we want to call the stored procedure to make the HTTP request:
insert into EQUIPMENT_EVENT (Id, SOURCE_ID, VALUE, EVENT_TIME) values (1, 'e1.avail', 'r1', SYSDATETIMEOFFSET())
The insertion database trigger for the table is created as:
CREATE TRIGGER [ON_EVENT]
ON [dbo].[EQUIPMENT_EVENT]
FOR INSERT
AS
BEGIN
SET NOCOUNT ON
-- event endpoint
declare @url nvarchar(128)
set @url = 'http://machine_ip:8184/event'
declare @response nvarchar(1024)
declare @sourceId nvarchar(64)
declare @value nvarchar(64)
declare @timestamp datetimeoffset(3)
declare @event_time nvarchar(64)
select @sourceId = i.SOURCE_ID, @value = i.VALUE, @timestamp = i.EVENT_TIME from inserted i
select @event_time = convert(nvarchar(64), @timestamp, 126)
exec PostEquipmentEvent @url, @sourceId, @value, @event_time, @response output
END
Here the HTTP data collector is running at "machine_ip" address on port 8184. The data to be sent to
the collector is obtained from the "inserted" row and then passed into the PostEquipmentEvent stored
procedure. The collector's JSON response is returned in the @response output parameter.
The PostEquipmentEvent stored procedure is written in C# as:
public partial class StoredProcedures
{
[Microsoft.SqlServer.Server.SqlProcedure]
public static void PostEquipmentEvent(string url, string sourceId, string value, string
timestamp, out string result)
{
// POST equipment event
// json content
42
string content = "{\"sourceId\":\"" + sourceId + "\",\"value\":\"" + value +
"\",\"timestamp\":\"" + timestamp + "\"}";
// create Http request
HttpWebRequest request = (HttpWebRequest)WebRequest.Create(url);
byte[] data = Encoding.ASCII.GetBytes(content);
request.Method = "POST";
request.ContentType = "application/json";
request.ContentLength = data.Length;
// make the request
Stream postStream = request.GetRequestStream();
postStream.Write(data, 0, data.Length);
// wait for the response
HttpWebResponse response = (HttpWebResponse)request.GetResponse();
result = new StreamReader(response.GetResponseStream()).ReadToEnd();
response.Close();
postStream.Close();
}
}
iOS/Android ExampleiOS/Android ExampleiOS/Android Example
The HTTP URL can be called from an IOS or Android mobile application. In this case, the user interface is
built using the native IDE (XCode and Swift for iOS, Android Studio and Java for Android). An HTTP
client API is then called to make a request and receive a response.
For example, a Swift function for a POST request is:
// send an HTTP POST request with body data
private func sendPostRequest(_ url: String, body: String) -> NSError? {
if let error = validateRequest() {
return error
}
let nsUrl = URL(string : url)!
var request = URLRequest(url: nsUrl)
request.httpMethod = "POST"
let bodyData : Data = body.data(using: String.Encoding.utf8)!
request.httpBody = bodyData
dataTask = dataSession.dataTask(with: request, completionHandler: {
data, response, error in
43
// flag that task is done
self.dataTask = nil
// call back handler
self.handler!.handleResponse(nsUrl, data: data, error: error)
})
dataTask?.resume()
return nil
}
The caller of this function provides the URL with the endpoint (e.g. “event”) and the JSON serialized
body.
TrendingTrendingTrending
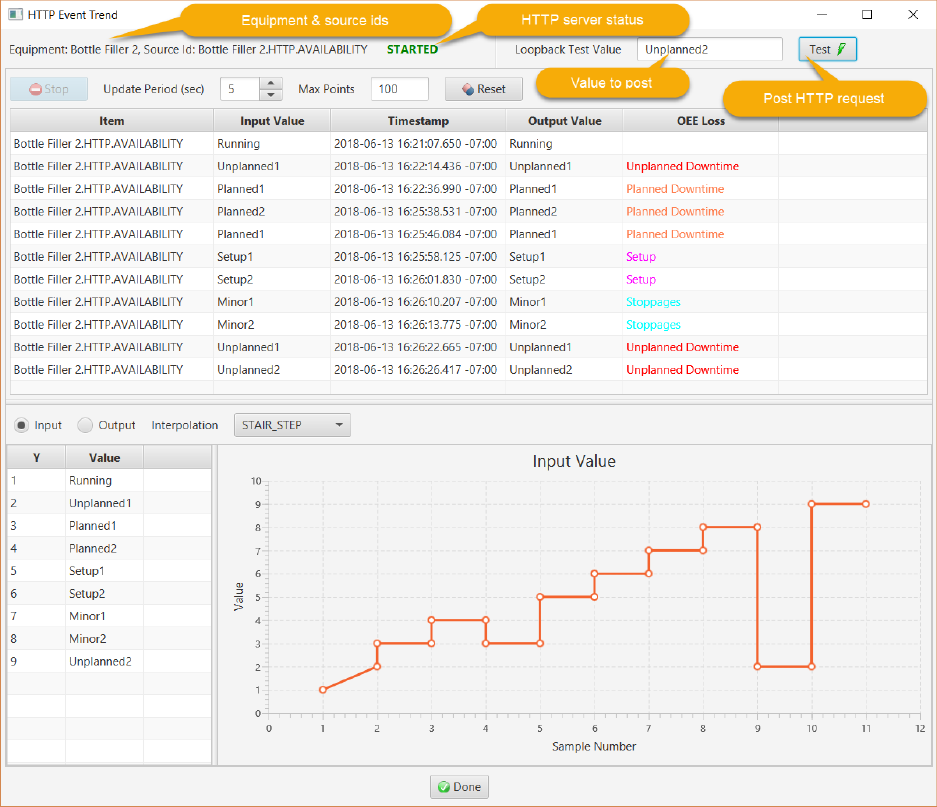
By clicking the Watch button for an HTTP resolver, the execution of the script can be observed. An HTTP
source for equipment availability with a pass-through resolver script of:
return value;
looks like:
44
In this example, reasons have been entered into the loop-back test field and the Test button clicked to
send a POST request to the HTTP server embedded in the controller for this dialog.
Messaging Data SourceMessaging Data SourceMessaging Data Source
DefinitionDefinitionDefinition
The messaging data source definition dialog is launched from the toolbar or from the Data Collection tab
for a messaging resolver after an equipment object has been selected in the physical model. It is used to
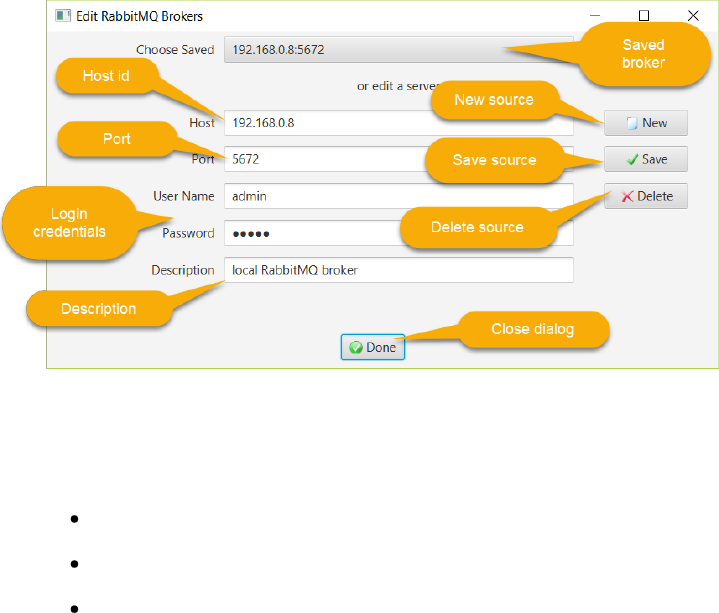
define the RabbitMQ broker host, port and login credentials.
This dialog looks like:
45
For this example, the RabbitMQ broker is running on host 192.168.0.8 on the default port of 5672. The
client will login as the “admin” user.
The actions for a messaging data source are:
New: clear the editing controls to define a new data source
Save: save the data source to the database
Delete: delete the data source from the database
Clicking the Done button will assign the broker as the script resolver’s input source.
TrendingTrendingTrending
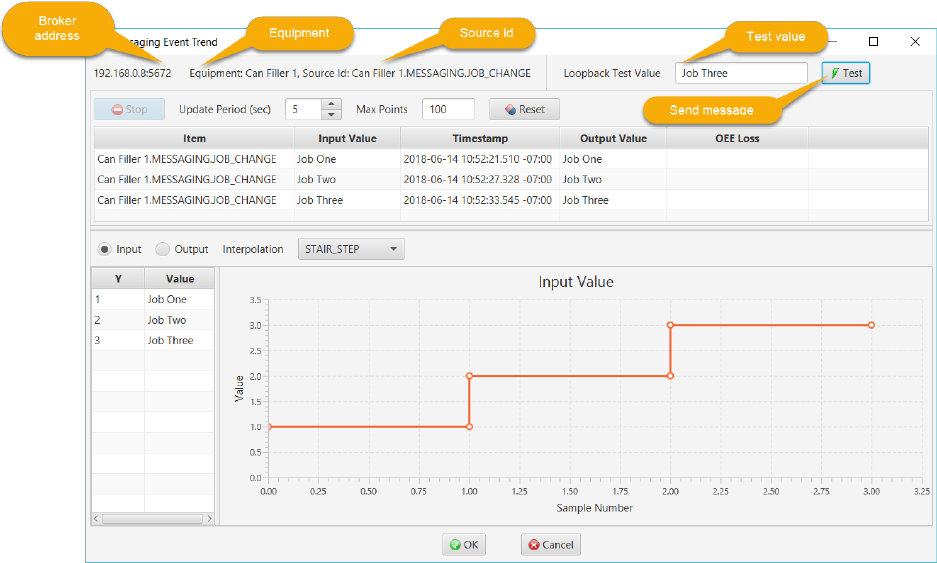
By clicking the Watch button for an messaging resolver, the execution of the script can be observed. A
trend for a messaging source for a job change with a pass-through resolver script of:
return value;
looks like:
46
In this example, job identifiers have been entered into the loop-back test field and the Test button
clicked to send a JSON serialized EquipmentEventMessage to the specified RabbitMQ broker. The
messaging trend controller is listening for these messages from the Point85 exchange and routed to its
queue.
The Java code is:
@FXML
private void onLoopbackTest() {
try {
if (pubSub == null) {
throw new Exception("The trend is not connected to an RMQ broker.");
}
EventResolver eventResolver = trendChartController.getEventResolver();
String sourceId = eventResolver.getSourceId();
String value = tfLoopbackValue.getText();
EquipmentEventMessage msg = new EquipmentEventMessage();
msg.setSourceId(sourceId);
msg.setValue(value);
pubSub.publish(msg, RoutingKey.EQUIPMENT_SOURCE_EVENT, 30);
} catch (Exception e) {
AppUtils.showErrorDialog(e);
}
47
}
Database Table Data SourceDatabase Table Data SourceDatabase Table Data Source
DefinitionDefinitionDefinition
The database interface table data source definition dialog is launched from the toolbar or from the Data
Collection tab for a database table resolver after an equipment object has been selected in the physical
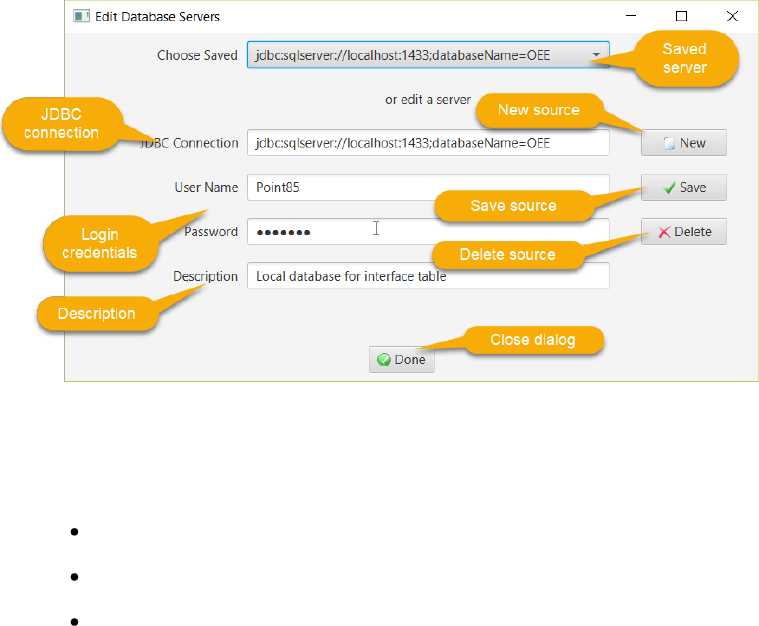
model. It is used to define the database server JDBC connection string and login credentials.
This dialog looks like:
For this example, the SQL Server is running on localhost on the default port of 1433. The client will login
as the “Point85” user to the OEE database where the DB_EVENT table has been created.
The actions for a database data source are:
New: clear the editing controls to define a new data source
Save: save the data source to the database
Delete: delete the data source from the database
Clicking the Done button will assign the DB_EVENT table as the script resolver’s input source.
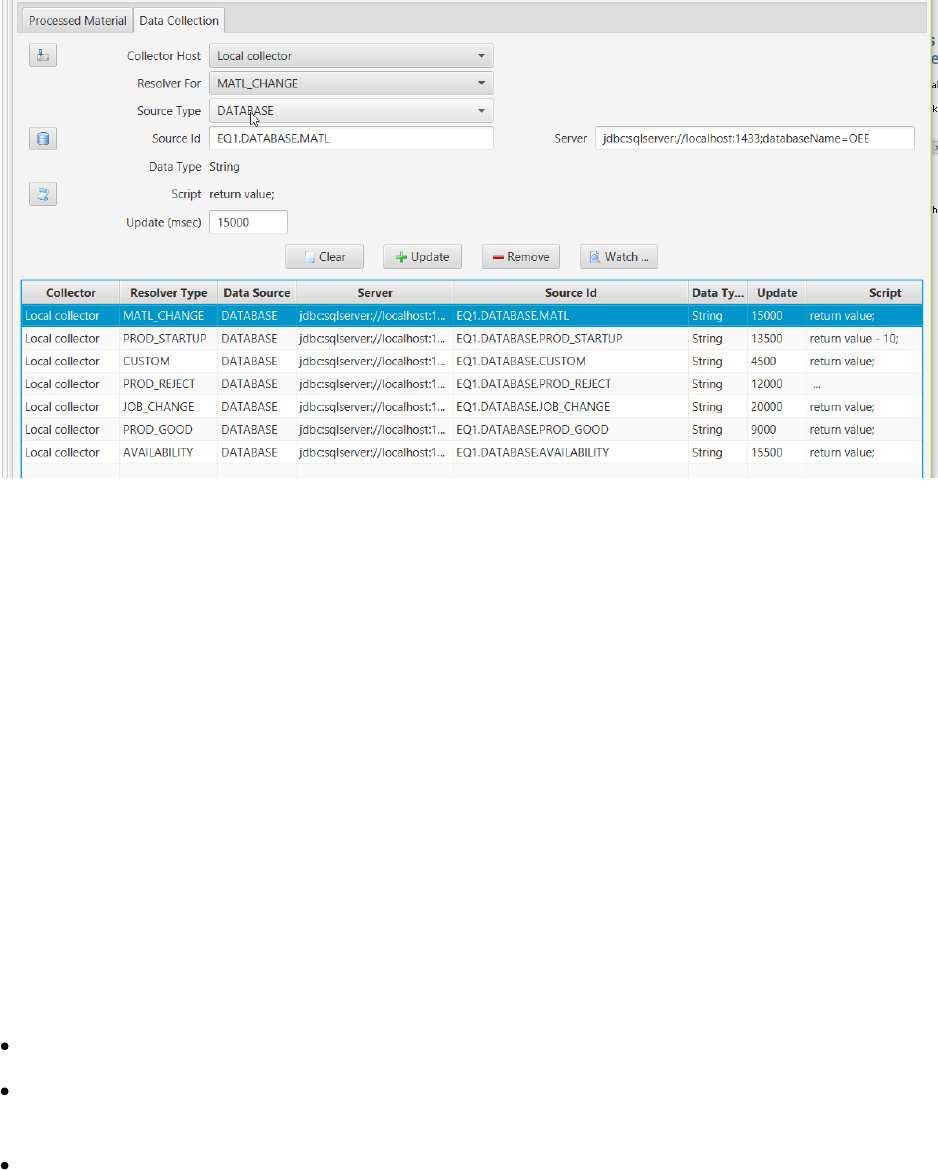
This table will be queried every N msec where N is the update period defined in the equipment
resolver(s). For example, there are 7 resolvers defined for this equipment with a source type of
“DATABASE”:
48
A material change event will be looked for every 15 seconds and a good production record every 9
seconds.
DB_EVENT Table SchemaDB_EVENT Table SchemaDB_EVENT Table Schema
The create_event_table.sql script in the \database\mssql folder will create this table for SQL Server. The
create_event_table.sql script in the \database\oracle folder will create this table for Oracle. For
example, for SQL Server the schema is:
CREATE TABLE [dbo].[DB_EVENT](
[EVENT_KEY] [bigint] NOT NULL,
[SOURCE_ID] [nvarchar](128) NOT NULL,
[IN_VALUE] [nvarchar](64) NOT NULL,
[TIME] [datetimeoffset](3) NOT NULL,
[STATUS] [nvarchar](16) NOT NULL,
[ERROR] [nvarchar](256) NULL
) ON [PRIMARY]
The column values are as follows:
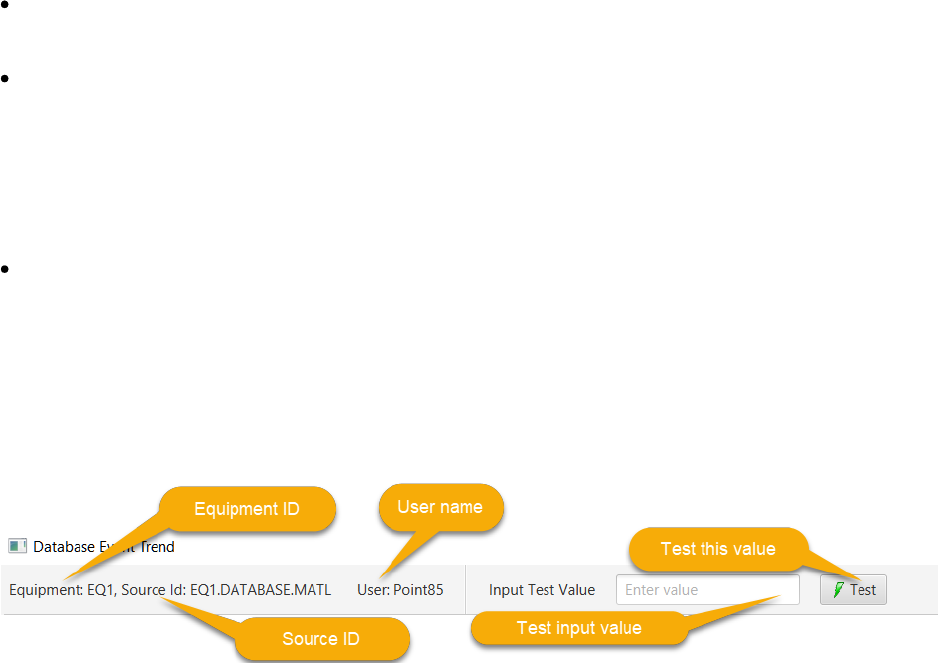
EVENT_KEY: must be unique for each record inserted into the table.
SOURCE_ID: must match that defined in the associated equipment resolver (e.g.
EQ1.DATABASE.MATL for a material change as above).
IN_VALUE: a string value that can be converted to the data type required by the resolver.
Availability, material, job and custom inputs are passed directly into the JavaScript resolver as a
string. Good, reject and startup amounts are converted to double values.
49
TIME: a date and time of day value with time zone offset when the event occurred (e.g. 2018-11-28
21:30:07.670 -08:00) in Pacific Standard Time.
STATUS: one of READY, PASS or FAIL. The record must be inserted with a status of READY. If the
JavaScript resolver successfully processes the record, the status will be updated to PASS. If there is
an error during processing, the status will be updated to FAIL and the ERROR column will contain
text explaining the error. The status can be set back from FAIL to READY in order to retry the event.
It is the responsibility of the orginator to delete PASSed or FAILedrecords when they are no longer of
any interest.
ERROR: this column will contain text explaining the error if the record was not successfully
processed.
TrendingTrendingTrending
By clicking the Watch button for an database table resolver, the execution of the script can be observed.
A trend for a database source is similar to the other trend charts. In this case however, the top portion
of the dialog looks like:
Entering a value, then clicking the Test button will write a record into the DB_EVENT table. It will be
read on the next polling cycle and processed. A successful execution of the script resolver will display
the point in the trend chart. A failure will result in an error dialog being displayed and a status of FAIL in
the table.
DDDASHBOARDASHBOARDASHBOARD
After equipment is selected, the dashboard can be displayed. This form consists of four tiles at the top
that display OEE, availability, production counts, material and job. The bottom portion has tabs for
event history, time losses by category and various Pareto charts:
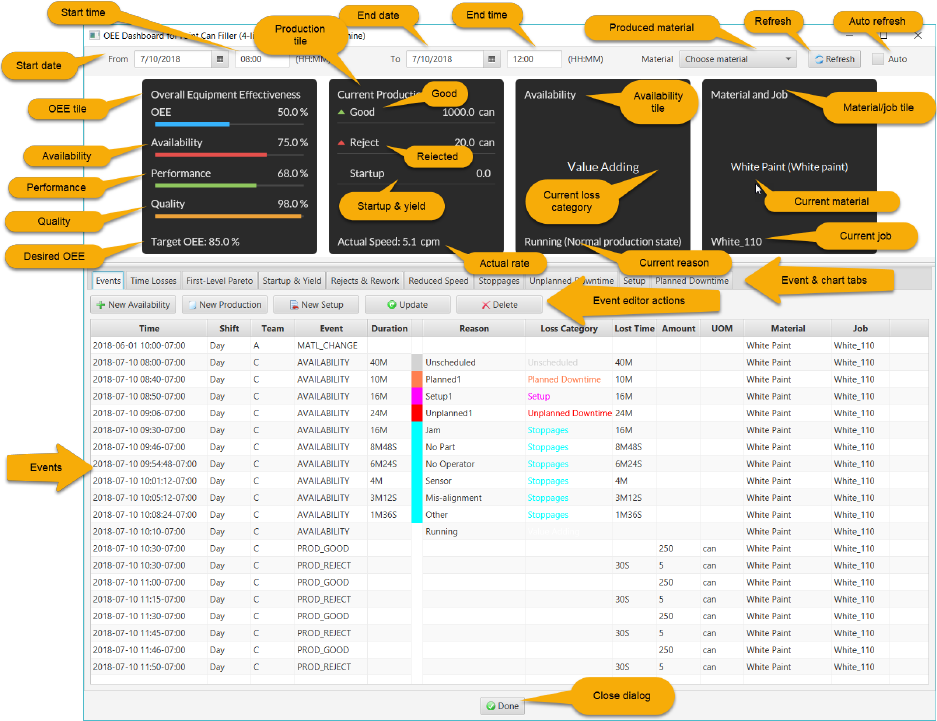
50
This dashboard is for a paint can filling machine as discussed in [Kennedy]. A time range is first selected
from a starting date and time of day to and ending date and time of day. In the above example, the
time period is 4 hours during a single day. A specific material that has setups can be selected in the
combobox, or all materials with setups during the specified time period. Clicking the refresh button will
query the event records from the database and compute the OEE with its three components. In this
case, the OEE is 50% where availability = 75%, performance = 68% and quality = 98%. The paint can
fillter machine has a desired OEE of 85%. If the “Auto” checkbox is checked, the form will refresh every
minute.
The current production tile displays the cumulative good (1000 cans), reject (20 cans) and startup
counts (0 cans) from the 8 event records.
The availability tile displays the last availability event (a Value Adding loss category) with a reason of
“Running” and description. Note that in this example, the availability events were entered in temporal
sequence for a 4 hour period starting at 8 am and ending at 12 noon. It is also possible to enter these
events in summary form (where the event duration includes multiple events for the same reason).
The material and job tile displays the current material being run (White Paint) and job name
(White_110).
Below the tiles the following tabs have more detailed information.
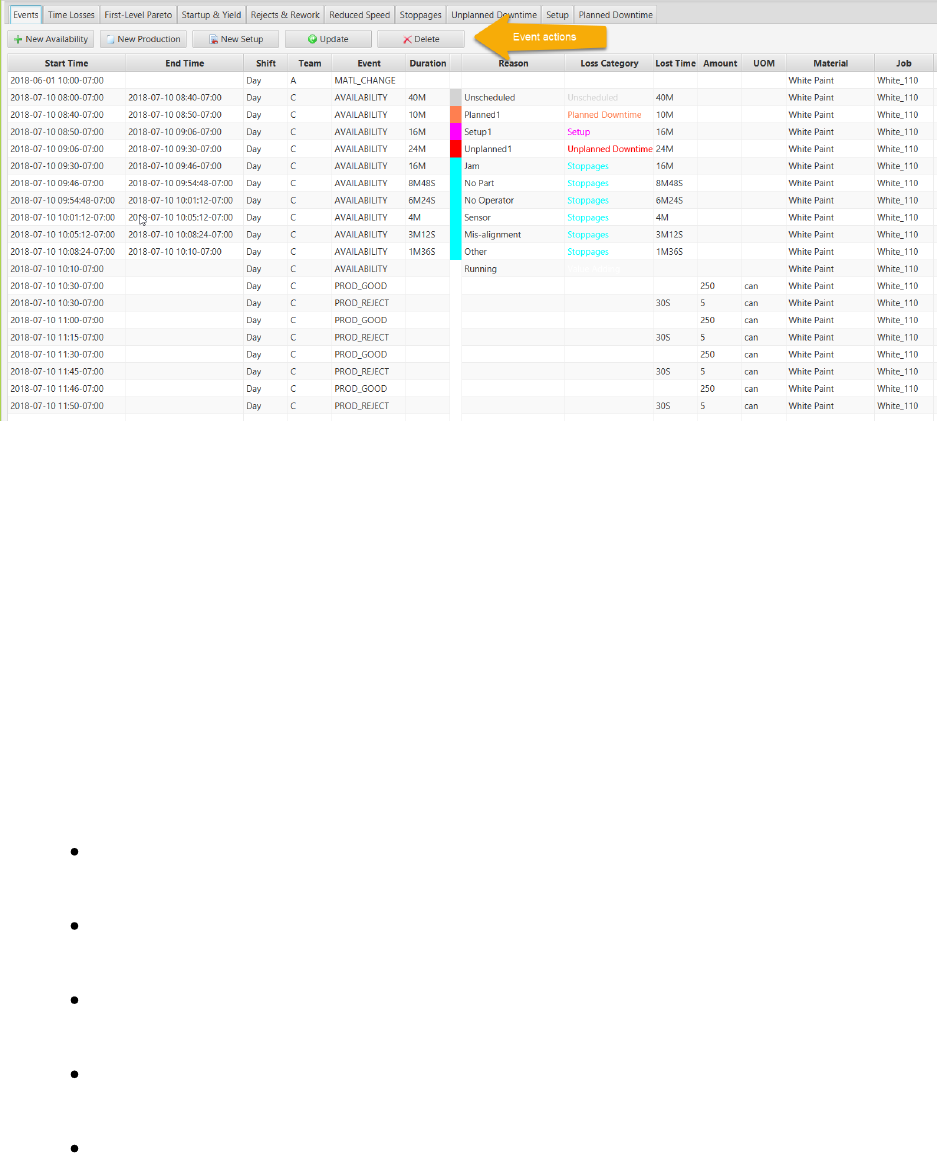
51
EventsEventsEvents
This tab displays the event history in a table:
Note that a job change without a corresponding material change is not shown since it does not affect
the OEE calculation. The starting and ending date and times of day are displayed. Current events do not
have an ending time (e.g. the setup that changed to the current material and job).
If a work schedule is defined for this equipment, the shift and team working that shift will be shown.
The duration of an event is the availability time period or the total time period for production events.
Therefore, for availability events, the lost time is equal to the duration. But, for reject or startup
production, the counts are converted into the equivalent time period as per the OEE time loss model.
The availability reason is shown and its color-coded loss category. Production events have the amount
and unit of measure. The last table columns show the material and job when the event ocurred.
The following actions are available:
New Availability: create an availability record. The dialog discussed below will be displayed
to enter the event information.
New Production: create a production record. The dialog discussed below will be displayed
to enter the event information.
New Setup: create a set up record. The dialog discussed below will be displayed to enter
the event information.
Update: edit an existing availability, production or setup record. The dialog discussed below
will be displayed to enter the event information.
Delete: delete an existing set up record.
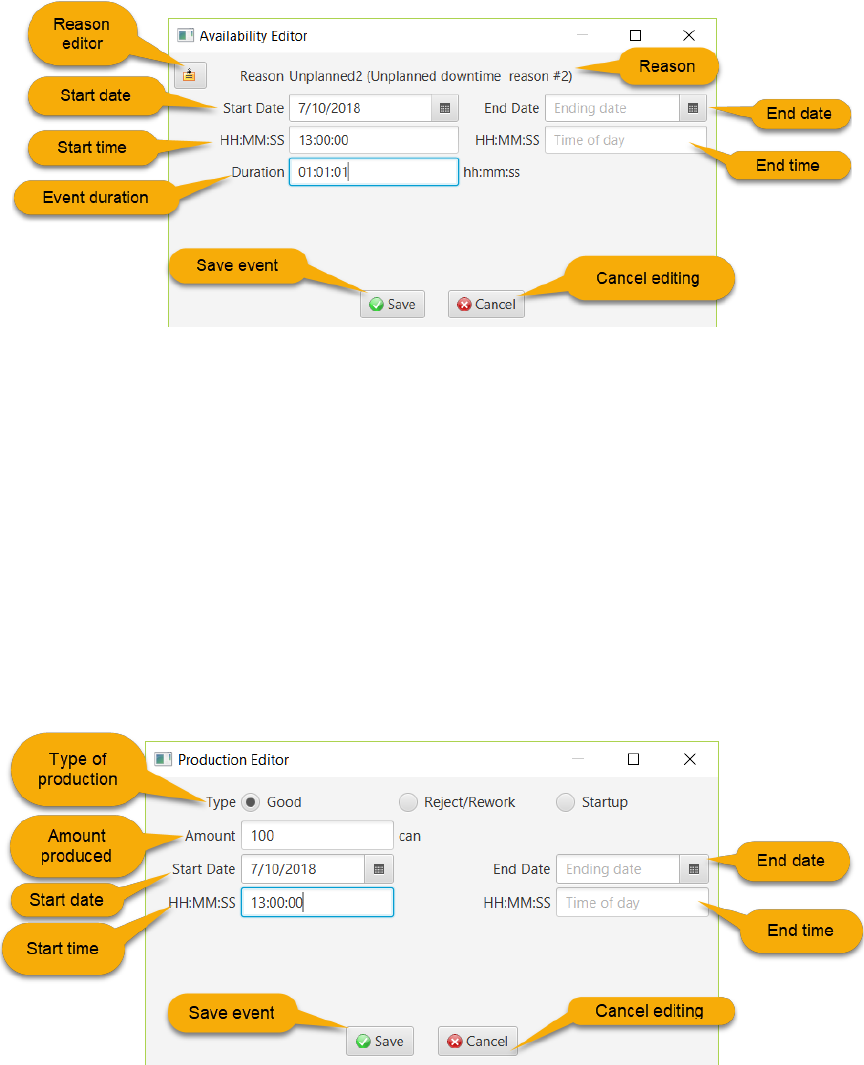
52
Availability EditorAvailability EditorAvailability Editor
To create an availability event or to edit an existing event, the following dialog is used:
If an existing event is being edited, the fields will be populated with current data.
A reason must be chosen by clicking on the reason editor button and selecting an existing reason or
creating a new reason. A starting date and time of day is required as is the duration of the event.
An ending time is not required if the events are being entered in chronological order as they happened.
On the other hand, if the event is being summarized over a period of time, the ending date and time of
day is required.
Clicking the Save button inserts a record into the database. Cancel will exit the editor without making
any changes.
Production Editor
To create a production event or to edit an existing event, the following dialog is used:
If an existing event is being edited, the fields will be populated with current data.
A type of production must be selected in the radio buttons and the amount produced. The unit of
measure is obtained from the UOM configured for the equipment.
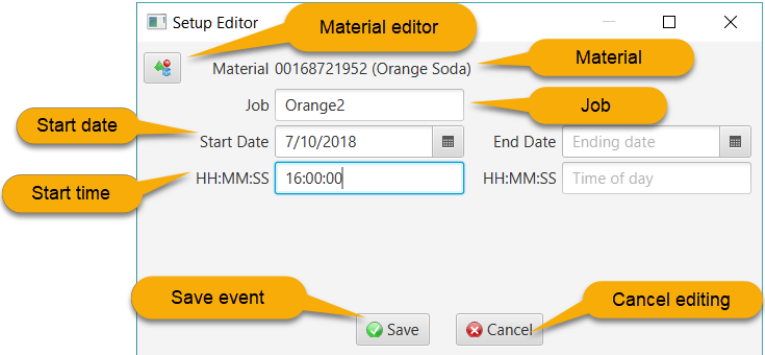
53
An ending time is not required if the events are being entered in chronological order as they happened.
On the other hand, if the event is being summarized over a period of time, the ending date and time of
day is required.
Clicking the Save button inserts a record into the database. Cancel will exit the editor without making
any changes.
Setup EditorSetup EditorSetup Editor
To create a setup event or to edit an existing event, the following dialog is used:
If an existing event is being edited, the fields will be populated with current data.
The material must be chosen by clicking on the material editor button and selecting an existing material
or creating a new material. The name of a job/order is optional. A starting date and time of day is
required.
An ending time is not required if the events are being entered in chronological order as they happened.
On the other hand, if the event is being summarized over a period of time, the ending date and time of
day is required. Note that there must be at least one open setup event since OEE data is dependent
upon knowing what material is being produced.
Clicking the Save button inserts a record into the database. Cancel will exit the editor without making
any changes.
Time LossesTime LossesTime Losses
The time losses tab displays a bar chart of of the losses encountered before arriving at the net defect
free or value adding time (see [Kennedy]).
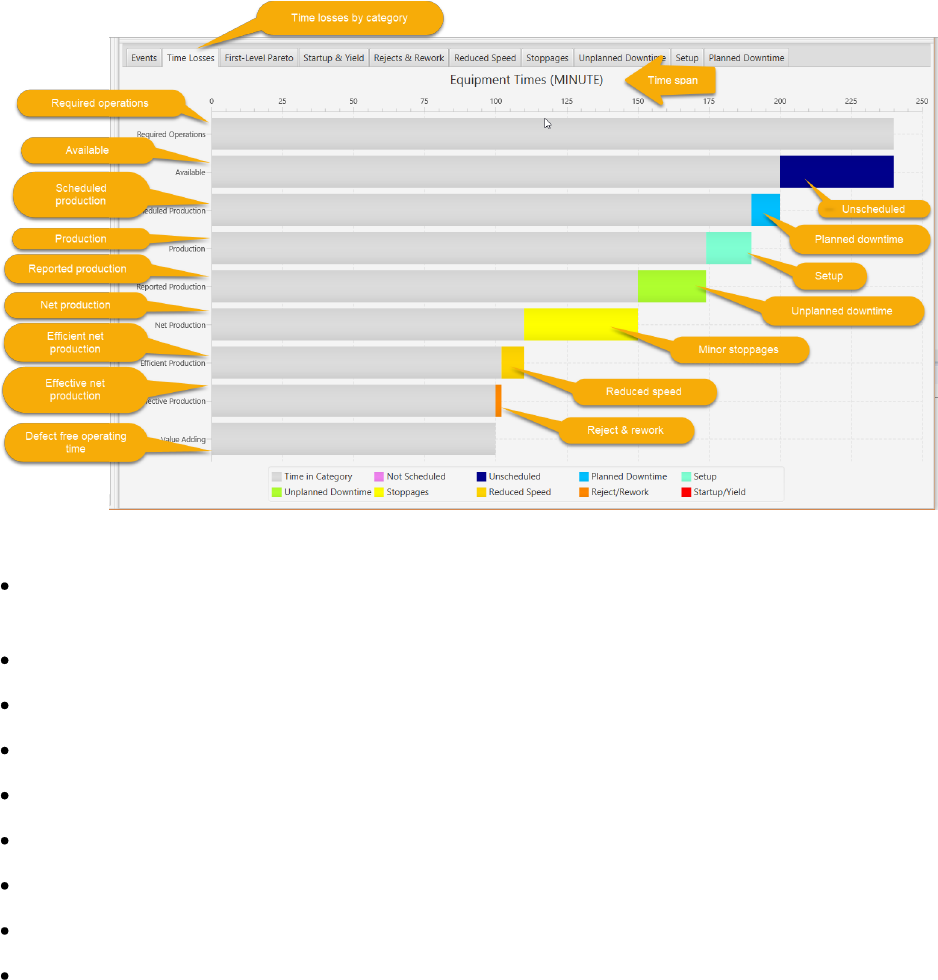
54
The bars represent:
Required Operations: the time period of interest (4 hours or 240 minutes in this example) minus the
Not Scheduled time (also 4 hours since there is no Not Scheduled time)
Available: the required production time that subtracts the Unscheduled time (40 minutes)
Scheduled Production: available time less Planned Downtime (10 minutes)
Production: scheduled production time less the Setup time (16 minutes)
Reported Production: production time less the Unplanned Downtime time (24 minutes)
Net Production: reported production time less the Minor Stoppages time (40 minutes)
Efficient Net Production: net production time less the Reduced Speed time (8 minutes)
Effective Net Production: effecient net production time less the Reject/Rework time (2 minutes)
Value Adding, Defect Free or Ideal Speed: effective net production time less the Startup & Yield time
(0 minutes)
First-Level Pareto ChartFirst-Level Pareto ChartFirst-Level Pareto Chart
The first-level pareto chart displays the percentage of Available Time consumed by each of the 7 OEE
losses:
1. Planned Downtime (10 minutes)
2. Setup (16 minutes)
3. Unplanned Downtime (24 minutes)
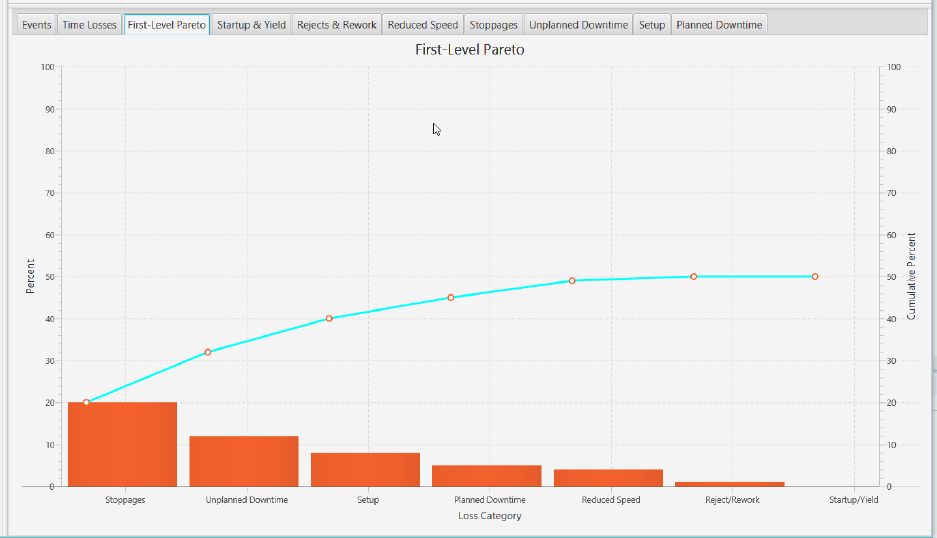
55
4. Minor Stoppages (40 minutes)
5. Reduced Speed (8 minutes)
6. Rejects and Rework (2 minutes)
7. Startup and Yield (0 minutes)
The total time lost in these 7 categories is thus 100 minutes.
The y-axis shows the 7 loss categories. For the example above, minor stoppages consumed 20% (40
minutes/ 200 minutes), whereas startup & yield has no losses.
This Pareto chart also shows the cumulative percentage increasing from 20% (40/200) to 50%
(100/200).
Second-Level Pareto ChartsSecond-Level Pareto ChartsSecond-Level Pareto Charts
A Pareto chart for each of the 7 loss categories is available by clicking on the color-coded bar chart
segment in the time loss chart, or by selecting the tab of interest. For example, the minor stoppages
Pareto looks like this:
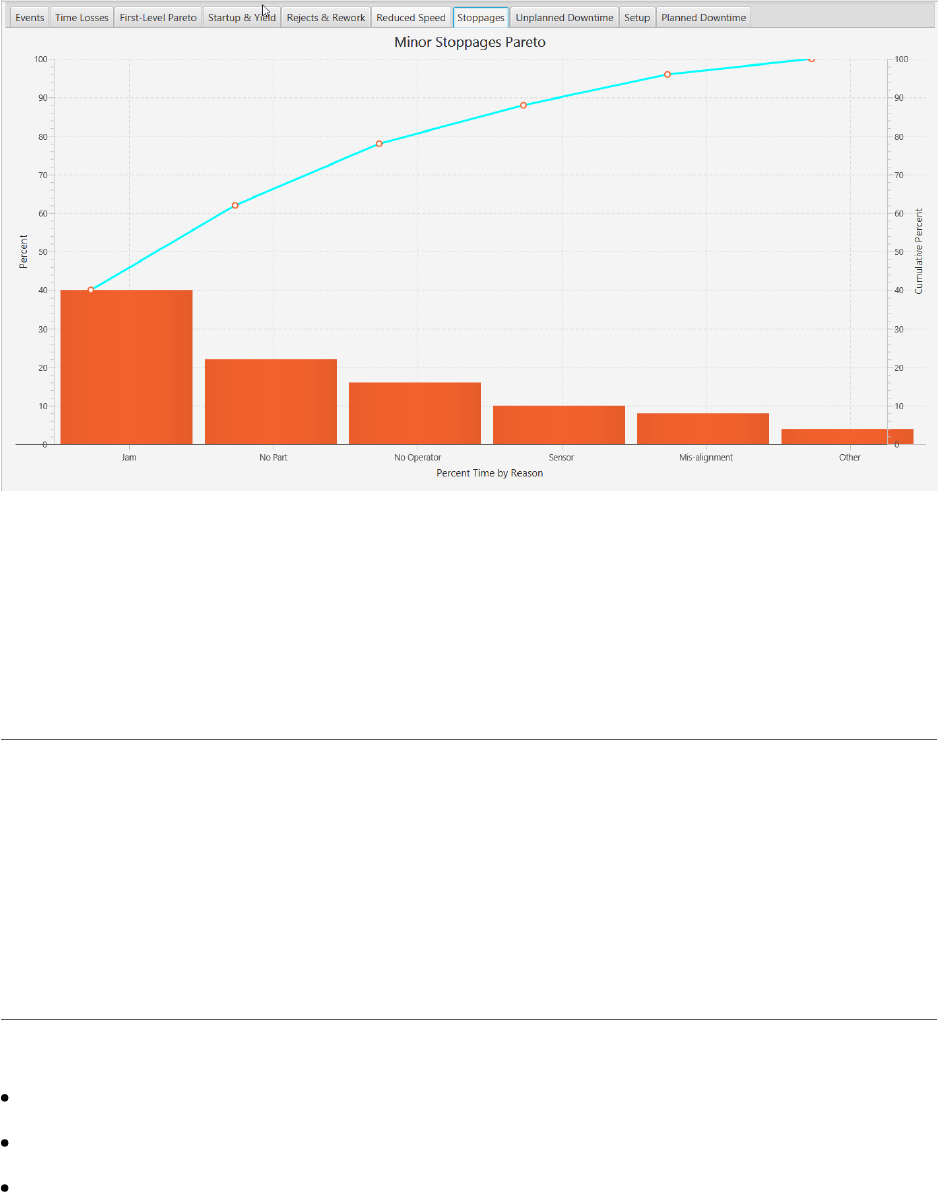
56
The y-axis shows the top 10 reasons for each minor stoppage (6 in this example). For example, 40% of
the minor stoppage losses were due to jams and 4% due to other reasons.
This Pareto chart also shows the cumulative percentage increasing from 40% (16 minutes/40 minutes)
to 100% (since there were only 6 reasons for all of the minor stoppages losses).
CCCOLLECTOROLLECTOROLLECTOR A A APPLICATIONPPLICATIONPPLICATION
The collector application runs as a Windows service or Unix daemon on the configured host computer.
A collector application executes equipment event resolver scripts upon receipt of an input value and
stores the availability, production, material or job change event data in the database. This data is used
for OEE calculations.
The Tanuki Java Service wrapper provides the infrastructure for the Windows service or Unix daemon.
MMMONITORONITORONITOR A A APPLICATIONPPLICATIONPPLICATION
The monitor application has three main functions, to observe:
Equipment performance via metrics available in the dashboard.
Notifications from the data collectors for abnormal conditions
Data collector status.
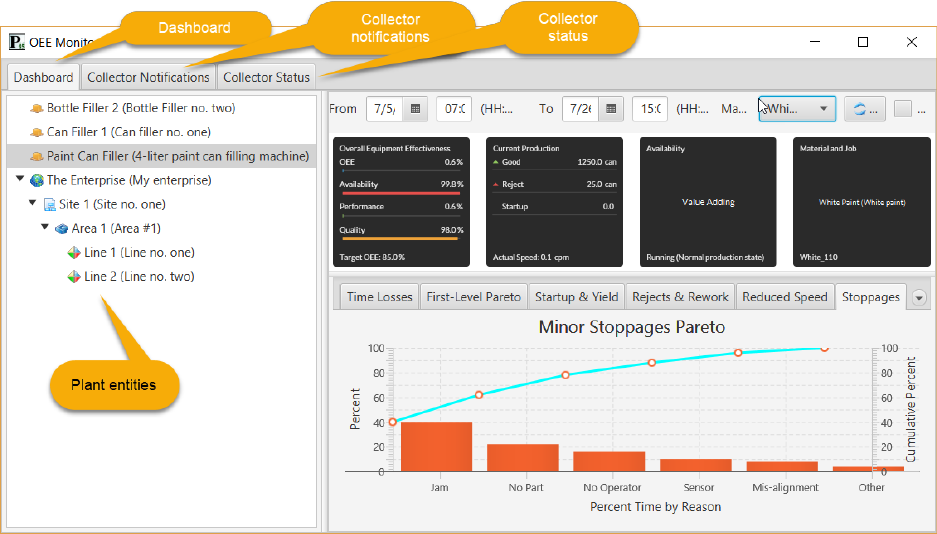
57
DDDASHBOARDASHBOARDASHBOARD
The dashboard is displayed by selecting the Dashboard tab. The plant entity hierarchy is displayed in the
tree view on the left. After selecting a piece of equipment, the dashboard is shown on the right. For
details on the dashboard, see the Designer dashboard section above.
The dashboard will update asynchronously as equipment event messages are received from the
RabbitMQ broker (if so configured). Otherwise, the auto-refresh feature can be enabled to periodically
query the database.
CCCOLLECTOROLLECTOROLLECTOR N N NOTIFICATIONSOTIFICATIONSOTIFICATIONS
Data collector notifications are displayed by selecting the Collector Notifications tab:
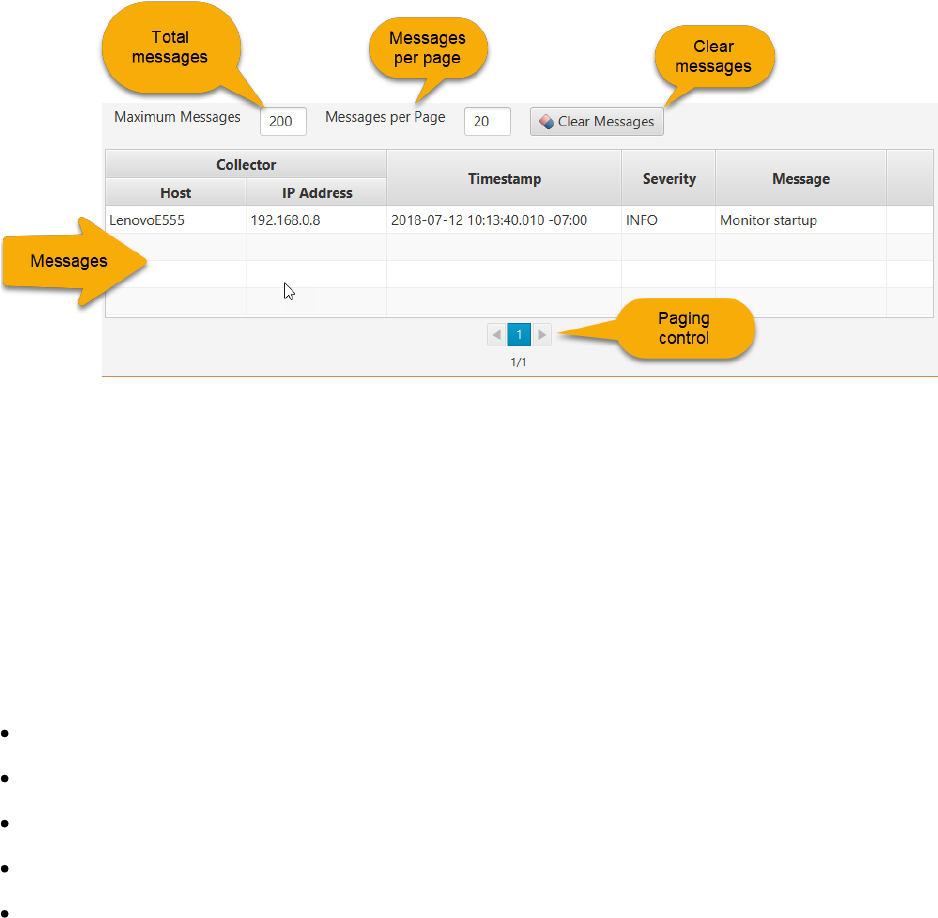
58
If the collector is configured for messaging, when a notification event occurs, a message is sent to the
RabbitMQ broker and delivered to all notification subscribers. In the example above, the Monitor sends
an informational startup message to itself.
The total number of messages to retain can be specified (e.g. 200). If more than this number of
messages is received, the oldest messages will be discarded. The number of messages to display in the
table can be specified (e.g. 20). If the number of messages exceeds this page count, the paging control
can be used to move forward or backward through them.
All messages can be removed by clicking on the Clear Messages button.
Information shown for each message is:
Host: the name of the computer on which the collector is running
IP Address: IP address of collector
Timestamp: date and time of day with time zone offset when the message was sent
Severity: severity of message (ERROR, WARNING, INFO)
Message: the text of the message
CCCOLLECTOROLLECTOROLLECTOR S S STATUSTATUSTATUS
Data collector status is displayed by selecting the Collector Status tab:

59
The top table shows the following information about each of the data collectors:
Name: collector host computer name
IP Address: collector host computer IP address
Timestamp: date and tinme of day with zone offset when the status message was sent
Used Memory: heap memory allocated by the collector’s JVM
Free Memory: free JVM heap memory
CPU: current CPU load
After selecting a host computer, the following information is shown:
Name: collector name
Description: collector description
State: collector state - one of DEV, READY or RUNNING
RMQ Broker Host: the host computer for the collector’s RabbitMQ broker
RMQ Broker Port: the TCP/IP port of the collector’s RabbitMQ broker
OOOPERATORPERATORPERATOR A A APPLICATIONPPLICATIONPPLICATION
The operator application is browser-based and allows a user to enter availability, performance,
production, material change and job events. The events can be recorded in chronological order as they
60
happened (“By Event”) or in summary form (“Summarized”) over a period of time by duration of event.
Value adding time is assumed in summary form for availability.
For example, during a four hour period from 07:00 to 11:00, the chronological events might be:
1. 07:30 - Unplanned downtime with reason #1
2. 08:00 - Running again
3. 09:00 - Good production of 100 units
4. 09:15 - Reject production of 10 units
5. 09:45 - Planned downtime for preventive maintenance with reason #2
6. 10:00 - Running again
7. 10:30 - Good production of 50 units
These 7 events would be entered in chronological order.
Now, in summary form for this time period, the records might be entered as:
1. Good production of 150 units
2. Reject production of 10 units
3. Planned downtime of 15 minutes with reason #2
4. Unplanned downtime of 30 minutes with reason #1
UUUSERSERSER I I INTERFACENTERFACENTERFACE
The user interface for availability/performance tab for a summarized event looks like:
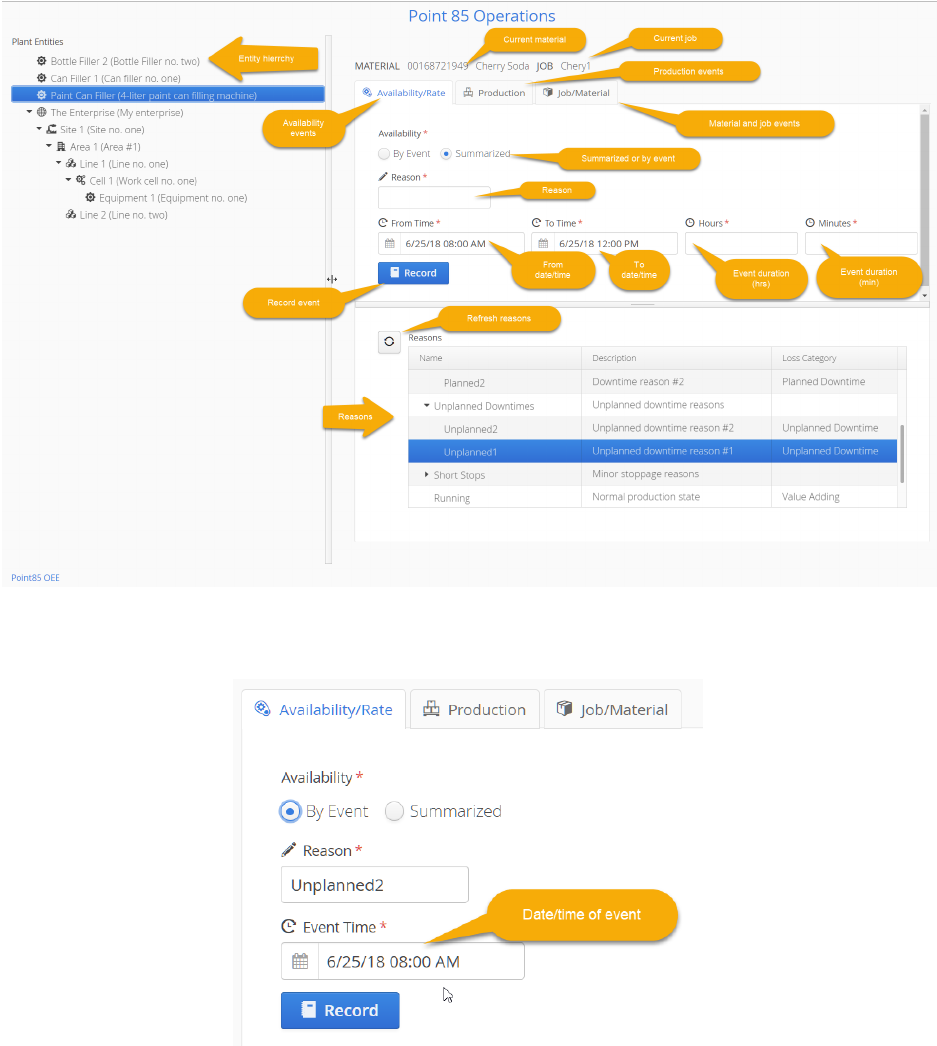
61
Note that if “By Event” is selected, the UI will change to allow entry of only the date and time of day
when the availability event occurred:
The production tab for a summarized event looks like:
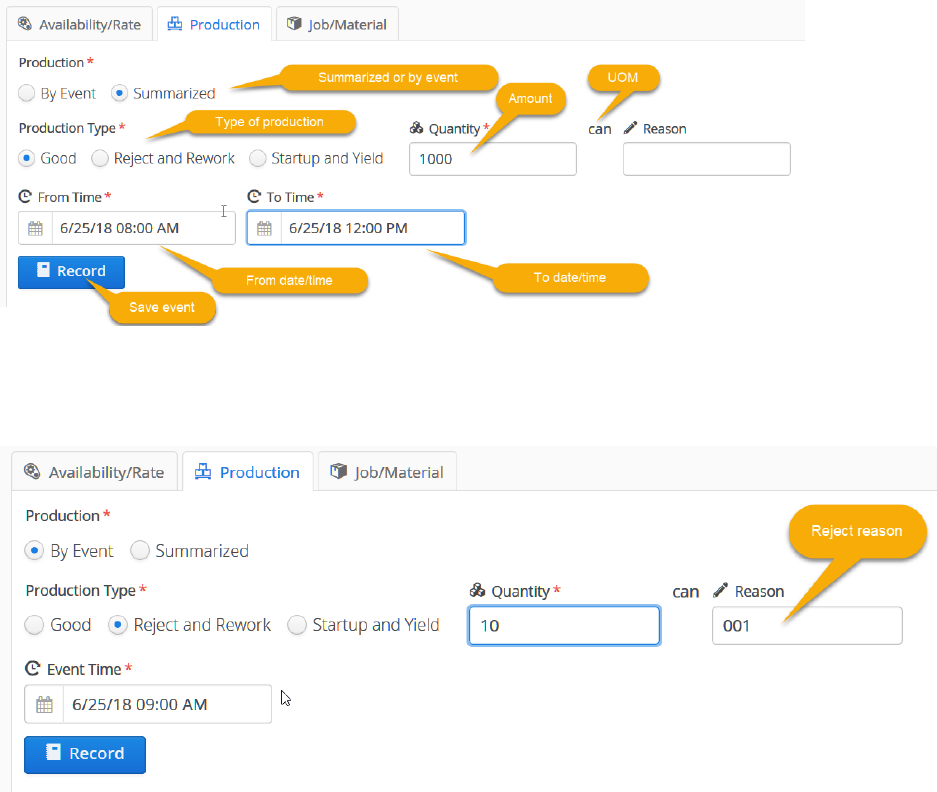
62
Note that if “By Event” is selected, the UI will change to allow entry of only the date and time of day
when the production event occurred. For reject and rework as well as startup and yield event, a reason
can be entered as well:
The material and job change tab looks like:
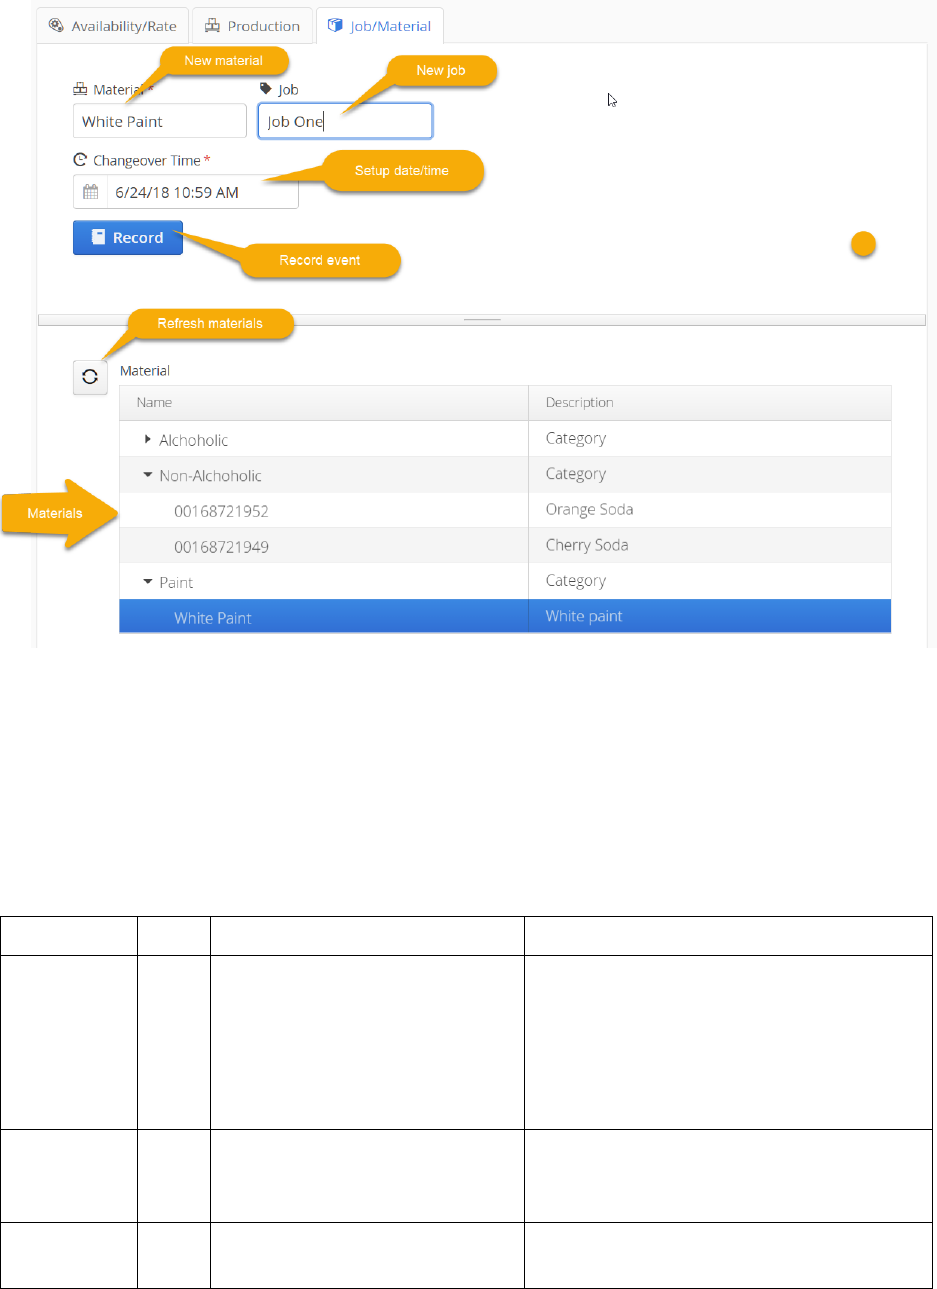
63
WWWEBEBEB S S SERVICEERVICEERVICE
Equipment availability and production events can be POSTed to the collector’s HTTP server. The plant
entity hierarchy, reasons, materials, data sources and data source ids are also accessible by a GET
request.
The table below lists the web service requests and responses. The Java DTO (Data Transfer Object) is
serialized into a JSON string.
Endpoint
Verb
Request Class
Response Class
/event
POST
EquipmentEventRequestDto
(sourceId, value and timestamp)
for availability, production of
material, setup or job change
event
EquipmentEventResponseDto (status and
errorText)
/reason
GET
N.A.
ReasonResponseDto (list of ReasonDto with
name, description, loss category, parent
and children)
/material
GET
N.A.
MaterialResponseDto (list of MaterialDto
with name, description and category)
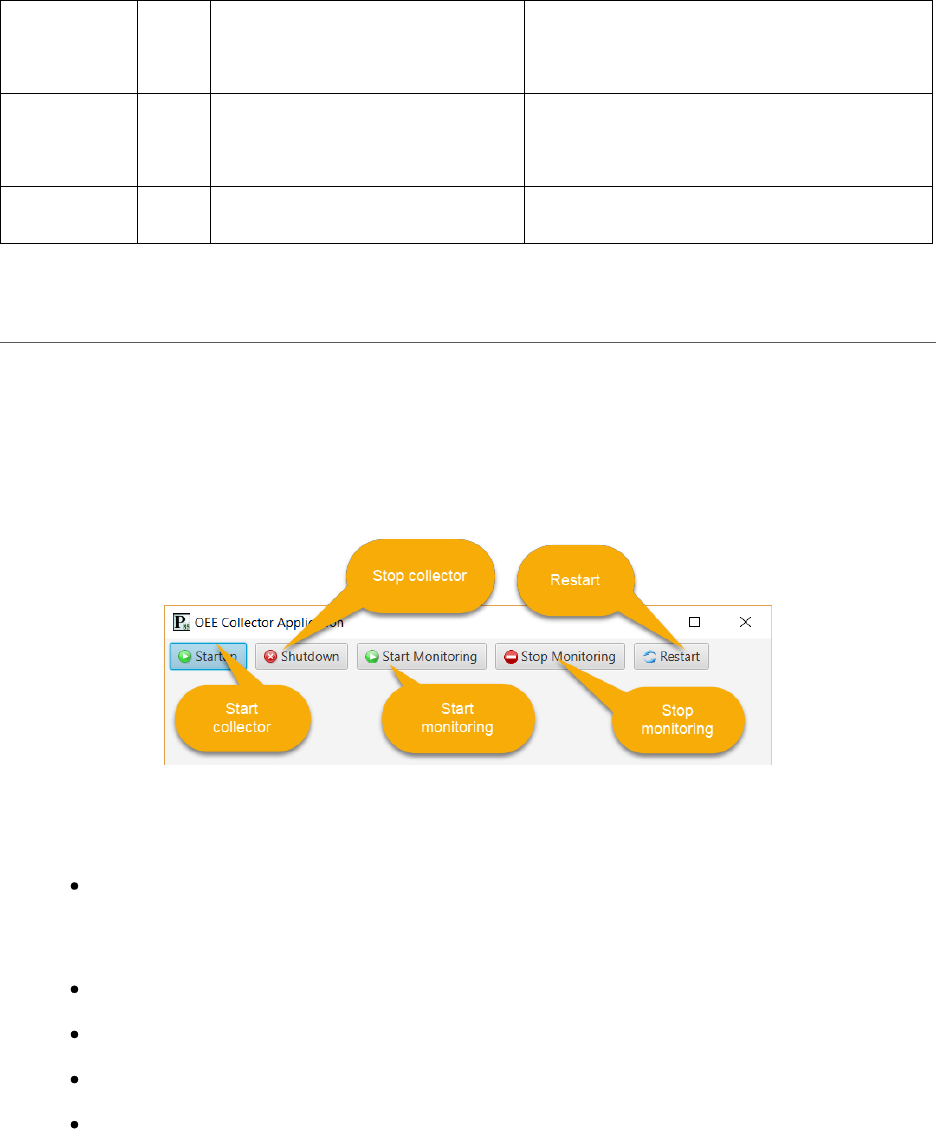
64
/entity
GET
N.A.
PlantEntityResponseDto (list of
PlantEntityDto with name, description,
level, parent and children)
/data_source
GET
N.A.
DataSourceResponseDto (list of
DataSourceDto with name, description,
host and port)
/source_id
GET
SourceIdResponseDto (list of source ids)
TTTESTINGESTINGESTING A A APPLICATIONSPPLICATIONSPPLICATIONS
CCCOLLECTOROLLECTOROLLECTOR U U USERSERSER I I INTERFACENTERFACENTERFACE
This application provides a user interface for a data collector and is used for testing purposes. The
application is launched from a host computer that has configured data sources. After the initial splash
screen, the main form is displayed:
The actions are:
Startup: Start the collector. It will connect to all OPC DA and OPC UA servers and be
prepared to listen to HTTP requests as well as receive messages. It is in the monitoring
state.
Shutdown: Stop the collector. It is in the shutdown state.
Start Monitoring: Start monitoring data input after having been stopped.
Stop Monitoring: Stop monitoring all data inputs.
Restart: Stop monitoring then restart monitoring.
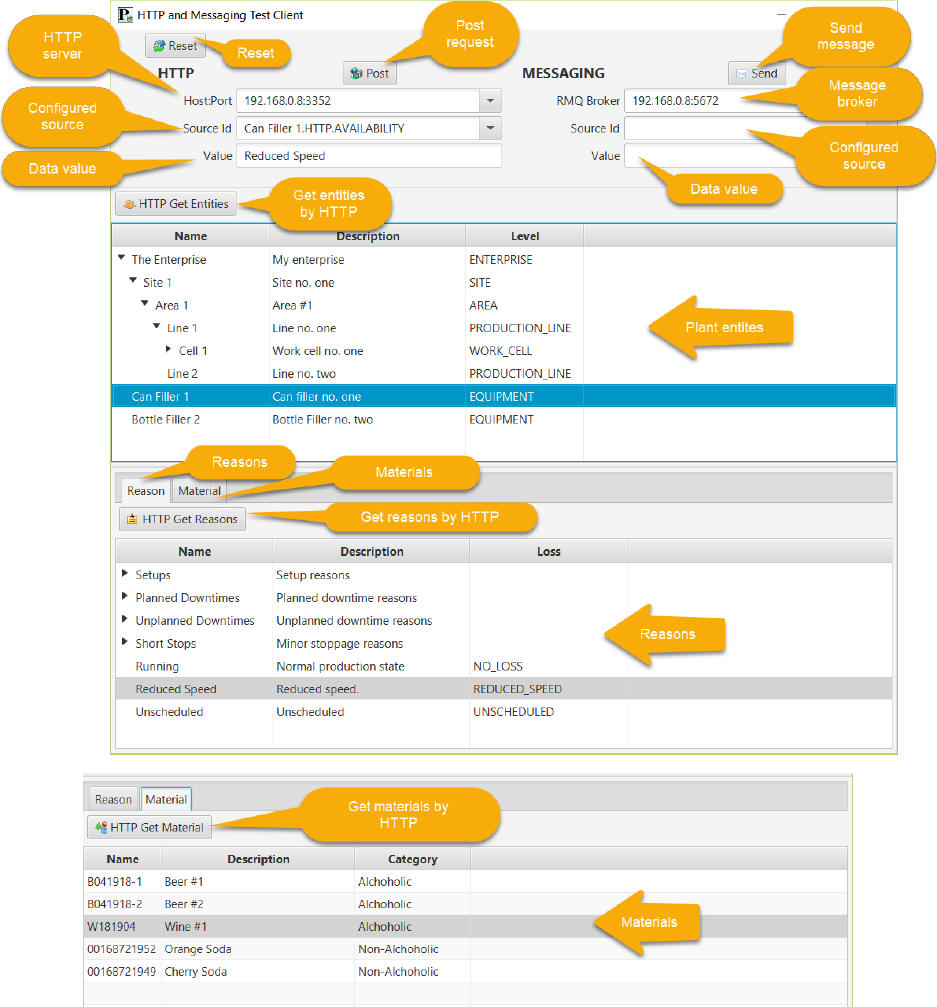
65
HTTP HTTP HTTP ANDANDAND M M MESSAGINGESSAGINGESSAGING
This application provides a user interface to send HTTP requests as well as RabbitMQ messages to a data
collector configured with these data sources. It is used for testing purposes. It also exercises the HTTP
APIs for fetching the plant entities, reasons and materials.
After the initial splash screen, the main form is displayed with the HTTP server and RabbitMQ broker
comboboxes listing these data sources:
Clicking the Reset button re-queries the database for HTTP servers and RabbitMQ brokers and clears the
source id and value fields.
66
HTTPHTTPHTTP
The configured HTTP servers will be listed in the combobox. Choose one to send requests to it. The
actions are:
HTTP Get Entities: get the plant entities and display them in the tree view. A GET request is
made to the “entity” endpoint and PlantEntityResponseDto serialized object is returned.
Selecting an equipment entity will populate the source id comboboxes with HTTP and
messaging data sources.
HTTP Get Reasons: get the reasons and display them in the tree table. A GET request is
made to the “reason” endpoint and ReasonResponseDto serialized object is returned.
Selecting a reason will populate the value text fields with the name of the reason.
HTTP Get Materials: get the materials and display them in the table. A GET request is made
to the “material” endpoint and MaterialResponseDto serialized object is returned. Selecting
a material will populate the value text fields with the name of the material.
Post: Make an HTTP POST equipement event request to the selected server with the event
data.
MessagingMessagingMessaging
The configured RabbitMQ brokers will be listed in the combobox. Choose one to send messages to it.
The actions are:
Send: Send an equipment event message to the selected broker with the event data.
DDDATABASEATABASEATABASE
The Java Persistence 2.0 API (JPA) as implemented by the Hibernate ORM framework together with the
Hikari connection pool is used to persist OEE information to the database.
Hibernate and JPA abstract-away database specific aspects of inserting, updating, reading and deleting
records in the tables. The API is designed to work with any relational database supported by Hibernate.
In particular, Microsoft SQL Server 2012 and Oracle 10g dialects have been tested.
DDDESIGNESIGNESIGN S S SCHEMACHEMACHEMA
The following sections document the design-time database schema. Note that foreign key relationships
are not defined in the schema. Rather, referential integrity is enforced in java code in the
PersistenceService class.
COLLECTOR TableCOLLECTOR TableCOLLECTOR Table
This table contains the data describing each data collector.
Column Name
Description
67
COLLECT_KEY
Primary key
VERSION
Optimistic locking version
NAME
Collector name
DESCRIPTION
Collector description
STATE
Current state of collector
HOST
Computer host name or IP address of the collector
BROKER_HOST
RabbitMQ broker host computer name or IP address
BROKER_PORT
RabbitMQ broker TCP/IP port
BROKER_USER
RabbitMQ broker user name
BROKER_PWD
RabbitMQ broker user password
DATA_SOURCE TableDATA_SOURCE TableDATA_SOURCE Table
This table contains the data describing each source of data for OEE events.
Column Name
Description
SOURCE_KEY
Primary key
VERSION
Optimistic locking version
NAME
Data source name
DESCRIPTION
Data source description
TYPE
Source type (OPC_DA, OPC_UA, HTTP or MESSAGING)
HOST
Computer host name or IP address of the source
USER_NAME
Name of authenticated user
PASSWORD
Password of authenticated user
PORT
Source TCP/IP port
END_PATH
OPC UA server path name
SEC_POLICY
OPC UA server security policy
MSG_MODE
OPC UA message mode
KEYSTORE
OPC UA java keystore name
KEYSTORE_PWD
OPC UA java keystore password
EQUIPMENT_MATERIAL Table
This table contains the data describing material produced by an equipment entity.
Column Name
Description
68
EM_KEY
Primary key
MAT_KEY
Primary key of produced material
EQ_KEY
Primary key of equipment
OEE_TARGET
Desired OEE
RUN_AMOUNT
Design speed or ideal run rate amount
RUN_UOM_KEY
Primary key of the design speed or ideal run rate unit of measure
REJECT_UOM_KEY
Primary key of the rejected/reworked material’s unit of measure
IS_DEFAULT
True if this material is the default material produced by the equipment
EVENT_RESOLVER TableEVENT_RESOLVER TableEVENT_RESOLVER Table
This table contains the data describing the JavaScript event resolvers.
Column Name
Description
ER_KEY
Primary key
ENT_KEY
Primary key of equipment
SOURCE_KEY
Primary key of the data source
COLLECT_KEY
Primary key of data collector
SOURCE_ID
Data source identifier
SCRIPT
JavaScript function body
PERIOD
OPC DA update period, OPC UA publishing interval
ER_TYPE
Event resolver type (availability, production, material or job)
DATA_TYPE
The source’s native data type
PLANT_ENTITY TablePLANT_ENTITY TablePLANT_ENTITY Table
This table contains the data for the plant entity hierarchy.
Column Name
Description
ENT_KEY
Primary key
VERSION
Optimistic locking version
NAME
Entity name
DESCRIPTION
Entity description
PARENT_KEY
Primary key of parent entity
HIER_LEVEL
Level in S95 hierarchy
WS_KEY
Primary key of work schedule
69
RETENTION
Event data retention period
MATERIAL TableMATERIAL TableMATERIAL Table
This table contains the data for the materials produced by equipment.
Column Name
Description
MAT_KEY
Primary key
VERSION
Optimistic locking version
NAME
Material name
DESCRIPTION
Material description
CATEGORY
Material category
NON_WORKING_PERIOD TableNON_WORKING_PERIOD TableNON_WORKING_PERIOD Table
This table contains the data for the non-working periods in a work schedule.
Column Name
Description
PERIOD_KEY
Primary key
WS_KEY
Primary key of work schedule
NAME
Non-working period name
DESCRIPTION
Non-working period description
START_DATE_TIME
Period starting date and time of day
DURATION
Duration of non-working period
LOSS
Loss category for non-working period
REASON TableREASON TableREASON Table
This table contains the data for the OEE loss reasons.
Column Name
Description
REASON_KEY
Primary key
VERSION
Optimistic locking version
NAME
Reason name
DESCRIPTION
Reason description
PARENT_KEY
Parent reason
LOSS
Loss category
70
ROTATION TableROTATION TableROTATION Table
This table contains the data for a work schedule rotation in a shift.
Column Name
Description
ROTATION_KEY
Primary key
NAME
Rotation name
DESCRIPTION
Rotation description
ROTATION_SEGMENT TableROTATION_SEGMENT TableROTATION_SEGMENT Table
This table contains the data for a portion of a work schedule rotation.
Column Name
Description
SEGMENT_KEY
Primary key
ROTATION_KEY
Primary key of rotation
SHIFT_KEY
Primary key of shift
SEQUENCE
The order of the sequence with a rotation
DAYS_ON
Number of days working the shift
DAYS_OFF
Number of days not working the shift
SHIFT TableSHIFT TableSHIFT Table
This table contains the data for a shift within a work schedule.
Column Name
Description
ROTATION_KEY
Primary key
WS_KEY
Primary key of work schedule
NAME
Shift name
DESCRIPTION
Shift description
START_TIME
Time of day when the shift begins
DURATION
Duration of shift
TEAM TableTEAM TableTEAM Table
This table contains the data for a team working a shift.
Column Name
Description
TEAM_KEY
Primary key
WS_KEY
Primary key of work schedule
ROTATION_KEY
Primary key of shift rotation
71
NAME
Team name
DESCRIPTION
Team description
ROTATION_START
Date when the rotation starts for this team
UOM TableUOM TableUOM Table
This table contains the data for a unit of measure.
Column Name
Description
UOM_KEY
Primary key
VERSION
Optimistic locking version
NAME
Unit of measure name
DESCRIPTION
Unit of measure description
SYMBOL
Unit of measure symbol
CATEGORY
‘System’ or user-defined category
UNIT_TYPE
Type or dimension, e.g. ‘LENGTH’
UNIT
Identifier for system-defined UOM
CONV_FACTOR
Linear conversion factor
CONV_UOM_KEY
Abscissa UOM primary key
CONV_OFFSET
Linear conversion offset
BRIDGE_FACTOR
Linear conversion factor to a UOM in a different system, e.g foot to metre
BRIDGE_UOM_KEY
Target UOM primary key
BRIDGE_OFFSET
Target UOM offset
UOM1_KEY
Scalar, dividend, multiplicand or base UOM primary key
EXP1
First UOM exponent
UOM2_KEY
Divisor or multiplier UOM primary key
EXP2
Second UOM exponent
WORK_SCHEDULE TableWORK_SCHEDULE TableWORK_SCHEDULE Table
This table contains the data for a work schedule.
Column Name
Description
WS_KEY
Primary key
VERSION
Optimistic locking version
NAME
Schedule name
DESCRIPTION
Schedule description
72
EEEXECUTIONXECUTIONXECUTION S S SCHEMACHEMACHEMA
The following sections document the runtime database schema.
OEE_EVENT TableOEE_EVENT TableOEE_EVENT Table
This table contains the data for the OEE availability, production, setup and job change events. Rows are
deleted according to the retention period for a plant entity.
Column Name
Description
EVENT_KEY
Primary key
ENT_KEY
Primary key of equipment plant entity
MATL_KEY
Primary key of produced material
REASON_KEY
Primary key of loss reason
SHIFT_KEY
Primary key of shift
TEAM_KEY
Primary key of team
AMOUNT
Amount of production
UOM_KEY
Primary key of unit of measure for production
JOB
Job/order
START_TIME
Date and time of day with zone offset for start of event
END_TIME
Date and time of day with zone offset for end of event
DURATION
Duration of event
EVENT_KEY
Type of event (availability, production, material or job change)
IIINSTALLATIONNSTALLATIONNSTALLATION
JJJAVAAVAAVAFX AFX AFX APPLICATIONSPPLICATIONSPPLICATIONS
The JavaFX applications are packaged in the oee.zip file in the OEE-Designer’s dist folder. Expand the zip
archive into the following folder structure:
root: oee-apps-1.0.0.jar (JavaFX Designer, Monitor, Collector and Tester apps), oee-collector-
1.0.0.jar (data collector in-process app), run-collector-app.bat (Windows shell script for executing
the data collector test UI), run-designer-app.bat (Windows shell script for executing the designer
application), run-monitor-app.bat (Windows shell script for executing the monitor app), run-tester-
app.bat (Windows shell script for executing the tester application).
config > logging: log4j.properties configuration file

73
database
import: example CSV import files (reasons.csv and materials.csv)
mssql: create_tables.sql SQL script to create the Microsoft SQL Server database tables
oracle: create_tables.sql SQL script to create the Oracle database tables
lib: oee-domain-1.0.0.jar domain classes plus dependent jars
log: empty folder to contain the Log4j and Java Service Wrapper logging files
wrapper
Win
bin: 32-bit Tanuki Java Service Wrapper community edition (wrapper.exe), install-
oee-collector.bat (Windows shell script to install the data collector as a Windows
service), uninstall-oee-collector.bat (Windows shell script to uninstall the data
collector Windows service), oee-collector.bat (Windows shell script to execute the
wrapper as a console app)
conf: wrapper.conf (Java Service Wrapper configuration file)
lib: wrapper.dll and wrapper.jar for Java Service Wrapper
MacOSX
bin: 64-bit Tanuki Java Service Wrapper community edition (wrapper), oee-collector
(OS X shell script to execute the wrapper as a console app)
conf: wrapper.conf (Java Service Wrapper configuration file)
lib: libwrapper.jnilib and wrapper.jar for Java Service Wrapper
The Java Service Wrapper wrapper.conf file requires that the following parameters be defined:
wrapper.java.command: path to a Windows 32-bit Java 8 JRE compatible with the 32-bit Java
Service Wrapper (or Unix 64-bit JRE compatible with a 64-bit Java Service Wrapper), e.g. for
Windows:
set.JAVA_HOME=C:/jdk/jdk1.8.0_152-32/jre
wrapper.java.command=%JAVA_HOME%/bin/java
program arguments for the JDBC connection string and autenticated user. For example for
Microsoft SQL Server running on localhost at port 1433 and connecting to the OEE database with
SQL Server authenticated user “Point85” and password “Point85”:
wrapper.app.parameter.2=jdbc:sqlserver://localhost:1433;databaseName=OEE
wrapper.app.parameter.3=Point85
wrapper.app.parameter.4=Point85
74
For Oracle, the JDBC connection string would be similar to jdbc:oracle:thin:@localhost:1521:orcl
SYSTEM admin
The steps to run the JavaFX applications are:
Create a database and then initialize it by executing the create_tables.sql script for SQL Server or
Oracle.
Edit the run*.bat scripts to set the JDBC connection and user credentials.
Edit the config/logging/log4j.properties file to set the location of the Point85.log file and logging
levels.
Execute the run-designer-app.bat script and define the plant model.
Optionally, download and install the RabbitMQ broker from https://www.rabbitmq.com. The
monitor application now can be used.
Optionally execute the collector and tester applications.
DDDATAATAATA C C COLLECTOROLLECTOROLLECTOR
For your operating system, the in-process data collector can be deployed as follows:
Edit the conf/wrapper.conf file to set JAVA_HOME and the database JDBC connection properties
Execute the shell script to install the collector as a Windows service, Unix daemon or console
program.
OOOPERATORPERATORPERATOR W W WEBEBEB A A APPLICATIONPPLICATIONPPLICATION
The operator web application’s war file in the OEE-Operations project’s dist folder can be deployed to
any web server (such as Tomcat) by following the server’s documented deployment method. The URL is
http://<host>:<port>/<war_file_name>/.
PPPROJECTROJECTROJECT S S STRUCTURETRUCTURETRUCTURE
There are four Maven projects:
OEE-Domain: domain logic with no user interface code
OEE-Designer: JavaFX user interface code for the Designer, Monitor, Collector and Tester
applications
OEE-Collector: the Windows service or Unix daemon in-process data collector with the Java Service
Wrapper
OEE-Operator: the Vaadin operator web application.

75
OEE-DOEE-DOEE-DOMAINOMAINOMAIN
The OEE-Domain GitHub Maven project contains the OEE domain logic - there is no user interface code.
The folders and files are:
root: pom.xml, README.md, LICENSE, install-opc-da-jars.bat (Windows shell script for local Maven
repository of OPC DA jars), install-opc-domain-jar.bat (Windows shell script for building the local
Maven repository of the domain jar)
lib: non-Maven jars
opcda: j-Interop and openSCADA jars
oracle: Oracle database JDBC driver jar
src
main > java: java code
main > resources: Unit.properties (resource bundle for units of measure),
UomMessage.properties (resource bundle for UOM error exceptions),
WorkScheduleMessage.properties (resource bundle for work schedule exceptions)
OEE-DOEE-DOEE-DESIGNERESIGNERESIGNER
The OEE-Designer GitHub Maven project contains the OEE JavaFX user interface code for the Designer,
Monitor, Collector and Tester applications. It depends on the OEE-Domain project. The folders and files
are:
root: pom.xml, README.md, LICENSE, build-jfx-app.bat (Windows shell script for building the JavaFX
application jar), build-distro.bat (Windows shell script for building the oee.zip file distribution), run-
designer-app.bat (Windows shell script for executing the Designer application for a SQL Server
database), run-monitor-app.bat (Windows shell script for executing the Monitor application for a
SQL Server database), run-collector-app.bat (Windows shell script for executing the Collector
application for a SQL Server database), run-tester-app.bat (Windows shell script for executing the
HTTP & messaging application for a SQL Server database), install-oracle-jdbc.bat (Windows shell
script for installing the Oracle JDBC driver jar in a local Maven repository)
config
logging: log4j.properties configuration file
security: copy the point85.keystore (java OPC UA keystore file) built in the ssl folder to here
database
import: example CSV import files (reasons.csv and materials.csv)
mssql: create_tables.sql SQL script to create the Microsoft SQL Server database tables
oracle: create_tables.sql SQL script to create the Oracle database tables

76
docs: this document (Point85 OEE User Guide.tmdx)
fxbuild: build.xml (ant build file)
archive: Point85 OEE.zip (distribution file)
dist: build folder
src
main > java: java code
main > resources: .css stylesheets, .png images, .otf fonts
ssl: example Windows shell scripts for creating an X509 certificate and a java keystore
OEE-COEE-COEE-COLLECTOROLLECTOROLLECTOR
The OEE-Collector GitHub Maven project contains the source code for the Windows service or Unix
daemon in-process data collector with the Java Service Wrapper. It depends on the OEE-Domain
project.
root: pom.xml, README.md, LICENSE, build-collector.bat (Windows shell script for building the
collector jar)
config
logging: log4j.properties configuration file
security: point85.keystore (java OPC UA keystore file)
src
main > java: java code
wrapper
bin: Tanuki Java Service Wrapper (wrapper.exe), install-oee-collector.bat (Windows shell
script to install the data collector as a Windows service), uninstall-oee-collector.bat
(Windows shell script to uninstall the data collector Windows service), oee-collector.bat
(Windows shell script execute the wrapper as a console app)
conf: wrapper.conf (Java Service Wrapper configuration file)
lib: wrapper.dll and wrapper.jar for Java Service Wrapper
OEE-OOEE-OOEE-OPERATIONSPERATIONSPERATIONS
The OEE-Operations GitHub Maven project contains the source code for the Vaadin operator web
application.
77
root: pom.xml, README.md, LICENSE, build-operator.bat (Windows shell script for building the
operator war)
dist: war distribution file
src
main > java: java code
main > webapp > WEB-INF: web.xml deployment descriptor file. The jdbcConn, userName
and password must be defined.
BBBUILDINGUILDINGUILDING
The build steps are:
1. Execute install-opc-da-jars.bat in the OEE-Domain project to install the OPC DA jars into a local
Maven repository
2. Execute install-oee-domain-jar.bat in the OEE-Domain project to build the domain jar and install it
into a local Maven repository
3. Execute build-jfx-app.bat in the OEE-Designer project to build the OEE JavaFX application
4. Execute build-collector.bat in the OEE-Collector project to build the data collector
5. Execute build-operator.bat in the OEE-Operations project to build the operator Vaadin application.
The war file is in the “dist” folder and can be deployed to a web server.
6. Execute build-distro.bat in the OEE-Designer project to build the oee.zip distribution file in the “dist”
folder. The zip archive contains the JavaFX applications and the in-process Java Service Wrapper
collector.
CCCONTRIBUTINGONTRIBUTINGONTRIBUTING T T TECHNOLOGYECHNOLOGYECHNOLOGY
The author wishes to acknowledge the following software upon which the OEE applications are built.
https://github.com/eclipse/milo
Milo is an open-source implementation of OPC UA. It includes a
high-performance stack (channels, serialization, data structures,
security) as well as client and server SDKs built on top of the stack.
j-interop.org
j-Interop is a Java Open Source library (under LGPL) that
implements the DCOM wire protocol (MSRPC) to enable
development of Pure, Bi-Directional, Non-Native Java applications
which can interoperate with any COM component.
openscada.org
openSCADA is an open source Supervisory Control And Data
Acquisition System. It is platform independent and based on a
modern system design that provides security and flexibility at the
78
same time.
https://github.com/NanoHttpd/n
anohttpd
NanoHTTPD is a light-weight HTTP server designed for embedding
in other applications, released under a Modified BSD licence.
http://hibernate.org
Hibernate ORM enables developers to more easily write
applications whose data outlives the application process. As an
Object/Relational Mapping (ORM) framework, Hibernate is
concerned with data persistence as it applies to relational
databases (via JDBC).
https://brettwooldridge.github.io
/HikariCP/
HikariCP is a “zero-overhead” production-quality connection pool.
https://www.rabbitmq.com/
RabbitMQ is an open source message broker software (sometimes
called message-oriented middleware) that originally implemented
the Advanced Message Queuing Protocol (AMQP) and has since
been extended with a plug-in architecture to support Streaming
Text Oriented Messaging Protocol (STOMP), Message Queuing
Telemetry Transport (MQTT), and other protocols.
www.erlang.org
Erlang is a general-purpose, concurrent, functional programming
language, as well as a garbage-collected runtime system.
https://mvnrepository.com/arti-
fact/com.google.code.gson/gson
Gson JSON serializer and deserializer
https://vaadin.com/
Vaadin is an open-source platform for web application
development.
https://wrapper.tanukisoftware.c
om
The Java Service Wrapper enables a Java Application to be run as a
Windows Service or UNIX Daemon. It also monitors the health of
your Application and JVM.
https://github.com/HanSolo/ti-
lesfx
A JavaFX library containing tiles that can be used for dashboards.
https://www.bouncycastle.org
Bouncy Castle is a collection of APIs used in cryptography.
http://logging.apache.org/log4j/1
.2/
Apache Log4j is a Java-based logging utility.
https://mvnrepository.com/arti-
fact/org.slf4j
Log4j logging facade
RRREFERENCESEFERENCESEFERENCES
[Kennedy]
Understanding, Measuring, and Improving Overall Equipment Effectiveness. How to
Use OEE to Drive Significant Process Improvement, Ross Kenneth Kennedy, CRC Press,
2018.
[Stamatis]
The OEE Primer, Understanding Overall Equipment Effectiveness, Reliability, and
Maintainability, D.H. Stamatis, CRC Press, 2010.
