Power Analysis Guide
User Manual:
Open the PDF directly: View PDF ![]() .
.
Page Count: 4

PowerAnalysis.m Guide
Roger Strong
Harvard University

General Notes
• PowerAnalysis.m does most the work, and is called in the example scripts
• NOTE: is version only simulates t-tests between within subject conditions
• Key Components:
– prefs.data:
• either a #subjects (rows) x #conditions (columns) array, or a string file name of an excel or .csv file with data
listed as #subjects x #conditions.
• Data can be listed as either decimal (.5) or percentage (50), although you will get a warning for the later (as
data will be converted to decimal)
• If using excel or csv file, there should NOT be a header row
– prefs.N_range
• Range of number of participants to simulate. E.g., 10:10:50 will simulate with 10, 20, 30, 40, and 50
participants
– prefs.trial_range
• Range of number of trials per condition to simulate. E.g., 8:4:24 will simulate with 8, 12, 16, 20, and 24
trials per condition
– prefs.alpha
• p-value to use in power simulations
– prefs.nSims
• How many simulations to use for every particpant/trial number combination. 10,000 is a decent estimate
and runs pretty quickly, 100,000 is slower but a more stable estimate.
– prefs.comps
• Which comparisons to test for significance. Each row is a comparison, with the condition expected to be
higher magnitude listed in the first column, and the condition expected to have lower magnitude in the
second column. A study will be classified as “successful” only if all listed comparisons are significant (see
examples).
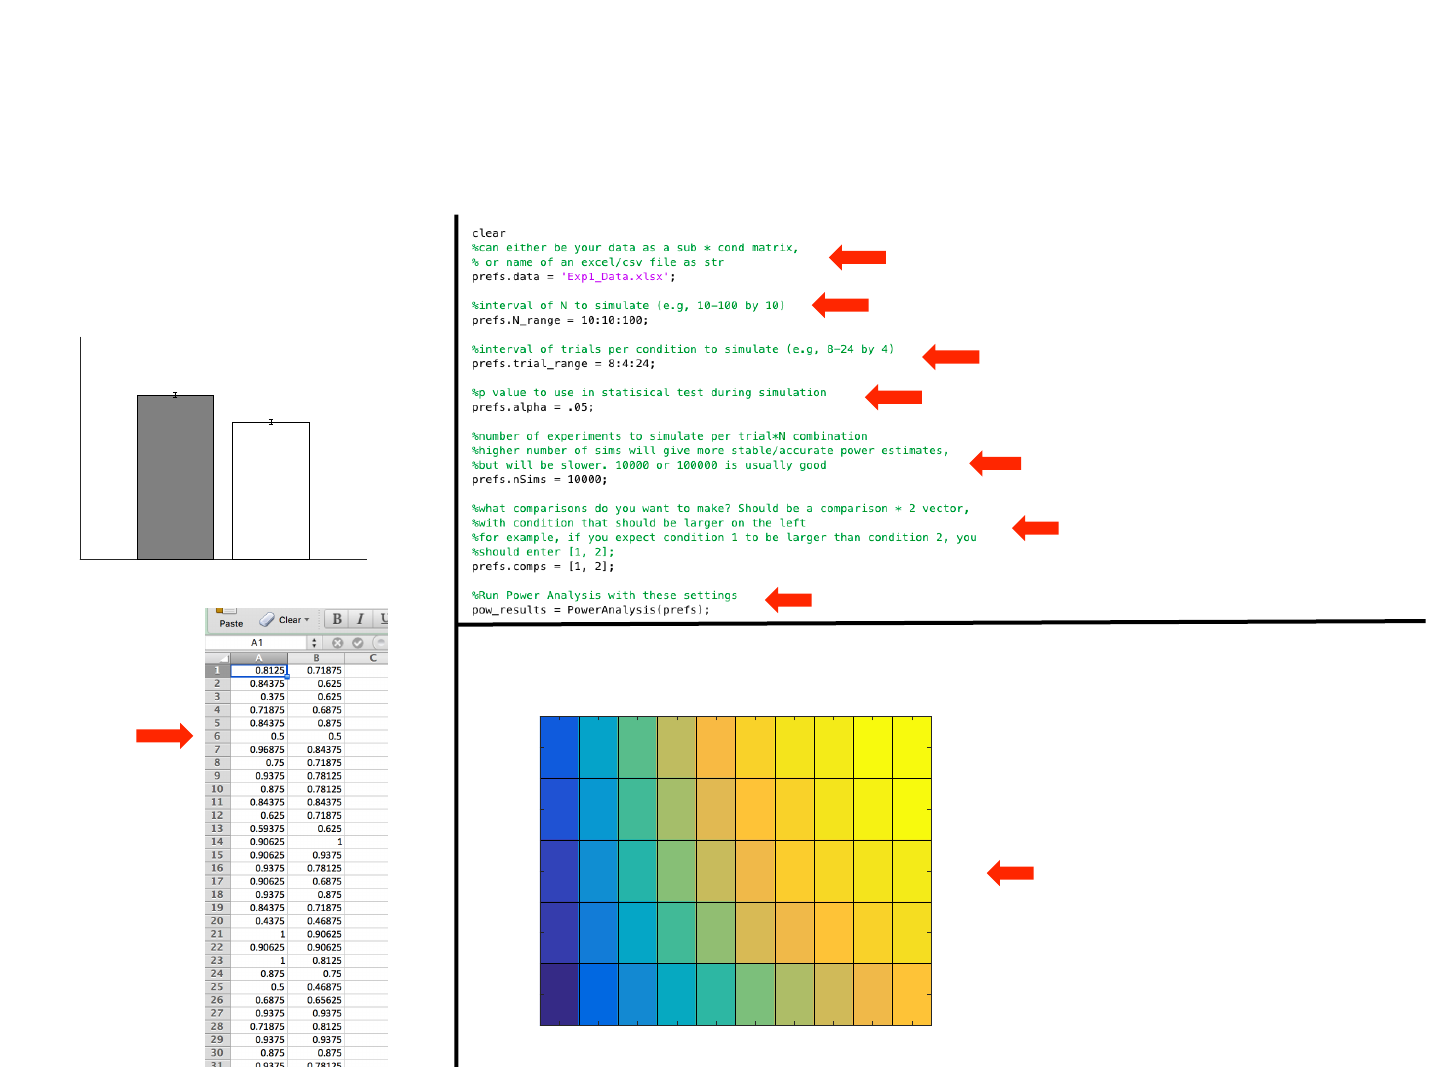
Example 1
Pilot Data Power Analysis Settings
Power Analysis Output
Within Across
0.5
0.6
0.7
0.8
0.9
1
Accuracy
Experiment 1
*
p < .001, dx = 0.56
N = 97
- 97 subjects, 2 conditions
- Excel file is 97 rows x 2 columns
Power by N and # of Trials
0.24
0.23
0.2
0.18
0.14
0.45
0.41
0.38
0.33
0.27
0.61
0.59
0.54
0.46
0.37
0.74
0.71
0.66
0.58
0.48
0.84
0.8
0.76
0.68
0.56
0.9
0.87
0.83
0.78
0.65
0.94
0.91
0.89
0.83
0.72
0.96
0.95
0.92
0.87
0.77
0.98
0.97
0.95
0.91
0.82
0.99
0.98
0.96
0.93
0.86
10 20 30 40 50 60 70 80 90 100
# of Subjects
24
20
16
12
8
# of Trials Per Condition
Exp1_Data.xlsx
File name as string (can also do data directly in matlab)
I decided to simulate N from 10-100 by 10
I decided to simulate trial number per condition from 8-24 by 4
P-value of .05 used in simulation
10,000 sims per N x num_trials combo (sims per cell in
output graph)
Only comparison I was interested in was condition
1 being larger than condition 2
Run power analysis using these settings
Simulated power for each N X number or trials per
condition combo we specified in settings. Looking
at this, I know I could achieve > 90% power by
running 90 subjects with 12 trials per condition, for
example
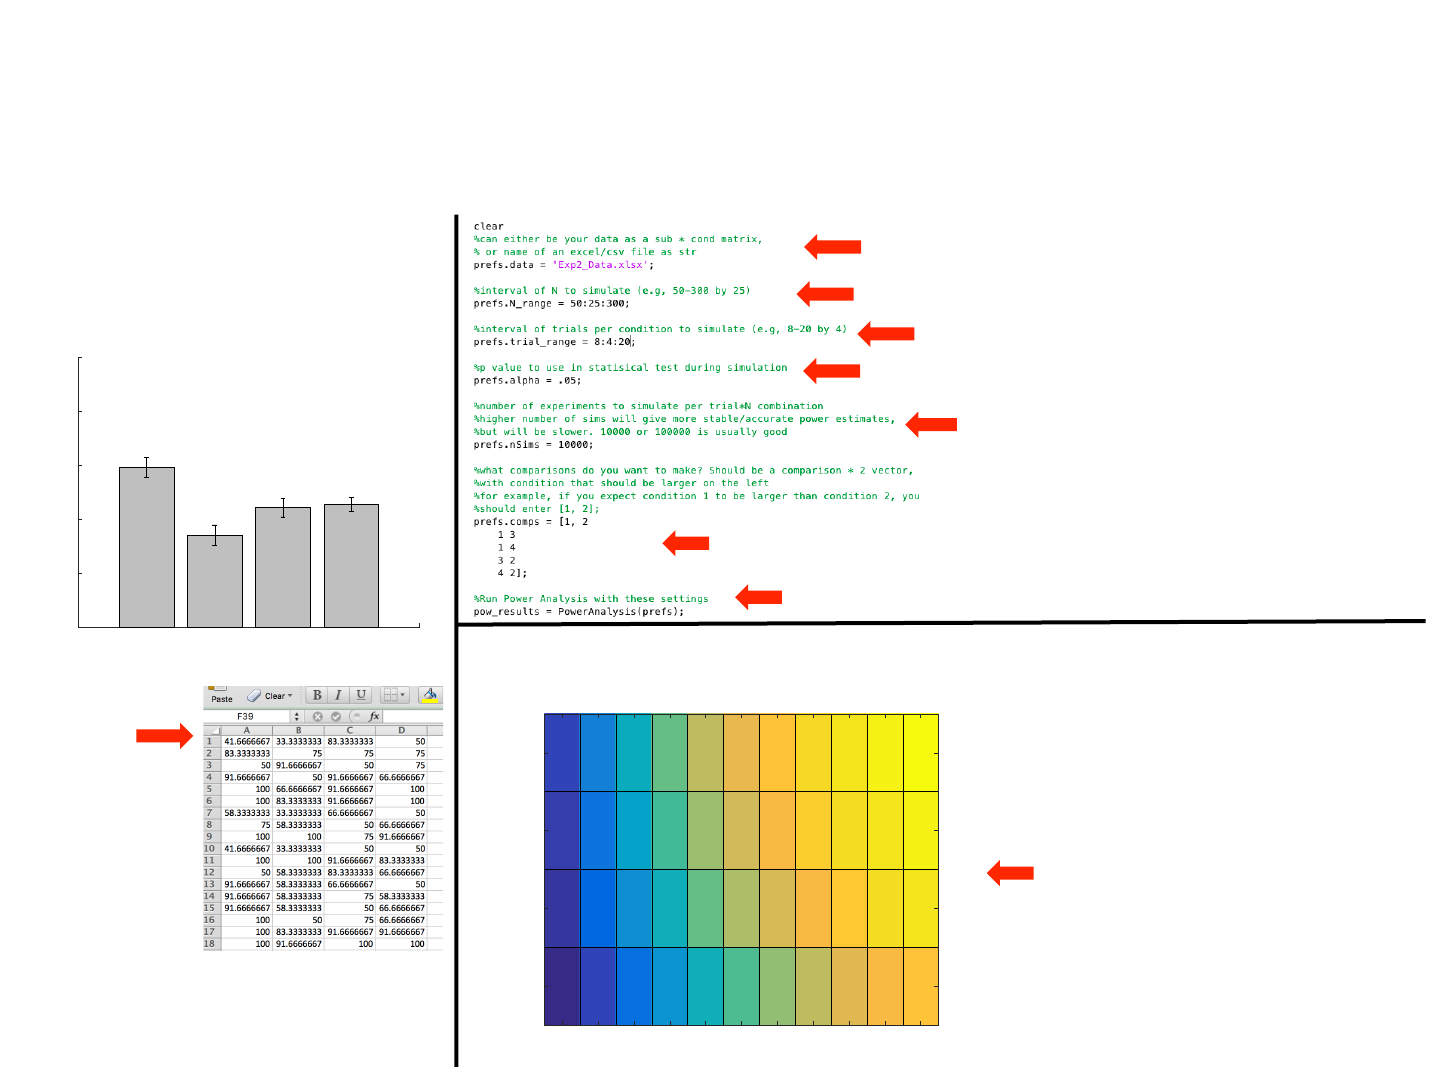
Example 2
Pilot Data Power Analysis Settings
Power Analysis Output
- 41 subjects, 4 conditions
- Excel file is 41 rows x 4 columns
Exp2_Data.xlsx
Data is in percent, so
script will convert to
decimal and give a
warning that this has
occurred.
File name as string (can also do data directly in matlab).
I decided to simulate N from 50-300 by 25
I decided to simulate trial number per condition from 8-20 by 4
P-value of .05 used in simulation
10,000 sims per N x num_trials combo (sims per cell in output
graph)
is time, I had 5 comparisons I am interested in. Specifically, I only want to call the study a
“success” if condition 1 >2, 1 >3, 1>4, 3>2, and 4>2. Each comparison specified as a separate row.
Run power analysis using these settings
Simulated power for each N X number or trials per
condition combo we specified in settings. Looking
at this, I know I could achieve > 90% power by
running 300 subjects with 12 trials per condition,
for example. Note that this is power for ALL 5
comparisons of interest being significant
Power by N and # of Trials
0.1
0.08
0.06
0.03
0.25
0.21
0.16
0.1
0.41
0.37
0.3
0.19
0.56
0.51
0.43
0.31
0.68
0.62
0.55
0.43
0.76
0.71
0.65
0.52
0.82
0.79
0.72
0.61
0.87
0.84
0.78
0.68
0.9
0.88
0.83
0.74
0.93
0.9
0.88
0.79
0.95
0.93
0.9
0.82
50 75 100 125 150 175 200 225 250 275 300
# of Subjects
20
16
12
8
# of Trials Per Condition
W-W B-B W-B B-W
50
60
70
80
90
100
Percent Correct
N = 41
