Programming Assignment 1 INSTRUCTIONS Air Pollution Coursera
User Manual:
Open the PDF directly: View PDF ![]() .
.
Page Count: 4
7/5/2018 Programming Assignment 1 INSTRUCTIONS: Air Pollution | Coursera
https://www.coursera.org/learn/r-programming/supplement/amLgW/programming-assignment-1-instructions-air-pollution 1/4
Back to Week 2 Lessons This Course: R Programming Prev Next
Introduction
For this rst programming assignment you will write three functions that are meant to
interact with dataset that accompanies this assignment. The dataset is contained in a zip
le specdata.zip that you can download from the Coursera web site.
Although this is a programming assignment, you will be assessed using a separate
quiz.
Data
The zip le containing the data can be downloaded here:
specdata.zip [2.4MB]
The zip le contains 332 comma-separated-value (CSV) les containing pollution
monitoring data for ne particulate matter (PM) air pollution at 332 locations in the
United States. Each le contains data from a single monitor and the ID number for each
monitor is contained in the le name. For example, data for monitor 200 is contained in
the le "200.csv". Each le contains three variables:
Date: the date of the observation in YYYY-MM-DD format (year-month-day)
sulfate: the level of sulfate PM in the air on that date (measured in micrograms per cubic
meter)
nitrate: the level of nitrate PM in the air on that date (measured in micrograms per cubic
meter)
For this programming assignment you will need to unzip this le and create the
directory 'specdata'. Once you have unzipped the zip le, do not make any modications
to the les in the 'specdata' directory. In each le you'll notice that there are many days
where either sulfate or nitrate (or both) are missing (coded as NA). This is common with
air pollution monitoring data in the United States.
Part 1
7/5/2018 Programming Assignment 1 INSTRUCTIONS: Air Pollution | Coursera
https://www.coursera.org/learn/r-programming/supplement/amLgW/programming-assignment-1-instructions-air-pollution 2/4
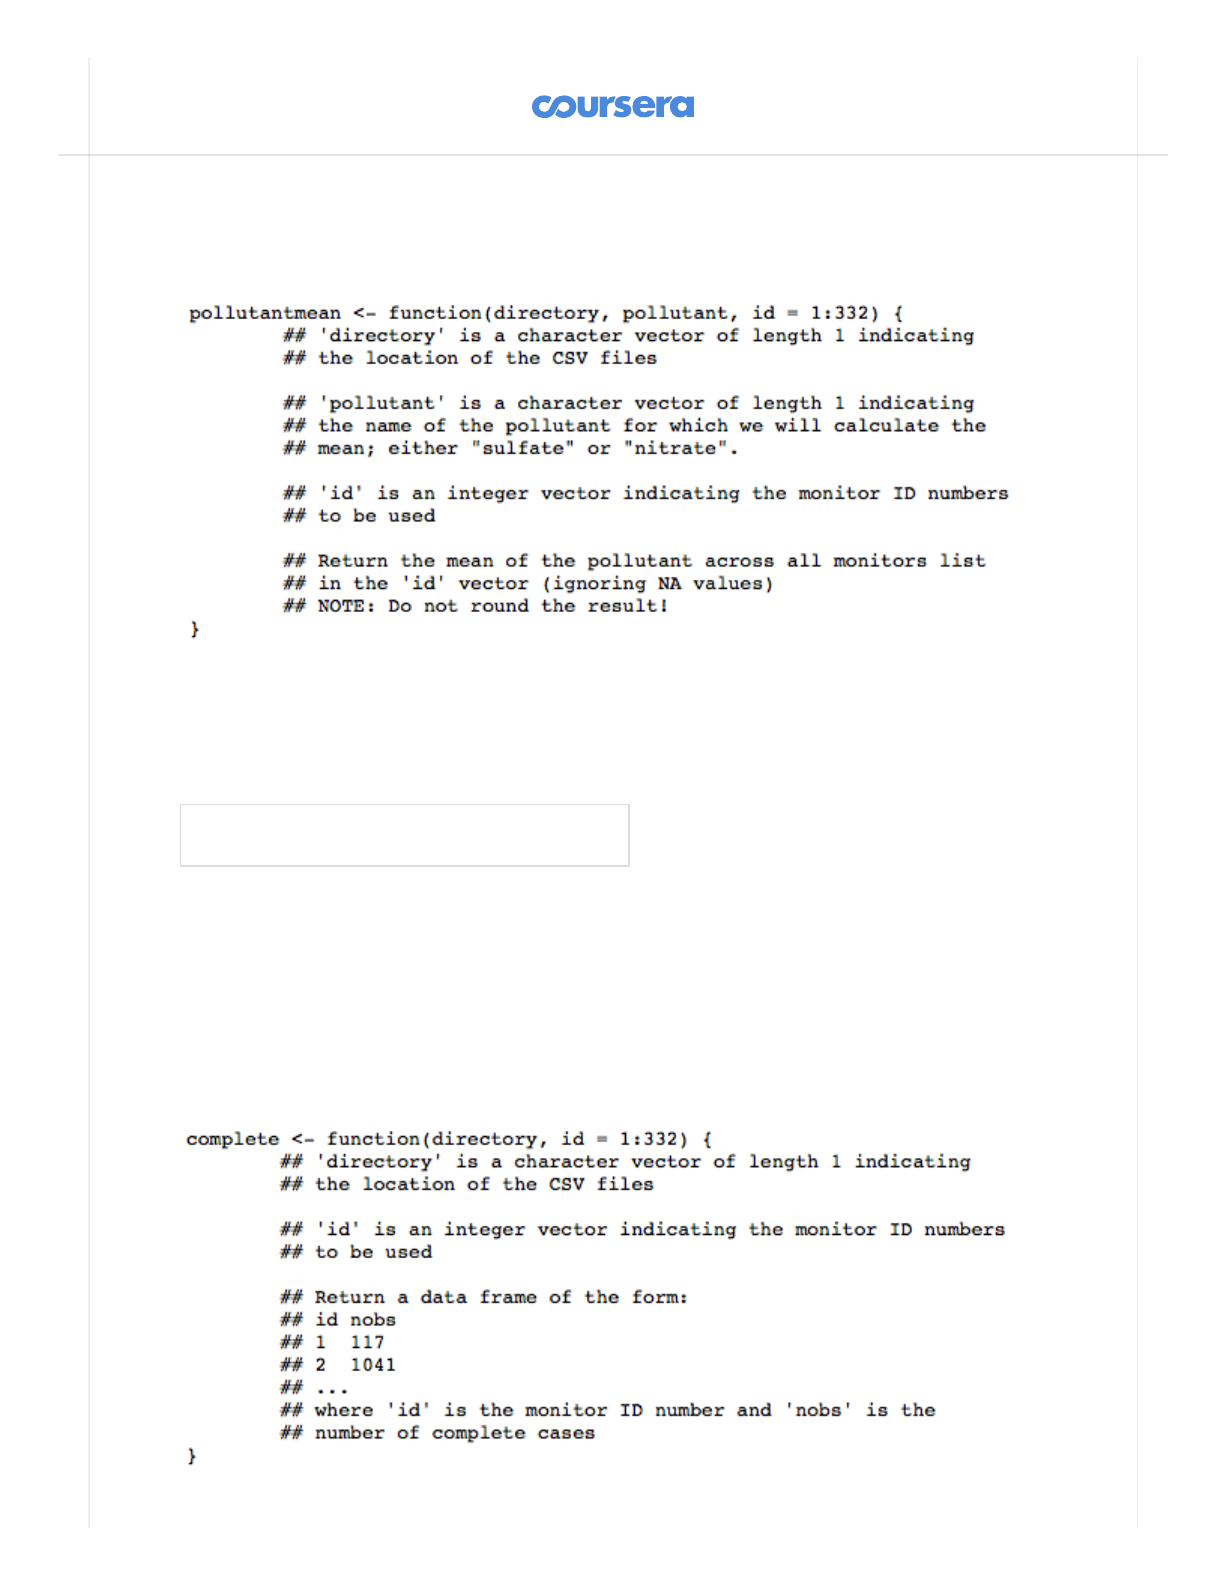
Write a function named 'pollutantmean' that calculates the mean of a pollutant (sulfate
or nitrate) across a specied list of monitors. The function 'pollutantmean' takes three
arguments: 'directory', 'pollutant', and 'id'. Given a vector monitor ID numbers,
'pollutantmean' reads that monitors' particulate matter data from the directory specied
in the 'directory' argument and returns the mean of the pollutant across all of the
monitors, ignoring any missing values coded as NA. A prototype of the function is as
follows
You can see some example output from this function below. The function that you write
should be able to match this output. Please save your code to a le named
pollutantmean.R.
pollutantmean-demo.html
Part 2
Write a function that reads a directory full of les and reports the number of completely
observed cases in each data le. The function should return a data frame where the rst
column is the name of the le and the second column is the number of complete cases.
A prototype of this function follows
7/5/2018 Programming Assignment 1 INSTRUCTIONS: Air Pollution | Coursera
https://www.coursera.org/learn/r-programming/supplement/amLgW/programming-assignment-1-instructions-air-pollution 3/4
You can see some example output from this function below. The function that you write
should be able to match this output. Please save your code to a le named complete.R.
To run the submit script for this part, make sure your working directory has the le
complete.R in it.
complete-demo.html
Part 3
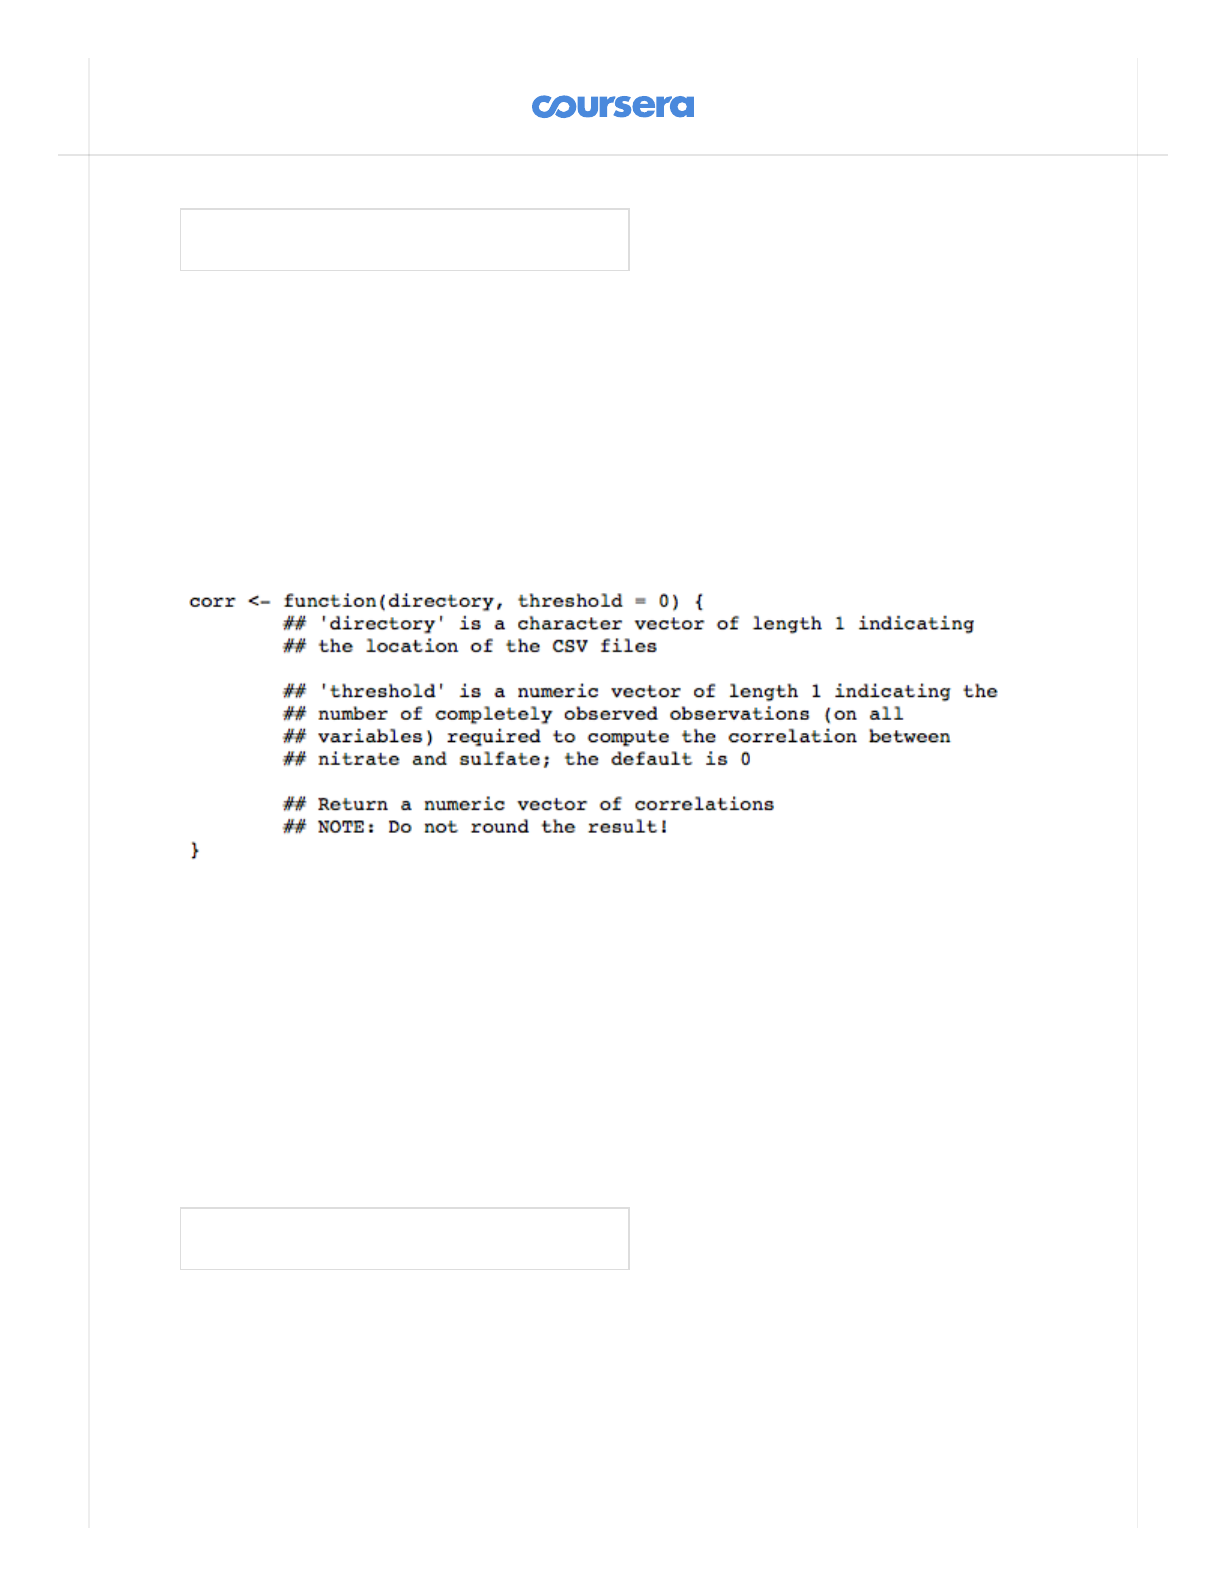
Write a function that takes a directory of data les and a threshold for complete cases
and calculates the correlation between sulfate and nitrate for monitor locations where
the number of completely observed cases (on all variables) is greater than the threshold.
The function should return a vector of correlations for the monitors that meet the
threshold requirement. If no monitors meet the threshold requirement, then the
function should return a numeric vector of length 0. A prototype of this function follows
For this function you will need to use the 'cor' function in R which calculates the
correlation between two vectors. Please read the help page for this function via '?cor'
and make sure that you know how to use it.
You can see some example output from this function below. The function that you write
should be able to approximately match this output. Note that because of how R
rounds and presents oating point numbers, the output you generate may dier
slightly from the example output. Please save your code to a le named corr.R. To run
the submit script for this part, make sure your working directory has the le corr.R in it.
corr-demo.html
Grading
This assignment will be graded using a quiz.
Complete