Microsoft Root Cause Analysis Webinar Introduction V2 987 RCA By Ops A La Carte
User Manual: 987
Open the PDF directly: View PDF ![]() .
.
Page Count: 106 [warning: Documents this large are best viewed by clicking the View PDF Link!]
Root Cause Analysis Webinar
Sponsored by
Ops A La Carte
DfR Solutions
SigmaQuest
Phone: (702) 824-9512
Access code 204-987-863

INTRODUCTION
• Thank you for joining us this morning (or afternoon)
• In April of this year, we held our annual Reliability Symposium
in Santa Clara, California, featuring 7 of our reliability seminars,
and Root Cause Analysis (RCA) was one of these seminar.
• Based on the response of that seminar, we decided to highlight
RCA as our featured service in our newsletter last quarter
http://www.opsalacarte.com/Newsletters/2008summer_news.htm
and decided to hold a webinar to provide further information.
• We invited two of our solutions partners – DfR Solutions and
SigmaQuest – to participate in this webinar because their
complementary offerings really help to portray a more complete
view on RCA.

INTRODUCTION
There are over 700 people
registered for this webinar so
we obviously hit on a very hot
topic.

FORMAT
• Four different experts will give presentations
• At the beginning and end of each presentation,
we will be asking “polling” questions to get a
better idea on the make-up of the audience and
your level of interest/experience. We will make
these statistics available to the audience after
the webinar is over.
• During the discussion, feel free to ask any
questions you’d like by typing into the question
area on the right.

FORMAT
• At the end of each presentation, we will review
all the questions that came in during that
portion of the presentation and then will
respond to as many as we have time for in the
remaining portion of that section.
• After the end of the webinar, there will be a
short set of prepared survey questions.
FORMAT
• For any questions not answered in that time, we
will respond to each person individually after
the webinar is over.
• If you think of a question after the end of the
webinar, feel free to email it to me at
mikes@opsalacarte.com and I will make sure to
get the question to the correct panelist.

FORMAT
• At the end of the presentation, we will send you
a follow-up email, thanking you for attending.
• For those of you interested, we can also send a
copy of the slides.
• We will also provide you with a way to contact
us if you need further information.

PRESENTATIONS
0) 9:00-9:15am: Introductions
1) 9:00-11:00am: Understanding the Motivation and Basics of
Root-Cause Analysis in Electronics.
By: Jim McLeish, CRE, Senior Technical Staff, DfR Solutions
2) 11:00-11:45am: Understanding Techniques to Address
Mechanical Components in the Evaluation of System
Reliability.
By: Cliff Lange, Ph.D., PE, Ops A La Carte
3) 11:45am-12:30pm: A Mechanical RCA Case Study.
By: Kim Parnell, Ph.D., PE, Ops A La Carte
4) 12:30pm-1:00pm: Data Collection: An Important Aspect of
RCA Investigation.
By: Al Alaverdi, VP Technology, SigmaQuest

PRESENTERS
Presentation 1: Understanding the Motivation and Basics of Root-
Cause Analysis in Electronics.
Summary: Before successful Root-Cause Analysis can even start,
organizations and individuals must understand the need to have
basic problem solving skills, tools and knowledge of how problems
occur and how they can be fixed. This portion of the webinar will
discuss the fundamentals of RCA and cover some of the best
practices in the electronics industry from the Physics of Failure
point of view.
Author: Jim McLeish, CRE, Senior Technical Staff, DfR Solutions
Jim has 30 years of automotive Electrical/Electronics (E/E)
experience. He has worked in systems engineering, design,
development, production, validation, reliability and quality
assurance of both components and vehicle systems. He holds
three patents, is the author or co-author of three GM E/E validation
and test standards and is credited with the introduction of Physics-
of-Failure engineering techniques to GM.

PRESENTERS
Presentation 2: Understanding Techniques to Address Mechanical
Components in the Evaluation of System Reliability
Summary: In this portion of the webinar, we will first review the
standard design guidelines for robust mechanical design. This is
followed by a brief review of the critical elements of mechanical
systems and the corresponding failure mechanisms. Then, we will
go through a detailed review of RCA for a high temperature power
plant creep failure and the analysis of fatigue of wind turbine
blades.
Author: Cliff Lange, Ph.D., PE, Ops A La Carte
Cliff has 30 years of industry experience in both reliability
engineering and root cause failure analysis. Most recently Dr.
Lange spent 12 years developing reliability programs for the
Semiconductor Equipment Manufacturing industry. He worked at
General Electric Company and Exponent Failure Analysis where he
gained extensive experience in finite element modeling and root
cause analysis of structural, mechanical and electrical failures.

PRESENTERS
Presentation 3: A Mechanical RCA Case Study
Summary: This portion of the webinar will provide an overview of a
particularly spectacular process plant accident in Nevada. This
incident became visible as a small fire which spread rapidly and
ultimately ended with two devastating explosions. Through this case
study, we will show how to develop a scenario and an initial sequence
of events, modify scenarios based on new evidence, and identify the
Root Cause of this accident and the sequence of events leading to the
ultimate catastrophe.
Author: Kim Parnell, Ph.D., PE, Ops A La Carte
Kim specializes in failure analysis and reliability of mechanical
systems. He is an expert in mechanical engineering design and
behavior of systems ranging from biomedical devices, to electronic
and miniature components, to power generation, automotive, and
aerospace applications. Kim is an independent consultant and was
previously a Senior Manager with Exponent where he analyzed and
investigated accidents and failures in a variety of industries. Kim has
MS and PhD degrees in Mechanical Engineering from Stanford.
PRESENTERS
Presentation 4: Data Collection: An Important Aspect of RCA
Investigation
Summary: A company needs a good data collection system that quickly
and easily identifies and corrects the root cause for failures which
result in warranty returns - to uncover emerging trends and
patterns before they become issues. This, in turn, will provide a
number of benefits which we will address in this portion of the
webinar.
Author: Al Alaverdi, VP Technology, SigmaQuest
Al has over 20 years of experience in testing and manufacturing
software development. Al is an expert at process engineering and
in the development of tools to enhance product performance and
manufacturing efficiencies.

SPONSORS
Ops A La Carte
DfR Solutions
SigmaQuest

SPONSORS
Ops A La Carte is a Professional Consulting Firm
focused on Reliability Engineering Services,
Reliability Management, and Reliability Education to
assist you in developing and executing any and all
elements of Reliability throughout your Organization
and your Product’s Life Cycle. We work in the area
of Electronics, Mechanical Systems, and Software.
In the area of RCA, Ops A La Carte has performed
countless root-cause analyses in the area of
electronics, mechanics, and software.

SPONSORS
DfR Solutions has world-renowned expertise in applying
the science of Reliability Physics to electrical and
electronics technologies, and the company is a leading
provider of quality, reliability, and durability (QRD)
research and consulting for the electronics industry.
DfR's integrated use of Physics-of-Failure (PoF) and
Best Practices provides crucial insights and solutions
early in product design and development, and
throughout the product life cycle.
In the area of RCA, DfR Solutions has their own failure
analysis lab in Maryland and has performed over 250
root-cause investigations in the past 4 years

SPONSORS
SigmaQuest provides an on-demand suite of solutions
that help companies build better products using
business intelligence techniques for product design,
manufacturing, supplier quality, repair and returns.
Benefits are reduced warranty costs; improved
product quality, lower costs of goods sold, and
increased revenue and profits.
In the area of RCA, SigmaQuest is well positioned
because its solutions can be used for collecting
failure data for use in the critical step of analyzing
and gathering data/evidence.
©2008
Understanding the Motivation and Basics
of Root-Cause Analysis in Electronics
Abstract: Before successful Root-Cause Analysis can begin, organizations and individuals must
understand the need to have basic problem solving skills, tools and knowledge of how
problems occur and how they can be fixed.
This portion of the webinar will discuss the fundamentals of RCA and cover some of the best
practices in the electronics industry from the Physics of Failure point of view.
James McLeish, CRE
2
©2008
Background: Jim McLeish
Education:
Dual EE/ME MS in Electronics Control Systems
ASQ-CRE (American Society of Quality - Certified Reliability Engineer)
32 years of Automotive, Military and Industrial Electrical/Electronics (E/E)
Part 1: Product Design, Development, Systems Engineering & Production
3 Patents Electronic Control Systems
EE System Engineering and Architecture Planning
Product Engineering Management
Part 2: Validation, Reliability, Quality Assurance, Warranty Problem Solving
& Test Technology Development
Variety of Management & Technical Leadership Positions:
Part 3: Senior Technical Staff/Consulting Associate - Design for Reliability Solutions.
Principle Investigator for E/E Failure Analysis and Root Cause Problem Solving.
E/E Manufacturing Process Optimization, Yield Improvement.
Reliability Demonstration, Product Validation and Accelerated Testing.
Field Return/ Warranty Analysis
Design Reviews for Proactive Problem Prevention
Society of Automotive Engineering (SAE) - Reliability Committee
DOD MIL-HDBK-217 Update & Enhancement Tea

3
©2008
Background: DfR Solutions
DfR Solutions is an Engineering- Laboratory Services and Consulting firm experienced
in Physics of Failure based Quality, Reliability and Durability (QRD) research, consulting
and applied science for electrical and electronics products and technologies.
The DfR staff provide knowledge and science based solutions that maximize
product integrity and accelerate product assurance activities.
DfR captures the broad range of reliability and quality issues in electronics through the
expansive expertise of our multi-discipline staff.
Physicists, Material Scientists, Chemists and Electronic Engineers from Various Industry Segment.
Over 500 failure analysis and root-cause investigations in the past 4 years,
A world leader in failure analysis in electronics.
Strong partnerships with the leading companies in the field of electronics,
DfR strives to make our clients life easier by providing knowledge based solutions for
electronic quality, reliability and durability issues.
From component specifications and computer modeling based lifetime predictions.
From robust design of products and process to accelerated product qualification.
From technology insertion to RCA and failure analysis.
4
©2008
1) Motivation for Root Cause Analysis
The 1st rule of business is now:
“The competitor who Consistently, Reliably and Profitably
provides the greatest value to customers FIRST wins.”
2nd rule is:
"There are NO OTHER RULES".
In other words it’s Survival of the Fittest and the Best.
Continuously Improvement is Essential to Becoming
and Staying the Best or At Least Remaining Competitive.
5
©2008
1) Motivation For Root Cause Analysis
- Continuous Improvement (C.I.)
Continuously Improvement is the ongoing effort to improve products,
services or processes, in order to advance the goals of an organization,
business or society.
A never ending effort to discover and eliminate:
Inefficient process road block and bottle necks,
Non value added activities,
Problems,
Either “incremental” improvement over time or
“breakthrough” improvement all at once.
Japanese Version Kaizen
- “Change for the Better”.
Examples of C.I. Tools
Statistical Process Control
6 Sigma Quality
Best Practices / Leasons Learned
Process Optimization
Problem Solving
6
©2008
2) Introduction to Root Cause Analysis
-Problem Solving
Problem Solving is an integral part of cognitive thinking & decision
making. It is essential to many aspect of daily live, it involves:
Using tools to obtain relevant data, information and knowledge,
Creating mental models of situations and how the world works,
Make logical connections that lead to the formation of potential solution
concepts,
Evaluate the potential solutions against goals, constrains and desires.
Problem solving method examples:
Trial-and-error
Brainstorming
Root Cause Analysis
Problem Solving uses similar skills as:
Solving a puzzle
Detective work.
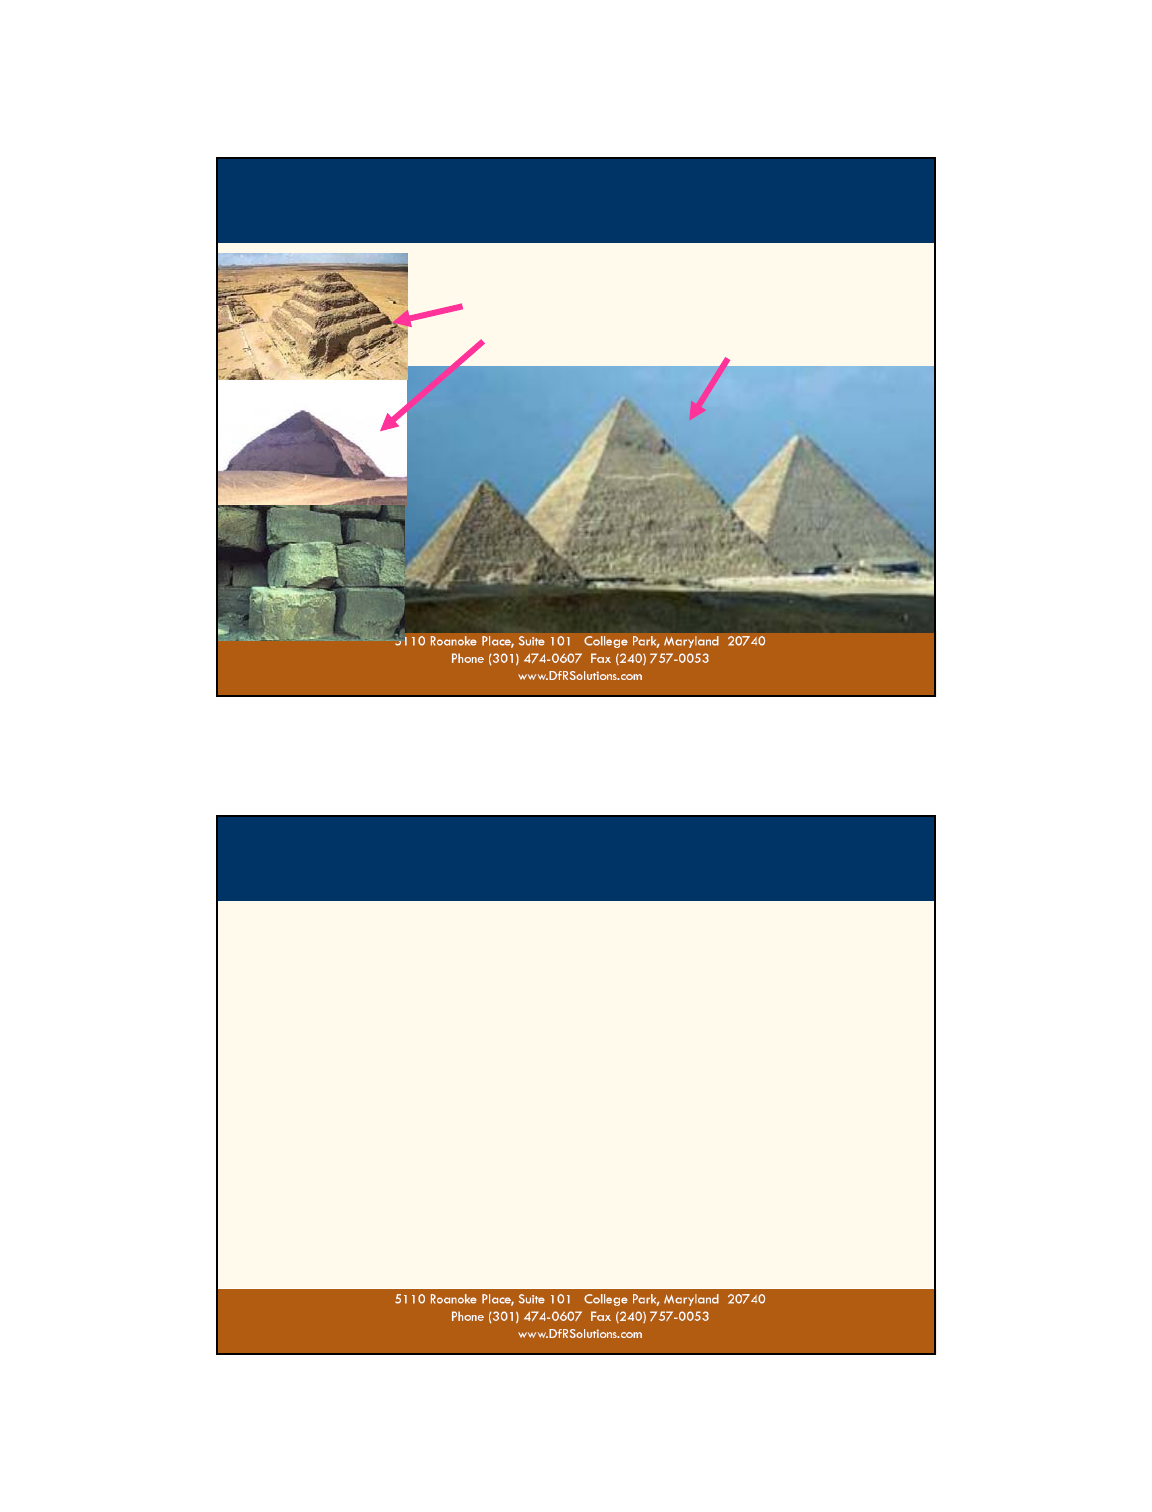
7
©2008
2) Problem Solving, Failure Analysis & Continuous Improvement
Has Been the Basis of Engineering Since
Humans First Make Tools & Structures
Lessons Learned for Problem Solving
During the Construction of the Early
Step & Bent Pyramid Enabled the Ancient Egyptians
To Later Build Bigger & Better Pyramids
8
©2008
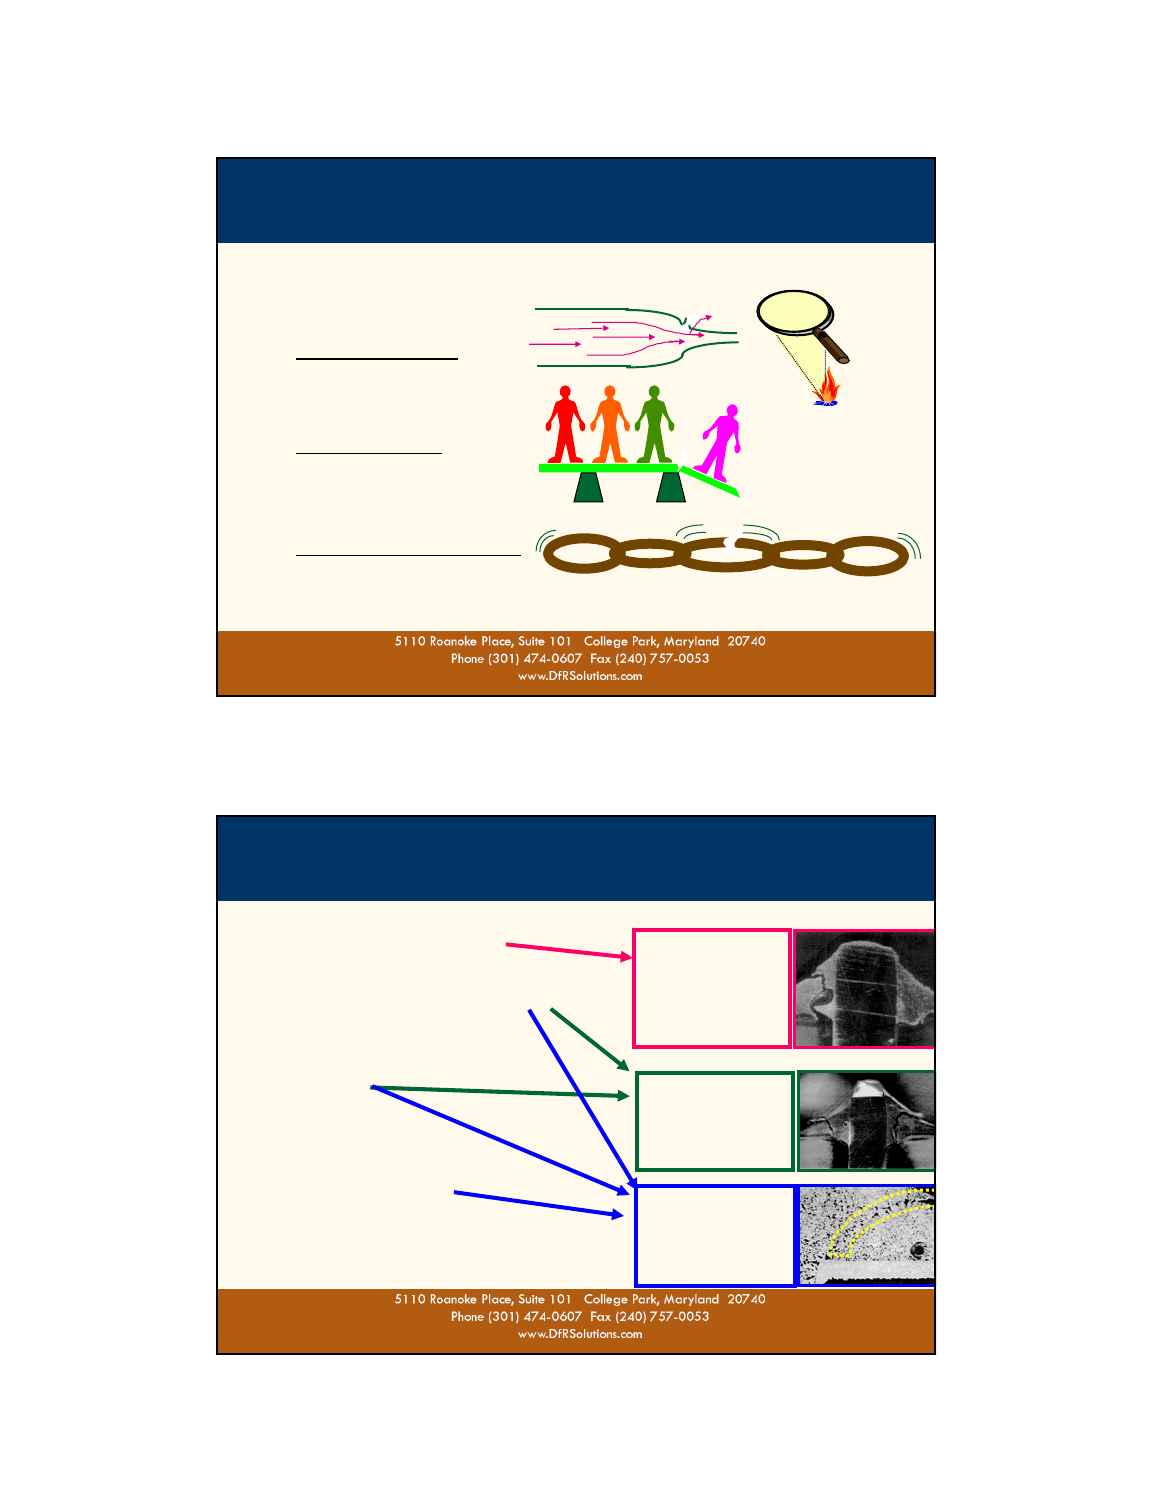
3) Introduction to Root Cause Analysis (RCA)
Root Cause Analysis - is a category or problem solving methods that focus on
identifying the ultimate underlying reason of why an event occurred.
Based on the belief that problems are more effectively solved by correcting or
eliminating the root causes, rather than merely addressing the obvious symptoms.
The root cause is the trigger point in a causal chain of events, which may be natural
or man-made, active or passive, initiating or permitting, obvious or hidden.
Efforts to prevent or mitigate the trigger event are expected to prevent the outcome
or at least reduce the potential for problem recurrence.
RCA is a full-blown analysis that identifies the chain of physical and human related
root cause(s) behind an undesirable event .
This differs from basic troubleshooting and problem-solving processes that typically
seek solutions to specific, relatively simple difficulties.
The undesired event may be a product durability failure, a safety incident, a customer
complaint, a quality defects, human error . . . etc.
It helps focus CA/PA (Corrective Action / Preventive Action) efforts at the points of
most leverage it is essential for pointing change management efforts in the right
direction.

9
©2008
3) Introduction to Root Cause Analysis
- Failure Analysis (FA)
Failure Analysis is a subcategory of RCA techniques
Systematic examination of “Failed Devices”
to determine the root cause of failure.
Use knowledge gained to improve
technology, quality and reliability.
Primarily associated with the physics and material science of mechanical, structural
and E/E (Electrical /Electronic) devices and materials (i.e. hardware).
Software FA is a growing subcategory involving computer science & programming.
Forensic Engineering a subcategory that uses science and technology to investigate
materials, structures, products or components that fail or malfunctions to establish
facts for criminal or civil legal actions.
10
©2008
3) Introduction to Root Cause Analysis
- Failure Analysis (FA)
Failure analysis is designed to:
Identify the failure modes (the way the product failed),
Identify the failure site (where in the product failure occurred),
Identify the failure mechanism
(the physical phenomena involved in the failure),
Determine the root cause
(the design, defect, or loads which led to failure)
and recommend failure prevention methods
FA begins with non-destructive techniques, then proceeds to destructive techniques.

11
©2008
3) Introduction to Root Cause Analysis
- Section Summary
The Hierarchary:
Continously Improvemet
Essential to being compeditive and advancing objectives.
Problem Solving
An important method for continuous Improvement.
Root Cause Analysis
One type or problem solving approach that works to identify not only what and
how an undesired event occurred, but also why it happened so as to prevent
reoccurance.
Failure Analysis
A broad subcategory of Root Cause Anaylsis techniques that can be used when
failed or malfunctioning devices are available for examination.
FA has many sub categories and specialists realated to the type of technologies
and materials that failured.
12
©2008
4) RCA Approaches, Management & Reporting Methods
Root cause analysis is a generic term for
diligent structured problem solving.
Over the years various RCA techniques and management methods
have been developed
5 of the most popular RCA approaches are:
The” 5 Whys” Technique
The 8D (Eight Disciplines) Problem Solving Process
Shainin Red “X” Statistical Problem Solving
Six Sigma
Physics of Failure / Reliability Physics
13
©2008
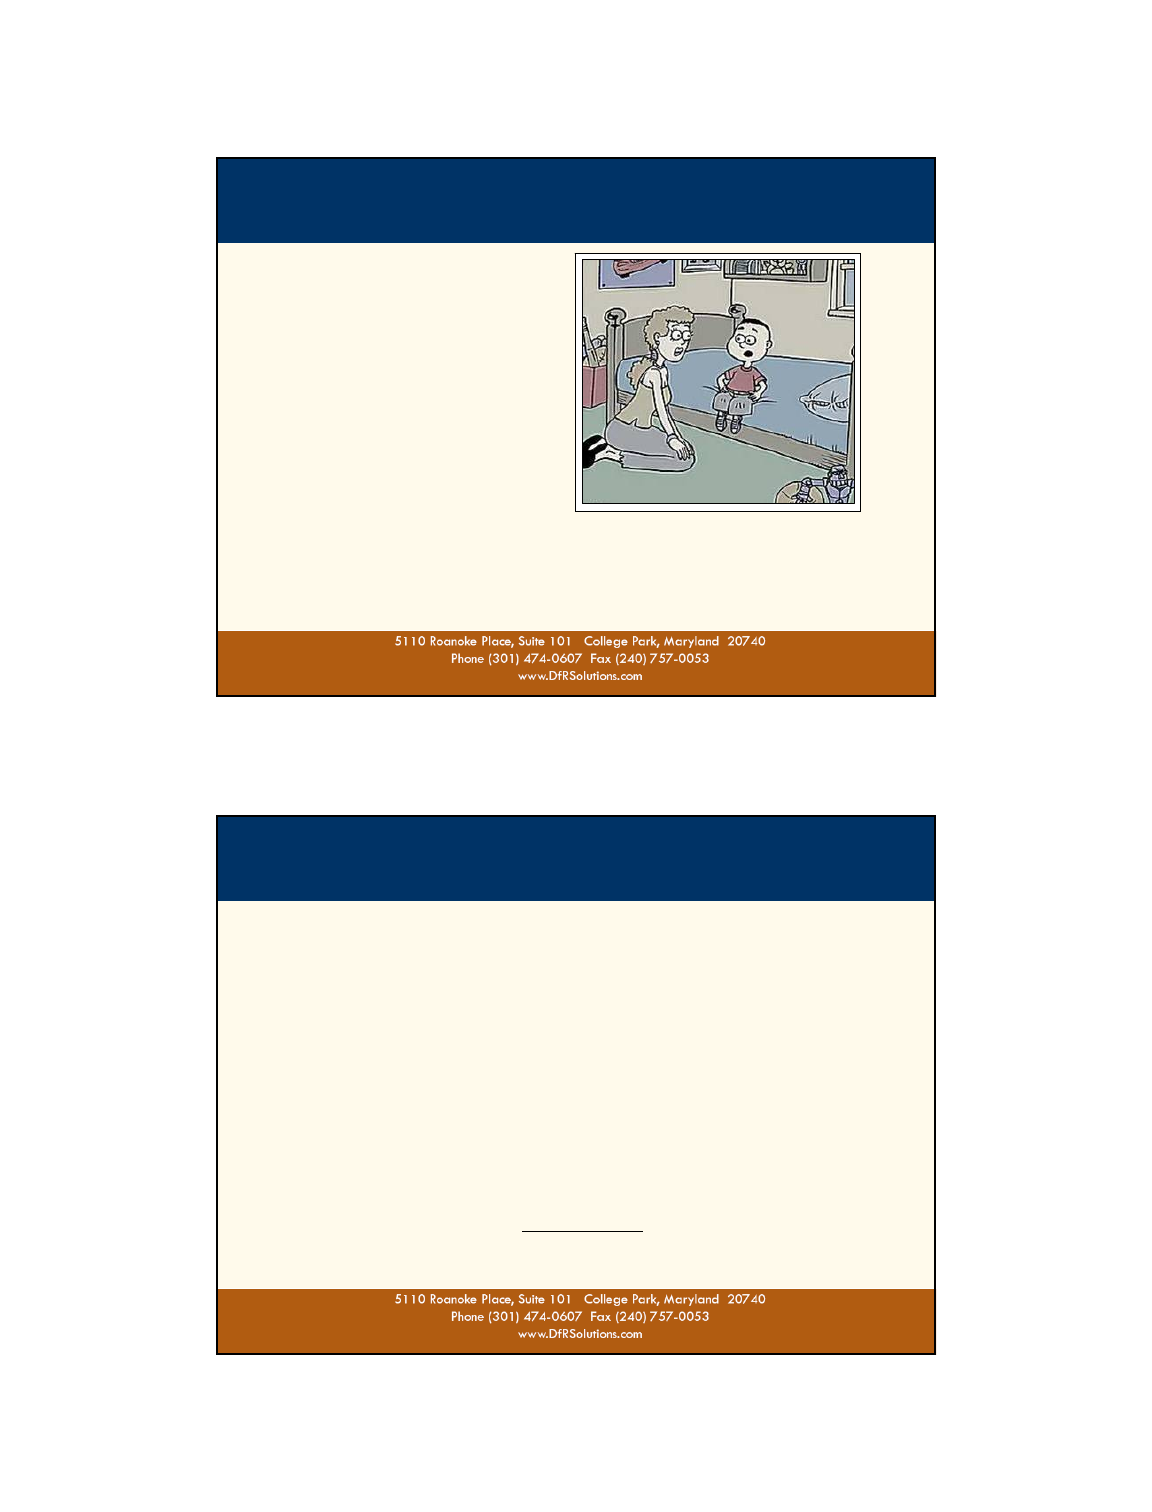
4.1) The 5 Why Approach
1) WHY?
2) WHY?
3) WHY?
4) WHY?
5) WHY?
Mom, Why is the Sky Blue?
Why Can’t we see God?
Why is water wet?
Why . . .
14
©2008
4.1) The 5 Why Approach
The 5 Why’s is a simple problem-solving technique developed by
Toyota* to quickly get to the root of a problem.
The 5 Why strategy involves looking at any problem and asking:
“Why”? and “What caused this problem”?
The answer to the first “why” must prompt another “why”
and the answer to the second “why” must prompt another and so on.
The rule of thumb is that the “Why” question must be asked & resolved
at least 5 times in order to identify the true underlining root cause of the problem.
Toyota’s Philosophy:
A Rush to action that addresses only symptoms or a problem
only produces temporary relief.
Only after the “True” Root Cause has been identified can an
“EFFECTIVE STRATEGY TO PERMANENTLY RESOLVE”
the issue be developed.
* Ref. “The Toyota Way, by Jeffrey K. Liker, McGraw-Hill 2004
15
©2008
4.1) The 5 Why Approach
Example:
ISSUE
There is an oil spill on the floor
A machine is leaking oil
A gasket has failed
The gasket is made out of paper
which breaks down quickly
Low cost paper gaskets were purchased
instead of durable graphic or silicon gaskets
Purchasing bonuses are based on up front
cost savings not long term performance
OBVIOUS RESPONSE
This is a safety hazard, Clean it up
Fix the oil leak
Replace the gasket
Find a better gasket
Developed detailed specifications to
provide better direction to purchasing
Change purchasing incentive policy to
promote total value over short term savings
WHY
WHY
WHY
WHY
WHY
Toyota is known of not stopping at the technical issues. They continue until the root causes
of organization, cultural & people motivation issues are also understood & addressed.
16
©2008
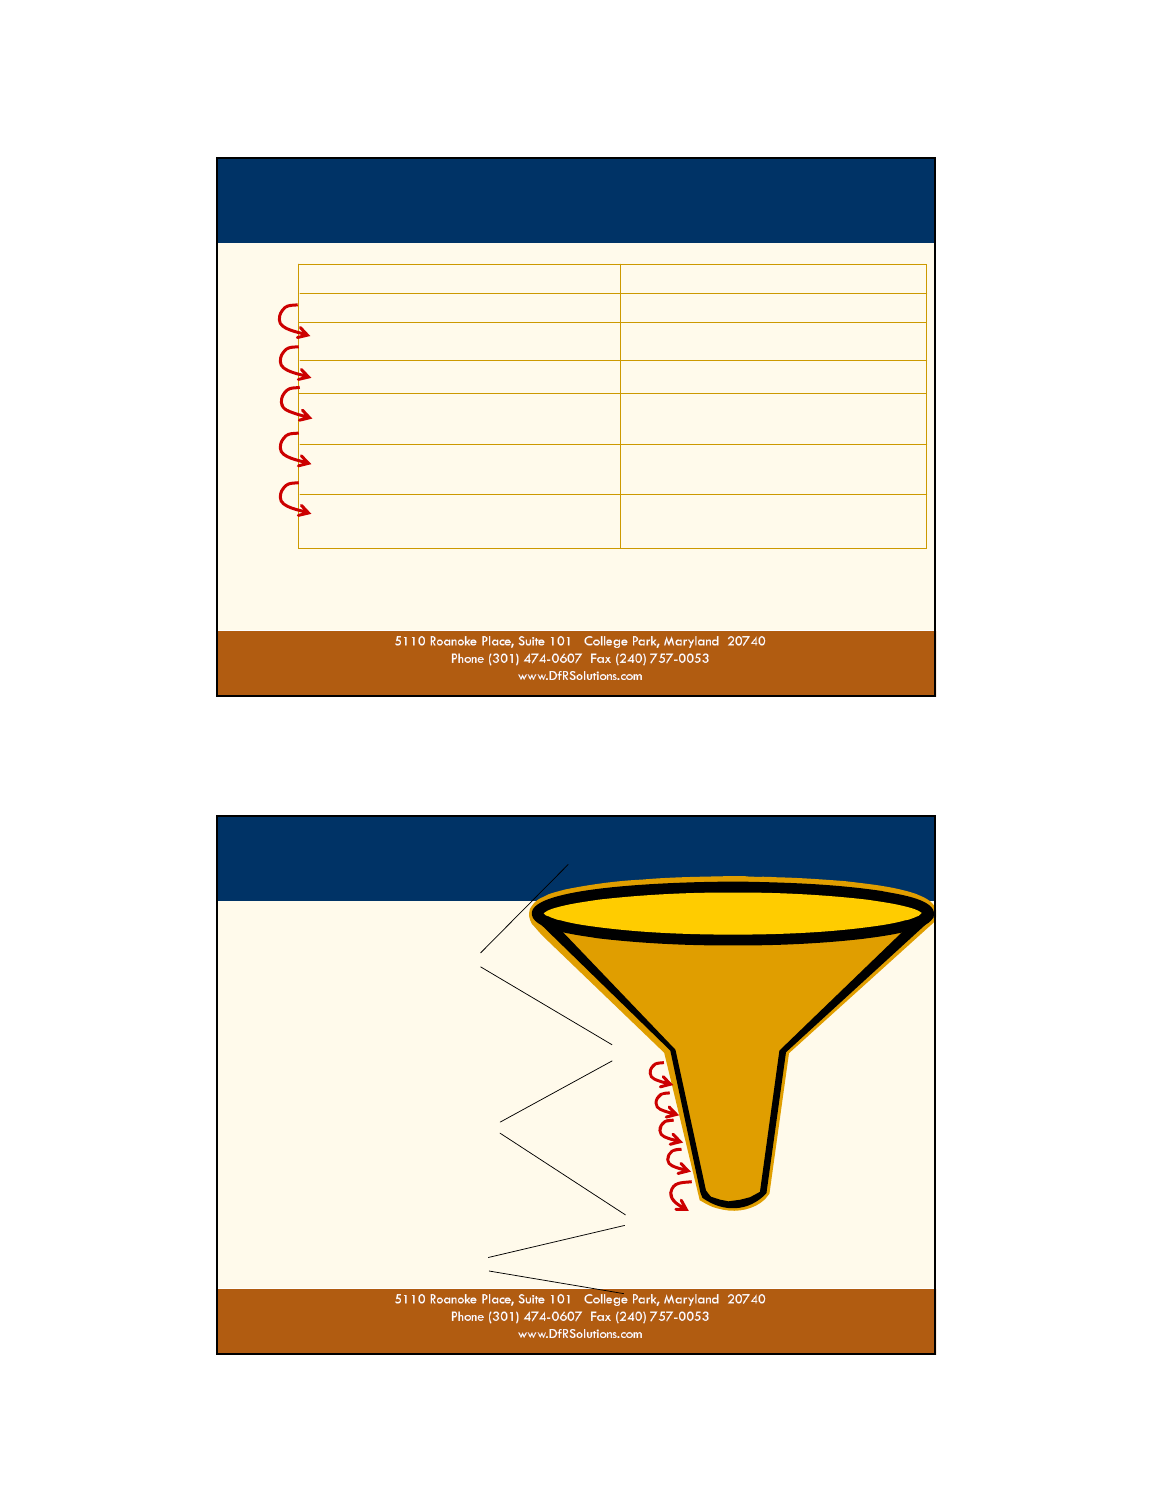
4.1) The 5 Why Approach
The “Funnel Model”
Phase 1) Identify the Issue
Phase 2) Issue Investigation
Phase 3) Corrective Action
Vague Perception of Problem
Clarify Issues
Identify a Problem
or Concern
Issue
Obvious Cause
Cause
Cause
Cause
Cause
ROOT CAUSE
Develop Corrective Action
Evaluate / Verify Effectiveness
Implement & Standardize Across the Organization
WHY
WHY
WHY
WHY
WHY

17
©2008
4.1) The 5 Why Approach - Summation
Benefits
Easy to remember, Simple to apply,
Gets deeper into “Root Cause” than many other problem solving techniques,
so better in the long run.
Informal, flexible, open structure, little bureaucracy
Organizations/users adapts to their own needs.
Potential Issues / Concerns.
More time consuming investigate than quick fix approaches.
Sorting out issues with MORE THAN 1 CAUSE.
Mistakes in developing/answering a “Why” question can mislead the investigation.
Requires some Subject Matter Expertise
Hardest part of 5-Whys is asking the right “Why” questions.
Every organization does not have access to experts in every area.
Depends on some knowledge of cause & effect.
To ask the right questions,
Know how to follow them up in order to reach the right conclusions.
Novices can follow the wrong path.
Informal, flexible, open structure, little bureaucracy = Little guidance.
Repeatedly ask why can appear threatening to involved people.
Fear of an inquisition and assigning blame.
Self preservation instincts can lead to lack of cooperation or hiding information.
18
©2008
4.2) 8D (Eight Disciplines)
Team Problem Solving Process
8D is a problem-solving methodology that
emphasize team synergy.
Originated in 1974’s as part of MIL-STD-1520
“Corrective Action & Disposition System for Nonconforming Material”
Ford introduced and popularized the process within the Auto Industry in 1987.
First known as TOPS - “Team Oriented Problem Solving“.
Evolved into today’s widely used 8D process.
Philosophy - When a problem cannot be solved quickly by an individual,
a team approach is the most effect way to resolve the situation.
Team are more effective than the sum efforts of individuals working separately.
Essential to assign the right members to each a team and support them.
Team members need to have the inclination and skills needed for each problem
Team members need to be provided with the time and resourced need to solve the problem.
19
©2008
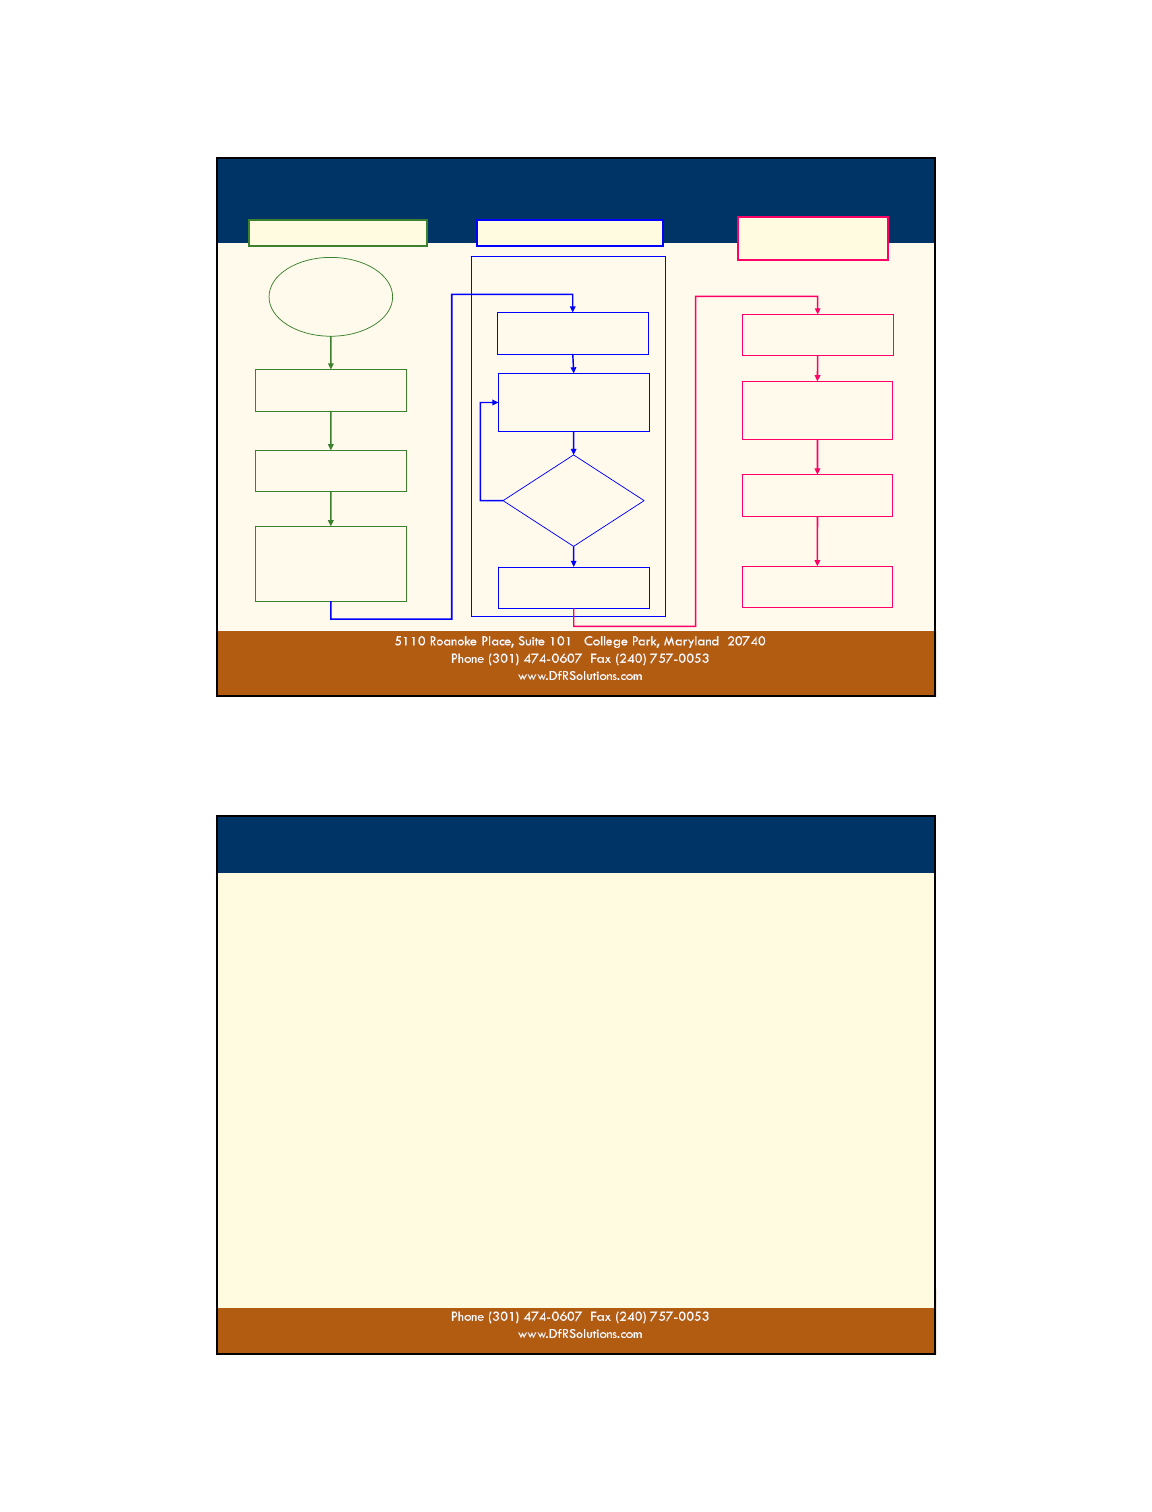
D4 – Determine & Verify
Root Causes
4.2) 8D Problem Solving Process (PSP)
Team
Appropriate
Problem
Identified
D1 - Select &
Empower a Team
D2 - Describe the
Problem
D3 - Implement &
Verify Interim
Containment
Actions
Identify Potential
Root Causes
Investigate and
Select Most Likely
Causes
Is
the Potential
Cause a Real
Cause
Identify Potential
Corrective Action
D5 – Verify
Corrective Action
D6 – Implement
Permanent
Corrective Action
D7 – Prevent
Reoccurrences
D8 – Congratulate
the Team
Project Initialization Root Cause Investigation Implement
Corrective Acton
Yes
No
20
©2008
4.2) 8D PSP - Phase 1 Project Initialization
Starting Point - An Appropriate Problem is Identified.
8D Method does not define how problem awareness is developed.
Always use the right tool for the job:
Ensure problem warrant the resources of team PSP effort.
Avoid one size fits all tool and processes.
Avoid management dictates i.e. “all departments MUST deploy at least five 8D PSP per year”.
D1 - Use Team Approach
Establish a small group of people with the collective knowledge, time, authority and skills
to solve the problem, develop and implement corrective actions.
Provide each team with an executive champion to report to and clear roadblocks.
Each team requires a team leader to pace the process, lead meetings, coordinate team efforts.
Intermix skills: problem solvers, technical knowledge, manuf. process, test, analysis . . . etc.
Ensure team members have the inclination to work towards a common goal.
D2 - Describe the Problem
You can not fix a problem you don’t know what’s broke.
Clearly describe the problem in measurable, specific terms.
Clarify what, when, where and how much, impact to customers.
Info will be needed later to measure corrective action effectiveness.
D3 - Implement and Verify Short-Term Containment Actions
Stop or limit the bleeding as quickly as possible.
Define and implement screens, extra Q.C procedures, Rework . . . other appropriate actions.
To protect the customer & limit losses from the problem until a permanent C.A. is implemented.
Verify effectiveness with data and enhance if necessary.

21
©2008
4.2) 8D PSP - Phase 2 - Root Cause Investigation
4. Determine and Verify Root Causes -
Phase where team conducts the actual root cause Investigation.
Team applied experience and brain storm of preliminary information
to identify potential causes.
Team collects data, follows leads, performs analysis, authorizes test,
apply statistics . . . etc.
Specific procedures or tools not defined by the 8D process.
Team empowered to follow the facts, apply their expertise and
available resources to determine the best investigation approach.
Identification of “true” root cause(s) must be verified,
proven and documented by data not opinion)
to proceed to corrective action activities.
Concludes with team proposal for potential corrective action(s).
22
©2008
4.2) 8D PSP - Phase 3 - Corrective Action
5. Verify Corrective Actions -
Select the best case or optimal corrective action.
Perform test builds, process runs & evaluations to verify effectiveness & feasibility.
Confirm that the selected CA effectively resolves the problem without side effects.
Develop Corrective Action business case and obtain management approval.
6. Implement Permanent Corrective Actions -
Revise the product and/or process to implement the permanent fix
Establish monitoring to make sure it’s working.
If issues reoccurs implement additional controls or go back a few steps & try again.
7. Prevent Recurrence -
Improve practices & procedures to prevent recurrence of this & similar problems.
Modify specifications, update training, document lessons learned, review work flow.
8. Congratulate Your Team -
Recognize the collective efforts of your team.
Publicize accomplishments, share knowledge & learning across the organization
Going public with success spreads knowledge and learning.
Letters of thanks, certificates of recognition.
23
©2008
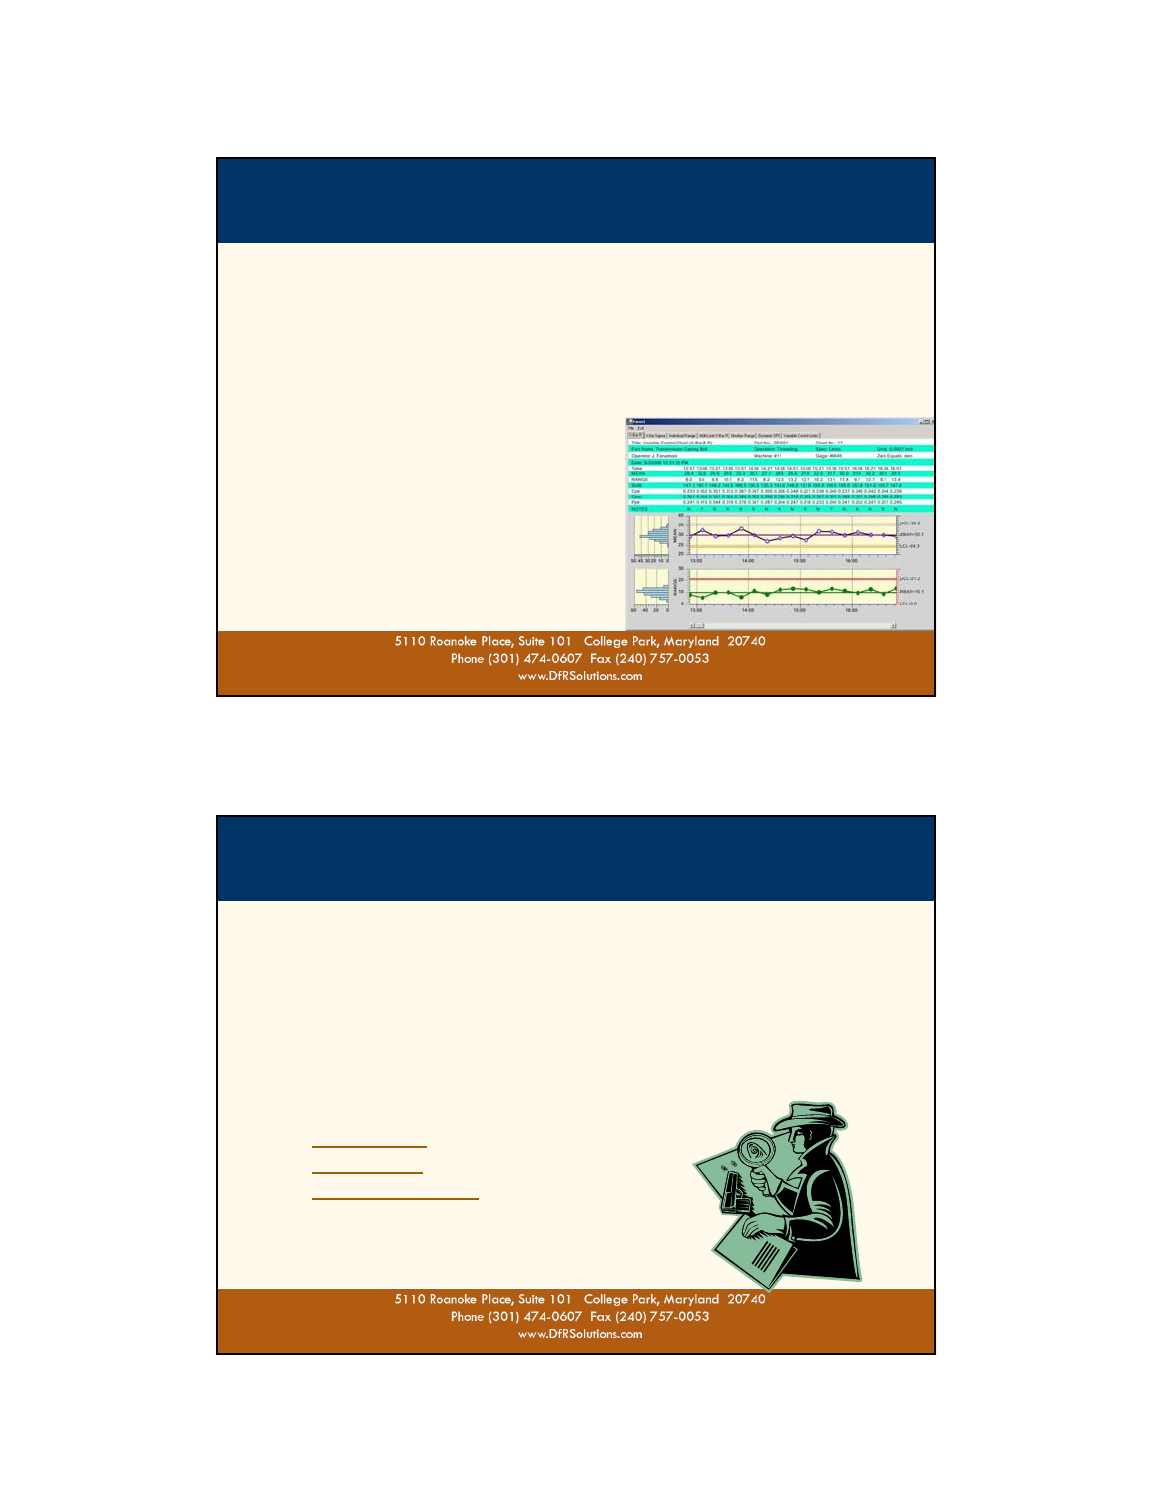
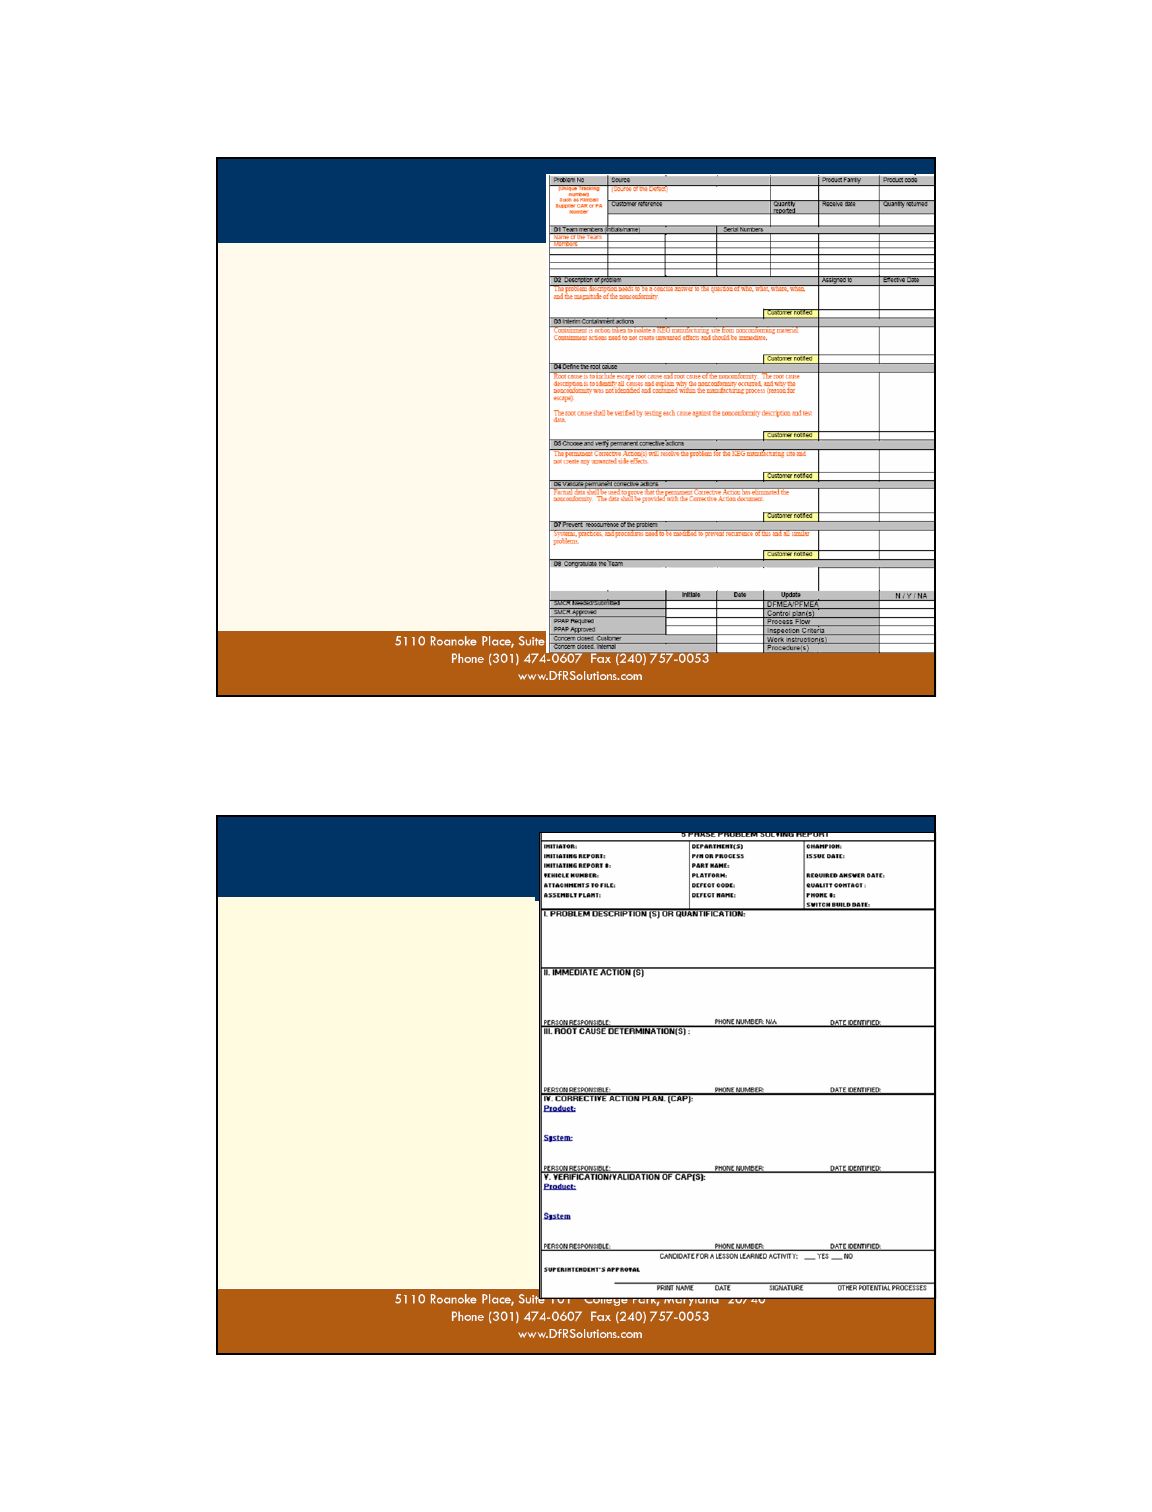
4.2) 8D Sample Reports
& Worksheets
Many 8D report templates exist.
Simple: “just the facts” & results
documentation reports
(Ref. Example right).
Complex: “document every step”
formats that include pages of
worksheets for preferred tools
(Ref. Following Example).
No Universal Format
Many format variations
possible.
Use what works for your
products, organization &
customers.
24
©2008
4.2) 8D PSP Variation
-The 5 Phase PSP
Simplified Version of the 8D.
Used to resolve & document less
complex / everyday issues.
That don’t require the resources
or expertise of a team approach.
Many Common Features:
1) Problem Description.
2) Immediate Actions.
2) Root Cause Conclusions.
RCA Investigation Plan Optional.
A Lesson Learned Opportunity?
4) Corrective Acton Plan (CAP)
Part / Process &
The System.
5) Verification/Validation of CAP.
No Universal Format
Many format variations possible.
Use what works for your
products, organization &
customers.
25
©2008
4.2) 8D/5 Phase Problem Solving Processes
-Summation
Benefits - Address a Number of 5 Why Concerns,
Early initial problem containment counter balance time need for thorough RCA
Drawing on team experience reduces potential for RCA errors.
Team format expands potential to tap available subject mater expertise.
Opportunity for novices to learn from more experienced personnel.
Provides a formal PSP structure without dictating methods and tools.
Team retain freedom to select tools and follows leads.
Team members feel empowered, respected and appreciate trust.
Easily converted into an 8D problem solving/ RCA report
Example 8D worksheet/ report template (on following pages) provides:
Sections for documenting outcome of all 8 steps.
RCA Worksheet for 5 Why and Fishbone Cause & Effect diagrams.
Status documentation
Potential Issues / Concerns.
8D structure provides susceptibility to excessive bureaucracy & micro-management.
Excessive status report updates detract from problem solving efforts.
Process management personnel represent non-value added overhead.
Management “throughput / efficiency” improvement efforts that degrade RCA effectiveness
(teams will avoid time consuming hard problems to avoid poor performance ratings
in systems that emphasize quantity over quality)
Management with lackluster team recognition / congratulations
26
©2008
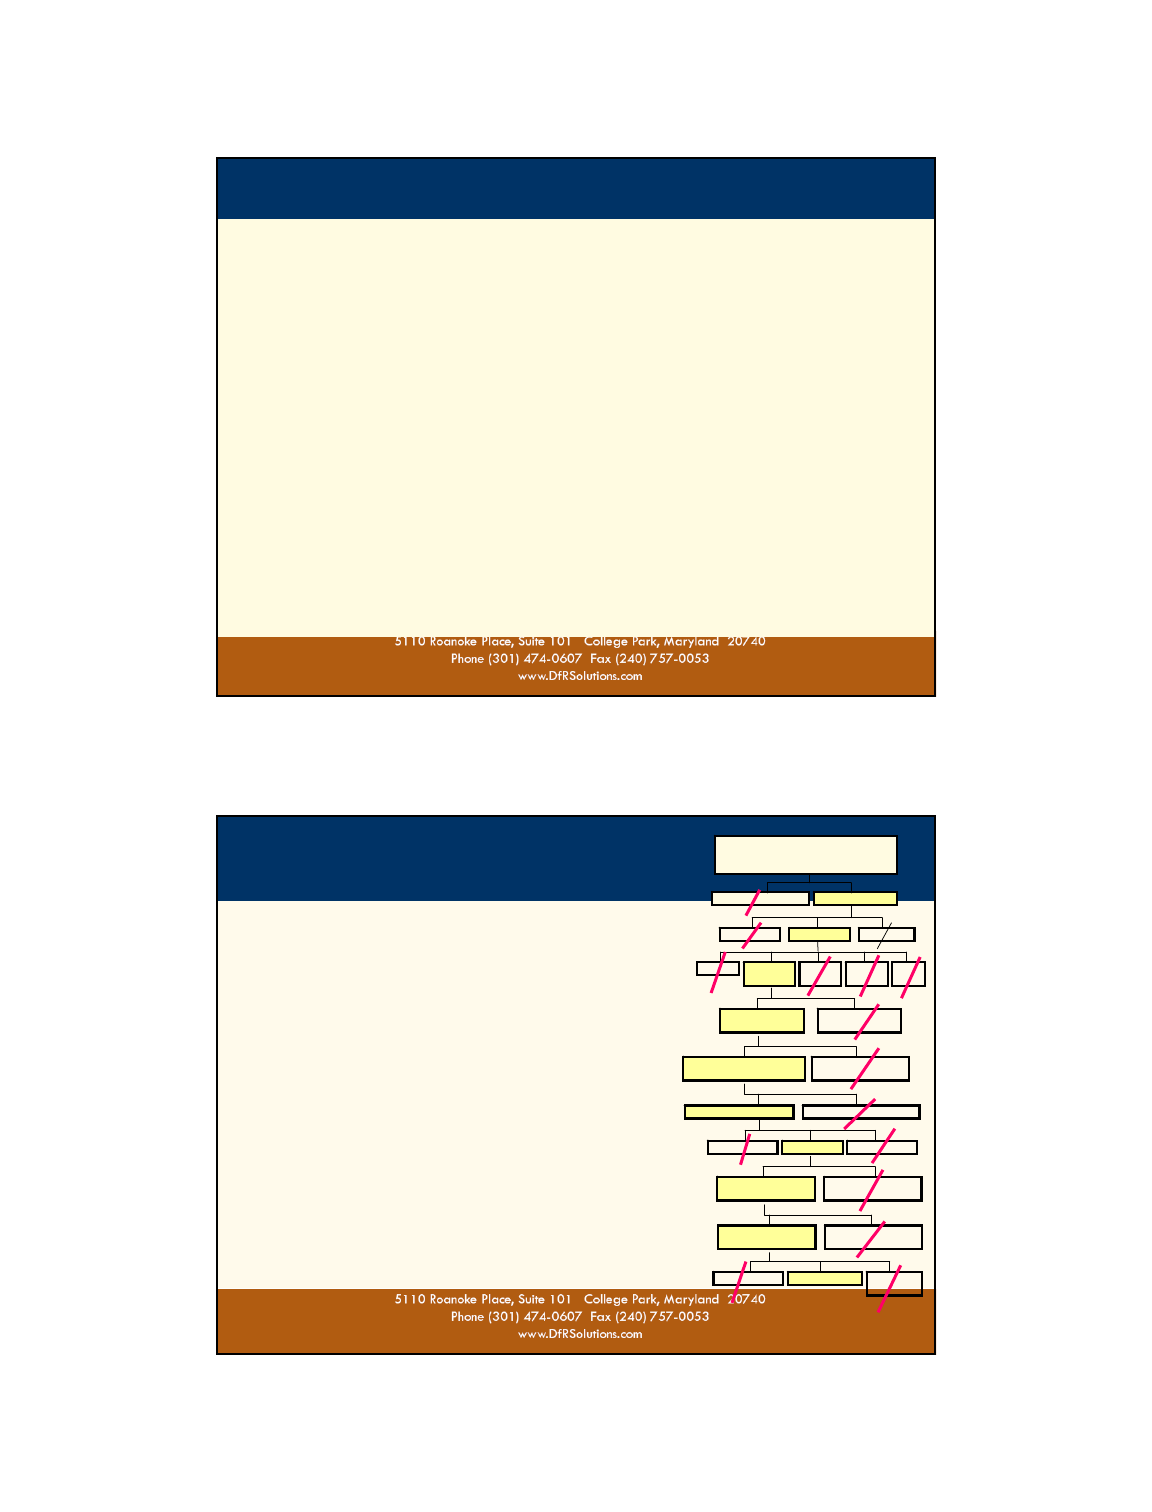
4.3) Shainin Red “X”
- Diagnostic Journey
A Red X Statistical “Journeyman” or “Master” start the
process by organizing a team of problem stake holders.
The team creates a problem definition tree diagram
(similar to a fault tree minus the logic symbols).
Create a visual map of the issue or sequence of events
that relate to or resulted in a failure.
Included relevant issues & realistic contributing factors.
Use the diagram as a guide for evaluating the impact
of each factor.
Use progressive search questioning strategy a series of
(yes/no) questions concerning degree contribution to
reduce the field of suspects.
Cross off the factors that are minor contributors
to the outcome to eliminate them from serious
consideration.
The remaining factor in each category line are
considered to be the factors worthy of detailed
statistically evaluations.
Eliminate Source of
Cracking/Breakage of Vehicle
Exterior Rear View Mirror Glass.
Vehicle Relate Part Related
Feature Defect (27) Event
Loose
(3)
Inop. (4) Cracked
(11) NTF
(8)
Falls Off
(1)
Non Customer
Induced (4)
Customer Induced
(7)
Power Heated Mirrors
(DL3/DL8/DFP)(4) Other Mirrors
(0).
Region to Region
Same Glass Other
Strategies)
Crack in Other
Directions
Crack in East-West
Direction
Center of GlassTop of Glass . Bottom of
Glass
Driver’s Side Pass SideBoth
Thin Line Cracks Other Types of Crack
27
©2008
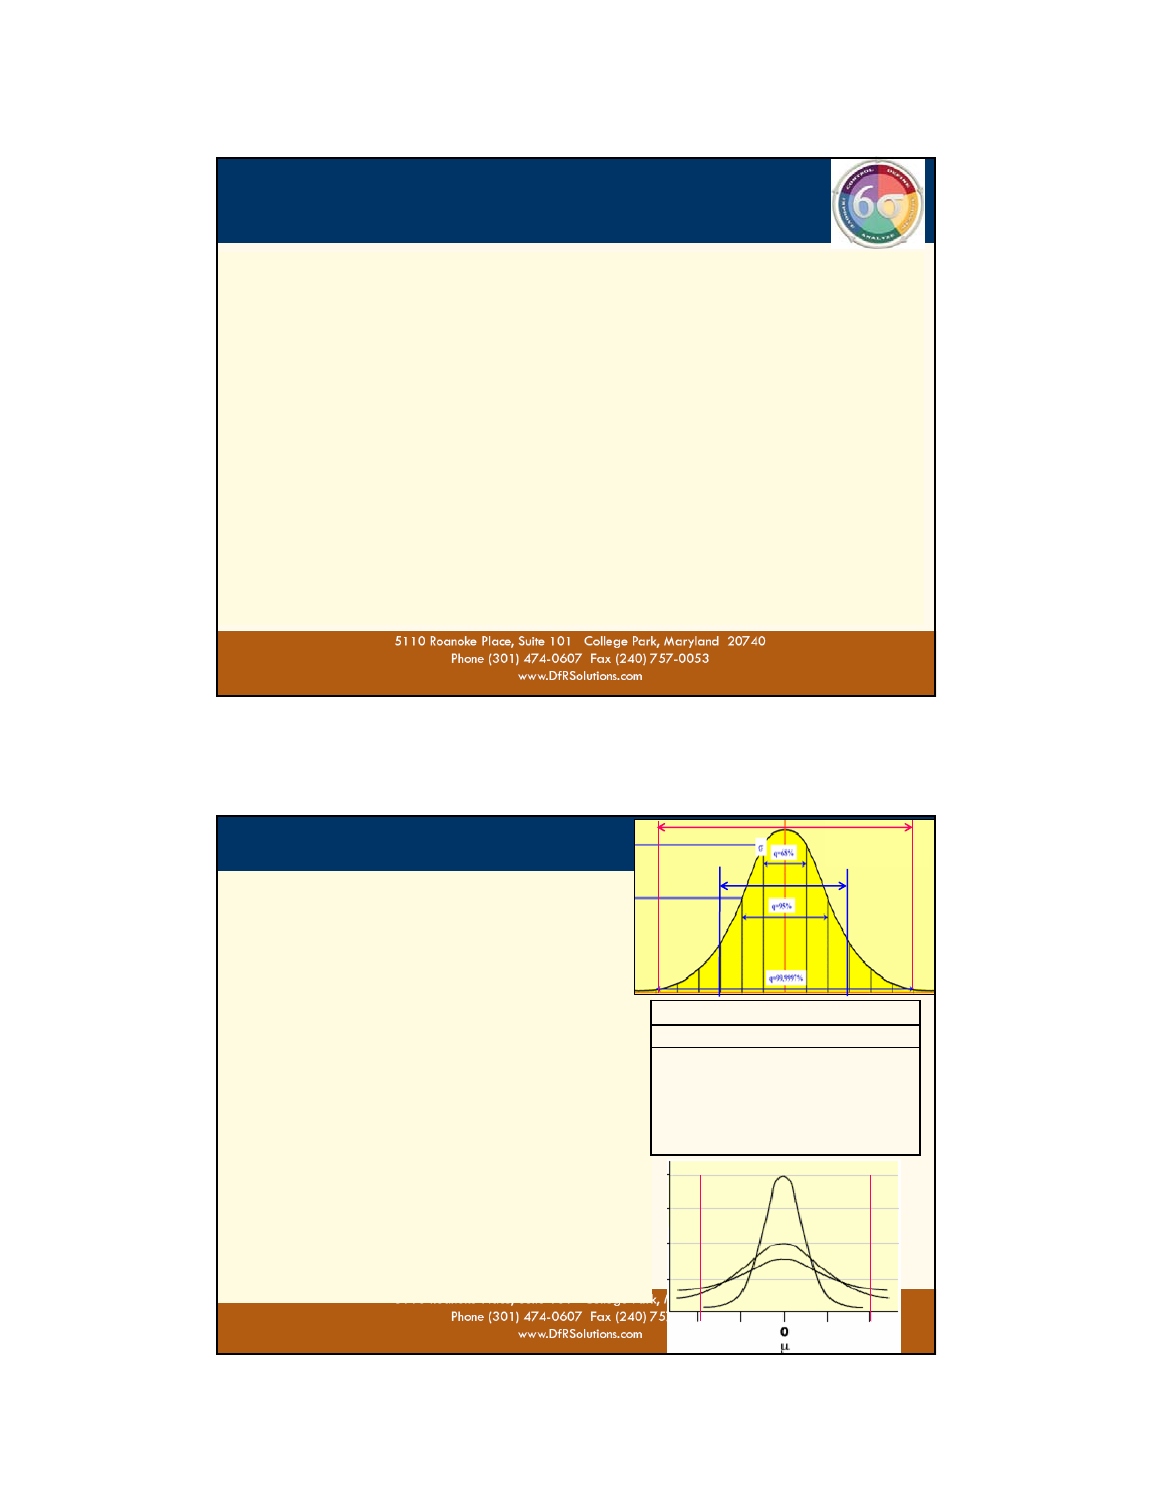
4.4) Six Sigma (6σ)
A methodology for “Improving Business Performance”.
Pioneered by Motorola Q.A. manager Bill Smith (mid 80’s) who proved that:
Manuf. lines with high in-process defects rates requiring Rework/Repairs (R/R) had higher
field failure rates & warranty costs than lines with low repair rates.
Low repair rate (build right on the first attempt) lines also had
improved customer satisfaction that resulted in better sales.
Root Causes:
Defect escapes from quality control systems.
Inadvertent, hidden damage during addition handling, rework & retest.
Lines with “better/tighter process capability” resulted in:
“Higher First Pass Quality” making them “More Efficient & Cheaper to Operate”,
even if the better equipment had higher up front costs, due to:
Less Effort & Costs for the “Hidden Factory” (Q.A, R/R & Root Cause).
Improved efficiency from higher throughput.
“Quality Pays” Even Better than Phil Crosby’s “Quality if Free” Philosophy.
Enabled QRD professional to communicate in the native language of executive
management: “Time and “$” Money”
28
©2008
Sigma σis the symbol for Statistical Standard
Deviation of the normal distribution (bell curve).
The “σ” measurement scale define how much
of process’s normal distribution is capable of
being contained within required tolerance limit
“ON THE FIRST PROCESS PASS”.
Out of spec “defects” are measured in terms of
Defects Per Million Opportunities (DPMO).
Processes that operate at a “6σ” quality capability
level produce < 3.4 DPMO “for each operation”.
DPMO is related to process operations not the
number of parts produced, Example:
A circuit board requires 100 component placement
operations so 1,000,000 placements ~ 10,000 boards.
The same board requires 500 solder joints so 1,000,000
soldering operations ~ 2,000 boards.
10,000 6σboards would require no more than
3.4 placement repairs & 17 solder repairs.
Wave soldering typ. run at 100-500 DPMO (4.78-5.19σ),
Reflow soldering is typ, 25-100 DPMO (5.55-4.78σ).
The goal is more capable processes that produce a
tighter variation spread within the spec limits
4.4) Six Sigma (6σ)
σ( Std Dev) Conversion Table
σIn Spec Yield DPMO (Outliers)
1 30.85% 691,462
2 69.14% 308,534
3 93.32% 66,807
4 99.38% 6,210
5 99.9767% 233
6 99.99966% 3.4
6σSpread
3σ
6σ
4σ
3σ

29
©2008
4.4) Six Sigma (6σ) Improvement Processes
DMAIC - Define, Measure, Analyze, Improve & Control
The 6σimprovement system for:
Existing” processes related problems
Sub-optimized process that fall below specification & yield expectations.
DMADV - Define, Measure, Analyze, Design & Verify
The 6σimprovement system for:
Developing new processes or products or
Resolving design related problems.
Also used in Design For Six Sigma (DFSS)
a methodology for new produce development.
Obvious similarities with the previously discussed 8D and 5 Phase PSP’s
Different definitions and terms.
Some differences in statistically tools.
30
©2008
4.5) Physics of Failure
- Definitions
Physics of Failure (PoF also known as Reliability Physics).
A Proactive, Science Based Engineering Philosophy.
Development & Applied Science of Product Assurance Technology base on:
A Formalized and Structured approach to Failure Analysis/Forensics Engineering
that focuses on total learning and not only fixing a current problem.
Material Science, Physics & Chemistry.
Variation Theory & Probabilistic Mechanics.
Up Front Understanding of Failure Mechanisms and Variation Effects.
Knowing how & why things fail is equally important to understand how & why things work.
Knowledge of how thing fail and the root causes of failures, enables engineers to identify
and design out potential failure mechanisms in new products and solve problems faster.
Provides scientific basis for evaluating usage life and hazard risks of new materials,
structures, and technologies, under actual operating conditions.
Applicable to the entire product life cycle
Design, Development, Validation, Manufacturing, Usage, Service.
31
©2008
4.5) PoF Grew Out of the Limitations of
Statistics Based Reliability Prediction
Fundamental Limitations
Statistical probability should be used only when we lack knowledge of the
situation and cannot obtain it at a reasonable cost.
"Statistics are applicable only when:
1. You are unavoidably ignorant about a given issue,
2. Some action is necessary and cannot be delayed."
Leonard Peikoff
In Book & Lectures on The Art of Thinking
In other words, if you're trying to determine a course of action:
- Your best bet is to acquire knowledge and
not to blindly use statistics to play the odds.
32
©2008
Focuses on 3 Separate Phases
with Separate Control & Improvement Strategies
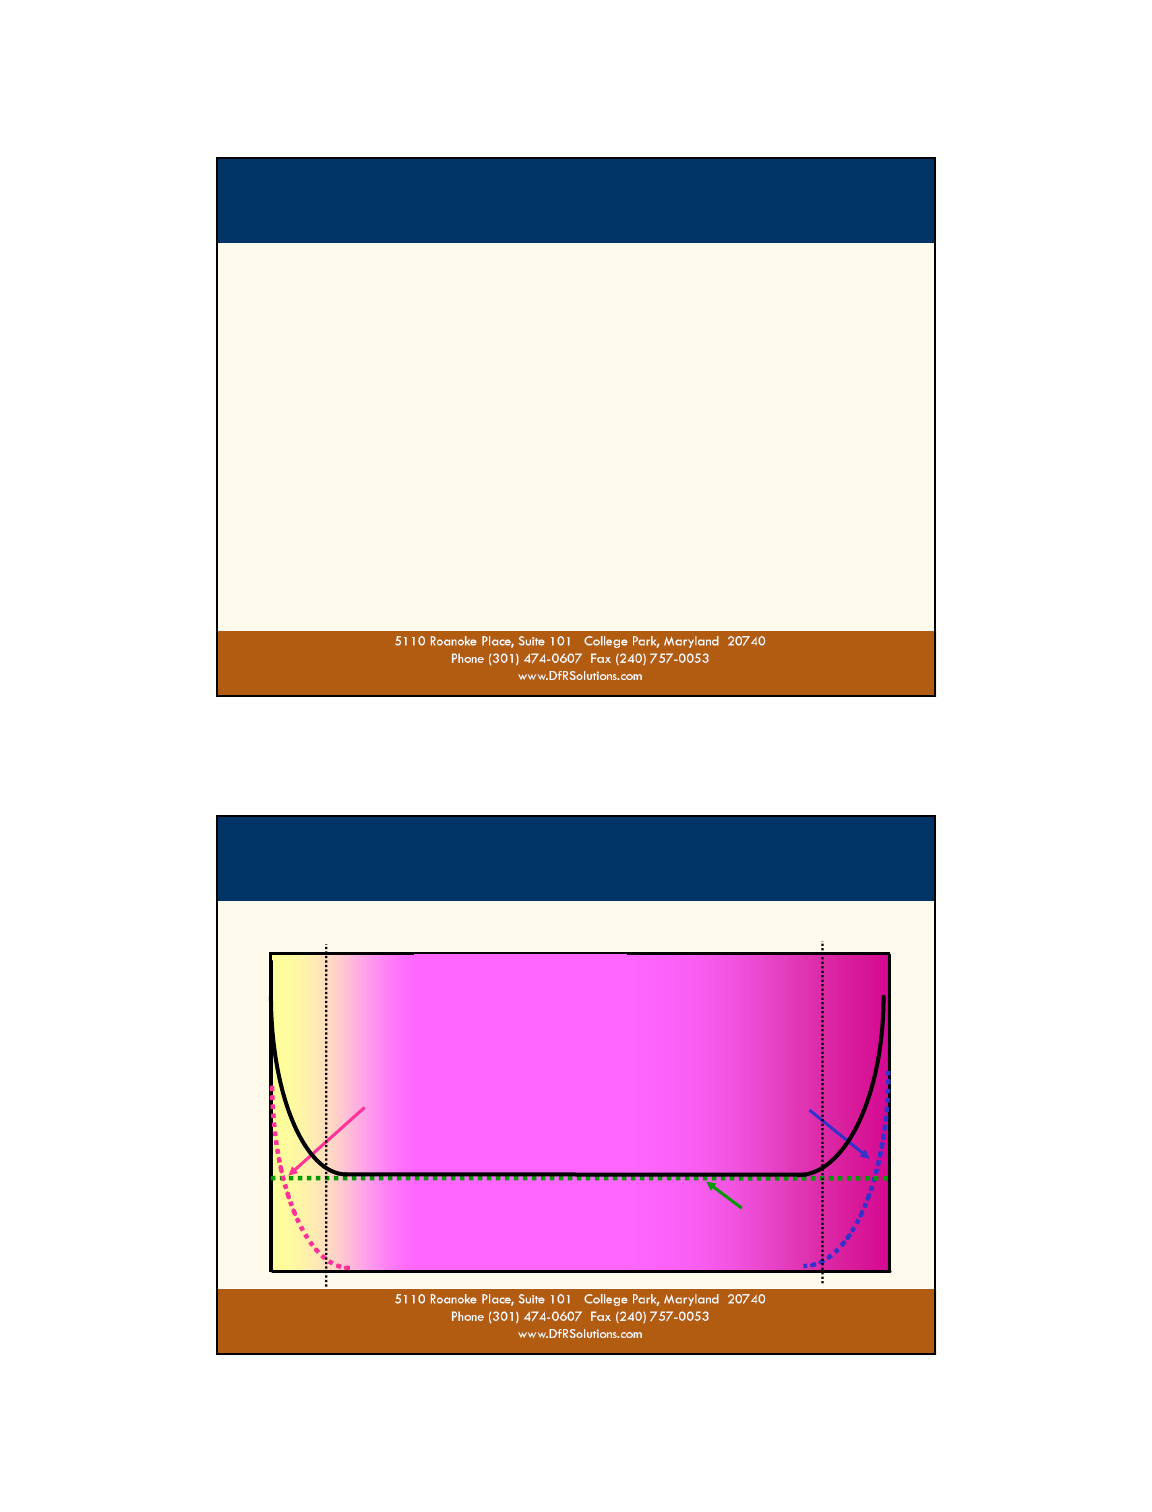
4.5) A View of Quality, Reliability & Durability (QRD) Via
The Traditional Product Life Cycle Failure Rate “Bath Tub” Curve
Problem or Failure Rate
Time 0 1 Year 2 Years 3 Years 4 Years 5 Years
Average
Repurchase
Decision
The Bath Tub Curve
(Sum of 3 Independent Phenomena)
Durability = Wear Out
(End of Useful Life)
Reliability = Random or Chance Problems
(Constant Unavoidable)
But “True” Root Causes Can Be Disguised by
Statistical Assumptions to Make QRD Easy to Administer
This is an Inaccurate & Misleading Point of View
Quality = Infant Mortality
33
©2008
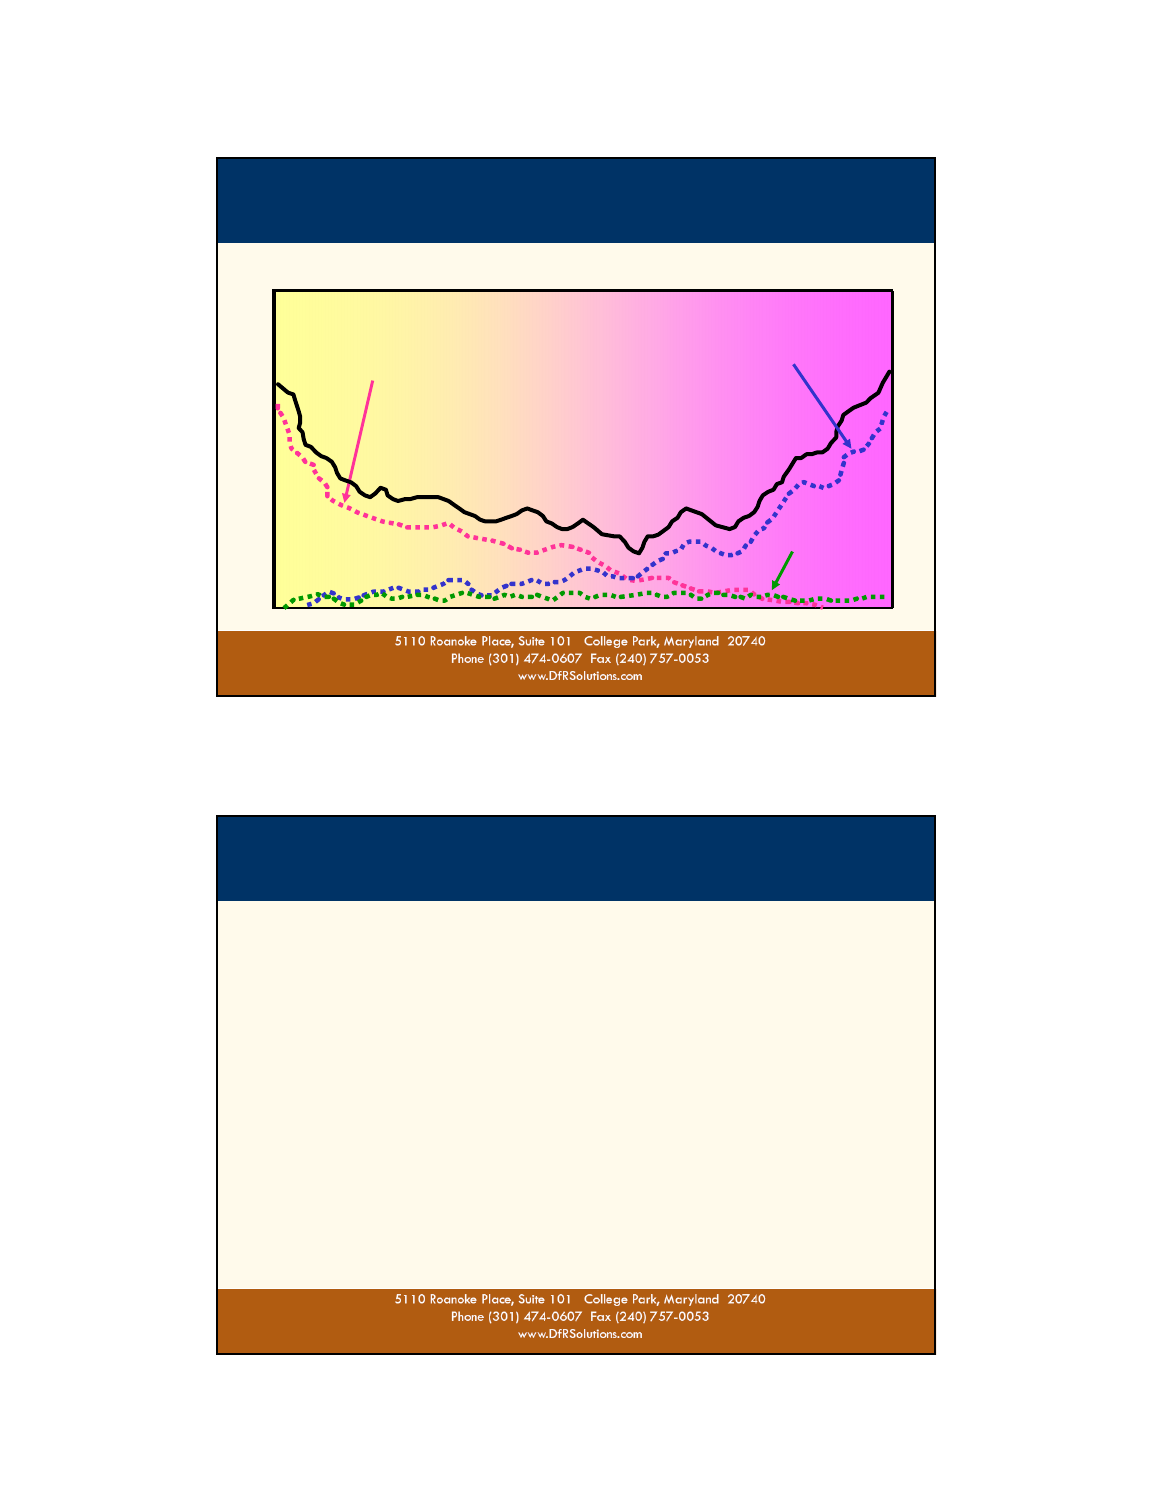
- Real failure rate curves are irregular, dynamic and full of valuable information,
not clean smooth curves to simplify the data plots.
4.5) A “PoF FAILURE MECHANISM” Based “REALISTIC” View
Reveals the True Interactive Relationships Between Q, R & D
Problem or Failure Rate
Time 0 1 Year 2 Years 3 Years 4 Years 5 Years
Manuf. Variation & Error
and Service Errors
That Cause Latent
Problems Throughout Life
“Cause & Effect”Root Causes
Can Be Disguised by Statistics
Once Problems Are Accurately Categorized
You Have a More Effective Point of View
Weak Designs That
Start to Wear Out
Prematurely
TRUE Random
Problems
Are Rare Once
Correlated to
“ACTS OF
GOD & WAR”
34
©2008
4.5) Root Cause Implications of the
Physics of Failure Point of view
The focus of “Traditional Reliability Methods” on “Random/Chance Failures”
conveys a perception that problems and failure are inevitable & unavoidable.
“Resistance is Futile”
The Physics of Failure approach emphasizes:
An ordered understandable, predictable universe of cause & effect relationships.
The role of root cause analysis problem solving for discovering, understanding
and mastering these cause and effect relationships.
Using RCA to build a “Compendium of Formalized, Institutionalized Knowledge”
for Future Problem Prevention as well as for solving today’s problems.
35
©2008
Failure Site :
The location of potential failures, typically the site of a designed in:
stress concentrator ,
design weakness or
(designed in)
material variation or defect.
(process related or Inherent)
Knowledge Used to Identify and Prioritized Potential Failure Sites and Risks
in New Designs During PoF Design Reviews.
4.5) Key PoF Terms and Definitions
36
©2008
GENERIC FAILURE CATEGORY TYP. FAILURE DETECTION
Errors - Incorrect Operations &
Variation Defects/Weaknesses.
Missing parts, incorrect assembly or process.
Process control errors (Torque, Heat treat).
Design errors
Missing functions,
Inadequate performance.
Inadequate strength.
Overstress.
Overheating.
Voltage/Current
Electro static discharge.
Immediate yield, buckling, crack.
Wearout/Changes,
via Damage Accumulation.
Friction wear.
Fatigue.
Corrosion.
Performance changes/parameter drift
4.5) 3 Generic PoF Failure Categories
and Detection Methods
Quality
Assurance
Immediate or
Latent defects
Performance
Capability
Assessments
Stress-Life
Durability
Assessments
37
©2008
4.5) Generic PoF Failure Categories
1) Overstress - When Loading Stress Exceed Material Strength
Variation of Design’s Material Strengths
- Related to Process Capabilities
Stress Variation of Usage &
Environments Loads &
Their Interactions
How well
do you
Understand
& Design
For
Strengths
& Stresses?
Typical
Deterministic
(Nominal) Analysis
FREQUENCY OF OCCURRENCE
STRESS/
STRENGTH
4
σ
|
9
9
%
t
i
l
e
2
σ
|
6
9
%
t
i
l
e
3
σ
|
9
3
%
t
i
l
e
DESIGN MARGIN
SAFETY FACTOR
UNRELIABILITY = Probability
that Load Exceed Strength
38
©2008
4.5) Generic PoF Failure Categories
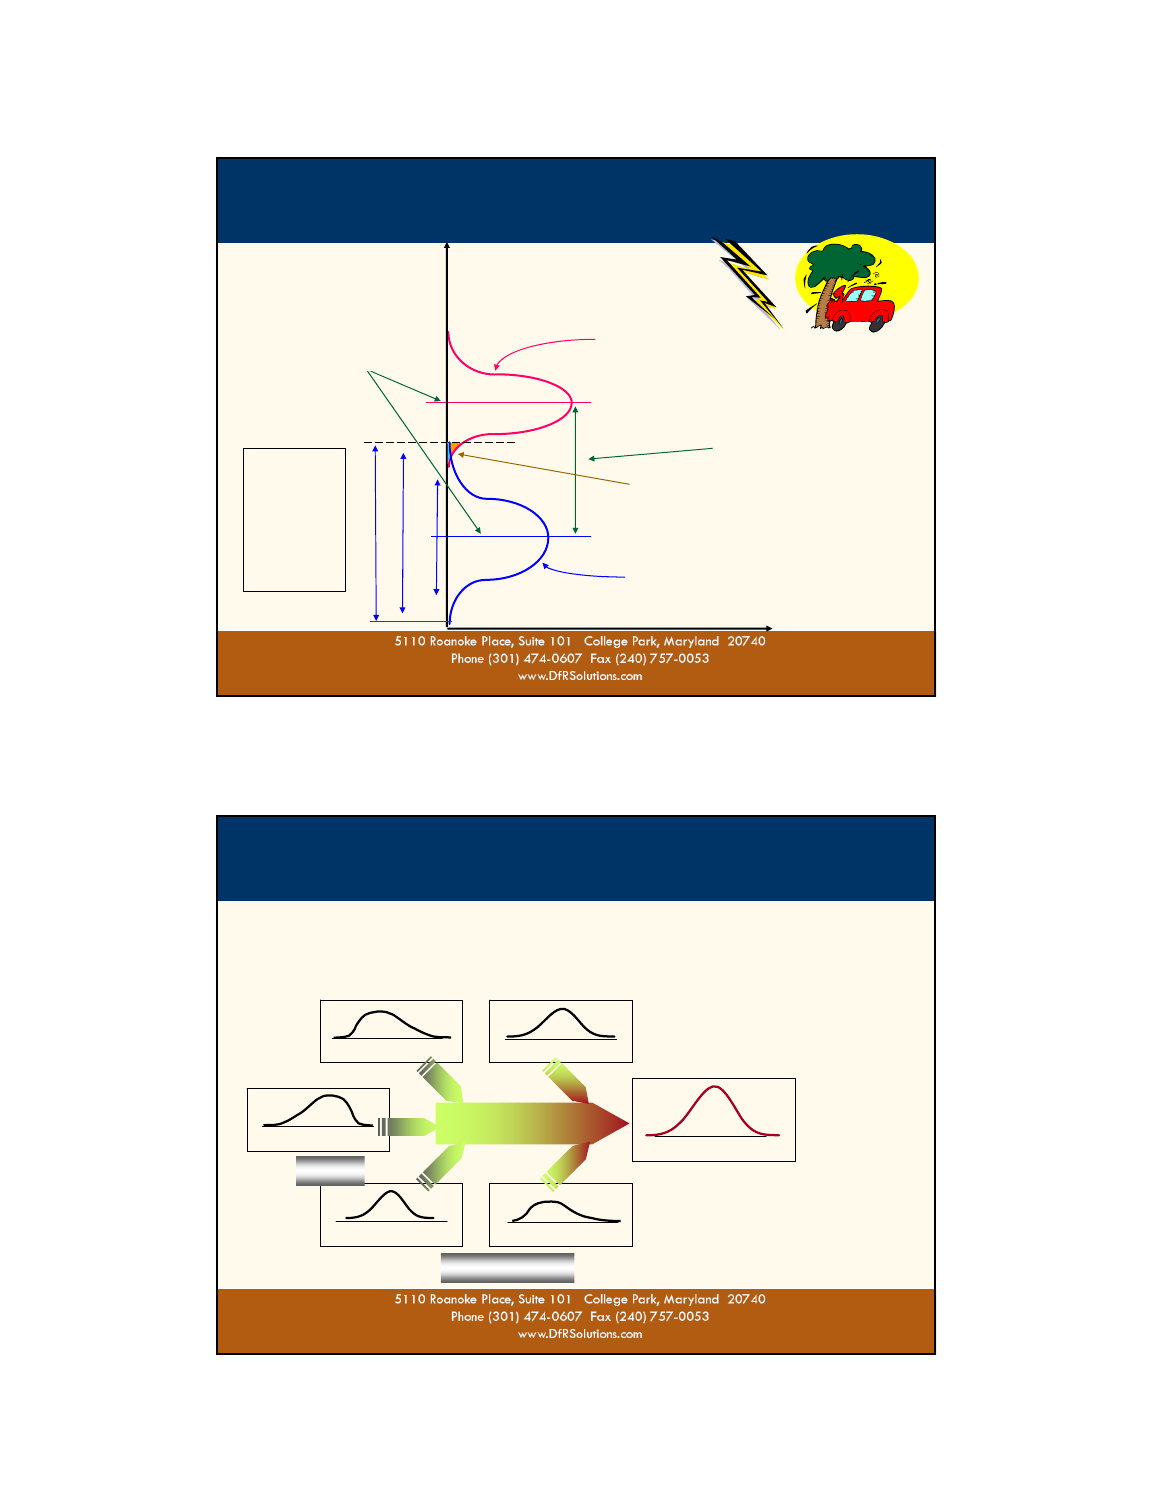
2) Errors and Variation Issues (They Are Everywhere)
People
Interface Equipment
Material Environment
Performance
Design & Process
Usage
Noise Factors
Errors Broadest Category
Errors in Design, Manufacturing, Usage &
Service.
Missing knowledge
Human factor Issues.
Variation
Fine line between excessive variation & out
right errors.
Both related to various quality issues.
Manufacturing equipment wear out & failure
could be related to maintenance errors.
Weak material could be raw material variation
or insufficient heat treat processing errors.
Equipment process capabilities limitation or
operator set up error.
39
©2008
4.5) Generic PoF Failure Categories
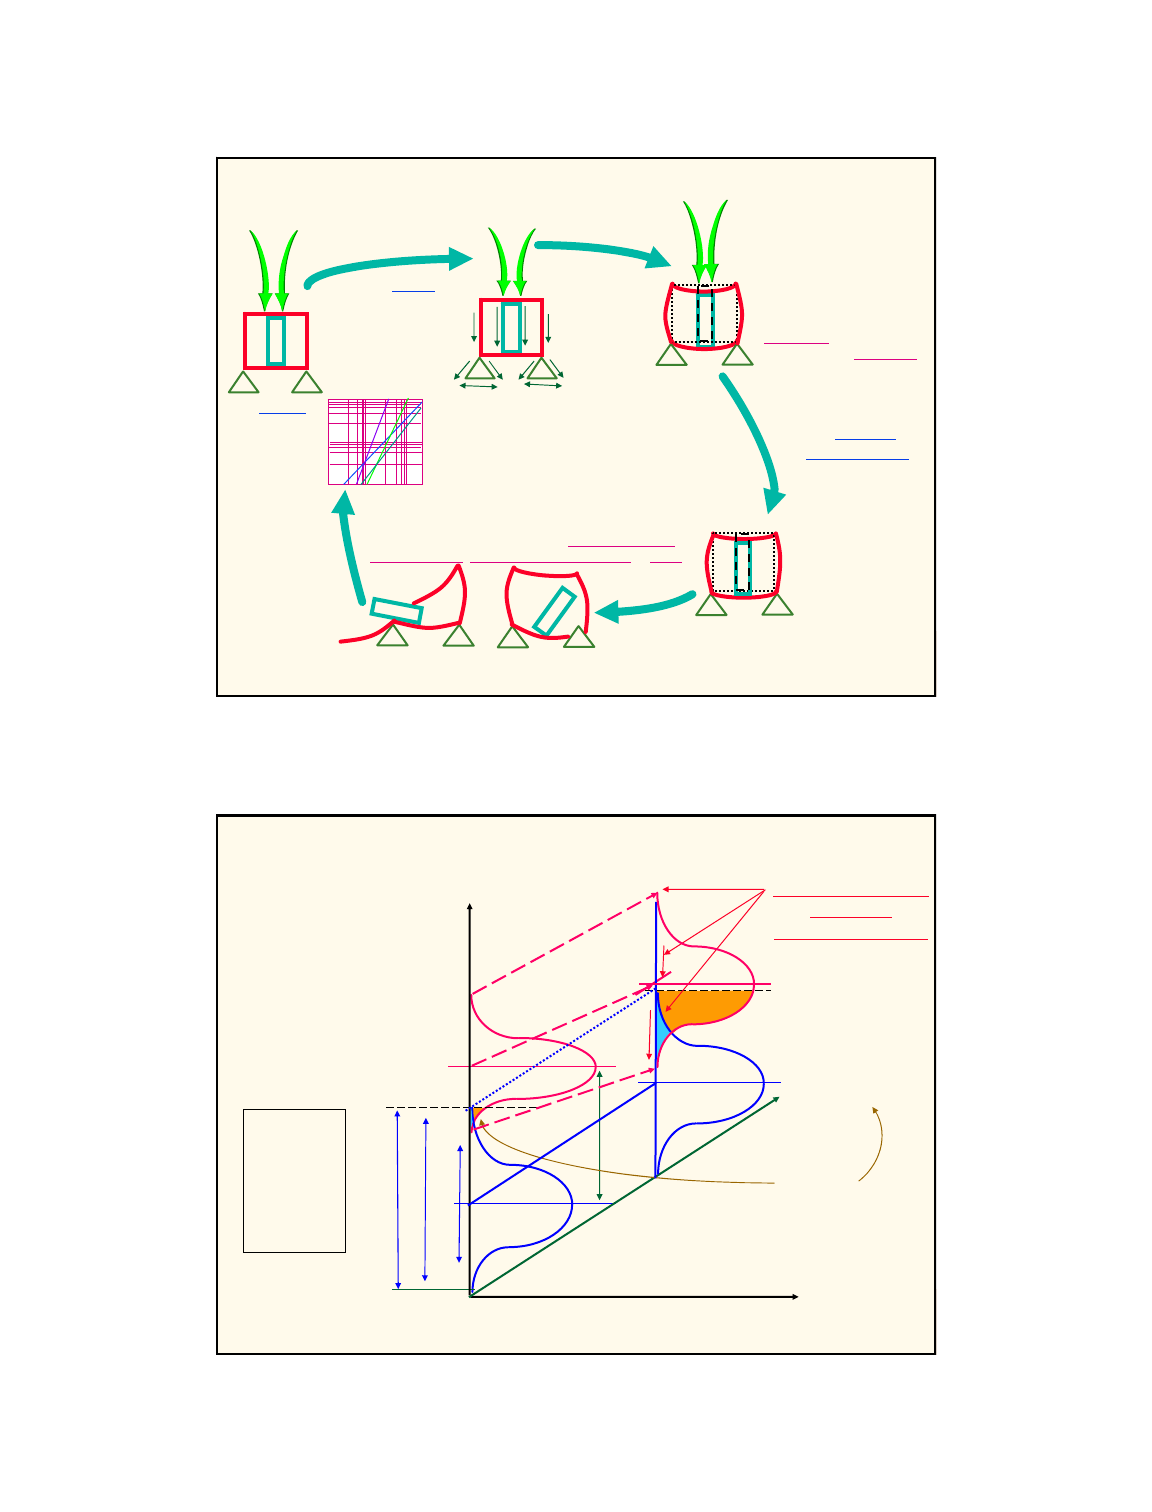
3) Wearout - Damage Accumulation In Materials
1. Loads
Elect. Chem.
Thermal, Mech...
Individual or
combined, from
environment &
usage act on
materials &
structure.
2. Stress
The distribution/
transmission of
loading forces
throughout
the device.
6. Time to 1st Failure:
(Damage Accumulation verses Yield Strength
A Function of: Σ [Stress Intensity, Material
Properties, & Stress Exposure Cycles/Duration].
7. Rate of Failure (Fall out)
A function of variation in; Usage, Device Strength
& Process Quality Control (i.e. latent defects).
3. Strain :
Instantaneous changes
(materials\structural) due
to loading, different loads
interact to contribute to a
single type of strain.
Knowledge of how/ which
“Key Loads” act & interact
is essential for “efficiently”
developing good products,
processes & evaluations.
4. Damage
Accumulation
(or Stress Aging):
Permanent change
degradation retained
after loads are removed.
From small incremental
damage, accumulated
during periods/cycles
of stress exposure.
5. Failure Site & Type:
Typically due to a designed in: stress concentrator ,
design weakness, material/process variation or defect.
40
©2008
4.5) Generic Failure Categories - Wearout (Damage Accumulation) con’t
3) Wear out Over Time and Intensity of Stress Exposure
How well
do you
Understand
& Design
For
Strengths
& Stresses?
4
σ
|
9
9
%
t
i
l
e
2
σ
|
6
9
%
t
i
l
e
3
σ
|
9
3
%
t
i
l
e
INITIAL
UNRELIABILITY
FREQUENCY OF OCCURRENCE
STRESS/
STRENGTH
STRESS
EXPOSURE TIME
or USAGE CYC’S
Material Decay
Increases
UNRELIABILITY
OVER TIME
STRESS INDUCED
DAMAGE
ACCUMULATION
Design’s Strength
Decay/Spreads Over
Time / Usage
41
©2008
4.5) Generic Failure Categories
Overstress - Examples of Wear Out Failure Mechanism
Mechanical
Fatigue
Creep
Wear
Electrical
Electro-Migration Driven
Molecular Diffusion & Inter Diffusion
Thermal Degradation
When Over Stress Issue are Detected.
Verify supplier’s are meeting material strength specs & purity expectation.
Re-evaluate field loading / stress expectation used to design the part.
Sort out stresses,
Combined stress issues are often involved.
Re-evaluate effectiveness of product durability testing
Chemical / Contaminate
Moisture Penetration
Electro-Chemical-Migration Driven
Dendritic Growth.
Conductive Filament Format (CFF)
Corrosion
Radiation Damage
42
©2008
4.6) Physics of Failure Examples
- Circuit Board Related Vibration Durability Issues
Board in Resonance
Components. Shaken Off/Fatigued
by Board Motion.
By Flexing Attachment Features
Components In Resonance.
Components Shake/Fatigue themselves apart or off the
Board.
Especially Large, Tall Cantilever Devices
3 Med. Sized Alum CAPS
1 Small Long Leaded Snsr
1 Hall Effect Sensor.
1 Large Coil Assembly
PC Board
Lead Motion
-Flexed Down
- Normal
- Flexed up
Bending Lead Wires
Stressed
Solder
Joint
Displacement
Gull Wing I.C.
Time to Failure Determine by
Intensity/Frequency of Stress Verses Strength of Material
For a 10 million cycle life, Z < 0.0008995·B/(C·h·r (L1/2)).
Ref: Vibration Analysis for Electronic Equipment, by David S. Steinberg
Steinberg’s Criterion:
Log (Number of Cycles to Failure)
Log (Peak Strain)
Solder Fatigue Life
43
©2008
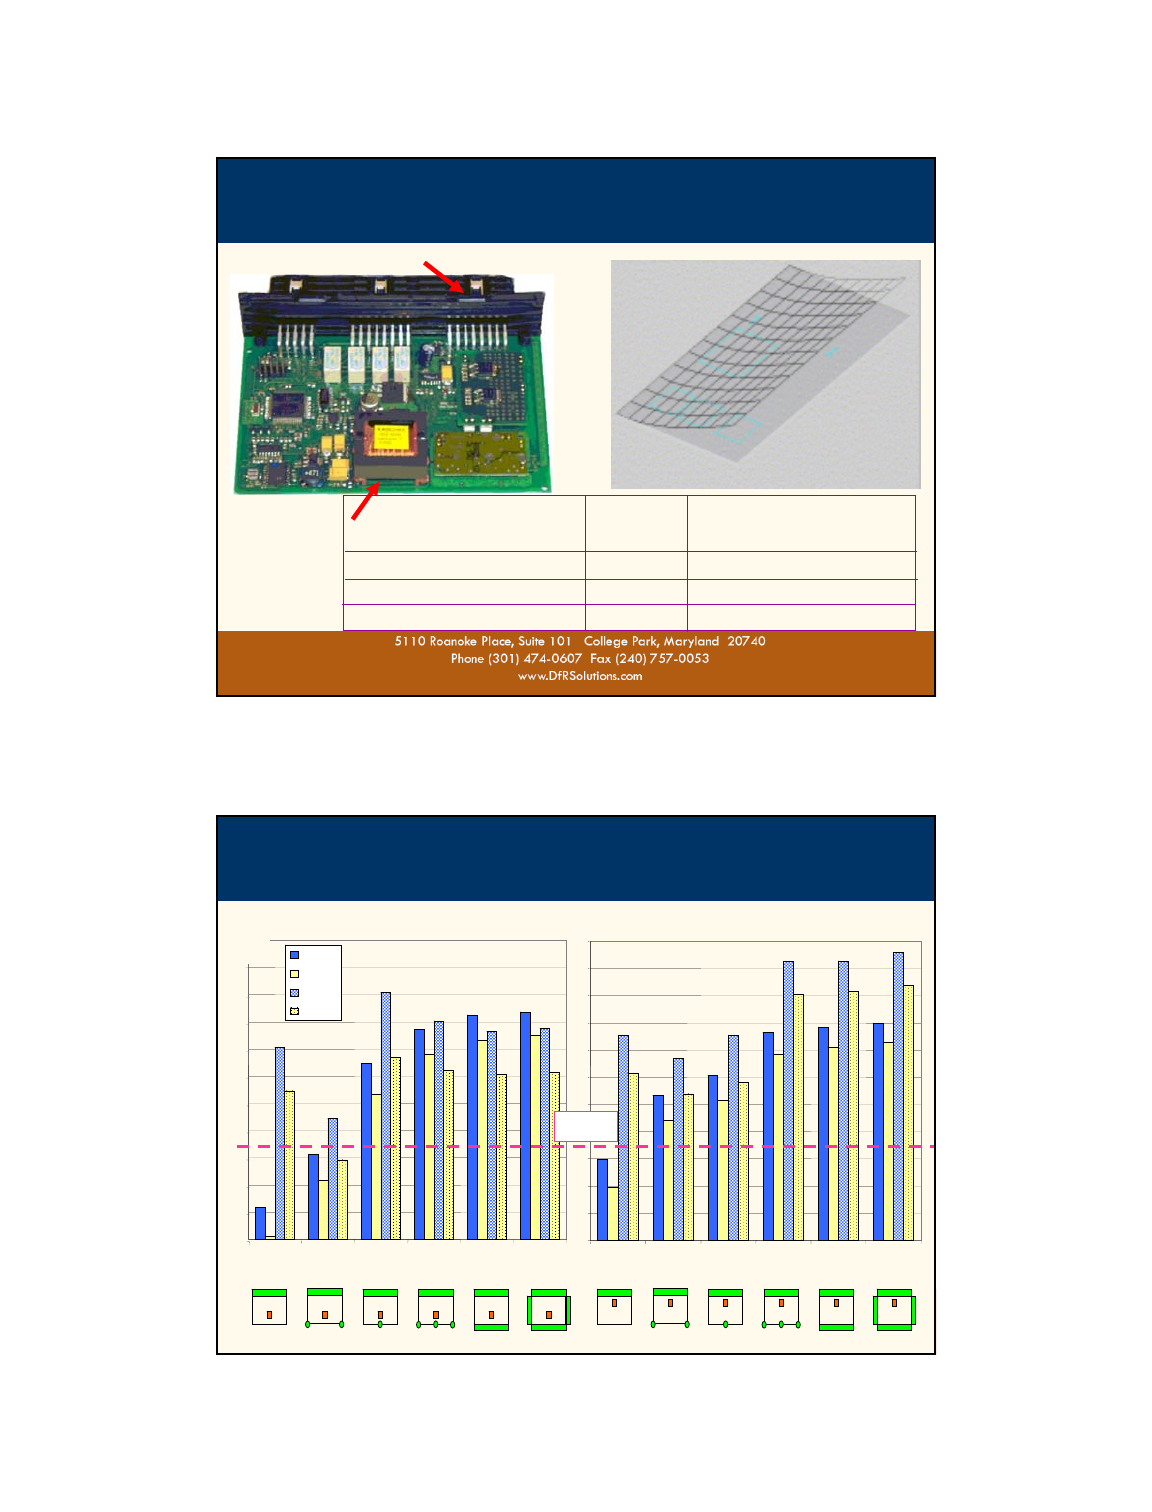
4.6) PoF Example
– E/E Module Vibration Analysis
Transformer
A Large Mass,
will drive a Large
Vibration Modal
Response
Connector Provides Primary PCB Support
Original CAE Guided Redesign
Adds Back Edge Support
Board Displacement (mils) 13.95 1.15
Natural Frequency (Hz) 89 489
Vib. Durability Calculation 25 Days > 50 Years
CAE Modal Simulation of Circuit Board Flexure
44
©2008
4.6) PoF Example Vibration Durability Calculations
-For Alternative PCBA Support & Mass Locations
ORIGINAL TRANSFORMER LOCATION
1
10
100
1000
10,000
100,000
1M
10 M
100 M
1000M
Edge1
(Connector) Edge1 &
Corners Edge1 &
Middle Edge1,
Corners
& Middle,
Edge1 &
Edge2 All Edges
|| R101
+ R102
|| R825
+ R824
TRANSFORMER RELOCATED
Edge1
(Connector) Edge1 &
Corners Edge1 &
Middle Edge1,
Corners
& Middle,
Edge1 &
Edge2 All Edges
DAYS TO
FAILURE
@ 2 Hrs
Vib / Day
|| +
|| +
|| +
|| +
|| +
|| +
|| +
|| +
|| +
|| +
|| +
|| +
|| +
|| +
|| +
|| +
|| +
|| +
|| +
|| +
|| +
|| +
|| +
|| +
3650 Days
(10 Years)
45
©2008
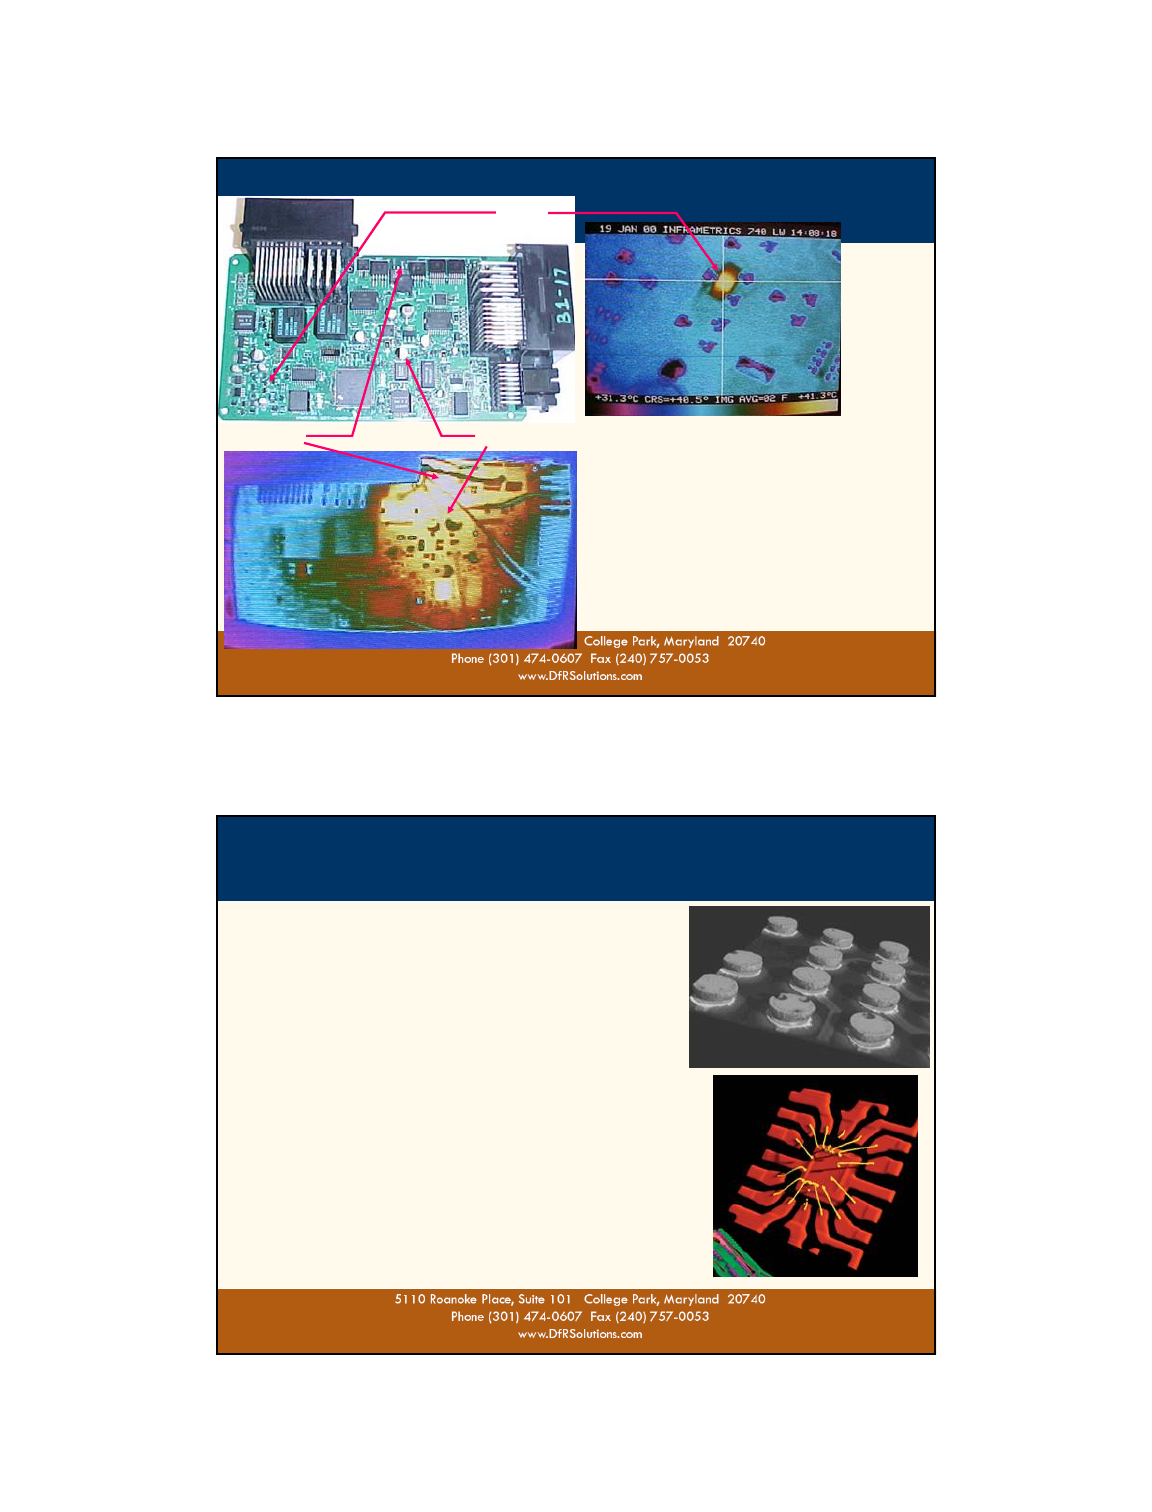
Infrared Thermal Imaging Reveals Hot Spots From
Concentration of High Power Component
Surrounding Heat Sensitive Alum. Electrolytic Cap.
4.6) PoF Example
-Thermal Stress Balance/Distribution & Stress Avoidance
Another Design Uses an Array of Thermal Vias as a
Heat Spreader to Lower Peak Temperatures.
Alum. Caps Located Away From High Power Areas
Alum.
Caps
Alum. Caps
Away From
Heat
46
©2008
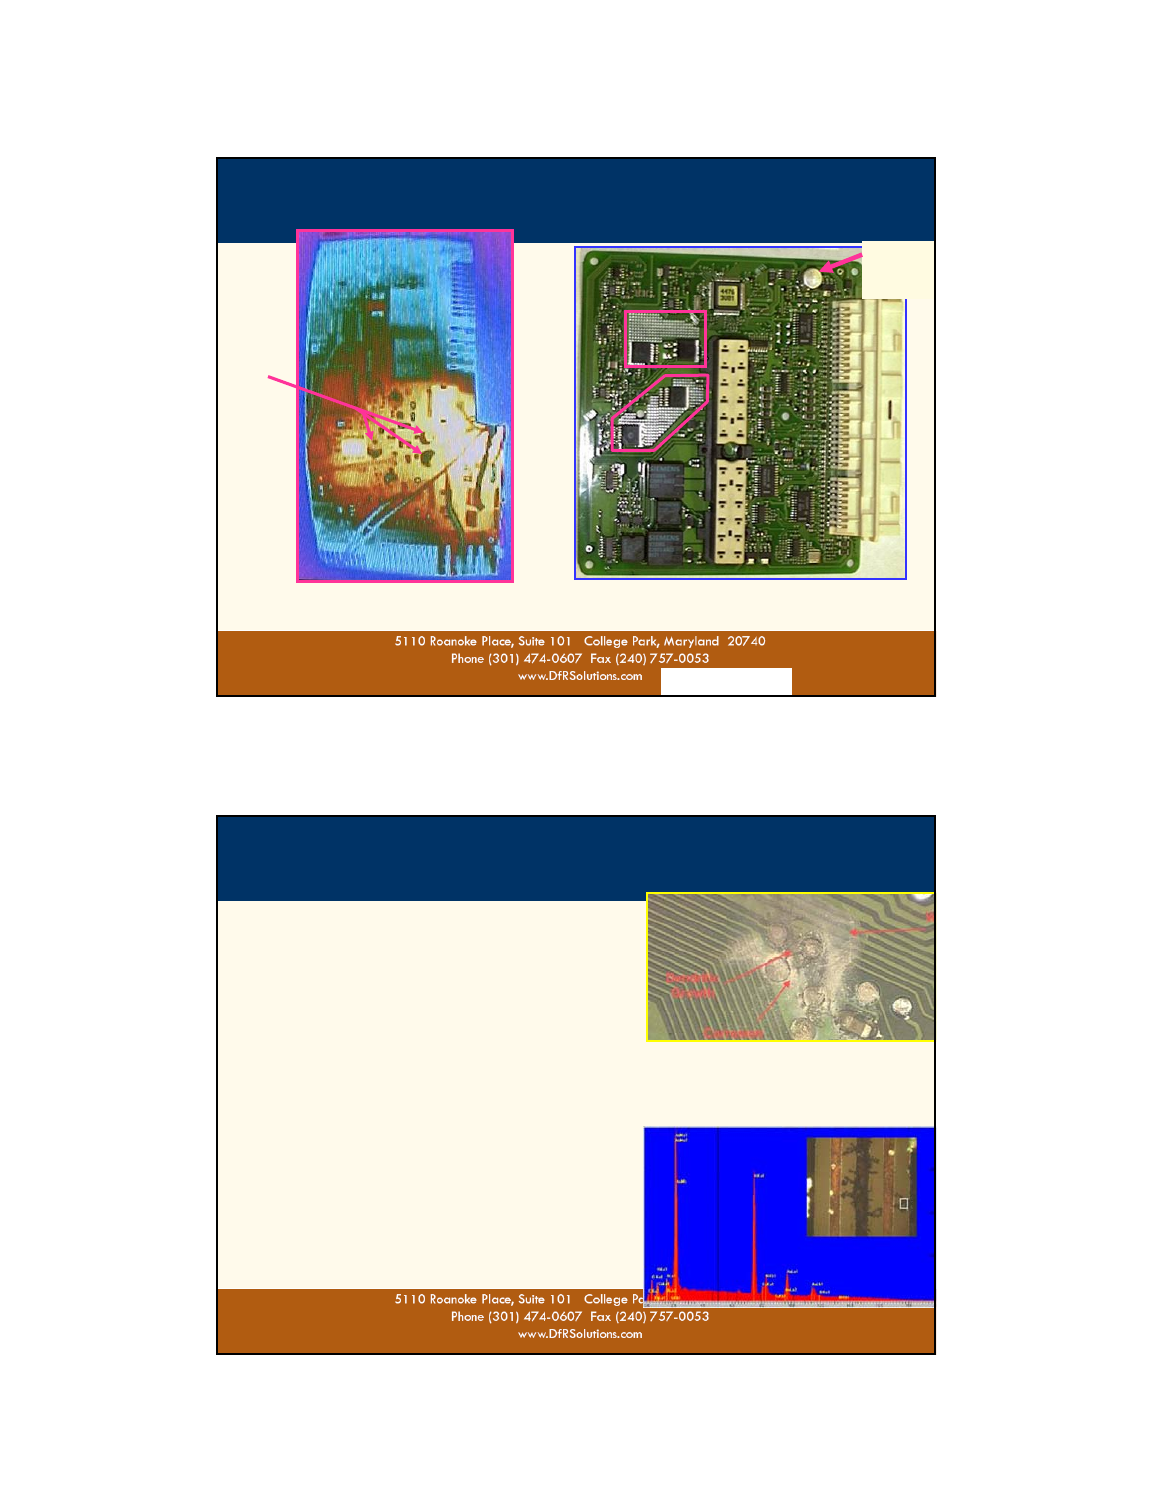
4.6) PoF Example - Moisture/Contaminate Failures
- Electro-Chemical Metal Migration Shorts - a.k.a. Dendritic Growth
Excessive Ionic Residue Contaminates on
Circuit Board can interact with atmospheric
humidity to form an electrolyte.
When a voltage differential is present
across a small distance copper ions can be
excited to migrate from the anode to the
cathode of the circuit ( + to -).
A copper trail will be deposited along the
way that will eventually support current
leakage short circuits.
4 factors are required:
1) Excessive Ionic Residues
2) Humidity (typ.>65% R.H. varies with Temp.
3) Exposed Copper.
4) Voltage difference bias over
a short distance
Ionic Chromatograph.
Identifies Electro-Chemical
Contaminates From Manuf. Processes

47
©2008
4.6) PoF Example - Moisture/Contaminate Failures
- Detrimental Contaminates
Chloride Residues
One of the more detrimental residues found on PCB
Typically related to flux residues.
Chlorides will initiate and propagate electrochemical failure mechanisms, such as
dendrite growth metal migration and electrolytic corrosion, when combined with
water vapor and an electrical potential.
Levels > 2 mg./sq. in. typically can not be tolerated.
Bromide residues
Generally related to bromide fire retardant in epoxy-glass laminates.
Can also come from solder masks, marking inks, or fluxes with bromide activators
Fire retardant, bromide is not typically degrading to long-term reliability of PCBs.
Bromide from a flux residue, can be very corrosive
Epoxy-glass laminate bromide levels typical range of 0 - 7 mg/sq. in.
Bromide levels >12 mg./sq. in. can be detrimental on organic PCB
Levels between 12-20 mg./sq. in. are borderline risks
Levels above 20 mg/sq. in. are a significant risk especially if from flux residues.
48
©2008
4.6) PoF Example - Moisture/Contaminate Failures
- Detrimental Contaminates
Sulfate Residue
Sulfates can come from many sources, contact with sulfur-bearing paper or
plastics, acid processes in fabrication, or from water used for rinsing & cleaning.
Minimal Risk: 0.0 – 1.0 mg./sq. in.
Marginal Risk: 1.0 – 3.0 mg./sq. in.
High Risk: > 3.0 mg./sq. in.
Sulfate levels above 3.0 mg./sq. in. are corrosive & detrimental to circuit reliability.
With sulfate levels above 3.0 mg/ sq in, look for a sulfate-bearing chemical used
in processing especially sodium/ammonium per-sulfate and sulfuric acid.
Nitrate Residue
Nitrate has approximately the same electronegative corrosivetivity as sulfate.
The mg./sq. in residue concentration risk levels for sulfate also apply to nitrate.
49
©2008
4.6) PoF Example - Moisture/Contaminate Failures
- Detrimental Contaminates
Wear Organic Acids (WOA)
WOAs like adipic or succinic acid, are activators in many solder fuxes
Residue levels vary greatly with the flux delivery system (foam, spray, paste) and
the heating profile the determines the rate of consumption during soldering.
Low solids solder paste: 0-20 mg./sq.in.
Spray-applied, low-solids flux: 20-120 mg./sq.in.
Foam-applied flux process: 120-150 mg./sq.in.
Water soluble flux w/good cleaning: 0-15 mg./sq.in.
Water-soluble fluxes generally have a much lower WOA content than low-solids
(no-clean) fluxes.
WOA levels are under 150 mg./sq. in. are generally not a risk.
Excessive WOA amounts (>150 mg/in2) present a significant PCB reliability risk.
Un-reacted WOA flux residues will readily absorb atmospheric moisture then
support corrosion and the formation for current leakage dendritic growth failures.
50
©2008
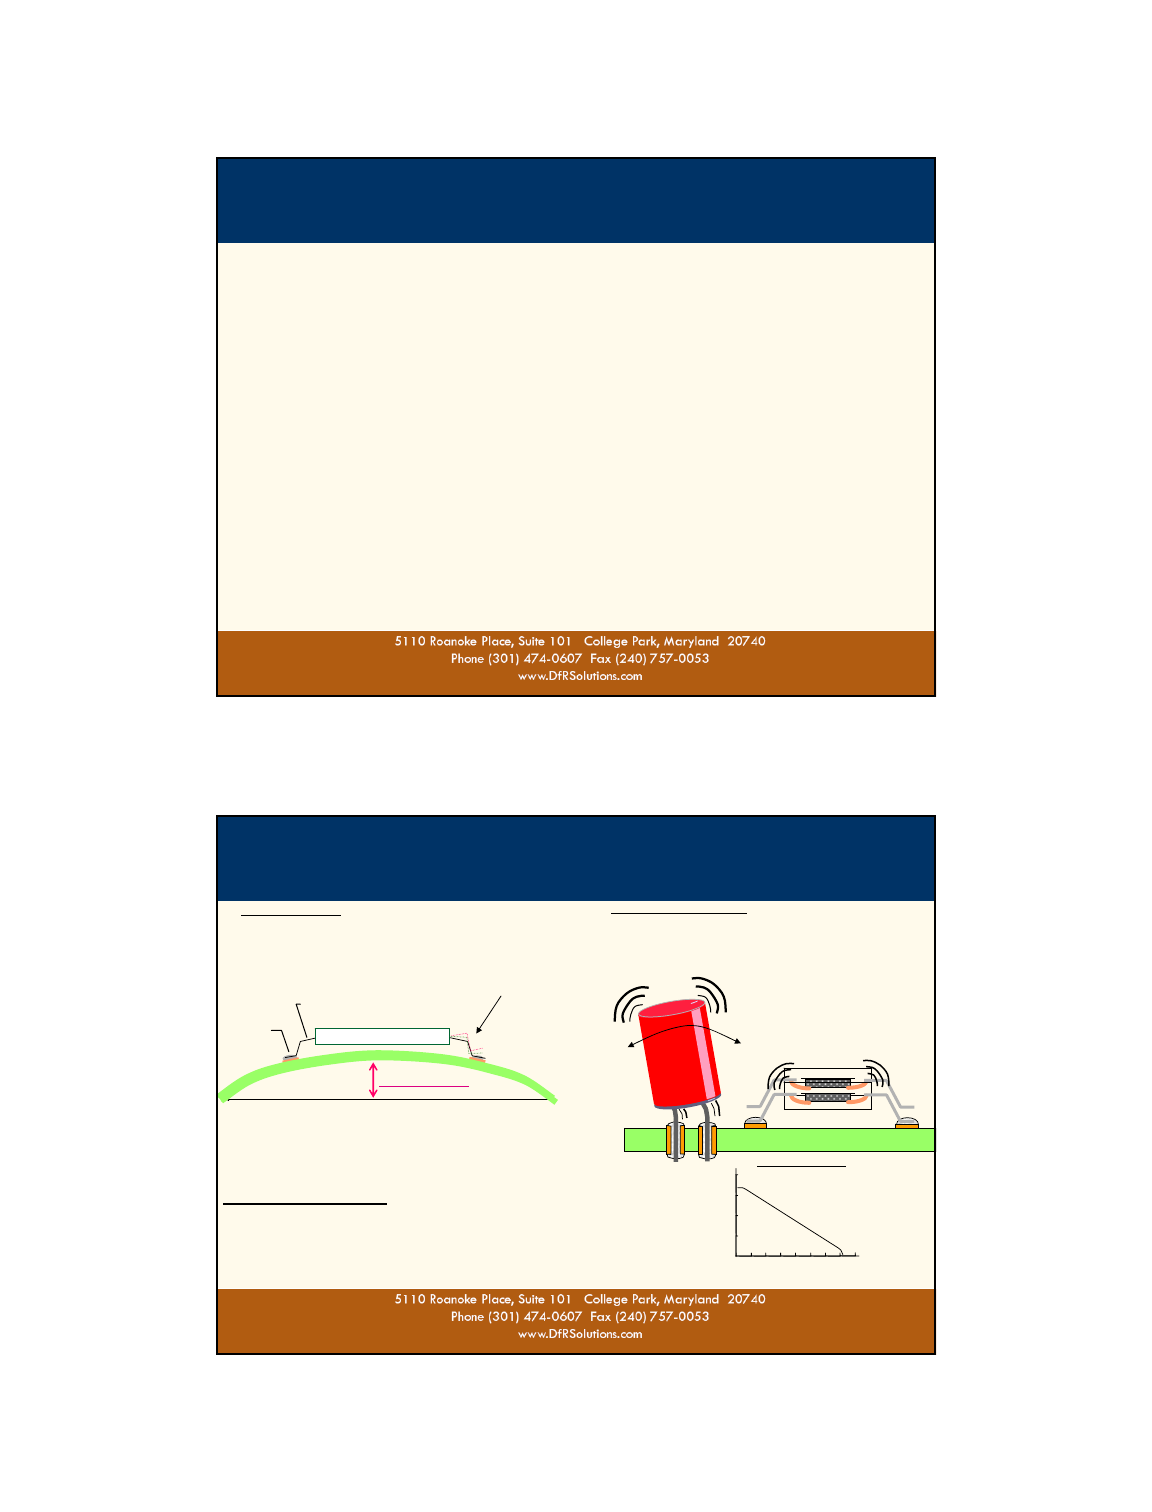
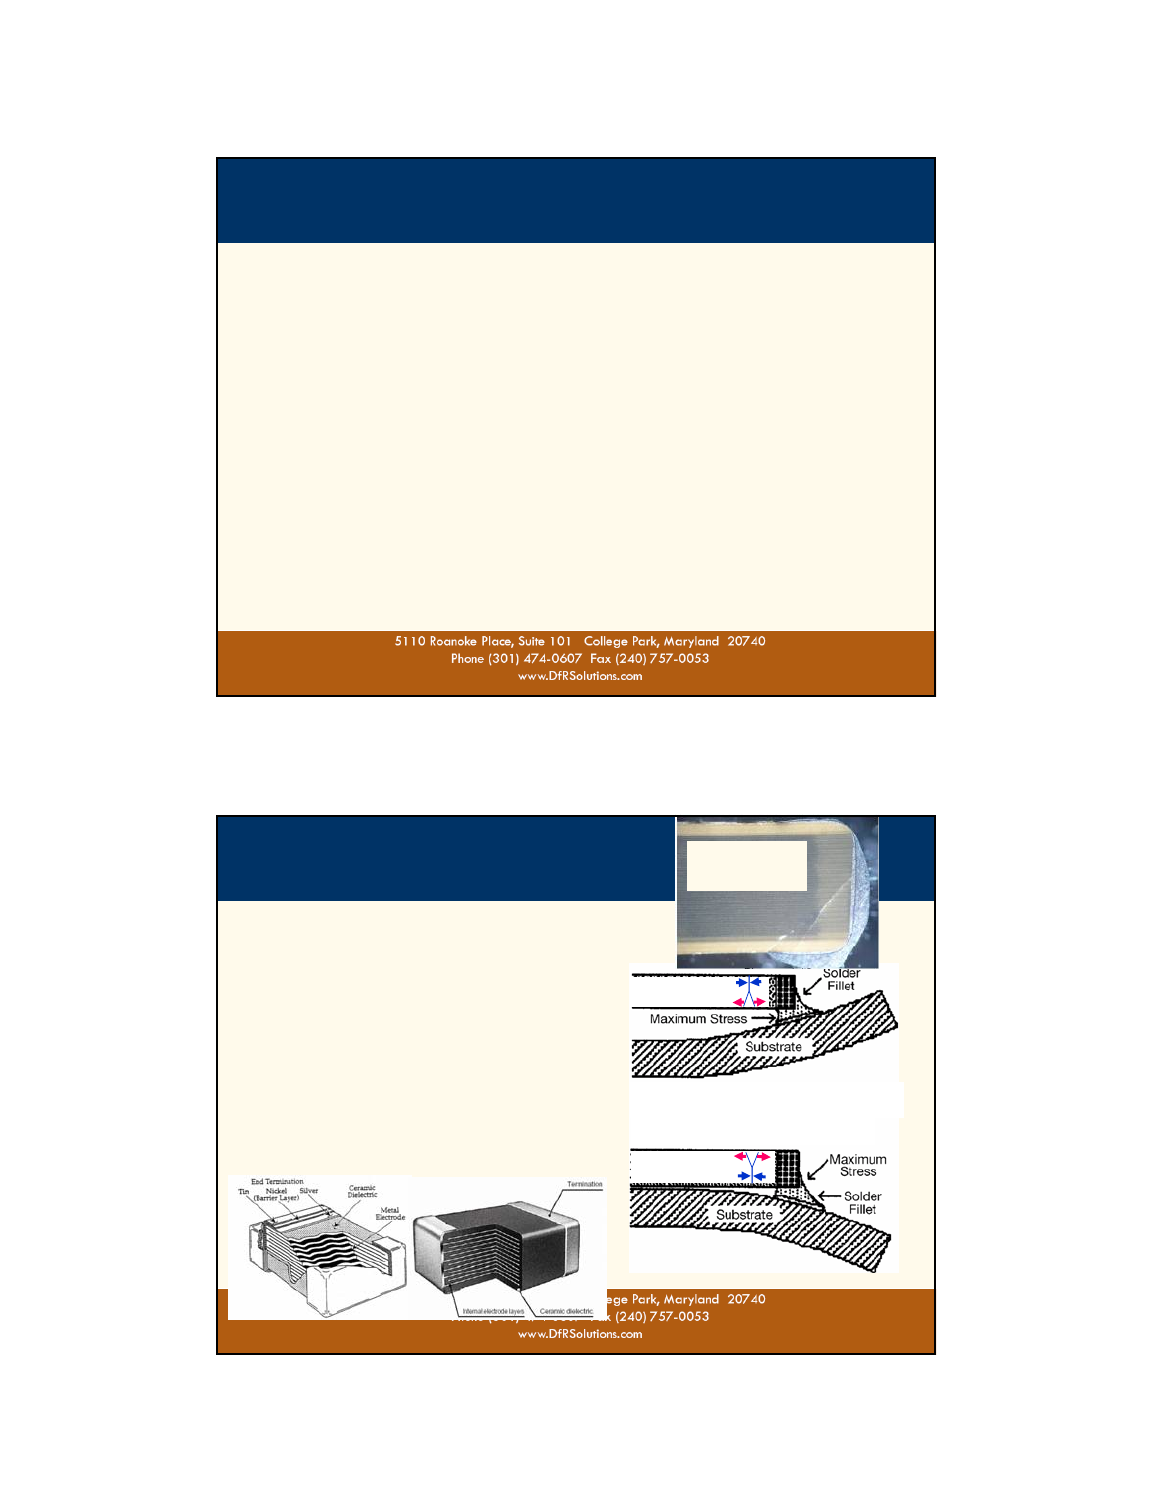
4.6) PoF Example
- Capacitor Flex Cracking Examples
Capacitor
Capacitor
Ends Bend Down
Tensile Stress (Crack Site) on Top
Ends Bend Up
Tensile Stress (Crack Site) on Bottom
Cracked
Chip Cap,
Capacitor are fundamental, passive electric devices for
energy/electron/charge storage.
A cap is formed by two parallel conducting plates
(electrodes) separated by a dielectric material.
- Dielectrics are insulators, poor conductor of electricity
that support electrostatic fields. Rather than passing
an electric current, dielectrics absorb electronics into
an electro-static field.
For solid dielectrics such as Barium Titanate (BaTiO3) a
hard, brittle ceramic, many small plates/dielectric
sections are stacked in parallel to create a large
capacitance in a very small package.
The brittle fragile nature of the thin dielectric ceramics
can result in fracture cracks in the capacitors if their
circuit boards experience occasional bending or flexing.
51
©2008
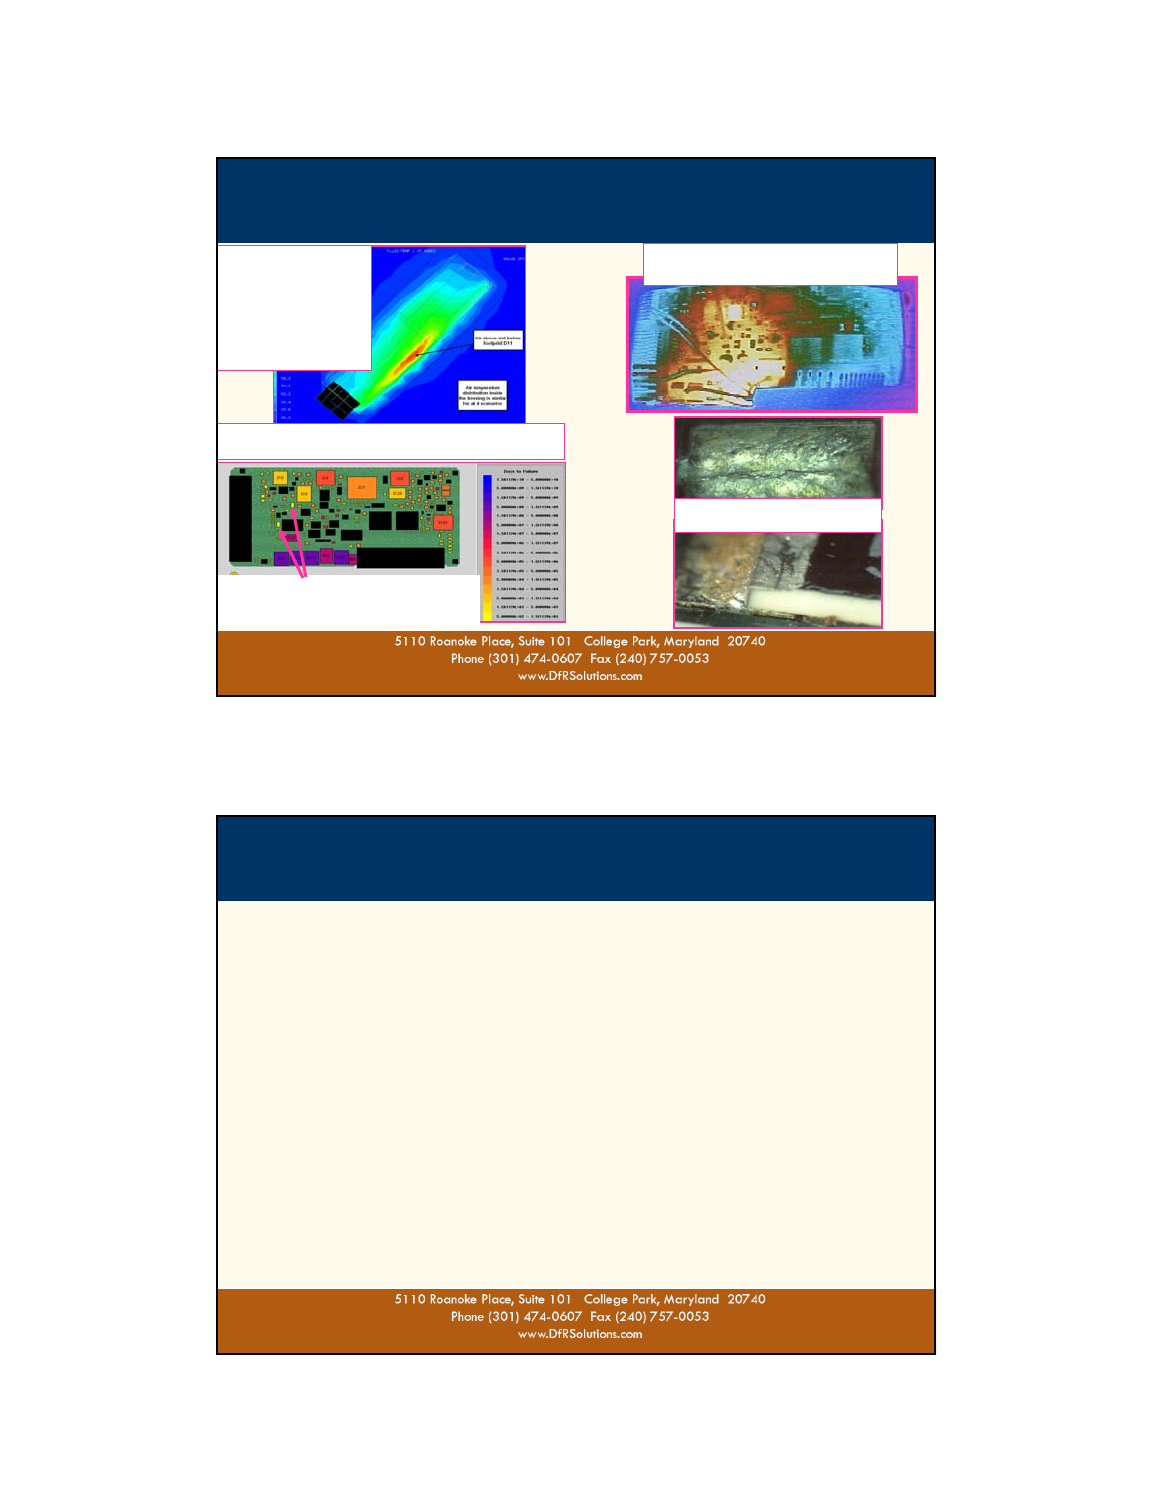
4.6) PoF Example
- Thermal Stress & Thermal-Mech. Durability
Durability Simulations Identifies Most Likely
Parts to Fail Due To Thermo-Mechanical Fatigue
Identified (Large Body 1020-S.M. Resistors)
Thermal Analysis
Identifies Internal
Thermal Stress &
Overstress “Hot Spots”
From Power Dissipation
& Environment
Conditions.
1020 Resistor Fatigue Confirmed
In Accelerated Life Test
Infrared Thermal Imaging Of Thermal
Stress & Overstress “Hot Spots”
Thermal-Mechanic Durability Modeling to Identify Potential
Intermittent Circuits Due to Themo-Mechanical Fatigue
52
©2008
5) Manufacturing Issues
Highly Reliable Products Need To Be
Built Right As Well As Designed Right.
A Robust Well Balanced Design Can Be Rendered
Un-Reliable by Fabrication and Assembly Errors or
Excessive Variation Issues.
A Consistent and Capable Manufacturing Process and
Supply Chain is also Required

53
©2008
5) Manufacturing Issues
The 5 Most Common E/E Device Manufacturing Issues
Rework & Repair
Latent Rework & Handling
Damage (% Varies)
RE-HEAT,
REWORK &
REPAIRS
In Process Board Flexure
Cracked & Missing Components.
(Related to up to 15% Of E/E Assembly Issues).
Ionic Contaminate
(Circuit Board Cleanliness to Prevent
Humidity Related Short Circuit Growths)
(Related to up to 20% Of E/E Assembly
Issues).
ASSEMBLY & SOLDERING PROCESS
(Related to up to 60% of E/E Assembly Issues)
6 Sigma
Electro Static Discharge (ESD)
(Component Damage)
(% Varies Often Related To Spills)
Most Root Cause techniques are only call upon after a failure has happen to determine what when wrong.
But the many of same methods can also be used to determine if new products are being built right
54
©2008
6) Identifying What the Problem Is
- Root Causes Failure Analysis Techniques
Return parts Root Cause Failure Analysis always starts with
Non-Destructive Evaluation (NDE).
Designed to obtain maximum information with minimal risk of damaging or
destroying physical evidence
Non Destructive Evaluation Methods
Visual Inspection
Electrical Characterization
Optical Microscopy
Scanning Electron Microscopy
Acoustic Microscopy
Xray Microscopy
Infrared Thermal Imaging
SQUID Microscopy
Spectral Material Analysis
(Elemental Composition)
Ion Chromatography-Chemical Analysis
Destructive Evaluation Methods
Decapsulation
Microsectioning
Metallographic Metallurgical Analysis
Focused Ion Beam Milling
Electrical Transient Probe Testing
Material Property Characterization
Thermo Mechanical Analysis (TMA)
Differential Scanning Calorimetry (DSC)
Polymer Thermal-Mechanical Properties
55
©2008
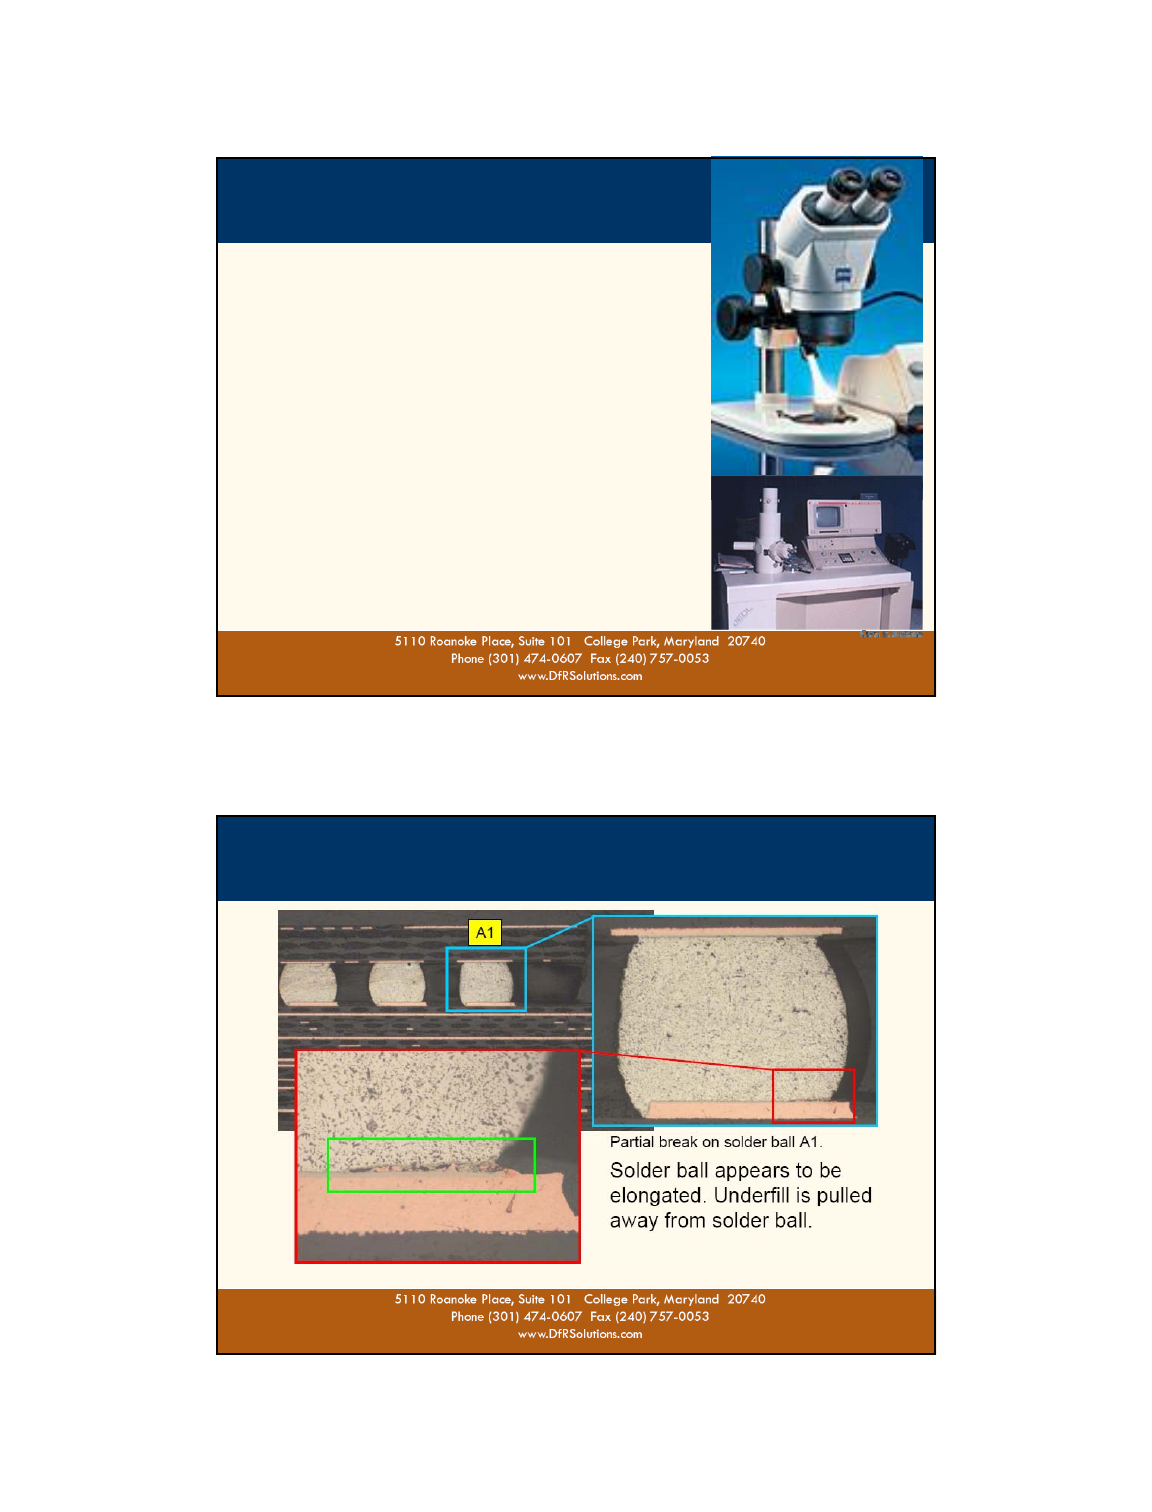
6.1 Visually Aided Inspection
- Microscopy Optical & SEM
Enables the visualization, inspection and evaluation of tiny
objects and details.
Light based optical Microscopes provides magnifications
up to 1500x, resolution down the 0.2 micrometer.
Electron beam based Scanning Electron Microscopes
provides magnifications up to 2,000,000x.
Modern professional grade microscopes are equipped with
digital imaging capture for documentation and comparison
purposes.
56
©2008
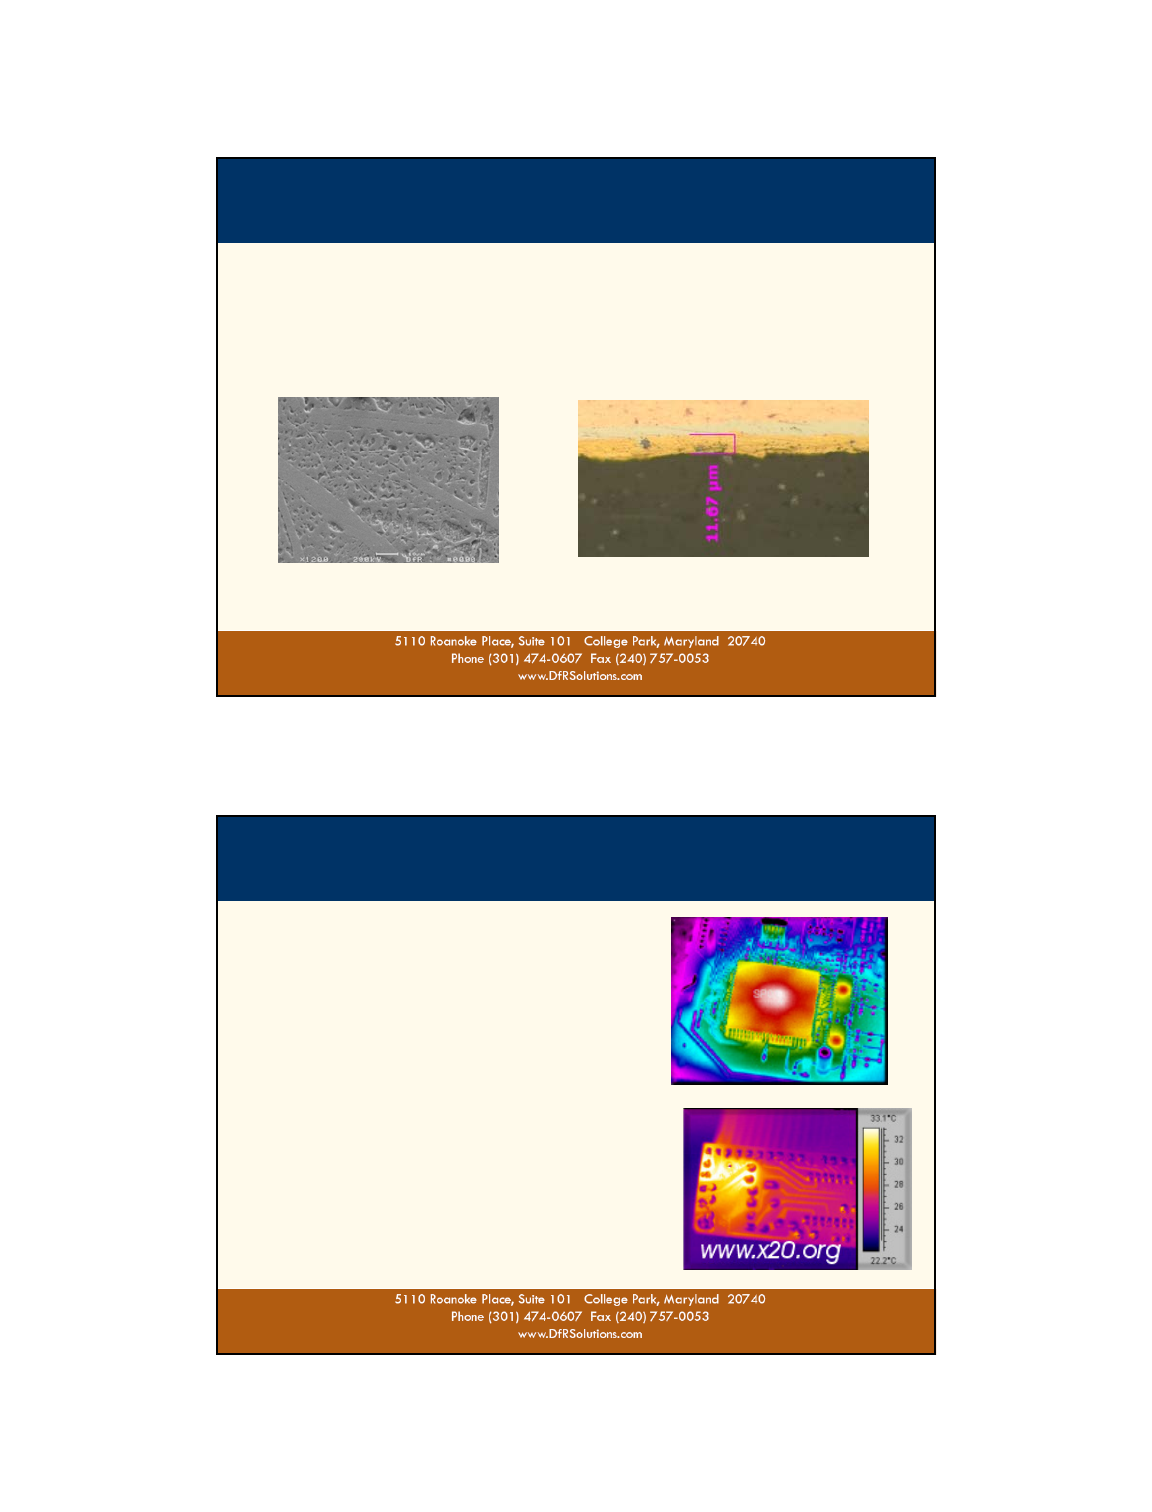
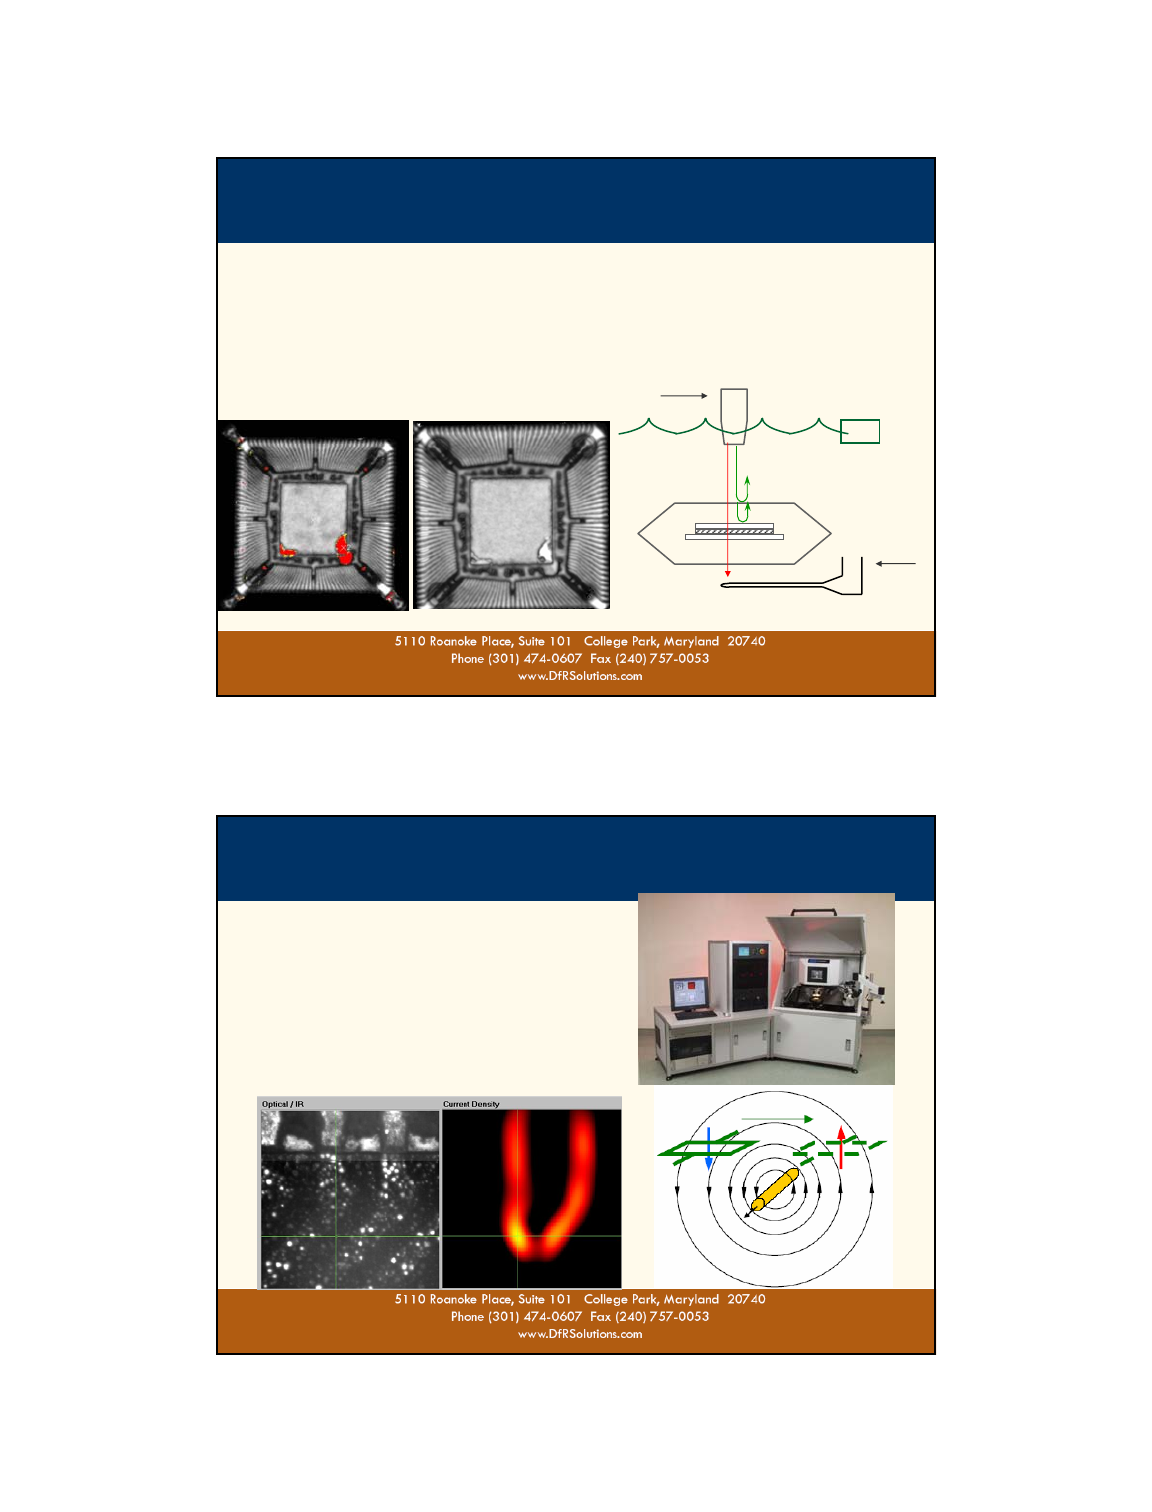
6.1) Microscopic Failure Analysis of Solder Separation in BGAs
- Root Cause: Excessive Underfill Thermal Expansion
57
©2008
6.1) Microscopic Failure Analysis of Solder Joint Fracture
- Root Cause: Failure Due to Gold Embitterment
Cross section of failed solder joint revealed excessive Gold-Tin (AuSn4) intermetallics.
SEM Energy Dispersive X-ray Spectroscopy (EDS) found solder’s gold content >8%.
Embrittlement will occur if gold content exceeds 3.5% by weight.
Excessive component gold plating allowed large amount gold to diffuse into the solder .
Controlling Factors: Excessive Gold, Soldering Temperature and Time Above Liquidus
1200x SEM image reveals needle-like
structures of AuSn4intermetallics in
the solder joint
Cross section of component with
thickness of gold plating layer.
58
©2008
6.2) Thermal Imaging Microscope
Thermography is the use of an infrared imaging
and measurement camera to "see" and "measure
" thermal energy emitted from an object.
Provides precise non-contact temperature
measurement capabilities.
Spectral range can be broken into one of four
ranges, near IR: 0.75-3 microns, middle IR: 3-6
microns, far IR: 6-15 microns and extreme IR: 15-
30 microns.
Important parameters include measurement
temperature range, spectral range, accuracy,
resolution and steady state vs. real-time
Resolution, PCBA: 15 microns
Resolution, on-die: 1 micron
Use points
Find Electrical shorts
Power Components
Identify Temperatures,
Find Hot Spots
Trace Heat Flow Paths
59
©2008
6.2) Infrared Thermal Imaging
D11
Q16
Thermal Anomalies Detected
- Q16 producing heat when is it suppose to
be in an off state - Sneak circuit detected.
- D11 detected a hot spot that exceeded
thermal bogies.
Resulting in over heating near by Alum Caps
Alum Caps
60
©2008
6.3) X-ray Microscope
Enables internal inspection through the use
of X-ray energy
Latest innovations
Digital Detector
Laminography (‘virtual’ cross-sectioning)
3D reconstruction
Nanofocus resolution
Oblique viewing
61
©2008
6.4 Acoustic Microscopy
Non destructive method for inspecting internal structures.
By mapping the echo pattern of high frequency (>20 kHz) sound waves.
Sonic energy excites loose or moveable structures.
Requires immersion in water (acoustic signals reflected by air)
Enable non-destructive detection/location of:
structures, cracks, voids and delamination
H2O
Transducer
Receive
62
©2008
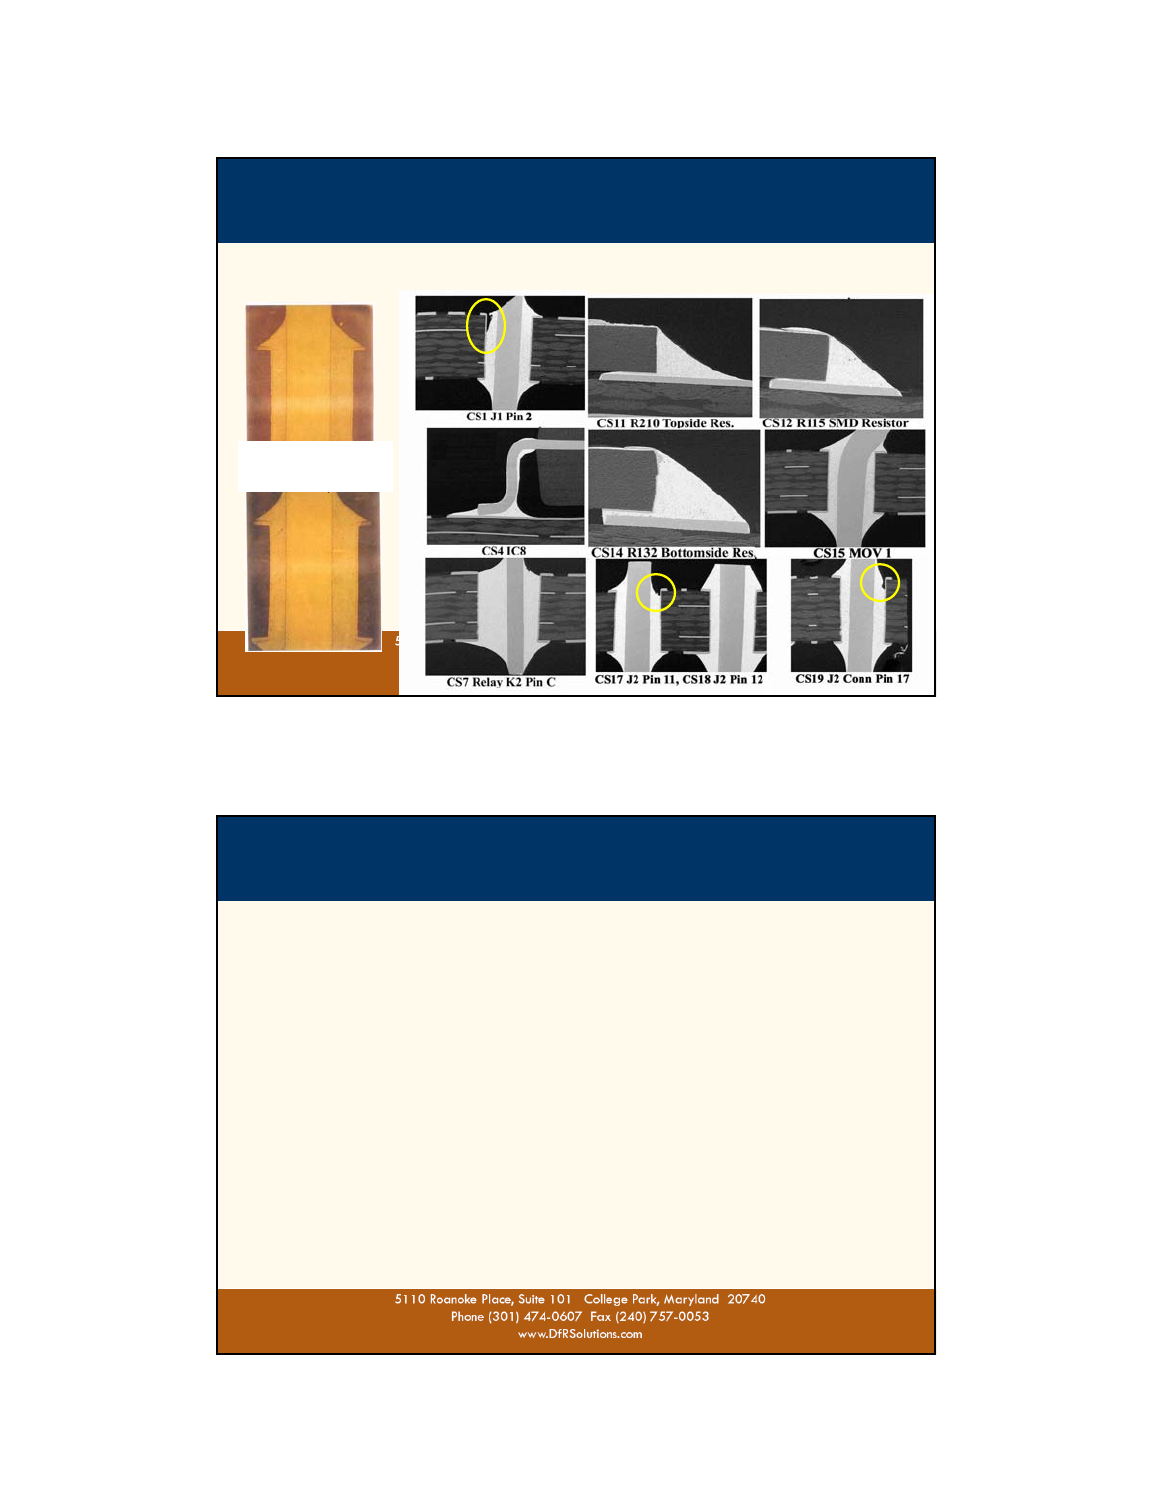
6.5) SQUID Microscopy
Superconducting QUantum Interference Device
Current flow in devices produce a magnetic field
SQUID uses a highly sensitive magnetic detector
(superconductor) to resolve these fields
Magnetic field image is converted to a current
density image, allowing for fault location
Resolution down to 300 nm
Critical technology for detecting the current path
of electrical shorts through a package or material.
63
©2008
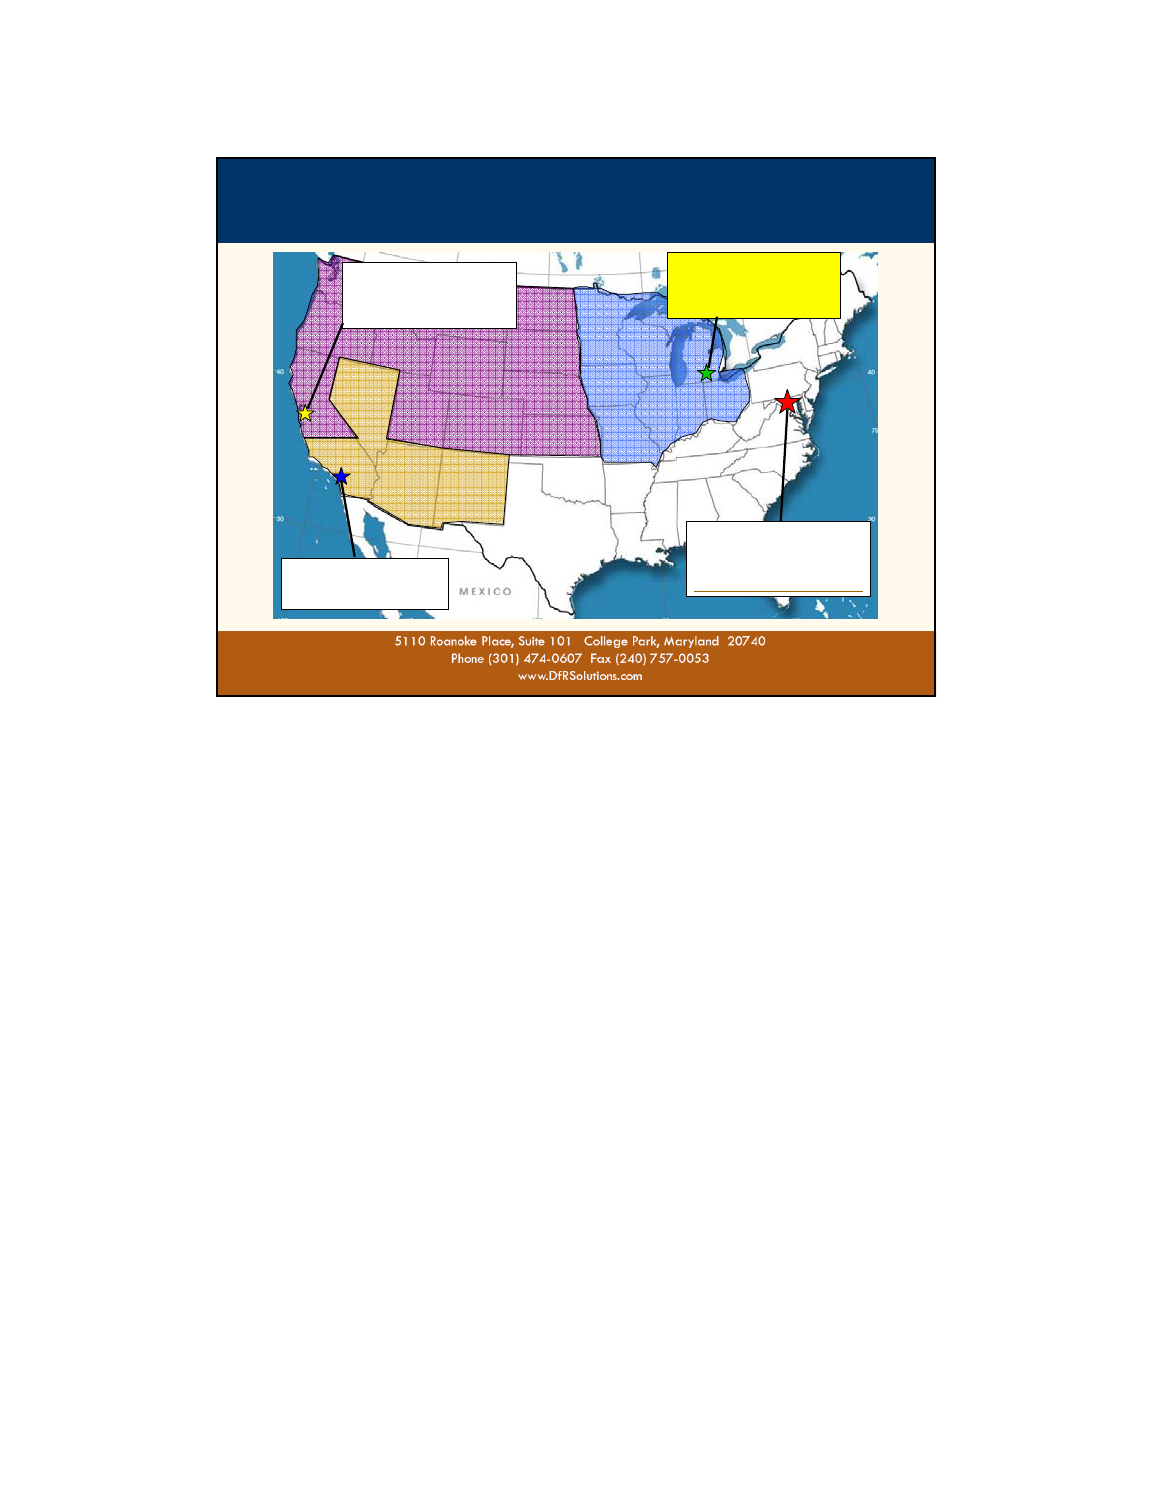
6.6) Micro Cross Sections - a Destructive Analysis technique for the
internal evaluations of component's good for detecting manuf. defects
-Metallographic Analysis involves X-Sections of metals
(i.e. Leads & Solders) for material quality evaluations.
Thru Hole Pins
Text Book Perfect
64
©2008
This Webinar is a based on a 2 day Short Course:
“Understanding Failure & Root-Cause Analysis in Electronics”
1) Introduction and Objectives
The Need for Root Cause Analysis
Difference Between Problem Solving, Failure Analysis
& RCA Of Field Failures
2) Root Cause Approaches, Management &
Reporting Methods
The” 5 Whys” Technique
The Eight Disciplines (8D) Technique
Shainin Red “X” Statistical Problem Solving
Six Sigma
Physics of Failure/ Reliability Physics
Break
3) Generic Failure Categories
Design Quality & Errors
Manufacturing Quality & Errors
Environmental & Usage Considerations - Their Role
in Over Stress & Accelerated Wear Out Failures
Environment & Self Heat Temperature Issues
Vibration, Shock & Drop
Humidity
Contaminates
4) Finding Failure Modes – Where Problems Are &
How They Manifest Themselves.
The Need for Data
Collecting & Analyzing Data for Problem Solving
Trending analysis results (plotting a timeline
Pareto Analysis
Other Data Sources
Test Reports
Warranty Data
Fleet Maintenance Logs/Reports
Customer Surveys
Investigation Interviews
Lunch

65
©2008
This Webinar is a based on a 2 day Short Course:
“Understanding Failure & Root-Cause Analysis in Electronics”
5) Fault/Failure Investigation - Identifying
What the Problems Is
- Part I) Developing a Hypothesis
Customer & Service Technician Feedback &
Interviews,
Reference Product & Technology History/Lessons
Learned
Identifying Contributing Events
Ishikawa (fishbone) diagrams
Fault Tree Analysis
Dealing with Multiple Problems – Event/Issue
Charting
6) Identifying What the Problem Is
- Part II) Return Parts Analysis
Managing a Return Part Program
Initial Issue Confirmation Functional Checks
Electrical Fault Isolation
Break
7) Identifying What the Problem Is
- Part III) Root Causes Failure Analysis
Physical Component Failure Analysis Laboratory
Methods
Cross-Sectioning / Metallographic Analysis
IC Decapsulation
Optical Microscopy
Electron Microscopy
Ion Chromatography
Surface Analysis (FTIR, EDS, XRF, etc.)
Material Analysis (DSC, TMA, TGA, etc.)
Mechanical Analysis Techniques
(Micro-tester, Bend Testing, Pull Testing, etc.)
End of Day One
66
©2008
This Webinar is a based on a 2 day Short Course:
“Understanding Failure & Root-Cause Analysis in Electronics”
8) Typical EE Failure Modes, Mechanism &
Signatures
Printed Circuit Board Substrate Issues
Manufacturing Defects
Plated Through-Hole Via Issues
Conductive Anodic Filaments
Electrochemical Migration (Dendritic Growth)
Integrated Circuit Packaging & Die Issues
Wire Bond Failures
IC Pop Corning
Integrated Circuit Die Issues
ESD/EOS
Fluid Penetration Issues (new)
Thermal Issues (new)
Break
Capacitors (Ceramic, Aluminum, Tantalum)
Passive Components
Electro-Mechanical Devices.
Terminals and Contacts
Wire Failures
Relay
Speakers & Audio Alarms PCB Assembly
Solder Quality Issues
Lunch
9)Using CAE Simulation in RCA
Vibration & Shock
Thermal Simulations
10) Developing/Implementing a Permanent Corrective
Action Plan
Developing the Corrective Action Plan
Stakeholder Teamwork & Buy In.
Fixing the Problem Rather Than Assigning Blame
Fixing the Design, the Supply Chain or Assembly Process
Building a Business Case/Getting Approval for the Plan
Internal Failure Rev. Board/Management Rpts & Approval
Customer Reports and Approval
Regulatory Agency Review & Approval
Break
Validating the Fix
Implementation Verification
Learning From Failure - Corrective Action to Prevention
Documenting the Issues
Document and Reusing Lessons Learned
Implementing the Fix
Engineering and Validation Issues
Assembly Processes, Maunf. & Quality Issues
Suppliers and Supplier Quality Issues
Wrap-Up & Adjourn
67
©2008
Want to Know More,
Contact Your Nearest DfR Solutions Location
Midwest Office
Jim McLeish
248-726-7600
jmcleish@dfrsolutions.com
Bay Area Office
John McNulty
415-806-7704
jmcnulty@dfrsolutions.com
Sales Manager, Southwest
Clayton Bonn
cbonn@dfrsolutions.com
Corporate Headquarters
College Park, MD
301-474-0607
askdfr@dfrsolutions.com

Page 1
Clifford H. Lange
Proprietary Document
Copyright © 2008
Root Cause Analysis
Mechanical Components and Systems
by Clifford Lange, PhD, PE, Ops A La Carte

Clifford H. Lange
Proprietary Document
Page 2
Copyright © 2008
Root Cause Analysis – Mechanical Components
Polling Questions
Are you familiar with creep related problems or have direct
experience with solving a creep issue?
Don’t know what creep is
Some familiarity with creep
Direct experience with creep behavior
Do you understand the application of structural reliability
methods (e.g. FORM/SORM) for the understanding of failure
mechanisms
Don’t know what structural reliability methods are
Some familiarity with structural reliability methods
Direct experience with structural reliability methods

Clifford H. Lange
Proprietary Document
Page 3
Copyright © 2008
Design for Reliability – Mechanical Components
Conform to accepted industry design standards (ASTM, SAE,
ANSI, etc.)
Avoid the need to use high tolerances (e.g. < 0.010”) and be
cognizant of tolerance stack up issues
Ensure compliance with all recommended rating guidelines
Anticipate unusual environmental effects
Incorporate contract manufacturers early in the design process
(they are the experts)
Perform reliability assessment on primary wearout
mechanisms

Clifford H. Lange
Proprietary Document
Page 4
Copyright © 2008
Critical elements of mechanical systems
Transmitting elements
Shafts, belt drives & flexible couplings
Springs & gears
Actuators, accumulators & reservoirs
Brakes & clutches
Motors, pumps & valves
Constraining, confining, & containing elements
Seals & gaskets
Bearings & Shaft sealing devices
Fixing elements
Bolted connections or threaded fasteners
Weldments
Elements supporting machinery functions
Lubrication systems

Clifford H. Lange
Proprietary Document
Page 5
Copyright © 2008
Typical failure mechanisms of mechanical systems
Stress rupture or fracture
Insufficient design
Changes in load history or component application
Fatigue
Poor material characterization or load history
Creep
Wear and/or fretting
Environmental effects
Corrosion
IGSCC
Hydrogen embrittlement

Clifford H. Lange
Proprietary Document
Page 6
Copyright © 2008
Reliability prediction for mechanical systems
Bloch, H.P. and Geitner, F.K.; “An Introduction to
Machinery Reliability Assessment;” Van Nostrand
Reinhold, 1990.
“Handbook of Reliability Prediction: Procedures for
Mechanical Equipment;” Naval Surface Warfare
Center – Carderock Division; CARDEROCKDIV,
NSWC-94/L07, March 1994.

Clifford H. Lange
Proprietary Document
Page 7
Copyright © 2008
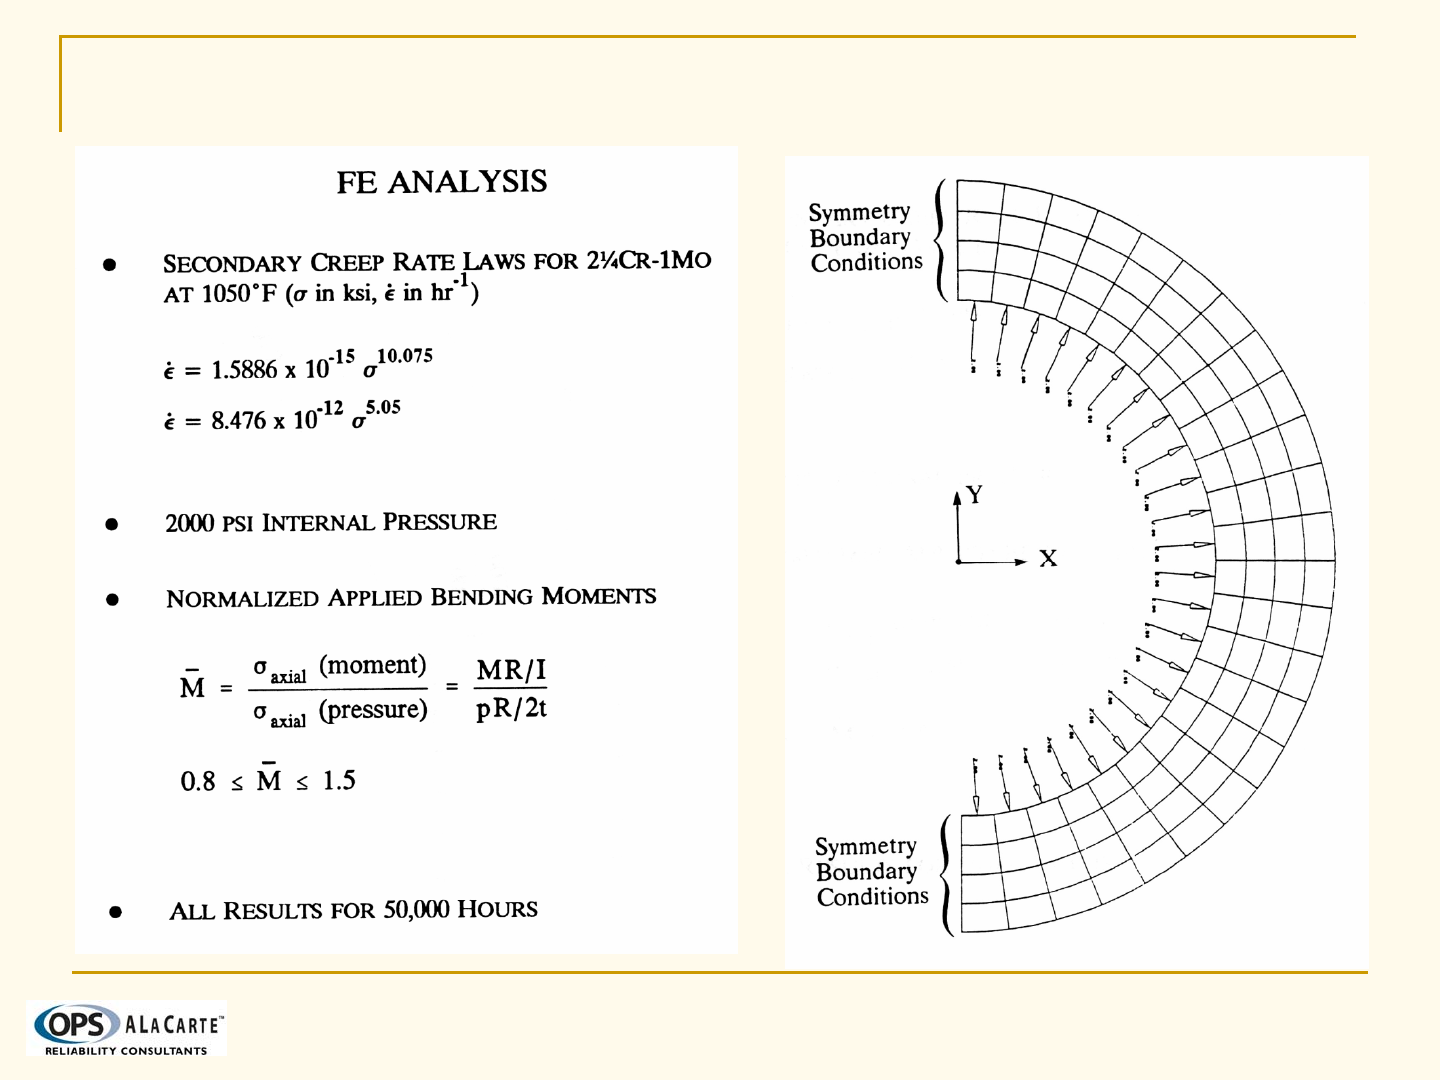
Example: Creep Failure
High temperature aluminum heater weldments
Pre-stressed concrete (water) pipe failures
Power plant steam pipe creep rupture
Steam pipe ruptures lead to in depth inspections at all aging
facilities
Main steam piping at TVA Gallatin Units 3 & 4 showed
excessive deformation (~ 10% radial strain – wall thinning)
Average diametral strain is 5.3% (swelling)
Initial “thin-wall” creep calculations indicated evidence of
bending moments but results were inconsistent with data
Thick wall “finite element” calculations improved predictions
Results indicated that the ASTM creep rate law predicts
approximately 2x service heater data
Clifford H. Lange
Proprietary Document
Page 8
Copyright © 2008
8.6 Example: Creep Failure of Steam Piping
Clifford H. Lange
Proprietary Document
Page 9
Copyright © 2008
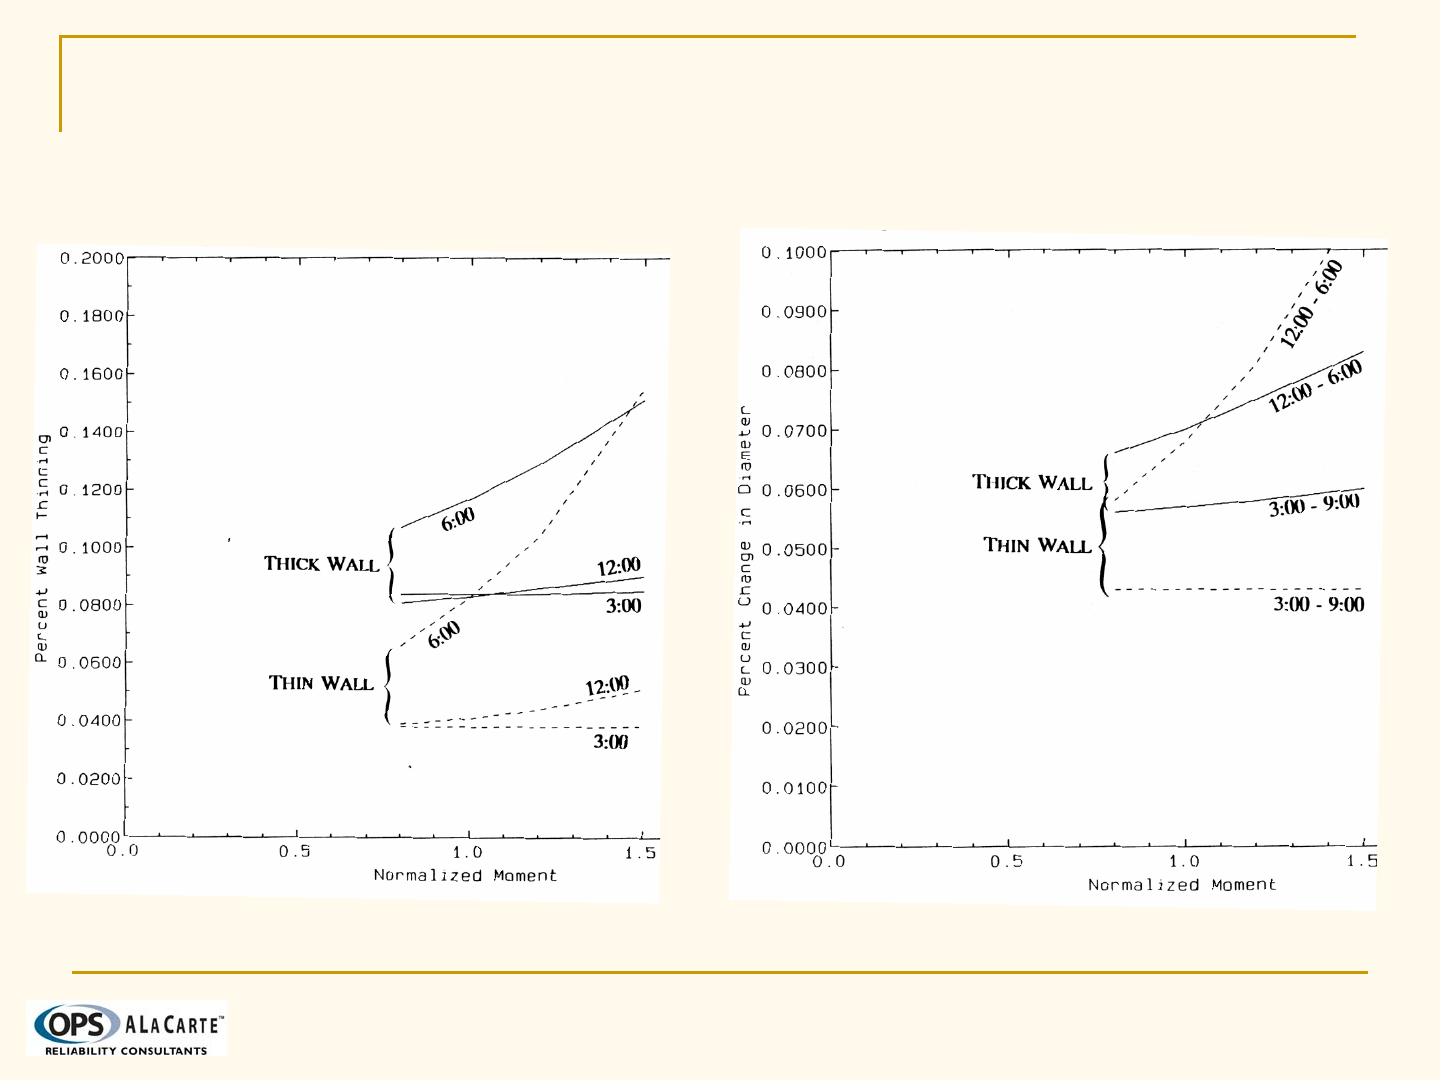
8.6 Example: Creep Failure of Steam Piping
Comparison of Wall Thinning Comparison of Diametral Swelling
Results reflect ASTM Creep Rate Law
Thick Wall creep results are more
consistent with measured diametral
swelling
Thick Wall creep results are more
consistent with measured wall thinning

Clifford H. Lange
Proprietary Document
Page 10
Copyright © 2008
8.6 Example: Structural Reliability as a RCA Tool
Wind Turbine design provides a good example of an
ongoing RCA program
Traditional fatigue analysis often focus on uncertainty with the
material properties and/or the load (e.g. stress) spectrum
New technology (e.g. Structural Reliability Methods)
employed to improve the RCA
In many cases uncertainty in the underlying load environment, the
stress response and the computational techniques employed can be
significant contributors to fatigue failures
Problems involving many different sources of uncertainty are
effectively addressed using Structural Reliability Techniques

Clifford H. Lange
Proprietary Document
Page 11
Copyright © 2008
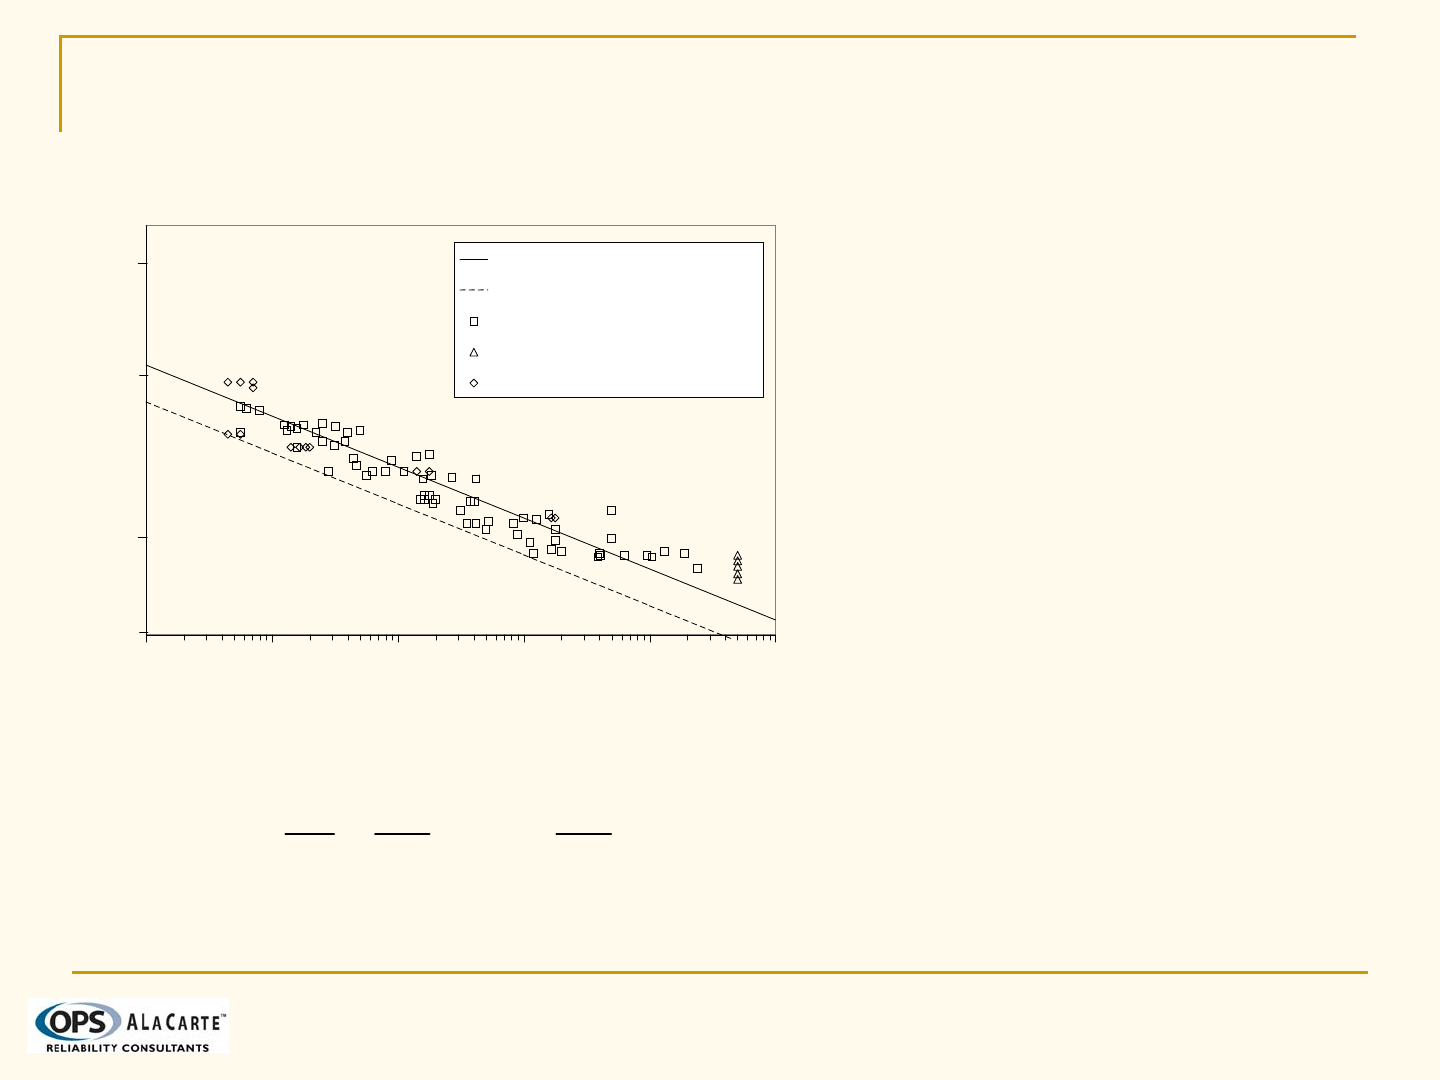
8.7 Example: Fatigue – Traditional Analysis
Wind turbine blade application
Typical S-N data for aluminum used for design
Stress spectrum assumed to be determined
experimentally – Monte Carlo simulation used
to generate sample stress distribution
Fatigue analysis considers both best fit and
95% CI on S-N properties as well as the
measured stress histogram and a bounding
load spectrum
Results compared across all assumed input
variables
Clifford H. Lange
Proprietary Document
Page 12
Copyright © 2008
8.7 Example: Fatigue – Material Behavior
Fatigue data is for 6063
Extruded Aluminum
Both a least squares best
fit and a 95% confidence
level used in fatigue
analysis
Miner’s Rule used to sum
fatigue contributions
over different stress
amplitudes
1.70
1.80
1.90
2.00
2.10
2.20
2.30
2.40
2.50
2.60
2.70
2.80
1.0E+04 1.0E+05 1.0E+06 1.0E+07 1.0E+08 1.0E+09
Cycles to Fail
Stress (MPa)
Least Sq. Fit, C=5.00E21
95% Lower CI, C=9.52E20
Teledyne Engr.
Runout Specimen
Southern Univ
50
100 N=Cσ-b
b= 7.3
250
500
1
2
2
1
1=+⋅⋅⋅⋅++=Δ
j
i
N
n
N
n
N
n
Clifford H. Lange
Proprietary Document
Page 13
Copyright © 2008
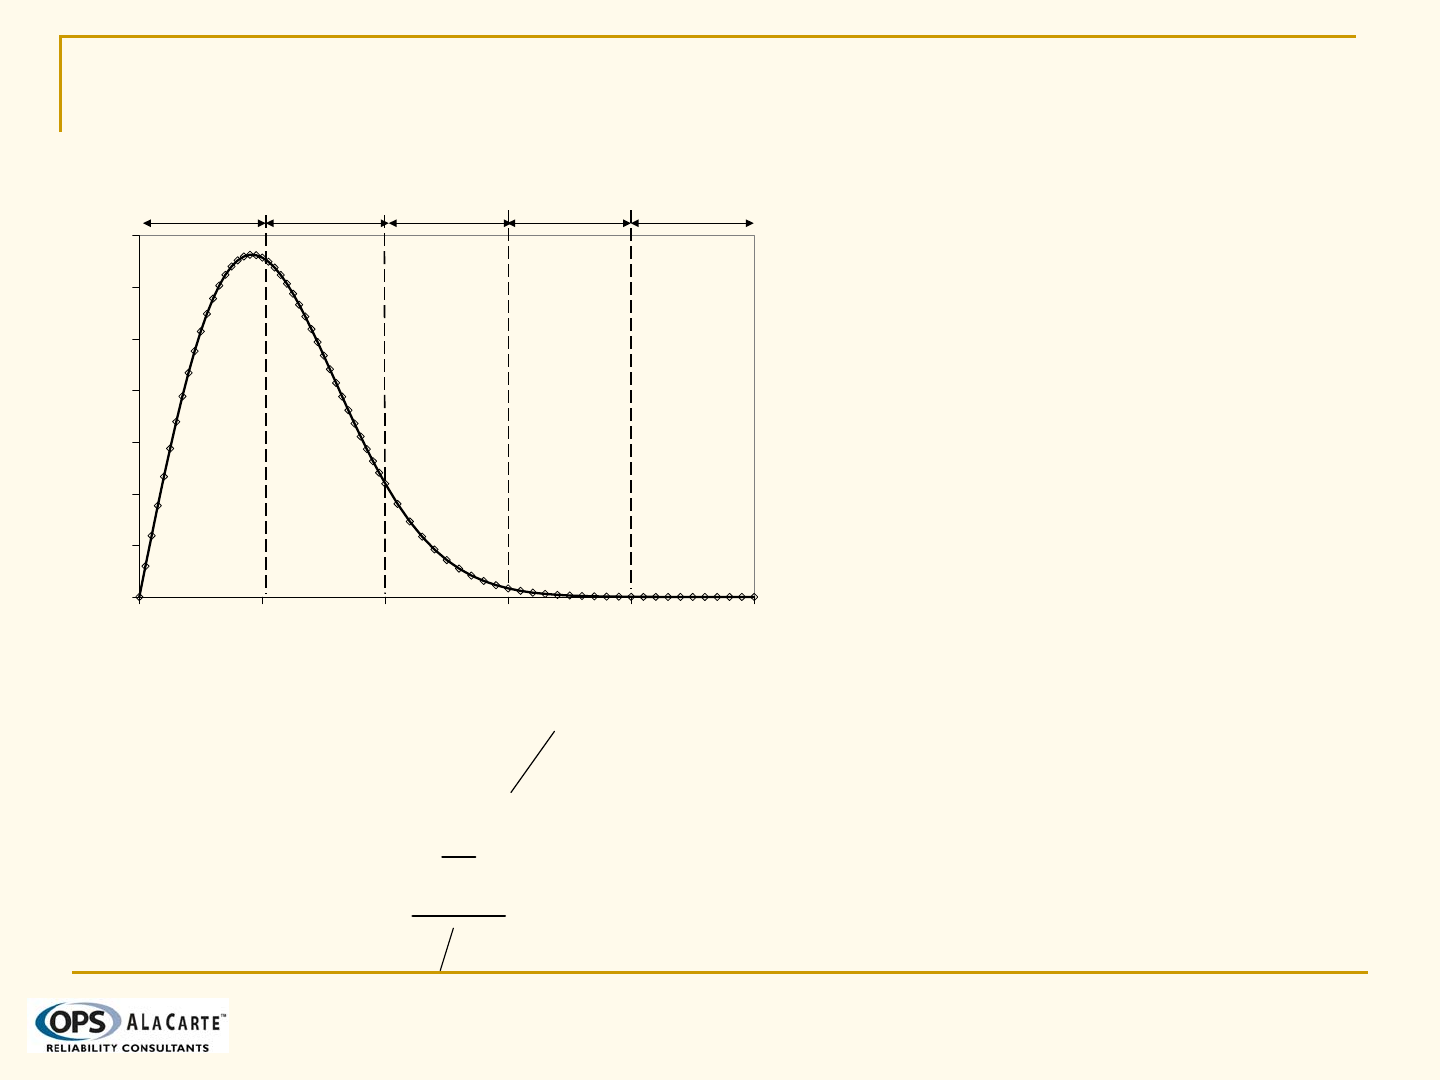
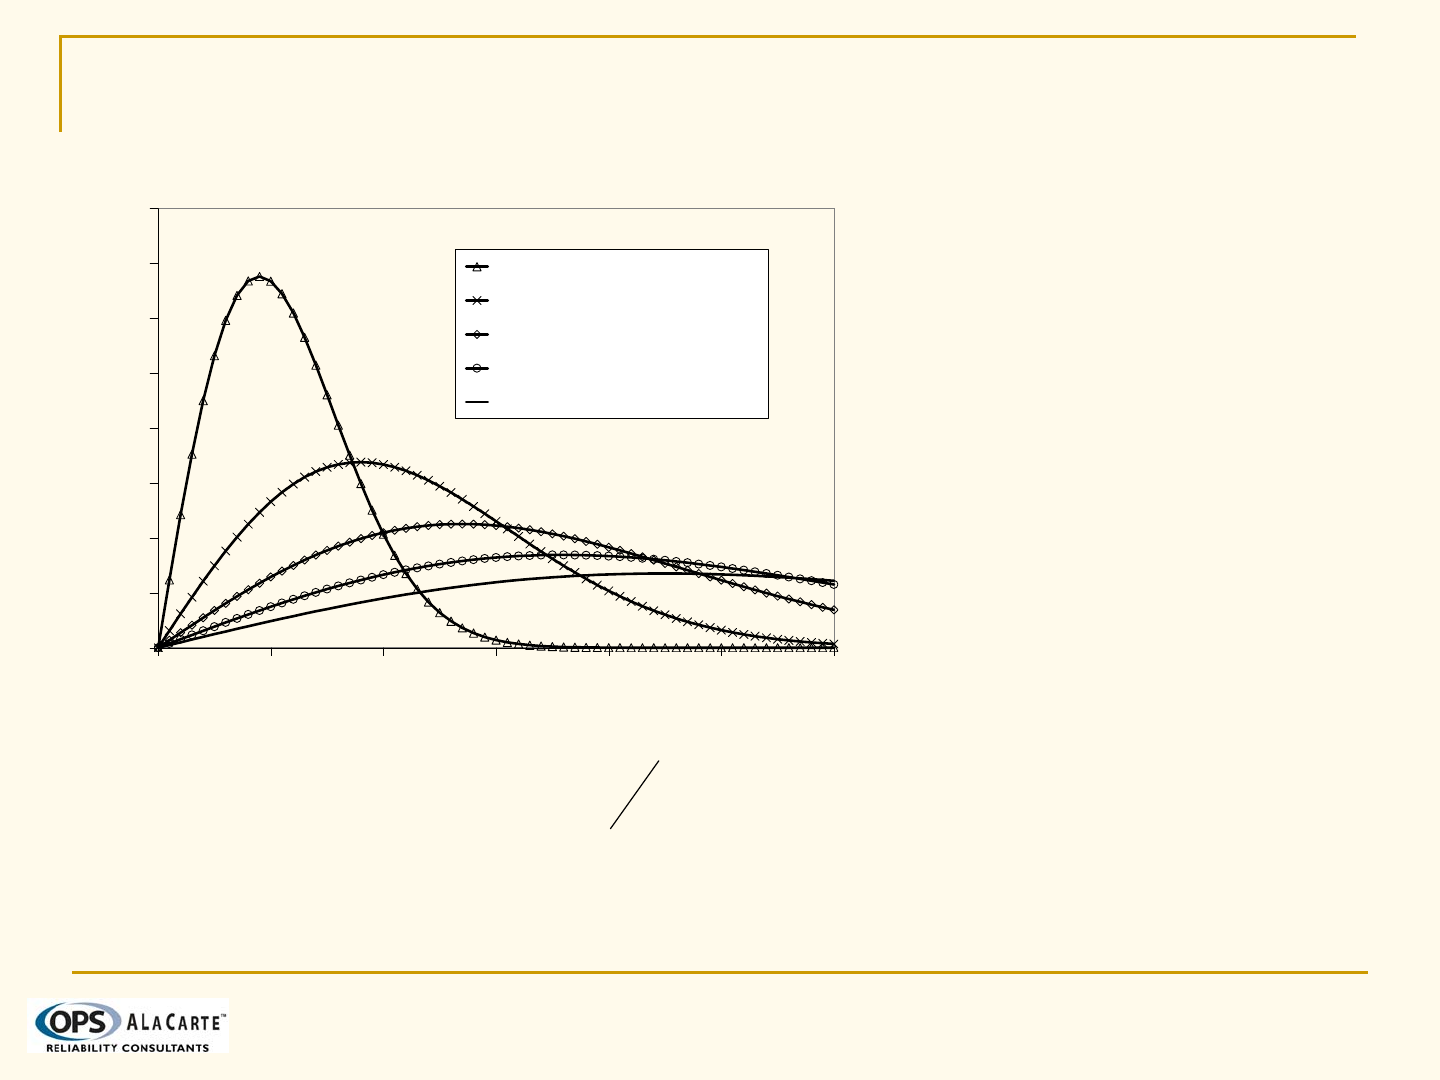
8.7 Example: Fatigue – Applied Stresses
Applied stresses for wind
turbine blade vary with
wind speed
A typical wind speed
distribution representative
of mid-west USA is
assumed
Distribution is Weibull with
α= 2.0 & μ= 6.3 m/s
5 different stress amplitude
distributions are assumed
for 5 corresponding wind
speed bins between 0 and
25 m/s.
[]
x
x
x
exXP
α
β
⎥
⎦
⎤
⎢
⎣
⎡
−
−=≤ 1
()
!1
α
β
X
x=
0
0.02
0.04
0.06
0.08
0.1
0.12
0.14
0 5 10 15 20 25
Wind Speed (m/s)
fX(x)
Bin 1 Bin 2 Bin 3 Bin 4 Bin 5
Clifford H. Lange
Proprietary Document
Page 14
Copyright © 2008
8.7 Example: Fatigue – Applied Stresses
Distribution of stress
amplitudes stresses in
each wind speed bin
also assumed Weibull
Assume αs= 2 with
shape factor βslinearly
dependent on wind
speed, X
Contribution potential
for high stress
amplitudes is evident
[]
s
s
xs
exsXSP
α
β
⎥
⎦
⎤
⎢
⎣
⎡
−
−=≤
|
1||
x
s
⋅
=
2.1
β
0
0.01
0.02
0.03
0.04
0.05
0.06
0.07
0.08
0 102030405060
Stress (Mpa)
fS(s)
Wind Speed Bin 0 - 5 m/s
Wind Speed Bin 5 - 10 m/s
Wind Speed Bin 10 - 15 m/s
Wind Speed Bin 15 - 20 m/s
Wind Speed Bin 20 - 25 m/s
Clifford H. Lange
Proprietary Document
Page 15
Copyright © 2008
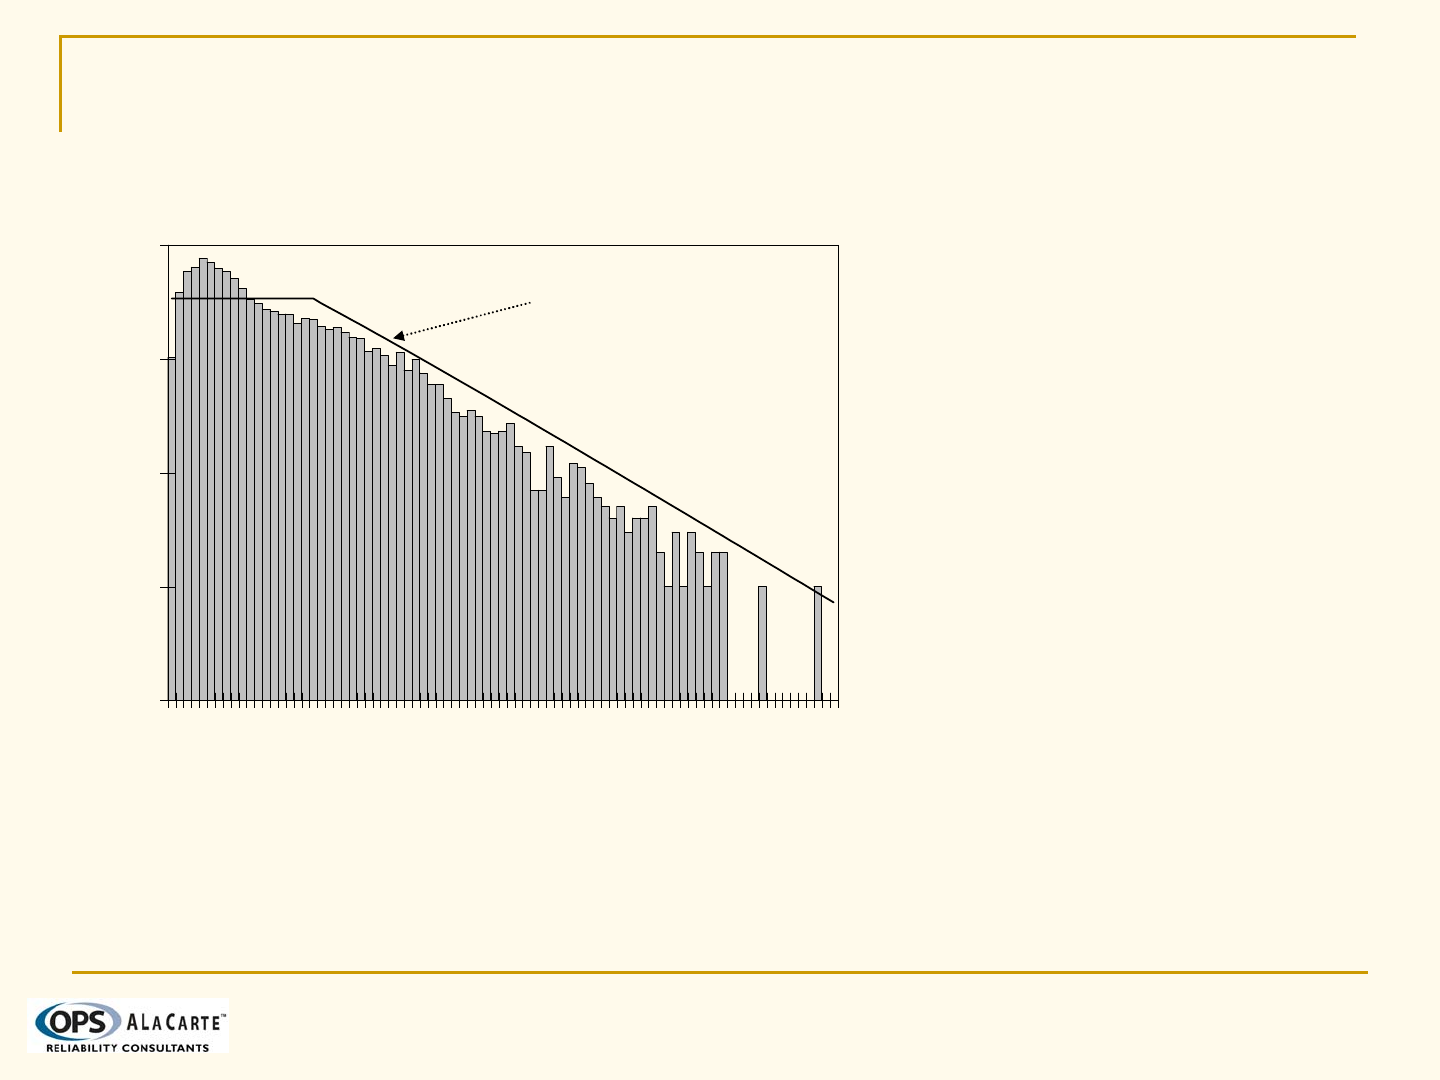
8.7 Example: Fatigue – load Spectrum
Monte Carlo simulation
used to produce 10K
stress amplitudes
Assumed design load
spectrum used to
model anticipated long
term loading conditions
Both histogram and
load spectrum used in
analyses
0.00001
0.0001
0.001
0.01
0.1
1 7 13 19 25 31 37 43 49 55 61 67 73 79 85
Stress (MPa)
Relative Frequency
Assumed Design
Load Spectrum

Clifford H. Lange
Proprietary Document
Page 16
Copyright © 2008
8.7 Example: Fatigue – Risk Level?
All 4 combinations of C and Loading used to evaluate
relative influence of each parameter & uncertainty level
Both fatigue lifetime and damage results presented
Results show satisfactory design against fatigue failure
S-N
Material Loading Lifetime:
years Damage
Δ
Cave Histogram Data 1232 .0162
Cave Design Spectrum 426 .0470
C.95 Histogram Data 216 .0925
C.95 Design Spectrum 81 .2465

Clifford H. Lange
Proprietary Document
Page 17
Copyright © 2008
8.7 Example: Fatigue – Structural Reliability
Used to evaluate designs probabilistically considering both
the mean and standard deviation of design inputs
Results are probabilities of failure and the relative
importance of each input (random variable)
For fatigue – rather than ask;
“What is the actual fatigue life of the component?”
the more appropriate question;
“With what confidence will the component meet it’s
target lifetime?”
can now be answered.
For RCA we can identify the leading contributors to failure
Clifford H. Lange
Proprietary Document
Page 18
Copyright © 2008
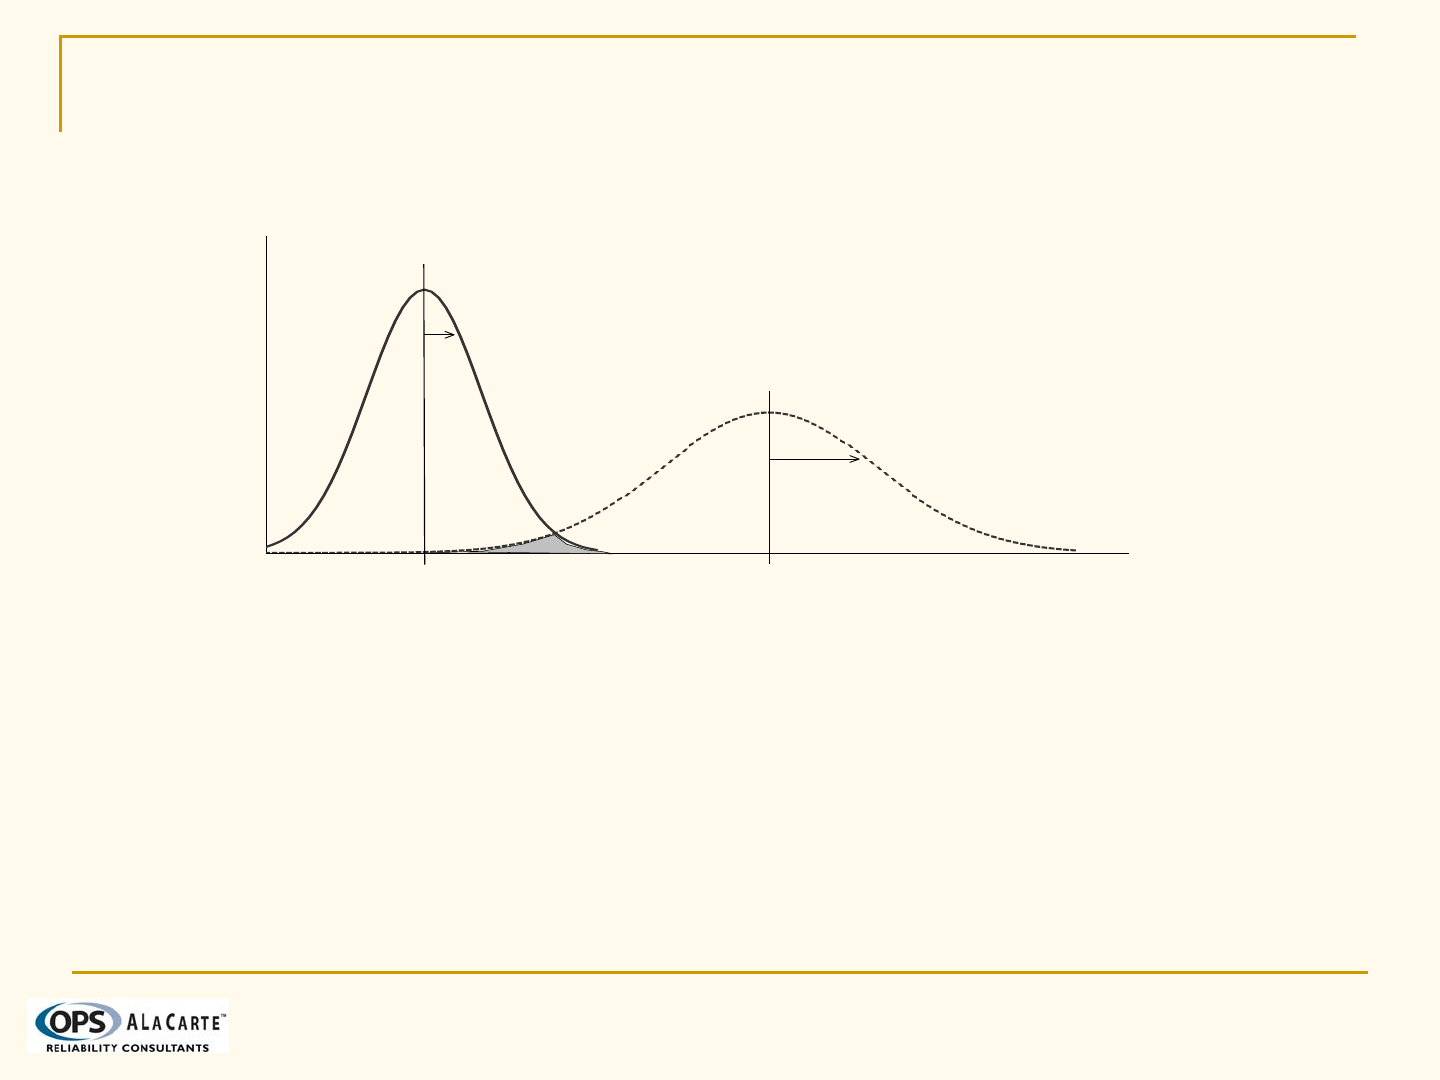
8.7 Example: Fatigue – Structural Reliability
Intuitively the risk or probability of failure can be inferred from the
overlap of the region of the load and resistance random variables
Both the relative values of the mean and variance of each random
variable affect the failure probability
σx2
σx1
μ
x2 (Load) μx1 (Resistance)
Clifford H. Lange
Proprietary Document
Page 19
Copyright © 2008
U2 =
U1 =
β
g(U) = 0
θ
2
2
2
x
x
x
σ
μ
−
1
11
x
x
x
σ
μ
−
Design Point
U2 =
U1 =
β
g(U) = 0
θ
2
2
2
x
x
x
σ
μ
−
1
11
x
x
x
σ
μ
−
Design Point
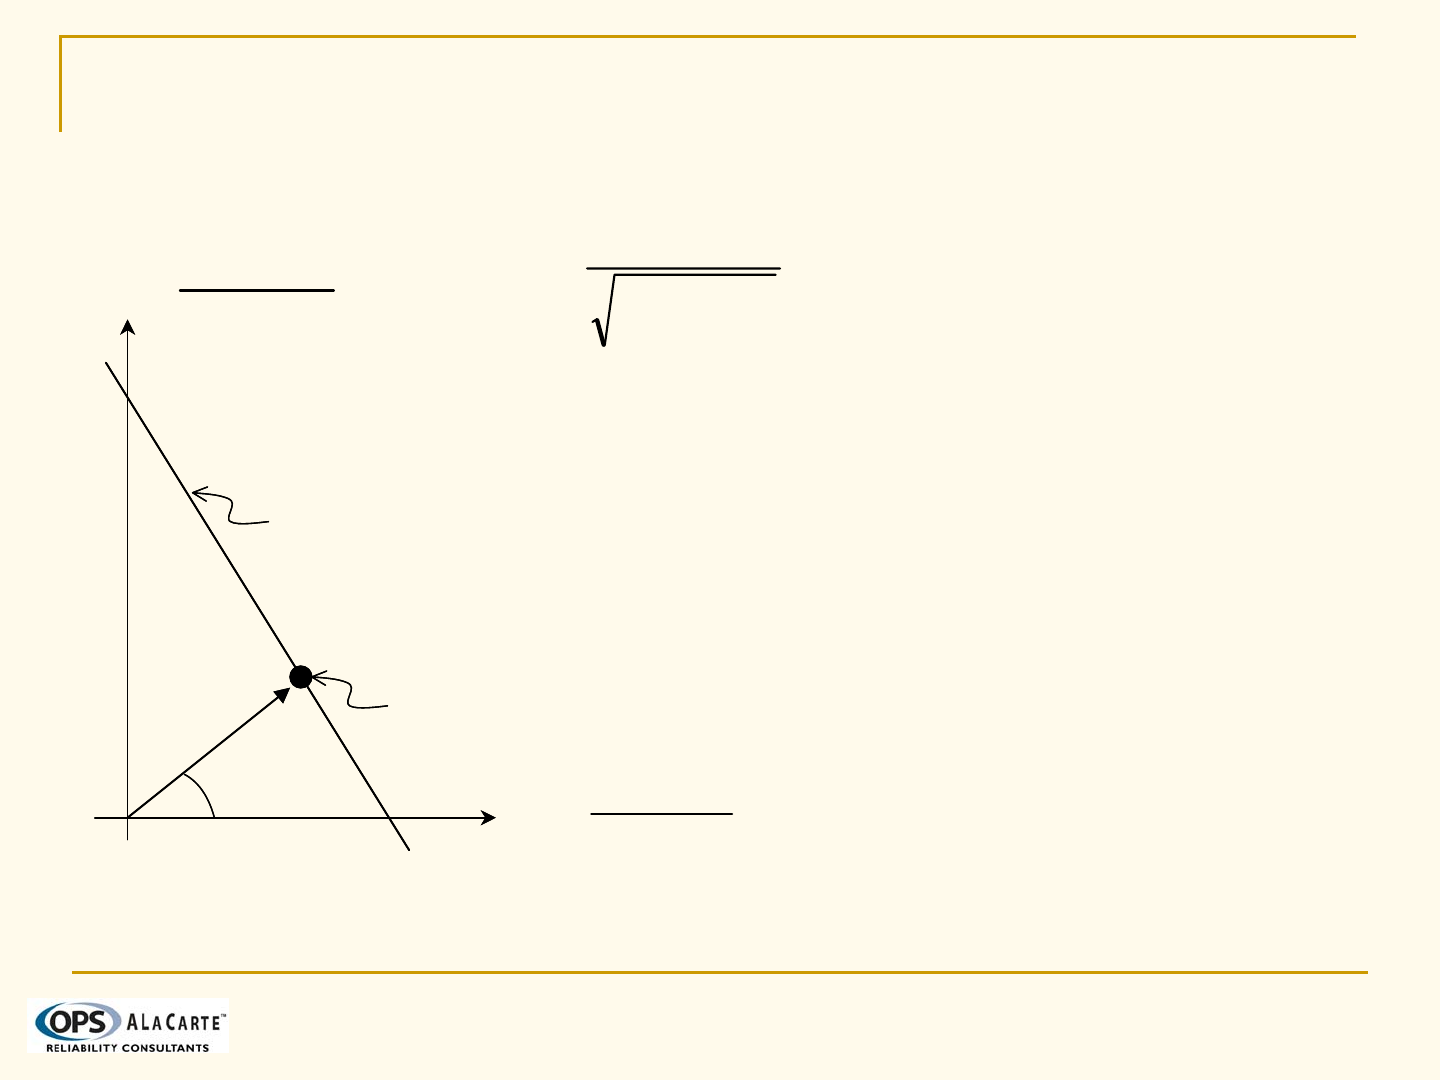
8.7 Example: Fatigue – Structural Reliability
Limit state equation,
G(X), defines the fail
and non-fail conditions
Failure probability
determined by the μ
and σ2of X1and X2
Calculations performed
in standard “U-space”
where the design point
determines both the pf
and the relative
importance of X1& X2
)(
1
β
−
Φ=
f
p
22
21
21
xx
xx
σσ
μμ
β
−
−
=
(
)
21 XXXG
−
=
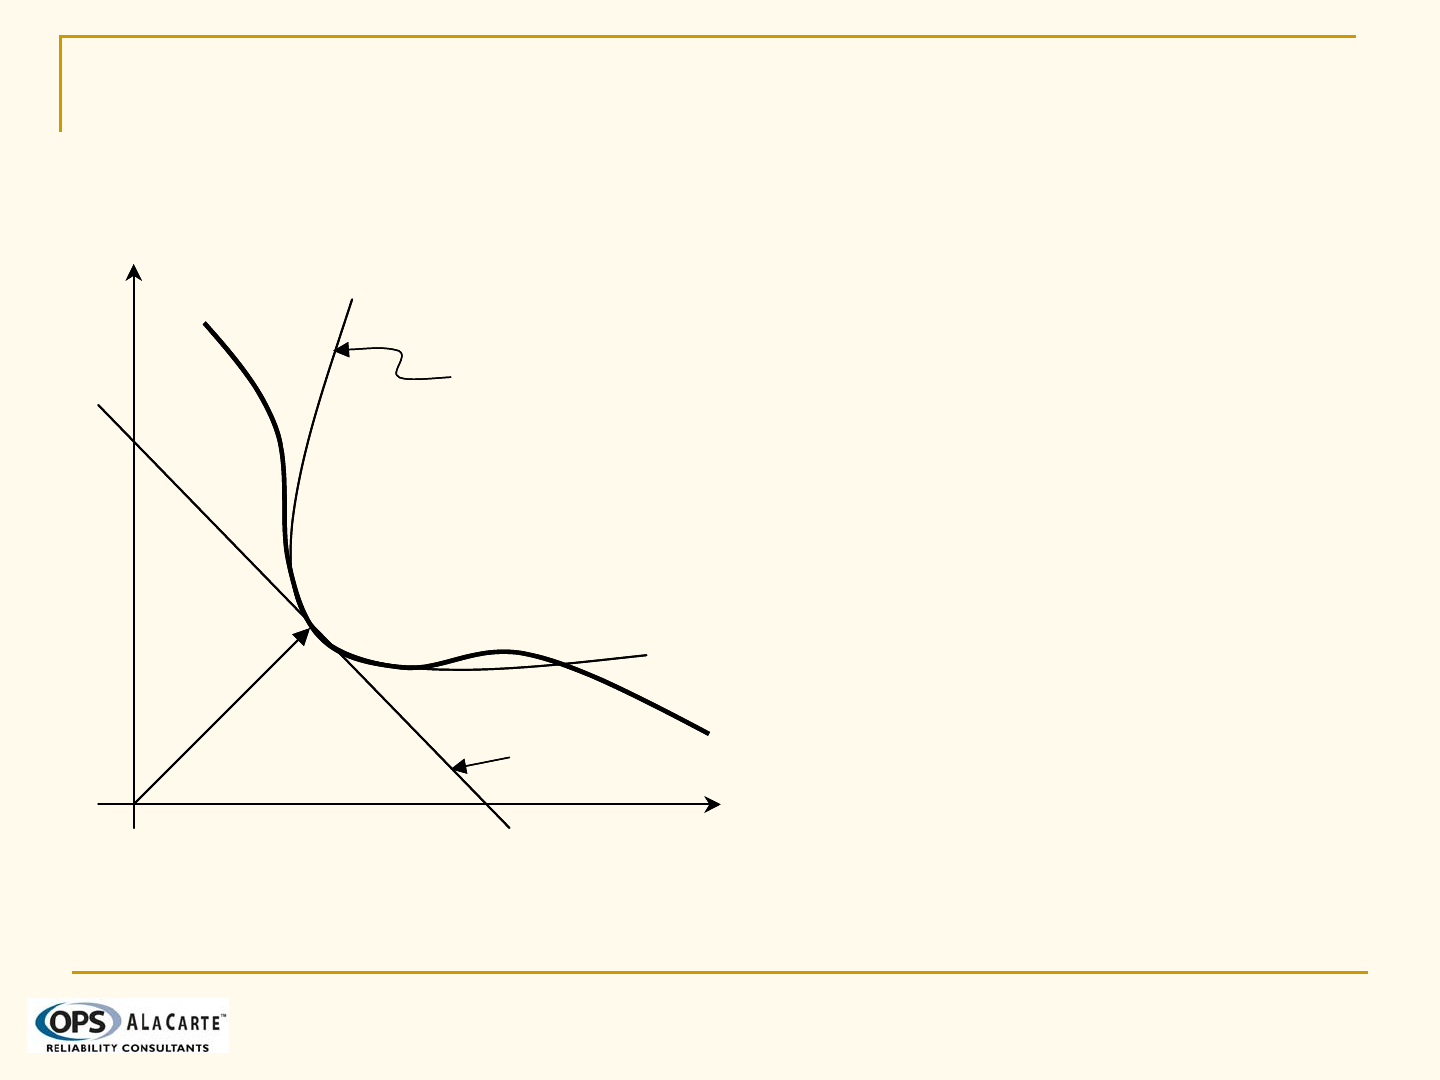
Clifford H. Lange
Proprietary Document
Page 20
Copyright © 2008
8.7 Example: Fatigue – Structural Reliability
In the general formulation
the limit state equation is
not linear and the random
variables are not Normal
Linear (FORM) and
parabolic (SORM)
approximations are used
at the design point to
calculate failure
probabilities and
importance factors
Uj
Ui
β
g(U) > 0
g(U) < 0
SORM
FORM
Uj
Ui
β
g(U) > 0
g(U) < 0
SORM
FORM

Clifford H. Lange
Proprietary Document
Page 21
Copyright © 2008
8.7 Example: Fatigue – Structural Reliability
Limit State Equation defines failure conditions
Time to failure determined using Miners rule with an average
damage per cycle
Average damage rate determined considers all possible stress
amplitudes and their incremental damage
()()
()
∫∫
∞
=
∞
=
=
00
||
xs f
XXS dsdx
sN
xfxsf
D
Df
Tf0
Δ
=
(
)
tf TTXG
−
=

Clifford H. Lange
Proprietary Document
Page 22
Copyright © 2008
8.7 Example: Fatigue – Structural Reliability
Both the underlying environmental variable, X, and the stress
amplitude, S, given the load environment, are Weibull distributions
With the shape factor, bX, of the environment determined from the
average, X, and the average of the stress response dependent upon
the environment
[]
x
x
x
exXP
α
β
⎥
⎦
⎤
⎢
⎣
⎡
−
−=≤ 1
[]
s
s
xs
exsXSP
α
β
⎥
⎦
⎤
⎢
⎣
⎡
−
−=≤
|
1||
()
!1
α
β
X
x=
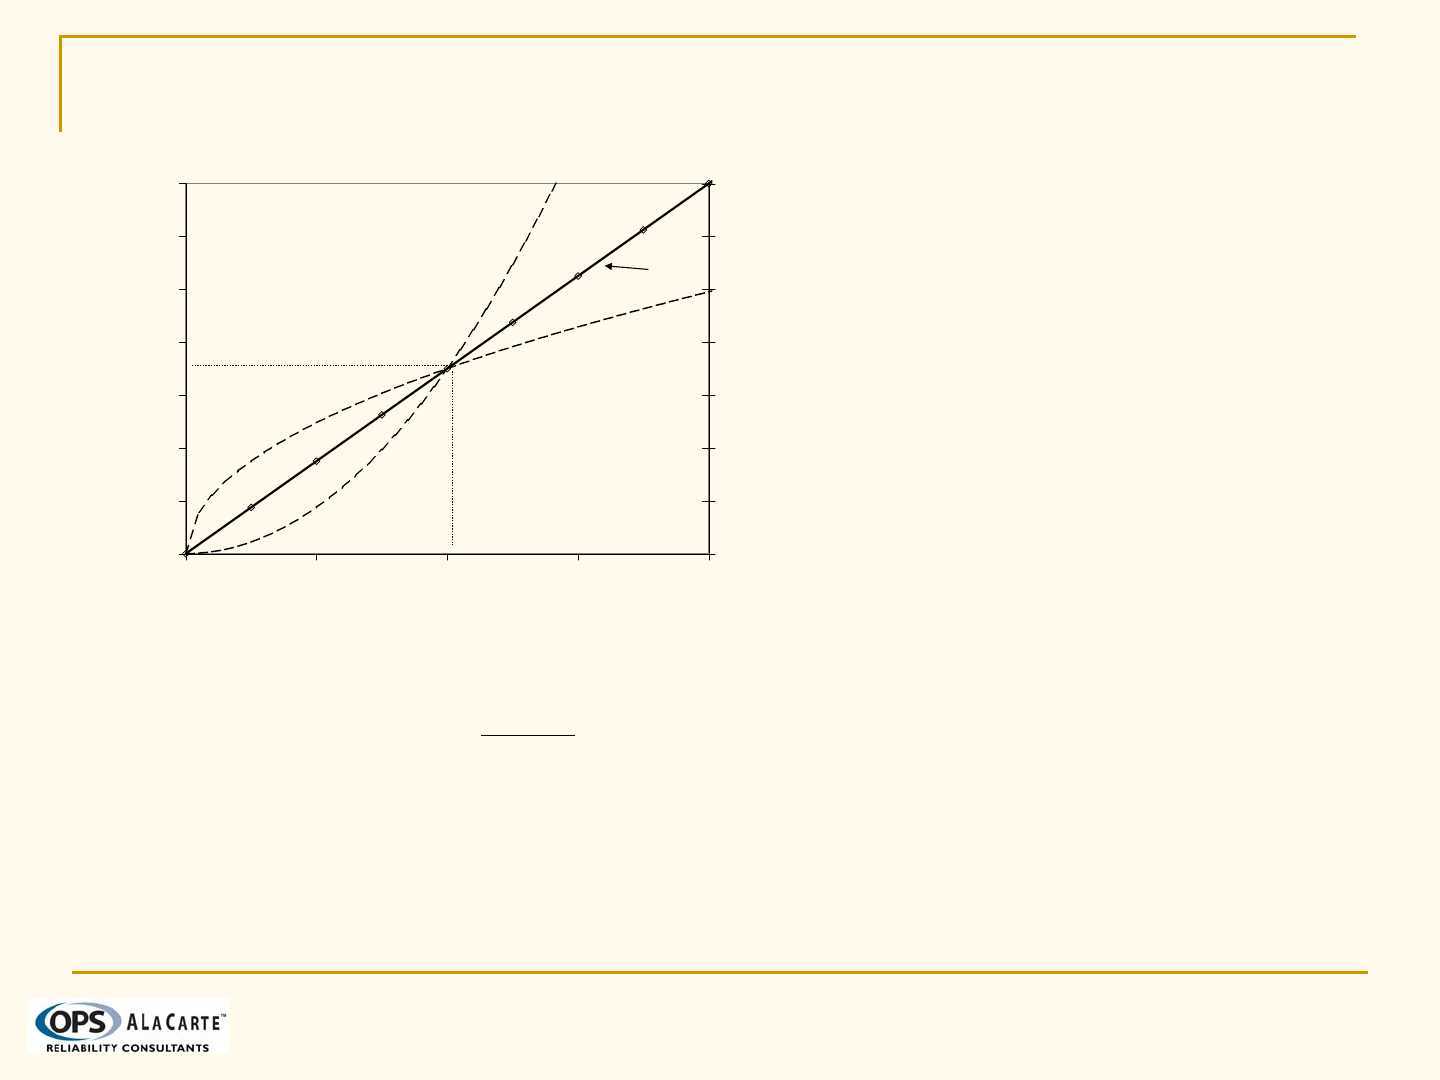
Clifford H. Lange
Proprietary Document
Page 23
Copyright © 2008
8.7 Example: Fatigue – Structural Reliability
The RMS of the stress
process is a function of
the underlying
environment variable, X
Random vibration theory
is used to define the
shape factor, βs, as a
function of the RMS
stress and shape factor,
as
The RMS exponent, p,
used to identify
increasing/decreasing
stress processes
0.0
0.5
1.0
1.5
2.0
2.5
3.0
3.5
0.00.51.01.52.0
Load (e.g. WInd Speed)
RMS Stress (MPa)
0.00
0.62
1.25
1.87
2.50
3.12
3.74
4.37
Average Stress (MPA)
σref = 1.75
Xref = 1.0
p=1
p>1
p<1
⎟
⎠
⎞
⎜
⎝
⎛
=ref
xx
p
ref
Kx
σσ
)(
2/1
])!/2/(2)[( ss x
ασβ
=
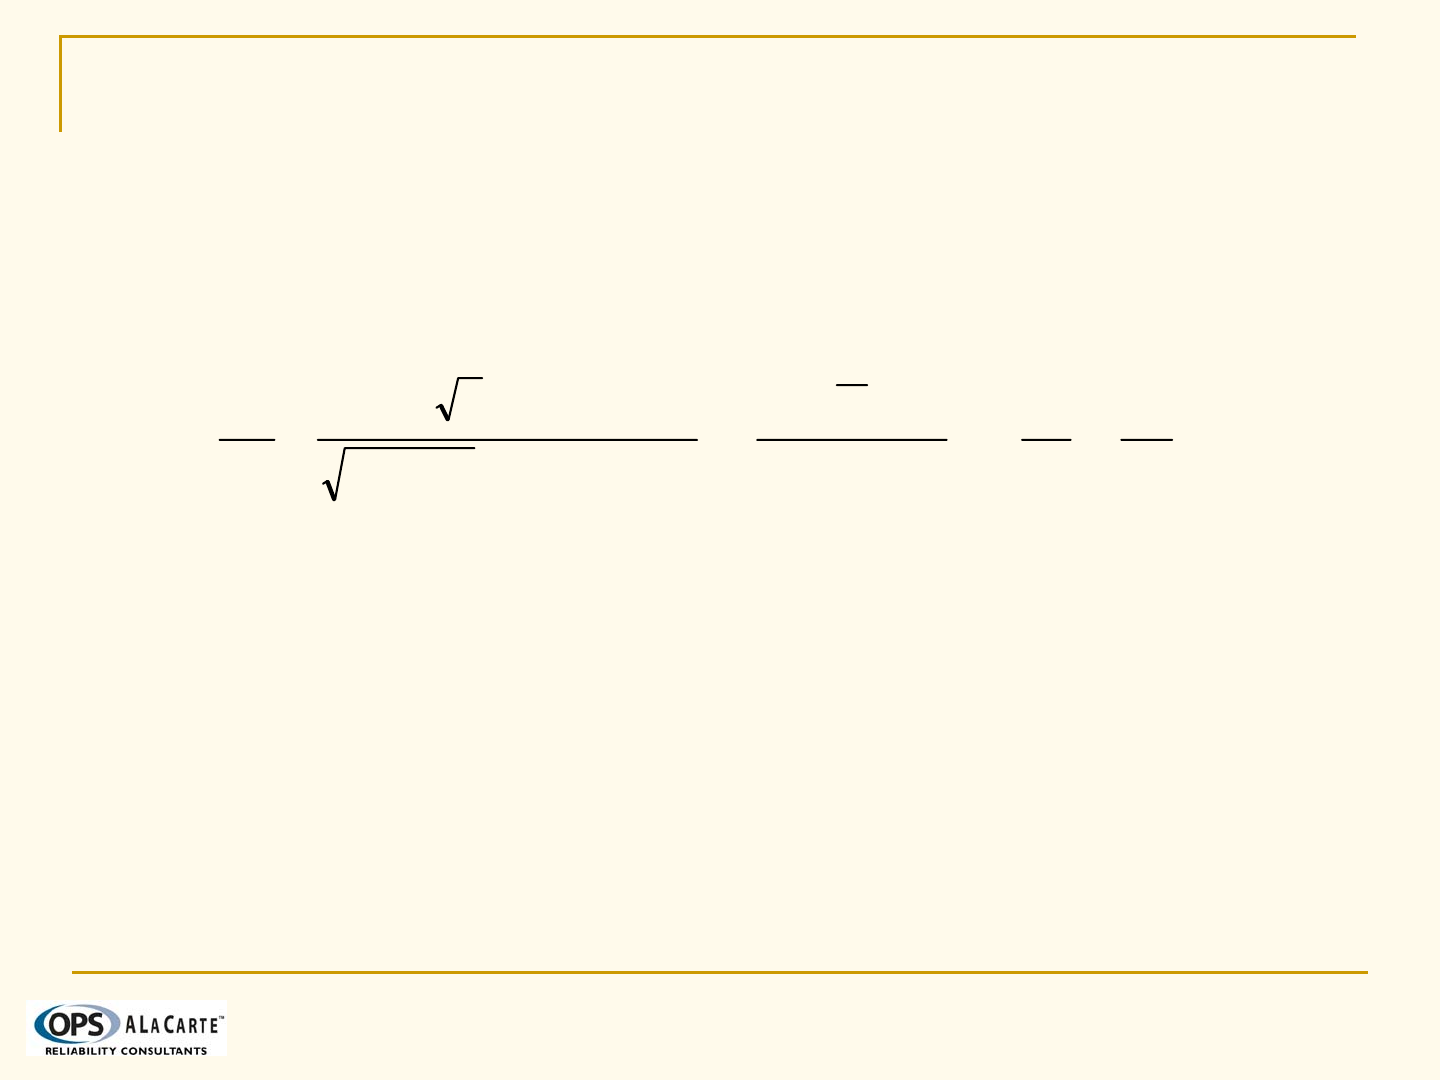
Clifford H. Lange
Proprietary Document
Page 24
Copyright © 2008
8.7 Example: Fatigue – Generalized Formulation
Resulting expression for fatigue life a function of 12
random variables
Stress parameters K and σref are raised to the power, b, as
a result of the S-N relationship
Environmental parameters, X, are raised to the composite
power, bp, reflecting the combined nonlinear effect of the
RMS stress on the environmental variable, X
⎥
⎥
⎥
⎦
⎤
⎢
⎢
⎢
⎣
⎡
⎟
⎟
⎠
⎞
⎜
⎜
⎝
⎛
⎟
⎟
⎠
⎞
⎜
⎜
⎝
⎛
⎟
⎟
⎠
⎞
⎜
⎜
⎝
⎛
⎟
⎟
⎠
⎞
⎜
⎜
⎝
⎛
−
Δ
=!!
)!/1(
)/1()!/2(
2
0xs
bp
xref
b
ums
ref
fbpb
x
X
SKS
K
f
C
T
ααα
σ
σ

Clifford H. Lange
Proprietary Document
Page 25
Copyright © 2008
8.7 Example: Fatigue – Traditional Approach
CYCLES computer
program used to perform
calculations
Input values reproduce
those used in the traditional
fatigue analysis
Results confirm previous
results that fatigue design is
not likely to fail
Most significant input is the
S-N coefficient
Var Definition Dist Type Mean COV
X Mean Wind Speed Constant 6.3 -
αx Wind Shape Factor Constant 2.0 -
xref Ref Wind Speed Constant 1.0 -
σref Reference Stress Constant 1.75 -
p RMS exponent Constant 1.0 -
K Stress Conc Factor Constant 1.0 -
αs Stress Shape Factor Normal 2.0 .15
C S-N Coefficient Weibull 5E21 .613
b S-N Exponent Constant 7.3 -
fo Cycle Rate Constant 1.2 -
Δ Miner’s Damage Constant 1.0 -
Mean Lifetime: 467 years
Failure Probability FORM .61 %
SORM .94 %
Importance
Factors: Stress Shape Factor: 24.9 %
S-N Coefficient, C: 75.1 %

Clifford H. Lange
Proprietary Document
Page 26
Copyright © 2008
8.7 Example: Fatigue – Generalized Approach
There exists uncertainty
in design inputs other
than the S-N law and
loading spectrum in
fatigue design
X, ax, sref, p and K are all
considered to be
uncertain in the wind
turbine example
Uncertainty in Miners
rule and the fluctuating
cycle rate are also
considered
Var Definition Dist Type Mean COV
X Mean Wind Speed Normal 6.3 .075
αx Wind Shape Factor Normal 2.0 .15
xref Ref Wind Speed Constant 1.0 -
σref Reference Stress Normal 1.75 .075
p RMS exponent Normal 1.0 .05
K Stress Conc Factor Normal 1.0 .1
αs Stress Shape Factor Normal 2.0 .15
C S-N Coefficient Weibull 5E21 .613
b S-N Exponent Constant 7.3 -
fo Cycle Rate Normal 1.2 .2
Δ Miner’s Damage Normal 1.0 .15

Clifford H. Lange
Proprietary Document
Page 27
Copyright © 2008
8.7 Example: Fatigue – Results
Considering uncertainty
contributions from all
potential sources
changes the conclusions
from the original analysis
Failure probabilities have
increased to
unacceptable levels (5-
10%) while the mean
lifetime remains
unchanged
Most significant inputs
are mean wind speed and
the RMS exponent, p
Mean Lifetime: 467 years
Failure
Probability
FORM 5.67 %
SORM 7.38 %
Importance
Factors:
Mean Wind Speed, X: 6.7 %
Wind Shape Factor, αx: 25.2 %
Reference Stress, σref: 6.2 %
RMS exponent, p: 24.0 %
Stress Conc Factor, K: 10.6 %
Stress Shape Factor, αs: 9.3 %
S-N Coefficient, C 16.6 %
Cycle Rate, fo: 0.8 %
Miner’s Damage, Δ 0.5 %

Clifford H. Lange
Proprietary Document
Page 28
Copyright © 2008
8.7 Example: Fatigue – Structural Reliability
Structural Reliability methods provide risk levels
(e.g. pf) as well as the relative importance of the
design inputs (e.g. random variables)
All 3 aspects of the fatigue problem; the loading
environment, structural response and the local
failure criterion may include uncertainty and can be
included in the fatigue evaluation
The methodology can employed through alternative
limit state equations or extended to other fatigue
problems (e.g. crack growth).
The most critical design inputs are identified

1
RCA Case Study
The PEPCON Incident
A Process Plant Accident &
Guidelines for General Investigations
T. Kim Parnell, PhD,PE
Root Cause Analysis Webinar
July 23, 2008
July 23, 2008 RCA - Root Cause Analysis - T. Kim Parnell © 2
Why Review a Plant Accident?
• Interesting and well-studied event
• Provides general guidelines for RCA team
organization
• Insights for investigation and
documentation
• Contrast investigation of “unique” event
like this with RCA of high-volume products

2
July 23, 2008 RCA - Root Cause Analysis - T. Kim Parnell © 3
The PEPCON Incident
• Fire and massive explosions at the PEPCON
plant in Henderson, NV on May 4, 1988.
• PEPCON produced Ammonium Perchlorate
(AP) – an oxidizer
• Combination of events:
– Human error – cigarette likely started initial fire
– Large quantity of AP on site due to Challenger
disaster
– 16” natural gas line running under the plant (with
leaking stitch welds)
July 23, 2008 RCA - Root Cause Analysis - T. Kim Parnell © 4
PEPCON Explosions
• Two large explosions equivalent to 200
Tons and 500 Tons of TNT (3.0 and 3.5 on
the Richter scale)
• Over $70M property damage; windows
broken up to 30 miles away
• 16” Natural Gas Pipeline
– Ruptured 40 foot section
– Crushed more than 260 feet
– Long-term leakage prior to blast from poor
stitch welds
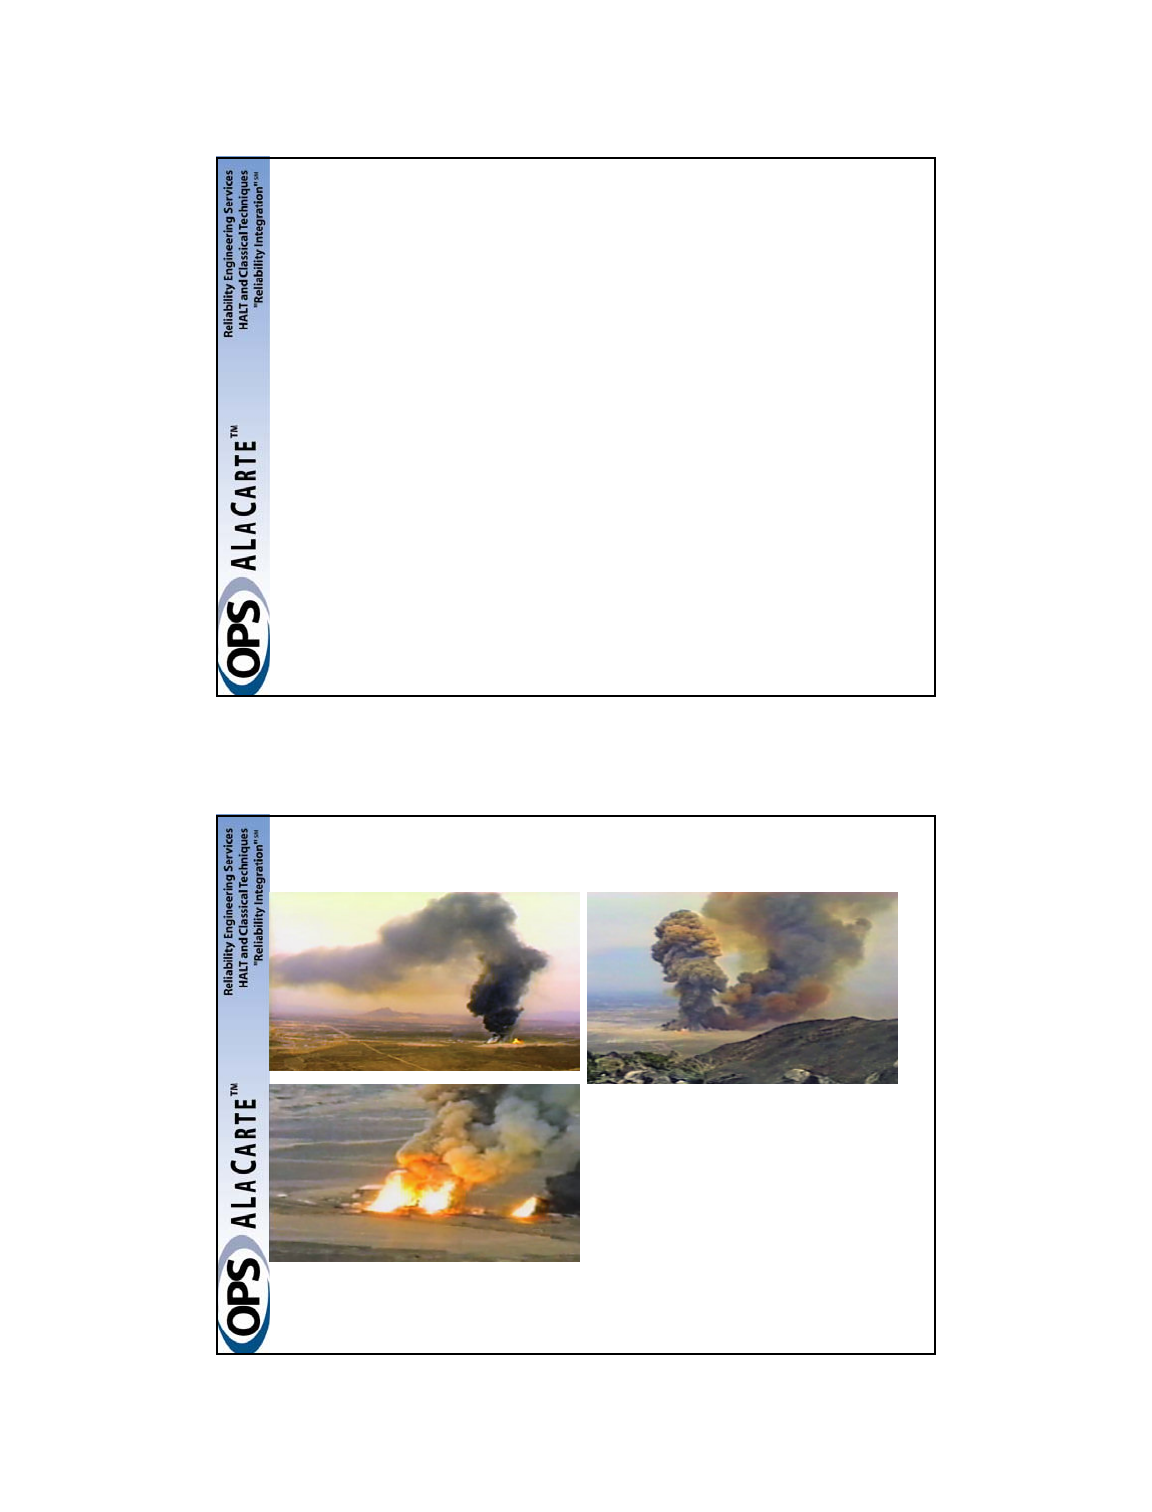
3
July 23, 2008 RCA - Root Cause Analysis - T. Kim Parnell © 5
PEPCON Incident Investigation
• Organization of Teams
• Site documentation and evidence
collection; develop timeline
• Metallurgical analysis; Fracture mechanics
• Fire cause & origin
• Gas migration through soil
• Blast effects & damage
• Conditions for AP deflagration/detonation
July 23, 2008 RCA - Root Cause Analysis - T. Kim Parnell © 6
Fire & Brimstone
• Rapid spread of fire;
catastrophic explosion
• Most of event captured on
video
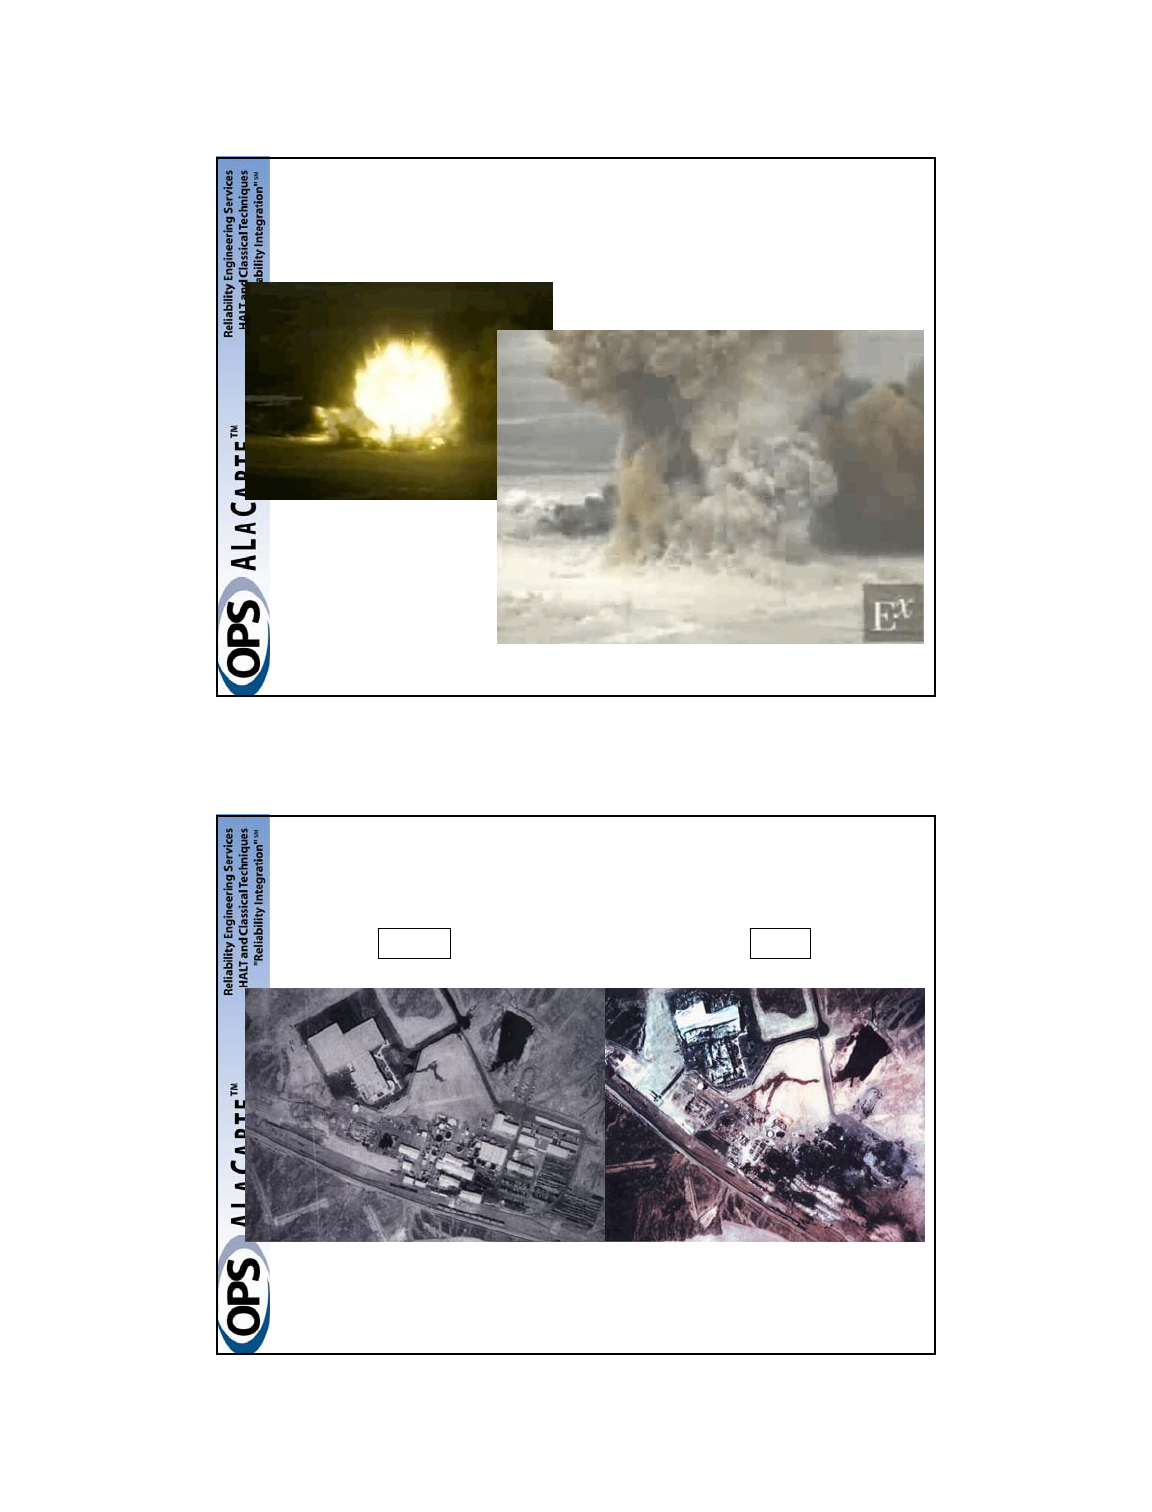
4
July 23, 2008 RCA - Root Cause Analysis - T. Kim Parnell © 7
Massive Explosion & Shockwave
• Stills from video shot from Black Mountain – over 10 miles away
July 23, 2008 RCA - Root Cause Analysis - T. Kim Parnell © 8
Aerial View - Before & After
Before After
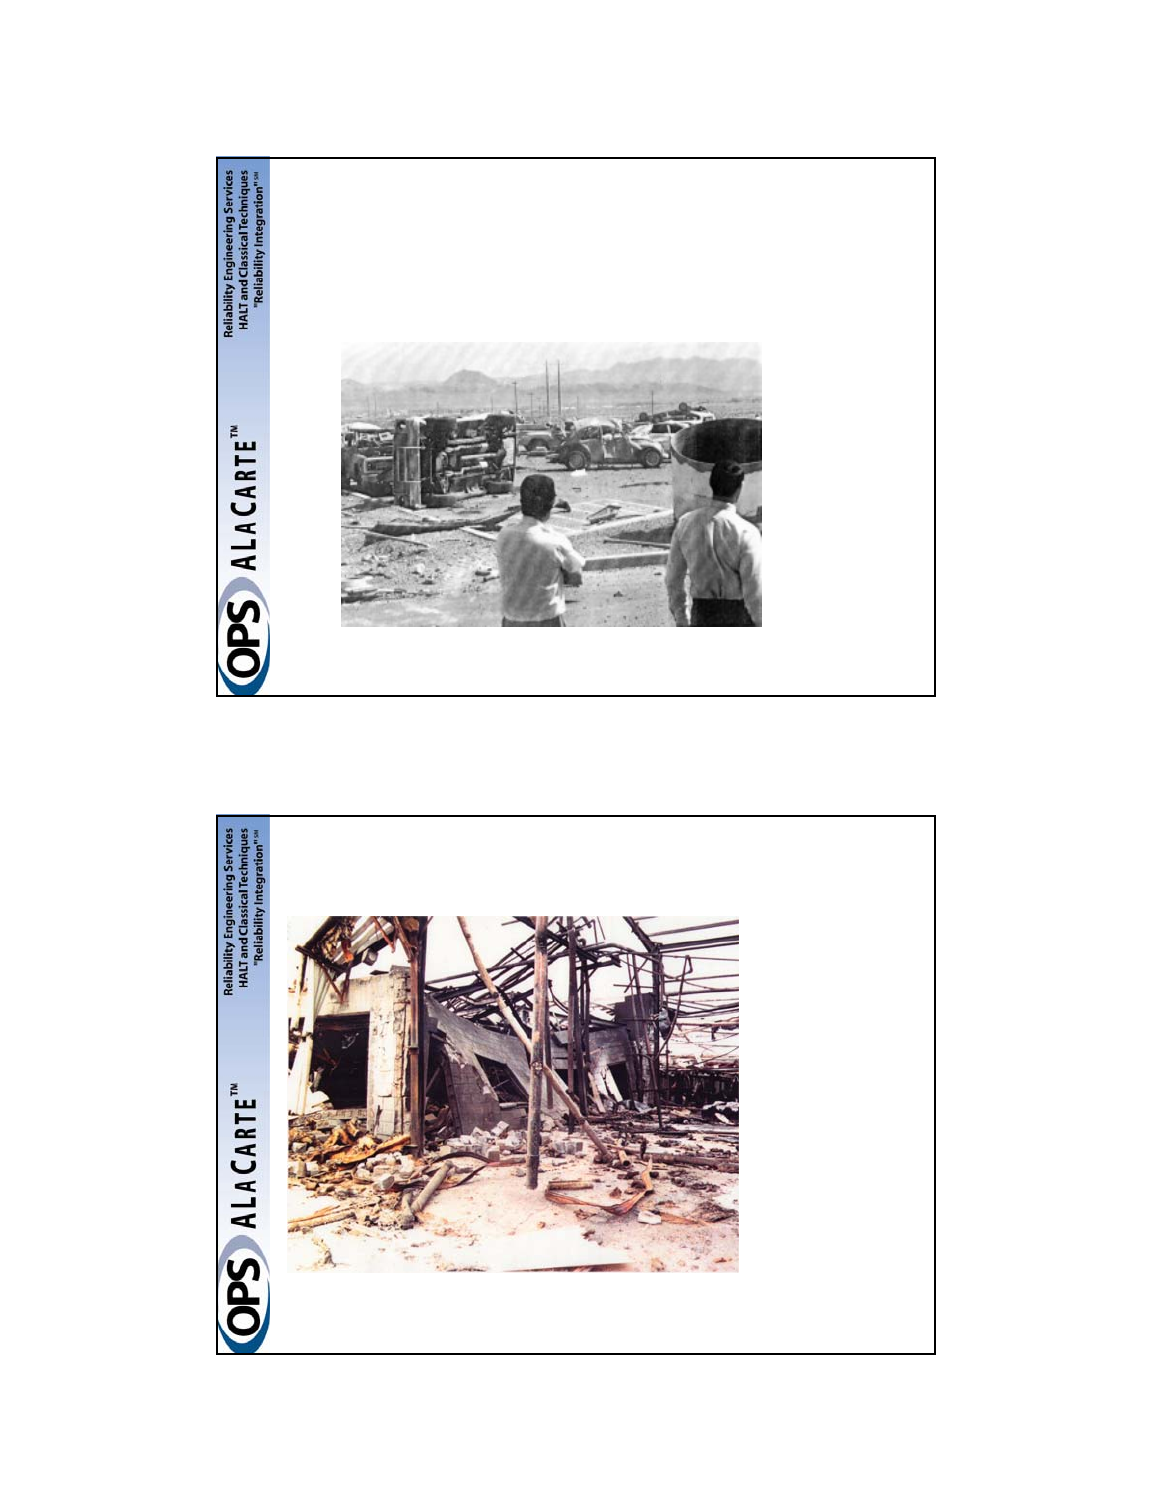
5
July 23, 2008 RCA - Root Cause Analysis - T. Kim Parnell © 9
Near Ground Zero…
• Rail cars overturned
• Autos overturned
July 23, 2008 RCA - Root Cause Analysis - T. Kim Parnell © 10
At the Plant
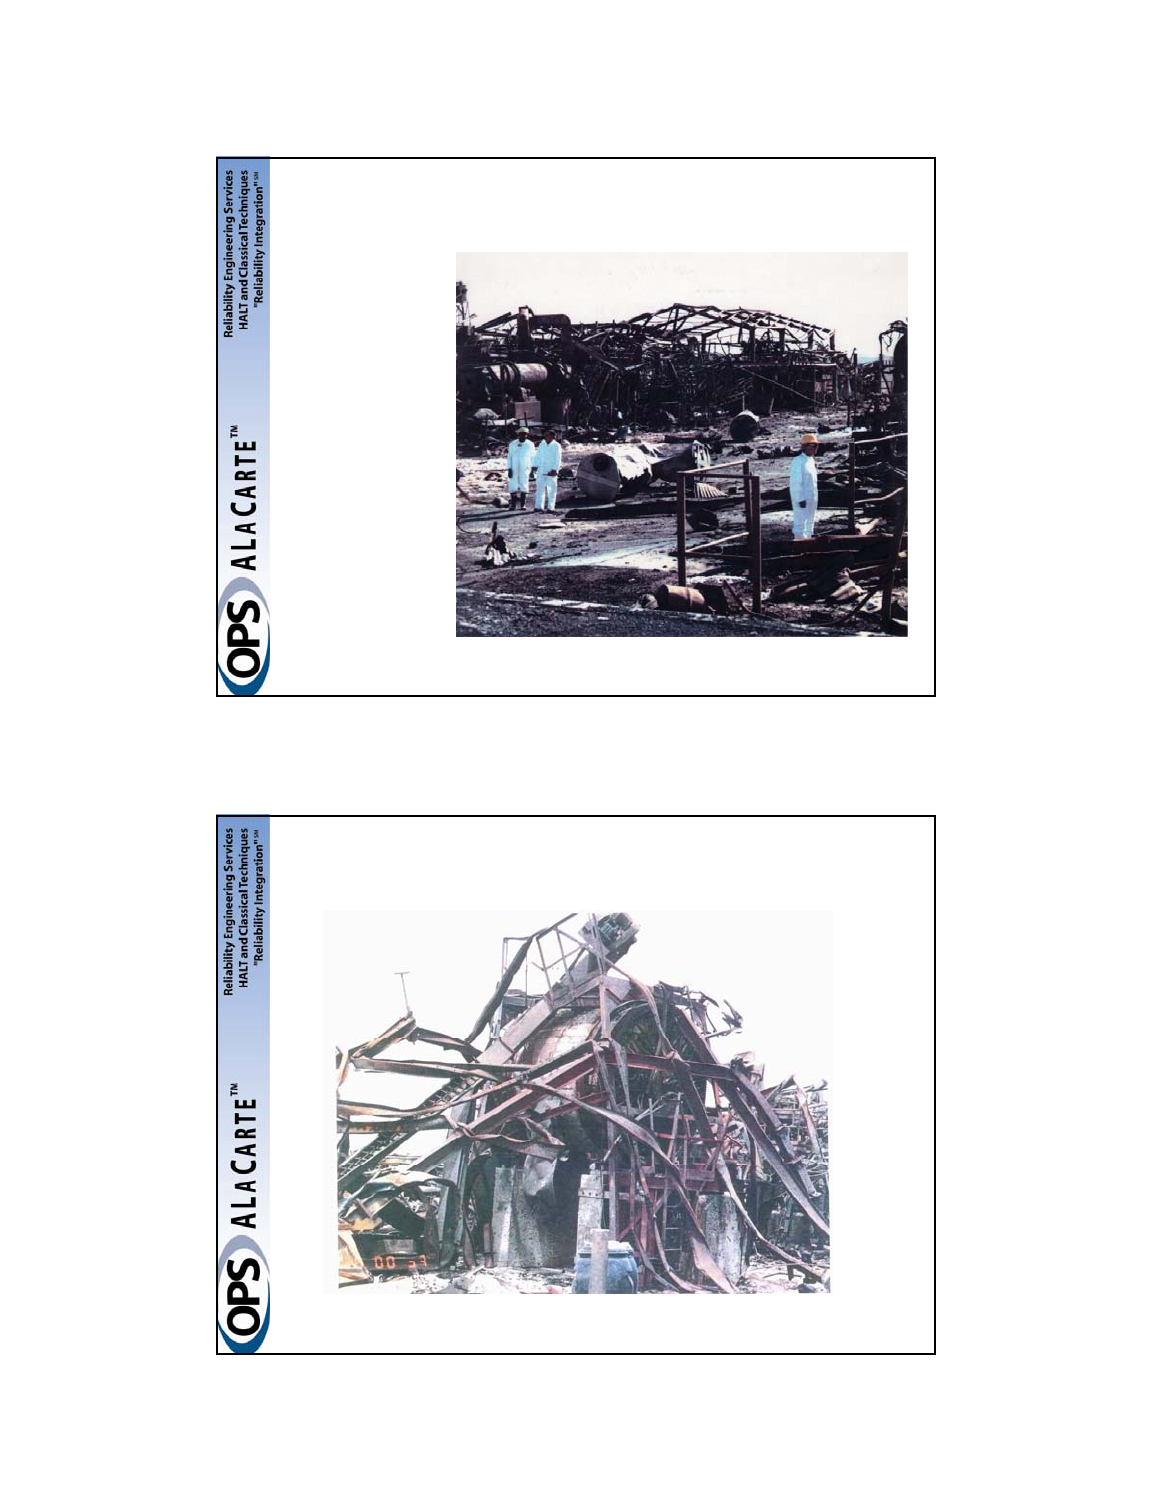
6
July 23, 2008 RCA - Root Cause Analysis - T. Kim Parnell © 11
Plant Buildings
July 23, 2008 RCA - Root Cause Analysis - T. Kim Parnell © 12
Production Equipment
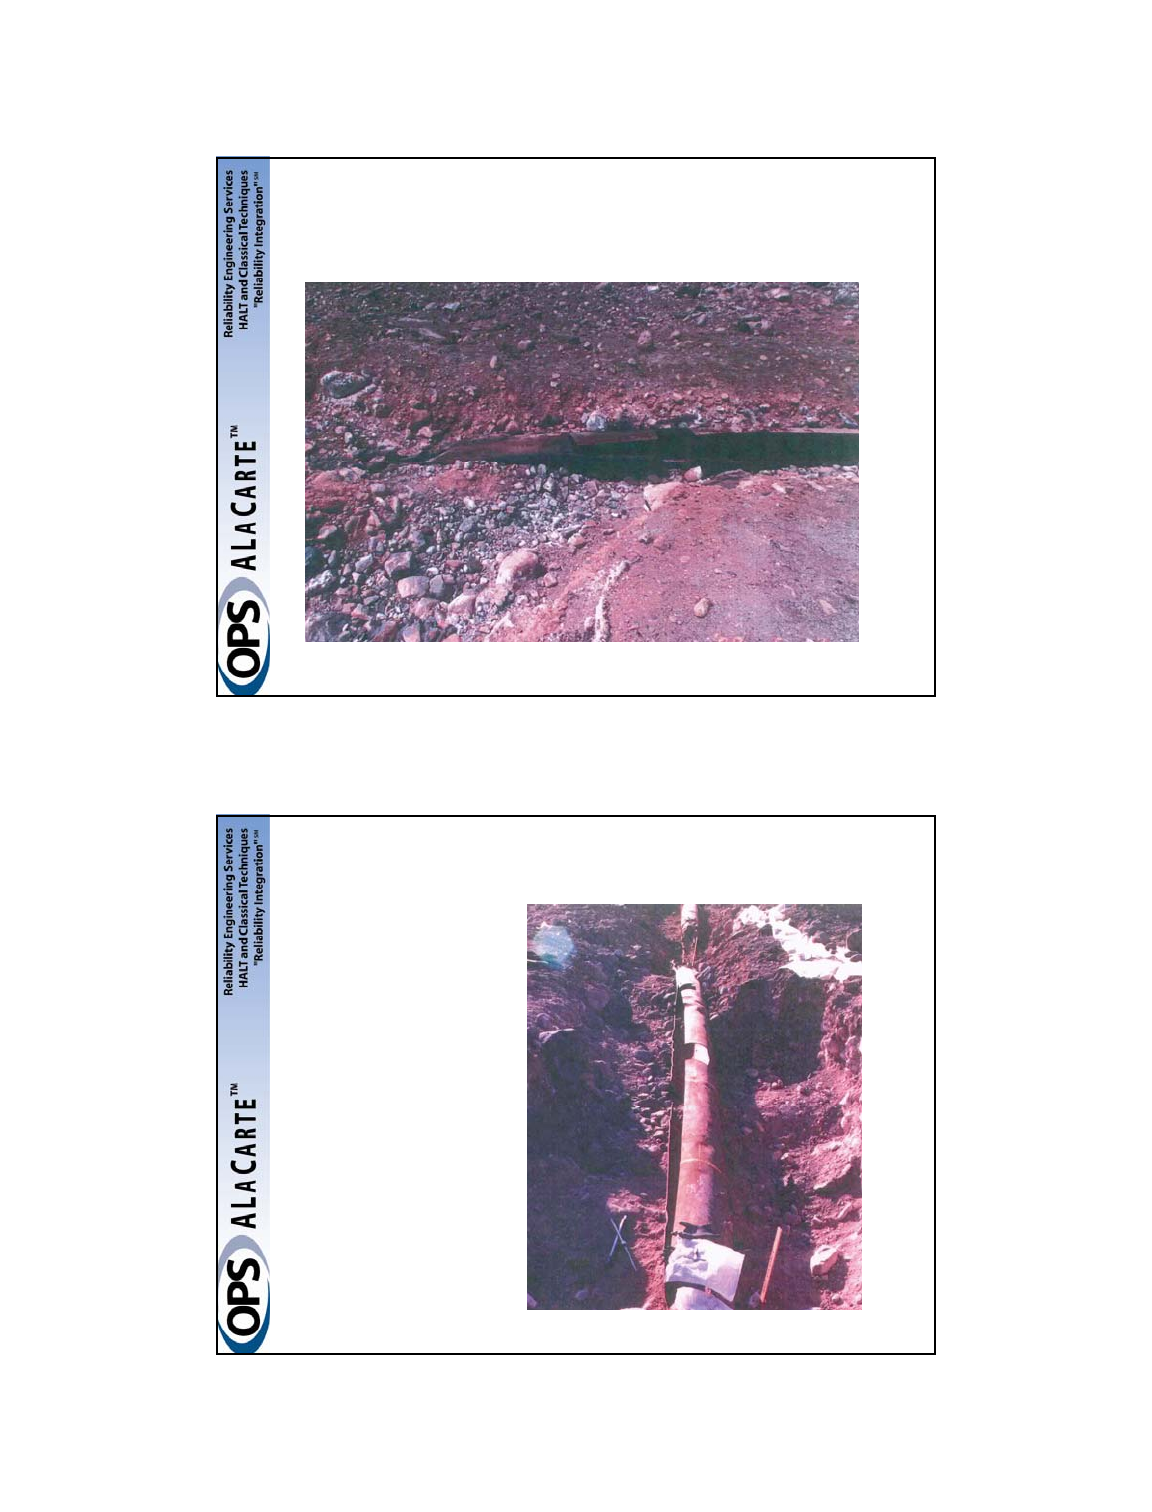
7
July 23, 2008 RCA - Root Cause Analysis - T. Kim Parnell © 13
Ruptured Gas Pipe – Initial View
July 23, 2008 RCA - Root Cause Analysis - T. Kim Parnell © 14
Pipe After Some Digging
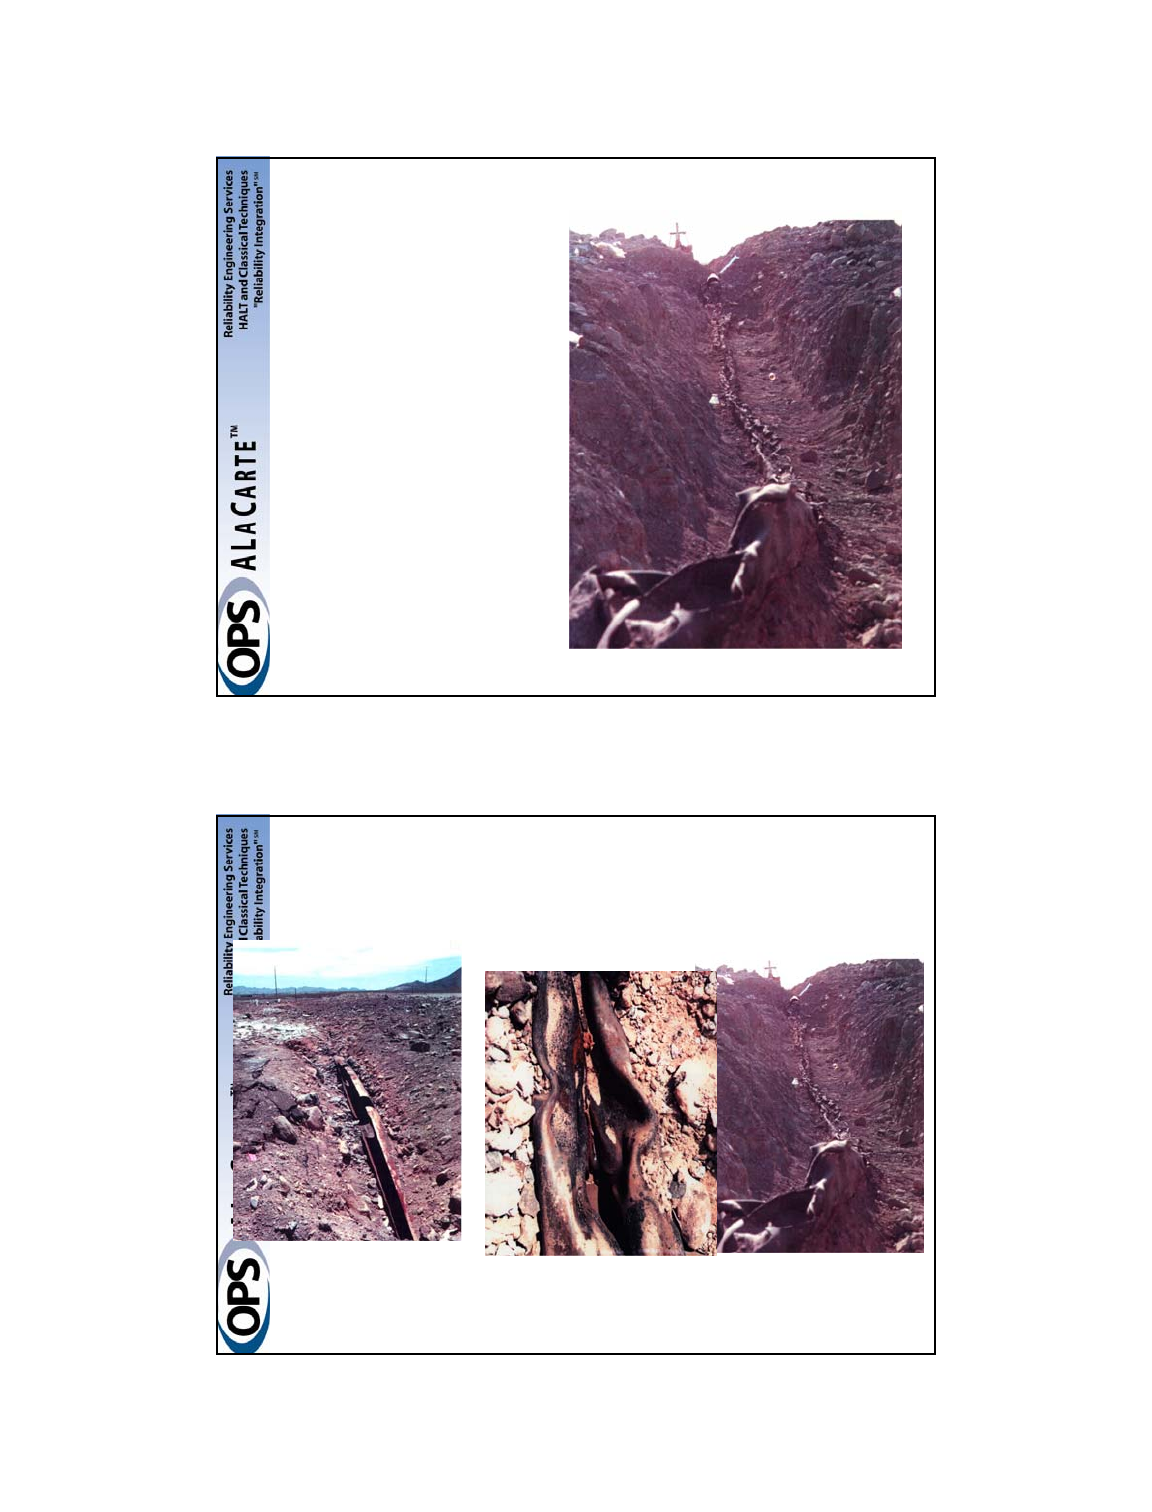
8
July 23, 2008 RCA - Root Cause Analysis - T. Kim Parnell © 15
Pipe After Complete Excavation
July 23, 2008 RCA - Root Cause Analysis - T. Kim Parnell © 16
Ruptured & Crushed Pipe Sections
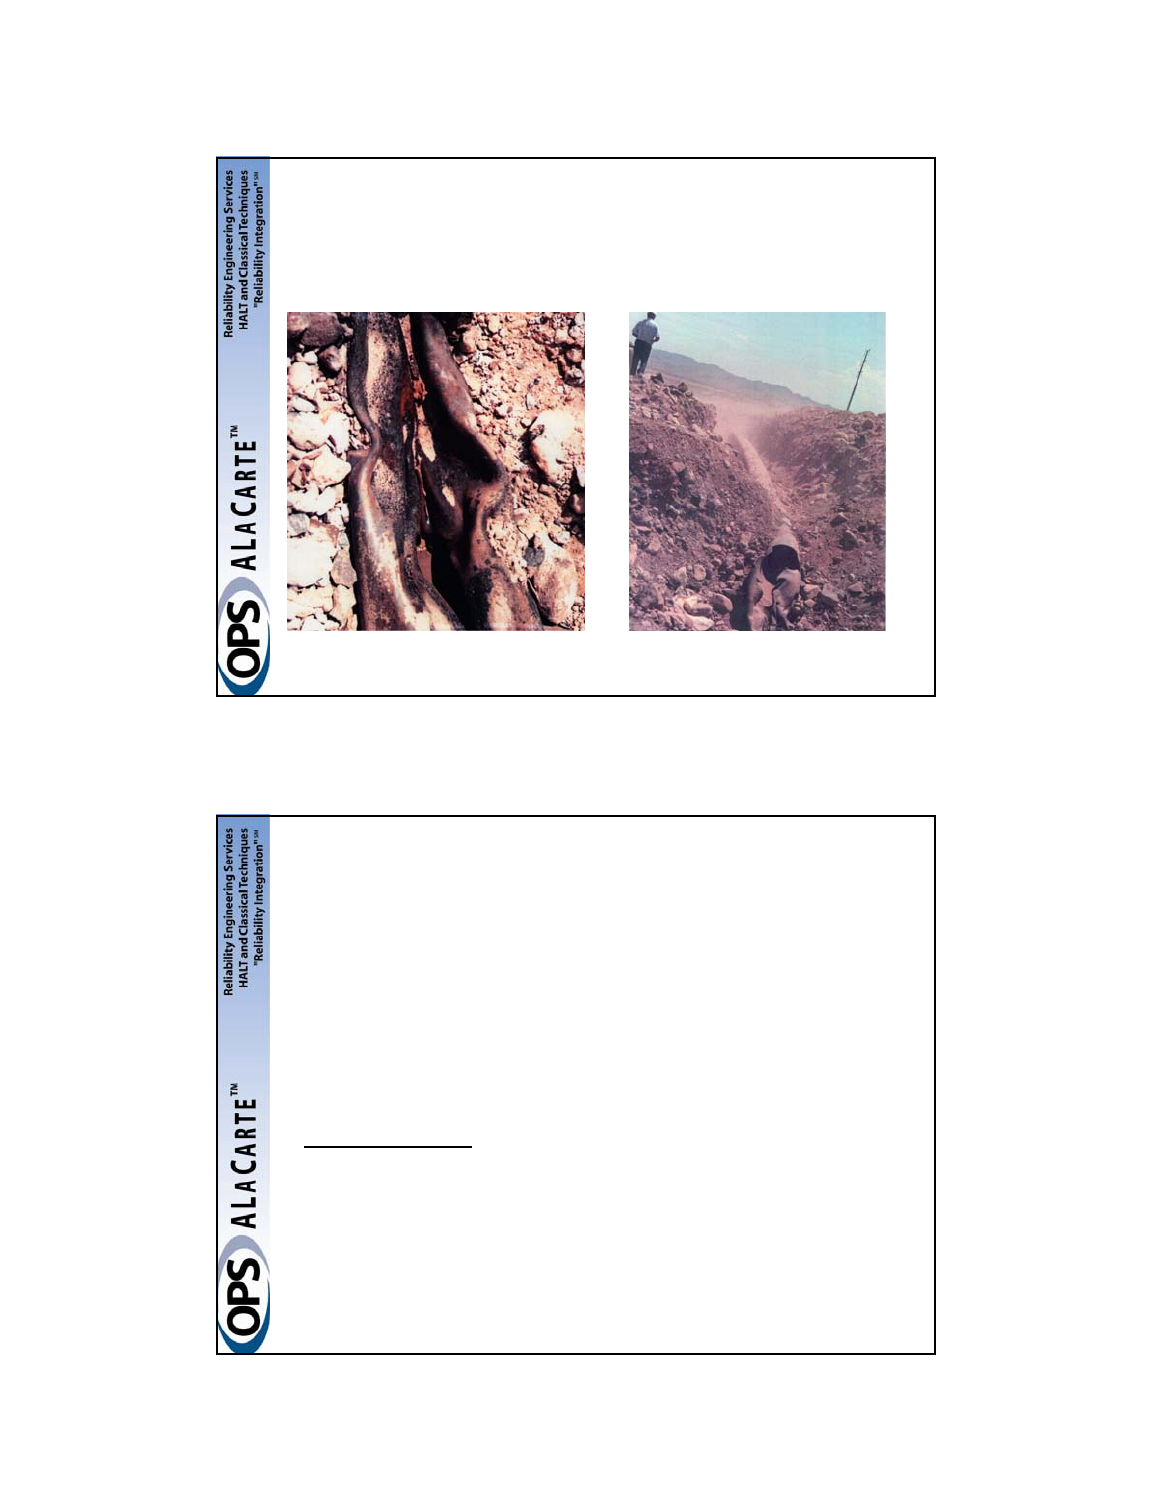
9
July 23, 2008 RCA - Root Cause Analysis - T. Kim Parnell © 17
Pipe Sections
July 23, 2008 RCA - Root Cause Analysis - T. Kim Parnell © 18
16” Natural Gas Pipeline
• Ruptured 40 foot section
• Crushed more than 260 feet
• Long-term leakage prior to blast from poor stitch
welds
• Big Question: Did the pipe rupture occur before
or after the explosions??
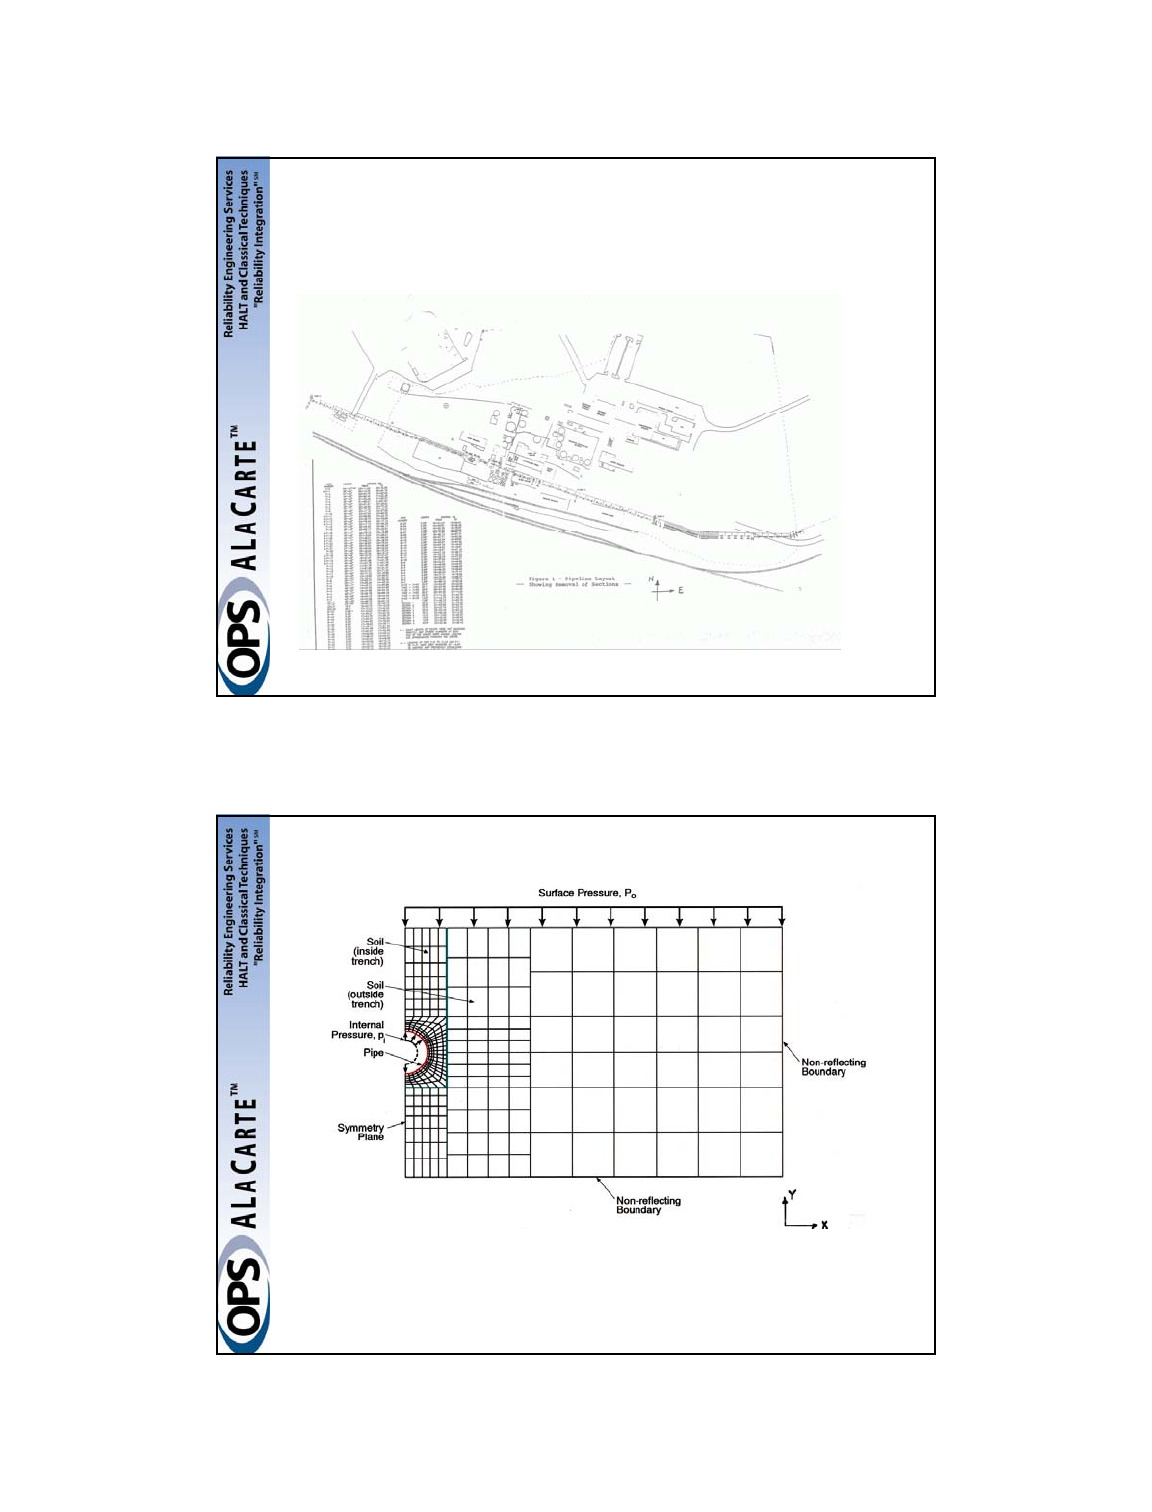
10
July 23, 2008 RCA - Root Cause Analysis - T. Kim Parnell © 19
Pipeline Section Identification
July 23, 2008 RCA - Root Cause Analysis - T. Kim Parnell © 20
Pipe/Soil Finite Element Model
Reference:
Parnell, T.K. and Caligiuri, R.D., “Analysis of the Dynamic Response of a Buried Pipeline
due to a Surface Explosion,” Computational Aspects of Impact and Penetration, L. E.
Schwer and R. F. Kulak, eds., Elme Press International, 1991.
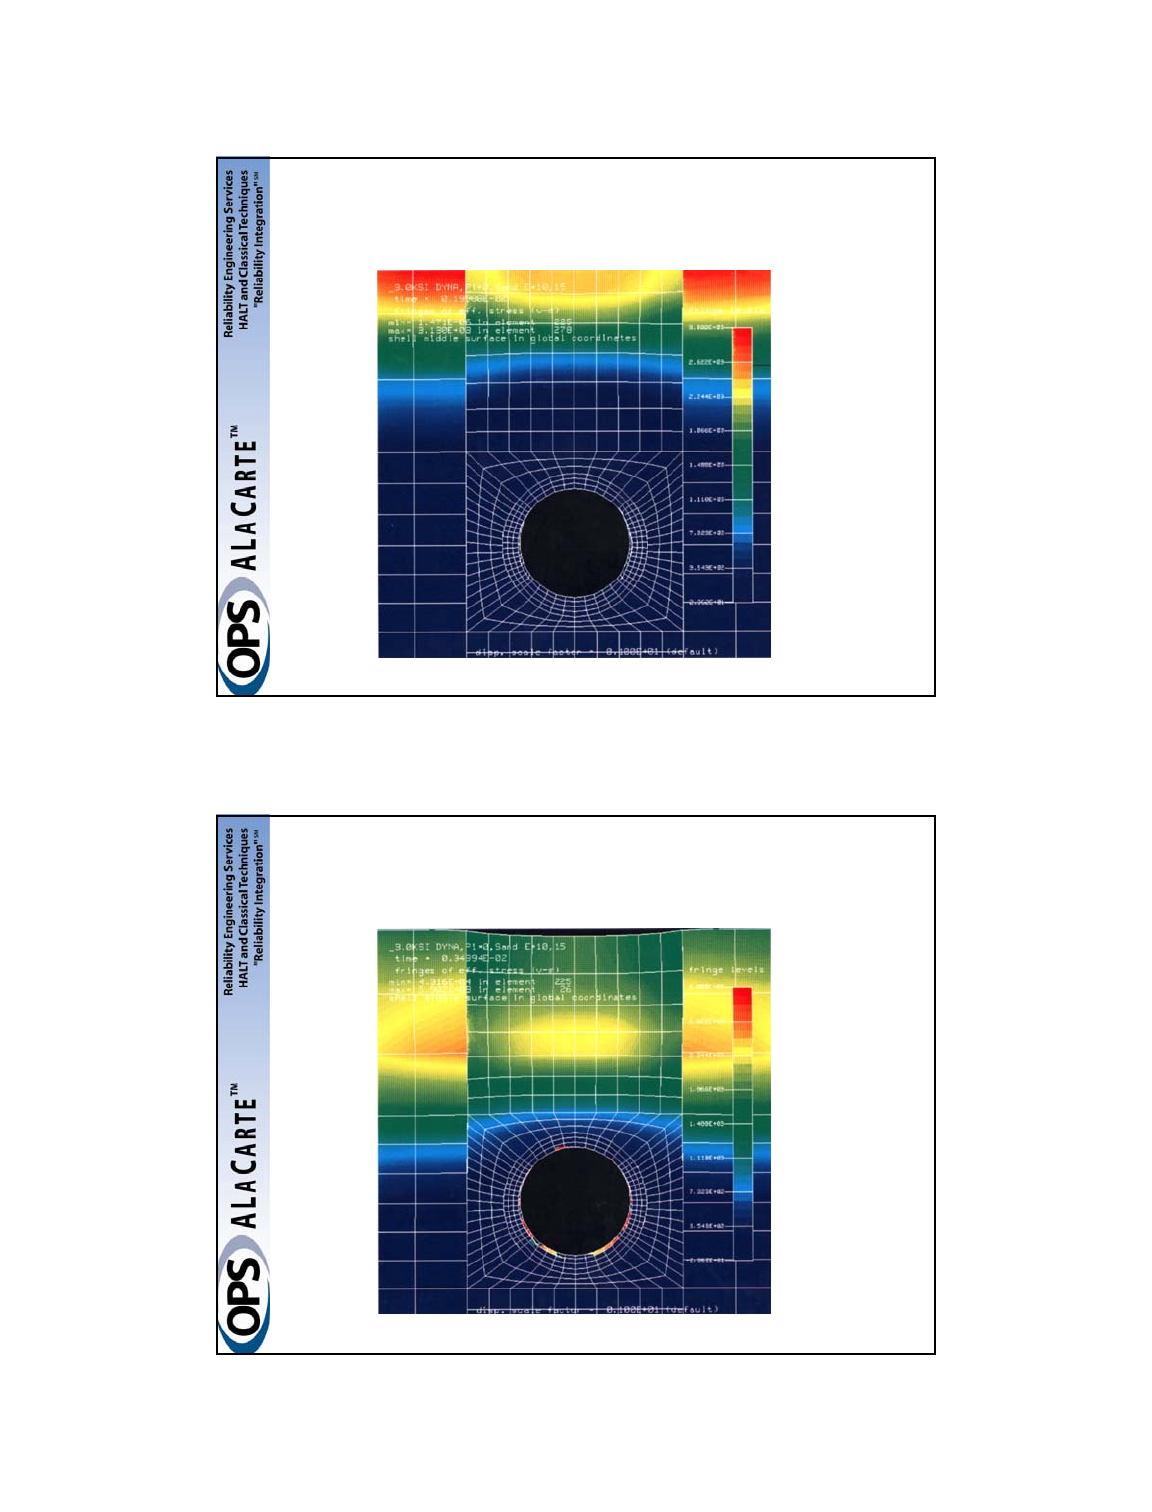
11
July 23, 2008 RCA - Root Cause Analysis - T. Kim Parnell © 21
Pipe Crushing Due to Blast
Response Sequence #1
July 23, 2008 RCA - Root Cause Analysis - T. Kim Parnell © 22
Pipe Crushing Due to Blast
Response Sequence #2
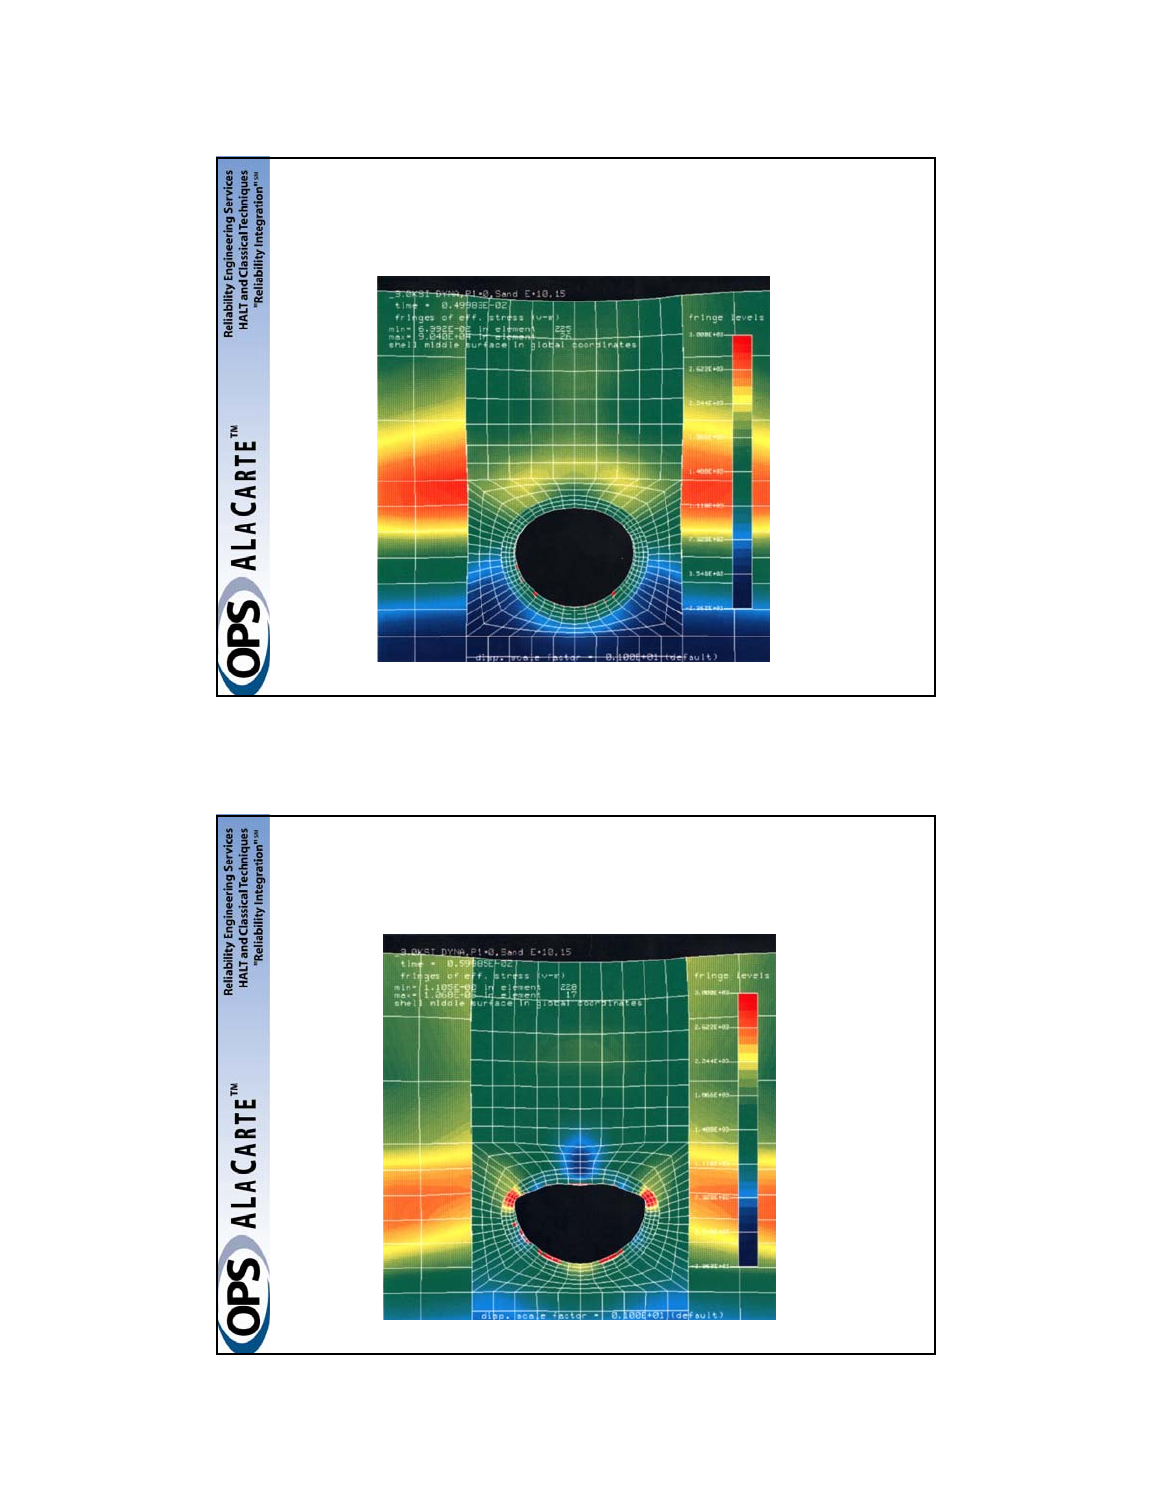
12
July 23, 2008 RCA - Root Cause Analysis - T. Kim Parnell © 23
Pipe Crushing Due to Blast
Response Sequence #3
July 23, 2008 RCA - Root Cause Analysis - T. Kim Parnell © 24
Pipe Crushing Due to Blast
Response Sequence #4
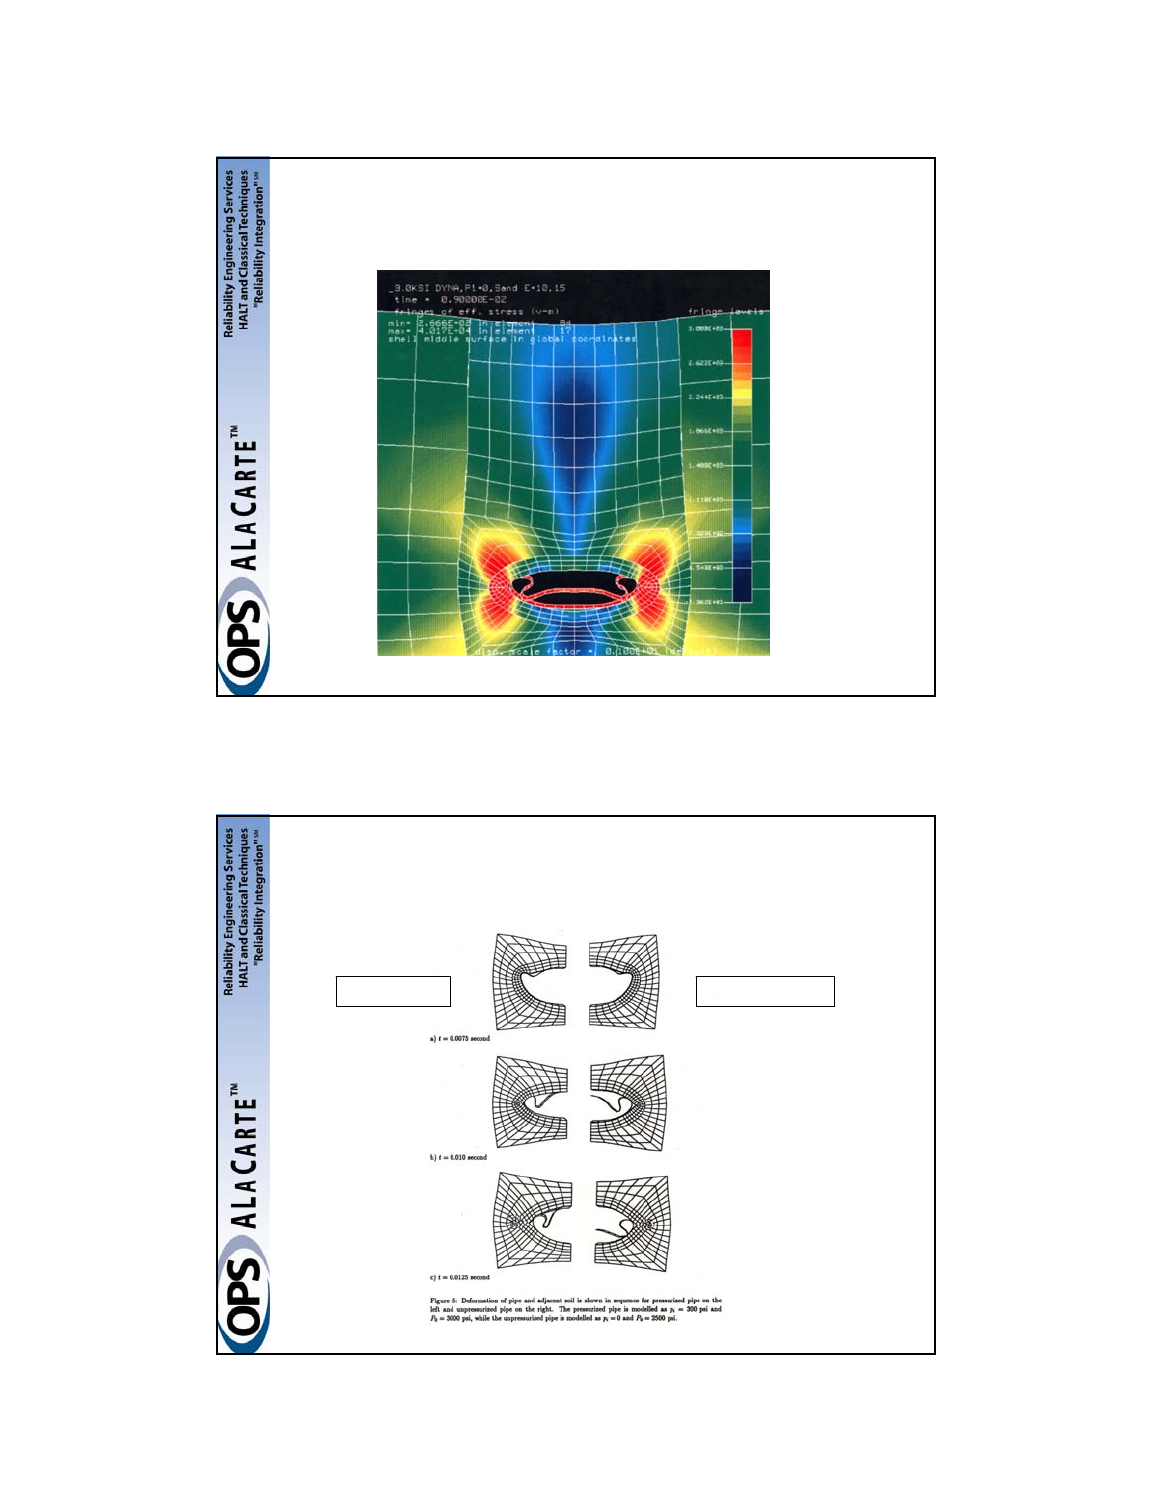
13
July 23, 2008 RCA - Root Cause Analysis - T. Kim Parnell © 25
Pipe Crushing Due to Blast
Response Sequence #5
July 23, 2008 RCA - Root Cause Analysis - T. Kim Parnell © 26
Pipe Crushing Due to Blast
Response Comparison
Pressurized Depressurized
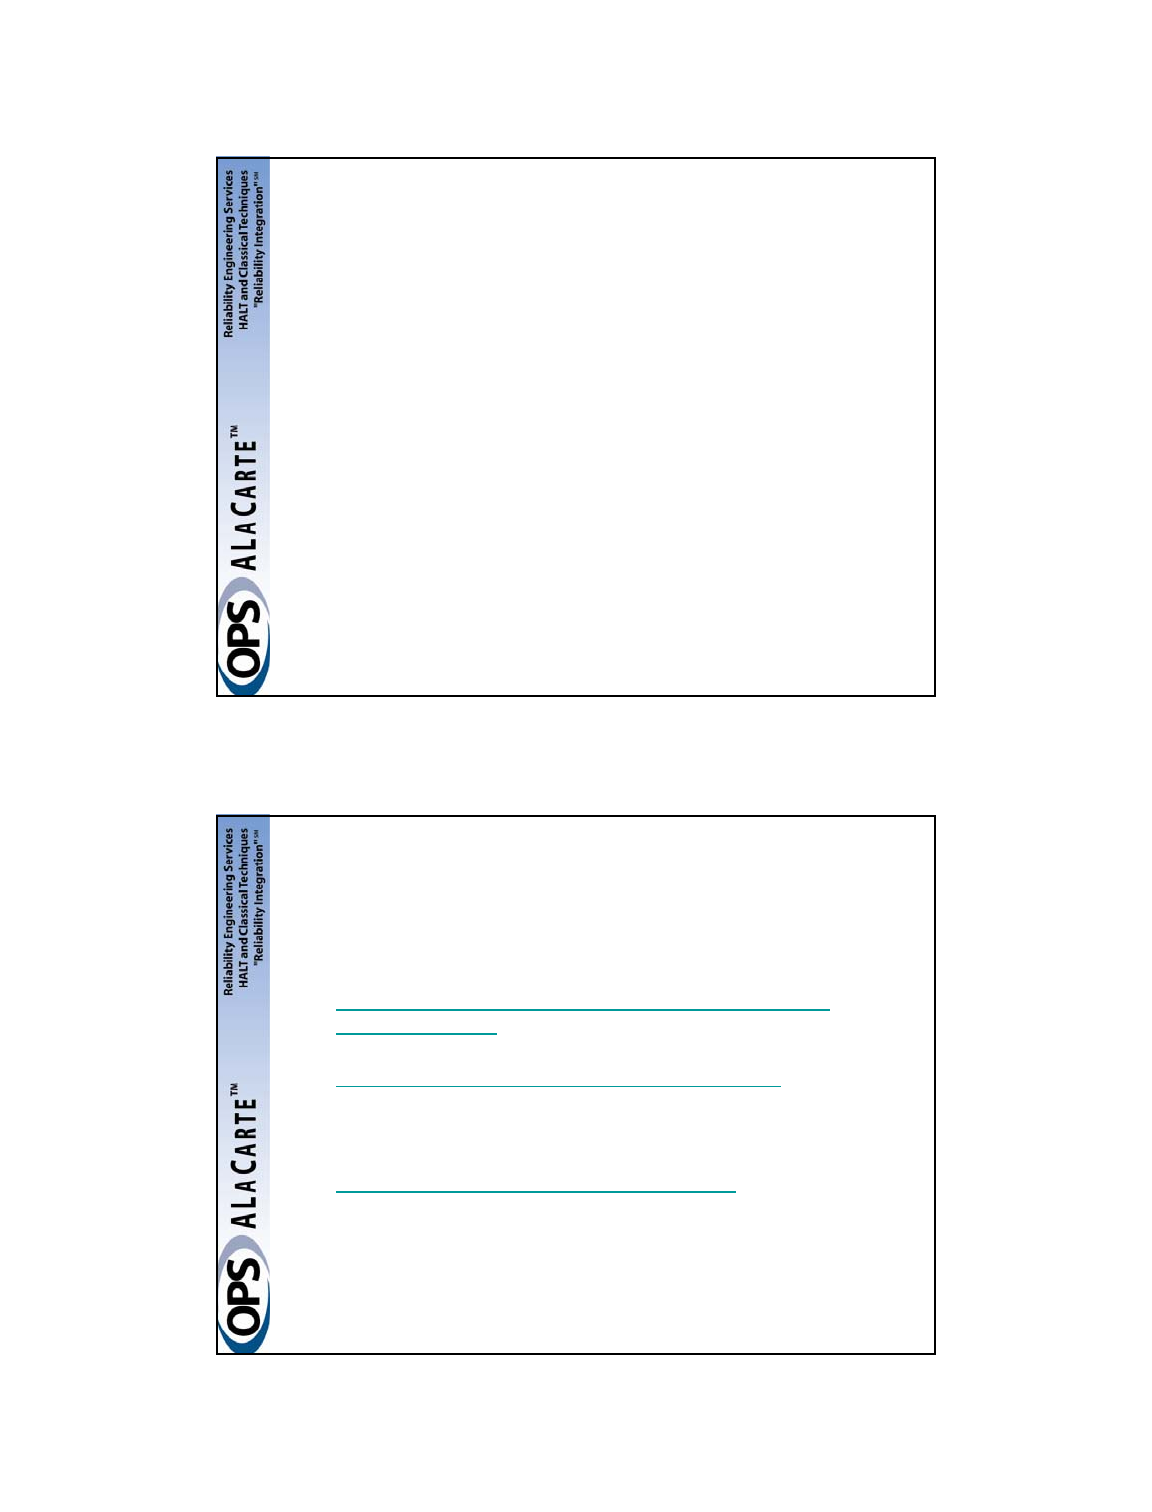
14
July 23, 2008 RCA - Root Cause Analysis - T. Kim Parnell © 27
Summary
• Document in detail
– Inspection
– Measurements
• Get the right expertise on the team; update
as needed
• Develop the scenario
• Test the hypotheses
July 23, 2008 RCA - Root Cause Analysis - T. Kim Parnell © 28
PEPCON Explosion - References
• Video links
– History Channel, 8:00 minutes
http://video.aol.com/video-detail/pepcon-explosion-may-
1988/1249549102
– Exponent – 2:00 minutes
http://www.youtube.com/watch?v=HJVOUgCm5Jk
–Z-Axis
http://podcasts.zaxis.com/pac/pepcon-explosion
– Summary article
http://www.interfire.org/res_file/pdf/Tr-021.pdf
http://www.reviewjournal.com/news/pepcon/

Data Driven RCA
Al Alaverdi
SigmaQuest

SigmaQuest
Solutions for Data Driven Quality
Management & RCA
Focus on High Tech, Telecom,
Consumer Electronics, Medical
Devices
Good Data = Shortest path to RCA
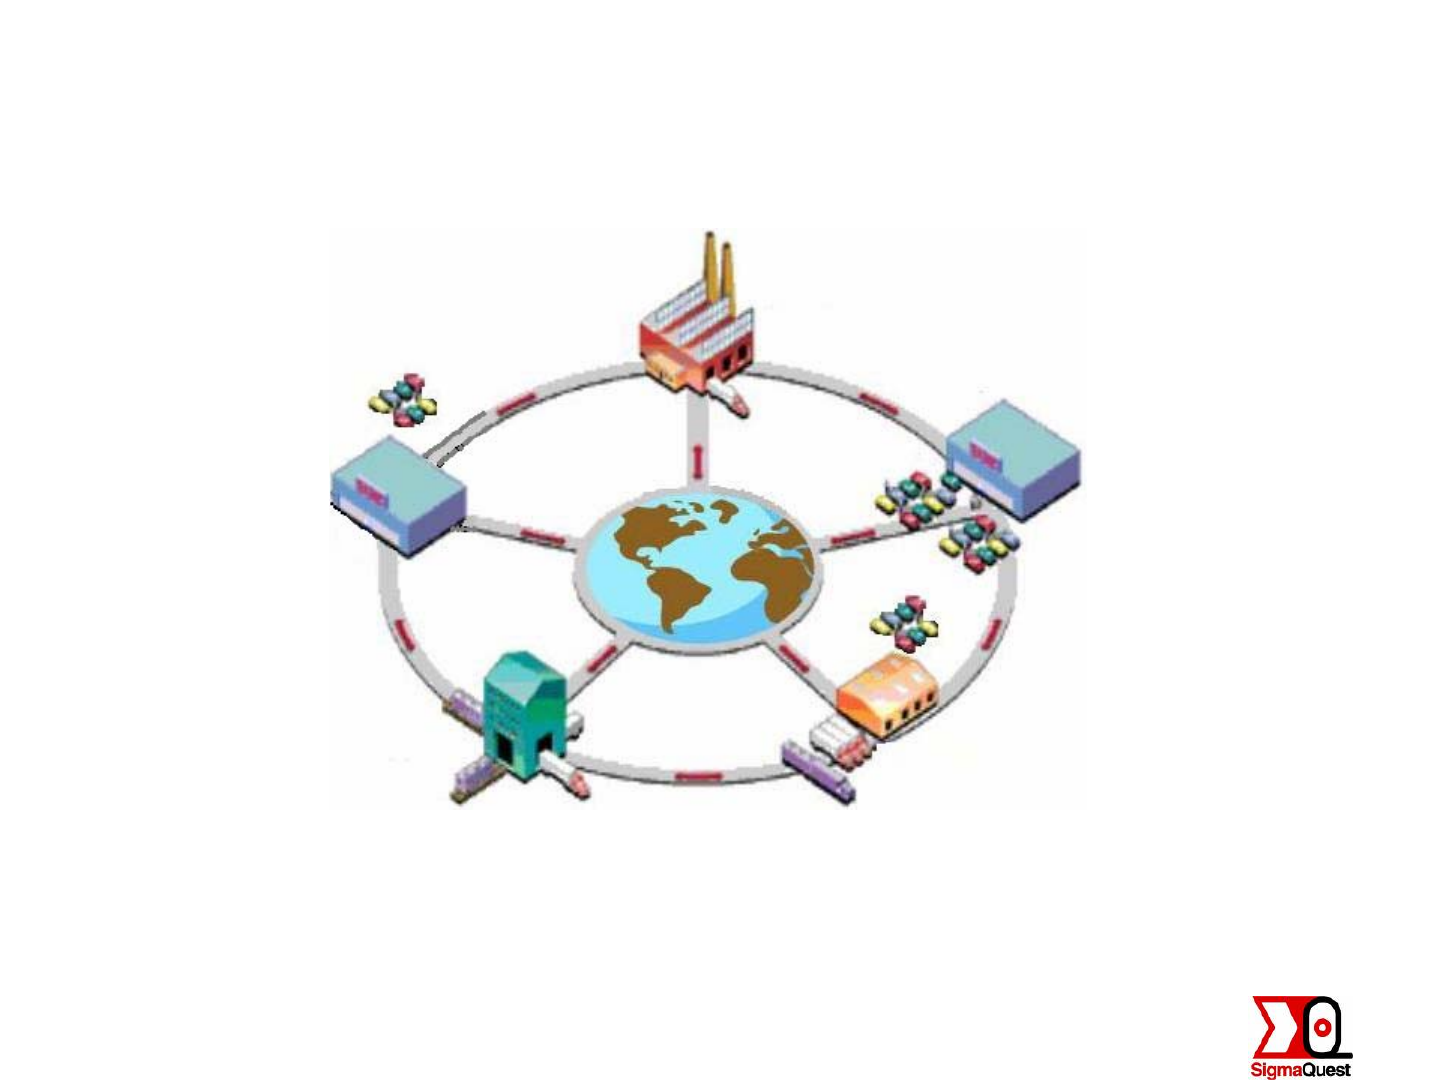
RCA – A 360°Perspective
Engineering
Manufacturing
Customer Complaints &
Returns
Component
Suppliers
Install Base
Feedback

Eliminate Data
Fragmentation
“Single View of Truth”

Data Acquisition Challenges
Political
Engineering, Ops, Service, Quality
Component Suppliers, CMs, Repair Centers
Data Quality
Are you collecting the right data ?
Accuracy, Granularity, Latency
Consistency (Part #, Serial #, Version, Revision)
IT
Data Storage, Analytics , Large volumes of data
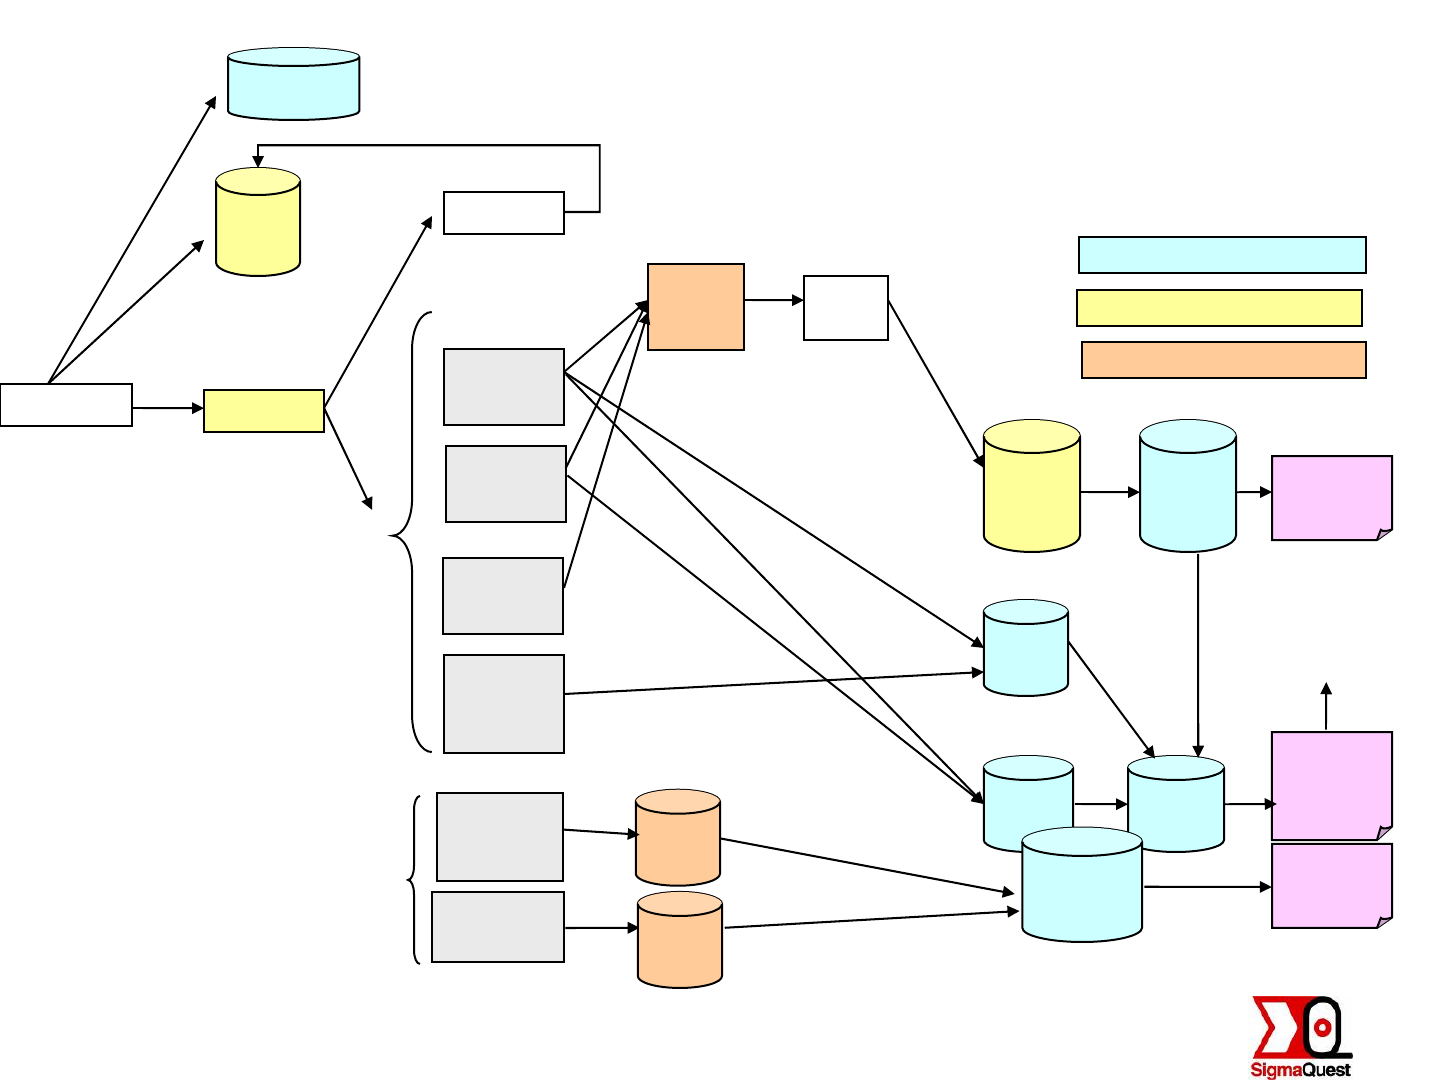
Typical Scenario - Data,
Data Everywhere
Customers Oracle
RCA
3PL-1
(Module)
3PL-2
(Module)
3PL-1
(System)
DW
Oracle
Quality
Corporate
Reliability
Reports
IFS /
Stars /
Tars
XML
(7C6)
Pass/Fail Data
Desktop
Database
Dept.
Database
Test Data
Part B
Test
database
Detailed
Test Data
Part A
Call Home
Screening / Failure
Analysis Centers
40% of customers
File Incident Ticket
RMA
Receipt
0.5%
99.5%
SAP
Repair-1
(Component)
Repair-2
(Component)
Repair Centers /
sub-tiers
Repair/
FA data
Home Grown Repository (OEM)
Supplier Repository
ERP / CRM software (OEM)
Legend
Other
Reports
Test & Repair
SQE FA
Reports
Internal
RMA
(System)
Engineering
Feedback
Supplier
Root Cause
FA data
Repair/
FA data
Partial Data
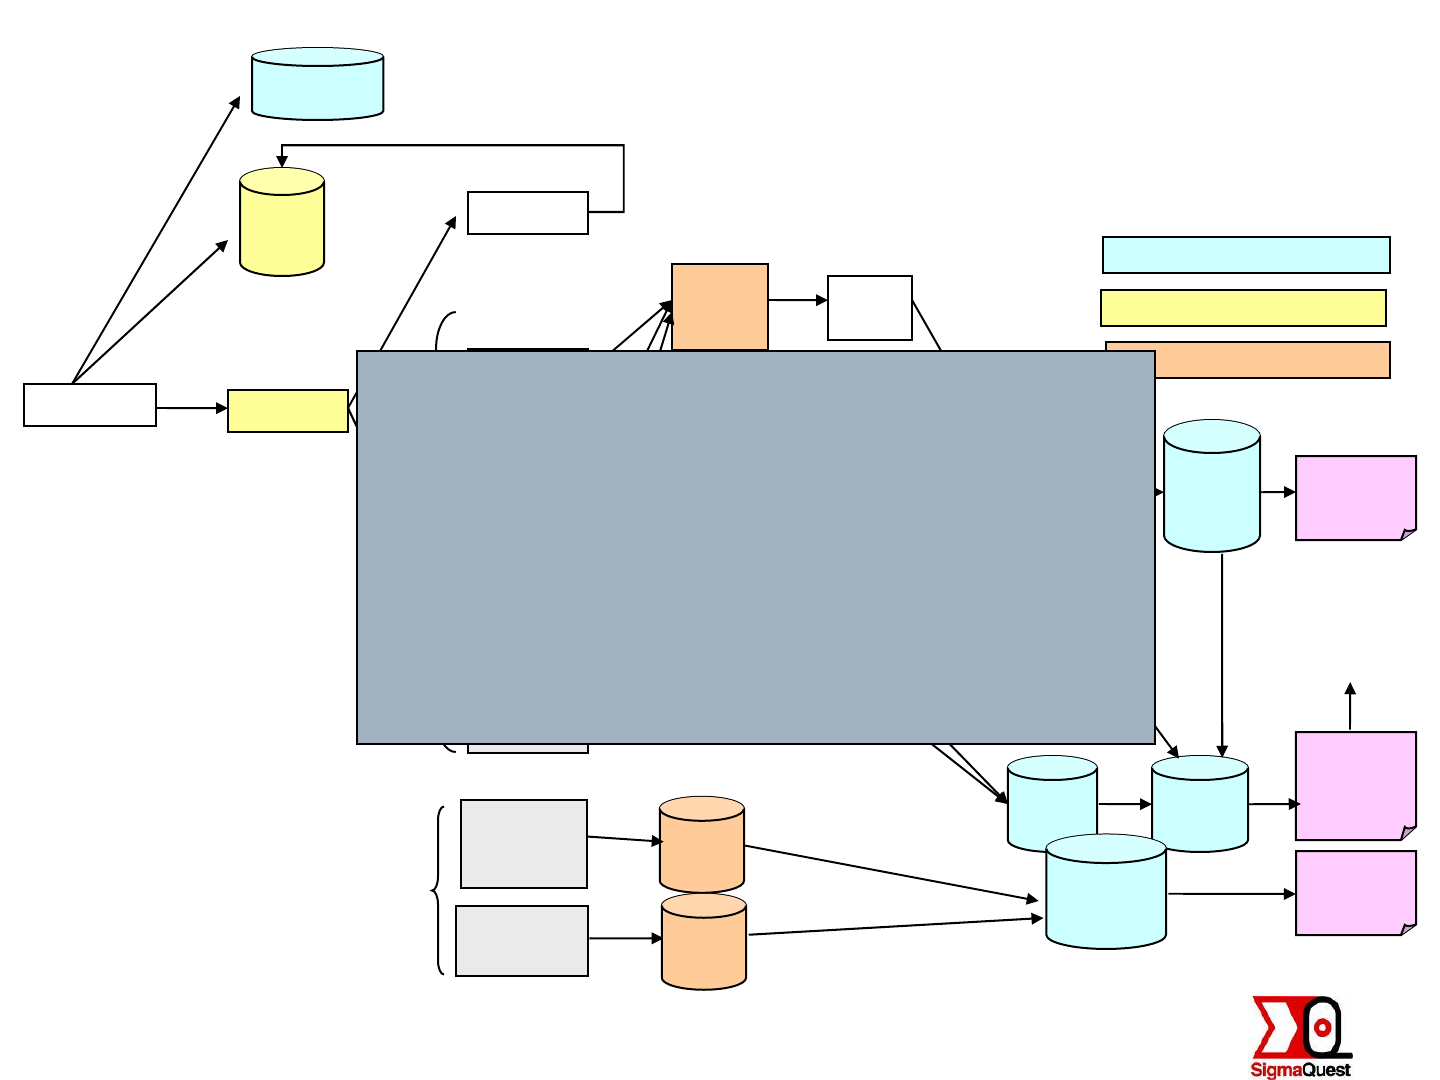
Customers Oracle
RCA
3PL-1
(Module)
3PL-2
(Module)
3PL-1
(System)
DW
Oracle
Quality
Corporate
Reliability
Reports
IFS /
Stars /
Tars
XML
(7C6)
Pass/Fail Data
Desktop
Database
Dept.
Database
Test Data
Part B
Test
database
Test
Data
Part B
Call Home
Screening / Failure
Analysis Centers
40% of customers
File Incident Ticket
RMA
Receipt
0.5%
99.5%
SAP
Repair-1
(Component)
Repair-2
(Component)
Repair Centers /
sub-tiers
Repair/
FA data
Home Grown Repository (OEM)
Supplier Repository
ERP / CRM software (OEM)
Legend
Other
Reports
Test & Repair
SQE FA
Reports
Internal
RMA
(System)
Engineering
Feedback
Supplier
Root Cause
FA data
Repair/
FA data
Partial Data
Fragmentation
> 15 Data Sources
Typical Scenario - Data,
Data Everywhere
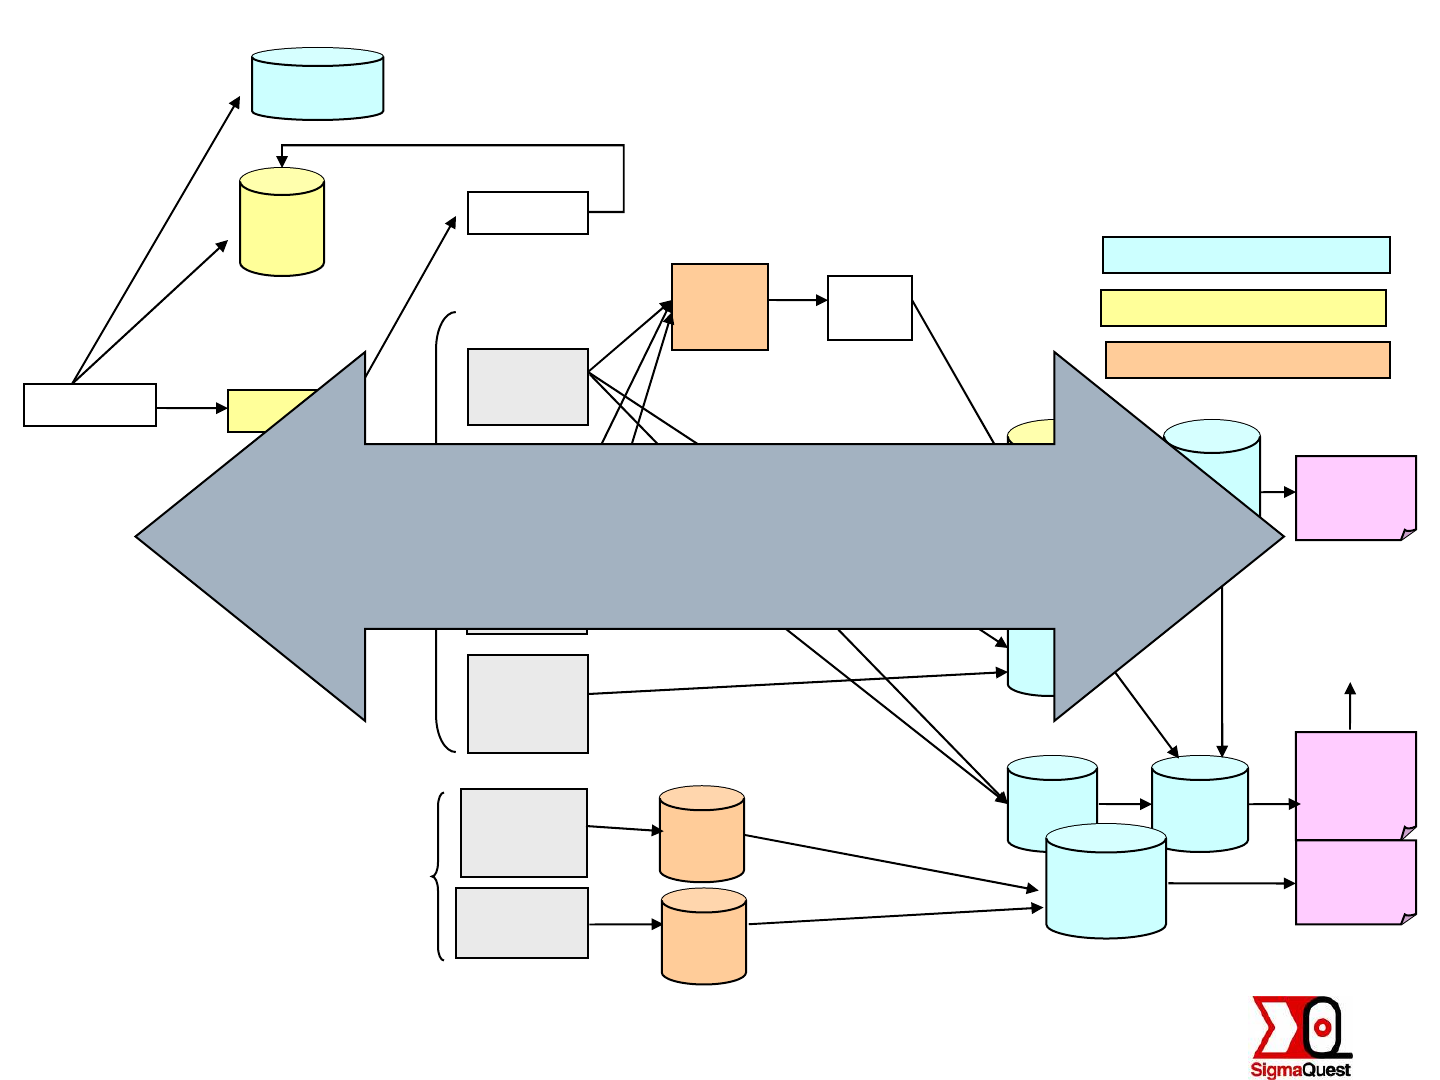
Customers Oracle
RCA
3PL-1
(Module)
3PL-2
(Module)
3PL-1
(System)
DW
Oracle
Quality
Corporate
Reliability
Reports
IFS /
Stars /
Tars
XML
(7C6)
Pass/Fail Data
Desktop
Database
Dept.
Database
Test Data
Part B
Test
database
Test
Data
Part B
Call Home
Screening / Failure
Analysis Centers
40% of customers
File Incident Ticket
RMA
Receipt
0.5%
99.5%
SAP
Repair-1
(Component)
Repair-2
(Component)
Repair Centers /
sub-tiers
Repair/
FA data
Home Grown Repository (OEM)
Supplier Repository
ERP / CRM software (OEM)
Legend
Other
Reports
Test & Repair
SQE FA
Reports
Internal
RMA
(System)
Engineering
Feedback
Supplier
Root Cause
FA data
Repair/
FA data
Partial Data
Latency
30 days
Typical Scenario - Data,
Data Everywhere

Building an Early Warning System
To Expedite RCA

Leading Risk Indicators
What happened ?
Why ?
-What is the root cause
-Is it a Design, Process or Supplier Issue?
-How do I prevent it from happening again

Demo

Using Data To Accelerate RCA
Cultivate holistic data strategy
Invest in Early Warning to accelerate
RCA
Empower intellectual resources to
make better decisions, sooner

Contact Information
For more information visit:
www.sigmaquest.com
Contact Information:
Al Alaverdi
408-524-3181
al.alaverdi@sigmaquest.com

Question & Answer
