RLCatalyst Command Centre User Manual V2.6
User Manual:
Open the PDF directly: View PDF ![]() .
.
Page Count: 53

Page 1
www.relevancelab.com
RLCatalyst Command Center User
Manual
Relevance Lab India Pvt Ltd
July 2018
Ver 2.6
Introduction
Welcome to the RLCatalyst Command Center user-guide. This user-guide is designed to provide
documentation for users who will be installing, administering and using the Command Center
product.
What is RLCatalyst Command Center
RLCatalyst Command Center is a cloud-based software product that can be used to monitor
services and their underlying infrastructure. The product provides early detection and warning of
Page 2
www.relevancelab.com
problems in the targeted services or infrastructure. The product also provides capabilities to
integrate problem tickets and capture incident details which can help to narrow down root cause.
Getting Started
You will be provided the following pieces of information in your starter kit:
URL:_______<application URL>________________________________
Company: _________________________________________________
User: _____________________________________________________
Password: _________________________________________________
Keep this information handy as you go through this guide and configure your system.
Planning your deployment
RLCatalyst Command Center is capable of multi-tenancy. Using the same instance of the
software, you can create several tenants. Each tenant can configure his own machines for
monitoring. Each tenant can also configure his own cloud accounts and get an independent view
of his cloud assets.
The landlord can create new tenants in the system.
Creating your first tenant
To plan the creation of a new tenant, use the planning sheet in Appendix A to collect all the
information required upfront. Keep the sheet handy as you go through the following steps.
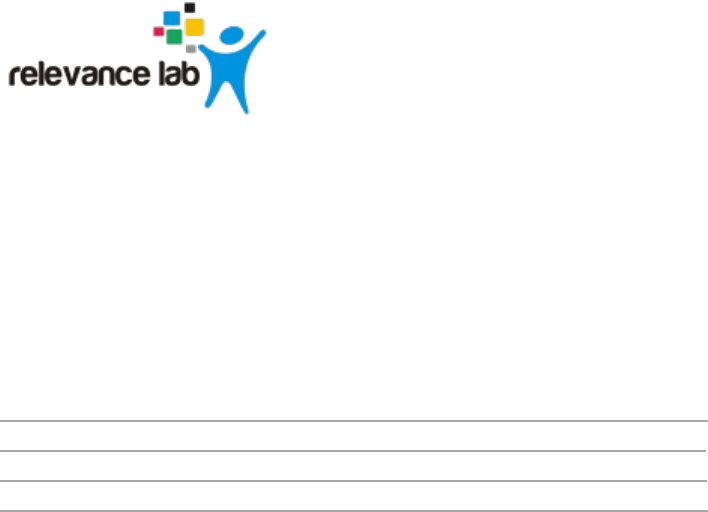
Open a browser (we recommend Chrome or Firefox). Enter the Application URL provided. The
login page should open.
Page 3
www.relevancelab.com
Image 1 - Login Page
To register a tenant, click on the Register link which is available on the login page & application
will display Register screen to the user.
Page 4
www.relevancelab.com
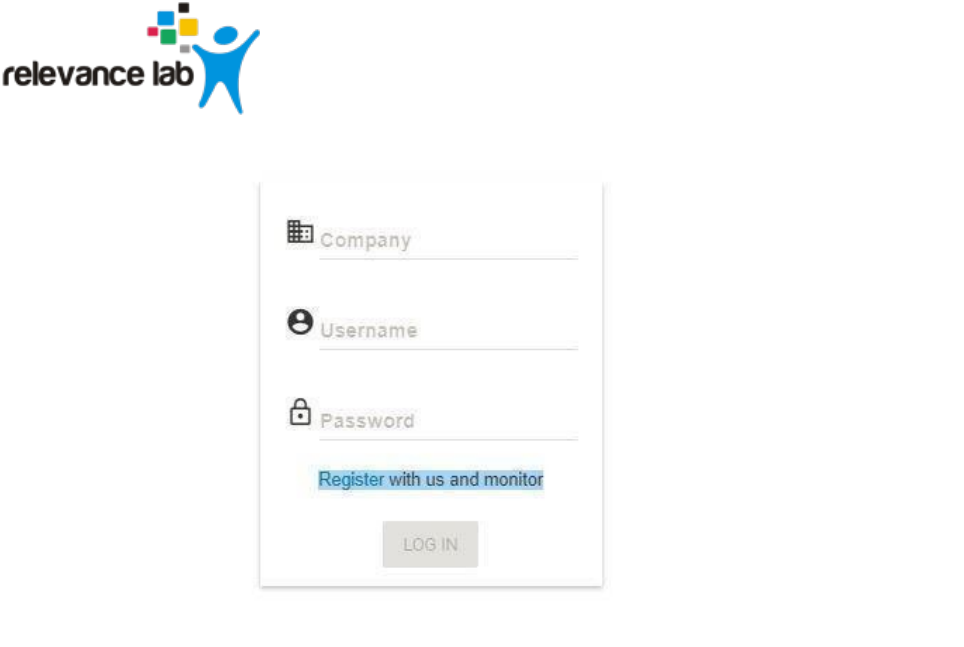
Image 2 - Register Account Page
Use details from Appendix A for Company Name, User Name, Email & set the Password as per
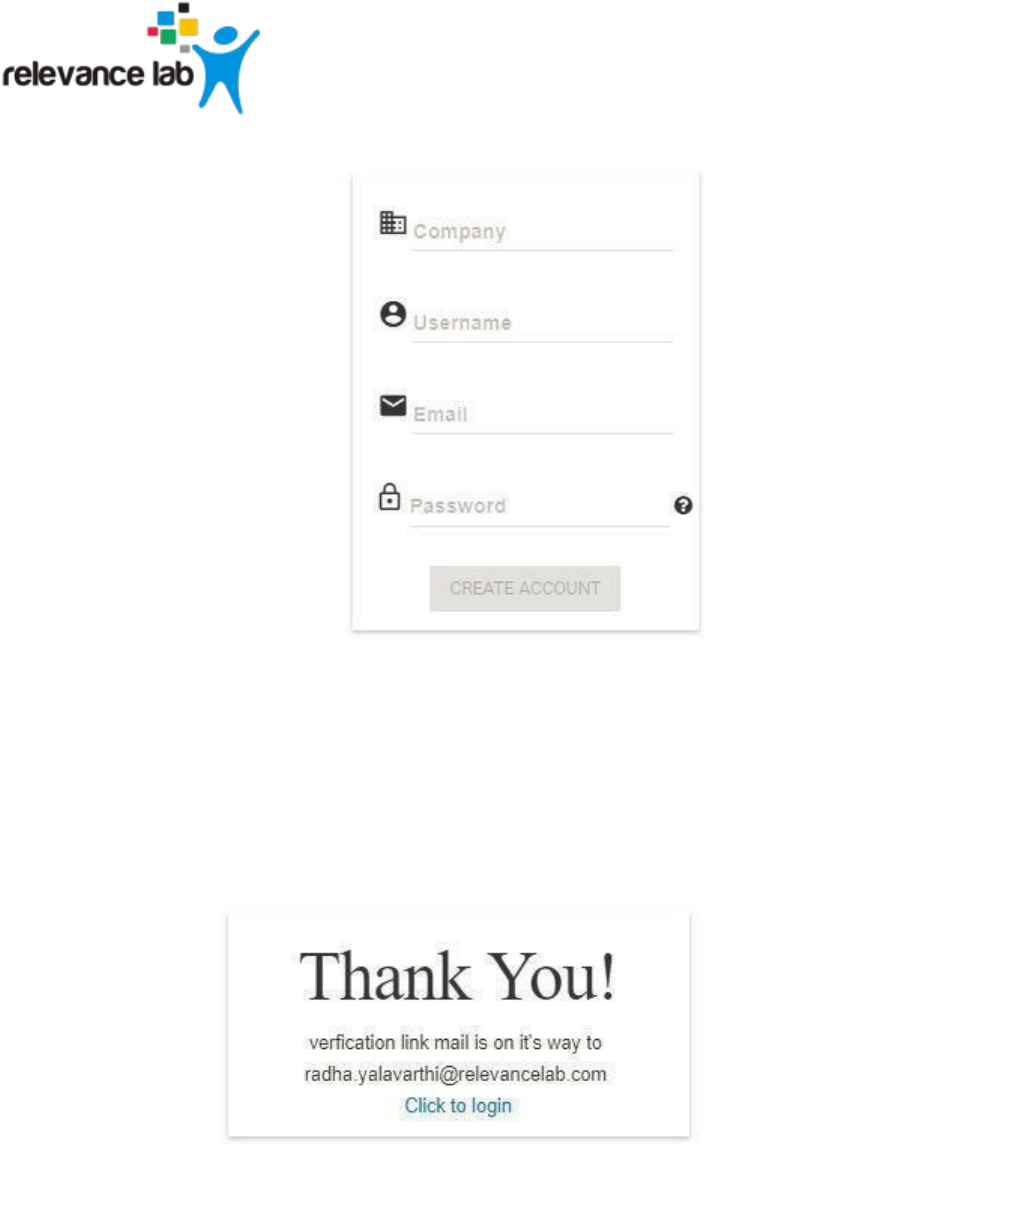
Password policy. Click on Create Account button. You will see a Thank You screen confirming
that a verification email has been sent to the email address registered.
Image 3 - Verification email sent
Page 5
www.relevancelab.com
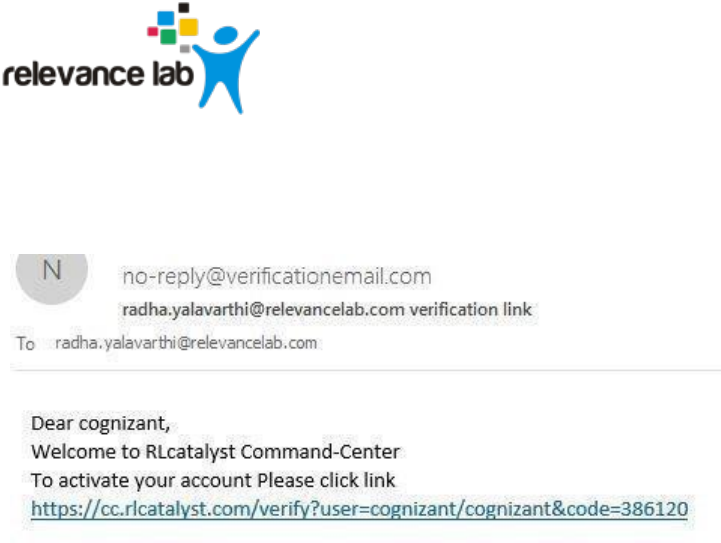
Check the verification email delivered to the registered email address & click on the verification
link to activate the account. On successful validation, tenant will be allowed to login into the
Command Center.
Image
4 - Verification email (sample)
Page 6
www.relevancelab.com
Logging in as a tenant
Open a browser (we recommend Chrome or Firefox). Enter the application URL provided. The
login page should open. On the login page, fill the Company, User and Password fields as
captured in Appendix A. Then click the Login button. You will see the landing page.
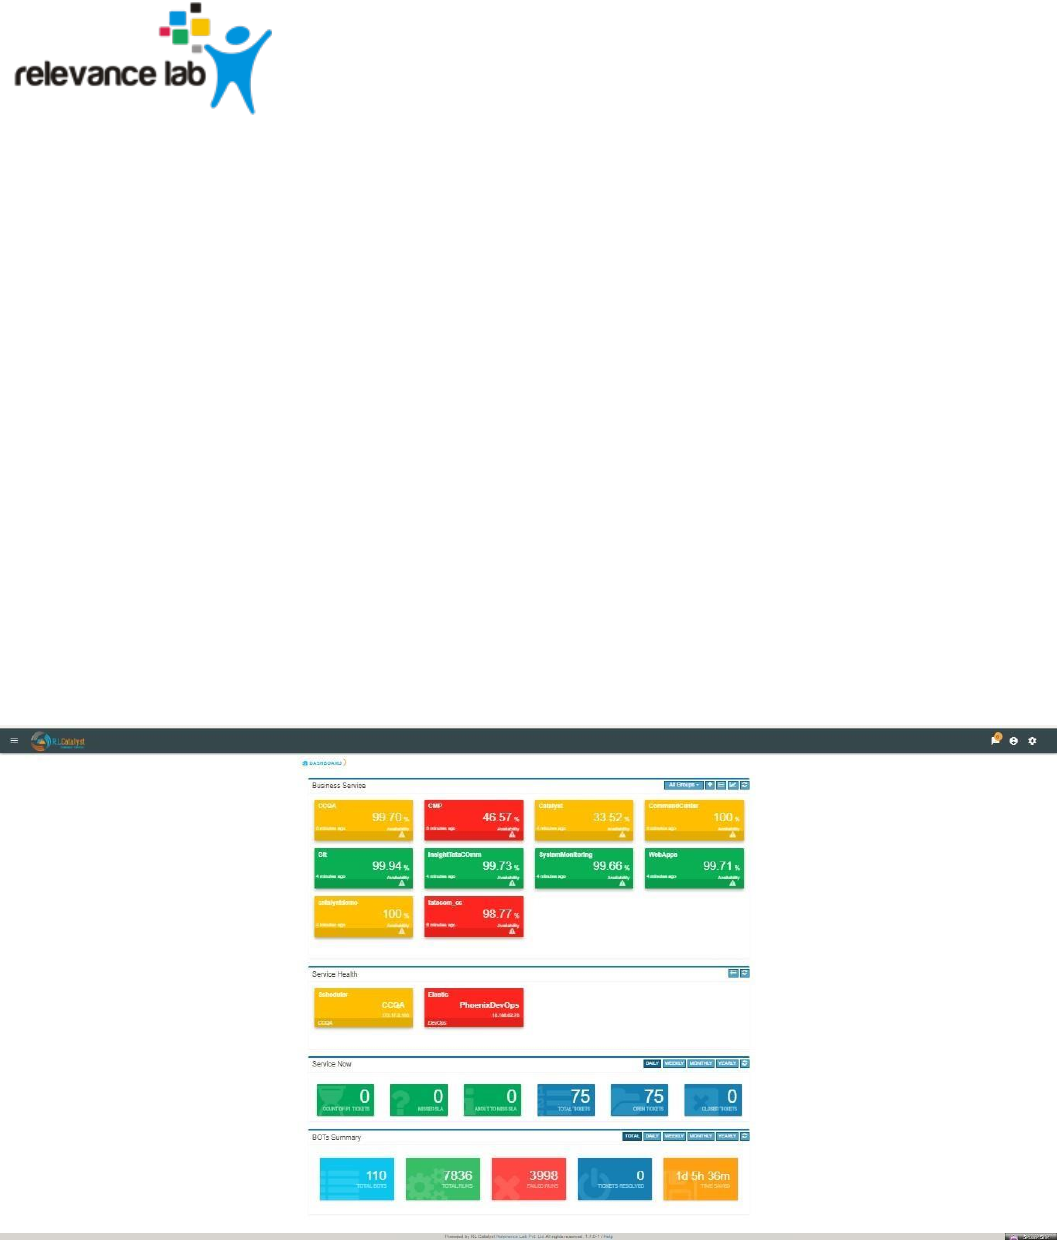
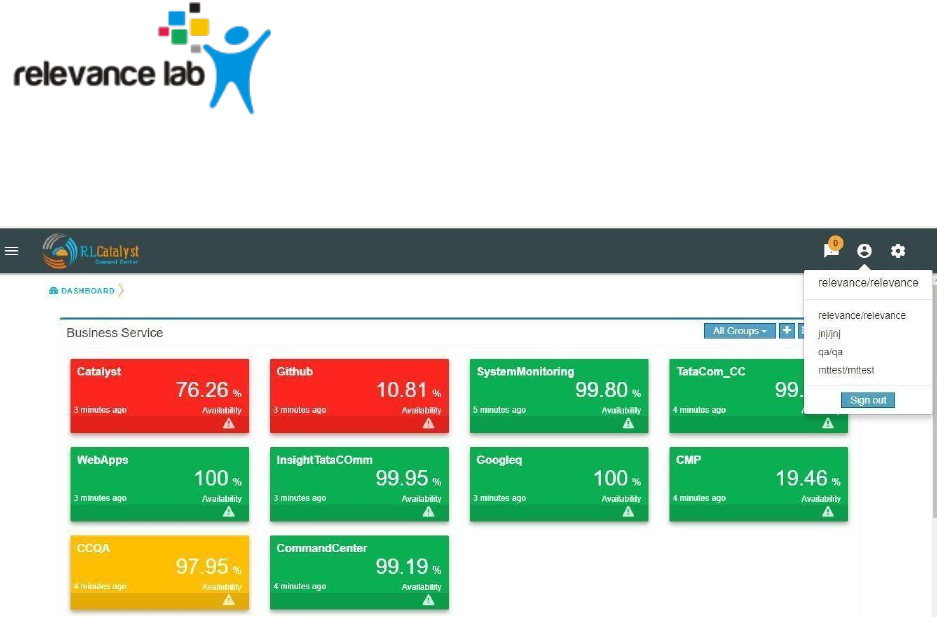
● Business Service Status View – by default this will not show any data. You will need to
configure business services following the instructions in this guide.
● Service Health – providing a quick way of viewing at a glance, if any of the linked services
(across BSM’s) are in alarm state (Yellow & Red). By clicking on critical/warning service
card, the system shall navigate to the Services page and should show the Service and
Nodes tabs related to selected service.
● ServiceNow Ticket Snapshot – by default this will not show any data. You will need to
configure a Service Now account following the instructions in this guide.
● BOT’s Summary (Total)- We need to configure a Catalyst Account to view the count of Bot’s
summary.
Image 5 - Dashboard View of Business Services
Page 7
www.relevancelab.com
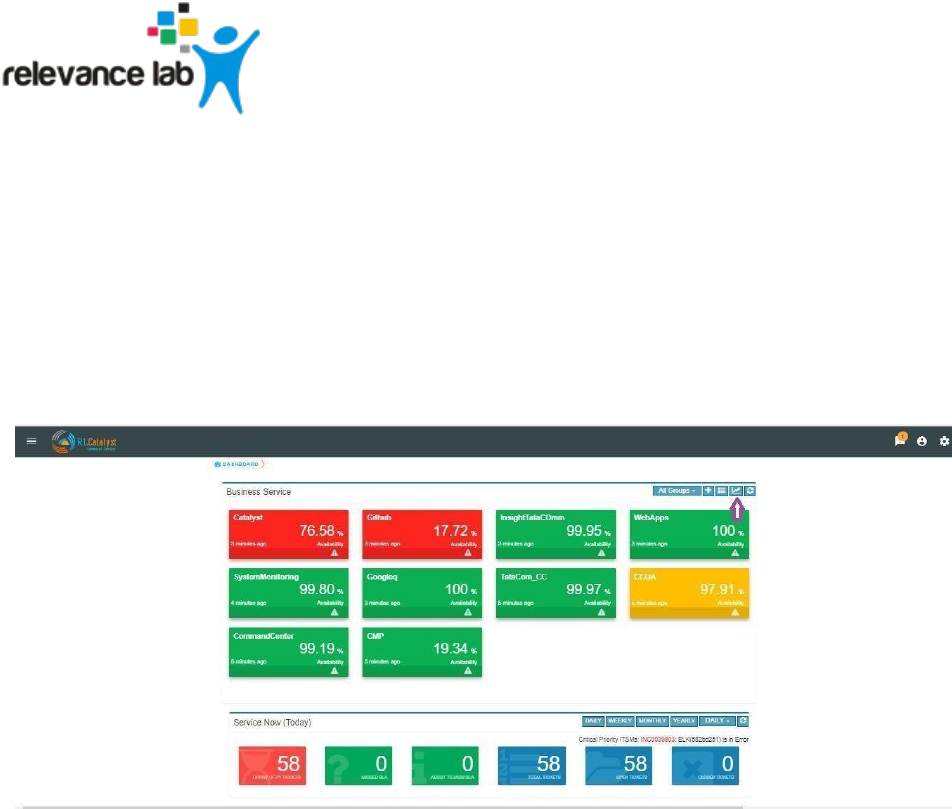
Historical BSM Health Indicator:
Historical BSM Health Indicator gives you the ability to see the trend of the BSM over last 30
days as a consolidated view. Using this view, the user can then navigate to specific outage view
of interest.
The view can be available with a “Trend Icon” on Top-Left of BSM View and clicking that can
show the Consolidated status of all BSM over last 30 days with appropriate status.
Image 6 - Trend Icon
Page 8
www.relevancelab.com
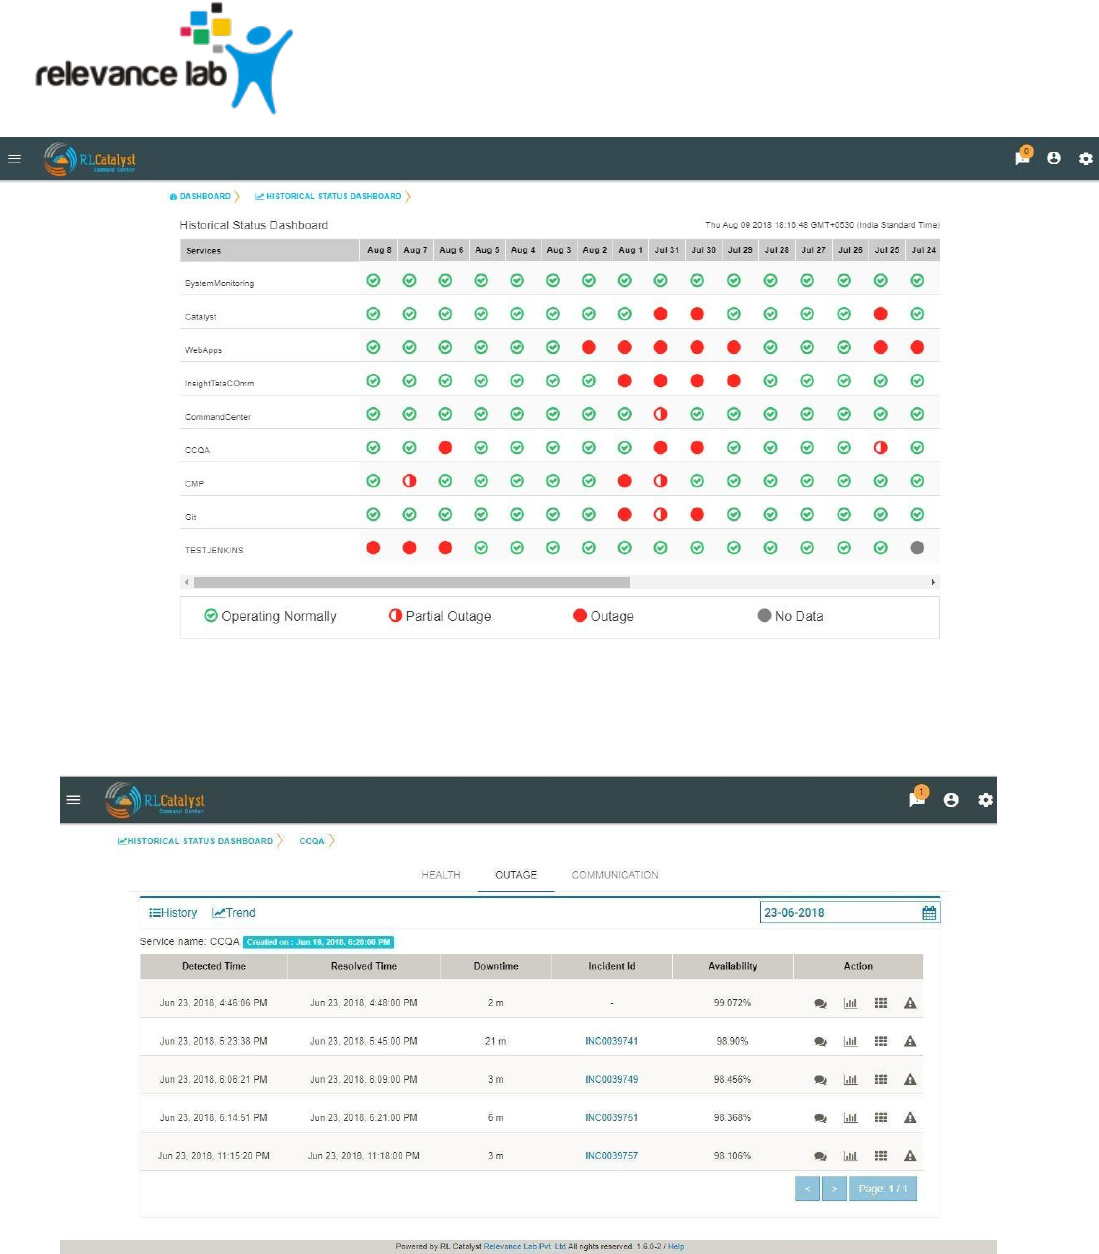
Image 7 - Historical Status Dashboard
Clicking the link of Outage (Red) or Partial Outage available in the Historical Status Dashboard will take
you to the appropriate Outage Drill-down page
Image 8 - Outage Drill-down page
Page 9
www.relevancelab.com
Configuring Cloud Credentials
RLCatalyst Command Centre gives you the ability to view all your cloud assets (spanning across
providers and accounts) in one place. These assets include:
● Virtual Machines
● ELBs
● Security Groups
● Networks
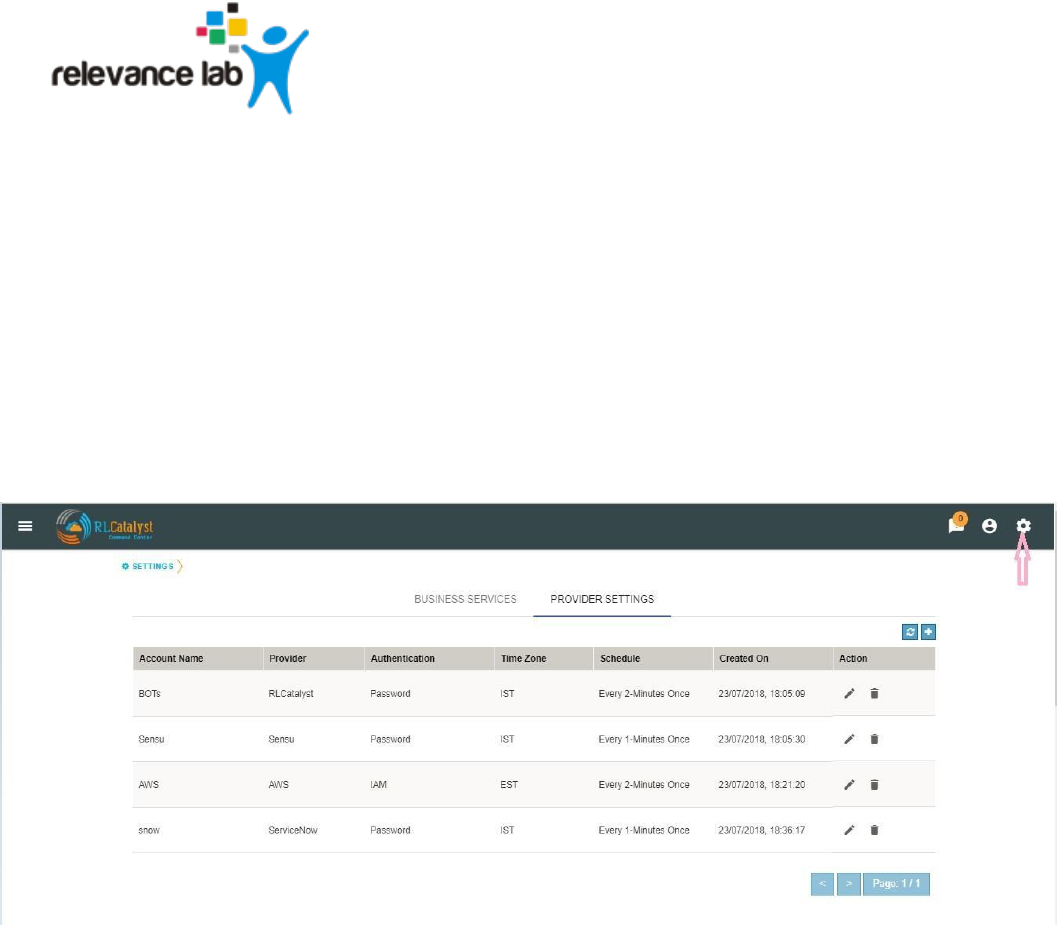
Configure your Cloud Account Details in the Command Centre Settings to view all your cloud
assets in one place. Command Centre collects the information from the configured cloud
account periodically. You can configure the interval in which this information refreshes.
Image
9 - Settings
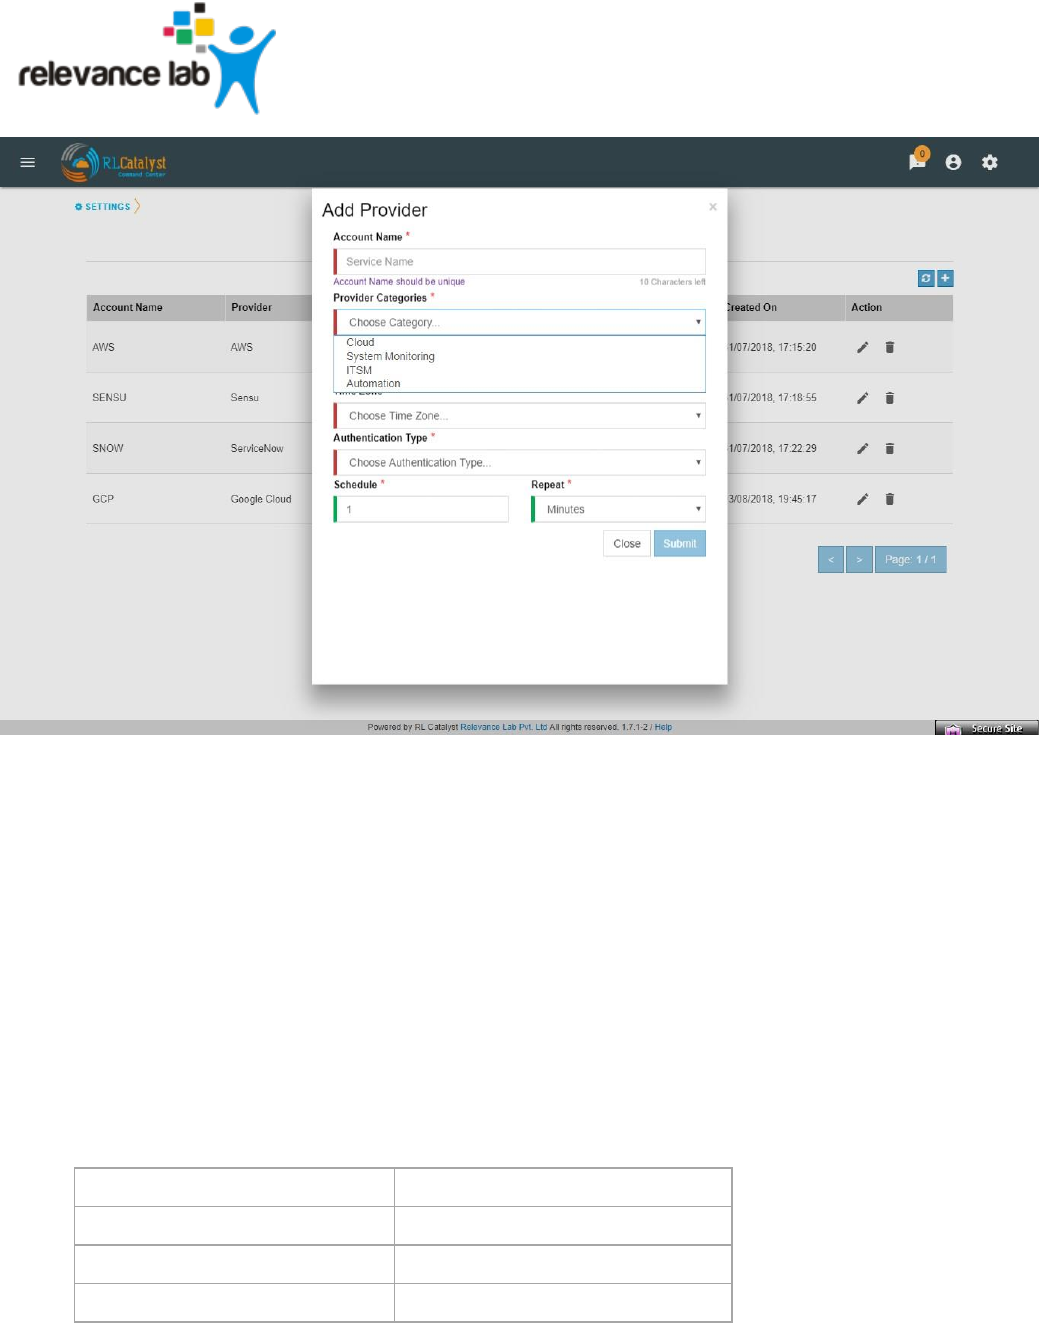
In Provider Settings, we have categorized the providers based on their services. Depending on
Category selection Provider List will load the available vendors.
Page 10
www.relevancelab.com
Image 10 - Provider Categories
Command Center will support for following Cloud Account providers.
• Microsoft Azure
• AWS
• Google Cloud
To configure a cloud account:
1. Click on the Settings icon in the top bar.
2. Click on the Provider Settings tab
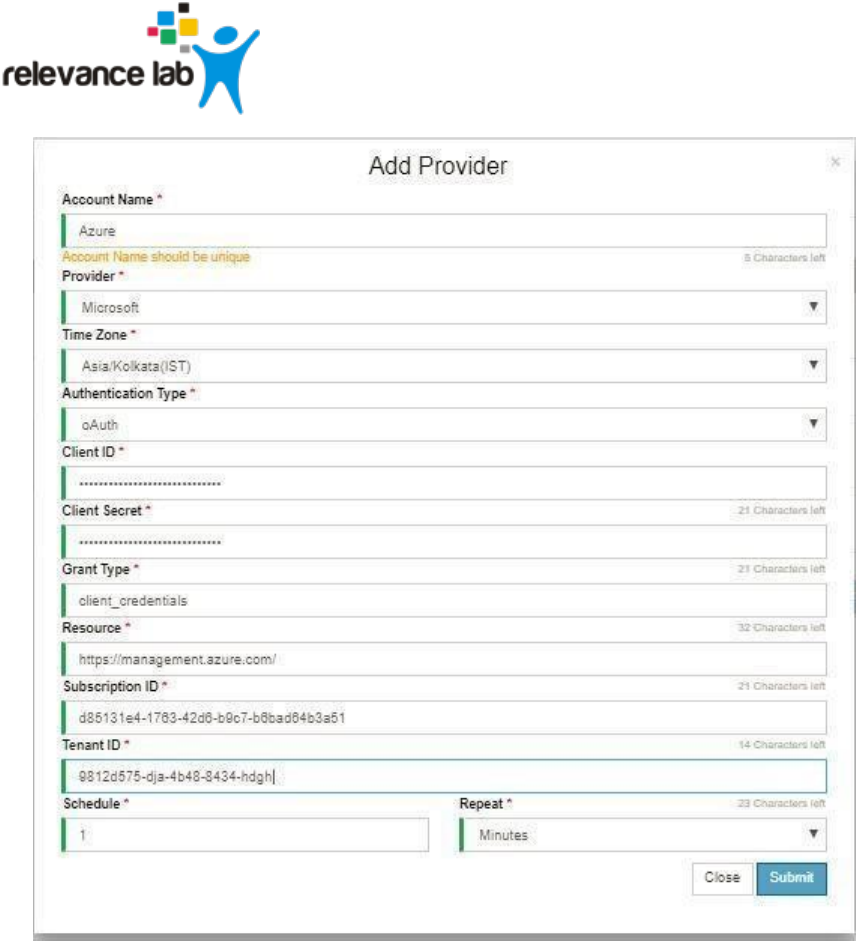
3. Click + button and add your cloud account credentials in Settings with the details
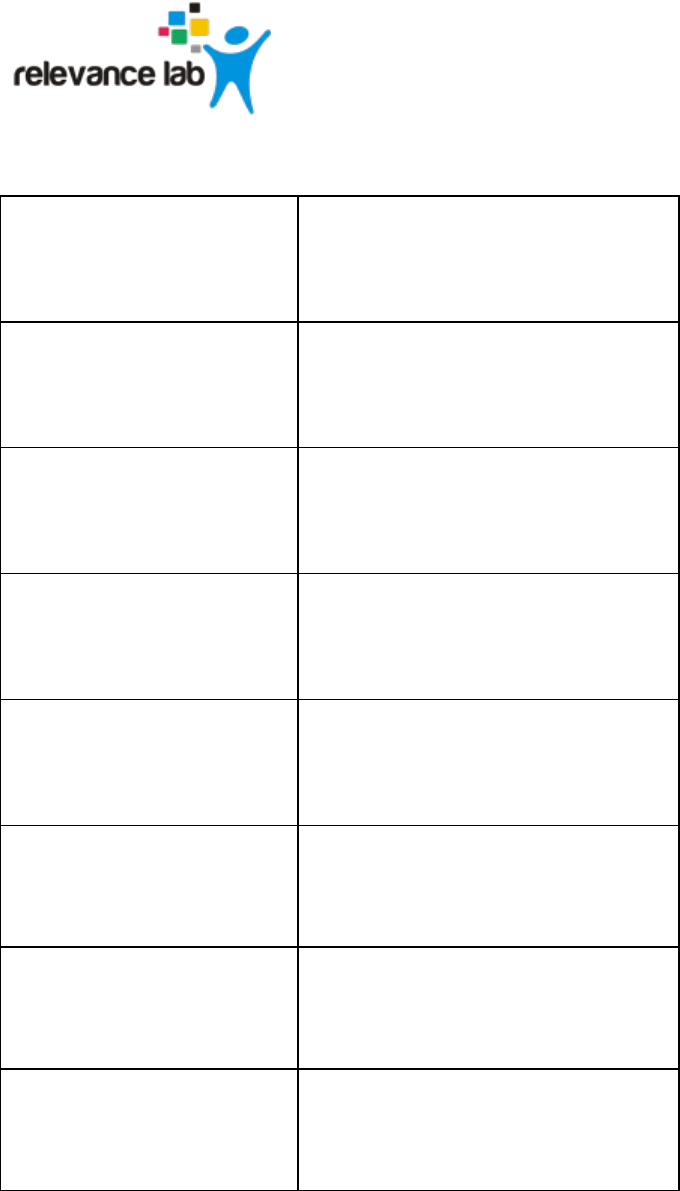
captured in Appendix A. Example provided below is for a Microsoft Azure account.
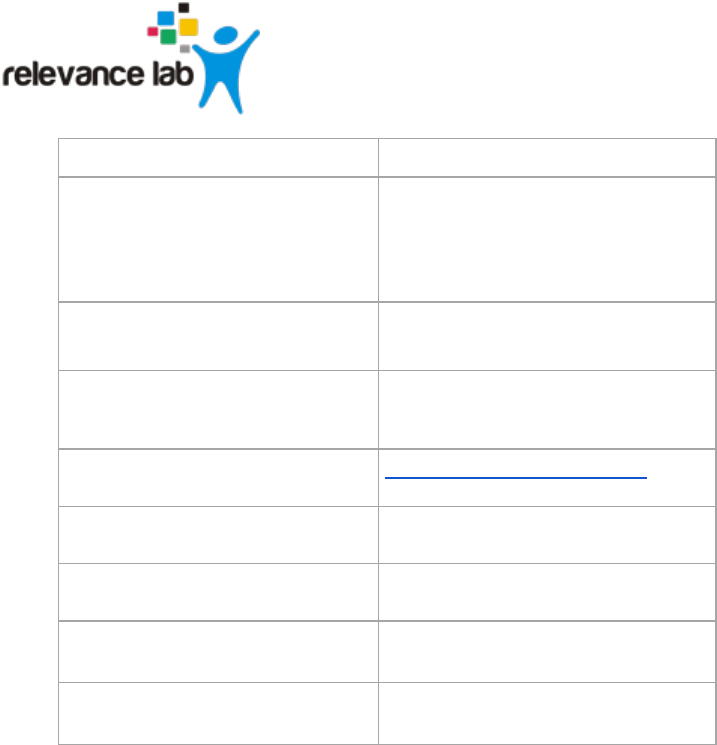
Field
Instructions
Account Name
Enter a Friendly name
Vendor
Choose Azure
Time Zone
Choose IST
Page 11
www.relevancelab.com
Authentication Type
Choose OAuth
Client ID
Enter the Client ID of your
Azure application E.g.:
9812d575-dja-4b48-8434-hdgh
Client Secret
Enter the Secret key of your
Azure Application
Grant Type
Enter the text ‘client credentials’
Resource
https://management.azure.com/
Subscription ID
Enter the Azure subscription ID
Tenant ID
Enter the Azure Tenant ID
Schedule
Enter the Time Interval for
collecting data from Cloud
Repeat
Choose the Interval Type –
Minutes/Hourly
Note: To get the Client ID and Client Secret key, create an application in Azure and set the Role
as Reader. To set the Role, Go to Subscription->Resource Group->Access Control
(IAM)>Add>Permissions->Add Reader Permission
Page 12
www.relevancelab.com
Image 11 - Add cloud account details
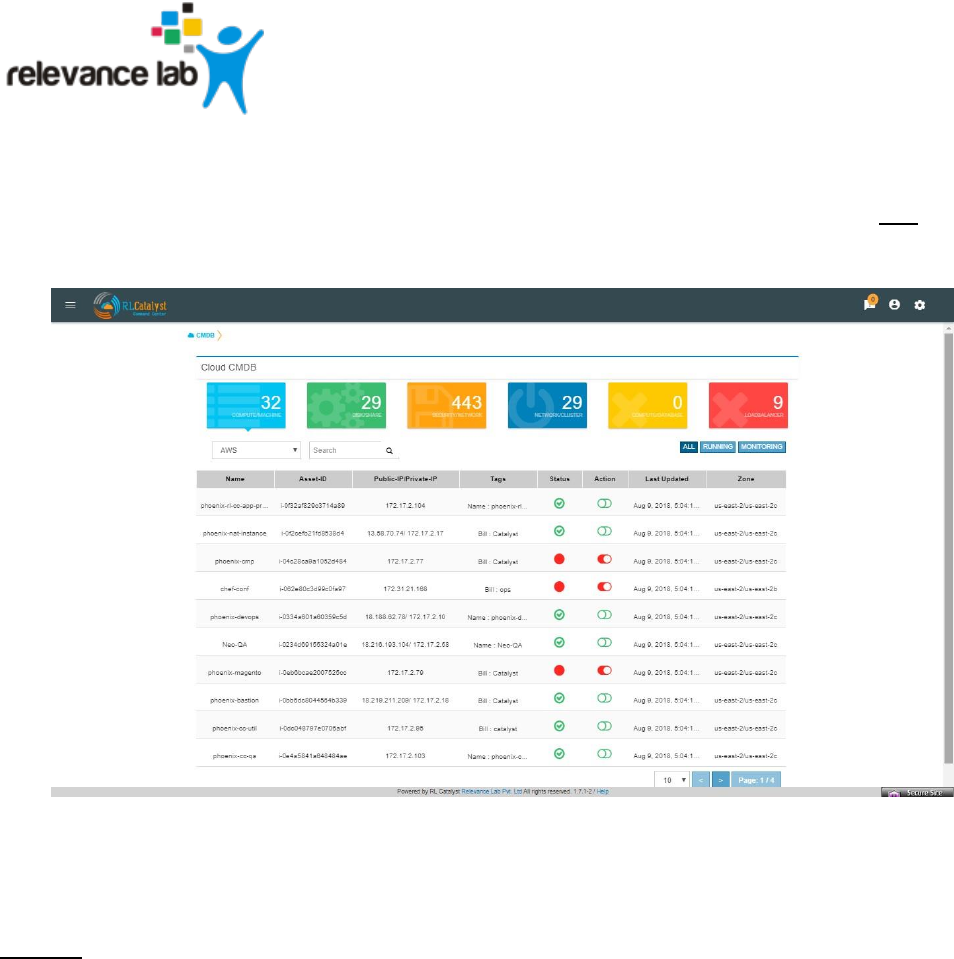
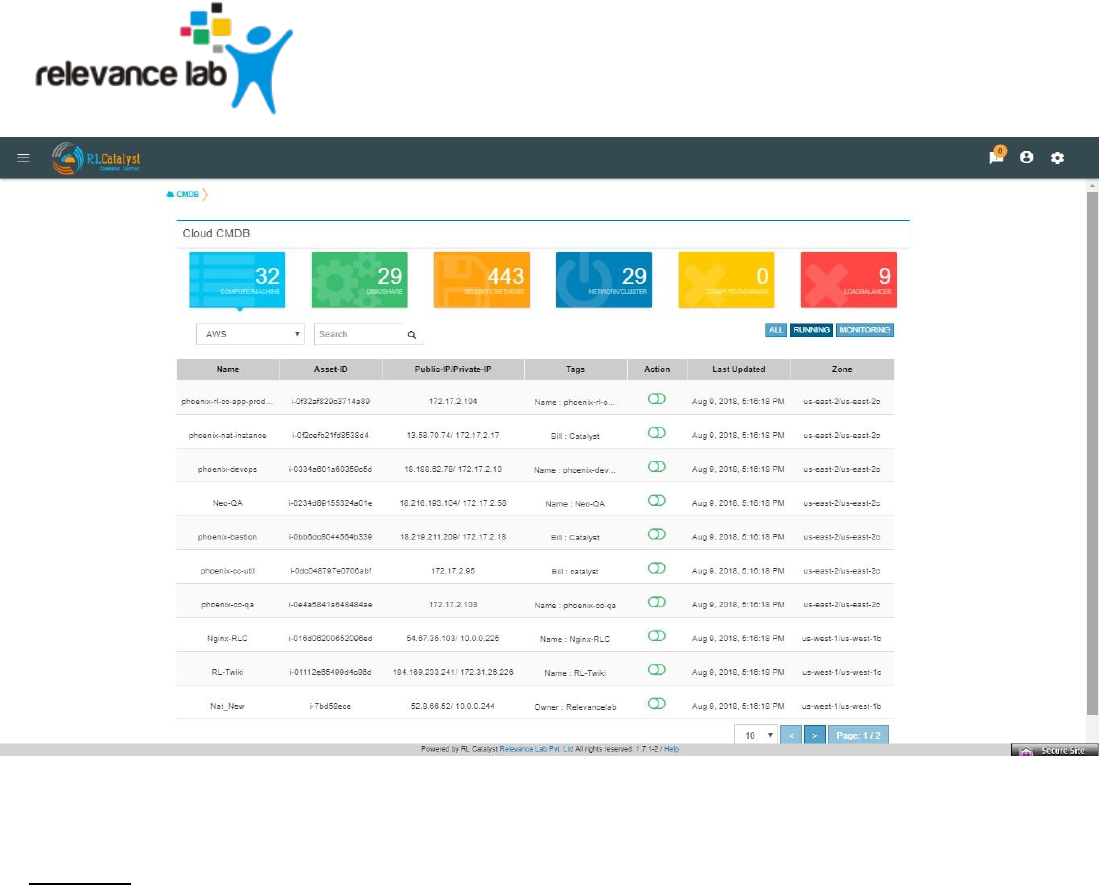
Viewing Cloud Assets
From the menu at the top left of the top bar, choose CMDB. Cloud assets will be listed once the
Cloud Credentials are added in Settings. From the dropdown choose the cloud account and
get the summary view and list view as shown in screenshot. The CMDB lists the following: ●
Virtual machines
● Disks
● Security Groups
● Network Cluster
● Compute Databases
● Load Balancers
Page 13
www.relevancelab.com
If the assets are tagged, the same information will be fetched into CMDB also.
You can filter the CMDB assets view by clicking on buttons “All, Running, Monitoring “which is
available in the right corner just above the table. By default, ALL filter should be selected. ALL:
displays all the nodes (Active & Inactive)
Image 12 - CMDB view of cloud assets (ALL)
Running: displays all the running nodes
Page 14
www.relevancelab.com
Image 13 - CMDB view of cloud assets (Running)
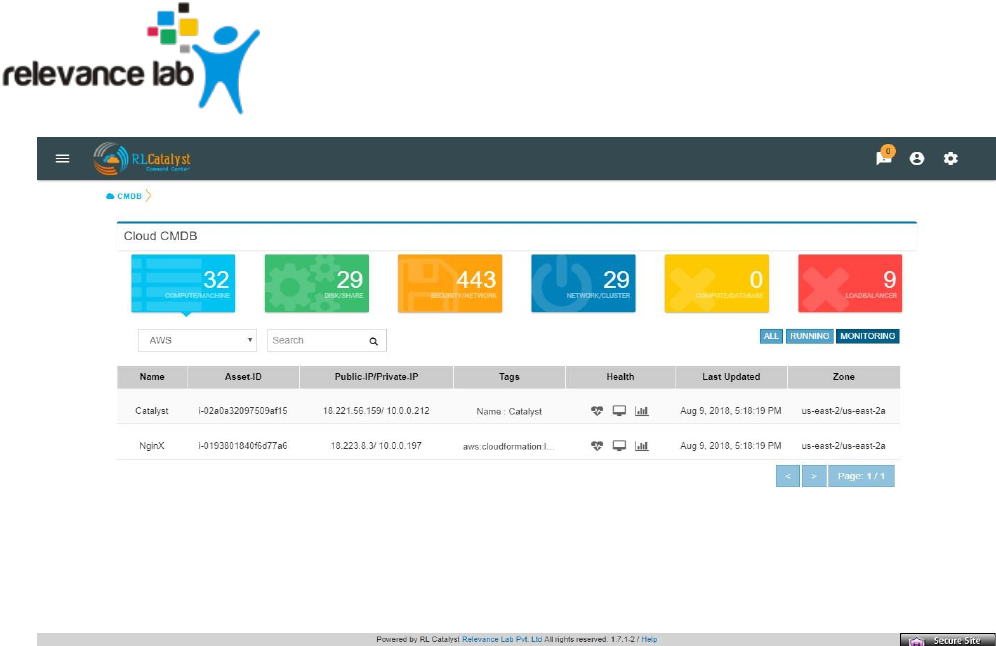
Monitoring: displays the monitoring nodes health services, Node, ELK Log Icons.
Clicking on Services, Node & ELK Log Icons shall take the user to respective pages.
Page 15
www.relevancelab.com
Image 14 - CMDB view of cloud assets (Monitoring)
Configuring Business Services
Add Business Services to be monitored in the dashboard view. Each service added will be
monitored in the predefined interval. The Business Services will appear as cards in the
dashboard each showing the latest status of the service. Clicking on a card will show you a drill
down view of the service with the alerts related to the service and the outage trends. Use the
Business Services information captured in Appendix A as you follow the steps below.
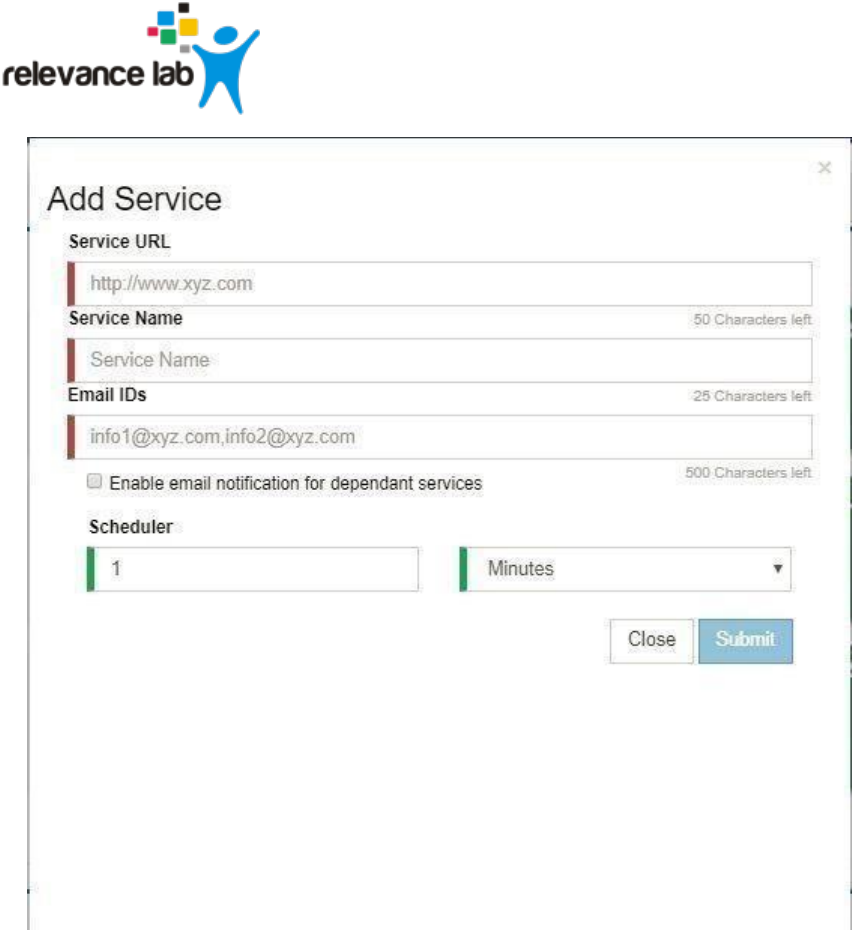
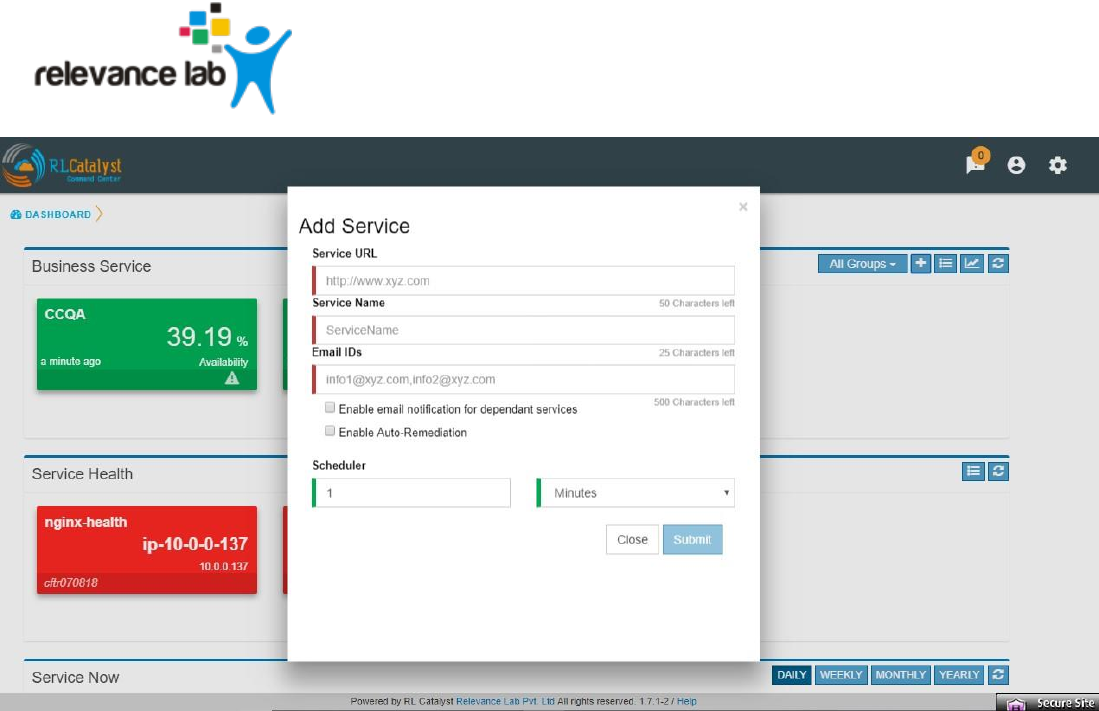
To configure a business service
1. Click the + icon in the dashboard view to bring up the Add Service dialog.
2. Add the Business Service URL (should be accessible from the Command Centre)
3. Enter an alias or a name of the service. This will be the name displayed on the card in the
dashboard.
4. Provide an email ID to which alerts will be send during Outages. You can provide more than
one email ID separated by commas.
5. A verification e-mail will be sent to each email ID provided above. Clicking on the link in the
email will confirm the email ID for receiving emails.
6. Check the box to get email notifications for linked services
Page 16
www.relevancelab.com
Image 15 - Add Business Service
Configuring the Catalyst Account
Configuring a Catalyst account allows you to access the summary of BOT runs on your
dashboard page. It also enables the Remediation and Auto-Remediation features.
To configure a catalyst account:
1. Click on the Settings icon in the top bar.
2. Click on the Provider Settings tab
3. Click + button and add your catalyst account credentials in Settings with the details
Page 17
www.relevancelab.com
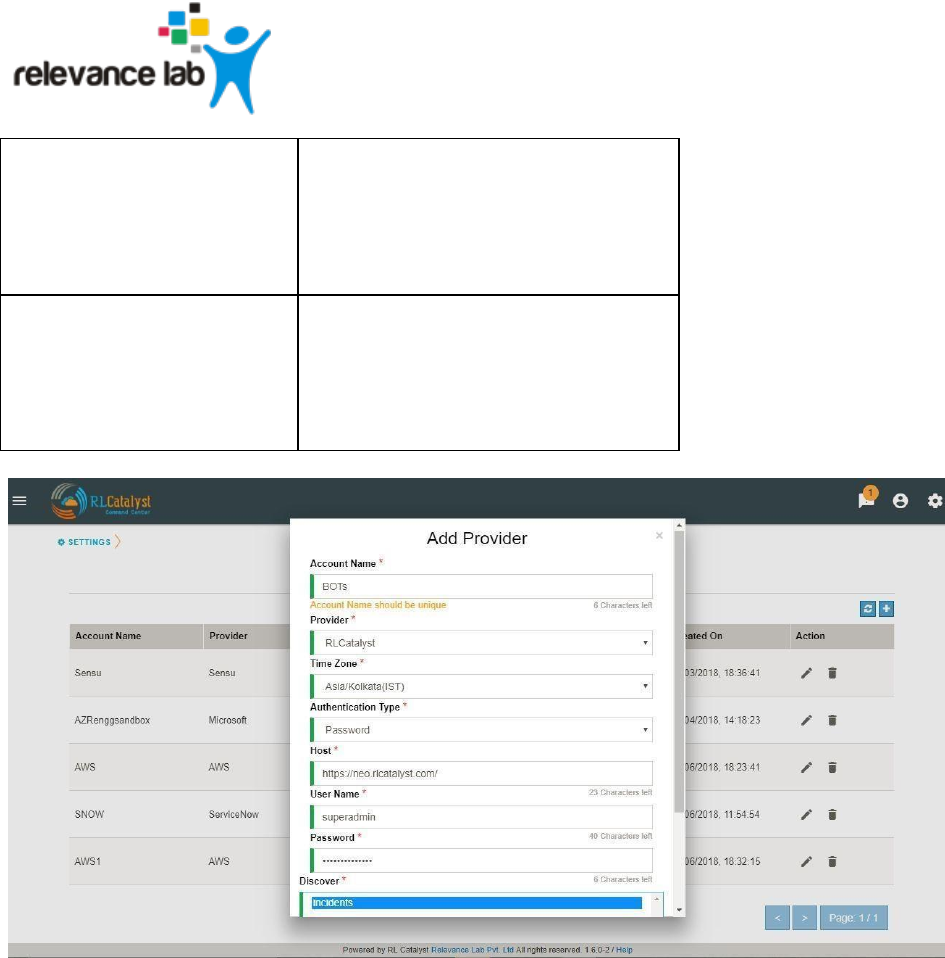
Field
Instructions
Account Name
Enter a Friendly name
Vendor
Choose RLCatalyst
Time Zone
Choose IST
Authentication Type
Password
Host
URL to your RLCatalyst Instance
E.g.: https://neo.rlcatalyst.com/
User Name
Enter User Name
Password
Enter Password
Page 18
www.relevancelab.com
Schedule
Enter the Time Interval for collecting
data from Catalyst
Repeat
Choose the Interval Type –
Minutes/Hourly
Image 16 - Add RL Catalyst Account
When you add a Catalyst account, BOTs Summary panel will appear on the dashboard.
Installing the Monitoring agents

Page 19
www.relevancelab.com
RLCatalyst Command Centre uses monitoring agents that run on the individual machines being
monitored. Monitoring Agents can be installed manually or via an automated way through
RLCatalyst.
Install Agents through RLCatalyst
RLCatalyst installs monitoring agents in the target nodes on which the Business Services are
running. This is done via a bootstrapping process which will install system monitoring, app
monitoring and services monitoring agents into the instances. Once installed, the real-time
monitoring alerts will be available under RLCatalyst Command Centre →Services and
RLCatalyst Command Centre→Monitoring Tools
● Login to <customer name>neo.rlcatalyst.com with the given credentials ● Go to Work zone.
● Click on the tree on the left to choose the Organization, Business Group, Project and
Environment. By default, there will be
o Organization with the customer name
o Business Group ‘DevOps’
o Project ‘Demo Project’
o Environments - <customer name>_EVL,
<customer name>_DEV,
<customer name>_QA, <customer name>_PROD, <customer name>_DEVOPS
● Choose one of the environments
● Click on ‘Import’ button. Enter the IP address of the instance, credentials and Import. The
agents will be installed automatically when imported.
Note: The checks added for monitoring your services in Consul should be tagged/grouped
properly with the business service name that has to be listed in the Dashboard View. RL
Team will provide necessary help to get the service checks added
Installing monitoring agents on a Linux machine using a downloaded script
Note: Perform the following steps on each machine listed under each Business Service in
Appendix A.
Prerequisites
1. To configure a machine or VM for monitoring with Command Center the following ports need
to be opened in the firewall: 8301 ,8302 ,8500,8600, 3030
Page 20
www.relevancelab.com
2. You need sudo privileges to install the clients
3. The machine should have a public IP address to communicate with the monitoring servers.
Procedure
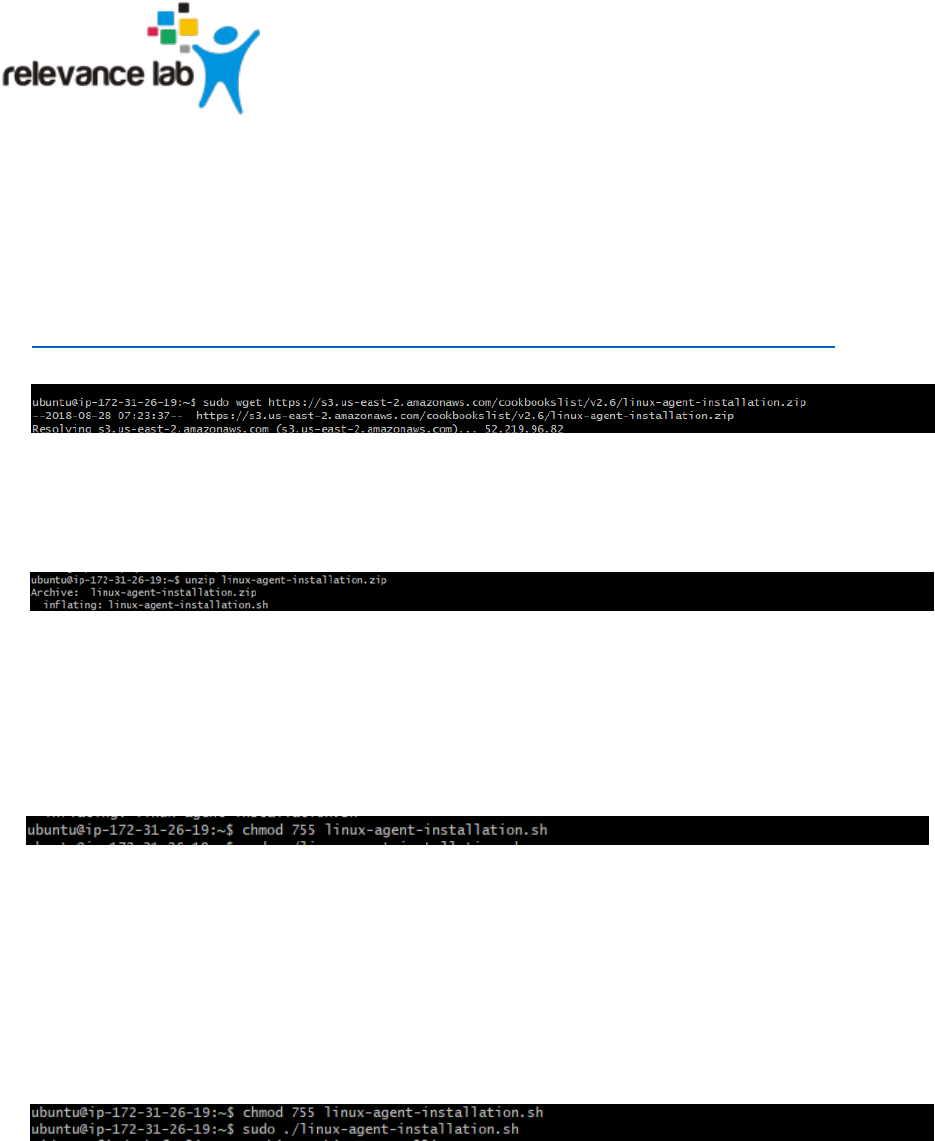
1. Download the agent_ installation.tar.gz file from the following URL:
https://s3.us-east-2.amazonaws.com/cookbookslist/v2.6/linux-agent-installation.zip
2. Extract the agent_installation.zip file by the following command
unzip linux-agent-installation.zip
Image 14 - Extracting the Monitoring agent installers
3. On successful extraction, execute the following command to give the privileges to run the
script
chmod 755 linux-agent-installation.sh
Image 15 - Preparing the Monitoring agent installers
4. Execute the script with the following command will install monitoring clients
sudo ./linux-agent-installation.sh
Image 16 - Running the Monitoring agent installers
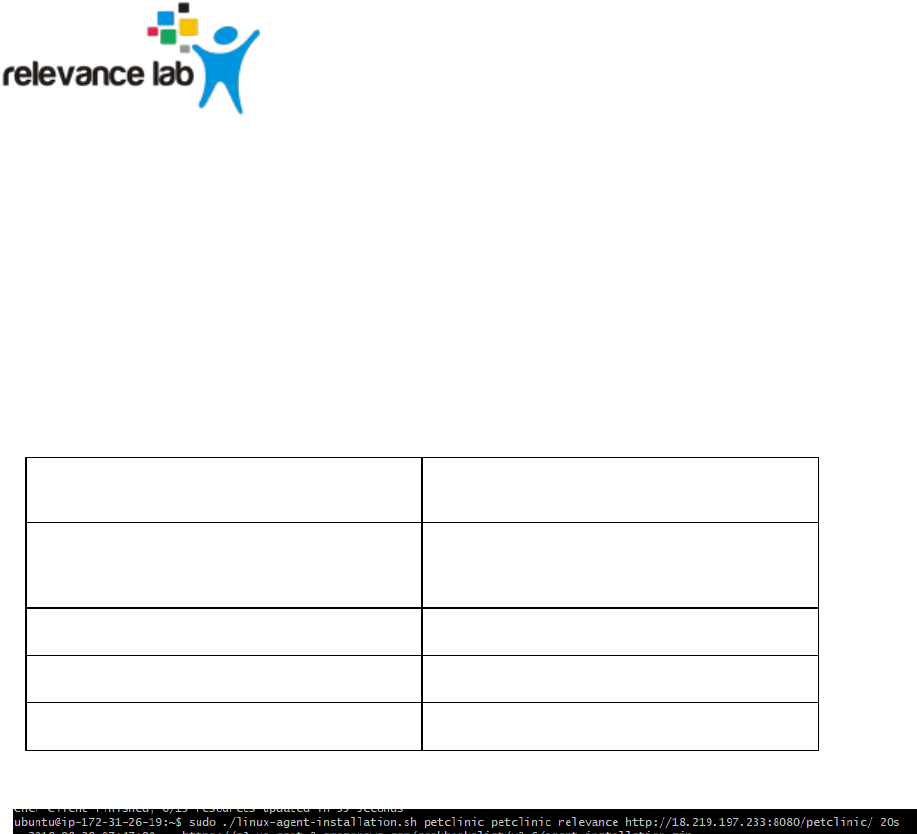
5. To create the Consul checks, pass the parameters using following command
Page 21
www.relevancelab.com
sudo ./linux-agent-installation.sh parameter1 parameter2 parameter3 parameter4 parameter5
Example:
sudo ./linux-agent-installation.sh petclinic petclinic relevance
http://18.219.197.233:8080/petclinic/ 20s
Parameter1
Service name <A friendly name for the service. This
will be your Business Service>
Parameter2
tag application name <Name of this application e.g.
MongoDB on which your Business Service
depends>
Parameter3
tag tenant id <Company Name for this Tenant>
Parameter4
URL
Parameter5
checks interval e.g. 60s
You should now have the monitoring agents running on your machine.
Install monitoring agents on a Windows machine through a downloaded script
Note: Perform the following steps on each machine listed under each Business Service in
Appendix A.
Prerequisites
1. To configure a machine or VM for monitoring with Command Center the following ports need
to be opened in the firewall: 8301 ,8302 ,8500,8600, 3030
2. You need to run PowerShell as Administrator (right-click and choose “Run As Administrator”)
3. The machine should have a public IP address to communicate with the monitoring servers.
Procedure
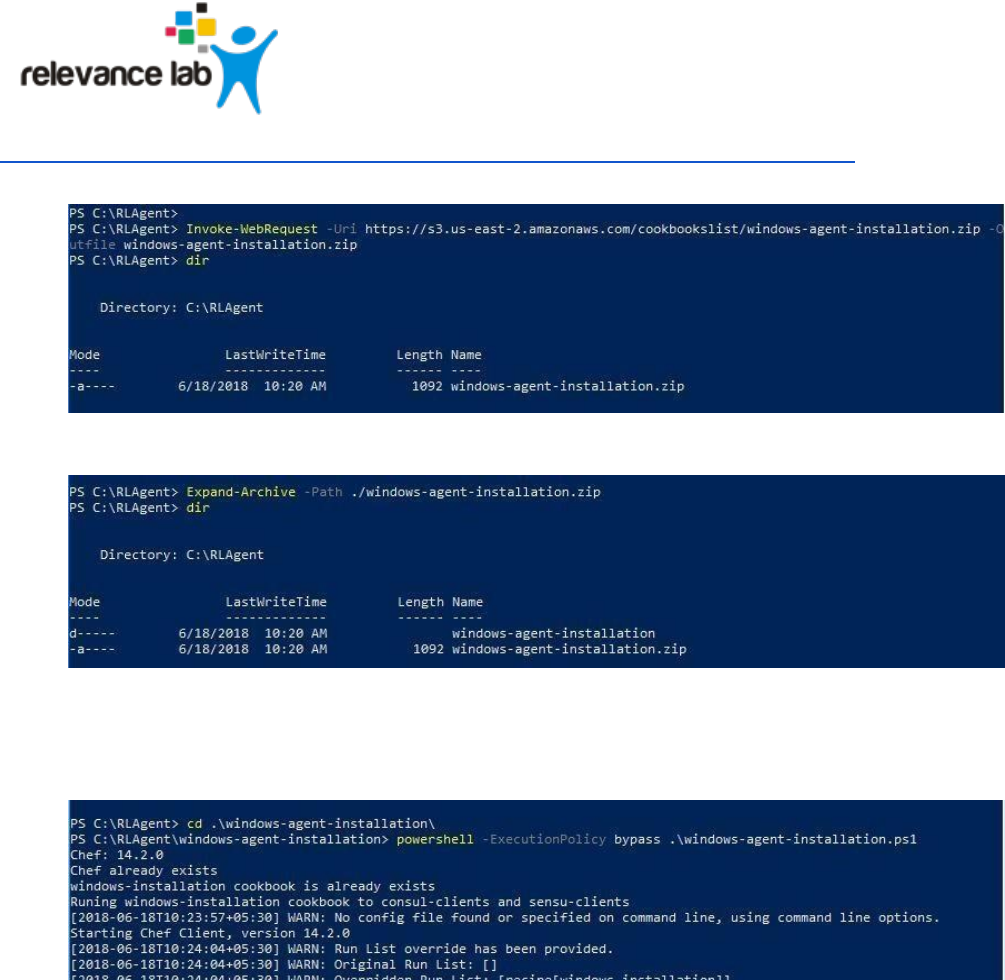
1. Download the agent_ installation.tar.gz file from the following URL:
Page 22
www.relevancelab.com
https://s3.us-east-2.amazonaws.com/cookbookslist/v2.6/windows-agent-installation.zip
1. Extract the script from the archive.
2. Set the directory to the extracted folder and run the script using the following command
PowerShell -ExecutionPolicy bypass ./windows-agent-installation.ps1
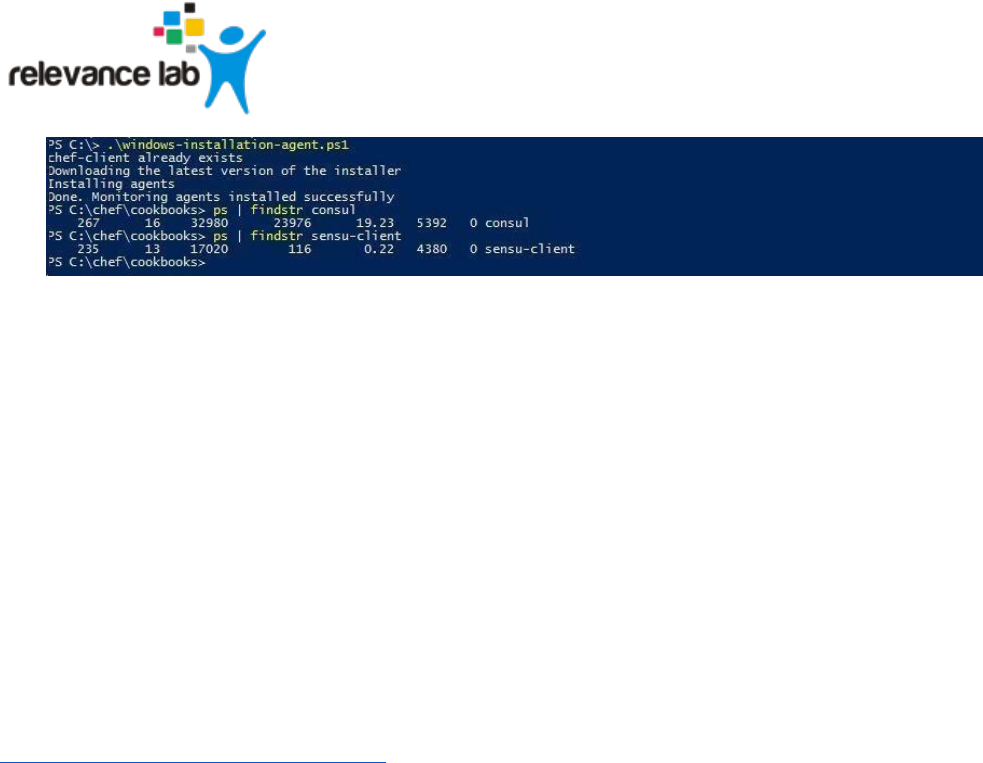
3. The script should install the Monitoring agents. Verify that the agents are running by typing
the following command
ps | findstr sensu
It should show the monitoring agent running
Similarly verify
ps | findstr consul
Page 23
www.relevancelab.com
Install monitoring agents on a Windows machine manually
Prerequisites
1. To configure a machine or VM for monitoring with Command Center the following ports need
to be opened in the firewall: 8301 ,8302 ,8500,8600, 3030
2. You need Administrator privileges to install the clients
3. The machine should have a public IP address to communicate with the monitoring servers.
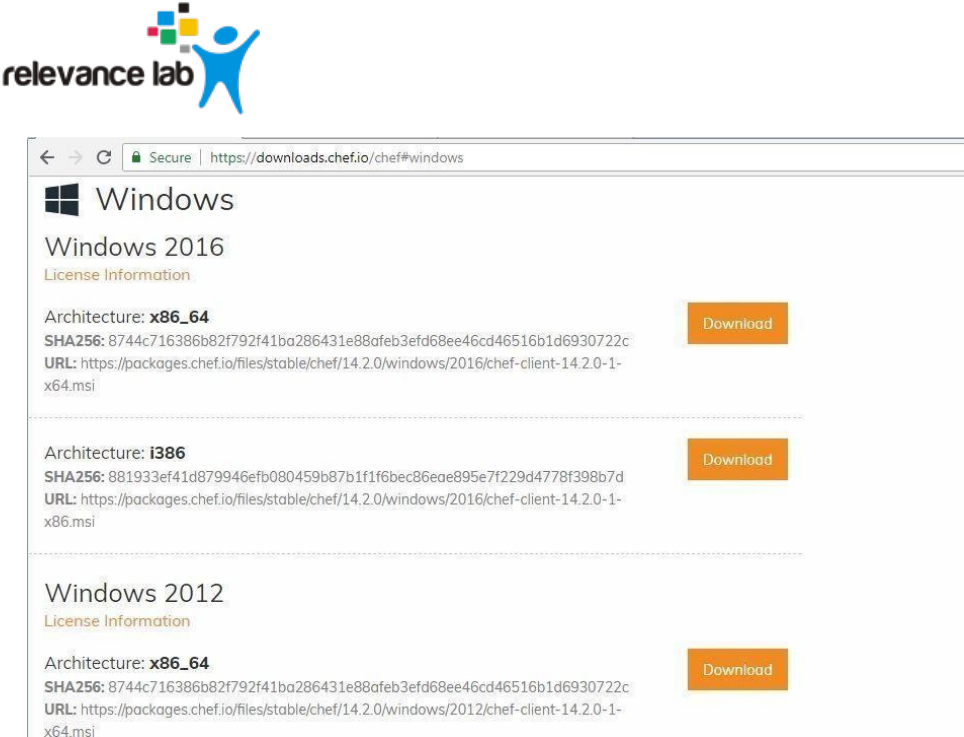
Procedures
1. Choose the Chef Windows package based on the Operating System (Ex: Windows 2012)
& Architecture (Ex: X86_64) from the below link in the required/available windows machine
https://downloads.chef.io/chef#windows
Page 24
www.relevancelab.com
Image 17 - Downloading Chef
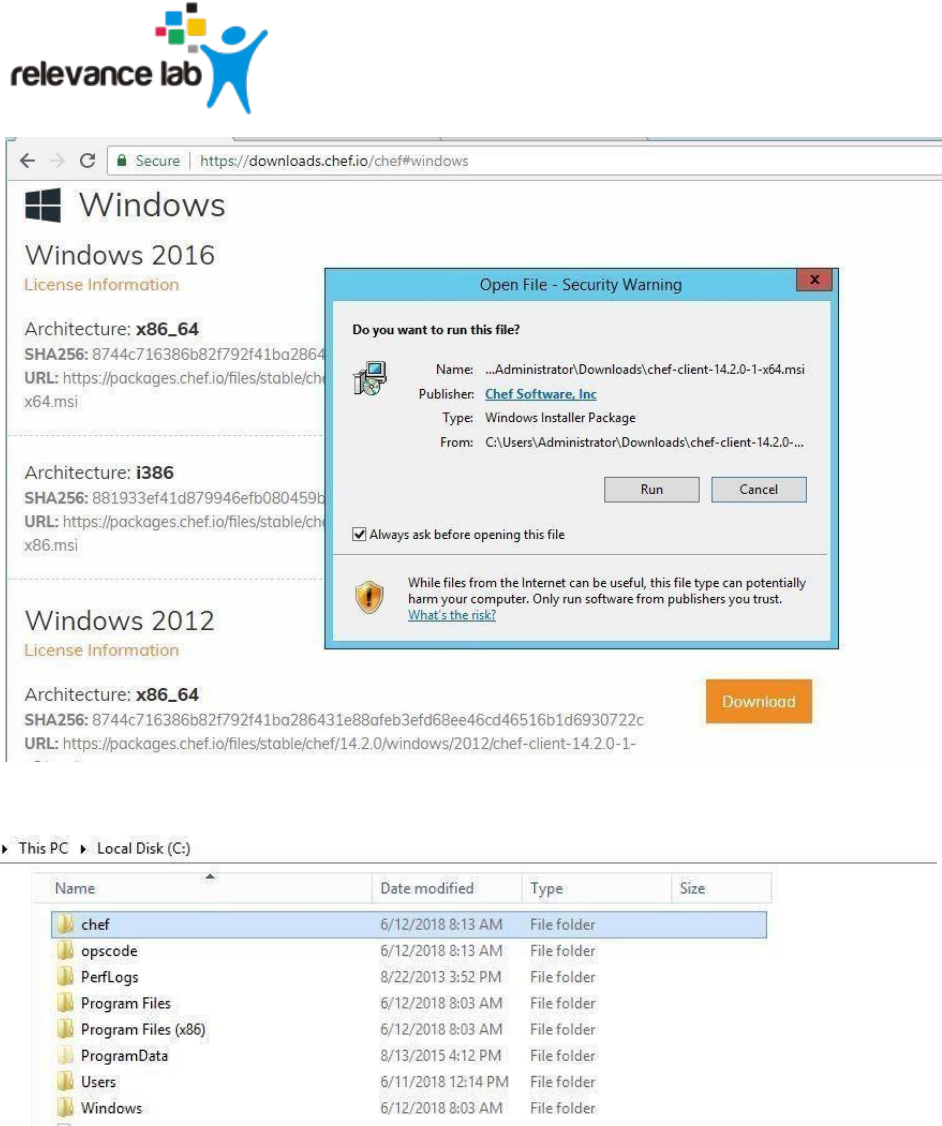
2. Install the downloaded windows package in the Windows machine on this location and it
will create a chef directory. E.g.: C://
Page 25
www.relevancelab.com
Image 18 - Installing Chef
Image 19 - Verifying the Chef Installation
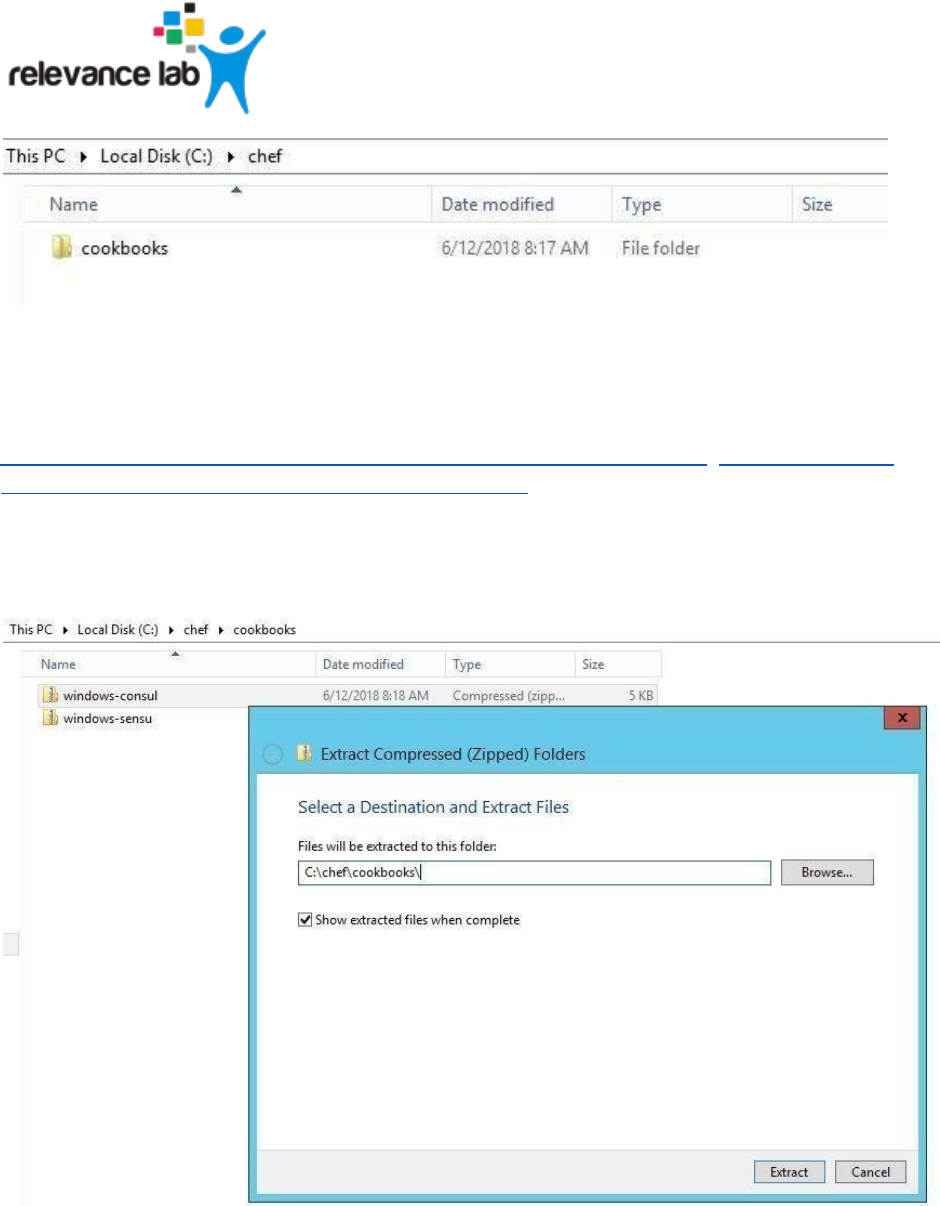
3. Create a directory with name “cookbooks” in “c:/chef” (optional).
Page 26
www.relevancelab.com
Image 20 - Chef cookbook location
4. Download the following files for sensu and consul clients from the s3 bucket.
https://s3.us-east-2.amazonaws.com/cookbookslist/v2.6/consul-client.zip https://s3.us-east-
2.amazonaws.com/cookbookslist/v2.6/sensu-client.zip
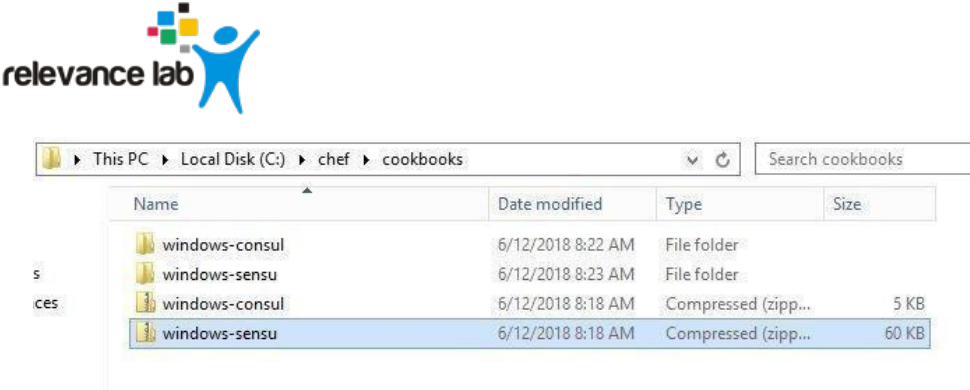
5. Please unzip the following files of s3 files and examples files should be like E.g.:
C://chef/cookbooks/ consul-client
C://chef/cookbooks/ sensu-client
Image 21 - Extracting the Monitoring Agent Installers
Page 27
www.relevancelab.com
Image 22 - Verifying the extracted installers
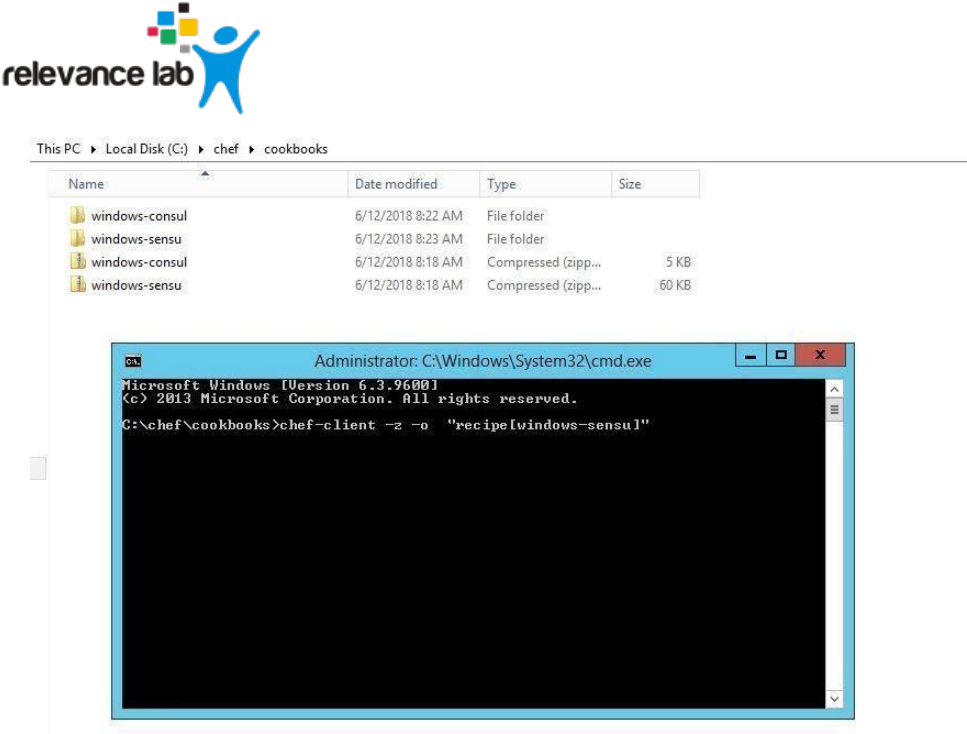
6. Open the command prompt and navigate to the following location
C:\chef\cookbooks\
7. Run the following commands to install the consul and sensu clients
chef-client -z -o "recipe[sensu-client]" chef-client
-z -o "recipe[consul-client]"
Page 28
www.relevancelab.com
Image 23 - Running the monitoring agent installers
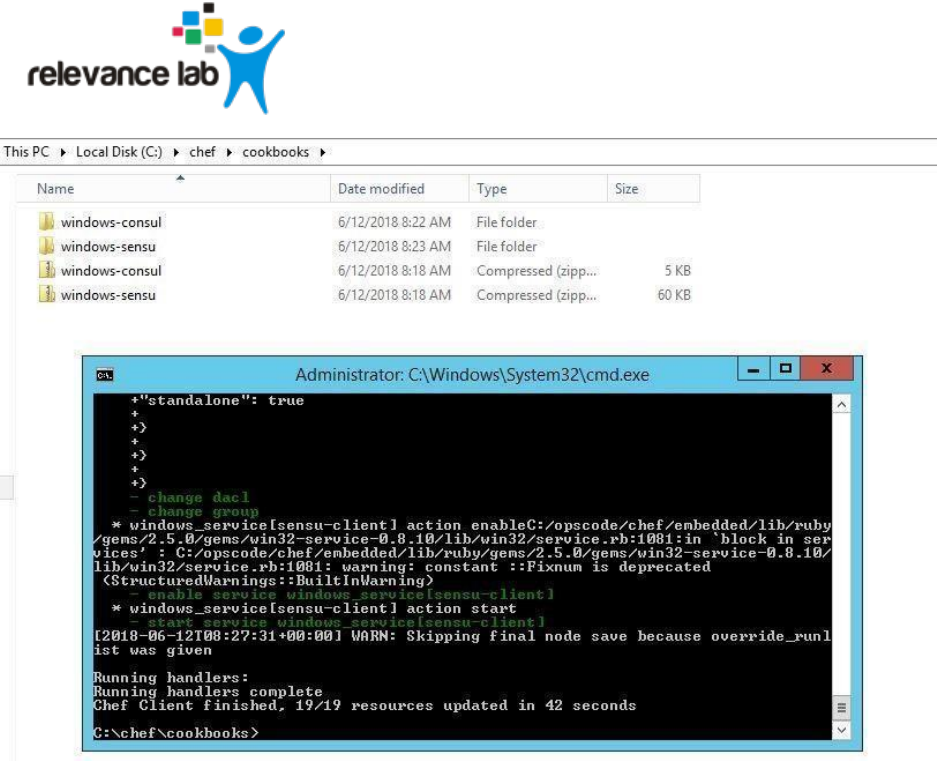
Page 29
www.relevancelab.com
Image 24 - Monitoring agent installation in progress
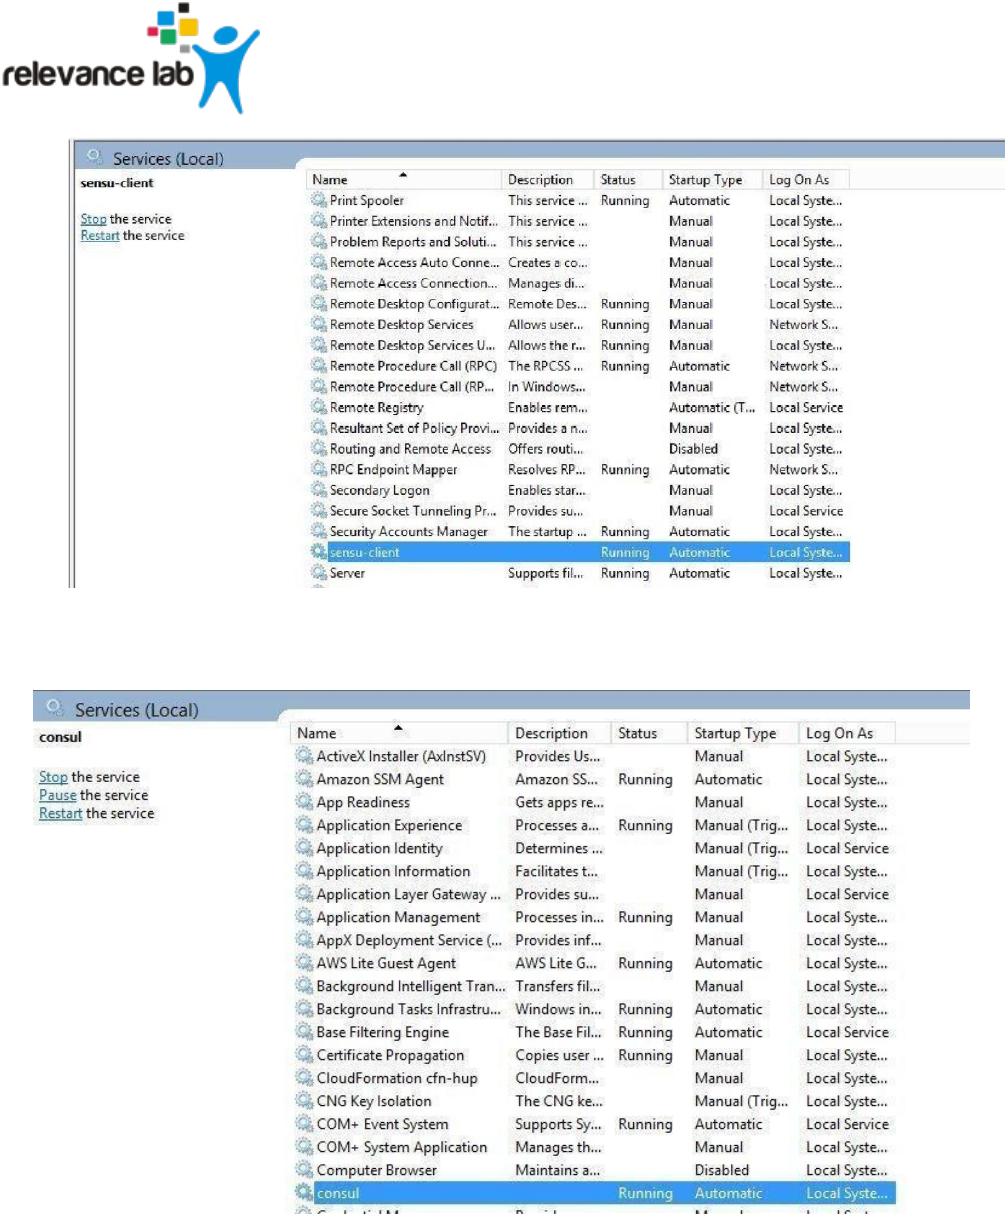
8. After the installation of clients, we can verify the services with names “consul and
sensuclient” or the other way testing the above-mentioned ports by “netstat” command.
Page 30
www.relevancelab.com
Image 25 - Verifying running agents
Image 26 - Verifying running agents
Page 31
www.relevancelab.com
Aggregated Alerts
Once the services are added and agents are installed, the alerts will be aggregated from multiple
monitoring sources by the respective collectors. Alerts are currently aggregated from
▪ Ping BOTs – Checks Availability of Services
▪ Consul – Monitors Services
▪ Sensu – System Monitoring
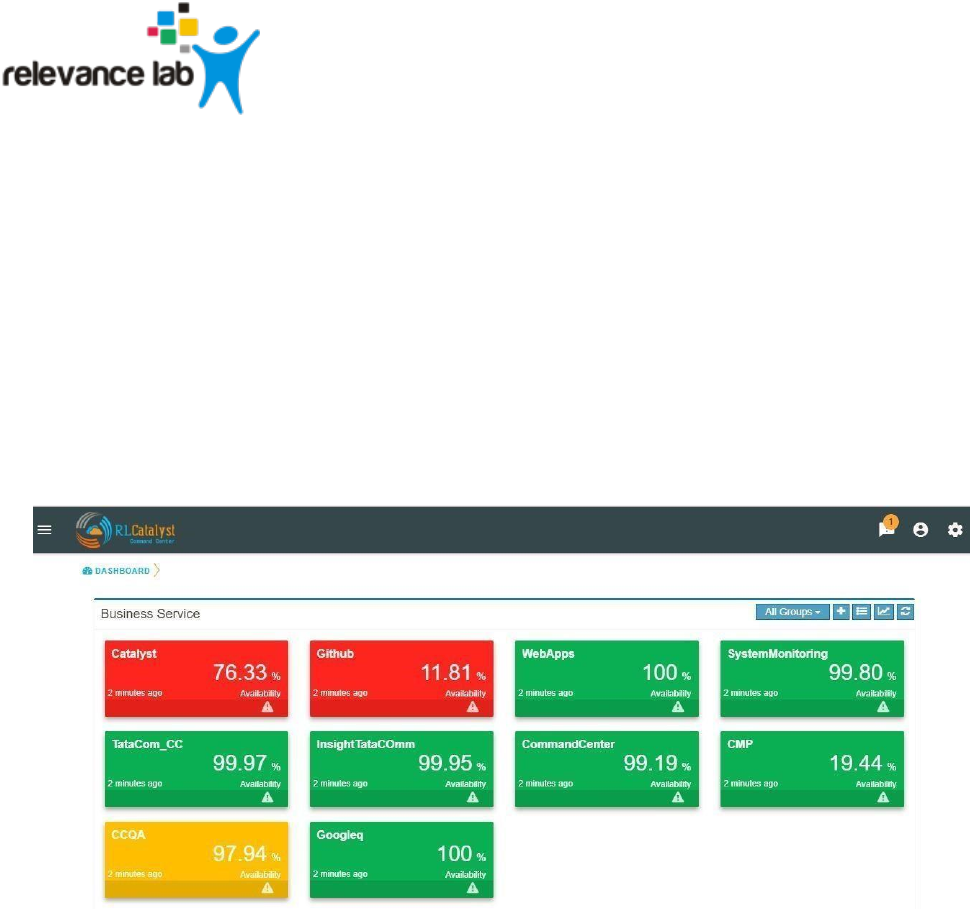
When the service goes down or if an Outage happens, the corresponding card on the
dashboard view will turn Red.
When any of the dependent services has a problem related to BSM will be Yellow. Clicking
on the card will give details on linked services and the associated nodes.
Image 27 - Outages as Red cards on Dashboard
Page 32
www.relevancelab.com
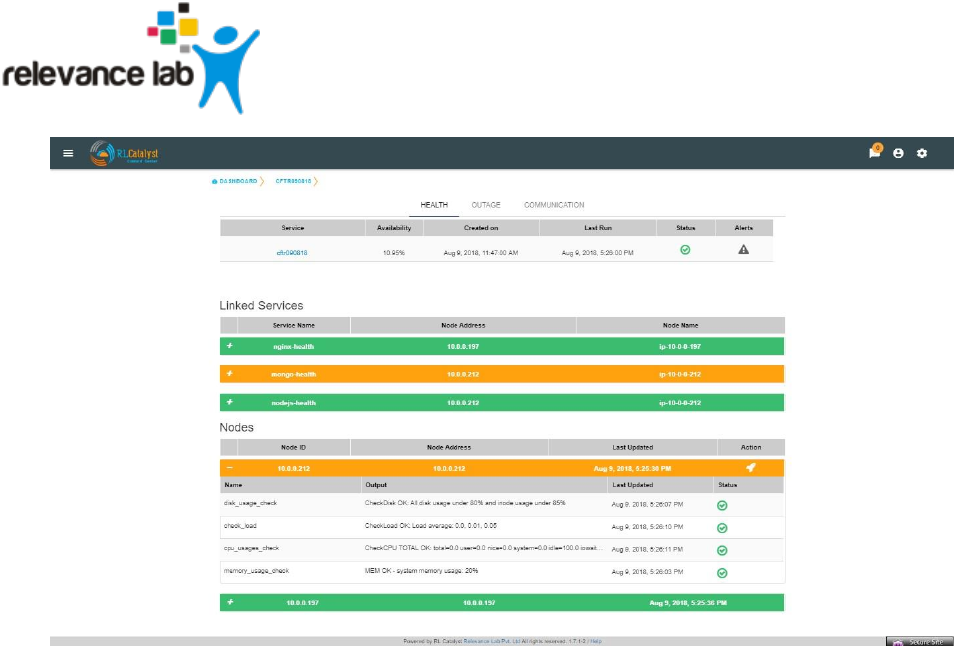
Image 28 - Drill down view from card
Click on the Alerts button to see the detailed Alerts from multiple sources (Pingbot, Consul &
Sensu). Alerts aggregated by Node or Service in the Alerts Monitor screen.
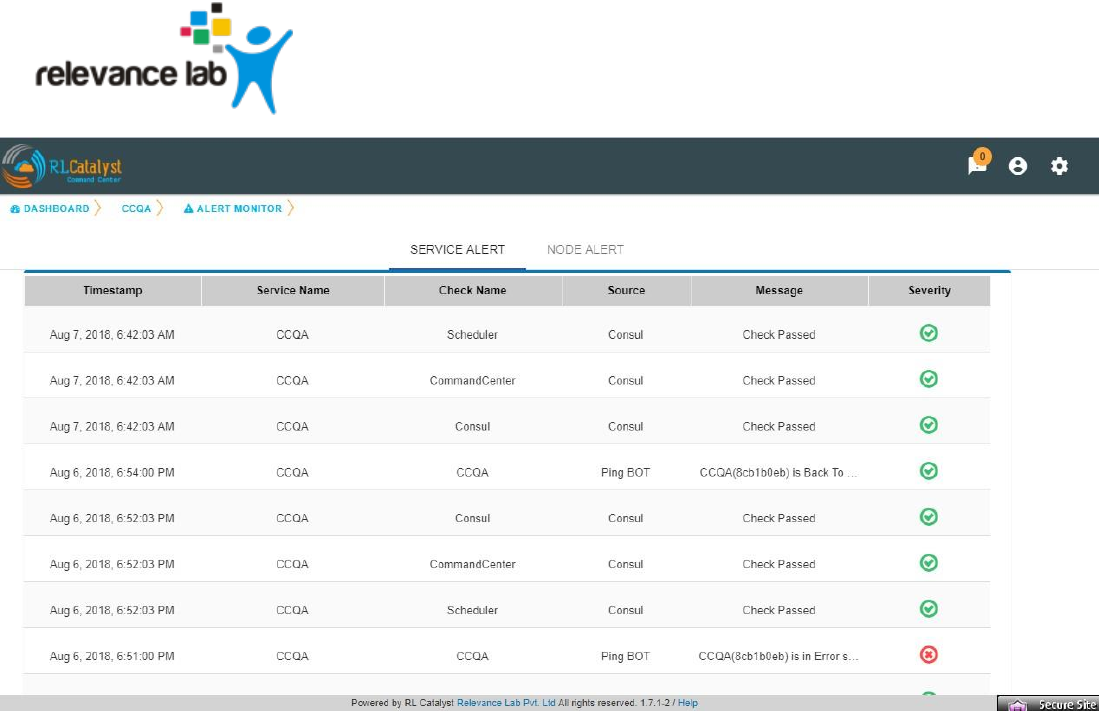
Service alerts are shown on the Services tab of the Alert Monitor.
Page 33
www.relevancelab.com
Image 29 - Service Alerts
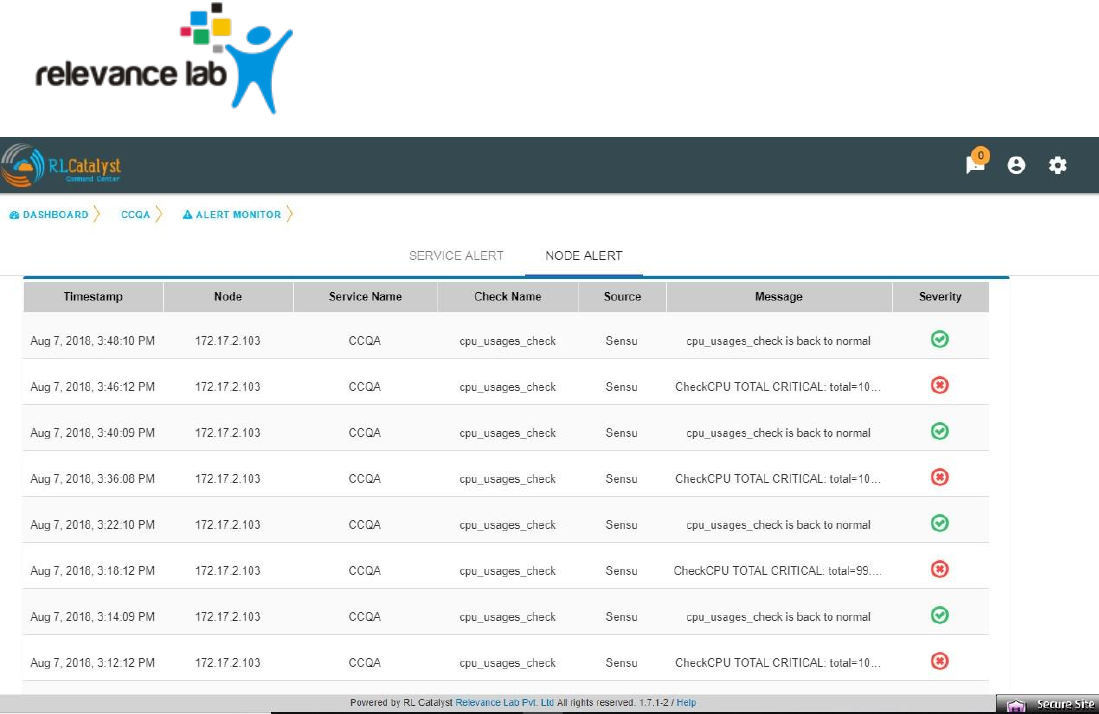
System alerts are shown in the Nodes tab of the Alert Monitor.
Page 34
www.relevancelab.com
Image 30 - Node Alerts
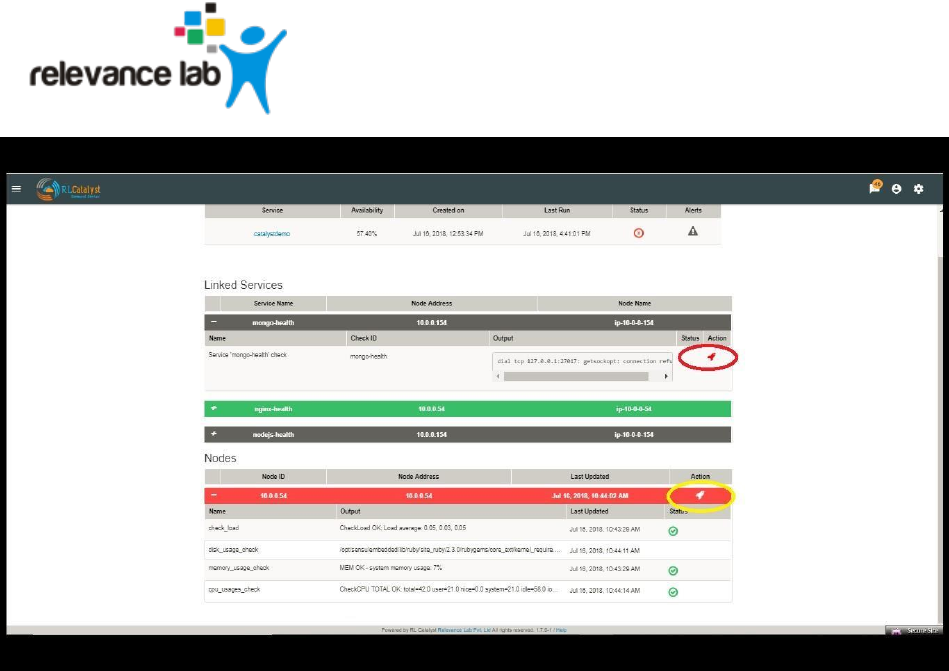
The dependent services of the Business Service and their health can be viewed under the Linked services
section of the same page.
The dependent nodes of the Business Service and their health can be viewed under the Nodes section of
the same page.
Click on the Outages tab to get a detailed list of all the outages detected by the system.
Page 35
www.relevancelab.com
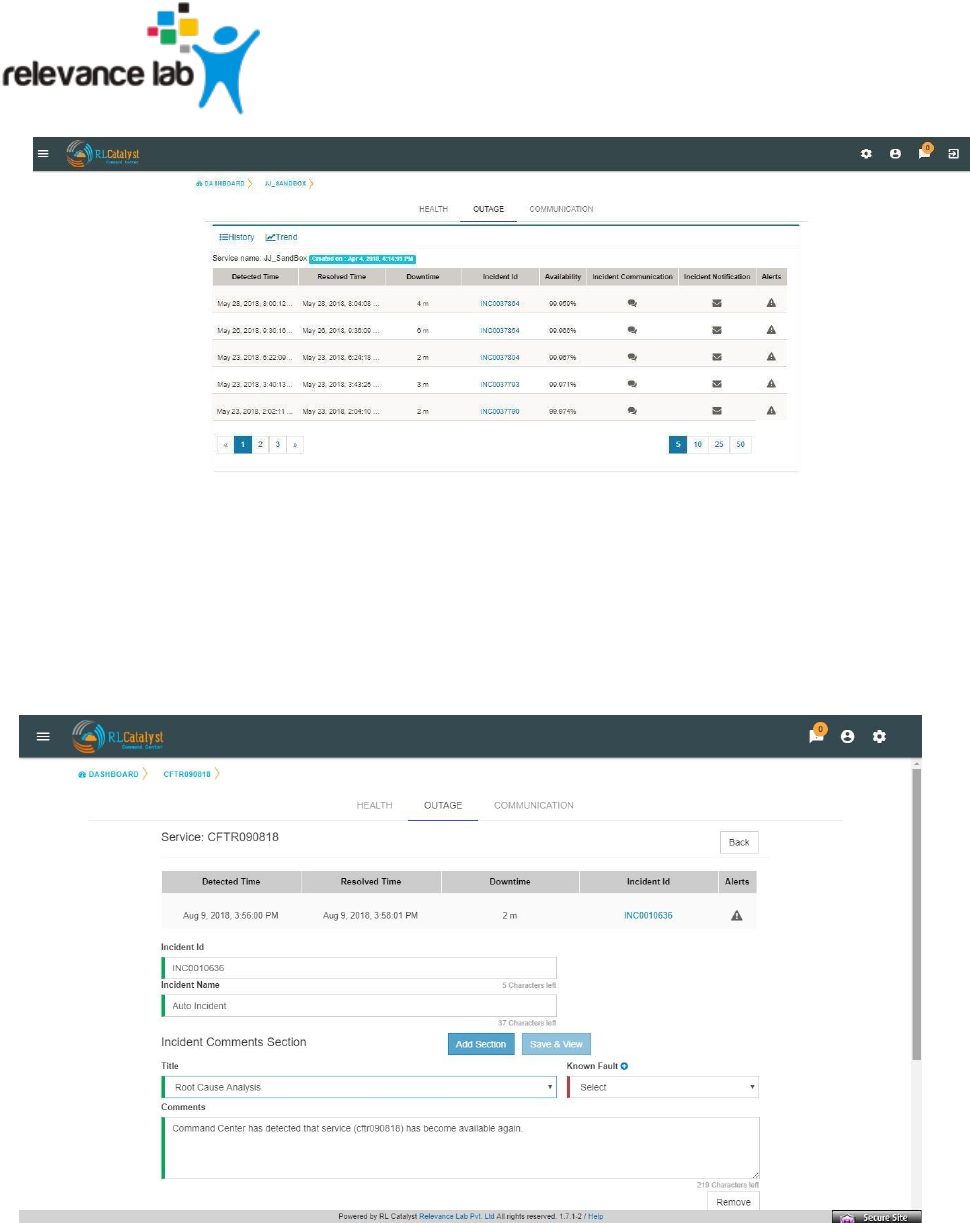
Image 31 - Outage Details
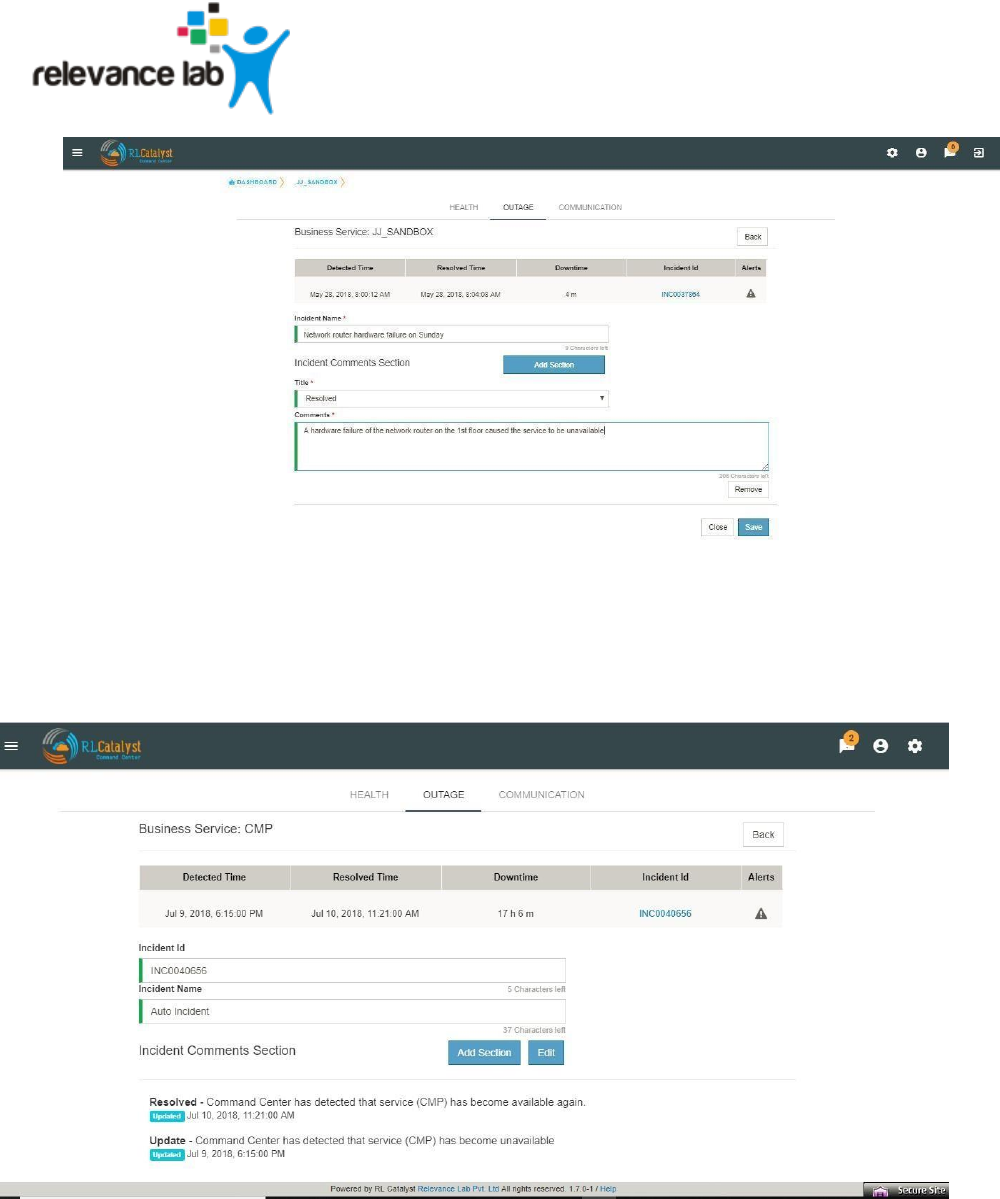
Click on the Incident Id to open the associated ServiceNow ticket on the ServiceNow portal. Click
on the Incident Communication icon to send out communication about the incident with Root Cause
Analysis & Category.
Image 32 - Incident Communication
Page 36
www.relevancelab.com
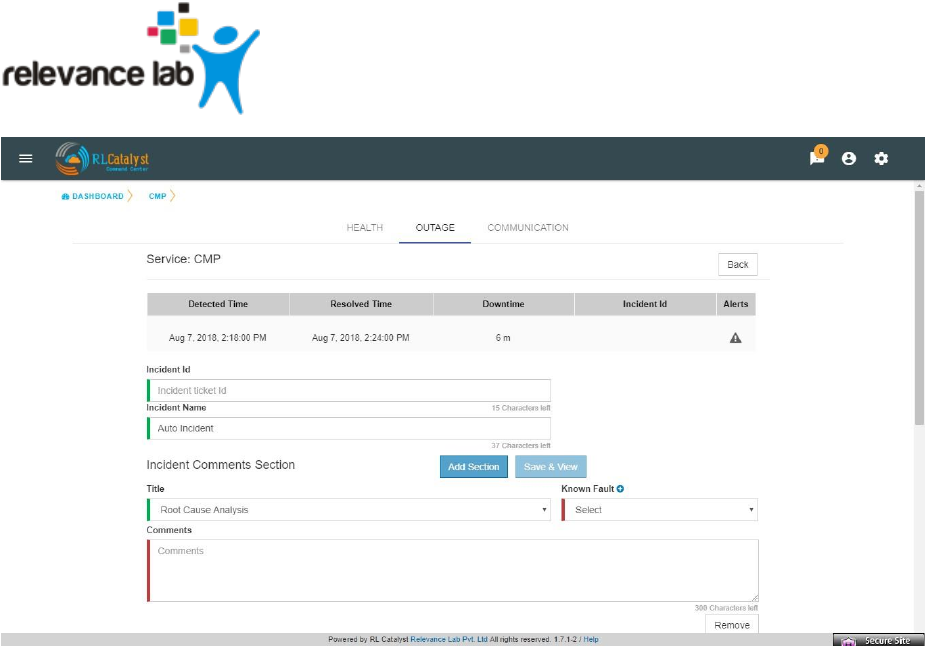
Image 33 - Incident Communication(Add Section)
Auto-create Incident Communications for Detection and Resolution: System automatically creates Incident
Communication for application outage detection and resolution.
Image 34 - Auto Create Incident Communication
Page 37
www.relevancelab.com
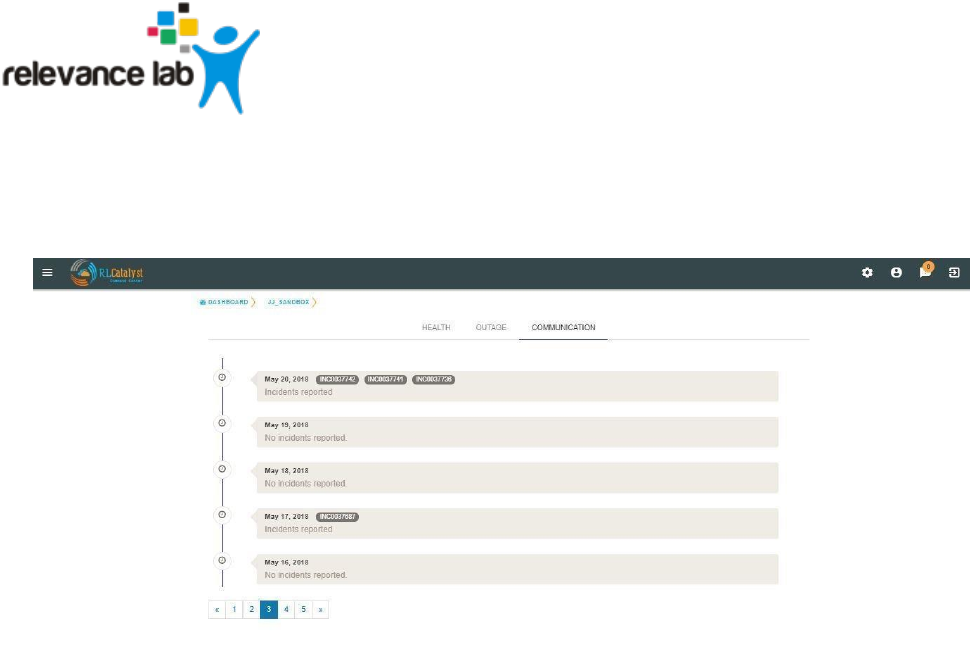
Click on the Communications tab to see a timeline of incidents.
Image 35 - Communication timeline
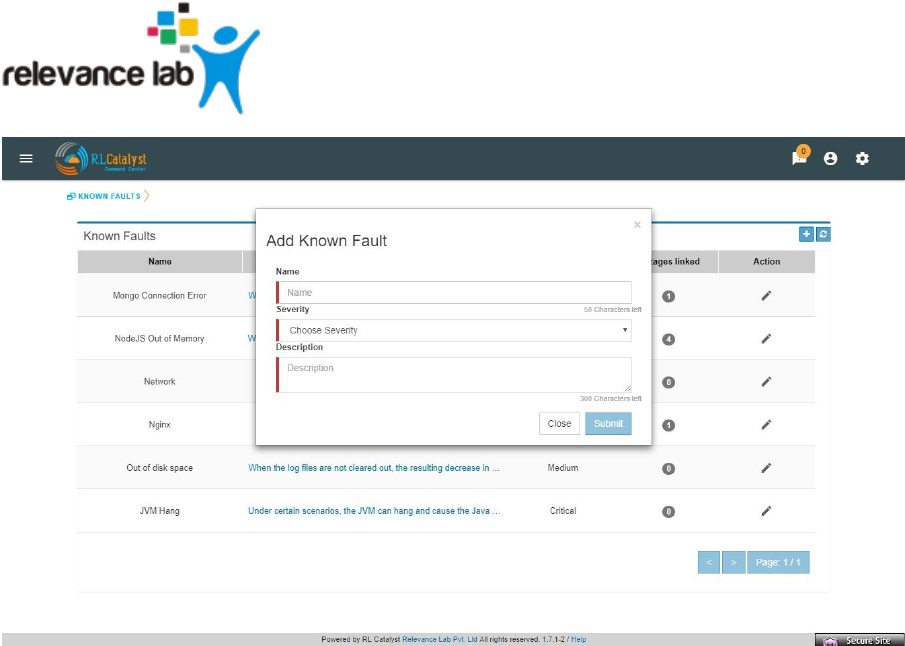
Command Center provides a feature called “Fault Table” to capture known problems related to a
service and then uses the information to help the user to categorize the root-cause of any
outage that occurs.
User can add fault to “Fault Table” by clicking on + icon which is available in the “Known Faults”
table (Menu->Known Faults link-> + icon)
Page 38
www.relevancelab.com
Image 36 - Add Known Fault
When a Root-cause identified incident communication is entered, the user can link the RCA
Incident Communication to an item in the Fault Table associated to the BSM through Add
Incident Communication screen.
Page 39
www.relevancelab.com
Image 37 - Known Fault Selection
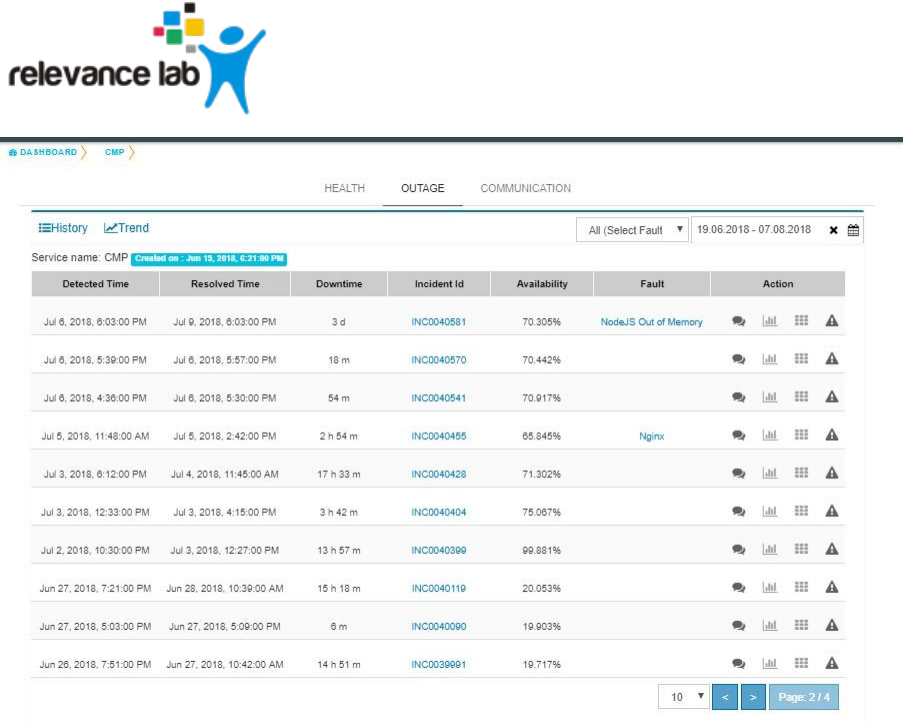
User shall be able to navigate to the Fault Table from any outage which is linked to a fault by
clicking on “Fault” link in the Outages screen.
Page 40
www.relevancelab.com
Image
38 - Faults Link
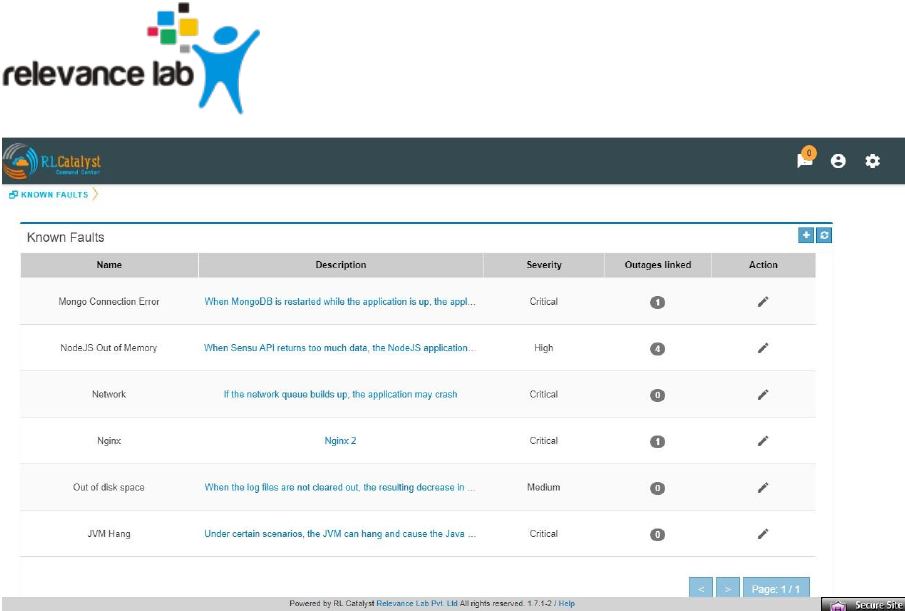
User can view the count of outages linked to a fault by clicking on the “Outages Linked” link in
the Fault table
Page 41
www.relevancelab.com
Image 39 - Outages Linked
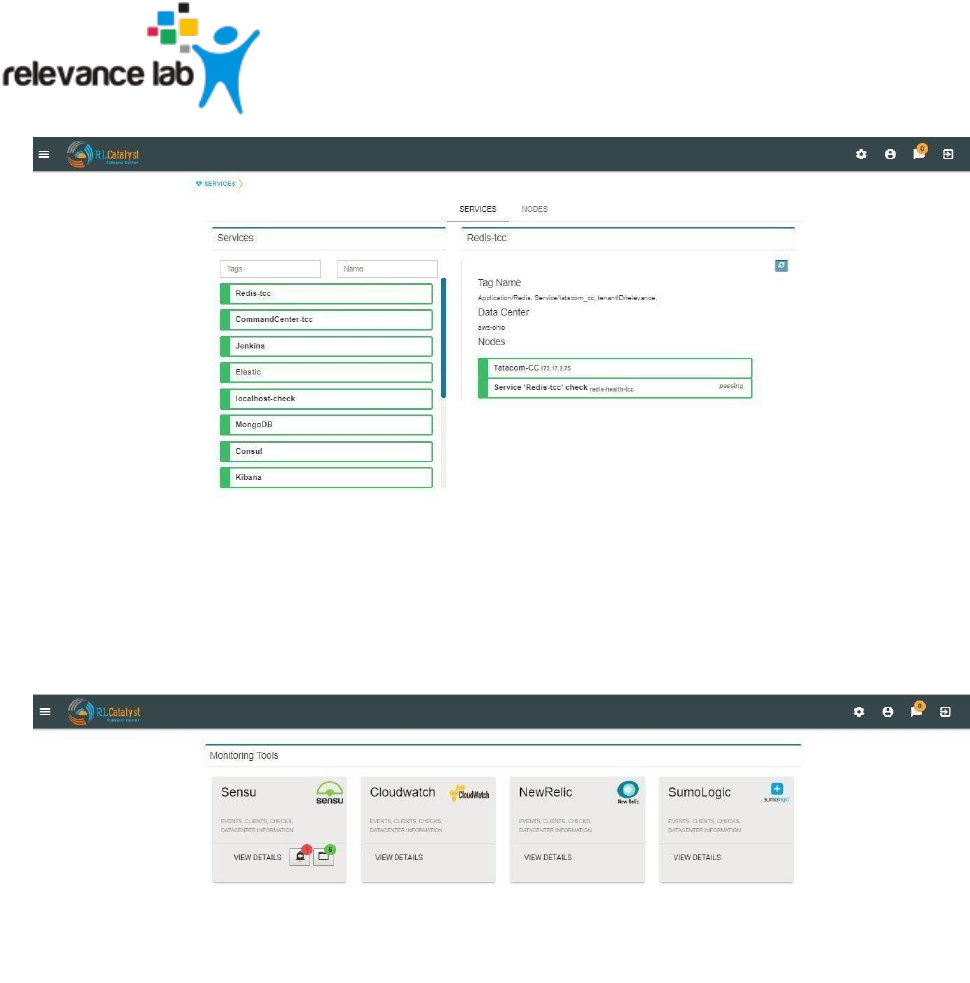
Aggregated Alerts for all services are available from the left pane menu ‘Services’.
Page 42
www.relevancelab.com
Image 40 - Aggregated Services Alerts View
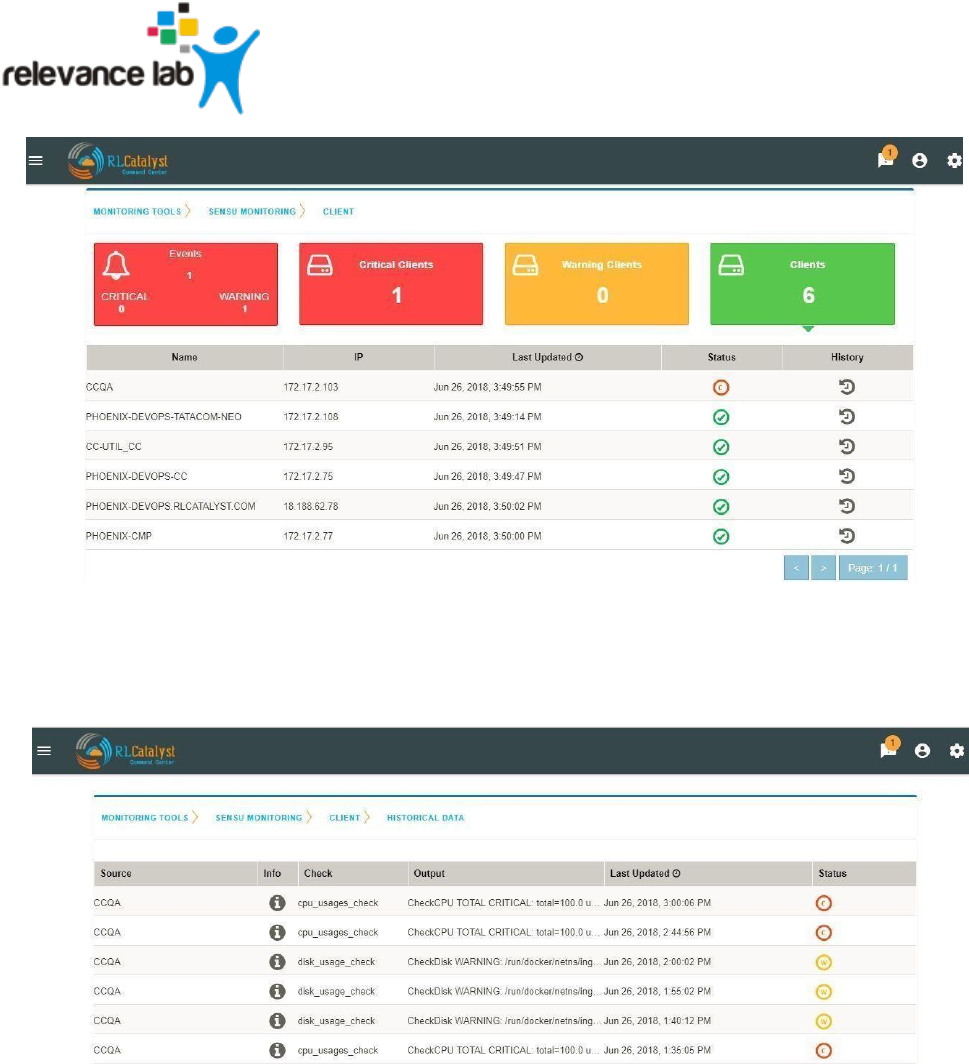
Aggregated Alerts for all servers/instances are available from the left pane menu ‘Monitoring Tools’.
Image 41 - Aggregated System Alerts View
History for all servers/instances are available from the Monitoring Tools->Clients->History
Page 43
www.relevancelab.com
Image
42 - History of Servers/Instances
Click on History Icon, to view the detailed history information regarding each client.
Image 43 - Historical Data related to Instances
Logging in as a landlord
Open a browser (we recommend Chrome or Firefox). Enter the application URL provided. The login page
should open. On the login page, fill the Company, User and Password fields as captured in Appendix A. Then
Page 44
www.relevancelab.com
click the Login button. You will see the landing page of the tenant created first and by choosing the tenant be
able to view the data of that tenant.
Image 44 - Landlord View
Remediation feature
Command Center allows you to restart the service if a problem is encountered either at an underlying Node
level or at a dependent service level. This feature is to give L0/L1 level support personnel a quick means of
attempting to correct a problem.
When a dependent node/service has a critical alert, you have an option to remediate the problem by
clicking on the icon to restart the service which is available in the BSM drilldown view screen. The
BOT would then restart the node.
Page 45
www.relevancelab.com
Image 45 - Remediation Icon
Auto-Remediation feature
Command Center allows you to choose to configure certain Business Services (Managed Nodes) for auto healing.
Whenever an outage is detected for a BSM configured with auto-healing, the system shall then kick-off the
auto-remediation process. Auto-healing shall be initiated for nodes provided are in warning or critical
status.
Manual remediation shall not be available for Nodes under a BSM that is enabled for Auto-healing.
You can opt for Auto-healing option by checking the Checkbox “Enable Auto-Remediation” which is available
in the “Add Service” screen.
Page 46
www.relevancelab.com
Image 46 - Auto Remediation
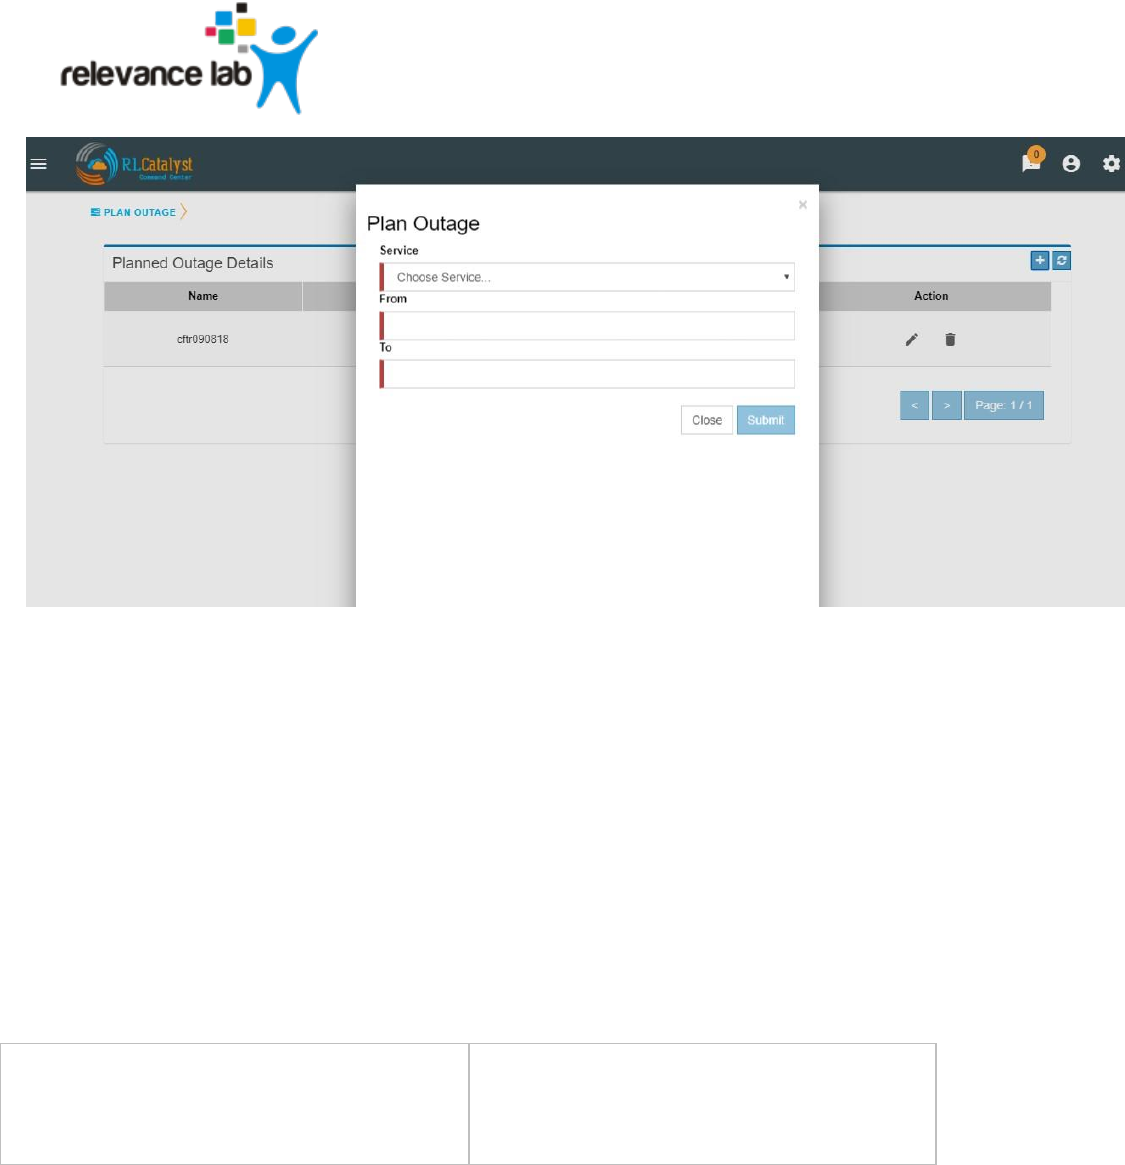
Planned versus Unplanned outages
The idea of this feature is to provide a capability to plan a down-time so that the availability of the Business
Service shall not be affected. CommandCenter has provided a screen to enter a planned outage. This screen
shall take a date-time range, the nodes that are affected and the BSMs that are affected.
When an outage occurs, check if the outage falls within a planned outage window. If yes, do not consider that
outage in the availability calculations.
By clicking on link “Plan Outage” which is available under the menu, application will open “Planned Outage
Details “screen. By clicking on + icon you can add Plan outage for the required service.
Page 47
www.relevancelab.com
Image 47 - Planned Outage Details
Appendix A
Registration Information
Page 48
www.relevancelab.com
Name of the tenant
<This will be used to fill the Customer Name
field in the registration form. This field will
have to be unique for each tenant configured
in the system>
User Name
<This will be the username with which the
tenant will login>
Password
<This will be the initial password allocated to
the tenant>
Email Address
<This will be the email ID which will be
verified by the system during registration.
Ensure you have access to this e-mail ID
during registration>
Provider Settings
Will an Amazon Web Services account be
configured for this tenant?
- AWS Access Key

Page 49
www.relevancelab.com
- AWS Secret Key
- AWS Region for this account
<e.g. us-east-1>
- AWS Account Number
Will a Microsoft Azure account be configured
for this tenant?
- Azure Client ID
< Client ID of your Azure application >
- Azure Client Secret
<Secret key of your Azure Application>
-
Subscription ID
<Enter the Azure subscription ID>
- Tenant ID
<Enter the Azure Tenant ID>

Page 50
www.relevancelab.com
Will a ServiceNow account be configured for
this tenant?
- Host
- User-name
<username for your ServiceNow account>
- Password
<Password to your ServiceNow account>
-
Will a Sensu account be configured for this
tenant?
- Host
- User-name
<username for your ServiceNow account>
Page 51
www.relevancelab.com
- Password
<Password to your ServiceNow account>
Business Services
<Business Service 1>
- Name
<Name of the service as it appears on the
dashboard>
- URL
< URL for the business service >
- Linked Services (if any)
< Service1 – IP Address of node it runs on,
Service2 – IP Address of node it runs on,
Service3 – IP Address of node it runs on >

Page 52
www.relevancelab.com
- Nodes (VMs or Machines)
<FQDN of Node1,
FQDN of Node 2, FQDN of Node3>
<Business Service 2>
- Name
<Name of the service as it appears on the
dashboard>
- URL
< URL for the business service >
- Linked Services (if any)
< Service1 – IP Address of node it runs on,
Service2 – IP Address of node it runs on,
Service3 – IP Address of node it runs on >
- Nodes (VMs or Machines)
<FQDN of Node1,
FQDN of Node 2, FQDN of Node3>
Page 53
www.relevancelab.com
<Business Service 3>
- Name
<Name of the service as it appears on the
dashboard>
- URL
< URL for the business service >
- Linked Services (if any)
< Service1 – IP Address of node it runs on,
Service2 – IP Address of node it runs on,
Service3 – IP Address of node it runs on >
- Nodes (VMs or Machines)
<FQDN of Node1,
FQDN of Node 2, FQDN of Node3>
