Rational Exp Reference Manual
User Manual:
Open the PDF directly: View PDF ![]() .
.
Page Count: 9
Package ‘RationalExp’
November 4, 2018
Title Rationalizing Rational Expectations ? Tests and Deviations
Version 0.9.8.9000
Description This package implements a test of the rational expectations hypothe-
sis from D’Haultfoeuille, Gaillac, and Maurel (2018, DGM hereafter) based on the marginal dis-
tributions of realizations and subjective beliefs. This test (function test be-
low) can be used in cases where realizations and subjective beliefs are observed in two differ-
ent datasets that cannot be matched, or when they are observed in the same dataset. The pack-
age also computes the estimator of the minimal deviations from rational expecta-
tions than can be rationalized by the data (function estimDev below).
Depends R (>= 3.0.0)
License GPL-3
Encoding UTF-8
LazyData true
Suggests knitr,
rmarkdown
VignetteBuilder knitr
RoxygenNote 6.1.0
Imports MASS,
sfsmisc,
snowfall,
stats,
matlab
Rtopics documented:
boot_stat........................................... 2
c_cube............................................ 3
c_fun ............................................ 3
estimDev .......................................... 4
inverse............................................ 4
S1 .............................................. 5
test.............................................. 5
test_base........................................... 7
T_stat ............................................ 8
which.min2 ......................................... 9
1
2boot_stat
Compute the bootstrap test statistic for parallel implementation
Description
This is an internal function to separately compute the bootsrap test statsitic.
Usage
Arguments
bootstrap index;
the vector stacking the realisations y then the anticipated values psi of respective
sizes n_y and n_p.
the matrix of covariates. Set to a vector of 1 by default (in which case the test
without covariates is performed).
the vector stacking the dummies for the dataset of realisation : n_y ones then
n_p zeros
the parameter epsilonon in Section 3 of DGM. Default value is 0.05.
equals to N if covariates, to 1 other wise.
the parameter p in Section 3 of DGM. Default is 0.05.
the number of points to be tested. Default is 30.
the total numeber of obs
matrix of bootrap indexes
"Add" if additive shocks for the generalized test
survey weights
the grid points. Default is quantile(Y_tilde,seq(0,1,length.out=30)).
the GMS function in DGM
the quantilty bar m in section 2 of DGM
the total number of covariates
Details
By default, the test is implemented without covariates. To perform the test with covariates, one
has to indicate in X a non-constant vector or matrix. Also, one can perform the « generalized »
tests allowing for aggregate shocks by using the dummy variable generalized. Survey weights can
be added. The user can modify the number of cores used by R to reduce the computational time.
Tuning parameters used in the test can also be modified.
c_cube 3
Instrumental functions computations
Description
This function defines, for each specified value of r_n the set of indicator funtions h(X_i) which are
the key elements for the RE test with co covariates
Usage
Arguments
the standardised version of the covariates X
the size of X
the number of covariates
the parameter indexing the number of instrumental function, which is chosen
according the the rule used in AS y default.
Value
a list containing, in order:
- the standardised version of the covariates X
- the parameter indexing the number of instrumental function, which is chosen
according the the rule used in AS y default.
- a vector containing part of the weights
- a matrix with the weights that enter the statistic T
- a binary matrix indexing the observations X that fall into the hypercubes indexed
by h.
Compute the difference between mean of subvectors of two vectors
Description
Compute the difference between mean of subvectors of two vectors
Usage
Arguments
starting index
final index
first vector of elements
second vector of elements
4inverse
Value
a real, the difference between means of subvectors of two vectors
Estimation of the minimal deviations from rational expectations with
unconstrained information set g*
Description
This function estimates of the minimal deviations from rational expectations with unconstrained
information set. Both vectors should have the same length. If not, one can randomly select a subset
of the longer vector with length equal to that of the shorter one. The function returns a function via
the approxfun of the package stats. This function can then be evaluated directly on a desired grid.
Usage
Arguments
vector of subjective expectations
vector of realisations of an individual outcome.
Inverse the function f
Description
This function implements the numerical inverse of the function f.
Usage
Arguments
the function to be inverted
a lower bound for the inverse
an lower bound for the inverse
S1 5
Core part of the Statistic T
Description
This function implements the core part of the Cramer-von-Mises test statistic T, denoted by S in
AS.
Usage
Arguments
the sample vector of moments for a specified vector $(h_a,r,y)$
the sample covariance matrix of m_bar
number of inequality moments
index of the $ h_a,r$ function considered
parameter p in the statistic
Value
a real number with the statistic evaluated
Implementation of the RE test with possible survey weights (direct and
with parallel computing)
Description
This function performs the test of rational expectations described in Section 3 of D’Haultfoeuille
et al. (2018). By default, the test is implemented without covariates. To perform the test with
covariates, one has to indicate in X a non-constant vector or matrix. Also, one can perform the «
generalized » tests allowing for aggregate shocks by using the dummy variable generalized. Survey
weights can be added. The user can modify the number of cores used by R to reduce the computa-
tional time. Tuning parameters used in the test can also be modified.
Usage
6test
Arguments
the vector stacking the realisations y then the anticipated values psi of respective
sizes n_y and n_p.
the vector stacking the dummies for the dataset of realisation : n_y ones then
n_p zeros
the matrix of covariates. Set to a vector of 1 by default (in which case the test
without covariates is performed).
the vector of survey weights. Uniform by default.
whether a generalized test should be performed or not: "Add" for additive
shocks (default), "Mult" for multiplicative shocks. Set by default to "No" (no
generalized test).
the number of cores used by the program. To reduce the computational time,
this function can use several cores, in which case the library snowfall should be
loaded first. By default nbCores is set to 1.
a dictionnary (see the example below for modification of the default parameters)
containing:
- the parameter p in Section 3 of DGM. Default is0.05.
- epsilon the parameter epsilonon in Section 3 of DGM. Default value is 0.05
and p is set to 0 if a generalized test is performed.
- B the number of bootstrap samples. Default value is 500.
- grid_y: the number of points to be tested.
Default is quantile(Y_tilde,seq(0,1,length.out=30)).
- c: the parameter c inSection 3 of DGM. Default is 0.3.
- kappa : the parameter kappapa in Section 3 of DGM. Default is 0.001.
Default values are associated with the test without covariates.
Value
a list containing, in order:
- N, the number of observations
- cv01, the 1% critical value
- cv05, the 5% critical value
- cv10, the 10% critical value
- T_n, the Test ststistic
- B, the number of bootstrap samples
- p_value, the p-value
- T_reps, the vector of bootstraped test statitics.
References
D’Haultfoeuille X, Gaillac C, Maurel A (2018). “Rationalizing Rational Expectations? Tests and
Deviations.” CREST Working paper
Andrews D, Shi X (2017). “Inference Based on Many Conditional Moment Inequalities.” Journal
of Econometrics, 196(2), 275–287.
Andrews DW, Kim W, Shi X (2017). “Commands for testing conditional moment inequalities and
equalities.” The Stata journal, 17(1).
test_base 7
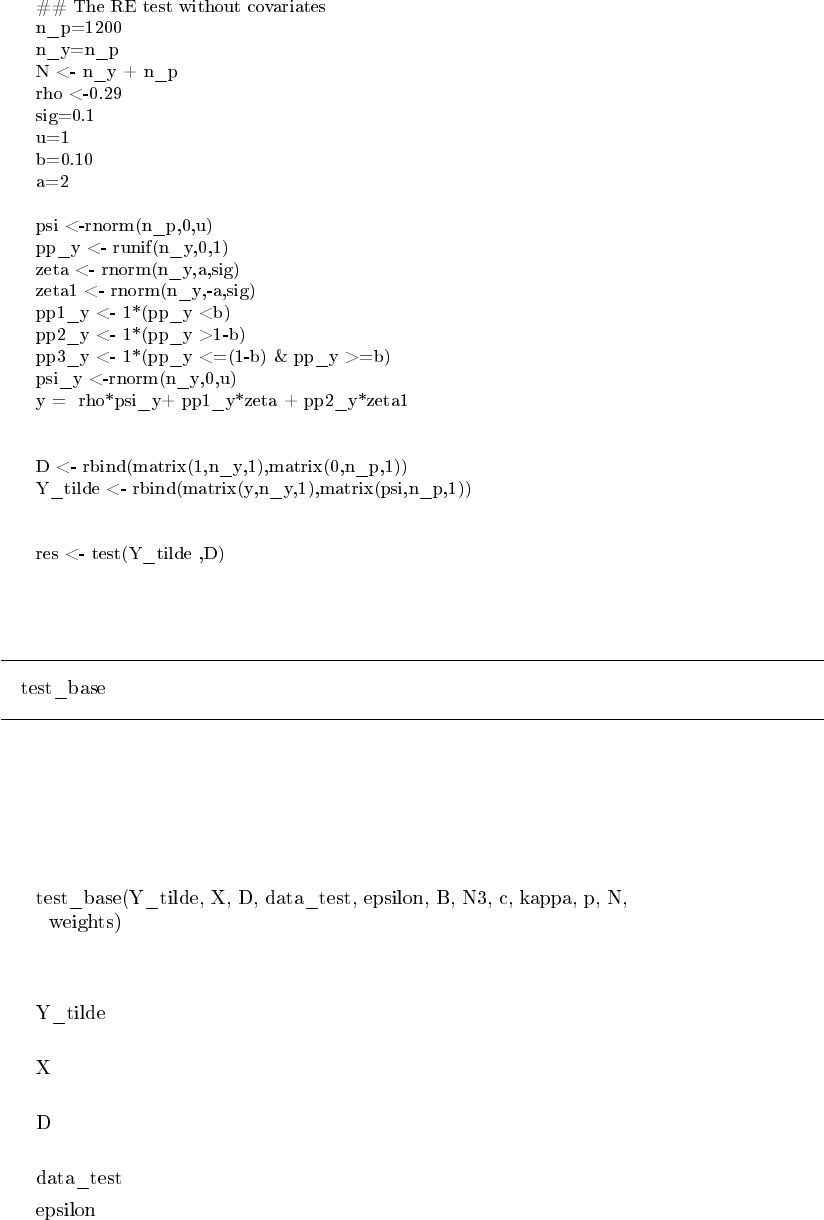
Examples
The test statistic for the RE test with survey weights
Description
This is an internal function used in the function test to compute the test statistic with survey weights.
Usage
Arguments
the vector stacking the realisations y then the anticipated values psi of respective
sizes n_y and n_p.
the matrix of covariates. Set to a vector of 1 by default (in which case the test
without covariates is performed).
the vector stacking the dummies for the dataset of realisation : n_y ones then
n_p zeros
the matrix of sample moments
the parameter epsilonon inSection 3
8T_stat
the number of bootstrap samples
a parameter equal to 1 if no covariates, to N otherwise
the parameter c in Section 3
the parameter kappapa in Section 3
the parameter p in Section 3. Equals 0.0 if generalized RE test.
total number of observations
the vector of survey weights. Uniform by default.
Details
By default, the test is implemented without covariates. To perform the test with covariates, one
has to indicate in X a non-constant vector or matrix. Also, one can perform the « generalized »
tests allowing for aggregate shocks by using the dummy variable generalized. Survey weights can
be added. The user can modify the number of cores used by R to reduce the computational time.
Tuning parameters used in the test can also be modified.
Value
a list containing, in order:
- T_n : the test statistic
- phi_n: the vector of coresponding GMS functions
- M_bar : the matrix of M_bar in Section 3
References
D’Haultfoeuille X, Gaillac C, Maurel A (2018). “Rationalizing Rational Expectations? Tests and
Deviations.” CREST Working paper
Andrews D, Shi X (2017). “Inference Based on Many Conditional Moment Inequalities.” Journal
of Econometrics, 196(2), 275–287.
Andrews DW, Kim W, Shi X (2017). “Commands for testing conditional moment inequalities and
equalities.” The Stata journal, 17(1).
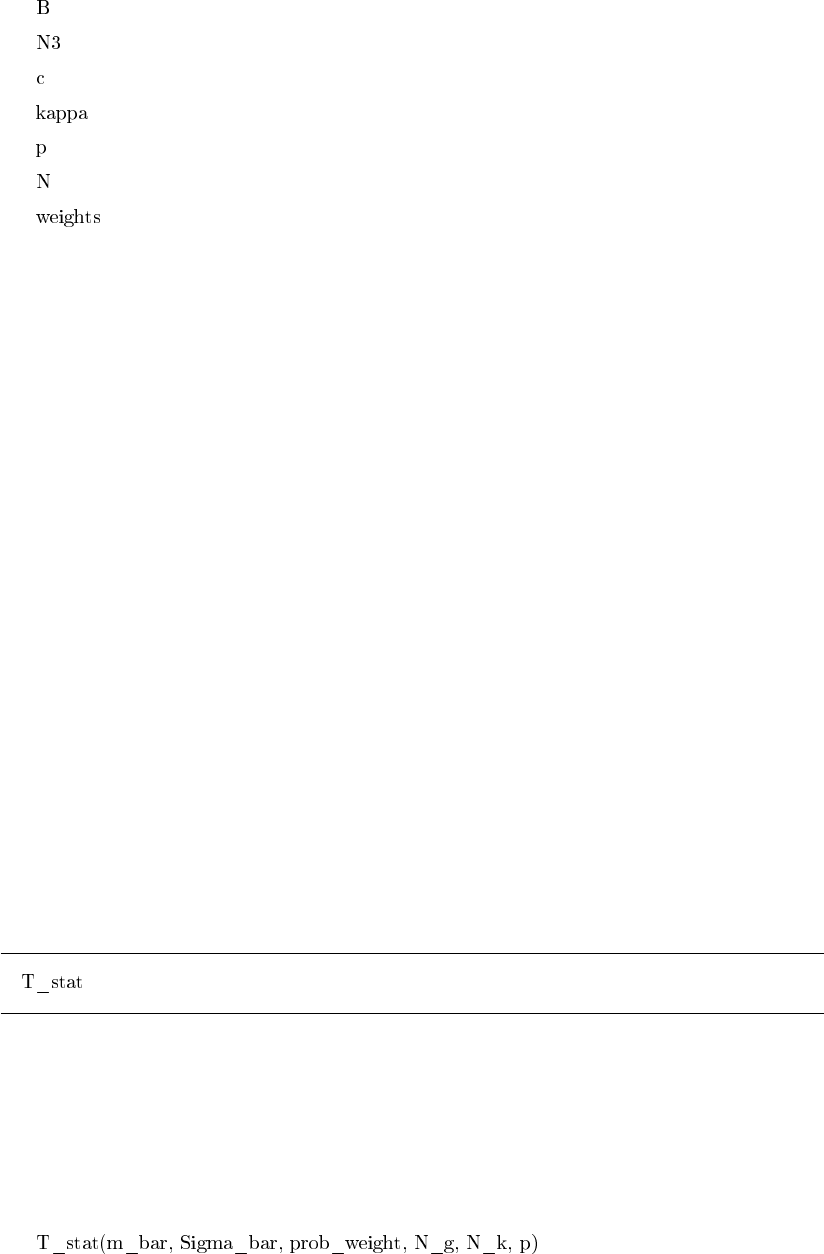
Computation of the test statistic
Description
This function implements the Computation of the test statistic T given in section 3. "Statistical
tests" of "Rationalizing Rational Expectations? Tests and Deviations".
Usage
which.min2 9
Arguments
the moments m_bar for the different instrumental functions h considered
the matrix of all the variances of the moments m_bar for the different instru-
mental functions h considered
vector of weigths for the test statistic
number of instrumental functions h considered
number of moments
the parameter p in the Statistic.
Value
a real T which is the test statistic
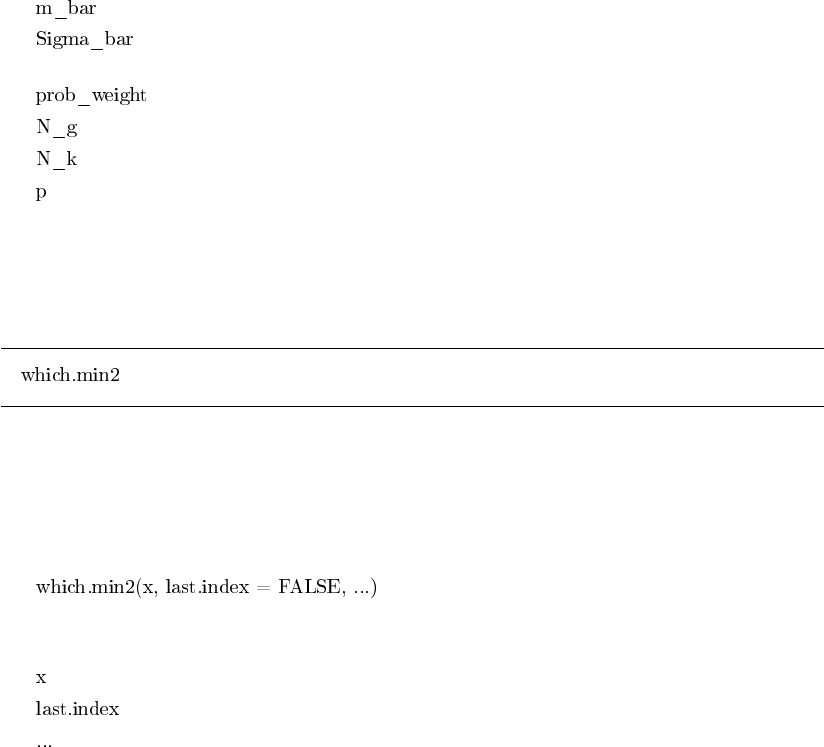
Find the min of a list starting from the end
Description
Find the min of a list starting from the end
Usage
Arguments
list of elements
starting from the last index (=TRUE). Default is false
hypotetical additional elements
