Road Lab Pro Brief App Manual
User Manual:
Open the PDF directly: View PDF ![]() .
.
Page Count: 14

“RoadLab Pro”
App Setup and Data Collection Guide
The RoadLab Pro app estimates the road roughness based on kinematic and GPS sensors in
smartphones. Please follow the guidelines here in order to get more reliable estimation of road
roughness and interpretation of information on the screen.
1. The cellphone should be mounted securely on the windshield (preferred) or flat and firm
dashboard (less preferred). The phone should be mounted in a vertical position.
2. It is important to select proper vehicle suspension type. Note the suspension type also
reflects the influence of cellphone cradle: a wobbling cradle could increase the variability of
the acceleration measured. The hard-medium type is suitable for most general passenger
cars while SUV can be selected separately as well.
3. It is a good practice to define “project” and “road (road link)” name first.
4. Link with personal or institute Dropbox or Google Drive account to allow data to be easily
uploaded to cloud.
5. Data collection interface displays several key parameters.
a. The dynamic plot in the middle shows the time series plot of vertical acceleration,
which is directly related to road roughness.
b. The color coded “roughness in the past 100 meters” provides a visual illustration of
road roughness.
i. It displays the roughness in the past 100 meters so there is a time lag: it
reflects the past 100 meters, NOT the current driving section.
ii. The roughness range is
1. IRI<2: Excellent
2. 2<IRI<4: Good
3. 4<IRI<6: Fair
4. IRI>6: Poor
Note this range is for visual display purpose. The output table contains the measured IRI values.
Figure 1 Setup Dropbox Pro
Setup a New Road
Setup a New Project
Link with Dropbox
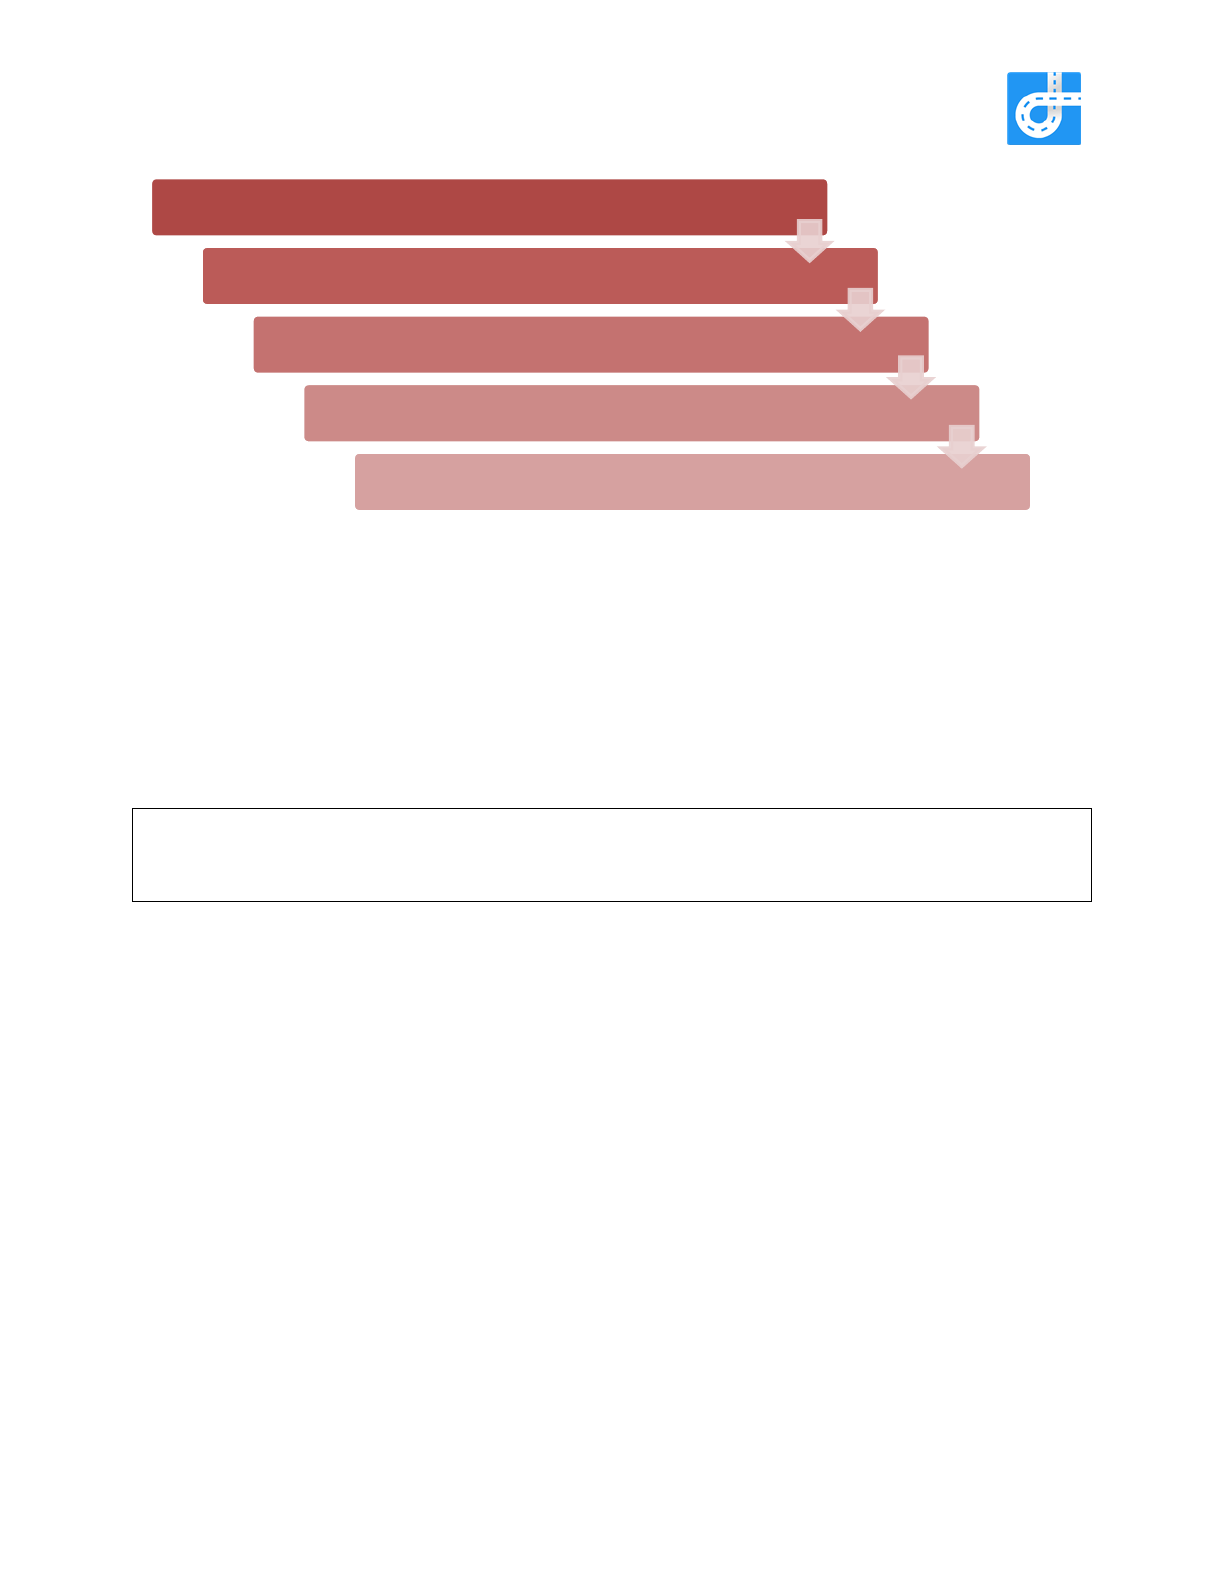
Figure 2 Data Collection Procedure
After clicking “Start” button, the IRI data collection will start when speed is higher than 15
km per hour (for better accuracy) while GPS coordinates are recorded all the time
regardless of speed.
If you like to monitor the data collection process, select “Screen Always On” button in the
“Setting” menu though this is more likely to consume battery faster.
There is a tab button (“+” sign) on the upper right corner of the data collection screen. You
can add tags if needed.
Warning: Driver should focus on driving at all time. Distracted driving can lead to traffic
accidents. There is no need for drivers to engage in app operation while driving. Any app
related operation during driving (for example adding a tag) should be done by a passenger.
1. First time application launch
When user installs the application for the first time, the application will show the Splash screen
and tutorial.
The settings are set by default:
- “Suspension Type” – Hard-Medium;
- “Always On Screen” – Off;
- “Dropbox account” - not set.
The recent Project and recent Road (road link) is not set.
Select Suspection Type based on testing vehicle (Default is hard-
medium suspension)
Select Project Name (You can select after data collection)
Push the "START TRACKING" button and the data collection will
start
Push "STOP TRACKING" button when data collection is complete
Uploading the data to you dropbox or export via cable to a
computer. You can export all the data or selected road
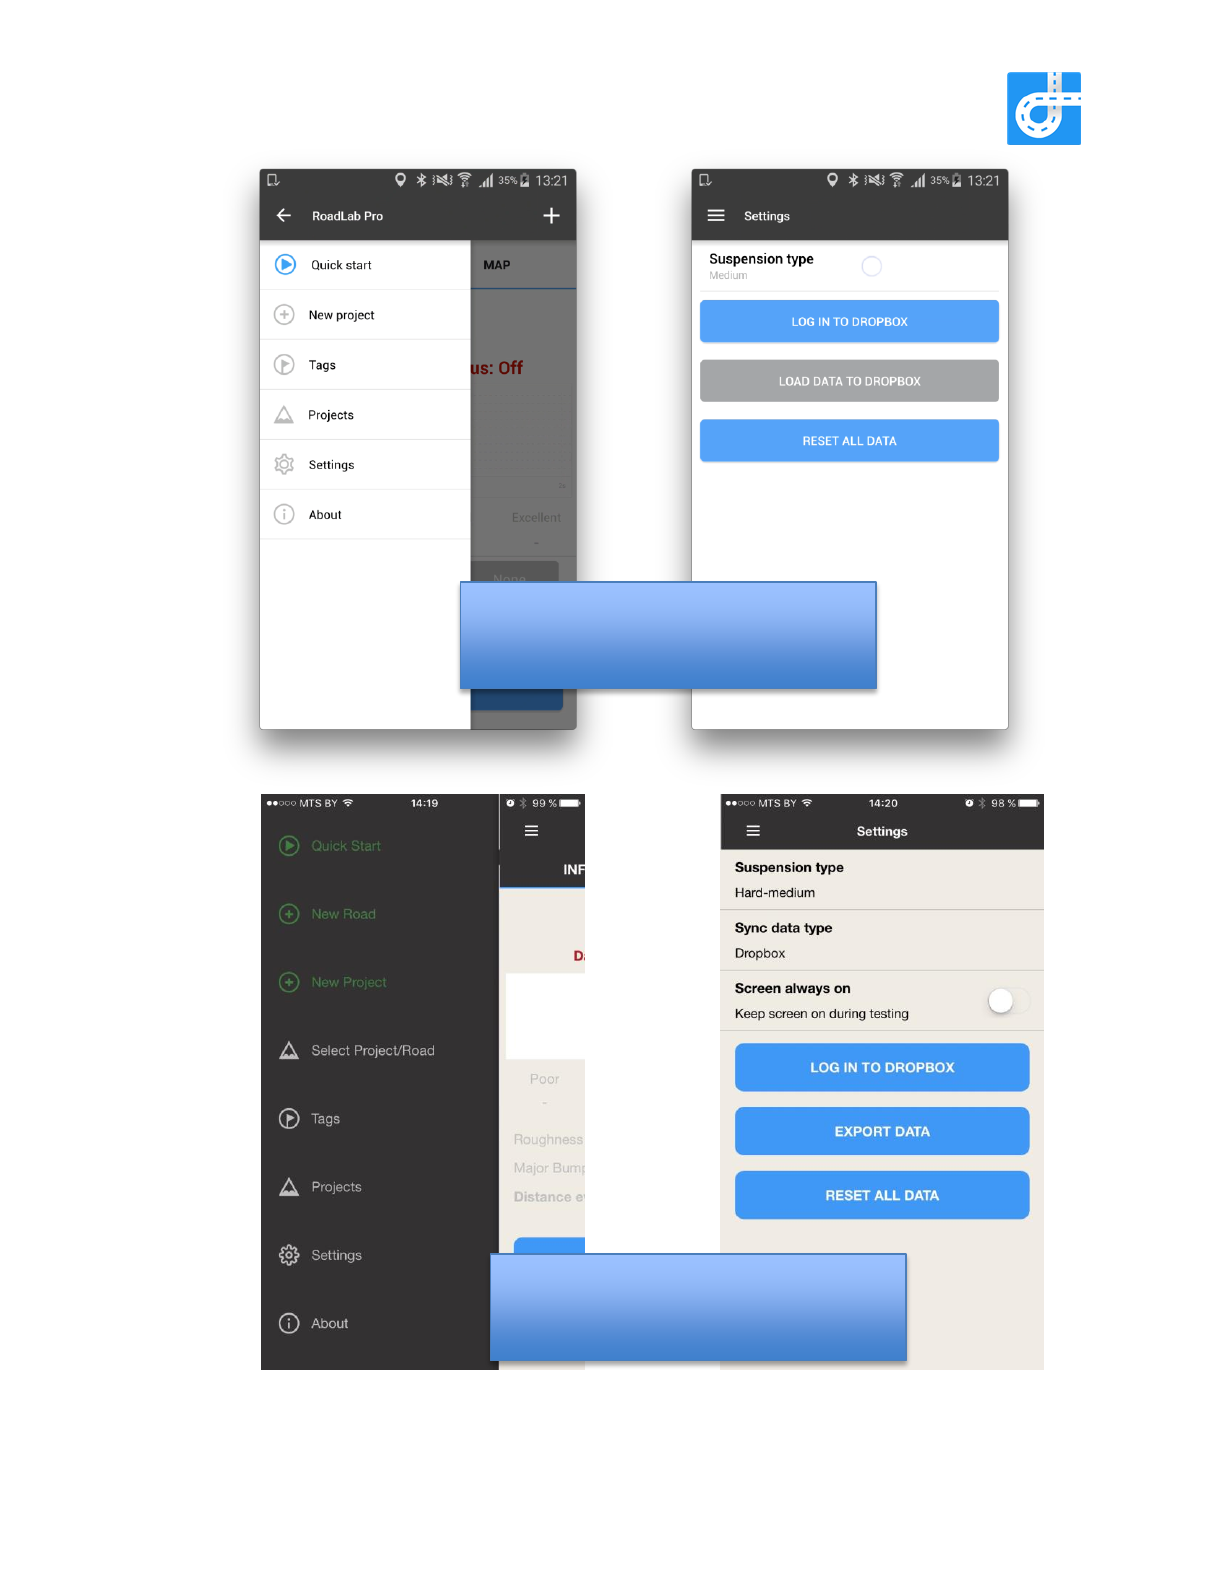
For Android Devices
For iOS Devices

The menu consists of standard menu items:
- Quick Start - to start measurement process, the application opens the Main screen and
user is able to immediately start data collection, user will be able to create a Project and
Road later; The Quick Start menu will be turned off after first use.
- New Project - to create a new Project, new Road and start measurement process;
- New Tag - to tag the recent geo-location;
- Projects - to manage all the data collected by the application;
- Settings - to manage application settings;
- About - screen to show some information about the application.

2. “Quick Start” and “New Project”
User is able to start immediately data collection procedure by tapping the “Quick Start” button.
The application opens the Measurement screen and user is able to start Measurement process.
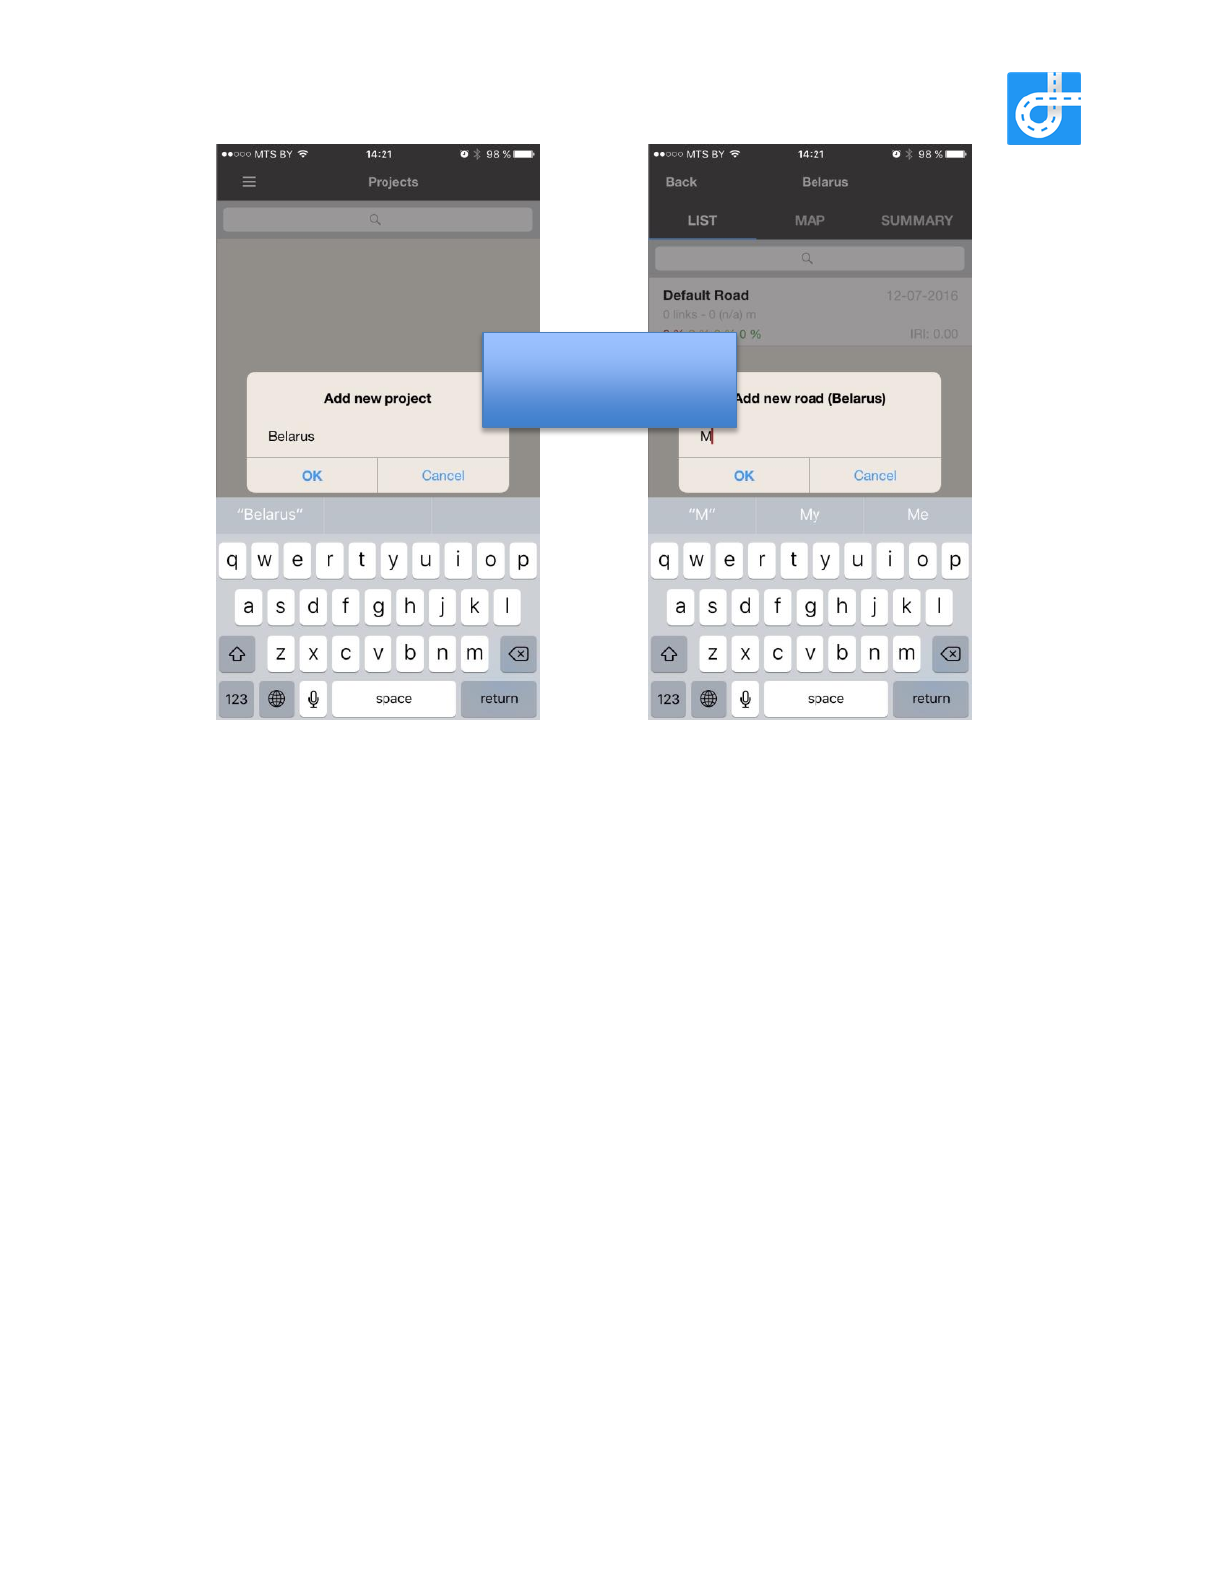
“New Project” menu item helps users to set data structure for new projects. The application
opens the Projects screen where user is able to create a new project and the new road link.
The new Project and new Road become the recent Project and recent Road after creation. Their
titles are put as the first item of the Slide Panel menu.
Tapping on the first item opens the Main screen and starts the data collection.
For Android Devices
3. Measurement screen
Data collection process can be displayed either on Info tab or on the Map tab:
- Info tab contains area with acceleration graph, icons to display the device orientation state
and the GPS status, some technical data related to recent measurement process and the
button to start/stop measurement;
- Map tab displays the recent Measurement data on the Google Maps screen: the road
intervals, road bumps and the tags of the recent measurement are displayed there.
For iOS Devices

Both tabs share common UI elements:
- “+” icon - adds a new Tag;
- Device orientation indicator - shows current position status of the device; “Red” means
the phone is not securely fixed and data collection will not start.
- GPS accuracy indicator - has two statuses: “red” (no GPS signal) or “green” (good);
- “Start tracking button” - initiates new session of collecting. When process starts, the text
on the button switches to “Stop tracking”;
- Some info relevant to current measurement is displayed along with graph (map).
When “Stop tracking” button is tapped, “Save to…” action sheet is displayed. It allows 10 seconds
to select a destination. The “Save to (9)” bar will show time left for selection. There are following
possibilities for saving measurement:
- “Save to current project” - saves data into project set to “Current”;
- “Select” - opens screen with the list of projects. User can either select one of the projects
in the list or create a new project. After that screen, the screen for selecting road is
displayed, where user can select existing roads or create a new road;
- “Select later” - saves data to “Unsorted” project. User can access and replace saved
data later in “Projects” section.

4. Adding a new tag
On tapping “+” icon on “Measurement” screen, a new tag on current location is stored and “Tag
was successfully added” dialog is displayed. Users can add additional details to this tag
immediately or skip and add details later (saved tags are displayed on the “Intervals” screen).
“Add tag details” screen allows adding following information about tag:
- “Road condition” – to allow road engineers manually enter visually observed road
conditions (excellent good, fair, poor)
- “Pictures” - add pictures from device or take new pictures;
- “Voice comments” - record audio comments to the tag;
- “Add IRI” – to allow road engineers manually enter visually estimated IRI number;
- “Notes” - add additional text notes.

5. Manage data collected
User is able to manage data collected from the app using “Projects” menu. There are four levels
of data:
1) Project - the top level of the data structure.
Usually this is at the “country” or “region” level. For example - “Belarus, Minsk region”, “Poland,
Warszaw” and etc. The Project contains one and more Roads entities. User is able to
create/read/update/delete any Project in the application data.
2) Road - the “road” level of the data structure.
Examples “M1 Minsk-Brest”, “E95 - May 2016” and etc. The Road contains one and more
Measurement entities. User is able to create/read/update/delete any Road in the application
data.
3) Measurement - the “distance” structure level.
This is the list of 100-meters road intervals. Measurement entity is created automatically when
the measurement process starts and then fills with the 100-meter intervals. When the
measurement stops, the Measurement entity is closed. User is able to create (by tapping
START button)/read/update/delete any Measurement in the application data.
4) Road Interval - the basic level of the data.
Usually this is approximately 100 meter interval (note due to GPS measurement precision, the
distance is not exactly 100 meters in most cases). Contains geo-tag (latt, long) of the start and
finish points, IRI and some additional technical data (id, date and time).
5) Road Bump - the bump event on the road.
This records bumps that were tracked during the measurement process. It contains the geo-tag
of the bump, maximum value of the standard deviation of the acceleration vector and some
technical information.
6) Tag - additional data structure to store important notes that user takes during the road
evaluation process. This element could be the part of road infrastructure assessment or
could be any other independent data element.
- if the Tag is recorded during the measurement process and the recent Project and
recent Road values are set - the tag is connected to this recent Road entity;
- In other cases the Tag is independent and does not contain any link to any Road.
The tag can contain the data that are entered and managed by user:
- Road evaluation (poor, moderate, good, excellent);
- Road evaluation - number from 0.0 to 100.0
- Photos;
- Voice message (audio file);
- Text notes;
… and technical data:
- Date and time;
- Unique identification.
User will be able to navigate through the Project - Road - Measurement - Road Interval / Road
Bump / Tag
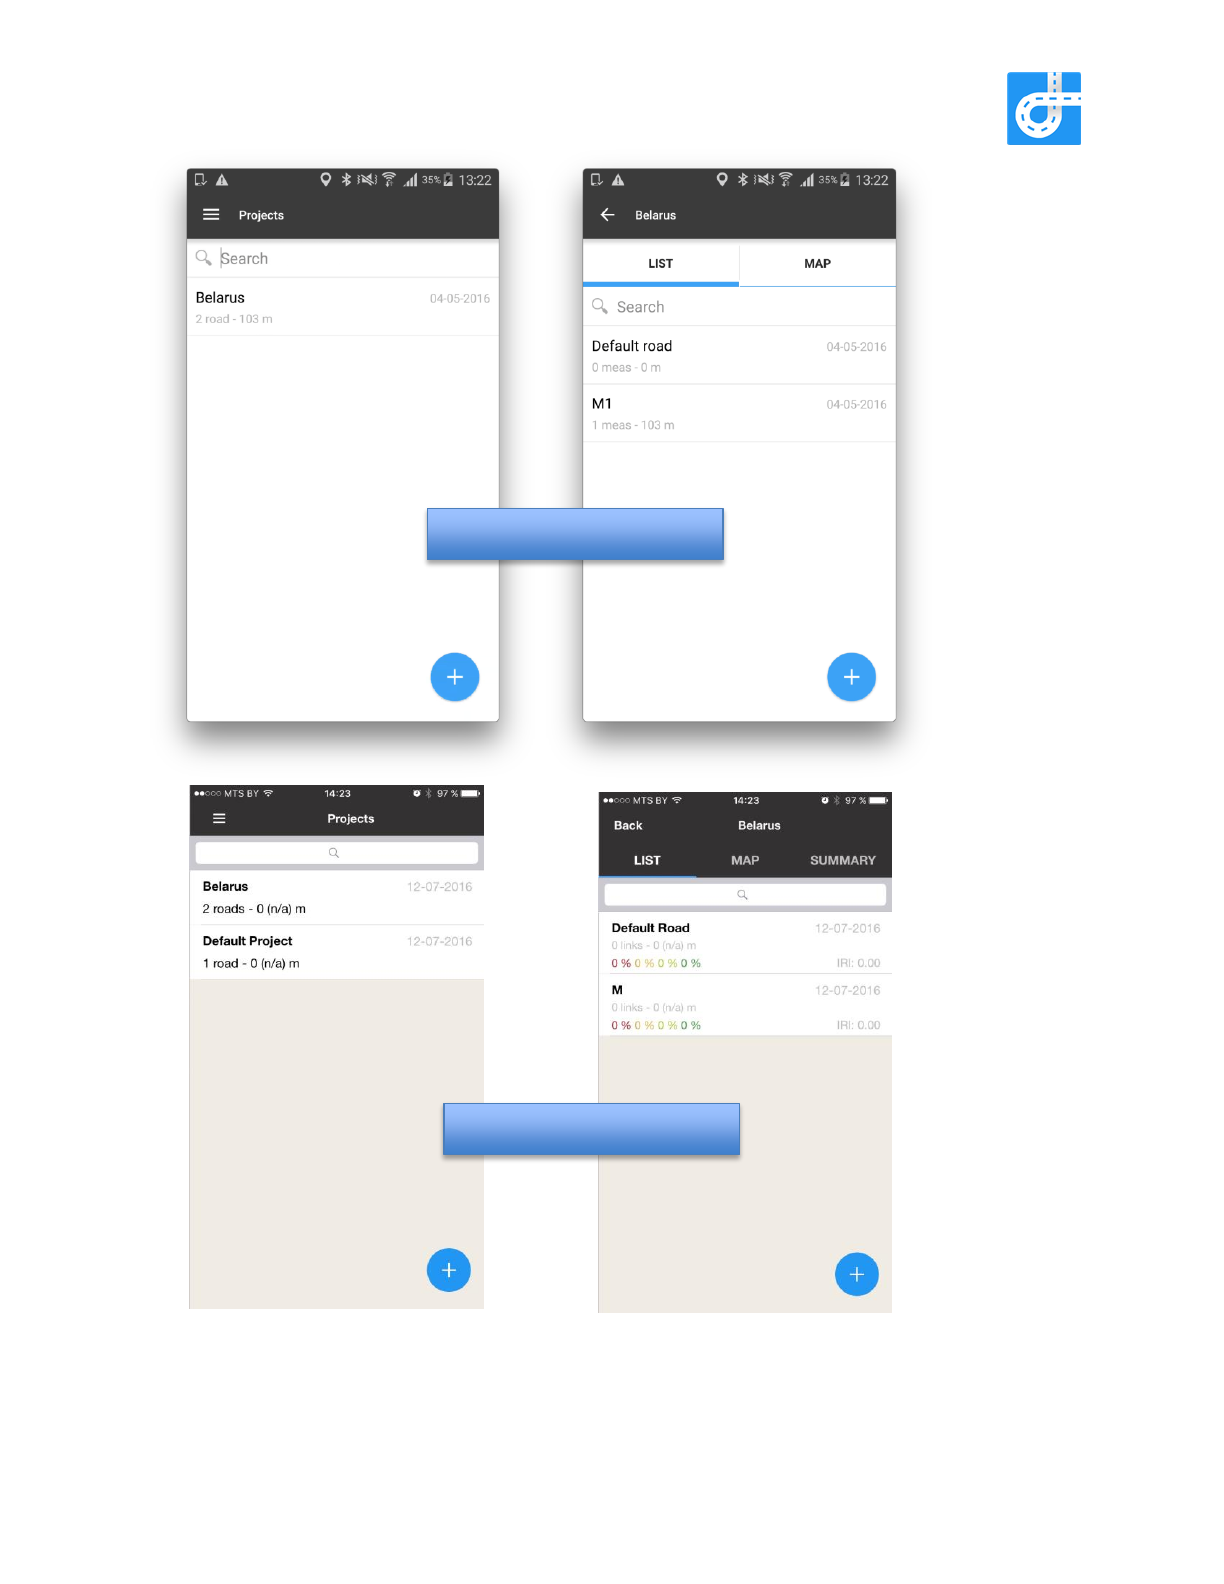
For Android Devices
For iOS Devices
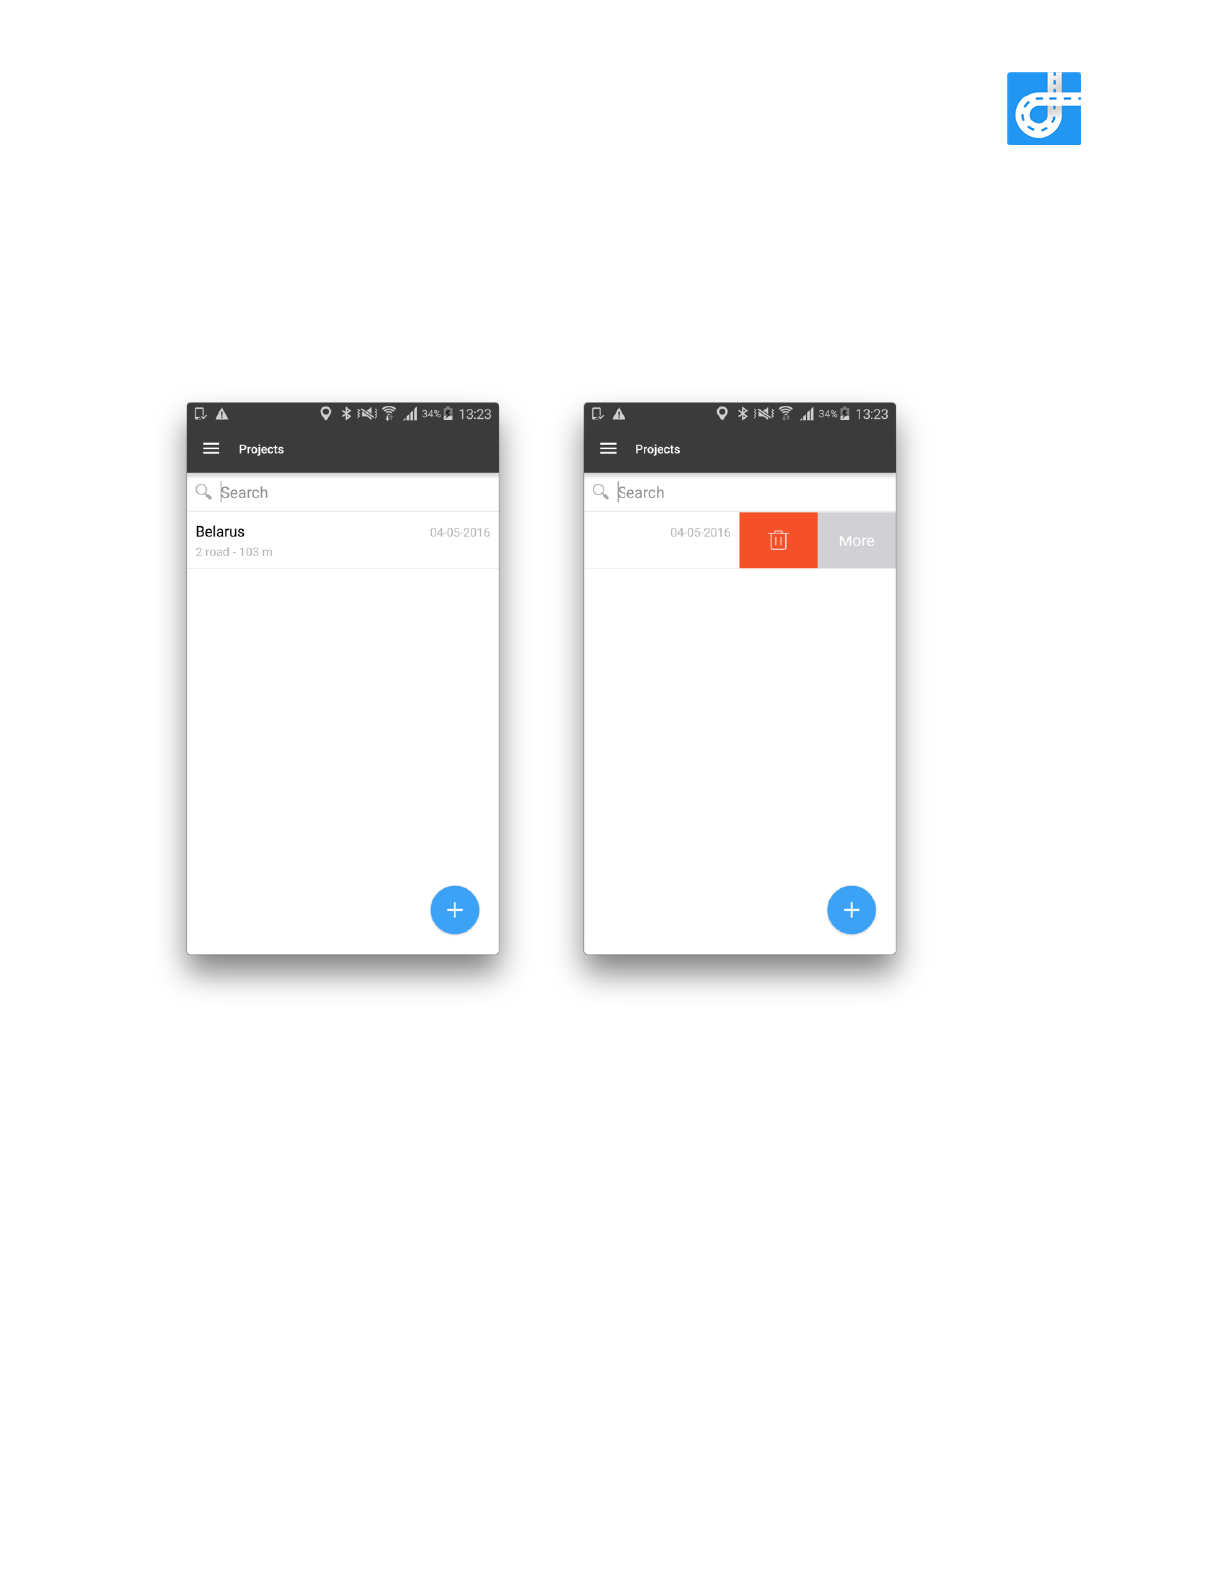
User is able to manage the Project/Road/Measurement/Interval/Bump/Tag using the standard
CRUD operations:
- Create
- Read
- Update
- Delete
All these operations could be done using native iOS and Android UI elements.
The standard “swipe-to-left” gesture functionality is implemented. User is able to delete the
selected entity by tapping DELETE button or tap MORE button and choose one of the following
operations:
- Rename;
- Select (to select as the recent);
- Send (send all the data via email);
- Synchronize (upload the data to Dropbox or Google Drive);
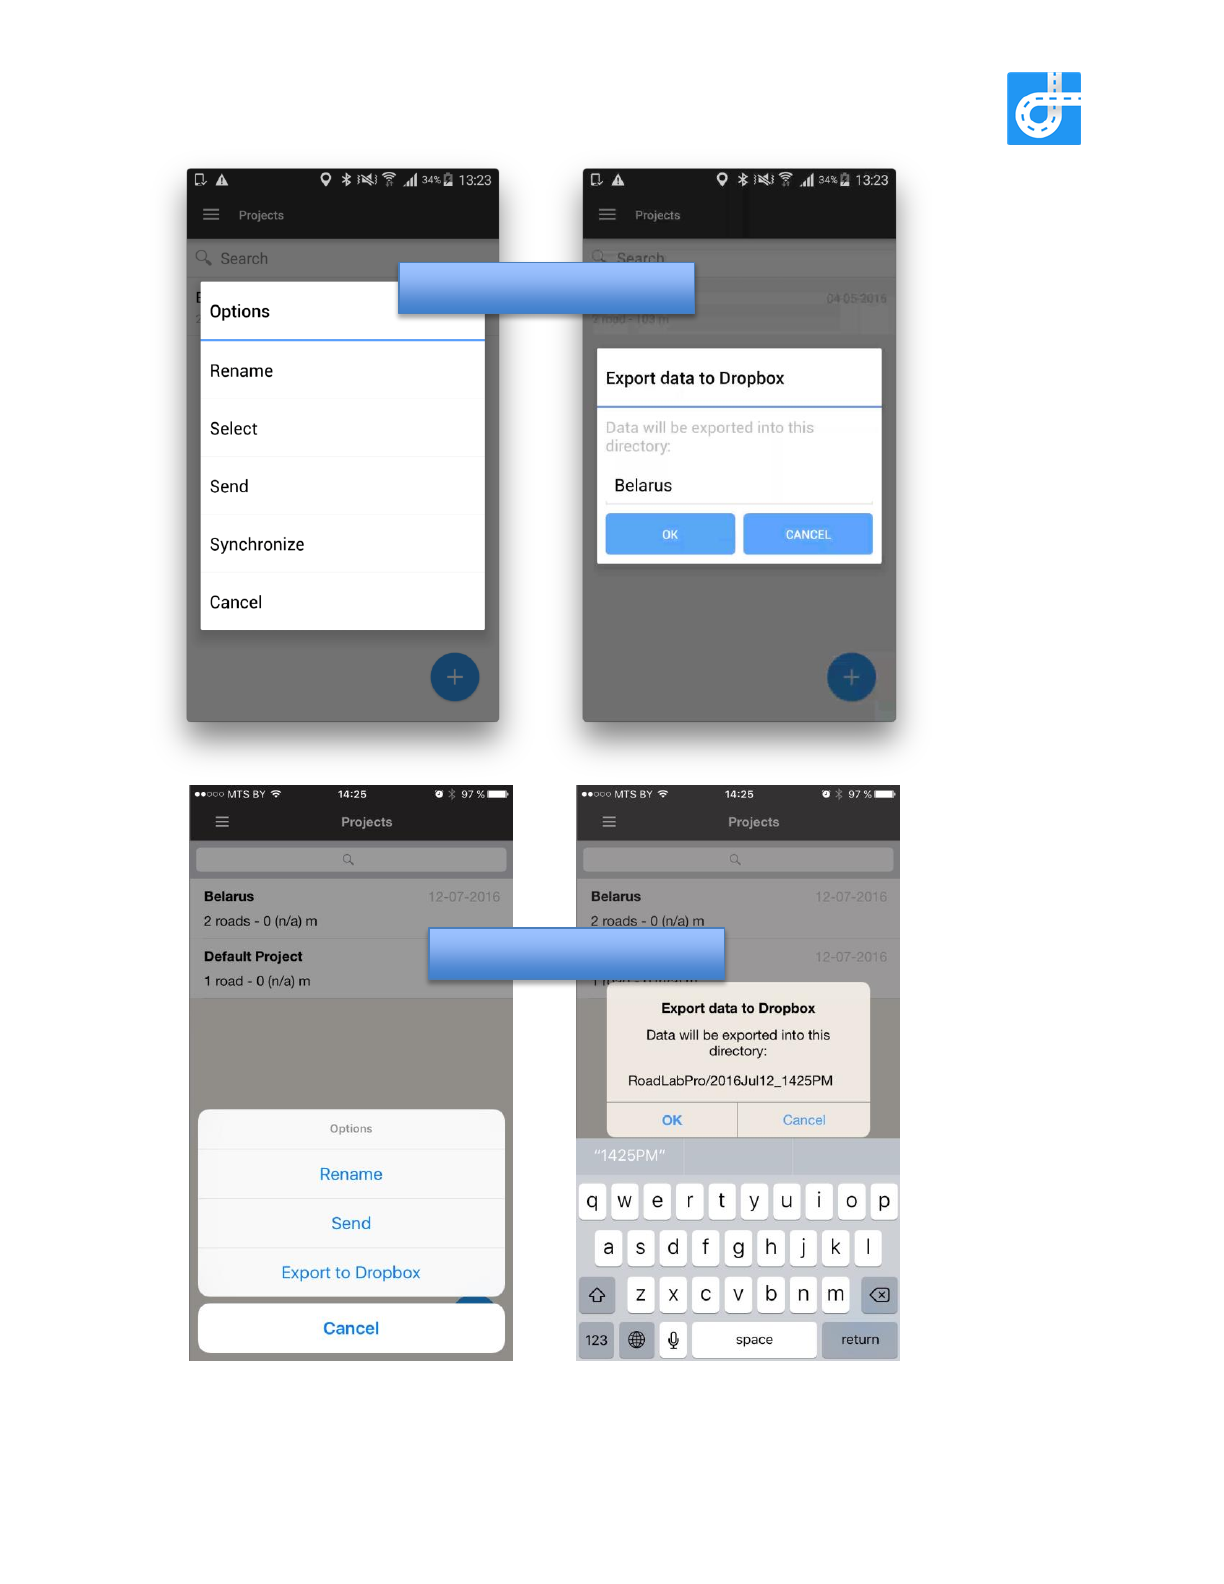
For Android Devices
For iOS Devices

6. Export data structure
The exporting functionality is implemented on the file system level. This means that all the data
are presented in the files.
There are two types of export:
- Export via email;
- Export via Dropbox or Google Drive
The export via email archives (zips) all the files of selected FOLDER or ROAD.
The export via Dropbox/Google Drive uploads all the files to the Dropbox/Google Drive directly.
Following is a brief description of the file structure:
- The high level of the data is the PROJECT entity. This is the highest level of
folders which contain the all projects that are exported from the device. If there is no
project set on the device, this folder will contain the “Default project” folder. This folder is
the storage of all the data not set to any project of any road.
- Each PROJECT folder contains the following elements:
- “Default road” – the road for all data for unset Road entity;
- The list of Roads in the project.
- Each ROAD folder contains the following elements:
- TAGs folder – the folder where all tags related to this Road are
stored;
- The list of folders with the MEASUREMENTS. This folder has very
specific filename: “id_11_2016-05-07-18-48-22”, where “11” is the number of
measurement, “2016-05-07” – date of creation, “18-48-22” – time of creation.
- Each MEASUREMENT contains of the following elements:
- The Bumps files of the measurement (csv and kml formats) – the
file where all the bumps detected during the measurement are stored;
- Road Intervals of the measurement (csv and kml formats) – the
file where all the evaluated road intervals are stored;
- Road Path of the measurement (csv and kml formats) – the file
where all GPS coordinates are stored no matter the vehicle speed and can be
used for road network mapping.
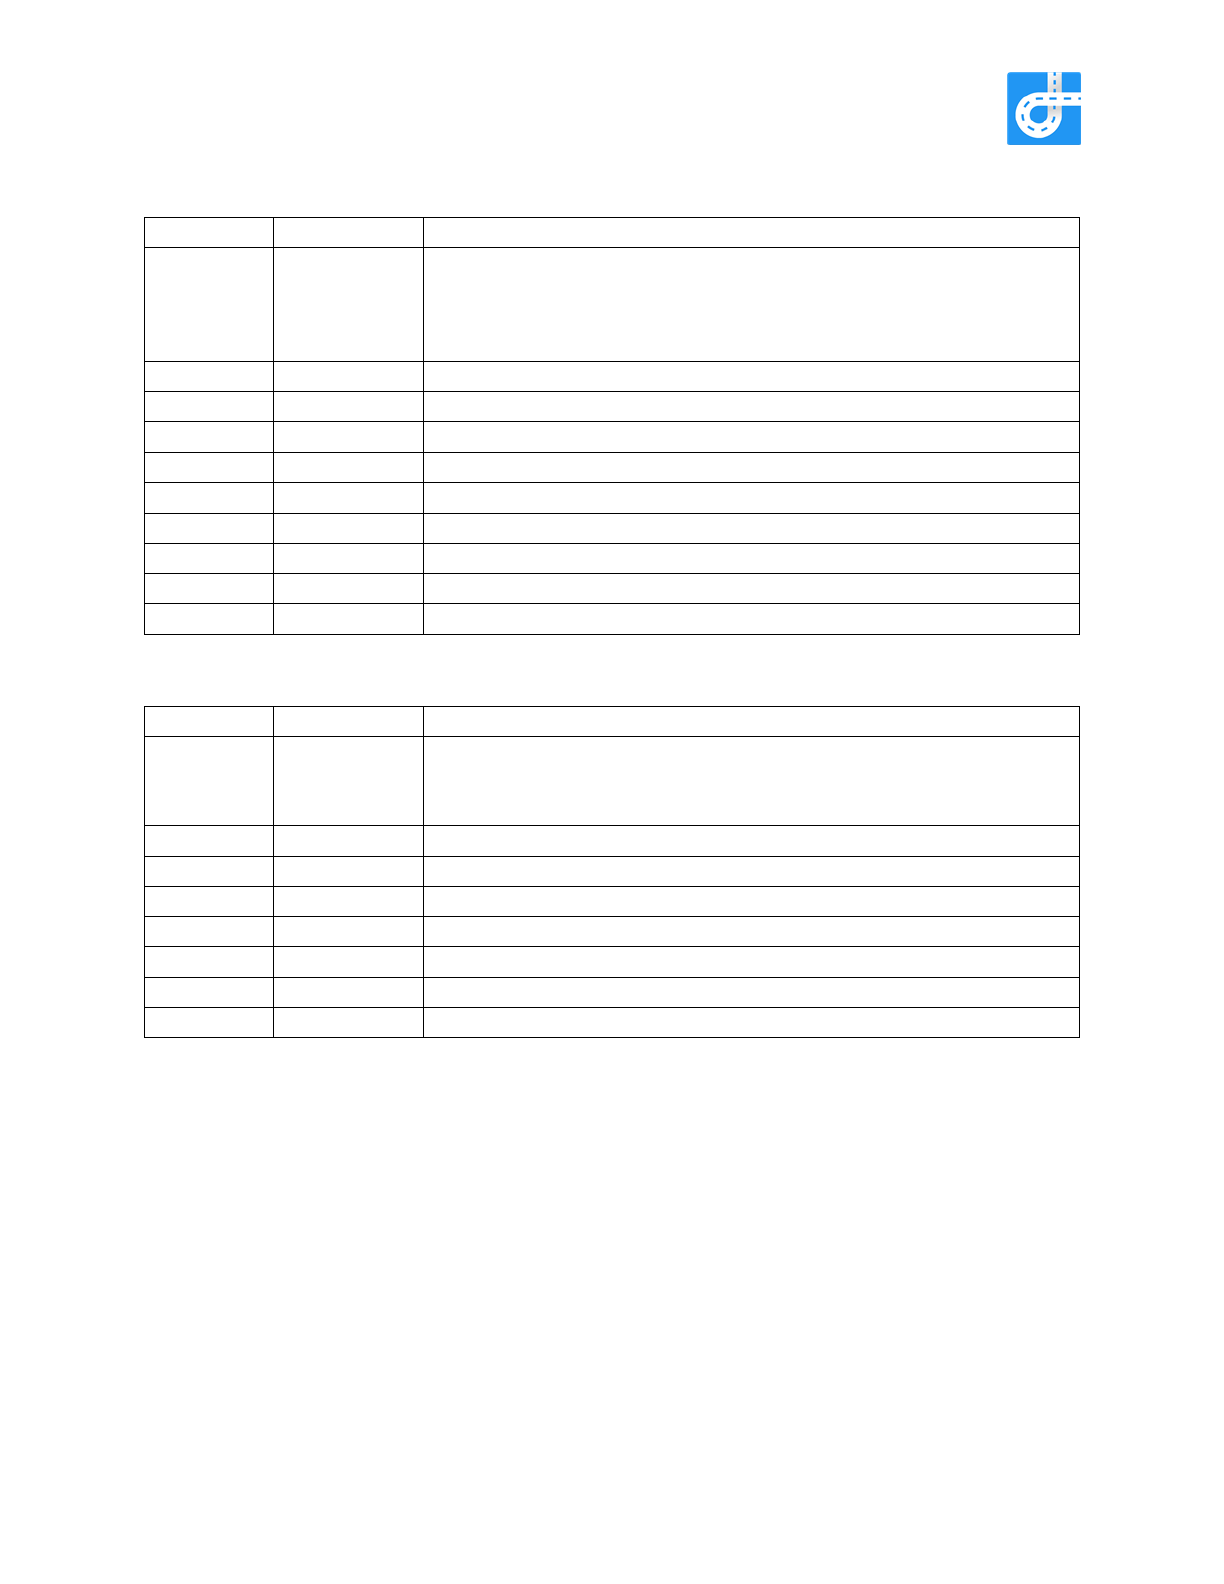
6.1 Road Interval csv file structure
Parameter
Example
Description
time
18:48:46
2016-May-
07
The date and time when the measurement of the evaluated road
interval starts
speed
36.13
The average speed (km/hour) for the road interval
category
EXCELLENT
The category of the road interval (excellent, good, fair, poor)
start_lat
53.87774263
The start point: latitude
start_lon
27.56801968
The start point: longitude
end_lat
53.87686959
The finish point: latitude
end_lon
27.56820651
The finish point: longitude
Is_fixed
true
The device position true –vertical, false horizontal
iri
1.65
The calculated IRI of the interval
distance
112.22
The distance of the road interval
6.2 Bump csv file structure
Parameter
Example
Description
time
18:53:46
2016-May-
07
The date and time when the bump was detected
speed
18.17
The average speed (km/hour) for the road interval
lat
53.84868593
Geo-tag: latitude
lon
27.57645522
Geo-tag: longitude
Ax
-0.41778821
The vertical acceleration vector of the bump X
Ay
6.76960516
The vertical acceleration vector of the bump Y
Az
2.52109432
The vertical acceleration vector of the bump Z
Is_fixed
true
The device position true –vertical, false horizontal