Roberts, Khattri 2012 Designing A Results Framework For Achieving How To Guide
User Manual:
Open the PDF directly: View PDF ![]() .
.
Page Count: 50
Independent evaluatIon Group
The World Bank Group
1818 H Street, N.W.
Washington, D.C. 20433, U.S.A.
Telephone: 202-477-1234
Facsimile: 202-477-6391
Internet: www.worldbank.org
Independent Evaluation Group
Strategy, Learning, and Communication
E-mail: ieg@worldbank.org
Telephone: 202-458-4497
Facsimile: 202-522-3125
designing a
results framework
for achieving
results:
a how-to guide

4

1
The World Bank
Washington, D.C.
Independent evaluatIon Group
designing a
results framework
for achieving
results:
a how-to guide

2
Acknowledgements
is booklet was written by Dawn Roberts (independent consultant)
and Nidhi Khattri (IEG). Peer review comments from Susan
Stout (consultant) and Maurya West Meiers (IEG) are gratefully
acknowledged. e task manager for the work was Nidhi Khattri.
e IEG Blue Booklet series disseminates practical information on
various aspects of monitoring and evaluation. Objectives of the series
are to focus on implementation aspects of monitoring and evaluation
and to disseminate information on other sources of knowledge. e
series is prepared under the overall guidance of Hans-Martin Boehmer,
Senior Manager, IEGCS.
© 2012 Independent Evaluation Group
Strategy, Learning, and Communication
International Bank for Reconstruction and Development/World Bank
1818 H Street, N.W.
Washington, DC 20433
Email: ieg@worldbank.org
Telephone: 202-458-4497
Facsimile: 202-522-3125
Internet: http://ieg.worldbankgroup.org
All rights reserved
ISBN-13: 978-1-60244-220-7
ISBN-10: 1-60244-220-7
e opinions expressed in the report do not necessarily represent the views of IEG/
the World Bank Group or its member governments. IEG/the World Bank Group do
not guarantee the accuracy of the data included in this publication and accept no
responsibility whatsoever for any consequence of their use.
2

Table of Contents
Introduction ............................................................................................... 5
What Is a Results Framework? .................................................................... 7
Uses of Results Frameworks ...................................................................... 14
What Is Required to Design a Results Framework? .................................. 20
Understanding of Problem and Needs Assessment ........................... 20
Specifying the eory of Change ..................................................... 21
Step-by-Step Guide .................................................................................. 26
Step 1. Establish Strategic Objective(s) for the Problem(s) to Be
Addressed ........................................................................................ 26
Step 2. Identify and Work with Stakeholders ................................... 27
Step 3. Dene Results (Outputs and Outcomes) ............................. 28
Step 4. Identify Critical Assumptions and Risks ............................... 29
Step 5. Review Available Data Sources and Specify Indicators .......... 29
Step 6. Assign Indicators and Data Sources for Each Level of Result 33
Step 7. Establish the Performance Monitoring Plan ......................... 38
Step 8. Establish a Communication and Dissemination Plan ........... 40
Challenges ................................................................................................ 41
Bibliography ............................................................................................. 43
3

4

5
Introduction
It is dicult to know if programs have succeeded or failed if the expected
results are not clearly articulated. An explicit denition of results—
precisely what is to be achieved through the project or program and by
when—keeps measurable objectives in sight, helps monitor progress
toward those objectives, and assists with adjustment and management
of program implementation.
Results-based management is a key tool for development eectiveness.
Recent years have witnessed a trend in explicitly specifying the results
(outcomes and impacts) of both broader country strategies and more
specic programs and projects. Internationally agreed principles have
underpinned this push for results, most notably with the adoption of
the United Nations Millennium Declaration (2000), which established
the Millennium Development Goals with targets and indicators to
provide the basis for measuring progress and the eectiveness of aid.
Landmarks in this emerging results orientation include the Monterrey
Consensus (2002), the Rome Declaration on Harmonization (2003),
the Paris Declaration (2005), the Hanoi Conference on Managing for
Development Results (2007), the Accra Agenda for Action (2008), and
the Busan Partnership for Eective Development Cooperation (2011).
Each of these agreements underscored the importance of increased
accountability of governments, donor agencies, and other partners
toward the achievement of results.
A results framework serves as a key tool in the development landscape,
enabling practitioners to discuss and establish strategic development
objectives and then link interventions to intermediate outcomes and
results that directly relate to those objectives. is publication provides
how-to guidance for developing results frameworks by discussing the
following:
■ The definition of a results framework. What is it? How does a results
framework complement and differ from a traditional monitoring
and evaluation logical framework?

De s i g n i n g a R e s u l t s F R a m e w o R k F o R a c h i e v i n g R e s u l t s
6
■ Uses for results frameworks. What are the functions of a results
framework? At what levels can one be developed and used
effectively?
■ Requirements to design a results framework. Is there an assessment
and diagnosis process to understand the problem and desired
results before the design and implementation of the intervention
is developed? Does the team adequately understand the problem
that a development intervention is designed to address? Has the
program or project logic been defined?
■ Designing a results framework step by step. What are the steps in
formulating a results framework? How should practitioners
establish strategic objectives and articulate the expected results?
What is the process through which results, indicators, and data
sources can be assigned for each level of desired result (output,
outcome, and impact)? What are the criteria for designing a useful
results framework? Who should be involved in developing and
using the framework?
■ Challenges. What are the potential pitfalls in developing results
frameworks? What strategies help in avoiding these?
is publication also provides various examples or excerpts of results
frameworks used at various levels (for example, country, project, and
organization) and oers references for further support to practitioners in
designing and using results frameworks for development eectiveness.
For more on context, see Binnendijk (2000) and OECD-DAC (2008).

7
What Is a Results Framework?
A results framework is an explicit articulation (graphic display, matrix,
or summary) of the dierent levels, or chains, of results expected from
a particular intervention—project, program, or development strategy.
e results specied typically comprise the longer-term objectives
(often referred to as “outcomes” or “impact”) and the intermediate
outcomes and outputs that precede, and lead to, those desired
longer-term objectives. Although the World Bank has used the term
“results framework” over the last decade, similar conceptual tools, also
designed to organize information regarding intended outcomes and
results, are used across dierent agencies: logical frameworks, logic
models, theories of change, results chains, and outcome mapping.
us, the results framework captures the essential elements of the
logical and expected cause-eect relationships among inputs, outputs,
intermediate results or outcomes, and impact.
ere are many debates, and considerable controversy, on the
distinctions among outputs, outcomes, and impact. A generally useful
approach is to consider outputs as the particular goods or services
provided by an intervention (for example, nutrition supplements),
whereas an outcome is usefully thought of as benets of that particular
good or service to the target population (such as improved nutrition
intake), and impact refers to evidence on whether outcomes are
actually changing beneciary behavior or longer-term conditions of
interest (for example, improved eating habits, a healthier population).
e key is to distinguish between the provision of goods and services
(which involves supply-side activities) and actual demand for and/or
utilization of those goods and services (demand-side response).
Dening cause-eect linkages for one or more interventions lays the
groundwork for a results framework. us, the development of a
good results framework requires clarity with respect to the theory of
change—the reasons why the project, program, or strategy will lead
to the outputs; why those outputs are likely to lead to the immediate
or intermediate outcomes; and how those outcomes are (at least
hypothetically) linked with longer-term outcomes or impact. e

De s i g n i n g a R e s u l t s F R a m e w o R k F o R a c h i e v i n g R e s u l t s
8
theory of change also requires knowing or estimating how long it will
take to achieve each stage of the program and how much of the outcome
is likely to be achieved. us, dening cause-eect linkages for one
or more development interventions lays the groundwork for a results
framework.
Outcomes and impacts are the main focus of a results framework; project
inputs and implementation processes are generally not emphasized,
although outputs are often noted. is conceptual presentation of a
results chain (outputs, outcomes, and impacts) is often accompanied
by a more detailed plan for monitoring progress toward the ultimate
objectives through measuring the achievement of outputs, outcomes,
and impacts at dierent intervals of time. Results are typically dened
through indicators, which are often, but not always, quantiable and
measurable or observable.1 (Some indicators are qualitative.) e
monitoring plan typically includes baseline values and targets expected
for outputs and outcomes, and it species the measures that will be
used for data gathering to ensure that the results framework is actually
populated with data, updated with information at key points during
program/project implementation, and used in decision making.
A results framework also often identies any underlying critical
assumptions that must be in place for the intervention to be successful,
that is, to lead to achieving the targeted outcomes and impacts.
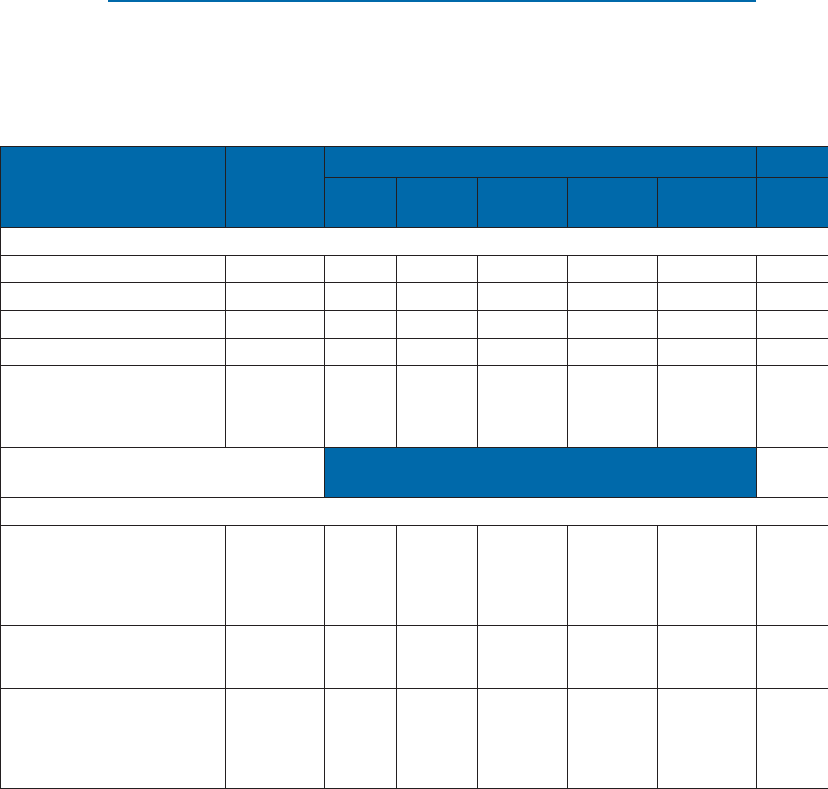
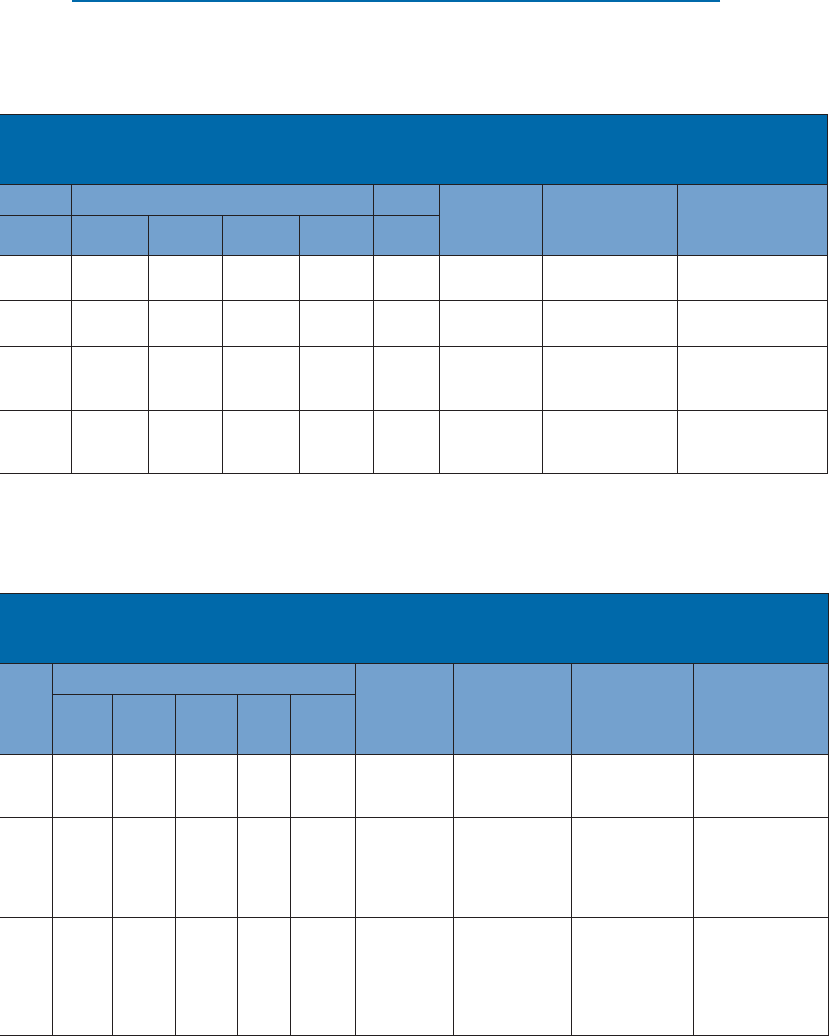
Table 1 presents a basic outline of a country-level results framework
that incorporates indicators for each level of result expected.
A well-constructed results framework is benecial for monitoring,
management, and evaluation in several ways:
■ It helps focus on specific outcomes. A well-conceived results framework
clearly outlines the ultimate objectives of the project, program,
or strategy, rather than simply listing implementation activities,
processes, and inputs. It facilitates a focus on specific expected
outcomes.
1. In some settings, desired outcomes may include changes in organizational or institutional
behaviors, which may best be tracked through qualitative data.

Wh a t I s a R e s u l t s F R a m e W o R k ?9
■ It highlights the key linkages in the theory of change that underpin
the intervention. A simple but clear results framework engages
constituents in thinking through the theory of change underpinning
the intervention. Discussion of a results framework often requires
program staff and other constituents to identify the development
hypothesis—Why would a particular intervention lead to the
outputs identified and the outcomes expected? How does it link
with the ultimate objective? This participatory discussion serves
a critical role in building consensus and ownership around shared
Table 1. Basic Outline of a Results Framework
Country
development
goals
Issues/
obstacles/
critical
assumptions
Outcomes
expected
Outputs/
milestones
Use of
monitoring
Statement of rst
country goal
Indicator
Baseline: xxxx (2005)
Target: xxxx (2010)
Additional/alternative
indicator
Baseline: xxxx (2005)
Target: xxxx (2010)
[continue with
additional indicators
or move to next goal]
Statement of second
country goal
Indicator
Baseline: xxxx (2005)
Target: xxxx (2010)
Additional/alternative
indicator
Baseline: xxxx (2005)
Target: xxxx (2010)
[continue with
additional indicators
or move to next goal]
[critical issues
and obstacles to
achieving country
development goals]
Statement of rst
outcome
Indicator
Baseline: xxxx (2005)
Midline: xxxx (2007)
Target: xxxx (2010)
Additional/alternative
indicator
Baseline: xxxx (2005)
Midline: xxxx (2007)
Target: xxxx (2010)
[continue with
additional indicators
or move to next
outcome]
Statement of second
outcome
Indicator
Baseline: xxxx (2005)
Midline: xxxx (2007)
Target: xxxx (2010)
Additional/alternative
indicator
Baseline: xxxx (2005)
Midline: xxxx (2007)
Target: xxxx (2010)
[continue with
additional indicators
or move to next
outcome]
Statement of rst
output/milestone to
be realized within the
time of the results
framework
Indicator (if quantitative
milestone)
Baseline: xxxx (2005)
Target: xxxx (2006)
xxxx (2007)
xxxx (2008)
xxxx (2009)
xxxx (2010)
Additional/alternative
indicator (if quantitative)
[continue with
additional indicators or
move to next milestone]
Statement of second
outputs/ milestone
[continue as above]
[short descriptive
text highlighting
how the
information will
be used]

De s i g n i n g a R e s u l t s F R a m e w o R k F o R a c h i e v i n g R e s u l t s
10 De s i g n i n g a R e s u l t s F R a m e w o R k F o R a c h i e v i n g R e s u l t s
10
objectives and clarifying different interpretations of the elements
of the hypothesis.
■ It helps establish an evidence-based approach to monitoring and
evaluation. By including specific indictors of outcomes and
impacts and identifying baselines and targets to be achieved, results
frameworks help answer the question, How will we know that the
intervention has succeeded?
■ It helps measure progress toward strategic objectives. The emphasis
on concrete outcomes rather than on the completion of activities
requires that program implementers monitor key outcome
variables and make midstream corrections as necessary. A results
framework is therefore a useful management tool, with program
implementation assessed in direct relationship to progress in
achieving results, at the outputs, outcomes, and impact levels.
■ It helps achieve strategic objectives. The strategic objective is
the ultimate driver of a program. Interventions might range
in complexity from a simple intervention in a community to a
number of interrelated interventions at a national level. A results
framework can include outcomes of many related projects or of
nonproject activities, if they arerelevant to the strategic objective,
rather than simply charting the expected achievements of an
isolated development initiative. All intermediate results needed
to achieve the strategic objective are specified, allowing partners
to harmonize their efforts or to identify areas where additional
program activities will be needed.
e preferred format and level of detail for results frameworks vary
by organization and by the scope and scale of the intervention, but
all include the same basic components to guide implementers in
achieving, and evaluators in assessing, results. Examples of project-level
results frameworks from one World Bank project are shown in Tables 2
and 3. For more information on what a results framework is, see Imas
and Rist (2009) and USAID (2000).

Wh a t I s a R e s u l t s F R a m e W o R k ?11
Table 2. Sample Project-Level Results Framework
Project development
objective
Project development
objective indicators Use of outcome monitoring
Increase small producers’
productivity and market
access for targeted
commodities in the project
area
Average yield of commodities in
targeted value chains (bananas,
irrigated rice, coee and milk)
(tons/ha or liters per cow,
respectively).
Project development objective indicators would
show the eciency and eectiveness of sub-
projects and other project investments in boosting
agricultural productivity (increase in yields)
and generating market surpluses (fraction of
production marketed) for targeted value chains.
Intermediate outcome Outcome indicators Use of outcome monitoring
Component 1: Agricultural
technology transfer and
linkage to market
Percentage of participating
farmers (male/female) adopting
new technology packages (for
production, post-harvest,
processing, etc.)
Percentage of producers adopting
animal breeds and husbandry
practices for milk production
Percent participating producer
groups/associations/cooperatives
having contractual arrangements
with marketing agents
Number of direct project
beneciaries of the new
technological packages and
market linkages
Number of indirect project
beneciaries of the new
technological packages and
market linkages
is indicator would show how eective project
services are in assisting farmers with technology
change.
is indicator would show the eectiveness of the
transfer of knowledge and advisory services.
is indicator would show to what degree
producer groups/associations/cooperatives are
embarking on commercial agriculture.
is indicator would show how the project would
aect other people living in the project area.
is indicator would show the overall eectiveness
of subproject completion.
Source: World Bank, adapted from the Agro Pastoral Productivity and Markets Development Project in Burundi (2010).
De s i g n i n g a R e s u l t s F R a m e w o R k F o R a c h i e v i n g R e s u l t s
12
Table 3. Sample Project-Level Results Framework, Including Target
Outcome Values
Project outcomes
indicators Baseline
Target values Data collection and reporting
YR1 YR2 YR3 YR4
YR5
(Target) Frequency and reports Data collection instruments
Responsibility for data
collection
Average yield of targeted commodities
Rice (t/ha) 2.5 2.8 3.3 3.8 4.0 4.0 End of cropping season Annual producer survey PCU
Banana (t/ha) 9.0 NA 12 14 16 16 End of annual marketing period Annual producer survey PCU
Coee (t cherries/ha) 0.4 0.5 0.6 0.7 0.8 0.8 End of annual marketing period Annual producer survey PCU
Milk (l/yr) 360 400 500 650 800 950 End of annual marketing period Annual producer survey PCU
Percent of production of
commodity in targeted value
chains marketed by participating
producers
10 12 18 22 26 30
End of annual marketing period
Annual producer survey PCU
Target values (cumulative)
Support to agricultural productivity and market process
Percentage of participating
farmers (male/female) adopting
new technology packages (for
production, post-harvest,
processing, and so forth)
10 15 30 45 60 70 Cropping season/annually Cropping season/
annual sample survey IPCU/PSP
Percentage of producers adopting
animal breeds and husbandry
practices for milk production
10 15 30 45 60 70 Annually Annual sample survey IPCU/PSP
Percentage of participating
producer groups/associations/
cooperatives having contractual
arrangements with marketing
agents
0 2 5 10 15 20 Annually Annual sample survey IPCU/PSP
Source: World Bank, adapted from the Agro Pastoral Productivity and Markets Development Project in Burundi (2010).
Note. PCU = Project Coordination Oce; IPC = Interprovincial Coordinating Unit; PS = Private Sector Providers

Wh a t I s a R e s u l t s F R a m e W o R k ?13
Table 3. Sample Project-Level Results Framework, Including Target
Outcome Values
Project outcomes
indicators Baseline
Target values Data collection and reporting
YR1 YR2 YR3 YR4
YR5
(Target) Frequency and reports Data collection instruments
Responsibility for data
collection
Average yield of targeted commodities
Rice (t/ha) 2.5 2.8 3.3 3.8 4.0 4.0 End of cropping season Annual producer survey PCU
Banana (t/ha) 9.0 NA 12 14 16 16 End of annual marketing period Annual producer survey PCU
Coee (t cherries/ha) 0.4 0.5 0.6 0.7 0.8 0.8 End of annual marketing period Annual producer survey PCU
Milk (l/yr) 360 400 500 650 800 950 End of annual marketing period Annual producer survey PCU
Percent of production of
commodity in targeted value
chains marketed by participating
producers
10 12 18 22 26 30
End of annual marketing period
Annual producer survey PCU
Target values (cumulative)
Support to agricultural productivity and market process
Percentage of participating
farmers (male/female) adopting
new technology packages (for
production, post-harvest,
processing, and so forth)
10 15 30 45 60 70 Cropping season/annually Cropping season/
annual sample survey IPCU/PSP
Percentage of producers adopting
animal breeds and husbandry
practices for milk production
10 15 30 45 60 70 Annually Annual sample survey IPCU/PSP
Percentage of participating
producer groups/associations/
cooperatives having contractual
arrangements with marketing
agents
0 2 5 10 15 20 Annually Annual sample survey IPCU/PSP

14
Uses of Results Frameworks
e advantages of using results frameworks translate to an array
of applications for practitioners or others pursuing development
objectives:
■ Planning. Working backwards from the strategic objectives, a
results framework offers a systematic approach for practitioners
to plan their strategies and to select interventions that are most
likely to address targeted problems. The process of designing a
results framework guides a program team in establishing a valid
development objective, assessing what intermediate outcomes
and outputs are needed to achieve that objective, and designing
or prescribing appropriate interventions aligned with the desired
cause-and-effect linkages. (See the “Step-by Step Guide” section in
this booklet.)
■ Consensus, coordination, and ownership. A results framework
provides the opportunity for the primary implementers (an
agency, operating unit, project team, and so forth) to work with
key stakeholders to agree on coordinating the implementation
approach, agreeing on the expected results, highlighting and
checking the underlying assumptions, and specifying needed
resources.
■ Management. Performance data can and should inform
programming decisions. A results framework is a tool for guiding
corrective adjustments to activities, reallocating resources, and
reevaluating targeted objectives or underlying assumptions. It
provides a way to understand and make decisions related to
unintended (especially negative) effects of the program (for example,
increased traffic accidents in the local community associated
with a new road). It is therefore very useful for those involved in
constructing a results framework to make explicit their assumptions
about who will be using indicators at each link in the chain, as well
as what form of and the frequency of decisions each user will be
encouraged to make in response to changes in the indicator(s).
■ Communication and reporting. In defining a program’s
causal relationships, a results framework acts as a vehicle for

us e s o F R e s u l t s F R a m e w o R k s 15
communicating about the resources, activities, and outcomes
to program staff, development partners, or other stakeholders.
These frameworks can be an important tool in illustrating to the
beneficiaries or community what a project is meant to achieve; steps
should be taken to share this information in posters at community
centers, on program websites, and through other means.
■ Evaluation. The specification of each level of results with associated
indicators, measures, and targets establishes an effective framework
for ongoing monitoring and evaluation, including early on in the
project or program cycle. A results framework clearly identifies
how progress toward the targeted objective(s) will be measured
and thus provides the basis for the development and use of the
implementing unit’s performance monitoring system. It also
serves as the basic accountability tool for developing an evaluation
approach to the intervention.
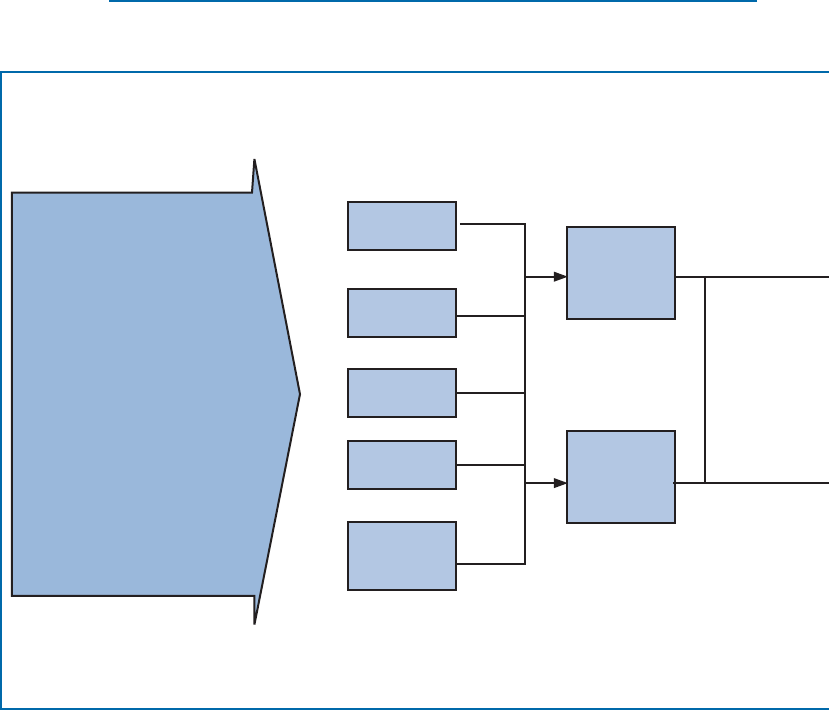
■ Harmonization. The planning, consensus building, and
communication functions of a results framework all help
development partners (for example, government teams, donors,
nongovernmental organizations, and so forth) clarify efficient
divisions of responsibilities for achieving specific results. Different
operating units can coordinate efforts to design related activities
(project or nonproject) to achieve the intermediate outcomes for
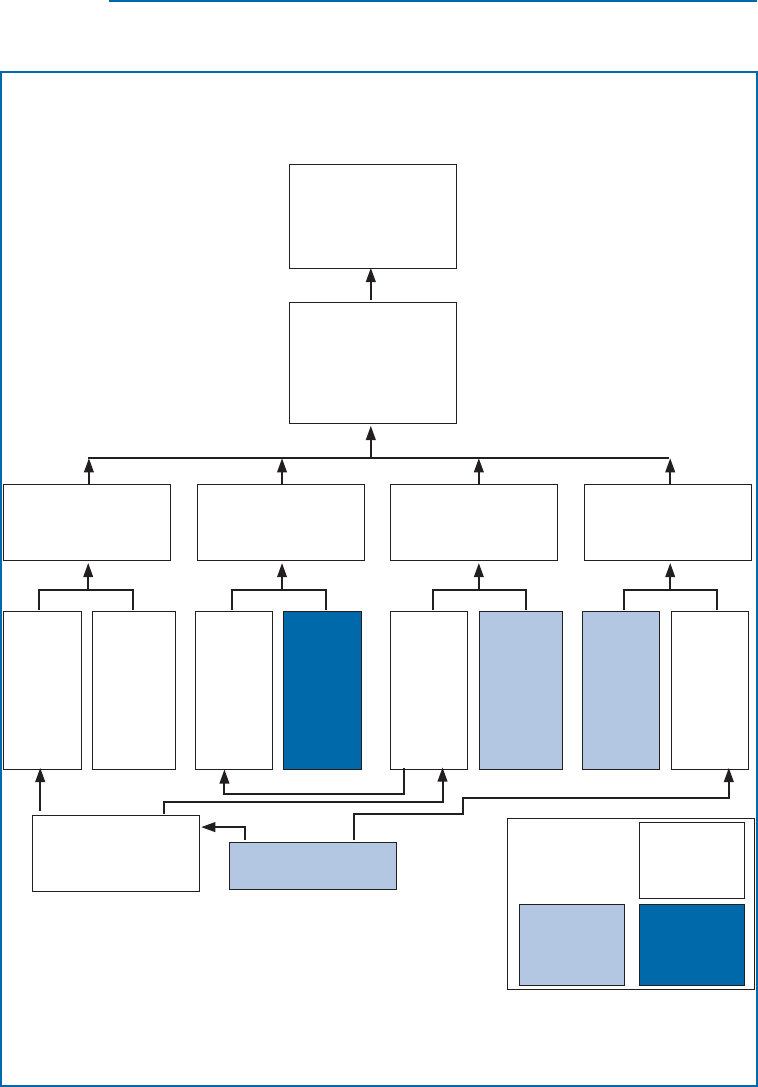
which they are responsible. Figure 1 provides an example of this
approach.
■ Learning from experience. Over time, the systematic use of results
frameworks allows practitioners to assess what approaches or
interventions contribute most effectively to achieving specific
development objectives, a process that helps identify good practices
for replication. A body of knowledge also forms regarding which
indicators, measures, and data sources are best suited to monitoring
progress in similar contexts.
In summary, a results framework underpins a strategic planning
process and serves as a living management tool—fostering ownership
and consensus, guiding corrective actions, facilitating the coordination
of development eorts, charting the course for achieving a strategic
objective, and ultimately serving as key accountability tool for
evaluation.
De s i g n i n g a R e s u l t s F R a m e w o R k F o R a c h i e v i n g R e s u l t s
16
Figure 1. Sample Results Framework: Harmonization of
Development Eorts
Agency objective
More rapid and
enhanced agricultural
development and food
security encouraged
Strategic objective
Increased use of
improved production
practices by farmers in
the Upper River Zone
(6 years)
Farmers’ access to
commercial capital
increased (5 years)
Farmers’ capacity to make
enterprise management
decisions increased
(3 years)
Adult literacy increased
(2 years)
USAID solely
materially
responsible
USAID plus
partner
materially
responsible
Partner(s)
solely materially
responsible
Farmers’
capacity
to develop
bankable
loan
applications
increased
(4 years)
Village
associations’
contract
negotiation
capacity
increased
(4 years)
Village
associations’
control
over local
resources
increased
(4 years)
New
technologies
available
(4 years)
Banks’ loan
policies more
favorable for
rural sector
(3 years)
Input/
output
markets
liberalized
(3 years)
Role of
forestry
agents
changed
from
regulatory to
outreach
(2 years)
Farmers’
exposure
to on-farm
experiences
of peers
increased
(3 years)
Farmers’ transport costs
decreased (5 years)
Community control over
local resources increased
(5 years)
Farmers’ knowledge
about production options
increased (4 years)
Key
Source: Adapted from USAID 2000.
Note: Critical assumptions: (i) Market prices for framers’ product remain stable or increase. (ii) Prices of agricultural inputs
(for example, fertilizer or seeds) remain stable or decrease. (iii) Roads needed to get produce to market are maintained. (iv)
Rainfall and other critical weather conditions remain stable.

us e s o F R e s u l t s F R a m e w o R k s 17
Results frameworks can serve these functions at various levels.
■ They can be used to chart the contributions of an individual project
to a development objective.
■ They help take a results-oriented approach to addressing objectives
for a particular sector or subsector.
■ An organization can use a results framework to guide and gauge
progress in pursuing its mission.
■ Country-level results frameworks are also commonly used, with
national governments and development partners including them
as part of their national development plans, country assistance
strategies, joint assistance strategies, country development
programming frameworks, or other official strategies. Table 4
provides an example of the World Bank Group’s contributions to
country-level goals. For more information on the uses of results
frameworks, see OECD-DAC (2008).

De s i g n i n g a R e s u l t s F R a m e w o R k F o R a c h i e v i n g R e s u l t s
18
Country dev’t.
goals
(from the NSDI)
Issues and obstacles Outcomes the World Bank Group
program is expected to inuence
Milestones World Bank Group
instrument
Strategic objective 1: Accelerating the recovery to Albania’s economic growth through improved competitiveness
(i) Improving business regulations and reducing compliance costs for the private sector
“A favorable business
climate will be created
for the dynamic
development of
private enterprise
and the attraction of
foreign investment.”
e cost of doing business in Albania
remains high in part due to administrative
corruption and a high “time tax.” Albania’s
investment climate is undermined by
inadequate property administration and
weaknesses in urban land administration.
Reduce the cost of business, as evidenced by:
•TwofullRegulatoryImpactAssessments
conduced per year by 2013.
•Decreaseinthenumberofinspectionsper
business per year (status: 32 in 2009; target:
12 in 2011)
•Decreaseintimetoreceiveabuildingpermit
(status: 180 days in 2007; target: 100 days at
end-2011)
Increase in government ocials trained in regulatory review
techniques (status: 3 in 2008; target: 375 in 2011).
Regulatory framework for inspections revised and adopted
Increase in number of titles issued in urban areas (status: 130,000
in 2009; target: 320,000 at end 2011)
Complete computerization if Immovable Property Registration
Oce.
Business Environment Reform and Inst
Strengthening Project
Land Administration and Management Project
Governance Partnership Facility Expropriations $
Safeguards TA
IFC Trade Logistics Program
IFC Tax Simplication Project
IFC Subnational Competitiveness Program
SEE Doing Business initiative
Strategic objective 2: Broadening and sustaining Albania’s social gains
(ii) Broader access to education, particularly secondary and higher education, and improved quality
“Establish a good
quality, inclusive and
exible education
system that will
respond to the
demands of the
market.”
Albania needs to broaden its sources of
productivity and employment growth
through more eective investment in
human capital – secondary enrollment is
low in part because of poor quality and
learning outcomes, and tertiary education
needs to be more market responsive.
Improved access to and quality of secondary
education, as indicated by:
•Increaseinsecondaryenrollment(status:60%
in2009;target:100%atend2014)
•Tripleshiftseliminated,doubleshiftsreduced
in secondary schools by 2014
Reform of higher education institutions as
indicated by:
•Fullyfunctioningqualityassurancesystemfor
higher education
Complete reform of all three grades of secondary curricula
Increase in teachers participating in continuous professional
development(status:25%in2009;target:70%atend2010)
Construction of 12 new schools; extension of 8 existing schools;
and rehabilitation of 10 schools completed by end 2013
Performance-based nancing in place for all (11) public
universities by 2014
Education, Excellence, and Equity Project
Education Project (FY14)
Source: World Bank.
Note: NSDI = National Strategy for Development and Integration; IFC = International Finance Corporation;
TA = Technical Assistance.
Table 4. Sample Results Matrix

us e s o F R e s u l t s F R a m e w o R k s 19
Country dev’t.
goals
(from the NSDI)
Issues and obstacles Outcomes the World Bank Group
program is expected to inuence
Milestones World Bank Group
instrument
Strategic objective 1: Accelerating the recovery to Albania’s economic growth through improved competitiveness
(i) Improving business regulations and reducing compliance costs for the private sector
“A favorable business
climate will be created
for the dynamic
development of
private enterprise
and the attraction of
foreign investment.”
e cost of doing business in Albania
remains high in part due to administrative
corruption and a high “time tax.” Albania’s
investment climate is undermined by
inadequate property administration and
weaknesses in urban land administration.
Reduce the cost of business, as evidenced by:
•TwofullRegulatoryImpactAssessments
conduced per year by 2013.
•Decreaseinthenumberofinspectionsper
business per year (status: 32 in 2009; target:
12 in 2011)
•Decreaseintimetoreceiveabuildingpermit
(status: 180 days in 2007; target: 100 days at
end-2011)
Increase in government ocials trained in regulatory review
techniques (status: 3 in 2008; target: 375 in 2011).
Regulatory framework for inspections revised and adopted
Increase in number of titles issued in urban areas (status: 130,000
in 2009; target: 320,000 at end 2011)
Complete computerization if Immovable Property Registration
Oce.
Business Environment Reform and Inst
Strengthening Project
Land Administration and Management Project
Governance Partnership Facility Expropriations $
Safeguards TA
IFC Trade Logistics Program
IFC Tax Simplication Project
IFC Subnational Competitiveness Program
SEE Doing Business initiative
Strategic objective 2: Broadening and sustaining Albania’s social gains
(ii) Broader access to education, particularly secondary and higher education, and improved quality
“Establish a good
quality, inclusive and
exible education
system that will
respond to the
demands of the
market.”
Albania needs to broaden its sources of
productivity and employment growth
through more eective investment in
human capital – secondary enrollment is
low in part because of poor quality and
learning outcomes, and tertiary education
needs to be more market responsive.
Improved access to and quality of secondary
education, as indicated by:
•Increaseinsecondaryenrollment(status:60%
in2009;target:100%atend2014)
•Tripleshiftseliminated,doubleshiftsreduced
in secondary schools by 2014
Reform of higher education institutions as
indicated by:
•Fullyfunctioningqualityassurancesystemfor
higher education
Complete reform of all three grades of secondary curricula
Increase in teachers participating in continuous professional
development(status:25%in2009;target:70%atend2010)
Construction of 12 new schools; extension of 8 existing schools;
and rehabilitation of 10 schools completed by end 2013
Performance-based nancing in place for all (11) public
universities by 2014
Education, Excellence, and Equity Project
Education Project (FY14)
Source: World Bank.
Note: NSDI = National Strategy for Development and Integration; IFC = International Finance Corporation;
TA = Technical Assistance.

20
What Is Required to Design a Results
Framework?
Designing a results framework is an iterative process, with objectives
and interventions providing the base for its design, and draft
results frameworks in turn helping to clarify specic objectives and
interventions. A results framework builds on, and helps articulate, a
project’s or program’s theory of change—the causal pathways from
the planned interventions to the intended outcomes. Actions for
developing a results framework therefore start with understanding
both the problem to be addressed and the desired outcomes, specifying
the program logic, and building stakeholder consensus related to this
theory of change. Once this agreement is in place, stakeholders can
focus on selecting appropriate indicators to measure intended outputs
and outcomes, setting baseline and target values, and exploring the
relevance of available data and data collection methods. All these
steps in the results framework process require that practitioners come
prepared with four types of information:
■ An understanding of the problem or assessment of needs that the
development intervention is intended to address
■ An initial theory of change for the project or program, even as it is
being designed
■ A working knowledge of evidence required for measuring and
assessing desired outcomes and impacts
■ Available data sources and proven data collection approaches
relevant for the project or program context.
ese components provide a solid foundation on which to base a
results framework.
Understanding of Problem and Needs Assessment
e needs assessment or problem analysis stage is critical for informing
the pathways and outputs and intermediate outcomes needed to achieve
each objective. Practitioners should consider the following questions:

Wh a t I s R e q u I R e d t o d e s I g n a R e s u l t s F R a m e W o R k ?21
■ What are the current results being achieved and the hoped-for
results related to the issue? In other words, what is the gap between
these results, and what are the expectations for minimizing the
gap?
■ What are the main challenges or barriers that have constrained
stakeholders from reaching the development objectives? For
example, is the limited access to markets for farmers and
manufacturers caused by poor roads or restrictive trade policies?
■ What current conditions in the area or population of interest might
hinder or facilitate progress toward the development objective?
What else is happening (for example, projects in the country,
community efforts, and so forth) that might also be working
toward addressing the gap in results?
■ What are the stepping stones that will lead from the current
status to the desired results? In other words, what outputs and
intermediate outcomes are most likely to contribute to and mark
progress toward the targeted objective?
■ What are the risks that the program might face from factors outside
the program?
■ What other relevant experiences in the region or the sector could
help the implementation team better understand how to achieve
the strategic objective?
■ Who is potentially affected by the interventions, and how can their
opinions inform the needs assessment process?
e answers to these questions help determine which stakeholders
should be engaged in program planning, implementation, and
assessment, as well as which intermediate objectives are critical to the
success of the intervention.
Specifying the eory of Change
A results framework must be based on a clear understanding and
specication of how any planned interventions are expected to lead to
desired outcomes. e theory of change model allows stakeholders to
visualize the logic of an intervention and identify the proposed causal
links among inputs, activities, outputs, and outcomes. An example
De s i g n i n g a R e s u l t s F R a m e w o R k F o R a c h i e v i n g R e s u l t s
22
of this logical sequence for achieving one national development goal
is shown in Figure 2. Various formats and approaches can be used
to depict this causal chain, with each designed to help practitioners
understand not only the intended outcomes of a program but also the
inputs and activities needed to achieve them.
Four main areas should be considered for accurately predicting and
explaining the conversion process from inputs to results:
■ Broader context. Development activities occur within a complex
system of factors, all of which might facilitate or hinder intended
outcomes. These include the macroeconomic environment, social
Figure 2. Sample Program Logic to Reduce Childhood
Morbidity through the Use of Oral Rehydration erapy
Goal
Outcome
Activities
Outputs
Inputs
Reduce mortality rates for children under 5 years old
Improved ORT for managing childhood diarrhea
• Launchmediacampaigntoeducatemothers
• TrainhealthprofessionalsinORT
• 15mediacampaignscompleted
• 100healthprofessionalstrained
• IncreasedmaternalknowledgeofORTservices
• IncreasedaccesstoORT
• Trainers
• ORTsupplies
• Funds
• Participants
ResultsImplementation
Sources: Kusek and Rist 2004; also adapted from Binnendijk 2000.
Note: ORT = Oral rehydration therapy.

Wh a t I s R e q u I R e d t o d e s I g n a R e s u l t s F R a m e W o R k ?23
norms, policy context, initiatives of government and development
organizations, the political climate, and even the weather.
■ Prior research and evaluation. Existing literature on prior studies
can shed valuable light on how effective proposed interventions
are likely to be. Theories that are based on lessons learned and
existing data will be stronger than unsubstantiated cause-and-
effect linkages.
■ Level of risk of assumptions. Although graphic presentations of a
program’s change theory often show a linear logic chain leading
to outcomes, cause-effect relationships are rarely simple and
linear. The many factors that affect each stage of the change
process must be assessed—by reviewing both the broader context
and prior research—to identify which underlying assumptions
would facilitate and which ones could endanger the success of the
proposed intervention.
■ Change agents. The success of most development interventions is
predicated on the changed behaviors of stakeholders. Depending
on the intended outcomes, these stakeholders might, for example,
include targeted beneficiaries making use of the intervention’s
products or services, government authorities delivering services
better or differently, or donors harmonizing their joint support
efforts more systematically so as to unburden the government aid
recipients.
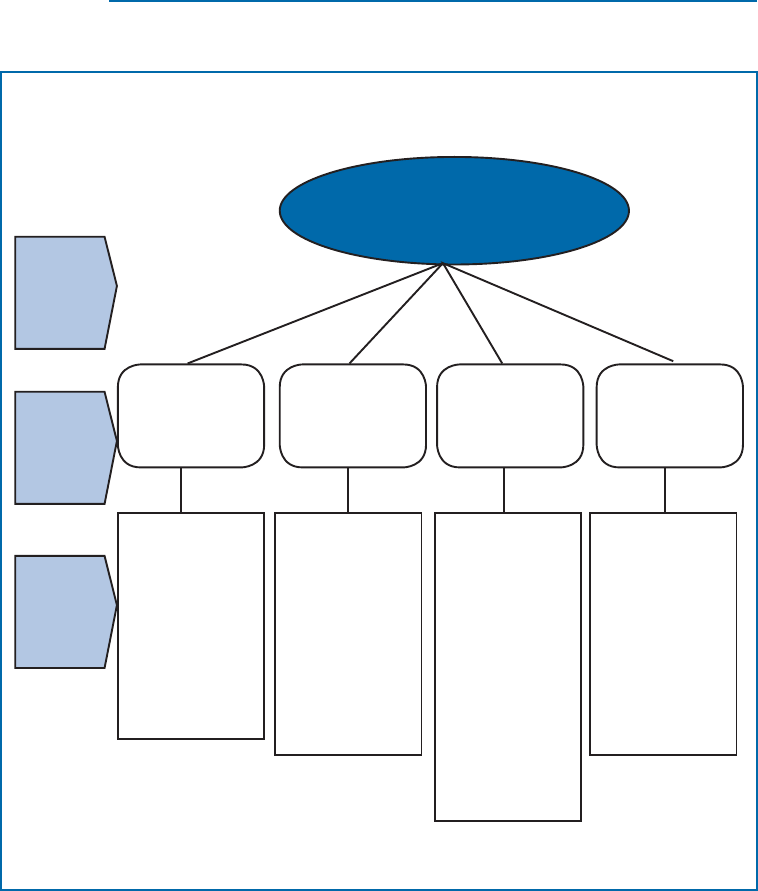
Once practitioners have considered the broader context, reviewed prior
research, and assessed underlying assumptions, a visual representation
of the causal chain can take various forms. e best foundation for a
comprehensive results framework will be established using a variation
that explicitly shows the assumptions that are behind the design of the
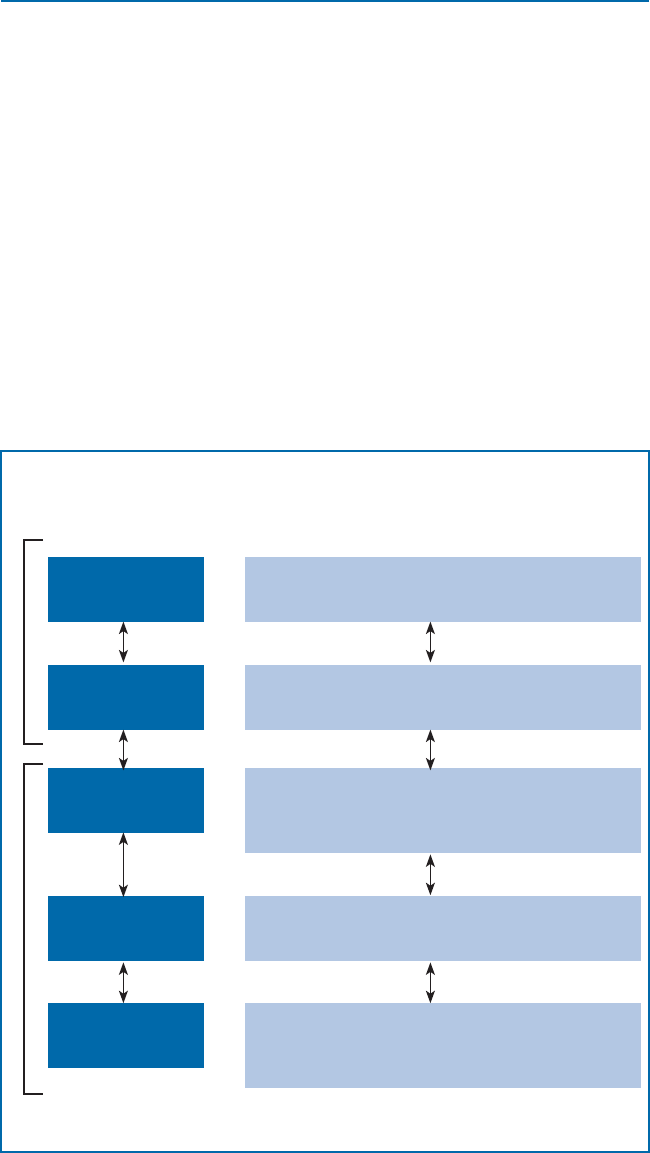
development initiative. Figure 3 shows an example of this approach.
For more information on change theory, see W.K. Kellog Foundation
(2004), Imas and Rist (2009), and Weiss (1997).
De s i g n i n g a R e s u l t s F R a m e w o R k F o R a c h i e v i n g R e s u l t s
24
Figure 3. Assumptions Underlying Expected Change
Assumptions Inputs Activities
Health is a community
issue; communities will form
partnerships to resolve health
care problems.
Communities can inuence and
shape policy at the local, state,
and national levels.
External agents as community
partners can serve as catalysts for
change.
Shifting revenues and incentives
to prevention and primary care
will improve overall health
status.
Information on health and
health systems is necessary to
make informed decisions.
Beginnings Planned work
External
technical
assistance
Consumers
Providers
Payers
Sta
Active
participation
in the reform
process
Inclusive
community
decision
making
Source: Adapted from W.K. Kellogg Foundation 2004.
Wh a t I s R e q u I R e d t o d e s I g n a R e s u l t s F R a m e W o R k ?25
Outputs Outcomes Impact
Intended results
More eective
distribution
of community
health care
resources
Communitywide coverage
and access Improved health status
Increased health care
system eciency
Comprehensive, integrated
delivery system
Community health assessment
Community-based health
information systems
Administrative
processes for
health data,
policy, and
advocacy

26
Step-by-Step Guide
Ideally, results frameworks are designed at the start of new initiatives
as part of the strategic planning process. A common practice, however,
is to retrot a results framework to an operation already in progress or
to design one for a new project or portfolio that builds on programs
recently completed or still under way. Either way, the following
eight steps can guide practitioners in developing an eective results
framework, as long as the prerequisite components are in place to
support this exercise.
Step 1. Establish Strategic Objective(s) for the
Problem(s) to Be Addressed
A results framework is centered on one or more strategic objectives, the
achievement of which represents the ultimate impact envisioned for a
set of activities. An appropriate strategic objective will likely
■ Represent higher-order changes in systems, communities, or
organizations
■ Reflect “an operating unit’s best assessment of what can realistically
be achieved… within a given timeframe and set of resources”
(USAID 2000)
■ Be stated clearly and precisely to lend itself easily to objective
measurement.
In short, a strategic objective is a calculated response to a known problem.
at calculated response should be rooted in evidence (ranging from
prior research to needs assessments), and the quality and quantity of that
evidence should be commensurate with the importance of the problem
to be addressed. Typically, simpler or low-stakes problems will require
less evidence, and complex or new problems will require a higher level of
evidence for decision making. e wording and intent of the objective
should be clear and specic enough that practitioners will be able to
identify when it has been achieved, as described in Box 1.

St e p -b y - S t e p G u i d e 27
Step 2. Identify and Work with Stakeholders
In practice, various key parties (for example, government authorities
or development partners) are already involved with the planning
and/or implementation at this stage. However, the team designing
a results framework should revisit whether all the main stakeholders
have been engaged to facilitate consensus and ownership of the
initiative. Wherever possible, the views and understanding of expected
beneciaries or target population should be considered in constructing
the results framework.
e needs assessment process has often highlighted additional players that
could inuence the outcomes of an intervention. In particular, eorts
should be directed at identifying and including the following groups:
■ Targeted beneficiaries or others from whom a behavior change is
expected. If new roads are constructed, are farmers or manufacturers
likely to use them to bring their goods to market? If health benefits
are provided, will those who are eligible avail themselves of needed
services?
Box 1. Tips for Eectively Stating Strategic Objectives
■ Emphasize the results of actions, not the actions themselves. For example,
instead of “reduce the transmission of HIV/AIDS,” use “reduced
transmission of HIV/AIDS.” Instead of “promote credit opportunities
for farmers,” use “increased credit available for farmers.”
■ Maintain a single focus. Multiple objectives with multiple components
are challenging to manage and measure.
■ Test wording to avoid ambiguity. Test the wording with various
stakeholders to ensure that the objective is consistently understood
and not interpreted dierently by dierent constituents.
■ Specify the time frame. e amount of time available helps determine
what is realistic and feasible for a strategic objective to be achieved.

De s i g n i n g a R e s u l t s F R a m e w o R k F o R a c h i e v i n g R e s u l t s
28
■ Those who may realize negative consequences from an intervention.
In addition to bringing new jobs to a community, will the
manufacturing plant contribute to air, water, and noise pollution
that will negatively affect those living nearby? What will the new
dam mean for those potentially displaced or who are reliant on the
downstream river for income generation?
■ Those who are expected to allocate additional resources for or related
the intervention. Is the planned awareness campaign relying
on an announcement that radios will be distributed by another
organization? Is the proposed distribution of textbooks and
teaching materials expected to be complemented by teacher
training initiatives supported by other donors?
■ Implementers of potentially conflicting development interventions. Are
a project’s efforts to reduce the HIV/AIDS infection rate at risk
of being compromised by transport corridor-related interventions
that give community members opportunities farther from home?
■ Those with needed decision-making authority. Will achieving
the strategic objective require policy changes during the project
implementation period?
Having representatives of key targeted stakeholder groups engaged early
in the planning process will increase the likelihood that intermediate
outcomes can be dened realistically and then achieved as planned.
Step 3. Dene Results (Outputs and Outcomes)
e needs assessment or problem analysis process, combined with a
review of critical stakeholders, helps the project team or operational unit
to identify the outputs and outcomes that must be achieved in order to
reach the intervention’s ultimate strategic objective. Typically, a team
can identify a large number of relevant intermediate results (outputs
and outcomes). An important task in developing a results framework is to
reach consensus on a small core set of critical outcomes.
Outputs and outcomes represent those causal links in the results chain
that bridge the gap between the current status and the desired high-level
results. Starting with the end strategic objective(s), practitioners can
backtrack to outline a program logic with immediate and intermediate

St e p -b y - S t e p G u i d e 29
outcomes. Figures 4 and 5 provide examples of how specifying outcomes
along the results chain establishes a framework for monitoring and
evaluation to which appropriate indicators can be assigned. To ensure
the accuracy of assigned intermediate outcomes, the consideration of
each proposed outcome should include reviewing who is best situated to
achieve the outcome (that is, is this within or outside the scope of this
intervention?) and how the outcome might be eectively measured.
Step 4. Identify Critical Assumptions and Risks
Development interventions inevitably rely on some assumptions about
factors that are beyond the control of the planners and implementers.
Results frameworks should not be based on critical assumptions that are
perceived to have a low probability of holding true over the implementation
period. If the risks are high, the intervention needs to be reconsidered.
For each output and outcome considered critical in the results chain,
the framework developers should explicitly note assumptions related to
external factors (for example, political environment, economy, climate
change, and so forth) that could carry risks. In cases where the assumption
is seen to represent a more substantial risk, practitioners commonly adjust
the development strategy, develop a contingency plan, and/or establish a
risk management plan to monitor and address conditions as needed.
Step 5. Review Available Data Sources and Specify
Indicators
Where possible, measurement strategies should be based on existing data
sources or tested data collection methodologies. Relevant information for
analysis and aggregation could already be available through administrative
databases or through sample or census-based surveys. Before specic
indicators are dened for desired outcomes, practitioners should identify
data sources that could be used to measure desired changes.
In many cases, governments are in the process of institutionalizing
monitoring and evaluation systems that rely on ministry data systems.
However, a review of the data systems and diagnosis of data capacity
relevant for the particular objectives is likely warranted. Beyond verifying
De s i g n i n g a R e s u l t s F R a m e w o R k F o R a c h i e v i n g R e s u l t s
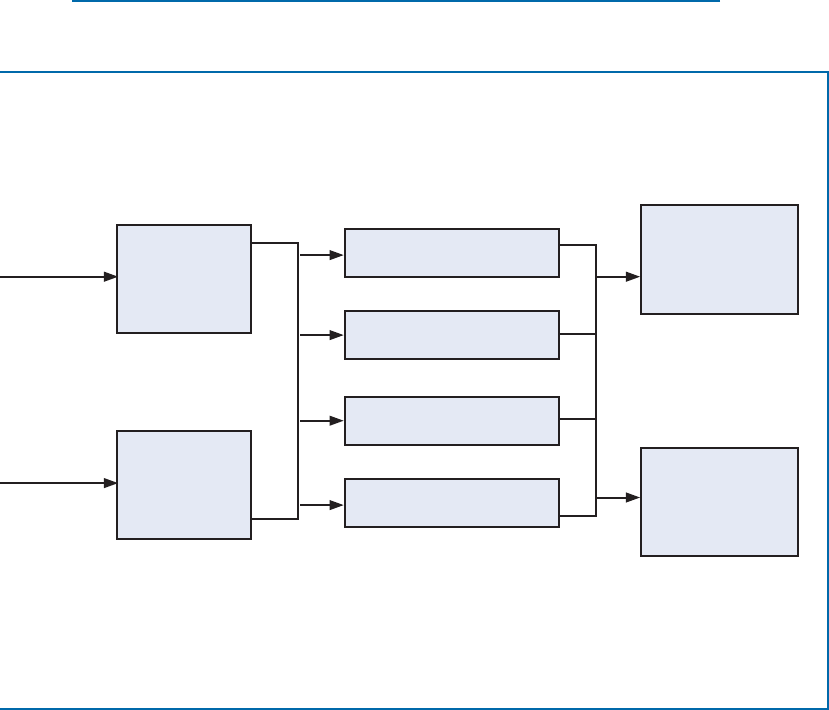
30
Figure 4. Summary Results for the International Development
Association’s Program in Burkina Faso
Accelerated and shared growth
Reduced poverty and
improved social welfare
Overarching
objectives
of poverty
reduction
strategy
Priority
country
outcomes
Country
outcomes
to which CAS
contributes
Strategic objective 1:
Accelerated and shared
growth
Strategic objective 2:
Improved access to
basic social services
Strategic objective 3:
Increased employment
and income
opportunities for the
poor
Strategic objective 4:
Better governance with
greater decentralization
1.1 Increased
regional
integration
1.2 Expanded and
diversied export
earnings
1.3 Improved
investment
climate
1.4 Ecient
economic
infrastructure
2.1 Improved access
to and quality of
basic education
2.2 Improved access
of the poor to
health and HIV/
AIDs services
2.3 Increased access
to potable water
and sanitation
services
2.4 Better targeted
social protection
3.1 Enhanced labor
market exibility
3.2 Increased
economic
opportunities for
women
3.3 Reduced risk
and increased
revenues for rural
households
3.4 Community-
based natural
resource
management
3.5 Expanded
access to rural
infrastructure
4.1 A more ecient
judiciary for
commercial cases
4.2 Improved
public resource
management in
a decentralized
context
4.3 Increased local
capacity and
participation in
public policy
decisions
Source: World Bank.
Note: CAS = Country Assistance Strategy.
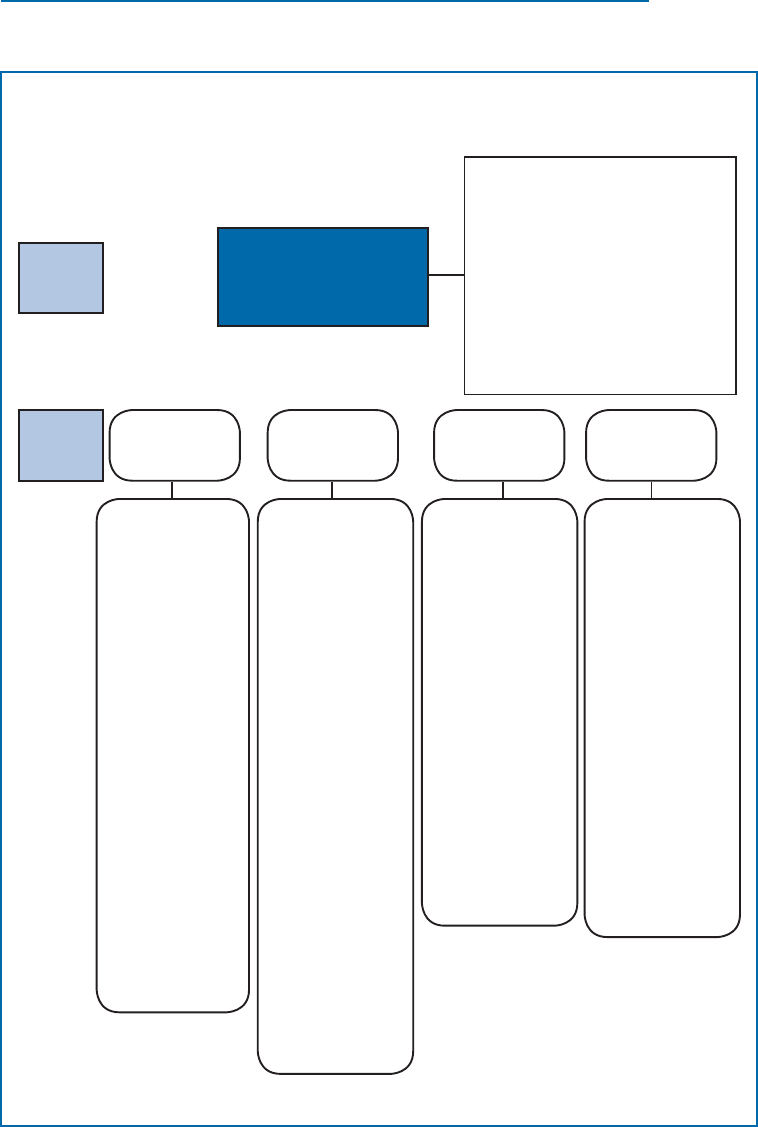
St e p -b y - S t e p G u i d e 31
Figure 5. Sample Monitoring and Evaluation Indicators
Associated with Strategic Objectives
Source: World Bank.
Note: CAS = Country Assistance Strategy.
High-level
country
outcomes
Sustained pro-poor growth
Reduced poverty and
improved social welfare
• Realpercapitaincomeincreasesby
4%perannumfrom2004onward.
• Realpercapitaincomeofthepoorest
quintile rises at least as fast as average
income.
• Povertyheadcountdeclinesfrom
46%in2003to41%in2006and
35%in2015.
• Under-5mortalitydeclinesfrom184
in 2003 to 150 in 2009.
• Under-5malnutrition(underweight)
declinesfrom38%in2003toless
than30%in2009.
Outcomes to
which CAS
contributes
Accelerated and
shared growth
Improved access to
basic social services
Increased income
and employment
opportunities
Better governance
with increased
decentralization
• Noncottonexport
earnings increase
byatleast8%per
annum from 2004
onward.
• Daystoregistera
business reduced
from 45 in 2004
to 20 or fewer in
2009.
• Rigidityof
employment index
drops from 90
to 50 or lower in
2009.
• Transferoffunds
reduced from 10
days in 2004 to 2
days.
• Increasedannual
electricity
generation of about
86 GWh at an
availability factor of
70%.
• Maintenance
carried out on
100%ofclassied
road network.
• Primaryschool
enrollment rate
risesfrom52%in
2003to60%in
2007and70%in
2009.
• Primary
completion rate
risesfrom26%in
2003to35%in
2009.
• Birthsattendedby
qualied health
sta increase from
36%in2002to
50%in2009.
• Immunizationrate
for DTC3 rises
from57%in2003
to87%in2009.
• Condomuse
during last risky
sexual encounter
risesfrom69%in
2003to80%in
2009 for men.
• Accesstosafe
drinking water
in rural and
semi-urban areas
increasesfrom88%
in2003to92%in
2009.
• Averageannual
production increase
ofatleast5%for
key noncotton
crops.
• Cottonyield
increases by at least
10%relativeto
2004 level.
• Numberof
property titles
issued in six pilot
rural areas increases
steadily.
• Femaleliteracy
increases to at
least50%in26
target provinces for
community-driven
development.
• Shareofrural
population within
2 km of all-season
road increases.
• Steadyincreasein
annual number of
decisions made by
commercial courts.
• Budgetary
execution fully
deconcentrated in
13 regions.
• Full
implementation of
human resources
information
system.
• Regulatory
framework dening
responsibilities and
resource transfers
to rural communes
is in eect.
• Independent
observers publish
reportson50%of
large-scale public
contracts.

De s i g n i n g a R e s u l t s F R a m e w o R k F o R a c h i e v i n g R e s u l t s
32
the existence of data sources and systems, program implementers or
evaluators will want to ensure that they would be given regular access
to data or data reports by the relevant government agency.
Construction of a results framework will often lead to the identication
of gaps or missing elements in the availability of information necessary
to populate the results framework. It is useful to recognize that
developing interventions to improve the availability, validity, and
reliability of information can be a useful byproduct of work on the
initial design of a results framework.
Data can be obtained two main ways: by using existing data available
from others or the program or by collecting new data (typically through
surveys, focus groups or observations). ere are advantages and
disadvantages to each. Resources to consult for nding or collecting
useful data include the following:
Existing Data
■ Sector or region-specific data sources. Household budget surveys,
demographic health surveys, and a host of other routine data
collections populate sectoral databases. Sectoral and regional
specialists on the team should have insights and expertise to locate
data for valid measurement.
■ Other development data. This includes the World Development
Indicators database (see www.worldbank.org/data) and other
databases administrated by international development agencies.
Collecting New Data
■ Proven approaches to collecting data. Where existing data cannot
effectively measure the desired changes, the lessons of other similar
interventions should inform plans for data collection. For example,
focus groups with community leaders or surveys of truckers are
best only proposed and planned if practitioners are able to draw on
experiences where these have been conducted before under similar
circumstances.
Newly designed data collection strategies, proposed specically for
the intervention, add an additional burden and risk for the project or
evaluation team and should be relied on only as a last resort.

St e p -b y - S t e p G u i d e 33
Step 6. Assign Indicators and Data Sources for Each
Level of Result
Strategic objective(s) and intermediate outcomes reect constructs that need
further denition to be measured. ese outcomes need to be translated into
a set of measurable indicators to establish whether progress is being achieved.
Indicators are tied to results by focusing on one or more characteristics of
the outcome. A measure then expresses an indicator’s value quantitatively or
qualitatively using SMART criteria, as described in Box 2.
ere can be indicators of inputs, activities, outputs, outcomes, and
impacts. Results frameworks focus on the eects of development interventions
and therefore need measures of short- and long-term outcomes and impact.
Indicators and measures should be agreed on by key stakeholders for
each level in the results chain, making it clear how progress toward
strategic objectives will be assessed.
Tables 5 and 6 provide examples.
Box 2. Characteristics of Eective—SMART—Indicators
■ Specic. Indicators should reect simple information that is
communicable and easily understood.
■ Measurable. Are changes objectively veriable?
– Students’ learning achievement
– Value of land (number of hectares, multiplied by price per hectare)
– Percentage of customers who are satised with the availability of
potable water or electricity
■ Achievable. Indicators and their measurement units must be achievable
and sensitive to change during the life of the project.
■ Relevant. Indicators should reect information that is important and
likely to be used for management or immediate analytical purposes.
■ Time bound. Progress can be tracked at a desired frequency for a set
period of time.
Source: World Bank Group.

De s i g n i n g a R e s u l t s F R a m e w o R k F o R a c h i e v i n g R e s u l t s
34
Project Development Objective:
e development objective of the proposed Second Rural Electrication Project is to
increase access to electricity in rural areas of Peru on an ecient and sustainable basis.
PDO-level results indicators Unit of measure Baseline
Cumulative target values
Frequency Data sources/
methodology
Responsibility
for data
collection
YR 1 YR 2 YR 3 YR 4
Indicator One: Infrastructure established with the capacity
to provide service to rural households in the long term
Number of potential
connections 00 20,000 42,500 Semestral Electricity service
providers PU
Indicator Two: Actual number of households and
businesses connected during the project Number of new connections 0 0 15,500 34,000 Semestral Electricity service
providers PU
Indicator ree: Number of households and businesses
connected using individual solar photovoltaic systems (to
be tracked, no target)
Number of new renewable
connections 00 Semestral Electricity service
providers PU
Indicator Four: Number of household productive units
adopting electricity using equipment Number of units adopting
electrical equipment 00 1,000 3,000 5,000 Semestral
Electricity service
providers and
contractors
PU
Table 5. Sample Project-Level Results Indicators
Table 6. Sample Project Development Objective with Target Values
Source: World Bank 2011b.
Note: PDO = project development objective; PU = project unit.
Project Development Objective:
To enable the government of Bangladesh to strengthen health systems and improve health
services, particularly for the poor
PDO-level results indicators Unit of measure Baseline
Cumulative target values
Fre-
quency
Data
source/
method-
ology
Respon-
sibility
for data
collection
Description
(indicator
denition,
and so on)
YR1 YR2 YR3 YR4 YR5
Proportion of delivery by skilled birth attendant among the
lowest two wealth quintile group Percent 11.5%
UESD 2010 15%
BDHS every
3 yrs; UESD
every 2 yrs
BDHS,
UESD NIPORT
SBA dened as
medically trained
providers
Coverage of modern contraceptives in the low-performing
areas of Sylhet and Chittagong
Percent
Sylhet:
35.7%
Chittagong:
46.8%
UESD 2010
Sylhet
&
Chitta-
gong:
50%
BDHS every
3 yrs; UESD
every 2 yrs
BDHS,
UESD NIPORT
Prevalence of underweight among children under 5 years of
age among the lowest two wealth quintile groups
Percent 48.3%
BDHS 2007 43.3% BDHS every
3 yrs BDHS NIPORT
Percent of children
in the two lowest
quintiles having
weight-for-age
≤2SD from the
median group
St e p -b y - S t e p G u i d e 35
Project Development Objective:
e development objective of the proposed Second Rural Electrication Project is to
increase access to electricity in rural areas of Peru on an ecient and sustainable basis.
PDO-level results indicators Unit of measure Baseline
Cumulative target values
Frequency Data sources/
methodology
Responsibility
for data
collection
YR 1 YR 2 YR 3 YR 4
Indicator One: Infrastructure established with the capacity
to provide service to rural households in the long term
Number of potential
connections 00 20,000 42,500 Semestral Electricity service
providers PU
Indicator Two: Actual number of households and
businesses connected during the project Number of new connections 0 0 15,500 34,000 Semestral Electricity service
providers PU
Indicator ree: Number of households and businesses
connected using individual solar photovoltaic systems (to
be tracked, no target)
Number of new renewable
connections 00 Semestral Electricity service
providers PU
Indicator Four: Number of household productive units
adopting electricity using equipment Number of units adopting
electrical equipment 00 1,000 3,000 5,000 Semestral
Electricity service
providers and
contractors
PU
Project Development Objective:
To enable the government of Bangladesh to strengthen health systems and improve health
services, particularly for the poor
PDO-level results indicators Unit of measure Baseline
Cumulative target values
Fre-
quency
Data
source/
method-
ology
Respon-
sibility
for data
collection
Description
(indicator
denition,
and so on)
YR1 YR2 YR3 YR4 YR5
Proportion of delivery by skilled birth attendant among the
lowest two wealth quintile group Percent 11.5%
UESD 2010 15%
BDHS every
3 yrs; UESD
every 2 yrs
BDHS,
UESD NIPORT
SBA dened as
medically trained
providers
Coverage of modern contraceptives in the low-performing
areas of Sylhet and Chittagong
Percent
Sylhet:
35.7%
Chittagong:
46.8%
UESD 2010
Sylhet
&
Chitta-
gong:
50%
BDHS every
3 yrs; UESD
every 2 yrs
BDHS,
UESD NIPORT
Prevalence of underweight among children under 5 years of
age among the lowest two wealth quintile groups
Percent 48.3%
BDHS 2007 43.3% BDHS every
3 yrs BDHS NIPORT
Percent of children
in the two lowest
quintiles having
weight-for-age
≤2SD from the
median group
(Table continues on the following page.)

De s i g n i n g a R e s u l t s F R a m e w o R k F o R a c h i e v i n g R e s u l t s
36
Project Development Objective:
To enable the government of Bangladesh to strengthen health systems and improve health
services, particularly for the poor
PDO-level results indicators Unit of measure Baseline
Cumulative target values
Fre-
quency
Data
source/
method-
ology
Respon-
sibility
for data
collection
Description
(indicator
denition,
and so on)
YR1 YR2 YR3 YR4 YR5
Intermediate result (component one): Service delivery improved
Proportion of births in health facilities
Percent 23.7%
UESD 2012 40%
BDHS every
3 yrs; UESD
every 2 yrs
BDHS,
UESD NIPORT
Number of functional community clinics
Number 10,323 CC
Project 2011
11,000 12,000 13,500
Every year Administra-
tive Record
CC Project/
MIS/
MOHFW
Coverage of measles immunization for children under 12
months of age Percent 82.4%
CES 2009 90% Every year CES EPI
Proportion of infants exclusively breastfed up to 6 months
of age Percent 43%
BDHS 2007 50% Every 3 yrs BDHS NIPORT
Proportion of postnatal care for women within 48 hours
(at least 1 visit) Percent 20.9%
UESD 2010 50%
BDHS every
3 yrs; UESD
every 2 yrs
BDHS,
UESD NIPORT
Table 6. Sample Project Development Objective with Target Values (cont.)
Source: World Bank 2011a.
Note: CC = community clinic; CES = Coverage Evaluation Survey; BDHS = Bangladesh Demographic and Health Survey;
EPI = Expanded Program for Immunization; MOHFW = Ministry of Health and Family Welfare; NIPORT = National
Institute of Population Research and Training; PDO = project development objective; UESD = Utilization of Essential Services
Delivery survey.
Definition of indicators at the PDO level:
Proportion of delivery by skilled birth attendant among the lowest two wealth quintile groups: e percentage of women
age 15–49 from two lowest wealth quintiles, giving live birth in the ve years preceding the survey, attended by a medically
trained provider. Numerators: Number of live births with a medically trained person providing delivery assistance, that is,
a qualied doctor, nurse, midwife, paramedic, family welfare visitor, or community skilled birth attendant. Denominator:
Number of live births in the last ve years.
Coverage of modern contraceptives in the low performing areas of Sylhet and Chittagong: e percentage of currently
married women who use any modern method of contraception. Numerator: e number of women who say they use one of
the following methods at the time of the survey: female sterilization, male sterilization, contraceptive pill, male condom, IUD,
injectables, implants (does not include abortions and menstrual regulation). Denominator: All women between ages 15 and 49
years who are currently married.
Prevalence of underweight among under-5 children from the lowest two wealth quintile groups: e percentage
of children under 5 years of age underweight from the two lowest wealth quintiles at the time of the survey. Numerator:
Number of children with weight-for-age z-score is less than –2 SD below the median of the WHO Child Growth Standards.
Denominator: Number of living children younger than 5 years.

St e p -b y - S t e p G u i d e 37
Project Development Objective:
To enable the government of Bangladesh to strengthen health systems and improve health
services, particularly for the poor
PDO-level results indicators Unit of measure Baseline
Cumulative target values
Fre-
quency
Data
source/
method-
ology
Respon-
sibility
for data
collection
Description
(indicator
denition,
and so on)
YR1 YR2 YR3 YR4 YR5
Intermediate result (component one): Service delivery improved
Proportion of births in health facilities
Percent 23.7%
UESD 2012 40%
BDHS every
3 yrs; UESD
every 2 yrs
BDHS,
UESD NIPORT
Number of functional community clinics
Number 10,323 CC
Project 2011
11,000 12,000 13,500
Every year Administra-
tive Record
CC Project/
MIS/
MOHFW
Coverage of measles immunization for children under 12
months of age Percent 82.4%
CES 2009 90% Every year CES EPI
Proportion of infants exclusively breastfed up to 6 months
of age Percent 43%
BDHS 2007 50% Every 3 yrs BDHS NIPORT
Proportion of postnatal care for women within 48 hours
(at least 1 visit) Percent 20.9%
UESD 2010 50%
BDHS every
3 yrs; UESD
every 2 yrs
BDHS,
UESD NIPORT

De s i g n i n g a R e s u l t s F R a m e w o R k F o R a c h i e v i n g R e s u l t s
38
e following considerations will help guide this process:
■ An objective or intermediate outcome could need more than one
indicator to measure both its qualitative and quantitative aspects.
■ A minimal number of indicators should be selected. More information
is not necessarily better. A common problem with results
frameworks and performance measurement systems is that they are
tied to a large set of indicators that are burdensome to track. There
is no correct number of indicators to assign per outcome, but the
following are useful questions to ask: Is this indicator absolutely
necessary to measure whether progress toward the strategic objective is
being achieved? Will it create additional burdens on the respondents
or on the staff collecting the data? How will this indicator help
with monitoring, management, and evaluation? Having multiple
stakeholder opinions on the design of the results framework
provides an opportunity for discussion and eventual consensus
on what good indicators and measures are and what number of
indicators will suffice.
■ Proxy indicators can be used as indirect measures of achievement
when direct measures are difficult to assign. For example, where
tests of student achievement have not been systematically applied
to assess education quality, a proxy measure might focus on student
completion rates. Such proxy indicators must be assigned carefully;
a common threat to the validity of results measurement is the use
of inadequate proxy indicators (for example, students’ self-reported
levels of achievement in mathematics).
Indicators assigned in the design of a results framework might be
modied during implementation, as data capacity increases and new
data elements become available.
Step 7. Establish the Performance Monitoring Plan
e next step in designing a results framework is to plan how it
will be operationalized to monitor progress and assess the eects of
interventions. e plan for monitoring performance typically lists the
following elements in a complementary tool, the monitoring plan:

St e p -b y - S t e p G u i d e 39
■ Baseline and target values for selected measures to provide the
means for verification to measure changes in the indicators. It is
important to remember that the construction of baseline values
can be based on available secondary data sources, which can be
improved or sharpened through subsequent work. Delaying the
preparation of an intervention until a “perfect” baseline is available
is rarely feasible or desirable. At the same time, the absence of a
baseline too often indicates that the problem definition stage
of intervention design is being conducted on the basis of either
conventional wisdom or untested assumptions.
■ Data sources or methods for data collection.
■ The agent(s) responsible for collecting or providing the data (for
example, independent evaluation team, project staff, and so forth).
■ Designated intervals at which the data will be collected or provided.
■ Assumptions and risks associated with the indictors or information
being collected (such as the assumption that data will be available
from a second party).
Areas of importance that are often overlooked in the planning process
involve the development of the management information system, data
entry, data quality, the ecient transmittal of data to a central database,
and the development of data utilization guidelines. When multiple
agents are involved with providing data or reports (for example, with
eld-based employees reporting to a central body), consideration
should be given to how that data will be transferred to the person(s) or
group maintaining the plan and how the users will or should be able to
use the information in making decisions. is is particularly important
when a program is aggregating information from multiple projects.
Web-based monitoring plans are becoming more common. Where
Internet access and high connectivity speed are available, and when
proper data entry and transmittal guidelines are in place, Web-based
monitoring plans allow for quicker reporting and use, contributing
to improvements in management and decision making. Although the
Internet and new information and communication technologies can
signicantly reduce the costs and diculty of collecting information,
they are only useful when developed on the basis of a sound

De s i g n i n g a R e s u l t s F R a m e w o R k F o R a c h i e v i n g R e s u l t s
40
understanding of the processes of decision making which are part of
the implementation of the intervention. Where Web-based data entry
and reporting are not practical, provisions should be made for the next
best means of transmission, such as the use of Excel templates, which
can be transferred by email or hard copy.
A basic results framework presenting the strategic development
objective and intermediate outcomes is most useful if it is directly
associated with a detailed results matrix that provides guidance to the
implementation team about how to consistently and systematically
track progress during implementation and adjust the design of the
intervention as needed. Table 6 illustrates how this progression from
high-level results to performance indicators for monitoring works in
practice.
Step 8. Establish a Communication and Dissemination
Plan
e nal step is to plan how the results framework will be used to
communicate the progress and results of the intervention and how the
results will be disseminated. Some common approaches are to include
results in a “dashboard,” highlighting only the key high-level objectives
and outcomes/outputs achieved, using the framework for planning and
review meetings (with the current status of the indicators highlighted),
and using the change in the indicators from baseline to highlight the
results. us, choosing the correct outcome indicator (for example,
change in rates of HIV) and connecting it to key intervention outputs
(number of education campaigns about how HIV is transmitted) can
provide a powerful communication and dissemination tool to inform
and gather support from key stakeholders.
For more information on steps to develop a results framework, see
USAID (2000), AusAid (2005), and Gorgens and Kusek (2009).

41
Challenges
Results frameworks oer clear benets to practitioners and others
working to achieve development results, but the approach is potentially
challenging:
■ An up-front investment of time and resources is needed at the start
of an intervention. The process of establishing an agreed-on set of
results and identifying relevant indicators and data sources can be
logistically intensive. However, this process is likely to yield greater
engagement and ownership among stakeholders and could reduce
the resources traditionally required to complete midterm and final
evaluations of the project or program.
■ The effects of interventions can be difficult to measure fully.
Translating complex processes into a core set of indicators carries
the risk of not fully capturing achievements and progress and
of missing unintended consequences, because they are generally
not noted in the results framework. This reality underscores the
importance of having key stakeholders collaborate in developing
and approving the results framework by which implementers will
be held accountable.
■ Results frameworks can become overly complicated. Attempts to apply
quantitative and qualitative measures to complex development
processes often end up establishing an unwieldy set of indicators to
monitor. Practitioners should be mindful that each indicator carries
a cost. Thus importance, relevance, cost, timeliness, and utility are
key considerations for determining which set of indicators should
be included.
■ Involving program staff in the evaluation process could bias results
measurement. Implementers are motivated to collect data that
reflect positively on an intervention and its results. Even in cases
where a results orientation is integrated throughout the project
cycle, evaluators should still be engaged adequately to supervise
the monitoring process and to disaggregate the data and conduct
analysis that goes beyond what is presented in the results framework.

De s i g n i n g a R e s u l t s F R a m e w o R k F o R a c h i e v i n g R e s u l t s
42
For more information on challenges, see Toolon-Weiss, Bertrand, and
Terrell (1999) and OECD-DAC (2008).
Ultimately, a results framework provides an important foundation for
the results-based management of a development initiative and helps
teams keep an eye the achievement of strategic objectives. Investing
the time and eort early on to dene targeted outcomes and using a
disciplined approach to assigning indicators, dening data collection
sources and strategies, and establishing a monitoring plan can yield a
comprehensive and powerful tool to promote and assess development
results.

43
Bibliography
Publications
AusAid (Australian Agency for International Development). 2005. “Using
the Results Framework Approach.” AusGuideline. http://www.
ausaid.gov/au/ausguide/pdf/ausguideline2.2.pdf.
Binnendijk, Annette. 2000. “Results Based Management in the Development
Cooperation Agencies: A Review of Experience.” Paper prepared for
OECD-DAC Working Party on Aid Evaluation, February 10–11.
Paris.
Canadian Department of Foreign Aairs and International Trade. 2005.
“Six Easy Steps to Managing for Results: A Guide for Managers.”
Evaluation Division, Ottawa.
Canadian International Development Agency. 2004. CIDA Evaluation Guide.
Evaluation Division, Performance and Knowledge Management
Branch, Ottawa.
Department for International Development. 2002. DFID Tools for
Development—Log Frame. London.
Gorgens, Marelize, and Jody Zall Kusek. 2010. Making Monitoring and
Evaluation Systems Work: A Toolkit for Development Practitioners.
Washington, DC: World Bank.
IEG (Independent Evaluation Group). 2007. How to Build M&E Systems to
Support Better Government. Washington, DC: World Bank.
Imas, Linda G. Morra, and Ray Rist. 2009. e Road to Results: Designing
and Conducting Eective Development Evaluations. Washington, DC:
World Bank.
Khan, M. Adil. 2001. A Guidebook on Results-Based Monitoring and Evaluation:
Key Concepts, Issues and Applications. Monitoring and Progress
Review Division, Ministry of Plan Implementation. Colombo, Sri
Lanka: Government of Sri Lanka.
Kusek, Jody Zall, and Ray C. Rist. 2004. Ten Steps to a Results-Based
Monitoring and Evaluation System. Washington, DC: World Bank.

De s i g n i n g a R e s u l t s F R a m e w o R k F o R a c h i e v i n g R e s u l t s
44
OECD-DAC Joint Venture on Managing for Development Results. 2008.
Managing for Development Results Principles in Action: Sourcebook on
Emerging Good Practice, 3rd ed. Paris: OECD.
Otoo, Samuel, Natalia Agapitova, and Joy Behrens. 2009. e Capacity
Development Results Framework: A Strategic and Results-Oriented
Approach to Learning for Capacity Development. Washington, DC:
World Bank Institute.
Scott, Alison. 2006. “Emerging Practices of Results-Based Country
Programming among Aid Agencies.” Managing for Development
Results Principles in Action: Sourcebook on Emerging Good Practice, 1st
ed. Paris: OECD-DAC Joint Venture on Managing for Development
Results.
Toolon-Weiss, Melissa M., Jane T. Bertrand, and Stanley S. Terrell. 1999.
“e Results Framework—An Innovative Tool for Program Planning
and Evaluation.” Evaluation Review 23 (3): 336–59.
USAID (United States Agency for International Development). 1996.
“Selecting Performance Indicators.” Performance Monitoring
and Evaluation Tips. Washington, DC: Center for Development
Information and Evaluation.
———. 2000. “Building a Results Framework.” Performance Monitoring
and Evaluation Tips. Washington, DC: Center for Development
Information and Evaluation.
Valdez, Joseph, and Michael Bamberger. 1994. Monitoring and Evaluation
Social Programs in Developing Countries: A Handbook for Policymakers,
Managers, and Researchers. Washington, DC: World Bank.
W.K. Kellogg Foundation. 2004. Logic Model Development Guide. Battle
Creek, MI.
Weiss, Carol H. 1007. Evaluation, 2nd ed. Upper Saddle River, NJ: Prentice
Hall.
World Bank. 2005a. “Burkina Faso—Country Assistance Strategy.” Report
No. 32187, Washington, DC.
———. 2005b. “e LogFrame Handbook: A Logical Framework Approach
to Project Cycle Management.” Working Paper No. 31240, World
Bank, Washington, DC.
———. 2006. “Lesotho—Country Assistance Strategy.” Report No. 35621,
Washington, DC.

Bi B l i o g r a p h y 45
———. 2007. Healthy Development: World Bank Strategy for Health,
Nutrition, and Population Results. Washington, DC: World Bank.
———. 2011a. “Proposed Credit in the Amount of SDR226.40 Million to
the People’s Republic of Bangladesh for a Health Sector Development
Program.” Project Appraisal Document No. 59979-BD, World
Bank, Washington, DC.
———. 2011b. “Proposed Loan in the Amount of US$50 Million to the
Republic of Peru for a Second Rural Electrication Project.” Project
Appraisal Document No. 60154-PE, World Bank, Washington, DC.
Websites
Asian Development Bank. Results Framework. http://www.adb.org/
Documents/Policies/ADB-Results-Framework/r166-08.pdf
AusAid (Australian Agency for International Development). 2005. Using the
Results Framework Approach. AusGuideline. http://www.ausaid.gov.
au/ausguide/pdf/ausguideline2.2.pdf
Independent Evaluation Group Monitoring and Evaluation Capacity
Development. http://www.worldbank.org/ieg/ecd/
OECD Development Assistance Committee Working Party on Aid
Evaluation. http://www.oecd.org/home/
OECD/DAC Joint Venture on Managing for Results. Sourcebook on
Managing for Development Results. http://www.mfdr.org
University of Wisconsin-Extension. Logic Model. http://www.uwex.edu/ces/
pdande/evaluation/evallogicmodel.html
USAID Center for Development Information and Evaluation. http://www.
usaid.gov/pubs/usaid_eval/
W.K. Kellogg Foundation. Evaluation Resources. http://www.wkkf.org/
World Food Programme. Strategic Results Framework. http://www.wfp.org/
content/strategic-results-framework

4

Independent evaluatIon Group
The World Bank Group
1818 H Street, N.W.
Washington, D.C. 20433, U.S.A.
Telephone: 202-477-1234
Facsimile: 202-477-6391
Internet: www.worldbank.org
Independent Evaluation Group
Strategy, Learning, and Communication
E-mail: ieg@worldbank.org
Telephone: 202-458-4497
Facsimile: 202-522-3125
designing a
results framework
for achieving
results:
a how-to guide
