Manual Audio Analyzer R&S UPV Rohde & Schwarz User
User Manual: Rohde & Schwarz UPV User Manual
Open the PDF directly: View PDF ![]() .
.
Page Count: 1008 [warning: Documents this large are best viewed by clicking the View PDF Link!]
- Manual Audio Analyzer R&S UPV
- Tabbed Divider Overview
- Safety Messages
- EC Certificate of Conformity (1)
- EC Certificate of Conformity (2)
- Certificate of Quality
- Customer Support
- Product Disposal
- Address List
- Putting into Operation
- Description of the Front Panel
- Description of the Rear Panel
- 1 LAN connection
- 2 USB device connector
- 3 RS-232-C interface
- 4 Printer interface
- 5 Connector for external monitor
- 6 USB connectors
- 7 BNC audio monitoring output
- 8 Trigger connectors
- 9 Analog auxiliary output
- 10 Digital synchronization and expansion interfaces
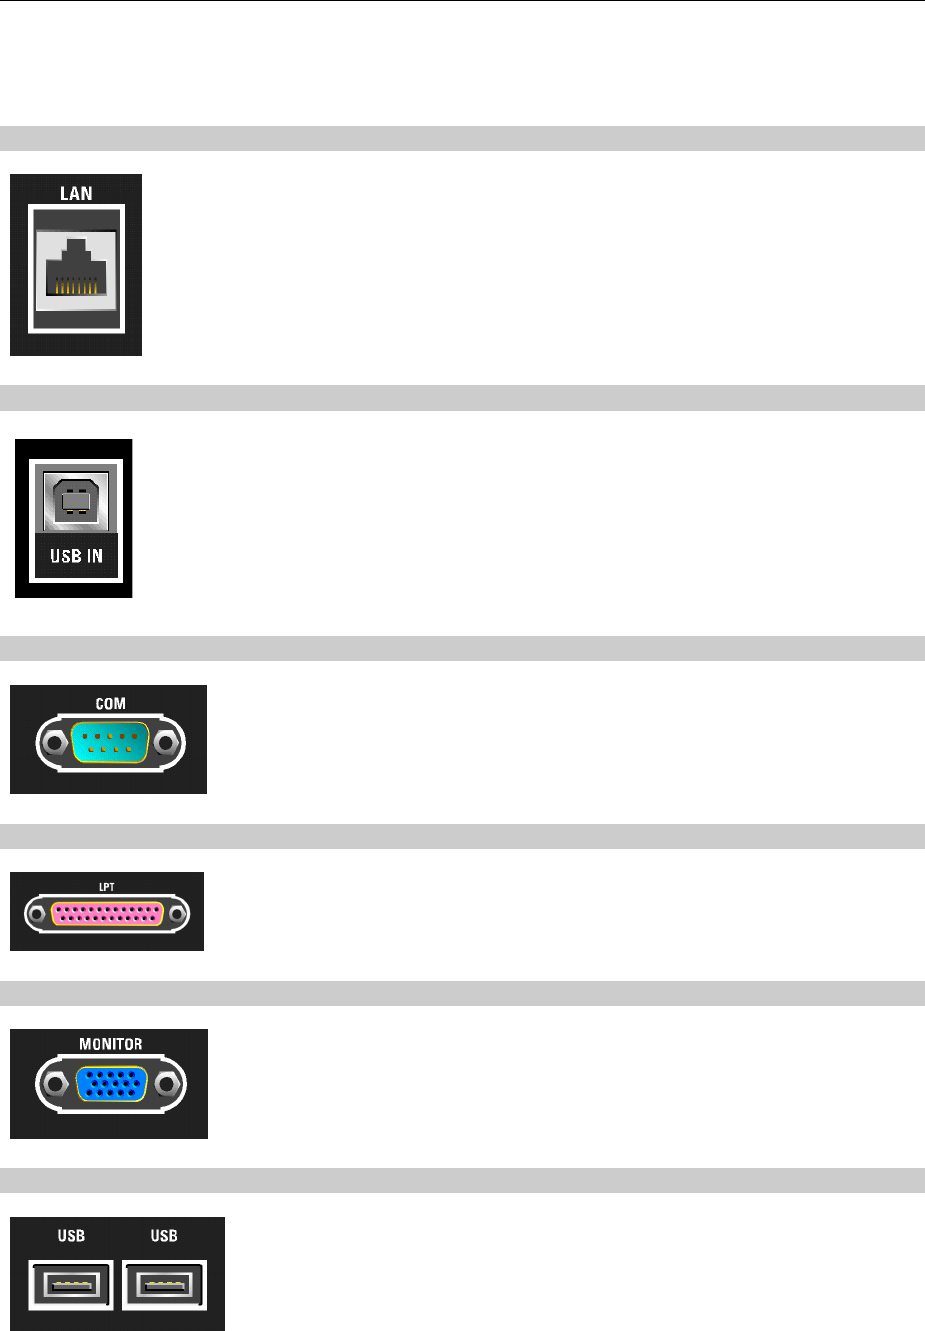
- 11 IEC/IEEE-bus connector
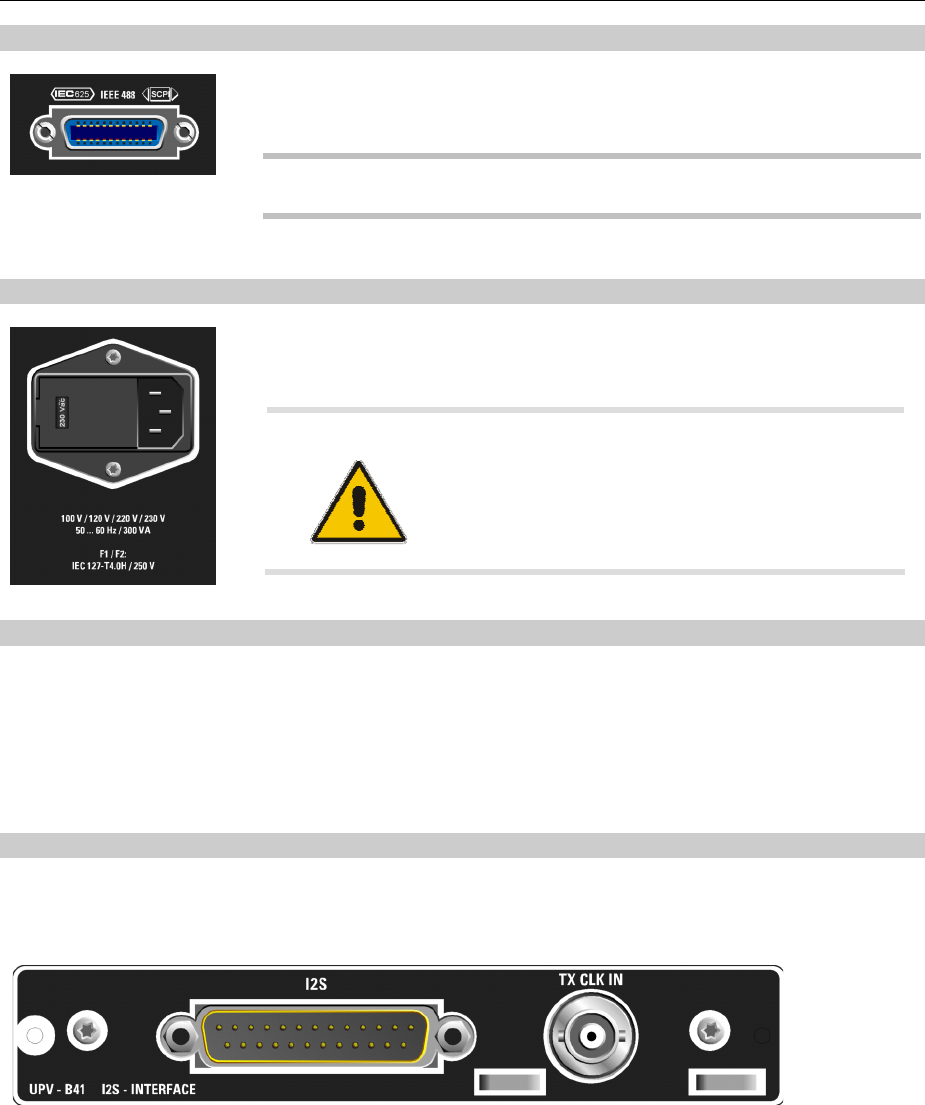
- 12 AC supply voltage connector
- 13 Slots for expansion plug-ins
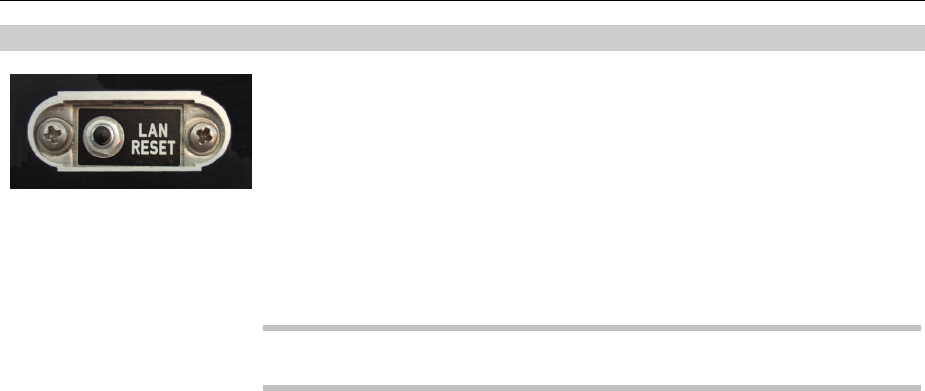
- 14 I²S interface
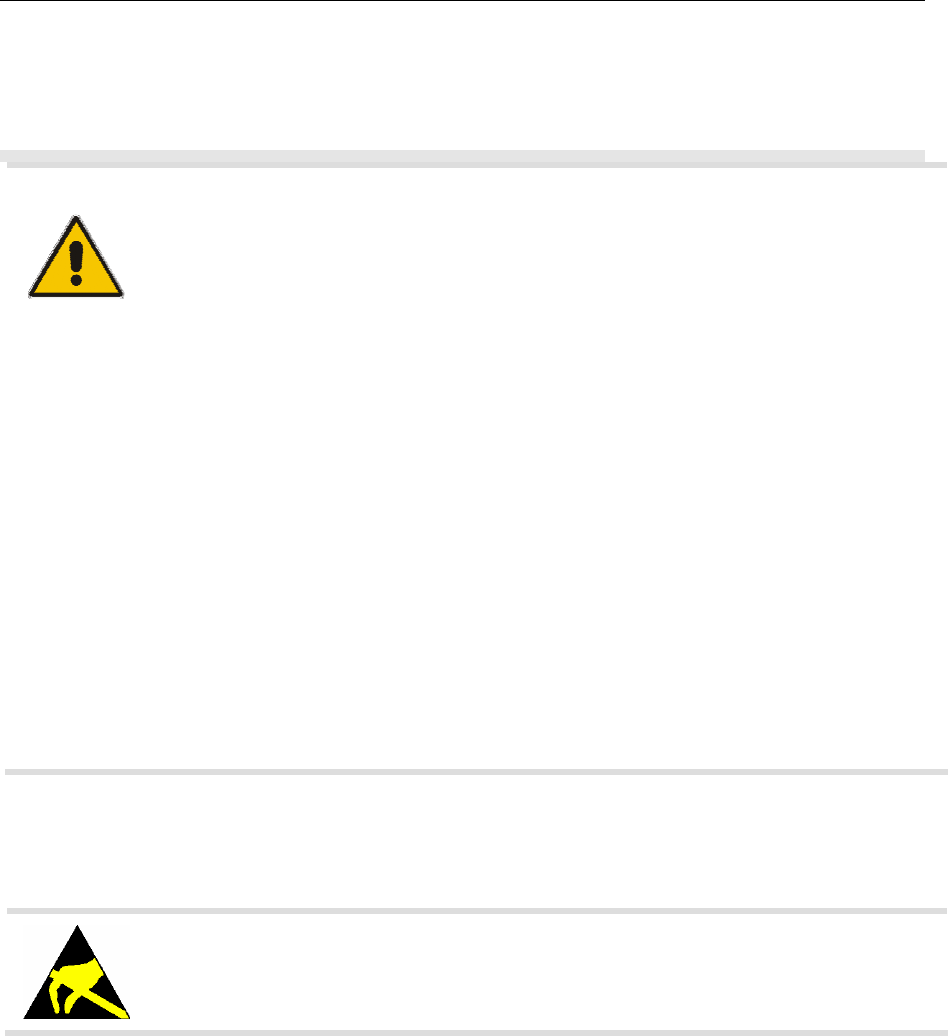
- 15 LAN Reset button
- Putting into Operation
- Function Check
- Presets
- Windows XP
- Connecting an External Keyboard
- Connecting a Mouse
- Connecting an External Monitor
- Changing the screen resolution
- Installing Options
- Connecting the R&S UPV to a Network (LAN)
- Firmware update
- Windows XP Recovery and Backup
- Getting Started
- Introduction - Getting Started
- Important Information for Measurements
- Brief Introduction to the R&S UPV Operating Concept
- Introduction to Instrument Operation Using Examples
- Measuring the Frequency Response of an Amplifier, Equalizer, etc
- Step 1: Loading the factory settings
- Step 2: Setting the required generator signal
- Step 3: Selecting the required measurement
- Step 4: Displaying the measurement results – Numeric measurement display
- Step 5: Starting the sweep
- Step 6: Displaying the measurement results – Graphical windows
- Step 7: Using a relative unit in the graphical window
- Step 8: Saving the instrument setup
- Measuring the Harmonic Distortion (THD+N) of a DUT
- Step 1: Loading the factory settings
- Step 2: Setting the required generator signal
- Step 3: Selecting the required measurement
- Step 4: Displaying the measurement results – Numeric measurement display
- Step 5: Displaying the spectrum in the graphical window
- Step 6: Evaluating the graphical display with markers and cursors
- Step 7: Saving the instrument setup
- Measuring the Frequency Response of an Amplifier, Equalizer, etc
- Loading Predefined Instrument Setups
- Manual Operation
- Introduction - Manual Operation
- Functional Organization of the Audio Analyzer R&S UPV
- General Information on Operation
- Display
- Panels
- Settings on the Audio Analyzer R&S UPV
- Settings in the Panels
- Focus
- Panels are opened using the menu bar (see the section "Open panel", page 3.22). How to move the focus is described in the section "Navigating in the Panels" (see page 3.27).Changing the Instrument
- Changing Functions
- Hiding Parameter Fields
- Highlighting Control Elements
- Activating/Deactivating Functions – Tick boxes
- Toggling Functions – Radio Buttons
- Selecting a Parameter – Selection Fields
- Numeric Entries – Numeric Entry Fields
- Alphanumeric Entries – Text Entry Fields
- Display Fields
- Adopting Parameters – Track Box
- Help Functions
- Completing Settings
- Entries During Measurement / Data Output
- Measurement Displays
- Settings in the Menu Bar
- Settings in the Toolbar
- Settings in the Operating System
- Auxiliaries Panel
- Rapid Deactivation of the Outputs
- Help System
- File Management
- Manual Remote Operation
- Units
- Units in Measurement Result Displays
- Units for analog level measurement results:
- Units for digital level measurement results:
- Units for distortion measurement results:
- Unit for S/N measurement results:
- Units for frequency measurement results:
- Units for phase measurement results:
- Units for group delay measurement results:
- Units for digital jitter measurement results:
- Unit for digital phase measurement results (Phase to Ref):
- Units for Value Entries
- Units in Measurement Result Displays
- Overview of Keys
- Overview of Panels and Measurement Displays (Graphical Windows)
- Overview of Status Messages
- Instrument Functions
- Selecting the Generator
- Configuring Analog Generator
- Configuring the Digital Generator
- Configuring the I2S Generator
- Configuring the USI Dual Channel Generator
- USI Dual Channel Generator Configuration Panel
- Clock
- Mixed Sampfrq
- Ratio
- Samples/Frame
- No of Slots
- TX_DATA1
- TX_DATA2
- TX_DATA3
- TX_DATA4
- Sync To
- First Bit
- Slot Length
- Audio Bits
- Lead Bits
- Sample Freq
- Fsync Freq
- BClk Freq
- Fsync Width
- Fsync Offset
- Fsync Slope
- BClk Slope
- SlClk Width
- SlClk Offset
- SlClk Slope
- MClk Ratio
- BClk Jitt Freq
- BClk Jitt Ampl
- MClk Jitt Freq
- MClk Jitt Ampl
- Logic Voltage
- Coding
- Ref Voltage
- Ref Frequency
- Resync
- Meaning of the TX_DATA 1 to TX_DATA 4 setting line strings
- Timing Diagrams
- Interface assignment
- USI Dual Channel Generator Configuration Panel
- Generator Signals
- Amplitude Variation
- Equalization
- Generator Filters
- Digital Audio Protocol Generator
- Sweeps
- Selecting the Analyzer
- Configuring the Analog Analyzer
- Configuring the Analog Multichannel Analyzer
- Configuring the Digital Analyzer
- Configuring the I2S Analyzer
- Configuring the USI Dual Channel Analyzer
- Configuring the USI 8 Channel Analyzer
- Starting Measurements
- Start Conditions
- Setting Start Condition
- Time-Controlled Measurement Value Recording
- External Sweeps and Level-Controlled Measurement Value Triggering
- Sweep Options
- Level Measurements
- Signal-to-Noise Measurements
- Distortion Measurements
- Polarity Measurement
- Frequency Band Analysis
- FFT Analysis
- Speech Quality Measurements (PESQ)
- Audio quality measurements (PEAQ)
- Analysis in the Time Domain
- Offline Analysis
- Infrasound Measurements
- Protocol Analysis
- Frequency, Phase and Group Delay Measurement
- Input Monitor
- Level Monitor
- Settling Methods
- Examples of Settling
- Filters
- User-Definable Filters
- Weighting Filters
- Highpass and Lowpass Filters
- Audio Monitoring
- Switcher Panel
- Traces, Spectrum Displays and Bargraphs
- Graphical Display, Explanation of the Elements
- Calling Up
- Parameter Fields of the Panel
- Display
- Data List
- Copy to other Window
- Scan
- History
- Show Min Max
- Y-Source
- Y-Source
- Y-Source
- Y-Source
- Y-Source
- Channel
- Trace File
- Track
- Label Auto
- Reference
- Reference Value
- Reference File
- Normalize
- Normalize Value
- Unit Fnct Track
- Unit
- Unit Auto
- Unit User String
- Engineering
- Auto Scale
- Spacing
- Top
- Bottom
- Main Grid
- Division
- Steps
- Sub Grid
- Limit Upper
- Source
- Source Value
- Source Filename
- Limit Lower
- Source
- Source Value
- Source Filename
- Limit Shift
- Parallel
- Symmetrical
- New scan
- Import from
- X-Source
- X Axis
- Unit
- Engineering
- Label Auto
- Unit Auto
- Unit User String
- Ref Value
- Scaling
- Spacing
- Left
- Right
- Main Grid
- Division
- Step
- Sub Grid
- Show A, Show B
- Description A, Description B
- Store Trace as
- Trace
- Norm Freq
- Invert
- Modify Equ.
- Offset
- Offset Value
- Store Trace to
- Resolution
- Scan
- Softkey Menu
- Single Sweep
- Trace Group
- Interpolation on the Common X Axis
- Result List
- Numeric Display
- Combi Display
- Limit Monitoring
- Measurement value sequences
- Saving
- Loading
- Trace files
- Switching measurements in multiscan mode:
- Loading a trace file with measurement in progress or halted:
- Switching from a loaded trace file to measurement:
- Loading trace files, depending on the single scan or multiscan setting:
- Appending or substituting scans
- Appending measurement scans to existing scans
- Measurement scan replaces an existing scan
- Importing scans from a file and appending them to existing scans
- Importing scans from a file and replacing an existing scan
- Equalization Files
- Sweep Lists
- Limit Files
- Trace files
- Format
- Editing
- Exporting
- Loading and Saving
- Loading and Saving Setups
- Printing and Saving the Display Screen
- Remote Control - Fundamentals
- Introduction - Remote Control Fundamentals
- Brief Instructions
- Changing to Remote Control
- Messages
- SCPI Command Structure and Syntax
- Device Model and Command Processing
- Command Recording
- Status Reporting System
- Structure of SCPI Status Register
- Overview of Status Registers
- Status Byte (STB) and Service Request Enable (SRE) Register
- IST Flag and Parallel Poll Enable (PPE) Register
- STATus:EVENt Register (ESR)
- STATus:OPERation Register
- STATus:QUEStionable Register
- STATus:QUEStionable:UNDERrange Register
- STATus:QUEStionable:OVERrange Register
- STATus:QUEStionable:MEASuring Register
- STATus:XQUEstionable Register
- Use of Status Reporting System
- Initializing the Status Reporting System
- Remote Control - Commands
- Maintenance and Instrument Interfaces
- Index
- Alphabetical List of Commands
1146.2084.32-09 I-1
Manual
Audio Analyzer DC to 250 kHz
R&SUPV R&SUPV66
1146.2003.02 1146.2003.66
Printed in Germany
Test and Measurement

1146.2084.32-09 2
The firmware of the instrument makes use of several valuable open source software packages. The
most important of them are listed below together with their corresponding open source license. The
verbatim license texts are provided in on the user documentation CD-ROM (included in delivery).
Package Link License
OpenSSL http://www.openssl.org OpenSSL/SSLeavy
Net-SNMP http://www.net-snmp.org NetSnmp-5.0.8
Xitami http://www.xitami.com 2.5b6
PHP http://www.php.net PHP, Version 3
DOJO-AJAX http://www.dojotoolkit.org Academic Free
License
ResizableLib http://www.geocities.com/ppescher Artistic License
BOOST Library http://www.boost.org Boost Software, v.1
zlib http://www.zlib.net zlib, v.1.2.3
Xalan
Xerces
http://xalan.apache.org/
http://xerces.apache.org/
Apache, Ver.2
ACE http://www.cs.wustl.edu/~schmidt/ACE.html ACE_TAO
TAO (The ACE ORB) http://www.cs.wustl.edu/~schmidt/TAO.html ACE_TAO
PC/SC-Lite http://www.linuxnet.com/ PCSCLite
ONC/RPC http://www.plt.rwth-aachen.de/index.php?id=258 SUN
The OpenSSL Project for use in the OpenSSL Toolkit (http://www.openssl.org/). includes cryptographic
software written by Eric Young (eay@cryptsoft.com) and software written by Tim Hudson
(tjh@cryptsoft.com).
Rohde & Schwarz would like to thank the open source community for their valuable contribution to
embedded computing.
R&S® is a registered trademark of Rohde & Schwarz GmbH & Co. KG
Trade names are trademarks of the owners.

R&S UPV Tabbed Divider Overview
1146.2084.32 RE E-9
Tabbed Divider Overview
Data Sheet
EC Certificate of Conformity
Support Center Address
List of R&S Representatives
Chapter 1: Putting into Operation
Chapter 2: Getting Started
Chapter 3: Manual Operation
Chapter 4: Instrument Functions
Chapter 5: Remote Control - Basics
Chapter 6: Remote Control - Description of Commands
Chapter 7: -
Chapter 8: Maintenance and Interfaces
Chapter 9: -
Chapter 10: Index

Grouped Safety Messages
Make sure to read through and observe the following safety instructions!
All plants and locations of the Rohde & Schwarz group of companies make every effort to keep the safety
standard of our products up to date and to offer our customers the highest possible degree of safety. Our
products and the auxiliary equipment required for them are designed and tested in accordance with the
relevant safety standards. Compliance with these standards is continuously monitored by our quality
assurance system. The product described here has been designed and tested in accordance with the EC
Certificate of Conformity and has left the manufacturer’s plant in a condition fully complying with safety
standards. To maintain this condition and to ensure safe operation, observe all instructions and warnings
provided in this manual. If you have any questions regarding these safety instructions, the Rohde &
Schwarz group of companies will be happy to answer them.
Furthermore, it is your responsibility to use the product in an appropriate manner. This product is designed
for use solely in industrial and laboratory environments or, if expressly permitted, also in the field and must
not be used in any way that may cause personal injury or property damage. You are responsible if the
product is used for an intention other than its designated purpose or in disregard of the manufacturer's
instructions. The manufacturer shall assume no responsibility for such use of the product.
The product is used for its designated purpose if it is used in accordance with its product documentation
and within its performance limits (see data sheet, documentation, the following safety instructions). Using
the product requires technical skills and a basic knowledge of English. It is therefore essential that only
skilled and specialized staff or thoroughly trained personnel with the required skills be allowed to use the
product. If personal safety gear is required for using Rohde & Schwarz products, this will be indicated at
the appropriate place in the product documentation. Keep the basic safety instructions and the product
documentation in a safe place and pass them on to the subsequent users.
Symbols and safety labels
Observe
product
documentation
Weight
indication for
units >18 kg
Danger of
electric
shock
Warning!
Hot
surface
PE terminal Ground Ground
terminal
Attention!
Electrostatic
sensitive devices
Supply
voltage
ON/OFF
Standby
indication
Direct
current
(DC)
Alternating
current (AC)
Direct/alternating
current (DC/AC)
Device fully protected
by double/reinforced
insulation
Observing the safety instructions will help prevent personal injury or damage of any kind caused by
dangerous situations. Therefore, carefully read through and adhere to the following safety instructions
before putting the product into operation. It is also absolutely essential to observe the additional safety
instructions on personal safety that appear in relevant parts of the product documentation. In these safety
instructions, the word "product" refers to all merchandise sold and distributed by the Rohde & Schwarz
group of companies, including instruments, systems and all accessories.
1171.0000.42-04.00 Sheet 1
Grouped Safety Messages
Tags and their meaning
DANGER DANGER indicates a hazardous situation which, if not avoided, will result in death or
serious injury.
WARNING WARNING indicates a hazardous situation which, if not avoided, could result in death or
serious injury.
CAUTION CAUTION indicates a hazardous situation which, if not avoided, may result in minor or
moderate injury.
NOTICE NOTICE indicates a property damage message.
In the product documentation, the word ATTENTION is used synonymously.
These tags are in accordance with the standard definition for civil applications in the European Economic
Area. Definitions that deviate from the standard definition may also exist in other economic areas or
military applications. It is therefore essential to make sure that the tags described here are always used
only in connection with the related product documentation and the related product. The use of tags in
connection with unrelated products or documentation can result in misinterpretation and thus contribute to
personal injury or material damage.
Basic safety instructions
1. The product may be operated only under the
operating conditions and in the positions
specified by the manufacturer. Its ventilation
must not be obstructed during operation.
Unless otherwise specified, the following
requirements apply to Rohde & Schwarz
products:
prescribed operating position is always with
the housing floor facing down, IP protection
2X, pollution severity 2, overvoltage category
2, use only in enclosed spaces, max.
operation altitude 2000 m above sea level,
max. transport altitude 4500 m above sea
level.
A tolerance of ±10% shall apply to the
nominal voltage and of ±5% to the nominal
frequency.
Rohde & Schwarz. Only original parts may
be used for replacing parts relevant to safety
(e.g. power switches, power transformers,
fuses). A safety test must always be
performed after parts relevant to safety have
been replaced (visual inspection, PE
conductor test, insulation resistance
measurement, leakage current
measurement, functional test).
3. As with all industrially manufactured goods,
the use of substances that induce an allergic
reaction (allergens, e.g. nickel) such as
aluminum cannot be generally excluded. If
you develop an allergic reaction (such as a
skin rash, frequent sneezing, red eyes or
respiratory difficulties), consult a physician
immediately to determine the cause.
2. Applicable local or national safety
regulations and rules for the prevention of
accidents must be observed in all work
performed. The product may be opened only
by authorized, specially trained personnel.
Prior to performing any work on the product
or opening the product, the product must be
disconnected from the supply network. Any
adjustments, replacements of parts,
maintenance or repair must be carried out
only by technical personnel authorized by
4. If products/components are mechanically
and/or thermically processed in a manner
that goes beyond their intended use,
hazardous substances (heavy-metal dust
such as lead, beryllium, nickel) may be
released. For this reason, the product may
only be disassembled, e.g. for disposal
purposes, by specially trained personnel.
Improper disassembly may be hazardous to
your health. National waste disposal
regulations must be observed.
1171.0000.42-04.00 Sheet 2
Grouped Safety Messages
of the connecting cable is regarded as the
disconnecting device. In such cases, it must
be ensured that the power plug is easily
reachable and accessible at all times
(corresponding to the length of connecting
cable, approx. 2 m). Functional or electronic
switches are not suitable for providing
disconnection from the AC supply. If
products without power switches are
integrated in racks or systems, a
disconnecting device must be provided at
the system level.
5. If handling the product yields hazardous
substances or fuels that must be disposed of
in a special way, e.g. coolants or engine oils
that must be replenished regularly, the safety
instructions of the manufacturer of the
hazardous substances or fuels and the
applicable regional waste disposal
regulations must be observed. Also observe
the relevant safety instructions in the product
documentation.
6. Depending on the function, certain products
such as RF radio equipment can produce an
elevated level of electromagnetic radiation.
Considering that unborn life requires
increased protection, pregnant women
should be protected by appropriate
measures. Persons with pacemakers may
also be endangered by electromagnetic
radiation. The employer/operator is required
to assess workplaces where there is a
special risk of exposure to radiation and, if
necessary, take measures to avert the
danger.
12. Never use the product if the power cable is
damaged. Check the power cable on a
regular basis to ensure that it is in proper
operating condition. By taking appropriate
safety measures and carefully laying the
power cable, ensure that the cable cannot be
damaged and that no one can be hurt by e.g.
tripping over the cable or suffering an electric
shock.
13. The product may be operated only from
TN/TT supply networks fused with max. 16 A
(higher fuse only after consulting with the
Rohde & Schwarz group of companies).
7. Operating the products requires special
training and intense concentration. Make
certain that persons who use the products
are physically, mentally and emotionally fit
enough to handle operating the products;
otherwise injuries or material damage may
occur. It is the responsibility of the employer
to select suitable personnel for operating the
products.
14. Do not insert the plug into sockets that are
dusty or dirty. Insert the plug firmly and all
the way into the socket. Otherwise, this can
result in sparks, fire and/or injuries.
15. Do not overload any sockets, extension
cords or connector strips; doing so can
cause fire or electric shocks.
8. Prior to switching on the product, it must be
ensured that the nominal voltage setting on
the product matches the nominal voltage of
the AC supply network. If a different voltage
is to be set, the power fuse of the product
may have to be changed accordingly.
16. For measurements in circuits with voltages
Vrms > 30 V, suitable measures (e.g.
appropriate measuring equipment, fusing,
current limiting, electrical separation,
insulation) should be taken to avoid any
hazards.
9. In the case of products of safety class I with
movable power cord and connector,
operation is permitted only on sockets with
earthing contact and protective earth
connection.
17. Ensure that the connections with information
technology equipment comply with IEC
950/EN 60950.
18. Unless expressly permitted, never remove
the cover or any part of the housing while the
product is in operation. Doing so will expose
circuits and components and can lead to
injuries, fire or damage to the product.
10. Intentionally breaking the protective earth
connection either in the feed line or in the
product itself is not permitted. Doing so can
result in the danger of an electric shock from
the product. If extension cords or connector
strips are implemented, they must be
checked on a regular basis to ensure that
they are safe to use.
19. If a product is to be permanently installed,
the connection between the PE terminal on
site and the product's PE conductor must be
made first before any other connection is
made. The product may be installed and
connected only by a license electrician.
11. If the product has no power switch for
disconnection from the AC supply, the plug
1171.0000.42-04.00 Sheet 3
Grouped Safety Messages
20. For permanently installed equipment without
built-in fuses, circuit breakers or similar
protective devices, the supply circuit must be
fused in such a way that suitable protection
is provided for users and products.
21. Do not insert any objects into the openings in
the housing that are not designed for this
purpose. Never pour any liquids onto or into
the housing. This can cause short circuits
inside the product and/or electric shocks, fire
or injuries.
22. Use suitable overvoltage protection to
ensure that no overvoltage (such as that
caused by a thunderstorm) can reach the
product. Otherwise the operating personnel
will be endangered by electric shocks.
23. Rohde & Schwarz products are not protected
against penetration of liquids, unless
otherwise specified (see also safety
instruction 1.). If this is not taken into
account, there exists the danger of electric
shock for the user or damage to the product,
which can also lead to personal injury.
24. Never use the product under conditions in
which condensation has formed or can form
in or on the product, e.g. if the product was
moved from a cold to a warm environment.
25. Do not close any slots or openings on the
product, since they are necessary for
ventilation and prevent the product from
overheating. Do not place the product on soft
surfaces such as sofas or rugs or inside a
closed housing, unless this is well ventilated.
26. Do not place the product on heat-generating
devices such as radiators or fan heaters.
The temperature of the environment must
not exceed the maximum temperature
specified in the data sheet.
27. Batteries and storage batteries must not be
exposed to high temperatures or fire. Keep
batteries and storage batteries away from
children. Do not short-circuit batteries and
storage batteries.
If batteries or storage batteries are
improperly replaced, this can cause an
explosion (warning: lithium cells). Replace
the battery or storage battery only with the
matching Rohde & Schwarz type (see spare
parts list). Batteries and storage batteries
must be recycled and kept separate from
residual waste. Batteries and storage
batteries that contain lead, mercury or
cadmium are hazardous waste. Observe the
national regulations regarding waste
disposal and recycling.
28. Please be aware that in the event of a fire,
toxic substances (gases, liquids etc.) that
may be hazardous to your health may
escape from the product.
29. The product can be very heavy. Be careful
when moving it to avoid back or other
physical injuries.
30. Do not place the product on surfaces,
vehicles, cabinets or tables that for reasons
of weight or stability are unsuitable for this
purpose. Always follow the manufacturer's
installation instructions when installing the
product and fastening it to objects or
structures (e.g. walls and shelves).
31. Handles on the products are designed
exclusively for personnel to hold or carry the
product. It is therefore not permissible to use
handles for fastening the product to or on
means of transport such as cranes, fork lifts,
wagons, etc. The user is responsible for
securely fastening the products to or on the
means of transport and for observing the
safety regulations of the manufacturer of the
means of transport. Noncompliance can
result in personal injury or material damage.
32. If you use the product in a vehicle, it is the
sole responsibility of the driver to drive the
vehicle safely. Adequately secure the
product in the vehicle to prevent injuries or
other damage in the event of an accident.
Never use the product in a moving vehicle if
doing so could distract the driver of the
vehicle. The driver is always responsible for
the safety of the vehicle. The manufacturer
assumes no responsibility for accidents or
collisions.
33. If a laser product (e.g. a CD/DVD drive) is
integrated in a Rohde & Schwarz product, do
not use any other settings or functions than
those described in the product documen-
tation. Otherwise this may be hazardous to
your health, since the laser beam can cause
irreversible damage to your eyes. Never try
to take such products apart, and never look
into the laser beam.
34. Prior to cleaning, disconnect the product
from the AC supply. Use a soft, non-linting
cloth to clean the product. Never use
chemical cleaning agents such as alcohol,
acetone or diluent for cellulose lacquers.
1171.0000.42-04.00 Sheet 4

1146.2003.02 CE E-5
EC Certificate of Conformity
Certificate No.: 2004-25
This is to certify that:
Equipment type Stock No. Designation
UPV 1146.2003.02 Audio Analyzer
UPV66 1146.2003.66
UPV-B1 1146.5202.02 Low Distortion Generator
UPV-B2 1146.4306.02 Digital Audio I/O
UPV-B20 1402.2000.02 Digital Audio I/O 48 kHz
UPV-B3 1146.4806.02 Second Analog Generator
UPV-B41 1146.5402.02 I2S Interface
UPV-B48 1402.2200.02 8 Channel Analog Inputs
UPV-U2 1402.1704.02 Additional BNC Phone Output
complies with the provisions of the Directive of the Council of the European Union on the
approximation of the laws of the Member States
-relating to electrical equipment for use within defined voltage limits
(2006/95/EC)
-relating to electromagnetic compatibility
(2004/108/EC)
Conformity is proven by compliance with the following standards:
EN61010-1 : 2001-12
EN55011 : 1998 + A1 : 1999 + A2 : 2002, Class B
EN61326 : 1997 + A1 : 1998 + A2 : 2001 + A3 : 2003
For the assessment of electromagnetic compatibility, the limits of radio interference for Class
Bequipment as well as the immunity to interference for operation in industry have been used
as a basis.
Affixing the EC conformity mark as from 2004
ROHDE & SCHWARZ GmbH & Co. KG
Mühldorfstr. 15, D-81671 München
Munich, 2008-04-09 Central Quality Management MF-QZ / Radde

1146.5802.02(2008-78) CE E-1
EC Certificate of Conformity
Certificate No.: 2008-78
This is to certify that:
Equipment type Stock No. Designation
UPV-B42 1146.5802.02 Universal Serial Interface
complies with the provisions of the Directive of the Council of the European Union on the
approximation of the laws of the Member States
-relating to electromagnetic compatibility
(2004/108/EC)
Conformity is proven by compliance with the following standards:
EN 55011 : 1998 + A1 : 1999 + A2 : 2002, Klasse A
EN 61326 : 1997 + A1 : 1998 + A2 : 2001 + A3 : 2003
For the assessment of electromagnetic compatibility, the limits of radio interference for Class
Aequipment as well as the immunity to interference for operation in industry () have been
used as a basis.
Affixing the EC conformity mark as from 2008
ROHDE & SCHWARZ GmbH & Co. KG
Mühldorfstr. 15, D-81671 München
Munich, 2008-09-16 Central Quality Management MF-QZ / Radde

1171.0200.11-03.00
QUALITÄTSZERTIFIKAT
Sehr geehrter Kunde,
Sie haben sich für den Kauf eines
Rohde & Schwarz-Produktes ent-
schieden. Hiermit erhalten Sie ein
nach modernsten Fertigungsme-
thoden hergestelltes Produkt. Es
wurde nach den Regeln unseres
Managementsystems entwickelt,
gefertigt und geprüft.
Das Rohde & Schwarz Management-
system ist zertifiziert nach:
DIN EN ISO 9001:2000
DIN EN 9100:2003
DIN EN ISO 14001:2004
CERTIFICATE OF QUALITY
Dear Customer,
you have decided to buy a Rohde &
Schwarz product. You are thus as-
sured of receiving a product that is
manufactured using the most modern
methods available. This product was
developed, manufactured and tested
in compliance with our quality mana-
gement system standards.
The Rohde & Schwarz quality
management system is certified
according to:
DIN EN ISO 9001:2000
DIN EN 9100:2003
DIN EN ISO 14001:2004
CERTIFICAT DE QUALITÉ
Cher Client,
vous avez choisi d‘acheter un produit
Rohde & Schwarz. Vous disposez
donc d‘un produit fabriqué d‘après les
méthodes les plus avancées. Le
développement, la fabrication et les
tests respectent nos normes de ges-
tion qualité.
Le système de gestion qualité de
Rohde & Schwarz a été homologué
conformément aux normes:
DIN EN ISO 9001:2000
DIN EN 9100:2003
DIN EN ISO 14001:2004
PD 5213.8744.99
=
V 01.00
=
May 2007

1171.0200.22-03.00
Customer Support
Technical support – where and when you need it
For quick, expert help with any Rohde & Schwarz equipment, contact one of our Customer Support
Centers. A team of highly qualified engineers provides telephone support and will work with you to find a
solution to your query on any aspect of the operation, programming or applications of Rohde & Schwarz
equipment.
Up-to-date information and upgrades
To keep your instrument up-to-date and to be informed about new application notes related to your
instrument, please send an e-mail to the Customer Support Center stating your instrument and your wish.
We will take care that you will get the right information.
USA & Canada Monday to Friday (except US public holidays)
8:00 AM – 8:00 PM Eastern Standard Time (EST)
Tel. from USA 888-test-rsa (888-837-8772) (opt 2)
From outside USA +1 410 910 7800 (opt 2)
Fax +1 410 910 7801
E-mail CustomerSupport@rohde-schwarz.com
East Asia Monday to Friday (except Singaporean public holidays)
8:30 AM – 6:00 PM Singapore Time (SGT)
Tel. +65 6 513 0488
Fax +65 6 846 1090
E-mail CustomerSupport@rohde-schwarz.com
Rest of the World Monday to Friday (except German public holidays)
08:00 – 17:00 Central European Time (CET)
Tel. from Europe +49 (0) 180 512 42 42*
From outside Europe +49 89 4129 13776
Fax +49 (0) 89 41 29 637 78
E-mail CustomerSupport@rohde-schwarz.com
*0.14 €/Min within the German fixed-line telephone network, varying prices
for the mobile telephone network and in different countries.

1171.0200.52-01.01
Customer Information Regarding Product Disposal
The
German
Electrical
and
Electronic
Equipment
(ElektroG)
Act
is
an
implementation
of
the following
EC
directives:
•
2002/96/EC
on
waste
electrical
and
electronic
equipment
(WEEE)
and
•
2002/95/EC
on
the
restriction
of
the
use
of
certain
hazardous
substances
in
e
lectrical
and
electronic
equipment
(RoHS).
Product
labeling
in
accordance
with
EN
50419
Once
the
lifetime
of
aproduct
has
ended,
this
product
must
not
be
disposed
of
in
the standard
domestic
refuse.
Even
disposal
via
the
municipal
collection
points
for
waste electrical
and
electronic
equipment
is
not
permitted.
Rohde
&Schwarz
GmbH
&Co.
KG
has
developed
adisposal
concept
for
the
environmental-friendly
disposal
or
recycling
of
waste
material
and
fully
assumes
its
obligation
as
aproducer
to
take
back
and
dispose
of
electrical
and
electronic
waste
in accordance
with
the
ElektroG
Act.
Please
contact
your
local
service
representative
to
dispose
of
the
product.

1171.0200.42-02.00
12
12
Address List
Headquarters, Plants and Subsidiaries
Headquarters
ROHDE&SCHWARZ GmbH & Co. KG
Mühldorfstraße 15 · D-81671 München
P.O.Box 80 14 69 · D-81614 München
Plants
ROHDE&SCHWARZ Messgerätebau GmbH
Riedbachstraße 58 · D-87700 Memmingen
P.O.Box 16 52 · D-87686 Memmingen
ROHDE&SCHWARZ GmbH & Co. KG
Werk Teisnach
Kaikenrieder Straße 27 · D-94244 Teisnach
P.O.Box 11 49 · D-94240 Teisnach
ROHDE&SCHWARZ závod
Vimperk, s.r.o.
Location Spidrova 49
CZ-38501 Vimperk
ROHDE&SCHWARZ GmbH & Co. KG
Dienstleistungszentrum Köln
Graf-Zeppelin-Straße 18 · D-51147 Köln
P.O.Box 98 02 60 · D-51130 Köln
Subsidiaries
R&S BICK Mobilfunk GmbH
Fritz-Hahne-Str. 7 · D-31848 Bad Münder
P.O.Box 20 02 · D-31844 Bad Münder
ROHDE&SCHWARZ FTK GmbH
Wendenschloßstraße 168, Haus 28
D-12557 Berlin
ROHDE&SCHWARZ SIT GmbH
Am Studio 3
D-12489 Berlin
R&S Systems GmbH
Graf-Zeppelin-Straße 18
D-51147 Köln
GEDIS GmbH
Sophienblatt 100
D-24114 Kiel
HAMEG Instruments GmbH
Industriestraße 6
D-63533 Mainhausen
Locations Worldwide
Please refer to our homepage: www.rohde-schwarz.com
◆Sales Locations
◆Service Locations
◆National Websites
Phone +49 (89) 41 29-0
Fax +49 (89) 41 29-121 64
info.rs@rohde-schwarz.com
Phone +49 (83 31) 1 08-0
+49 (83 31) 1 08-1124
info.rsmb@rohde-schwarz.com
Phone +49 (99 23) 8 50-0
Fax +49 (99 23) 8 50-174
info.rsdts@rohde-schwarz.com
Phone +420 (388) 45 21 09
Fax +420 (388) 45 21 13
Phone +49 (22 03) 49-0
Fax +49 (22 03) 49 51-229
info.rsdc@rohde-schwarz.com
service.rsdc@rohde-schwarz.com
Phone +49 (50 42) 9 98-0
Fax +49 (50 42) 9 98-105
info.bick@rohde-schwarz.com
Phone +49 (30) 658 91-122
Fax +49 (30) 655 50-221
info.ftk@rohde-schwarz.com
Phone +49 (30) 658 84-0
Fax +49 (30) 658 84-183
info.sit@rohde-schwarz.com
Phone +49 (22 03) 49-5 23 25
Fax +49 (22 03) 49-5 23 36
info.rssys@rohde-schwarz.com
Phone +49 (431) 600 51-0
Fax +49 (431) 600 51-11
sales@gedis-online.de
Phone +49 (61 82) 800-0
Fax +49 (61 82) 800-100
info@hameg.de

R&S UPV Contents – Putting into Operation
1146.2078.62 I-1.1 E-5
Contents - Chapter 1 "Putting into Operation"
1Putting into Operation ...............................................................................................................1.1
Description of the Front Panel ........................................................................................................1.2
1Screen with softkeys ...................................................................................................1.2
2Navigation keys ...........................................................................................................1.4
3Data entry keys ...........................................................................................................1.4
4CONTROL panel .........................................................................................................1.5
5VARIATION panel .......................................................................................................1.7
6USB connectors ..........................................................................................................1.7
7CD/DVD Combo drive .................................................................................................1.8
8Ground socket .............................................................................................................1.8
9Headphone connector .................................................................................................1.8
10 SETUP panel...............................................................................................................1.8
11 HELP key ....................................................................................................................1.8
12 WINDOW panel...........................................................................................................1.8
13 Analog audio interfaces...............................................................................................1.9
14 WINBAR key ...............................................................................................................1.9
15 Digital audio interfaces ..............................................................................................1.10
16 Power switch .............................................................................................................1.10
17 Status LEDs ..............................................................................................................1.11
Description of the Rear Panel .......................................................................................................1.13
1LAN connection .........................................................................................................1.13
2USB device connector...............................................................................................1.13
3RS-232-C interface....................................................................................................1.13
4Printer interface .........................................................................................................1.13
5Connector for external monitor..................................................................................1.13
6USB connectors ........................................................................................................1.13
7BNC audio monitoring output ....................................................................................1.14
8Trigger connectors ....................................................................................................1.14
9Analog auxiliary output ..............................................................................................1.14
10 Digital synchronization and expansion interfaces .....................................................1.14
11 IEC/IEEE-bus connector ...........................................................................................1.15
12 AC supply voltage connector ....................................................................................1.15
13 Slots for expansion plug-ins ......................................................................................1.15
14 I²S interface ...............................................................................................................1.15
15 LAN Reset button ......................................................................................................1.16

Contents – Putting into Operation R&S UPV
1146.2078.62 I-1.2 E-5
Putting into Operation ...................................................................................................................1.17
Unpacking the Instrument ......................................................................................................1.17
Setting up the Instrument or Installing it in a 19" Rack ..........................................................1.17
Safety Instructions..................................................................................................................1.18
General Safety Instructions .........................................................................................1.18
Protection Against Electrostatic Discharge..................................................................1.18
Setting Up the Instrument ............................................................................................1.19
Cleaning the Outside and Storing................................................................................1.19
EMC Safety Precautions..............................................................................................1.19
Connecting the R&S UPV to the AC Supply ..........................................................................1.20
Setting the AC Supply Voltage...............................................................................................1.20
Switching On ..........................................................................................................................1.21
Start Screen and Booting of the R&S UPV............................................................................1.21
Restarting the R&S UPV ........................................................................................................1.22
Switching off the instrument...................................................................................................1.22
Function Check...............................................................................................................................1.24
Presets.............................................................................................................................................1.24
Windows XP ....................................................................................................................................1.25
Connecting an External Keyboard................................................................................................1.26
Connecting a Mouse ......................................................................................................................1.26
Connecting an External Monitor...................................................................................................1.27
Changing the screen resolution ...................................................................................................1.28
FMR6......................................................................................................................................1.28
FMR7......................................................................................................................................1.32
Installing Options ...........................................................................................................................1.35
Connecting the R&S UPV to a Network (LAN).............................................................................1.36
Connection to the Network.....................................................................................................1.36
Configuring the R&S UPV for Network Operation .......................................................1.37
Preparations.................................................................................................................1.38
Entering the IP Address ...............................................................................................1.38
Querying the Computer Name.....................................................................................1.40
Accessing Directories in the Network ..........................................................................1.41
Configuration via LXI (R&S UPV66) ......................................................................................1.42
LXI classes and LXI functionality .................................................................................1.42
LXI LAN Indicator.........................................................................................................1.43
LXI Default State of Network Settings .........................................................................1.44
LXI Browser Interface ..................................................................................................1.44
IP Configuration ...........................................................................................................1.46
Advanced LAN Configuration ......................................................................................1.47
Ping Client....................................................................................................................1.48

R&S UPV Contents – Putting into Operation
1146.2078.62 I-1.3 E-5
Configuration for Manual Remote Operation .........................................................................1.49
Activating the Remote Desktop Connection program at the R&S UPV.......................1.50
Starting manual remote operation at the external computer .......................................1.51
Firmware update.............................................................................................................................1.53
Windows XP Recovery and Backup .............................................................................................1.54
Call the Windows XP Recovery and Backup Partition Menu.................................................1.54
Backup Current System Partition...........................................................................................1.55
Recover Selected Version of System Partition ......................................................................1.56
Recover Factory Default ........................................................................................................1.57
Delete Backups ......................................................................................................................1.58
Front Panel R&S UPV
1146.2078.62 I-1.4 E-5
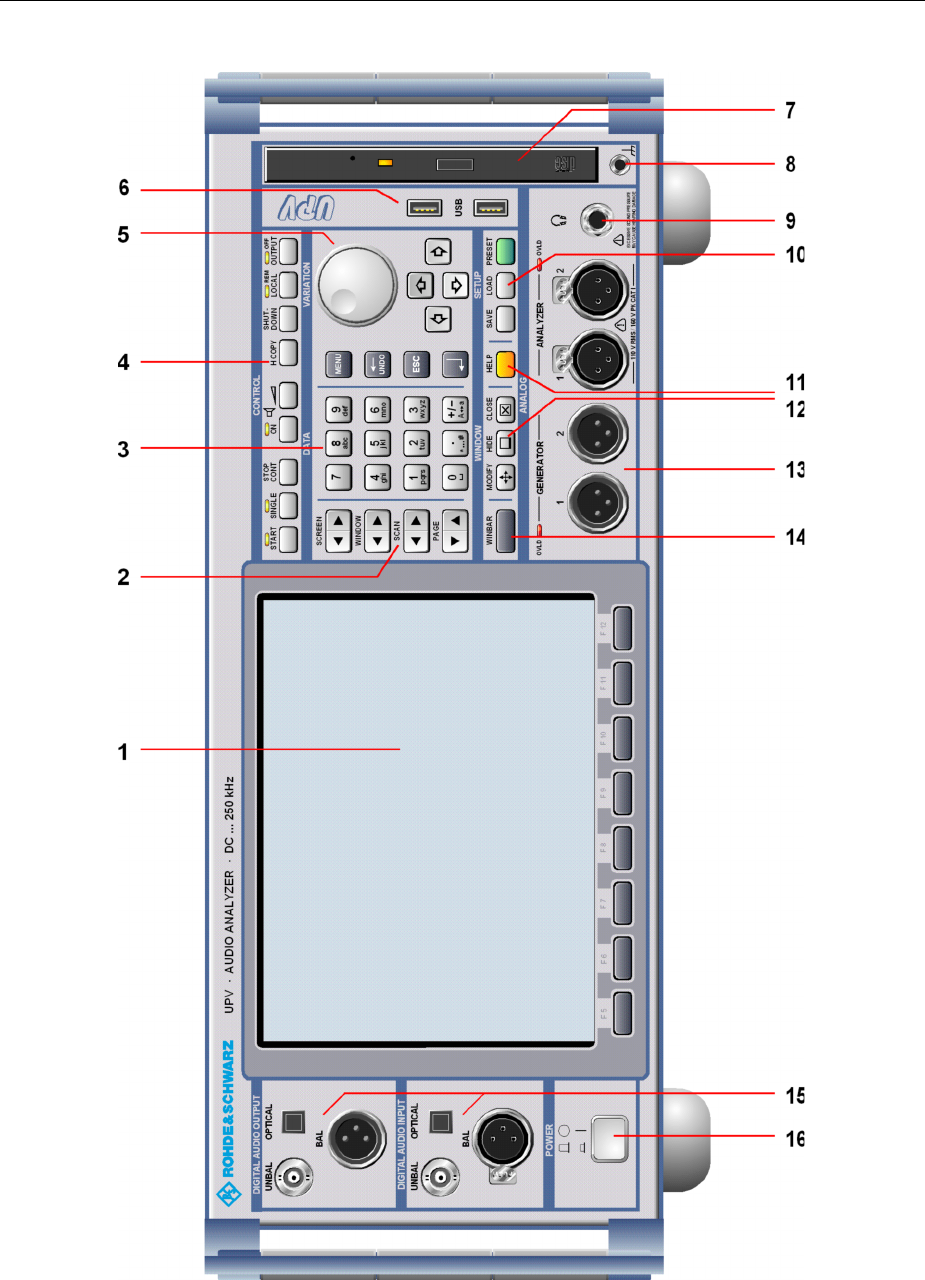
Front Panel R&S UPV
Fig. 1-1 Front Panel R&S UPV
R&S UPV Contents – Putting into Operation
1146.2078.62 I-1.5 E-5
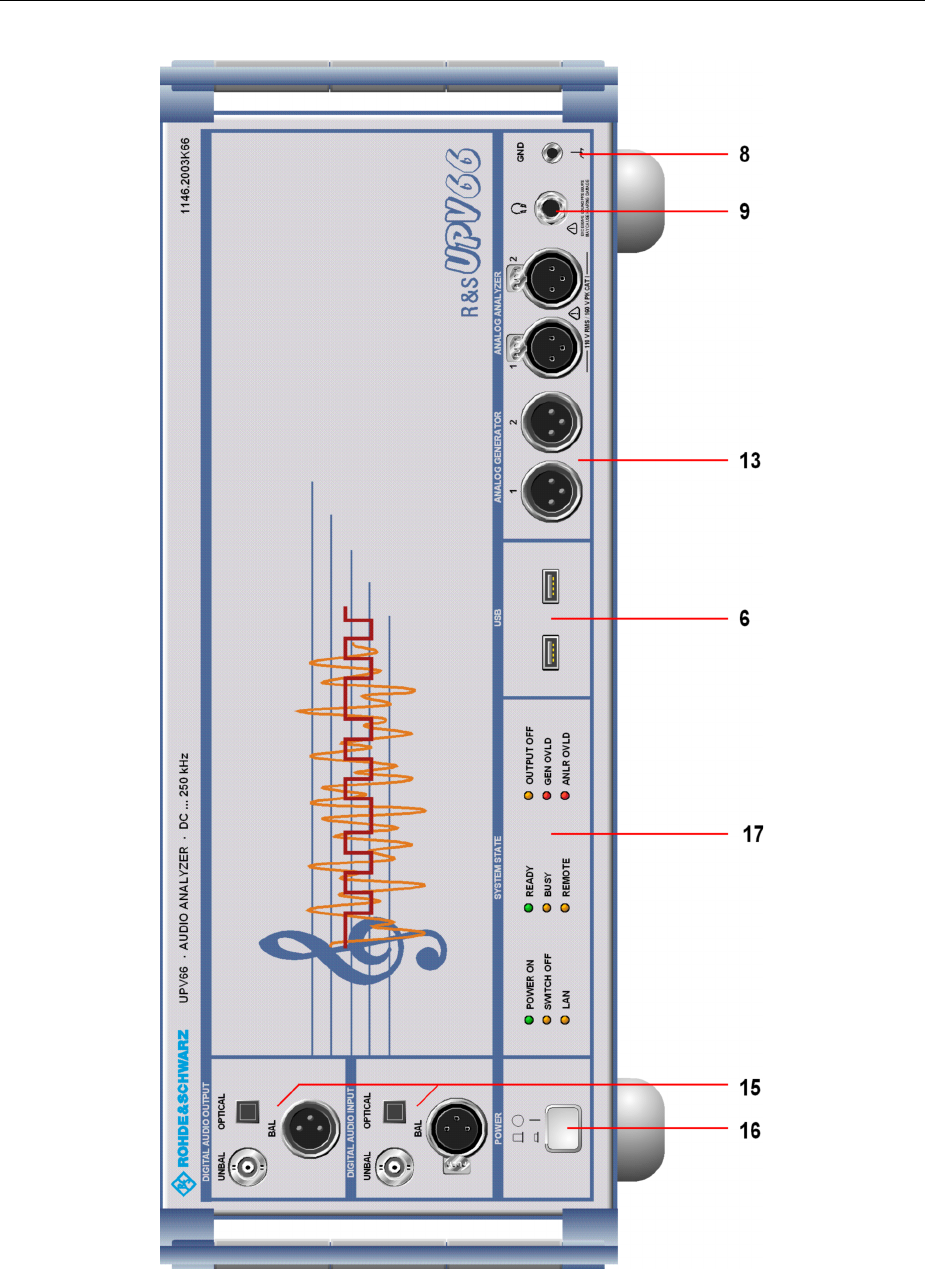
Front Panel R&S UPV66
Fig. 1-1a Front Panel R&S UPV66

R&S UPV Description of the Front Panel
1146.2078.62 1.1 E-5
1Putting into Operation
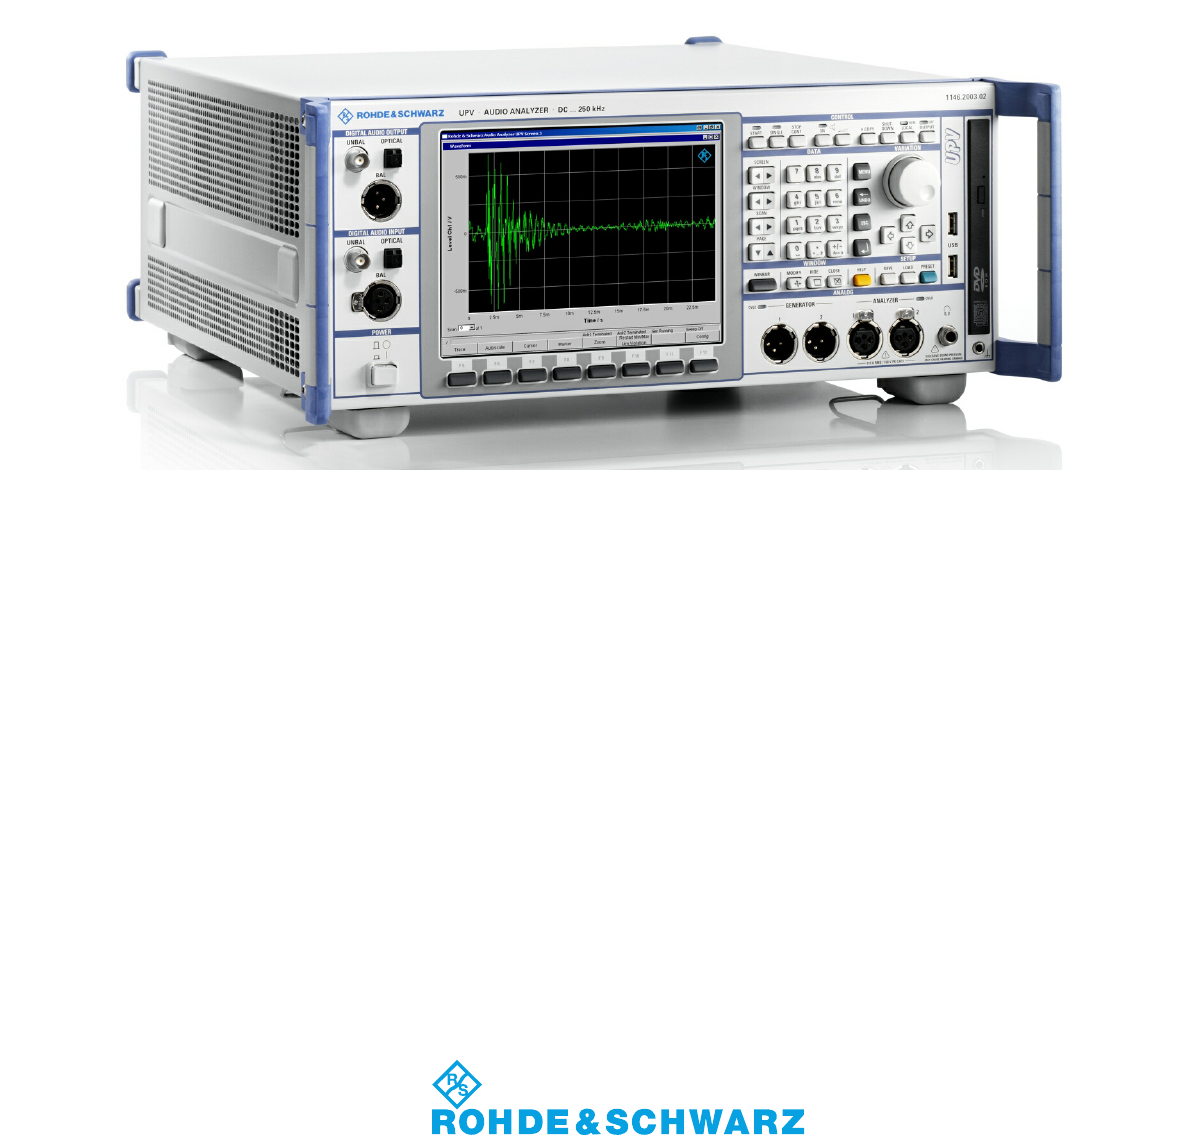
The R&S UPV audio analyzer is available in two models. The R&S UPV standard model and the
R&S UPV66, which is specially designed for use in systems. The R&S UPV66 has no display, no front
panel control elements, and no CD/DVD drive. Apart from the omission of front-panel operation, the
R&S UPV66 model has largely the same functions as the standard model. This manual therefore
describes both instruments in parallel, and any differences are indicated at the appropriate points in the
text.
Chapter 1, "Putting into Operation",describes the control elements and connectors at the front and rear
of the Audio Analyzer R&S UPV and shows how the instrument is put into operation. It also describes
the connection of peripherals such as printer, keyboard, mouse and monitor. Specifications for the
interfaces can be found in the data sheet.
The introduction in Chapter 2, "Getting Started", provides an overview of the functions and operating
concept of the audio analyzer. Detailed operating instructions and an overview of the menus are
provided in Chapter 3, "Manual Operation".
The CD-ROM contains the entire manual complete with the other chapters in printable PDF format: The
individual menus and functions of the instrument including the associated remote-control commands
are explained in detail in the reference section (Chapter 4). Basic information on remote control of the
instrument is provided in Chapters 5 to 7, "Remote Control - Fundamentals" and "Remote Control -
Commands". A detailed description of the instrument interfaces can be found in Chapter 8,
"Maintenance and Interfaces".Chapter 9, "Error Messages" contains an overview of the possible error
messages output by the instrument.
Notes:
The audio analyzer has the WindowsXP
operating system. No special knowledge of the operating
system used is required for operation of the instrument.
It is, however, assumed that users possess basic PC knowledge, such as what files and directories etc
are or how data is transferred using the Windows
Explorer. This information is therefore not specified
in detail here.
The R&S UPV audio analyzer can be fully operated via the control elements on the front panel. It is,
however, also possible to operate the instrument using an external keyboard and mouse. Operation
follows the same basic rules which apply to other Windows programs in use today. It is also assumed
that users are familiar with these basic rules. This information is therefore not specified in detail here.
The R&S UPV66 model has no front panel keypad, no display, and no CD/DVD drive; however, as is
the case with the R&S UPV standard model, it can be operated by means of a keyboard or mouse,
provided that an external screen is connected.
Description of the Front Panel R&S UPV
1146.2078.62 1.2 E-5
Description of the Front Panel
This section provides an overview of the control elements and connectors on the front of the R&S UPV.
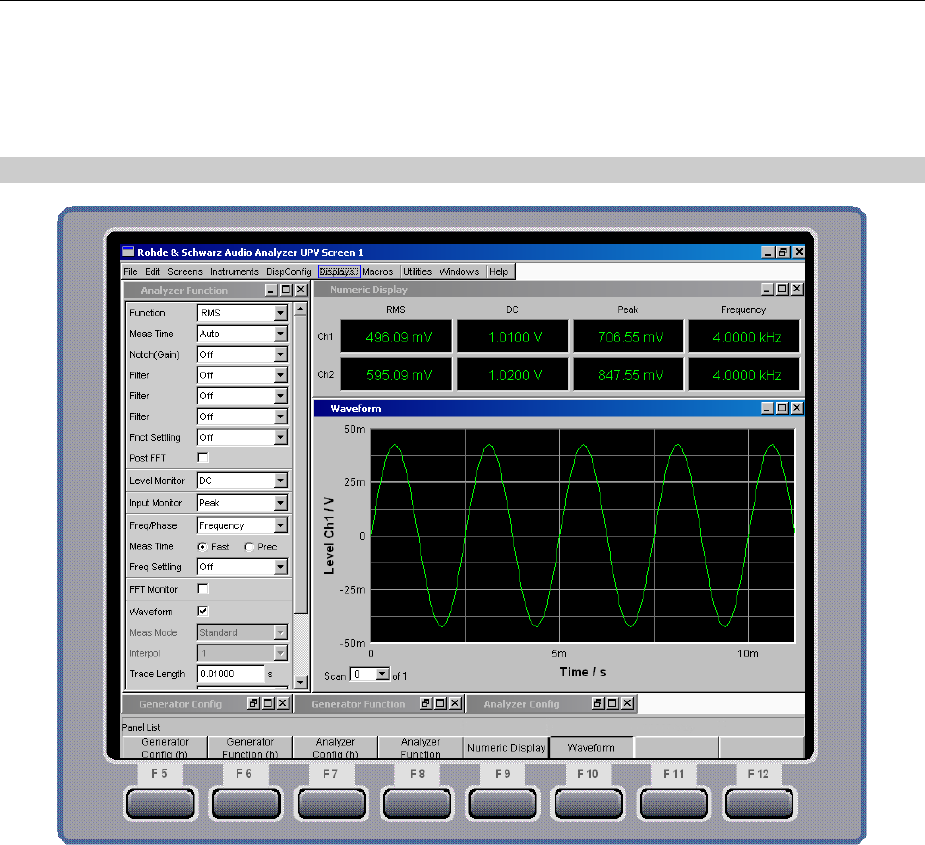
1Screen with softkeys
Fig. 1-2 Screen

R&S UPV Description of the Front Panel
1146.2078.62 1.3 E-5
The large screen shows all of the important settings and states of the audio
analyzer in a clearly organized display. 5 displays ("screens") are provided to
ensure clearer organization of the many possible panels and display windows.
The display is divided into the following sections:
-menu bar
-operating and display area
-WINBAR with softkey labels
-softkeys
The menu bar
-contains a row of pull-down menus which can be used to, for example, load
instrument settings, select panels and screens or call up help functions.
-The menu bar appears when the MENU key is pressed or the mouse pointer
is moved to the left of the screen.
It otherwise remains hidden in order to save space.
In the operating and display area
-the Audio Analyzer R&S UPV is operated using numerous panels which can
be selected by the user
-the measurement results are displayed numerically and/or graphically in the
format selected by the user
The softkey bar/WINBARat the bottom of the screen has two functions:
-In normal operating mode, the softkey bar containing the functions available
in the selection windows of the panels is visible; the softkeys permit rapid
selection without needing to use the mouse.
-When the WINBAR key is pressed, the WINBAR containing the names of all
opened panels / graphical windows is displayed in place of the softkey bar.
Pressing the associated softkey puts the focus on the corresponding panel /
graphical window, i.e. it becomes active. At the same time, the system
returns to normal operating mode (see above).
-It is possible to toggle between the softkey bar and WINBAR at any time by
pressing the WINBAR key.
The function of the softkeys
-corresponds to the label on the softkey bar and WINBAR. The softkeys can
also be operated using the function keys on the external keyboard or by
clicking the associated button.
Description of the Front Panel R&S UPV
1146.2078.62 1.4 E-5
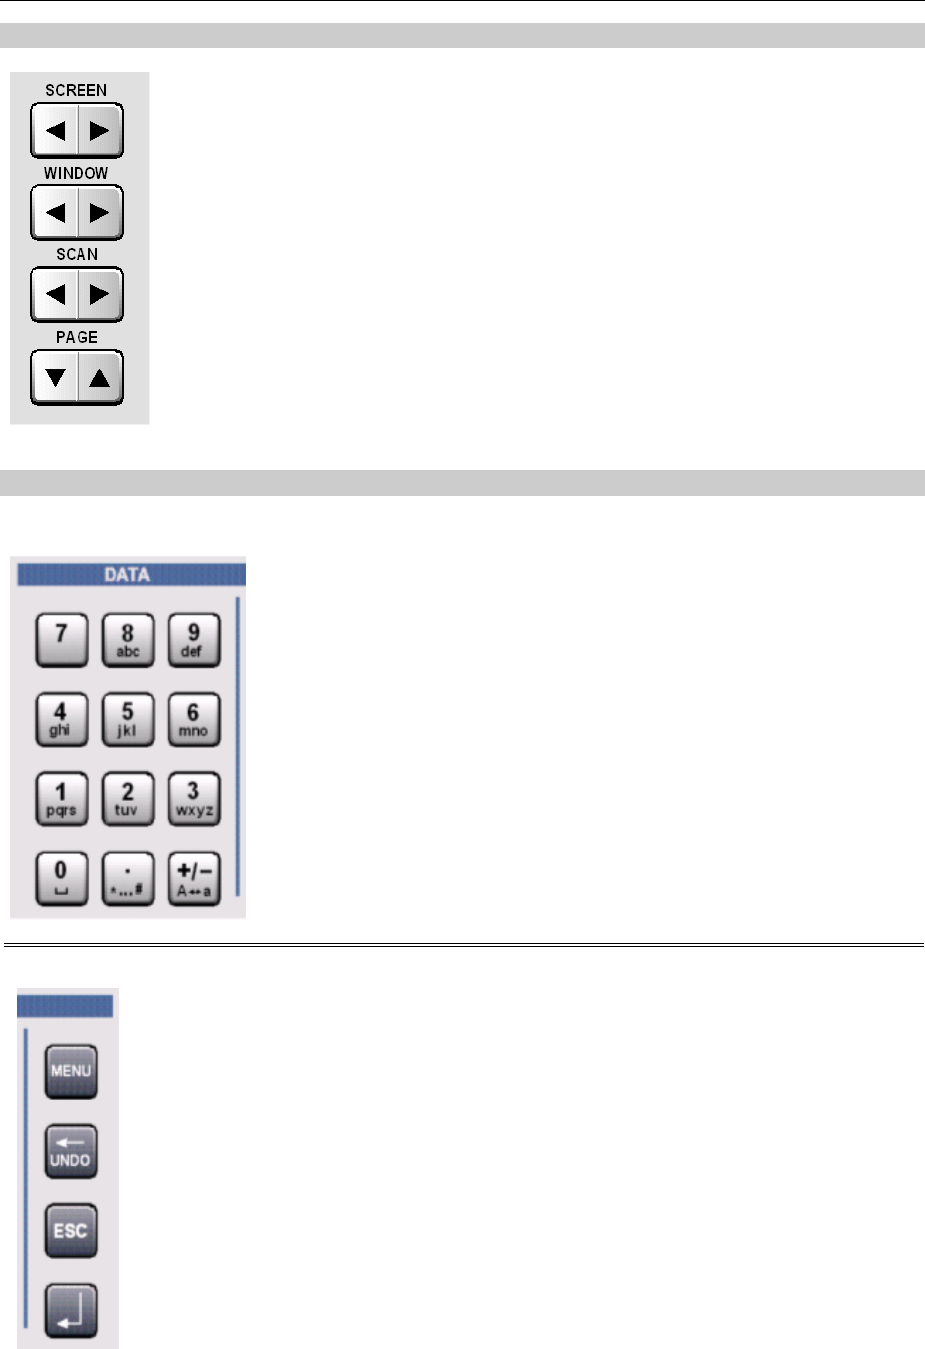
2Navigation keys
The navigation keysare 4 rocker buttons which are used for forward
and backward switching.
SCREEN Switches between the individual display settings (the
"screens").
WINDOW Switches the focus to each of the panels open in the
visible screen in sequence (the panel with the focus
is active).
SCAN Changes between the individual curve traces
("scans") in graphical displays so that, for example,
measurement values can be read off from the curves
using the cursor.
PAGE Scrolls back and forward in the tables one page at a
time.
3Data entry keys
Numeric keys
0...9
.
+/–
abc
*... #
Aa
Entry of numeric values
Entry of decimal point
Entry of sign
Entry of letters
Entry of a space
Entry of special characters
Switchover between uppercase and lowercase letters
MENU Displays the menu bar on the screen
UNDO Deletes the character to the left of the cursor
Undoes the action last performed
ESC Closes the open window; the old value or parameter
is retained
Function keys
ENTER Completes the data entry; the new value is adopted
Confirms (OK) and closes open entry windows
Pressing the rotary knob has the same effect
R&S UPV Description of the Front Panel
1146.2078.62 1.5 E-5
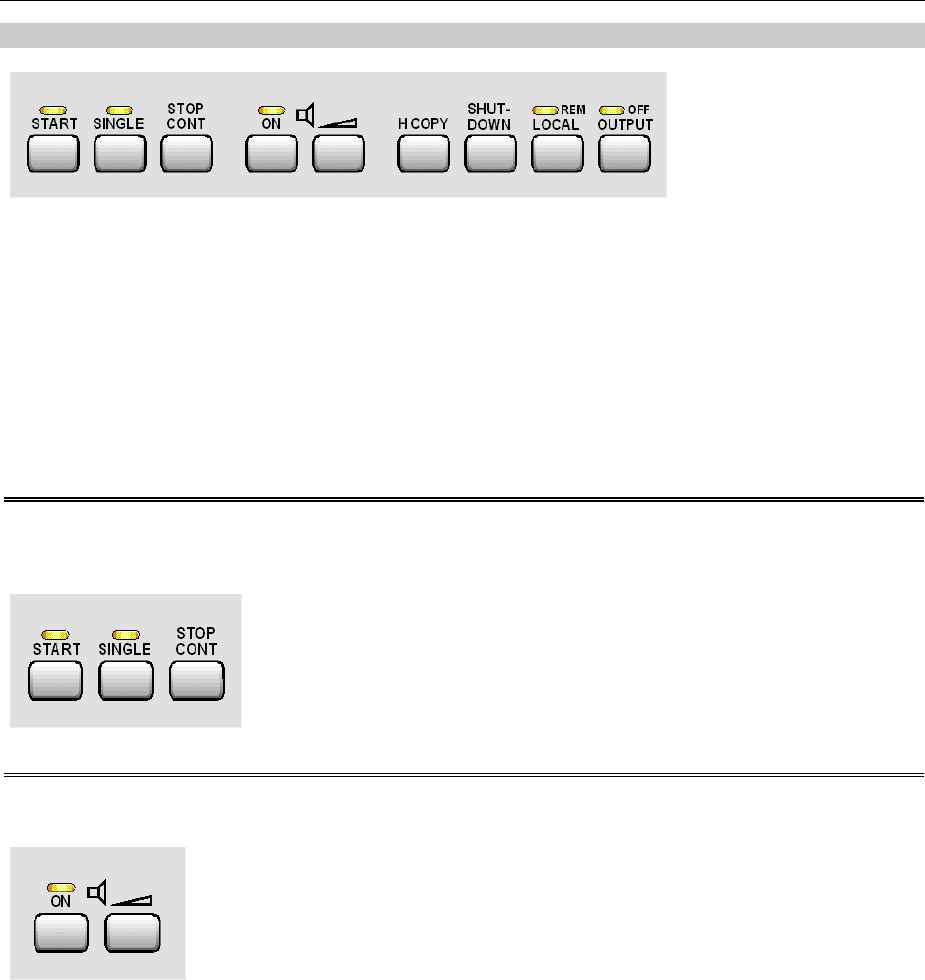
4CONTROL panel
The CONTROL panel contains the following operating functions. These functions are described in
detail below:
Start measurements / sweeps
Loudspeaker control
Hardcopy of the screen contents
Shut down the operating system
Switch between remote / manual operation
Switch off outputs
START Starts continuous measurements and sweeps
(LED lights up);
Resets Min/Max values for bargraph displays,
averaging for measurement results, and limit
overranging
SINGLE Starts a single measurement or a single sweep
(LED lights up during execution)
Keys for starting
measurements and
sweeps
STOP/CONT Measurement / sweep is stopped or continued
(toggle function)
ON Switches the loudspeaker or connected
headphones on and off (toggle function)
Keys for setting the
loudspeaker
Volume Opens a window for adjusting the audio
monitoring volume

Description of the Front Panel R&S UPV
1146.2078.62 1.6 E-5
Keys for printing hardcopies, shutting down the operating system, switching between remote
control/local operation, switching off outputs
HCOPY Depending on the settings under Utilities printout
of the screen contents on the connected printed is
started
the screen contents are stored in a file
SHUT-
DOWN
Stores the current settings on the hard disk and
then shuts down the Windows operating system
LOCAL
Switches from remote control to manual
operation; the LED lights up with remote control
OUTPUT
Switches all outputs of the measuring instrument
off or on again; the LED lights up when the
outputs are switched off

R&S UPV Description of the Front Panel
1146.2078.62 1.7 E-5
5VARIATION panel
Moves the focus in the panels, selection windows and tables
Varies the entry value at the cursor position
Moves the active cursor inside the graphical windows
Pressing the rotary knob has the same effect as pressing the
Enter key
Rotary knob
Cursor keys
/
Move the focus in the panels, selection windows and tables
Vary the entry value at the cursor position
Cursor keys
/
Move the active cursor inside the graphical windows
Move the cursor position in entered values
6USB connectors
USB (Universal Serial Bus) interfaces of type A (host USB) for:
connecting peripherals such as mouse, keyboard, printer
connecting a USB stick for transferring files
There are two additional USB interfaces (type A) at the rear of
the instrument.

Description of the Front Panel R&S UPV
1146.2078.62 1.8 E-5
7CD/DVD Combo drive
The integrated combined CD/DVD drive is used to
–install software updates on the R&S UPV
–install sequence programs and macros
–import data and instrument settings from other R&S UPVs
–store data on a CD
8Ground socket
Connect ground socket with the instrument housing
9Headphone connector
Connection of headphones for audio monitoring of the analysis or
generator signal
10 SETUP panel
SAVE Opens a window for storing instrument settings
LOAD Opens a window for loading predefined instrument
settings
PRESET Loads the factory settings of the instrument
11 HELP key
Pressing this key displays a context-sensitive help text
12 WINDOW panel
MODIFY Opens a selection of functions on the softkey bar;
these functions can be used in conjunction with
the rotary knob to move or resize the active panel
or graphical window
HIDE Minimizes ("hides") the active panel or graphical
window
CLOSE Closes the active panel or graphical window
R&S UPV Description of the Front Panel
1146.2078.62 1.9 E-5
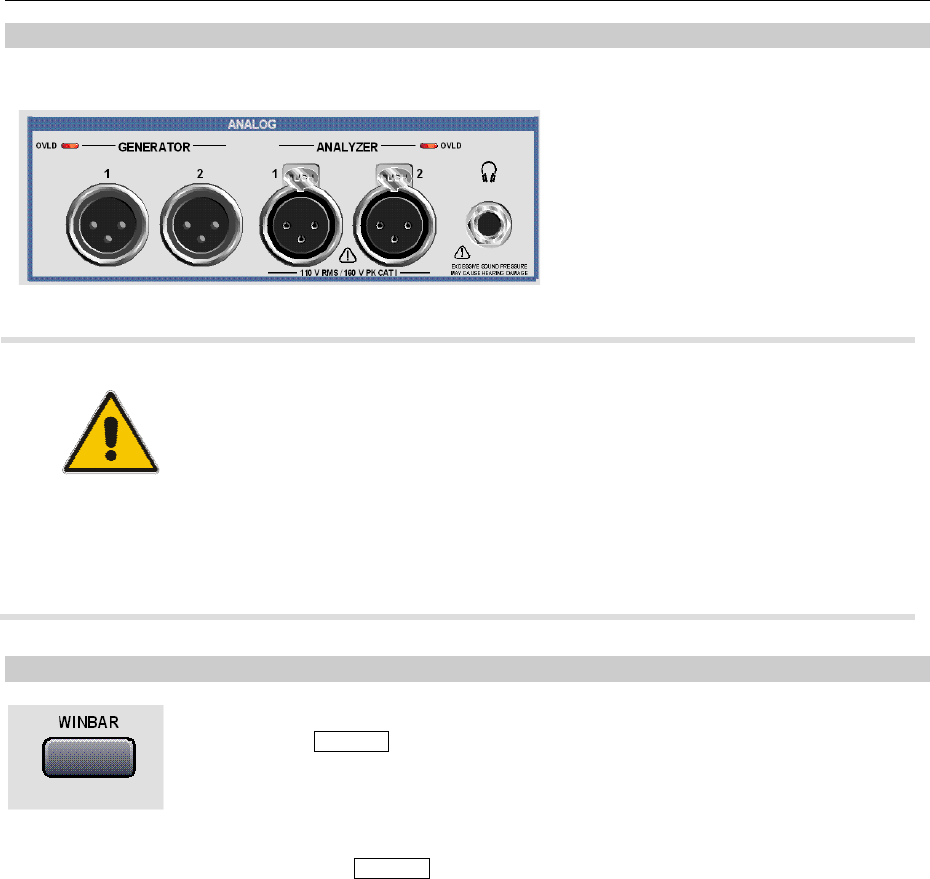
13 Analog audio interfaces
Output and input connectors of the analog generators and analyzers
ATTENTION Risk of instrument damage
The instrument complies with measuring category I; make sure that the
input voltage at the connectors of the analog analyzers does not exceed
110 V (effective, sinusoidal) and 160 V (peak value).
Do not use the instrument in measuring categories II, III and IV.
Explanation:
Measuring circuits as defined in section 6.7.4 of EN61010-1:
Measuring category I is intended for measurements on circuits which are
not connected to the high-voltage current system.
14 WINBAR key
It is possible to toggle between the softkey bar and WINBAR at any time by
pressing the WINBAR key:
In normal operating mode, the softkey bar containing the functions
available in the selection windows of the panels is visible; the softkeys
permit rapid selection without needing to use the mouse.
When the WINBAR key is pressed, the WINBAR containing the names of
all opened panels / graphical windows is displayed in place of the softkey
bar. Pressing the associated softkey puts the focus on the corresponding
panel / graphical window, i.e. it becomes active. At the same time, the
system returns to normal operating mode (see above).
Description of the Front Panel R&S UPV
1146.2078.62 1.10 E-5
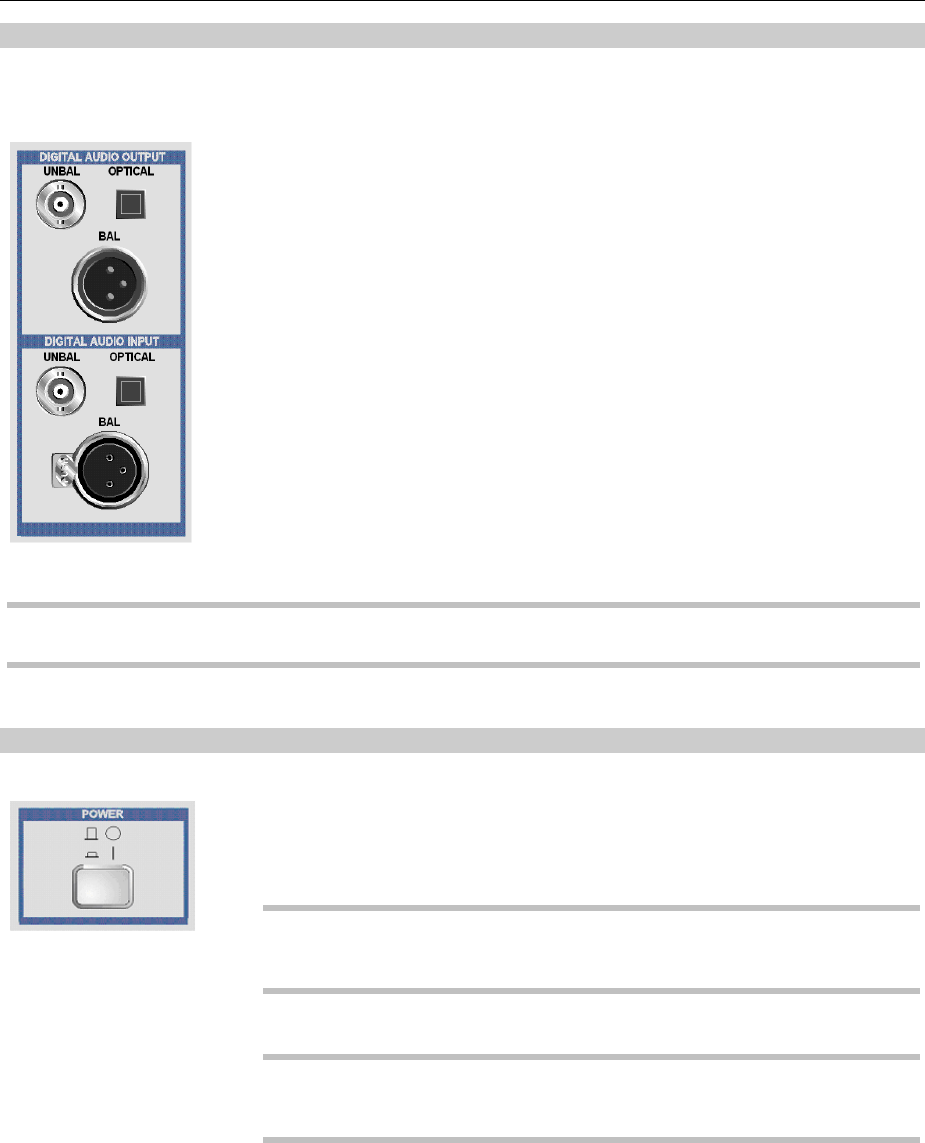
15 Digital audio interfaces
Inputs and outputs for connecting digital consumer devices and professional studio equipment.
UNBAL BNC connectors
OPTICAL Optical interface conforming to
EIAJ CP-340, TOSLINK system
BAL XLR female and male connector
Note:
These interfaces are only available when the R&S UPV-B2 or -B20 options have been installed.
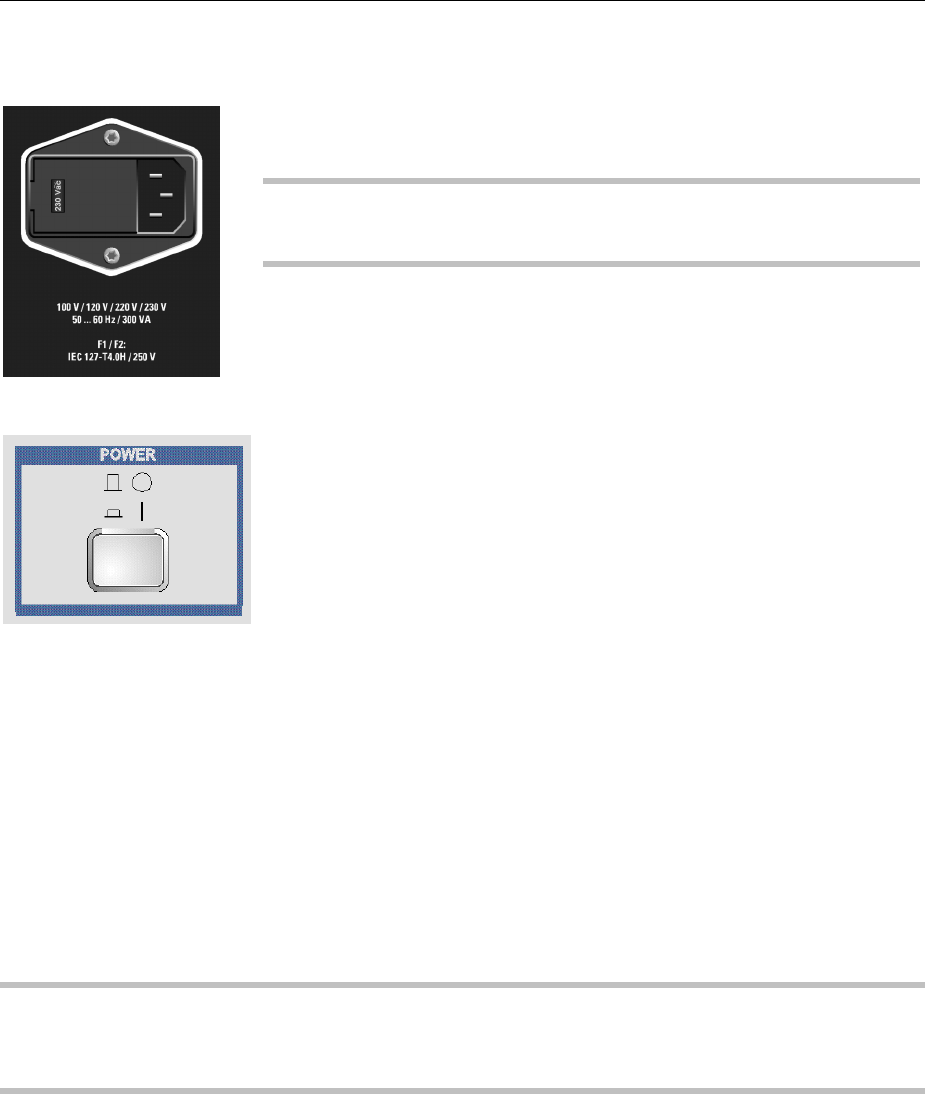
16 Power switch
The power switch switches on the instrument and starts the booting
process.
Warning:
The instrument must be set up in such a way that operation of the power
switch is not obstructed.
Note:
It is strongly recommended to shut down the operating system before
switching off the instrument (using the SHUT-DOWN key or the mouse).

R&S UPV Description of the Front Panel
1146.2078.62 1.11 E-5
17 Status LEDs
With the R&S UPV66 audio analyzer, the instrument’s state is
indicated via LEDs. The individual LEDs have the following meaning:
POWER ON:
The instrument is switched on.
SWITCH OFF:
The operating system has been shut down; you can now
switch off the instrument.
LAN:
The instrument is connected to a local area network.
READY:
The measuring instrument is ready for operation.
BUSY:
Illuminated as long as a measurement is running.
REMOTE:
The instrument is in remote-control operation.
OUTPUT OFF:
All outputs of the R&S UPV66 audio analyzer are switched off.
GEN OVLD:
The generator is overloaded.
ANLR OVLD:
The low impedance input resistors (300 Ohm or 600 Ohm) are
overloaded and have been switched off.

Description of the Front Panel R&S UPV
1146.2078.62 1.12 E-5
Rear Panel
Fig. 1-3 Rear panel
R&S UPV Description of the Rear Panel
1146.2078.62 1.13 E-5
Description of the Rear Panel
This section provides an overview of the connectors at the rear of the R&S UPV.
1LAN connection
LAN interface
Integration of the audio analyzer in a network
Remote operation of the audio analyzer from a remote computer
Remote control of the audio analyzer (with the R&S UPV-K4
option)
2USB device connector
USB device connector for remote operation of the audio analyzer (with
the R&S UPV-K4 option).
3RS-232-C interface
RS-232-C interface, 9-pin D-Sub connector (male)
To connect the R&S UPV via the RS-232-C interface, use a well-shielded
cable.
4Printer interface
Parallel printer interface, 25-pin D-Sub connector (female)
To connect a printer, use a well-shielded cable.
5Connector for external monitor
Connector for an external monitor,
15-pin D-Sub connector (female), 3-tier.
Use a very well shielded cable with ferrite cores in order to connect the
external monitor to the R&S UPV.
6USB connectors
USB (Universal Serial Bus) interfaces of type A (host USB).
Connection of peripherals such as mouse, keyboard, printer
Connection of a USB stick for transferring files
There are additional USB interfaces on the front of the instrument.

Description of the Rear Panel R&S UPV
1146.2078.62 1.14 E-5
7BNC audio monitoring output
The signal that is output on these BNC connectors is the same as the
signal on the headphone output on the front panel.
Note:
Requires the R&S UPV-U2 option (BNC audio monitoring outputs).
8Trigger connectors
TRIG IN Input for triggering measurements
TRIG OUT Trigger output and clock output
9Analog auxiliary output
Additional analog output for special applications
–DC output, e.g. for supplying power to hearing aids
–Output for the analog generator signal via an integrated amplifier for
the direct actuation of small loudspeakers
10 Digital synchronization and expansion interfaces
Inputs and outputs for reference and sync signals for the R&S UPV-B2 option (digital audio interfaces)
SYNC IN Synchronization input for word-clock signals
SYNC OUT Output for synchronizing digital peripherals to the word clock or biphase clock of
the R&S UPV
AUX IN Input for a digital audio reference signal (DARS)
AUX OUT Output for a digital audio reference signal (DARS) generated by the R&S UPV
Note:
These interfaces are only available in conjunction with the R&S UPV-B2 option.
R&S UPV Description of the Rear Panel
1146.2078.62 1.15 E-5
11 IEC/IEEE-bus connector
IEC/IEEE-bus connector (IEC 625/IEEE 488) for remote control of the
R&S UPV
Note:
Requires the R&S UPV-K4 option (remote control).
12 AC supply voltage connector
AC supply voltage connector with indication of the set nominal AC supply
voltage
ATTENTION Risk of instrument damage
The R&S UPV must be set to the nominal
voltage of the AC system used.
Before switching on the instrument for the first
time, check whether the correct ACsupply
voltage is set.
13 Slots for expansion plug-ins
In the rear panel of the R&S UPV, there are two slots into which expansion plug-ins can be inserted
(see Chap. 4 and data sheet). For example, an I²S interface can be fitted in addition or alternatively to
the optional digital audio interfaces on the front of the instrument.
The left plug-in slot at the rear panel of the R&S UPV is designated as Slot 1, and the right one as
Slot 2.
14 I²S interface
The R&S UPV-B41 option, which is an I²S interface, is shown here as an example of how an
expansion plug-in can be installed in addition to or as an alternative to any optional digital audio
interfaces that may be present on the front panel of the instrument.
I²S 25-contact D-Sub connector for connecting the input and output lines of the I²S
interfaces. The interface assignment is described in Chapter 4.
To connect the DUT, use a well-shielded cable.
TX CLK IN Additional BNC connector for connecting an external master clock signal. Details
are provided in Chapter 4.
Description of the Rear Panel R&S UPV
1146.2078.62 1.16 E-5
15 LAN Reset button
The LAN RESET button has two functions:
•Resets the LAN default settings:
To do this, you have to press the button for 5 seconds until READY
LED switches off on the front panel of the R&S UPV66.
•Shuts down the operating system:
If the operating system of the R&S UPV66 is to be shut down
manually without using a mouse, you have to press the LAN RESET
button three times within 5 seconds.
Note:
This button is present only on the R&S UPV66 model.

R&S UPV Putting into Operation
1146.2078.62 1.17 E-5
Putting into Operation
The following section describes how to put the instrument into operation and to connect peripherals
such as printer and monitor. It contains general safety instructions for instrument operation.
Installation of the options is described separately for each option in the respective sections of Chapter
4, "Instrument Functions";software updates are explained in Chapter 8, "Maintenance and Interfaces".
Unpacking the Instrument
Remove the instrument from its packaging and check the equipment for completeness using
the delivery note and the accessory lists for the various items.
First, pull off the polyethylene protection pads from the instrument's rear feet and then carefully
remove the pads from the instrument handles at the front.
Pull off the corrugated cardboard cover that protects the rear of the instrument.
Carefully unthread the corrugated cardboard cover at the front that protects the instrument
handles and remove it.
Check the instrument for any damage. If there is damage, immediately contact the carrier who
delivered the instrument. In this case, make sure not to discard the box and packing material.
It is advisable to keep the original packing material in order to prevent control elements and
connectors from being damaged in case the instrument is to be transported or shipped at a
later date.
Setting up the Instrument or Installing it in a 19" Rack
The instrument is designed for indoor use. It can either be set up as a separate unit or mounted in a 19"
rack.
Arack adapter (see the data sheet for the order number) is required for installation in a 19" rack . The
mounting instructions are supplied with the adapter.
CAUTION Risk of overheating
To less airflow for cooling may cause overheating of the instrument.
Prior to putting the instrument into operation always check for space between the
ventilation holes and the rack casing to get sufficient air supply in the rack.
Putting into Operation R&S UPV
1146.2078.62 1.18 E-5
Safety Instructions
General Safety Instructions
ATTENTION Instrument damage caused by disregarding the following precautions!
Any non-compliance with the following precautions may cause damage to the
instrument. Prior to putting the instrument into operation, check the following:
The covers of the housing are in place and screwed on.
Vents are not obstructed. Make sure that the air can escape freely through the
vents at the rear and at the sides. The minimum distance to the wall should
therefore be at least 10 cm.
The signal levels at the inputs do not exceed permissible limits.
The outputs of the instrument are not overloaded, incorrectly connected or the
polarity is incorrect.
The instrument should only be operated in horizontal position on an even surface.
The ambient temperature must not exceed the range specified in the data sheet.
The instrument complies with measuring category I; the input voltage at the
connectors of the analog analyzers should not exceed 110 V (effective, sinusoidal)
and 160 V (peak value). The instrument should not be used in measuring
categories II, III and IV.
Explanation:
Measuring circuits as defined in section 6.7.4 of EN61010-1:
Measuring category I is intended for measurements on circuits which are not
connected to the high-voltage current system.
Please also observe the instructions in the following sections and the general safety
instructions at the beginning of this manual.
Protection Against Electrostatic Discharge
To avoid damaging the electronic components of the EUT due to electrostatic
discharge produced by contact, the use of appropriate protective measures is
recommended.
R&S UPV Putting into Operation
1146.2078.62 1.19 E-5
Setting Up the Instrument
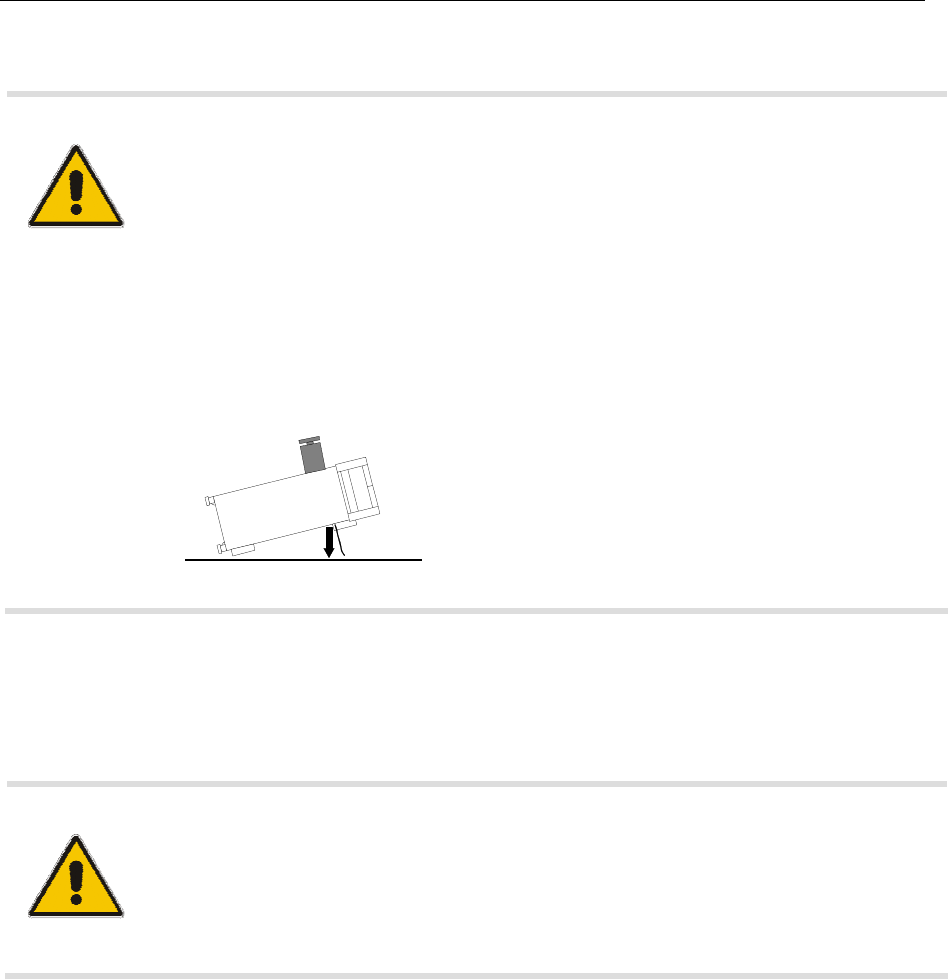
WARNING Risk of injury and instrument damage.
Safe operation with support feet!
•Stacked instruments may slip off.
Secure stacked instruments against slipping (e.g. by locking the feet to the
top of the front-panel frame).
The feet must be fully folded in or folded out. Only then a stable position of the
instrument and reliable operation can be ensured. The uniform pressure on the
folded-out feet must not exceed 500 N (weight of instrument and of equipment
stacked on top).
•When the instrument with expanded feet, the feet might collapse and fold in.
Do not shift the instrument with the feet out.
<500N
Cleaning the Outside and Storing
What is necessary is essentially the cleaning of the instrument.
ATTENTION Instrument damage caused by cleaning agents!
Cleaning agents contain substances that may damage the instrument, e.g. solvent-
containing cleaning agents may damage the front panel labeling or plastic parts.
Never use cleaning agents such as solvents (thinners, acetone, etc), acids, bases, or
other substances.
The outside of the instrument is suitably cleaned using a soft, line-free dust cloth.
EMC Safety Precautions
To prevent electromagnetic interference, only suitable, shielded signal and control cables should be
used.
Putting into Operation R&S UPV
1146.2078.62 1.20 E-5
Connecting the R&S UPV to the AC Supply
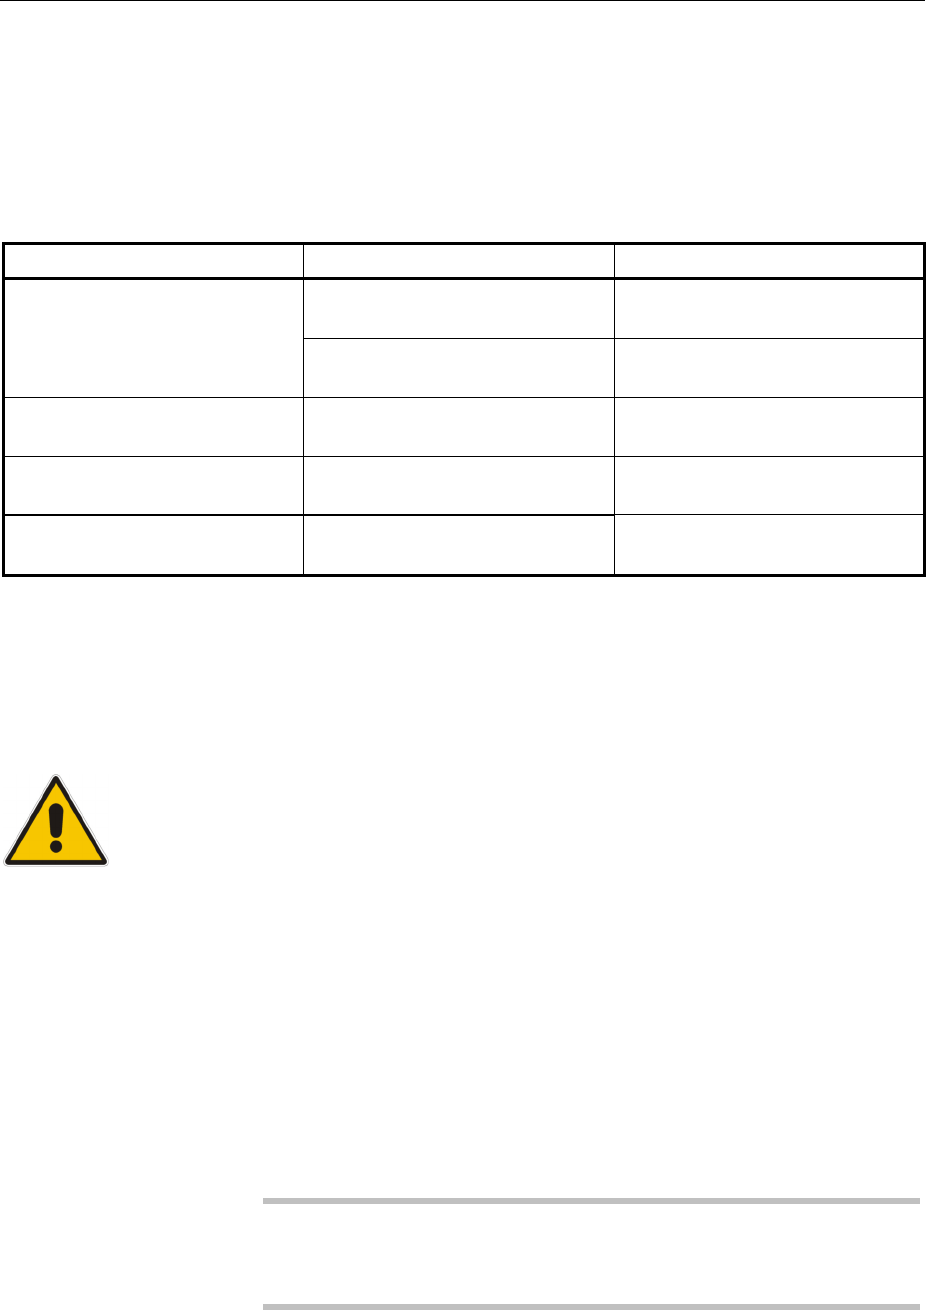
The power supply connector is at the rear of the instrument (see below). The Audio Analyzer R&S UPV
can be set up for connection to AC supply systems of 100 V,120 V,220 V and 230 V and can be
operated with ±10% tolerance and an AC supply frequency of 47 Hz to 63 Hz. The instrument is also
suitable for operation with power supply systems with the other nominal voltages specified in the table
below :
Nominal AC supply voltage Voltage selector setting Tolerance of Instrument
+4%
100 V -18%
+20%
110 V
120 V -6%
+15%
115 V 120 V -10%
+4%
127 V 120 V -18%
+10%
240 V 230 V -14%
Setting the AC Supply Voltage
ATTENTION Danger of instrument impairment
Before switching on the instrument for the first time, check whether the
correct AC supply voltage is set. If the AC supply voltage is not correct, it
must be adjusted in the following way:
Disconnect the power cable.
Open the flap covering the voltage selector using a small screwdriver
(or similar).
Remove the cylinder labeled with the nominal voltages and reinsert it
so that the value visible through the hole in the cover flap when
refitted corresponds to the desired nominal voltage. If the desired
voltage is not printed on the cylinder, select the nearest suitable
value according to the table above.
Close the flap.
Note:
The Audio Analyzer R&S UPV is operated with the same fuses for all of
the specified nominal AC supply voltages. The precise designation of the
fuses is indicated on the rear of the instrument .
R&S UPV Putting into Operation
1146.2078.62 1.21 E-5
Switching On
Connect the audio analyzer to the power supply system using the
supplied power cable.
Note:
Since the instrument is in compliance with safety class EN61010-1, it
should only be connected to a socket with earthing contact.
Press the power switch on the front of the instrument.
The instrument starts the booting process and all modules are
supplied with power.
Start Screen and Booting of the R&S UPV
After the instrument has been switched on, the installed BIOS version and the processor details are
displayed on the screen for a few seconds.
After this, the WindowsXPoperating system boots first followed by the instrument firmware. During
booting of the instrument firmware, a self-test is performed. The most recent instrument settings saved
automatically at power-off are then loaded so that the instrument is in the same state as it was before
power-off. After booting is completed, the audio analyzer screen appears and the instrument is ready to
be operated.
Note:
If the software should crash unexpectedly and the instrument is operated via the front panel, it can only
be rebooted by pressing the power switch. If the instrument is operated using an external keyboard, it is
recommended to attempt a restart by pressing Ctr+Alt+Del (warm start) first.
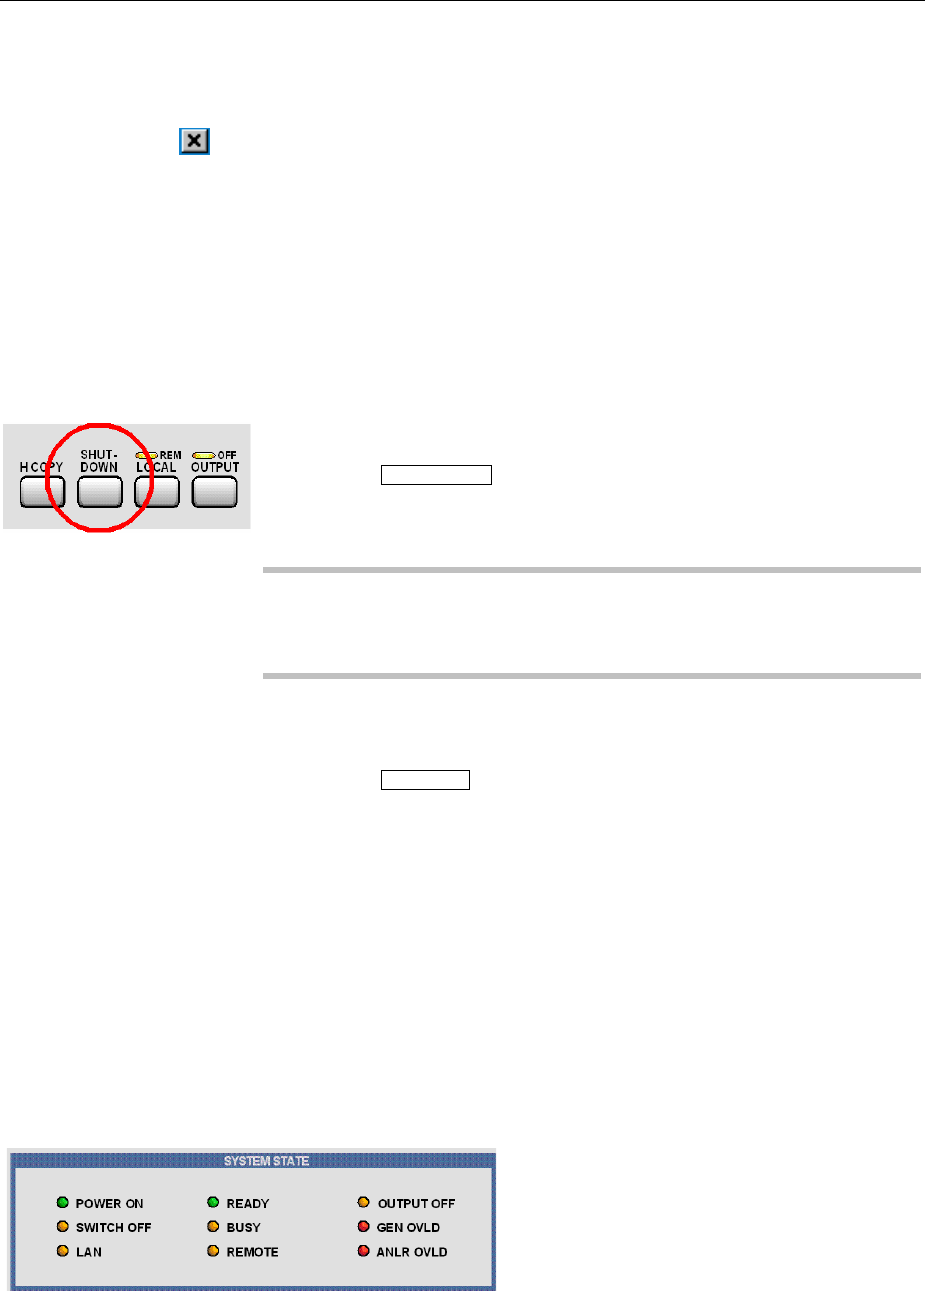
Putting into Operation R&S UPV
1146.2078.62 1.22 E-5
Restarting the R&S UPV
If the R&S UPV firmware was closed without shutting down the operating system
(e.g. by clicking the icon in the title bar),
the program can be restarted in two different ways using the mouse:
Click the "R&S UPV" icon on the desktop
Click the start button in the task bar, then select the folders "All Programs", "Rohde & Schwarz",
"UPV" and click the "R&S UPV" icon.
Switching off the instrument
R&S UPV model:
Press the SHUT-DOWN button on the front of the instrument.
The R&S UPV will save the current settings to hard disk and then shut
down the operating system.
Note:
If the instrument is operating under mouse control, it is also possible to
shut down the operating system by using the same method as is
commonly used in Windows applications.
R&S UPV66 model:
Press the LAN REST key at the rear of the instrument three times
within 5 seconds.
The R&S UPV66 stores the current settings on the hard disk and then
shuts down the operating system.
With remote control, you can also shut down the operating system by
using the SYSTem:SHUTdown command.
Alternatively, the operating system can also be shut down in the same
way as other Windows applications by using the mouse.
As soon as the operating system is shut down, the SWITCH OFF LED
will illuminate. You can disconnect the instrument from the supply
system via the power switch.
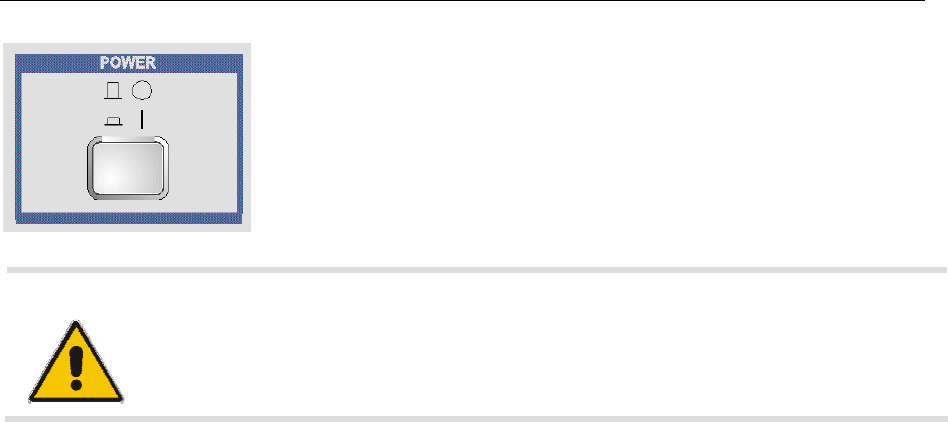
R&S UPV Putting into Operation
1146.2078.62 1.23 E-5
Press the power switch on the front of the instrument.
The instrument will be disconnected from the AC mains, and power
will be removed from all modules.
ATTENTION Danger of data loss or instrument impairment!
Switching off the instrument without first shutting down the operating system in an
orderly manner can cause loss of data or problems with the boot process the next
time the instrument is switched on.
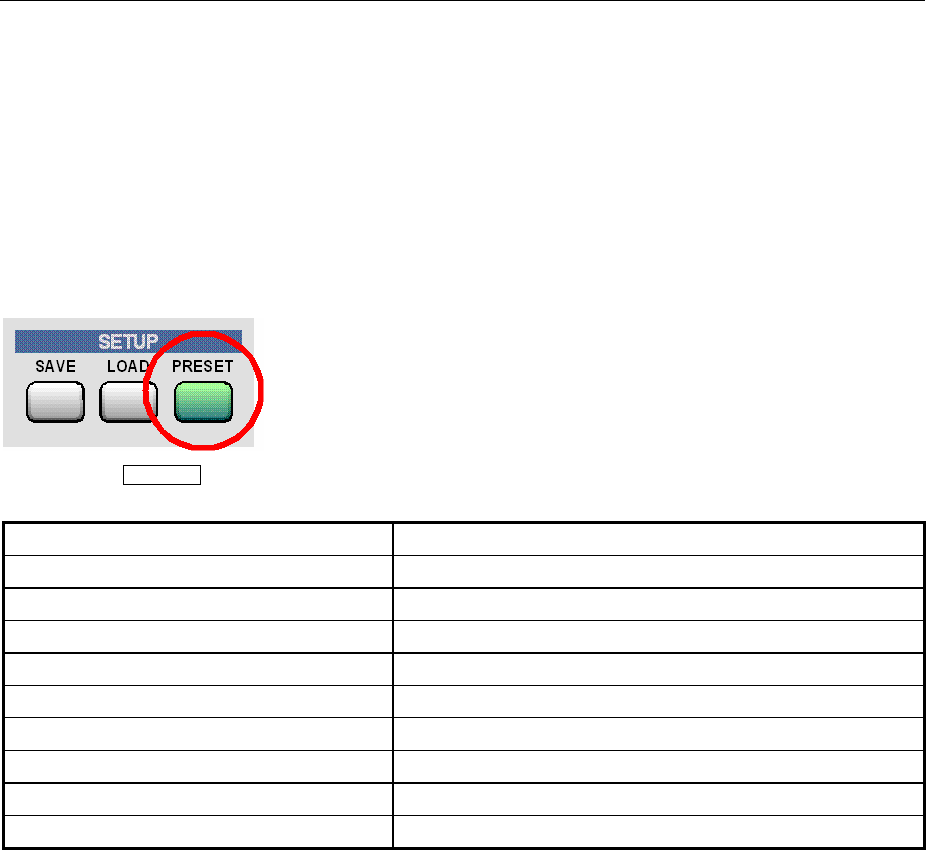
Function Check R&S UPV
1146.2078.62 1.24 E-5
Function Check
The audio analyzer monitors the most important instrument functions automatically when it is switched
on.
Presets
Pressing the PRESET key loads a set of defined instrument settings. The most important parameters
set here are:
Generator frequency (analog) 1 kHz
Generator level (analog) 0.1 V
Generator signal Sinusoidal
Generator frequency (digital) 997 Hz
Generator level (digital) 0.1 FS
Generator signal Sinusoidal
Analyzer interface (analog) XLR measuring input (analog)
Analyzer interface (digital) XLR measuring input (digital)
Analyzer function RMS
Frequency measurement ON
The preset function sets all parameters and settings, even those of inactive operating modes.

R&S UPV Windows XP
1146.2078.62 1.25 E-5
Windows XP
ATTENTION Possible impairment of the instrument functioning
The instrument is equipped with the WindowsXPoperating system. It is thus
possible to install commercial off-the-shelf software on the instrument. The use and
installation of commercial off-the-shelf software may impair the instrument function.
For this reason, we recommend that you only execute programs tested by Rohde &
Schwarz with regard to their compatibility with the instrument software.
The drivers and programs used on the instrument under WindoesXP
have been
adapted to the instrument. Existing instrument software must only be modified with
update software released by Rohde & Schwarz.
The audio analyzer has the WindowsXPoperating system. When supplied, the configuration of this
operating system is optimized to the functions of the audio analyzer. Changes in the system setup are
only required when peripherals like keyboard and printer are installed or in the event that the network
configuration does not comply with the default settings (see sections below).
When the audio analyzer is switched on, the operating system boots and the instrument firmware is
then started automatically without a password query (auto login).
Note:
Auto login is performed with the user name and the password "instrument". The standard user has
administrator rights so that printer and network installations are possible.
The operating system can only be accessed if an external keyboard is connected. Pressing the
Windows key on the external keyboard (next to the CTRL key) opens the WindowsXPStart menu
where the WindowsXPprograms can be called up. Connecting a mouse makes WindowsXPeasier
to use.
The system settings under WindowsXPare made in the menu Start – Settings - Control Panel (the
required settings can be found in the descriptions of WindowsXPand the hardware).
The R&S UPV does not have a floppy disk drive. Data is exchanged using a USB stick which is inserted
into one of the USB interfaces. The USB stick is automatically assigned a free drive letter and the data
can be transferred in Windows Explorer.

Connecting an External Keyboard R&S UPV
1146.2078.62 1.26 E-5
Connecting an External Keyboard
Acommercially available, external keyboard with USB interface can be connected to the R&S UPV. A
keyboard simplifies the input of list entries, comment texts, file names, etc and is required for operating
WindowsXP.
The keyboard is connected to one of the USB interfaces at the front or rear of the instrument.
The keyboard is detected automatically when it is connected. The US keyboard assignment is the
default setting. The keyboard language and special settings, e.g. the repeat rate and so on, can be
changed in the WindowsXPmenu Start - Control Panel - Keyboard or Regional and Language
Options.The menu is opened by pressing the Windows key on the external keyboard .
Connecting a Mouse
Acommercially available mouse with USB interface can be connected to the R&S UPV. The mouse
makes it easier to move and resize the panels / graphical windows on the screen and provides
alternative operating modes. It is recommended for easy operation of WindowsXP.
The mouse is connected to one of the USB interfaces on the front or rear of the instrument.
The mouse is detected automatically when it is connected. Special settings, e.g. the speed of the
mouse pointer and so on, can be made in the WindowsXPmenu Start - Control Panel - Mouse.The
menu is opened by pressing the Windows key on the external keyboard.
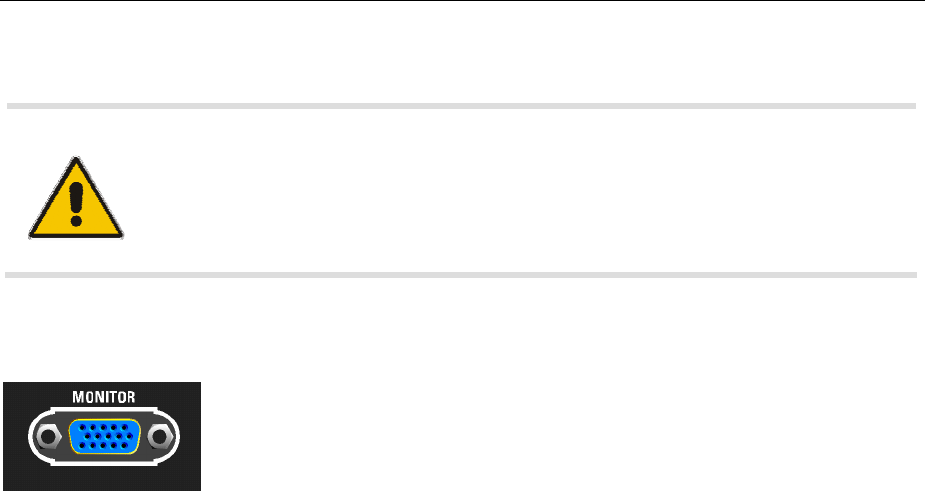
R&S UPV Connecting an External Monitor
1146.2078.62 1.27 E-5
Connecting an External Monitor
ATTENTION Danger of damage to the monitor or the instrument
Make sure that the instrument is switched off before connecting the monitor. The
monitor and the R&S UPV could otherwise be damaged.
Do not modify the screen driver (Display type) and the display configuration since this
will impair instrument operation.
An external monitor with an analog interface can be connected to the MONITOR connector at the rear
of the R&S UPV.
The connector interface is described in Chapter 8 "Maintenance and Interfaces".
Connection
To prevent damage to the monitor and R&S UPV, the instrument must be switched off before an
external monitor is connected. After connection, the external monitor is detected when the instrument is
started (but not if it is connected while the instrument is in operation). The screen display with all
elements, e.g. panels, measurement displays, WINBAR and so on, then appears both on the external
screen and on the instrument. No further settings are required.
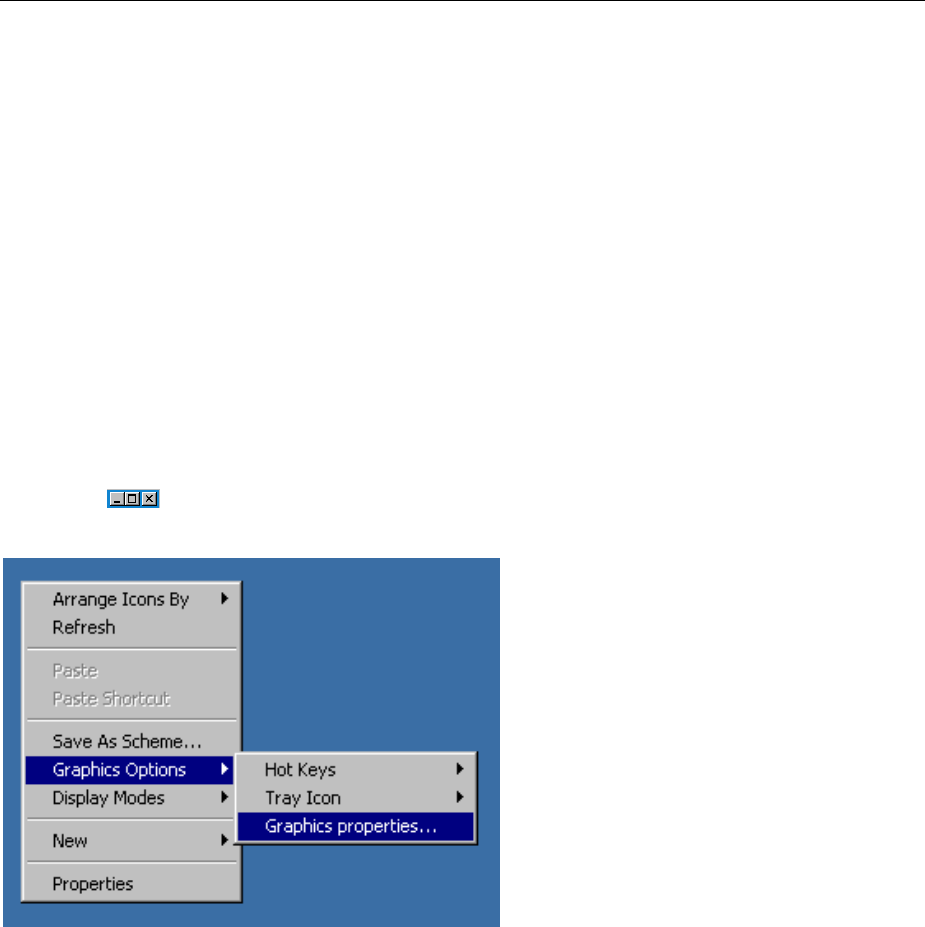
Changing the screen resolution R&S UPV
1146.2078.62 1.28 E-5
Changing the screen resolution
The R&S UPV audio analyzer comes with a built-in PC. Before March 2007, the instruments were
supplied with a PC carrying the Rohde & Schwarz designation FMR6; instruments supplied as of March
2007 include a PC of the FMR7 type.
The procedure for setting the screen resolution when using an external monitor is different for the two
PC models. The procedure for each is described below.
FMR6
Set external screen resolution to higher than 800 x 600 pixels.
Switch off the R&S UPV. Connect external screen, keyboard, and mouse to the R&S UPV.
Switch on the R&S UPV. After starting the R&S UPV, terminate or minimize the R&S UPV program by
clicking the buttons on the right-hand edge of the title bar.
Using the right mouse button, click the desktop to open the following context menu.
Select Graphics properties…
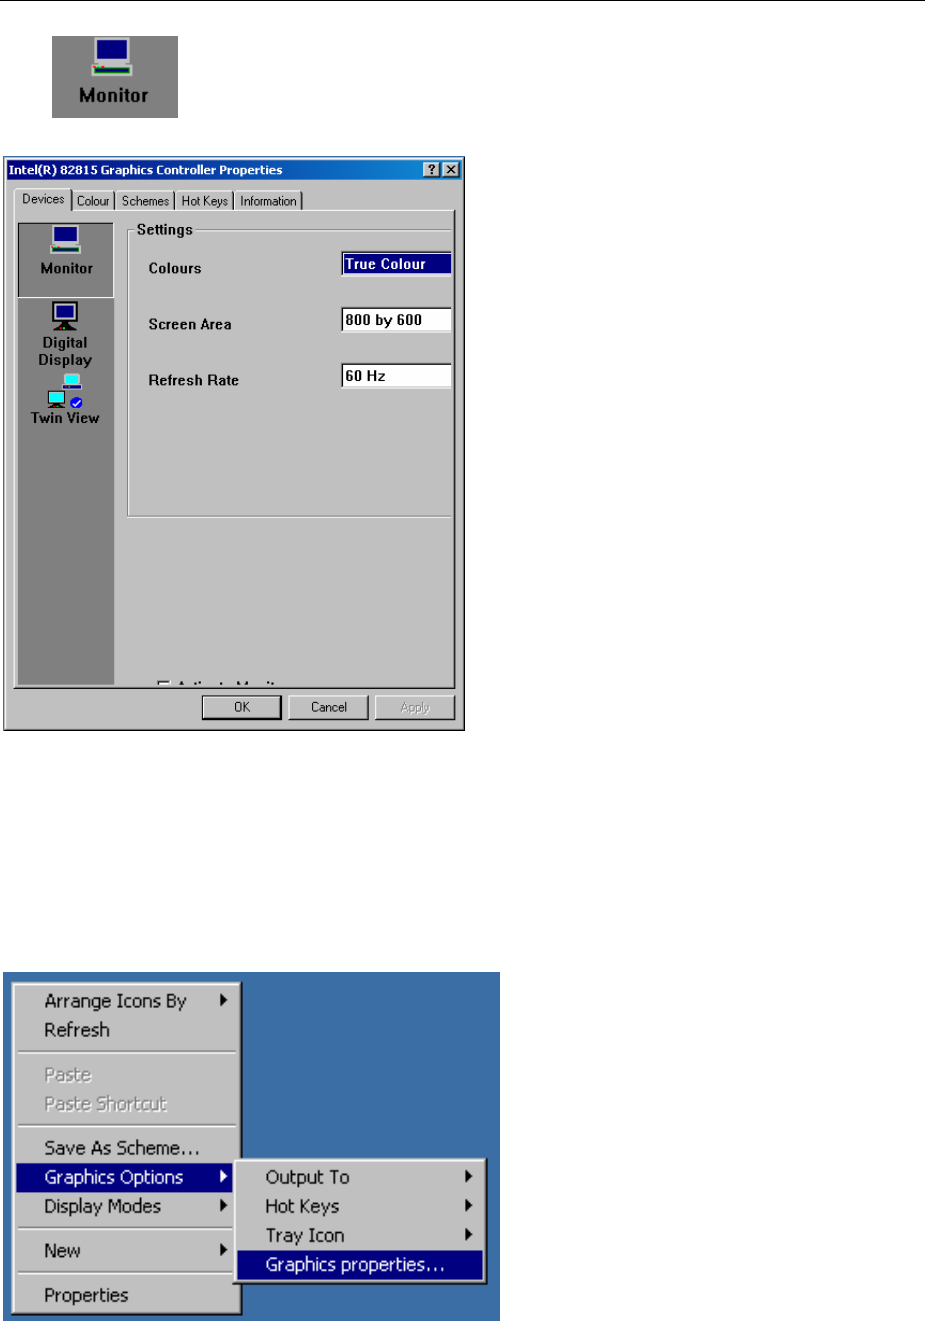
R&S UPV Changing the screen resolution
1146.2078.62 1.29 E-5
Click and place the focus on the True Color field, as shown in the screenshot below.
Press the TAB key three times to select the invisible button; then press the space key.
Now press the Apply key.
The internal LC screen (digital display) will be switched off.
Click OK to confirm the change. Now click OK again to close the window.
You can now set the external screen to a resolution higher than 800 x 600 pixels.
Using the right mouse button, click the desktop to open the following context menu again.
Select Graphics properties…
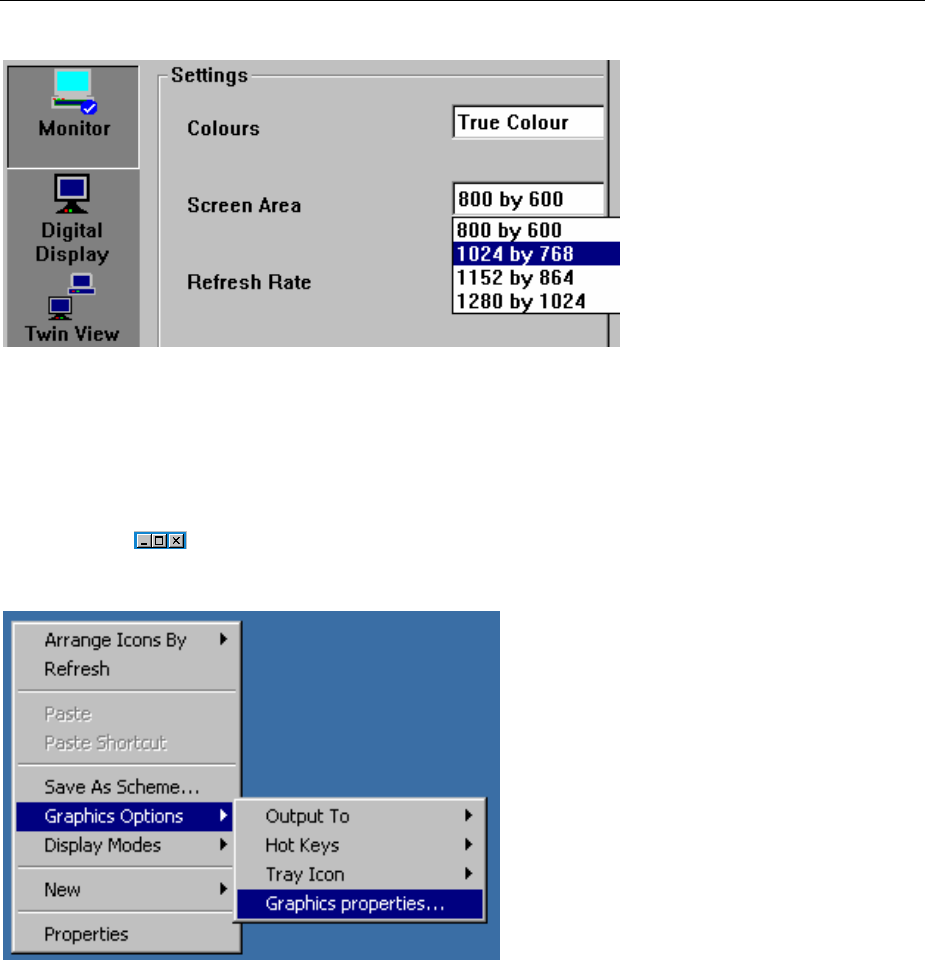
Changing the screen resolution R&S UPV
1146.2078.62 1.30 E-5
From the Screen Area field, select the resolution you want, e.g. 1024 by 768.
Click Apply.
Click OK to confirm the change. Now click OK again to close the window.
Reset external screen resolution to 800 x 600 pixels.
External keyboard and mouse are connected to the R&S UPV. Terminate or minimize the UPV program
by clicking the buttons on the right-hand edge of the title bar.
Using the right mouse button, click the desktop to open the following context menu.
Select Graphics Properties...
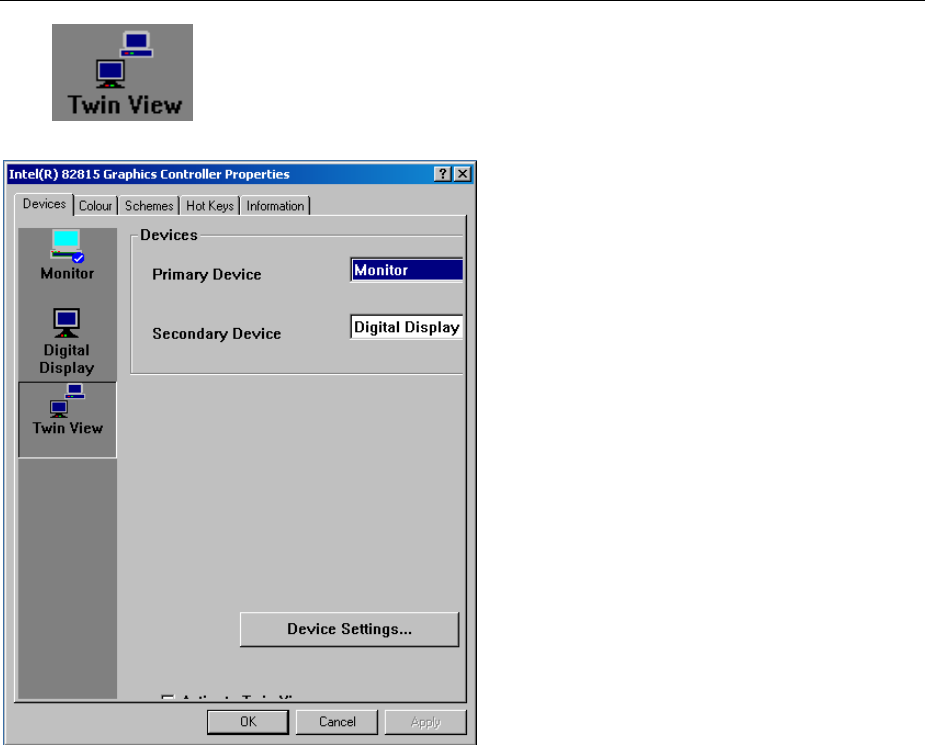
R&S UPV Changing the screen resolution
1146.2078.62 1.31 E-5
Click and place the focus on the Monitor field, as shown in the screenshot below.
Press the TAB key three times to select the invisible button. Now press the space key and then the
Apply button.
The resolution will be reset to 800 x 600 pixels. This is the same as for the internal LC screen, which
will be switched on again.
Click OK to confirm the change. Now click OK again to close the window.
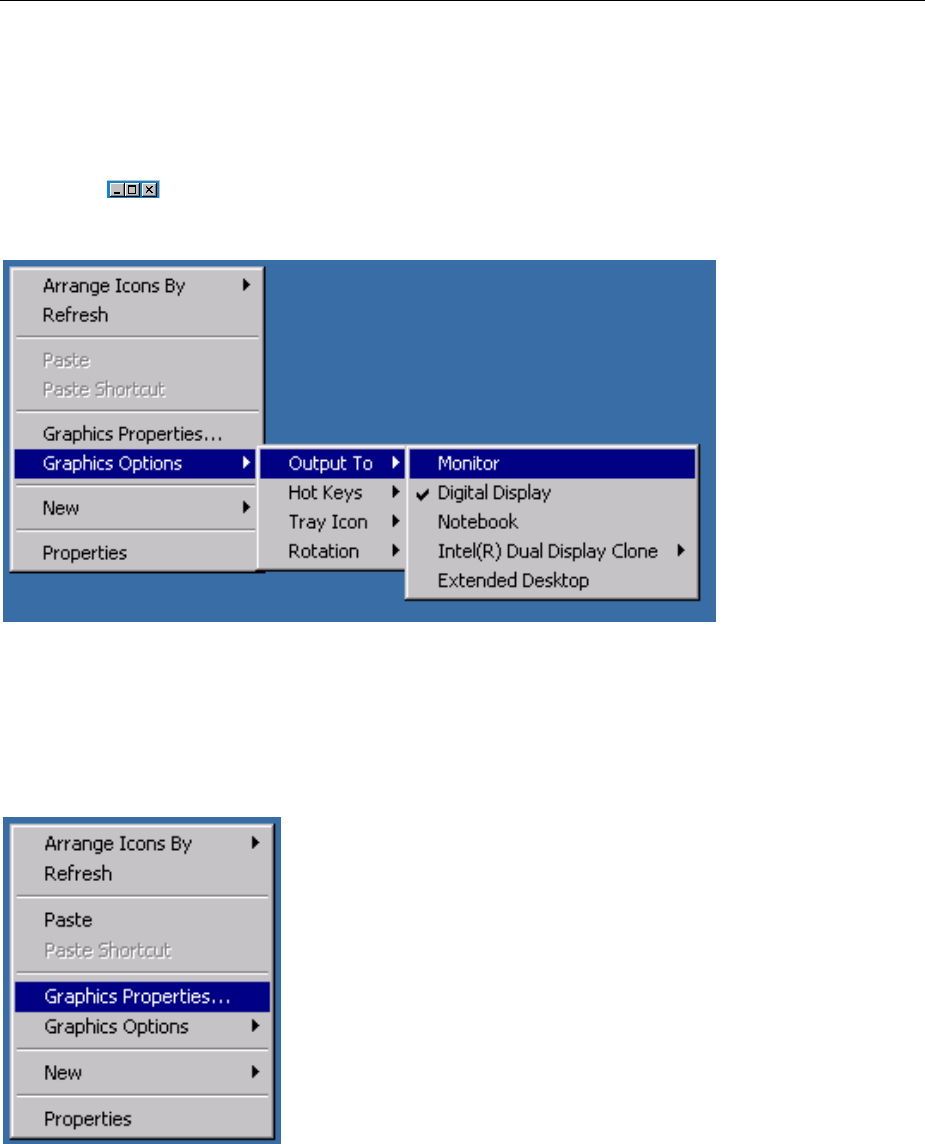
Changing the screen resolution R&S UPV
1146.2078.62 1.32 E-5
FMR7
Set external screen to a resolution higher than 800 x 600 pixels.
Switch off the R&S UPV. Connect external screen and mouse to the R&S UPV.
Switch on the R&S UPV. After starting the R&S UPV, terminate or minimize the UPV program by
clicking the buttons on the right-hand edge of the title bar.
Using the right mouse button, click the desktop to open the following context menu.
Select Monitor
Switch off the internal LC screen and switch on the external screen if it was previously switched off.
Now you can set the external screen to a resolution higher than 800 x 600 pixels.
Using the right mouse button, click the desktop to open the following context menu again.
Select Graphics Properties…
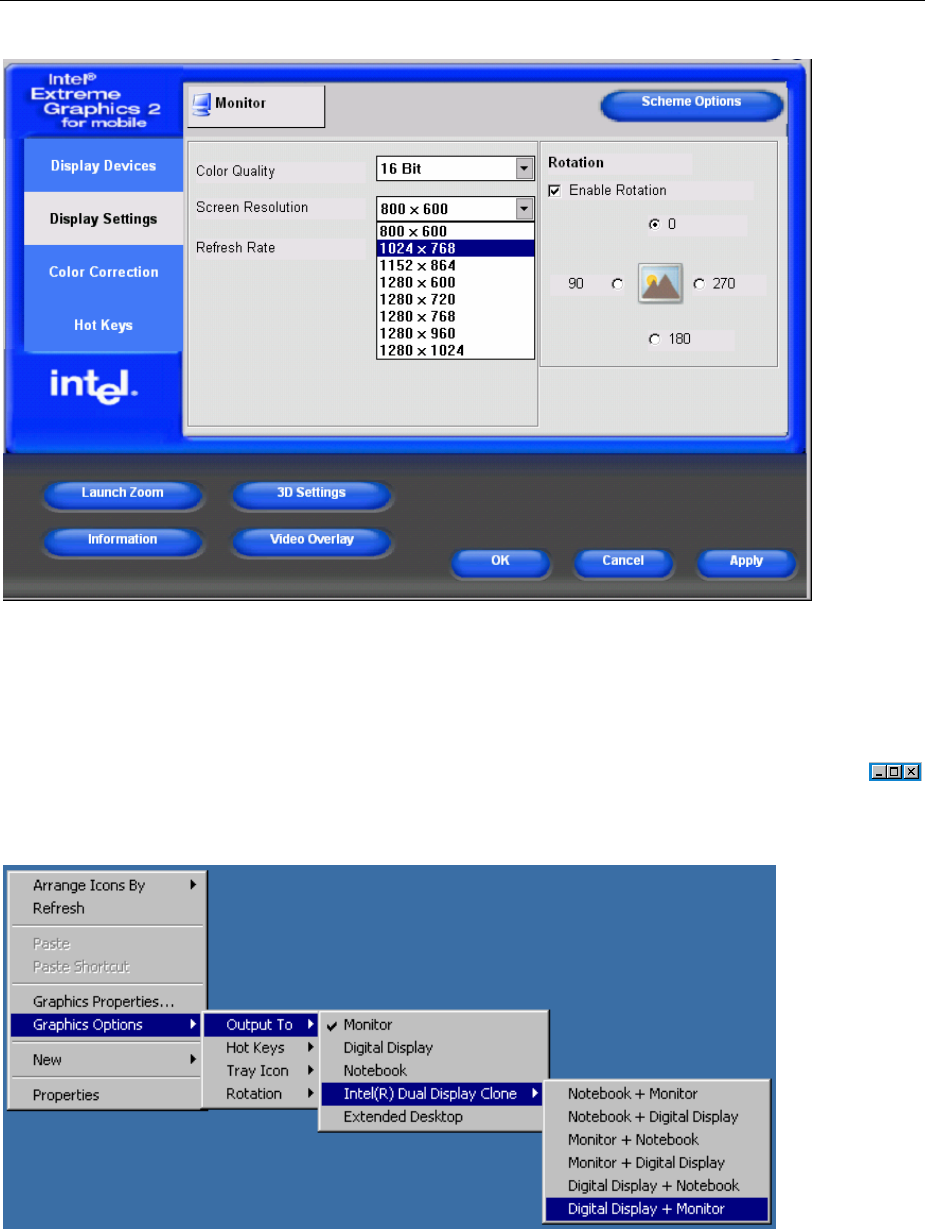
R&S UPV Changing the screen resolution
1146.2078.62 1.33 E-5
Select Display Settings,and then select the resolution you want, e.g. 1024 x 768 pixels.
Click Apply
Click OK to confirm the change, and then click OK again to close the window.
Reset external screen to a resolution of 800 x 600 pixels
Amouse is connected to the R&S UPV. Terminate or minimize the UPV program by clicking the
buttons on the right-hand edge of the title bar.
Using the right mouse button, click the desktop to open the following context menu.
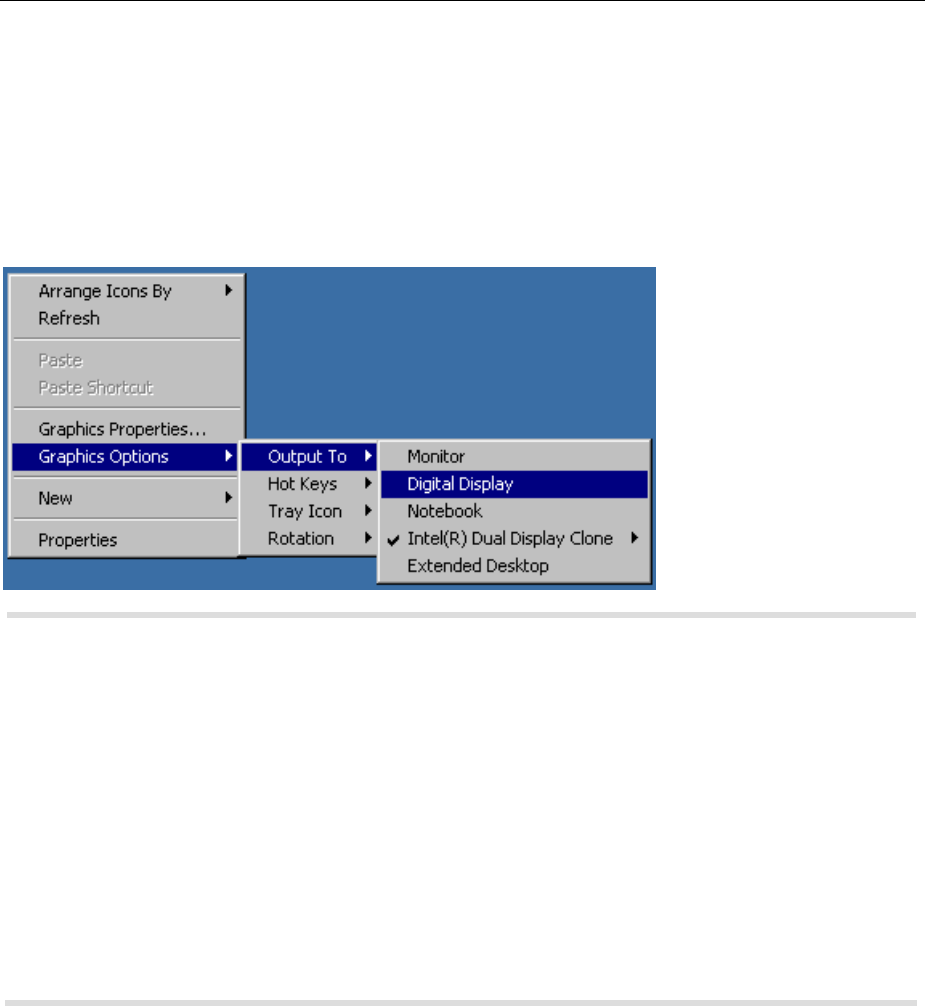
Changing the screen resolution R&S UPV
1146.2078.62 1.34 E-5
Select Digital Diplay and Monitor
Reset resolution to 800 x 600 pixels, which is the same resolution as for the internal LC screen, which is
switched on again.
Switch off external screen
Using the right mouse button, click the desktop to open the following context menu.
Select Digital Display.The external screen will be switched off.
Important The graphics driver of the FMR7 PC module in the R&S UPV saves the screen
configuration that was last selected and detects whether an external monitor is
connected.
If the R&S UPV was previously operated only with an external monitor and was
switched off in that state, the internal screen will remain deactivated the next time the
R&S UPV is switched on if no external monitor is connected. Since no external
monitor is detected in this case when the instrument is switched on, the monitor
output will remain deactivated even if a monitor is connected at a later time.
To reactivate the screen display, you need an external keyboard:
By using the key combination CTRL + ALT + F1 on an external keyboard, you can
switch to the external monitor.
By using the key combination CTRL + ALT + F4 on an external keyboard, you can
switch on the screen. From march 2008 R&S UPV is shipped with a new LCD, which
can be switched on using the key combination CTRL + ALT + F3.

R&S UPV Installing Options
1146.2078.62 1.35 E-5
Installing Options
The R&S UPV can be equipped with numerous options. These options can be divided into three basic
categories:
Software options Can be installed by the user himself; a unique activation code supplied
with the option is required.
Hardware plug-ins Inserted into the appropriate slots in the rear of the Audio Analyzer
R&S UPV (usually by a Rohde & Schwarz Service Center).
Hardware options Installed in the Audio Analyzer R&S UPV; these options can only be
retrofitted by a Rohde & Schwarz Service Center.
Connecting the R&S UPV to a Network (LAN) R&S UPV
1146.2078.62 1.36 E-5
Connecting the R&S UPV to a Network (LAN)
The R&S UPV has a network connector and can be connected to a LAN (Local Area Network).
Network administrators with the appropriate rights can transfer files across the network and use network
resources such as the network directories or printers. The instrument can also be remote-controlled and
manually operated in the network.
With manual remote operation, the R&S UPV can be operated from an external computer at any remote
location. For example, from your desk you can operate one or more R&S UPVs that are part of a test
setup located in another section of the building.
The R&S UPV comes equipped with an activated WindowsXP® firewall. File transfer via LAN or manual
remote operation using the remote desktop requires only a partial exception in the firewall. It is
advisable to coordinate the configuration of the firewall with the network administrator.
Remote control of the instrument via the LAN interface is described in Chapter 5, "Remote Control -
Fundamentals".
Connection to the Network
ATTENTION Risk of network errors!
Connecting errors may affect the entire network.
We recommend that connection of the instrument to the network be co-ordinated with
the network administrator.
Do not connect or disconnect the network cable until the instrument is switched
off (standby). Only then the network connection can be reliably detected and
impairments to instrument operation can be avoided.
The instrument is connected to the network using a commercially available RJ45 cable connected to the
LAN interface at the rear of the instrument.
The connector is described in Chapter 8 "Maintenance and Interfaces".

R&S UPV Connecting the R&S UPV to a Network (LAN)
1146.2078.62 1.37 E-5
Configuring the R&S UPV for Network Operation
The network interface operates with 100 MHz-Ethernet IEEE 802.3u. The TCP/IP network protocol and
the associated network services are preconfigured.
In order to exchange data in a local network (LAN), each connected computer or instrument must have
aunique IP address or a unique computer name. In addition, network access of the different users is
organized by the assignment of access rights.
The access rights determine which of the available network resources, e.g. file storage systems, are
available for the R&S UPV.
Networks with DHCP
The R&S UPV is preconfigured for networks using DHCP (Dynamic Host Configuration Protocol). In
these networks, the R&S UPV is automatically assigned a free IP address. In this case, a unique
computer name is used for identification in the network.
Each R&S UPV is given a unique computer name at the factory. This name can be queried and
changed in the WindowsXPmenu Start - My Computer (see "Querying the Computer Name" below).
Networks with fixed IP addresses
In networks using fixed IP addresses, usually the network operator organizes the addresses. The IP
address has to be entered in the Windows menue Start - Control Panel (see "Entering the IP
Address").
Point-to-point connections
To set up a simple network (a LAN connection between an R&S UPV and a computer without
integration in a large network), an IP address must be assigned to the R&S UPV and the computer. The
IP addresses 192.168.xxx.yyy are available, whereby both xxx and yyy can have the values 1 to 254;
the value for the subnet mask is 255.255.255.0.
In this case, a commercially available cross-over RJ45 cable must be used for the connection.
User ID
The user "instrument"is set for the R&S UPV. The user is used for the auto login when the instrument
is started and for manual remote operation. The password is also "instrument".By assigning the
respective rights, the network administrator decides which directories and resources in the network can
be accessed by the R&S UPV.

Connecting the R&S UPV to a Network (LAN) R&S UPV
1146.2078.62 1.38 E-5
Preparations
The instrument is configured for network operation in the menus of the WindowsXPoperating system.
The operating system can only be accessed if an external keyboard is connected; connection of a
mouse is recommended for easy operation. The instrument should be switched off before the keyboard
and mouse are connected. This will ensure that the keyboard and mouse are correctly detected by the
operating system.
Entering the IP Address
The default setting is "Obtain an IP address automatically" (Dynamic Host Configuration Protocol
(DHCP)).
1. Start – Settings – Control Panel
2. Click Network and Internet Connections and then click Network Connections bottom right in this
menu.
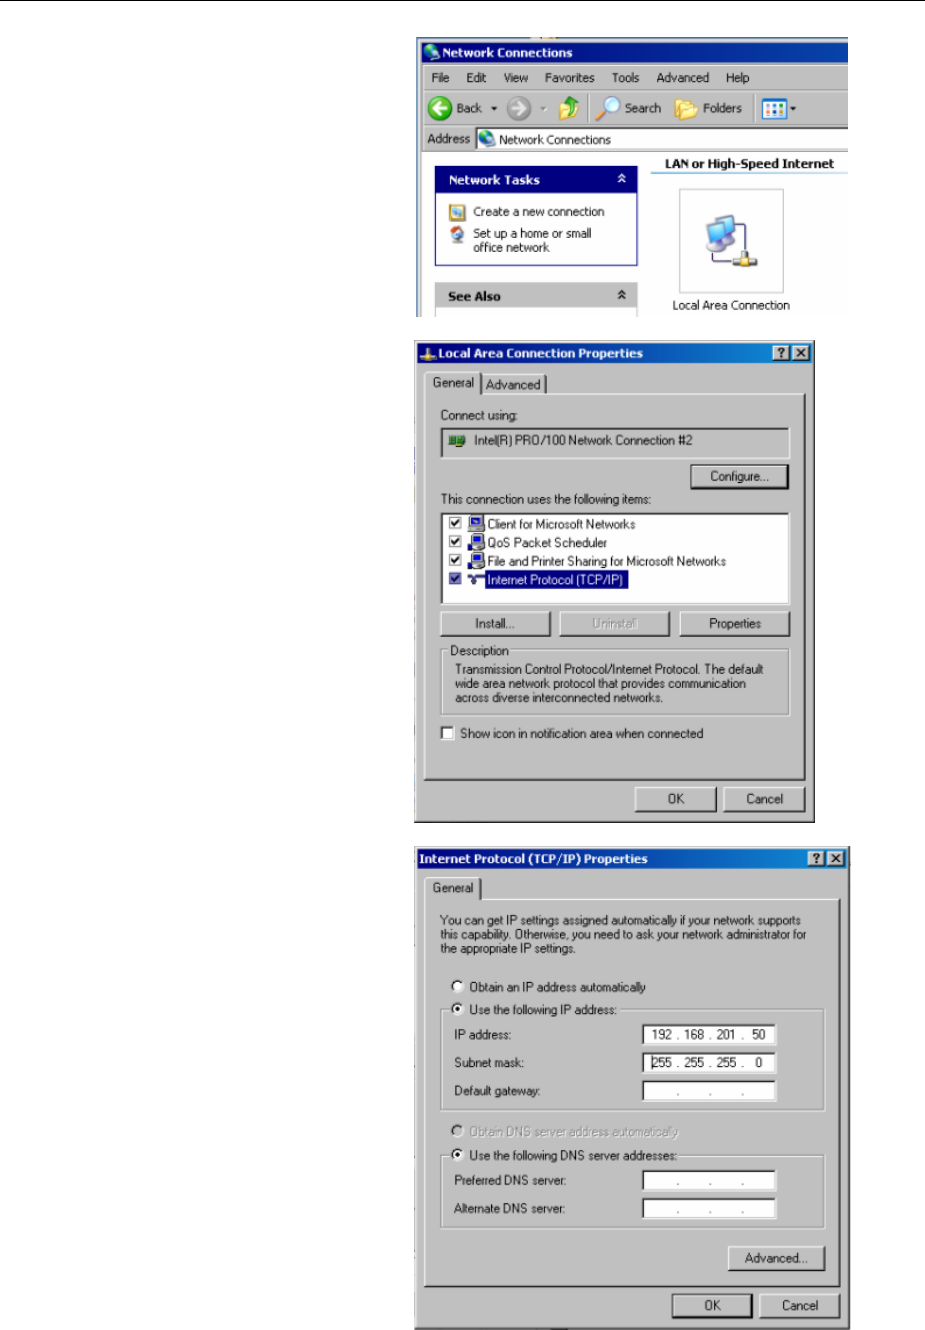
R&S UPV Connecting the R&S UPV to a Network (LAN)
1146.2078.62 1.39 E-5
3. In the Network Connections menu,
right-click Local Area Connection
and then click the Properties
button.
4. On the General tab, select Internet
Protocol (TCP/IP) in the field This
connection uses the following
items: and then click the Properties
button.
5. In the Internet Protocol (TCP/IP)
Properties menu, enter the IP
address in the Use the following IP
address: field (all data can be
accessed by the network
administrator). Terminate the entry
in all menus with OK.

Connecting the R&S UPV to a Network (LAN) R&S UPV
1146.2078.62 1.40 E-5
Querying the Computer Name
1. Click Start – Settings – Control Panel: Performance and Maintenance.
2. Click System and select the Computer Name tab in the menu.
The computer name is displayed under Full Computer Name:. The name can be changed in the
Change submenu.

R&S UPV Connecting the R&S UPV to a Network (LAN)
1146.2078.62 1.41 E-5
Accessing Directories in the Network
Access to network drives depends on access rights and whether the drives in question have been
enabled. The complete integration of the R&S UPV in a large network with the necessary assignment of
rights is highly complex and normally performed by a network administrator.
Accessing the hard disk of a computer connected to the network from the R&S UPV is, however,
relatively easy. The directory which the R&S UPV is to access simply has to be enabled on the remote
computer. This directory is then accessed from the R&S UPV using a WindowsXPsearch function.
This procedure is also of importance for a point-to-point connection, for instance in order to start a
firmware update for which the files have been stored on the hard disk of the remote computer.
Note:
Both the computer and the audio analyzer must have a computer name and an IP address (see the
section "Configuring the R&S UPV for Network Operation")
Enabling the desired directory on the remote computer
Note:
The menu name may deviate from the name specified in the operating sequence, depending on the
language and on the operating system used on the computer.
1. On the computer, select the directory to be enabled in Windows Explorer and right-click to call up
the Properties menu.
2. In the Sharing panel, activate the Share this folder tick box.
3. Write down the name of the computer (see the section "Querying the Computer Name").
Accessing the enabled directory from the R&S UPV
1. Press the Windows key to call up the Start menu.
2. In the Search menu, select Computers or People and then AComputer on the Network.
3. Enter the name of the computer under Which Computer you are looking for? and start the search
by pressing Enter.
The name of the computer is given as the search result.
4. Click the computer name. The enabled directory is displayed and the files stored there can be used
in the R&S UPV.
Note:
If a user name and password are requested when you click the computer, the login name and password
used on the computer must be entered.
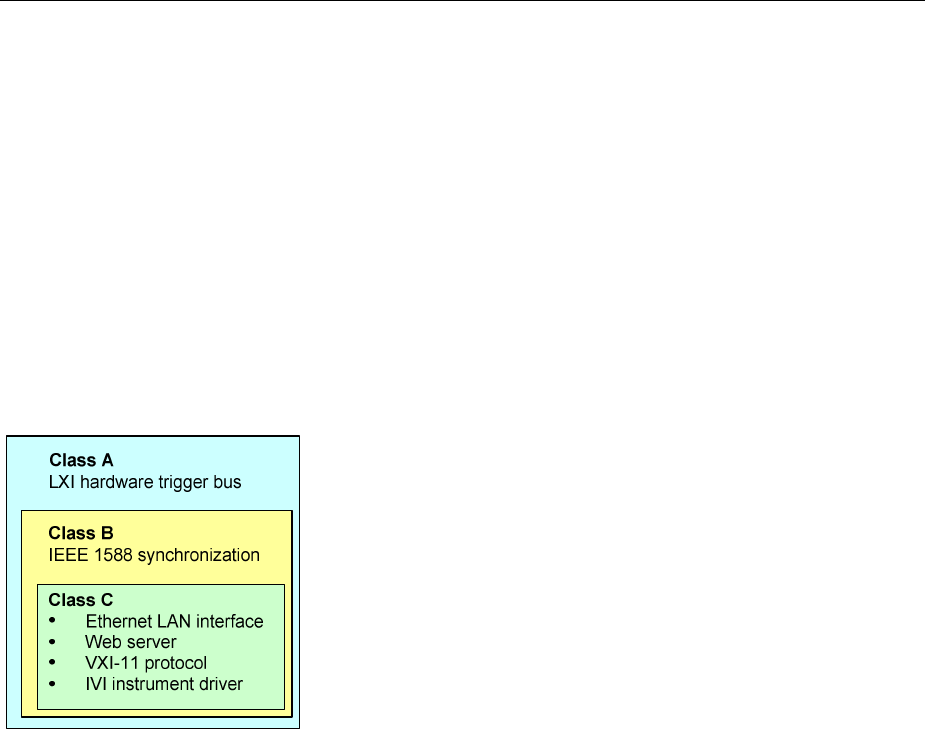
Connecting the R&S UPV to a Network (LAN) R&S UPV
1146.2078.62 1.42 E-5
Configuration via LXI (R&S UPV66)
LAN eXtensions for Instrumentation (LXI) is an instrumentation platform for measuring instruments and
test systems that is based on standard Ethernet technology. LXI is intended to be the LAN-based
successor to GPIB, combining the advantages of Ethernet with the simplicity and familiarity of GPIB.
This standard provides a new way for configuring virtual front panel instruments by using a network and
aWeb interface. The main tool for this configuration method is a browser, such as Microsoft Internet
Explorer, but it is also possible to use other browsers such as Firefox or Netscape.
LXI classes and LXI functionality
LXI-compliant instruments are divided into three classes, A, B and C, with the functionality of the
classes hierarchically based one upon the other:
•Class C instruments are characterized by a common LAN implementation, including an ICMP ping
responder for diagnostics. The instruments can be configured via a web browser; a LAN Configuration
Initialize (LCI) mechanism resets the LAN configuration. The LXI class C instruments shall also support
automatic detection in a LAN via the VXI-11 discovery protocol and programming by means of IVI drivers.
•Class B adds IEEE 1588 Precision Time Protocol (PTP) and peer-to-peer communication to the
base class. IEEE 1588 allows all instruments on the same network to automatically synchronize to
the most accurate clock available and then provide time stamps or time-based synchronization
signals to all instruments with exceptional accuracy.
•Class A instruments are additionally equipped with the eight-channel hardware trigger bus (LVDS
interface) defined in the LXI standard.
Instruments of classes A and B can generate and receive software triggers via LAN messages and
communicate with each other without involving the controller.
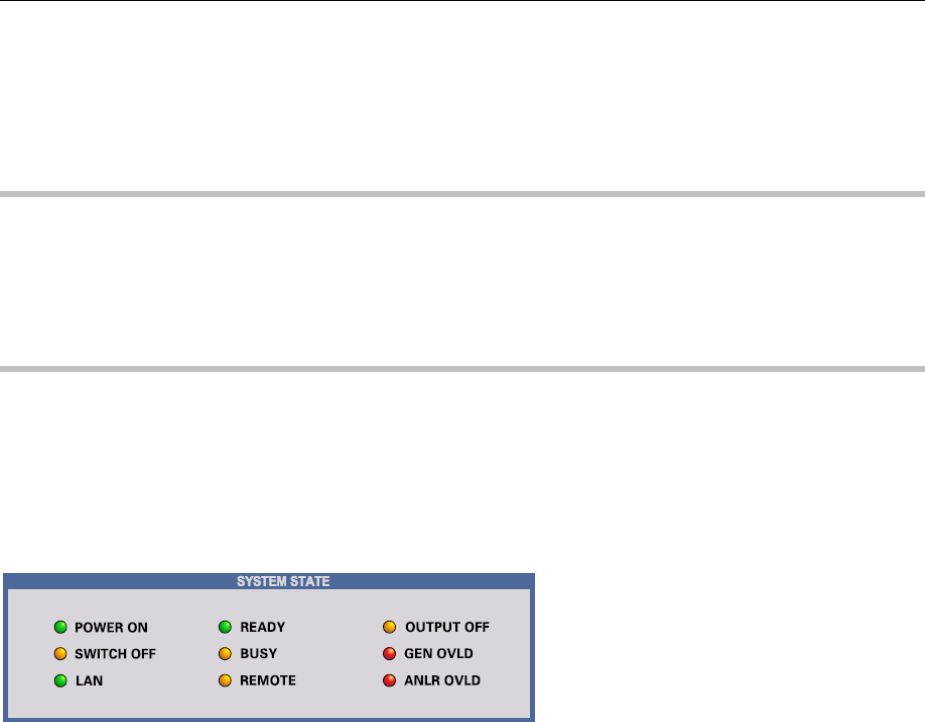
R&S UPV Connecting the R&S UPV to a Network (LAN)
1146.2078.62 1.43 E-5
The R&S UPV66 complies with LXI class C. In addition to the general class C features described
above, it provides the following LXI-related functionality:
•Integrated display of the current instrument settings
•Possibility of remote controlling the instrument within the WEB browser.
Note:
LXI is only available as a standard feature with the R&S UPV66, but it can also be retrofitted to the
R&S UPV if necessary.
The LXI functionality for R&S UPV requires a Windows XP operating system with service pack 2, which
may not yet be installed on older instruments. In this case please contact your Rohde & Schwarz
service representative. The version of the operating system can be checked in the General menu of the
Instrument Properties dialog.
LXI LAN Indicator
The LAN Indicator at the front panel of the R&S UPV66 always gives an information about the
accessibility of the instrument via LAN. The indicator lights in green color and has three states.
LAN Indicator is OFF
The instrument has no valid IP address. This may happen on one of following reasons: 1) the
device is configured with DHCP but no DHCP router present, 2) the device is configured
manually and has a IP address conflict, 3) the device lost a DHCP configured IP address and
switched to Auto IP.
This state is called "error state" and normally can be resolved by the LCI mechanism (LAN
reset). This mechanism also is required by the standard and can be invoked with the "LAN
RESET" button on the rear side of the instrument. Please refer to the section "Description of the
Rear Panel"in the same chapter for further details.
LAN Indicator is ON
The instrument has a valid IP address and is reachable via TCP/IP.
LAN Indicator flashes
The instrument is in the "Device Indicator" state initiated by the WEB interface. This state is
required by the standard and is used for finding instruments in racks. Please refer to the section
"LXI Browser Interface" for further details.

Connecting the R&S UPV to a Network (LAN) R&S UPV
1146.2078.62 1.44 E-5
LXI Default State of Network Settings
After an LCI (LAN reset) the instrument automatically reboots and starts up with following LAN settings:
Parameter Value
Hostname RSUPV66-<serial number>
Description Audio Analyzer
TCP/IP Mode DHCP + Auto IP Address
Dynamic DNS Enabled
ICMP Ping Enabled
Negotiation Auto Detect
VXI-11 Discovery Enabled
Password for LAN Configuration LxiWebIfc
Tip:
For information about the LXI standard refer to the LXI website at http://www.lxistandard.org. See also
"News from Rohde & Schwarz, article 2006/II - 190".
LXI Browser Interface
The only information necessary for performing configuration via the LXI/Web interface is the name of
the instrument (which means its Windows name) in networks that operate with DHCP enabled, or its IP
address in networks that operate with manual network configuration. In rare cases where neither one of
these names is known, it is also possible to derive the IP address from the MAC address, which is
printed on the rear panel of the instrument.
The instrument's LXI browser interface works correctly with all W3C compliant browsers. Typing the
instrument's host name or IP address in the address field of the browser on your PC, e.g.
http://rsupv66-100002 or http://10.113.10.203
opens the Instrument Home Page (welcome page).The instrument name is always RSUPV66-xxxxxx
for the R&S UPV66, where “xxxxxx” stands for the six-digit serial number of the instrument.
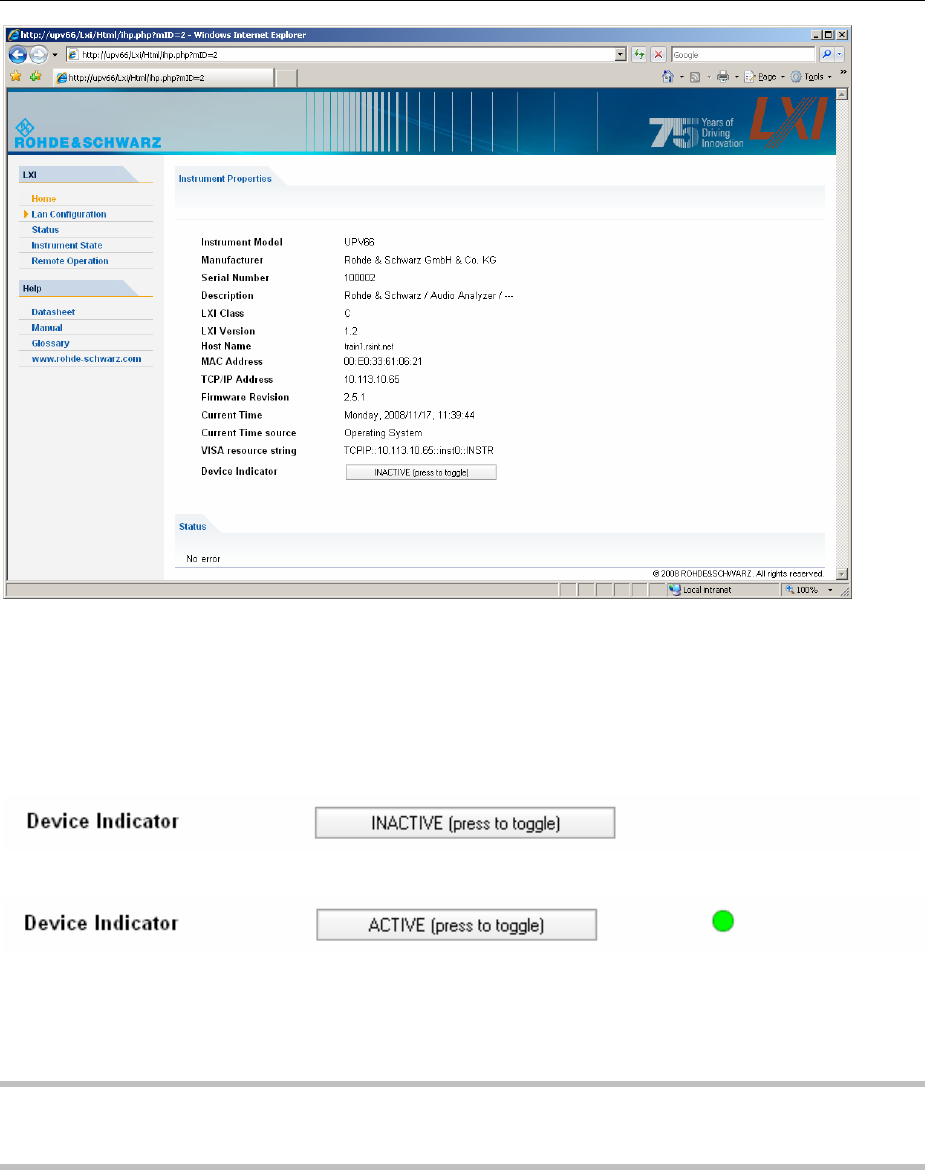
R&S UPV Connecting the R&S UPV to a Network (LAN)
1146.2078.62 1.45 E-5
The instrument home page shows all important information in a compact form. This includes the MAC
address and the IP address, which is often assigned dynamically, as well as the full resource string for
VISA remote control (see Chapter 5, Remote Control via LAN Interface).
The LAN indicator on the instrument will blink if Device Indicator is set to ACTIVE. Pressing the
INACTIVE (press to toggle) button alternately enables and disables the Device Indicator function. It
can be used to quickly identify an instrument that is mounted together with several other instruments of
the same type, such as in a 19" rack.
Pressing ACTIVE (press to toggle) disables the blinking function.
Anavigation panel is displayed on the left-hand side of the window, with a link to the important LAN
Configuration page. This page of the LXI Web configuration website enables extensive configuration
of all important LAN parameters, which is necessary because the configuration steps mentioned in the
next sections cannot be performed as described with a virtual front panel instrument.
Note:
Changing the LAN configuration is password-protected. The password reads LxiWebIfc (notice upper
and lower case characters). This password cannot be changed in the current firmware version.
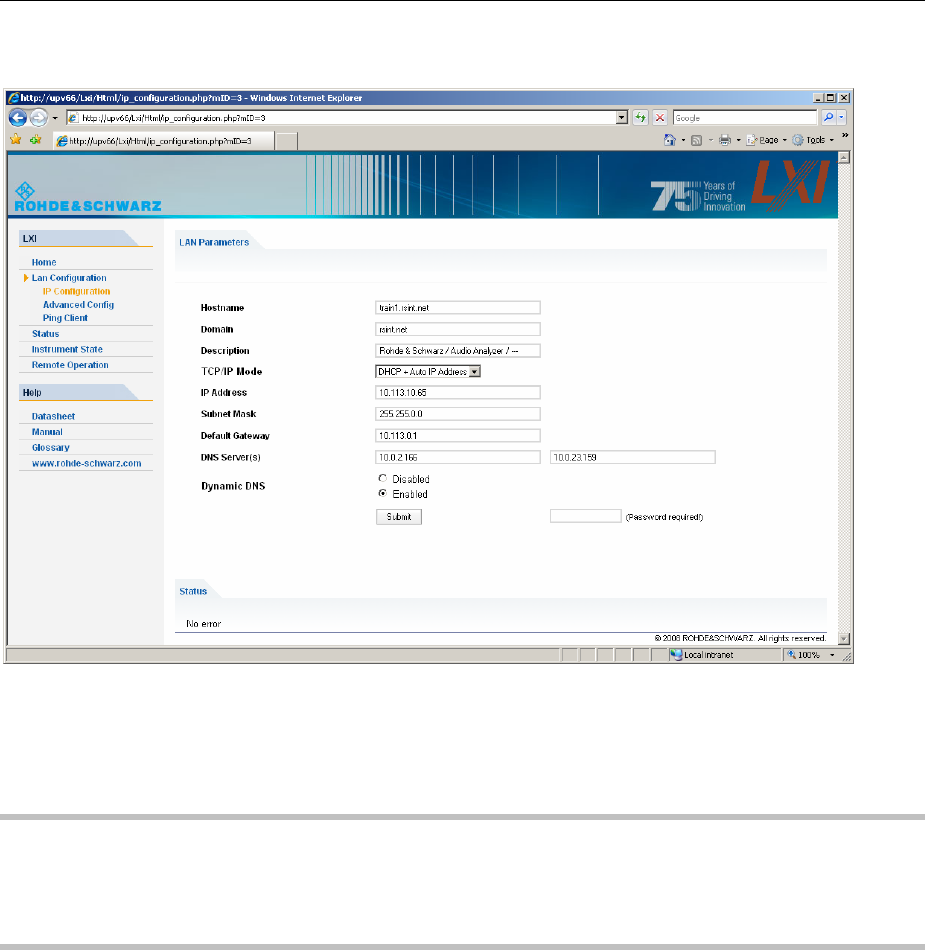
Connecting the R&S UPV to a Network (LAN) R&S UPV
1146.2078.62 1.46 E-5
IP Configuration
TCP/IP Mode
Determines whether DHCP is enabled or disabled. The IP Address, Subnet Mask, Default
Gateway and DNS Server configuration fields are only enabled if DHCP is disabled. Consult the
network administrator if it is necessary to modify these settings or any other settings.
Note:
Switching from DHCP enabled mode to manual configuration mode may trigger an instrument restart
when the new setting is confirmed (depends on the configuration). If incorrect network configuration
settings have been entered, LAN RESET on the rear panel of the instrument must be used to restore
access to the Web interface.
IP Address
Allows the IP address of the instrument to be modified if DHCP is disabled.
Subnet Mask, Default Gateway
It is sometimes necessary to change these settings from the displayed default values when
DHCP is disabled. Consult the network administrator for the proper values if it is necessary to
modify these settings.
DNS Server
This is the IP address of the domain name server of the network segment. Consult the network
administrator if it is necessary to modify this setting when operating with DHCP disabled.
Dynamic DNS
Allows different DNS servers to be addressed in succession. Consult the network administrator
if it is necessary to modify this setting when operating with DHCP disabled.
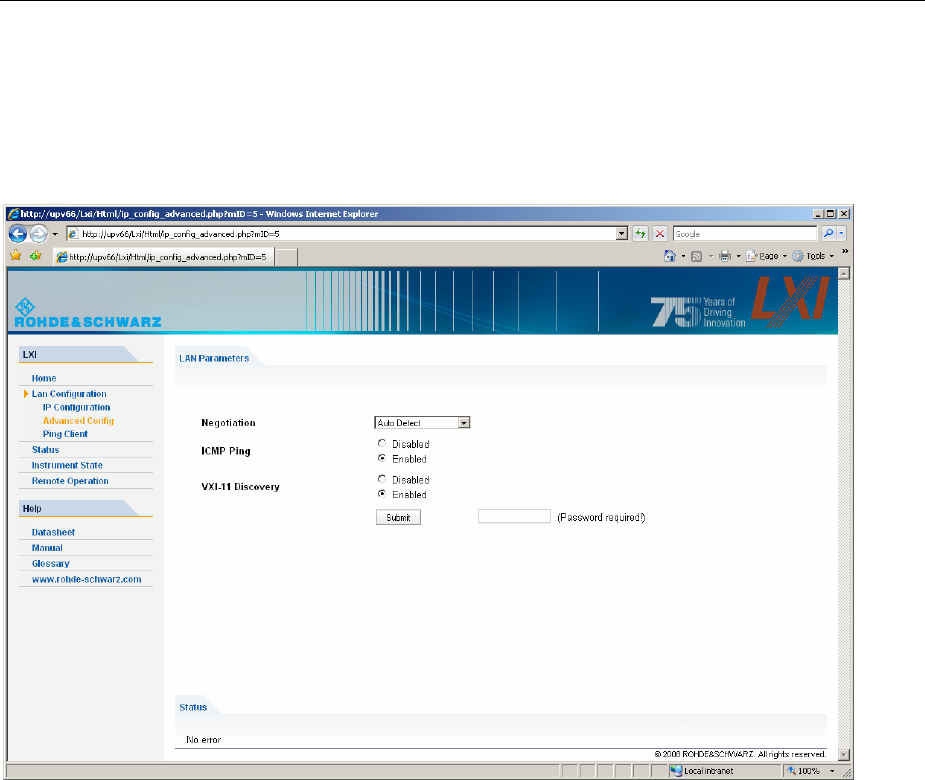
R&S UPV Connecting the R&S UPV to a Network (LAN)
1146.2078.62 1.47 E-5
Advanced LAN Configuration
Advanced LAN Configuration provides LAN settings that are not declared mandatory by the LXI
standard.
These advanced parameters should only be modified by experienced users.
Negotiation
The Negotiation configuration field provides different Ethernet speed and duplex mode settings.
In general, the Auto Detect mode is sufficient.
ICMP Ping
ICMP Ping must be enabled to use the ping utility.
VXI-11 Discovery
Enables or prevents discovering the instrument via the “VXI-11 Discovery” protocol, which is a
protocol jointly developed by National Instruments and VISA for searching for devices on aLAN.
VXI-11 is the protocol that is used for discovery of the instrument in the LAN. According to the
standard, LXI devices must use VXI-11 to provide a discovery mechanism; other additional
discovery mechanisms are permitted.
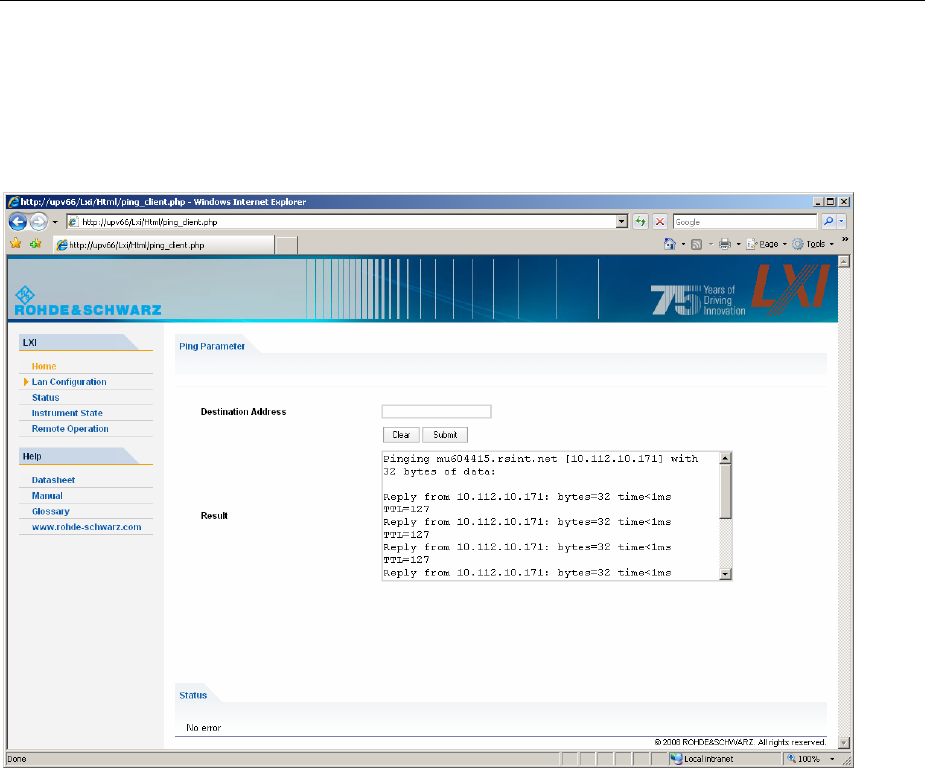
Connecting the R&S UPV to a Network (LAN) R&S UPV
1146.2078.62 1.48 E-5
Ping Client
Ping is a utility that verifies the connection between the LXI-compliant instrument and another device.
The ping command uses the ICMP echo request and echo reply packets to determine whether the LAN
connection is functional. Ping is useful for diagnosing IP network or router failures.
The ping utility is not password-protected.
To initiate a ping between the LXI-compliant instrument and a second connected device,
1. Enable ICMP Ping on the Advanced LAN Configuration page (enabled after an LCI).
2. Enter the IP address of the second device without the ping command and without any further
parameters into the Destination Address field (e.g. 10.113.10.203).
3. Click Submit.

R&S UPV Connecting the R&S UPV to a Network (LAN)
1146.2078.62 1.49 E-5
Configuration for Manual Remote Operation
The R&S UPV can be operated manually from an external computer via a network connection. The
Windows program Remote Desktop Connection is used for operation. Manual remote operation is
described in Chapter 3 in the section "Manual Remote Operation".
Manual remote operation of the audio analyzer is only possible if
-the Windows 95 operating system or higher and the Remote Desktop Connection program are
installed on the external computer and a LAN interface is configured for the network
-the audio analyzer and the computer are connected via the LAN (see "Configuring the R&S UPV for
Network Operation")
-the Remote Desktop Connection program is activated on the audio analyzer (see "Activating the
Remote Desktop Connection program at the R&S UPV")
-the R&S UPV data has been entered in the Remote Desktop Connection program on the external
computer (IP address or computer name of the R&S UPV in the network (see "Querying the
Computer Name"))
-the user has logged on at the R&S UPV from the external computer by entering the correct user
name (instrument) and the correct password (instrument) (see "Starting manual remote operation at
the external computer")
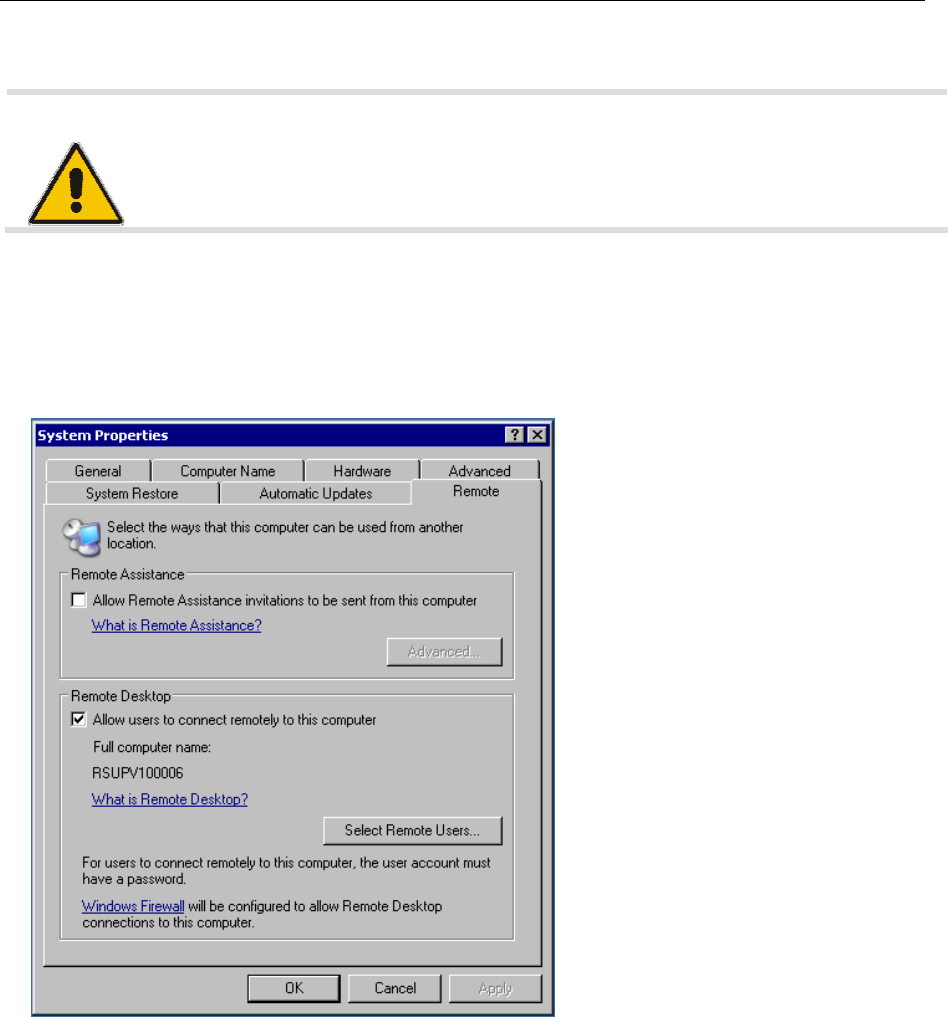
Connecting the R&S UPV to a Network (LAN) R&S UPV
1146.2078.62 1.50 E-5
Activating the Remote Desktop Connection program at the R&S UPV
ATTENTION Risk of unauthorized access!
After activation of the remote desktop, any user on the network who knows the
computer name and login data of the audio analyzer can access this R&S UPV.
1. Click Start – Settings – Control Panel: Performance and Maintenance.
2. Click System and select the Remote tab in the menu.
3. Activate the Allow users to connect remotely to this computer tick box.
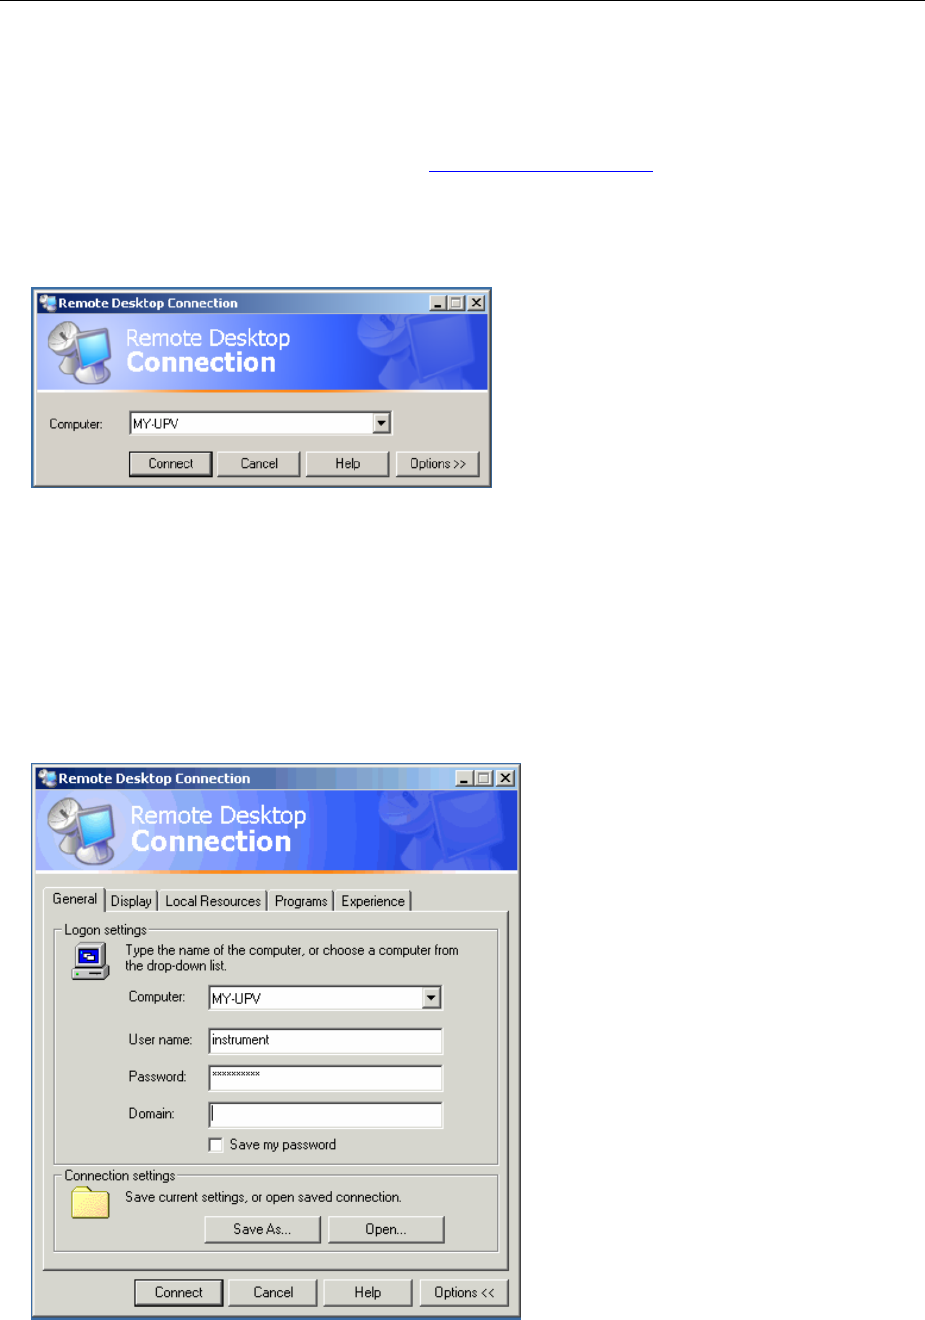
R&S UPV Connecting the R&S UPV to a Network (LAN)
1146.2078.62 1.51 E-5
Starting manual remote operation at the external computer
The Remote Desktop Connection program is already installed in the WindowsXPoperating system.
For all other Windows operating systems from Windows95and higher, the program can be
downloaded free-of-charge from the Internet (http://www.microsoft.com).It can be loaded onto any
external computer by following the instructions also provided on the Internet.
1. If necessary, install the Remote Desktop Connection program on the external computer.
2. Start the program in the Windows menu Start - All Programs - Accessories - Communications.
Before the program can be used for the first time, the instrument and user ID of the R&S UPV must be
entered on the external computer. The instrument ID (i.e. the computer name of the R&S UPV)
identifies the R&S UPV in the network. Every R&S UPV is supplied together with a computer name
which can be used for manual remote operation. Querying the computer name is described in the
section "Querying the Computer Name".
The user ID is necessary as it authorizes access to the R&S UPV. It is preset on the R&S UPV and is
instrument for both the user name and the password. No entry is needed in the Domain field.
3. Enter the instrument and user ID on the General tab of the extended Remote Desktop Connection
menu (called up by pressing the Options>> button).
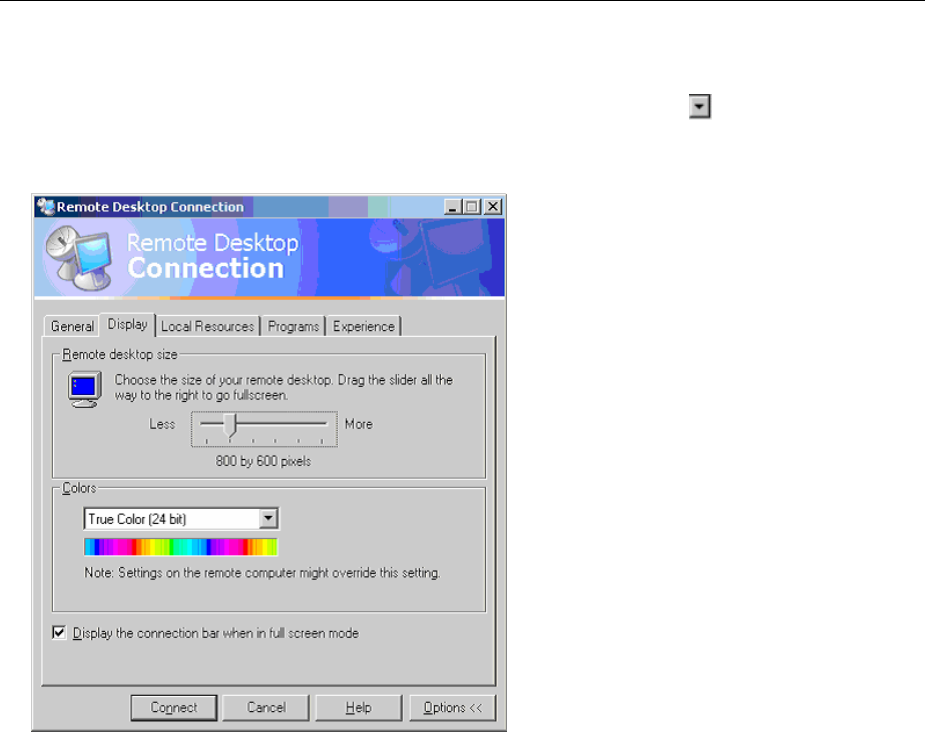
Connecting the R&S UPV to a Network (LAN) R&S UPV
1146.2078.62 1.52 E-5
4. The login data can be stored with the Save As button.
If it is stored as the file default.rdp,the connection to the R&S UPV is offered by default when the
program is started. If it is stored under a different name, the setting for the connection to the
R&S UPV is offered in the selection list which is displayed by pressing the button in the
Computer: field.
5. Set the display resolution of the R&S UPV screen to 800 x 600 on the Display tab.
6. Set up the connection by pressing the Connect button.
When the connection has been set up, the audio analyzer screen appears on the external computer.
Operation is possible with the mouse and/or the keyboard. Keys on the front panel which do not
have a direct equivalent on the keyboard can be replaced by key combinations (see the table in
Chapter 3 in the section "Operation Using an External PC Keyboard").
If several R&S UPVs are to be manually operated from one computer by means of manual remote
control, a separate Remote Desktop Control window must be opened for each R&S UPV. This is
possible by repeatedly starting the program on the external computer.

R&S UPV Firmware update
1146.2078.62 1.53 E-5
Firmware update
The R&S UPV firmware is supplied in a file named "setupxxxRelease.exe". The sequence of digits for
"xxx" consists of the main version number followed by the subversion number, revision number and
build number.
The initial installation and firmware updates are carried out by starting this EXE file. By doing this you
start an Installer program which automatically checks which type of installation is necessary:
Main installation The Installer displays what it has found out about the environment into which the
firmware will be installed and how much disk space is needed. It then takes you
through the "Setup Wizard". You normally just click the "Next" button to go from
step to step.
Major update The Installer detects that the installed firmware is too old for a minor update to be
carried out. It therefore displays a message asking you to uninstall the old
software completely.
Minor update The Installer simply displays a short prompt asking whether you wish to update
the firmware. The rest is performed automatically.
The two most common problems that can occur when installing the software (or during a major update)
are these:
a) At the very start, before the progress bar appears, the progress window displays the message
"Installshield is preparing installscript“. Occasionally you then see an error message and
installation is canceled.
This problem can usually be solved by restarting Windows and carrying out the firmware
installation again.
b) When the Installer has installed the firmware and the progress bar is full, the progress window
displays the message "Removing Backup Files", "Registering Components" or "Publishing Product
Information". Here, too, it occasionally happens that an error message is followed by a second
message, and the firmware is then not installed.
This problem can sometimes be solved by restarting Windows and carrying out the setup again. If
the error occurs again, this may be for two reasons:
1) Installation of the front panel driver went wrong. In this case, you must install it using the
Windows Wizard; the necessary INF file is called c:\UPV\fpnl_wdm.inf. You should now
reinstall the firmware.
2) The installation of additional Windows settings went wrong. In this case, execute the files
"C:\UPV\ScanFirmwareVersions.exe" and "C:\UPV\SetReg.exe" one after the other. You
should now reinstall the firmware.
If neither of these steps is successful, the instrument needs to go in for service (or the Windows
image program must be reloaded).
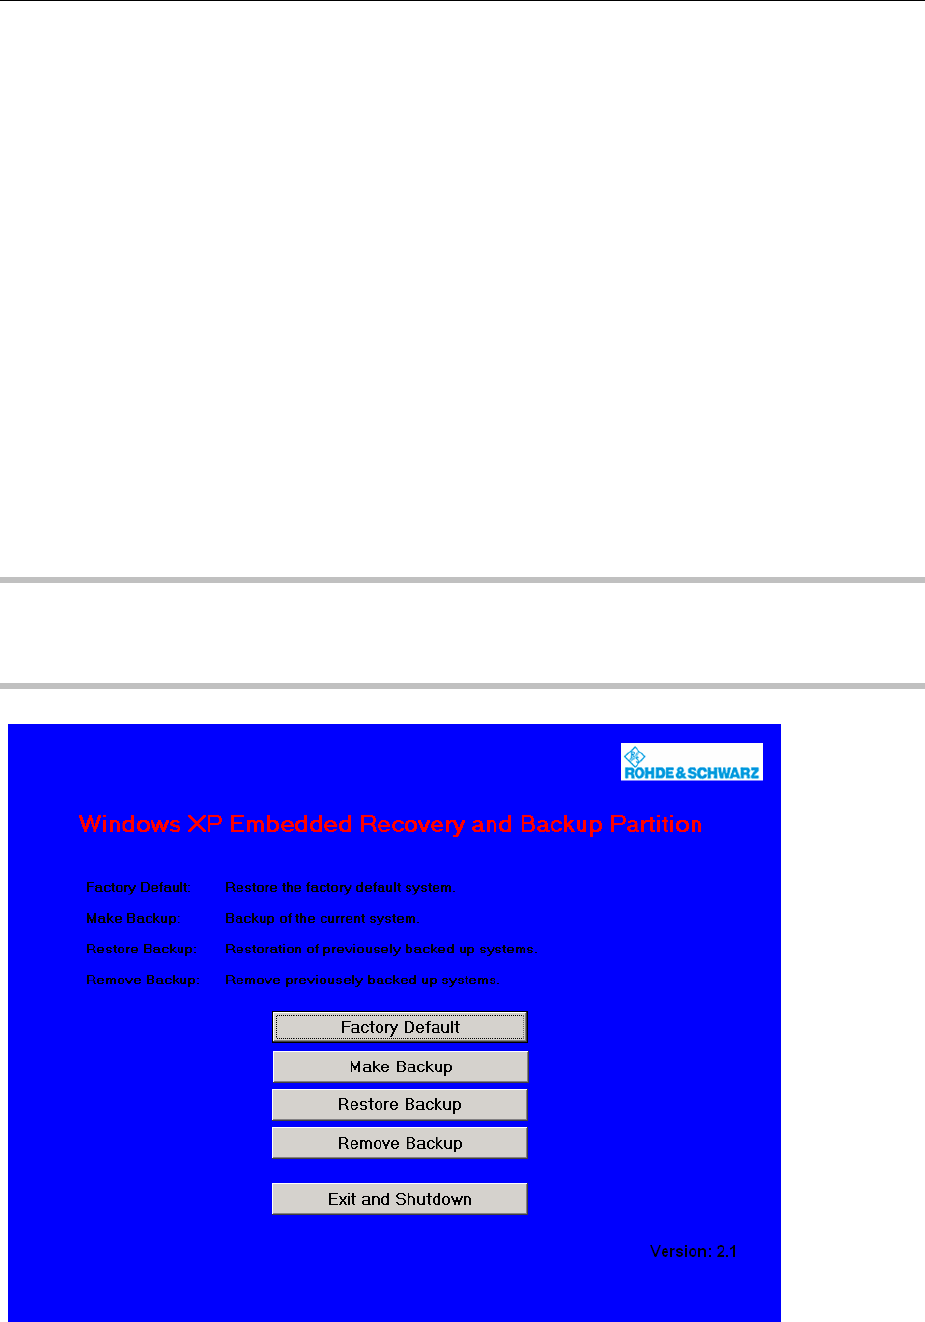
Windows XP Recovery and Backup R&S UPV
1146.2078.62 1.54 E-5
Windows XP Recovery and Backup
The R&S UPV provides an invisible backup and recovery partition. A backup of the factory system
partition (C:\) is stored per default and can be recovered in case of a system crash.
In addition, backups of up to 5 firmware versions can be stored on this partition. It is e.g. possible to
backup the current system partition prior to a firmware update or to provide different system
configurations for different environments.
When recovered, the system partition (C:\) is deleted, formatted and then newly written. The data
partition (D:\) is not affected.
Call the Windows XP Recovery and Backup Partition Menu
1. Switch the instrument off and on again
2. In the boot menu select line Backup/Recovery with the up/down cursors.
3. Open Windows XP Recovery and Backup Partition menu by pressing the rotary knob.
The menu shows the available selections for the recovery and backup partition:
Note:
If several backups are already stored on the disk, the remaining space might not be sufficient for an
additional backup. In this case a warning is indicated in the Windows XP Recovery and Backup
Partition menu and the user is requested to remove an old backup before making a new one.
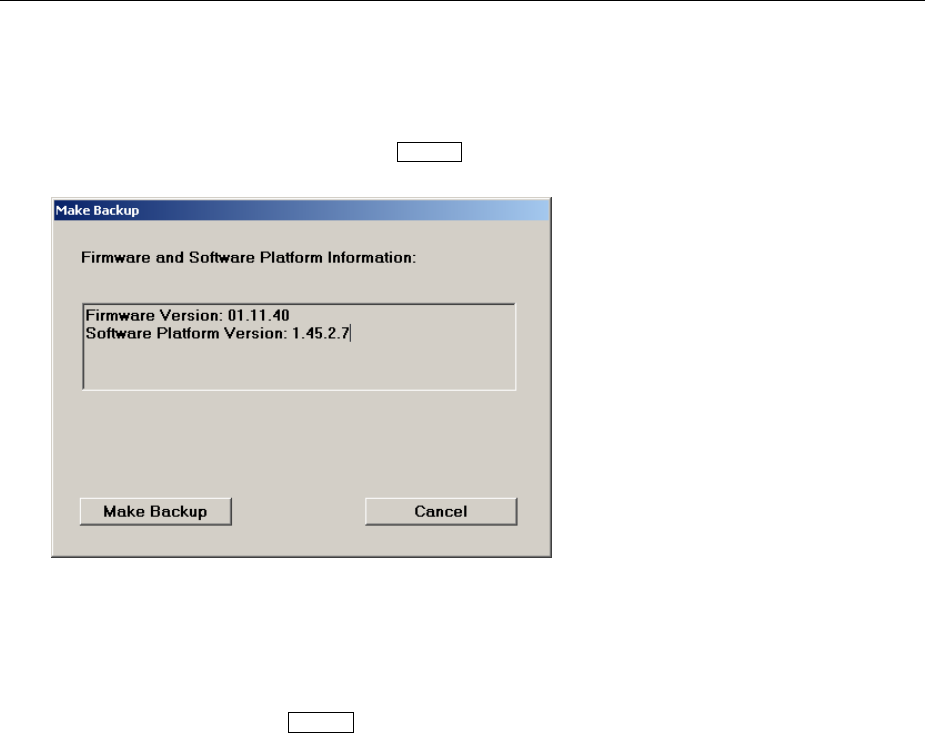
R&S UPV Windows XP Recovery and Backup
1146.2078.62 1.55 E-5
Backup Current System Partition
1. Select the Make Backup button in the Windows XP Recovery and Backup Partition menu with the
rotary knob.
2.Open the Make Backup menu with the ENTER key.
The menu shows the current versions of the firmware and the software platform.
3. Select the Make Backup button with the rotary knob.
4. Start the backup with the ENTER key.
After the backup, the Windows XP Recovery and Backup Partition menu appears again.
5. Select the Exit and Shutdown button with the rotary knob.
6. Exit and shut down with the ENTER key.
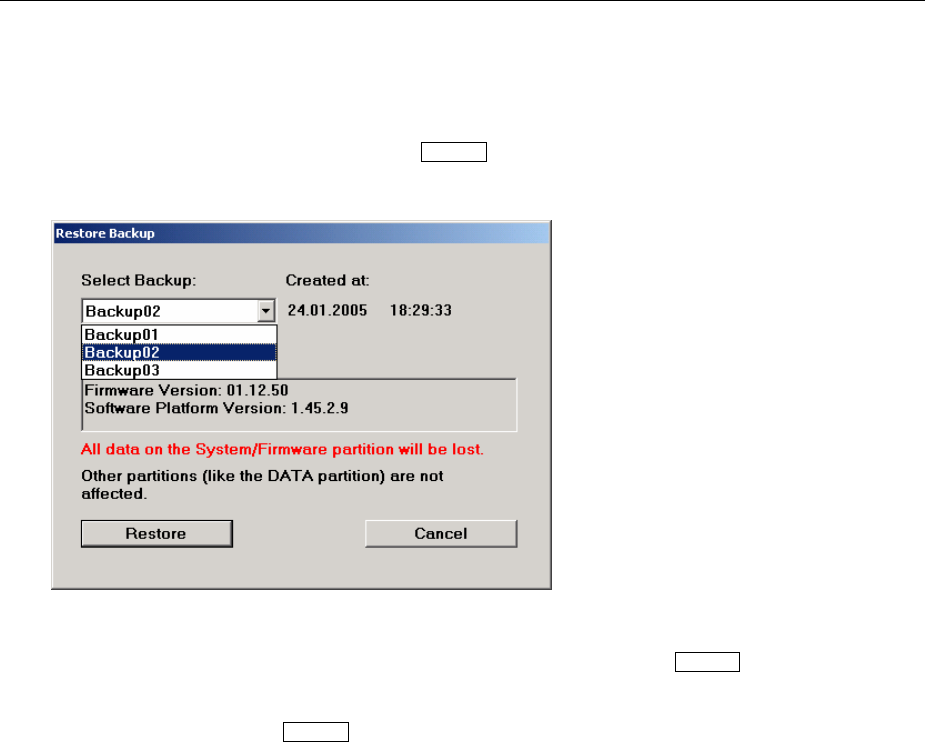
Windows XP Recovery and Backup R&S UPV
1146.2078.62 1.56 E-5
Recover Selected Version of System Partition
1. Select the Restore Backup button in the Windows XP Recovery and Backup Partition menu
with the rotary knob to recover a selected version of the system partition.
2.Open the Restore Backup menu with the ENTER key.
The menu shows the versions of the firmware and the software platform of the backup displayed in
the Select Backup window.
3. Select the Select Backup window with the rotary knob.
4. Select the backup to be restored with the up/down cursor keys and the ENTER key.
5. Select the Restore button with the rotary knob.
6. Start the recovery with the ENTER key.
The script that is performed during recovery is displayed.
After the recovery, the instrument is shut down and switched off.
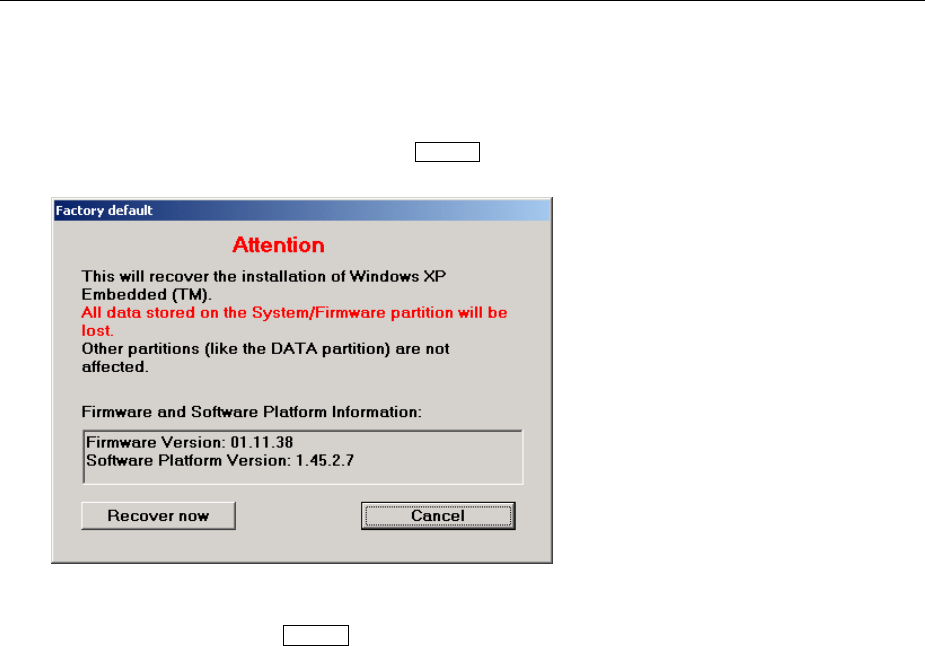
R&S UPV Windows XP Recovery and Backup
1146.2078.62 1.57 E-5
Recover Factory Default
1. Select the Factory Default button in the Windows XP Recovery and Backup Partition menu
with the rotary knob to recover the factory version of the system partition.
2.Open the Factory Default menu with the ENTER key.
The menu shows the versions of the firmware and the software platform on delivery.
3. Select the Recover now button with the rotary knob.
4. Start the recovery with the ENTER key.
The script that is performed during recovery is displayed.
After the recovery, the instrument is shut down and switched off.
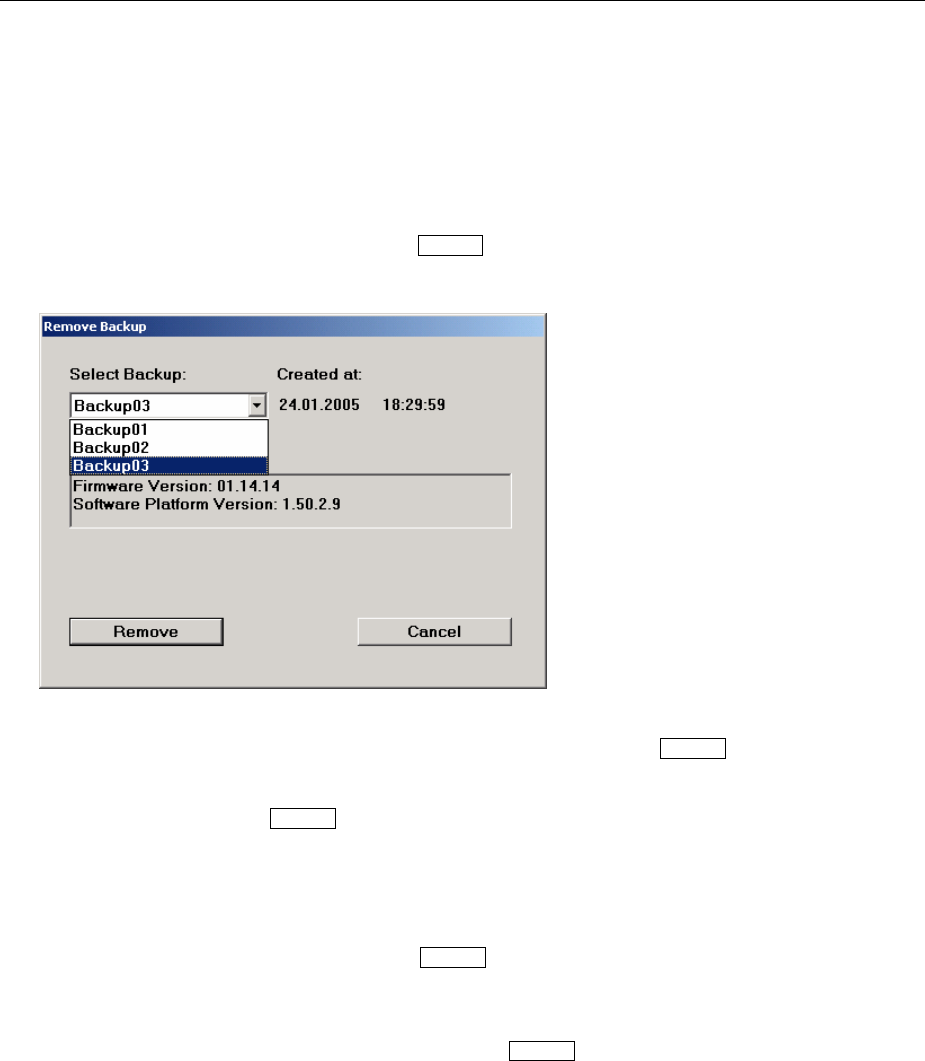
Windows XP Recovery and Backup R&S UPV
1146.2078.62 1.58 E-5
Delete Backups
Up to five backups in addition to the factory default can be stored on the recovery partition. To provide
space for new backups, it might be necessary to remove older backups. The factory default cannot be
deleted.
1. Select Remove Backup button in the Windows XP Recovery and Backup Partition menu with
the rotary knob to delete a selected backup.
2. Open the Remove Backup menu with the ENTER key.
The menu shows the versions of the firmware and the software platform of the backup displayed in
the Select Backup window.
3. Select the Select Backup window with the rotary knob.
4. Select the backup to be deleted with the up/down cursor keys and the ENTER key.
5. Select the Remove button with the rotary knob.
6. Start the deletion with the ENTER key.
After the deletion, the instrument returns to the Remove Backup menu as long as backups are still
available. If the last backup is deleted, the Windows XP Recovery and Backup Partition menu
opens again.
7. Select the Cancel button with the rotary knob.
8. Close the Remove Backup menu with the ENTER key.
The Windows XP Recovery and Backup Partition menu opens.
9. Select the Exit and Shutdown button with the rotary knob.
10. Exit the menu and shut down the instrument with the ENTER key.

R&S UPV Contents - Getting Started
1146.2078.62 I-2.1 E-5
Contents - Chapter 2 "Getting Started"
2Getting Started..............................................................................................................................2.1
Introduction - Getting Started .........................................................................................................2.1
Important Information for Measurements......................................................................................2.2
Maximum Output Voltage of the R&S UPV Generator ............................................................2.2
Rapid Deactivation of the Outputs ...........................................................................................2.2
Avoiding Hum Loops ................................................................................................................2.3
Help System .............................................................................................................................2.3
Brief Introduction to the R&S UPV Operating Concept................................................................2.4
Windows User Interface and Control Elements .......................................................................2.4
Display......................................................................................................................................2.4
Panels and Display Windows...................................................................................................2.6
Structure of the Panels and Display Windows .........................................................................2.7
Basic Rules of Operation .........................................................................................................2.9
Function Selection and Value Entry.........................................................................................2.9
Help function ..........................................................................................................................2.15
Measurement Functions and Displaying Measurement Results............................................2.16
Numeric display field....................................................................................................2.17
Combi display ..............................................................................................................2.17
Configuring the numeric display field and combi display.............................................2.18
Graphical windows.......................................................................................................2.19
Introduction to Instrument Operation Using Examples .............................................................2.20
Measuring the Frequency Response of an Amplifier, Equalizer, etc .....................................2.20
Step 1: Loading the factory settings ............................................................................2.20
Step 2: Setting the required generator signal ..............................................................2.20
Step 3: Selecting the required measurement ..............................................................2.23
Step 4: Displaying the measurement results – Numeric measurement display ..........2.25
Step 5: Starting the sweep...........................................................................................2.25
Step 6: Displaying the measurement results – Graphical windows.............................2.26
Step 7: Using a relative unit in the graphical window ..................................................2.28
Step 8: Saving the instrument setup............................................................................2.30
Measuring the Harmonic Distortion (THD+N) of a DUT.........................................................2.31
Step 1: Loading the factory settings ............................................................................2.31
Step 2: Setting the required generator signal ..............................................................2.31
Step 3: Selecting the required measurement ..............................................................2.32
Step 4: Displaying the measurement results – Numeric measurement display ..........2.33
Step 5: Displaying the spectrum in the graphical window ...........................................2.33
Step 6: Evaluating the graphical display with markers and cursors ............................2.36
Step 7: Saving the instrument setup............................................................................2.37
Loading Predefined Instrument Setups .......................................................................................2.38

R&S UPV Introduction - Getting Started
1146.2078.62 2.1 E-5
2Getting Started
Introduction - Getting Started
This chapter describes the manual operation of the R&S UPV audio analyzer. The information in this
chapter also largely applies to the R&S UPV66 (which was primarily designed for use in systems)
provided that an external monitor, keyboard, and mouse are connected to the instrument.
The Audio Analyzer R&S UPV is able to perform virtually all measurements occurring in the audio
world, from frequency response measurements through distortion factor and spectral displays to the
analysis of digital data streams. Several measurement functions can be carried out and displayed at the
same time, whereby in the audio frequency range the measurements are performed as real two-
channel functions.
The R&S UPV performs all measurements using digital signal processing. Here, analog signals to be
measured are first subjected to complex preprocessing on analog measurement modules before they
are digitalized and fed to the digital measurement routines.
This concept offers numerous advantages, for example:
•The measurement methods at the analog and digital interfaces are identical.
•The measurement functions are available at both the analog and the digital interfaces.
•Operation at the analog and digital interfaces is the same.
The many available options mean that the Audio Analyzer R&S UPV can be adapted to perform a wide
variety of different tasks. The basic version of the instrument has analog audio interfaces. A number of
other measurement functions are also available, but only after the appropriate options have been
installed (see the data sheet for details).
This chapter, "Getting Started", only describes the functions available in the basic version of the Audio
Analyzer R&S UPV.
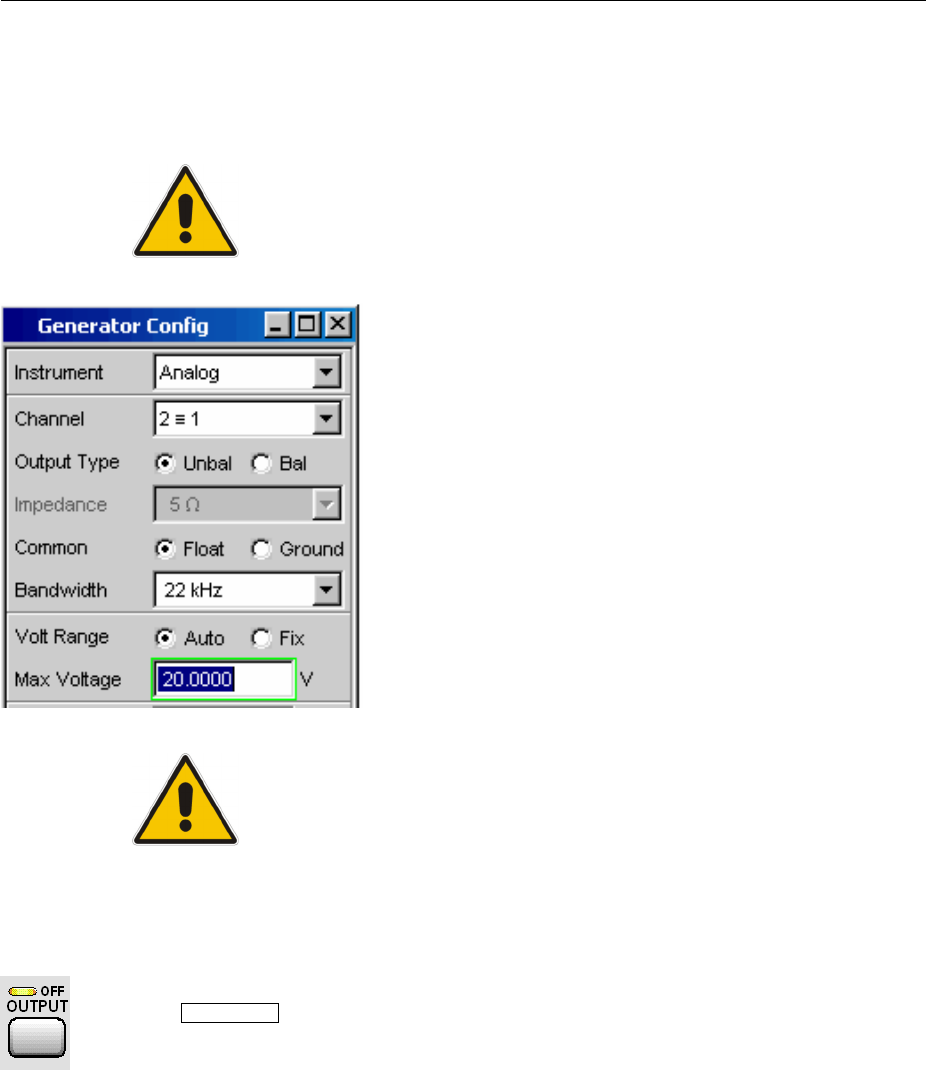
Important Information for Measurements R&S UPV
1146.2078.62 2.2 E-5
Important Information for Measurements
Maximum Output Voltage of the R&S UPV Generator
The generator of the Audio Analyzer R&S UPV can generate
analog output voltages with an RMS of up to 20 V. These
levels can damage or even destroy sensitive input circuits.
In the Generator Config panel, it is possible to limit the
analog output voltage. For measurements on sensitive
circuits, it is advisable to set an appropriately low value in the
Max Voltage field; this value then applies to all analog
output signals, irrespective of the signal shape. The
maximum voltage is not exceeded even in the case of
changes made using the rotary knob.
The section "Function Selection and Value Entry" from
page 2.9 onwards and Chapter 3 "Manual Operation" explain
how to set these values and change values using the rotary
knob.
The pulse level of the digital audio signals can be up to 8 V.
Although the risk of destruction is generally much smaller
than for analog circuits, care must still be taken when making
settings for digital circuit energization.
Rapid Deactivation of the Outputs
In the event of faults, all outputs of the R&S UPV can be deactivated by pressing the
Output OFF key. The key affects all audio outputs, i.e. for both analog and digital
audio signals.
The deactivated lines can only be reactivated by pressing the OUTPUT OFF key
again.
The status of the key is indicated by an LED. Illumination of the LED means
OUTPUT OFF.
More detailed information on this key can be found in Chapter 3 in the section "Rapid
Deactivation of the Outputs".
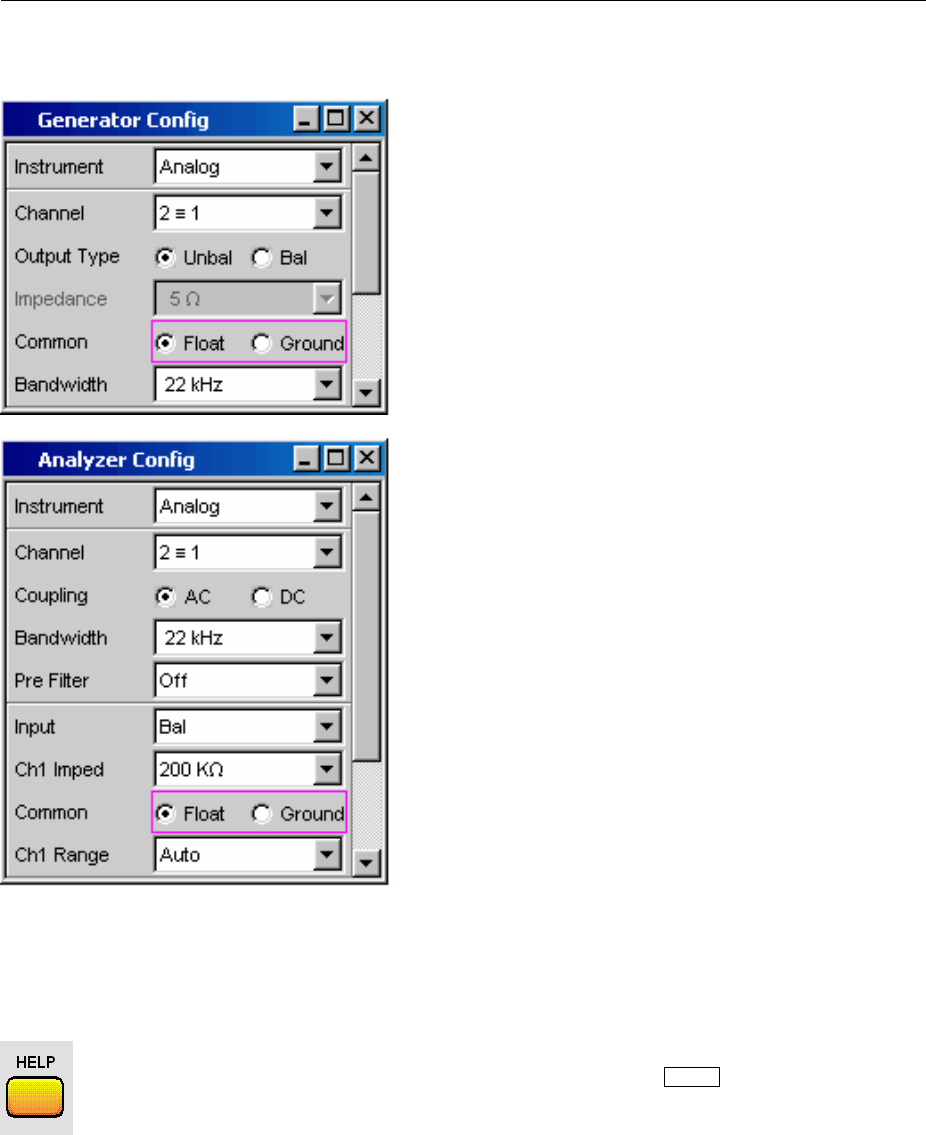
R&S UPV Important Information for Measurements
1146.2078.62 2.3 E-5
Avoiding Hum Loops
It is generally known in audio engineering that analog
circuits must always be set up in such a way that hum
signal pick-up is avoided. For this reason, it is important
that a ground connection (grounding contact) be provided
at only one point in the entire circuit.
Both the generator and the analyzer are configured as
floating devices in order to prevent an additional,
inadvertent ground connection via the Audio Analyzer
R&S UPV. The two Common fields of the
Generator Config and Analyzer Config panels are
factory-set to Float.
There are, however, some applications where the audio
circuit to be tested is set up without any ground
connection at all. It may be necessary to create a defined
ground connection especially if hum pick-up is suspected.
This can be done at the Audio Analyzer R&S UPV by
switching the Common field to Ground for either the
generator or the analyzer (depending on the application).
More detailed information on how to make these settings
can be found in this chapter in the section "Function
Selection and Value Entry" from page 2.9 onwards and in
Chapter 3 "Manual Operation".
Help System
The Audio Analyzer R&S UPV has a context-sensitive help system. If you have a
question while operating the instrument, pressing the HELP key opens a help page
containing information on the currently highlighted parameter field. From here it is
possible to move to other help pages using the contents list, the index, scroll arrows
and page-internal links.
More detailed information on this key can be found in Chapter 3 in the section "Help
System".

Brief Introduction to the R&S UPV Operating Concept R&S UPV
1146.2078.62 2.4 E-5
Brief Introduction to the R&S UPV Operating Concept
Windows User Interface and Control Elements
To provide the user with a familiar environment, operation is largely based on the Windows® user
interfaces. All panels, entry windows, etc are made up of known elements.
Operation follows the same basic rules which apply to other Windows® programs in use today. It is
assumed that the user is familiar with these basic rules. This information is therefore not given in detail
in this manual.
The R&S UPV can be operated via the front panel. Additional peripherals such as a mouse and
keyboard can be connected but are not essential requirements.
After being switched on, the instrument is in the same state as it was before it was switched off. This
applies to all setting parameters of the R&S UPV, including those not currently displayed on the screen.
The instrument is operated using function keys with permanently assigned functions, softkeys with
functions which vary according to the application, the rotary knob with integrated entry function, and the
display screen via which the panels are operated.
Operation using an external keyboard and mouse is also possible; this is explained in Chapter 3
"Manual Operation".
Selection frames or the highlighting of an entry field (dark background) indicate the current entry focus.
Entries can be made in the element with entry focus.
Display
The display is the central element for operating the R&S UPV. Both the instrument settings in the
various panels, and the measurement results are displayed here.
To make the various functions of the Audio Analyzer R&S UPV easier to operate, they are organized in
aseries of panels. The measurement results can be displayed as digital numeric values, data lists, in
analog bargraphs or in result graphics. The user can freely choose the number of panels and the
number of graphical windows to be shown in the display. The size of the windows can be changed
within wide limits, whereby the font size, scaling and so on are adapted automatically (depending on the
selected window). Panels and display windows can be activated by pressing the WINBAR key.
5display windows (or "screens") are provided so that the wealth of information can be better organized.
The direction keys are used to toggle between the individual screens.
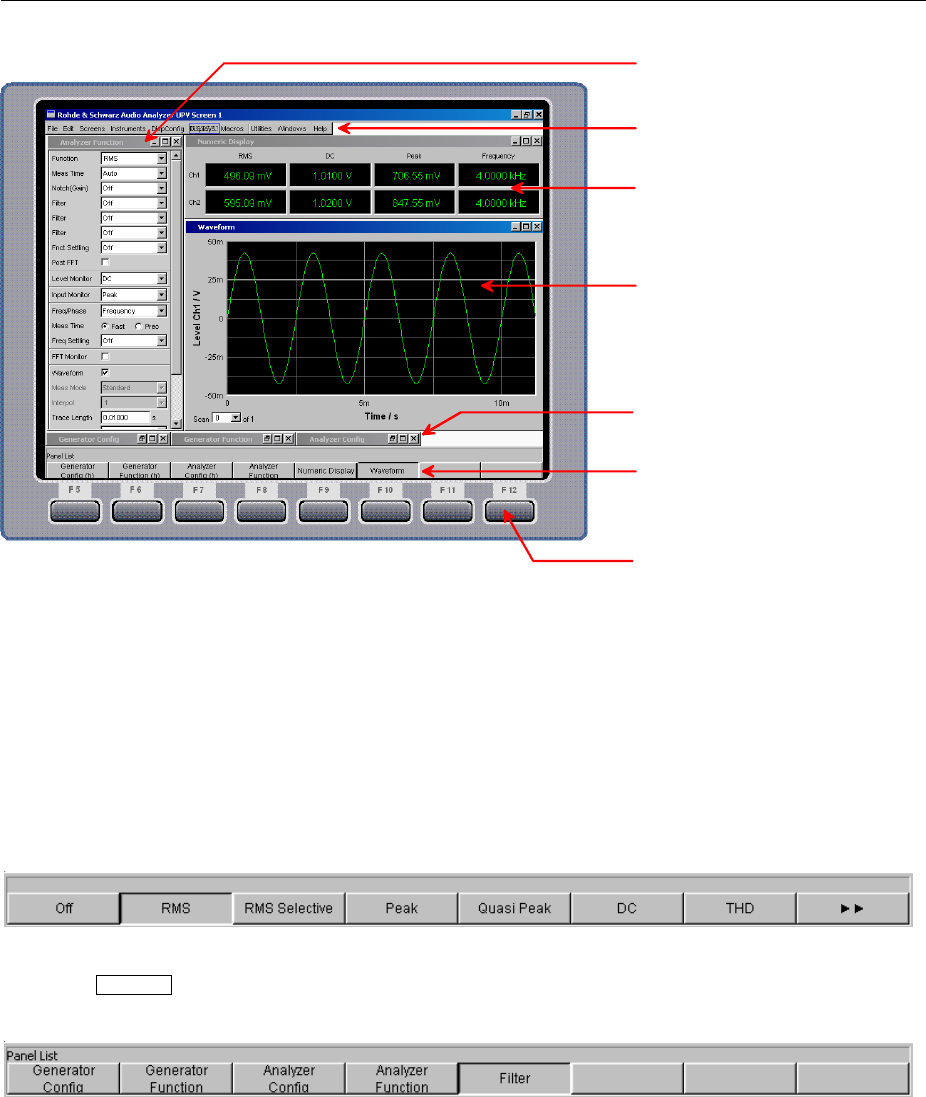
R&S UPV Brief Introduction to the R&S UPV Operating Concept
1146.2078.62 2.5 E-5
Panel
Menu bar
Numeric
display
Graphical
window
"Hidden"
Panels
WINBAR
Softkeys
Fig. 2-1 R&S UPV display with main elements
One of the two bars (either the softkey bar or the WINBAR) is always displayed at the bottom of the
screen.
In normal operating mode, the softkey bar is visible; it contains eight buttons which are assigned the
functions available in the selection windows of the panels. The softkeys underneath the buttons are
labeled with their assigned function; pressing the respective softkey permits rapid selection.
If there are more than 8 elements to choose from, the hidden elements in the selection list can be
displayed by pressing the last softkey containing the symbol or the first softkey containing the
symbol.
When the WINBAR key is pressed, the WINBAR appears in place of the softkey bar; this is indicated by
"Panel List" in the left-hand corner:
The labeled buttons show the names of all panels and graphical windows open in the current screen.
Pressing the associated softkey puts the focus on the corresponding panel / graphical window, i.e. it
becomes active. At the same time, the system returns to normal operating mode (i.e. the softkey bar).
Hidden panels (see "Panels and Display Windows")are also listed in the WINBAR. If a hidden panel is
selected, it is redisplayed on the screen with its previously set size and position; it simultaneously
receives the focus.

Brief Introduction to the R&S UPV Operating Concept R&S UPV
1146.2078.62 2.6 E-5
Panels and Display Windows
The Audio Analyzer R&S UPV distinguishes between the following panels and display windows:
•Panels used to make function settings
•Configuration panels used for configuring how the measurement values are to be displayed
•Numeric display fields for displaying the measurement values of the various measurement
functions
•Combi displays in which numeric measurement values can be supplemented by bargraphs
and limit monitoring
•Graphical windows in which measurement values are displayed in the form of diagrams
•Data lists in which the measurement values are listed in tabular form
Panels are opened on the currently displayed screen by activating the menu bar using the MENU key,
highlighting the Instruments or DispConfig button with the rotary knob or cursor keys, opening the
pulldown menu with the Enter key or rotary-knob click, and then highlighting the desired panel and
selecting it with a rotary-knob click.
Display windows are selected in the same way, except that they are listed under the Displays button.
Each panel and display window is a separate window which can be either closed, opened or hidden.
Panels / display windows are open if they are displayed on the currently visible screen. If the window is
minimized and moved to the bottom of the screen, it is referred to as being "hidden". In both cases, the
panel / window is assigned an entry in the WINBAR at the bottom of the display. Only one window on
the screen can be activated at any one time using the softkeys on the WINBAR (active windows are
identified by their blue title bar).
As soon as a panel / display window is active, it can be moved around on the screen. This is done in
the following way:
•Press the MODIFY key; the following softkeys then appear on the WINBAR:
After selecting the desired direction of movement using the appropriate softkey, the panel can be
moved / resized using the rotary knob.
The same panel / display window can be displayed in several screens at the same time. The display
characteristics can be different for each of the screens; the content is, however, always the same.

R&S UPV Brief Introduction to the R&S UPV Operating Concept
1146.2078.62 2.7 E-5
Structure of the Panels and Display Windows
The table below shows the panels of the Audio Analyzer R&S UPV as well as the main settings that can
be made in these panels (a detailed list of all panels together with the most important setting
parameters can be found at the end of Chapter 3 "Manual Operation"):
Panels which can be selected via the Instruments menu bar button:
Generator Config •Selection of instrument (analog or digital interfaces)
•Configuration of channels and bandwidths
•Reference values
Generator Function •Selection of test signals
•Sweep function
•Frequency and level settings
•Filter and equalizer
Analyzer Config •Selection of instrument (analog or digital interfaces)
•Configuration of channels and measurement bandwidth
•Start and trigger conditions
Analyzer Function •Selection of measurement functions
•Measurement speed and accuracy
•Activation of filter and equalizer
•Activation of Post-FFT
•Selection and settings for level monitor
•Selection and settings for input monitor
•Selection and settings for frequency, phase, group delay
measurement
•Selection and settings for FFT monitor
•Selection and settings for waveform monitor
Filter •Definition of filter properties
Auxiliaries •Settings for integrated loudspeaker and connected headphones
•Settings for the R&S UPV-U2 option (BNC audio monitoring outputs)
•Settings for auxiliary analog output
•Settings for trigger input and trigger output
Switcher Panel •Operation of one or more Audio Switchers R&S UPZ
Protocol Generator •Settings for the Digital Audio Protocol R&S UPV-K21

Brief Introduction to the R&S UPV Operating Concept R&S UPV
1146.2078.62 2.8 E-5
Panels which can be selected via the DispConfig menu bar button:
Function Config
Level Monitor
Config
Input Config
Freq Phase Config
These four panels contain settings for displaying measurement values
•in the numeric display fields
•in the associated combi displays
•and settings for limits, minimum values and maximum values
Sweep Graph Config
FFT Graph Config
Waveform Config
Bargraph Config
Up to four of each of these panels are available; they contain settings for
displaying measurement values in the graphical windows, e.g.
•one or two-channel display
•units, scaling, gridlines, etc
•evaluation of minimum values and maximum values
•entry of limit curves
•settings for cursors and markers
The measurement results of the Audio Analyzer R&S UPV are shown in the following display windows
(a detailed list of all panels together with the most important setting parameters can be found at the end
of Chapter 3 "Manual Operation"):
Numeric Display •Display of measurement results for measurement function selected in
Analyzer Function panel
•Display of measurement results for level monitor and/or input monitor
selected in Analyzer Function panel
•Frequency measurement results, or frequency measurement result and
phase / group delay measurement result
Funct Ch1…2
Lev Mon Ch1…2
Input Ch1…2
Freq Ch1
Freq / Phase
These combi displays are extensions to the numeric measurement displays;
they show the respective numeric value plus the following additional
features:
•Analog bargraphs
•Limits
•Minimum and maximum values
Sweep Graph 1…4
FFT Graph 1…2
Waveform
Bargraph 1…2
•Up to four of each of these display windows can be opened (depending
on the window type) in order to display the scans of the different
measurements
•Graphical display shows one or two channels
•The measurement results are displayed in the way defined in the
associated configuration panel
Dig Analyzer Protocol
•The analyzed data of the digital audio protocol (R&S UPV-K21 option) is
displayed here
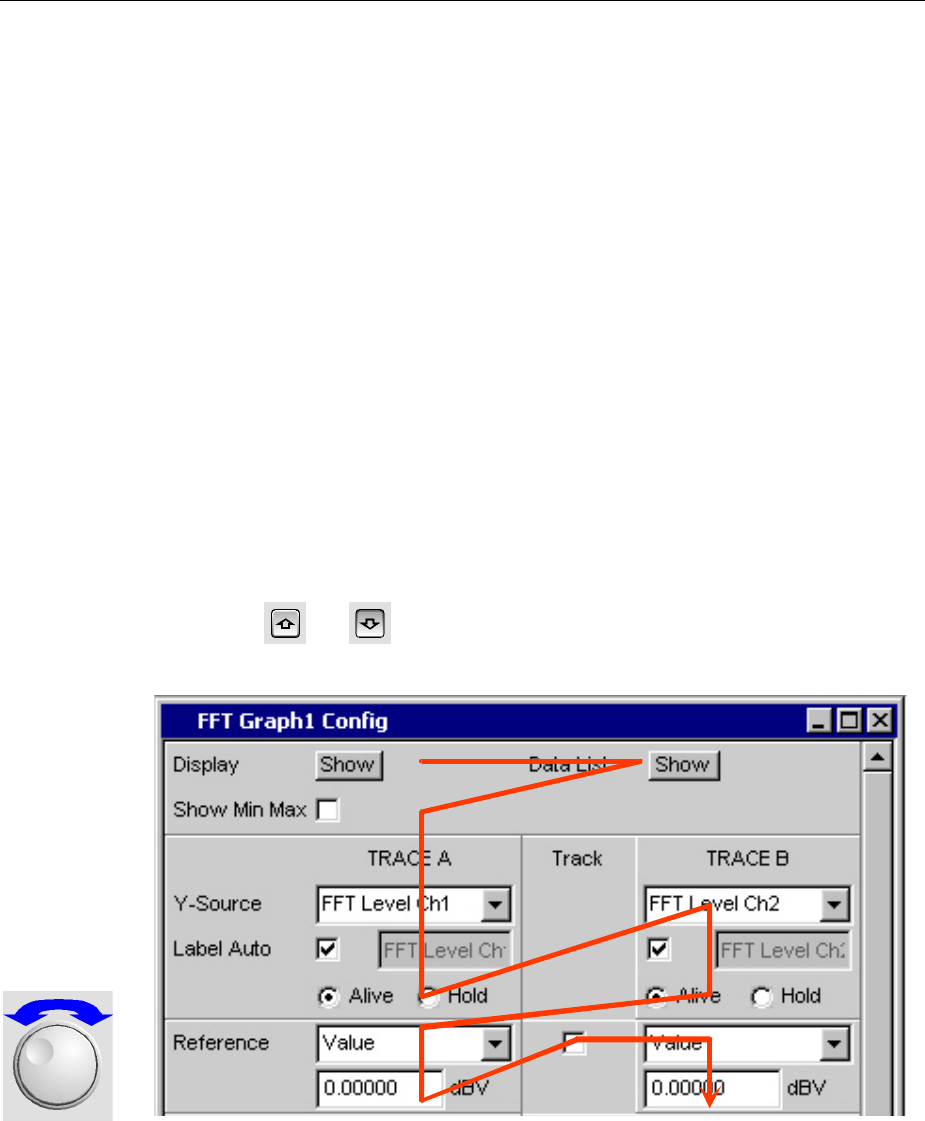
R&S UPV Brief Introduction to the R&S UPV Operating Concept
1146.2078.62 2.9 E-5
Basic Rules of Operation
The following basic rules are intended to simplify operation of the Audio Analyzer R&S UPV:
•Operating sequence in the panels: top to bottom
Changes to parameters of individual menu items may affect the selection or value range of menu
items which are usually located further down (they affect the selection or value range in fields
located higher up in only a few exceptional cases).
•Sequence: generator – analyzer – measurement value display
Many setting parameters can be used in other panels. For example, the sweep frequency settings
can automatically be adopted as the scaling for the graph.
Observing this sequence saves the user having to enter parameters twice.
Function Selection and Value Entry
All functions and parameters are set in the panels.
The rotary wheel is used for navigating inside the panels. Turning the rotary knob clockwise moves the
cursor down or to the right. Here the cursor first moves to the right inside a field, then down through the
current group, then jumps over to the right-hand column, down again to the end of the group from
where the cursor then moves to the left-hand column of the following group, and so on.
Alternatively, the cursor keys and can also be used for navigation.
Panels can only be operated if they have the focus (indicated by the blue title bar).
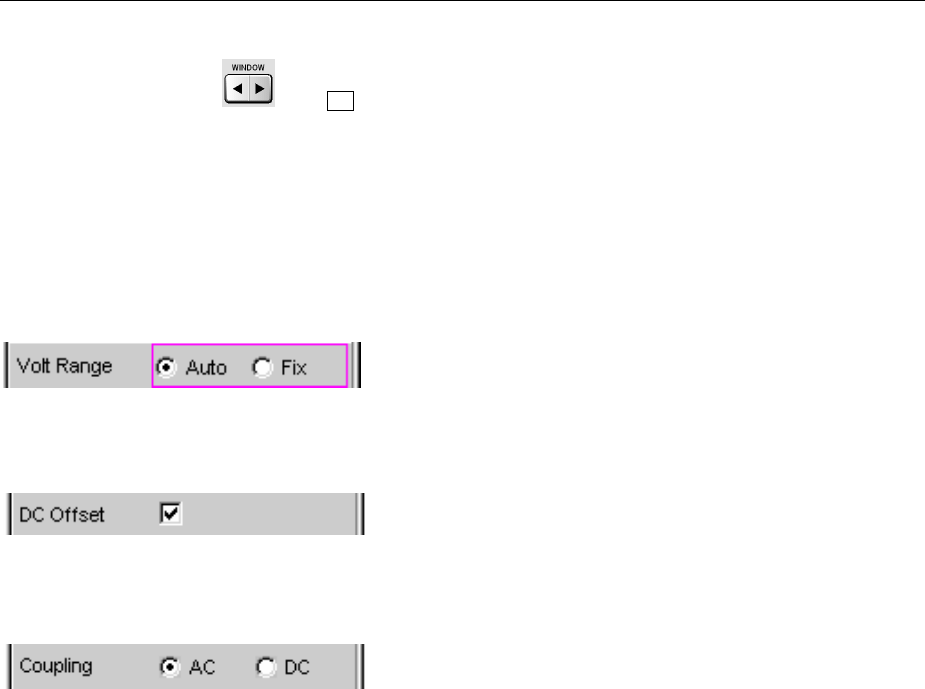
Brief Introduction to the R&S UPV Operating Concept R&S UPV
1146.2078.62 2.10 E-5
The simplest way of changing from one panel to another in the case of operation via the front panel is
using the direction keys .The key switches from panel to panel in the sequence in which the
panels were opened. Changing to a different open (or to a hidden) panel is also possible using the
WINBAR (see the section "Display" on page 2.4).
Before settings can be made in a panel, the relevant parameter field must be highlighted, i.e. it must
have the focus. This is indicated by a selection frame around the entry field.
The settings are made in the following ways:
Highlighting control elements
Acontrol element is activated by shifting the focus to this
element using the rotary knob. The entry focus is indicated
by a blue, green or magenta border.
Activating/deactivating functions
Atick box is used to activate or deactivate functions. If the
tick box is activated (checkmark), the assigned setting is
selected / enabled.
Toggling functions
Radio buttons are used for functions which can be toggled
between two settings. A black dot in the appropriate button
indicates the selected status.
Only one of the two options can be active at any one time.
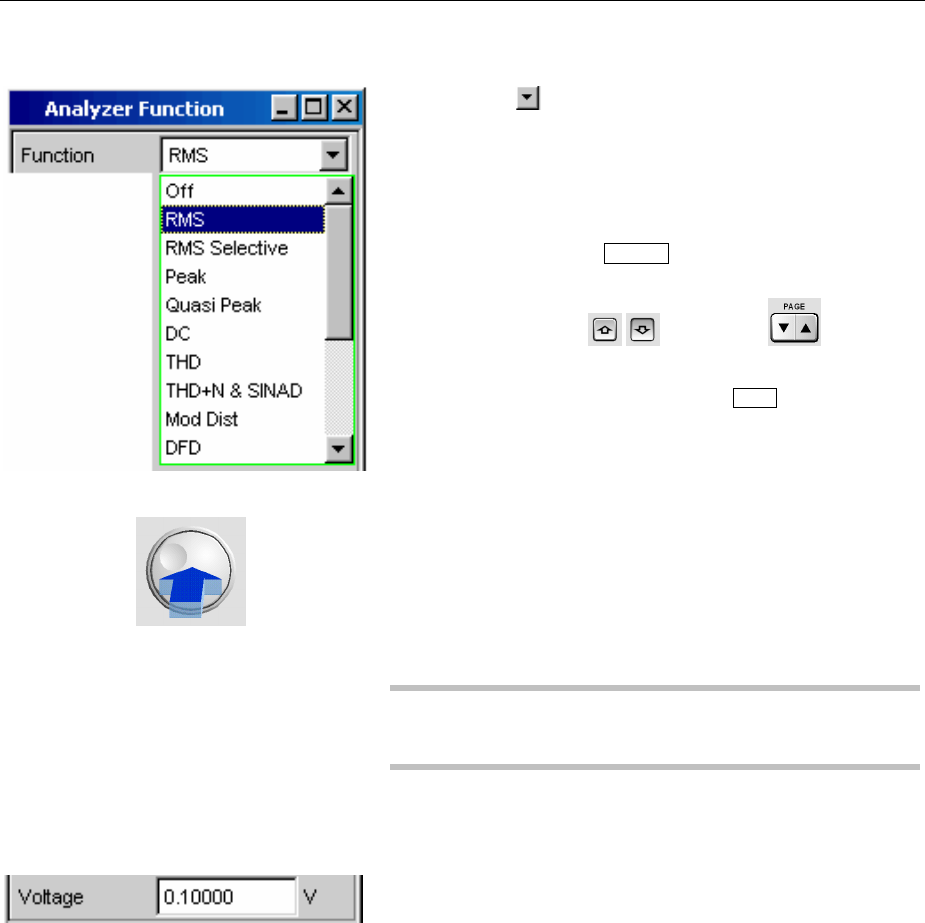
R&S UPV Brief Introduction to the R&S UPV Operating Concept
1146.2078.62 2.11 E-5
Selecting a parameter
Actuating the button opens a selection field. As soon as
this parameter field has the focus, a list for selecting the
available parameters can be opened with a rotary-knob
click. The fold-down parameter list is displayed below the
selection field.
Parameters are selected by highlighting the desired item
and confirming with the ENTER key or rotary-knob click.
Items in the parameter list are highlighted using the rotary
knob, the cursor keys or the keys .
The parameter list can be quit without adopting the
highlighted parameter by pressing the ESC key.
If the list is longer than the displayed window, a scroll bar
is available.
Alternatively, parameters can also be selected using the
softkeys.
Note:
The contents of the parameter lists are not fixed but vary
depending on other settings selected.
Numeric value entries
Numeric values can be entered or edited in these fields.
The following applies: Entries outside the possible value
range are not accepted; an audible warning is issued and
the entry is changed to its permissible minimum or
maximum value. The possible value range is displayed
above the softkey bar.
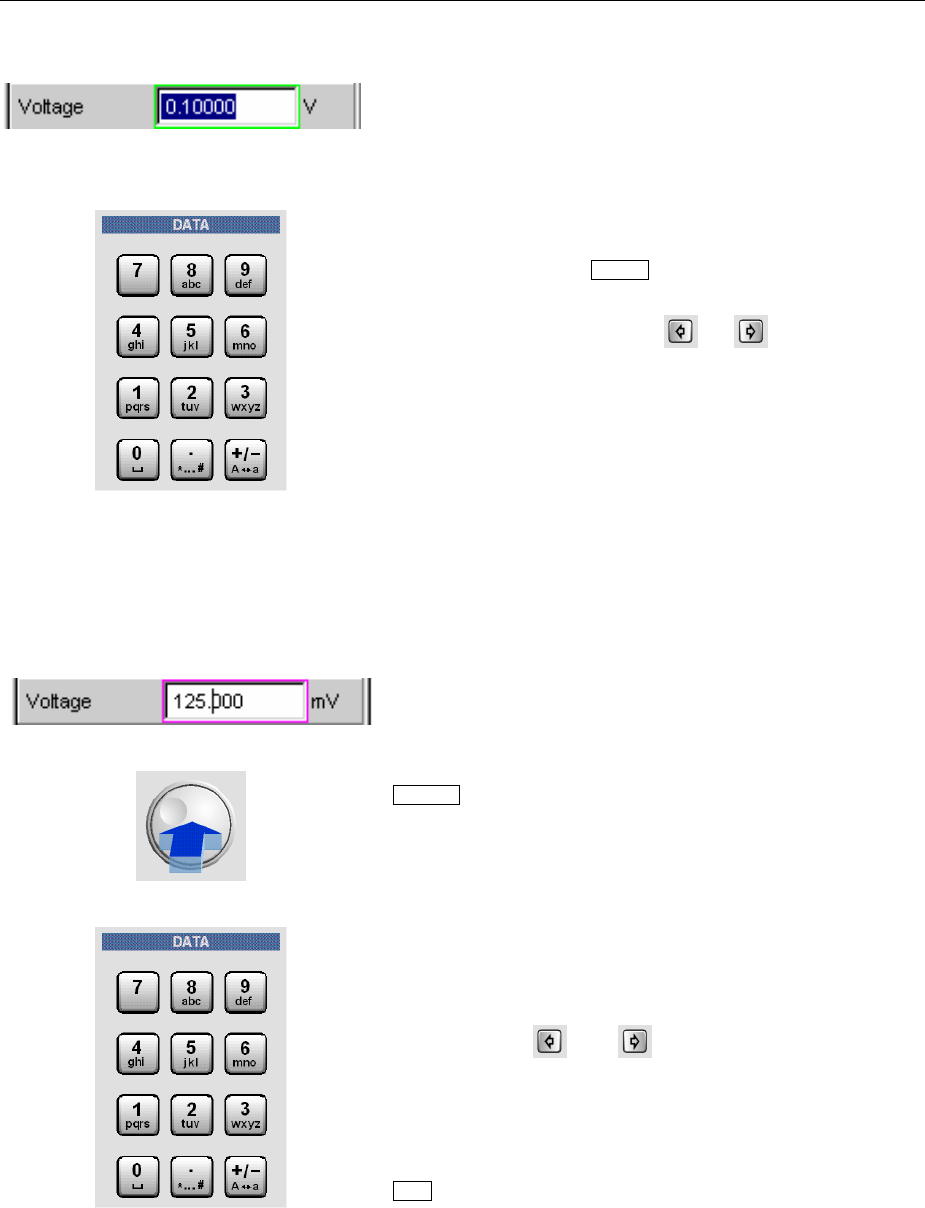
Brief Introduction to the R&S UPV Operating Concept R&S UPV
1146.2078.62 2.12 E-5
Value entries in Edit mode
When the focus is moved to a numeric entry field, the
system enters Edit mode, which is indicated by a green
selection frame.
To enter the new value, simply begin entering digits using
the numeric keypad on the front panel; the old value is
deleted automatically when the first key is pressed. The
digit to the left of the cursor can be deleted at any time
during entry using the UNDO key.
If certain digits only are to be changed, position the digit
cursor accordingly using the or cursor key and
enter the new digits.
The numeric entry field is closed with:
ENTER The newly entered value is adopted.
ESC The old value is retained.
Softkeys The selected unit is set and adopted
together with the newly entered value.
The entered value is set in the hardware as soon as the
numeric entry field is closed.
Value entries in Direct mode
When the focus is moved to a numeric entry field, the
system enters Edit mode, which is indicated by a green
selection frame.
Changing to Direct mode is performed by pressing the
ENTER key or with rotary-knob click; the color of the
selection frame then changes to magenta.
The digit cursor then moves to the first digit to the right of
the decimal point or, if there is no decimal point, to the digit
at the extreme right.
Adigit can now be entered using the keypad on the front
panel; the digit at the cursor position is replaced. The
cursor does not change its position.
The digit cursor can be placed at a different position at any
time using the and cursor keys. Digits are then
entered at the new position.
In Direct mode, every setting change is immediately
passed on to the hardware and executed.
Direct
mode can be quit using the ENTER function or the
ESC key.
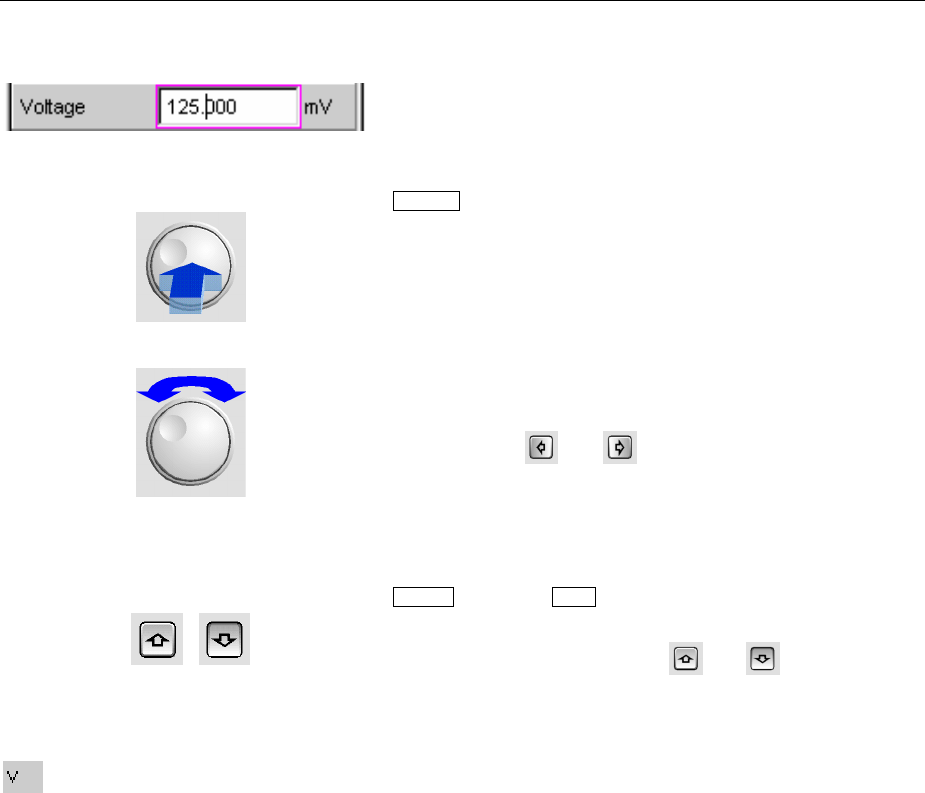
R&S UPV Brief Introduction to the R&S UPV Operating Concept
1146.2078.62 2.13 E-5
Rotary-knob entries in Direct mode
When the focus is moved to a numeric entry field, the
system enters Edit mode, which is indicated by a green
selection frame.
Changing to Direct mode is performed by pressing the
ENTER key or with rotary-knob click; the color of the
selection frame then changes to magenta.
The digit cursor then moves to the first digit to the right of
the decimal point or, if there is no decimal point, to the digit
at the extreme right.
The highlighted digit can then be changed directly using
the rotary knob, whereby the numeric value is "carried
over", i.e. transferred to the next digit.
The digit cursor can be placed at a different position at any
time using the and cursor keys so that other digits
can be changed using the rotary knob.
This method is ideal for adjustment work as every change
has an immediate effect in the hardware.
Value entry can be completed with a rotary-knob click, the
ENTER key or the ESC key.
As an alternative to the rotary knob, the numeric values
can also be changed using the and cursor keys.
Entering / changing the unit of a value
The unit of a numeric value is displayed next to the entry
field. When the value is entered, all units available for the
respective function are offered on the softkey bar (on more
than one level where necessary). The entry can be
completed by selecting the unit using a softkey.
This is done differently depending on the selected mode:
•In Edit mode, the newly entered numeric value is
adopted and set together with the selected unit.
•In Direct mode, the physical value (number with the
previously selected unit) is converted to the newly
selected unit and adopted as the new numeric value.
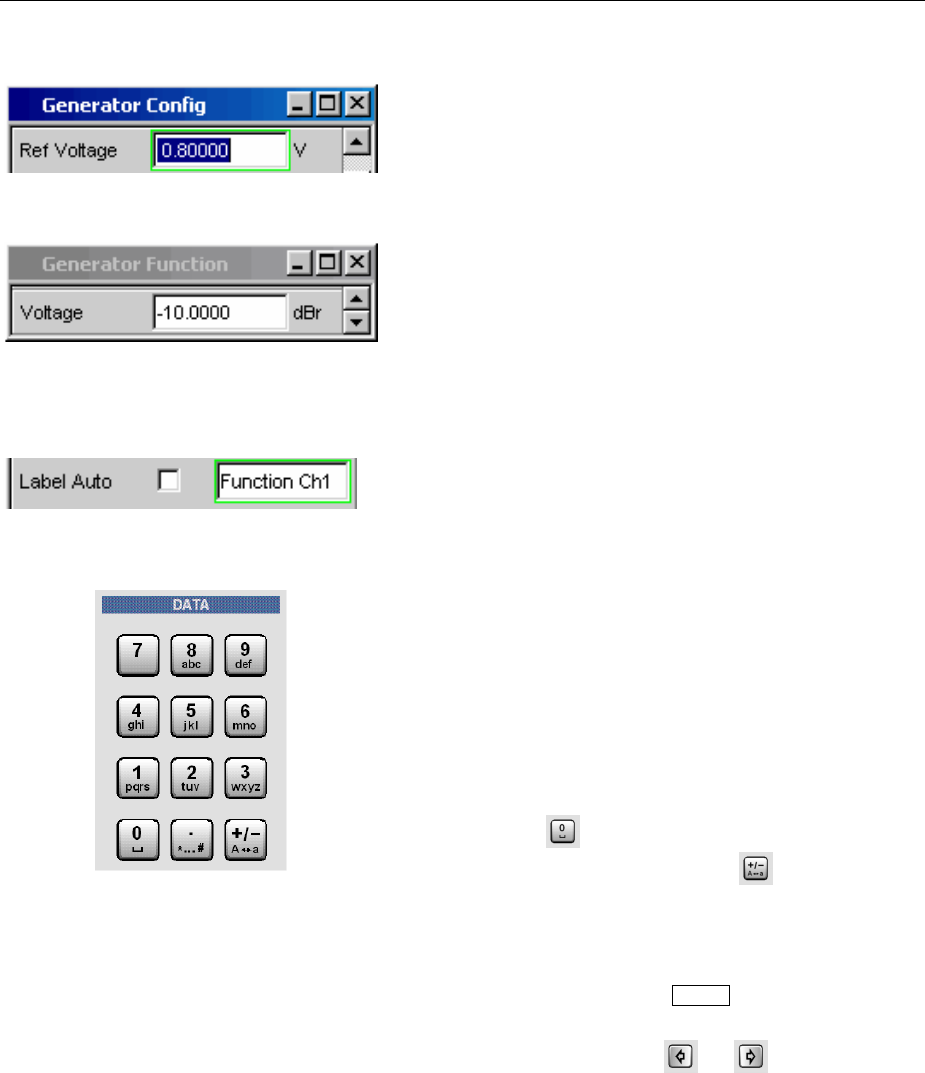
Brief Introduction to the R&S UPV Operating Concept R&S UPV
1146.2078.62 2.14 E-5
Information on using reference values
The Audio Analyzer R&S UPV allows reference values to
be used when entering various values. These reference
values are used as a basis for settings for other
parameters.
The example below explains these interdependencies:
Areference voltage (Ref Voltage) can be set in the
Generator Config panel. The actual output voltage is set
in the Generator Function panel where the unit is dBr, i.e.
it is possible to enter the output voltage in dB relative to
this reference value.
Alphanumeric entries
When the focus is moved to a text entry field, the system
enters Edit mode, which is indicated by a green selection
frame.
If the complete text (e.g. for graph labels) is to be newly
entered, simply begin entering characters using the keypad
on the front panel; the old text is deleted automatically
when the first key is pressed. The keypad on the front
panel of the R&S UPV is automatically switched to the
mode for entering alphanumeric characters. Text is
entered in the same way as on mobile phones: The
characters assigned to a key are called up in sequence by
repeatedly pressing the key. A different key can be
pressed immediately to enter the next character; a brief
pause must, however, be made when entering characters
assigned to the same key. The space character is
assigned to the key, special characters are entered
using the decimal-point key and the key is used to
toggle between upper and lower-case characters.
The character to the left of the cursor can be deleted at
any time during entry using the UNDO key.
If certain characters only are to be changed, position the
cursor accordingly using the or cursor key and
enter the new characters (if the position of the cursor is
changed before the first character is entered, the old text
will not be deleted).
The text entry field is closed with:
ENTER The newly entered text is adopted.
ESC The old text is retained.
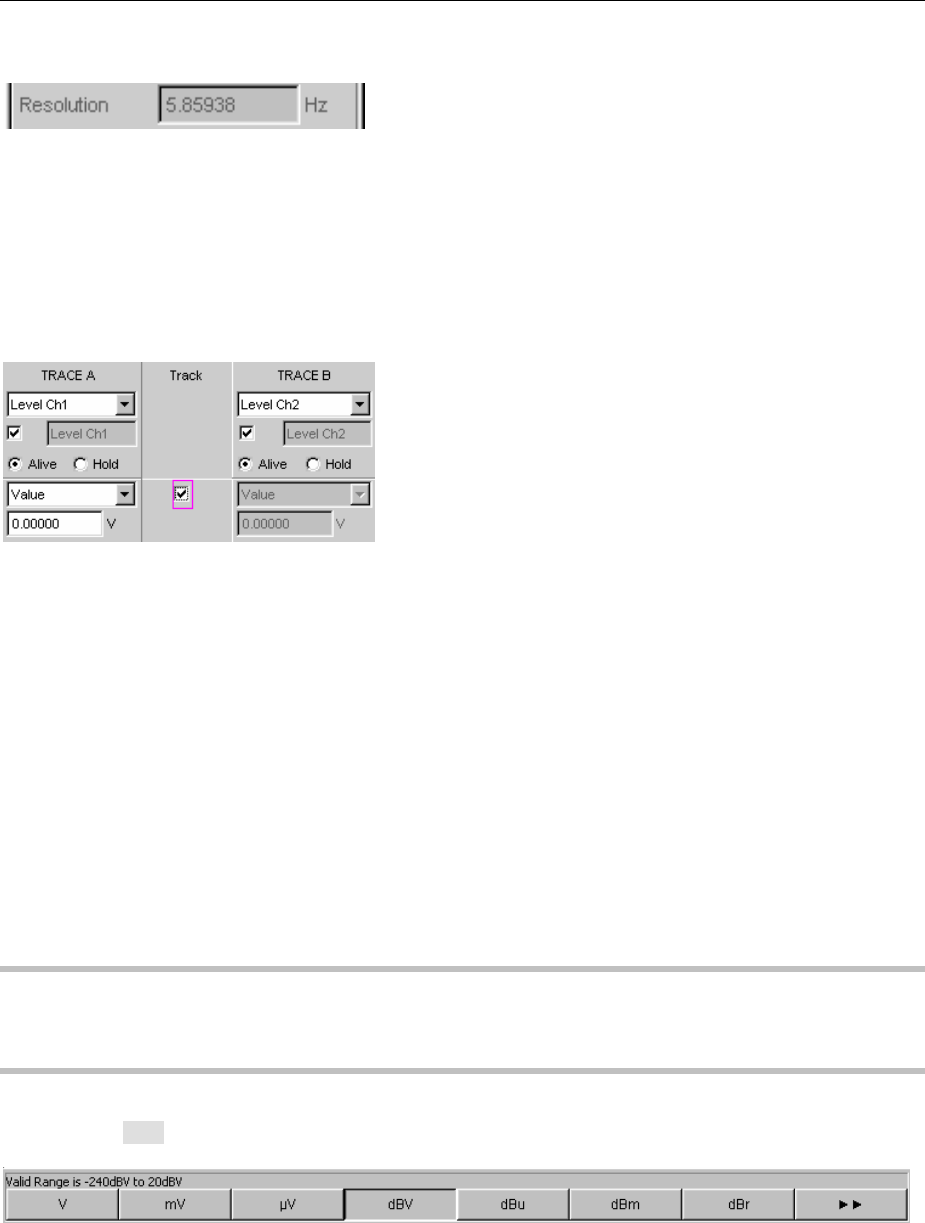
R&S UPV Brief Introduction to the R&S UPV Operating Concept
1146.2078.62 2.15 E-5
Display fields
Sometimes it is very useful for operators to receive
additional information about their settings.
Display fields inside the panels are used in such cases.
These fields are shown in grey and cannot be accessed.
They always contain valid values and therefore always
show settings active in the background; the fields are
updated as soon as a setting in the associated parameter
field is changed.
Adopting parameters
In many cases, settings are to apply e.g. to both
measurement channels or to both traces. Here the
R&S UPV provides multi-column panels which allow
settings to be transferred from the left-hand to the right-
hand column without the parameter having to be entered a
second time.
If the track box has a checkmark, all of the settings within
the function group are applicable to both columns. All fields
with transferred settings in the right-hand column are
shown as display fields. They appear grey and cannot be
accessed while the track function is active. If a setting is
changed in the associated parameter field in the left-hand
column, this change is also shown in the display field in the
right-hand column.
Help function
Information on the possible entries is given at the bottom of the screen above the softkey bar. The units
offered in the softkey bar and the limits specified in the "Valid Range" field always refer to the
highlighted parameter field. The valid value range is given in the unit currently selected.
Entries outside the specified value range are not accepted; an audible warning is issued and the entry
is changed to its permissible minimum or maximum value.
Note:
The specified ranges for value entries always take the current status of the instrument into
consideration. They are therefore not constant and depend on the presets already configured for other
parameters.
Below is an example for entry of the generator output voltage; additional units can be displayed by
actuating the button:
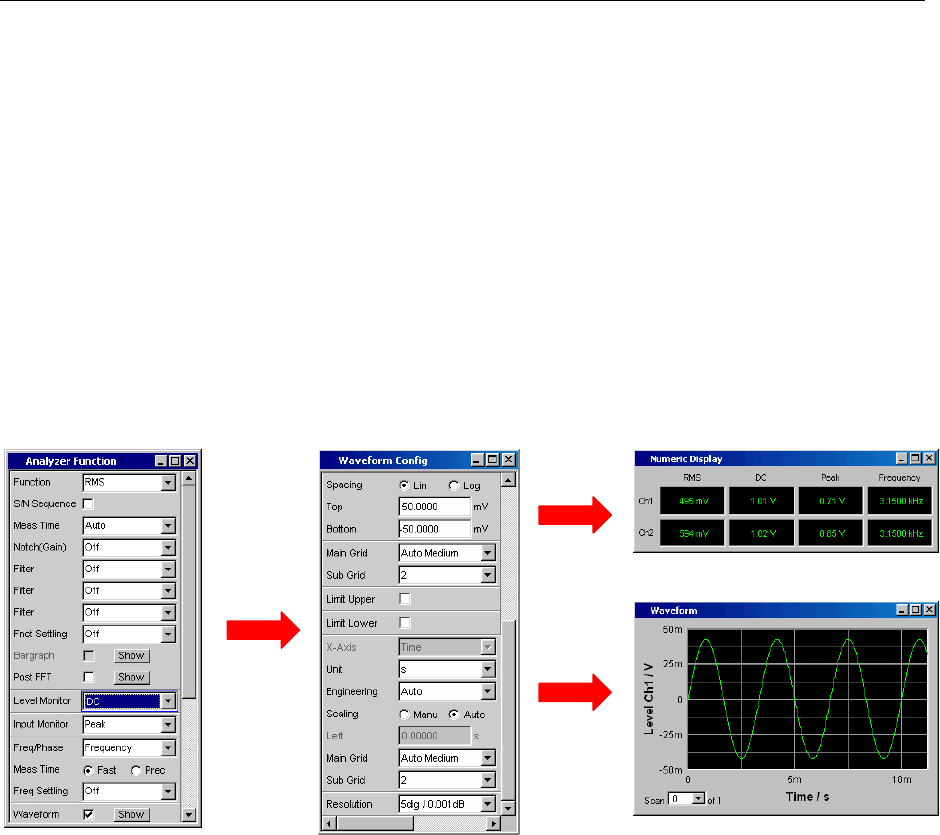
Brief Introduction to the R&S UPV Operating Concept R&S UPV
1146.2078.62 2.16 E-5
Measurement Functions and Displaying Measurement Results
The Audio Analyzer R&S UPV offers various types of measurement windows for displaying the results
of the numerous measurement functions. The measurement results can be displayed as digital numeric
values, in analog bargraphs, in result graphics or in data lists. The user can open any number of
measurement windows on the screen.
•What (which measurement function) is measured and how (which measurement method)
measurement is performed, is preset in the Analyzer Function panel.
•The panels for configuring the measurement value display are used to determine how the
measurement results are presented (i.e. which unit, how many digits, etc). A series of panels for the
different measurement windows are provided for this purpose.
•The results are finally displayed in the various measurement windows.
What is measured and
how measurement is
performed
Display type for
measurement results
Display of measurement results
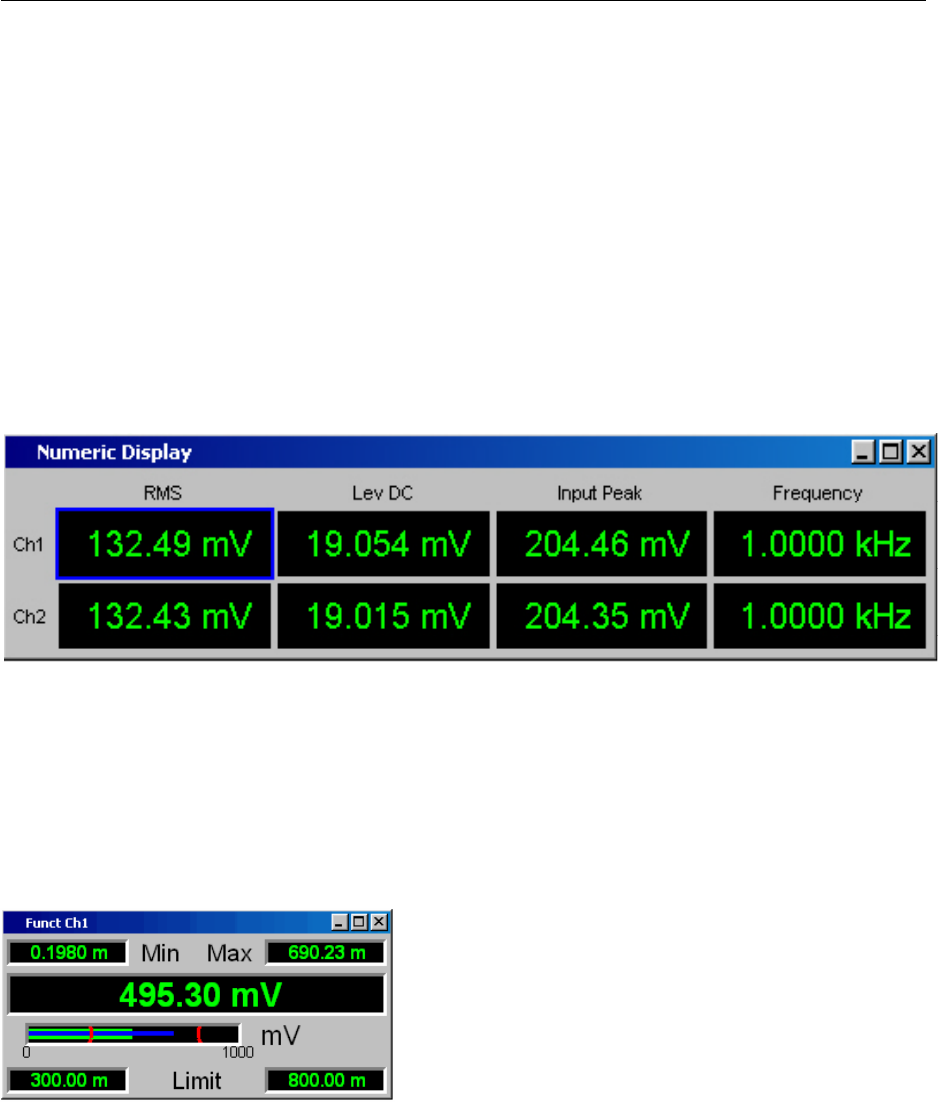
R&S UPV Brief Introduction to the R&S UPV Operating Concept
1146.2078.62 2.17 E-5
Numeric display field
The numeric display field provides a clear overview of the numeric values from various analyzer
functions and displays a maximum of 8 numeric value results from the Analyzer Function panel. The
individual columns are permanently assigned, from left to right:
Column 1: Measurement results from the function which is set in the Function field of the
Analyzer Function panel.
Column 2: Measurement results for the set Level Monitor function.
Column 3: Measurement results for the Input Peak function.
Column 4: Display of either the frequency measurement result or, if Freq & Phase or
Freq & GrpDel is set, display of the frequency measurement result in the first row and
display of the phase or group delay measurement in the second row.
Combi display
The combi display is used if the numeric value of a measurement result is to be supplemented by
analog bargraphs, limit monitoring or the storage of maximum and minimum values.
The free selection and free scalability mean that especially important or critical results can be monitored
and tracked even when viewing the R&S UPV screen from a relatively long distance.
Measured minimum and maximum
values
Measurement display
Bargraph
Limit settings
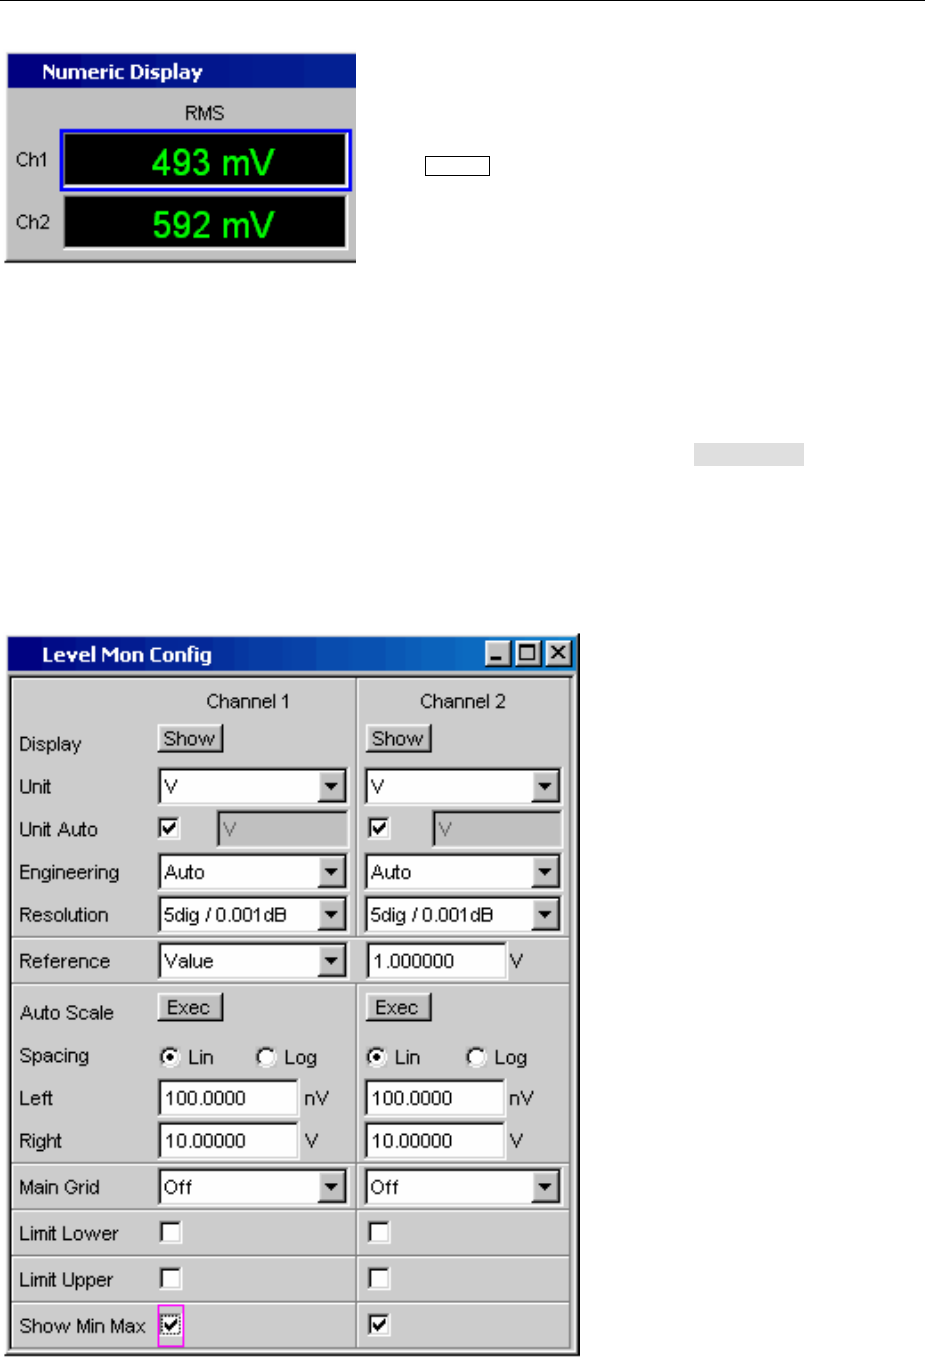
Brief Introduction to the R&S UPV Operating Concept R&S UPV
1146.2078.62 2.18 E-5
Opening combi displays
The easiest way to open combi displays is to highlight the
respective measurement display in the numeric display
field (blue selection frame) and to select the display with
the ENTER key or rotary-knob click.
Configuring the numeric display field and combi display
The settings for the individual columns of the numeric display field or for the combi displays are made in
the following four configuration panels which can be opened by actuating the DispConfig button in the
menu bar:
•Funct Config
•Lev Mon Config
•Input Config
•Freq / Phase Config
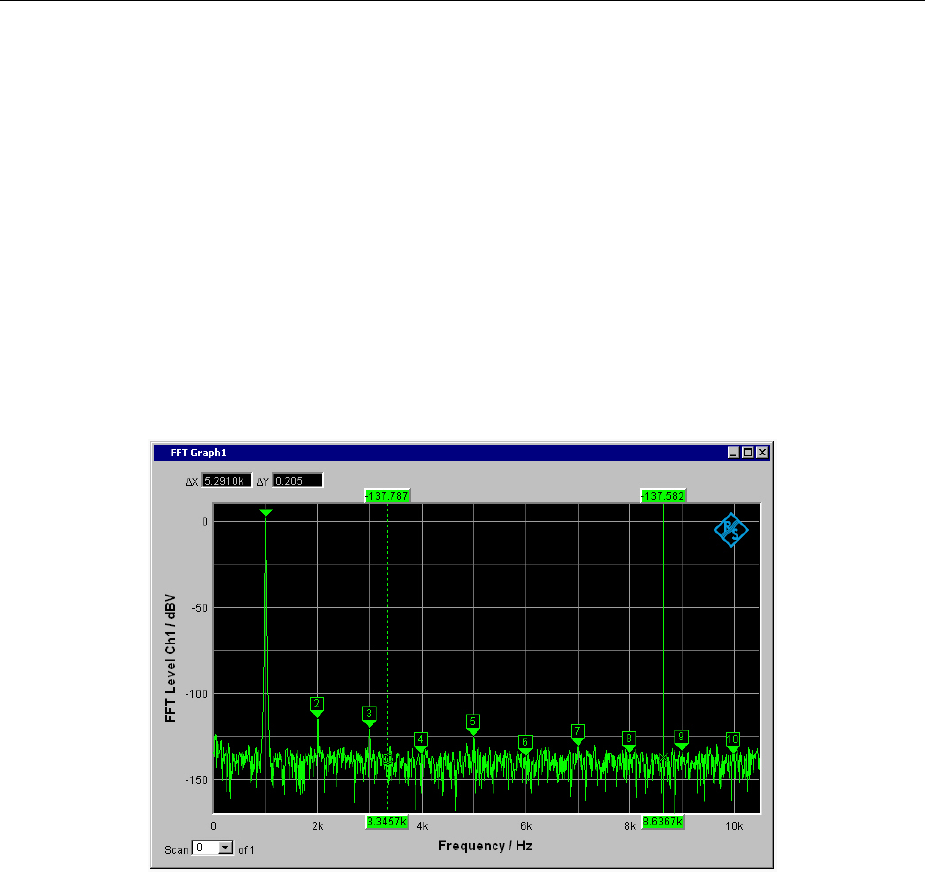
R&S UPV Brief Introduction to the R&S UPV Operating Concept
1146.2078.62 2.19 E-5
Graphical windows
The most informative way of displaying measurement results is to use a two-dimensional graph. The
Audio Analyzer R&S UPV makes a distinction between the following graphical windows:
•Sweep Graph
•FFT Graph
•Waveform
•Bargraph
These windows can be set using the associated configuration panels.
All graphical displays can be evaluated using horizontal and vertical cursors; markers are used to
identify important measurement points. A broad range of softkey control functions can be used to scale
graphs, to display sections of graphs, and to perform many other tasks.
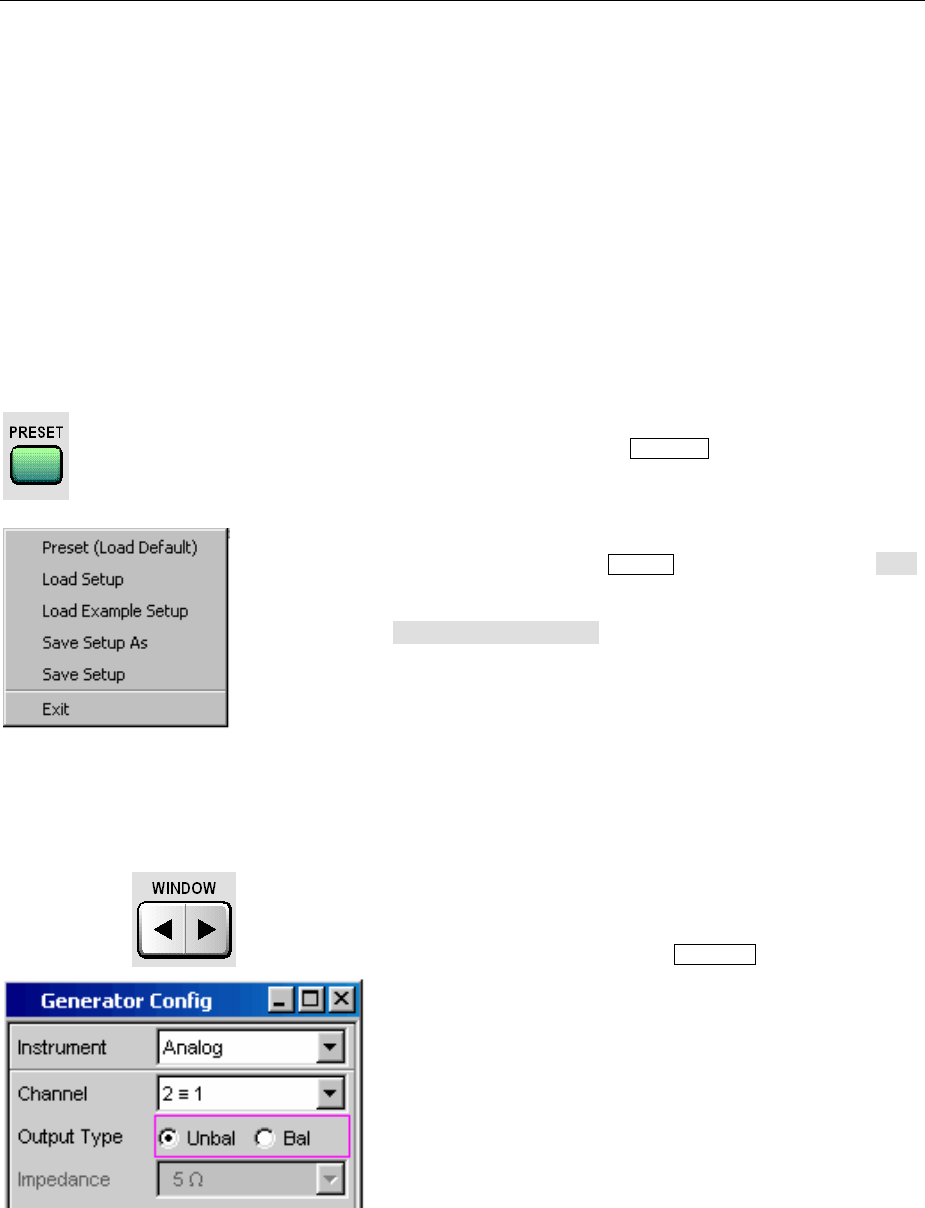
Introduction to Instrument Operation Using Examples R&S UPV
1146.2078.62 2.20 E-5
Introduction to Instrument Operation Using Examples
Measuring the Frequency Response of an Amplifier, Equalizer, etc
This example is based on the factory settings of the Audio Analyzer R&S UPV. It explains the changes
made in the individual panels to set up the measurement and describes how to graphically display the
measurement results. Finally, the example shows how to save the defined measurement setup on the
R&S UPV so that it can be used again for other applications.
Step 1: Loading the factory settings
The easiest way to load the factory settings of the
instrument is to press the PRESET key on the front of the
R&S UPV.
Alternatively, the factory settings can be loaded by opening
the menu bar with the MENU key, highlighting the File
button with the rotary knob and actuating it with a rotary-
knob click, and then highlighting and actuating
Preset (Load Default) in the displayed list in the same
way.
Step 2: Setting the required generator signal
The basic settings for configuring the generator are
made in the Generator Config panel.
The panel must have the focus before it can be
operated. This is already the case with the default
setup, otherwise press the WINDOW key until the color
of the title bar in the desired panel changes to blue.
The frequency response is usually measured on both
channels; this is already configured in the Channel
field.
Depending on the DUT, Output Type can be
switched to balanced circuitry; various output
impedances can then be selected in the field below. If
necessary, the required parameter field can be
highlighted with the rotary knob; this is then indicated
by a selection frame (see the screenshot to the left). A
rotary-knob click toggles between the two radio
buttons.

R&S UPV Introduction to Instrument Operation Using Examples
1146.2078.62 2.21 E-5
Floating output circuitry for the generator (see the
section "Avoiding Hum Loops" on page 2.3)and a
maximum signal frequency of 22 kHz are normally the
right settings to be used.
The other settings are also suitable for the majority of
applications and do not have to be adjusted unless
necessary.
This completes the settings in the Generator Config
panel.
The Generator Function panel must now be
activated; once again, press the WINDOW key until the
color of the panel's title bar changes to blue.
Sinusoidal signals (Sine) are required; this setting is
already selected.
To be able to measure the frequency response, the
sinusoidal signal must be swept in the frequency. A
fixed frequency of 1 kHz is preset in the default
instrument setup.
To activate the sweep, highlight the Sweep Ctrl field
by actuating the rotary knob until this field has the
blue selection frame (see the screenshot to the left).
The fold-down parameter list is opened with a rotary-
knob click or by pressing the ENTER key.
Use the rotary knob to highlight Auto Sweep and
activate this setting with another rotary-knob click or
with the ENTER key.
The parameter list closes and a number of additional
fields appear in which further sweep parameters can
be set.
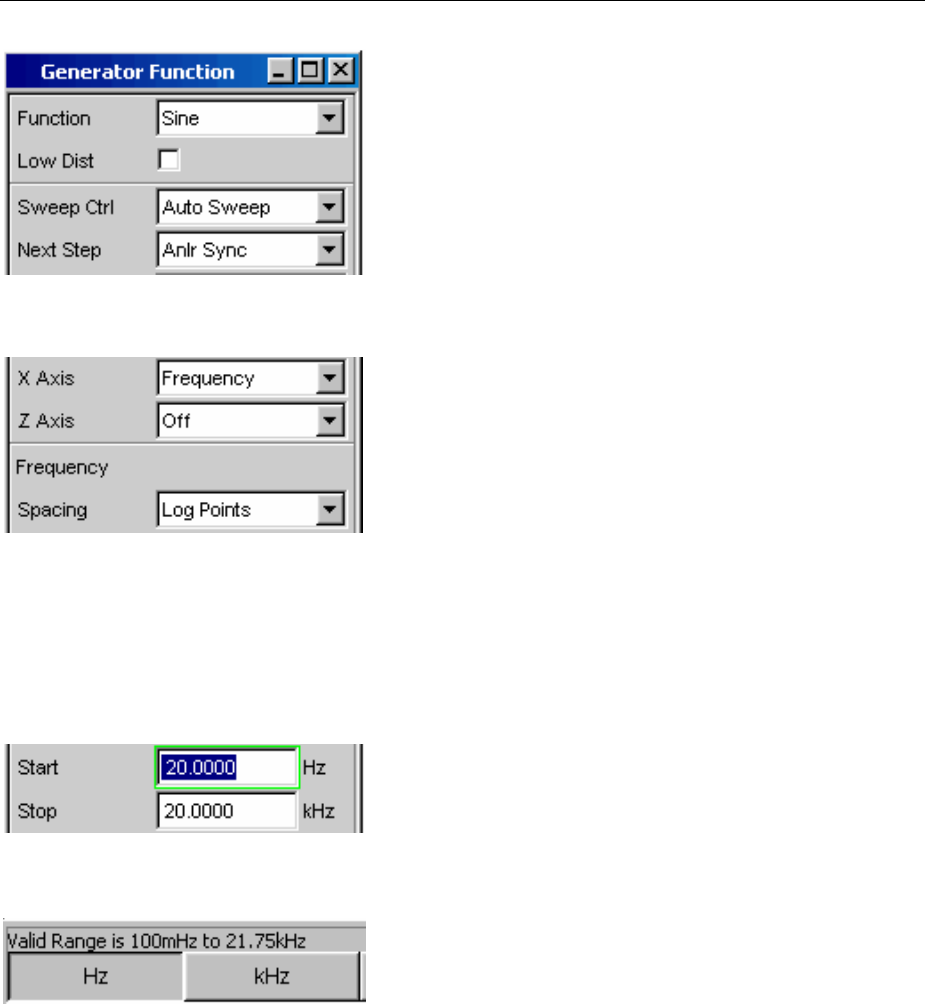
Introduction to Instrument Operation Using Examples R&S UPV
1146.2078.62 2.22 E-5
The Next Step field must remain set to Anlr Sync;
this setting causes the next sweep step to be
triggered as soon as a valid measurement result is
available in the analyzer part. This synchronization
optimizes the sweep speed.
The sweep variable must now be specified in the next
field. Frequency is already preset here (as required in
this example).
No other sweep variable is required; the ZAxis field
therefore remains set to Off.
The next selection field is used to select the algorithm
for advancing through the sweep points.
This can be done using a linear or logarithmic step
size; the number of individual sweep points (Points)
or the step size from point to point (Steps)can be set.
This selection field is factory-set to Log Points;this is
the usual setting for frequency response
measurements.
The values for the start and stop frequency of the
sweep must be entered in the next two fields.
Highlighting the desired field gives it the green
selection frame. The required frequency value can
now be entered directly using the numeric keypad on
the front panel (20 Hz in this example). Pressing the
ENTER key adopts the value and adjusts the
hardware accordingly.
The possible value range is given above the softkey
bar. Entries outside the specified value range are not
accepted; an audible warning is issued and the entry
is changed to its permissible minimum or maximum
value.
As soon as the value entry field is highlighted, all
available units are displayed on the softkey bar;
additional hidden units can be shown by actuating the
button. Value entry can be completed by
actuating the softkey labeled with the desired unit; this
is a particularly useful feature if a value is to be
changed to a different unit.
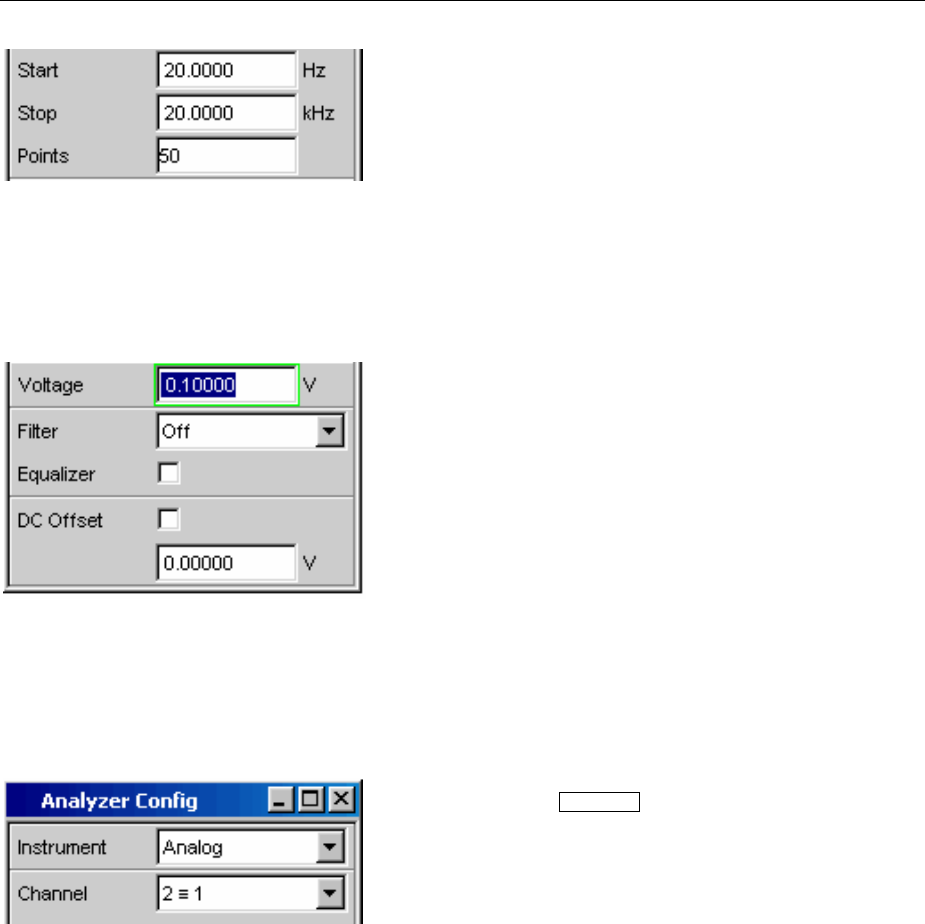
R&S UPV Introduction to Instrument Operation Using Examples
1146.2078.62 2.23 E-5
The value for the stop frequency is entered in the
same way (here 20 kHz).
The number of desired sweep points must be entered
in the Points field; 30 points are preset here. Up to
1024 points can be selected. 50 points are entered in
this example; this generally provides an adequate
number of measurement values without making the
overall measurement cycle too long.
The desired output voltage for the measurement is
entered in the Voltage field; once again, the field must
be highlighted before the value can be entered. The
value range is again displayed above the softkeys and
the available units are shown in the softkeys.
The remaining fields are not relevant for this example.
Configuration of the generator is therefore complete.
Step 3: Selecting the required measurement
The basic settings for configuring the analyzer are
made in the Analyzer Config panel.
Once again, the panel must have the focus before it can
be operated ( WINDOW key).
The frequency response is usually measured on both
channels; this is already configured in the Channel
field. The setting 2
1means that both channels have
the same settings; the following parameter fields appear
once only in the panel but affect both channels.
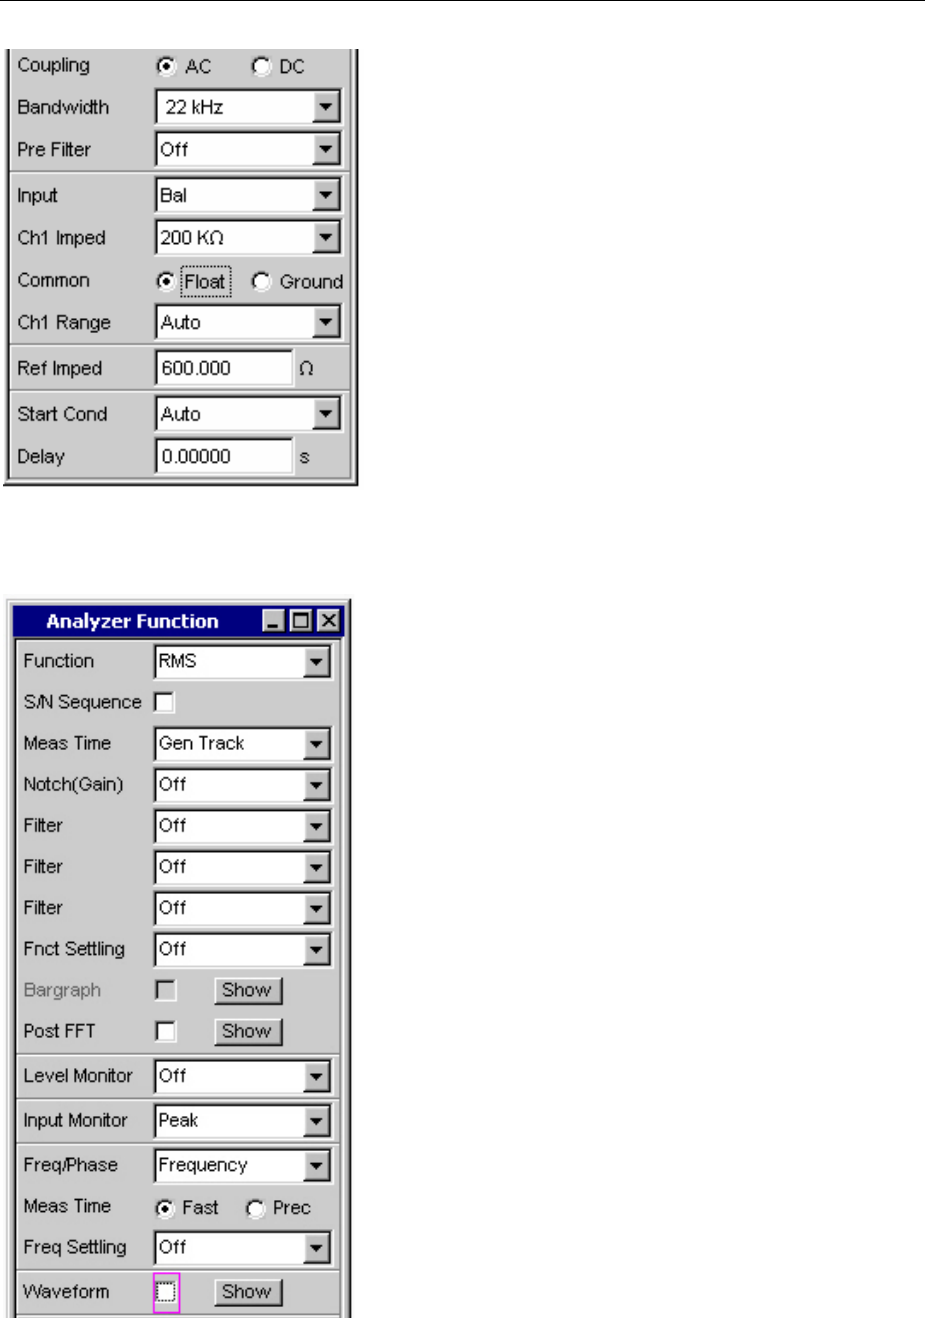
Introduction to Instrument Operation Using Examples R&S UPV
1146.2078.62 2.24 E-5
If necessary, it is possible to toggle between AC and
DC coupling using the two radio buttons.
The fields for the measurement bandwidth are already
preset with the appropriate setting; no prefilter is
required here.
In this example, the signal to be measured is supplied
via the balanced input sockets (Bal setting). The
analyzer can also be connected to the generator
internally.
Floating input circuitry for the analyzer (see the section
"Avoiding Hum Loops" on page 2.3)and the autorange
function are normally the right settings to be used.
The default settings in the following fields are also
correct.
This completes the settings in the Analyzer Config
panel.
The following are set in the Analyzer Function panel:
•what is measured (which measurement function)
and
•how measurement is performed (which
measurement method)
The RMS of the voltage must be measured for the
frequency response measurement described here; the
required setting (RMS)is already preselected.
The measurement time for each individual
measurement point is selected in the Meas Time field.
The default instrument setting here is Auto which
means that the measurement time is automatically
adapted to the input frequency, i.e. the measurement
cycle speeds up as the frequency increases. This
setting can (with just a few exceptions) be used for the
majority of applications.
If the integrated generator is used for measuring the
frequency response (as in this example), the setting
Gen Track should be used. The measurement time is
then automatically adapted to the frequency generated
in the generator. The frequency information from the
generator is passed on directly to the analyzer. The
analyzer then adjusts its measurement time to precisely
one period (or to an integer multiple of one period). The
advantage of this method is maximum measurement
speed with maximum accuracy.
All other parameter fields are not relevant for this
example; the settings in the Analyzer Function panel
are therefore complete.
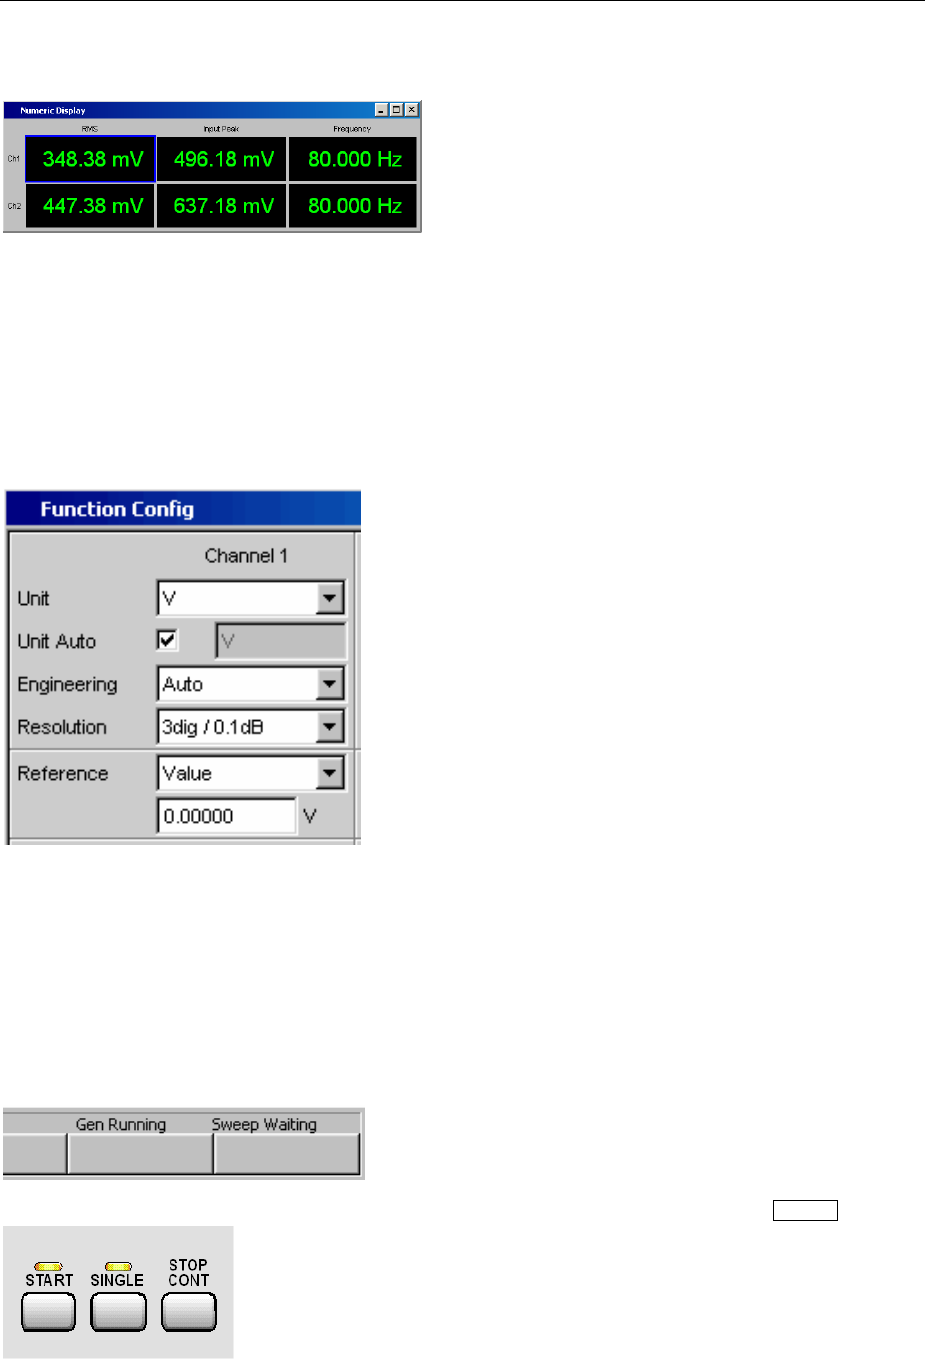
R&S UPV Introduction to Instrument Operation Using Examples
1146.2078.62 2.25 E-5
Step 4: Displaying the measurement results – Numeric measurement display
Inthe default instrument setup, the numeric
measurement display is also already open.
If the DUT is correctly connected to the Audio Analyzer
R&S UPV, measurement values will already be
displayed.
The panels for configuring the measurement value
display are used to determine how the measurement
results are presented (i.e. which unit, how many digits,
etc). A series of panels for the different measurement
windows are provided for this purpose.
The Function Config panel is shown here as an
example; the first column of the numeric measurement
display is configured in this panel, i.e. the display fields
which show the measured level values for the
frequency response measurement described here.
The panel has two columns; to simplify matters, only
Channel 1 is shown here.
The unit for the numeric measurement displays is set in
the Unit field.
The Engineering parameter is used to determine
whether the display automatically toggles between KV,
mV and V, for example, or whether other unit formats
are desired.
If the measurement results are to be displayed as
relative values, they are referred to the reference value
set in the Reference field.
Other parameter fields in this panel are used to set
limits and to display extreme values. These functions
are described in detail in Chapter 3 "Manual Operation"
and Chapter 4 "Instrument Functions".
Step 5: Starting the sweep
Although the analyzer is already supplying
measurement results, the status message
"Sweep Waiting"above the softkeys indicates that the
sweep has not yet been started, although it has been
configured in the Generator Function panel.
The sweep is started by pressing the START key in the
top right-hand part of the R&S UPV front panel. The
status message "Sweep Run Cont"informs the user
that when this key is pressed the sweep will start and
be repeated continuously.
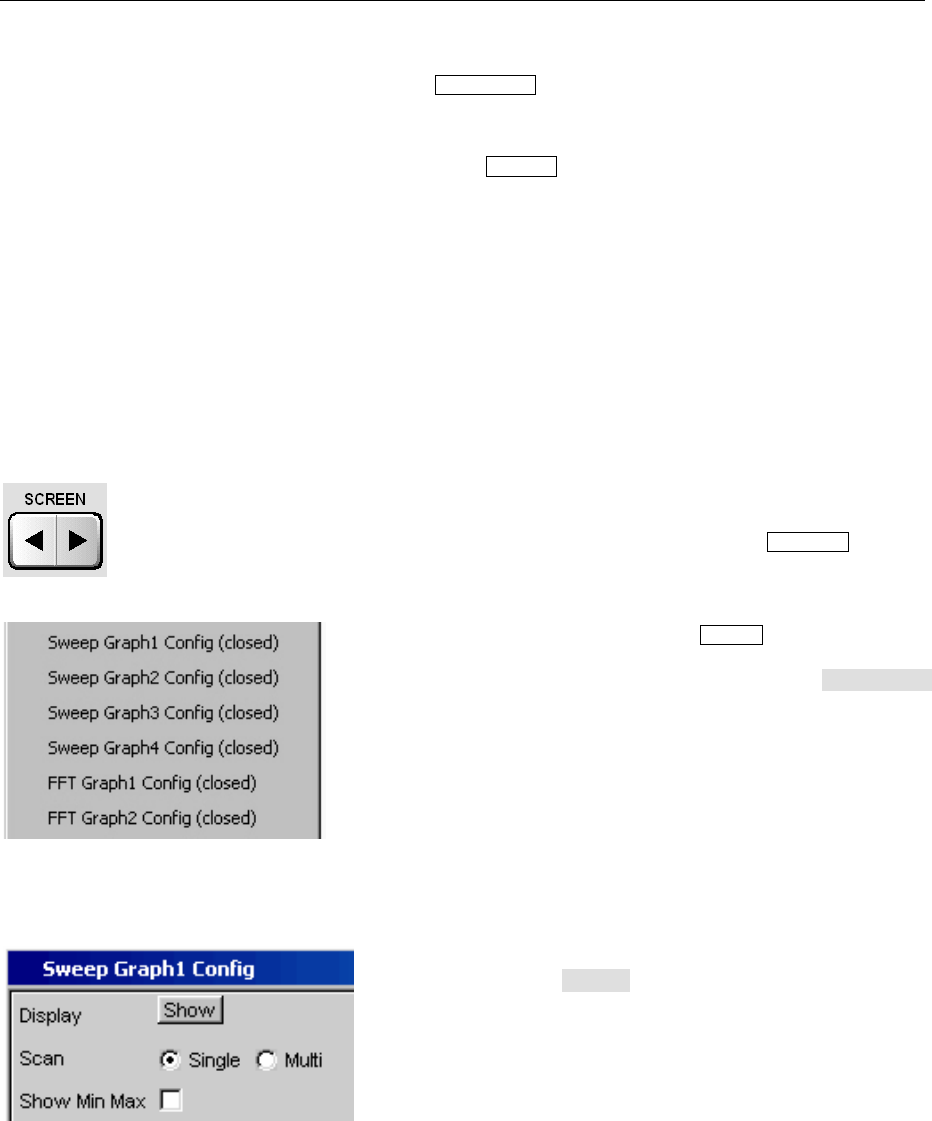
Introduction to Instrument Operation Using Examples R&S UPV
1146.2078.62 2.26 E-5
The sweep can be stopped at a
ny time by pressing the
STOP CONT key (the status message "Sweep Stopped"
is displayed); the sweep continues if the key is pressed
again.
If the SINGLE key is pressed, the sweep is started once
only; "Sweep Terminated"appears in the status field
when the sweep cycle has been terminated.
Step 6: Displaying the measurement results – Graphical windows
The results of a frequency response measurement are usually displayed graphically with the measured
output voltage values of the DUT being plotted on the frequency axis.
The following settings are required for this:
Use a different screen for the graphical display so that
Screen 1 is not filled with too many panels. To do this,
change to Screen 5 by pressing the SCREEN key; this
screen is empty in the default R&S UPV setup.
Open the menu bar with the MENU key and open the
Sweep Graph 1 Config panel by selecting it in the
selection list displayed by actuating the DispConfig
button.
As explained above, the way in which the measurement
results are presented is determined in the
configuration panels.Each graphical window has its
own configuration panel.
The Sweep Graph 1 Config panel required here has
two columns; to simplify matters, only Trace A is shown
in the example.
The associated graphical window can be opened by
actuating the Show button in the Display field. The
window appears in the same screen so that the effect of
the following settings can be observed directly.
In each graphical window, one or two traces (Trace A
and Trace B) can be plotted on one X-axis. Each trace
can consist of a large number of scans. In this example,
only one single scan is to be displayed; the Scan field
can therefore remain set to Single.
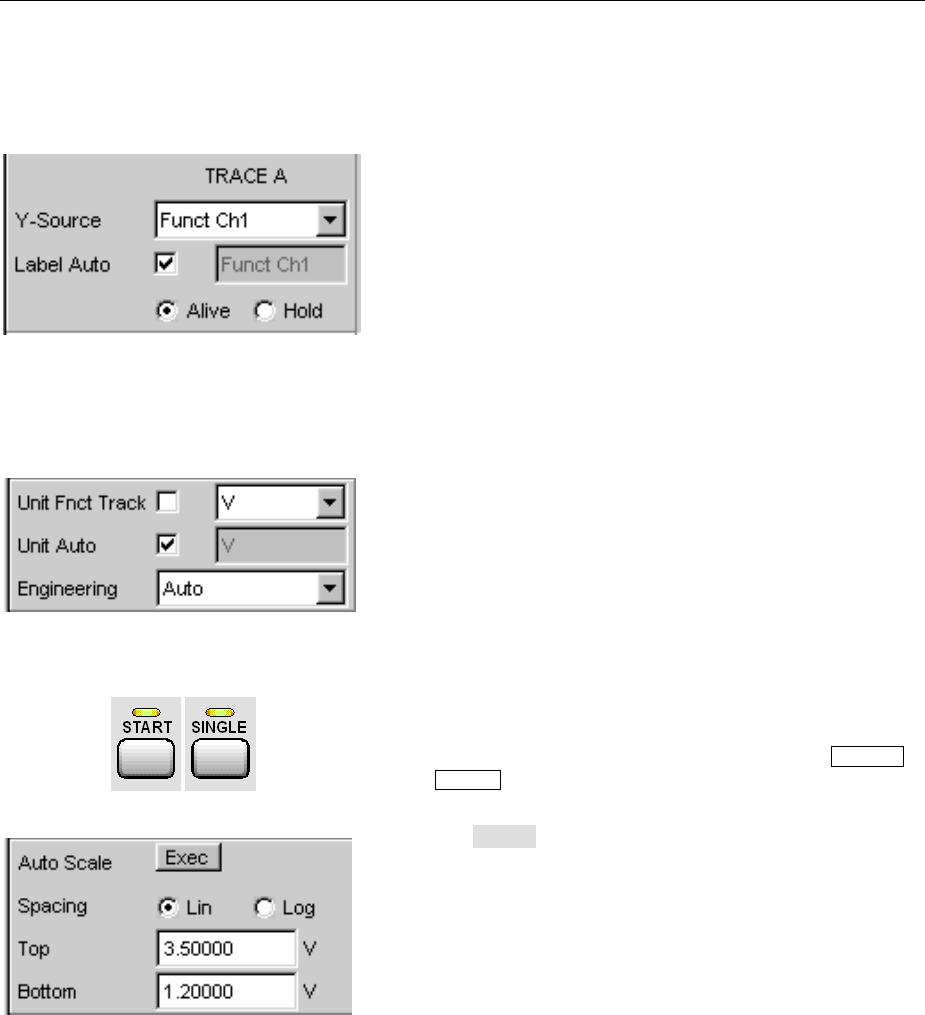
R&S UPV Introduction to Instrument Operation Using Examples
1146.2078.62 2.27 E-5
The scans can display the results of the different
measurements available in the R&S UPV.
For the frequency response measurement, the
measurement results for the measurement function
selected in the Function field in the Analyzer Function
panel (here the RMS measurement) must be displayed
on a graph. For Trace A, the Source field is therefore
set to the function result of measuring channel 1 (this is
already preset in the default setup).
The Alive setting means that the results are displayed
continuously; the Hold setting "freezes" the traces.
The units to be used for the measurement values on the
Y-axis are set in the next section.
If the unit used in the numeric display window is also to
be used in the graphical window, the Unit Fnct Track
tick box must be activated. If this is not the case, a unit
can be selected from the parameter list next to the tick
box.
The Engineering parameter is used to determine
whether the display automatically toggles between KV,
mV and V, for example, or whether other unit formats
are desired.
All the other default instrument settings are correct and
allow a result to be displayed immediately in the form of
agraph. If the sweep is started with the START or
SINGLE key, the scan appears in the graphical window.
The scaling will probably need to be adjusted. Actuating
the Exec button in the line Autoscale rescales the
graph on the basis of the measured minimum and
maximum values so that the entire trace fits in the
graphical window.
The end values for the Y-axis can, however, also be
entered in the two fields Top and Bottom.
The default R&S UPV settings for the X-axis are also
mostly correct for this example:
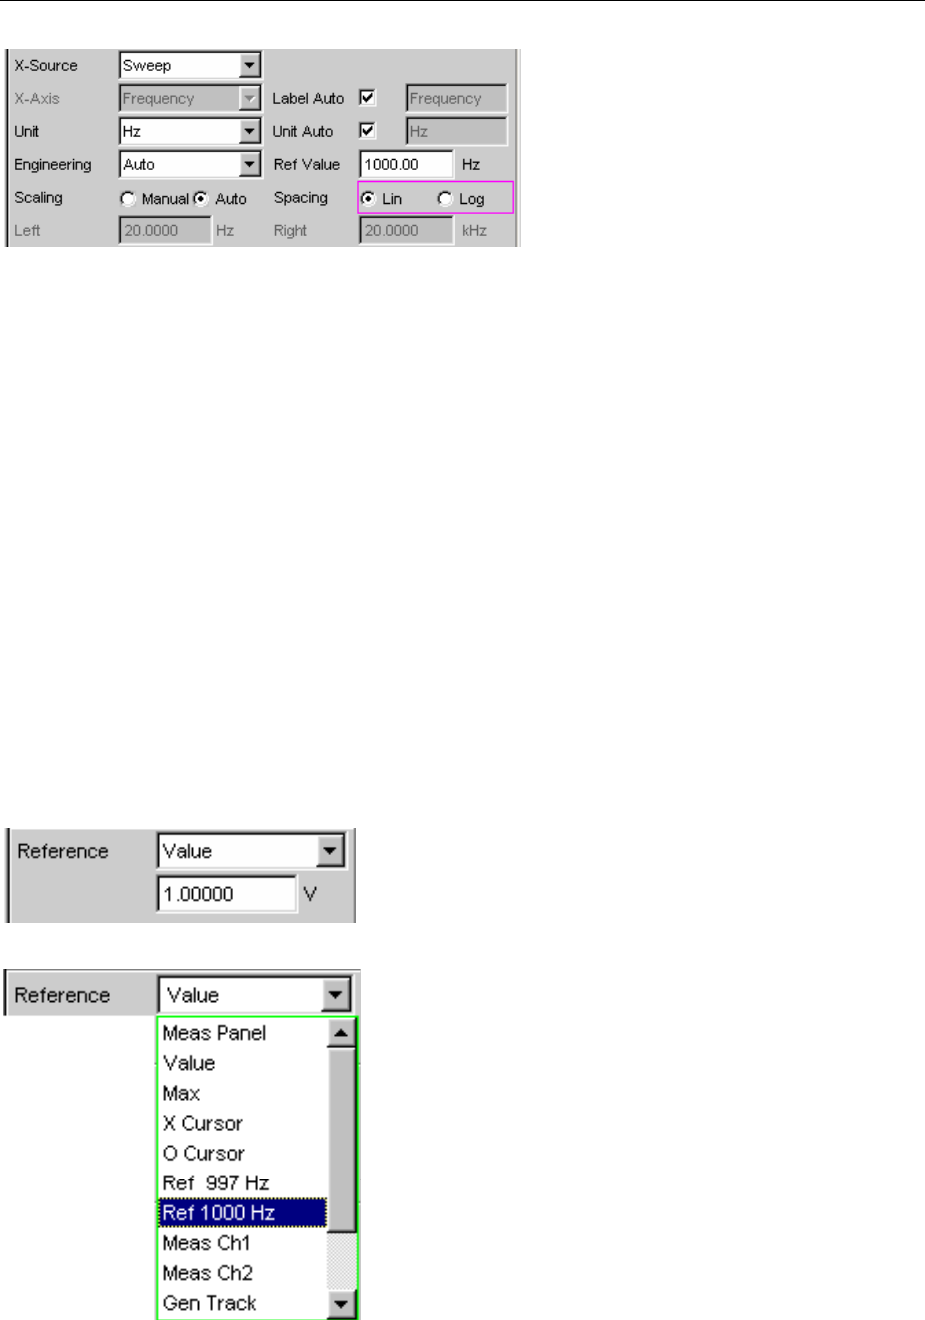
Introduction to Instrument Operation Using Examples R&S UPV
1146.2078.62 2.28 E-5
By selecting a frequency sweep in the
Generator Function panel, the X-axis is
automatically defined as the frequency axis
with the unit Hz.
If Auto is set in the Scaling field, the start
and stop frequency of the sweep defined in
the Generator Function panel is
automatically used as the upper and lower
end value for the X-axis.
The Lin setting in the Spacing field is
unsuitable for this example. Since a sweep
with logarithmic step size has been selected
for this measurement, the X-axis should also
be subdivided logarithmically. This setting
can be changed quickly with a rotary-knob
click.
Step 7: Using a relative unit in the graphical window
The settings so far made allow the frequency response of the DUT to be displayed graphically but not in
away that conforms to standards.
In the case of frequency response measurement, the relevant standards stipulate that the deviations of
the output voltage must be plotted over frequency, whereby the output voltage of the DUT at the
reference frequency 1 kHz (for analog measurements) is used as the reference level.
The following settings in the Sweep Graph 1 Config panels are used to adapt the graph for this
measurement example:
Adefault reference value of 1 V is set in the Reference
field.
This value must be replaced by the output voltage value
of the DUT measured with the reference frequency of
1kHz.
The R&S UPV offers a very simple way of doing this:
Open the parameter list in the Reference field and
select the Ref 1000 Hz setting. With this setting, the
value measured at this frequency is determined (if
necessary by means of interpolation between the
measurement values at the two adjacent frequencies)
and used as the reference value.

R&S UPV Introduction to Instrument Operation Using Examples
1146.2078.62 2.29 E-5
All that remains is to select the unit dBr in the
Unit Fnct Track field. All measurement values are then
displayed in dB relative to the reference value selected
above. This satisfies the standards defining frequency
response measurement.
The Y-axis must now be scaled according to
requirement, e.g. from +20 dBr to -20 dBr.
If the measurement result of the
second channel has been selected
for Trace B, the graphical display
for the measured frequency
response may look like the
example shown opposite.
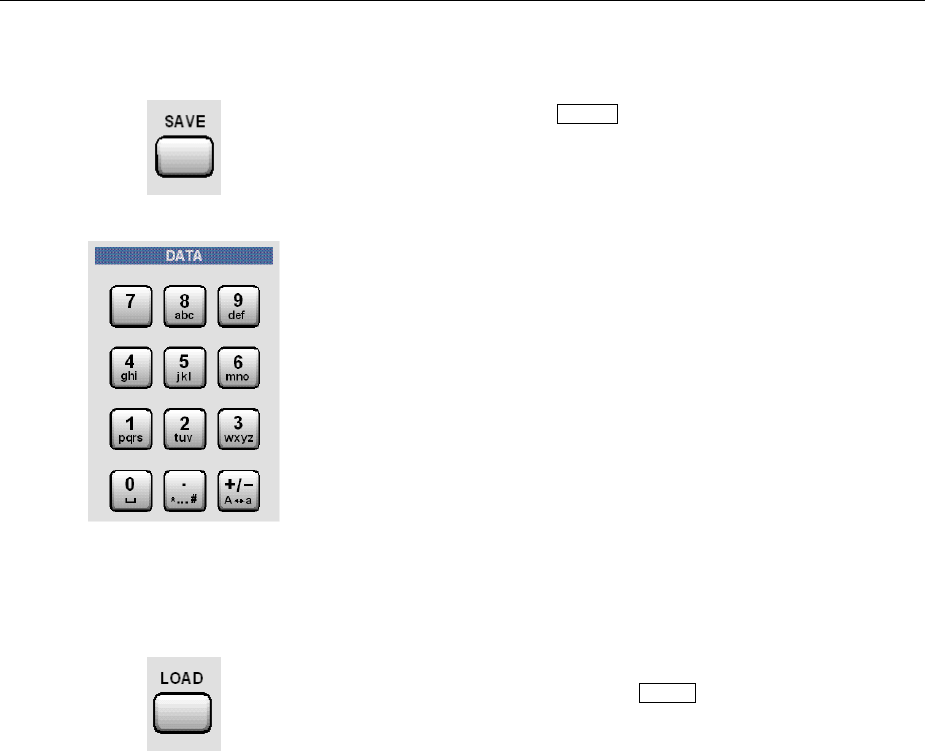
Introduction to Instrument Operation Using Examples R&S UPV
1146.2078.62 2.30 E-5
Step 8: Saving the instrument setup
Pressing the SAVE key opens the window for saving
files.
The desired file name can now be entered using the
keypad on the front panel.
The keypad on the front panel of the R&S UPV is
automatically switched to the mode for entering
alphanumeric characters. Text is entered in the same
way as on mobile phones: The characters assigned to a
key are called up in sequence by repeatedly pressing
the key. A different key can be pressed immediately to
enter the next character; a brief pause must, however,
be made when entering characters assigned to the
same key.
The file extension is assigned automatically once the
file name has been entered (here .SET); it is advisable
to use this automatic assignment function as it prevents
entry errors.
If this instrument setup is to be used again at a later
date, simply press the LOAD key to reload the setup in
the file window.
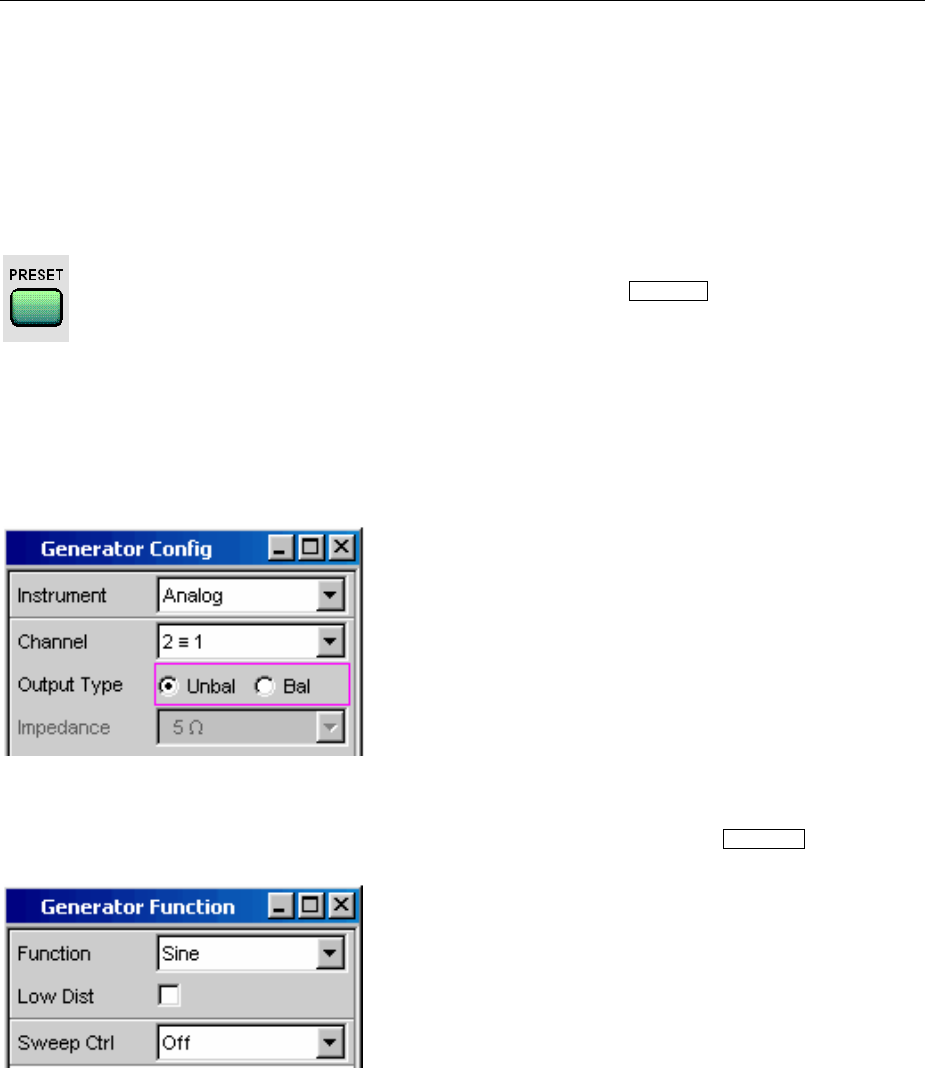
R&S UPV Introduction to Instrument Operation Using Examples
1146.2078.62 2.31 E-5
Measuring the Harmonic Distortion (THD+N) of a DUT
This example is also based on the factory settings of the Audio Analyzer R&S UPV. However, only the
settings in the individual panels which differ from the settings in the previous example are explained.
Step 1: Loading the factory settings
The easiest way to load the factory settings of the
instrument is to press the PRESET key on the front of the
R&S UPV.
Alternatively, the default setup can also be loaded via the
menu bar.
Step 2: Setting the required generator signal
In the Generator Config panel, the basic settings for
configuring the generator in this example are the
same as those set for the frequency response
measurement described in the previous section.
Depending on the DUT, Output Type may have to be
switched to balanced circuitry.
The Generator Function panel must now be
activated; once again, press the WINDOW key until the
color of the panel's title bar changes to blue.
Sinusoidal signals (Sine) are required; this setting is
already selected.
The harmonic distortion is often only specified for the
reference frequency 1 kHz (for analog applications).
Fixed frequencies are therefore used for
measurement; as a result, Sweep Ctrl must remain
set to Off.
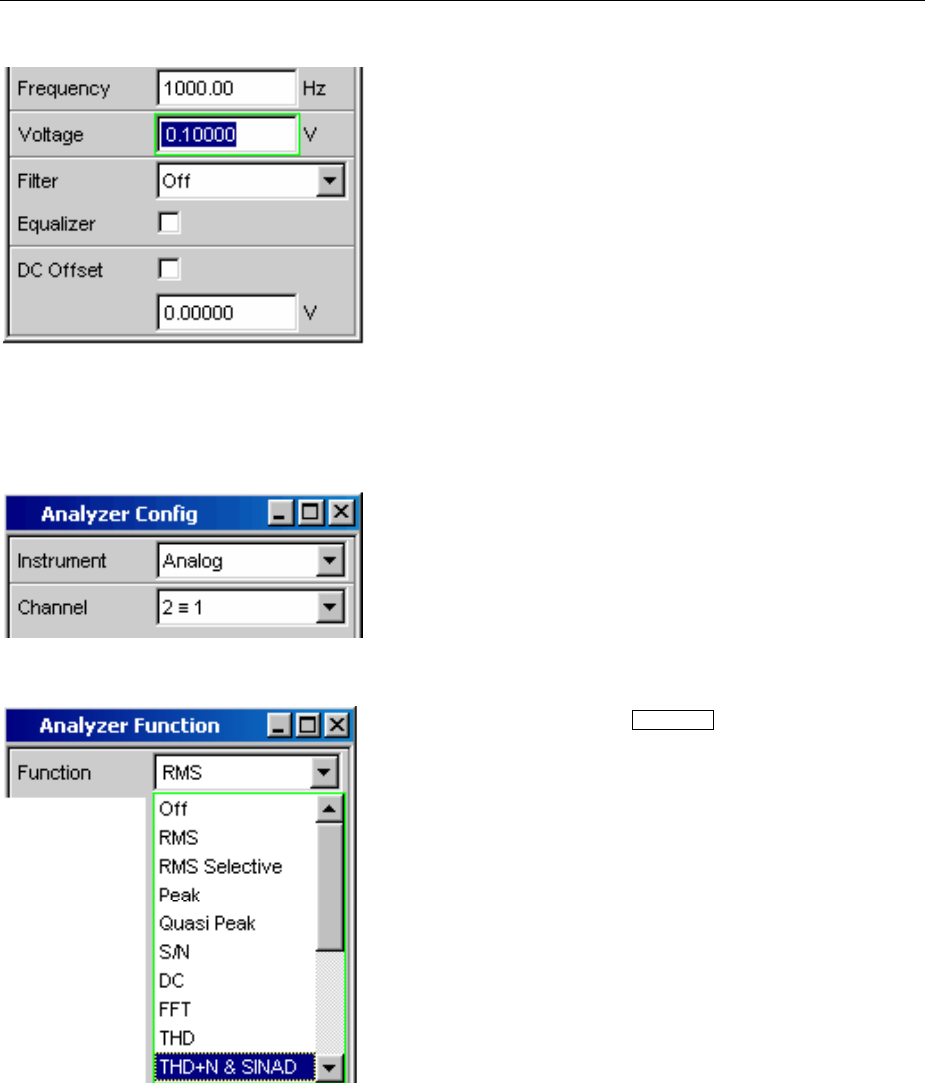
Introduction to Instrument Operation Using Examples R&S UPV
1146.2078.62 2.32 E-5
The frequency 1 kHz is already preset in the default
instrument setup.
Only the output level required for the measurement
may have to be adjusted (in the Voltage field).
The remaining fields are not relevant for this example.
Configuration of the generator is therefore complete.
Step 3: Selecting the required measurement
The basic settings for configuring the analyzer are
again made in the Analyzer Config panel.
These settings are made in the same way as shown in
the previous example.
The Analyzer Function panel must now be activated;
once again, press the WINDOW key until the color of the
panel's title bar changes to blue.
The measurement function and measurement method
are set in this panel.
The measurement function is selected first; the fold-
down parameter list is opened with a rotary-knob click
or by pressing the ENTER key.
Use the rotary knob to highlight THD+D & SINAD and
activate this setting with another rotary-knob click or
with the ENTER key. The parameter list is then closed
again.
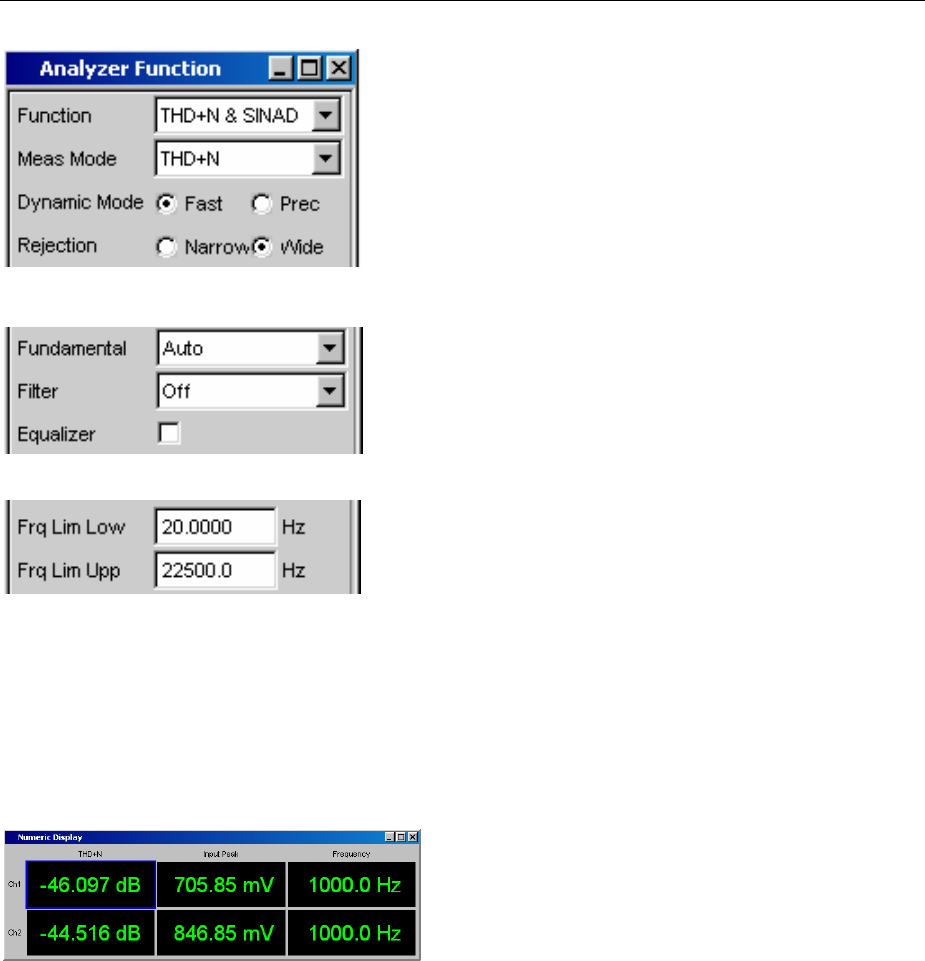
R&S UPV Introduction to Instrument Operation Using Examples
1146.2078.62 2.33 E-5
In the next field Meas Mode,various modes for
distortion factor measurement can be selected; the
presetting THD+N is correct for this example.
Dynamic Mode determines the maximum dynamic
response for this measurement: fast measurement with
restricted dynamic response or maximum dynamic
response with a slightly longer measurement time are
the two possible options.
With the THD+N measurement, the fundamental of the
signal to be measured is suppressed using a notch
filter. The R&S UPV can automatically determine the
fundamental from the spectrum and adjust the notch
filter to it (Fundamental Auto).
Filter and Equalizer are only required in exceptional
cases.
The calculation for harmonics and noise components
can if necessary be restricted to within band limits
which can be entered in the two fields Freq Lim Low
and Freq Lim Upp.
All other parameter fields are not relevant for this
example; the settings in the Analyzer Function panel
are therefore complete.
Step 4: Displaying the measurement results – Numeric measurement display
In the default instrument setup, the numeric
measurement display is already open.
If the DUT is correctly connected to the Audio Analyzer
R&S UPV, the measurement values for the harmonic
distortion can be read off in the first column.
In the default setup, THD+N values are given in dB; if a
display in % is desired, this unit can be changed in the
Function Config panel.
Step 5: Displaying the spectrum in the graphical window
Display of the numeric value alone is sufficient for the majority of harmonic distortion measurements.
Here, however, the spectral composition of the output signal at the DUT is also to be analyzed. With the
Audio Analyzer R&S UPV, it is possible to follow up all distortion measurements with an FFT analysis.
The necessary settings for this are explained in the following section:
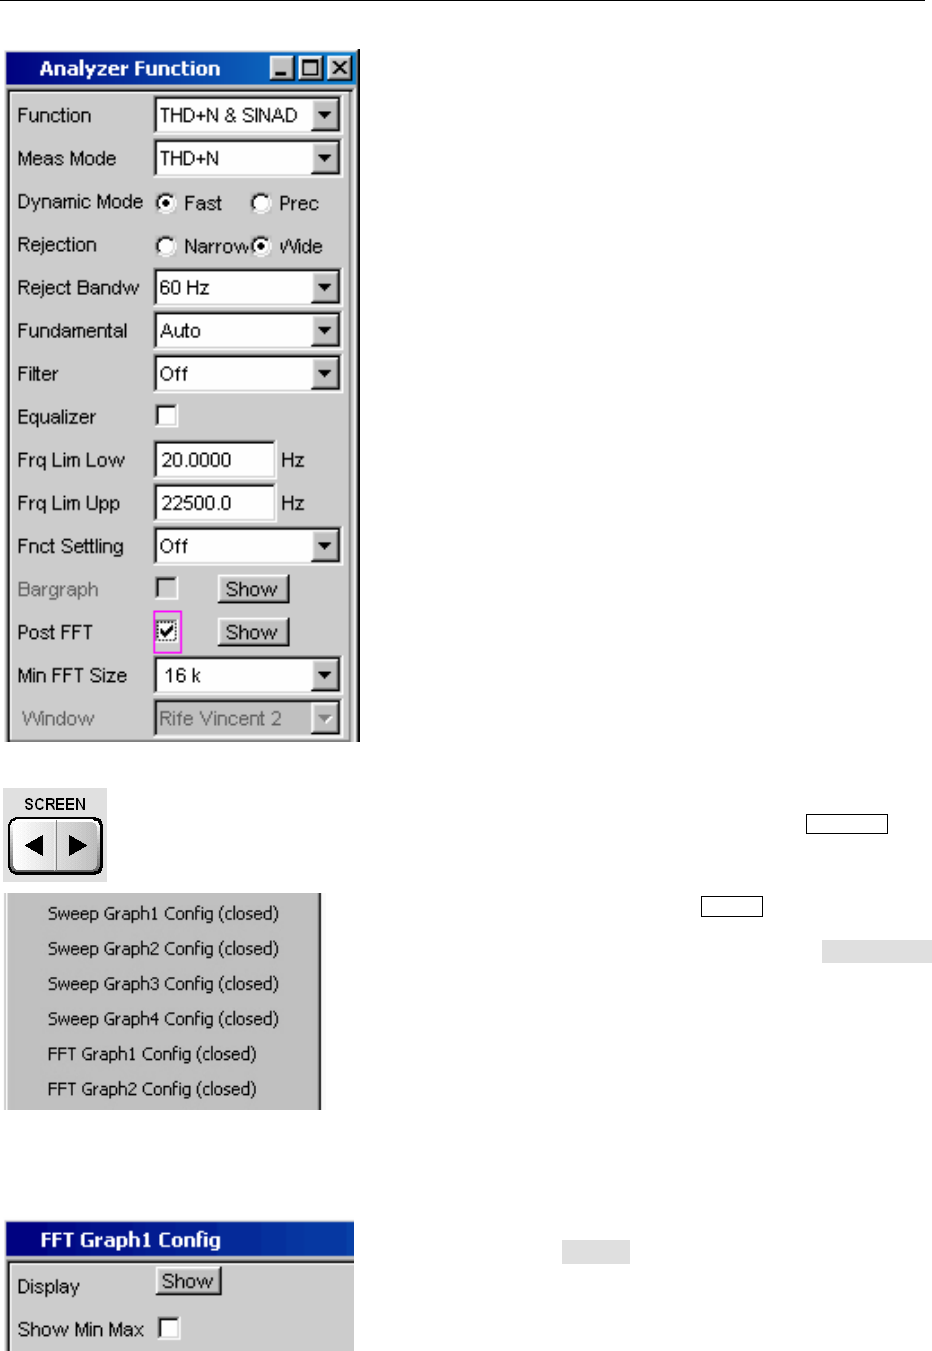
Introduction to Instrument Operation Using Examples R&S UPV
1146.2078.62 2.34 E-5
In the Analyzer Function panel already used for
configuring the THD+N measurement, an FFT analysis
to be performed following the measurement can be set
after the actual measurement function has been
selected.
To do this, highlight the Post FFT tick box with the
rotary knob and activate it with a rotary-knob click.
The size of the FFT can be adjusted if necessary.
To display the results of the FFT analysis graphically,
first change to Screen 5 by pressing the SCREEN key;
this screen is empty in the default R&S UPV setup.
Open the menu bar with the MENU key and open the
FFT Graph 1 Config panel by selecting it in the
selection list displayed by actuating the DispConfig
button.
As explained in the previous example, the way in which
the measurement results are presented is determined in
the configuration panels.Each graphical window has
its own configuration panel.
The FFT Graph 1 Config panel required here has two
columns; to simplify matters, only Trace A is shown in
the example.
The associated graphical window can be opened by
actuating the Show button in the Display field. The
window appears in the same screen so that the effect of
the following settings can be observed directly.
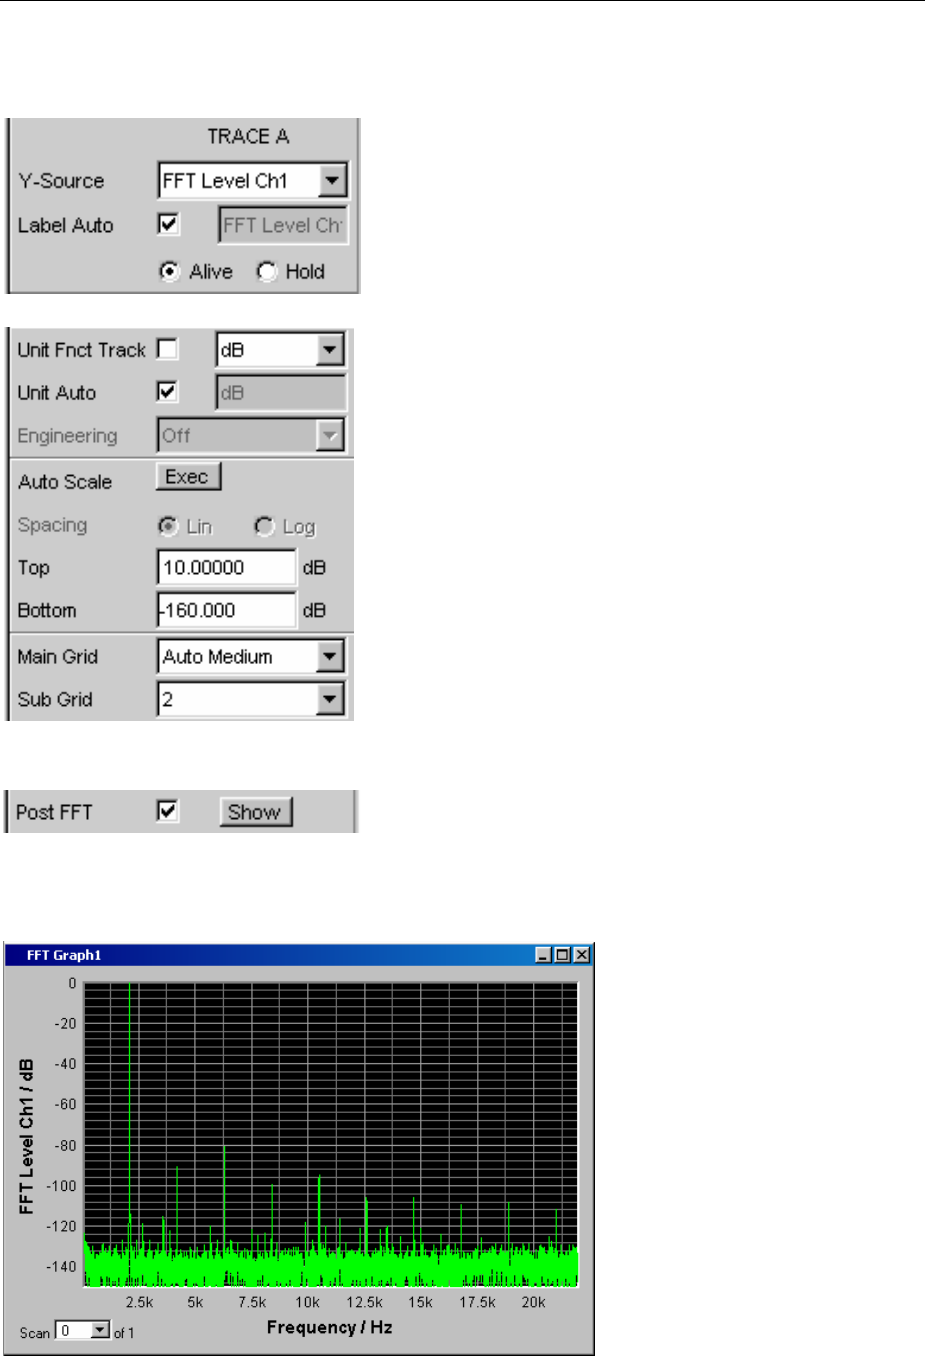
R&S UPV Introduction to Instrument Operation Using Examples
1146.2078.62 2.35 E-5
In each FFT window, one or two traces (Trace A and
Trace B) can be plotted on the frequency axis.
In this example, the level measurement results of the
FFT analysis are to be displayed on a graph. For
Trace A, the Source field is therefore set to
FFT Level Ch1 (this is already preset in the default
setup).
The Alive setting means that the results are displayed
continuously; the Hold setting "freezes" the traces.
The settings for unit, Y-axis scaling and grid are already
preset in the default setup; a result should therefore be
visible. If necessary, these settings must be adjusted.
The settings for the X-axis are also mostly correct for
this example; they were explained in the previous
example.
Note:
In the Analyzer Function panel, you can also use the
Show button to open the graphical window for
Post FFT. However, this displays the window in the
same screen, without opening the associated
configuration panel.
The spectral display of the output
signal with its harmonics may now
look like the example shown
opposite.
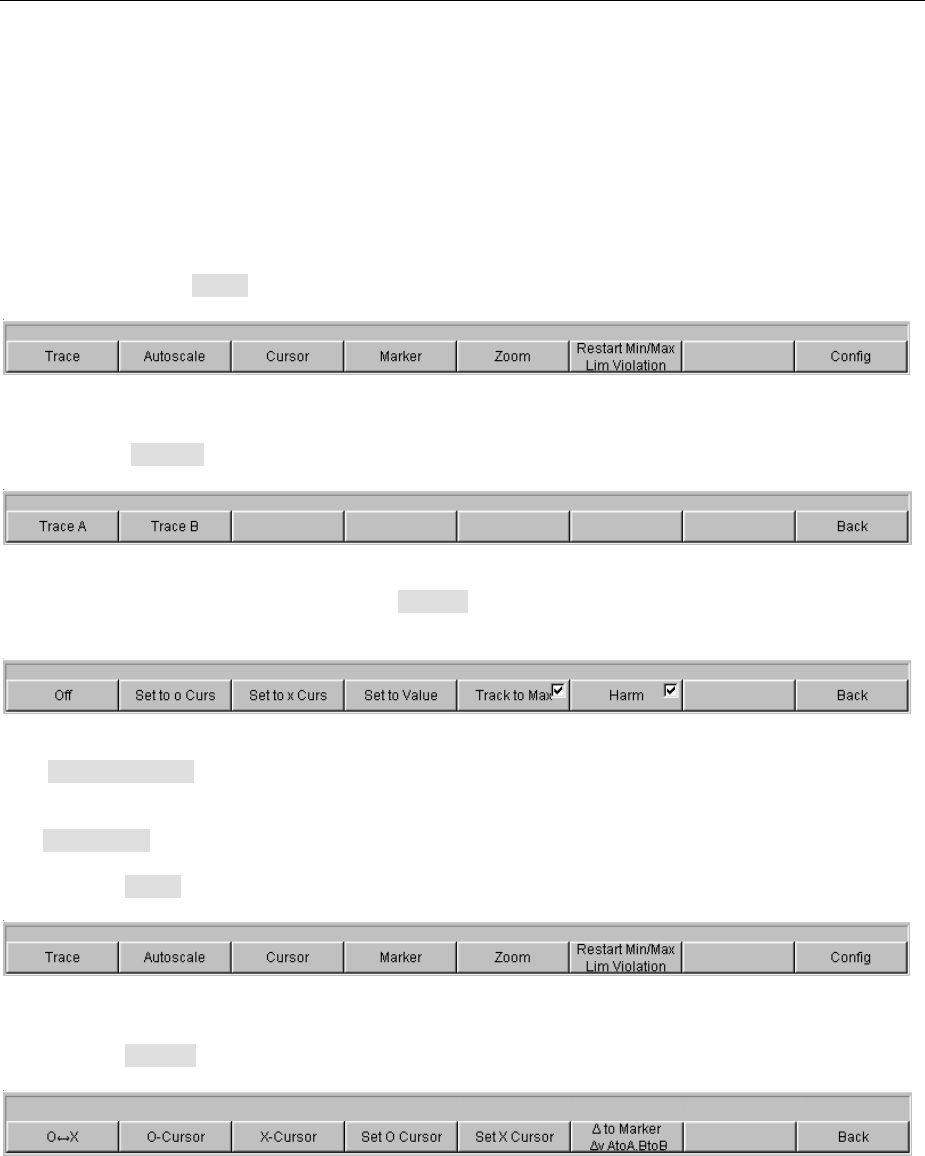
Introduction to Instrument Operation Using Examples R&S UPV
1146.2078.62 2.36 E-5
Step 6: Evaluating the graphical display with markers and cursors
All graphical displays can be evaluated using horizontal and vertical cursors; the X and Y-values shown
in the display fields associated with the cursors are always current values.
Markers are used to identify important measurement points.
The cursors and markers can only be operated using the softkey bar; the required softkeys are
displayed at the bottom of the screen as soon as the graphical window has the focus.
The softkeys are arranged in several levels; the lower levels are accessed by actuating the respective
button. Actuating the Back button redisplays the higher level.
Setting markers:
Actuating the Marker button displays the marker softkeys:
The trace in which markers are to be set (Trace A in this example) must first be selected using the
softkey. The next softkey level appears simultaneously:
The Track to Max button is used to set a marker at the maximum value of the curve, i.e. the
fundamental in this example THD+N measurement.
The Harmonics button is used to mark the harmonics of the fundamental indicated by the marker.
Actuating the Back softkey twice redisplays the first softkey level.
Using cursors:
Actuating the Cursor button displays the cursor softkeys:
The Audio Analyzer R&S UPV uses two cursors which are identified by the and symbols. These
symbols are used to mark the measured points in the graph (see the example graph below).
Only one cursor is active and can be moved in the graph at any one time. The active cursor is displayed
with a solid line; the inactive cursor is displayed with a broken line.
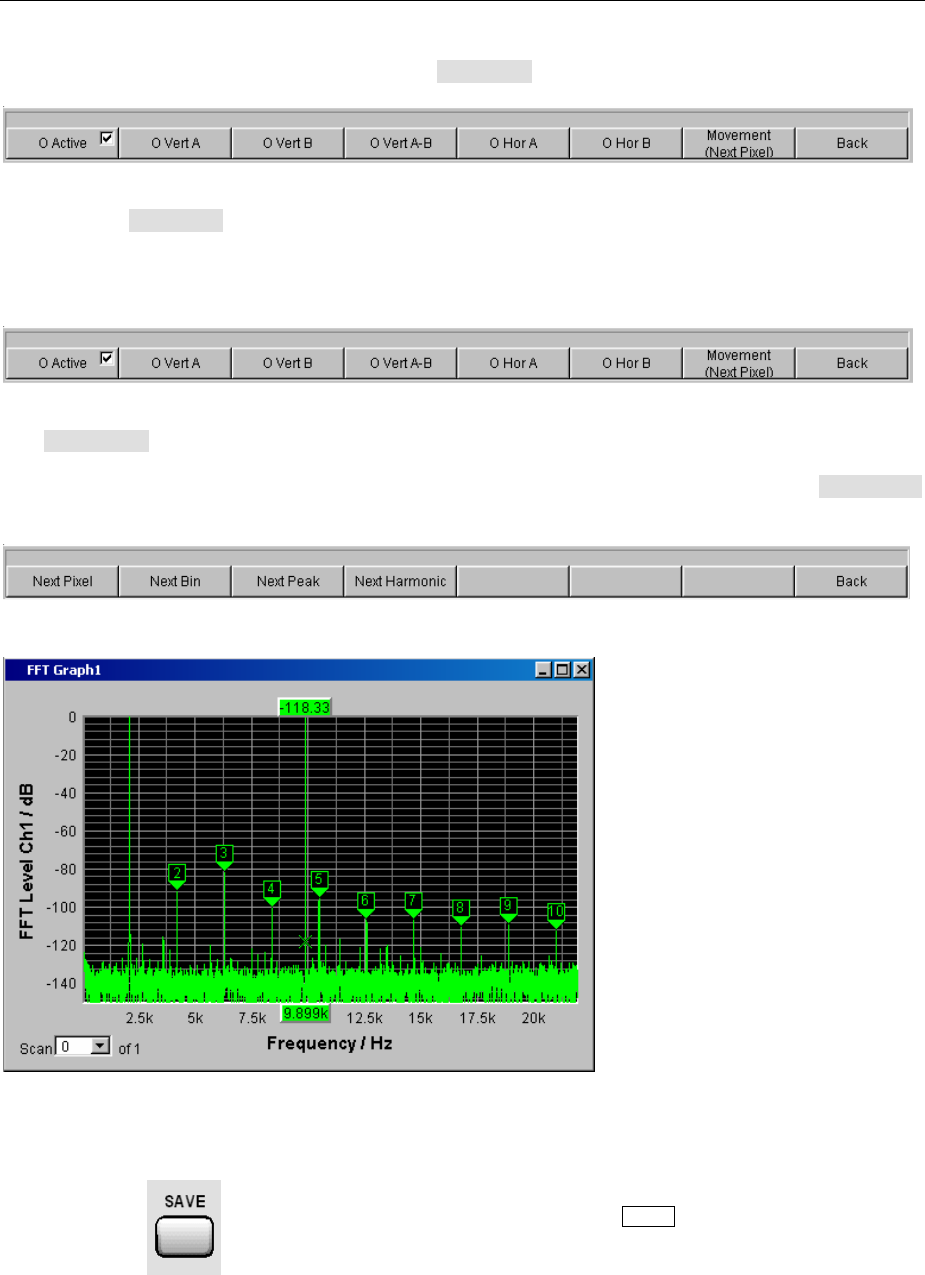
R&S UPV Introduction to Instrument Operation Using Examples
1146.2078.62 2.37 E-5
The <->button or a rotary-knob click is used to toggle between the and -cursor.
If, for example, the cursor was activated with the -Cursor button, the following softkeys appear:
Actuating the Vert A button activates a vertical cursor on Trace A; this cursor can then be moved
using the rotary knob.
The step size with which the cursor is moved can be set using further softkeys.
The Movement button opens the next softkey level where various step sizes for moving the cursor are
offered.
The currently selected step size is indicated in brackets in the second label line of the Movement
button.
With activated markers and a
cursor, the graphical display of the
output signal with its harmonics
may look like the example shown
opposite.
Step 7: Saving the instrument setup
This example can also be saved as an instrument
setup. Pressing the SAVE key opens the file window.
The file is then saved in the way described in the
previous example.
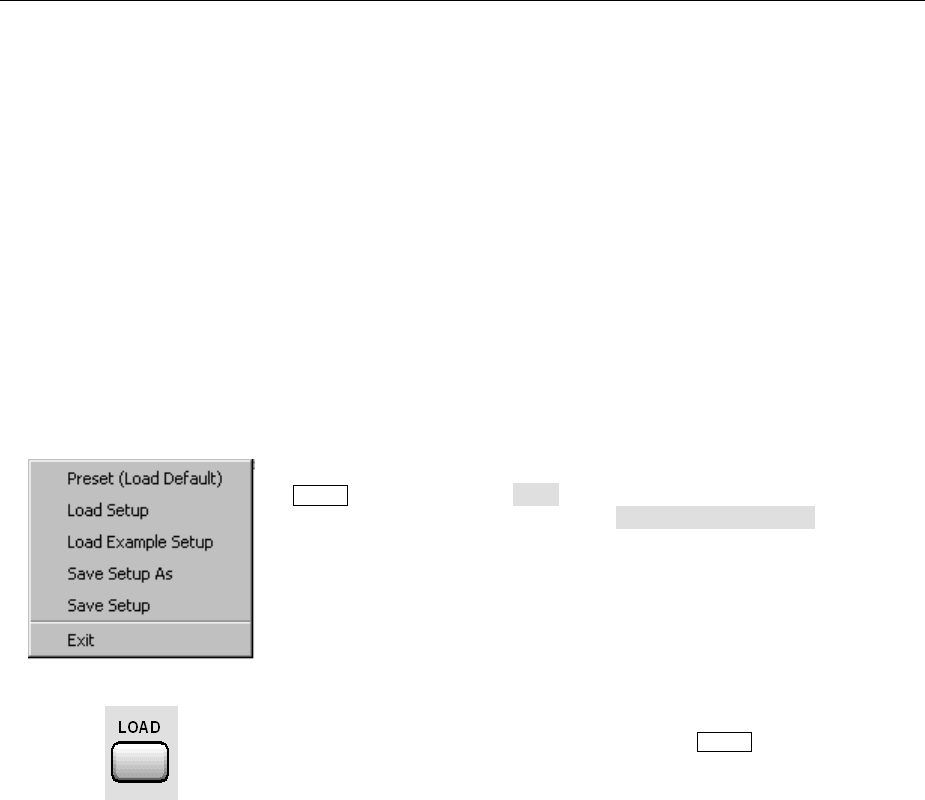
Loading Predefined Instrument Setups R&S UPV
1146.2078.62 2.38 E-5
Loading Predefined Instrument Setups
To make initial measurements easier for new users, example setups for the basic measurements
required in audio engineering are supplied with every Audio Analyzer R&S UPV. These setups allow the
instrument to be used almost immediately.
The setup files are available for the different domains (analog or digital) of the generator and analyzer.
They are stored in the AA to DD subdirectories of the D:\UPV\Applications directory; the generator
domain is listed first followed by the analyzer domain. The file name indicates the respective
application.
Many of these example measurements (essentially those at the analog interfaces) can be performed
using the basic version of the Audio Analyzer R&S UPV. The R&S UPV-B2 option or the R&S UPV-B20
option (digital audio interfaces) is required for all measurements at the digital interfaces.
The predefined instrument setups can be loaded in the following way:
The quickest way to load setups is to open the menu bar with the
MENU key, highlight the File button with the rotary knob and actuate
it with a rotary-knob click. The item Load Example Setup in the fold-
down list that then appears must then be highlighted and actuated in
the same way.
The file window is opened already displaying the directory in which the
example measurements can be selected.
Alternatively, the file window used to select the example
measurements can also be opened using the LOAD key on the front of
the R&S UPV; in this case, however, the appropriate directories must
be selected manually.
All of the setups listed here use the same basic settings.
Basic settings for analog inputs/outputs:
•Both channels of the generator and analyzer are active; the balanced XLR connections with
minimum generator impedance and maximum analyzer impedance are used.
•All inputs/outputs are floating; the autorange function is activated.
•Frequency sweeps are usually performed logarithmically from 20 Hz to 20 kHz; the appropriate
graphical windows are open on the screen; the X-axis is scaled automatically in the associated
configuration panels; the Y-axis is permanently set to standard values.
•Voltages are mostly given in volts; the generator output voltage is set to 0.1 V; distortion and
intermodulation values are given in dB.

R&S UPV Loading Predefined Instrument Setups
1146.2078.62 2.39 E-5
Basic settings for digital inputs/outputs:
•Both channels are active; the generator generates 24 bit words; the analyzer analyzes 24 audio
bits. The sampling frequency is set to 48 kHz; the Professional format to AES 3 is used. The digital
pulse amplitude of the generator is 1 V at the BNC outputs; this corresponds to 4 V at the XLR
sockets.
•Levels are mostly given in dBFS; audio signals are usually generated at a level of –20 dBFS.
Users can, of course, adapt the used basic settings to their own specific measurement tasks at any
time. To do this, the respective setup must be loaded and the appropriate changes are then made in the
panels. The setup can then be saved again.
The application setups are also updated when new R&S UPV firmware is installed. Modified setups
should therefore be saved under a different file name.
Users are also free to create new directories for their customized setups.

R&S UPV Contents - Manual Operation
1146.2078.62 I-3.1 E-5
Contents - Chapter 3 "Manual Operation"
3Manual Operation.........................................................................................................................3.1
Introduction - Manual Operation.....................................................................................................3.1
Functional Organization of the Audio Analyzer R&S UPV...........................................................3.2
Instrument Concept..................................................................................................................3.2
Generators ...............................................................................................................................3.2
Analyzers..................................................................................................................................3.4
General Information on Operation..................................................................................................3.9
Windows User Interface ...........................................................................................................3.9
Using the Rotary Knob .............................................................................................................3.9
Operation Using the Mouse ...................................................................................................3.10
Operation Using an External PC Keyboard ...........................................................................3.11
Display.............................................................................................................................................3.12
Display and Screens ..............................................................................................................3.12
WINBAR and Softkeys ...........................................................................................................3.14
Moving and Resizing Panels and Graphical Windows ..........................................................3.16
Status Displays and Messages..............................................................................................3.19
Panels ..............................................................................................................................................3.21
Panel and Window Types ......................................................................................................3.21
Opening, Operating, Hiding and Closing Panels ...................................................................3.21
Panel Structure ......................................................................................................................3.23
Navigating in the Panels ........................................................................................................3.27
Settings on the Audio Analyzer R&S UPV ...................................................................................3.28
Settings in the Panels ....................................................................................................................3.29
Focus......................................................................................................................................3.29
Changing the Instrument........................................................................................................3.30
Changing Functions ...............................................................................................................3.30
Hiding Parameter Fields.........................................................................................................3.31
Highlighting Control Elements................................................................................................3.32
Activating/Deactivating Functions – Tick boxes.....................................................................3.32
Toggling Functions – Radio Buttons ......................................................................................3.33
Selecting a Parameter – Selection Fields..............................................................................3.34
Numeric Entries – Numeric Entry Fields ................................................................................3.35
Alphanumeric Entries – Text Entry Fields..............................................................................3.42
Display Fields.........................................................................................................................3.43
Adopting Parameters – Track Box .........................................................................................3.44
Help Functions .......................................................................................................................3.44
Completing Settings ...............................................................................................................3.45
Entries During Measurement / Data Output...........................................................................3.46

Contents - Manual Operation R&S UPV
1146.2078.62 I-3.2 E-5
Measurement Displays ..................................................................................................................3.47
Measurement Functions and Displaying Measurement Results............................................3.47
Numeric Display Field ............................................................................................................3.48
Combi Display ........................................................................................................................3.50
Graphical Windows ................................................................................................................3.56
Evaluating Graphical Displays with Cursors and Markers .....................................................3.69
Data Lists ...............................................................................................................................3.82
Settings in the Menu Bar ...............................................................................................................3.86
Settings in the Toolbar ..................................................................................................................3.91
Settings in the Operating System.................................................................................................3.94
Auxiliaries Panel.............................................................................................................................3.94
Audio Monitor Function ..........................................................................................................3.94
Auxiliary Analog Output..........................................................................................................3.96
Trigger Input, Trigger Output .................................................................................................3.97
Rapid Deactivation of the Outputs ...............................................................................................3.98
Help System ....................................................................................................................................3.99
Operating Help .......................................................................................................................3.99
Help Text Language.............................................................................................................3.100
File Management ..........................................................................................................................3.102
Selecting the File Select Window.........................................................................................3.103
Integrated File Select Window .............................................................................................3.104
File Manager ........................................................................................................................3.105
Loading and Saving Instrument Settings .............................................................................3.106
List of File Extensions Used.................................................................................................3.107
Manual Remote Operation...........................................................................................................3.109
Units...............................................................................................................................................3.110
Units in Measurement Result Displays ................................................................................3.111
Units for Value Entries .........................................................................................................3.115
Overview of Keys..........................................................................................................................3.118
Overview of Panels and Measurement Displays (Graphical Windows)..................................3.122
Overview of Status Messages.....................................................................................................3.126

R&S UPV Introduction - Manual Operation
1146.2078.62 3.1 E-5
3Manual Operation
Introduction - Manual Operation
The R&S UPV audio analyzer is available in two models. The R&S UPV standard model and the
R&S UPV66, which is specially designed for use in systems. The R&S UPV66 has no display, no front
panel control elements, and no CD/DVD drive. Apart from the omission of front-panel operation, the
R&S UPV66 model has largely the same functions as the standard model. This manual therefore
describes both instruments in parallel, and any differences are indicated at the appropriate points in the
text.
The Audio Analyzer R&S UPV uses the WindowsXP® operating system. The instrument is therefore
operated in largely the same way as other Windows® applications. All panels and display windows
have the standard Windows® format and are operated in the same way. The rotary knob, keys and
softkeys, or alternatively an external keyboard and/or mouse, allow direct and convenient access to
entries and settings. The clearly organized display shows the current state of the audio analyzer.
The R&S UPV model can be fully operated using the control elements on the front panel; additional
peripherals such as a mouse and keyboard are not essential requirements. They can, however, be
connected so that the user is free to decide how he would like to operate the R&S UPV. Mixed
operation is also possible.
If the R&S UPV66 model is to be operated manually, you need to connect an external screen, a mouse,
and a PC keyboard. The section "Overview of Keys"at the end of this chapter provides the keys and
key combinations on a PC keyboard that correpond to the front-panel keys available with the R&S UPV
model. For further information on operation by means of mouse and keyboard, refer to the sections
"Operation Using the Mouse"and "Operation Using an External PC Keyboard"in this chapter. The use
of the toolbar simplifies the operation of both models when using the mouse. See the section "Settings
in the Toolbar"in this chapter.
Numerous online help functions assist the user in making settings.
After being switched on, the instrument is in the same state as it was before it was switched off. This
applies to all setting parameters of the R&S UPV, including those not currently displayed on the screen.
The following chapter describes manual operation of the Audio Analyzer R&S UPV. This includes a
description of the screen displays, how to operate the panels and how to set parameters. Each of the
setting descriptions is accompanied by a table explaining how the different functions are performed via
the front panel and using an external PC keyboard or mouse.
An overview of the keys, panels and display windows can be found at the end of this chapter.
The functions of the Audio Analyzer R&S UPV are described in detail in Chapter 4. Chapter 2 contains
adescription of the general operating concept and a brief introduction in which initial measurements are
configured step by step. Remote control of the instrument is described in Chapters 5, 6 and 7.

Functional Organization of the Audio Analyzer R&S UPV R&S UPV
1146.2078.62 3.2 E-5
Functional Organization of the Audio Analyzer
R&S UPV
Instrument Concept
The Audio Analyzer R&S UPV combines the following components in a single housing:
•generators with analog and (with the R&S UPV-B2 and -B20 options) digital audio interfaces
for generating the various test signals
•analyzers with analog and (with the R&S UPV-B2 and -B20 options) digital audio interfaces
for comprehensive measuring possibilities and
•acomputer (PC) with the WindowsXP® operating system
for controlling and operating the entire instrument and with connections for PC peripherals and LAN
Generators
Universal generator
The universal generator consists of signal processors and generates the various test signals from
sinusoidal tones through intermodulation test signals (two-tone signals) to noise signals and multi-
tones. Following appropriate conversion, these signal are made available at the analog outputs.
Using the R&S UPV-B2 and -B20 options, they can also be output as digital data streams in various
formats at the AES/EBU and SPDIF interfaces and at optical interfaces.
The R&S UPV-B4x options, which can be installed in the expansion slots at the rear of the instrument,
provide further interfaces for outputting the test signals.
By using the R&S UPV-B2 and -K21 options, you can also generate additional digital data such as
channel status data as well as validity and parity bits.
By using the R&S UPV-B20 and -K22 options, the universal generator can also be used to generate
impairment signals for applying jitter or common-mode interference to the DUT connected to the
AES/EBU and SPDIF interfaces.
All test signals can be output on one or two channels. With the R&S UPV-B2 (and R&S UPV-B20)
option, two different signals are also available at the digital outputs.
The hardware option R&S UPV-B3 provides the R&S UPV with a second analog output amplifier.
This allows different signals to be output on the two analog output channels.
Low-distortion generator
The low-distortion generator (R&S UPV-B1 option) is required for all applications where extremely
pure analog signals are necessary or an extended frequency range up to 185 kHz is needed. Its
intrinsic distortion is considerably less than the already excellent values for the universal generator.

R&S UPV Functional Organization of the Audio Analyzer R&S UPV
1146.2078.62 3.3 E-5
Function blocks and their assignment to the panels
The diagram below shows the function blocks of the generators in the Audio Analyzer R&S UPV:
AES / SPDIF Output
Play-
back
Extend.
Interface
Slot 1
Digital Output
Extension 1
Digital
Audio
Board
Filter /
Equa-
lizer
internal (Jitter, Common)
D
A
DSP
Gen
Low
Dist
Gen
Digital Output
Extension 2
Analog Output
Filter
standard circuits
optional circuits
Extend.
Interface
Slot 2
The generators of the R&S UPV are operated in two steps:
In the first step, the following settings are made in the Generator
Config panel:
the audio interfaces at which the test signals are to be
output
the channels which are to be active
maximum level and reference values
etc
Output as impairment test signals is also set here.
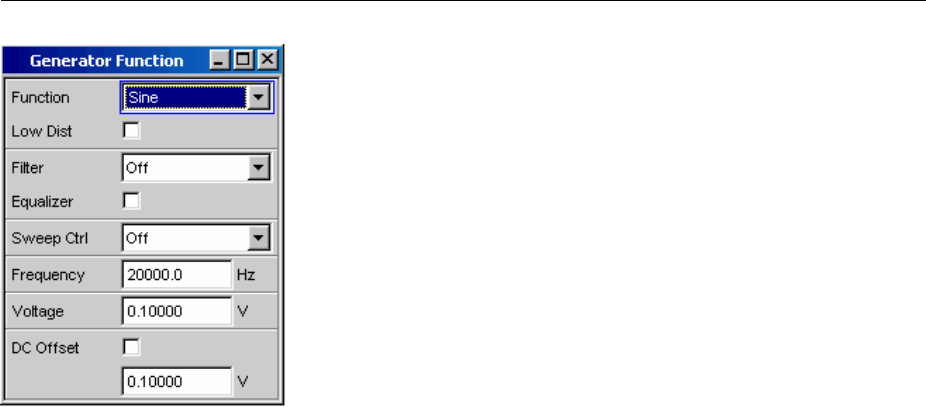
Functional Organization of the Audio Analyzer R&S UPV R&S UPV
1146.2078.62 3.4 E-5
In the second step, the following settings are made in the Generator
Function panel:
type of test signal
output level
frequencies
etc
Analyzers
Basic concept of the analyzers
The R&S UPV performs all measurements using digital signal processing. Here, analog signals to be
measured are first subjected to complex 2-channel analog preprocessing on analog measurement
modules before they are digitalized and fed to the digital measurement routines.
This concept has the following advantages:
•All audio measurement functions are available at both the analog and the digital interfaces.
•The measurement methods at the analog and digital interfaces are identical.
•Operation at the analog and digital interfaces is always the same.
•The analog preprocessing makes it possible to achieve a higher dynamic response than that
provided by the internally used 24-bit converter.
•The R&S UPV can also perform the complex measurement functions simultaneously on both
channels; this alone halves the time required for stereo measurements.
•Several measurement functions, e.g. level measurement, FFT analysis, waveform analysis, etc, are
calculated simultaneously on separate signal processors and can therefore be displayed at the
same time without a delay.
•The digital measurement routines can continuously adapt their speed to the current input frequency
and thus achieve high measurement speeds.
•Since the filters are also digital, an almost infinite number of filters is available and can also be used
for measurements at analog interfaces.
With the R&S UPV-B2 (and R&S UPV-B20) option, digital audio data streams can also be measured at
the AES/EBU and SPDIF interfaces.
The R&S UPV-B4x options, which can be installed in the expansion slots at the rear of the instrument,
provide further interfaces for analyzing signals in other formats.

R&S UPV Functional Organization of the Audio Analyzer R&S UPV
1146.2078.62 3.5 E-5
Function blocks and measurement levels
The analyzer part of the R&S UPV offers a large range of measurement options which are organized in
various measurement levels. The measurement results of these levels can also be displayed
simultaneously.
The unfiltered input signal is analyzed in the input level.The peak level at the input connectors is
analyzed here.
The pre-filter, which can be looped into the signal path before all other analyses, is located in front of
the monitor level.Here you can analyze the RMS value or the DC voltage component of the signal to
be tested.
Following any additional filtering using up to 3 filters, detailed analysis is initiated in the function level.
All the usual analysis tools for measuring linear and non-linear distortion, interferences etc can be found
here. The analysis in the time domain (waveform) as well as the FFT analysis with extreme dynamic
response and frequency resolution take place here. Moreover, it is possible to record input signals to
the hard disk in order to analyze them at some point later.
The measurement values for frequency and phase or group delay can be displayed in a different
measurement window parallel to the structure described above.
The audio monitoring output (integrated loudspeaker or headphones connection) can be activated on
each of the three levels and thus permits audio monitoring of analog or digital input signals both directly
at the input and in the different analysis levels. The generator signal can also be switched to the
loudspeaker / headphones.
With the R&S UPV-U2 option, the signals of the audio monitoring output can also be output at the BNC
connectors on the rear panel of the instrument.
By using the R&S UPV-B2 and -K21, you can also analyze additional digital data such as channel
status data as well as validity and parity bits.
With the R&S UPV-B2 and -K22 options, it is also possible to analyze the digital interface parameters
of DUTs (e.g. jitter, pulse amplitude, sampling frequency, etc) at the AES/EBU and SPDIF interfaces.
The results of these different measurement functions can be displayed in various ways in the
measurement windows.The type of display, the units used, scaling, etc can be set differently for each
measurement function in the associated panels.
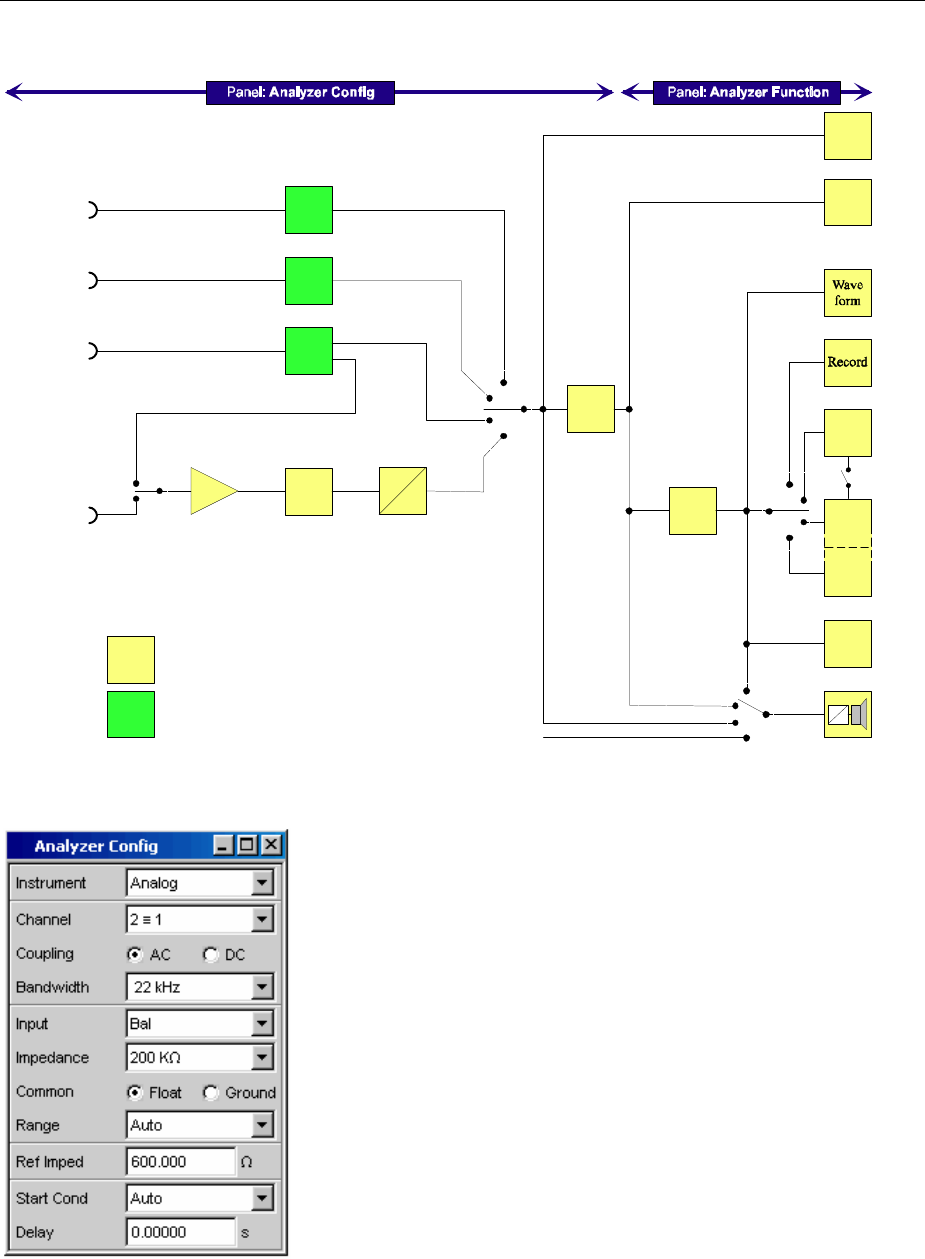
Functional Organization of the Audio Analyzer R&S UPV R&S UPV
1146.2078.62 3.6 E-5
The diagram below shows the function blocks and the analysis levels of the R&S UPV analyzer part:
Pre
Filter
FFT
Filter Meas.
Funct.
:
Input
Display
D
A
Level
Monitor
:
:
:
Post FFT
AES / SPDIF
Input
Analog
Pre-
Process.
A
D
Analog Input
Extend.
Interface
Slot 2
Extend.
Interface
Slot 1
Digital Input
Extension 2
Digital Input
Extension 1
Digital
Audio
Board
Impairment Measurements
(Jitter, Common Mode)
selectable
bandwidth 0...3
0...1
Freq.
Phase
GrpDel
standard circuits
optional circuits
internal UPV Generator
The analyzer part of the R&S UPV is also operated in two steps:
Operation begins in the Analyzer Config panel with the selection
of:
analog or digital input connectors
number of channels
AC or DC coupling
measurement bandwidth
and a number of other parameters
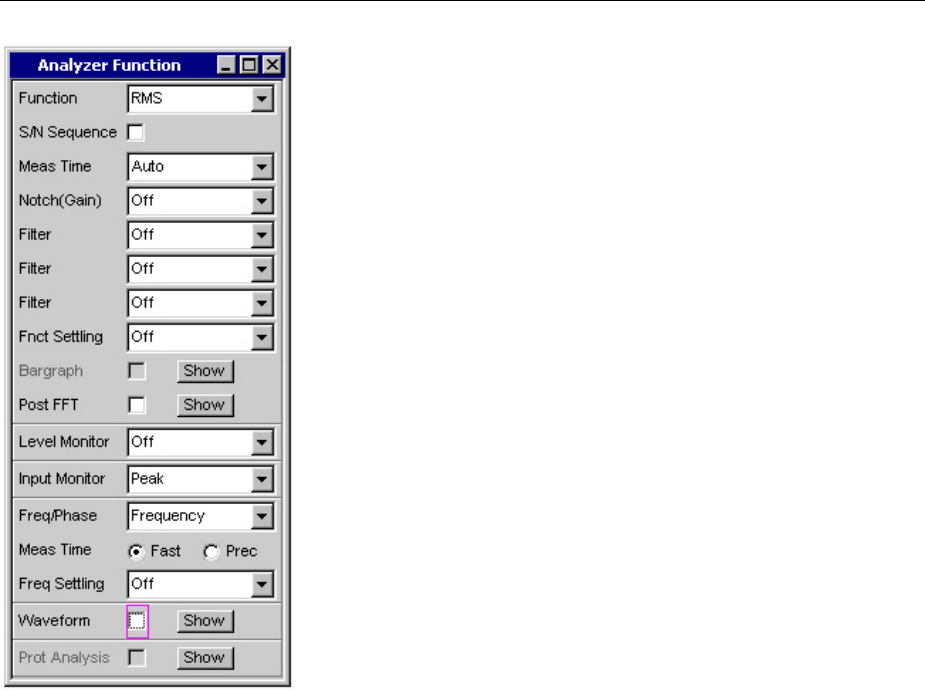
R&S UPV Functional Organization of the Audio Analyzer R&S UPV
1146.2078.62 3.7 E-5
Following this step, the measurements at the various analysis
levels of the R&S UPV are set in the Analyzer Function panel.
The measurements are set in the order of their importance:
measurements in the function level,
e.g. distortion measurements
(possibly with Post-FFT enabled)
settings in the monitor level,
e.g. DC measurement
display of the peak value in the input level
display of frequency, phase / group delay
In addition, the Waveform and, if necessary, Protocol Analysis
functions can be switched on and off in this panel.

Functional Organization of the Audio Analyzer R&S UPV R&S UPV
1146.2078.62 3.8 E-5
If audio monitoring using the integrated loudspeaker or with
headphones is required, this is set in the Auxiliaries panel.
The following settings can be made in other panels:
the way in which the measurement results are to be
displayed (numerically or graphically)
scaling
limit monitoring
minimum and/or maximum values
and many other parameters

R&S UPV General Information on Operation
1146.2078.62 3.9 E-5
General Information on Operation
Windows User Interface
To provide the user with a familiar environment, operation is largely based on the Windows® user
interfaces. All panels, entry windows, etc are made up of known elements, for example:
Selection fields with parameter lists
Tick boxes
Radio buttons
Entry fields
Ablue, green or magenta selection frame or the highlighting of an entry field (dark background)
indicates the current entry focus. Entries can be made in the element with entry focus.
Operation follows the same basic rules which apply to other Windows® programs in use today. It is
assumed that the user is familiar with these basic rules. This information is therefore not given in detail
in this manual.
Using the Rotary Knob
Operation is possible using the front-panel keys, an external keyboard and/or a mouse. However, most
of the settings can be made with the rotary knob:
•Turning the rotary knob shifts the entry focus to the desired element.
•Pressing the rotary knob (rotary-knob click) opens the parameter list in the selection fields; a
parameter can be selected from the list by again turning and then clicking with the rotary knob.
•Tick boxes are activated/deactivated by clicking with the rotary knob.
•The individual radio buttons are selected by turning the rotary knob; they are toggled by clicking
with the rotary knob.
•In the entry fields, the numeric values can be changed directly (with immediate effect on the
setting) or first edited and then adopted by clicking again with the rotary knob.

General Information on Operation R&S UPV
1146.2078.62 3.10 E-5
Operation Using the Mouse
Similar to other Windows® programs, the Audio Analyzer R&S UPV can also be operated using a
mouse. To permit this, a commercially available mouse (not supplied with the instrument) is connected
to one of the 4 USB interfaces at the front or rear of the instrument (see Chapter 1, "Connecting a
Mouse",page 1.26).
The mouse makes it easier to move and resize the panels and graphical windows on the screen and
provides alternative operating modes. It allows easy operation of Windows®.
The Audio Analyzer R&S UPV also features a special tool bar for mouse operation. You can define
whether the tool bar should always be visible at the top edge of the screen or whether it should appear
at the right-hand edge of the screen as soon as you move the mouse pointer there. This tool bar
contains a number of icons for calling up frequently used functions.
The functions of the mouse correspond to the following front-panel functions:
Mouse Front panel Function
Left-click ENTER key,
rotary-knob click
Activates selection fields
Selects parameters
Activates/deactivates tick boxes
Toggles radio buttons
Quits the Edit mode
Move mouse pointer to left-
hand edge of screen
MENU key Shows the menu bar
Turning mouse wheel Turning rotary knob Navigation in panels, parameter
lists, etc
Changes numeric values
Pressing mouse wheel Rotary-knob click Selects parameters
Quits the Edit mode

R&S UPV General Information on Operation
1146.2078.62 3.11 E-5
Operation Using an External PC Keyboard
Acommercially available, external PC keyboard (not supplied with the instrument) can be connected to
one of the 4 USB interfaces at the front or rear of the instrument (see Chapter 1, "Connecting an
External Keyboard",page 1.26).
It simplifies the input of list entries, comment texts, file names, etc. A keyboard is required for operating
Windows®.
The keys on the front panel of the Audio Analyzer R&S UPV correspond to the following keys and key
combinations on the external PC keyboard:
Front panel PC keyboard Front panel PC keyboard
Softkeys F5 … F12 F5 … F12 0 … 9; A … Z 0 … 9; A … Z
START CTRL + F5 SPACE
SINGLE CTRL + F6 •; * … # •; * … #
STOP CONT CTRL + F7 + / - + / -
Loudspeaker ON CTRL + F8 AaSHIFT + A … Z
Volume CTRL + F9 MENU CTRL + M
HCOPY CTRL + P UNDO BACKSPACE
SHUT-DOWN CTRL + F10 ESC ESC
LOCAL CTRL + F11 Enter, rotary-knob
click
ENTER
OUTPUT OFF CTRL + F12 Cursor keys Cursor keys
SCREEN CTRL + PAGE UP WINBAR ALT + W
SCREEN CTRL + PAGE DOWN MODIFY ALT + M
WINDOW CTRL + SHIFT + TAB HIDE ALT + H
WINDOW CTRL + TAB CLOSE ALT + C
SCAN ALT + PAGE UP HELP F1
SCAN ALT + PAGE DOWN SAVE ALT + S
PAGE PAGE DOWN LOAD ALT + L
PAGE PAGE UP PRESET ALT + P
Display R&S UPV
1146.2078.62 3.12 E-5
Display
Display and Screens
The display is the central element for operating the R&S UPV. Both the instrument settings in the
various panels, and the measurement results are displayed here.
To make the various functions of the Audio Analyzer R&S UPV easier to operate, they were organized
in a series of panels.
The measurement results can be displayed as digital numeric values, in data lists, in analog bargraphs
or in result graphics. The user can freely choose the number of panels and the number of graphical
windows to be shown in the display. The size of the panels can be changed within wide limits, whereby
the font size, scaling and so on are adapted automatically according to the type of display window.
5display windows (or "screens") are provided so that the wealth of information can be better organized.
The user can toggle between the individual screens in the following way:
From front panel Use the direction keys
With PC keyboard Use the key combinations CTRL + PAGE UP
and CTRL + PAGE DOWN
With mouse First open the menu bar at the top of the display, then click the Screen
button and finally select the desired screen.
Alternatively, you can also select the desired screen directly by clicking it
on the tool bar.
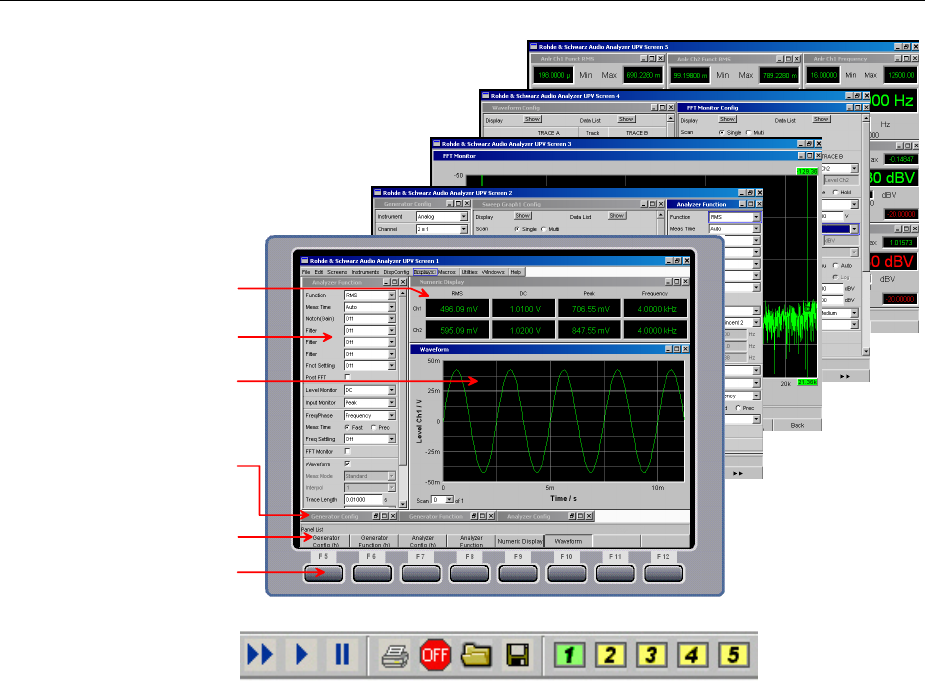
R&S UPV Display
1146.2078.62 3.13 E-5
Numeric display field
Panel
Graphical window
"hidden" Panels
Softkey bar
Softkeys
Tool bar (example)
Fig.: 3-1 R&S UPV display with its 5 screens and example of a tool bar
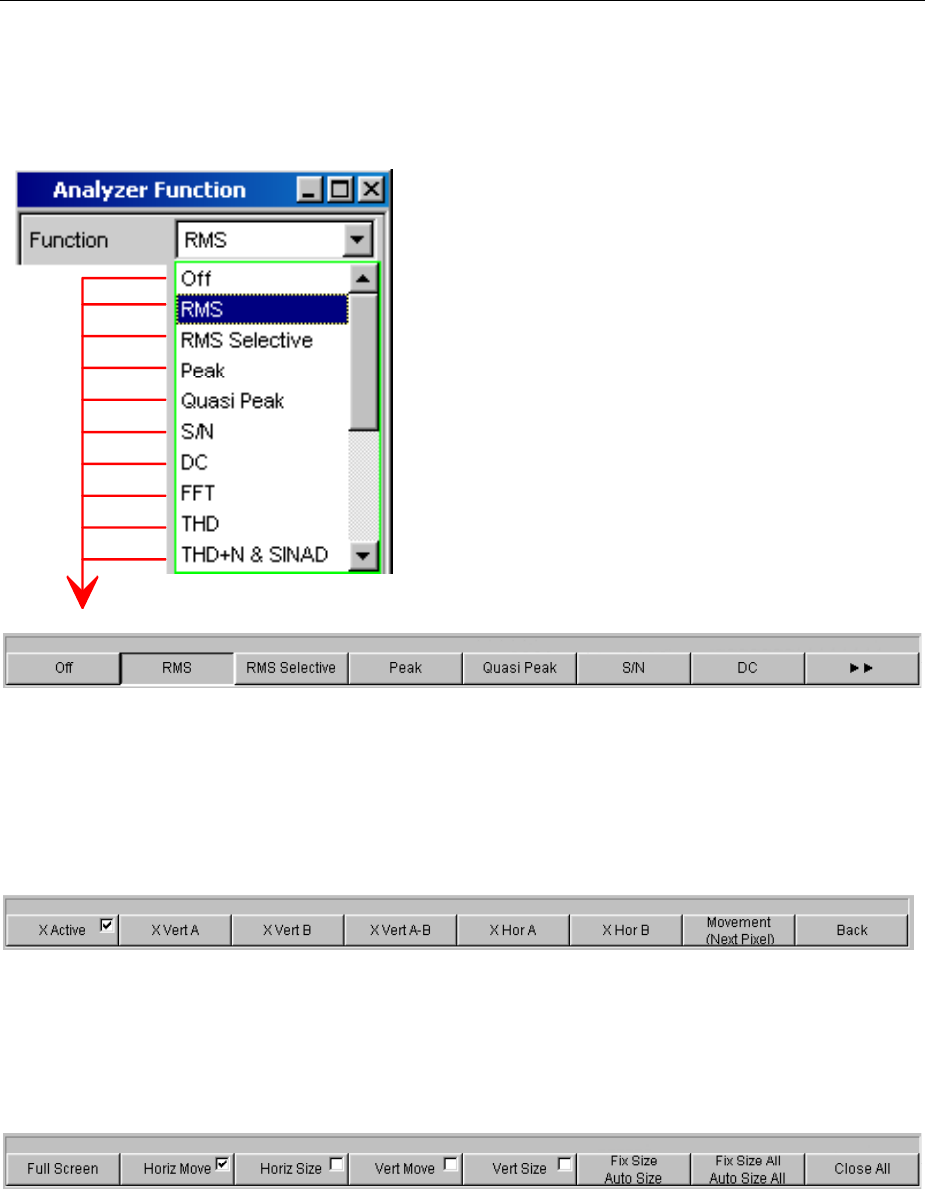
Display R&S UPV
1146.2078.62 3.14 E-5
WINBAR and Softkeys
One of the two bars (either the softkey bar or the WINBAR) is always displayed at the bottom of the
screen.
The softkey bar which has a varying range of functions
is visible in normal operating mode.
In most cases, the functions available in the selection
windows of the panels are displayed in the eight
buttons; these functions are displayed even if the
parameter lists have not (yet) been opened. The
labelling of these buttons indicates the functions of the
softkeys underneath them.
The function that has just been selected is indicated by
a"pressed" button, as shown in the example below for
the "RMS" function.
If there are more than 8 elements to choose from, the
hidden elements in the selection list can be displayed
by pressing the last softkey containing the symbol
or the first softkey containing the symbol.
Pressing the respective softkey permits rapid selection.
Softkeys with an additional tick box are also used for a number of applications. In the example below,
the left-hand softkey F5 can be used to activate and deactivate the X cursor in a curve diagram. The
other softkeys are used to make other settings affecting this cursor. The advantage of this combination
is that the user can activate/deactivate a function (here the cursor) using one button and at the same
time use the other softkeys for additional settings.
Another variant is the combination of several softkeys with tick box and softkeys without tick box. The
example below shows the softkeys for the MODIFY function, described in detail in the section "Moving
and Resizing Panels and Graphical Windows" on page 3.16.When a softkey with tick box is selected,
the softkey bar remains open so that further settings (e.g. moving a panel) can be carried out. Actuating
the other softkeys immediately triggers an action (here, for example, fixing the size of the panel),
whereupon the softkey bar is hidden.
If an external PC keyboard is used, the softkeys can be operated using the F5 to F12 keys; if a mouse
is used, the buttons in the softkey bar can be clicked directly.

R&S UPV Display
1146.2078.62 3.15 E-5
When the WINBAR key is pressed, the WINBAR appears in place of the softkey bar; this is indicated by
"Panel List" in the left-hand corner:
The labeled buttons show the names of all panels and graphical windows open in the current screen.
Pressing the associated softkey puts the focus on the corresponding panel / graphical window, i.e. it
becomes active. At the same time, the system returns to normal operating mode (i.e. the softkey bar).
Hidden panels (see "Opening, Operating, Hiding and Closing Panels",page 3.21)are also listed in the
WINBAR. If a hidden panel is selected, it is redisplayed on the screen with its previously set size and
position; it simultaneously receives the focus.
The panels and graphical windows displayed in the WINBAR can also be selected by pressing the F5 to
F12 keys on the PC keyboard or by clicking with the mouse.
The panel with the focus can be recognized by the highlighted title bar (as shown here in the example
on the right-hand side):
It is possible to toggle between the softkey bar and WINBAR at any time by pressing the WINBAR key.
Function Front panel PC keyboard Mouse
Select softkey function Press softkey. Press keys F5 to F12. Click button of associated
softkey.
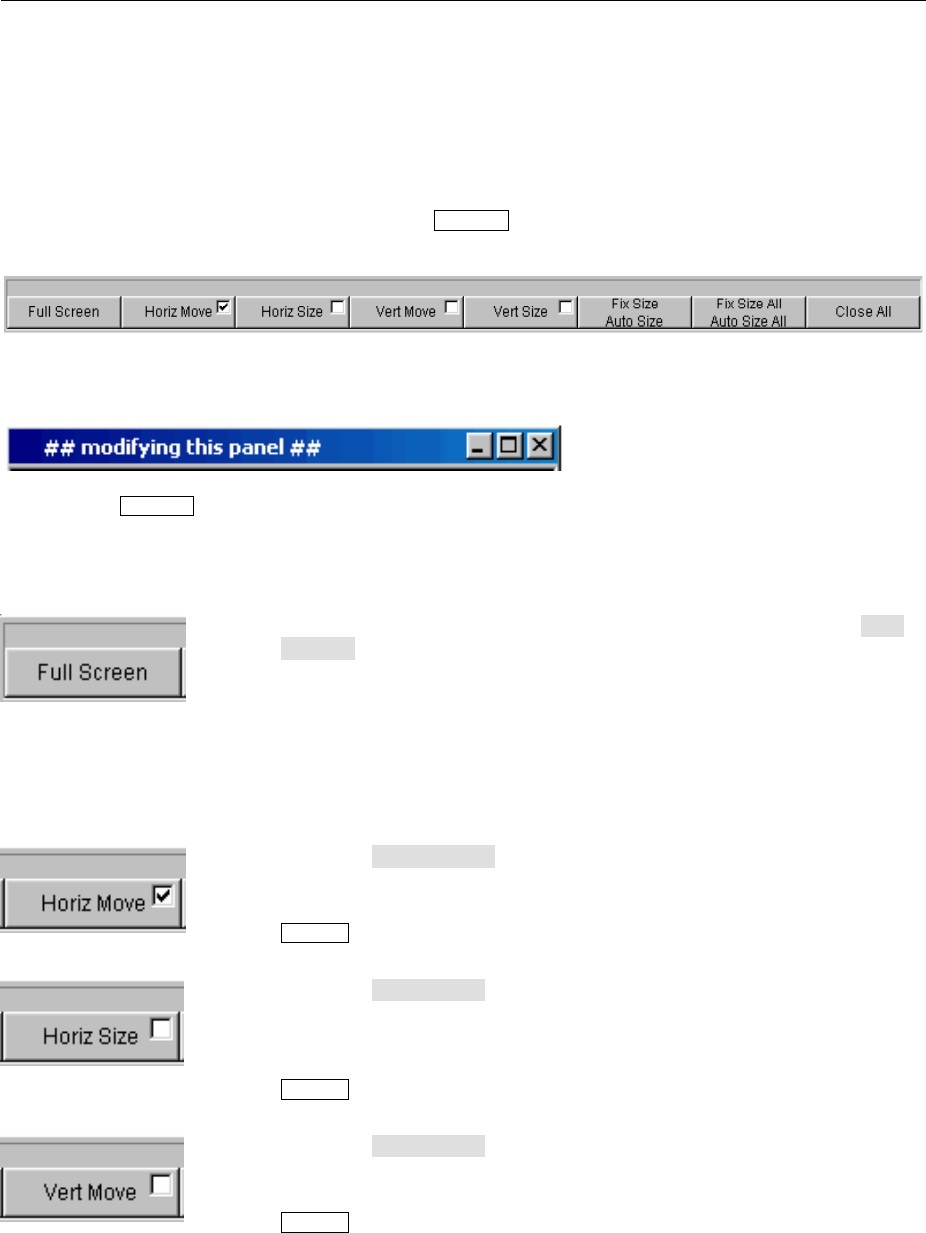
Display R&S UPV
1146.2078.62 3.16 E-5
Moving and Resizing Panels and Graphical Windows
Assoon as a panel or display window has the focus, it becomes active and can be moved around the
screen or resized. This can be done in the following ways:
•The mouse can be used to move or resize the selected panel directly in the same way as other
Windows® applications.
•In the case of operation without mouse, the MODIFY key (key combination ALT + M on an external
PC keyboard) must be pressed, whereupon the following labels appear on the softkey bar:
The associated panel can now be resized or moved; this is indicated by the label in the title bar:
Pressing the MODIFY key again restores the original operating mode.
Apart from resizing and moving, the MODIFY mode also offers a number of other functions described in
the following list:
This button is particularly useful for graphical windows. When the Full
Screen button is actuated, the selected panel is enlarged so that it
covers the entire screen.
If this command is used for panels, they are enlarged to their full length
and width. Panels the length of which exceeds the screen height are
reduced to full screen height.
Actuating this softkey quits the MODIFY mode and the selected panel
becomes active again.
When the Horiz Move button is selected, the rotary knob can be used
to move the panel/window horizontally without changing the size.
When all modifications to the panel have been made, pressing the
MODIFY key restores the original operating mode.
When the Horiz Size button is selected, the rotary knob can be used
to resize the panel/window (the right-hand edge of the selected panel is
moved).
When all modifications to the panel have been made, pressing the
MODIFY key restores the original operating mode.
When the Vert Move button is selected, the rotary knob can be used
to move the panel/window vertically without changing the size.
When all modifications to the panel have been made, pressing the
MODIFY button restores the original operating mode.
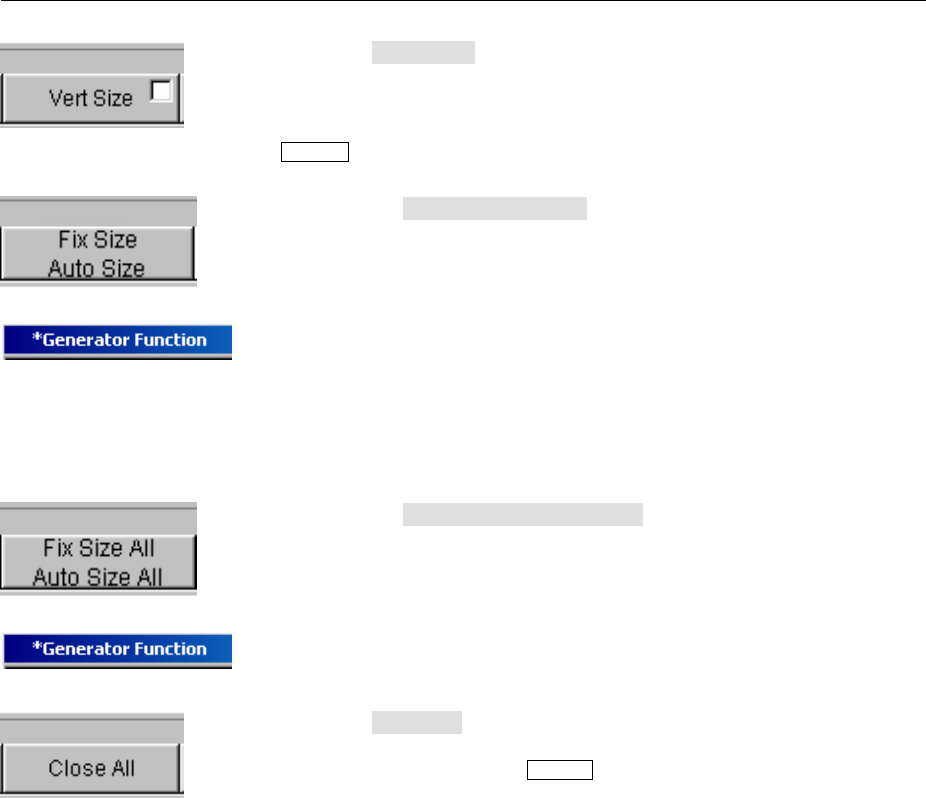
R&S UPV Display
1146.2078.62 3.17 E-5
When the Vert Size button is selected, the rotary knob can be used to
resize the panel/window (the bottom edge of the selected panel is
moved).
When all modifications to the panel have been made, pressing the
MODIFY key restores the original operating mode.
Actuating the Fix Size Auto Size button switches to "Auto Size" mode
and adjusts the size of the selected panel/window to display all setting
times or to use the full height of the screen. This state is indicated by an
asterisk in the title bar.
The default setting is "Fix Size". With this setting, the panel is not
enlarged if, for example, additional fields appear in the panel when
certain functions are selected; only the scroll bar indicates the presence
of additional fields.
Actuating the button again toggles between the two modes.
Actuating this softkey quits the MODIFY mode and the selected panel
becomes active again.
Actuating the Fix Size All Auto Size All button switches all
panels/windows to "Auto Size" mode and adjusts the size of the
panels/windows to display all setting times or to use the full height of
the screen. This state is indicated by an asterisk in the title bars.
Actuating the button again toggles between the two modes.
Actuating this softkey quits the MODIFY mode and the selected panel
becomes active again.
When the Close All button is selected, all of the panels and
measurement windows displayed on the screen are closed. The
function corresponds to the CLOSE key, except that it affects all panels
and measurement windows displayed on the screen.
Actuating this softkey quits the MODIFY mode and the selected panel
becomes active again.

Display R&S UPV
1146.2078.62 3.18 E-5
Function Front panel PC keyboard Mouse
Enlarge graphical window
to full screen size
Press MODIFY key and
actuate F5 softkey.
Press key combination ALT +
Mand then F5 key. Click button in title bar of
respective graphical window.
Move panel/graphical
window Press MODIFY key, select
direction of movement using
softkey and move panel
using rotary knob.
Press key combination ALT +
M, select direction of
movement using keys F6 or
F8 and move panel using
keys TAB and SHIFT + TAB.
Click title bar of panel and
drag to resize.
Resize panel/graphical
window horizontally and
vertically
Press MODIFY key, select
resizing direction using
softkey and resize panel
using rotary knob.
Press key combination ALT +
M, select resizing direction
using keys F7 or F9 and
resize panel using keys TAB
and SHIFT + TAB.
Drag top/bottom or side edge
of panel.
Resize panel/graphical
window proportionally
(horizontally and vertically)
Press MODIFY key,
change to second level using
button, actuate F6
softkey and resize panel
using rotary knob.
Press key combination ALT +
M, press F12 key and then
F6 key, and resize panel
using keys TAB and SHIFT +
TAB.
Drag one corner of panel.
Adjust panel/graphical
window to the required
size
Press MODIFY key and
actuate Fix Size Auto Size
or Fix Size All Auto Size All
button.
Press key combination ALT +
M, then press F10 or F11
key.
---
Close all panels/panel on
screen Press MODIFY key,
change to second level using
button and actuate F10
softkey.
Press key combination ALT +
M, F12 key and then F10
key.
---
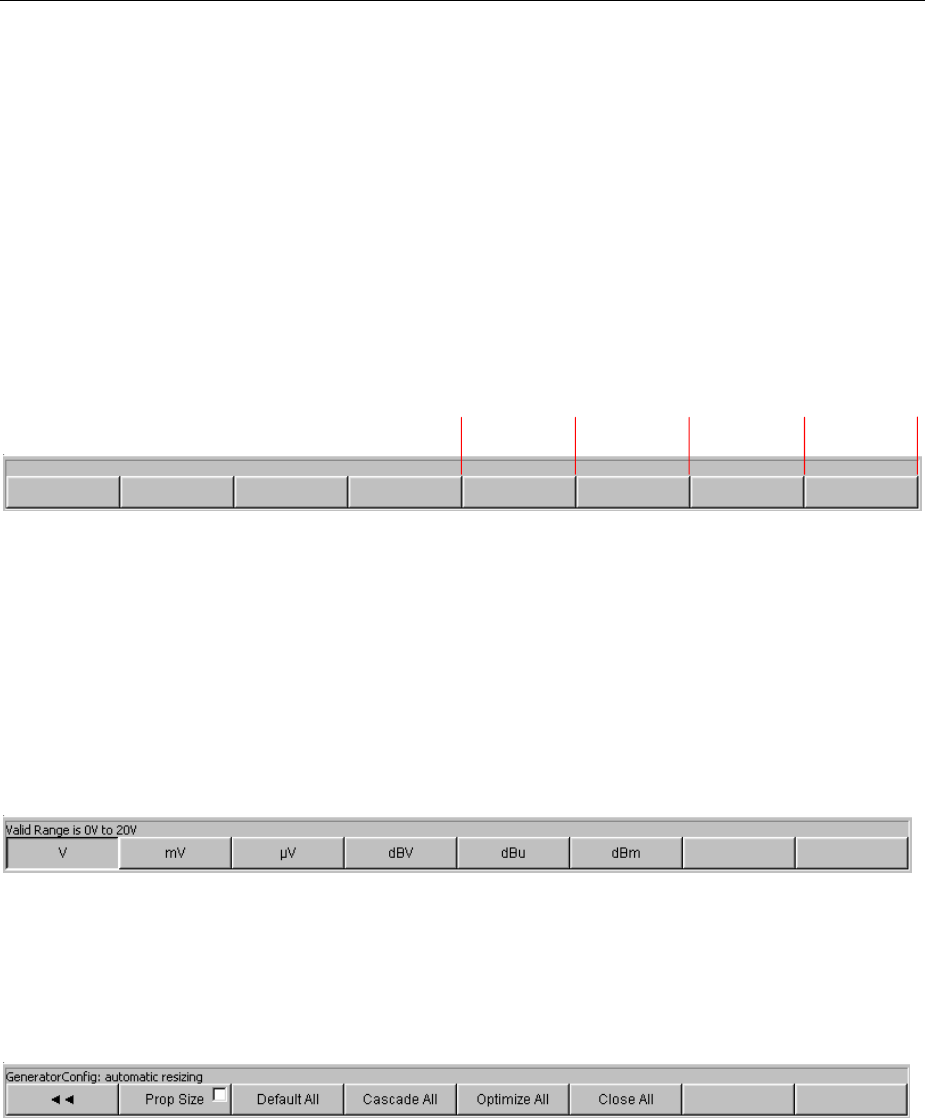
R&S UPV Display
1146.2078.62 3.19 E-5
Status Displays and Messages
Insome cases, the user is presented with additional information on the screen. This information
includes status messages, messages concerning the value ranges, information on settings, warnings
and error messages.
Status displays
The status of the R&S UPV is continuously displayed for the generator, analyzer, sweep system and
other instrument states at the bottom of the screen above the four right-hand softkeys.
Status displays always appear at the same position; they are assigned to the fields above the softkeys
as shown below.
Analyzer
Channel 1
Analyzer
Channel 2 Generator Sweep
Alist of all possible status messages can be found at the end of this chapter (section "Overview of
Status Messages",page 3.126).
Valid value range
Information on the possible entries is given at the bottom of the screen above the softkey bar. The
ranges for value entries specified here always take the current status of the instrument into
consideration and therefore depend on the presets already configured. Below is an example for entry of
the generator output voltage:
Information
Information concerning the panel settings and so on is also given at the bottom of the screen above the
softkey bar (only the space above the four left-hand softkeys is used).

Display R&S UPV
1146.2078.62 3.20 E-5
Warnings
If the user attempts to make measurement settings which conflict with the usual test specifications,
warnings appear on the screen; and remain there until they are acknowledged with ENTER.
Warnings are issued if no measurement results are produced during measuring mode. This is normally
the result of unsuitable input signals or settings. For example, input signals may be too low to produce a
stable measurement result. In this case, a warning is displayed in the middle of the screen instead of
the measurement result. The warning indicates why no measurement result can be displayed and may
also list several reasons for this.
Error messages
If faults in the instrument occur during operation, an error message appears in the middle of the screen.
This message remains on screen until it is acknowledged with ENTER.

R&S UPV Panels
1146.2078.62 3.21 E-5
Panels
Panel and Window Types
In the case of the Audio Analyzer R&S UPV, associated settings and functions are always combined in
"panels". Each of these panels has a name (headline in the title bar) by which it is called up.
Only one panel can have the focus, i.e. only one panel can be active at any one time. The panel with
the focus can be identified by its blue title bar.
The Audio Analyzer R&S UPV distinguishes between the following panels and display windows:
•Panels used to make function settings
•Configuration panels used for configuring how the measurement values are to be displayed
•Numeric display fields for displaying the measurement values of the various measurement
functions
•Combi displays in which the numeric display of measurement values can be supplemented by
bargraphs, min/max values and limit monitoring
•Graphical windows in which measurement values are displayed in the form of diagrams
•Data lists in which the measurement values are listed in tabular form; this also includes the
"Dig Analyzer Protocol" display window, in which the values of the protocol data of a digital
audio data stream are displayed (R&S UPV-K21 option).
Adetailed list of all panels together with the most important setting parameters can be found at the end
of this chapter (see "Overview of Panels and Measurement Displays (Graphical Windows)",page
3.122).
Opening, Operating, Hiding and Closing Panels
Each panel and display window is a separate panel which can be either closed, opened or hidden. All
panels/display windows visible on the currently displayed screen are referred to as being "open". If the
panel is minimized and moved to the bottom of the screen, it is referred to as being "hidden". In both
cases, the panel/window is assigned an entry in the WINBAR at the bottom of the display.
The same panel or display window can be displayed (i.e. opened) in several screens. The display
characteristics (position, size) can be different for each of the screens; the content is, however, always
the same.
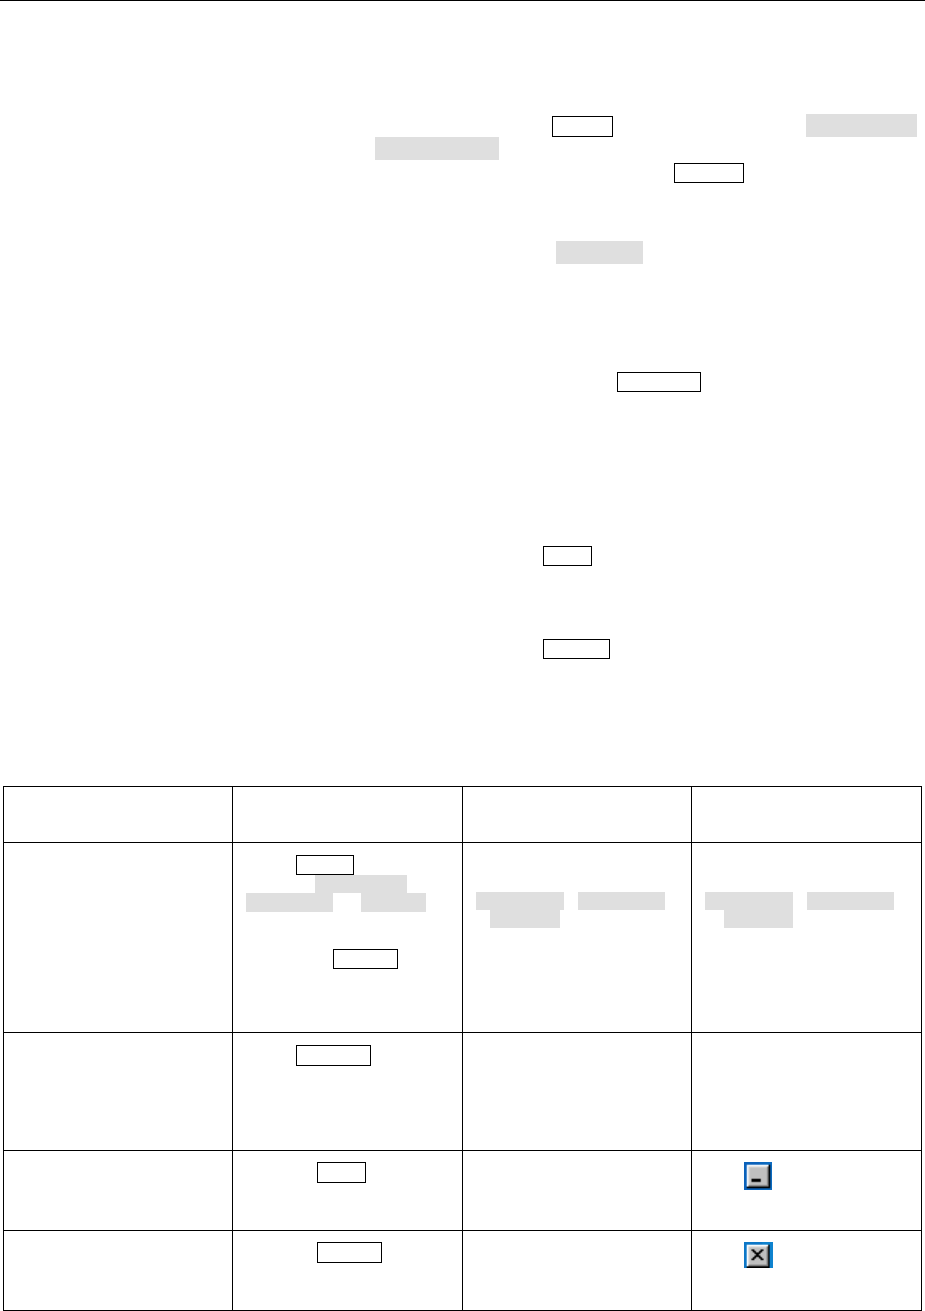
Panels R&S UPV
1146.2078.62 3.22 E-5
Open panel Panels/display windows are open if they are visible on the
currently displayed screen.
Apanel is opened on the currently displayed screen by activating
the menu bar using the MENÜ key, highlighting the Instruments
or Disp Config button with the rotary knob or cursor keys,
opening the pulldown menu with the ENTER key or rotary-knob
click, and highlighting and selecting a panel.
Graphical windows are selected in the same way, except that
they are listed under the Displays button.
Activate panel Only one panel can be active on the screen at any one time.
Every open or hidden panel can be activated using the softkeys
on the WINBAR or using the Windows key (active panels are
identified by their blue title bar).
Hide panel Open panels/display windows can be minimized and placed at
the bottom of the screen. They are referred to as being "hidden".
Apanel must be activated before it can be hidden. It is then
hidden by pressing the HIDE key.
Close panel Apanel must be activated before it can be closed. It is then
closed by pressing the CLOSE key and no longer appears on the
WINBAR.
The table below shows the alternative operating modes for mouse and external keyboard:
Function Front panel PC keyboard Mouse
Open panel Press MENU key and
highlight Instruments ,
Disp Config or Displays
button using rotary knob or
cursor keys, open pulldown
menu using ENTER key or
rotary-knob click, and
highlight and select a panel.
Press key combination
CTRL + M, then highlight
Instruments , Disp Config
or Displays button using
TAB or SHIFT + TAB keys,
open pulldown menu using
Enter key, highlight a panel
using cursor keys and select
using Enter key.
Open menu bar by moving to
left edge of screen, actuate
Instruments , Disp Config
or Displays button and click
desired panel.
Activate panel Press WINBAR key and
actuate softkey of desired
panel.
Press key combination
ALT + F5, then actuate
softkey of desired panel
using appropriate key F5 to
F12.
Click anywhere in desired
panel.
Hide panel Pressing HIDE key hides
currently active panel.
Pressing key combination
ALT + H hides currently
active panel.
Click button in title bar of
respective panel.
Close panel Pressing CLOSE key
closes currently active panel.
Pressing key combination
ALT + C hides currently
active panel.
Click button in title bar of
respective graphical window.
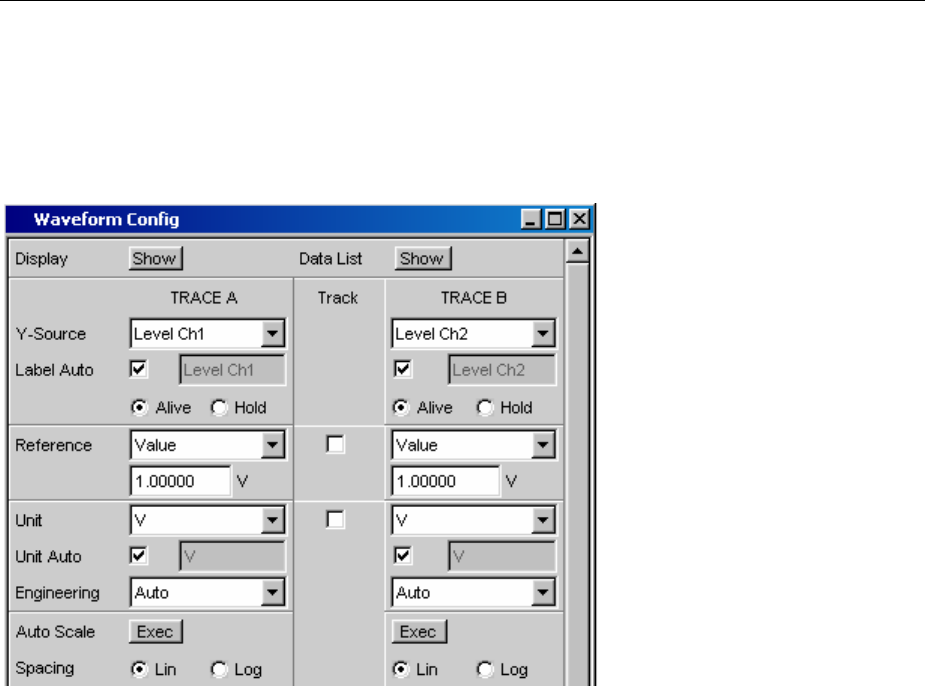
R&S UPV Panels
1146.2078.62 3.23 E-5
Panel Structure
This section describes the panel structure. The section "Opening, Operating, Hiding and Closing
Panels", page 3.21 describes how to operate panels on the screen; the section "Selecting a Parameter
–Selection Fields",page 3.34 describes how to set the parameters.The panels are in Windows®
format. They differ in detail depending on their function but they consist of the same main elements.
Panels consist of up to three columns, depending on the function block on which the panel is based.
For example, two-channel functions are operated in panels with two columns. When defining graphical
windows, settings from Trace 1 can be adopted for Trace 2 in a third column between the two original
columns so that Trace 2 does not have to be configured separately.
Each panel contains a selection of different parameter fields which are combined in groups. Various
types of parameter fields, which are operated in different ways, are used. The parameter fields have
labels indicating their function.
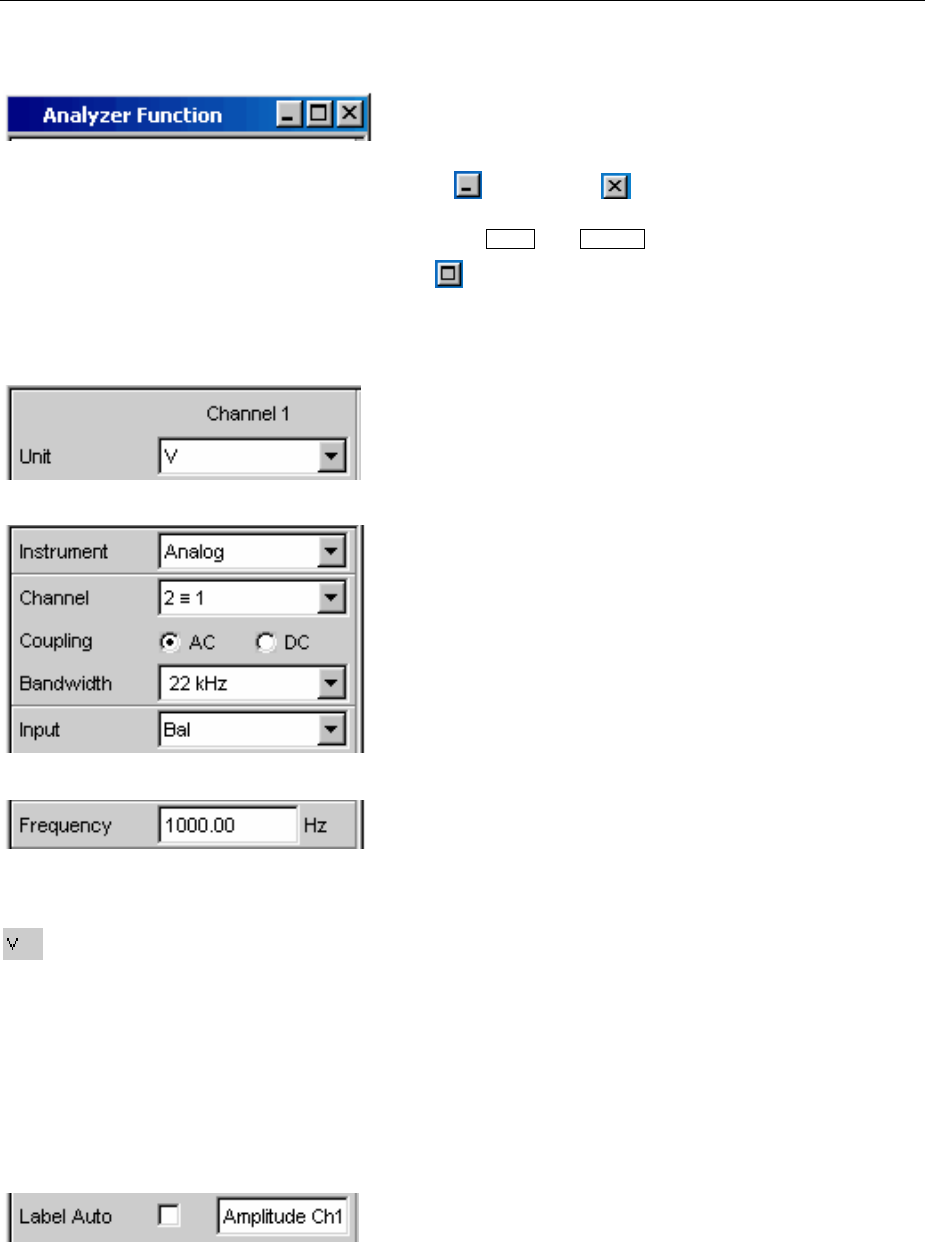
Panels R&S UPV
1146.2078.62 3.24 E-5
Panels consist of the following elements:
Title bar
The top field contains the name of the panel ("Analyzer
Function" in the example) and the title-bar buttons for
hiding and closing the menu. The buttons can be
operated with the mouse. For operation using the front
panel, the HIDE and CLOSE keys can be used.
The button maximizes graphical windows so that they
cover the entire screen (see "WINBAR and Softkeys",page
3.14).
Headlines in panels
With multi-column panels, each column has a headline.
Function groups
In panels, parameter fields which belong together with
respect to their function are frequently combined in
function groups. Grey lines indicate these groups.
Numeric entry field
Anumeric value (e.g. the frequency) can be entered in this
field.
Units
The unit of a numeric value is displayed next to the entry
field. When the value is entered, all possible units are
offered on the softkey bar (on more than one level where
necessary). The entry can be completed by selecting the
unit using a softkey. The unit can be changed after the
entry has been made. In this case, the physical value
remains unchanged; however, the value displayed in the
entry field is adapted automatically to the changed unit.
Text entry field
An alphanumeric value (e.g. a label text) can be entered in
this field.
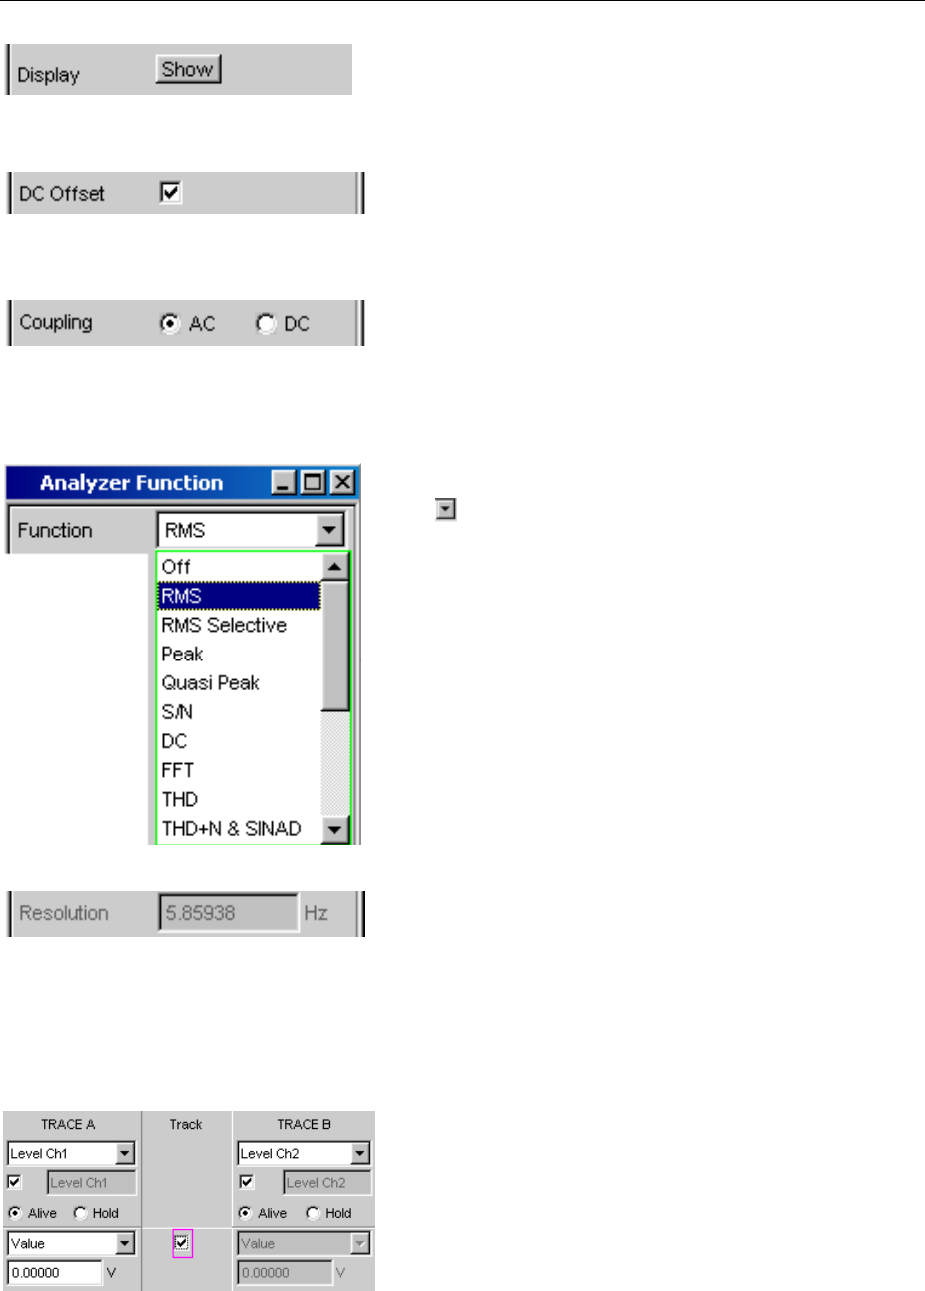
R&S UPV Panels
1146.2078.62 3.25 E-5
Button
Buttons are used to trigger actions; here, for example, to
show the display of a measurement graph.
Tick box
If a tick box is activated, the assigned setting can be
disabled or enabled.
Radio button
With radio buttons, it is possible to toggle between two
settings by simply clicking the desired setting.
Only one of the two options can be active at any one time.
Selection field
The button indicates that a parameter list is available.
The fold-down parameter list is displayed below the
selection field. Depending on the number of items, the full
list or only part of it is shown.
Only one item at a time can be selected from the
parameter list.
Display fields
Some settings can only be made in a specific
configuration. If the setting is not permitted with the specific
configuration selected, the respective item is disabled and
displayed in grey and the field cannot be accessed. In this
case, the field acts as a display field, i.e. the value
displayed there corresponds to the value actually set.
Track box
With multi-column panels, settings can be transferred from
the left-hand to the right-hand column without the
parameter having to be entered a second time. If the track
box has a checkmark, all of the settings within the function
group are applicable to both columns. All fields with
transferred settings are shown as display fields and cannot
be accessed while the track function is active.

Panels R&S UPV
1146.2078.62 3.26 E-5
Hidden parameter fields
The R&S UPV always attempts to keep the panels as short
as possible. For this reason, unneeded fields are hidden.
The example to the left demonstrates this more clearly:
The fields for Zoom Factor, Center and Span only appear if
the Zooming function is activated.
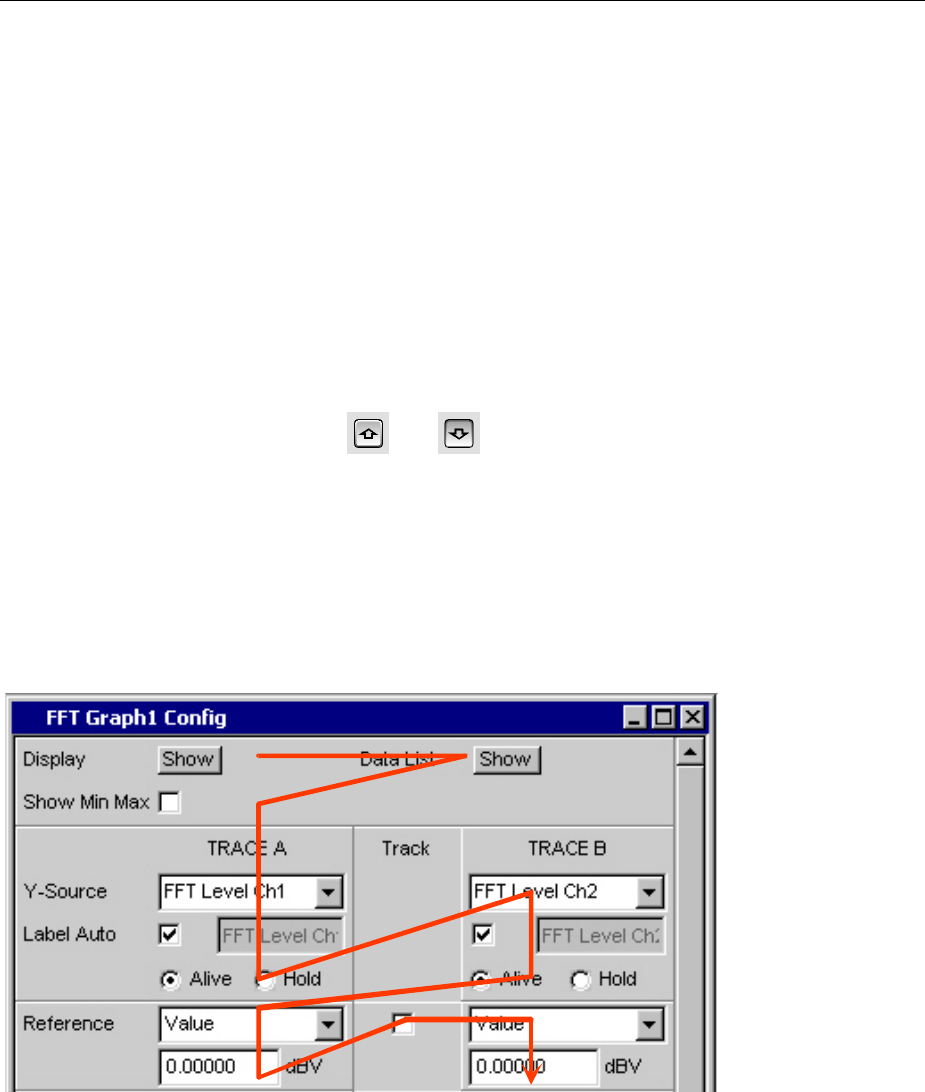
R&S UPV Panels
1146.2078.62 3.27 E-5
Navigating in the Panels
If a panel has more fields than can be displayed on the screen or if the size of the panel has been fixed
such that its full length cannot be displayed (see "Moving and Resizing Panels and Graphical
Windows",page 3.16), the scroll bar appears along the right-hand side of the panel. The length of the
scroll bar symbolizes the overall length of the panel; the dark part of the scroll bar indicates which
section of the panel is currently visible.
There are various ways of navigating inside panels, i.e. moving the entry focus:
•With operation via the front panel, the easiest navigation method is using the rotary knob.
Turning the rotary knob clockwise moves the focus down or to the right. Here the focus first
moves to the right inside a field, then down through the current group, then jumps over to the
right-hand column, down again to the end of the group from where the focus then moves to the
left-hand column of the following group, and so on.
•Alternatively, the cursor keys and can also be used for navigation; the movement
sequence is the same as that described for operation using the rotary knob.
•In the case of an external PC keyboard, the cursor keys and can be used to move around
apanel. Once again, the movement sequence is the same as that described for navigation
using the rotary knob. The TAB and SHIFT + TAB keys on the external keyboard can also be
used as an alternative to the cursor keys.
•The mouse can also be used to move inside the panels in the same way as other Windows®
applications, i.e. by directly clicking the desired parameter fields or by moving the scroll bar.

Settings on the Audio Analyzer R&S UPV R&S UPV
1146.2078.62 3.28 E-5
Settings on the Audio Analyzer R&S UPV
The R&S UPV offers several and sometimes alternative options for setting parameters. Operation is
possible via the front panel, using a mouse and/or a connected PC keyboard (see the sections "Using
the Rotary Knob","Operation Using the Mouse" and "Operation Using an External PC Keyboard" from
page 3.9 onwards). The tables below list the operating options with the available entry media.
Some keys on the front panel of the R&S UPV trigger a setting immediately; for example, the
OUTPUT OFF key deactivates or reactivates outputs. An overview showing the function of all keys can
be found at the end of this chapter (section "Overview of Keys",page 3.118).
Most of the parameters are set in the panels. The panels are operated on the screen in the way
described in the section "Opening, Operating, Hiding and Closing Panels" (see page 3.21).How to
enter and select setting parameters in the panels is described in the following sections; a detailed
description of all setting parameters can be found in Chapter 4, "Instrument Functions".
Entries for file management tasks, such as saving and loading instrument settings, saving files, and so
on, are made in special panels. Refer to the section "File Management" (see page 3.102)for more
detailed information.
Anumber of settings are made via the menu bar. These include all global configuration settings for the
R&S UPV, e.g. setting of the IEC/IEEE-bus address, the function of the H Copy key, etc. More detailed
information can be found in the section "Settings in the Menu Bar" on page 3.86 and in Chapter 4,
"Instrument Functions".
The R&S UPV uses the WindowsXPoperating system. Settings at system level are only rarely
required, e.g. installation of a new printer driver. Connecting a keyboard and mouse makes Windows
easier to use.
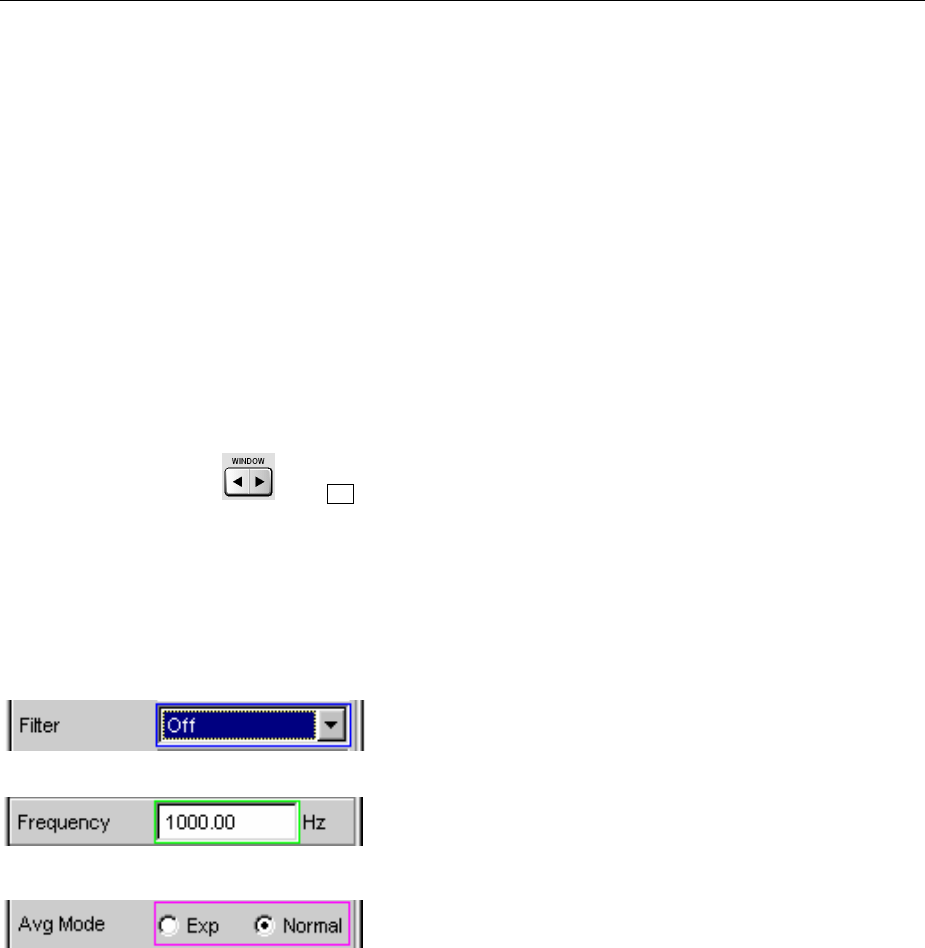
R&S UPV Settings in the Panels
1146.2078.62 3.29 E-5
Settings in the Panels
Associated settings and functions are combined in panels of the Audio Analyzer R&S UPV. Each
function block has its own panel.
The panels can be set independently of each other; however, there are also a number of
interdependencies. For example, the digital measurement function of the protocol analysis only appears
in the Analyzer Function panel if a digital analyzer has been selected in the Analyzer Config panel. If
an analog analyzer is selected, the protocol analysis is automatically deactivated in the
Analyzer Function panel and a message is displayed on the screen.
Focus
Panels can only be operated if they have the focus (indicated by the blue title bar).
The simplest way of changing from one panel to another in the case of operation via the front panel is
using the direction keys .The key switches from panel to panel in the sequence in which the
panels were opened. Hidden panels are not highlighted. Changing to a different open (or to a hidden)
panel is also possible using the WINBAR; this has already been explained in the section "WINBAR and
Softkeys" on page 3.14.
Before settings can be made in a panel, the relevant parameter field must be highlighted, i.e. it must
have the focus. This is indicated by a selection frame which is blue, green or magenta depending on the
entry mode.
The colors of the selection frame have the following meaning:
Ablue selection frame indicates a highlighted field.
Agreen selection frame highlights fields in which
parameters can be selected or in which an entry can be
made without the selection / entry having an immediate
effect on the hardware of the R&S UPV.
Amagenta selection frame indicates that selecting a
button, activating a tick box or changing a numeric value
will be immediately passed on to the hardware and
executed.
When the instrument is switched on, the most recently saved instrument settings are loaded
automatically so that the instrument is in the same state as it was before power-off. The focus is placed
on the first position of the active panel.
Panels are opened using the menu bar (see the section "Open panel",page 3.22). How to move the
focus is described in the section "Navigating in the Panels" (see page 3.27).
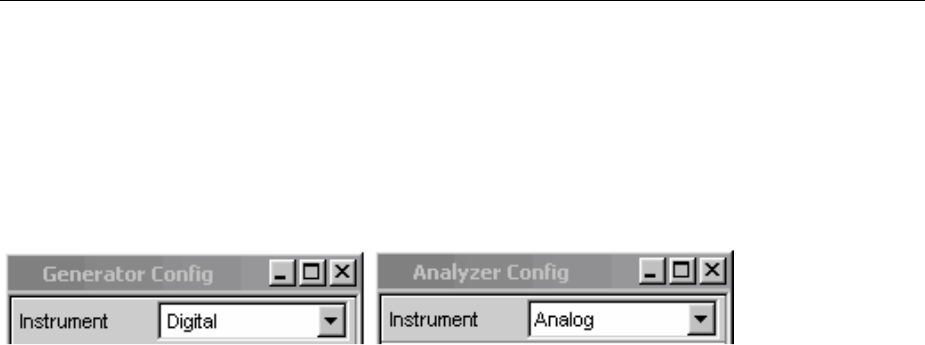
Settings in the Panels R&S UPV
1146.2078.62 3.30 E-5
Changing the Instrument
The Audio Analyzer R&S UPV can, depending on the installed options, be used at analog and digital
interfaces. Optional plug-ins can be installed to allow additional interfaces to be operated. Each of these
interfaces determines the basic characteristics of the R&S UPV, whereby these characteristics are
separate for generator and analyzer. These interface characteristics define quasi-independent
instruments within the R&S UPV. The settings for these instruments are made in the selection field in
the first field of the Generator Config and Analyzer Config panel.
Each of these instruments has its own data set. If a different instrument is selected, this data set is
saved. As a result, the previous settings are available when the original instrument is selected again.
The data set has a different content for each instrument. The data sets differ with regard to the following
points:
•Selection of parameter fields / parameters
Example: In the case of analog instruments, all settings for configuring the analog interfaces are
available (e.g. impedances); all settings for the other instruments, e.g. the digital sampling rate and
so on, do not appear in the panel but remain in the background.
•Valid value range of parameters
For example, the frequency ranges can be different in the different instruments.
•Units used
Levels are given in different units in analog and digital applications.
•Selection of functions
Anumber of measurement functions are only available for digital audio applications; they are
therefore not offered in analog instruments. Examples: Digital protocol analysis, jitter, etc.
The examples given above show that the choice of instrument not only affects the Generator Config
and Analyzer Config panel, but also has an effect on the other panels.
Changing Functions
The principles that apply to changing an instrument also apply to changing functions (e.g. from an RMS
measurement to a THD measurement or from generating a sinusoidal to a multi-tone signal):
Each measurement function and generator function has its own data set. If a different function is
selected, this data set is saved. As a result, the previous settings are available again when a different
function is selected.
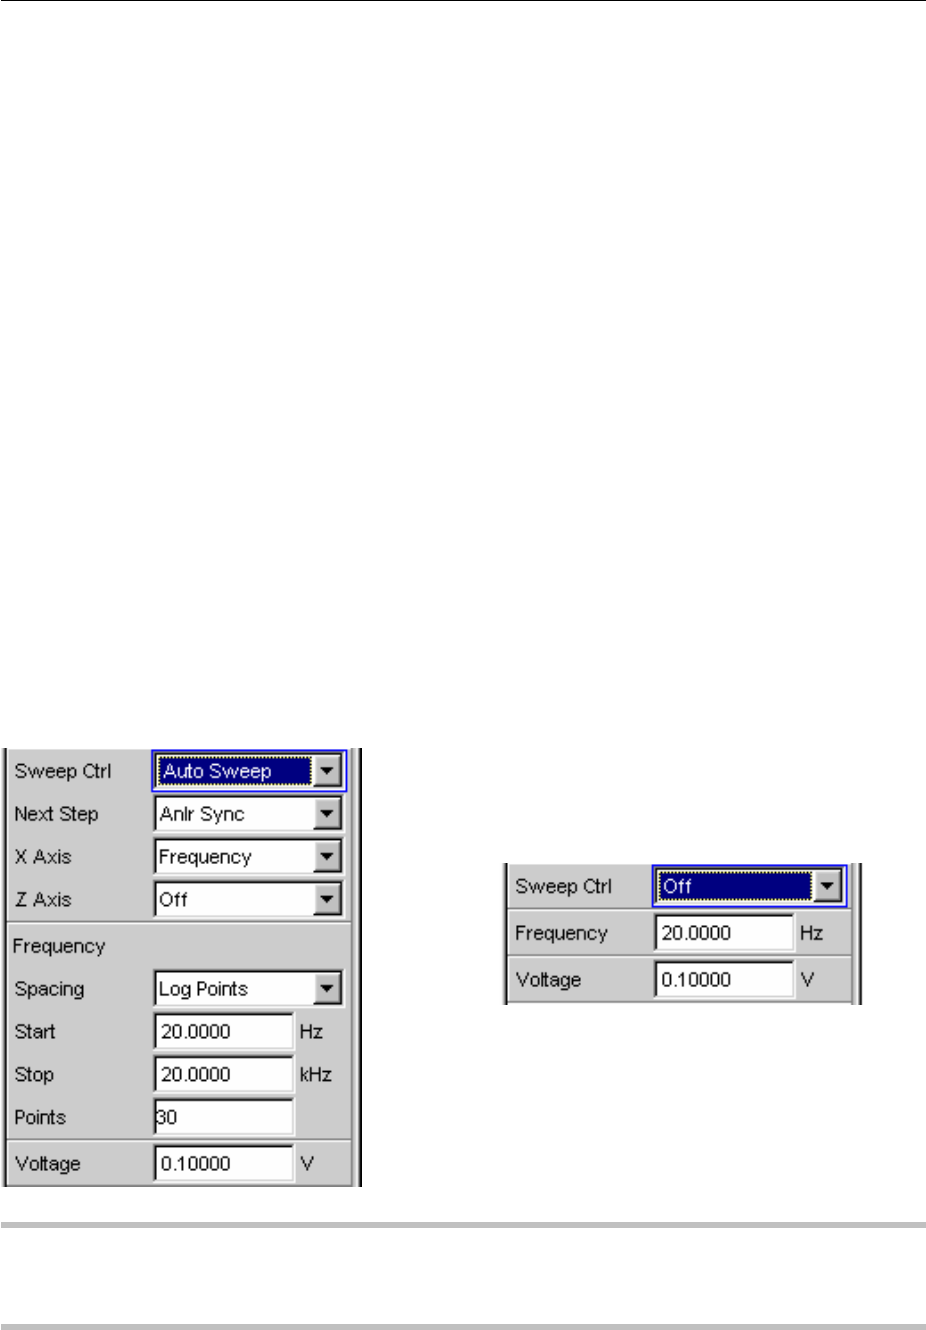
R&S UPV Settings in the Panels
1146.2078.62 3.31 E-5
The data set has a different content for each function. The data sets differ with regard to the following
points:
•Selection of parameter fields / parameters:
Example: With the RMS measurement, various measurement times are offered; this is not the case
for the FFT analysis.
•Valid value range of parameters
For example, the frequencies which can be set for intermodulation test signals are different to those
which can be set for sinusoidal signals.
•Units used
For example, THD measurements and level measurements are given in different units.
The following generally applies: All the settings for the other functions, e.g. filter settings and so on,
remain in the background with the function settings and are displayed in the panel and set in the
instrument again the next time this function is called up.
Hiding Parameter Fields
The R&S UPV always attempts to keep the panels as short as possible. For this reason, unneeded
fields are hidden.
The example below explains this more clearly: As soon as Auto Sweep is selected in the Sweep Ctrl
menu item in the Generator Function panel, all of the fields required for configuring the sweep are
displayed in the panel (together with the parameters set for the sweep last performed). If the sweep is
deactivated, all of the sweep parameter fields are hidden. The user is presented with a shorter panel
and is not burdened with parameter fields which are currently not needed.
Note:
The sequence of the individual parameter fields in the panel is such that changes to parameters usually
only cause changes in the fields below. When making settings in panels, it is therefore recommended to
begin at the top of the panel and work down.
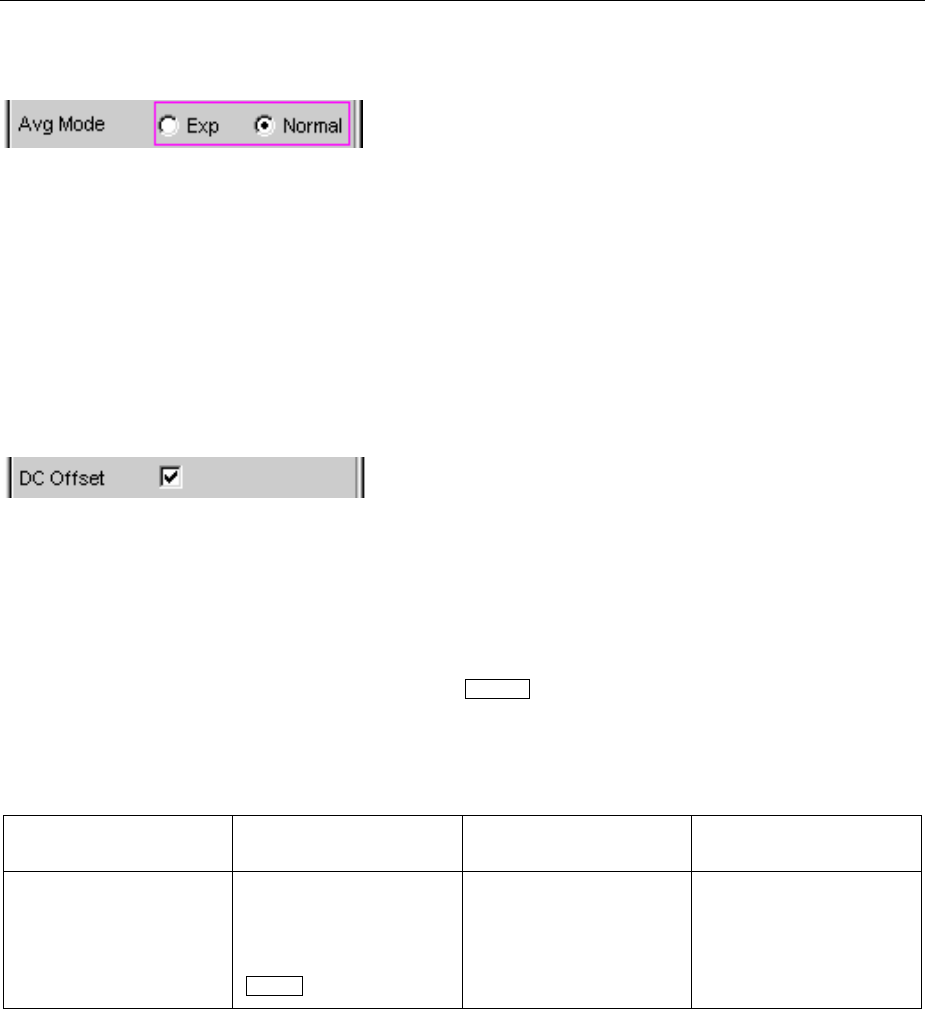
Settings in the Panels R&S UPV
1146.2078.62 3.32 E-5
Highlighting Control Elements
Acontrol element is always selected in the same way,
regardless of whether it is a tick box, radio button, entry
field and so on.
Acontrol element is activated by shifting the focus to this
element. The entry focus is indicated by a blue, green or
magenta border.
The entry focus can be moved using the rotary knob,
cursor keys or mouse. Refer to the section "Navigating in
the Panels",page 3.27.
Activating/Deactivating Functions – Tick boxes
Atick box is always used for functions which can be
activated and deactivated only. If the tick box is activated
(checkmark), the assigned setting can be disabled or
enabled.
Before a function can be activated and deactivated, the
associated element must be highlighted (see the section
"Highlighting Control Elements",page 3.32). The
highlighted element is then activated or deactivated (toggle
function) using the ENTER functions of the various entry
media ( ENTER key, rotary-knob click and so on).
If the mouse is used, functions are activated/deactivated
as soon as the tick box is clicked.
Function Front panel PC keyboard Mouse
Activate/deactivate Highlight desired element
using rotary knob or cursor
keys,
activate/deactivate function
with rotary-knob click or
ENTER key.
Highlight desired element
using cursor keys,
activate/deactivate function
with Enter key.
Click tick box.

R&S UPV Settings in the Panels
1146.2078.62 3.33 E-5
Toggling Functions – Radio Buttons
Radio buttons are used for functions which can be toggled
between two settings. A black dot in the appropriate button
indicates the selected status.
Only one of the two options can be active at any one time.
Before a function can be toggled, the associated element
must be highlighted (see the section "Highlighting Control
Elements",page 3.32). The ENTER functions of the
various entry media can then be used to switch between
the two settings (toggle function).
If the mouse is used, settings are executed as soon as the
corresponding radio button is clicked.
Function Front panel PC keyboard Mouse
Toggle Highlight desired element
using rotary knob or cursor
keys,
toggle function with rotary-
knob click or ENTER key.
Highlight desired element
using cursor keys,
toggle function with Enter
key.
Click desired radio button.
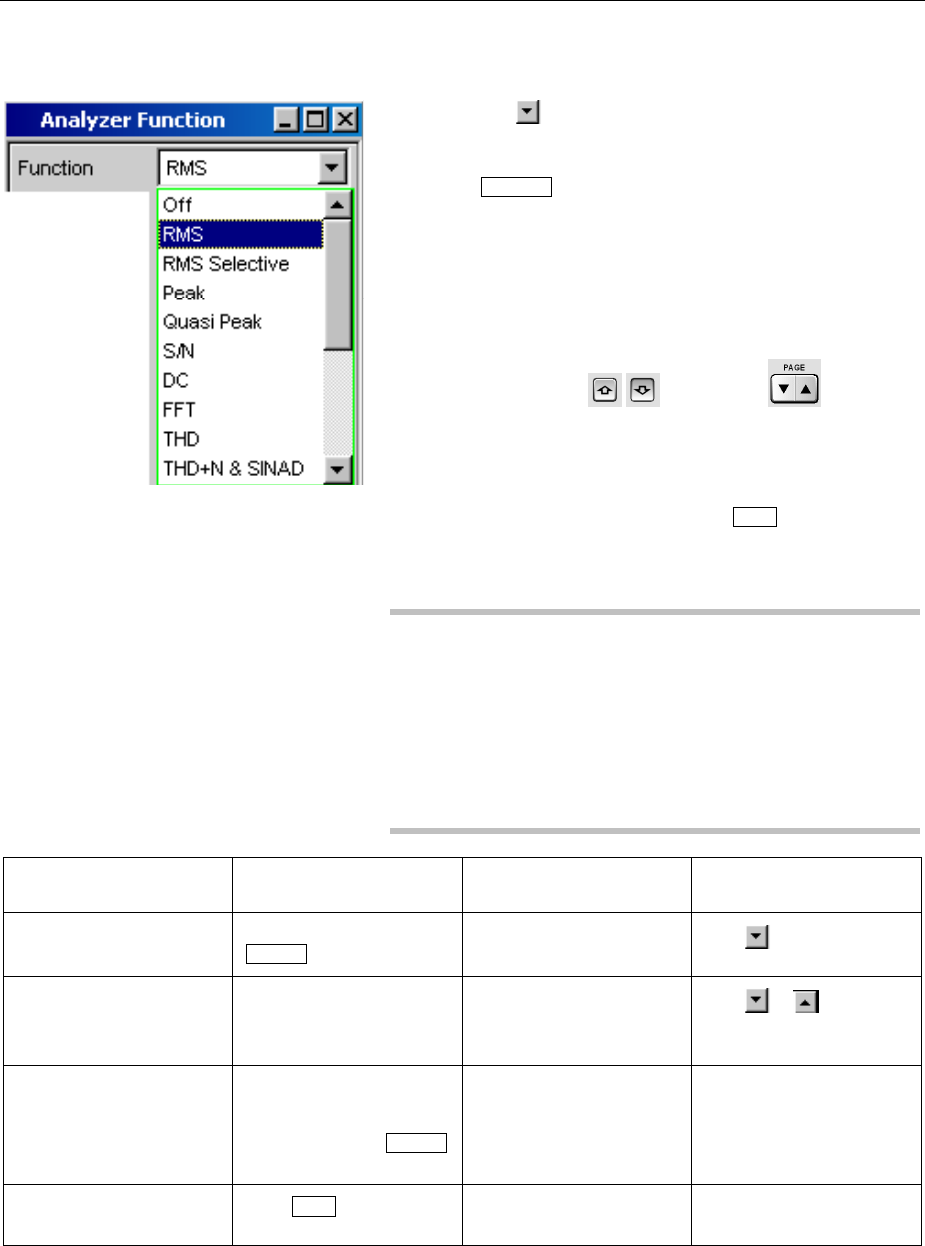
Settings in the Panels R&S UPV
1146.2078.62 3.34 E-5
Selecting a Parameter – Selection Fields
Actuating the button opens a selection field. As soon as
aparameter field has the focus, a list for selecting the
available parameters can be opened with a rotary-knob
click, the ENTER key or by clicking with the mouse. The
fold-down parameter list is displayed below the selection
field.
Selection is made by highlighting the desired item and
confirming with ENTER; only one item at a time can be
selected.
Items in the parameter list are highlighted using the rotary
knob, the cursor keys or the keys .
If a mouse is used, the items are selected and activated by
clicking with the mouse.
The parameter list can be quit without adopting the
highlighted parameter by pressing the ESC key.
If the list is longer than the displayed window, a scroll bar
is available.
Note 1:
The contents of the parameter lists are not fixed but vary
depending on other settings selected.
Note 2:
Alternatively, parameters can also be selected using the
softkeys (see the section "WINBAR and Softkeys",
page 3.14).
Function Front panel PC keyboard Mouse
Open parameter list Rotary-knob click or press
ENTER key.
Press Enter key. Click button.
Scroll Move displayed section of list
using rotary knob or up/down
cursor keys.
Move displayed section of list
using up/down cursor keys. Click or button in
scroll bar until desired item is
displayed.
Select parameter Highlight selection using
rotary knob or up/down
cursor keys and confirm with
rotary-knob click or ENTER
key.
Highlight selection using
up/down cursor keys and
press Enter key.
Click parameter.
Quit parameter list without
adopting a setting
Press ESC key. Press ESC key. Click anywhere outside
parameter list.
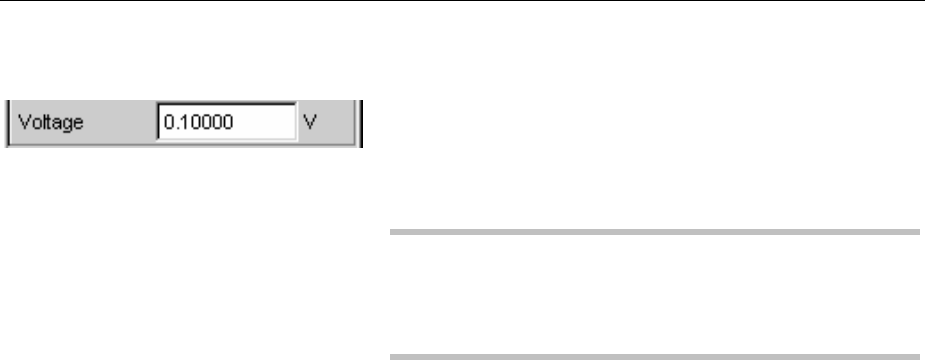
R&S UPV Settings in the Panels
1146.2078.62 3.35 E-5
Numeric Entries – Numeric Entry Fields
Numeric values (e.g. the output voltage) can be entered or
edited in these fields.
This can be done is various ways. However, the following
applies irrespective of the chosen method:
Note:
Entries outside the possible value range are not accepted;
an audible warning is issued and the entry is changed to its
permissible minimum or maximum value. The possible
value range is displayed above the softkey bar.
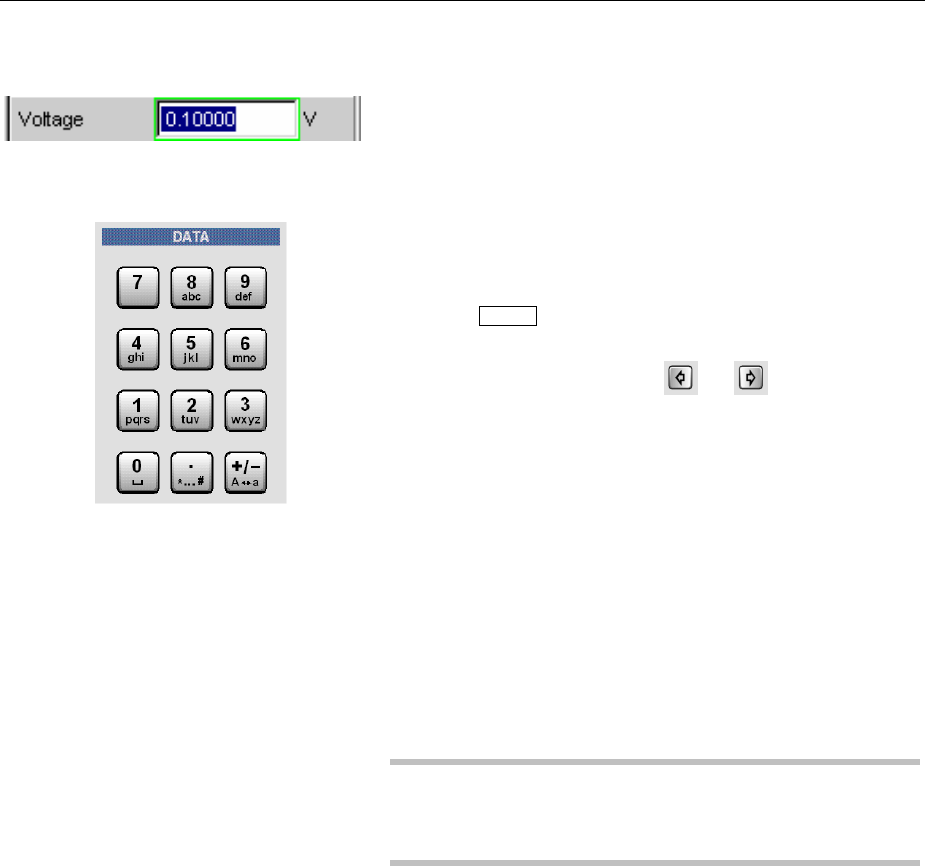
Settings in the Panels R&S UPV
1146.2078.62 3.36 E-5
Value entries in Edit mode – green selection frame
When the focus is moved to a numeric entry field, the
system enters Edit mode, which is indicated by a green
selection frame. In addition, the current numeric value is
highlighted with a blue background.
If a completely new value is to be entered, simply begin
entering digits using the numeric keypad on the front panel
or external PC keyboard; the old value is deleted
automatically when the first key is pressed. The digit to the
left of the cursor can be deleted at any time during entry
using the UNDO key.
If certain digits only are to be changed, position the digit
cursor accordingly using the or cursor key and
enter the new digits (if the position of the digit cursor is
changed before the first digit is entered, the old value will
not be deleted). The default setting is insert mode. It is only
possible to change between insert and overwrite mode if
an external PC keyboard is used.
The numeric entry field is closed with:
ENTER The newly entered value is adopted.
ESC The old value is retained.
Softkeys The selected unit is set and adopted
together with the newly entered value.
The entry is set in the hardware as soon as the numeric
entry field is closed.
Note:
Only the number keys and cursor keys are accepted; the
rotary knob, letters and special characters have no effect
when numeric values are being entered.
When an external PC keyboard is connected, digit entry
can also be completed by entering the unit. Here it is
sufficient for example to enter mto the set voltage value to
mV, or kto set a frequency value to kHz.
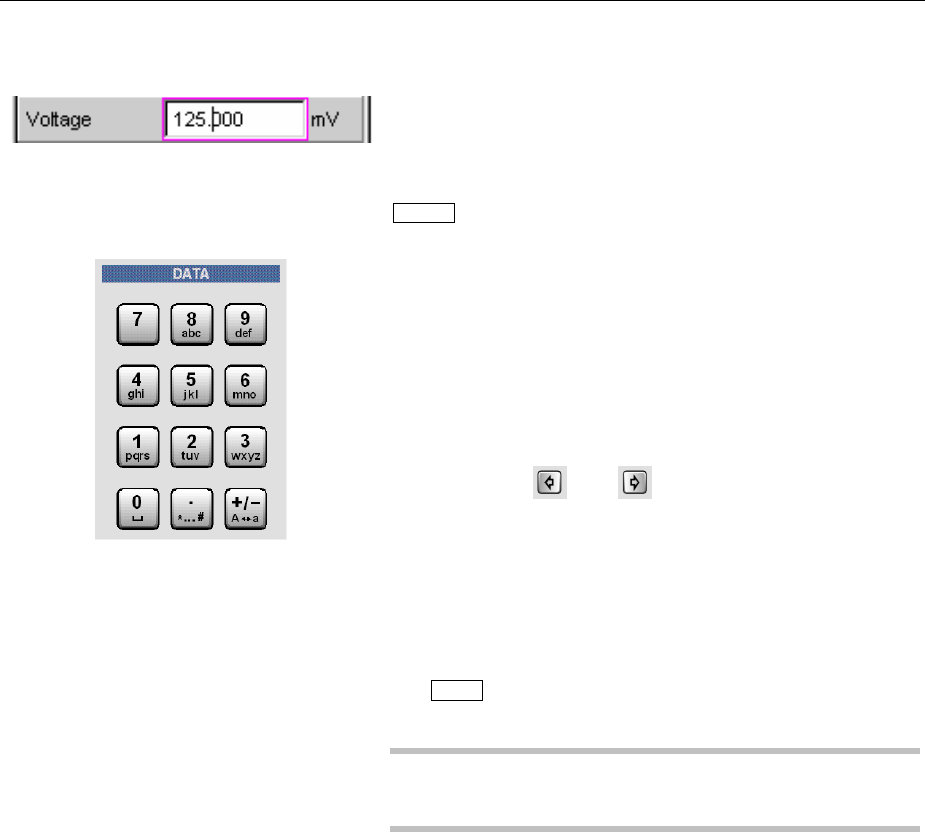
R&S UPV Settings in the Panels
1146.2078.62 3.37 E-5
Value entries in Direct mode – magenta selection frame
When the focus is moved to a numeric entry field, the
system enters Edit mode, which is indicated by a green
selection frame.
Changing to the Direct mode is performed by pressing the
ENTER key or with rotary-knob click, the selection frame is
changed to magenta.
The digit cursor then moves to the first digit to the right of
the decimal point or, if there is no decimal point, to the digit
at the extreme right.
Adigit can now be entered using the keypad on the front
panel or the external PC keyboard; the digit at the cursor
position is replaced. The cursor does not change its
position.
The digit cursor can be placed at a different position at any
time using the and cursor keys. Digits are then
entered at the new position.
Entries in Direct mode are always made in overwrite mode
(this also applies when an external PC keyboard is used).
In Direct mode, every setting change is immediately
passed on to the hardware and executed.
The Direct mode can be quit using the ENTER function,
the ESC key or by clicking in a different field with the
mouse.
Note:
Only rotary-knob entries, number keys and cursor keys are
accepted; letters and special characters have no effect.

Settings in the Panels R&S UPV
1146.2078.62 3.38 E-5
Rotary-knob entries in Direct mode – magenta selection frame
When the focus is moved to a numeric entry field, the
system enters Edit mode, which is indicated by a green
selection frame.
Changing to the Direct mode is performed by pressing the
ENTER key or with rotary-knob click, the selection frame is
changed to magenta.
The digit cursor then moves to the first digit to the right of
the decimal point or, if there is no decimal point, to the digit
at the extreme right.
The highlighted digit can then be changed directly using
the rotary knob, whereby the numeric value is "carried
over", i.e. transferred to the next digit.
The digit cursor can be placed at a different position at any
time using the and cursor keys so that other digits
can be changed using the rotary knob.
This method is ideal for calibration work as every change
has an immediate effect in the hardware.
Value entry can be completed with a rotary-knob click or,
alternatively, using the ENTER function, the ESC key or by
clicking in a different field with the mouse.
As an alternative to the rotary knob, the numeric values
can also be changed using the and cursor keys.
Note:
Changes made to values using the rotary wheel are not
accepted if the entries are outside the possible value
range; an audible warning is issued and the entry is
changed to its permissible minimum or maximum value.
The possible value range is displayed above the softkey
bar.

R&S UPV Settings in the Panels
1146.2078.62 3.39 E-5
Entering / changing the unit of a value
The unit of a numeric value is displayed next to the entry
field. When the value is entered, all units available for the
respective function are offered on the softkey bar (on more
than one level where necessary). The entry can be
completed by selecting the unit using a softkey.
This is done differently depending on the selected mode:
•In Edit mode, the newly entered numeric value is
adopted and set together with the selected unit.
•In Direct mode, the physical value (number with the
previously selected unit) is converted to the newly
selected unit and adopted as the new numeric value.
It is possible to change the unit in any highlighted numeric
field using the softkeys at a later stage after value entry
has been completed and also if the value itself is not to be
changed. In this case, the physical value remains
unchanged (as in the Direct mode); however, the value
displayed in the entry field is adapted automatically to the
changed unit. This function allows numeric values to be
"converted" to other units very easily.
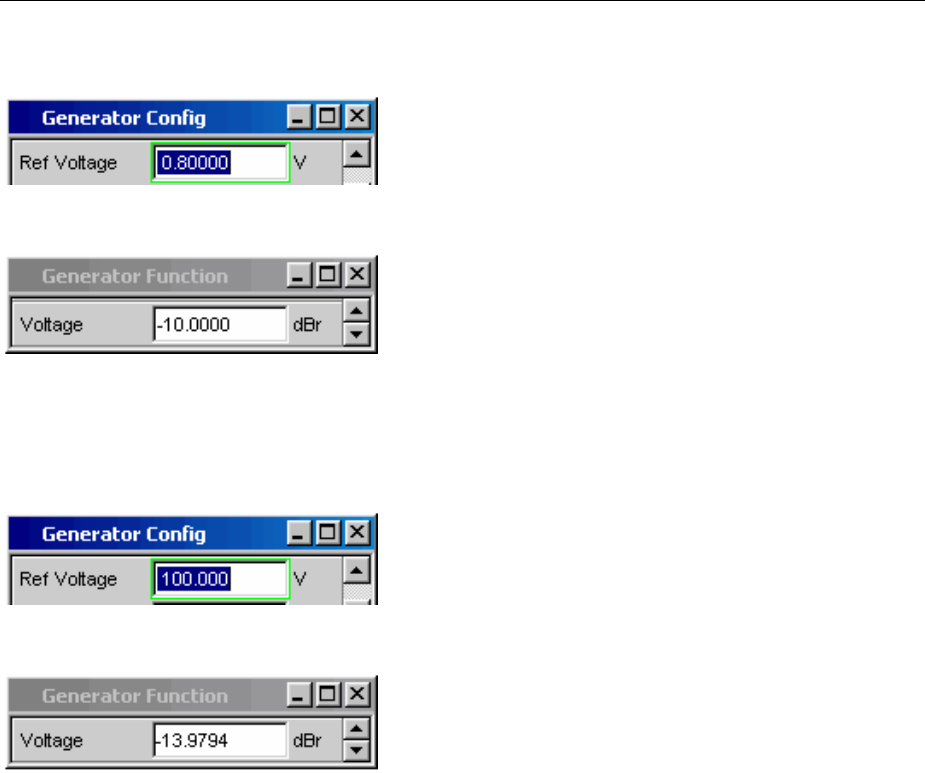
Settings in the Panels R&S UPV
1146.2078.62 3.40 E-5
Information on using reference values when entering values
The Audio Analyzer R&S UPV allows reference values to
be used when entering various values. These reference
values are used as a basis for settings for other
parameters.
The example below explains these interdependencies:
Areference voltage (Ref Voltage) can be set in the
Generator Config panel. The actual output voltage is set
in the Generator Function panel where the unit is dBr, i.e.
it is possible to enter the output voltage in dB relative to
this reference value.
This method is particularly useful if, e.g. with an A/D
converter, the clipping level has been determined and
other measurements (frequency response, THD+N, etc)
have to be performed using test signals which are a certain
dB value (defined in the test specifications) below this full-
scale level.
However, it is important to note that the maximum values
of the R&S UPV cannot be exceeded; this applies to both
system-specific maximum values and maximum values
which originate from other elements (here for example the
Max. Voltage setting).
If by increasing the reference value the maximum output
voltage is exceeded, the value for Voltage in the
Generator Function panel is automatically reduced. In the
example shown opposite, the maximum output voltage of
20 V forms the limit; setting the reference value to 100 V
results in a reduction of the Voltage value in the bottom
window.
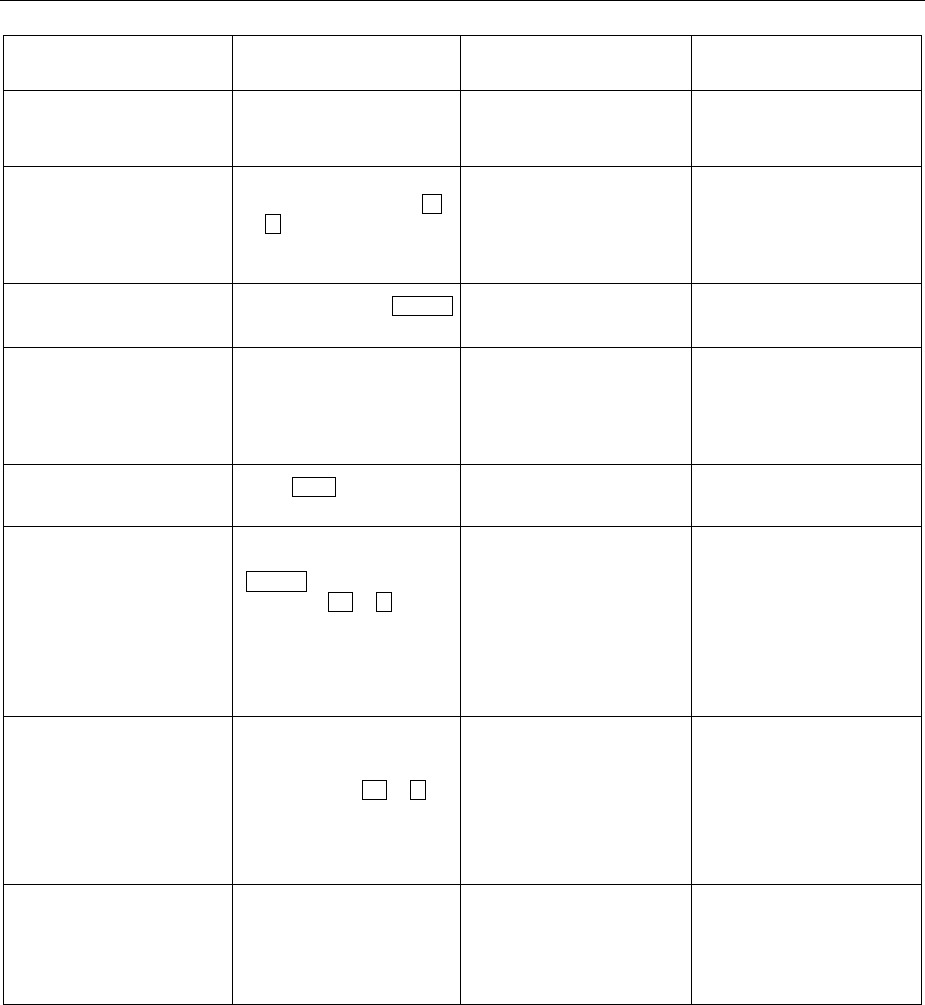
R&S UPV Settings in the Panels
1146.2078.62 3.41 E-5
Function Front panel PC keyboard Mouse
Enter new value
(Edit mode)
Highlight numeric entry field
and enter new value directly
using numeric keypad.
Highlight numeric entry field
and enter new value directly
using number keys.
---
Change individual digits
(Edit mode)
Highlight numeric entry field,
position digit cursor with
or cursor key and enter
new digit directly using
numeric keypad.
Highlight numeric entry field,
position digit cursor with or
cursor key and enter new
digit directly using number
keys.
---
Complete value entry Complete entry with ENTER
key.
Complete entry with ENTER
key. ---
Complete value entry with
unit selection
Press softkey with desired
unit.
Use F5 to F12 keys to select
desired unit or
Complete entry by pressing
the keys m, k,etc. to set the
value to mV, kHz, etc.
Click softkey button with
desired unit.
Quit value entry without
adopting value
Press ESC key. Press ESC key. Click in a different entry field.
Change value
(Direct mode)
Highlight numeric entry field,
switch to Direct mode with
ENTER key, position digit
cursor with or cursor
key and enter new digit
directly using numeric
keypad.
All changes are set directly
in hardware.
Highlight numeric entry field,
switch to Direct mode with
ENTER key, position digit
cursor with or cursor key
and enter new digit directly
using number keys. All
changes are set directly in
hardware.
---
Vary value
(Direct mode)
Highlight numeric entry field,
switch to Direct mode with
rotary-knob click; position
digit cursor with or
cursor key. Vary numeric
value using rotary knob.
All changes are set directly
in hardware.
Highlight numeric entry field,
switch to Direct mode with
ENTER key; position digit
cursor with or cursor
key. Vary numeric value
using or cursor key.
All changes are set directly in
hardware.
---
Change unit Highlight numeric entry field,
select unit using appropriate
softkey.
Physical value is converted
to new numeric value with
newly selected unit.
Highlight numeric entry field,
select unit using F5 to F12
keys.
Physical value is converted
to new numeric value with
newly selected unit.
Highlight numeric entry field,
click appropriate softkey
button to select unit.
Physical value is converted
to new numeric value with
newly selected unit.
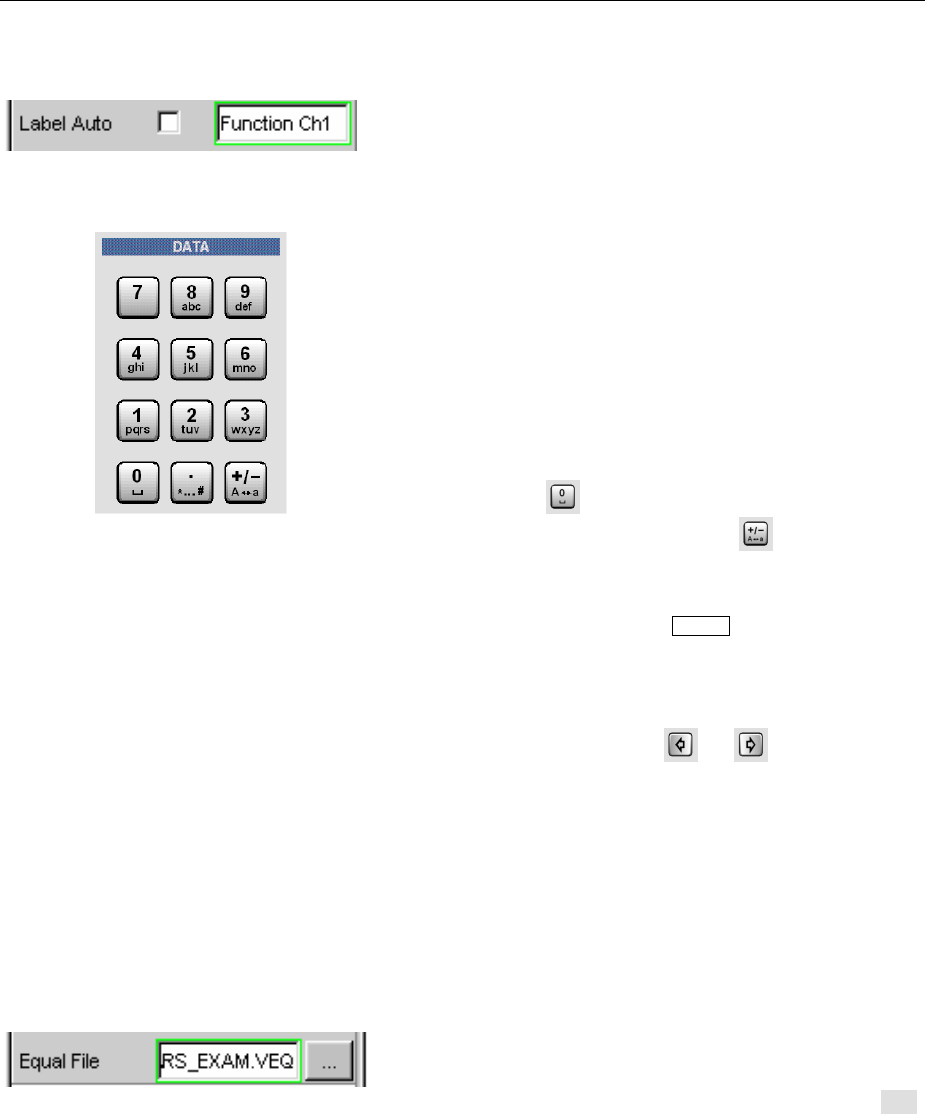
Settings in the Panels R&S UPV
1146.2078.62 3.42 E-5
Alphanumeric Entries – Text Entry Fields
When the focus is moved to a text entry field, the system
enters Edit mode, which is indicated by a green selection
frame.
If the complete text (e.g. for graph labels) is to be newly
entered, simply begin entering characters using the keypad
on the front panel; the old text is deleted automatically
when the first key is pressed. The keypad on the front
panel of the R&S UPV is automatically switched to the
mode for entering alphanumeric characters. Text is
entered in the same way as on mobile phones: The
characters assigned to a key are called up in sequence by
repeatedly pressing the key (see also the section
"Overview of Keys",page 3.118). A different key can be
pressed immediately to enter the next character; a brief
pause must, however, be made when entering characters
assigned to the same key. The space character is
assigned to the key, special characters are entered
using the decimal-point key and the key is used to
toggle between upper and lower-case characters.
The character to the left of the cursor can be deleted at
any time during entry using the UNDO key.
If an external PC keyboard is used, characters can be
entered in the usual way.
If certain characters only are to be changed, position the
cursor accordingly using the or cursor key and
enter the new characters (if the position of the cursor is
changed before the first character is entered, the old text
will not be deleted). The default setting is insert mode. It is
only possible to change between insert and overwrite
mode if an external PC keyboard is used.
The text entry field is closed with:
ENTER The newly entered text is adopted.
ESC The old text is retained.
Atext entry field also appears whenever files saved on the
R&S UPV are to be called up (e.g. to load saved scans in a
diagram) or special functions are to be adopted from files,
and so on. Here, the file name can be typed or the •••
button can be actuated to call up the file directory where
the desired file can then be selected (details are given in
the section "File Management" on page 3.102).
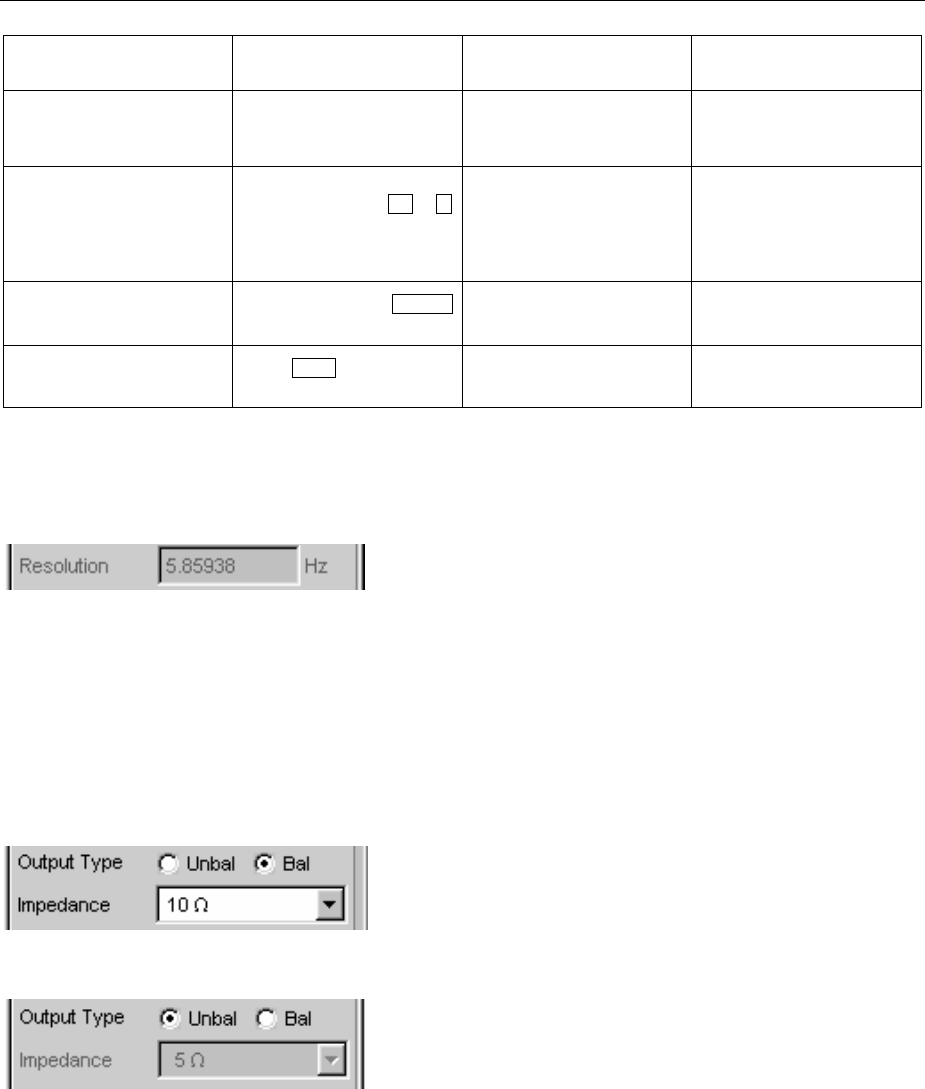
R&S UPV Settings in the Panels
1146.2078.62 3.43 E-5
Function Front panel PC keyboard Mouse
Enter new text Highlight text entry field and
enter new text directly using
front panel keypad.
Highlight text entry field and
enter new text directly using
keyboard.
---
Change individual characters Highlight text entry field,
position cursor with or
cursor key and enter new
character directly using front
panel keypad.
Highlight text entry field,
position cursor with or
cursor keys and enter new
character directly using
keyboard.
---
Complete character entry Complete entry with ENTER
key.
Complete entry with ENTER
key. ---
Quit text entry without
adopting entered characters
Press ESC key. Press ESC key. Click in a different entry field.
Display Fields
Sometimes it is very useful for operators to receive
additional information about their settings. For example,
the selected FFT parameter directly affects the frequency
resolution in the displayed spectrum. Display fields inside
the panels are used in such cases. These fields are shown
in grey and cannot be accessed. They always contain valid
values and therefore always show settings active in the
background; the fields are updated as soon as a setting in
the associated parameter field is changed.
Depending on the settings selected beforehand, it may in
some cases no longer be possible to operate certain
elements – the entry field then becomes a display field and
is shown in grey as described above.
Example: In the case of the analog generator, various
impedances can be set for balanced output. If the
generator is switched to unbalanced output, the entry field
for impedance becomes a display field and shows the
impedance that is valid in this case.
Display fields are also used when adopting parameters
using track boxes.
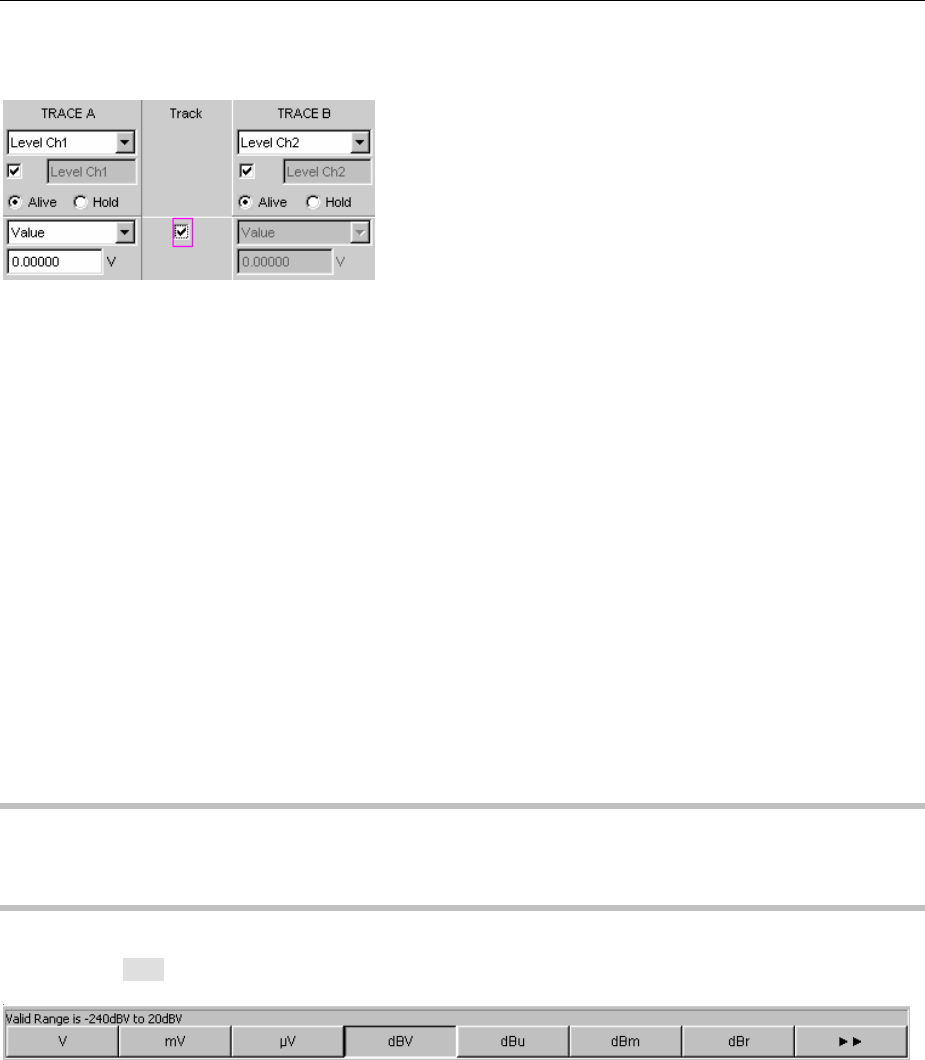
Settings in the Panels R&S UPV
1146.2078.62 3.44 E-5
Adopting Parameters – Track Box
Inmany cases, settings are to apply e.g. to both
measurement channels or to both traces. Here the
R&S UPV provides multi-column panels which allow
settings to be transferred from the left-hand to the right-
hand column without the parameter having to be entered a
second time.
The track boxes, which are displayed in a separate
column, are used for this purpose. Track boxes always
apply to an entire function group (information on function
groups can be found in the section "Panel Structure" on
page 3.23).If the track box has a checkmark, all of the
settings within the function group are applicable to both
columns. All fields with transferred settings in the right-
hand column are shown as display fields. They appear
grey and cannot be accessed while the track function is
active. If a setting is changed in the associated setting field
in the left-hand column, this change is also shown in the
display field in the right-hand column.
Help Functions
Information on the possible entries is given at the bottom of the screen above the softkey bar. The units
offered in the softkey bar and the limits specified in the "Valid Range" field always refer to the
highlighted parameter field. The valid value range is given in the unit currently selected.
Entries outside the specified value range are not accepted; an audible warning is issued and the entry
is changed to its permissible minimum or maximum value.
Note:
The specified ranges for value entries always take the current status of the instrument into
consideration. They are therefore not constant and depend on the presets already configured for other
parameters.
Below is an example for entry of the generator output voltage; additional units can be displayed by
actuating the button:

R&S UPV Settings in the Panels
1146.2078.62 3.45 E-5
Completing Settings
When numeric values are entered, the R&S UPV makes a distinction between Edit mode (indicated by
agreen selection frame) and Direct mode (indicated by a magenta selection frame). See also the
section "Numeric Entries – Numeric Entry Fields" from page 3.35 onwards.
•Numeric entries in Edit mode are not adopted and set in the hardware until the ENTER function
is actuated ( ENTER key or rotary-knob click) or a unit is selected using the softkey bar.
•In Direct mode, numeric values entered or changed using the rotary knob are immediately
passed on to the hardware and executed.
With tick boxes, functions are activated and deactivated by the hardware as soon as the status of the
tick box is toggled with the ENTER function. In the case of operation using the mouse, functions are
activated/deactivated as soon as the tick box is clicked.
With radio buttons, settings are executed by the hardware as soon as the radio button is toggled with
the ENTER function. In the case of operation using the mouse, functions are toggled as soon as the
corresponding radio button is clicked.
Aparameter from a selection field is also executed by actuating the ENTER function. In this case, a
simple mouse-click will select and activate the desired parameter.
Most settings are made without any noticeable adjustment or calculation times. If a brief calculation time
is necessary (e.g. to calculate a multi-tone signal adapted to the FFT analysis), the calculation is
performed in the background while the current measurements are continued.
Function Front panel PC keyboard Mouse
Complete numeric value
entry (Edit mode)
Complete entry with ENTER
key or
press softkey with desired
unit.
Complete entry with ENTER
key or
use F5 to F12 keys to select
desired unit or
Complete entry by pressing
the keys m, k,etc. to set the
value to mV, kHz, etc.
Click softkey button with
desired unit.
Adopt changed numeric
values in hardware
immediately
(Direct mode)
Highlight numeric entry field,
switch to Direct mode with
ENTER key, position digit
cursor with or cursor
key and enter new digit
directly using numeric
keypad.
Highlight numeric entry field,
switch to Direct mode with
ENTER key, position digit
cursor with or cursor key
and enter new digit directly
using number keys.
---
Change numeric values with
immediate adoption by
hardware
(Direct mode)
Highlight numeric entry field,
switch to Direct mode with
rotary-knob click; position
digit cursor with or
cursor key. Vary numeric
value using rotary knob.
Highlight numeric entry field,
switch to Direct mode with
ENTER key; position digit
cursor with or cursor
key. Vary numeric value
using or cursor key.
---
Activate/deactivate function Highlight desired element
using rotary knob or cursor
keys,
activate/deactivate function
with rotary-knob click or
ENTER key.
Highlight desired element
using cursor keys,
activate/deactivate function
with Enter key.
Click tick box.

Settings in the Panels R&S UPV
1146.2078.62 3.46 E-5
Function Front panel PC keyboard Mouse
Toggle function Highlight desired element
using rotary knob or cursor
keys,
toggle function with rotary-
knob click or ENTER key.
Highlight desired element
using cursor keys,
toggle function with Enter
key.
Click desired radio button.
Select parameter from list Highlight selection using
rotary knob or up/down
cursor keys and confirm with
rotary-knob click or ENTER
key.
Highlight selection using
up/down cursor keys and
press Enter key.
Click parameter.
Entries During Measurement / Data Output
Entries can be made at any time.
Single measurements, spectral displays:
If the entry affects parameters of the current measurement, the current measurement or output is
terminated as soon as the entry is confirmed (the newly selected parameters are set and the
measurement or output is restarted).
Sweep activated:
Since changes to parameters during a sweep can influence the measurement and thus have a negative
effect on the reliability of the results displayed in the screen graphic, the current sweep is stopped and
then after restarted such changes are made.
Entries which do not affect the measurement process:
Entries which do not affect the current measurement process (e.g. changing a unit) are adopted
immediately without the current measurement being interrupted.
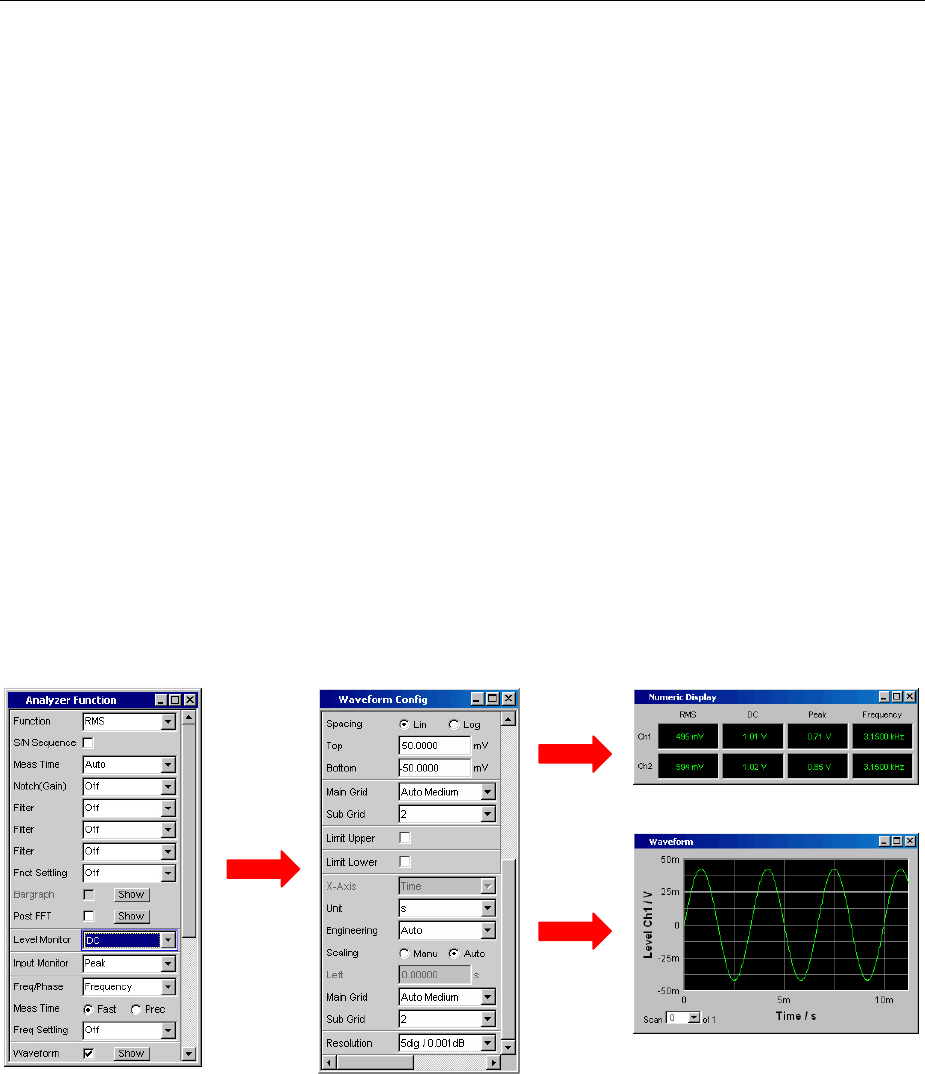
R&S UPV Measurement Displays
1146.2078.62 3.47 E-5
Measurement Displays
The Audio Analyzer R&S UPV offers various types of measurement windows for displaying the results
of the numerous measurement functions. The measurement results can be displayed as digital numeric
values, in analog bargraphs, in result graphics or in data lists. The user can open any number of
measurement windows on the screen. The size of the panels can be changed within wide limits,
whereby the font size, scaling and so on are adapted automatically (see also the section "Moving and
Resizing Panels and Graphical Windows" on page 3.16).
Measurement Functions and Displaying Measurement Results
•What (which measurement function) is measured and how (which measurement method)
measurement is performed, is preset in the Analyzer Function panel.
•The panels for configuring the measurement value display are used to determine how the
measurement results are presented (i.e. which unit, how many digits, etc). A series of panels for the
different measurement windows are provided for this purpose.
•The results are finally displayed in the various measurement windows.
The basic settings in these configuration panels and measurement windows are described in the
following sections. A detailed description of the individual parameter fields can be found in Chapter 4
"Graphical Display".
What is measured
and
how measurement is
performed
Display type for
measurement results
Display of measurement
results
Fig.: 3-2 Measurements and display of results with Audio Analyzer R&S UPV
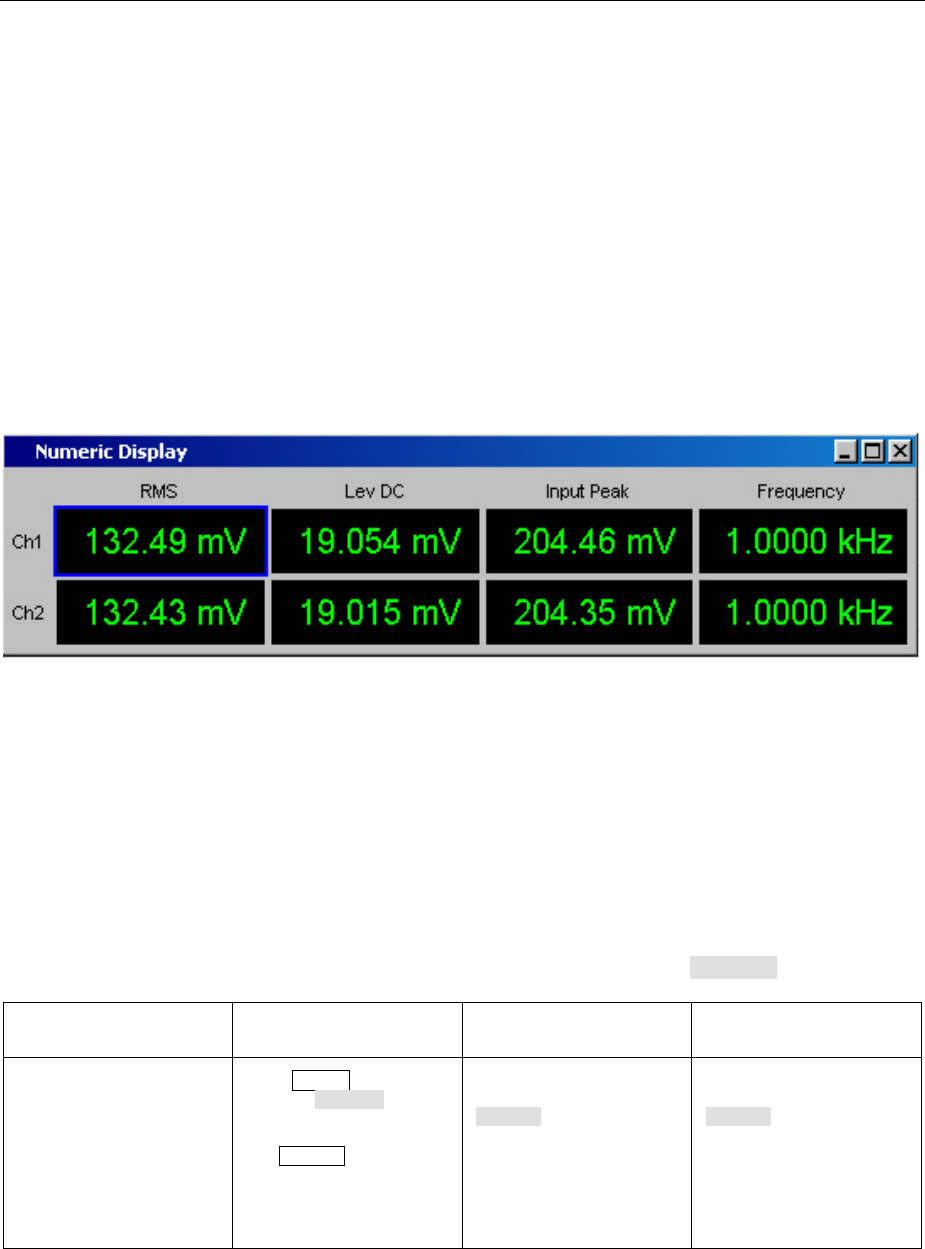
Measurement Displays R&S UPV
1146.2078.62 3.48 E-5
Numeric Display Field
The numeric display field provides a clear overview of the numeric values from various analyzer
functions and displays a maximum of 8 numeric value results from the Analyzer Function panel. The
individual columns are permanently assigned, from left to right:
Column 1: Measurement results from the function which is set in the Function field of the
Analyzer Function panel.
Column 2: Measurement results for the set Level Monitor function.
Column 3: Measurement results for the Input Peak function.
Column 4: Display of either the frequency measurement result or, if Freq & Phase or
Freq & GrpDel is set, display of the frequency measurement result in the first row and
display of the phase or group delay measurement in the second row.
Each column is labeled with the name of the displayed measurement function, whereby additional,
more specific function-related information may also be shown. Example: With difference frequency
distortion measurement, the type of measurement and the associated measurement standard, e.g.
DFD d2 (IEC 268),is also displayed.
The results from the two measurement channels are shown in both rows (exception: frequency/phase
or frequency/group delay measurement).
If not all of the columns are required because one or more of the associated measurement functions is
deactivated, the column in question is hidden.
The numeric display field is opened via the menu bar; it is called up using the Displays button.
Function Front panel PC keyboard Mouse
Open numeric display field Press MENU key and
highlight Displays button
using rotary knob or cursor
keys, open pulldown menu
with ENTER key or rotary-
knob click, and highlight and
select numeric display field.
Press key combination
CTRL + M, then highlight
Displays button using TAB
or SHIFT + TAB keys, open
pulldown menu using Enter
key, highlight numeric
display field using cursor
keys and select using Enter
key.
Open menu bar by moving to
left edge of screen, actuate
Displays button and click
numeric display field.
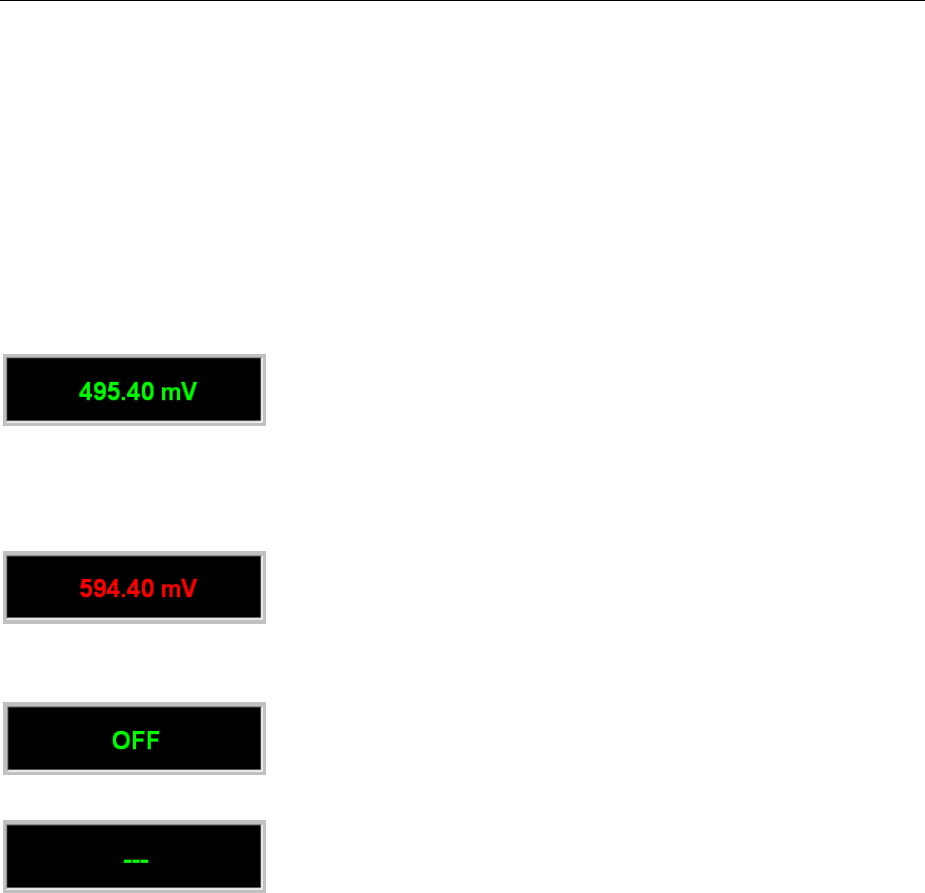
R&S UPV Measurement Displays
1146.2078.62 3.49 E-5
Measurement result display in numeric display field
The display of measurement results in the numeric display field is configured in the following panels:
•Funct Config
•Lev Mon Config
•Input Config
•Freq / Phase Config
The following examples of measurement value displays demonstrate the various display options. A
number of basic settings made in these configuration panels are described in the following section. A
detailed description of the display options can be found in Chapter 4 "Graphical Display".
If the measurement value is within the preset limits or no limits were
specified, the measurement value is displayed in green on a black
background.
Ameasurement value in a linear unit is displayed with 3 to 7 digits; a
measurement value in logarithmic units can be displayed with a
resolution of 0.1 dB to 0.00001 dB.
If the measurement value overranges or underranges preset limits, the
measurement value is displayed in red on a black background.
As soon as the measurement value is within the limits again, it is
displayed in green.
If one of the two measurement channels is deactivated, OFF appears in
the associated measurement display.
If no measurement result is available (e.g. there is no frequency result
during a DC measurement), --- is displayed.

Measurement Displays R&S UPV
1146.2078.62 3.50 E-5
Combi Display
Itis often the case that the numeric value of a measurement result does not contain adequate
information. Additional features such as analog bargraphs, limit monitoring or the storage of maximum
and minimum values are frequently required.
The combi display is used for this purpose. Additional information can be displayed for every
measurement shown in the numeric display field.
The free selection and free scalability mean that especially important or critical results can be monitored
and tracked even when viewing the R&S UPV screen from a relatively long distance.
Measured minimum and
maximum values
Measurement display
Bargraph
Limit settings
Opening combi displays
The easiest way to open combi displays is to highlight the
respective measurement display in the numeric display
field (blue selection frame) and to trigger an ENTER
function ( ENTER key or rotary-knob click).
Alternatively, the combi displays can also be opened using
the associated configuration panel (see the following
section). The associated combi display is activated using
the Show button in the Display line.
Another way is to open the combi display
via the menu bar; they are called up
using the Display button.

R&S UPV Measurement Displays
1146.2078.62 3.51 E-5
Function Front panel PC keyboard Mouse
Activate combi display via
numeric display field
Highlight desired
measurement display in
numeric display field and
open combi display with
ENTER key or rotary-knob
click.
Highlight desired
measurement display in
numeric display field and
open combi display with
Enter key.
Double-click desired
measurement display in
numeric display field.
Activate combi display via
Config panel
Highlight DISPLAY button
in associated Config panel
and open combi display with
ENTER key or rotary-knob
click.
Highlight DISPLAY button
in associated Config panel
and open combi display with
Enter key.
Click DISPLAY button in
associated Config panel.
Settings for measurement result display in combined fields
Since a combi display is available for each measurement display of the numeric display field, up to eight
of these displays can be opened. The settings for the combi displays (and for the numeric display field
itself) are made in four configuration panels, whereby the two measurement channels are displayed in
one panel. This results in the following four panels for configuring the measurement results in the combi
displays:
•Funct Config
•Lev Mon Config
•Input Config
•Freq / Phase Config
The associated panels for configuring the combi displays are opened via the menu bar; they are called
up using the Disp Config button.
Function Front panel PC keyboard Mouse
Open panel for configuring
combined field or numeric
display field
Press MENU key and
highlight Disp Config
button using rotary knob or
cursor keys, open pulldown
menu with ENTER key or
rotary-knob click, and
highlight and select desired
panel.
Press key combination
CTRL + M, then highlight
Disp Config button using
TAB or SHIFT + TAB keys,
open pulldown menu using
Enter key, highlight desired
panel using cursor keys and
select using Enter key.
Open menu bar by moving to
left edge of screen, actuate
Disp Config button and click
desired panel.
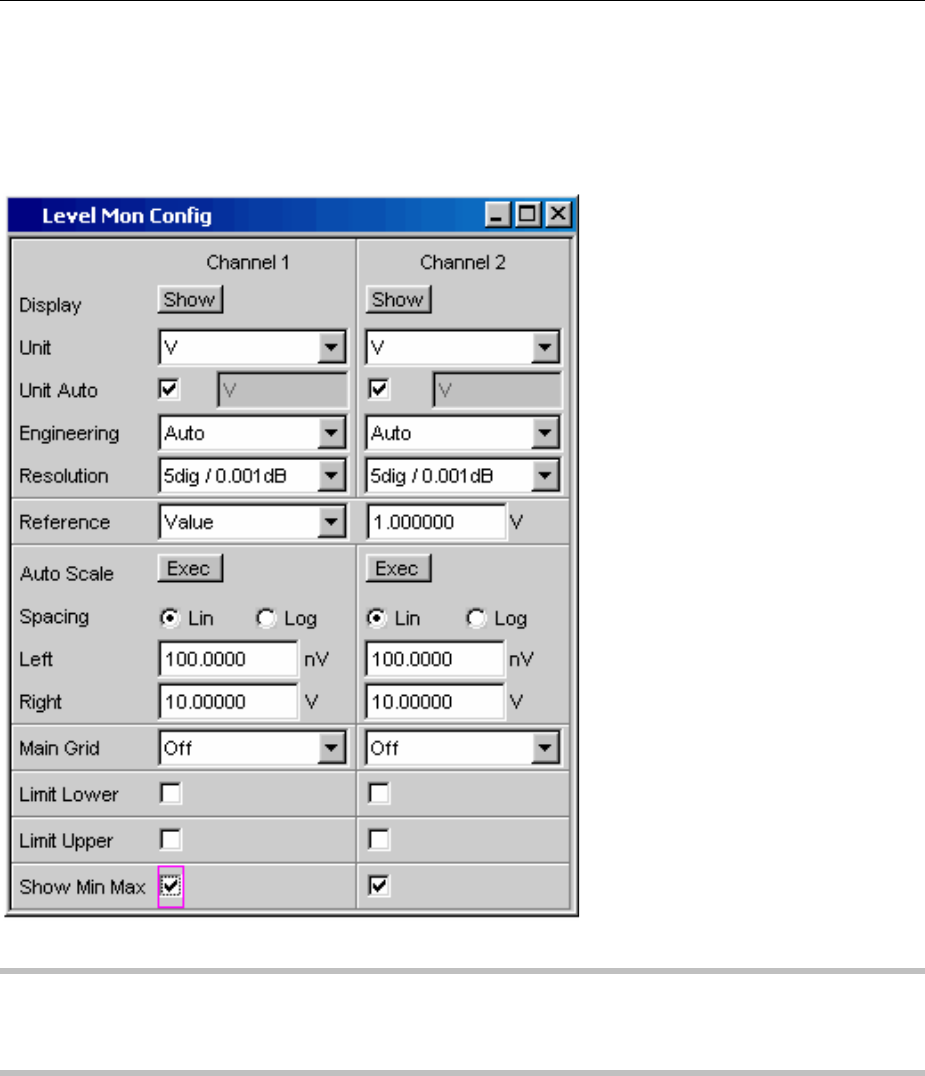
Measurement Displays R&S UPV
1146.2078.62 3.52 E-5
Some of the basic settings in these panels are described here using the Lev Mon Config panel as an
example. Since the combi display is an extension of the numeric display field, the settings also
influence the numeric display field.
Adetailed description of the display options can be found in Chapter 4 "Instrument Functions" in the
section "Graphical Display".
Note:
Some of the settings described below are only visible if the combi display is of adequate size on the
screen. For example, scaling and gridlines are hidden automatically and stepwise if the display is
reduced in size.
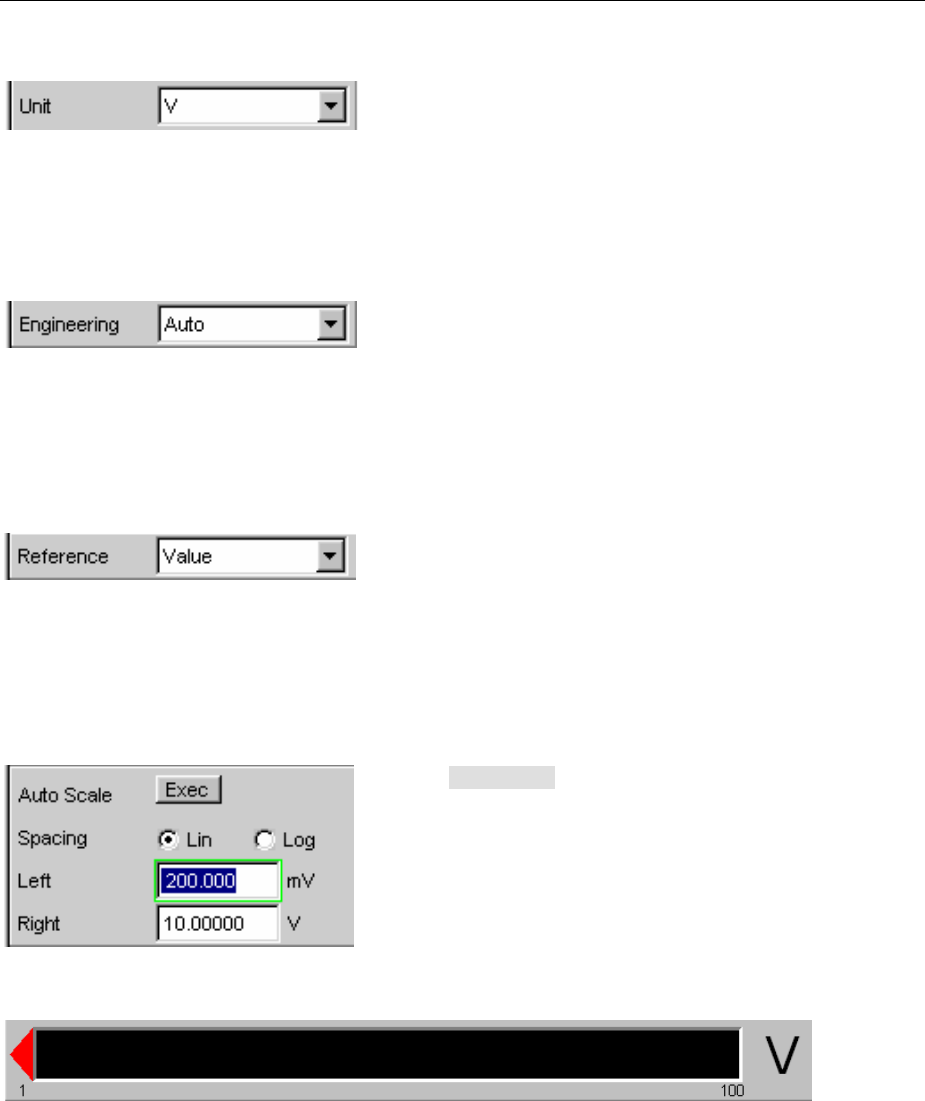
R&S UPV Measurement Displays
1146.2078.62 3.53 E-5
Unit of measurement result
This parameter field is used to set the unit for the
measurement result display. The units available in the
parameter list depend in the type of measurement.
An overview of all units used with the Audio Analyzer
R&S UPV and their conversion formulae can be found at
the end of this chapter (section "Units" from page 3.110
onwards).
Details concerning the numeric value display can be
specified here for all linear units.
For example, it is possible to select whether voltage is to
be given in V, mV, PV, and so on. If "Auto" is set, these
unit prefixes are automatically adapted to the
measurement value.
Reference values
The reference value for relative measurement values can
be set here.
This can be a fixed preset value; however, values
measured at a different location or values based on the
generator settings and so on can also be adopted
automatically as reference values.
Bargraph scaling
If the Autoscale button is actuated, the extreme values
that have so far occurred are used for scaling the left-hand
and right-hand scale end value. The scaling can, however,
also be set manually.
The axis can be displayed with linear or logarithmic
subdivisions.
If manual scaling was selected, the start and end value of
the bargraph must be entered in the two fields.
If the selected scaling does not encompass all
measurement values, a red arrow indicates the end of the
scale at which the measurement value is beyond the range
of the bargraph.
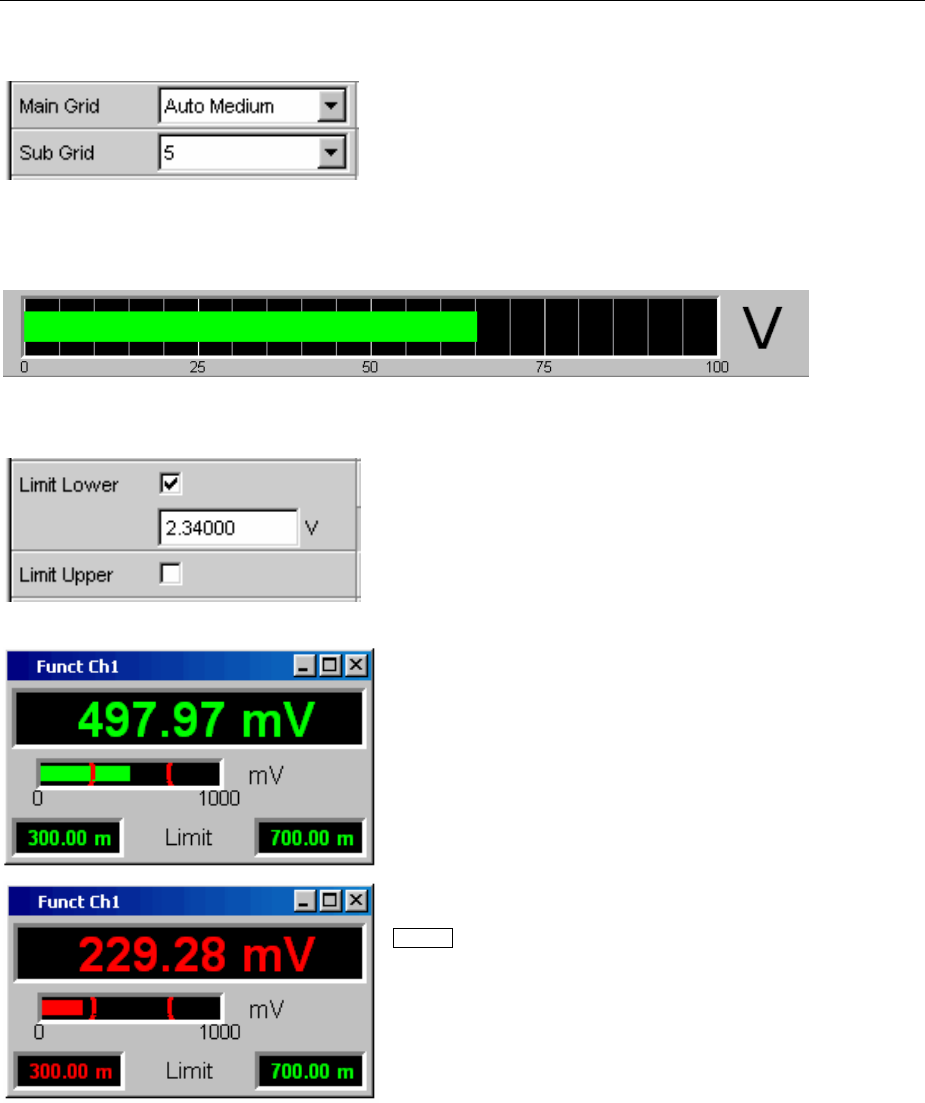
Measurement Displays R&S UPV
1146.2078.62 3.54 E-5
Gridlines
The settings Main Grid and Sub Grid are used to
subdivide the bargraph.
Main gridlines which are labeled with the associated
numeric values can be added with different intervals.
Subgridlines are used for further subdivisions; these lines
are not labeled.
Limits
Alower and/or upper limit can be defined for each
measurement result.
If the limit is activated, each measurement value is
compared with the limit.
The set limits are shown in the bottom part of the combi
display and appear as a red limit marking on the bargraph.
As soon as one of the limits is exceeded, the measurement
display and measurement bar changes from green to red.
If the measurement value is within the limits, the
measurement display and measurement bar are displayed
in green.
In order to monitor limit violations over a long period of
time without having to watch the measurement displays
continuously, the lower and/or upper limit is displayed
permanently in red as soon as it is exceeded. Pressing the
START key again or entering a new limit resets the limit to
green.
The measurement display in the numeric display field
always behaves in the same way as the measurement
display in the combined field; current limit violations can
therefore also be monitored in the numeric display field.
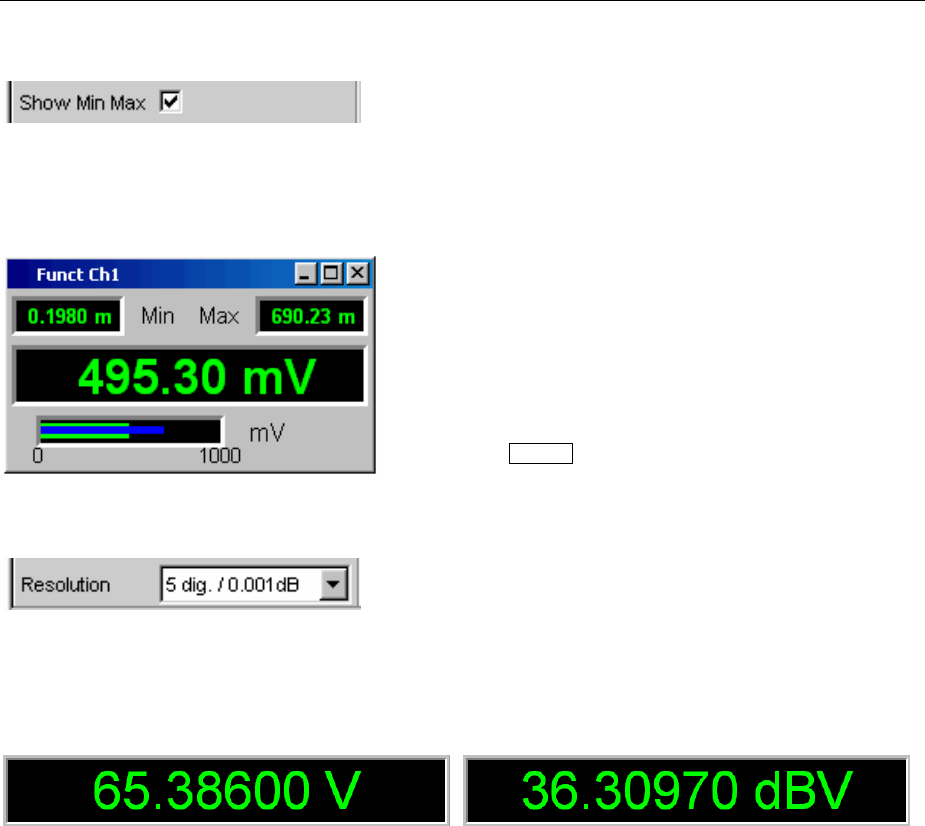
R&S UPV Measurement Displays
1146.2078.62 3.55 E-5
Extreme values
If this tick box is activated, the lowest and highest
measurement value is displayed.
Display of the Min/Max values can be set separately for
each measurement display and for the two measurement
channels.
The minimum and maximum values which have been
measured are shown in the top part of the combi display;
an additional blue bar which records the span between the
extreme values is also displayed.
The Min/Max values can thus also be recorded over a long
period of time without the measurement displays having to
be monitored continuously.
Pressing the START key again resets the Min/Max values.
Number of displayed digits
The Resolution field is used to set the number of digits
used when displaying the measurement values, Min/Max
values and limits.
Values in linear units can be displayed with 3 to 7 digits;
values in logarithmic units can be displayed with a
resolution of 0.1 dB to 0.00001 dB.
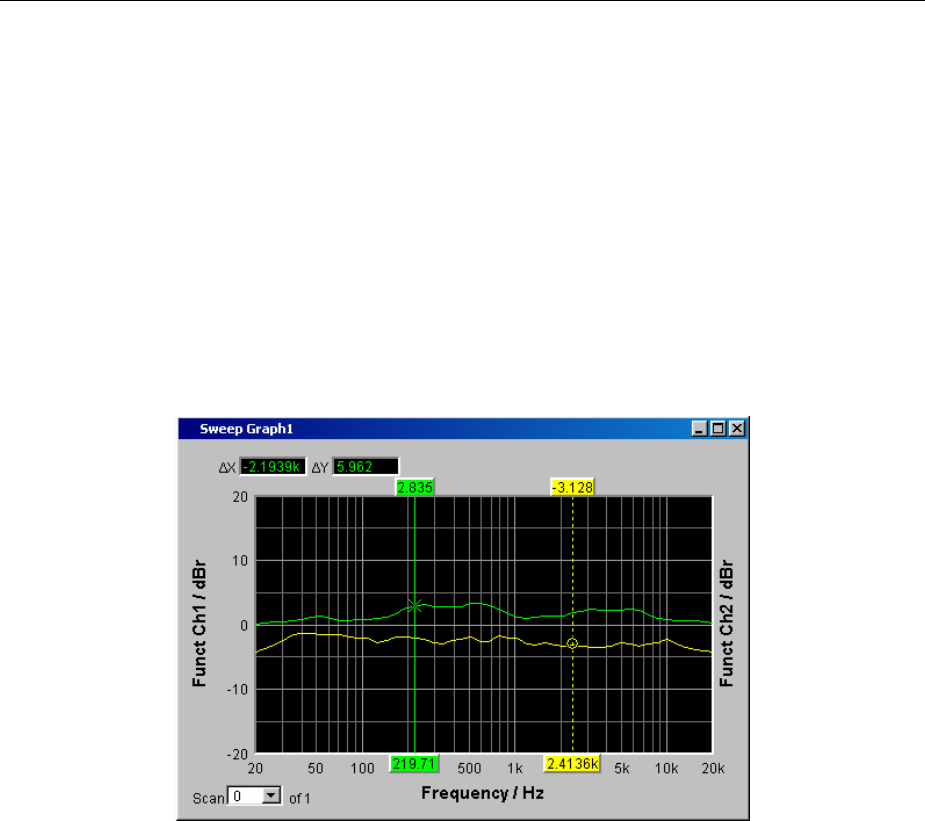
Measurement Displays R&S UPV
1146.2078.62 3.56 E-5
Graphical Windows
The most informative method of displaying measurement results is usually a two-dimensional graph.
Measurement values as a function of frequency, measurements over a time axis and so on are just a
few examples of the many possible applications. The Audio Analyzer R&S UPV makes a distinction
between the graphical windows (shown in the following sections) which can be set and modified using
the associated configuration panels.
All graphical displays can be evaluated using horizontal and vertical cursors; markers are used to
identify important measurement points. A broad range of softkey control functions can be used to scale
graphs, to display sections of graphs, and to perform many other tasks.
Sweep graph
Here, the measurement values of a measurement sequence (sweep) can be displayed as a line
diagram in a co-ordinate system. One or two traces (TRACE A and TRACE B) can be recorded along
an X-axis. Each trace can consist of a large number of scans. The traces can be saved and saved
traces, reference curves and/or limit curves can be imported into the graph.
Up to four sweep graphs can be displayed at the same time and can all be configured differently. As a
result, it is possible to display different measurement functions or display the same measurement
function in a different way.
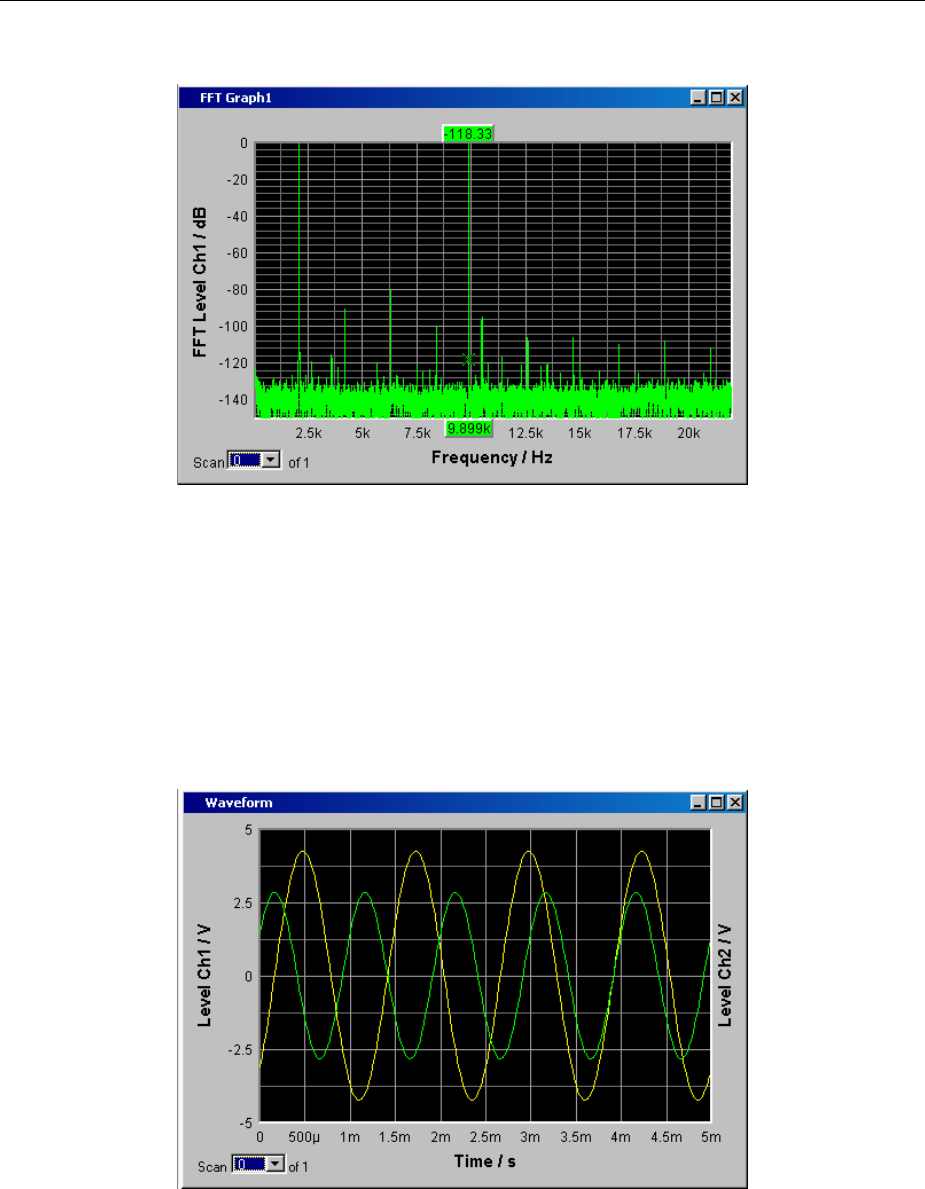
R&S UPV Measurement Displays
1146.2078.62 3.57 E-5
FFT graph
The frequency spectrum of the FFT measurement function and of the Post FFT which follows a
different measurement function is displayed in these panels. One or two traces (TRACE A and
TRACE B) can be recorded along a frequency axis. Each trace can consist of a large number of scans.
The traces can be saved and saved traces, reference curves and/or limit curves can be imported into
the graph.
Up to two FFT graphs can be displayed at the same time and can both be configured differently.
Waveform
The waveform display is a type of oscillogram in which the signal characteristic of the analyzed audio
signal over time is displayed. One or two traces (TRACE A and TRACE B) can be recorded along a
time axis. The traces can be saved and saved traces, reference curves and/or limit curves can be
imported into the graph.
This graph can be displayed once only; it is linked to the Waveform Monitor function in the
Analyzer Function panel.
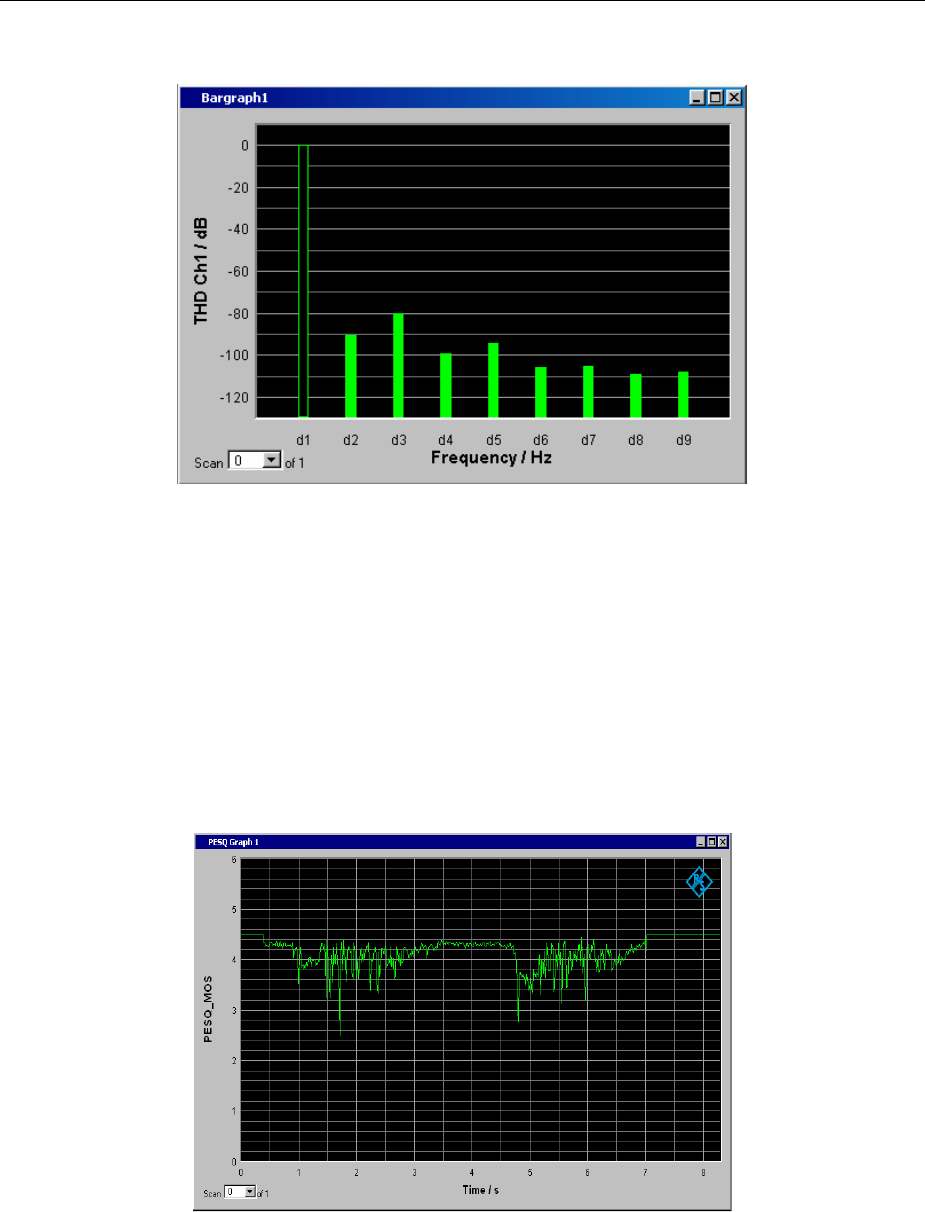
Measurement Displays R&S UPV
1146.2078.62 3.58 E-5
Bargraph
If one of the functions THD, Mod Dist, DFD or DIM is selected in the Analyzer Function panel, the
function measurement result can be displayed broken down into its frequency components on a
bargraph. The individual distortion products are recorded along a frequency axis. The structure of the
distortion products (2nd, 3rd, 4th, … harmonic, DFD of 2nd or 3rd order, etc) can be recognized at a
glance. The bargraph can display one or two channels; once again, the results can be saved and saved
results can be imported into the graph.
Two bargraphs are available so that, for example, THD values at two different measurement points can
be displayed or the measurement values of both input channels can be shown on two separate graphs.
PESQ graph
In these graphics windows, you can display the MOS value of the PESQ measurement as well as the
time delay between the reference and measurement signal over a time axis. It is possible to display up
to two PESQ graphs simultaneously, where they can be configured differently.

R&S UPV Measurement Displays
1146.2078.62 3.59 E-5
Opening graphical windows
The graphical windows can be opened
via the menu bar; they are called up
using the Displays button.
Alternatively, the graphical windows can also be opened
using the associated configuration panels (see the
following section). The associated graphical window is
activated using the Show button.
In the Analyzer Function panel, it is also possible to use
the Show button to open some graphical or data
windows. They will then be displayed in the same screen,
without opening the associated configuration panels.
Function Front panel PC keyboard Mouse
Open graphical window via
menu bar
Press MENU key and
highlight Displays button
using rotary knob or cursor
keys, open pulldown menu
with ENTER key or rotary-
knob click, and highlight and
select desired graphical
window.
Press key combination
CTRL + M, then highlight
Displays button using TAB
or SHIFT + TAB keys, open
pulldown menu using Enter
key, highlight desired
graphical window using
cursor keys and select using
Enter key.
Open menu bar by moving to
left edge of screen, actuate
Displays button and click
desired graphical window.
Open graphical window via
Config panel
Highlight Show button in
associated Config panel and
open graphical window with
ENTER key or rotary-knob
click.
Highlight Show button in
associated Config panel and
open graphical window with
Enter key.
Click Show button in
associated Config panel.
Open graphical window via
Analyzer Function panel
Highlight SHOW button in
Analyzer Function panel and
open graphical window with
ENTER key or rotary-knob
click.
Highlight SHOW button in
Analyzer Function panel and
open graphical window with
ENTER key.
Click SHOW button in
Analyzer Function panel.
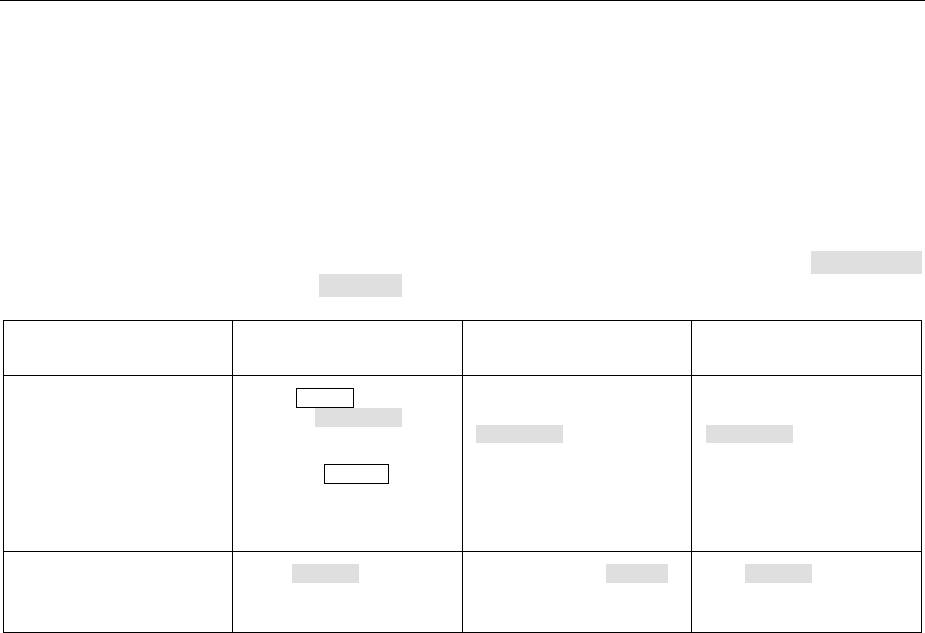
Measurement Displays R&S UPV
1146.2078.62 3.60 E-5
Settings for measurement result display in the graphical windows
The settings for configuring the graphical displays are made in the following panels:
•Sweep Graph1 … 4 Config
•FFT Graph 1 … 2 Config
•Waveform Config
•Bargraph1 … 2 Config
The associated panels for configuring the graphical windows are opened either using the Disp Config
button in the menu bar or using the Settings softkey in the graphical window.
Function Front panel PC keyboard Mouse
Open panel for configuring a
graphical window
Press MENU key and
highlight Disp Config
button using rotary knob or
cursor keys, open pulldown
menu with ENTER key or
rotary-knob click, and
highlight and select desired
panel.
Press key combination
CTRL + M, then highlight
Disp Config button using
TAB or SHIFT + TAB keys,
open pulldown menu using
Enter key, highlight desired
panel using cursor keys and
select using Enter key.
Open menu bar by moving to
left edge of screen, actuate
Disp Config button and click
desired panel.
Open panel for configuring a
graphical window via
softkeys in graphical window
Press Settings softkey of
respective graphical window.
Press F12 key for Settings
softkey in respective
graphical window.
Click Settings softkey in
respective graphical window.

R&S UPV Measurement Displays
1146.2078.62 3.61 E-5
Some of the basic settings in these panels are described here using the FFT Graph1 Config panel as
anexample.
Adetailed description of the display options can be found in Chapter 4 "Graphical Display".
Note:
Some of the settings described below are only visible if the graphical window is of adequate size on the
screen. For example, scaling and gridlines are hidden automatically and stepwise if the display is
reduced in size.
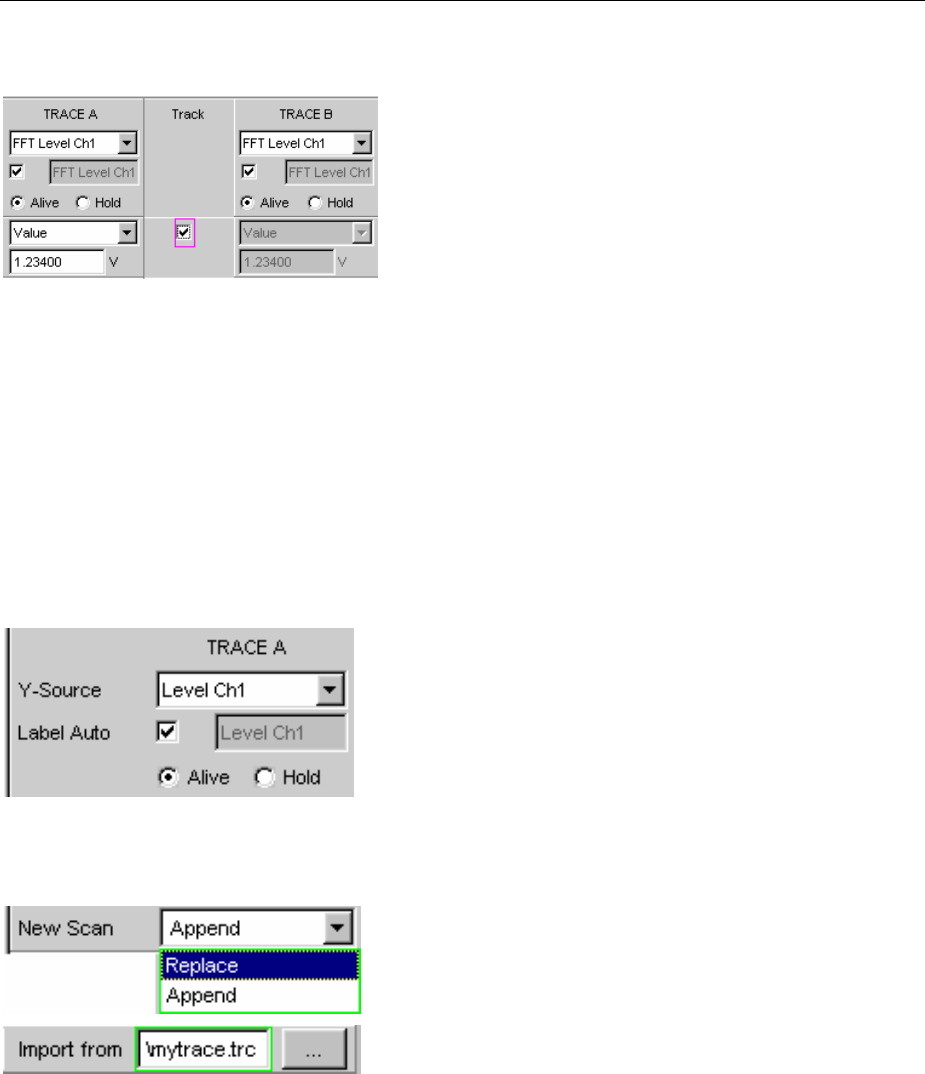
Measurement Displays R&S UPV
1146.2078.62 3.62 E-5
Settings for the Y-axis
All the panels used for configuring graphical windows have
three columns.
In all graphical windows, two traces (TRACE A and
TRACE B) can be recorded along an X-axis. Each trace
can consist of several scans.
In many cases, settings are to apply to both traces. The
track boxes provide multi-column panels which allow
settings to be transferred from the left-hand to the right-
hand column without the parameters having to be entered
asecond time.
If the track box has a checkmark, all of the settings within
the function group are applicable to both columns. All fields
with transferred settings are shown in the right-hand
column as grey display fields. These fields cannot be
accessed while the track function is active. If a setting is
changed in the associated parameter field in the left-hand
column, this change is also shown in the display field in the
right-hand column.
Values to be displayed
The data which is to be graphically displayed can be
determined for each trace. Usually this data comes from
the selected measurement functions; however, saved data
(reference data) can also be displayed.
With Label Auto,the Y-axis of the graph can be labeled
with the data name selected under Source (see example
below), or users can define their own label.
The Hold radio button is used to "freeze" the graphical
display.
Additional scans can be added to a graph ("Append"), or
existing scans in a graph can be replaced by new ones
("Replace").
Furthermore, it is also possible to load previously
measured and saved scans and append them to the
current measurement or replace individual scans with
saved ones.
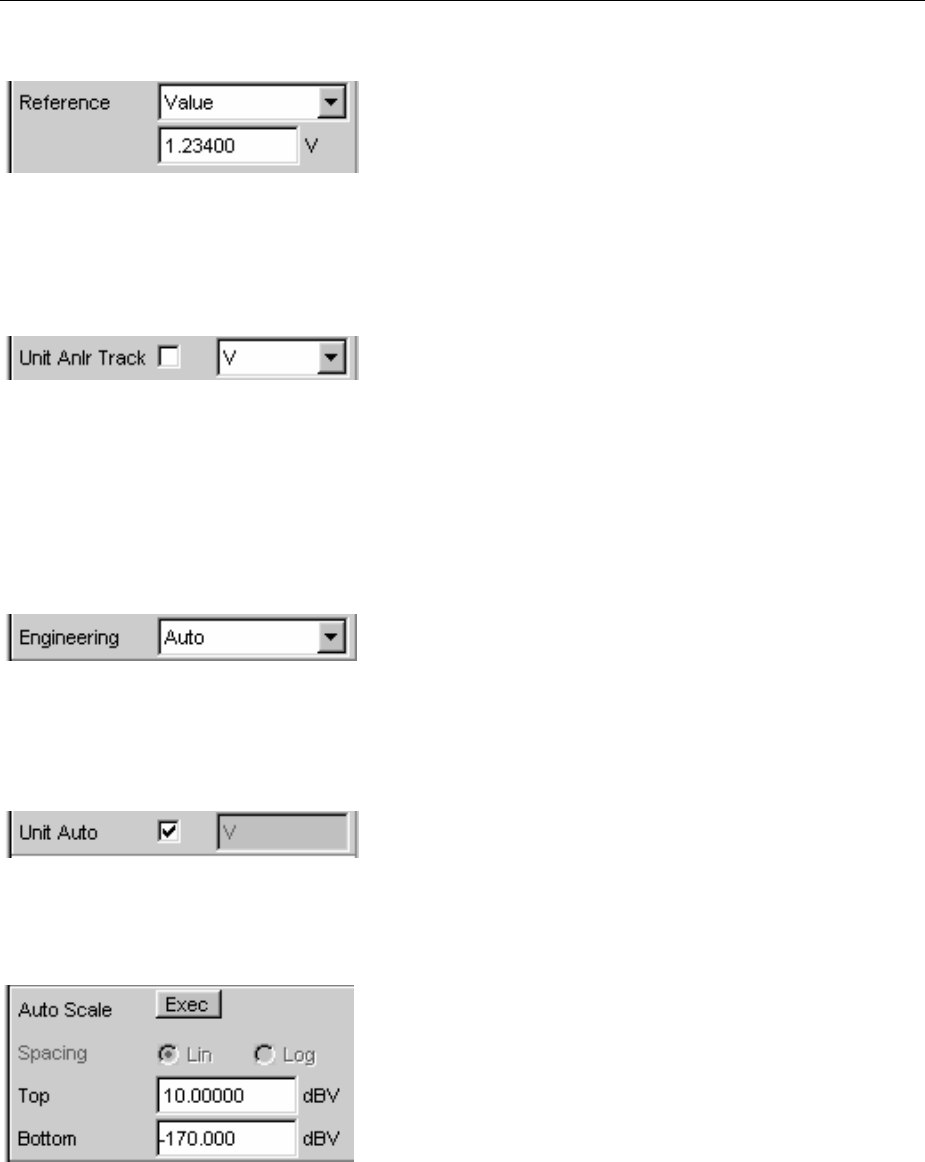
R&S UPV Measurement Displays
1146.2078.62 3.63 E-5
Reference values
The reference value for relative measurement values can
be set here.
This can be a fixed preset value; however, values
measured at a different location or entire scans from files,
from the other measurement channel and so on can also
be used automatically as reference values / reference
curves.
Units of measurement values
This parameter field is used to set the unit for the trace.
The units available in the parameter list depend in the type
of measurement.
Alternatively, if the tick box is selected, the unit used in the
analyzer will be used.
An overview of all units used with the Audio Analyzer
R&S UPV and their conversion formulae can be found at
the end of this chapter (section "Units" from page 3.110
onwards).
Details concerning the numeric value display can be
specified here for all linear units.
For example, it is possible to select whether voltage is to
be given in V, mV, PV, and so on. If "Auto" is set, these
unit prefixes are automatically adapted to the
measurement value.
The used unit will appear on the Y-axis of the graph (see
example below). Sometimes it is better to use a label
defined by the user; this label can be entered in the
parameter field.
Y-axis scaling
If the button for automatic scaling is selected, the Audio
Analyzer R&S UPV uses the minimum and maximum
values of the available measurement cycle to automatically
determine a suitable value range for the graph to be
displayed. This scaling is determined once and retained
until the autoscale function is triggered again.
If manual scaling is required, the upper and lower end
value of the Y-axis must be entered in the two fields.
If a linear unit has been selected for the Y-axis, this axis
can be displayed with linear or logarithmic subdivisions.
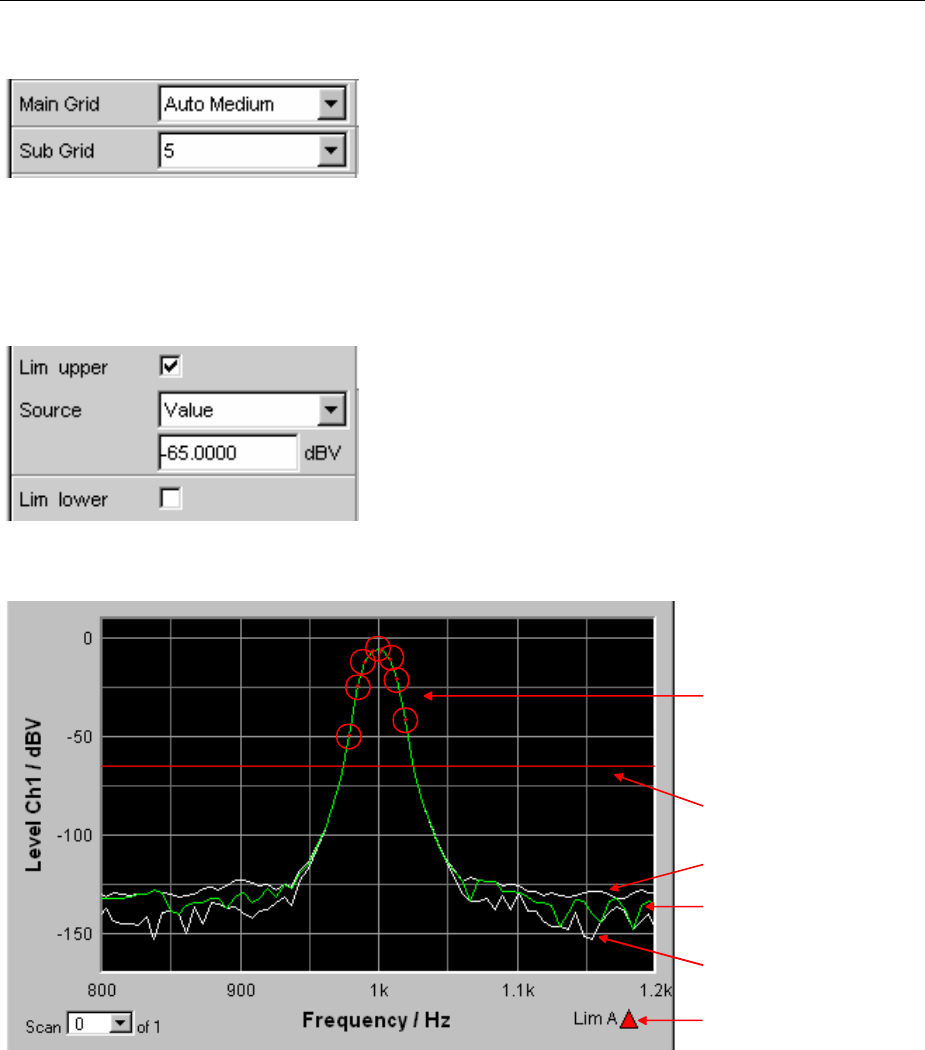
Measurement Displays R&S UPV
1146.2078.62 3.64 E-5
Gridlines
The settings Main Grid and Sub Grid are used to
subdivide the graph with horizontal gridlines.
Main gridlines which are labeled on the Y-axis with the
associated numeric values can be added with different
intervals.
Subgridlines are used for further subdivisions; these lines
are not labeled.
Limits
Lower and/or upper limits can be defined for each trace;
these limits can be different or the same for the two traces.
The limits can be fixed preset values; however, values
measured at a different location or entire scans from files,
from the other measurement channel and so on can also
be used automatically as limits / limit curves.
If the limits are activated, each measurement value is
compared with the limits.
Limit overranging
(additionally
highlighted here with
circles)
Limit line
Max value curve
Measurement value
curve
Min value curve
Limit display

R&S UPV Measurement Displays
1146.2078.62 3.65 E-5
Limit curves appear as a red line on the graph.
Each measurement value which violates a limit is
highlighted by a red dot on the curve.
In addition, a red arrow pointing up/down in the bottom
right-hand corner of the graph provides a permanent
indication of limit overranging/underranging.
Limit monitoring is reset each time the START key is
pressed.
Limit monitoring can also be reset using a softkey; see the
section "Restart Min/Max, Lim Viol function" on page 3.81.
Extreme values
If this tick box is activated, the lowest and highest
measurement value is displayed.
Two additional grey lines which represent the measured
extreme values (see the example above) then appear in
the graph.
Extreme value recording is reset each time the START key
is pressed.
Extreme value recording can also be reset using a softkey;
see the section "Restart Min/Max, Lim Viol function" on
page 3.81.
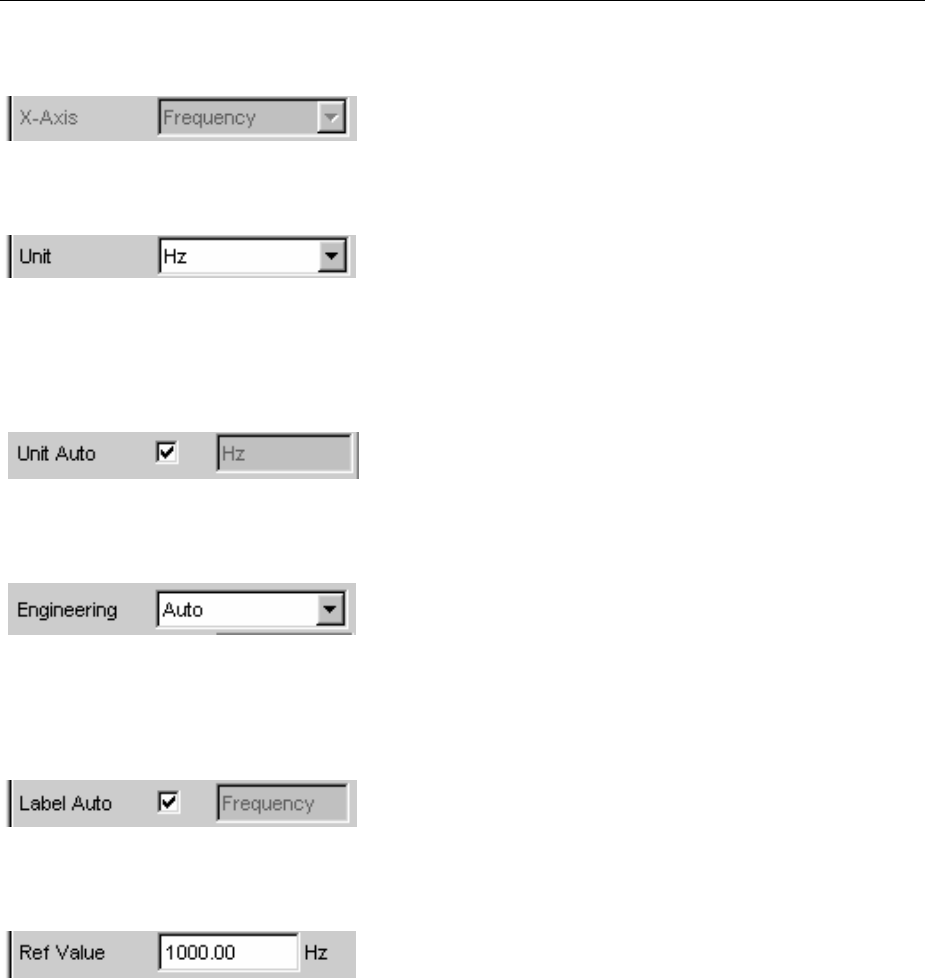
Measurement Displays R&S UPV
1146.2078.62 3.66 E-5
Settings for the X-axis
The quantity displayed on the X-axis is normally
determined by the type of measurement; it can be seen in
the display field shown opposite.
Units for the X-axis
The units available in the parameter list depend in the type
of measurement.
An overview of all units used with the Audio Analyzer
R&S UPV and their conversion formulae can be found at
the end of this chapter (section "Units" from page 3.110
onwards).
Usually it is the used unit that is displayed on the X-axis of
the graph.
Sometimes it is better to use a label defined by the user;
this label can be entered in the parameter field.
Details concerning the numeric value display can be
specified here for all linear units.
For example, it is possible to select whether frequency is to
be given in Hz, mHz, kHz, and so on. If "Auto" is set, these
unit prefixes are automatically adapted to the
measurement value.
With Label Auto,the X-axis of the graph can be labeled
with the data name selected under X-Axis,or users can
define their own label in the entry field.
Reference values
Areference value can be set here for labels of X-values
with relative units.
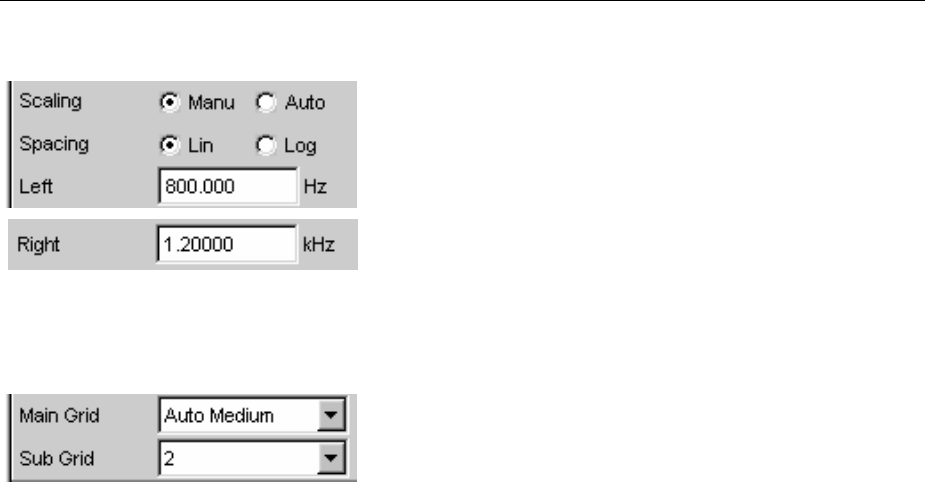
R&S UPV Measurement Displays
1146.2078.62 3.67 E-5
X-axis scaling
If automatic scaling is selected, the Audio Analyzer
R&S UPV uses the minimum and maximum values defined
for the measurement, e.g. by the start/stop values of a
sweep, by the measurement bandwidth of an FFT analysis,
and so on.
If manual scaling has been selected, the upper and lower
end value of the X-axis must be entered in the two fields.
If a linear unit has been selected for the X-axis, this axis
can be displayed with linear or logarithmic subdivisions.
Gridlines
The settings Main Grid and Sub Grid are used to
subdivide the graph with vertical gridlines.
Main gridlines which are labeled on the X-axis with the
associated numeric values can be added with different
intervals.
Subgridlines are used for further subdivisions; these lines
are not labeled.
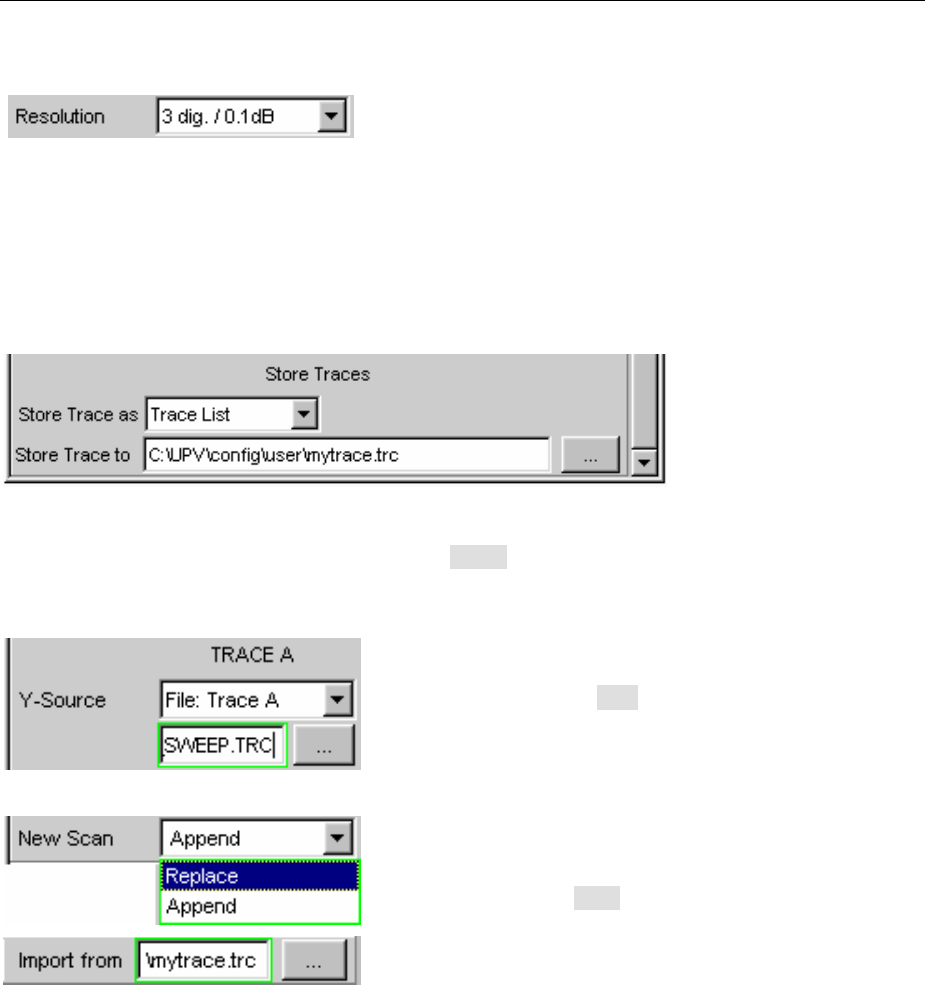
Measurement Displays R&S UPV
1146.2078.62 3.68 E-5
X- and Y-value display
The Resolution field is used set how many digits the
values on the X and Y-axis and at the cursor are to have.
Values in linear units can be displayed with 3 to 7 digits;
values in logarithmic units can be displayed with a
resolution of 0.1 dB to 0.00001 dB.
Loading and saving traces / scans
The current trace together with all scans can be saved in
these parameter fields by calling up the file directory using
the ••• button (for details see the section "File
Management" on page 3.102).
Here, saved traces together with all of their scans can be
loaded and displayed in the current graph by calling up the
file directory using the ••• button (details are given in the
section "File Management" on page 3.102).
On a graph, it is possible to replace individual scans with
saved scans; it is also possible to add (append) additional
saved scans. Once again, this is done by calling up the file
directory using the ••• button (details are given in the
section "File Management" on page 3.102).
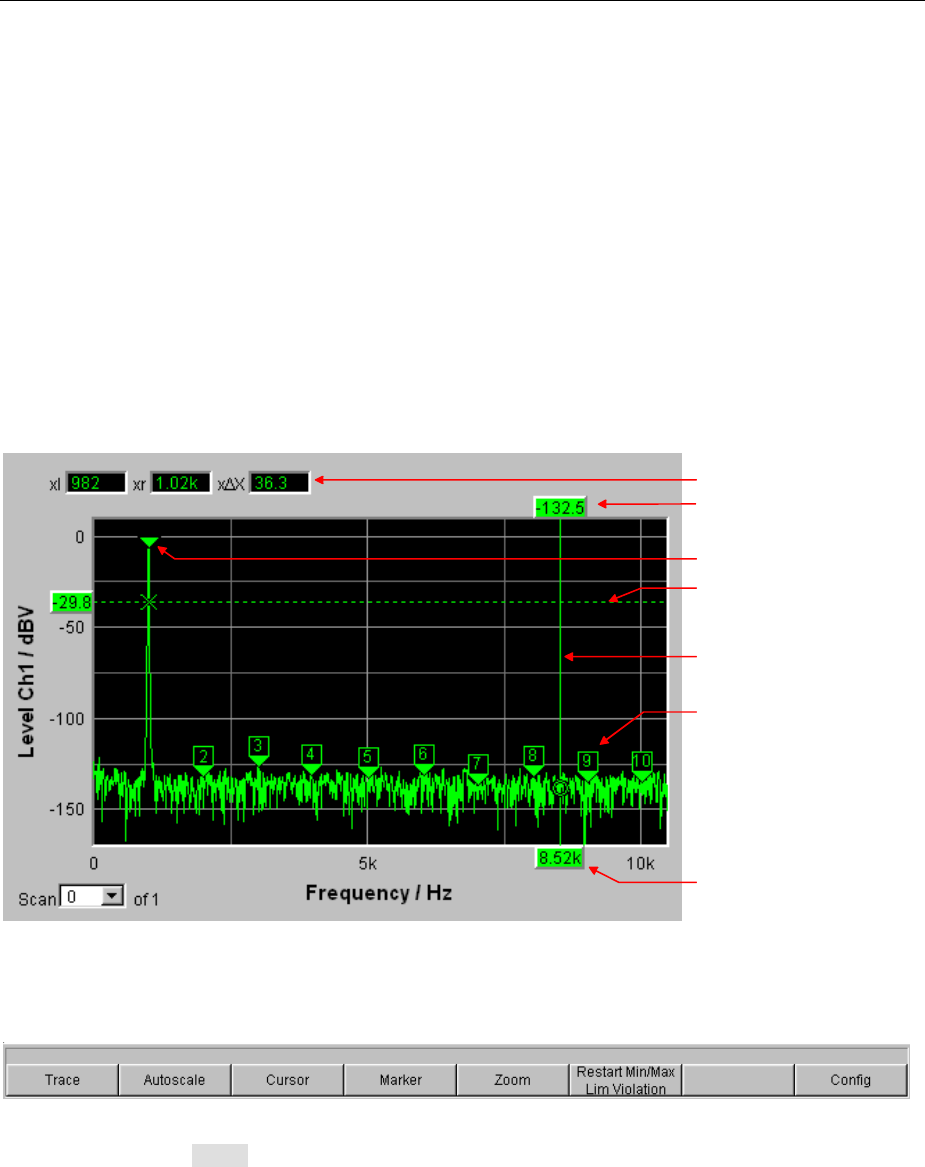
R&S UPV Measurement Displays
1146.2078.62 3.69 E-5
Evaluating Graphical Displays with Cursors and Markers
All graphical displays can be evaluated using horizontal and vertical cursors; the X and Y-values shown
in the display fields associated with the cursors are always current values.
Markers are used to identify important measurement points.
The cursors and markers can only be operated using the softkey bar; the softkeys can be operated from
the front panel, using the keys F5 to F12 on the external PC keyboard or by clicking with the mouse.
As an alternative and in a slightly different way to operation via the panels, the softkeys can also be
used to scale the graphs or to zoom sections of the displays.
The basic settings in these functions are described here using examples.
Adetailed description of the display options can be found in Chapter 4 "Graphical Display".
Addit. cursor values
Cursor Y-value
Marker
Horizontal cursor
Vertical cursor
Harmonic marker
Cursor X-value
As soon as the graphical window has the focus, the softkey bar for operating the graphical elements is
shown at the bottom of the screen.
The softkeys are arranged in several levels; the lower levels are accessed by actuating the respective
button. Actuating the Back button redisplays the higher level.
The level currently displayed is indicated in the info line above the softkey.
The desired function is executed by actuating the buttons displayed in the lowest level.

Measurement Displays R&S UPV
1146.2078.62 3.70 E-5
Showing and hiding traces – Trace function
Actuating the Trace button opens another softkey level.
The two buttons Show A and Show B are used to show and hide the associated trace. These buttons
only affect the curve display; the measurement values are retained in the background even when the
curve is hidden, and can be used as reference values, for example.
Scaling graph – Autoscale function
Actuating the Autoscale button opens another softkey level.
The softkeys available here are used to rescale the selected axes (if required, it is also possible to
rescale the axes for certain traces only). The action triggered with these buttons corresponds to that of
the Autoscale button for the X and Y-axis in the associated configuration panels.
The All button scales both the X and Y-axis simultaneously.
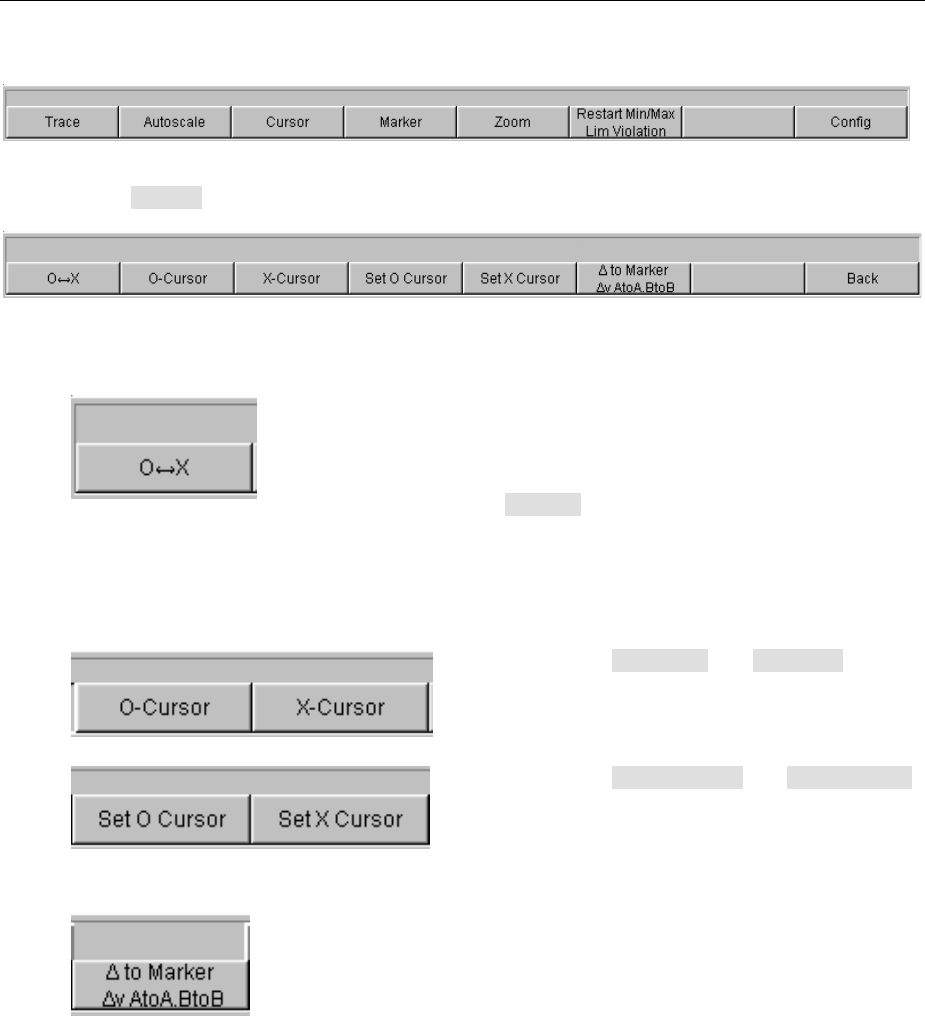
R&S UPV Measurement Displays
1146.2078.62 3.71 E-5
Operating the cursors
Actuating the Cursor button displays the cursor softkeys:
The Audio Analyzer R&S UPV uses two cursors which are identified by the and symbols. These
symbols indicate the measured point in the graph (see the example graph above).
Only one cursor is active and can be moved in the
graph at any one time. The active cursor is
displayed with a solid line; the inactive cursor is
displayed with a broken line.
The <->button is used to activate the and
-cursor alternately.
Alternatively, the Enter key or a rotary-knob click
can also be used to toggle between the two
cursors.
The two buttons -Cursor and -Cursor
activate the associated cursor and display the next
softkey level.
The two buttons Set Cursor and Set Cursor
open the next softkey level where the associated
cursor can be set to certain values, e.g. maximum,
minimum, etc.
This button is used to display a further level. A
large selection of differential values can be
displayed using the softkeys on this level.
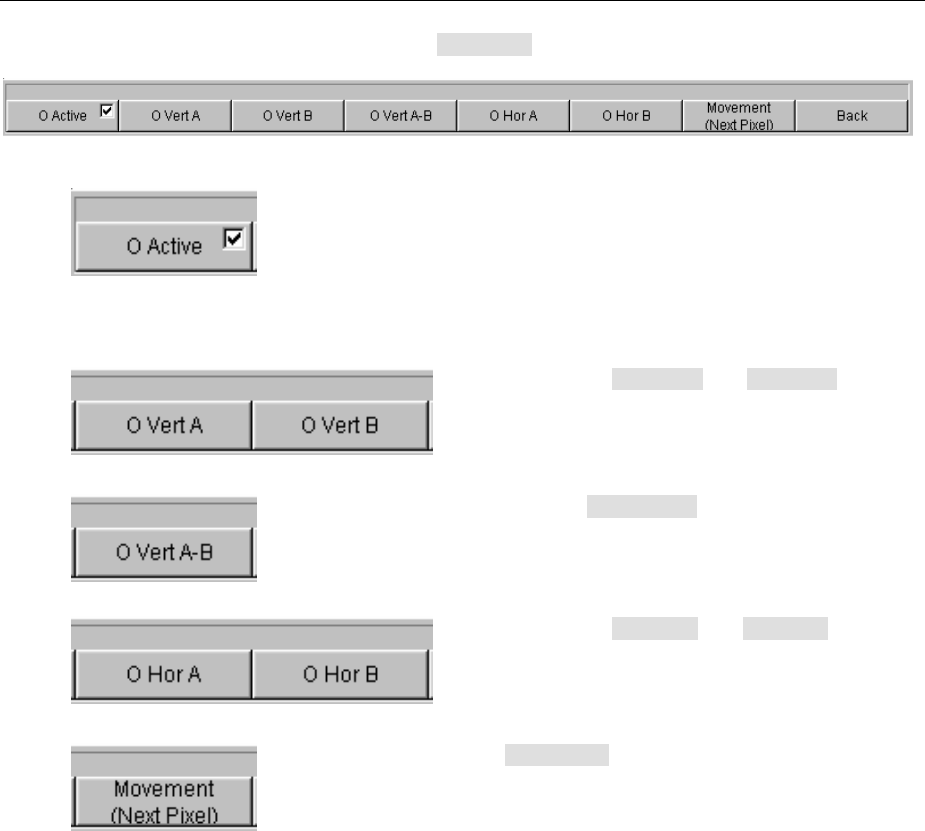
Measurement Displays R&S UPV
1146.2078.62 3.72 E-5
If, for example, the cursor was activated with the -Cursor button, the following softkeys appear:
Here a softkey with an additional tick box is used.
The softkey indicates that the -cursor is active
and that further settings for this cursor are
available under the adjacent softkeys.
Activating/deactivating the tick box shows/hides
the cursor in the graph.
The two buttons Vert A and Vert B activate
vertical cursors and place them on TRACE A and
TRACE B. Both the cursor and its label fields are
displayed in the color of the associated trace.
Actuating the Vert A-B button displays a grey
cursor which represents the difference between
the values for TRACE A and TRACE B.
The two buttons Hor A and Hor B activate
horizontal cursors and place them on TRACE A
and TRACE B. Both the cursor and its label fields
are displayed in the color of the associated trace.
The Movement button opens the next softkey
level where it is possible to set how the cursor is
moved with the rotary knob (see the next section).
The second line of the label shows the currently
set step size in brackets.
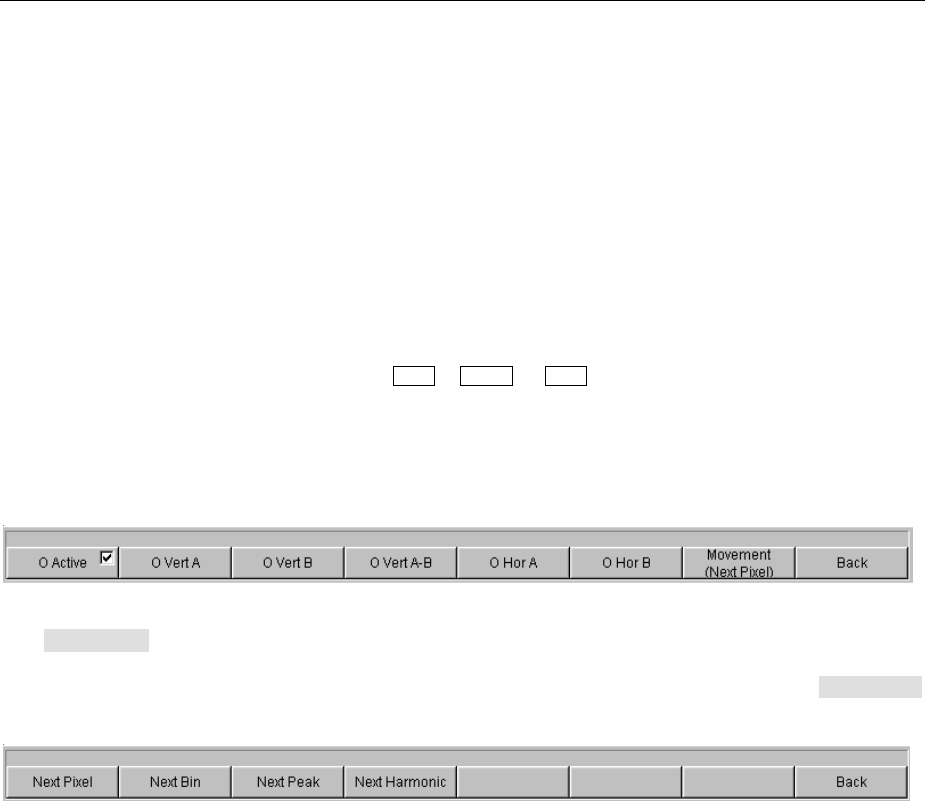
R&S UPV Measurement Displays
1146.2078.62 3.73 E-5
Moving cursor
Only one cursor is active and can be moved in the graph at any one time. The active cursor is displayed
with a solid line; the inactive cursor is displayed with a broken line.
The <->button is used to activate the and -cursor alternately. Alternatively, the Enter key or a
rotary-knob click can also be used to toggle between the two cursors.
In the case of operation using the mouse, the desired cursor or one of its display fields can be activated
and moved by simply clicking with the mouse.
Acursor can be moved in a number of different ways:
•The active cursor is linked to the rotary knob and can be moved directly using the rotary knob.
•On the external PC keyboard, the keys TAB / CTRL + TAB move the cursor to the right / left.
•In the case of operation using the mouse, the cursor can be clicked and moved by holding down the
mouse key.
The step size with which a cursor is moved can be set using softkeys. To do so, the softkey of the
desired or -cursor must first be selected:
The Movement button opens the next softkey level where various step sizes for moving the cursor are
offered irrespective of the graph currently being used. This is described in greater detail below.
The currently selected step size is indicated in brackets in the second label line of the Movement
button.
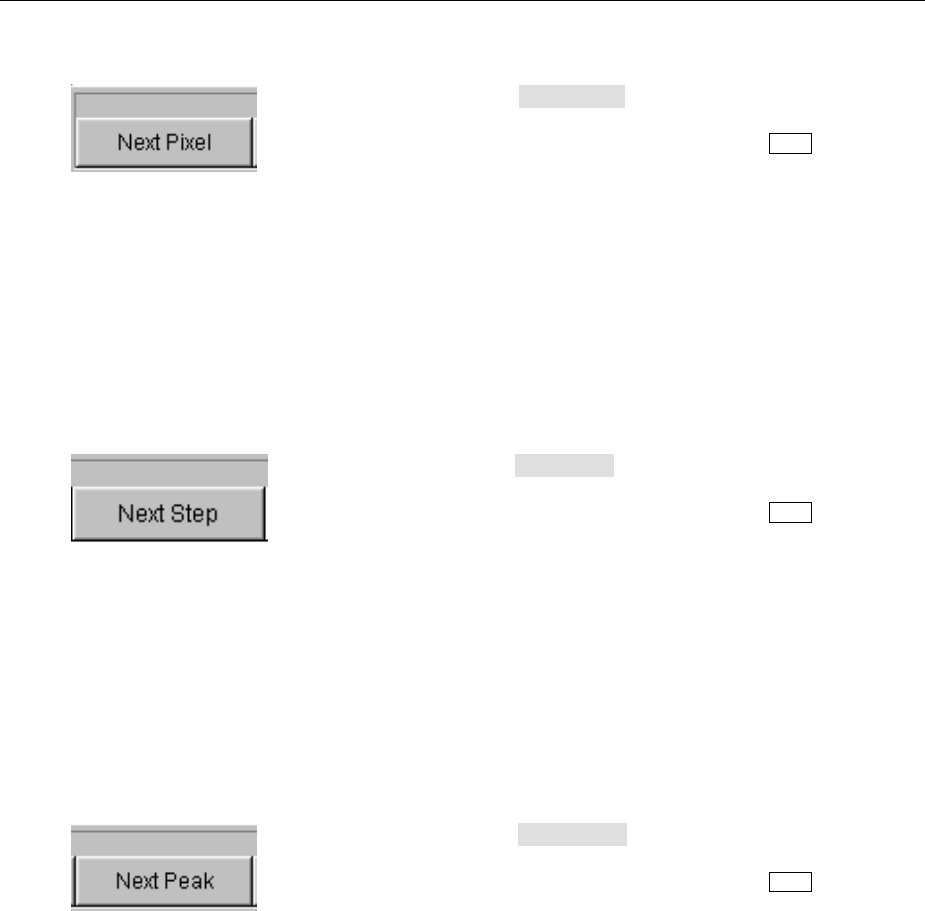
Measurement Displays R&S UPV
1146.2078.62 3.74 E-5
Sweep graph:
If the Next Pixel button is selected, the cursor is
moved in the graph by one pixel with each
increment (rotary knob, mouse or TAB key).
If in the graphical display there is not a
measurement value at every pixel (because only a
few measurement points were recorded relative to
the size of the displayed graph), the cursor value is
interpolated linearly at the pixels between the
measurement values.
If in the graph the number of recorded
measurement points is greater than the number of
pixels available for display, the largest
measurement value in each case is displayed at
the corresponding pixel with X and Y-value.
If the Next Step button is selected, the cursor is
moved to the next measurement value with each
increment (rotary knob, mouse or TAB key).
The cursor is therefore moved in smaller or larger
steps depending on the number of measurement
points.
If the graph is displayed relatively small or the
number of recorded measurement values
displayed is greater than the number of pixels
available in the graphical field, the cursor
sometimes does not appear to move (it remains on
the same pixel). However, the associated display
fields always show the currently selected
measurement point with X and Y-value.
If the Next Peak button is selected, the cursor is
moved to the next measured peak with each
increment (rotary knob, mouse or TAB key).
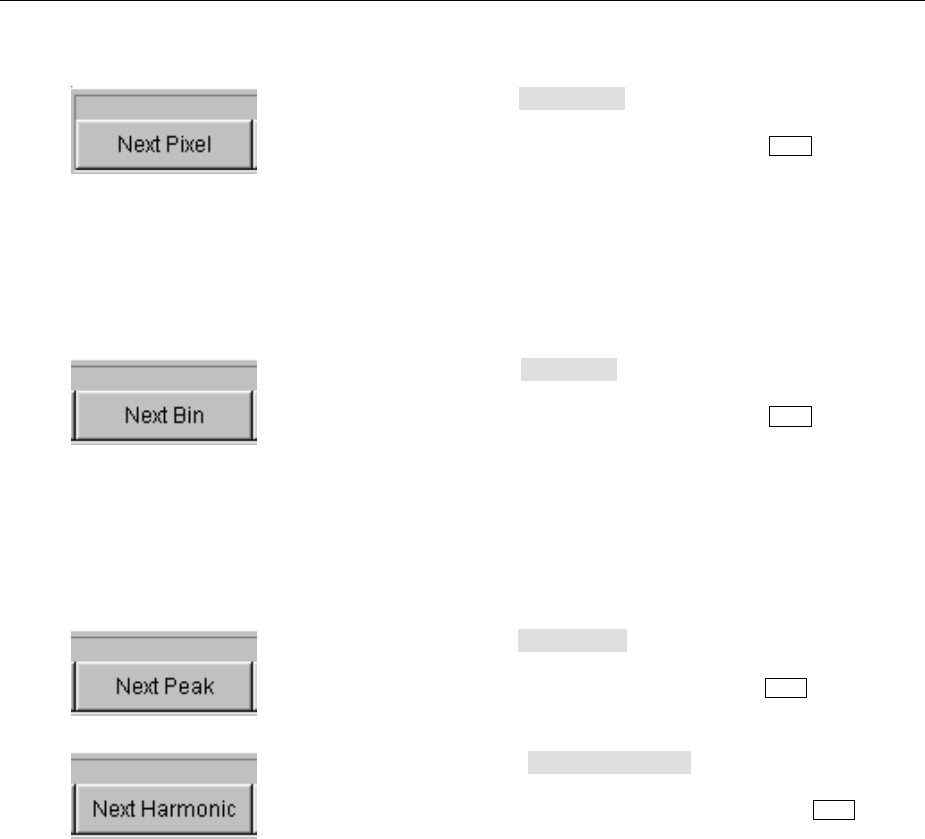
R&S UPV Measurement Displays
1146.2078.62 3.75 E-5
FFT graph:
If the Next Pixel button is selected, the cursor is
moved in the graph by one pixel with each
increment (rotary knob, mouse or TAB key).
With FFT analyses, the number of recorded
measurement points (bins) is usually much greater
than the number of pixels available for display in
the graph; the cursor then indicates the bin with
the largest measurement value at the pixel in
question and displays this bin with its X and Y-
values.
If the Next Bin button is selected, the cursor is
moved to the next measured bin with each
increment (rotary knob, mouse or TAB key).
Since with FFT analyses the number of recorded
measurement points (bins) is usually much greater
than the number of pixels available for display, the
cursor sometimes does not appear to move (it
remains on the same pixel). However, the
associated display fields always show the currently
selected measurement point with X and Y-value.
If the Next Peak button is selected, the cursor is
moved to the next measured peak with each
increment (rotary knob, mouse or TAB key).
If the Next Harmonic button is selected, the
cursor is moved to the next marked harmonic with
each increment (rotary knob, mouse or TAB key).
This button is also available if the harmonic marker
is not active (see the next section "Operating the
markers"). In this case, the button activates the
harmonic marker.
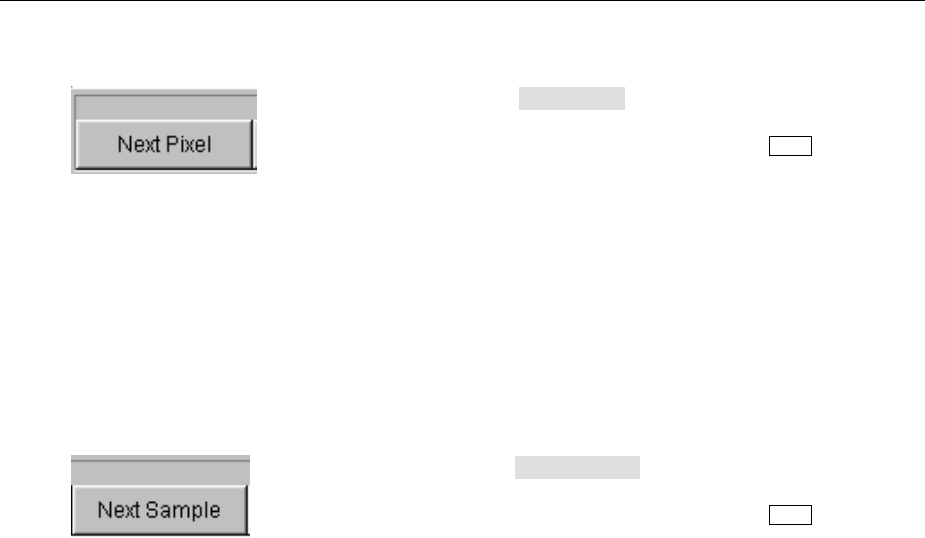
Measurement Displays R&S UPV
1146.2078.62 3.76 E-5
Waveform:
If the Next Pixel button is selected, the cursor is
moved in the graph by one pixel with each
increment (rotary knob, mouse or TAB key).
Ifin the graphical display there is not a
measurement value at every pixel (because only a
few measurement points were recorded relative to
the size of the displayed graph), the cursor value is
interpolated linearly at the pixels between the
measurement values.
If in the graph the number of recorded measure-
ment points is greater than the number of pixels
available for display, the largest measurement
value in each case is displayed at the
corresponding pixel with X and Y-value.
If the Next Sample button is selected, the cursor
is moved to the next measurement value with each
increment (rotary knob, mouse or TAB key).
If the graph is displayed relatively small or the
number of recorded measurement values
(samples) displayed is greater than the number of
pixels available in the graphical field, the cursor
sometimes does not appear to move (it remains on
the same pixel). However, the associated display
fields always show the currently selected
measurement point with X and Y-value.
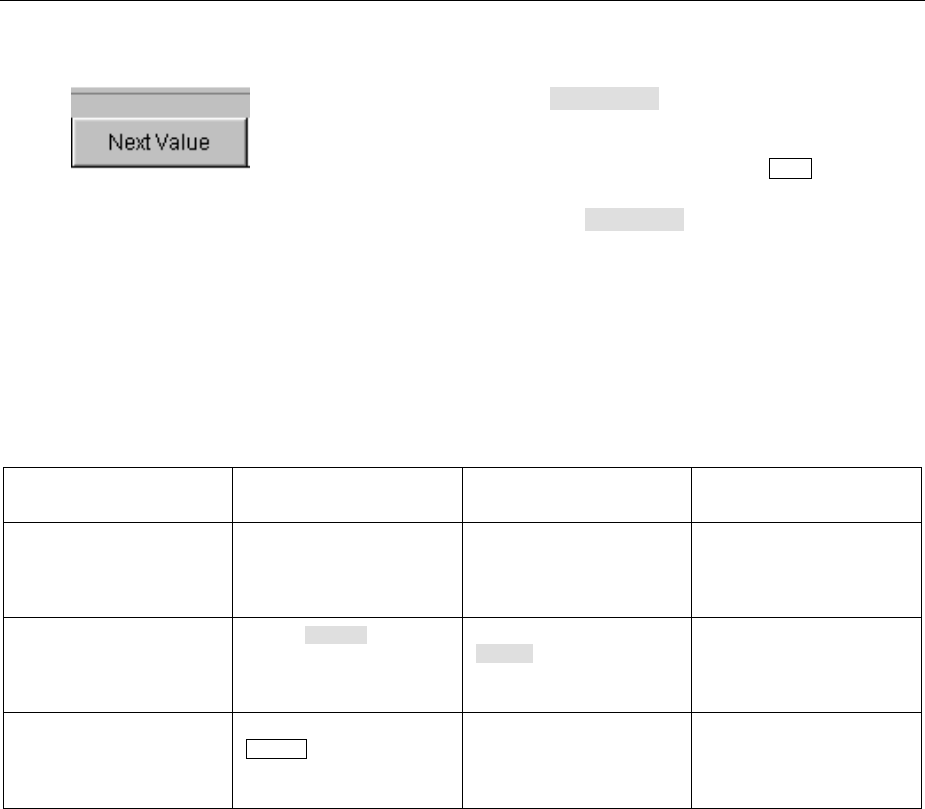
R&S UPV Measurement Displays
1146.2078.62 3.77 E-5
Bargraph:
Only the Next Value setting is available here; the
cursor moves to the next measured distortion point
(harmonic or intermodulation product) with each
increment (rotary knob, mouse or TAB key).
This button does not open a further softkey level;
actuating the Movement softkey displays the step
size without further settings being made.
All of the step-size settings for cursor movement described here only affect the currently selected cursor
and are only applicable in the selected graphical window. This means that when a different cursor is
activated or a different graphical window is selected, the cursor is moved using the settings applicable
there.
The selected step size applies equally to vertical and horizontal cursors.
Function Front panel PC keyboard Mouse
Move cursor Activate desired cursor via
softkeys and move using
rotary knob.
Activate desired cursor via
softkeys and move using
keys TAB and CTRL + TAB.
Click desired cursor or
associated display field and
move cursor with mouse key
held down.
Select active cursor via
softkey
Actuate <->softkey;
this softkey toggles between
and -cursor.
Press F5 function key for
<->softkey; this softkey
toggles between and -
cursor.
Click desired cursor or one of
its display fields.
Select active cursor via Enter
function
If desired graph has focus,
ENTER key or rotary-knob
click toggles between both
cursors.
If desired graph has focus,
Enter key toggles between
both cursors.
Click desired cursor or one of
its display fields.
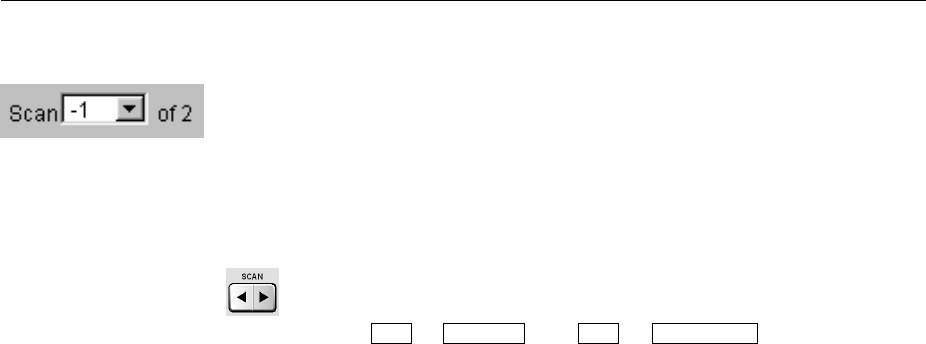
Measurement Displays R&S UPV
1146.2078.62 3.78 E-5
Cursor in traces with several scans
If a trace consists of several scans, the cursors only move along one
scan and indicate the X and Y-values of this scan. The scan number
displayed in the bottom left-hand corner of the graph in the respective
display field indicates which scan is being analyzed.
In order to analyze individual scans with cursors, the cursor is switched to the desired scan in the
following way:
•Front panel: with the keys
•External PC keyboard: with the keys ALT + PAGE UP and ALT + PAGE DOWN
•Mouse: by clicking the "Scan" field shown above
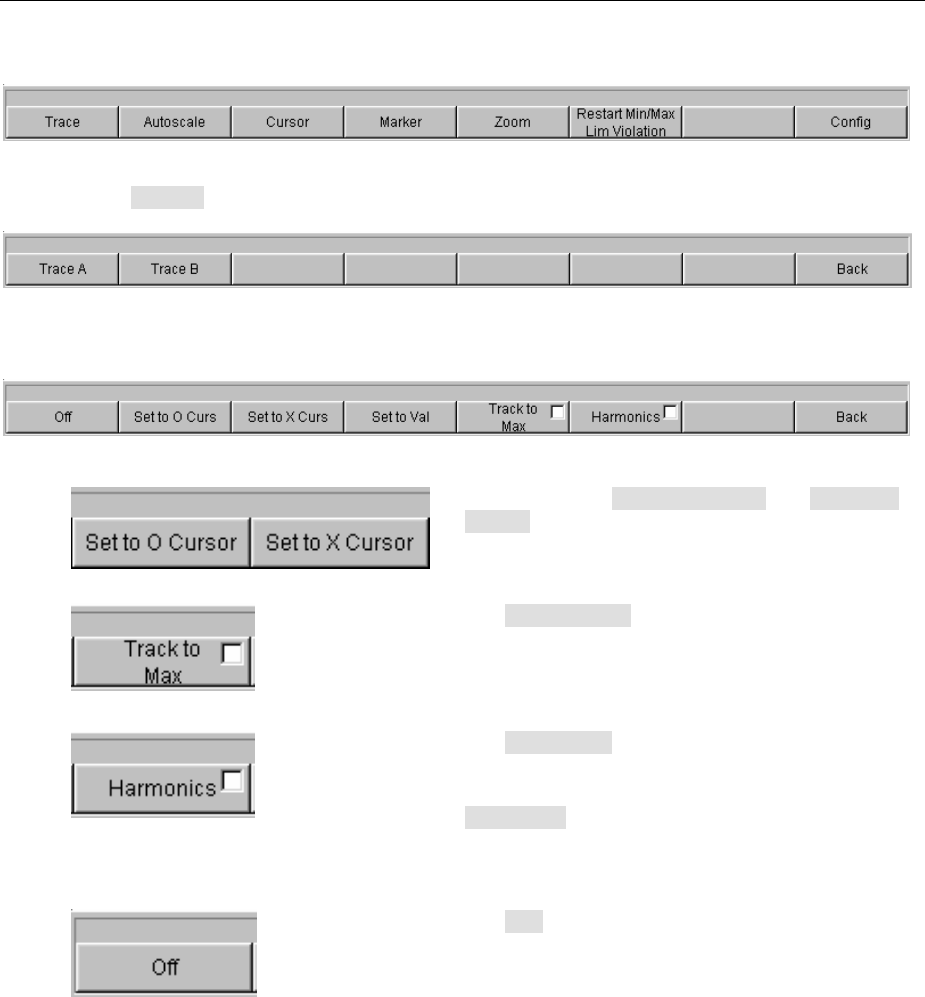
R&S UPV Measurement Displays
1146.2078.62 3.79 E-5
Operating the markers
Actuating the Marker button displays the marker softkeys:
The user must then first select the trace on which a marker is to be set. The next softkey level appears
simultaneously:
The two buttons Set to -Cursor and Set to -
Cursor set the marker to the value of the currently
selected cursor.
The Track to Max button is used to set a marker
at the maximum value of the curve. If the
maximum value changes, the marker is set at the
new maximum value.
The Harmonics button marks harmonics of the
frequency indicated by the marker.
If no marker has been set, actuating the
Harmonics button sets the marker to the
maximum value of the trace and calculates and
marks the harmonics from this frequency.
The Off button deactivates the marker and
indication of the harmonics.
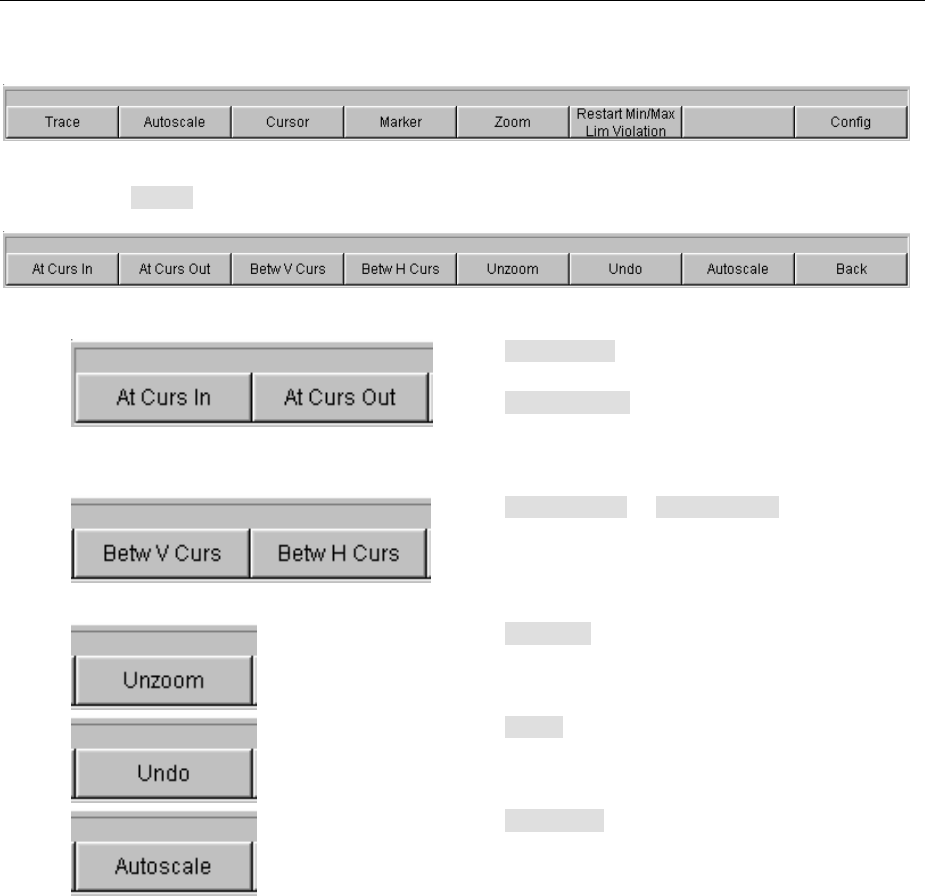
Measurement Displays R&S UPV
1146.2078.62 3.80 E-5
Zooming the graph
Actuating the Zoom button displays the zoom functions.
The Act Curs In button zooms in on the section of
graph on either side of the active X-cursor.
The Act Curs Out button zooms out from the
section of graph on either side of the active X-
cursor.
The Betw V Curs or Betw H Curs button zooms
in on the area between the two X or Y-cursors. The
zoomed display is fitted to the size of the set
graph.
The Unzoom button restores the original axis, i.e.
undoes all of the zoom operations performed.
The Undo button undoes the zoom operation last
performed.
The Autoscale button displays the next softkey
level. The softkeys available here are used to
rescale the selected axes (if required, it is also
possible to rescale the axes for certain traces
only). The action triggered with this button
corresponds to that of the Autoscale button in the
associated configuration panels, as described in
the section "Scaling graph – Autoscale function" on
page 3.70.

R&S UPV Measurement Displays
1146.2078.62 3.81 E-5
Restart Min/Max, Lim Viol function
Actuating the Restart Min/Max, Lim Violation button displays another softkey level.
If the Show Min Max function was selected in the associated configuration panel, actuating the
appropriate button in the softkey bar reactivates indication of the lowest and highest measurement
value.
If the Lim upper or Lim lower function was selected in the associated configuration panel, actuating
the appropriate button in the softkey bar reactivates limit monitoring.
Config function
The Config softkey allows the user to open or close the configuration panel while operating the
associated graphical window.
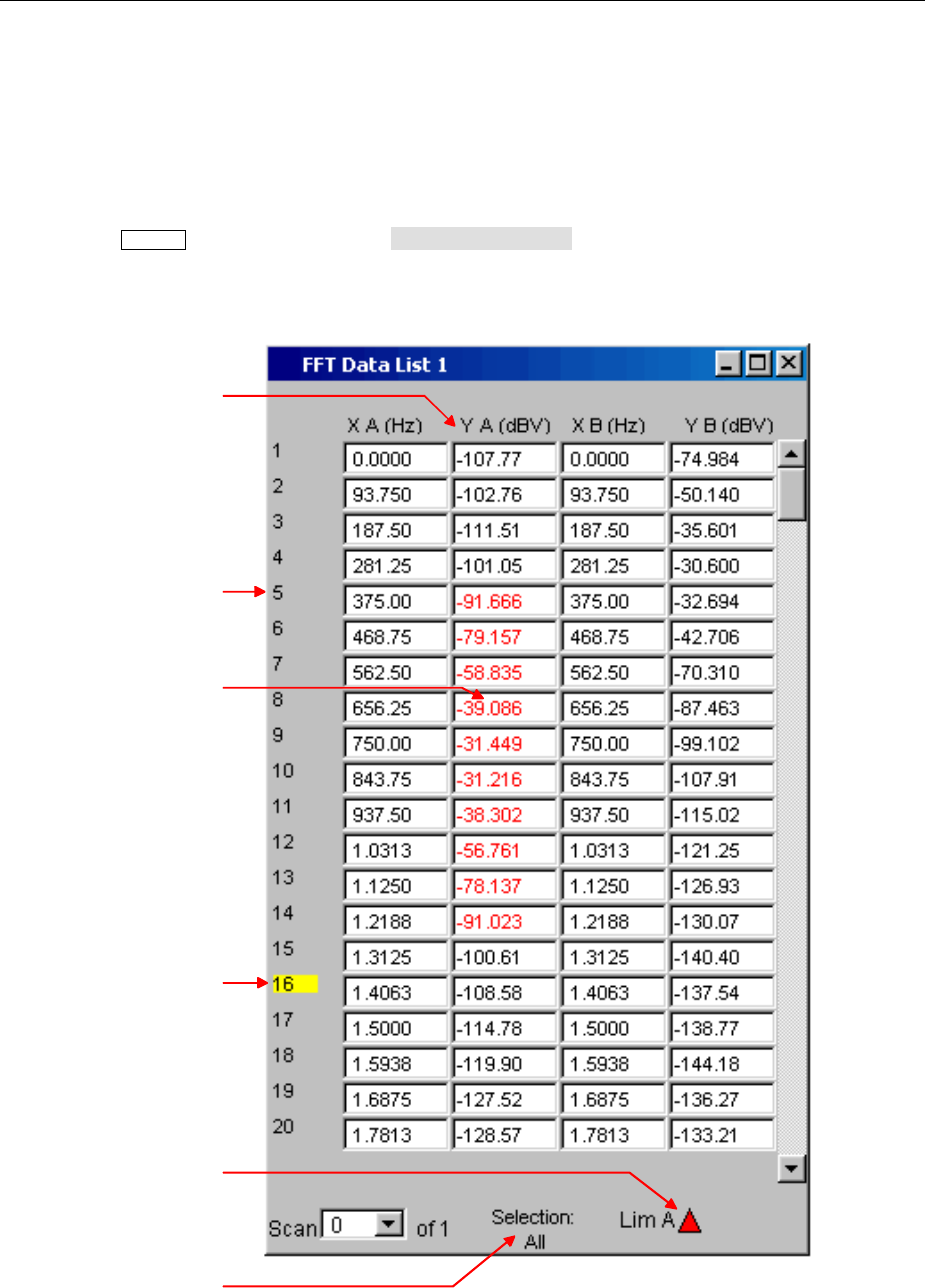
Measurement Displays R&S UPV
1146.2078.62 3.82 E-5
Data Lists
The measurement values can also be displayed in lists instead of or in combination with the graphical
windows.
Measurement values which have violated the preset limits are display in red.
In addition, a red arrow pointing up/down in the bottom right-hand corner of the graph provides a
permanent indication of limit overranging/underranging.
Pressing the START key and actuating the Start Min/Max, Lim button (see "Restart Min/Max, Lim Viol
function" on page 3.81)resets the limit monitoring function.
Columns with
measurement values
Numbering
of measurement values
Measurement value
with limit violation
Cursor
Limit violation
indicator
Display filter

R&S UPV Measurement Displays
1146.2078.62 3.83 E-5
Opening data list
Data lists can be opened using the associated
configuration panel (see "Data Lists"). The associated
graphical window is activated using the Data List button.
Function Front panel PC keyboard Mouse
Open data list Highlight Data List button
in associated Config panel
and open graphical window
with ENTER key or rotary-
knob click.
Highlight Data List button
in associated Config panel
and open graphical window
with Enter key.
Click Data List button in
associated Config panel.
Data list settings
The settings for configuring the data lists are made in the same panels used to configure the graphical
windows:
•Sweep Graph1 … 4 Config
•FFT Monitor Config
•FFT Graph 1 … 2 Config
•Waveform Config
•Bargraph1 … 2 Config
The panels for configuring the data lists are opened via the menu bar; they are called up using the
Disp Config button.
Function Front panel PC keyboard Mouse
Open panel for configuring a
data list
Press MENU key and
highlight Disp Config
button using rotary knob or
cursor keys, open pulldown
menu with ENTER key or
rotary-knob click, and
highlight and select desired
panel.
Press key combination
CTRL + M, then highlight
Disp Config button using
TAB or SHIFT + TAB keys,
open pulldown menu using
Enter key, highlight desired
panel using cursor keys and
select using Enter key.
Open menu bar by moving to
left edge of screen, actuate
Disp Config button and click
desired panel.
Adetailed description of the setting options in these panels can be found in Chapter 4 "Graphical
Display".
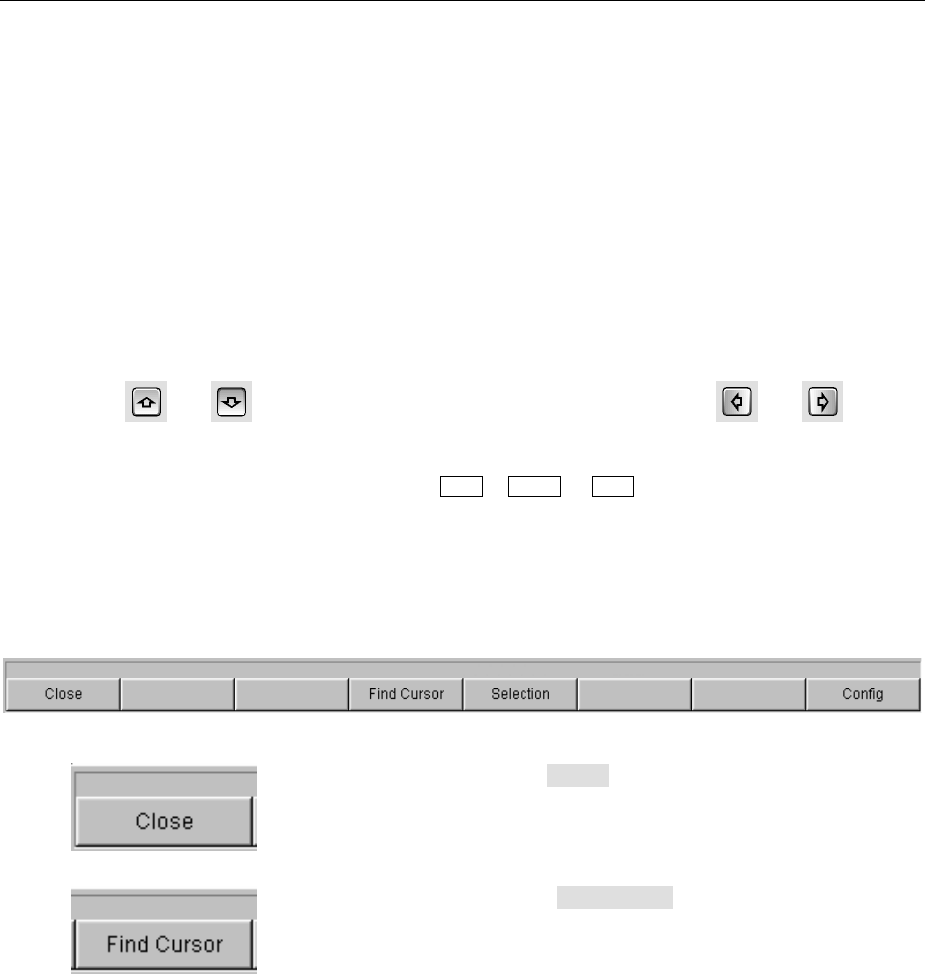
Measurement Displays R&S UPV
1146.2078.62 3.84 E-5
Anumber of basic settings for the data lists are described here using examples.
The measurement values displayed in the lists are always linked to the values in the result graphics.
This means that all settings in the configuration panels, e.g. unit, engineering, set limits and so on, are
also applied to the measurement values in the lists.
The position of the cursor is also shown in the lists; the highlighted measurement number indicates the
location of the cursor. Similarly, the step size of cursor movement set via the softkey bar (see the
previous section) also affects the movement of the cursor in the data list.
There are three ways of navigating in the lists:
•As soon as a value has been highlighted in the list (blue selection frame), it is possible to use the
rotary knob to move from value to value within the column.
The cursor keys can also be used to move around in the lists.
The keys and are used to navigate through columns and the keys and to
navigate through rows.
•If an external PC keyboard is used, the keys TAB / CTRL + TAB can also be used to move
down/up within the column. Once again, the cursor keys and are used to navigate through the
columns and the cursor keys and to navigate through the rows.
•If a mouse is used, you can either click the desired value or navigate using the scroll bar.
As soon as the data list has the focus, softkeys appear at the bottom of the screen.
The Close button closes the data list.
If the Find Cursor button is actuated, the
displayed section of the data list changes so
that the value highlighted with the cursor is in
the middle of the list. If both cursors are
activated, this button is used to toggle
between the two cursor values.
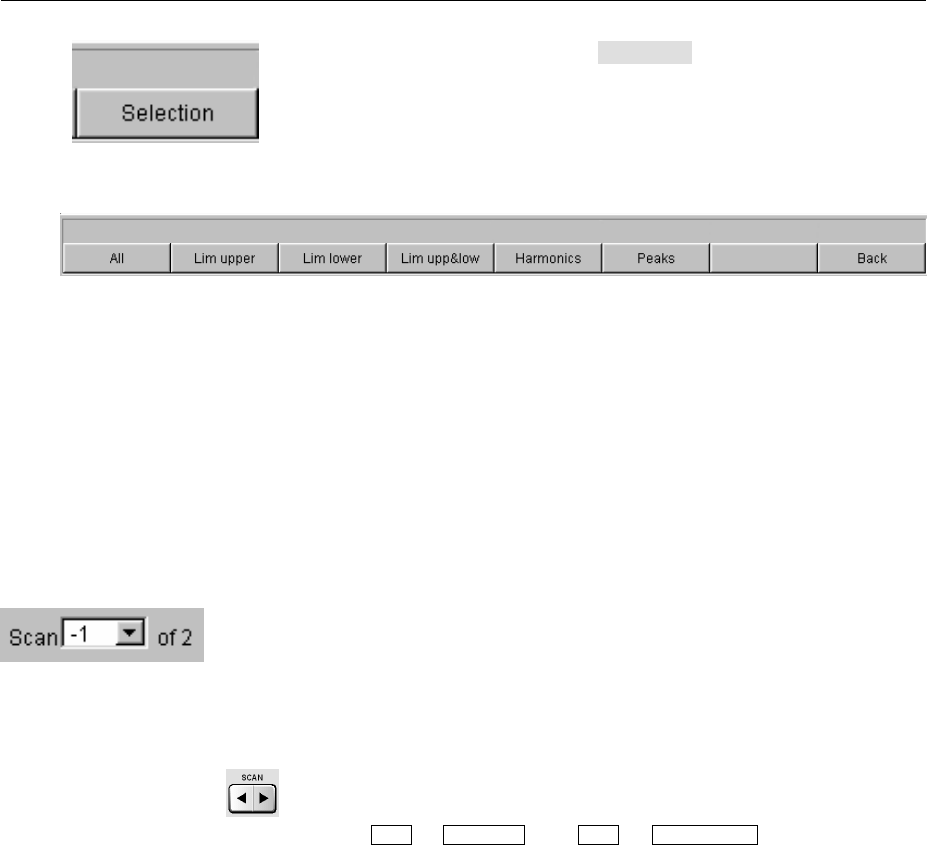
R&S UPV Measurement Displays
1146.2078.62 3.85 E-5
Using the Selection button , it is possible to
filter the list of displayed measurement
values, i.e. to list only selected rows.
If this button is actuated, a further softkey
level appears containing softkeys for selecting
the displayed values:
Depending on the selected softkey,
•all
•only the values which exceed the upper, lower or both limits
•only harmonics or
•only peaks
are listed in the data list.
Cursor in lists with several individual scans
If a trace consists of several scans, only the values of one scan can be
displayed in the list at any one time. The scan number displayed in the
bottom left-hand corner of the data list in the respective display field
indicates which scan is entered in the list.
In order to list individual scans, the desired scan is selected in the following way:
•Front panel: with the keys
•External PC keyboard: with the keys ALT + PAGE UP and ALT + PAGE DOWN
•Mouse: by clicking the "Scan" field shown above
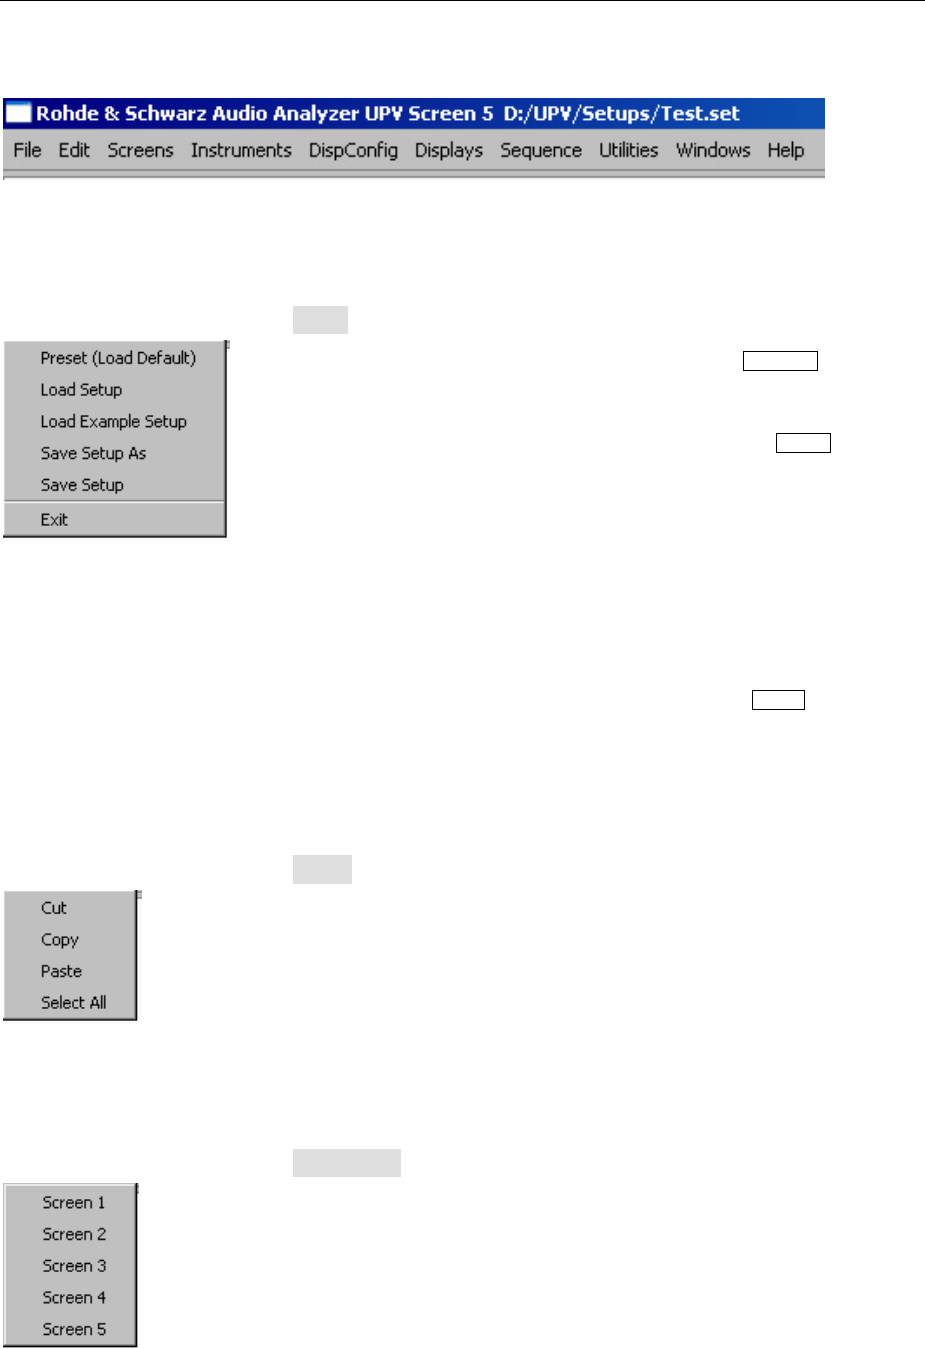
Settings in the Menu Bar R&S UPV
1146.2078.62 3.86 E-5
Settings in the Menu Bar
The menu bar of the Audio Analyzer R&S UPV is used in a similar way to other Windows® applications.
The following settings are made in the menu bar:
File button
•To load default settings (same function as the PRESET key on
the front panel, see the section "Loading and Saving Instrument
Settings",page 3.106).
•To load instrument settings (same function as the LOAD key on
the front panel, see the section "Loading and Saving Instrument
Settings",page 3.106).
•To load instrument settings already prepared by
Rohde & Schwarz for a broad range of typical measurements and
available on the instrument as example applications; these setups
are divided into various application areas (AA, AD, DD, DA)
depending on whether the generator or analyzer is operated with
analog or digital interfaces.
•To save instrument settings under a new name or to overwrite a
setup that already exists (same function as the SAVE key on the
front panel, see the section "Loading and Saving Instrument
Settings",page 3.106).
•To exit the R&S UPV measurement program.
Edit button
•To cut characters, character strings, data, etc and transfer them to
the clipboard.
•To copy characters, character strings, data, etc to the clipboard.
•To paste characters, character strings, data, etc from the
clipboard.
•To select characters, character strings, data, etc and transfer
them to the clipboard.
Screens button
•To select one of the five display options (screens), see the section
"Display and Screens",page 3.12.
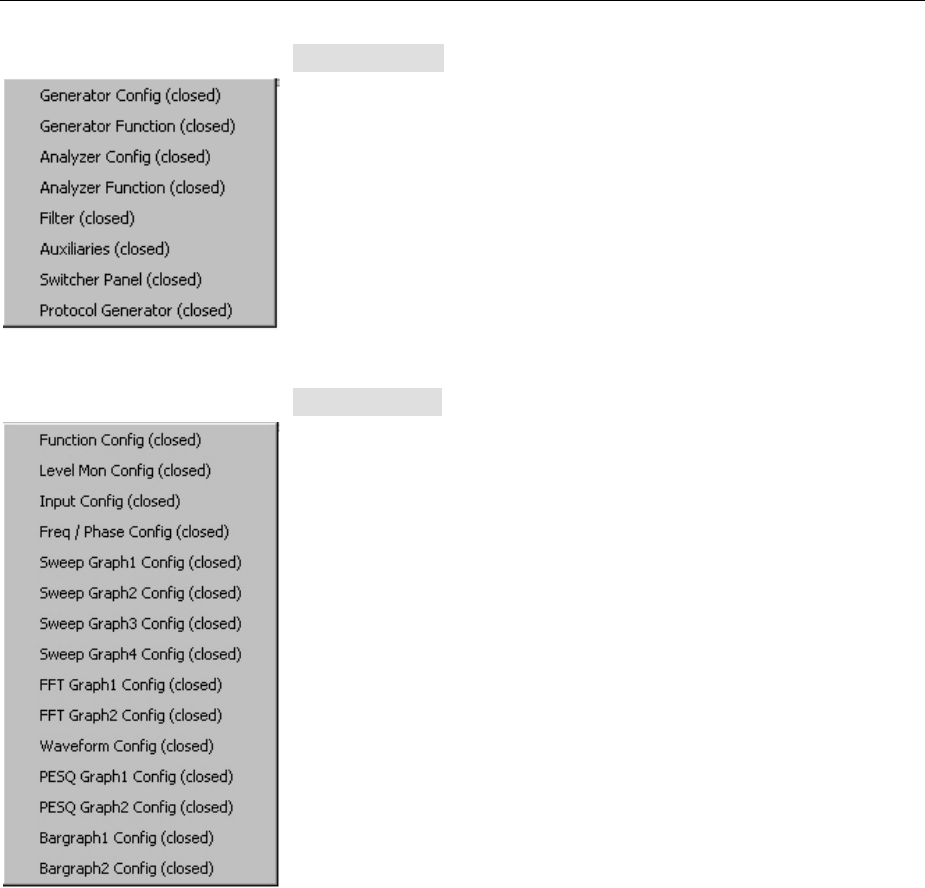
R&S UPV Settings in the Menu Bar
1146.2078.62 3.87 E-5
Instruments button
•To select the panels for configuring the generators, analyzers,
filters and supplementary functions.
•The desired panel must first be highlighted and is then displayed
in the currently selected screen (see the section "Opening,
Operating, Hiding and Closing Panels",page 3.21).
•In the list, open panels are displayed without a suffix, closed
panels are identified by the suffix "closed", and open minimized
panels by the suffix "hidden".
Disp Config button
•To select the panel used to configure the measurement display
windows.
•The desired panel must first be highlighted and is then displayed
in the currently selected screen (see the section "Opening,
Operating, Hiding and Closing Panels",page 3.21).
•In the list, open panels are displayed without a suffix, closed
panels are identified by the suffix "closed", and open minimized
panels by the suffix "hidden".
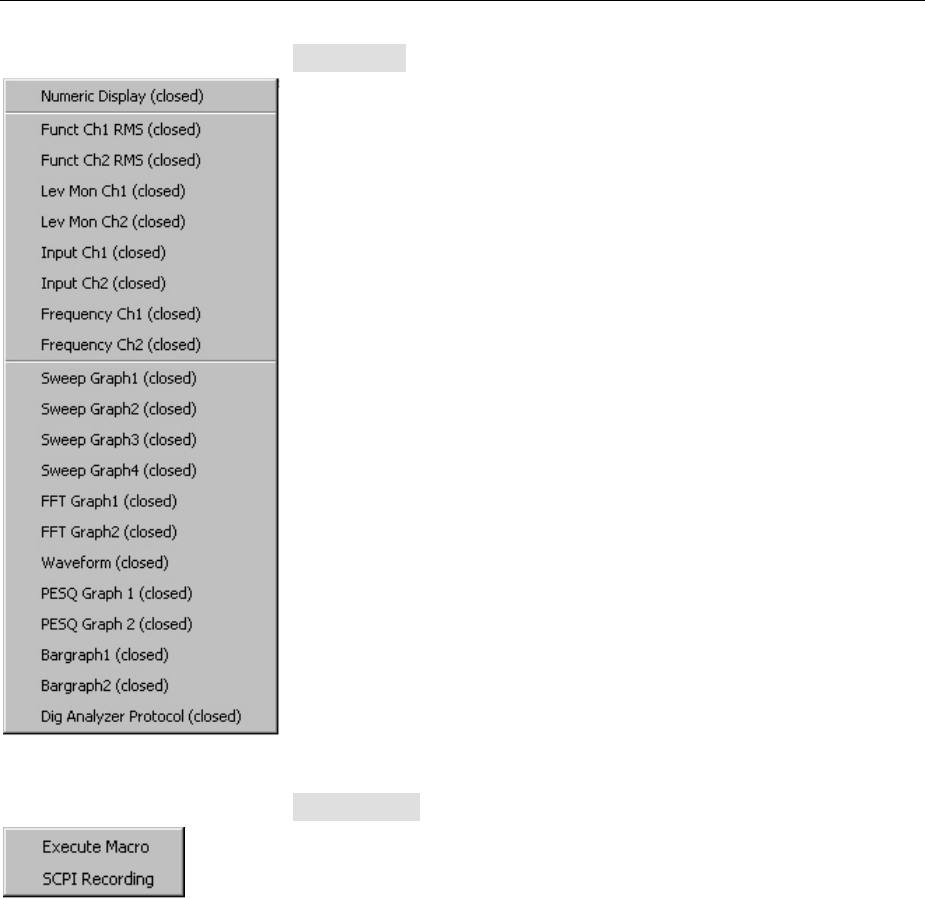
Settings in the Menu Bar R&S UPV
1146.2078.62 3.88 E-5
Displays button
•To select the measurement display windows.
•The desired measurement window must first be highlighted and is
then displayed in the currently selected screen (see the section
"Opening, Operating, Hiding and Closing Panels",page 3.21).
•In the list, open windows are displayed without a suffix, closed
windows are identified by the suffix "closed", and open minimized
windows by the suffix "hidden".
Sequence button
•To select sequences (macros) used to automate previously
programmed measurement procedures to start.
•To record remote-control commands used to simplify the creation
of measurement programs (see Chapter 5, "Remote Control –
Basics").
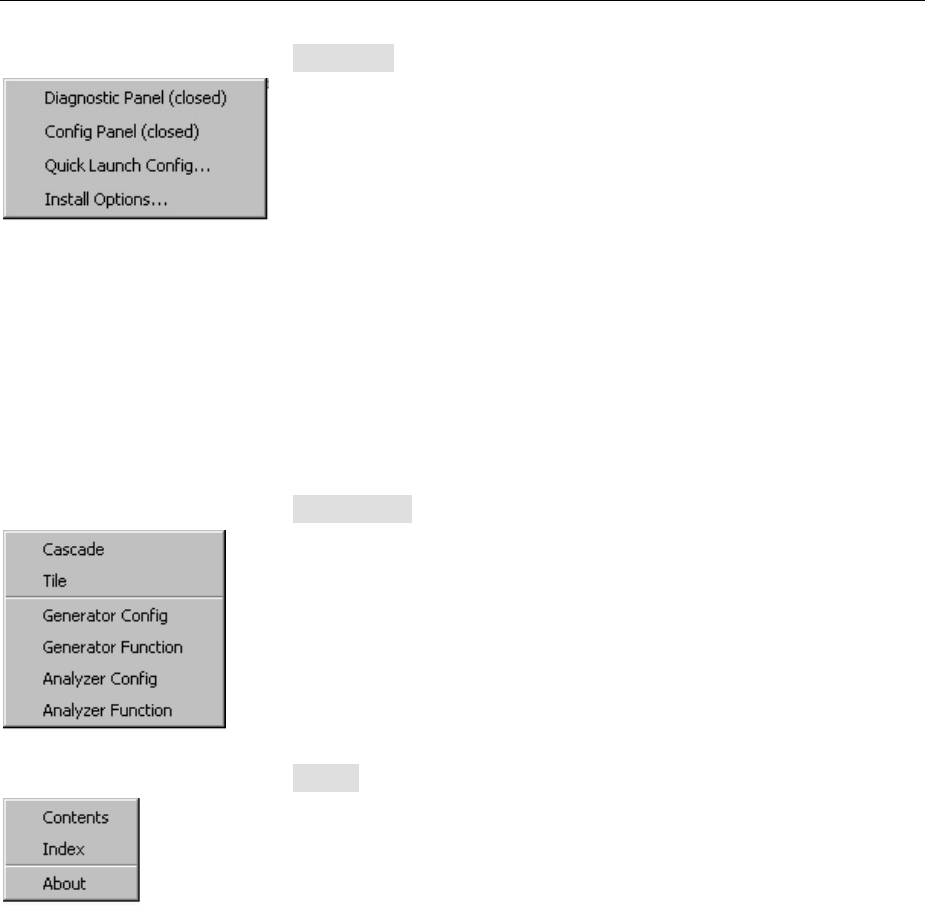
R&S UPV Settings in the Menu Bar
1146.2078.62 3.89 E-5
Utilities button
Aseries of settings for configuring the Audio Analyzer R&S UPV are
grouped under this button:
•To install software options.
•To set the remote-control interface (see Chapter 5).
•To perform service functions.
•To set the Quick Launch Config function.
•To define whether the menu bar and the tool bar should always be
visible on the screen or only when the mouse pointer is moved to
the left-hand edge (for menu bar) or right-hand edge (for tool bar)
of the screen (see below).
•To define the form of the file selector (see section "File
Management").
Windows button
•To cascade all open panels / measurement windows.
•To tile all open panels / windows.
•To display and select all panels / measurement windows which
are open and displayed in the current screen.
Help button
•To call up the help system of the Audio Analyzer R&S UPV (see
the section "Help System",page 3.99).To call up information
about the firmware version installed on the instrument.
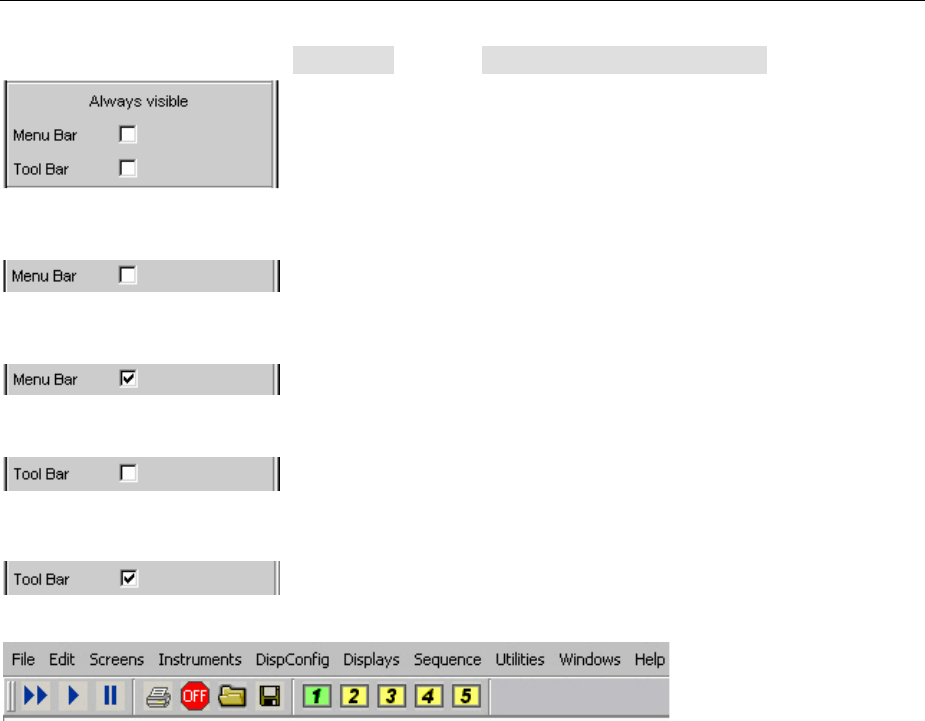
Settings in the Menu Bar R&S UPV
1146.2078.62 3.90 E-5
Utilities button, "Always visible" setting
The Audio Analyzer R&S UPV allows you to have the menu bar and/or
the tool bar displayed at the top edge or at the right-hand edge of the
screen all the time. This feature is primarily for operation with the
mouse.
Menu bar:
If the Menu Bar box is not activated, the menu bar appears at the top
edge of the screen as soon as you move the mouse pointer to the left-
hand edge of the screen. It disappears again after a function has been
selected.
If the Menu Bar box is activated, the menu bar always remains visible
at the top edge of the screen.
Tool bar:
If the Tool Bar box is not activated, the tool bar appears at the right-
hand edge of the screen as soon as you move the mouse pointer to
this edge. The bar disappears again after a function has been
selected.
If the Tool Bar box is activated, the tool bar always remains visible at
the top edge of the screen.
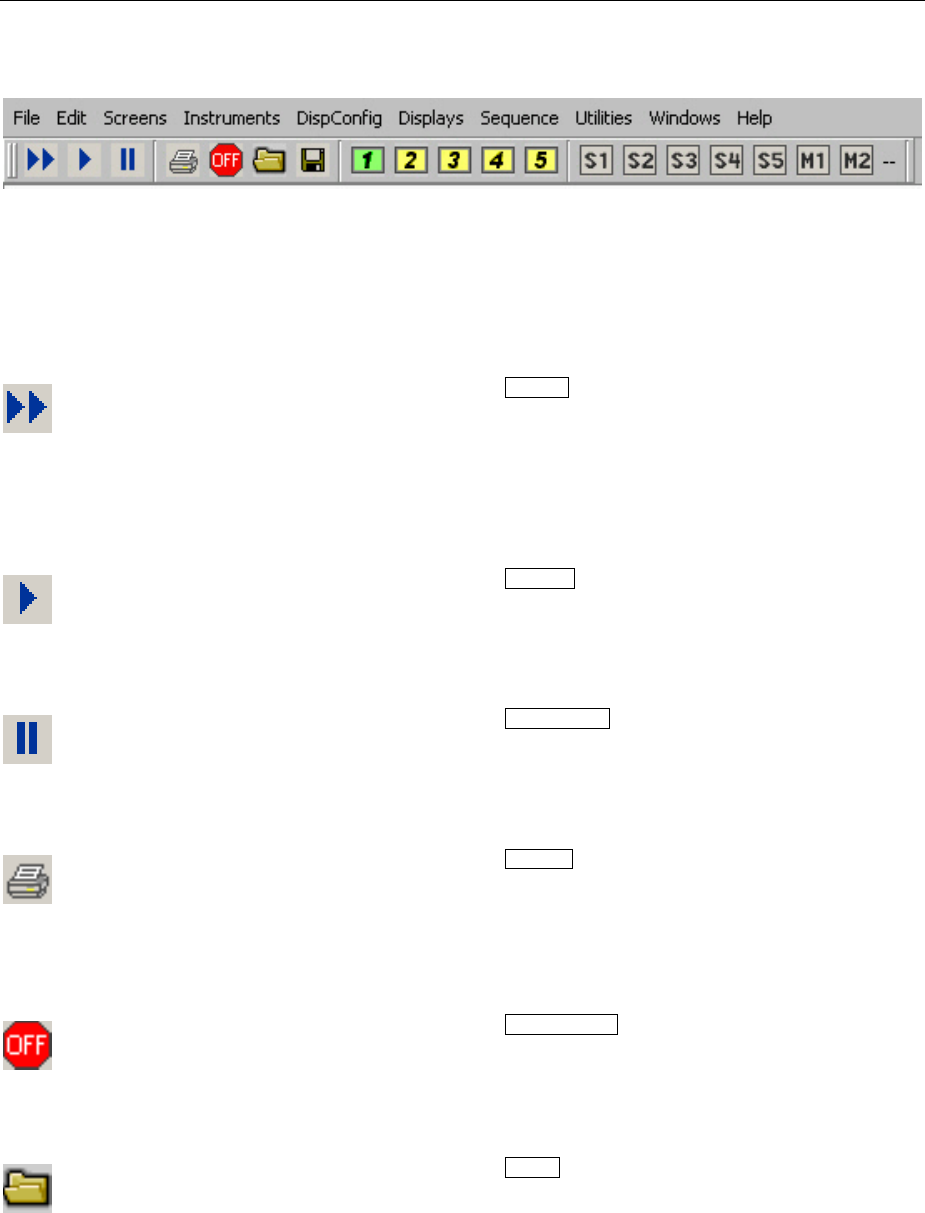
R&S UPV Settings in the Toolbar
1146.2078.62 3.91 E-5
Settings in the Toolbar
As with other Windows® applications, the toolbar on the R&S UPV audio analyzer uses symbols that
perform functions when clicked with the mouse. These are mainly functions that are also available as
keys on the front panel of the R&S UPV model. The symbols simplify operation with the mouse and can
thus also be used with the R&S UPV66 model.
The following functions are offered:
•Corresponds to the START key on the front panel of the R&S UPV
model.
•Starts continuous measurements or sweeps.
•Resets MIN/MAX values for bargraph displays, averaging for
measurement results, and limit overranging.
•Corresponds to the SINGLE key on the front panel of the
R&S UPV model.
•Starts a single measurement or a single sweep.
•Corresponds to the STOP CONT key on the front panel of the
R&S UPV model.
•Measurement/sweep is stopped or continued (toggle function).
•Corresponds to the HCOPY key on the front panel of the
R&S UPV model.
•Depending on the settings under Utilities, printout of the screen
contents on the connected printer is started or the screen contents
are stored in a file.
•Corresponds to the OUTPUT OFF key on the front panel of the
R&S UPV model.
•Switches all outputs of the measuring instrument off or on again
(toggle function).
•Corresponds to the LOAD key on the front panel of the R&S UPV
model.
•Opens a panel for storing predefined instrument settings.
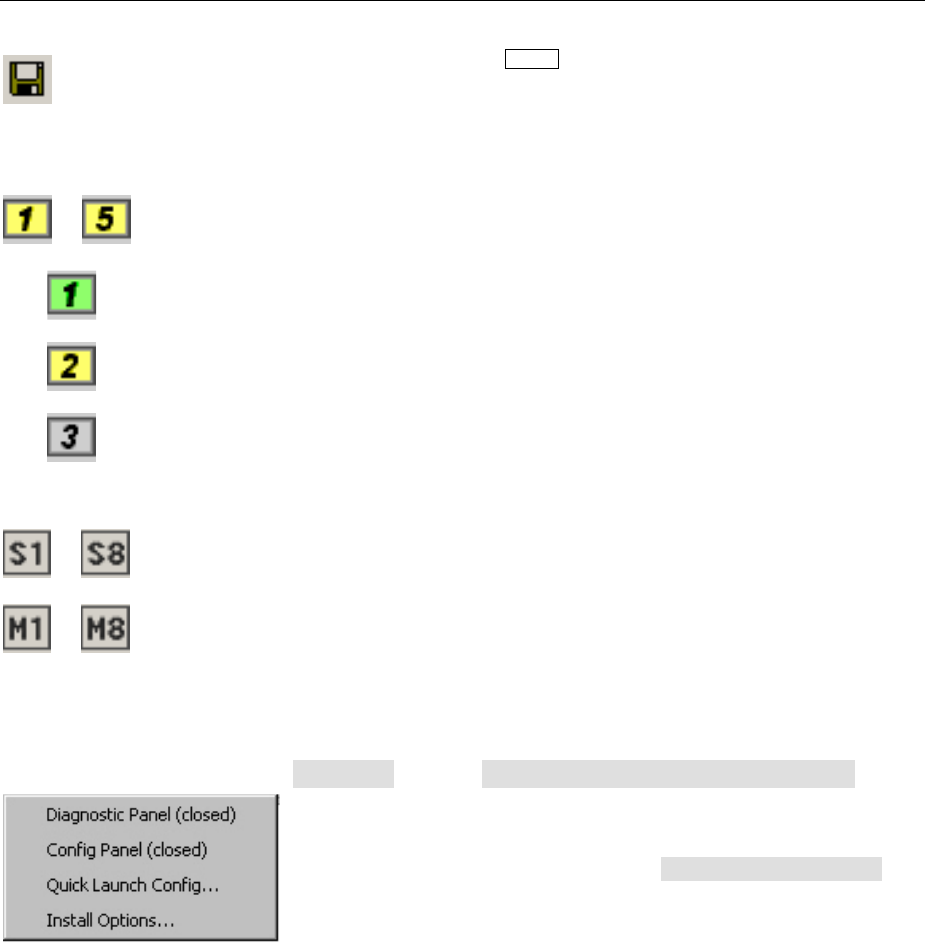
Settings in the Toolbar R&S UPV
1146.2078.62 3.92 E-5
•Corresponds to the SAVE key on the front panel of the R&S UPV.
•Opens a panel for storing instrument settings.
…
•Selects the appropriate display window (screen), where the colors
used have the following meaning:
•The currently selected visible display window is indicated in green.
•All screens in which windows are activated are indicated in yellow.
•Blank display windows are indicated in grey.
…
…
•Symbols for conveniently loading predefined instrument settings
or for starting macros by means of the mouse.
The required settings are described in the following section.
Utilities button, "Quick Launch Config…" setting
In the toolbar, you can define up to eight icons that either load setups
or execute macros when clicked with the mouse.
You can determine these functions in the Quick Launch Config…
window.

R&S UPV Settings in the Toolbar
1146.2078.62 3.93 E-5
•If this check box is enabled, the corresponding setup or macro
can be performed by means of the LOCAL key on the front panel.
•In this column, you can define icons however you want. You can
do this by using the symbols (S1 to S8 or M1 to M8), which are
standard on the instrument and can be found in the
C:\UPV\Config\res directory.
However, you can also use any other icon. The only
requirements are that the icon has a size of 20 x 20 pixels and
that it is available as a BMP file on the hard disk of the R&S UPV.
Clicking the button with the mouse opens the File Selector,
where you can select the icon file you want.
•In these text lines, you can enter comments to describe the
individual setup/macro.
•In the command column, you can select the setup/macro that is
to be activated with the symbol. The easiest way to do this is to
click the button with the mouse, whereupon the File
Selector is opened, making it possible to select the required file.
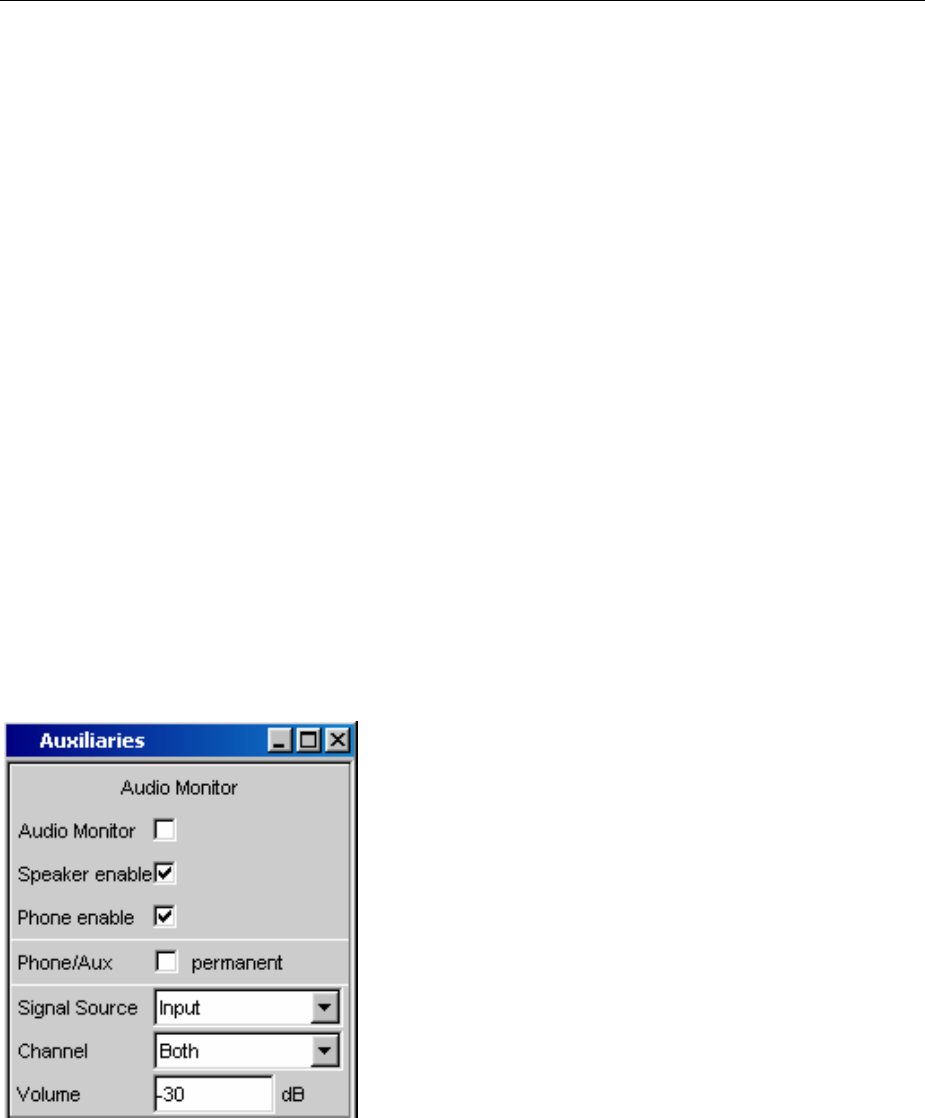
Settings in the Operating System R&S UPV
1146.2078.62 3.94 E-5
Settings in the Operating System
The R&S UPV uses the WindowsXPoperating system. Settings at system level are only rarely
required, e.g. installation of a new printer driver.
Connecting a keyboard and mouse makes Windowseasier to use.
Auxiliaries Panel
Anumber of supplementary functions can be selected in the Auxiliaries panel.
It is divided into the following sections:
•Audio Monitor,
for configuring the audio-monitoring functions
•Anlg Aux Out,
the auxiliary analog output at the rear of the R&S UPV can be configured here
•Trigger In / Out,
for configuring the trigger inputs and outputs at the rear of the instrument
Audio Monitor Function
The audio monitoring output (integrated loudspeaker or
headphone connection) permits audio monitoring of analog
or digital input signals both directly at the i
nput of the
Audio Analyzer R&S UPV and at the various analysis
levels after any filters that may be active. Audio monitoring
of the generator signal is also possible.
If the R&S UPV-U2 option is installed, the signal of the
headphone output is also available at two BNC connectors
on the instrument's rear panel.
The required settings are made in the Auxiliaries panel; the
settings described here are intended as examples.
Adetailed description of the options can be found in
Chapter 4 "Instrument Functions".

R&S UPV Auxiliaries Panel
1146.2078.62 3.95 E-5
These tick boxes are used to operate the audio monitoring
function.
•Audio Monitor switches the loudspeaker or the
headphones on/off. This function corresponds to the
loudpeaker ON key on the front panel of the
instrument.
•Speaker enable and Phone enable are used to
preselect which of the two components the on/off
function described above applies to.
•If installed, the R&S UPV-U2 option is connected in
parallel to the headphone output; these BNC
connectors are therefore switched on and off just like
the jack.
•If the Phone/Aux box is activated, the headphone
output and, if installed, the BNC connectors (R&S
UPV-U2 option) remain permanently activated. The
ON key only affects the loudspearker. This
"permanent" setting is very useful, for example, if you
connect an oscilloscope on which the signal is to be
continuously monitored and the loudspeaker is to
remain selectable at the same time.
The Signal Source field is used to select which signal is to
be monitored. This can be the measurement signal
switched to the analysis path either in the input level,
monitor level or function level, i.e. with or without filtering.
Alternatively, the generator signal can also be monitored.
The individual levels of the analyzer are explained in
greater detail in the section "Function blocks and
measurement levels" on page 3.5.
Either the signal of a single channel (Mono) or the stereo
signal can be applied at the audio monitoring output.
If Both is set, both channels are separately available at the
two headphone outputs; the loudspeaker outputs the signal
from both channels.
If the R&S UPV-U2 option is installed, the same applies to
the two BNC connectors, which are then available.
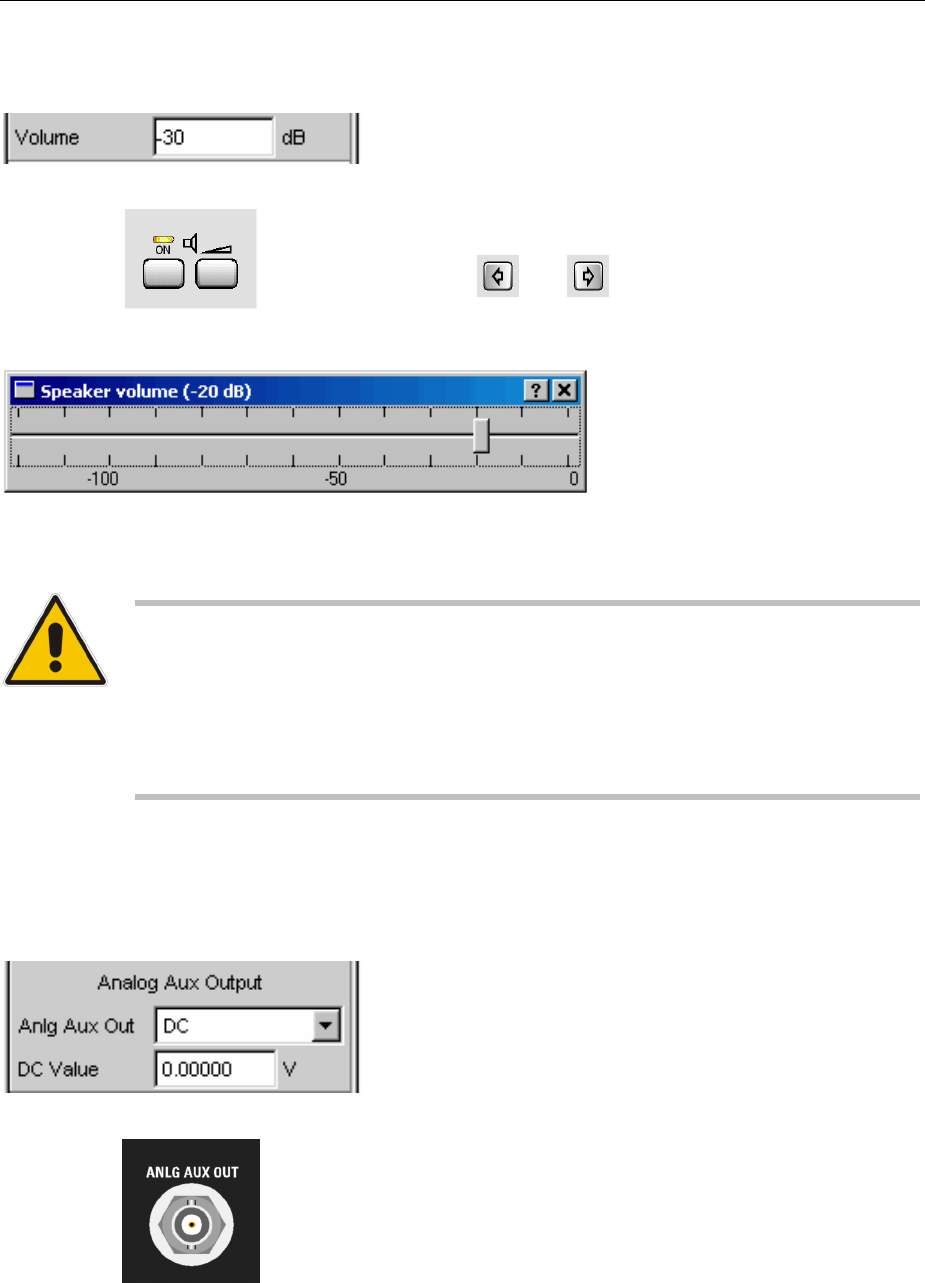
Auxiliaries Panel R&S UPV
1146.2078.62 3.96 E-5
The volume at the loudspeaker or connected headphones
can be set in two ways:
•By entering or changing the numeric value in the
associated field of the panel (permitted range: 0 dB to
-120 dB).
•Pressing the volume key on the front of the instrument
opens a window containing a volume control which can
be operated directly using the rotary knob, the cursor
keys and or using the mouse. The ENTER
function or pressing the volume key again confirms the
setting and closes the window.
Warning:
The output voltage of the built-in headphones amplifier is influenced by the incoming
signal, by instrument settings such as the selected measurement range and test
function, as well as by the set volume. If the volume is set to maximum, the headphones
amplifier may generate high output voltages with an RMS value of up to 8 V. Depending
on the headphones' sensitivity, this may produce very high sound pressure levels that
may cause hearing damage. To monitor varying input signals, therefore, it is advisable
to reduce the volume and take off the headphones until the signal has settled.
Auxiliary Analog Output
An auxiliary analog output for the following special
applications is provided at the rear of the R&S UPV:
•Output of a DC signal, e.g. for supplying power to
hearing aids
•Auxiliary output for the analog generator signal via an
integrated amplifier for the direct actuation of small
loudspeakers
•Output for single-channel audio monitoring
Details are given in Chapter 4 "Instrument Functions".
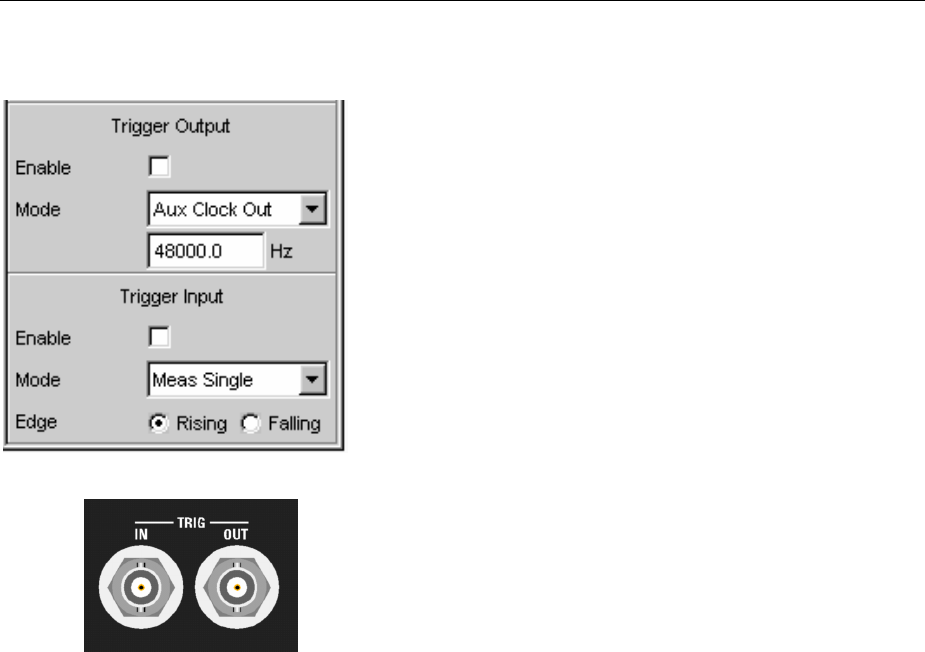
R&S UPV Auxiliaries Panel
1146.2078.62 3.97 E-5
Trigger Input, Trigger Output
Atrigger input and trigger output for the following
applications are provided at the rear of the R&S UPV:
•Input for triggering measurements
•Output for a measurement-event-dependent signal
that can be used to trigger external instruments /
circuits
•Alternatively, clock signals can also be output at the
TRIG OUT socket
Details are given in Chapter 4 "Instrument Functions".
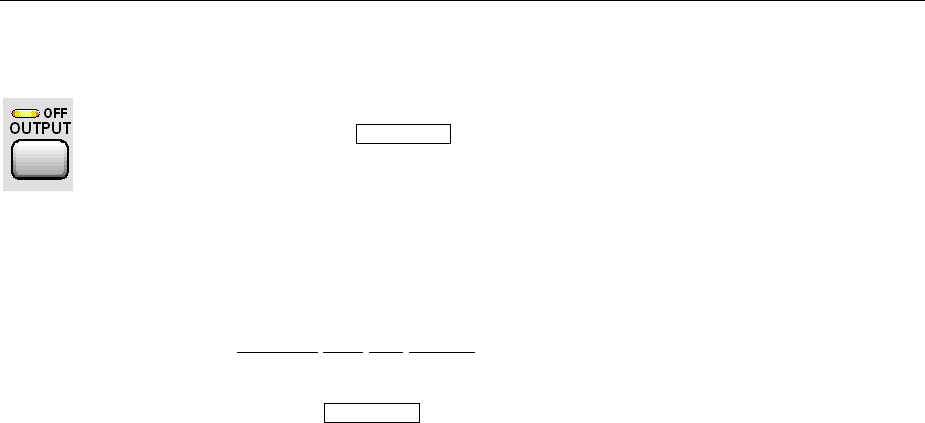
Rapid Deactivation of the Outputs R&S UPV
1146.2078.62 3.98 E-5
Rapid Deactivation of the Outputs
In the event of faults, the outputs of the R&S UPV can be deactivated by
pressing the Output OFF key. This means the following:
•The levels of all digital outputs are set to 0 V
•The levels of all analog outputs are set to 0 V; the outputs remain
terminated (i.e. the impedance is retained)
The deactivated lines can only be reactivated by pressing the OUTPUT OFF
key again.
Specialty Anlg Aux Output:
If DC is selected as signal source in the Anlg Aux Out line in the Auxiliaries
panel, the DC voltage indicated in the line below will be retained even if you
press the Output OFF key.
This ensures the supply voltage or the operation point is retained when a
device under test (DUT) is connected.
The status of the key is indicated by an LED. Illumination of the LED means
OUTPUT OFF.
In order to protect the analyzer input, the generator output is also
deactivated automatically if the analyzer inputs are overloaded (input voltage
at 300 or 600 is higher than 25 V), and the OUTPUT OFF LED lights up
as if the OUTPUT OFF key has been pressed. After the analyzer inputs have
been overloaded in this way, measurements can be resumed provided that
the overvoltage has been rectified or the input impedance has been switched
to 200 k.
Remote-control command:
OUTPut ON | OFF

R&S UPV Help System
1146.2078.62 3.99 E-5
Help System
The R&S UPV has a context-sensitive help system. The help system provides a help page for every
parameter and can be called up at any time while the instrument is being operated.
The help system has a navigation bar, i.e. starting from the context-sensitive page it is possible to move
toother help pages using the contents list, the index, scroll arrows and page-internal links.
In addition to the context-sensitive help, online help for all functions of the R&S UPV is compiled on the
supplied CD-ROM. This help can be called up on any computer using the Internet Explorer (version 4.0
and higher).
Operating Help
The Help window is divided into three areas. On the left-hand side is a column that displays either the
entire help contents list or the index. To the right of that is a large area showing the current help page
and, if necessary, a vertical scrollbar. This area can also be moved up or down with the rotary knob.
The bottom of the window contains several buttons for operating the help system.
Note:
If the left-hand area containing the contents list or the index is activated, you can use the letter keys to
go directly to the desired first letters in the area.

Help System R&S UPV
1146.2078.62 3.100 E-5
You can use the rotary knob to move the blue highlighting. Clicking the rotary knob activates the
highlighted segment, and its color changes to gray. Pressing the ESC key deactivates the segment, and
you can use the rotary knob again to move the highlighting.
The bottom of the window contains several buttons for operating the help system. These buttons can be
operated using the mouse or the buttons:
Go to Index This button changes the display on the left-hand side to the index. You also use this
button to return to the contents list; the button is then called "Go to Content".
Find
Back If you navigate in the online help by activating links, actuating this button returns you
to the previous page.
Scroll Left
Scroll Right
Sometimes the help pages are too wide to fit completely in the display. In this case, a
horizontal scrollbar is displayed. You can then use these buttons to scroll horizontally
without losing the input focus.
Zoom In This button makes the help display larger.
Zoom Out This button makes the help display smaller.
The advantage of using these buttons is that the appropriate help area is always activated, allowing you
to work smoothly.
Help Text Language
Both the context-sensitive help and the online help are available in English and German. The language
of the help texts can be set under the Utilities button on the menu bar.
Help
Language
Selects the language in which the online help is to be displayed.
English The online help is displayed in English.
Deutsch The online help is displayed in German.
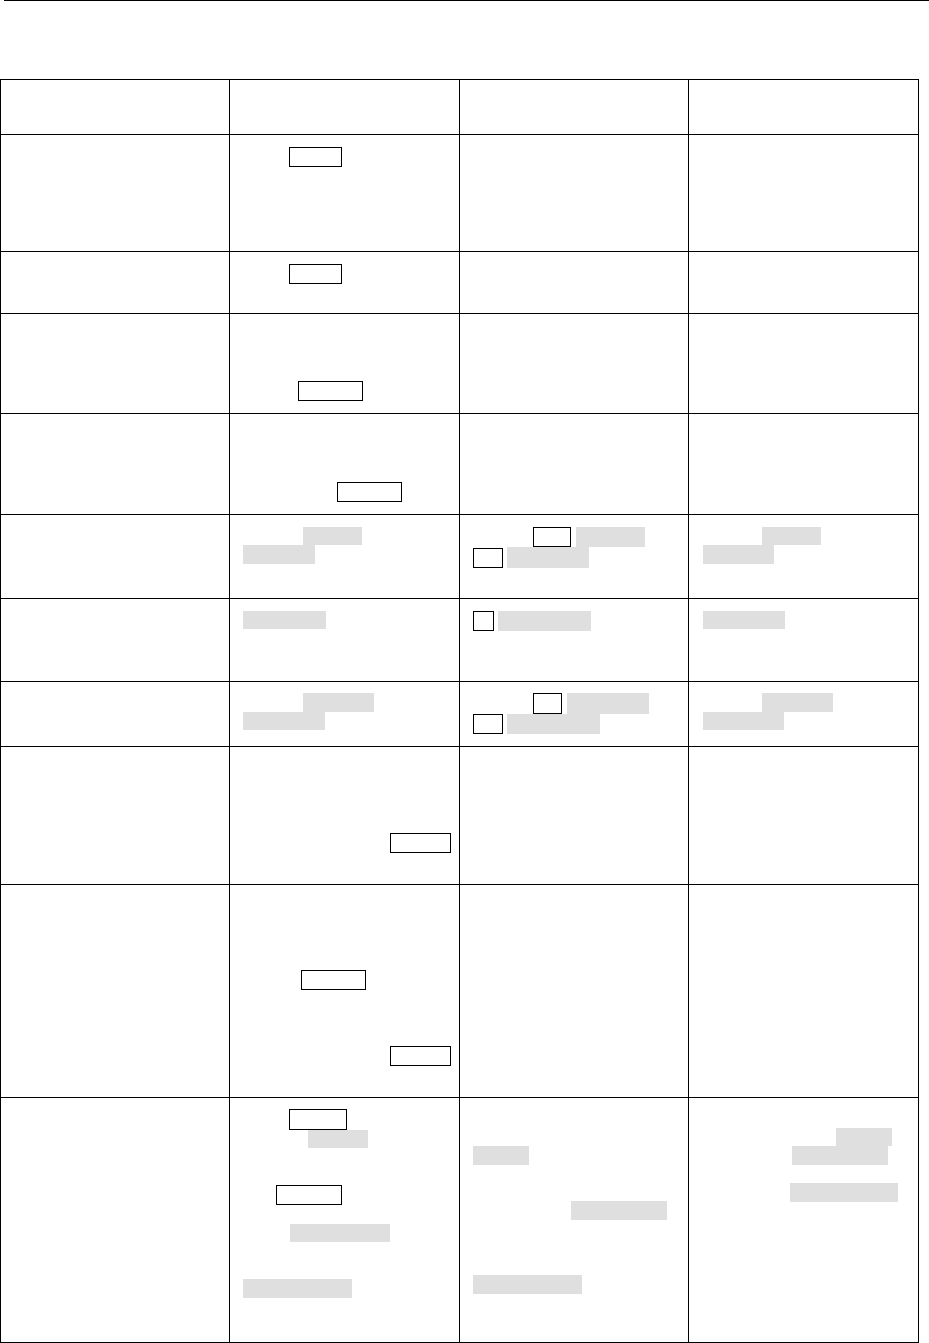
R&S UPV Help System
1146.2078.62 3.101 E-5
Overview of operating the context-sensitive help system
Function Front panel PC keyboard Mouse
Open help
Help page for selected
parameter is displayed.
Press HELP key. Press F1 key. ---
Close help
Press HELP key again. Press F1 key again. ---
Activate link
Help opens linked page.
Highlight link using rotary
knob or arrow keys and
activate with rotary-knob
click or ENTER key.
Highlight link using cursor
keys and activate with Enter
key.
Click link.
Scroll through help
Highlight Previous or Next
in help window using cursor
keys and activate with rotary-
knob click or ENTER key.
Highlight Previous or Next
in help window using cursor
keys and activate with Enter
key.
Click Previous or Next.
Change size of text Use the Zoom In and
Zoom Out softkeys to set the
desired size.
Use the F11 (Zoom In) and
F12 (Zoom Out) keys to set
the desired size.
Use the Zoom In and
Zoom Out buttons to set the
desired size.
Switch to index Go to Index softkey switches
to index or back to contents
list.
F5 (Go to Index) key
switches to index or back to
contents list.
Go to Index button switches
to index or back to contents
list.
Scroll horizontally Use the Scroll Left and
Scroll Right softkeys.
Use the F9 (Scroll Left) and
F10 (Scroll Right) keys.
Use the Scroll Left and
Scroll Right buttons.
Select item from contents
list
Help page for selected item
is displayed.
Press Focus button below
contents list. Highlight
desired item using rotary
knob or cursor keys and then
press rotary knob or ENTER
key.
Highlight Focus button
below contents list using
cursor keys and activate with
Enter key. Highlight desired
item using cursor keys and
then press Enter key.
Click item.
Select index item
Help page for selected item
is displayed.
Press Focus button below
index.
Type desired term in entry
field and then press rotary
knob or ENTER key
or
highlight item using rotary
knob or cursor keys and then
press rotary knob or ENTER
key.
Highlight Focus button
below index using cursor
keys and activate with Enter
key.
Type desired term in entry
field and press Enter key
or
highlight item using cursor
keys and press Enter key.
Click item.
Select help text language Press MENU key and
highlight Utilities button
using rotary knob or cursor
keys, open pulldown menu
with ENTER key or rotary-
knob click, highlight and
select Config Panel button,
and highlight and select
desired language in
Help Language item in next
level.
Press key combination
CTRL + M, then highlight
Utilities button using keys
TAB or SHIFT + TAB, open
pulldown menu with Enter
key, highlight Config Panel
button using cursor keys,
select with Enter key and
highlight desired language in
Help Language item in next
level using cursor keys and
select with Enter key.
Click top of screen to open
menu bar, actuate Utilities
button, click Config Panel
button and click desired
language in Help Language
item in next level.

File Management R&S UPV
1146.2078.62 3.102 E-5
File Management
The R&S UPV uses files to store all instrument data, i.e. system and user data. User data includes
stored instrument settings, data for equalizer files, lists for sweeps, and so on.
The files are stored on the instrument's hard disk. The D:\ drive is available for storing user-defined data
and can have any number of directory structures. A number of default directories are preconfigured;
they can ,however, be changed at any time.
The C:\ drive is a protected system drive. The files on this drive contain data which should not be
modified. This drive should therefore not be accessed, otherwise reconstruction of the system partition
will not be possible without loss of data. To prevent system files from being deleted or overwritten
inadvertently, the C:\ drive is not displayed in the File menu. It can be accessed by disabling a
protection level (see Protection Level in the Setup menu).
Files can be transferred either using a USB stick or via a connected network. The USB stick is inserted
into one of the USB interfaces and is assigned the drive letter F:\. If the instrument is connected to a
network, all network drives for which the user has access authorization are also available (see Chapter
1, section Accessing Directories in the Network,page 1.41.The files are distinguished by their
extension; each file type has a certain content. Normally, the extension is of no importance to the user
since the files are accessed in the associated panels where only the relevant file type is available. For
example, the files with equalizer settings can only be loaded in the Generator Function and
Analyzer Function panels if the appropriate function settings have been made.
To load loaded settings or to store results, the File Manager must be called up using the ••• button in
the respective panel; a File Select window then appears.
R&S UPV File Management
1146.2078.62 3.103 E-5
Selecting the File Select Window
You can select between two fundamentally different types of the File Select window. You can set the
style you wish to have by using the Utilities button in the menu bar.
•Windows Style:
The File Select window known from Windows is used to select files. This makes for very convenient
operation when using the mouse, but operation via the front panel is very restricted.
•UPV Style:
The R&S UPV uses its integrated File Select window to select files. This window is fully operable via
the front panel and allows you, for example, to enter file names via the number keys as on a mobile
phone.
File Selector
Selects the style in which the File Select window is to be displayed.
ON The R&S UPV displays the File Select window
known from Windows ("Windows Style").
OFF
The R&S UPV displays the integrated File Select
window ("UPV Style").

File Management R&S UPV
1146.2078.62 3.104 E-5
Integrated File Select Window
The File Select window has several sections.
The files last used are listed in the top section Recent Data Sets; a maximum of ten files are displayed.
The available drives and directories are shown underneath on the left-hand side, and the files in the
selected directory are shown on the right-hand side. The currently selected path is displayed above the
window. Only the relevant files (without file extensions) are shown. If several files are opened, the path
selected last is displayed.
Any file name can be used when saving and creating files; the file extension is, however, assigned
automatically and cannot be entered. The file is saved on the selected path.
This panel is operated in the same way as other panels, whereby each section of the File Select
window is treated as a separate panel: The rotary knob or cursors are used to highlight the desired
section and the entry focus is moved to this section by pressing the rotary knob or the Enter key. The
rotary knob and up/down cursors then only navigate within this section. The left/right cursor can be
used to toggle between the directory tree and the file list. After a brief delay, the subdirectories of the
selected directory are displayed to permit fast navigation in the directory tree. Pressing the ESC key
moves the entry focus up again by one level. The button used to save or load the file can be highlighted
and actuated. After the desired operation has been completed, e.g. selection of the file, the menu is
closed automatically.
•Loading file:
Highlight the file and load by pressing the rotary knob or actuating the Select button/softkey.
•Saving file:
Enter the file name in the File Name: field. Highlight the directory in which the file is to be saved and
then actuate the Save button/softkey.
•Creating file:
Enter the file name in the File Name: field. Highlight the directory in which the file is to be saved and
then actuate the Create button/softkey. The created file is empty; it has to be filled with the desired
values using the associated editor.

R&S UPV File Management
1146.2078.62 3.105 E-5
File Manager
The File Manager is used to perform general file management tasks, such as copying, moving,
renaming and deleting files and creating new directories. It can also be used to save externally created
files in the R&S UPV by copying them from a USB stick, from a CD ROM or from a network to the
internal hard disk.
The File Manager can be called up in all panels in which files can be loaded. It is called up using the
File Manager… button in the File Select window.
Additionally, it is also possible to call up the File Manager via the menu bar.
The file types which are to be displayed can be selected in the File Type section at the top of the File
Manager.All files (All Files (*:*)) or specific file types (e.g. Waveforms (*.wav)) can be selected. A list of
file types is given in the panel at the end of this section.
The available drives and directories are shown underneath on the left-hand side, and the files in the
selected directory are shown on the right-hand side. The currently selected path is displayed above the
window. If several files are opened, the path selected last is displayed. Unlike the File Select window,
the File Manager displays the complete file name including the extension.
The buttons/softkeys trigger the assigned action, e.g. copying, moving or deleting the highlighted file. In
addition, it is possible to create a new directory in the level below the highlighted directory.
The File Manager is operated in the same way as other panels, whereby each section of the
File Manager is treated as a separate panel: The rotary knob or cursors are used to highlight the
desired section and the entry focus is moved to this section by pressing the rotary knob or the Enter
key. The rotary knob and up/down cursors then only navigate within this section. The left/right cursor
can be used to toggle between the directory tree and the file list. After a brief delay, the subdirectories
of the selected directory are displayed to permit fast navigation in the directory tree. Pressing the ESC
key moves the entry focus up again by one level. The buttons/softkeys can be selected and actuated.
•Moving file:
Highlight the file and then actuate the Cut button/softkey. Highlight the directory to which the file is
to be moved and then actuate the Paste button/softkey. If a file with the same name already exists
in the target directory, a confirmation query appears which the user must acknowledge before the
file is overwritten.
•Copying file:
Highlight the file and then actuate the Copy button/softkey. Highlight the directory to which the file
is to be copied and then actuate the Paste button/softkey. If a file with the same name already
exists in the target directory, a confirmation query appears which the user must acknowledge before
the file is overwritten.
•Renaming file:
Highlight the file and then actuate the Rename button/softkey. A window opens in which the new
file name can be entered. Enter the name and press the Enter key. If a file with the same name
already exists, a confirmation query appears which the user must acknowledge before the file is
overwritten.
•Deleting file:
Highlight the file and then actuate the Delete button/softkey. A confirmation query then appears
which the user must acknowledge before the file is deleted.
•Creating a new directory:
Highlight the drive or directory level under which the new directory is to be created, and then actuate
the Create New Directory button/softkey. A window opens in which the new directory name can be
entered. Enter the name and press the Enter key.

File Management R&S UPV
1146.2078.62 3.106 E-5
Loading and Saving Instrument Settings
Instrument settings are loaded and saved in the same way as described for loading and saving files in
the previous section. The File Select window is opened using the File button in the menu bar.
Instrument settings can also be loaded/saved directly using the LOAD /SAVE keys on the front of the
instrument. Pressing these keys opens the File Select window.
Every Audio Analyzer R&S UPV has a range of instrument settings which have been prepared by
Rohde & Schwarz for a broad selection of typical measurements and which are available on the
instrument as example setups. These setups are divided into various application areas (AA, AD, DD,
DA) depending on whether the generator or analyzer is operated with analog or digital interfaces. This
allows users to make settings for their own specific measurement tasks very simply by modifying these
example setups.
All of these example settings can be found in the Applications directory.
The default factory presettings are also available on every R&S UPV. These can be called up directly
using the File button on the menu bar or by pressing the PRESET key on the front of the instrument.

R&S UPV File Management
1146.2078.62 3.107 E-5
List of File Extensions Used
List of the user-file extensions which are assigned automatically in the R&S UPV:
File type File
extension
Meaning
Instrument settings
.SET Setup file for saving and loading the instrument parameters set by
the user ("complete" setup)
.SAC Setup file for saving and loading the instrument parameters set by
the user ("current" setup)
Equalizer settings
.FTF Amplitude/frequency table for noise generation in the frequency
range
.VEQ Equalizer file; loaded in the "Equal File" parameter field of the
Generator Function and Analyzer Function panels
Sweep settings
.SWL Sweep list for the following:
-Dwell times for automatic generator sweeps, loaded in the
"Dwell File" field of the Generator Function panel
-Frequency of the generator or of the selective RMS
measurement; loaded in the Generator Function panel
("Freq File", "Mean Freq File", "Upper Freq File" fields) or in
the Analyzer Function panel ("File Name" field)
-Burst interval; loaded in the "Interval File" field of the
Generator Function panel
-Burst duration; loaded under the "On Time File" menu item of
the Generator Function panel
-Generator voltage; loaded in the "Volt File" or "Tot Volt File"
field (depending on the function) of the Generator Function
panel
Files for data or limit lists
.LIM Limit curve, loaded in the configuration panels for measurement
windows under "Limit Upper" and "Limit Lower"
.TRC Trace lists for measurement values, loaded in the configuration
panels for measurement windows
Graphic files
.BMP Pixel graphic
Other instrument files
.ARB Time table for generating arbitrary signals
.WAV Standard format for audio signals to allow processing with PC
sound cards

File Management R&S UPV
1146.2078.62 3.108 E-5
File type File
extension
Meaning
Filter files
.COE Coefficient file for file-defined filters, loaded in the Filter panel in
the "File Name" field
.NPZ
.XPZ
.ZPZ
Pole/zero file for file-defined filters, loaded in the Filter panel in the
"File Name" field
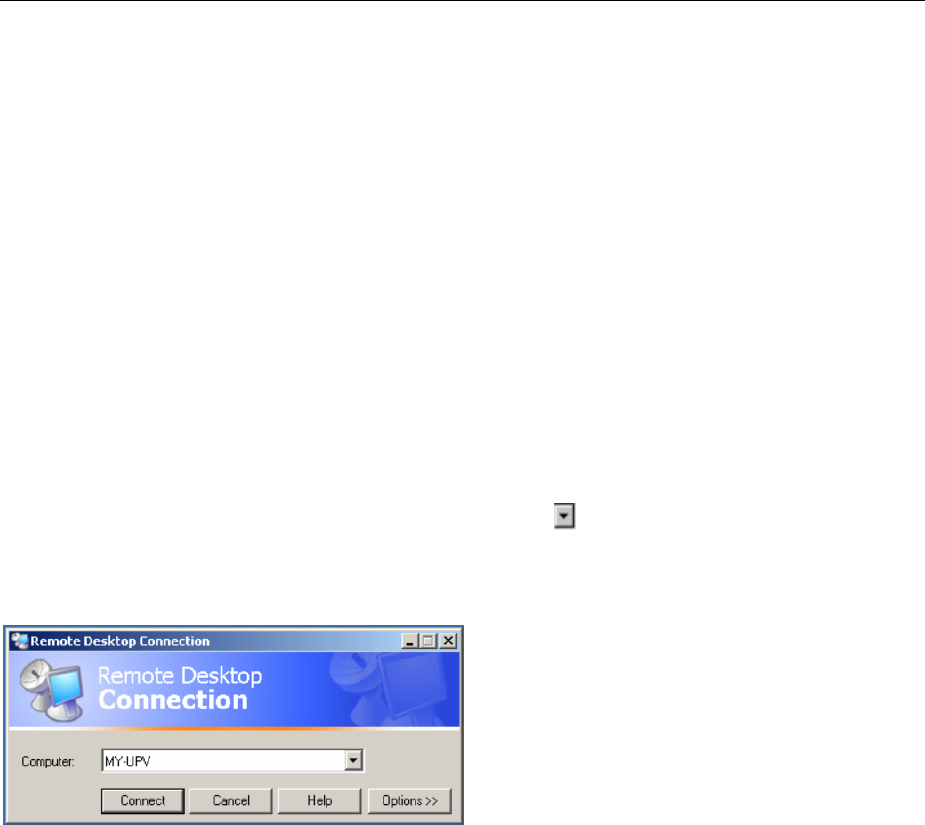
R&S UPV Manual Remote Operation
1146.2078.62 3.109 E-5
Manual Remote Operation
The R&S UPV permits manual remote operation using an external computer. As a result, the audio
analyzer can be operated conveniently from the user's desk even if, for example, the audio analyzer is
installed in a rack in a different room.
Unlike remote control where remote-control commands are used, manual remote operation requires
separate Windows® software which is installed on the external computer. When launched, the
Windowssoftware Remote Desktop Connection simulates the R&S UPV user interface. This allows
the instrument to be manually operated at the external computer in the same way as at the instrument
itself.
Manual remote operation is only possible if the audio analyzer and computer are connected via LAN
and the Windows® software is installed on the computer.
How to set up a connection and install the remote operation software on the external computer is
described in Chapter 1 in the section Configuration for Manual Remote Operation on page 1.49
Manual remote operation is started on the external computer by calling up the Remote Desktop
Connection program and clicking the Connect button. The R&S UPV must be selected as the remote
operation device, i.e. its computer name must be displayed in the Computer: field. If the computer has
been configured for remote operation of more than one instrument, the desired instrument can be
selected from the list which is displayed by clicking the button. The user ID and password
(instrument in both cases) can be stored when the software is first installed. The entries are made in
the extended menu "Options>>" (see Chapter 1, section Configuration for Manual Remote Operation,
page 1.49.
After login, the instrument firmware of the R&S UPV boots on the external computer. After booting is
completed, the audio analyzer screen appears and the R&S UPV is ready for manual remote operation
from the external computer. The starting configuration is that which was active before the connection
was set up. The individual functions are operated using the mouse and panel. Front panel keys which
are not directly available on the panel may be replaced by key combinations (see the section "Overview
of Keys" starting on page 3.118). The instrument firmware on the R&S UPV is terminated when the
connection is set up. Operation at the R&S UPV itself is not possible during manual remote operation.
Access by an external computer and the identity of the remote user is indicated on the login display of
Windows.
To enable direct operation at the R&S UPV again, the external user must first log out and then log in as
the local user.
The external user can log out at the external computer in the Start menu of the R&S UPV window by
clicking Disconnect in the bottom right-hand corner of the menu.
It is also possible to log off directly at the R&S UPV in the remote operation window.
The local user must press the key combination Ctrl + Alt + Del before logging in at the remote operation
screen on the R&S UPV. The default name of the local user on the R&S UPV is "instrument"; the
password is also "instrument".
After login, the instrument software starts with the settings used for manual remote operation.

Units R&S UPV
1146.2078.62 3.110 E-5
Units
There are two types of unit in the R&S UPV:
•Units for measurement result display:
In the configuration panels for the measurement displays, a display unit must be selected for each
measurement function. This unit is then used for the measurement result displayed in the
measurement display windows. The unit is selected in the Unit fields of the respective panel.
•Units for value entries (e.g. reference values, frequencies, levels, etc):
When data is entered, the available units are displayed on the softkeys. This allows value entries to
be adopted by selecting the unit without a further entry window having to be opened.

R&S UPV Units
1146.2078.62 3.111 E-5
Units in Measurement Result Displays
Tosimplify matters:
In the following conversion formulae the entry values are designated by the unit only.
Example: "dBu" means "value in dBu".
Units for analog level measurement results:
Basic unit: V
Table 3-1 Units for analog level measurement results
Value in IEC/IEEE-bus notation Conversion formula
V V
dBV DBV 20 ×lg (V)
dBu DBU 20 ×lg (V/0.7745967)
dBm DBM 10 ×lg (V2×1000/RREF)
W W V2/RREF
%V DPCTV (V/UREF-1)×100
VDV V-UREF
V/Vr VVR V/UREF
%V/Vr PCTVVR 100 ×V/UREF
%W DPCTW (((V2/RREF)-PREF)×100)/PREF
WDW (V2/RREF) – PREF
P/Pr PPR (V2/RREF)/PREF
%P/Pr PCTPPR (V2/RREF)/PREF ×100
dBr DBR 20 ×lg (V/UREF)
RREF = Reference impedance (Ref Imped) from Analyzer Config panel
UREF = Reference level (Reference) from Config panel for measurement function
PREF = (UREF)2/RREF
Units R&S UPV
1146.2078.62 3.112 E-5
Units for digital level measurement results:
Basic unit:FS (Full Scale)
Table 3-2 Units for digital level measurement results
Value in IEC/IEEE-bus notation Conversion formula
FS FS
%FS PCTFS FS×100
dBFS DBFS 20 ×lg (FS)
Hex *) HEX FS ×(2Audiobits-1-1) for FS > 0
FS ×(2Audiobits-1-1) + (2 Audiobits-1) for FS < 0
%DPCT (FS/UREF-1) ×100
dBr DBR 20 ×lg (FS/UREF)
LSBs LSBS FS ×2Audiobits-1
bits BITS 1 + ld (FS ×2Audiobits-1)
UREF = Reference level (Reference) from Config panel for measurement function
*) Level measurement result in hex notation
All digital analyzer measurement functions usually deliver values ranging from 0 to 1 FS.
FS values >1 may occur in the following cases:
•In the case of the peak measurement function with Meas Mode Peak to Peak.
•In the case of a filter with gain (e.g. CCIR wtd) is used.
FS values <0 may occur in the following cases:
•In the case of the peak measurement function with Meas Mode Neg Peak.
•In the case of the DC measurement function.
Units for distortion measurement results:
Basic unit: %
Table 3-3 Units for distortion measurement results
Value in IEC/IEEE-bus notation Conversion formula
%PCT
dB DB 20 ×lg (% / 100)
In the case of SINAD: -20 ×lg (% / 100)
R&S UPV Units
1146.2078.62 3.113 E-5
Unit for S/N measurement results:
Table 3-4 Units for S/N measurement results
Value in IEC/IEEE-bus notation Formula
dB DB 20 ×lg(S/N)
S: Measurement level with activated generator
N: Measurement level with deactivated generator
Units for frequency measurement results:
Basic unit:Hz
Table 3-5 Units for frequency measurement results
Value in IEC/IEEE-bus notation Conversion formula
Hz HZ
Hz DHZ Hz-FREF
%Hz DPCTHZ 100
×(Hz – FREF)/FREF
Toct * TOCT lg (Hz/FREF)×9.96578
Oct OCT lg (Hz/FREF)×3.32193
Dec DEC lg (Hz/FREF)
f/fr FFR Hz/FREF
*) Toct = Third octave
FREF = Reference frequency (Ref Freq) from Freq Phase Config panel for frequency measurement
Units for phase measurement results:
Basic unit: ° (degrees)
Table 3-6 Units for phase measurement results
Value in IEC/IEEE-bus notation Conversion formula
°DEG
RAD RAD °×/180
°DDEG °– PREF
RAD DRAD (°– PREF)×/180
PREF = Reference phase (Ref Phase) from Freq Phase Config panel for phase measurement

Units R&S UPV
1146.2078.62 3.114 E-5
Units for group delay measurement results:
Basic unit: s
Table 3-7 Units for group delay measurement results
Value in IEC/IEEE-bus notation Conversion formula
s S
sDS s – TREF
TREF = Reference time (Ref Grp Del) from Freq Phase Config panel for group delay measurement
Units for digital jitter measurement results:
Basic unit:UI (unit interval)
Table 3-8 Units for digital jitter measurement results
Value in IEC/IEEE-bus notation Conversion formula
UI UI
%UI PCTUI 100 ×UI
dBUI DBUI 20 ×log (UI)
ppm PPMUI 106×UI
ns NS
109×UI /(128 ×sampling frequency)
dBr DBR 20 ×log (UI/UREF)
UIr UIR UI/UREF
UREF = Reference level (Reference) from Config panel for measurement function
Unit for digital phase measurement results (Phase to Ref):
Basic unit:UI (unit interval)
Table 3-9 Units for digital phase measurement results
Value in IEC/IEEE-bus notation Conversion formula
UI UI
%FRM PCTFRM 100 ×UI / 128
°FRM DEGFRM 360 ×UI / 128
ns NS
109×UI /(128 ×sampling frequency)
The magnitude of jitter and phase is normally indicated in UI (unit interval). One UI corresponds to the
clock period with which the digital signal is clocked (biphase clock). With digital audio signals, one UI
corresponds to 128th of the sampling period. At 48 kHz, one UI is 162.76 ns.
R&S UPV Units
1146.2078.62 3.115 E-5
Units for Value Entries
To simplify matters:
In the following conversion formulae the entry values are designated by the unit only.
Example: "dBu" means "value in dBu".
Table 3-10 Absolute analog level units (without reference)
Conversion formulae IEC/IEEE-bus notation
V, mV, PV
Vpp, mVpp, PVpp (peak-to-peak voltage of signal)
dBu = 20 *lg (V/0.7746) V = 0.7746 *10 (dBu/20)
dBV = 20 *lg (V) V = 10 (dBV/20)
dBm = 10 *lg (V2*1000/RREF)*) VR
dBm REF
=10 1000
10(/)
*/
W = V2/RREF V=()*WR
REF
V, MV, UV
VPP, MVPP, UVPP
DBU
DBV
DBM
W, MW, UW
RREF = Reference impedance (Ref Imped) from the Analyzer Config panel
*) In the case of the generator, the reference impedance RREF is always 600 Ohm. The IEC/IEEE-bus notation is DBMG. To
calculate the open-circuit voltage Vo, the source impedance Rs (Impedance) from the Generator Config panel is also taken into
account, which means that V = Vo *RREF /(Rs + RREF)is to be used in the above formula.
Table 3-11 Relative analog level units (with reference)
Conversion formulae IEC/IEEE-bus notation
V = V-UREF V = V+UREF
%V = (V/UREF-1) ×100 V = UREF ×(1+%V/100)
V/Vr= V/UREF V = V/Vr×UREF
dBr = 20 ×lg (V/UREF) V = 10(dBr/20) ×UREF
V/on= V/Burst amp[V] V = V/on *Burst amp[V]
%on = 100 *V/Burst amp[V] V = %on *Burst amp[V]/100
dBon= 20 *lg (V/Burst amp[V]) V = 10 (dBon/20) * Burst amp[V]
DV, DMV, DUV
DPCTV
VVR
DBR
VON
PCTON
DBON
UREF = Reference level (Ref Voltage) in V from the Generator Config panel
Table 3-12 Absolute digital level units (without reference)
Conversion formulae IEC/IEEE-bus notation
FS
bits = 1 + ld (FS ×2Audio bits-1)FS = 2 Bits-1 /2Audio bits-1
%FS = 100 ×FS FS = %FS/100
dBFS = 20 ×lg (FS) FS = 10 (dBFS/20)
LSBS = FS ×2Audio bits-1 FS = LSBS /2Audio bits-1
FS
BITS
PCTFS
DBFS
LSBS

Units R&S UPV
1146.2078.62 3.116 E-5
Table 3-13 Relative digital level units (with reference)
Conversion formulae IEC/IEEE-bus notation
dBr = 20 ×lg (FS/UREF)FS = 10 (dBr/20) ×UREF
% = 100 ×(FS/UREF – 1) FS = (% / 100 + 1) ×UREF
%on = 100 ×FS/Burst amp[FS] FS = %on ×Burst amp[FS]/100
dBon= 20 ×lg (FS/Burst amp[FS]) FS =10 (dBon/20) ×Burst amp[FS]
DBR
DPCT
PCTON
DBON
UREF = Reference level (Ref Voltage) in FS from the Generator Config panel
Table 3-14 Absolute time units
Conversion formulae IEC/IEEE-bus notation
sS, MS, US
min = 60 s s = min / 60 MIN
cyc = s *signal frequency s = cyc / signal frequency CYC, KCYC, MCYC
Table 3-15 Absolute frequency units
Conversion formulae IEC/IEEE-bus notation
Hz, kHz HZ, KHZ
Table 3-16 Relative frequency units (with reference)
Conversion formulae IEC/IEEE-bus notation
Hz = Hz-FREF Hz = Hz+FREF
f/fr = Hz/FREF Hz = f/fr ×FREF
%Hz= 100 ×(Hz-FREF)/FREF Hz = (%Hz/100 + 1) ×FREF
Toct = lg (Hz/FREF)×9.96578 Hz = 2
Toct/3 ×FREF
Oct = lg (Hz/FREF)×3.32193 Hz = 2 Oct ×FREF
Dec = lg (Hz/FREF)Hz = 10 Dec ×FREF
(Toct = Third octave)
DHZ, DKHZ
FFR
DPCTHZ
TOCT
OCT
DEC
FREF = Reference frequency (Ref Frequency) from the Generator Config panel

R&S UPV Units
1146.2078.62 3.117 E-5
Table 3-17 Absolute phase units
Conversion formulae IEC/IEEE-bus notation
°
rad = °×(Z/180)° = rad ×(180/Z)
DEG
RAD
Table 3-18 Deviations (tolerance) relative to previous measurement values in settling function
Conversion formulae IEC/IEEE-bus notation
% = (10 dB/20 -1) ×100 dB = 20 ×lg (%/100 + 1) DB, PCT
Table 3-19 Step size of a logarithmic level sweep
Conversion formulae IEC/IEEE-bus notation
MLT = 10 dB/20 dB = 20 ×lg (MLT) [MLT], DB
Table 3-20 Absolute resistance unit
Conversion formulae IEC/IEEE-bus notation
OHM, KOHM
Table 3-21 Unit for jitter
Conversion formulae IEC/IEEE-bus notation
UI UI
%UI = 100 ×UI UI = %UI / 100 PCTUI
dBUI = 20 ×log (UI) UI = 10 dBUI/20 DBUI
ppm = 106×UI UI = 10-6 ×ppm PPMUI
ns = 109×UI /(128 ×sampling frequency) UI = 128 ×sampling frequency ×10-9 ×ns NS
Table 3-22 Unit for Phase to Ref
Conversion formulae IEC/IEEE-bus notation
UI UI
%FRM = 100 ×UI / 128 UI = 128 ×%FRM / 100 PCTFRM
°FRM = 360 ×UI / 128 UI = 128 ×°FRM / 360 DEGFRM
ns = 109×UI /(128 ×sampling frequency) UI = 128 ×sampling frequency ×10-9 ×ns NS
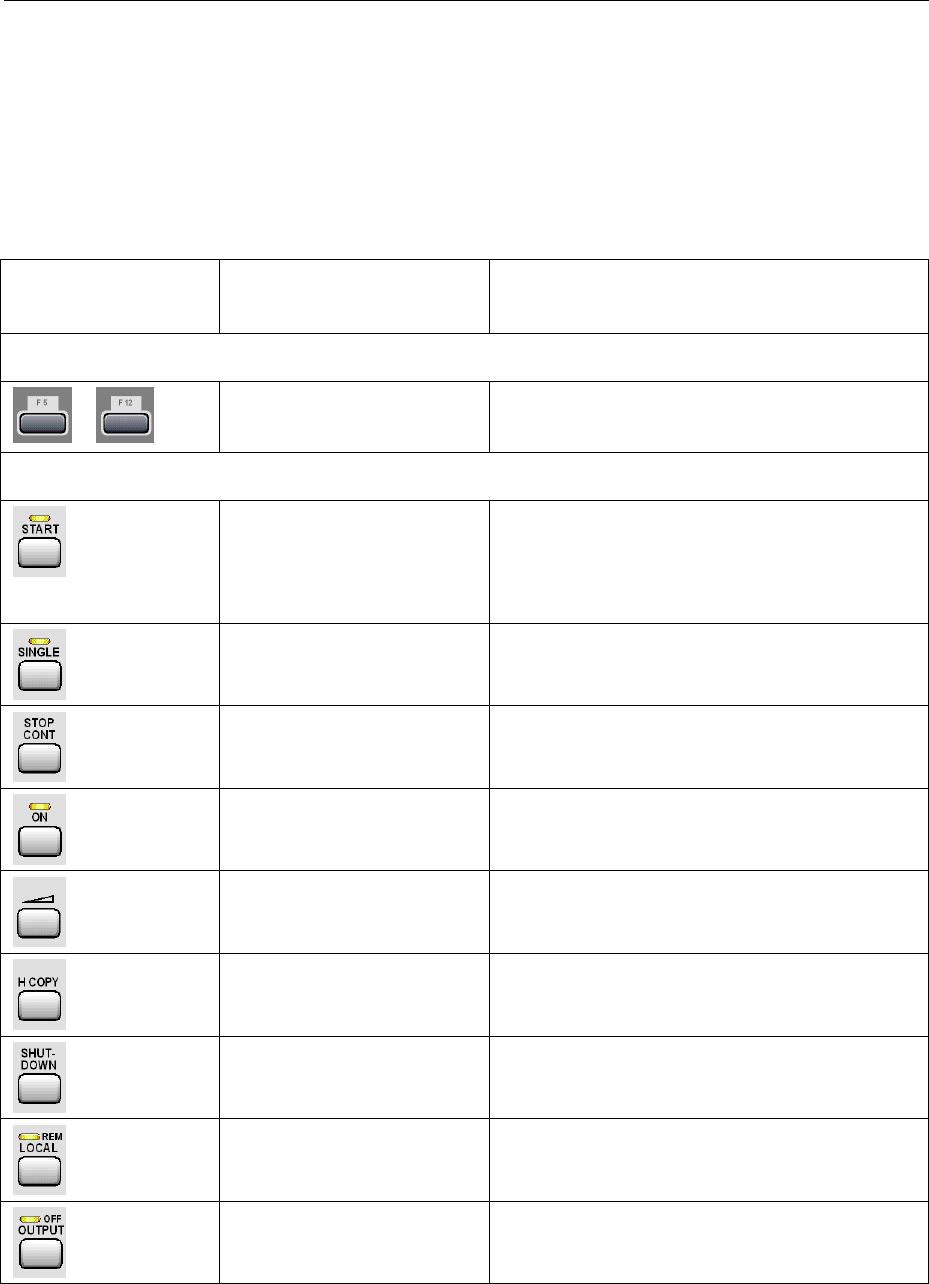
Overview of Keys R&S UPV
1146.2078.62 3.118 E-5
Overview of Keys
The following table gives an overview of the key functions on the front panel. The table also gives the
PC keyboard key combinations which can be used to trigger the functions of the keys on the front of the
instrument. Details regarding mouse operation are also included in this column.
The table is sorted according to the function blocks on the front panel.
Key on front panel Key on PC keyboard
Mouse operation
Function
Softkeys
…
F5 … F12 Triggers the function assigned to the softkey.
CONTROL panel
CTRL + F5 – Starts continuous measurements and sweeps
–Resets the Min/Max values for bargraph displays,
averaging for measurement results, and limit
overranging
CTRL + F6 Starts a single measurement or a single sweep
CTRL + F7 Measurement / sweep is stopped or continued (toggle
function)
CTRL + F8 Switches the loudspeaker or connected headphones on
and off (toggle function)
CTRL + F9 Opens / closes the window for adjusting the audio
monitoring volume
CTRL + P Depending on the settings under Utilities, printout of the
screen contents on the connected printer is started or the
screen contents are stored in a file
CTRL + F10 Stores the current settings on the hard disk and then shuts
down the Windows® operating system
CTRL + F11 Switches the instrument from remote operation to manual
operation
CTRL + F12 Switches the outputs of the measuring instrument off or on
again (toggle function)
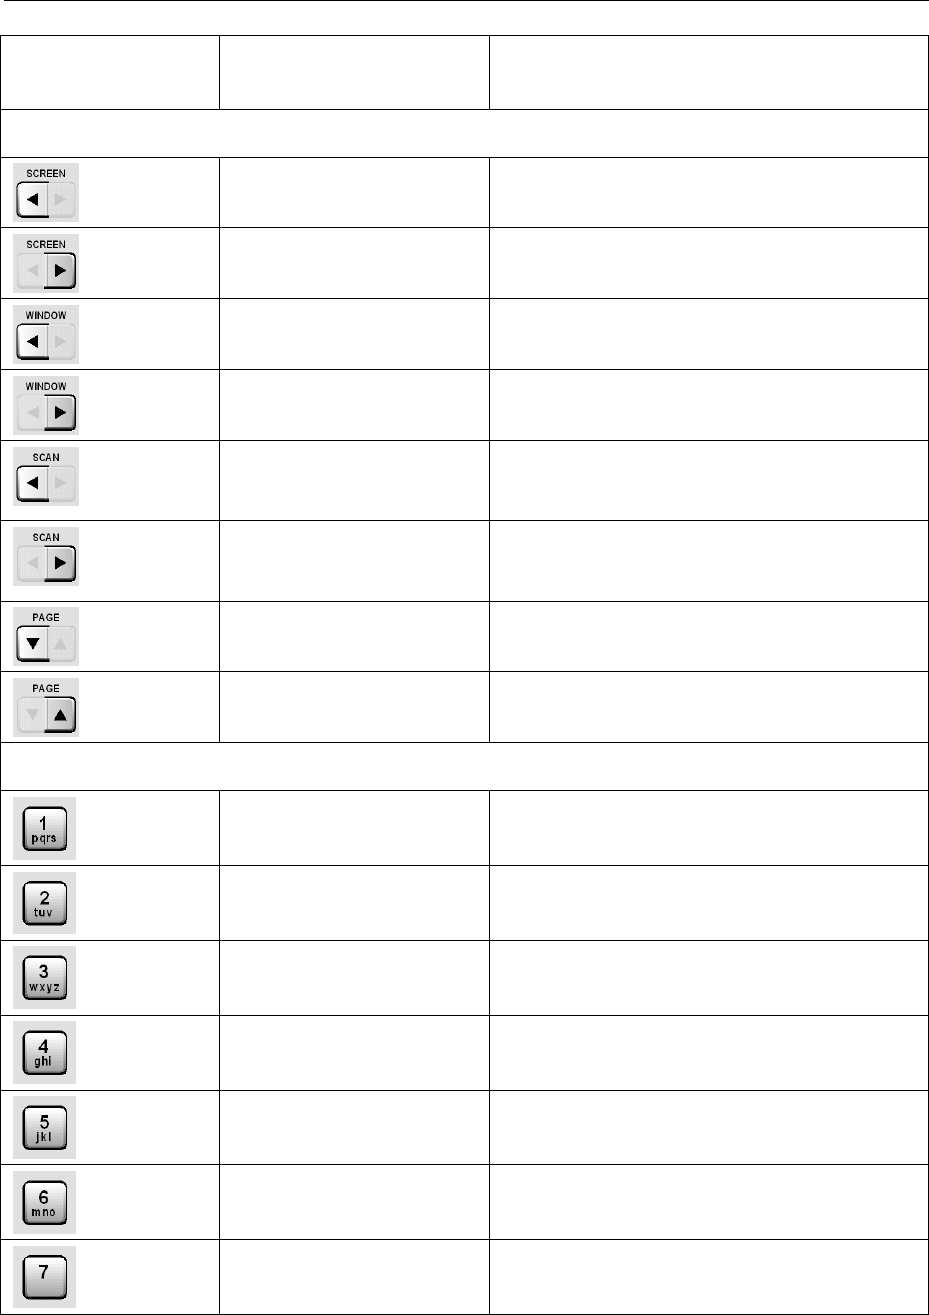
R&S UPV Overview of Keys
1146.2078.62 3.119 E-5
Key on front panel Key on PC keyboard
Mouse operation
Function
Navigation keys
CTRL + PAGE UP Switches to the previous display setting (screen)
CTRL + PAGE DOWN Switches to the next display setting (screen)
CTRL + SHIFT + TAB Switches the focus to the previous panel open in the
visible screen (the panel with the focus is active)
CTRL + TAB Switches the focus to the next panel open in the visible
screen (the panel with the focus is active)
ALT + PAGE UP Changes to the previous scan in graphical displays so that,
for example, measurement values can be read off using
the cursor
ALT * PAGE DOWN Changes to the next scan in graphical displays so that, for
example, measurement values can be read off using the
cursor
PAGE DOWN Scrolls to the next page in tables
PAGE UP Scrolls to the previous page in tables
Data entry keys
1
p, q, r, s
Entry of numeric value: 1
Entry of letters: p, q, r, s
2
t, u, v
Entry of numeric value: 2
Entry of letters: t, u, v
3
w, x, y, z
Entry of numeric value: 3
Entry of letters: w, x, y, z
4
g, h, i
Entry of numeric value: 4
Entry of letters: g, h, i
5
j, k, l
Entry of numeric value: 5
Entry of letters: j, k, l
6
m, n, o
Entry of numeric value: 6
Entry of letters: m, n, o
7Entry of numeric value: 7
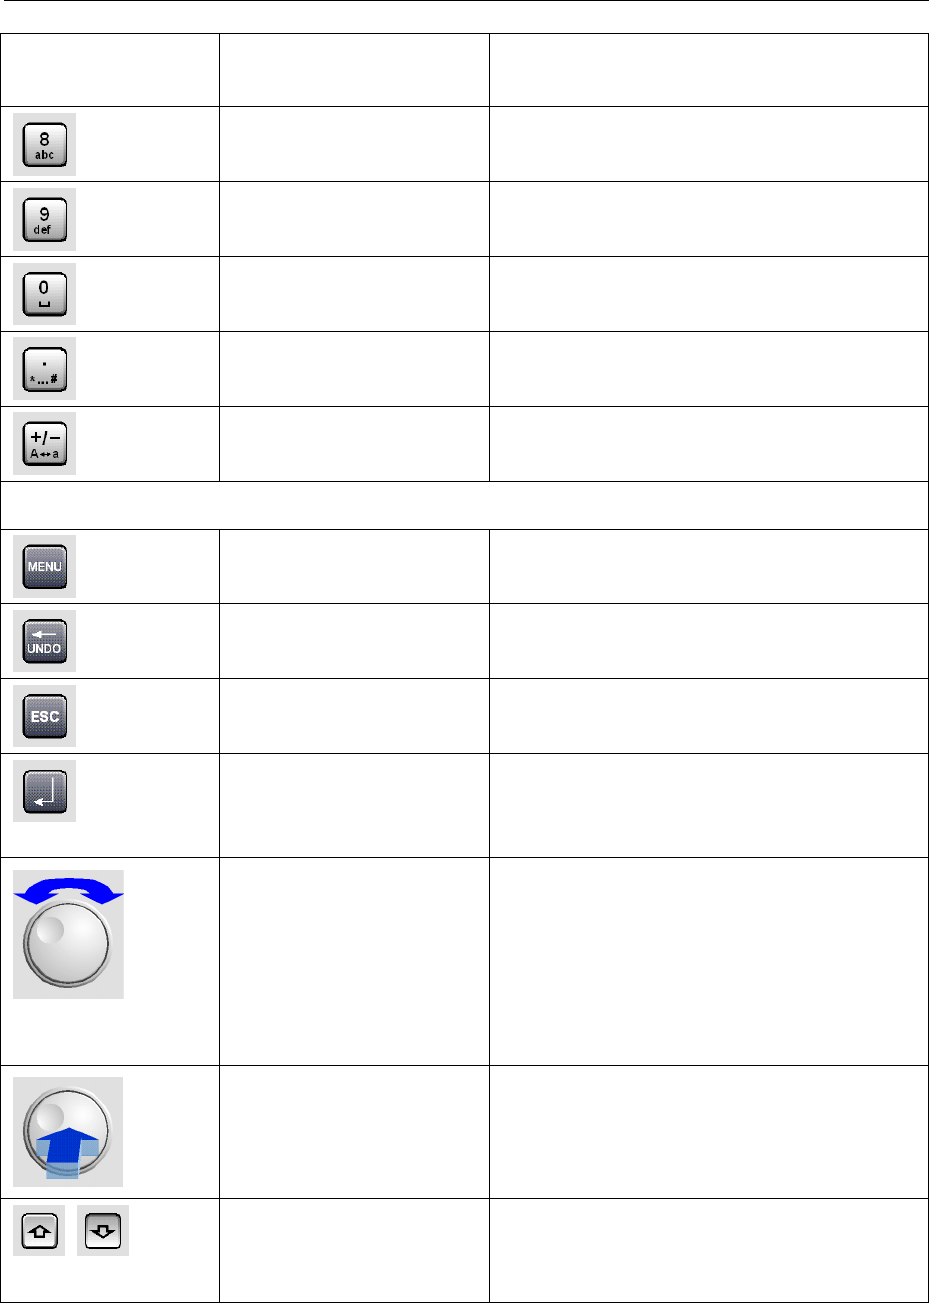
Overview of Keys R&S UPV
1146.2078.62 3.120 E-5
Key on front panel Key on PC keyboard
Mouse operation
Function
8
a, b, c
Entry of numeric value: 8
Entry of letters: a, b, c
9
d, e, f
Entry of numeric value: 9
Entry of letters: d, e, f
0
SPACE
Entry of numeric value: 0
Entry of a space
.
*... #
Entry of a dot / decimal point;
entry of special characters
-
(SHIFT +) A … Z
Entry of sign;
switchover between uppercase and lowercase letters
VARIATION panel
CTRL + M Displays the menu bar on the screen
BACKSPACE Deletes the character to the left of the cursor;
undoes the action last performed
ESC Closes the open panel; the old value or parameter is
retained
ENTER
Click with left-hand mouse key
Press mouse wheel
Completes the data entry (the new value is adopted);
confirms and closes open entry windows
TAB (to right)
SHIFT + TAB (to left)
Turn mouse wheel
–Moves the focus in the panels, selection windows
and tables
–Varies the entry value at the cursor position
–Moves the active cursor in the graphical windows
–Switches the measuring steps forwards and
backwards for manual sweeps
ENTER Pressing the rotary knob has the same effect as pressing
the ENTER key
UP/DOWN cursor keys – Move the focus in the panels, selection windows and
tables
–Vary the entry value at the cursor position

R&S UPV Overview of Keys
1146.2078.62 3.121 E-5
Key on front panel Key on PC keyboard
Mouse operation
Function
LEFT/RIGHT cursor keys – Move the active cursor inside the graphical windows
–Move the cursor position in entered values
–Switch the measuring steps forwards and backwards
for manual sweeps
WINDOW and SETUP panels
ALT + W Toggles between the softkey bar and the WINBAR
ALT + M Opens a selection of functions on the softkey bar; these
functions can be used in conjunction with the rotary knob
to move or resize the active panel or graphical window
ALT + H Minimizes ("hides") the active panel or graphical window
ALT + C Closes the active panel or graphical window
F1 Opens and closes the context-sensitive help function
ALT + S Opens a panel for storing instrument settings
ALT + L Opens a panel for loading predefined instrument settings
ALT + P Loads the factory settings of the instrument

Overview of Panels and Measurement Displays (Graphical Windows) R&S UPV
1146.2078.62 3.122 E-5
Overview of Panels and Measurement Displays
(Graphical Windows)
Panels which can be selected via the Instruments menu bar button:
Generator Config •Selection of instrument (analog or digital interfaces)
•Configuration of channels
•Bandwidth and sampling rate
•Reference values
•Synchronization settings and wordwidth (for digital interfaces)
Generator Function •Selection of test signals
•Sweep function
•Frequency and level settings
•Filter and equalizer
Analyzer Config •Selection of instrument (analog or digital interfaces)
•Configuration of channels
•Measurement bandwidth and sampling rate
•Reference impedance
•Start and trigger conditions
Analyzer Function •Selection of measurement functions
•Measurement speed and accuracy
•Activation of filter and equalizer
•Activation of Post-FFT
•Selection and settings for level monitor
•Selection and settings for input monitor
•Selection and settings for frequency, phase, group delay measurement
•Selection and settings for waveform monitor
Filter •Definition of filter properties
Auxiliaries Audio monitoring function
•Settings for integrated loudspeaker and connected headphones
•Signal source and channels
•Volume
•ON/OFF and volume control also possible using keys in CONTROL
panel
Auxiliary Analog Output
•Function selection and settings
Trigger Input, Trigger Output
•Function selection and settings
Switcher Panel •Function settings and operation of one or more connected
Audio Switchers R&S UPZ
Protocol Generator •Settings for the generator functions for generating the digital audio
protocol of the R&S UPV-K21 option

R&S UPV Overview of Panels and Measurement Displays (Graphical Windows)
1146.2078.62 3.123 E-5
Panels which can be selected via the Disp Config menu bar button:
Function Config •Settings for measurement values of active measurement function in
numeric display field
•Settings for associated combi displays
•Settings for limits, minimum values and maximum values
Level Monitor
Config
•Settings for numeric measurement values of level monitor in numeric
display field
•Settings for associated combi displays
•Settings for limits, minimum values and maximum values
Input Config •Settings for measurement values of input monitor in numeric display field
•Settings for associated combi displays
•Settings for limits, minimum values and maximum values
Freq / Phase Config •Settings for measurement values of frequency, phase and group delay
measurement in numeric display field
•Settings for associated combi displays
•Settings for limits, minimum values and maximum values
Sweep Graph 1…4
Config
•Four of these panels are available so that up to 4 sweep graphical
windows can be displayed simultaneously
•Setting of all details for one-channel or two-channel graphical display of
sweep functions, e.g. units, scaling, gridlines, etc
•Evaluation of minimum values and maximum values
•Entry of limit curves
•Settings for cursors and markers
FFT Graph 1…2
Config
•Two of these panels are available so that up to 2 FFT graphical windows
can be displayed simultaneously
•Setting of all details for one-channel or two-channel display of FFT
graph, e.g. units, scaling, gridlines, etc
•Evaluation of minimum values and maximum values
•Entry of limit curves
•Settings for cursors and markers
Waveform Config •Setting of all details for graphical display of waveform analyzer, e.g.
number of curves, units, scaling, gridlines, etc
•Entry of limit curves
•Settings for cursors and markers
PESQ Graph 1…2
Config
•Two of these panels are available, allowing you to display up to two
PESQ windows simultaneously
•Setting of all details for the display of the PESQ MOS value and the
DELAY, e.g. units, scaling, gridlines, etc
•Evaluation of minimum values and maximum values
•Entry of limits
•Settings for cursors and markers

Overview of Panels and Measurement Displays (Graphical Windows) R&S UPV
1146.2078.62 3.124 E-5
Bargraph1…2
Config
•Two of these panels are available so that up to 2 bargraph windows can
be displayed simultaneously
•Setting of all details for one-channel or two-channel display of
bargraphs, e.g. units, scaling, gridlines, etc
•Evaluation of minimum values and maximum values
•Entry of limits
•Settings for cursors and markers
Measurement windows which can be selected via the Displays menu bar button:
Numeric Display •Display of one-channel or two-channel measurement results of
measurement function selected in Analyzer Function panel
•Display of one-channel or two-channel measurement results of level
monitor selected in Analyzer Function panel
•Display of one-channel or two-channel measurement results of input
monitor selected in Analyzer Function panel
•Display of one-channel or two-channel frequency measurement results,
or display of frequency measurement result and phase or group delay
measurement result
•The measurement results are displayed in the way defined in the
configuration panel
Funct Ch1…2
•These combi displays are extensions to the numeric measurement
displays of the measurement function selected in the Analyzer Function
panel; they show the respective numeric value plus the following
additional features:
•Analog bargraphs
•Monitoring and display of limits
•Storage of minimum and maximum values
•The measurement results are displayed in the way defined in the
configuration panel
Lev Mon Ch1…2
•These combi displays are extensions to the numeric measurement
display of the level monitor selected in the Analyzer Function panel; they
show the respective numeric value plus the following additional features:
•Analog bargraphs
•Monitoring and display of limits
•Storage of minimum and maximum values
•The measurement results are displayed in the way defined in the
configuration panel
Input Ch1…2
•These combi displays are extensions to the numeric measurement
display of the input monitor selected in the Analyzer Function panel; they
show the respective numeric value plus the following additional features:
•Analog bargraphs
•Monitoring and display of limits
•Storage of minimum and maximum values
•The measurement results are displayed in the way defined in the
configuration panel

R&S UPV Overview of Panels and Measurement Displays (Graphical Windows)
1146.2078.62 3.125 E-5
Freq Ch1
Phase Ch2/Ch1
•These combi displays are extensions to the numeric measurement
display for one-channel or two-channel frequency measurement results
or for the frequency measurement result and the phase or group delay
measurement result; they show the respective numeric value plus the
following additional features:
•Analog bargraphs
•Monitoring and display of limits
•Storage of minimum and maximum values
•The measurement results are displayed in the way defined in the
configuration panel
Sweep Graph 1…4 •Up to four of these display windows can be open simultaneously to
display scans from sweep measurements
•One-channel or two-channel graphical display
•The measurement results are displayed in the way defined in the
Sweep Graph 1…4 Config panel
FFT Graph 1…2 •Up to two of these display windows can be open simultaneously to
display the FFT analyses of the selected measurement function or of the
Post-FFT
•One-channel or two-channel graphical display
•The measurement results are displayed in the way defined in the
FFT Graph 1…2 Config panel
Waveform •This display window shows the characteristic of the measurement signal
over time
•One-channel or two-channel graphical display
•The measurement results are displayed in the way defined in the
Waveform Config panel
PESQ Graph 1…2 •Up to two of these windows can be opened simultaneously to display
PESQ measurement values
•The measurement results are displayed in the manner defined in the
individual PESQ Graph 1…2 Config panel
Bargraph 1…2 •Up to two of these display windows can be opened to display bargraphs
of the selected measurement function
•One-channel or two-channel graphical display
•The measurement results are displayed in the way defined in the
Bargraph 1…2 Config panel
Dig Analyzer Protocol •Display window for the data regarding the digital audio protocol of the
R&S UPV-K21 option
Overview of Status Messages R&S UPV
1146.2078.62 3.126 E-5
Overview of Status Messages
The status of the R&S UPV is continuously displayed for the generator, analyzer, sweep system and
other instrument states at the bottom of the screen in four fields above the four right-hand softkeys.
Status displays always appear at the same position; they are assigned to the fields above the softkeys
as shown below.
Analyzer
Channel 1
Analyzer
Channel 2 Generator Sweep
The following overview shows the possible status messages and their meaning:
Analyzer status:
Status information which applies to the two channels Anlr1 and Anlr2
Off Measurement channel is deactivated
Overload Analyzer has been deactivated owing to overload
Over Measuring range has been overranged; this can occur if:
•Range Fix setting is being used
•asignal with a level at range limit is applied with a
crest factor > 2
•common-mode voltage is applied in BAL input
configuration
Under Measuring range has been underranged; this can occur if
Range Fix or Lower setting is being used
Single Single measurement is being performed
Cont Continuous measurement is being performed
Terminated Single measurement has been terminated
Stopped Measurement has been stopped
Wait for Trigger Analyzer is waiting for set trigger condition

R&S UPV Overview of Status Messages
1146.2078.62 3.127 E-5
Wait for DC Adj Analyzer is waiting for internal DC offset adjustment;
this is, however, not possible at present because:
•cyclic DC offset adjustment has been deactivated or
•cyclic DC offset adjustment is disabled owing to a
currently active sweep
DC Adjusting Cyclic internal DC offset adjustment of A/D converter is
being performed
Generator status:
Gen Off Generator is deactivated
Gen Running Generator signals are being output
Output Off All output lines are deactivated
Gen Overload Generator has been deactivated owing to overload
Sweep status:
Sweep Off No sweep is being performed
Sweep Waiting Sweep has been defined but not yet started
Sweep Terminated Single sweep has been terminated
Sweep Stopped Sweep has been stopped but can be continued
Sweep Run Cont Continuous sweep is being performed
Sweep Run Single Single sweep is being performed
Sweep Run Manual Manual sweep is being performed

R&S UPV Selecting the Generator
1146.2084.32 I-4.1 E-9
Contents - Chapter 4 "Instrument Functions"
4Instrument Functions.................................................................................................................4.1
Selecting the Generator...................................................................................................................4.1
Generator Configuration Panel ................................................................................................4.1
Configuring Analog Generator........................................................................................................4.2
Analog Generator Config Panel ...............................................................................................4.2
Generator Outputs ...................................................................................................................4.8
Output Power .........................................................................................................................4.16
Configuring the Digital Generator ................................................................................................4.16
Digital Generator Configuration Panel ...................................................................................4.16
Digital Impairments Configuration Panel................................................................................4.27
Configuring the I2SGenerator.......................................................................................................4.29
I2SGenerator Configuration Panel.........................................................................................4.29
Timing Diagrams ....................................................................................................................4.38
Interface Assignment .............................................................................................................4.40
Configuring the USI Dual Channel Generator .............................................................................4.42
USI Dual Channel Generator Configuration Panel ................................................................4.42
Meaning of the TX_DATA 1 to TX_DATA 4 setting line strings.............................................4.56
Timing Diagrams ....................................................................................................................4.60
Interface assignment..............................................................................................................4.61
Generator Signals...........................................................................................................................4.63
Sine ........................................................................................................................................4.63
Stereo Sine.............................................................................................................................4.66
Multisine .................................................................................................................................4.70
Sine Burst...............................................................................................................................4.73
Sine2Burst..............................................................................................................................4.76
Mod Dist .................................................................................................................................4.77
DFD ........................................................................................................................................4.80
DIM.........................................................................................................................................4.82
Random..................................................................................................................................4.84
Arbitrary..................................................................................................................................4.91
Play ........................................................................................................................................4.93
Play+Anlr................................................................................................................................4.98
Polarity .................................................................................................................................4.106
Modulation............................................................................................................................4.106
DC (Direct-Current Voltage).................................................................................................4.108
Square..................................................................................................................................4.108
Amplitude Variation......................................................................................................................4.110
Equalization ..................................................................................................................................4.111
Generator Filters...........................................................................................................................4.112

Selecting the Generator R&S UPV
1146.2084.32 I-4.2 E-9
Digital Audio Protocol Generator ...............................................................................................4.113
Advanced Settings ...............................................................................................................4.113
Setting Bytes as Numerical Values......................................................................................4.114
Setting Bytes in Remote-Control Mode................................................................................4.116
Displaying and Setting Parameters in Plain Text.................................................................4.117
Sweeps ..........................................................................................................................................4.119
Activating / Deactivating the Sweep System........................................................................4.120
One-Dimensional Sweep .....................................................................................................4.122
Two-Dimensional Sweep .....................................................................................................4.124
Automatic Sweep .................................................................................................................4.126
Linear and Logarithmic Sweep ............................................................................................4.129
List Sweep............................................................................................................................4.134
Sweep Speed .......................................................................................................................4.135
Selecting the Analyzer .................................................................................................................4.140
Analyzer Configuration Panel ..............................................................................................4.140
Configuring the Analog Analyzer ...............................................................................................4.142
Analog Analyzer Configuration Panel ..................................................................................4.142
Configuring the Analog Multichannel Analyzer ........................................................................4.154
Multichannel Analyzer Configuration Panel .........................................................................4.154
Configuring the Digital Analyzer.................................................................................................4.166
Digital Analyzer Configuration Panel ...................................................................................4.166
Configuring the I2SAnalyzer .......................................................................................................4.174
I2SAnalyzer Configuration Panel.........................................................................................4.174
Timing Diagrams ..................................................................................................................4.179
Interface Assignment ...........................................................................................................4.180
Configuring the USI Dual Channel Analyzer .............................................................................4.183
USI Dual Channel Analyzer Configuration Panel.................................................................4.183
Timing Diagrams ..................................................................................................................4.198
Interface allocation ...............................................................................................................4.199
Configuring the USI 8 Channel Analyzer ...................................................................................4.201
USI 8 Channel Analyzer Configuration Panel......................................................................4.201
Timing Diagrams ..................................................................................................................4.215
Interface assignment............................................................................................................4.215
Starting Measurements................................................................................................................4.216
Overview of the Measurement System ................................................................................4.216
Activating and Deactivating Measurement Types................................................................4.216
States of the Measurement System.....................................................................................4.217
Start Conditions............................................................................................................................4.221
Setting Start Condition .........................................................................................................4.222
Time-Controlled Measurement Value Recording.................................................................4.230
External Sweeps and Level-Controlled Measurement Value Triggering .............................4.231

R&S UPV Selecting the Generator
1146.2084.32 I-4.3 E-9
Sweep Options..............................................................................................................................4.235
Overview of the Sweep Options...........................................................................................4.235
Activating and Deactivating Sweeps....................................................................................4.236
States of the Sweep System ................................................................................................4.236
Several Sweep Traces in One Diagram...............................................................................4.240
Level Measurements ....................................................................................................................4.241
Filter Settings .......................................................................................................................4.241
RMS Measurement, Broadband ..........................................................................................4.246
RMS Measurement, Selective..............................................................................................4.249
Rub & Buzz Measurement ...................................................................................................4.263
Peak Measurement ..............................................................................................................4.268
Quasi Peak Measurement....................................................................................................4.270
DC Voltage Measurement....................................................................................................4.271
Signal-to-Noise Measurements...................................................................................................4.272
S/N Measurement Function .................................................................................................4.273
S/N Sequence in Level Measurements................................................................................4.279
Distortion Measurements ............................................................................................................4.280
General Settings ..................................................................................................................4.282
THD ......................................................................................................................................4.285
THD+N / SINAD ...................................................................................................................4.291
MOD DIST............................................................................................................................4.299
DFD ......................................................................................................................................4.301
DIM (dynamic intermodulation distortion analysis) ..............................................................4.304
Polarity Measurement ..................................................................................................................4.307
Frequency Band Analysis ...........................................................................................................4.308
Nth Octave Analysis.............................................................................................................4.308
FFT Analysis .................................................................................................................................4.316
FFT Size...............................................................................................................................4.316
Window Function..................................................................................................................4.318
Post FFT...............................................................................................................................4.320
FFT Measurement Function.................................................................................................4.321
Speech Quality Measurements (PESQ)......................................................................................4.333
PESQ Value and MOS Value ..............................................................................................4.334
Electrical PESQ Measurements...........................................................................................4.335
Acoustic PESQ Measurements............................................................................................4.335
PESQ Graphs ......................................................................................................................4.337
PESQ Measurement Function .............................................................................................4.338
Audio quality measurements (PEAQ).........................................................................................4.345
DI value and ODG value ......................................................................................................4.346
PEAQ measurements ..........................................................................................................4.347
PEAQ graphics.....................................................................................................................4.347
PEAQ measurement function ..............................................................................................4.348

Selecting the Generator R&S UPV
1146.2084.32 I-4.4 E-9
Analysis in the Time Domain ......................................................................................................4.353
Waveform Monitor................................................................................................................4.353
Delay Measurement .............................................................................................................4.364
Offline Analysis ............................................................................................................................4.368
Applications ..........................................................................................................................4.369
Recording Format ................................................................................................................4.369
Monitoring the Recording .....................................................................................................4.370
Recording Modes of the Record Function ...........................................................................4.371
Operating the Record Function............................................................................................4.371
Creating WAV Files for External Sweeps ............................................................................4.378
Infrasound Measurements...........................................................................................................4.379
Infrasound Signals ...............................................................................................................4.379
Infrasound Analysis..............................................................................................................4.379
Protocol Analysis .........................................................................................................................4.383
Activating and Configuring the Protocol Analysis ................................................................4.383
Channel-Status Information Display ....................................................................................4.386
Error Flag Display ................................................................................................................4.387
Frequency, Phase and Group Delay Measurement ..................................................................4.389
Input Monitor.................................................................................................................................4.397
Level Monitor ................................................................................................................................4.399
Settling Methods...........................................................................................................................4.401
Applications ..........................................................................................................................4.401
Settling Algorithms ...............................................................................................................4.402
Settling for Measurement Functions ....................................................................................4.403
Settling for Frequency Measurements .................................................................................4.406
Settling for Phase Measurements........................................................................................4.409
Settling for Start Conditions (Event-Triggered Measurements)...........................................4.412
Examples of Settling ....................................................................................................................4.415
Filters.............................................................................................................................................4.416
Analyzer Prefilter..................................................................................................................4.416
Analyzer Function Filters......................................................................................................4.417
Generator Filters ..................................................................................................................4.417
Filter Table ...........................................................................................................................4.419
User-Definable Filters ..................................................................................................................4.420
Filter 0i..................................................................................................................................4.420
Low-Pass Filter and High-Pass Filter...................................................................................4.421
Band-Pass Filters and Band-Stop Filters.............................................................................4.422
Notch Filter, Third-Octave Filter and Octave Filter ..............................................................4.423
File-Defined Filter.................................................................................................................4.424
Parameters Common to All Filters .......................................................................................4.426
Filter Settling Time ...............................................................................................................4.427
Weighting Filters ..........................................................................................................................4.428
Highpass and Lowpass Filters....................................................................................................4.435

R&S UPV Selecting the Generator
1146.2084.32 I-4.5 E-9
Audio Monitoring..........................................................................................................................4.436
Auxiliaries Panel...................................................................................................................4.436
Switcher Panel ..............................................................................................................................4.446
Connecting the Switcher to the R&S UPV ...........................................................................4.446
Default Setting......................................................................................................................4.447
Operation..............................................................................................................................4.447
Traces, Spectrum Displays and Bargraphs...............................................................................4.450
Graphical Display, Explanation of the Elements ..................................................................4.450
Calling Up.............................................................................................................................4.457
Parameter Fields of the Panel..............................................................................................4.458
Softkey Menu .......................................................................................................................4.539
Single Sweep .......................................................................................................................4.544
Trace Group .........................................................................................................................4.544
Interpolation on the Common X Axis ...................................................................................4.547
Result List .....................................................................................................................................4.547
Graphical Display, Explanation of the Elements ..................................................................4.547
Calling Up.............................................................................................................................4.549
Parameter Fields of the Panel..............................................................................................4.549
Softkey Menu .......................................................................................................................4.552
Numeric Display ...........................................................................................................................4.552
Graphical Display, Explanation of the Elements ..................................................................4.553
Calling Up.............................................................................................................................4.555
Parameter Fields of the Panel..............................................................................................4.555
Softkey Menu .......................................................................................................................4.555
Combi Display...............................................................................................................................4.555
Graphical Display, Explanation of the Elements ..................................................................4.556
Calling Up.............................................................................................................................4.558
Parameter Fields of the Panel..............................................................................................4.560
Softkey Menu .......................................................................................................................4.574
Limit Monitoring ...........................................................................................................................4.576
Traces and Bargraphs..........................................................................................................4.576
Measurement Results ..........................................................................................................4.578
Measurement value sequences ..................................................................................................4.580
Saving............................................................................................................................................4.580
Trace files.............................................................................................................................4.580
Equalization files ..................................................................................................................4.581
Sweep list .............................................................................................................................4.581
Limit files ..............................................................................................................................4.582
Loading..........................................................................................................................................4.583
Trace files.............................................................................................................................4.583
Equalization Files .................................................................................................................4.589
Sweep Lists ..........................................................................................................................4.589
Limit Files .............................................................................................................................4.589

Selecting the Generator R&S UPV
1146.2084.32 I-4.6 E-9
Format ...........................................................................................................................................4.590
Trace Files............................................................................................................................4.590
Equalization Files .................................................................................................................4.594
Sweep Lists ..........................................................................................................................4.595
Limit Files .............................................................................................................................4.597
Editing ...........................................................................................................................................4.598
Exporting.......................................................................................................................................4.604
Loading and Saving .....................................................................................................................4.607
Integrated File selection box ................................................................................................4.607
File manager ........................................................................................................................4.607
Windows file selection box...................................................................................................4.608
Loading and Saving Setups ........................................................................................................4.608
Printing and Saving the Display Screen ....................................................................................4.609
Configuring Print and Save Operations ...............................................................................4.609
Starting Print and Save Operations .....................................................................................4.612

R&S UPV Selecting the Generator
1146.2084.32 4.1 E-9
4Instrument Functions
Selecting the Generator
Generator Configuration Panel
The Config panel allows settings for analog and digital generators.
To adapt the R&S UPV generator to the measurement task at hand, first define the settings in the
Generator Config panel. These settings will determine which capabilities are available in the Generator
Function panel.
Instrument
Used to select the generator.
Analog In the Generator Function panel, the user can
choose between the universal generator for virtually
any signal shape (up to max. 80 kHz) and a low-
distortion sinewave generator (R&S UPV-B1 option
"Low-Distortion Generator" up to max. 185 kHz). The
sinewave generator can be activated for the
generator function "Sine".
The digital audio generator continues to run.
Remote-control command:
INSTrument[1][:SELect] ANLG
Digital Audio Select digital audio generator.
If no impairments were applied (jitter or a common-
mode signal), the analog generator continues to run
(see section "Configuring the Digital Generator" on
page 4.16).
Remote-control command:
INSTrument[1][:SELect] DIG
I2SBoard The I2Sgenerator can generate audio data in I2S
format.
The analog generator is deactivated.
Remote-control command:
INSTrument[1][:SELect] I2SBoard
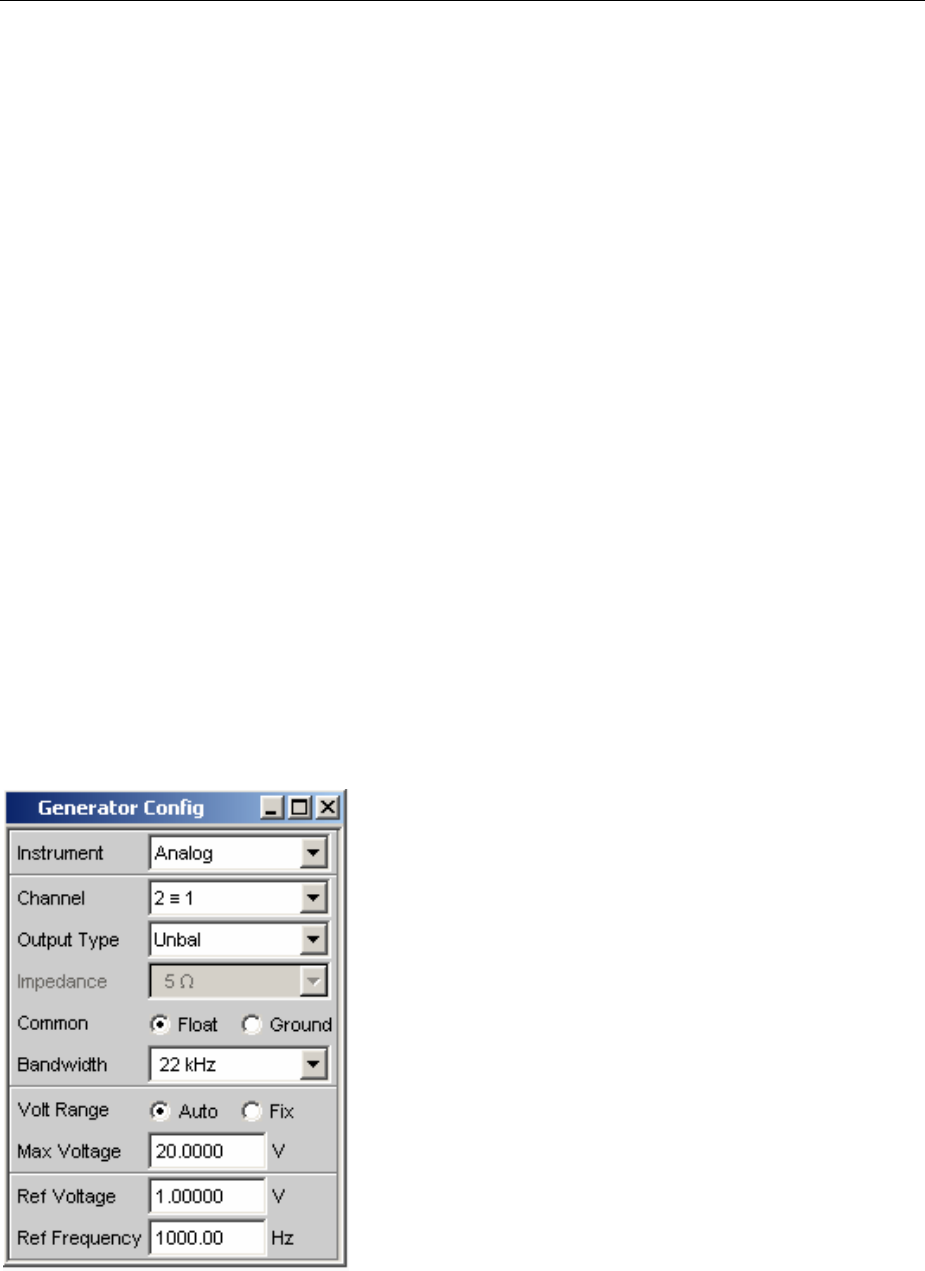
Configuring Analog Generator R&S UPV
1146.2084.32 4.2 E-9
Digital
Impairment
(with
R&S UPV-B2
only)
The impairments (jitter or a common mode signal)
are configured for the digital-audio generator in this
panel (see section "Digital Impairments
Configuration Panel" on page 4.27), which can then
beswitched on or off on the digital generator
operating panel (see section "Digital Generator
Configuration Panel" on page 4.16).
The analog generator is switched off as soon as
this panel is opened as it is used internally for the
production of the impairments.
Remote control command:
INSTrument[1][:SELect] IMPairment
USI Dual
Channel
Audio data can be produced in serial format with
the USI dual channel generator. The analog
generator is switched off.
Remote control command:
INSTrument[1][:SELect] U2Channel
Configuring Analog Generator
Analog Generator Config Panel
Figure 4-1 Analog generator configuration panel
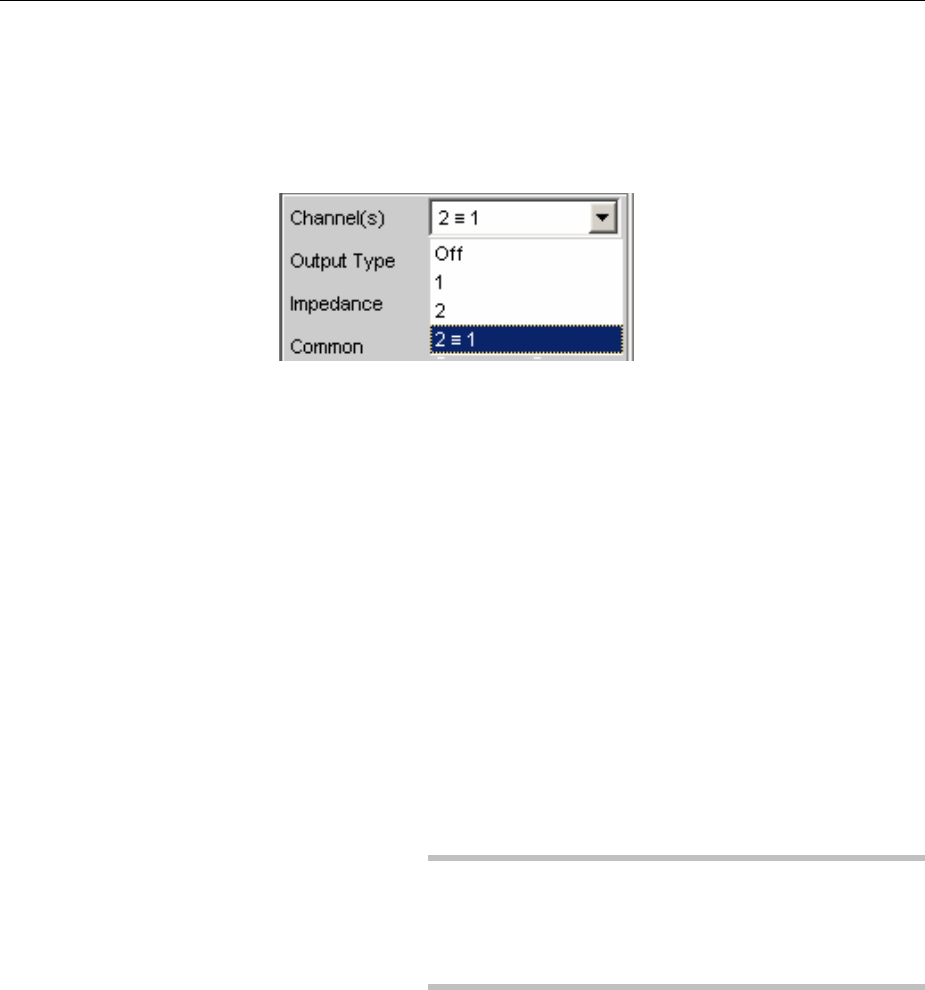
R&S UPV Configuring Analog Generator
1146.2084.32 4.3 E-9
The Config panel is used to set up the analog and digital generator. The configuration options for the
analog generator are described below.
Channel
Used to select the signal-carrying XLR plugs in the bottom right-hand
part of the R&S UPV front panel.
OFF Both XLR plugs are deactivated.
Remote-control command:
OUTput:CHANnel OFF
1XLR plug 1 supplies the generator signal; XLR plug 2 is
deactivated.
Remote-control command:
OUTput:CHANnel CH1
2XLR plug 2 supplies the generator signal; XLR plug 1 is
deactivated.
Remote-control command:
OUTput:CHANnel CH2
281Both XLR plugs supply an output signal.
Note:
If the generator function "Stereo Sine" is selected (in
the Generator Function panel; the R&S UPV-B3 option
is required for this), the level and frequency can be
different for each channel of the output signal.
Remote-control command:
OUTput:CHANnel CH2Is1

Configuring Analog Generator R&S UPV
1146.2084.32 4.4 E-9
Output Type
The generator output can be configured to be unbalanced (Unbal) or
balanced (Bal). The setting always applies to both outputs.
The generator can also supply a common-mode signal.
Unbal The RMS of the generator signal can be max. 10 V.
The output impedance is 5 Ohm.
If commercially available BNC cables are to be
used, it is recommended to use an XLR/BNC
adapter R&S UPL-Z1.
Remote-control command:
OUTPut:TYPE UNBalanced
Bal The RMS of the generator signal can be max. 20 V.
The user can choose between three different output
impedance values.
Remote-control command:
OUTPut:TYPE BALanced
Com Mode
Test
Identical output signals are present at pins 2 and 3
of the XLR connectors. The signal lines are
referenced to the generator ground. The output
impedance is made up of two identical resistances in
the two signal lines.
This generator output configuration is suitable for
measuring the common-mode rejection of balanced
DUTs.
To correctly address the object to be measured it is
necessary to set the generator earth (Common) to
“Ground” because otherwise the input signal has no
ground reference and is not detected by the object
to be measured.
If “Common” is set to “Float”, the following warning
appears:
This function is only available for firmware 1.4.0.206
and higher. If the selection is not available with this
firmware, the R&S UPV is equipped with an older
Analog Audio Board (AAB) which doesn’t support
this function.
Remote-control command:
OUTPut:TYPE CTESt
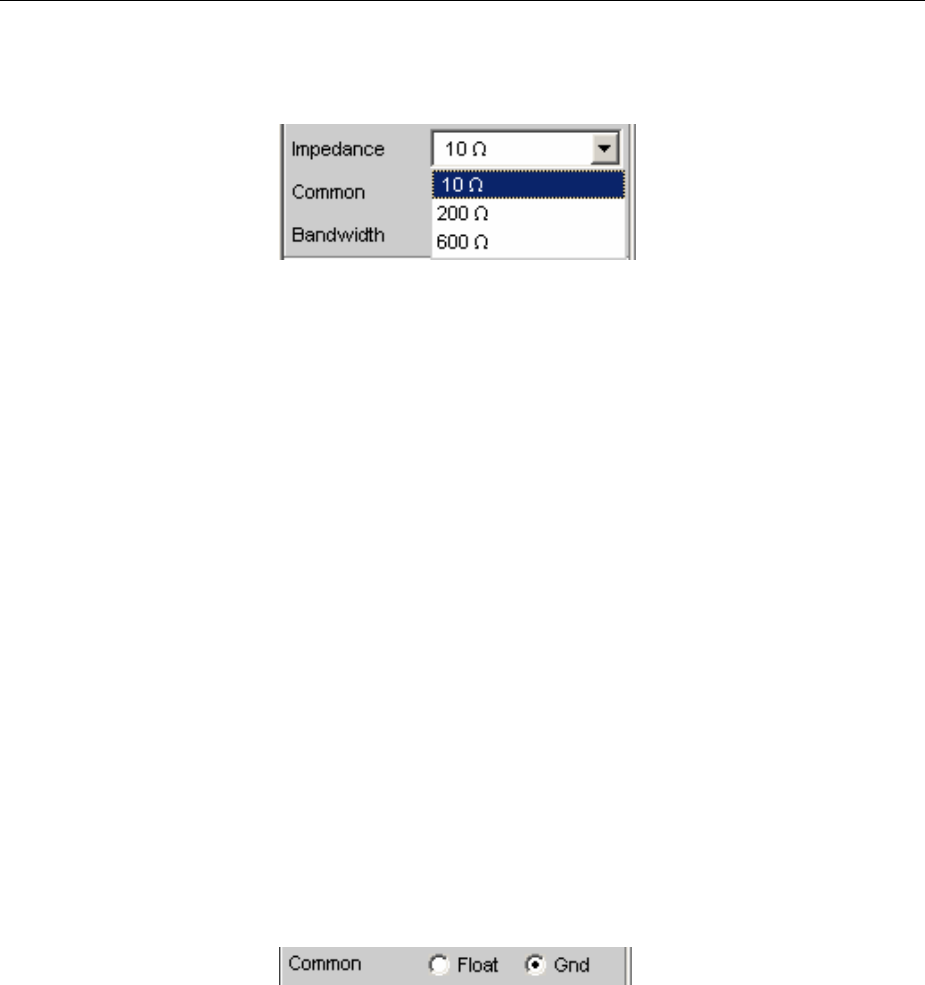
R&S UPV Configuring Analog Generator
1146.2084.32 4.5 E-9
Impedance
This field can only be operated if "Bal" has been selected as the
Output Type in the field above. If "Unbal" has been selected, only a
field showing a fixed impedance (5 Ohm in this case) is displayed.
10 Ohm The output impedance is 10 Ohm.
Remote-control command:
OUTPut:IMPedance R10
200 Ohm The output impedance is 200 Ohm. If the R&S UPV-
U1 option is installed, the output impedance is
150 Ohm. After the R&S UPV-U1 option has been
installed, the R&S UPV must be informed of this via
the diagnostics panel so that "150 Ohm" is then
displayed in the selection box. The installation
instructions supplied with the option explain which
entries are required for this.
Remote-control command:
OUTPut:IMPedance R200
600 Ohm The output impedance is 600 Ohm.
Remote-control command:
OUTPut:IMPedance R600
Common
The generator ground can be floating or connected to the instrument
ground.
XLR Pin 1 always remains unconnected, regardless of the selected
configuration.
Float The generator ground is not electrically connected to
the instrument ground. With the default configuration
"Unbal", a capacitance of approx. 25 nF is
connected between the two ground connections.
With "Bal", the capacitance is approx. 2 nF and is
primarily determined by the layout and coupling
capacitance inside the toroidal transformer which
delivers the supply voltages for the generator.
Remote-control command:
OUTPut:LOW FLOat
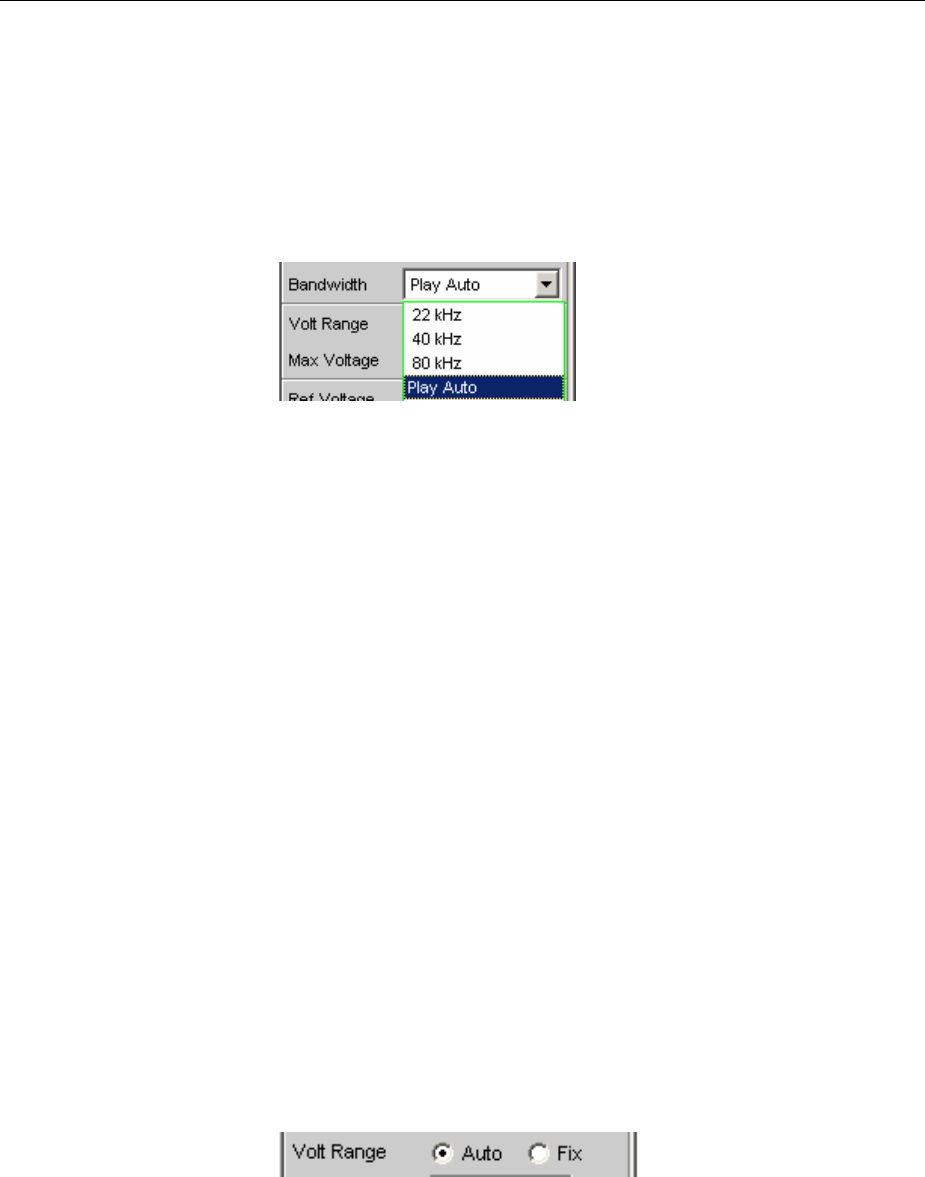
Configuring Analog Generator R&S UPV
1146.2084.32 4.6 E-9
Ground The generator ground is electrically connected to the
instrument ground with approx. 50 Ohm.
Remote-control command:
OUTPut:LOW GROund
Bandwidth
When you choose the universal generator you can set three different
fixed frequency ranges and one signal-dependent sampling frequency.
22 kHz The maximum output frequency is 22 kHz. The
generator D/A converter is then clocked at 48 kHz.
Remote-control command:
OUTPut:BANDwidth:MODE B22
40 kHz The maximum output frequency is 40 kHz. The
generator D/A converter is then clocked at 96 kHz.
Remote-control command:
OUTPut:BANDwidth:MODE B40
80 kHz The maximum output frequency is 80 kHz. The
generator D/A converter is then clocked at 192 kHz.
Remote-control command:
OUTPut:BANDwidth:MODE B80
Play Auto For the Play generator function only. The bandwidth
is automatically determined as a function of the
sample rate entered in the WAV file.
This sample rate is likewise used for clocking the
generator DAC.
Remote-control command:
OUTPut:BANDwidth:MODE AUTo alias AUTO
Volt Range
Two different modes are available for generator level control.
R&S UPV Configuring Analog Generator
1146.2084.32 4.7 E-9
Auto The internal signal paths are optimally driven; the
output voltage is adjusted using the analog
hardware.
Advantage:
Optimum noise and distortion values.
Remote-control command:
SOURce:VOLTage:RANGe AUTO
Fix The analog hardware is permanently set to the
specified maximum voltage. The actual output
voltage is obtained by controlling the level of the D/A
converter; the analog hardware settings remain
unchanged.
Advantage:
Faster level changes and better settling. Voltage
dips when switching over the attenuator are avoided
as no relays are connected.
Note:
This setting is ignored if the "Low-Distortion
Generator" option (R&S UPV-B1) is used. In this
case, level control is always performed according to
the Auto algorithm.
If the Volt Range = Fix setting is chosen for the
signal to noise measurement, the generator level
does indeed oscillate more rapidly, but in certain
cases the lowest possible noise level may not be
obtained. This restricts the dynamic response of the
signal to noise measurement.
Remote-control commands:
SOURce:VOLTage:RANGe FIX
SOURce:VOLTage:MAXimum <nu>
Max Voltage
Maximum value for the output voltage; prevents excessively high
voltage values from being entered inadvertently in the
Generator Function panel.
The voltage set in the Generator Function panel cannot be higher than
the voltage specified here.
The RMS for sinewave signals is entered, i.e. the maximum peak
value is higher by a factor of 2.
Remote-control command:
SOURce:VOLTage:MAXimum <nu>
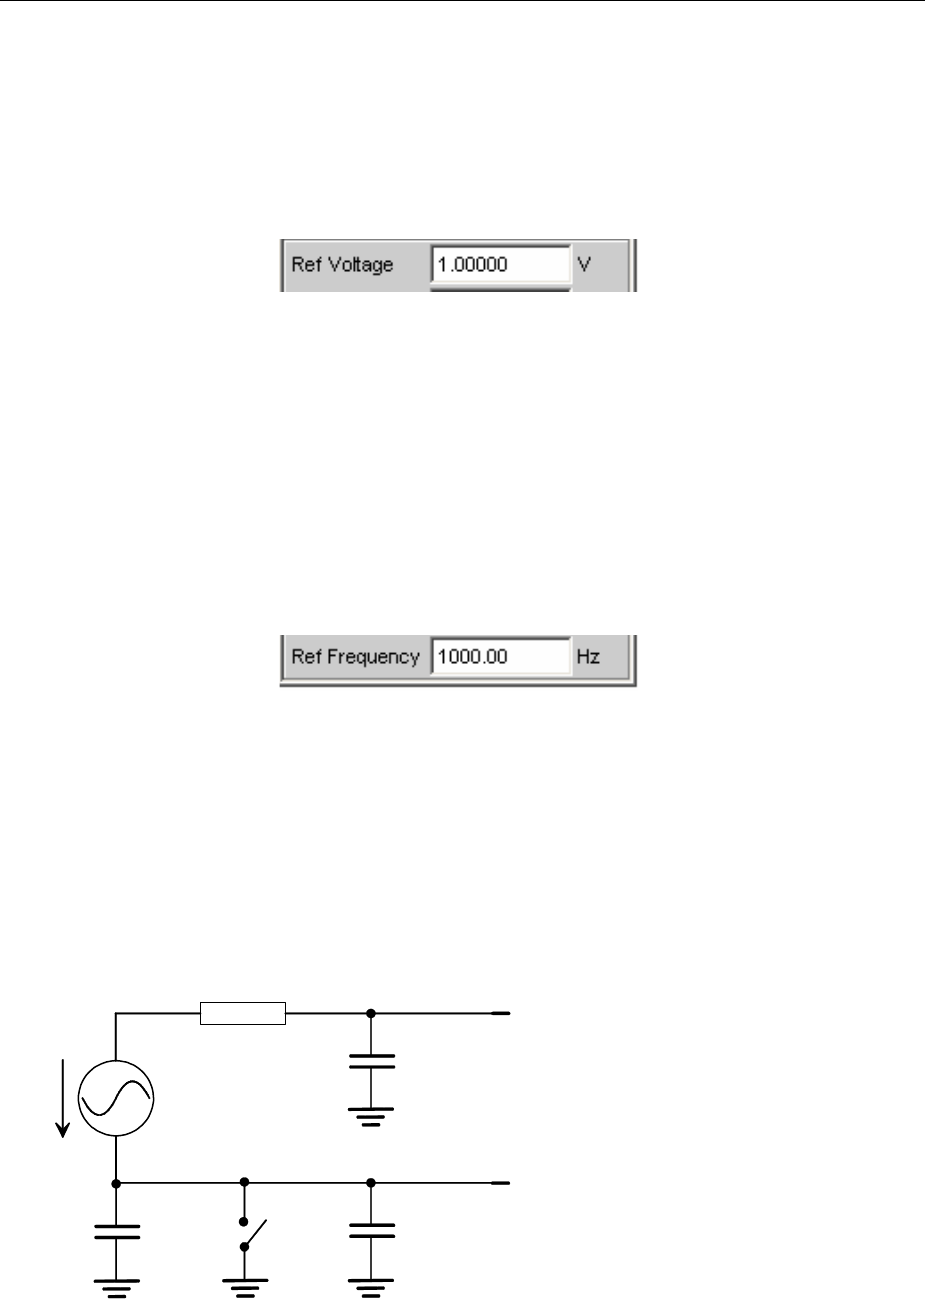
Configuring Analog Generator R&S UPV
1146.2084.32 4.8 E-9
Ref Voltage
Reference value for the relative voltage units.
Ifthe reference level is changed, all voltage settings linked to the
reference value also change. The relative voltage of the generator
signal remains unchanged.
By varying the reference voltage, a level sweep defined with relative
start and stop levels, for example, can be shifted by a constant "gain
factor".
Remote-control command:
SOURce:VOLTage:REFerence <nu>
Ref Frequency
Reference value for the relative frequency units.
If the reference frequency is changed, all frequency settings linked to
the reference value also change. The relative frequency of the
generator signal remains unchanged.
By varying the reference frequency, the fundamental of a distortion
spectrum set using a multi-sinewave, for example, can thus be shifted
without the harmonics having to be calculated and set again by the
user.
Remote-control command:
SOURce:FREQuency:REFerence <nu>
Generator Outputs
Each output of the analog R&S UPV generator can be configured differently (see the panel description
under "Channel", "Output Type", "Impedance" and "Common"). The circuit diagrams for the generator
output are shown below.
Unbalanced Output (Output Type "Unbal")
XLR
connector,
male
2
3
U
5
120 pF
120 pF
25 nF
Float / Ground
Figure 4-2 Unbalanced Output
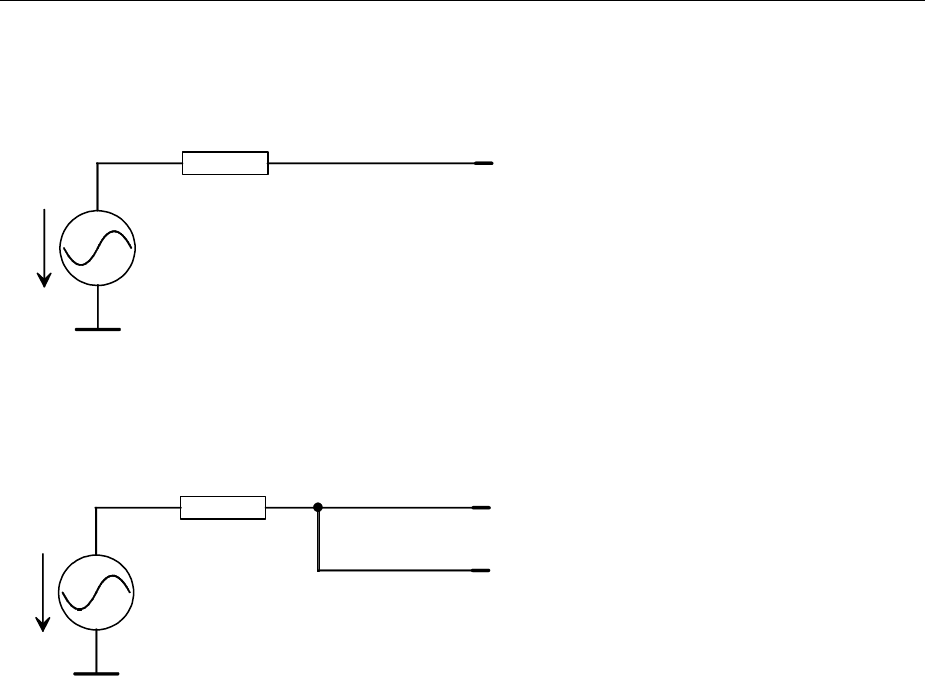
R&S UPV Configuring Analog Generator
1146.2084.32 4.9 E-9
The following output circuit configurations are available depending on the selected channel setting
(capacitors are not shown; the ground symbol denotes the floating generator ground connection):
U
5
Channel 1 or 2
Figure 4-3 Channel = 1 or 2
U
5
Channel 1
Channel 2
Figure 4-4 Channel = 2 M1
The selected output impedance is retained even if the output is deactivated; XLR Pin 3 is connected to
the generator ground.
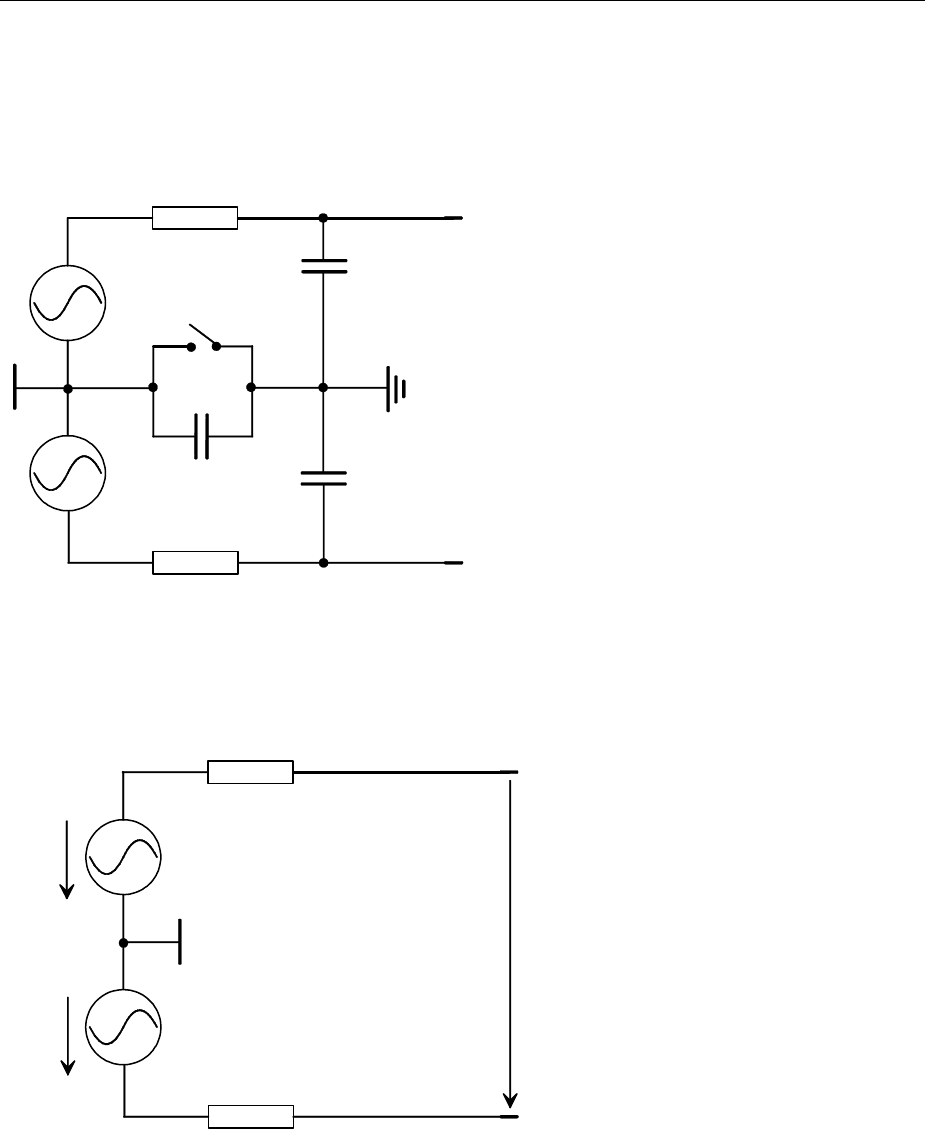
Configuring Analog Generator R&S UPV
1146.2084.32 4.10 E-9
Balanced Output (Output Type "Bal")
The balanced output signal is applied between Pin 2 and Pin 3 of the XLR plug. Pin 1 is not connected.
The source impedance consists of two identical resistors in both signal lines. In the diagrams, the
ground symbol with the single line represents the floating generator ground connection and the earth
symbol represents the R&S UPV housing ground connection.
1/2 Ri
XLR
connector,
male
2
3
120 pF
120 pF
2nF
1/2 Ri
Float / Ground
Figure 4-5 Balanced Output
The following output circuit configurations are available depending on the channel and impedance
(capacitors are not shown):
2
3
1/2 Ri
1/2 Ri
10 ,200 ,600
1/2U
1/2U
U
Figure 4-6 Channel = 1 or 2
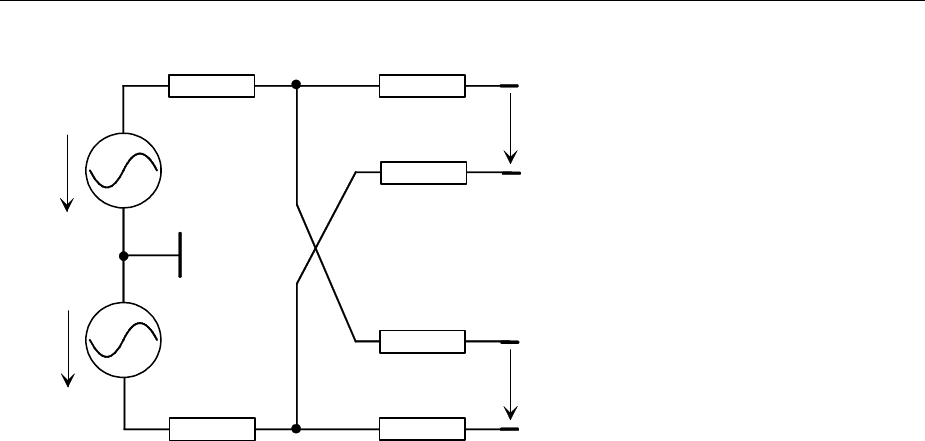
R&S UPV Configuring Analog Generator
1146.2084.32 4.11 E-9
5
2
3
10 (R = 0 )
200 (R = 95 )
600 (R = 295 )
1/2U
1/2U
U
5
R
R
U
2
3
R
R
Figure 4-7 Channel = 2 = 1
The selected output impedance is retained even if the output is deactivated. The deactivated generator
output is not connected to generator ground.
The diagrams above apply to all generator functions, except "Stereo Sine" and "DIM". The R&S UPV-
B3 option (Second Generator) is required if a stereo or DIM signal is to be generated. In this case, the
XLR plugs Ch1 and Ch2 are supplied slightly differently.
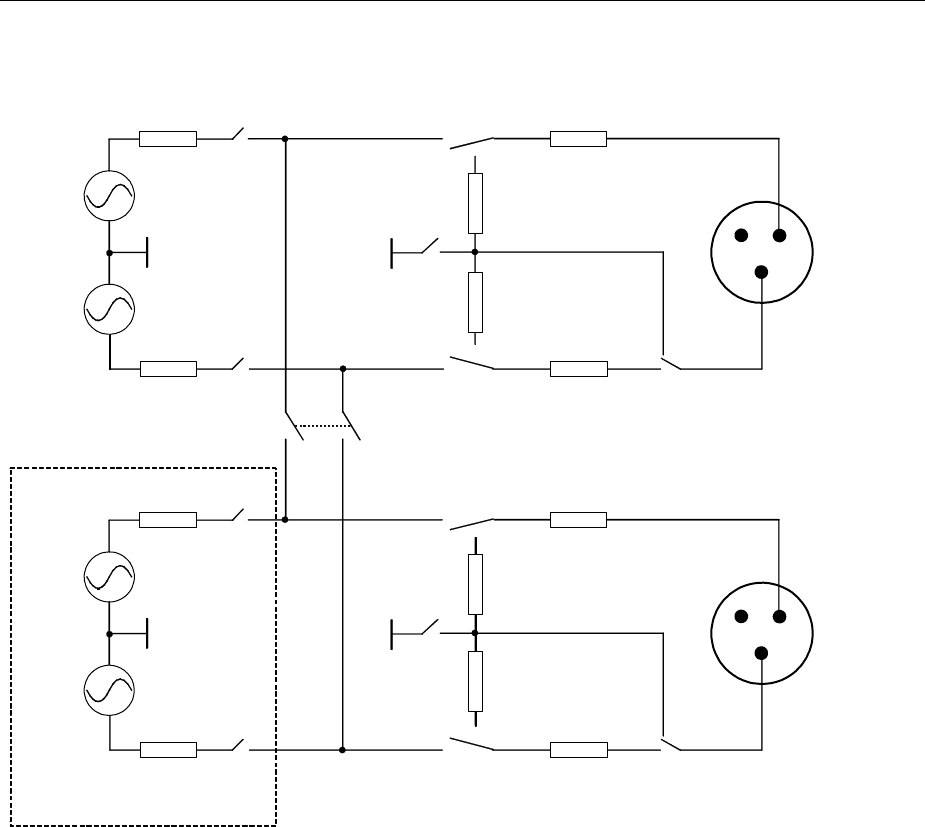
Configuring Analog Generator R&S UPV
1146.2084.32 4.12 E-9
If the R&S UPV-B3 option (Second Generator) is installed and the generator function "Stereo Sine"is
set, the XLR plugs of the outputs are connected as shown below:
5
5
Gen1
5
5
R
R
12
3
UNBAL
BAL
Ch1
5
5
Gen2
5
5
R
R
12
3
UNBAL
BAL
Ch2
Option UPV-B3
Figure 4-8 Connection of outputs with "Stereo Sine"
As can be seen in the circuit diagram, the two generator outputs are supplied by two independent
sources.
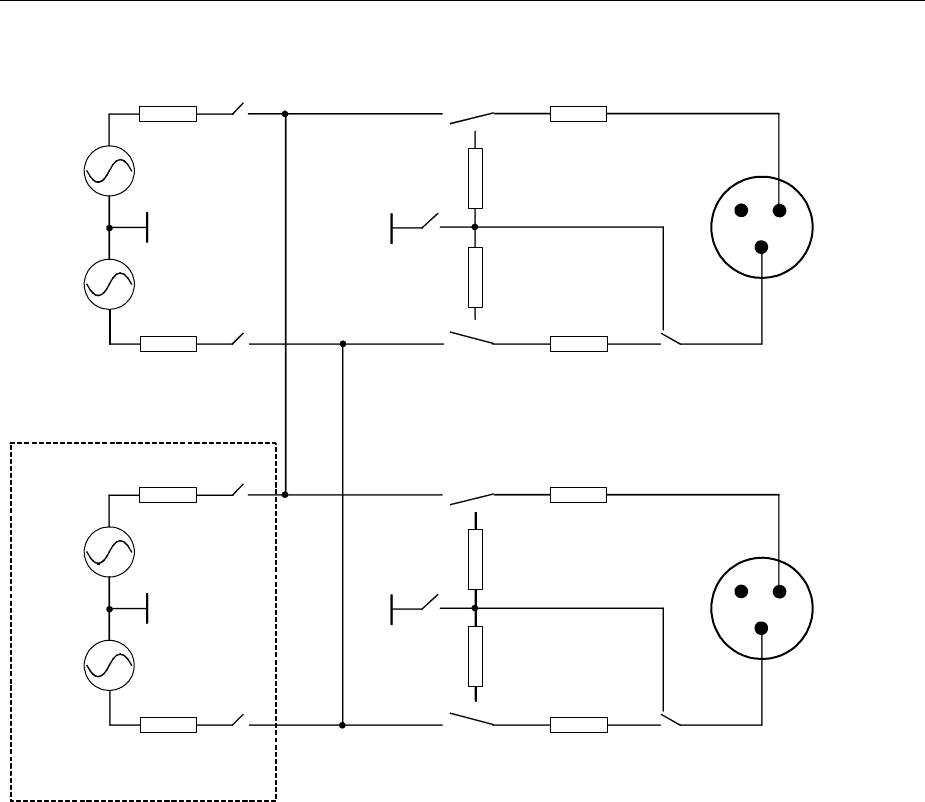
R&S UPV Configuring Analog Generator
1146.2084.32 4.13 E-9
If the R&S UPV-B3 option (Second Generator) is installed and the generator function "DIM"is set, the
XLR plugs of the outputs are connected as shown below:
5
5
Gen1
5
5
R
R
12
3
UNBAL
BAL
Ch1
5
5
Gen2
5
5
R
R
12
3
UNBAL
BAL
Ch2
Option UPV-B3
Figure 4-9 Connection of outputs with "DIM"
The two generator outputs are supplied by the R&S UPV-B3 option (Second Generator).
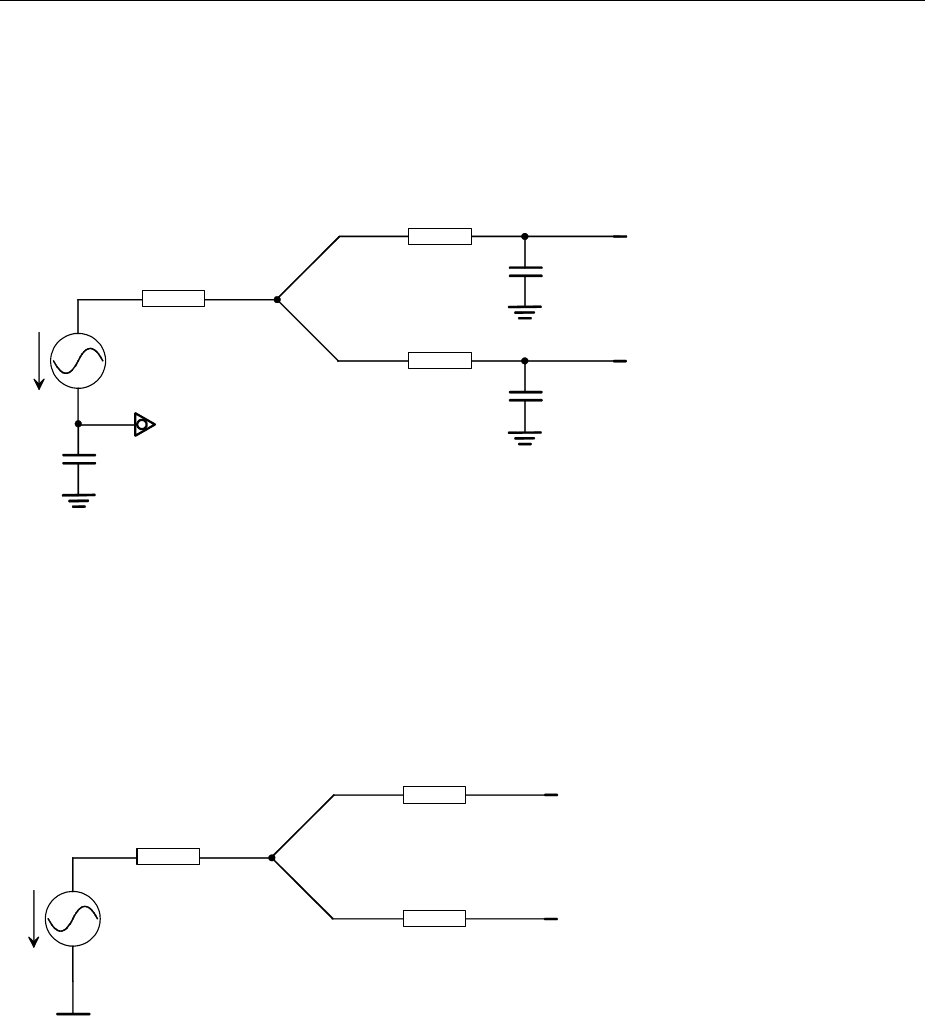
Configuring Analog Generator R&S UPV
1146.2084.32 4.14 E-9
Balanced Output with Common-Mode Signal (Output Type "Com Mode Test")
The generator output signal is present with equal phase at pins 2 and 3 of the XLR connectors. The
signal lines are referenced to the generator ground. The output impedance is made up of two identical
resistances in the two signal lines. The signal source is connected via a 5 Nresistance to the node
where the signal line branches into two.
XLR
connector
2
3
U
5120 pF
120 pF
2nF
1/2Ri
1/2Ri
Generator ground
Housing ground
Figure 4-10 Balanced Output with common mode signal
Depending on the selected channel/channels, the impedance and the waveform, various output
configurations are possible as shown below (capacitors not shown).
The common source impedance is 5 Nfor all configurations. The resistances designated ½ Ri
represent half the value of the set output impedance.
Channel 1 oder 2
XLR
connector
2
3
U
5
1/2Ri
1/2Ri
Gen1
(Gen2 at "DIM")
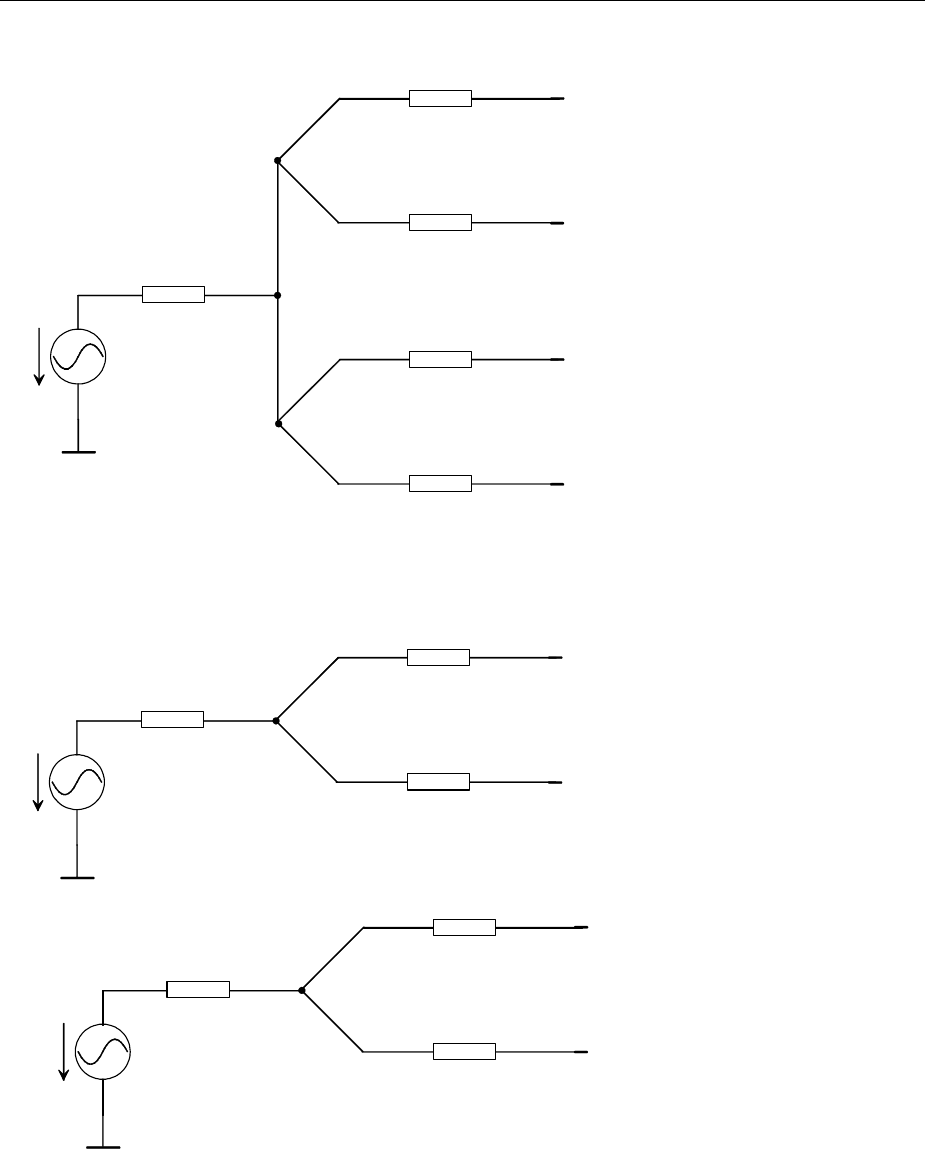
R&S UPV Configuring Analog Generator
1146.2084.32 4.15 E-9
Channel 2 81
2
3
U
5
1/2Ri
1/2Ri
Gen1
(Gen2 at "DIM")
Ch1
2
3
1/2Ri
1/2Ri
Ch2
If "Stereo Sine" is set in the Generator Function panel, the two generator outputs are fed by two
separate sources:
2
3
U
5
1/2Ri
1/2Ri
Gen1
2
3
U
5
1/2Ri
1/2Ri
Gen2
Ch1
Ch2
Configuring the Digital Generator R&S UPV
1146.2084.32 4.16 E-9
Output Power
The output amplifier, attenuator and all internal resistors are short-circuit-proof. The peak current value
is limited to approx. 200 mA. With a maximum RMS of 20 V (balanced) / 10 V (unbalanced), the
maximum power loss in the load resistor (in the case of a short-circuit in the internal resistor) is 2.8 W /
1.4 W.
Configuring the Digital Generator
Digital Generator Configuration Panel
The configuration settings for the digital audio generator are described below.
With digital audio interfaces, there are basically two signal types which occur: the analog interface
signal and the encoded audio signal itself. The digital interface signal has analog parameters on which,
for example, noise or other interference signals can be superimposed – this interference is also
noticeable as shifting of the signal edges. When this effect (known as "jitter") exceeds a certain
magnitude, it becomes impossible to decode or regenerate the audio signal correctly.
The R&S UPV can generate the various digital signal impairments: Shifting of the signal edges (jitter)
and superimposition of a common-mode voltage on the digital lines (common mode). The internal
analog generator is used for generating such interference signals.
Generating impairments require options R&S UPV-B2 and R&S UPV-K22.
Add Impairment
(with R&S UPV-B2 only)
Used to set whether impairments (jitter or a common-mode signal) are
to be added to the output signal of the digital audio generators: (see
also section "Digital Impairments Configuration Panel" on page 4.27).
ON
The impairment signal (jitter or common-mode) is
activated.
The analog generator is deactivated, since it is
used for generating the impairment signal.
Remote control commans:
SOURce:IMPairment ON
OFF
The impairment signal is deactivated.
Remote control command:
SOURce:IMPairment OFF
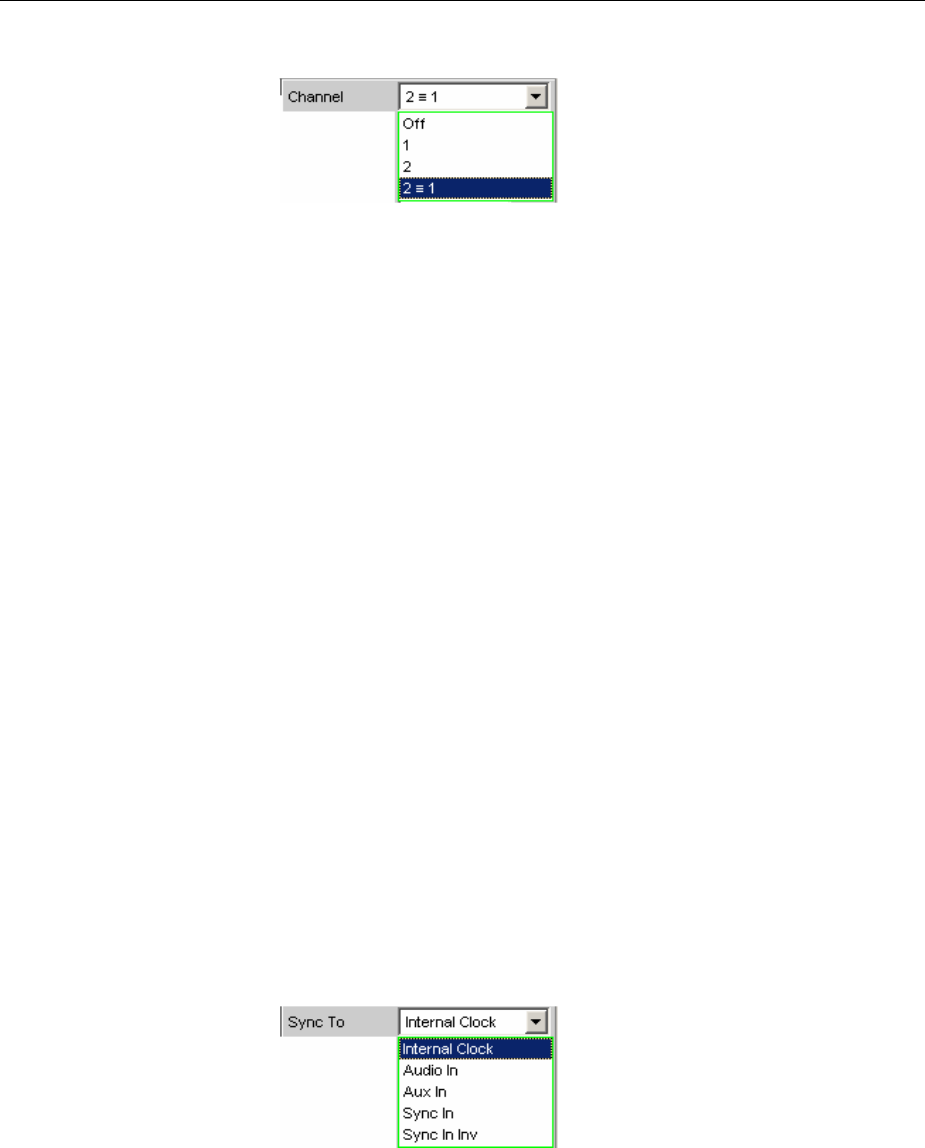
R&S UPV Configuring the Digital Generator
1146.2084.32 4.17 E-9
Channel
Used to select the digital audio channels left and right.
OFF Both channels are deactivated.
The frequency and level setting of the channels
have no effect.
An "empty frame" which does not contain any audio
data is generated.
Remote-control command:
OUTput:CHANnel OFF
1Only the left-hand channel supplies the generator
signal; the right-hand channel is deactivated.
Remote-control command:
OUTput:CHANnel CH1
2Only the right-hand channel supplies the generator
signal; the left-hand channel is deactivated.
Remote-control command:
OUTput:CHANnel CH2
2 = 1 Both the left and right-hand channel supply the
same output signal.
If the generator function "Stereo Sine" is selected,
both channels may differ with regard to frequency,
phase and amplitude.
Remote-control command:
OUTput:CHANnel CH2Is1
Sync To
(with R&S UPV-B2 only)
Used to select the source to which the digital audio generator is
synchronized.
Internal CLK The generator is synchronized to the internal clock
generator.
The clock frequency is determined by the sample
frequency setting.
Remote-control command:
SOURce:SYNC:TO INTClock
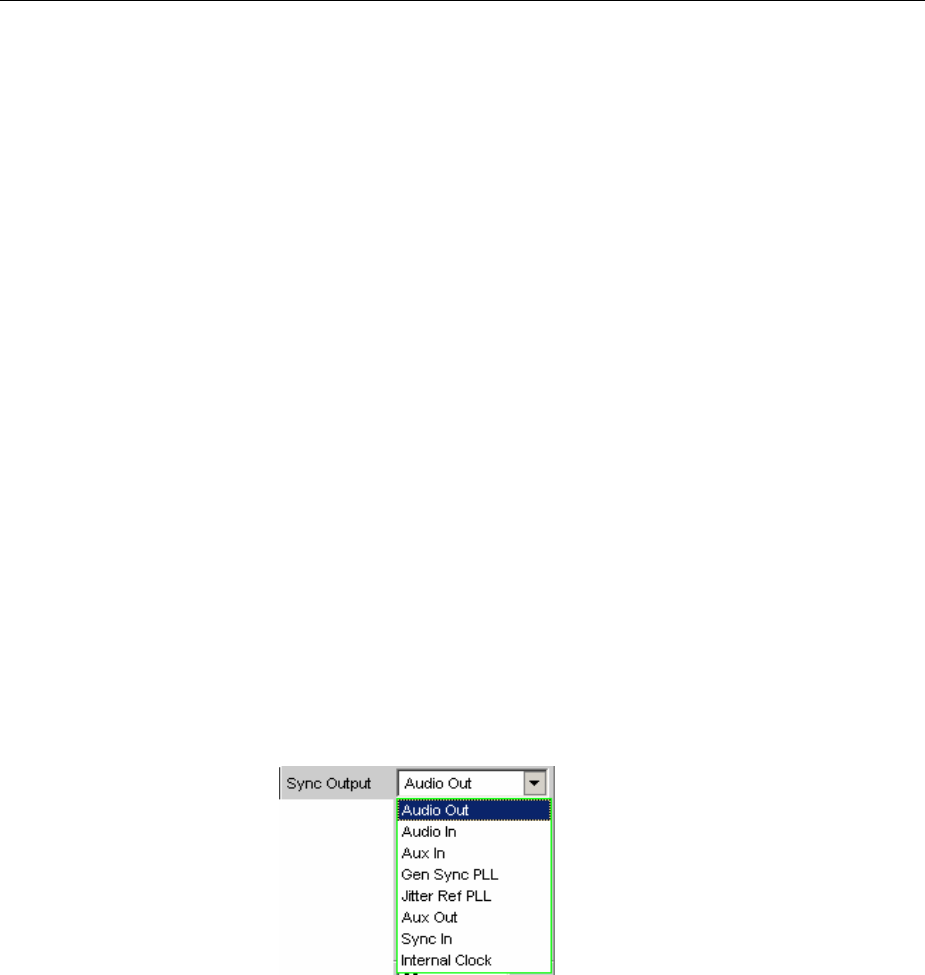
Configuring the Digital Generator R&S UPV
1146.2084.32 4.18 E-9
Audio In Synchronization to the digital audio input signal.
Remote-control command:
SOURce:SYNC:TO AINPut
Aux In Synchronization to the digital audio signal at the
AUX input XLR socket at the rear of the instrument.
Remote-control command:
SOURce:SYNC:TO AUXinput
Sync In Synchronization to the word-clock signal at the
SYNC input BNC socket at the rear of the
instrument. The generator sync PLL is used.
Remote-control command:
SOURce:SYNC:TO SINPut
Sync In inv Synchronization to the inverted word-clock signal at
the SYNC input BNC socket at the rear of the
instrument.
Remote-control command:
SOURce:SYNC:TO SINVinput
Sync Output
(with R&S UPV-B2 only)
Used to select the source for the digital audio sync output at the rear
of the instrument.
"Sync Out Type" can be set to either Word Clock or Biphase Clock
(the frequency of the biphase clock is 128 times that of the word
clock).
Audio Out Clock signal of the digital audio generator. Always
the same as the clock rate of the digital audio output
on the front panel.
If "Jitter" is set, jitter is applied to this output.
Remote-control command:
OUTPut:SYNC:OUTPut ADOutput
Audio In Clock signal of the selected digital audio input on the
front panel.
Remote-control command:
OUTPut:SYNC:OUTPut ADINput

R&S UPV Configuring the Digital Generator
1146.2084.32 4.19 E-9
Aux In Clock signal of the digital audio auxiliary input at the
rear of the instrument.
Remote-control command:
OUTPut:SYNC:OUTPut AXINput
Gen Sync PLL Clock signal at the output of the generator sync PLL.
Allows the frequency of a word clock applied at the
sync input to be increased by a factor of 128.
If "Jitter" is set, the set jitter is not applied to this
output.
See setting of the generator sampling rate.
Remote-control command:
OUTPut:SYNC:OUTPut GSYPll
Jitt Ref PLL Clock signal at the output of the jitter reference PLL.
Allows a low-jitter clock to be recovered from the
digital audio input signal.
See setting of the digital audio analyzer sampling
rate.
Remote-control command:
OUTPut:SYNC:OUTPut JRFPll
Aux Out Clock signal of the digital audio auxiliary generator.
This generator is used e.g. for the frame phase
setting and the reclock function.
Remote-control command:
OUTPut:SYNC:OUTPut AXOutput
Sync In Loop-through option of the digital audio sync input,
e.g. for cascading several instruments which
synchronize to the word clock.
Remote-control command:
OUTPut:SYNC:OUTPut SYINput
Internal Clk Output signal of the internal clock source.
If the digital audio generator is not synchronized to
the internal clock, the internal clock is available as
an independent clock source and is set using the
selection parameter "Int Clk Freq".
Remote-control command:
OUTPut:SYNC:OUTPut INTClock
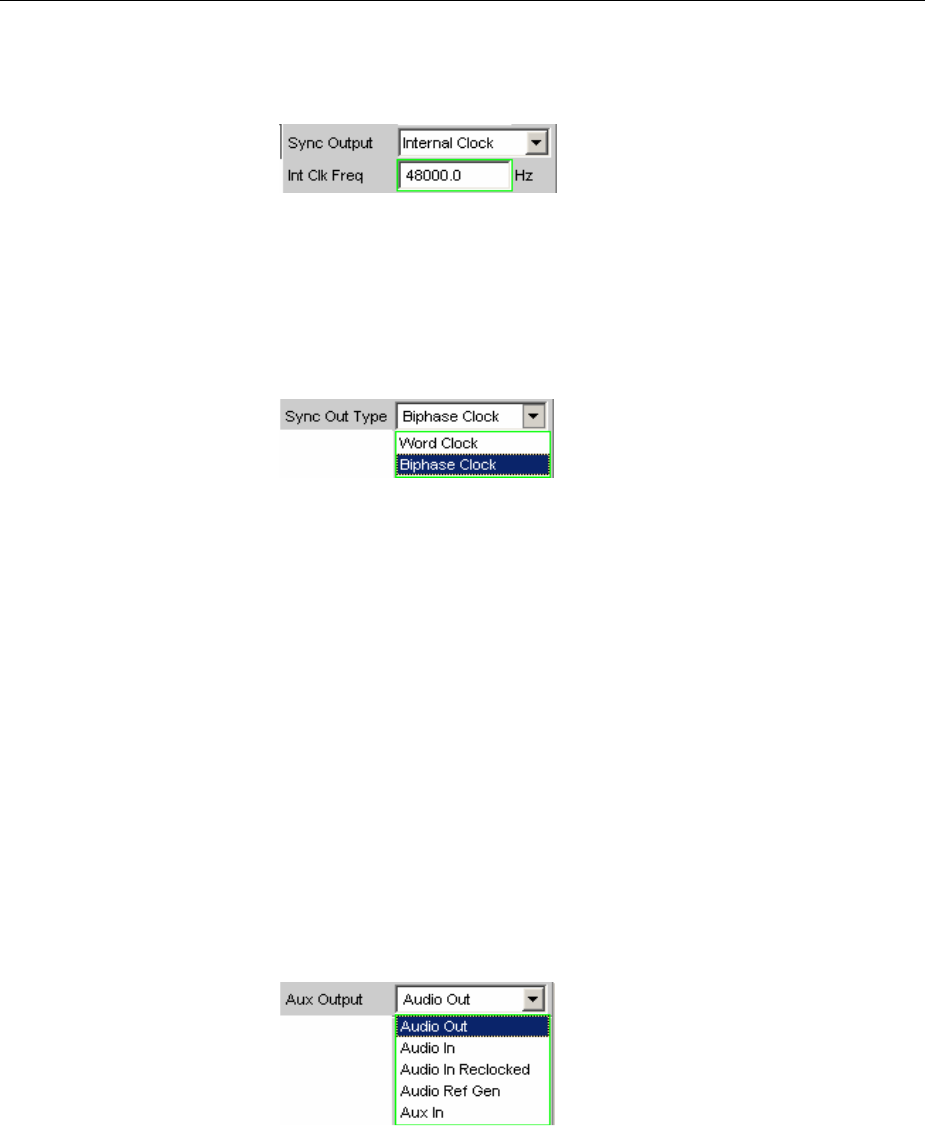
Configuring the Digital Generator R&S UPV
1146.2084.32 4.20 E-9
Int Clk Freq
(with R&S UPV-B2 only)
Used to set the (word-clock) frequency of the internal clock generator
ifthe internal clock generator is used as an independent clock source
at the digital audio sync output.
Remote-control command:
OUTPut:INTClockfreq <nu>
Sync Out Type
(with R&S UPV-B2 only)
"Sync Out Type" can be set to either Word Clock or Biphase Clock
(the frequency of the biphase clock is 128 times that of the word
clock).
Word CLK The signal of the digital audio sync output
corresponds to the sampling frequency of the
selected source.
Remote-control command:
OUTPut:SYNC:TYPE WCLock
Biphase CLK The signal of the digital audio sync output
corresponds to the biphase clock, i.e. 128 times the
sampling frequency of the selected source. The
biphase clock is often used for direct clocking of the
digital audio modules.
Remote-control command:
OUTPut:SYNC:TYPE BCLock
Aux Output
(with R&S UPV-B2 only)
Used to select the source for the digital audio auxiliary output at the
rear of the instrument.

R&S UPV Configuring the Digital Generator
1146.2084.32 4.21 E-9
Audio Out The digital audio generator signal at the auxiliary
output is identical to the signal at the front output.
The signal output level is constant and does not
depend on the selected BAL / UNBAL output level.
The long cable simulator and common-mode
superimposition have no effect on this output.
If a jitter is set, it will also affect this output.
Remote-control command:
OUTPut:AUXiliary AOUTput
Audio In Loop-through option of the digital audio signal from
the selected input to the digital audio auxiliary
output.
The signal output level is constant and does not
depend on the selected input or the pulse amplitude
at the digital input.
Remote-control command:
OUTPut:AUXiliary AINPut
Audio In
Reclocked
The jitter-reduced input signal is output.
The audio data content is extracted from the input
signal and output again via the digital audio auxiliary
generator. This generator is controlled using the low-
jitter clock from the jitter reference PLL.
Remote-control command:
OUTPut:AUXiliary AINReclock
Audio Ref Gen Here, the digital audio auxiliary generator is used as
the reference generator for the frame phase setting
of the digital audio generator.
If this setting is selected, it is then possible to set a
frame phase and select the reference generator
data.
This setting cannot be selected if the digital
generator is synchronized to the sync input.
Remote-control command:
OUTPut:AUXiliary RGENerator
Aux In Loop-through option of the digital audio auxiliary
input, e.g. for cascading several instruments.
Remote-control command:
OUTPut:AUXiliary AUXin
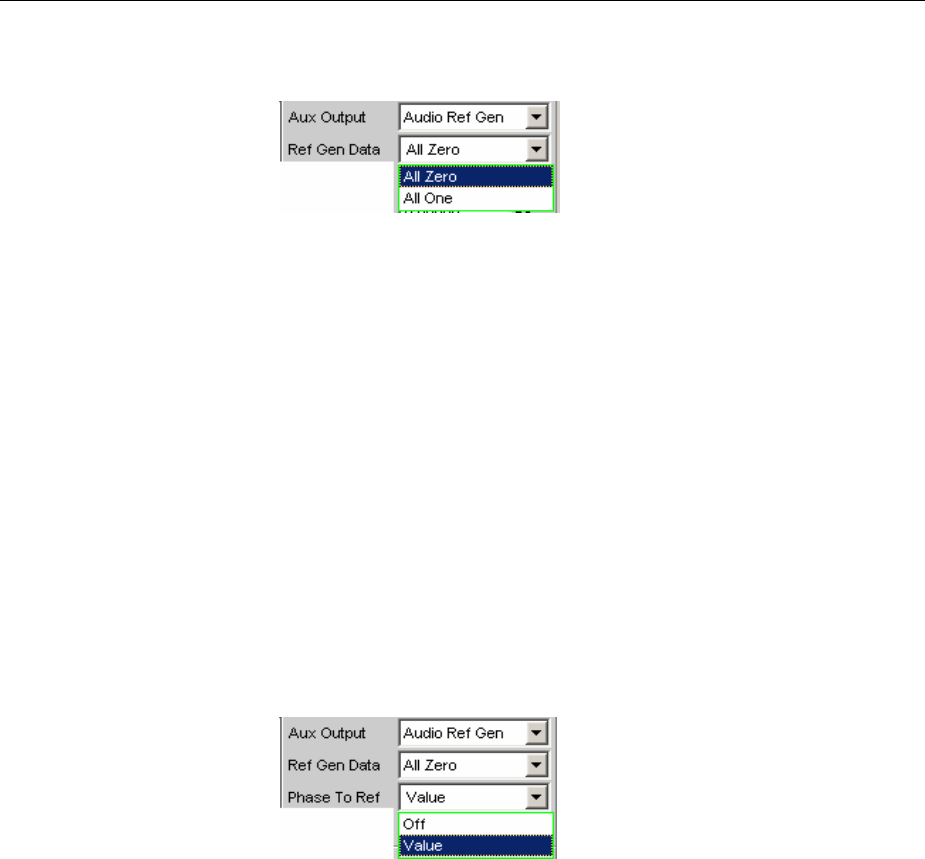
Configuring the Digital Generator R&S UPV
1146.2084.32 4.22 E-9
Ref Gen Data
(with R&S UPV-B2 only)
If "Audio Ref Gen" is selected as the "Aux Output" source, it is then
possible to configure the audio data for this reference generator.
All Zero All audio data bits are set to zero.
An "empty frame" is output (this is normally the
case).
Remote-control command:
SOURce:REFerence AZERo
All One To allow digital audio receivers to be tested, the
audio data bits can all be set to one.
Remote-control command:
SOURce:REFerence AONE
Phase To Ref
(with R&S UPV-B2 only)
If "Audio Ref Gen" is selected as the "Aux Output" source, it is then
possible to vary the frame phase offset of the digital audio signal
between the front output and the digital audio AUX output at the rear
of the instrument.
The phase is shifted internally using the generator sync PLL.
Off "Phase To Ref" variation is deactivated.
Here, the generator sync PLL is bypassed, which
generally results in an improvement of the clock for
the digital audio generator.
Remote-control command:
SOURce:PTORef OFF
Value Aframe phase shift is activated and an appropriate
setting value can be entered.
Remote-control command:
SOURce:PTORef VALue
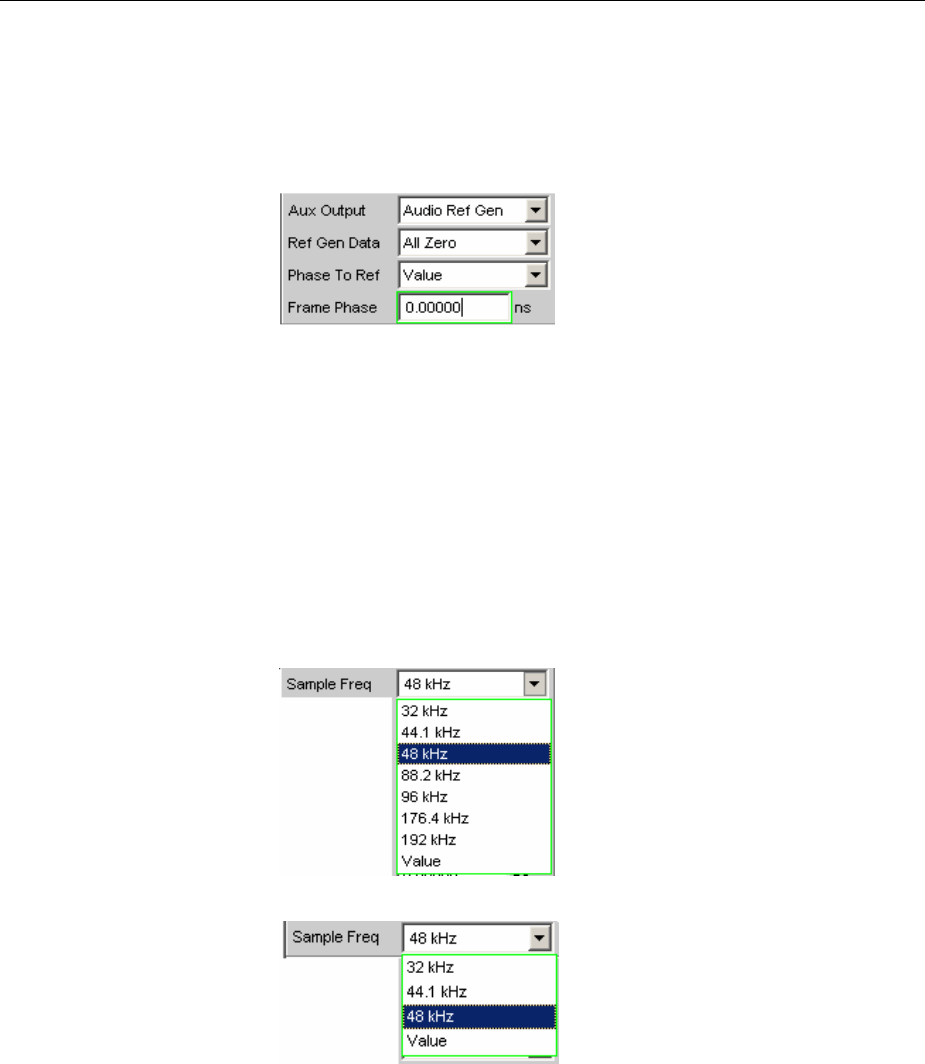
R&S UPV Configuring the Digital Generator
1146.2084.32 4.23 E-9
Frame Phase
(with R&S UPV-B2 only)
Used to enter the value for the desired frame phase shift.
The value can be entered in various units.
The maximum variation range for the shift always corresponds to a
phase shift of +/- 180° relative to the frame phase of the reference
generator.
The generator sync PLL is used for generating the phase shift.
Remote-control command:
SOURce:FRAMephase <nu>
Sample Frequency
Used to set the clock rate of the digital audio signal for the generator.
The sample frequency setting is used as a reference whenever audio
data signals are generated.
With "Common Only" and "Jitter Only" generation (with R&S UPV-B2
only), this setting therefore determines the clock rate of the generated
empty frame.
The selected clock rate determines the maximum signal frequency
which can be input. For sinus signals this is 49.9% of the sampling
rate.
R&S UPV-B2:
R&S UPV-B20:
If the entered sample frequency is not the same as the actual clock
rate (e.g. with external synchronization), the frequency of all audio
data signals is shifted accordingly.
This setting is also used to select the correct range for the generator
sync PLL.
Value range for numeric entries:
30 kHz to 200 kHz (30 to 55 kHz with R&S UPV-B20)
Standard sampling frequencies can be set directly in the selection
field.

Configuring the Digital Generator R&S UPV
1146.2084.32 4.24 E-9
Only R&S UPV-B2:
Synchronization ranges for the generator sync PLL:
30 kHz to 64 kHz (base rate range)
65 kHz to 128 kHz (high rate range)
129 kHz to 200 kHz (extended rate range)
If "Audio In" is selected as the synchronization in the "Sync To" line,
the generator can be set to the same sample frequency as the digital
analyzer by selecting "Sync to Anlr" from the "Sample Freq" line.
32 kHz Standard sampling rate 32 kHz
Remote-control command:
OUTPut:SAMPle:MODE F32
44.1 kHz Standard sampling rate 44.1 kHz
Remote-control command:
OUTPut:SAMPle:MODE F44
48 kHz Standard sampling rate 48 kHz
Remote-control command:
OUTPut:SAMPle:MODE F48
88.2 kHz Standard sampling rate 88.2 kHz
Remote-control command:
OUTPut:SAMPle:MODE F88
96 kHz Standard sampling rate 96 kHz
Remote-control command:
OUTPut:SAMPle:MODE F96
176.4 kHz Standard sampling rate 176.4 kHz
Remote-control command:
OUTPut:SAMPle:MODE F176
192 kHz Standard sampling rate 192 kHz
Remote-control command:
OUTPut:SAMPle:MODE F192
Sync To Anlr The sampling rate of the digital audio analyzer is
used for synchronization.
Remote-control command:
OUTPut:SAMPle:MODE SYNChron
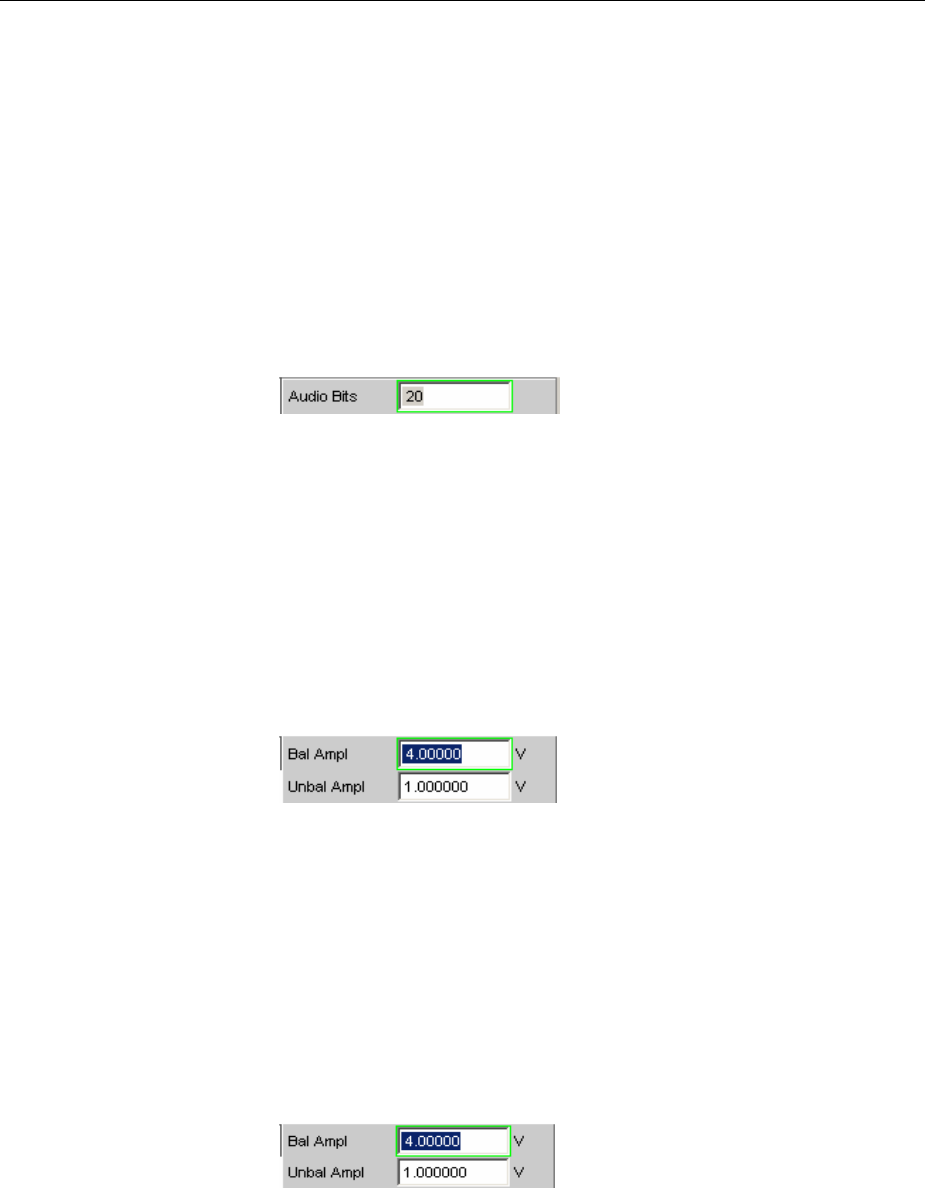
R&S UPV Configuring the Digital Generator
1146.2084.32 4.25 E-9
Value: Variable sampling rate entry
Remote-control command:
OUTPut:SAMPle:MODE VALue
OUTPut:SAMPle:FREQuency <nu>
Audio Bits
Wordwidth used by the digital audio generator for the Source Mode
"Audio Data".
If the wordwidth is reduced, the values of the audio samples are
rounded off to the specified wordwidth. Unused data bits are encoded
as zeroes in the digital audio signal.
Value range: 8 to 24
Remote-control command:
OUTPut:AUDiobits <n>
Bal Ampl
Used to set the pulse amplitude of the digital audio signal at the BAL
(XLR) output. The set voltage corresponds to the peak-to-peak value
of the pulse amplitude when the output is terminated with the nominal
impedance (110 Ohm)
The standard voltage is 4 V
Setting range: 0 V to 8.5 V
This voltage is linked to the setting for the UNBAL amplitude and is
always 4 times higher than this amplitude.
Remote-control command:
OUTPut:SIGNal:BALanced:LEVel <nu>
Unbal Ampl
Used to set the pulse amplitude of the digital audio signal at the
UNBAL (BNC) output. The set voltage corresponds to the peak-to-
peak value of the pulse amplitude when the output is terminated with
the nominal impedance (75 Ohm)
The standard voltage is 1 V
Setting range: 0 V to 2.125 V
This voltage is linked to the setting for the BAL amplitude and is
always a quarter of this amplitude.
Remote-control command:
OUTPut:SIGNal:LEVel <nu>

Configuring the Digital Generator R&S UPV
1146.2084.32 4.26 E-9
Unbal Output
The unbalanced output can be switched so that the digital audio signal
ofthe selected BAL or UNBAL input is output. If the BAL input is
selected, the balanced signal is converted into an unbalanced signal.
The signal at the BAL input can then be monitored conveniently e.g.
on a connected oscilloscope.
Audio Out The digital audio generator signal is output.
Remote-control command:
OUTPut:UNBalanced:OUTPut AOUTput
Audio In The digital audio signal from the selected BAL or
UNBAL input is output.
It is not possible to output the signal of the optical
input in this case.
The pulse amplitude setting and the cable simulator
do not have any effect on this output.
Remote-control command:
OUTPut:UNBalanced:OUTPut AINPut
Cable Sim
Cable simulation used to check the effect of attenuated input signals
along long cables when tests are performed on digital audio receivers.
Acable length of approx. 100 m is simulated.
Off Cable simulation is deactivated.
Remote-control command:
OUTPut:CSIMulator OFF
Long Cable simulation for the BAL and UNBAL outputs is
activated.
Remote-control command:
OUTPut:CSIMulator SIMLong
Ref Voltage
Reference value for the relative amplitude units.
If the reference value is changed, all amplitude settings linked to the
reference value also change.
Remote-control command:
SOURce:VOLTage:REFerence <nu>
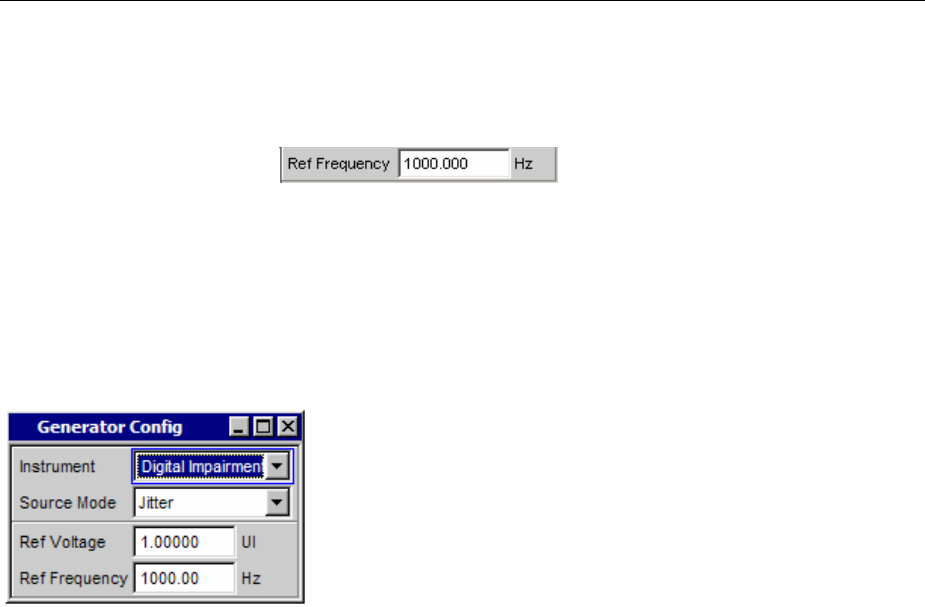
R&S UPV Configuring the Digital Generator
1146.2084.32 4.27 E-9
Ref Frequency
Reference value for the relative frequency units.
If the reference frequency is changed, all frequency settings linked to
the reference value also change.
Remote-control command:
SOURce:FREQuency:REFerence <nu>
Digital Impairments Configuration Panel
The digital impairment configuration panel requires option R&S UPV-B2.
This panel is used to select the digital impairment signal - jitter or
common-mode - which can be added to the output signal of the
digital audio generator. The parameters of the signals are set in
the generator function panel.
The impairments are activated or deactivated in the Digital Audio
Generator Config panel.
Source Mode
Used to set whether jitter or a common-mode signal is generated.
Jitter
Adigital audio signal with jitter for tests on digital audio receivers can
be generated.
The value of the jitter and delay impairment is normally specified in UI
(Unit Interval). One UI is defined as the smallest pulse width of the
digital audio signal (eye width) and does not depend on the selected
sampling rate. One UI corresponds to the clock period with which the
digital signal is clocked ("biphase clock"). With digital audio signals,
one UI corresponds to the 128th part of the sampling period; at
48 kHz, one UI is 163 approx. ns.
Remote control command:
SOURce:SRCMode JITTer
Common
Adigital audio signal with superimposition of a common-mode signal
at the BAL output can be generated.
Balanced cables are also used for the digital audio signal links. Here,
coupled impairments (e.g. from ground loops) occur as common-
mode voltage at the interfaces.
Remote control command:
SOURce:SRCMode COMMon
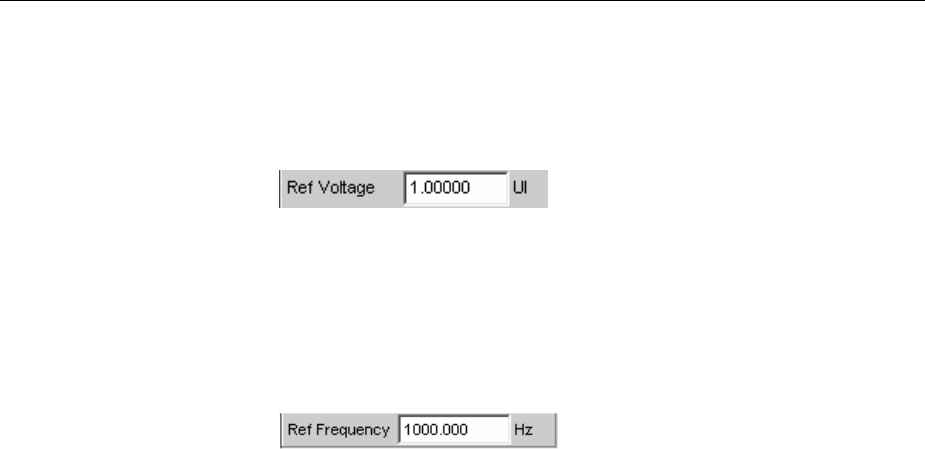
Configuring the Digital Generator R&S UPV
1146.2084.32 4.28 E-9
Ref Voltage
Reference value for the relative amplitude units.
The unit for the reference value corresponds to the selected source
mode (e.g. UI in the source mode "Jitter").
If the reference value is changed, all amplitude settings linked to the
reference value also change.
Remote-control command:
SOURce:VOLTage:REFerence <nu>
Ref Frequency
Reference value for the relative frequency units.
If the reference frequency is changed, all frequency settings linked to
the reference value also change.
Remote-control command:
SOURce:FREQuency:REFerence <nu>
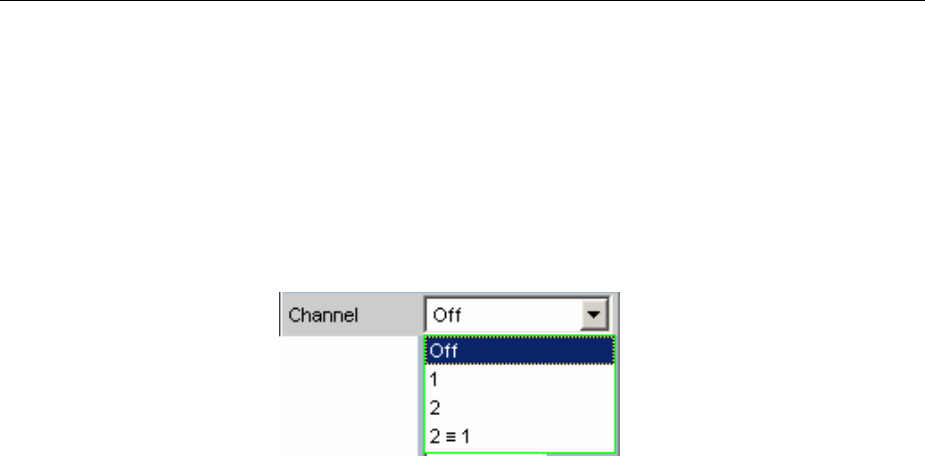
R&S UPV Configuring the I2S Generator
1146.2084.32 4.29 E-9
Configuring the I2SGenerator
I2SGenerator Configuration Panel
The Config panel is used to set the analog and digital generator. The configuration options for the I2S
generator are described below.
Channel
Used to select the digital audio channels left (Ch1) and right (Ch2).
OFF Both channels are deactivated.
The frequency and level setting of the channels have
no effect.
An "empty frame" that does not contain any audio data
(all bits = zero) is generated.
Remote-control command:
OUTPut:CHANnel OFF
1Only the left channel supplies the generator signal; the
right channel is deactivated (all bits = zero).
Remote-control command:
OUTPut:CHANnel CH1
2Only the right channel supplies the generator signal;
the left channel is deactivated (all bits = zero).
Remote-control command:
OUTPut:CHANnel CH2
281Both the left and right channels supply the same
output signal.
If the generator function "Stereo Sine" is selected, the
two may differ with regard to frequency, phase and
amplitude.
Remote-control command:
OUTPut:CHANnel CH2Is1

Configuring the I2S Generator R&S UPV
1146.2084.32 4.30 E-9
Sync To
Used to select the source to which the I2Sgenerator is synchronized.
Intern The generator uses the internal clock.
Remote-control command:
SOURce:DIGital:SYNC:TO INTern
Extern
Masterclk
Synchronization to the applied master clock signal at
the rear TX CLK IN connector.
Remote-control command:
SOURce:DIGital:SYNC:TO EXTMasterclock
Extern
Wordclk
Synchronization to the applied word clock signal at the
rear TX CLK IN connector.
Remote-control command:
SOURce:DIGital:SYNC:TO EXTWordclock
Word Length
Word length of a data frame for each channel.
Value range: 16, 24, 32.
16 bit Word length 16 bits
Remote-control command:
OUTPut:WLENgth W16
24 bit Word length 24 bits
Remote-control command:
OUTPut:WLENgth W24
32 bit Word length 32 bits
Remote-control command:
OUTPut:WLENgth W32
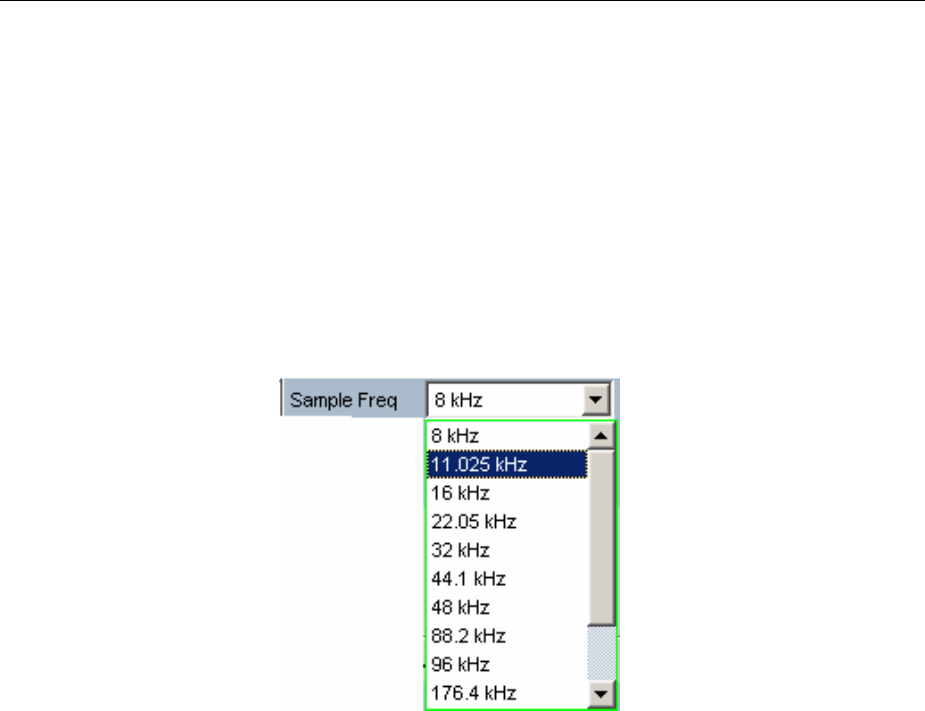
R&S UPV Configuring the I2S Generator
1146.2084.32 4.31 E-9
Sample Frequency
Used to set the sampling frequency.
The sampling frequency corresponds to the frequency of the FSYNC
signal. All frequency information of generated audio data are with
reference to this setting. If the I2Sgenerator is operated with external
wordclock synchronization and the frequency of the external clock
signal does not correspond to the set sampling frequency, the I2S
generator generates audio data with an incorrect frequency. Even with
external masterclock synchronization, the external clock signal must
correspond to the set sampling frequency multiplied by the selected
MClk ratio. Otherwise, the I2Sgenerator also generates audio data with
an incorrect frequency.
The selected clock rate determines the maximum signal frequency
which can be input. For sinus signals this is 49.9% of the sampling rate.
Value range for numeric entry:
6.75 kHz to 410 kHz
Standard sampling frequencies can be set directly in the selection field.
8kHz Standard sampling rate 8 kHz
Remote-control command:
OUTPut:SAMPle:MODE F08
11.025 kHz Standard sampling rate 11.025 kHz
Remote-control command:
OUTPut:SAMPle:MODE F11
16 kHz Standard sampling rate 16 kHz
Remote-control command:
OUTPut:SAMPle:MODE F16
22.05 kHz Standard sampling rate 22.05 kHz
Remote-control command:
OUTPut:SAMPle:MODE F22

Configuring the I2S Generator R&S UPV
1146.2084.32 4.32 E-9
32 kHz Standard sampling rate 32 kHz
Remote-control command:
OUTPut:SAMPle:MODE F32
44.1 kHz Standard sampling rate 44.1 kHz
Remote-control command:
OUTPut:SAMPle:MODE F44
48 kHz Standard sampling rate 48 kHz
Remote-control command:
OUTPut:SAMPle:MODE F48
88.2 kHz Standard sampling rate 88.2 kHz
Remote-control command:
OUTPut:SAMPle:MODE F88
96 kHz Standard sampling rate 96 kHz
Remote-control command:
OUTPut:SAMPle:MODE F96
176.4 kHz Standard sampling rate 176.4 kHz
Remote-control command:
OUTPut:SAMPle:MODE F176
192 kHz Standard sampling rate 192 kHz
Remote-control command:
OUTPut:SAMPle:MODE F192
384 kHz Standard sampling rate 384 kHz
Remote-control command:
OUTPut:SAMPle:MODE F384
Value: Variable sampling rate entry
Remote-control commands:
OUTPut:SAMPle:MODE VALue
OUTPut:SAMPle:FREQuency <nu>
BClk Freq
Bitclock frequency display. This is calculated from the product of Word
Length / Sample Freq.
Value range: 216 kHz ... 26.24 MHz
Remote control command:
OUTPut:BCLk:FREQuency?

R&S UPV Configuring the I2S Generator
1146.2084.32 4.33 E-9
MClk Ratio
Ratio between MCLK and FSYNC.
Value range: 64, 96, 128, 192, 256, 512
The value range is limited by word length and sampling frequency.
Word Length 16 bit, Sync To Intern:
Sampling frequency Selectable MClk ratio
6.75 kHz to 108 kHz 64, 128, 256, 512
>108 kHz to 216 kHz 64, 128, 256
>216 kHz to 410 kHz 64, 128
Word Length 24 bit, Sync To Intern:
Sampling frequency Selectable MClk ratio
6.75 kHz to 108 kHz 96, 192, 384
>108 kHz to 216 kHz 96, 192
Word Length 32 bit, Sync To Intern:
Sampling frequency Selectable MClk ratio
6.75 kHz to 108 kHz 128, 256, 512
>108 kHz to 216 kHz 128, 256
>216 kHz to 410 kHz 128
Word Length 16 bit, Sync To Extern Masterclk:
Sampling frequency Selectable MClk ratio
6.75 kHz to 108 kHz 128, 256, 512
>108 kHz to 216 kHz 128, 256
>216 kHz to 410 kHz 128
Word Length 24 bit, Sync To Extern Masterclk:
Sampling frequency Selectable MClk ratio
6.75 kHz to 108 kHz 192, 384
>108 kHz to 216 kHz 192

Configuring the I2S Generator R&S UPV
1146.2084.32 4.34 E-9
Word Length 32 bit, Sync To Extern Masterclk:
Sampling frequency Selectable MClk ratio
6.75 kHz to 108 kHz 128, 256, 512
>108 kHz to 216 kHz 128, 256
>216 kHz to 410 kHz 128
Word Length 16 bit, Sync To Extern Wordclk:
Sampling frequency Selectable MClk ratio
6.75 kHz to 108 kHz 64, 128, 256, 512
>108 kHz to 216 kHz 64, 128, 256
>216 kHz to 410 kHz 64, 128
Word Length 24 bit, Sync To Extern Wordclk:
Sampling frequency Selectable MClk ratio
6.75 kHz to 108 kHz 96, 192, 384
>108 kHz to 216 kHz 96, 192
Word Length 32 bit, Sync To Extern Wordclk:
Sampling frequency Selectable MClk ratio
6.75 kHz to 108 kHz 128, 256, 512
>108 kHz to 216 kHz 128, 256
>216 kHz to 410 kHz 128
64 64 times the sampling rate (with word length 16 bits)
Remote-control command:
OUTPut:MCLKratio M64
96 96 times the sampling rate (with word length 24 bits)
Remote-control command:
OUTPut:MCLKratio M96
128 128 times the sampling rate (with word length 16 and
32 bits)
Remote-control command:
OUTPut:MCLKratio M128
192 192 times the sampling rate (with word length 24 bit)
Remote-control command:
OUTPut:MCLKratio M192
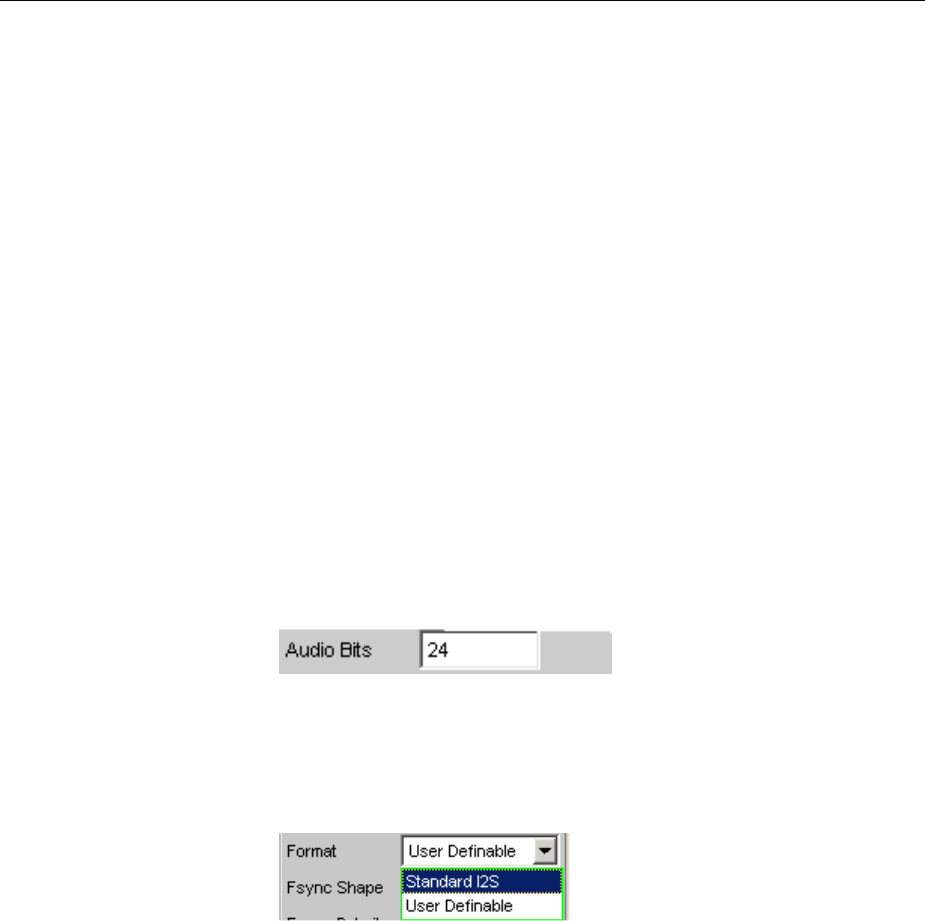
R&S UPV Configuring the I2S Generator
1146.2084.32 4.35 E-9
256 256 times the sampling rate (with word length 16 and
32bit)
Remote-control command:
OUTPut:MCLKratio M256
384 384 times the sampling rate (with word length 24 bits)
Remote-control command:
OUTPut:MCLKratio M384
512 512 times the sampling rate (with word length 16 and
32 bits)
Remote-control command:
OUTPut:MCLKratio M512
Audio Bits
Resolution of audio data within a frame.
If the resolution is reduced, the values of the audio samples are
rounded off to the specified word length. Unused data bits are encoded
as zeroes in the digital audio signal.
Value range: 8 ... "Word Length"
Remote-control command:
OUTPut:AUDiobits <n>
Format
Selection of the I2Sgenerator function.
Standard I2S The I2Sgenerator transmits in the standard I2Sformat.
The following parameters are assigned a fixed default:
Fsync Shape Square Pulse
Fsync Polarity Left(1) = Low
Word Offset -1
Remote-control command:
OUTPut:FORMat SI2S

Configuring the I2S Generator R&S UPV
1146.2084.32 4.36 E-9
User-
definable
Der I2Sgenerator transmits in I2S-like format. The
following format-influencing parameters are
additionally available:
Fsync Shape
Fsync Polarity
Word Offset
Remote-control command:
OUTPut:FORMat USER
Fsync Shape
Selection of the FSYNC signal form.
Square Pulse The FSYNC signal is transmitted as a symmetrical
rectangle.
Remote-control command:
OUTPut: FSHape SQU
Bit Pulse The FSYNC signal is transmitted as a bit pulse.
Remote-control command:
OUTPut: FSHape BITP
Fsync Polarity
FSYNC signal polarity.
If Fsync Shape is set to Square Pulse, the following selection is
available:
Left (1) = Low While the left channel (channel 1) is being sent, a low
level is applied at the FSYNC signal at a word offset of
0.
Remote-control command:
OUTPut:FPUlse LFTL
Left (1) = High While the left channel (channel 1) is being sent, a high
level is applied at the FSYNC signal at a word offset of
0.
Remote-control command:
OUTPut:FPUlse LFTH
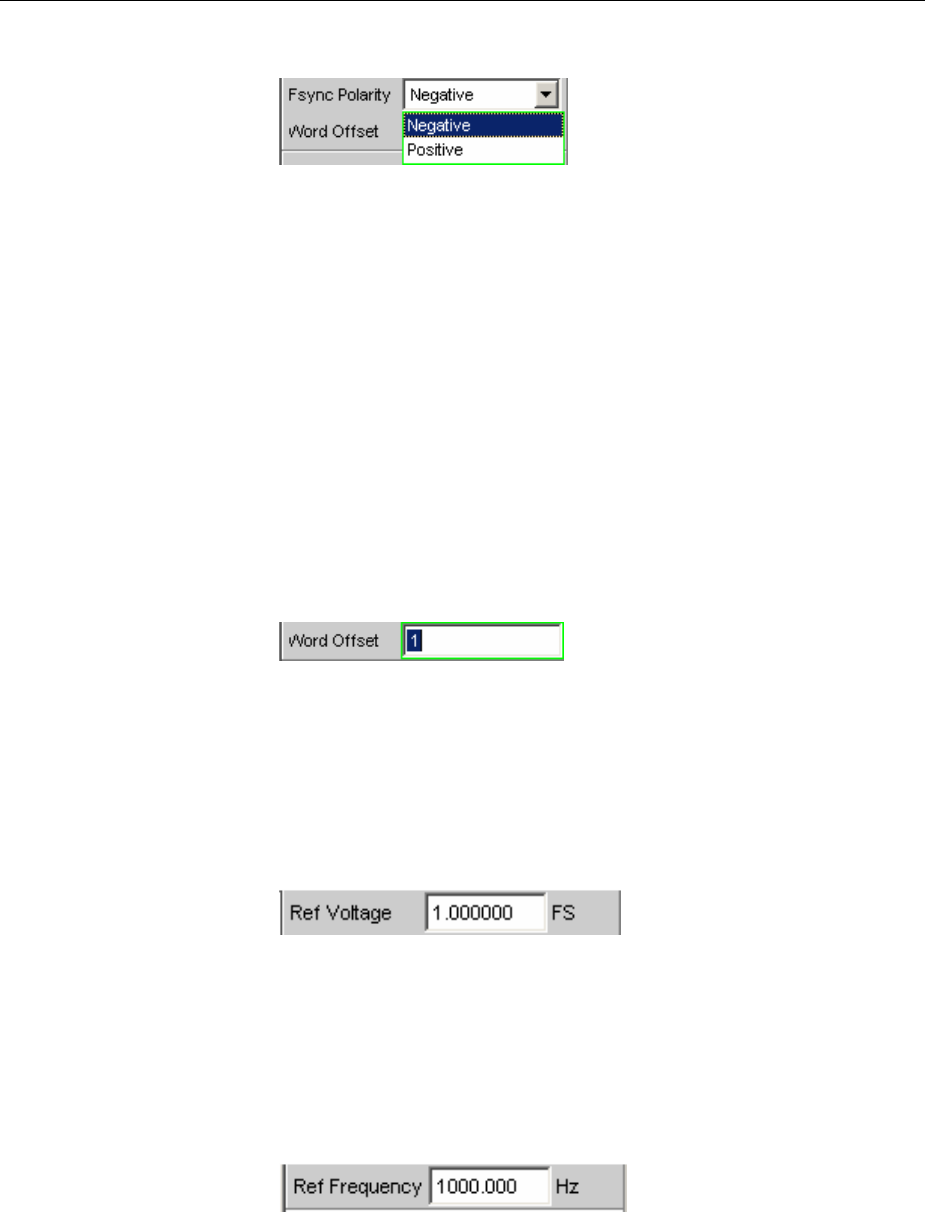
R&S UPV Configuring the I2S Generator
1146.2084.32 4.37 E-9
If Fsync Shape is set to to Bit Pulse, the following selection is available:
Positive At a Word Offset of 0, a positive pulse marks the
beginning of the left data word.
Remote-control command:
OUTPut:FPUlse POS
Negative At a Word Offset of 0, a negative pulse marks the
beginning of the left data word.
Remote-control command:
OUTPut:FPUlse NEG
Word Offset
By using Word Offset, you can set the number of SCK clock cycles by
which the Fsync signal transmission is delayed relative to the audio
data.
Value range: -"Word Length"… 0 ... +"Word Length"-1
Remote-control command:
OUTPut:WOFFset <n>
Ref Voltage
Reference value for the relative amplitude units.
If this reference value is changed, all amplitude settings linked to the
reference value also change.
Remote-control command:
SOURce:VOLTage:REFerence <nu>
Ref Frequency
Reference value for the relative frequency units.
If this reference frequency is changed, all frequency settings linked to
the reference value also change.
Remote-control command:
SOURce:FREQuency:REFerence <nu>
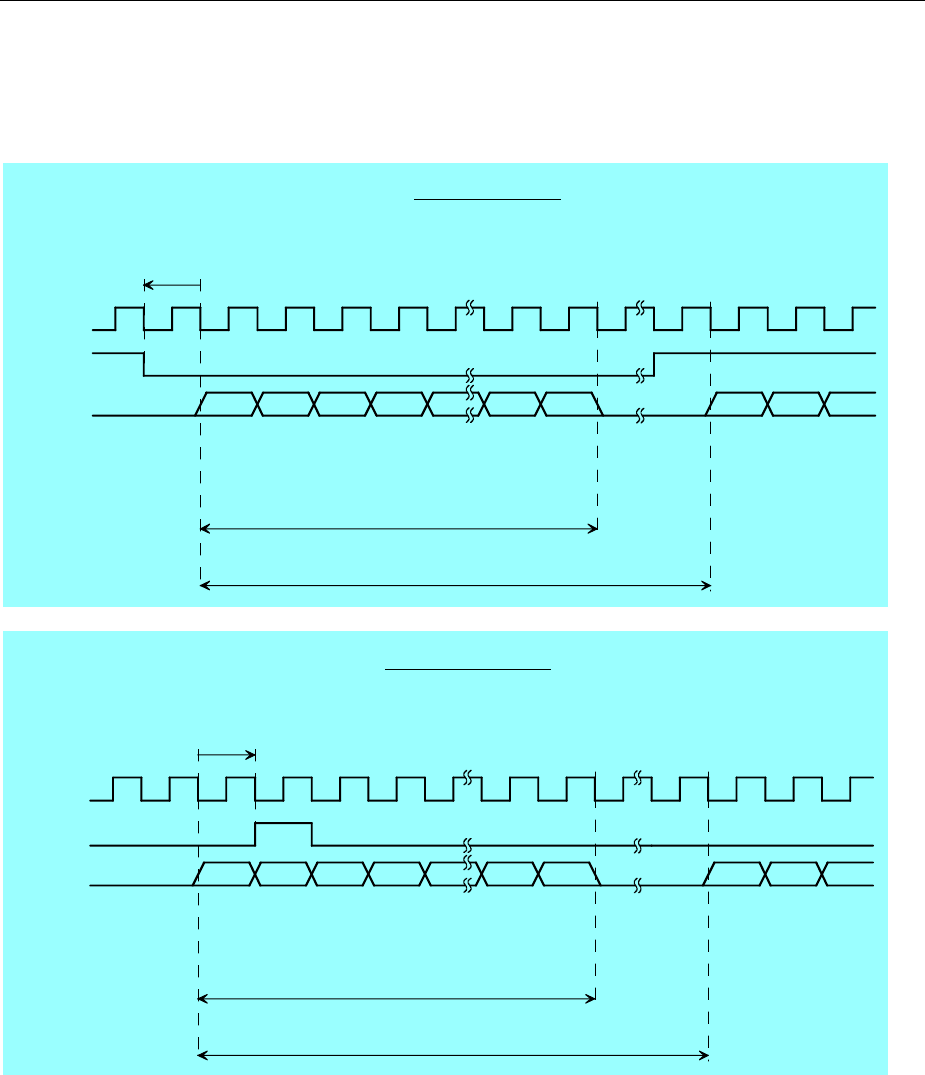
Configuring the I2S Generator R&S UPV
1146.2084.32 4.38 E-9
Timing Diagrams
The timing diagrams below show a number of configuration examples that illustrate the effect of the
parameters.
Standard I2S
SCK
FSYNC
DATA MSB
Word n-1
Sample r-1
Right Channel
Word n
Sample l
Left Channel
Word n+1
Sample r
Right Channel
MSBLSB
Word Length
Audio Bits
Word Offset (Fsync Polarity = Left (1) = Low)
(Word Offset = -1)
(Fsync Shape = Square Pulse)
SCK
FSYNC
DATA MSB
Word n-1
Sample r-1
Right Channel
Word n
Sample l
Left Channel
Word n+1
Sample r
Right Channel
MSBLSB
Word Length
Audio Bits
Word Offset
User-Definable
Fsync Polarity = positive
Word Offset = 1
Fsync Shape = Bit Pulse
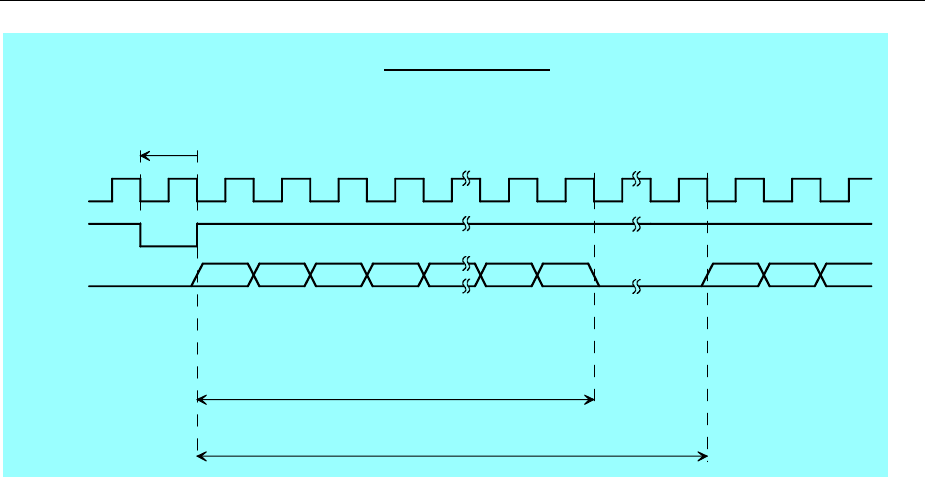
R&S UPV Configuring the I2S Generator
1146.2084.32 4.39 E-9
SCK
FSYNC
DATA MSB
Word n-1
Sample r-1
Right Channel
Word n
Sample l
Left Channel
Word n+1
Sample r
Right Channel
MSBLSB
Word Length
Audio Bits
Word Offset
User-Definable
Fsync Polarity = negative
Word Offset = -1
Fsync Shape = Bit Pulse
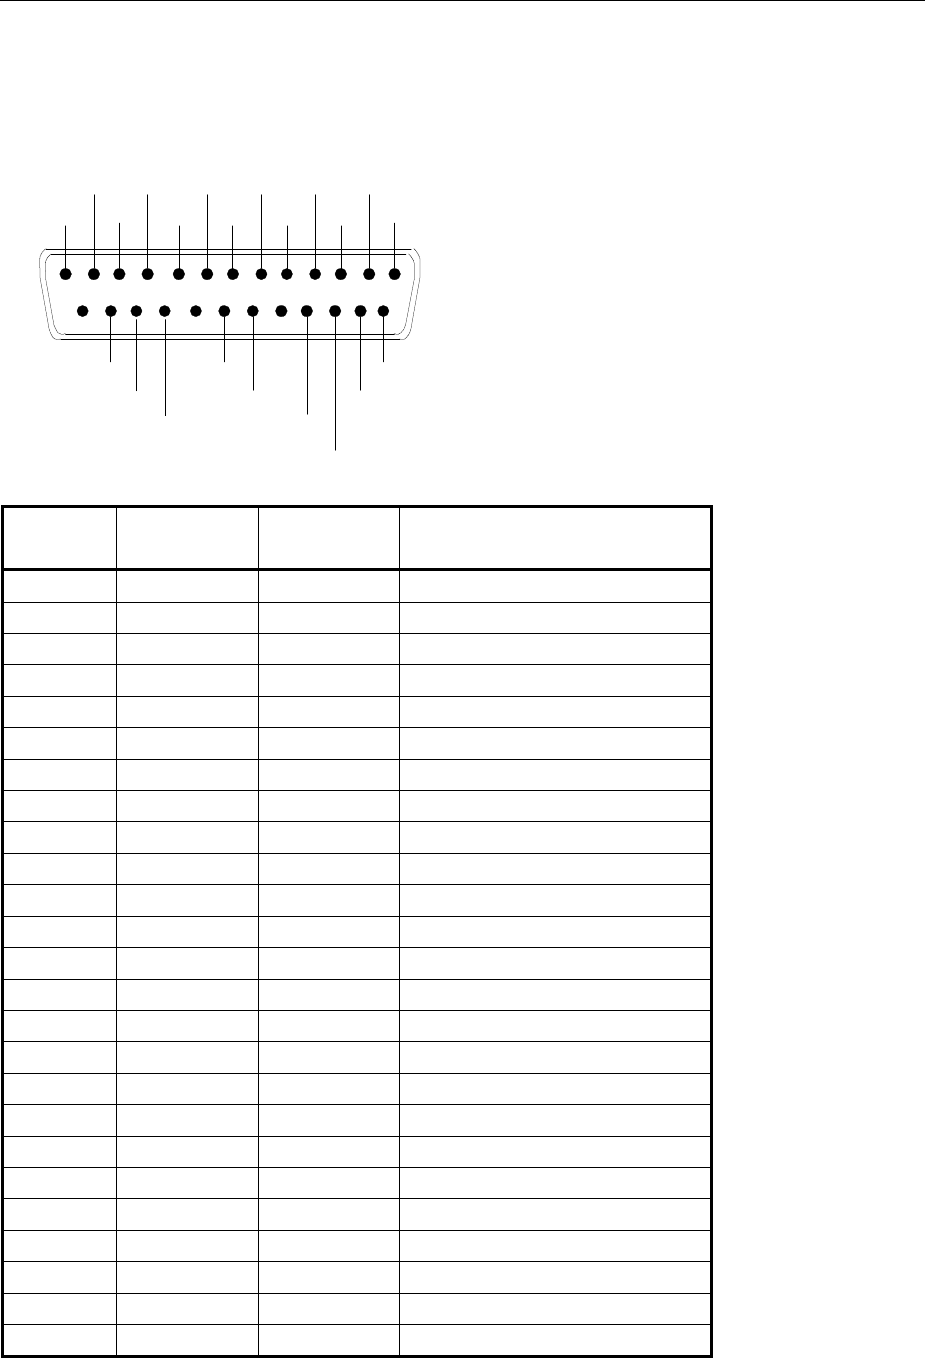
Configuring the I2S Generator R&S UPV
1146.2084.32 4.40 E-9
Interface Assignment
I2Sconnector (25-contact D-Sub connector)
It is recommended to use a shielded cable when connecting the R&S UPV via the RS 232-C-interface.
13
25
1
14
GND
GND
GND
GND
GND
GND
GND
GND
GND
GND
GND
GND GND
TX_MCLK
TX_FSYNC
TX_DATA
+5V
+3.3V
RX_DATA
RX_FSYNC
RX_SCK
TX_SCK
Pin Signal Input (I)
Output (O) Data direction
1GND Ground connection
2GND Ground connection
3GND Ground connection
4GND Ground connection
5GND Ground connection
6GND Ground connection
7GND Ground connection
8GND Ground connection
9GND Ground connection
10 GND Ground connection
11 GND Ground connection
12 GND Ground connection
13 GND Ground connection
14 not connected
15 RX_SCK I Serial clock analyzer
16 RX_FSYNC I Frame sync analyzer
17 RX_DATA I Serial data analyzer
18 not connected
19 +3.3 V (500 mA) O Power supply
20 +5 V (500 mA) O Power supply
21 not connected
22 TX_DATA O Serial data generator
23 TX_FSYNC O Frame sync generator
24 TX_SCK O Serial clock generator
25 TX_MCLK O Master clock output generator

R&S UPV Configuring the I2S Generator
1146.2084.32 4.41 E-9
TX CLK IN (BNC connector)
Pin Signal Input (I)
Output (O) Data direction
1GND Ground connection
2TX_CLK I Master clock input generator
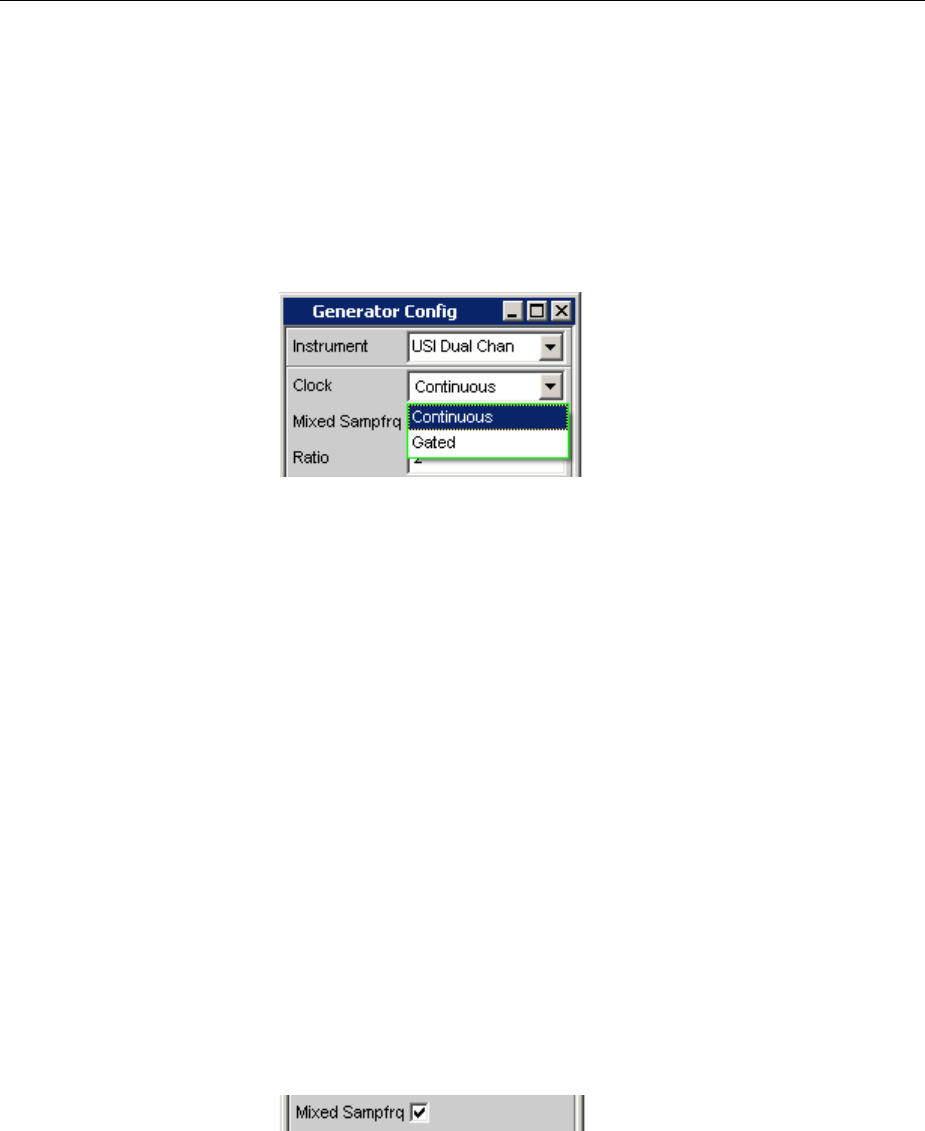
Configuring the USI Dual Channel Generator R&S UPV
1146.2084.32 4.42 E-9
Configuring the USI Dual Channel Generator
USI Dual Channel Generator Configuration Panel
The configuration panel is used for the analog and digital generator settings. The configuration options
for the USI dual channel generator are described below.
Clock
Used to select the continuous clock or gated clock operating modes.
Continuous The continuous clock operating mode requires a
continuous clock for the generator. The clock source
may be internal or external. Several types of
synchronisation are available if the timing device is
external.
Remote control command:
OUTPut:CLOCk CONTinous
Gated The gated clock operating mode must be selected if
the externally supplied bit clock (BClk) and the
externally supplied word clock (Fsync) are
discontinuous or have such a large jitter that the
internal PLL can no longer follow this clock.
The synchronisation type is limited to the “external
word clock and bit clock” (Ext Fsync&BClk) mode.
Audio monitoring of the audio signal generated is not
possible.
Remote control command:
OUTPut:CLOCk GATed
Mixed Sampfrq
Used to produce data streams of varying sampling rates in both
generator channels. When activated, the generator filter is not available.
Remote control command:
OUTPut:MSAMplefrequency ON|OFF

R&S UPV Configuring the USI Dual Channel Generator
1146.2084.32 4.43 E-9
Ratio
Down-sampling factor for 2nd generator channel with regard to the
sampling rate.
Value range: 2 … 6
Remote control command:
OUTPut:RATio <n>
Samples/Frame
Defines the number of samples of a generator channel per frame.
The parameter simultaneously determines the minimum settable
sampling rate according to the relationship: fs_min = 843.75 Hz *
samples/frame.
Value range: 1 ... 32
Remote control command:
OUTPut:SPFRame <n>
No of Slots
Defines the number slots per frame.
Value range: 1 ... 256
No_of_Slots * Slot_Length <= 2048
Slot_Length * No_of_Slots * Sample_Freq <= 55.926 MHz
Remote control command:
OUTPut:NOSLots <n>
TX_DATA1
Defines which signal is output on the individual slots of the TX_DATA1
data line.
Remote control command:
OUTPut:TXData <string>
TX_DATA2
Defines which signal is output on the individual slots of the TX_DATA2
data line.
Remote control command:
OUTPut:TXData2 <string>
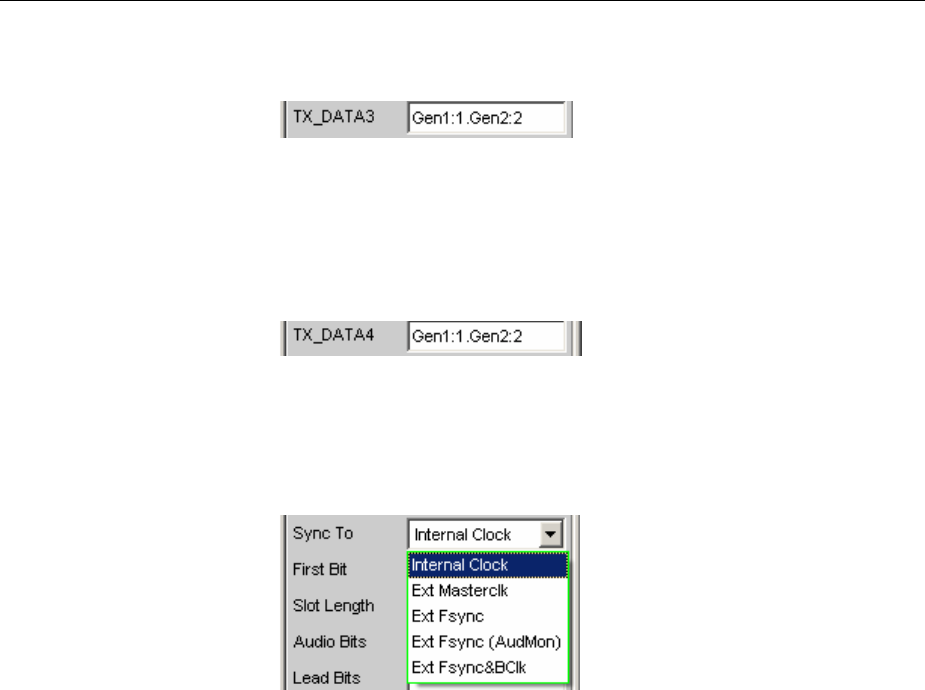
Configuring the USI Dual Channel Generator R&S UPV
1146.2084.32 4.44 E-9
TX_DATA3
Defines which signal is output on the individual slots of the TX_DATA3
data line.
Remote control command:
OUTPut:TXData3 <string>
TX_DATA4
Defines which signal is output on the individual slots of the TX_DATA4
data line.
Remote control command:
OUTPut:TXData4 <string>
Sync To
Used to select the source to which the USI generator is synchronised.
Internal Clock The generator uses the device’s internal clock.
Remote control command:
SOURce:SYNC:TO IClock
Ext Masterclk Synchronises to the externally supplied master clock
signal (TX_MCLK_IN).
Remote control command:
SOURce:SYNC:TO EMASterclock
Ext Fsync Synchronises to the external FrameSync signal
(TX_FSYNC_IN). The generator signal cannot be
audio-monitored. A master clock signal is additionally
generated and output.
Remote control command:
SOURce:SYNC:TO EFSYnc
Ext Fsync
(AudMon)
Synchronises to the external FrameSync
(TX_FSYNC_IN) signal. The generator signal can be
audio-monitored. No master clock signal is ouptut.
Remote control command:
SOURce:SYNC:TO EFAMon

R&S UPV Configuring the USI Dual Channel Generator
1146.2084.32 4.45 E-9
Ext
Fsync&BClk
Synchronises to the external FrameSync
(TX_FSYNC_IN) and bit clock (TX_BCLK_IN) signals.
Remote control command:
SOURce:SYNC:TO EFBClk
Overview of the various synchronisation modes:
Internal
clock
External
master clock
External
frame sync
External frame sync
with audio monitor
External frame
sync, bit clock
External frame sync,
bit clock (gated)
Master clock output otri o tri o tri
Master clock input -- x -- -- -- --
Bit clock output o o o o tri tri
Bit clock input -- -- -- -- x x
Frame sync output o o o o tri tri
Frame sync input -- -- x x x x
Slot clock output o o o o o o
xInput signal must be present
oOutput signal is available
tri Output in tristate mode (high impedance)
-- input not used
First Bit
Defines the sequence in which the data bits are transmitted
MSB The most significant bit is transmitted first.
Remote control command:
OUTPut:FBIT MSB
LSB The least significant bit is transmitted first.
Remote control command:
OUTPut:FBIT LSB
Slot Length
Slot length of a slot including gaps ( 0 bits)
Value range: 8 to 256
No_of_Slots * Slot_Length <= 2048
Slot_Length * No_of_Slots * Sample_Freq <= 55.926 MHz
Remote control command:
OUTPut:SLTLength <n>
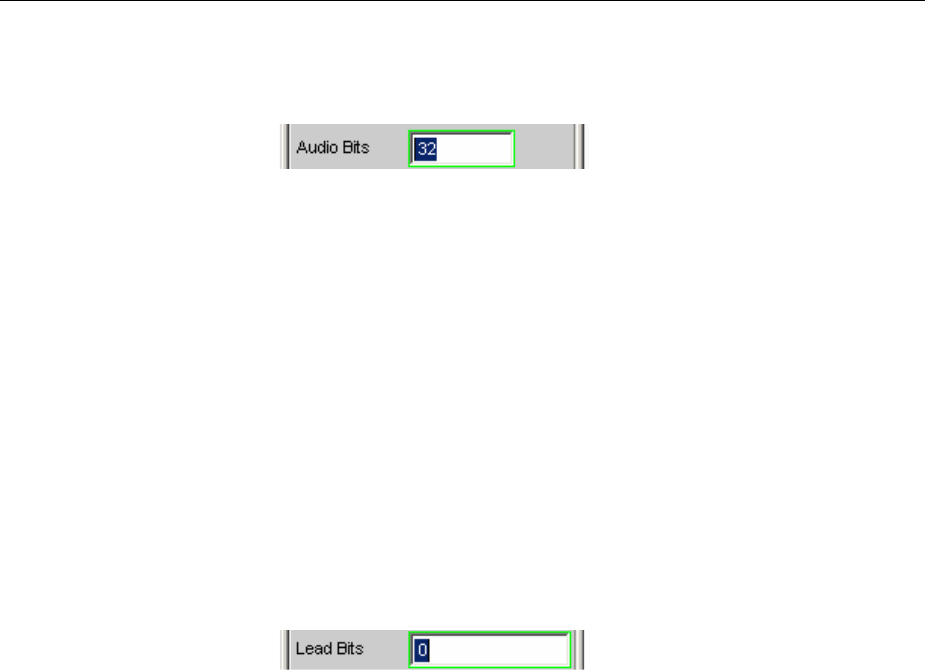
Configuring the USI Dual Channel Generator R&S UPV
1146.2084.32 4.46 E-9
Audio Bits
Slot length of the audio data within a slot (sub-frame).
Unused data bits are coded as zeros in the digital audio signal.
Value range: 8 to slot length (max 32)
Remote control command:
OUTPut:AUDiobits <n>
Lead Bits
Defines the offset of the audio bits within a slot relative to the start of
the slot.
If LSB is selected as first bit the lead bits setting is automatically
corrected if the audio bits setting is changed so that the MSB is
transmitted in the same position. This has the advantage that the
resolution of the signal transmitted is changed but not the amplitude if
the audio bits are changed.
Example:
Channel Length: 32
Audio bits: 24 23 (setting changed by user)
Lead bits: 8 9(automatic correction)
Value range: 0 to slot length - audio bits
Remote control command:
OUTPut:LBITs <n>
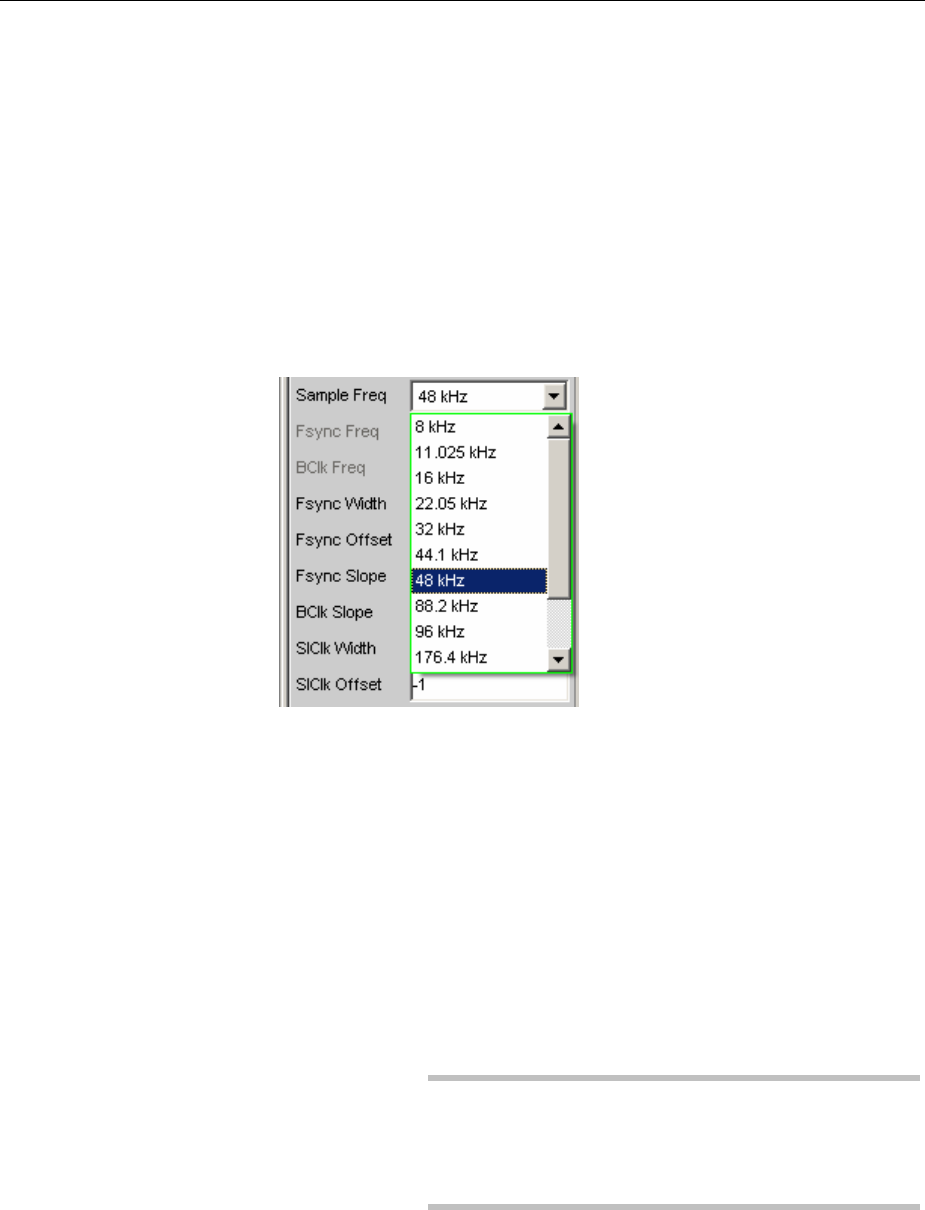
R&S UPV Configuring the USI Dual Channel Generator
1146.2084.32 4.47 E-9
Sample Freq
Used to set the sample frequency.
All frequency specifications of the audio data transmitted refer to this
setting. If the USI generator is operated with external synchronisation
and the frequency of the external clock signal does not correspond to
the set frequency of the Fsync signal, the generator generates signals
with the wrong frequency.
The selected clock rate determines the maximum signal frequency
which can be input. For sinus signals this is 49.9% of the sampling rate.
For data formats with one sample per frame, the sample frequency
corresponds to the FSync signal frequency. In the case of several audio
data samples from one source within a frame, the frequency of the
FSync signal results from the sample frequency divided by the
samples/frame factor.
Value range for numeric input:
0.84375 kHz to 400 kHz
No_of_Slots * Slot_Length <= 2048
Slot_Length * No_of_Slots * Sample_Freq <= 55.926 MHz
Standard sampling frequencies can be set directly in the selection list.
Auto Automatic setting of the sampling rate. The sampling
rate is measured, set and displayed in the following
line. The set value is automatically updated if the
existing sampling rates changes. This setting is only
available with external synchronisation.
Note:
The digital generator must be re-initialized with every
new sampling frequency. If an external clock with a
large jitter is fed in a fixed frequency should be
selected instead of the Auto setting.
Remote control command:
OUTPut:SAMPle:MODE AUTO

Configuring the USI Dual Channel Generator R&S UPV
1146.2084.32 4.48 E-9
8kHz 8kHz standard sampling frequency
Remote control command:
OUTPut:SAMPle:MODE F08
11,025 kHz 11.025 kHz standard sampling frequency
Remote control command:
OUTPut:SAMPle:MODE F11
16 kHz 16 kHz standard sampling frequency
Remote control command:
OUTPut:SAMPle:MODE F16
22,05 kHz 22.05 kHz standard sampling frequency
Remote control command:
OUTPut:SAMPle:MODE F22
32 kHz 32 kHz standard sampling frequency
Remote control command:
OUTPut:SAMPle:MODE F32
44,1 kHz 44.1 kHz standard sampling frequency
Remote control command:
OUTPut:SAMPle:MODE F44
48 kHz 48 kHz standard sampling frequency
Remote control command:
OUTPut:SAMPle:MODE F48
88,2 kHz 88.2 kHz standard sampling frequency
Remote control command:
OUTPut:SAMPle:MODE F88
96 kHz 96 kHz standard sampling frequency
Remote control command:
OUTPut:SAMPle:MODE F96
176,4 kHz 176.4 kHz standard sampling frequency
Remote control command:
OUTPut:SAMPle:MODE F176
192 kHz 192 kHz standard sampling frequency
Remote control command:
OUTPut:SAMPle:MODE F192
384 kHz 384 kHz standard sampling frequency
Remote control command:
OUTPut:SAMPle:MODE F384
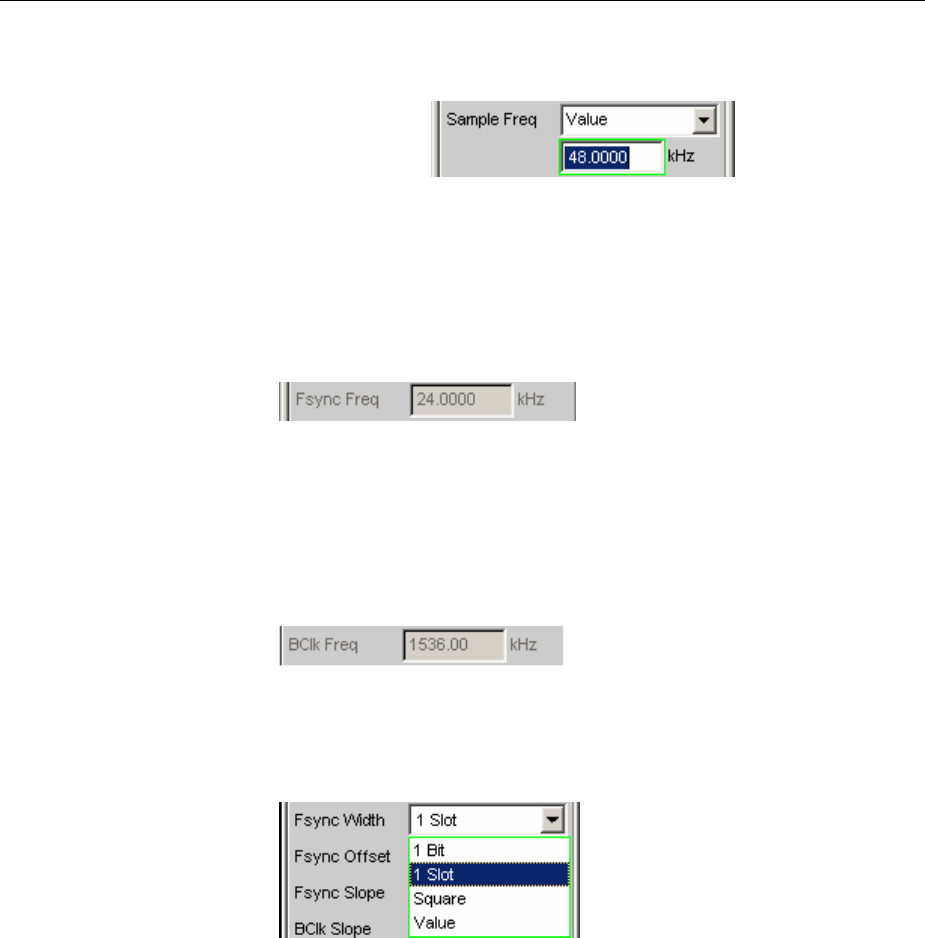
R&S UPV Configuring the USI Dual Channel Generator
1146.2084.32 4.49 E-9
Value Numeric input of the sampling frequency
Remote control command:
OUTPut:SAMPle:MODE VALue
OUTPut:SAMPle:FREQuency <nu>
Fsync Freq
Is only displayed for multi-sampling formats. The Frame Sync frequency
corresponds to the sampling frequncy divided by the samples/frame
factor.
Remote control command:
OUTPut:FSYNc:FREQuency?
BClk Freq
Displays the bit clock frequency. Is calculated from the product of
channel length * no of slots * sample freq / samples/frame.
Value range: 6.75 kHz ... 55.296 MHz
Remote control command:
OUTPut:BCLk:FREQuency?
Fsync Width
Width of the FSYNC pulse
1bit The FSYNC pulse is one data bit in length (BClk
period)
Remote control command:
OUTPut:FWIDth ONEBit
1slot The FSYNC pulse is the length of an audio channel (=
slot length)
Remote control command:
OUTPut:FWIDth ONESlot
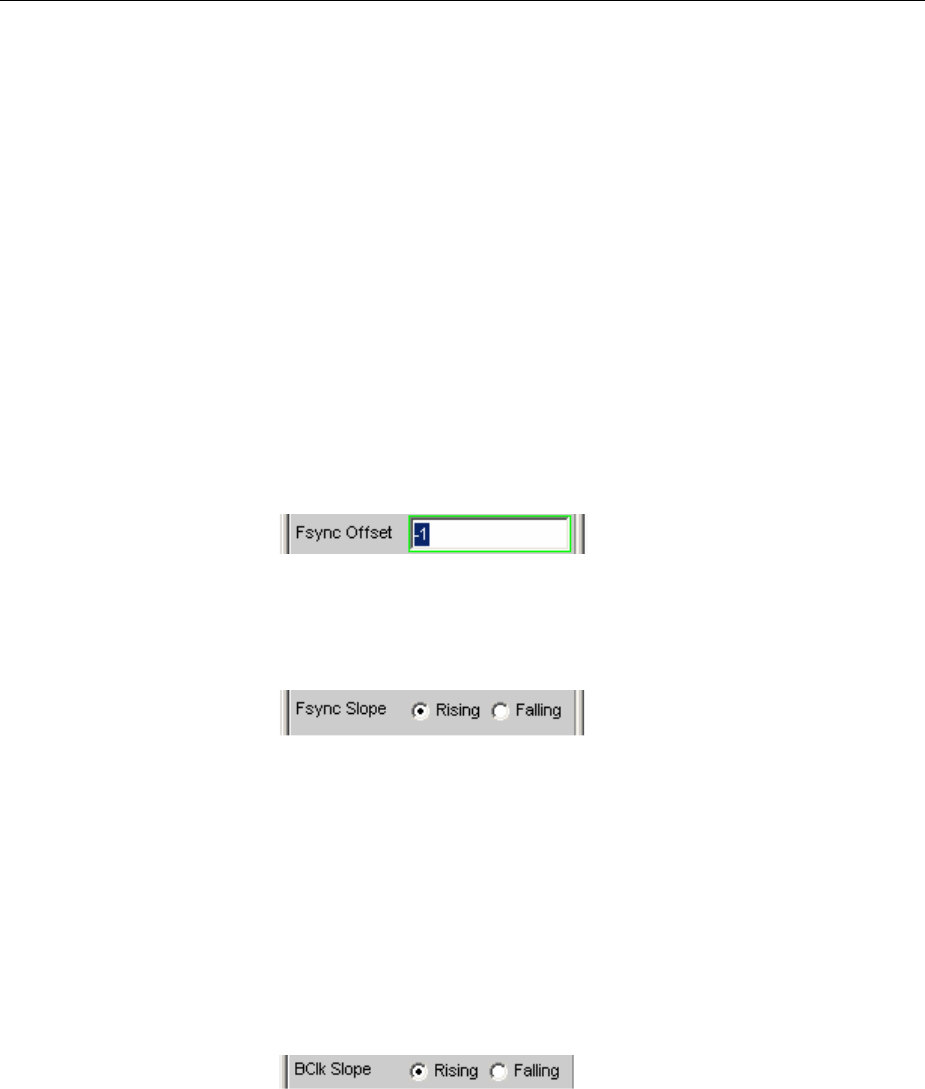
Configuring the USI Dual Channel Generator R&S UPV
1146.2084.32 4.50 E-9
Square The FSYNC pulse has the shape of a symmetrical
rectangle. If the number of the slot’s bit clock (BClk)
cycles is odd the high phase is one cycle longer than
the low phase (if Fsync slope = rising)
Remote control command:
OUTPut:FWIDth SQUare
Value The length of the FSYNC pulse corresponds to the
numeric value in data bits (BClk periods).
Value range: 1 to (slot length*no of slots)-1
Remote control command:
OUTPut:FWIDth VALue
OUTPut:FWIDth:VALue <n>
Fsync Offset
Determines the offset of the Fsync pulse relative to the reference point
(start of the first slot)
Value range: -slot length*(no of slots)...+slot length*(no of slots)-1
Remote control command:
OUTPut:FOFFset <n>
Fsync Slope
Polarity of the Fsync pulse
Rising The Fsync pulse begins with a positive edge.
Remote control command:
OUTPut:FSLope RISing
Falling The Fsync pulse begins with a negative edge.
Remote control command:
OUTPut:FSLope FALLing
BClk Slope
Bit clock polarity (BClk)
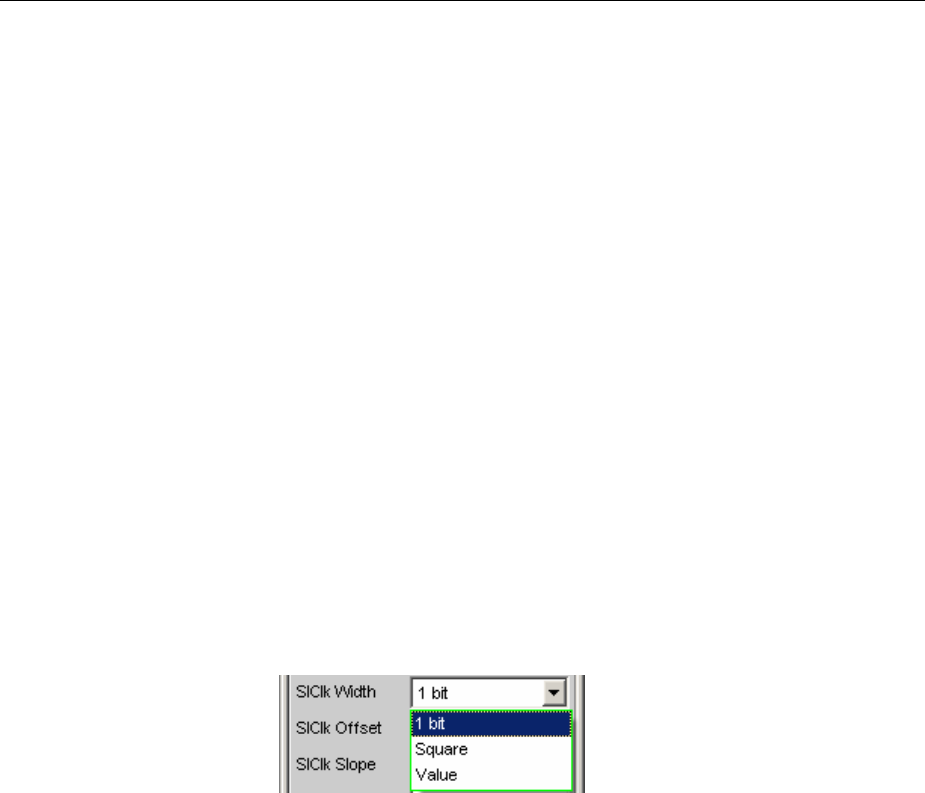
R&S UPV Configuring the USI Dual Channel Generator
1146.2084.32 4.51 E-9
Rising The TX_FSYNC_OUT, TX_SLCLK_OUT, TX_DATA1,
TX_DATA2, TX_DATA3 and TX_DATA4 signals are
sampled with a rising bit clock edge (relative to
TX_BCLK_IN in slave mode or TX_BCLK_OUT in
master operation and with internal synchronisation). In
case of external synchronisation the TX_FSYNC_IN
signal is always sampled with the reverse bit clock
edge (TX_BCLK_IN). In this case with the falling edge
of the external bit clock signal.
Remote control command:
OUTPut:BSLope RISing
Falling The TX_FSYNC_OUT, TX_SLCLK_OUT, TX_DATA1,
TX_DATA2, TX_DATA3 and TX_DATA4 signals are
sampled with a falling bit clock edge (relative to
TX_BCLK_IN in slave mode or TX_BCLK_OUT in
master operation and with internal synchronisation). In
case of external synchronisation, the TX_FSYNC_IN
signal is always with the reverse bit clock edge
(TX_BCLK_IN). In this case with the rising edge of the
external bit clock signal.
Remote control command:
OUTPut:BSLope FALLing
SlClk Width
Slot clock pulse (SlClk) width
1bit The SlClk pulse is one data bit in length (BClk period).
Remote control command:
OUTPut:SLCWidth ONEBit
Square The SlClk pulse has the shape of a symmetrical
rectangle. If the number of the slot’s bit clock (BClk)
cycles is odd the high phase is one cycle longer than
the low phase (with SlClk slope = rising).
Remote control command:
OUTPut:SLCWidth SQUare
Value The length of the SlClk pulse corresponds to the
numeric value in data bits (BClk periods).
Value range: 1 to slot length -1
Remote control command:
OUTPut:SLCWidth VALue
OUTPut:SLCWidth:VALue <n>
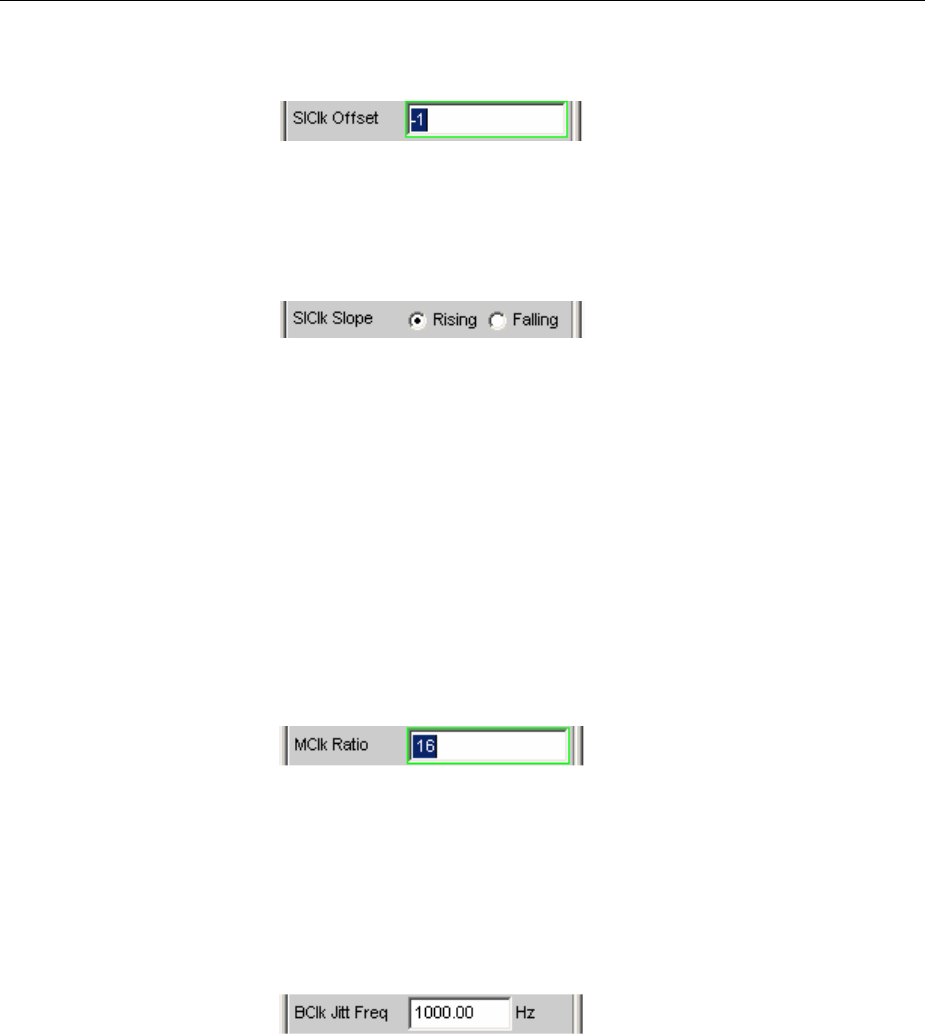
Configuring the USI Dual Channel Generator R&S UPV
1146.2084.32 4.52 E-9
SlClk Offset
Determines the slot clock (SlClk) offset relative to the start of the slot.
Value range: -slot length ... + slot length-1
Remote control command:
OUTPut:SLCOffset <n>
SlClk Slope
Slot clock (SlClk) pulse polarity.
Rising The SlClk pulse begins with a positive edge.
Remote control command:
OUTPut:SLCSlope RISing
Falling The SlClk pulse begins with a negative edge.
Remote control command:
OUTPut:SLCSlope FALLing
MClk Ratio
Relationship between the master clock (MCLK) and the FrameSync
(FSYNC).
Value range: 16 to 768
MClk_Ratio * Sample_Freq <= 110,592 MHz
Remote control command:
OUTPut:MRATio <n>
BClk Jitt Freq
The generator output signals (TX_BCLK_OUT, TX_FSYNC_OUT,
TX_SLCLK_OUT, TX_DATA1 to 4) can be jittered sinusoidally. The
jitter oscillator frequency is set with this parameter.
Value range: 100 mHz to 110 MHz max (depending on the amplitude set).
Remote control command:
OUTPut:BCLock:JITFrequency <nu>
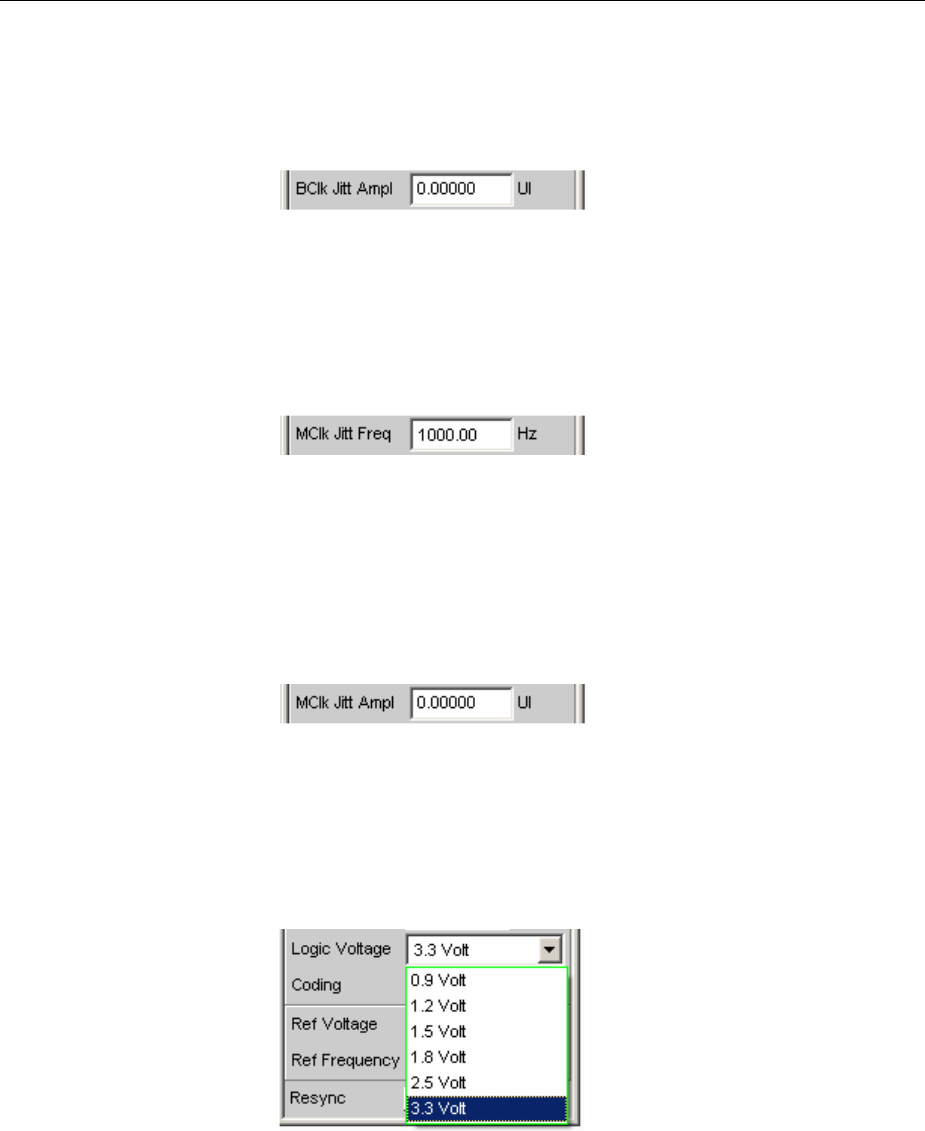
R&S UPV Configuring the USI Dual Channel Generator
1146.2084.32 4.53 E-9
BClk Jitt Ampl
The generator output signals (TX_BCLK_OUT, TX_FSYNC_OUT,
TX_SLCLK_OUT, TX_DATA1 to 4) can be jittered sinusoidally. This
parameter determines the jitter oscillator’s peak amplitude.
Value range: 0 to 2.5 UI max (depending on the frequency set).
One UI corresponds to the bit clock (BClk) cycle period.
Remote control command:
OUTPut:BCLock:JITAmplitude <nu>
MClk Jitt Freq
The TX_MCLK_OUT generator signal can be jittered sinusoidally. The
jitter oscillator frequency is set with this parameter.
Value range: 100 mHz to 110 MHz max (depending on the amplitude
set).
Remote control command:
OUTPut:MCLock:JITFrequency <nu>
MClk Jitt Ampl
The TX_MCLK_OUT generator signal can be jittered sinusoidally. This
parameter determines the jitter oscillator peak amplitude.
Value range: 0 to 2.5 UI max (depending on the set freqeuency).
One UI corresponds to the master clock (MCLK) cycle period.
Remote control command:
OUTPut:MCLock:JITAmplitude <nu>
Logic Voltage
Used to set the generator logic voltage. Changing the voltage level
causes the probe to be reloaded. The probe can be attached and
disconnected and put back into operation during operation with this
mechanism.
0.9 Volt 0.9 volts CMOS logic voltage
Remote control command:
OUTPut:LOGVoltage MV0900
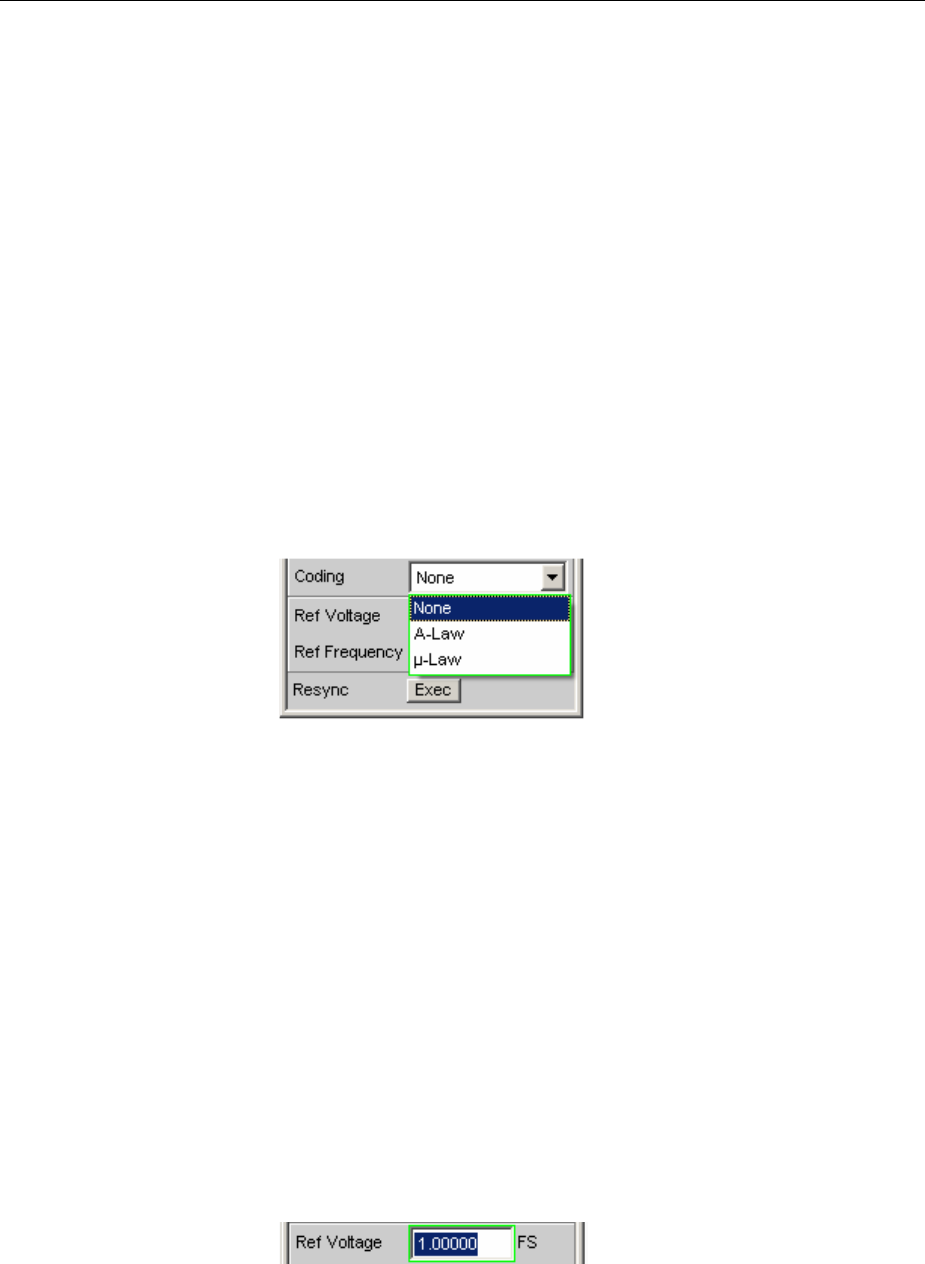
Configuring the USI Dual Channel Generator R&S UPV
1146.2084.32 4.54 E-9
1.2 Volt 1.2 volts CMOS logic voltage
Remote control command:
OUTPut:LOGVoltage MV1200
1.8 Volt 1.8 volts CMOS logic voltage
Remote control command:
OUTPut:LOGVoltage MV1800
2.5 Volt 2.5 volts CMOS logic voltage
Remote control command:
OUTPut:LOGVoltage MV2500
3.3 Volt 3.3 volts LVTTL logic cvoltage
Remote control command:
OUTPut:LOGVoltage MV3300
Coding
Generator data coding regulation. A Law and ZLaw quantification
characteristics are available for telephony applications.
None Generator data is analyzed linearly PCM coded.
Remote control command:
OUTPut:CODing NONE
A-Law Generator data is quantified in accordance with A Law.
Remote control command:
OUTPut:CODing ALAW
J-Law Generator data is quantified in accordance with ZLaw.
Remote control command:
OUTPut:CODing ULAW
Ref Voltage
Reference value for the relative amplitude units.
If this reference value is changed, all reference value-related amplitude
settings are also changed.
Remote control command:
SOURce:VOLTage:REFerence <nu>

R&S UPV Configuring the USI Dual Channel Generator
1146.2084.32 4.55 E-9
Ref Frequency
Reference value for the relative frequency units.
Ifthe reference frequency is changed, all reference value-related
frequency settings are also changed.
Remote control command:
SOURce:FREQuency:REFerence <nu>
Resync
Using this function triggers renewed synchronisation of the generator. If
this is synchronised externally, this function must be called once after
applying the external clock signal
Remote control command:
OUTPut:RESYnc ONCE
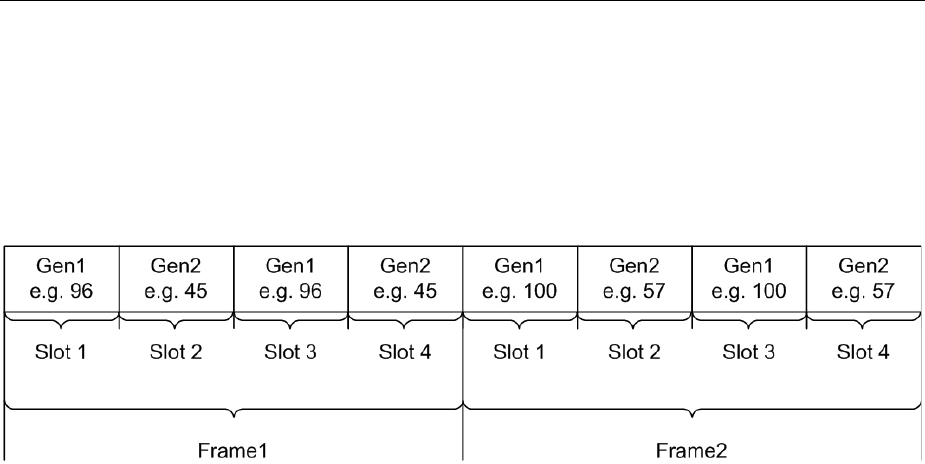
Configuring the USI Dual Channel Generator R&S UPV
1146.2084.32 4.56 E-9
Meaning of the TX_DATA 1 to TX_DATA 4 setting line
strings
Setting strings for standard formats with one sample per frame:
If the generator is configured with the following setting lines, each slot within a frame contains the same
sample of the selected signal source. The exemplary format visualised below corresponds to current
converter formats.
In the TX_DATA1 to 4 setting lines the “Generator1”, “Generator2”, “Null” and “Tristate” signal sources
can be separately assigned to the maximum 256 slots of any single data line.
Syntax:
<Source>:<Target>.<Traget>.<Source>:<Target>.<Target>.<Target>.<Target> etc.
Signal sources:
Gen1 = keyword for generator 1 Gen2 = keyword for generator 2
Zero = zeros are output Tri = output is switched to high impedance
The following targets are available:
n=slot n (mit n=1...256) x-y =slot x to slot y
all = all slots even/odd = all even/odd slots
The individual target slots are separated from one another by dots (.). They can be both separately
addressed (e.g. 1. 2. 3.), specified as a slot range (e.g. 4-15) or addressed via the pre-defined “all”,
“even” or “odd” group designations. All undefined target slots are set to signal source zero by default.
Spaces are ignored by the software, even if they occur within keywords. The assignment commands
can be written in any combination of capital and small letters. The setting string for any given data line
is analyzed from left to right so that commands situated further to the right overwrite previous settings.
The combination of the “Tri:ext” keywords can occur at any position in the string and transfers the
tristate control to the externally supplied TX_OE signal; this has a higher priority than the OE control
which can be set internally with the”Tri:<target>” command line.
The following applies for external OE control activated by "Tri:ext":
TX_OE = "1"
The generator behaves as defined in the string
TX_OE = "0"
The generator switches the data line to tristate for the duration of the low level, regardless of the
content of the command string.
The external TX_OE does not function combinatively but must be applied one cycle before the start of
the slot or the desired action time. The signal is transferred with the same BClk edge with which the
date is output. The following diagram shows how the external Output Enable signal works.
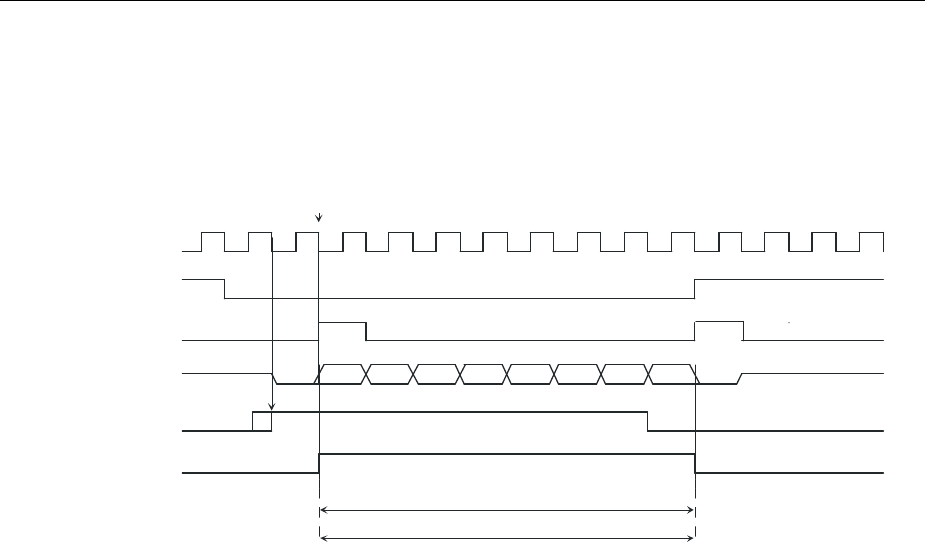
R&S UPV Configuring the USI Dual Channel Generator
1146.2084.32 4.57 E-9
Reference Point:
Beginning of Slot1
TX_BCLK_OUT
TX_FSYNC_OUT
TX_DATA
MSB LSB
Wordlength
Audio Bits
TX_SLCLK_OUT
TX_OE
Output enabled
Output disabled Output disabled
Parameters:
Sync to: Internal Clock
No of Slots: 2
Slot Length: 10
Audiobits:8
TX_DATA: Gen1:1.2.tri:2
Bitclk Slope: Falling
Fsync Offset: 0
Fsync Wdith. Square 10
Fsync Slope: Falling
SlClk Wdith: 1bit 1
SlClk Offset: 0
SlClk Slope: Rising
Lead Bits 0
Bit Order: MSB first
or
or
Slot 2 Slot 1 Slot 2
(external OE signal)
OE
(internal generated OE)
Sampling time of external OE
Examples for common setting strings:
gen1:even.1.3.5.Tri:ext
All even slot numbers and also slots 1, 3 and 5 contain the audio signal generated in generator 1. The
external tristate control is also switched on.
tri:all.gen1:1.3.6.gen2:3.4-6
Slot 1 transmits the audio signal generated in generator 1 whilst slots 3, 4, 5 and 6 contain the second
generator’s signal. All other slots are switched to tristate.
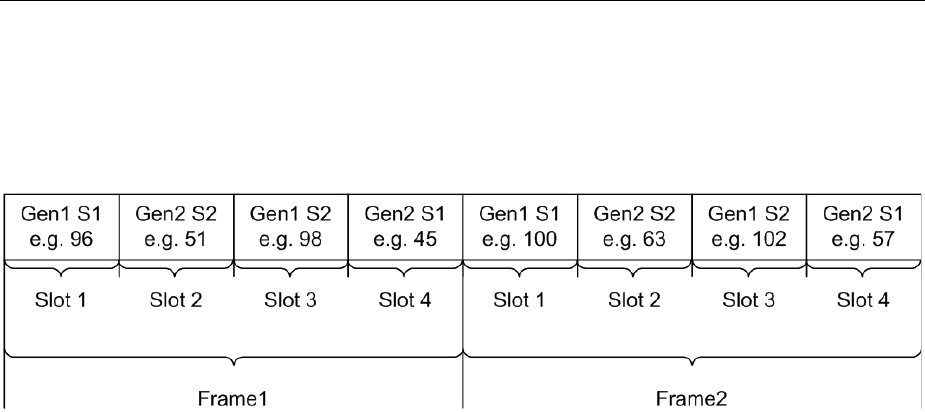
Configuring the USI Dual Channel Generator R&S UPV
1146.2084.32 4.58 E-9
Setting strings for multi-sample formats with several samples per frame:
Ifthe generator is configured with the following setting strings any sample from the selected signal
source can be assigned to any slot within a frame; these can even be placed in any arbitrary order. This
freedom of selection is intended for specific proprietary formats and permits all imaginable
combinations. The following shows a format with two samples per frame which can be placed in any
slot.
The individual samples from the “Generator1”, “Generator2”, “Null” und “Tristate” signal sources can be
arbitrarily assigned to the maximum 256 slots of each data line in the TX_DATA1 - 4 setting lines. The
transmission sequence of the individual samples is not important. Care must just be taken that the
product of the number of signal sources (e.g. Gen1 and Gen2 = 2 signal sources) and the number of
samples per frame remains smaller or equal to the the number of slots. With three samples per frame
and the use of both generator slots there must be at least six slots.
Syntax:
<source>-<sample number>:<target>.<target>.<source>-<sample number>:<target>.<target>.<target>.
etc.
Signal source:
Gen1 = keyword for generator 1 Gen2 = keyword for generator 2
Zero = zeros are output Tri = output is switched to high impedance
The following targets are available:
n=slot n (with n=1 to 256) x-y =slot x to slot y
all = all slots even/odd = all even /odd slots
The individual target slots are separated by points (.). They can be addressed separately (e.g. 1. 2. 3.),
specified as a range (e.g. 4-15) or addressed with the pre-defined “all”, “even” or “odd” group
designations. Every undefined target slot is assigned signal source zero by default.
Spaces are ignored by the software, even if they occur within keywords. The assignment commands
can be written in any combination of capital and small letters.
The setting string for any given data line is analyzed from left to right so that commands situated further
to the right overwrite previous settings.
The combination of the “Tri:ext” keywords can occur at any position in the string and transfers the
tristate control to the externally supplied TX_OE signal which has a higher priority than the OE control
which can be set internally with the”Tri:<target>” command line.
The following applies for external OE control activated by "Tri:ext":
TX_OE = "1"
The generator behaves as defined in the string
TX_OE = "0"
The generator switches the data line to tristate for the duration of the low level, regardless of the
content of the command string.
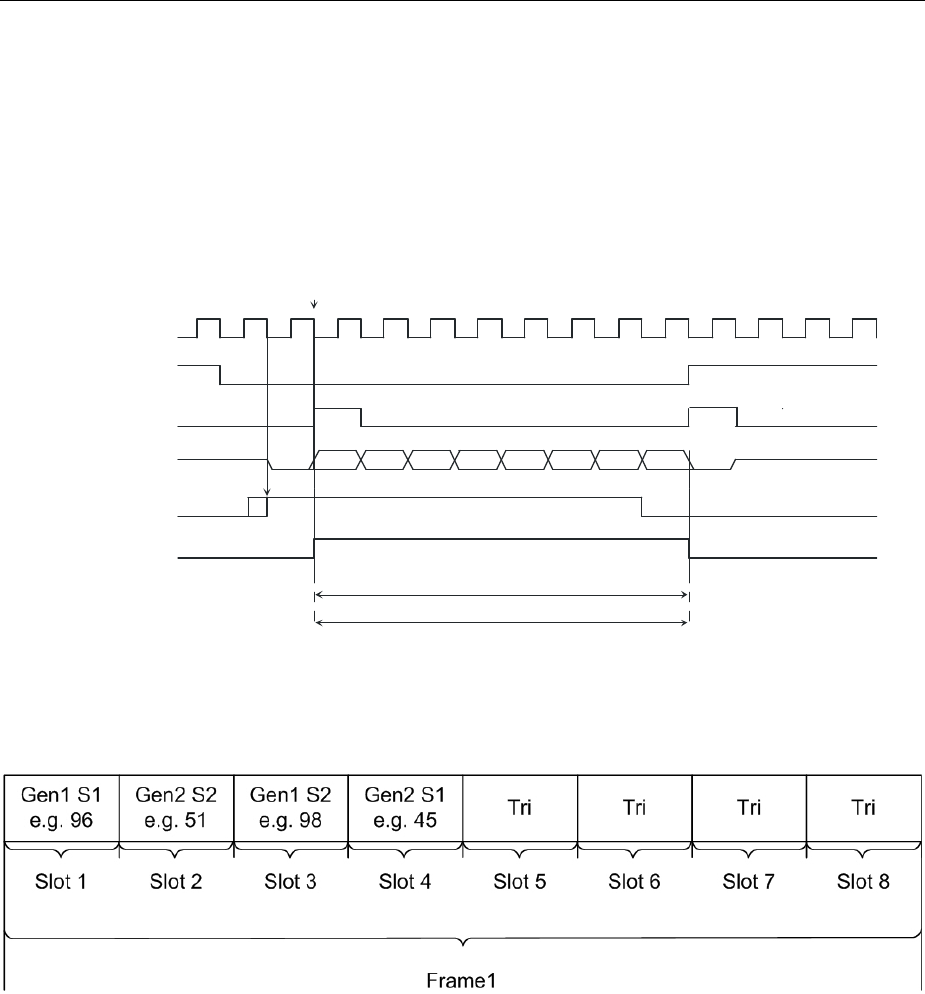
R&S UPV Configuring the USI Dual Channel Generator
1146.2084.32 4.59 E-9
The external TX_OE does not function combinatively but must be applied one cycle before the start of
the slot or the desired action time. The signal is transferred with the same BClk edge with which the
date is output. The following diagram shows how the external Output Enable signal works.
Reference Point:
Beginning of Slot 1
TX_BCLK_OUT
TX_FSYNC_OUT
TX_DATA
MSB LSB
Wordlength
Audio Bits
TX_SLCLK_OUT
TX_OE
Output enabled
Output disabled Output disabled
Parameters:
Sync to: Internal Clock
Noof Slots: 2
Slot Length: 10
Audiobits:8
TX_DATA: Gen1:1.2.tri:2
Bitclk Slope: Falling
Fsync Offset: 0
Fsync Wdith. Square 10
Fsync Slope: Falling
SlClk Wdith: 1bit 1
SlClk Offset: 0
SlClk Slope: Rising
Lead Bits 0
Bit Order: MSB first
or
or
Slot 2 Slot 1 Slot 2
(external OE signal)
OE
(internal generated OE)
Sampling time of external OE
Examples of settings strings:
Tri:all.gen1-1:1.gen1-2:3.gen2-1:4.gen2-2:2
The samples from generator 1 are transmitted consecutively in slots 1 and 3, whilst the samples from
generator 2 are located in reverse order in slots 2 and 4.
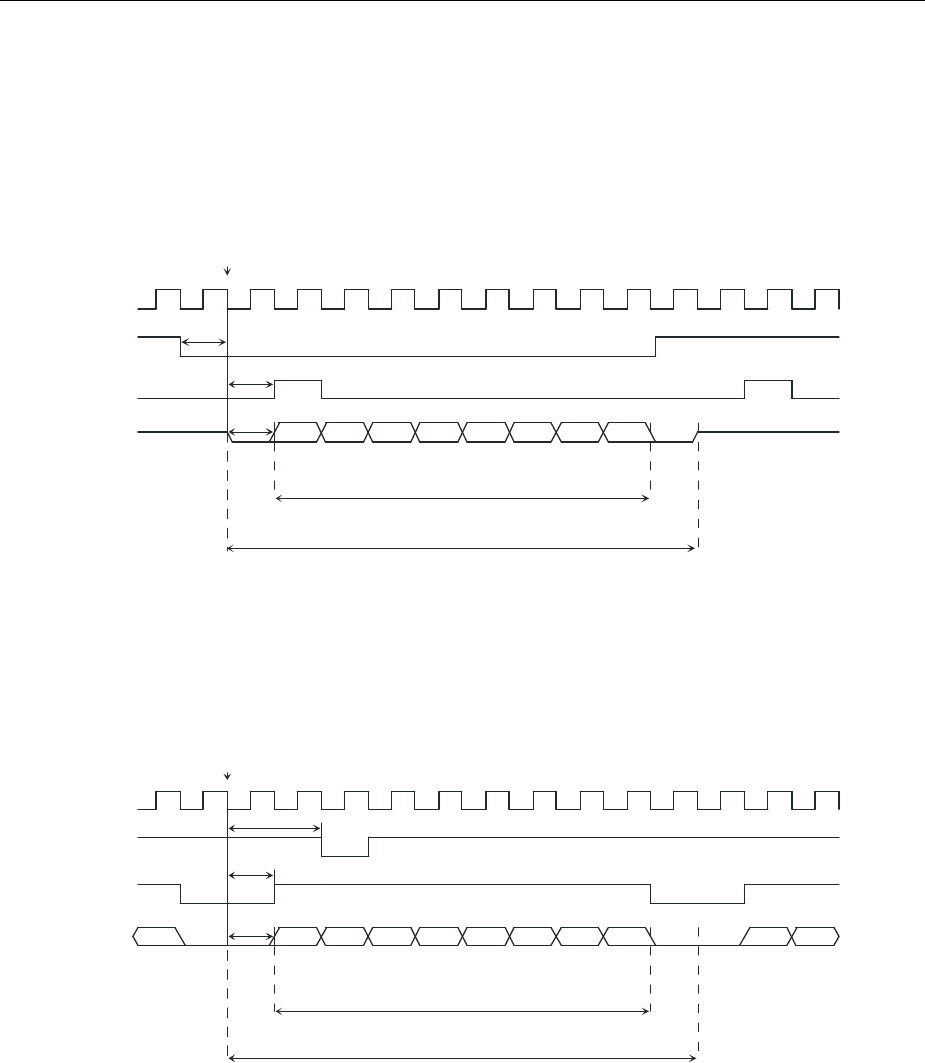
Configuring the USI Dual Channel Generator R&S UPV
1146.2084.32 4.60 E-9
Timing Diagrams
Reference Point:
Beginning of Slot 1
TX_BCLK_OUT
TX_FSYNC_OUT
TX_DATA
MSB LSB
Slot Length
Audio Bits
TX_SLCLK_OUT
Parameters:
Sync to: Internal Clock
No of Slots: 2
Slot Length: 10
Audiobits:8
TX_DATA: Gen1:1.2.tri:2
BClk Slope: Falling
Fsync Offset: -1
Fsync Wdith. Square 10
Fsync Slope: Falling
SlClk Wdith: 1bit 1
SlClk Offset: 1
SlClk Slope: Rising
Lead Bits 1
Bit Order: MSB first
or
or
Slot 2
Output: Tristate Slot 1
Output: Enabled
Slot 2:
Output: Tristate
Fsync Offset
SlClk Offset
Lead Bits
Fsync Offset
SlClk Offset
Lead Bits
TX_BCLK_OUT
TX_FSYNC_OUT
TX_DATA MSBLSB
Slot Length
Audio Bits
TX_SLCLK_OUT
Parameters:
Sync to: Internal Clock
No of Slots: 2
Slot Length: 10
Audiobits:8
TX_DATA: Gen1:1.2
BClk Slope: Falling
Fsync Offset: 2
Fsync Wdith. 1 bit 1
Fsync Slope: Falling
SlClk Wdith: 8
SlClk Offset: 1
SlClk Slope: Rising
Lead Bits 1
Bit Order: LSB first
or
Slot 2 Slot 1 Slot 2
LSBMSB
Reference Point:
Beginning of Slot 1
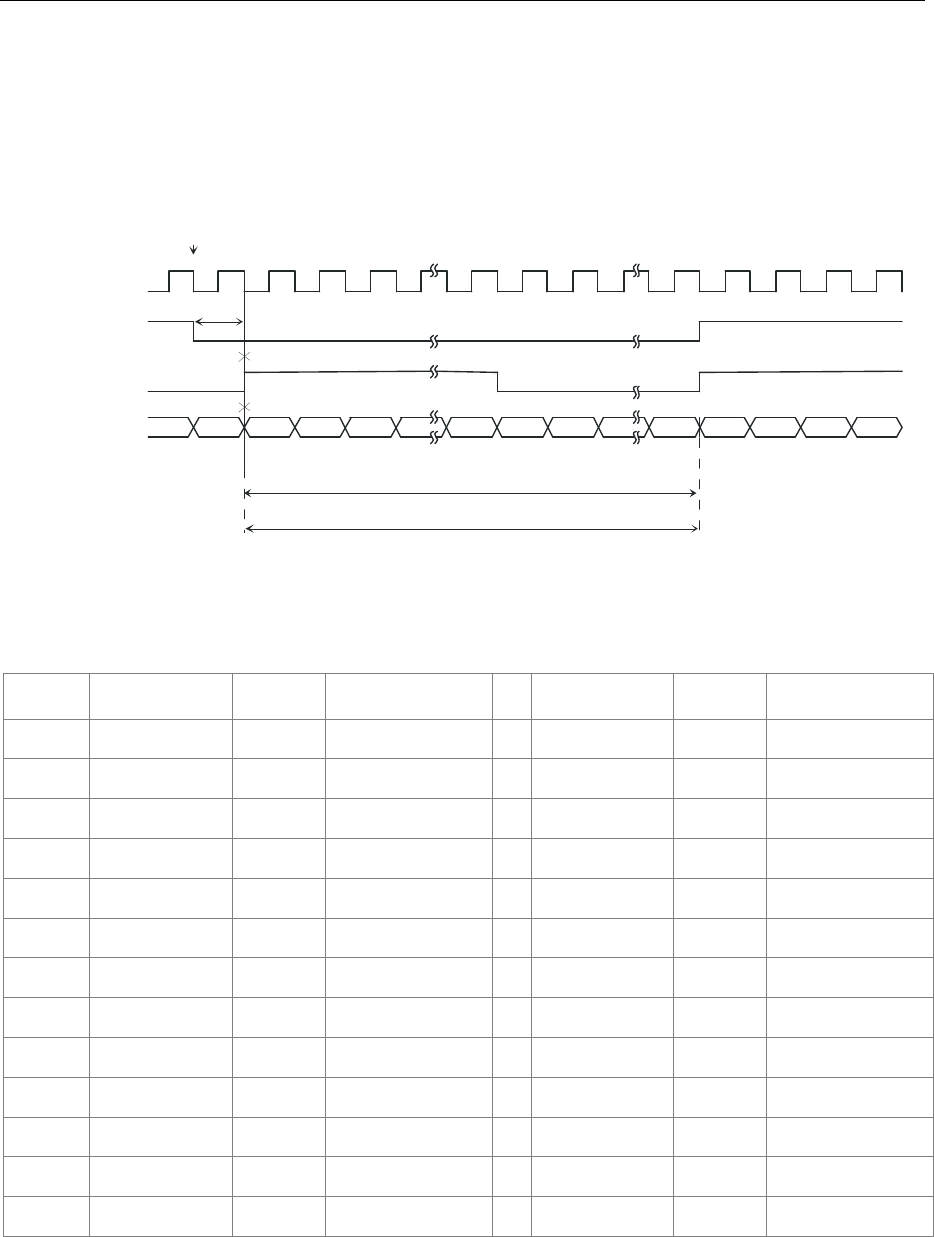
R&S UPV Configuring the USI Dual Channel Generator
1146.2084.32 4.61 E-9
Reference Point:
Fsync Slope
TX_BCLK_OUT
TX_FSYNC_OUT
TX_DATA MSB LSB
Slot Length
Audio Bits
TX_SLCLK_OUT
SlClk Offset
Parameters:
No of Slots: 2
Slot Length: 32
Audiobits: 32
TX_DATA: Gen1:1.Gen2:2
Fsync Offset: -1
Fsync Wdith. Square 32
Fsync Slope: Falling
or
SlClk Wdith: Square 16
SlClk Offset: 1
SlClk Slope: Rising
Lead Bits: 0
Bit Order: MSB first
or
LSB MSB
Fsync Offset
Lead Bits
Slot 2
Slot 1
Slot 2
Interface assignment
Pin Signal (I)nput
(O)utput Signal description Pin Signal (I)nput
(O)utput Signal description
1TX_MCLK_OUT A Master clock output
generator 14 GND Ground connection
2GND Ground connection 15 TX_DATA1 ASerial Data 1
generator
3TX_MCLK_IN EMaster clock input
generator 16 GND Ground connection
4GND Ground connection 17 TX_DATA2 ASerial Data 2
generator
5TX_BCLK_OUT ASerial clock output
generator 18 GND Ground connection
6GND Ground connection 19 TX_DATA3 ASerial Data 3
generator
7TX_BCLK_IN ESerial clock
generator 20 GND Ground connection
8GND Ground connection 21 TX_DATA4 ASerial Data 4
generator
9TX_FSYNC_OUT AFrame Sync output
generator 22 GND Ground connection
10 GND Ground connection 23 TX_OE EOutput enable
generator
11 TX_FSYNC_IN EFrame Sync input
generator 24 TX_RESERVED1 Reserved for future
expansion
12 GND Ground connection 25 TX_RESERVED2 Reserved for future
expansion
13 TX_SLCLK_OUT AChannel clock output
generator 26 TX_RESERVED3 Reserved for future
expansion

Configuring the USI Dual Channel Generator R&S UPV
1146.2084.32 4.62 E-9
CLK IN (BNC connector)
Connection Signal Input (I)
output (O) Signal description
CLK_IN E Reserved for future
expansion
CLK OUT (BNC connector)
Connection Signal Input (I)
output (O) Signal description
CLK_OUT A Reserved for future
expansion
Probe Generator/Analyzer Layout:
Recommended PCB Male Plug:
TYCO AMP LATCH 2-827745-6
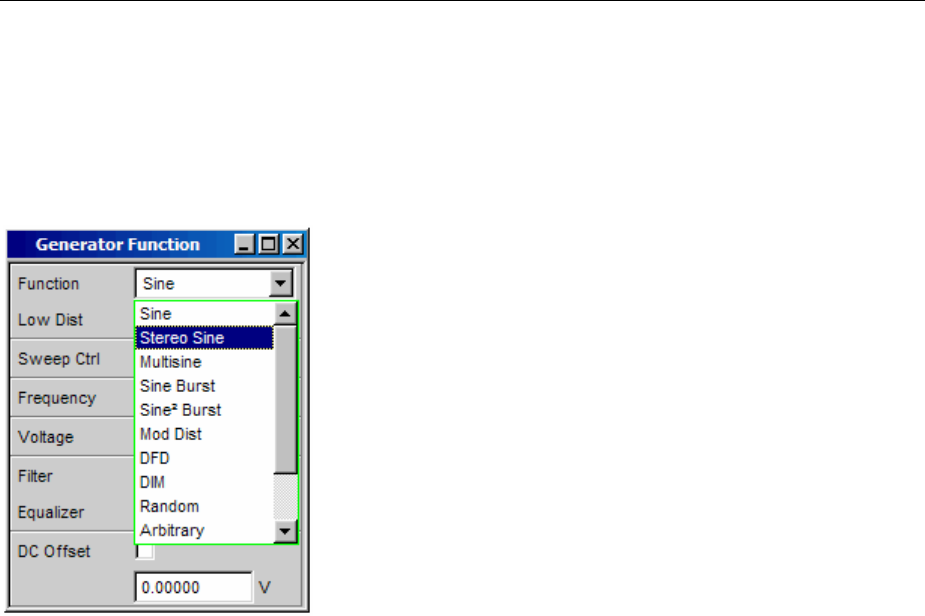
R&S UPV Generator Signals
1146.2084.32 4.63 E-9
Generator Signals
The section "Generator Signals" describes the setting parameters for all signals which can be
generated at the analog or digital outputs. The signals are selected using the "Function" selection field
in the "Generator Function" panel. The selected function determines which parameter fields are
available in the panel.
The panels for the analog and digital generator are almost identical; the settings are therefore described
together. Any differences are indicated.
Sine
The generator generates a sinewave signal. Frequency and level are the same for both channels.
Remote-control command:
SOURce:FUNCtion[:SHAPe] SINusoid
Low Dist
In the analog generator, the very low-noise and low-distortion
generator (R&S UPV-B1 option) can be used to generate a sinewave
signal instead of the universal generator. The maximum frequency is
185 kHz, irrespective of the bandwidth set in the "Generator Config"
panel.
This parameter field does not appear in the digital generator.

Generator Signals R&S UPV
1146.2084.32 4.64 E-9
ON
The low-distortion generator is activated.
ADC Offset is not possible; the parameter field is
displayed in grey and cannot be accessed.
No filters can be used; the parameter field is hidden.
Note:
When the low distortion generator is active, "Gen
Track" measurement modes and times should be
avoided in the analyzer, because the frequency
setting is not quartz accurate and thus inaccurate
measurement results can be expected.
Remote-control command:
SOURce:LOWDistortion ON
OFF
The low distortion generator is deactivated. The
frequency setting is quartz accurate and limited to
80 kHz as a function of bandwidth.
Remote-control command:
SOURce:LOWDistortion OFF
Dither
In the digital generator, a noise component with adjustable amplitude
can be superimposed on the signal. The tick box is used to
activate/deactivate this function. The distribution function for amplitude
can be selected in the "PDF" parameter field.
The parameter fields for Dither and PDF do not appear in the analog
generator.
Remote-control commands:
SOURce:SINusoid:DITHer:STATe ON | OFF
SOURce:SINusoid:DITHer <nu>
SOURce:RANDom:PDF GAUSsian | TRIangle | RECTangle
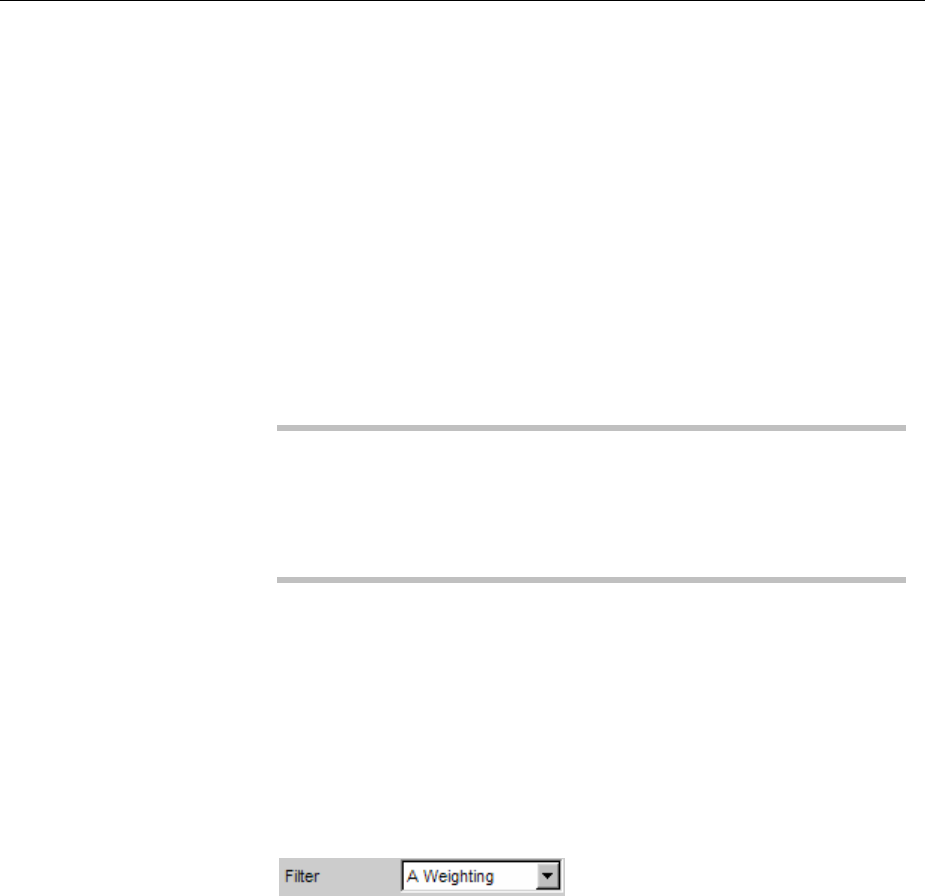
R&S UPV Generator Signals
1146.2084.32 4.65 E-9
Sweep Ctrl
Used to activate the sweep system. The frequency or level of the
signal can be varied within a selectable range from the start to the
stop value. If frequency or level is selected as the X-axis, the
measurement values can be displayed as a curve in the Sweep Graph
graphical window.
Sweep points: Linear or logarithmic between start and stop or read
from a file.
Stepping: Automatic in a defined time grid or synchronized to the
measurement time of the analyzer. Manual using the rotary knob. All
the setting parameters of the sweep system are described in the
section "Sweeps" on page 4.119.
Frequency
Used to set the frequency of the sinewave. The value range depends
on the analog bandwidth set in the Generator Config panel or the
digital clock rate. Digital generator sinus signals can be produced up
to 49.9% of the sampling rate.
Note:
If "Gen Track" is selected as the measurement time in the analyzer,
the measurement time and generator frequency are synchronized to
each other so that the signal periods recorded in the measurement
time contain a whole number of samples. If necessary the generator
frequency is modified slightly to allow this to happen.
Remote-control command:
SOURce:FREQuency[1] <nu>
Voltage
Used to set the level of the sinewave. The maximum value depends
on the set DC offset. In the analog generator, the maximum total
voltage also depends on the settings for Output Type and Max
Voltage in the Generator Config panel.
Remote-control command:
SOURce:VOLTage[1] <nu>
Filter
The generator signal is filtered in the time domain. One of the user-
definable filters in the filter panel or a weighting filter can be selected.
It is not possible to use a filter if the low-distortion oscillator is
activated.
See also the section "Generator Filters" on page 4.112.
Remote-control command:
SOURce:FILTer <parameter>
List of <parameter> see section "Filter Table" on page 4.419.
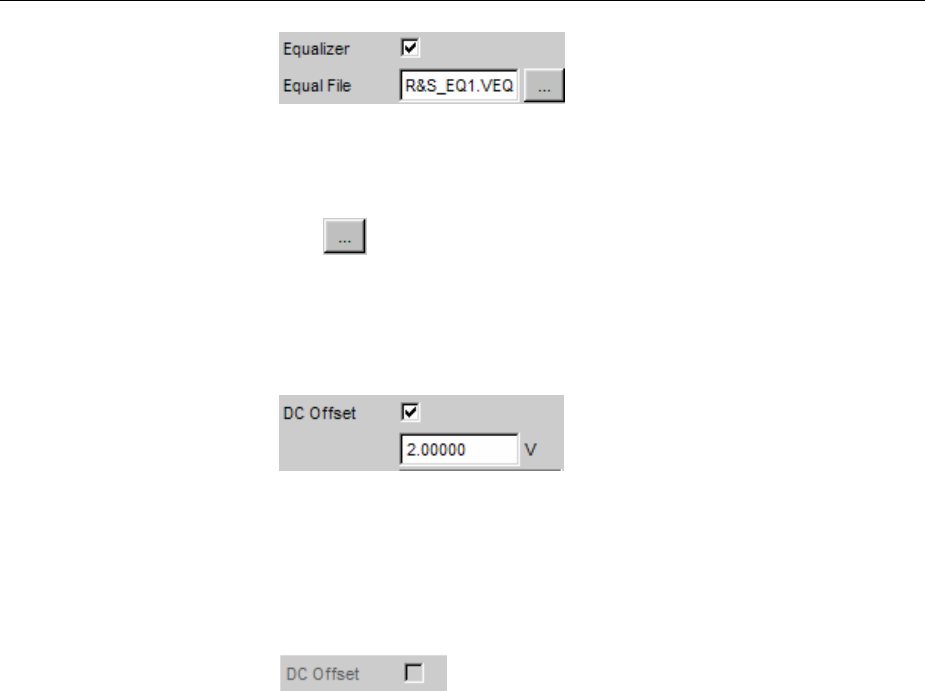
Generator Signals R&S UPV
1146.2084.32 4.66 E-9
Equalizer
The generator signal is precorrected in the frequency domain using
the file selected in the "Equal File" parameter field. The tick box is
used to activate/deactivate this function.
The button opens a browser which can be used to select the
precorrector file, see also the section "Equalization" on page 4.111.
Remote-control commands:
SOURce:VOLTage:EQUalize:STATe ON | OFF
MMEMory:LOAD:OEQualize ’filename’
DC Offset
ADC offset is superimposed on the generator signal. This offset
reduces the maximum possible AC voltage. The tick box is used to
activate/deactivate this function. The value set for the offset voltage is
always displayed.
If the low-distortion generator is activated, no DC offset is possible; the
parameter field is displayed in grey and cannot be accessed.
Remote-control commands:
SOURce:VOLTage:OFFSet:STATe ON | OFF
SOURce:VOLTage:OFFSet <nu>
Stereo Sine
The generator generates a sinewave signal on both channels. The frequency, level and phase can be
set freely and separately for Channel 1 and 2. In the analog generator, the R&S UPV-B3 option is
required for this function.
Remote-control command:
SOURce:FUNCtion[:SHAPe] STEReo
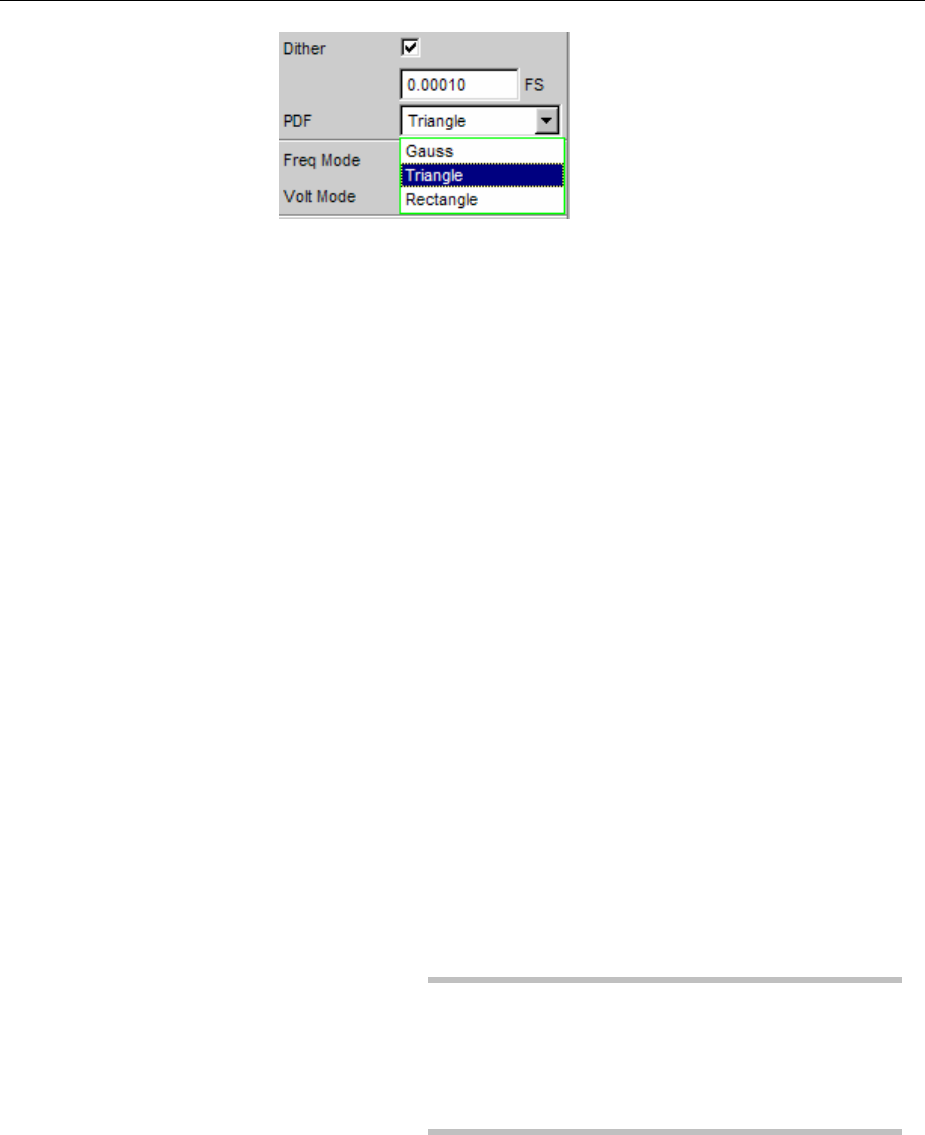
R&S UPV Generator Signals
1146.2084.32 4.67 E-9
Dither
In the digital generator, a noise component with adjustable amplitude
can be superimposed on the signal. The tick box is used to
activate/deactivate this function. The distribution function for amplitude
can be selected in the "PDF" parameter field. The Dither setting is the
same for both channels.
The parameter fields for Dither and PDF do not appear in the analog
generator.
Remote-control commands:
SOURce:SINusoid:DITHer:STATe ON | OFF
SOURce:SINusoid:DITHer <nu>
SOURce:RANDom:PDF GAUSsian | TRIangle | RECTangle
Freq Mode
Determines the frequency and phase setting for Channel 1 and 2. The
value range for frequency depends on the analog bandwidth set in the
Generator Config panel or the digital clock rate.
F&Ph Channel 1 and 2 have the same frequency but the
phase between the two channels can be selected.
With the frequency sweep, the phase between the
two channels remains constant.
Remote-control command:
SOURce:FREQuency:SELect FQPH
Ch1&2 The frequency can be entered separately for
Channel 1 and 2. There is no fixed phase
relationship between the channels.
With the frequency sweep, the frequency of Channel
1is swept but Channel 2 remains unchanged.
Note:
If "Gen Track" is selected as the measurement time
in the analyzer, measurement channel 1 tracks the
frequency of generator channel 1 and measurement
channel 2 tracks the frequency of generator
channel 2.
Remote-control command:
SOURce:FREQuency:SELect FQFQ
Volt Mode
Determines the level setting for Channel 1 and 2. The maximum value
depends on the set DC offset. In the analog generator, the maximum
total voltage also depends on the settings for "Output Type" and "Max
Voltage" in the Generator Config panel.

Generator Signals R&S UPV
1146.2084.32 4.68 E-9
Ch2/1 The levels of Channel 1 and 2 have a fixed ratio
relative to each other.
With the level sweep, this ratio remains constant.
Remote-control command:
SOURce:VOLTage:SELect VLRT
Ch1&2 The level can be set separately for Channel 1 and 2.
With the level sweep, the level of Channel 1 is swept
but Channel 2 remains unchanged.
Remote-control command:
SOURce:VOLTage:SELect VLVL
Sweep Ctrl
Used to activate the sweep system. The frequency, phase or level of
the signal can be varied within a selectable range from the start to the
stop value. The Freq Mode and Volt Mode settings determine how
frequencies and levels are changed during the sweep.
If frequency, phase or level is selected as the X-axis, the
measurement values can be displayed as a curve in the Sweep Graph
graphical window.
Sweep points: Linear or logarithmic between start and stop or read
from a file.
Stepping: Automatic in a defined time grid or synchronized to the
measurement time of the analyzer. Manual using the rotary knob. All
the setting parameters of the sweep system are described in the
section "Sweeps" on page 4.119.
Frequency
The frequency is identical for both channels (Freq Mode F&Ph).
Note:
If "Gen Track" is selected as the measurement time in the analyzer,
the measurement time and generator frequency are synchronized to
each other so that the signal periods recorded in the measurement
time contain a whole number of samples. If necessary the generator
frequency is modified slightly to allow this to happen.
Remote-control command:
SOURce:FREQuency[1] <nu>
Freq Ch1
Frequency of Channel 1 (Freq Mode Ch1&2).
Note:
If "Gen Track" is selected as the measurement time in the analyzer,
measurement channel 1 tracks the frequency of generator channel 1.
If necessary the generator frequency is modified slightly so that the
signal periods recorded in the measurement time contain a whole
number of samples.
Remote-control command:
SOURce:FREQuency[1] <nu>
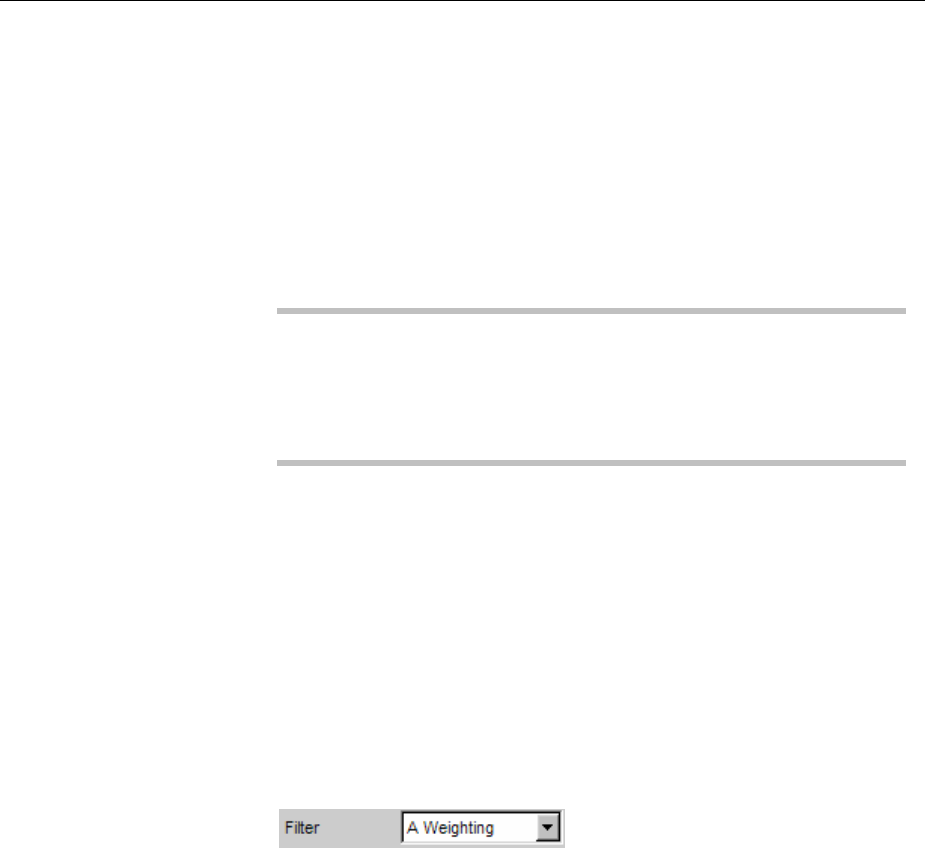
R&S UPV Generator Signals
1146.2084.32 4.69 E-9
Volt Ch1
Level of Channel 1.
Remote-control command:
SOURce:VOLTage[1] <nu>
Phase Ch2/1
Phase of Channel 2 relative to Channel 1 (Freq Mode F&Ph).
Remote-control command:
SOURce:PHASe <nu>
Freq Ch2
Frequency of Channel 2 (Freq Mode Ch1&2).
Note:
If "Gen Track" is selected as the measurement time in the analyzer,
measurement channel 2 tracks the frequency of generator channel 2.
If necessary the generator frequency is modified slightly so that the
signal periods recorded in the measurement time contain a whole
number of samples.
Remote-control command:
SOURce:FREQuency:CH2Stereo <nu>
Volt Ch2
Level of Channel 2 (Volt Mode Ch1&2).
Remote-control command:
SOURce:VOLTage:CH2Stereo <nu>
Volt Ch2/1
Ratio of the level of both channels relative to Channel 1 (Volt Mode
Ch2/1).
Remote-control command:
SOURce:VOLTage:RATio <n>
Filter
The generator signal is filtered in the time domain. One of the user-
definable filters in the filter panel or a weighting filter can be selected,
see also the section "Generator Filters" on page 4.112.
Remote-control command:
SOURce:FILTer <parameter>
List of <parameter> see section "Filter Table" on page 4.419.

Generator Signals R&S UPV
1146.2084.32 4.70 E-9
Equalizer
The generator signal is precorrected in the frequency domain using
the file selected in the "Equal File" parameter field. The tick box is
used to activate/deactivate this function. The precorrection is the
same for both channels.
The button opens a browser which can be used to select the
precorrector file, see also the section "Equalization" on page 4.111.
Remote-control commands:
SOURce:VOLTage:EQUalize:STATe ON | OFF
MMEMory:LOAD:OEQualize ’filename’
DC Offset
ADC offset is superimposed on the generator signal. This offset
reduces the maximum possible AC voltage. The tick box is used to
activate/deactivate this function. The value set for the offset voltage is
always displayed. The DC voltage is the same for both channels.
Remote-control commands:
SOURce:VOLTage:OFFSet:STATe ON | OFF
SOURce:VOLTage:OFFSet <nu>
Multisine
The generator generates a multi-tone signal with up to 32 sinewave tones. The frequency, level and
phase can be freely selected for each tone. However, it is also possible to optimize the phase so that
the ratio of peak value to rms value is minimal, as is often required in the case of noise-like signals.
Owing to the absence of associated windowing, linking the frequency spacing of the multi-sinewave to
the resolution of the FFT allows extremely fast frequency response measurement.
Remote-control command:
SOURce:FUNCtion[:SHAPe] MULTisine
Spacing
Used to set the frequency spacing. The frequency of each sinewave
line is an integer multiple of this frequency spacing.
Def The frequency spacing can be freely defined.
Minimum value: Sampling rate/262144
Remote-control command:
SOURce:RANDom:SPACing:MODE USERdefined
SOURce:RANDom:SPACing:FREQuency <nu>

R&S UPV Generator Signals
1146.2084.32 4.71 E-9
Anl Trk The frequency spacing is adopted from the FFT set
inthe analyzer. This value depends on the sampling
rate and the size of the FFT. This setting is only
possible if an FFT or Post FFT is selected in the
analyzer.
The parameter field for entering values is then
hidden.
Remote-control command:
SOURce:RANDom:SPACing:MODE ATRack
Voltage Mode
Used to select the entry mode for the voltages of the individual
sinewave tones.
Equal All sinewave lines have the same amplitude. It is
entered in the "Volt No1" parameter field.
Remote-control command:
SOURce:FUNCtion:MODE EQUalvoltage
Define Aseparate amplitude can be defined for each
sinewave line.
Remote-control command:
SOURce:FUNCtion:MODE DEFinedvoltage
Crest Factor
The peak value to rms value ratio (crest factor) of the signal can be
influenced by the phase of the individual sinewave lines.
Optimized The ratio of peak value to RMS of the signal is
minimized.
Remote-control command:
SOURce:VOLTage:CREStfactor:MODE
MINimized
Define Phase The start phase of each sinewave line can be
defined.
Remote-control command:
SOURce:VOLTage:CREStfactor:MODE DPHase
No of Sine
Used to set the number of sinewave tones of the multi-sinewave
signal.
Remote-control command:
SOURce:MULTisine:COUNt <n>
Freq No i
Used to set the frequency of sinewave number i of the multi-sinewave
signal.
Remote-control command:
SOURce:FREQuency<i> <nu>

Generator Signals R&S UPV
1146.2084.32 4.72 E-9
Phase No i
Used to set the start phase of sinewave number i of the multi-
sinewave signal. This parameter field only appears if Define Phase is
selected for Crest Factor.
Remote-control command:
SOURce:PHASe<i> <nu>
Volt No i
Used to set the voltage of sinewave number i of the multi-sinewave
signal. The maximum value depends on the set DC offset. In the
analog generator, the maximum total voltage also depends on the
settings for Output Type and Max Voltage in the Generator Config
panel.
Remote-control command:
SOURce:VOLTage<i> <nu>
Total Gain
Used to set a gain factor which can be used to vary the total level of
the multi-sinewave signal. The maximum value depends on the set
DC offset. In the analog generator, the maximum total voltage also
depends on the settings for Output Type and Max Voltage in the
Generator Config panel.
Remote-control command:
SOURce:VOLTage:TOTal:GAIN <n> DB
Total Peak
Indicates the peak value of the multi-sinewave signal.
Remote-control command:
SOURce:VOLTage:TOTal?
Total RMS
Indicates the RMS of the multi-sinewave signal (only in the analog
generator).
Remote-control command:
SOURce:VOLTage:RMS?
Amplitude variation
The amplitude of the signal can be varied as sinewave or pulse
shaped (burst) with a frequency selected by the user (see section
"Amplitude Variation" on page 4.110).
Filter
The generator signal is filtered in the time domain. One of the user-
definable filters in the filter panel or a weighting filter can be selected,
see also the section "Generator Filters" on page 4.112.
Remote-control command:
SOURce:FILTer <parameter>
List of <parameter> see section "Filter Table" on page 4.419.
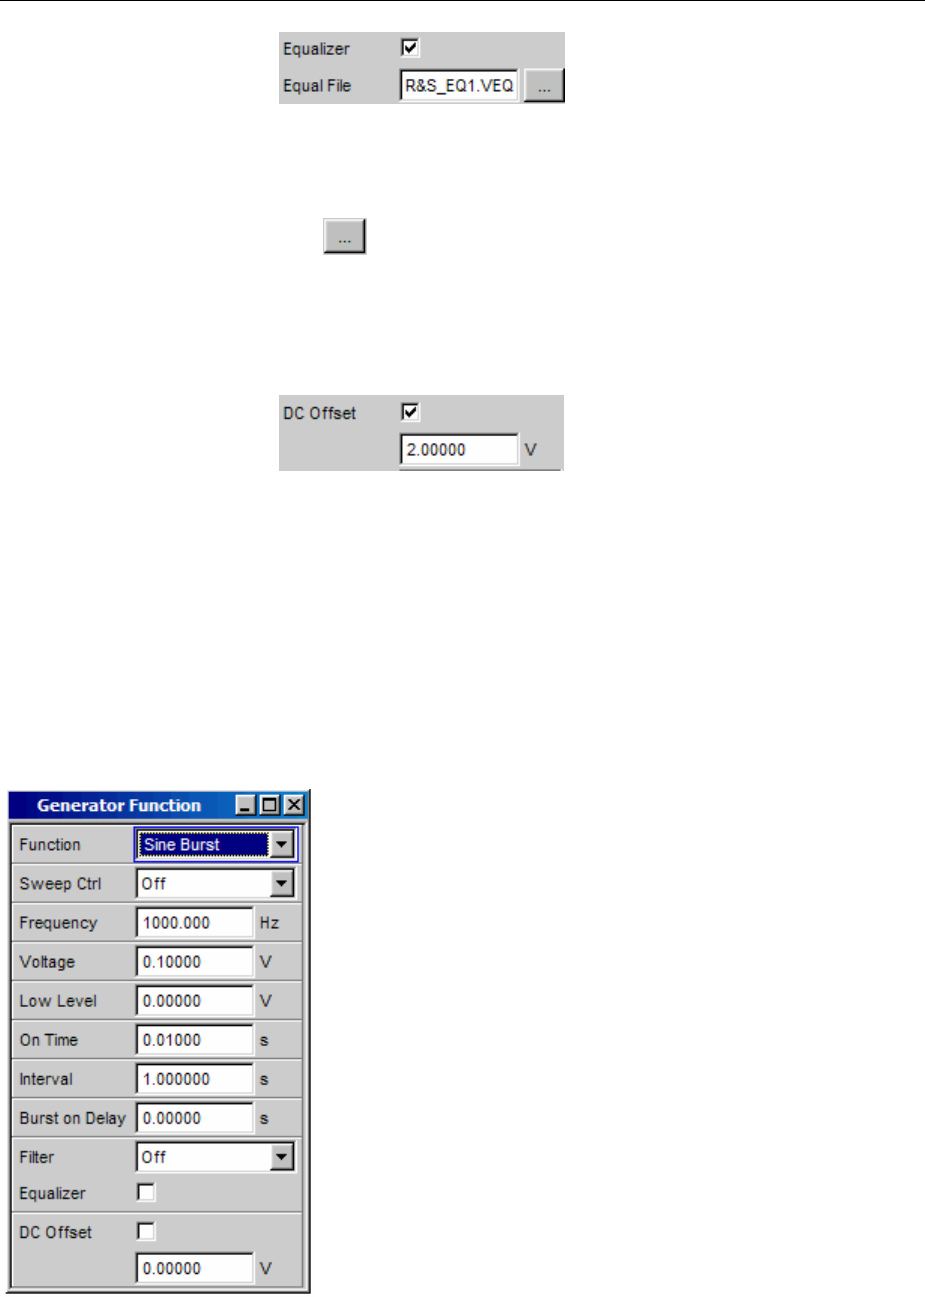
R&S UPV Generator Signals
1146.2084.32 4.73 E-9
Equalizer
The generator signal is precorrected in the frequency domain using
the file selected in the "Equal File" parameter field. The tick box is
used to activate/deactivate this function.
The button opens a browser which can be used to select the
precorrector file, see also the section "Equalization" on page 4.111.
Remote-control command:
SOURce:VOLTage:EQUalize:STATe ON | OFF
MMEMory:LOAD:OEQualize ’filename’
DC Offset
ADC offset is superimposed on the generator signal. This offset
reduces the maximum possible AC voltage. The tick box is used to
activate/deactivate this function. The value set for the offset voltage is
always displayed.
Remote-control command:
SOURce:VOLTage:OFFSet:STATe ON | OFF
SOURce:VOLTage:OFFSet <nu>
Sine Burst
The generator generates a sinewave signal, the amplitude of
which changes periodically between high level (Voltage) during
the burst duration (On Time) and low level (Low Level) during the
burst pause. The "Interval" parameter field is used to set the
repetition rate of the burst. The following always applies: Burst
pause = Burst period (Interval) – Burst duration (On Time). Low
Level can be set as a fixed value or as a ratio relative to the burst
level.
When generator settings have been changed or a measurement
has been started, the burst starts with the positive sinusoidal half-
wave of the burst duration (On Time). The "Burst On Delay"
parameter is used to set a defined delay time.
Remote-control command:
SOURce:FUNCtion[:SHAPe] BURSt

Generator Signals R&S UPV
1146.2084.32 4.74 E-9
Sweep Ctrl
Used to activate the sweep system. The frequency, level, ON-time
and interval of the burst signal can be varied within a selectable range
from the start to the stop value. If one of these parameters is selected
as the X-axis, the measurement values can be displayed as a curve in
the Sweep Graph graphical window.
Sweep points: Linear or logarithmic between start and stop or read
from a file.
Stepping: Automatic in a defined time grid or synchronized to the
measurement time of the analyzer. Manual using the rotary knob. All
the setting parameters of the sweep system are described in the
section "Sweeps" on page 4.119.
Frequency
Used to set the frequency of the sinewave. The value range depends
on the analog bandwidth set in the Generator Config panel or the
digital clock rate.
Remote-control command:
SOURce:FREQuency[1] <nu>
Voltage
Used to set the level of the sinewave during the burst duration. The
maximum value depends on the set DC offset. In the analog
generator, the maximum total voltage also depends on the settings for
"Output Type" and "Max Voltage" in the Generator Config panel.
Remote-control command:
SOURce:VOLTage[1] <nu>
Low Level
Used to set the level of the sinewave during the burst pause. Low
Level cannot be higher than the Voltage; if Voltage is reduced (also
during a sweep), Low Level may also be reduced. Low Level can also
be set as a fixed ratio relative to Voltage; the units %on, dBon and (in
the analog generator only) V/on are available for this purpose.
Remote-control command:
SOURce:VOLTage:LOWLevel <nu>
On Time
Used to set the burst duration. Entered as a fixed time or as a number
of periods (cycles) of the sinewave frequency. On Time is always less
than Interval; if increased, Interval may also be increased.
Minimum value: 1 sample
Maximum value: 60 s – 1 sample
Remote-control command:
SOURce:ONTime <nu>
Interval
Used to set the repetition rate of the burst signal. Entered as a fixed
time or as a number of periods (cycles) of the sinewave frequency.
Interval is always greater than or equal to On Time.
Minimum value: On Time
Maximum value: 60 min
Remote-control command:
SOURce:INTerval <nu>
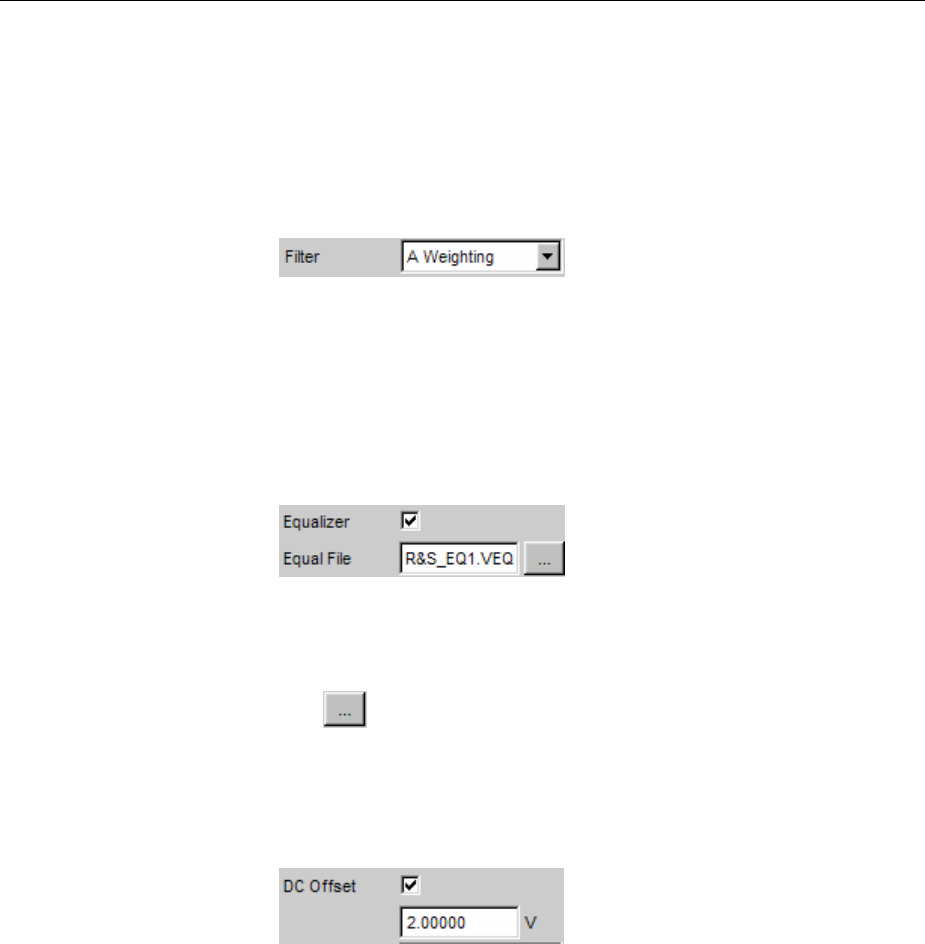
R&S UPV Generator Signals
1146.2084.32 4.75 E-9
Burst on Delay
Used to set the delay time which must expire (after generator settings
have been changed or a measurement has been started) before the
generator can start the burst with the high level (Voltage). During this
time, the signal is output with the low level (Low Level).
Value range: 0 to 60 s
Remote-control command:
SOURce:ONTime:DELay <nu>
Filter
The generator signal is filtered in the time domain. One of the user-
definable filters in the filter panel or a weighting filter can be selected,
see also the section "Generator Filters" on page 4.112.
Remote-control command:
SOURce:FILTer <parameter>
List of <parameter> see section "Filter Table" on page 4.419.
Equalizer
The generator signal is precorrected in the frequency domain using
the file selected in the "Equal File" parameter field. The tick box is
used to activate/deactivate this function.
The button opens a browser which can be used to select the
precorrector file, see also the section "Equalization" on page 4.111.
Remote-control command:
SOURce:VOLTage:EQUalize:STATe ON | OFF
MMEMory:LOAD:OEQualize’filen ame’
DC Offset
ADC offset is superimposed on the generator signal. This offset
reduces the maximum possible AC voltage. The tick box is used to
activate/deactivate this function. The value set for the offset voltage is
always displayed.
Remote-control command:
SOURce:VOLTage:OFFSet:STATe ON | OFF
SOURce:VOLTage:OFFSet <nu>
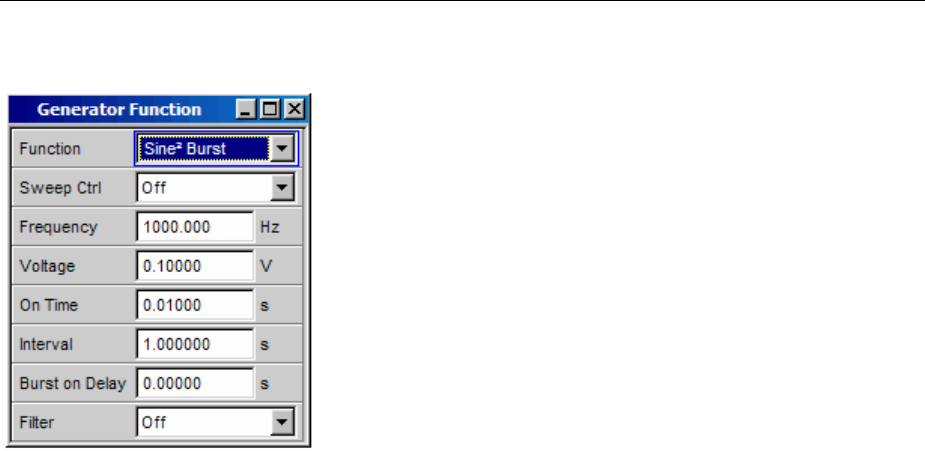
Generator Signals R&S UPV
1146.2084.32 4.76 E-9
Sine2Burst
The generator generates a sine2signal, the amplitude of which is
periodically activated (during the burst duration, i.e. On Time) and
deactivated. The pulse can be inverted by entering a negative
voltage.
The "Interval" parameter field is used to set the repetition rate of
the burst. The following always applies: Burst pause = Burst period
(Interval) – Burst duration (On Time).
The burst starts after generator settings have been changed or a
measurement has been started. The "Burst On Delay" parameter is
used to set a defined delay time.
Remote-control command:
SOURce:FUNCtion[:SHAPe] S2Pulse
Sweep Ctrl
Used to activate the sweep system. The frequency, level, ON-time
and interval of the burst signal can be varied within a selectable range
from the start to the stop value. If one of these parameters is selected
as the X-axis, the measurement values can be displayed as a curve in
the Sweep Graph graphical window.
Sweep points: Linear or logarithmic between start and stop or read
from a file.
Stepping: Automatic in a defined time grid or synchronized to the
measurement time of the analyzer. Manual using the rotary knob. All
the setting parameters of the sweep system are described in the
section "Sweeps" on page 4.119.
Frequency
Used to set the frequency of the sinewave. The value range depends
on the analog bandwidth set in the Generator Config panel or the
digital clock rate.
Remote-control command:
SOURce:FREQuency[1] <nu>
Voltage
Used to set the level of the sinewave during the burst duration. The
pulse is inverted by entering a negative voltage; conversion into
logarithmic units is then not possible. In the analog generator, the
maximum total voltage depends on the settings for Output Type and
Max Voltage in the Generator Config panel.
Remote-control command:
SOURce:VOLTage[1] <nu>

R&S UPV Generator Signals
1146.2084.32 4.77 E-9
On Time
Used to set the burst duration. Entered as a fixed time or as a number
ofperiods (cycles) of the sinewave frequency. On Time is always less
than Interval; if increased, Interval may also be increased.
Minimum value: 1 sample
Maximum value: 60 s – 1 sample
Remote-control command:
SOURce:ONTime <nu>
Interval
Used to set the repetition rate of the burst signal. Entered as a fixed
time or as a number of periods (cycles) of the sinewave frequency.
Interval is always greater than or equal to On Time.
Minimum value: On Time
Maximum value: 60 min
Remote-control command:
SOURce:INTerval <nu>
Burst on Delay
Used to set the delay time which must expire (after generator settings
have been changed or a measurement has been started) before the
generator can start the burst. During this time, the signal voltage is 0 V
(or 0 FS in the digital range).
Value range: 0 to 60 s
Remote-control command:
SOURce:ONTime:DELay <nu>
Filter
The generator signal is filtered in the time domain. One of the user-
definable filters in the filter panel or a weighting filter can be selected,
see also the section "Generator Filters" on page 4.112.
Remote-control command:
SOURce:FILTer <parameter>
List of <parameter> see section "Filter Table" on page 4.419.
Mod Dist
The generator generates a test signal for the intermodulation measurement in accordance with SMPTE
and for the modulation factor analysis in accordance with IEC 268-3.
The signal consists of two sinewaves: a low-frequency noise signal and a high-frequency useful signal.
The level of the noise signal is 1 to 10 times higher than that of the useful signal.
According to IEC 268-3, the frequency of the noise signal must be between 0.5 and 1.5 octaves above
the lower limit frequency of the DUT (60 Hz according to SMPTE).
According to IEC 268-3, the frequency of the useful signal must be between 0.5 and 1.5 octaves below
the upper limit frequency of the DUT (7 kHz according to SMPTE).
The frequency ratio of useful signal to noise signal should be greater than 8.
According to SMPTE, the level ratio of noise signal to useful signal must be 4:1; according to IEC 268-
3, a ratio of 10:1 is also possible.

Generator Signals R&S UPV
1146.2084.32 4.78 E-9
Panel of digital generator with Mod Dist function selected
Remote-control command:
SOURce:FUNCtion[:SHAPe] MDISt
Dither
In the digital generator, a noise component with adjustable amplitude
can be superimposed on the signal. The tick box is used to
activate/deactivate this function. The distribution function for amplitude
can be selected in the "PDF" parameter field.
The parameter fields for Dither and PDF do not appear in the analog
generator.
Remote-control command:
SOURce:SINusoid:DITHer:STATe ON | OFF
SOURce:SINusoid:DITHer <nu>
SOURce:RANDom:PDF GAUSsian | TRIangle | RECTangle
Sweep Ctrl
Used to activate the sweep system. The frequency of the useful signal
(Upper Freq) or the total level (Total Voltage) of the signal can be
varied within a selectable range from the start to the stop value. If
frequency or level is selected as the X-axis, the measurement values
can be displayed as a curve in the Sweep Graph graphical window.
Sweep points: Linear or logarithmic between start and stop or read
from a file.
Stepping: Automatic in a defined time grid or synchronized to the
measurement time of the analyzer. Manual using the rotary knob. All
the setting parameters of the sweep system are described in the
section "Sweeps" on page 4.119.

R&S UPV Generator Signals
1146.2084.32 4.79 E-9
Upper Freq
Used to set the frequency of the high-frequency useful signal.
Remote-control command:
SOURce:FREQuency[1] <nu>
Lower Freq
Used to set the frequency of the low-frequency noise signal.
Remote-control command:
SOURce:FREQuency2 <nu>
Volt LF:UF
Used to set the level ratio of noise signal to useful signal as a
dimension-less number.
Remote-control command:
SOURce:VOLTage:RATio <n>
Total Voltage
Used to set the level of the overall signal. The maximum RMS
depends on the level ratio. The maximum value depends on the set
DC offset. In the analog generator, the maximum total voltage also
depends on the settings for Output Type and Max Voltage in the
Generator Config panel.
Remote-control command:
SOURce:VOLTage:TOTal <nu>
Filter
The generator signal is filtered in the time domain. One of the user-
definable filters in the filter panel or a weighting filter can be selected,
see also the section "Generator Filters" on page 4.112.
Remote-control command:
SOURce:FILTer <parameter>
List of <parameter> see section "Filter Table" on page 4.419.
DC Offset
ADC offset is superimposed on the generator signal. This offset
reduces the maximum possible AC voltage. The tick box is used to
activate/deactivate this function. The value set for the offset voltage is
always displayed.
Remote-control command:
SOURce:VOLTage:OFFSet:STATe ON | OFF
SOURce:VOLTage:OFFSet <nu>
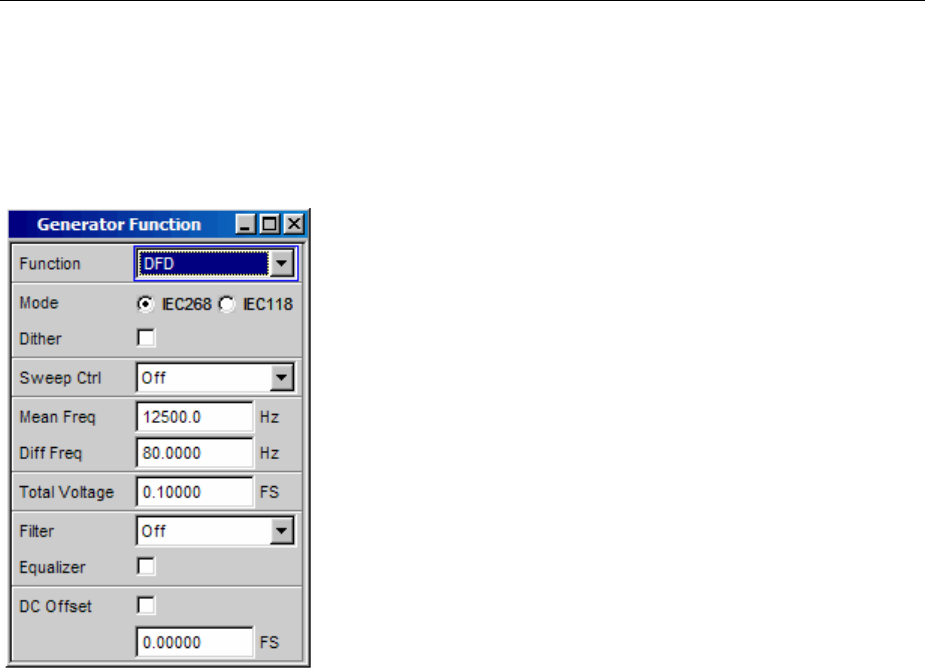
Generator Signals R&S UPV
1146.2084.32 4.80 E-9
DFD
The generator generates a test signal for the intermodulation measurement using the differential-tone
method in accordance with IEC 118 or 268.
The signal consists of two very close sinewaves of the same amplitude.
Panel of digital generator with DFD function selected
Remote-control command:
SOURce:FUNCtion[:SHAPe] DFD
Mode
Used to select the entry mode for the frequencies of both signals.
IEC 268 Entry of center frequency (Mean Freq) and
difference frequency (Diff Freq). If a frequency
sweep (for the X or Z-axis) is selected, the center
frequency is swept.
Remote-control command:
SOURce:FUNCtion:MODE IEC268
IEC 118 Entry of upper frequency (Upper Freq) and
difference frequency (Diff Freq). If a frequency
sweep (for the X or Z-axis) is selected, the upper
frequency is swept.
Remote-control command:
SOURce:FUNCtion:MODE IEC118

R&S UPV Generator Signals
1146.2084.32 4.81 E-9
Dither
In the digital generator, a noise component with adjustable amplitude
can be superimposed on the signal. The tick box is used to
activate/deactivate this function. The distribution function for amplitude
can be selected in the "PDF" parameter field.
The parameter fields for Dither and PDF do not appear in the analog
generator.
Remote-control command:
SOURce:SINusoid:DITHer:STATe ON | OFF
SOURce:SINusoid:DITHer <nu>
SOURce:RANDom:PDF GAUSsian | TRIangle | RECTangle
Sweep Ctrl
Used to activate the sweep system. The center frequency (in the
IEC 118 mode) and the upper frequency (in the IEC 268 mode) or the
total level (Total Voltage) of the signal can be varied within a
selectable range from the start to the stop value. If frequency or level
is selected as the X-axis, the measurement values can be displayed
as a curve in the Sweep Graph graphical window.
Sweep points: Linear or logarithmic between start and stop or read
from a file.
Stepping: Automatic in a defined time grid or synchronized to the
measurement time of the analyzer. Manual using the rotary knob. All
the setting parameters of the sweep system are described in the
section "Sweeps" on page 4.119.
Mean Freq
Used to set the center frequency (in the IEC 268 mode).
Remote-control command:
SOURce:FREQuency:MEAN <nu>
Upper Freq
Used to set the upper frequency (in the IEC 118 mode).
Remote-control command:
SOURce:FREQuency[1] <nu>
Diff Freq
Used to set the frequency difference of the two sinewaves.
Remote-control command:
SOURce:FREQuency:DIFFerence <nu>
Total Voltage
Used to set the level of the overall signal. The maximum value
depends on the set DC offset. In the analog generator, the maximum
total voltage also depends on the settings for Output Type and Max
Voltage in the Generator Config panel.
Remote-control command:
SOURce:VOLTage:TOTal <nu>
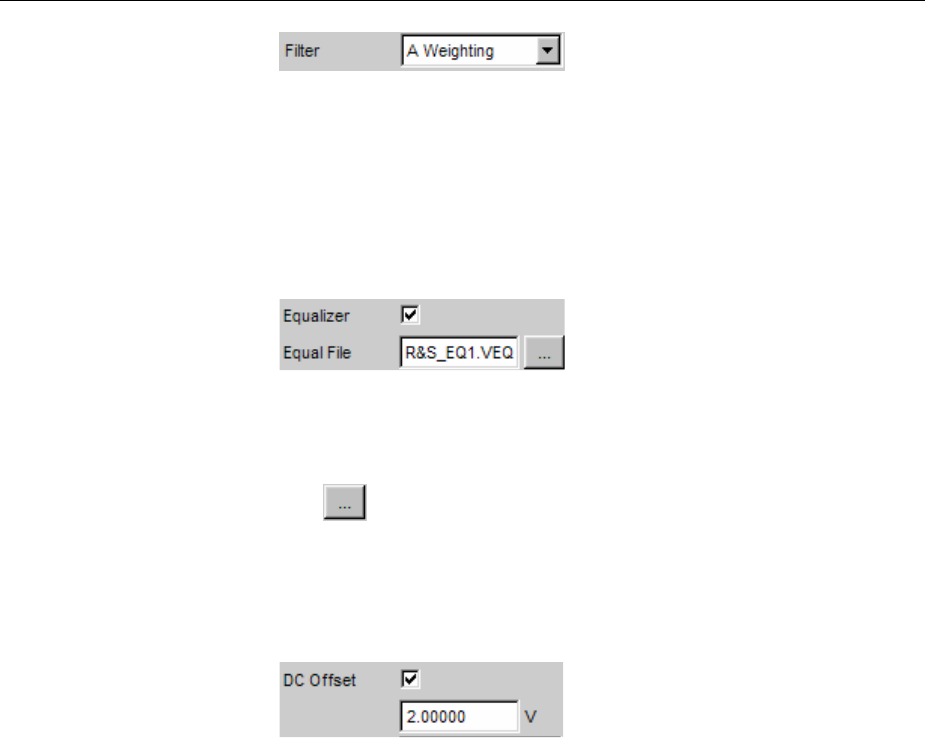
Generator Signals R&S UPV
1146.2084.32 4.82 E-9
Filter
The generator signal is filtered in the time domain. One of the user-
definable filters in the filter panel or a weighting filter can be selected,
see also the section "Generator Filters" on page 4.112.
Remote-control command:
SOURce:FILTer <parameter>
List of <parameter> see section "Filter Table" on page 4.419.
Equalizer
The generator signal is precorrected in the frequency domain using
the file selected in the "Equal File" parameter field. The tick box is
used to activate/deactivate this function.
The button opens a browser which can be used to select the
precorrector file, see also the section "Equalization" on page 4.111.
Remote-control command:
SOURce:VOLTage:EQUalize:STATe ON | OFF
MMEMory:LOAD:OEQualize ’filename’
DC Offset
ADC offset is superimposed on the generator signal. This offset
reduces the maximum possible AC voltage. The tick box is used to
activate/deactivate this function. The value set for the offset voltage is
always displayed.
Remote-control command:
SOURce:VOLTage:OFFSet:STATe ON | OFF
SOURce:VOLTage:OFFSet <nu>
DIM
The generator generates a test signal for measuring the Dynamic InterModulation distortions in
accordance with IEC 268-3. The R&S UPV-B3 option is required to generate this signal in the analog
range.
Ahigh-frequency sinewave is superimposed on a low-frequency squarewave signal. The squarewave
signal is limited with respect to bandwidth using a first-order filter. The amplitude of the squarewave
signal is 4 times higher than that of the sinewave signal.

R&S UPV Generator Signals
1146.2084.32 4.83 E-9
Panel of generator with DIM function selected
Remote-control command:
SOURce:FUNCtion[:SHAPe] DIM
Square/Sine
Used to select the ratio between the frequencies of the squarewave
signal and sinewave signal.
2.96/14 Squarewave signal: 2.96 kHz; sinewave signal:
14.0 kHz
Remote-control command:
SOURce:DIM DIMA
3.15/15 Squarewave signal: 3.15 kHz; sinewave signal:
15.0 kHz
Remote-control command:
SOURce:DIM DIMB
2.96/8 Squarewave signal: 2.96 kHz, sinewave signal:
8.0 kHz
Remote-control command:
SOURce:DIM DIMS
Bandwidth
Used to select the bandwidth (3 dB) of the first-order filter in order to
limit the bandwidth of the squarewave signal.
30kHz Bandwidth limited to 30 kHz.
Remote-control command:
SOURce:BANDwidth F30
100kHz Bandwidth limited to 100 kHz.
Remote-control command:
SOURce:BANDwidth F100

Generator Signals R&S UPV
1146.2084.32 4.84 E-9
Sweep Ctrl
Used to activate the sweep system. The total level (Total Voltage) of
the signal can be varied within a selectable range from the start to the
stop value. If the level is selected as the X-axis, the measurement
values can be displayed as a curve in the Sweep Graph graphical
window.
Sweep points: Linear or logarithmic between start and stop or read
from a file.
Stepping: Automatic in a defined time grid or synchronized to the
measurement time of the analyzer. Manual using the rotary knob. All
the setting parameters of the sweep system are described in the
section "Sweeps" on page 4.119.
Total Voltage
Used to set the level of the overall signal. The maximum value
depends on the settings for Output Type and Max Voltage in the
Generator Config panel.
Remote-control command:
SOURce:VOLTage:TOTal <nu>
Random
The generator generates a noise signal, the characteristics of which can be defined in either the time or
frequency domain:
Time domain
Selectable distribution function for amplitude
Frequency domain
Several thousand equidistant sinewave lines in a selectable frequency domain
Special application:
If the frequency spacing of the sinewave lines generated here is identical to the analysis grid of the
FFT, analysis can be performed without leakage in the FFT. It is therefore possible to obtain a
selectivity of one line with the squarewave window. This type of generator/analyzer configuration allows
frequency responses of DUTs to be determined in one go with high precision and selectivity.
Remote-control command:
SOURce:FUNCtion[:SHAPe] RANDom
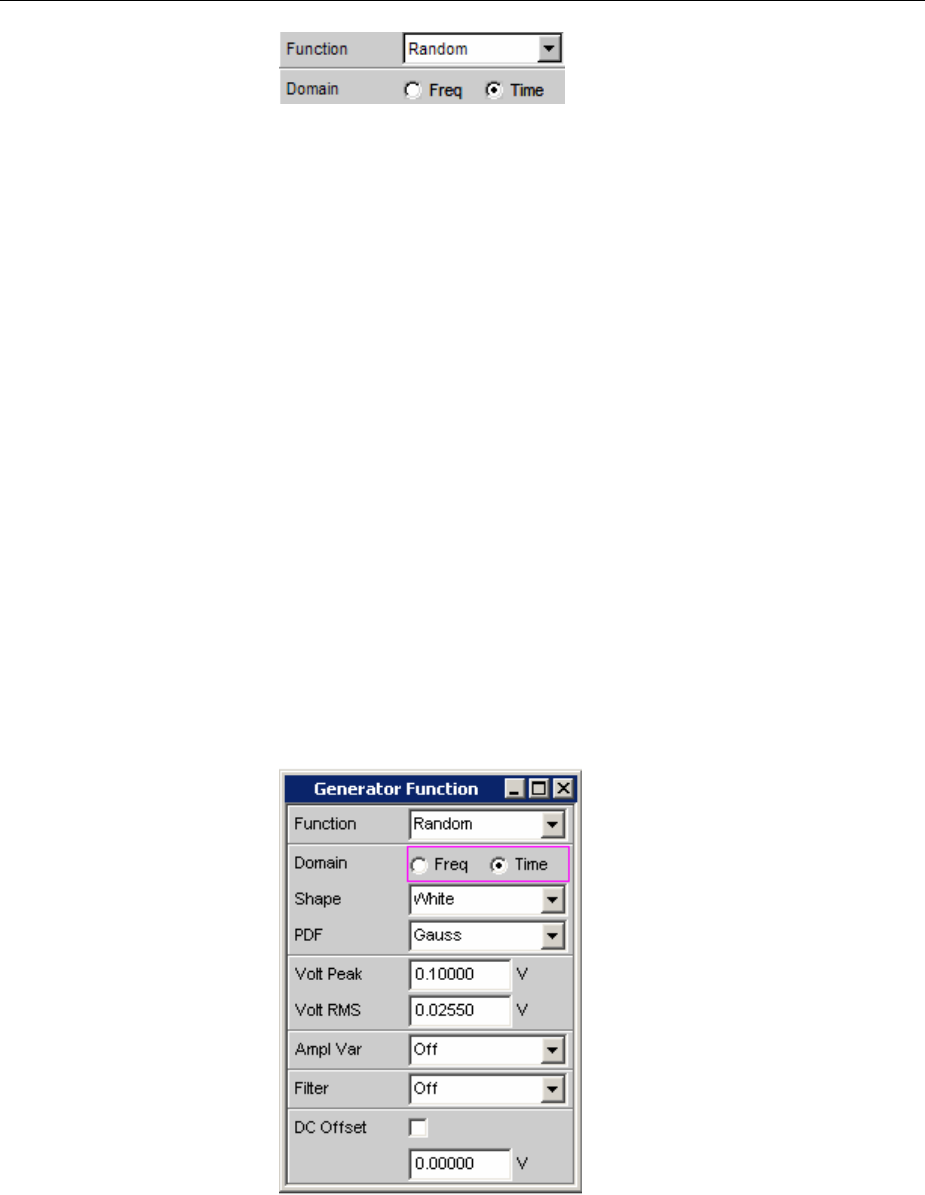
R&S UPV Generator Signals
1146.2084.32 4.85 E-9
Domain
Used to select whether the characteristics of the noise signal are
defined in the frequency or time domain.
Freq To generate the output signal, sinewave lines with
adjustable amplitude are generated and
superimposed on each other with a defined
frequency spacing. Depending on the selectivity of
the analyzer, the output signal is displayed not as a
sequence of individual lines but as a noise signal
with a continuous level versus frequency. The
frequency-defined noise can be used to generate
several thousand single tones of any given
amplitude (multi-tone).
Remote-control command:
SOURce:RANDom:DOMain FREQuency
Time In this mode, noise signals are generated with
interleaved random functions which have been
optimized for uniformly distributed noise. Periodicity
only occurs after at least 1 day.
Remote-control command:
SOURce:RANDom:DOMain TIME
Time domain
Panel used to define the noise signal in the time domain.
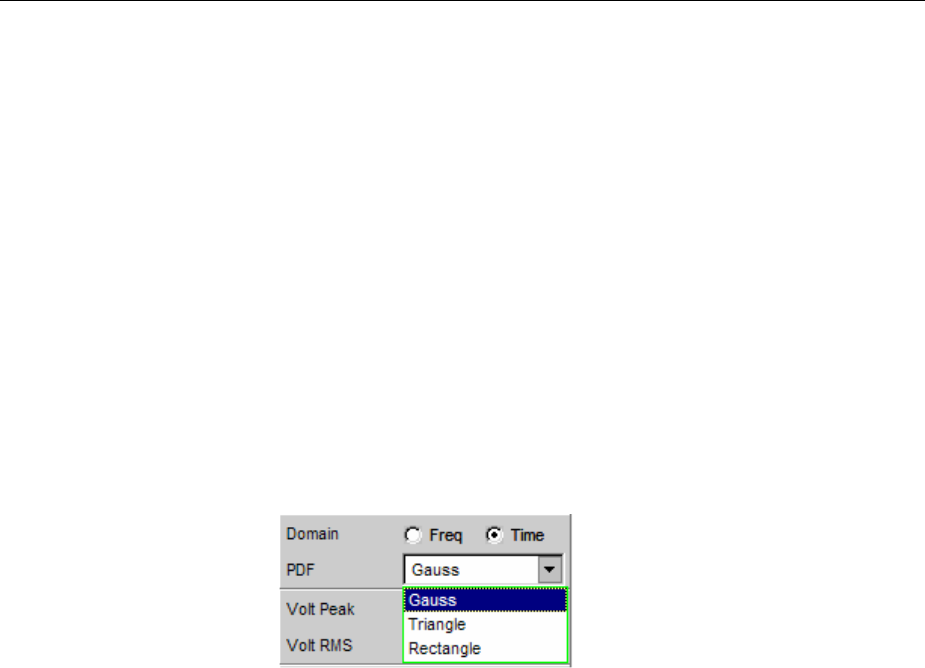
Generator Signals R&S UPV
1146.2084.32 4.86 E-9
Shape
Defines the amplitude distribution of the signal spectrum within a
selectable frequency range.
White Uncorrelated white noise without periodicity is
produced.
Remote control command:
SOURce:RANDom:SHAPe WHITe
Pink WAV files are available in the User folder for
producing broadband periodicity-free pink noise for
the fixed frequencies between 11.025 kHz and 192
kHz (and thus for all settable generator
bandwidths). They can be played with the Play
generator function and are labeled
Pink_Noise_xxxxx.WAV, xxxxx being the sampling
rate in Hz.
Remote control command:
SOURce:RANDom:SHAPe PINK
PDF
The distribution function for amplitude can be selected in the "PDF"
parameter field.
Remote-control command:
SOURce:RANDom:PDF GAUSsian | TRIangle | RECTangle
The other settings for time-domain noise (level, filter and DC offset) are described following the settings
for frequency-domain noise at the end of this chapter, starting with Volt Peak.
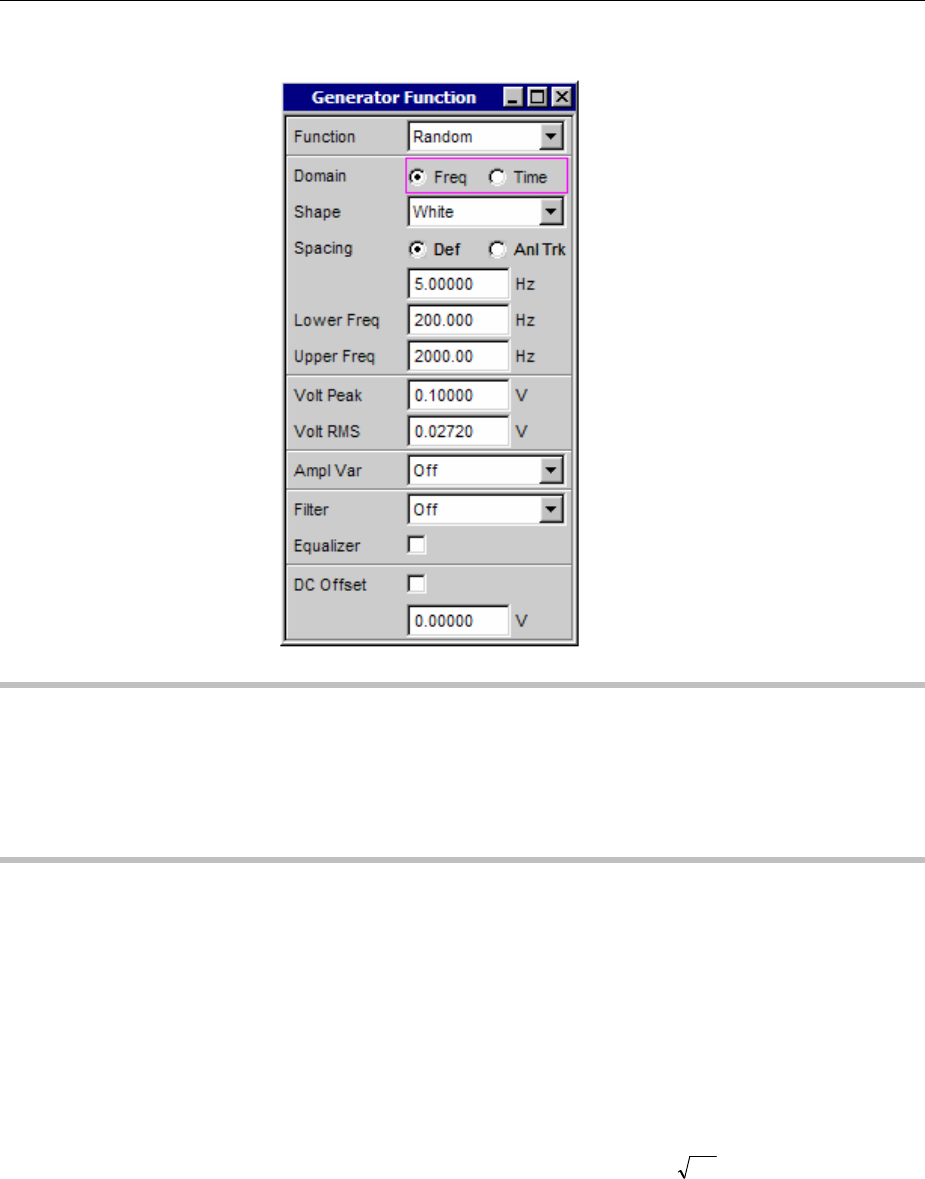
R&S UPV Generator Signals
1146.2084.32 4.87 E-9
Frequency domain
Panel used to define the noise signal in the frequency domain.
Please note:
The noise signals generated in the frequency range demonstrate an audible periodicity which, however,
does not represent a disadvantage with measurement in any way. A reduction of the periodicity can be
achieved with refined frequency resolution and a correspondingly longer cycle duration. ARB files
labelled pseudoRandomxxxk.arb are available for this in the User folder, xxx being the FFT size
expressed in k which requires the same channel spacing when the sampling frequency of the generator
and the analyzer are identical.
Shape
Used to define the amplitude distribution of the signal spectrum within
aselectable frequency domain.
White All sinewave lines between the lower and upper
frequency limit have the same amplitude.
Remote-control command:
SOURce:RANDom:SHAPe WHITe
Pink Pink noise. The amplitude of the sinewave lines
between the lower and upper frequency limit is
proportional to the function f/1 ,i.e. it decreases
by 3 dB per octave. Measurements performed using
athird-octave analyzer return a uniform frequency
spectrum.
Remote-control command:
SOURce:RANDom:SHAPe PINK
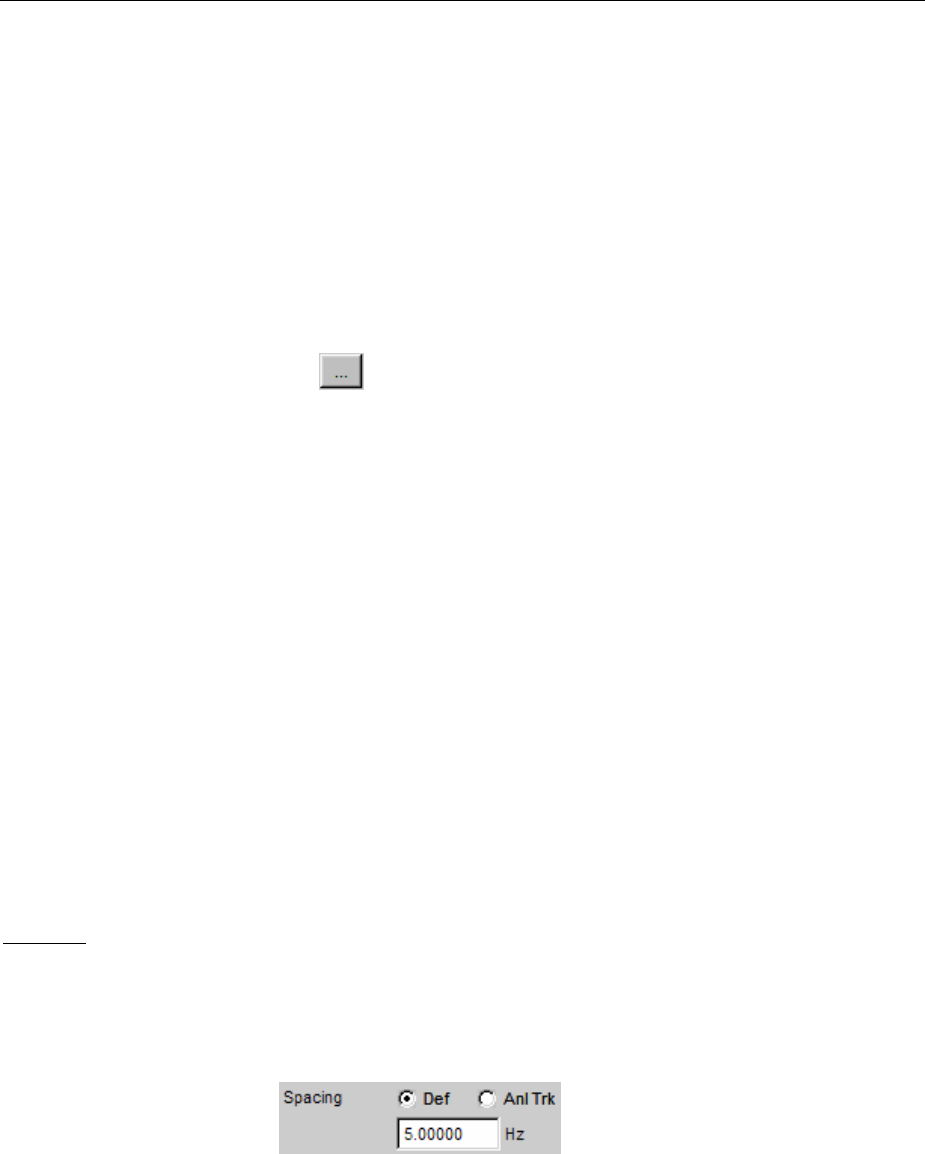
Generator Signals R&S UPV
1146.2084.32 4.88 E-9
Third Octave Pink noise with a bandwidth of one third octave. The
center frequency is adjustable.
Remote-control command:
SOURce:RANDom:SHAPe TOCTave
File The amplitude distribution is read from the file which
is displayed in the next parameter field "Shape File".
Remote-control command:
SOURce:RANDom:SHAPe FILE
Shape File
File containing the amplitude distribution.
The button opens a browser which can be used to select the file.
Remote-control command:
MMEMory:LOAD:LIST ARBitrary,’filename’
File format:
ASCII file containing max. 8192 amplitude values which have to be entered as a sequence of numbers
(value range FLOAT). The file must contain one line with the keyword "FREQUENCY_FILE" before the
number sequence. Comment lines must begin with '#' and can be used anywhere in the file. No
distinction is made between upper-case and lower-case characters. The recommended and preset file
extension is '.FTF'. However, due to the keyword "FREQUENCY_FILE" which must always be entered,
it is also possible to use any other file extension.
The amplitudes of the individual frequency lines must be entered as dimensionless numeric values
starting with 0 Hz. The numbers only indicate the amplitude ratio of the lines with respect to each other
and not the output amplitude. The output amplitude is set following phase optimization according to the
value defined in the "Volt Peak" parameter field. Since the ratio of peak value to RMS is calculated
internally, it is also possible to enter the RMS.
The frequency spacing is taken from the "Spacing" setting defined in the panel. Alternatively it can also
be defined in the file. To do this, specify the keyword "frequency_spacing" (not case-sensitive), followed
by the value in Hz. If this value is lower than the minimum value (sampling rate/16384), the minimum
value is set.
Example: rs_exam.ftf in the directory D:\UPV\User
In addition to this file format, an equalization file (example: rs_exam.veq in directory D:\UPV\User) can
be loaded as the shape file. The amplitudes of individual frequency lines are set with respect to the
equalization frequency response. The noise signal band is limited to the frequency range defined in the
equalization file.
Spacing
Used to set the frequency spacing. The frequency of each sinewave
line is an integer multiple of this frequency spacing.

R&S UPV Generator Signals
1146.2084.32 4.89 E-9
Def The frequency spacing can be freely defined.
Minimum value: Sampling rate/16384
If frequency spacing has been defined in the file, the
line where a value would be entered for this setting
is grayed out and the value is displayed instead.
Remote-control command:
SOURce:RANDom:SPACing:MODE USERdefined
SOURce:RANDom:SPACing:FREQuency <nu>
Anl Trk The frequency spacing is adopted from the FFT set
in the analyzer. This value depends on the sampling
rate and the size of the FFT. This setting is only
possible if an FFT or Post FFT is selected in the
analyzer.
The line where a value would be entered for this
setting is grayed out and the value is displayed.
Please note:
The finest channel spacing corresponds to an FFT
size of 16 k. To measure with longer FFTs – and
thus a smaller channel spacing – ARB files labeled
pseudoRandomxxxk.arb are available in the User
folder, xxx being the FFT size in k to which the
generator channel spacing is dimensioned. The
generator and the analyzer must be operated with
the same sampling rate and the same analog
bandwidth.
Remote-control command:
SOURce:RANDom:SPACing:MODE ATRack
Lower Freq
Used to define the lower frequency limit of the noise signal if Shape is
set to White or Pink.
Remote-control command:
SOURce:RANDom:FREQuency:LOWer <nu>
Upper Freq
Used to define the upper frequency limit of the noise signal if Shape is
set to White or Pink.
Remote-control command:
SOURce:RANDom:FREQuency:UPPer <nu>
Mean Freq
Used to set the center frequency in the case of third-octave noise.
Remote-control command:
SOURce:FREQuency:MEAN <nu>
Volt Peak
Used to enter the peak value of the noise signal. The maximum value
depends on the set DC offset. In the analog generator, the maximum
total voltage also depends on the settings for Output Type and Max
Voltage in the Generator Config panel.
The peak value to rms value ratio of the signal (crest factor) is
minimized. If the noise is defined in the time domain, the selected
distribution function for amplitude determines the crest factor.
Remote-control command:
SOURce:VOLTage:TOTal <nu>
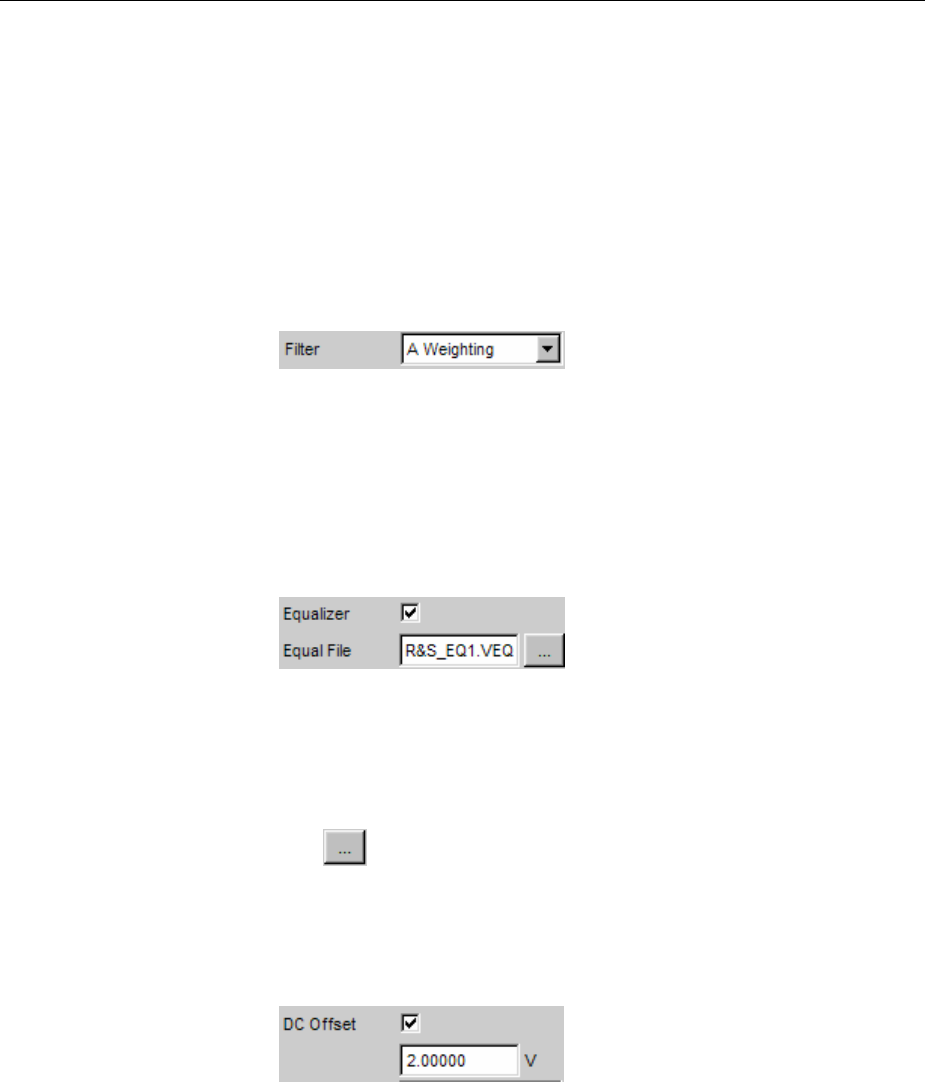
Generator Signals R&S UPV
1146.2084.32 4.90 E-9
Volt RMS
Used to enter the RMS of the noise signal (only in the analog
generator). The peak value to rms value ratio of the signal (crest
factor) is minimized. If the noise is defined in the time domain, the
selected distribution function for amplitude determines the crest factor.
Remote-control command:
SOURce:VOLTage:RMS <nu>
Amplitude variation
The amplitude of the signal can be varied as sinewave or pulse
shaped (burst) with a frequency selected by the user (see section
"Amplitude Variation" on page 4.110).
Filter
The generator signal is filtered in the time domain. One of the user-
definable filters in the filter panel or a weighting filter can be selected,
see also the section "Generator Filters" on page 4.112.
Remote-control command:
SOURce:FILTer <parameter>
List of <parameter> see section "Filter Table" on page 4.419.
Equalizer
The generator signal is precorrected in the frequency domain using
the file selected in the "Equal File" parameter field. The tick box is
used to activate/deactivate this function.
These parameter fields are hidden if time-domain noise (Domain
Time) is selected.
The button opens a browser which can be used to select the
precorrector file, see also the section "Equalization" on page 4.111.
Remote-control command:
SOURce:VOLTage:EQUalize:STATe ON | OFF
MMEMory:LOAD:OEQualize ’filename’
DC Offset
ADC offset is superimposed on the generator signal. This offset
reduces the maximum possible AC voltage. The tick box is used to
activate/deactivate this function. The value set for the offset voltage is
always displayed.
Remote-control command:
SOURce:VOLTage:OFFSet:STATe ON | OFF
SOURce:VOLTage:OFFSet <nu>

R&S UPV Generator Signals
1146.2084.32 4.91 E-9
Arbitrary
The generator generates a freely definable curve shape which is read out from a file as a sequence of
samples. The maximum length is 262144 (256 k) samples. When output, the curve is repeated
continuously in an unbroken sequence. If a measurement is restarted (Start button), the curve starts
again from the beginning of the file. The individual samples are output at the sampling rate selected in
the generator.
Remote-control command:
SOURce:FUNCtion[:SHAPe] ARBitrary
File
File from which the curve shape is read.
The button opens a browser which can be used to select the file.
Remote-control command:
MMEMory:LOAD:ARBitrary ’filename’
File format:
ASCII file with max. 524288 (512 k) samples. The individual samples are entered as a sequence of
numbers (value range -1.0 bis +1.0). The file must contain one line with the keyword "TIMETAB_FILE"
before the number sequence. Comment lines must begin with '#' and can be used anywhere in the file.
No distinction is made between upper-case and lower-case characters. The recommended and preset
file extension is '.ARB'. However, due to the keyword "TIMETAB_FILE" which must always be entered,
it is also possible to use any other file extension.
The numerically highest value (Maximum) is output with the peak voltage set in the "Volt Peak" entry
field; the other samples are level-controlled according to their ratio to the maximum. Since the ratio of
peak value to RMS is calculated internally from the samples, it is also possible to enter the RMS.
Example: rs_exam.arb in the directory D:\UPV\User
Volt Peak
Used to enter the peak value of the arbitrary signal. The maximum
value depends on the set DC offset. In the analog generator, the
maximum total voltage also depends on the settings for Output Type
and Max Voltage in the Generator Config panel. The peak value and
RMS are interlinked by means of the crest factor.
Remote-control command:
SOURce:VOLTage:TOTal <nu>
Volt RMS
Used to enter the RMS of the arbitrary signal (only in the analog
generator). The peak value and RMS are interlinked by means of the
crest factor.
Remote-control command:
SOURce:VOLTage:RMS <nu>
Amplitude variation
The amplitude of the signal can be varied as sinewave or pulse
shaped (burst) with a frequency selected by the user (see section
"Amplitude Variation" on page 4.110).

Generator Signals R&S UPV
1146.2084.32 4.92 E-9
Filter
The generator signal is filtered in the time domain. One of the user-
definable filters in the filter panel or a weighting filter can be selected,
see also the section "Generator Filters" on page 4.112.
Remote-control command:
SOURce:FILTer <parameter>
List of <parameter> see section "Filter Table" on page 4.419.
DC Offset
ADC offset is superimposed on the generator signal. This offset
reduces the maximum possible AC voltage. The tick box is used to
activate/deactivate this function. The value set for the offset voltage is
always displayed.
Remote-control command:
SOURce:VOLTage:OFFSet:STATe ON | OFF
SOURce:VOLTage:OFFSet <nu>
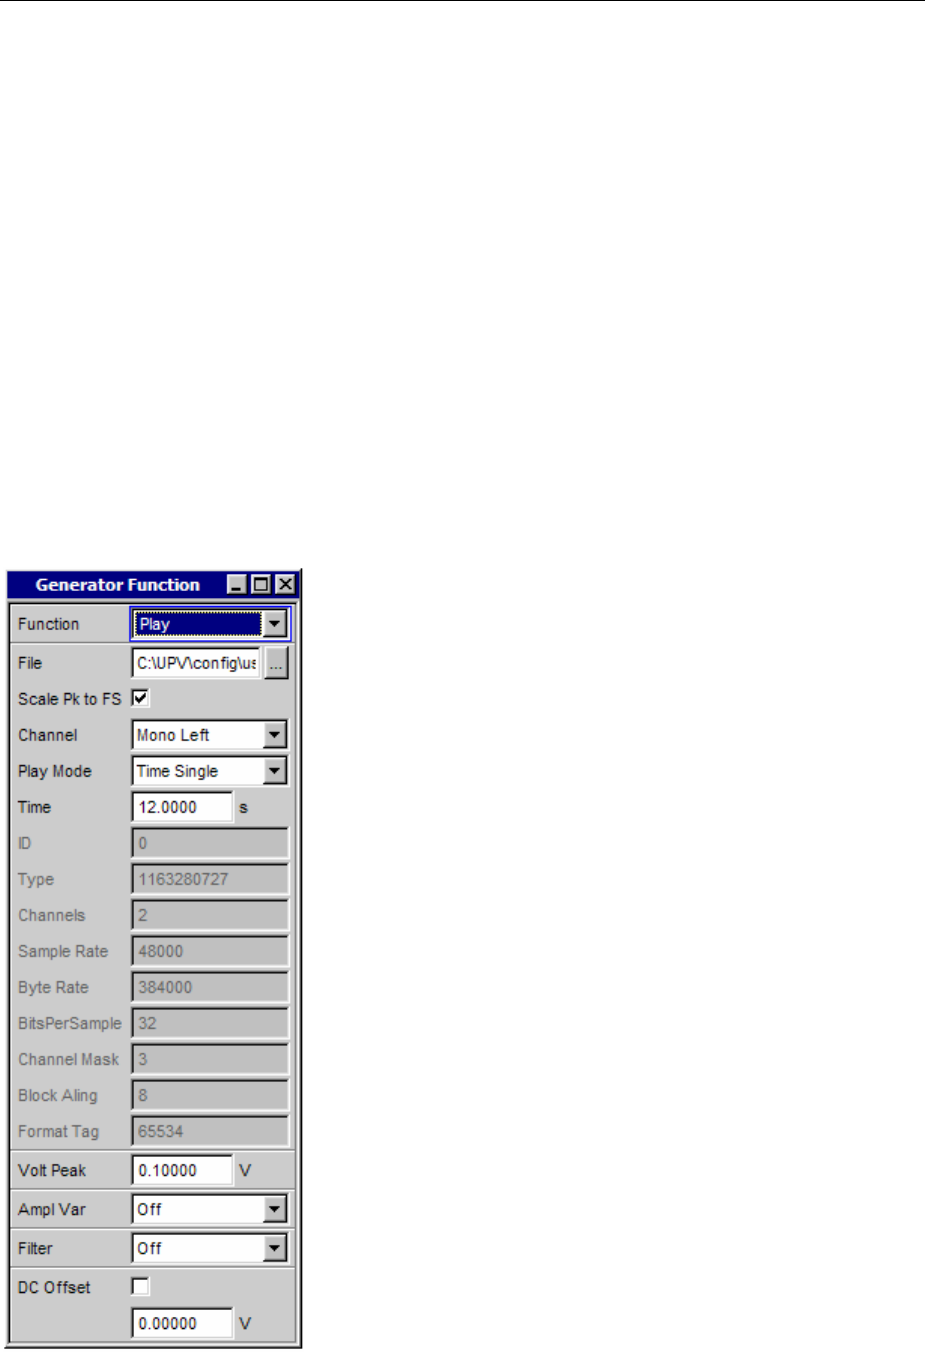
R&S UPV Generator Signals
1146.2084.32 4.93 E-9
Play
This function enables any WAV file to be replayed. These files may have been created with the aid of
the "Record" measurement function (reference), though this is not obligatory. Coded audio signals are
not decoded, but instead are played back to the DUT unchanged. This generator function covers the
following cases:
•Offline analysis of data streams that have been recorded using the "Record" analyzer function or
some other suitable recording instrument.
•Playing back specific speech and music signals for special measurements in mobile radio or for
gearing aids,
•Playing back specific test sequences such as for external sweeps.
•Data source for coded audio signals that are intended to be decoded by a connected DUT.
For offline analysis the generator is not connected to the DUT, but directly (i.e. internally) to the
R&S UPV analyzer, which then performs all the desired measurements sequentially or simultaneously.
All available interfaces (preferably digital) can be used for this. Thus for example a formerly analog
measurement signal can be examined loss-free in offline analysis via one of the optional R&S UPV
digital interfaces.
Playback starts as soon as the WAV file has been successfully loaded. Playback starts again every
time a generator setting is changed or the START key is clicked.
Panel of the analog generator for the Play function.
This panel also displays information about the WAV header. The
meanings attached to this information are dependent on the format
(standard or extended) and may be inferred from the WAV
specification.
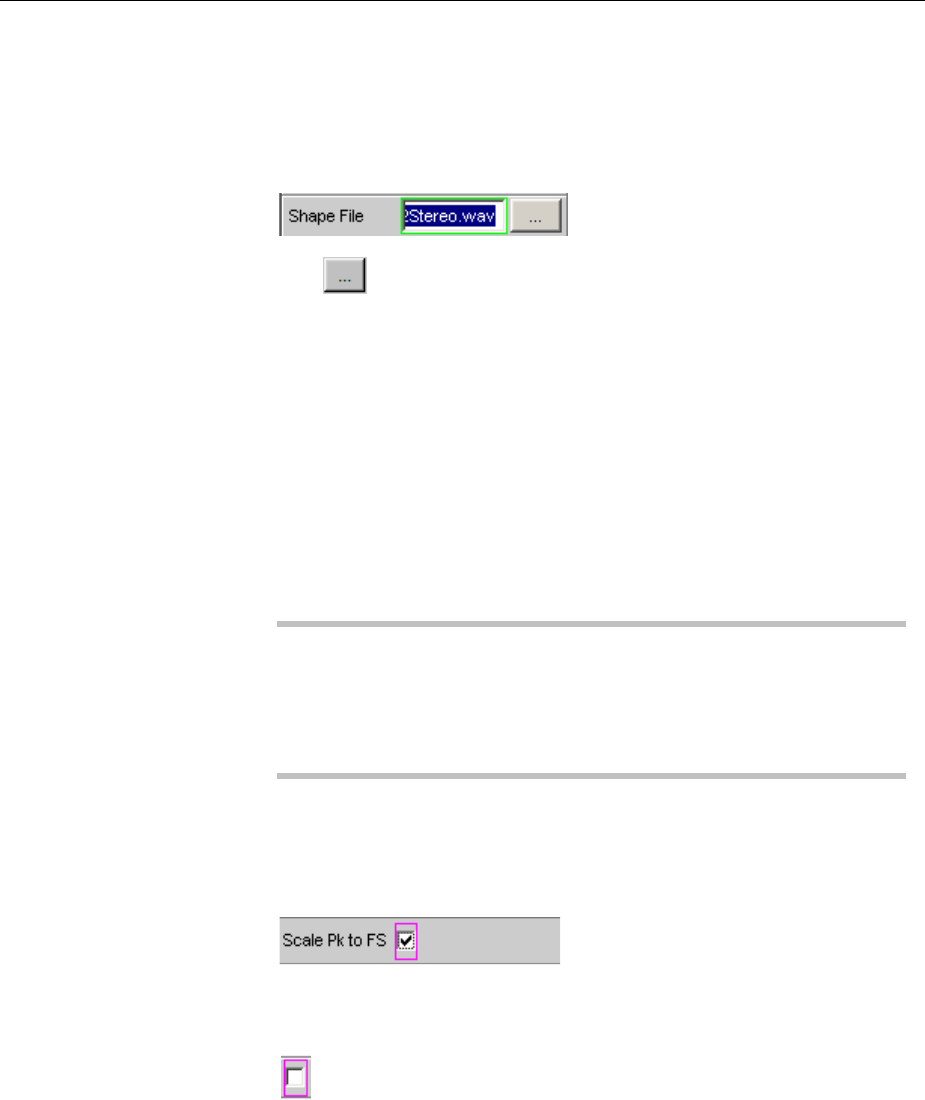
Generator Signals R&S UPV
1146.2084.32 4.94 E-9
Remote-control command:
SOURce:FUNCtion[:SHAPe] PLAY
Shape File
For entering the drive, path and file name of the WAV file from which
the waveform will be read.
The button opens a browser which can be used to select the
WAV file.
Since the file is read online during playback, only data media having a
high transfer rate are suitable. These include data partition of the hard
drive or a network drive with at least 100 MBits/s. USB sticks and
drives should be used only for files of less than 0.5 Msamples.
When the file name has been entered, the WAV file header
information is displayed in the panel and playback starts. At this time a
check is made on whether the set sampling rate (or bandwidth in the
analog analyzer) matches the sampling rate stored in the WAV file. If
appropriate a warning is given, but the sampling rate set in the
Generator Config panel is still used.
Note:
The sampling rate in the analog analyzer is derived from the set
bandwidth (reference). The special setting "Play Auto" has the effect
that the sampling rate stored in the WAV file is used, so that even
WAV files with "crooked" sampling rates (e.g. 44.1 kHz) can be played
back in the analog generator.
Remote-control command:
MMEMory:LOAD:ARBitrary ’filename’
Scale Pk to FS
Enables optional scaling up of samples in order to obtain full control.
The samples from the WAV file are output without
change. This mode enables the WAV file to be
loaded faster, since it does not need to be fully
scanned.
WAV files that are already fully controlled should be
used in this mode.
Remote-control command:
SOURce:PLAY:SCALepktofs OFF
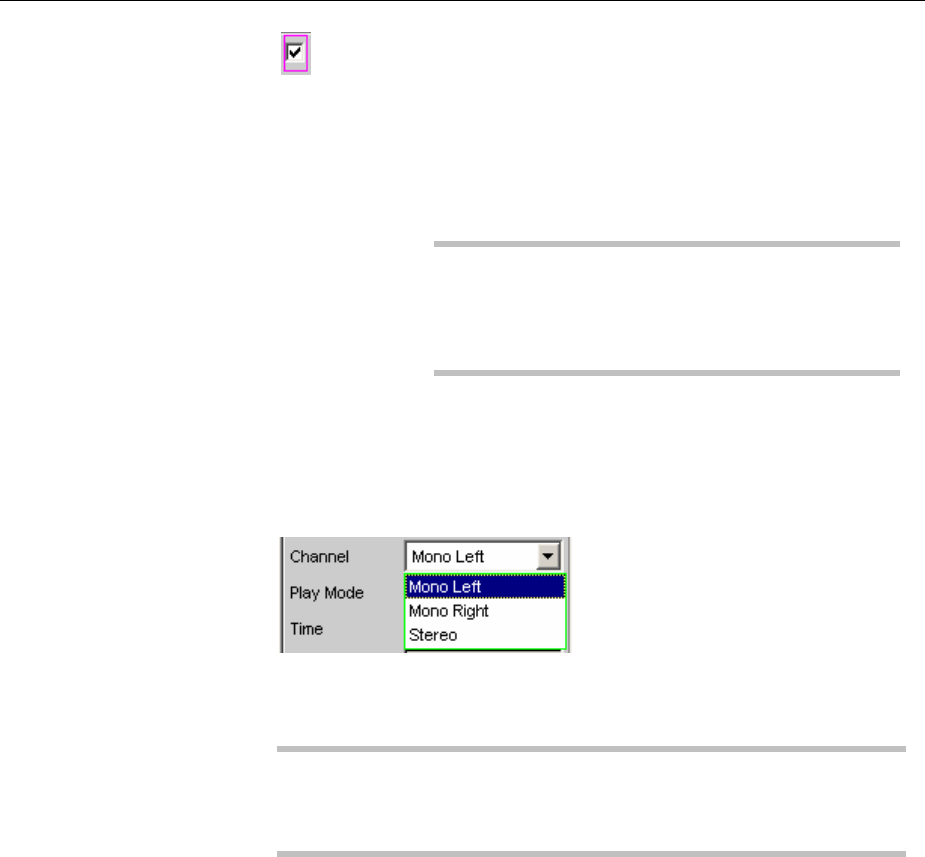
R&S UPV Generator Signals
1146.2084.32 4.95 E-9
The WAV file is searched for the highest sample
and is scaled during playback in such a way that
the highest occurring sample reaches exactly to full
scale and is therefore output with the specified peak
voltage.
In the case of poorly controlled WAV files, this
mode improves the dynamic response of the analog
generator.
Note:
Since the entire WAV file must be searched during
loading in order to determine the scaling factor, the
loading process takes somewhat longer in this
mode, especially with large files.
Remote-control command:
SOURce:PLAY:SCALepktofs ON
Channel
For stereo WAV files only. Enables a single WAV channel to be output
as a mono signal on both generator channels.
In the case of mono WAV files this choice is not available. Such files
are always output to both generator channels.
Note:
As with all generator signals, the question of whether the generator
channels actually output a signal depends on the appropriately named
menu item in the Generator Config panel.
Mono Left The left WAV channel is output to all active
generator channels.
Remote-control command:
SOURce:PLAY:CHANnel MLEFt
Mono Right The right WAV channel is output to all active
generator channels.
Remote-control command:
SOURce:PLAY:CHANnel MRIGht
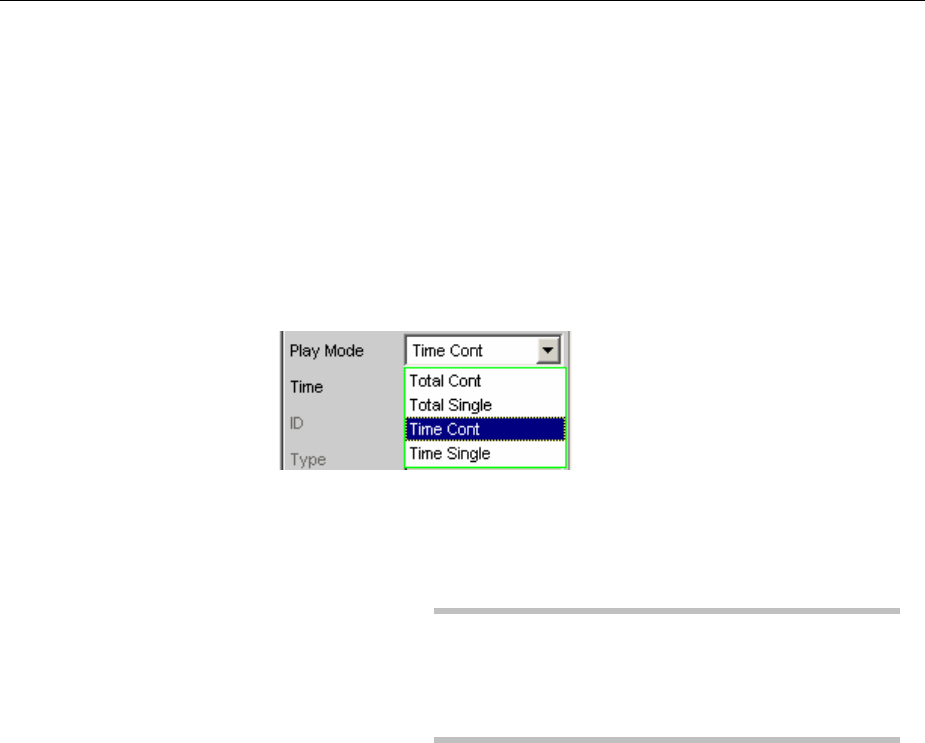
Generator Signals R&S UPV
1146.2084.32 4.96 E-9
Stereo The left WAV channel is output to generator
channel 1 and the right WAV channel is output to
generator channel 2.
Stereo mode can only be switched on in the analog
generator if option R&S UPV-B3 has been installed.
This menu item will therefore be available only if the
R&S UPV-B3 option has been installed.
Remote-control command:
SOURce:PLAY:CHANnel STEReo
Play Mode
Defines the playback mode of the loaded WAV file.
Total Cont The complete WAV file is played back continuously.
On reaching the end of the file, playback returns
without uninterruption to the start of the file.
Note:
There is normally a discontinuity in the signal during
the return. In the case of pure sinewave signals this
is visible as noise in the spectrum close to the
carrier.
Remote-control command:
SOURce:PLAY:MODE TOCont
Total Single The complete WAV file is played back once, after
which the generator is muted.
Remote-control command:
SOURce:PLAY:MODE TOSingle
Time Cont The start of the WAV file is played back
continuously. After expiration of the playback time,
which can be selected from the next menu line,
playback returns without uninterruption to the start
of the file.
Remote-control command:
SOURce:PLAY:MODE TICont
Time Single The start of the WAV file is played back once. After
expiration of the playback time, which can be
selected from the next menu line, playback is
interrupted and the generator is muted.
Remote-control command:
SOURce:PLAY:MODE TISingle
R&S UPV Generator Signals
1146.2084.32 4.97 E-9
Time
For displaying or entering the playback time.
The maximum playback time is derived from the number of samples in
the WAV file and the set sampling rate, and can last up to 24 hours.
Depending on the selected play mode, the playback time can be
•displayed ("Play Mode Total …") if the intention is to play back the
WAV file in full;
•entered ("Play Mode Time …") in order to reset or prematurely
interrupt playback.
Note:
In the event of a subsequent increase in the sampling rate the
playback time is reduced as necessary.
Remote-control command:
SOURce:PLAY:TIME <nu>
Volt Peak
Sets the level of the whole signal. The maximum value depends on
the DC offset that has been set. In the analog generator, the
maximum total voltage also depends on the settings for Output Type
and Max Voltage in the Generator Config panel.
This voltage value is output when the samples in the loaded WAV file
are at full scale, that is, fully controlled.
Note:
The “Scale Pk to FS” option must be enabled in order to ensure that
this level is achieved even with WAV files that do not utilize the full
amplitude range.
Remote-control command:
SOURce:VOLTage:TOTal <nu>
Amplitude variation
The amplitude of the signal can be varied as sinewave or pulse
shaped (burst) with a frequency selected by the user (see section
"Amplitude Variation" on page 4.110).
Filter
The generator signal is filtered in the time domain. One of the user-
definable filters in the filter panel or a weighting filter can be selected;
see also section "Generator Filters" on page 4.112.
Remote-control command:
SOURce:FILTer
Generator Signals R&S UPV
1146.2084.32 4.98 E-9
DC Offset
ADC offset is superimposed on the generator signal. This reduces the
maximum possible AC voltage. The tick box switches this function on or
off. The set value of the offset voltage is always displayed.
Remote-control command:
SOURce:VOLTage:OFFSet:STATe ON | OFF
SOURce:VOLTage:OFFSet <nu>
Play+Anlr
Using this function, you can play back any WAV file, and optionally superimpose on it a signal looped
back from the analyzer. This function is needed to perform the stability margin measurement included in
the GSM acoustic test cases 30.6.2. It is available only if the R&S UPV-K6 option is installed.
Afile containing narrowband noise in line with ITU-T Recommendation O.131 should be used as a
WAV file. A suitable file with the name O_131.WAV is supplied as standard and loaded as a default file.
Note:
Playing back coded audio signals is possible but not meaningful for practical purposes.
The analyzer signal can be a mono signal taken from one measurement channel or a stereo signal
taken from both channels. It can be amplified or attenuated by a selectable factor.
To generate this special signal, a few conditions must be met:
•The active analog generator must be operated with a fixed analog gain. To this effect, "Volt Range"
must be set to FIX and be assigned, as a minimum value, the value of the voltage maximally to be
set.
•The active digital generator is to be synchronized to the analyzer. To this effect, "Sync To" must be
set to "Audio In".
•The analyzer used must not be a multichannel instrument.
The "Play+Anlr" signal will not be available until the above conditions are met. The following
recommendations should be observed in addition:
•The analog analyzer channels should be operated with fixed level ranges in order to ensure a
constant loop gain.
•An identical sampling rate should be used for the generator and the analyzer. The WAV file
supplied as standard was recorded with a sampling rate of 48 kHz; the digital sampling rate should,
therefore, also be 48 kHz, and a bandwidth of 22 kHz should be used in the analog domain.
Note:
When "Play+Anlr" has been switched on in the analog generator, the bandwidth of the analog analyzer
can no longer be selected manually but is automatically set to the generator bandwidth. This is to
prevent operator errors.

R&S UPV Generator Signals
1146.2084.32 4.99 E-9
Playback is started immediately after the WAV file has been successfully loaded. Playback will be
restarted each time a generator setting is modified or the START key is operated.
Digital generator panel for Play+Anlr function.
Remote-control command:
SOURce:FUNCtion[:SHAPe] PLYAnlr
File
Used to select the drive, directory and name of the WAV file from
which the waveform is to be read.
The button opens a browser for selecting the WAV file.
The file "O_131.WAV" is loaded as a default file. This file is supplied
as standard and stored in the "C:\upv\config\ref" directory. It contains
narrowband noise (white noise band-limited to 350 Hz to 550 Hz) in
line with ITU-T Recommendation O.131; the signal is driven to full
scale; and the playback duration is exactly 1 s at 48 kHz sampling
rate.
After the file name has been entered, playback is started. It is checked
whether the selected sampling rate (or bandwidth in the analog
generator) equals the sampling rate stored in the WAV file. If this is
not the case, a warning will be output. In any case, the sampling rate
selected in the Generator Config panel will be used.
Note:
For the analog generator, the sampling rate results from the set
bandwidth (see section "Bandwidth" on page 4.6). The "Play Auto"
special setting is not available for the "Play+Anlr" function.
Remote-control command:
MMEMory:LOAD:ARBitrary ’filename’
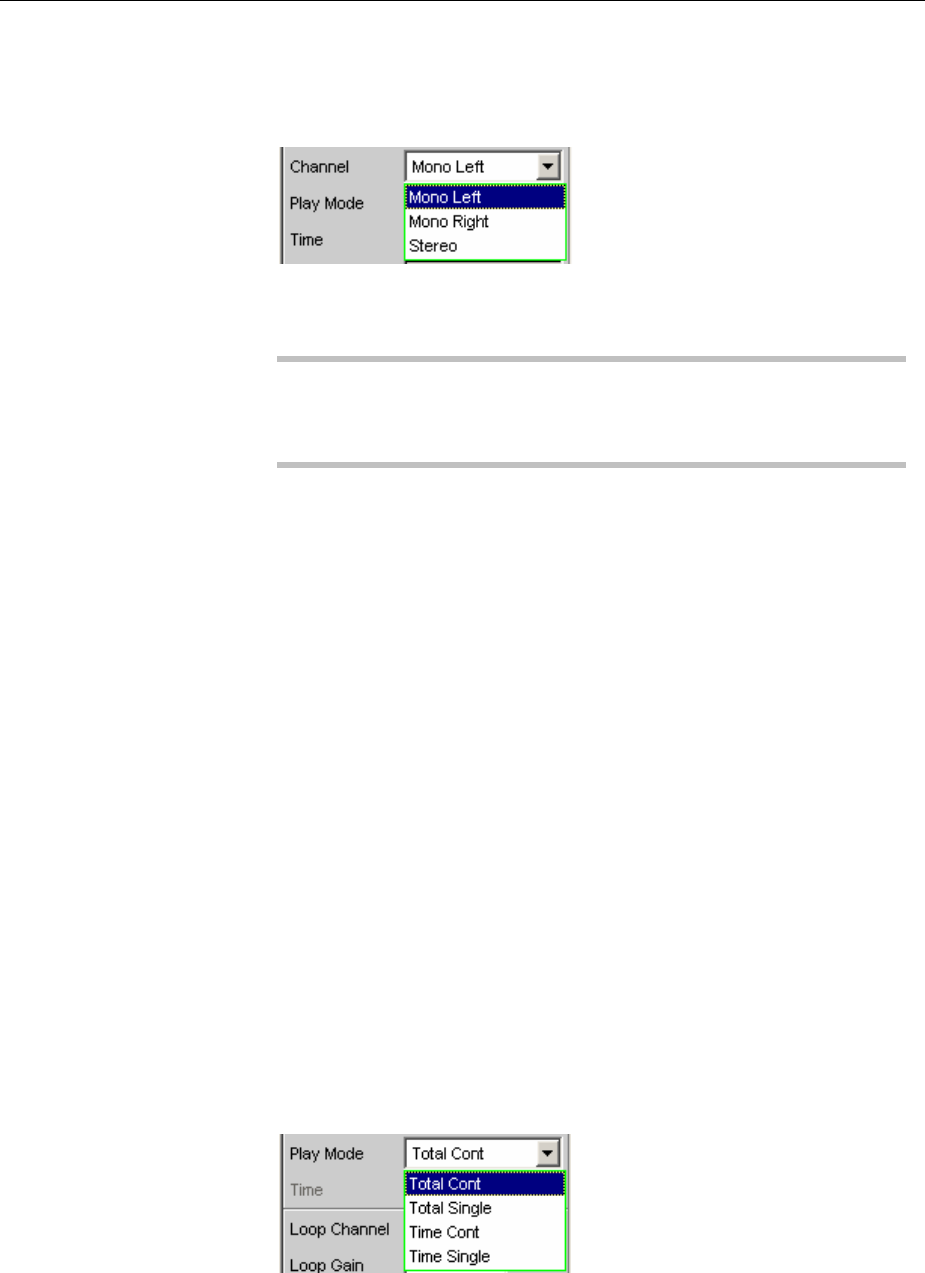
Generator Signals R&S UPV
1146.2084.32 4.100 E-9
Channel
Available for stereo WAV files only. This function enables a single
WAV channel to be played back as a mono signal on both generator
channels.
This selection is not available for mono WAV files. Their signal is
always output on both generator channels.
Note:
As with all generator signals, it depends on the setting of the menu
item of identical name in the Generator Config panel whether or not a
signal is actually output on the generator channels.
Mono Left The left WAV channel is output on all active
generator channels.
Remote-control command:
SOURce:PLAY:CHANnel MLEFt
Mono Right The right WAV channel is output on all active
generator channels.
Remote-control command:
SOURce:PLAY:CHANnel MRIGht
Stereo The left WAV channel is output on generator
channel 1, the right WAV channel on generator
channel 2.
In the analog generator, the stereo mode can be
switched on only if the R&S UPV-B3 option is
installed. The stereo menu item will, therefore, be
available in the analog generator only if the
R&S UPV-B3 is installed.
Remote-control command:
SOURce:PLAY:CHANnel STEReo
Play Mode
Used to select the play mode of the WAV file that has been loaded.

R&S UPV Generator Signals
1146.2084.32 4.101 E-9
Total Cont Playback of the entire WAV file is continuously
repeated. On reaching the end of the file, playback is
restarted at the beginning without any interruption.
Note:
On returning from the end to the beginning of the
file, a discontinuity normally occurs in the signal,
which, in the case of a pure sinewave signal, is
visible in the spectrum as a noise surge close to the
carrier.
Remote-control command:
SOURce:PLAY:MODE TOCont
Total Single The entire WAV file is played a single time; then the
generator is muted.
When the O_131.WAV default file is used, this
setting delivers noise for the duration of a second,
which is followed by silence.
Remote-control command:
SOURce:PLAY:MODE TOSingle
Time Cont Playback of the beginning of the WAV file is
continuously repeated; i.e. playback is resumed
without interruption at the beginning of the file when
the playback time – which is selected in the next
menu line – has elapsed.
Remote-control command:
SOURce:PLAY:MODE TICont
Time Single The beginning of the WAV file is played a single
time. When the playback time – which is selected in
the next menu line – has elapsed, playback is
stopped and the generator is muted.
Remote-control command:
SOURce:PLAY:MODE TISingle
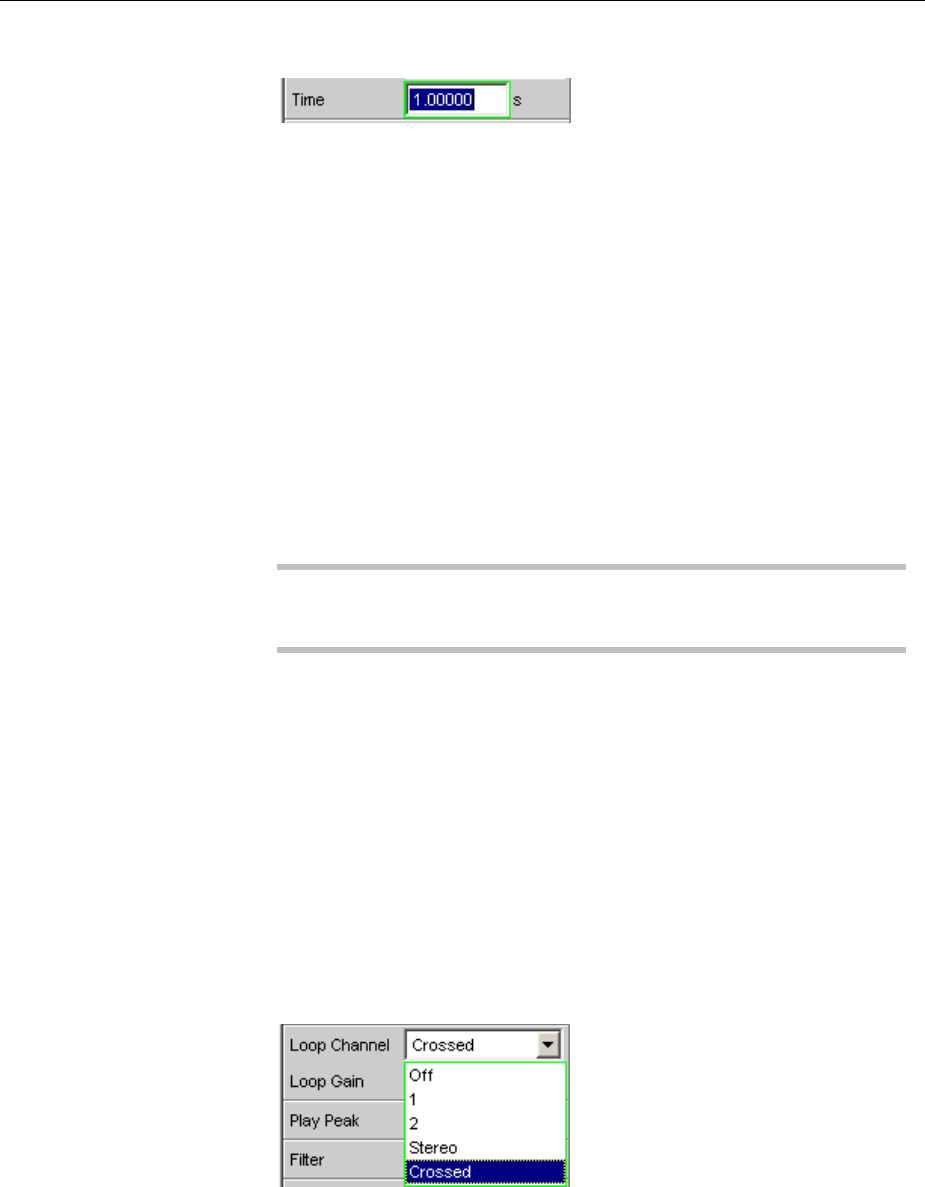
Generator Signals R&S UPV
1146.2084.32 4.102 E-9
Time
Used to display or enter the playback time.
The maximum playback time is determined by the number of samples
contained in the WAV file and the selected sampling rate. It may be as
long as 24 hours.
Depending on the selected "Play Mode", there are the following
options for the playback time:
•It can be displayed if the entire WAV file is to be played
("Play Mode Total …")
or
•Avalue not exceeding the playback time of the loaded WAV file
can be entered in order to stop or restart playback before the end
of the file is reached ("Play Mode Time …").
When the O_131.WAV default file is used and the sampling rate and
bandwidth are correct, "1 s" is displayed here.
Note:
If the sampling rate is increased subsequently, the playback time may
be decreased if necessary.
Remote-control command:
SOURce:PLAY:TIME <nu>
Loop Channel
Used to select the analyzer channel whose signal is to be looped back
to the generator and to be superimposed on the noise signal.
The analyzer signal can be looped back in mono or stereo mode.
•In the mono mode, one of the two analyzer channels is looped
back to both generator channels.
•In the stereo mode, both analyzer channels are looped back
separately and superimposed on the generator channels.
This can be done by superimposing each analyzer channel on the
generator channel of the same number or by crossing the channels.

R&S UPV Generator Signals
1146.2084.32 4.103 E-9
Off Loopback is switched off. Only the WAV signal is
played.
The loop gain can be set by means of the following
menu item, but it is not active with loopback off.
Remote-control command:
SOURce:LOOP:CHANnel OFF
1The analyzer channel 1 is superimposed on both
generator channels.
Remote-control command:
SOURce:LOOP:CHANnel CH1
2The analyzer channel 2 is superimposed on both
generator channels.
Remote-control command:
SOURce:LOOP:CHANnel CH2
Stereo The analyzer channel 1 is superimposed on the
generator channel 1.
The analyzer channel 2 is superimposed on the
generator channel 2.
Remote-control command:
SOURce:LOOP:CHANnel STEReo
Crossed The analyzer channel 1 is superimposed on the
generator channel 2.
The analyzer channel 2 is superimposed on the
generator channel 1.
Remote-control command:
SOURce:LOOP:CHANnel CROSsed
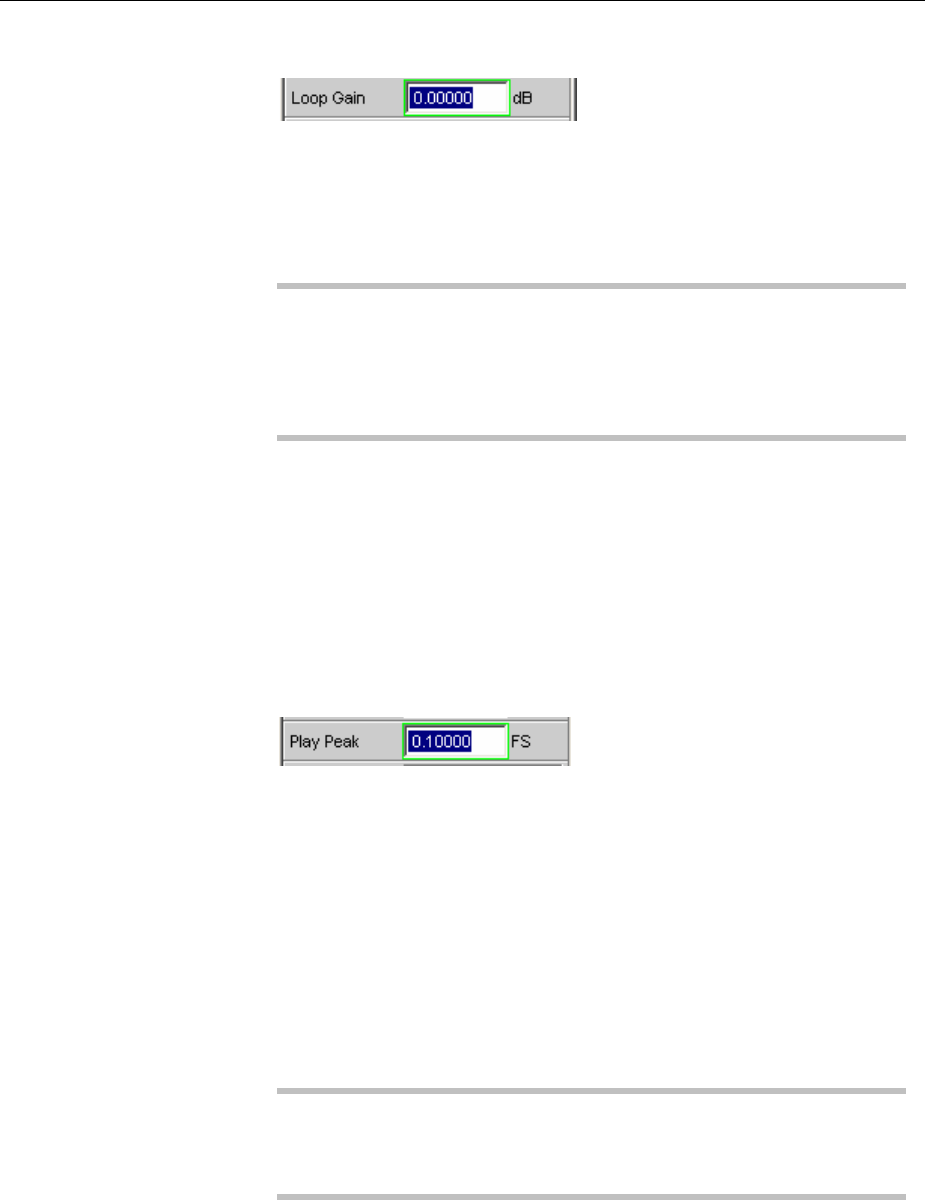
Generator Signals R&S UPV
1146.2084.32 4.104 E-9
Loop Gain
Used to set the gain for loopback of the analyzer signal.
The analyzer input signal of the selected channel is tapped ahead of
the filters and superimposed on the generator signal without
undergoing further division. The gain should be set such that the level
of the input signal, after amplification, does not exceed the headroom
allowed for the WAV playback signal.
Note:
The two signals are combined by adding the sample of the level-
controlled WAV signal and the corresponding sample of the amplified
loopback signal. The resulting signal is available as the generator
output sample. If the sum sample exceeds a value of 1.0 FS, it is
limited to FS.
Avalue lower than 1 (or lower than 0 dB) causes an attenuation of the
analyzer signal.
Entering the value of 0 (or -240 dB) will switch off the loopback signal.
Remote-control command:
SOURce:LOOP:GAIN <nu>
Play Peak
Used to set the peak output level of the noise signal. This entry does
not affect the loopback signal.
The maximum total voltage in the analog generator depends on the
settings in the Generator Config panel.
This voltage value is attained by those samples in the loaded WAV file
that are driven to maximum level (+/- FS).
When entering the peak output level, it must be taken into account
that the analyzer signal will be added to the entered value. An
appropriate headroom must therefore be allowed for the analyzer
signal. Entering a peak level of 1.0 FS is, therefore, meaningful only if
the loopback is switched off or if the WAV file in question already
comes with a headroom, i.e. if the file is not scaled to FS.
Note:
Unlike the Play function, the Play+Anlr function does not provide for
automatic scaling up to FS of the WAV signal. The O.131 signal
supplied as standard is already scaled to FS.
Remote-control command:
SOURce:VOLTage:TOTal <nu>
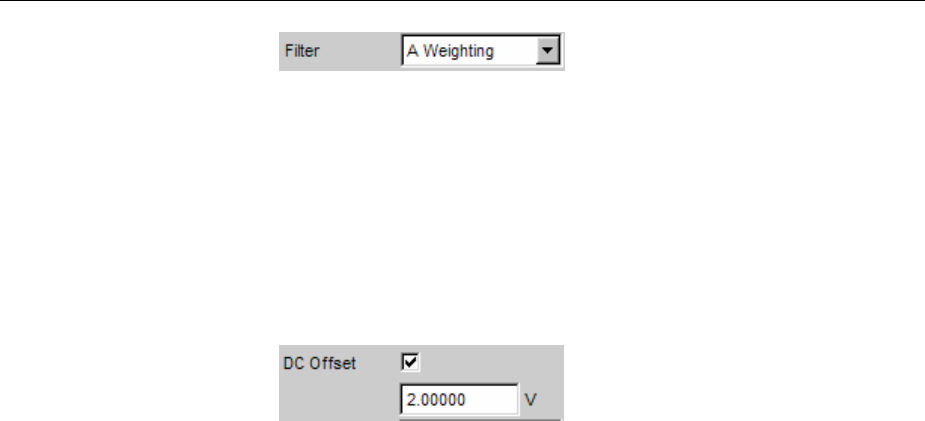
R&S UPV Generator Signals
1146.2084.32 4.105 E-9
Filter
The WAV playback signal is filtered in the time domain. This filtering
has no effect on the loopback signal.
You can use either a user-defined filter (to be defined in the filter
panel) or a weighting filter, see also section "Generator Filters" on
page 4.112.
Remote-control command:
SOURce:FILTer <parameter>
List of <parameter> see section "Filter Table" on page 4.419.
DC Offset
ADC voltage offset is superimposed on the generator signal. The offset
reduces the maximum possible DC voltage. The tick box is used to
switch this function on or off. The offset voltage entered is displayed in
either case.
Remote-control command:
SOURce:VOLTage:OFFSet:STATe ON | OFF
SOURce:VOLTage:OFFSet <nu>

Generator Signals R&S UPV
1146.2084.32 4.106 E-9
Polarity
The generator generates a test signal for polarity measurement. This measurement is used to check the
polarity of the input signal transmitted by the DUT.
Remote-control command:
SOURce:FUNCtion[:SHAPe] POLarity
The test signal consists of two sinewaves, one of which is a fundamental and the other a harmonic,
having the same amplitude in each case. The phase of the harmonic is selected so that the positive
peak value is greater than the negative.
Frequency
Used to set the frequency of the fundamental.
Remote-control command:
SOURce:FREQuency[1] <nu>
Total RMS
Used to set the level of the signal. In the analog generator, the
maximum total voltage depends on the settings for Output Type and
Max Voltage in the Generator Config panel.
Remote-control command:
SOURce:VOLTage[1] <nu>
Total Peak
Used to display the peak value of the signal.
Remote-control command:
SOURce:VOLTage:TOTal?
Modulation
The generator generates a sinewave signal which can be modulated with respect to frequency or
amplitude according to a sinusoidal function.
Remote-control command:
SOURce:FUNCtion[:SHAPe] MODulation
Mode
Used to select the modulation type: amplitude or frequency
modulation.
FM Frequency modulation
Remote-control command:
SOURce:FUNCtion:MODE FM
AM Amplitude modulation
Remote-control command:
SOURce:FUNCtion:MODE AM

R&S UPV Generator Signals
1146.2084.32 4.107 E-9
Mod Freq
Used to set the modulation frequency.
Remote-control command:
SOURce:FREQuency[1] <nu>
Carrier Freq
Used to set the carrier frequency.
Remote-control command:
SOURce:FREQuency2 <nu>
Deviation
With FM, this parameter field is used to set the modulation deviation in
%relative to the carrier frequency.
Remote-control command:
SOURce:VOLTage[1] <n> [PCT]
Mod Depth
With AM, this parameter field is used to set the modulation depth in %
relative to the carrier amplitude.
Remote-control command:
SOURce:VOLTage[1] <n> [PCT]
Carrier Volt
Used to set the level of the unmodulated sinewave signal. With AM,
only up to half of the maximum value; this ensures that 100 % AM can
always be set. The maximum value depends on the set DC offset. In
the analog generator, the maximum total voltage also depends on the
settings for Output Type and Max Voltage in the Generator Config
panel.
Remote-control command:
SOURce:VOLTage2 <nu>
Filter
The generator signal is filtered in the time domain. One of the user-
definable filters in the filter panel or a weighting filter can be selected,
see also the section "Generator Filters" on page 4.112.
Remote-control command:
SOURce:FILTer <parameter>
List of <parameter> see section "Filter Table" on page 4.419.
DC Offset
ADC offset is superimposed on the generator signal. This offset
reduces the maximum possible AC voltage. The tick box is used to
activate/deactivate this function. The value set for the offset voltage is
always displayed.
Remote-control command:
SOURce:VOLTage:OFFSet:STATe ON | OFF
SOURce:VOLTage:OFFSet <nu>
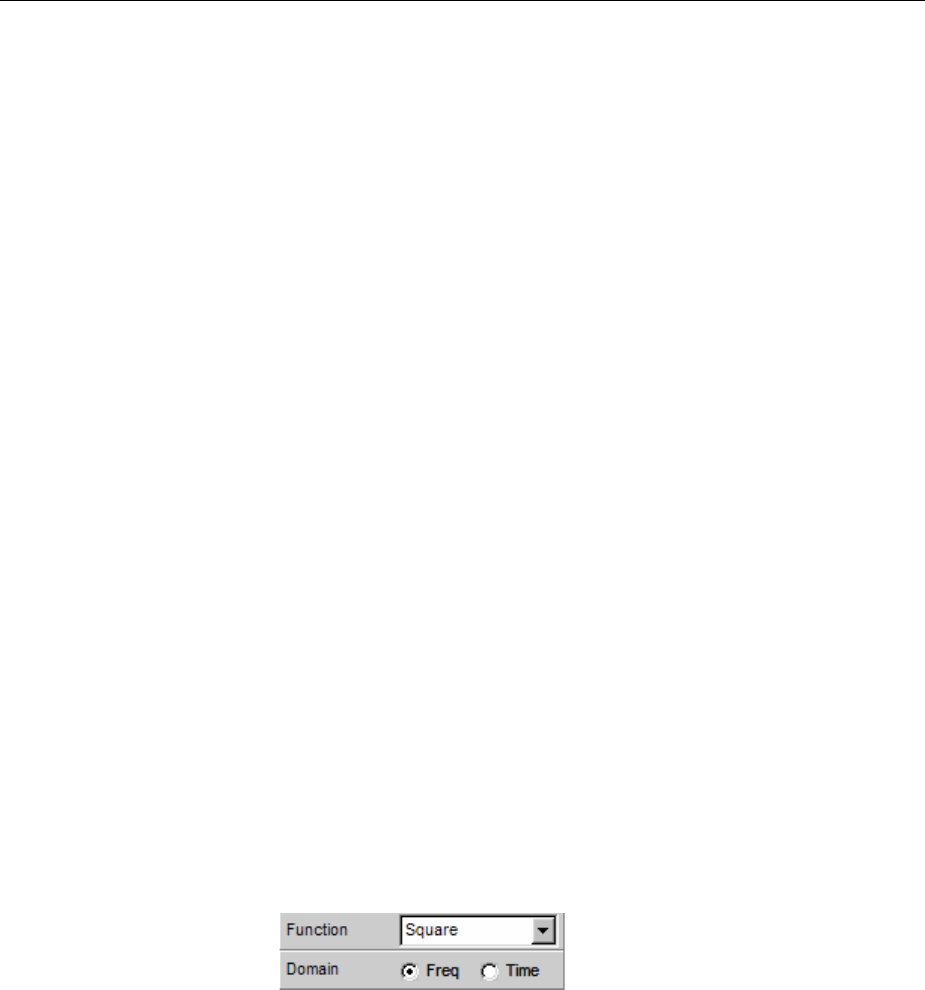
Generator Signals R&S UPV
1146.2084.32 4.108 E-9
DC (Direct-Current Voltage)
The generator generates a DC voltage signal. Unlike the DC offset, it is possible to sweep this DC
voltage.
Remote-control command:
SOURce:FUNCtion[:SHAPe] DC
Sweep Ctrl
Used to activate the sweep system. The DC voltage can be varied
within a selectable range from the start to the stop value. If the level is
selected as the X-axis, the measurement values can be displayed as
acurve in the Sweep Graph graphical window.
Sweep points: Linear or logarithmic between start and stop or read
from a file.
Stepping: Automatic in a defined time grid or synchronized to the
measurement time of the analyzer. Manual using the rotary knob. All
the setting parameters of the sweep system are described in the
section "Sweeps" on page 4.119.
Voltage
DC voltage level. In the analog generator, the maximum value
depends on the settings for Output Type and Max Voltage in the
Generator Config panel.
Remote-control command:
SOURce:VOLTage:TOTal <nu>
Square
The generator produces a square wave signal. The frequency and the level are the same for both
channels.
Remote control command:
SOURce:FUNCtion[:SHAPe] SQUare
Domain
Here it is possible to define whether the square wave signal should be
defined in the frequency or the time domain.
Freq The square wave signal is formed from a series of
sinus oscillations whose amplitudes and phases are
calculated correspondingly to the Fourier expansion
of a rectangle. The maximum frequency of the
fundamental wave is selected so that the spectrum
reaches at least to the fifth fundamental wave. The
frequency resolution is good. In the time domain,
however, the signal demonstrates system theory-
related overshoots.
Remote control command:
SOURce:RANDom:DOMain FREQuency

R&S UPV Generator Signals
1146.2084.32 4.109 E-9
Time In the analogue domain this is only possible with
the UPV-B3 option (second generator channel
which also contains the square wave generator).
The frequency resolution is good. The edge
sharpness corresponds to a first-order low pass
with a critical frequency of 100 kHz. A DC offset is
not possible.
In the digital domain,the signal consists of a
series of sampling values which alternate between
the maximum positive and negative value. Only
sub-harmonics of the sampling frequency with an
even number of sampling values can be produced
so that the rectangle remains symmetrical. The
frequency resolution increasingly deteriorates at
higher frequencies. The time behavior is ideal.
Remote control command:
SOURce:RANDom:DOMain TIME
Sweep Ctrl
Activation of the sweep system. The frequency or the level of the
signal can be varied between the start and stop values within a
selectable range. With the frequency or the level as the X axis the
measurement values can be shown as a curve in the sweep graph
dialog.
Sweep points: linear or logarithmic between start and stop or read out
of a file.
Switching over: automatically synchronized within a defined time
frame or to the measurement time of the analyzer. All sweep system
setting parameters are described in detail in the section Sweeps.
Frequency
Sets the square wave signal frequency. The value range depends on
the analogue bandwidth or the digital clock frequency set in the
generator configuration panel.
Remote control command:
SOURce:FREQuency[1] <nu>
Voltage
Sets the level effective value of the square wave signal. The maximum
value depends on the set DC offset. In the analogue generator the
maximum total voltage additionally depends on the output type and
maximum voltage settings in the generator configuration panel.
Remote control command:
SOURce:VOLTage[1] <nu>

Amplitude Variation R&S UPV
1146.2084.32 4.110 E-9
DC Offset
Adirect voltage offset is superimposed on the generator signal. This
reduces the maximum possible alternating voltage. The checkbox
switches this function on or off. The set offset voltage value is constantly
displayed.
ADC offset in the time domain is not possible in the analogue generator
when the square wave signal is generated; the setting line is not visible.
Remote control commands:
SOURce:VOLTage:OFFSet:STATe ON | OFF
SOURce:VOLTage:OFFSet <nu>
Amplitude Variation
With generator signals multisine, arbitrary, random and play, the amplitude can be varied either with
respect to sinewave between the maximum value set on the panel and a selectable minimum value or
with respect to pulse shape.
Amplitude variation
The amplitude of the signal can be varied either with respect to
sinewave or pulse shape (burst) with selectable frequency.
OFF Amplitude variation is deactivated.
Remote control command:
SOURce:AM:MODE OFF
Sine The amplitude of the generator signal is modulated
with respect to sinewave.
Remote control command:
SOURce:AM:MODE SINusoid
Modulation frequency
Used to set the modulation frequency. The value range depends on
the analog bandwidth set in the Generator Config panel or the digital
clock rate.
Remote control command:
SOURce:FREQuency:AM <nu>
Variation
Used to set the value in % by which the amplitude of the signal is
reduced. Value range 0 to -100 %.
Example: If an amplitude of 1 V and a variation of -80 % is selected,
the generator level varies between 1 V and 200 mV.
Remote control command:
SOURce:VOLTage:AM <n> [PCT]
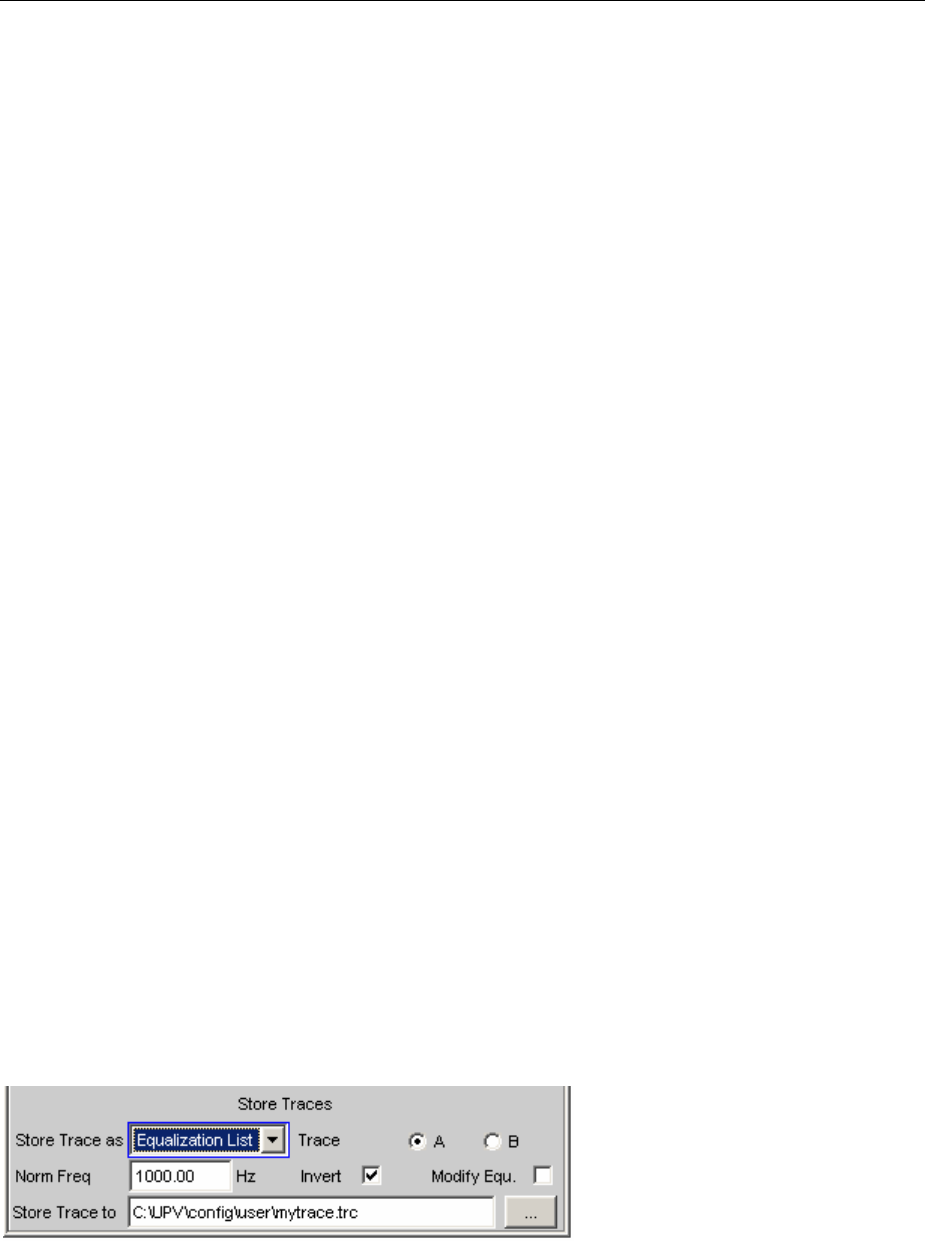
R&S UPV Equalization
1146.2084.32 4.111 E-9
Amplitude variation
The amplitude of the signal can be varied with respect to sinewave or
pulse shape (burst) with selectable frequency.
Burst The generator signal is cyclically activated and
deactivated. This setting is not possible in the Play
generator function.
Remote control command:
SOURce:AM:MODE BURSt
On Time
Used to set the time during which the signal is activated. On Time is
always less than Interval; if increased, Interval may also be increased.
Remote control command:
SOURce:ONTime <nu>
Interval
Used to set the repetition rate of the burst signal. Interval is always
greater than or equal to On Time.
Remote control command:
SOURce:INTerval <nu>
Burst on Delay
Used to set the delay time which must expire (after generator settings
have been changed or a measurement has been started) before the
generator can start the signal. During this time, the generator signal is
deactivated.
Remote control command:
SOURce:ONTime:DELay <nu>
Equalization
The generator can be given a predefined frequency response using a table containing frequency points
and the associated gain factors. The set amplitude of the generator is changed automatically according
to frequency on the basis of this table.
The table must be saved in a particular format in a file (see example RS_EXAM.VEQ in the folder
d:/upv/user) which can be loaded in the "Equalization" parameter field in the Generator Function panel.
The file can also be created from a measured curve or a curve imported from a file by storing the trace
as Equalization List in the Display Config panel. A number of different settings are available.
Norm Freq The gain factors are normalized to the level at this frequency.
Invert The measured frequency response is inverted. There is then a flat frequency
response when this file is loaded in the generator.

Generator Filters R&S UPV
1146.2084.32 4.112 E-9
Modify Enables several equalization curves to be chained. If equalization is turned on in the
generator, the file already loaded and the new file stored here are "connected in
series" and loaded in the generator.
Generator Filters
The generator signal is filtered in the time domain. One of the user-definable filters in the filter panel or
aweighting filter can be selected. All level settings apply to the unfiltered signal (see section "Filters" on
page 4.416).
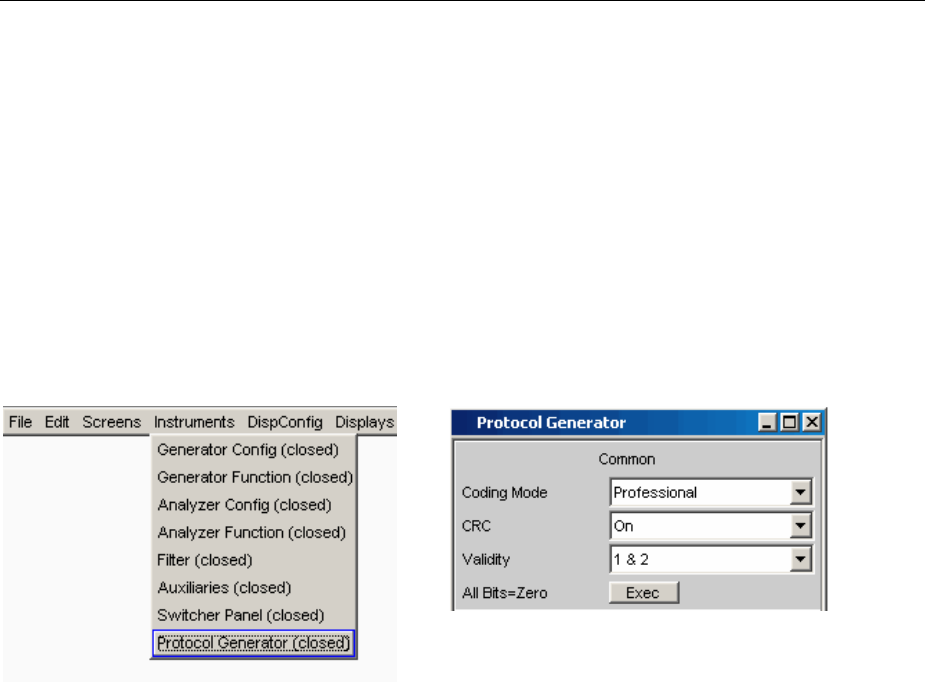
R&S UPV Digital Audio Protocol Generator
1146.2084.32 4.113 E-9
Digital Audio Protocol Generator
The option R&S UPV-K21 can be used to generate and analyze the channel status data in the data
stream of the digital audio interface (Option R&S UPV-B2) according to IEC standard 60958-3 for the
Consumer mode and IEC standard 60958-4 or AES3 for the Professional mode. The various settings of
the protocol generator are described below.
Advanced Settings
Open the control panel for the digital audio protocol generator by means of
Menu – Instruments – Protocol Generator
Coding Mode
Set the entry mask for channel status data to Consumer or
Professional.
Automatic The mask is set in accordance with bit 0 in byte 0,
and can be different for each of the two channels.
Bit 0 = 0 => Consumer
Bit 0 = 1 => Professional
Remote-control command:
SOURce:PROTocol:MODE AUTomatic
Consumer Entry mask for the Consumer mode, for both
channels in common.
Remote-control command:
SOURce:PROTocol:MODE CONSumer
Professional Entry mask for the Professional mode, for both
channels in common.
Remote-control command:
SOURce:PROTocol:MODE PROFessional

Digital Audio Protocol Generator R&S UPV
1146.2084.32 4.114 E-9
CRC
Cyclic redundancy check character: A checksum is generated from
the content of bytes 0 to 22 of the channel status data and transferred
to byte 23 (Professional mode only).
ON The checksum is generated and transferred to Byte
23.
Remote-control command:
SOURce:PROTocol:CRC ON
OFF No checksum is generated.
Remote-control command:
SOURce:PROTocol:CRC OFF
Validity
Defines the state of the validity bit.
1 & 2 The validity bit is set in both channels.
Remote-control command:
SOURce:PROTocol:VALidity CH1And2
None The validity bit is not set in either channel.
Remote-control command:
SOURce:PROTocol:VALidity NONE
All Bits = Zero
This sets all bits to zero. Exception: Bit 0 in byte 0, which defines the
coding mode as Consumer or Professional, is not changed.
Remote-control command:
SOURce:PROTocol:AZERo ONCE
Setting Bytes as Numerical Values
Achannel byte can be set to any value in this entry
block. It is even possible to set bit combinations
that are not yet defined in the standard.
Channel
Selects the channel, 1 or 2.
Remote-control command:
SOURce:PROTocol:NUMerical:CH <n>
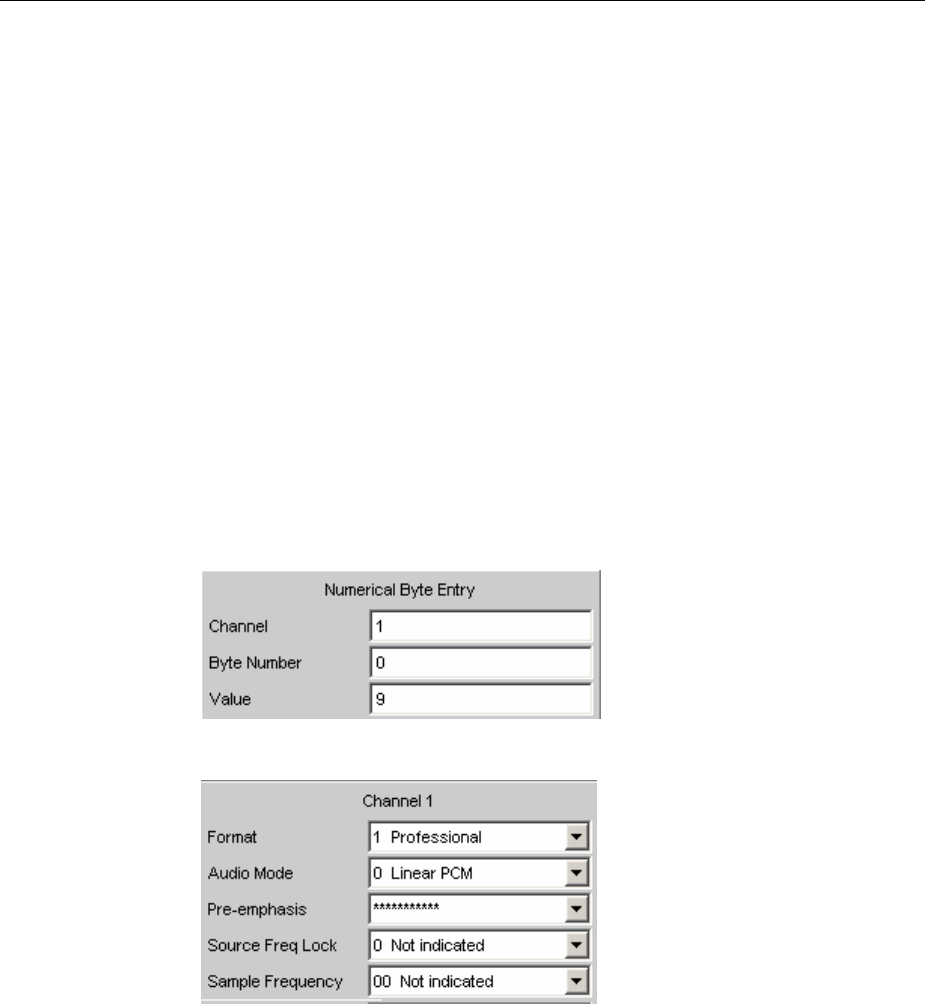
R&S UPV Digital Audio Protocol Generator
1146.2084.32 4.115 E-9
Byte Number
Selects the byte, 0 to 3.
Remote-control command:
SOURce:PROTocol:NUMerical:BYTE <n>
Value
The decimal value for the byte selected in channel
1or 2 is displayed
here and can also be entered.
Remote-control command for a query:
SOURce:PROTocol:NUMerical:VALue?
Remote-control command for an entry:
SOURce:PROTocol:NUMerical:VALue <n>
Hex Entry
The byte value can be displayed or entered in hexadecimal, binary or
decimal.
Remote-control command: ---
If the entry brings about a bit combination that is not yet defined in the standard, the parameter has no
meaning that can be displayed. In this event *********** is displayed.
Example: The entry …
…gives the following display, since the meaning of the bit combination "010" for
pre-emphasis is not defined in the standard.
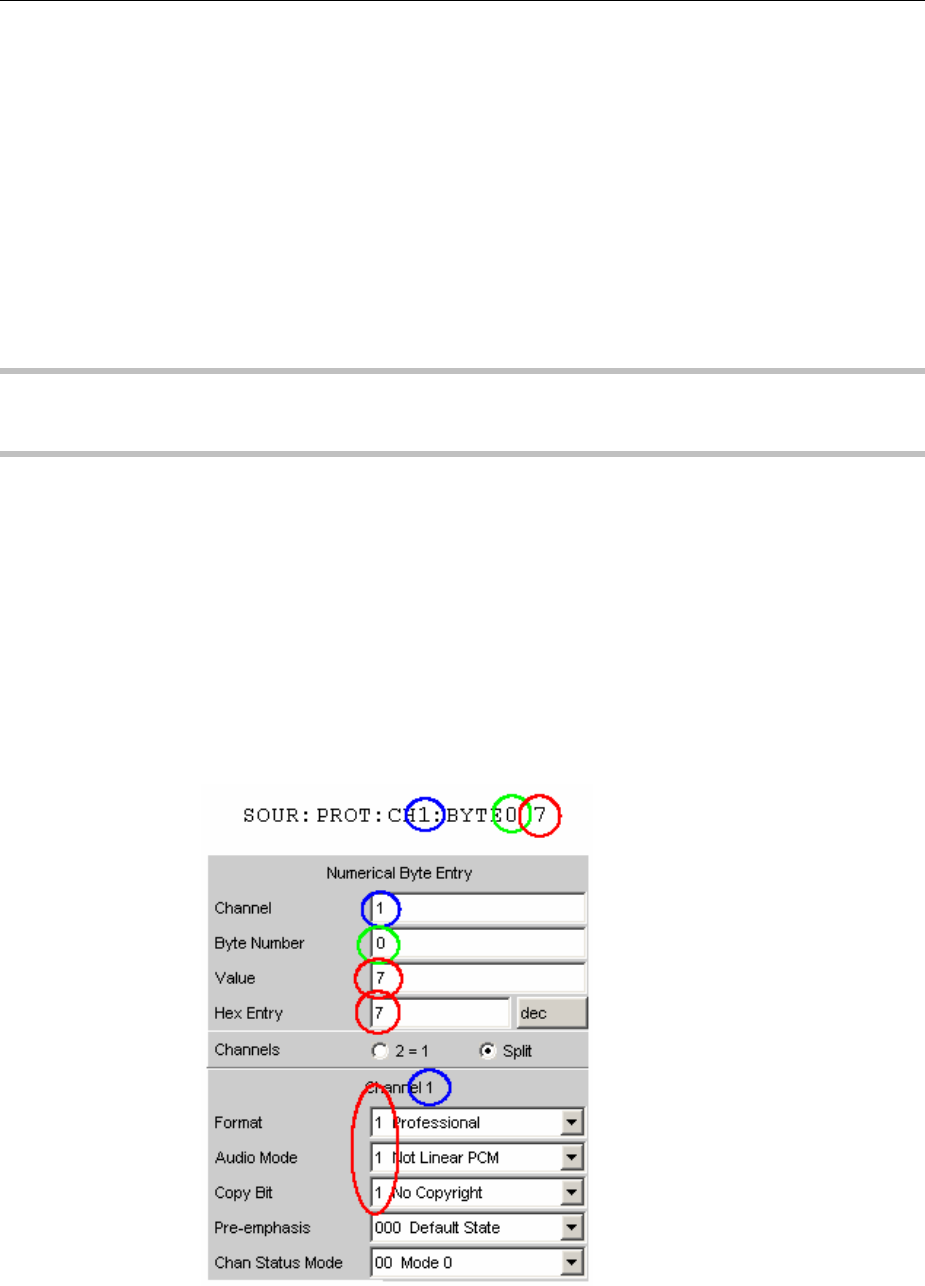
Digital Audio Protocol Generator R&S UPV
1146.2084.32 4.116 E-9
Setting Bytes in Remote-Control Mode
When entering or querying values in remote control mode, an easier method than the three individual
commands described in the previous section for channel, byte and value
SOURce:PROTocol:NUMerical:CH <x>
SOURce:PROTocol:NUMerical:BYTE <y>
SOURce:PROTocol:NUMerical:VALue <n>
is to use the following, combined remote-control command:
SOURce:PROTocol:CH<x>:BYTE<y> <n> for an entry
SOURce:PROTocol:CH<x>:BYTE<y> ? for a query
Note:
If this remote-control command is used to set a byte in Channel 2, the parameter display is switched to
atwo-channel (split) version.
After switching back to local mode, the settings entered via this remote-control command are displayed
in plain text in the corresponding parameter fields of the Protocol Generator panel.
Parameter: <x> 1 or 2
<y> 0 to 3
<n> 0 to 255 (decimal)
Example: "SOUR:PROT:CH1:BYTE0 7"
makes the Protocol Generator panel look like this:
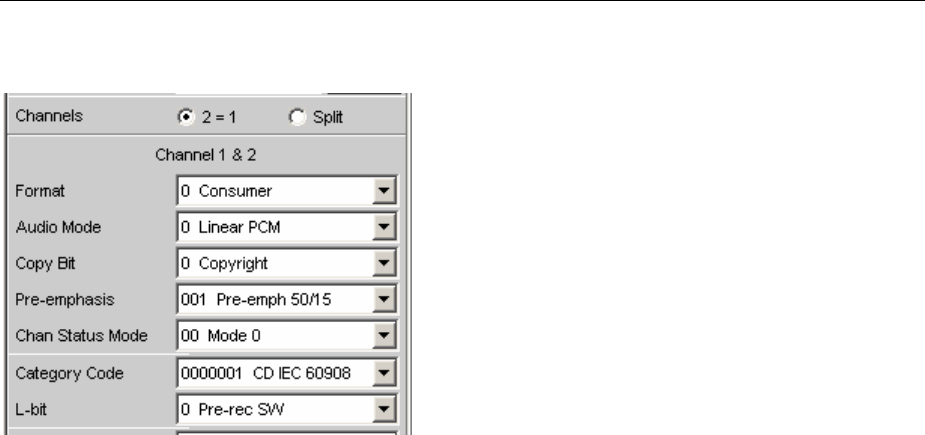
R&S UPV Digital Audio Protocol Generator
1146.2084.32 4.117 E-9
Displaying and Setting Parameters in Plain Text
Parameters can be entered here as defined in the
standard. This is possible only for manual
operation, and is not available in remote-control
mode.
The bit combination and meaning are displayed.
The effect of an entry via Numerical Byte Entry is
also displayed here.
Channels
Parameters can be set separately or for both channels in common.
2 = 1 The same parameters for both channels. On
switching over from Split, Channel 2 takes the
settings of Channel 1.
Remote-control command:
SOURce:PROTocol:CHANnels CH2Is1
Split Different parameters can be entered for each of the
two channels. On switching over to 2 = 1, Channel 2
takes the settings of Channel 1.
Remote-control command:
SOURce:PROTocol:CHANnels SPLit
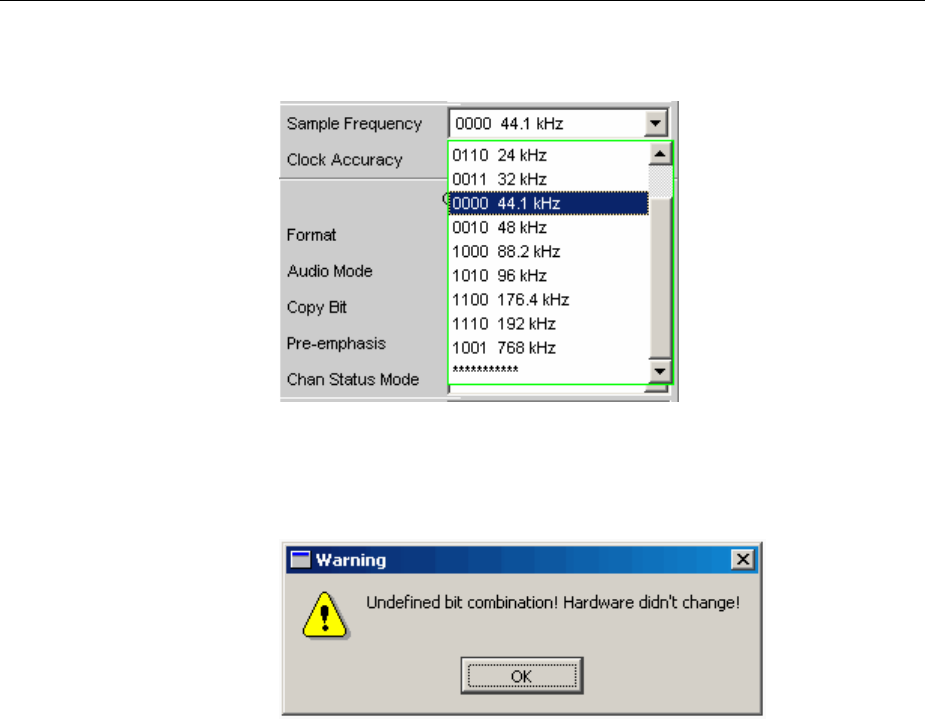
Digital Audio Protocol Generator R&S UPV
1146.2084.32 4.118 E-9
Setting parameters
Aselection is offered for each parameter as defined in the standard.
This example is for the Sample Frequency in Consumer mode.
The line *********** indicates an undefined bit combination (which is
possible when Numeric Byte Entry is used).
An attempt to set this line is met with the following message:
The hardware remains unchanged and the prior status is displayed.

R&S UPV Sweeps
1146.2084.32 4.119 E-9
Sweeps
With many generator functions, it is advisable to output the signal parameters (level, frequency and,
with burst signals, ON-time and interval length) not only statically but also to vary them over time.
Varying one or more of the signal parameters is referred to as a (generator) sweep. The measurement
values obtained can be, but do not have to be, recorded as series of measurement values.
For this purpose, the R&S UPV has a very flexible sweep system where up to two generator
parameters or one analyzer parameter can be varied in many different ways. When the generator
sweep is activated, any analyzer sweep that may be active (variation of the center frequency for the
RMS Selective filter) is deactivated.
The sweep results (series of measurement values) can be displayed graphically (2-D graph in a sweep
window) or numerically (sweep list, see section "List Sweep" on page 4.134). With the graphical display,
the 1stsweep parameter is usually plotted on the X-axis, the recorded measurement value on the Y-axis
and the optional 2nd sweep parameter on the Z-axis (not visible in the 2-D graph).
AZsweep is therefore equivalent to a sweep with two parameters (2-dimensional sweep). It is also
possible to plot the measured frequency (X-Source: Frequency)or the measured level (X-Source:
LevMon…)along the X axis.
Up to 8 measurement values can be recorded for each sweep point (in 4 sweep windows each with 2
traces).
To plot a specific measurement parameter, the following setting has to be made in (at least) one of the
four sweep display panels:
•X-Source has to be set to Sweep or the desired X parameter to be measured.
•(At least)one trace has to be set to the desired Y parameter to be measured.
It is also possible to set more than one trace to one measurement value.
The generator sweeps can be configured in many different ways and can be distinguished according to
the following characteristics:
•number of varied signal parameters in 1or 2-dimensional sweeps ("Z-sweeps")
•type of stepping in manual and automatic sweeps
•stepping condition in synchronous and time-triggered sweeps
•sweep-axis spacing in linear, logarithmic and list-controlled sweeps
•sweep direction in upward and downward sweeps
•physical basic unit of the sweep parameter in frequency, level, time and phase sweeps
•behavior when the stop value is reached in single and continuous sweeps
Which sweep parameters are available for the individual generator functions depends on the
characteristics of the respective signal. The following generally applies:
•Afrequency sweep is not possible for multi-tone signals or noise signals.
•Aphase sweep, i.e. the variation in phase shift between Channel 1 and 2, is only possible for
stereo-sinewaves and should only be performed if both frequencies are the same.
•Time sweeps, i.e. the variation in ON-time and interval length, are only possible with burst signals.

Sweeps R&S UPV
1146.2084.32 4.120 E-9
•Z-sweeps are only possible if at least 2 signal parameters of the set generator function have sweep
capability.
Table 4-1 List of sweep-capable function parameters depending on selected function
Function VOLTAGE FREQUENCY Phase ON-TIME INTERVAL
Sine yes yes --- --- ---
Stereo Sine yes yes yes --- ---
Multisine no no --- --- ---
Sine Burst yes yes --- yes yes
Sine2burst yes yes --- yes yes
Mod Dist yes (total voltage) yes (user frequency) --- --- ---
DFD yes (total voltage) IEC268 mode: center
frequency
IEC118 mode: upper
frequency
--- --- ---
DIM yes (total voltage) --- --- --- ---
Random no --- --- --- ---
Arbitrary no --- --- --- ---
Polarity no --- --- --- ---
Modulation no no --- --- ---
DC yes --- --- --- ---
Activating / Deactivating the Sweep System
The sweep system is activated and deactivated using "Sweep Ctrl". How the sweep is to be stepped
and how the sweep axis is to be defined are also determined at the same time. For generator sweeps,
this parameter field is available in the generator functions; the analyzer sweep is only available for the
measurement function "RMS Selective" and is described in greater detail in the associated section
"RMS Measurement, Selective" on page 4.249.
The sweep system can be activated and configured separately in each generator function. If the
function (or instrument) is changed, the sweep system is reconfigured, activated or deactivated
implicitly.
The generator sweep is also deactivated when the analyzer sweep is activated and when "Time Chart"
is selected as the start condition, see section "Start Conditions" on page 4.221.
Asweep cycle is started by pressing the START key (for continuous sweeps) or SINGLE key (for single
sweeps).
Each new sweep point that the sweep system sets automatically triggers a new measurement. When
using one of the burst functions of the R&S UPV universal generator, the generator signal is reset at the
same time, that is, the generator starts at the burst phase or "Burst on Delay". If the measurement
values generated during measurement are to be recorded and displayed (graphically or numerically),
the desired measurement values (e.g. "Funct Ch1") must be selected as "Traces" in the sweep display
panels. Furthermore, it must also be ensured that during measurement value recording the X-axis is set
to "Auto" in the used sweep display panels.
On completion of the sweep measurements, the used traces and the associated X-axes should be
switched to "Hold" to prevent the sweep results from being deleted if instrument settings are changed
inadvertently.
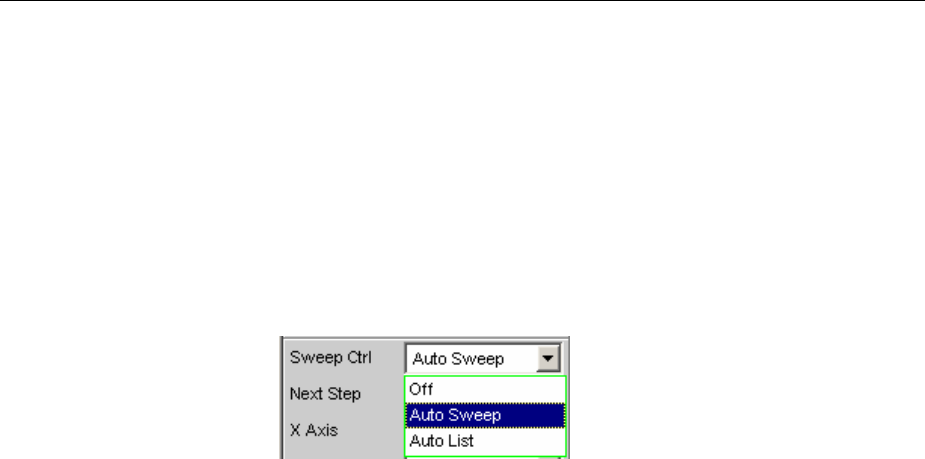
R&S UPV Sweeps
1146.2084.32 4.121 E-9
When the sweep system is active, the START, SINGLE and STOP/CONT keys have the following
effect:
•START starts a continuous sweep.
•SINGLE starts a single sweep or causes an already started continuous sweep to be continued as a
single sweep.
•STOP/CONT stops an active sweep or restarts a stopped sweep.
Sweep Ctrl
Used to activate and configure or deactivate the generator sweep
system.
Off The generator sweep system is deactivated;no
additional parameter fields are displayed.
If the analyzer sweep system is also deactivated, the
START, SINGLE and STOP/CONT keys affect the
measurement system:
•START starts a continuous measurement
•SINGLE starts a single measurement or causes
an already started continuous measurement to
be continued as a single measurement
•STOP/CONT stops an active measurement or
starts a stopped or completed measurement as
acontinuous measurement
Remote-control command:
SOURce:SWEep:CONTrol OFF
Auto Sweep The generator sweep system is activated;the sweep
stepping is performed automatically; the sweep axis
is calculated from the start value, stop value and
step size or point number.
The stepping condition (fixed time grid or
synchronized to the analyzer) is determined in the
"Next Step" parameter field.
Remote-control command:
SOURce:SWEep:CONTrol ASWeep
Auto List The generator sweep system is activated;the sweep
stepping is performed automatically; the sweep axis
is determined from the predefined list of sweep
points (usually loaded as a file).
The stepping condition (fixed time grid or
synchronized to the analyzer) is determined in the
"Next Step" parameter field.
Remote-control command:
SOURce:SWEep:CONTrol ALISt
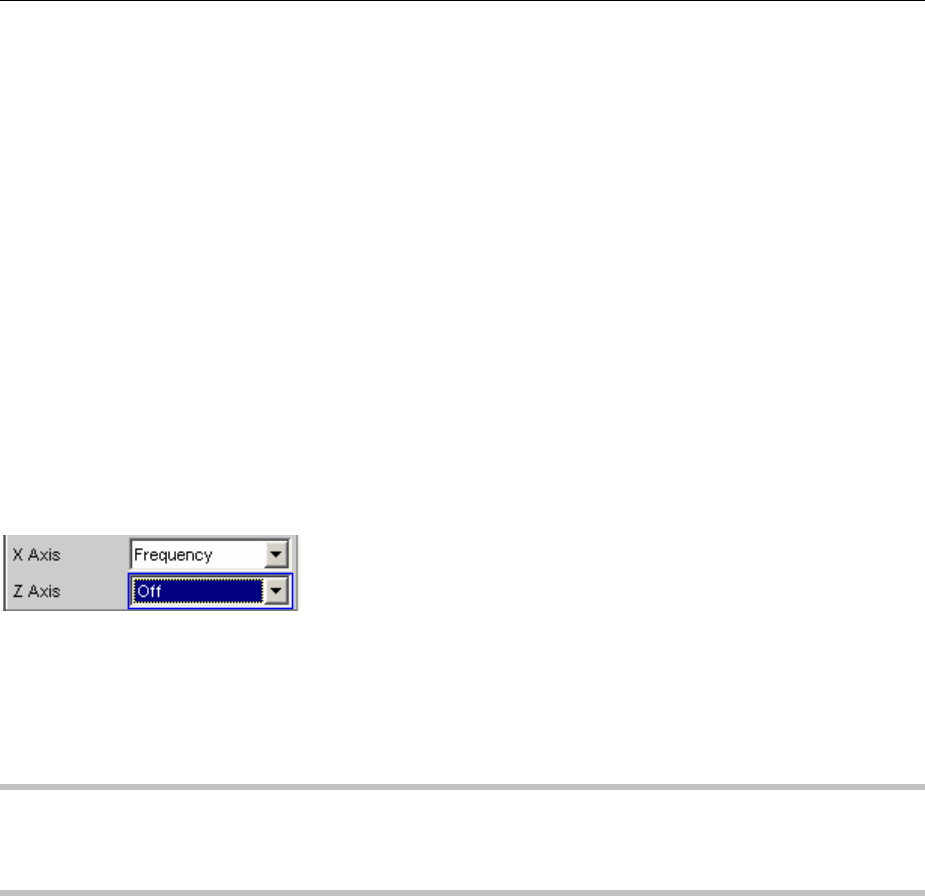
Sweeps R&S UPV
1146.2084.32 4.122 E-9
Manual Sweep The generator sweep system is activated; the sweep
stepping is performed manually; the sweep axis is
calculated from the start value, stop value and step
size or point number.
Remote-control command:
SOURce:SWEep:CONTrol MSWeep
Manual List The generator sweep system is activated;the sweep
stepping is performed manually; the sweep axis is
determined from the predefined list of sweep points
(usually loaded as a file).
Remote-control command:
SOURce:SWEep:CONTrol MLISt
One-Dimensional Sweep
With one-dimensional sweeps, only 1 parameter is varied; the Z-axis is deactivated.
Each sweep cycle can consist of max. 1024 individual points, which means that the X-axis is divided
into max. 1023 steps.
As soon as all of the points on the X-axis have been processed, the analyzer returns to the 1st X-value
and performs the next sweep cycle using the same settings.
Note:
The last 20 sweep cycles (scans) are available as the data set. If more than 20 scans have been
performed, only the last 20 can be saved as the trace data set. Similarly, only the last 20 scans are
retained if the graph is rescaled.
Aone-dimensional continuous sweep which was started by pressing the START key is repeated
infinitely often.
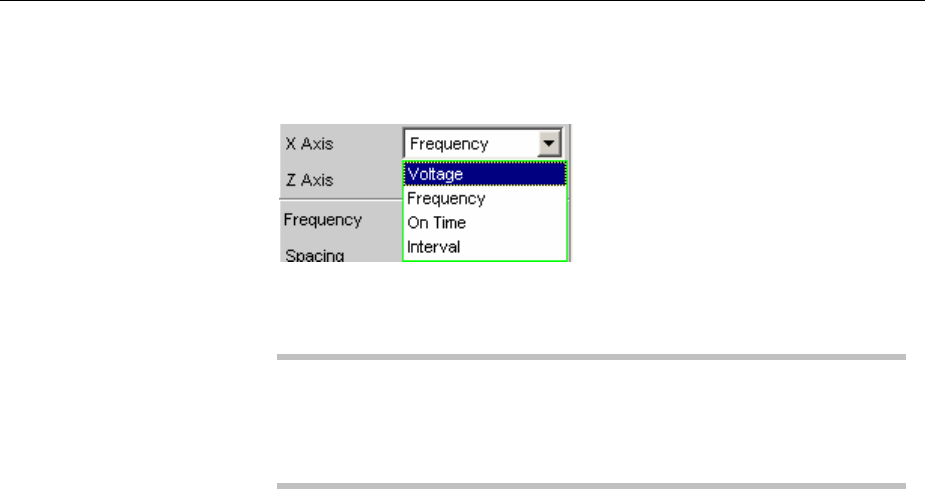
R&S UPV Sweeps
1146.2084.32 4.123 E-9
XAxis
Used to select the sweep parameter (with one-dimensional sweeps) or
the first sweep parameter (with two-dimensional sweeps). Only visible
for activated generator sweep system.
The reason why the sweep axis is referred to as the X-axis is because
this sweep parameter is usually plotted on the X-axis in the 2-D graph.
Note:
It is also possible to plot a measurement value on the X-axis (e.g. the
measured RMS in the case of external measurement value triggering).
In such cases, the sweep axis (sweep X-axis) and the graphical X-axis
are not necessarily identical.
Voltage Used to activate a level sweep. Which signal
parameter is actually swept (e.g. the level of a single
sinewave line or the total level of a multi-tone signal)
depends on the respective generator function.
Remote-control command:
SOURce:SWEep:XAXis VOLTage
Frequency Used to activate a frequency sweep. Not possible for
noise signals and multi-tone signals. Which signal
parameter is actually swept (e.g. the frequency of a
single sinewave line or the center frequency of a
two-tone signal) depends on the respective
generator function.
Remote-control command:
SOURce:SWEep:XAXis FREQuency
Phase Used to activate a phase sweep. Only possible for
stereo signal.
Remote-control command:
SOURce:SWEep:XAXis PHASe
On Time Used to activate a burst-duration sweep. Only with
burst signals.
The ON-time of the burst signal is swept, i.e. the
time during which the high level of the burst is
output.
Remote-control command:
SOURce:SWEep:XAXis ONTIme
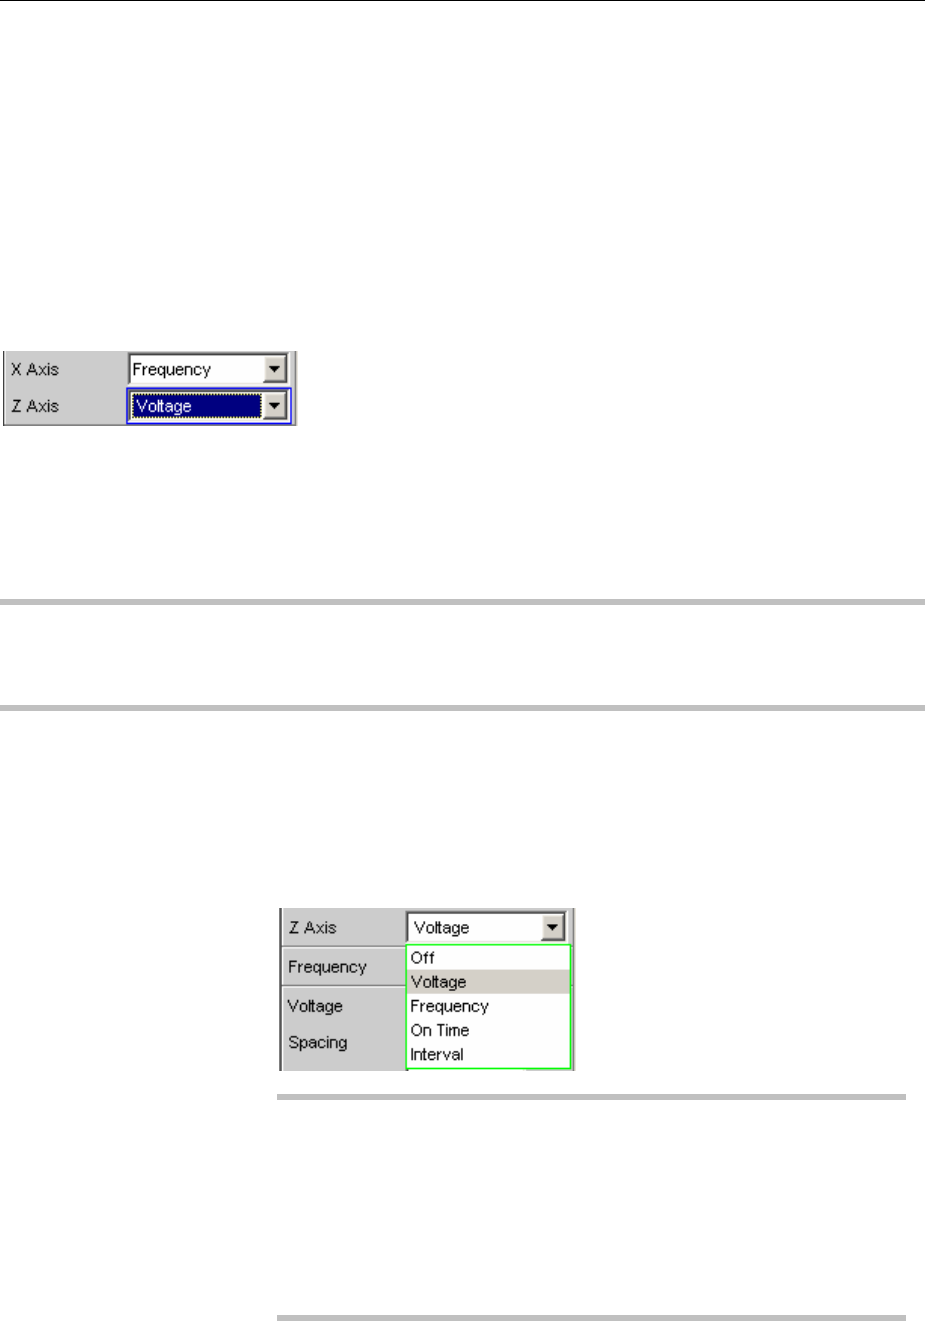
Sweeps R&S UPV
1146.2084.32 4.124 E-9
Interval Used to activate a burst-interval sweep. Only with
burst signals.
The interval length of the burst signal is swept.
Remote-control command:
SOURce:SWEep:XAXis INTervall
Two-Dimensional Sweep
With two-dimensional sweeps, 2 (different) parameters are varied; the 1st parameter is selected as the
X-axis and the 2nd parameter as the Z-axis.
Both axes (sweep dimensions) can each consist of max. 1024 individual points, which means that each
axis is divided into max. 1023 steps.
As soon as all of the points on the X-axis have been processed, the analyzer returns to the 1stX-value
and simultaneously sets the next Z-value. When the sweep cycle for the last Z-point has been
completed, the X and Z-values are reset to their original start values.
Note:
The last 20 sweep cycles (scans) are available as the data set. If the Z-axis contains more than 20
points, only the last 20 scans can be saved as the trace data set. Similarly, only the last 20 scans are
retained if the graph is rescaled.
Atwo-dimensional continuous sweep which was started by pressing the START key is stopped after the
sweep cycle for the last Z-point.
ZAxis
Used to select the second sweep parameter for the two-dimensional
sweep. Used both to activate and to deactivate the two-dimensional
sweep. Only visible for activated generator sweep system.
Note:
With some generator functions (e.g. DC, DIM), it is possible to sweep
one parameter only. The "Z Axis" parameter field (and therefore a two-
dimensional sweep) is not available in this case.
When “Z Sweep” is enabled, the Sweep Graph Config panel is
switched to “Multi Scan” if the X source of the current window is set to
“Sweep.”. At the same time, the number of points on the Z axis (20
maximum) is copied to the Sweep Graph Config panel as “History” if it
is larger than the value specified there.

R&S UPV Sweeps
1146.2084.32 4.125 E-9
Off Used to deactivate the two-dimensional sweep
(switch-over to a one-dimensional sweep).
Remote-control command:
SOURce:SWEep:ZAXis OFF
Voltage Used to activate the two-dimensional sweep and
select the level variation as the second sweep
parameter. Which signal parameter is actually swept
(the level of a single sinewave line or the total level
of a multi-tone signal) depends on the respective
generator function.
Remote-control command:
SOURce:SWEep:ZAXis VOLTage
Frequency Used to activate the two-dimensional sweep and
select the frequency variation as the second sweep
parameter. Not possible for noise signals and multi-
tone signals. Which signal parameter is actually
swept (the frequency of a single sinewave line or the
center frequency of a two-tone signal) depends on
the respective generator function.
Remote-control command:
SOURce:SWEep:ZAXis FREQuency
Phase Used to activate a two-dimensional sweep and select
phase variation as the second sweep parameter.
Only possible for stereo signal.
Remote-control command:
SOURce:SWEep:ZAXis PHASe
On Time Used to activate the two-dimensional sweep and
select the burst-duration variation as the second
sweep parameter. Only with burst signals.
The ON-time of the burst signal is swept, i.e. the
time during which the high level of the burst is
output.
Remote-control command:
SOURce:SWEep:ZAXis ONTIme
Interval Used to activate the two-dimensional sweep and
select the burst-interval variation as the second
sweep parameter. Only with burst signals.
The interval length of the burst signal is swept.
Remote-control command:
SOURce:SWEep:ZAXis INTervall

Sweeps R&S UPV
1146.2084.32 4.126 E-9
Note:
The smallest "Interval" value must be greater than the largest occurring "On Time" value. With
logarithmic and linear sweeps, this is ensured by limiting and, where necessary, correcting the start and
stop values. With the list sweep, the user should make sure that this condition is observed in the used
lists since automatic correction (if required) only begins with the currently active sweep, which can lead
to unexpected results.
Theoretically, it is possible (and not forbidden on the user interface) to specify the same parameter (e.g.
voltage) for both axes. In this case, the Z-parameter has no effect but nevertheless still determines the
number of sweep cycles.
Automatic Sweep
With automatic sweeps, the sweep stepping is performed automatically when a measurement has been
completed (synchronous sweep) or when a definable dwell time has expired (time-triggered sweep,
dwell sweep). Once started, the sweep continues to run indefinitely if no further user entries are made
(in the case of one-dimensional continuous sweeps) or until the last sweep point has been reached.
Synchronous sweep ensures that sweep stepping is performed when the analyzer has carried out all
the required measurements. At the same time it ensures the highest possible sweep speed, since the
next sweep point is set as soon as measurements have finished.
Time-triggered sweep is only worthwhile in exceptional cases:
•When the analyzer is not in use.
•When the analyzer is actually being used, but the intention is for sweep stepping to be performed
independently of measurement time. However, the chosen dwell time must be long enough for all
measurements to have been completed before the dwell time expires.
•For the purpose of creating WAV files for external sweeps with the aid of the "Record"
measurement function (Reference).
Note:
If it is also intended to generate valid measurement values in the course of a time-triggered sweep, it is
recommended that the settings in the analyzer should be selected so as to exclude incalculable
lengthening of measurement times (e.g. turn off settling, turn off autorange in the analog analyzer,
select a fixed measurement time).
The automatic sweeps are selected in the "Sweep Ctrl" parameter field, whereby the sweep axis
•is calculated from user entries ("Auto Sweep") or
•is loaded with a predefined list (e.g. from a file) ("Auto List")
Next Step
Used to select the sweep stepping. Only visible for automatic sweeps.
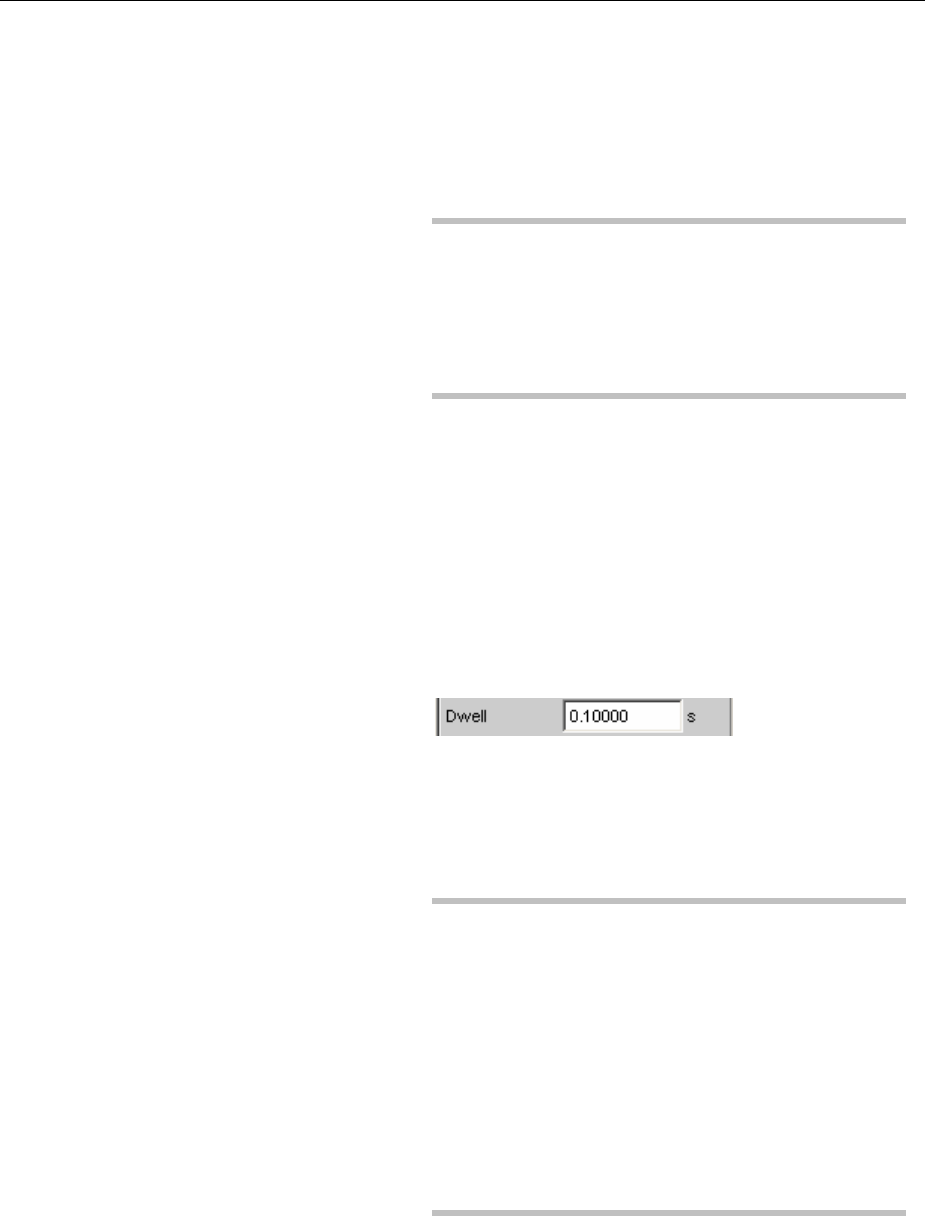
R&S UPV Sweeps
1146.2084.32 4.127 E-9
Anlr Sync The sweep stepping is synchronized to the analyzer,
i.e. a new sweep point is set automatically when all
measurements activated in the analyzer have been
completed. This setting should be selected
whenever the internal analyzer is used for sweeping.
It ensures that a measurement value is determined
for every sweep point with minimum sweep time.
Note:
If one or more measurement values cannot be
determined for a particular sweep point (e.g. the
selected level range of the analyzer is too low or the
signal supplies a level which is too high), the
measurement values concerned are marked as
invalid ("NAN") and the next sweep point is set.
Remote-control command:
SOURce:SWEep:NEXTstep ASYNc
Dwell Value The sweep stepping is time-controlled in constant
intervals, i.e. a new sweep point is set automatically
if the preset time has expired, irrespective of
whether the measurements activated in the analyzer
have been completed. A new measurement is
started at the same time.
The user can enter the dwell time in the next
parameter field.
This setting ensures that sweep stepping is carried
out in a fixed time grid. It should only be chosen if
the internal analyzer is not in use, measurement
values are not needed or the dwell time is longer
than the longest measurement time.
Note:
The measurement time needed at individual sweep
points differs very widely, particularly in the case of
frequency sweeps. If it is intended to generate
measurement values, the "slowest" sweep point
must be taken as a basis when defining the
necessary dwell time (for frequency sweeps this is
normally the lowest frequency). A higher sweep
speed can be achieved by using "dwell files".
If the selected dwell time is too short thus preventing
one or more measurement values from being
determined, the measurement values concerned are
marked as invalid ("NAN").
Remote-control command:
SOURce:SWEep:NEXTstep DWELl
SOURce:SWEep:DWELl <nu>

Sweeps R&S UPV
1146.2084.32 4.128 E-9
Dwell File The sweep stepping is time-controlled in individually
set intervals, i.e. a new sweep point is set
automatically if the associated time has expired,
irrespective of whether the measurements activated
in the analyzer have been completed. A new
measurement is started at the same time.
The file containing the list of dwell times can be
specified by the user in the parameter field below.
This setting makes it possible to specify not only a
separate dwell time for each sweep point, but also
an individual measurement time. It should only be
chosen if the internal analyzer is not in use,
measurement values are not needed or the dwell
time of a sweep point is longer than the associated
measurement time.
The dwell list is processed in the direction of the
sweep, i.e. starting with the last entry in the case of
adownward sweep.The specified dwell time will
thus be maintained for each sweep point even if the
sweep direction is changed.
Note:
If measurement values are also required in this
mode, the individual measurement time should be
determined and entered for each sweep point in
order to achieve a high sweep speed. This applies
particularly to frequency sweeps using automatic
measurement time.
If the dwell-time list is shorter than the sweep list or
the length of the sweep axis, the last dwell time in
the list is applicable for all remaining sweep points.
Remote-control command:
SOURce:SWEep:NEXTstep LIST
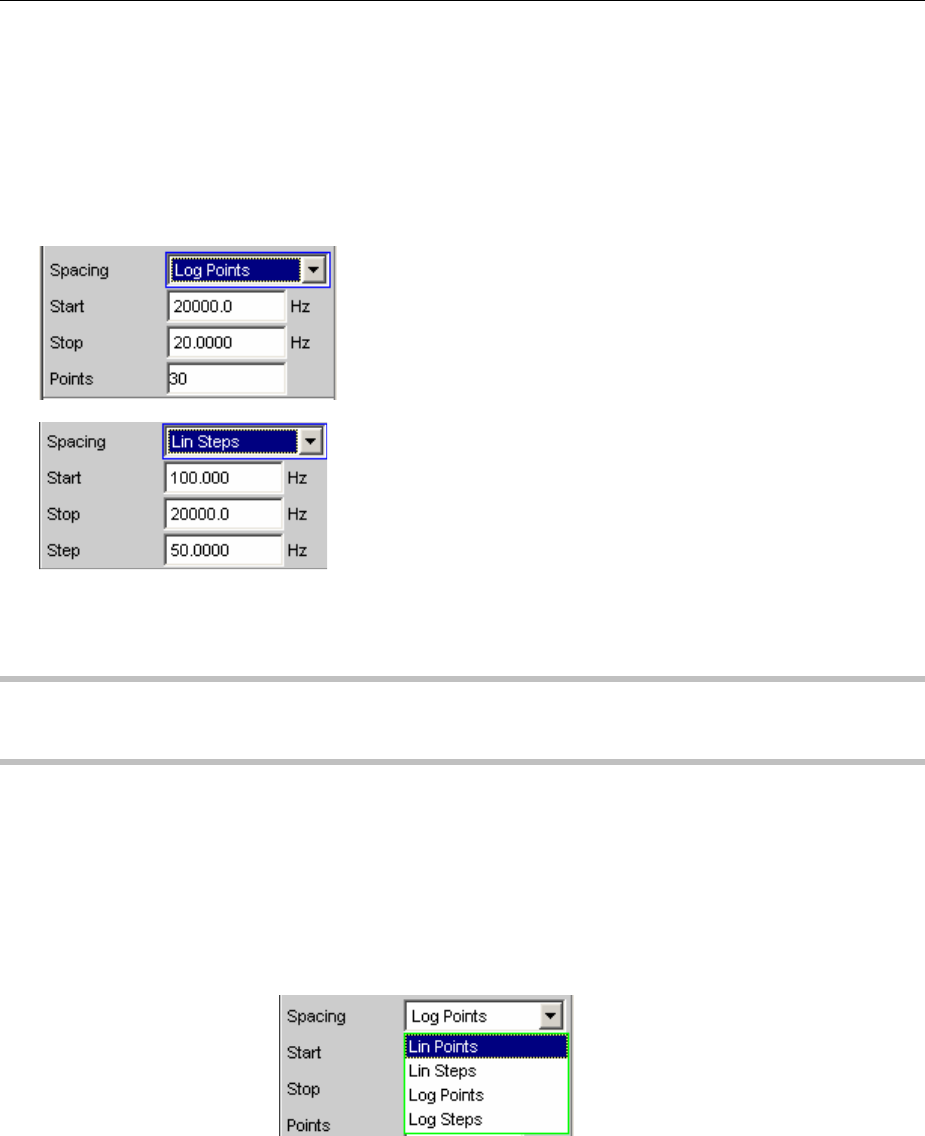
R&S UPV Sweeps
1146.2084.32 4.129 E-9
Linear and Logarithmic Sweep
Both linear and logarithmic sweeps are calculated automatically from user entries. For this purpose, the
user must specify:
•the spacing type (logarithmic or linear)
•either the number of points ("Points") or the step size ("Step")
•the start and stop value ("Start" and "Stop"), which implies the sweep direction
Note:
Since the start and stop values indicate the part of the X axis that is of interest, they are used to scale
the X axis in the sweep graphs if the X axis scaling is "Auto".
Amaximum of 1024 points are available for each sweep axis which means that each axis can be
divided into max. 1023 (linear or logarithmic) equidistant steps.
Spacing
Used to select the sweep range spacing, i.e. the way in which the
sweep points are distributed on the sweep axes. Only visible for
activated generator sweep system. It is set separately for each sweep
parameter.
It can be selected separately for each sweep parameter (i.e. X and Z-
axis).

Sweeps R&S UPV
1146.2084.32 4.130 E-9
Lin Points The sweep range is divided linearly by specifying a
number of points (linear sweep). This number is
entered in the "Points" parameter field.
Should be selected if equidistant, linear spacing of
all points is required.
Remote-control command:
(must be entered separately for each
sweep parameter used)
SOURce:SWEep:FREQuency:SPACing
LINPoints
SOURce:SWEep:PHASe:SPACing LINPoints
SOURce:SWEep:VOLTage:SPACing LINPoints
SOURce:SWEep:ONTime:SPACing LINPoints
SOURce:SWEep:INTerval:SPACing
LINPoints
Lin Steps The sweep range is divided into intervals of a
specified linear step size starting at "Start" (linear
sweep). This step size is entered in the "Step"
parameter field.
Remote-control command:
(must be entered separately for each
sweep parameter used)
SOURce:SWEep:FREQuency:SPACing
LINSteps
SOURce:SWEep:PHASe:SPACing LINSteps
SOURce:SWEep:VOLTage:SPACing LINSteps
SOURce:SWEep:ONTime:SPACing LINSteps
SOURce:SWEep:INTerval:SPACing LINSteps
Log Points The sweep range is divided logarithmically by
specifying a number of points (logarithmic sweep).
This number is entered in the "Points" parameter
field. Not possible for phase sweep.
Should be selected if equidistant, logarithmic
spacing of all points is required.
Remote-control command:
(must be entered separately for each
sweep parameter used)
SOURce:SWEep:FREQuency:SPACing
LOGPoints
SOURce:SWEep:VOLTage:SPACing LOGPoints
SOURce:SWEep:ONTime:SPACing LOGPoints
SOURce:SWEep:INTerval:SPACing
LOGPoints
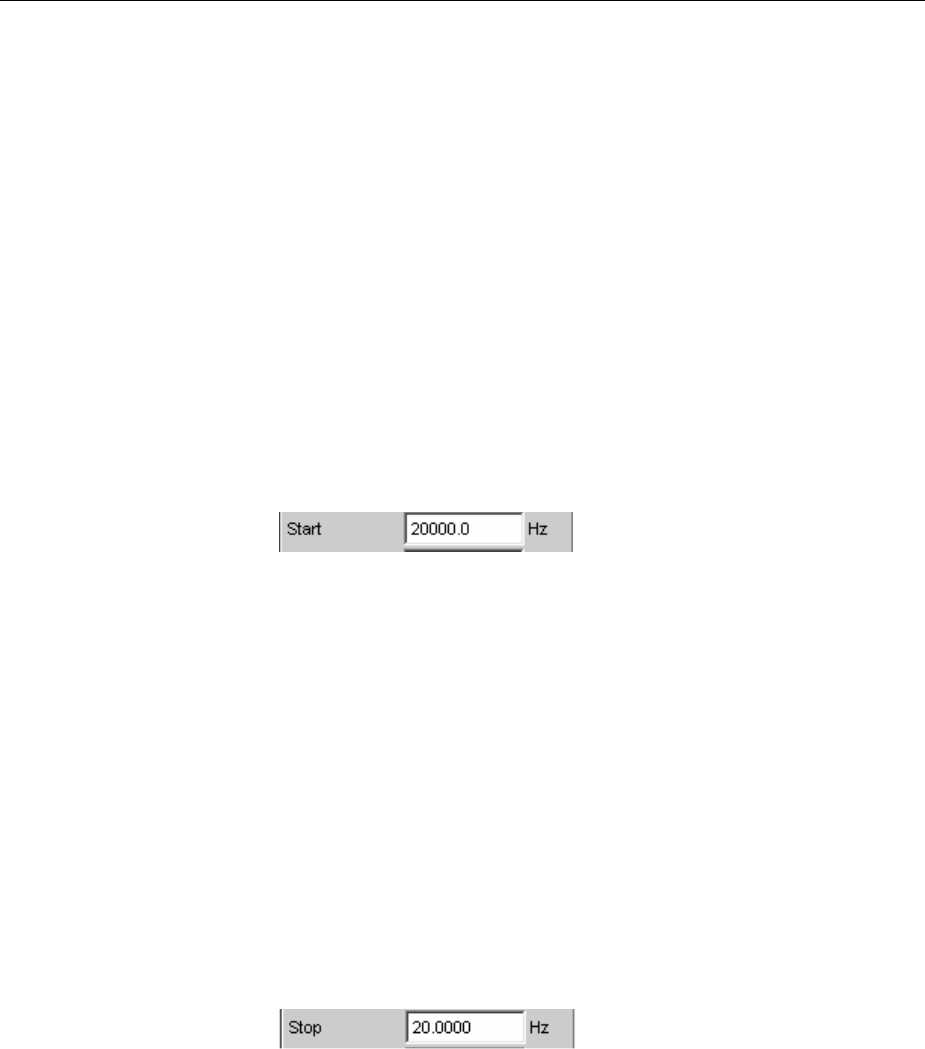
R&S UPV Sweeps
1146.2084.32 4.131 E-9
Log Steps The sweep range is divided into intervals of a
specified logarithmic step size starting at "Start"
(logarithmic sweep). Each sweep point is calculated
by multiplying the previous point by a constant
factor. This factor is entered in the "Step" parameter
field. Not possible for phase sweep.
Remote-control command:
(must be entered separately for each
sweep parameter used)
SOURce:SWEep:FREQuency:SPACing
LOGSteps
SOURce:SWEep:VOLTage:SPACing LOGSteps
SOURce:SWEep:ONTime:SPACing LOGSteps
SOURce:SWEep:INTerval:SPACing LOGSteps
Start
Used to enter the start value for the sweep parameter set in the
parameter field above. Only visible for activated generator sweep
system. It is set separately for each sweep parameter.
The start and stop value implicitly determine the sweep direction:
If the start value is less than the stop value, an upward sweep is
performed, otherwise a downward sweep will be performed.
If a start value identical to the stop value is entered, the stop value is
automatically loaded with the old start value. In this way, it is possible
to change the sweep direction by entering just one value.
Remote-control command:
SOURce:SWEep:FREQuency:STARt <nu>
SOURce:SWEep:PHASe:STARt <nu>
SOURce:SWEep:VOLTage:STARt <nu>
SOURce:SWEep:ONTime:STARt <nu>
SOURce:SWEep:INTerval:STARt <nu>
Stop
Used to enter the stop value for the sweep parameter set in the
parameter field above. Only visible for activated generator sweep
system. It is set separately for each sweep parameter.
The start and stop value implicitly determine the sweep direction:
If a stop value identical to the start value is entered, the start value is
automatically loaded with the old stop value.
Remote-control command:
SOURce:SWEep:FREQuency:STOP <nu>
SOURce:SWEep:PHASe:STOP <nu>
SOURce:SWEep:VOLTage:STOP <nu>
SOURce:SWEep:ONTime:STOP <nu>
SOURce:SWEep:INTerval:STOP <nu>
Sweeps R&S UPV
1146.2084.32 4.132 E-9
Points
Used to enter the number of sweep points for the sweep parameter
set in the parameter field above. Only visible for activated generator
sweep system if "Lin Points" or "Log Points" is set for "Spacing". It is
set separately for each sweep parameter.
The sweep range is divided into "Points – 1" (linear or logarithmic)
equidistant steps. At least 2 points (start and stop value) are required.
Amaximum of 1024 points can be selected for each sweep
parameter.
Note:
If the Z-axis contains more than 20 points, only the last 20 scans are
available as the data set (for saving and rescaling the graph). If a two-
dimensional sweep is to be saved as a complete trace data set, the
number of points on the Z-axis must not exceed 20.
The number of points on the Z axis (20 maximum) is copied to the
Sweep Graph Config panel as “History” if it is larger than the value
specified there and the X source of the current window is set to
“Sweep”.
Remote-control command:
SOURce:SWEep:FREQuency:POINts <nu>
SOURce:SWEep:PHASe:POINts <nu>
SOURce:SWEep:VOLTage:POINts <nu>
SOURce:SWEep:ONTime:POINts <nu>
SOURce:SWEep:INTerval:POINts <nu>
R&S UPV Sweeps
1146.2084.32 4.133 E-9
Step
Used to enter the (linear or logarithmic) step size for the sweep
parameter set in the parameter field above. Only visible for activated
generator sweep system if "Lin Steps" or "Log Steps" is set for
"Spacing". It is set separately for each sweep parameter.
The entry range is limited automatically so that at least one and at
most 1023 steps exist (corresponding to 1024 sweep points).
With linear step, the size of the step must always be entered, i.e. the
numeric value is positive even if the start value is greater than the stop
value. The physical unit is the same as that used when specifying
"Start" and "Stop".
(Example for lin. frequency sweep)
With logarithmic step, the factor must be entered by which each
sweep point is to be multiplied in order to move to the next sweep
point. The logarithmic step size of level sweeps can also be specified
in dB. Swapping the start and stop value (reversal of the sweep
direction), therefore produces the reciprocal value and changes the
sign of the dB value. The closer the numeric value is to 1.0 or 0 dB,
the more sweep steps will be performed.
(Example for log. downward sweep)
Note:
Since the last step of the sweep is automatically adapted such that it
corresponds exactly to the stop value, it may deviate by max. 50 %
from the selected step size. If this is to be avoided, either the start /
stop value must be corrected accordingly or the sweep spacing must
be set using the "Points" parameter.
The number of points on the Z axis (resulting from the Start, Stop and
Step values) is copied to the Sweep Graph Config panel as “History” if
it is larger than the value specified there and the X source of the
current window is set to “Sweep”.
Remote-control command:
SOURce:SWEep:FREQuency:STEP <nu>
SOURce:SWEep:PHASe:STEP <nu>
SOURce:SWEep:VOLTage:STEP <nu>
SOURce:SWEep:ONTime:STEP <nu>
SOURce:SWEep:INTerval:STEP <nu>

Sweeps R&S UPV
1146.2084.32 4.134 E-9
List Sweep
With list-controlled sweeps, any sweep axis can be defined. The sweep points may be any distance
apart, but must be in ascending or descending order ("Random sweep"). The sweep points are
processed by the sweep system in the order in which they exist in the list. To define the list sweep as
an upward or downward sweep, the sweep points must be entered in the appropriate order. Whereas in
anormal sweep each sweep point is measured once only within a scan, the list sweep also offers the
ability to measure individual sweep points a multiple number of times. This is achieved by entering the
relevant sweep point in the list an appropriate number of times.
The list is usually loaded as a file. It must contain at least two (different) points.
Amaximum of 1024 points are available for each sweep axis; if the list contains more than 1024 values,
only the first 1024 points are loaded. The first and last points in the list define the sweep direction. If the
list contains a point which does not comply with this direction, the point and all subsequent points are
ignored.
Note:
Since the first and last (valid) points in the sweep list indicate the part of the X axis that is of interest,
they are used to scale the X axis in the sweep graphs if the X axis scaling is "Auto".
When the sweep list is being loaded, a check is made to see whether the actual basic measurement
unit of the sweep file matches the sweep parameter. In addition to the R&S UPV list format (preferably
with the extension *.SWL), files originating from earlier instruments (R&S UPL and R&S UPD) are also
accepted.
Note:
If the Z-axis of the two-dimensional sweep is defined as a list containing more than 20 points, only the
last 20 scans are available as the data set (for saving and rescaling the graph). If a two-dimensional
sweep is to be saved as a complete trace data set, the number of points on the Z-axis must not exceed
20.
Tot Volt File
Used to enter the file name for the list of the level sweep parameter
(level sweep list). Only visible for activated generator list sweep.
Which signal parameter is actually swept (the level of a single
sinewave line or the total level of a multi-tone signal) depends on the
selected generator function.
Remote-control command:
MMEMory:LOAD:VOLTage ’filename’
R&S UPV Sweeps
1146.2084.32 4.135 E-9
Freq File
Used to enter the file name for the list of the frequency sweep
parameter (frequency sweep list). Only visible for activated generator
list sweep.
Which signal parameter is actually swept (the frequency of a single
sinewave line or the center frequency of a two-tone signal) depends
on the selected generator function.
Remote-control command:
MMEMory:LOAD:FREQuency 'filename’
Phase File
Entry of file name for the phase sweep list. Only visible with generator
list sweep activated.
Remote-control command :
MMEMory:LOAD:PHASe 'filename’
On Time File
Used to enter the file name for the list of the burst-duration sweep
(burst-duration sweep list). Only visible for activated generator list
sweep in the generator functions "Burst" and "Sine² Burst".
Remote-control command:
MMEMory:LOAD:ONTime ’filename’
Interval File
Used to enter the file name for the list of the burst-interval sweep
(burst-interval sweep list). Only visible for activated generator list
sweep in the generator functions "Burst" and "Sine² Burst".
Remote-control command:
MMEMory:LOAD:INTerval ’filename’
Sweep Speed
The time required for a sweep cycle is only relevant for automatic sweeps and is determined by the
following factors:
•Setting time of the generator
•Required dwell time; depends on the characteristics of the DUT (e.g. settling time)
•Only with synchronous sweeps (i.e. when using the internal analyzer): measurement speed
Sweeps R&S UPV
1146.2084.32 4.136 E-9
The setting times of the generator and, if necessary, the measurement time should be minimized in
order to ensure the shortest possible cycle time and thus a high sweep speed. A series of optimization
options are provided for this purpose:
Minimizing the generator setting time
The setting time of the digital generator part is just a few microseconds and can therefore be
disregarded. However, configuration of the analog software in the analog generator (which involves
settling procedures) requires a number of milliseconds and should therefore be avoided for sweeps
wherever possible.
•Using the universal generator instead of the low-distortion generator for frequency sweeps. With
low frequencies in particular, the low-distortion generator requires long settling times for frequency
changes. The universal generator is superior to the low-distortion generator with respect to
frequency setting time and accuracy and is therefore preferable as a sweep generator. The low-
distortion generator should only be used if the DUT and the measurement function require its
extremely good distortion properties or large frequency range.
•Using a fixed level range for level sweep and with active precorrection; the level should be set to
the highest value occurring in the sweep. The automatic operating mode controls the level of the
analog hardware to maximize the signal-to-noise value of the generator at every level. This mode
should only be used if sweeping is to be performed over several decades and both the DUT and the
measurement function require a high S/N value.
•Deactivating filtering.An activated filter needs a short settling time for every frequency or level
change.
•Deactivating frequency response precorrection for frequency sweeps. If the equalizer is
activated, a new level must be set for each new frequency. An alternative method of frequency
response correction is to use suitable reference curves when recording the measurement values.
•Reducing the dwell time when using an external analyzer. The dwell time required by the DUT
and the external analyzer must be determined by trial and error and can be specified as a fixed
value or separately for each sweep point as a list.
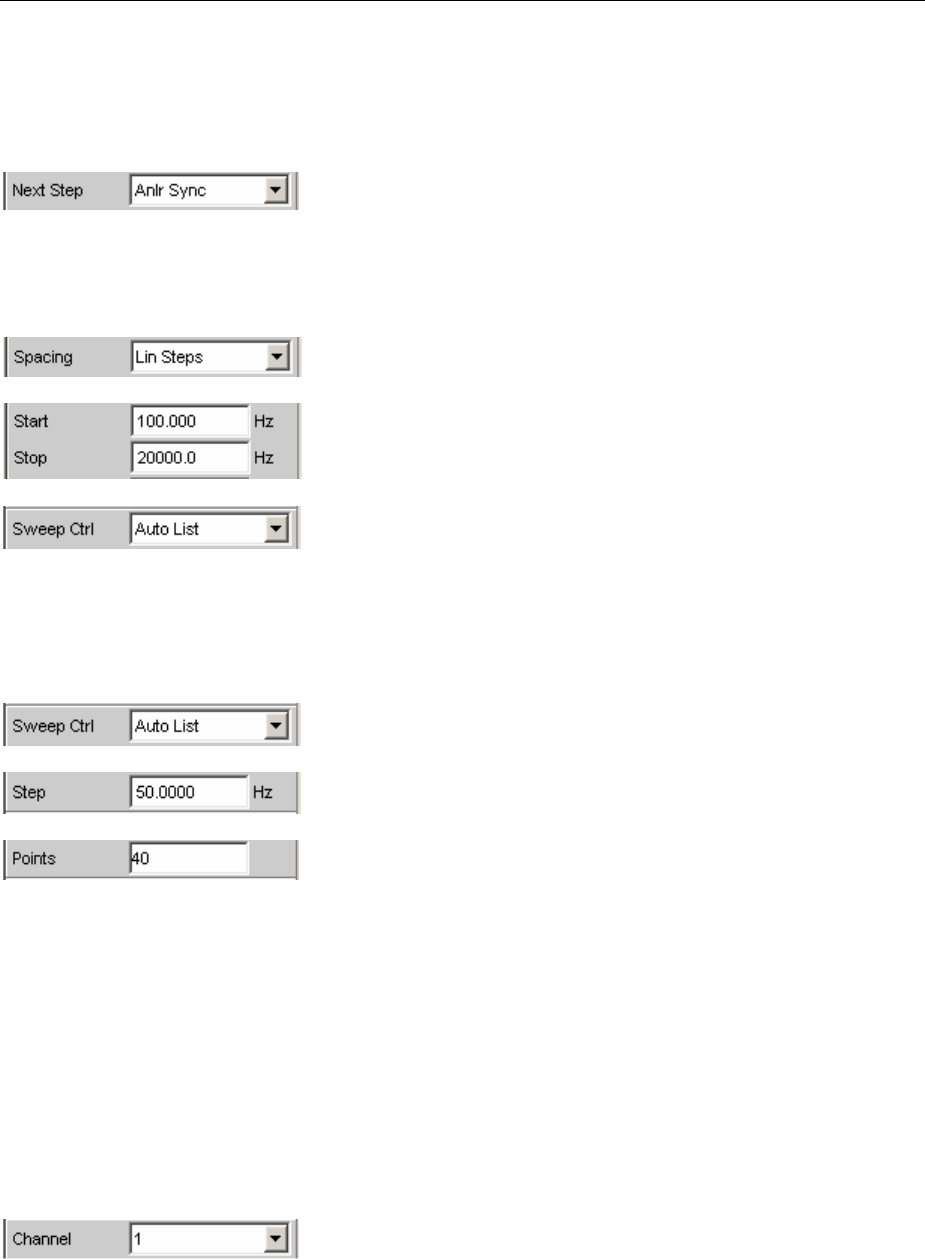
R&S UPV Sweeps
1146.2084.32 4.137 E-9
•Synchronizing the generator to the analyzer when using an internal analyzer. If the generator and
analyzer of the R&S UPV are operated together, a generator sweep should always be synchronized
to the analyzer. This ensures that the generator is advanced precisely at the point when all
measurement results are available and have settled (where applicable also frequency, level monitor
and input measurements on the active channels).
•Reducing the measurement points for low frequencies.Low frequencies require longer
measurement times than higher frequencies. The sweep axis should therefore be divided in such a
way that only a few low tones are used. This can be achieved in the following ways:
Linear instead of logarithmic spacing
Increasing the lower sweep limit
List sweep
•Reducing the measurement points. The duration of the sweep cycle increases more or less linearly
with the number of sweep points. The list sweep allows the intervals between the individual sweep
points to be freely selected. This means that it is possible to group sweep points together at points
of interest without needing to drastically increase their number.
List sweep
Avoiding an unnecessarily small step size
Avoiding an unnecessarily large number of sweep points
Minimizing the measurement time
When using the internal analyzer, the required measurement time depends on the selected
measurement functions. Generally speaking, every measurement function used should wherever
possible be configured for high measurement speed; this, of course, depends on the specific
measurement function. For this reason, only a few generally applicable rules are given below:
•Only activate those measurement channels which are to be measured. An unconnected
measurement input can increase the measurement time considerably because measurement is
only completed when a measurement value exists for this channel. A number of measurement
functions require considerably more time to measure a signal with a low level (noise). Even if there
is a signal on the second channel, the measurement time will still be at least slightly longer than for
single-channel mode since the second channel must be fully evaluated and displayed.
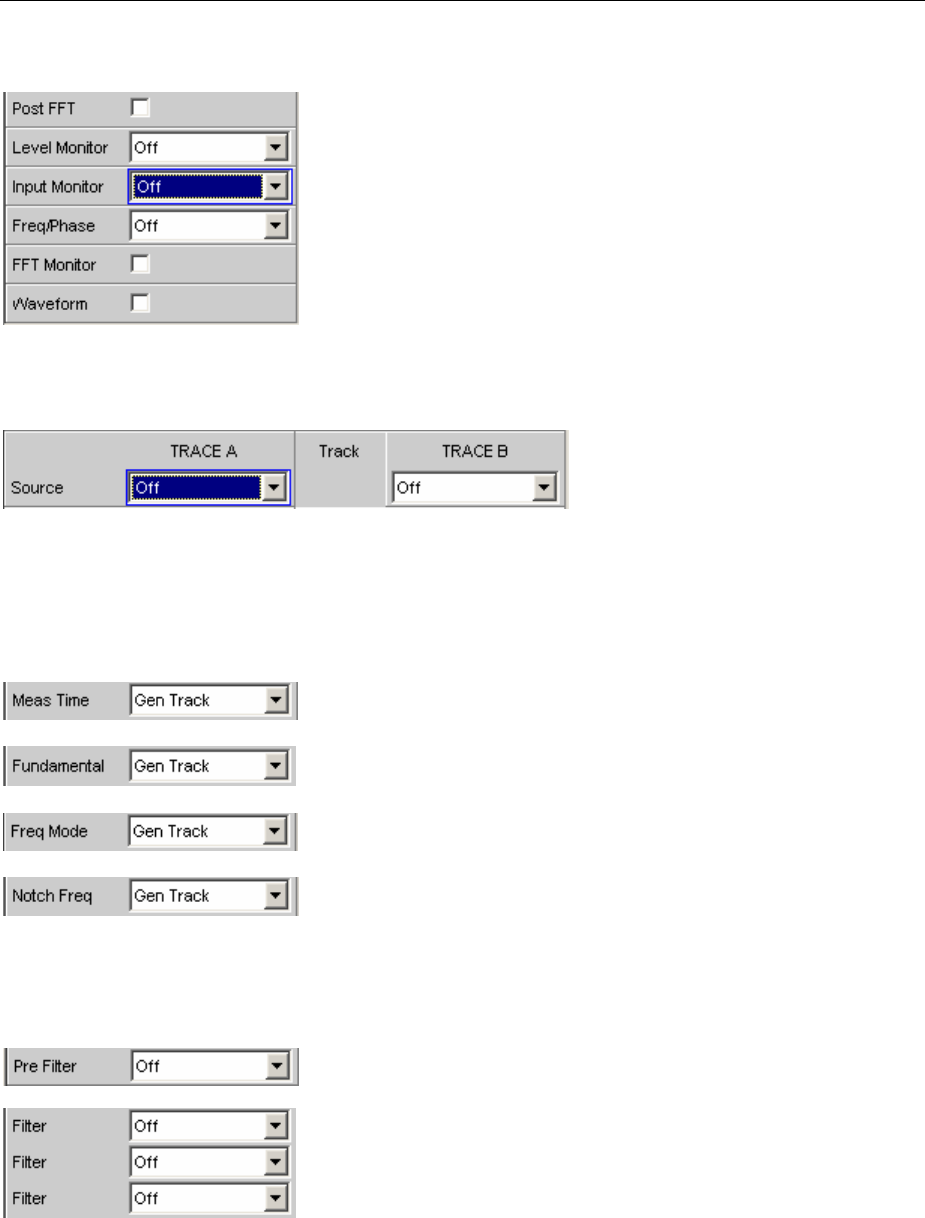
Sweeps R&S UPV
1146.2084.32 4.138 E-9
•Only activate those measurement functions which are required for the specific measurement task.
•Deactivate any traces that are not required. In 4 sweep windows, 2 traces can be activated in each
window. Only those traces that are required for measurement value recording should be active.
•If the internal generator is used, many measurement functions allow reference to its settings ("Gen
Track"). These functions should be used since they not only shorten the measurement time
(because, for example, the frequency does not have to be measured) but can also increase the
measurement accuracy (e.g. sample-precise setup and measurement over entire periods without
errors due to measurement termination in the case of RMS).
(With RMS and RMS Selective)
(With THD+N and THD)
(With RMS Selective)
(With activated notch filter)
•Deactivating unnecessary filters. The filters must resettle whenever generator settings are changed.
Measurement is not possible during this time. The start of measurement is delayed by the sum of
settling times for all activated filters.

R&S UPV Sweeps
1146.2084.32 4.139 E-9
•Reducing the order and/or attenuation with user-defined high-pass and low-pass filters. This
reduces the settling time.
•Deactivating the settling functions. The settling function does not need to be activated for the
majority of measurement signals. If the DUT supplies a stable signal, the R&S UPV will return
settled measurement values making the settling function unnecessarily. Using the settling (or
averaging) function multiplies the measurement time by at least the number of set "samples".
•Deactivating the measurement start delay. The measurement start delay is intended to compensate
delays of the DUT. Whenever generator or analyzer settings are changed, the start of the 1st
measurement (and consequently every single sweep point) is delayed by the specified time. This
time should be set to 0.0 if no start delay is required.
•Manual selection of the analyzer level range (only with analog measurement signals). If the level of
the measurement signal is known and a limitation of the dynamic response is acceptable, the
analyzer level range should be selected manually. It should be set to the highest anticipated level;
an "UNDERRANGE" must be expected and tolerated in this case; a new measurement with
corrected range setting is not performed. "Range LOWER" can be selected to make sure that a
higher level which would invalidate the measurement does not occur. This mode allows the
measurement to correct the measuring range in the case of "OVERRANGE".

Selecting the Analyzer R&S UPV
1146.2084.32 4.140 E-9
Selecting the Analyzer
Analyzer Configuration Panel
The Analyzer Config panel enables you to enter settings for the analog or digital analyzer.
To adapt the R&S UPV analyzer to the measurement task at hand, first define the settings in the
Analyzer Config panel. These settings will influence which capabilities are available in the Analyzer
Function panel.
The first step is to select one of the two analyzers (analog or digital).
Instrument
Used to selection the analyzer.
Analog The user can choose between analyzers of various
bandwidths.
Remote-control command:
INSTrument2[:SELect] ANLG
Analog 8 Chan Up to 8 channels can be synchronously measured.
Remote-control command:
INSTrument2[:SELect] A8CHannel
Analog 16
Chan
Up to 16 channels can be measured.
Remote-control command:
INSTrument2[:SELect] A16CHannel
Digital Audio Either audio data, amplitude, jitter and phase or a
common signal can be measured, see section
"Configuring the Digital Analyzer" on page 4.166.
Remote-control command:
INSTrument2[:SELect] DIG
I2SBoard The I2Saudio analyzer can measure audio data (8
bit to 32 bit) in I2Sformat.
Remote-control command:
INSTrument2[:SELect] I2SBoard

R&S UPV Selecting the Analyzer
1146.2084.32 4.141 E-9
USI Dual Chan Audio data in a serial format can be measured with
the USI Dual channel analyzer.
Remote-control command::
INSTrument2[:SELect] U2Channel
USI 8 Chan Audio data in a serial format can be measured with
the USI 8 channel analyzer.
Remote control command:
INSTrument2[:SELect] U8Channel

Configuring the Analog Analyzer R&S UPV
1146.2084.32 4.142 E-9
Configuring the Analog Analyzer
Analog Analyzer Configuration Panel
Figure 4-11 Analyzer Config panel
The Config panel is used to set up the analog and digital analyzer. The configuration options for the
analog analyzer are described below.

R&S UPV Configuring the Analog Analyzer
1146.2084.32 4.143 E-9
Channel
Used to select the active XLR sockets in the bottom right-hand part of
the R&S UPV front panel.
If a single-channel measurement is selected (1 or 2), the channel not
being measured is disabled. Disabled inputs are floating; they are
terminated with the set input impedances (300 Ohm, 600 Ohm or
200 kOhm).
1Only the signal applied at XLR socket 1 is
measured.
Remote-control command:
INPut:CHANnel CH1
2Only the signal applied at XLR socket 2 is
measured.
Remote-control command:
INPut:CHANnel CH2
1 & 2 Both XLR sockets are available for analysis of the
applied signals.
Channel 1 and Channel 2 can have different
settings.
Remote-control command:
INPut:CHANnel CH1And2
281Both XLR sockets are available for analysis of the
applied signals.
Here, however, the setting for Channel 1 is also
used for Channel 2.
Remote-control command:
INPut:CHANnel CH2Is1
182Both XLR sockets are available for analysis of the
applied signals.
Here, however, the setting for Channel 1 is also
used for Channel 2.
Remote-control command:
INPut:CHANnel CH1Is2
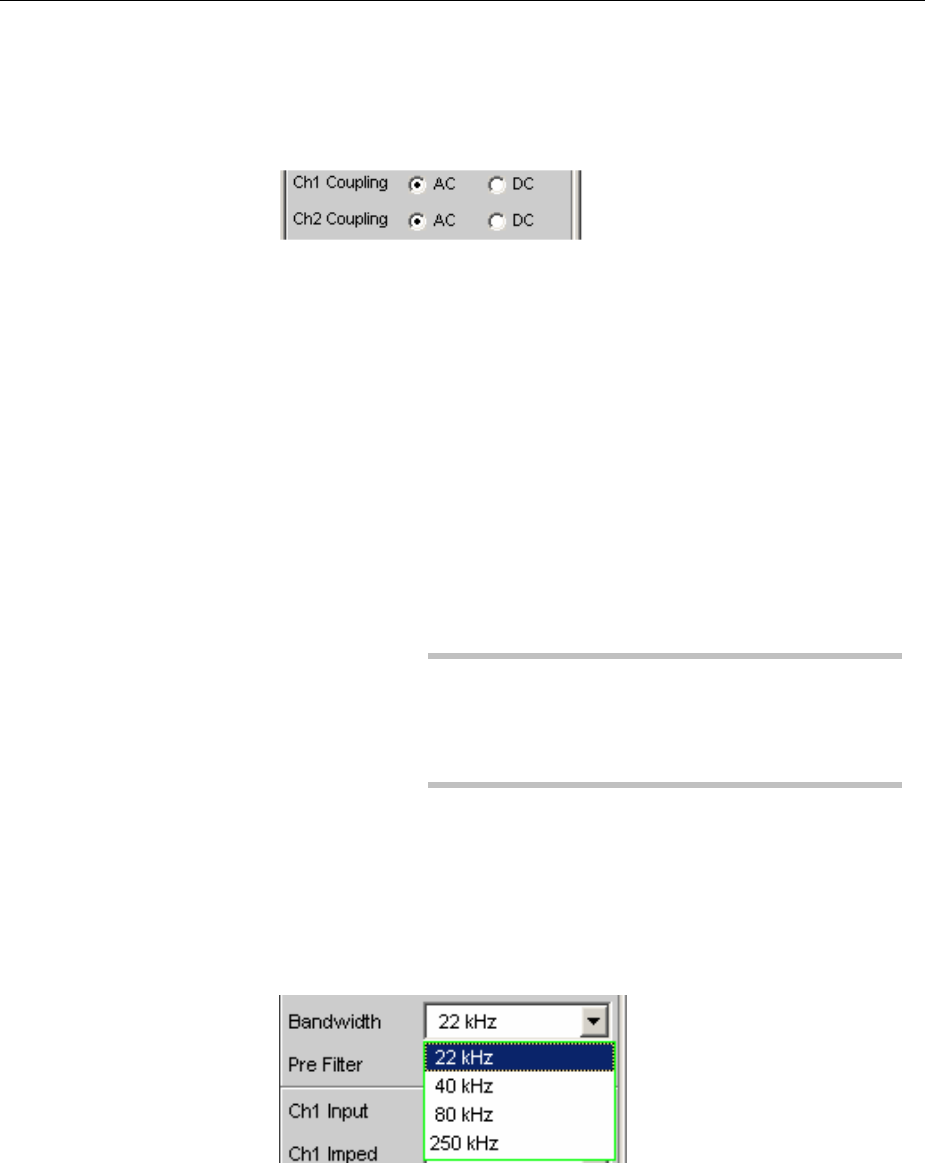
Configuring the Analog Analyzer R&S UPV
1146.2084.32 4.144 E-9
Coupling
Used to select the input coupling.
ACor DC coupling can be selected. The coupling can be selected
separately for both channels if "Channel 1&2" is set.
DC coupling should be selected if input voltages with very low-
frequency signal components are to be measured.
Remote-control command:
INPut[1]|2:COUPling AC|DC
AC The DC component of the measurement signal is
removed at the input using a high-pass filter and
therefore cannot affect the measurement result.
Remote-control command:
INPut:COUPling AC
DC Measurement signals up to 0 Hz are recorded and
taken into consideration in the measurement results
of RMS, RMS Selective, Peak, Quasi Peak, DC,
FFT and Waveform.
Caution:
If the input signal contains a large DC component,
this results in a reduced dynamic response for the
AC component since the measuring range of the
input amplifier is based on the overall signal.
Remote-control command:
INPut:COUPling DC
Bandwidth
4different analyzer bandwidths are available; the selected bandwidth
determines the upper frequency limit for the measurement signal.
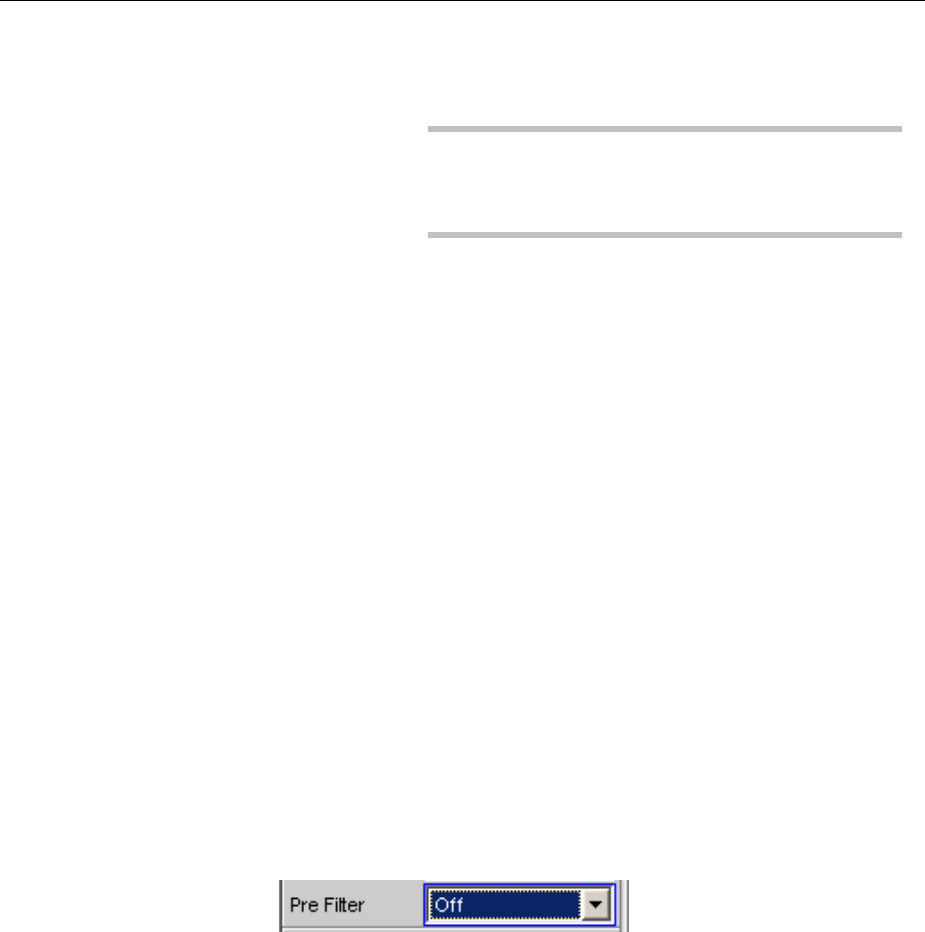
R&S UPV Configuring the Analog Analyzer
1146.2084.32 4.145 E-9
22 kHz The maximum signal frequency is 22 kHz. The
signal is sampled at 48 kHz.
Note:
At this bandwidth it is possible to observe the input
signal continuously (in particular via FFT and
waveform).
Remote-control command:
INPut:BANDwidth:MODE B22
40 kHz The maximum signal frequency is 40 kHz. The
signal is sampled at 96 kHz.
Remote-control command:
INPut:BANDwidth:MODE B40
80 kHz The maximum signal frequency is 80 kHz. The
signal is sampled at 192 kHz.
Remote-control command:
INPut:BANDwidth:MODE B80
250 kHz The maximum signal frequency is 250 kHz. The
signal is sampled at 768 kHz.
Remote-control command:
INPut:BANDwidth:MODE B250
Pre Filter
The selected prefilter affects all measurement functions. This means
that prefiltering is possible without having to select the required filter
for every single measurement function.
The description or characteristic of the various filters is found in
section "Filters" on page 4.416.
Remote-control comand:
INPut:FILTer<parameter>
List of <parameter> see section "Filter Table" on page 4.419.
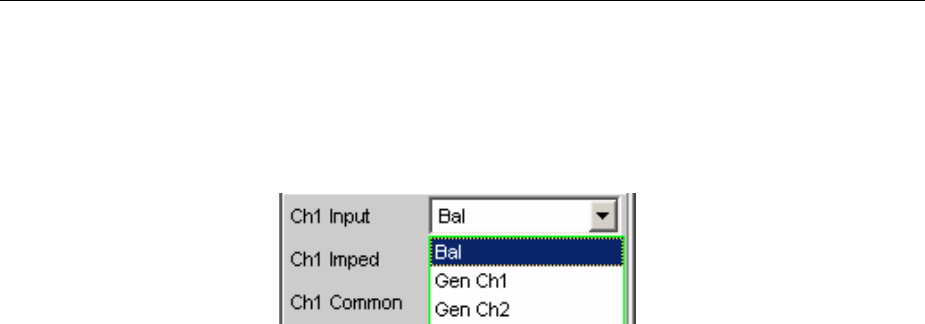
Configuring the Analog Analyzer R&S UPV
1146.2084.32 4.146 E-9
Ch1 Input
(Ch2 Input)
Used to select the signal source for Channel 1.
Ifboth channels have the same settings (2 = 1 or 1 = 2), only the text
"Input" appears to the left of the selection field.
If Channel 1 & 2 is selected, the fields "Ch2 Input" to "Ch2 Range"
also appear in which settings different to those for Channel 1 can be
made for Channel 2.
Bal Balanced = Balanced-to-ground measurement
inputs.
Unbalanced DUTs can be connected using
XLR/BNC adapters (R&S UPL-Z1 option).
Remote-control command:
INPut[1]|2:TYPE BALanced
Gen Ch1 Internal connection of analyzer channel 1 to
generator output 1. The analyzer input impedance is
200 kOhm.
Remote-control command:
INPut[1]|2:TYPE GEN1
Gen Ch2 Internal connection of analyzer channel 1 to
generator output 2. The analyzer input impedance is
200 kOhm.
Remote-control command:
INPut[1]|2:TYPE GEN2
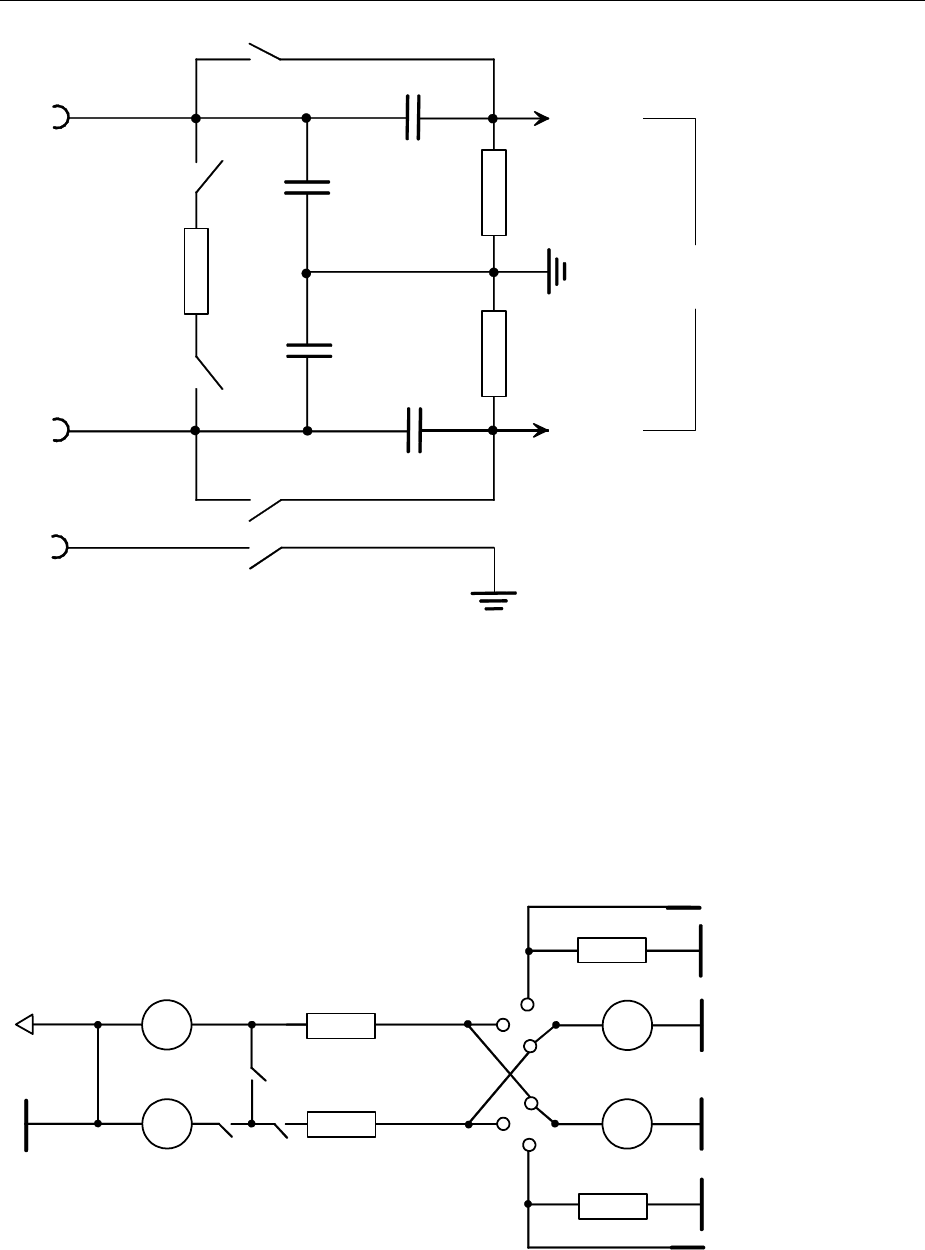
R&S UPV Configuring the Analog Analyzer
1146.2084.32 4.147 E-9
XLR connector
female
2
3
100 k
120 pF
100 k
120 pF
CAC
1
300/600
CAC
AC/DC
AC/DC
Float/Ground
Balanced
input amplifier
Figure 4-12 Balanced analyzer input
The two analyzer inputs can be connected to the XLR sockets to allow external signals to be measured.
They can, however, also be freely connected to the outputs of the internal R&S UPV generator, as
shown in the diagram below (the ground symbol represents the floating generator ground, and the earth
symbol represents the analyzer and housing ground):
Ri
G1
Ri
G2
A1
A2
BAL
BAL
300
300
CH1
CH2
UPV
CH1
CH2
10V
0V
Figure 4-13 Possible connections for analyzer inputs
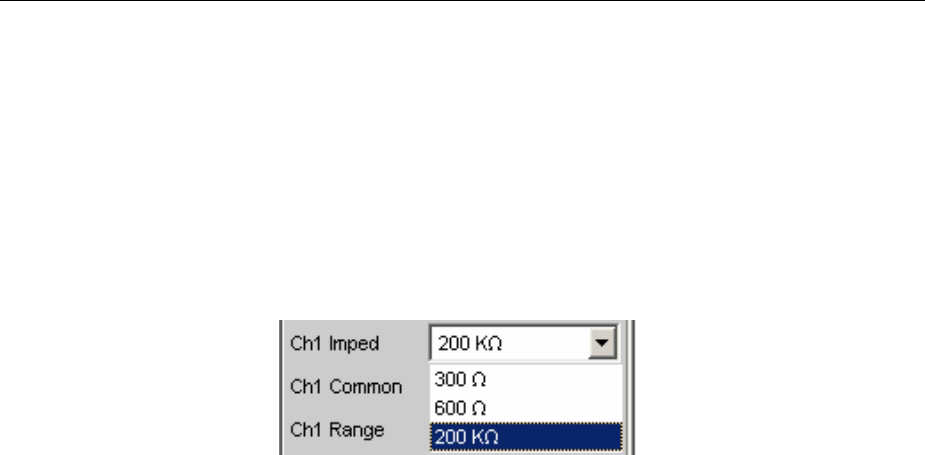
Configuring the Analog Analyzer R&S UPV
1146.2084.32 4.148 E-9
The sources labelled G1 and G2 represent generators 1 and 2 if the R&S UPV-B3 option (Second
Generator) is installed. S1 and S2 represent the input selectors of the two analyzer inputs. They are
used to switch the analyzer to an external signal or to set up an internal connection to the R&S UPV
generator. Rout represents the generator output resistors and Rirepresents the analyzer input resistors.
The circles labelled A1 and A2 symbolize the R&S UPV analyzers.
Ch1 Imped
(Ch2 Imped)
Used to select the input impedance; can only be selected if Input is set
to "Bal".
If both channels have the same settings (2 = 1 or 1 = 2), only the text
"Impedance" appears to the left of the selection field.
With impedances of 300 Ohm and 600 Ohm, only voltages up to 25 V
can be applied (this applies to both DC and AC coupling because the
low input impedances are located upstream of the coupling
capacitors). In the case of voltages > 25 V, the input is protected
against overloading: The input impedance is switched to 200 kOhm
and the generator output is disabled (see Chapter 3 Manual
Operation, Rapid Deactivation of the Outputs). The "OVLD" LEDs on
the front panel of the R&S UPV (immediately next to the generator
outputs and analyzer inputs) indicate the status.
300 Ohm The input impedance is 300 Ohm.
Remote-control command:
INPut[1]|2:IMPedance R300
600 Ohm The input impedance is 600 Ohm.
Remote-control command:
INPut[1]|2:IMPedance R600
200 kOhm The input impedance is 200 kOhm.
Remote-control command:
INPut[1]|2:IMPedance R200K
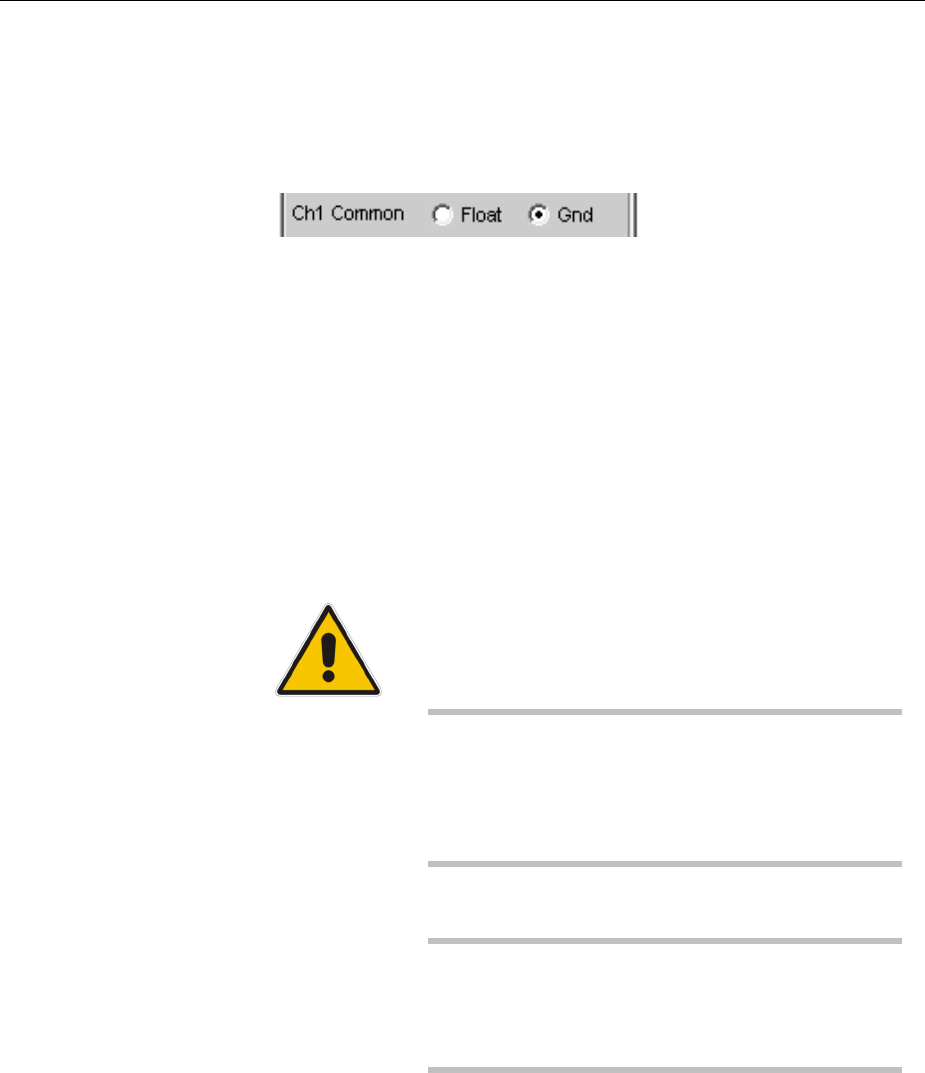
R&S UPV Configuring the Analog Analyzer
1146.2084.32 4.149 E-9
Ch1 Common
(Ch2 Common)
Potential reference of Pin 1 of the XLR inputs; can only be selected if
Input is set to "Bal".
"Float" must always be set if the analyzer inputs are disabled or
connected to the internal generator.
If both channels have the same settings (2 = 1 or 1 = 2), only the text
"Common" appears to the left of the selection field.
Float The connection between XLR Pin 1 and instrument
ground is interrupted by means of a tripped contact.
The permissible voltage to EN 61010-1 is 30 V AC
or 70 V DC with respect to the instrument housing.
Remote-control command:
INPut[1]|2:COMMon FLOat
Ground
XLR Pin 1 is connected to the instrument ground
(PE conductor).
The ground reference is cancelled if the analyzer is
later switched to the internal generator or the set
balanced channel is disabled.
Important:
Measurement potential reference only; not a safety
connection to VDE 0411!
Note:
If an XLR/BNC adapter (R&S UPL-Z1) is used, XLR
Pins 1 and 3 are connected by means of the
adapter. Float/Ground switching therefore allows the
potential reference of the BNC outer conductor to be
selected, (see also Figure 4-14).
Warning:
If dangerous contact voltages Urms > 30 V are to be
measured, the user must ensure that the outer
conductor of the used BNC/XLR adapter is safely
connected to protective earth.
Remote-control command:
INPut[1]|2:COMMon GROund
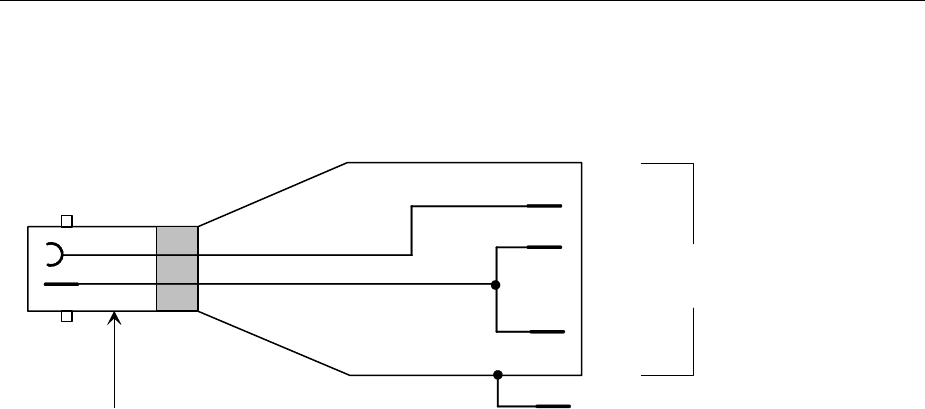
Configuring the Analog Analyzer R&S UPV
1146.2084.32 4.150 E-9
If the signal is to be supplied via unbalanced analyzer inputs, it is advisable to use the XLR/BNC
adapter R&S UPL-Z1. The internal connection of this adapter is shown in the illustration below.
1
3
2
BNC connector,
female
XLR connector, male
Analyzer
XLR input, female
Housing
Outer conductor, insulated from housing
Figure 4-14 XLR/BNC adapter UPL-Z1

R&S UPV Configuring the Analog Analyzer
1146.2084.32 4.151 E-9
Ch1 Range
(Ch2 Range)
The possibility of selecting the measuring range allows optimum
adaptation to a voltage range required for a specific measurement
task. When the selection window is opened, the user can toggle
between 3 modes.
If both channels have the same settings (2 = 1 or 1 = 2), only the text
"Range" appears to the left of the selection field.
If the Fix or Lower mode is selected, the set nominal range value
appears in the next field where a new range can be set by opening the
selection window.
Remote-control command:
SENSe[1]:VOLTage:RANGe[1]|2:VALue <nu> [V]
..nu = range nominal value or any voltage value
nu = 18 mV (0.0 … 0.01979 V)
nu = 30 mV (0.0198 … 0.03299 V)
nu = 60 mV (0.033 … 0.06599 V)
nu = 100 mV (0.066 … 0.10999 V)
nu = 180 mV (0.11 … 0.19799 V)
nu = 300 mV (0.198 … 0.32999 V)
nu = 600 mV (0.33 … 0.65999 V)
nu = 1 V (0.66 … 1.09999 V)
nu = 1.8 V (1.1 … 1.97999 V)
nu = 3 V (1.98 … 3.29999 V)
nu = 6 V (3.3 … 6.59999 V)
nu = 10 V (6.6 … 10.9999 V)
nu = 18 V (11.0 … 19.7999 V)
nu = 30 V (19.8 … 32.9999 V)
nu = 60 V (33.0 … 65.9999 V)
nu = 100 V (66.0 … 110.0 V)
The query response to this command returns the range nominal value
in volts, e.g.
SENSe:VOLTage:RANGe2:VALue?
Response = 0.18
For the 180 mV RMS range
Any voltage value can be specified instead of the range nominal value
to specifically set the respective measurement range. This range is
shown in brackets.

Configuring the Analog Analyzer R&S UPV
1146.2084.32 4.152 E-9
Auto Automatic measuring range selection. The optimum
range is set separately for each channel; this also
applies to the channel settings "2 = 1" or "1 = 2".
Remote-control command:
SENSe[1]:VOLTage:RANGe[1]|2:MODE AUTO
Fix The set measuring range is fixed.
Note:
If a voltage exceeding the selected level range is
applied, the analyzer status display is shown as
"Overrange" and the measurement values are
shown as invalid ("---").
On switching from Auto to Fix, the currently valid
range in the channel is taken over. In the
configuration channels "2 J1" or "1 J2" the less
sensitive range of Channels 1 and 2 is adopted.
Remote-control command:
SENSe[1]:VOLTage:RANGe[1]|2:MODE FIXed
Lower The set measuring range is fixed as the lowest
range; in the case of overranging, this range is
automatically substituted by higher ranges.
Note:
On switching from Auto to Lower, the currently valid
range in the channel is taken over. In the
configuration channels "2 J1" or "1 J2" the less
sensitive range of Channels 1 and 2 is adopted.
Remote-control command:
SENSe[1]:VOLTage:RANGe[1]|2:MODE LOWer
If Channel 1 & 2 is selected, the fields "Ch2 Input" to "Ch2 Range" appear after this parameter block. In
these fields, settings different to those for Channel 1 can be made for Channel 2.
The ranges are graduated in steps of 5 dB from 18 mV to 100 V and allow optimum dynamic response
when measuring non-linear distortion. If "Auto" (automatic range selection) is set, overranging or
underranging of the limits in a current measuring range causes the instrument to switch to the next step.
This is also the case for the "Lower" range setting; here, however, the instrument only goes down to the
selected range limit.
The range values are RMS values for sinewaves or other signal shapes up to a crest factor of 2.
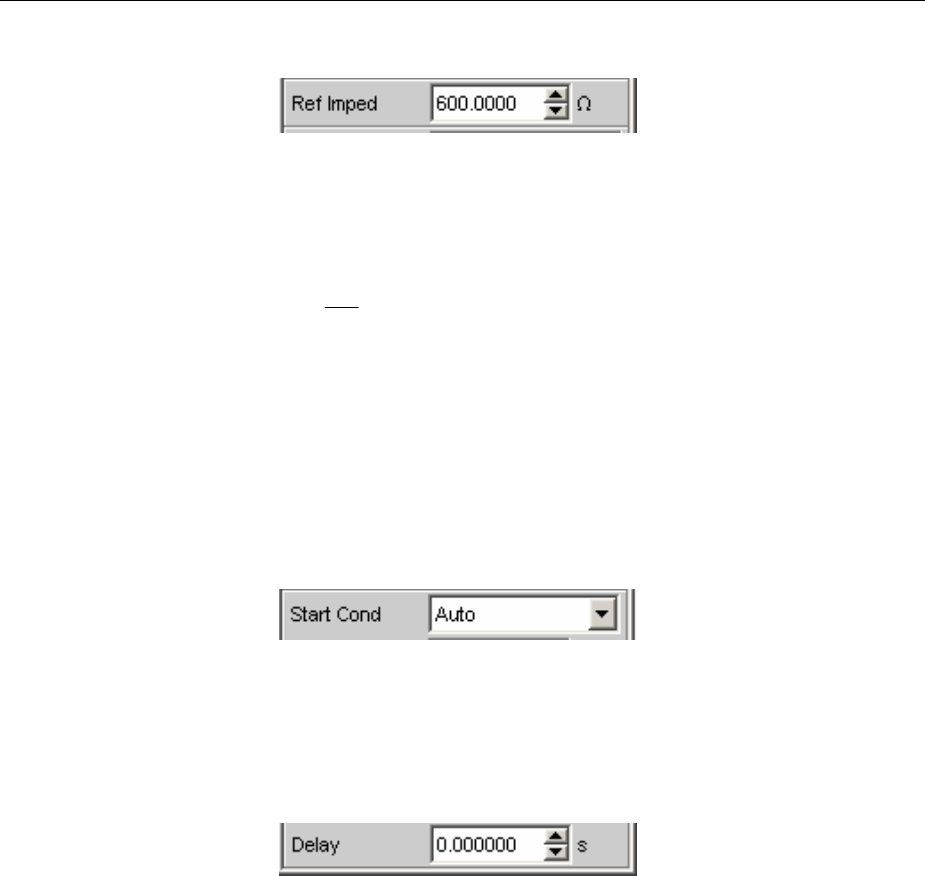
R&S UPV Configuring the Analog Analyzer
1146.2084.32 4.153 E-9
Ref Imped
Reference value for impedance.
Reference impedance for the indicated power in the units dBm, W,
%W, W, P/Pr and %P/Pr.
The power is calculated using the following formula:
R
U
P
2
=
where U is the measured voltage and R is the set reference
impedance. The indicated power is only correct if the reference
impedance is identical to the resistance of the DUT.
Remote-control command:
SENSe[1]:POWer:REFerence:RESistance <nu>
Start Cond
Indicates the event which triggers a measurement.
Depending on the selected "Start Cond", measurement begins either
immediately (Auto) or not until the desired trigger condition has been
satisfied. For details, see section "Start Conditions" on page 4.221.
Delay
Delay for Start Cond.
Adelay can be entered if "Auto" is selected as the Start Cond. For
details, see section "Start Conditions" on page 4.221.
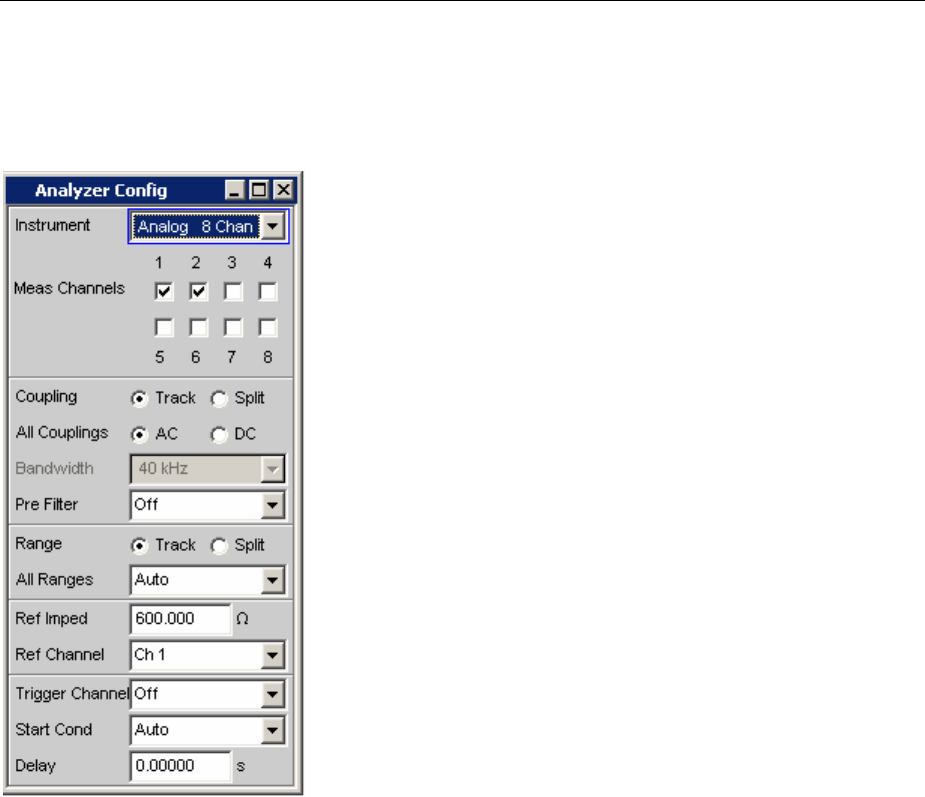
Configuring the Analog Multichannel Analyzer R&S UPV
1146.2084.32 4.154 E-9
Configuring the Analog Multichannel Analyzer
Multichannel Analyzer Configuration Panel
Figure 4-15 Multichannel Analyzer Config panel
The Config panel allows you to make settings for the analog analyzers and the digital analyzer. The
configuration options for the analog multichannel analyzer are described in the following. When the
multichannel analyzer is called for the first time, channels Ch1 and Ch2 are activated and all ranges are
set to "Auto" in order to avoid overranging when creating a user-defined input signal. For safety reasons
the inactive channels are set to the most sensitive measurement range (50 V).
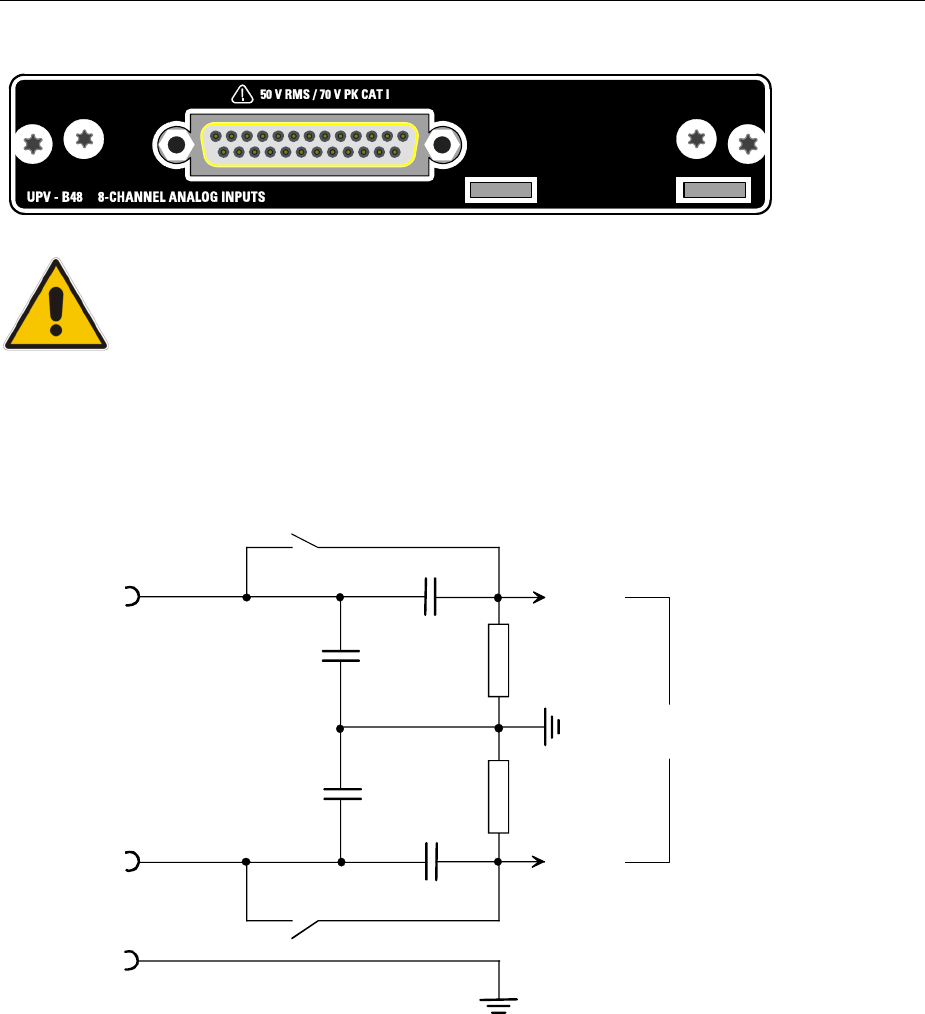
R&S UPV Configuring the Analog Multichannel Analyzer
1146.2084.32 4.155 E-9
Input connector of the option R&S UPV-B48:
NOTICE!
The instrument complies with measuring category I; make sure that
the input voltage at the connectors of the analog analyzers does not
exceed 50 V (effective, sinusoidal) and 70 V (peak value).
Do not use the instrument in measuring categories II, III and IV.
Explanation:
Measuring circuits as defined in section 6.7.4 of EN61010-1:
Measuring category I is intended for measurements on circuits which
are not connected to the high-voltage current system.
100 k
220 pF
100 k
220 pF
CAC
CAC
AC/DC
AC/DC
Balanced
input amplifier
High
Low
Ground
D-Sub connector (female)
Pin 1 of
breakout cable
Figure 4-16 Balanced analyzer input
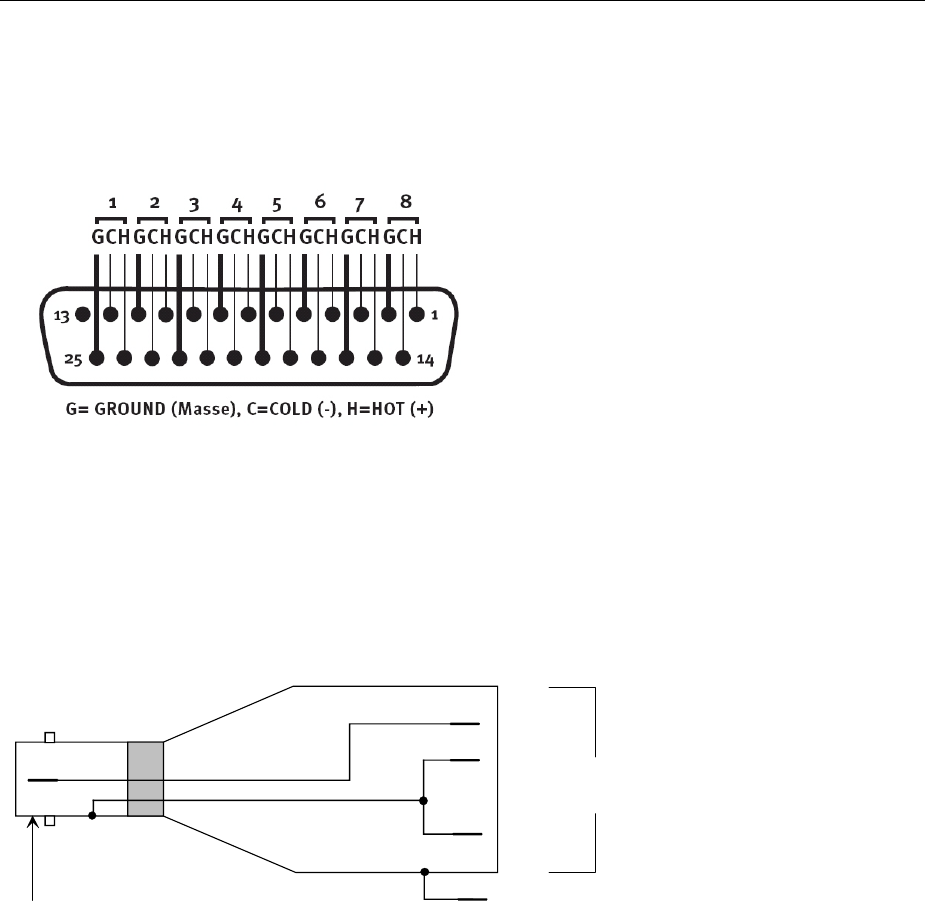
Configuring the Analog Multichannel Analyzer R&S UPV
1146.2084.32 4.156 E-9
The eight analyzer inputs are available on the pins of a 25-contact D-Sub female connector. To adapt to
the XLR connectors conventionally used in the audio world, a breakout cable with eight XLR input
sockets on one side and a 25-contact D-Sub male connector on the other side must be connected to
the D-Sub female connector (option R&S UPV-Z48).
Figure 4-17 Pin assignment of the 25-contact D-Sub male connector
To enable unbalanced feed to the analyzer inputs, it is advisable to use the R&S UPL-Z1 XLR/BNC
adapter in addition to the breakout cable described above. The internal wiring of this adapter is shown
in the following diagram.
1
3
2
BNC female connector XLR male connector
Analyzer
XLR input socket
Housing
External conductor isolated from housing
Figure 4-18 R&S UPL-Z1 XLR/BNC adapter
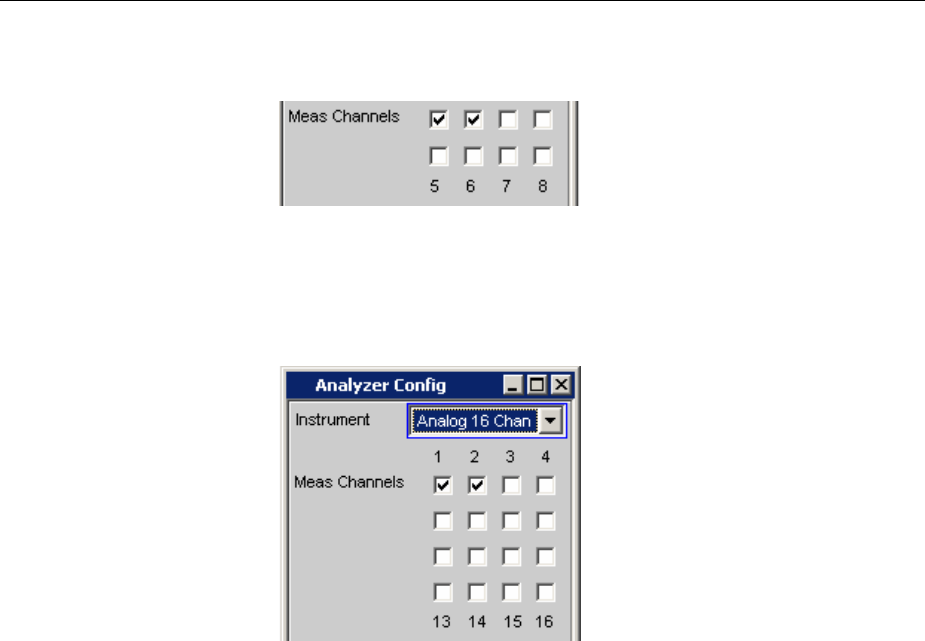
R&S UPV Configuring the Analog Multichannel Analyzer
1146.2084.32 4.157 E-9
Meas Channels
Used to select the active inputs on the R&S UPV rear panel
(25-contact D-Sub connector.
The active measurement channels are selected by enabling the
desired channels. All inputs are floating; they are terminated with an
input impedance of 200 kOhm.
If the R&S UPV is equipped with two R&S UPV-B48 options,
16 channels will be available:
Remote-control command:
INPut:MCHannels<n> ON|OFF

Configuring the Analog Multichannel Analyzer R&S UPV
1146.2084.32 4.158 E-9
Coupling
Used to select the input coupling.
ACor DC coupling can be selected. The coupling can be selected for
all channels together (Track) or separately from each other (Split).
Remote-control command:
INPut:COUPling:CHANnels TRACk|SPLit
If Track is selected in the top line, you see the following line:
The reference channel for the Track function is always the reference
channel. The coupling of the inactive channels does not change.
If Split is set, coupling can be selected for each channel individually:
The number of new displayed control lines depends on the number of
activated measurement channels.
DC coupling should be selected if input voltages with very low-
frequency signal components are to be measured.
AC The DC component of the measurement signal is
removed at the input using a high-pass filter and
therefore cannot affect the measurement result.
Track mode
Remote-control command:
INPut:COUPling AC
Split mode
Remote-control command:
INPut<n>:COUPling AC
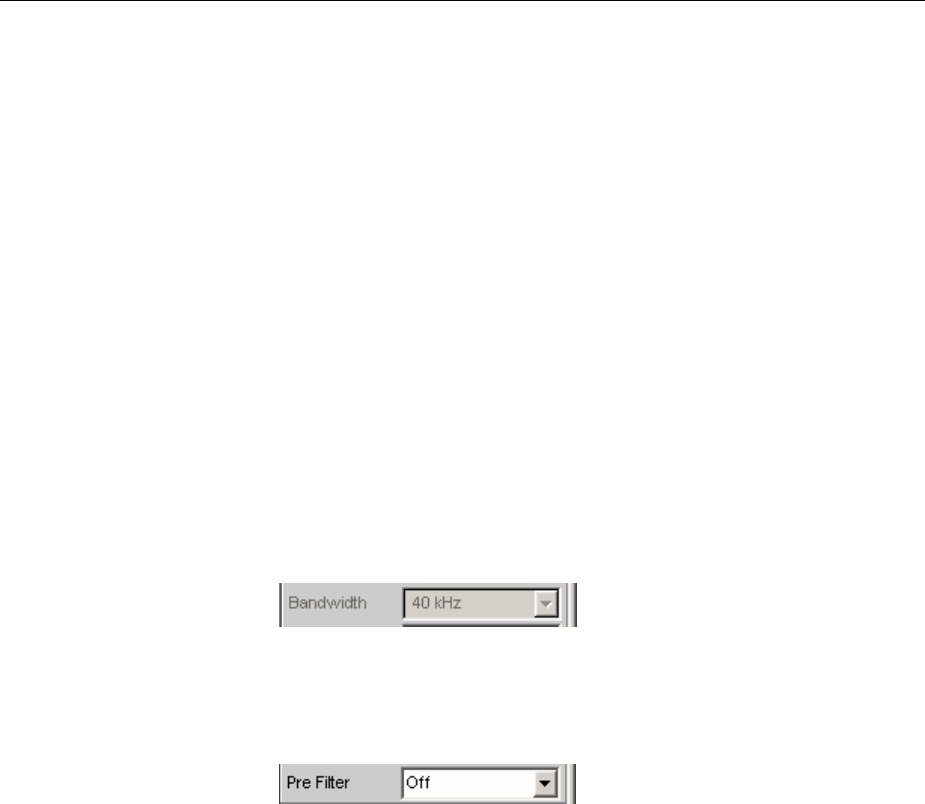
R&S UPV Configuring the Analog Multichannel Analyzer
1146.2084.32 4.159 E-9
DC Measurement signals up to 0 Hz are recorded and
taken into consideration in the measurement results
of RMS, RMS Selective, Peak, Quasi Peak, DC,
FFT and Waveform.
Caution:
If the input signal contains a large DC component,
this results in a reduced dynamic response for the
AC component, since the measurement range of
the input amplifier is based on the overall signal.
Track mode
Remote-control command:
INPut:COUPling DC
Split mode
Remote-control command:
INPut<n>:COUPling DC
Bandwidth
The analyzer bandwidth is permanently set at 40 kHz. This line is a
pure display window for informing the user of the maximum possible
measurement bandwidth.
Pre Filter
The selected prefilter affects all measurement functions. This means
that prefiltering is possible without having to select the required filter
for every single measurement function.
The description or characteristic of the various filters is found in
section "Filters" on page 4.416.
Remote-control command:
INPut:FILTer <parameter>
List of <parameter>, see section "Filter Table" on page 4.419.
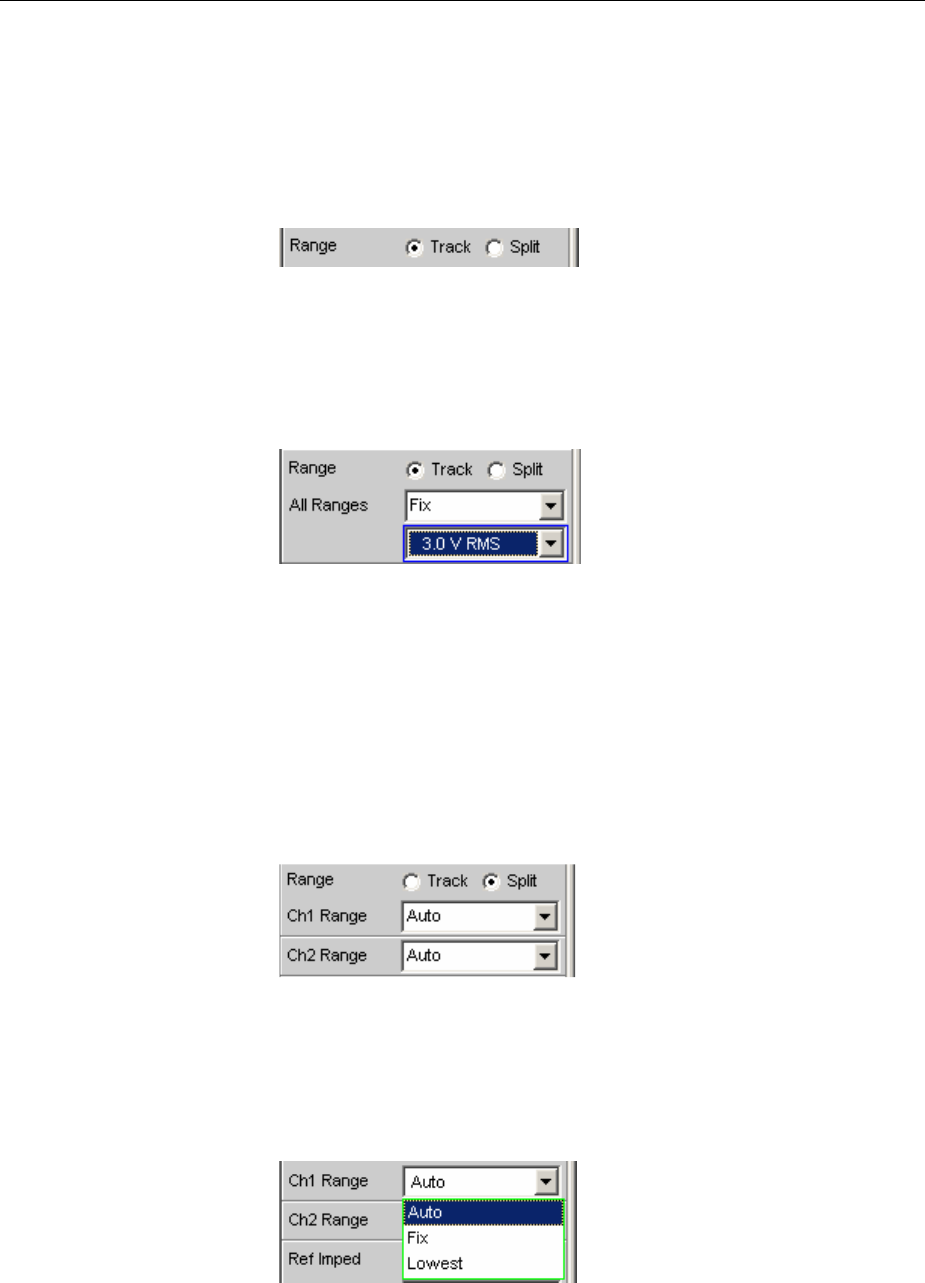
Configuring the Analog Multichannel Analyzer R&S UPV
1146.2084.32 4.160 E-9
Ch1 Range
(Ch2 to Ch16 Range)
The possibility of selecting the measurement range allows optimum
adaptation to a voltage range required for a specific measurement
task.
As with the switch-over between AC and DC coupling, it is also
possible to select between two options for range setting: either a
common setting function for all ranges of the active channels or
independent setting of individual channels.
The reference channel for the Track function is always the active
channel. Independent of this, the inactive channels always remain in
the most insensitive range.
Remote-control command:
INPut:RANGe:CHANnels TRACk|SPLit
To prevent overranging of one or more active channels, the least
sensitive range of all active channels is set by the following manual
switch-overs:
•In Track mode when switching over from Auto to Lowest, or from
Fix to Lowest
•When switching over from Split to Track if the reference channel is
set to Fix or Lowest.
If Split was selected in the top line, the range settings can be selected
separately for each activated channel above.
The number of newly displayed lines depends on the number of
activated measurement channels.
After opening the selection window, you can toggle between three
modes. If all channels have the same setting (Track), only the text "All
Ranges" appears to the left of the selection box.

R&S UPV Configuring the Analog Multichannel Analyzer
1146.2084.32 4.161 E-9
If the Fix or Lowest mode is selected, the set nominal range value
appears in the next line, where a new range can be set by opening the
selection window.
Remote-control command:
SENSe:VOLTage:RANGe<ch>:VALue <nu>
ch = channel number 1 … 16
..nu = range nominal value or any voltage value
nu = 200 mV (0.00 ... 0.21999 V)
nu = 800 mV (0.22 ... 0.87999 V)
nu = 3 V (0.88 ... 3.29999 V)
nu = 12 V (3.3 ... 13.19999 V)
nu = 50 V (13.2 ... 55.00 V)
The query response to this command returns the range nominal value
in volts, e.g.
SENSe:VOLTage:RANGe<n>:VALue?
Response = 0.8
For the 800 mV RMS range
Any voltage value can be specified instead of the range nominal value
to specifically set the respective measurement range. This range is
shown in brackets.
Auto Automatic measurement range selection. The
optimum range is set separately for each channel.
Track mode
Remote-control command:
SENSe:VOLTage:RANGe:MODE AUTo
Split mode
Remote-control command:
SENSe:VOLTage:RANGe<n>:MODE AUTo

Configuring the Analog Multichannel Analyzer R&S UPV
1146.2084.32 4.162 E-9
Fix The set measurement range is fixed.
Note:
If a voltage exceeding the selected level range is
applied, the analyzer status is displayed with a red
digit in the lower status line (the digit indicates the
channel that is overranged) and the measurement
values are shown as invalid ("---"). On switching
from Auto to Fix, the currently valid range in the
channel is taken over.
Track mode
Remote-control command:
SENSe:VOLTage:RANGe:MODE FIXed
Split mode
Remote-control command:
SENSe:VOLTage:RANGe<n>:MODE FIXed
Lowest The set measurement range is fixed as the lowest
range; in the case of overranging, this range is
automatically substituted by higher ranges.
Note:
On switching from Auto to Lowest, the currently
valid range in the channel is taken over.
Track mode
Remote-control command:
SENSe:VOLTage:RANGe:MODE LOWer
Split mode
Remote-control command:
SENSe:VOLTage:RANGe<n>:MODE LOWer
The ranges are graduated in steps of 12 dB from 200 mV to 50 V and allow very good dynamic
response when measuring nonlinear distortion. If "Auto" (automatic range selection) is set, overranging
or underranging of the limits in a current measurement range causes the instrument to switch to the
next step. This is also the case for the "Lowest" range setting; here, however, the instrument only goes
down to the selected range limit.
The range values are RMS values for sinewaves or other signal shapes up to a crest factor of 2.
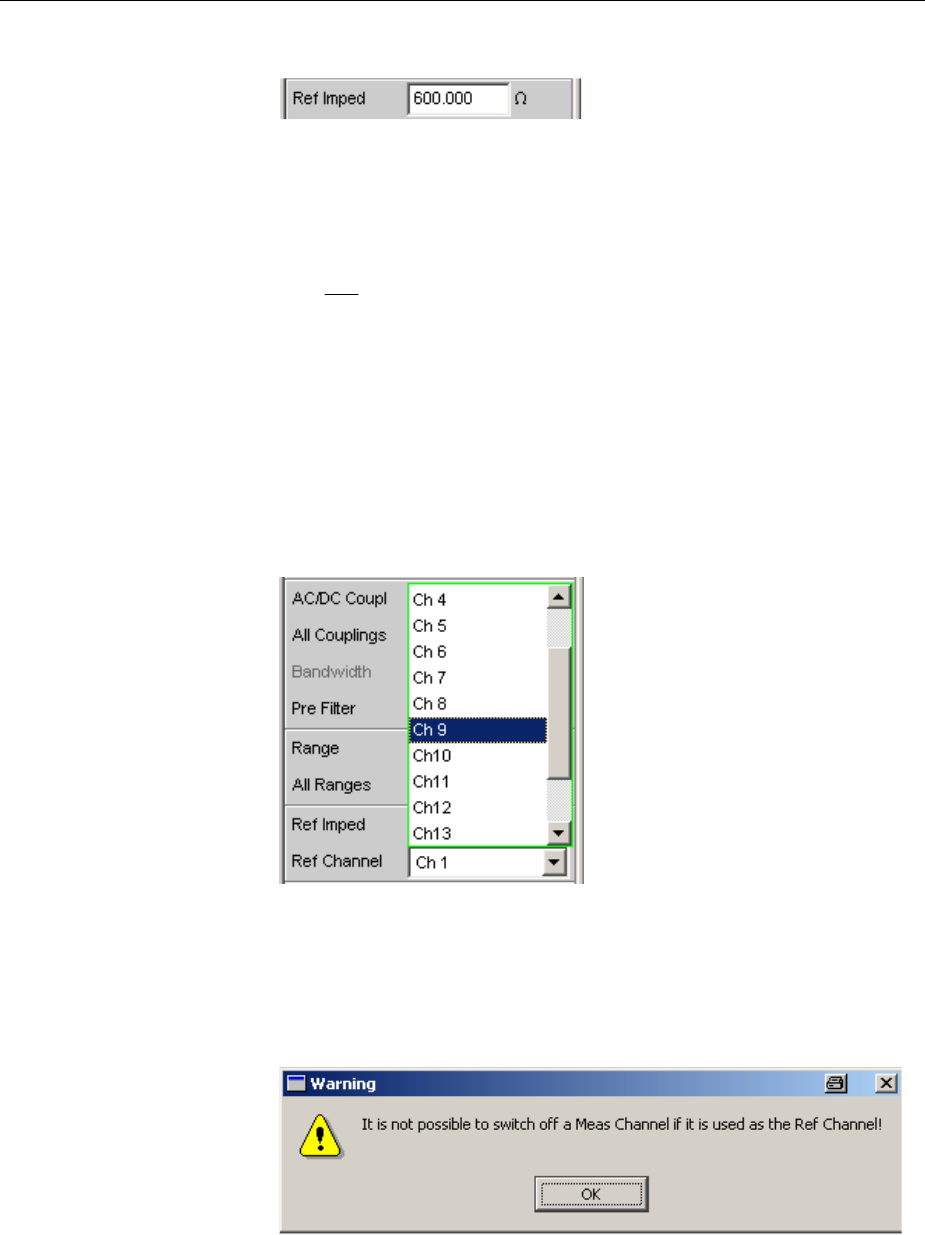
R&S UPV Configuring the Analog Multichannel Analyzer
1146.2084.32 4.163 E-9
Ref Imped
Reference value for impedance.
Reference impedance for the indicated power in the units dBm, W,
%W, W, P/Pr and %P/Pr.
The power is calculated using the following formula:
R
U
P
2
=
where U is the measured voltage and R is the set reference
impedance. The indicated power is only correct if the reference
impedance is identical to the resistance of the DUT.
Remote-control command:
SENSe[1]:POWer:REFerence:RESistance <nu>
Ref Channel
Reference channel for phase measurements, channel-specific
measurements such as common-channel selectivity and the like.
Any measurement channel can be chosen as the reference channel. If
achannel that is not yet active (i.e. switched off) is selected as the
reference channel, this channel is automatically switched on.
Switching off a channel that was selected as the reference channel is
prevented, and the user is advised of this by the following warning:
Remote-control command:
SENSe:REFerence:CHANnel CH<n>
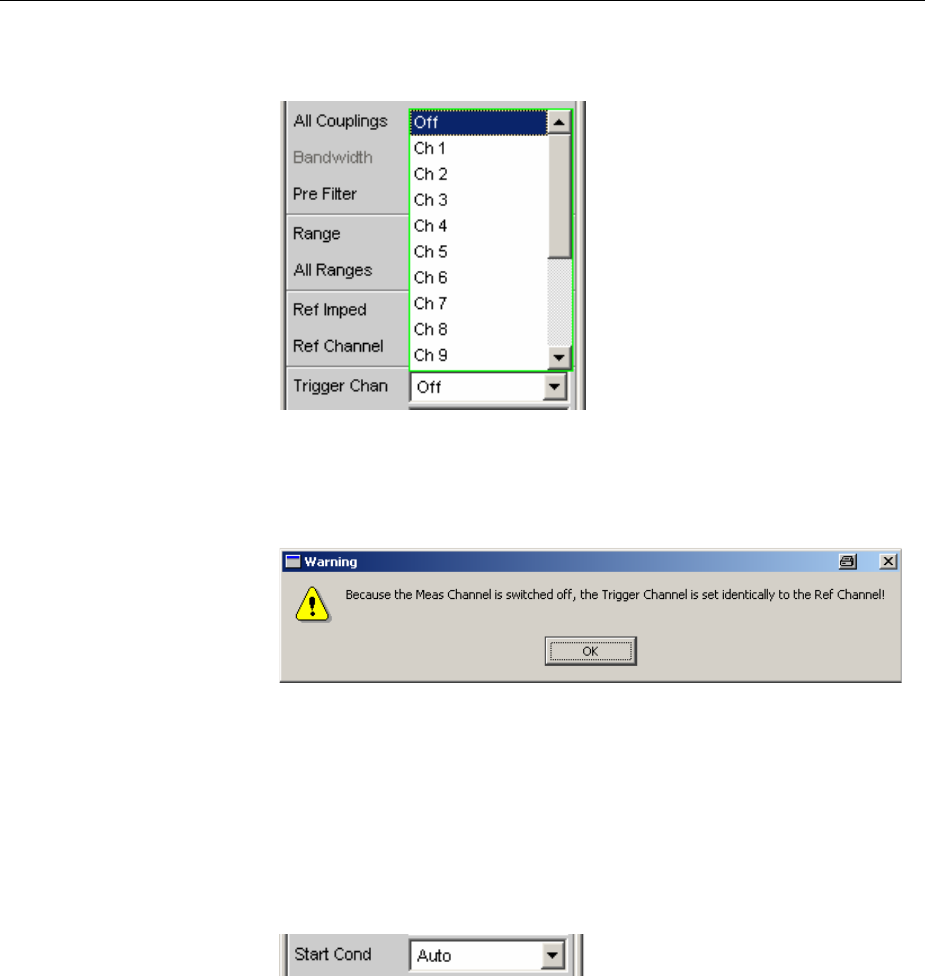
Configuring the Analog Multichannel Analyzer R&S UPV
1146.2084.32 4.164 E-9
Trigger Channel
Allows the channel whose event triggers a measurement to be
selected.
If a measurement channel that has been inactive up to now has been
selected as the trigger channel, it is automatically switched on. If the
channel selected as the trigger channel is switched off, the following
warning appears:
Switching off the measuring channel, which was selected as the
trigger channel, therefore changes the trigger channel after this
warning has been acknowledged.
Remote-control command:
TRIGger:CHANnel CH<n>
TRIGger:CHANnel OFF
Start Cond
Indicates the event that triggers a measurement.
Depending on the selected "Start Cond", measurement begins either
immediately (Auto) or not until the desired trigger condition has been
satisfied. For details, see section "Start Conditions" on page 4.221.
Remote-control command:
TRIGger:SOURce AUTO|TIM


Configuring the Digital Analyzer R&S UPV
1146.2084.32 4.166 E-9
Configuring the Digital Analyzer
Digital Analyzer Configuration Panel
The configuration panel is used to set up the analog and digital analyzer.
The configuration options for the digital analyzer are described below.
Meas Mode
(with R&S UPV-B2 only)
Meas Mode specifies what is to be measured at the digital interfaces.
With digital audio interfaces, there are basically two signal types which
have to be measured, i.e. the interface signal and the encoded audio
signal itself.
Apart from the encoded audio signal (Audio Data), the R&S UPV can
also measure various noise signals (impairments) at the interface:
Shifting of the signal edges (jitter) or superimposition of a common-
mode voltage on the balanced digital lines (common mode). The
internal analog analyzer is used for measuring such signals.
Audio Data
The data content of the selected digital audio input is
extracted from the digital audio signal and analyzed.
The Analyzer Config panel contains the selection
fields relevant for this Meas Mode.
Remote-control command:
SENSe:DMODe ADATa
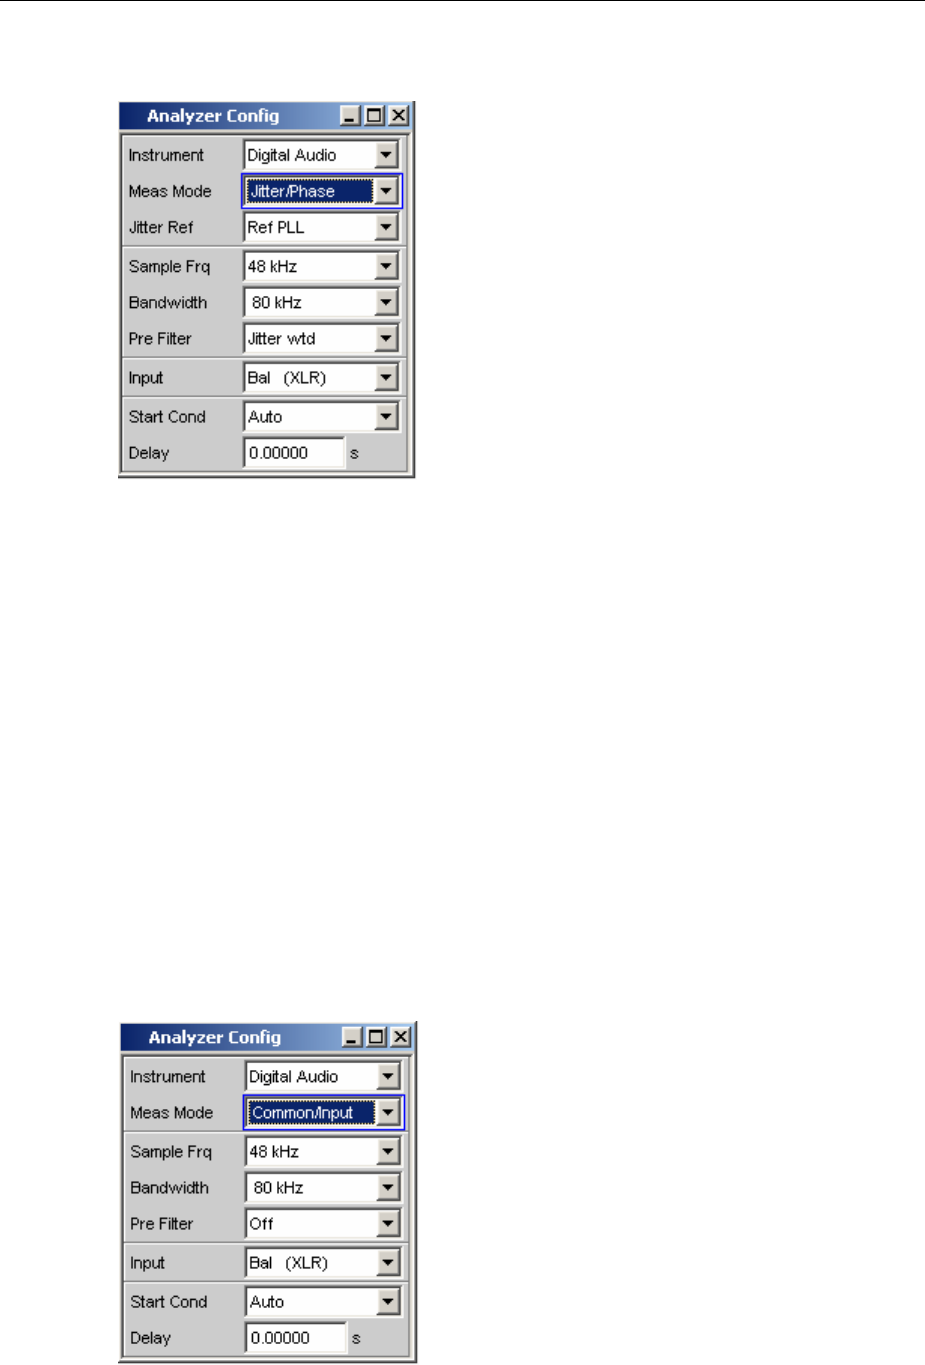
R&S UPV Configuring the Digital Analyzer
1146.2084.32 4.167 E-9
Jitter/Phase
(with R&S UPV-B2 only)
Measurement of jitter signals at the digital audio
inputs.
Measurement of a frame phase offset of the digital
audio signal between the front input and AUX input.
The digital interface signal has analog parameters
on which, for example, noise or other interference
signals can be superimposed – this interference is
also noticeable as shifting of the signal edges. When
this effect (known as "jitter") exceeds a certain
magnitude, it becomes impossible to decode or
regenerate the audio signal correctly. Here, the
decoders used in practice often behave differently
which means that it may be advisable to perform
measurements across the entire range of jitter
compatibility, for example.
The value of the jitter and delay fault is normally
given in UI (Unit Interval). One UI is defined as the
smallest pulse width of the digital audio signal (eye
width) and does not depend on the selected
sampling rate. One UI corresponds to the clock
period with which the digital signal is clocked
("biphase clock"). With digital audio signals, one UI
corresponds to 128th of the sampling period; at
48 kHz, one UI is 163 ns.
If several digitally encoded signals are merged
(common practice in, for example, studio
engineering), the phase position of the frames in the
digital audio signals (i.e. the components which
contain the sample value of the left and right-hand
channel) plays a significant role. Using the
R&S UPV, this shift can be measured as the phase
between the digital input (on the front panel) and the
reference channel (AUX input on the rear panel).
Remote-control command:
SENSe:DMODe JPHase
Common/Input
(with R&S UPV-B2 only)
Measurement of the common signal at the digital
Bal input.
The DIGITAL INPUT amplitude can be measured at
the Bal or Unbal input.
As is customary in analog technology, balanced
cables are also used for digital audio signal links.
Here, interference (e.g. from ground loops) occurs
as common-mode voltage at the interfaces.
Remote-control command:
SENSe:DMODe CINPut

Configuring the Digital Analyzer R&S UPV
1146.2084.32 4.168 E-9
Channel
Used to set the active measurement channel in the Meas Mode
"Audio Data".
Used to select the audio data for the left-hand channel (Channel = 1),
right-hand channel (Channel = 2) or both channels (Channel = Both).
If a single-channel measurement is selected (Ch1 or Ch2), the data
content of the other channel is not taken into consideration.
1Only the signal on the left-hand channel is
measured.
Remote-control command:
INPut:CHANnel CH1
2Only the signal on the right-hand channel is
measured.
Remote-control command:
INPut:CHANnel CH2
Both Both channels are measured (stereo).
Remote-control command:
INPut:CHANnel BOTH
Jitter Ref
(with R&S UPV-B2 only)
Used to select the jitter reference clock (only available for jitter
measurement).
If jitter is to be measured, a reference clock must be available. The
internal oscillator (generator clock) can be used for this purpose.
Alternatively, a reference PLL (Phase Locked Loop) can also be used
if the DUT is not synchronized to the generator of the R&S UPV. The
PLL has a lower limit frequency for the obtained jitter signal; if the
frequency drops below this limit, the PLL changes with the jitter signal.
The clock rate of the jitter reference must be the same as the clock
rate of the digital audio signal at the input. The clock of the digital
audio generator or the clock obtained from the jitter reference PLL of
the analyzer is provided for this purpose.
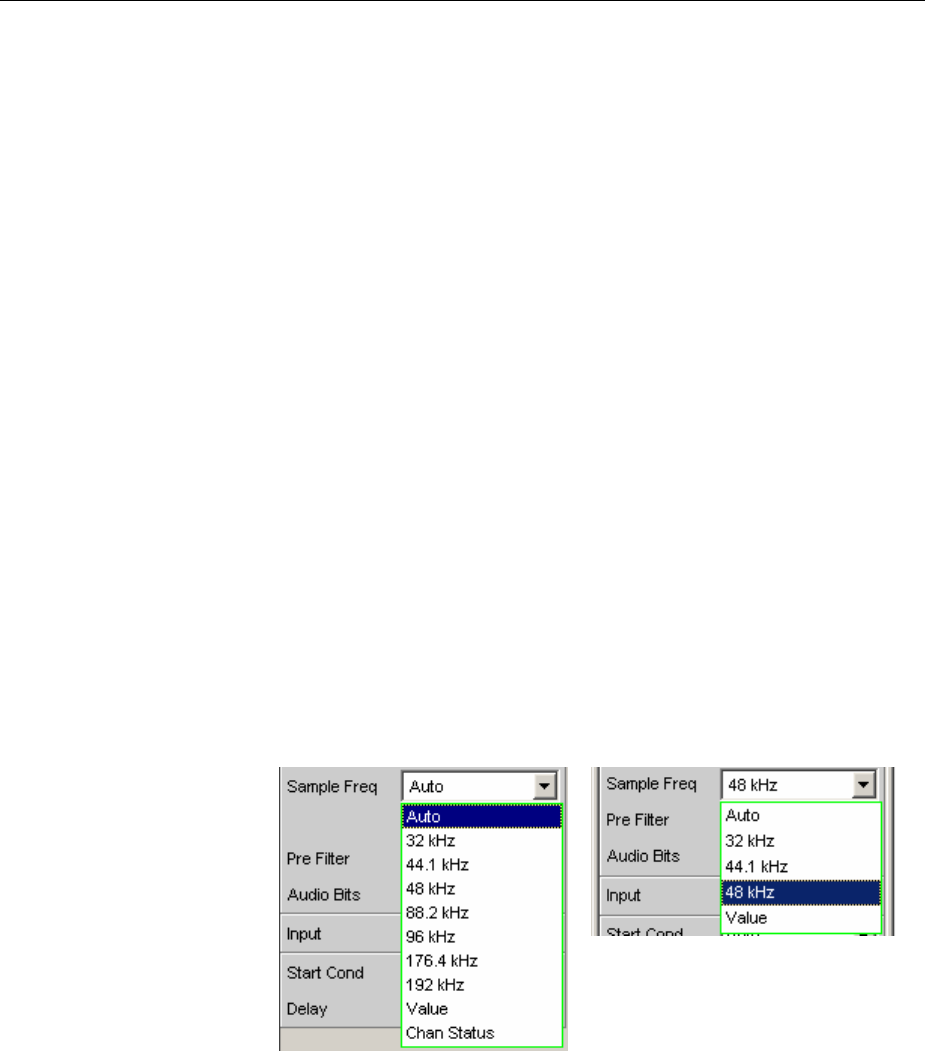
R&S UPV Configuring the Digital Analyzer
1146.2084.32 4.169 E-9
Internal CLK The internal clock generator is used for the jitter
reference. It is always best to use this setting if the
digital audio signal to be measured is supplied by
the digital audio generator of the R&S UPV and this
generator is running at the internal clock rate.
In this case, no lower limit frequency has to be taken
into consideration for the jitter measurement.
Remote-control command:
SENSe:JITTer:REFerence INTClock
Ref PLL The reference signal is the clock signal obtained
from the digital audio input signal using the jitter
reference PLL.
The lower limit frequency of this PLL must be taken
into consideration for the jitter measurement; if the
frequency drops below this limit, the reference signal
changes with the jitter signal and a low jitter value is
measured.
The limit frequency of the jitter reference PLL is
approx. 500 Hz.
Remote-control command:
SENSe:JITTer:REFerence REFPll
Sample Freq
Used to set the clock rate of the digital audio signal for the analyzer.
The sample frequency setting is used as a reference for all audio data
frequency measurements.
R&S UPV-B2:
R&S UPV-B20:

Configuring the Digital Analyzer R&S UPV
1146.2084.32 4.170 E-9
If the entered frequency does not correspond to the applied frequency, all filters and frequency
measurements are shifted accordingly with respect to frequency.
When jitter measurements are performed and the jitter-reduced digital audio signal is output at the
AUX output (reclock function), this parameter is used to select the correct range for the reference PLL
(only with R&S®UPV-B2).
Value range for numeric entries:
30 kHz to 200 kHz (30 kHz to 55 kHz with R&S®UPV-B2)
Standard sampling frequencies can be set directly in the selection field.
Note:
Sampling rates below 50 kHz allow the input signal to be monitored across the entire frequency range
(particularly via FFT and waveform).
Synchronization ranges for the jitter reference PLL:
30 kHz to 64 kHz (Base Rate range)
65 kHz to 128 kHz (High Rate range)
129 kHz to 200 kHz (Extended Rate range)
Auto The sampling rate is measured, adjusted and
displayed in the next menu line. In the event of a
change of the input sampling rate, the value is
automatically updated.
Note:
The digital analyzer has to be re-initialized each time
anew sampling frequency is set. To avoid this time-
consuming procedure being repeated an
unnecessary number of times, minor variations
(below 3 Hz) are ignored.
Remote-control command:
INPut:SAMPle:FREQuency:MODE AUTo
32 kHz Standard sampling rate 32 kHz
Remote-control command:
INPut:SAMPle:FREQuency:MODE F32
44.1 kHz Standard sampling rate 44.1 kHz
Remote-control command:
INPut:SAMPle:FREQuency:MODE F44
48 kHz Standard sampling rate 48 kHz
Remote-control command:
INPut:SAMPle:FREQuency:MODE F48
88.2 kHz Standard sampling rate 88.2 kHz
Remote-control command:
INPut:SAMPle:FREQuency:MODE F88

R&S UPV Configuring the Digital Analyzer
1146.2084.32 4.171 E-9
96 kHz Standard sampling rate 96 kHz
Remote-control command:
INPut:SAMPle:FREQuency:MODE F96
176.4 kHz Standard sampling rate 176.4 kHz
Remote-control command:
INPut:SAMPle:FREQuency:MODE F176
192 kHz Standard sampling rate 192 kHz
Remote-control command:
INPut:SAMPle:FREQuency:MODE F192
Value Variable entry for sampling rate
Remote-control command:
INPut:SAMPle:FREQuency:MODE VALue
INPut:SAMPle:FREQuency <nu>
Chan Status The sampling rate is determined by decoding the
corresponding channel status bits in the AES/EBU
protocol of the measured signal. Different bits (24 to
27 or 6 to 7 and 35 to 38) are decoded, depending
on the format used (consumer or professional). The
sampling rate is updated when a different sampling
rate is decoded from the channel status bits.
If the channel status bits do not supply any
information ("not indicated"), the sampling rate last
determined remains active.
Remote-control command:
INPut:SAMPle:FREQuency:MODE CHSTatus
Bandwidth
(with R&S UPV-B2 only)
With impairment analysis, jitter and common signals are measured up
to this bandwidth setting.
22 kHz Analog analyzer bandwidth 22 kHz
Remote-control command:
INPut:BANDwidth:MODE B22
40 kHz Analog analyzer bandwidth 40 kHz
Remote-control command:
INPut:BANDwidth:MODE B40
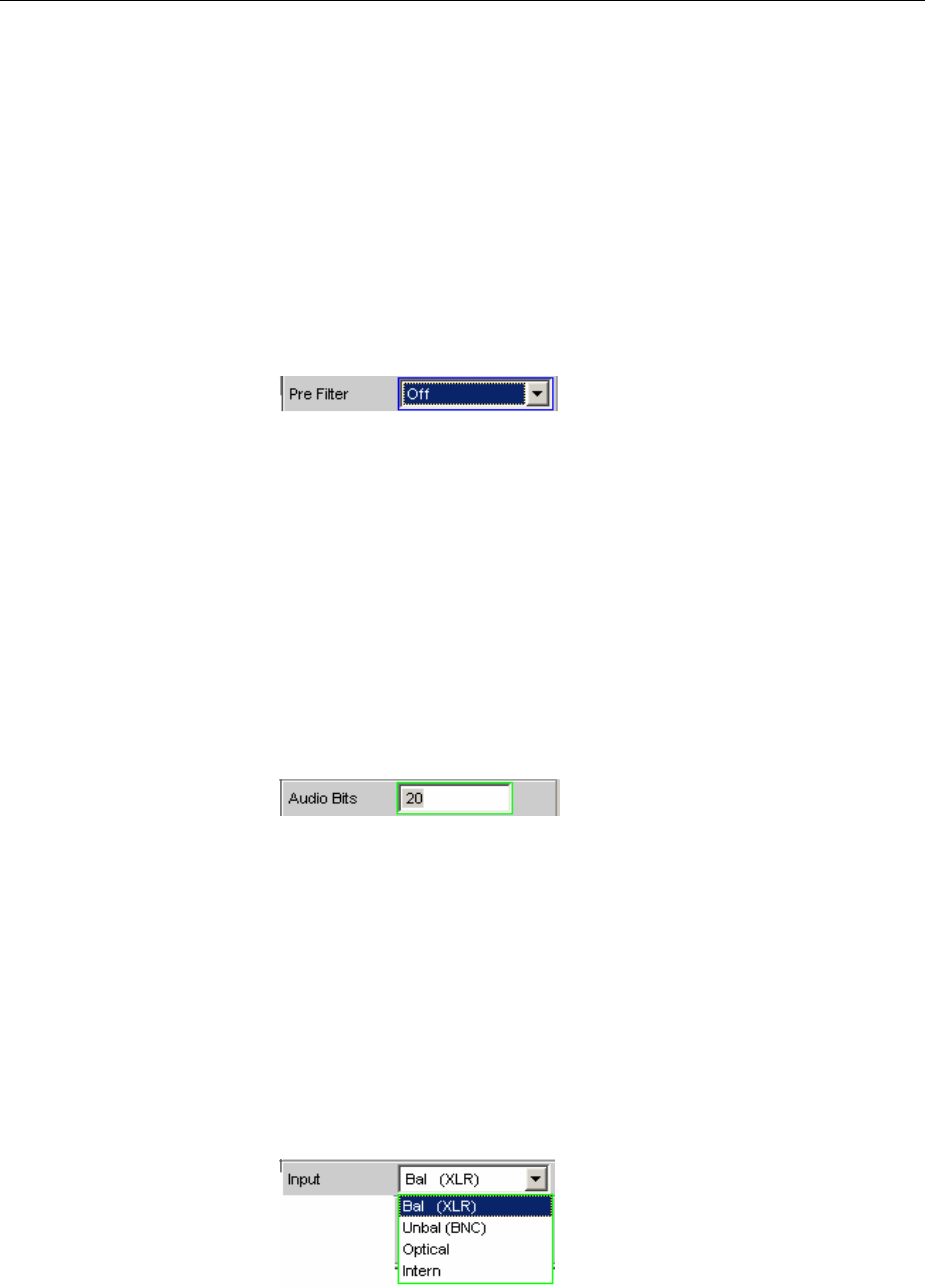
Configuring the Digital Analyzer R&S UPV
1146.2084.32 4.172 E-9
80 kHz Analog analyzer bandwidth 80 kHz
Remote-control command:
INPut:BANDwidth:MODE B80
250 kHz Analog analyzer bandwidth 250 kHz
Remote-control command:
INPut:BANDwidth:MODE B250
Pre Filter
The selected prefilter affects all measurement functions. This means
that prefiltering is possible without having to select the required filter
for every single measurement function.
The description or characteristic of the various filters is found in
section "Filters" on page 4.416.
Remote-control command:
INPut:FILTer
Audio Bits
Wordwidth used by the digital audio analyzer in the Meas Mode
"Audio Data".
Value range: 8 to 24
If the wordwidth is reduced, the values of the audio samples are
trimmed down to the specified wordwidth. Reduced wordwidth results
in a corresponding reduction in dynamic response.
Remote-control command:
INPut:AUDiobits <n>
Input
Used to select the input interface for the digital audio analyzer:
In the Meas Mode "Common/Input" (R&S UPV-K22 option), the
common-mode signal is always measured at the XLR socket (Bal)
regardless of which digital input is selected.
The "DIG INP AMP" measurement is performed at the selected input
(Bal or Unbal).
The Common/Input measurement is not possible for the optical input
or if "Intern" is selected.
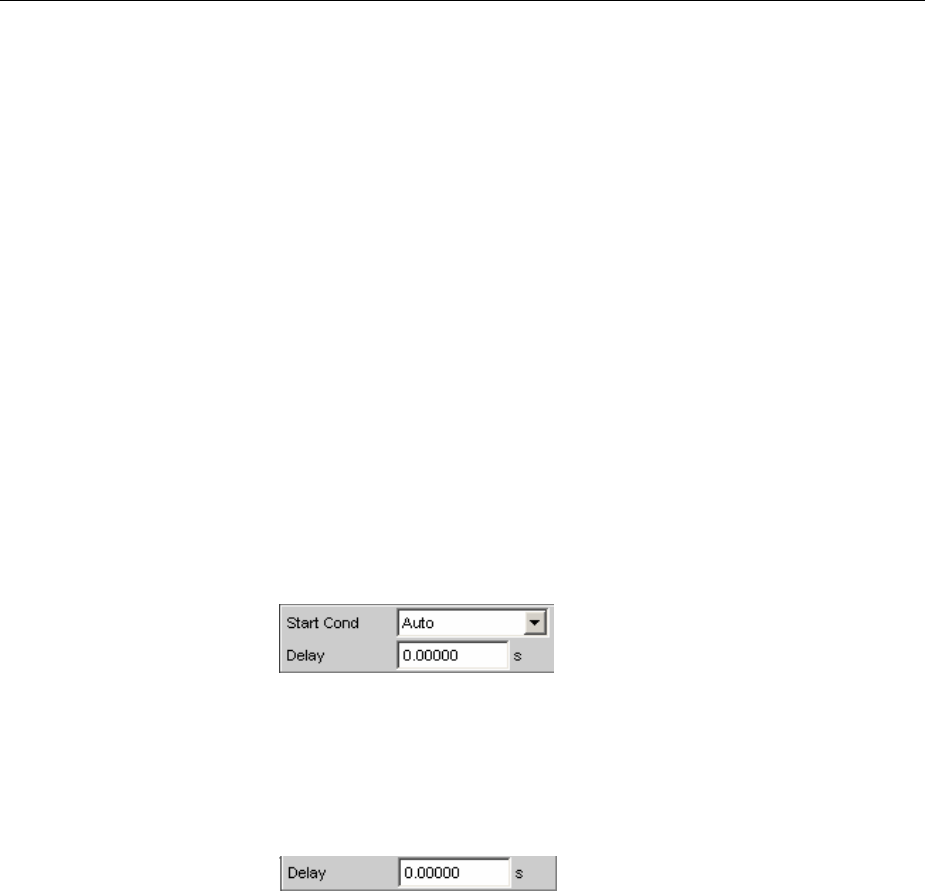
R&S UPV Configuring the Digital Analyzer
1146.2084.32 4.173 E-9
Bal (XLR) Balanced digital audio input (XLR).
Remote-control command:
INPut:TYPE AESebu
Unbal (BNC) Unbalanced digital audio input (BNC).
Remote-control command:
INPut:TYPE SPDif
Optical Optical digital audio input (TOSLINK).
Remote-control command:
INPut:TYPE OPTical
Intern Internal at digital audio generator output.
Loop measurement possible without connected
cable.
Remote-control command:
INPut:TYPE INTern
Start Cond
Indicates the event which triggers a measurement.
Depending on the "Start Cond" selected, the measurement starts
either immediately (Auto) or only once the required trigger condition is
met. For details, see section "Start Conditions" on page 4.221.
Delay
Delay for Start Cond.
The "Delay" setting determines the time which must elapse between
the above-mentioned events and restarting of the measurement so
that, for example, a DUT has sufficient time to settle.
You can enter a delay for menu item Start Cond "Auto". For details,
see section "Start Conditions" on page 4.221.
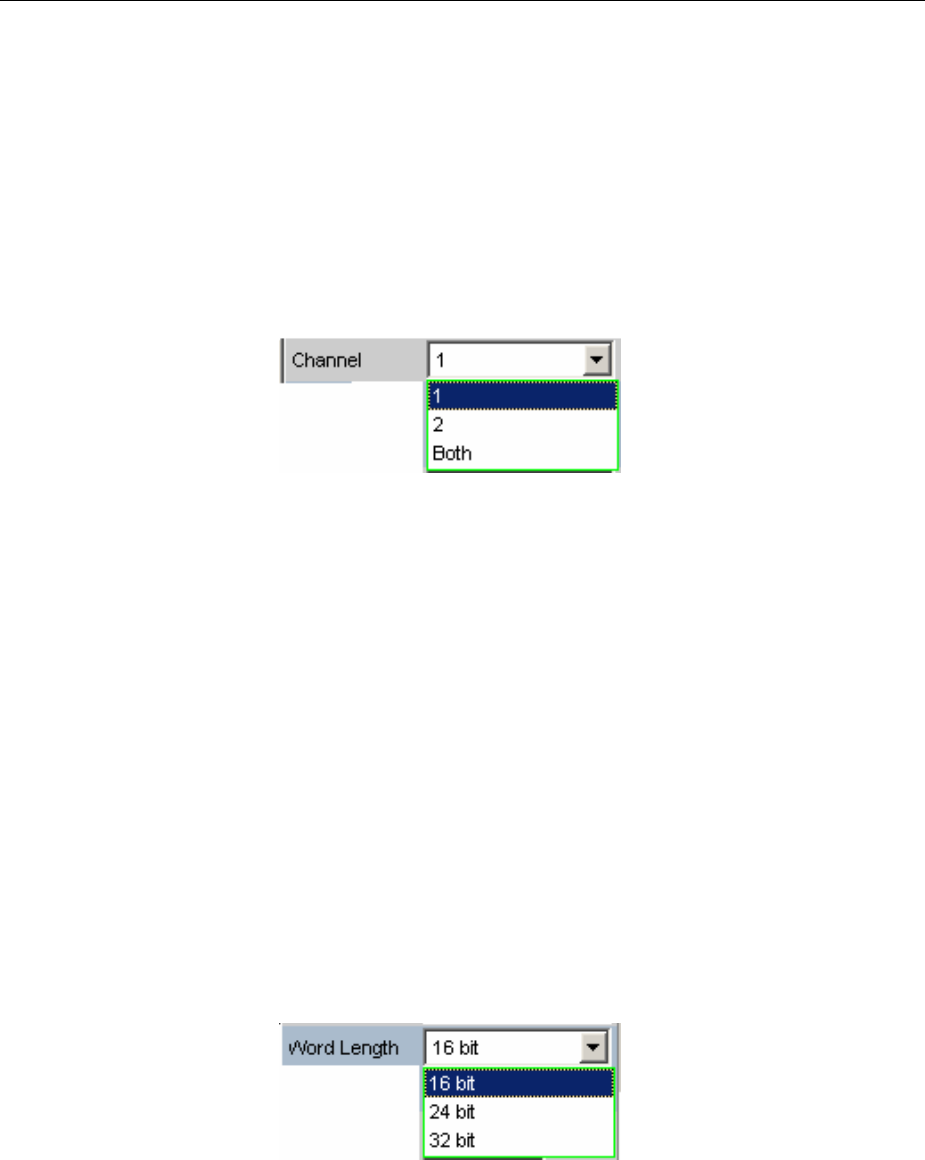
Configuring the I2S Analyzer R&S UPV
1146.2084.32 4.174 E-9
Configuring the I2SAnalyzer
I2S Analyzer Configuration Panel
The Analyzer Config panel enables you to enter settings for the analog or digital analyzer.
The configuration options for the I2Sanalyzer are described below.
Channel
Used to set the currently active measurement channel.
Used to select the audio data for the left channel (Ch1), right channel
(Ch2) or both channels.
If a single-channel measurement is selected (Ch1 or Ch2), the data
content of the other channel is not taken into consideration.
1Only the signal on the left channel is measured.
Remote-control command:
INPut:CHANnel CH1
2Only the signal on the right channel is measured.
Remote-control command:
INPut:CHANnel CH2
Both Both channels are measured (stereo).
Remote-control command:
INPut:CHANnel BOTH
Word Length
Word length of a data frame for each channel.
Value range: 16, 24, 32
16 bit Word length 16 bits
Remote-control command:
INPut:WLENgth W16
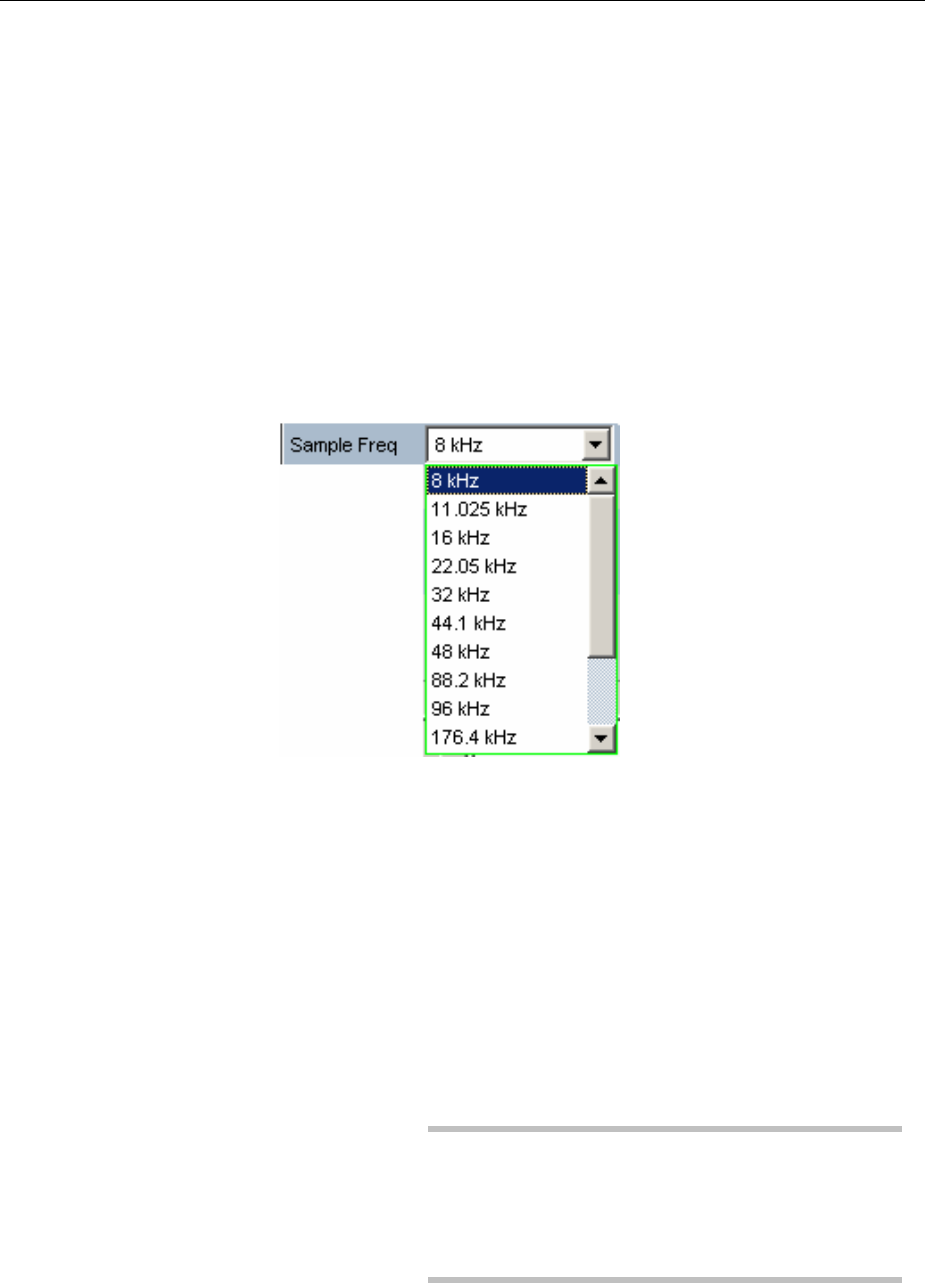
R&S UPV Configuring the I2S Analyzer
1146.2084.32 4.175 E-9
24 bit Word length 24 bits
Remote-control command:
INPut:WLENgth W24
32 bit Word length 32 bits
Remote-control command:
INPut:WLENgth W32
Sample Frequency
Used to set the sampling frequency.
The sampling frequency corresponds to the frequency of the FSYNC
signal. All frequency information of generated audio data is with
reference to this setting.
If the selected frequency does not correspond to the applied
frequency, all filters and frequency measurements are shifted
accordingly with respect to frequency.
Value range for numeric entry:
6.75 kHz to 410 kHz
Standard sampling frequencies can be set directly in the selection
field.
Auto The sampling rate is measured, adjusted and
displayed in the next menu line. In the event of a
change of the input sampling rate, the value is
automatically updated.
Note:
The digital analyzer has to be re-initialized each time
anew sampling frequency is set. To avoid this time-
consuming procedure being repeated an
unnecessary number of times, minor variations
(below 3 Hz) are ignored.
Remote-control command:
INPut:SAMPle:FREQuency:MODE AUTo

Configuring the I2S Analyzer R&S UPV
1146.2084.32 4.176 E-9
8kHz Standard sampling rate 8 kHz
Remote-control command:
INPut:SAMPle:FREQuency:MODE F08
11.025 kHz Standard sampling rate 11.025 kHz
Remote-control command:
INPut:SAMPle:FREQuency:MODE F11
16 kHz Standard sampling rate 16 kHz
Remote-control command:
INPut:SAMPle:FREQuency:MODE F16
22.05 kHz Standard sampling rate 22.05 kHz
Remote-control command:
INPut:SAMPle:FREQuency:MODE F22
32 kHz Standard sampling rate 32 kHz
Remote-control command:
INPut:SAMPle:FREQuency:MODE F32
44.1 kHz Standard sampling rate 44.1 kHz
Remote-control command:
INPut:SAMPle:FREQuency:MODE F44
48 kHz Standard sampling rate 48 kHz
Remote-control command:
INPut:SAMPle:FREQuency:MODE F48
88.2 kHz Standard sampling rate 88.2 kHz
Remote-control command:
INPut:SAMPle:FREQuency:MODE F88
96 kHz Standard sampling rate 96 kHz
Remote-control command:
INPut:SAMPle:FREQuency:MODE F96
176.4 kHz Standard sampling rate 176.4 kHz
Remote-control command:
INPut:SAMPle:FREQuency:MODE F176
192 kHz Standard sampling rate 192 kHz
Remote-control command:
INPut:SAMPle:FREQuency:MODE F192
384 kHz Standard sampling rate 384 kHz
Remote-control command:
INPut:SAMPle:FREQuency:MODE F384
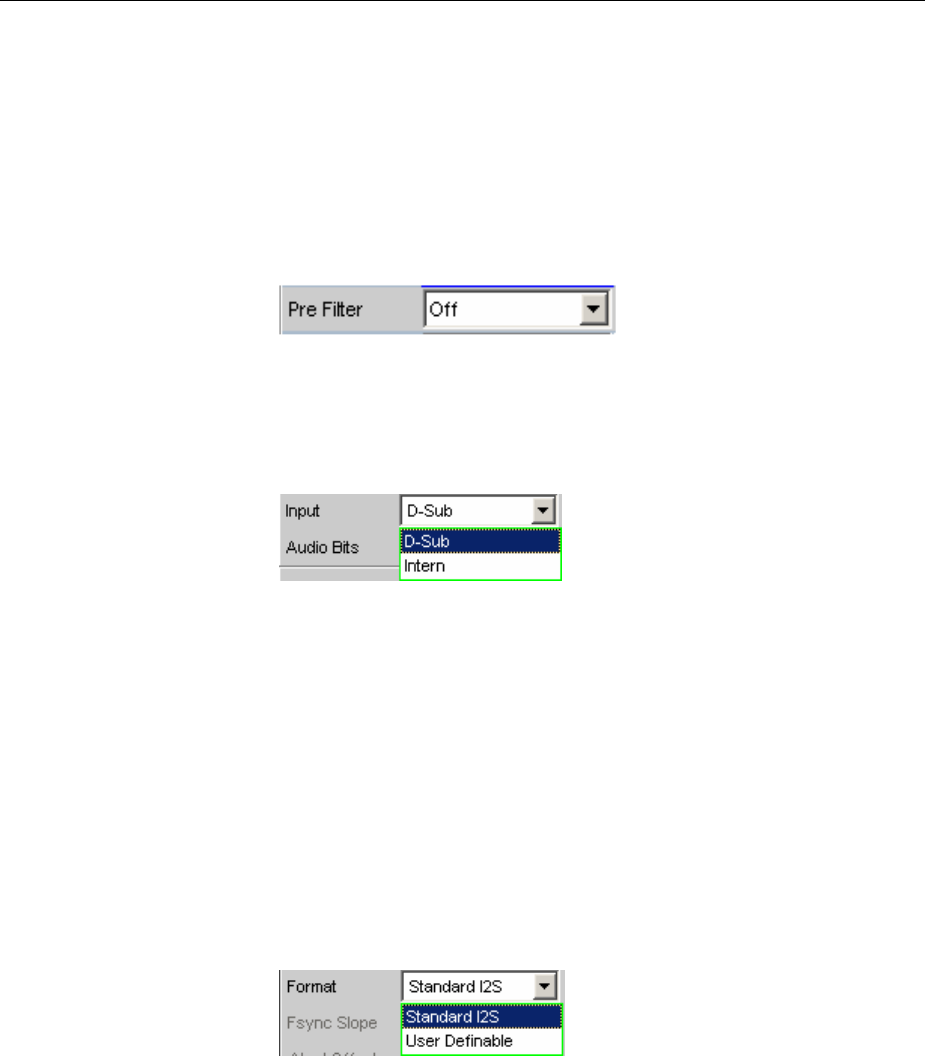
R&S UPV Configuring the I2S Analyzer
1146.2084.32 4.177 E-9
Value: Variable sampling rate entry
Remote-control command:
INPut:SAMPle:FREQuency:MODE VALue
INPut:SAMPle:FREQuency <nu>
Pre Filter
The selected prefilter affects all measurement functions. This means
that prefiltering is possible without having to select the required filter
for every single measurement function.
Remote-control command:
INPut:FILTer <parameter>
Input
Used to select the data source for the I2Saudio analyzer:
D-Sub The D-Sub connector at the rear of the instrument is
selected as the input.
Remote-control command:
INPut:INPut DSUB
Intern The internal generator is selected as the input.
Aloop measurement can be performed without a
connected cable being required (loopback test).
Remote-control command:
INPut:INPut INTern
Format
Selection of the I2Sanalyzer format.
Standard I2S The I2Sanalyzer receives in the standard I2Sformat.
The following format-influencing parameters are
assigned a fixed default:
Fsync Slope Left(1) = Falling
Word Offset -1
Remote-control command:
INPut:FORMat SI2S
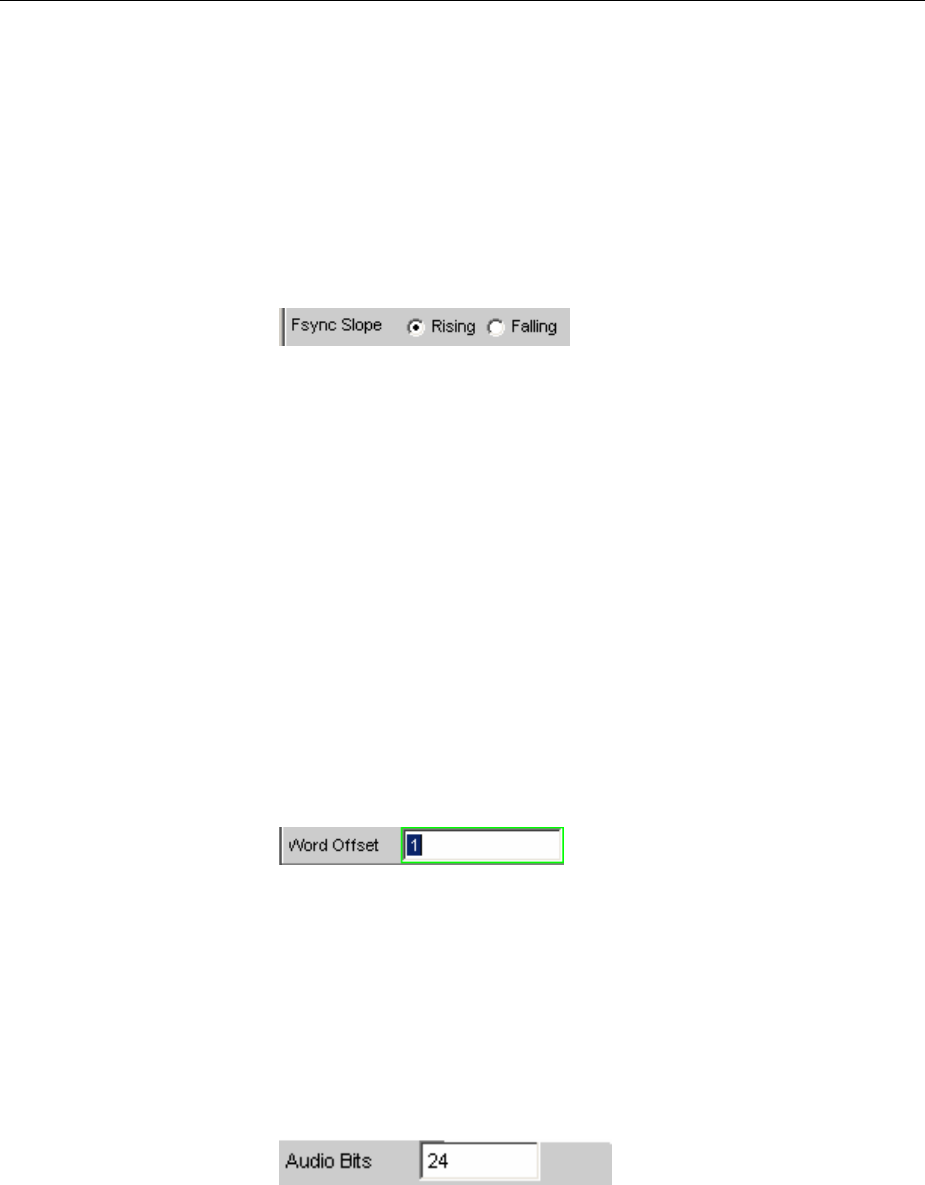
Configuring the I2S Analyzer R&S UPV
1146.2084.32 4.178 E-9
User-
definable
The I2Sanalyzer receives in I2S-like format. The
following format-influencing parameters are
additionally available:
Fsync Slope
Word Offset
Remote-control command:
INPut:FORMat USERdefined
Fsync Slope
Polarity of the Fsync signal.
Rising With a word offset of 0 a rising signal edge indicates
the word beginning of the left data word (channel 1).
Remote control command:
INPut:FSLope LFTRising
Falling With a word offset of 0 a falling signal edge indicates
the word beginning of the left data word (channel 1).
Remote control command:
INPut:FSLope LFTFalling
Word Offset
By using Word Offset, you can set the number of the SCK cycles by
which the Fsync signal is analyzed with delay with respect to the audio
data.
Value range: -"Word Length"… 0 ... +"Word Length"-1
Remote-control command:
INPut:WOFFset <n>
Audio Bits
Word width of audio data that is analyzed.
If the word width is reduced, the values of the audio samples are
rounded off to the specified word length. A reduced word length leads
to a reduction in the dynamic range.
Value range: 8 ... "Word Length"
Remote-control command:
INPut:AUDiobits <n>

R&S UPV Configuring the I2S Analyzer
1146.2084.32 4.179 E-9
Start Cond
Specifies the event that leads to a measurement.
Depending on the selected "Start Cond", the measurement either
starts immediately (Auto) or not until the required trigger condition has
been fulfilled. For details, refer to section "Start Conditions" on page
4.221.
Delay
Delay time for Start Cond.
Adelay can be entered for the Start Cond "Auto" menu item. For
details, refer to section "Start Conditions" on page 4.221.
Timing Diagrams
Anumber of configuration examples are shown in the timing diagrams below which illustrate the effect
of some parameters.
Standard I2S
SCK
FSYNC
DATA MSB
Word n-1
Sample r-1
Right Channel
Word n
Sample l
Left Channel
Word n+1
Sample r
Right Channel
MSBLSB
Word Length
Audio Bits
Word Offset
(Word Offset = -1)
(Fsync Slope = Left (1)=Falling)

Configuring the I2S Analyzer R&S UPV
1146.2084.32 4.180 E-9
User-Definable
SCK
FSYNC
DATA MSB
Word n-1
Sample r-1
Right Channel
Word n
Sample l
Left Channel
Word n+1
Sample r
Right Channel
MSBLSB
Word Length
Audio Bits
Word Offset
Word Offset = 1
Fsync Slope = Left (1)=Rising
Interface Assignment
I2Sconnector (25-contact D-Sub connector)
Zum Anschluss des R&S UPV über die RS 232-C-Schnittstelle wird die Verwendung eines sehr gut
geschirmten Kabels empfohlen.
13
25
1
14
GND
GND
GND
GND
GND
GND
GND
GND
GND
GND
GND
GND GND
TX_MCLK
TX_FSYNC
TX_DATA
+5V
+3.3V
RX_DATA
RX_FSYNC
RX_SCK
TX_SCK

R&S UPV Configuring the I2S Analyzer
1146.2084.32 4.181 E-9
Pin Signal Input (I)
Output (O) Data direction
1GND Ground connection
2GND Ground connection
3GND Ground connection
4GND Ground connection
5GND Ground connection
6GND Ground connection
7GND Ground connection
8GND Ground connection
9GND Ground connection
10 GND Ground connection
11 GND Ground connection
12 GND Ground connection
13 GND Ground connection
14 not connected
15 RX_SCK I Serial Clock Analyzer
16 RX_FSYNC I Frame Sync Analyzer
17 RX_DATA I Serial Data Analyzer
18 not connected
Pin Signal Input (I)
Output (O) Data direction
19 +3.3 V (500 mA) O Power Supply
20 +5 V (500 mA) O Power Supply
21 not connected
22 TX_DATA O Serial Data Generator
23 TX_FSYNC O Frame Sync Generator
24 TX_SCK O Serial Clock Generator
25 TX_MCLK O Master Clock Output
Generator

Configuring the I2S Analyzer R&S UPV
1146.2084.32 4.182 E-9
TX CLK IN (BNC connector)
Pin Signal Input (I)
Output (O) Data direction
1GND Ground connection
2TX_CLK I Master Clock Input
Generator
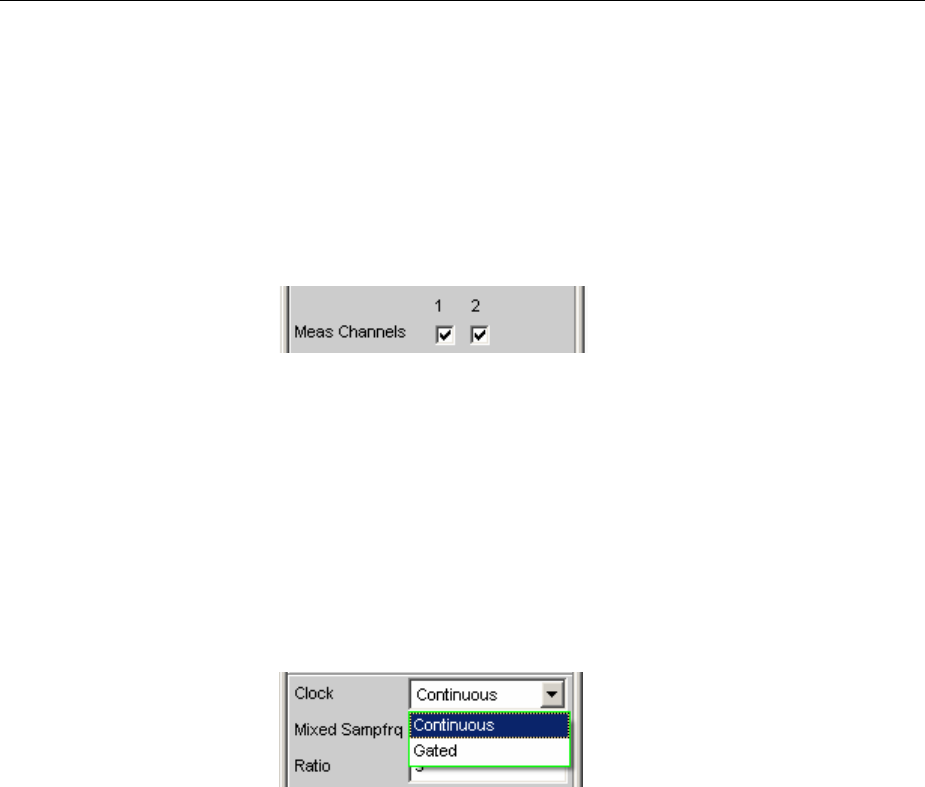
R&S UPV Configuring the USI Dual Channel Analyzer
1146.2084.32 4.183 E-9
Configuring the USI Dual Channel Analyzer
USI Dual Channel Analyzer Configuration Panel
The Config panel is used to set the analog and digital analyzer. The configuration options for the USI
dual channel analyzer are described below.
Meas Channels
Used to set the active measurement channel.
1Measurement channel 1 is switched on or off.
Remote control command:
INPut:MCHannels[1] ON|OFF
2Measurement channel 2 is switched on or off.
Remote control command:
INPut:MCHannels[2] ON|OFF
Clock
Used to set the continuous clock or gated clock operating mode.
Continuous Prerequisite for the continuous clock mode is a
continuous clock for the analyzer. The clock source
may be internal or external. If synchronization is
external, several types of synchronization are available
for selection.
Remote control command:
INPut:CLOCk CONTinous
Gated The gated clock mode must be selected if the
externally supplied bit clock (BClk) and FrameSync
(Fsync) are discontinuous or have such a large jitter
that the internal PLL can no longer follow this clock.
In this operating mode, synchronisation is limited to
the external FrameSync & bit clock (Ext Fsync&BClk)
option. The audio signal generated cannot be
monitored.
Remote control command:
INPut:CLOCk GATed
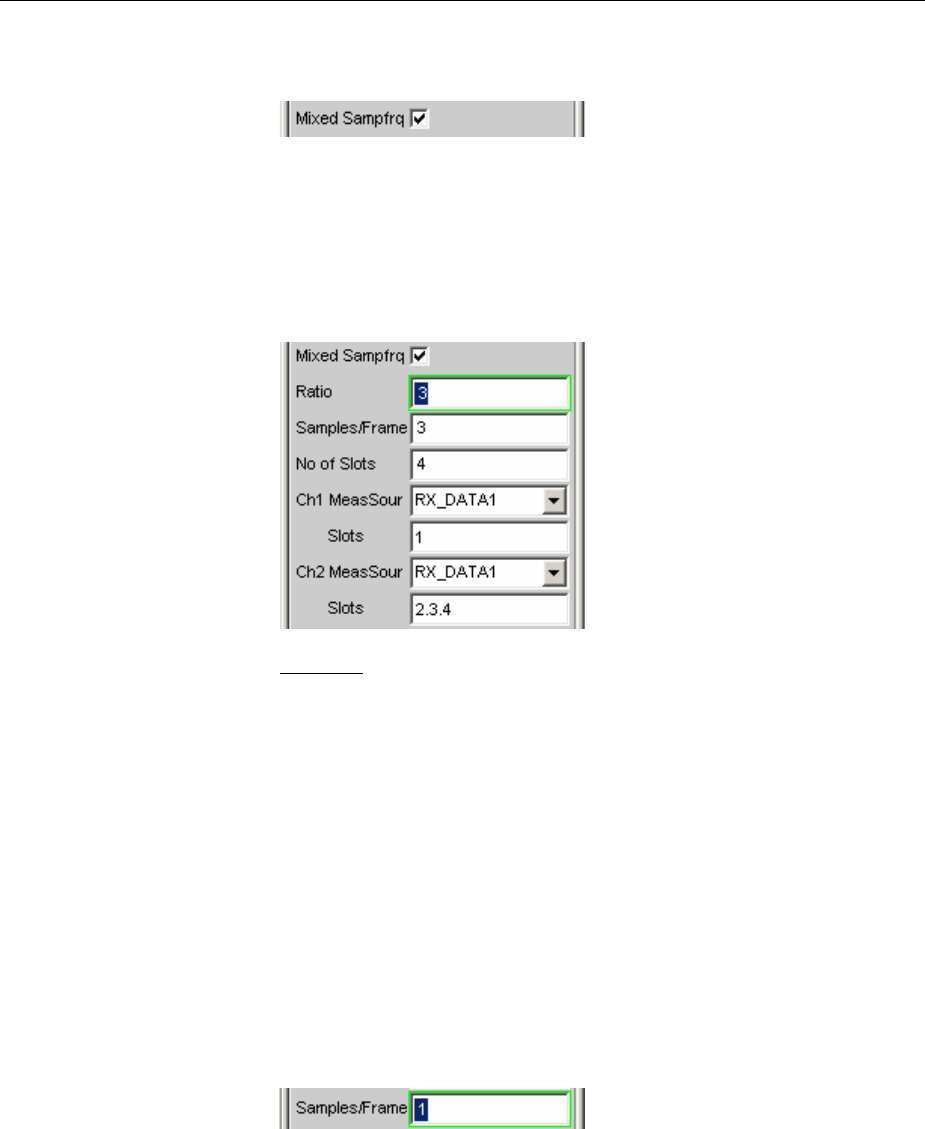
Configuring the USI Dual Channel Analyzer R&S UPV
1146.2084.32 4.184 E-9
Mixed Sampfrq
Permits simultaneous analysis of data streams at varying sampling
rates. The pre-filter is not available when this is activated.
Remote control command:
INPut:MSAMplefrequency ON|OFF
Ratio
Up-sampling factor for the slower data stream. The input data with the
lower sampling rate is characterised by correspondingly fewer entries in
the Slots input field.
Value range: 2 to 6
Example:
The sampling rate of the input data differs by a factor of 3. This means
that one frame always contains 3 samples of the channels with the
higher sampling rate and just 1 sample of the channel with the lower
sampling rate. The sample of the channel with the lower data rate is in
channel 1 on line 1, whilst the samples of the channel with the higher
data rate are in chanels 2, 3 and 4 of the same data line.
Remote control command:
INPut:RATio <n>
Samples/Frame
Used to define the number of samples per frame.
The parameter simultaneously determines the minimum settable
sampling rate according to the relationship: fs_min = 843.75 Hz /
samples/frame.
Value range: 1 to 32
Remote control command:
INPut:SPFRame <n>
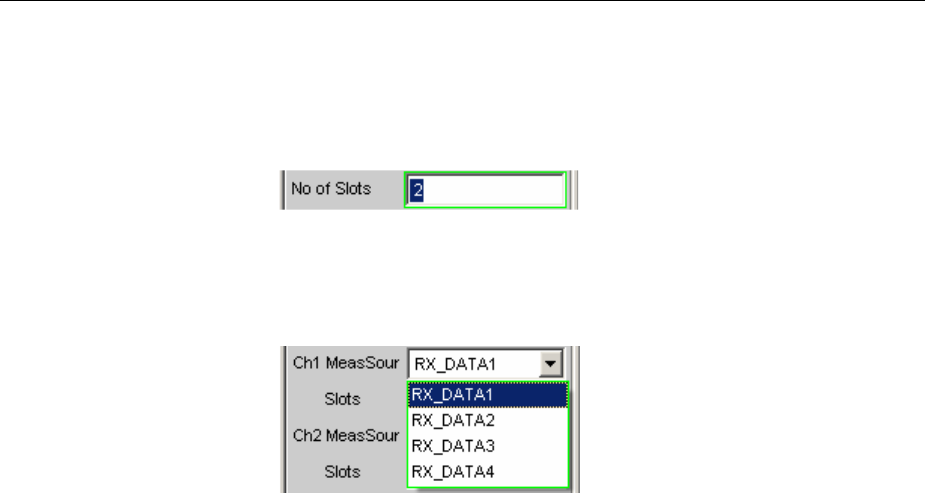
R&S UPV Configuring the USI Dual Channel Analyzer
1146.2084.32 4.185 E-9
No of Slots
Used to define the number of slots in a frame.
Value range: 1 to 256
No_of_Slots * Slot_Length <= 2048
Slot_Length * No_of_Slots * Sample_Freq <= 55.926 MHz
Remote control command:
INPut:NOSLots <n>
Ch1 MeasSour
Used to select the input data line for measuring channel 1.
RX_DATA1 Measuring channel 1 analyzes the RX_DATA1 data
line.
Remote control command:
INPut:MCHSource RX1Data
RX_DATA2 Measuring channel 1 analyzes the RX_DATA2 data
line.
Remote control command:
INPut:MCHSource RX2Data
RX_DATA3 Measuring channel 1 analyzes the RX_DATA3 data
line.
Remote control command:
INPut:MCHSource RX3Data
RX_DATA4 Measuring channel 1 analyzes the RX_DATA4 data
line.
Remote control command:
INPut:MCHSource RX4Data
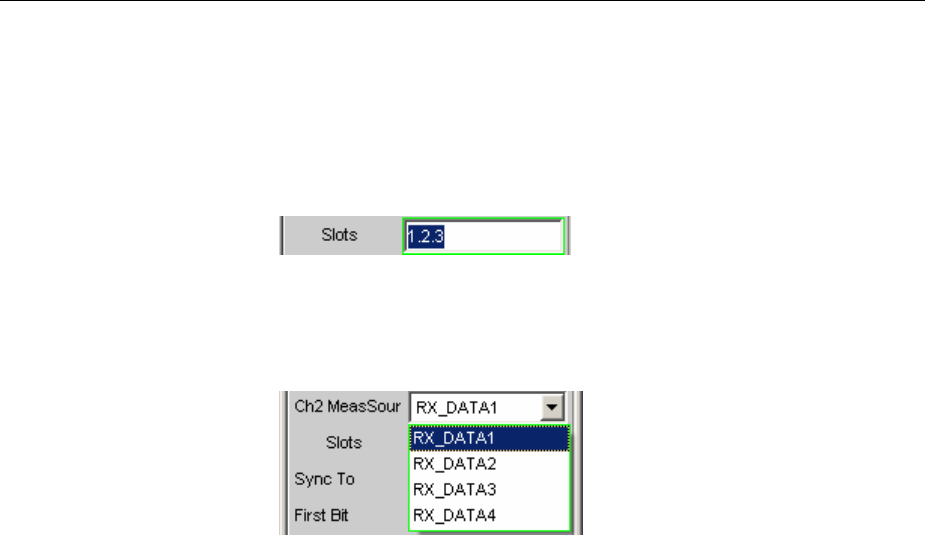
Configuring the USI Dual Channel Analyzer R&S UPV
1146.2084.32 4.186 E-9
Slots
Used to select the audio frame slots to be analyzed for measuring
channel 1.
(Selection of several slots is only possible with multi-sample formats! In
this case a frame contains several consecutive samples from the same
signal source).
Value range: 1 to no of slots
Remote control command:
INPut:SLOTs 'a.b.c. ... .z'
Ch2 MeasSour
Used to select the input data line for measuring channel 2.
RX_DATA1 Measuring chanel 2 analyzes the RX_DATA1 data
line.
Remote control command:
INPut:MCHSource2 RX1Data
RX_DATA2 Measuring channel 2 analyzes the RX_DATA2 data
line.
Remote control command:
INPut:MCHSource2 RX2Data
RX_DATA3 Measuring channel 2 analyzes the RX_DATA3 data
line.
Remote control command:
INPut:MCHSource2 RX3Data
RX_DATA4 Measuring channel 2 analzyes the RX_DATA4 data
line.
Remote control command:
INPut:MCHSource2 RX4Data
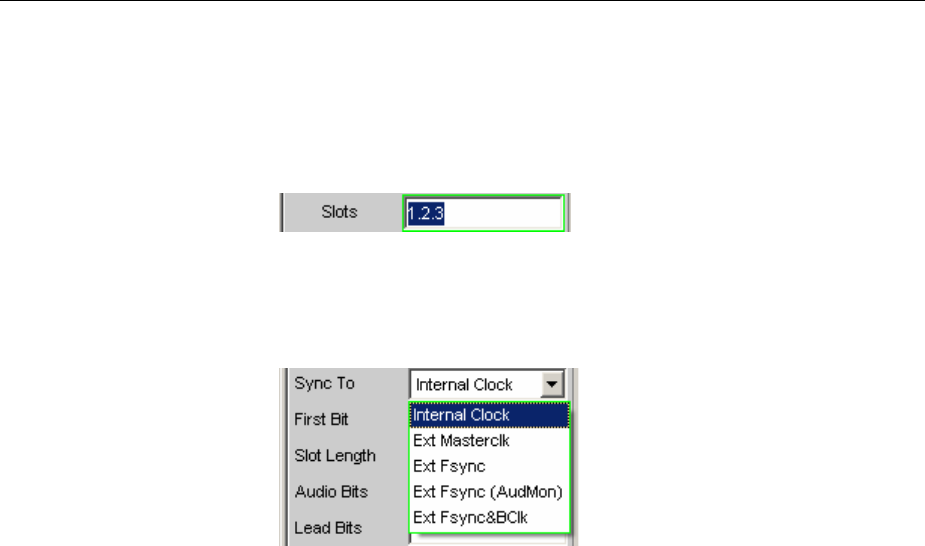
R&S UPV Configuring the USI Dual Channel Analyzer
1146.2084.32 4.187 E-9
Slots
Used to select the audio frame slots to be analyzed for measuring
channel 2.
(Selection of several slots only possible with multi-sample formats! In
this case a frame contains several consecutive samples from the same
signal source).
Value range: 1 no No of slots
Remote control command:
INPut:SLOTs2 'a.b.c. ... .z'
Sync To
Used to select the source on which the USI analyzer is synchronised.
Internal Clock The analyzer uses the device’s internal clock.
Remote control command:
INPut:SYNCto IClock
Ext Masterclk Synchronisation to an external master clock
(TX_MCLK_IN).
Remote control command:
INPut:SYNCto EMASterclock
Ext Fsync Synchronisation to an external FrameSync signal
(TX_FSYNC_IN). Audio monitoring of the analyzer
signal is not possible. A master clock is additionally
generated and output.
Remote control command:
INPut:SYNCto EFSYnc
Ext Fsync
(AudMon)
Synchronisation to an external FrameSync signal
(TX_FSYNC_IN). It is not possible to audio monitor the
analyzer signal. No master clock is output.
Remote control command:
INPut:SYNCto EFAMon
Ext
Fsync&BClk
Synchronisation to the external FrameSync signals
(TX_FSYNC_IN) and the bit clock (TX_BCLK_IN).
Remote control command:
INPut:SYNCto EFBClk
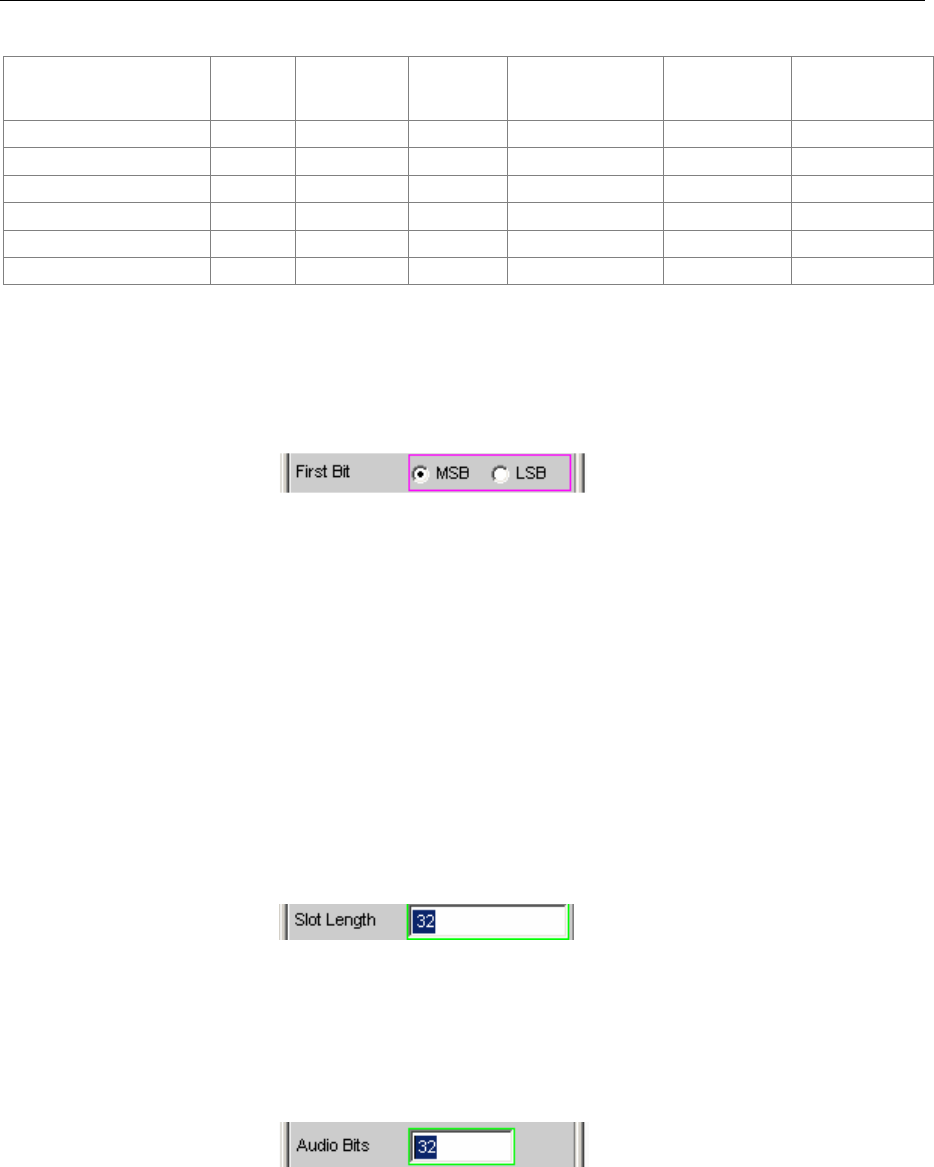
Configuring the USI Dual Channel Analyzer R&S UPV
1146.2084.32 4.188 E-9
Overview of the various synchronisation modes:
Internal
clock
External
master clock
External
frame sync
External frame sync
with audiomonitor
External frame
sync, bit clock
External frame
sync, bit clock
(gated)
Master clock Output otri o tri tri tri
Master clock Input -- x -- -- -- --
Bit clock Output o o o o tri tri
Bit clock Input -- -- -- -- x x
Frame sync Output o o o o tri tri
Frame sync Input -- -- x x x x
xInput Signal must be present
oOutput Signal is available
tri Output in tristate mode (high impedance)
-- Unused Input
First Bit
Used to define the data bit receiving sequence
MSB The most significant data bit is received first.
Remote control command:
INPut:FBIT MSB
LSB The least significant data bit is received first.
Remote control command:
INPut:FBIT LSB
Slot Length
Slot length of a slot including gaps (0 bits)
Value range: 1 to 256
No_of_Slots * Slot_Length <= 2048
Slot_Length * No_of_Slots * Sample_Freq <= 55.926 MHz
Remote control command:
INPut:SLTLength <n>
Audio Bits
Slot length of the audio data within a slot.
Only the specified number of data bits are analyzed.
Value range: 8 to slot length(max 32)
Remote control command:
INPut:AUDiobits <n>
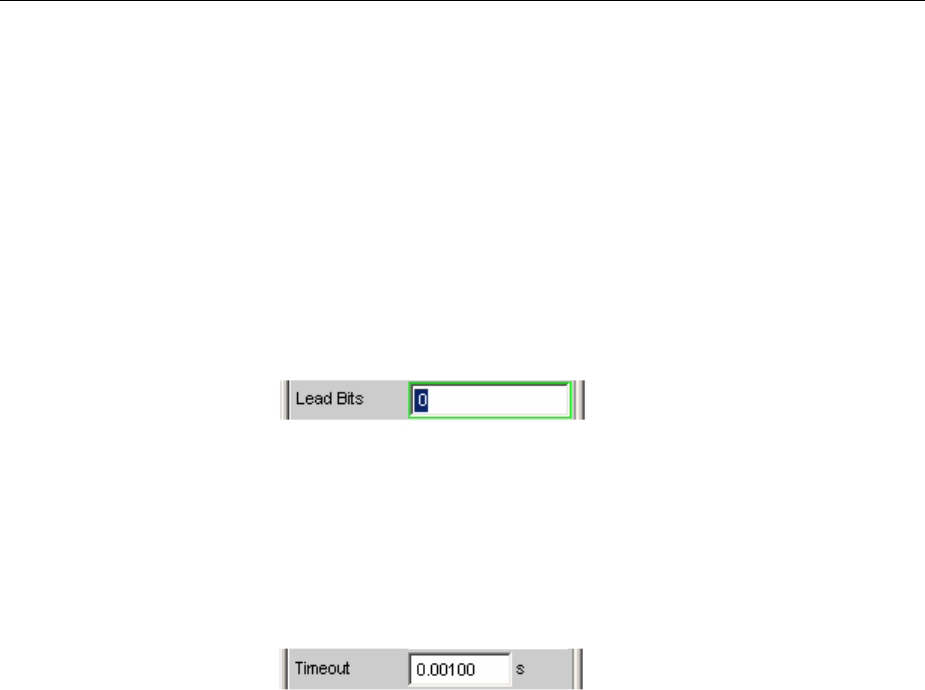
R&S UPV Configuring the USI Dual Channel Analyzer
1146.2084.32 4.189 E-9
Lead Bits
Determines the offset of the audio bits within a slot relative to the start
ofthe slot.
If LSB is selected as the first bit, the setting for lead bits is automatically
corrected if the setting for audio bits is changed so that the MSB is
received at the same location. This has the advantage that the
resolution and not the amplitude of the measured signal is changed if
the audio bits are changed.
Example:
Slot length: 32
Audio bits: 24 23 (setting changed by user)
Lead bits: 8 9(automatic correction)
Value range: 0 to slot length-audio bits
Remote control command:
INPut:LBITs <n >
Timeout
Only availabe in Gated Clock mode. This parameter defines the
maximum time span for which external clocks are allowed to
discontinue before the measurement is declared as invalid.
Value range: 1 to 500ms
Remote control command:
INPut:TIMeout <nu>
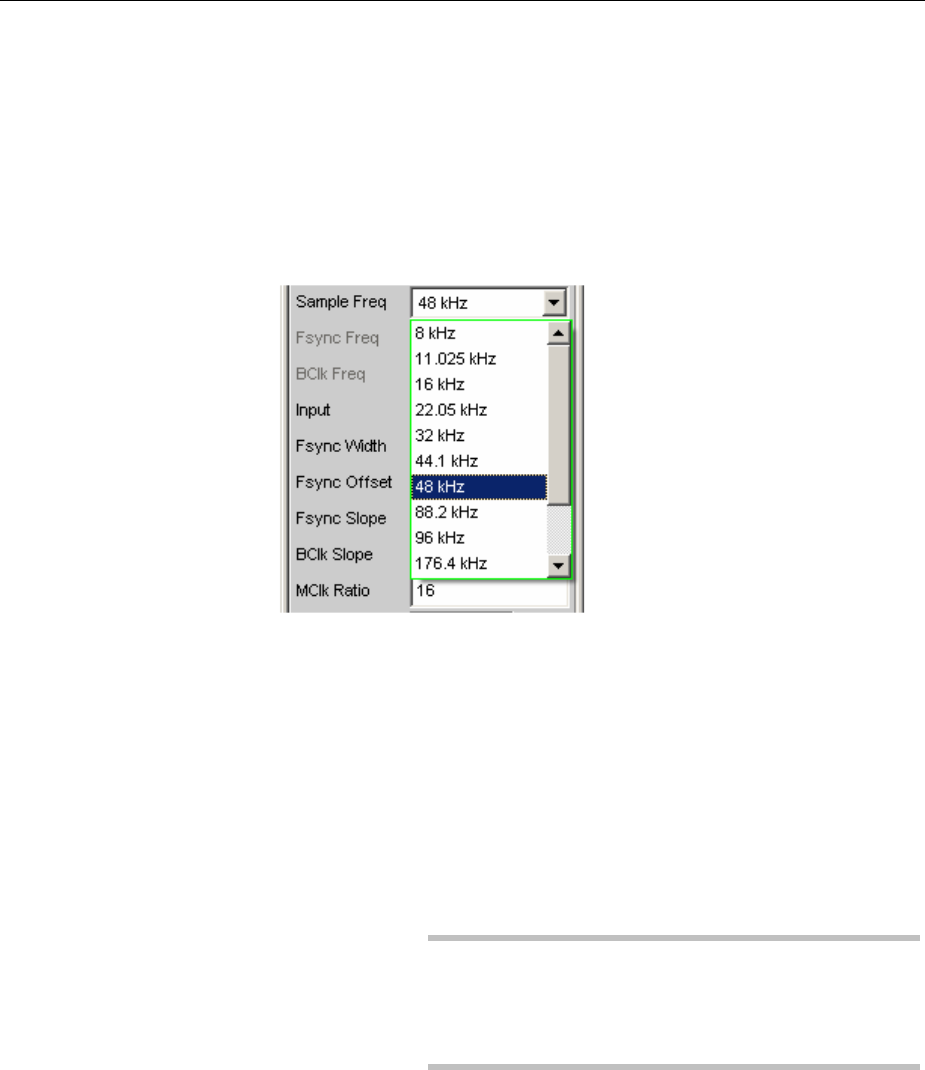
Configuring the USI Dual Channel Analyzer R&S UPV
1146.2084.32 4.190 E-9
Sample Freq
Used to set the sample frequency.
All received audio data frequency specifications relate to this setting. If
the USI analyzer is operated with external synchronisation and the
frequency of the external clock does not correspond to the set sampling
frequency, the analyzer displays incorrect frequency values.
For data formats with one sample per frame, the sampling frequency
corresponds to the frequency of the Fsync signal. In case of several
audio data samples from one source within a frame, the frequency of
the Fsync signal is the product of the sampling frequency divided by the
factor of samples/frame.
Value range for numeric input:
0.84375 kHz to 400 kHz
No_of_Slots * Slot_Length <= 2048
Slot_Length * No_of_Slots * Sample_Freq <= 55.926 MHz
Standard sampling rates can be directly set in the selection field.
Auto The sampling rate is measured and displayed in the
following line. If the sampling rate applied changes, the
set value is automatically updated.
Note:
the digital analyzer must be re-initialised for every new
sampling frequency. So that this time-consuming task
does not have to be performed too often, small
deviations or fluctuations (below 3 Hz) are ignored.
Remote control command:
INPut:SAMPle:FREQuency:MODE AUTo
8kHz 8kHz standard sampling rate
Remote control command:
INPut:SAMPle:FREQuency:MODE F08
11,025 kHz 11.025 kHz standard sampling rate
Remote control command:
INPut:SAMPle:FREQuency:MODE F11

R&S UPV Configuring the USI Dual Channel Analyzer
1146.2084.32 4.191 E-9
16 kHz 16kHz standard sampling rate
Remote control command:
INPut:SAMPle:FREQuency:MODE F16
22,05 kHz 22.05 kHz standard sampling rate
Remote control command:
INPut:SAMPle:FREQuency:MODE F22
32 kHz 32 kHz standard sampling rate
Remote control command:
INPut:SAMPle:FREQuency:MODE F32
44,1 kHz 44.1 kHz standard sampling rate
Remote control command:
INPut:SAMPle:FREQuency:MODE F44
48 kHz 48 kHz standard sampling rate
Remote control command:
INPut:SAMPle:FREQuency:MODE F48
88,2 kHz 88.2 kHz standard sampling rate
Remote control command:
INPut:SAMPle:FREQuency:MODE F88
96 kHz 96 kHz standard sampling rate
Remote control command:
INPut:SAMPle:FREQuency:MODE F96
176,4 kHz 176.4 kHz standard sampling rate
Remote control command:
INPut:SAMPle:FREQuency:MODE F176
192 kHz 192 kHz standard sampling rate
Remote control command:
INPut:SAMPle:FREQuency:MODE F192
384 kHz 384 kHz standard sampling rate
Remote control command:
INPut:SAMPle:FREQuency:MODE F384
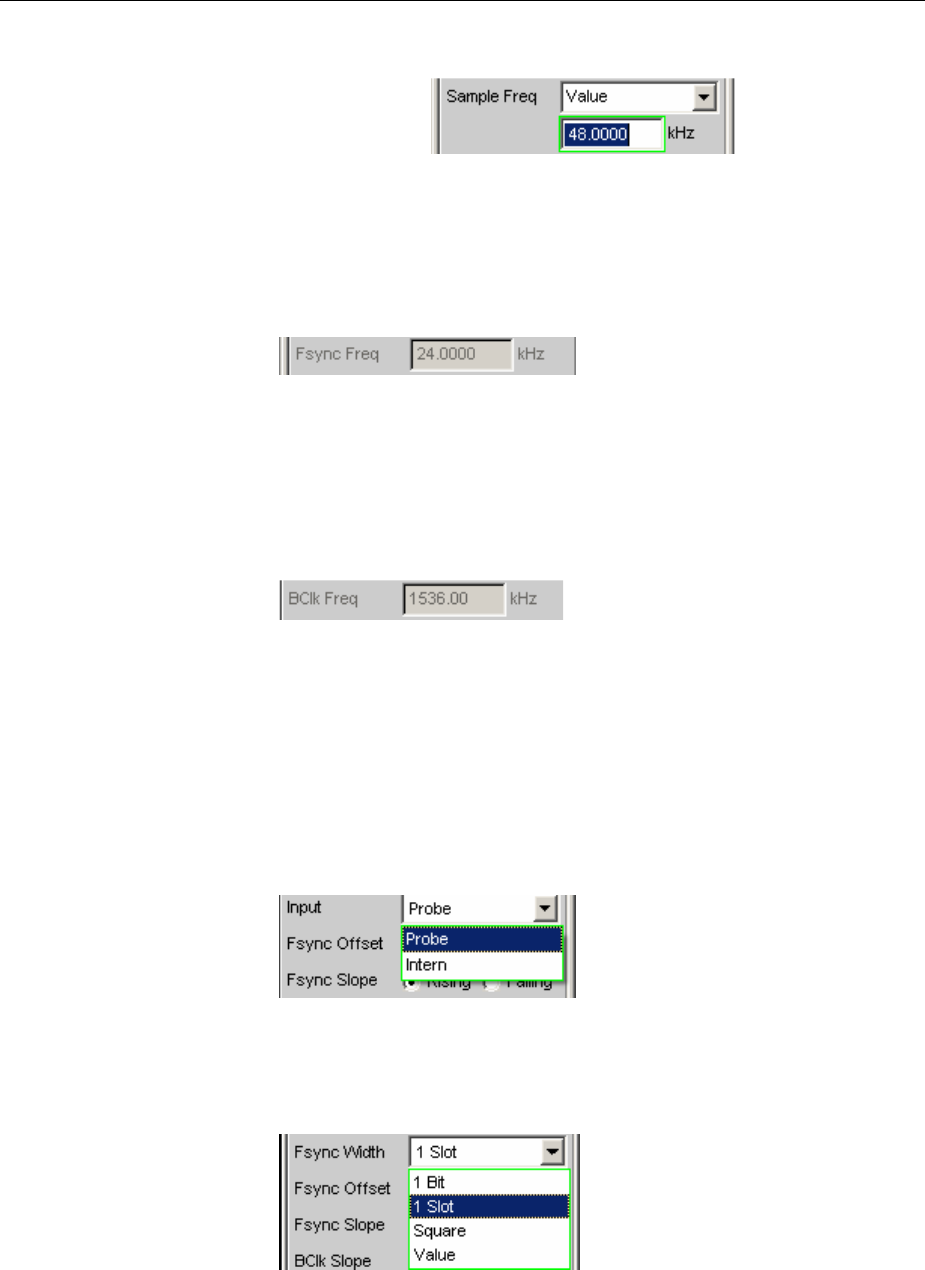
Configuring the USI Dual Channel Analyzer R&S UPV
1146.2084.32 4.192 E-9
Value Sampling rate numeric input
Remote control command:
INPut:SAMPle:FREQuency:MODE VALue
Fsync Freq
Is only displayed for multi-sample formats. The Frame Sync frequency
corresponds to the sampling rate divided by the factor of
samples/frame.
Remote control command:
INPut:FSYNc:FREQuency?
BClk Freq
Displays the bit clock frequency. Is calculated from the product of slot
length * no of slots * sample freq / samples/frame.
Value range: 6.75 kHz ... 55.296 MHz
Remote control command:
INPut:BCLk:FREQuency?
Input
Selection of the analyzer source. In internal mode, the probe is run in
short circuit operation with the generator. For this the generator must be
operated in internal clock synchronization mode and the analyzer in
ExtFsync&BClk mode. The signals produced by the generator can thus
be analyzed without using an external plug connection. If the probe is
selected as a source, the analyzer analyzes the signals at the
connector.
Remote control command:
INPut:INPut INTern|PROBe
Fsync Width
FSync pulse width
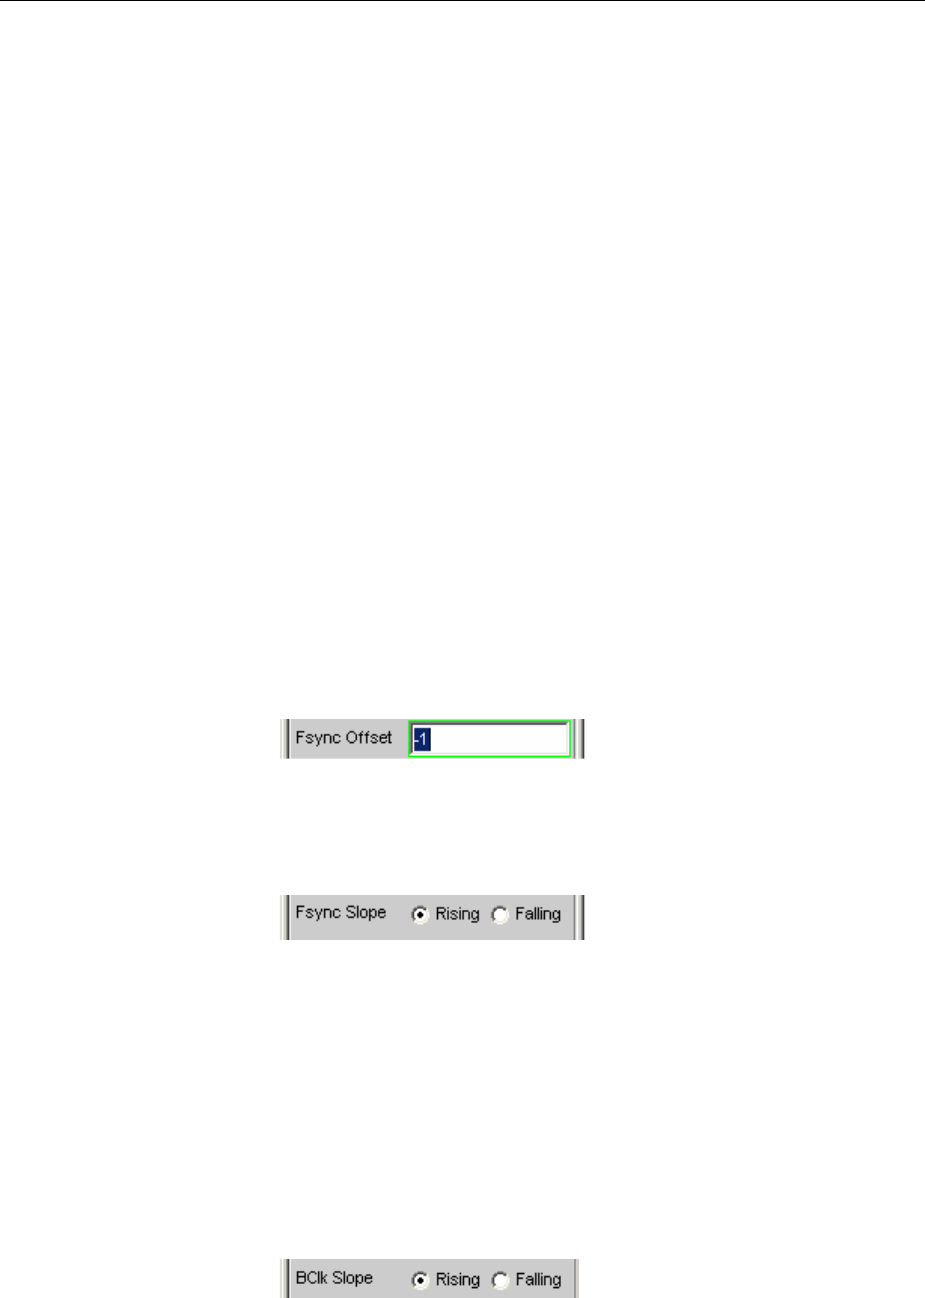
R&S UPV Configuring the USI Dual Channel Analyzer
1146.2084.32 4.193 E-9
1bit Fsync is one data bit in length (BClk period)
Remote control command:
INPut:FWIDth ONEBit
1Slot The FSYNC pulse is one slot in length (= slot length)
Remote control command:
INPut:FWIDth ONESlot
Square The FSYNC pulse has the shape of a symmetrical
rectangle. If the number of bit clock (BClk) cycles is
odd, the high phase is one cycle longer than the low
phase (with Fsync Slope = Rising)
Remote control command:
INPut:FWIDth SQUare
Value The length of the FSYNC pulse corresponds to the
numeric value in data bits (1 BClk period)
Value range: 1 to (slot length*no of slots)-1
Remote control command:
OUTPut:FWIDth VALue
OUTPut:FWIDth:VALue <n>
Fsync Offset
Determines the offset of the Fsync pulse relative to the reference point
(start of the first slot).
Vaue range: -(slot length *no of slots) to (slot length*no of slots) -1
Remote control command:
INPut:FOFFset <n>
Fsync Slope
FSYNC pulse polarity
Rising The FSYNC pulse begins with a positive edge.
Remote control command:
INPut:FSLope RISing
Falling The FSYNC pulss begins with a negative edge.
Remote control command:
INPut:FSLope FALLing
BClk Slope
Bit clock (BClk) polarity
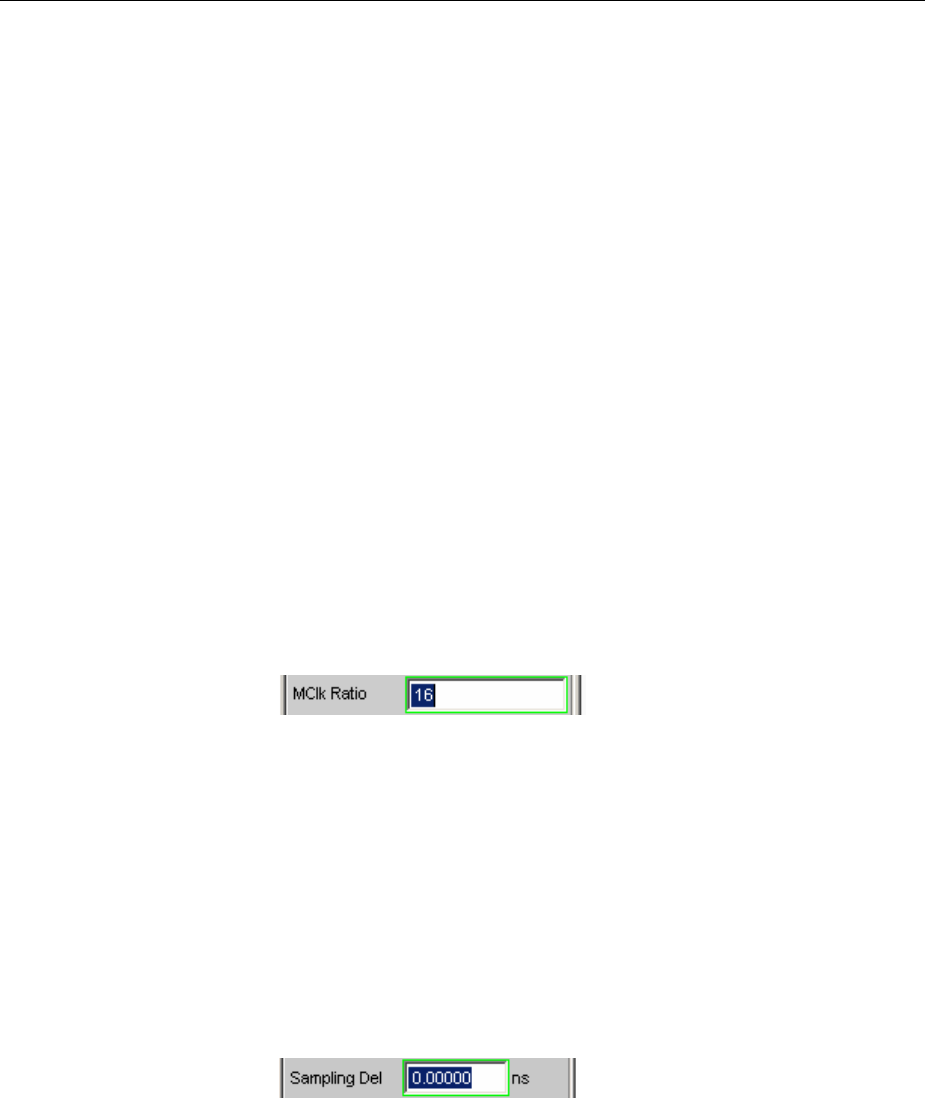
Configuring the USI Dual Channel Analyzer R&S UPV
1146.2084.32 4.194 E-9
Rising The RX_FSYNC_IN, RX_DATA1, RX_DATA2,
RX_DATA3 and RX_DATA4 signals are synchronized
with a rising bit clock edge (RX_BCLK_IN if the
analyzer is synchronised externally, or
RX_BCLK_OUT if it is internally synchronised). The
FrameSync (RX_FSYNC_OUT) generated in master
mode changes, however, with a falling bit clock edge
(RX_BCLK_OUT).
Remote control command:
INPut:BSLope RISing
Falling The RX_FSYNC_IN, RX_DATA1, RX_DATA2,
RX_DATA3 and RX_DATA4 signals are synchronised
with a falling bit clock edge (RX_BCLK_IN if the
analyzer is synchronised externally, and
RX_BCLK_OUT if it is internally synchronised). The
FrameSync (RX_FSYNC_OUT) generated in master
mode changes, however, with a rising bit clock edge
(RX_BCLK_OUT).
Remote control command:
INPut:BSLope FALLing
MClk Ratio
Relationship between the master clock (MCLK) and FrameSync
(FSYNC).
Value range: 16 to 768 (max. 110.592 MHz)
Remote control command:
INPut:MRATio <n>
Sampling Del
This parameter permits a delay of the RX_FSYNC_IN, RX_DATA1,
RX_DATA2, RX_DATA3 and RX_DATA4 input signal sampling times in
relation to the RX_BCLK_IN or RX_BCLK_OUT clocks. Positive values
delay the sampling to a later time.
This feature is used above all if TCO delays, in other words response
times of a device under test being operated in slave mode at high
frequencies, reach the size of a bit clock period. In order to compensate
for bit shifts when analyzing in the analyzer these delay times are
compensated by a later sampling point.
Value range: -10 to +10 ns
Remote control command:
INPut:SDELay <nu>

R&S UPV Configuring the USI Dual Channel Analyzer
1146.2084.32 4.195 E-9
Logic Voltage
Used for setting the analyzer logic voltage. Changing the voltage level
causes the probe to be reloaded. The probe can be attached and
disconnected and put back into operation during operation with this
mechanism.
0.9 Volt 0.9 volts CMOS logic voltage
Remote control command:
INPut:LOGVoltage MV0900
1.2 Volt 1.2 volts CMOS logic voltage
Remote control command:
INPut:LOGVoltage MV1200
1.8 Volt 1.8 volts CMOS logic voltage
Remote control command:
INPut:LOGVoltage MV1800
2.5 Volt 2.5 volts CMOS logic voltage
Remote control command:
INPut:LOGVoltage MV2500
3.3 Volt 3.3 volts LVTTL logic voltage
Remote control command:
INPut:LOGVoltage MV3300
Coding
Generator data coding regulation. A Law and ZLaw quantification
characteristics are available for telephony applications.
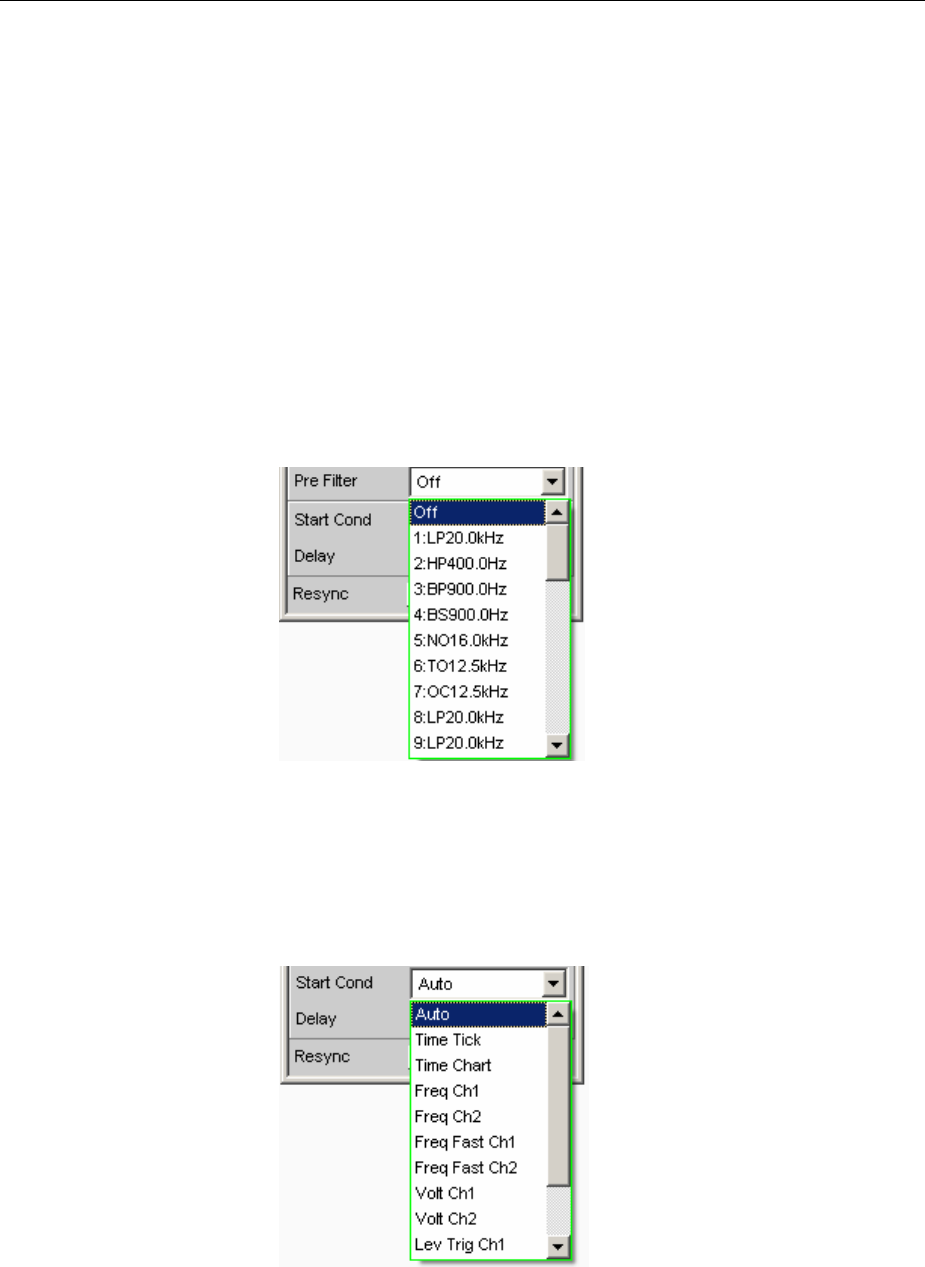
Configuring the USI Dual Channel Analyzer R&S UPV
1146.2084.32 4.196 E-9
None Input data is analyzed linearly PCM coded.
Remote control command:
INPut:CODing NONE
A-Law Input data is analyzed according to A Law.
Remote control command:
INPut:CODing ALAW
J-Law Input data is analyzed according to ZLaw.
Remote control command:
INPut:CODing ULAW
Pre Filter
The selected pre-filter affects all measuring functions. This makes
desired pre-filtering possible without selecting the appropriate filter for
the individual measuring functions.
Remote control command:
INPut:FILTer <parameter>
For a list of the <parameters> see the Filter Table section,Page
4.419.
Start Cond
Specifies the event which triggers a measurement.
Depending on the Start Cond selected the measurement either begins
immediately (Auto) or only when the desired trigger condition is fulfilled;
for details see the Start Conditions section, Page 4.221.

R&S UPV Configuring the USI Dual Channel Analyzer
1146.2084.32 4.197 E-9
Delay
Delay time for Start Cond.
Adelay time can be entered under the Start Cond Auto menu item; for
details see the Start Conditions section, Page 4.221.
Resync
This button causes a complete renewed synchronisation of the
analyzer. If the analyzer is synchronised by external signals in slave
mode the resync mechanismus should be performed once after the
application and synchronisation of the external cocks.
Remote control command:
INPut:RESYnc ONCE
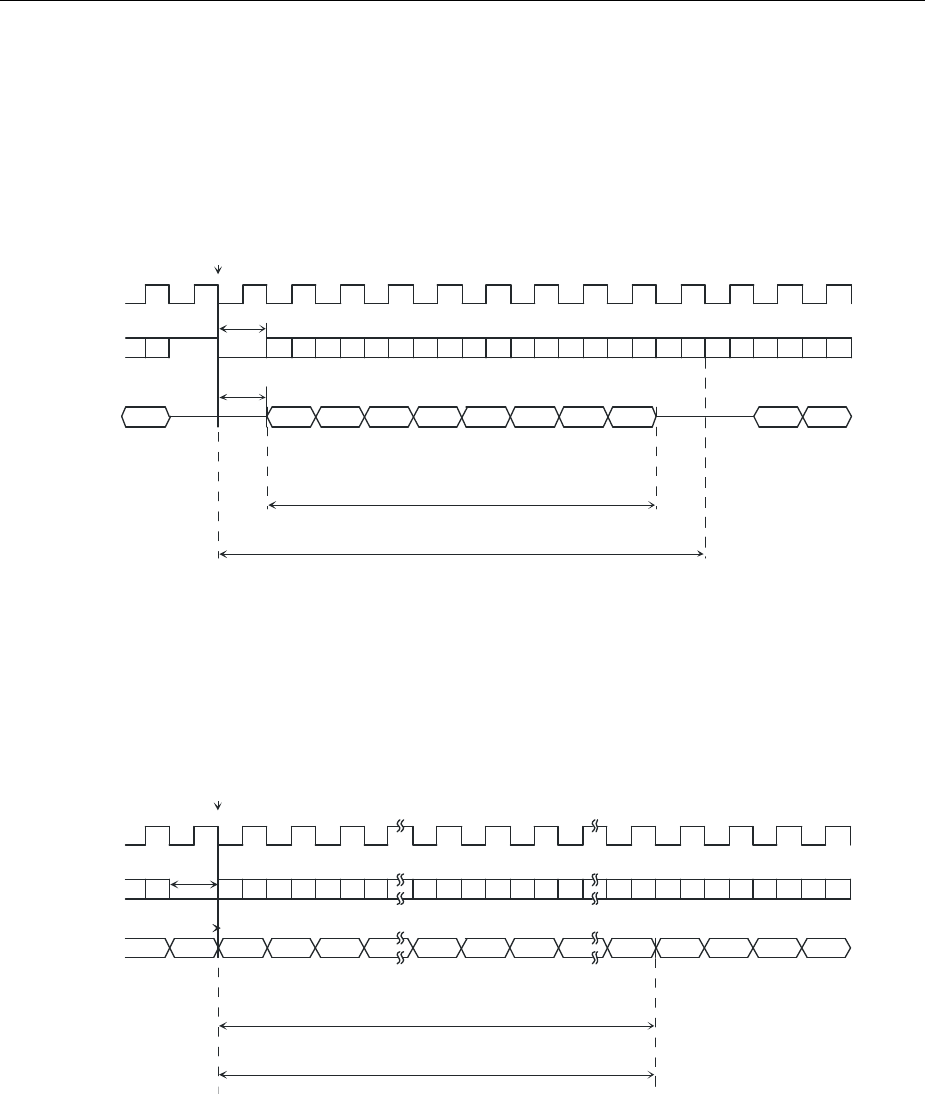
Configuring the USI Dual Channel Analyzer R&S UPV
1146.2084.32 4.198 E-9
Timing Diagrams
Fsync Offset
Lead Bits
RX_BCLK_IN
RX_FSYNC_IN
RX_DATA
MSBLSB
Slot length
Audio Bits
Parameters:
Sync to:EXT Wclk&Bitclk
No of Slots: 2
Slot Length: 10
Audiobits:8
Slot 2 Slot 1 Slot 2
LSBMSB
Reference Point:
Beginning of Slot 1
Bitclk Slope: Rising
Fsync Offset: 1
Fsync Slope: Rising
Lead Bits 1
Bit Order: LSB first
RX_BCLK_IN
RX_FSYNC_IN
RX_DATA MSB LSB
Slot Length
Audio Bits
Lead Bits
Slot 1(left) Slot 2 (right)
LSB MSB
IS Format
2
Slot 2 (right)
Reference Point:
Beginning of Slot 1
Fsync Offset
Parameters:
Sync to:EXT Wclk&Bitclk
No of Slots: 2
Slot Length: 32
Audiobits:32
BClk Slope: Rising
Fsync Offset: -1
Fsync Slope: Falling
Lead Bits 0
Bit Order: MSB first
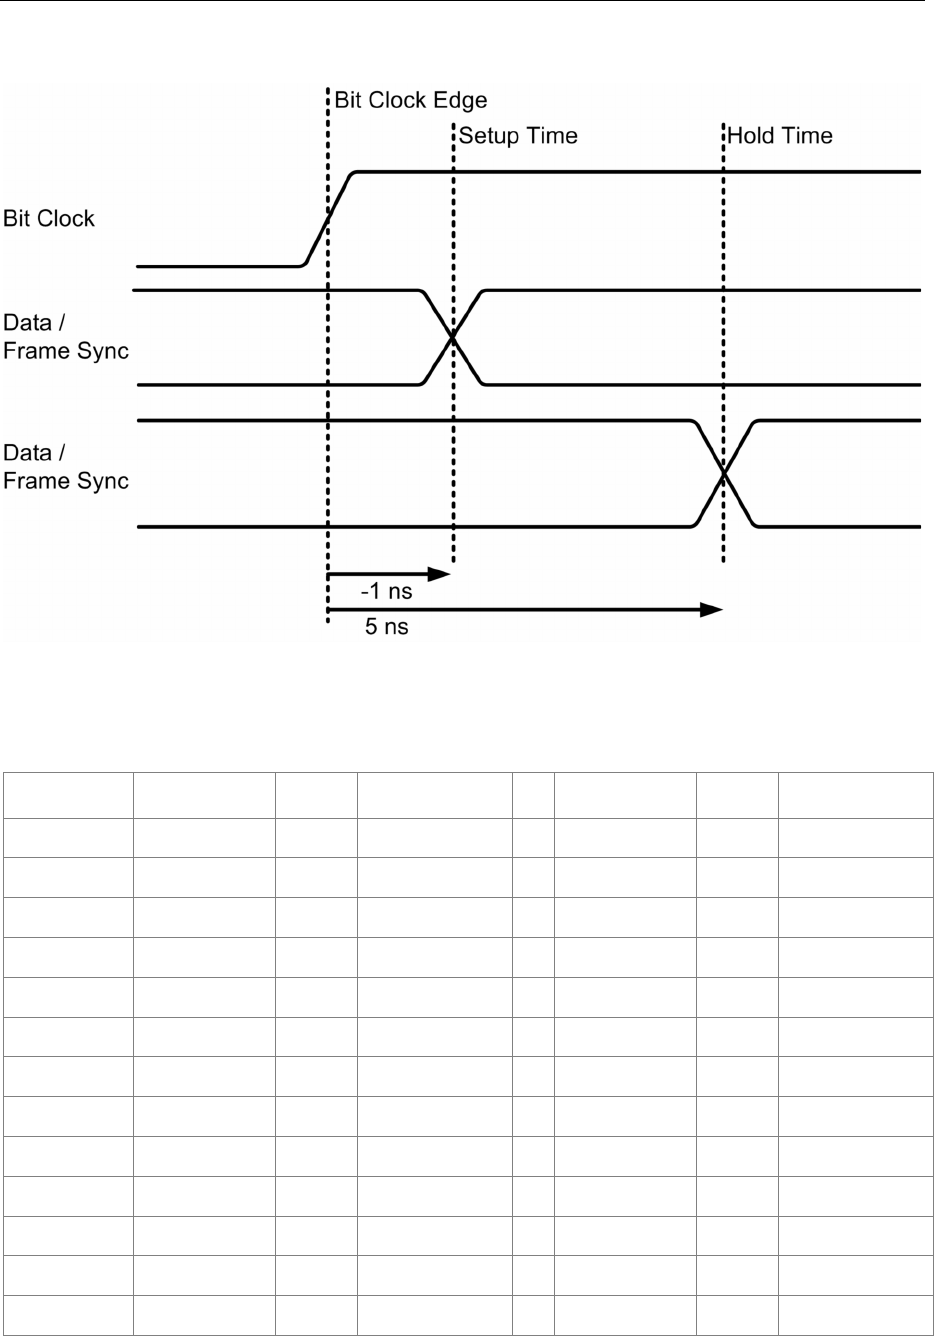
R&S UPV Configuring the USI Dual Channel Analyzer
1146.2084.32 4.199 E-9
Set-up and hold times
Interface allocation
Pin Signal
(I)nput
(O)utput Signal description Pin Signal (I)nput
(O)utput Signal description
1RX_MCLK_OUT A Master clock output
analyzer 14 GND Ground connection
2GND Ground connection 15 RX_DATA2 ESerial data 2
analyzer
3RX_MCLK_IN EMaster clock input
analyzer 16 GND Ground connection
4GND Ground connection 17 RX_DATA3 ESerial data 3
analyzer
5RX_BCLK_OUT ASerial clock output
analyzer 18 GND Ground connection
6GND Ground connection 19 RX_DATA4 ESerial data 4
analyzer
7RX_BCLK_IN ESerial clock input
analyzer 20 GND Ground connection
8GND Ground connection 21 RX_RESERVED1 Reserved for future
expansion
9RX_FSYNC_OUT AFrame Sync output
analyzer 22 RX_RESERVED2 Reserved for future
expansion
10 GND Ground connection 23 RX_RESERVED3 Reserved for future
expansion
11 RX_FSYNC_IN EFrame Sync input
analyzer 24 RX_RESERVED4 Reserved for future
expansion
12 GND Ground connection 25 RX_RESERVED5 Reserved for future
expansion
13 RX_DATA1 ESerial data 1
analyzer 26 RX_RESERVED6 Reserved for future
expansion
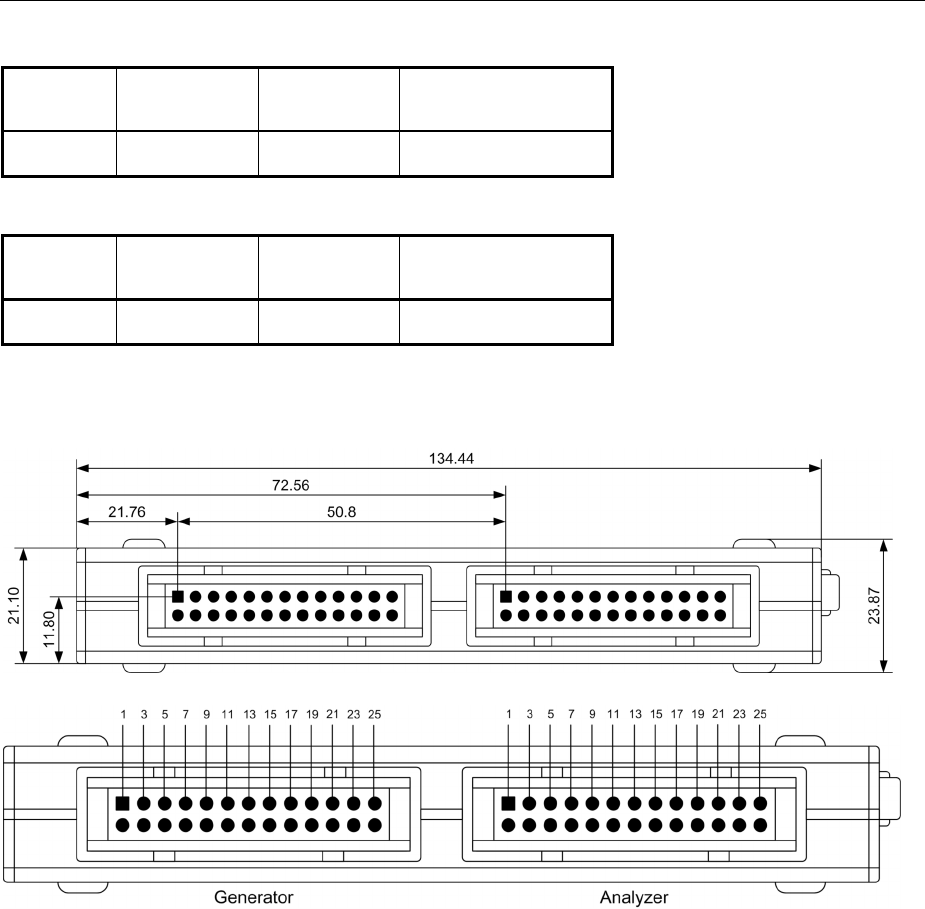
Configuring the USI Dual Channel Analyzer R&S UPV
1146.2084.32 4.200 E-9
CLK IN (BNC connector)
Pin Signal Input (I)
Output (O) Signal description
CLK_IN E Reserved for future
expansion
CLK OUT (BNC connector)
Pin Signal Input (I)
Output (O) Signal description
CLK_OUT A Reserved for future
expansion
Probe Generator/Analyzer Layout:
Recommended PCB push-fit connector:
TYCO AMP LATCH 2-827745-6

R&S UPV Configuring the USI 8 Channel Analyzer
1146.2084.32 4.201 E-9
Configuring the USI 8 Channel Analyzer
USI 8 Channel Analyzer Configuration Panel
The Config panel is used to set the analog and digitalen analyzer. The configuration options for the USI
8channel analyzer are described below.
Meas Channels
Used to set the active measurement channel.
1,2,3,4,5,6,7,8 Measurement channel <n> is switched on or off.
Remote control command:
INPut:MCHannels<n> ON|OFF
Clock
Used to select the continuous clock or gated clock operating mode.
Continuous The continuous clock operating mode requires a
continuous clock for the analyzer. The clock source
may be internal or external. Several types of
synchronisation are available if external
synchronisation is selected.
Remote control command:
INPut:CLOCk CONTinous
Gated The gated clock operating mode must be selected if
the externally supplied bit clock (BClk) and FrameSync
(Fsync) are discontinuous or have such a large jitter
that the internal PLL can no longer follow this clock.
In this operating mode, synchronisation is limited to
the external word clock and bit clock (Ext Fsync&BClk)
option. Audio monitoring of the generated audio signal
is not possible.
Remote control command:
INPut:CLOCk GATed
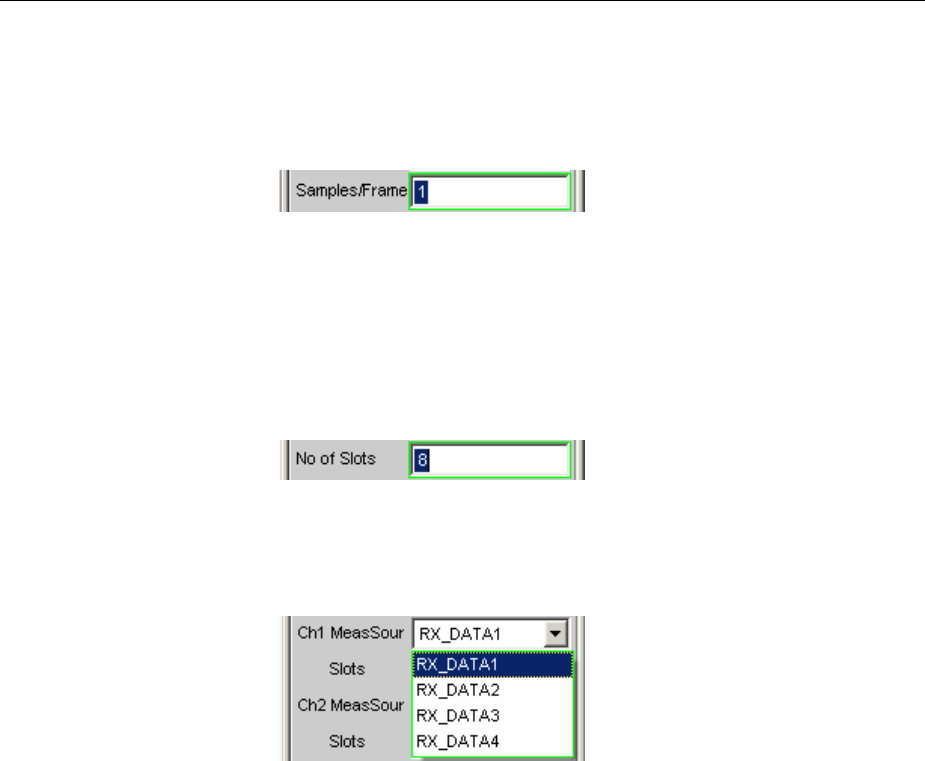
Configuring the USI 8 Channel Analyzer R&S UPV
1146.2084.32 4.202 E-9
Samples/Frame
Used to set the number of samples per frame. The parameter
simultaneously determines the minimum settable sampling rate
according to the designation: fs_min = 843.75 Hz * samples/frame.
Value range: 1 to 32
Remote control command:
INPut:SPFRame <n>
No of Slots
Used to define the number of slots in a frame.
Value range: 1 to 256
No_of_Slots * Slot_Length <= 2048
Slot_Length * No_of_Slots * Sample_Freq <= 55.926MHz
Remote control command:
INPut:NOCHannels <n>
Ch<n> MeasSour
Used to select the input data line for the measuring channel <n>.
RX_DATA1 The RX_DATA1 data line is selected for measurement
channel <n>.
Remote control command:
INPut:MCHSource<n> RX1Data
RX_DATA2 The RX_DATA2 data line is selected for measurement
channel <n>.
Remote control command:
INPut:MCHSource<n> RX2Data
RX_DATA3 The RX_DATA3 data line is selected for measurement
channel <n>.
Remote control command:
INPut:MCHSource<n> RX3Data
RX_DATA4 The RX_DATA4 data line is selected for measurement
channel <n>.
Remote control command:
INPut:MCHSource<n> RX4Data
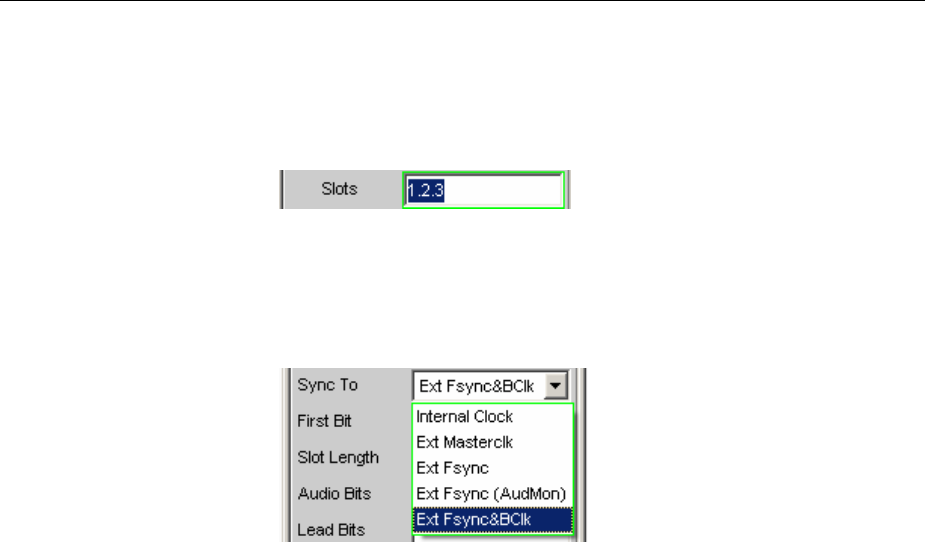
R&S UPV Configuring the USI 8 Channel Analyzer
1146.2084.32 4.203 E-9
Slots
Used to select the audio frame channel for measurement channel <n>.
(More than one channel can only be selected with multi-sample formats!
In this case a frame contains several consecutive samples from one
signal source)
Value range: 1 to.no of slots
Remote control command:
INPut:SLOTs<n> 'a.b.c. ... .z'
Sync To
Used to select the clock source with which the USI analyzer is
synchronised.
Internal Clock The analyzer uses the internal device clock.
Remote control command:
INPut:SYNCto IClock
Ext Masterclk Synchronisation with the externally supplied master
clock signal (TX_MCLK_IN).
Remote control command:
INPut:SYNCto EMASterclock
Ext Fsync Synchronisation with an external FrameSync signal
(TX_FSYNC_IN). The analyzer signal cannot be audio
monitored. A master clock is additionally supplied.
Remote control command:
INPut:SYNCto EFSYnc
Ext Fsync
(AudMon)
Synchronisation with an external FrameSync signal
(TX_FSYNC_IN). The analyzer signal can be audio
monitored. No master clock signal is supplied.
Remote control command:
INPut:SYNCto EFAMon
Ext
Fsync&BClk
Synchronisation with the external FrameSync
(TX_FSYNC_IN) nd bit clock (TX_BClk_IN) signals.
Remote control command:
INPut:SYNCto EFSYnc
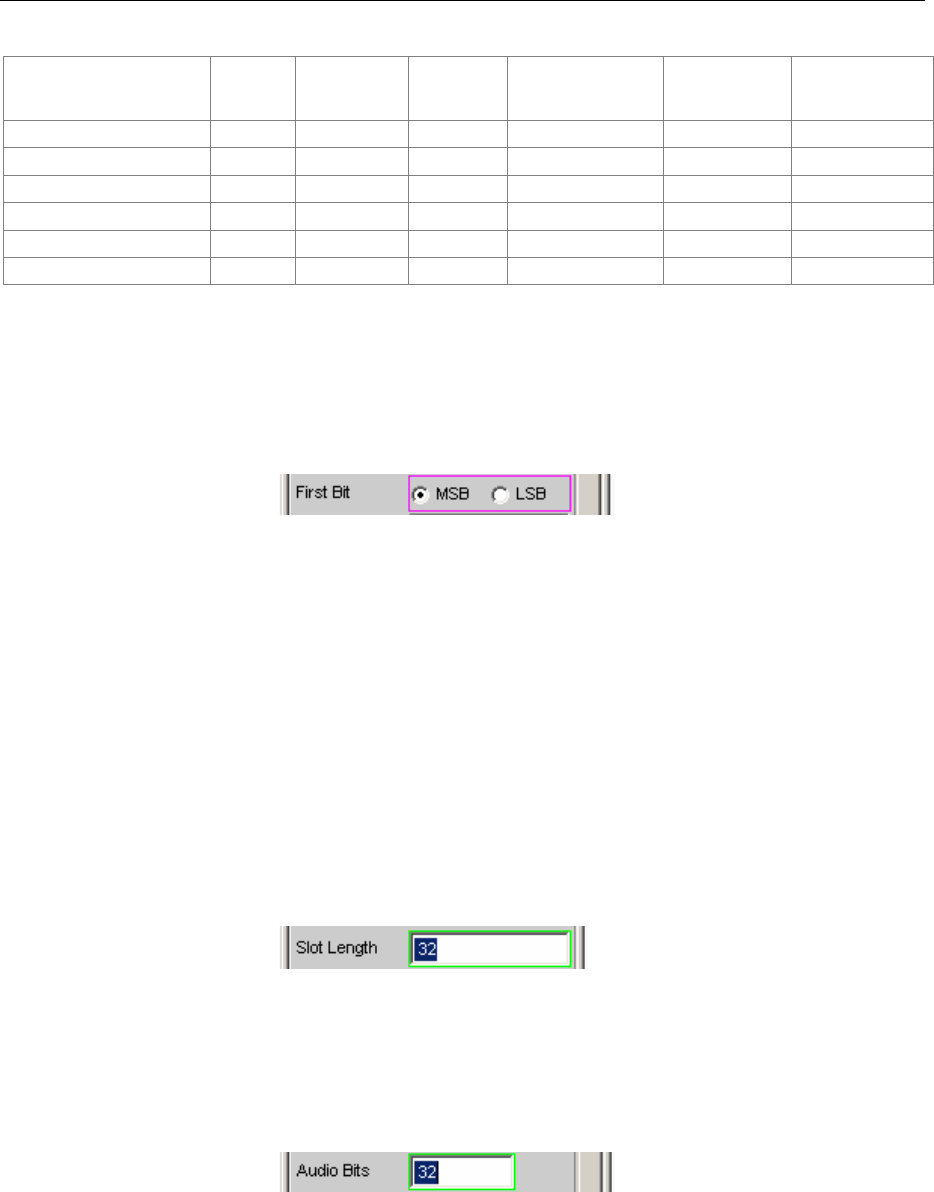
Configuring the USI 8 Channel Analyzer R&S UPV
1146.2084.32 4.204 E-9
Overview of the various synchronisation modes:
Internal
clock
External
master clock
External
frame sync
External frame sync
with audiomonitor
External frame
sync, bit clock
External frame
sync, bit clock
(gated)
Master clock Output otri o tri tri tri
Master clock Input -- x -- -- -- --
Bit clock Output o o o o tri tri
Bit clock Input -- -- -- -- x x
Frame sync Output o o o o tri tri
Frame sync Input -- -- x x x x
xInput Signal must be present
oOutput Signal is available
tri Output in tristate mode (high impedance)
-- Unused Input
First Bit
Used to define the sequence in which the data bits are received.
MSB The most significant data bit is received first.
Remote control command:
INPut:FBIT MSB
LSB The least significant data bit is received first.
Remote control command:
INPut:FBIT LSB
Slot Length
Word length of a slot including gaps (0 bits)
Value range: 1 to 256
No_of_Slots * Slot_Length <= 2048
Slot_Length * No_of_Slots * Sample_Freq <= 55.926 MHz
Remote control command:
INPut:SLTLength <n>
Audio Bits
Slot length of the audio data within a slot.
Only the specified number of data bits are analyzed.
Value range: 8 to slot length(max 32)
Remote control command:
INPut:AUDiobits <n>
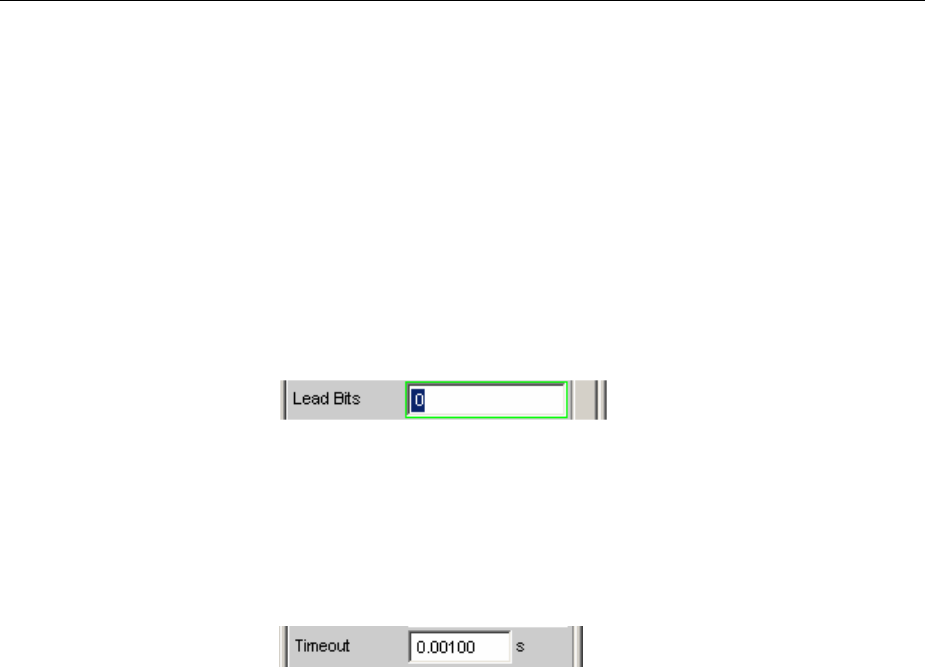
R&S UPV Configuring the USI 8 Channel Analyzer
1146.2084.32 4.205 E-9
Lead Bits
Defines the offset for the audio bits within a slot relative to the start of
the slot.
If LSB is selected as first bit the setting for lead bits is automatically
corrected if the setting for audio bits is changed so that the MSB is
transmitted at the same location. This has the advantage that the
resolution of the signal transmitted is changed but not the amplitude if
the audio bits are changed.
Example:
Slot Length: 32
Audio Bits: 24 23 (setting changed by user)
Lead Bits: 8 9(automatic correction)
Value range: 0 to audio bits slot length
Remote control command:
OUTPut:LBITs <n >
Timeout
Only availabe in Gated Clock mode. This parameter defines the
maximum time span for which external clocks are allowed to
discontinue before the measurement is declared as invalid.
Value range: 1 to 500ms
Remote control command:
INPut:TIMeout <nu>
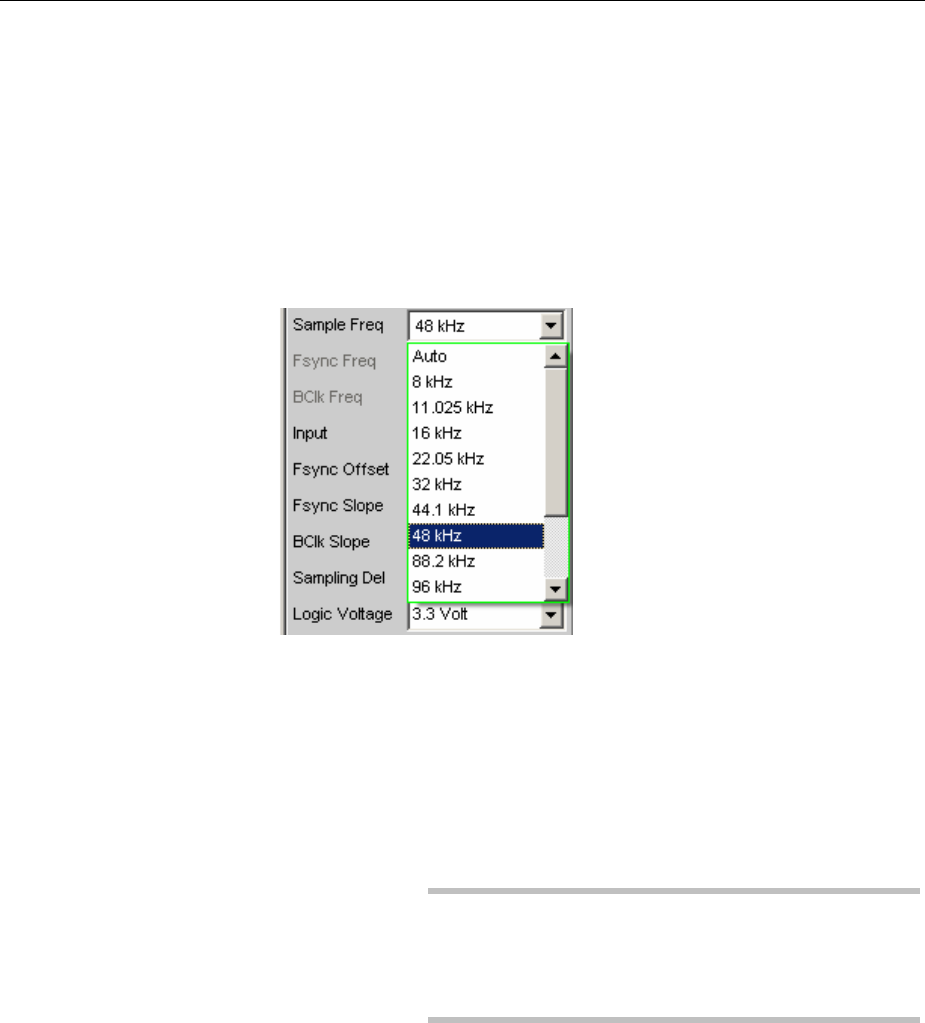
Configuring the USI 8 Channel Analyzer R&S UPV
1146.2084.32 4.206 E-9
Sample Freq
Setting the sampling frequency.
All frequency specifications of the generated audio data refer to this
setting. If the USI analyzer is operated with external synchronisation
and the frequency of the external clock signal does not correspond to
the set sampling frequency the analyzer displays incorrect frequency
values.
For data formats with one sample per frame, the sampling frequency
crorresponds to the frequency of the Fsync signal. In case of several
audio data samples from one source within one frame, the frequency of
the Fsync signal is the product of the sampling frequency divided by the
factor of samples/frame.
Value range for numeric input: 0.84375 kHz to 400 kHz
No_of_Slots * Slot_Length <= 2048
Slot_Length * No_of_Slots * Sample_Freq <= 55.926 MHz
Standard sampling frequencies can be set directly in the selection field.
Auto The sampling rate is measured, set and displayed in
the following line. If the applied sampling rate is
changed the set value is automatically updated.
Note:
The digital analyzer must re-initialised with every new
sampling frequency. Small deviations (below 3 Hz) are
ignored to prevent this time-consuming process having
to be performed more often than necessary.
Remote control command:
INPut:SAMPle:FREQuency:MODE AUTo
8kHz 8kHz standard sampling rate
Remote control command:
INPut:SAMPle:FREQuency:MODE F08
11,025 kHz 11.025 kHz standard sampling rate
Remote control command:
INPut:SAMPle:FREQuency:MODE F11

R&S UPV Configuring the USI 8 Channel Analyzer
1146.2084.32 4.207 E-9
16 kHz 16 kHz standard sampling rate
Remote control command:
INPut:SAMPle:FREQuency:MODE F16
22,05 kHz 22.05 kHz standard sampling rate
Remote control command:
INPut:SAMPle:FREQuency:MODE F22
32 kHz 32 kHz standard sampling rate
Remote control command:
INPut:SAMPle:FREQuency:MODE F32
44,1 kHz 44.1 kHz standard sampling rate
Remote control command:
INPut:SAMPle:FREQuency:MODE F44
48 kHz 48 kHz standard sampling rate
Remote control command:
INPut:SAMPle:FREQuency:MODE F48
88,2 kHz 88.2 kHz standard sampling rate
Remote control command:
INPut:SAMPle:FREQuency:MODE F88
96 kHz 96 kHz standard sampling rate
Remote control command:
INPut:SAMPle:FREQuency:MODE F96
176,4 kHz 176.4 kHz standard sampling rate
Remote control command:
INPut:SAMPle:FREQuency:MODE F176
192 kHz 192 kHz standard sampling rate
Remote control command:
INPut:SAMPle:FREQuency:MODE F192
384 kHz 384 kHz standard sampling rate
Remote control command:
INPut:SAMPle:FREQuency:MODE F384
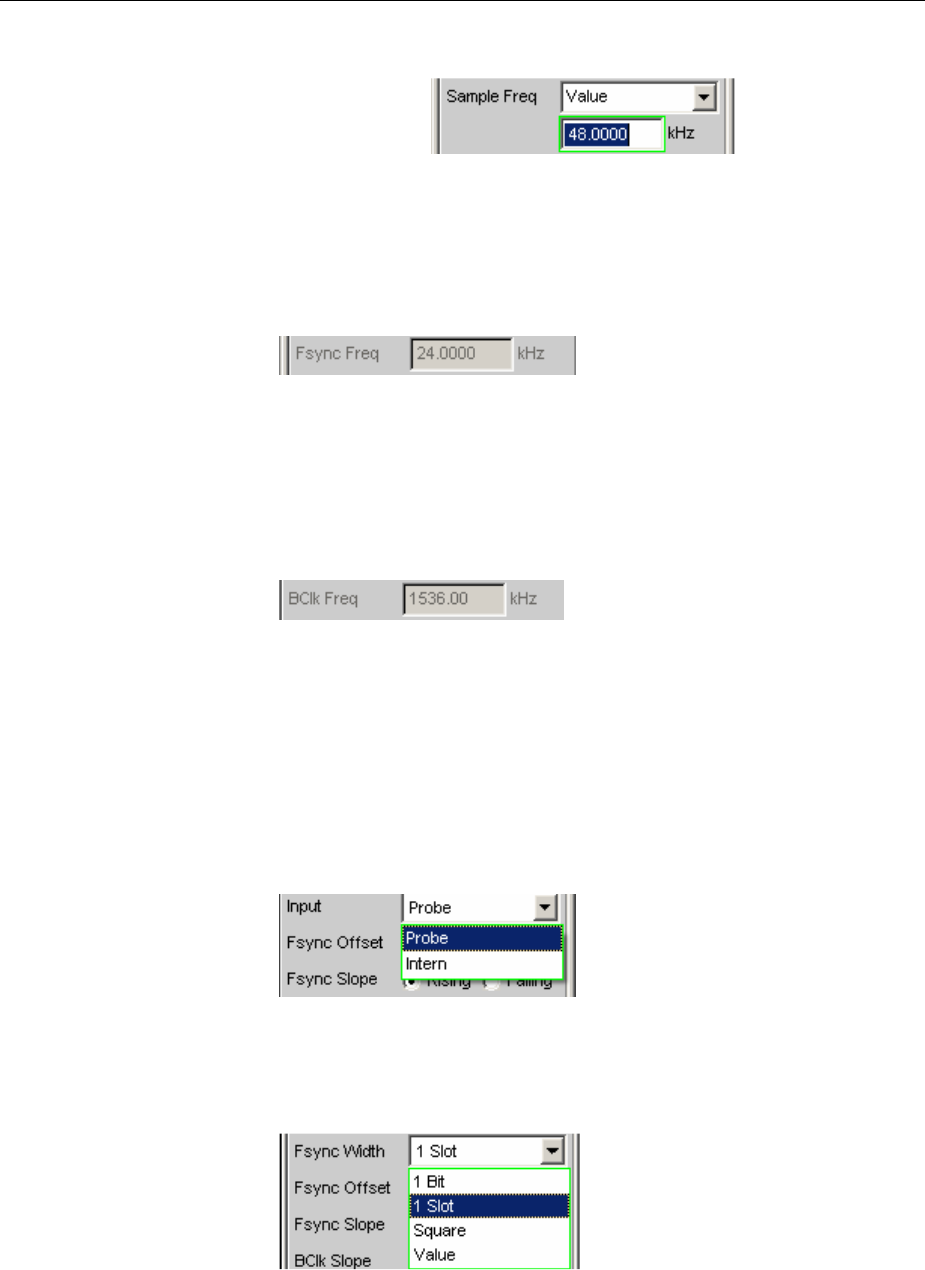
Configuring the USI 8 Channel Analyzer R&S UPV
1146.2084.32 4.208 E-9
Value Variable sampling rate input
Remote control command:
INPut:SAMPle:FREQuency:MODE VALue
INPut:SAMPle:FREQuency <nu>
Fsync Freq
Is only displayed for multi-sample formats. The Frame Sync frequency
corresponds to the sampling rate divided by the samples/frame factor.
Remote control command:
INPut:FSYNc:FREQuency?
BClk Freq
Displays the bit clock frequency. Is the product of slot length * no of
slots * sample freq / samples/frame.
Value range: 6.75 kHz ... 55.296 MHz
Remote control command:
INPut:BCLk:FREQuency?
Input
Selection of the analyzer source. In internal mode, the probe is run in
short circuit operation with the generator. For this the generator must be
operated in internal clock synchronization mode and the analyzer in
ExtFsync&BClk mode. The signals produced by the generator can thus
be analyzed without using an external plug connection. If the probe is
selected as a source, the analyzer analyzes the signals at the
connector.
Remote control command:
INPut:INPut INTern|PROBe
Fsync Width
FSYNC pulse length
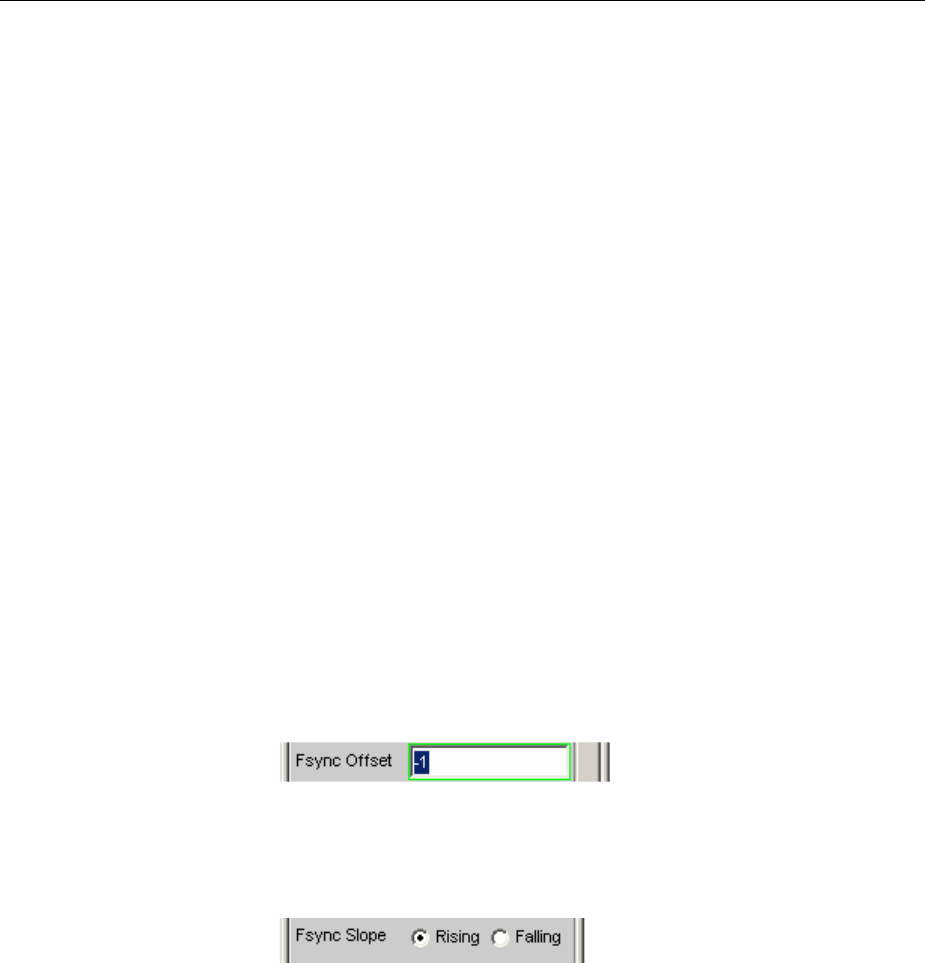
R&S UPV Configuring the USI 8 Channel Analyzer
1146.2084.32 4.209 E-9
1bit The FSYNC pulse is one data bit in length (1 BClk
period)
Remote control command:
INPut:FWIDth ONEBit
1Slot FSYNC is one audio slot in length (= slot length)
Remote control command:
INPut:FWIDth ONEChannel
Square FSYNC pulse has the shape of a symmetrical
rectangle. If the number of the bit clock (BClk) cycles
is odd the high phase is one cycle longer than the low
phase (if Fsync slope = rising)
Remote control command:
INPut:FWIDth SQUare
Value The FSYNC length corresponds to the numeric value
in data bits (1 BClk period)
Value range: 1 to (slot length*no of slots)-1
Remote control command:
INPut:FWIDth VALue
INPut:FWIDth:VALue <n>
Fsync Offset
Used to define the offset of the Fsync pulse relative to the reference
point (the start of the first slot)
Value range: -slot length to+slot length-1
Remote control command:
INPut:FOFFset <n>
Fsync Slope
FSYNC pulse polarity
Rising The FSYNC pulse begins with a positive edge.
Remote control command:
INPut:FSLope RISing
Falling The FSYNC pulse begins with a negative edge.
Remote control command:
INPut:FSLope FALLing
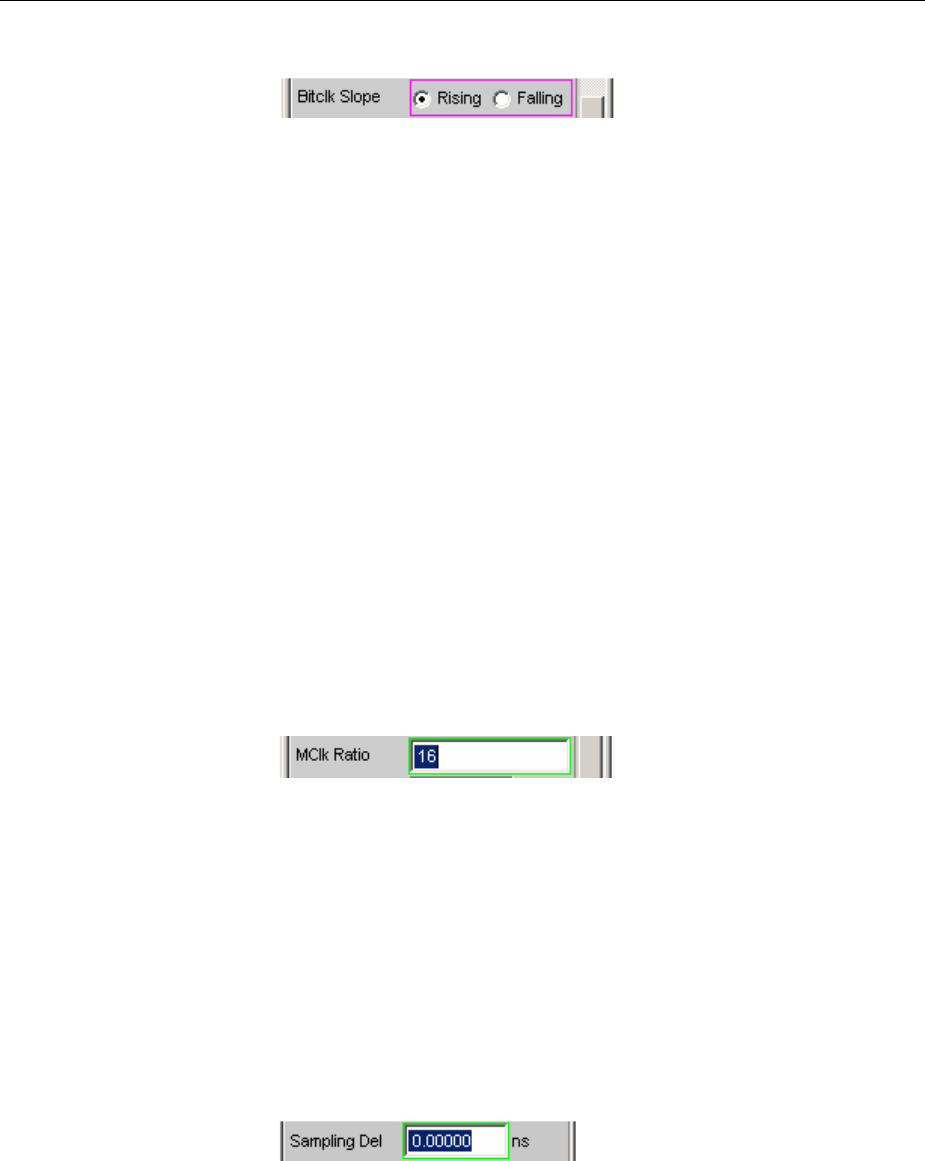
Configuring the USI 8 Channel Analyzer R&S UPV
1146.2084.32 4.210 E-9
BClk Slope
Bit clock polarity (BClk)
Rising RX_FSYNC_IN, RX_DATA1, RX_DATA2, RX_DATA3
and RX_DATA4 are sampled and the
RX_FSYNC_OUT signal is output with a rising bit
clock edge (the bit clock signal to which this setting
refers is either RX_BClk_IN if the analyzer is operated
as a slave, or RX_BClk_OUT if the analyzer is clocked
internally).
Remote control command:
INPut:BSLope RISing
Falling RX_FSYNC_IN, RX_DATA1, RX_DATA2, RX_DATA3
and RX_DATA4 are sampled and the
RX_FSYNC_OUT is output with a falling bit clock edge
(the bit clock signal to which this setting refers is either
RX_BClk_IN if the analyzer is operated as a slave, or
RX_BClk_OUT if the analyzer is clocked internally).
Remote control command:
INPut:BSLope FALLing
MClk Ratio
Relationship between the master clock (MCLK) and FrameSync
(FSYNC).
Value range: 16 to 768 (max. 110,592 MHz)
Remote control command:
INPut:MRATio <n>
Sampling Del
This parameter permits the sampling time for RX_FSYNC_IN,
RX_DATA1, RX_DATA2, RX_ATA3 and RX_DATA4 input signals to be
delayed relative to the RX_BClk_IN or RX_BClk_OUT clock. Positive
values move the sampling towards a later time.
This feature is used above all if TCO delays, in other words response
times of a device under test being operated in slave mode at high
frequencies, reach the size of a bit clock period. In order to compensate
for bit shifts when analyzing in the analyzer these delay times are
compensated by a later sampling point.
Value range: -10 to +10 ns
Remote control command:
INPut:SDELay <nu>

R&S UPV Configuring the USI 8 Channel Analyzer
1146.2084.32 4.211 E-9
Logic Voltage
Used for setting the analyzer logic voltage. Changing the voltage level
causes the probe to be reloaded. This mechanism permits the probe to
be detached and attached and put back into operation during operation.
0.9 Volt 0.9 Volt CMOS logic voltage
Remote control command:
INPut:LOGVoltage MV0900
1.2 Volt 1.2 Volt CMOS logic voltage
Remote control command:
INPut:LOGVoltage MV1200
1.5 Volt 1.5 Volt CMOS logic voltage
Remote control command:
INPut:LOGVoltage MV1500
1.8 Volt 1.8 Volt CMOS logic voltage
Remote control command:
INPut:LOGVoltage MV1800
2.5 Volt 2.5 Volt CMOS logic voltage
Remote control command:
INPut:LOGVoltage MV2500
3.3 Volt 3.3 Volt LVTTL logic voltage
Remote control command:
INPut:LOGVoltage MV3300

Configuring the USI 8 Channel Analyzer R&S UPV
1146.2084.32 4.212 E-9
Coding
Input data decoding regulation. A Law and ZLaw quantification
characteristics are available for telephony applications.
None Input data is analyzed linearly PCM-coded.
Remote control command:
INPut:CODing NONE
A-Law Input data is analyzer accoridng to A Law.
Remote control command:
INPut:CODing ALAW
J-Law Input data is analyzed according to ZLaw.
Remote control command:
INPut:CODing ULAW
Pre Filter
The selected pre-filter affects all measuring functions. This permits
desired pre-filtering without selecting appropriate filters for the
individual measuing functions.
Remote control command:
INPut:FILTer <parameter>
For a list of <parameters> see the Filter Table section,Page 4.419.

R&S UPV Configuring the USI 8 Channel Analyzer
1146.2084.32 4.213 E-9
Ref Channel
Reference channel for phase measurements or other channel-related
measurements.
Each measurement channel can be selected as a reference channel. If
achannel which is selected as a reference channel is not yet active
(switched off) the channel is automatically switched on.
Switching off a measurement channel which has been selected as a
reference channel is prevented and the user is made aware of this by a
warning:
Ch <n> Channel <n> is selected as a reference channel
Remote control command:
SENSe:REFerence:CHANnel CH<n>
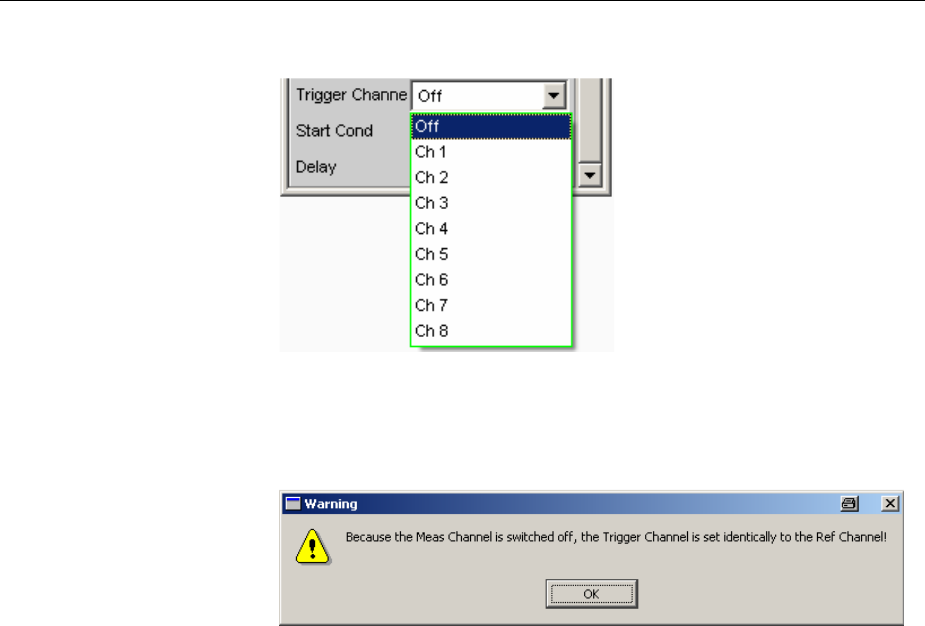
Configuring the USI 8 Channel Analyzer R&S UPV
1146.2084.32 4.214 E-9
Trigger Channel
Used to select the channel whose event triggers a measurement.
If a measuring channel which was inactive is selected as a trigger
channel it is automatically switched on.
If the channel selected as a trigger channel is switched off the following
warning appears:
The trigger channel can be switched off; however, this causes the
reference channel to automatically become the trigger channel.
Off Triggering is not active.
Remote control command:
TRIGger:CHANnel OFF
Ch <n> Triggering is active. Channel <n> is selected as trigger
channel.
Remote control command:
TRIGger:CHANnel CH<n>
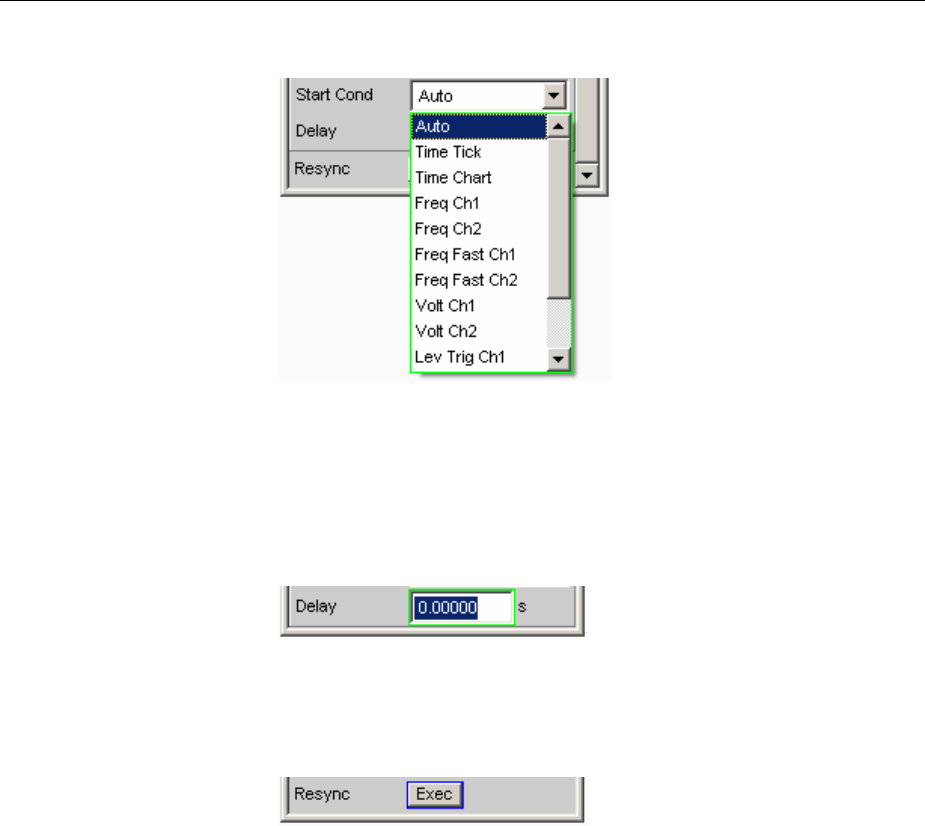
R&S UPV Configuring the USI 8 Channel Analyzer
1146.2084.32 4.215 E-9
Start Cond
Specifies the event which triggers a measurement.
After the Start Cond has been selected the measurement either begins
immediately (Auto) or only when the desired trigger condition is fulfilled;
for details see the Start Conditions section, Page 4.221.
Delay
Delay time for Start Cond.
Adelay time can be entered under the Auto Start Cond menu item; for
details see the Start Conditions section, Page 4.221.
Resync
This button causes a complete re-synchronisation of the analyzer. If the
analyzer is synchronised by external signals whilst in slave mode the
resync mechanism should be perfomed once after the external clock
has been applied and attuned.
Remote control command:
INPut:RESYnc ONCE
Timing Diagrams
Identical to the Dual Channel Analyzer (see page 4.198)
Interface assignment
Identical to the Dual Channel Analyzer (see page 4.199)

Starting Measurements R&S UPV
1146.2084.32 4.216 E-9
Starting Measurements
In manual operating mode, measurements are started (and also stopped) using the keys "START",
"SINGLE" and "STOP/CONT" in the "CONTROL" panel. The effect of these keys depends on whether
or not the sweep system is active:
•The measurement system can only be directly controlled using the keys if the sweep system is
inactive.
•If, however, the sweep system is active,the measurement system is controlled by the sweep
system and the keys are used to control the sweep system.
Overview of the Measurement System
The following information refers to a deactivated sweep system,i.e. a sweep is not activated in either
the generator or the analyzer.
Ameasurement, in a narrower sense, is the one-off or continuous recording of measurement values
for all activated measurement types. It can take the form of a single measurement value or a data set
(sample in the time domain, spectral lines in the frequency domain).
The one-off recording of measurement values is referred to as a single measurement (see section
"Single measurement" on page 4.219 and continuous recording as a continuous measurement (see
section "Continuous measurement" on page 4.218.
The measurement system is controlled
•explicitly using the control keys START (Ctrl F5), SINGLE (Ctrl F6) and STOP/CONT (Ctrl F7).
•implicitly by means of "termination events". These are events (user entries) which invalidate the
measurement currently being performed, i.e. changes in the generator, analyzer or filter bank.
Following a termination event, the current measurement is restarted automatically. This ensures
that the displayed measurement data is not corrupted by internal switching operations. Since it
takes a few milliseconds to terminate and restart a measurement in progress, settings should not be
entered in remote-control mode unless measurement has stopped.
Activating and Deactivating Measurement Types
With the R&S UPV it is possible to record up to 8 different measurement values simultaneously and
display them numerically and/or graphically. These measurement values are
•selected measurement function for channel 1 and 2
•level monitor (RMS or DC downstream of the prefilter) for channel 1 and 2
•input monitor (peak measurement upstream of the prefilter) for channel 1 and 2
•frequency on channel 1; frequency, phase or group delay on channel 2

R&S UPV Starting Measurements
1146.2084.32 4.217 E-9
It is also possible to record a large number of data sets which can also be displayed numerically and/or
graphically:
•Post FFT and/or bargraph for channel 1 and 2 with distortion measurements; FFT as measurement
function
•FFT Monitor (4 k FFT) for channel 1 and 2
•Waveform (display of the measurement signal in the time domain) for channel 1 and 2
Although the measurement types mentioned above are performed simultaneously and therefore affect
each other only slightly with respect to time, it is only possible to display the results of these
measurements in sequence. It is therefore recommended to deactivate any measurement types that are
not required in order to reduce the total measurement time:
•Switching over to single-channel measurement (in the "Analyzer Config" panel) stops the other
measurement channel from being measured and displayed.
•Deactivating individual measurement types (in the "Analyzer Function" panel) stops measurement
results which are not required from being recorded and displayed.
(with distortion measurements)
All activated measurement types are measured in each (single) measurement. The measurement is not
regarded as having been completed until all of the desired results (possibly also with settling) are
available. Only then can the sweep be stepped or a triggered measurement result be retrieved by the
remote control station. Consequently, the slowest measurement type determines the measurement
speed of the entire instrument.
States of the Measurement System
The states of the measurement system are displayed above the softkeys (channel 1 above the 5th
softkey and channel 2 above the 6th softkey). The current state is also indicated by the two LEDs above
the START and SINGLE key.

Starting Measurements R&S UPV
1146.2084.32 4.218 E-9
The following states are possible:
Off Channel is deactivated; measurement values are not recorded on this channel.
Single Single measurement is being performed.
Cont Continuous measurement is being performed.
Terminated (Single) measurement has been terminated.
Stopped Measurement has been terminated; continuous measurement has been stopped.
The state of a current measurement (e.g. "Rang") or of the terminated measurement (e.g. "Over" if no
measurement result is available due to "OVERRANGE") is also indicated.
More detailed information on these status displays can be found in chapter 3, "Overview of Status
Messages".
SINGLE or Abort
SINGLE or
Abort SINGLE or Abort
STOPPED STOP/CONT SNGL RUNNING
START
STOP/CONT
CONT RUNNING
Abort
START
START, STOP/CONT START, STOP/CONT
SINGLE
TERMINATED
Continuous measurement
This is the standard operating mode of the measurement system and is set each time the R&S UPV is
switched on. With continuous measurement, only the START LED lights up. The R&S UPV measures
all activated measurement types continuously until one of the following events occurs:
Pressing the START key stops the current measurement immediately,
resets the MIN/MAX indicator, the MIN/MAX values, the limit violations
of the measurement displays and the highlighting of the protocol
analysis, and causes the continuous measurement to be restarted.
Furthermore, starting or restarting a measurement also causes certain
generator functions to restart:
•Burst signals (sine burst and sine² burst) are reset, that is, they start
at the burst phase or "Burst on Delay".
•The Play function starts again at the first sample in the WAV file.
•The Arbitrary function also starts again at the beginning.
Remote-control command:
INIT:CONT ON
INIT:FORCe STARt
Pressing the SINGLE key switches the instrument to single
measurement mode. Each measurement type first completes the
measurement that has already been started; when all measurement
types have been completed, the measurement system is in the "Term"
(terminated) state. Continuous measurement can be reactivated by
pressing the START or STOP/CONT key.
Remote-control command:
INIT:CONT OFF
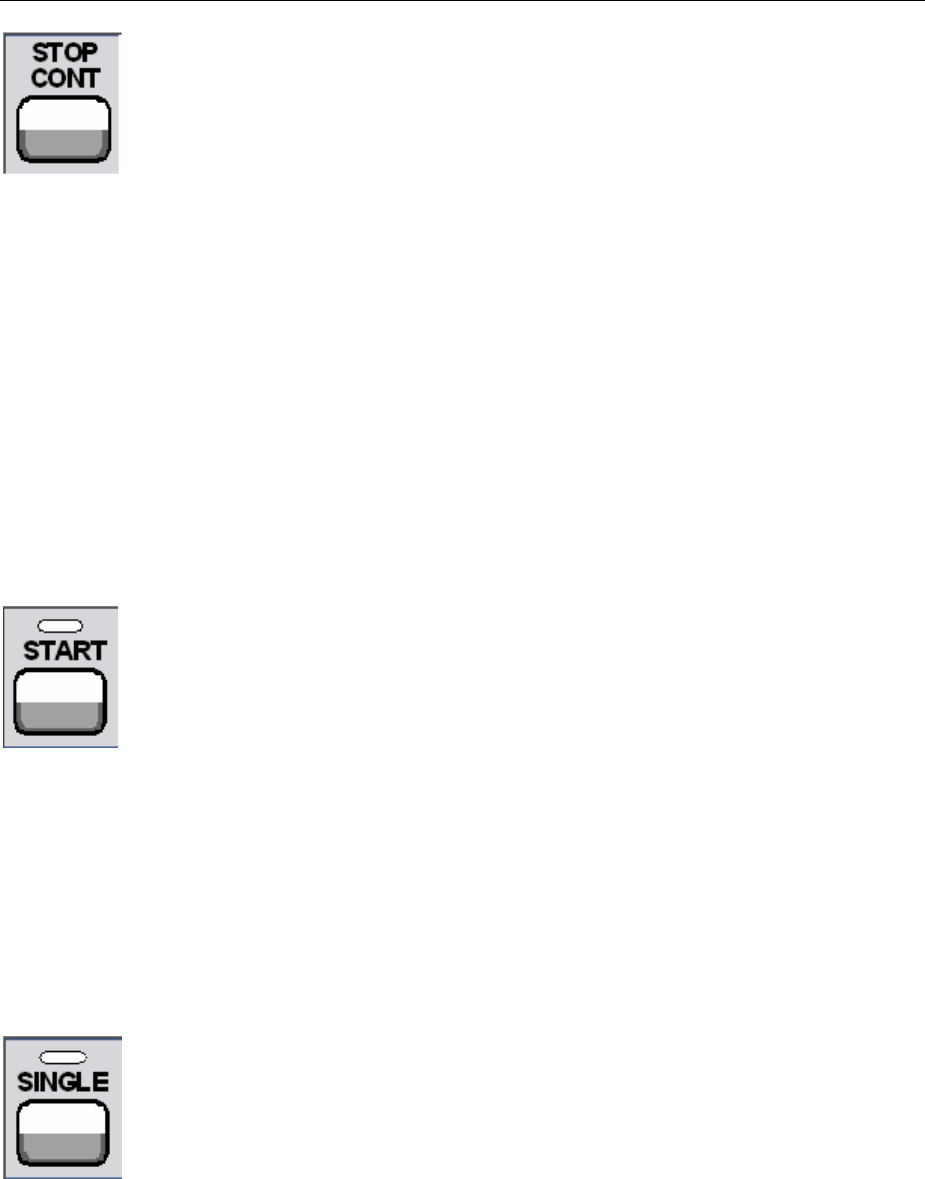
R&S UPV Starting Measurements
1146.2084.32 4.219 E-9
Pressing the STOP/CONT key stops the current measurement
immediately and causes the measurement system to enter the "Stop"
state. Continuous measurement can be reactivated using the START
key or by pressing the STOP/CONT key again.
Remote-control command:
INIT:FORCe STOP
INIT:FORCe CONT
Termination event ... stops the current measurement immediately and causes the
continuous measurement to be restarted (see section "Overview of the
Measurement System" on page 4.216).
Single measurement
Each measurement type is performed once only; the measurement system then assumes the "Term"
(terminated) state. The measurement does not necessarily have to produce a real result: if an error
occurs during the measurement, the measurement result is classed as invalid. "----" appears in the
associated measurement window instead of the measurement value; a NAN value ("not a number",
9.97e37) is read out by the remote-control station.
Each single measurement must be triggered again by pressing the SINGLE key or by means of a
termination event. The START LED and SINGLE LED light up in the case of a single measurement.
The control keys have the following function while a single measurement is being performed:
Pressing the START key stops the current single measurement
immediately, resets the MIN/MAX indicator, the MIN/MAX values, the
limit violations of the measurement displays and the highlighting of the
protocol analysis, and causes continuous measurement to be started.
Furthermore, starting or restarting a measurement also causes certain
generator functions to restart:
•Burst signals (sine burst and sine² burst) are reset, that is, they start
at the burst phase or "Burst on Delay".
•The Play function starts again at the first sample in the WAV file.
•The Arbitrary function also starts again at the beginning.
Remote-control command:
INIT:CONT ON
INIT:CONT ON
INIT:FORCe STARt
Pressing the SINGLE key stops the current measurement immediately
and causes the single measurement to be restarted.
Furthermore, restarting a single measurement also causes a restart of
the burst signals (sine burst and sine² burst), that is, they start at the
burst phase or "Burst on Delay".
Remote-control command:
INIT:CONT OFF
INIT:FORCe SINGle
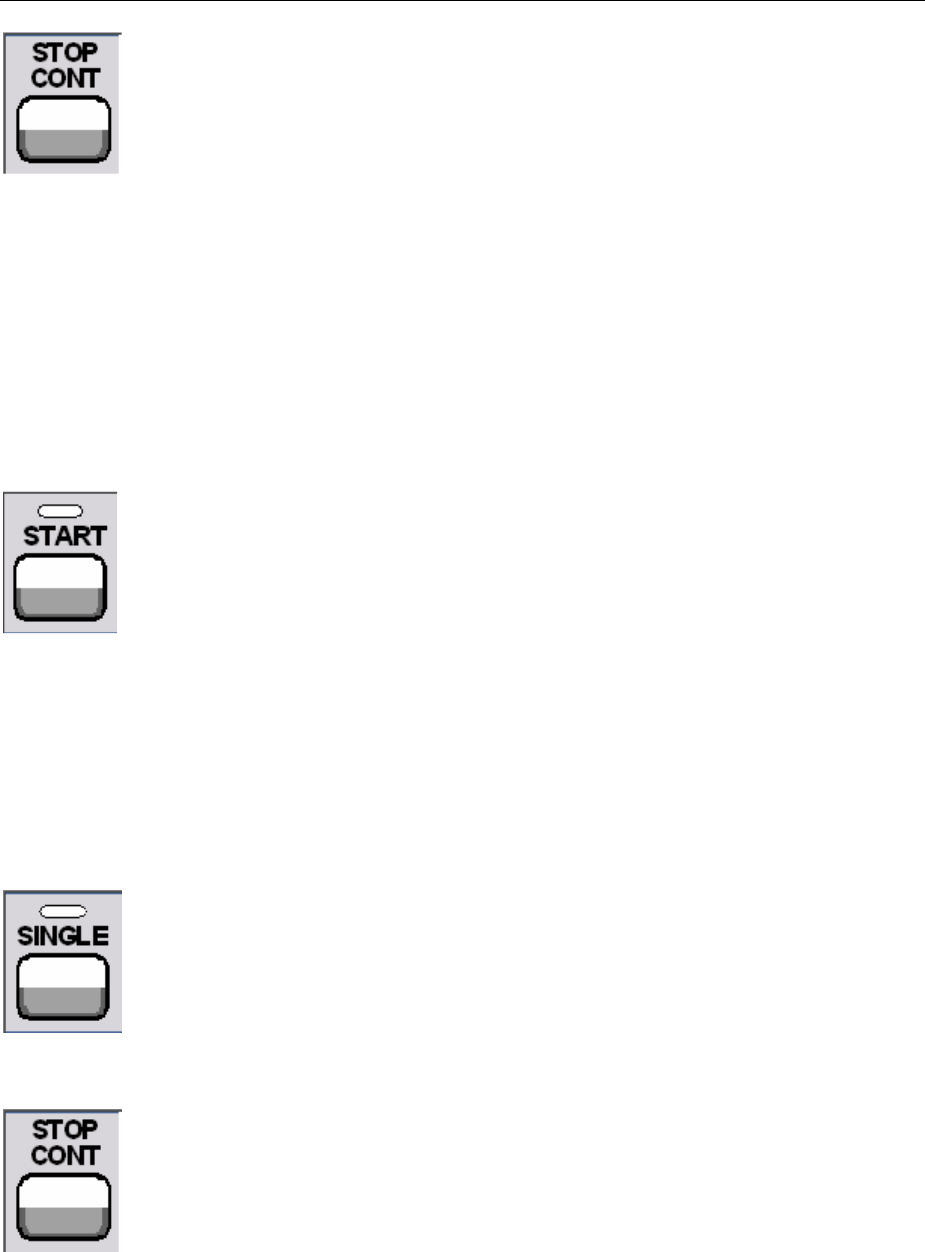
Starting Measurements R&S UPV
1146.2084.32 4.220 E-9
Pressing the STOP/CONT key stops the current measurement
immediately and causes the measurement system to enter the "Stop"
state. The single measurement is reactivated by pressing the SINGLE
key.
Remote-control command:
INIT:FORCe STOP
Termination event ... stops the current measurement immediately and causes the single
measurement to be restarted (see section "Overview of the
Measurement System" on page 4.216).
Terminated measurement
The measurement system only assumes this state when a single measurement is terminated. No
further measurements are performed; the measurement values and data sets are frozen until the next
measurement is started. Measurement values should only be read out via the remote-control station
when the system is in this state. None of the LEDs light up when a measurement has been terminated.
The control keys have the following function:
Pressing the START key resets the MIN/MAX indicator, the MIN/MAX
values, the limit violations of the measurement displays and the
highlighting of the protocol analysis, and causes continuous
measurement to be started.
Furthermore, starting or restarting a measurement also causes certain
generator functions to restart:
•Burst signals (sine burst and sine² burst) are reset, that is, they start
at the burst phase or "Burst on Delay".
•The Play function starts again at the first sample in the WAV file.
•The Arbitrary function also starts again at the beginning.
Remote-control command:
INIT:CONT ON
INIT:FORCe STARt
Pressing the SINGLE key causes a single measurement to be started.
Furthermore, starting a single measurement also causes a restart of the
burst signals (sine burst and sine² burst), that is, they start at the burst
phase or "Burst on Delay".
Remote-control command:
INIT:CONT OFF
INIT:FORCe SINGle
Pressing the STOP/CONT key causes continuous measurement to be
started.
Remote-control command:
INIT:FORCe CONT
Termination event ... causes a single measurement to be started (see section "Overview of
the Measurement System" on page 4.216). In remote-control mode, the
automatic measurement start is disabled so that setting commands can
be dealt with at maximum speed.

R&S UPV Start Conditions
1146.2084.32 4.221 E-9
Stopped measurement
The measurement system only assumes this state when the STOP/CONT key is pressed while a
measurement is being performed. No currently valid measurement values or data sets are available.
Measurement values should not be read out via the remote-control station when the system is in this
state. The control keys have the same function as for a terminated measurement (see "Terminated
measurement").
Start Conditions
The Analyzer Config panel is used to define which conditions trigger the start of a measurement.
The menu item "Start Cond" defines when, how often or under what conditions measurement values
are to be recorded. In addition to continuous operation, the following operating modes for recording
measurement values can be selected from this panel:
•Time-controlled measurement value recording
•Externally controlled measurement value recording (i.e. controlled by altering the measurement
signal), known for short as "external sweeps"
•Level-controlled measurement value triggering
When the conditions for measurement value recording are met, the measurement value is triggered,
displayed in the measurement results panel and if appropriate stored in a measurement value buffer
internal to the R&S UPV. The measurement value list can be displayed numerically or graphically in one
or more "sweep graphs" out of the available total of four.
Note:
In order for the measurement value list to be recorded, the measurement values of interest must be
selected as traces (Y source) in the "Sweep Graph Config" panels. "X-Axis" ("X-Source") should be set
to "Sweep". Four sweep graphs with two traces each are available for measurement value recording, so
that a maximum of eight measurement values can be recorded simultaneously.

Start Conditions R&S UPV
1146.2084.32 4.222 E-9
Setting Start Condition
Ref Channel
Indicates the reference channel ; only appears on multichannel
analyzers.
The "Ref Channel" is the reference channel for measurements
between two channels. They include the following measurements:
•Phase and group-delay measurement (the frequency
measurement result is shown on the reference channel)
•Crosstalk measurements (ratio of two level measured values)
•Frequency tracking of selective RMS measurement
The reference channel cannot be switched off. If a reference channel
that is not yet active is selected, then this channel is automatically
switched on. Conversely, the attempt to switch off a channel that has
been selected as the reference channel is rejected with a
corresponding error message.
Note:
If the trigger channel is used in the 16-channel analyzer, the reference
and trigger channel must be in the same channel range (both
channels either on channels 1 to 8 or 9 to 16).
Ch 1
Ch 2
Ch 3
…
Selection of the reference channel from the
parameter list.
Remote-control command:
SENSe:REFerence:CHANnel CH<i>
<i> = 1, 2, 3, ...
…
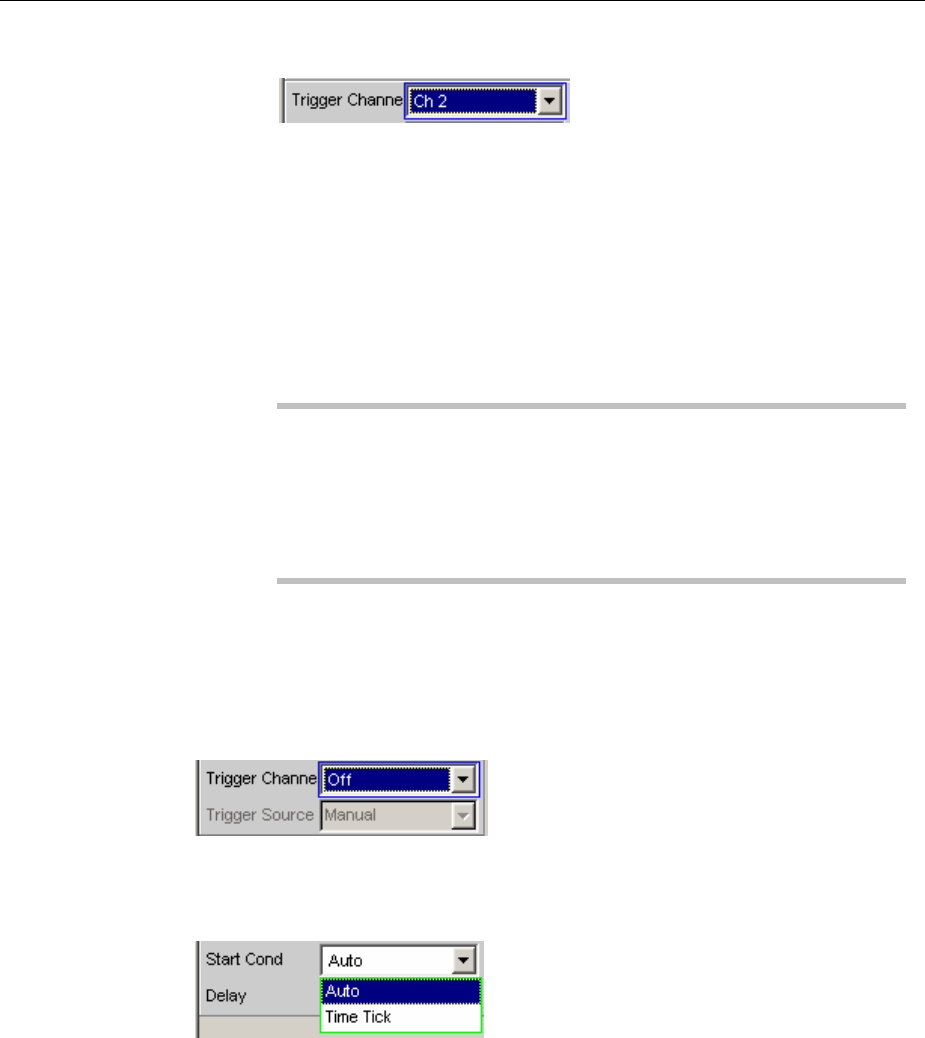
R&S UPV Start Conditions
1146.2084.32 4.223 E-9
Trigger Channel
Indicates the trigger channel; only appears on multichannel analyzers.
The "Trigger Channel" deterrmines on which channel the trigger
condition is tested. The following are affected:
•The "Start Condition"
•The trigger source of the waveform monitors
If a channel that is not yet active is selected as the trigger channel,
this channel is switched on automatically. If the measurement channel
that is selected as the trigger channel is deactivated, then the trigger
channel is automatically switched over to the reference channel.
Note:
The reference and trigger channel in the 16-channel analyzer must be
in the same channel range (both channels either on channel 1 to 8 or
9to 16).
The parameter field for the trigger channel which is visible in the
waveform monitor is identical with the parameter field in the "Start
Condition" menu.
Off No trigger channel is defined; the following
restrictions apply:
•The waveform monitor operates in untriggered
mode; "Trigger Source" is unavailable.
•Only "Auto" or "Time Tick" can be selected as
"Start Cond".
Remote-control channel:
TRIGger:CHANnel OFF
Ch 1
Ch 2
Ch 3
…
Selection of the trigger channel from the parameter
list.
Remote-control channel:
TRIGger:CHANnel CH<i>
<i> = 1, 2, 3, ...
…
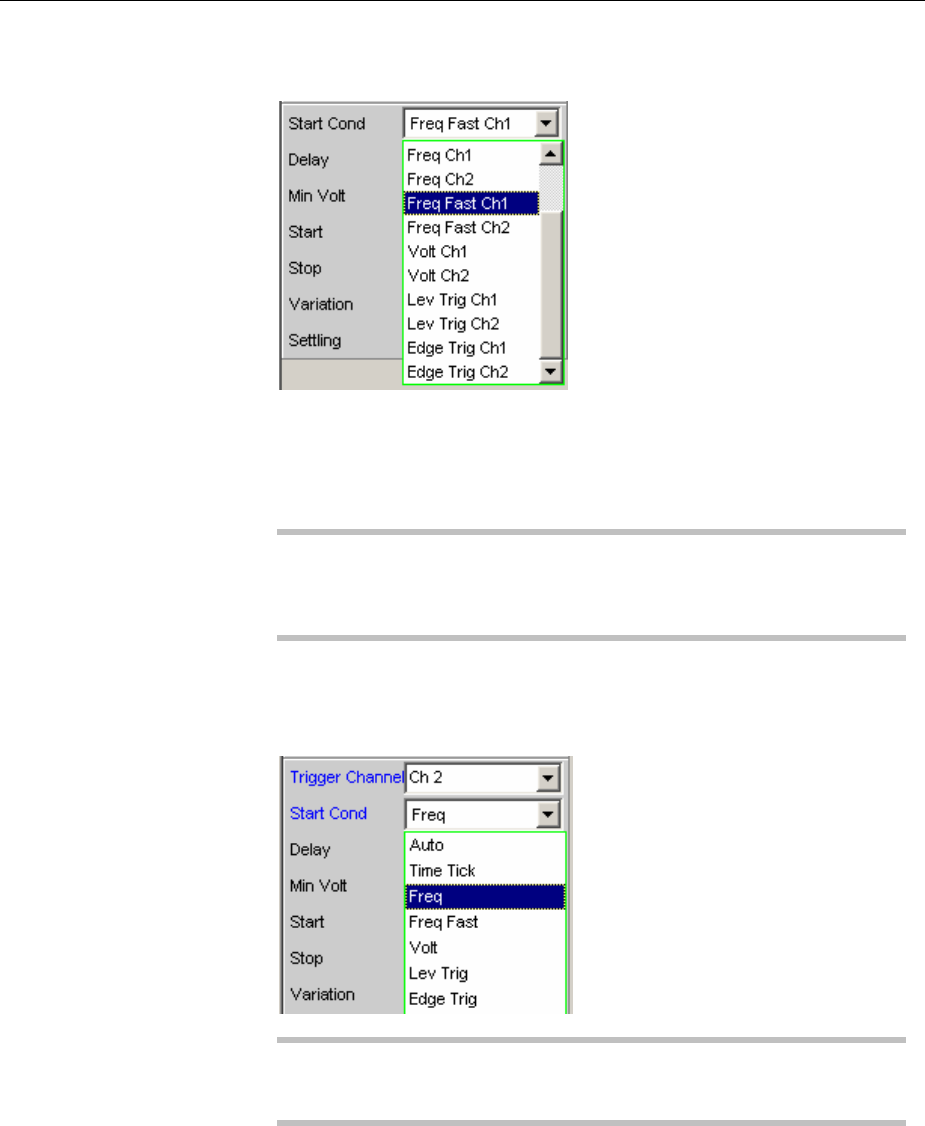
Start Conditions R&S UPV
1146.2084.32 4.224 E-9
Start Cond
Indicates the event that triggers a measurement.
Depending on the "Start Cond" selected, the measurement starts
either immediately (Auto) or only once the required trigger condition is
met.
Note:
With the two-channel analyzers, the trigger conditions combined with
the possibble trigger channels appear in the parameter list; only the
active channels are available as trigger channels.
In the multichannel analyzers,first a trigger channel must be
specified so that all start conditions are available. If the trigger channel
is switched off, only "Auto" or "Time Tick" can be selected.
Note:
With the multichannel analyzers, the trigger conditions without explicit
channel specification appear in the parameter list.

R&S UPV Start Conditions
1146.2084.32 4.225 E-9
Auto Continuous measuring mode without trigger
condition.
Values are recorded in the measurement value
buffer only if the frequency sweep for the selective
RMS measurement or any type of generator sweep
is active at the same time.
Pressing the "Single" or "Start" key toggles between
single and continuous measurement if no sweep is
active.
Remote-control command:
TRIGger:SOURce AUTO
Time Tick Time-controlled measurement value recording;
measurement value triggering at fixed intervals. In
the gap between time ticks, measurements are
started, the measurement results are entered in the
measurement value buffer and displayed in the
measurement results panel.
This start condition cannot be combined with a time-
triggered generator sweep.
If time tick is combined with the frequency sweep of
the selective RMS measurement or with a
synchronous generator sweep, sweep stepping is
performed as usual, but measurement starts only
after the time tick has expired.
If neither the frequency sweep of the selective RMS
measurement nor any generator sweep is active, the
time tick defines the sweep X axis:
•During the time tick sweep, the time stamps on
the X axis are updated and corrected if
necessary (e.g. if a measurement lasts longer
than the set time tick) and the individual
measurement values are entered according to
their correct times.
•When the "START" button is pressed a series of
periodic measurement value recordings begins,
and when the number of sweep points specified
under "Points" is reached the series starts again
from the beginning.
•When the "SINGLE" button is pressed a single
series of periodic measurement value recordings
begins. When the number of sweep points
specified under "Points" is reached the sweep
goes to "terminated" status.
Remote-control command:
TRIGger:SOURce TIMer

Start Conditions R&S UPV
1146.2084.32 4.226 E-9
Time Chart Time-controlled measurement value recording;
measurement value acquisition at fixed intervals; not
available in the multichannel analyzers.
Measurement values (from the currently running
continous measurement) are entered in a time chart
in the timescale that can be entered under "Time". In
contrast to "Time Tick", where at each tick a new
(single) measurement starts and the result is only
entered when the measurement ends, with "Time
Chart" intermediate results can also be displayed.
This is particularly desirable in the case of quasi
peak measurements.
Note:
If the chosen time grid (update rate) is shorter than
the measurement time required for the
measurement function, intermediate results are
displayed. Otherwise end results are displayed.
This start condition cannot be combined with a
frequency sweep of the selective RMS
measurement or a generator sweep. The time
stamps of the measurement value acquisition define
the sweep X axis:
•When the "START" button is pressed and
immediately after the time chart sweep is
switched on, a series of periodic measurement
value recordings begins. When the number of
sweep points specified under "Points" is reached
the series starts again from the beginning.
•When the "SINGLE" button is pressed a single
series of periodic measurement value recordings
begins. When the number of sweep points
specified under "Points" is reached the sweep
goes to "terminated" status.
Note:
The sweep starts as soon as time chart is switched
on, that is, intermediate or end results of the
selected continuous measurement are displayed
and recorded at fixed intervals.
Remote-control command:
TRIGger:SOURceTCHart

R&S UPV Start Conditions
1146.2084.32 4.227 E-9
Freq Ch1
Freq Ch2
Freq
Freq Fast Ch1
Freq Fast Ch2
Freq Fast
Externally controlled measurement value recording;
measurement value triggering when a significant
frequency change occurs on the trigger channel
(external frequency sweep); available in the
multichannel analyzers only if the trigger channel is
switched on.
The measurement results are entered in the
measurement value buffer and displayed in the
measurement results panel. The measured
frequency is entered as an X value of the sweep.
This start condition cannot be combined with the
frequency sweep of the selective RMS
measurement. The sweep X axis is always
predefined by the external frequency sweep, even if
the internal generator is generating the sweep
signal.
Note:
For particularly fast frequency sweeps with a clean
signal (e.g. from a CD) the fast variant can be
selected. However, if the signal contains a high
noise component it will be necessary to switch to the
slower measurement method FREQ CH1/2.
Remote-control command:
TRIGger:SOURce CH1Freq
TRIGger:SOURce CH2Freq
TRIGger:SOURce FREQuency
TRIGger:SOURce CH1Rapidfreq
TRIGger:SOURce CH2Rapidfreq
TRIGger:SOURce RAPidfreq
Volt Ch1
Volt Ch2
Volt
Externally controlled measurement value recording;
measurement value triggering when a significant
level change occurs on the trigger channel (external
level sweep); available in the multichannel analyzers
only if the trigger channel is switched on.
The measurement results are entered in the
measurement value buffer and displayed in the
measurement results panel. The measured level is
entered as an X value of the sweep.
This start condition cannot be combined with the
frequency sweep of the selective RMS
measurement. The sweep X axis is always
predefined by the external level sweep, even if the
internal generator is generating the sweep signal.
Remote-control command:
TRIGger:SOURce CH1Level
TRIGger:SOURce CH2Level
TRIGger:SOURce LEVel

Start Conditions R&S UPV
1146.2084.32 4.228 E-9
Lev Trig Ch1
Lev Trig Ch2
Lev Trig
Measurement value triggering due to a level
detected at the analyzer input on the trigger channel;
available in the multichannel analyzers only if the
trigger channel is switched on.
This start condition can be combined with any
sweep and has no effect on the sweep X axis.
Sweep stepping or, if the sweep system is inactive,
pressing the START or SINGLE key, alerts level
monitoring to wait until a level in the range between
start and stop is measured (level triggering). When
this occurs a single measurement is started, if
necessary after a specified delay.
In the case of continuous measurement, a further
triggering in the specified range occurs only if the
level has gone over or under the set range in the
interim. This means that level monitoring is not put
on alert again until a level outside of the specified
range is detected.
Remote-control command:
TRIGger:SOURce CH1Trigger
TRIGger:SOURce CH2Trigger
TRIGger:SOURce TRIGger
Edge Trig Ch1
Edge Trig Ch2
Edge Trig
Measurement value triggering due to a voltage edge
detected at the analyzer input on the trigger channel;
available in the multichannel analyzers only if the
trigger channel is switched on.
This start condition can be combined with any
sweep and has no effect on the sweep X axis.
Sweep stepping or, if the sweep system is inactive,
pressing the START or SINGLE key, starts the level
monitoring function. However, it is not put on alert
until a level beyond the start level (outside of the
start-stop interval) is measured. Triggering occurs at
the moment when the level first enters the range
between start and stop (edge triggering). When this
occurs a single measurement is started, if necessary
after a specified delay.
In the case of continuous measurement, a further
triggering in the specified range occurs only if in the
interim the level has left the set range and moved in
the direction of the start level. This means that level
monitoring is not put on alert again until a level
beyond the start level is detected.
Remote-control command:
TRIGger:SOURce CH1Edgetrigger
TRIGger:SOURce CH2Edgetrigger
TRIGger:SOURce EDGetrigger
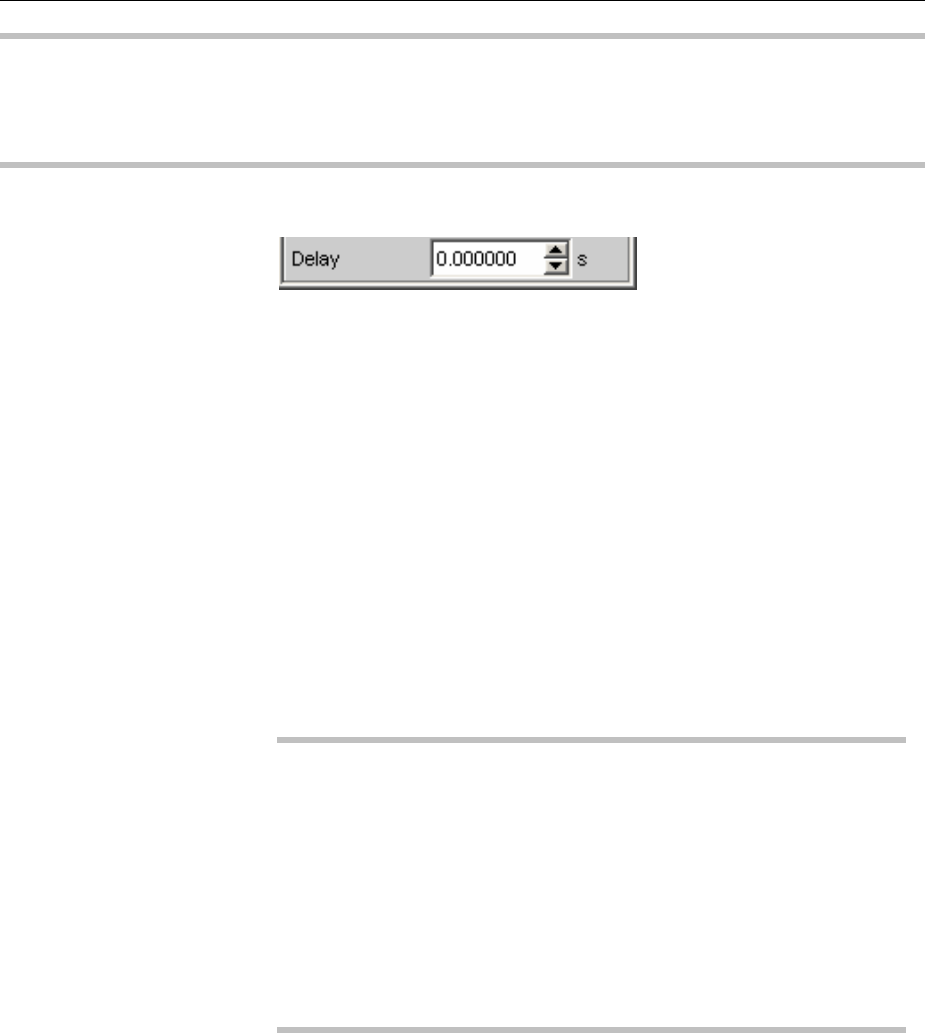
R&S UPV Start Conditions
1146.2084.32 4.229 E-9
Note:
If the reference points of a sweep are modified under the influence of the start condition during the
sweep (e.g. due to over long measurement times during a time tick sweep), some sweep points may be
outside of the visible X axis of the sweep graphs. A further Autoscale call at the end of the sweep will
enter the new X limits in the sweep graph.
Delay
Delay for Start Cond.
You can enter a delay for menu item Start Cond "Auto". It applies
under the following conditions:
•Signal change on the generator (value entry, value change via
rotary knob)
•Performance of sweeps
•Pressing of Stop/Cont or Start key (continuous measurement)
•Pressing of Single key (single measurement)
•Change in the Analyzer panels
•Change in the Generator panels
•Change in the Filter panel
The "Delay" setting determines the time that must elapse between the
above events and restarting of the measurement so that, for example,
aDUT has sufficient time to settle. The total measuring time – i.e. the
time that elapses until the measuring result is available – is thus
increased by the specified delay.
Note:
In the case of continuous measurement, a delay is only applied to the
first measurement after the start. No delay is applied to subsequent
measurements.
If the overall delay (including internal delays) is greater than 2 s, the
measurement will not be restarted automatically if modifications are
performed in the generator, analyzer or in the filter bank.
The delay is applied to all measured channels. In the case of
multichannel analyzers, the delay only extends the total measuring
time of the first partial measurement (first pair of channels); all further
(measured offline) channel pairs can be measured without an
additional time loss.
Remote-control command:
TRIGger:DELay <nu>
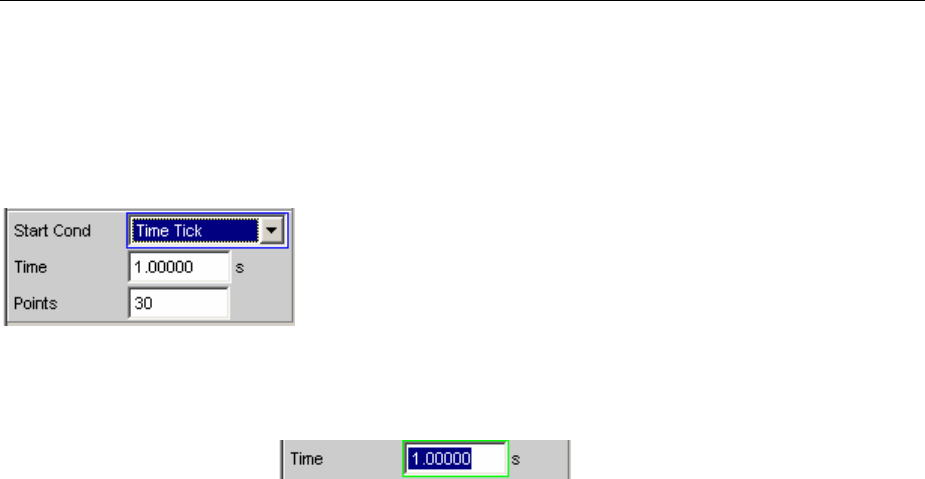
Start Conditions R&S UPV
1146.2084.32 4.230 E-9
Time-Controlled Measurement Value Recording
In time-controlled measurement value recording, the estimated total recording time is derived from the
product of the time interval per measurement and the number of measurement value acquisitions. The
actual duration of the measurement value recording may be considerably longer in the case of the time
tick start condition if the value entered for the time tick is shorter than the required measurement time.
Time
Used for entering the time grid in which it is intended measurements
should be started ("time tick") or measurement values should be read
("time chart").
When the start condition is "Time Tick"the measurement has priority
over the start of a new measurement. If the time tick is longer than the
measurement time, the system waits for the next time tick after each
single measurement. During this waiting time no measurement is
performed. If the time tick is shorter than the measurement time, any
time ticks occurring during a running measurement will be ignored.
This means that measurements will be started at time intervals
corresponding to an integer multiple (b1) of the selected time tick.
When the start condition is "Time Chart" (not available in the
multichannel analyzers) the measurement value is read in the
specified time grid, regardless of whether a new measurement value
is present. If the chosen time grid (update rate) is longer than the
measurement time for the measurement function, then only end
results are displayed. If the time grid is shorter than the measurement
time, intermediate results are displayed if available. If no intermediate
results are yet available, the last valid results are entered in the time
chart again.
Remote-control command:
TRIGger:TIMer <nu>
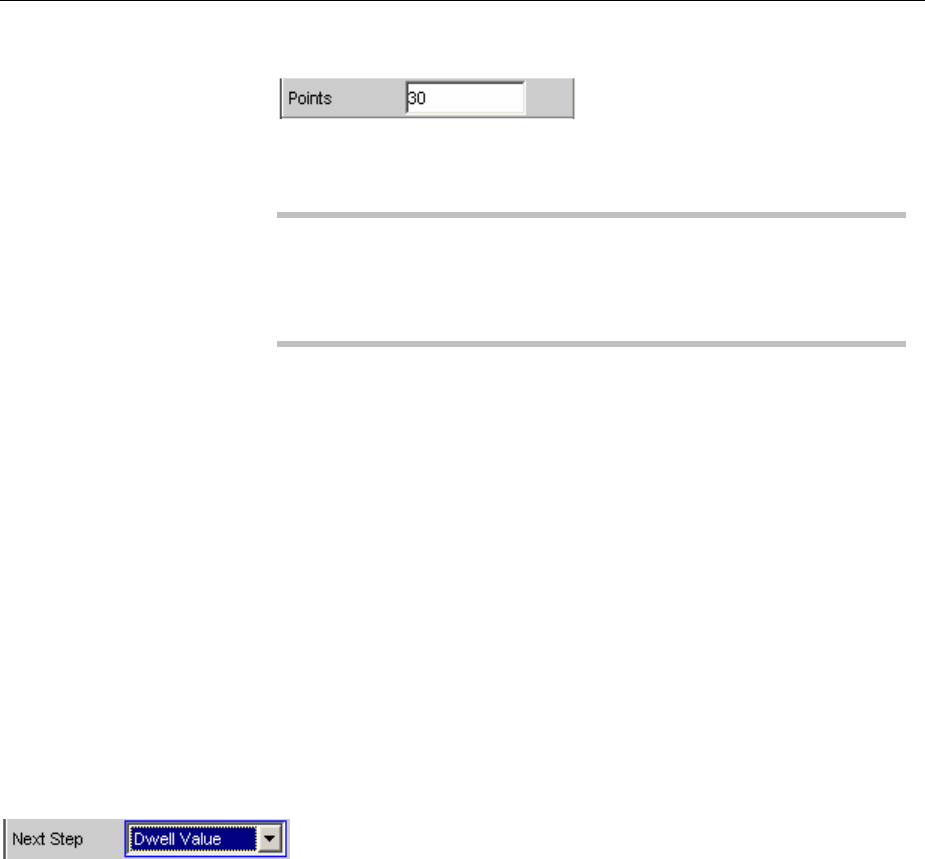
R&S UPV Start Conditions
1146.2084.32 4.231 E-9
Points
For entering the number of measurement value recordings.
Time-controlled measurement value recording ends as soon as the
number of measured data items specified here are available.
Note:
If the start condition "Time Tick" is combined with a frequency sweep
of the selective RMS measurement or a synchronous generator
sweep, the number of sweep points is taken from there and cannot be
entered separately.
Remote-control command:
TRIGger:COUNt <nu>
External Sweeps and Level-Controlled Measurement Value
Triggering
External sweeps are usually controlled by means of an external signal source. The internal sweep
generator should be deactivated in this case. A warning message is output if the internal sweep
generator is still active when an external sweep is activated.
Basically, the internal sweep generator can be used as a signal source also with external sweeps.This
is meaningful, for example, if the delay of the DUT is not known or not constant and it is, therefore, not
possible to couple the generator stepping permanently to the measurement start. Sweep stepping is
performed as usual, but measurement does not start until a trigger event occurs.
Generator stepping should be time controlled (dwell sweep; generator setting: "Next Step Dwell …"), in
order to make generator sweep stepping independent of measurement.
In the case of analyzer-synchronous stepping (generator setting: "Next Step Anlr Sync") it is important
to ensure that each sweep step overwrites the chosen start condition "Variation". If this condition is not
met, the external sweep comes to a stop. The following generator setting rules for external sweeps
must be followed:
•"Spacing" must be set to "Log Steps" (optional for dwell sweep).
•The sweep direction (specified by the sequence between "Start" and "Stop") must agree with the
recording direction chosen in the analyzer.
•The sweep range must be within the recording range (optional for dwell sweep).
•The step width, or increment (specified in the generator as a factor under "Step") must be greater
than "Variation" in the analyzer (optional for dwell sweep).
The following applies to an upward sweep (Start < Stop): Step > 1 + Variation / 100
and the following at a downward sweep (Start > Stop): Step < 1 – Variation / 100
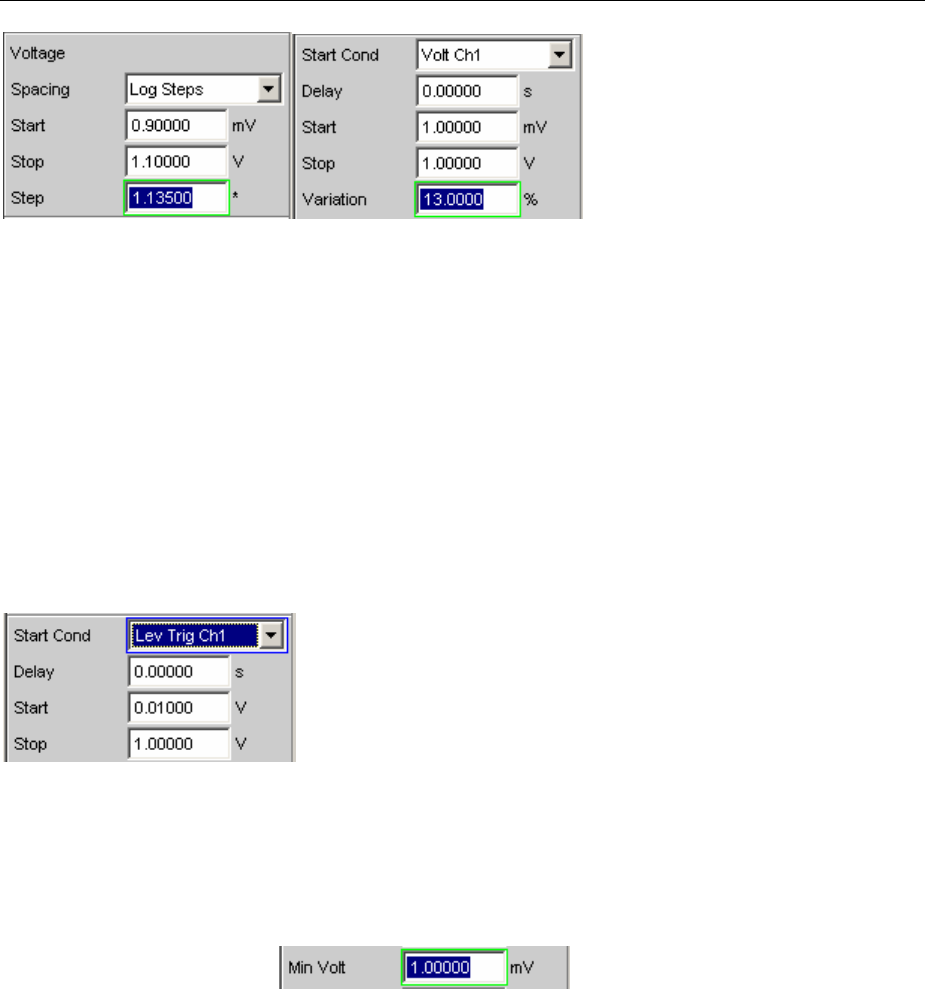
Start Conditions R&S UPV
1146.2084.32 4.232 E-9
The sweep X axis is always predefined by the external sweep, even if it is the internal generator that
generates the sweep signal.
In the case of external sweeps the start and stop values define the sweep direction: If the start value is
less than the stop value, the sweep is upward, otherwise it is downward. Signal changes counter to the
sweep direction affect continuous mode and single mode differently:
•If an external continuous sweep was started using the "START" key, any significant change of
frequency in the stop to start direction causes the sweep to restart.
•If an external single sweep was started using the "SINGLE" key, changes in in the stop to start
direction are interpreted as interference and ignored. A measurement value beyond the stop value
terminates the sweep.
Though using the internal generator for level-controlled measurement value triggering is not actually
prohibited, in most cases it gives no advantage.
In the case of edge-sensitive triggering,the triggering edge is defined by the start and stop values: If
the start value is less than the stop value, triggering occurs on a positive edge, that is, at the exact
moment when a value below "Start" is followed by a value above "Start".
Min Volt
This is used to enter a minimum level for external frequency sweeps.
If the signal is below this threshold, no triggering occurs.
It prevents triggering at pauses in the signal. An excessively low
minimum level would cause even frequency values measured in the
noise to be used for triggering.
Remote-control command:
ARM:LEVel:MIN <nu>
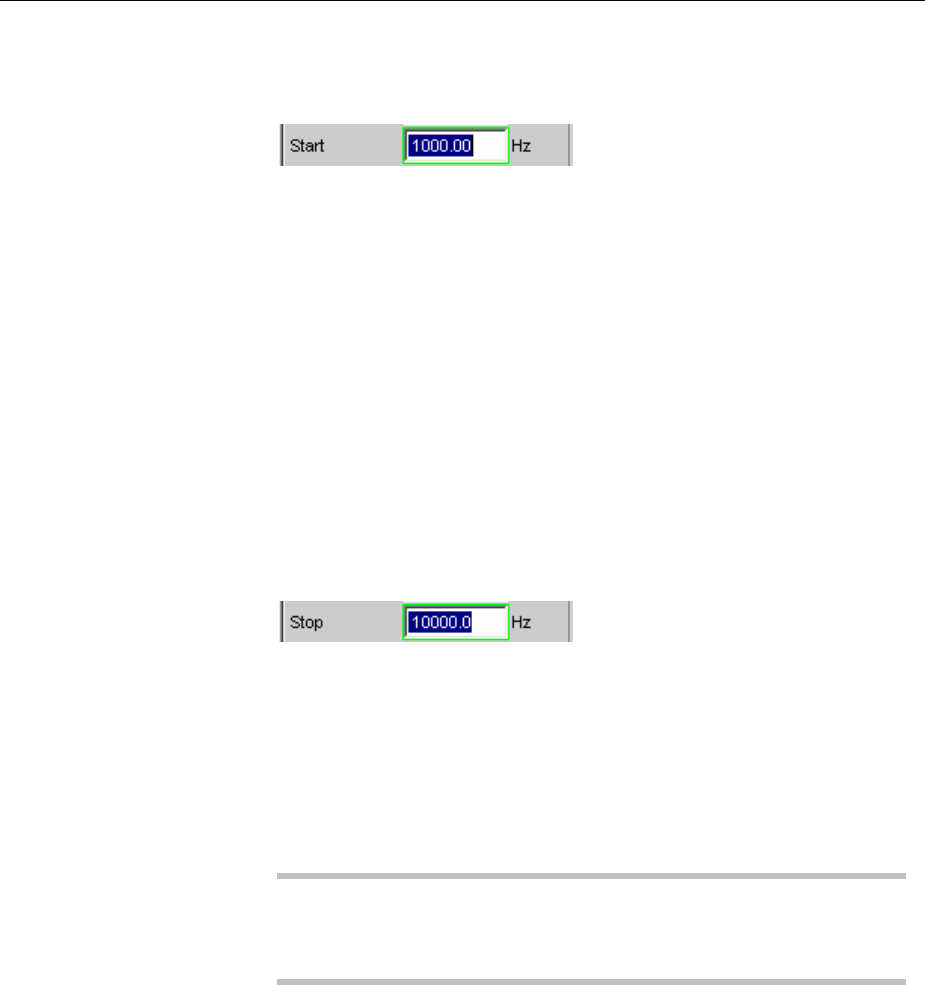
R&S UPV Start Conditions
1146.2084.32 4.233 E-9
Start
This is used to enter the start value for the recording interval (in the
case of external sweeps) or for the trigger range (in the case of level
triggering).
If the start value is less than the stop value, the external sweep runs
as an upward sweep; in the case of edge triggering the system awaits
apositive edge. Measurement values that are lower than "Start" are
ignored.
If the present stop value is entered as the start value, the sweep
direction is automatically reversed and the stop value is given the old
start value.
Remote-control command:
ARM:FREQuency:STARt <nu>
ARM:VOLTage:STARt <nu>
Stop
This is used to enter the stop value for the recording interval (in the
case of external sweeps) or for the trigger range (in the case of level
triggering).
If the stop value is less than the start value, the external sweep runs
as a downward sweep; in the case of edge triggering the system
awaits a negative edge. Measurement values that are lower than
"Stop" are ignored.
If the present start value is entered as the stop value, the sweep
direction is automatically reversed and the start value is given the old
stop value.
Note:
In the case of single sweeps the stop value is used to detect the end
of the sweep. It should therefore be somewhat lower than the
expected signal range.
Remote-control command:
ARM:FREQuency:STOP <nu>
ARM:VOLTage:STOP <nu>
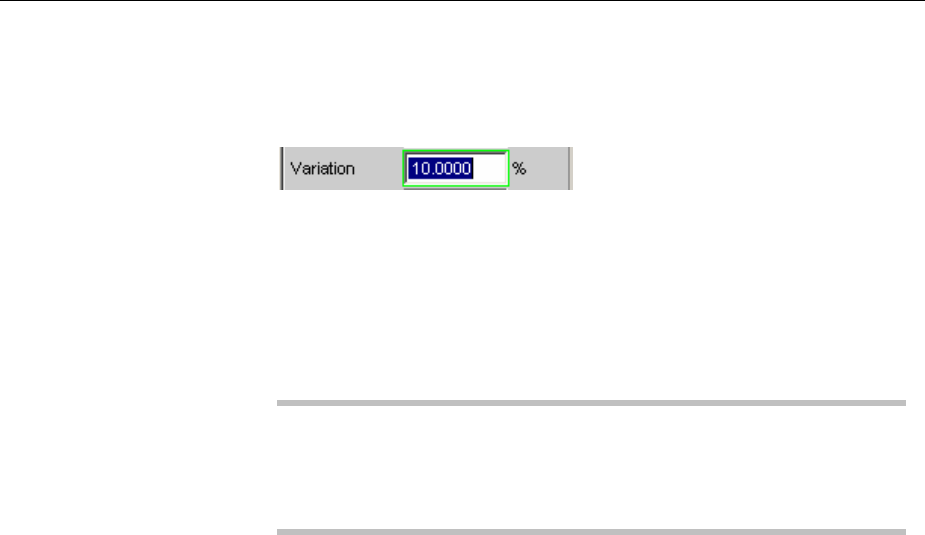
Start Conditions R&S UPV
1146.2084.32 4.234 E-9
Variation
For entering the relative change of frequency or level in the form of a
percentage with effect from which a new measurement is triggered in
the case of external sweeps. For external level sweeps the value can
also be entered in dB.
The variation chosen should be some 5% to 10% smaller than the
expected changes, so that on the one hand triggering will occur
reliably and on the other hand will not occur on intermediate values.
The entered value is used to calculate the internal variationfactor
•For upward sweeps: 1 + var/100
•For downward sweeps: 1 – var/100
Note:
Due to the different variation factors for upward and downward
sweeps, the number of sweep points in an upward sweep (given
identical values for "Start", "Stop" and "Variation") is somewhat higher
than in a downward sweep.
In the case of continuous sweeps, a change by at least this value in
the stop to start direction (i.e. counter to the sweep direction) causes
measurement value recording to restart.
The lower entry value takes account of the current start and stop
values and is automatically limited so that regardless of the sweep
direction a maximum of 1024 measurement values can be recorded.
Values of less than 0.1% cannot generally be entered.
Remote-control command:
TRIGger:FREQuency:VARiation <nu>
TRIGger:VOLTage:VARiation <nu>

R&S UPV Sweep Options
1146.2084.32 4.235 E-9
Sweep Options
Apart from the measurement system, the R&S UPV also has a comprehensive sweep system. This
sweep system is enabled as a generator sweep system by activating a generator sweep or as an
analyzer sweep system by activating the RMS selection sweep, and then takes control of the
measurement system.
When a sweep system is activated, sweeps are started and also stopped in manual operating mode
using the keys "START", "SINGLE" and "STOP/CONT" in the "CONTROL" panel.
Starting or restarting a sweep (via the START key) also causes certain generator functions to restart:
•Burst signals (sine burst and sine² burst) are reset, that is, they start at the burst phase or "Burst on
Delay".
•The Play function starts again at the first sample in the WAV file.
•The Arbitrary function also starts again at the beginning.
Overview of the Sweep Options
The following information refers to an activated sweep system,i.e. a sweep is activated in either the
generator or the analyzer.
Sweeps are measurement cycles in which the individual measurements are triggered by predefined
generator and analyzer settings. The generator and analyzer sweeps can be defined either by entering
the start value, stop value, spacing and points/step or by specifying a sweep list. Both methods
ultimately define a table of settings (X axis) which is processed when the sweep is started.
Aone-off sweep is referred to as a single sweep and a continuously repeated sweep as a continuous
sweep.
The active sweep system is controlled
•explicitly using the control keys START (Ctrl F5), SINGLE (Ctrl F6) and STOP/CONT (Ctrl F7).
•implicitly by means of "termination events". These are events (user entries) which invalidate the
current measurement and, therefore, the current sweep, i.e. changes in the generator, analyzer or
filter bank. Following a termination event, the current sweep is restarted automatically. This ensures
that the recorded data sets are based on the same settings.
It is not possible to control the measurement system if the sweep system is activated. Exception: If a
sweep is terminated, "continuous measurement"is activated by pressing the STOP/CONT key or by
means of a termination event (see section "Terminated sweep" on page 4.238).
The R&S UPV provides a large number of different sweep options. These options are summarized
below:
•Generator sweep system: time-synchronous sweeps (DWELL sweeps) and analyzer-synchronous
sweeps (AUTO sweeps). They can also be 2-dimensional (provided that more than one sweepable
parameter exists for the selected generator function), i.e. 2 generator parameters are varied. This is
then referred to as a Z sweep because the Z axis is swept in addition to the X axis.
•Analyzer sweep system: analyzer-synchronous sweep of the RMS selection frequency.
All sweeps can be performed either as parameter sweeps with constant increment or as list sweeps.
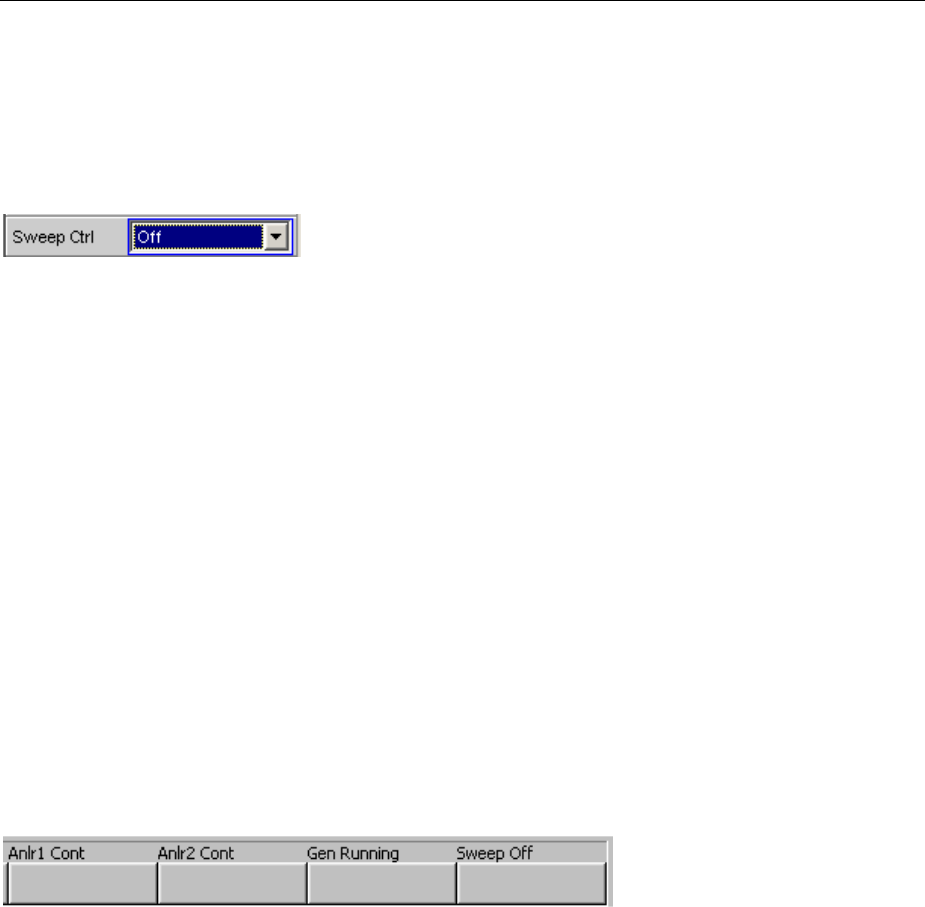
Sweep Options R&S UPV
1146.2084.32 4.236 E-9
Activating and Deactivating Sweeps
In the R&S UPV, the desired sweep system is activated/deactivated directly in the associated function
panel:
•generator sweep under "Sweep Ctrl" in the "Generator Function" panel.
•sweep of the tracking filter for the "RMS Selective" measurement function under "Sweep Ctrl" in the
"Analyzer Function" panel.
Only one of the two sweep systems can be active at any one time. If the user activates a sweep while
another sweep is already active, the already active sweep is deactivated and a warning is issued. If an
instrument or function which contains a sweep is activated while another sweep is already active, the
new sweep is deactivated and an appropriate warning is issued.
When a sweep is activated,the measurement system first continues to run in continuous or single-
measurement mode; the sweep system does not assume control of the measurement system until the
sweep is started.
When the active sweep is deactivated,the measurement system switches back to continuous
measurement.
States of the Sweep System
The state of the sweep system is indicated above the 8th softkey. If the sweep system is activated, the
current state is also indicated by the two LEDs above the START and SINGLE key.
The following states are possible:
Off Sweep is deactivated; the measurement system is controlled directly by
the user.
Single Single sweep is being performed
Cont Continuous sweep is being performed
Waiting Sweep is waiting for a (re)start; has been reactivated or has been run at
least once as a single sweep.
Stopped Sweep has been stopped; can be continued or restarted.
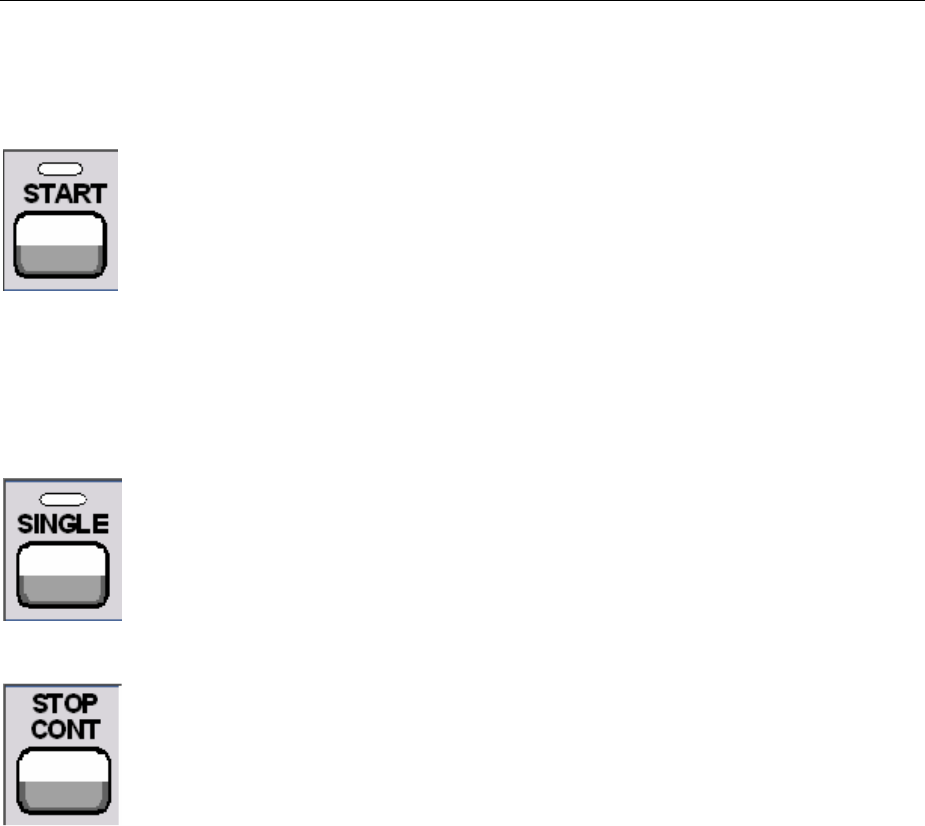
R&S UPV Sweep Options
1146.2084.32 4.237 E-9
Continuous sweep
Continuous sweeps are started with the START key. The sweep state is indicated by "Sweep Cont" and
illuminated START LED.When the sweep reaches the stop value of the X axis or the end of the
Xsweep list, it starts again at the start value. This is repeated until one of the following events occurs:
Pressing the START key
•interrupts the currently running sweep at once
•deletes the sweep curves (in multiscan mode all scans are deleted)
including the min/max curves
•resets the min/max data and limit violations of the sweep curves as
well as the highlighting of the protocol analysis
•causes the continuous sweep to restart
Remote-control command:
INIT:CONT ON
INIT:FORCe STARt
Pressing the SINGLE key switches the instrument to single sweep
mode. The remaining points are plotted on the trace and the sweep
system then enters the "Sweep Waiting" state.
The continuous sweep is reactivated by pressing the START key.
Remote-control command:
INIT:CONT OFF
INIT:FORCe SINGle
Pressing the STOP/CONT key causes the current measurement to be
completed and then stops the sweep system ("Sweep Stopped" state).
The continuous sweep is reactivated either using the START key
(sweep starts from the beginning) or by pressing the STOP/CONT key
again (sweep continues from the point at which it was stopped).
Remote-control command:
INIT:FORCe STOP
Termination event …stops the current sweep immediately and causes the continuous
sweep to be restarted (see section "Overview of the Sweep Options" on
page 4.235).
Zstop value reached The continuous sweep is stopped; the sweep system changes to the
"Sweep Waiting" state (only with 2-dimensional generator sweeps, see
section "Two-Dimensional Sweep" on page 4.124.
Single sweep
Single sweeps are started by pressing the SINGLE key and are performed once only. When the stop
value (of the X axis) has been reached, the sweep system switches to the "Sweep Waiting" state. With
a2-dimensional sweep, every new Z point (and the associated sweep over the X axis) must therefore
be retriggered.
The sweep state is indicated by "Sweep Single"; the START LED and SINGLE LED light up.
Acurrent single sweep is interrupted or terminated by the following events:

Sweep Options R&S UPV
1146.2084.32 4.238 E-9
Pressing the START key
•interrupts the currently running sweep at once
•deletes the sweep curves (in multiscan mode all scans are deleted)
including the min/max curves
•resets the min/max data and limit violations of the sweep curves as
well as the highlighting of the protocol analysis
•starts a continuous sweep
Remote-control command:
INIT:CONT ON
INIT:FORCe STARt
Pressing the SINGLE key stops the current sweep immediately and
causes the single sweep to be restarted.
Remote-control command:
INIT:CONT OFF
INIT:FORCe SINGle
Pressing the STOP/CONT key causes the current measurement to be
completed and then stops the sweep system ("Sweep Stopped" state).
The single sweep is reactivated either using the SINGLE key (sweep
starts from the beginning) or by pressing the STOP/CONT key again
(sweep continues from the point at which it was stopped).
Remote-control command:
INIT:FORCe STOP
Termination event …stops the current sweep immediately and causes the single sweep to
be restarted (see section "Overview of the Sweep Options" on page
4.235).
Xstop value reached The single sweep is stopped; the sweep system changes to the "Sweep
Waiting" state.
Remote-control command: -
Terminated sweep
The sweep system only enters this state if a single sweep or a 2-dimensional continuous sweep is
terminated. No further measurements are performed; the measurement values, data sets and sweep
traces are frozen. Sweep traces should only be read out via the remote-control station when the system
is in this state.
The sweep state is indicated by "Sweep Waiting"; none of the LEDs light up.
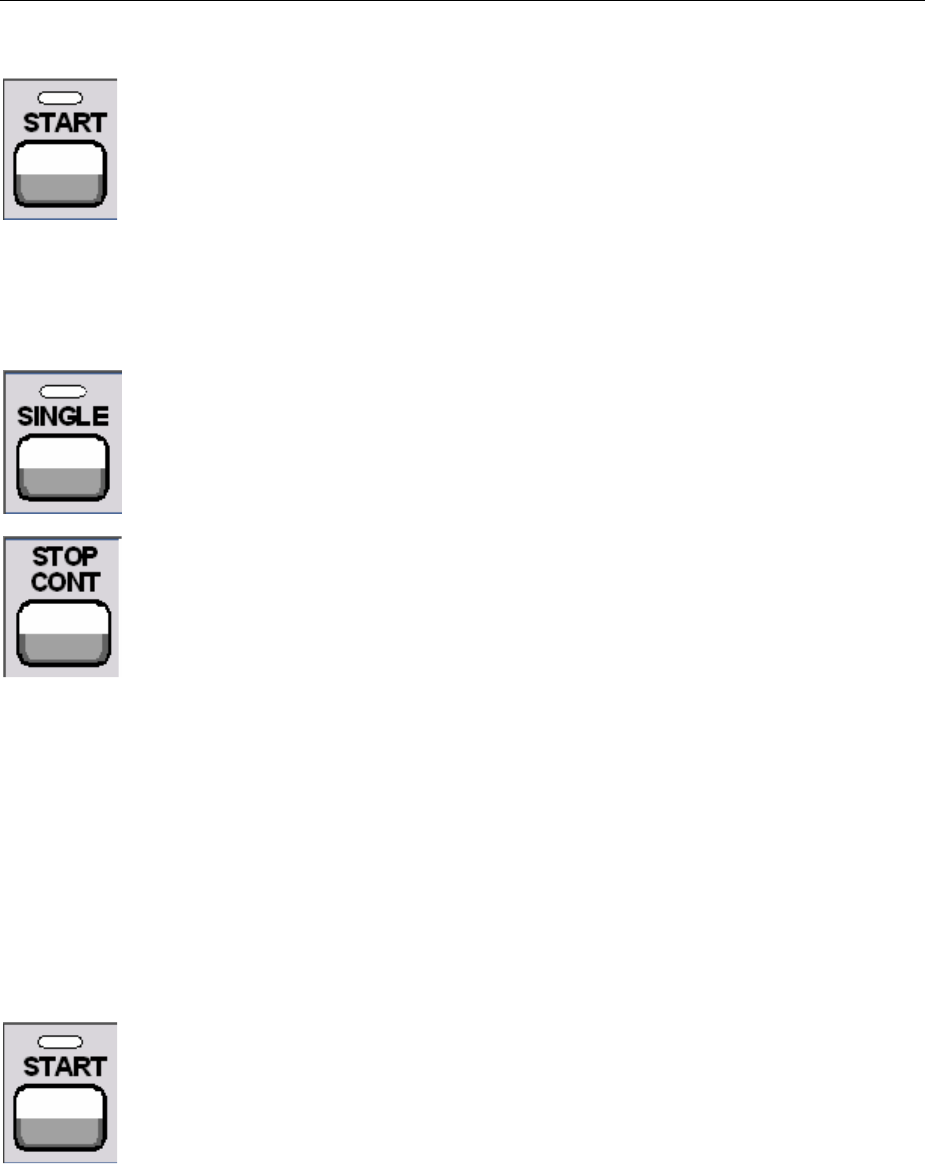
R&S UPV Sweep Options
1146.2084.32 4.239 E-9
Aterminated single sweep is affected by the following events:
Pressing the START key
•deletes the sweep curves (in multiscan mode all scans are deleted)
including the min/max curves
•resets the min/max data and limit violations of the sweep curves as
well as the highlighting of the protocol analysis
•starts a continuous sweep
Remote-control command:
INIT:CONT ON
INIT:FORCe STARt
Pressing the SINGLE key causes a single sweep to be restarted.
Remote-control command:
INIT:CONT OFF
INIT:FORCe SINGle
Pressing the STOP/CONT key starts "continuous measurement". The
single sweep is reactivated by pressing the SINGLE key.
Remote-control command: -
Termination event …starts "continuous measurement"(see section "Overview of the
Sweep Options" on page 4.235).
Stopped sweep
The measurement system only assumes this state when the STOP/CONT key is pressed while a
measurement is being performed. Valid measurement values and data sets from the sweep point last
set are available. However, only some of the measurement values of the sweep trace are available.
Sweep traces should not be read out via the remote-control station when the system is in this state.
The sweep state is indicated by "Sweep Stopped"; none of the LEDs light up.
Astopped sweep is affected by the following events:
Pressing the START key
•deletes the sweep curves (in multiscan mode all scans are deleted)
including the min/max curves
•resets the min/max data and limit violations of the sweep curves as
well as the highlighting of the protocol analysis
•starts a continuous sweep
Remote-control command:
INIT:CONT ON
INIT:FORCe STARt
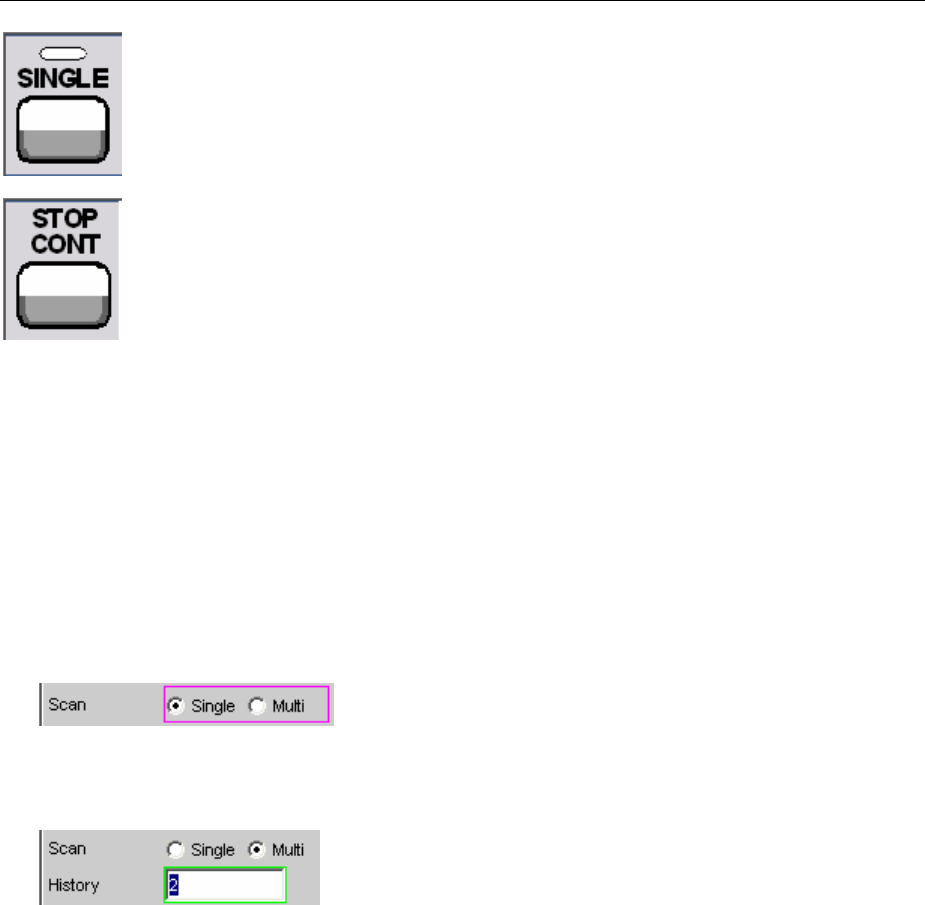
Sweep Options R&S UPV
1146.2084.32 4.240 E-9
Pressing the SINGLE key causes a single sweep to be restarted.
Remote-control command:
INIT:CONT OFF
INIT:FORCe SINGle
Pressing the STOP/CONT key restarts the sweep from the point at
which it was stopped.
Remote-control command: -
Termination event …starts "continuous measurement"(see section "Overview of the
Sweep Options" on page 4.235).
Several Sweep Traces in One Diagram
Up to 2 traces can be displayed in every sweep window. There are two options for displaying the sweep
traces. These options can be selected in the individual sweep windows:
•Each new sweep cycle deletes the old trace; only one trace (or trace pair) is visible at any one time
(single-scan mode).
•Each new sweep cycle plots a new trace without deleting the old trace; all recorded traces are
visible (multi-scan mode).
Since only a finite number of traces (i.e. the last 20 traces) can be stored in multi-scan mode, all the
traces only remain visible until rescaling is performed. When rescaling is performed, the graphical
display is deleted and the most recent traces are replotted making the graph easier to read. The
number of traces to be replotted can be set in the "History" entry field.

R&S UPV Level Measurements
1146.2084.32 4.241 E-9
Level Measurements
The R&S UPV provides various level measurements which can be used to determine the AC or DC
voltage component of a measurement signal using various methods.
•"RMS" determines the RMS of any given signal using a broadband analysis, optionally with
suppression of a DC component contained in the signal.
•"RMS Selective" determines the RMS of a specific frequency inside or outside a selectable
frequency band (by using a band-pass filter or a band-stop filter). Once again, it is possible to
suppress a DC component contained in the signal.
•"Rub & Buzz" determines the RMS value above a selectable harmonic of the signal frequency (by
using a tracking highpass filter).
•"DC" determines the DC component of any given signal.
•"Quasi Peak" determines the peak value of any given signal,the rise and fall of the measurement
value occur with defined time constants.
•"Peak" determines the peak value of any given signal, the measurement value changes with the
peak value without a delay.
The voltage of an analog signal is determined in volts and the amplitude of a digital signal is determined
in FS. According to AES-17, a full-scale digital sinewave signal has a peak value and an RMS of
1.0 FS, i.e. in contrast to the analog signal, the RMS determined for a digital signal is higher by a factor
of v2.
Note:
Level measurement is also possible using the FFT analysis by means of integration via the frequency
lines. If the measurement function FFT is selected, the RMS determined in this way is displayed as the
function measurement value.
The interval during which the level of the measurement signal is monitored can be specified by the user
as the measurement time or the interval time.
With AC measurements, other digital filters or (in the two-channel analog analyzer) an analog notch
filter can be looped into the measurement path in addition to the input filter.
Filter Settings
DC Suppress
Used to activate DC suppression (only with RMS measurements in the
digital analyzer).
With the level measurements "RMS" and "RMS Selective", the user can
decide whether DC levels are to be taken into consideration or
suppressed in the RMS.
This parameter field is not available in the analog analyzer because the
suppression function is already provided by the AC coupling which can
be set up using the hardware.
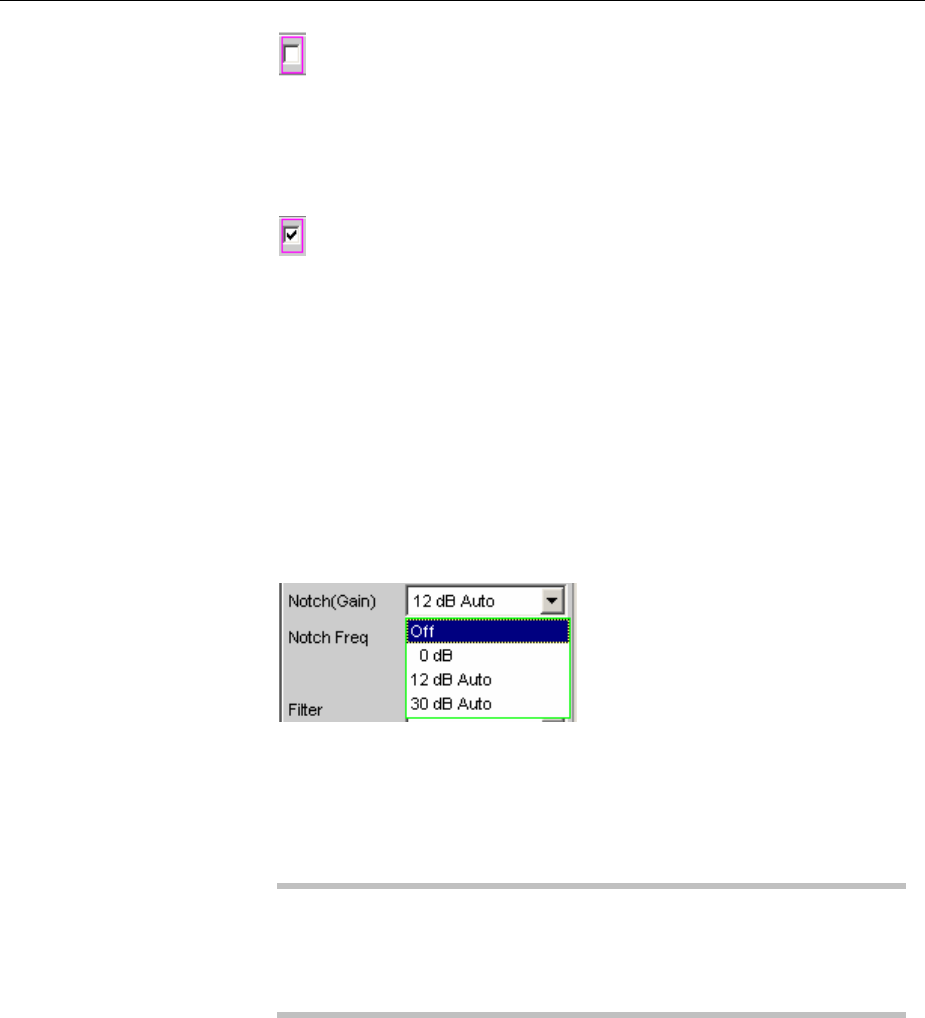
Level Measurements R&S UPV
1146.2084.32 4.242 E-9
DC suppression deactivated.
The DC component of the measurement signal is
not suppressed ("DC coupling") and is included in
the measurement result.
Remote-control command:
SENSe[1]:FUNCtion:DCSuppression OFF
DC suppression activated.
The DC component of the measurement signal is
suppressed ("AC coupling"); the measurement
result includes the AC component only.
For DC suppression in the digital analyzer, the DC
level is measured and subtracted from the total
RMS value.
Remote-control command:
SENSe[1]:FUNCtion:DCSuppression ON
Notch(Gain)
Used to activate/deactivate the analog notch filter and select the post-
gain. Available only in the two-channel analog analyzer for the two
types of RMS measurements and with "Quasi Peak".
The second-order analog notch filter can be activated for narrowband
suppression of an unwanted frequency line. If the fundamental is
suppressed with the notch filter, the residual signal can be amplified in
order to increase the dynamic response. Three notch gain levels are
available.
Note:
If frequency components occur outside the analyzer frequency range
(out-of-band signals), the notch gain could cause overloading of the
analyzer. In this case, the notch gain is reduced automatically, which
is indicated by "Auto" in the list items 12 dB and 30 dB.
Off The notch filter is deactivated;no additional
parameter fields are displayed.
Remote-control command:
SENSe[1]:NOTCh OFF
0dB The notch filter is activated;the notch gain is
deactivated.The notch frequency can be selected in
the next parameter field.
Remote-control command:
SENSe[1]:NOTCh DB0
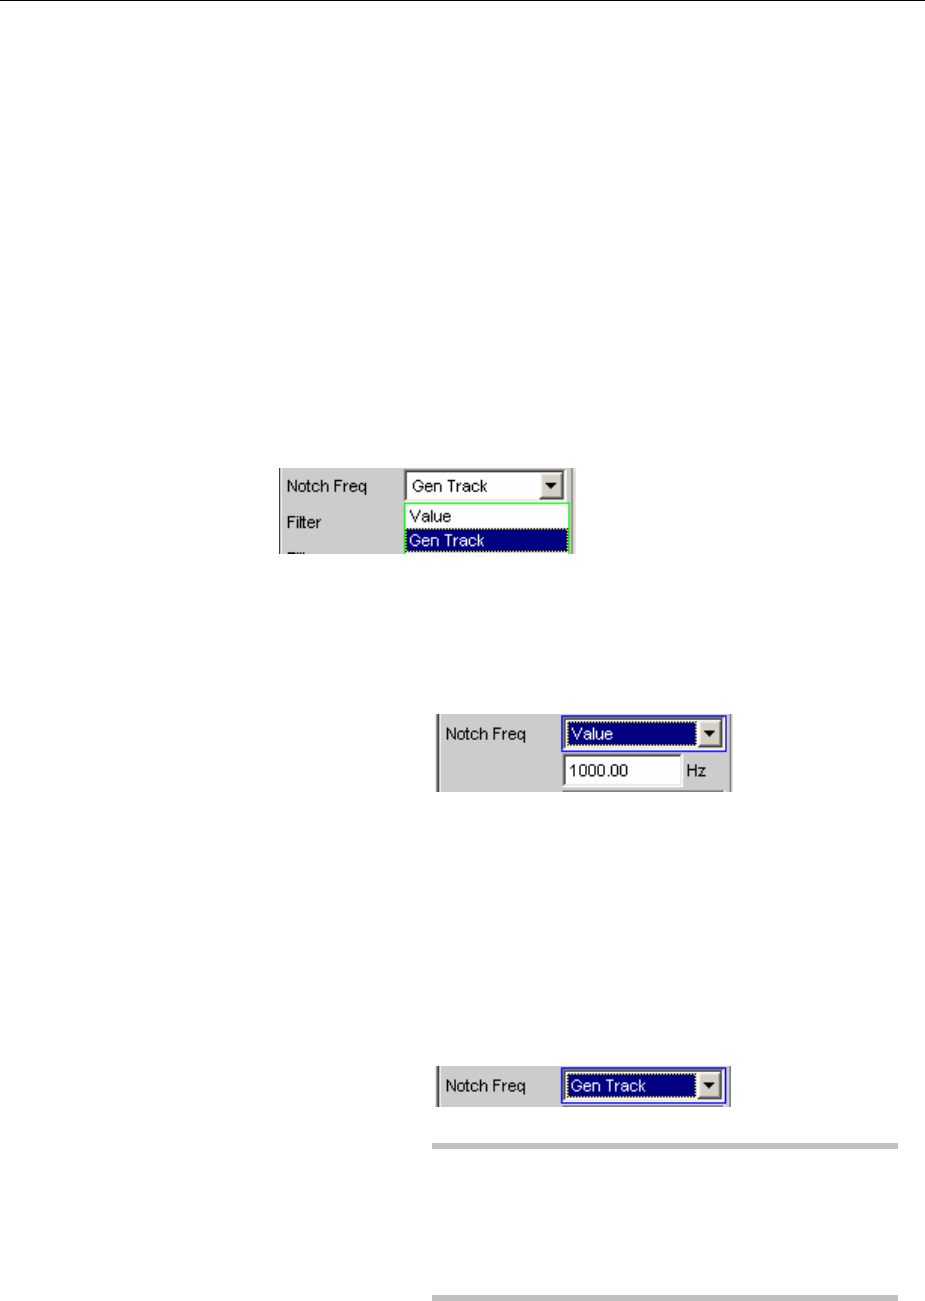
R&S UPV Level Measurements
1146.2084.32 4.243 E-9
12 dB Auto The notch filter is activated;the notch gain is 12 dB
(is deactivated if out-of-band signals occur). The
notch frequency can be selected in the next
parameter field.
Remote-control command:
SENSe[1]:NOTCh DB12
30 dB Auto The notch filter is activated;the notch gain is 30 dB
(is reduced gradually to 12 or 0 dB if out-of-band
signals occur). The notch frequency can be selected
in the next parameter field.
Remote-control command:
SENSe[1]:NOTCh DB30
Notch Freq
Used to select the center frequency of the notch filter (notch
frequency); only with activated analog notch filter.
Value The user can enter the notch-filter center frequency
in the next parameter field. If "Value" is selected,
the center frequency last active is displayed.
Remote-control commands:
SENSe[1]:NOTCh:FREQuency:MODE VALue
SENSe[1]:NOTCh:FREQuency <nu>
Gen Track The notch-filter center frequency is adopted from
the generator panel (if possible). If the generator
frequency is changed, the notch frequency also
changes. If an unsuitable generator signal (e.g.
noise) is set, an error message is output and the
center frequency last valid is retained.
Note:
If the Low-Distortion Generator option is used,
"Gen Track" should be avoided on account of the
rigid coupling to the generator's nominal frequency,
otherwise measuring inaccuracy resulting from
slight frequency offset could occur.
Remote-control command:
SENSe[1]:NOTCh:FREQuency:MODE GENTrack
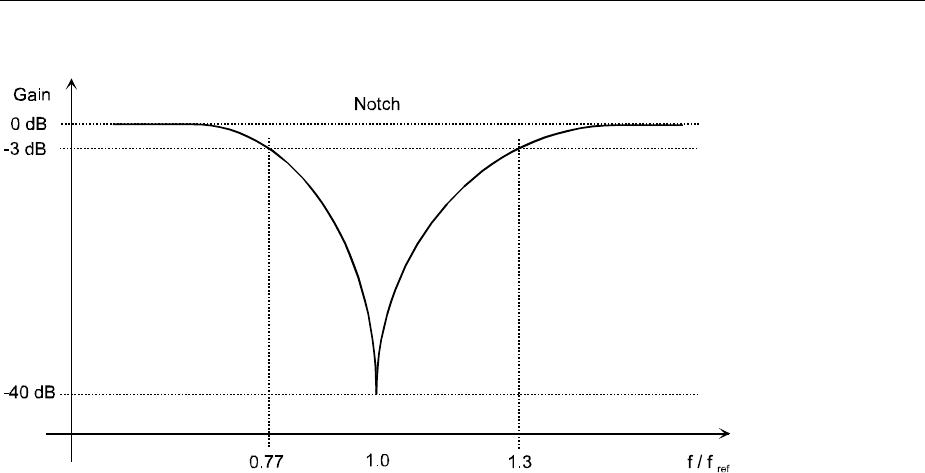
Level Measurements R&S UPV
1146.2084.32 4.244 E-9
Figure 4-19 Characteristic of analog notch filter
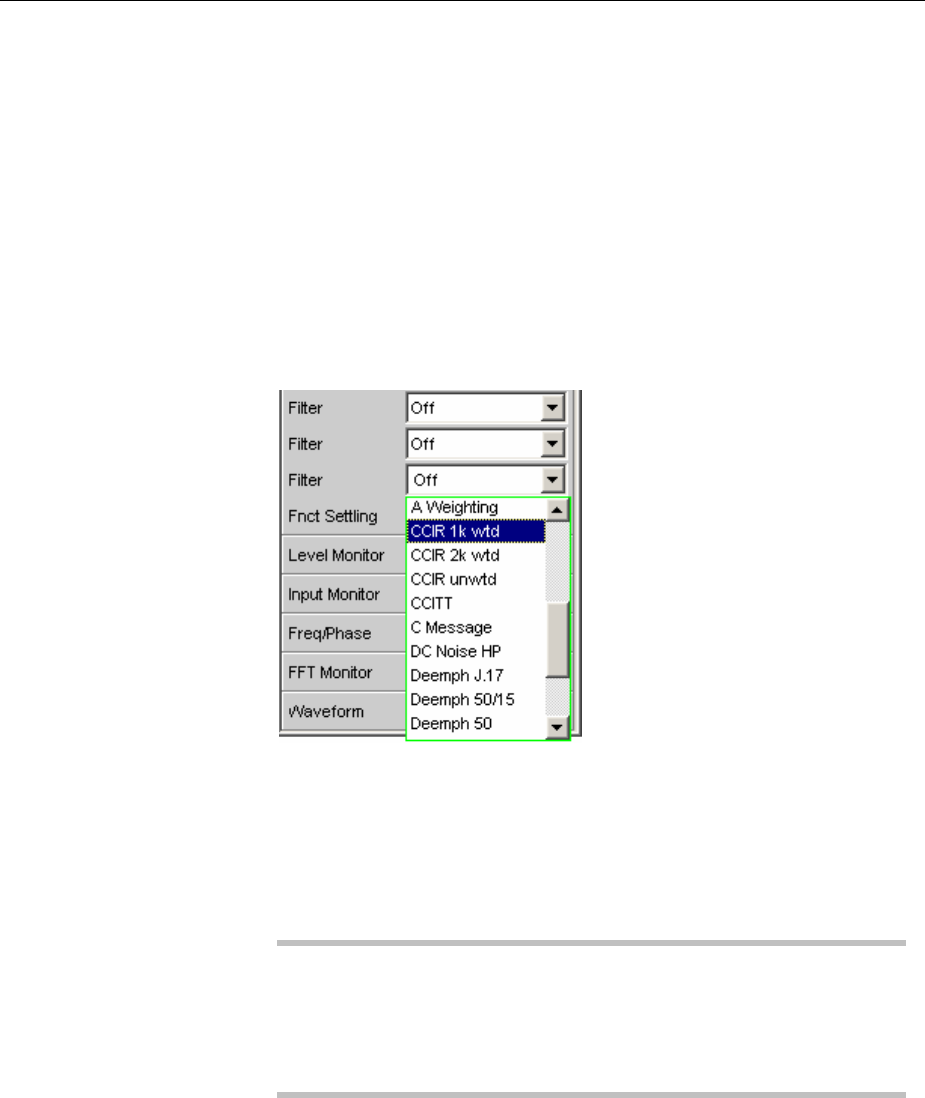
R&S UPV Level Measurements
1146.2084.32 4.245 E-9
Filter
Used to activate a digital filter in the measurement path. Depending on
the selected level measurement method, up to 3 user-defined filters or
weighting filters can be looped into the measurement path:
•RMS: max. 3 filters
•RMS Selective: max. 1 filter in addition to selection filter
•Rub & Buzz: max. 2 filters in addition to the tracking highpass filter
•Peak: max. 3 filters
•Quasi Peak: max. 3 filters
•DC: no filters
•FFT: max. 3 filters
The user-defined filters are configured as Filter 01 to 09 in the Filter
panel (see section "User-Definable Filters" on page 4.420) and can
then be used in the analyzer (more than once if required).
The selectable weighting filters are described in section "Weighting
Filters" on page 4.428.
Note:
Irrespective of the digital filters selected here, it is also possible to loop
an additional input filter ("Pre Filter") into the measurement path.
Furthermore, the analog bandwidth can be limited using the
"Bandwidth" parameter field, which has the same effect as an
additional low-pass filter.
Remote-control command:
SENSe[1]:FILTer[1] <parameter>
SENSe[1]:FILTer2 <parameter>
SENSe[1]:FILTer3 <parameter>
List of <parameter> see section "Filter Table" on page 4.419.

Level Measurements R&S UPV
1146.2084.32 4.246 E-9
RMS Measurement, Broadband
Method used to measure the RMS of an AC voltage, either taking account of or disregarding a
superimposed DC voltage. Any given signal shape can be measured.
Digital operation:
The true RMS value of the signal content is displayed as a full-scale value from 0.0 to 1.0. Depending
on whether "DC Suppress" is activated or deactivated, a superimposed DC component is measured
(deactivated) or suppressed (activated).
Analog operation:
Depending on the selected coupling, a superimposed DC component is measured (DC coupling) or
suppressed (AC coupling).
Remote-control command:
SENSe[1]:FUNCtion RMS
Meas Time
Used to select the measurement time for adapting the measurement
speed to the signal shape or (with single-tone signals) to the signal
frequency.
Short measurement times or a high degree of accuracy can be given
priority according to the specific measurement requirements.
With the automatic measurement modes, the measurement time is
adapted to the (measured) signal frequency, provided that a
sufficiently strong AC signal with not too low a frequency (f = 10 Hz) is
available.
Note:
With severely noise-corrupted or distorted signals and multi-tone
signals, the automatic measurement modes (especially "Auto Fast")
may no longer be able to clearly detect the signal period. To prevent
measurement errors, such signals should therefore be measured
using "Gen Track" or (if an external generator is used) using the
"Value" measurement mode.
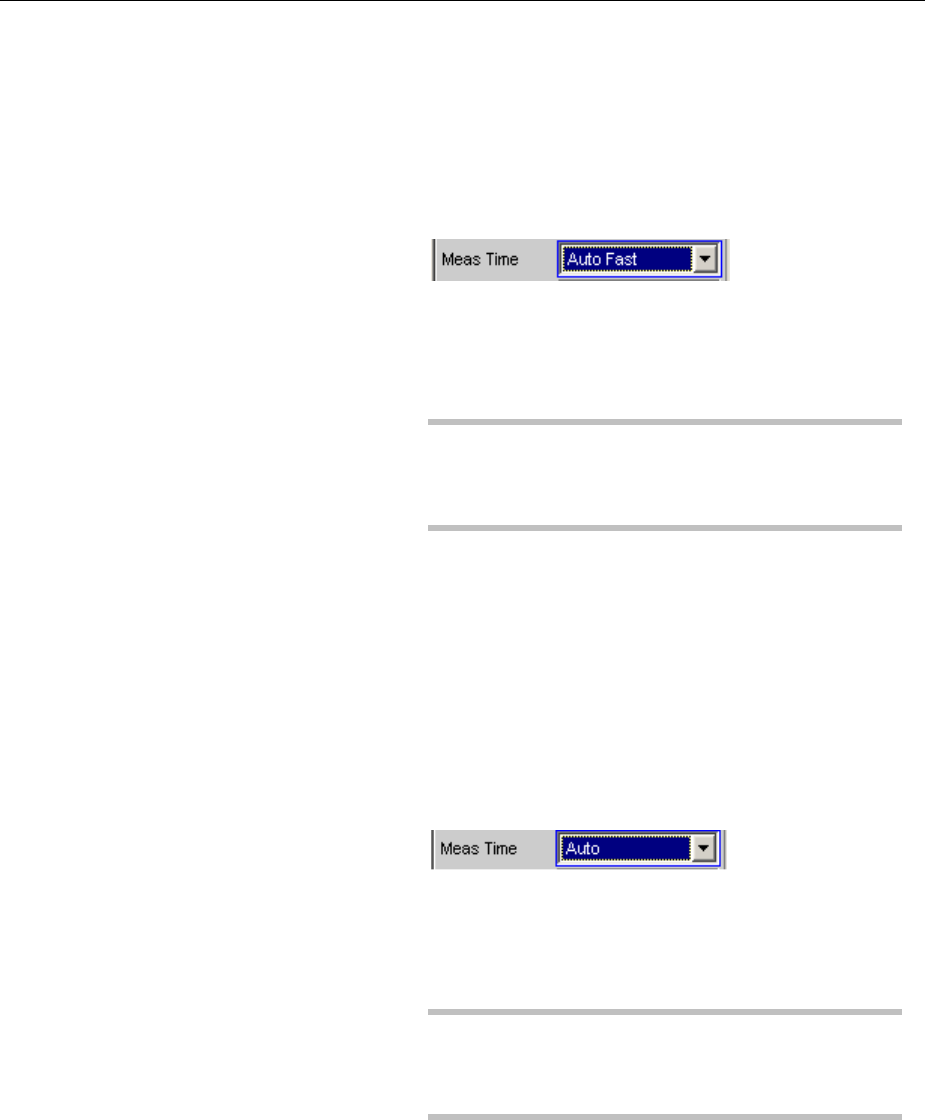
R&S UPV Level Measurements
1146.2084.32 4.247 E-9
Auto Fast Where possible, the RMS measurement is
performed over entire AC periods; with high
frequencies, the measurement time is increased so
that the maximum algorithmic error does not exceed
1 %.
With very weak, low-frequency or pure DC signals,
the maximum measurement time is limited to
100 ms (corresponding to 1 period at 10 Hz).
Recommended for single-tone measurements using
the low-distortion generator or an unknown external
signal source if maximum measurement speed is
desired.
Note:
Infrasound (below 10 Hz) can only be measured
using a fixed measurement time (Value or Gen
Track).
Remote-control command:
SENSe[1]:FUNCtion:APERture:MODE AFASt
Auto Where possible, the RMS measurement is
performed over entire AC periods; with medium or
high frequencies, the measurement time is
increased so that the maximum algorithmic error
does not exceed 0.05 %.
With very weak, low-frequency or pure DC signals,
the maximum measurement time is limited to
200 ms (corresponding to 2 periods at 10 Hz).
Recommended for single-tone measurements using
the low-distortion generator or an unknown external
signal source if maximum measurement accuracy is
desired.
Note:
Infrasound (below 10 Hz) can only be measured
using a fixed measurement time (Value or Gen
Track).
Remote-control command:
SENSe[1]:FUNCtion:APERture:MODE AUTO
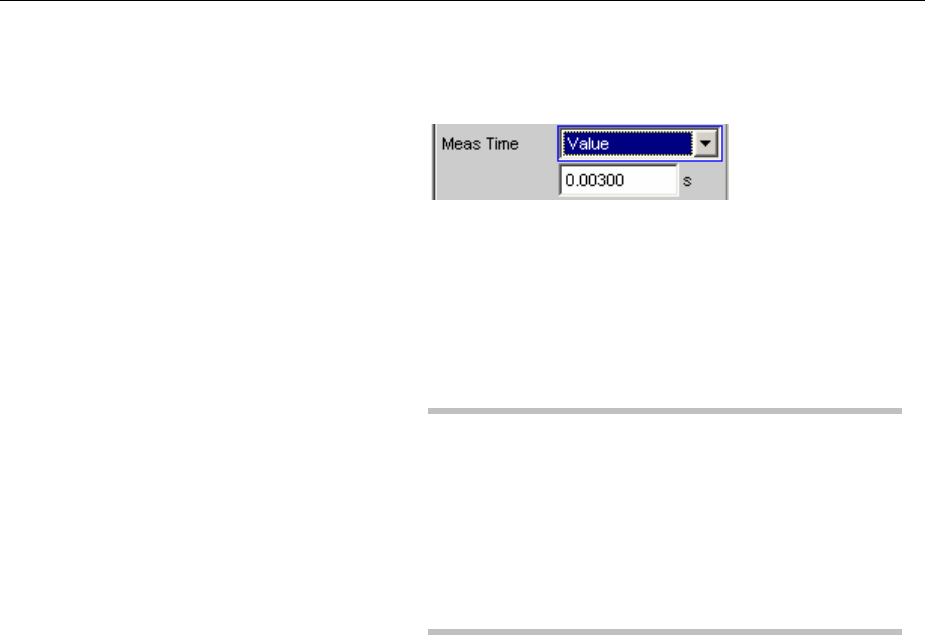
Level Measurements R&S UPV
1146.2084.32 4.248 E-9
Value The RMS measurement is performed over a preset
time which must be entered in the parameter field
below.
To prevent errors due to termination of
measurements, the selected measurement time
should be an integer multiple of the period. If the
frequency of the signal to be measured is unknown
or not constant, the selected measurement time
should be as long as possible in order to minimize
such errors.
Note:
If a multichannel analyzer is used, max. 1.44 million
samples can be observed. In these analyzers, the
maximum measuring time is therefore dependent on
the sampling rate and the analog bandwidth; at
40 kHz analog bandwidth, for example, it is 15 s. If a
longer measuring time is required, one of the two-
channel analyzers must be used for the
measurement (max. 100 s).
Recommended for
•AC measurements of a known external signal
source
•measurements of severely noise-corrupted or
distorted signals of unknown frequency
•measurements of noise signals or multi-tone
signals
Remote-control command:
SENSe[1]:FUNCtion:APERture:MODE VALue
SENSe[1]:VOLTage:APERture <nu>
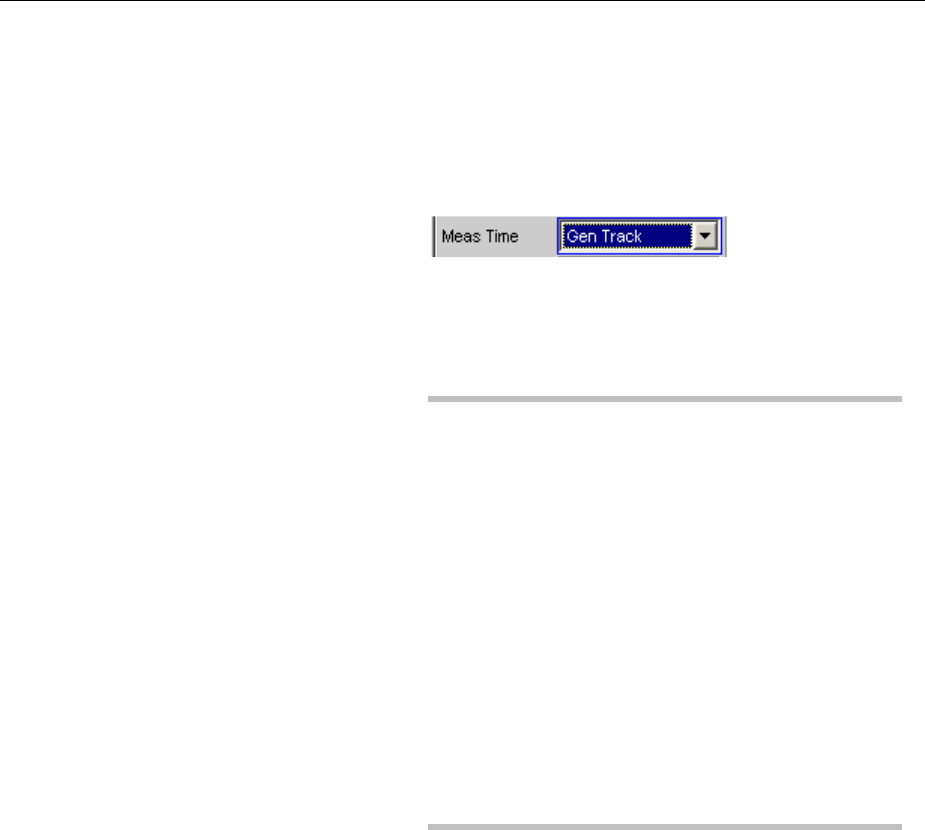
R&S UPV Level Measurements
1146.2084.32 4.249 E-9
Gen Track The RMS measurement is performed over (at least)
1whole period of the generator signal; to allow this,
the generator frequency is adapted to the sampling
rate of the analyzer, if necessary. With high
frequencies, the measurement time is increased to
several periods in order to improve measurement
accuracy.
Recommended for all AC measurements using the
R&S UPV universal generator; particularly suitable
for measuring severely noise-corrupted or distorted
signals and for fast sweeps.
Note:
If the Low-Distortion Generator option is used,
"Gen Track" should be avoided on account of the
rigid coupling to the generator's nominal frequency,
otherwise measuring inaccuracy resulting from slight
frequency offset could occur.
If the "Mod Dist" signal is used as the generator
signal, the measurement time is based on the
(usually dominant) "Lower Frequency".
If "Stereo Sine" is used as the generator signal,
measurement channel 1 tracks generator channel 1
and measurement channel 2 tracks generator
channel 2.
If "Arbitrary" is used as the generator signal, the
measurement time is synchronized to the number of
samples in the loaded file. As a result, measurement
is always performed over a complete period of the
(repeatedly output) ARB signal.
Remote-control command:
SENSe[1]:FUNCtion:APERture:MODE
GENTrack
See section "Level Measurements" on page 4.241 for further settings.
RMS Measurement, Selective
Selective RMS measurement with narrowband band-pass filter or narrowband band-stop filter, either
taking account of or disregarding a superimposed DC voltage. If a band-pass filter is used, the desired
frequency component is measured;if a band-stop filter is used, this component is suppressed.Any
given signal shape can be measured.
Remote-control command:
SENSe[1]:FUNCtion RMSSelect
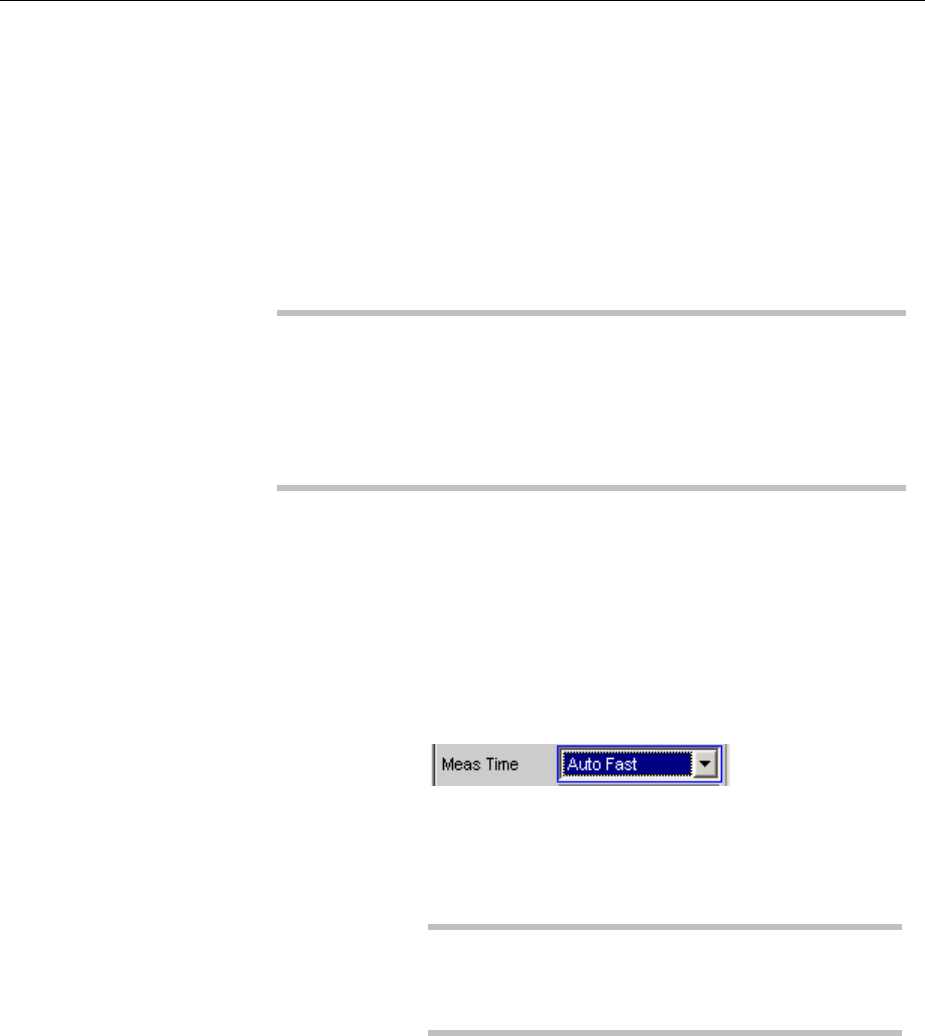
Level Measurements R&S UPV
1146.2084.32 4.250 E-9
Meas Time
Used to select the measurement time for adapting the measurement
speed to the signal shape or (with single-tone signals) to the signal
frequency.
Short measurement times or a high degree of accuracy can be given
priority according to the specific measurement requirements.
With the automatic measurement modes, the measurement time is
adapted to the (measured) signal frequency, provided that a
sufficiently strong AC signal with not too low a frequency (f = 10 Hz) is
available.
Note:
With severely noise-corrupted or distorted signals and multi-tone
signals, the automatic measurement modes (especially "Auto Fast")
may no longer be able to clearly detect the signal period. To prevent
measurement errors, such signals should therefore be measured
using "Gen Track" or (if an external generator is used) using the
"Value" measurement mode.
Auto Fast Where possible, the RMS measurement is
performed over entire AC periods; with high
frequencies, the measurement time is increased so
that the maximum algorithmic error does not exceed
1 %.
With very weak, low-frequency or pure DC signals,
the maximum measurement time is limited to
100 ms (corresponding to 1 period at 10 Hz).
Recommended for single-tone measurements using
the low-distortion generator or an unknown external
signal source if maximum measurement speed is
desired.
Note:
Infrasound (below 10 Hz) can only be measured
using a fixed measurement time (Value or Gen
Track).
Remote-control command:
SENSe[1]:FUNCtion:APERture:MODE AFASt
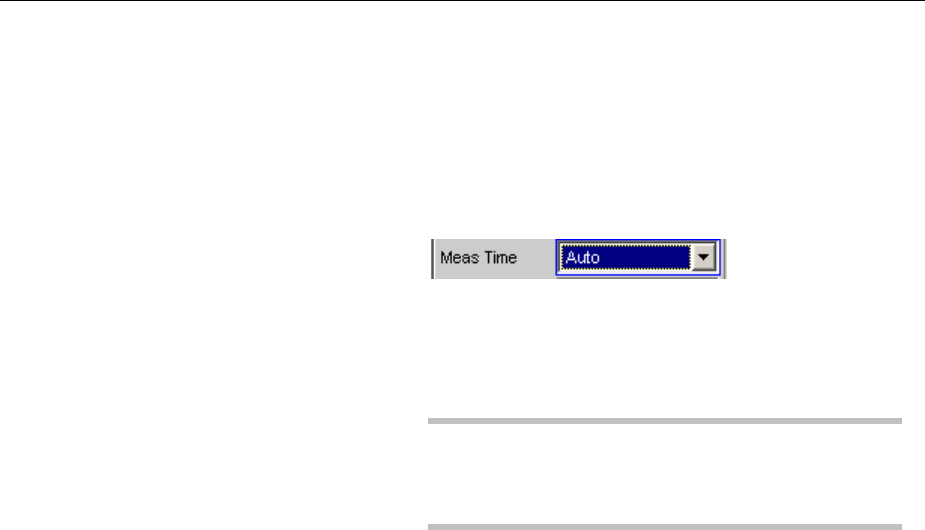
R&S UPV Level Measurements
1146.2084.32 4.251 E-9
Auto Where possible, the RMS measurement is
performed over entire AC periods; with medium or
high frequencies, the measurement time is
increased so that the maximum algorithmic error
does not exceed 0.05 %.
With very weak, low-frequency or pure DC signals,
the maximum measurement time is limited to
200 ms (corresponding to 2 periods at 10 Hz).
Recommended for single-tone measurements using
the low-distortion generator or an unknown external
signal source if maximum measurement accuracy is
desired.
Note:
Infrasound (below 10 Hz) can only be measured
using a fixed measurement time (Value or Gen
Track).
Remote-control command:
SENSe[1]:FUNCtion:APERture:MODE AUTO

Level Measurements R&S UPV
1146.2084.32 4.252 E-9
Value The RMS measurement is performed over a preset
time which must be entered in the parameter field
below.
To prevent errors due to termination of
measurements, the selected measurement time
should be an integer multiple of the period. If the
frequency of the signal to be measured is unknown
or not constant, the selected measurement time
should be as long as possible in order to minimize
such errors.
Note:
If a multichannel analyzer is used, max. 1.44 million
samples can be observed. In these analyzers, the
maximum measuring time is therefore dependent on
the sampling rate and the analog bandwidth; at
40 kHz analog bandwidth, for example, it is 15 s. If a
longer measuring time is required, one of the two-
channel analyzers must be used for the
measurement (max. 100 s).
Recommended for
•AC measurements of a known external signal
source
•measurements of severely noise-corrupted or
distorted signals of unknown frequency
•measurements of noise signals or multi-tone
signals
Remote-control command:
SENSe[1]:FUNCtion:APERture:MODE VALue
SENSe[1]:VOLTage:APERture <nu>
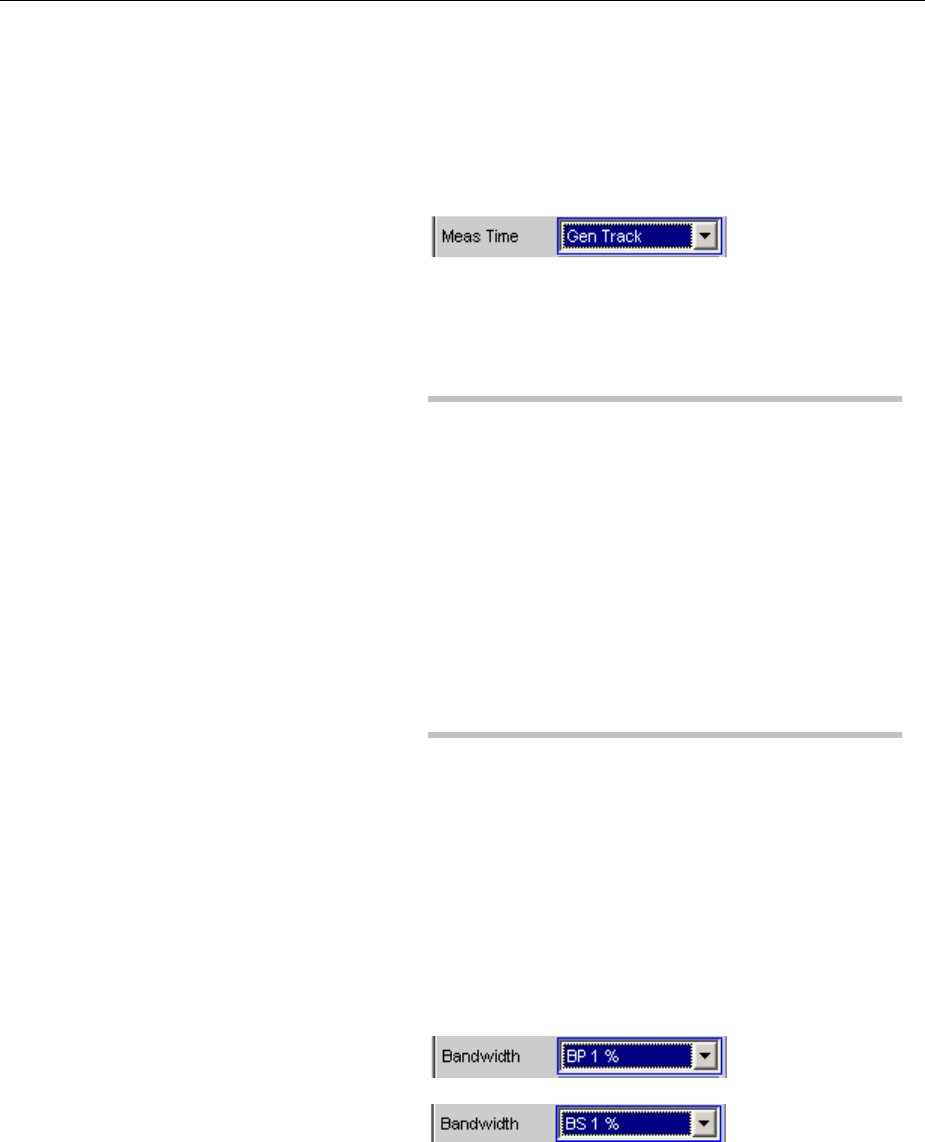
R&S UPV Level Measurements
1146.2084.32 4.253 E-9
Gen Track The RMS measurement is performed over (at least)
1whole period of the generator signal; to allow this,
the generator frequency is adapted to the sampling
rate of the analyzer, if necessary. With high
frequencies, the measurement time is increased to
several periods in order to improve measurement
accuracy.
Recommended for all AC measurements using the
R&S UPV universal generator; particularly suitable
for measuring severely noise-corrupted or distorted
signals and for fast sweeps.
Note:
If the Low-Distortion Generator option is used,
"Gen Track" should be avoided on account of the
rigid coupling to the generator's nominal frequency,
otherwise measuring inaccuracy resulting from slight
frequency offset could occur.
If the "Mod Dist" signal is used as the generator
signal, the measurement time is based on the
(usually dominant) "Lower Frequency".
If "Arbitrary" is used as the generator signal, the
measurement time is synchronized to the number of
samples in the loaded file. As a result, measurement
is always performed over a complete period of the
(repeatedly output) ARB signal.
Remote-control command:
SENSe[1]:FUNCtion:APERture:MODE
GENTrack
Bandwidth
Used to select the bandwidth and filter type (band-pass filter BP… or
band-stop filter BS…).
BP 1 %
BS 1 %
Band-pass filter / band-stop filter with the relative
width of 1 % (geometrically symmetrical around the
center frequency).
(Band-Pass filter)
(Band-Stop filter)
Remote-control command:
SENSe[1]:BANDwidth:MODE PPCT1
SENSe[1]:BANDwidth:MODE SPCT1
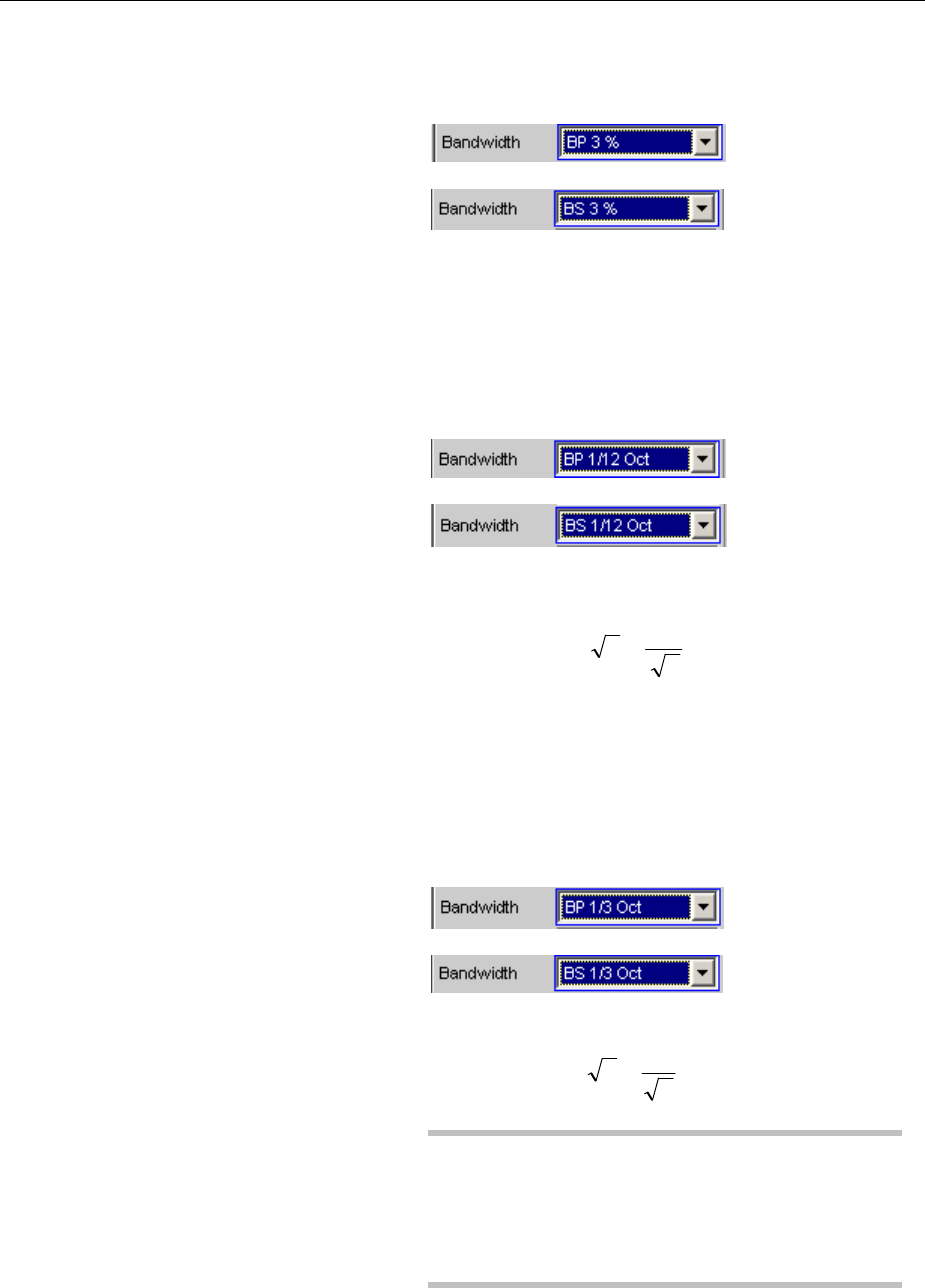
Level Measurements R&S UPV
1146.2084.32 4.254 E-9
BP 3 %
BS 3 %
Band-pass filter / band-stop filter with the relative
width of 3 % (geometrically symmetrical around the
center frequency).
(Band-Pass filter)
(Band-Stop filter)
Remote-control command:
SENSe[1]:BANDwidth:MODE PPCT3
SENSe[1]:BANDwidth:MODE SPCT3
BP 1/12 Oct
BS 1/12 Oct
Band-pass filter / band-stop filter with the relative
width of one twelfth octave (geometrically
symmetrical around the center frequency).
(Band-Pass filter)
(Band-Stop filter)
The relative bandwidth of one twelfth octave is
˜ 6 %.
(Calculated from 2
1
20 0577 5 77%
24
24
==..)
Remote-control command:
SENSe[1]:BANDwidth:MODE PPCT12
SENSe[1]:BANDwidth:MODE SPCT12
BP 1/3 Oct
BS 1/3 Oct
Band-pass filter / band-stop filter with the relative
width of one third octave (geometrically symmetrical
around the center frequency).
(Band-Pass filter)
(Band-Stop filter)
The relative bandwidth of one third octave is ˜ 23 %.
(Calculated from 2
1
20 2315 23 15%
6
6
==..)
Note:
With the third-octave filter, the 0.1 dB bandwidth is
reduced until an attenuation of approx. 3 dB is
obtained for the cutoff frequencies. The effective
bandwidth is therefore smaller than the precise
bandwidth determined by calculation.
Remote-control command:
SENSe[1]:BANDwidth:MODE PTOC
SENSe[1]:BANDwidth:MODE STOC
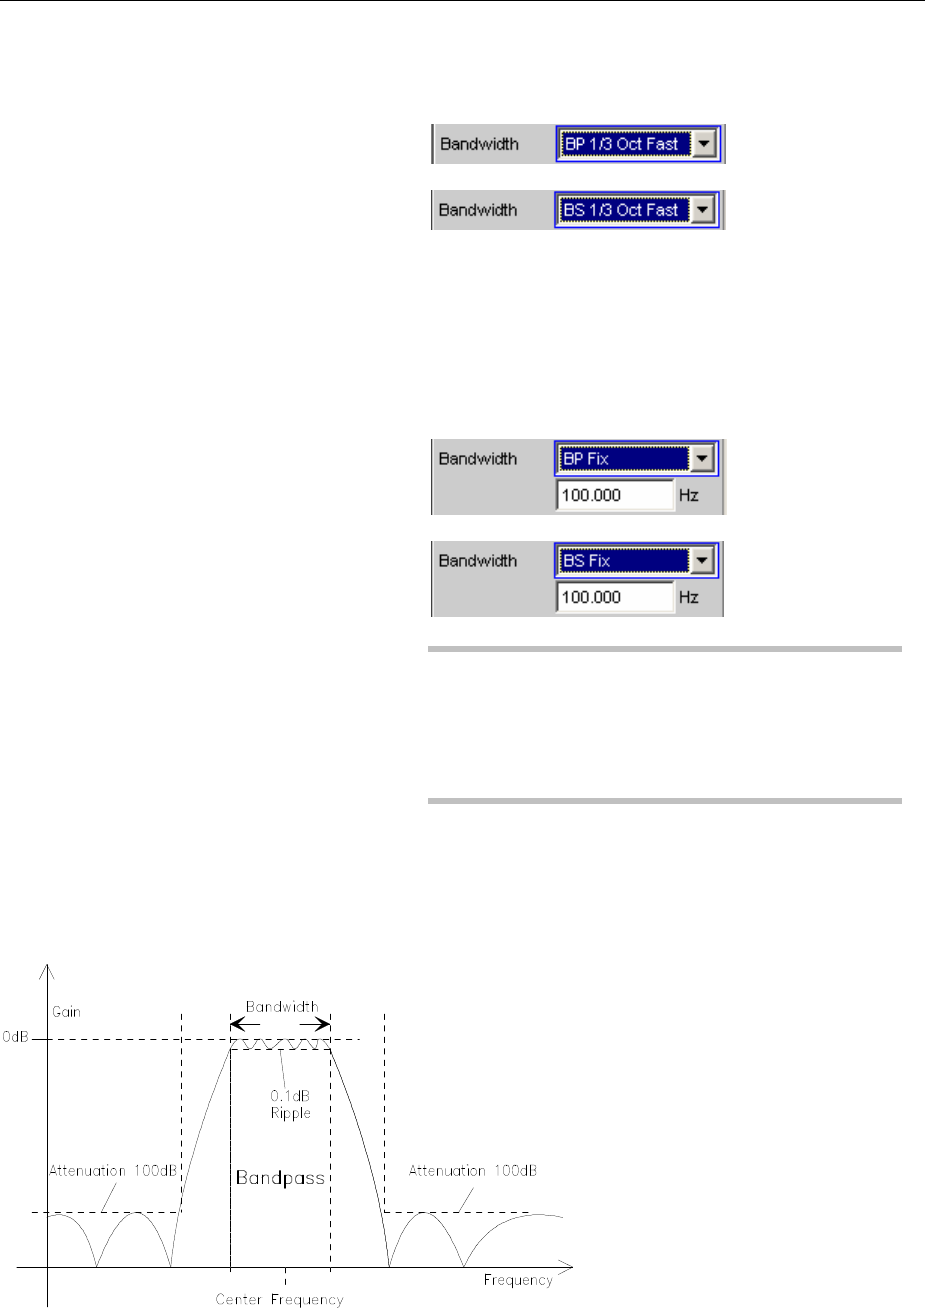
R&S UPV Level Measurements
1146.2084.32 4.255 E-9
BP 1/3 Oct
Fast
BS 1/3 Oct
Fast
Very fast settling third-octave filter (see above) with
only 40 % attenuation.
(Band-Pass filter)
(Band-Stop filter)
Remote-control command:
SENSe[1]:BANDwidth:MODE PFAS
SENSe[1]:BANDwidth:MODE SFAS
BP Fix
BS Fix
Band-pass filter / band-stop filter with selectable,
arithmetically symmetrical bandwidth which must be
entered in the parameter field below.
(Band-Pass filter)
(Band-Stop filter)
Note:
For infrasound measurements, the bandwidth can
be reduced down to a sampling rate/48000 (but at
least 1 Hz). As very long filter settling times occur in
the range below 10 Hz, measurement results can
only be viewed after several seconds.
Remote-control command:
SENSe[1]:BANDwidth:MODE PFIX
SENSe[1]:BANDwidth:MODE SFIX
SENSe[1]:BANDwidth <nu>
Figure 4-20 Filter characteristic of an RMS Selective band-pass filter

Level Measurements R&S UPV
1146.2084.32 4.256 E-9
Sweep Ctrl
Used to activate and configure or deactivate the band-pass sweep /
band-stop sweep in the analyzer sweep system.
In the two channel analog analyzer, the notch frequency of the analog
notch filter (which can be enabled if required) is also swept.
Note:
The sweeps are also deactivated implicitly when the generator sweep
is activated and when certain start conditions are selected (e.g.
external sweeps or "Time Chart").
Off The band-pass sweep / band-stop sweep is
deactivated;the band center frequency can be
specified in the "Freq Mode" parameter field.
If the generator sweep system is also deactivated,
the START, SINGLE and STOP/CONT keys affect
the measurement system:
•START starts a continuous measurement
•SINGLE starts a single measurement or
continues an already started continuous
measurement as a single measurement.
•STOP/CONT stops an active measurement or
starts a stopped or completed measurement as
acontinuous measurement.
Remote-control command:
SENSe:SWEep:CONTrol OFF
Auto Sweep The band-pass sweep / band-stop sweep is
activated;the sweep stepping is performed
automatically; the sweep axis is calculated from the
start value, stop value and step size or point
number.
Remote-control command:
SENSe:SWEep:CONTrol ASWeep
Auto List The band-pass sweep / band-stop sweep is
activated;the sweep stepping is performed
automatically; the sweep axis is determined from the
predefined list of sweep points (usually loaded as a
file).
Remote-control command:
SENSe:SWEep:CONTrol ALISt

R&S UPV Level Measurements
1146.2084.32 4.257 E-9
Spacing
Used to select the sweep range spacing, i.e. the way in which the
sweep points are distributed on the sweep axis. Only visible for
activated band-pass / band-stop sweep.
Lin Points The sweep range is divided linearly by specifying a
number of points (linear sweep). This number is
entered in the "Points" parameter field.
Should be selected if equidistant, linear spacing of
all points is required.
Remote-control command:
SENSe:SWEep:SPACing LINPoints
Lin Steps The sweep range is divided into intervals of a
specified linear step size starting at "Start" (linear
sweep). This step size is entered in the "Step"
parameter field.
Remote-control command:
SENSe:SWEep:SPACing LINSteps
Log Points The sweep range is divided logarithmically by
specifying a number of points (logarithmic sweep).
This number is entered in the "Points" parameter
field.
Should be selected if equidistant, logarithmic
spacing of all points is required.
Remote-control command:
SENSe:SWEep:SPACing LOGPoints
Log Steps The sweep range is divided into intervals of a
specified logarithmic step size starting at "Start"
(logarithmic sweep). Each sweep point is calculated
by multiplying the previous point by a constant
factor. This factor is entered in the "Step" parameter
field.
Remote-control command:
SENSe:SWEep:SPACing LOGSteps
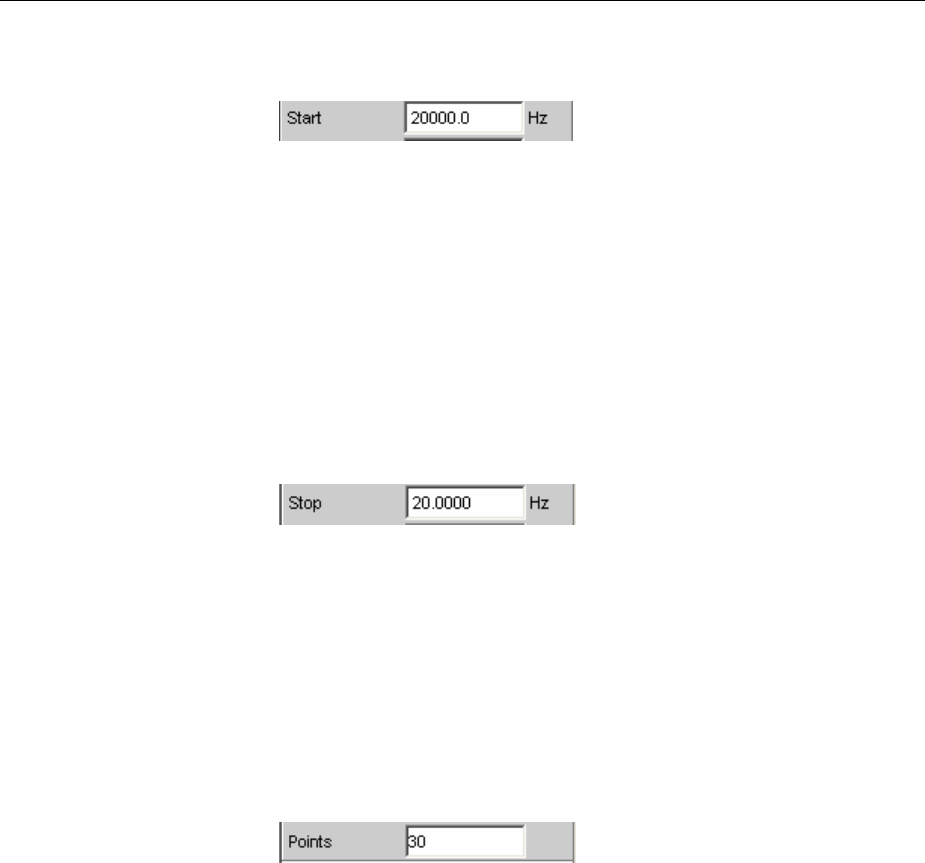
Level Measurements R&S UPV
1146.2084.32 4.258 E-9
Start
Used to enter the start value for the band-pass / band-stop center
frequency. Only visible for activated band-pass / band-stop sweep.
The start and stop value implicitly determine the sweep direction:
If the start value is less than the stop value, an upward sweep is
performed, otherwise a downward sweep will be performed.
If a start value identical to the stop value is entered, the stop value is
automatically loaded with the old start value. In this way, it is possible
to change the sweep direction by entering just one value.
Remote-control command:
SENSe:SWEep:STARt <nu>
Stop
Used to enter the stop value for the band-pass / band-stop center
frequency. Only visible for activated band-pass / band-stop sweep.
The start and stop value implicitly determine the sweep direction:
If a stop value identical to the start value is entered, the start value is
automatically loaded with the old stop value.
Remote-control command:
SENSe:SWEep:STOP <nu>
Points
Used to enter the number of sweep points for the band-pass / band-
stop center frequency. Only visible for activated band-pass / band-
stop sweep if "Lin Points" or "Log Points" is set for "Spacing".
The sweep range is divided into "Points – 1" (linear or logarithmic)
equidistant steps. At least 2 points (start and stop value) are required.
Amaximum of 1024 points can be selected.
Remote-control command:
SENSe:SWEep:POINts <nu>
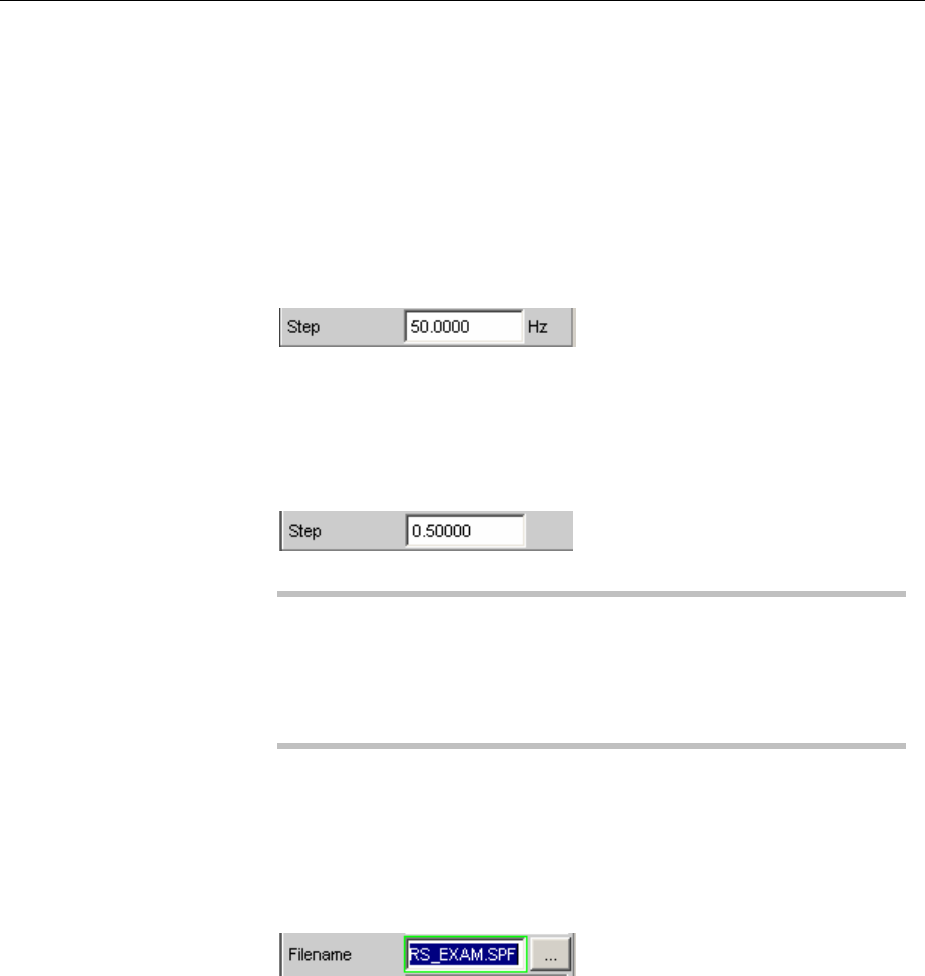
R&S UPV Level Measurements
1146.2084.32 4.259 E-9
Step
Used to enter the (linear or logarithmic) step size for the band-pass /
band-stop center frequency. Only visible for activated band-pass /
band-stop sweep if "Lin Steps" or "Log Steps" is set for "Spacing".
The entry range is limited automatically so that at least one and at
most 1023 steps exist (corresponding to 1024 sweep points).
With linear step, the size of the step must always be entered, i.e. the
numeric value is positive even if the start value is greater than the stop
value. The physical unit is the same as that used when specifying
"Start" and "Stop".
(Example for lin. frequency sweep)
With logarithmic step, the factor must be entered by which each
sweep point is to be multiplied in order to move to the next sweep
point. Swapping the start and stop value (reversal of the sweep
direction) therefore produces the reciprocal value. The closer the
numeric value is to 1.0, the more sweep steps will be performed.
(Example for log. downward sweep)
Note:
Since the last step of the sweep is automatically adapted such that it
corresponds exactly to the stop value, it may deviate by max. 50 %
from the selected step size. If this is to be avoided, either the start /
stop value must be corrected accordingly or the sweep spacing must
be set using the "Points" parameter.
Remote-control command:
SENSe:SWEep:STEP <nu>
Filename
Used to enter the file name for the list of band-pass / band-stop center
frequencies (frequency sweep list). Only visible for activated band-
pass / band-stop list sweep.
Remote-control command:
MMEMory:LOAD:FILE 'filename'

Level Measurements R&S UPV
1146.2084.32 4.260 E-9
Freq Mode
Used to determine the band-pass / band-stop center frequency.
In the two channel analog analyzer, this field is used to determine the
notch frequency of the analog notch filter (which can be enabled if
required).
Fix Fixed band-pass / band-stop center frequency – in
the two channel analog analyzer, also the notch
frequency if notch is activated. The center frequency
must be entered in the parameter field below.
Note:
For infrasound measurements, the center frequency
can be reduced down to a sampling rate/48000 (but
at least 1 Hz). As very long filter settling times occur
in the range below 10 Hz, measurement results can
only be viewed after several seconds.
Remote-control command:
SENSe:FREQuency:SELect FIX

R&S UPV Level Measurements
1146.2084.32 4.261 E-9
Gen Track The bandpass/band-stop center frequency – in the
two-channel analog analyzer, also the notch
frequency if notch is activated – changes with the
generator (nominal)frequency. This can be changed
by means of manual entry in the Generator Function
panel or owing to a generator frequency sweep. If
the internal stereo generator is used, measurement
channel 1 tracks generator channel 1 and
measurement channel 2 tracks generator channel 2.
By entering a factor in the next parameter field, the
user can select whether the center frequency is to
be identical to the generator frequency (factor = 1) or
amultiple of the generator frequency. Setting a
whole number for this factor will allow individual
harmonics to be measured.
Note:
If the Low-Distortion Generator option is used,
"Gen Track" should be avoided on account of the
rigid coupling to the generator's nominal frequency,
otherwise measuring inaccuracy resulting from slight
frequency offset could occur.
An error message is output if an unsuitable signal
function is selected in the generator (e.g. a multi-
tone signal or noise signal).
Recommended when using the internal R&S UPV
universal generator.
Remote-control command:
SENSe:FREQuency:SELect GENTrack
Freq Ch1
The bandpass/band-stop center frequency – in the
two-channel analog analyzer, also the notch
frequency if notch is activated – changes with the
frequency measured in Channel 1; not available in
the multichannel analyzers.
Recommended when using the low-distortion
generator or an external signal source.
Remote-control command:
SENSe:FREQuency:SELect CH1F
Freq Ch2
The bandpass/band-stop center frequency – in the
two-channel analog analyzer, also the notch
frequency if notch is activated – changes with the
frequency measured in Channel 2; not available in
the multichannel analyzers.
Recommended when using the low-distortion
generator or an external signal source.
Remote-control command:
SENSe:FREQuency:SELect CH2F

Level Measurements R&S UPV
1146.2084.32 4.262 E-9
Auto Each
In each channel the bandpass/band-stop center
frequency tracks the measured frequency in the
channel concerned, as does the notch frequency
when notch is active in the two-channel analog
analyzer.
If one of the channels does not provide
unambiguous frequency information (e.g. in the case
of multitone signals or noise signals), or if there is no
input signal, the measurement for this channel is
marked as invalid. This does not have any negative
impact on the measured value for the other (valid)
channel, but the measurement time is considerably
longer. It is thus recommended to use the
appropriate mode (“Freq Ch1” or “Freq Ch2”) in such
cases.
This is to be recommended when using an external
stereo signal source.
Remote-control command:
SENSe:FREQuency:SELect AUTO
Freq RefCh
The bandpass/band-stop center frequency tracks
the frequency measured in the reference channel;
only available in the multichannel analyzers.
Recommended when using the low-distortion
generator or an external signal source.
Remote-control command:
SENSe:FREQuency:SELect REFFrequency
Factor
Used to enter the factor by which the center frequency of the band-
pass filter or band-stop filter is to be higher than the generator
frequency. Only visible in "Freq Mode Gen Track".
Setting an integer factor greater than 1 will therefore allow an
individual harmonic to be measured. If the fundamental is to be
selected, the factor must be set to 1.
Note:
The factor does not affect the notch filter frequency. In "Freq Mode
Gen Track", the notch filter is set to exactly the generator frequency
without taking "Factor" into consideration so that a higher dynamic
response can be achieved by means of (analog) suppression of the
fundamental irrespective of the measurement task.
Remote-control command:
SENSe:FREQuency:FACTor <nu>
See section "Level Measurements" on page 4.241 for further settings.
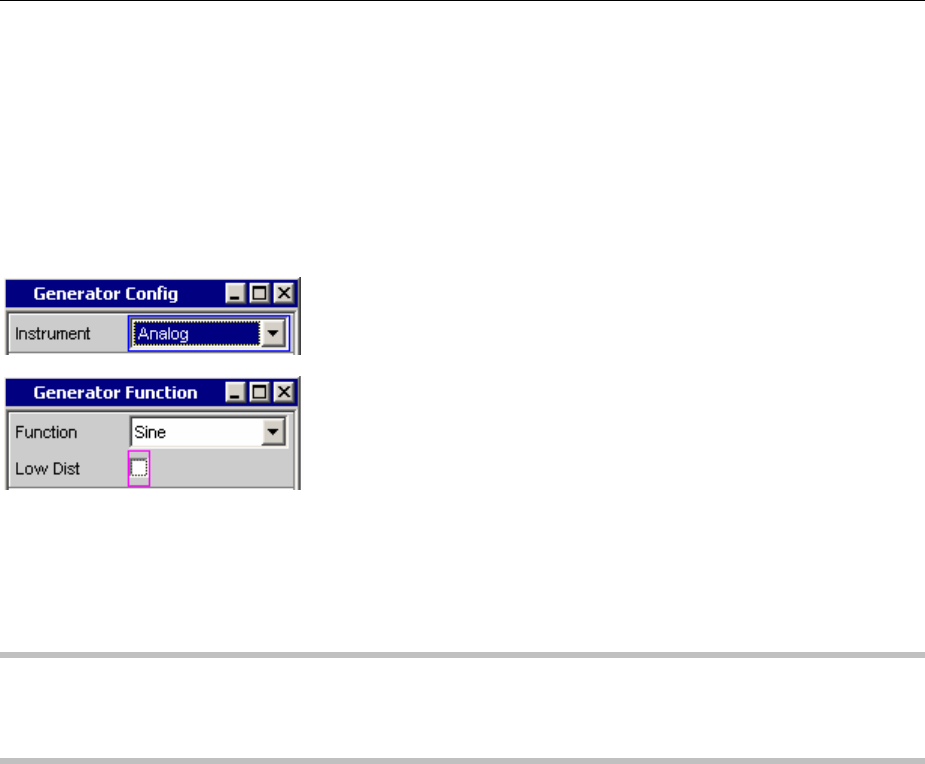
R&S UPV Level Measurements
1146.2084.32 4.263 E-9
Rub & Buzz Measurement
This is an RMS measurement with a tracking highpass filter whose passband starts above a selectable
harmonic of the signal frequency.
This measurement function is available only if the R&S UPV-K6 option (Extended Analysis Functions)is
installed and only for the two-channel analog analyzer. It is meaningful only if used in conjunction with
the sinewave signal of the internal universal generator. When you switch on the "Rub & Buzz"
measurement function, the corresponding generator settings will automatically be made:
The purpose of the rub & buzz measurement is to pinpoint manufacturing defects on (single)
loudspeakers, such defects being noticeable as nonharmonic noise or harmonics with a high amplitude.
THDN measurements are not suitable for this purpose, since loudspeakers free from defects also
produce k2 and k3 harmonics. What is needed is a measurement function that suppresses not only the
fundamental but also the first harmonics and measures the remaining signal.
Note:
An RMS measurement that takes into account the prefilter only can be performed with the level monitor
function simultaneously with the rub & buzz measurement. It is thus possible to determine and display
the frequency response and the rub & buzz characteristic simultaneously for two channels.
Remote-control command:
SENSe[1]:FUNCtion RUBBuzz
Meas Time
Used to select the measurement time to match the measurement
speed to the signal frequency.
In most cases – especially with sweeps – selecting "Gen Track" will be
the most appropriate thing, since the rub & buzz measurement
requires the use of the internal function generator.
With the automatic measurement modes, the measurement time is
adapted to the (measured) signal frequency, provided that an
AC signal is detected that is sufficiently strong and whose frequency is
not too low (f b10 Hz). However, since the fundamental is filtered out,
these measurement modes are meaningful only in exceptional cases,
e.g. where modification of the generator frequency cannot be
accepted, such modification being unavoidable with "Gen Track".
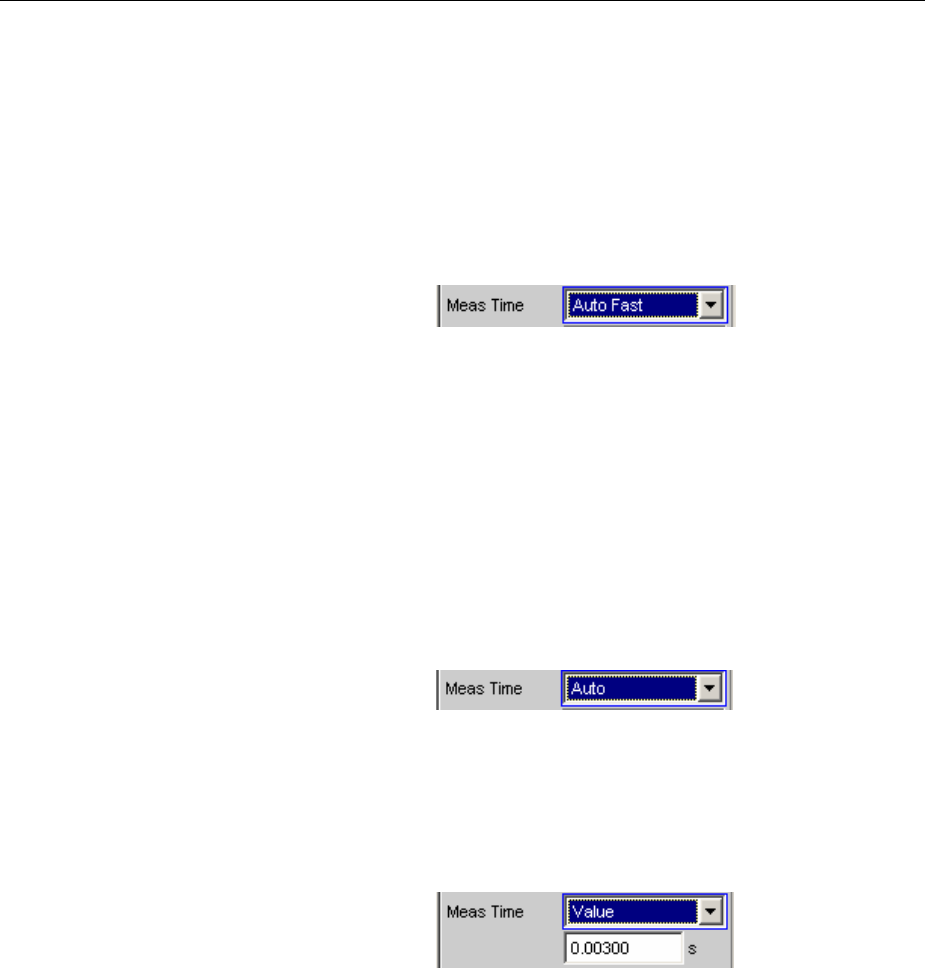
Level Measurements R&S UPV
1146.2084.32 4.264 E-9
Auto Fast The rub & buzz measurement is performed, as far
aspossible, over complete AC periods of the
strongest harmonic detected. With high
frequencies, the measurement time is extended so
that the maximum algorithmic error does not
exceed 1 %.
With very weak or low-frequency signals or pure DC
signals, the measurement time is limited to a
maximum of 100 ms (corresponding to one period
at 10 Hz).
Remote-control command:
SENSe[1]:FUNCtion:APERture:MODE AFASt
Auto The rub & buzz measurement is performed, as far
as possible, over complete AC periods of the
strongest harmonic detected. With high
frequencies, the measurement time is extended so
that the maximum algorithmic error does not
exceed 0.05 %.
With very weak or low-frequency signals or pure DC
signals, the measurement time is limited to a
maximum of 200 ms (corresponding to two periods
at 10 Hz).
Remote-control command:
SENSe[1]:FUNCtion:APERture:MODE AUTO
Value The rub & buzz measurement is performed for a
fixed period of time, which is to be entered in the
next menu line.
This option is recommended for measurement tasks
in which a modification of the generator frequency
cannot be accepted, such modification being
unavoidable with "Gen Track".
The longer the measurement time, the more
accurate the rub & buzz measurement results and,
optionally, the RMS results obtained with the level
monitor.
Remote-control command:
SENSe[1]:FUNCtion:APERture:MODE VALue
SENSe[1]:VOLTage:APERture <nu>
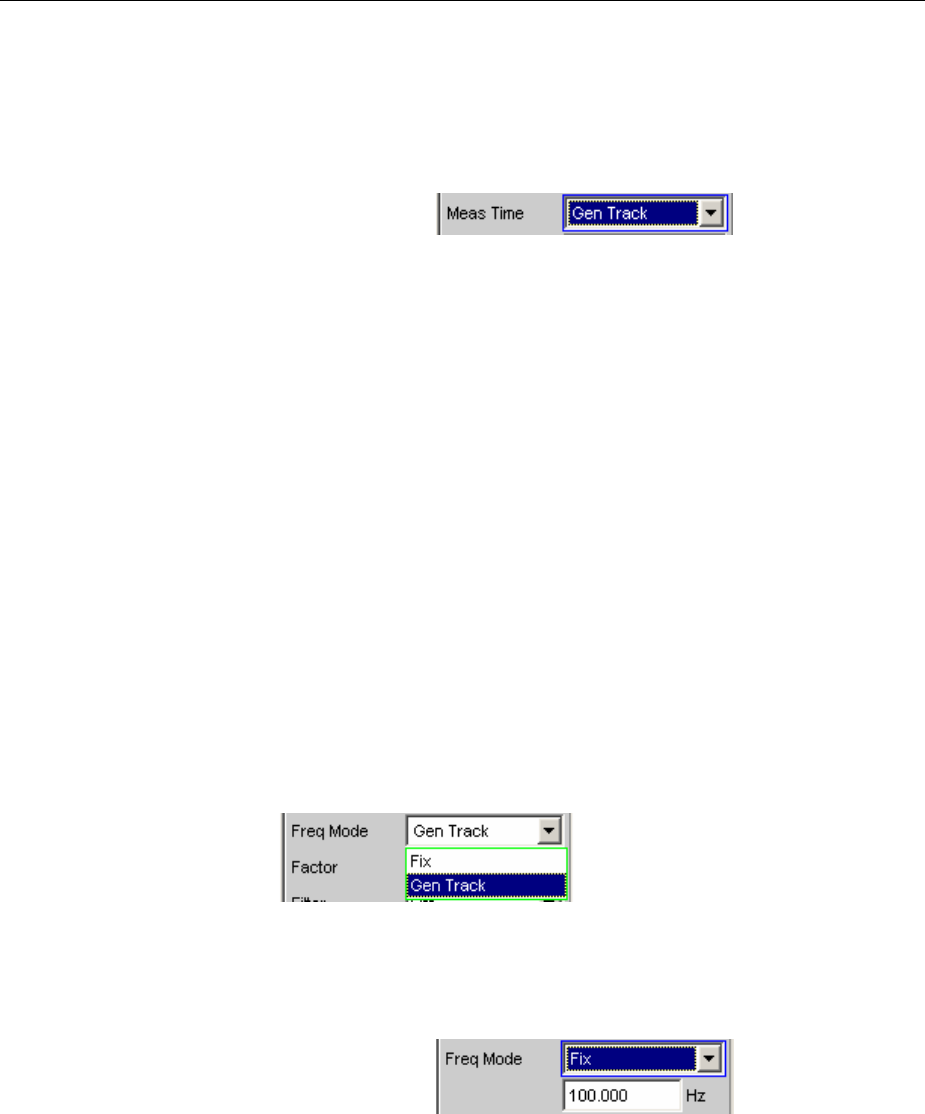
R&S UPV Level Measurements
1146.2084.32 4.265 E-9
Gen Track The RMS measurement is performed over (at least)
one complete period of the generator signal.
If necessary, the generator frequency is adapted to
the analyzer sampling rate. For high frequencies,
the measurement is performed over several periods
in order to increase measurement accuracy.
In conjunction with the R&S UPV universal
generator, this measurement mode ensures
maximum accuracy at minimum measurement time.
This mode is recommended for the rub & buzz
measurement, since this measurement uses the
R&S UPV universal generator as a signal source.
Remote-control command:
SENSe[1]:FUNCtion:APERture:MODE
GENTrack
Freq Mode
Used to define the highpass filter frequency or band.
The following options are possible:
•The highpass filter can be assigned a fixed frequency.
•The highpass filter can track the generator with n times the
generator frequency.
•Acombination of the above can be selected. This is done by
defining a tracking range by entering an upper and a lower
frequency; outside this range, the pass frequency of the filter is
maintained at the respective limit frequency.
Fix Use of a highpass filter with a fixed pass frequency,
which is to be entered in the next menu line.
Remote-control command:
SENSe:FREQuency:SELect FIX
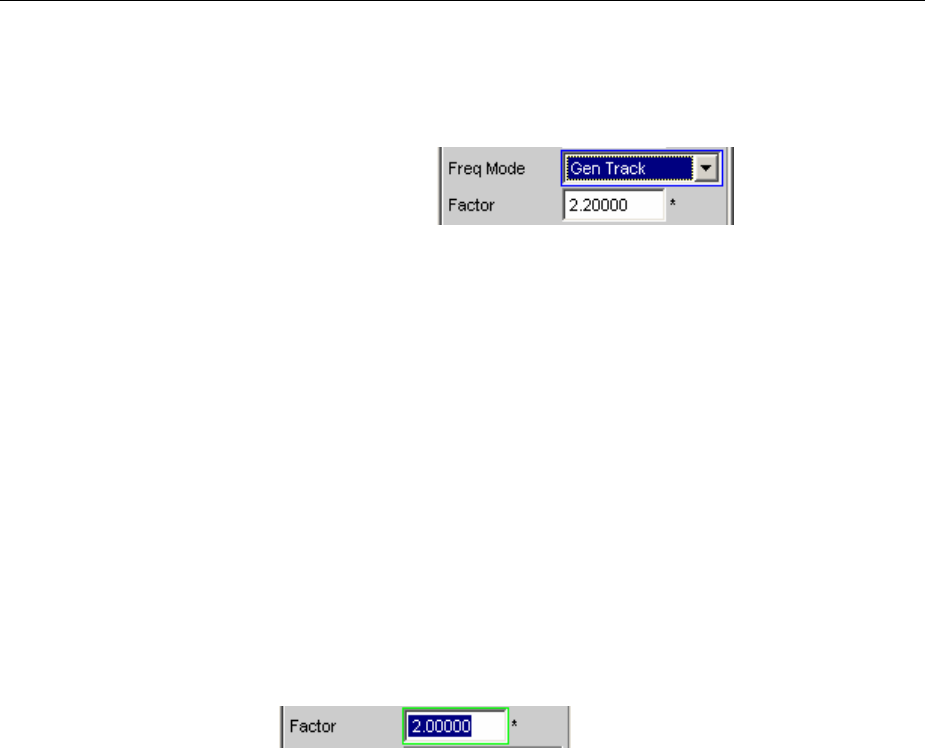
Level Measurements R&S UPV
1146.2084.32 4.266 E-9
Gen Track Use of a tracking highpass filter whose pass
frequency follows a multiple of the generator
(nominal)frequency, which is to be entered in the
next menu line.
Moreover, the frequency limits for the tracking
range can be selected. On attaining the lower or
upper limit (FrqLim Low or Upp), the filter frequency
is maintained at the limit frequency. This yields a
tracking highpass filter that becomes a fixed-
frequency highpass filter below FrqLim Low and
above FrqLim Upp.
If the filter is to act as a tracking filter over the entire
frequency range, the frequency limits are to be set
to the minimum and maximum values.
Remote-control command:
SENSe:FREQuency:SELect GENTrack
Factor
Used to enter the factor by which the pass frequency should be higher
than the generator frequency. Meaningful values for rub & buzz
measurements would be around approx. 5. The factor can be
displayed only under "Freq Mode: Gen Track".
The following should be noted:
•If the product of the generator frequency and the factor attains the
value of "FrqLim Upp", the highpass filter becomes a fixed-
frequency filter operating at the upper limit frequency.
•If the product of the generator frequency and the factor attains the
upper limit frequency of the analyzer used, no rub & buzz value
will be determined. Any other measurement performed
simultaneously (e.g. frequency response measurement with the
level monitor function) is carried out at a correspondingly higher
speed.
Remote-control command:
SENSe:FREQuency:FACTor <nu>

R&S UPV Level Measurements
1146.2084.32 4.267 E-9
Frq Lim Low
Lower limit of the highpass filter tracking range.
Can be displayed only under "Freq Mode: Gen Track".
If the product of the generator frequency and the factor is lower than
the limit entered here, the highpass filter becomes a fixed-frequency
filter operating at the lower limit frequency.
This setting does not affect the rub & buzz measurement, i.e. the rub
&buzz measurement will be performed.
Remote-control command:
SENSe[1]:FREQuency:LIMit:LOWer <nu>
Frq Lim Upp
Upper limit of the highpass filter tracking range.
Can be displayed only under "Freq Mode: Gen Track".
If the product of the generator frequency and the factor is higher than
the limit entered here, the highpass filter becomes a fixed-frequency
filter operating at the upper limit frequency.
This setting does not affect the rub & buzz measurement, i.e. the rub
&buzz measurement will be performed.
Remote-control command:
SENSe[1]:FREQuency:LIMit:UPPer <nu>
For further settings see section "Level Measurements" on page 4.241.
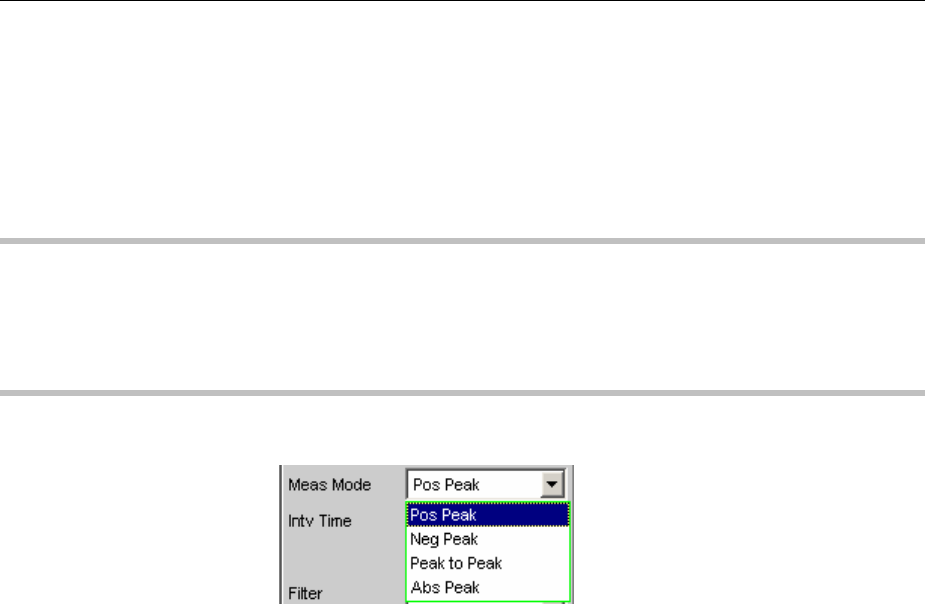
Level Measurements R&S UPV
1146.2084.32 4.268 E-9
Peak Measurement
Measurement of the peak value of any given signal, and the rise and fall of the measurement value all
occur without a delay. The measurement value contains both AC and DC components.
Remote-control command:
SENSe[1]:FUNCtion PEAK
Note:
If a squarewave signal is applied, it is limited with respect to bandwidth by the upper measurement limit
of the selected analyzer, whereby the overshoots occur at the edges (Gibbs phenomenon). The
overshoots are also measured during the peak analysis, which means that the returned measurement
value may be greater than the input peak. FS values greater than 1 may be measured, especially in the
digital range.
Meas Mode
Used to select the measurement mode.
Pos Peak The highest positive voltage value is measured.
Remote-control command:
SENSe[1]:FUNCtion:MMODe PPEak
Neg Peak The (numerically) highest negative voltage value is
measured.
Remote-control command:
SENSe[1]:FUNCtion:MMODe NPEak
Peak to Peak The difference between the highest and lowest level
is measured (peak-to-peak voltage).
Remote-control command:
SENSe[1]:FUNCtion:MMODe PTOPeak
Abs Peak The numerically highest (positive or negative)
voltage value is measured.
Remote-control command:
SENSe[1]:FUNCtion:MMODe PABSolut
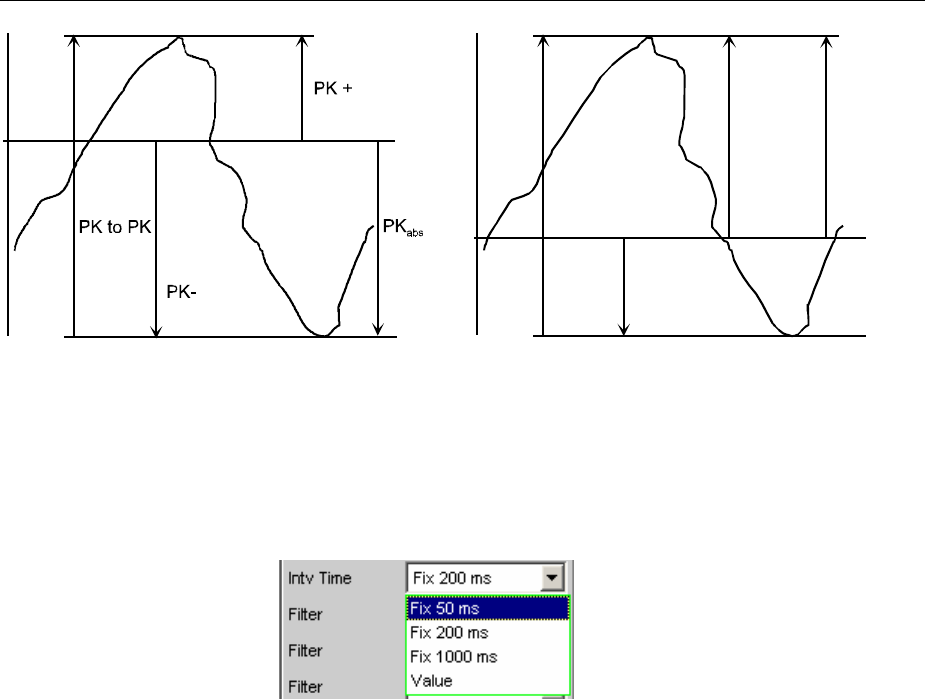
R&S UPV Level Measurements
1146.2084.32 4.269 E-9
PKabs zeigt immer den größten der beiden Werte PK+ oder PK-
PK to PK
PK-
PK + PKabs
Figure 4-21 Result of Peak measurement on 2 example signals depending on selected measurement
mode
Intv Time
Used to select the measurement interval within which the peak search
is to be performed. When the interval time has expired, the peak value
memory is reset and the next peak value is sought.
Fix 50 ms Measurement interval 50 ms.
Remote-control command:
SENSe[1]:VOLTage:INTVtime:MODE SFASt
Fix 200 ms Measurement interval 200 ms.
Remote-control command:
SENSe[1]:VOLTage:INTVtime:MODE FAST
Fix 1000 ms Measurement interval 1000 ms.
Remote-control command:
SENSe[1]:VOLTage:INTVtime:MODE SLOW
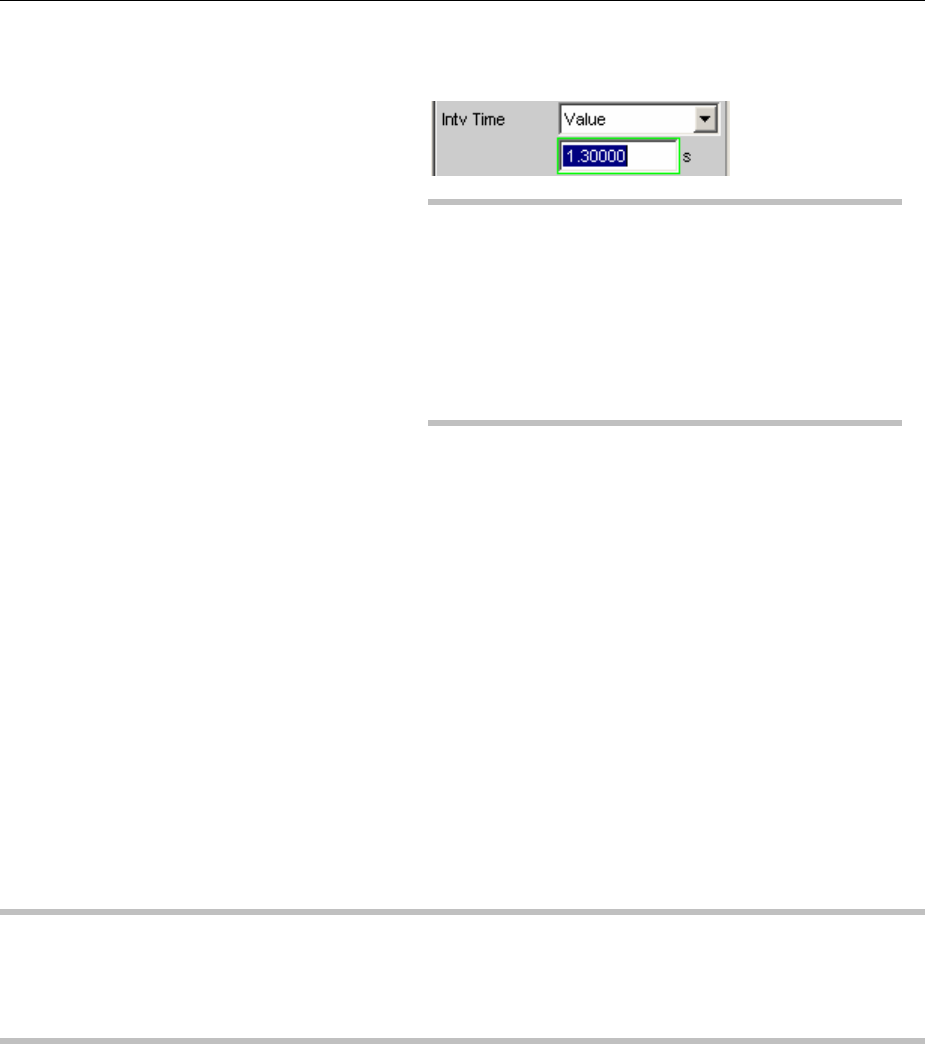
Level Measurements R&S UPV
1146.2084.32 4.270 E-9
Value The interval time is entered in the parameter field
below.
Note:
If a multichannel analyzer is used, max. 1.44 million
samples can be observed. In these analyzers, the
maximum measuring time is therefore dependent on
the sampling rate and the analog bandwidth; at
40 kHz analog bandwidth, for example, it is 15 s. If a
longer measuring time is required, one of the two-
channel analyzers must be used for the
measurement (max. 100 s).
Remote-control command:
SENSe[1]:VOLTage:INTVtime:MODE VALue
SENSe[1]:VOLTage:INTVtime <nu>
See section "Level Measurements" on page 4.241 for further settings.
Quasi Peak Measurement
Measurement of the peak value of any given signal, and the rise and fall of the measurement value, all
occur with defined time constants. The measurement is implemented as an RFI voltage measurement
to CCIR 468-4 and DIN 45405.
Due to the constants for rise time and fall time, the measured quasi peak value is frequency-dependent.
The displayed level is adjusted internally to 1 kHz sinusoidal, that is, in the settled state the quasi peak
value at this frequency corresponds to the measurement value of a RMS measurement.
Note:
This measurement requires uninterrupted monitoring of the measurement signal over an extended
period of time. When using a multichannel analyzer, which only performs single measurements that are
limited by time, it does not yield meaningful results. It is therefore only available with two-channel
analyzers.
Remote-control command:
SENSe[1]:FUNCtion QPEak
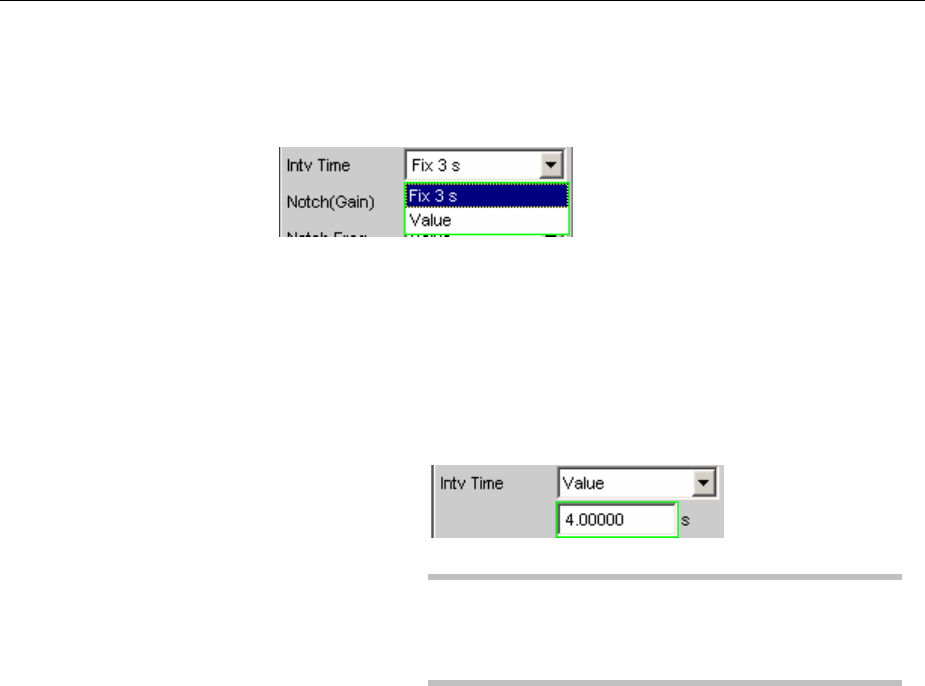
R&S UPV Level Measurements
1146.2084.32 4.271 E-9
Intv Time
Used to select the measurement interval within which the Quasi Peak
measurement is to be performed. Once this interval has expired, the
peak hold is deleted and the next peak value is determined, starting
with the instantaneous value.
Fix 3 s Measurement interval 3000 ms.
Remote-control command:
SENSe[1]:VOLTage:INTVtime:MODE FIXed
Value The interval time is entered in the parameter field
below.
Note:
In order to obtain settled measurement values, the
measurement time should not be less than
3seconds for triggered measurements and sweeps.
Remote-control command:
SENSe[1]:VOLTage:INTVtime:MODE VALue
SENSe[1]:VOLTage:INTVtime <nu>
See section "Level Measurements" on page 4.241 for further settings.
DC Voltage Measurement
Measurement of the DC voltage component of an analog or digital signal. The DC measurement is not
aseparate measurement function, but a measurement method that can be selected under “Level
Monitor” This makes it possible to perform any other desired measurement function at the same time as
aDC level measurement.
The level is acquired at the Monitor level, which means after the prefilter and the analog notch filter that
can optionally be switched on (in the two-channel analog analyzer).
The measurement is performed using zero-crossing detection to eliminate the level component of any
superimposed periodic AC signal that may be present. As a result, the measurement time is not
constant, but instead is an integer multiple of the period of the superimposed AC signal.
In the case of very weak signals or signals with no AC component, the upper measurement time limit is
100 ms.
If “DC” is selected as a measurement function, a reference to the Level Monitor is shown and the
previously configured measurement function is maintained.

Signal-to-Noise Measurements R&S UPV
1146.2084.32 4.272 E-9
Signal-to-Noise Measurements
The R&S UPV provides signal-to-noise measurements (S/N measurements) according to a number of
weighting methods. Each of these measurement functions measures the level with and without a signal:
For measurement of the signal the set generator signal is output; for noise measurement the generator
signal is turned off and the noise level of the DUT is measured. The measured signal-to-noise ratio is
displayed as the measurement result.
The S/N sequence consists of two complete level measurement cycles that are performed and
displayed independently of one another.
•The measurement values for level monitor, input monitor, post FFT and waveform are displayed for
signal measurement first, and then for noise measurement.
•The frequency and phase are measured only during signal measurement. The measurement values
remain unchanged during noise measurement.
•The result of the function can be determined only at the end of noise measurement. In continuous
measurement mode the display shows the latest valid result or "---" during signal measurement.
The internal generator (universal or low distortion) must be used during noise measurements, since an
external generator cannot be controlled by the measurement function. If the DUT is inadvertently not
connected to the internal generator, measurement values of around 0 dB would be determined.
The signal for noise measurement is generated by an analog or digital generator depending on the
DUT:
•In the case of an analog generator instrument, the generator output voltage is switched off and the
output impedance remains unchanged.
•In the case of digital generator instruments with unchanged clock rates, a level value of 0,0 fullscale
is output (all bits 0)
Note:
When the analog universal generator is used, care should be taken to make the right choice of "Volt
Range" in the "Generator Config" panel: In Auto mode the analog gain is canceled during noise
measurement, which on the one hand brings about an improvement in the inherent noise (and therefore
in the S/N dynamic response), but on the other hand results in a longer measurement time.
The level weighting method can be chosen from the following:
•"RMS": root-mean-square broadband measurement
•"Peak": peak-value measurement.
•"Quasi Peak": peak-value measurement with quasi-peak weighting; measurement values rise and
fall with defined time constants.
When the analog analyzer is used, switching off the generator causes a DC jump at the analyzer input,
and this must not be allowed to affect the highly sensitive noise measurement. There are two measures
which will solve this problem:
•The S/N measurement should preferably be carried out using a low-frequency highpass or
comparable weighting filter. Failing to use a suitable filter will resuIt in an error message.
•For measurement at low frequencies, where a highpass filter cannot be used, the recommended
alternative is a file-defined delay filter with around 1.5 s of delay. This allows the DC jump to decay
before the noise measurement starts.

R&S UPV Signal-to-Noise Measurements
1146.2084.32 4.273 E-9
S/N measurement can be performed via the S/N measurement function. This measurement function is
found at menu item "Meas Mode" and offers a choice of level weighting methods.
Conversely it is also possible, as in the case of the earlier instruments R&S UPD and R&S UPL, to
activate the S/N sequence during level measurements. This alternative operating mode ensures
compatibility with the earlier models mentioned, and in particular enables remote-control programs to be
used unchanged.
S/N Measurement Function
Measurement function for determining the signal to noise of a DUT.
Remote-control command:
SENSe[1]:FUNCtion SN
Meas Mode
Used for choosing the level weighting method for signal measurement
and noise measurement.
RMS Both level measurements are carried out in the form
of broadband RMS measurements.
Remote-control command:
SENSe[1]:FUNCtion:MMODe RMS
Quasi Peak Both level measurements are carried out in the form
of peak value measurements with the aid of a
quasi peak rectifier, that is, the level measurement
value tracks the signal trace using defined rise and
fall times.
Remote-control command:
SENSe[1]:FUNCtion:MMODe QPE
Pos Peak Both level measurements are carried out in the form
of peak value measurements of the highest positive
level.
Remote-control command:
SENSe[1]:FUNCtion:MMODe PPE
Neg Peak Both the level measurements are carried out in the
form of peak value measurements of the highest
negative level
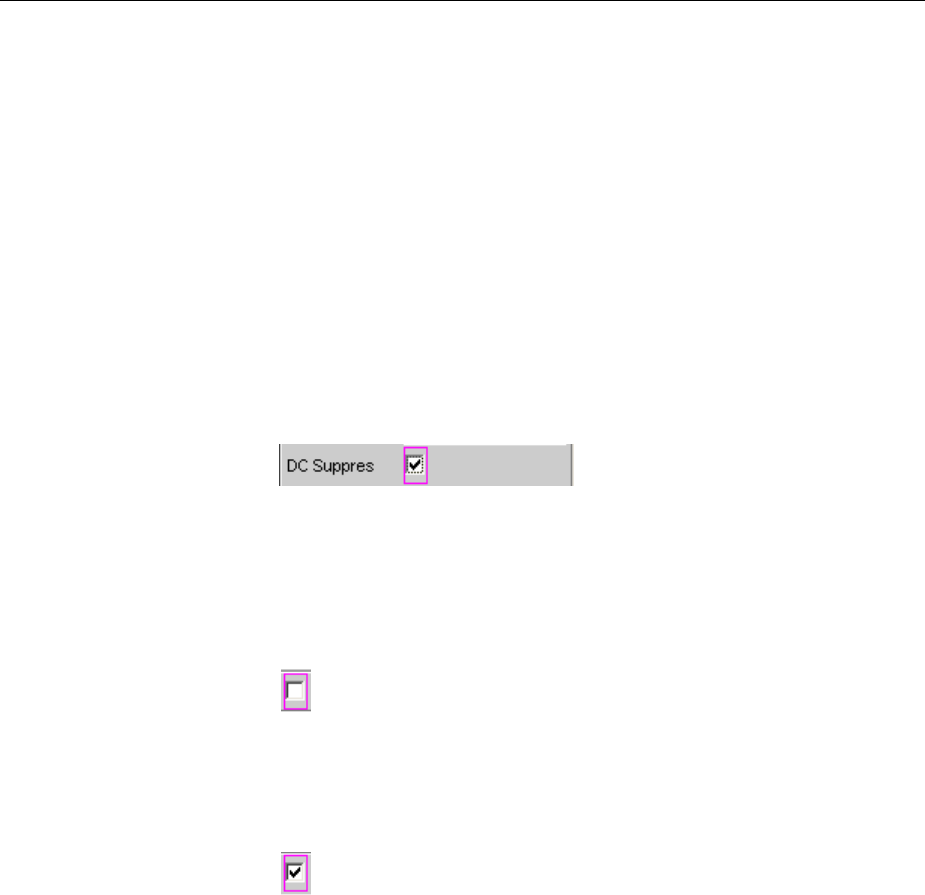
Signal-to-Noise Measurements R&S UPV
1146.2084.32 4.274 E-9
Remote-control command:
SENSe[1]:FUNCtion:MMODe NPE
Pkto Pk Both level measurements are carried out in the form
of peak to peak measurements
Remote-control command:
SENSe[1]:FUNCtion:MMODe PTOP
Abs Peak Both the level measurements are carried out in the
form of peak value measurements of the absolute
magnitude of the highest level.
Remote-control command:
SENSe[1]:FUNCtion:MMODe PABS
DC Suppress
For activating DC suppression (in the digital analyzer only)
You can decide whether any DC level which may be present in the RMS
value should be taken into account or suppressed.
This parameter field is not available in the analog analyzer, because the
corresponding functionality is already provided by the hardware-
controlled AC coupling.
DC suppression is disabled.
The DC component of the measurement signal is
not suppressed ("DC coupling") and is included in
the measurement result.
Remote-control command:
SENSe[1]:FUNCtion:DCSuppression OFF
DC suppression is enabled.
The DC component of the measurement signal is
suppressed ("AC coupling"); the measurement
result includes the AC component only.
DC suppression is achieved by measuring the DC
level in the digital analyzer and deducting this level
from the total RMS value.
Remote-control command:
SENSe[1]:FUNCtion:DCSuppression ON
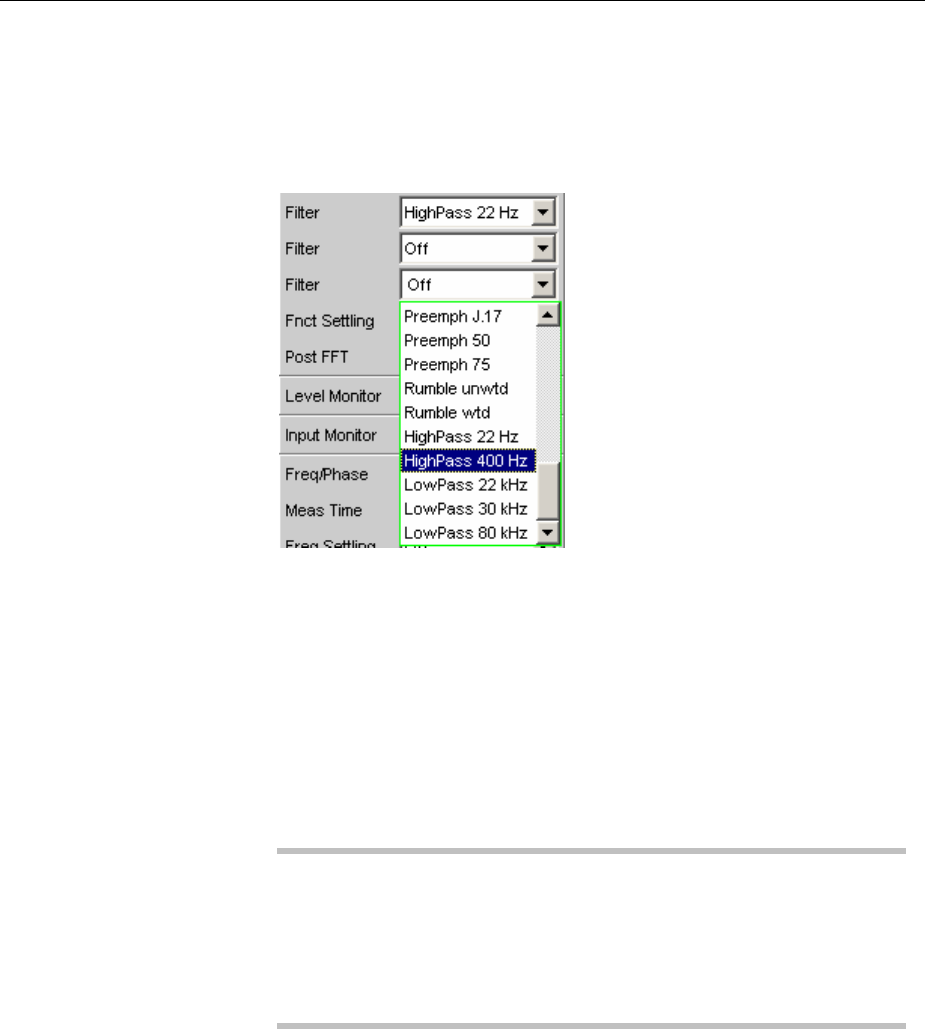
R&S UPV Signal-to-Noise Measurements
1146.2084.32 4.275 E-9
Filter
For activating a digital filter in the test channel. Up to three user-
defined or weighting filters can be looped into the test channel. At
least one of the three filters in the analog analyzer should be a
highpass or comparable weighting filter in order to filter out the DC
jump when the generator is turned off. For this purpose the "HighPass
22 Hz" is enabled in filter #1 as standard.
The user-definable filters are configured as filters 01 to 09 in the filter
panel (see section "User-Definable Filters" on page 4.420) and can
then be used (repeatedly if necessary) in the analyzer.
The selectable weighting filters are described in the section
"Weighting Filters" on page 4.428.
The filters chosen in this way work during noise measurement only.
During signal measurement they are bypassed. This makes it possible
to apply a deliberate weighting to the noise signal without affecting the
other signal level.
Note:
The input filter (or "prefilter") in the configuration part of the analyzer
affects both signal measurement and noise measurement. Thus if
there is a need for a filter that also filters the signal component, it can
be chosen as a prefilter. Moreover the analog bandwidth can be
restricted with the aid of the "Bandwidth" parameter field, which
corresponds to an additional low pass filter.
Remote-control command:
SENSe[1]:FILTer[1] <parameter>
SENSe[1]:FILTer2 <parameter>
SENSe[1]:FILTer3 <parameter>
For a <parameter> list see section "Filter Table" on page 4.419.
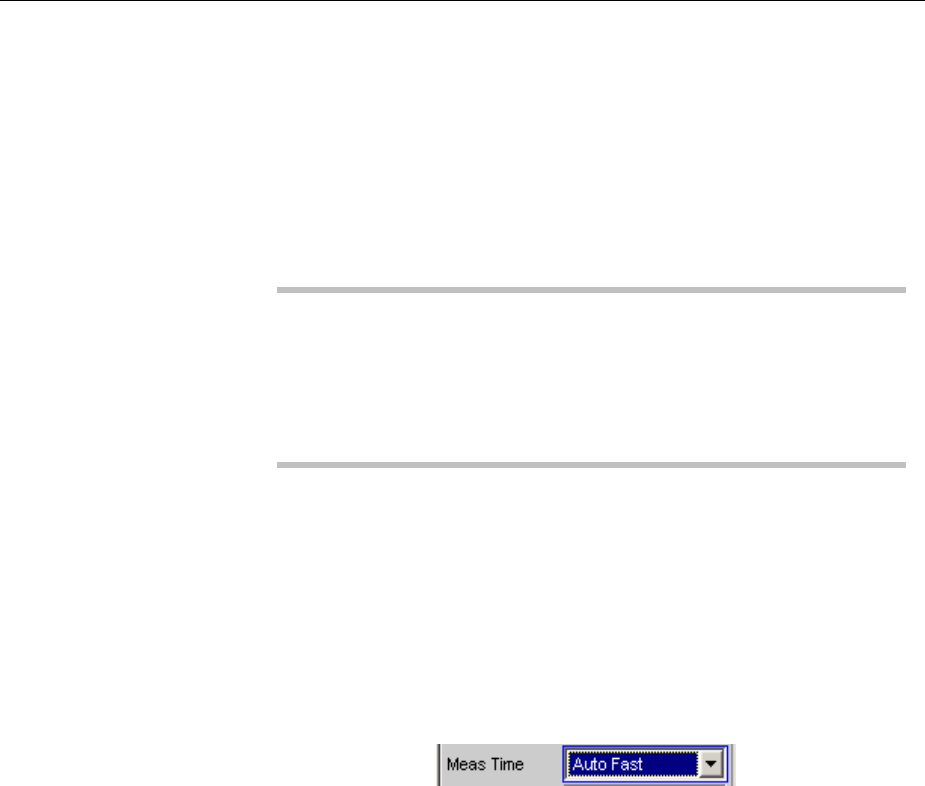
Signal-to-Noise Measurements R&S UPV
1146.2084.32 4.276 E-9
Meas Time
This is used for choosing the measurement time for the purpose of
adapting the measurement speed to the waveform or, in the case of
single tone signals, to the signal frequency.
Priority can be given to short measurement time or high accuracy,
depending on the measurement requirements.
Inautomatic measurement modes the measurement time is adapted
to the measured signal frequency, provided an AC signal that is
sufficiently strong and not too low in frequency is present (f b10 Hz).
Note:
In the case of very strong signals that are noisy or distorted, and in the
case of multitone signals, the automatic measurement modes, in
particular "Auto Fast", are unable to detect the signal period with
certainty. For the avoidance of measurement errors, such signals
should therefore preferably be measured using "Gen Track" or
"Value".
Auto Fast For use with the "RMS" measurement mode only.
Level measurements are performed as far as
possible over whole AC periods. In the case of high
frequencies the measurement time is extended so
that a maximum algorithmic error of 1 % is not
exceeded.
In the case of low-noise DUTs the upward
measurement time for noise measurement is limited
to 100 ms (corresponding to 1 period at 10 Hz).
This setting is recommended when the excitation (in
signal measurements) is a single tone signal,
particularly when the low-distortion generator is
being used, if the aim is to achieve the highest
measurement speed.
Remote-control command:
SENSe[1]:FUNCtion:APERture:MODE AFASt
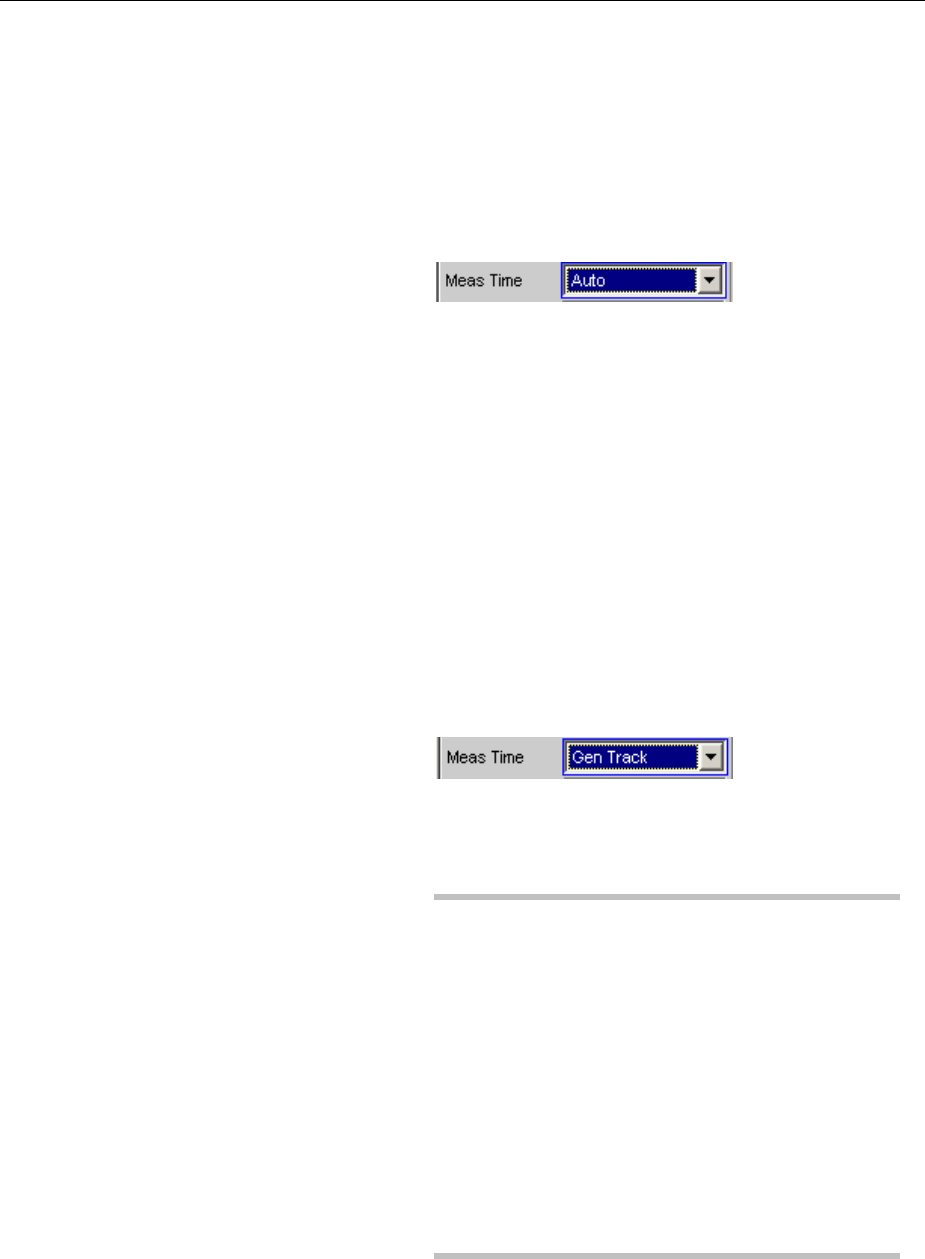
R&S UPV Signal-to-Noise Measurements
1146.2084.32 4.277 E-9
Auto For use with the "RMS" measurement mode only.
Level measurements are performed as far as
possible over whole AC periods. In the case of
center or high frequencies the measurement time is
extended so that a maximum algorithmic error of
0.05 % is not exceeded.
In the case of low-noise DUTs the upward
measurement time for noise measurement is limited
to 200 ms (corresponding to 2 periods at 10 Hz).
This setting is recommended when the excitation (in
signal measurements) is a single tone signal,
particularly when the low-distortion generator is
being used, if the aim is to achieve the highest
measurement accuracy.
Remote-control command:
SENSe[1]:FUNCtion:APERture:MODE AUTO
Gen Track For use with the "RMS" measurement mode only.
Level measurements are performed over at least 1
whole period of the generator signal. For this
purpose the generator frequency is adapted as
necessary to the sampling rate of the analyzer. In
the case of high frequencies the measurement time
is extended to several periods in order to increase
the measurement accuracy.
This setting is recommended when the excitation (in
signal measurements) is a single tone signal and
the R&S UPV universal generator is being used.
Note:
If the Low-Distortion Generator option is used,
"Gen Track" should be avoided on account of the
rigid coupling to the generator's nominal frequency,
otherwise measuring inaccuracy resulting from
slight frequency offset could occur.
If "Stereo Sine" is used as the generator signal,
measurement channel 1 tracks generator channel 1
and measurement channel 2 tracks generator
channel 2.
If "Arbitrary" is used as the generator signal, the
measurement time is synchronized to the number of
samples in the loaded file. As a result,
measurement is always performed over a complete
period of the (repeatedly output) ARB signal.
Remote-control command:
SENSe[1]:FUNCtion:APERture:MODE
GENTrack

Signal-to-Noise Measurements R&S UPV
1146.2084.32 4.278 E-9
Value Measurement is performed inside a predefined time
which has to be entered in the following parameter
field.
In order to avoid errors caused by the termination of
measurements, the chosen measurement time
should be an integer multiple of the period and, due
to the noise measurement, should not be too short.
In the "Quasi Peak" measurement mode, the
measurement time should not be significantly less
than 3 s on account of the long rise time constants.
This setting is recommended when the excitation (in
signal measurements) consists of noise signals or
multitone signals.
Remote-control command:
SENSe[1]:FUNCtion:APERture:MODE VALue
SENSe[1]:VOLTage:APERture <nu>
Fix 50 ms For use with the peak measurement mode only.
The measurement time is 50 ms.
Remote-control command:
SENSe[1]:FUNCtion:APERture:MODE SFASt
Fix 200 ms For use with the peak measurement mode only.
The measurement time is 200 ms.
Remote-control command:
SENSe[1]:FUNCtion:APERture:MODE FAST
Fix 1000 ms For use with the peak measurement mode only.
The measurement time is 1000 ms.
Remote-control command:
SENSe[1]:FUNCtion:APERture:MODE SLOW
Fix 3 s For use with the "Quasi Peak" measurement mode
only.
3000 ms is the recommended measurement time
for quasi peak measurements.
Remote-control command:
SENSe[1]:FUNCtion:APERture:MODE FIXed
For further settings see section "Level Measurements",page 4.241.
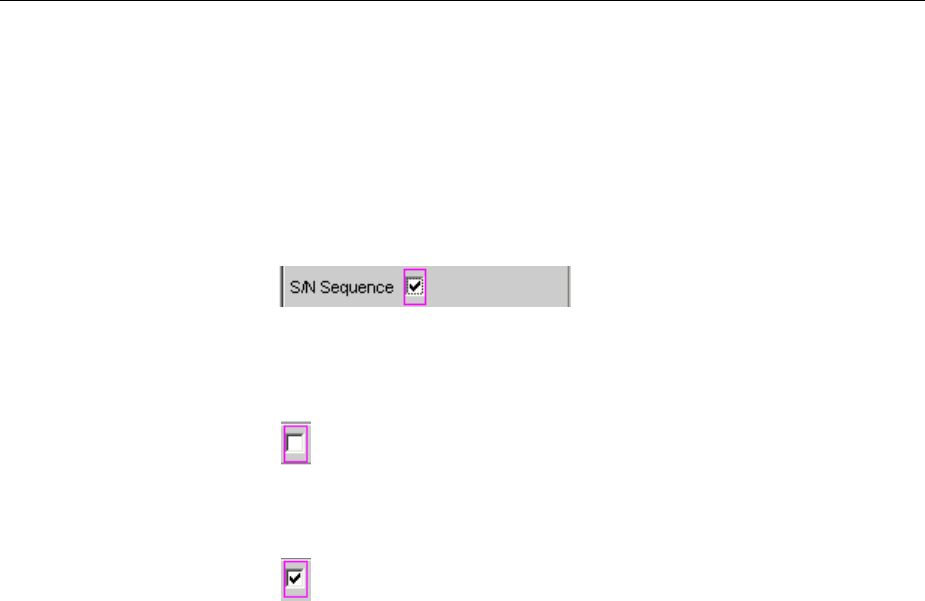
R&S UPV Signal-to-Noise Measurements
1146.2084.32 4.279 E-9
S/N Sequence in Level Measurements
In order to retain compatibility with the earlier models R&S UPD and R&S UPL, the R&S UPV also
provides the option to activate the S/N sequence during level measurements, in particular enabling
remote-control programs to be used unchanged.
S/N Sequence
Used for activating the S/N sequence in order to determine the signal to
noise.
Signal-to-noise measurement can thus be performed in the "RMS",
"Peak" and "Quasi Peak" level measurement modes.
The S/N sequence is disabled.
Apure level measurement is carried out.
Remote-control command:
SENSe[1]:FUNCtion:SNSequence OFF
The S/N sequence is enabled.
Level measurement is performed with the generator
signal switched on and then with it switched off. The
S/N measurement result is determined from this.
Remote-control command:
SENSe[1]:FUNCtion:SNSequence ON
For further settings see section "Level Measurements",page 4.241.

Distortion Measurements R&S UPV
1146.2084.32 4.280 E-9
Distortion Measurements
The R&S UPV provides various methods for measuring distortions. These methods can be used to
determine harmonic and intermodulation distortions of a DUT. The measurement signals required in
each case can be generated by the internal generator (recommended) or by an external signal source.
•"THD" ("total harmonic distortion") is a distortion measurement over the first 8 harmonics or over
any given combination of the first 8 harmonics. The noise between the harmonics is not measured.
An ultra-pure sinewave signal is required as the measurement signal.
•"THD+N & SINAD" ("total harmonic distortion + noise") is a distortion measurement which
measures the energy of the broadband noise and (optionally) of all harmonics within a selectable
frequency band. An ultra-pure sinewave signal is required as the measurement signal.
•"Mod Dist" is a modulation factor analysis which determines the total intermodulation factor of the
2nd and 3rd order a low-frequency interfering signal to a high-frequency useful signal. The
interfering signal should have the same or a higher amplitude than the useful signal (preferably an
amplitude ratio of 4 : 1).
•"DFD" is a difference-tone factor analysis which determines the 2nd and 3rd order intermodulation
products generated by two sinewave signals of the same amplitude.
•"DIM" is a dynamic intermodulation measurement for which a low-frequency squarewave signal and
asinewave signal of a higher frequency are used.
Note:
The individual distortion components can be assessed visually using the "bargraph" or (Post) FFT.
The measurement values can only have the full dynamic range if both the signal source and the
analyzer are at full-scale level. If the measurement values are worse than expected, the following rules
should be checked and observed.
•The digital generator should use all available audio bits, the (overall) signal should have a level of
1.0 FS and as little dither as possible.
•The analog generator should be operated in the optimum "Volt Range", preferably in the "Auto"
mode. If the "Fix" mode is used, it is important to ensure that the selected range is not significantly
higher than the set (total) voltage.
•The digital analyzer should use all available audio bits.
•The analog analyzer should be operated in the optimum "Range", preferably in the "Auto" mode. If
the "Fix" or "Lower" mode is used, it is important to ensure that the selected range is not
significantly higher than the applied total voltage.
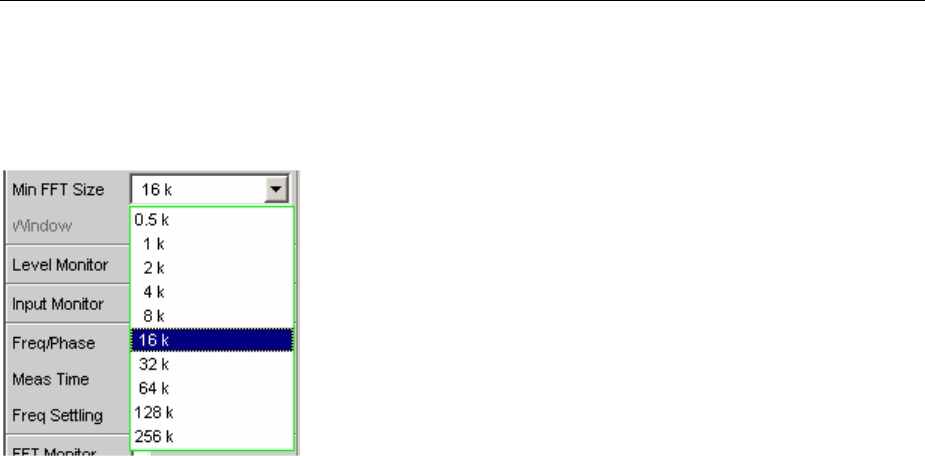
R&S UPV Distortion Measurements
1146.2084.32 4.281 E-9
Calculation of the individual distortion component (harmonics or intermodulation products) and thus of
the distortion measurement values is carried out using FFT. The FFT value is automatically adapted to
the measurement signal. The longer the required FFT, the longer the necessary integration and
therefore the longer the total measurement time. You can choose the minimum FFT value when Post
FFT is enabled:
By increasing the minimum FFT value you can increase the ratio of measurement accuracy to
measurement speed loading, since the distortion components are then measured in a narrower band.
If the selected FFT value is not large enough to capture the measurement signal, increase the FFT
gradually by a factor of 2. The maximum FFT value depends on the bandwidth or sampling rate:
•at a 22 kHz bandwidth (analog) the FFT value can be increased to a maximum of 64 k,
•at sampling rates of less than 50 kHz (digital) or at a 40 kHz bandwidth (analog) the FFT value can
be increased to a maximum of 128 k,
•at sampling rates of more than 50 kHz (digital) or a bandwidth of 80 or 250 kHz (analog) the FFT
value can be increased to a maximum of 256 k.
The maximum integration time in the analog analyzer (fast mode) is therefore around 1.4 s.
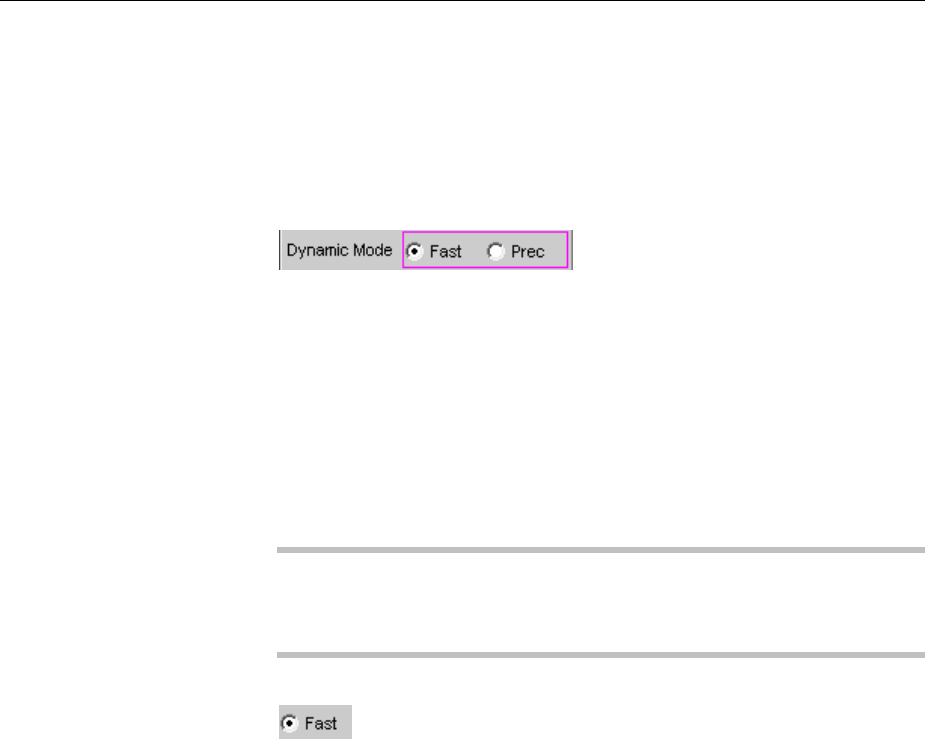
Distortion Measurements R&S UPV
1146.2084.32 4.282 E-9
General Settings
This chapter contains the settings that occur in a number of distortion measurements where they have
the same meaning.
Dynamic Mode
Only available in the two-channel analog analyzer; the digital analyzers
and the multichannel analog analyzers always perform measurements
with the full dynamic range (without any reduction in speed).
Measurements performed with a high dynamic range ("Precision") take
longer. Conversely, the dynamic range of the R&S UPV analyzer is not
fully utilized if a short measurement time is selected ("Fast"). The
decision as to whether a fast measurement would be sufficient or
whether a precision measurement is required should therefore be made
depending on the DUT (by comparing the fast and precision
measurement). If the measurement value from the precision
measurement is not better than that from the fast measurement, the
user can decide against a high dynamic range in favour of a shorter
measurement time.
Note:
Since notch measurement is not meaningful for dynamic intermodulation
measurement (DIM) or for 3rd order (d3) difference frequency distortion
(DFD) analysis, it is not made available.
Afast measurement with low dynamic range is
performed (fast measurement).
This is recommended in the case of signals with
poor dynamic response (less than 30 dB).
It is necessary when measuring total harmonic
distortion in signals with fundamentals higher than
115 kHz.
Remote-control command:
SENSe[1]:FUNCtion:DMODe FAST

R&S UPV Distortion Measurements
1146.2084.32 4.283 E-9
Aprecision measurement with maximum dynamic
range but a longer measurement time is performed.
Following preliminary measurement to determine
the fundamental frequency and the total level (in
the case of total harmonic distortion measurements)
or the single signal components (in the case of
intermodulation measurements), the main
measurement is performed with activated analog
filter and post-gain of the residual signal (to
increase the dynamic range).
The analog filter reduces the modulation of the fed-
in signal components to make it possible to amplify
the residual signal to be measured without the
danger of overloading.
Either a notch filter (for narrowband suppression of
the harmonic with total harmonic distortion
measurements or of the dominant interferer with
Mod Dist) or a lowpass filter (for suppressing the
dual tone in the case of DFD d2) is used as analog
filter.
The total measurement time is just over twice that
required for the "Fast" dynamic mode.
Note:
When measuring total harmonic distortion (THD
and THD+N), precision measurements with
fundamentals higher than 115 kHz are identified as
invalid because the notch filter does not work in this
frequency range. Fast mode must then be used for
such measurements.
If the dynamic range of the measurement signal
(including any out-of-band signals) is lower than
30 dB, the post-gain is reduced step by step to 12
or 0 dB in order to prevent overranging. This
"notch-ranging" once again increases the
measurement time; the measurement value is,
however, no more accurate than that obtained
using the "Fast" measurement. The "Fast" dynamic
mode should therefore be selected in such cases.
Remote-control command:
SENSe[1]:FUNCtion:DMODe PRECision
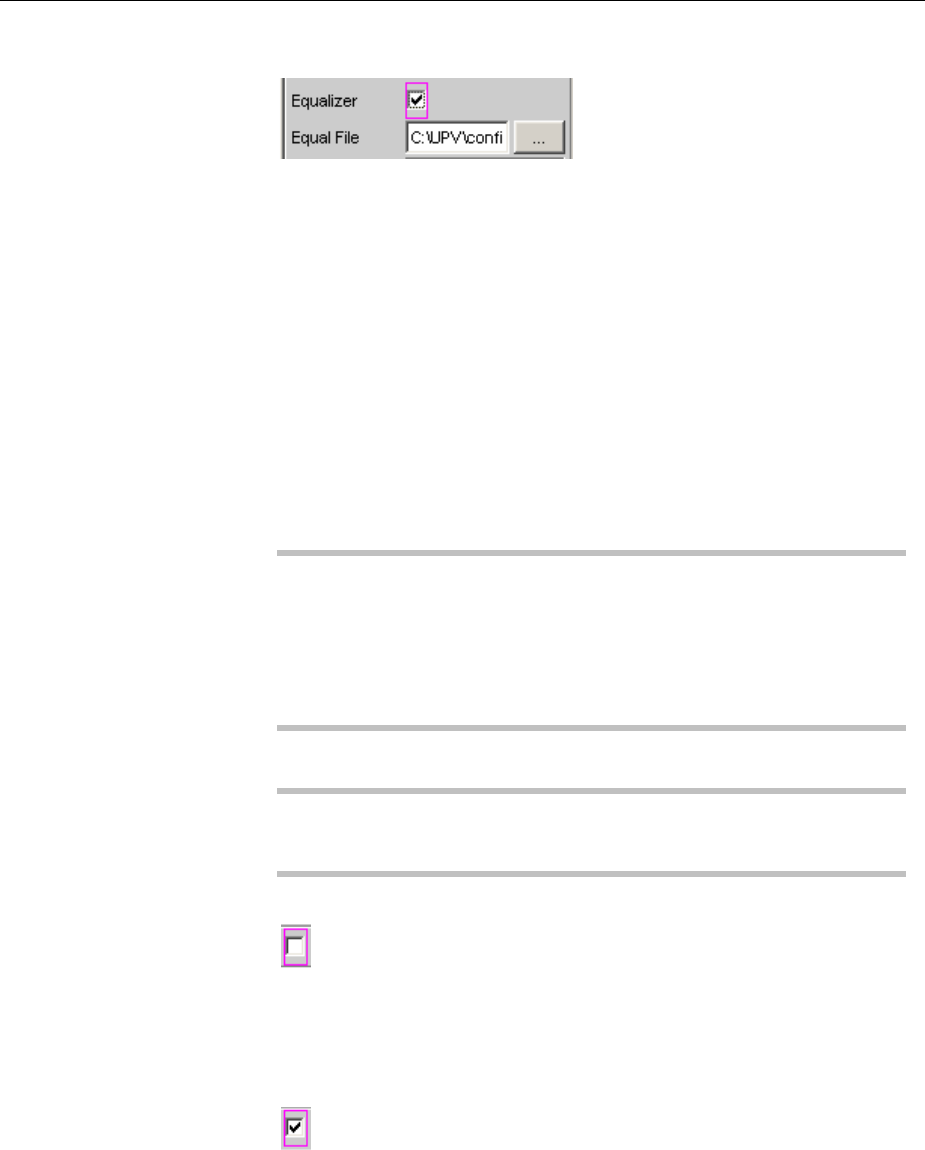
Distortion Measurements R&S UPV
1146.2084.32 4.284 E-9
Equalizer
Used for activating/deactivating a precorrector table for the FFT bins.
In this way the frequency response of a transmission link can be
precorrected, for example, and in so doing the measurement point is
transformed into another reference point.
When precorrection is enabled the computed FFT bins are multiplied
by a frequency-dependent factor after which they are used to calculate
the distortion measurement and applied to the display.
The factor is determined by interpolation between the two adjacent
frequency reference points in the precorrector table.
Precorrection of the FFT spectrum is an attractive alternative to
filtering the input signal, since the precorrector file can simply be
generated from the frequency response requiring precorrection and
need not be in the form of a coefficient file or pole/zero file.
Application:
In the case of acoustic measurements (e.g. involving mobile
telephones) on artificial ears of type 3.2 or higher, it is possible to
compensate for the transfer function ERP (ear reference point) to DRP
(drum reference point). Measurement of the sound waves by the
microphone applied to the "eardrum" can thus be referred to the
required measurement point (at the auricle).
Note:
The precorrector table is created after acquiring or reading in the trace
data from the DUT in the "DispConfig" panels.
The precorrector is disabled. The FFT bins are
used and displayed without change. The
measurement value is calculated from the original
FFT spectrum.
Remote-control command:
SENSe[1]:VOLTage:EQUalize OFF
The precorrector is enabled. The next entry field,
which is "Equal File", for the file name of the
precorrector table, is activated and the file shown
there is loaded. The measurement value is
calculated from the precorrected FFT spectrum.
Remote-control command:
SENSe[1]:VOLTage:EQUalize
ONMMEMory:LOAD:IEQualize ’filename’

R&S UPV Distortion Measurements
1146.2084.32 4.285 E-9
Bargraph
Used for activating bargraph computation and display. In addition the
"Bargraph1" window can be opened from here.
Configuration of the bargraphs is reserved for the "Bargraph1 Config"
and/or "Bargraph2 Config" windows. The actual display takes place in
the "Bargraph1" or "Bargraph2" windows.
Note:
When measuring total harmonic distortion (THD+N or SINAD) there is
no point in having a bargraph display, since the measurement does
not involve discrete harmonics but rather the entire harmonic
spectrum complete with noise. Therefore "Bargraph" is not available
and the graph is not updated.
Bargraph computation (and update) disabled.
Recommended for increasing the measurement
speed (e.g. for sweeps or remote control).
Remote-control command:
SENSe:FUNCtion:BARGraph OFF
Bargraph computation (and update) enabled. The
associated measurement function defines the
remaining settings dynamically.
Remote-control command:
SENSe:FUNCtion:BARGraph ON
Post FFT
Activation of the Post FFT; furthermore, the graphics window "FFT
Graph1" can be opened from here.
For details, see section "Post FFT".
THD
THD (Total Harmonic Distortion) is a distortion measurement over the first 8 harmonics or over any
given combination of the first 8 harmonics (d2 to d9) whereby the amplitudes of the individual
harmonics are measured selectively. The root from the squared sum of the harmonics can be displayed
either as an RMS or as a ratio to the total RMS. Unlike with the THD+N measurement, the noise
between the harmonics is not measured.
An ultra-pure sinewave signal is required as the measurement signal. The selected frequency of this
sinewave signal should be such that the significant components of the distortion spectrum are still
below the upper measurement limit.
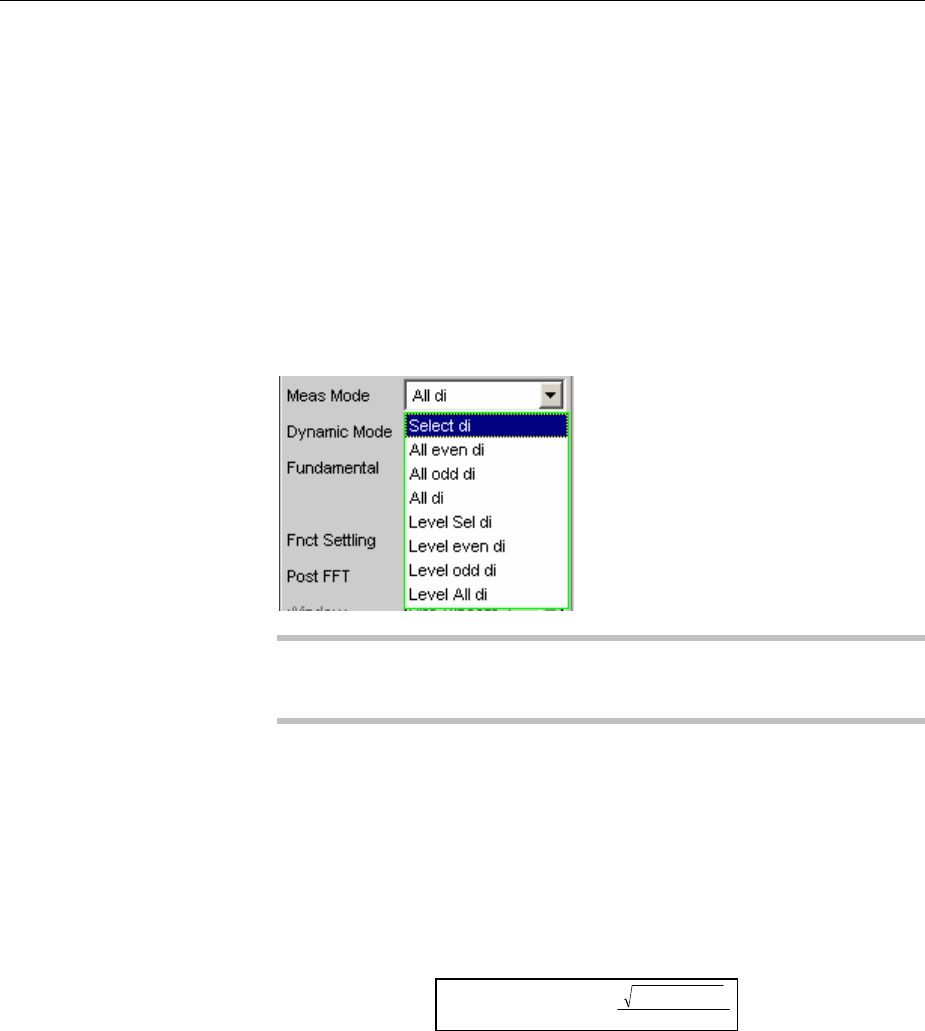
Distortion Measurements R&S UPV
1146.2084.32 4.286 E-9
The "Sine" signal function of the internal generator is recommended as the signal source.If the optional
low-distortion generator is available, it should be activated for measurements on low-distortion DUTs.
The sinewave level and frequency can be varied or swept.
Remote-control command:
SENSe[1]:FUNCtion THD
See section "THD+N / SINAD" on page 4.291 for alternative distortion measurement.
See section "Signal-to-Noise Measurements" on page 4.280 for further distortion measurements.
Meas Mode
Used to select the harmonics to be taken into consideration in the THD
measurement value and to select the calculation formula for the
measurement value.
Note:
All 8 harmonics (and the fundamental) are always displayed in the
graphic irrespective of the selected measurement mode.
The term "Level"indicates that the measurement result is displayed as
an RMS and is not referenced to the total RMS (as is customary with
distortion measurements).
Select di The distortion of any given combination of
harmonics d2 to d9 (root from the squared sum of
the selected harmonics) is measured referenced to
the total RMS.
[]
ktivwertGesamteffe
UU
THD
dd
dBU...
2
3
2
2
log*20 ++
=
The measurement value can be displayed in % as
well as in dB.
Remote-control command:
SENSe[1]:FUNCtion:MMODe SELectdi

R&S UPV Distortion Measurements
1146.2084.32 4.287 E-9
All even di The distortion of all even harmonics d2 to d8 (root
from the squared sum of the even harmonics) is
measured referenced to the total RMS.
[]
ktivwertGesamteffe
UUUU
THD
d
ddd
dBU
2
8
2
6
2
4
2
2
log*20 +++
=
The measurement value can be displayed in % as
well as in dB.
Remote-control command:
SENSe[1]:FUNCtion:MMODe DEVen
All odd di The distortion of all odd harmonics d3 to d9 (root
from the squared sum of the odd harmonics) is
measured referenced to the total RMS.
[]
ktivwertGesamteffe
UUUU
THD
dddd
dBU
2
9
2
7
2
5
2
3
log*20 +++
=
The measurement value can be displayed in % as
well as in dB.
Remote-control command:
SENSe[1]:FUNCtion:MMODe DODD
All di The distortion of all harmonics d2 to d9 (root from
the squared sum of all 8 harmonics) is measured
referenced to the total RMS.
[]
ktivwertGesamteffe
UUUU
THD
dddd
dBU
2
9
2
8
2
3
2
2.....
log*20 ++++
=
The measurement value can be displayed in % as
well as in dB.
Remote-control command:
SENSe[1]:FUNCtion:MMODe DALL
Level Select
di
The distortion voltage of any given combination of
harmonics d2 to d9 (root from the squared sum of
the selected harmonics) is measured.
[]
.....
2
3
2
2++= ddTHD UUVU
The measurement value is displayed in voltage
units (volts or FS).
The desired harmonics are selected in the
parameter fields below.
Remote-control command:
SENSe[1]:FUNCtion:MMODe LSELectdi
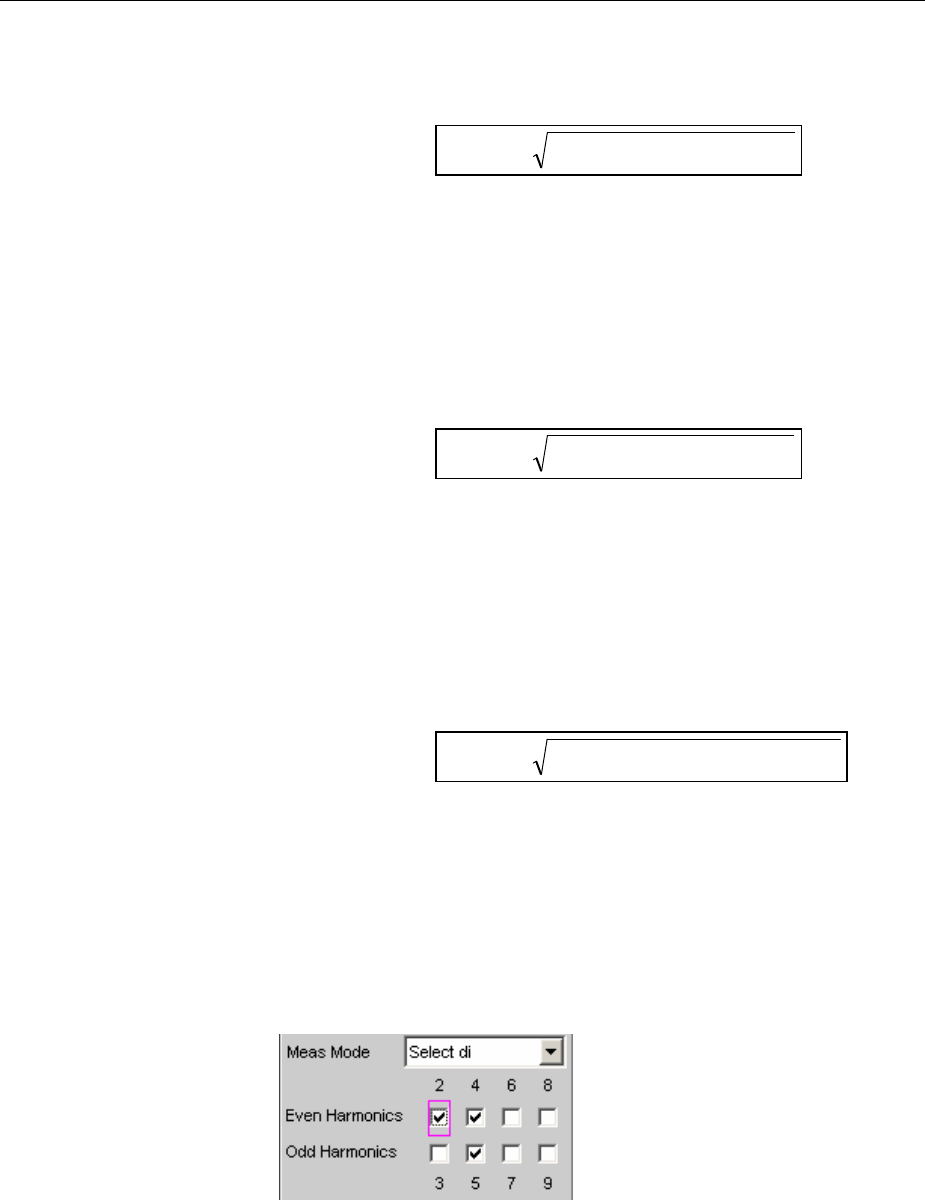
Distortion Measurements R&S UPV
1146.2084.32 4.288 E-9
Level even di The distortion voltage of all even harmonics d2 to
d8(root from the squared sum of the even
harmonics) is measured.
[]
2
8
2
6
2
4
2
2ddddTHD UUUUVU +++=
The measurement value is displayed in voltage
units (volts or FS).
Remote-control command:
SENSe[1]:FUNCtion:MMODe LDEVen
Level odd di The distortion voltage of all odd harmonics d3 to d9
(root from the squared sum of the even harmonics)
is measured.
[]
2
9
2
7
2
5
2
3ddddTHD UUUUVU +++=
The measurement value is displayed in voltage
units (volts or FS).
Remote-control command:
SENSe[1]:FUNCtion:MMODe LDODd
Level all di The distortion voltage of all harmonics d2 to d9
(root from the squared sum of all 8 harmonics) is
measured.
[]
2
9
2
8
2
3
2
2..... ddddTHD UUUUVU ++++=
The measurement value is displayed in voltage
units (volts or FS).
Remote-control command:
SENSe[1]:FUNCtion:MMODe LDALl
Even Harmonics
Used to select the desired even harmonics; only available if "(Level)
Select di" is selected under "Meas Mode".
Remote-control command:
SENSe[1]:FUNCtion:DISTortion<i> ON | OFF
<i> designates the harmonic 2, 4, 6, 8
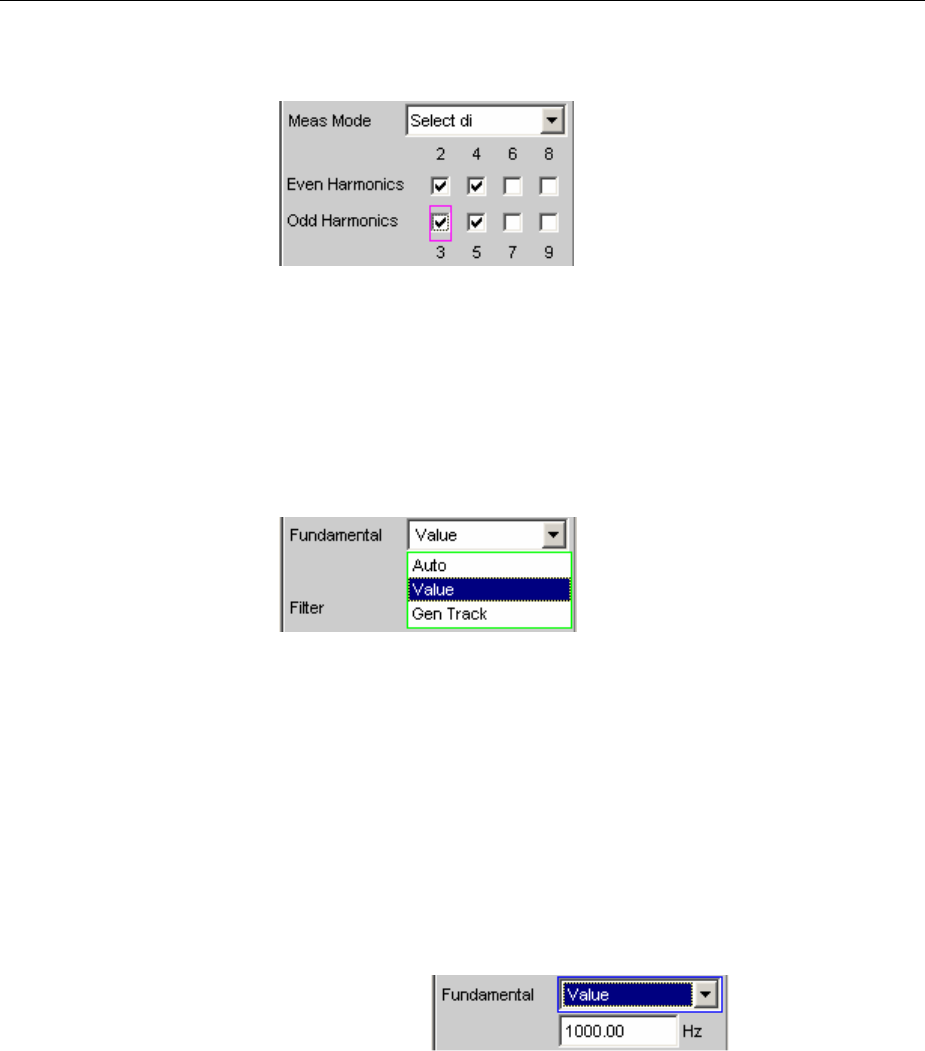
R&S UPV Distortion Measurements
1146.2084.32 4.289 E-9
Odd Harmonics
Used to select the desired odd harmonics; only available if "(Level)
Select di" is selected under "Meas Mode".
Remote-control command:
SENSe[1]:FUNCtion:DISTortion<i> ON | OFF
<i> designates the harmonic 3, 5, 7, 9
Fundamental
Used to determine the fundamental frequency.
With precision measurement (in the two-channel analog analyzer
only), this field is also used to determine the notch frequency of the
automatically activated analog notch filter.
Auto
The fundamental frequency is determined
(separately for each channel) by means of internal
frequency measurement.
Recommended when using the low-distortion
generator or an external signal source.
Remote-control command:
SENSe[1]:VOLTage:FUNDamental:MODE AUTO
Value Fixed fundamental frequency; the value must be
entered in the parameter field below.
Recommended for signals with a high noise
component if an external generator is used as the
signal source.
Remote-control commands:
SENSe[1]:VOLTage:FUNDamental:MODE
VALue
SENSe[1]:VOLTage:FUNDamental <nu>
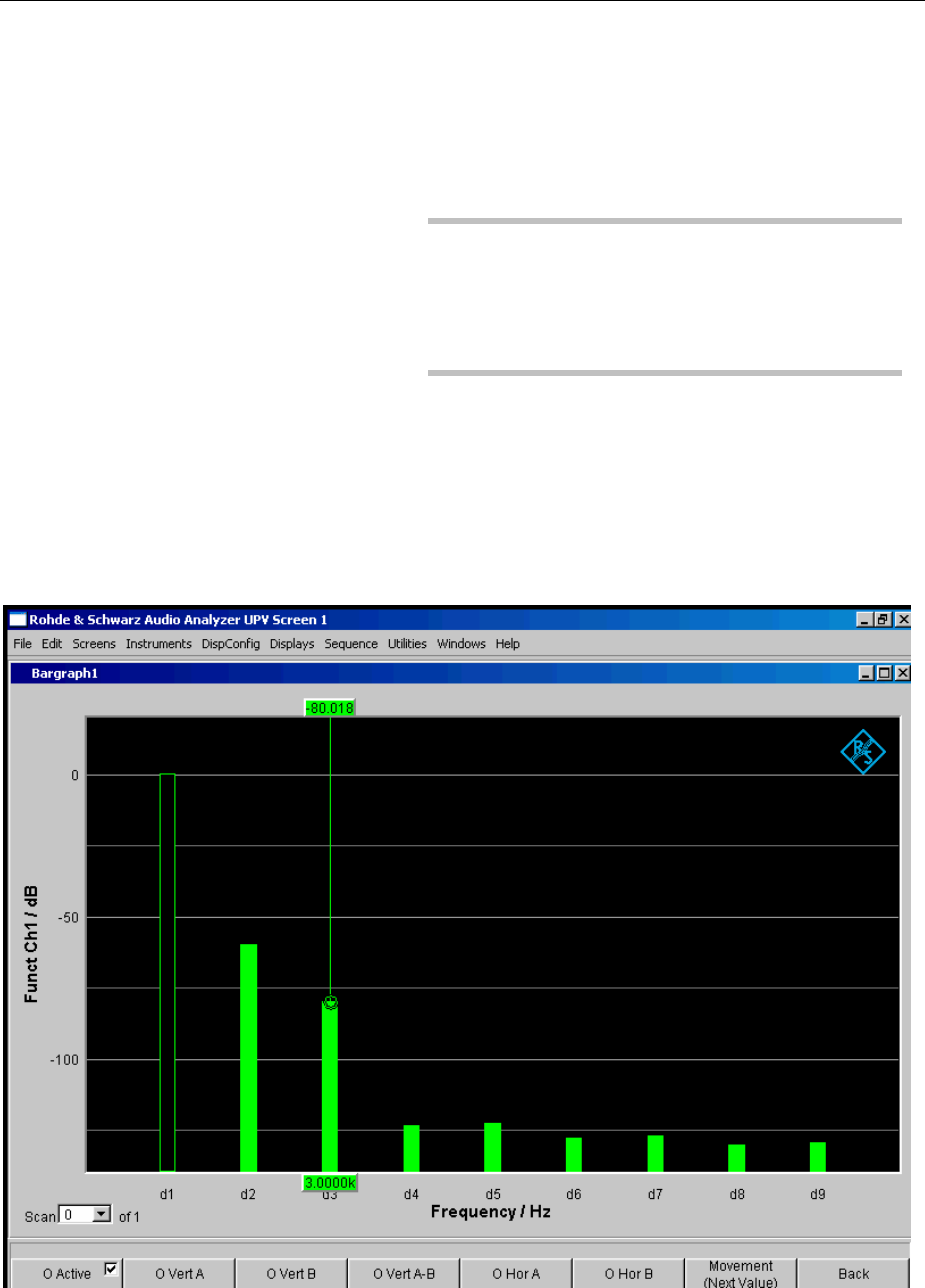
Distortion Measurements R&S UPV
1146.2084.32 4.290 E-9
Gen Track The fundamental frequency changes with the
generator (nominal)frequency. The generator
frequency may change as a result of manual entries
in the Generator Function panel or owing to a
generator frequency sweep. Setting reliability in the
case of signals with a high noise component is thus
improved and measurement speed is increased.
Note:
If the Low-Distortion Generator option is used,
"Gen Track" should be avoided on account of the
rigid coupling to the generator's nominal frequency,
otherwise measuring inaccuracy resulting from slight
frequency offset could occur.
An error message is output if an unsuitable signal
function is selected in the generator (e.g. a multi-
tone signal or interfering signal).
Recommended when using the internal universal
generator.
Remote-control command:
SENSe[1]:VOLTage:FUNDamental:MODE
GENTrack
Figure 4-22 THD measurement of a 1 kHz sinewave signal with two harmonics of -60 dB and -80 dB
See section "Signal-to-Noise Measurements" on page 4.280 for further distortion measurements.
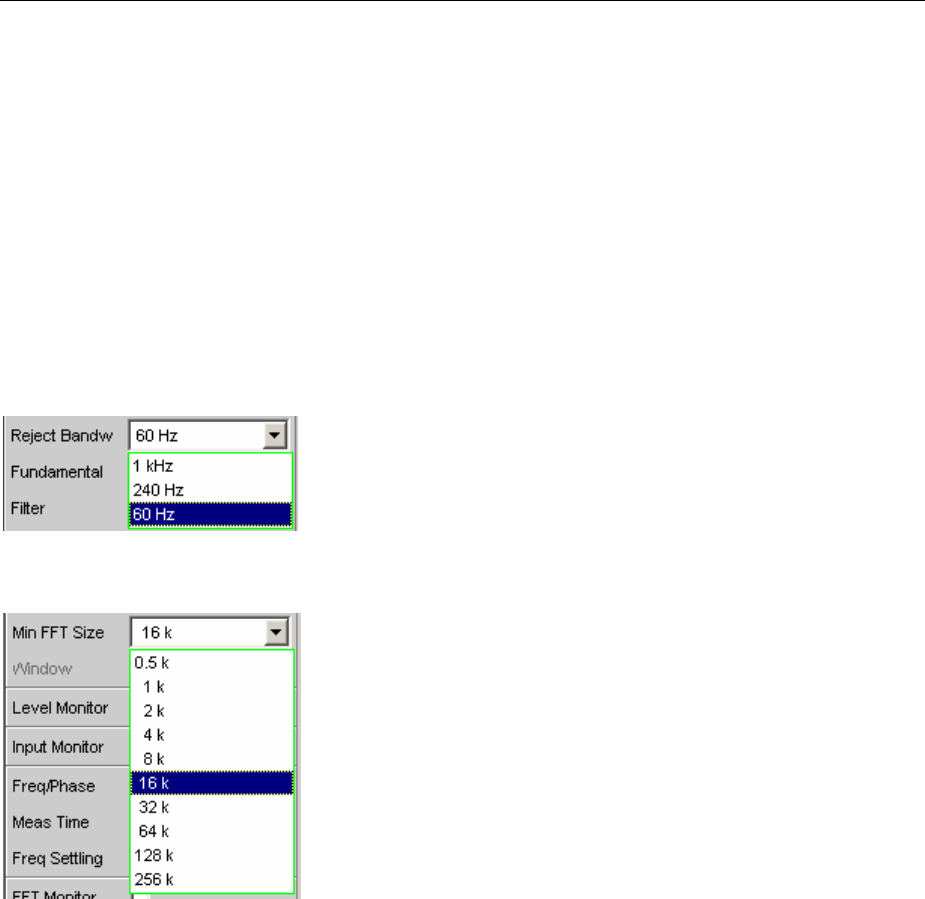
R&S UPV Distortion Measurements
1146.2084.32 4.291 E-9
THD+N / SINAD
THD+N & SINAD (Total Harmonic Distortion + Noise) is a distortion measurement which measures and
displays the energy of the broadband noise without the fundamental (residual signal) within a selectable
frequency band (optionally, the energy can also be displayed referenced to the total energy). This
measurement function allows different measurement modes; it is also possible to eliminate the
harmonics, except for the fundamental, so that the measurement value only contains non-harmonic
components and noise.
An FFT is used to record the spectrum, filter out the fundamental and calculate the total remaining
energy (residual spectrum) – comprising of harmonics and broadband noise – within the band limits
specified with "Frq Lim Low" and "Frq Lim Upp". The FFT value is automatically adapted to the
measured fundamental frequency; the lower the frequency is, the longer the required FFT and,
therefore, the integration time will be. The user can select the minimum FFT value:
•implicitly by selecting the rejection bandwidth (with deactivated Post FFT)
•explicitly by selecting the minimum FFT length ("Min FFT Size"; with activated Post FFT)
Here a compromise must be made between measurement speed and measurement accuracy:
•Asmall (initial) FFT length and a large rejection bandwidth ("Rejection Bandwidth") mean a short
measurement time; the filtered-out sideband of the fundamental is, however, relatively large. Non-
harmonic signal components close to the fundamental are not measured.
•Alarge (initial) FFT length means a long sampling time; the filtered-out sideband of the fundamental
is, however, relatively small so that signal components (non-harmonics and noise) close to the
fundamental are also measured.
If the selected FFT value is not large enough to determine the fundamental of the measurement signal,
the length of the FFT is increased gradually by a factor of 2. The maximum FFT value depends on the
bandwidth or sampling rate:
•at a 22 kHz bandwidth (analog) the FFT value can be increased to a maximum of 64 k,
•at sampling rates of less than 50 kHz (digital) or at a 40 kHz bandwidth (analog) the FFT value can
be increased to a maximum of 128 k,
•at sampling rates of more than 50 kHz (digital) or a bandwidth of 80 or 250 kHz (analog) the FFT
value can be increased to a maximum of 256 k.
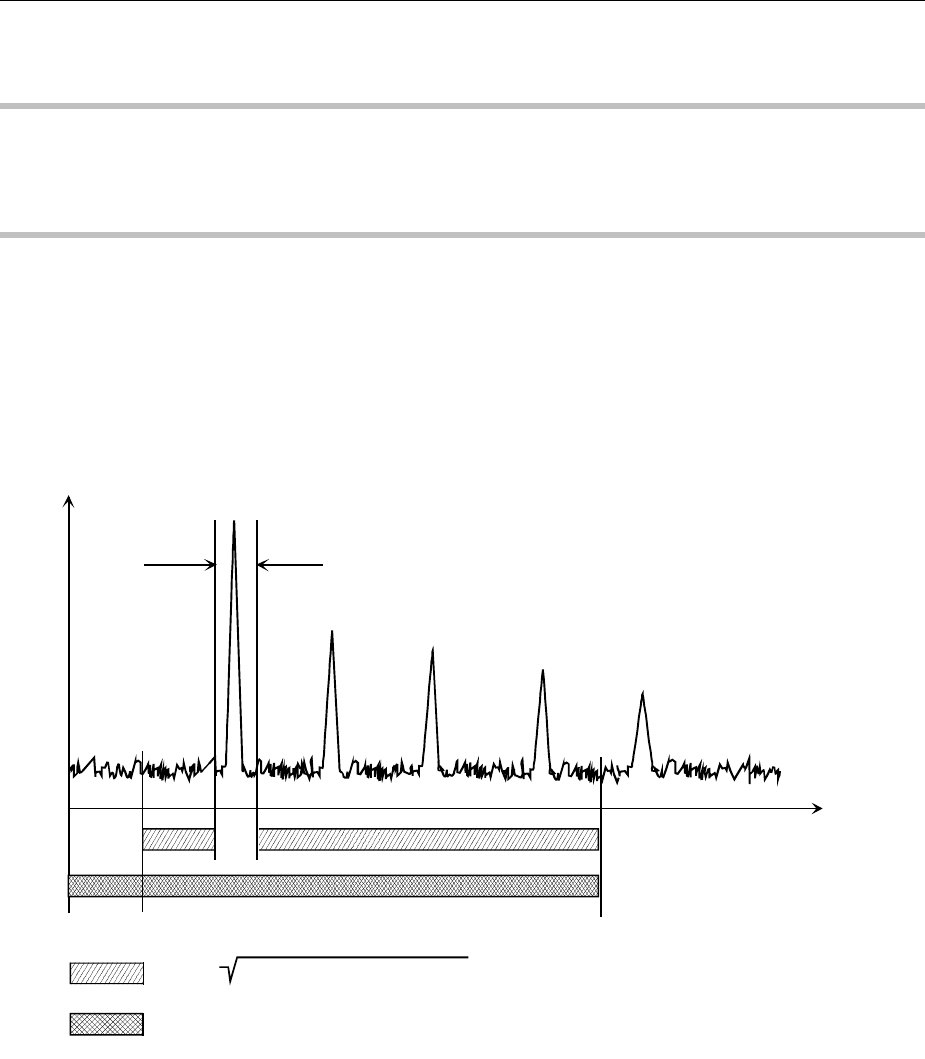
Distortion Measurements R&S UPV
1146.2084.32 4.292 E-9
The maximum integration time in the two-channel analog analyzer (fast mode) is therefore around 1.4 s.
Note:
Sideband suppression is designed for the shortest possible measurement time. In the case of very low-
frequency signals (less than 12 Hz), sideband suppression can be improved at the expense of longer
measurement time by increasing “Min FFT Size” to 128 K (at a sampling rate of 48 kHz or a bandwidth
of 22 kHz) or 256 K (at a sampling rate of 96 kHz or a bandwidth of 40 kHz).
The energy of the noise and (if applicable) the harmonics can be displayed either as an RMS or as a
ratio to the total RMS. The total RMS is band-limited to "Frq Lim Upp".
An ultra-pure sinewave signal is required as the measurement signal. The selected frequency of this
sinewave signal should be such that the significant components of the distortion spectrum are still
below the upper measurement limit.
The "Sine" signal function of the internal generator is recommended as the signal source.If the optional
low-distortion generator is available, it should be activated for measurements on low-distortion DUTs.
The sinewave level and frequency can be varied or swept.
U
Fundamental
2 x N x FFT resolution
d2d3d4
d5
Frq Lim Low Frq Lim Upp
=Ud2
2+Ud3
2+... + UNoise
2(Fundamental, filtered)
=Total RMS
f
Remote-control command:
SENSe[1]:FUNCtion THDNsndr
See section "THD" on page 4.285 for alternative distortion measurement.
See section "Signal-to-Noise Measurements" on page 4.280 for further distortion measurements.
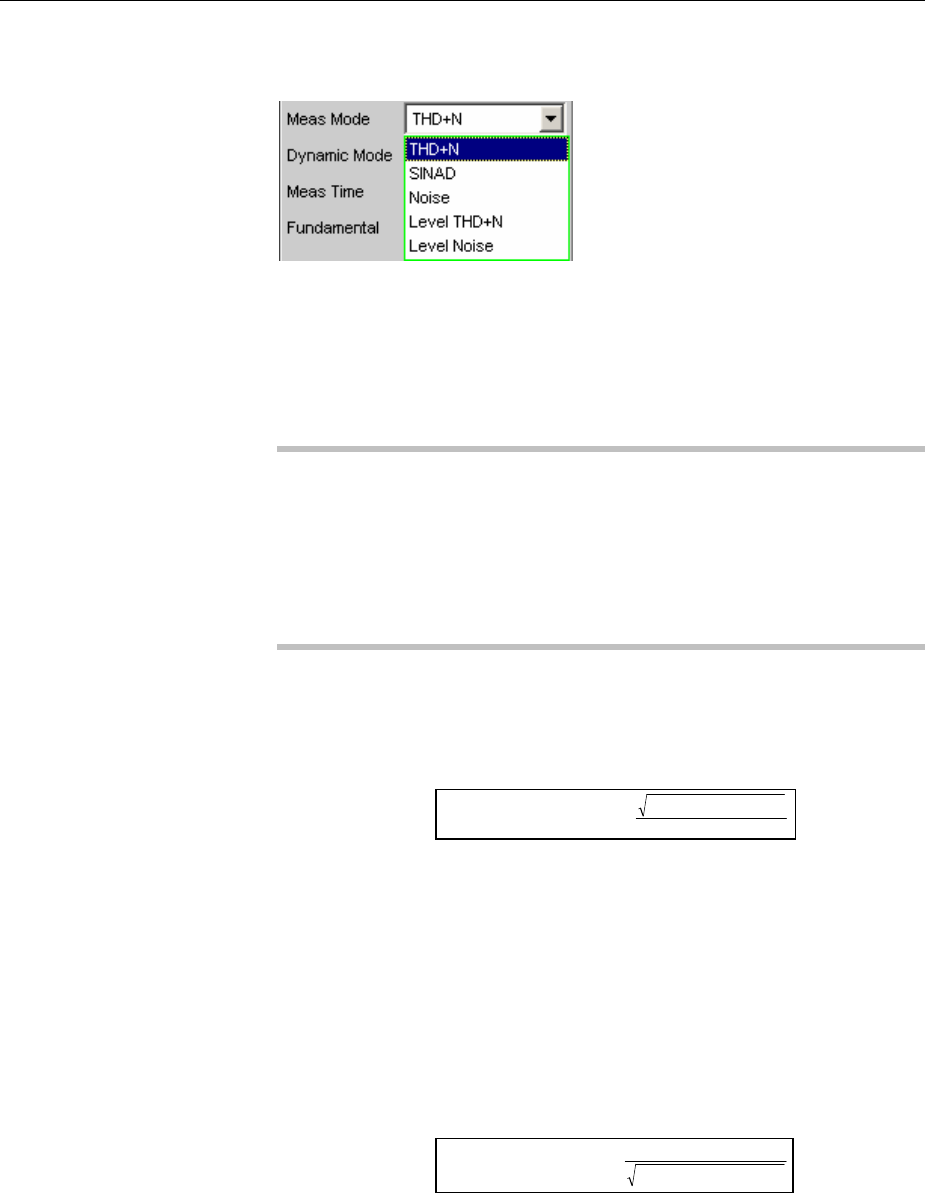
R&S UPV Distortion Measurements
1146.2084.32 4.293 E-9
Meas Mode
Used to select the THD+N measurement method and the calculation
formula for the measurement value.
The term "Level"indicates that the measurement result is displayed as
an RMS and is not referenced to the total RMS (as is customary with
distortion measurements).
With the Noise measurements, it is also possible to filter all harmonics
(except the fundamental) out of the overall signal.
Note:
The noise energy of the respective sideband is also filtered out with
each harmonic so that with very low frequencies (and, theoretically, with
large numbers of harmonics) a large part of the noise energy is lost. To
counter this, measurement is performed with a very fine frequency
resolution, which (compared to the THD+N measurement) results in a
considerably longer measurement time. The Level measurement modes
should therefore only be used for high frequencies.
THD+N The total distortion (broadband noise and
harmonics, referenced to the total RMS) is
measured.
[]
ktivwertGesamteffe
UUU
NTHD
Noisedd
dBU
22
3
2
2...
log*20 +++
+=
The total RMS is band-limited to "Frq Lim Upp".
The measurement value can be displayed in % as
well as in dB.
Remote-control command:
SENSe[1]:FUNCtion:MMODe THDN
SINAD Measurement method similar to THD+N, but the
result is displayed as a positive dB value, i.e. the
total RMS is referenced to the residual signal
(overall spectrum without fundamental).
[
]
22
3
2
2...
log*20
Noisedd UUU
ktivwertGesamteffe
SINAD dBU+++
=
The total RMS is band-limited to “Frq Lim Upp.”
Remote-control command:
SENSe[1]:FUNCtion:MMODe SNDRatio
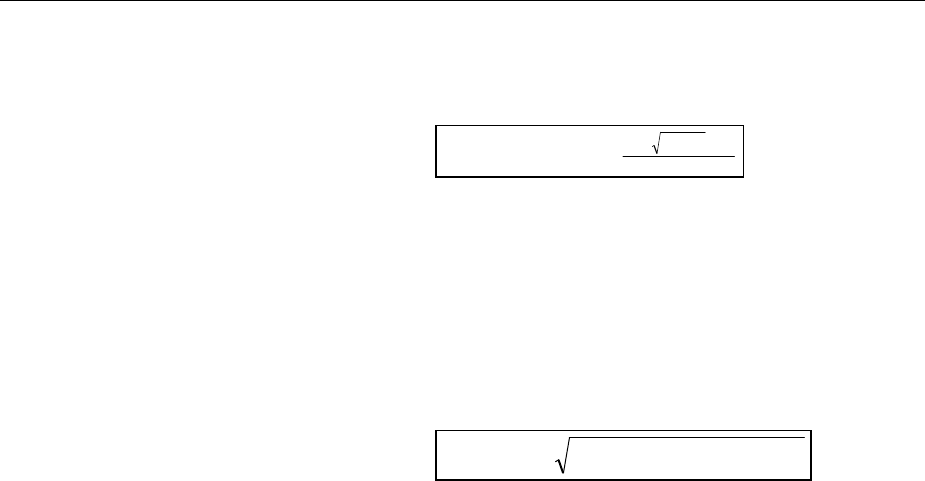
Distortion Measurements R&S UPV
1146.2084.32 4.294 E-9
Noise The noise factor (broadband noise without
harmonics, referenced to the total RMS) is
measured.
[]
ktivwertGesamteffe
U
Noise
Noise
dBU
2
log*20=
The total RMS is band-limited to "Frq Lim Upp".
The measurement value can be displayed in % as
well as in dB.
Remote-control command:
SENSe[1]:FUNCtion:MMODe NOISe
Level THD+N The total distortion voltage (comprising of
broadband noise and the harmonics) is measured.
[]
22
3
2
2... NoiseddNTHD UUUVU +++=
+
The measurement value is displayed in voltage
units (volts or FS).
Remote-control command:
SENSe[1]:FUNCtion:MMODe LTHDn
Level Noise The noise voltage (broadband noise without the
harmonics) is measured.
The measurement value is displayed in voltage
units (volts or FS).
Remote-control command:
SENSe[1]:FUNCtion:MMODe LNOise

R&S UPV Distortion Measurements
1146.2084.32 4.295 E-9
Rejection
Used to select the fundamental rejection. Only available in "Dynamic
Mode Fast" as well as in multichannel analog and digital analog
analyzers.
Narrow The fundamental is suppressed extremely narrowly.
As a result, it is also possible to detect noise
components which are immediately next to the
carrier.
Remote-control command:
SENSe[1]:THDN:REJection NARRow
Wide Adigital notch filter with properties identical to those
previously implemented in analog measuring
instruments is used to reject the fundamental. The
broader filtering range produces slightly better
measurement values since noise components close
to the carrier are also suppressed.
Recommended if the measurement results are to
be comparable to those of analog measuring
instruments.
Remote-control command:
SENSe[1]:THDN:REJection WIDE
Reject Bandw
Used to select the rejection bandwidth ("Rejection Bandwidth") by
implicitly entering the initial FFT value.
Only functions with deactivated Post FFT; with activated Post FFT, the
initial FFT value must be specified explicitly by the user.
The larger the bandwidth is (absolute frequency band around the
fundamental), the smaller the initial FFT and the higher the
measurement speed will be.
The actual initial value of the FFT is determined automatically taking the
sampling rate, the analog bandwidth and the dynamic range of the used
analyzer into consideration.
The final value of the FFT is determined by the frequency of the
measurement signal; it is increased automatically with low frequencies.
Apart from the measurement frequency, the actual measurement time
also depends on the analog bandwidth and sampling frequency.
Note:
When the Post FFT is activated, the internally calculated initial FFT
value is entered in the "Min FFT Size" parameter field. It can then be
freely changed by the user.

Distortion Measurements R&S UPV
1146.2084.32 4.296 E-9
1kHz max The rejection bandwidth is max. 1 kHz, i.e. 500 Hz
below and above the fundamental.
The initial FFT value is very small (e.g. 1 k at
22 kHz analog bandwidth and 48 kHz sampling
rate) and the measurement time is very short
(especially at high frequencies).
Non-harmonic signal components close to the
fundamental are not measured.
Recommended for fast measurement of the
harmonics.
Remote-control command:
SENSe[1]:FUNCtion:APERture:MODE WIDE
240 Hz max The rejection bandwidth is max. 240 Hz, i.e. 120 Hz
below and above the fundamental.
The initial FFT value is at least 4 k.
Compromise between measurement time and loss
of sideband energy.
Remote-control command:
SENSe[1]:FUNCtion:APERture:MODE MEDium
60 Hz max The rejection bandwidth is max. 60 Hz, i.e. only
30 Hz below and above the fundamental.
The initial FFT value is not below 16 k.
Recommended for measuring signal components
close to the fundamental and especially for noise
measurements as this bandwidth ensures that the
fundamentals and harmonics are suppressed as
narrowly as possible.
Remote-control command:
SENSe[1]:FUNCtion:APERture:MODE NARRow
Fundamental
Used to determine the fundamental frequency.
With precision measurement (in the analog analyzer only), this field is
also used to determine the notch frequency of the automatically
activated analog notch filter.
Auto
The fundamental frequency is determined
(separately for each channel) by means of internal
frequency measurement.
Recommended when using the low-distortion
generator or an external signal source.
Remote-control command:
SENSe[1]:VOLTage:FUNDamental:MODE AUTO
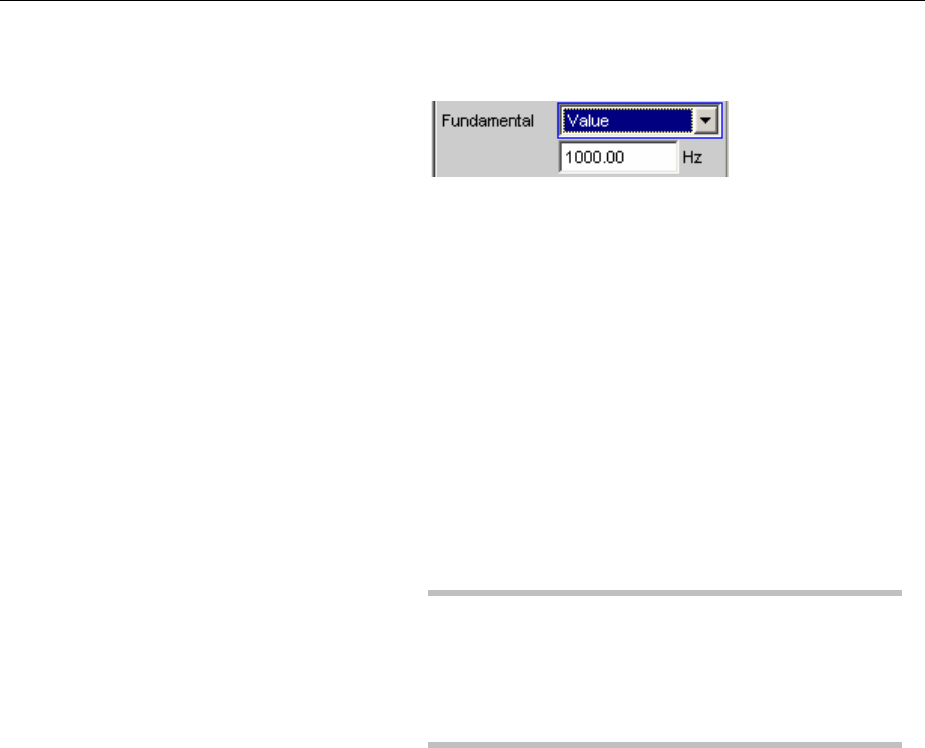
R&S UPV Distortion Measurements
1146.2084.32 4.297 E-9
Value Fixed fundamental frequency; the value must be
entered in the parameter field below.
Recommended for signals with a high noise
component if an external generator is used as the
signal source.
Remote-control command:
SENSe[1]:VOLTage:FUNDamental:MODE
VALue
SENSe[1]:VOLTage:FUNDamental <nu>
Gen Track The fundamental frequency changes with the
generator (nominal)frequency. The generator
frequency may change as a result of manual entries
in the Generator Function panel or owing to a
generator frequency sweep. Setting reliability in the
case of signals with a high noise component is thus
improved and measurement speed is increased.
Note:
If the Low-Distortion Generator option is used,
"Gen Track" should be avoided on account of the
rigid coupling to the generator's nominal frequency,
otherwise measuring inaccuracy resulting from slight
frequency offset could occur.
An error message is output if an unsuitable signal
function is selected in the generator (e.g. a multi-
tone signal or interfering signal).
Recommended when using the internal universal
generator.
Remote-control command:
SENSe[1]:VOLTage:FUNDamental:MODE
GENTrack
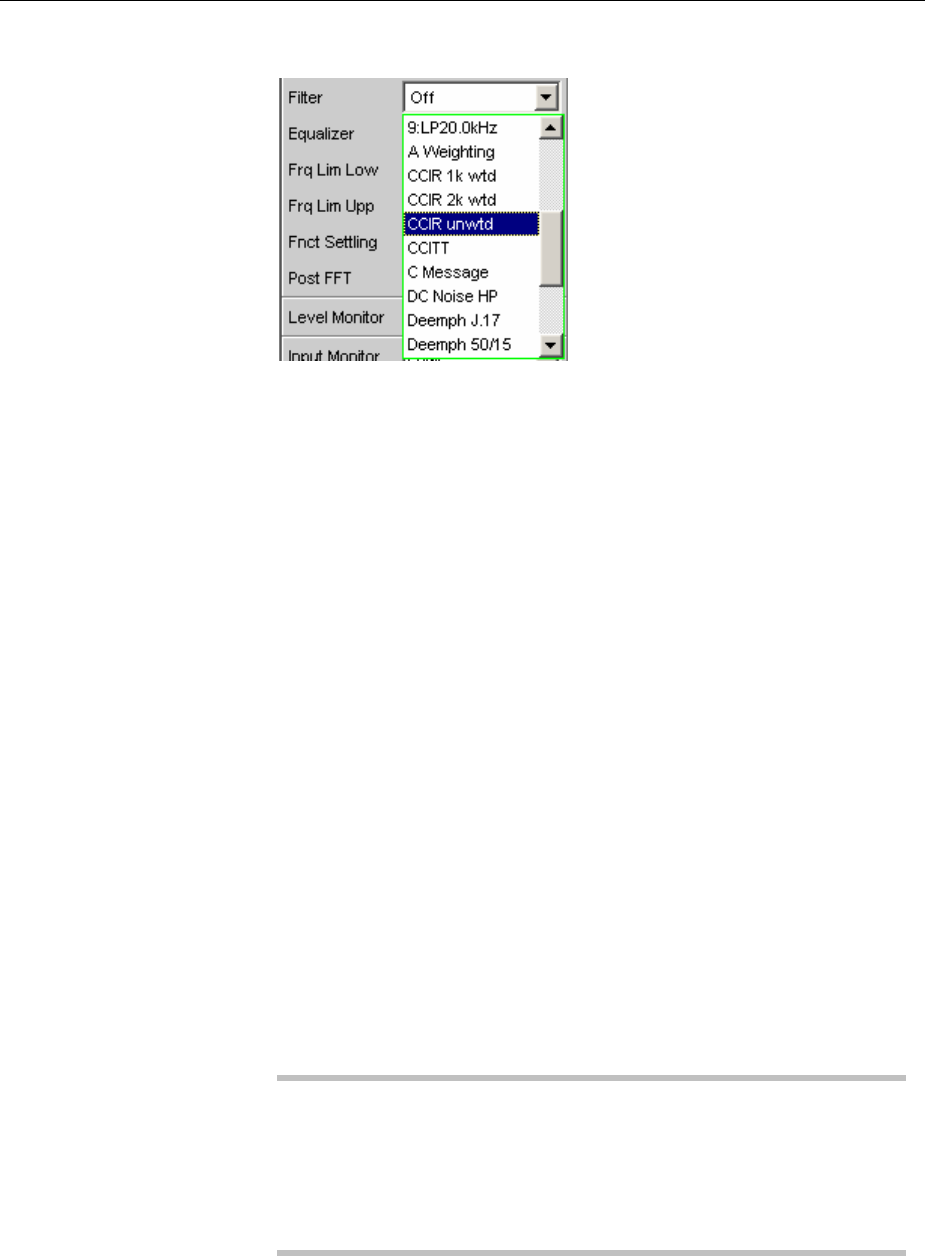
Distortion Measurements R&S UPV
1146.2084.32 4.298 E-9
Filter
Used to activate a digital filter (user-definable filter or weighting filter)
inthe measurement path.
The filter used here only affects the residual signal. In other words, the
THD+N reference value is always the RMS signal at the Monitor level,
regardless of the filter selected here.
By contrast, the input filter (“Pre Filter”) affects the residual signal and
the total RMS value.
Five measurement scenarios for THD+N, SINAD and noise can thus
be distinguished based on the selected input and function filters:
1. Both filters off:
The reference value is the unweighted input signal, band-
limited to “Freq Lim Upp” (such as with the R&S UPL or
R&S UPD without a weighting filter).
2. Prefilter off,function filter on:
The reference value is the unweighted,wideband input signal.
3. Prefilter used as a weighting filter, function filter off:
The reference value is the weighted input signal, band-limited
to “Freq Lim Upp.”
4. Prefilter used as a weighting filter, function filter on:
The reference value is the weighted,wideband input signal.
5. Prefilter used as a low-pass filter with a stop frequency
corresponding to “Freq Lim Upp,” function filter used as a
weighting filter:
The reference value is the unweighted input signal, band-
limited to “Freq Lim Upp” (such as with the R&S UPL or
R&S UPD with a weighting filter).
The available weighting filters are described in section "Weighting
Filters" on page 4.428.
Note:
The previous generation of instruments (R&S UPL and R&S UPD) did
not allow a prefilter to be selected. Consequently, only measurement
scenarios 1 and 5 were possible with these instruments.
The upper band limit can be limited in the analog analyzer using the
"Bandwidth" parameter field, which has the same effect as an
additional low-pass filter.
Remote-control command:
SENSe[1]:FILTer <parameter>
List of <parameter> see section "Filter Table" on page 4.419.
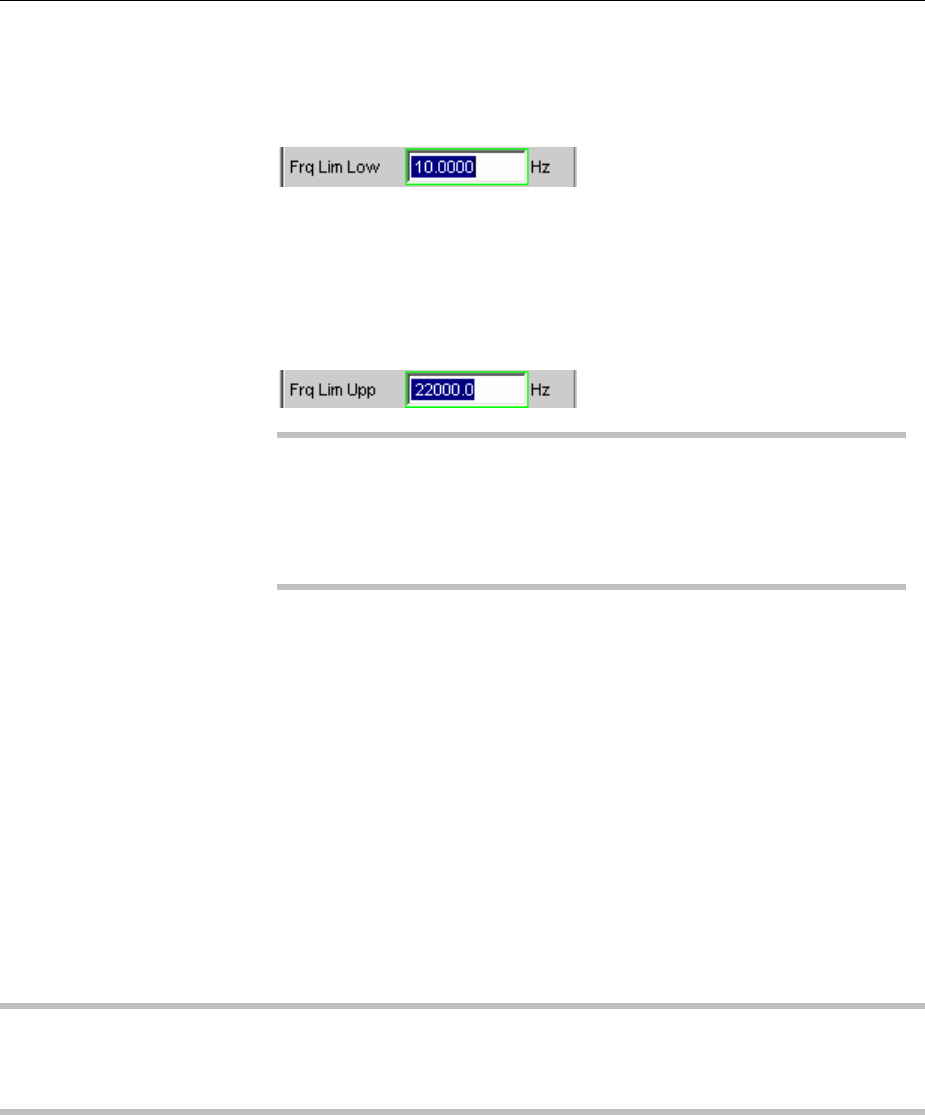
R&S UPV Distortion Measurements
1146.2084.32 4.299 E-9
Frq Lim Low
Used to enter the lower band limit for calculating the distortion voltage;
this limit does not affect calculation of the total RMS.
Remote-control command:
SENSe[1]:FREQuency:LIMit:LOWer <nu>
Frq Lim Upp
Used to enter the upper band limit for calculating the distortion voltage
and the total RMS.
Note:
If the fundamental of the measurement signal is above "Frq Lim Upp",
the referenced measurements (THD+N, SINAD and Noise) should not
be performed because the energy of the fundamental is filtered out in
the reference value. An error message appears in the user info line
and the measurement value is identified as invalid ("---").
Remote-control command:
SENSe[1]:FREQuency:LIMit:UPPer <nu>
See section "Signal-to-Noise Measurements" on page 4.280 for further distortion measurements.
MOD DIST
Mod Dist is a modulation factor analysis which determines the intermodulation of a low-frequency
(dominant) interfering signal to a high-frequency useful signal. According to IEC 60268 Part 3, the
interfering signal should be 60 Hz, the useful signal 7 kHz and the amplitude ratio 4 : 1. The R&S UPV
measures the 2nd and 3
rd order intermodulation products selectively (measurements are therefore
largely unaffected by noise) and calculates their squared sum. Contrary to the recommendation in
IEC 60268, the total intermodulation factor is therefore measured to ensure that this measurement
method is comparable to the customary SMPTE measurement method.
Note:
The measurement algorithm is highly tolerant with respect to the level ratio of the noise signal to the
useful signal. The level of the noise signal may be 48 dB lower than the level of the (higher-frequency)
useful signal. The level of the useful signal may be max. 68 dB lower than that of the noise signal.

Distortion Measurements R&S UPV
1146.2084.32 4.300 E-9
The "Mod Dist" signal function of the internal universal generator is recommended as the signal source.
This allows the frequencies of the interfering and useful signal as well as their amplitude ratio to be
varied. Furthermore, it is also possible to sweep the total level and useful frequency.
0,1 0,2 0,3 0,4 0,5 8,7 8,8 8,9 9,0 9,1 9,2 9,3
d3
d2 d2
d3
f1 (Interfering signal)
f2 (Useful signal)
frequency in kHz
)2(
)12()21(
2d f
ffff
U
UU ++
=2ndorder intermodulation product
)2(
)122()122(
3d f
ffff
U
UU ++
=3rd order intermodulation product
)32(lg*20=[dB] DIST MOD 22 dd +Total intermodulation factor in dB
Remote-control command:
SENSe[1]:FUNCtion MDISt
See section "DFD" on page 4.301 for alternative intermodulation measurement.
See section "Signal-to-Noise Measurements" on page 4.280 for further distortion measurements.
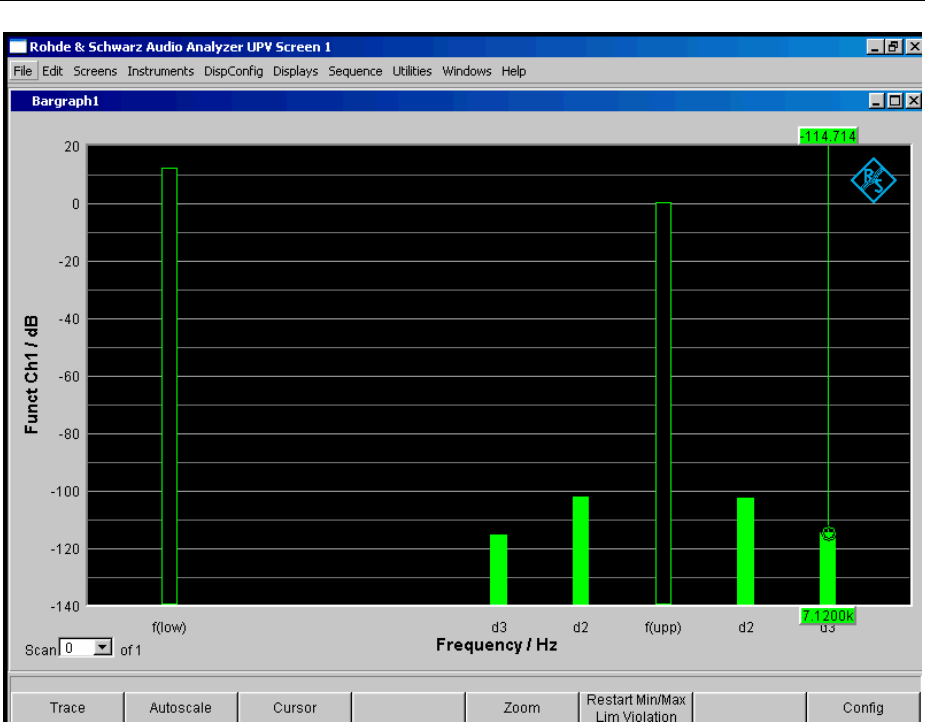
R&S UPV Distortion Measurements
1146.2084.32 4.301 E-9
Figure 4-23 Mod-Dist measurement with 7 kHz useful signal and quadrupled interferer at 60 Hz
DFD
DFD is a difference-tone factor analysis which determines the intermodulation products generated by
two sinewave signals of the same amplitude. Depending on the selected measurement mode, the
R&S UPV measures the 2nd or 3
rd intermodulation products selectively in accordance with
DIN IEC 60268 Part 3 (measurements are therefore largely unaffected by noise). The arithmetic center
frequency of the double-tone signal should be selected from the third-octave band (5, 6.3, 8, 10, 12.5,
16, 20 kHz) and the frequency difference should be 80 Hz.
The "DFD" signal function of the internal universal generator is recommended as the signal source.This
allows the center frequency and difference frequency (for IEC 60268) and the upper frequency and
difference frequency (for IEC 60118) to be varied. Furthermore, it is also possible to sweep the center
frequency and upper frequency.
Remote-control command:
SENSe[1]:FUNCtion DFD
See section "MOD DIST" on page 4.299 for alternative intermodulation measurement.
See section "Signal-to-Noise Measurements" on page 4.280 for further distortion measurements.
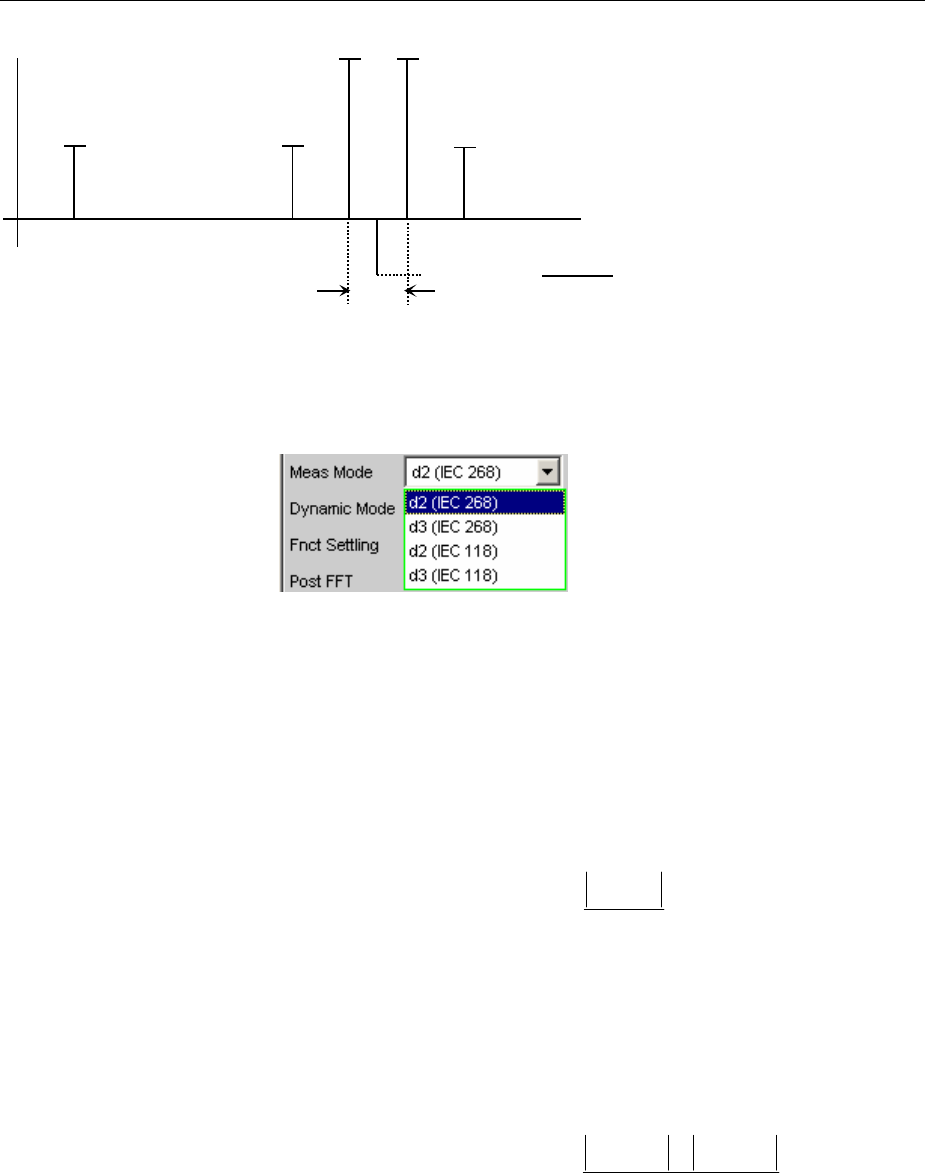
Distortion Measurements R&S UPV
1146.2084.32 4.302 E-9
Frequency offset
Center
frequency
f1+ f2
2
2nd order 3rd order 3rd order intermodulation
products
f2- f12f1- f2f1f22f2- f1
f2- f1
Uf2
Uf1
Meas Mode
Used to select the order of the intermodulation products and the
measurement standard.
With IEC 60268, the measured intermodulation products are referenced
to double the upper frequency; with IEC 60118, the measured
intermodulation products are referenced to the undoubled upper
frequency only. The results to IEC 60268 are therefore approx. 6 dB
better than the results to IEC 60118.
d2 (IEC 268) Measurement of the 2nd order intermodulation
product referenced to double the upper frequency
level (to IEC 60268):
)(
)(
2
2
12
2
lg20][
f
ff
xU
U
xdBd
=
Remote-control command:
SENSe[1]:FUNCtion:MMODe D2_268
d3 (IEC 268) Measurement of the 3rd order intermodulation
products referenced to double the upper frequency
level (to IEC 60268):
)(
)2()2(
3
2
2112
2
lg20][
f
ffff
U
UU
xdBd ×
+
=
Remote-control command:
SENSe[1]:FUNCtion:MMODe D3_268

R&S UPV Distortion Measurements
1146.2084.32 4.303 E-9
d2 (IEC 118) Measurement of the 2ndorder intermodulation
product referenced to the undoubled upper
frequency level (to IEC 60118):
ddB x U
U
ff
f
220 21
2
[] lg ()
()
=
Remote-control command:
SENSe[1]:FUNCtion:MMODe D2_118
d3 (IEC 118)) Measurement of the lower 3rd order intermodulation
product referenced to the undoubled upper
frequency level (to IEC 60118):
ddB x U
U
ff
f
3
2
20 12
2
[] lg ()
()
=
Remote-control command:
SENSe[1]:FUNCtion:MMODe D3_118
Figure 4-24 DFD-d2 measurement in accordance with IEC 60118
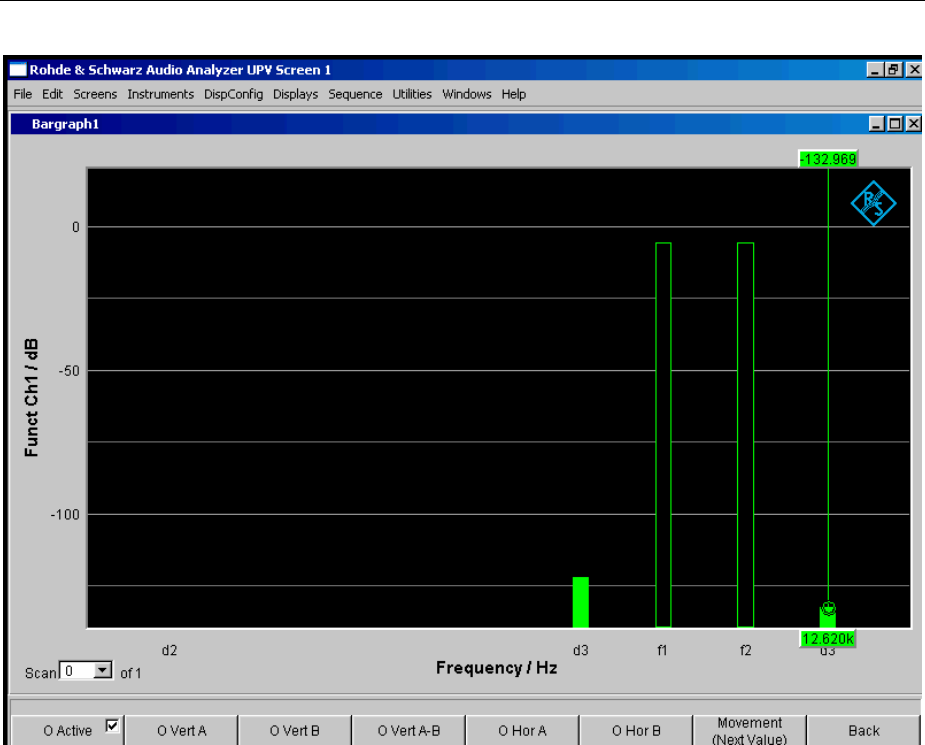
Distortion Measurements R&S UPV
1146.2084.32 4.304 E-9
Figure 4-25 DFD-d3 measurement in accordance with IEC 60268
See section "Signal-to-Noise Measurements" on page 4.280 for further distortion measurements.
DIM (dynamic intermodulation distortion analysis)
DIM is an analysis of intermodulation distortion that determines the nine components of dynamic
intermodulation in the audio range caused by a mixture of a low-frequency squarewave signal and a
high-frequency sine signal. It is mainly used to determine the nonlinear distortion of amplifiers that are
forced to operate up to their maximum rise speed due to the short rise time of the squarewave signal.
According to Part 3 of IEC 60268, the amplifier is to be operated under nominal conditions (fully
loaded). The squarewave signal with the basic frequency of 3.15 kHz has to be limited to 30 kHz (or,
optionally, 100 kHz) via a one-contact lowpass filter. The peak amplitude of the sinwave signal with a
frequency of 15 kHz must be 12 dB below the squarewave signal. In sound broadcasting, the
squarewave/sinewave combination of 2.96 kHz/14 kHz is used. A mode with a reduced sinewave
frequency (2.96/8 kHz) is often used for making measurements on narrowband DUTs.
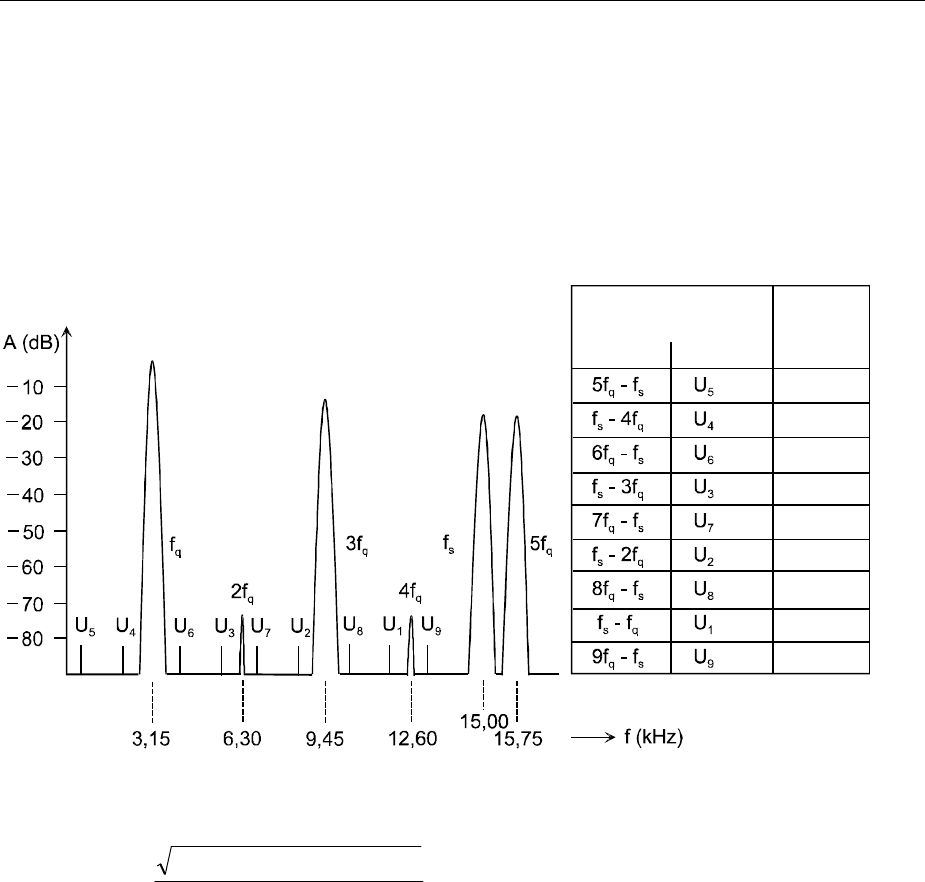
R&S UPV Distortion Measurements
1146.2084.32 4.305 E-9
The Audio Analyzer R&S UPV supports both frequency pairs and automatically determines the
combination that is created in each case provided that the frequency drift is within the tolerance range
stipulated by DIN IEC. This is only possible if the DUT can transfer the sinewave frequency without
significant attenuation. The allowable deviation of the sinewave signal from the nominal level is 20%.
The DIM signal function of the internal basic generator is recommended as the signal source
(reference). This signal function provides a standard-compliant frequency setting – including with
respect to frequency accuracy.
Remote-control command:
SENSe[1]:FUNCtion DIM
Intermodulation
components
0.75
Voltage
13.35
2.40
3.90
5.55
7.05
8.70
10.20
11.85
Frequency
Frequency
kHz
The measurement result is the rms value of the selectively measured intermodulation components (up
to 9th order) relative to the rms value of the sinwave signal and is displayed in dB (or, optionally, in %).
s
U
UUUU
dBd
2222 9...321
lg20][ +++
×=
See section "MOD DIST" on page 4.299 for alternative intermodulation measurement.
See section "Signal-to-Noise Measurements" on page 4.280 for further distortion measurements.
Since the used frequency pair is recognized automatically, you do not have to make any special
settings.

R&S UPV Polarity Measurement
1146.2084.32 4.307 E-9
Polarity Measurement
Polarity measurement is used to test whether a DUT (such as a cable) forwards an applied signal with
the identical or reversed polarity.
Todetermine the polarity, a peak measurement is performed for a measurement time of 20 ms and the
highest positive peak is compared with the highest negative peak. The signal applied to the DUT must
therefore fulfill the following requirements:
•The positive amplitude must be greater than the negative amplitude.
•The repetition rate must be 50 Hz or an integer multiple thereof.
The "Polarity" signal function of the internal universal generator is recommended as the signal source.
However, the polarity signals of other R&S audio analyzers (e.g. R&S UPL, R&S UPD) can also be
used. If using an external signal source, something like a sine² burst signal with 50 % duty cycle can be
applied.
Function
For switching the measurement function to polarity measurement.
The measurement result for the function is displayed as
•"+ 1.0 Pol" for a non-reversed signal and
•"– 1.0 Pol" for a reversed signal.
No further settings are needed.
Note:
When using polarity signals that are not DC free (e.g. sine² burst)
measurements in the analog analyzer should preferably be performed
using DC coupling in order to keep the negative amplitude as low as
possible.
Remote-control command:
SENSe[1]:FUNCtion POLarity

Frequency Band Analysis R&S UPV
1146.2084.32 4.308 E-9
Frequency Band Analysis
Nth Octave Analysis
This measurement function is only available when option R&S UPV-K6 (extended analysis functions) is
installed. It is not provided in the multichannel analyzers.
Nth octave analysis is a selective level measurement performed simultaneously in a number of adjacent
frequency bands. The levels of the individual frequency bands are, however, not measured by narrow
bandpass filters as in the case of conventional octave or third analysis, but instead with the aid of a
special high-resolution FFT by integration of the FFT bins (frequency lines) in the respective band.
The advantage compared to the filter method is the significantly higher frequency resolution, which
enables bandwidths down to 1/24th of an octave. The bandwidth of the subbands is theoretically fully
scaleable by varying "n" or using frequency tables such as the "Critical Bands" defined by means of the
Bark scale. The advantage compared to pure FFT is the logarithmic or user-definable stepping of the
frequency range.
Each subband has the relative bandwidth of n
n
2
2
2
1
2(upper band limit – lower band limit).
Referred to the band center this gives the following results:
•Octave analysis 70.71 %,
•Third octave analysis (third analysis) 23.16 %,
•Sixth octave analysis 11.56 %,
•Twelfth octave analysis 5.78 %,
•Twenty-fourth octave analysis 2.89 %,
The reference frequency is 1 kHz. All other band center frequencies are computed by reference to this
frequency by multiplying or dividing by n
1
2
.
Selecting the frequency bands to be measured involves specifying the upper and lower limit
frequencies. A separate RMS value is determined for each selected frequency band by integrating all
the FFT bins in the said band together with the attenuated bins in the adjacent band. The total RMS
value of all the selected frequency bands is applied to the display of measurement results for the
function.
The measurement range of the nth octave analysis starts at a nominal band center frequency of 16 Hz
and ends at half the sampling rate or the bandwidth of the analog analyzer.
The exact, computed frequency bands are used in measurements and for numerical displays (e.g. with
the X value displayed graphically as a cursor or for values displayed in the "Data List"). The nominal
band center frequencies (in line with DIN 323) are given only for the numerical display of the third and
the twelfth octave. Only the octave frequencies are captioned in the graphical display due to space
restrictions.
Note:
Since nth octave analysis is usually performed in the audio range only, the bandwidth in the analog
analyzer should be set to 22 kHz. This avoids not only needlessly large FFTs but also long computation
times.
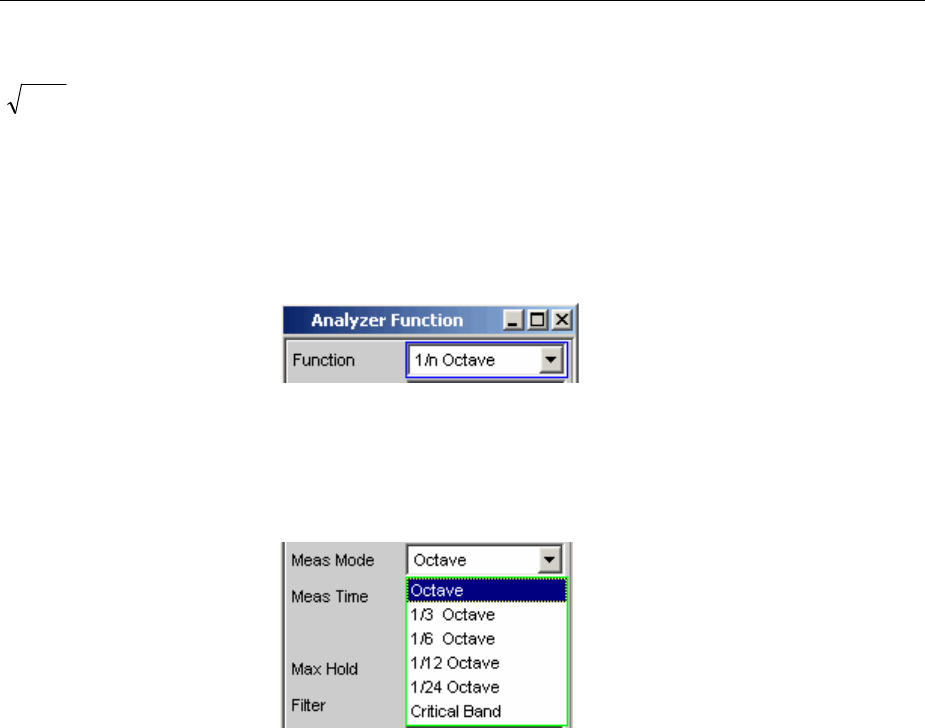
R&S UPV Frequency Band Analysis
1146.2084.32 4.309 E-9
The recommended trigger signal for nth octave analysis is the frequency-defined pink noise which can
begenerated with the aid of the R&S UPV generator (Reference). Unlike white noise, its level roll-off
1/ fcompensates for the apparent level increase encountered with nth octave analysis, which
results from the absolute bandwidth increasing as the frequency increases. If possible the spacing of
the frequency lines on the FFT size should be synchronized ("Spacing Anlr Track").
Function
For selecting FFT based nth octave analysis.
The RMS value of the signal is displayed in the range "Frq Lim Low" to
"Frq Lim Upp" as the measurement result for the function.
Remote-control command:
SENSe[1]:FUNCtion NOCTave
Meas Mode
This defines the measurement mode and thus implicitly the center
frequencies and relative bandwidth of the bandpass filters.
The center frequencies of the subbands are spaced at intervals of 21/n
from the 1 kHz reference frequency. The exact values can be taken
from the "Bargraph Data List" (Reference).
The band limits of a subband are separated from the center frequency
by 21/(2*n).
The larger the chosen value of "n" the narrower the bands and the
longer the minimum measurement time.
Octave The audio range is divided into octave bands.
Remote-control command:
SENSe[1]:FUNCtion:MMODe OCT1
1/3 Octave The audio range is divided into third octave bands.
Remote-control command:
SENSe[1]:FUNCtion:MMODe OCT3
1/6 Octave The audio range is divided into sixth octave bands.
Remote-control command:
SENSe[1]:FUNCtion:MMODe OCT6

Frequency Band Analysis R&S UPV
1146.2084.32 4.310 E-9
1/12 Octave The audio range is divided into twelfth octave
bands.
Remote-control command:
SENSe[1]:FUNCtion:MMODe OCT12
1/24 Octave The audio range is divided into twenty-fourth octave
bands. Due to the extremely narrow bands, analysis
is only possible with effect from 21.5 Hz.
Remote-control command:
SENSe[1]:FUNCtion:MMODe OCT24
Critical
Bands
The audio range is divided into "critical bands"
according to the Bark scale. The band limits are on
the Bark scale and the center frequencies are 0.5
Bark above the lower band limit in each case.
Due to the division into "critical bands" the low
frequency bands are wider than in the case of the
comparable third octave analysis, for which reason
both the required FFT size and the measurement
time are smaller.
Remote-control command:
SENSe[1]:FUNCtion:MMODe CBANd
Meas Time
For selecting the measurement time.
The minimum measurement time is the same as the sampling time of
the FFT and is therefore defined by the FFT size used. When a longer
measurement time is selected, a greater number of FFTs is performed
and averaged, reducing both the update rate and fluctuations in the
measurement values.
In turn the required FFT size is dependent on the sampling rate or the
analog bandwidth and the width of the narrowest subband, that is, on
the measurement mode and the lower band limit.
Auto This sets the minimum possible measurement time.
This setting is recommended for the purpose of
measuring independently of the lower band limit
and measurement mode, and always using the
highest measurement speed.
Remote-control command:
SENSe[1]:FUNCtion:APERture:MODE AUTO

R&S UPV Frequency Band Analysis
1146.2084.32 4.311 E-9
Value Anumerical value for the measurement time is
entered in the next parameter field.
The measurement time entered is rounded to an
integer multiple of the minimum measurement time
and thus implicitly defines the number of averages.
This setting is recommended for the purpose of
reducing the update rate and fluctuations in the
measurement values.
Remote-control command:
SENSe[1]:FUNCtion:APERture:MODE
VALueSENSe[1]:VOLTage:APERture <nu>
Filter
For activating a digital filter in the test channel. Up to three user-
defined or weighting filters can be looped into the test channel:
The user-definable filters are configured as filters 01 to 09 in the filter
panel (see section "User-Definable Filters" on page 4.420) and can
then be used (repeatedly if necessary) in the analyzer.
The selectable weighting filters are described in section "Weighting
Filters" on page 4.428.
Note:
Regardless of the digital filters selected here, a further input filter
("prefilter") can be looped into the test channel. Moreover the analog
bandwidth can be restricted with the aid of the "Bandwidth" parameter
field, which corresponds to an additional low pass filter.
Remote-control command:
SENSe[1]:FILTer[1] <parameter>SENSe[1]:FILTer2
<parameter>SENSe[1]:FILTer3 <parameter>
For a <parameter> list see section "Filter Table" on page 4.419.
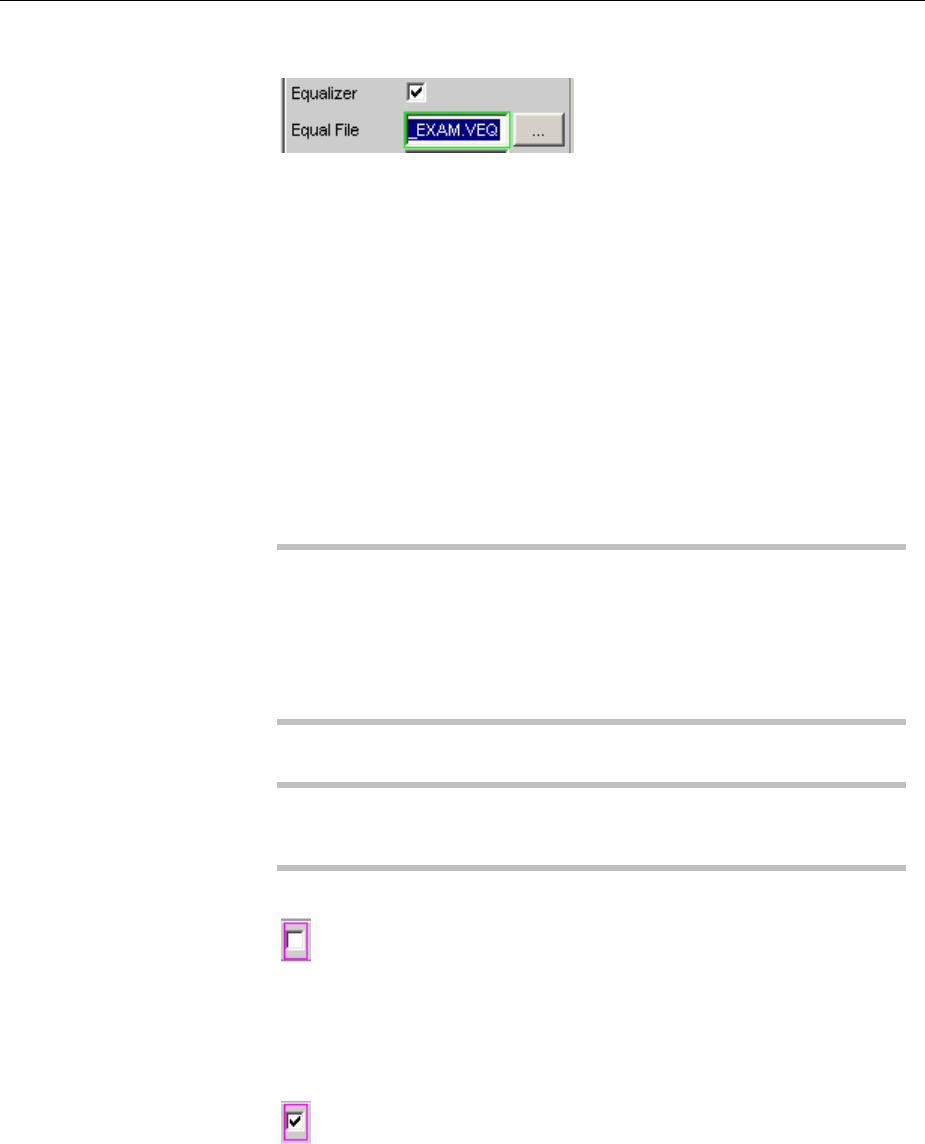
Frequency Band Analysis R&S UPV
1146.2084.32 4.312 E-9
Equalizer
Used for activating/deactivating a precorrector table for the FFT bins.
In this way the frequency response of a transmission link can be
precorrected, for example, and in so doing the measurement point is
transformed into another reference point.
When precorrection is enabled the computed FFT bins are multiplied
by a frequency-dependent factor after which they are used to calculate
the nth octave bands and applied to the display.
The factor is determined by interpolation between the two adjacent
frequency reference points in the precorrector table.
Precorrection of the FFT spectrum is an attractive alternative to
filtering the input signal, since the precorrector file can simply be
generated from the frequency response requiring precorrection and
need not be in the form of a coefficient file or pole/zero file.
Application:
In the case of acoustic measurements (e.g. involving mobile
telephones) on artificial ears of type 3.2 or higher, it is possible to
compensate for the transfer function ERP (ear reference point) to DRP
(drum reference point). Measurement of the sound waves by the
microphone applied to the "eardrum" can thus be referred to the
required measurement point (at the auricle).
Note:
The precorrector table is created after acquiring or reading in the trace
data from the DUT in the "DispConfig" panels.
The precorrector is disabled. The FFT bins are
used and displayed without change. The levels of
the subbands are calculated from the original FFT
spectrum.
Remote-control command:
SENSe[1]:VOLTage:EQUalize OFF
The precorrector is enabled. The next entry field,
which is "Equal File", for the file name of the
precorrector table, is activated and the file shown
there is loaded. The levels of the subbands are
calculated from the precorrected FFT spectrum.
Remote-control command:
SENSe[1]:VOLTage:EQUalize ON
MMEMory:LOAD:IEQualize ’filename’
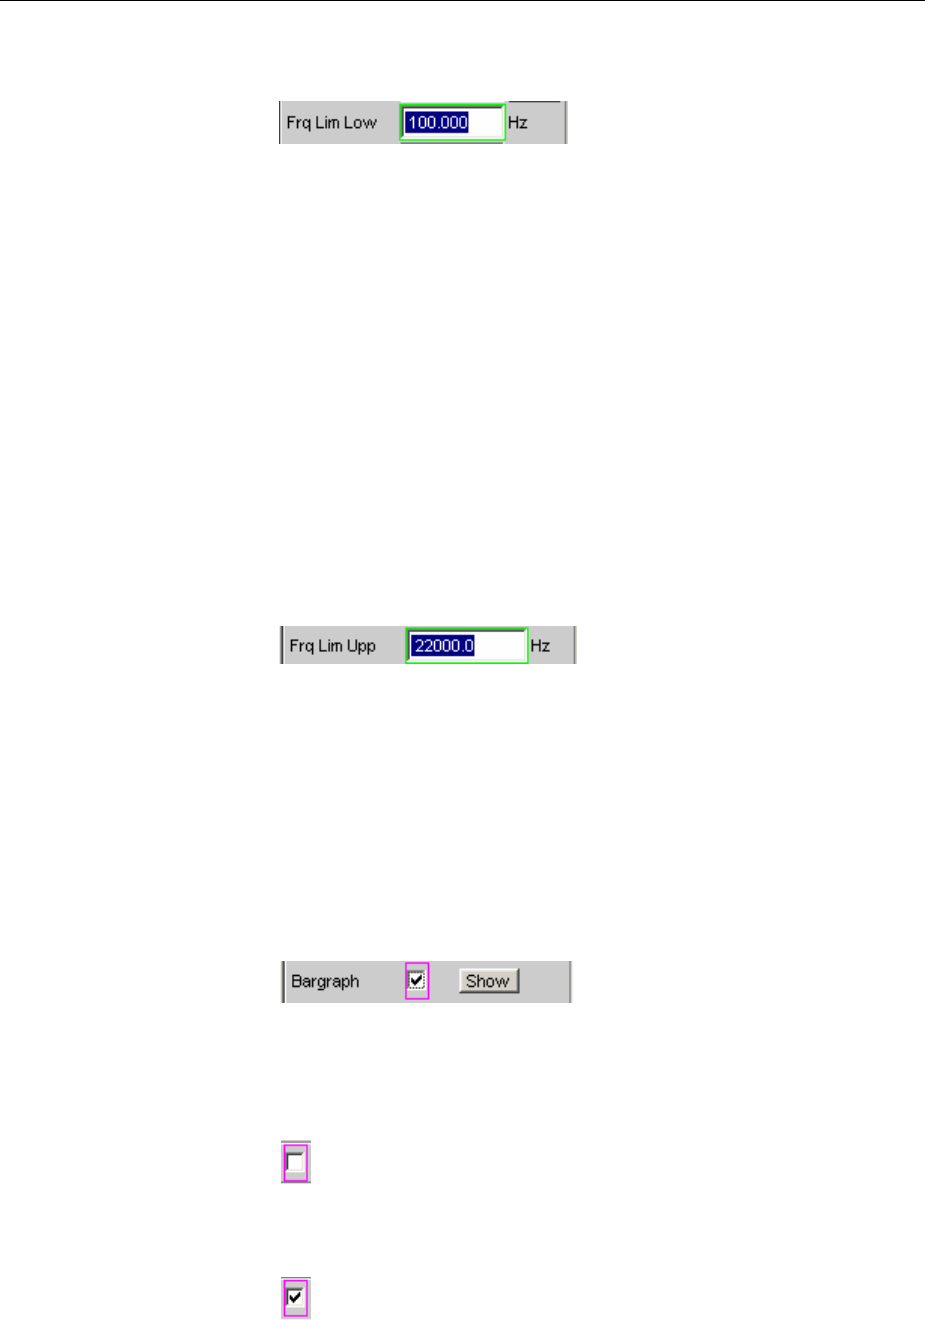
R&S UPV Frequency Band Analysis
1146.2084.32 4.313 E-9
Frq Lim Low
For entering the lower band limit for computing the subbands and the
total RMS value.
Display and computation of the subbands starts at the band in which
the lower limit frequency is located. The lower subband is measured in
full, that is, the limit frequency entered does not alter the energy
content of the lower band.
The lower the frequency of the lower limit frequency, the narrower the
frequency bands which have to be measured. In order to not to drop
below a minimum number of bins per band, the FFT resolution and the
FFT size must be increased in the narrower frequency bands.
The lower limit frequency therefore has a decisive influence on the
measurement speed and should therefore not be lower than the
measurement task requires.
Remote-control command:
SENSe[1]:FREQuency:LIMit:LOWer <nu>
Frq Lim Upp
For entering the upper band limit for computing the subbands and the
total RMS value.
Display and computation of the frequency bands ends at the band in
which the upper limit frequency is located. The upper subband is
measured in full, that is, the limit frequency entered does not alter the
energy content of the upper band.
The upper limit frequency has no effect on the measurement speed.
Remote-control command:
SENSe[1]:FREQuency:LIMit:UPPer <nu>
Bargraph
Used for activating bargraph computation and display. In addition the
"Bargraph1" window can be opened from here.
Configuration of the bargraphs is reserved for the "Bargraph1 Config"
and/or "Bargraph2 Config" windows. The actual display takes place in
the "Bargraph1" or "Bargraph2" windows.
Bargraph computation (and update) disabled. Only
the band-limited total RMS value is measured.
Remote-control command:
SENSe:FUNCtion:BARGraph OFF
Bargraph computation (and update) enabled.
Remote-control command:
SENSe:FUNCtion:BARGraph ON
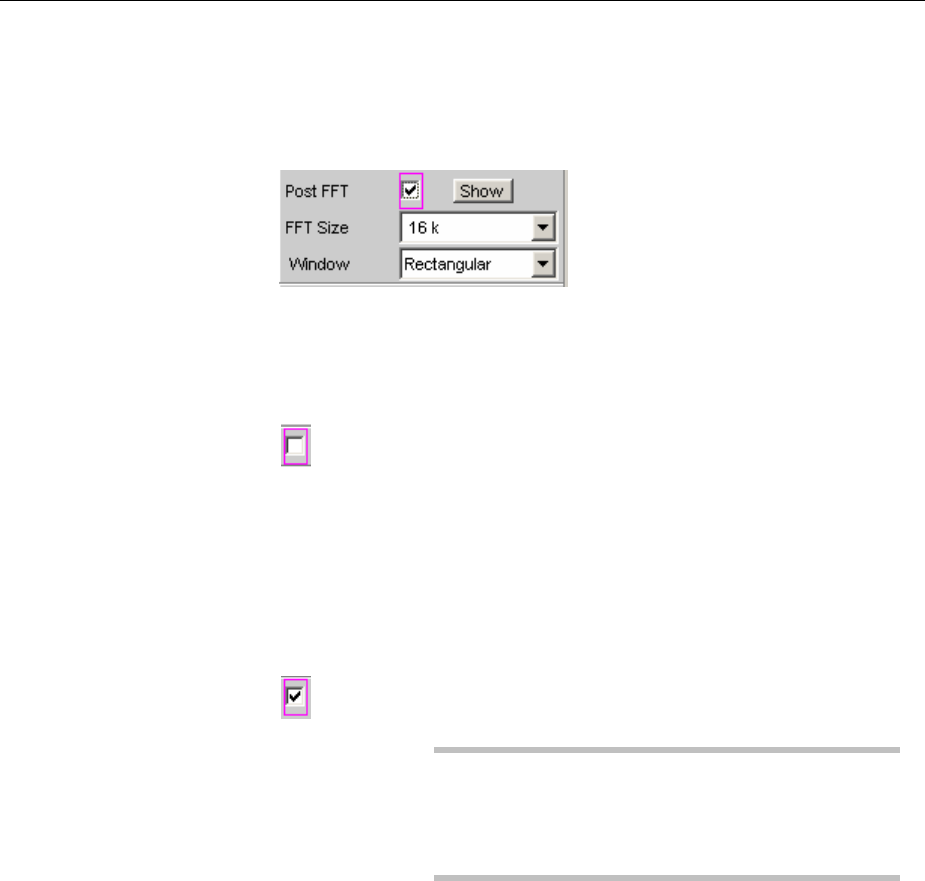
Frequency Band Analysis R&S UPV
1146.2084.32 4.314 E-9
Post FFT
For activating/deactivating Post FFT. At the same time it is possible to
switch between automatic and manual selection of the FFT size and
window. In addition the "FFT Graph1" window can be opened from
here.
Configuration of the FFT Graph is reserved for the "FFT Graph1
Config" and/or "FFT Graph2 Config" windows. The actual display
takes place in the "FFT Graph1" or "FFT Graph2" windows.
Post FFT is disabled.
The necessary Post FFT size is computed
automatic from the sampling rate and the width of
the narrowest subband (defined by the lower limit
frequency and the measurement mode).
The received samples are weighted using the Hann
window function.
Remote-control command:
SENSe[1]:FUNCtion:FFT:STATe OFF
Post FFT is enabled and can be displayed. The
FFT size and window can be selected manually.
Note:
When Post FFT is turned on the FFT size and
window are loaded with the recommended standard
settings. The manual settings are discarded when
Post FFT is turned off.
Remote-control command:
SENSe[1]:FUNCtion:FFT:STATe ON
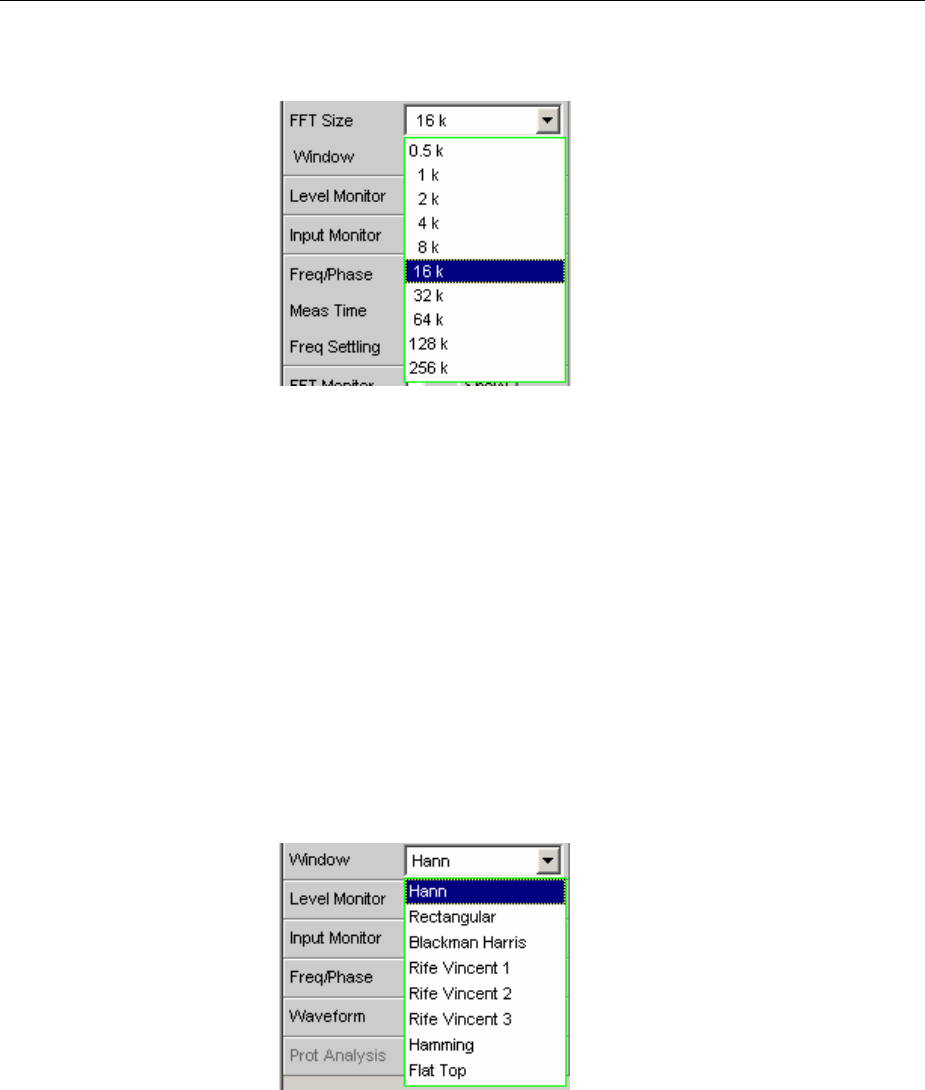
R&S UPV Frequency Band Analysis
1146.2084.32 4.315 E-9
FFT Size
This is the FFT size to be used in computing the subbands, and is
adjustable in powers of 2 from 512 (0.5 k) to 256 k. (FFT Function)
When using manual selection the FFT size should not be less than the
recommended value (which is produced when Post FFT is activated),
otherwise there will be too few FFT bins in the lower subbands.
With every increase in FFT size the measurement accuracy and
stability increase, particularly in the relatively narrow lower subbands.
At the same time, however, the measurement time doubles.
In the interests of shorter measurement times it would be best to avoid
an unnecessarily large FFT size.
Remote-control command:
SENSe[1]:FUNCtion:FFT:Size <parameter>
The <parameter> list:
S512, S1K, S2K, S4K, S8K, S16K, S32K, S64K, S128K,
S256K
Window
Selection of the window function.
For details, see section "Window Function".

FFT Analysis R&S UPV
1146.2084.32 4.316 E-9
FFT Analysis
The FFT analysis (Fast Fourier Transformation) allows the input signal to be displayed in the spectral
range (frequency range). The (digitalized) input signal is recorded over a selectable time period and
transformed into the frequency range by means of a fast DFT (Discrete Fourier Transformation). The
result is a "list" of equidistant frequency lines (bins) which indicate the magnitude or the phase of the
respective frequency components. The graphical display of the magnitude or phase bins is referred to
as a spectrum or spectral display.
According to system theory, the FFT analysis assumes that the signal is periodic, i.e. it continues
continuously beyond the observed time period. Since this ideal state only exists in a few exceptional
cases, the input signal can if required be weighted using a window which attenuates both ends of the
observed signal section with respect to zero.
The recording time for the FFT, i.e. the length of the measurement interval (integration time), is
determined using the FFT size and, like the frequency resolution, also depends on the used sampling
rate and bandwidth.
2different types of FFT can be selected in the R&S UPV:
•The Post FFT for distortion measurements are calculated with double precision with up to 256 k
points thus ensuring a very high frequency resolution and dynamic response. The size of the FFT
and the used window cannot be selected, but instead are preset according to the requirements of
the respective measurement function. The Post FFT is displayed in the "FFT Function" graphical
window.
•The FFT as measurement function (Function FFT) is, like the Post FFT, also calculated with
double precision but additionally allows a number of other functions such as averaging and
undersampling (limiting the frequency range to increase the frequency resolution) as well as free
selection of the FFT size and window. The Function FFT is displayed in the "FFT Function"
graphical window.
FFT Size
The size of the FFT (FFT Size) together with the sampling rate and bandwidth determines the length of
the measurement interval (integration time) and thus the frequency resolution of the calculated
spectrum. The following correlations apply:
•Integration time = FFT size / Sampling rate
•Number of lines = FFT size / 2
•Frequency resolution = Sampling rate / FFT size = 1 / Integration time
Therefore, if a higher sampling rate and bandwidth are used, a higher FFT size will be required to
produce the same frequency resolution.
Note:
In the analog analyzer, the internal sampling rate is determined by the selected bandwidth.
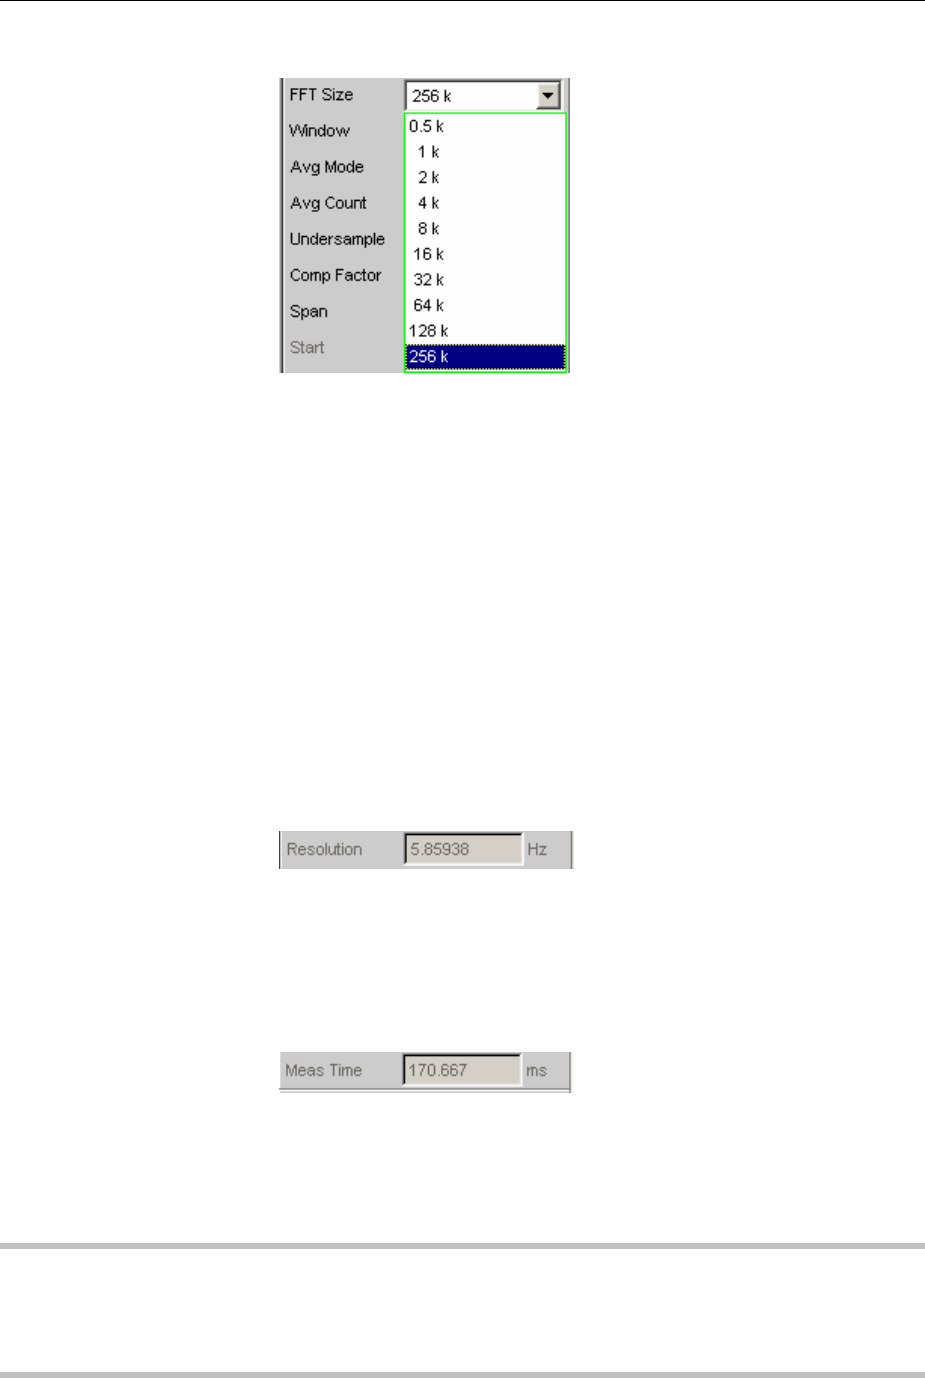
R&S UPV FFT Analysis
1146.2084.32 4.317 E-9
FFT Size (Function FFT)
Size of the Function FFT, can be set in powers of 2 from 512 (0.5 k) to
256 k.
The measurement time also doubles with each increase in FFT size.
Unnecessarily high FFT sizes should be avoided in order to reduce
measurement times.
Remote-control command:
SENSe[1]:FUNCtion:FFT:Size <parameter>
List of <parameter>:
S512, S1K, S2K, S4K, S8K, S16K, S32K, S64K, S128K,
S256K
For the Post FFT,no fixed FFT size but only a (variable) lower limit ("Min FFT Size") can be entered.
The measurement function carried out in each case can dynamically increase the FFT size as a
function of the measurement signal frequency.
Other variables which appear as display fields in the group of FFT parameter fields are derived from the
FFT size:
Resolution
Displays the frequency resolution.
The frequency resolution is the quotient of sampling rate and FFT
size.
Remote-control command: (query only)
SENSe[1]:FUNCtion:FFT: RESolution?
Meas Time
Displays the integration time.
The integration time is the quotient of FFT size and sampling rate.
Remote-control command: (query only)
SENSe[1]:FUNCtion:FFT:MTIMe?
Note:
Not only the integration time but also the time required to calculate the transformation and graphical
display increase with increasing FFT size. This results in an overproportional increase in the total
measurement time. Unnecessarily high FFT sizes should therefore be avoided in order to reduce the
measurement time.
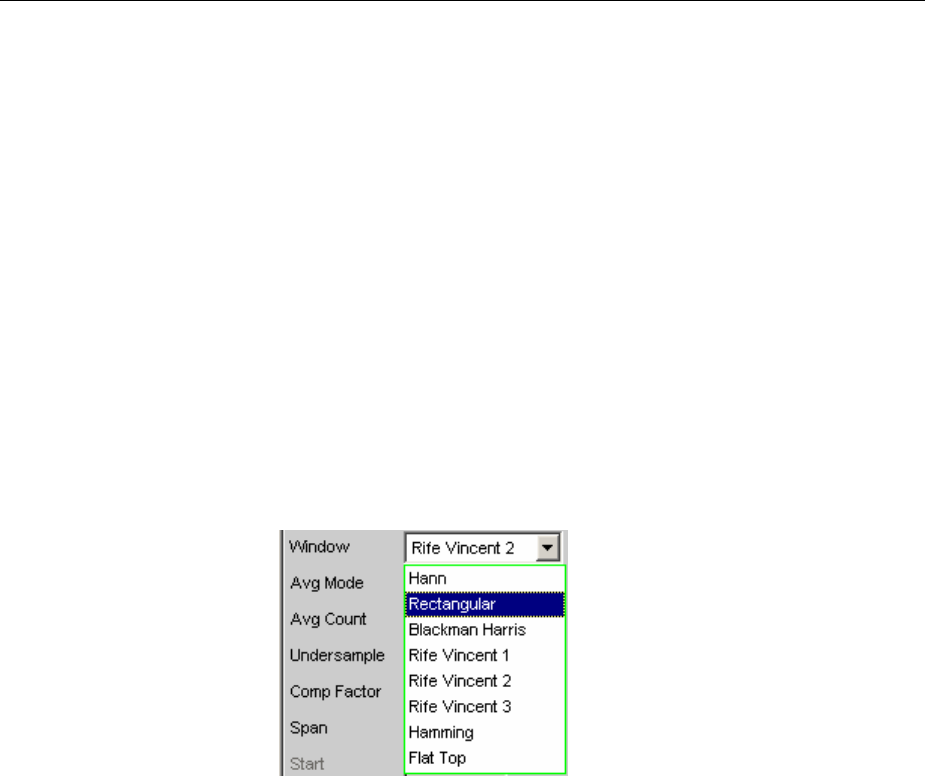
FFT Analysis R&S UPV
1146.2084.32 4.318 E-9
Window Function
According to system theory, the FFT analysis requires a periodic signal which continues continuously
beyond the observed time period. Normally, however, there is no continuous continuation (even with
periodic signals). The FFT would interpret any discontinuity at the boundaries of the signal section as a
pulse whose (white) spectrum would be superimposed on the useful signal spectrum.
In order to prevent this "leakage" effect, the input signal is weighted using a window which attenuates
both ends of the observed signal section with respect to zero. As a result, the signal is continuous for
the FFT; there is, however, a reduction in selectivity, indicated by a relatively wide bell-shaped curve.
By selecting the window function, the user makes a compromise between selectivity (frequency
selectivity, width of bell-shaped curve at top), crosstalk between adjacent lines (width of bell-shaped
curve at bottom), slope of the bell-shaped curve and "leakage" suppression in the far-off range.
Selecting the rectangular window deactivates windowing.
Window
Used to select the window function.
With the Post FFT of the distortion and level measurements, the
window cannot be selected by the user but instead is preset by the
respective measurement function and displayed here.
Only the "Hann" and "Rife Vincent" windows can be selected for the
Monitor FFT.
Hann This window combines selectivity with good leakage
suppression in the "far-off range " but has a
relatively wide bell-shaped curve around the signal
lines.
Recommended application: Standard window.
Remote-control command:
SENSe[1]:FUNCtion:FFT:WINDow HANNing

R&S UPV FFT Analysis
1146.2084.32 4.319 E-9
Rectangular Window function deactivated (by using a rectangular
window with a constant weighting of 1).
If the signal fits in the section for the FFT exactly
with an integer multiple of periods, there is no
discontinuity at the section boundaries. A window is
then not required and the maximum frequency
resolution is possible. This feature may be of
advantage when using a special generator signal
("FFT noise") as it allows fast measurement of
frequency responses at specific frequencies. (see
Noise, Fast Frequency Response Measurement)
Recommended application: Only suitable for special
signals.
Remote-control command:
SENSe[1]:FUNCtion:FFT:WINDow
RECTangular
Blackman
Harris
Only for Function FFT.
The slope of the bell-shaped curve up to approx.
80 dB is very steep; however, this window has
considerable "leakage" for values under 80 dB.
Remote-control command:
SENSe[1]:FUNCtion:FFT:WINDow
BLACkman_harris
Rife Vincent 1
Rife Vincent 2
Rife Vincent 3
The suppression of far-off interference is very good
for all 3 windows. The width of the bell-shaped
curve at the bottom of the individual lines drops and
the width at the top increases as the Rife Vincent
number increases. It is therefore possible to set
various compromises between frequency resolution
and the suppression of adjacent lines.
Recommended application: For precise frequency
determination.
Remote-control commands:
SENSe[1]:FUNCtion:FFT:WINDow RIF1
SENSe[1]:FUNCtion:FFT:WINDow RIF2
SENSe[1]:FUNCtion:FFT:WINDow RIF3
Hamming This window does not provide any significant
advantages; it was implemented simply to complete
the range.
Remote-control command:
SENSe[1]:FUNCtion:FFT:WINDow HAMMing
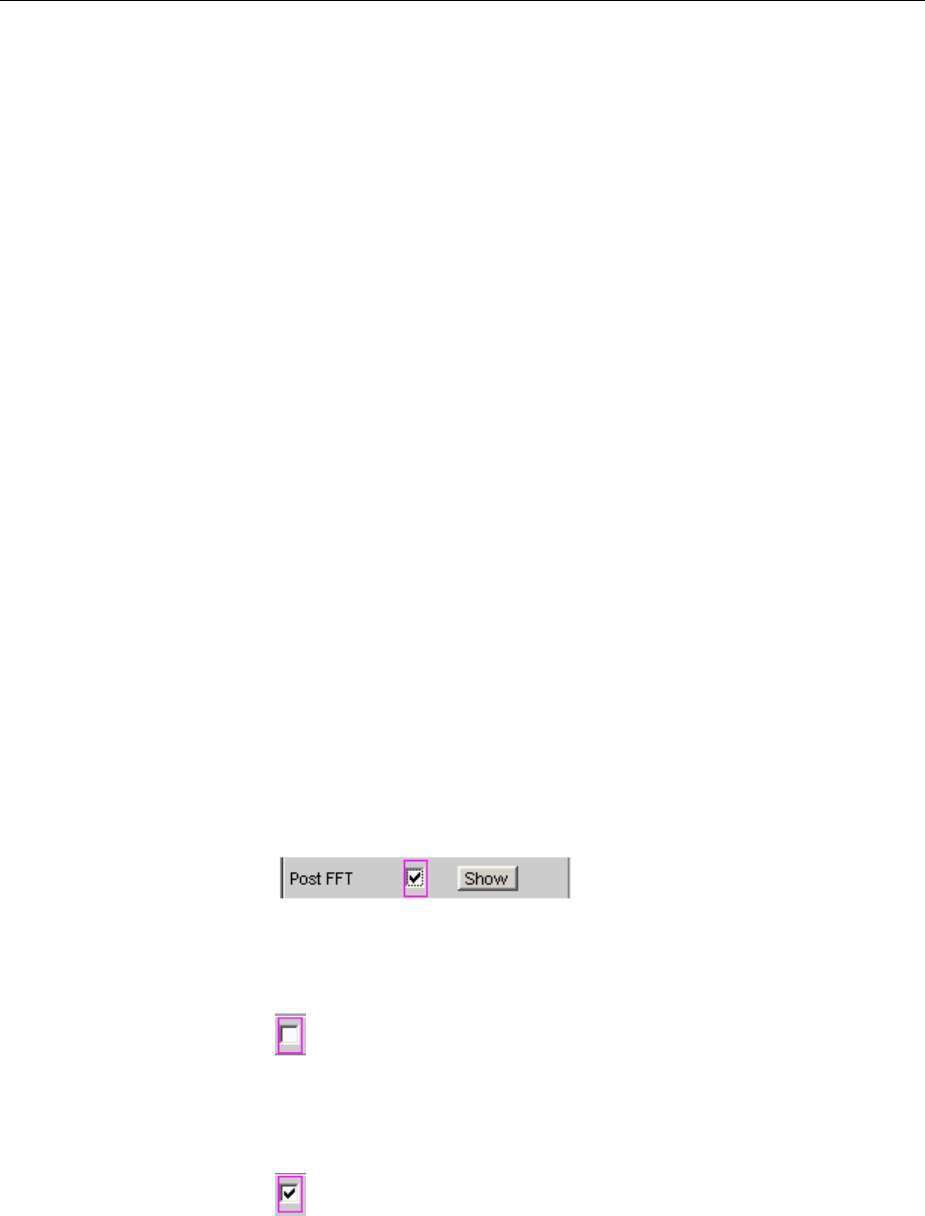
FFT Analysis R&S UPV
1146.2084.32 4.320 E-9
Flat Top Only for Function FFT.
Here, the region around the carrier is deliberately
distorted to such an extent that at least two
adjacent lines (in the case of excitation with one
sinewave line only) always have roughly the same
magnitude.
This allows the amplitude to be read off very
precisely from the graph. In contrast, the frequency
selectivity is rather poor.
Recommended application: For precise level
determination.
Remote-control command:
SENSe[1]:FUNCtion:FFT:WINDow FLATtop
Post FFT
For distortion measurements, the Post FFT displays the frequency spectrum recorded for calculating
the measurement values. It can be activated for the measurement functions THD+N & SINAD, THD,
DFD, Mod Dist, DIM, and RMS measurements.
Measurement is performed in the same level as the associated measurement function, i.e. downstream
of all filters.
The respective measurement function adjusts the FFT size and window to its specific requirements. For
example, the required FFT size increases as the signal frequency decreases. The settings for the
Post FFT cannot therefore be selected by the user and can vary from measurement to measurement.
The Post FFT is calculated with double precision with up to 256 k points thus ensuring a very high
frequency resolution and dynamic response.
The Post FFT of a measurement channel is displayed in the graphical windows "FFT, Panel 1" or "FFT,
Panel 2" either as a magnitude or phase. Since 2 traces are displayed in each graphical window, the
magnitude and phase of both channels can be recorded simultaneously.
Post FFT
Used to activate the Post FFT. In addition the "FFT Graph1" window
can be opened from here.
Configuration of the FFT Graph is reserved for the "FFT Graph1
Config" and/or "FFT Graph2 Config" windows. The actual display
takes place in the "FFT Graph1" or "FFT Graph2" windows.
Post FFT deactivated.
Recommended for increasing the measurement
speed (e.g. for sweeps or remote-control mode).
Remote-control command:
SENSe[1]:FUNCtion:FFT:STATe OFF
Post FFT activated; all other settings are determined
dynamically by the associated measurement
function.
Remote-control command:
SENSe[1]:FUNCtion:FFT:STATe ON
In measurement functions for which users cannot select Post FFT, this line of the menu is grayed out:

R&S UPV FFT Analysis
1146.2084.32 4.321 E-9
FFT is not needed by any currently selected measurement and is therefore not computed in order to
save time. There is no live FFT in the FFT graph.
FFT is needed by at least one selected measurement (e.g. phase measurement, precision frequency
measurement) and cannot be deactivated. The internally used FFT can be displayed in the FFT graph.
FFT Measurement Function
The FFT can be selected as a separate measurement function (Function FFT). Unlike the other FFT
analyses, all FFT parameters can be determined by the user. The following additional functions are also
available:
•Delay compensation
•DC suppression (digital only)
•Filtering (3 user-definable filters and – in the two-channel analog analyzer – 1 analog notch)
•Averaging
Measurement is performed in the same level as the other measurement functions, i.e. downstream of
all filters.
The Function FFT is calculated with double precision with up to 256 k points thus ensuring a very high
frequency resolution and dynamic response.
The Function FFT of a measurement channel is displayed in the graphical windows "FFT, Panel 1" or
"FFT, Panel 2" either as a magnitude or phase. Since 2 traces are displayed in each graphical window,
the magnitude and phase of both channels can be recorded simultaneously.
The FFT can be generated continuously if the sampling rate is less than 100 kHz or the analog
bandwidth is 40 kHz. It is also necessary to ensure that no special functions (such as delay
compensation) are enabled and that no “supplementary” measurement (such as waveform monitoring
or frequency measurement) takes longer than the actual FFT. To ensure this, it is advisable to switch
off all other measurements.
(in generator and analyzer)
(analog only)
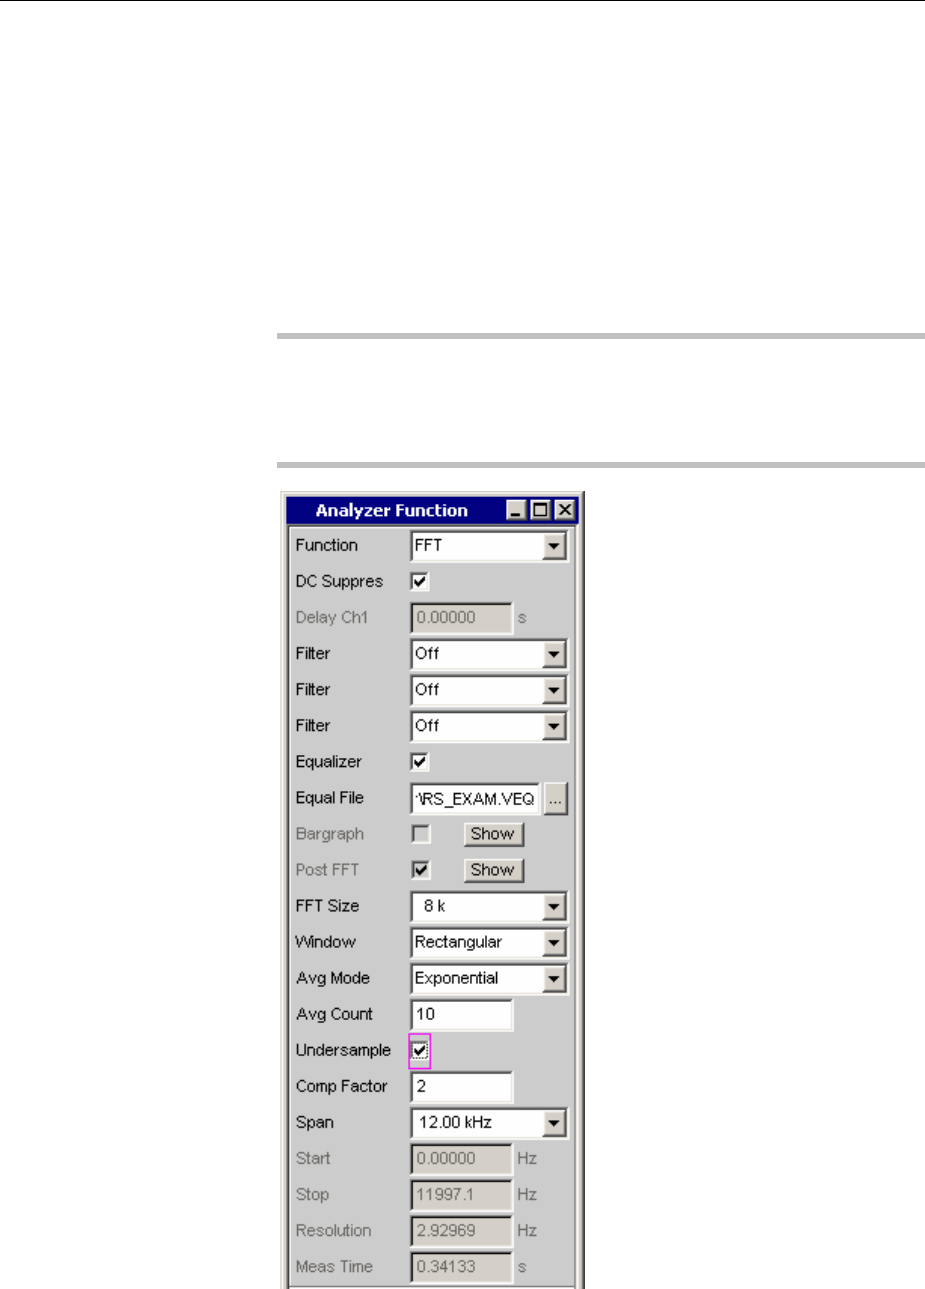
FFT Analysis R&S UPV
1146.2084.32 4.322 E-9
Function
Used to change the measurement function to FFT analysis.
The band-limited and, possibly, filtered RMS is displayed as the function
measurement result. The RMS is calculated by means of integration
over all magnitude frequency lines from "Start" to "Stop".
The frequency and phase value derived from the FFT is displayed as
the "Freq/Phase" measurement result if "Precision" is set as
"Meas Time" for the frequency measurement.
With AC coupling (analog) or "DC Suppress" (digital), the
DC component (bell-shaped curve) is not included in the measurement.
If the window function is selected, this curve has a width of five bins,
which means that the lower six bins are not included in the RMS result.
Note:
To include signals of very low frequency in the RMS measurement, the
size of the FFT must be selected sufficiently large (so that the signal
components to be included are above the 6th bin), or the square window
must be used (which ignores only the DC bin).
The panel segment shown here represents a digital FFT that is band-
limited to 12 kHz (which means it is undersampled with a compression
factor of 2).
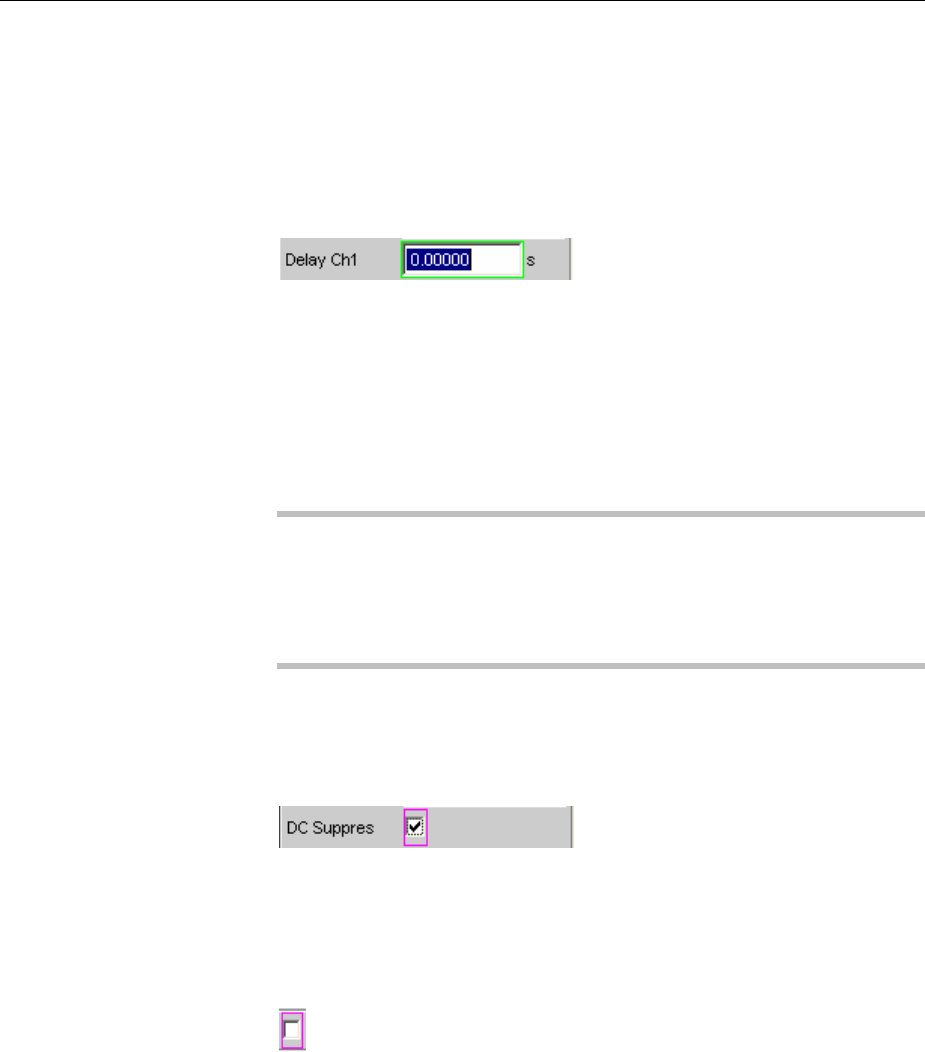
R&S UPV FFT Analysis
1146.2084.32 4.323 E-9
The “Start” value of this FFT is always 0.0 Hz, and the “Stop” value is
set to the resulting bandwidth. ”Resolution”and "Meas Time" are
determined by the selected “FFT Size” and the compression factor.
Remote-control command:
SENSe[1]:FUNCtion FFT
Delay Ch1
Used to activate the delay compensation.
This compensates delay differences of the DUT.
The time by which Channel 1 is to be delayed relative to Channel 2 is
entered. If the delay of Channel 2 is shorter than that of Channel 1, this
can be compensated by entering a negative time.
The compensation of delay differences is particularly useful for phase
measurements since a time offset of both measurement signals causes
afrequency-dependent phase displacement and can thus invalidate the
phase measurement result.
Note:
Delay compensation cannot be selected when the “Compressed” or
“Undersample” waveform mode is used, or when “Undersample” is
enabled.
Delay compensation must also be switched off (set to 0.0 s) for
continuous FFT generation.
Remote-control command:
SENSe[1]:CHANnel:DELay <nu>
DC Suppress
Used to activate DC suppression (in the digital analyzer only).
For DC suppression in the digital analyzer, the DC level is measured in
the Monitor level and subtracted from the input samples.
This parameter field is not available in the analog analyzer because the
suppression function is already provided by the AC coupling which can
be set up using the hardware.
DC suppression deactivated.
The DC component of the measurement signal is
not suppressed ("DC coupling") and is included in
the measurement result and the graphical display.
Recommended when using a high-pass or band-
pass filter because additional DC suppression is not
necessary in these cases and would increase the
calculation time (slightly).
Remote-control command:
SENSe[1]:FUNCtion:DCSuppression OFF
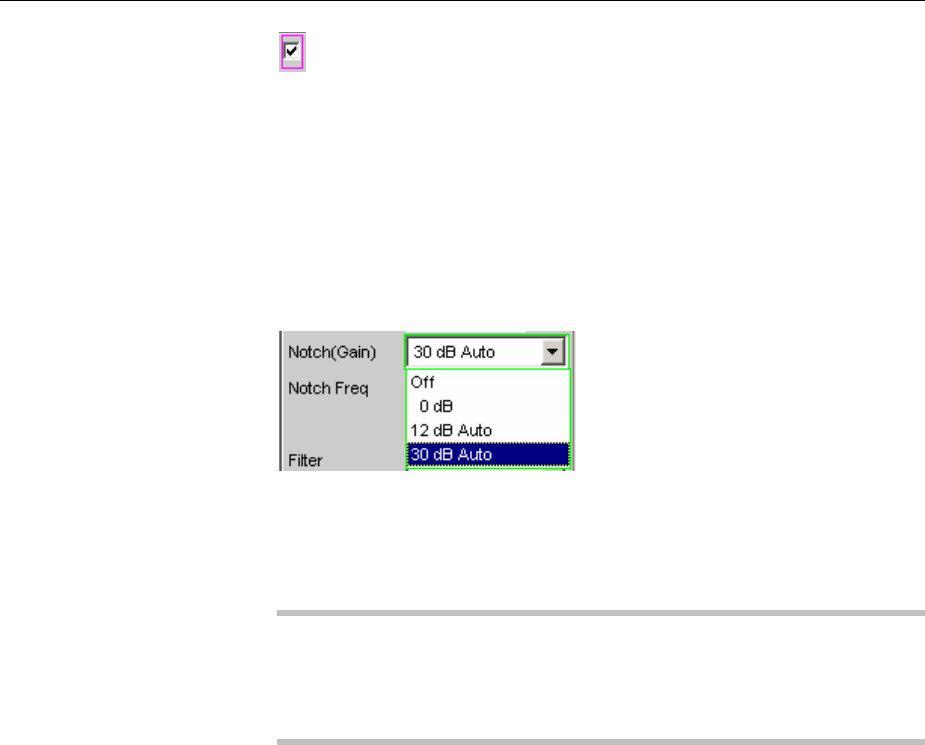
FFT Analysis R&S UPV
1146.2084.32 4.324 E-9
DC suppression activated.
The DC component of the measurement signal is
suppressed ("AC coupling"); the measurement
result and the graphical display only include the AC
component.
Remote-control command:
SENSe[1]:FUNCtion:DCSuppression ON
Notch(Gain)
Used to activate the analog notch filter and select the notch gain.
Only available in the two-channel analog analyzer.
In the two-channel analog analyzer, a second-order analog notch filter
can be activated for narrowband suppression of unwanted frequency
lines. When the notch filter is activated, the user can choose between 3
different gain factors.
Note:
If frequency components occur outside the analyzer frequency range,
the notch gain could cause overloading of the analyzer. In this case, the
notch gain is reduced step by step, which is indicated by "Auto" in the
list items 12 dB and 30 dB.
Off Analog notch filter deactivated.
Remote-control command:
SENSe[1]:NOTCh OFF
0dB Analog notch filter activated; no gain in effect.
Remote-control command:
SENSe[1]:NOTCh DB0
12 dB Auto Analog notch filter activated; gain 12 dB.
Remote-control command:
SENSe[1]:NOTCh DB12
30 dB Auto Analog notch filter activated; gain 30 dB.
Remote-control command:
SENSe[1]:NOTCh DB30
Notch Freq
Numeric or automatic selection of the notch-filter center frequency; only
appears in the two-channel analog analyzer if "Notch(Gain)" is activated.
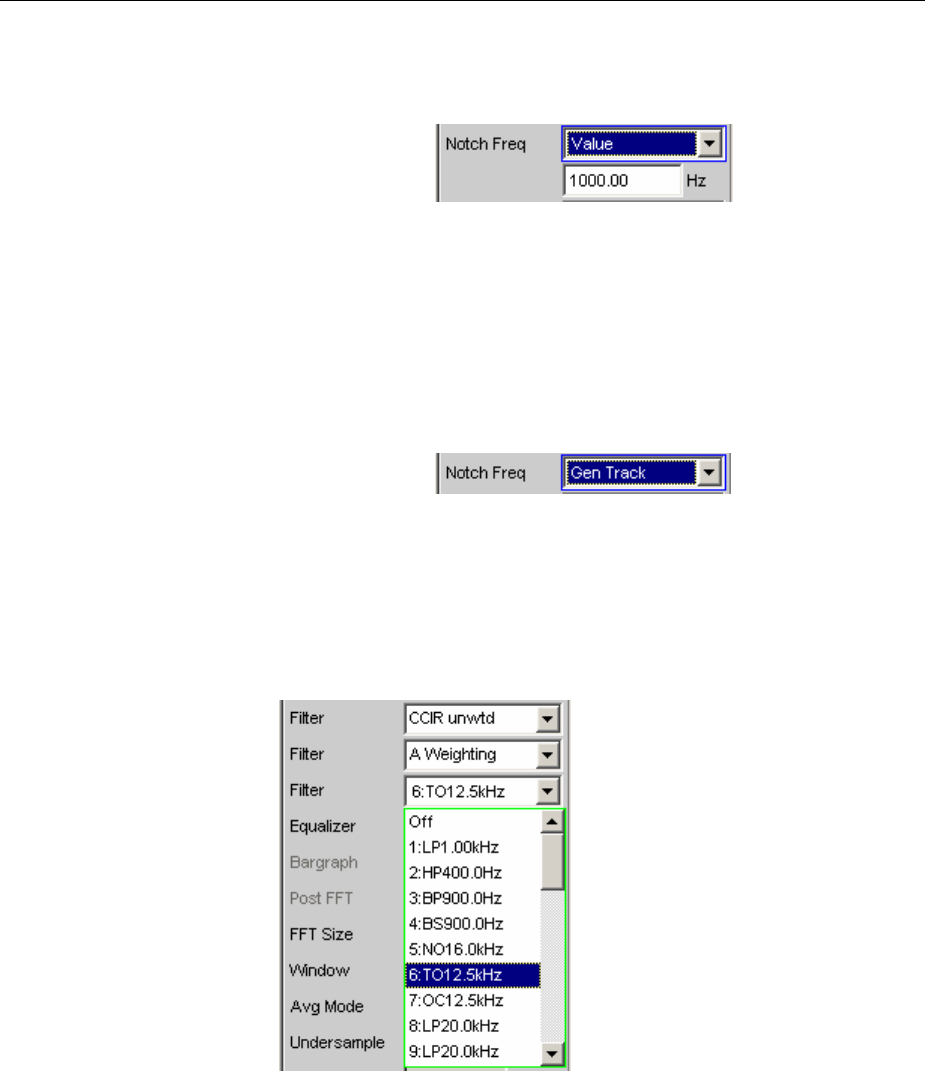
R&S UPV FFT Analysis
1146.2084.32 4.325 E-9
Value The user can enter the notch-filter center frequency
inthe next parameter field. If "Value" is selected,
the center frequency last active is displayed.
Remote-control command:
SENSe[1]:NOTCh:FREQuency:MODE FIXed
SENSe[1]:NOTCh:FREQuency <nu>
Gen Track The notch-filter center frequency is adopted from
the generator panel (if possible). If the generator
signals are unsuitable (e.g. noise), an error
message is output and the center frequency last
valid is retained.
Remote-control command:
SENSe[1]:NOTCh:FREQuency:MODE GENTrack
Filter
3separate filters can be looped into the measurement path. Apart from
those filters which can be user-defined in the filter panel, filters can also
be selected from a set of supplied weighting filters.
Selecting "OFF" deactivates the respective filter.
Remote-control command:
SENSe[1]:FILTer[1] <parameter>
SENSe[1]:FILTer2 <parameter>
SENSe[1]:FILTer3 <parameter>
List of <parameter> see section "Filter Table" on page 4.419.
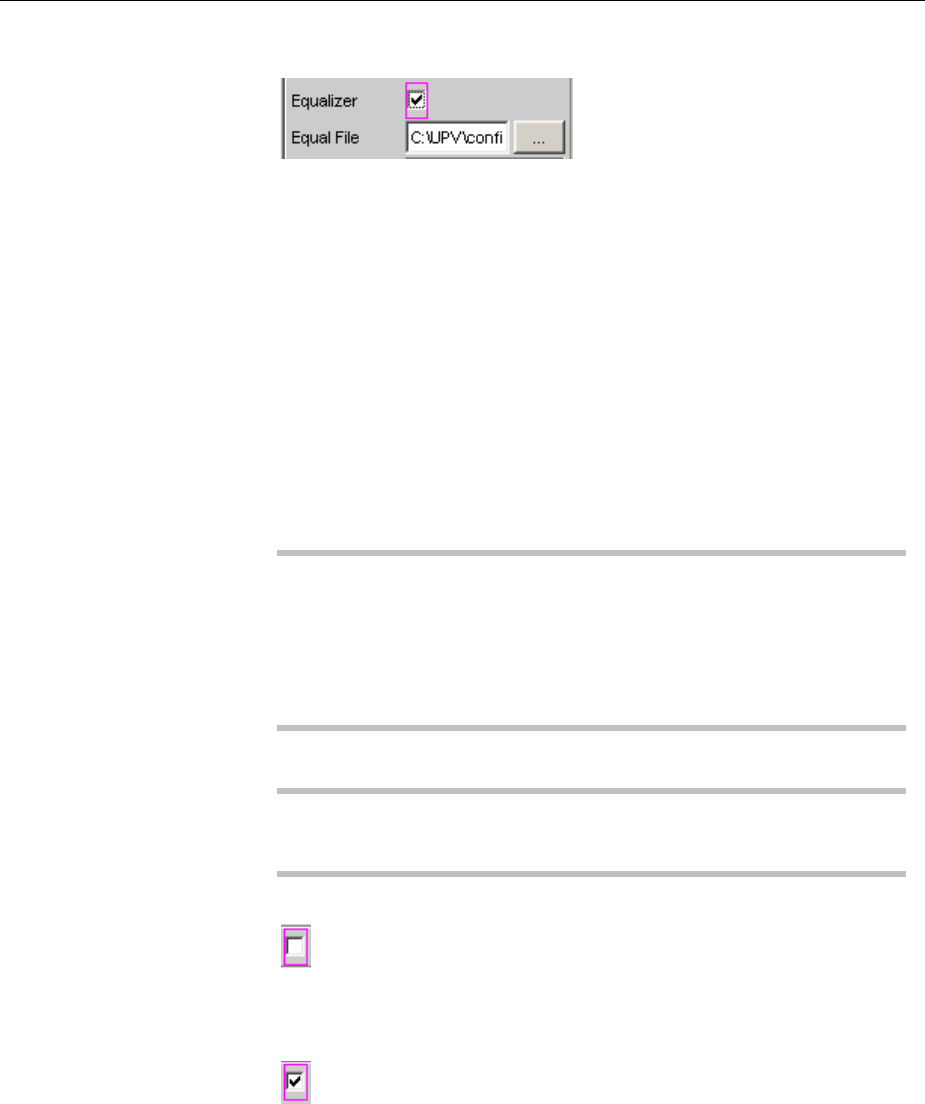
FFT Analysis R&S UPV
1146.2084.32 4.326 E-9
Equalizer
Used for activating/deactivating a precorrector table for the FFT bins.
In this way the frequency response of a transmission link can be
precorrected, for example, and in so doing the measurement point is
transformed into another reference point.
When precorrection is enabled the computed FFT bins are multiplied
by a frequency-dependent factor after which they are used to calculate
the total RMS value and applied to the display.
The factor is determined by interpolation between the two adjacent
frequency reference points in the precorrector table.
Precorrection of the FFT spectrum is an attractive alternative to
filtering the input signal, since the precorrector file can simply be
generated from the frequency response requiring precorrection and
need not be in the form of a coefficient file or pole/zero file.
Application:
In the case of acoustic measurements (e.g. involving mobile
telephones) on artificial ears of type 3.2 or higher, it is possible to
compensate for the transfer function ERP (ear reference point) to DRP
(drum reference point). Measurement of the sound waves by the
microphone applied to the "eardrum" can thus be referred to the
required measurement point (at the auricle).
Note:
The precorrector table is created after acquiring or reading in the trace
data from the DUT in the "DispConfig" panels.
The precorrector is disabled. The FFT bins are
used and displayed without change.
Remote-control command:
SENSe[1]:VOLTage:EQUalize OFF
The precorrector is enabled. The next entry field,
which is "Equal File", for the file name of the
precorrector table, is activated and the file shown
there is loaded.
Remote-control commands:
SENSe[1]:VOLTage:EQUalize ON
MMEMory:LOAD:IEQualize ’filename’
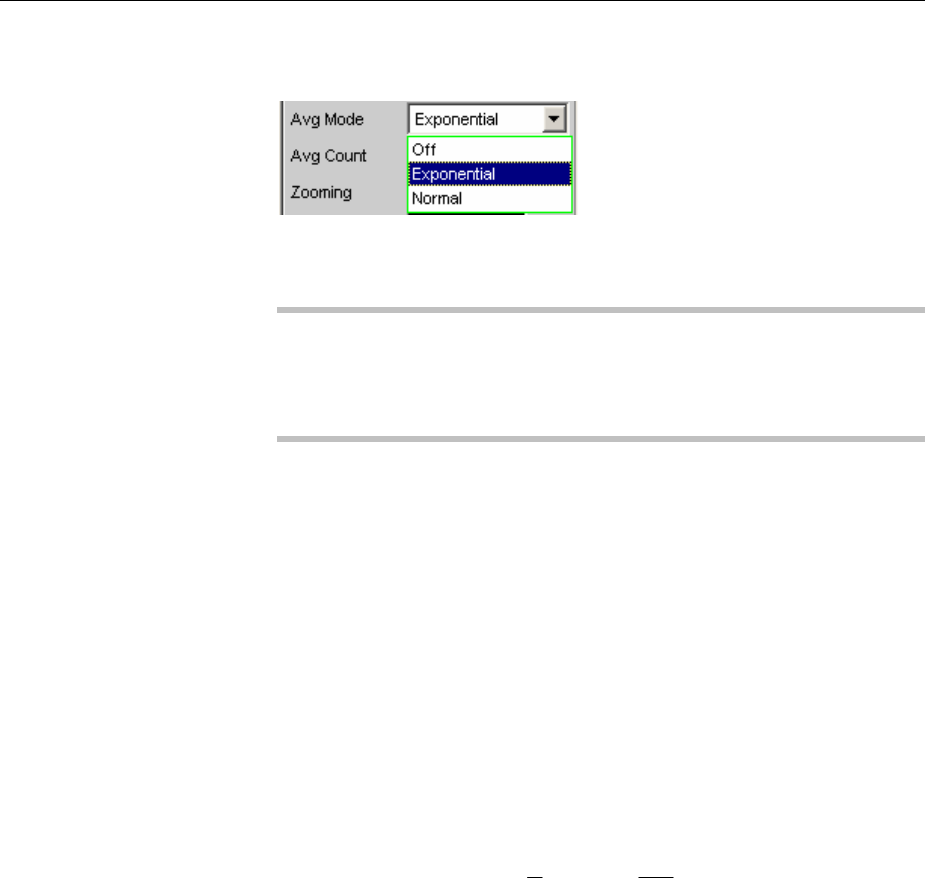
R&S UPV FFT Analysis
1146.2084.32 4.327 E-9
Avg Mode
Used to activate the averaging function and select the averaging
method.
When averaging is activated, an additional parameter field appears in
which the average count can be specified.
Note:
The level is not averaged, but rather the energy of the individual bins.
This is necessary so that the displayed RMS value, which is computed
by integration over all bins (of the averaged FFT), can be correctly
determined.
OFF No averaging; each FFT analysis result is displayed
immediately and is independent of previous
analyses.
Remote-control command:
SENSe[1]:FUNCtion:FFT:AVERage:MODE OFF
Exponential Averaging is performed continuously and displayed.
When the current result is calculated, the previous
measurements are taken into consideration using a
constant factor. The weighting of the current
measurement (n) and of the previous
measurements (n-1) is determined by the
selectable average count (k); the displayed result of
the nth measurement (n =2) is derived using the
following formula:
AVG n
k
FFT n k
k
AVG n()() ()=+
11
1
Remote-control command:
SENSe[1]:FUNCtion:FFT:AVERage:MODE
EXPonential
Normal The specified number of FFT cycles is performed,
the partial results added together and then divided
by this number. The result does not appear until all
"k" cycles have been completed.
Remote-control command:
SENSe[1]:FUNCtion:FFT:AVERage:MODE
NORMal

FFT Analysis R&S UPV
1146.2084.32 4.328 E-9
Avg Count
Used to enter the average count; only if averaging is activated.
With "normal averaging", the number entered here determines how
many consecutive FFTs are used for averaging.
With "exponential averaging", the number "k" entered here determines
the extent to which the previous measurements are taken into
consideration in the result. The weighting of the previous measurements
is (k-1)/k.
If, for example, 20 is entered as the average count (k), the current
analysis result is weighted with 5 % and the previous measurements
with 95 %.
Remote-control command:
SENSe[1]:FUNCtion:FFT:AVERage <n>
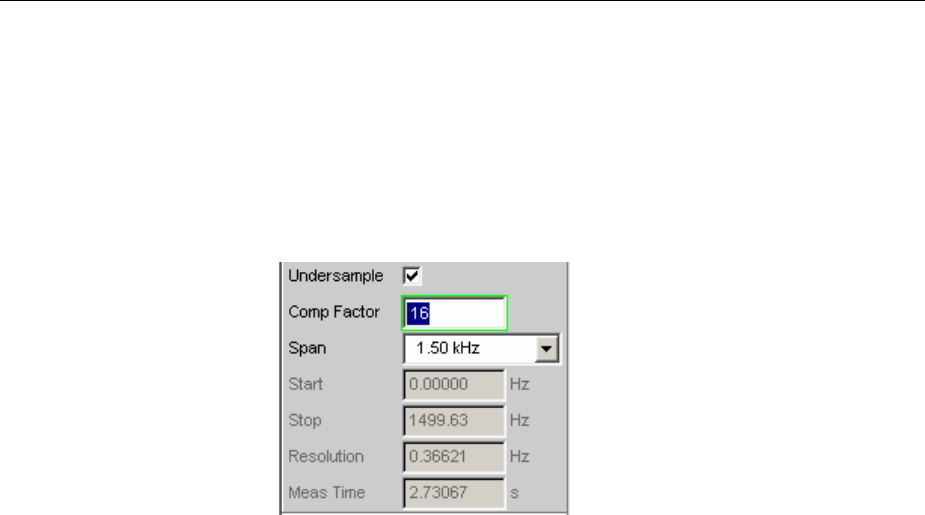
R&S UPV FFT Analysis
1146.2084.32 4.329 E-9
Undersample
Enables undersampling for the FFT.
This function is only available if the R&S UPV-K6 option (Extended
Analysis Functions) is installed.
It is used to increase the frequency resolution for low frequencies so that
measurements can be made on extremely low-frequency signals (deep
into the infrasonic range) and they can be visualized (along with their
harmonics).
In contrast to graphic zooming of a wideband FFT (Undersample OFF),
an undersampled FFT analyzes a selectable frequency segment with
the full FFT size. The compression factor can be adjusted by powers of
2. The frequency resolution is doubled with each change in the
compression factor (with a constant FFT size). However, the
measurement time also doubles in parallel. In the interest of short
measurement times, unnecessarily high compression factors (and
unnecessarily large FFT sizes) should be avoided.
There are two ways to achieve a particular frequency resolution:
•Wideband FFT with large FFT size
•Undersampled FFT over a limited frequency band (“Span”) with a
small FFT size
The time required to acquire the measurement data is the same in both
cases. The total time is slightly less with an undersampled FFT, since
the smaller number of points means that it takes less time to perform the
FFT computation and generate the graphic display. A smaller number of
points is also advantageous for external processing of the bins. If the
desired frequency resolution is higher than what can be achieved with
the maximum FFT size, an undersampled FFT is the only way this
requirement can be met.
Afrequency resolution of 178 ZHz (with an FFT bandwidth of 23 Hz) can
be achieved with the two-channel analog analyzer by using the
maximum FFT size and compression value. However, the sampling time
is around 1.5 hours (5592 seconds) in this case. The same values apply
for the digital analyzer with a 48 kHz sampling rate.
Undersampling disabled; a wideband FFT analysis is performed.
Remote-control command:
SENSe:FUNCtion:FFT:USAMple OFF
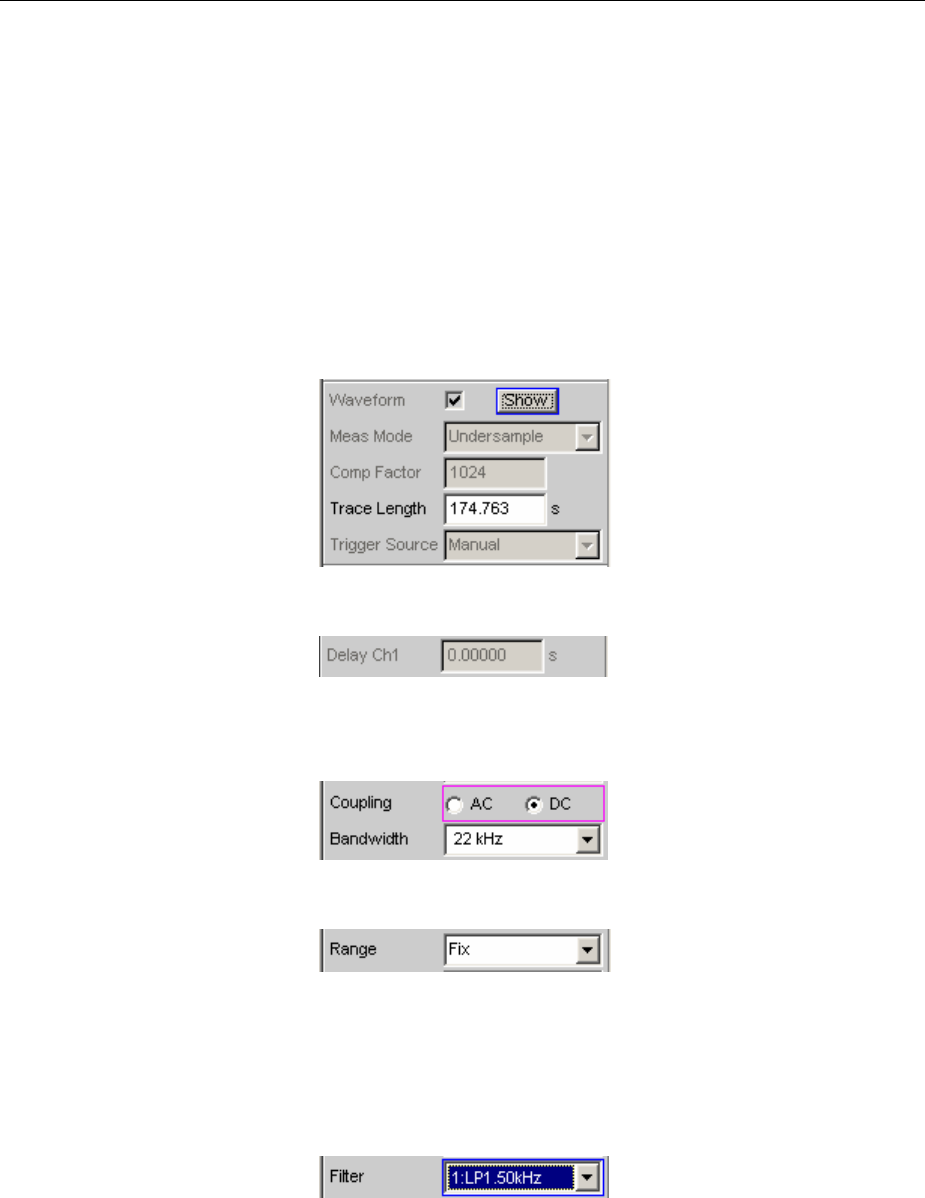
FFT Analysis R&S UPV
1146.2084.32 4.330 E-9
Undersampling enabled; the FFT analysis is performed using a reduced
bandwidth but higher frequency resolution.
The setting times shown above are displayed.
Cannot be selected if the bandwidth of the (analog) analyzer is set to
250 kHz.
If “Undersample FFT” is enabled, some instrument settings are
configured to fixed default values that cannot be changed by the user:
•“Waveform Monitor” is enabled and configured with fixed settings.
The FFT compression factor is copied to the Waveform
Compression factor. Although “Trace Length” can be entered by the
user, its minimum value is limited to the FFT measurement time.
•FFT delay compensation is disabled.
The following recommendations also apply:
•The analog analyzer should be set to DC coupling and the
narrowest bandwidth
•Autoranging in the analog analyzer should be disabled (for both
channels)
•If signal components outside the selected FFT bandwidth (see
“Span”) can be expected to be present, they must be blocked by
using a digital low-pass filter in order to avoid corrupting the
measurement.
This filter can be enabled as a function filter or a prefilter. Its cutoff
frequency should be less than or equal to the selected FFT
bandwidth.
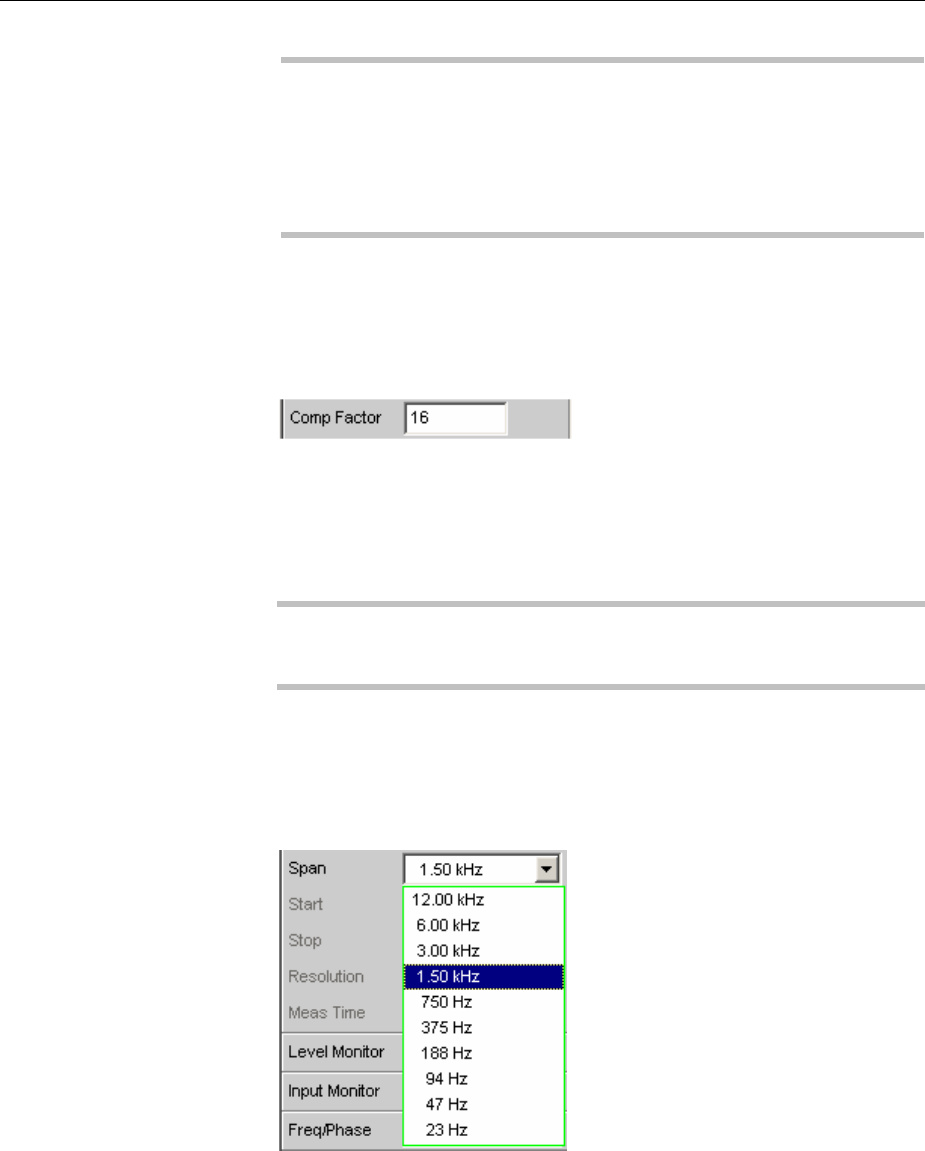
R&S UPV FFT Analysis
1146.2084.32 4.331 E-9
Note:
Continuous processing of the measured data over a relatively long time
is only guaranteed for sampling rates up to 96 kHz or analog
bandwidths up to 40 kHz. If the sampling rate is too high or the
bandwidth is too large, the measurement will be terminated with a
suitable error message. If this happens, it may be necessary to reduce
the number of analyzer filters that are being used.
Remote-control command:
SENSe:FUNCtion:FFT:USAMple ON
Comp Factor
Numeric entry of the compression factor; only possible if “Undersample
FFT” is enabled.
The compression factor entered is adjusted to the closest integer power
of 2 (2, 4, 8, …, 1024).
The number specified here determines the reduction factor for the total
band (sampling frequency / 2). The resulting frequency band
corresponds to the “Span” value.
Note:
If a multichannel analyzer is used, max. 1.44 million samples can be
observed. Compression is therefore possible only up to the factor 4.
Remote-control command:
SENSe:FUNCtion:FFT:CMPFactor <n>
<n> = 2 .. 1024
Span
FFT bandwidth selection; only active if “Undersample FFT” is enabled.
The displayed parameter list is generated dynamically as a function of
the current sampling rate (or bandwidth). The selected value is directly
related to the compression factor; reducing the span by a factor of two
thus corresponds to doubling the compression factor.
FFT Analysis R&S UPV
1146.2084.32 4.332 E-9
Note:
If a multichannel analyzer is used, max. 1.44 million samples can be
observed. Therefore, only two compression levels are available here;
with 40 kHz analog bandwidth, for example, 24 kHz and 12 kHz.
In the case of an undersampled FFT, the selected “Span” value
determines the frequency band that is analyzed by the FFT. The start
and end values of the frequency band are shown under “Start” (always
0.0 Hz) and “Stop”.
The frequency range that is actually shown (“Stop” value) is one bin
smaller than the selected “Span” value.
Remote-control command:
SENSe:FUNCtion:FFT:SPAN R<n>
<n> = 2, 4, 8, 16, 32, 64, 128, 256, 512, 1024 -
Start
Start value of the FFT frequency band (display only)
Remote-control command (query only):
SENSe[1]:FUNCtion:FFT:STARt?
Stop
End value of the FFT frequency band (display only)
In the case of a wideband FFT in the digital analyzer, this is 23 or 48
times the sampling frequency; in the case of an undersampled FFT, the
value here is the “Span” value less one bin.
Remote-control command (query only):
SENSe[1]:FUNCtion:FFT:STOP?
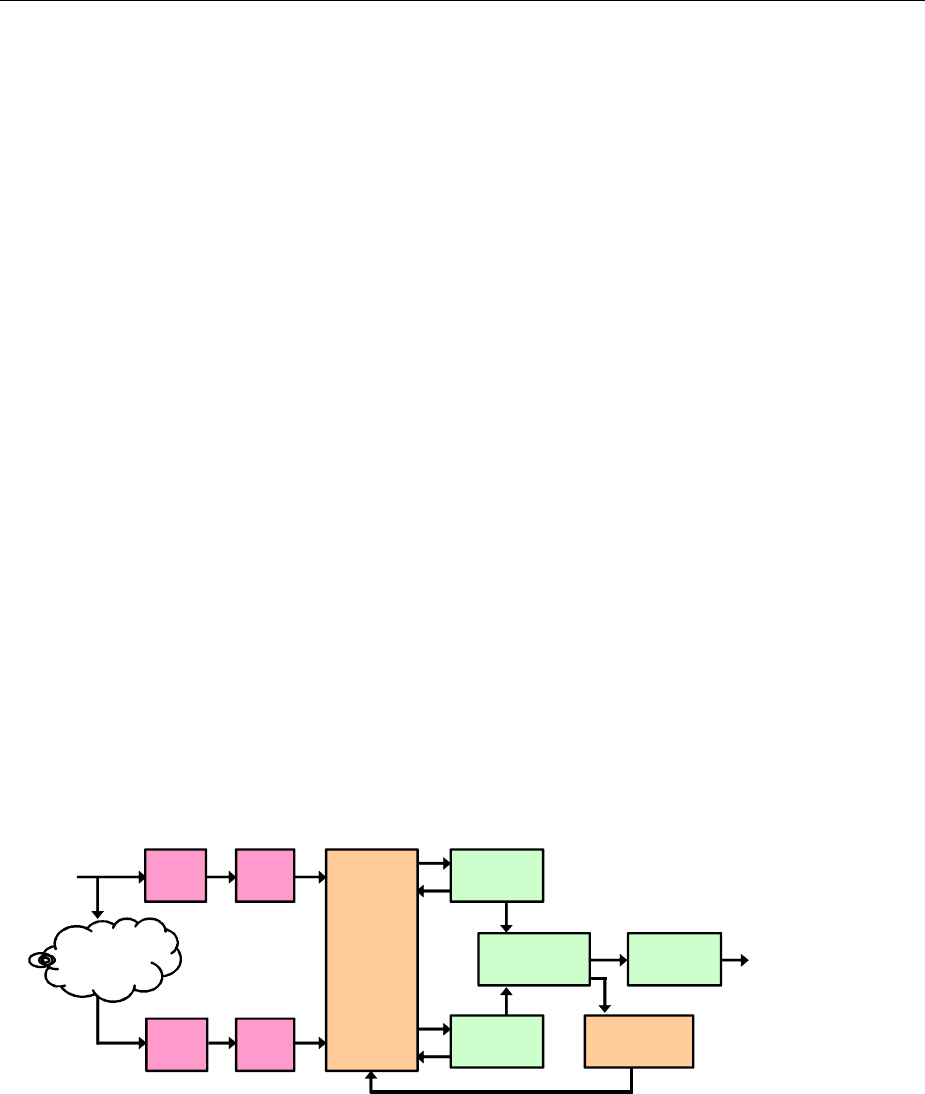
R&S UPV Speech Quality Measurements (PESQ)
1146.2084.32 4.333 E-9
Speech Quality Measurements (PESQ)
This measurement function is only available if the R&S UPV-K61 option is installed, and it is provided
as single-channel measurement for the Analog Analyzer only.
The “Perceptual Evaluation of Speech Quality” (PESQ) measurement method, which was published by
the International Telecommunications Union in 2001 as Recommendation ITU-T P.862,enables
measurements to be made on the quality of speech signals that are transmitted at low bit rates using
highly compressive psychoacoustic coding methods. PESQ employs an algorithm that enables these
signals to be evaluated by comparing them with reference signals. The R&S UPV provides this
measuring method, which is licensed by OPTICOM Dipl.-Ing. M. Keyhl GmbH,Erlangen, Germany.
PESQ®is a registered trademark of said company and of Psytechnics Ltd., UK.
Acommon feature of all psychoacoustic coding methods is that they utilize the properties of the human
hearing to modify the transmitted signal so that the portions of the signal that would in any case not be
perceived are removed from the signal. Compression can be made even simpler with speech signals,
since they occupy considerably less bandwidth than other types of signals such as music. When
speech compression is used, it is necessary to be able to determine objectively, with the aid of
psychoacoustic measuring methods, whether such speech transmission paths produce unacceptable
changes to the signal.
PESQ was developed using a large number of recordings containing sentences spoken by a variety of
speakers in a variety of languages. The recordings were made using several different speech encoders
having different levels of quality and with typical network transmission disturbances. In a series of
listening tests, a adequate number of test listeners classified these examples on the well-known speech
quality scale ranging from 1 (bad)to 5 (excellent).
The goal in the development of PESQ was to develop a method for determining an objective
measurement value MOS (mean opinion score) that correlates very well with the listening test results,
based on comparing the original, undegraded speech signal (the reference signal) with the degraded
signal (the measured signal). This means that in order to perform a PESQ measurement, the reference
signal must be connected to the input of the system under test and the measurement signal must be
taken from the output of the system under test.
prediction
of
perceived
speech
quality
cognitive
modelling
identify bad
intervals
auditory
transform
disturbance
processing
auditory
transform
realign bad intervals
time align
and
equalize
input
filter
level
align
input
filter
level
align
system
under test
reference
signal
degraded
signal
Remote-control command:
SENSe[1]:FUNCtion PESQ
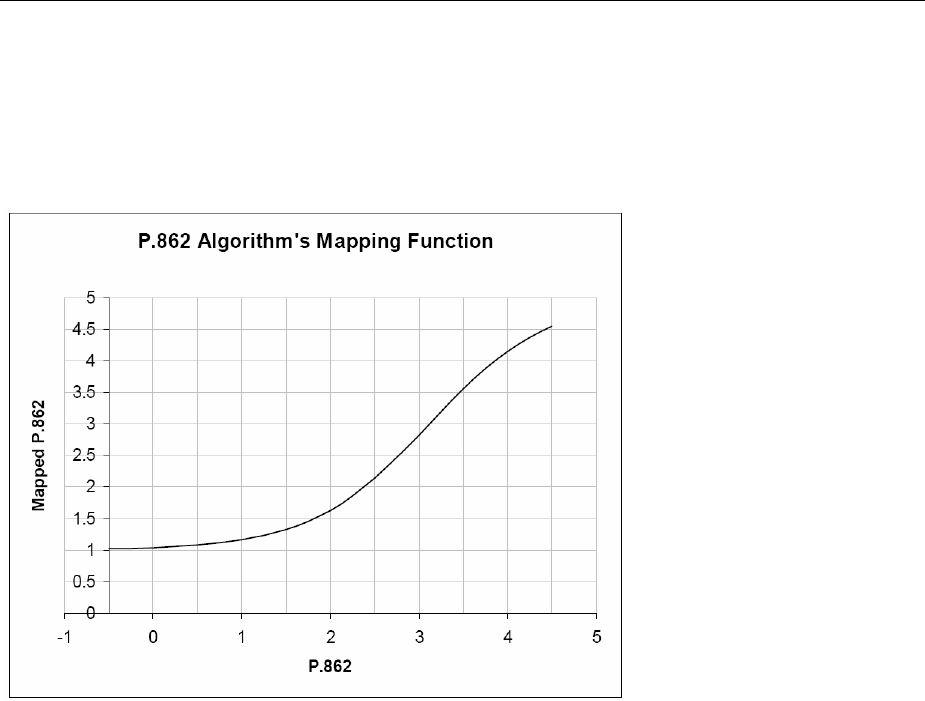
Speech Quality Measurements (PESQ) R&S UPV
1146.2084.32 4.334 E-9
PESQ Value and MOS Value
With recommendation P.862 the ITU has standardized a method for calculating objective measurement
values to match the subjective MOS values of the listening test results. The calculation of the objective
MOS value is based on the PESQ value and is performed by using a mapping function such as the
example shown below.
The Mos values according to P.862.1 are plotted on the Y axis, and the associated PESQ values
according to P.862.1 are shown on the X axis.
The R&S UPV implements the three most important measuring methods, which differ only slightly from
each other and have been approved by the ITU:
•ITU-T P.862:
The measured value is the PESQ Score. The range of values extends from –0.5 (worst) to +4.5
(best).
•ITU-T P.862.1:
The measured value is the MOS-LQON (Listening Quality Objective Narrowband). The range of
values extends from –0.5 (worst) to +4.5 (best).
•ITU-T P.862.2:
This is the wideband extension of P.862. The measured value is the MOS-LQOW (Listening Quality
Objective Wideband). The range of values extends from –0.5 (worst) to +4.5 (best). Note that
measurements obtained using this option cannot be compared with results obtained in accordance
with P.862 or P.862.1!
The measurement values can be displayed for the total signal or made with reference to the speech
component or the silence component of the signal. The latter is particularly interesting because it shows
how well a codec substitutes background noise.
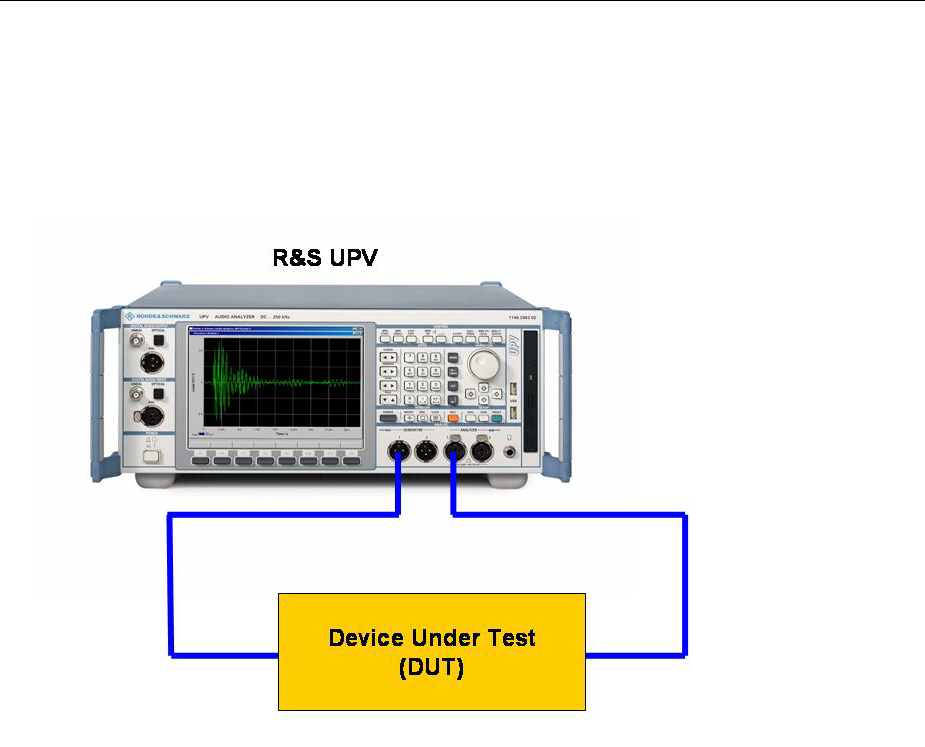
R&S UPV Speech Quality Measurements (PESQ)
1146.2084.32 4.335 E-9
Electrical PESQ Measurements
Producers of new psychoacoustic coding methods wish to optimize their algorithms for speech
transmission, and network operators need suitable test tools that supplement the already commonly
used signal and distortion measurements. This type of measurement is typically performed electrically,
directly at the input and output ports of the R&S UPV.
The figure shows how the reference signal is routed directly from the generator output to the device
under test, and the output of the device under test is fed back to the analyzer as the measurement
signal. At the same time, the original reference signal is routed internally to the analyzer so it can
access both signals for the evaluation.
Acoustic PESQ Measurements
Manufacturers of mobile telephones increasingly wish use speech quality as a way to make their
products stand out from the competition. Speech quality is essentially influenced by the coding method
used in the mobile telephone. In this case, PESQ measurements are made under realistic conditions by
using an acoustic link to the mobile telephone. The measurement setup consists of a combination of the
R&S CMU radio communication tester and the R&S UPV audio analyzer.
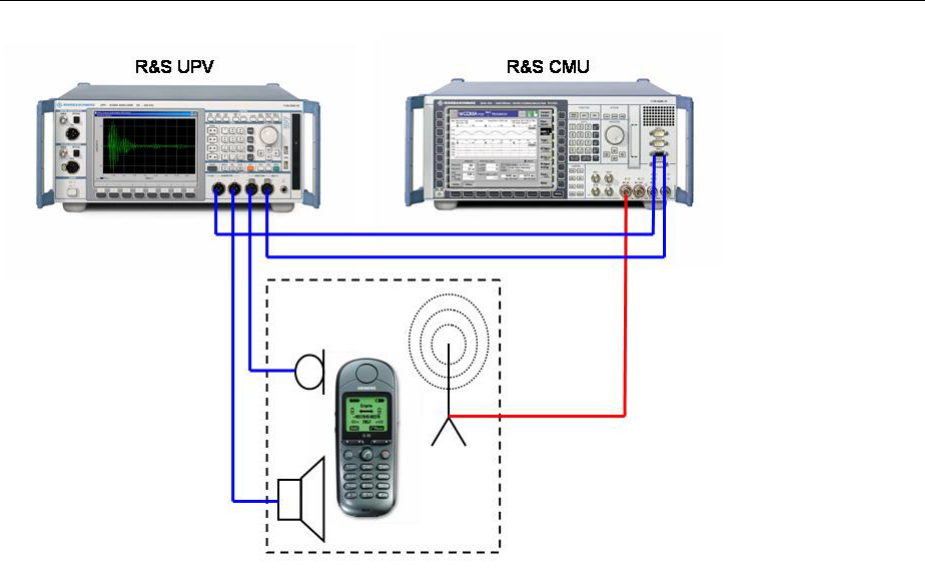
Speech Quality Measurements (PESQ) R&S UPV
1146.2084.32 4.336 E-9
The reference signal is sent to the mobile telephone via an acoustic transducer (artificial mouth) . It is
coded in the mobile telephone and then sent to the R&S CMU via a radio link. It is decoded in the CMU
and sent to the input of the analyzer as the measurement signal. As with electrical measurement, the
original reference signal is also routed internally to the analyzer so that it can access both signals for
the evaluation. In the opposite direction, the reference signal is sent to the R&S CMU, where it is coded
and transmitted to the mobile telephone via the radio link. Another acoustic transducer (artificial ear)
converts the speech signal emerging from the speaker of the mobile telephone into the measurement
signal.
Good acoustic coupling between mobile phone and artificial ear is needed for measurements in
receiving direction of the phone. Any background noise should be as low as possible. Thus acoustic
measurements should be conducted in a sound isolated chamber.
PESQ measurements should not be used for handsfree measurements or to assess the influence of
background noise.
The advantages of the R&S UPV can be fully exploited with acoustic measurements. Due to the
outstanding characteristics of the analog hardware, no PESQ-relevant quality impairments arise in the
measured signal even when there are large differences in signal level between the output and input
signals. In addition, a simple application running in the R&S UPV can utilize the dual-channel capability
of the R&S UPV to make measurements in both directions (transmit and receive) without any changes
to the test setup. The results can then be displayed in a single graph.
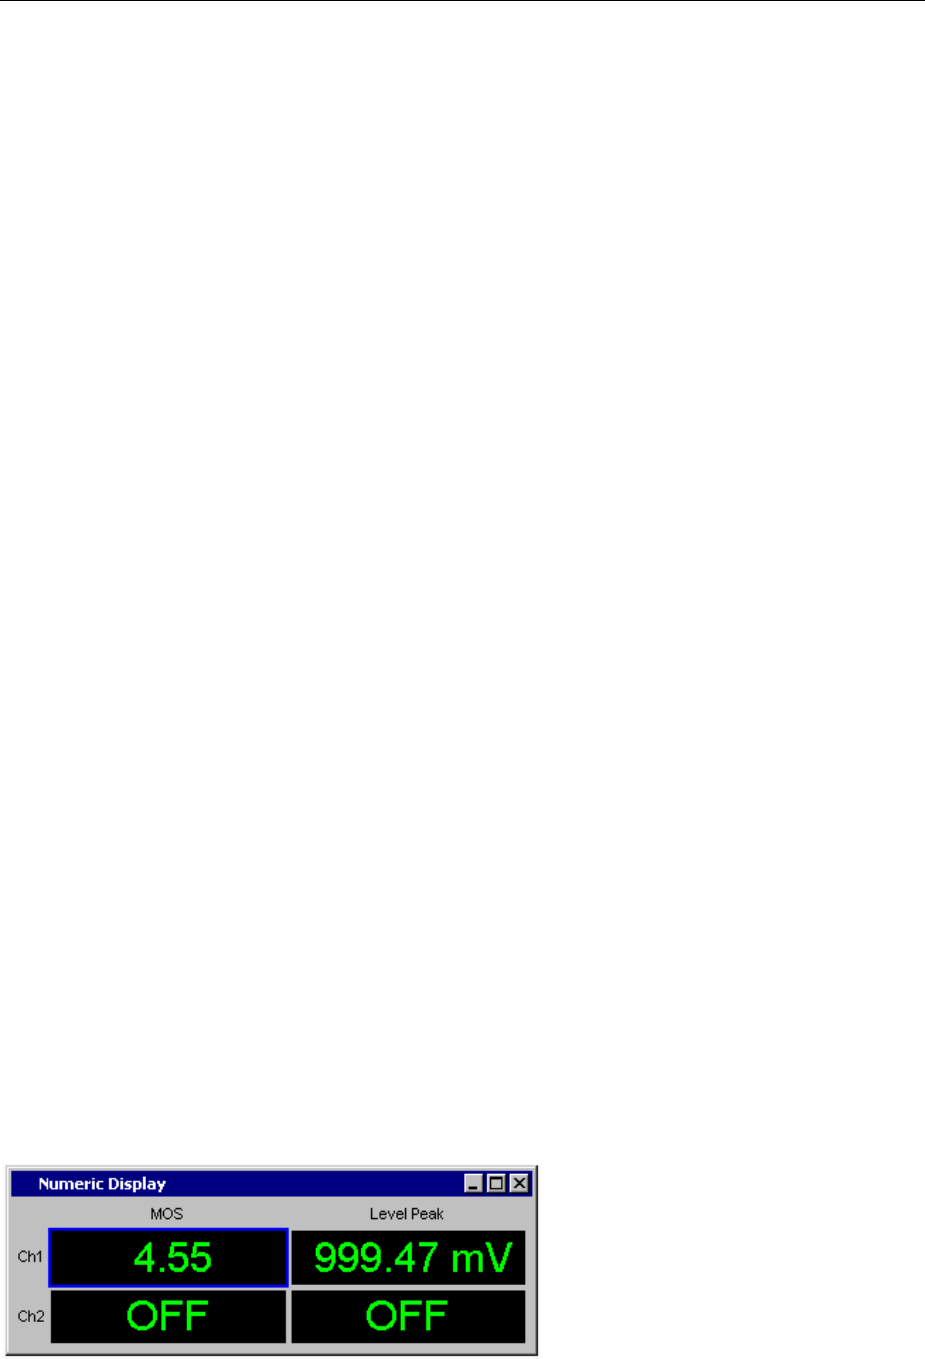
R&S UPV Speech Quality Measurements (PESQ)
1146.2084.32 4.337 E-9
PESQ Graphs
For PESQ measurements, the Waveform Monitor is used to check the signal in the time domain. In
particular, the specified silence periods at the start and end of the test signal can be checked, as well as
correct signal amplitude.
•The Waveform Monitor is enabled in the Analyzer Function panel and configured with regard to the
trigger condition and memory depth. The “Waveform” graphics window can also be opened from
this panel.
•The scaling (including limit checking and the reference source) are selected in the Waveform Config
panel.
•The graph is shown in the “Waveform” graphics window.
With the PESQ Graph windows, the R&S UPV provides two additional types of graphs associated with
PESQ measurements. This is because the measurement process analyzes the signals in small
increments and determines the measured value (PESQ_MOS) and the time delay (Delay) between the
reference signal and the measured signal for each increment. For the measurement display always
shows the selected measurement value referenced to the entire signal. Using the graphs, it is also
possible to see the regions of the reference signal where the measured codec deviates from the
expected behavior. The values plotted against time are displayed in the “PESQ Graph” graphical
systems. In wideband mode P862.2 the MOS value against time can not be displayed with the current
version of the PESQ software.
•The desired signal (PESQ or MOS versus time or delay versus time) in “PESQ Graph Config”, as
well as the scaling – including the limit test – is selected.
•The graph is shown in the “PESQ Graph” graphics window.
In addition, the traces of reference and/or measurement signal, as well as display of the dropouts, can
be shown in in the "PESQ Graph" windows. Depending on the signal selected on the other axis, the
resolution on the x-axis is selected automatically so that both signals can always be displayed in the
same graphic. For example, the resolution of "MOS versus time" is much smaller than "reference signal
versus time", so the graph shows the reference signal in reduced resolution – but without swallowing
samples. In contrast, in the display of "delay versus time" vis-à-vis "reference signal versus time" there
is a much higher resolution on the x-axis; it corresponds to the resolution of the WAV file.
•In "PESQ Graph Config" the desired comparison signal (reference signal versus time or
measurement signal versus time or dropouts versus time) and the scaling is selected.
•The graphic representation is shown in the "PESQ Graph" graphics window.
•"Reference signal versus time" corresponds to the waveform of the reference signal.
•"Measurement signal versus time" corresponds to the waveform of the measurement signal. This
waveform can also be shown in full resolution in a separate graphic via the "Waveform Monitor"
function.
•"Dropouts versus time" corresponds to a hypothetical representation in which the values of an
amplitude- and time-corrected measurement signal and the reference signal are subtracted from
each other in proper phase relation and thus only the stray signals deviate from the zero line.
The Numeric Display shows the PESQ or MOS value.

Speech Quality Measurements (PESQ) R&S UPV
1146.2084.32 4.338 E-9
The Level Monitor indicates the RMS or peak value of the total test signal (after the measurement).
During measurement intermediate values are displayed. The peak indication should be used to check
the correct level for the selected measurement range. The peak value must not be more than 3 dB
above the nominal value of the measurement range.
PESQ Measurement Function
The "Perceptual Evaluation of Speech Quality" (PESQ) measurement method, which was published by
the International Telecommunication Union in 2001 as Recommendation ITU-T P.862,enables
measurements to be made on speech signals that are transmitted at low bit rates using highly
compressive psychoacoustic coding methods. PESQ employs an algorithm that enables these signals
to be evaluated by comparing them with reference signals.
In Recommendation P.862.3, the ITU defined the criteria by which reference signals for the PESQ
measurement must be generated:
•The reference signal must be mono and have a sample rate of 8 kHz or 16 kHz.
•There should be at least 0.5 seconds of silence at the beginning and at the end of the signal.
Silence of up to 2 seconds is recommended for devices under test with large delay.
•In realtime mode of R&S UPV the length of the test signal is identical to the length of the reference
signal. The delay of the device under test must not be longer than the silence at the end of the
reference signal, because otherwise the end of the speechsignal is not measured.
•The ratio between speech and silence must be suitable for the particular application. The duration
of the speech portion should be at least 3.2 seconds and should be within 40 % to 80 % of the total
signal length.
•The speakers must come as close as possiible to the application in pitch and cadence, e.g. "at least
one female and one mail voice should dictate representative texts in the target language".
It is strongly recommended to follow ITU-T P.862.3 paper.
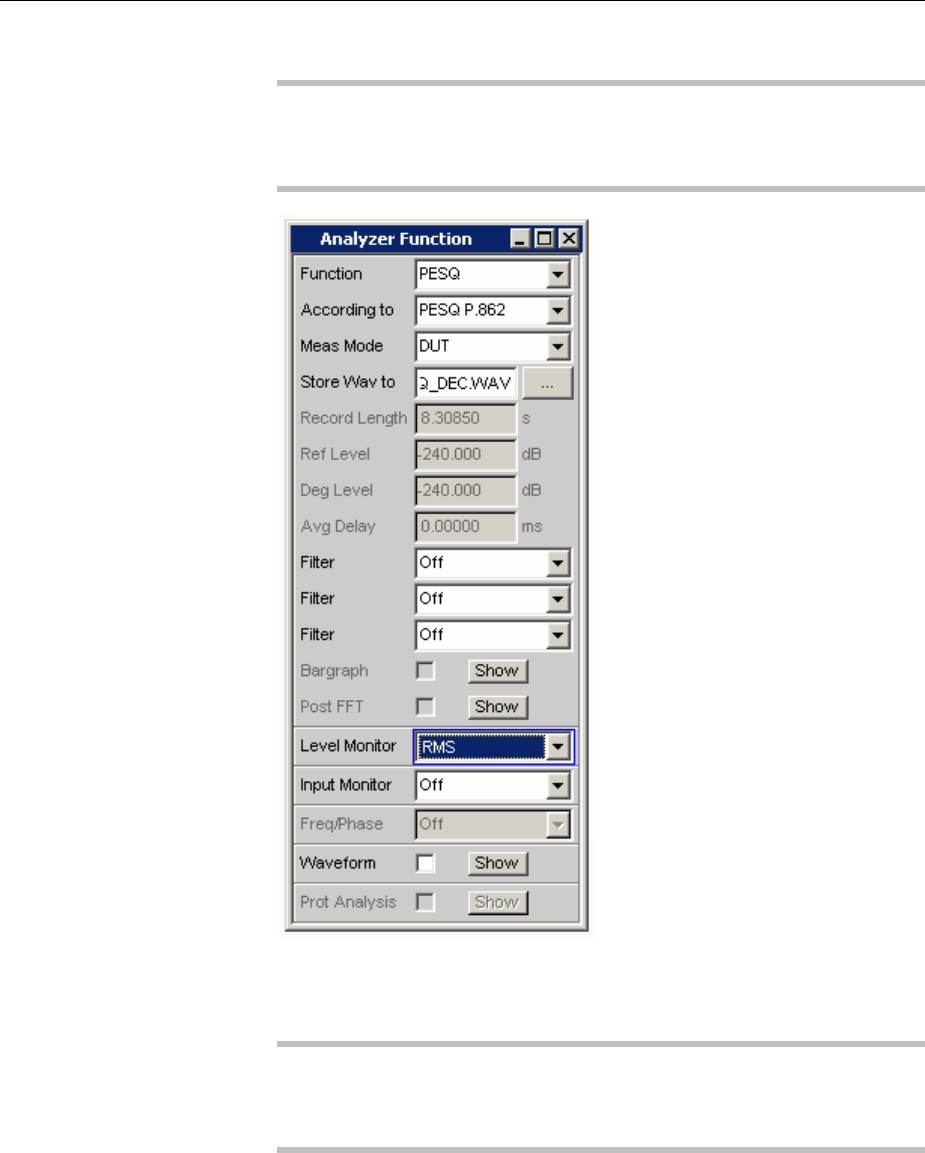
R&S UPV Speech Quality Measurements (PESQ)
1146.2084.32 4.339 E-9
Function
Switches the measurement function to PESQ.
Note:
PESQ measurements require the generator settings "Bandwidth = Play
Auto“, generator function "Play" and analyzer settings „single channel
with "Fix Range".
The measurement plays the WAV file that is selected for the generator
and compares its content with the measured signal. Only files with a
sample rate of 8 or 16 kHz can be used.
Note:
The PESQ measurement is always performed as a single measurement,
i.e. even when the START button is pressed the measurement is also
automatically ended as soon as the measurement values are available.
Remote-control command:
SENSe[1]:FUNCtion PESQ
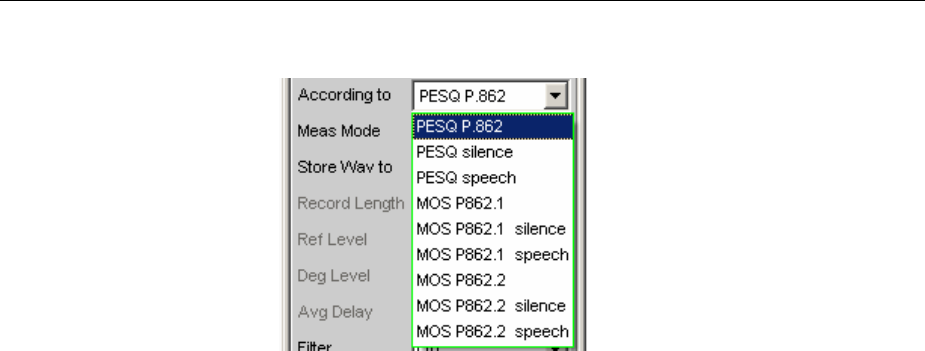
Speech Quality Measurements (PESQ) R&S UPV
1146.2084.32 4.340 E-9
According to
Select the display mode for the PESQ or MOS value
This setting specifies whether the PESQ value or MOS value should
be referenced to the entire signal or only to the speech portion or the
silence portion.
Switching over the display mode does not trigger a new measurement
but calculates the desired PESQ or MOS value from the last logged
record according to the selected process. The respective
measurement result is thus immediately available.
PESQ P.862 The measured PESQ value is referenced to the
entire reference signal. The calculation conforms to
the ITU-T P.862 standard.
Remote-control command:
SENSe[1]:FUNCtion:PESQ:ACCording PP862
PESQ Silence The measured PESQ value is referenced to the
silence portion of the reference signal. The
calculation conforms to the ITU-T P.862 standard.
Remote-control command:
SENSe[1]:FUNCtion:PESQ:ACCording
PPSI862
PESQ Speech The measured PESQ value is referenced to the
speech portion of the reference signal. The
calculation conforms to the ITU-T P.862 standard.
Remote-control command:
SENSe[1]:FUNCtion:PESQ:ACCording
PPSP862
MOS P862.1 The measured MOS value is referenced to the
entire reference signal. The mapping of the
measurement conforms to the ITU-T P.862.1
standard.
Remote-control command:
SENSe[1]:FUNCtion:PESQ:ACCording
MP8621

R&S UPV Speech Quality Measurements (PESQ)
1146.2084.32 4.341 E-9
MOS P862.1
silence
The measured MOS value is referenced to the
silence portion of the reference signal. The mapping
of the measurement conforms to the ITU-T P.862.1
standard
Remote-control command:
SENSe[1]:FUNCtion:PESQ:ACCording
MPSI8621
MOS P862.1
speech
The measured MOS value is referenced to the
speech portion of the reference signal. The
mapping of the measurement conforms to the ITU-T
P.862.1 standard
Remote-control command:
SENSe[1]:FUNCtion:PESQ:ACCording
MPSP8621
MOS P862.2 The measured MOS value is referenced to the
entire reference signal. The mapping of the
measurement conforms to the ITU-T P.862.2
standard
Remote-control command:
SENSe[1]:FUNCtion:PESQ:ACCording
MP8622
MOS P862.2
silence
The measured MOS value is referenced to the
silence portion of the reference signal. The mapping
of the measurement conforms to the ITU-T P.862.2
standard
Remote-control command:
SENSe[1]:FUNCtion:PESQ:ACCording
MPSI8622
MOS P862.2
speech
The measured MOS value is referenced to the
speech portion of the reference signal. The
mapping of the measurement conforms to the ITU-T
P.862.2 standard
Remote-control command:
SENSe[1]:FUNCtion:PESQ:ACCording
MPSP8622
Meas Mode
Select the measurement mode for PESQ measurement
This setting specifies whether a measurement is to be made in
realtime (DUT) or whether an offline evaluation of a previously stored
WAV file is to be performed (“Offline”).
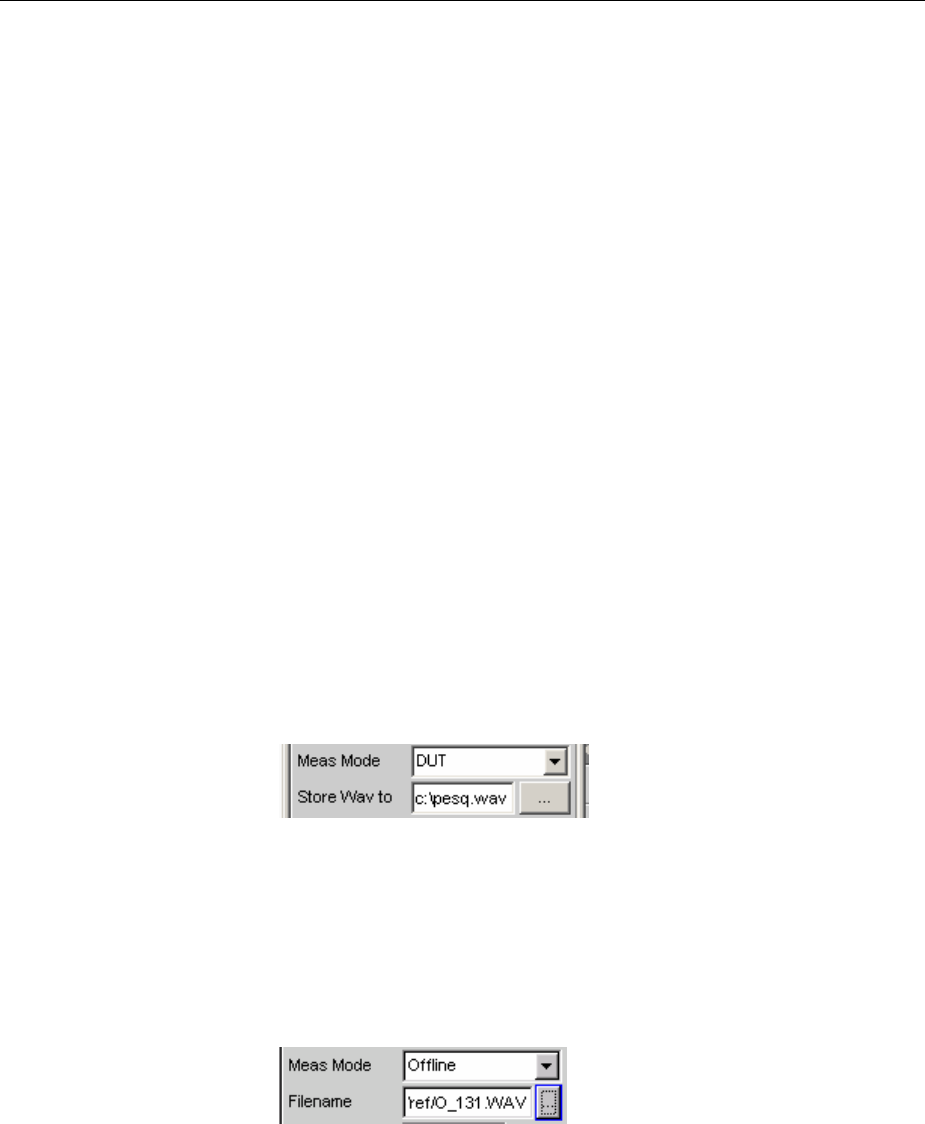
Speech Quality Measurements (PESQ) R&S UPV
1146.2084.32 4.342 E-9
DUT The PESQ measurement is to be made in realtime.
The reference WAV file will be played back, and the
measurement signal will be recorded by the
analyzer at the same time. The measurement signal
has the same length as the reference signal. If
there is a delay in the device under test, the silence
at the end of the reference signal must be longer
than this delay to make sure that the speech portion
is completely recorded. The evaluation is performed
immediately after playback of the reference signal is
finished.
Remote-control command:
SENSe[1]:FUNCtion:MMODe DUT
Offline The PESQ measurement is to be performed on
previously stored WAV files. After the files
containing the reference signal and the
measurement signal are specified, the evaluation
can be started by pressing the START button.
Possible sample rate of the stored WAV files can be
8, 16, 48 or 96 kHz. The length of the recorded
signal must be at least the length of the generator
reference signal.
Remote-control command:
SENSe[1]:FUNCtion:MMODe OFFL
Store WAV to
Allows the measured signal to be stored as a WAV file
(only if Meas Mode="DUT").
The WAV file is always stored in the same sample rate in which the
reference signal is present.
Remote-control command:
MMEMory:STORe:PWAVeform 'filename'
Filename
Selects the WAV file containing the stored measurement data (only if
Meas Mode = “Offline”)
Remote-control command:
MMEMory:LOAD:PWAVeform 'filename'
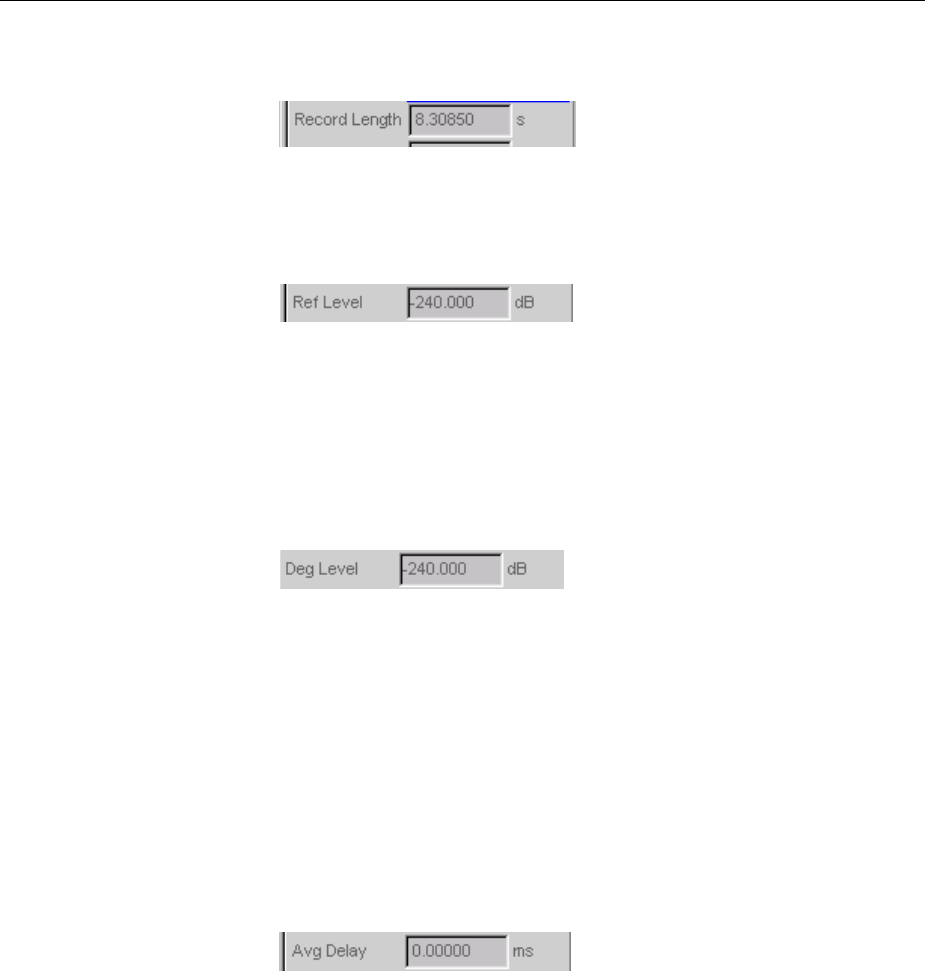
R&S UPV Speech Quality Measurements (PESQ)
1146.2084.32 4.343 E-9
Record Length
Shows the length of the WAV file selected for the reference signal in
the generator function panel.
Remote-control command:
SENSe[1]:FUNCtion:REC:LENGth?
Ref Level
Shows the RMS value of the reference signal (after the measurement)
The RMS value of the reference signal is shown in dB referenced to
the full scale value of the reference signal file.
Remote-control command:
SENSe[1]:FUNCtion:PESQ:REFLevel?
Deg Level
Shows the RMS value of the measurement signal (after the
measurement)
The RMS value of the measurement signal is shown in dB referenced
to the full scale value of the measurement signal file.
The PESQ algorithm is configured properly if the difference between
Ref Level and Deg Level is as small as possible, less than 10 dB is
recommended. PESQ measurement can compensate for differences
of up to 30 dB.
Remote-control command.
SENSe[1]:FUNCtion:PESQ:DEGLevel?
Avg Delay
Shows the average time offset between the reference signal and the
measurement signal (after the measurement)
The reference and measurement signals are internally divided into
small time frames. The time offset between the two signal paths is
measured for each of these frames. The displayed value is the
average of all of the measured offset values for the entire signal.
Remote-control command:
SENSe[1]:FUNCtion:PESQ:AVGDelay?

Speech Quality Measurements (PESQ) R&S UPV
1146.2084.32 4.344 E-9
Filter
Used to activate a digital filter in the measurement path. Up to 3 user-
defined filters or weighting filters can be looped into the measurement
path:
The user-defined filters are configured as Filter 01 to 09 in the Filter
panel (see section "User-Definable Filters" on page 4.420) and can
then be used in the analyzer (more than once if required).
The selectable weighting filters are described in section "Weighting
Filters" on page 4.428.
Note:
Irrespective of the digital filters selected here, it is also possible to loop
an additional input filter ("Pre Filter") into the measurement path.
Remote-control command:
SENSe[1]:FILTer[1] <parameter>
SENSe[1]:FILTer2 <parameter>
SENSe[1]:FILTer3 <parameter>
List of <parameter> see section "Filter Table" on page 4.419.
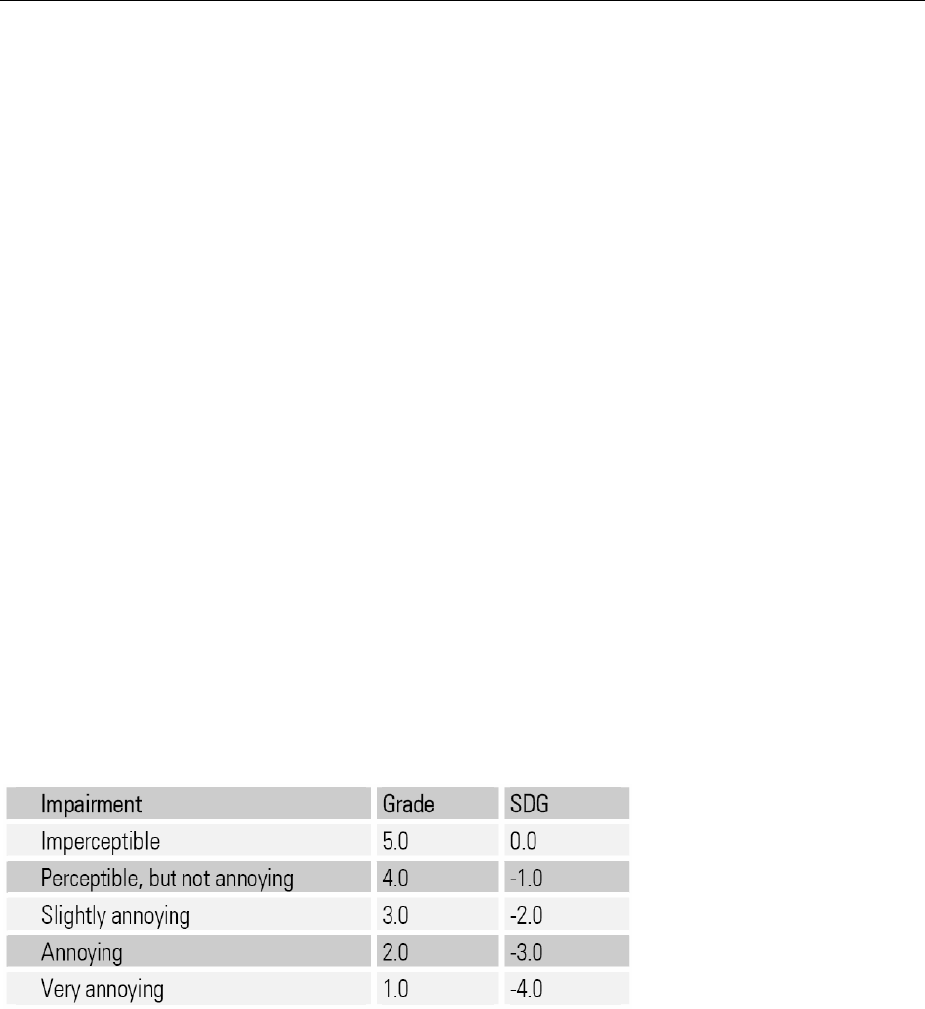
R&S UPV Audio quality measurements (PEAQ)
1146.2084.32 4.345 E-9
Audio quality measurements (PEAQ)
This measurement function is only available if the R&S UPV-K62 option is installed. It is not provided in
the multi-channel analyzers.
The Perceptual Evaluation of Audio Quality (PEAQ) measurement process, which was published by the
International Telecommunication Union in 1998 as Recommendation ITU-R BS.1387,permits the
measurement of the quality of sound signals which are transmitted at a low bit rate with the assistance
of compressing psycho-acoustic coding processes. PEAQ is an algorithm which permits these signals
to be analyzed by comparing them with the reference signal. The R&S UPV provides this measurement
–licensed by OPTICOM Dipl.-Ing. M. Keyhl GmbH,Erlangen, Germany. PEAQ®is a registered
trademark of said company.
Acommon feature of all psychoacoustic coding methods is that they utilize the properties of the human
hearing to modify the transmitted signal so that the portions of the signal that would in any case not be
perceived are removed from the signal. Whether such a transmission link for general sound signals
such as music causes impermissible changes to the signal must be objectively verifiable with the
assistance of suitable psycho-acoustic measurement procedures.
Alarge number of recordings containing music signals of different kinds were used for developing
PEAQ. The recordings were overlaid with interference typically caused by filters and also by using
various coders and thus qualities. A sufficiently large number of test listeners classified these examples
in a series of listening tests on the familiar scale for audio quality from 1 (bad)to 5 (excellent). In
contrast to the measurement of speech quality also available in the R&S UPV (PESQ), with PEAQ the
listeners have always had the comparison with the original signal. A negative scale, the so-called SDG
value (Subjective Difference Grade) emerges from the comparison for the difference between the
quality of the test signal and the quality of the reference signal. The worse the test signal becomes
compared to the reference signal, the more negative the SDG value.
SDG = GradeSignal Under Test – GradeReference Signal
The objective for the development of PEAQ was to develop a process which compares the original,
undistorted music signal (reference signal) with the distorted signal (measurement signal) to establish
an objective measurement value which correlates very well with the mean values of the listening
results. Though the results of subjective and objective assessment correlate very well, is it not possible
to directly compare the numeric results of SDG and ODG.
The PEAQ measurement is then performed in such a way that the system to be tested is connected at
its input to the reference signal and the measurement signal is measured at its output.
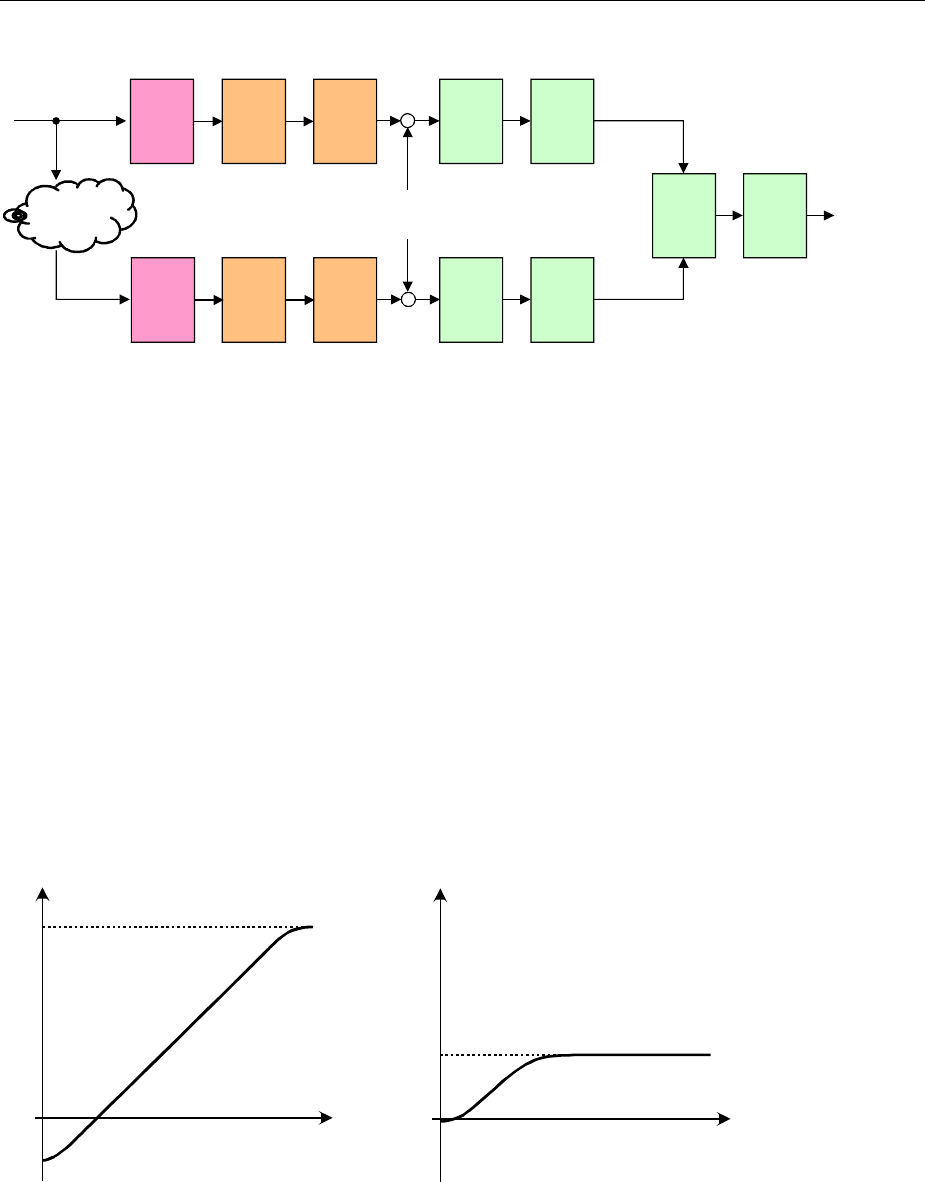
Audio quality measurements (PEAQ) R&S UPV
1146.2084.32 4.346 E-9
The next figure shows the block diagram of the PEAQ algorithm’s Basic model.
prediction of
perceived
audio
quality
reference signal
test
signal
system
under test
simul-
taneous
masking
outer
and
middle
ear
weighting
grouping
into
critical
bands
FFT
and
scaling
feature
extractor
cognitive
model
outer
and
middle
ear
weighting
FFT
and
scaling
+
+
internal
noise
grouping
into
critical
bands
simul-
taneous
masking
forward
masking
forward
masking
At first the PEAQ measurement process was designed for signals with small impairments (almost
transparent studio quality) and a constant delay. But it is nevertheless suitable for the assessment of
signals with larger impairments.
It is not suitable, for example, for assessing loudspeakers, cables, speech codecs, and IP-based
interference (variable delay and packet losses).
It was not yet validated for codecs with extremely low bit rates, e.g. those ones using the method of
spectral band replication.
Remote control command:
SENSe[1]:FUNCtion PEAQ
DI value and ODG value
The ODG value (Objective Difference Grade) directly corresponds to the result of the objective
measurement and correlates with the SDG value of the listening test. The calculation is done using a
so-called mapping function, as shown here in the example.
-12
- 8
- 4
0
excellent bad
quality
DI
+2,6 fair
- 4
excellent bad
quality
ODG
+0.1
fair
Distortion Index (DI) and Objective Difference Grade (ODG)
The ODG or DI value calculated by the PEAQ algorithm is depicted on the Y axis; the X axis points in
the direction of sinking SDG values, i. e. lower quality.
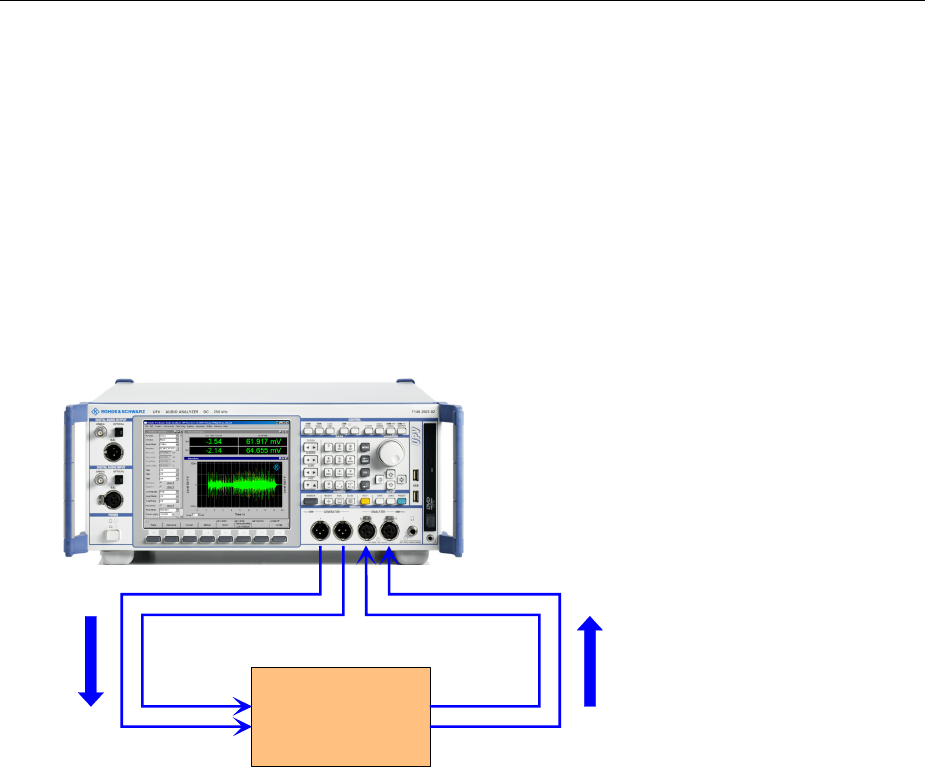
R&S UPV Audio quality measurements (PEAQ)
1146.2084.32 4.347 E-9
The R&S UPV calculates both the ODG and the DI value for each measurement and displays them in
channels 1 and 2 of the function column of the Numeric Display respectively. Since the saturation of the
mapping functions for ODG and DI are different, the following basic rule applies when reading them off:
•ODG should be read off as long as ODG is greater than -3.6
•DI should be read off as soon as ODG becomes smaller than -3.6
PEAQ measurements
The manufacturers of psycho-acoustic compression processes such as MP3 or also surround coders
want to optimize their algorithms for sound transmission; manufacturers of playback devices are able to
assess the audio quality in addition to the usual signal and distortion measurements.
device under test
(DUT)
reference
signal
test
signal
The illustration shows how the reference signal is guided to the device under test from the generator
output and fed into the analyzer again from the device’s output as a measurement signal. The original
reference signal is simultaneously fed internally to the analyser so that the analysis can access both
signals.
PEAQ graphics
With PEAQ measurement, the Waveform Monitor is used to check the signal in the time domain. The
recommended periods of silence at the beginning and the end of the test signal and also the correct
level range can be checked here.
•The wave form is activated in the analyzer function panel and configured with regard to the trigger
condition and storage depth. The wave form graphics dialog can also be opened from here.
•The scaling – including the limit check and reference basis – is selected in the wave form
configuration panel.
•The graphic display is shown in the wave form graphics dialog.
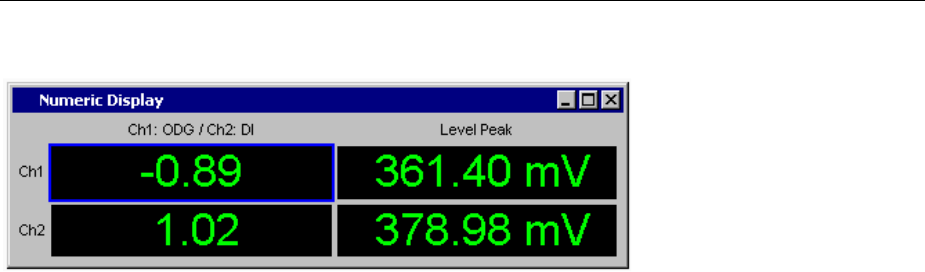
Audio quality measurements (PEAQ) R&S UPV
1146.2084.32 4.348 E-9
The Numeric Display shows the ODG and the DI value.
The Level Monitor indicates the RMS or peak values of both channels of the total test signal (after the
measurement). During measurement intermediate values are displayed. The peak indication should be
used to check the correct level for the selected measurement range. The maximum peak value must
not be more than 3 dB above the nominal value of the measurement range.
PEAQ measurement function
The Perceptual Evaluation of Audio Quality (PEAQ) measurement process, which was published by the
International Telecommunication Union in 1998 as Recommendation ITU-R BS.1387, permits the
measurement of the quality of sound signals which are transmitted at a low bit rate with the assistance
of compressing psycho-acoustic coding processes. PEAQ is an algorithm which permits these signals
to be analysed by comparing them with the reference signal. A general introduction to PEAQ can be
found in the chapter on "Audio quality measurements (PEAQ)". PEAQ is available in the R&S UPV as a
digital and an analogue measurement and mixed operation is also possible.
•The reference signal must be dual-channel and available with a sample rate of 48 kHz.
•The signal should begin and end with at least 0.5 seconds of silence.
•In realtime mode of UPV (Meas Mode = DUT) the length of the test signal is identical to the length
of the reference signal. The delay of the device under test must not be longer than the silence at the
end of the reference signal, because otherwise the end of the music signal is not measured.
•The ODG value is displayed in channel 1 and the DI value in channel 2. Both values are, however,
respectively based on the overall dual-channel signal.
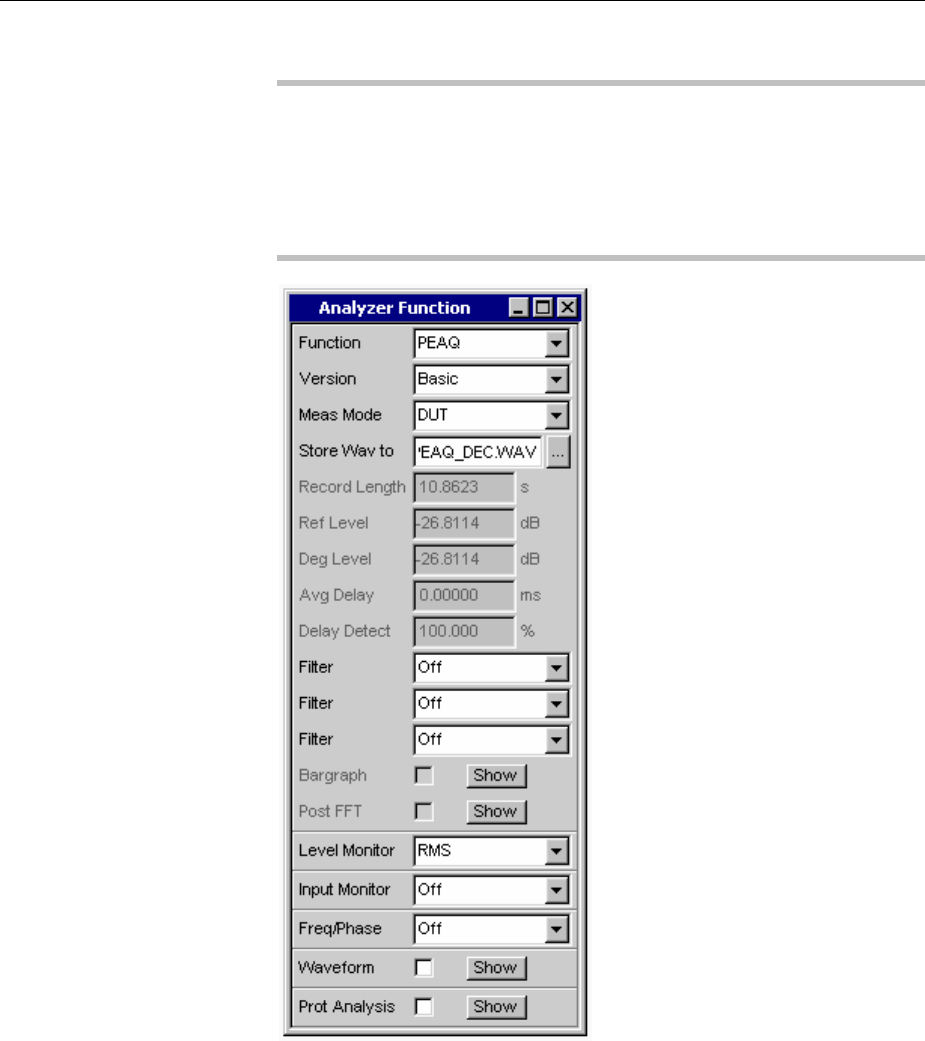
R&S UPV Audio quality measurements (PEAQ)
1146.2084.32 4.349 E-9
Function
Switching over the measurement function to PEAQ.
Please note:
The PEAQ measurement requires the settings bandwidth = PlayAuto or
afixed bandwidth of 22 kHz and generator function Play for the analog
generator. The analogue analyzer must be set to dual-channel, with
22 kHz bandwidth and with fixed range (the same for both channels). In
digital domain generator and analyzer must be set to dual-channel and
48 kHz sample rate.
The measurement plays the WAV file selected by the generator and
compares its content with the measured signal. Only files with a sample
rate of 48 kHz can be used as a source.
Remote control command:
SENSe[1]:FUNCtion PEAQ
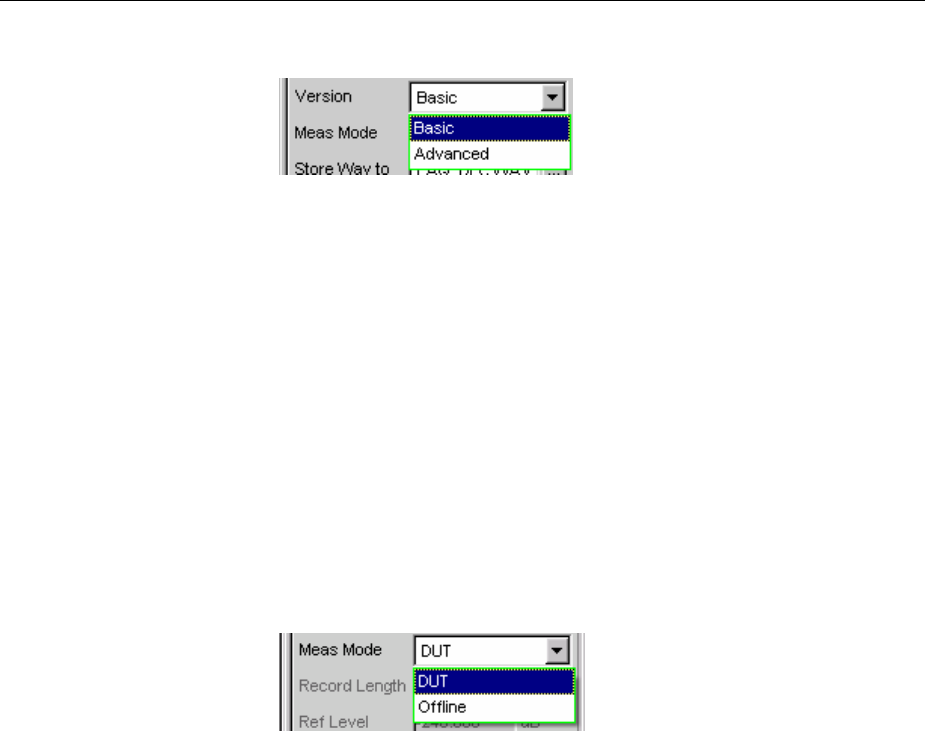
Audio quality measurements (PEAQ) R&S UPV
1146.2084.32 4.350 E-9
Version
Selection of the model version for the calculation of ODG and DI value
This setting specifies whether the Basic or the Advanced model is to
be used.
Basic The measurement value is based on the ITU-R BS-
1387 basic procedure with just one ear model.
Remote control command:
SENSe[1]:FUNCtion:PEAQ:VERSion BASic
Advanced The measurement value is based on the advanced
procedure with a second ear model for refining the
time resolution.
Remote control command:
SENSe[1]:FUNCtion:PEAQ:VERSion
ADVanced
Meas Mode
Selection of the measurement mode for the PEAQ measurement
This setting defines whether the measurement is to be performed in
real time (DUT) or with an analysis using previously stored WAV files
(Offline).
DUT The PEAQ measurement is to be performed in real
time. The reference WAV file is run; the
measurement signal is simultaneously recorded at
the analyzer. The analysis takes place as soon as
the reference signal has been run completely
Remote control command:
SENSe[1]:FUNCtion:MMODe DUT
Offline The PEAQ measurement is to be performed on
previously stored WAV files. After the files
containing the reference signal and the
measurement signal are specified, the evaluation
can be started by pressing the START button.
The sample rate of the stored WAV files must be
48 kHz. The length of the recorded signals must not
be shorter than that of the reference signal selected
in the generator
Remote control command:
SENSe[1]:FUNCtion:MMODe OFFL
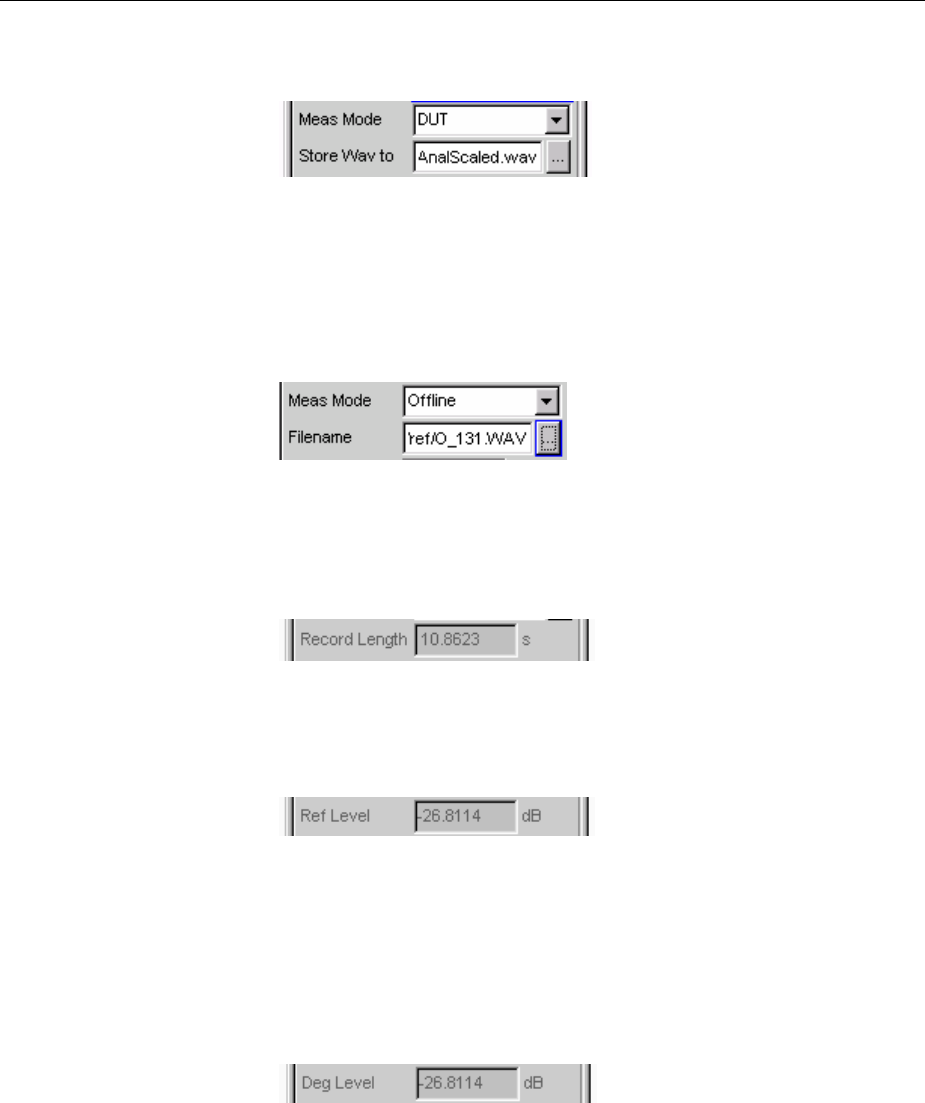
R&S UPV Audio quality measurements (PEAQ)
1146.2084.32 4.351 E-9
Store WAV to
Permits the measured signals to be stored as a WAV file (with Meas
Mode = DUT only)
The WAV file is always stored with a sampling rate of 48 kHz.
Remote control command:
MMEMory:STORe:PWAVeform 'filename'
Filename
Selects the WAV file with the stored measurement data (with Meas
Mode = DUT only)
Remote control command:
MMEMory:LOAD:PWAVeform 'filename'
Record Length
Shows the length of the WAV file selected for the reference signal in
the generator function panel.
Remote control command:
SENSe[1]:FUNCtion:REC:LENGth?
Ref Level
Displays the RMS value of the reference signal after measurement.
The RMS value of the reference signal is shown in dB referenced to
the full scale value of the reference signal file. Both channels are
averaged.
Remote control command:
SENSe[1]:FUNCtion:PEAQ:REFLevel?
Deg Level
Displays the RMS value of the measurement signal after
measurement.
The RMS value of the measurement signal is shown in dB referenced
to the full scale value of the measurement signal file for the PEAQ
algorithm. Both channels are averaged.
The PEAQ algorithm is configured properly if the difference between
Ref Level and Deg Level is as small as possible, less than 10 dB is
recommended. PEAQ measurement can compensate for differences
of up to 30 dB
Remote control command:
SENSe[1]:FUNCtion:PEAQ:DEGLevel?
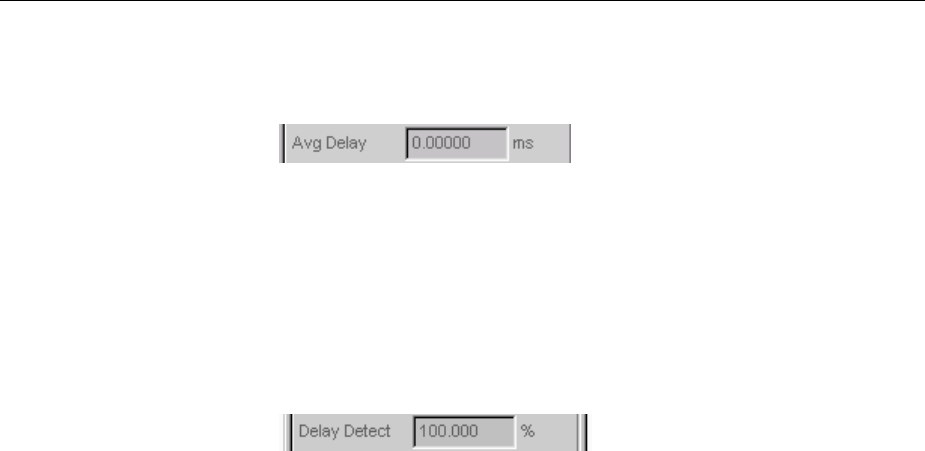
Audio quality measurements (PEAQ) R&S UPV
1146.2084.32 4.352 E-9
Avg Delay
Displays the time offset between the reference and the measurement
signals after measurement.
The PEAQ algorithm can only correctly process signals with a
constant time offset of less than 1 second.
Remote control command:
SENSe[1]:FUNCtion:PEAQ:AVGDelay?
Delay Detect
Displays (after the measurement) how good the algorithm could
compensate the time offset between the reference and the
measurement signal.
The value should be close to 100 %. For strongly periodic signals
and/or signals with severe distortions this value can be significantly
lower. Values below 70 % indicate that the ODG and DI values may
become uncertain. In this case a subjective verification – by listening
to the signals - is recommended.
Remote control command:
SENSe[1]:FUNCtion:PEAQ:DELDetect?
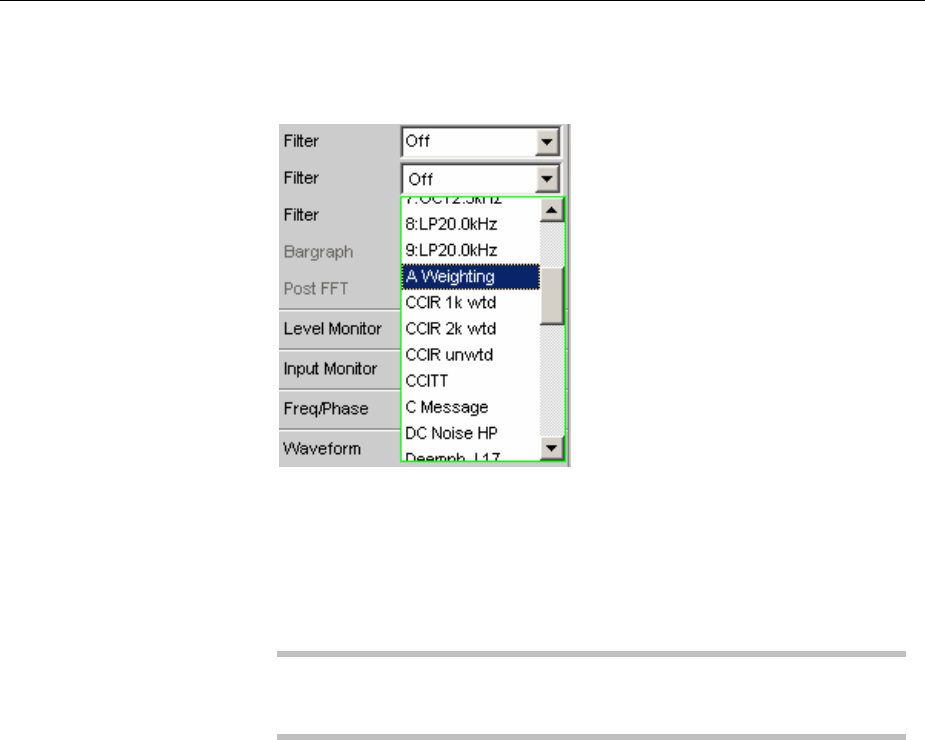
R&S UPV Analysis in the Time Domain
1146.2084.32 4.353 E-9
Filter
Used to activate a digital filter in the measurement path. Up to 3 user-
defined filters or weighting filters can be looped into the measurement
path:
The user-defined filters are configured as Filter 01 to 09 in the Filter
panel (see section "User-Definable Filters" on page 4.420) and can
then be used in the analyzer (more than once if required).
The selectable weighting filters are described in section "Weighting
Filters" on page 4.428.
Note:
Irrespective of the digital filters selected here, it is also possible to loop
an additional input filter ("Pre Filter") into the measurement path.
Remote-control command:
SENSe[1]:FILTer[1] <parameter>
SENSe[1]:FILTer2 <parameter>
SENSe[1]:FILTer3 <parameter>
List of <parameter> see section "Filter Table" on page 4.419.
Analysis in the Time Domain
In addition to analysis in the frequency domain, the R&S UPV can also be used to analyze input signals
in the time domain. Time and frequency-domain analyses can be performed simultaneously and
irrespective of the selected measurement function.
Waveform Monitor
The waveform monitor is used for signal analysis in the time domain. Both channels of the active
analyzer can be measured and displayed simultaneously and synchronously.
•The "Analyzer Function" panel is used to activate the waveform monitor and to configure its trigger
condition and memory depth. In addition the "Waveform" window can be opened from here.
•The "Waveform Config" panel is used to select the scaling (incl. limit check and reference).
•The measurement results are displayed graphically in the "Waveform" graphical window.
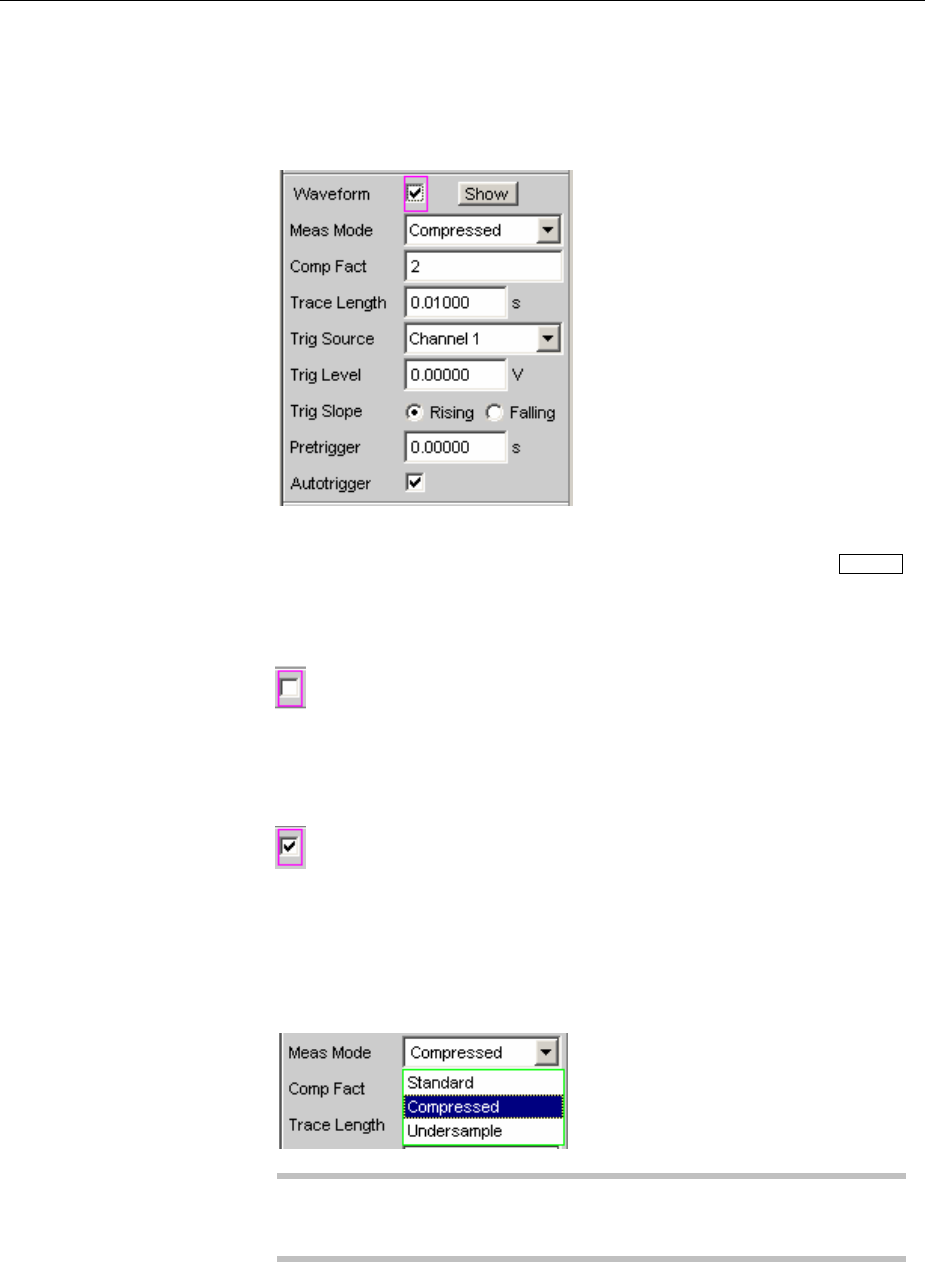
Analysis in the Time Domain R&S UPV
1146.2084.32 4.354 E-9
Waveform
Used to activate the waveform monitor; the graphic is configured and
displayed in the configuration and graphical window "Waveform
(Config)".
Click the Show button to open the Waveform graphic. You can close
the graphic – as with any other window – by means of the CLOSE
button or by clicking on the X button in the title bar, provided it is the
active window.
Waveform monitor deactivated.
Recommended for increasing the measurement
speed (e.g. for sweeps or remote-control mode).
Remote-control command:
SENSe7:FUNCtion OFF
Waveform monitor activated; the parameter fields
shown above appear.
Remote-control command:
SENSe7:FUNCtion ON
Meas Mode
Used to select the operating mode.
Note:
If “Undersample FFT” is enabled, the waveform mode cannot be
selected. Instead, it is automatically set to “Undersample”.
In certain measurement functions (e.g. "Record") "Meas Mode" cannot
be selected, but instead stays at "Standard".

R&S UPV Analysis in the Time Domain
1146.2084.32 4.355 E-9
Standard Uncompressed recording of all samples. A
maximum of 480000 samples can be stored. The
possible recording length depends only on the
bandwidth (analog) or sampling rate (digital). At a
sampling rate of 48 kHz or an analog bandwidth of
22 kHz, the probable time is 10 s.
Recommended for short recordings (maximum of a
few seconds) and for periodic signals.
Remote-control command:
SENSe7:MMODe STANdard
Undersample Compressed recording of the samples produced by
undersampling. Specifying a value (n) for the "Comp
Fact" (compression factor) in the next operator field
means that only every nth sample is recorded. The
maximum recording time increases in proportion to
the factor n.
Recommended for recording low-frequency signals if
the Standard recording time is too short and the
aspect of interest is the signal trace over time.
Note:
“Delay Ch1” (only for the FFT measurement
function) cannot be used in this mode and is thus set
to 0 s.
Continuous processing of the measured data over a
relatively long time is only guaranteed for sampling
rates up to 96 kHz or analog bandwidths up to
40 kHz. If the sampling rate is too high or the
bandwidth is too large, the measurement will be
terminated with a suitable error message. If this
happens, it may be necessary to reduce the number
of analyzer filters that are being used.
Remote-control command:
SENSe7:MMODe USAMple

Analysis in the Time Domain R&S UPV
1146.2084.32 4.356 E-9
Compressed Compressed recording of the samples produced by
peak value rectification. Specifying a value (n) for
the "Comp Fact" (compression factor) in the next
operator field means that the highest value out of
every n consecutive samples is determined and this
peak value is used as the input signal for the
waveform function. The maximum recording time
increases in proportion to the factor n.
Since this waveform contains only positive data, a
logarithmic display is possible.
Recommended for recording low-frequency signals if
the Standard recording time is too short or the only
aspect of interest is the peak value trace (envelope).
Note:
“Delay Ch1” (only for the FFT measurement
function) cannot be used in this mode and is thus set
to 0 s.
Continuous processing of the measured data over a
relatively long time is only guaranteed for sampling
rates up to 96 kHz or analog bandwidths up to
40 kHz. If the sampling rate is too high or the
bandwidth is too large, the measurement will be
terminated with a suitable error message. If this
happens, it may be necessary to reduce the number
of analyzer filters that are being used.
Remote-control command:
SENSe7:MMODe COMPressed
R&S UPV Analysis in the Time Domain
1146.2084.32 4.357 E-9
Comp Factor
Used for entering the compression factor in compressed recording.
The factor entered here is the factor by which
•the maximum recording and pretrigger times increase compared
to standard recording
•the time resolution deteriorates compared to standard recording
The size of the trace memory (480000 samples) and pretrigger
memory (19200 samples) remains unaffected.
Areduction in the compression factor reduces the maximum possible
recording time and therefore where appropriate also the set recording
and pretrigger times.
An increase in the compression factor does not alter the set recording
time, but only the maximum possible recording and pretrigger times.
You can then set a longer recording time ("Trace Length") and a
longer pretrigger time.
Note:
If Undersample FFT is enabled, the waveform compression factor
cannot be selected. Instead, it is automatically set to match the FFT
compression factor.
Remote-control command:
SENSe7:CMPFactor <n>
Analysis in the Time Domain R&S UPV
1146.2084.32 4.358 E-9
Trace Length
Used to enter the recording length (memory depth), including an
optional pretrigger, in seconds.
Amaximum of 480000 samples can be stored. Apart from the
bandwidth (analog) and sampling rate (digital), the possible recording
length also depends on the selected operating mode (the compression
factor):
•The higher the bandwidth or sampling rate is, the shorter the
maximum possible recording length will be.
•The recording length can be multiplied by using one of the
compression modes.
Note:
If a multichannel analyzer is used, max. 1.44 million samples can be
observed. This is equivalent to e.g. 15 s at 40 kHz analog bandwidth.
Therefore, if one of the compression modes is used, the recording
length is automatically limited to this time.
The recording length does not depend on the length of the time axis
(selected in the "Waveform Config" panel).
The lower the selected recording length is, the higher the update rate
for the graphic will be.
If a long recording duration is set, any section of the recorded samples
can be analyzed by reducing the graphical time axis (also possible at
alater stage).
Note:
The selected "Trace Length" (and not the length of the displayed trace
section) determines the recording duration for each measurement and
therefore the total measurement time. If a high measurement speed is
required (e.g. for sweeps or remote-control mode), the memory depth
should not be longer than the measurement time of the measurement
function.
If “Undersample FFT” is enabled, the lower limit of the waveform
recording length is set to the FFT measurement time.
Remote-control command:
SENSe7:TRIGger:TRCLength <nu>
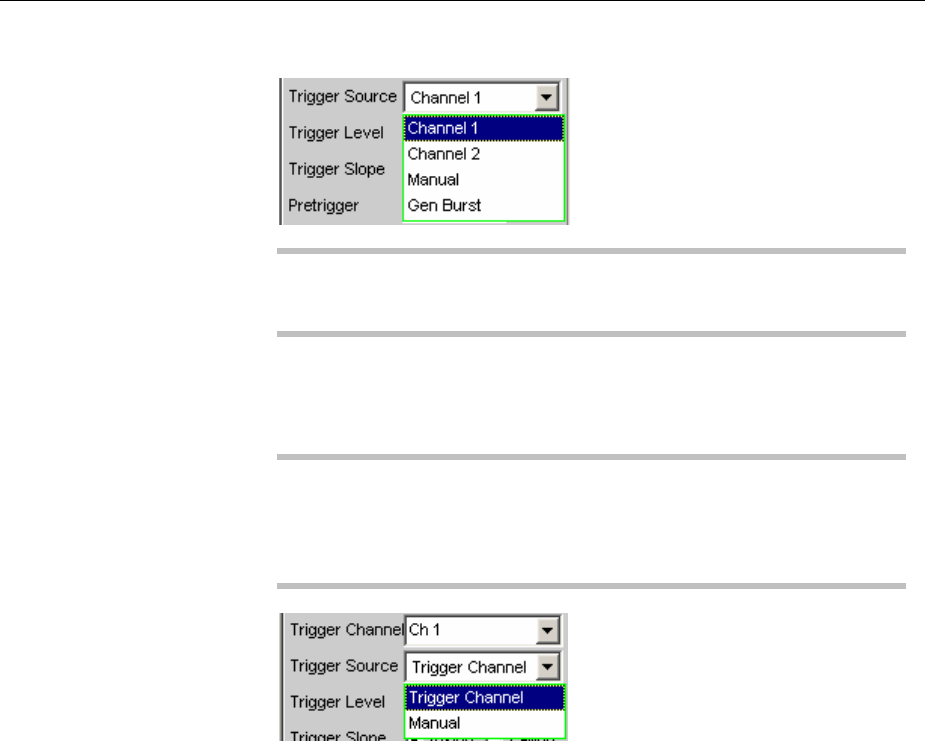
R&S UPV Analysis in the Time Domain
1146.2084.32 4.359 E-9
Trigger Source
Used to activate the trigger and to select the trigger source.
Note:
If Undersample FFT is enabled, the waveform trigger source cannot
be selected. Instead, it is automatically set to Manual.
Selects the source (usually one of the measurement channels) which
is to trigger measurement recording if the trigger threshold is
overranged or underranged.
Note:
In the case of multichannel analyzers, the trigger channel must be
defined before it can be used as trigger source for the waveform. If no
trigger channel is activated, the trigger source is automatically set to
"Manual".
Channel 1 Measurement channel 1 triggers recording.
Only available in the two-channel analayzers if
measurement channel 1 (or both channels) is
activated.
Remote-control command:
SENSe7:TRIGger:SOURce CH1
Channel 2 Measurement channel 2 triggers recording.
Only available in the two-channel analayzers if
measurement channel 2 (or both channels) is
activated.
Remote-control command:
SENSe7:TRIGger:SOURce CH2

Analysis in the Time Domain R&S UPV
1146.2084.32 4.360 E-9
Trigger
Channel
The measurement channel selected as "Trigger
Channel" triggers the recording.
Only available in the multichannel analyzers if the
trigger channel is not deactivated.
Note:
If the trigger channel is deactivated, the "Trigger
Source" is not operable.
Remote-control command:
SENSe7:TRIGger:SOURce TRGChannel
Manual Recording is triggered as soon as the measurement
starts.
Remote-control command:
SENSe7:TRIGger:SOURce MAN
Gen Burst Recording is synchronized to the start of the
generator signal (preferably Sine Burst). Not
available in multichannel analyzers.
The generator signal is first muted briefly (approx.
3ms) and then restarted with zero-degree phase
(“Burst On” phase). Measurement data recording is
started at the same time, taking internal signal
delays into account.
It is thus possible to graphically determine the signal
delay of the device under test from the waveform
display by selecting “Gen Burst” and using a suitable
signal from the internal generator (see “Delay
Measurement”.
Note:
In this mode, the settling time of any filter that may
be enabled is not taken into account for starting the
measurement. In other words, the measurement
starts without any delay and thus includes the
settling time response of the filter.
Remote-control command:
SENSe7:TRIGger:SOURce GENBurst
R&S UPV Analysis in the Time Domain
1146.2084.32 4.361 E-9
Trigger Level
Used to enter the trigger threshold.
Recording is triggered according to the "Trigger Slope" when this level
is overranged or underranged.
When measurement has been started or recording has been triggered
(in the case of continuous measurement), a new recording cycle is not
armed again until the trigger threshold is violated in the opposite
direction.
Remote-control command:
SENSe7:TRIGger:LEVel <nu>
Trigger Slope
Used to select the signal edge on which measurement is to be
triggered (trigger slope).
Rising Triggering occurs when the level on the
measurement channel selected as the "Trigger
Source" exceeds the trigger threshold for the first
time.
(Re-) arming occurs as soon as a level below the
trigger threshold exists.
Remote-control command:
SENSe7:TRIGger:SLOPe RISing
Falling Triggering occurs when the level on the
measurement channel selected as the "Trigger
Source" drops below the trigger threshold for the first
time.
(Re-) arming occurs as soon as a level above the
trigger threshold exists.
Remote-control command:
SENSe7:TRIGger:SLOPe FALLing
Analysis in the Time Domain R&S UPV
1146.2084.32 4.362 E-9
Pretrigger
Used to activate the pretrigger and to enter the pretrigger interval in
seconds:
The pretrigger is deactivated by entering a pretrigger time of 0.0 s.
Entering a pretrigger time moves the instant known as the trigger time
within the recording time selected as the "Trace Length".
The pretrigger memory is 19200 samples in size, that is, 4 % of the
maximum possible trace length. With a compressed waveform display
(“Compressed” or “Undersample”), the maximum possible pretrigger
time (and the trace length) is increased by the compression factor.
The pretrigger memory is filled from the start of the measurement and
always contains the latest samples of the time frame selected as the
pretrigger, before triggering occurs. For so long as the pretrigger is not
completely full, triggering remains locked. It is only armed when the
pretrigger memory is full and is at least one sample below the trigger
threshold.
The pretrigger memory is filled from the front in the manner of a shift
register, so that the older samples move back one position as each
new sample is added:
•If the pretrigger time is longer than the total trace length, triggering
takes place when the trace length is reached. The pretrigger
memory (which is only partially full) is then displayed.
•If the desired pretrigger interval has expired, the older samples in
the back part are replaced by newer samples.
The trigger time is always t = 0.0 s; the pretrigger time is given as a
negative time.
Note:
The total length of the waveform trace is 480000 samples and is
entered under "Trace Length". If the pretrigger is used, the recording
duration for the triggered section of the signal is reduced.
Remote-control command:
SENSe7:TRIGger:PRE <nu>
Autotrigger
For activating the autotrigger, that is, forced triggering, when the trigger
condition is not fulfilled ("true") within the time selected as "Trace
Length".
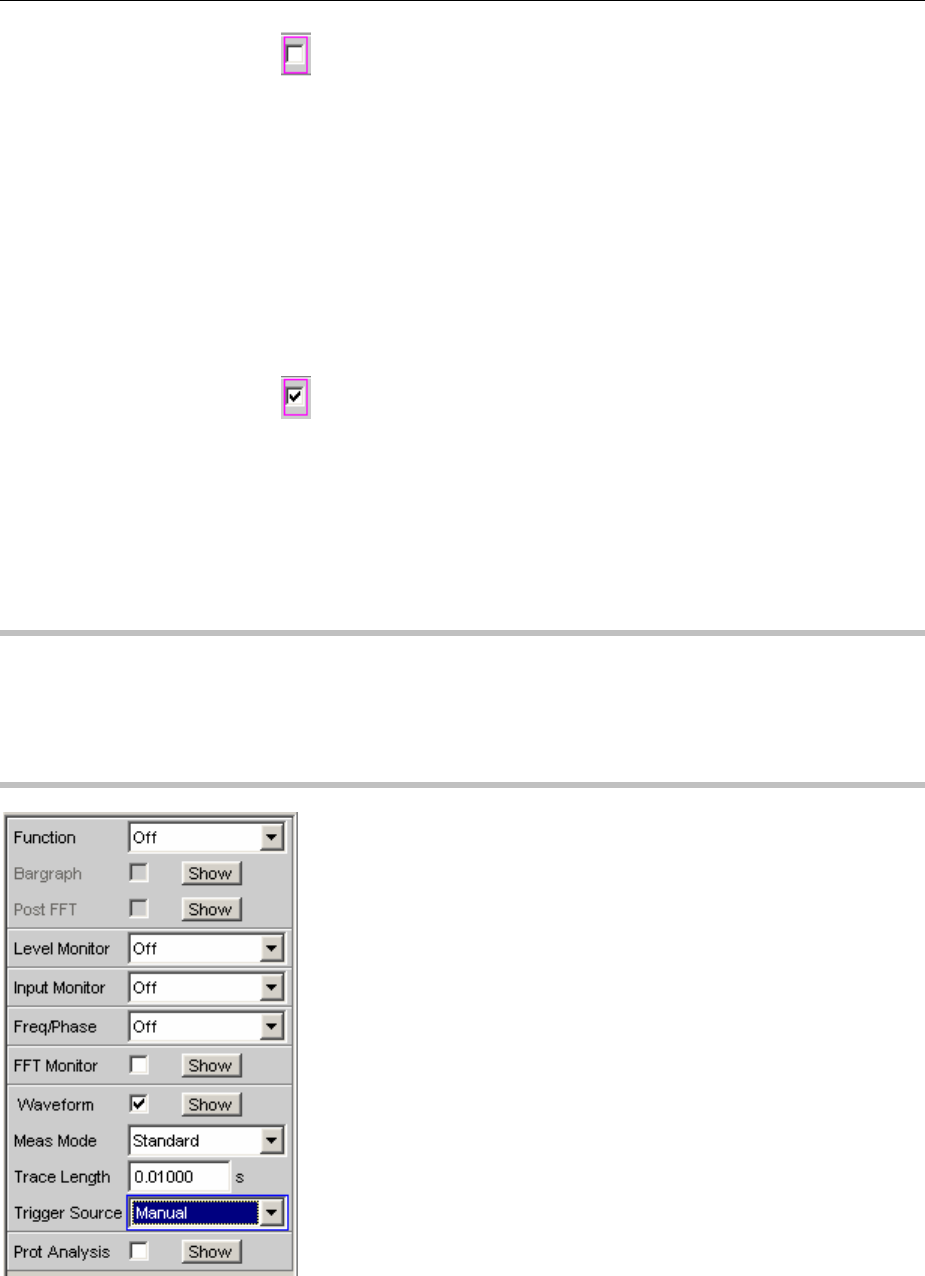
R&S UPV Analysis in the Time Domain
1146.2084.32 4.363 E-9
Autotrigger off.
The triggering of waveform recording – and thus the
termination of a single measurement that has been
started – occurs only when the trigger event has
occurred (i.e. has changed to "true").
If an unfavorable trigger condition is chosen (e.g.
the trigger level is too high) the measurement
continues indefinitely and must be interrupted
manually (STOP key).
This setting is recommended if the waveform is to
be displayed only if the trigger condition is fulfilled.
Remote-control command:
SENSe7:TRIGger:AUTO OFF
Autotrigger on.
When the trace length has expired, forced triggering
occurs, that is, the waveform is then displayed
untriggered, as in the case of manual triggering.
This setting is recommended if you wish to ensure
that the measurement terminates, or in the case of
an unknown signal trace.
Remote-control command:
SENSe7:TRIGger:AUTO ON
Note:
With sampling rates below 100 kHz or an analog bandwidth up to 40 kHz, a continuous waveform
measurement can be performed. For this it must be ensured that neither the selected measurement
function nor any other measurement performed at the same time (e.g. a level monitor or a frequency
measurement) requires more time than the waveform measurement. To ensure this, it is advisable to
switch off all other measurements and to use manual triggering.

Analysis in the Time Domain R&S UPV
1146.2084.32 4.364 E-9
Delay Measurement
The delay measurement function is used to measure signal propagation delay in a DUT (e.g. between
the input and the output). For this purpose, a known signal is applied to the input of the DUT and the
time required for the signal to appear at the output of the DUT is measured.
With this type of measurement, it is essential for the time measurement to be started exactly when the
signal appears at the input of the DUT, i.e. at the output of the generator. The internal delays of the
generator and the analyzer must be taken into account automatically. To allow measurements to be
made at the D/A and A/D converters, this synchronization must effectively extend over both domains –
from analog to digital and from digital to analog.
Just like the previous UPD and UPL instruments, the R&S UPV provides a specific waveform
measurement mode for this measurement task: the “Gen Burst” mode. In this operating mode, the start
of the measurement (and thus the start of waveform recording) is synchronized to the start of the
generator signal (preferably Sine Burst):
•The generator signal is muted briefly (approximately 3 ms) and then restarted with zero-degree
phase (in the case of a burst signal with “Burst On”).
•The analyzer does not start recording until it receives an internal trigger signal from the generator
and the internal signal delays of the generator and analyzer being used have expired.
Note:
As the generator signal contains an (intentional) signal dropout and reset at the start of each
measurement cycle in this operating mode, it should only be used for measuring delays and not for
measuring signal quality.
The delay of the DUT can be read directly from the waveform display by comparison with the start of
the generator signal. A sine burst signal is particularly suitable for this type of measurement, since it has
azero level before and after the burst if the “Low Level” value, burst duration and burst interval
parameters are suitably configured.
Note:
Internal triggering to the generator signal cannot be applied if a multichannel analyzer is used. Instead,
however, one of the measurement channels – as reference and trigger channel – can record the
generator signal and trigger the waveform measurement while two other channels are displayed as
waveform.
Sine Burst is equally suitable for single and continuous measurements, since the trigger for the next
measurement is automatically re-armed by the burst pause. However, any other type of generator
signal can also be used for single measurements, since the start of the signal can be recognized from
the brief signal blanking interval. The settings for operation with a sine burst signal are described below:
Note:
To run the delay measurement as a constant measurement or sweep Burst must be selected as the
generator function with Low Level = 0 (no offset) so that arming can be performed by the burst pause.
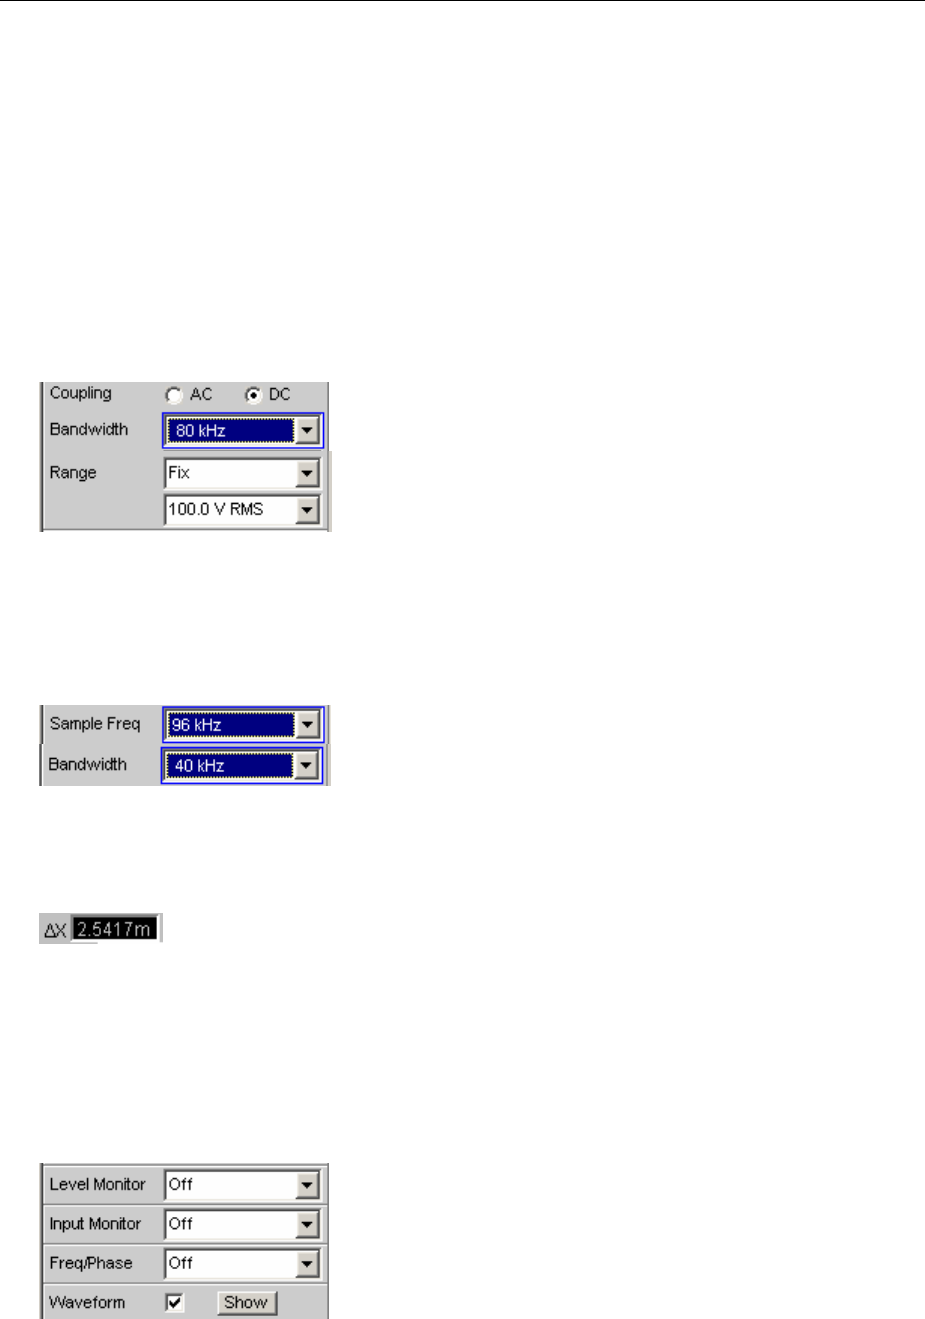
R&S UPV Analysis in the Time Domain
1146.2084.32 4.365 E-9
•The measurement can be made using one or two channels.If only one signal is to be observed,
the unused channel should be disabled in the Analyzer Config panel and Trace B should be
disabled in the Waveform Config panel.
•The Filter and Equalizer should not be used unless absolutely necessary. If a filter or filters are
used, it must be borne in mind that the settling of the filter will be visible in the waveform trace,
since in this case the start of the measurement cannot be delayed by the filter settling time as is
otherwise usual.
•In the case of analog measurement,the two-channel analog analyzer must be used, autoranging
must be disabled (“Range Fix” for the measurement channel(s) used) and the input coupling must
be set to “DC”. A range that is large enough to acquire the expected signal level without
overranging must be selected. A bandwidth of 80 kHz should be selected to obtain the highest
possible time resolution; 250 kHz is not supported for delay measurement. The only case in which
the bandwidth must be reduced is when the delay is very long (more than 2 s).
•With pure analog measurements (analog generator and analog analyzer), the generator and
analyzer should be configured with the same bandwidth. With D/A measurements,it is
recommended that you adapt the generator bandwidth to the analyzer sampling rate (i.e. 22 kHz
bandwidth at a 48 kHz sampling rate, 40 kHz bandwidth at a 96 kHz sampling, or 80 kHz bandwidth
at a 192 kHz sampling rate).
•For evaluation of the measurement, the waveform window must visible and a vertical graphic
cursor (or two cursors for two-channel measurements) must be enabled (“Movement Next
Sample”). With a two-channel measurement, this allows the relative delay of the two measurement
signals to be read in addition to the absolute delay of each signal.
The X-axis should initially be scaled automatically so that the entire waveform trace can be seen.
The graphic zoom function can then be used for more precise examination of the signal start.
•Ameasurement function with a short measurement time (such as FFT with a size of 1 K) should
be selected in the Analyzer Function panel, and all unnecessary supplementary measurement
functions (especially frequency and level monitoring) should be disabled. The Waveform Monitor
must be enabled.
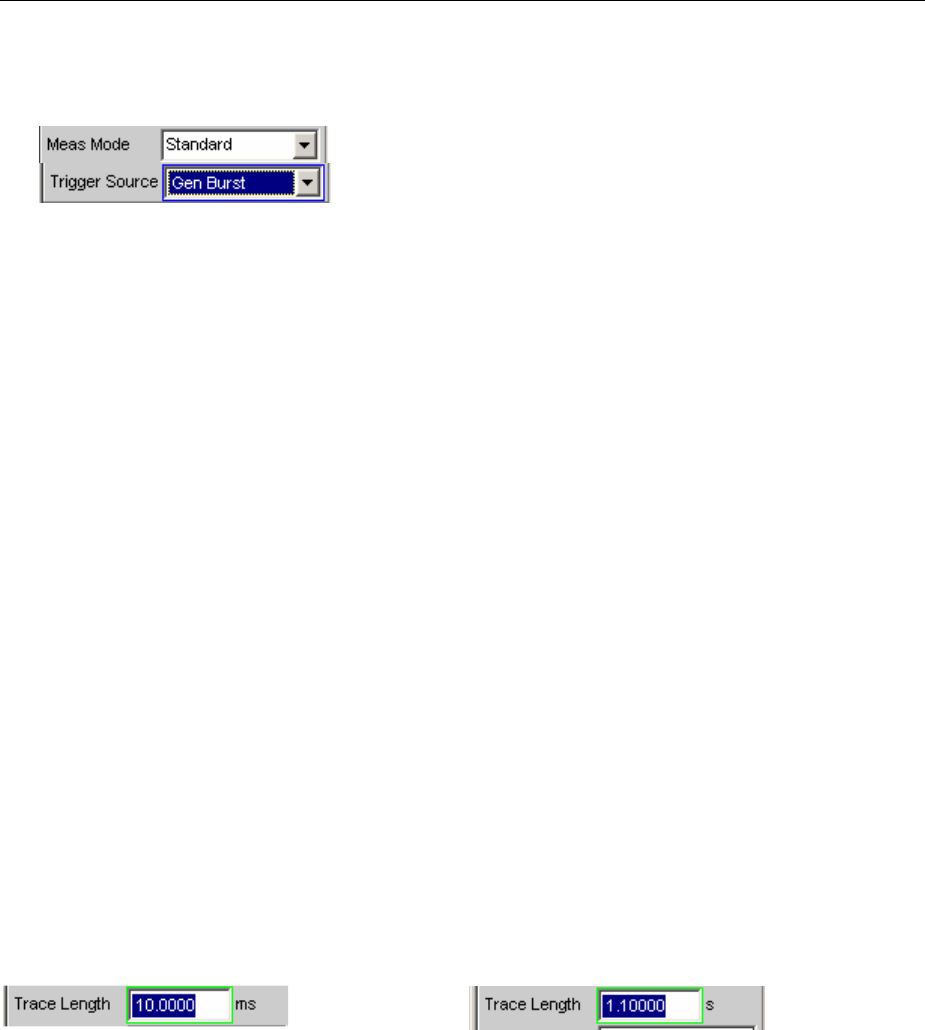
Analysis in the Time Domain R&S UPV
1146.2084.32 4.366 E-9
•“Meas Mode Standard” should be selected in the Waveform menu of the Analyzer Function panel.
It is not necessary to select “Undersample” except for very long delays (more than 9 s). “Trigger
Source” must be set to “Gen Burst.”
•The generator function should always be set to “Sine Burst,” although other types of signals from
the internal generator can also be used for single measurements.
•The “Low Level”of the burst signal must be set to “0.0” (V or FS), especially for continuous
measurements, so that the burst pause can arm the trigger for the next measurement. The voltage
must be greater than 0.0; otherwise the message “No Generator Signal” will be displayed and it will
not be possible to trigger the measurement.
•“Burst on Delay” is normally not necessary. It can be used to lengthen the standard generator mute
time (3 ms) at the start of the measurement.
The following settings depend on the length of the expected delay and apply to the generator “Sine
Burst” function:
•The recording length (“Trace Length”) should be around 110% of the maximum expected delay,
but in any case at least 10 ms. Reducing the recording time increases the update rate with
continuous measurements and the time resolution of the graphic display.
•The burst interval should be 110% to 200% of the recording time, but at least 100 ms longer than
the recording time. The interval can be set to any desired value for single measurements. The
maximum allowable interval for continuous measurements is 2 s. If the selected value is too large, a
timeout will occur during continuous measurement and the message “No Generator Signal” will be
displayed. The shorter the interval, the higher the update rate with continuous measurement.
•The frequency of the burst signal should be selected such that the period of the signal is
approximately 2% to 10% of the recording length. If possible, it should be a subharmonic of the
generator sampling frequency.
•The burst duration should not exceed 10% of the recording time, and it should be set to an integer
multiple of the period (1 to 5 cycles) so that the test signal will not have a DC component.
The following two examples show configurations for very short (1 ms) and very long (1 s) delays.
DUT delay 1 ms
DUT delay 1 s
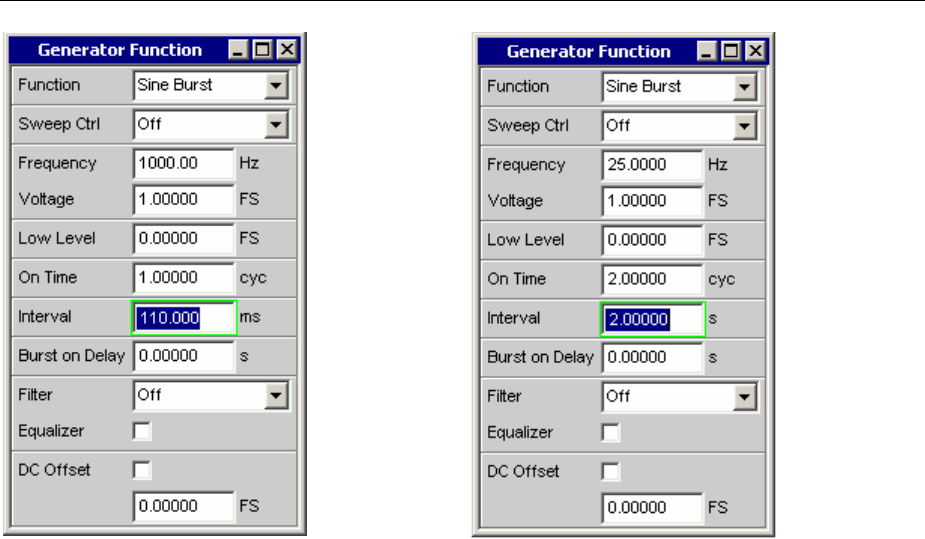
R&S UPV Analysis in the Time Domain
1146.2084.32 4.367 E-9

Offline Analysis R&S UPV
1146.2084.32 4.368 E-9
Offline Analysis
All R&S UPV measurement functions can of course be executed online (in realtime), which produces
results quickly and is indispensable particularly for use in production and in adjustment procedures.
They can all, however, be used offline as well.
This is done by recording the signal that needs to be measured and playing it back and analysing it at a
later time.
The R&S UPV provides the RECORD function for the purpose of recording the signal. Since the
standard WAV format is used for playback, in principle any recording instrument that creates WAV files
can be used. When recording analog signals the R&S UPV analyzer or a similar high-quality 24 bit A/D
converter should preferably be used, in order to take full advantage of the extensive dynamic response
of the R&S UPV during offline measurements.
Note:
This measurement requires uninterrupted monitoring of the measurement signal over an extended
period of time. When using a multichannel analyzer, which only performs single measurements that are
limited by time, it does not yield meaningful results. RECORD is therefore only available with two-
channel analyzers.
These files are played back for analysis with the aid of the PLAY generator function (Reference), while
the R&S UPV analyzer – connected internally to the generator – executes all the required
measurements one after the other. All available interfaces can be used for this. For instance an analog
measurement signal can be analyzed loss-free via one of the optional R&S UPV digital interfaces
during offline analysis.
The maximum recording time depends on the required format (mono/stereo, 8/16/32 bit), the sampling
rate and the available memory, and can last up to one day (8 bit mono recording at 48 kHz). In the case
of a two channel analog recording with a 22 kHz bandwidth the maximum is three hours.
Note:
Due to considerations of memory space and performance, the smallest possible bandwidth or sampling
rate should be used.
Data partition of the hard disk (D;) or a network drive can be used as the storage location for the WAV
file, and a USB stick can also be used for short files.
In order to synchronize the start of the recording on a certain level (e.g. interference peak), a trigger
system can be activated. A pretrigger optionally also records the events leading up to the trigger event.
The signal is stored unchanged or filtered according to choice. As with all level measurements, a
maximum of three further filter banks with user-definable filters is available in addition to the prefilter,
and can be used to weight and band-limit the signal.
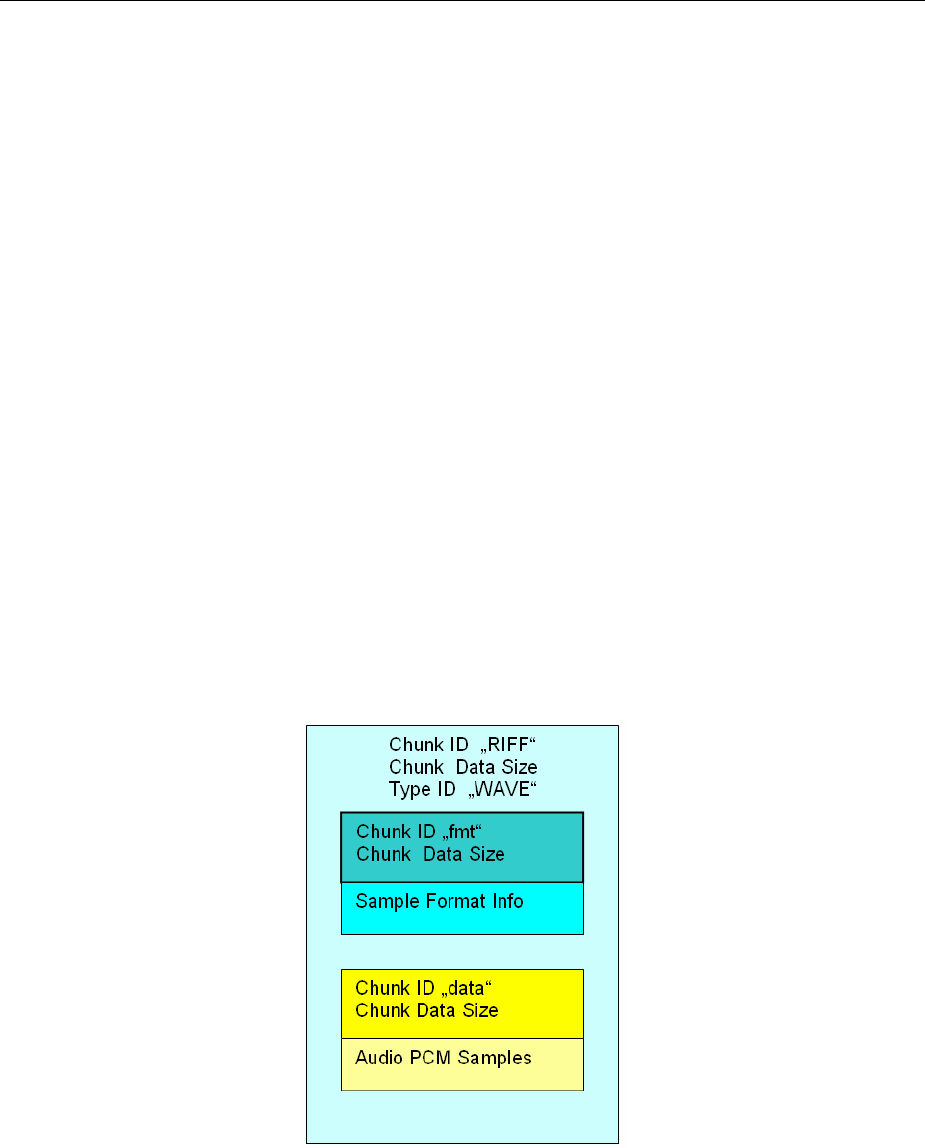
R&S UPV Offline Analysis
1146.2084.32 4.369 E-9
Applications
The following situations or applications call for offline measurement and the use of the Record function:
•The signal to be measured does not occur cyclically or occurs only sporadically.
•The DUT is available for only a short time.
•The intention is to use a single signal to carry out more different measurements than the Audio
Analyzer can carry out simultaneously.
•The signal to be measured needs to be analyzed with the aid of an external diagnostics program.
•The place or time of the measurement value acquisition are not favorable to technical assessment.
Recording Format
Measurement signals can be recorded as WAV files in PCM format at a sampling rate of up to 192 kHz
(digital) or at a bandwidth of 80 kHz (analog)
The WAV format supported during Record and Play is based on the RIFF (Resource Interchange File
Format) specification developed by Microsoft and IBM in 1991. This standard is virtually a container for
all possible multimedia resources such as video, audio, bitmaps or even text in RTF format. RIFF has
meanwhile become an interchange format which is now cross-platform (Windows, Unix/Linux, Mac OS).
This means that the analysis of a PCM coded audio stream acquired with the aid of the R&S UPV is not
limited to tools that will run in Windows. The one thing to be aware of is that some older audio analysis
software supports only the standard WAV format with up to 16 bit resolution.
Recording takes place in standard or extended WAV format, depending on the word width. The
extended format (with 32 bit integer) is necessary in the case of analog signals and in the case of more
than 16 audio bits in the digital analyzer. The R&S UPV automatically determines the smallest possible
format and all header entries on the basis of sampling rate or bandwidth, number of channels (mono or
stereo) and word width (number of audio bits).
Acquisition is in dual-channel mode in the stereo format, but if only one channel is switched on the
system switches automatically to a suitable mono format.

Offline Analysis R&S UPV
1146.2084.32 4.370 E-9
Playback and offline measurement can take place regardless of the word width during acquisition. In
the case of the larger word widths, audio bits that are not present are zero-filled and in the case of the
smaller word widths unused audio bits are rounded. In this way recorded signals (analog or digital) can
be played back and measured via one of the optional digital interfaces (e.g. I²S) with a narrower word
width in order to examine what effect different word widths may have. In the case of stereo acquisitions
the two channels can also be played back and examined individually (mono).
Note:
So that analog signals acquired in dual-channel mode can be played back as stereo signals, either
option R&S UPV-B3 or a digital option must be installed. Otherwise the two channels must be played
back and examined in sequence.
The sampling rate set for the acquisition should also be used on playback. In the analog analyzer and
generator, the set bandwidth implicitly defines the sampling rate:
•Bandwidth 22 kHz: Record / playback with a sampling rate of 48 kHz
•Bandwidth 40 kHz: Record / playback with a sampling rate of 96 kHz
•Bandwidth 80 kHz: Record / playback with a sampling rate of 192 kHz
When the WAV file is loaded, the generator issues an appropriate warning if the generator sampling
rate does not match the sampling rate entered in the WAV file.
Note:
For analog playback of digital signals that have been acquired using a sampling rate that is not suited to
analog (e.g. audio CDs with 44.1 kHz), the generator provides the bandwidth setting "Play Auto". When
this setting is used the generator sampling rate is automatically set to the sampling rate of the WAV file.
Monitoring the Recording
Important signal parameters are measured and displayed during the actual recording. These include:
•Frequency and in some cases the sampling rate
•Peak value at input level (prior to prefilter)
•Peak or RMS value at monitor level (after prefilter)
•RMS value at function level (after the function filters)
In addition the following are displayed so that the signal can be assessed graphically:
•The waveform monitor, continuously, from the start of the Record function to the triggering of
recording,
•The start of the recording, if necessary taking into account the pretrigger, in the time and frequency
domains (waveform monitor and post FFT).
Additional acoustic monitoring of the acquisition is available via the audio monitor.

R&S UPV Offline Analysis
1146.2084.32 4.371 E-9
Recording Modes of the Record Function
Depending on the application, the RECORD function can be for a continuous or single measurement,
and may be either triggered or started manually:
•The recommended method for examining a signal at a later time or with an external analysis
program is manual single recording over a fixed time period.
•To look for a seldom occurring event the most suitable method is triggered single recording,
provided the event is capable of being triggered.
•To analyze sporadically occurring events that can be triggered, the recommended method is
triggered continuous recording.Create a separate file for each trigger event. This then receives
the time stamp of the event concerned.
•To look for interference that cannot be triggered but can certainly be detected by the user
(acoustically or from the measurement values), the method to use is manual continuous
recording:Choose a maximum recording time and stop recording as soon as the event in question
has occurred. The starting time of the acquisition is deferred so that the desired recording time is
not exceeded even if the event takes a very long time to occur.
Acontinuous recording is started in the usual way with the START key, and a single recording is started
with the SINGLE key. Once started, a continuous recording can be terminated at any time with the aid
of the SINGLE key as with a single recording. When the STOP key is used, a continuous recording
must be halted and terminated, whereas a single recording may be halted and terminated in this way.
Note:
After closing a manual continuous recording a short merge procedure is required in order to shorteh the
recording to the desired length. The file is not ready for playback or copying until the relevant message
has disappeared from the status line.
Atriggered continuous recording which deliberately or otherwise has not been stopped keeps writing to
the data medium until it is full. This means that no data is lost except for the last incompletely written
WAV file. However, in order to continue working with the data medium (e.g. to store trace data or
setups), the data medium should be "tidied up" as soon as possible.
Operating the Record Function
In preparation for recording, select any file name from the hard drive or network drive. Short files may
also be stored on a USB stick. The R&S UPV then checks how much storage is available on the
medium and determines the maximum recording time according to the sampling rate or bandwidth, the
number of channels and the word width. You then only need to enter the length of the acquisition and
you can start recording straight away ("Trig Source Manual").
In order to synchronize the start of recording with a particular level, a trigger system can be activated
("Trig Source Channel 1 / Channel 2). In this case the length of an optional pretrigger can also be
specified in addition to the trigger conditions (trigger channel, exceeding or dropping below a selectable
trigger threshold). This makes it possible to record the history of events leading up to the trigger event.
The settings cannot be charged after the recording function has been started. Any user entry or change
of the sampling rate (if “Sample Freq Auto” is enabled) causes recording to stop immediately (the same
as pressing the STOP button). In contrast to online measurements, recording is not restarted
automatically after a user entry. It must be triggered explicitly by the user.
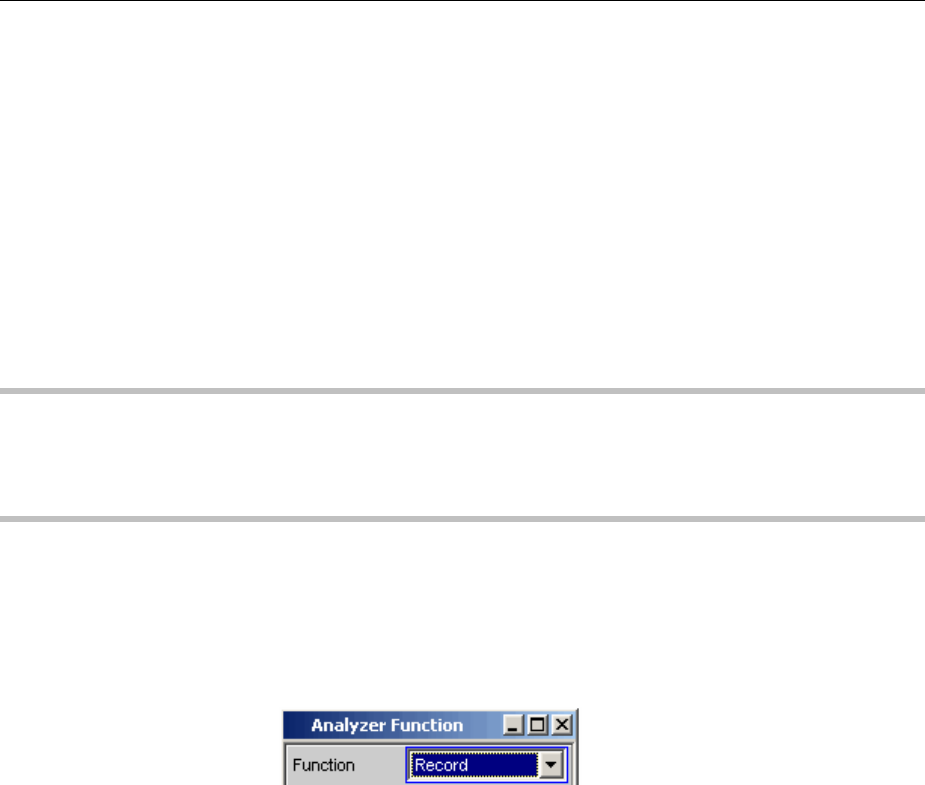
Offline Analysis R&S UPV
1146.2084.32 4.372 E-9
There are one or two restrictions on the permitted settings compared to online measurements. These
are checked when the Record function starts, and an error message is issued if necessary:
•Autoranging is not possible in the analog analyzer. "Range" must be set to "Fix"
•"Auto" must be set as the "Start Condition"; the Record function provides a dedicated trigger system
for triggering.
•Only time triggered automatic sweeps ("dwell sweeps") are permitted in the generator. WAV files for
external sweeps can be created with the aid of of these sweeps (Reference).
•The sampling rate must not exceed 200 kHz, and the bandwidth of the analog analyzer must not be
set to 250 kHz.
•Only one analyzer filter should be enabled at high sampling rates (digital sampling rates greater
than 100 kHz or analog bandwidths greater than 40 kHz).
Note:
Continuous processing of the measured data over a relatively long time is only guaranteed for sampling
rates up to 96 kHz or analog bandwidths up to 40 kHz. If the sampling rate is too high or the bandwidth
is too large, the measurement will be terminated with a suitable error message. If this happens, it may
be necessary to reduce the number of analyzer filters that are being used.
Function
For activating offline analysis by switching the measurement function to
"Record".
The RMS value of the signal is displayed as the result of the
measurement function.
Remote-control command:
SENSe[1]:FUNCtion RECord
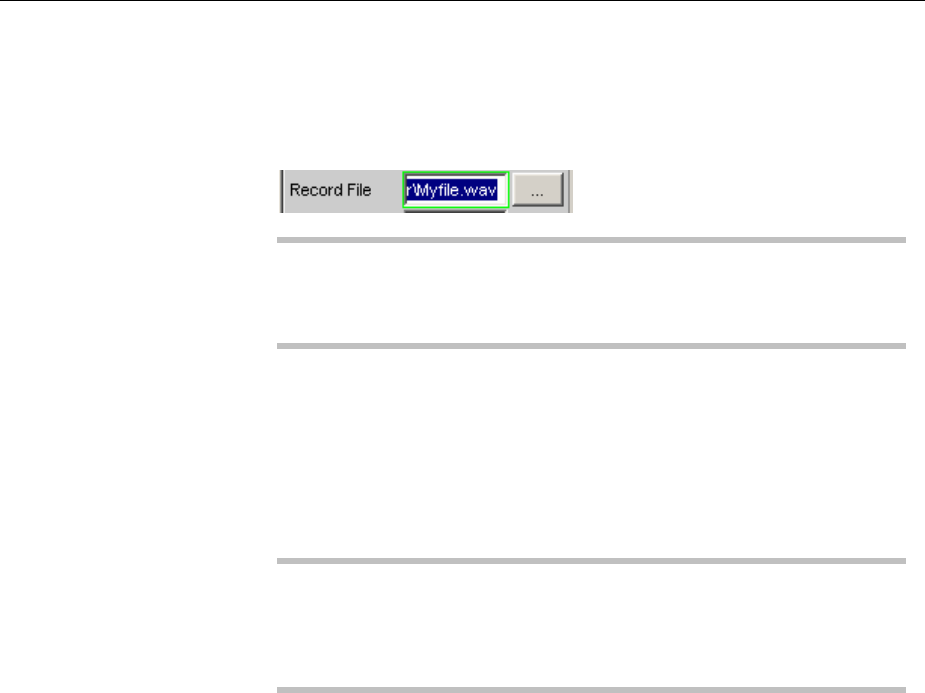
R&S UPV Offline Analysis
1146.2084.32 4.373 E-9
Record File
For entering thedrive, path and file name of the WAV file.
The recommended data medium is the data partition of the hard disk
(default setting "D:\UPV\USER") or a fast network drive (at least 100
Mbits/s). Due to their low transfer rate, USB sticks and USB drives
should be used for short files only.
Note:
When Record and Play are operated simultaneously, you should take
care that the same file is not used. This way of operating is not
actually prohibited, but the results are not usually meaningful.
Once the file name is entered (acquisition does not start yet) a check
is made to see how much storage is available on the data medium. An
existing WAV file having the name you specified is deemed to be free
memory space, since it will be overwritten during recording. The size
of the available storage together with the required formats are used to
compute the maximum possible recording length and this is entered
as the upper limit in the following menu item "Record Length".
Note:
The maximum size of a WAV file is 4 GByte. Only 30 % of the
available storage is provided for a single WAV file. The remainder is
kept free for a second temporary WAV file and for other user files (e.g.
setups, trace data, screenshots).
In the "triggered continuous recording"mode, the file names of the
individual WAV files must be generated automatically. For this the
selected file name is given a numeric name extension which starts at
0and is incremented for each subsequent acquisition. This counter is
only reset when a new file name is entered in "Record File" or you quit
the R&S UPV, in order to avoid inadvertently overwriting the
generated WAV files when starting a new recording.
Remote-control command:
SENSe:FUNCtion:RECord:FILe ’filename’

Offline Analysis R&S UPV
1146.2084.32 4.374 E-9
Record Length
For entering the recording time.
The maximum recording time depends on the following parameters:
•The amount of memory available on the proposed data medium;
around 30 % of the current storage capacity can be used
•The maximum size of a WAV file, being around 4 GByte (232-1
bytes for samples plus header information)
•The number of channels to be acquired (1 or 2)
•The sampling rate (in the analog analyzer this is determined from
the selected bandwidth)
•The word width (8, 16, or 32; always 32 in the analog analyzer)
If these parameters are subsequently changed, the recording time is.
reduced as necessary.
For a dual-channel analog acquisition (22 kHz bandwidth 48 kHz
sampling rate) the maximum time is three hours due to the size
restriction on the WAV files (186.414 min).
Note:
In the case of triggered continuous recording the recording lengths are
summed, as are also the storage requirements of the individual WAV
files, so that in the worst case the data medium becomes completely
filled. It is therefore best to work with only short recording times in this
recording mode.
Remote-control command:
SENSe:FUNCtion:RECord:LENGth <nu>
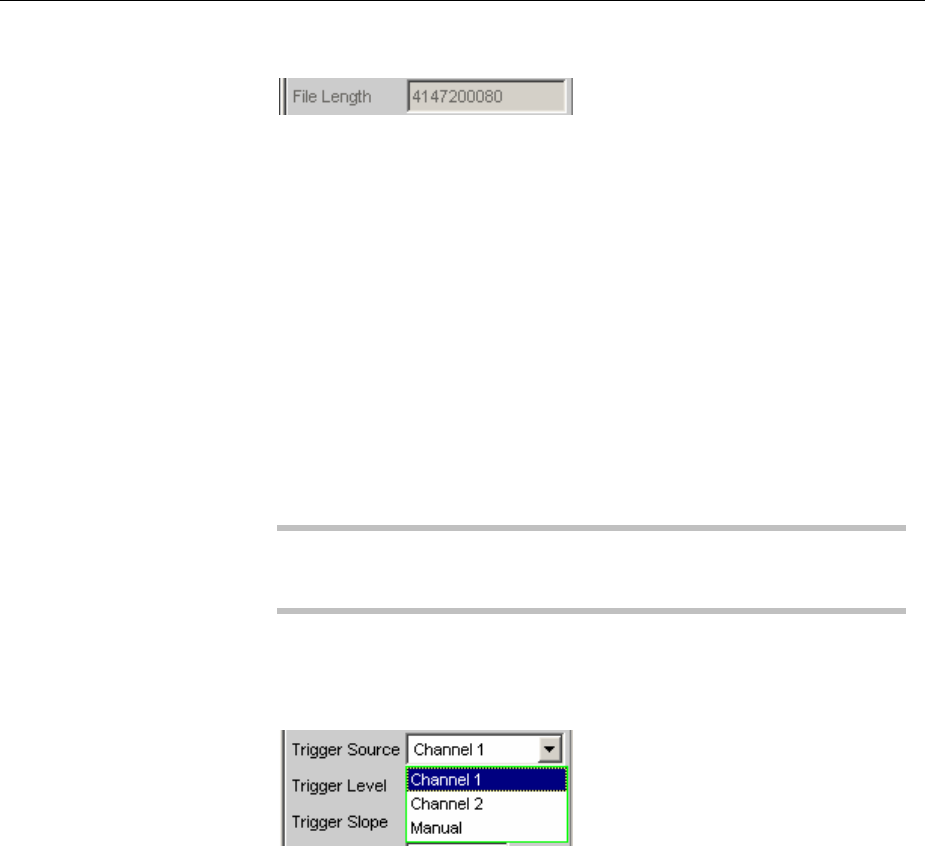
R&S UPV Offline Analysis
1146.2084.32 4.375 E-9
File Length
This displays the file length in bytes
The file length depends on the following parameters:
•The selected recording time
•The number of channels to be acquired (1 or 2)
•The sampling rate (in the analog analyzer this is determined from
the selected bandwidth)
•The word width (8, 16, or 32; always 32 in the analog analyzer)
In the case of maximum recording time and sufficient storage capacity
this comes to 4 GByte.
In triggered continuous recording mode the number specified here
is the length of each individual file. The total storage needed for this
operating mode is therefore n times greater.
Note:
If recording is terminated prematurely, the actual length of the WAV
file is correspondingly less.
Trigger Source
For activating / deactivating the Record trigger system and selecting
the trigger source.
Selects the source which is intended to trigger recording on exceeding
or dropping below the trigger level.
Channel 1 For activating the Record trigger system;
measurement channel 1 triggers recording.
Only selectable if measurement channel 1 is
switched on (or both channels).
Remote-control command:
SENSe:FUNCtion:RECord:TRIGger:SOURce
CH1
Channel 2 For activating the Record trigger system;
measurement channel 2 triggers recording.
Only selectable if measurement channel 2 is
switched on (or both channels).
Remote-control command:
SENSe:FUNCtion:RECord:TRIGger:SOURce
CH2
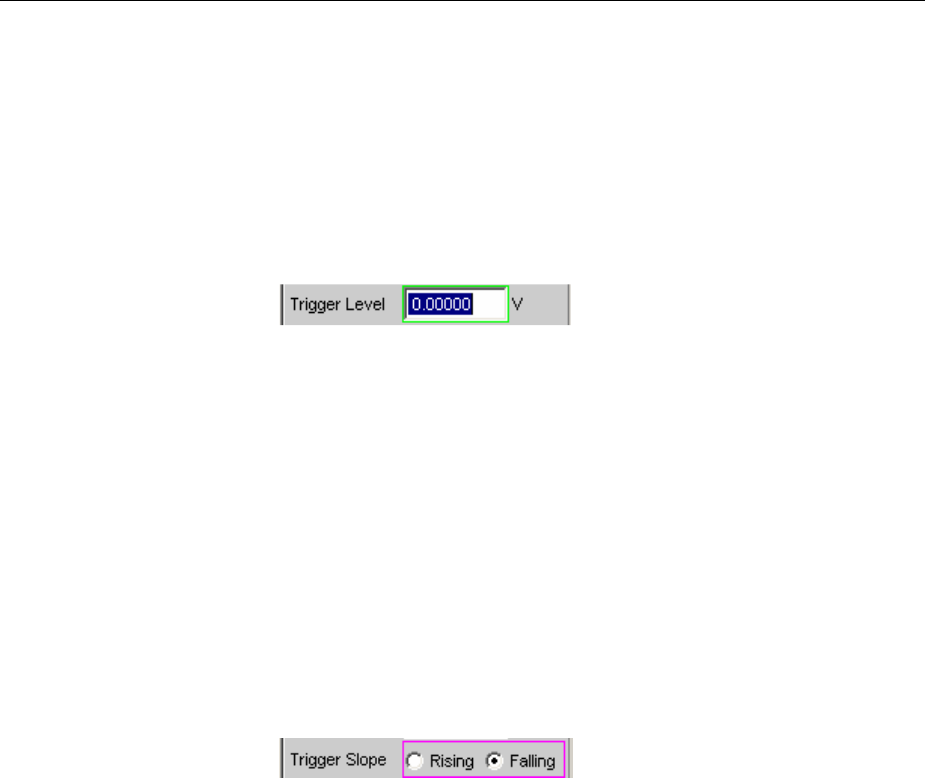
Offline Analysis R&S UPV
1146.2084.32 4.376 E-9
Manual For deactivating the Record trigger system;
recording starts immediately the Record function
starts.
Remote-control command:
SENSe:FUNCtion:RECord:TRIGger:SOURce
MANual
Trigger Level
For entering the trigger threshold; appears only when the trigger
system is active.
Depending on the trigger slope, recording is triggered on exceeding
this level threshold (Trigger Slope Rising) or dropping below it (Trigger
Slope Falling).
Once the Record function has started or (in triggered continuous
recording mode) once the old recording has ended, a new recording
is only alerted (armed) again if at least one sample is below the trigger
threshold (for Trigger Slope Rising) or above the trigger threshold (for
Trigger Slope Falling).
Remote-control command:
SENSe:FUNCtion:RECord:TRIGger:LEVel <nu>
Trigger Slope
For selecting the signal edge on which it is intended triggering shall
take place (Trigger Slope); appears only when the trigger system is
active.
Rising Triggering takes place when the level on the
measurement channel selected as the trigger
source first exceeds the trigger threshold.
Arming takes place again as soon as a level below
the trigger threshold occurs.
Remote-control command:
SENSe:FUNCtion:RECord:TRIGger:SLOPe
RISing
Falling Triggering takes place when the level on the
measurement channel selected as the trigger
source first falls below the trigger threshold.
Arming takes place again as soon as a level above
the trigger threshold occurs.
Remote-control command:
SENSe:FUNCtion:RECord:TRIGger:SLOPe
FALLing
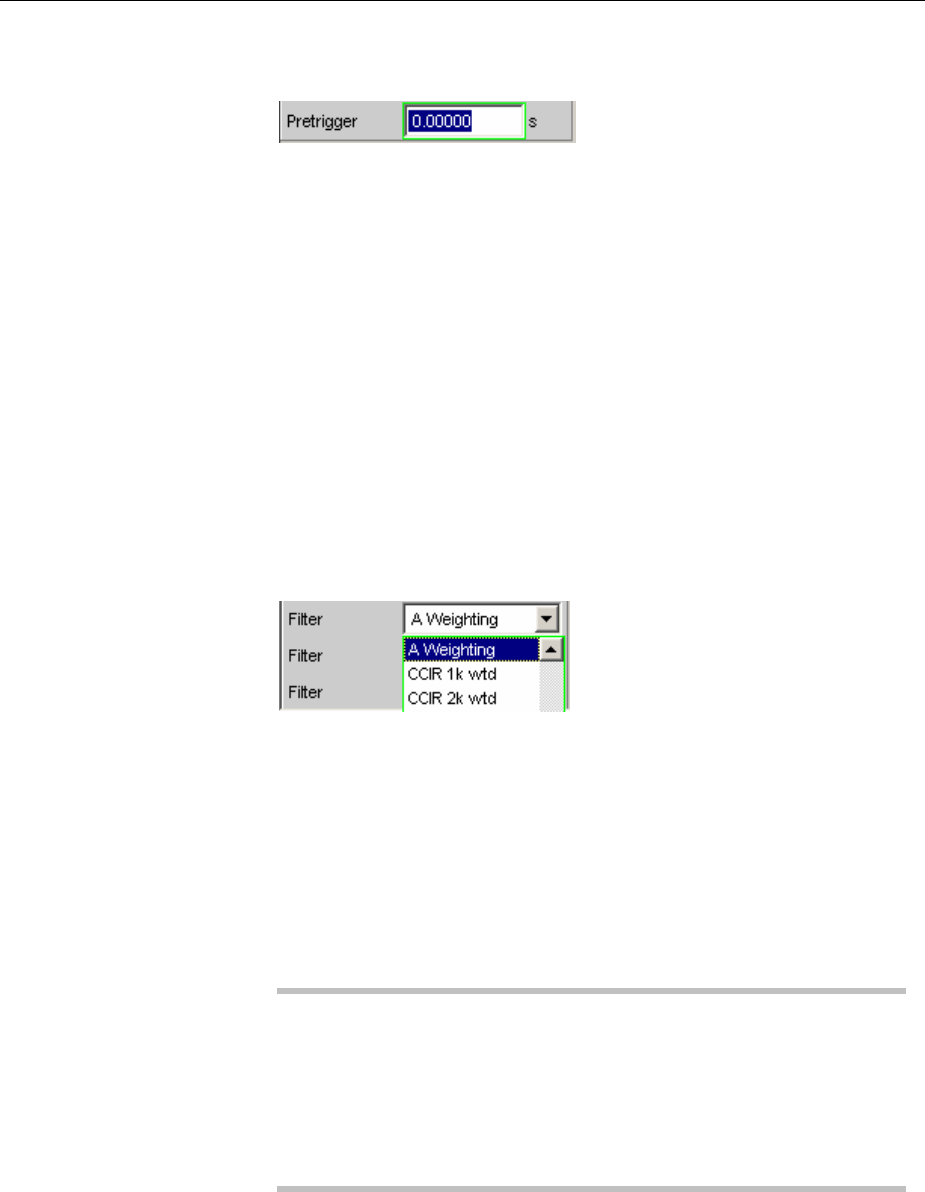
R&S UPV Offline Analysis
1146.2084.32 4.377 E-9
Pretrigger
For activating / deactivating the pretrigger and entering the pretrigger
interval in seconds.
The pretrigger is deactivated by entering a pretrigger time of 0.0 s.
Specifying a pretrigger time shifts the instant of triggering within the
selected recording time; the total recording time stays unchanged.
The size of the pretrigger memory is 19200 samples, which is
therefore 100 to 400 ms depending on the sampling rate.
When the waveform monitor is on, the pretrigger time is visible as a
negative time segment of the time axis.
Remote-control command:
SENSe:FUNCtion:RECord:TRIGger:PRE <nu>
Filter
For activating a digital filter in the acquisition data stream.
Up to three user-defined or weighting filters can be looped into the
acquisition data stream in order to apply a weighting to the acquired
samples or to carry out band limiting.
If the intention is to acquire the samples as raw data, all three filters
and the prefilter (in the "Analyzer Config" panel) must be off. Filtering
can then take place during offline measurement.
The user-definable filters are configured as filters 01 to 09 in the filter
panel (see section "User-Definable Filters" on page 4.420) and can
then be used (repeatedly if necessary) in the analyzer.
The selectable weighting filters are described in section "Weighting
Filters" on page 4.428.
Note:
Regardless of the digital filters selected here, a further input filter
("prefilter") can be looped into the acquisition data stream. Moreover
the analog bandwidth can be restricted with the aid of the "Bandwidth"
parameter field, which corresponds to an additional low pass filter.
Due to considerations of memory space and performance, the Record
function should always be operated using the smallest possible
bandwidth.
Remote-control command:
SENSe[1]:FILTer[1] <parameter>
SENSe[1]:FILTer2 <parameter>
SENSe[1]:FILTer3 <parameter>
For a <parameter> list see section "Filter Table" on page 4.419.
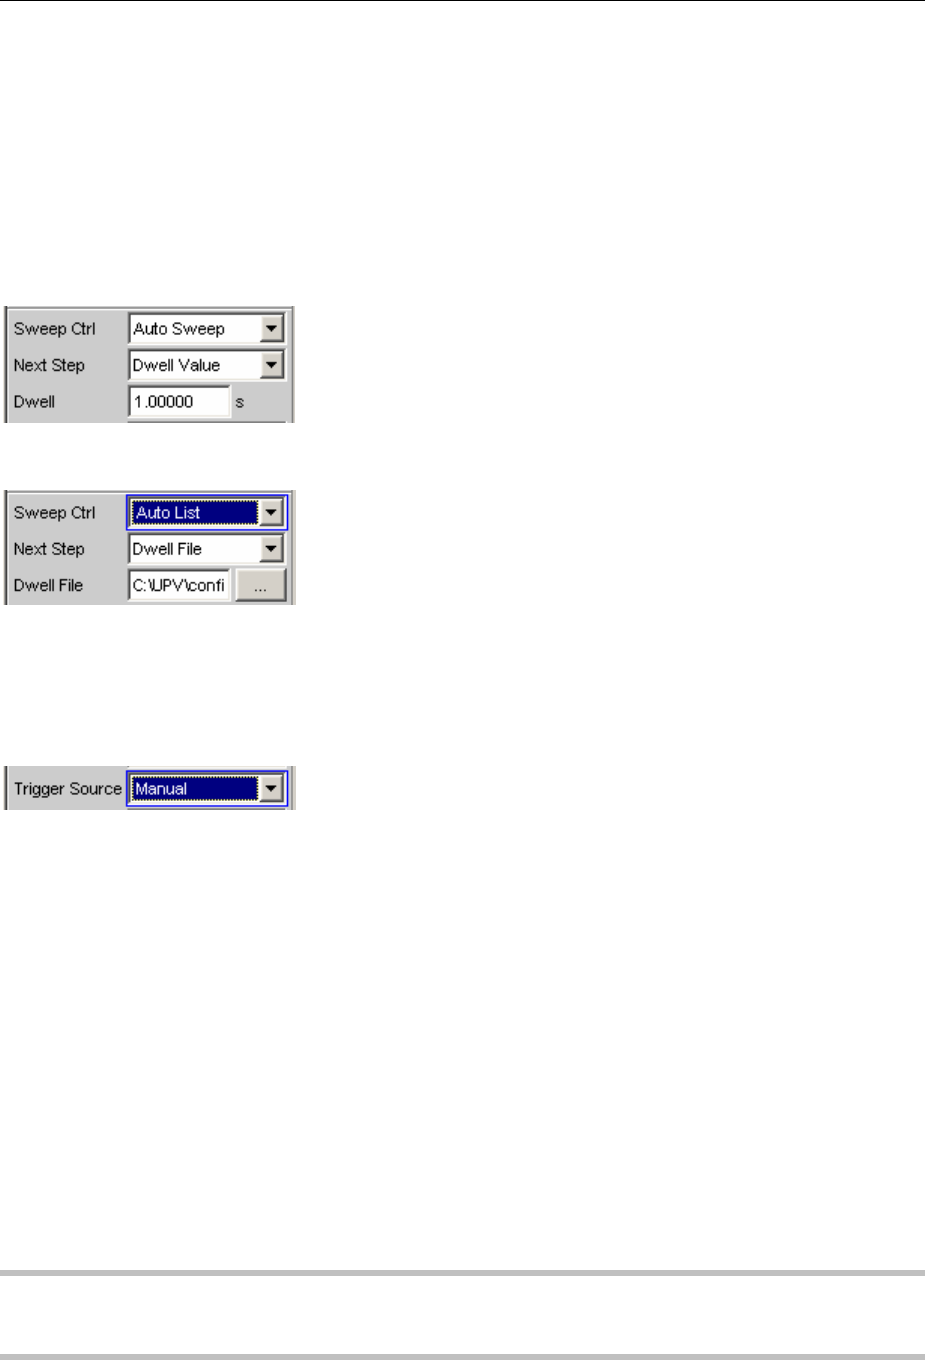
Offline Analysis R&S UPV
1146.2084.32 4.378 E-9
Creating WAV Files for External Sweeps
When there is an internal connection between the generator and the analyzer, the Record function can
be used in conjunction with the internal generator to create WAV files for external sweeps. This should
preferably take place in a digital domain (via a digital audio or I²S interface), because then any format
can be generated (8 or 16 bit standard, 32 bit extended) using any sampling rate (e.g. 44.1 kHz) without
the need for D/A and A/D conversion. In fact even an analog interface is suitable if need be, for instance
if there is no digital option installed; but then only the 32 bit extended format can be generated.
Select the desired signal form from the generator and activate a time triggered automatic sweep,
or a list sweep.
The sweep can be one-dimensional or two-dimensional (z sweep); the dwell time may be specified as a
constant value or with the aid of a dwell list.
The Record function should be set as an untriggered single or continuous recording; a triggered (single)
recording is also allowed.
If you wish filters to be used, you may switch them on in the generator or analyzer.
Using the START key begins a continuous sweep in the generator at the same time as the untriggered
single recording in the analyzer. When the set recording time is reached, acquisition stops and the
generator sweep keeps running unchanged until halted by the STOP key or, in the case of two-
dimensional sweeps, until the z axis has been processed.
Using the SINGLE key starts a single sweep in the generator at the same time as the untriggered single
recording in the analyzer. If the set recording time is shorter than the sweep time, acquisition stops and
the generator sweep keeps running until the end of the sweep. If the sweep ends before the set
recording time is reached, recording is also stopped (prematurely).
Using the STOP key halts the sweep and the recording immediately in all cases.
In order to create a WAV file containing exactly one sweep scan, "Record Length" should be set to the
maximum value and a single sweep should then be started with the SINGLE key. If a two-dimensional
sweep needs to be recorded, the START key should be used.
Note:
The special mode "triggered continuous measurement" is not useful and is therefore not to be used;
instead the trigger system should be activated so that a normal single recording can be triggered.
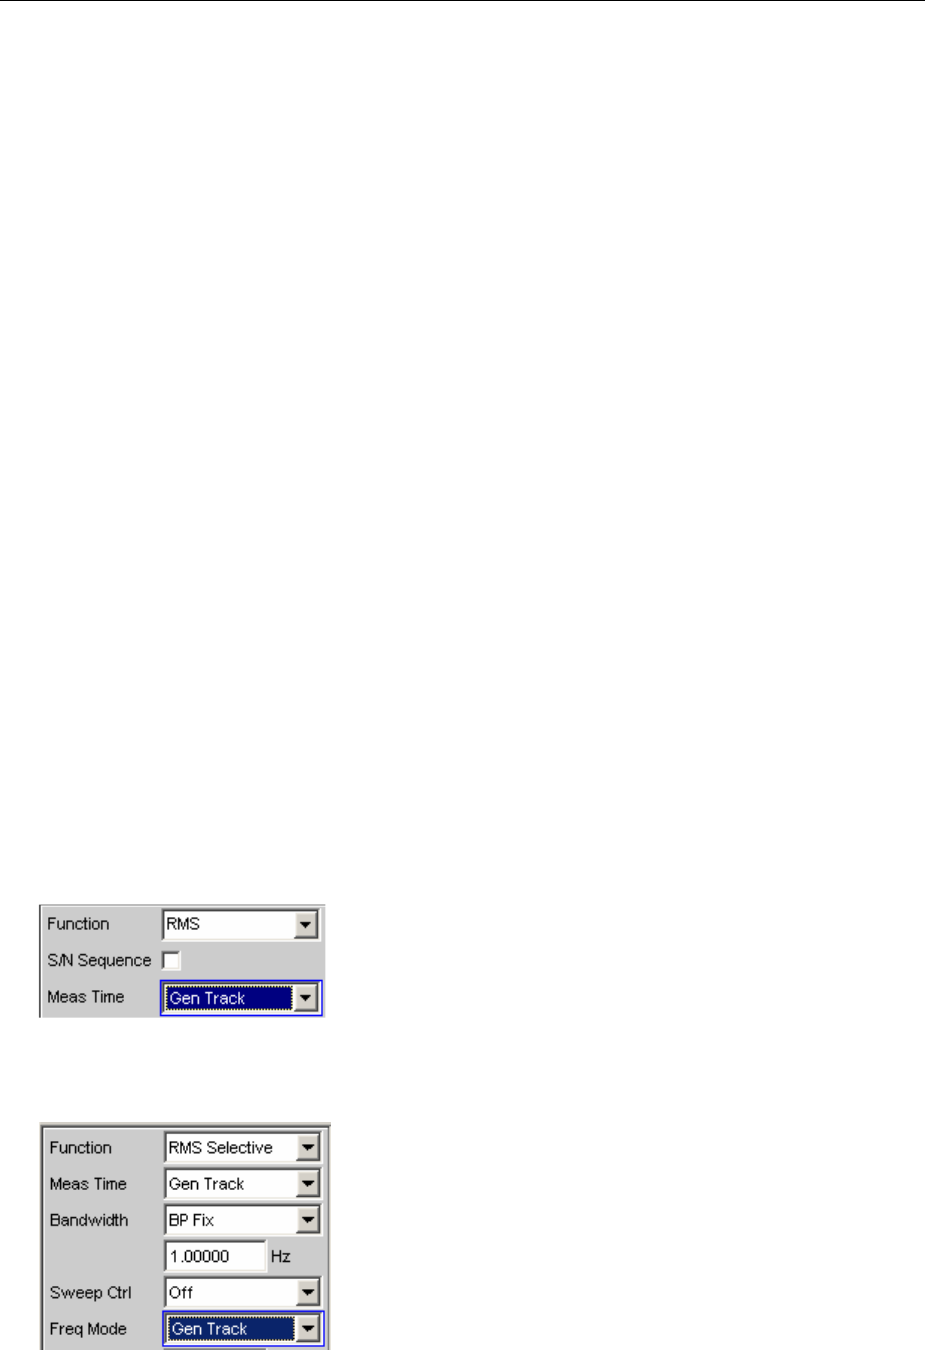
R&S UPV Infrasound Measurements
1146.2084.32 4.379 E-9
Infrasound Measurements
“Infrasound” refers to the frequency range extending from the lower limit of the human auditory range
(16 Hz) down to the low millihertz region.
Although the R&S UPV is primarily designed for use in the audible frequency range, it can work with
frequencies much lower than 10 Hz (i.e. generate and acquire such signals for measurement). It is
recommended that the R&S UPV-K6 option (Extended Analysis Functions) is installed in order to take
full advantage of the infrasound functionality of the R&S UPV.
Infrasound Signals
The following types of signals can be used for simulations in the infrasound range:
•Multisine for frequencies down to 1 Hz, with a frequency resolution of 1 Hz
•Sine for frequencies down to 100 mHz, or down to 10 mHz if the R&S UPV-K6 option (Extended
Analysis Functions) is installed.
•Stereo Sine for frequencies down to 100 mHz, or down to 10 mHz if the R&S UPV-K6 option
(Extended Analysis Functions) is installed.
These signals can be output via any desired digital or analog interface.
Infrasound Analysis
The measurement options with infrasound are limited to the following types of measurements:
•RMS measurement (wideband, without S/N sequencer) with a fixed measurement time or generator
tracking
•RMS measurement (selective with fixed bandwidth) with fixed measurement time or generator
tracking down to a sampling rate / 48000 (limited to 1 Hz).

Infrasound Measurements R&S UPV
1146.2084.32 4.380 E-9
•Waveform display (recommended operating mode: “Undersample”)
•Frequency measurement (the “Precision” measuring mode is only available if the R&S UPV-K6
option is installed and “Undersample FFT” is enabled)
The frequency resolution can be increased considerably by undersampling if the R&S UPV-K6 option
(Extended Analysis Functions) is installed. In this case, the following types of measurements are also
possible:
•FFT in the ‘Undersample” operating mode
•Phase measurement (only if ‘Undersample FFT” is enabled)
•Level monitor measurements (only if ‘Undersample FFT” is enabled)
•Input peak measurement (only if ‘Undersample FFT” is enabled)
The automatic operating modes, which are optimized for the audible frequency range, cannot be used
for analyzing infrasonic signals, Consequently, the following restrictions must be observed:
•Analog analyzer: The autoranger must be switched off, the input coupling must be set to DC, and
the smallest possible bandwidth should be selected.
•RMS measurement: The only modes that can be used for “Meas Time” are “Gentrack” and
“Value.” The longest measurement time is 100 s, which means that signals as low as 10 mHz can
be captured.
Undersampling can be used to visualize extremely low-frequency signals in an FFT and distinguish
them from DC. With undersampling, the compression factor can either be entered directly (in which
case it is automatically rounded to the nearest power of 2) or set by entering the desired FFT
bandwidth. If the FFT bandwidth is entered, the compression factor is calculated automatically from the
FFT bandwidth. The following aspects must always be taken into account when selecting the
compression factor:
•The measurement bandwidth is decreased by the selected compression factor.
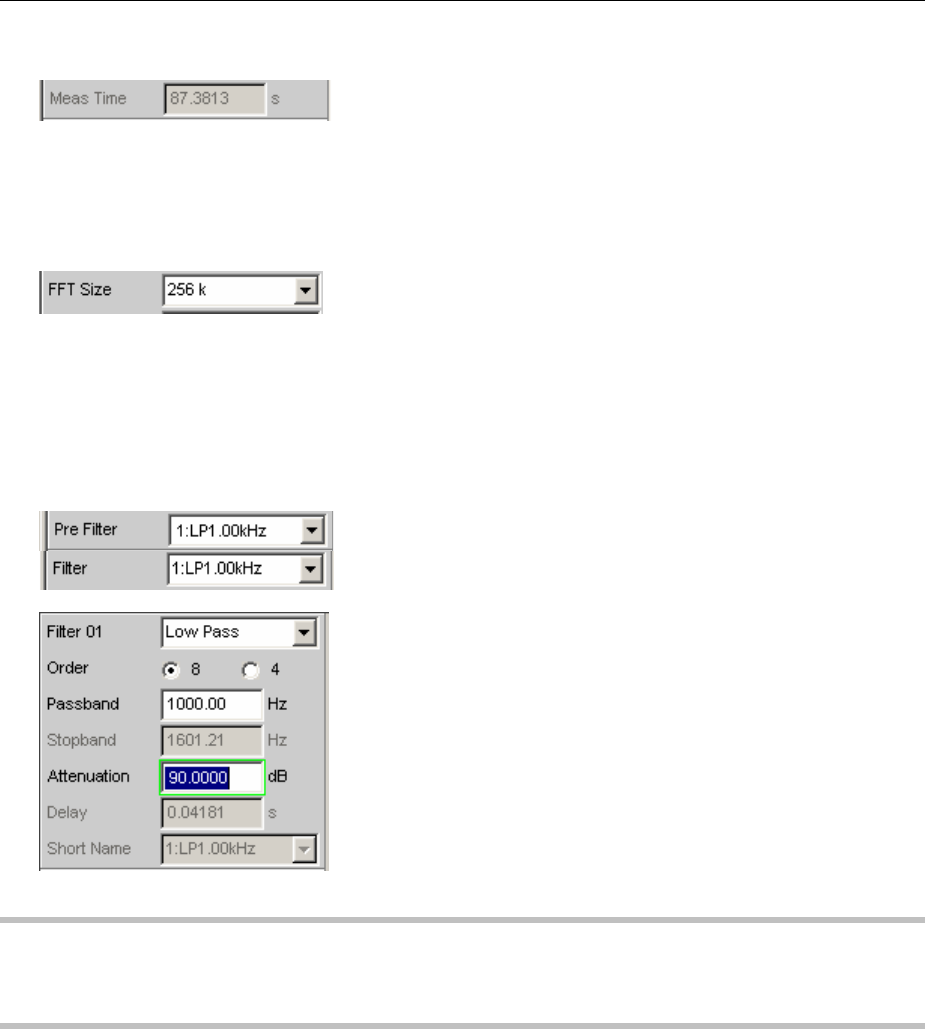
R&S UPV Infrasound Measurements
1146.2084.32 4.381 E-9
•The measurement time is increased by the selected compression factor.
•The FFT size should be as large as possible. For a given frequency resolution, reducing the FFT
size causes the compression factor to increase, which unnecessarily limits the FFT bandwidth.
Although the computation time is somewhat less with a smaller FFT size, this is far more than offset
by the increased sampling time.
•High-frequency signal components (outside the selected FFT bandwidth) will be visible in the
observed frequency band as image frequencies. Consequently, it is necessary to use a suitable
low-pass filter with a cutoff frequency that adequately suppresses signal components outside the
selected FFT bandwidth. It can be configured as an input filter or as a function filter selected from
the FFT menu. If the analog analyzer is used, it is of course also possible to use an external analog
filter.
Note:
If the low-pass filter is configured as a prefilter, it also affects the level monitor and fast frequency
measurements. If it is configured as a function filter, it only affects the FFT and waveform displays and
precision frequency measurements.
Bearing these aspects in mind, the compression factor or FFT bandwidth (span) should be dimensioned
according to the signal components to be examined, as follows:
•Generally speaking, the compression factor should be as small as possible in order to minimize the
measurement time.
•The FFT size should be set to 256 K.
•The compression factor must be large enough to allow the signal components under investigation
to be visualized with sufficient frequency resolution.
•The FFT bandwidth must be large enough to acquire the highest frequencies under investigation.
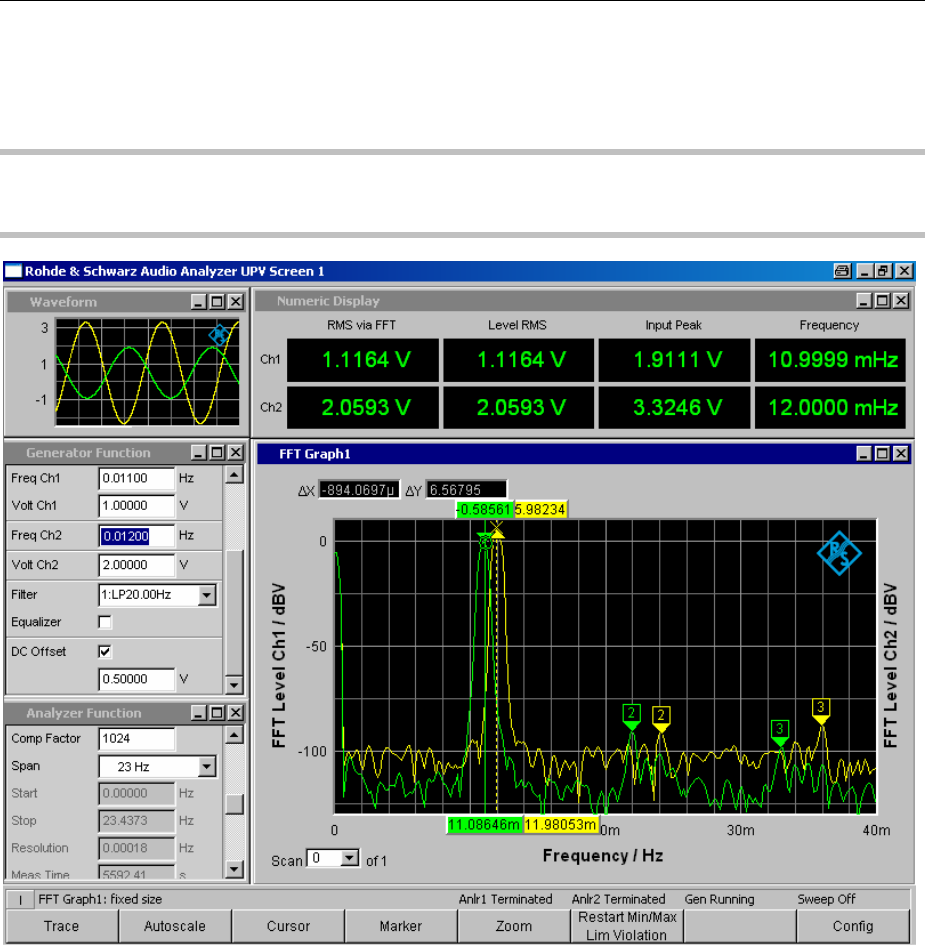
Infrasound Measurements R&S UPV
1146.2084.32 4.382 E-9
The following sample measurement of a stereo signal with offset shows the maximum frequency
resolution that can be achieved in the analog domain (0.18 mHz). The measurement time is approx.
93 minutes. After the measurement data has been recorded, the graphic zoom function can be used to
examine selected regions of the 256 K FFT (e.g. the range of 0 to 40 mHz as shown in the example).
Note:
The measurements described here should be performed as single measurements due to their long
measurement times.

R&S UPV Protocol Analysis
1146.2084.32 4.383 E-9
Protocol Analysis
In order for it to be possible to select protocol analysis from the Digital Audio instrument, the options
R&S UPV-B2 (digital audio I/O 192 kHz) and R&S UPV-K21 (digital audio protocol) must be installed;
the R&S UPV-K21 option cannot be used if the R&S UPV-B20 option is installed.
The Digital Audio interface can be used not only to analyze the audio data content of both channels, but
also at the same time to decode the channel-status information and display transmission errors by
means of error flags.
Activating and Configuring the Protocol Analysis
The protocol analysis is configured in the Analyzer Function panel. The channel-status information and
error flags are displayed in a separate window known as the "Dig Analyzer Protocol" window. This
window can be opened via the main menu (at "Displays") or from the "Analyzer Function" panel.
Prot Analysis
For activating the protocol analyzer.
Click the Show button to open the "Dig Analyzer Protocol" window.
You can close the window, as with any other, by means of the CLOSE
button or by clicking on the X button in the title bar.
The protocol analyzer is off.
This setting is recommended for increasing the
measurement speed (e.g. in the case of sweeps or
in remote-control mode), if protocol data is not
currently needed.
The current channel-status information is frozen
when this feature is switched off.
Remote-control command:
SENSe8:FUNCtion OFF
The protocol analyzer is on. The parameter fields
shown above are displayed.
The channel-status information is read out from
both channels at the end of a single measurement.
When a continuous measurement is running the
channels are read in sequence, that is, only one
channel is updated each measurement cycle.

Protocol Analysis R&S UPV
1146.2084.32 4.384 E-9
Note:
The internal hardware determines the channel-
status information for channels 1 and 2 on a
sequential basis only. This information is therefore
available only after 2*192 samples at the earliest. A
single measurement must therefore capture at least
384 samples, which can lengthen the measurement
time during fast measurements.
Remote-control command:
SENSe8:FUNCtion ON
Display Mode
For selecting the display format of the channel-status information.
Depending on the format bit (bit #0 of the channel-status bits), the
following bit fields have a different meaning. This menu item defines
whether the channel-status information is interpreted according to the
Consumer format or the Professional format.
Automatic The channel-status bits are interpreted in the format
specified by bit #0.If this bit changes, the format is
changed automatically to the correct one.
Remote-control command:
SENSe8:PROTocol:MODE AUTomatic
Consumer The channel-status bits are always interpreted in
Consumer format in accordance with the IEC
60958-3 standard regardless of the state of bit #0.
This avoids the possibility that a bit error in bit #0
might cause the display format to switch over.
Remote-control command:
SENSe8:PROTocol:MODE CONSumer
Professional The channel-status bits are always interpreted in
Professional format in accordance with the IEC
60958-4 standard regardless of the state of bit #0.
This avoids the possibility that a bit error in bit #0
might cause the display format to switch over.
Remote-control command:
SENSe8:PROTocol:MODE PROFessional
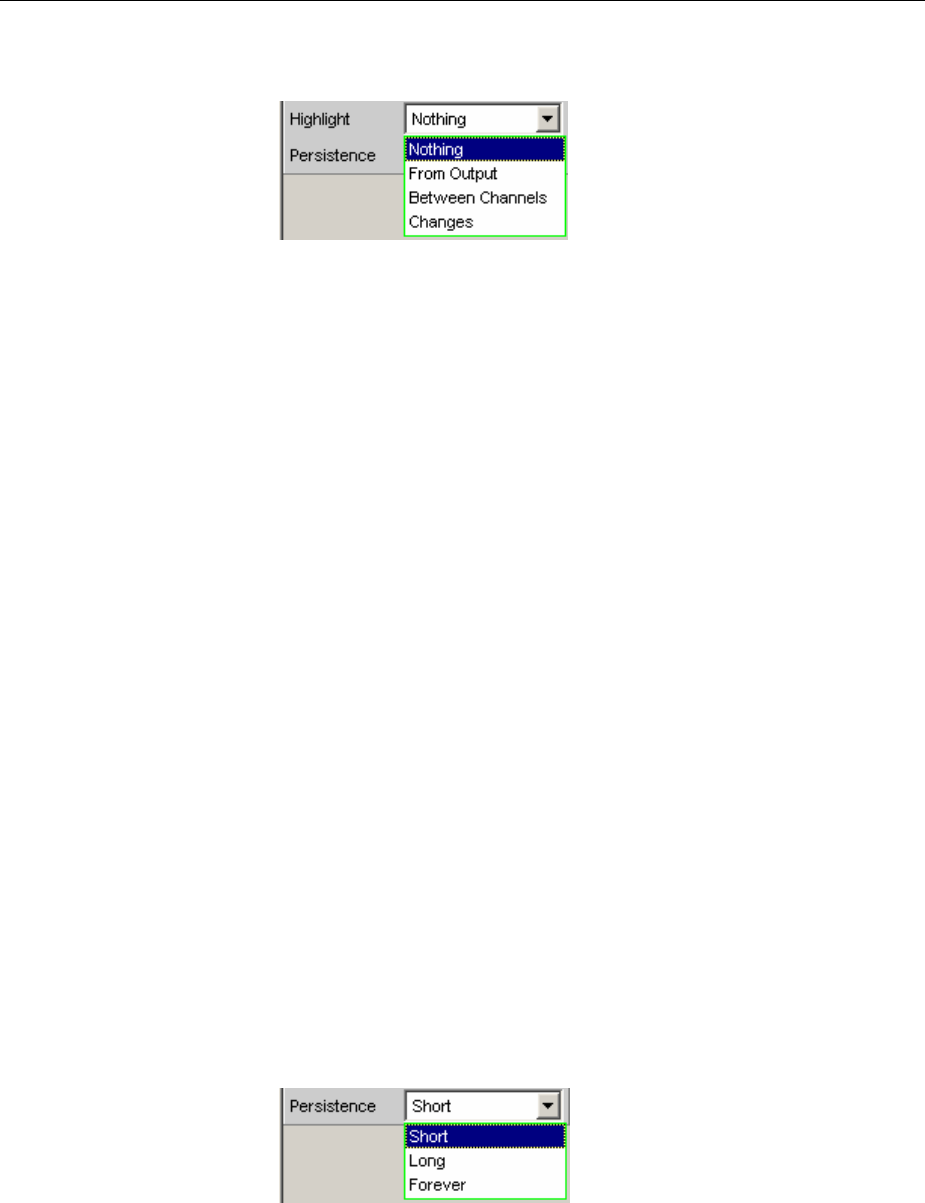
R&S UPV Protocol Analysis
1146.2084.32 4.385 E-9
Highlight
For defining whether and if so when channel-status information is to
behighlighted.
Highlighted channel-status information is displayed in red instead of
black.
Nothing Channel-status information is not highlighted.
Remote-control command:
SENSe8:PROTocol:HIGHlight NOTHing
From Output Changes compared to the channel-status
information generated by the R&S UPV generator
are highlighted.
This setting is only worthwhile when the internal
generator is used and channel-status information is
being generated.
Remote-control command:
SENSe8:PROTocol:HIGHlight FOUTput
Between
Channels
Differences between the two channels are
highlighted. The differences are displayed on both
channels.
Remote-control command:
SENSe8:PROTocol:HIGHlight BETWeen
Changes This is for highlighting all changes since the start of
the measurement, that is, since the START key was
last used.
Remote-control command:
SENSe8:PROTocol:HIGHlight FSTart
Persistence
For defining how long a highlight should stay.
Regardless of the setting selected here, all highlighting is reset when
the START key is used.
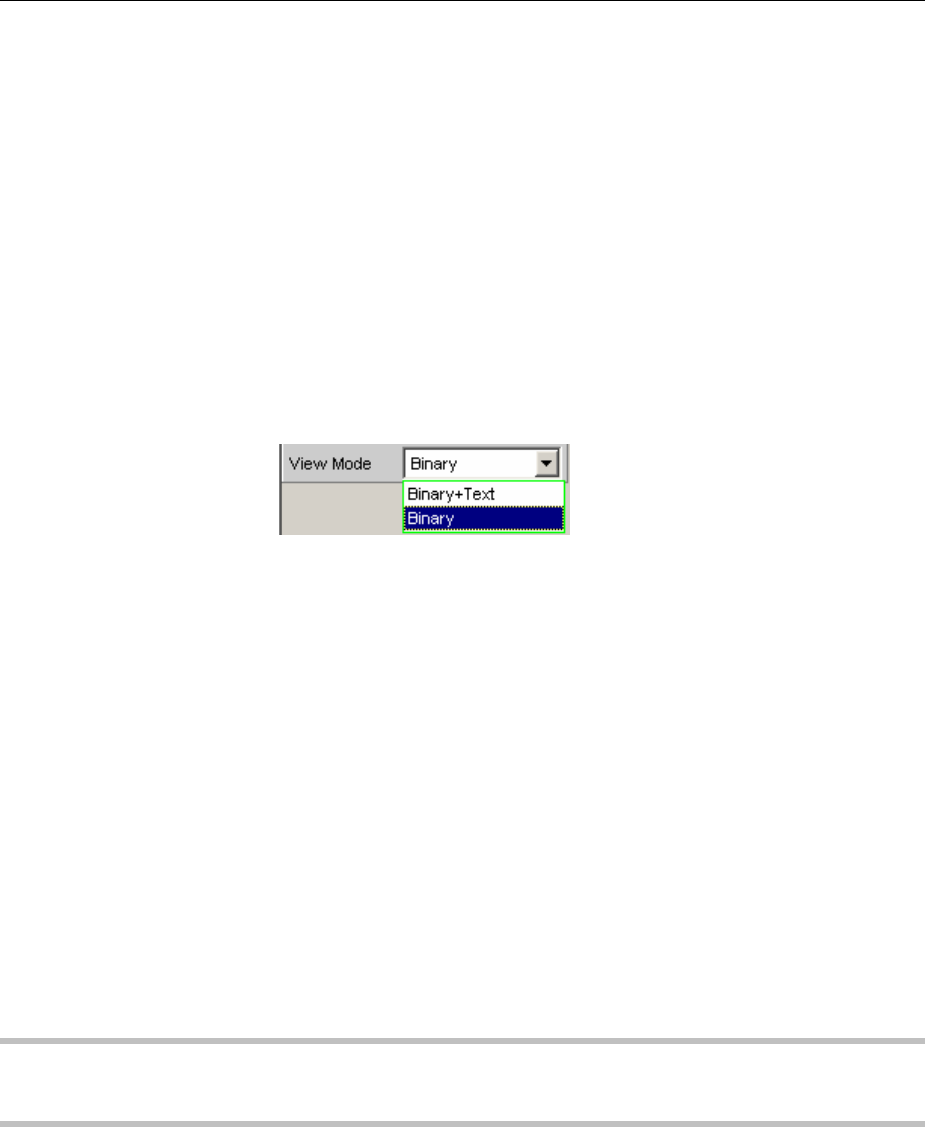
Protocol Analysis R&S UPV
1146.2084.32 4.386 E-9
Short Highlighting is only brief and is reset after one
second.
Remote-control command:
SENSe8:PROTocol:PERSistence SHORt
Long Highlighting is reset after five seconds.
Remote-control command:
SENSe8:PROTocol:PERSistence LONG
Forever Highlighting is never reset.
Remote-control command:
SENSe8:PROTocol:PERSistence FORever
View Mode
For defining how the channel-status information should appear.
Binary+Text The bit fields are displayed both as binary values
(MSB first) and in plain text.
Remote-control command:
SENSe8:PROTocol:VIEW BINT
Binary The bit fields are displayed only as binary values
(MSB first). This reduces the space required by the
"Dig Analyzer Protocol" window.
Remote-control command:
SENSe8:PROTocol:VIEW BIN
Channel-Status Information Display
The R&S UPV decodes the first five bytes of each channel and displays the current information from the
individual bit fields in a readable form for both channels in the "Dig Analyzer Protocol" window.
Note:
Channel information is always decoded and displayed for both channels, regardless of whether only
one or both audio channels are being measured.
There are two different formats, defined by the value of the first bit:
•The format for general use (Consumer format); bit #0 = 0
•The format for Professional use (Professional format); bit #0 = 1
In the Automatic display mode the correct format (Consumer or Professional) is set for each channel
according to its format bit, so that even data streams with a different format in channels 1 and 2 can be
displayed.
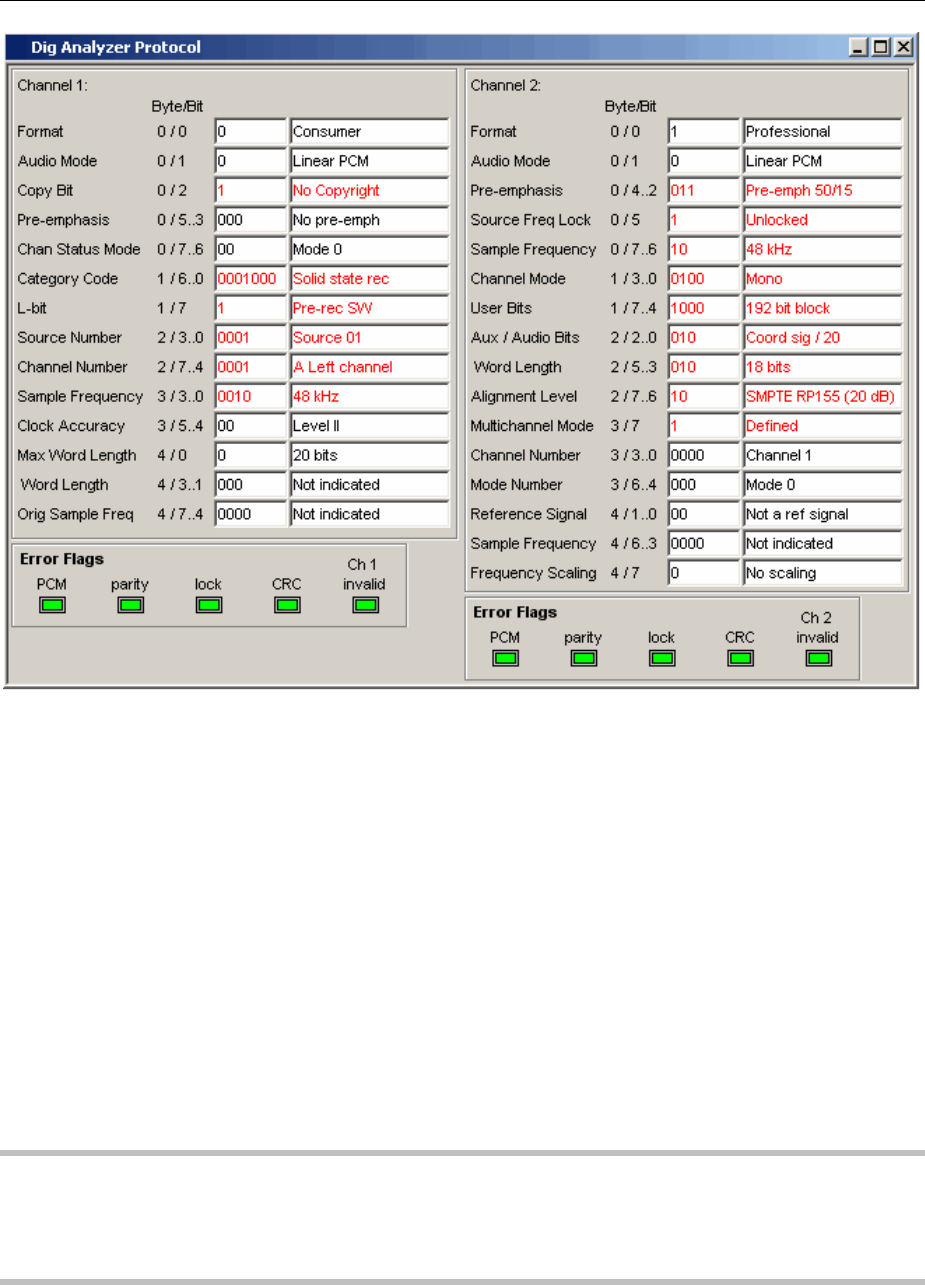
R&S UPV Protocol Analysis
1146.2084.32 4.387 E-9
When the format is predefined the meaning of the individual bit fields, as well as the interpretation of the
content and even of the position and length of the bit fields depend on other, preceding bit fields. These
formats are continually being developed by the IEC standardization committee, for which reason new
and previously reserved bit combinations are added. The "Dig Analyzer Protocol" window can be
upgraded to the latest state with the aid of updates to the R&S UPV software.
The values and meanings currently available for a bit field can be found in IEC standard 60958-3
(Consumer Applications) or IEC 60958-4 (Professional Applications), or the "Protocol Generator" panel.
Error Flag Display
In addition to channel-status information, the "Dig Analyzer Protocol" window also displays the error
flags which indicate errors in the data stream. When an error occurs the color of the "LED" changes
from green to red. As soon as the error disappears the "LED" goes back to green.
Note:
Just as with the channel-status information, the error flags are read at the end of a measurement cycle.
The error flag update rate therefore depends on the measurement time of the function that has been
set. In the case of single measurement the status read at the end of the measurement stays unchanged
until a new measurement has started and finished.
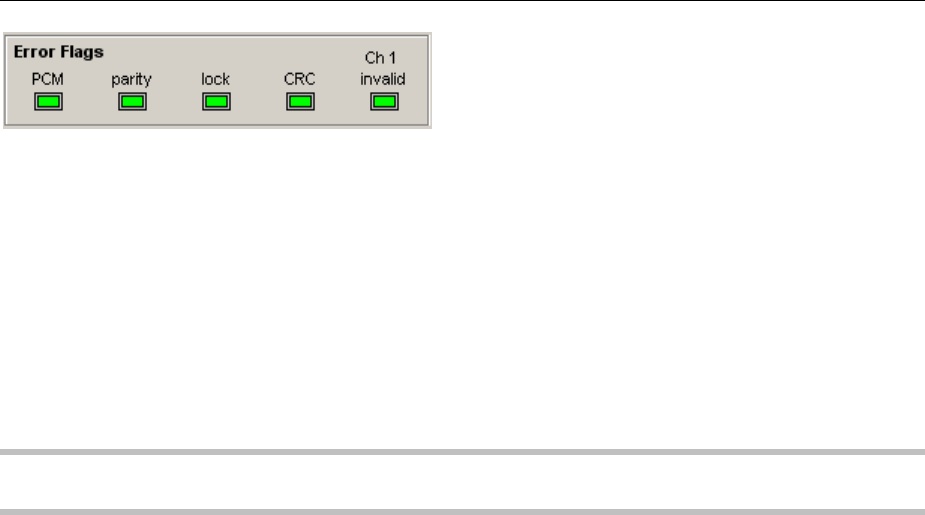
Protocol Analysis R&S UPV
1146.2084.32 4.388 E-9
•"PCM" indicates whether the signal is Linear PCM-coded (green) or not (red). This error flag
corresponds to audio mode (bit #1 of the channel-status data).
•"parity" indicates whether parity checking has detected an error (red).
•"lock" indicates whether a valid digital signal is present (green); if the DUT delivers no clock or the
input is open, "lock" ist red.
•"CRC" indicates that CRC checking has detected an error (red).
•"CH1 invalid" or "CH2 invalid" indicates the status of the validity bit in the protocol. Red means that
the corresponding channel is invalid.
Note:
All error flags will be set (red) if a Lock error occurs.
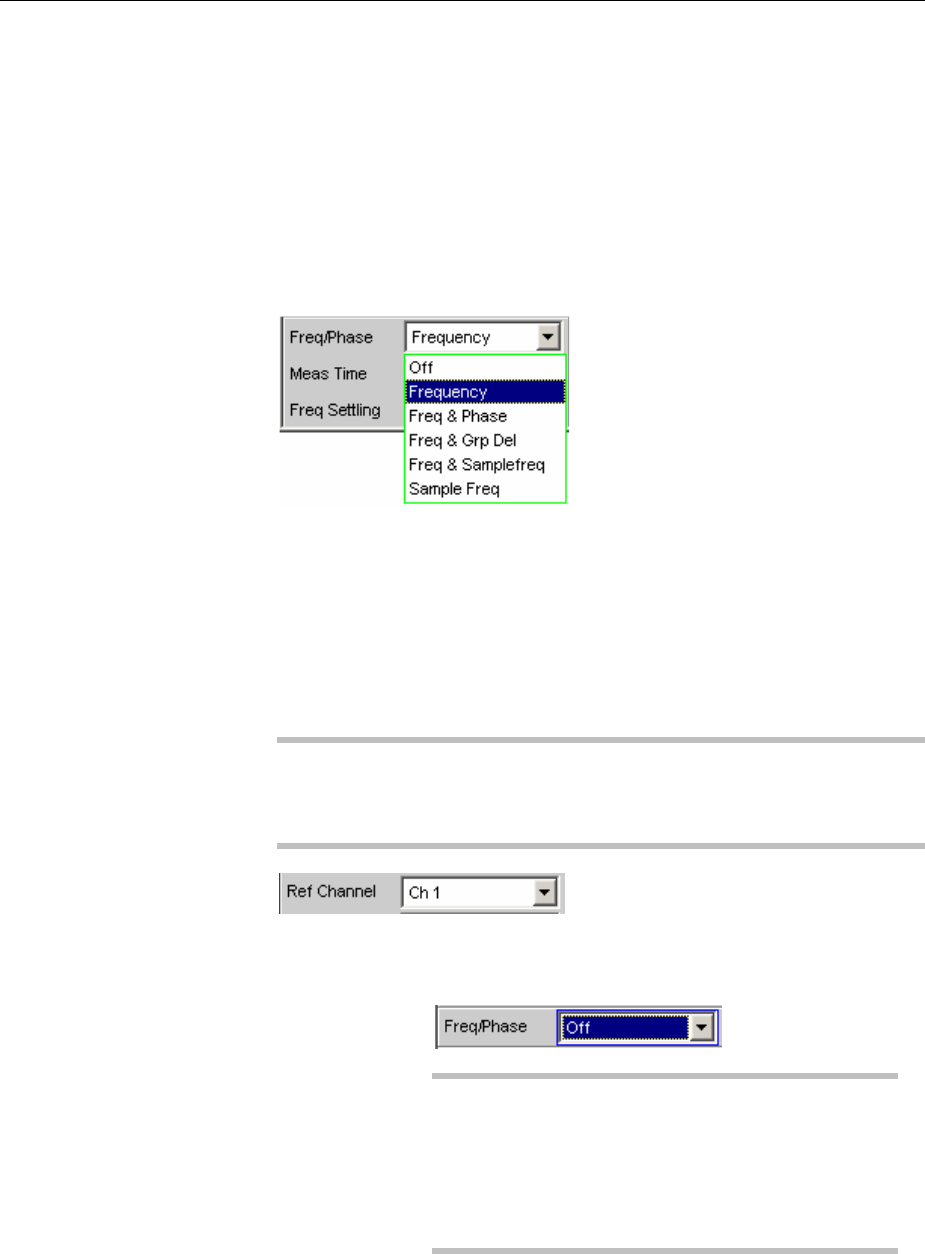
R&S UPV Frequency, Phase and Group Delay Measurement
1146.2084.32 4.389 E-9
Frequency, Phase and Group Delay Measurement
The frequency measurement and combined frequency/phase/group delay measurement are performed
upstream of the function-specific digital filters, but downstream of the prefilter. In the two-channel
analog analyzer, the frequency is measured downstream of the notch filter (if the analog notch filter is
activated). If the fundamental is rejected with the notch filter, the frequency meter determines the
frequency of the residual signal.
Freq/Phase
Used to activate the frequency measurement (for the reference channel)
and to select the measurement value for the other channels.
With 1-channel measurements, it is only possible to select the frequency
measurement here; measurement of the sampling frequency can be
selected here in the digital analyzer.
With 2-channel or multichannel measurements, the frequency on the
other channels is often the same as the frequency on the reference
channel. In such cases, it is advisable to display a frequency-related
measurement value instead of the frequency in the measurement
window of the other channels.
Note:
In two-channel analyzers, the reference channel is always channel 1;
in multichannel analyzers, the reference channel is user-definable in the
analyzer Config panel.
Off Frequency measurement is deactivated.
Note:
For signals for which no zero-axis crossing can be
detected (e.g. weak noise signals, pure DC signals
or AC signals of extremely low frequency), the
frequency measurement can be switched off, which
will considerably reduce the total measurement
time.
Remote-control command:
SENSe3:FUNCtion OFF
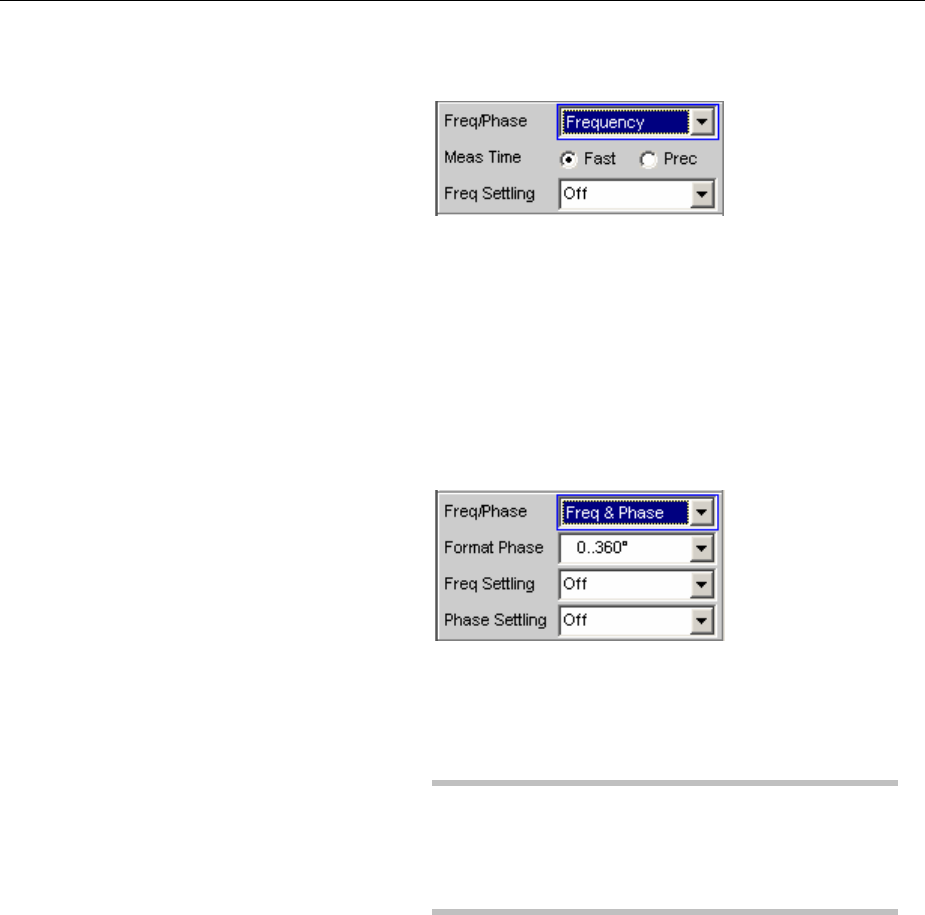
Frequency, Phase and Group Delay Measurement R&S UPV
1146.2084.32 4.390 E-9
Frequency Frequency measurement is performed on all
activated channels.
Remote-control command:
SENSe3:FUNCtion FREQuency
Freq & Phase Only available for two-channel measuring mode or
in a multichannel analyzer.
Frequency measurement is performed on the
reference channel; the measurement windows of
the other channels contain the phase of the other
channel referenced to the reference channel.
If a phase is shown as invalid, the frequencies of
this channel and the reference channel are different
or one of the channels does not have an input
signal.
Note:
This measuring mode should only be selected if the
frequency on the reference channel is identical with
the frequency on at least one other measurement
channel.
Remote-control command:
SENSe3:FUNCtion FQPHase
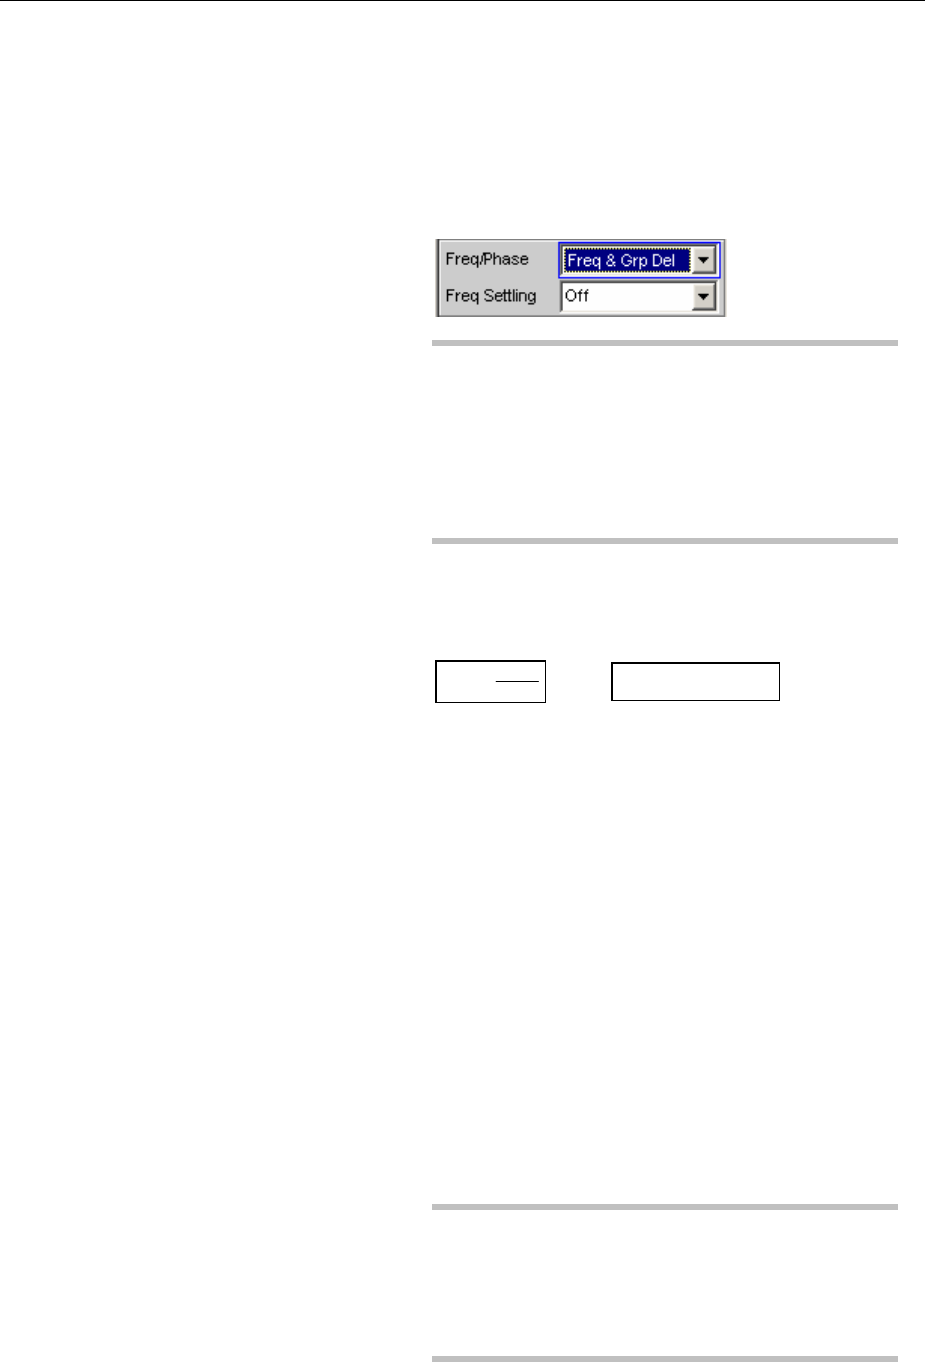
R&S UPV Frequency, Phase and Group Delay Measurement
1146.2084.32 4.391 E-9
Freq & Grp
Del
Only available for two-channel measuring mode or
in a multichannel analyzer.
Frequency measurement is performed on the
reference channel; the measurement windows of
the other channels contain the group delay of the
respective channel referenced to the reference
channel.
Note:
This measuring mode should only be selected if the
frequency on the reference channel is identical with
the frequency on at least one other measurement
channel. The group delay measurement should only
be used in the case of frequency changes (e.g. with
frequency sweeps); a group delay is not defined in
the case of constant frequency.
The group delay is measured by differentiation of
phase with respect to frequency, i.e. by evaluating
the difference quotient.
[
]
f
st
=
2
2where mesmes 12
=
The following points must be taken into
consideration when selecting a frequency sweep for
measuring the group delay:
•The frequency step size and the number of
sweep points must be selected such that no
phase shifts of more than 180° occur between
two consecutive sweep points.
•The spacing should be linear; with logarithmic
spacing the frequency increments at the bottom
could become too small and the phase shifts at
the top could become too large.
•In the case of group delay measurement over
frequency (e.g. by means of a generator
frequency sweep), the first sweep point is
undefined because a reference point for
calculating the delta values of frequency and
phase is only available as of the 2nd frequency
value.
Note:
For signals with a poor S/N ratio, the quality of the
group delay measurement can be improved by
increasing the FFT size or by FFT averaging (Avg
Normal). To this effect, the measurement function is
to be set to FFT.
Remote-control command:
SENSe3:FUNCtion FQGRoupdelay

Frequency, Phase and Group Delay Measurement R&S UPV
1146.2084.32 4.392 E-9
Freq &
Samplefreq
Only available for two-channel or multichannel
measuring mode in the digital analyzer.
The sampling frequency is measured on the
channel last activated. On all other channels (i.e.
channel 1 in two-channel analyzers), a frequency
measurement is performed.
Note:
In this measuring mode, the audio frequency of the
last channel is not measured.
The sampling frequency is measured with a
resolution of 22.9 mHz and an update interval of
approx. 700 ms.
Remote-control command:
SENSe3:FUNCtion FQSamplefrequency
Sample Freq Only available in the digital analyzer.
The measurement windows contain the sampling
frequency.
Note:
In this measuring mode, the audio frequency is not
measured.
The sampling frequency is measured with a
resolution of 22.9 mHz and an update interval of
approx. 700 ms.
Remote-control command:
SENSe3:FUNCtion SFRequency
Note:
If the sampling frequency varies by at least 3 Hz, a precision measurement is performed that takes
max. 1.5 s. If the "Sampl Freq" measurement is activated, therefore, the total time required by a single
measurement may be extended to up to 1.5 s.
For frequency measurements, the input signal – beginning in the zero crossing – must be observed
over one complete period, but with at least 100 samples. For function measurements with an extremely
short measurement time (e.g. peak measurement 1 ms interval), the frequency measurement should
therefore be deactivated.
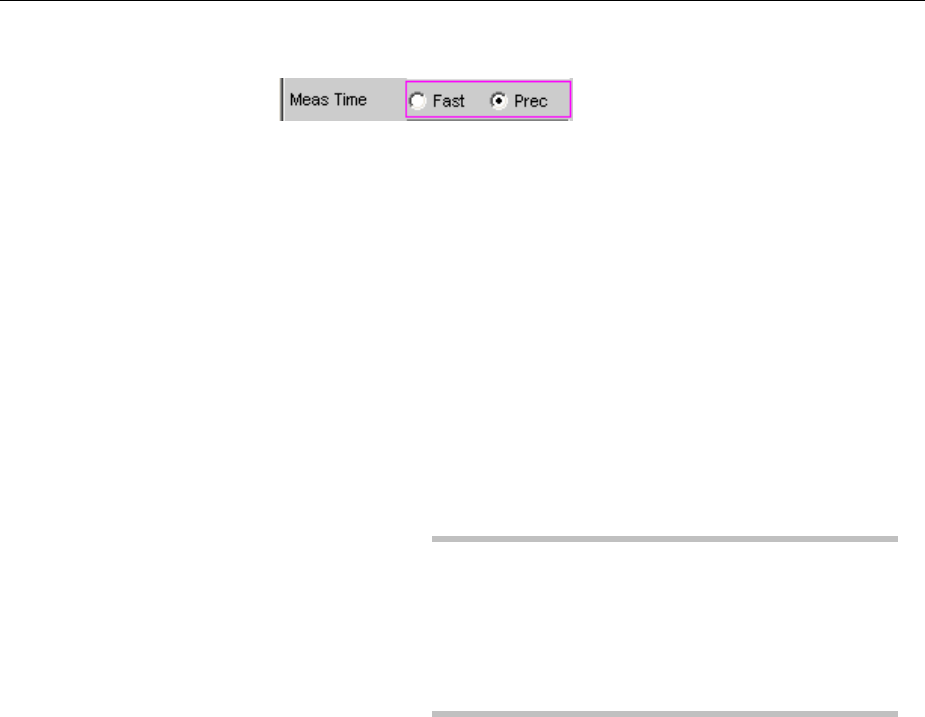
R&S UPV Frequency, Phase and Group Delay Measurement
1146.2084.32 4.393 E-9
Meas Time
Used to select the measurement speed.
Fast The frequency and (if applicable) phase
measurement is optimized with respect to speed. A
4 k FFT is used as the measurement basis for high
frequencies and the phase; low frequencies are
determined by means of an evaluation of period
(with interpolation). This measuring mode does not
require any additional processing performance, i.e.
the total measurement time of all activated
measurement functions does not increase.
Recommended for pure frequency measurements
on single-tone signals or for phase measurements
on signals whose frequency is not too low (higher
than 2 % of the bandwidth and 1 % of the sampling
frequency).
Note:
In the case of distortion measurements the
frequency must be very accurately determined. The
accurate result of this frequency measurement is
then displayed. The frequency accuracy in fast
mode therefore depends on the measurement
function selected.
Remote-control command:
SENSe3:FREQuency:APERture:MODE FAST

Frequency, Phase and Group Delay Measurement R&S UPV
1146.2084.32 4.394 E-9
Prec The frequency and (if applicable) phase
measurement is optimized with respect to precision.
Aprecision FFT with up to 256 k points is used as
the measurement basis. The FFT length is
automatically adapted to the measured signal
frequency so that measurement can always be
performed with the smallest possible FFT (and,
therefore, in the shortest possible time).
Depending on the activated measurement function,
the total measurement time can increase in this
measuring mode since it may be necessary to
calculate an (additional) FFT.
Note:
Digital or analog filters which are active in the
activated function measurement are also used in
the frequency measurement. If only the unfiltered
frequency or phase measurement result is required,
the function measurement should be deactivated.
Recommended for signals with a high noise
component, multi-tone signals and for measuring
the phase of low frequencies.
Remote-control command:
SENSe3:FREQuency:APERture:MODE
PRECision
Format Phase
Used to select the phase display format; only available if phase
measurement is activated.
or
depending on whether degrees or RAD has been selected for the phase
unit.

R&S UPV Frequency, Phase and Group Delay Measurement
1146.2084.32 4.395 E-9
0..360° The phase is displayed in the range 0° to 360°; only
available if "°" has been selected for the phase unit.
Remote-control command:
SENSe3:PHASe:FORMat POSitive
-180..180° The phase is displayed in the range +/- 180°; only
available if "°" has been selected for the phase unit.
Remote-control command:
SENSe3:PHASe:FORMat POSNegative
-360..0° The phase is displayed in the range -360° to 0°;
only available if "°" has been selected for the phase
unit.
Remote-control command:
SENSe3:PHASe:FORMat NEGative
0..2VThe phase is displayed as a radian from 0 to 2V;
only available if "RAD" has been selected for the
phase unit.
Remote-control command:
SENSe3:PHASe:FORMat RAD
-V..+VThe phase is displayed as a radian from -Vto +V;
only available if "RAD" has been selected for the
phase unit.
Remote-control command:
SENSe3:PHASe:FORMat RADBipolar
-2V..0 The phase is displayed as a radian from –2Vto 0;
only available if "RAD" has been selected for the
phase unit.
Remote-control command:
SENSe3:PHASe:FORMat RADNegative
Frequency, Phase and Group Delay Measurement R&S UPV
1146.2084.32 4.396 E-9
Infinite The phase is displayed continuously (-hto +h).
Note:
The continuous phase display is mainly used for
frequency sweeps to allow the phase characteristic
to be displayed even in the case of phase
displacement above 360°. This measuring mode is
usually unsuitable for measurements without
frequency variation since such measurements do
not have a valid previous value.
The continuous phase is measured by adding the
phase difference between two consecutive phase
measurement results to the phase measurement
value of the first measurement result:
+= 12 where mesmes 12
=
When configuring a frequency sweep for measuring
the continuous phase, the frequency step size and
the number of sweep points must be selected such
that no phase shifts of more than 180° occur
between two consecutive sweep points.
Remote-control command:
SENSe3:PHASe:FORMat INFinite

R&S UPV Input Monitor
1146.2084.32 4.397 E-9
Input Monitor
The input monitor is a level meter which determines the input level upstream of all digital filters (i.e. also
upstream of the prefilter). In the two-channel analog analyzer, only the analog notch filter (if activated) is
located upstream of the measurement point of the input monitor.
Input Monitor
Used to activate the input level meter and to select the measurement
method.
Off The input monitor is deactivated.
Remote-control command:
SENSe2:FUNCtion OFF
Peak The peak input value is measured. The numerically
highest input sample is determined within a preset
interval.
Note:
Unlike the peak measurement, which (like all
measurement functions) is performed downstream
of the filters, no interpolation filter (oversampling
filter) is used.
Remote-control command:
SENSe2:FUNCtion IPEAk
Phase To Ref Measurement of the phase between the selected
digital input and the reference input.
Selectable only in the digital analyzer when the
jitter/phase measurement mode is activated.
The jitter measurement data (function, level and
frequency) is simultaneously displayed in the other
measurement windows.
Remote-control command:
SENSe2:FUNCtion PHASetoref
Dig Inp Amp Measurement of the digital input amplitude at the
selected digital input ("Bal" or "Unbal").
Selectable only in the digital analyzer when the
common/input measurement mode is activated.
The common-mode voltage data (function, level
and frequency) is simultaneously displayed in the
other measurement windows.

Input Monitor R&S UPV
1146.2084.32 4.398 E-9
Note:
The common-mode voltage can be measured only
at the balanced input connector ("Bal"). If the
unbalanced ("Unbal") input has been selected as
"Input", only the digital input amplitude can be
displayed. The measurement values for the
common measurement (function, level and
frequency values) are not displayed.
Remote-control command:
SENSe2:FUNCtion DIGinpampl
See section "Level Measurements" on page 4.241 and section "Level Monitor" on page 4.399 for further
level measurement options.
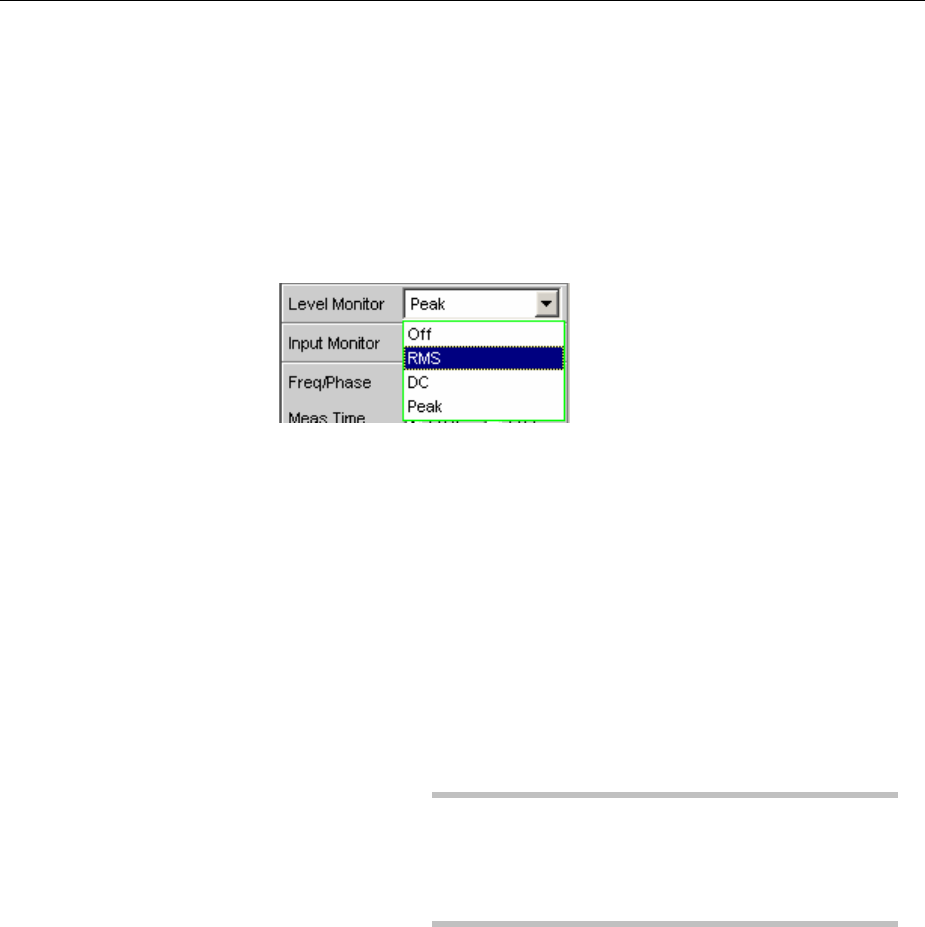
R&S UPV Level Monitor
1146.2084.32 4.399 E-9
Level Monitor
The level monitor is a level meter which is used to determine the level downstream of the prefilter but
upstream of the function-specific digital filters. In the two-channel analog analyzer, the analog notch
filter (if activated) is also located upstream of the measurement point of the level monitor.
Level Monitor
Used to activate the level monitor and to select the measurement
method.
Off The level monitor is deactivated.
Remote-control command:
SENSe6:FUNCtion OFF
RMS Abroadband RMS measurement is performed
which – with the frequency measurement switched
on – uses automatic period detection. (The
measurement method in this case corresponds to
the RMS measurement function in the "Meas Time
Auto" mode). With weak signals, measurement is
performed over a fixed period of 100 ms. Any
superimposed DC components are also measured
but (in the analog analyzer) are suppressed by the
system hardware if the AC coupling is activated.
Note:
In the case of multi-tone signals without dominant
components, period detection cannot deliver
reliable results; in this case, the RMS result will
exhibit slightly larger fluctuations.
Remote-control command:
SENSe6:FUNCtion LRMS

Level Monitor R&S UPV
1146.2084.32 4.400 E-9
DC ADC voltage measurement with automatic AC
suppression is performed. With weak signals,
measurement is performed over a fixed period of
100 ms. In the analog analyzer, DC coupling should
be selected for this measurement mode because
the DC component of the measurement signal is
filtered out with AC coupling. A suitable warning will
bedisplayed if the coupling is switched to AC with
DC measurement enabled or if the mode is
switched to DC measurement with AC coupling
selected; however, the measurement will be
performed.
Note:
In the case of multi-tone signals without dominant
components, AC period detection cannot deliver
reliable results; in this case, the DC result will
exhibit slightly larger fluctuations.
Remote-control command:
SENSe6:FUNCtion DC
Peak Ameasurement of the input peak value is
performed. The input sample with the highest
magnitude is determined within a predefined time
interval. This time interval is obtained from the
period length of the measurement signal. A fixed
time of 100 ms is required in order to measure
weak signals.
Note:
In contrast to the peak measurement, which, like all
measurement functions, is performed after the
filters, no interpolation filter (oversampling filter) is
required.
Remote-control command:
SENSe6:FUNCtion PEAK
See section "Level Measurements" on page 4.241 and section "Input Monitor" on page 4.397 for further
level measurement options.
Note:
The level monitor uses period detection and measures the input signal – beginning in the zero crossing
–over one complete period, but with at least 100 samples. For function measurements with an
extremely short measurement time (e.g. peak measurement 1 ms interval), the level monitor should
therefore be deactivated.

R&S UPV Settling Methods
1146.2084.32 4.401 E-9
Settling Methods
Applications
Each signal that is output by the R&S UPV generator passes through several delay elements until –
after being applied to the DUT – it returns to the R&S UPV analyzer, where it is measured. The delay
times must be taken into account in order to prevent a new measurement being started – after a signal
change – before the new signal becomes visible on the analyzer. The total measurement time,
therefore, is made up of the actual measurement time and the delay time.
The internal delays of the R&S UPV are known and taken into account automatically upon starting a
measurement. The R&S UPV delays are in the range of a few milliseconds, depending on the sampling
rate. What may actually cause problems are delays and settling times that occur in the DUT and, possibly,
also on the transmission lines from the generator to the DUT and from the DUT to the analyzer.
If these delays and settling times are known and constant for all signal changes that may occur, the
total delay can be entered as "Delay" under "Start Condition", and will then be treated as a waiting time
prior to the start of the measurement – same as the internal delays of the R&S UPV.
If external delays and settling times are known but not constant,the worst-case value can be entered
as the total delay. In the case of most measurements, however, this will unduly extend total
measurement time, especially where the actual measurement time is significantly shorter than the
waiting time. Conditions are particularly difficult if external waiting or settling times are unknown or if an
external signal source is used.
For the latter two cases it is advantageous to determine – by way of measurement – the time at which
the DUT has settled and start the measurement only then.
The purpose of the settling method described here is to determine the settling time by means of a
measurement. The basic idea is to perform as many measurements as possible while settling is still in
progress and to determine the time at which the signal has settled to an extent that the measured value
can be regarded as stable. This time is determined based on the – continuously decreasing – difference
between successive measured values.
The settling method is particularly reliable when combined with a trigger condition, as with an external
sweep or an external level trigger. In such cases, the trigger condition will not be fulfilled until a signal
change is detected of the measured parameter and the new signal has stabilized over several
measurements.
If no such trigger condition is active (e.g. with manually started single measurements), it may happen –
in the case of very long delays or very short measurement times – that the desired number of
measurements has been completed before the signal change (new signal) becomes visible on the
analyzer. With manually started single measurements, therefore, the external signal delay should be
entered as exactly as possible as "Delay" under "Start Condition", while the settling method is activated
as well.
•The external signal delay is entered as a fixed delay under "Start Condition".
•The settling time is dynamically measured with the settling method.
The following types of settling can be activated and also combined with one another as desired
(i.e. several types of settling can be used simultaneously):
•Settling in the "Start Condition" menu, i.e. with an external level or frequency sweep or with an
external level trigger. An additional delay is not required.

Settling Methods R&S UPV
1146.2084.32 4.402 E-9
•Function settling in the case of distortion measurements and (most) level measurements; in
multichannel analyzers, only "Averaging" can be selected. As the measurement time becomes
shorter relative to the signal delay, it becomes more important to compensate for the signal delay.
•Frequency Settling (not for multichannel analyzers)
•Phase Settling (not for multichannel analyzers)
Settling Algorithms
The R&S UPV offers two different settling algorithms. As a feature common to both algorithms, each
current measured value is compared to up to five of the immediately preceding measured values and
will be accepted as valid only if the differences between the current value and the preceding values are
within specified tolerances.
In addition, an averaging function is available in order to reduce measured-value variations.
Flat Settling employs a tolerance mask with a completely flat characteristic (tolerance band).
The "capture range" of this mask is determined by fixed tolerance limits. In the case of very small
tolerance values, this algorithm supplies a result only if the DUT has almost completely settled.
Exponential Settling uses a tolerance mask with an exponential characteristic (tolerance funnel,
whose "capture range" enlarges toward the earlier measured values, i.e. larger deviations are tolerated
for the earlier values. This algorithm is suitable for level and distortion measurements, where most
DUTs likewise exhibit an exponential settling characteristic.
Tolerance characteristic
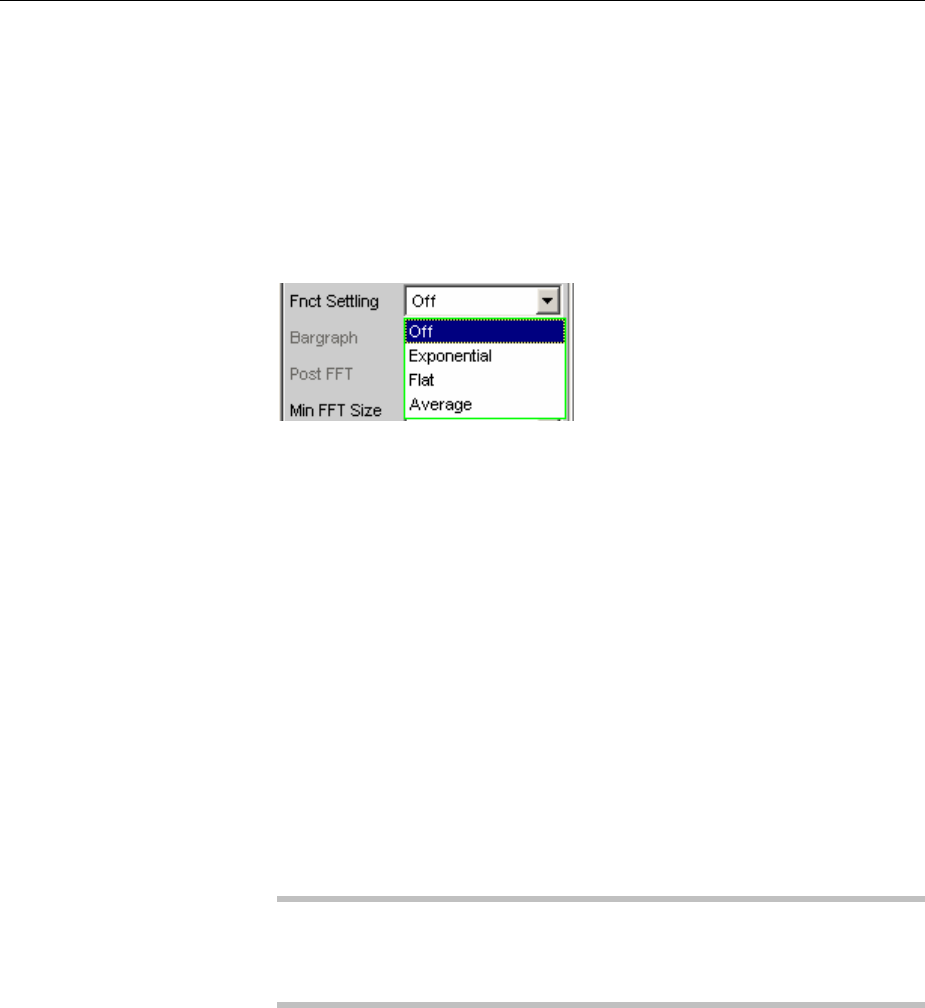
R&S UPV Settling Methods
1146.2084.32 4.403 E-9
Settling for Measurement Functions
Fnct Settling
Used to activate the settling measurement for results of measurement
functions and to select the settling method; for multichannel analyzers,
only "Averaging" is available.
Results of measurement functions are valid only if the selected settling
condition is fulfilled.
With the S/N measurement function and with level measurement functions
in the S/N mode, the instrument determines the settling times separately for
the useful signal plus noise and for the noise signal only. This yields two
level values, of which the signal-to-noise quotient is formed.
Function Settling is available for most level measurement functions
(except rub & buzz) and for distortion measurements.
The following applies to settling measurements, irrespective of the
selected unit:
•With level measurements, the settling measurement is based on the
results in volts (analog) or FS (digital).
•With distortion measurements, the settling measurement is based
on the results in %.
Note:
For the FFT measurement function, averaging of FFT data is available
instead of a settling measurement, which is possible for measured
values only (see section "Avg Mode" on page 4.327).
Off Function Settling is switched off. The measurement
time is very short, since only a single measurement
is performed.
This setting is recommended if the DUT settling time
•can be ignored.
•is known and taken into account by entering a
fixed delay.
Remote-control command:
SENSe:FUNCtion:SETTling:MODE OFF

Settling Methods R&S UPV
1146.2084.32 4.404 E-9
Exponential Function Settling is switched on and the exponential
method is employed; this function is not available
for multichannel analyzers. Several measurements
have to be performed. The measurement time is,
therefore, considerably longer than with Function
Settling switched off.
This setting is recommended if the DUT settling
time cannot be taken into account by entering a
fixed delay because
•it is not known.
•it is not constant.
Remote-control command:
SENSe:FUNCtion:SETTling:MODE
EXPonential
Flat Function Settling is switched on and the flat method
is employed; this function is not available for
multichannel analyzers. All measurement samples
should fall within a tolerance band of uniform width.
This method, therefore, usually requires a higher
number of measurements than the exponential
method,which allows for greater tolerance.
This setting is recommended if it must be ensured
that the results of several successive
measurements have settled.
Remote-control command:
SENSe:FUNCtion:SETTling:MODE FLAT
Average The arithmetic average of a selectable number of
successive results (obtained with a measurement
function) is formed.
This setting is recommended in order to
compensate for measured-value variations.
Where possible, the DUT settling time should
additionally be taken into account by entering a
corresponding delay under "Start Condition".
Remote-control command:
SENSe:FUNCtion:SETTling:MODE AVERage

R&S UPV Settling Methods
1146.2084.32 4.405 E-9
Samples
Designates the number of measured values to be covered by the
settling algorithm, i.e. it defines how many measured values are to be
used in the settling measurement or for averaging.
Note:
In this exceptional case, the term "sample" is used to designate an
internal measurement result instead of a digital sample.
Remote-control command:
SENSe:FUNCtion:SETTling:COUNt <n>
Tolerance
The tolerance value designates the maximum permissible value by
which the current measured value may differ from the preceding
measured values so that it will be accepted as having settled.
With exponential settling,the selected tolerance value applies only to
the difference between the current and the last preceding measured
value; for each earlier measured value, the tolerance value will
increase by a factor of 2.
Remote-control command:
SENSe:FUNCtion:SETTling:TOLerance <nu>
Resolution
The resolution value designates the maximum permissible absolute
value by which the current measured value may differ from the
preceding measured values in order to be accepted as having settled,
although the tolerance condition may have been violated.This means
that a measured value will be regarded as not having settled only if it
fails to meet both the tolerance and the resolution condition.
With exponential settling,the selected resolution value applies only to
the difference between the current and the last preceding measured
value; for each earlier measured value, the resolution value will
increase by a factor of 2.
Remote-control command:
SENSe:FUNCtion:SETTling:RESolution <nu>
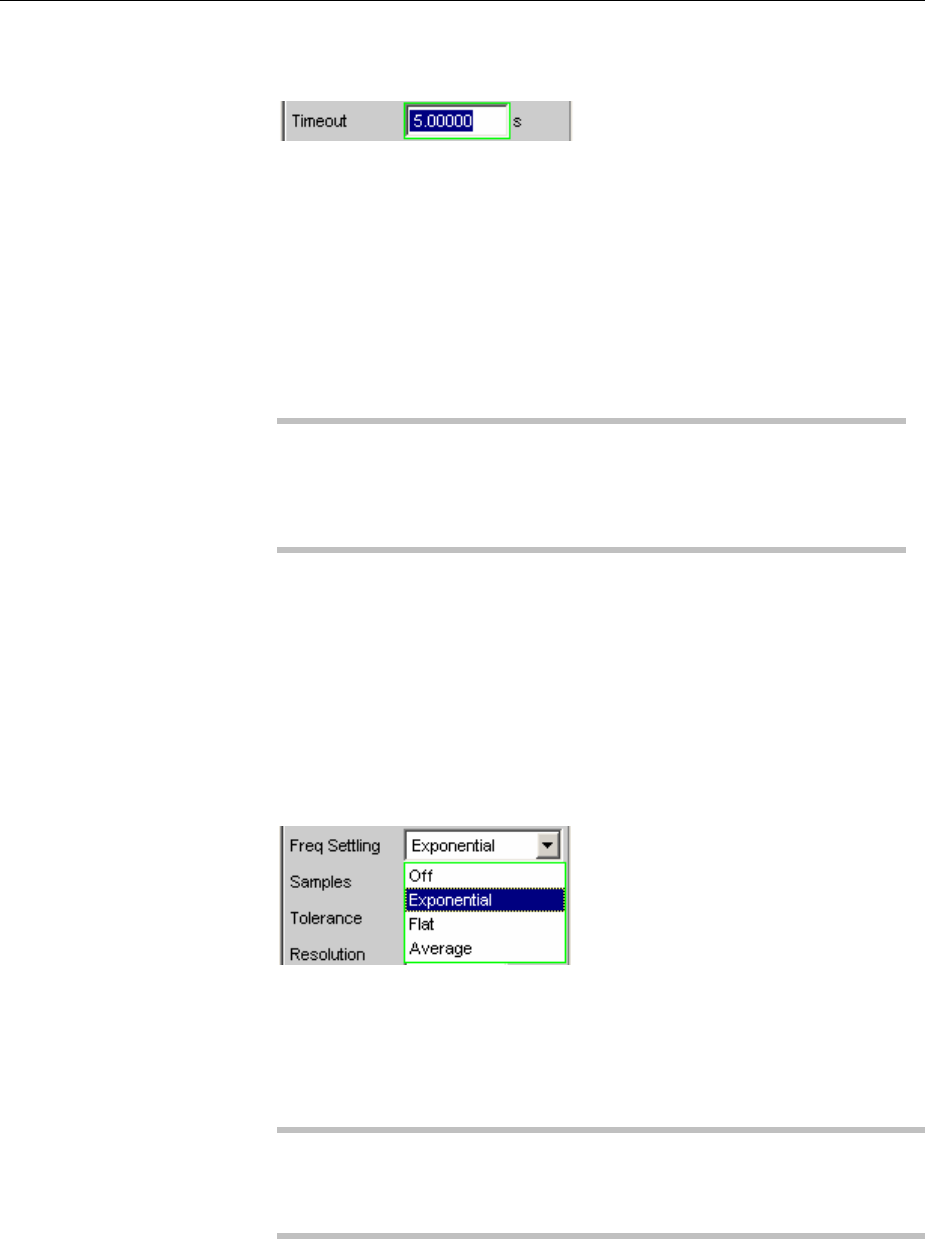
Settling Methods R&S UPV
1146.2084.32 4.406 E-9
Timeout
Defines the maximum time that a settling algorithm is allowed to
detect a settled result after the start of a measurement.
If no stable measurement value is detected during this time, the
measurement is aborted. An invalid result is output in the numeric and
the sweep display and also via the remote line.
Defining a timeout is important especially with the "true" settling
methods, because with these methods a settled value may never be
detected if tolerance limits are too narrow. If averaging is employed,
on the other hand, the number of measurements and thus the
measurement time are finite, and the timeout may be deactivated, as it
were, by entering the maximum value of 2000 s.
Note:
If a multichannel analyzer is used, max. 1.44 million samples can be
observed. In these analyzers, the maximum timeout is therefore
dependent on the sampling rate and the analog bandwidth; at 40 kHz
analog bandwidth, for example, it is 15 s.
Remote-control command:
SENSe:FUNCtion:SETTling:TOUT <nu>
Settling for Frequency Measurements
Freq Settling
Used to activate the settling function for frequency measurements and
to select the settling method (not for multichannel analyzers).
Results of frequency measurements are valid only if the selected settling
condition is fulfilled.
The settling measurement is always based on Hz irrespective of the
selected unit.
Note:
The settling function is not performed for the sampling rate (digital
analyzers). Even if "Sample Freq" is selected as the frequency
measurement, the settling function is performed for the signal frequency.

R&S UPV Settling Methods
1146.2084.32 4.407 E-9
Off Frequency Settling is switched off. There will be no
extension of the overall measurement time due to
the settling procedure, since only a single
measurement will be performed.
This setting is recommended if the signal delay in
the DUT
•can be ignored.
•is known and taken into account by entering a
fixed delay.
Remote-control command:
SENSe:FREQuency:SETTling:MODE OFF
Exponential Frequency Settling is switched on and the
exponential method is employed. This method
requires several measurements to be performed.
The overall measurement time is, therefore, longer
than with the settling function switched off.
Frequency settling of a DUT does however not
follow an exponential characteristic. In the event of
afrequency change, only one invalid intermediate
value will maximally be obtained in most cases.
The exponential method is, therefore, usually not in
line with practical requirements. It is more advisable
to use the flat algorithm and a reduced number of
samples.
Remote-control command:
SENSe:FREQuency:SETTling:MODE
EXPonential
Flat Frequency Settling is switched on and the
flat method is employed.
This setting is recommended if it must be ensured
that the results of several successive
measurements have settled.
Remote-control command:
SENSe:FREQuency:SETTling:MODE FLAT
Average The arithmetic average of a selectable number of
successive frequency results is formed.
This setting is recommended in order to
compensate for measured-value variations.
Where possible, the DUT signal delay should
additionally be taken into account by entering a
corresponding delay under "Start Condition".
Remote-control command:
SENSe:FREQuency:SETTling:MODE AVERage
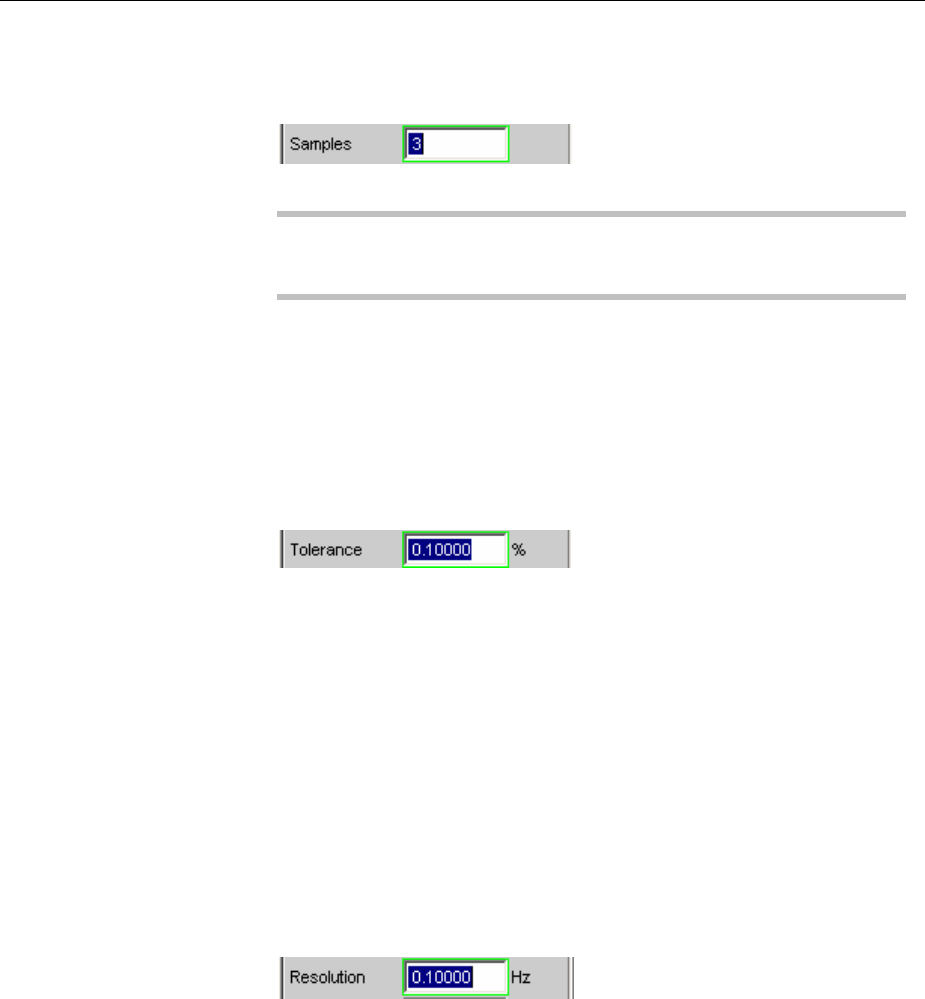
Settling Methods R&S UPV
1146.2084.32 4.408 E-9
Samples
Designates the number of measured values to be covered by the
settling algorithm, i.e. it defines how many measured frequency values
are to be used in the settling measurement or for averaging.
Note:
In this exceptional case, the term "sample" is used to designate an
internal measurement result instead of a digital sample.
Remote-control command:
SENSe:FREQuency:SETTling:COUNt <n>
Tolerance
The tolerance value designates the maximum permissible value by
which the current measured value may differ from the preceding
measured values so that it will be accepted as having settled.
With exponential settling,the selected tolerance value applies only to
the difference between the current and the last preceding measured
value; for each earlier measured value, the tolerance value will
increase by a factor of 2.
Remote-control command:
SENSe:FREQuency:SETTling:TOLerance <nu>
Resolution
The resolution value designates the maximum permissible absolute
value by which the current measured value may differ from the
preceding measured values in order to be accepted as having settled,
although the tolerance condition may have been violated.This means
that a measured value will be regarded as not having settled only if it
fails to meet both the tolerance and the resolution condition.
With exponential settling,the selected resolution value applies only to
the difference between the current and the last preceding measured
value; for each earlier measured value, the resolution value will
increase by a factor of 2.
Remote-control command:
SENSe:FREQuency:SETTling:RESolution <nu>
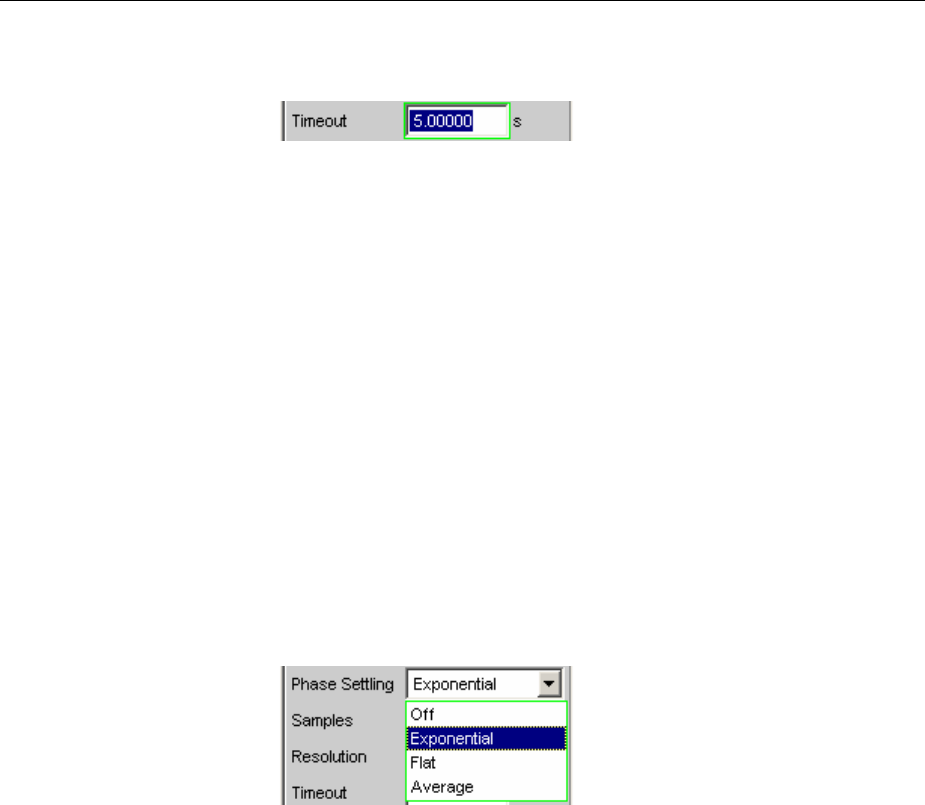
R&S UPV Settling Methods
1146.2084.32 4.409 E-9
Timeout
Defines the maximum time that a settling algorithm is allowed to
detect a settled result after the start of a measurement.
If no stable measurement value is detected during this time, the
measurement is aborted. An invalid result is output in the numeric and
the sweep display and also via the remote line.
Defining a timeout is important especially with the "true" settling
methods, because with these methods a settled value may never be
detected if tolerance limits are too narrow. If averaging is employed,
on the other hand, the number of measurements and thus the
measurement time are finite and the timeout may be deactivated, as it
were, by entering the maximum value of 2000 s.
Remote-control command:
SENSe:FREQuency:SETTling:TOUT <nu>
Settling for Phase Measurements
Phase Settling
Used to activate the settling function for phase measurements and to
select the settling method (not for multichannel analyzers).
Results of phase measurements are valid only if the selected settling
condition is fulfilled.
The settling measurement is always based on ° irrespective of the
selected unit.
Off Phase Settling is switched off. There will be no
extension of the overall measurement time due to
the settling procedure, since only a single
measurement will be performed.
This setting is recommended if the signal delay in
the DUT
•can be ignored.
•is known and taken into account by entering a
fixed delay.
Remote-control command:
SENSe:PHASe:SETTling:MODE OFF

Settling Methods R&S UPV
1146.2084.32 4.410 E-9
Exponential Phase Settling is switched on and the exponential
method is employed. This method requires several
measurements to be performed. The overall
measurement time is, therefore, longer than with
the settling function switched off.
Phase settling of a DUT does however not follow an
exponential characteristic. In the event of a phase
change, only one invalid intermediate value will
maximally be obtained in most cases. The
exponential method is, therefore, usually not in line
with practical requirements. It is more advisable to
use the flat algorithm and a reduced number of
samples.
Remote-control command:
SENSe:PHASe:SETTling:MODE EXPonential
Flat Phase Settling is switched on and the flat method is
employed.
This setting is recommended if it is to be ensured
that the results of several successive
measurements have settled.
Remote-control command:
SENSe:PHASe:SETTling:MODE FLAT
Average The arithmetic average of a selectable number of
successive phase results is formed.
This setting is recommended in order to
compensate for measured-value variations.
Where possible, the DUT signal delay should
additionally be taken into account by entering a
corresponding delay under "Start Condition".
Remote-control command:
SENSe:PHASe:SETTling:MODE AVERage
Samples
Designates the number of measured values to be covered by the
settling algorithm, i.e. it defines how many measured phase values are
to be used in the settling measurement or for averaging.
Note:
In this exceptional case, the term "sample" is used to designate an
internal measurement result instead of a digital sample.
Remote-control command:
SENSe:PHASe:SETTling:COUNt <n>
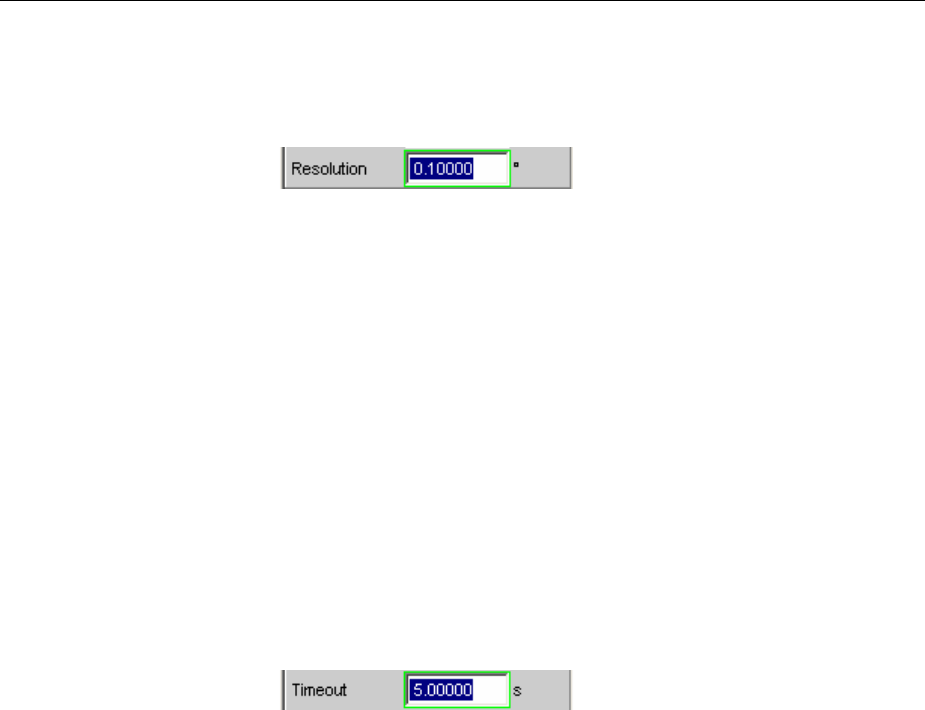
R&S UPV Settling Methods
1146.2084.32 4.411 E-9
Resolution
The resolution value designates the maximum permissible absolute
value by which the current measured value may differ from the
preceding measured values so that it will be accepted as having
settled.
For phase measurements, specifying the resolution value is
meaningful only. This is the absolute value by which the current
measured phase value may differ – in ° – from the preceding
measured phase values. Specifying a tolerance value for phase
results would not be meaningful, since minimal phase variations in the
order of around 0 ° would result in major relative tolerance variations,
which would mean a constant violation of the tolerance condition.
With exponential settling,the selected resolution value applies only to
the difference between the current and the last preceding measured
value; for each earlier measured value, the resolution value will
increase by a factor of 2.
Remote-control command:
SENSe:PHASe:SETTling:RESolution <nu>
Timeout
Defines the maximum time that a settling algorithm is allowed to
detect a settled result after the start of a measurement.
If no stable measurement value is detected during this time, the
measurement is aborted. An invalid result is output in the numeric and
the sweep display and also via the remote line.
Defining a timeout is important especially with the "true" settling
methods, because with these methods a settled value may never be
detected if tolerance limits are too narrow. If averaging is employed,
on the other hand, the number of measurements and thus the
measurement time are finite and the timeout may be deactivated, as it
were, by entering the maximum value of 2000 s.
Remote—control command:
SENSe:PHASe:SETTling:TOUT <nu>

Settling Methods R&S UPV
1146.2084.32 4.412 E-9
Settling for Start Conditions (Event-Triggered
Measurements)
The settling procedure can also be applied to all event-triggered measurements – i.e. measurements
that are measured-value-triggered rather than time-triggered.
With external sweeps, the value of a measured parameter never changes simultaneously with the start
of the frequency or level measurement that monitors the measured parameter for changes. In the event
of a value change, therefore, the monitoring routine usually does not measure the new frequency or
level value but an intermediate value, i.e. a value between the old and the new value. If the trigger
threshold (variation) is smaller than the actual value change, it may happen that even the measured
intermediate value triggers the next measurement in a sweep. This does not produce an errored result
(Y value of the sweep display) since the next measurement is not started until the value change is
detected. However, the sweep parameter (X value of the sweep display) that triggers the next
measurement is too close to the preceding X value.
To ensure that the X values of an external sweep are also measured with great accuracy, the settling
procedure should be applied to external sweeps as well.
With some DUTs, it takes a long time until the level has settled upon a frequency change (e.g. hearing
aids with a sound level limiter or compander/expander circuits with short level rise times and long decay
times). With such DUTs, it will not be sufficient to apply the settling procedure to the trigger routine only.
Rather should a start delay or Function Settling be activated in addition.
Note:
Timeout monitoring is not meaningful in settling procedures applied to event triggers (i.e. not time
triggers), since it takes an indefinite period of time until the external event triggering a measurement
occurs, and an early abortion of the monitoring routine would be of no avail.
If a multichannel analyzer is used, max. 1.44 million samples can be observed. In these analyzers, the
maximum measuring time for detecting (and settling to) the external trigger condition is therefore
dependent on the sampling rate and the analog bandwidth; at 40 kHz analog bandwidth, for example, it
is 15 s.
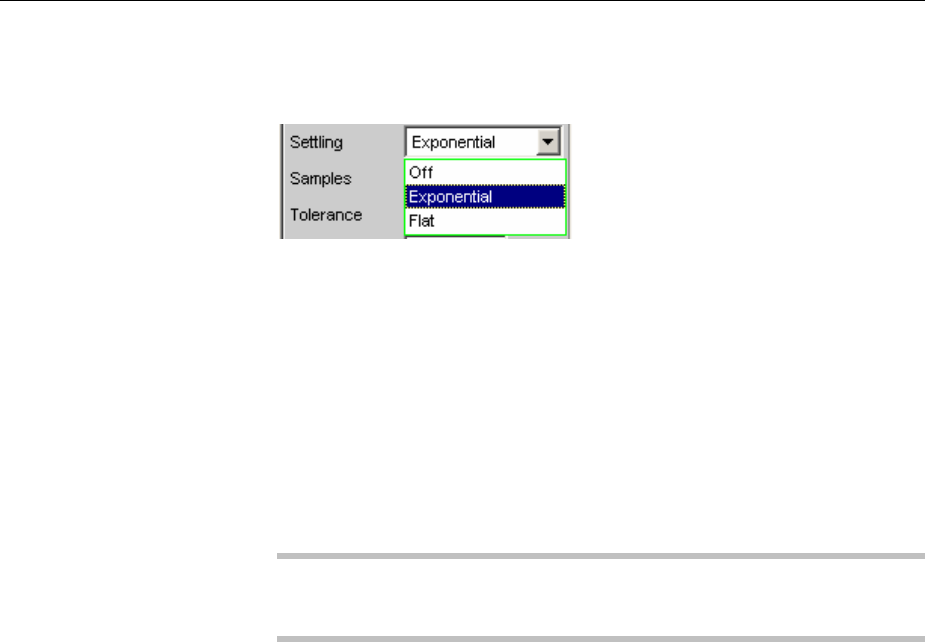
R&S UPV Settling Methods
1146.2084.32 4.413 E-9
Settling
Used to activate the settling measurement for the frequency/level
monitoring routine in the case of external sweeps and external
level/edge triggering, and to select the settling method.
Results of trigger signal measurements are valid only if the selected
settling condition is fulfilled.
The following applies to settling measurements, irrespective of the
selected unit:
•With external level sweeps and external level/edge triggering, the
settling measurement is based on the results of the trigger signal
measurement in volts (analog) or FS (digital).
•With external frequency sweeps, the settling measurement is based
on the results of the trigger signal measurement in Hz.
Note:
Averaging the results of trigger signal measurements would not provide
conclusive information and has therefore not been implemented.
Off The frequency/level monitoring routine is performed
without the settling function. This setting offers the
shortest possible response time to a detected signal
change. It is not sure, however, whether the
nominal trigger value (X value of the sweep display)
is actually attained.
Remote-control command:
SENSe:TRIGger:SETTling:MODE OFF
Exponential The settling function is switched on for the
frequency/level monitoring routine, and the
exponential method is employed. Several
measurements have to be performed, which
extends the response time to a detected signal
change.
This setting is recommended for external level
sweeps and external level/edge triggering since
most DUTs exhibit an exponential level settling
characteristic.
Remote-control command:
SENSe:TRIGger:SETTling:MODE
EXPonential
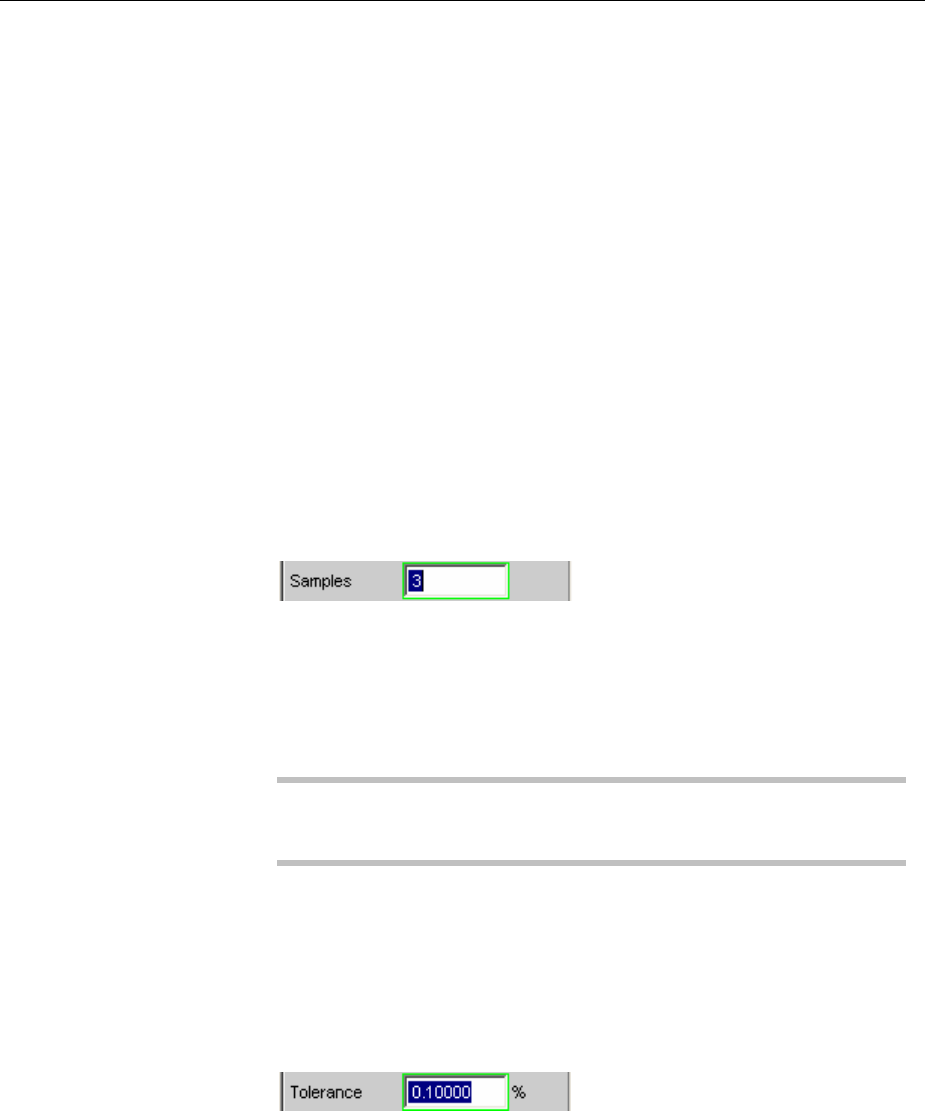
Settling Methods R&S UPV
1146.2084.32 4.414 E-9
Flat The settling function is switched on for the
frequency/level monitoring routine, and the flat
method is employed. Several measurements have
to be performed, which extends the response time
to a detected signal change.
This setting is recommended for external frequency
sweeps if the actual trigger value (X value of the
sweep display) is to be determined very accurately.
In the event of a frequency change, the DUT will
maximally supply one invalid intermediate
frequency value. It is, therefore, sufficient to set the
number of samples to a value of "2", so that only
two or three measurements of the trigger signal are
performed.
Remote-control command:
SENSe:TRIGger:SETTling:MODE FLAT
Samples
Designates the number of measured values to be covered by the
settling algorithm, i.e. it defines how many measured frequency values
are to be used in the settling measurement.
For "n samples" selected, the following number of trigger-value
measurements will be performed:
•With frequency triggering and flat settling: n or n+1
•With level triggering and exponential settling: > n
Note:
In this exceptional case, the term "sample" is used to designate an
internal measurement result instead of a digital sample.
Remote-control command:
SENSe:TRIGger:SETTling:COUNt <n>
Tolerance
The tolerance value designates the maximum permissible value by
which the current trigger value may differ from the preceding trigger
values so that it will be accepted as having settled.
With exponential settling,the selected tolerance value applies only to
the difference between the current and the last preceding trigger
value; for each earlier trigger value, the tolerance value will increase
by a factor of 2.
Remote-control command:
SENSe:TRIGger:SETTling:TOLerance <nu>
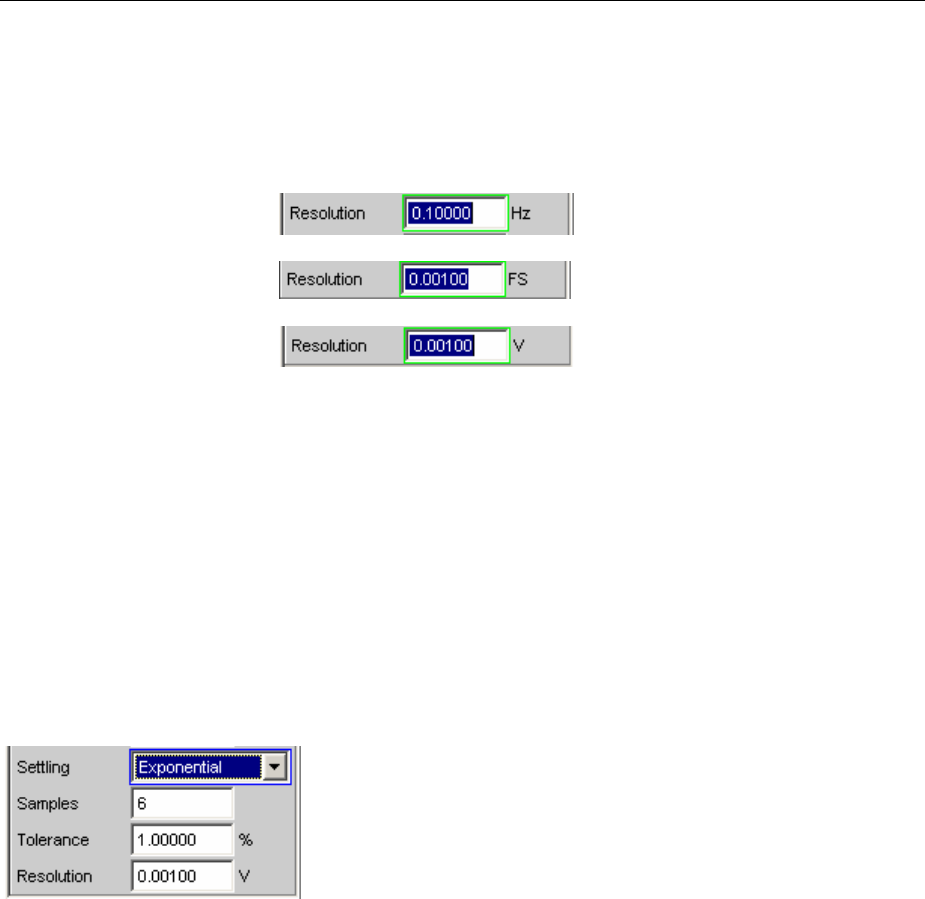
R&S UPV Examples of Settling
1146.2084.32 4.415 E-9
Resolution
The resolution value designates the maximum permissible absolute
value by which the current trigger value may differ from the preceding
trigger values in order to be accepted as having settled, although the
tolerance condition may have been violated.This means that a trigger
value will be regarded as not having settled only if it fails to meet both
the tolerance and the resolution condition.
(for external frequency sweeps)
(for external digital level sweeps)
(for external analog level sweeps)
With exponential settling,the selected resolution value applies only to
the difference between the current and the last preceding trigger
value; for each earlier trigger value, the resolution value will increase
by a factor of 2.
Remote-control command:
SENSe:TRIGger:SETTling:RESolution <nu>
Examples of Settling
The examples below are based on the following settings:
With the above settings, the current measured value may deviate
•from the last measured value by maximally +/- 1 % (or +/- 0.086 dB).
•from the 2nd last measured value by maximally +/- 2 % (or +/- 0.172 dB).
•from the 3rd last measured value by maximally +/- 4 % (or +/- 0.340 dB).
•from the 4th last measured value by maximally +/- 8 % (or +/- 0.668 dB).
•from the 5th last measured value by maximally +/- 16 % (or +/- 1.289 dB).
For an analog level measurement with a result of 1 V this means that
•the last measured value must be between 0.99 V and 1.01 V.
•the 2nd last measured value must be between 0.98 V and 1.02 V.
•the 3rd last measured value must be between 0.96 V and 1.04 V.
•the 4th last measured value must be between 0.92 V and 1.08 .
•the 5th last measured value must be between 0.84 V and 1.16 V.

Filters R&S UPV
1146.2084.32 4.416 E-9
For a distortion measurement with a result of 0.01 % this means that
•the last measured value must be between 0.0099 % and 0.0101 %.
•the 2nd last measured value must be between 0.0098 % and 0.0102 %.
•the 3rd last measured value must be between 0.0096 % and 0.0104 %.
•the 4th last measured value must be between 0.0092 % and 0.0108 %.
•the 5th last measured value must be between 0.0084 % and 0.0116 %.
If all of the above conditions are fulfilled, the result will be indicated as having settled.
Filters
This section describes the setting options for User-Definable Filters and the available Weighting Filters.
The user-definable filters are configured in the Filter panel. They can then be used in the analyzer as
prefilters and function filters and also in the generator.
The weighting filters and the fixed highpass and lowpass filters are not selected in the Filter panel. They
are selected together with the user-configurable filters in the selection fields of the analyzer and
generator.
The section "Filter Table" provides an overview of the filters which can be set up in the analyzer and
generator, together with the remote-control parameters.
Analyzer Prefilter
Afilter which influences all measurement functions can be selected in the Analyzer Config panel. One
of the user-definable filters in the Filter panel or a weighting filter can be selected. This means that
prefiltering is possible without having to select the required filter for every single measurement function.
Remote-control command:
INPut:FILTer CMES
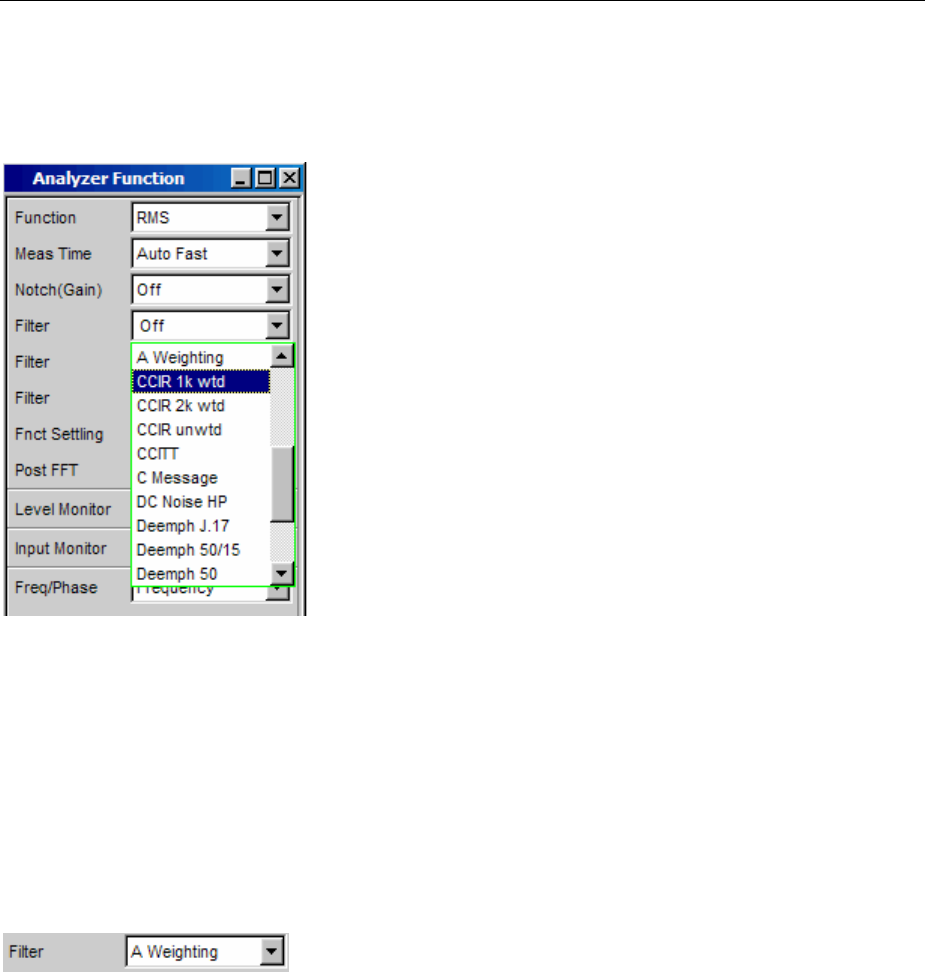
R&S UPV Filters
1146.2084.32 4.417 E-9
Analyzer Function Filters
In the Analyzer Function panel, up to 3 of the user-definable filters in the Filter panel or weighting filters
can be looped into the measurement path regardless of which level measurement method is selected.
Remote-control command:
SENSe[1]:FILTer[1] CCIR
SENSe[1]:FILTer2 UFIL5
SENSe[1]:FILTer3 OFF
Generator Filters
Most of the generator signals can be filtered in the time domain. A user-defined filter, a weighting filter,
or a high-pass or low-pass filter can be selected in the Function panel.
Remote-control command:
SOURce:FILTer AWE
If a filter with gain is used (such as the “CCIR 1k wtd” weighting filter), the generator signal level must
be selected as described below in such a way that overranging cannot occur with the maximum filter
gain.
Analog generator:
In the Generator Config panel, set “Voltage Range” to “Fix”, and in the Generator Function panel set the
level low enough to ensure that the amplified level will always be less than the selected fixed voltage
range.

Filters R&S UPV
1146.2084.32 4.418 E-9
Example:
Here the maximum allowable gain of the filter is 4 (12 dB).
Digital generator:
Select a level that is low enough to ensure that the level plus the maximum gain of the filter will always
be less than the full-scale level.
With both types of generator (analog and digital), any DC offset that has been configured must be taken
into account when setting the level.

R&S UPV Filters
1146.2084.32 4.419 E-9
Filter Table
Overview of the filters which can be set up in the analyzer and generator, together with the remote-
control parameters.
Filter deactivated Display in selection field Remote-control parameter
Off OFF
User-definable filters Defined in Filter panel as Remote-control parameter
Filter 01 UFIL1
Filter 02 UFIL2
Filter 03 UFIL3
Filter 04 UFIL4
Filter 05 UFIL5
Filter 06 UFIL6
Filter 07 UFIL7
Filter 08 UFIL8
Filter 09 UFIL9
Weighting filter Display in selection field Remote-control parameter
AWeighting AWE
CWeighting CWE
CCIR 1k wtd CCIR
CCIR 2k wtd CARM
CCIR unwtd CCIU
CCITT CCIT
CMessage CMES
DC Noise HP DCN
Deemph J.17 DEMP17
Deemph 50/15 DEMP5015
Deemph 50 DEMP50
Deemph 75 DEMP75
IEC Tuner IECT
Jitter wtd JITT
Preemph 50/15 PEMP5015
Preemph 50 PEMP50
Preemph 75 PEMP75
Rumble unwtd URUM
Rumble wtd WRUM
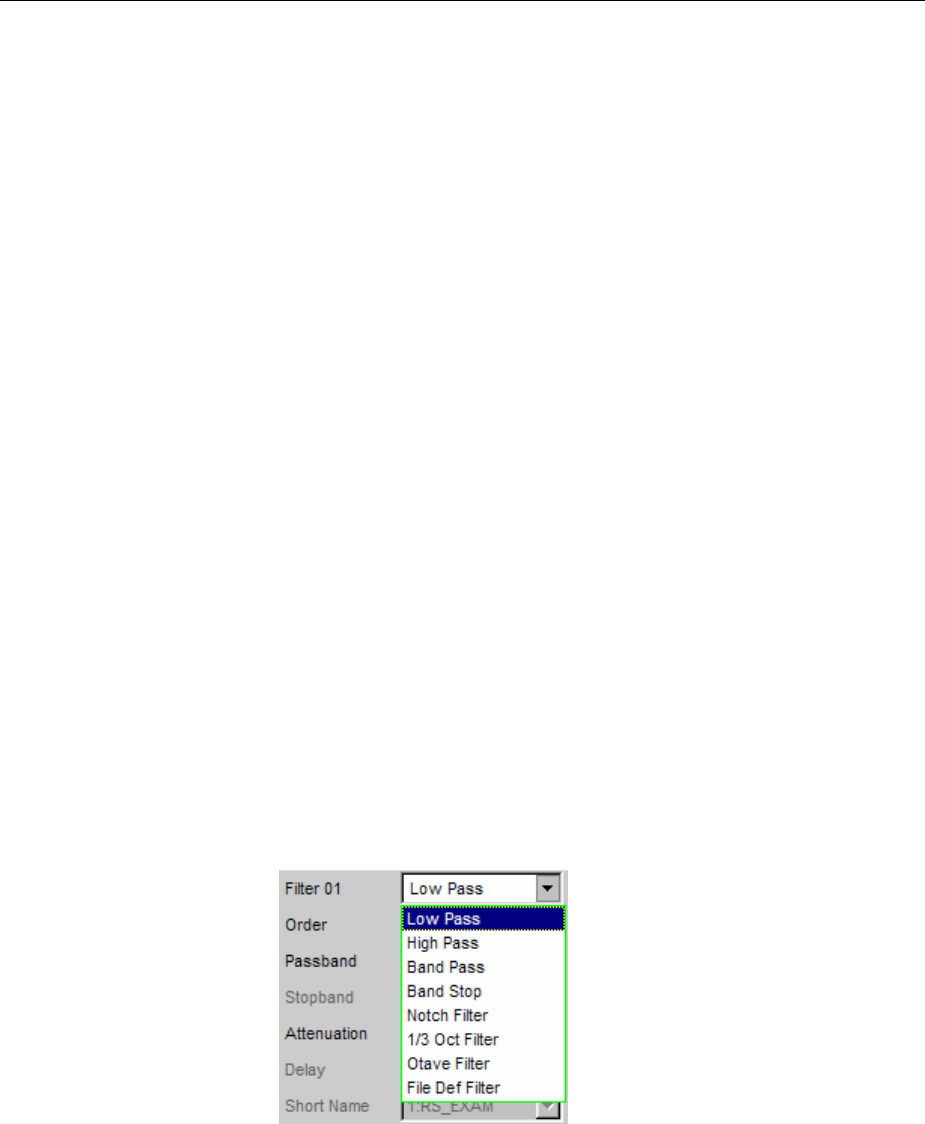
User-Definable Filters R&S UPV
1146.2084.32 4.420 E-9
Highpass and lowpass Display in selection field Remote-control parameter
HighPass 22 Hz HP22
HighPass 400 Hz HP400
LowPass 22 kHz LP22
LowPass 30 kHz LP30
LowPass 80 kHz LP80
AES 17 AES17
User-Definable Filters
In the Filter panel, 9 filters (defined as Filter 01 to Filter 09) can be defined individually as low-pass
filters, high-pass filters, bandpass filters, band-stop filters, notch filters, third-octave filters or octave
filters.
These filters are implemented as recursive, elliptical eighth-order digital filters (exception: fourth order is
also possible for low-pass and high-pass filters). All filters are calculated by means of frequency
transformation from a database with standardized reference low-pass filters. The ripple in the passband
is 0.1 dB; stopband attenuation is available in steps of approx. 10 dB.
The user only has to enter the passband and the minimum stopband attenuation. The frequencies of
the stopband are calculated and displayed taking the required stopband attenuation into consideration.
The implemented stopband attenuation is always equal to or greater than the specified value.
Apart from the parameters entered in the Filter panel, the sampling rate must also be known to allow
calculation of the filter. The other parameters (stop frequency, delay and the attenuation actually
implemented) can therefore only be calculated and displayed after the filter has been activated in the
analyzer or generator.
Filter 0i
Filter 0i
Used to select the filter type for Filter i, where i = 1 to 9.
Remote-control command:
SENSe[1]:UFILter<i>
LPASs
HPASs
BPASs
BSTOp
NOTCh
TOCTave
OCTave
FILE
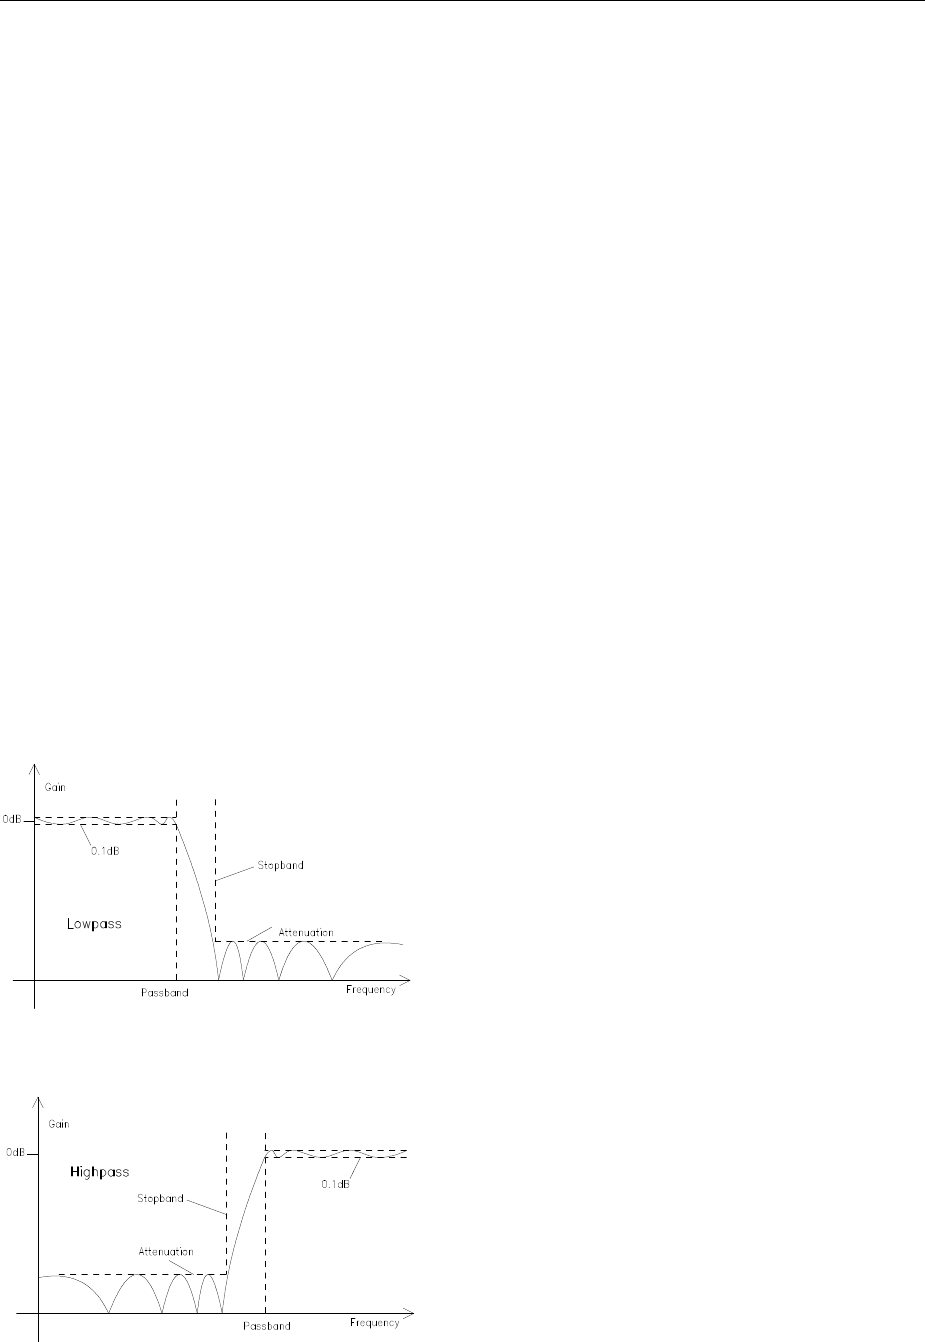
R&S UPV User-Definable Filters
1146.2084.32 4.421 E-9
Low-Pass Filter and High-Pass Filter
Order
Used to specify the filter order. Only available for low-pass and high-
pass filters. Low-order filters have edges with a lower rate of rise, but
settle more quickly.
44th order filter.
Remote-control command:
SENSe:UFILter<i>:ORDer N4
88thorder filter.
Remote-control command:
SENSe:UFILter<i>:ORDer N8
Passband
Used to specify the cutoff frequency (-0.1 dB) of the passband in the
case of low-pass and high-pass filters.
Remote-control command:
SENSe[1]:UFILter<i>:PASSb <nu>
Stopband
Displays the cutoff frequency of the stopband in the case of low-pass
and high-pass filters; the cutoff frequency is derived from the selected
passband and the stopband attenuation. This value is only updated
after the filter is activated.
Remote-control command:
SENSe[1]:UFILter<i>:STOPb?
Figure 4-27 Low-pass and high-pass frequency response with filter parameters

User-Definable Filters R&S UPV
1146.2084.32 4.422 E-9
Band-Pass Filters and Band-Stop Filters
Passb Low
Used to specify the lower cutoff frequency (-0.1 dB) of the passband in
the case of bandpass and band-stop filters.
Remote-control command:
SENSe[1]:UFILter<i>:PASSb:LOWer <nu>
Passb Upp
Used to specify the upper cutoff frequency (-0.1 dB) of the passband
in the case of bandpass and band-stop filters.
Remote-control command:
SENSe[1]:UFILter<i>:PASSb:UPPer <nu>
Stopb Low
Displays the lower cutoff frequency of the stopband in the case of
bandpass and band-stop filters; the cutoff frequency is derived from
the selected passband and the stopband attenuation. This value is
only updated after the filter is activated.
Remote-control command:
SENSe[1]:UFILter<i>:STOPb:LOWer?
Stopb Upp
Displays the upper cutoff frequency of the stopband in the case of
bandpass and band-stop filters; the cutoff frequency is derived from
the selected passband and the stopband attenuation. This value is
only updated after the filter is activated.
Remote-control command:
SENSe[1]:UFILter<i>:STOPb:UPPer?
Figure 4-28 Band-pass frequency response with filter parameters
Figure 4-29 Band-stop frequency response with filter parameters
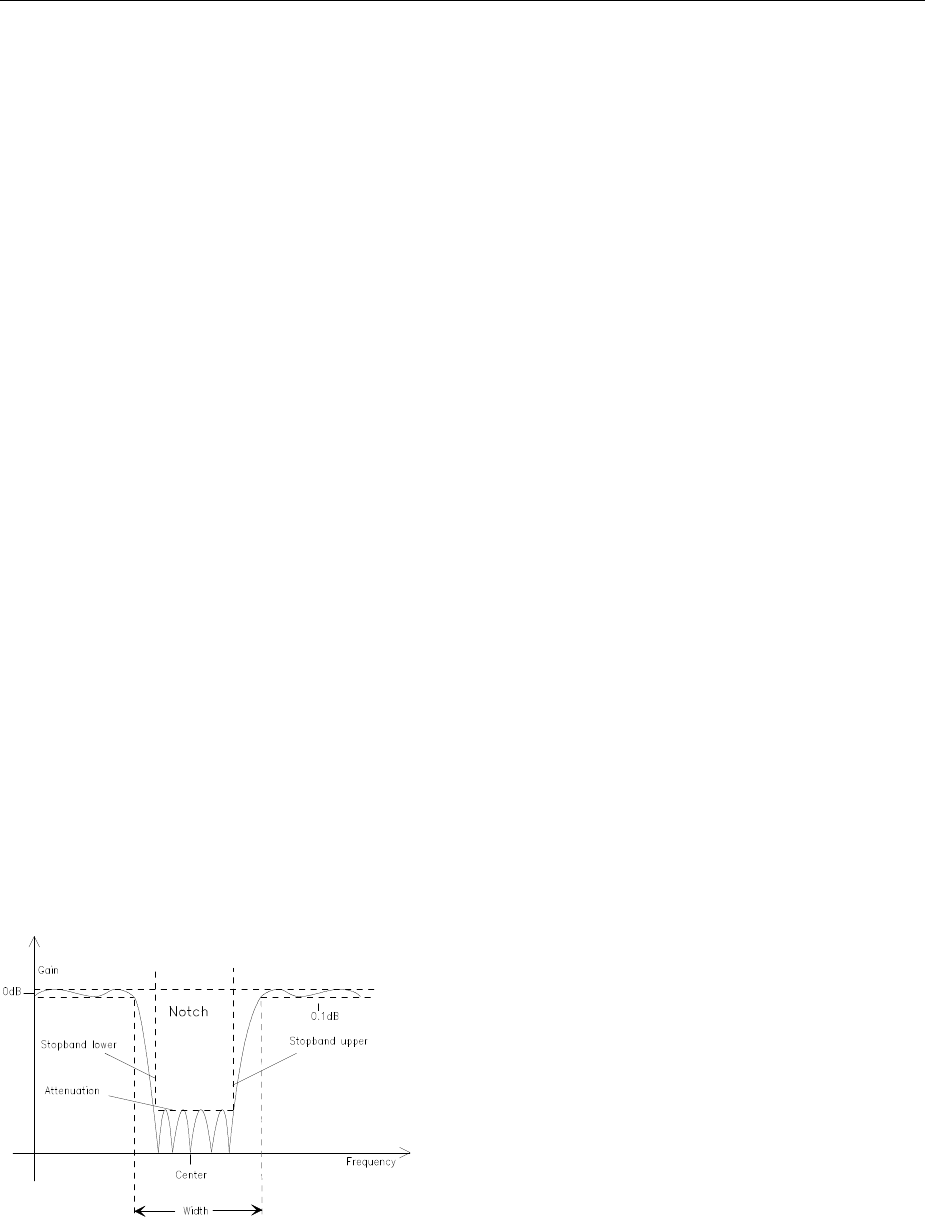
R&S UPV User-Definable Filters
1146.2084.32 4.423 E-9
Notch Filter, Third-Octave Filter and Octave Filter
Center Freq
Used to specify the center frequency. The notch filter has a
transmission zero at the center frequency; the attenuation at this
frequency is considerably greater than the specified stopband
attenuation.
Remote-control command:
SENSe[1]:UFILter<i>:CENTer <nu>
Width
For notch filter: used to specify the difference between the upper and
lower cutoff frequency (-0.1 dB) of the passband.
Remote-control command:
SENSe[1]:UFILter<i>:WIDTh <nu>
For third-octave and octave filter: displays the width of the passband.
Remote-control command:
SENSe[1]:UFILter<i>:WIDTh?
Stopb Low
Displays the lower cutoff frequency of the stopband; the cutoff
frequency is derived from the selected passband and the stopband
attenuation (only for the notch filter). This value is only updated after
the filter is activated.
Remote-control command:
SENSe[1]:UFILter<i>:STOPb:LOWer?
Stopb Upp
Displays the upper cutoff frequency of the stopband; the cutoff
frequency is derived from the selected passband and the stopband
attenuation (only for the notch filter). This value is only updated after
the filter is activated.
Remote-control command:
SENSe[1]:UFILter<i>:STOPb:UPPer?
Figure 4-30 Notch-filter frequency response with filter parameters
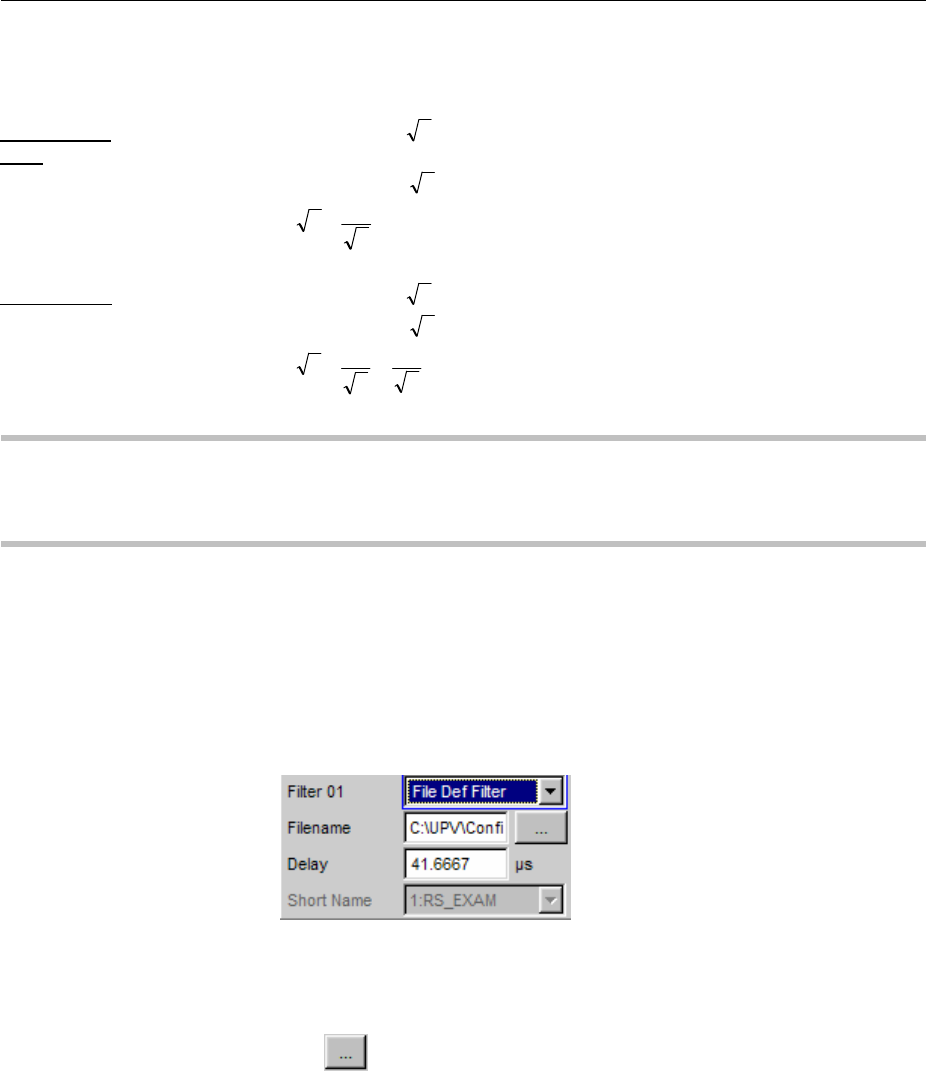
User-Definable Filters R&S UPV
1146.2084.32 4.424 E-9
Third-octave and octave filters are bandpass filters whose passband is geometrically symmetrical to the
center frequency, whereby the passband frequencies are derived from the center frequency as follows:
Third-octave
filter:
Passband low = CenterFreq / 62
Passband upp = CenterFreq ·62
Bandwidth = %15.232315.0
2
1
26
6==
Oktave filter: Passband low = CenterFreq / 2
Passband upp = CenterFreq ·2
Bandwidth = %71,707071.0
2
1
2
1
2===
Note:
With the third-octave and octave filters, the 0.1 dB bandwidth is reduced until an attenuation of approx.
3dB is obtained for the cutoff frequencies. The displayed numeric value for "Width" is therefore less
than the 3 dB bandwidth of the third-octave and octave filter.
File-Defined Filter
If the filters installed on the instrument do not satisfy the requirements of the application concerned, it is
possible to read in a filter from a file. Two file formats are supported in which the filter is described
either by means of the coefficients of the transmission function (*.coe) or using the poles and zeros
(*.zpz or *.npz and *.xpz) on the Z level.
File Def Filter
Afile can be loaded in which the filter is described either by means of
the coefficients of the transmission function (*.coe) or using the poles
and zeros (*.zpz or *.npz and *.xpz) on the Z level.
The button opens a browser which can be used to select the
filter file.
Remote-control command:
SENSe[1]:UFILter<i>:FNAMe 'filename'

R&S UPV User-Definable Filters
1146.2084.32 4.425 E-9
Coefficients of the transmission function
The filter in the file must be an IIR filter with four pairs of poles and zeros in the form of four consecutive
biquads.
The transmission function S(z) is then derived as follows:
=
=
++
=3
0
2
3
0
2
)21(
)21(
)(
i
ii
i
ii
aazz
bbzz
gainzS
Example: See the file RS_EXAM.COE in the directory D:\UPV\USER
Note:
The coefficient file *.COE is only valid for the sampling rate determined during the design stage, i.e. the
frequency response of the filter is standardized to this sampling rate. If a different sampling rate is set in
the R&S UPV, the frequency response changes accordingly.
Poles and zeros of the transmission function
The filter is defined by specifying the poles and zeros on the Z level. Four pairs of poles and zeros are
permitted. Unused poles and zeros must be placed at the origin of the Z level.
The transmission function S(z) is then derived as follows:
=
=
=3
0
3
0
*))((
*))((
)(
i
pipi
i
oioi
zzzz
zzzz
gainzS
where: z0=zeros, zp=poles, z* = conjugate complex number.
File format *.zpz
Example: See the file RS_EXAM.ZPZ in the directory D:\UPV\USER
Note:
The pole/zero file *.ZPZ is only valid for the sampling rate determined during the design stage, i.e. the
frequency response of the filter is standardized to this sampling rate. If a different sampling rate is set in
the R&S UPV, the frequency response changes accordingly.
File format *.npz
Example: See the file RS_EXAM.NPZ in the directory D:\UPV\USER

User-Definable Filters R&S UPV
1146.2084.32 4.426 E-9
Note:
Poles and zeros in the *.NPZ file are standardized to the sampling frequency specified there. If a
different sampling rate is set in the R&S UPV, poles and zeros are converted to this rate so that the
frequency response of the filter remains unchanged. A reference point for the frequency response
(defined by the reference frequency and reference gain at this frequency) must be specified in the file.
File format *.xpz
This file format is an extension of the “npz” format. The file can contain multiple parameter sets for the
pole and zero locations. For each parameter set, the associated sampling frequency must be specified,
along with the sampling frequency range within which the pole and zero locations can be transformed
such that the frequency response of the filter remains within the specified tolerance. This file format
allows filters with tight tolerances to be used over a wide range of sampling frequencies.
Note:
The pole and zero locations in the *.xpz file are normalized to the sampling frequencies specified for the
individual parameter sets. If a different sampling frequency is configured in the R&S UPV, the pole and
zero locations in the allowable frequency range are transformed to correspond to the actual sampling
frequency so the frequency response of the filter remains unchanged. A reference point for the
frequency response, defined in terms of a reference frequency and the reference gain at this frequency,
must be specified in the file.
Parameters Common to All Filters
Attenuation
Used to specify the desired filter attenuation of the stopband in dB.
When the filter is activated, the attenuation actually implemented must
be entered here (this attenuation is normally greater than the entered
value). Filter attenuation in steps of approx. 10 dB is possible.
Remote-control command:
SENSe[1]:UFILter<i>:ATTenuation <nu>
Delay
Displays the estimated settling time of the filter. This value is only
updated after the filter is activated.
Remote-control command:
SENSe[1]:UFILter<i>:DELay?
Exception: With file-defined filters, a settling time is calculated and
displayed after the coefficients are read in. This settling time can then
be changed manually.
Remote-control command:
SENSe[1]:UFILter<i>:DELay <nu>

R&S UPV User-Definable Filters
1146.2084.32 4.427 E-9
Short Name
Displays a short name under which the filter can be called up in the
analyzer or generator. The short name consists of the filter type code
(2 letters) and the frequency. (LP = low-pass filter, HP = high-pass
filter, BP = bandpass filter, BS = band-stop filter, TZ = third-octave
filter, OC = octave filter, NO = notch filter).
The name of the file is shown here in the case of file-defined filters.
Filter Settling Time
The settling time of the filter can be estimated from the filter parameters. Certain filters (e.g. filters with
steep edges and narrowband bandpass filters) have longer settling times.
When measurement is started (e.g. by making new settings, pressing the start key or in the case of a
sweep), the R&S UPV waits until this settling time expires for every filter before performing the actual
signal integration. If (in exceptional cases) the calculated time is too short, the filters cannot settle
properly before the measurement is started. This can result in unstable measurement values.
The following trick can be used to remedy this problem:
If the file-defined filter "DELAY.COE" (in the directory D:\UPV\USER) is selected, a settling time can be
entered there which is then added to the settling time of the other filters when measurement is
performed. The DELAY.COE filter has no other function.
Note:
If a multichannel analyzer is used, the total settling time of all activated analyzer filters is limited to
150 000 samples (at 40 kHz analog bandwidth, this corresponds to a settling time of approx. 1.5 s). If
this is not long enough (e.g. if four very steep-edged filters are used), an additional delay may be
entered under "Start Condition".
With continuous measurement, the filter settling time is added only with the (re)start of the first
measurement. All further measurements in this case are performed without delay.
Note:
If a multichannel analyzer is used, the signal is not observed continuously during continuous
measurement; the filter settling time is therefore added with each subsequent measurement as well.
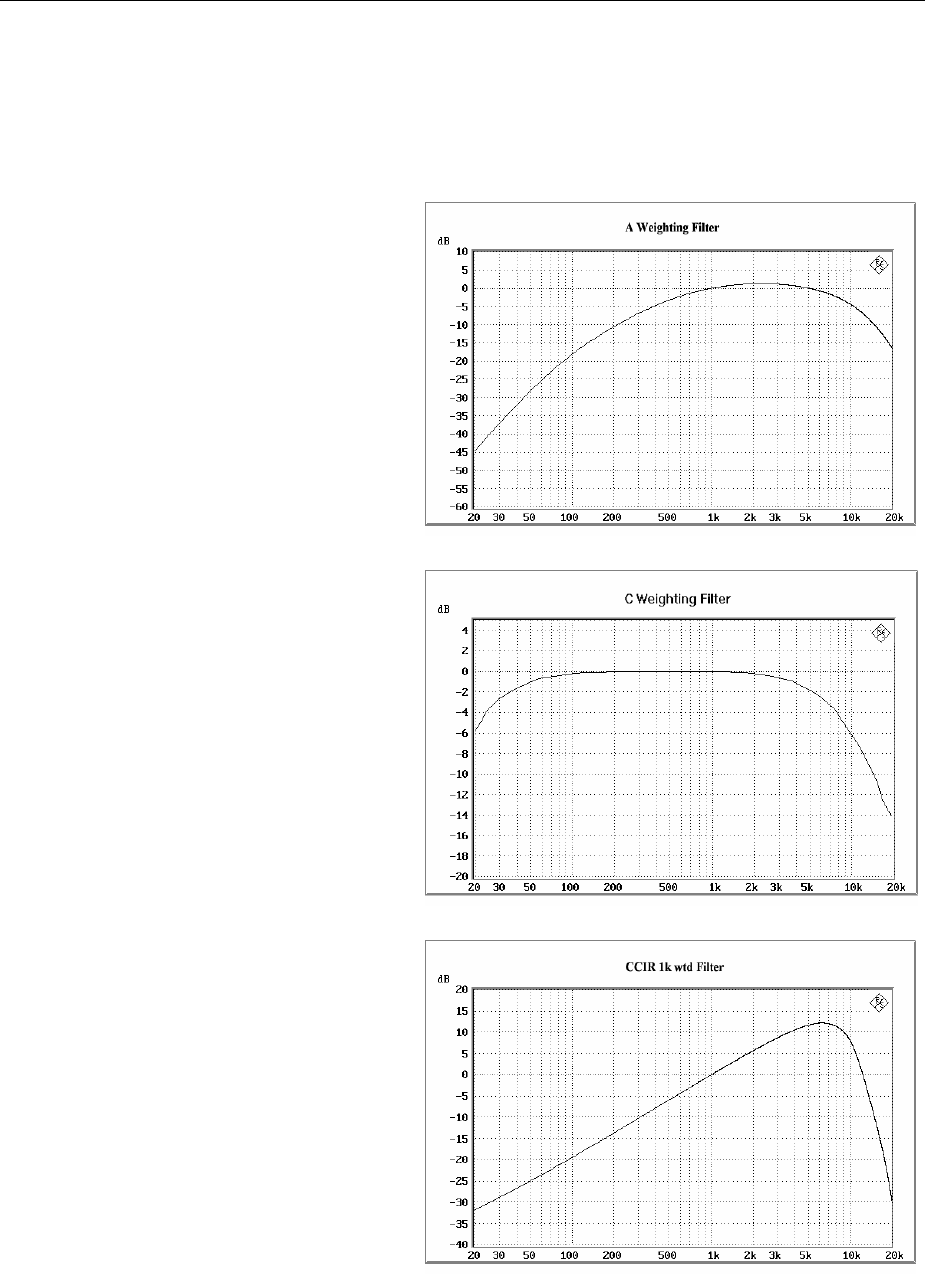
Weighting Filters R&S UPV
1146.2084.32 4.428 E-9
Weighting Filters
In addition to the user-definable filters, the R&S UPV also offers a large number of weighting filters
which conform to the relevant standards.
Filter: A Weighting
Standards: DIN 45412, DIN 45633
IEC 179, IEC 651
ANSI S1.4
Application: Weighted
noise measurement
Filter: C Weighting
Standards: IEC 179, IEC 651
ANSI S1.4
Application: Weighted
noise measurement
Filter: CCIR 1k wtd
Standards: CCIR Rec. 468-4
DIN 45405
CCITT Rec. N21
CISPR 6-76
ITU-T J.16
Application: Weighted
noise measurement
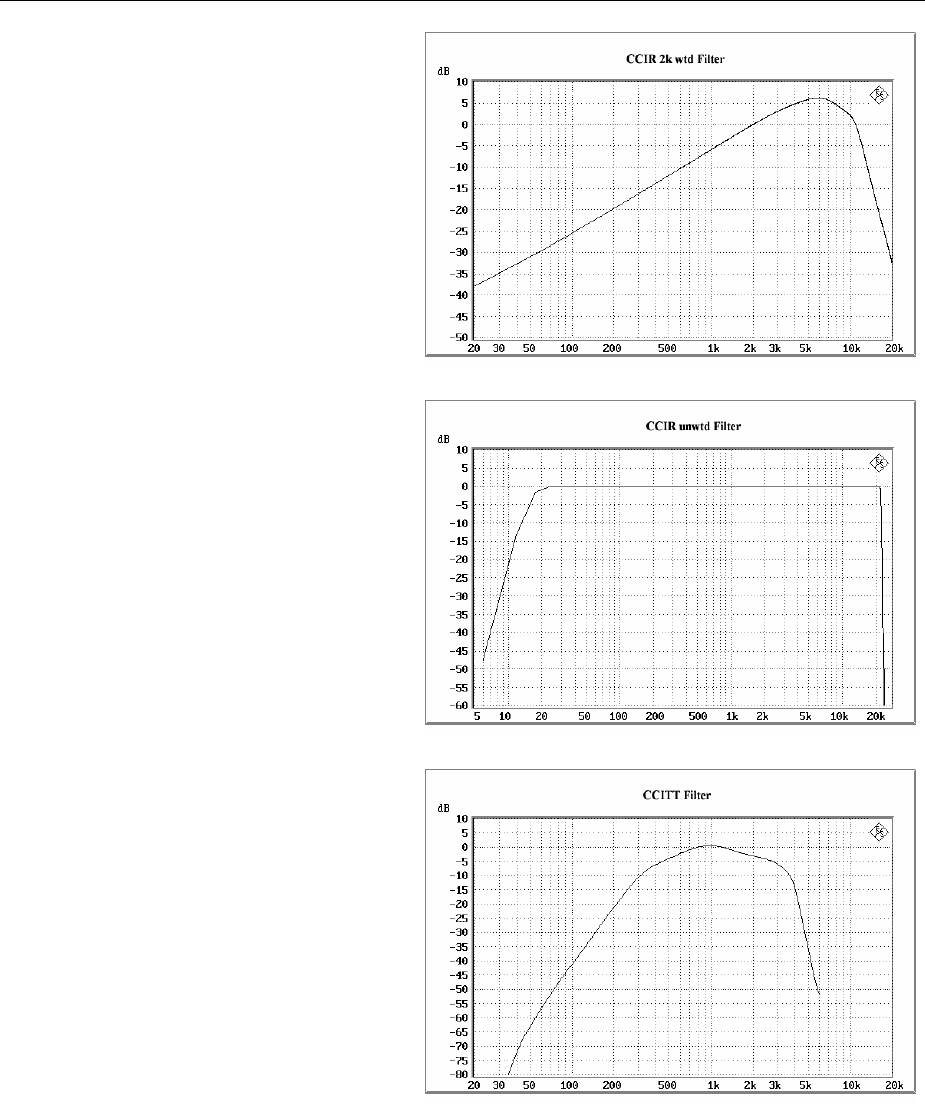
R&S UPV Weighting Filters
1146.2084.32 4.429 E-9
Filter: CCIR 2k wtd
Standard: Dolby
Application: NAB Standard
Filter: CCIR unwtd
Standards: CCIR Rec. 468-4
ITU-T J.16
Application: Band-pass filter from 20 Hz
to 20 kHz for band-
limited unweighted
measurement to CCIR
Filter: CCITT
Standards: ITU-T Rec. O.41
CISPR 6-76
ITU-T Rec. P.53
Application: Psophometric weighting
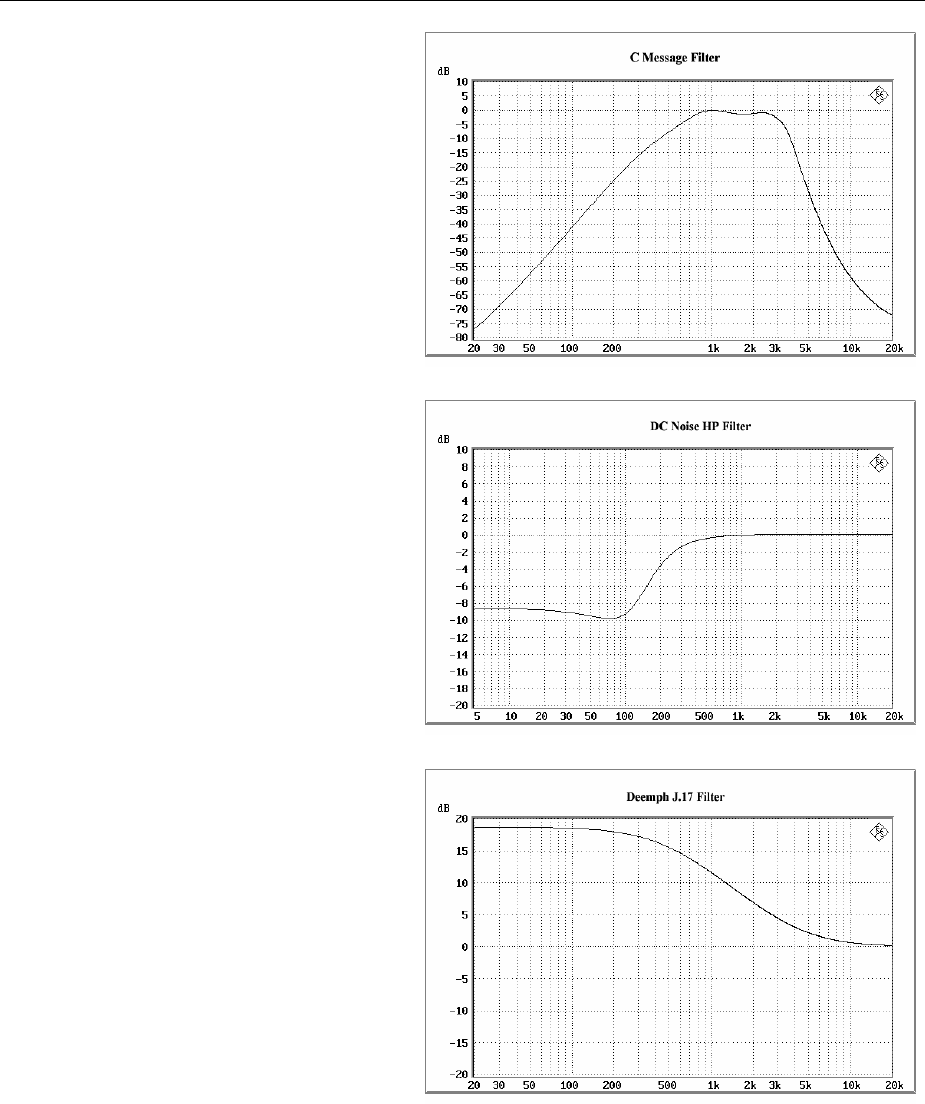
Weighting Filters R&S UPV
1146.2084.32 4.430 E-9
Filter: C Message
Standard: IEEE 743-1995
Application: Weighted noise measurement
Filter: DC Noise HP
Standard: ARD Spec. 3/4
ARD Spec. 12/2
Application: High-pass filter for
measurement of DC noise
(tape recorders)
Filter: Deemph J.17
Standard: ITU-T J.17
Application: Weighted noise measurement
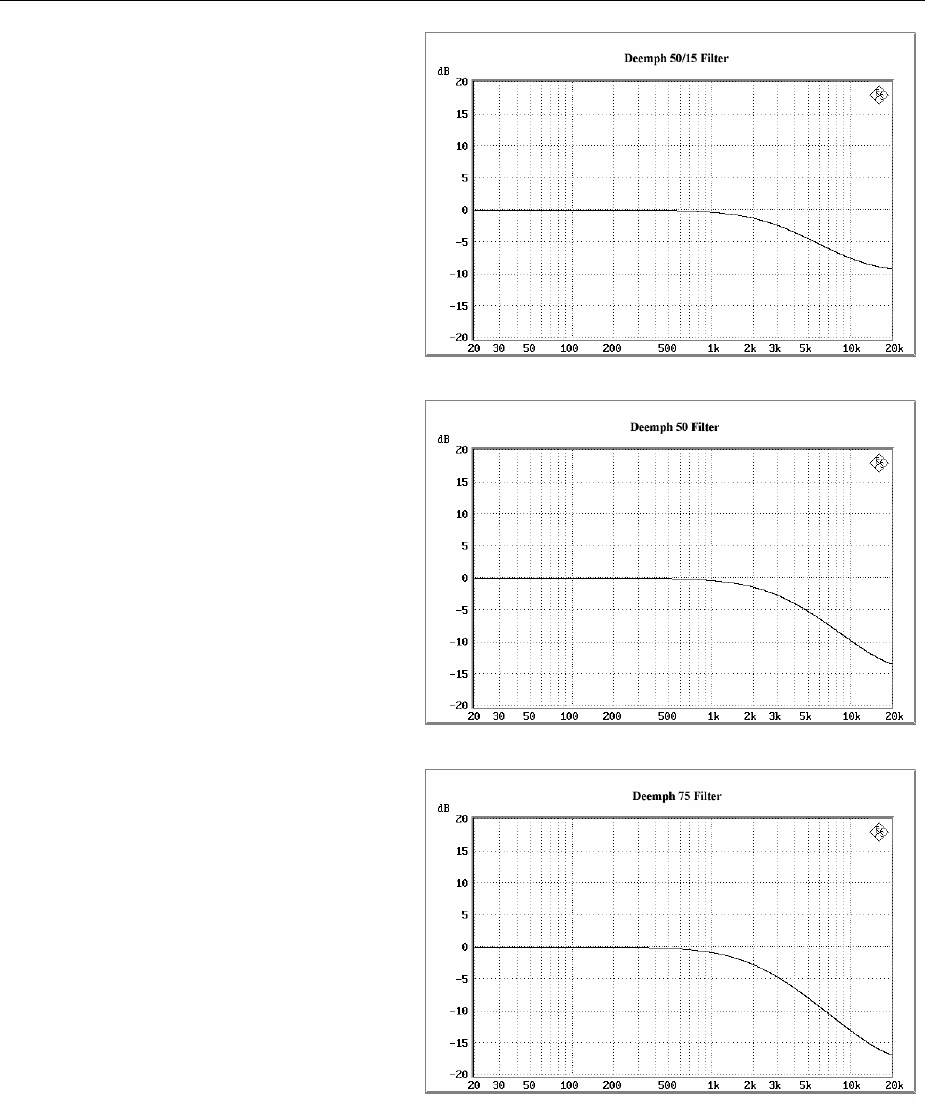
R&S UPV Weighting Filters
1146.2084.32 4.431 E-9
Filter: Deemph 50/15
Standard: CCIR Rec. 651
Application: Compact disc
Filter: Deemph 50
Standard: ARD Spec. 5/3.1
Application: Weighted noise
measurement
Filter: Deemph 75
Standard: ARD Spec. 5/3.1
Application: Weighted noise
measurement
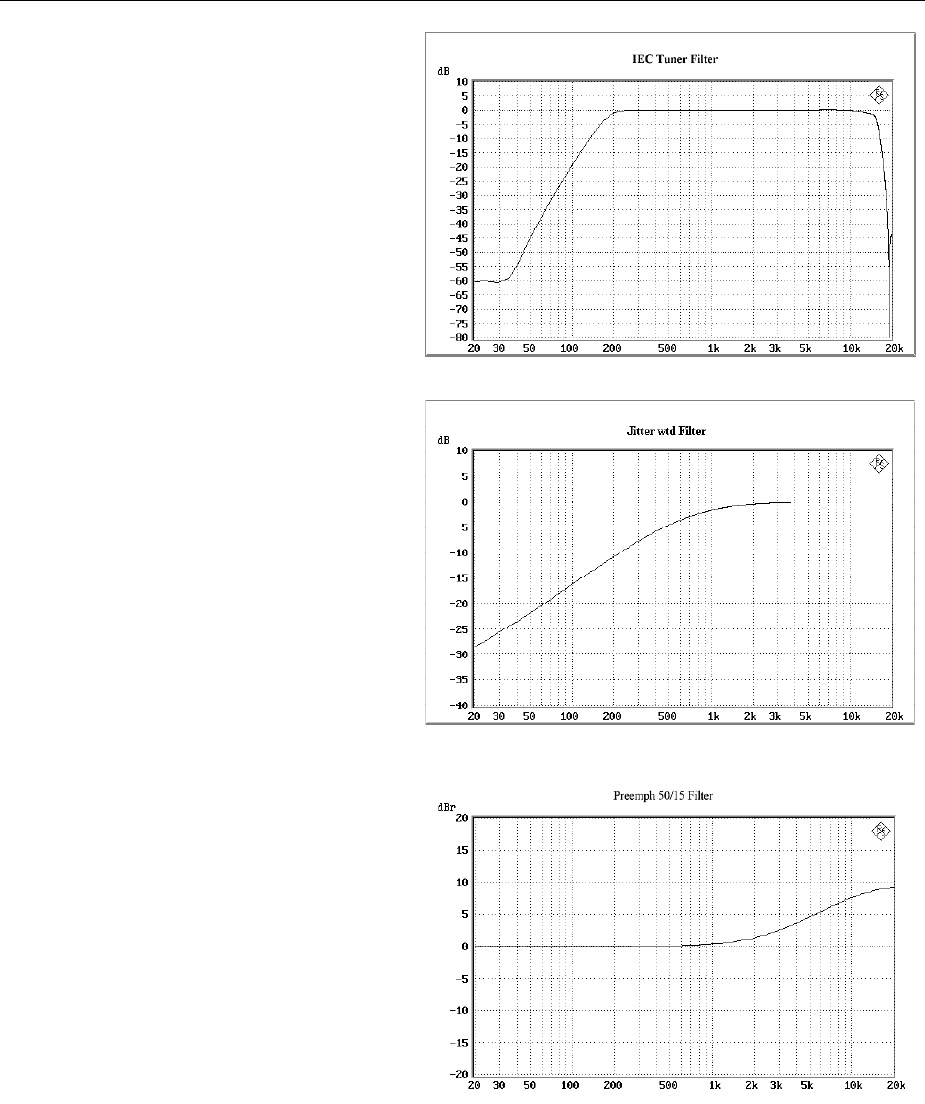
Weighting Filters R&S UPV
1146.2084.32 4.432 E-9
Filter IEC Tuner
Standard: DIN/IEC 60315-4
Application: Measurements on FM tuners
Filter Jitter wtd
Standard: AES 3
Application: Weighting of jitter
transmission function 1st
order HP
-3 dB at 700 Hz
-20 dB at 70 Hz
Filter: Preemph 50/15
Standard: CCIR Rec. 651
Application: Compact Disc
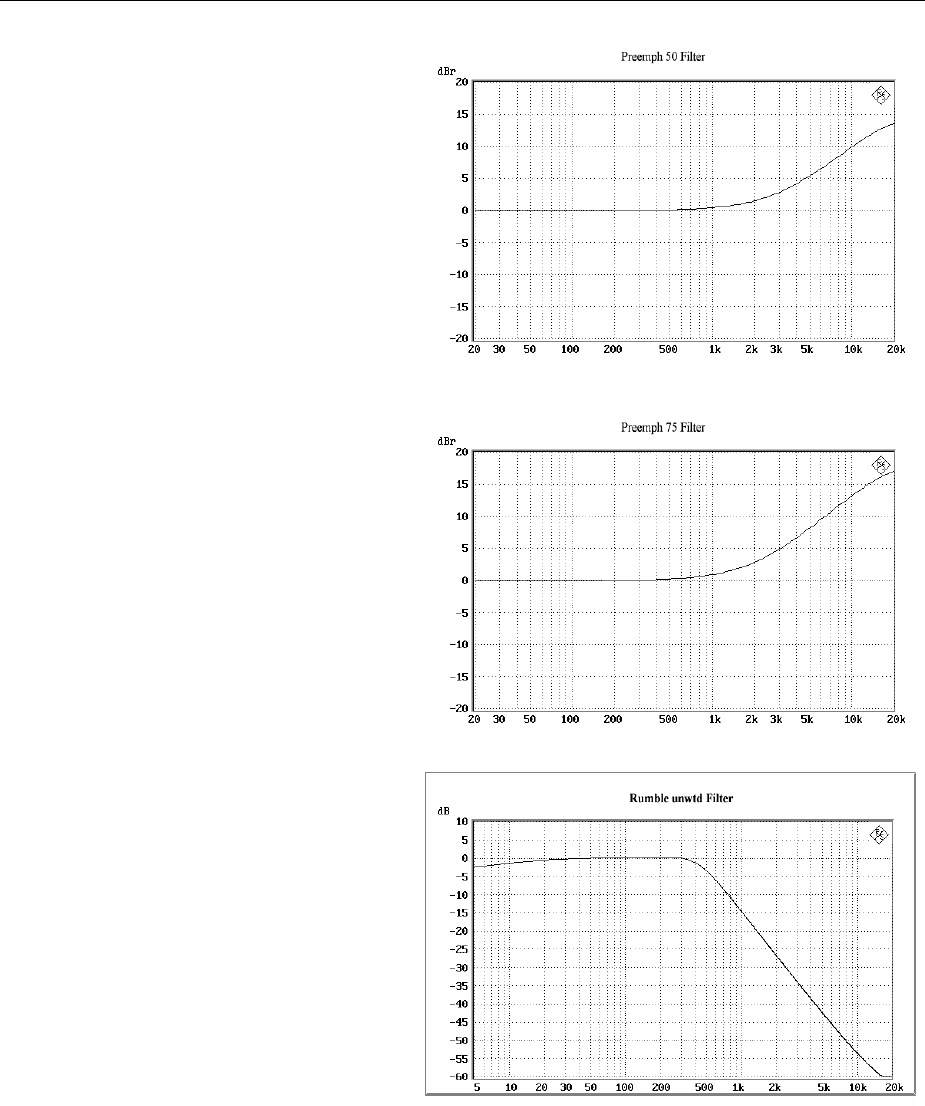
R&S UPV Weighting Filters
1146.2084.32 4.433 E-9
Filter: Preemph 50
Standard: ARD Spec. 5/3.1
Application: Weighted noise
measurement
Filter: Preemph 75
Standard: ARD Spec. 5/3.1
Application: Weighted noise
measurement
Filter: Rumble unwtd
Standards: DIN 368.3
DIN 45539
Application: Testing of record players
Unweighted noise
measurement

Weighting Filters R&S UPV
1146.2084.32 4.434 E-9
Filter: Rumble wtd
Standard: DIN 45539
Application: Testing of record players
Weighted noise measurement

R&S UPV Highpass and Lowpass Filters
1146.2084.32 4.435 E-9
Highpass and Lowpass Filters
In addition to the user-definable filters and the weighting filters, the R&S UPV also offers a selection of
preset highpass and lowpass filters.
HighPass 22 Hz
Highpass (3rd-order Butterworth) with 3 dB cutoff frequency at
22.4 Hz
HighPass 400 Hz
Highpass (3rd-order Butterworth) with 3 dB cutoff frequency at 400 Hz
LowPass 22 kHz
Lowpass (4th-order Butterworth) with 3 dB cutoff frequency at
22.4 kHz
LowPass 30 kHz
Lowpass (3rd-order Butterworth) with 3 dB cutoff frequency at 30 kHz
LowPass 80 kHz
Lowpass (3rd-order Butterworth) with 3 dB cutoff frequency at 80 kHz
AES 17
20 kHz low-pass (8th-order elliptic) in accordance with the AES 17
standard.
Passband: maximum ripple ±0.1 dB below 20 kHz
Stopband: attenuation > 60 dB above 24 kHz
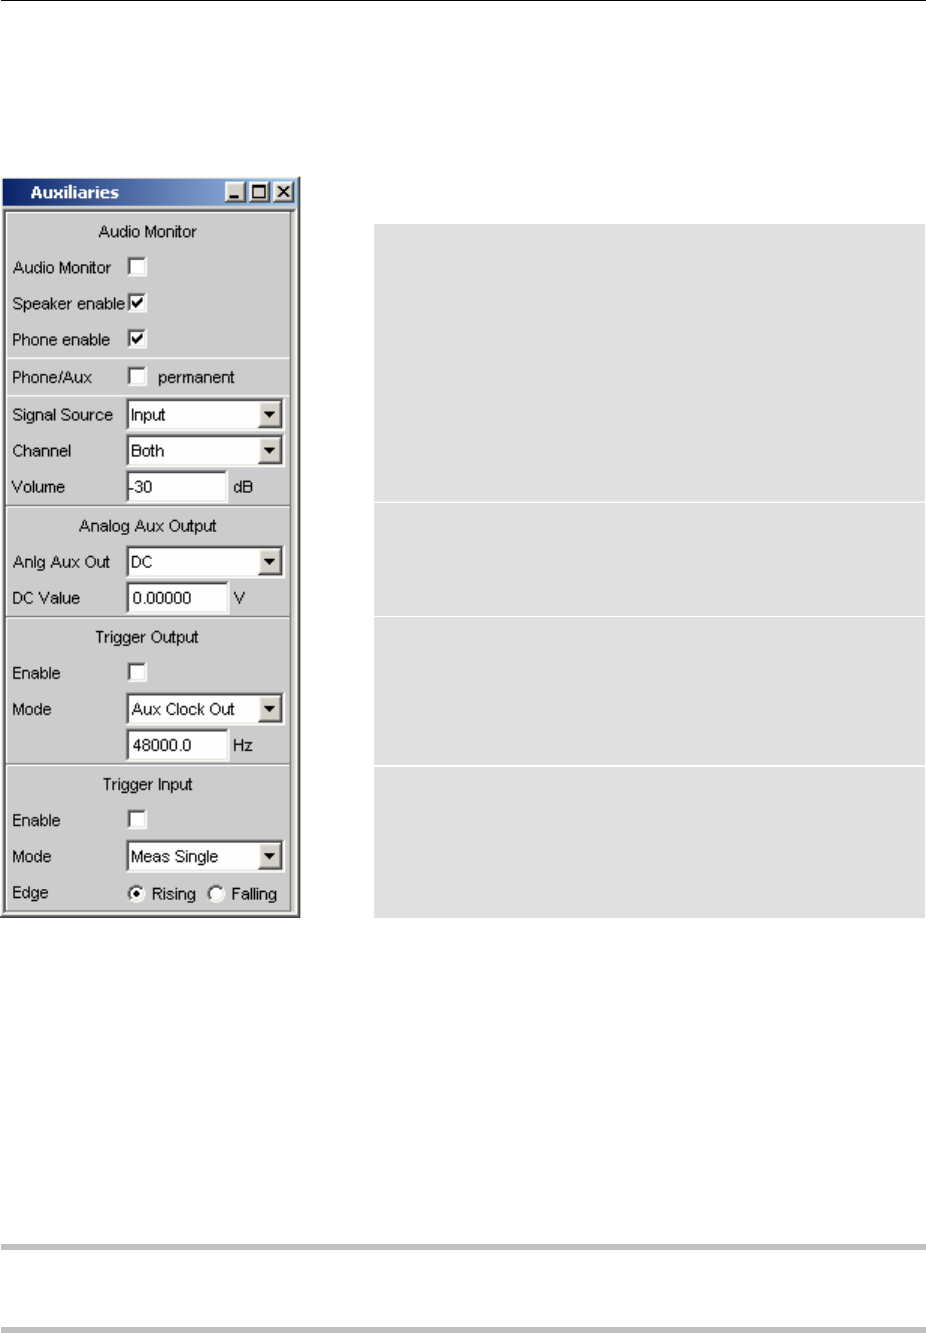
Audio Monitoring R&S UPV
1146.2084.32 4.436 E-9
Audio Monitoring
Auxiliaries Panel
Various functionalities are brought together in the Auxiliaries
panel:
Audio Monitor
The Audio Monitor allows audio monitoring of many different
sources inside the R&S UPV. Applied and measured analog
signals, external digital signals and also analog input signals
which have been converted into digital signals and
processed can all be monitored by ear.
Analog Aux Output
Optionally a DC voltage for powering e.g. hearing aids or
channel 1 of the signal being monitored by ear can be output
via the Analog Aux Output.
Trigger Output
Trigger Output delivers a clock signal or a pulse triggered by
ameasurement, depending on the "Mode" setting.
Trigger Input
Various measurements can be started or the internal trigger
system can be tested via the Trigger Input.
Figure 4-31 Auxiliaries panel
You can monitor a signal by ear at many different points on the signal path with the aid of the "Audio
Monitor" control panel in the Auxiliaries panel. The signal to be monitored can be an analog or digital
signal, or an externally applied or internally generated signal.
To allow audio monitoring of digital signals, the Audio Monitor output has an audio-monitoring D/A
converter which converts the digital signals into analog signals.
The audio monitoring signal is output from a loudspeaker integrated in the R&S UPV, at a 6.3 mm jack
socket at the bottom right-hand side of the R&S UPV front panel, or at the BNC socket labelled "Anlg
Aux Out" at the rear of the R&S UPV. The maximum output voltage can be up to 5 V, depending on the
selected configuration.
Note:
Audio monitoring is not possible with sampling rates exceeding 200 kHz nor generally if multichannel
analyzers are used.
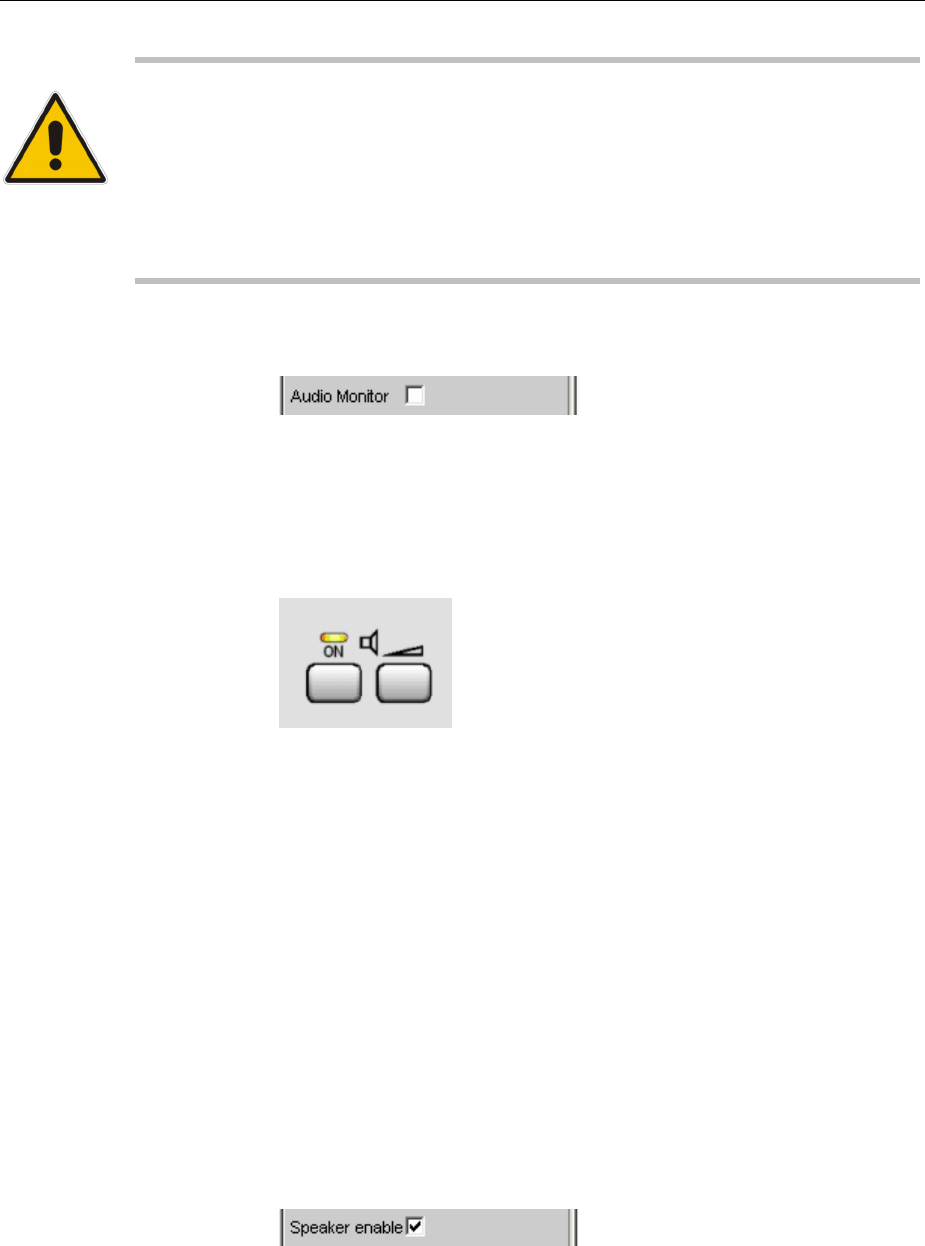
R&S UPV Audio Monitoring
1146.2084.32 4.437 E-9
WARNING Possible Hearing Damage!
High sound pressure levels may cause hearing damage:
The output voltage of the built-in headphones amplifier is influenced by the incoming
signal, by instrument settings such as the selected measurement range and test
function, as well as by the set volume. If the volume is set to maximum, the headphones
amplifier may generate high output voltages with an RMS value of up to 8 V. Depending
on the headphones' sensitivity, this may produce very high sound pressure levels that
may cause hearing damage. To monitor varying input signals, therefore, it is advisable
to reduce the volume and take off the headphones until the signal has settled.
Audio Monitor
Activates/deactivates the audio monitoring function.
If the tick box is empty, the audio monitoring function is deactivated. If
the audio monitoring function is activated, a tick is shown in the tick
box. The monitoring signal is then output using the volume or voltage
set at "Volume", and in the subsequent parameter fields you can
select whether the internal loudspeaker, the headphone jack or both
are to be used for playback.
The illustration above shows a section of the R&S UPV front-panel
keypad. The internal loudspeaker can be operated directly via these
keys. The left-hand key has a toggle function, i.e. the audio monitor is
activated/deactivated alternately each time the key is pressed. The
ON key on the frontpanel therefore equates to the "Audio Monitor" tick
box in the Auxiliaries panel. Pressing the right-hand key opens the
window used for setting the volume.
Remote-control command:
AUXiliaries:AUDMonitor ON | OFF
Speaker enable
The internal loudspeaker plays back the signal selected at “Signal
Source” with the volume that was set at "Volume", provided the
monitoring option has been enabled by ticking the "Audio Monitor" tick
box.
If the internal loudspeaker was earlier disabled and is made active by
ticking, the Audio Monitor tick box in the field above is also provided
with a tick. At the same time the Speaker LED on the front panel
begins to shine.
Remote-control command:
AUXiliaries:SPEaker ON | OFF
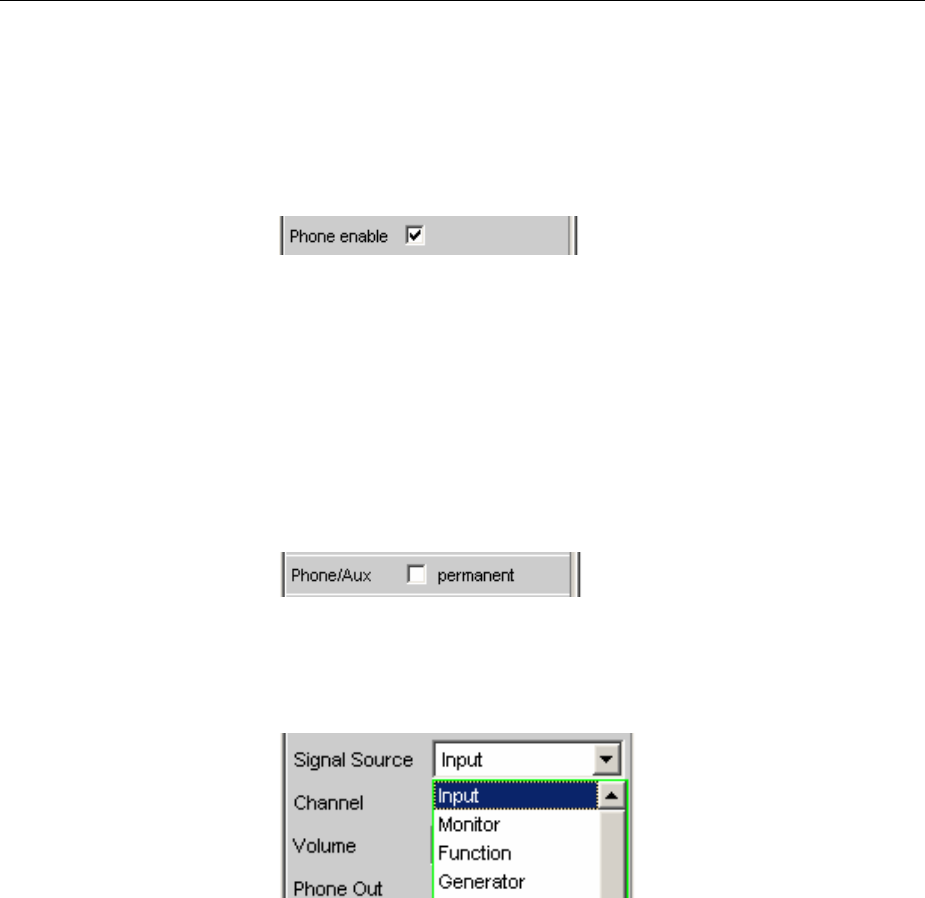
Audio Monitoring R&S UPV
1146.2084.32 4.438 E-9
Phone enable
The signal selected at “Signal Source” is output with the volume that
was set at "Volume" on the front phone jack, provided the monitoring
option has been enabled by ticking the "Audio Monitor" tick box.
If the phone output was earlier disabled and is made active by ticking,
the Audio Monitor tick box in the field above is also provided with a
tick. At the same time the Speaker LED on the front panel begins to
shine.
Remote-control command:
AUXiliaries: PHONe ON | OFF
Phone/Aux permanent
If the tick box in this field is ticked, Phone Out and Anlg Aux Out are
always active. Enabling Audio Monitor via the tick box in the first
parameter field of the Auxiliaries panel or the front panel key with the
speaker symbol then affects only the internal loudspeaker. The tick
box "Phone enable" is ticked in this setting and displayed with a gray
background, which means it cannot be altered.
If the "OUTPUT OFF" key on the front panel is operated, Phone Out
and Anlg Aux Out are also turned off at the same time.
Remote-control command:
AUXiliaries:PHPermanent ON | OFF
Signal Source
Used to select the audio monitoring point along the signal path.
Input Audio monitoring of a signal applied at the analyzer
inputs. The input signal of the activated analyzer is
automatically switched to the audio monitoring
output.
Remote-control command:
AUXiliaries:SPEaker:SOURce INPut
Monitor Audio monitoring downstream of the digital prefilter.
Remote-control command:
AUXiliaries:SPEaker:SOURce MONitor

R&S UPV Audio Monitoring
1146.2084.32 4.439 E-9
Function The input signal can undergo digital post-processing
(processing type depends on the set measurement
function) before it is listened to by the user.
So as to avoid overloading in the active filter, level
attenuation is carried out in the case of certain
weighting filters in order to compensate for the
increase in the frequency response. This attenuation
isof course taken into account in the measurement
value display, but is just noticeable in the level of the
monitor output.
Note:
If high requirements are placed on the internal
processing of measurement values (sample rates of
192 kHz or more while using several filters), the
audio monitoring output is muted in this operating
mode in order not to slow down the measurement.
This deactivation does not corrupt the measurement
result. Pressing the START button automatically
reactivates the audio monitoring output.
Remote-control command:
AUXiliaries:SPEaker:SOURce FUNCtion
Generator The digital data signal from the DSP for the currently
activated generator is fed to the audio monitoring
output via the audio monitoring D/A converter. If the
analog generator is being monitored, the audio
monitoring D/A converter is actuated using the same
digital signals as those fed to the main D/A converter
of the analog generator. Audio monitoring is not
possible with the generator functions "DIM" or "Sine"
with activated Low Dist. After one of these functions
has been switched on, the following message will
appear: "Speaker not available for generator
function DIM or Low Dist activated!"
Remote-control command:
AUXiliaries:SPEaker:SOURce GENerator
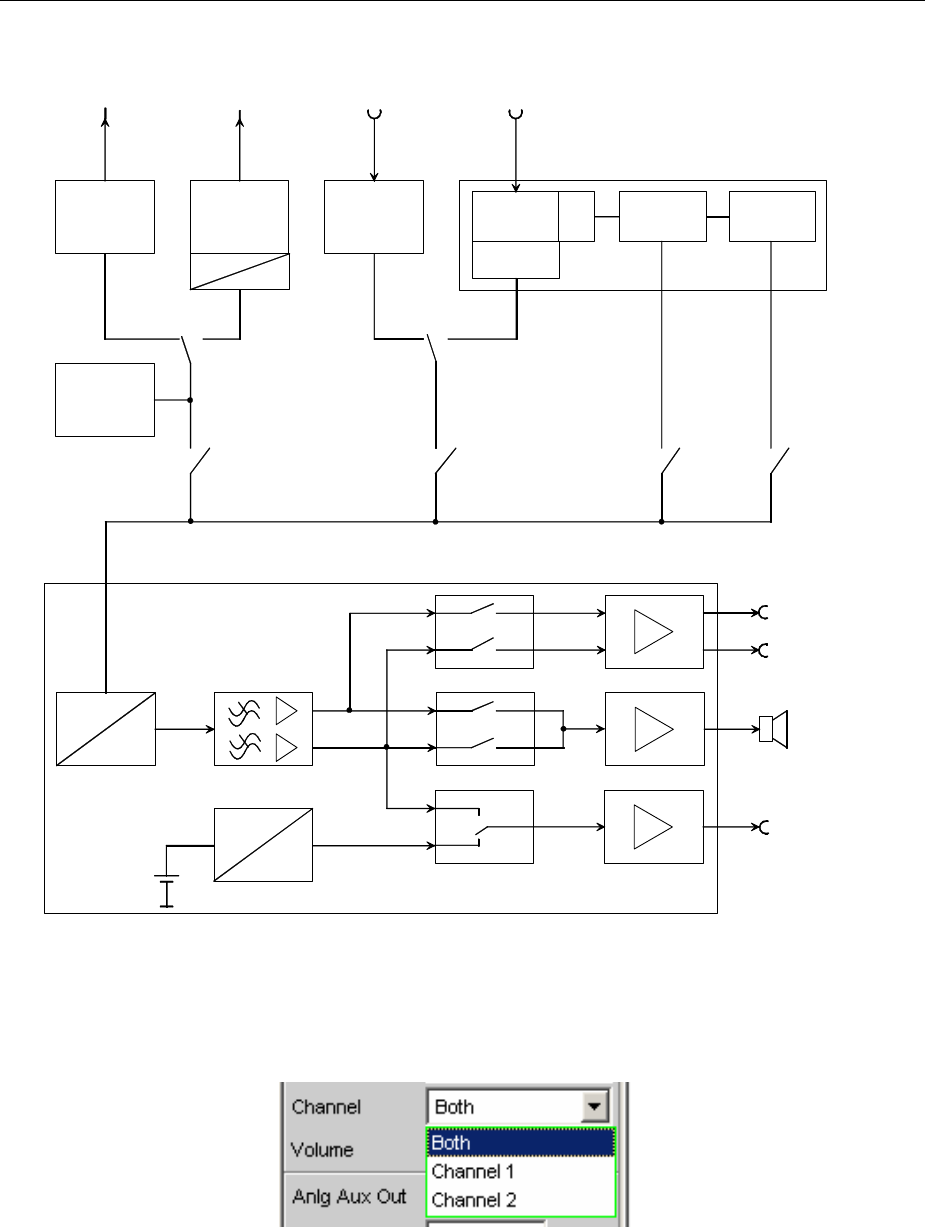
Audio Monitoring R&S UPV
1146.2084.32 4.440 E-9
The block diagram below shows the points along the signal processing path at which the signal is
tapped and fed to the audio monitoring output:
D
A
Aux-DC
Phone-Out-L
Phone-Out-R
D
A
Anlg-Aux-Out
Speaker
Analog
Generator
Digital
Generator
Digital
Analyzer
Analog
level
adjustment
AD
Generator
DSP
Prefilter
Measurement
value
processing
Analog
Analyzer
Generator Input Monitor Function
Signal
Source:
Auxiliaries
Audio monitor.
DAC
Meas.
DAC
Figure 4-32 Connection to audio monitoring output
Channel
Used to select the audio monitoring channel.
This menu item is used to decide whether both channels (Stereo) or
just one channel (either Channel 1 or 2) are to be monitored.
R&S UPV Audio Monitoring
1146.2084.32 4.441 E-9
Both The audio monitoring signal is output on both
channels at the audio monitoring output. The internal
loudspeaker outputs the signal from both channels.
Remote-control command:
AUXiliaries:SPEaker:CHANnel STEReo
Channel 1 Only the signal applied and analyzed via Channel 1
or generated internally is output at the audio
monitoring output.
Remote-control command:
AUXiliaries:SPEaker:CHANnel CH1
Channel 2 Only the signal applied and analyzed via Channel 2
or generated internally is output at the audio
monitoring output.
Remote-control command:
AUXiliaries:SPEaker:CHANnel CH2
Volume
Used to set the volume.
Setting range from 0 dB (highest volume or output voltage) to -120 dB
(lowest volume or output voltage). This setting affects all three internal
signal paths: the internal loudspeaker, the jack socket on the front
panel of the instrument, and the BNC socket (Anlg Aux Out) at the
rear of the instrument.
If "Function" was selected as signal source, the volume can be
increased up to +120 dB. This is done by multiplying the digital signal
by a corresponding factor prior to D/A conversion. Signals of low
digital modulation can then also be heard at sufficient volume.
Note:
Volume settings above 0 dB may cause the enlarged digital signal to
be overdriven and thus the audio monitoring signal to be distorted. For
this reason, the selected gain must not be higher than the underdrive
of the digital signal.
The output voltage can be adjusted by entering values directly in the
panel. If Direct mode is active (the entry field has a magenta frame
when the field is selected and the selection is confirmed with "Enter"),
the output voltage can be adjusted almost steplessly using the cursor
keys or the rotary knob.

Audio Monitoring R&S UPV
1146.2084.32 4.442 E-9
If the loudspeaker volume symbol (right-hand key) on the R&S UPV
keypad is pressed, the following panel appears on the screen:
In this panel, the volume can be adjusted in steps of 1 dB using the
rotary knob or cursor keys /or in steps of 10 dB using the keys
"Page "and "Page ".
If a mouse is connected to the R&S UPV, the horizontal slider can be
operated directly.
On an external keyboard, this panel can be called up by pressing
"Ctrl F9". The output voltage can then be adjusted using the same
keys as on the R&S UPV front-panel keypad. The keys "Tab" and
"Shift Tab" are used to adjust the output voltage in steps of 1 dB.
The entry window is closed again by pressing the ENTER key, the
Escape key or by pressing the loudspeaker volume symbol again. If a
mouse is used, the window is closed by simply clicking the cross in
the top right-hand corner.
Remote-control command:
AUXiliaries:SPEaker:VOLume <n>
Anlg Aux Out
Auxiliary BNC output at the rear of the R&S UPV.
DC The auxiliary output supplies DC voltage to the BNC
socket at the rear of the instrument. This voltage can
be used to power an external DUT (Device Under
Test, e.g. a hearing aid).
Attention:
The „Output OFF“ key on the front panel is without
effect if Anlg Aux Out is set to „DC“. The DC current
is still provided at the output to ensure that the DUT
keeps the operating voltage/point!
Remote-control command:
AUXiliaries:AAUXout DC
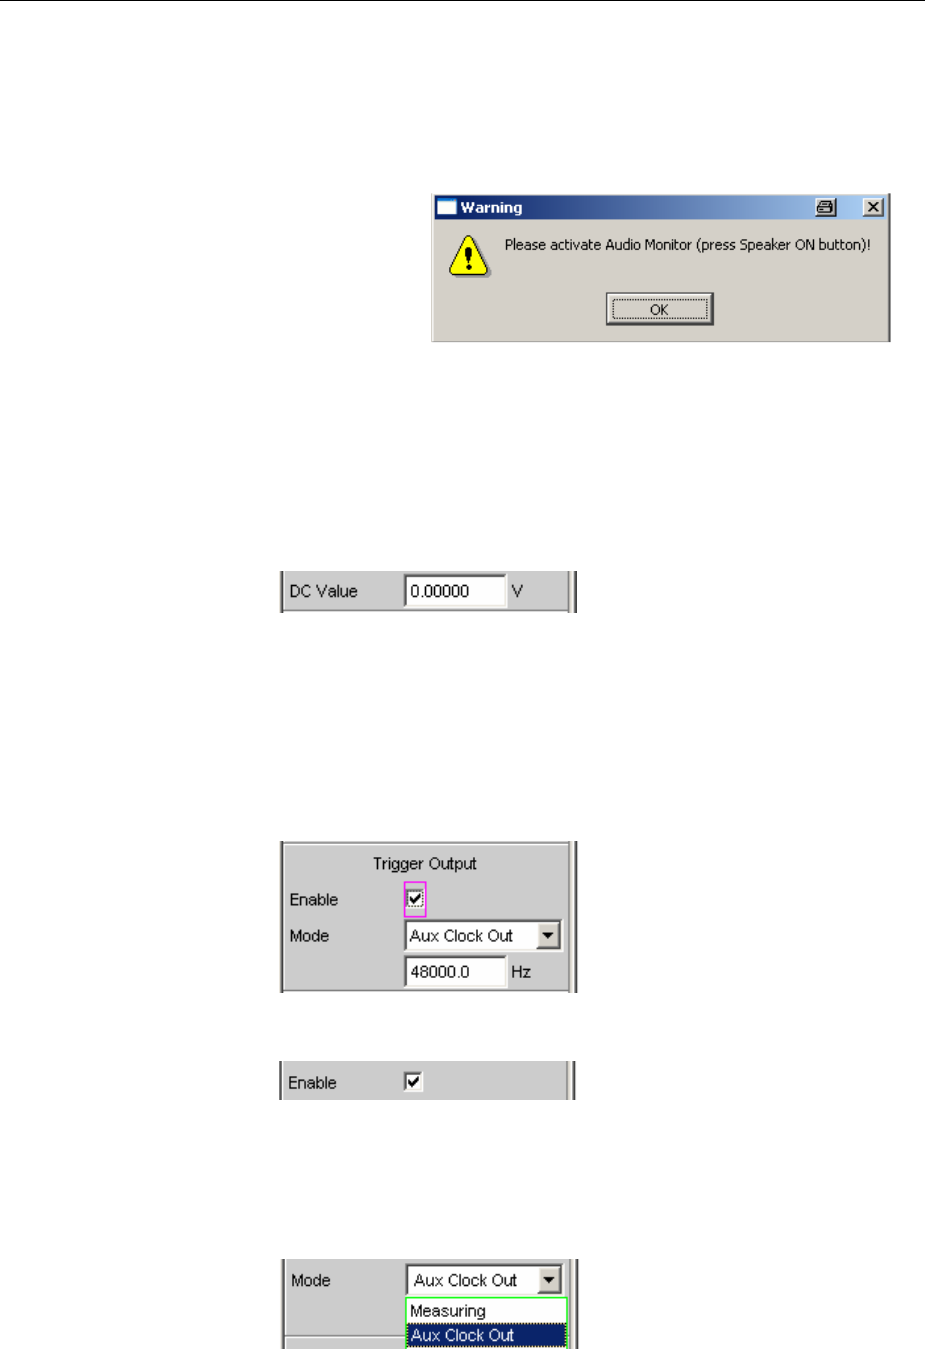
R&S UPV Audio Monitoring
1146.2084.32 4.443 E-9
AudioMon Ch1 The left-hand channel of the audio monitoring signal
isoutput at the rear BNC socket.
If you select this setting and the Audio Monitor (top
line) is still not enabled, the message below appears
(only if Phone/Aux = permanent is not ticked):
This requests you to activate the Audio Monitor so
that a signal is output from the BNC output on the
rear of the R&S UPV.
Remote-control command:
AUXiliaries:AAUXout AUDM1
DC Value
Magnitude of the DC voltage level at the rear BNC socket.
The DC output voltage can be adjusted between -2.5 V and +2.5 V.
This line appears only if "DC" has been set as Anlg Aux Out in the
parameter field above.
Remote-control command:
AUXiliaries:DCValue <nu>
Trigger Output
Additional BNC output on the rear of the R&S UPV.
Enable
For enabling or disabling the trigger output.
Remote-control command:
AUXiliaries:TRIGger:OUTPut:ENABle ON | OFF
Mode
The R&S UPV outputs either a pulse, while a measurement is running,
or a squarewave signal.
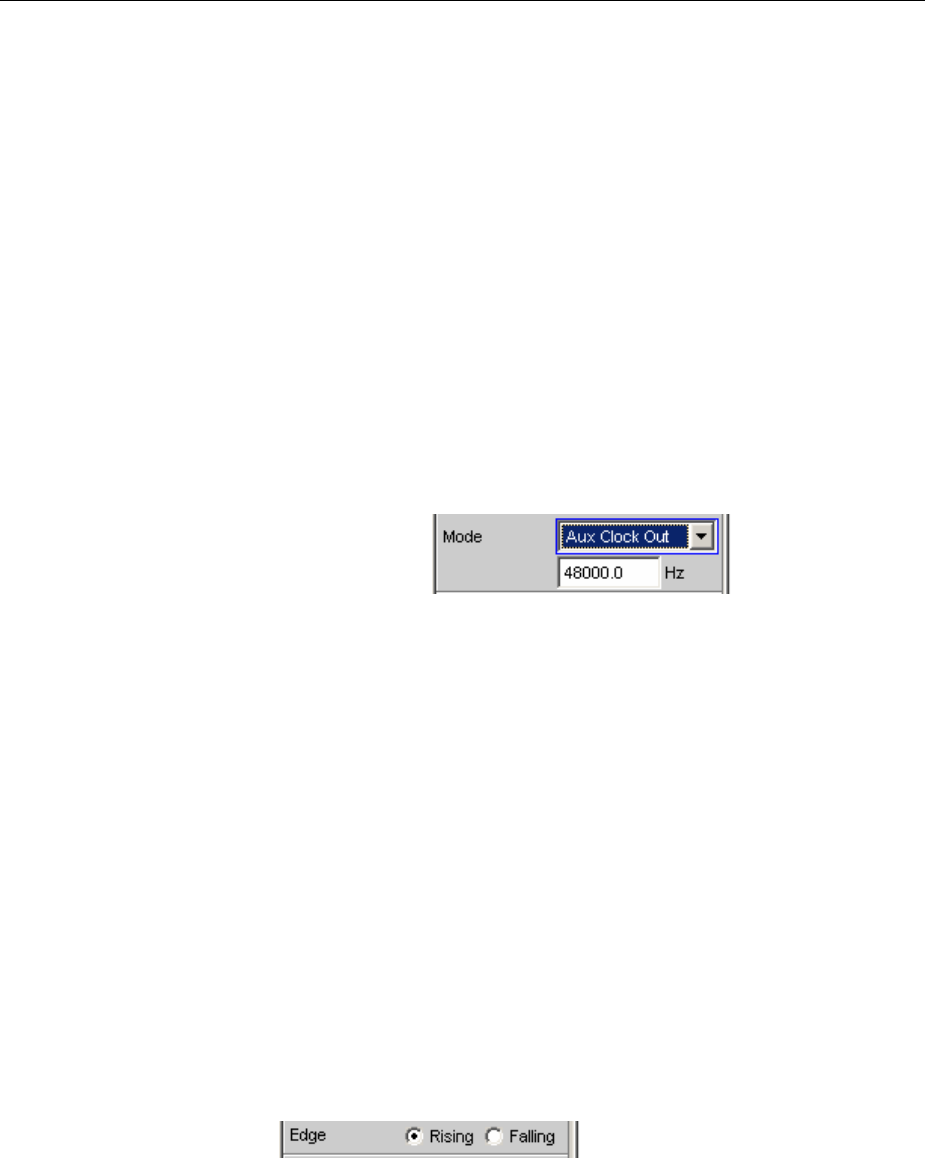
Audio Monitoring R&S UPV
1146.2084.32 4.444 E-9
Measuring While a measurement is being performed in a 2-
channel analyzer, the R&S®UPV outputs a low or
high level, depending on the setting in the Edge line.
In multichannel analyzers, the trigger signal is not
available and is muted. A corresponding warning will
then be output.
Remote-control command:
AUXiliaries:TRIGger:OUTPut:MODE MEAS
Aux Clock Out The frequency of the internal DDS oscillator on the
Digital Mainboard (DMB) is output as a squarewave
signal.
Remote-control command:
AUXiliaries:TRIGger:OUTPut:MODE AUXC
If "Aux Clock Out" is selected as the Mode in Trigger
Output, an additional line appears so that you can
enter a frequency:
The frequency of the DDS oscillator can be used for
synchronization purposes.
At the bandwidths 22, 40 and 80 kHz (in the
Generator Config panel) the frequency is
independent of the sampling frequency of the
generator.
If "Play Auto" is selected, the frequency is 512 times
the sampling frequency (master clock) with which a
waveform signal has been acquired by the analyzer
(recorded waveforms) and can be played back via
the generator ("Play Auto" bandwidth in the
Generator Config panel and "Play" function in the
Generator Function panel).
Remote-control command:
AUXiliaries:TRIGger:OUTPut:FREQuency
<parameter>
Edge
This line defines whether you want the R&S UPV to output a high or
low level during measurement.
This parameter field appears only if "Measuring" was set as the Mode.
Remote-control command:
AUXiliaries:TRIGger:OUTPut:EDGE FALL | RIS
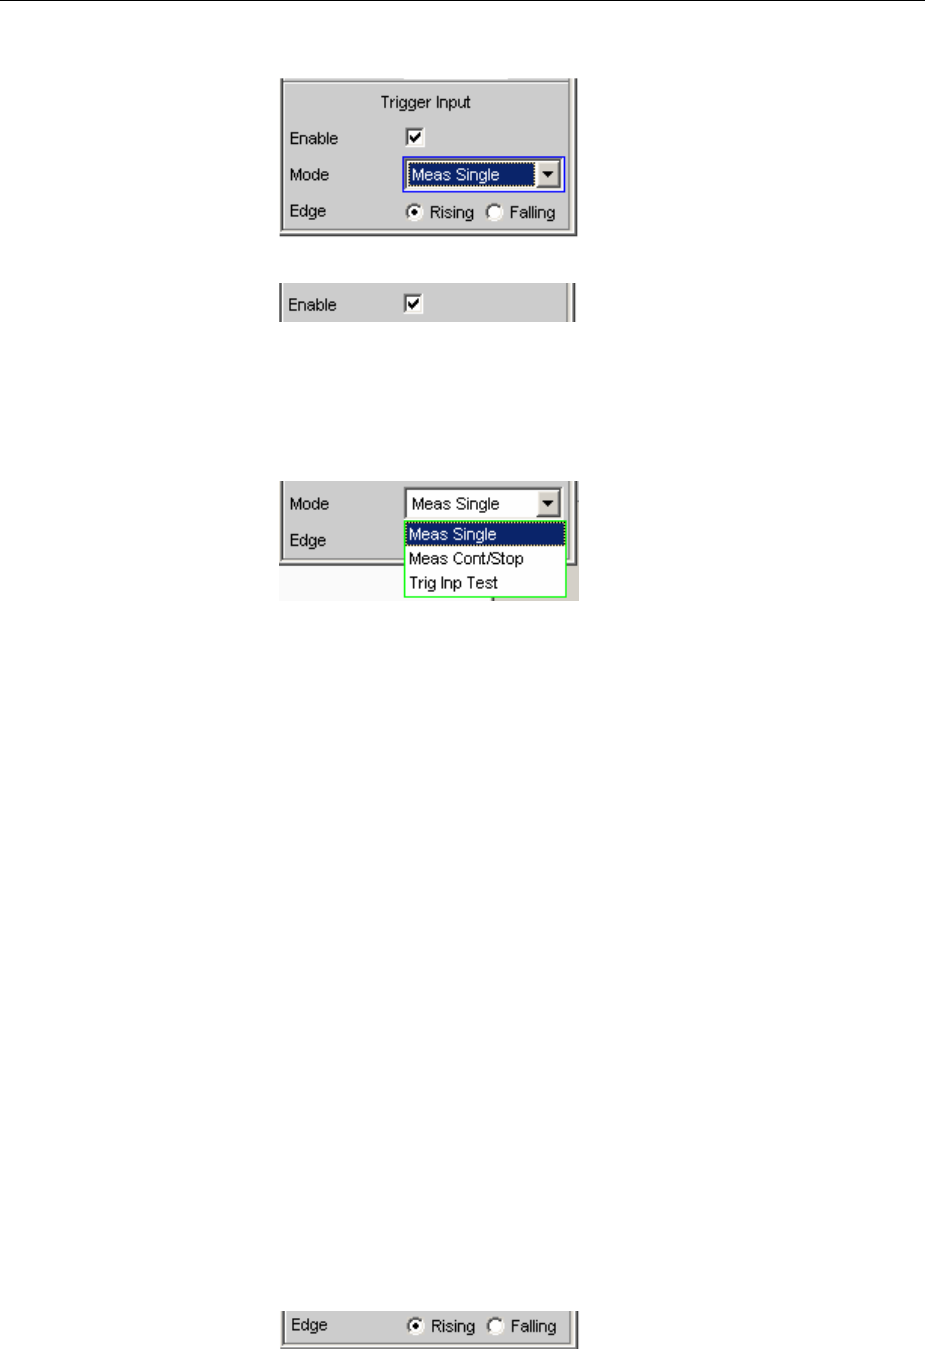
R&S UPV Audio Monitoring
1146.2084.32 4.445 E-9
Trigger Input
Additional BNC input on the rear of the R&S UPV.
Enable
For enabling or disabling the trigger input.
Remote-control command:
AUXiliaries:TRIGger:INPut:ENABle ON | OFF
Mode
The presence of a pulse on the "Trigger In" BNC connector can trigger
various events.
Meas Single The trigger pulse launches a single measurement.
The “START”, “SINGLE” and “STOP/CONT” keys on
the front panel are disabled.
Remote-control command:
AUXiliaries:TRIGger:INPut:MODE MSIN
Meas Cont/Stop The trigger pulse launches a continuous
measurement. Due to the toggle function the
measurement can be started or stopped while
running.
The “START”, “SINGLE” and “STOP/CONT” keys on
the front panel are disabled.
Remote-control command:
AUXiliaries:TRIGger:INPut:MODE MCON
Trig Inp Test All LEDs light up according to the voltage that is
present (TTL level).
Low = Off
High = On
Remote-control command:
AUXiliaries:TRIGger:INPut:MODE TRIG
Edge
This is for defining whether you want the R&S UPV to react on the
rising or falling edge of the input signal.
This line is not visible if the "Trig Inp Test" mode has been selected.
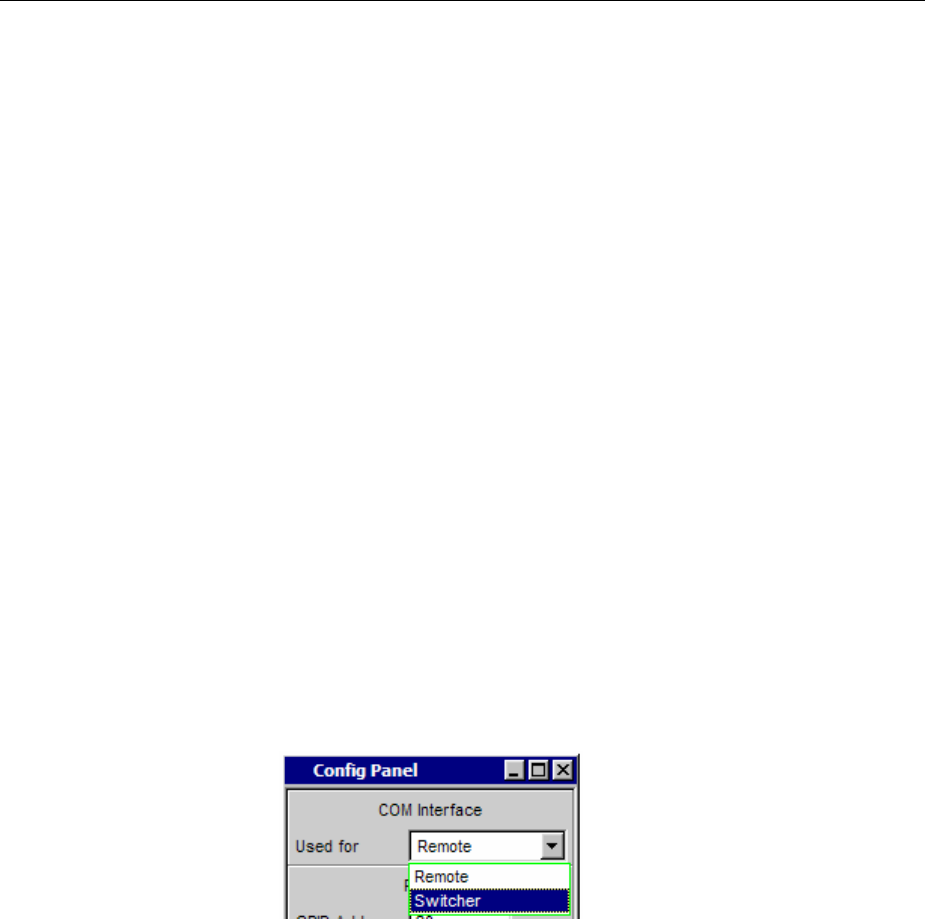
Switcher Panel R&S UPV
1146.2084.32 4.446 E-9
Switcher Panel
This section describes how to connect and operate the R&S UPZ Switcher on the R&S UPV.
Connecting the Switcher to the R&S UPV
R&S UPZ Audio Switchers can be connected to the R&S UPV. An R&S UPZ may be an input switcher
or an output switcher. An input switcher makes it possible to connect up to eight different DUTs to the
two analyzer inputs without having to change connectors each time. An output switcher can supply up
to eight DUTs with the generator channels delivered by the R&S UPV.
Up to 16 input and 16 output switchers can be connected to the R&S UPV, making up to 128 channels
available.
The two busbar connections A and B on the front panel of the R&S UPZ have to be connected to the
R&S UPV. In the case of an input switcher the XLR connectors on the busbar are connected to the
analyzer inputs, and in the case of an output switcher the XLR connectors on the busbar are connected
to the generator outputs.
For further information see the operating manual for the R&S UPZ.
The R&S UPZ is controlled via the COM interface of the R&S UPV, which is not only used for operating
the R&S UPZ but can also be used to remotely control the R&S UPV.
The function of the COM interface is set in the Config Panel (in the utilities menu):
COM Interface Used for
Anew selection becomes effective as soon as the R&S UPV is
restarted.
Remote The COM interface can be used for the remote
control of the R&S UPV.
Switcher The COM interface is used for the control of the
switchers R&S UPZ.
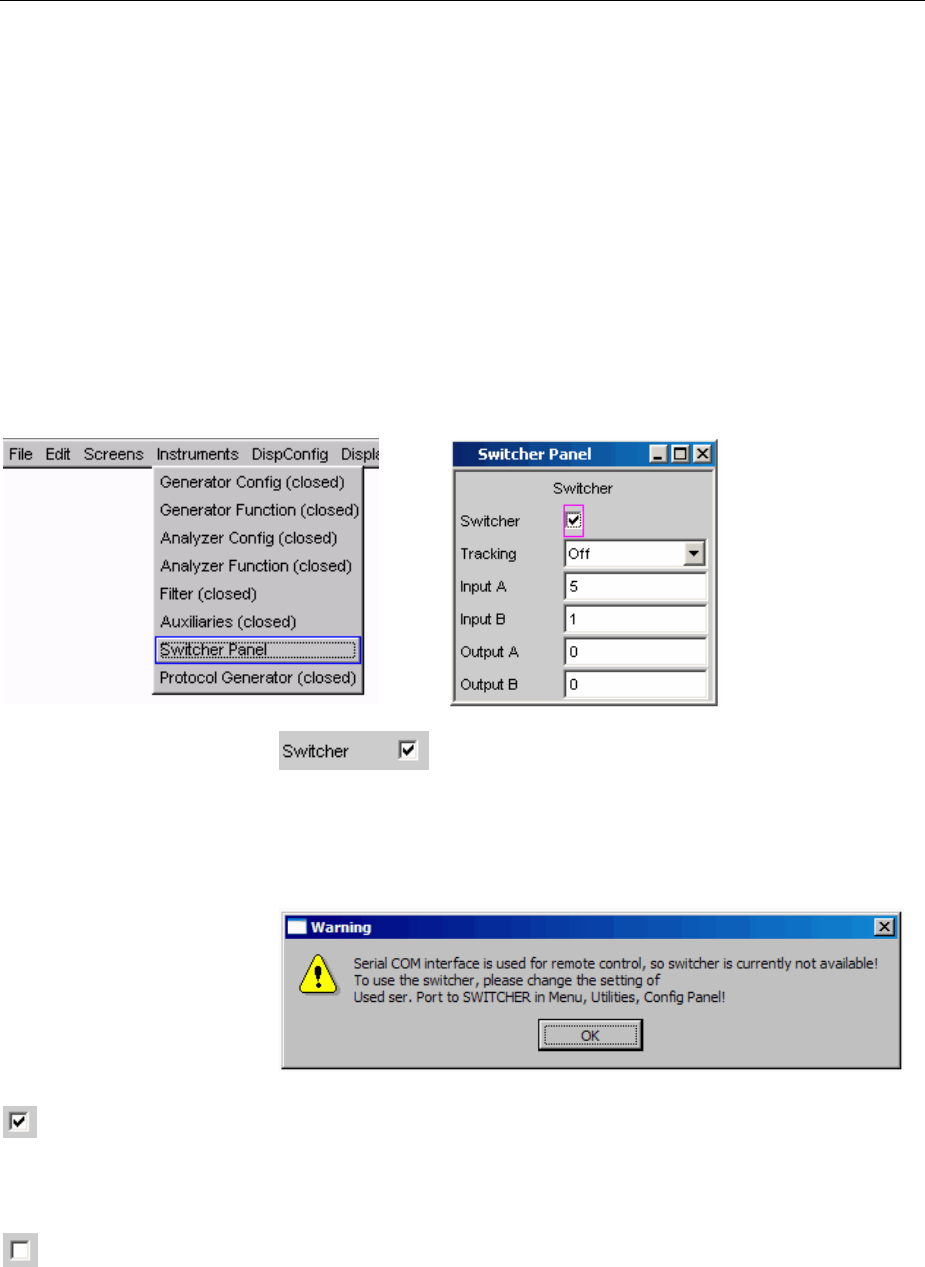
R&S UPV Switcher Panel
1146.2084.32 4.447 E-9
Default Setting
If the switcher is operated for the first time after loading the R&S UPV default setup (preset), the
channels are set to a defined default state: All channels of the two switcher types are set to "0", i.e.
open. If additionally tracking is activated for the first time, tracking B vs A is set to "-1" and tracking Out
vs Inp is set to "0". This ensures that when the user interface is opened all channels are open and thus
prohibited states in the test setup are avoided.
If you wish to obtain the same setting as in the default state manually, simply enter All as the Tracking
setting and set any channel to "0". All the others are then also adapted.
Operation
Open the panel for operating the switcher as follows:
Menu – Instruments – Switcher Panel
Switcher
The checkbox activates or deactivates the operation of the switcher.
This status is not dependent on whether the panel itself is open or not.
Operation can only be activated if a setting was previously made in
the Config Panel to specify that the COM interface is to be used to
control the switcher. If not, the following note appears
Operation of the switcher is activated.
Remote control command:
SWITcher:STATe ON
Operation of the switcher is deactivated.
Remote control command:
SWITcher:STATe OFF

Switcher Panel R&S UPV
1146.2084.32 4.448 E-9
Tracking
The channels of the connected switchers can be used not only
independently of one another (Tracking Off), but also in common. This
makes it possible to select a channel offset between the two busbars
and/or between input and output switchers. When one of the
parameter fields Input A/B or Output A/B is then used, the other one(s)
is/are automatically adapted by the R&S UPV in accordance with the
offset that has been set. Channels < 0 are set to 0, that is, the busbar
isswitched off.
Off Tracking is off and the channels can be connected
independently of one another.
Remote-control command:
SWITcher:TRACking OFF
Bvs A The channels are switched to an offset between the
busbars A and B. This offset can be set in the
parameter field B vs A.
Application:
Measurements of multichannel DUTs.
Remote-control command:
SWITcher:TRACking BVSA
Out vs Inp The channels of input and output switchers are
switched to an offset that can be set in the
parameter field Out vs Inp.
Application:
Crosstalk measurements in the adjacent channel.
Remote-control command:
SWITcher:TRACking OVSI
All Combines both tracking options described above.
Remote-control command:
SWITcher:TRACking ALL
Bvs A
For entering the channel offset between the busbars A and B, in
common for input and output switchers.
This parameter field only appears when Tracking B vs A or All is
selected.
Remote-control command:
SWITcher:OFFSet:BVSA <n>
Out vs Inp
For entering the channel offset between input and output switchers.
This parameter field only appears when Tracking Out vs Inp or All is
selected.
Remote-control command:
SWITcher:OFFSet:OVSI <n>

R&S UPV Switcher Panel
1146.2084.32 4.449 E-9
Input A
For entering the channel number of the input switcher that is to be
connected to busbar A.
Remote-control command:
SWITcher:INPA <n>
Input B
For entering the channel number of the input switcher that is to be
connected to busbar B.
Remote-control command:
SWITcher:INPB <n>
Output A
For entering the channel number of the output switcher that is to be
connected to busbar A.
Remote-control command:
SWITcher:OUTA <n>
Output B
For entering the channel number of the output switcher that is to be
connected to busbar B. Here it is possible to enter "-1"as the channel
number. The effect of this is that in busbar B all channels of all
connected switchers are closed with the exception of the one selected
in busbar A.
This setting is useful for worst-case crosstalk measurements. If no
channel is selected in busbar A (Output A = 0), all channels in busbar
Bare closed.
Remote-control command:
SWITcher:OUTB <n>
Note:
It is not possible to set the same channel to busbars A and B. If an attempt is made to do this, the
R&S UPV skips the set channel.

Traces, Spectrum Displays and Bargraphs R&S UPV
1146.2084.32 4.450 E-9
Traces, Spectrum Displays and Bargraphs
The most informative method of displaying measurement results is usually a two-dimensional graphic.
Measurement values as a function of frequency, measurements over a time axis and so on are just a
few examples of the many possible applications. The Audio Analyzer R&S UPV makes a distinction
between the following graphical windows: Sweep Graph, FFT Graph, Waveform, Bargraph and PESQ.
These windows are set up and modified using the associated configuration panel and displayed as
traces or bargraphs.
Graphical Display, Explanation of the Elements
Whether a graphical display is shown as a trace or a bargraph depends on the selected display
configuration panel.
-The sweep graphs, FFT graphs, waveform and PESQ graphical windows are displayed as traces,
whereas
the bargraphs display the measurement results of the analyzer measurement functions THD,
THD+N & SINAD, Mod Dist, DFD, DIM,Third Octave or 1/n Octave as bargraphs.
See the section "Calling Up" on page 4.457 for information on how to set up the various display
configurations.
The individual elements in the trace and bargraph displays are virtually identical but for one or two
exceptions. Only a bargraph which requires a symbolic X axis (that is, the bargraph for the analyzer
measurement functions THD, THD+N & SINAD, Mod Dist, DFD and DIM) does not offer certain
elements, such as markers or grid lines for the X axis.
Graphical window
Cursor Y value
Cursor intersection points
Markers
Curve
Label of Y axis 2
Limit line
Harmonic markers
Min/Max curve
Scaling of X axis
Limit indication
Softkey bar
Scan number
Label of Y axis 1
Scaling of Y axis
Main grid, subgrid
Additional cursor values
Cursor Y value
Cursor X value
Label of X axis
Limit violations
Additional cursor values
Cursor Y value
Main grid, subgrid
Label of Y axis 1
Scaling of Y axis
Cursor X value
Scan number
Softkey bar
Graphical window
Cursor Y value
Cursor intersection points
Limit line
Limit violations in red
Label of Y axis 2
Scaling of X axis
Limit indication
Label of X axis
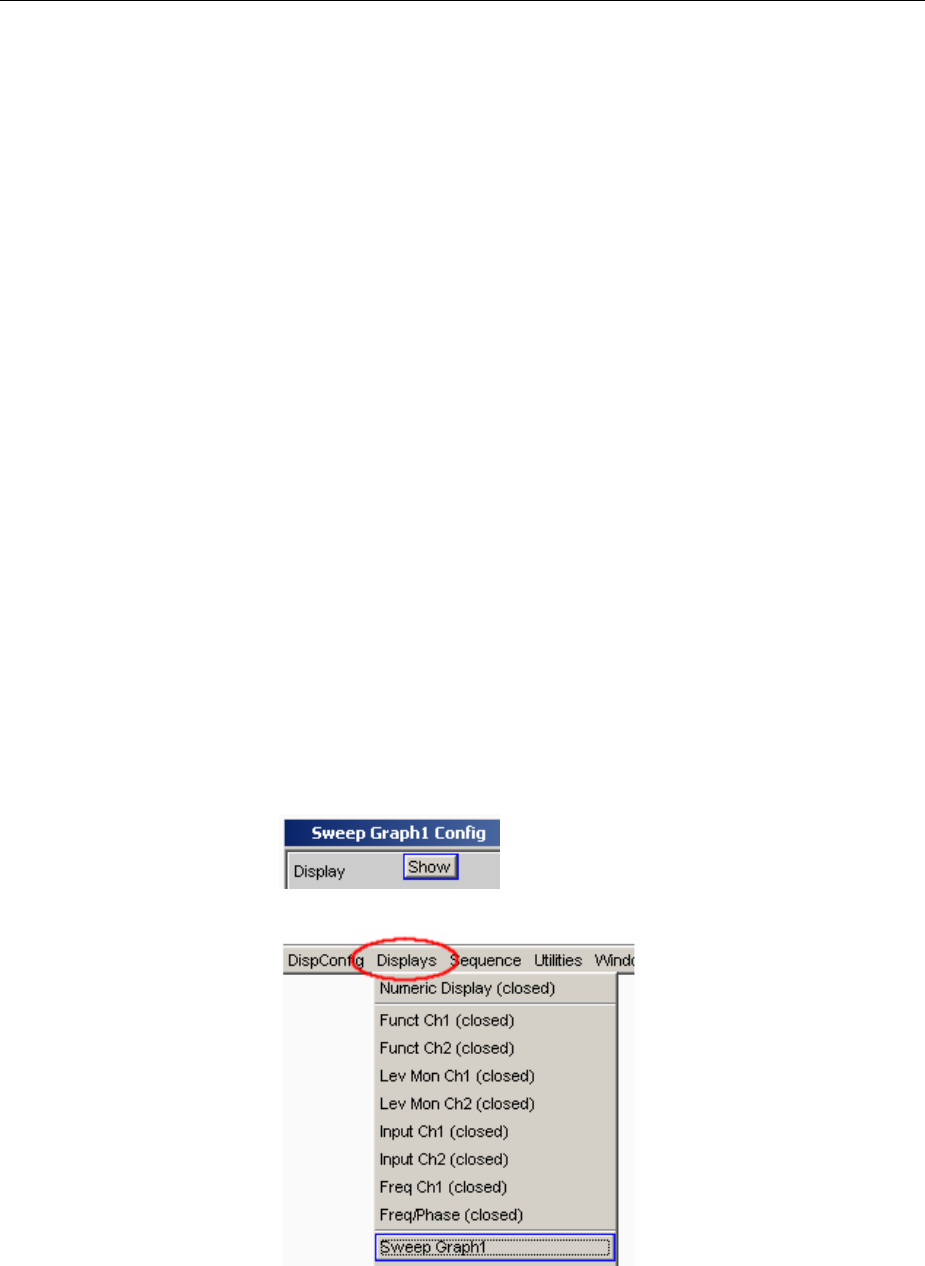
R&S UPV Traces, Spectrum Displays and Bargraphs
1146.2084.32 4.451 E-9
Cursor intersection points The points Oor Xat which the cursor line intersects the trace / lines
identify the cursor so that a reference to the labels in the softkey bar
(e.g. OVert A or XHor A)is provided.
Cursor X value X value for vertical cursors.
Cursor Y value Vertical cursors:
Yvalue, or if O Vert A-B / X Vert A-B is set, the difference between the
Yvalues for the A and B trace / A and B line.
Horizontal cursors:
Yvalue on the Y1 and/or Y2 axis.
Additional cursor values
jX, jY, ol, or, ojX,
xl, xr, xjX
jX: Difference between the X values if the o and x cursor are both
activated as the vertical cursor at the same time.
jY: Difference between the Y values if the o and x cursor are both
activated as the vertical cursor at the same time.
Only for traces (not for bargraphs):
ol: The point to the left of the marker at which the o cursor
intersects the trace.
or: The point to the right of the marker at which the o cursor
intersects the trace.
ojX: Difference between ol and or.
xl: The point to the left of the marker at which the x cursor
intersects the trace.
xr: The point to the right of the marker at which the x cursor
intersects the trace.
xjX: Difference between xl and xr.
Graphical window The graphical window for the respective graphic subsystem, opened
with
from the respective Display Config panel,
or straight from the menu bar

Traces, Spectrum Displays and Bargraphs R&S UPV
1146.2084.32 4.452 E-9
Harmonic markers In the following example the harmonics (2 kHz and 3 kHz) are marked,
staring from the X position of the marker (1 kHz).
The harmonic markers are activated using the softkeys:
Available in the graphics subsystems
FFT
Main grid, subgrid Set in the associated DispConfig panel using the parameter fields
in the sections Trace A, Trace B and X Axis.
In graphic systems Bargraph1 | 2 a grid cannot be set for the X axis,
since this makes no sense for an unscaled X axis.
Limit line Fixed limit value or fixed limit value curve from a file, for activation in
the associated DispConfig panel via the parameter fields
and
in sections Trace A and Trace B.
Limit indication
"Limit Upper" is activated and there is no "limit violation".
"Limit Lower" is activated and there is no "limit violation".
The "Limit Upper" value has been violated in the past but there is
currently no "limit violation". The violation is indicated until the START
key is pressed again.
The "Limit Lower" value has been violated in the past but there is
currently no "limit violation". The violation is indicated until the START
key is pressed again.
The "Limit Upper" value is currently being violated.
The "Limit Lower" value is currently being violated.
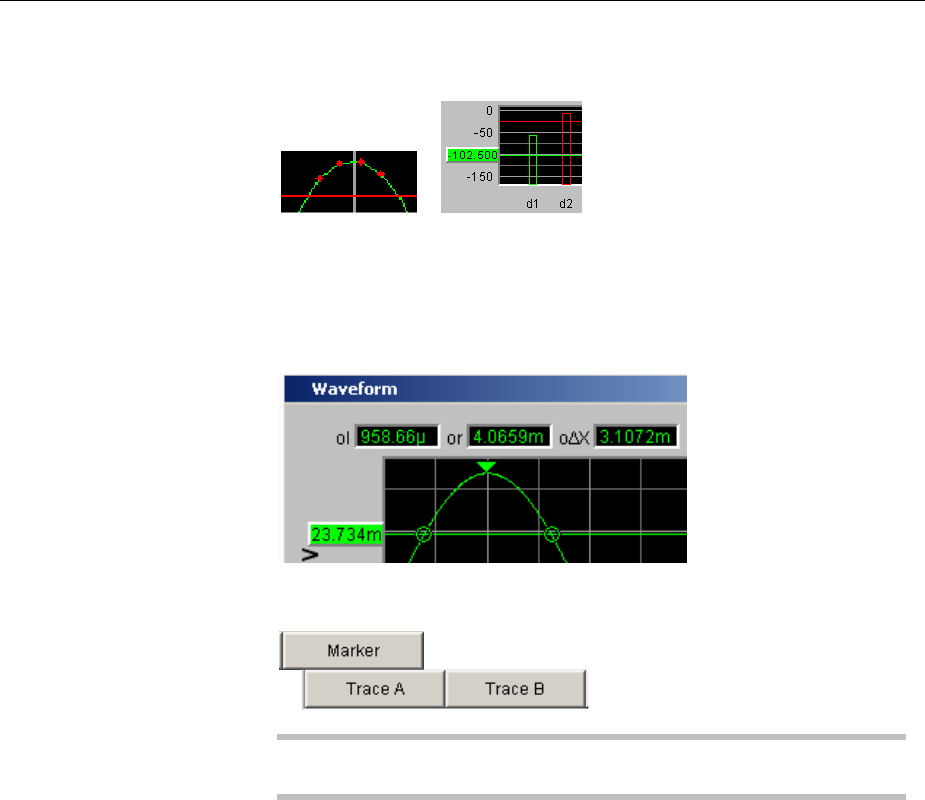
R&S UPV Traces, Spectrum Displays and Bargraphs
1146.2084.32 4.453 E-9
Limit violations Limit violations are indicated by red dots on traces or by red bars in
bargraphs:
Markers Marking of the value on the X axis from which the left and right
intersections of a horizontal cursor will be displayed with the curve.
Additionally for the graphic systems FFT Graph1 | 2:
Marking of a value on the X axis from which harmonics are calculated.
The marker is set using the softkeys:
Available in the graphics subsystems
Sweep, FFT, Waveform, PESQ
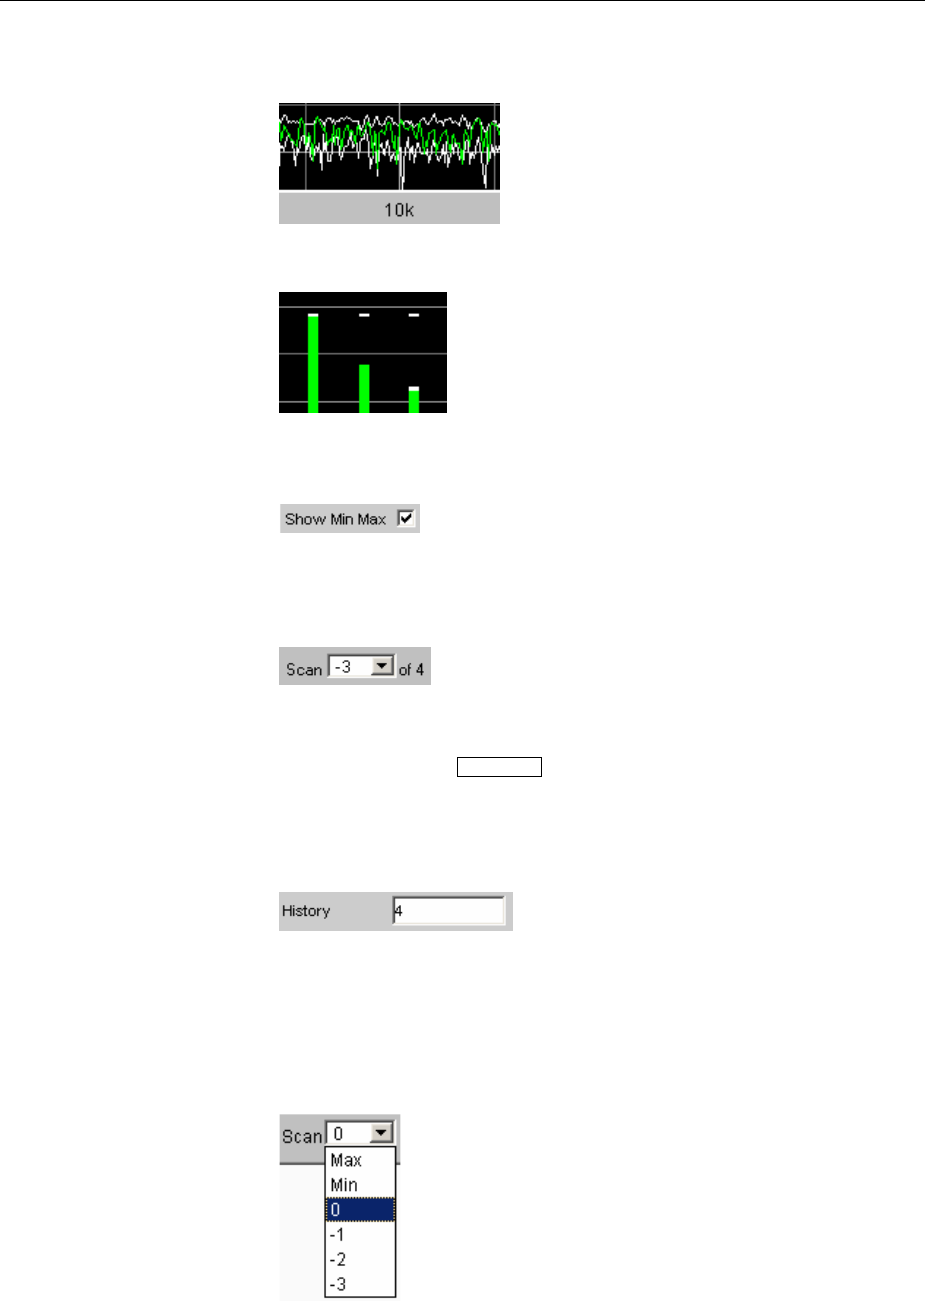
Traces, Spectrum Displays and Bargraphs R&S UPV
1146.2084.32 4.454 E-9
Min/Max curve The min/max curves are displayed in white.
The min curve represents the lowest value of Y in a measurement
sequence and the max curve represents the highest.
In the graphic system Bargraph1 | 2 the minimum and maximum
values are shown as small white blocks.
To be set in the upper part of the associated panel via the parameter
field.
The min/max curves are to be thought of as scans of a multiscan
display. If “Show Min Max” is on, there is a single scan from three
scans.
Scan number
Multiscan mode:
The number of the current scan is displayed here by scrolling through
the scans using the Next Scan rocker key. The number 0 indicates the
most recent scan; the more negative the number, the older the scan.
"of 4"shown in the example indicates the currently set history and
informs the user how many scans are stored in the memory or saved
in the file. This value is set in the associated DispConfig panel using
See section "History" on page 4.463.
The entries Min and Max denote the min/max curves, provided these
are switched on and are also available in single-scan mode.
Right-clicking the arrow opens a box
in which the desired scan can be selected by clicking the appropriate
number. The cursors, markers, limit values and so on are then
referenced to this scan.

R&S UPV Traces, Spectrum Displays and Bargraphs
1146.2084.32 4.455 E-9
Softkey bar The softkey menu for the graphical window allows quick configuration
of all the important and frequently used settings, especially cursor,
marker and zoom functions by means of the keys provided below the
menu.
The softkeys can also be operated with the mouse.
See section "Softkey Menu" on page 4.539 for a detailed description
offunctionality.
Label of X axis Consists of the label and unit; set with
See section "Parameter Fields of the Panel" on page 4.458.
Scaling of X axis Only for displaying curves, not in grapic system Bargraph1 | 2:
Automatic or manually set scaling of the X axis; set with
See section "Parameter Fields of the Panel" on page 4.458.
Label of Y axis 1
Label of Y axis 2
Consists of the label and unit; set with
and
See section "Parameter Fields of the Panel" on page 4.458.
Scaling of Y axis Automatic or manually set scaling of the Y axis; set with
See section "Parameter Fields of the Panel" on page 4.458.
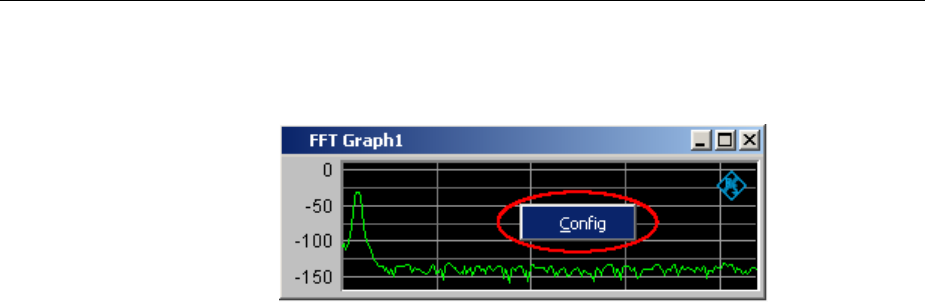
Traces, Spectrum Displays and Bargraphs R&S UPV
1146.2084.32 4.456 E-9
Config Right-clicking anywhere in the graphical display calls up a button
labeled "Config". Left-clicking on this Config button opens the
associated DispConfig panel.
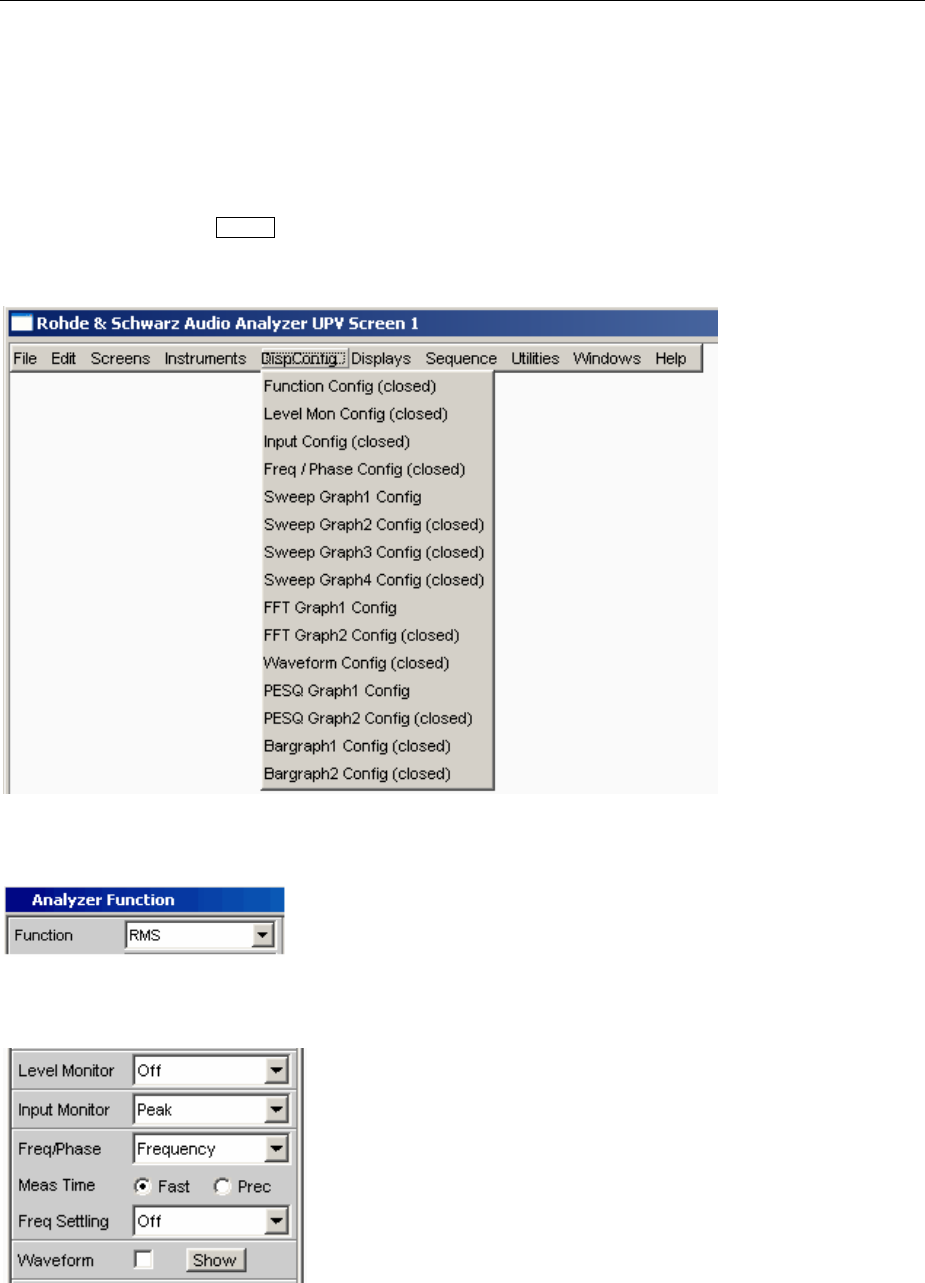
R&S UPV Traces, Spectrum Displays and Bargraphs
1146.2084.32 4.457 E-9
Calling Up
The Display Configuration panel is used to set how measurement results will be graphically displayed.
What will be measured and how is set in the "Analyzer Config" and "Analyzer Function" panels or, in
the case of sweeps, defined in "Generator Config" and "Generator Function".
The display configuration panels are opened via the menu bar of the R&S UPV. The menu bar is
opened by pressing the MENU key on the front panel or, with mouse operation, by moving the pointer to
the left-hand edge of the R&S UPV application window; the menu bar then appears at the top left-hand
edge of the R&S UPV application.
11 different display configuration panels are available, some with two or four windows; i.e. the
measurement data sets for the analyzer measurement function RMS
and the measurement data sets for the additional measurement functions Level Monitor, Input Monitor,
Freq/Phase Measurement and Waveform
can be displayed at the same time.

Traces, Spectrum Displays and Bargraphs R&S UPV
1146.2084.32 4.458 E-9
Sweep in 4 windows
Listed in the menu as Sweep Graph1 Config to Sweep Graph4 Config.
The panel is used to configure the display of measurement results from a measurement sequence
(sweep) as a diagram in the Cartesian co-ordinate system. Two dependent values can be displayed
as TRACE A and TRACE B over an independent X axis.
FFT Graph in two windows
Listed in the menu as FFT Graph1 Config and FFT Graph2 Config.
The panel offers the configuration for displaying a frequency spectrum if the measurement function
FFT or the measurement function RMS, RMS Selective, S/N, THD, THD & SINAD, Mod Dist, DFD,
DIM and Record with post-FFT is selected in the analyzer panel.
Waveform
Listed in the menu as Waveform Config
The panel is used to configure the display of a waveform (trace of the signal over time) if Waveform
is selected as the additional measurement function in the analyzer panel.
Bargraph in two windows
Listed in the menu as Bargraph1 Config and Bargraph2 Config.
The panel offers the configuration for displaying a bargraph with symbolic, i.e. non-scaled X axis
if the measurement function THD, THD+N & SINAD, Mod Dist, DFD or DIM is selected in the
analyzer panel.
The panel offers the configuration for displaying a bargraph with an X axis in Hz if the
measurement function Third Octave or 1/n Octave gewählt is selected in the analyzer panel.
PESQ in two windows
Listed in the menu as PESQ Graph1 Config and PESQ Graph2 Config.
The panel offers the configuration for displaying the PESQ measurement if the PESQ measurement
function is selected in the analyzer panel.
Parameter Fields of the Panel
The layout of the display configuration panels is almost identical for all of the graphic systems.
Depending on the graphic system, parameter fields may be omitted or different parameter lists may
appear in the selection fields.
For example, the display configuration panels for FFT and Sweep offer various choices for the sources
of the measurement results. The differences are explained for the individual fields.
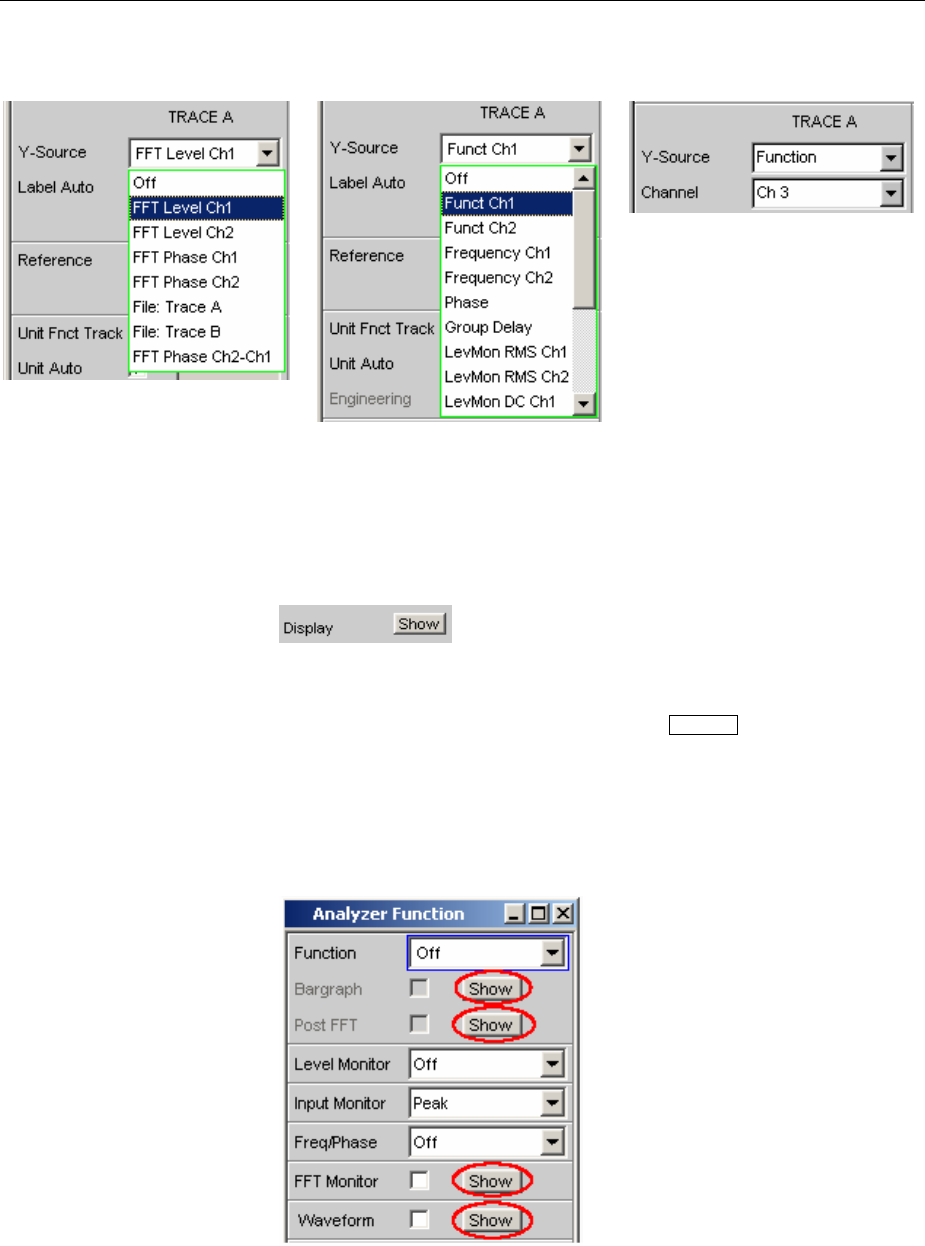
R&S UPV Traces, Spectrum Displays and Bargraphs
1146.2084.32 4.459 E-9
FFT
for two-channel instrument
Sweep
for two-channel instrument
Sweep
for a multichannel instrument
The source of the measurement
results (FFT Level) and the
channel number (Ch1) are
combined in the selection list
(FFT Level Ch1).
The source of the measurement
results (FFT Level) and the
channel number (Ch1) are
combined in the selection list
(FFT Level Ch1)
The source of the measurement
results and the channel number
are separated, since the
manifold possible combinations
could no longer be displayed in
aselection box.
Display
Clicking this button in the Display parameter field activates the
graphical display of traces or bargraphs.
The display is deactivated by pressing the CLOSE key or by clicking
the X button in the title bar using the mouse, provided that the display
window has the focus (see section "Traces, Spectrum Displays and
Bargraphs" on page 4.450).
Aduplicate of this Show button can also be found in the Analyzer
Function panel so that you can conveniently call up the graphical
display for Bargraph, FFT or Waveform from there.

Traces, Spectrum Displays and Bargraphs R&S UPV
1146.2084.32 4.460 E-9
Data List
Clicking the button opens a separate window in which the
measurement results for Trace A, Trace B and the values to the
corresponding X axis are displayed numerically. The display is
deactivated by pressing the CLOSE key or by clicking the X button in
the title bar using the mouse, provided that the display window has the
focus (see section "Result List" on page 4.547).
Copy to other Window
The Copy to other Window function is available for the respective first
window of the Sweep, FFT, Bargraph and PESQ sub-systems; in
other words, for all sub-systems which have more than one window.
As the name says, settings from the first window are copied into all the
sub-system’s other windows. This happens once when the Exec
button is pressed.
This copying process is performed for almost all commands following
anew installation of the R&S UPV.
If only specific command areas are to be transferred from the first
window to the subsequent windows, limitations can be set in the
dialog box which opens when the Config button is pressed.
The ticks in the dialog can easily be assigned to the respective panel
areas, which are marked by thin lines, by means of their labels.
The selection of command areas made here is unaffected by preset or
by loading a setup; it is therefore bound to the device.
Scan
For the graphics subsystems Sweep Graph 1 to 4
Used to specify whether one (Single) or several (Multi) measurement
sequences are recorded or loaded from a file.
Available in the graphics sub-systems
Sweep
If a Z sweep is set in the generator, Scan will automatically be set to
Multi, provided that X-Source = Sweep is set in the display panel.

R&S UPV Traces, Spectrum Displays and Bargraphs
1146.2084.32 4.461 E-9
Single Only one trace (measurement sequence) or one
trace pair (TRACE A and B) is to be recorded or
loaded (see section "Measurement value
sequences" on page 4.580).
The display can be in the form of a trace or a
bargraph.
The following parameter fields are hidden:
History
New Scan
Import From
If the “Show Min Max” tick box is ticked, two scans
are added to the single measurement sequence,
and the toggle key Next Scan can be used to choose
between three scans.
Remote-control command:
DISPlay:SWEep<i>:SMODe SINGle
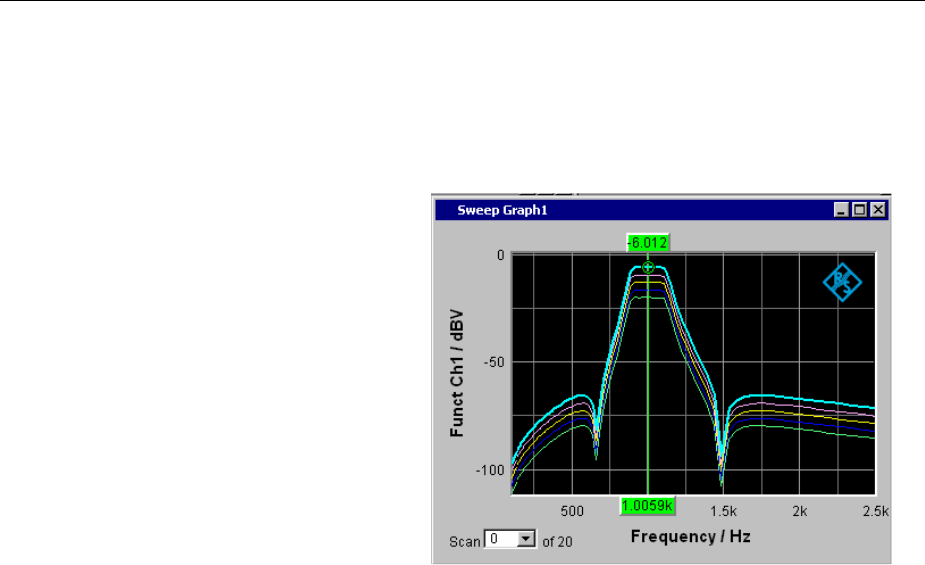
Traces, Spectrum Displays and Bargraphs R&S UPV
1146.2084.32 4.462 E-9
Multi With this setting, not just one measurement
sequence or pair of measurement sequences
(Trace A and Trace B) is recorded/loaded and
displayed but any number of sequences and
sequence pairs (see section "Measurement value
sequences" on page 4.580).
However, only the number selected in the History
parameter field (max. 20) is stored internally and
written to a file (see Saving) or read from a file (see
Loading). The scans that are not stored are only
available in the graphic and are lost if the graphical
window is moved or resized, if rescaling is
performed, if trace files are stored/loaded, or if
setups are stored/loaded.
The following parameter fields become available:
History
New Scan
Import From
Remote-control command:
DISPlay:SWEep<i>:SMODe MULTiscan

R&S UPV Traces, Spectrum Displays and Bargraphs
1146.2084.32 4.463 E-9
History
Only available if "Scan" is set to "Multi" and therefore only for the
graphic systems Sweep Graph 1 to 4.
Available in the graphics sub-systems
Sweep
History determines how many scans are stored in the memory or
saved in the file. It is not possible to select "1" as this number
represents single-scan mode.
When the x-source in the display panel is set to Sweep, and when a z-
sweep is set in the generator, and when the number of z-sweep points
in the generator is larger than the number of scans set in History, the
number of sweep points from the generator will be entered in the
History field.
When the x-source in the display panel is set to Sweep, and when a z-
sweep is set in the generator, and when the number of z-sweep points
is larger than the number of scans set in History, the number of sweep
points will be transferred from the generator to the History field.
Remote-control command:
DISPlay:SWEep<i>:HISTory <n>
Traces, Spectrum Displays and Bargraphs R&S UPV
1146.2084.32 4.464 E-9
Show Min Max
If the tick box is activated, the Min/Max curves will be displayed.
The Min curve represents the lowest value of a measurement
sequence and the Max curve the highest value. Recording of Min/Max
values will be restarted each time the START key is pressed.
If Min/Max scans have already been recorded and measurement is
stopped, the Min/Max curves can be hidden and shown by turning the
tick on and off.
AMIN/MAX display is also possible for graphic systems which do not
have any scans (e.g. FFT Graph), i.e. a MIN scan and a MAX scan
are recorded. The Show MIN/MAX function is available for the
following graphic systems:
Available in the graphics subsystems
Sweep, FFT, Bargraph, PESQ
The "Show Min Max" function is not available in the Waveform graphic
system only.
The min/max curves are to be thought of as scans of a multiscan
display. If “Show Min Max” is on, there is a single scan from three
scans.
If a trace file containing Min/Max scans is loaded by using the y-
source command: "File: Trace A" or "File: Trace B", the "Show Min
Max" check box will automatically be enabled so that these scans are
displayed in the graphic.
Remote-control command:
DISPlay:SWEep<i>:MINMax ON | OFF
DISPlay:FFT<i>:MINMax ON | OFF
DISPlay:BARgraph<i>:MINMax ON | OFF
DISPlay:PESQ<i>:MINMax ON | OFF
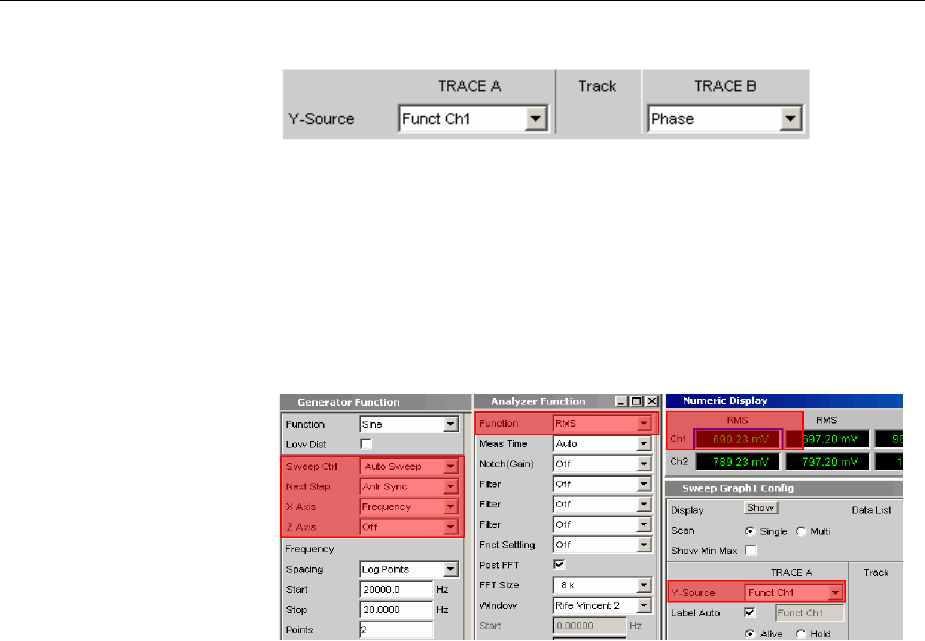
R&S UPV Traces, Spectrum Displays and Bargraphs
1146.2084.32 4.465 E-9
Y-Source
Sweep Graph graphic system
Used to select which sweep measurement results (obtained from one
of the sweep functions listed below) are to be collected as TRACE A
orTRACE B and displayed graphically on the left-hand or right-hand
Yaxis.
Example:
The frequency response of a DUT is determined by means of a
generator frequency sweep and the analyzer measurement function
"RMS" and displayed in the Sweep Graph 1 graphic system as
TRACE A.
For more information on Y Source see section "Measurement value
sequences" on page 4.580.
Off No trace is displayed or an available trace is
deleted.
Remote-control command:
DISPlay:SWEep<i>:A|B:YSOurce OFF
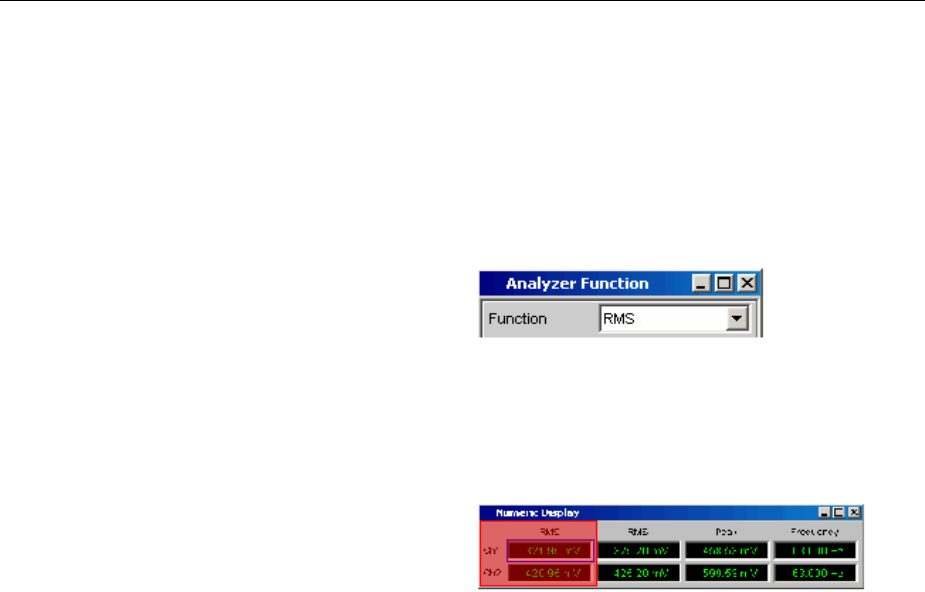
Traces, Spectrum Displays and Bargraphs R&S UPV
1146.2084.32 4.466 E-9
Funct Ch1
Funct Ch2
Function
The function measurement result obtained by
means of a generator sweep with the set
analyzer measurement function for
•channel 1 or
•channel 2 or
•the channel number specified under the
following "Channel" parameter field in the
case of a multichannel instrument
is displayed as Trace A or Trace B versus a
basic physical quantity selected under "X Axis"
on page 4.123.
The measurement result is displayed in the
numeric display:
Remote-control command:
DISPlay:SWEep<i>:A|B:YSOurce FUNC1
DISPlay:SWEep<i>:A|B:YSOurce FUNC2
DISPlay:SWEep<i>:A|B:YSOurce
FUNCtion
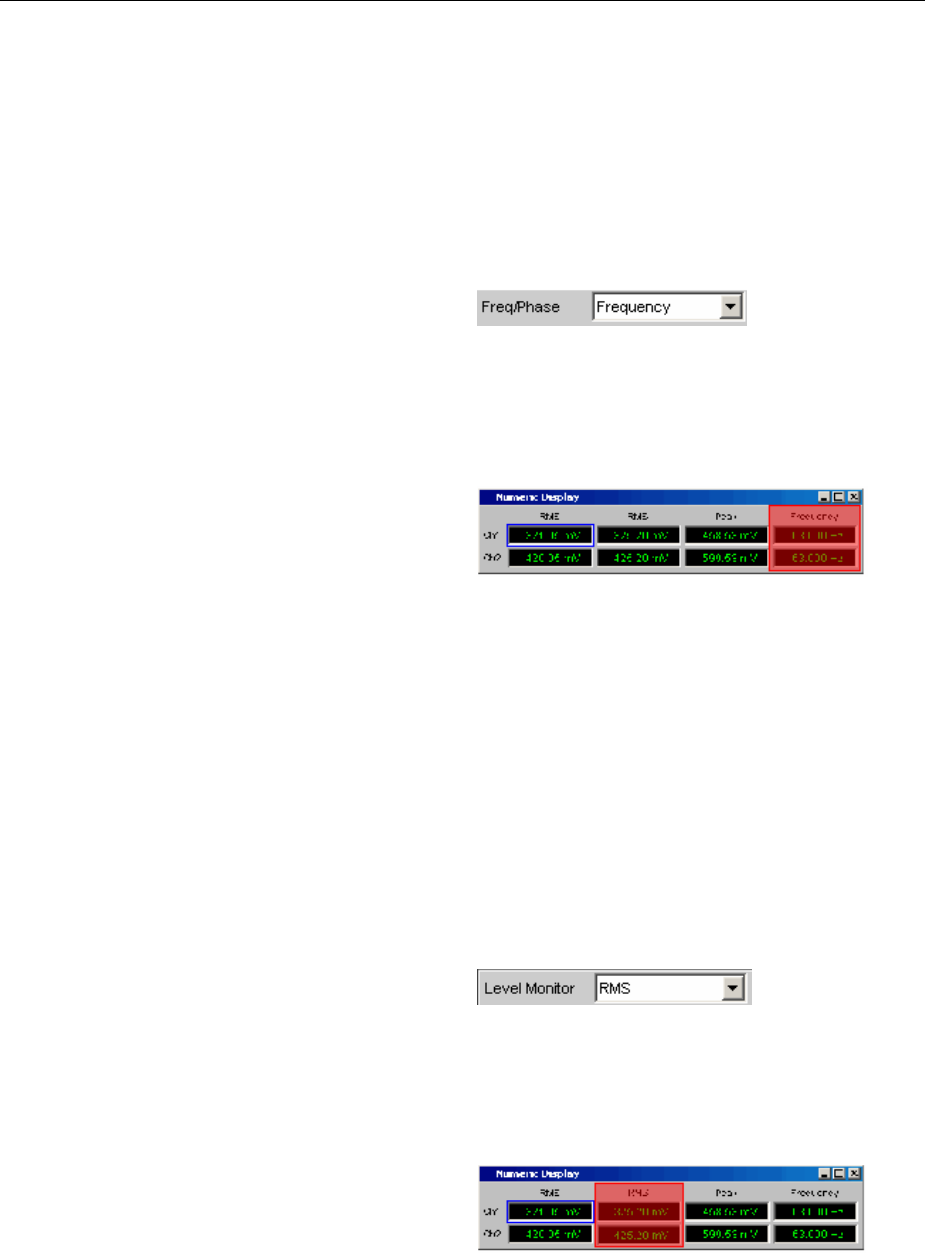
R&S UPV Traces, Spectrum Displays and Bargraphs
1146.2084.32 4.467 E-9
Frequency Ch1
Frequency Ch2
Frequency
The frequency measurement result obtained
bymeans of a generator sweep with the
additional measurement function Freq/Phase
for
•channel 1 or
•channel 2 or
•the channel number specified under the
following "Channel" parameter field in the
case of a multichannel instrument
is displayed as Trace A or Trace B versus a
basic physical quantity selected under "X Axis"
on page 4.123.
The measurement result is displayed in the
numeric display:
Remote-control command:
DISPlay:SWEep<i>:A|B:YSOurce FREQ1
DISPlay:SWEep<i>:A|B:YSOurce FREQ2
DISPlay:SWEep<i>:A|B:YSOurce
FREQuency
LevMon RMS Ch1
LevMon RMS Ch2
LevMon RMS
The RMS measurement result obtained by
means of a generator sweep with the additional
measurement function Level Monitor = RMS for
•channel 1 or
•channel 2 or
•the channel number specified under the
following "Channel" parameter field in the
case of a multichannel instrument
is displayed as Trace A or Trace B versus a
basic physical quantity selected under "X Axis"
on page 4.123.
The measurement result is displayed in the
numeric display:
Remote-control command:
DISPlay:SWEep<i>:A|B:YSOurce LMRM1
DISPlay:SWEep<i>:A|B:YSOurce LMRM2
DISPlay:SWEep<i>:A|B:YSOurce LMRMs
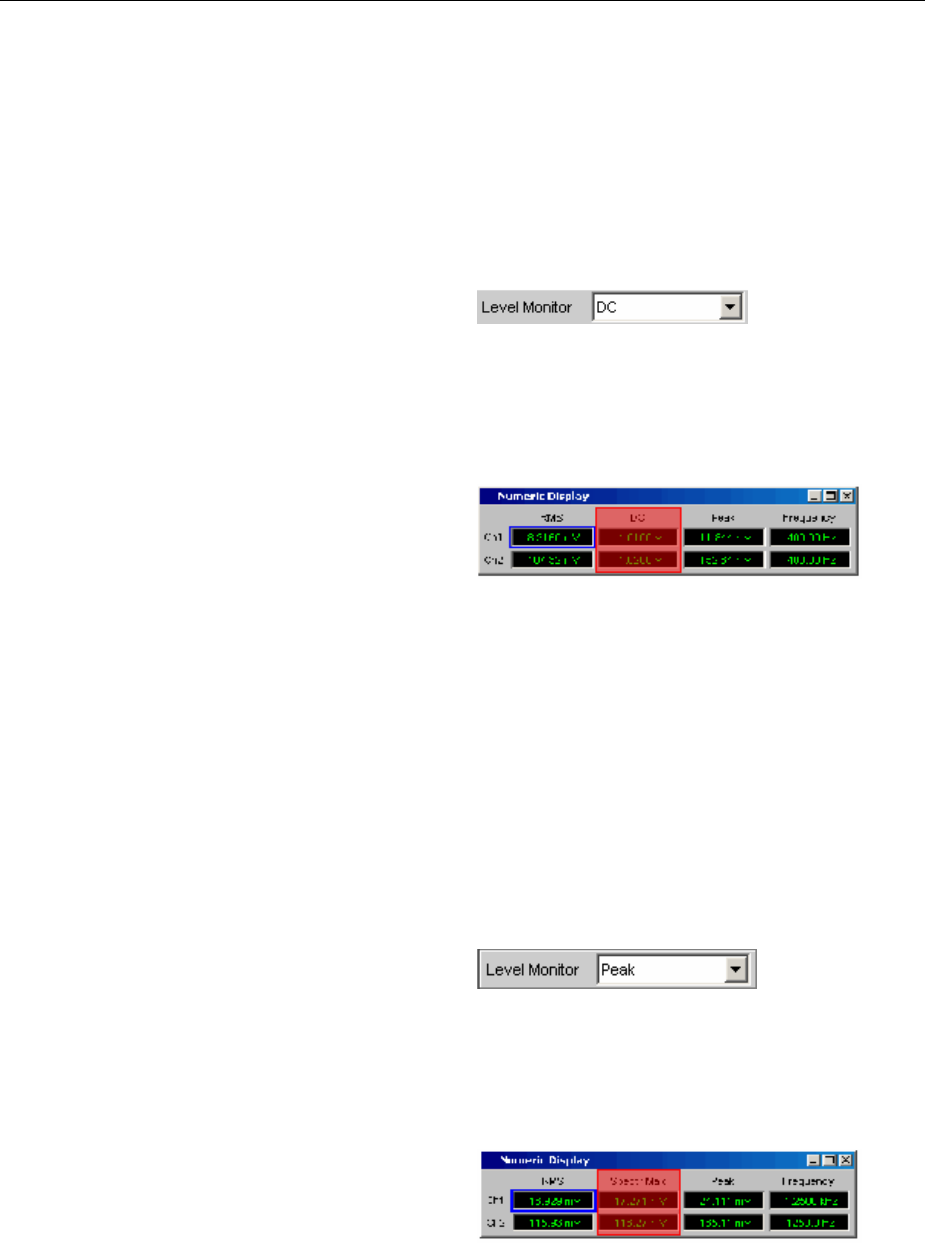
Traces, Spectrum Displays and Bargraphs R&S UPV
1146.2084.32 4.468 E-9
LevMon DC Ch1
LevMon DC Ch2
LevMon DC
The DC measurement result obtained by
means of a generator sweep with the additional
measurement function Level Monitor = DC for
•channel 1 or
•channel 2 or
•the channel number specified under the
following "Channel" parameter field in the
case of a multichannel instrument
is displayed as Trace A or Trace B versus a
basic physical quantity selected under "X Axis"
on page 4.123.
The measurement result is displayed in the
numeric display:
Remote-control command:
DISPlay:SWEep<i>:A|B:YSOurce LMDC1
DISPlay:SWEep<i>:A|B:YSOurce LMDC2
DISPlay:SWEep<i>:A|B:YSOurce LMDC
LevMon Peak Ch1
LevMon Peak Ch2
LevMon Peak
The peak measurement result obtained by
means of a generator sweep with the additional
measurement function Level Monitor = Peak for
•channel 1 or
•channel 2 or
•the channel number specified under the
following "Channel" parameter field in the
case of a multichannel instrument
is displayed as Trace A or Trace B versus a
basic physical quantity selected under "X Axis"
on page 4.123.
The measurement result is displayed in the
numeric display:
Remote-control command:
DISPlay:SWEep<i>:A|B:YSOurce LMPK1
DISPlay:SWEep<i>:A|B:YSOurce LMPK2
DISPlay:SWEep<i>:A|B:YSOurce LMPK
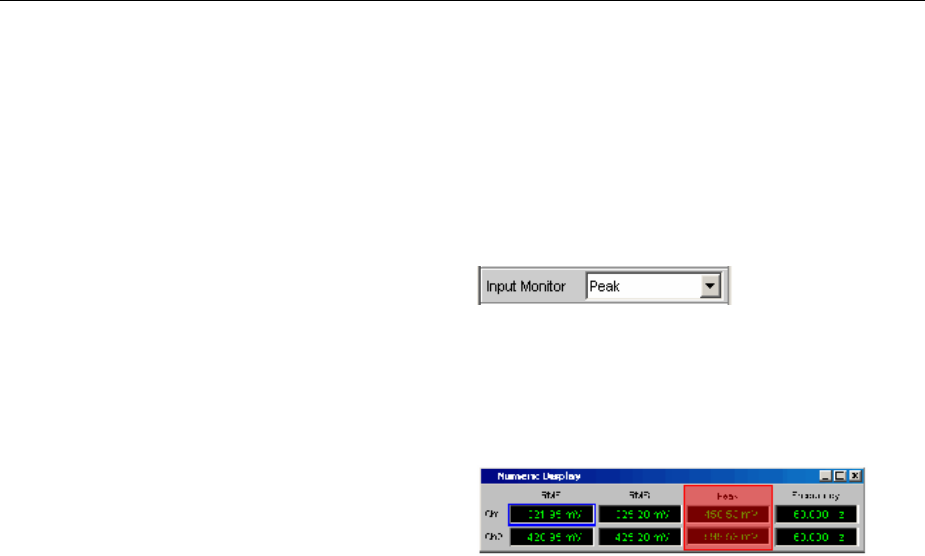
R&S UPV Traces, Spectrum Displays and Bargraphs
1146.2084.32 4.469 E-9
Inp Peak Ch1
Inp Peak Ch2
Inp Peak
The Peak measurement result obtained by
means of a generator sweep with the additional
measurement function Input Monitor = Peak for
•channel 1 or
•channel 2 or
•the channel number specified under the
following "Channel" parameter field in the
case of a multichannel instrument
is displayed as Trace A or Trace B versus a
basic physical quantity selected under "X Axis"
on page 4.123.
The measurement result is displayed in the
numeric display:
Remote-control command:
DISPlay:SWEep<i>:A|B:YSOurce INPP1
DISPlay:SWEep<i>:A|B:YSOurce INPP2
DISPlay:SWEep<i>:A|B:YSOurce
INPPeak
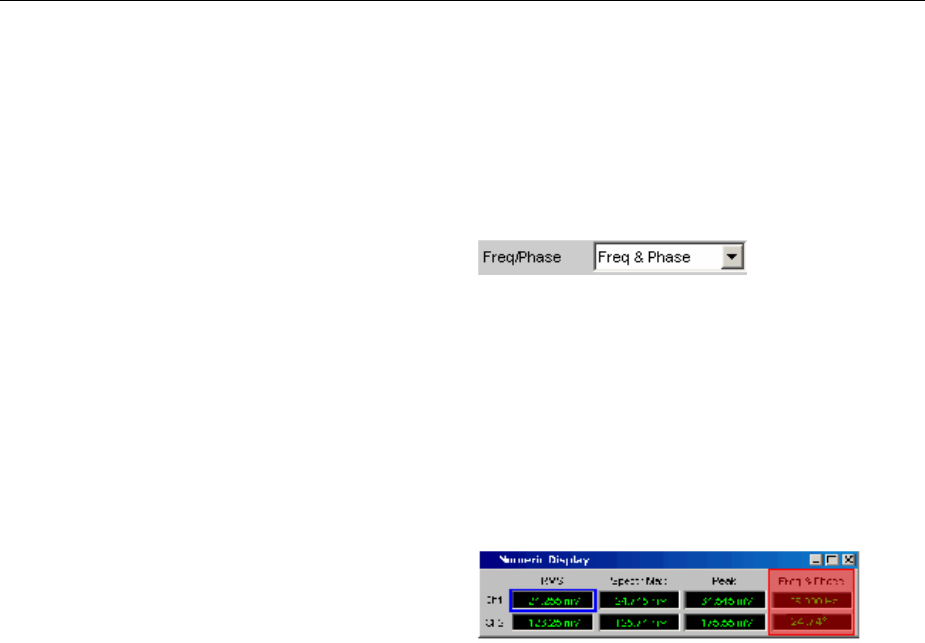
Traces, Spectrum Displays and Bargraphs R&S UPV
1146.2084.32 4.470 E-9
Phase The phase measurement result obtained by
means of a generator sweep with the additional
measurement function Freq/Phase = Freq &
Phase
If you are using a multichannel instrument, set
the channel reference by means of the
following "Channel" parameter field.
is displayed as Trace A or Trace B versus a
basic physical quantity selected under "X Axis"
on page 4.123.
In the case of a multichannel instrument, the
channel reference is made by means of the
following "Channel" parameter field.
The measurement result is displayed in the
numeric display:
Remote-control command:
DISPlay:SWEep<i>:A|B:YSOurce PHASe
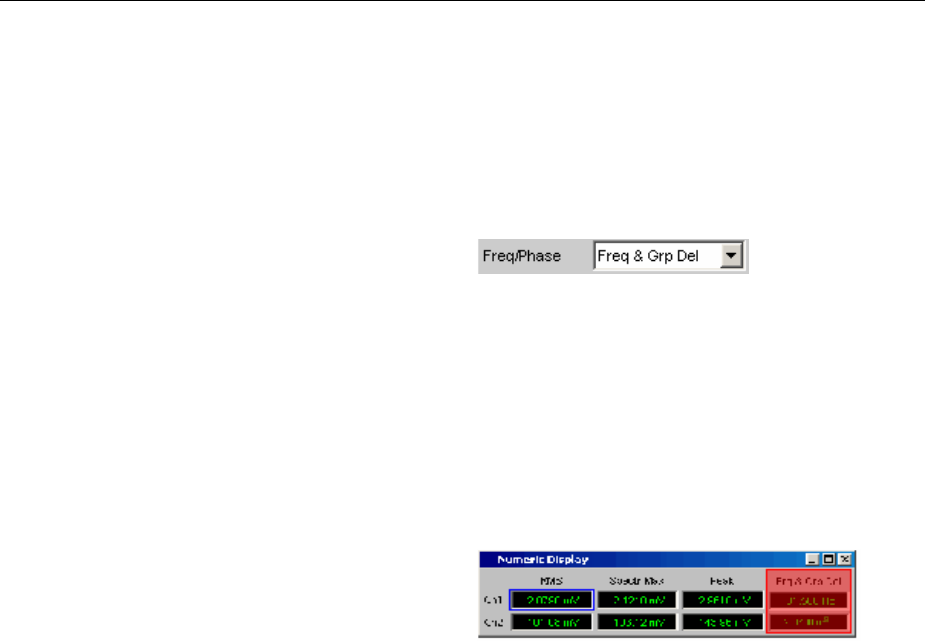
R&S UPV Traces, Spectrum Displays and Bargraphs
1146.2084.32 4.471 E-9
Group Delay The group delay measurement result obtained
bymeans of a generator sweep with the
additional measurement function Freq/Phase =
Freq & Grp Del
If you are using a multichannel instrument, set
the channel reference by means of the
following "Channel" parameter field.
is displayed as Trace A or Trace B versus a
basic physical quantity selected under "X Axis"
on page 4.123.
In the case of a multichannel instrument, the
channel reference is made by means of the
following "Channel" parameter field.
The measurement result is displayed in the
numeric display:
Remote-control command:
DISPlay:SWEep<i>:A|B:YSOurce
GROupdelay
File: Trace A Trace A is loaded from a file, see section
"Measurement value sequences" on page
4.580.
The file name is entered in the subsequent
parameter field.
Remote-control command:
DISPlay:SWEep<i>:A|B:YSOurce FILEA
DISPlay:SWEep<i>:A|B:YSOurce:FILE
'filename'
File: Trace B Trace B is loaded from a file, see section
"Measurement value sequences" on page
4.580.
The file name is entered in the subsequent
parameter field.
Remote-control command:
DISPlay:SWEep<i>:A|B:YSOurce FILEB
DISPlay:SWEep<i>:A|B:YSOurce:FILE
'filename'
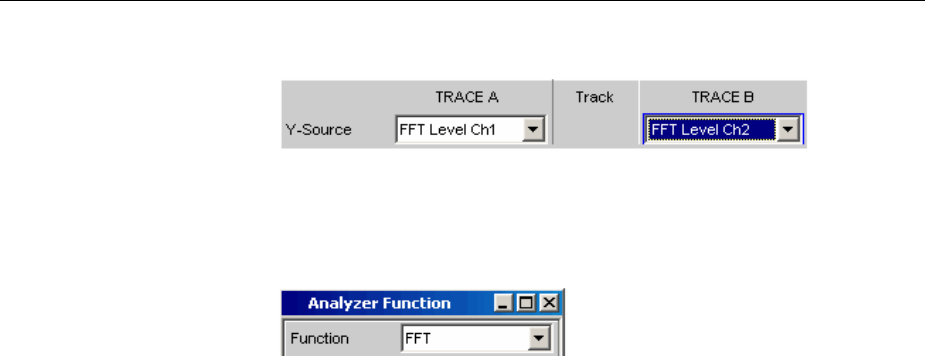
Traces, Spectrum Displays and Bargraphs R&S UPV
1146.2084.32 4.472 E-9
Y-Source
FFT Graph graphic system
Used to select which measurement results obtained with the analyzer
measurement function FFT or Post-FFT are displayed graphically.
Section of the Analyzer Function panel:
For more information on Y Source see section "Measurement value
sequences" on page 4.580.
Off No trace is displayed or an available trace is
deleted.
Remote-control command:
DISPlay:FFT<i>:A|B:YSOurce OFF
FFT Level Ch1
FFT Level Ch2
FFT Level
The level characteristic versus the frequency of
•channel 1 or
•channel 2 or
•the channel number specified under the
following "Channel" parameter field in the
case of a multichannel instrument
of the FFT or Post-FFT analyzer measurement
function is displayed as Trace A or Trace B
versus a frequency X-axis.
Remote-control command:
DISPlay:FFT<i>:A|B:YSOurce FFTL1
DISPlay:FFT<i>:A|B:YSOurce FFTL2
DISPlay:FFT<i>:A|B:YSOurce FFTLevel

R&S UPV Traces, Spectrum Displays and Bargraphs
1146.2084.32 4.473 E-9
FFT Phase Ch1
FFT Phase Ch2
FFT Phase
The FFT phase is the phase characteristic
versus the frequency of
•channel 1 or
•channel 2 or
•the channel number specified under the
following "Channel" parameter field in the
case of a multichannel instrument
of the FFT or Post FFT analyzer measurement
function that is obtained from the calculation of
the complex FFT. The phase characteristic is
displayed as Trace A or Trace B along a
frequency X-axis.
Remote-control command:
DISPlay:FFT<i>:A|B:YSOurce FFTP1
DISPlay:FFT<i>:A|B:YSOurce FFTP2
DISPlay:FFT<i>:A|B:YSOurce FFTPhase

Traces, Spectrum Displays and Bargraphs R&S UPV
1146.2084.32 4.474 E-9
FFT Phase Ch2-Ch1
FFT Phase to
Refch
The phase difference between the phase
characteristic of
•channel 2 and channel 1
•the channel number specified under the
following "Channel" parameter field and
the reference channel specified in the
"Ref Channel" parameter field in the
Analyzer Config panel in the case of a
multichannel instrument
obtained from the calculation of the complex
FFT by means of the FFT or Post FFT
analyzer measurement function. The phase
characteristic is displayed as Trace A or
Trace B along a frequency x-axis.
The yellow trace shows the phase characteristic near the
10 kHz frequency line.
Remote-control command:
DISPlay:FFT<i>:A|B:YSOurce FFTP21
DISPlay:FFT<i>:A|B:YSOurce
FFTRefchphase
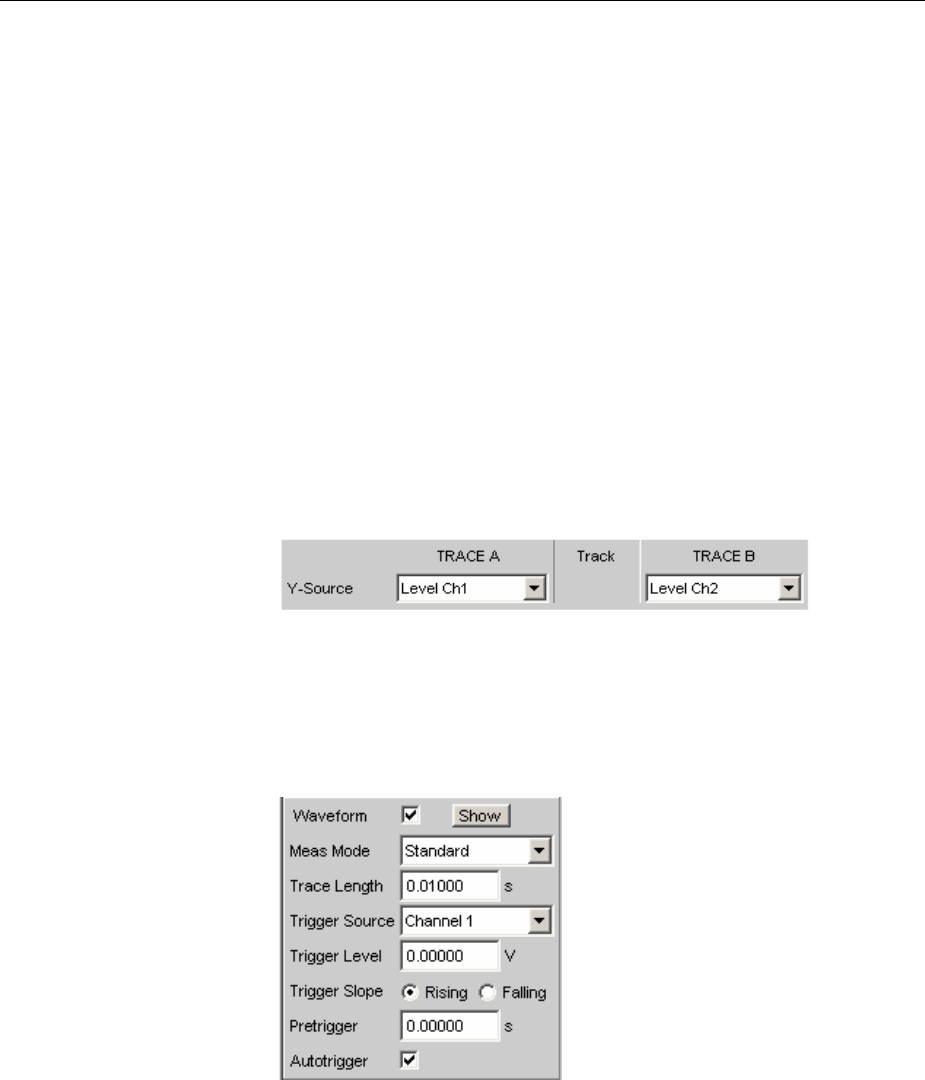
R&S UPV Traces, Spectrum Displays and Bargraphs
1146.2084.32 4.475 E-9
File: Trace A Trace A is loaded from a file, see section
"Measurement value sequences" on page
4.580. The file name is entered in the
subsequent parameter field.
Remote-control command:
DISPlay:FFT<i>:A|B:YSOurce FILEA
DISPlay:FFT<i>:A|B:YSOurce:FILE
'filename'
File: Trace B Trace B is loaded from a file, see section
"Measurement value sequences" on page
4.580. The file name is entered in the
subsequent parameter field.
Remote-control command:
DISPlay:FFT<i>:A|B:YSOurce FILEB
DISPlay:FFT<i>:A|B:YSOurce:FILE
'filename'
Y-Source
Waveform graphic system
Used to select which measurement results obtained with the additional
measurement function Waveform are to be collected as TRACE A or
TRACE B and displayed graphically on the left-hand or right-hand
Yaxis.
Section of the Analyzer Function panel:
For more information on Y Source see section "Measurement value
sequences" on page 4.580.
Off No trace is displayed or an available trace is
deleted.
Remote-control command:
DISPlay:WAVeform:A|B:YSOurce OFF

Traces, Spectrum Displays and Bargraphs R&S UPV
1146.2084.32 4.476 E-9
Level Ch1
Level Ch2
Level
The level measurement result for
•channel 1 or
•channel 2 or
•the channel number specified under the
following "Channel" parameter field in the
Analyzer Config panel in the case of a
multichannel instrument
with the waveform measurement function is
displayed as Trace A or Trace B along a time
X-axis.
Remote-control command:
DISPlay:WAVeform:A|B:YSOurce LEV1
DISPlay:WAVeform:A|B:YSOurce LEV2
DISPlay:WAVeform:A|B:YSOurce LEVel
File: Trace A Trace A is loaded from a file, see section
"Measurement value sequences" on page
4.580.
The file name is entered in the subsequent
parameter field.
Remote-control command:
DISPlay:WAVeform:A|B:YSOurce FILEA
DISPlay:WAVeform:A|B:YSOurce:FILE
'filename'
File: Trace B Trace B is loaded from a file, see section
"Measurement value sequences" on page
4.580.
The file name is entered in the subsequent
parameter field.
Remote-control command:
DISPlay:WAVeform:A|B:YSOurce FILEB
DISPlay:WAVeform:A|B:YSOurce:FILE
'filename'
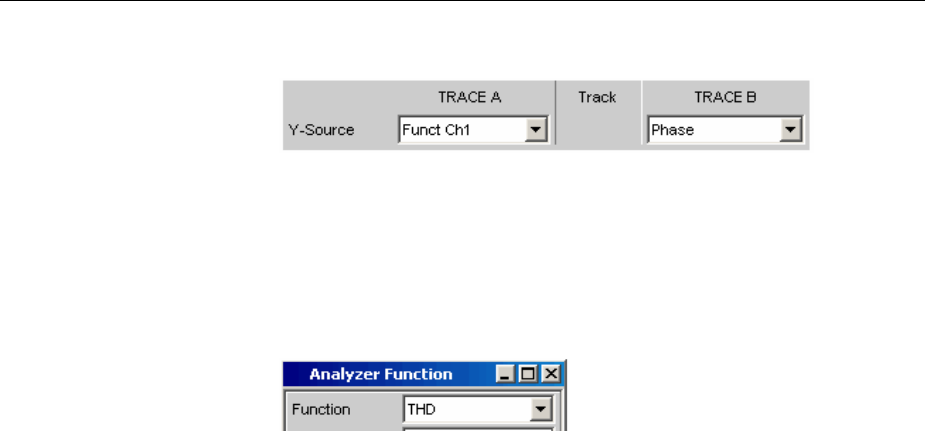
R&S UPV Traces, Spectrum Displays and Bargraphs
1146.2084.32 4.477 E-9
Y-Source
Bargraph graphic system
Used to select whether the measurement result for channel 1 or
channel 2 obtained with the analyzer measurement function THD,
THD+N & SINAD, Mod Dist, DFD Third Octave or 1/n Octave is to be
collected as TRACE A or TRACE B and displayed graphically on the
left-hand or right-hand Y axis.
Section of the Analyzer Function panel:
For more information on "Y Source" see section "Measurement value
sequences" on page 4.580.
Off No trace is displayed or an available trace is
deleted.
Remote-control command:
DISPlay:BARgraph<i>:A|B:YSOurce OFF
Funct Ch1
Funct Ch2
Function
The measurement result for
•channel 1 or
•channel 2 or
•the channel number specified under the
following "Channel" parameter field in the
Analyzer Config panel in the case of a
multichannel instrument
obtained for the THD, THD+N & SINAD,
Mod Dist, DFD and DIM analyzer measurement
functions is displayed as Trace A or Trace B
versus an X-axis that is not true to scale; the
result for the Third Octave and 1/n Octave
measurement functions versus an X-axis that is
true to scale.
Remote-control command:
DISPlay:BARgraph<i>:A|B:YSOurce
FUNC1
DISPlay:BARgraph<i>:A|B:YSOurce
FUNC2
DISPlay:BARgraph<i>:A|B:YSOurce
FUNCtion

Traces, Spectrum Displays and Bargraphs R&S UPV
1146.2084.32 4.478 E-9
File: Trace A Trace A is loaded from a file, see section
"Measurement value sequences" on page
4.580.
The file name is entered in the subsequent
parameter field.
Remote-control command:
DISPlay:BARgraph<i>:A|B:YSOurce
FILEA
DISPlay:BARgraph<i>:A|B:YSOurce:FIL
E'filename'
File: Trace B Trace B is loaded from a file, see section
"Measurement value sequences" on page
4.580.
The file name is entered in the subsequent
parameter field.
Remote-control command:
DISPlay:BARgraph<i>:A|B:YSOurce
FILEB
DISPlay:BARgraph<i>:A|B:YSOurce:FIL
E'filename'
Y-Source
PESQ graphics system
Used to select which measurement results of the PESQ measurement
function are to be collected as TRACE A or as TRACE B and
displayed graphically on the left-hand or right-hand y-axis.
Perceptual evaluation of speech quality (PESQ) is a method for
assessing the speech quality of transmission systems.
Off No trace is displayed or an available trace is
deleted.
Remote-control command:
DISPlay:PESQ<i>:A|B:YSOurce OFF
PESQ & MOS Function value of the PESQ MOS
measurement. Depending on the setting in the
"According to" field in the Analyzer panel, a
PESQ or a MOS measurement result is
displayed graphically.
MOS
MOS (mean opinion score) is described in the
ITU Recommendation P.862.1 or P.862.2.
PESQ
PESQ (perceptual evaluation of speech
quality) is described in the ITU
Recommendation P.862.
Remote-control command:
DISPlay:PESQ<i>:A|B:YSOurce PEMO

R&S UPV Traces, Spectrum Displays and Bargraphs
1146.2084.32 4.479 E-9
Delay The delay measurement shows the time offset
between the reference and the measurement
signal. The signal is divided into a specific
number of time intervals. Each time interval is
displayed as a point, and all points taken
together form a trace.
Remote-control command:
DISPlay:PESQ<i>:A|B:YSOurce DELAY
Ref Signal Waveform of the signal output on the
generator.
Remote-control command:
DISPlay:PESQ<i>:A|B:YSOurce
REFSignal
Deg Signal Waveform of the measured signal in the
resolution of the reference signal.
Remote-control command:
DISPlay:PESQ<i>:A|B:YSOurce
DEGSignal
Dropouts Measured dropouts displayed in such a way
as if the difference between the reference
signal and the time-corrected measurement
signal would be displayed.
Remote-control command:
DISPlay:PESQ<i>:A|B:YSOurce
DROPouts
File: Trace A Trace A is loaded from file, (see section
"Measurement value sequences", on page
4.580).
The file name is entered in the subsequent
parameter field.
Remote-control command:
DISPlay:PESQ<i>:A|B:YSOurce FILEA
DISPlay:PESQ<i>:A|B:YSOurce:FILE
'filename'
File: Trace B Trace B is loaded from file, (see section
"Measurement value sequences", on page
4.580).
The file name is entered in the subsequent
parameter field.
Remote-control command:
DISPlay:PESQ<i>:A|B:YSOurce FILEB
DISPlay:PESQ<i>:A|B:YSOurce:FILE
'filename'

Traces, Spectrum Displays and Bargraphs R&S UPV
1146.2084.32 4.480 E-9
Channel
Channel number
for multichannel instrument
For multichannel instruments it is no longer possible to show the
source of the measurement results and the channel numbers in a
combined display, due to the large number of possible combinations in
the selection list for the Y-source. The source of the measurement
results (Y-Source) and the channel number (Channel) are therefore
offered in separate parameter fields.
For Y-Source = "OFF", "File: Trace A" or "File: Trace B", a channel
specification has no significance, and this parameter field disappears.
Available in the graphics subsystems
Sweep, FFT, Waveform, Bargraph
Ch1 to Ch8 Channel number 1 to 8
Remote-control command:
DISPlay:SWEep<i>:A|B:CHANnel
CH1…CH8
DISPlay:FFT<i>:A|B:CHANnel CH1…CH8
DISPlay:WAVeform:A|B:CHANnel
CH1…CH8
DISPlay:BARgraph<i>:A|B:CHANnel
CH1…CH8
Trace File
All graphic systems
File name of the trace files to be loaded at parameter fields "Y-
Source" = "File: Trace A" and/or "File: Trace B".
If a file cannot be loaded because it does not match the current
graphic system or is defective, "not loaded" is displayed. For the file
format see section "Random" on page 4.84.
If a trace file that contains Min/Max scans is loaded, "Show Min Max"
is enabled automatically so that these scans are displayed in the
graphic.
If files with different x-axes are loaded one after the other, the last file
that was loaded always determines the x-axis. If a sweep with a
different x-axis is then loaded, it will determine the x-axis.
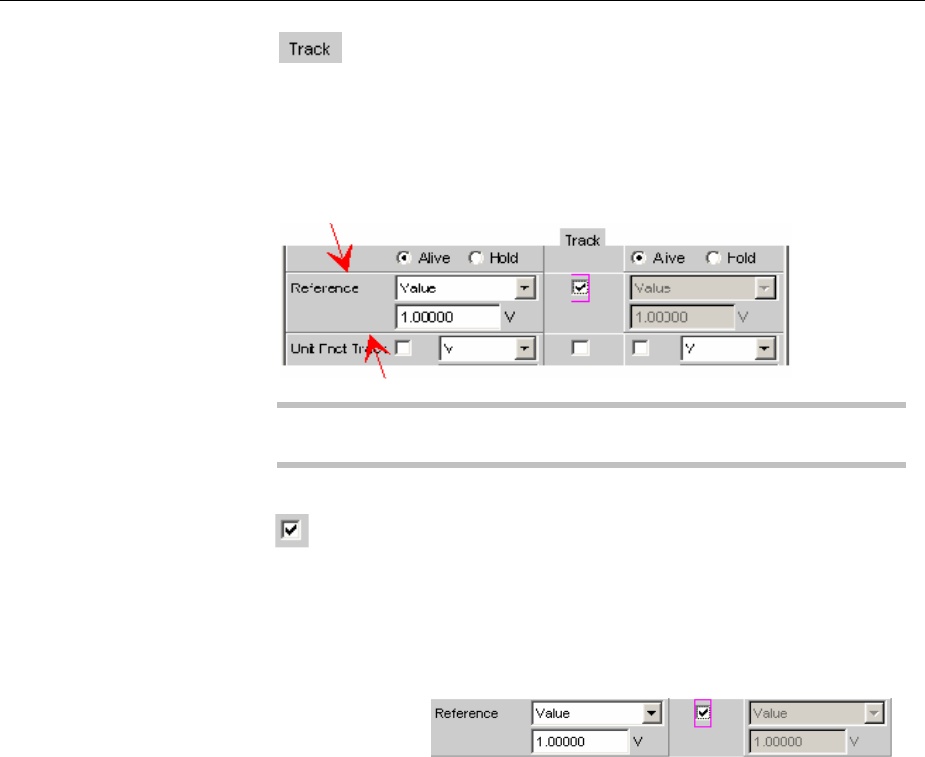
R&S UPV Traces, Spectrum Displays and Bargraphs
1146.2084.32 4.481 E-9
Track
If a tick box is available in the "Track" column, the settings for the
parameters concerned can be transferred from TRACE A to
TRACE B. The horizontal partition lines in the panel indicate the
parameters for which tracking applies. Tracking capabilities are
available for the Reference, Scaling and Limit functions.
Available in the graphics subsystems
Sweep, FFT, Waveform, Bargraph, PESQ
The content of the parameter fields for TRACE A are
transferred to TRACE B. The parameter fields for
TRACE B then appear grey and cannot be
accessed.
Changes made to the settings in TRACE A are
transferred immediately to TRACE B.
Example:
Remote-control command:
DISPlay:SWEep<i>:TRACk
LIMit|REFerence|SCALing ON
DISPlay:FFT<i>:TRACk
LIMit|REFerence|SCALing ON
DISPlay:WAVeform:TRACk
LIMit|REFerence|SCALing ON
DISPlay:BARgraph<i>:TRACk
LIMit|REFerence|SCALing ON
DISPlay:PESQ<i>:TRACk
LIMit|REFerence|SCALing ON
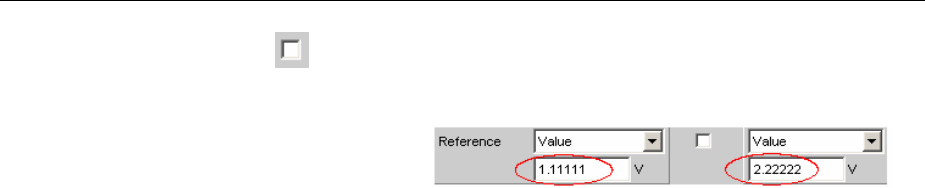
Traces, Spectrum Displays and Bargraphs R&S UPV
1146.2084.32 4.482 E-9
The parameter fields for TRACE A and TRACE B
can be accessed and changed separately.
Example:
Remote-control command:
DISPlay:SWEep<i>:TRACk
LIMit|REFerence|SCALing OFF
DISPlay:FFT<i>:TRACk
LIMit|REFerence|SCALing OFF
DISPlay:WAVeform:TRACk
LIMit|REFerence|SCALing OFF
DISPlay:BARgraph<i>:TRACk
LIMit|REFerence|SCALing OFF
DISPlay:PESQ<i>:TRACk
LIMit|REFerence|SCALing OFF

R&S UPV Traces, Spectrum Displays and Bargraphs
1146.2084.32 4.483 E-9
Label Auto
This setting is for whether the label for the left (Trace A) or right
(Trace B) Y axis is oriented on the setting in the "Y-Source" parameter
field, or is freely configurable.
Available in the graphics subsystems
Sweep, FFT, Waveform, Bargraph, PESQ
The label (which is selected under TRACE A or
TRACE B), i.e. the name of the measurement result
which is displayed as TRACE A or TRACE B, is
displayed in grey (cannot be accessed) in the text
field to the right of the tick box and also on the
Yaxis in the graphical display.
Here rotated by 90°.
Remote-control command:
DISPlay:SWEep<i>:A|B:LABel:AUTO ON
DISPlay:FFT<i>:A|B:LABel:AUTO ON
DISPlay:WAVeform<i>:A|B:LABel:AUTO ON
DISPlay:BARgraph<i>:A|B:LABel:AUTO ON
DISPlay:PESQ<i>:A|B:LABel:AUTO ON
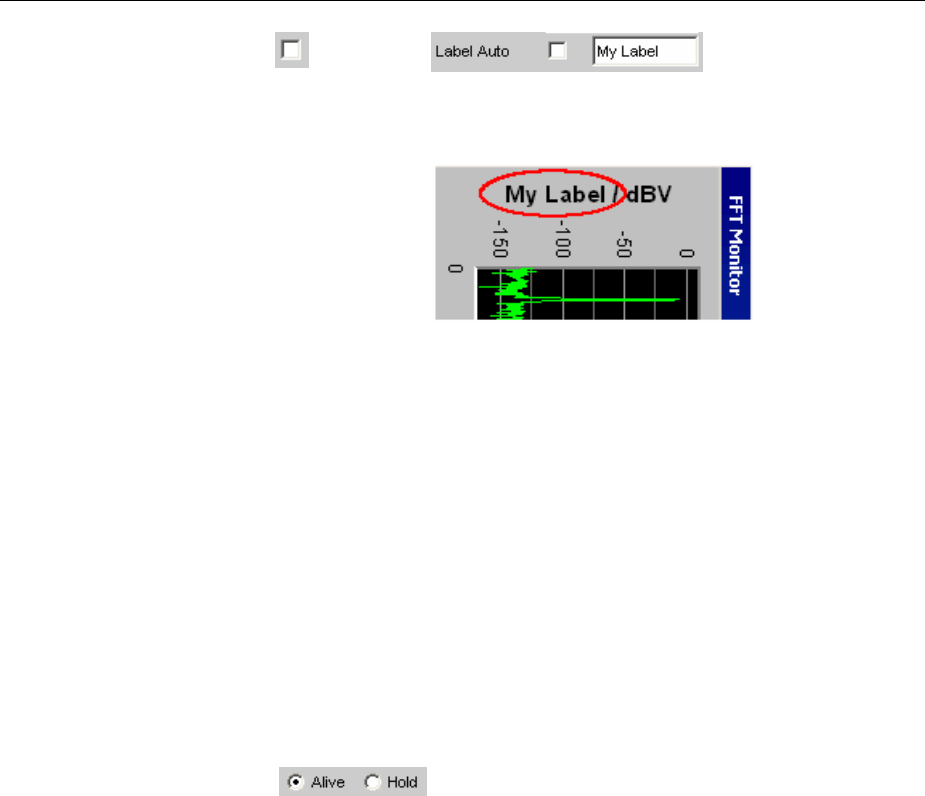
Traces, Spectrum Displays and Bargraphs R&S UPV
1146.2084.32 4.484 E-9
Auser-definable label appears on the Y axis of the
graphical display.
Here rotated by 90°.
Remote-control command:
DISPlay:SWEep<i>:A|B:LABel:AUTO OFF
DISPlay:FFT<i>:A|B:LABel:AUTO OFF
DISPlay:WAVeform<i>:A|B:LABel:AUTO OFF
DISPlay:BARgraph<i>:A|B:LABel:AUTO OFF
DISPlay:PESQ<i>:A|B:LABel:AUTO OFF
DISPlay:SWEep<i>:A|B:LABel:USER
'string'
DISPlay:FFT<i>:A|B:LABel:USER 'string'
DISPlay:WAVeform<i>:A|B:LABel:USER
'string'
DISPlay:BARgraph<i>:A|B:LABel:USER
'string'
DISPlay:PESQ<i>:A|B:LABel:USER
'string'
Used to enable or freeze the display of new measurement values for
Trace A or Trace B.
Alive New measurement values are displayed, see
section "Measurement value sequences" on page
4.580.Remote-control command:
DISPlay:SWEep<i>:A|B:UPDate ALIVe
DISPlay:FFT<i>:A|B:UPDate ALIVe
DISPlay:WAVeform:A|B:UPDate ALIVe
DISPlay:BARgraph<i>:A|B:UPDate ALIVe
DISPlay:PESQ<i>:A|B:UPDate ALIVe
Hold The last trace remains in the display, see section
"Measurement value sequences" on page 4.580.
Remote-control command:
DISPlay:SWEep<i>:A|B:UPDate HOLD
DISPlay:FFT<i>:A|B:UPDate HOLD
DISPlay:WAVeform:A|B:UPDate HOLD
DISPlay:BARgraph<i>:A|B:UPDate HOLD
DISPlay:PESQ<i>:A|B:UPDate HOLD
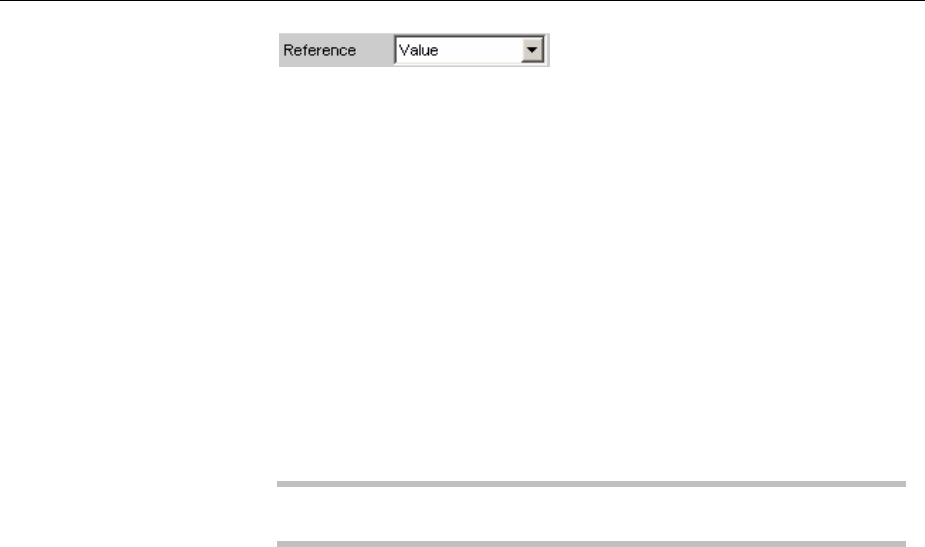
R&S UPV Traces, Spectrum Displays and Bargraphs
1146.2084.32 4.485 E-9
Reference
Used to select the reference for referenced units (e.g. dBr, V/Vr or
mHz) for Trace A or Trace B. Can be a single integer value or a
reference trace. The reference can be a sequence of measurement
values, the current generator frequency or voltage, or it can be loaded
from a file (e.g. as a reference trace).
The reference value applies to all integer values in the trace, i.e.
measurement values, top, bottom and limit values, as well as to all
scans of a trace. The same reference value thus apples to all scans.
The "Reference" setting line will be hidden, if you select the function
measurement result under Y source by using
Funct Ch1 | Funct Ch2 and if an intermodulation measurement is set
in the analyzer function panel. Intermodulation measurement results
are measurement results that have already been referenced and
cannot be referenced again.
Available in the graphics subsystems
Sweep, FFT, Waveform, Bargraph
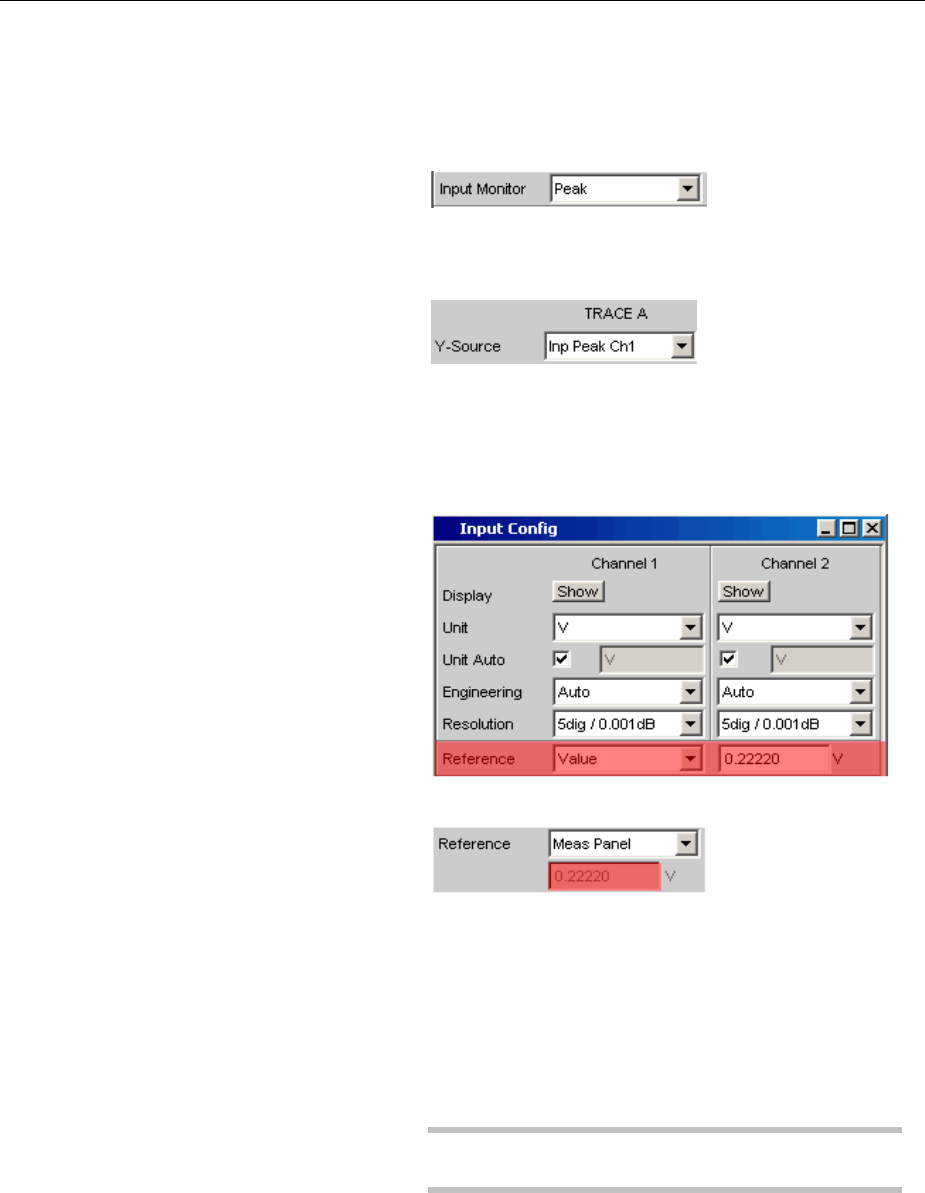
Traces, Spectrum Displays and Bargraphs R&S UPV
1146.2084.32 4.486 E-9
Meas Panel The reference value from the associated
measurement function configuration panel is used.
Example:
The additional measurement function Input Monitor
=Peak is activated in the analyzer panel:
In the Sweep Graph1 graphic system, the result of
the Input Peak measurement for channel 1 is
selected as the source for Trace A:
The measurement results of the additional
measurement function "Input Monitor Peak" are
therefore plotted as Trace A on the Y1 axis.
In the Input Config panel, the reference value for the
additional measurement function is set to 0.2222 V.
If Reference is now set to Meas Panel,
the reference value from the Input Config panel is
entered here and used if referenced units are
selected.
This transfer of the reference value allows, in the
case of referenced units,to compare measured
values in the numerical display field or the combined
display (Combi display) with measured values in the
graphical display.
Available in the graphics subsystems
Sweep, FFT, Bargraph
Remote-control command:
DISPlay:SWEep<i>:A|B:REFerence
MEASpanel
DISPlay:FFT<i>:A|B:REFerence MEASpanel
DISPlay:BARgraph<i>:A|B:REFerence
MEASpanel

R&S UPV Traces, Spectrum Displays and Bargraphs
1146.2084.32 4.487 E-9
Value Anumeric value with unit must be entered as the
reference value in the parameter field below.
Remote-control command:
DISPlay:SWEep<i>:A|B:REFerence VALue
DISPlay:FFT<i>:A|B:REFerence VALue
DISPlay:WAVeform:A|B:REFerence VALue
DISPlay:BARgraph<i>:A|B:REFerence
VALue
Max The maximum Y value of the measurement
sequence is actuated once as the reference value.
The display then returns to Value and the maximum
Yvalue is displayed as the new reference value in
the parameter field below.
Remote-control command:
DISPlay:SWEep<i>:A|B:REFerence MAXimum
DISPlay:FFT<i>:A|B:REFerence MAXimum
DISPlay:BARgraph<i>:A|B:REFerence
MAXimum
*Cursor The Y value of the Cursor is actuated once as the
reference value. The display then returns to Value
and the Y value ofnthe Cursor is displayed as the
new reference value in the parameter field below.
Remote-control command:
DISPlay:SWEep<i>:A|B:REFerence XCURsor
DISPlay:FFT<i>:A|B:REFerence XCURsor
DISPlay:BARgraph<i>:A|B:REFerence
XCURsor
oCursor The Y value of the o Cursor is actuated once as the
reference value. The display then returns to Value
and the Y value of the o Cursor is displayed as the
new reference value in the parameter field below.
Remote-control command:
DISPlay:SWEep<i>:A|B:REFerence OCURsor
DISPlay:FFT<i>:A|B:REFerence OCURsor
DISPlay:BARgraph<i>:A|B:REFerence
OCURsor
Ref 997 Hz The Y value at 997 Hz is actuated once as the
reference value. The display then returns to Value
and the Y value at 997 Hz is displayed as the new
reference value in the parameter field below.
If the X axis is not a frequency axis (e.g. in the case
of level sweeps or waveform displays), an error
message is displayed and the reference value
remains unchanged.
Remote-control command:
DISPlay:SWEep<i>:A|B:REFerence REF997
DISPlay:FFT<i>:A|B:REFerence REF997
DISPlay:BARgraph<i>:A|B:REFerence
REF997

Traces, Spectrum Displays and Bargraphs R&S UPV
1146.2084.32 4.488 E-9
Ref 1000 Hz Asfor Ref 997 but with 1000 Hz
Remote-control command:
DISPlay:SWEep<i>:A|B:REFerence REF1000
DISPlay:FFT<i>:A|B:REFerence REF1000
DISPlay:BARgraph<i>:A|B:REFerence
REF1000
Meas Ref Ch This selection option is only displayed for
multichannel instruments.
Every level measurement result of the channel
specified in the Analyzer Config panel under Ref
Channel is saved as a reference value.
If a reference-specific unit was selected in the "Unit"
parameter field, the measurement result is
referenced to this floating reference value and
displayed.
Meas Ch1 Each level measurement value of channel 1 is
stored as reference value
and is used for referenced display, provided you
have selected a referenced unit. These selection
choices are only available for two-channel
measurement.
Remote-control command:
DISPlay:SWEep<i>:A|B:REFerence CH1Meas
DISPlay:FFT<i>:A|B:REFerence CH1Meas
DISPlay:BARgraph<i>:A|B:REFerence
CH1Meas
Meas Ch2 As for Meas Ch1 but with channel 2
Remote-control command:
DISPlay:SWEep<i>:A|B:REFerence CH2Meas
DISPlay:FFT<i>:A|B:REFerence CH2Meas
DISPlay:BARgraph<i>:A|B:REFerence
CH2Meas
Gen Track The reference trace is deleted and the currently
applicable generator voltage, and then each newly
set generator voltage, is used as the reference
value.
Remote-control command:
DISPlay:SWEep<i>:A|B:REFerence
GENTrack
DISPlay:FFT<i>:A|B:REFerence GENTrack
DISPlay:BARgraph<i>:A|B:REFerence
GENTrack

R&S UPV Traces, Spectrum Displays and Bargraphs
1146.2084.32 4.489 E-9
File The reference trace is loaded from a file. The file
name is entered in the parameter field below, see
section "Measurement value sequences" on page
4.580.
Remote-control command:
DISPlay:SWEep<i>:A|B:REFerence FILE
DISPlay:FFT<i>:A|B:REFerence FILE
DISPlay:BARgraph<i>:A|B:REFerence FILE
File Intern "File Intern" has to be offered and displayed only if
"File: Trace A or File: Trace B is set at "Y-Source"
and a trace file containing a reference value scan in
addition to the data scan is loaded.
Remote-control command:
DISPlay:SWEep<i>:A|B:REFerence IFILe
DISPlay:FFT<i>:A|B:REFerence IFILe
DISPlay:BARgraph<i>:A|B:REFerence
IFILe
Noise Density Noise density measurement.
Offered only in the FFT subsystem.
If you perform an FFT analysis via a noise signal,
the level of a bin will change with respect to its
width. The width of a bin, which is also called
analysis bandwidth, depends on the FFT size.
Thus, the level of a bin changes with respect to the
FFT size.
To relativize this effect, i.e. to become independent
of the actual analysis bandwidth, you calculate the
noise density. This is the noise power that would
occur in an intended analysis bandwidth of 1 Hz.
The noise density depends on the FFT window.
When calculating the noise density, the set window
is taken into consideration to eliminate the effect of
the window.
Thus, the noise-density measurement is not an
independent measurement function but a
referenced level display, based on the relative unit
V/Vr.
In the FFT graphic, the result is displayed in the
usual V/oHz unit.
Remote-control command:
DISPlay:FFT<i>:A|B:REFerence
NOISedensity

Traces, Spectrum Displays and Bargraphs R&S UPV
1146.2084.32 4.490 E-9
Hold Nofurther changes are made to the reference value
or reference trace.
If a trace file having a reference value or reference
trace is loaded, the reference values from the file
have no effect, and the reference value or reference
trace last set is used.
If a floating reference value (Meas Ch1, Meas Ch2
or Gen Track) was set before the switchover to
"Hold", this reference trace is used.
If "Hold" is selected in the absence of any valid
reference trace data, a warning is issued and the
last chosen valid reference is set again.
Remote-control command:
DISPlay:SWEep<i>:A|B:REFerence HOLD
DISPlay:FFT<i>:A|B:REFerence HOLD
DISPlay:WAVeform:A|B:REFerence HOLD
DISPlay:BARgraph<i>:A|B:REFerence HOLD
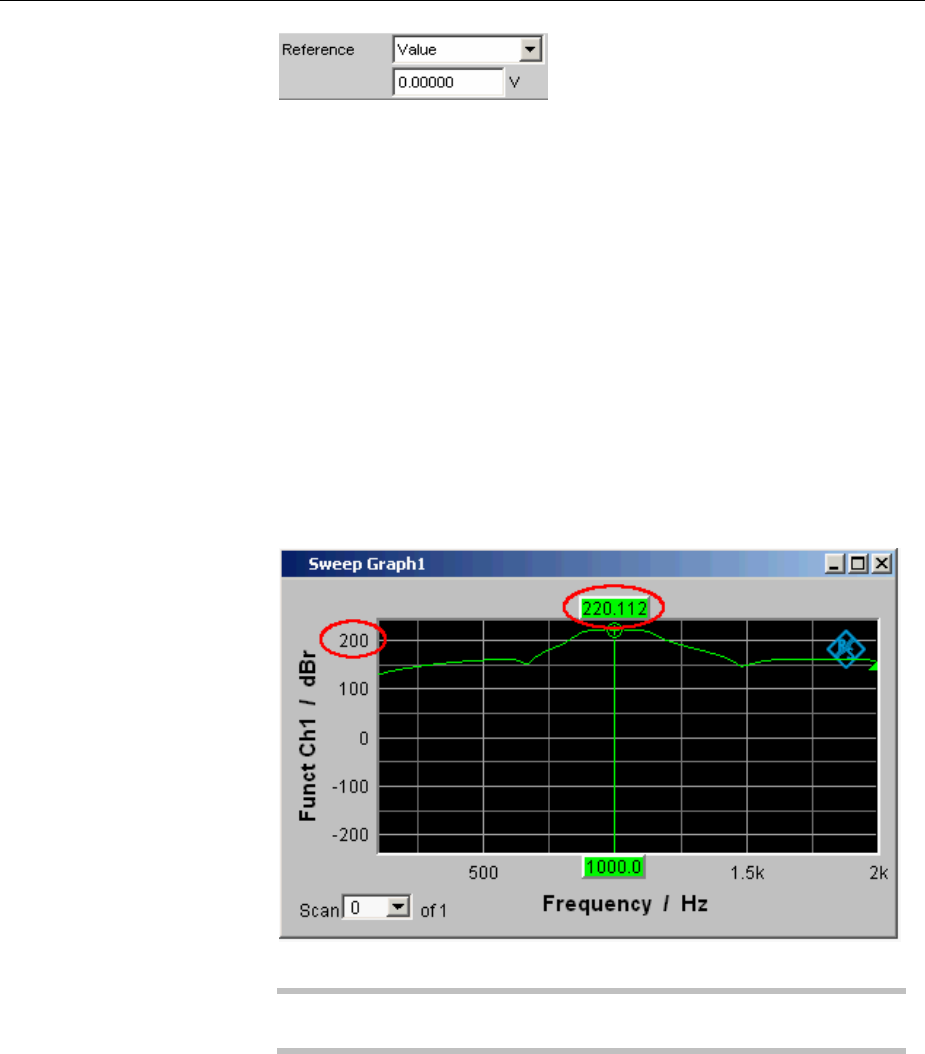
R&S UPV Traces, Spectrum Displays and Bargraphs
1146.2084.32 4.491 E-9
Reference Value
Reference value with unit for the reference parameter Value.
Regardless of the graphic system, the value range allows the value
0 V or negative values to be entered. A reference value of 0 V or a
negative reference value makes good sense for display units such as
jVor jW, but causes problems in the case of logarithmic units such
as dBr and in the case of units that have the reference value in the
denominator, such as V/Vr.
To get round these problems, a reference value around 0.0 (or more
exactly: between -1.0E-12 and.0 E-12) is always computed using the
value 1.0E-12.
Negative reference values < -1.0E-12 are computed using their
magnitude, that is, they are made into positive values.
As a result, trace displays in the referenced unit dBr, for instance, at a
reference value of 0.0 V have very high values for the upper limit,
since the trace data is computed within the R&S UPV using the
reference value 1.0E-12.
Available in the graphics subsystems
Sweep, FFT, Waveform, Bargraph
Remote-control command:
DISPlay:SWEep<i>:A|B:REFerence:VALue <nu>
DISPlay:FFT<i>:A|B:REFerence:VALue <nu>
DISPlay:WAVeform:A|B:REFerence:VALue <nu>
DISPlay:BARgraph<i>:A|B:REFerence:VALue <nu>

Traces, Spectrum Displays and Bargraphs R&S UPV
1146.2084.32 4.492 E-9
Reference File
File name for the reference parameter File.
Available in the graphics subsystems
Sweep, FFT, Waveform, Bargraph
Remote-control command:
DISPlay:SWEep<i>:A|B:REFerence FILE 'filename'
DISPlay:FFT<i>:A|B:REFerence FILE 'filename'
DISPlay:BARgraph<i>:A|B:REFerence FILE 'filename'
Normalize
If a referenced unit (e.g. dBr or V/Vr) and a floating reference value,
as in Reference = Meas Ch1, Meas Ch2, Gen Track, or a reference
trace held in a file, as in "File" or "File Intern", are used, the displayed
trace is normalized with the aid of the above by shifting the whole
curve, that is, multiplying it by the normalization value.
The normalization value is transferred to all scan data sets; the same
normalization value therefore applies to all scans.
The "Normalize" setting line will be hidden if you select the function
measurement result under Y source by using Funct Ch1 | Funct Ch2 |
Function and if an intermodulation measurement is set in the analyzer
function panel. Intermodulation measurement results are
measurement results that have already been referenced and cannot
be referenced again.
Available in the graphics subsystems
Sweep, FFT, Bargraph
Remote-control command:
DISPlay:SWEep<i>:A|B:NORMalize OFF | VALue |
OCURsor | XCURsor
DISPlay:FFT<i>:A|B:NORMalize OFF | VALue | OCURsor
|XCURsor
DISPlay:BARgraph<i>:A|B:NORMalize OFF | VALue |
OCURsor | XCURsor
OFF Normalization is deactivated.
Value Fixed normalization value which is entered as a
multiplication factor or a dB value in the parameter
field below.
oCursor The trace is normalized once only at the o cursor to
0dBr or V/Vr = 1. For this purpose, the referenced
trace value is read out and the reciprocal value is
entered in the parameter field below. The parameter
then changes back to VALUE.
*Cursor As for the o cursor.
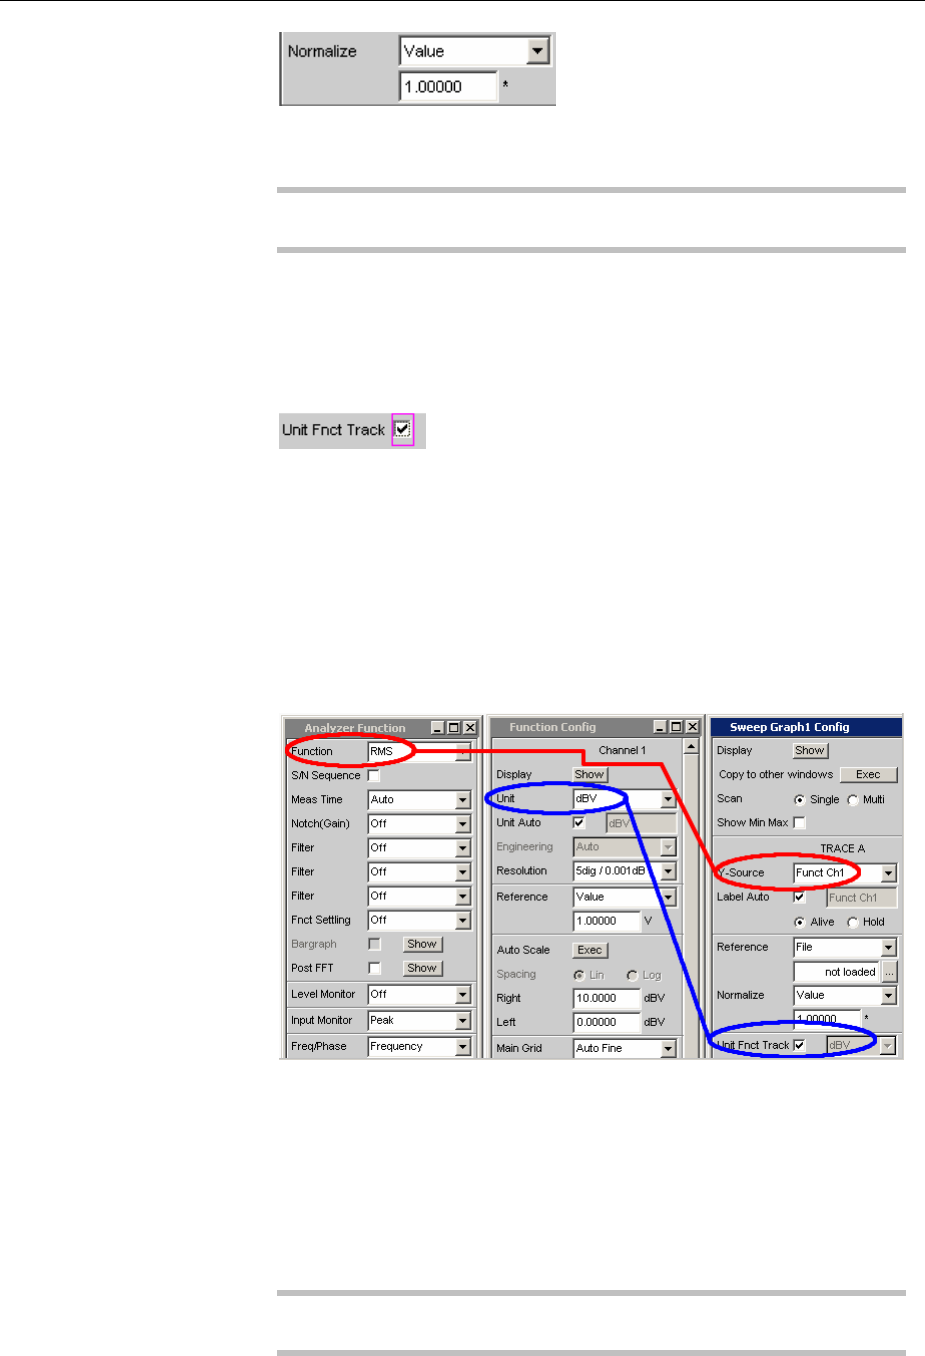
R&S UPV Traces, Spectrum Displays and Bargraphs
1146.2084.32 4.493 E-9
Normalize Value
Used to enter a fixed normalization value as a factor.
This value applies to all scans.
Available in the graphics subsystems
Sweep, FFT, Bargraph
Remote-control command:
DISPlay:SWEep<i>:A|B:NORMalize:VALue <nu>
DISPlay:FFT<i>:A|B:NORMalize:VALue <nu>
DISPlay:BARgraph<i>:A|B:NORMalize:VALue <nu>
Unit Fnct Track
Used to determine whether the unit is the same as that set in the
analyzer or whether it can be user-selected. This parameter field is
displayed only for graphics systems that are referenced to the
measurement function in the analyzer and whose display unit can
beset in the corresponding Config panel.
Example 1:
In the sweep subsystem, "y-source" is set to "Funct Ch1".
In the Analyzer panel, RMS has been set as measurement function for
which dBV has been selected as the unit in the Function Config panel.
The dBV display unit for the RMS measurement function can be
transferred to the Display panel if "Unit Fnct Track" is enabled.
Example 2:
For the additional measurement function Waveform, there is no
individually assigned unit that may be set in a Config panel.Thus, no
unit can be transferred from the analyzer for the Waveform graphics
subsystem and the check box for Unit Fnct Track is not offered here.
Available in the graphics subsystems
Sweep, FFT, Bargraph

Traces, Spectrum Displays and Bargraphs R&S UPV
1146.2084.32 4.494 E-9
The unit selected in the analyzer is used for the
measurement data displayed on the Y axis and for
the displayed top, bottom and limit values.
It is displayed in grey (cannot be accessed) next to
the tick box and also on the Y axis of the graphical
display.
If a logarithmic unit (dBu, dBV, dBr, dBm, dBFS or
dBUI) appears here, the parameter field below
(Spacing) cannot be accessed and its parameter is
set to Lin (it would be pointless to display
measurement values with a logarithmic unit on an
axis with logarithmic spacing).
Here rotated by 90°.
The unit which appears here depends on the
parameter selected under Trace A or Trace B e.g.
"Level Ch1", "Phase Ch1" and on the analyzer
instrument e.g. "Analog" or Digital Audio.
In the event of changing between similar units (e.g.
dBu pdBV pdBm pdBr) a new value is
computed for the subsequent parameter fields
"Top", "Bottom",
"Main Grid Steps",
"Limit Lower Value", "Limit Upper Value",
"Limit Shift Parallel", "Limit Shift Symmetrical";
in the event of changing between different units (e.g.
dBV pW) a value entered earlier is retrieved.
Remote-control command:
DISPlay:SWEep<i>:A|B:UNIT:TRACk ON
DISPlay:FFT<i>:A|B:UNIT:TRACk ON
DISPlay:BARgraph<i>:A|B:UNIT:TRACk ON
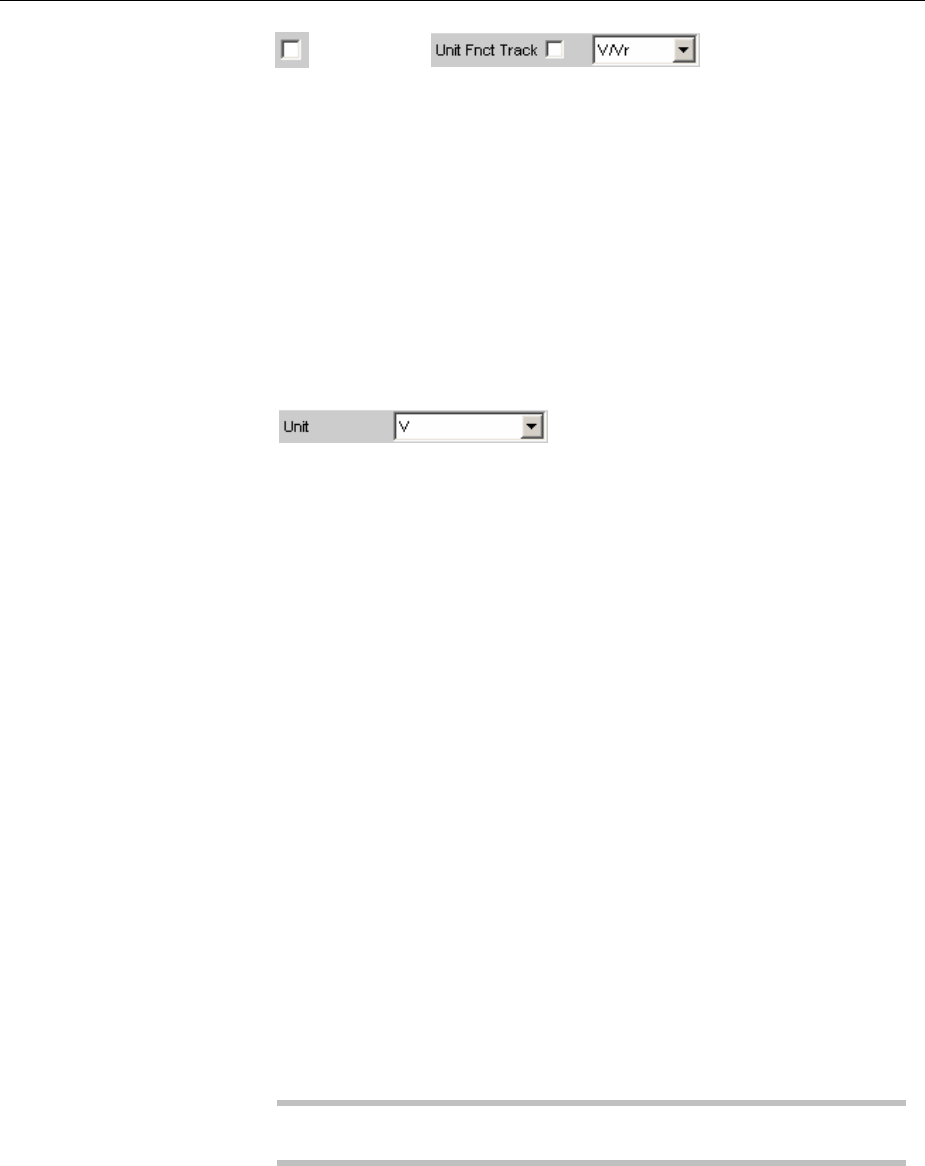
R&S UPV Traces, Spectrum Displays and Bargraphs
1146.2084.32 4.495 E-9
The unit can be user-selected from the list of
available parameters.
If a logarithmic unit (dBu, dBV, dBr, dBm, dBFS or
dBUI) is selected here, the parameter field below
(Spacing) cannot be accessed and its parameter is
set to Lin (it would be pointless to display
measurement values with a logarithmic unit on an
axis with logarithmic spacing).
Remote-control command:
DISPlay:SWEep<i>:A|B:UNIT:TRACk OFF
DISPlay:FFT<i>:A|B:UNIT:TRACk OFF
DISPlay:BARgraph<i>:A|B:UNIT:TRACk OFF
Unit
This parameter field without the "Unit Funct Track" (see above) is
displayed only for the graphic system Waveform, since this additional
measurement function is independent of a function setting in the
analyzer and even deliver measurement results when the
measurement function is turned off. Therefore tracking the unit of the
measurement function is meaningless.
The list of units offered at this point is dependent on whether the
analog or digital analyzer is selected and in the digital case, on
whether the Meas Mode = Audio Data, Jitter/Phase and
Common/Input.
The unit can be user-selected from the parameter list.
If a logarithmic unit (dBu, dBV, dBr, dBm, dBFS, dBUI) is selected, or
linear units in which negative numbers can occur (e.g. jV, jW), the
following parameter field "Spacing" is displayed as not user-accessible
and its parameter is set to Lin, since it makes no sense / is not
possible to display measurement values with a logarithmic unit or
negative values on a logarithmically scaled axis.
In the event of changing between similar units (e.g. dBu pdBV p
dBm pdBr) a new value is computed for the subsequent parameter
fields
"Top", "Bottom",
"Main Grid Steps",
"Limit Lower Value", "Limit Upper Value",
"Limit Shift Parallel", "Limit Shift Symmetrical";
in the event of changing between different units (e.g. dBV pW) a
value entered earlier is retrieved.
Available in the graphics subsystems
Sweep, FFT, Waveform, Bargraph
Remote-control command:
DISPlay:SWEep<i>:A|B:UNIT V | DBV | DBU …
DISPlay:FFT<i>:A|B:UNIT V | DBV | DBU …
DISPlay:WAVeform:A|B:UNIT V | DBV | DBU …
DISPlay:BARgraph<i>:A|B:UNIT V | DBV | DBU …
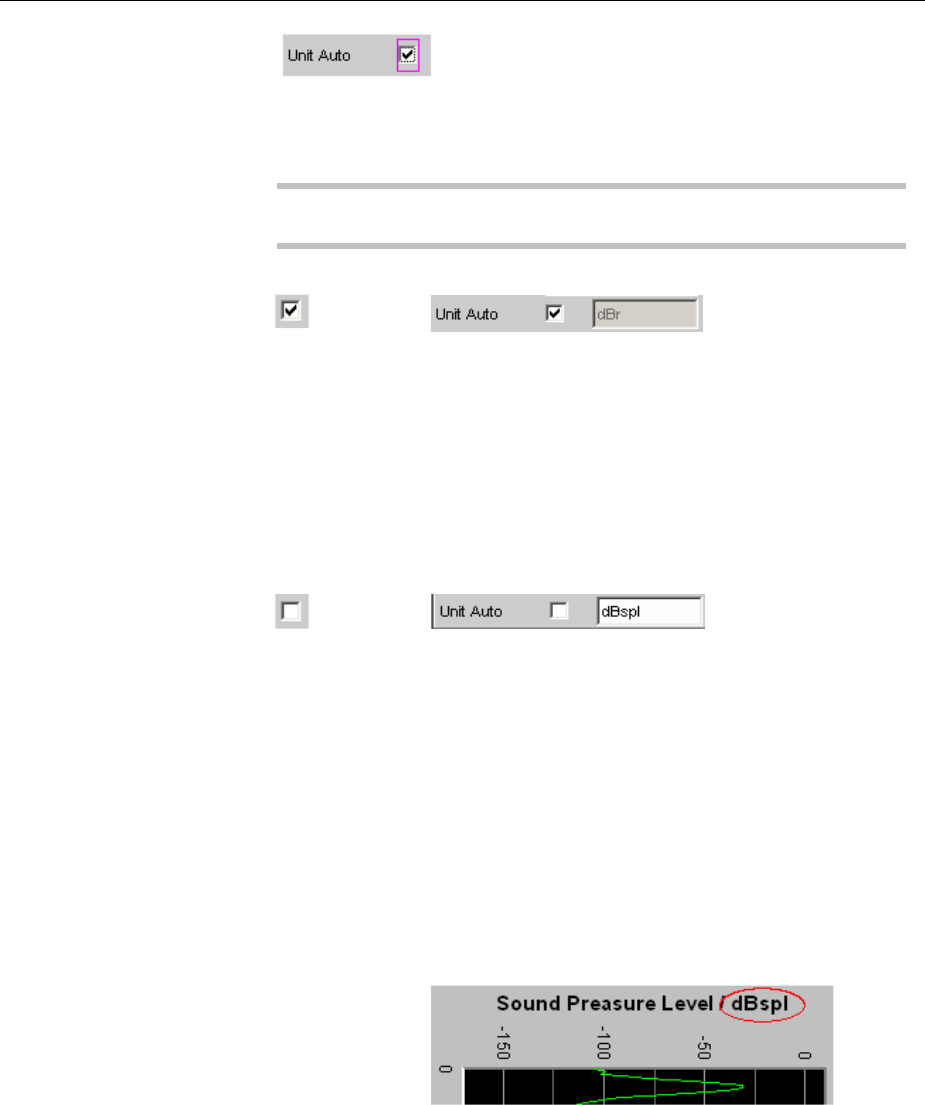
Traces, Spectrum Displays and Bargraphs R&S UPV
1146.2084.32 4.496 E-9
Unit Auto
Used to determine whether the unit label displayed on the Y axis for
Trace A or Trace B is the same as the unit set in the "Unit Funct
Track" or "Unit" parameter field or whether it can be user-selected.
Available in the graphics subsystems
Sweep, FFT, Waveform, Bargraph
The unit label displayed on the Y axis for Trace A or
Trace B is the same as the unit set in the "Unit Funct
Track" or "Unit" parameter field and is therefore
generated automatically by the R&S UPV.
Remote-control command:
DISPlay:SWEep<i>:A|B:UNIT AUTO ON
DISPlay:FFT<i>:A|B:UNIT AUTO ON
DISPlay:WAVeform:A|B:UNIT AUTO ON
DISPlay:BARgraph<i>:A|B:UNIT AUTO ON
Auser-defined unit label can be entered.
Practical example:
The output level U0dBspl which is output at a sound
pressure of 0 dBspl (spl = sound pressure level) is
specified for high-quality microphones.
If the measured microphone output level is displayed
in the referenced unit dBr and entered for the
reference value U0dBspl,the level displayed on the
R&S UPV will be in dBr but corresponds to the
sound pressure in dBspl. In the graphical display,
however, an axis label in dBspl is desirable. To allow
this, the unit label can be changed from dBr to
dBspl.
Here rotated by 90°.
Remote-control command:
DISPlay:SWEep<i>:A|B:UNIT AUTO OFF
DISPlay:FFT<i>:A|B:UNIT AUTO OFF
DISPlay:WAVeform:A|B:UNIT AUTO OFF
DISPlay:BARgraph<i>:A|B:UNIT AUTO OFF

R&S UPV Traces, Spectrum Displays and Bargraphs
1146.2084.32 4.497 E-9
Unit User String
User-defined unit designation if Unit Auto is not selected.
The specified designation appears on the Y-axis label instead of the
usual units.
Available in the graphics subsystems
Sweep, FFT, Waveform, Bargraph
Remote-control command:
DISPlay:SWEep<i>:A|B:UNIT:USER 'string'
DISPlay:FFT<i>:A|B:UNIT:USER 'string'
DISPlay:WAVeform:A|B:UNIT:USER 'string'
DISPlay:BARgraph<i>:A|B:UNIT:USER 'string'
Engineering
Conversion of the Trace A or Trace B-related cursor and scaling
values in the graphical display by a factor of 1000.
This parameter field cannot be accessed if a dB or % unit is selected
in the "Unit Funct Track" or "Unit" parameter field above since these
units do not have an engineering function.
Available in the graphics subsystems
Sweep, FFT, Waveform, Bargraph
Auto Automatic engineering assignment from p to M. The
cursor and scaling values are displayed with the
engineering symbol.
The Y axis is labelled with the unit without
engineering.
Off Engineering is deactivated.
Values are always displayed in 1.0 E0format.
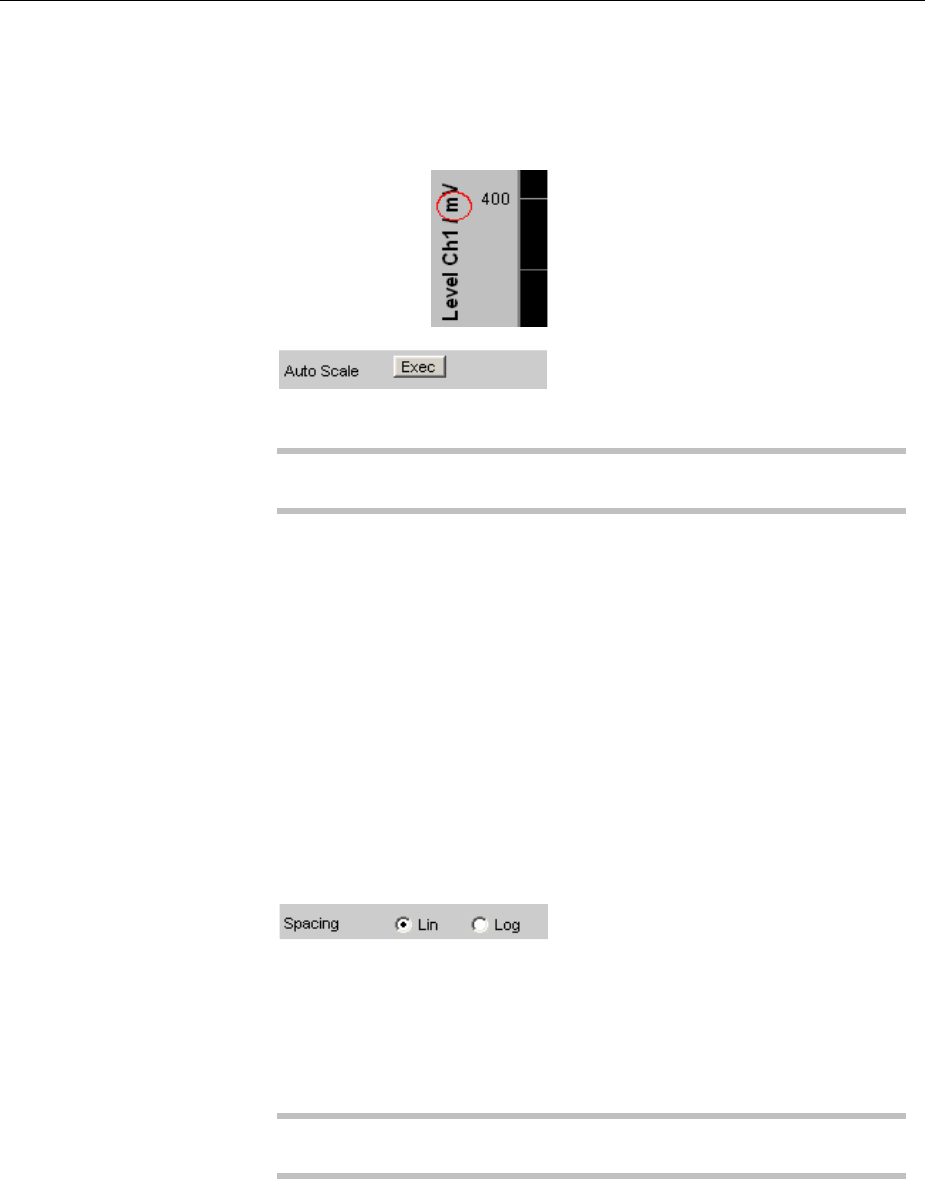
Traces, Spectrum Displays and Bargraphs R&S UPV
1146.2084.32 4.498 E-9
J
m
k
Engineering fixed to Z, m or k.
The cursor and scaling values are displayed without
engineering symbol.
The Y axis is labelled with engineering and unit.
Auto Scale
One-off automatic scaling of the Y axes for Trace A or Trace B.
Available in the graphics subsystems
Sweep, FFT, Waveform, Bargraph, PESQ
Exec Clicking this button triggers a one-off scaling
process which uses the minimum and maximum
values of the existing measurement sequence for
TRACE A or TRACE B.
The end values of the new scaling are approx. 5%
less or greater than the exact values. The
determined values are entered in the Top and
Bottom parameter fields below.
If the "Track" tick box is enabled for this range, then
using "Exec" causes automatic scaling of both
Yaxes in trace A, taking the highest maximum value
and the lowest minimum value of both traces into
account. If the Min/Max curves are switched on,
these are used for the autoscaling.
Spacing
Linear or logarithmic spacing of the Y axis for Trace A or Trace B.
For logarithmic units (dB units) and linear units in which negative
numbers can occur (e.g. jV, jW) , this parameter field is displayed as
not user-accessible and is set to "Lin", since it would be pointless to
display dB values or negative values logarithmically.
Available in the graphics subsystems
Sweep, FFT, Waveform, Bargraph, PESQ

R&S UPV Traces, Spectrum Displays and Bargraphs
1146.2084.32 4.499 E-9
Lin Linear spacing of the Y axis.
If a logarithmic unit (dB unit) has been selected in
the "Unit Fnct Track" line, this line is displayed as
not user-accessible and its parameter is set to "Lin",
since it would be pointless to display measured
values with a logarithmic unit on an axis with
logarithmic spacing.
Remote-control command:
DISPlay:SWeep<i>:A|B:SPACing LINear
DISPlay:FFT<i>:A|B:SPACing LINear
DISPlay:WAVeform:A|B:SPACing LINear
DISPlay:BARgraph<i>:A|B:SPACing LINear
DISPlay:PESQ<i>:A|B:SPACing LINear
Log Logarithmic spacing of the Y axis.
This parameter is available only if in the "Unit Fnct
Track" line a linear unit has been selected whose
value range cannot contain any negative numbers
(e.g. V, W, etc).
Example:
jVis a linear unit, yet measured values obtained
with this unit may be negative, which means that
logarithmic spacing is not possible.
Remote-control command:
DISPlay:SWeep<i>:A|B:SPACing
LOGarithmic
DISPlay:FFT<i>:A|B:SPACing LOGarithmic
DISPlay:WAVeform:A|B:SPACing
LOGarithmic
DISPlay:BARgraph<i>:A|B:SPACing
LOGarithmic
DISPlay:PESQ<i>:A|B:SPACing
LOGarithmic
Top
Used to set the top value of the Y axis for Trace A or Trace B.
If Auto Scale has been triggered, the value is reset on the basis of the
current trace data.
Negative values or the value 0.00000 are not permitted if Spacing is
set to Log.
Available in the graphics subsystems
Sweep, FFT, Waveform, Bargraph, PESQ
Remote-control command:
DISPlay:SWEep<i>:A|B:TOP <nu>
DISPlay:FFT<i>:A|B:TOP <nu>
DISPlay:WAVeform:A|B:TOP <nu>
DISPlay:BARgraph<i>:A|B:TOP <nu>
DISPlay:PESQ<i>:A|B:TOP <nu>

Traces, Spectrum Displays and Bargraphs R&S UPV
1146.2084.32 4.500 E-9
Bottom
Used to set the bottom value of the Y axis for Trace A or Trace B.
If Auto Scale has been triggered, the value is reset on the basis of the
current trace data.
This value must always be lower than the top value.
Negative values or the value 0.0000 are not permitted if Spacing is set
to Log.
Available in the graphics subsystems
Sweep, FFT, Waveform, Bargraph, PESQ
Remote-control command:
DISPlay:SWEep<i>:A|B:BOTTom <nu>
DISPlay:FFT<i>:A|B:BOTTom <nu>
DISPlay:WAVeform:A|B:BOTTom <nu>
DISPlay:BARgraph<i>:A|B:BOTTom <nu>
DISPlay:PESQ<i>:A|B:BOTTom <nu>
Main Grid
Division of the graphical display with horizontal main gridlines.
Available in the graphics subsystems
Sweep, FFT, Waveform, Bargraph, PESQ
Off No main gridlines are used in the graphical display.
On With Spacing = Log:
Decadic division of a logarithmically divided Y axis
with the aid of main gridlines.
Auto Coarse
Auto Medium
Auto Fine
With Spacing = Lin:
Coarse, medium or fine division of a Y axis with
main gridlines. One or two, 3 or 4, 8 or 9 main
gridlines are displayed depending on the scale end
values.
Main gridlines may be hidden if the graphical
window is reduced in size.
Divisions With Spacing = Lin:
Preset division of a Y axis with main gridlines.
The desired number of divisions is set in the
parameter field below.
These main gridlines are not hidden if the graphical
window is reduced in size.
Steps With Spacing = Lin:
Preset division of a Y axis in a fixed step size.
The step size is set in the parameter field below.
These main gridlines are not hidden if the graphical
window is reduced in size.
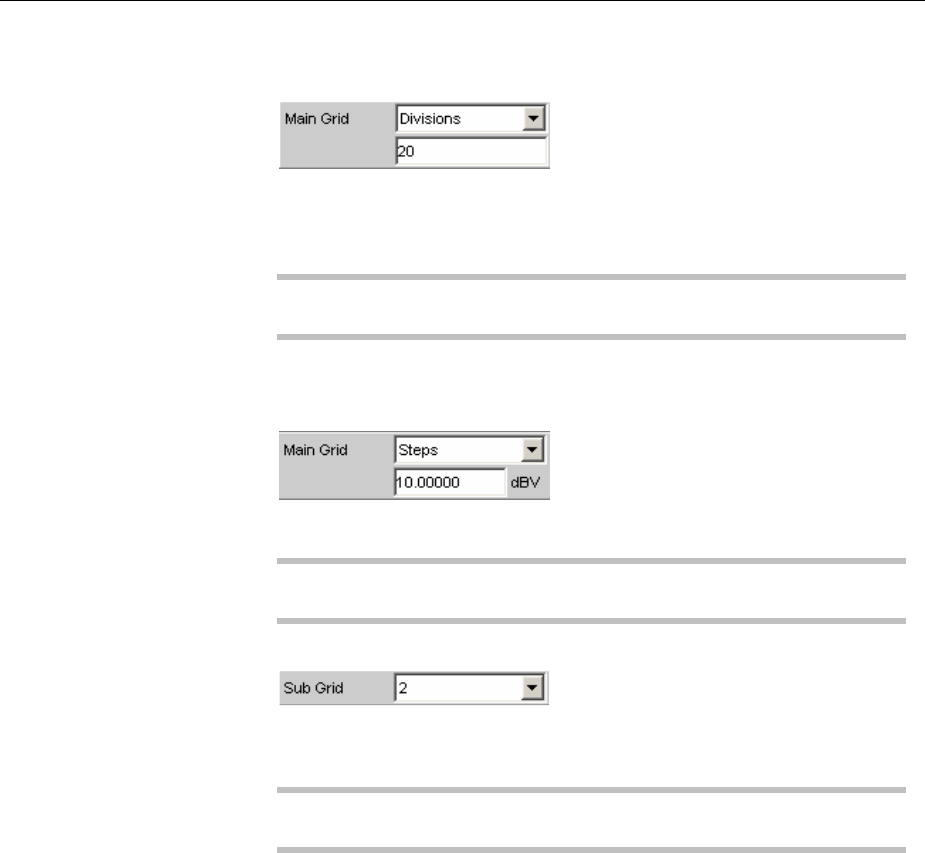
R&S UPV Traces, Spectrum Displays and Bargraphs
1146.2084.32 4.501 E-9
Division
With Spacing = Lin:
Used to enter the number of main gridline divisions for a Y axis.
If, for example, 2is entered, the Y axis is divided into two sections,
i.e. one main gridline is displayed.
Available in the graphics subsystems
Sweep, FFT, Waveform, Bargraph, PESQ
Steps
With Spacing = Lin:
Used to enter the main gridline step size for a Y axis.
Available in the graphics subsystems
Sweep, FFT, Waveform, Bargraph, PESQ
Sub Grid
Subdivision of the main gridlines in a graphical display using
subgridlines.
Available in the graphics subsystems
Sweep, FFT, Waveform, Bargraph, PESQ
Off Subgridlines are deactivated.
2
4
5
With Spacing = Lin:
Subdivision of the main gridlines of a Y axis into 2, 4
or 5 sections.
If, for example, 2is selected, the area between two
main gridlines is divided into 2sections, i.e. one
subgridline appears between the main gridlines.
These subgridlines are not hidden if the graphical
window is reduced in size.

Traces, Spectrum Displays and Bargraphs R&S UPV
1146.2084.32 4.502 E-9
Coarse
Fine
With Spacing = Log:
Coarse or fine subdivision of the main gridlines of a
Yaxis with subgridlines.
Coarse Fine
Only All
subgridlines subgridlines
2and 5

R&S UPV Traces, Spectrum Displays and Bargraphs
1146.2084.32 4.503 E-9
Limit Upper
It is possible to define for a measurement an upper limit / limit curve,
such that each measured value is compared with the upper limit or
limit curve. The limit / limit curve is plotted in red in the co-ordinate
system of the graphical display.
Limit violations are marked by red dots on a curve or by red bars on a
bargraph.
The upward-pointing arrow in the bottom right-hand corner of the
graphical display indicates overranging of the upper limit or the limit
line.
See section "Graphical Display, Explanation of the Elements",page
4.547 for the meaning of the limit violation symbols.
Pressing the START key causes the existing limit overranging to be
reset and new violations to be recorded.
Available in the graphics subsystems
Sweep, FFT, Waveform, Bargraph, PESQ
Remote-control command:
DISPlay:SWeep<i>:A|B:LIMUpper ON | OFF
DISPlay:FFT<i>:A|B:LIMUpper ON | OFF
DISPlay:WAVeform:A|B:LIMUpper ON | OFF
DISPlay:BARgraph<i>:A|B:LIMUpper ON | OFF
DISPlay:PESQ<i>:A|B:LIMUpper ON | OFF
Source
Used to determine how the upper limit is set.
Available in the graphics subsystems
Sweep, FFT, Waveform, Bargraph, PESQ

Traces, Spectrum Displays and Bargraphs R&S UPV
1146.2084.32 4.504 E-9
Value
Available in the graphics subsystems
Sweep, FFT, Waveform, Bargraph, PESQ
Afixed limit can be entered (Source must be set to
Value).
In the parameter field below, an upper limit constant
for all X values is entered in the unit which has been
selected in the Unit Funct Track parameter field. If a
relative unit is selected, the associated reference
value (a few parameter fields higher up) is used.
All scans of a trace (except the Min/Max scans) are
compared to this common limit and the limit
violations are marked.
Remote-control command:
DISPlay:SWeep<i>:A|B:LIMUpper:SOURce
VALue
DISPlay:SWeep<i>:A|B:LIMUpper:SOURce
VALue <nu>
DISPlay:FFT<i>:A|B:LIMUpper:SOURce
VALue
DISPlay:FFT<i>:A|B:LIMUpper:SOURce
VALue <nu>
DISPlay:WAVeform:A|B:LIMUpper:SOURce
VALue
DISPlay:WAVeform:A|B:LIMUpper:SOURce
VALue <nu>
DISPlay:BARgraph<i>:A|B:LIMUpper:SOURc
eVALue
DISPlay:BARgraph<i>:A|B:LIMUpper:SOURc
eVALue <nu>
DISPlay:PESQ<i>:A|B:LIMUpper:SOURce
VALue
DISPlay:PESQ<i>:A|B:LIMUpper:SOURce
VALue <nu>
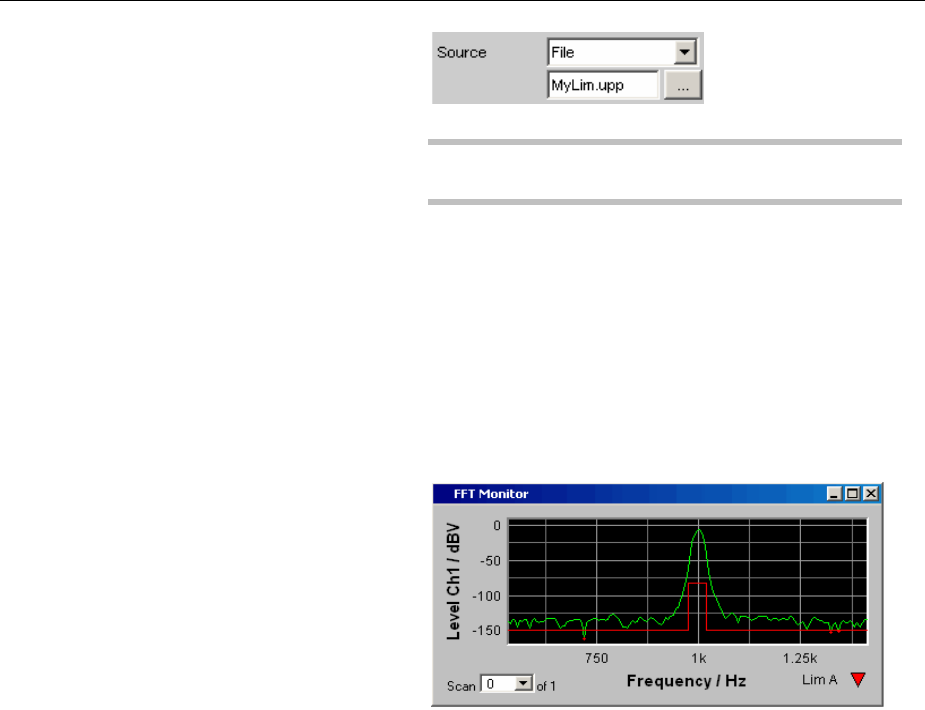
R&S UPV Traces, Spectrum Displays and Bargraphs
1146.2084.32 4.505 E-9
File
Available in the graphics subsystems
Sweep, FFT, Bargraph, PESQ
Limits are checked by using a limit file.
The name of the limit file is entered in the parameter
field below.
This limit file contains reference values for a limit
curve in a special format.
Each new scan interpolates the entries in the limit
file to the X values of the scan.
All scans of a trace (except the Min/Max scans) are
compared to this common limit curve and the limit
violations are marked.
Remote-control command:
DISPlay:SWeep<i>:A|B:LIMUpper:SOURce
FILE
DISPlay:FFT<i>:A|B:LIMUpper:SOURce
FILE
DISPlay:BARgraph<i>:A|B:LIMUpper:SOURc
eFILE
DISPlay:PESQ<i>:A|B:LIMUpper:SOURce
FILE
File Intern "File Intern" has to be offered and displayed only if
"File: Trace A or File: Trace B is set at "Y-Source"
and a trace file containing a limit scan in addition to
the data scans is loaded.
The Limit Upper curve from the trace file is displayed
in the graph and all scans are compared to this limit
curve (except the Min/Max scans).
Remote-control command:
DISPlay:SWeep<i>:A|B:LIMUpper:SOURce
IFILE
DISPlay:FFT<i>:A|B:LIMUpper:SOURce
IFILE
DISPlay:BARgraph<i>:A|B:LIMUpper:SOURc
eIFILE
DISPlay:PESQ<i>:A|B:LIMUpper:SOURce
IFILE

Traces, Spectrum Displays and Bargraphs R&S UPV
1146.2084.32 4.506 E-9
Hold The limit value or limit trace is no longer changed.
If a trace file is loaded with limit value or limit trace,
the limit values from the file are not applied but
instead, the previously set limit value or limit trace is
used.
If "Hold" is selected without valid limit trace data
already being present, a warning is issued and the
last valid Limit selection is reset.
Remote-control command:
DISPlay:SWeep<i>:A|B:LIMUpper:SOURce
HOLD
DISPlay:FFT<i>:A|B:LIMUpper:SOURce
HOLD
DISPlay:WAVeform:A|B:LIMUpper:SOURce
HOLD
DISPlay:BARgraph<i>:A|B:LIMUpper:SOURc
eHOLD
DISPlay:PESQ<i>:A|B:LIMUpper:SOURce
HOLD
Source Value
Upper limit value if "Value" has been selected under "Source".
Available in the graphics subsystems
Sweep, FFT, Waveform, Bargraph, PESQ
Remote-control command:
DISPlay:SWeep<i>:A|B:LIMUpper:SOURce:VALue <nu>
DISPlay:FFT<i>:A|B:LIMUpper:SOURce:VALue <nu>
DISPlay:WAVeform:A|B:LIMUpper:SOURce:VALue <nu>
DISPlay:BARgraph<i>:A|B:LIMUpper:SOURce:VALue <nu>
DISPlay:PESQ<i>:A|B:LIMUpper:SOURce:VALue <nu>
Source Filename
File name for an upper limit curve if "File" has been selected under
"Source".
Available in the graphics subsystems
Sweep, FFT, Bargraph, PESQ
Remote-control command:
DISPlay:SWeep<i>:A|B:LIMUpper:SOURce:FILE
'filename'
DISPlay:FFT<i>:A|B:LIMUpper:SOURce:FILE 'filename'
DISPlay:BARgraph<i>:A|B:LIMUpper:SOURce:FILE
'filename'
DISPlay:PESQ<i>:A|B:LIMUpper:SOURce:FILE 'filename'
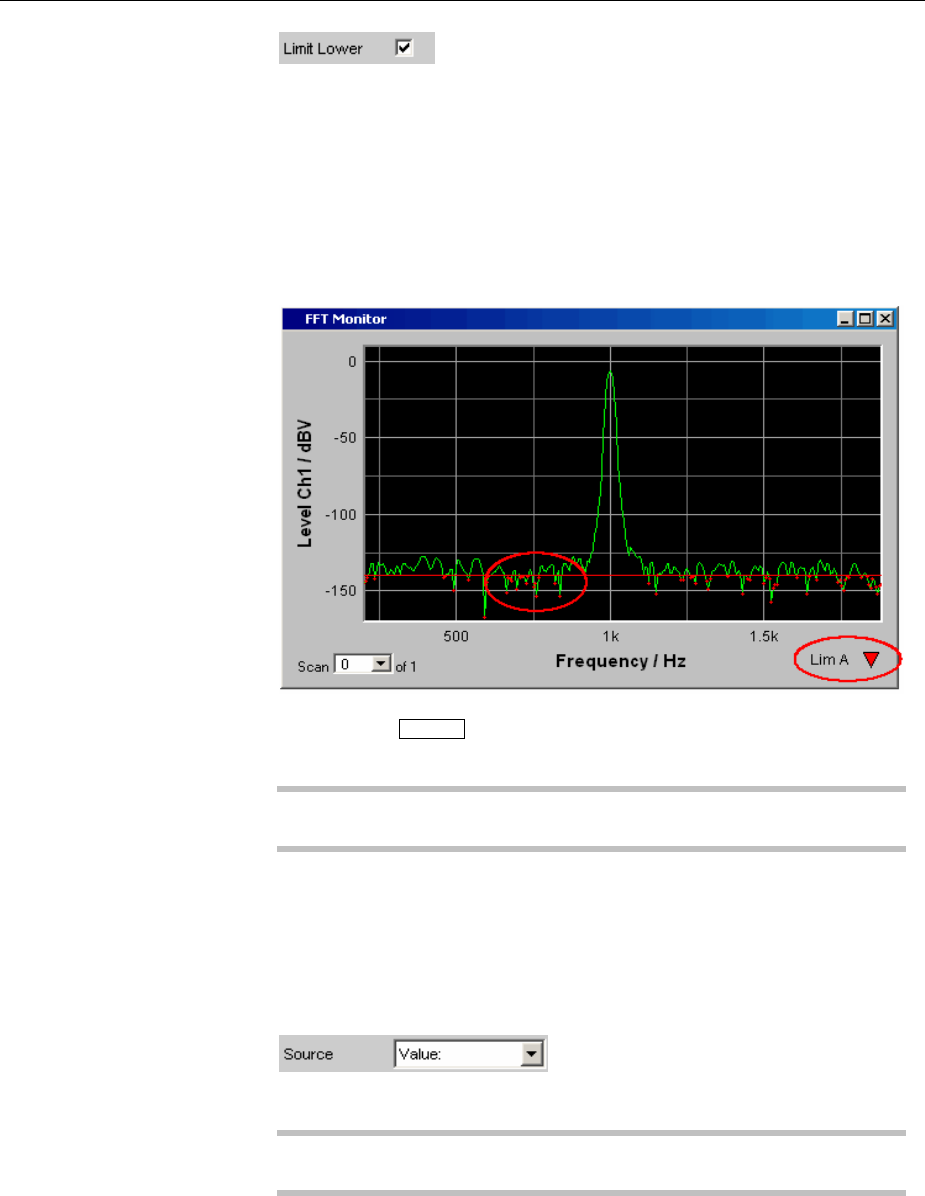
R&S UPV Traces, Spectrum Displays and Bargraphs
1146.2084.32 4.507 E-9
Limit Lower
Alower limit / limit curve can be defined for the measurement,
whereby each measurement value is compared with the limit / limit
curve. The limit / limit curve is plotted in red in the co-ordinate system
of the graphical display.
Limit violations are marked by red dots on a curve or by red bars on a
bargraph.
The downward-pointing arrow in the bottom right-hand corner of the
graphical display indicates underranging of the lower limit or the limit
line.
Pressing the START key causes the existing limit underranging to be
reset and new violations to be recorded.
Available in the graphics subsystems:
Sweep, FFT, Waveform, Bargraph, PESQ
Remote-control command:
DISPlay:SWeep<i>:A|B:LIMLower ON | OFF
DISPlay:FFT<i>:A|B:LIMLower ON | OFF
DISPlay:WAVeform:A|B:LIMLower ON | OFF
DISPlay:BARgraph<i>:A|B:LIMLower ON | OFF
DISPlay:PESQ<i>:A|B:LIMLower ON | OFF
Source
Used to determine how the lower limit is set.
Available in the graphics subsystems:
Sweep, FFT, Waveform, Bargraph, PESQ

Traces, Spectrum Displays and Bargraphs R&S UPV
1146.2084.32 4.508 E-9
Value
Afixed limit can be entered (Source must be set to
Value).
In the parameter field below, a lower limit constant
for all X values is entered in the unit which has been
selected in the Unit Funct Track parameter field. If a
relative unit is selected, the associated reference
value (a few parameter fields higher up) is used.
All scans of a trace are compared to this common
limit and the limit violations are marked.
Remote-control command:
DISPlay:SWeep<i>:A|B:LIMLower:SOURce
VALue
DISPlay:FFT<i>:A|B:LIMLower:SOURce
VALue
DISPlay:WAVeform:A|B:LIMLower:SOURce
VALue
DISPlay:BARgraph<i>:A|B:LIMLower:SOURc
eVALue
DISPlay:PESQ<i>:A|B:LIMLower:SOURce
VALue
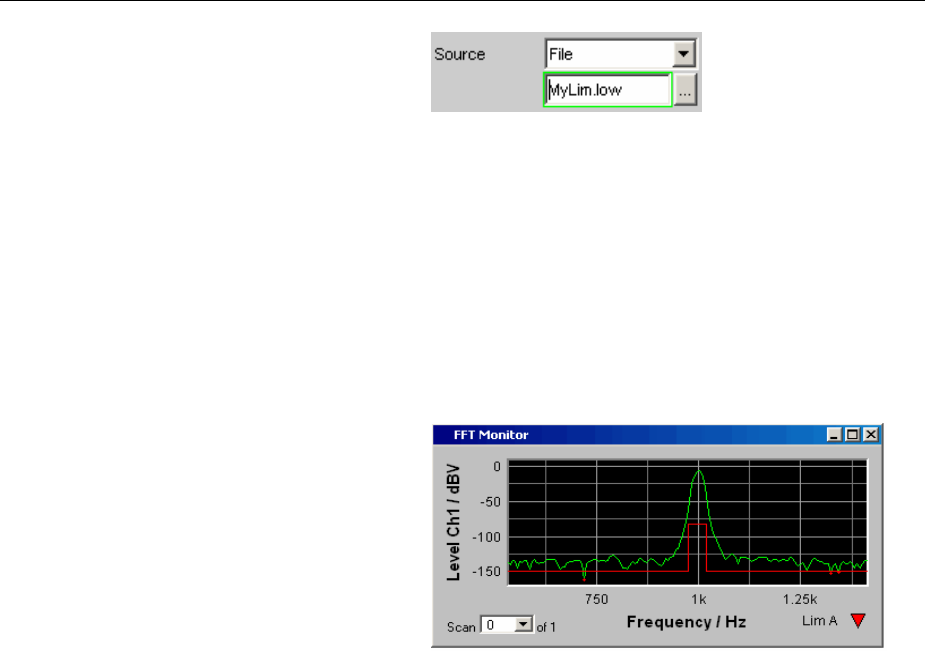
R&S UPV Traces, Spectrum Displays and Bargraphs
1146.2084.32 4.509 E-9
File
Available to all graphic systems except Waveform.
Limits are checked by using a limit file.
The name of the limit file is entered in the parameter
field below.
This limit file contains reference values for a limit
curve in a special format.
Each new scan interpolates the entries in the limit
file to the X values of the scan.
All scans of a trace are compared to this common
limit curve and the limit violations are marked.
Remote-control command:
DISPlay:SWeep<i>:A|B:LIMLower:SOURce
FILE
DISPlay:FFT<i>:A|B:LIMLower:SOURce
FILE
DISPlay:BARgraph<i>:A|B:LIMLower:SOURc
eFILE
DISPlay:PESQ<i>:A|B:LIMLower:SOURce
FILE
File Intern "File Intern" has to be offered and displayed only if
"File: Trace A or File: Trace B is set at "Y-Source"
and a trace file containing limit scans in addition to
the data scans is loaded.
The Limit Lower curve from the trace file is displayed
in the graph and all scans (except the Min/Max
scans) are compared to this limit curve.
Remote-control command:
DISPlay:SWeep<i>:A|B:LIMLower:SOURce
IFILe
DISPlay:FFT<i>:A|B:LIMLower:SOURce
IFILe
DISPlay:BARgraph<i>:A|B:LIMLower:SOURc
eIFILe
DISPlay:PESQ<i>:A|B:LIMLower:SOURce
IFILe
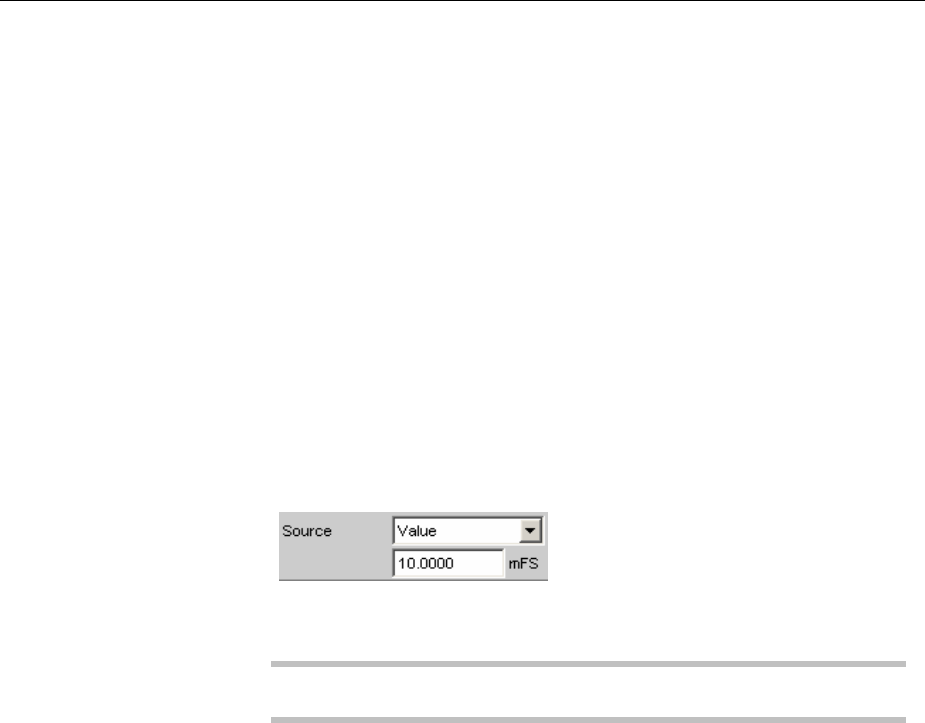
Traces, Spectrum Displays and Bargraphs R&S UPV
1146.2084.32 4.510 E-9
Hold The limit value or limit trace is no longer changed.
If a trace file is loaded with limit value or limit trace,
the limit values from the file are not applied but
instead the previously set limit value or limit trace is
used.
If "Hold" is selected when no valid limit trace data is
already available, a warning is issued and the last
valid Limit selection is reset.
Remote-control command:
DISPlay:SWeep<i>:A|B:LIMLower:SOURce
HOLD
DISPlay:FFT<i>:A|B:LIMLower:SOURce
HOLD
DISPlay:WAVeform:A|B:LIMLower:SOURce
HOLD
DISPlay:BARgraph<i>:A|B:LIMLower:SOURc
eHOLD
DISPlay:PESQ<i>:A|B:LIMLower:SOURce
HOLD
Source Value
Lower limit value if "Value" has been selected under "Source".
Available in the graphics subsystems:
Sweep, FFT, Waveform, Bargraph, PESQ
Remote-control command:
DISPlay:SWeep<i>:A|B:LIMLower:SOURce:VALue <nu>
DISPlay:FFT<i>:A|B:LIMLower:SOURce:VALue <nu>
DISPlay:WAVeform:A|B:LIMLower:SOURce:VALue <nu>
DISPlay:BARgraph<i>:A|B:LIMLower:SOURce:VALue <nu>
DISPlay:PESQ<i>:A|B:LIMLower:SOURce:VALue <nu>
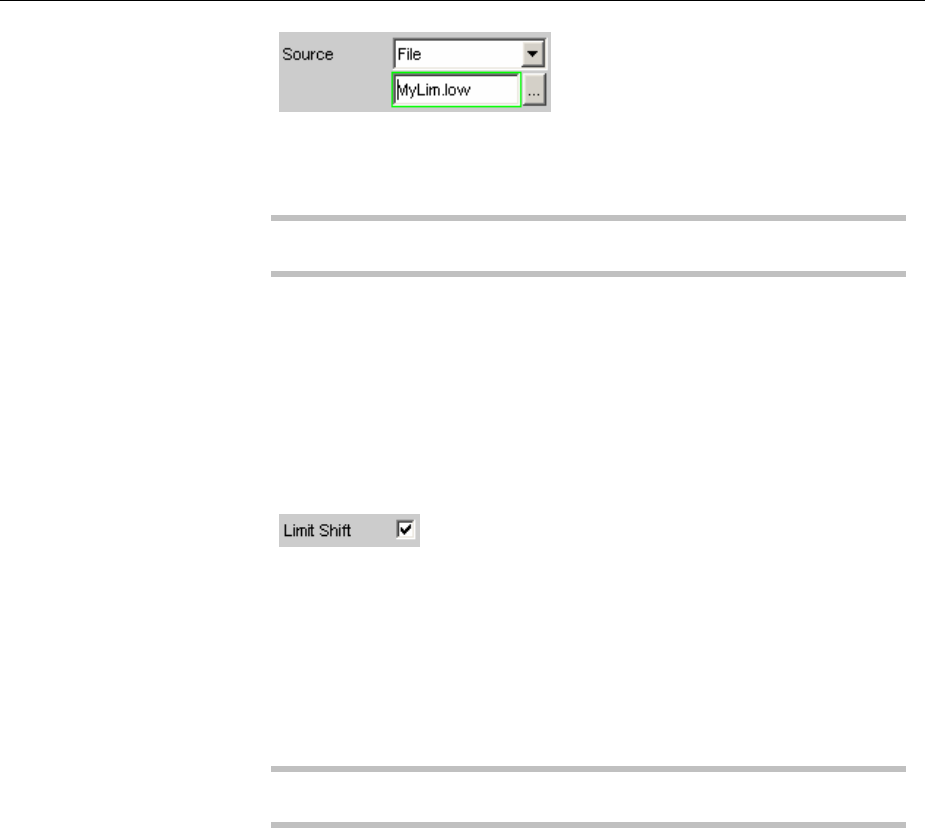
R&S UPV Traces, Spectrum Displays and Bargraphs
1146.2084.32 4.511 E-9
Source Filename
Filename for a lower limit curve if "File" has been selected under
"Source".
Available in the graphics subsystems:
Sweep, FFT, Bargraph, PESQ
Remote-control command:
DISPlay:SWeep<i>:A|B:LIMLower:SOURce:FILE
'filename'
DISPlay:FFT<i>:A|B:LIMLower:SOURce:FILE 'filename'
DISPlay:BARgraph<i>:A|B:LIMLower:SOURce:FILE
'filename'
DISPlay:PESQ<i>:A|B:LIMLower:SOURce:FILE 'filename'
Limit Shift
Not for the PESQ graphics subsystem.
This enables limit lines or limit curves to be shifted according to the
parameters in the subsequent parameter fields "Parallel" and
"Symmetrical".
If the Limit Shift function is enabled without activating limit monitoring,
the subsequent parameter fields should be regarded as default
settings.
Available in the graphics subsystems:
Sweep, FFT, Waveform, Bargraph
Remote-control command:
DISPlay:SWeep<i>:A|B:LIMShift ON | OFF
DISPlay:FFT<i>:A|B:LIMShift ON | OFF
DISPlay:WAVeform:A|B:LIMShift ON | OFF
DISPlay:BARgraph<i>:A|B:LIMShift ON | OFF
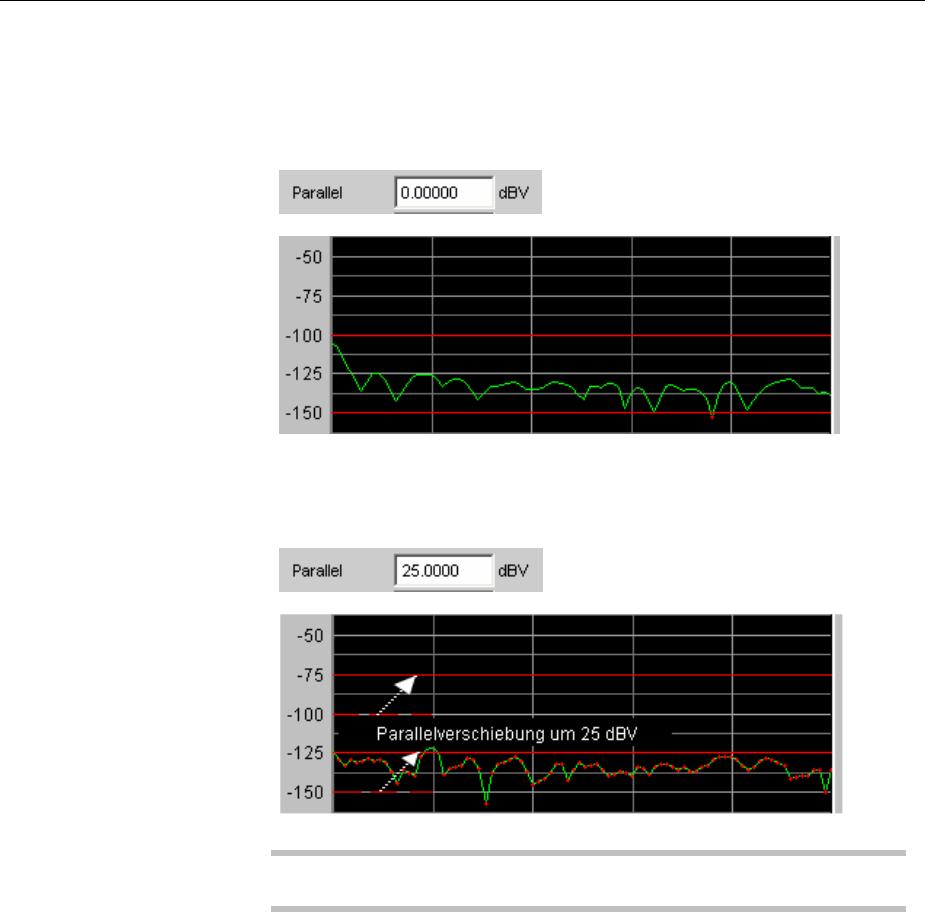
Traces, Spectrum Displays and Bargraphs R&S UPV
1146.2084.32 4.512 E-9
Parallel This enables limit lines or limit curves to be parallel shifted.
In this way limit curves derived from a "golden unit", for example, can
be adapted very easily to new circumstances (see section “Editing”,
on page 4.598).
The limit lines, which were determined using -100 dBV and - 150 dBV,
are to be parallel shifted by a value of 25 dBV to - 75 dBV and - 125
dBV.
Available in the graphics subsystems:
Sweep, FFT, Waveform, Bargraph
Remote-control command:
DISPlay:SWeep<i>:A|B:LIMShift PARallel <nu>
DISPlay:FFT<i>:A|B:LIMShift PARallel <nu>
DISPlay:WAVeform:A|B:LIMShift PARallel <nu>
DISPlay:BARgraph<i>:A|B:LIMShift PARallel <nu>
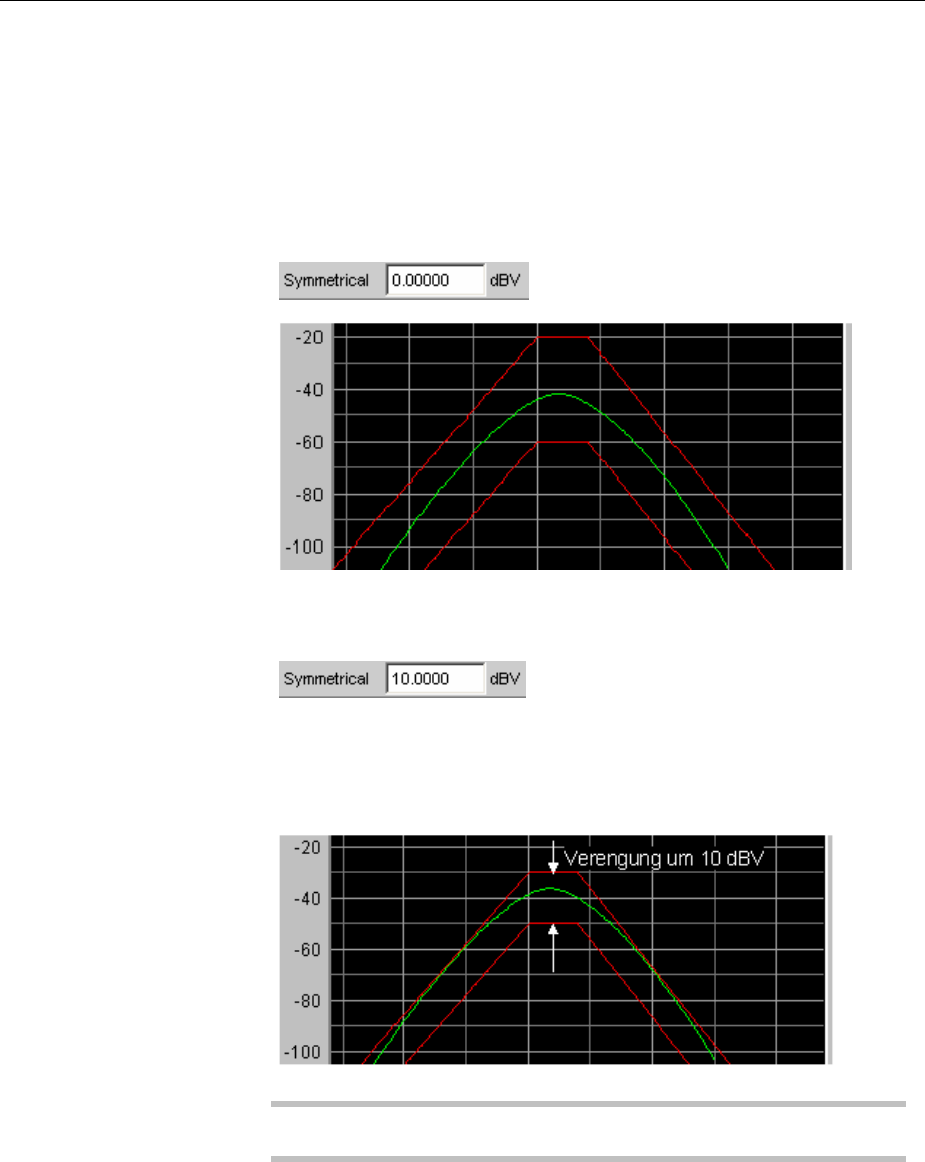
R&S UPV Traces, Spectrum Displays and Bargraphs
1146.2084.32 4.513 E-9
Symmetrical This enables a tolerance band formed from two limit lines or limit
curves to be made broader or narrower (see section “Editing”, on page
4.598).
In this way a tolerance band derived from a "golden unit", for example,
can be very easily narrowed or broadened.
Although a single limit curve may be symmetrically shifted it is not very
meaningful, and would be better done using the "Parallel" parameter
field.
The limit curves which, after loading from a file, have a separation of
40 dBV, are in each case to be shifted by 10 dBV
and their signs are to be reversed. This produces a symmetrical shift
in both curves.
Following the symmetrical shift the two curves have a separation of
only 20 dBV.
Available in the graphics subsystems:
Sweep, FFT, Waveform, Bargraph, PESQ
Remote-control command:
DISPlay:SWeep<i>:A|B:LIMShift SYMMetrical <nu>
DISPlay:FFT<i>:A|B:LIMShift SYMMetrical <nu>
DISPlay:WAVeform:A|B:LIMShift SYMMetrical <nu>
DISPlay:BARgraph<i>:A|B:LIMShift SYMMetrical <nu>

Traces, Spectrum Displays and Bargraphs R&S UPV
1146.2084.32 4.514 E-9
New scan
This parameter field appears only for graphic systems that allow
multiscans ("Scan" = "Multi"), and is therefore available to the
following graphic system:
Sweep Graph1 to 4
"Replace" means that a selected scan of the current trace will be
replaced.
"Append" means that a selected scan will be appended to the current
trace.
Here it is irrelevant whether the scan originates from a measurement
or is imported from a trace file specified in the Import from parameter
field below.
Details see section "Measurement value sequences" on page 4.580.
Available in the graphics subsystem:
Sweep
Replace The scan (selected using the Next Scan rocker key or
by means of the scan number in the graphical
display) is replaced by the scan from a
measurement or from the trace file specified in the
Import from parameter field below.
See section "Measurement value sequences" on
page 4.580 for further details.
Append The scans from a measurement or from the trace
file specified in the Import from parameter field
below are appended to the current trace.
See section "Measurement value sequences" on
page 4.580 for further details.
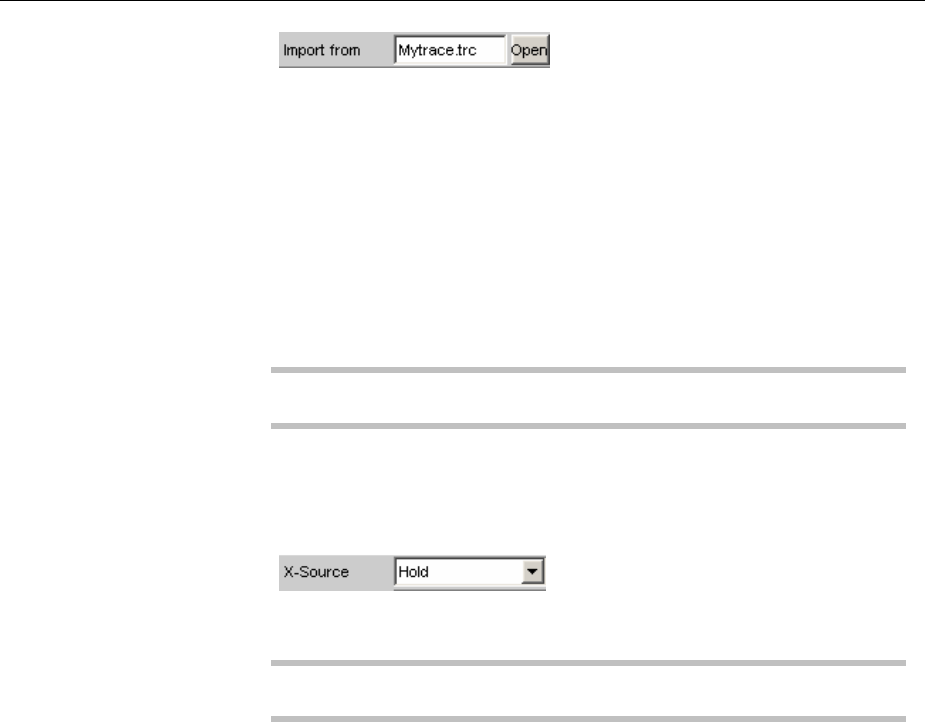
R&S UPV Traces, Spectrum Displays and Bargraphs
1146.2084.32 4.515 E-9
Import from
This parameter field appears only for graphic systems that allow
multiscans ("Scan" = "Multi"), and is therefore available to the
following graphic system:
Sweep Graph1 to 4
It is used to enter the name of a trace file whose scans are to replace
acurrent scan or are to be appended to the current trace.
Whether scans are to be replaced or appended is determined in the
New scan parameter field above:
Replace: "New scan" must be set to "Replace".
Append: "New scan" must be set to "Append".
Available in the graphics subsystem:
Sweep
See section "Measurement value sequences" on page 4.580 for
further details.
X-Source
Determines the response of the X axis parameter field.
Available in the graphics subsystem:
Sweep
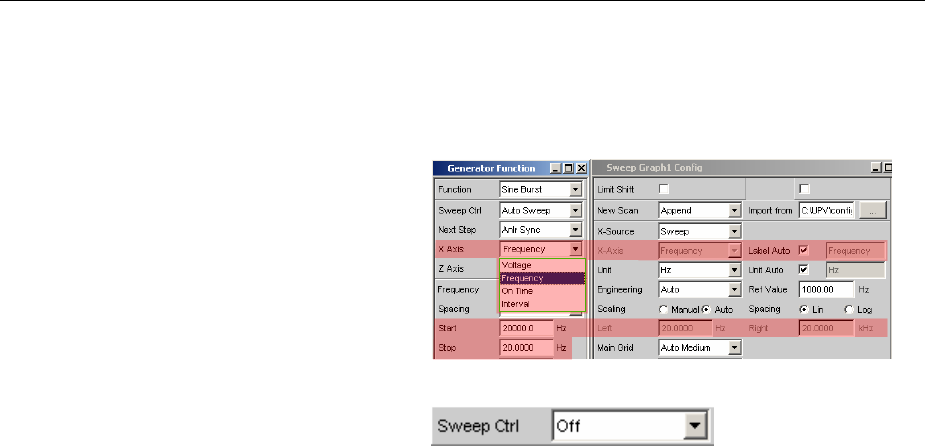
Traces, Spectrum Displays and Bargraphs R&S UPV
1146.2084.32 4.516 E-9
Sweep The X Axis parameter field is not available in a
sweep that is switched on in the Generator Function
panel; the X axis in the DispConfig Panel Sweep is
thus automatically adapted to the X axis sweep
setting in the generator.
The sweep is turned off in the generator
the X Axis parameter field is operable and the user
can select the functionality.
When the x-source in the display panel is set to
Sweep, and when a z-sweep is set in the generator,
and when the number of z-sweep points in the
generator is larger than the number of scans set in
History, the number of sweep points from the
generator will be entered in the History field.
Remote-control command:
DISPlay:SWeep<i>:X:SOUrce SWEep
Hold The X Axis parameter field is not available. The X
axis retains the current setting at the time of the
switchover to Hold and helps prevent the X axis from
being unintentionally destroyed.
Remote-control command:
DISPlay:SWeep<i>:X:SOUrce HOLD

R&S UPV Traces, Spectrum Displays and Bargraphs
1146.2084.32 4.517 E-9
Manu
The X Axis parameter field is operable and
completely independent of a sweep setting in the
generator. It is reserved for the special case of
graphically displaying self-generated or manipulated
test data records that are transferred from the
controller via the IEC/IEEE bus to the R&S UPV
(see “Transferring trace data”).
Example:
The distortion of an amplifier versus its output
voltage is to be graphically displayed by means of a
generator sweep.
At first glance, this does not seem to be possible, for
normally only the generator voltage supplied by the
R&S UPV (i.e. the amplifier's input voltage) can be
swept and projected onto the X axis.
However, to be able to evaluate how the distortion
changes when the amplifier clips, the user wants to
display the distortion versus the output voltage on
the amplifier.
To be able to display the output voltage on the X
axis, this voltage must be measured in addition to
the distortion. From these two series of
measurements, it is possible to generate a trace
data set and save it as a trace file using Visual
Basic, for example, in order to graphically display
the data set with the setting "Manu" and the "X Axis"
="Voltage" parameter field.
Remote-control command:
DISPlay:SWeep<i>:X:SOUrce MANual
LevMon RMS The measured level monitor RMS value is plotted
on the X-axis if the level monitor is on.
Remote-control command:
DISPlay:SWeep<i>:X:SOUrce LRMS
LevMon DC The measured level monitor DC value is plotted on
the X-axis if the level monitor is on.
Remote-control command:
DISPlay:SWeep<i>:X:SOUrce LDC
LevMon Peak The measured level monitor peak value is plotted
on the X-axis if the level monitor is on.
Remote-control command:
DISPlay:SWeep<i>:X:SOUrce LPEak
Frequency The measured frequency is plotted on the X-axis.
Remote-control command:
DISPlay:SWeep<i>:X:SOUrce FREQuency
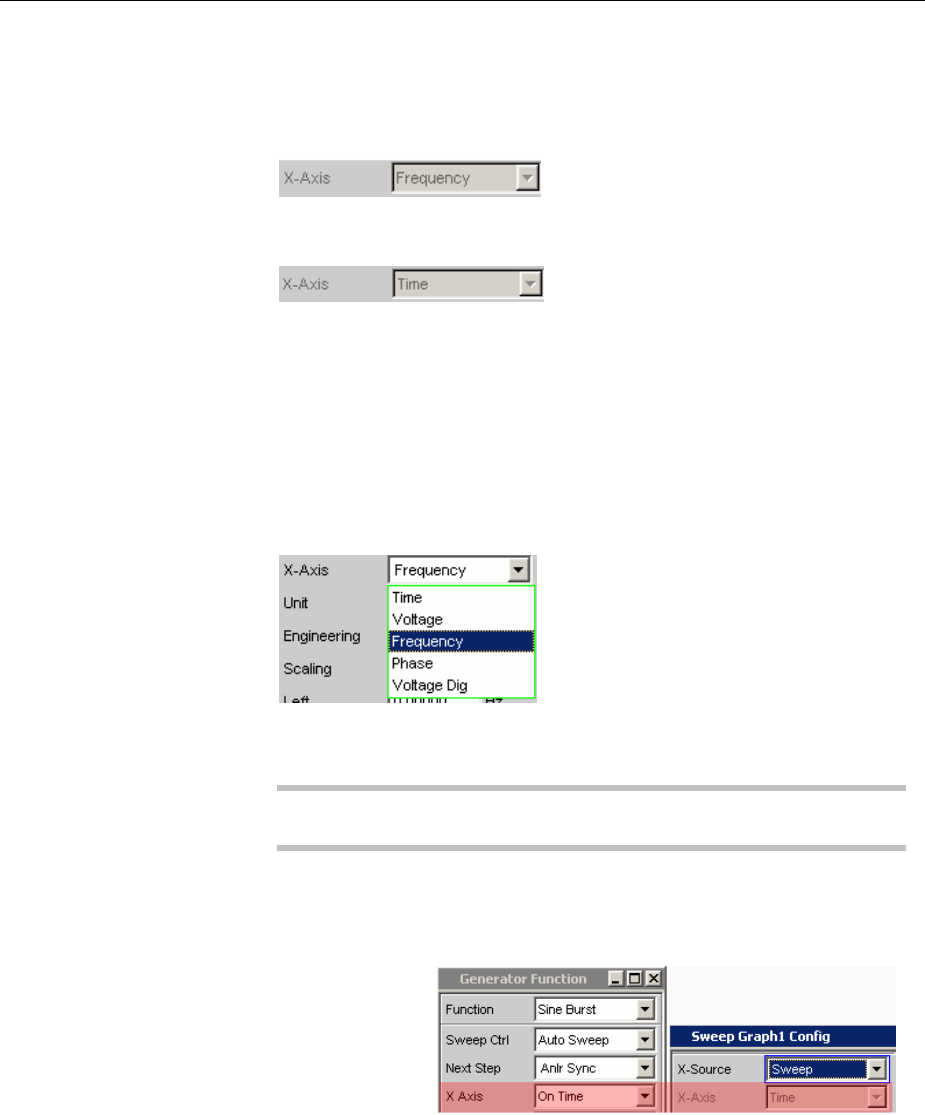
Traces, Spectrum Displays and Bargraphs R&S UPV
1146.2084.32 4.518 E-9
XAxis
The parameter displayed in the selection field depends on the graphic
subsystem in which the parameter field is offered.
For the graphic subsystem FFT Graph, the parameter is always
Frequency and cannot be changed.
For the graphic subsystems Waveform and PESQ, the parameter is
always Time and can also not be changed.
Any other X axis functionality is impractical for these subsystems.
The Bargraph graphics subsystem has an unscaled x-axis that is not
displayed, and thus cannot be changed.
In contrast, for the graphic subsystem Sweep Graph1 … 4, the
functionality of this parameter field is determined by the X-Source
parameter field above it, which is only offered in the display
configuration panel Sweep Graph1 … 4, and by the sweep setting of
the generator.
See section "X-Source" on page 4.515.
Available in the graphics subsystems:
Sweep, FFT, Waveform, PESQ
Time Depending on the current sweep setting in the
generator, the X-axis is displayed as the time axis.
Remote-control command:
DISPlay:SWeep<i>:X:AXIS TIME
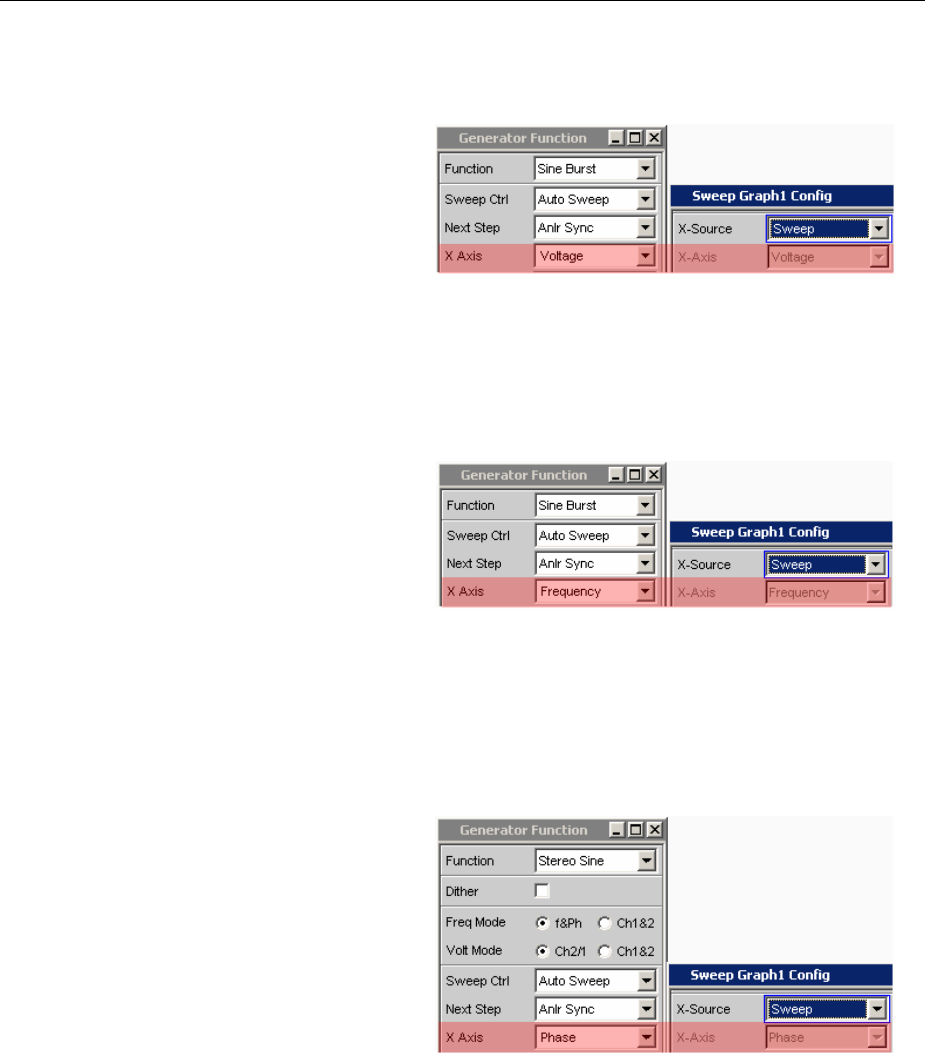
R&S UPV Traces, Spectrum Displays and Bargraphs
1146.2084.32 4.519 E-9
Voltage Depending on the current sweep setting in the
generator, the X-axis is displayed as the analog
level axis.
Remote-control command:
DISPlay:SWeep<i>:X:AXIS VOLTage
Frequency Depending on the current sweep setting in the
generator, the X-axis is displayed as the frequency
axis.
Remote-control command:
DISPlay:SWeep<i>:X:AXIS FREQuency
Phase Depending on the current sweep setting in the
generator, the X-axis is displayed as the phase
axis. Only available if the generator function Stereo
Sine is selected.
Remote-control command:
DISPlay:SWeep<i>:X:AXIS PHASe
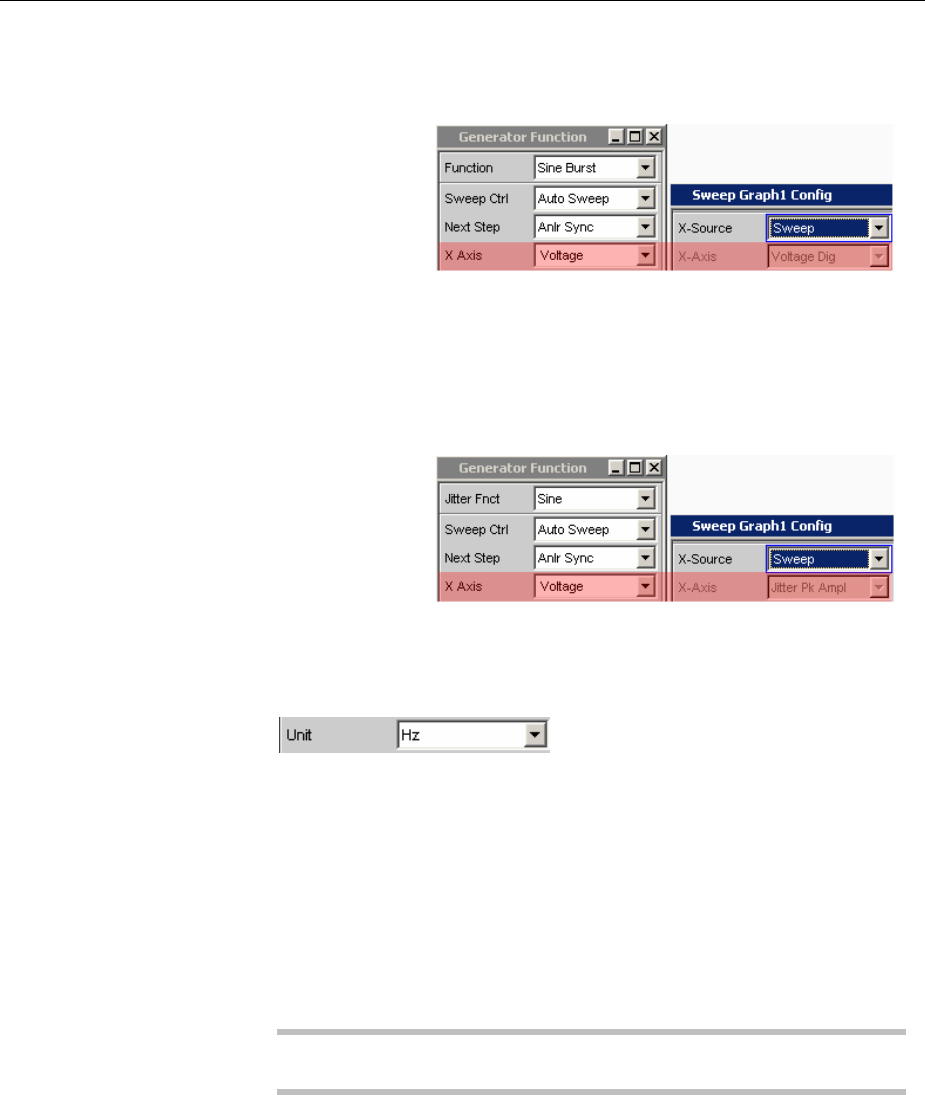
Traces, Spectrum Displays and Bargraphs R&S UPV
1146.2084.32 4.520 E-9
Voltage Dig Depending on the current sweep setting in the
digital generator instruments, the X-axis is
displayed as the digital phase axis.
Remote-control command:
DISPlay:SWeep<i>:X:AXIS VDIGital
Jitter Pk
Ampl
Depending on the current sweep setting in the
generator instrument "Digital Impairment", the X-
axis is displayed as Jitter Peak Amplitude .
Remote-control command:
DISPlay:SWeep<i>:X:AXIS JPKamplitude
Unit
This defines the unit of the values for measurement results, cursor
scaling and left/right scaling of the X axis as well as the units offered
for the Ref Value for referenced units. The list of units is determined
by the setting in the "X Axis" parameter field. If "Frequency" is
selected in that field, frequency units are offered here. If "voltage" is
selected in that field, volt units are offered, and so on.
Recorded measurement sequences can be redisplayed with different
units at any time.
Available in the graphics subsystems:
Sweep, FFT, Waveform
Remote-control command:
DISPlay:SWeep<i>:X:UNIT HZ | DHZ | ...
DISPlay:FFT<i>:X:UNIT HZ | DHZ | ...
DISPlay:WAVeform:X:UNIT HZ | DHZ | ...
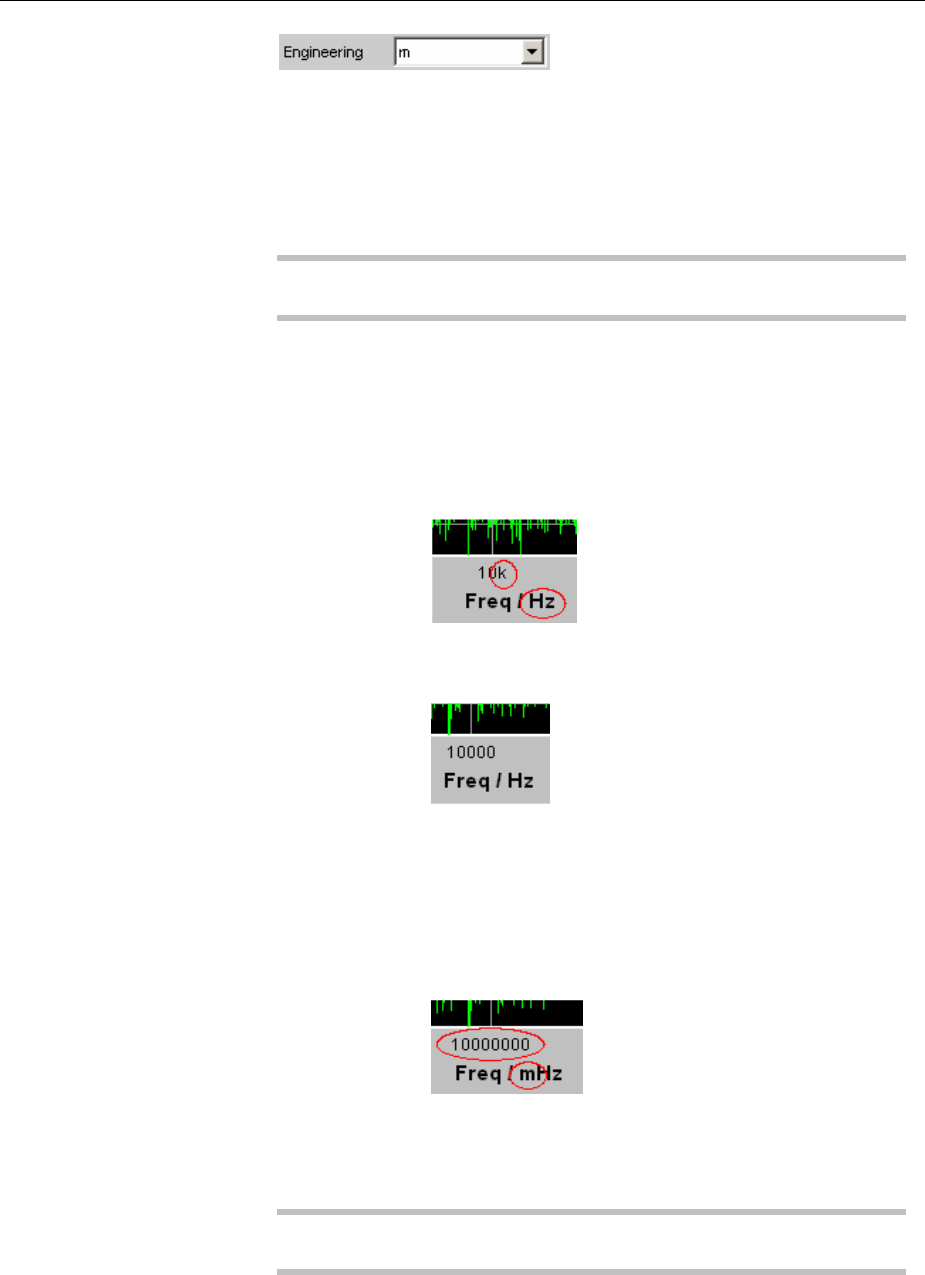
R&S UPV Traces, Spectrum Displays and Bargraphs
1146.2084.32 4.521 E-9
Engineering
Displays the cursor and scaling values of the X axis in the graphical
display.
This parameter field cannot be accessed if a dB or % unit is selected
in the Unit Funct Track parameter field above since these units do not
have an engineering function.
Available in the graphics subsystems:
Sweep, FFT, Waveform
Auto Automatic engineering assignment from p to M. The
cursor and scaling values are displayed with the
engineering symbol.
The X axis is labelled with the unit without
engineering.
Off Engineering is deactivated.
Values are always displayed in 1.0 E0format.
J
m
k
Engineering fixed to Z, m or k.
The values to be displayed are multiplied by the
factor 1.0 E6,1.0 E3or 1.0 E-3.
The cursor and scaling values are displayed without
engineering symbol.
The X axis is labelled with engineering and unit.
Label Auto
Used to determine whether the X axis label is the same as that set in
the X Axis parameter field or whether the label can be user-selected.
Available in the graphics subsystems:
Sweep, FFT, Waveform, PESQ

Traces, Spectrum Displays and Bargraphs R&S UPV
1146.2084.32 4.522 E-9
The label in the X Axis parameter field is displayed
in grey (cannot be accessed) in the text field to the
right of the tick box and also on the X axis in the
graphical display.
Remote-control command:
DISPlay:SWEep<i>:X:LABel:AUTO ON
DISPlay:FFT<i>:X:LABel:AUTO ON
DISPlay:WAVeform<i>:X:LABel:AUTO ON
DISPlay:PESQ<i>:X:LABel:AUTO ON
Auser-definable label appears on the X axis of the
graphical display.
Remote-control command:
DISPlay:SWEep<i>:X:LABel:AUTO OFF
DISPlay:FFT<i>:X:LABel:AUTO OFF
DISPlay:WAVeform<i>:X:LABel:AUTO OFF
DISPlay:PESQ<i>:X:LABel:AUTO OFF
Unit Auto
Used to determine whether the unit label displayed on the X axis is the
same as the unit set in the Unit parameter field or whether it can be
user-selected.
Available in the graphics subsystems:
Sweep, FFT, Waveform, PESQ

R&S UPV Traces, Spectrum Displays and Bargraphs
1146.2084.32 4.523 E-9
The unit label displayed on the X axis is the same as
the unit set in the Unit parameter field and is
therefore generated automatically by the R&S UPV.
Remote-control command:
DISPlay:SWeep<i>:X:UNIT:AUTO ON
DISPlay:FFT<i>:X:UNIT:AUTO ON
DISPlay:WAVeform:X:UNIT:AUTO ON
DISPlay:PESQ<i>:X:UNIT:AUTO ON
Auser-defined unit label can be entered.
Remote-control command:
DISPlay:SWeep<i>:X:UNIT:AUTO OFF
DISPlay:FFT<i>:X:UNIT:AUTO OFF
DISPlay:WAVeform:X:UNIT:AUTO OFF
DISPlay:PESQ<i>:X:UNIT:AUTO OFF
Unit User String
User-defined unit designation if Unit Auto is not selected. This
designation appears on the Y-axis label instead of the usual unit.
Available in the graphics subsystems:
Sweep, FFT, Waveform
Remote-control command:
DISPlay:SWeep<i>:X:UNIT:USER 'string'
DISPlay:FFT<i>:X:UNIT:USER 'string'
DISPlay:WAVeform:X:UNIT:USER 'string'
DISPlay:PESQ<i>:X:UNIT:USER 'string'
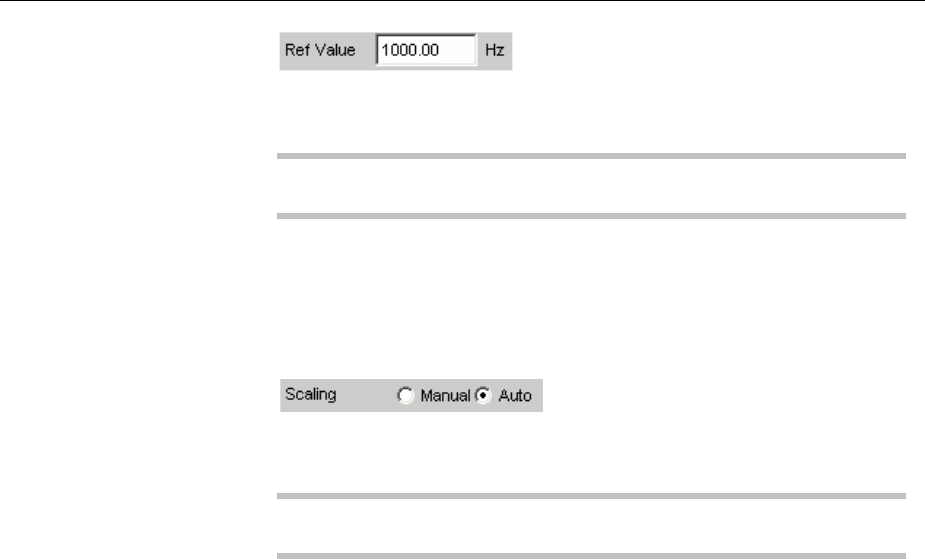
Traces, Spectrum Displays and Bargraphs R&S UPV
1146.2084.32 4.524 E-9
Ref Value
Reference value with unit for referenced units of the X-axis.
Available in the graphics subsystems:
Sweep, FFT, Waveform
Remote-control command:
DISPlay:SWEep<i>:X:REFerence:VALue <nu>
DISPlay:FFT<i>:X:REFerence:VALue <nu>
DISPlay:WAVeform:X:REFerence:VALue <nu>
Scaling
Manual or automatic scaling of the X axis.
Available in the graphics subsystems:
Sweep, FFT, Waveform, PESQ
Manu Manual scaling
The scaling of a graphical display is determined
using the "Left" and "Right" parameter fields below.
Each time the "Manu" parameter is set, the graphical
display is deleted and then replotted with the scale
end values entered under Left and Right.
Remote-control command:
DISPlay:SWeep<i>:X:SCALing MANual
DISPlay:FFT<i>:X:SCALing MANual
DISPlay:WAVeform:X:SCALing MANual
DISPlay:WAVeform:X:SCALing
MANualDISPlay:PESQ:X:SCALing MANual

R&S UPV Traces, Spectrum Displays and Bargraphs
1146.2084.32 4.525 E-9
Auto Automatic scaling
Auto Scale uses suitable default values for one-off
scaling of the X axis. These values depend on the
measurement task and the subsystem (e.g. the
start/stop values of the sweep or FFT are used in
the generator and analyzer panel).
The entry fields for the Left and Right parameter
fields below are displayed in grey (cannot be
accessed) with the obtained values.
Remote-control command:
DISPlay:SWeep<i>:X:SCALing AUTO
DISPlay:FFT<i>:X:SCALing AUTO
DISPlay:WAVeform:X:SCALing AUTO
DISPlay:PESQ:X:SCALing AUTO
Spacing
Linear or logarithmic spacing of the X axis.
For logarithmic units (dB units) and linear units in which negative
numbers can occur (e.g. jV, jW), this parameter field is displayed as
not user-accessible and is set to "Lin", since it makes no sense / is not
possible to display dB values or negative values logarithmically.
Available in the graphics subsystems:
Sweep, FFT, Waveform, PESQ
Lin Linear spacing of the X axis.
Remote-control command:
DISPlay:SWeep<i>:X:SPACing LINear
DISPlay:FFT<i>:X:SPACing LINear
DISPlay:WAVeform:X:SPACing LINear
DISPlay:PESQ:X:SPACing LINear
Log Logarithmic spacing of the X axis.
Remote-control command:
DISPlay:SWeep<i>:X:SPACing LOGarithmic
DISPlay:FFT<i>:X:SPACing LOGarithmic
DISPlay:WAVeform:X:SPACing LOGarithmic
DISPlay:PESQ:X:SPACing LOGarithmic

Traces, Spectrum Displays and Bargraphs R&S UPV
1146.2084.32 4.526 E-9
Left
Used to set the left-hand value on the X axis.
This parameter field can only be accessed if Scaling is set to Manu.
Negative values or the value 0.00000 are not permitted if "Spacing" is
set to "Log".
Available in the graphics subsystems:
Sweep, FFT, Waveform, PESQ
Remote-control command:
DISPlay:SWeep<i>:X:LEFT <nu>
DISPlay:FFT<i>:X:LEFT <nu>
DISPlay:WAVeform:X:LEFT <nu>
DISPlay:PESQ:X:LEFT <nu>
Right
Used to set the right-hand value on the X axis.
This parameter field can only be accessed if Scaling is set to Manu.
This value must always be higher than the Left value.
Negative values or the value 0.0000 are not permitted if "Spacing" is
set to "Log".
Available in the graphics subsystems:
Sweep, FFT, Waveform, PESQ
Remote-control command:
DISPlay:SWeep<i>:X:RIGHt <nu>
DISPlay:FFT<i>:X:RIGHt <nu>
DISPlay:WAVeform:X:RIGHt <nu>
DISPlay:PESQ:X:RIGHt <nu>
Main Grid
Division of the graphical display with vertical main gridlines.
Available in the graphics subsystems:
Sweep, FFT, Waveform,PESQ
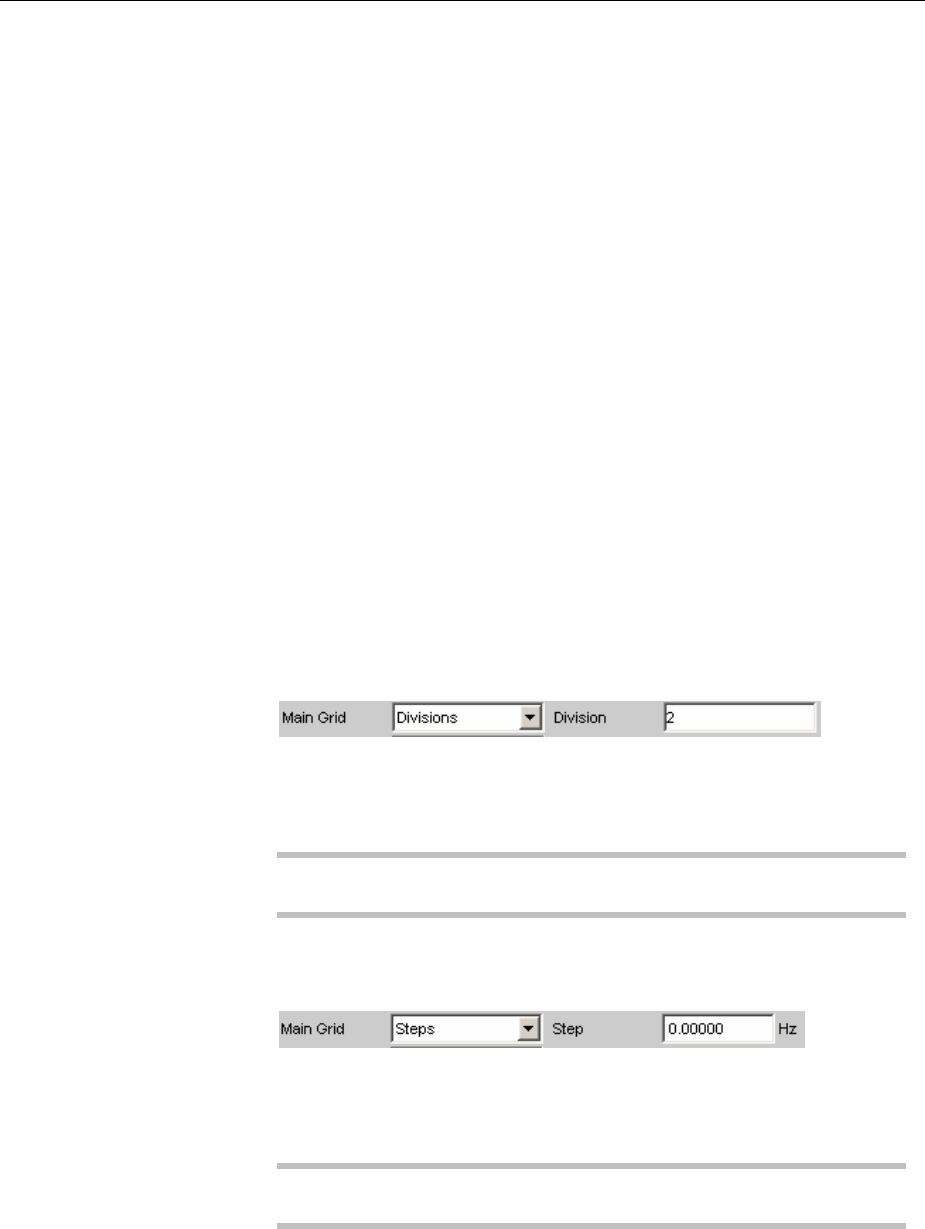
R&S UPV Traces, Spectrum Displays and Bargraphs
1146.2084.32 4.527 E-9
Off No main gridlines are used in the graphical display.
On With Spacing = Log:
Decadic division of an X axis with main gridlines.
Auto Coarse
Auto Medium
Auto Fine
With Spacing = Lin:
Coarse, medium or fine division of an X axis with
main gridlines. One to two, 3 to 4 or 8 to 9 main
gridlines are displayed depending on the scale end
values.
Main gridlines may be hidden if the graphical
window is reduced in size.
Divisions With Spacing = Lin:
Preset division of an X axis with main gridlines.
The desired number of divisions is set in the
parameter field below.
These main gridlines are not hidden if the graphical
window is reduced in size.
Steps With Spacing = Lin:
Preset division of an X axis in a fixed step size.
The step size is set in the parameter field below.
These main gridlines are not hidden if the graphical
window is reduced in size.
Division
With Spacing = Lin:
Used to enter the number of main gridline divisions for an X axis.
If, for example, 2is entered, the X axis is divided into two sections,
i.e. one main gridline is displayed.
Available in the graphics subsystems:
Sweep, FFT, Waveform, PESQ
Step
With Spacing = Lin:
Used to enter the main gridline step size for an X axis.
The unit of the value is linked to the unit selected in the "Unit Funct
Track" parameter field.
Available in the graphics subsystems:
Sweep, FFT, Waveform, PESQ
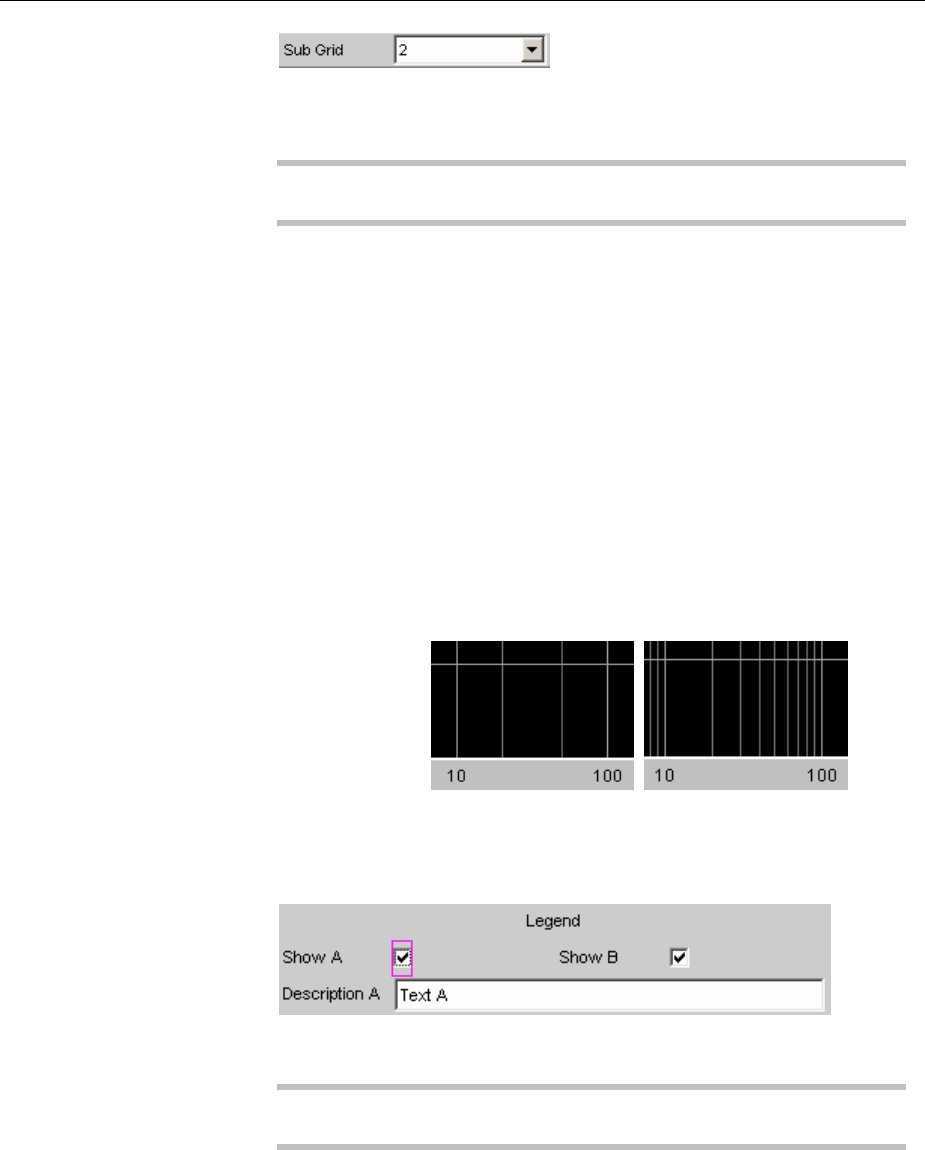
Traces, Spectrum Displays and Bargraphs R&S UPV
1146.2084.32 4.528 E-9
Sub Grid
Subdivision of the main gridlines in a graphical display using
subgridlines.
Available in the graphics subsystems:
Sweep, FFT, Waveform, PESQ
Off Subgridlines are deactivated.
2
4
5
With Spacing = Lin:
Subdivision of the main gridlines of an X axis into 2,
4or 5 sections.
If, for example, 2is selected, the area between two
main gridlines is divided into 2sections, i.e. one
subgridline appears between the main gridlines.
These subgridlines are not hidden if the graphical
window is reduced in size.
Coarse
Fine
With Spacing = Log:
Coarse or fine subdivision of the main gridlines of an
Xaxis with subgridlines.
Coarse Fine
Only All
subgridlines subgridlines
2and 5
Show A,
Show B
Permits or prevents the display of free texts in the graphical displays.
Available in the graphics sub-systems
Sweep, FFT, Waveform, Bargraph, PESQ
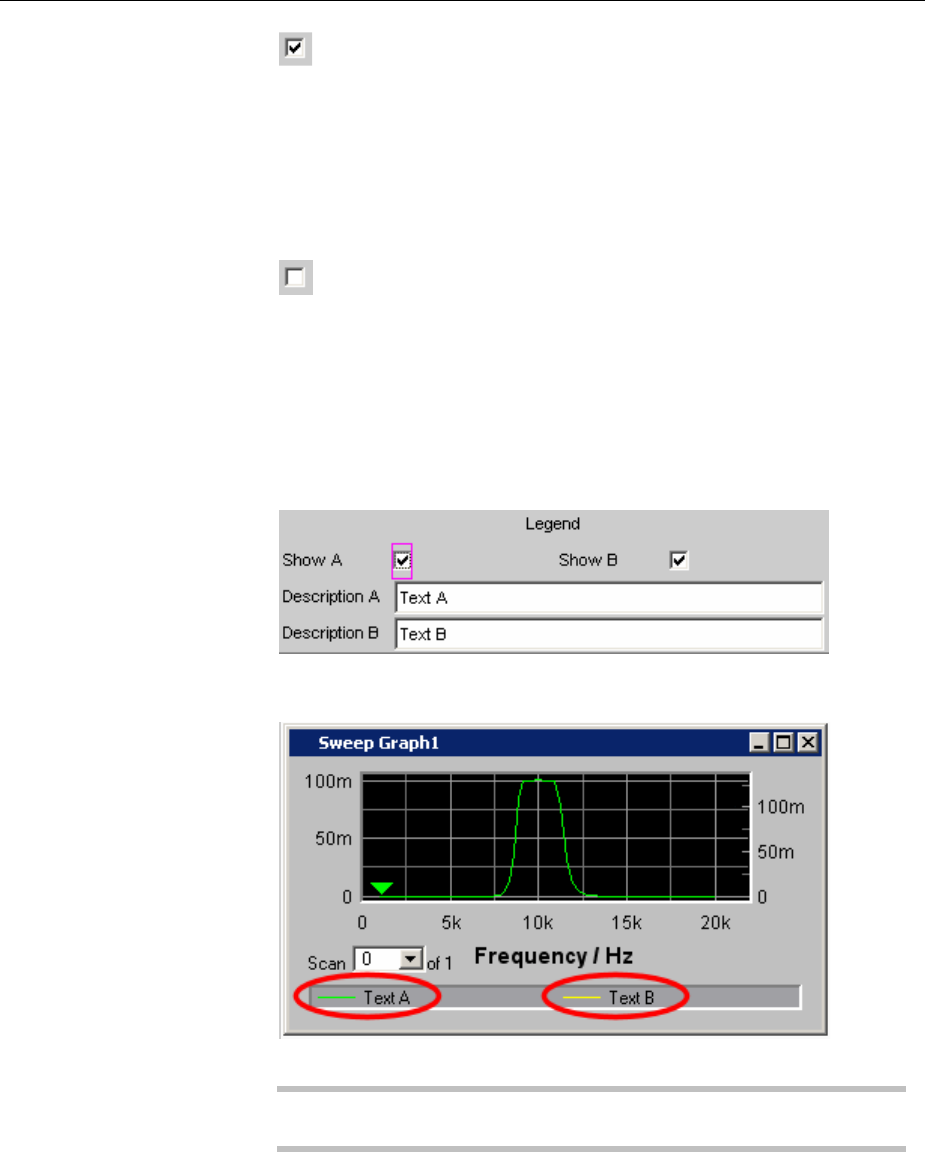
R&S UPV Traces, Spectrum Displays and Bargraphs
1146.2084.32 4.529 E-9
Permits the display of free texts in the graphical
displays.
Remote control commands:
DISPlay:SWEep<i>:A|B:LEGend:SHOW ON
DISPlay:FFT<i>:A|B:LEGend:SHOW ON
DISPlay:WAVeform:A|B:LEGend:SHOW ON
DISPlay:BARgraph<i>:A|B:LEGend:SHOW ON
DISPlay:PESQ<i>:A|B:LEGend:SHOW ON
Prevents the display of free texts in the graphical
displays.
Remote control commands:
DISPlay:SWEep<i>:A|B:LEGend:SHOW OFF
DISPlay:FFT<i>:A|B:LEGend:SHOW OFF
DISPlay:WAVeform:A|B:LEGend:SHOW OFF
DISPlay:BARgraph<i>:A|B:LEGend:SHOW
OFF
DISPlay:PESQ<i>:A|B:LEGend:SHOW OFF
Description A,
Description B
Input fields for free text for display in the graphical displays.
Available in the graphics sub-systems
Sweep, FFT, Waveform, Bargraph, PESQ
Remote control commands:
DISPlay:SWEep<i>:A|B:LEGend:DESCription 'string'
DISPlay:FFT<i>:A|B:LEGend:DESCription 'string'
DISPlay:WAVeform:A|B:LEGend:DESCription 'string'
DISPlay:BARgraph<i>:A|B:LEGend:DESCription 'string'
DISPlay:PESQ<i>:A|B:LEGend:DESCription 'string'
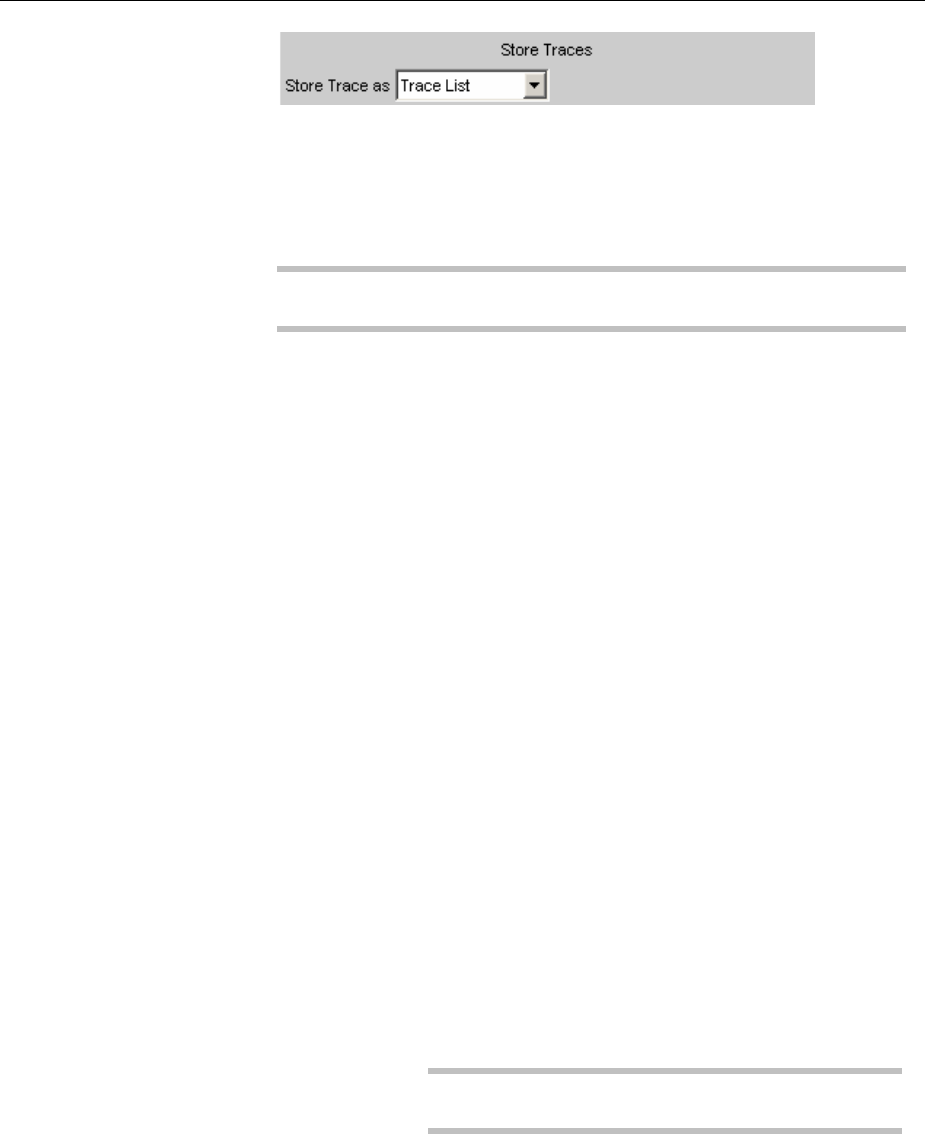
Traces, Spectrum Displays and Bargraphs R&S UPV
1146.2084.32 4.530 E-9
Store Trace as
This specifies the format in which the current trace is to be stored.
Depending on this setting, further command lines for modifying the
data set that has to be stored are added or removed.
Available in the graphics subsystems:
Sweep, FFT, Waveform, PESQ
Trace List Atrace is stored complete with all its scans, X and Y
data, limit data and reference values (see “Trace
Files”).
This file can be loaded as a trace file at parameter
field "Y-Source" "File: Trace A" or "File: Trace B"
and can be displayed.
Remote-control command:
MMEMory:SWEep<i>:STAS TRCList
MMEMory:FFT<i>:STAS TRCList
MMEMory:WAVeform:STAS TRCList
MMEMory:BARgraph<i>:STAS
TRCListMMEMory:PESQ<i>:STAS TRCList
Equalization
List
Atrace is stored as an equalization file in order to
make it available to the generator as a preemphasis
file.
Each time an equalization file is stored the generator
equalization file is loaded again, regardless of
whether or not Modify Equ. is enabled. Then
whenever a new equalization file is saved the
precorrector becomes immediately effective on the
next sweep scan.
If the name of the stored equalization file and of the
equalization file used in the generator are not
identical, a warning is issued to notify that the newly
created equalization file will now be used in the
generator (see “Equalization”).
Available in the graphics subsystems:
Sweep, FFT, Bargraph
Remote-control command:
MMEMory:SWEep<i>:STAS EQUList
MMEMory:FFT<i>:STAS EQUList
MMEMory:BARgraph<i>:STAS EQUList

R&S UPV Traces, Spectrum Displays and Bargraphs
1146.2084.32 4.531 E-9
Sweep List Available in all graphic systems except for
"Waveform".
Atrace is stored as a sweep list.
If an Auto List Sweep or Manu List Sweep is set in
the generator, the sweep parameters are read from
this file.
Available in the graphics subsystems:
Sweep, FFT, Bargraph
Remote-control command:
MMEMory:SWEep<i>:STAS SWPList
MMEMory:FFT<i>:STAS SWPList
MMEMory:BARgraph<i>:STAS SWPList
Limit List Available in all graphic systems except for
"Waveform".
Atrace is stored as a limit list.
This file can be loaded at "Limit Upper" or
"Limit Lower". It can then be displayed as a
limit curve and used for limit monitoring.
Available in the graphics subsystems:
Sweep, FFT, Bargraph, PESQ
Remote-control command:
MMEMory:SWEep<i>:STAS LLISt
MMEMory:FFT<i>:STAS LLISt
MMEMory:BARgraph<i>:STAS LLISt
MMEMory:PESQ<i>:STAS LLISt

Traces, Spectrum Displays and Bargraphs R&S UPV
1146.2084.32 4.532 E-9
DataList
Select
The filtered data of a trace is stored complete with
all its scans, X and Y data, limit data and reference
values.
Data filtering is set in the measurement value list via
softkey menu item "Selection". The following filters
can be selected:
-Upper limit violations only
-Lower limit violations only
-Upper and lower limit violations
-Harmonics only
-Peaks only.
The IEC/IEEE bus command is as
follows:
DISPlay:Subsys<i>:DLISt:FILTer ALL |
LIMUpper | LIMLower | LIMBoth |
HARMonics | PEAKs
Atrace file stored in the "DataList Select" mode in
conjunction with filters enabled in the measurement
value list usually consists of significantly fewer data
sets than when unfiltered and the number of data
sets for Trace A and Trace B is usually different.
Available in the graphics subsystems:
Sweep, FFT, Bargraph, PESQ
Remote-control command:
MMEMory:SWEep<i>:STAS DSELect
MMEMory:FFT<i>:STAS DSELect
MMEMory:BARgraph<i>:STAS DSELect
MMEMory:PESQ<i>:STAS DSELect
Trace
This is offered for "Store Trace as" "Equalization List" or "Limit List"
and specifies whether the data set of Trace A or Trace B will be used
for creating the corresponding lists.
Available in the graphics subsystems:
Sweep, FFT, Bargraph, PESQ
Remote-control command:
MMEMory:SWEep<i>:TRACe A | B
MMEMory:FFT<i>:TRACe A | B
MMEMory:BARgraph<i>:TRACe A | B
MMEMory:PESQ<i>:TRACe A | B
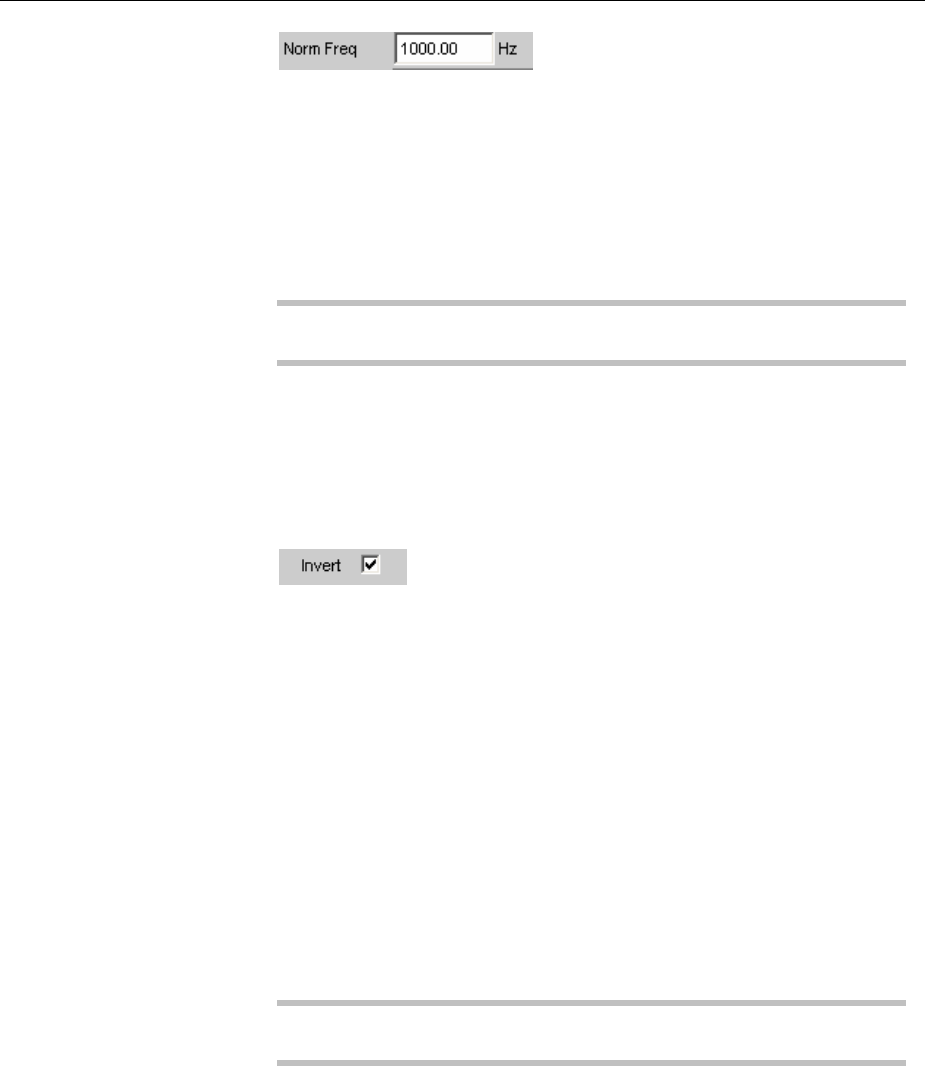
R&S UPV Traces, Spectrum Displays and Bargraphs
1146.2084.32 4.533 E-9
Norm Freq
This is offered for “Store Trace = Equalization List”.
This specifies the frequency whose voltage value is used for
normalization. If the frequency selected is that at which the frequency
response curve is at its maximum, the precorrector file contains only
values from 0.0 to 1.0. If a different frequency is selected, factors
greater than 1.0 also occur.
Available in the graphics subsystems:
Sweep, FFT, Bargraph
Remote-control command:
MMEMory:SWEep<i>:EQUalization:NORMfrequency <nu>
MMEMory:FFT<i>:EQUalization:NORMfrequency <nu>
MMEMory:BARgraph<i>:EQUalization:NORMfrequency <nu>
Invert
This is offered for “Store Trace = Equalization List”.
The effect of inverting the frequency response in the generator by
means of an equalization file created with the "Invert" setting is that
the same DUT - with the precorrector enabled - now receives an
undistorted frequency response (see “Equalization”).
Application: Constant (i.e. frequency response independent) power
output, preemphasis/deemphasis.
If there is no tick in the tick box, the equalization data set that is
acquired corresponds to the frequency response of the DUT.
If the DUT is removed and a generator sweep is carried out using this
equalization data set, the DUT can be simulated since a frequency
response arises as if the DUT were present.
Available in the graphics subsystems:
Sweep, FFT, Bargraph
Remote-control command:
MMEMory:SWEep<i>:EQUalization:INVert ON | OFF
MMEMory:FFT<i>:EQUalization:INVert ON | OFF
MMEMory:BARgraph<i>:EQUalization:INVert ON | OFF
Traces, Spectrum Displays and Bargraphs R&S UPV
1146.2084.32 4.534 E-9
Modify Equ.
This is offered for "Store Trace as" "Equalization List".
The current generator equalization data set is taken into account when
the new equalization list is stored in order to obtain a significantly
more accurate precorrection.
What is the purpose of multistage preemphasis?
Example:
At high frequencies a loudspeaker frequency response has a rolloff of
approx. 10 dB.
The intention is to compensate the frequency response by means of a
generator preemphasis (equalization). For this purpose a generator
sweep is started and the frequency response curve is acquired. An
equalization file is created from this trace and made available to the
generator. Another sweep is started using the equalization file and the
frequency response is acquired.
The frequency response now seems considerably better, though the
expected straight line has not appeared and there are inaccuracies in
regions showing greater generator level increases.
The causes for this are non-linearities in the loudspeaker system. An
increase in the generator level of 10 dB has not, as first expected, also
increased the loudspeaker sound pressure by 10 dB but rather by only
some 9.8 dB due to non-linearities.
In order to compensate for these inaccuracies a further equalization
using Modify Equ.can be performed. This second scan, based on the
data set of the equalization file loaded in the generator, usually
produces the expected level frequency response.
If "Modify Equ." is enabled and a new equalization file is created but
equalization is not yet enabled in the generator, equalization is turned
on by default using the newly created file name (see “Equalization”).
Available in the graphics subsystems:
Sweep, FFT, Bargraph
Remote-control command:
MMEMory:SWEep<i>:EQUalization:MODify ON | OFF
MMEMory:FFT<i>:EQUalization:MODify ON | OFF
MMEMory:BARgraph<i>:EQUalization:MODify ON | OFF
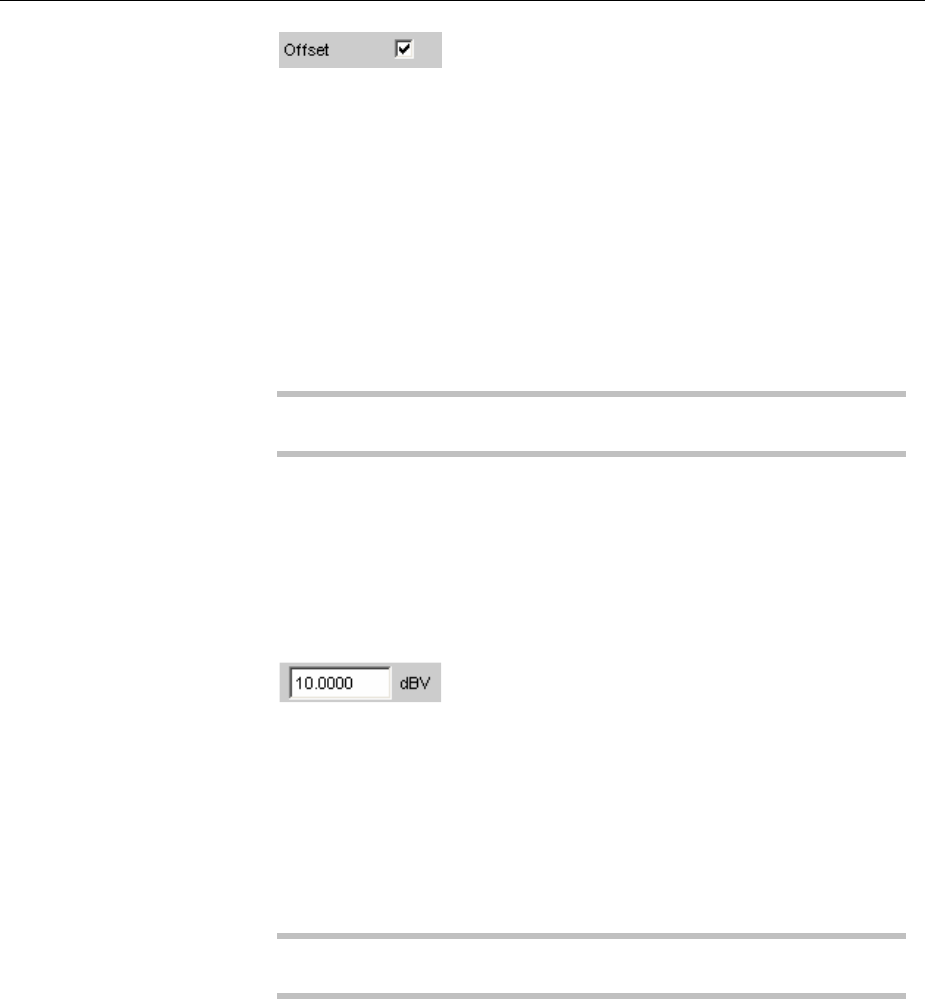
R&S UPV Traces, Spectrum Displays and Bargraphs
1146.2084.32 4.535 E-9
Offset
This is offered for "Store Trace as" "Limit List".
When a limit file is generated, an offset value is added to the Y data.
This value is specified in the following parameter field.
Offset allows for example two limit files to be generated from a
"golden unit", together forming a tolerance band, by generating a limit
file for Upper Limit with an offset value of say 10 dBV and a limit file
for Lower Limit with an offset value of -10 dBV. This produces a
tolerance band with a width of 20 dBV so that the ideal frequency
response of a selected DUT can be compared with the currently
different DUT (see “Editing”).
Available in the graphics subsystems:
Sweep, FFT, Bargraph, PESQ
Remote-control command:
MMEMory:SWEep<i>:LIMit:OFFSet ON | OFF
MMEMory:FFT<i>:LIMit:OFFSet ON | OFF
MMEMory:BARgraph<i>:LIMit:OFFSet ON | OFF
MMEMory:PESQ<i>:LIMit:OFFSet ON | OFF
Offset Value
This is offered for Store Trace as Limit List, when the Offset tick box is
enabled.
It is an additive value for generating limit files based on the trace data
set of an ideal DUT. Generating two limit files, one with a positive and
the other with a negative offset, allows a tolerance band to be
generated (see “Editing”).
Available in the graphics subsystems:
Sweep, FFT, Bargraph, PESQ
Remote-control command:
MMEMory:SWEep<i>:LIMit:OFFSet:VALue <nu>
MMEMory:FFT<i>:LIMit:OFFSet:VALue <nu>
MMEMory:BARgraph<i>:LIMit:OFFSet:VALue <nu>
MMEMory:PESQ<i>:LIMit:OFFSet:VALue <nu>
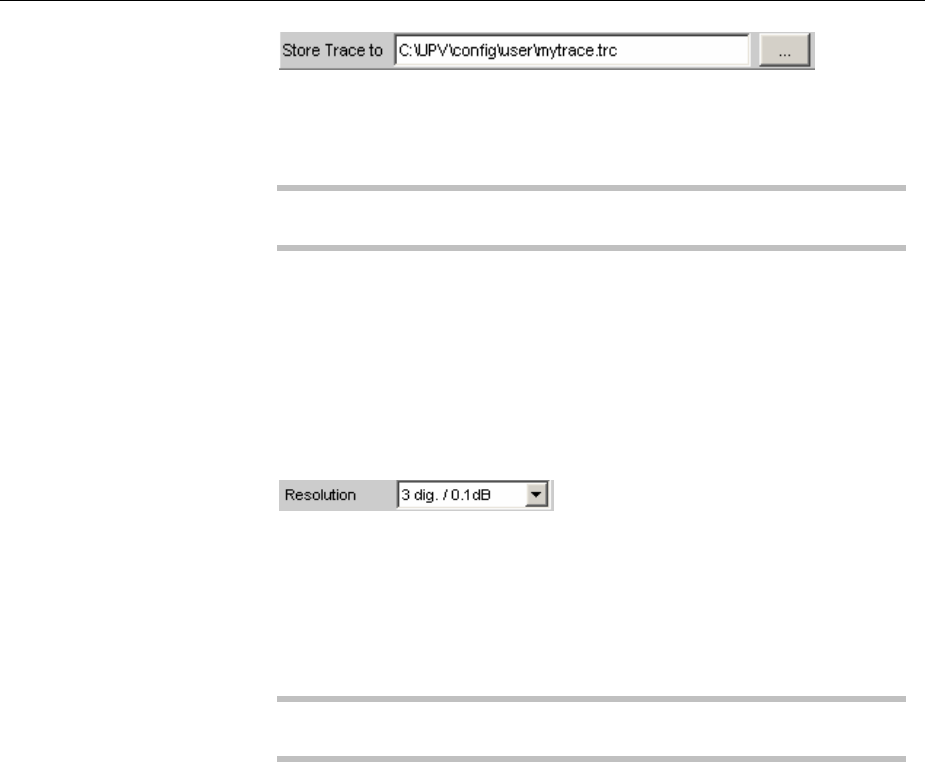
Traces, Spectrum Displays and Bargraphs R&S UPV
1146.2084.32 4.536 E-9
Store Trace to
This stores the current trace, complete with all scans, in the format
specified by Store Trace as, under the specified file name.
Available in the graphics subsystems:
Sweep, FFT, Bargraph, Waveform, PESQ
Remote-control command:
MMEMory:SWEep<i>:STORe 'filename'
MMEMory:WAVeform:STORe 'filename'
MMEMory:FFT<i>:STORe 'filename'
MMEMory:BARgraph<i>:STORe 'filename'
MMEMory:PESQ<i>:STORe 'filename'
Resolution
Used to set the number of digits used to display the cursor and scaling
values in the graphical window.
If "Engineering" is set to "Auto", the Resolution setting only applies to
the cursor values and not to the scale values.
Available in the graphics subsystems:
Sweep, FFT, Bargraph, Waveform, PESQ
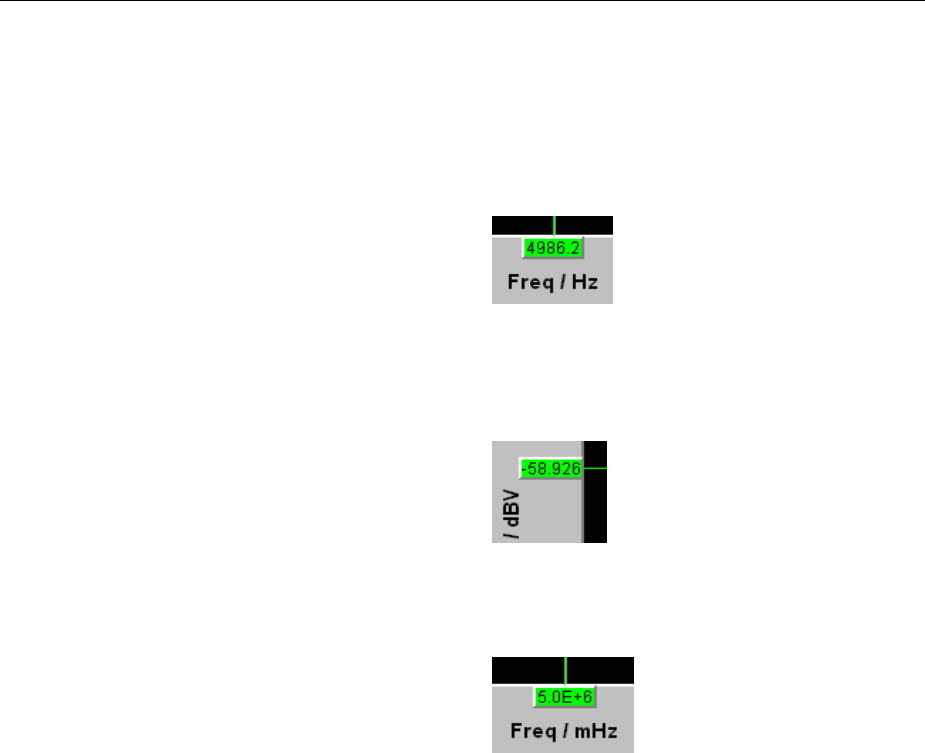
R&S UPV Traces, Spectrum Displays and Bargraphs
1146.2084.32 4.537 E-9
3dig. / 0.1 dB
4dig. / 0.01 dB
5dig. / 0.001 dB
6dig. / 0.0001 dB
7dig. / 0.00001 dB
The parameters are explained below using an
example:
5dig. / 0.001 dB
5dig.:Values which are displayed with a
linear unit (V, Hz, etc) are output
with 5 digits:
0.001 dB:Values which are displayed with a
logarithmic unit (dBV, dBu, etc)
are output to three decimal
places:
If the numeric values can no longer be
displayed with the selected resolution, they
are rounded off and shown as an exponent:
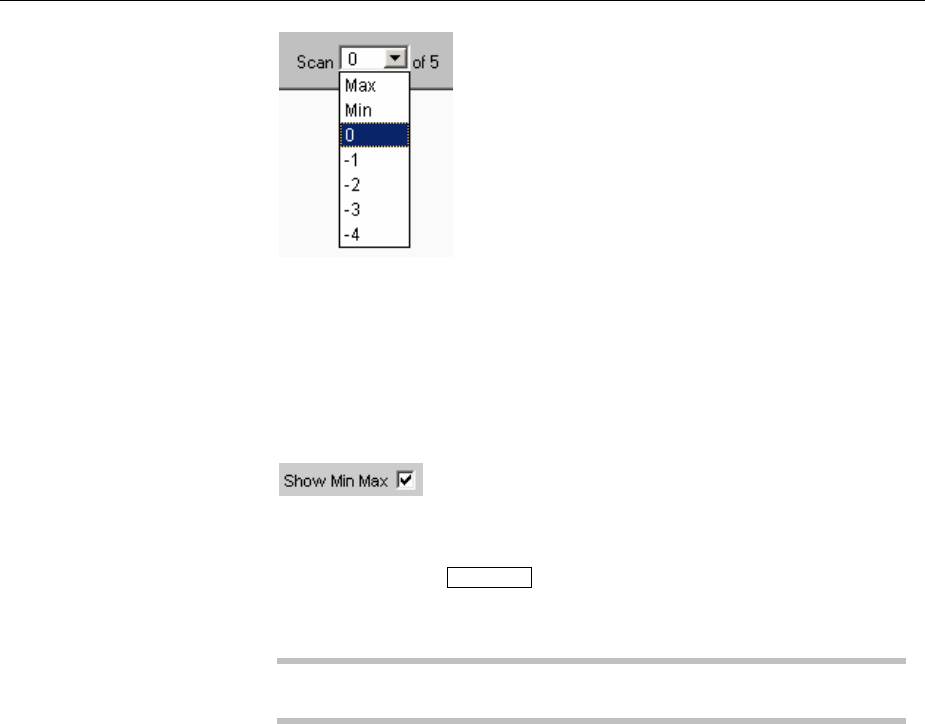
Traces, Spectrum Displays and Bargraphs R&S UPV
1146.2084.32 4.538 E-9
Scan
This is a display for the current scan and an opportunity to select a
scan in the graphical display. For those graphic system that allows
multiscan recording (Sweep Graph1 to 4) the desired scan can be
selected. Number 0 means the most recent scan. The lower the
negative number, the older the scan.
Scans identified as Min and Max are available to all graphic systems,
provided they are enabled by ticking the
tick box.
When you use the Next Scan toggle key to scroll through the scans the
current value is entered here.
Available in the graphics subsystems:
Sweep, FFT, Bargraph, Waveform, PESQ
Remote-control command:
DISPlay:SWEep<i>:SCANoffset <n>
DISPlay:FFT<i>:SCANoffset <n>
DISPlay:WAVeform:SCANoffset <n> (nur n = 0 möglich)
DISPlay:BARgraph<i>:SCANoffset <n>
DISPlay:PESQ<i>:SCANoffset <n>
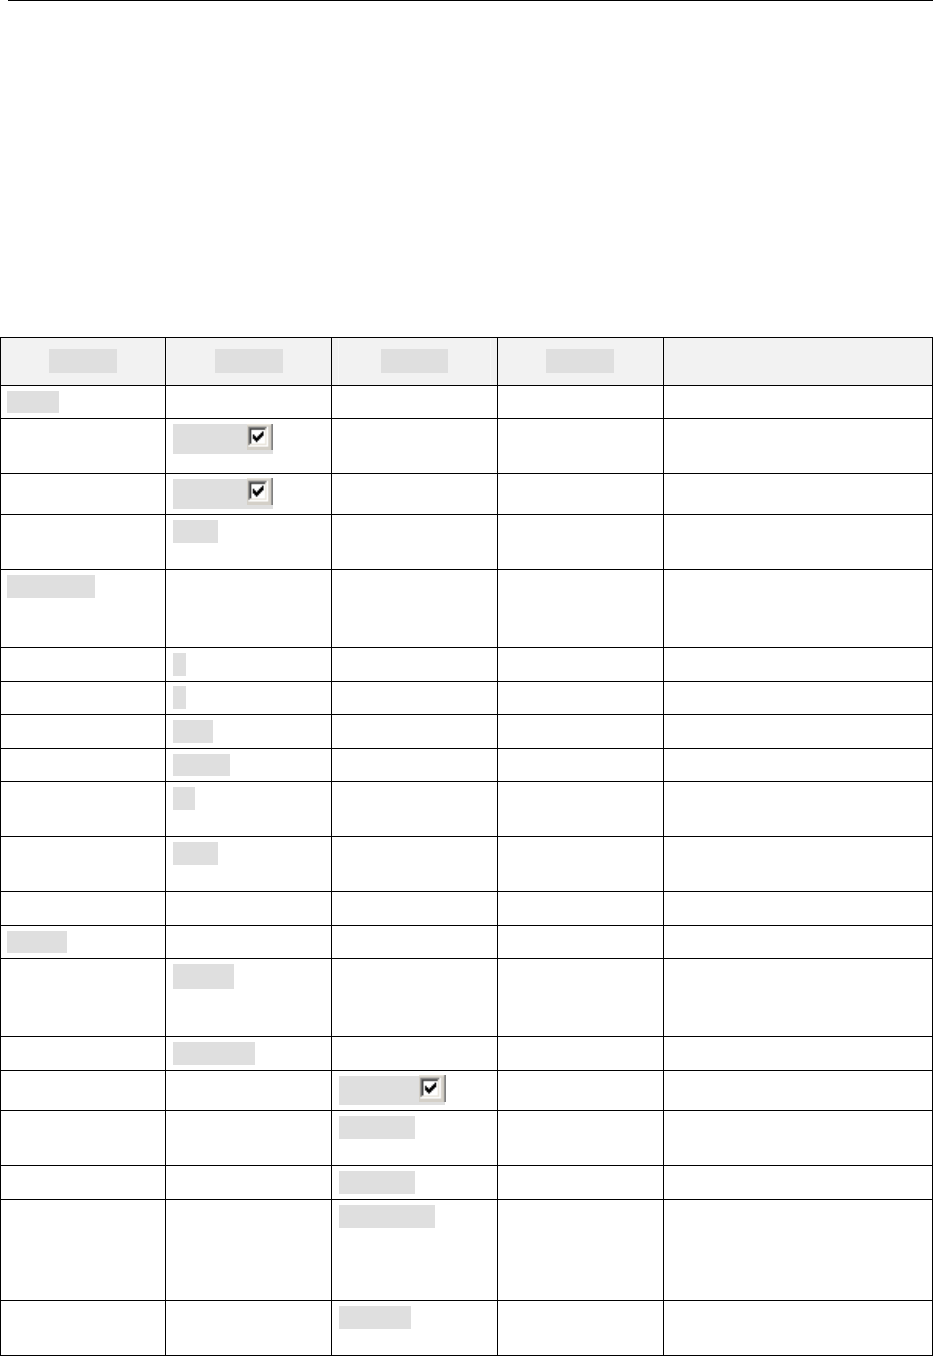
R&S UPV Traces, Spectrum Displays and Bargraphs
1146.2084.32 4.539 E-9
Softkey Menu
Using an extensive softkey menu the display can be, among other things,
•automatically scaled (Autoscale)
•expanded (Zoom)
•measured using vertical and horizontal cursor (Cursor) or
•provided with markers (Marker).
Explanation of the individual softkey menu items:
Level 1 Level 2 Level 3 Level 4 Brief description
Trace
Show A (Temporarily) show/hide
graphical display of Trace A
Show B Ditto for Trace B
Back Move back by one menu
level
Autoscale Single scaling of co-ordinate
system using minimum and
maximum values
AFor Trace A
BDitto for Trace B
A&B Ditto for Trace A and B
XAxis Ditto for X axis
All Ditto for Trace A, B and
Xaxis
Back Move back by one menu
level
Cursor Cursor settings
OXUsed to determine whether
Oor X cursor is moved with
rotary knob
O-Cursor Ocursor settings
OActive Activate/deactivate O cursor
OVert A Ocursor becomes vertical
cursor on Trace A
OVert B Ditto on Trace B
OVert A-B Ditto on Trace A and
Trace B and shows
difference between
Yvalues.
OHor A Ocursor becomes horizontal
cursor on Trace A
Traces, Spectrum Displays and Bargraphs R&S UPV
1146.2084.32 4.540 E-9
Level 1 Level 2 Level 3 Level 4 Brief description
OHor B Ditto on Trace B
Movement
(Next Pixel)
Movement behaviour of
Ocursor when it is moved
using rotary knob
Next Pixel Pixel-by-pixel movement
Next Bin
Next Sample
Next Value
Next Step
Between reference points
With FFT
With Waveform and PESQ
With Bargraph
With Sweep
Next Peak Movement between partial
curve peaks
Next Harmonic FFT display: movement
between harmonics
Back Move back by one menu
level
X-Cursor Xcursor settings
XActive Activate/deactivate X cursor
XVert A Xcursor becomes vertical
cursor on Trace A
XVert B Ditto on Trace B
XVert A-B Ditto on Trace A and
Trace B and shows
difference between
Yvalues.
XHor A Xcursor becomes horizontal
cursor on Trace A
XHor B Ditto on Trace B
Movement
(Next Pixel)
Movement behaviour of
Xcursor when it is moved
using rotary knob
Next Pixel Pixel-by-pixel movement
Next Bin
Next Sample
Next Value
Next Step
Between reference points
With FFT
With Waveform
With Bargraph
With Sweep
Next Peak Movement between partial
curve peaks
Next Harmonic FFT display: movement
between harmonics
R&S UPV Traces, Spectrum Displays and Bargraphs
1146.2084.32 4.541 E-9
Level 1 Level 2 Level 3 Level 4 Brief description
Back Move back by one menu
level
Set O Cursor Sets O cursor …
Max …to trace maximum
Min …to trace minimum
Marker A …to position of Marker A
Marker B ... to position of Marker B
Value …to a value that can be
entered later
Back Move back by one menu
level
Set X Cursor Sets X cursor …
Max …to trace maximum
Min ... to trace minimum
Marker A …to position of Marker A
Marker B ... to position of Marker B
Value …to a value that can be
entered later
Back Move back by one menu
level
Back Move back by one menu
level
Marker Marker settings
Trace A Marker settings for Trace A
Off Marker deactivated
Set to O Cursor Set marker to position of
Ocursor
Set to X Cursor Set marker to position of
Xcursor
Set to Value Set marker to a value that
can be entered later
Track to
Max
Set marker to maximum of
Trace A; marker changes
with maximum
Harm Harmonics are calculated
and displayed based on
Xposition of marker
Back Move back by one menu
level
Traces, Spectrum Displays and Bargraphs R&S UPV
1146.2084.32 4.542 E-9
Level 1 Level 2 Level 3 Level 4 Brief description
Zoom Increase / reduce size of
graphical display
Act Curs In Size of graphical display is
increased around active
cursor (solid line). If active
cursor is a vertical cursor, a
section of X axis is
displayed; if it is a horizontal
cursor, a section of Y axis is
displayed. In both cases,
displayed section is adjusted
so that cursor appears at
center of display.
Act Curs Out Ditto for reducing size of
graphical display
Betw V Curs Zooming between two
vertical cursors
Betw H Curs Zooming between two
horizontal cursors
Unzoom Undoes all zoom operations
Undo Undoes zoom operation last
performed. Several zoom
operations can be undone.
Entering new axis limits
(Top, Bottom, Left, Right)
resets undo memory.
Autoscale Automatic scaling of co-
ordinate system using
minimum and maximum
values
AFor Trace A
BDitto for Trace B
A&B Ditto for Trace A and B
XAxis Ditto for X axis
All Ditto for Trace A, B and
Xaxis
Back Move back by one menu
level
Restart Min/Max
Lim Violation
Deletes Min/Max curves and
limit violation symbols for
graphical display and
restarts collection of
Min/Max data and checking
of limit violations.
MinMax A Min/Max curves of Trace A
MinMax B Ditto for Trace B
R&S UPV Traces, Spectrum Displays and Bargraphs
1146.2084.32 4.543 E-9
Level 1 Level 2 Level 3 Level 4 Brief description
MinMax A+B Ditto for Trace A and
Trace B
Lim Viol A Limit violation symbols for
Trace A, i.e. red dots which
indicate limit violations on
trace, and red triangular
symbols for limit violations
are deleted and only a grey
triangle is displayed.
or ?
Lim Viol B Ditto for Trace B
Lim Viol A+B Ditto for Trace A and
Trace B
Back Move back by one menu
level
Config Opens associated Config
panel
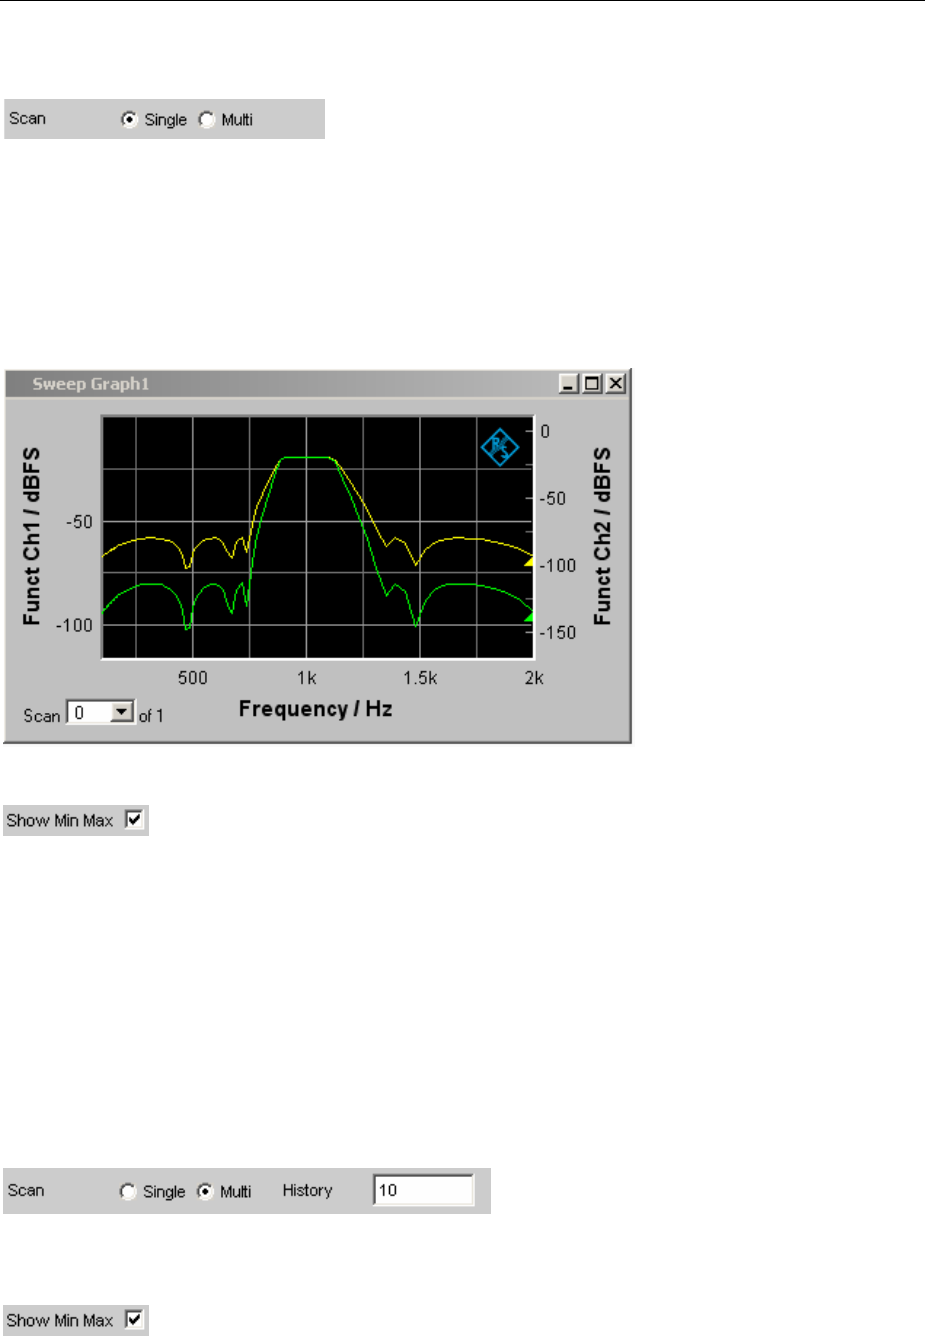
Traces, Spectrum Displays and Bargraphs R&S UPV
1146.2084.32 4.544 E-9
Single Sweep
For the two independent Y axes (Trace A and Trace B) on the graphical display, the user can display
two out of eight simultaneously acquired measurement values. These can include not only level
measurement results, frequencies or total harmonic distortions from the left and right channels, but also
physically different values such as voltage and phase. The measurement function relevant to the
measurement value display is set in the Analyzer Function panel, and the measurement function
relevant to the trace display is selected from the Gfx-Configuration panel at "Y-Source".
The graph shows a single sweep on Trace A (green) and Trace B (yellow).
In addition the setting
produces two further scans in which the Min and Max curves are generated, exactly as in the following
graph which shows a crowded set of curves.
Trace Group
With the R&S UPV, the number of measurement sequences is not restricted to x number of scans.
Instead, between 2 and 20 can be set for the FFT Monitor and the Sweep Graphs 1 to 4 using the Scan
and History parameter field (see section "Graphical Display, Explanation of the Elements" on page
4.450).
in the appropriate configuration panels. Additionally, two other scans (the Min and Max curves) can be
generated using the setting
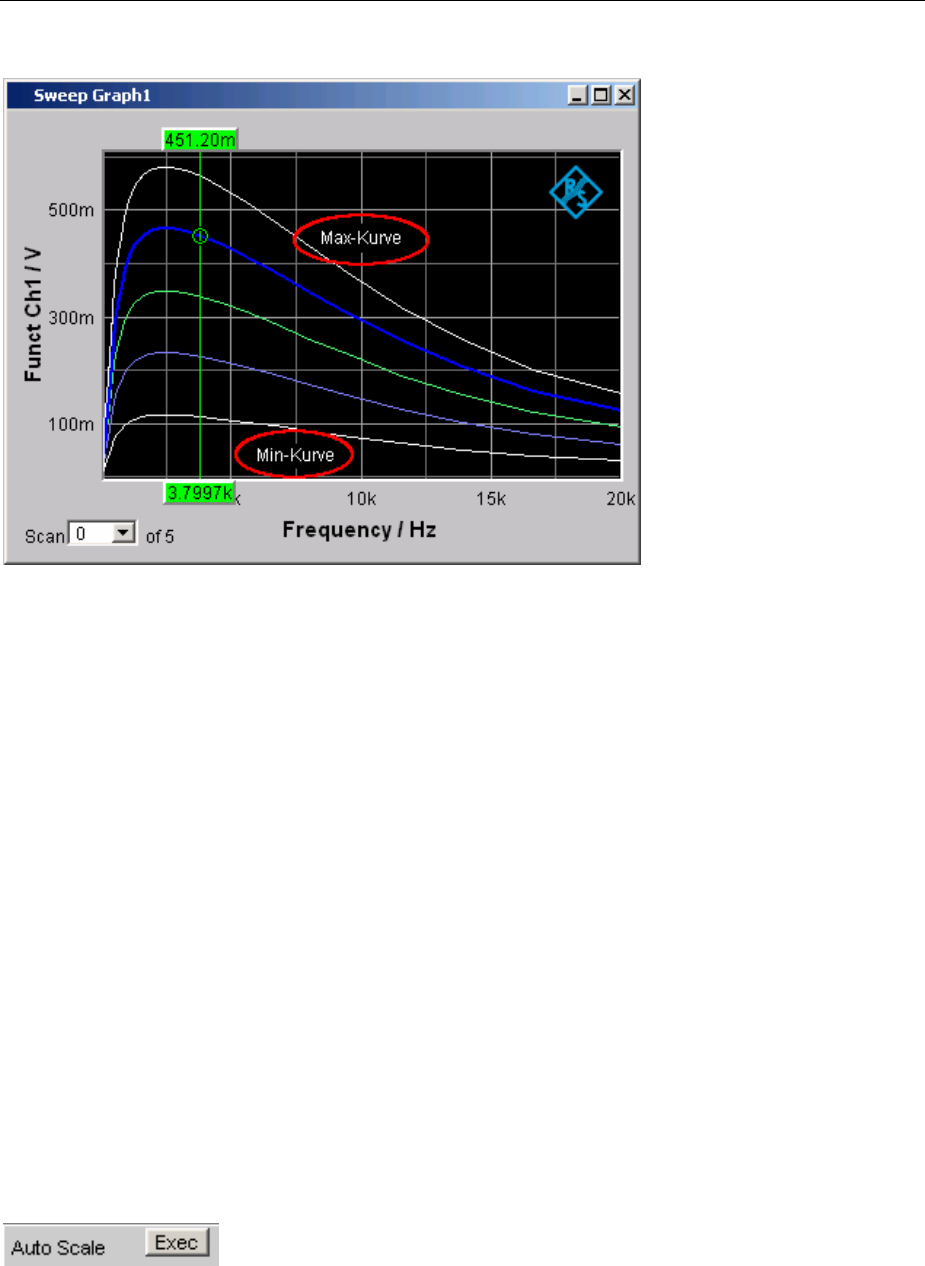
R&S UPV Traces, Spectrum Displays and Bargraphs
1146.2084.32 4.545 E-9
Atrace group is shown as the graphical display.
All of the recorded measurement sequences are saved (both internally and, if the user requires, as a
file) and can be displayed, rescaled and reloaded as a single unit.
With the generator, a second sweep (the Z sweep) is possible in addition to the X sweep. It is called the
Zsweep because it is usually displayed on the Z axis of a 3D co-ordinate system.
Generally, in a graphical window which allows scans to be recorded, a trace group or a trace pair
consisting of Trace A and Trace B each with one trace group will be displayed in the respective
graphical window if History is set to b2.
If History is set to the maximum value of 20 and “Show Min Max” is activated: a maximum of 44 scans
are displayed.,
Trace A, 20 scans
Trace A 1 Min curve
Trace A 1 Max curve
Trace B, 20 scans
Trace B 1 Min curve
Trace B 1 Max curve
----------------------------------
44 curves
As long as a measurement is running and scans are performed, they are displayed in gray. When the
measurement is completed or the scan was stopped by means of Hold, the scans are displayed in
automatically assigned colors.
In the case of automatic scaling of the Y axis
all available traces are taken into account in order to determine the maxima and minima.
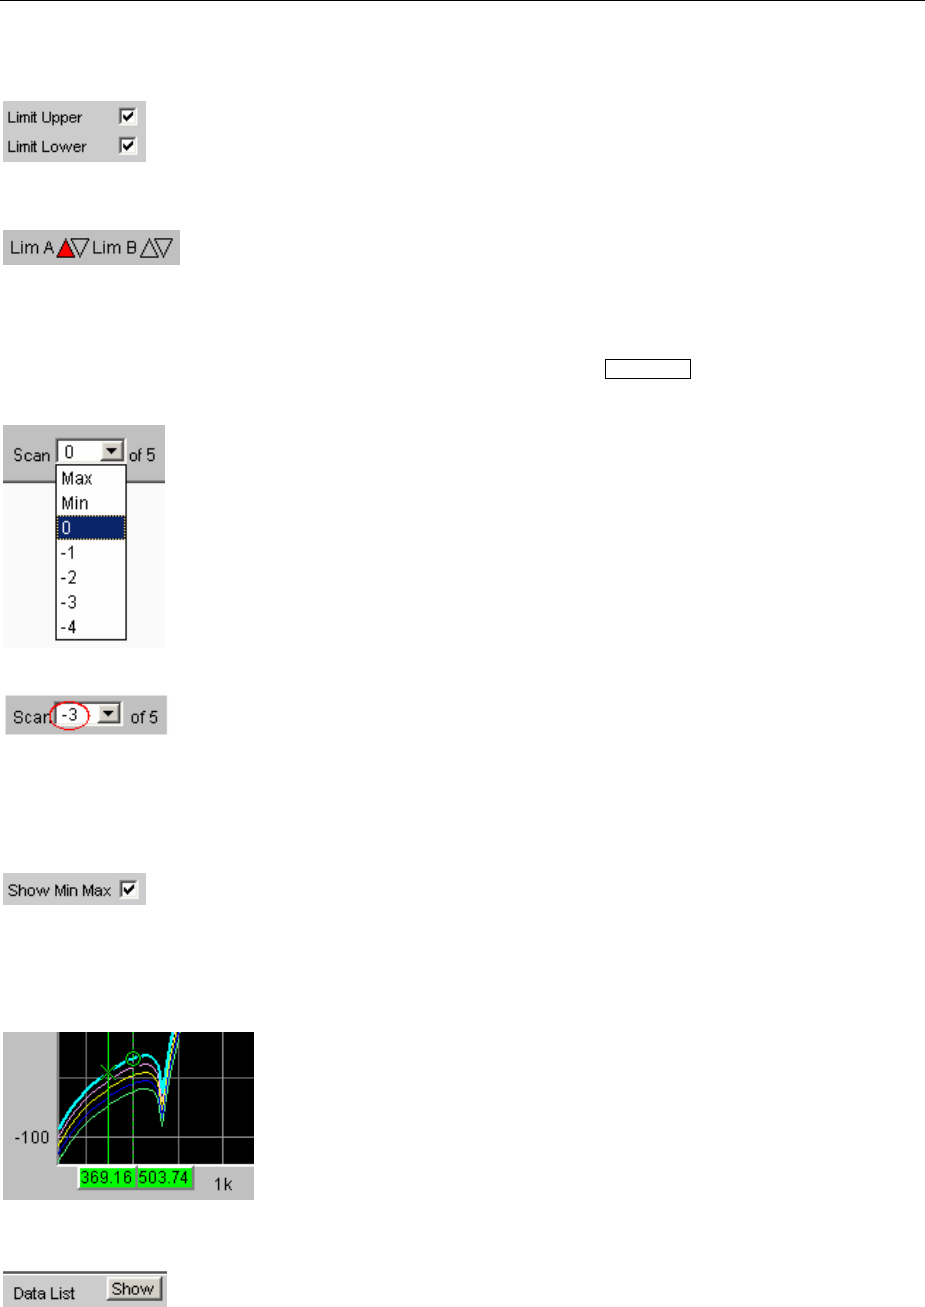
Traces, Spectrum Displays and Bargraphs R&S UPV
1146.2084.32 4.546 E-9
All other actions, e.g. setting the cursor to the Min or Max value, always relate to the current scan. For
limit violation monitoring, which is set up using
all traces are checked against the same two limit curves. The symbol for limit violation
always relates to the current trace pair.
The current scan (one trace if only Trace A or Trace B is activated, two traces if both traces are
activated) is changed in the graphical window or result list using the Next Scan rocker key or the "Scan"
selection field.
The number in the "Scan" selection field
displays for graphic systems that allow multiscan recording (Sweep Graph1 to 4) the current value, the
so-called scan index . Number 0 means the most recent scan. The lower the negative number, the older
the scan.
Scans identified as Min and Max are available to all graphic systems, provided they are enabled by
ticking the
tick box.
If Cursor is switched on in the graph, an O or X identifies the intersection of the cursor with the current
trace or trace pair. If the scan index changes, this marking jumps to the next scan.
If the measurement value list is enabled,
the lists are reconfigured after every change in the scan index, because only one scan is displayed in
the measurement value list.
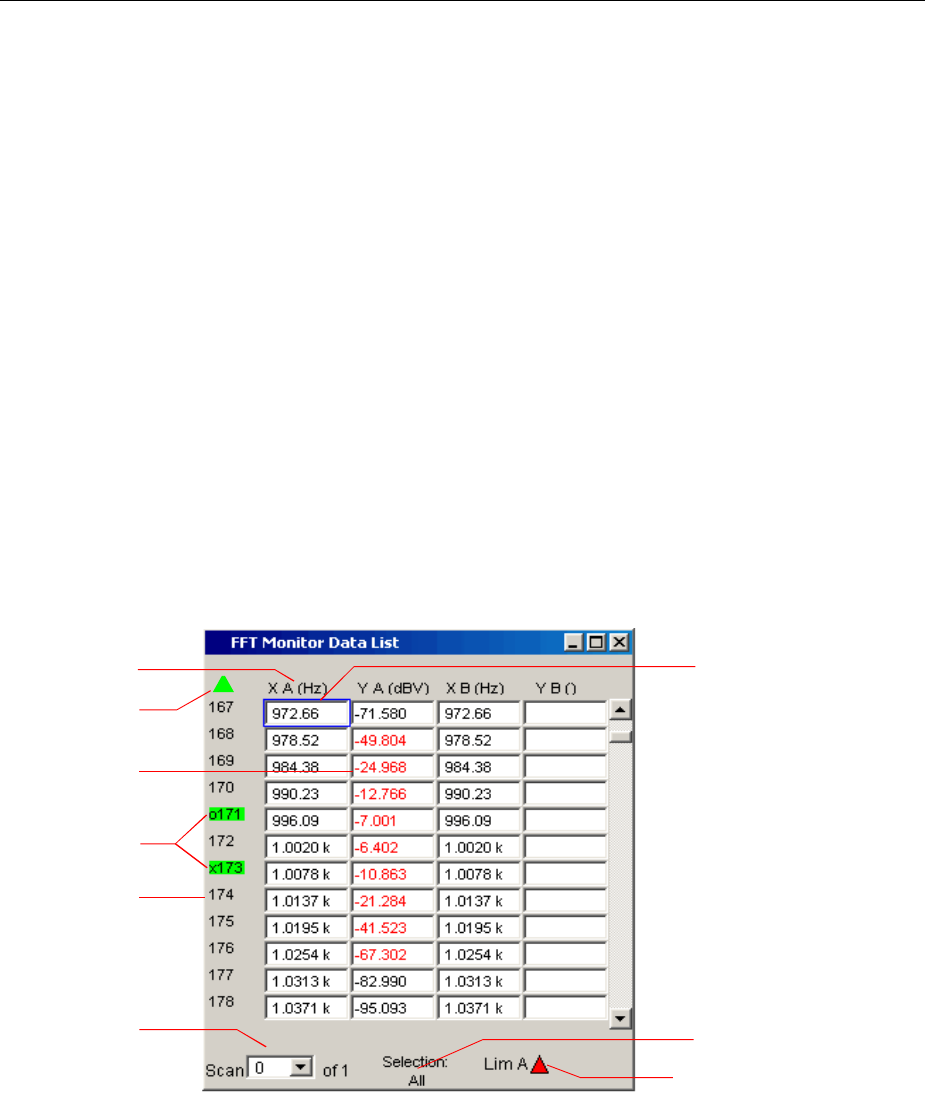
R&S UPV Result List
1146.2084.32 4.547 E-9
Interpolation on the Common X Axis
So that any traces can be used as reference or displayed simultaneously for comparison and measured
with the cursors, such traces should actually all have the same X values. The R&S UPV, however, can
use any X divisions, by interpolating the measurement value sequences, reference traces and limit
curves onto the current X axis.
Likewise the equalization lists are interpolated onto the X axis of the generator sweep (see
“Equalization”) as are waiting time curves for sweep stepping.
Reference traces, limit curves and waiting time curves therefore need consist of only a few interpolation
points.
The interpolation takes into account whether the X and Y axes are divided on a linear or logarithmic
basis, because segments of ellipses are generally produced from straight lines in the other display.
Result List
All measurement values from all graphic subsystems can also be displayed in lists instead or in
combination with the graphical windows.
Graphical Display, Explanation of the Elements
Symbols indicating
limit violations
Display filter
Columns with
measurement values
Measurement value
with limit violation
Numbering of
measurement values
Cursor markers
Scan number
Arrow
Selection frame
Display filter If the result list has the focus, a softkey menu appears. Pressing the
"Selection" button opens the next softkey level where it is possible to
select the measurement values according to the following criteria, i.e.
to list only those rows which satisfy the selection criteria:
All
Lim upper
Lim lower
Lim upp&low
Harmonics
Peaks
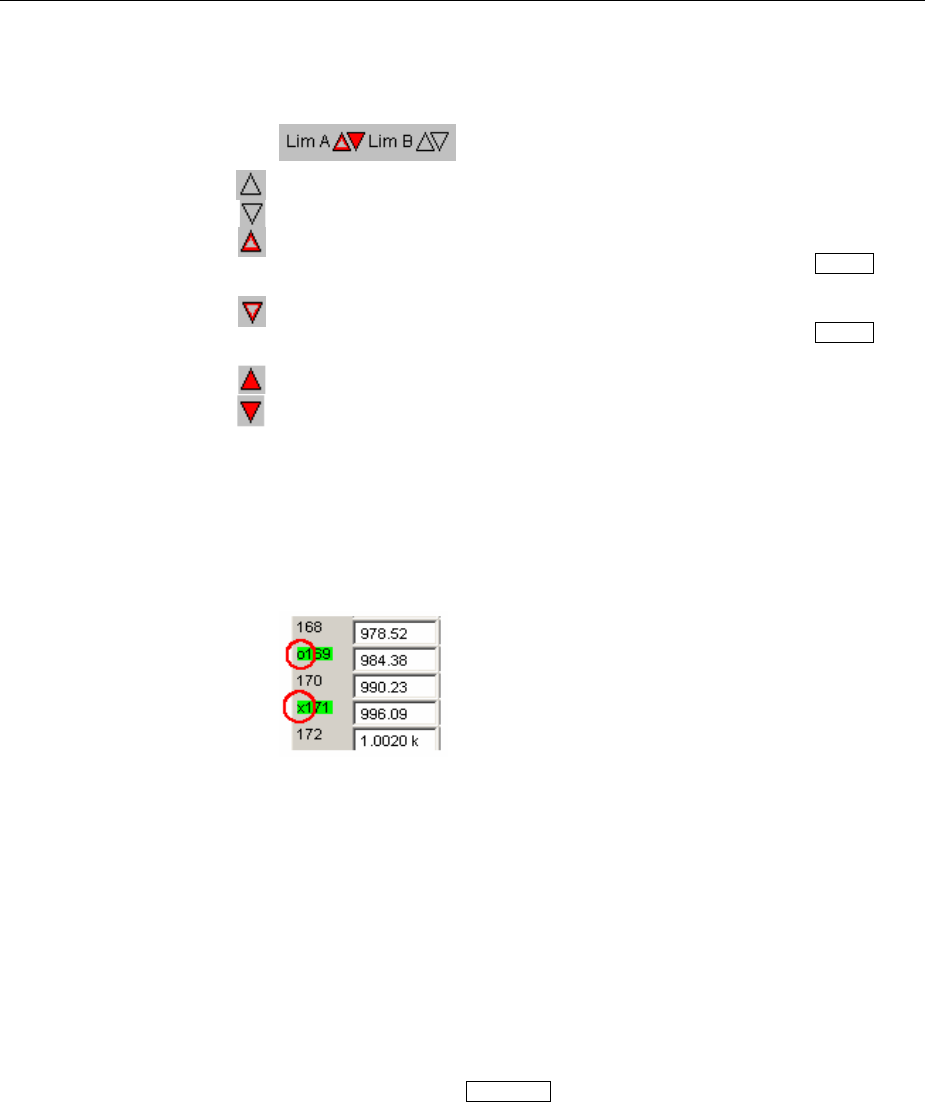
Result List R&S UPV
1146.2084.32 4.548 E-9
Selection frame Used to scroll through the result list using the rotary knob. When the
selection frame reaches the top or bottom of the result list, the list is
scrolled below the window.
Symbols indicating limit
violations
"Limit Upper" is activated and there is no limit violation.
"Limit Lower" is activated and there is no limit violation.
The "Limit Upper" value has been violated in the past but there is
currently no limit violation. The violation is indicated until the START
key is pressed again.
The "Limit Lower" value has been violated in the past but there is
currently no limit violation. The violation is indicated until the START
key is pressed again.
The "Limit Upper" value is currently being violated.
The "Limit Lower" value is currently being violated.
Columns with measurement
values
Trace A, Trace B and the associated X axes are displayed as numeric
values in a maximum of four columns.
Cursor markers A coloured rectangular marking indicates the row containing the value
at which the cursor is located (also applies to traces and bargraphs).
"o" or "x" to the left of the measurement number indicates the O or X
cursor.
Pressing the Find Cursor softkey adjusts the display window so that
the active cursor appears at the center of the display.
Arrow Coloured arrow symbols indicate the direction in which a cursor left
the display window.
Measurement value with limit
violation
Alimit violation, which is identified by red dots / red bars on the traces
and bargraphs, is indicated by red measurement values in the result
list.
Numbering of measurement
values
The individual measurement values are numbered consecutively from
1to n.
Scan number If a trace consists of several scans, the desired scan can be selected
here by pressing the Next Scan rocker key or using the mouse. In the
result list, only the values of the selected scans are shown. The scan
number shown in this display field indicates which scan is listed.
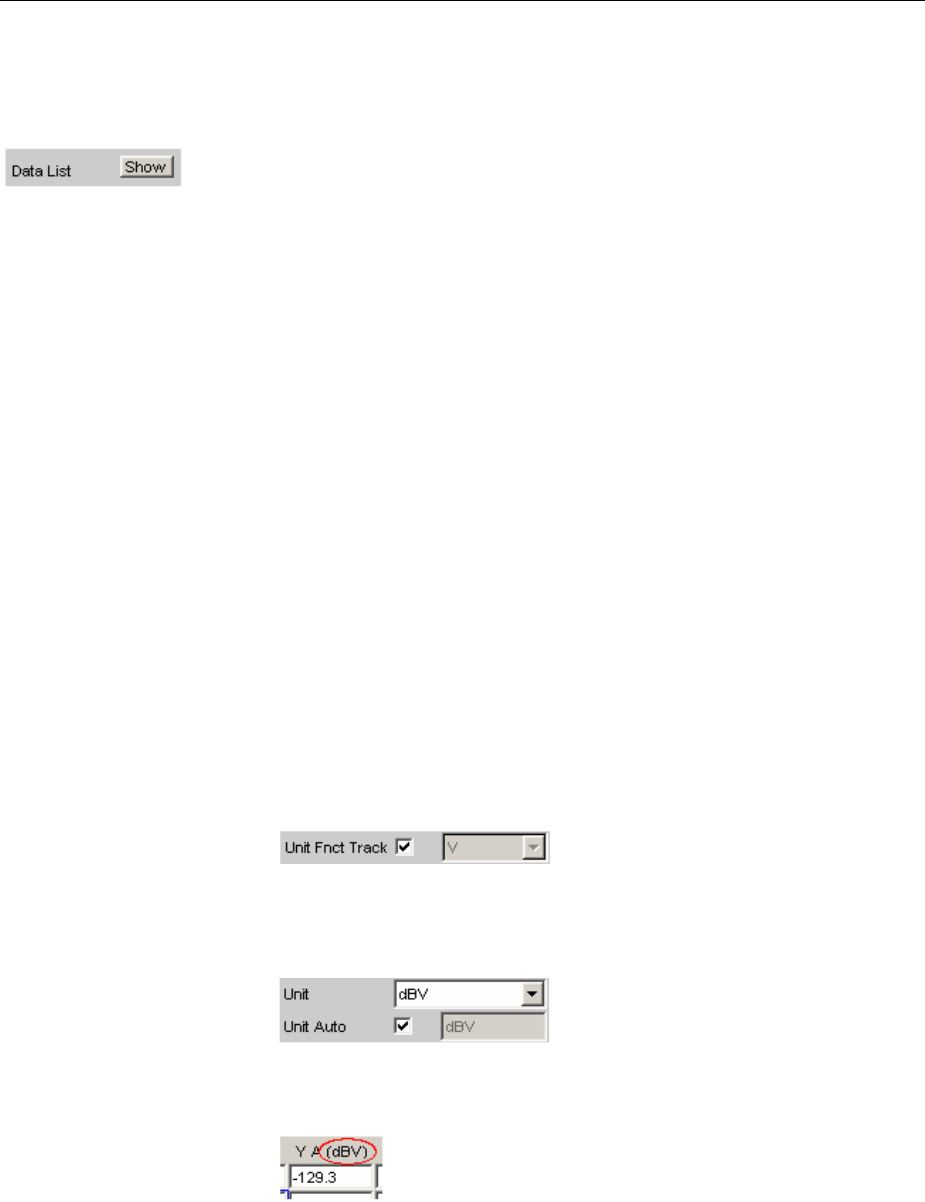
R&S UPV Result List
1146.2084.32 4.549 E-9
Calling Up
Adata list button can be found in the first line of every display configuration panel
and can be used to open a measurement value list for each graphic system or for additional graphic
display.
Trace A, Trace B and the associated X axes are displayed as numeric values in a maximum of four
columns.
The column on the left-hand side contains the number of the measurement value, a coloured marking
indicating the row containing the value at which the cursor is located and may also contain coloured
arrow symbols indicating the direction in which a cursor left the display window. Pressing the Find
Cursor softkey adjusts the display window so that the data set appears together with the cursor at the
center of the display.
In the columns for the Y values of Trace A and Trace B, digits highlighted in colour by pressing the
Selection softkey indicate whether the measurement result is violating the "Limit Upper" and/or "Limit
Lower" parameters or whether the value is a harmonic or a peak.
Hidden sections of the data set can be shown in the display window using the scroll bar on the right-
hand side of the panel or using the blue selection frame.
Parameter Fields of the Panel
The result list does not have its own panel; it is configured according to the settings in the display
configuration panel from which it was opened.
The following parameter fields and softkey functions affect the result list (and, at the same time, the
traces and bargraphs):
Unit Funct Track
Used to determine whether the unit is the same as that set in the
analyzer or whether it can be user-selected.
Unit
The unit set here is displayed above the measurement result column
for Trace A / Trace B or above the values on the X axis:
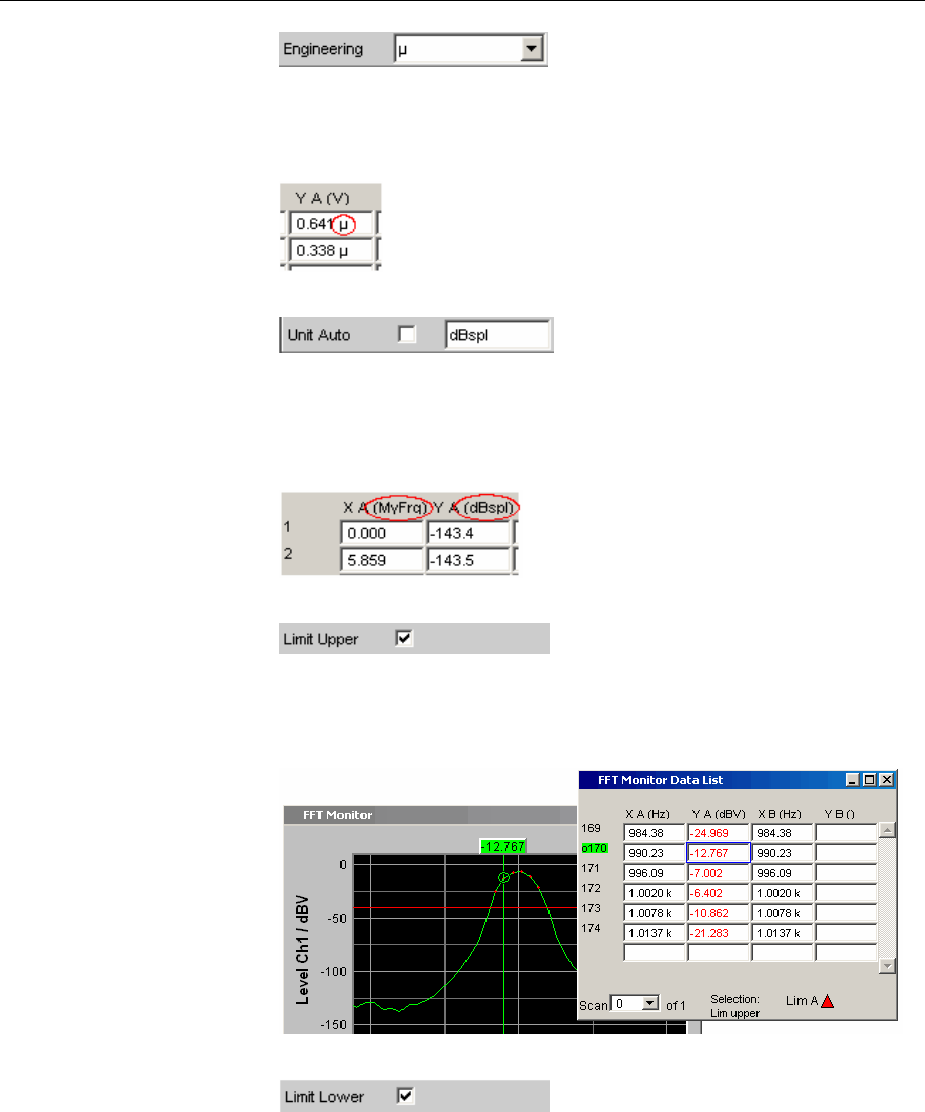
Result List R&S UPV
1146.2084.32 4.550 E-9
Engineering
The measurement values for Trace A or Trace B and the values on
the X axis are displayed with the engineering selected in this
parameter field:
Unit Auto
Used to determine whether the unit label displayed above the
measurement result column for Trace A / Trace B or above the values
on the X axis is the same as the unit set in the "Unit Funct Track" or
Unit parameter field, or whether it can be user-selected.
Limit Upper
If a "Limit Upper" value or scan is set here, the measurement values
which violate the limit are displayed in red if "Limit Upper" or
"LimUpp&Low" is set under the "Selection" softkey.
Limit Lower
If a "Limit Lower" value or scan is set here, the measurement values
which violate the limit are displayed in red if "Limit Lower" or
"LimUpp&Low" is set under the "Selection" softkey.
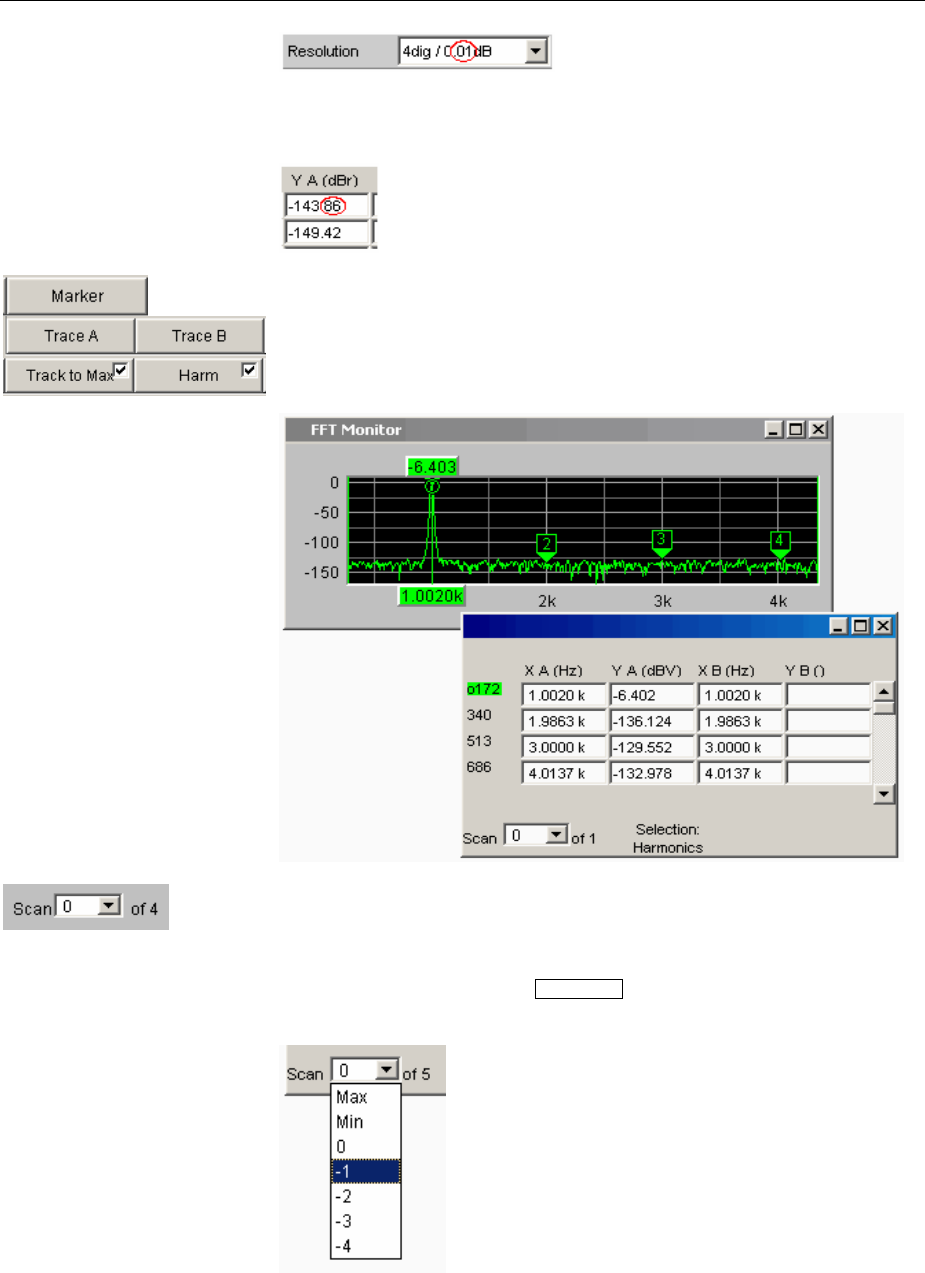
R&S UPV Result List
1146.2084.32 4.551 E-9
Resolution
Used to set the number of digits used to display the measurement
results for Trace A and Trace B and the values on the X axis.
If harmonics are shown in the graphical display (activated using the
softkey menu), a display filter which only shows the values of the
harmonics can be applied to the list display by setting "Harmonics"
under the "Selection" softkey. There are gaps in the numbering of the
values on the left side of the window.
in graphical display
This field and selection option in the graphical display also appears in
the result list. It indicates the selected scan for Sweep Graph1 to 4
graphic subsystems which have multi-scan recording.
The current value for the respective scan is entered here by scrolling
through the scans using the Next Scan rocker key; this value can then
be changed.
Number 0 means the most recent scan. The lower the negative
number, the older the scan. The number 2 identifies the Max scan,
and 1 means the Min scan.

Numeric Display R&S UPV
1146.2084.32 4.552 E-9
Softkey Menu
Explanation of the individual menu items:
Level 1 Level 2 Brief description
Close Used to close the result list.
Find Cursor Used to adjust the display window containing the result list so
that the data set appears together with the cursor at the center
of the display.
If both cursors are activated, this button is used to toggle
between the two cursors.
Selection The following values are listed in the result list:
All All
Lim upper Only those values which overrange the upper limit
Lim lower Only those values which underrange the lower limit
Lim upp&low Only those values which overrange the upper limit and
underrange the lower limit
Harmonics Only harmonics
Peaks Partial trace maxima
Numeric Display
The numeric display provides a clear overview of max. 8 measurement results (two-channel
instruments) or max. 32 measurement results (multichannel instruments) from max. four analyzer
measurement functions from the Analyzer Function panel. If all of the analyzer measurement functions
are activated, the individual columns are assigned the measurement functions in the following
sequence (from left to right):
Measurement results for Analyzer Function, Level Monitor, Input Monitor, Freq/Phase.
If certain analyzer measurement functions in the Analyzer Function panel are deactivated, the
associated measurement results are hidden. The name of the measurement function, however, clearly
indicates which column refers to which measurement function.
For more detailed information on the assignment of the individual measurement results to the analyzer
measurement functions see "Combi Display" on page 4.555.

R&S UPV Numeric Display
1146.2084.32 4.553 E-9
Graphical Display, Explanation of the Elements
The explanation of the elements is based on the numeric display for two-channel instruments.
Name of measurement function
Measurement result for Ch1
Measurement result for Ch2
Meas. result for Function
Meas. result for Level Monitor Meas. result for Input Monitor
Measurement result for
Freq/Phase
Selection frame
Limit violation display
For multichannel instruments, the only difference are the additional lines Ch3 to Ch8.
Name of measurement
function
Name of the current measurement function from left to right:
Function, Level Monitor, Input Monitor, Freq/Phase
If the measurement function is changed in the analyzer panel, the
labels here also change.
Measurement result for
Channel 1
In the sequence specified above.
Measurement result for
Channel 2
In the sequence specified above.
Measurement result for
Function
Column 1: Measurement results for the function which is set in
the Function field of the Analyzer Function panel.
Measurement result for
Level Monitor
Column 2: Measurement results for the set Level Monitor
function.
Measurement result for
Input Monitor
Column 3: Measurement results for the Input Monitor function.
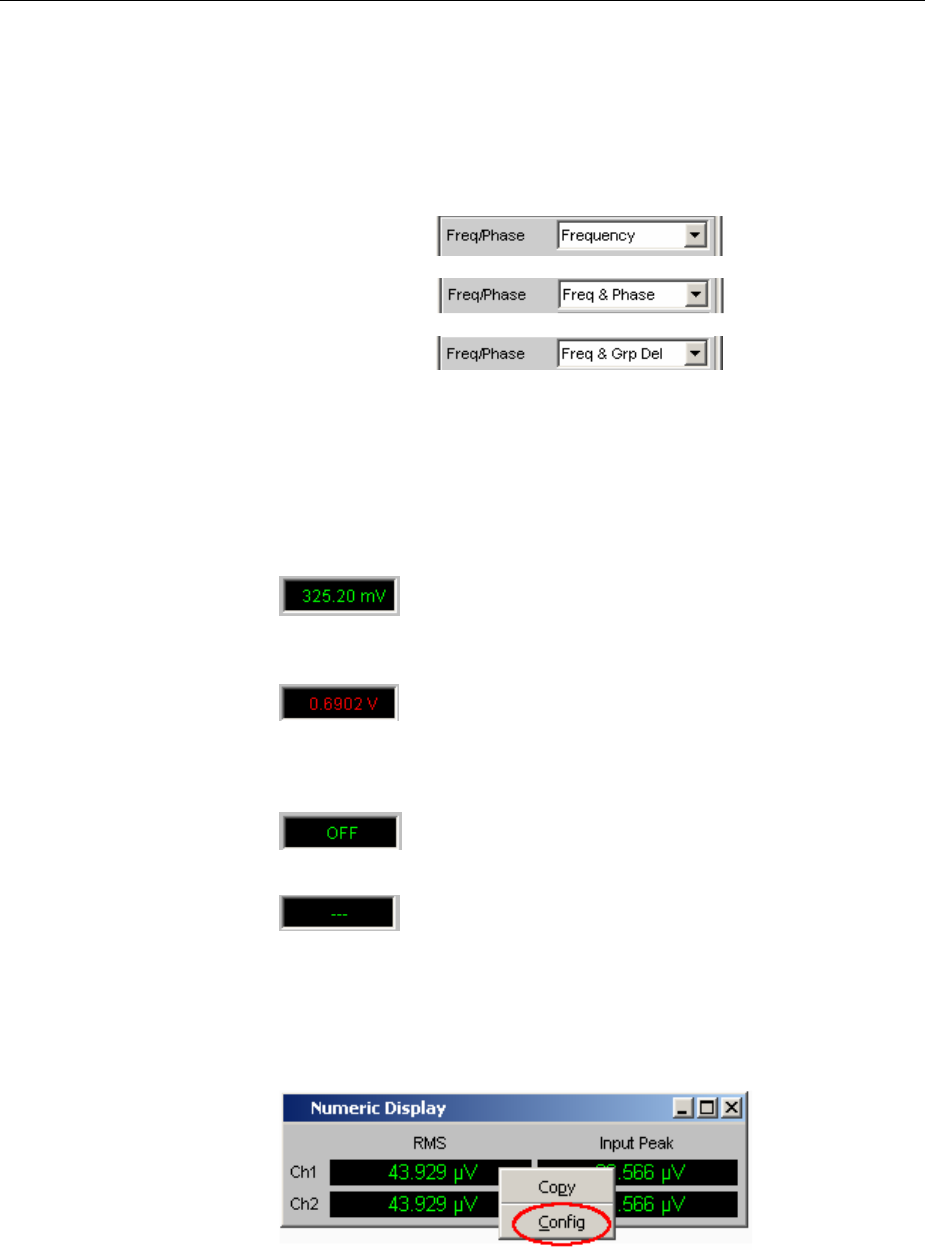
Numeric Display R&S UPV
1146.2084.32 4.554 E-9
Measurement result for
Freq/Phase
Column 4: Measurement result for the Freq/Phase
measurement function.
Display of the frequency measurement result in the
first row for Frequency or Freq & Phase /
Freq & GrpDel,and display of the phase or group
delay measurement in the second row.
Selection frame If the numeric display has the focus, measurement results can be
selected by moving the blue selection frame with the rotary knob or by
clicking with the mouse. Clicking with the rotary knob or double-
clicking with the mouse opens the associated combi display (see
"Combi Display" on page 4.555).
Limit violation display
Measurement result displayed in green: Limit monitoring is
deactivated or the measurement result is within the preset limits.
Measurement result displayed in red: A limit has been violated. See
"Combi Display" on page 4.555 for information on how to set the
limits.
The measurement is deactivated in the analyzer panel.
No measurement result is available (yet).
Config
Right-clicking in a field displaying measurement results calls a popup
menu with the entry "Config". Left-clicking on this entry opens the
associated DispConfig panel.
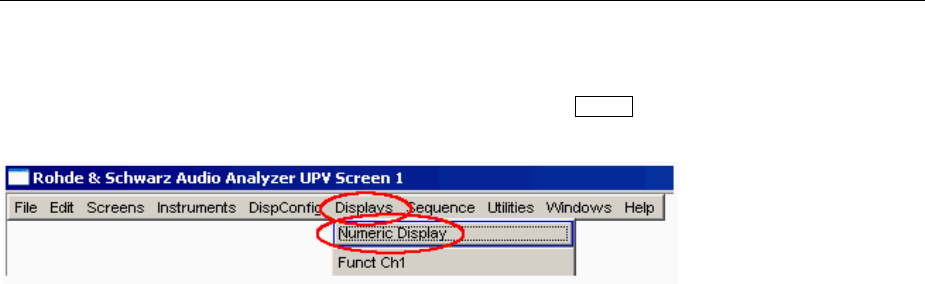
R&S UPV Combi Display
1146.2084.32 4.555 E-9
Calling Up
The numeric display is opened via the menu bar by pressing the MENU key on the front panel or, with
mouse operation, by moving the pointer to the left-hand edge of the R&S UPV application window.
Parameter Fields of the Panel
The numeric display does not have its own panel; however, a number of settings made in the
measurement result configuration panels in the combi displays affect the way in which the
measurement results are displayed:
Unit
Unit Auto
Resolution
Engineering
Reference
Limit Lower
Limit Upper
See "Combi Display" on page 4.555 for more detailed information.
Softkey Menu
The numeric display does not have its own softkey menu; however, the softkey functions of the combi
displays affect the way in which the measurement results are displayed.
See "Combi Display" on page 4.555 for more detailed information.
Combi Display
It is often the case that the measurement results in the numeric display do not contain adequate
information. Additional features such as analog bargraphs, limit monitoring or the storage of maximum
and minimum values are frequently required.
The combi display is used for this purpose. Additional information can be displayed for every
measurement shown in the numeric display.
The free selection and free scalability mean that especially important or critical results can be monitored
and tracked even when viewing the R&S UPV screen from a relatively long distance.
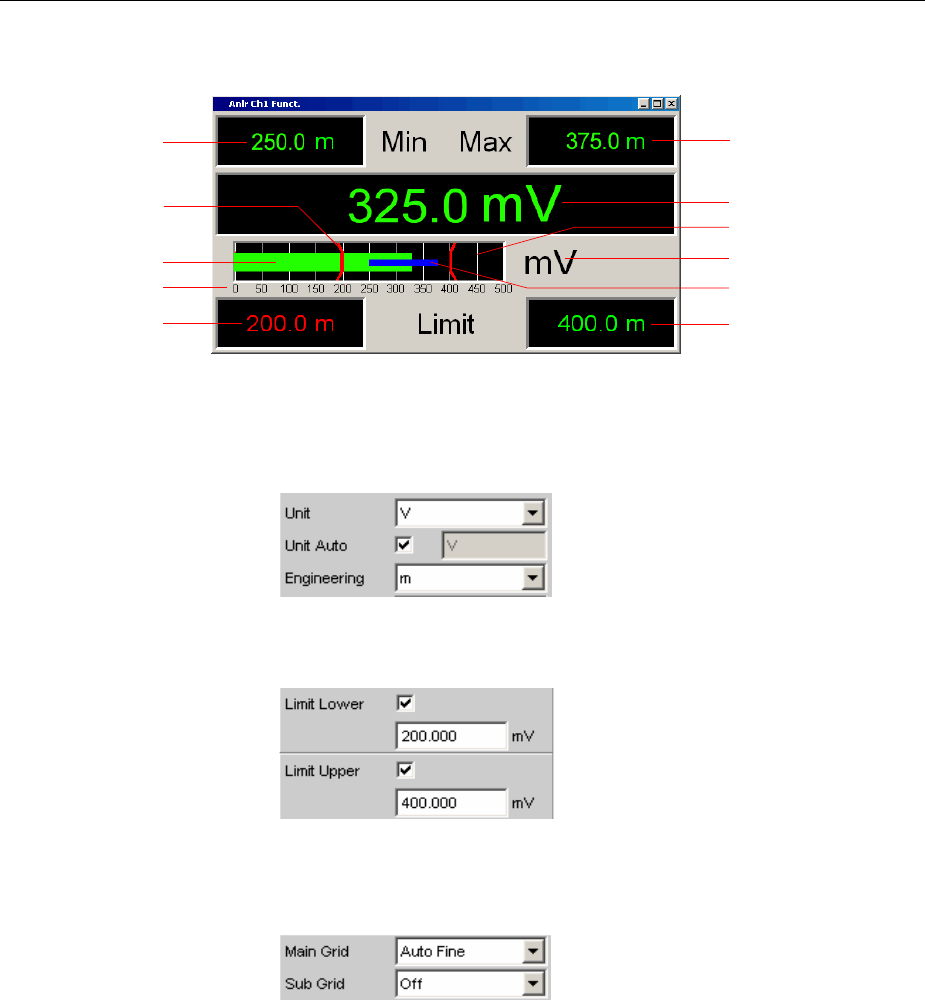
Combi Display R&S UPV
1146.2084.32 4.556 E-9
Graphical Display, Explanation of the Elements
Measurement display
Unit
Upper limit
Lower limit
Maximum value
Minimum value
Limit marker
Bargraph
Min/Max bargraph
Main grid, subgrid
Scaling
Bargraph Displays the measurement result as a bar on a scale.
If the bar changes to red, there is a limit violation.
Unit Unit of the bargraph; set with
Limit marker Displays the lower and upper limit specified under
in the bargraph.
Main grid, subgrid Main grid and subgrid; set with
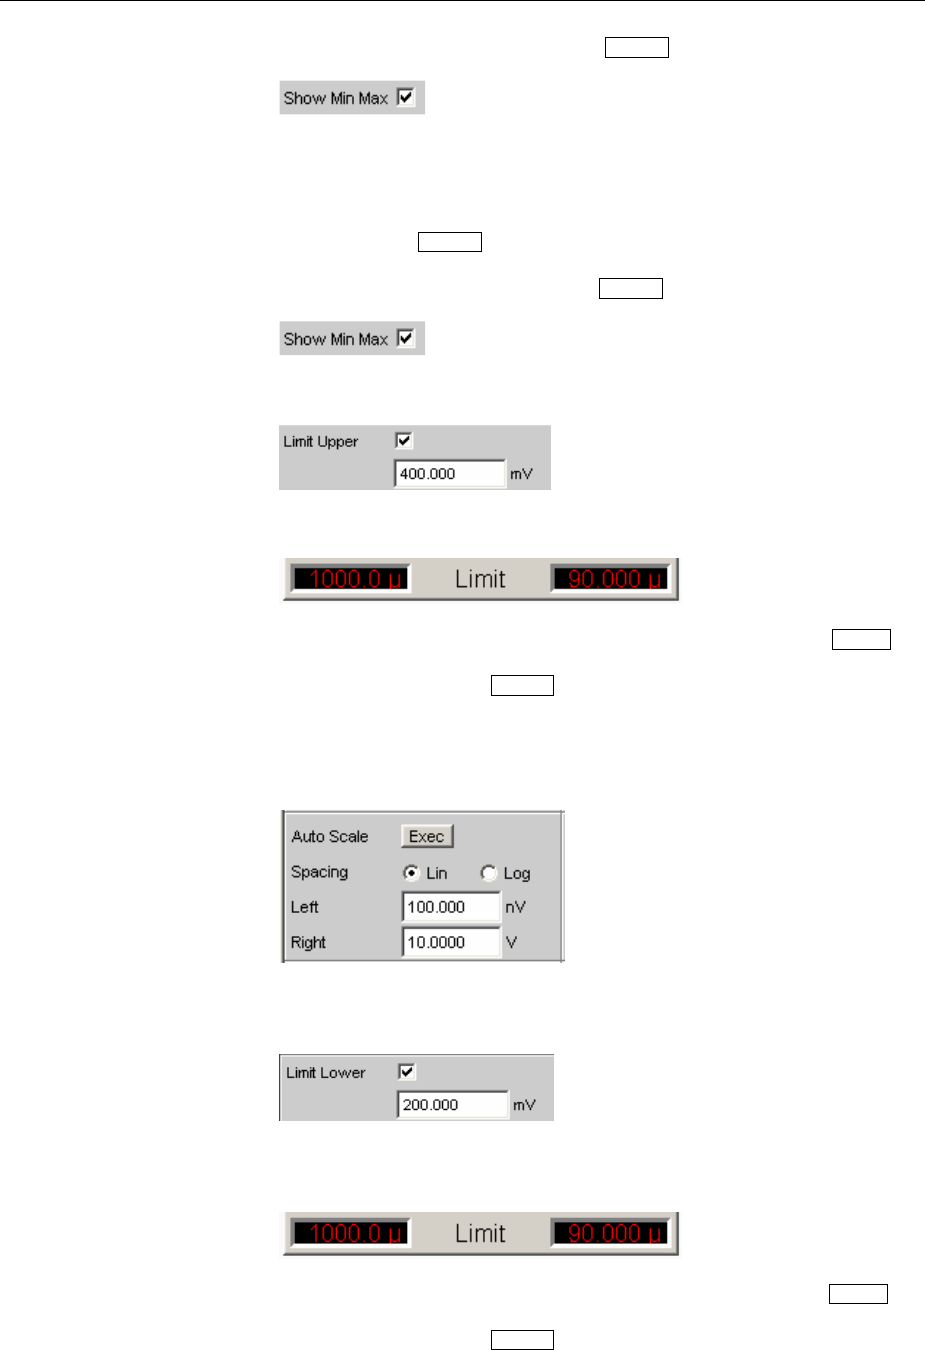
R&S UPV Combi Display
1146.2084.32 4.557 E-9
Maximum value Maximum value measured since the START key was pressed; set with
Measurement display Current measurement value.
If the measurement value changes to red, there is a limit violation.
Min/Max bargraph The ends of the blue bar indicate the lowest and highest measurement
value since the START key was pressed.
Minimum value Minimum value measured since the START key was pressed; set with
Upper limit Displays the upper limit specified under
as a numeric value.
If the right value changes to red,
this means that a violation of the upper limit occurred after the START
key was pressed. This limit violation is indicated until the hold function
is reset by pressing the START key again or by entering a new upper
limit.
Scaling Measurement range of the bargraph; set with
Lower limit Displays the lower limit specified under
as a numeric value.
If the left value changes to red,
this means that a violation of the lower limit occurred after the START
key was pressed. This limit violation is indicated until the hold function
is reset by pressing the START key again or by entering a new lower
limit.

Combi Display R&S UPV
1146.2084.32 4.558 E-9
Config Right-clicking anywhere in the combi display calls up a button labeled
"Config". Left-clicking on this Config button opens the associated
DispConfig panel.
Calling Up
There are several ways to open the combi display:
•Open the Display menu.
Select the Numeric Display menu item.
Move the blue selection frame to the desired measurement result using the rotary knob and then
click with the rotary knob or, with mouse operation, double-click the desired measurement result in
the numeric display.
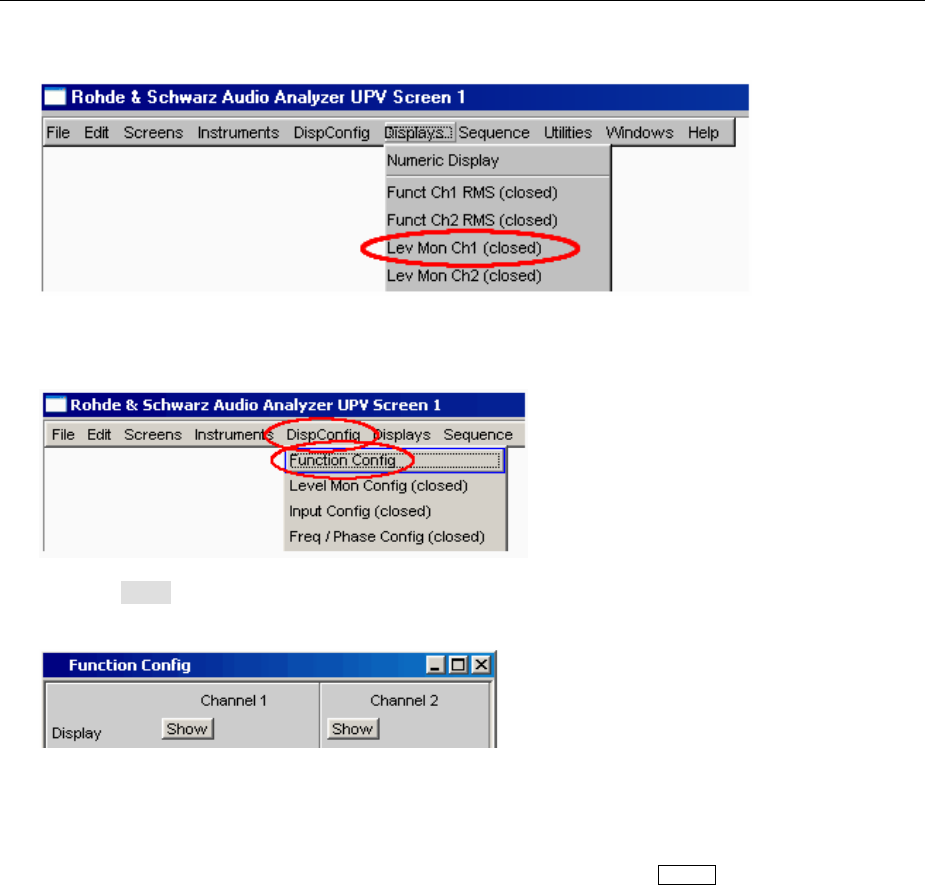
R&S UPV Combi Display
1146.2084.32 4.559 E-9
•Open the combi display directly via the menu bar.
•Select a measurement result configuration panel from the menu field as follows:
Click the Show button in the Display field of the configuration panel (only for two-channel
instruments).
The measurement result configuration panels are used to determine how measurement results are
displayed in the numeric display and the combi display. What is measured and how measurement
is performed is configured in the analyzer panel.
The measurement result configuration panels are opened by pressing the MENU key on the front panel
or, with mouse operation, by moving the pointer to the top left-hand edge of the R&S UPV application
window.
4different measurement result configuration panels are available.
Function Config
The panel is used to configure how the measurement results for the analyzer measurement function
"Function" are displayed.
Level Mon Config
The panel is used to configure how the measurement results for the additional measurement
function "Level Monitor" are displayed.
Input Config
The panel is used to configure how the measurement results for the additional measurement
function "Input Peak" are displayed.
Freq / Phase Config
The panel is used to configure how the measurement results for the additional measurement
function "Freq/Phase" are displayed.
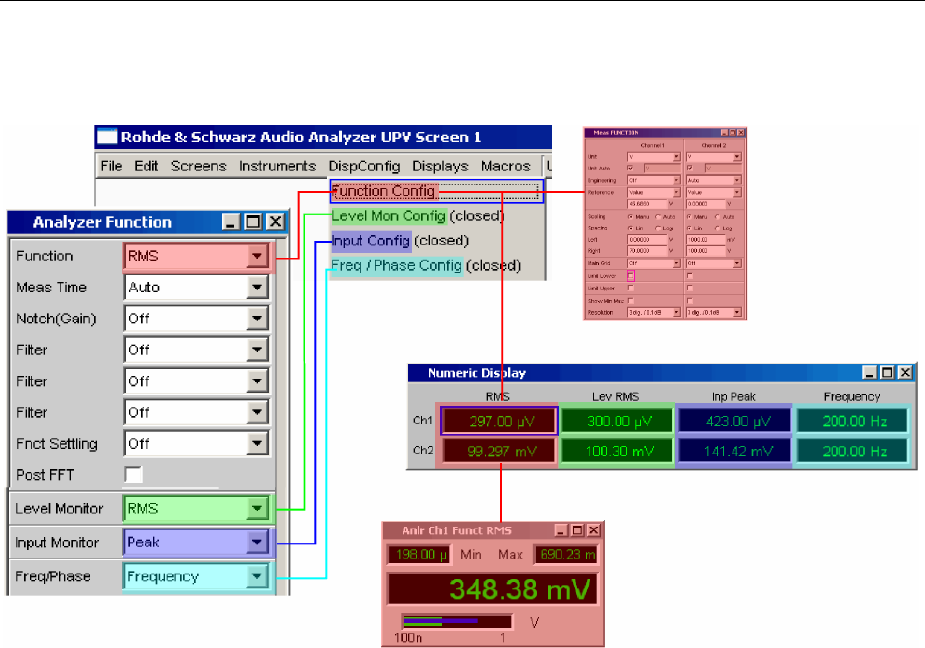
Combi Display R&S UPV
1146.2084.32 4.560 E-9
The illustration below shows the assignment of the analyzer measurement functions to the
measurement result configuration panels and the measurement result displays.
Parameter Fields of the Panel
The layout of the measurement result configuration panels is almost identical for all of the displays. The
differences are explained in the respective setting function description.
The individual setting lines of the various measurement result configuration panels are addressed with
remote control commands which differ by one figure in accordance with the SENSe lettering on the
basis of SCPI.
Function: SENSe[1]
Input: SENSe2
Freq / Phase: SENSe3
Level Mon: SENSe6
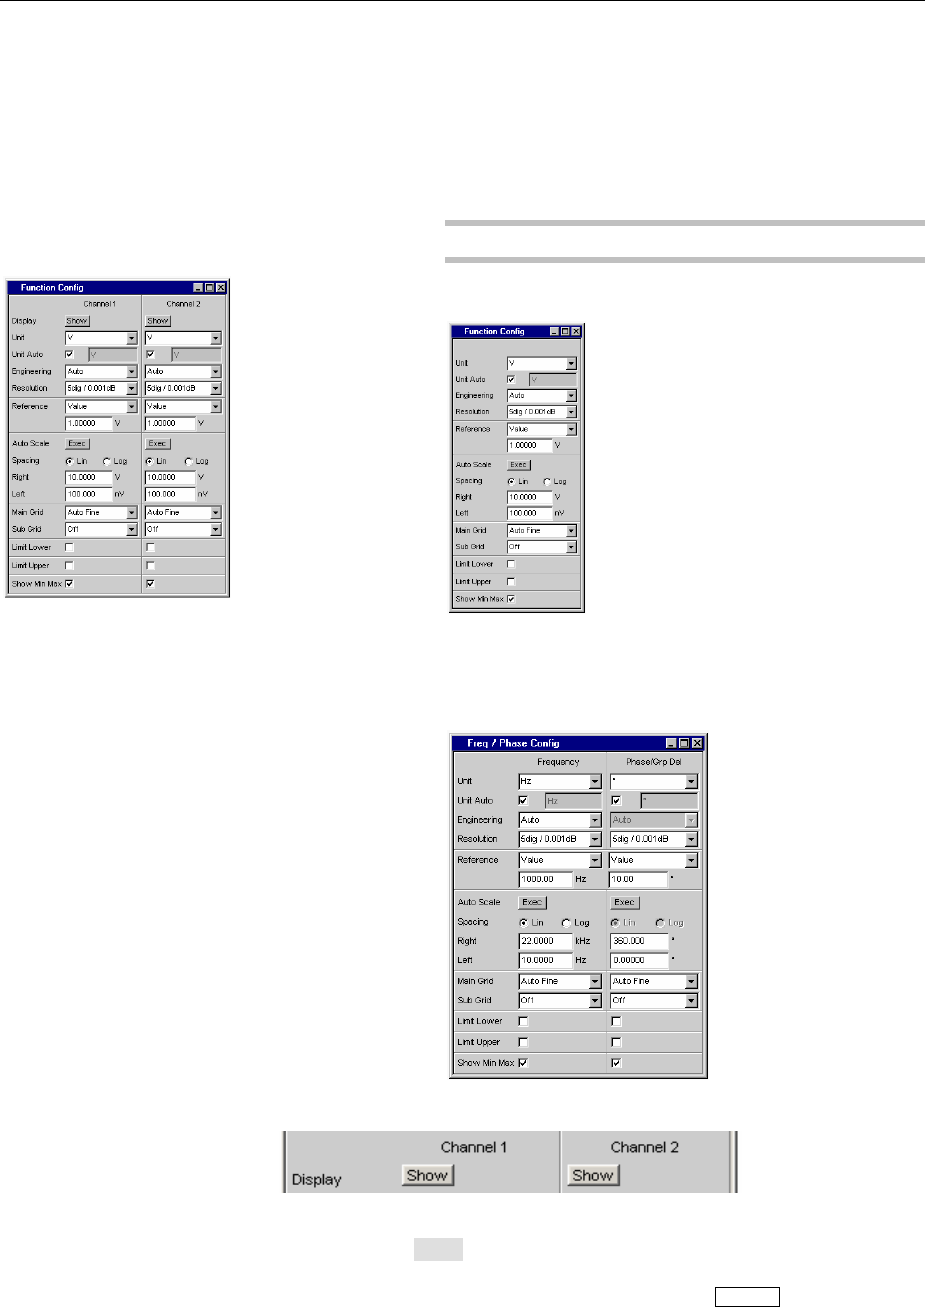
R&S UPV Combi Display
1146.2084.32 4.561 E-9
Measurement result configuration panels
for two-channel instruments
Measurement result configuration panels for
multichannel instruments
For two-channel instruments, channel 1 and
channel 2 can be configured separately for
each measurement function. For this reason,
both columns are always provided for the
Function, Level Monitor and Input Peak
measurement results.
For the configuration of the measurement result
displays of Function, Level Monitor and Input Monitor
in the case of multichannel instruments,
All channels are configured fully identically.
Therefore, only one column is provided.
Configuring the Freq/Phase measurement result
displays for multichannel instruments also requires
two columns:
Display
Not for multichannel instruments:
Clicking the Show button activates the combi display for a
measurement value.
To close it, provided it has the focus, click on the CLOSE button or on
the X in the title bar.

Combi Display R&S UPV
1146.2084.32 4.562 E-9
Copy to Ch2
Not for multi-channel instruments:
The Copy to Ch2 function exists for two-channel measurements for
the Function Config, Level Mon Config and Input Config measurement
result configuration panels.
As the name says, the setting lines from the first channel are
transferred to the second channel. This happens once for almost all
setting lines when the Exec button is pressed.
In the Freq/Phase configuration panel this setting line is not available
as the transfer of frequency setting lines makes no sense in the phase
area.
Unit
This parameter field is used to determine the unit in which the
measurement results are to be displayed.
The parameter list available in this parameter field depends on
whether the analog or digital analyzer instrument has been selected
and under which of the 4 analyzer measurement functions
-Function
-Level Monitor
-Input measurement
-Frequency/phase measurement
the panel was opened.
Approx. 30 different units are available to allow all measurement
functions of the analyzer to be displayed.
If a logarithmic unit (dBu, dBV, dBr, dBm, dBFS, dBUI) is selected, or
alinear unit in which negative numbers can occur (e.g. jV, jW), the
following parameter field "Spacing" is displayed as not user-accessible
and its parameter is set to Lin, since it makes no sense to display
measurement values with a logarithmic unit or negative values on a
logarithmically scaled axis.
Remote-control command:
SENSe[1]:UNIT[1]|2 V|DBV| …
SENSe6:UNIT[1]|2 V|DBV| …
SENSe2:UNIT[1]|2 V|DBV| …
SENSe3:FREQuency:UNIT HZ|DHZ| …
SENSe3:PHASe:UNIT DEG|DDEG| …
Unit Auto
Used to determine whether the unit label displayed in the numeric
display and in the combi display is the same as that set in the Unit
parameter field above or whether it can be user-selected.
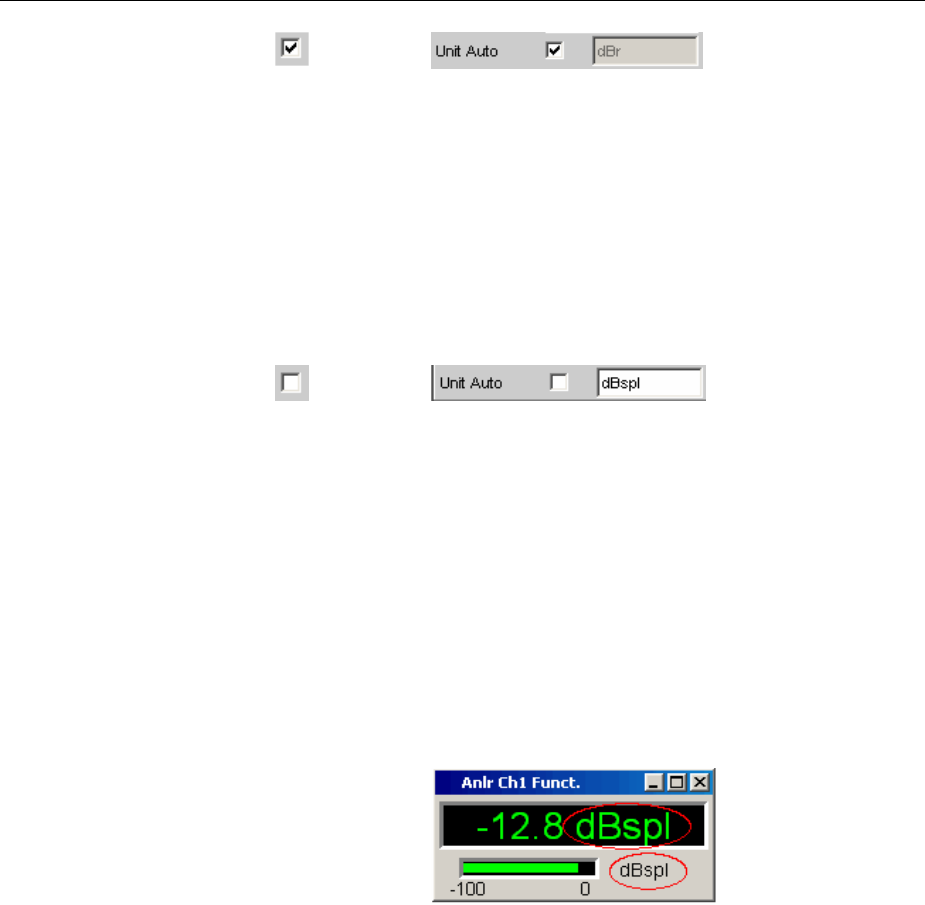
R&S UPV Combi Display
1146.2084.32 4.563 E-9
The unit label displayed in the numeric display and
in the combi display is the same as the unit set in
the Unit parameter field and is therefore generated
automatically by the R&S UPV.
Remote-control command:
SENSe[1]:UNAuto[1]|2 ON
SENSe6:UNAuto[1]|2 ON
SENSe2:UNAuto[1]|2 ON
SENSe3:FREQuency:UNAuto ON
SENSe3:PHASe:UNAuto ON
Auser-defined unit label can be entered.
Practical example:
The output level U0dBspl which is output at a sound
pressure of 0 dBspl (spl = sound pressure level) is
specified for high-quality microphones.
If the measured microphone output level is displayed
in the referenced unit dBr and entered for the
reference value U0dBspl,the level displayed on the
R&S UPV will be in dBr but corresponds to the
sound pressure in dBspl. For the measurement
result display, however, a numeric value in dBspl is
desirable. To allow this, the unit label can be
changed from dBr to dBspl.
Remote-control command:
SENSe[1]:UNAuto[1]|2 OFF
SENSe6:UNAuto[1]|2 OFF
SENSe2:UNAuto[1]|2 OFF
SENSe3:FREQuency:UNAuto OFF
SENSe3:PHASe:UNAuto OFF
SENSe[1]:USERunit[1]|2 'string'
SENSe6:USERunit[1]|2 'string'
SENSe2:USERunit [1]|2 'string'
SENSe3:FREQuency:USERunit [1]|2
'string'
SENSe3:PHASe:USERunit [1]|2 'string'
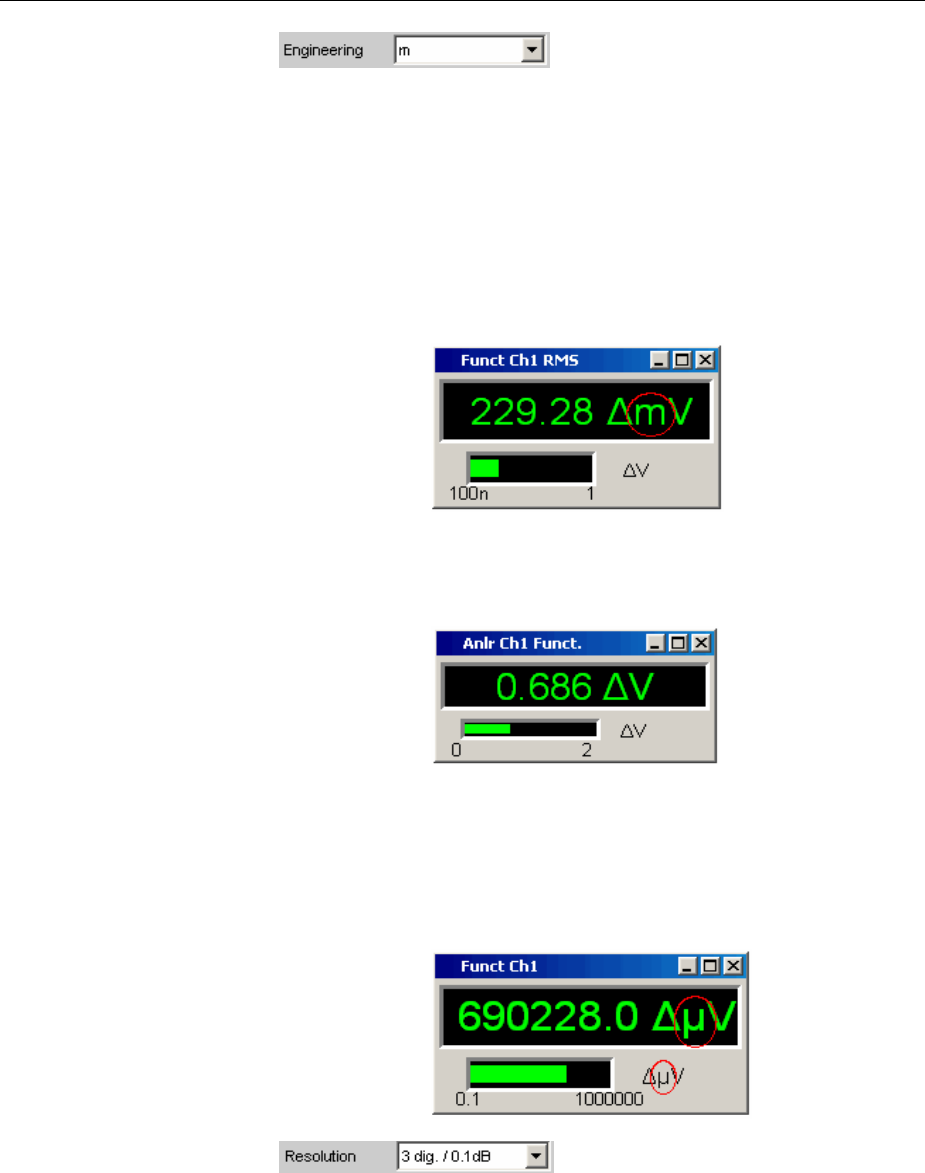
Combi Display R&S UPV
1146.2084.32 4.564 E-9
Engineering
Computes the measurement results in the numeric display field and in
the combi display using a power of ten that is divisible by three.
This parameter field cannot be accessed if a dB or % unit is selected
in the Unit parameter field above since these units do not usually have
an engineering function.
Auto Automatic engineering assignment from p to M, for
the measurement result, limits and Min/Max values;
depends on the magnitude of the respective value.
Off Engineering is deactivated.
Measurement result, limits and Min/Max values are
always displayed in 1.0 E0format.
J
m
k
Engineering fixed to Z, m or k.
The values to be displayed are multiplied by the
factor 1.0 E6,1.0 E3or 1.0 E-3.
Measurement results, limits and Min/Max values are
displayed with the selected engineering.
Resolution
Used to set the number of digits used to display the measurement
result, limits and Min/Max values.

R&S UPV Combi Display
1146.2084.32 4.565 E-9
3dig. / 0.1 dB
4dig. / 0.01 dB
5dig. / 0.001 dB
6dig. / 0.0001 dB
7dig. / 0.00001 dB
Significance of the parameter list using an
example:
5dig. / 0.001 dB
5dig.:Values which are displayed with
alinear unit (V Hz, …) are
displayed with 5 digits:
0.001 dB:Values which are displayed with
alogarithmic unit (dBV, dBu, …)
are displayed with three decimal
points:
If the numerical values can no longer be
displayed with the selected resolution (e.g.
because the number of places is too high
with the selected engineering setting) the
display is rounded in exponential style:
Reference
Used to select the reference for referenced units for the measurement
result.
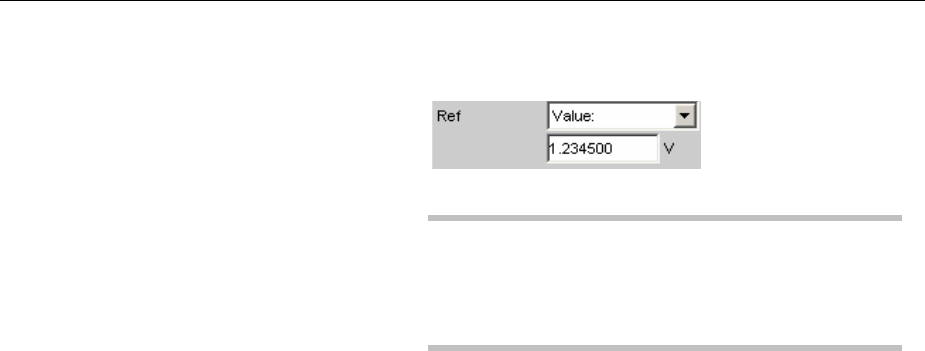
Combi Display R&S UPV
1146.2084.32 4.566 E-9
Value Anumeric value with unit must be entered as the
reference value in the parameter field below.
Note:
If manual switchover is made from a variable
reference value (Meas Ch1, Meas Ch2, Gen Track),
to Value, the fixed reference value (Value) last valid
will be restored.
Remote-control command:
SENSe[1]:REFerence:MODE[1]|2 VALue
SENSe6:REFerence:MODE VALue
SENSe2:REFerence:MODE VALue
SENSe3:FREQuency:REFerence:MODE VALue
SENSe3:PHASe:REFerence:MODE VALue
SENSe[1]:REFerence[1]|2 <nu>
SENSe6:REFerence <nu>
SENSe2:REFerence <nu>
SENSe3:FREQuency:REFerence <nu>
SENSe3:PHASe:REFerence <nu>
Store The current measurement result of a single-channel
measurement is stored under Value when the
ENTER key is pressed or the rotary knob/mouse key
is clicked; this measurement result is then displayed
as the new reference value. The reference value
does not change while measurements are being
performed. This selection option is only available for
1-channel measurement.
Remote-control command:
SENSe[1]:REFerence:MODE[1]|2 STORe
SENSe6:REFerence:MODE STORe
SENSe2:REFerence:MODE STORe
SENSe3:FREQuency:REFerence:MODE STORe
SENSe3:PHASe:REFerence:MODE STORe

R&S UPV Combi Display
1146.2084.32 4.567 E-9
Store Ch1
Store Ch2
Store Ch3
Store Ch4
Store Ch5
Store Ch6
Store Ch7
Store Ch8
Store Ch9
Store Ch10
Store Ch11
Store Ch12
Store Ch13
Store Ch14
Store Ch15
Store Ch16
The current measurement result for the specified
channel is stored under Value when the ENTER key
is pressed or the rotary knob/mouse key is clicked;
this measurement result is then displayed as the
new reference value. The reference value does not
change while measurements are being performed.
These selection options are only available for two-
channel or multichannel measurement.
Remote-control command:
SENSe[1]:REFerence:MODE CH1Store |…
SENSe6:REFerence:MODE CH1Store |…
SENSe2:REFerence:MODE CH1Store |…
SENSe3:FREQuency:REFerence:MODE
CH1Store |…
Meas Ch1
Meas Ch2
These selection options are only available for two-
channel measurement. Every level measurement
result for Channel 1 and Channel 2 is stored as the
reference value. If a referenced unit has been
selected in the Unit parameter field, the
measurement result is referenced to this variable
reference value and displayed.
This selection option is only available for 2-channel
measurement.
Remote-control command:
SENSe[1]:REFerence:MODE CH1Meas |
CH2Meas
SENSe6:REFerence:MODE CH1Meas |
CH2Meas
SENSe2:REFerence:MODE CH1Meas |
CH2Meas
SENSe3:FREQuency:REFerence:MODE
CH1Meas | CH2Meas
Meas Ref Ch This selection option is only available for
multichannel instruments.
Every level measurement result of the channel
specified in the Analyzer Config panel under Ref
Channel is saved as a reference value.
If a reference-specific unit was selected in the "Unit"
parameter field, the measurement result is
referenced to this floating reference value and
displayed.
Remote-control command:
SENSe[1]:REFerence:MODE MREFchannel
SENSe6:REFerence:MODE MREFchannel
SENSe2:REFerence:MODE MREFchannel
SENSe3:FREQuency:REFerence:MODE
MREFchannel
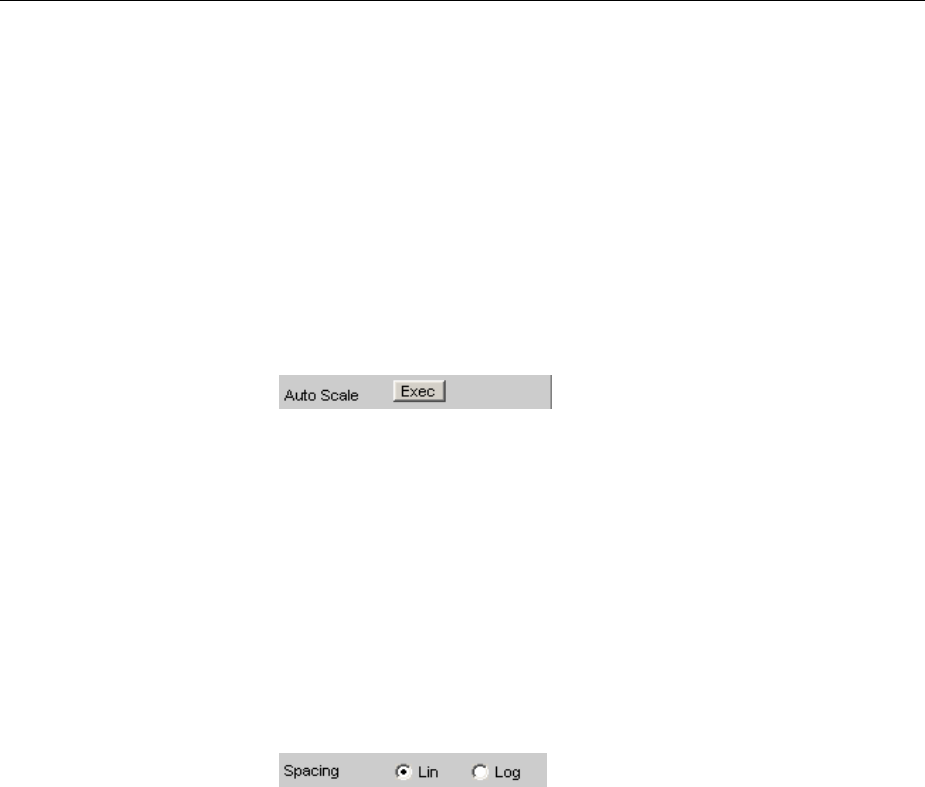
Combi Display R&S UPV
1146.2084.32 4.568 E-9
Gen Track The currently valid and every newly set generator
voltage is stored as the reference value and can
then be used for referenced display (by both
channels). If a referenced unit has been selected in
the Unit parameter field, the measurement result is
referenced to this reference value and displayed.
Remote-control command:
SENSe[1]:REFerence:MODE[1]|2 GENTrack
SENSe6:REFerence:MODE GENTrack
SENSe2:REFerence:MODE GENTrack
SENSe3:FREQuency:REFerence:MODE
GENTrack
SENSe3:PHASe:REFerence:MODE GENTrack
Auto Scale
One-off automatic scaling of the bargraph.
Exec Clicking this button triggers one-off scaling of the
bargraph; the current minimum and maximum
values are used for the scaling process.
The determined values are entered in the Left and
Right parameter fields below.
For multichannel instruments the lowest minimum
value and the highest maximum value of all open
combi displays are determined and entered for all
channels in the Left and Right right parameter fields
below.
Spacing
Linear or logarithmic spacing of the bargraph.
Lin Linear spacing of the bargraph.
If a logarithmic unit (dB unit) was selected in the
"Unit"parameter field, this field is displayed as not
user-accessible and is set to "Lin", since it makes no
sense / is not possible to use a logarithmic bargraph
to display negative values, or measurement values
that have a logarithmic unit.
Log Logarithmic spacing of the bargraph.
This parameter is only available if a linear unit (V, W,
etc) has been selected in the Unit parameter field
and its value range cannot contain negative
numbers.
Example:
Although jVis a linear unit, the measurement
results can be negative which means that
logarithmic display is not possible.
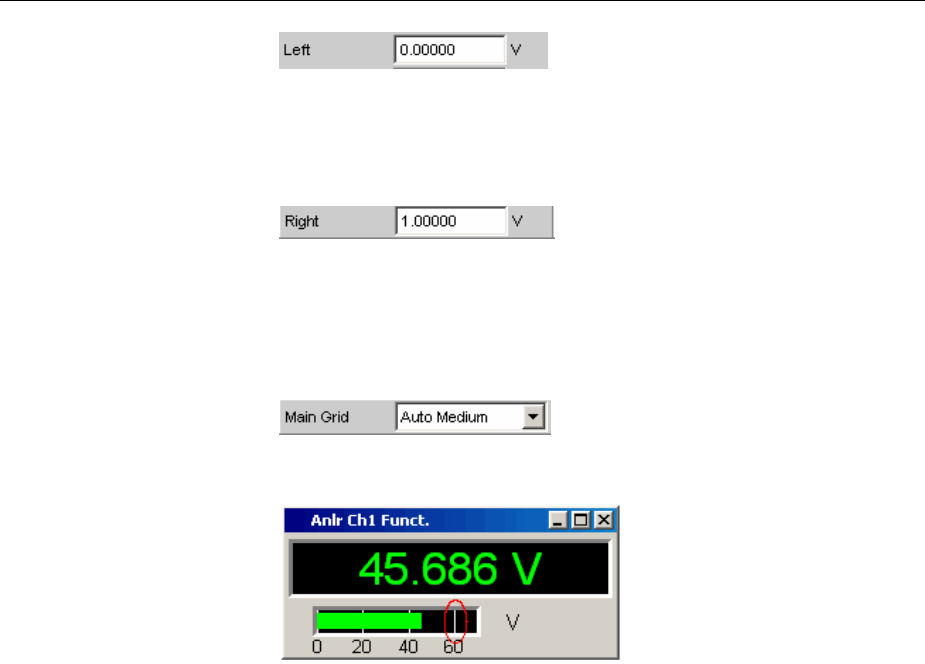
R&S UPV Combi Display
1146.2084.32 4.569 E-9
Left
Used to set the left-hand value on the bargraph.
Negative values or the value 0.00000 are not allowed when
Spacing = Log, in which case they cannot be entered.
Right
Used to set the right-hand value on the bargraph.
This value must always be higher than the Left value.
Negative values or the value 0.00000 are not allowed when
Spacing = Log, in which case they cannot be entered.
Main Grid
Division of the bargraph with vertical main lines.
Off No main lines are used in the bargraph.
On With Spacing = Log:
Decadic division of a bargraph with main lines.
Auto Coarse
Auto Medium
Auto Fine
With Spacing = Lin:
Coarse, medium or fine division of a bargraph with
main lines. One to two, 3 to 4 or 8 to 9 main lines
are displayed depending on the scale end values.
Main lines may be hidden if the combi display is
reduced in size.
Divisions With Spacing = Lin:
Preset division of a bargraph with main lines.
The desired number of divisions is set in the
parameter field below.
These main lines are not hidden if the combi display
is reduced in size.
Steps With Spacing = Lin:
Preset division of a bargraph in a fixed step size.
The step size is set in the parameter field below.
These main lines are not hidden if the combi display
is reduced in size.

Combi Display R&S UPV
1146.2084.32 4.570 E-9
Division
With Spacing = Lin:
Used to enter the number of main line divisions for a bargraph.
If, for example, 2is entered, the bargraph is divided into two
sections,i.e. one main line is displayed.
Step
With Spacing = Lin:
Used to enter the main line step size for a bargraph.
The unit of the value is not linked to the unit selected in the Unit
parameter field; the value can be given in different units.
Sub Grid
Subdivision of the main lines in a bargraph using sublines.
Off Sublines are deactivated.
2
4
5
With Spacing = Lin:
Subdivision of the main lines of a bargraph into 2, 4
or 5 sections.
If, for example, 2is selected, the area between two
main lines is divided into 2sections, i.e. one subline
appears between the main lines.
These sublines are not hidden if the combi display is
reduced in size.
Coarse
Fine
With Spacing = Log:
Coarse or fine subdivision of the main lines of a
bargraph with sublines.
Coarse:
Sublines 2 and 5 only
Fine:
All sublines

R&S UPV Combi Display
1146.2084.32 4.571 E-9
Limit Lower
Used to activate/deactivate the lower limit check.
The lower limit check is activated.
The parameter field below is used to enter a lower
limit in the units selected in the Unit parameter field.
Alower limit can be defined for the measurement
result; every measurement value is then compared
with this limit.
If a relative unit is selected, the associated reference
value (a few parameter fields higher up) is used.
The lower limit is displayed as a value (bottom left)
and as a red limit marker in the bargraph.
As soon as a limit is underranged, the measurement
result and bargraph change from green to red; if the
limit violation no longer exists, the measurement
result and bargraph are displayed in green again.
Ared measurement value in the numeric display
also indicates a limit violation:
In order to monitor limit violations over a long period
of time without having to watch the measurement
result display continuously, the lower limit is
displayed permanently in red as soon as the limit is
underranged after the START key has been
pressed.
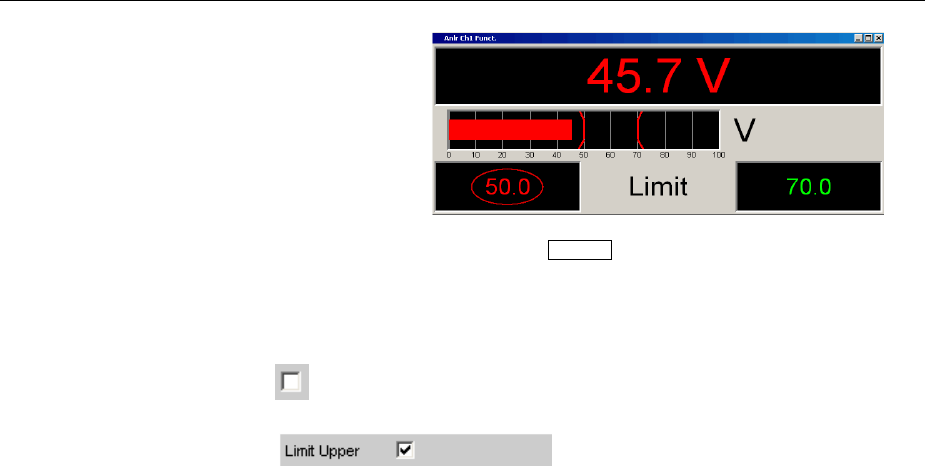
Combi Display R&S UPV
1146.2084.32 4.572 E-9
Pressing the START key or re-entering the limit
resets the hold function.
This hold function is not visible in the numeric
display.
The lower limit check is deactivated.
Limit Upper
Used to activate/deactivate the upper limit check.

R&S UPV Combi Display
1146.2084.32 4.573 E-9
The upper limit check is activated.
The parameter field below is used to enter an upper
limit in the units selected in the Unit parameter field.
An upper limit can be defined for the measurement
result; every measurement value is then compared
with this limit.
If a relative unit is selected, the associated reference
value (a few parameter fields higher up) is used.
The upper limit is displayed as a value (bottom right)
and as a red limit marker in the bargraph.
As soon as a limit is overranged, the measurement
result and bargraph change from green to red; if the
limit violation no longer exists, the measurement
result and bargraph are displayed in green again.
Ared measurement value in the numeric display
also indicates a limit violation:
In order to monitor limit violations over a long period
of time without having to watch the measurement
result display continuously, the upper limit is
displayed permanently in red as soon as the limit is
overranged after the START key has been pressed.
Pressing the START key or re-entering the limit
resets the hold function.
This hold function is not visible in the numeric
display.
The upper limit check is deactivated.
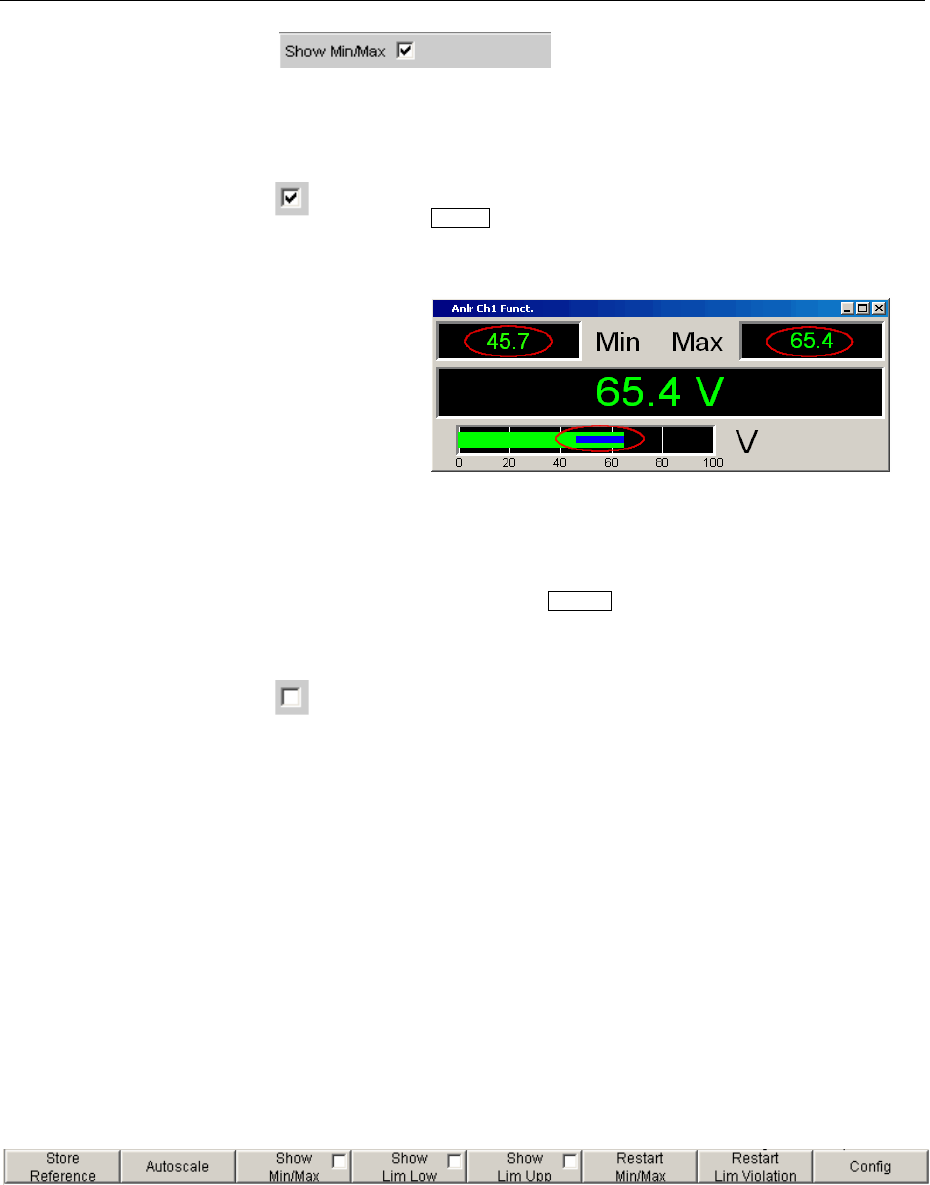
Combi Display R&S UPV
1146.2084.32 4.574 E-9
Show Min Max
Used to activate/deactivate the Min/Max display.
Two numeric values and the ends of the blue bar inside the green bar
indicate the lowest and highest values measured.
The lowest and highest value measured since the
START key was pressed are displayed.
The Min/Max values are shown in the top left and
right-hand corners of the combi display.
The ends of the blue Min/Max bar indicate the
lowest and highest values measured since the
START key was pressed.
Pressing the START key resets Min/Max value
recording and the collection of measurement values
begins again.
The Min/Max display is deactivated.
Softkey Menu
Two-channel instruments:
Every combi display has its own softkey menu. The settings selected in the menu apply exclusively to
the associated combi display and affect no other combi display.
Multichannel instruments:
If a softkey menu from a combi display of a specific measurement function (e.g. Level Monitor) was
used, the chosen setting affects all open combi displays for this measurement function. In the case of
multichannel instruments, there are no customized settings for individual channels.
The settings for "Store Reference", "Show Min/Max", "Show Lim Low" and "Show Lim Upp" can
therefore be immediately displayed 1 to 1 in the associated measurement result configuration panel .
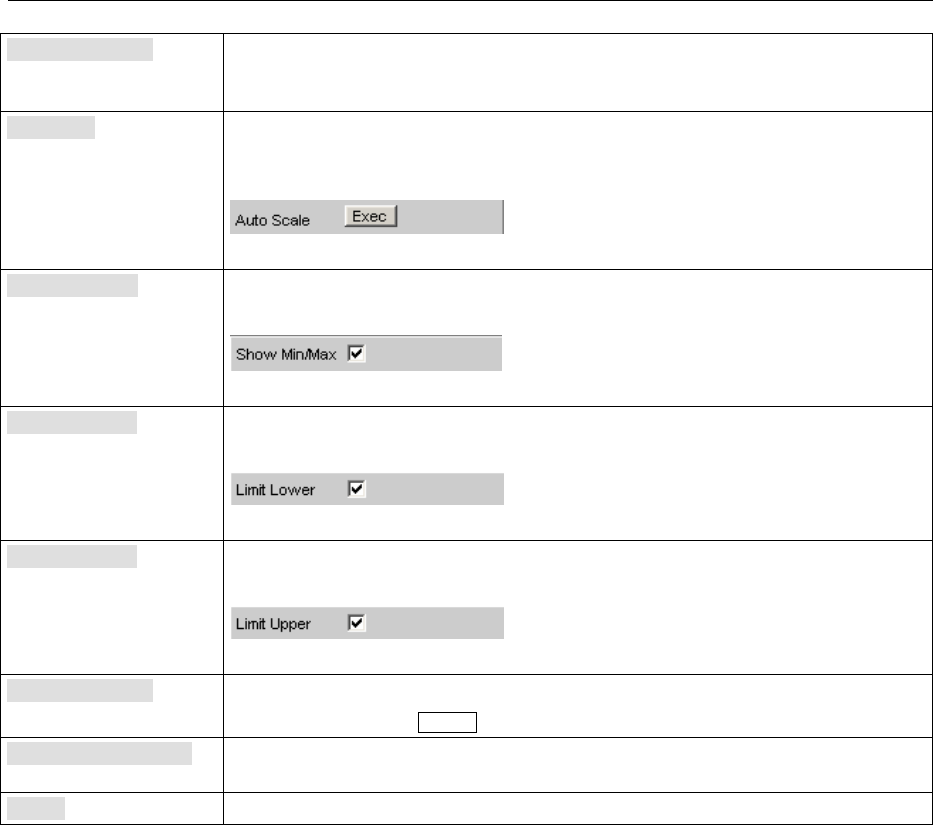
R&S UPV Combi Display
1146.2084.32 4.575 E-9
Store Reference The current measurement value is stored as a reference value. If, for example,
the reference unit dBr is selected as the unit, the next measurement value is
0.0 dBr.
Autoscale One-time scaling of the bargraph on the basis of the minimum and maximum
values.
Corresponds to
in the associated configuration panel.
Show Min Max If the tick is set, the min/max values are displayed.
Corresponds to
in the associated configuration panel.
Show Lim Low If the tick is set, the lower limit value is displayed.
Corresponds to
in the associated configuration panel.
Show Lim Upp If the tick is set, the upper limit value is displayed.
Corresponds to
in the associated configuration panel.
Restart Min/Max Resets min/max value recording in order to restart measurement.
Equates to using the START key
Restart Lim Violation Resets the red colour marking (measurement value, bar and limit value) for
indicating a limit violation and restarts a test for a limit violation.
Config Opens the configuration panel for this combi display.
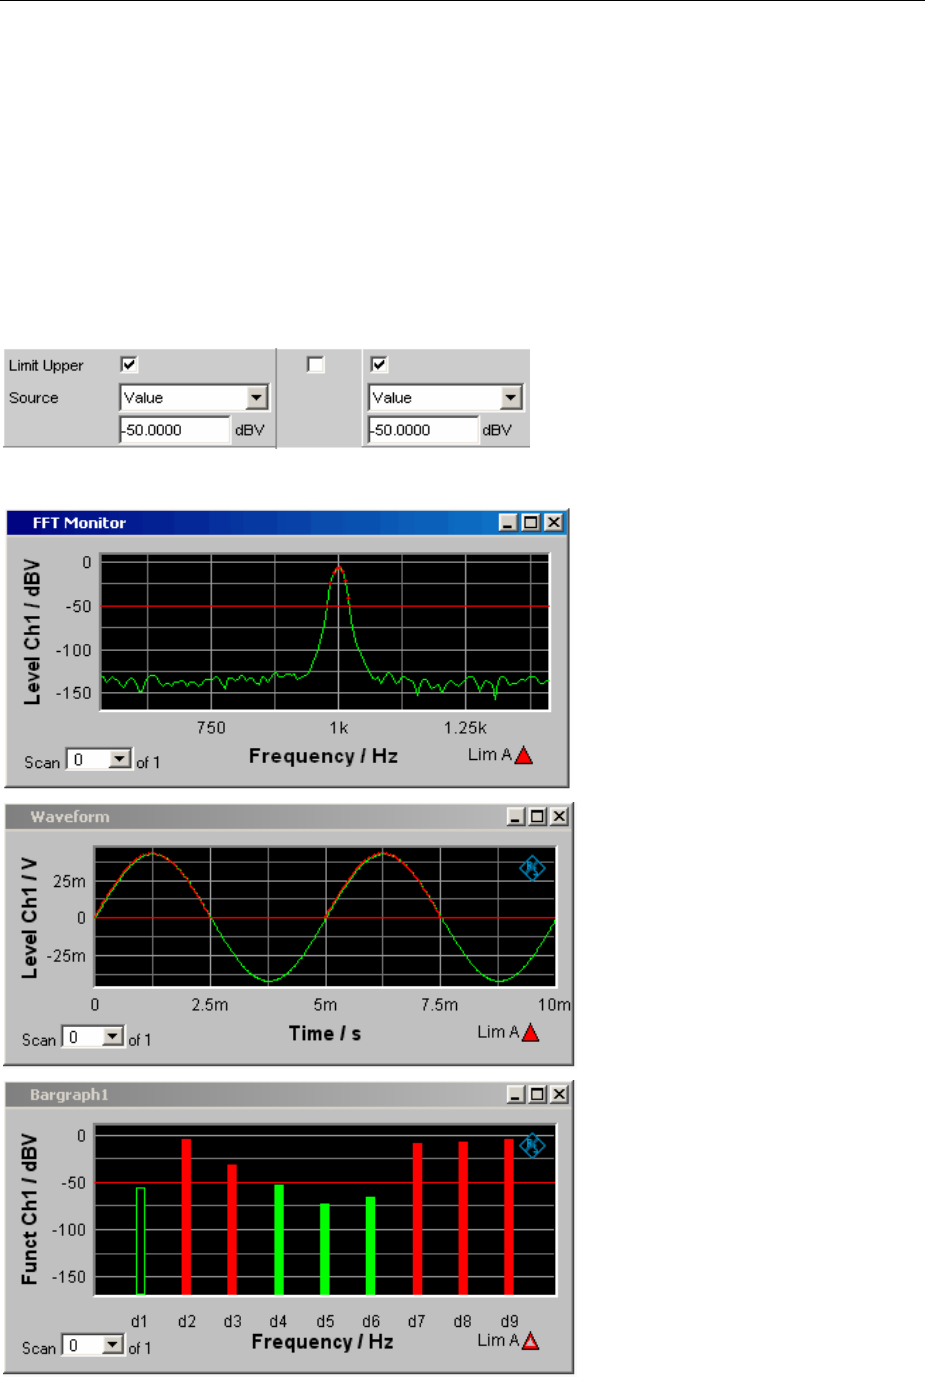
Limit Monitoring R&S UPV
1146.2084.32 4.576 E-9
Limit Monitoring
Both traces/bargraphs and measurement results can be monitored to determine whether limits or limit
curves have been overranged or underranged.
Traces and Bargraphs
Upper and lower limits or a limit curve can be entered separately for Trace A and Trace B in every
display configuration panel for every graphic subsystem.
Limit entered as a value:
The limit in a graphical display is shown as a straight line.
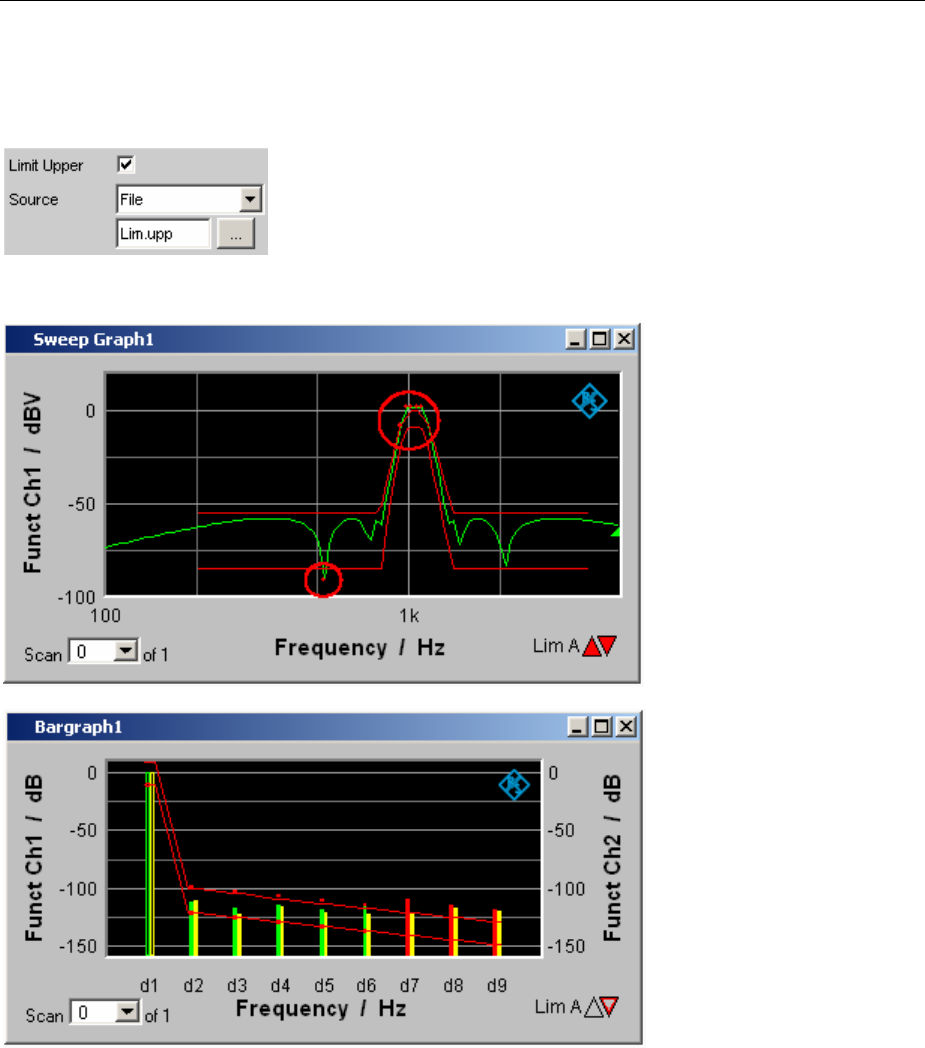
R&S UPV Limit Monitoring
1146.2084.32 4.577 E-9
Limit entered as a curve:
Alimit curve can be entered only for the graphic systems Sweep, FFT Function, Bargraph and PESQ. A
limit curve makes no sense for the Waveform graphic system and is not offered.
The limit in a graphical display is shown as a user-defined curve.
Each measurement value is compared with the limit value or the limit curve and in the event of a limit
violation is identifed as a red dot in the trace display or as a red bar in the bargraph.
If multi-scan recording is performed in the Sweep Graph 1…4 graphic subsystems, all of the scans of a
trace are checked against the associated limit or limit curve.
In the result list (see section "Result List" on page 4.547), rows containing measurement values which
violate the specified limits are displayed in red.
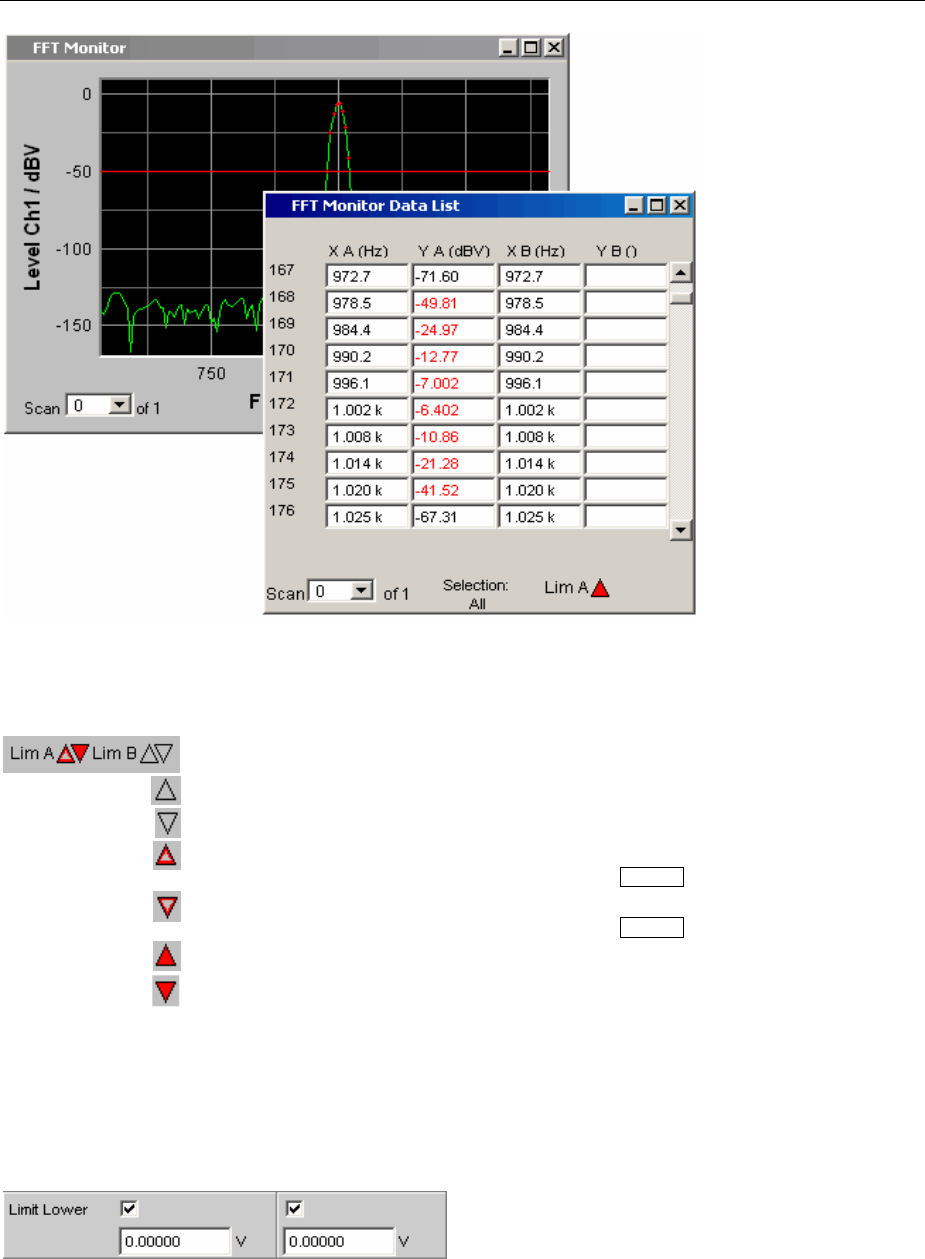
Limit Monitoring R&S UPV
1146.2084.32 4.578 E-9
In addition to the red dots in the trace or the red bars in the bargraph, in the lower right corner of the
graphic display and the measurement value list there is an indicator of limit violations, so that it is
possible to see at a glance whether any limit violation exists. The interpretation is as follows:
Symbols indicating limit violations
"Limit Upper" is activated and there is no limit violation.
"Limit Lower" is activated and there is no limit violation.
The "Limit Upper" value has been violated in the past but there is currently no
limit violation. The violation is indicated until the START key is pressed again.
The "Limit Lower" value has been violated in the past but there is currently no
limit violation. The violation is indicated until the START key is pressed again.
The "Limit Upper" value is currently being violated.
The "Limit Lower" value is currently being violated.
Measurement Results
Alower and upper limit can be specified in any measurement result configuration panel:
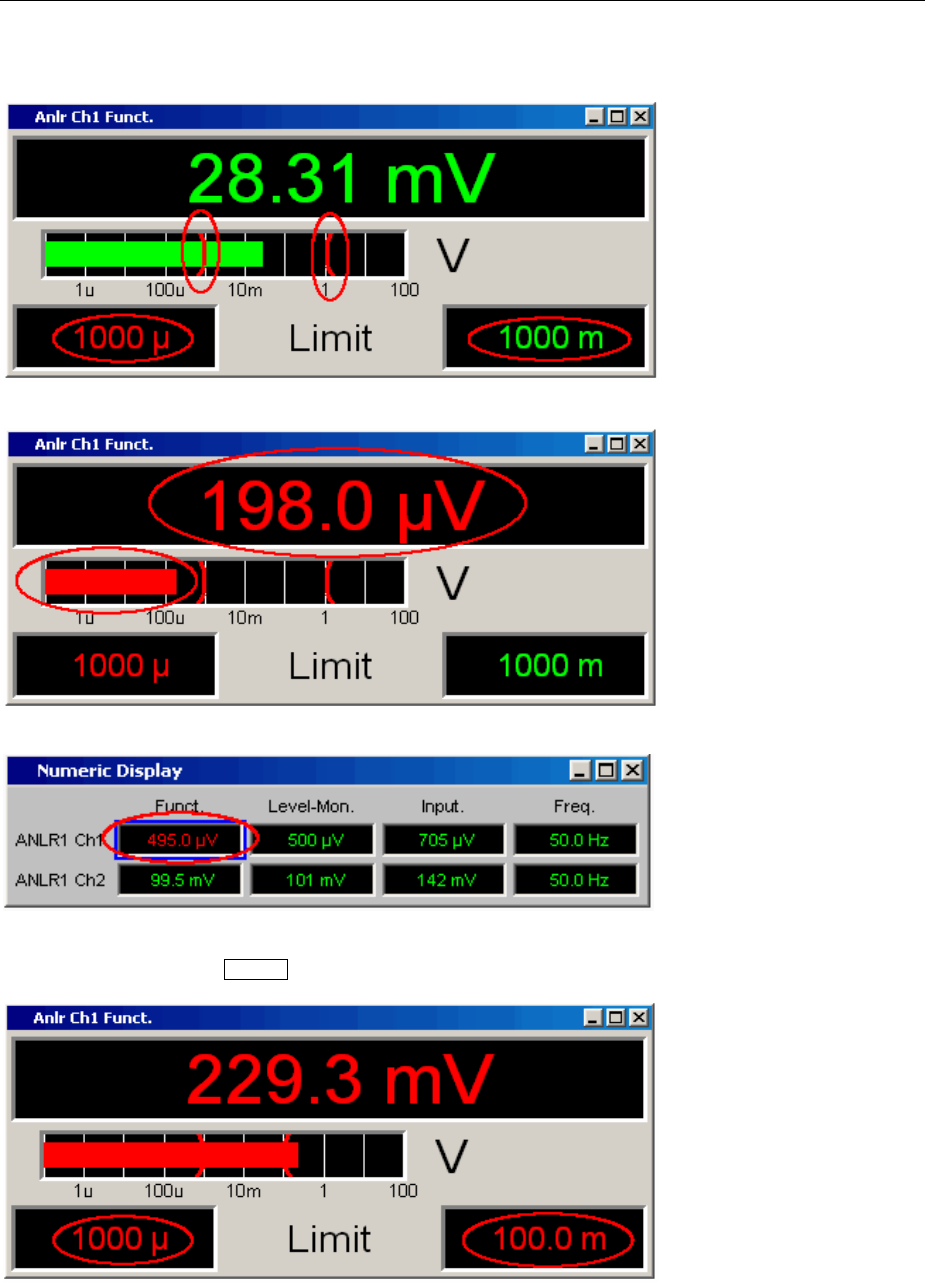
R&S UPV Limit Monitoring
1146.2084.32 4.579 E-9
Inthe combi display, the limits are displayed as red limit markers (brackets) in the bargraph and as
numeric values:
Ared measurement value and bar indicate that there is a limit violation:
Ared measurement value in the numeric display also indicates a current limit violation:
In order to indicate that the lower or upper limit was violated in the past, the lower or upper limit is
displayed in red until the START key is pressed, which resets the hold function and restarts monitoring
of the measurement values:
This hold function is not visible in the numeric display.

Measurement value sequences R&S UPV
1146.2084.32 4.580 E-9
Measurement value sequences
Measurement value sequences consisting of acquired function measurement results, sweeps, FFT
data, Waveform data,Bargraph data or PESQ datacan be stored in a file for different purposes:
-To load the measurement values again as a report, to permit comparison or to allow processing at a
later stage. When loaded using commands in the display panel, the series of measurement values are
initially displayed exactly as they were when saved. They can, however, be rescaled or, for example,
converted into different units.
-The files are stored in ASCII format so that they can be easily imported into other programs where the
data can be processed further (e.g. Microsoft Excel). See section "Format" on page 4.590 for
information on the ASCII format and how data can be imported into other programs.
Saving
Trace files
When a Trace list is saved no distinction is made between Trace A or Trace B.
Both traces are always stored to the file, provided that both traces are switched on. In the multiscan
mode, all scans selected by means of the "History" line are stored to the file. If “Show Min Max“ is
enabled, these scans are stored too.
In addition to measurement value sequences, a further range of information is stored since it is needed
so that on loading the trace list the graph is displayed just as when it was saved:
•Functionality on the X and Y axes
•Axis labeling
•Display units on the axes
•Scaling on the axes (lin/log)
•Left/right and top/bottom values of the axis scaling
•Limit values for the Y axes
•Reference values on the axes
When the trace file is loaded, this information affects the corresponding DispConfig panel so that the
parameter fields reproduce the information stored in the file.
Exception: If "Hold" is set in the parameter fields "Reference", "Limit Upper" and "Limit Lower", the
current settings are not overwritten.
The format in which the trace list is stored is the same for all subsystems.
If the file name is specified without an extension, the suggested file name extension is .TRC, but any
desired extension can be specified.
For a detailed description of the storage format, see section "Trace Files" on page 4.590).
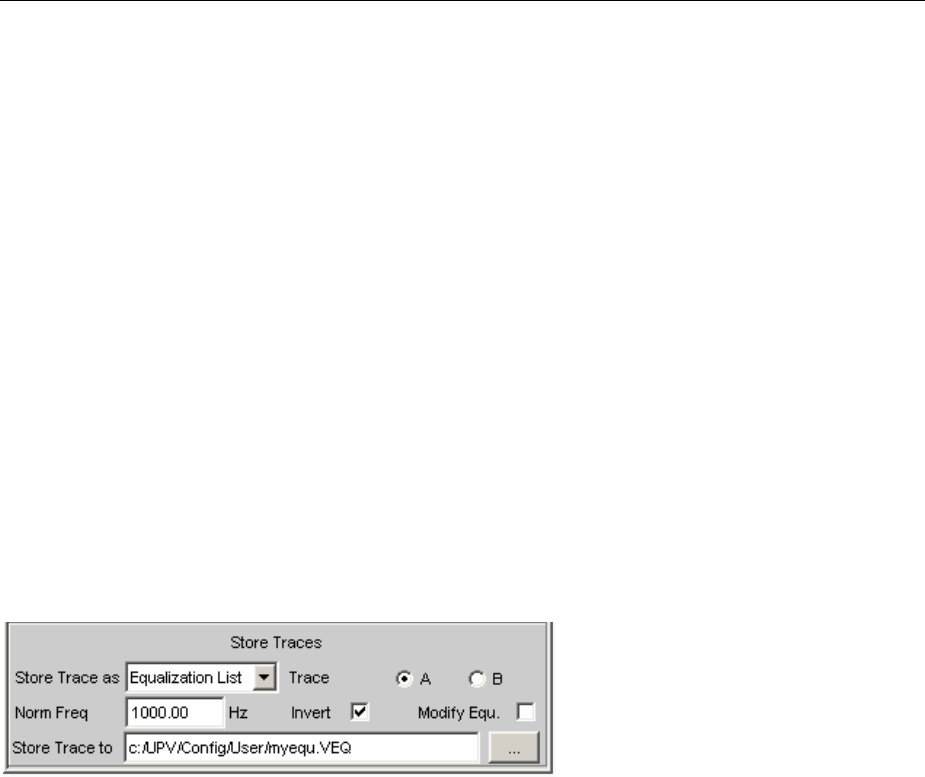
R&S UPV Saving
1146.2084.32 4.581 E-9
Equalization files
An equalization list is a table that contains frequency points and associated gain factors. The list can
be used to apply a predefined frequency response to the generator. The set amplitude of the generator
is changed as a function of frequency in accordance with the values specified in the table (see section
“Equalization”, on page 4.111). Frequency values are stored to the list in the basic unit of Hz,
irrespective of the unit used for X-axis value display.
An equalization list in ASCII format is generated from the current measurement value sequence, taking
into account the settings made under "Trace", "Norm Freq", "Invert" and "Modify Equ.". The list is stored
to a file, which can be loaded by selecting it in the "Equalizer" line in the Generator Function panel.
An equalization file may contain up to 1024 X/Y pairs, because a generator sweep can have a
maximum of 1024 sweep points. If a measurement value sequence contains more than 1024 X/Y pairs,
data will be compressed automatically such that only every 2nd, 4th, 8th X/Y pair and so forth is stored
to the equalization file.
If an equalization list is generated from a multiscan display (including also the Min/Max scans of a
single-scan display), the Y values of the currently selected scan are taken to generate the list.
If a file name is specified without an extension, .VEQ is suggested as a default extension, but any other
extension can be used instead.
For a detailed description of the storage format, see section "Equalization Files" on page 4.594).
Sweep list
Asweep list contains any desired sweep axis. Since the individual values of X are extracted from a
current measurement value sequence, they are in ascending order. If the file is then manually
processed, the separations of the sweep points can be freely selected in order to place a greater
number at places of particular interest without drastically increasing the total number of sweep points.
The sweep points must, however, be specified in ascending or descending order – they must not
change direction. The sweep points are processed by the sweep system in the order in which they are
listed, . There must be at least two different points in the list.
The file can contain a maximum of 1024 X values, because a generator sweep can have a maximum of
only 1024 sweep points. If a measurement value sequence has more than 1024 X/Y pairs, the data is
compressed automatically by saving only every 2nd, 4th, 8th, etc. value for the sweep list.
If a sweep list is saved from a multiscan display (including the Min/Max scans in the case of a single
scan display), the currently selected scan plays no role, since the X values are the same for all scans.
If the file name is specified without an extension, the suggested file name extension is .SPL, but any
desired extension can be specified.
For a precise description of the storage format, see section "Sweep Lists" on page 4.595).
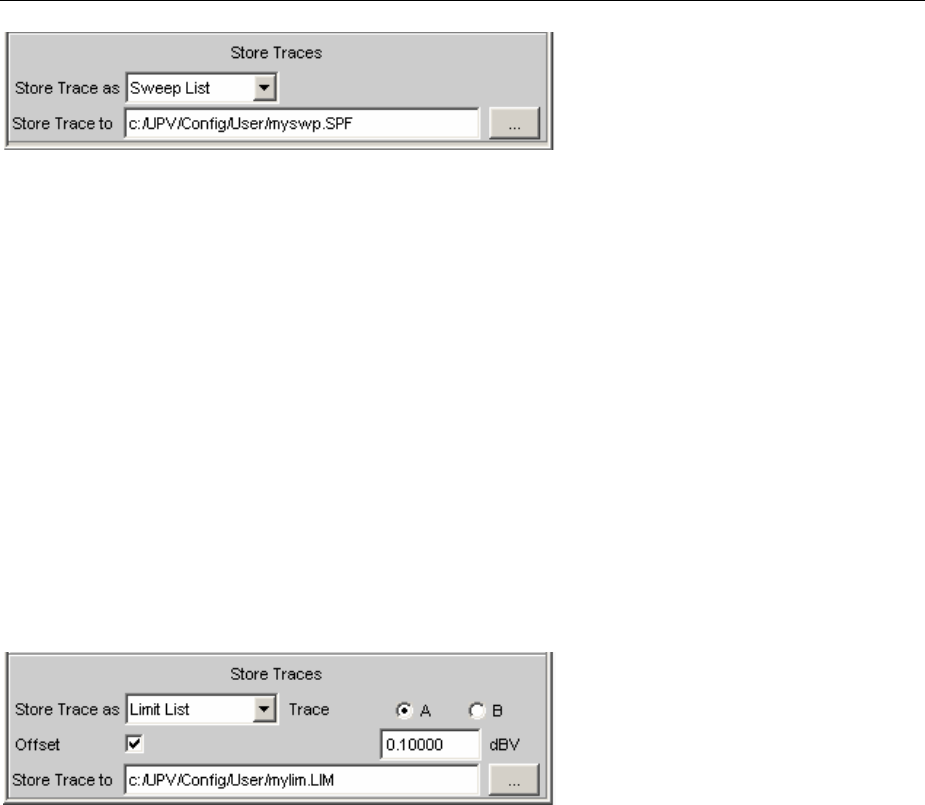
Saving R&S UPV
1146.2084.32 4.582 E-9
Limit files
Alimit list contains X and Y data that has been extracted from the current measurement value
sequence. When it is saved, no distinction is made about whether the file will be used later as an Upper
Limit or as a Lower Limit. This depends on whether the file is loaded as an Upper Limit file or as a
Lower Limit file. A limit list that has been obtained from a measurement value sequence usually has
more interpolation points than necessary, and it is therefore often necessary to process the file further.
For information on how to do this see section "Editing" on page 4.598).
Alimit list must contain at least two different points forming a straight line.
If a limit list is saved from a multiscan display (including the Min/Max scans in the case of a single scan
display), the Y values are extracted from the currently selected scan.
The file can contain a maximum of 1024 X/Y pairs.
If the file name is specified without an extension, the suggested file name extension is .LIM, but any
desired extension can be specified.
For a precise description of the storage format, see section "Limit Files" on page 4.597).
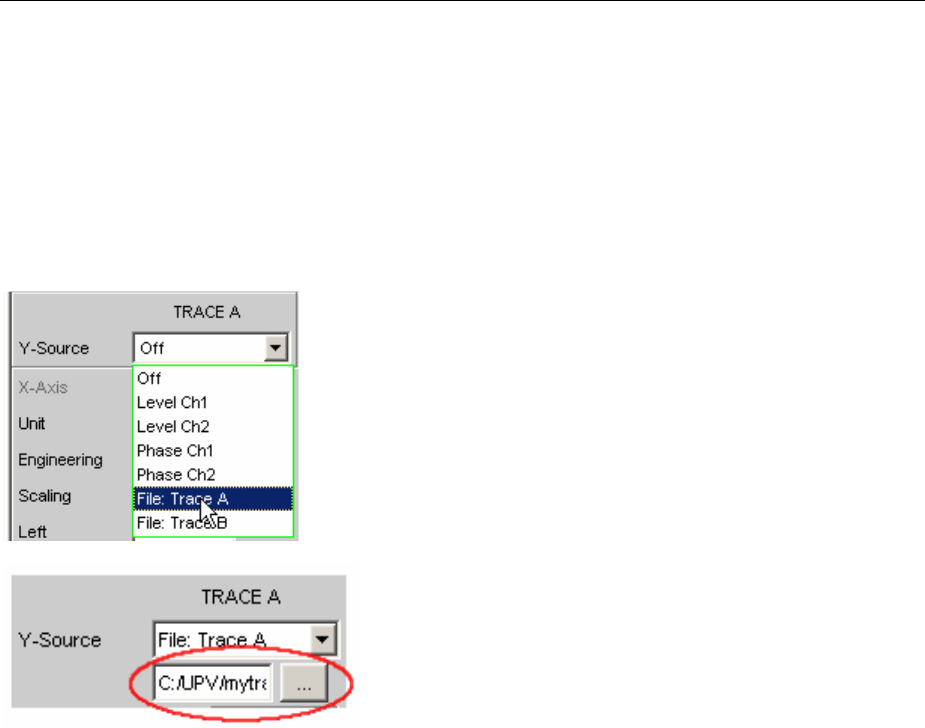
R&S UPV Loading
1146.2084.32 4.583 E-9
Loading
Trace files
When traces are loaded, unlike when they are saved, a distinction is made between Trace A or Trace
B. Since the trace file always contains both traces, provided both traces were enabled when saved, a
decision is made via the parameter field "Y-Source" = "File: Trace A" or "File: Trace B" about which
trace to load from the file.
All trace files have the file name extension *.TRC as a default setting, that is, if the file name only is
specified, without an extension, this extension is automatically added. Other extensions are allowed.
Clicking the … button opens the file selector with all known properties (see chapter 3).
During the loading procedure, the system tests whether the trace file can be loaded. When trace files
are stored an identifier is entered so that it is obvious from which graphic system the file was saved.
Trace files can only be loaded into the graphic system from which they were saved; in all other cases
the attempt to load is ignored and an error message id issued (see section “Trace Files”, on page
4.590). When Bargraph trace files are being loaded, the system recognizes from the number of stored
lines whether the file matches the set measurement function. For example a Bargraph trace file with 9
frequency lines in a bargraph display would be rejected for the measurement function DFD, because
only 5 lines are expected there.
However, if there is ever a need to load a trace file of a different type into a graphic system, acceptance
of the file can be forced through by changing the trace file identifier in an ASCII editor; see section
"Editing" on page 4.598).
If a trace file cannot be loaded, or if "Y-Source" = "File: Trace A" or "File: Trace B" addresses a trace file
in which the required trace does not exist, an appropriate warning is issued and the loading procedure
is terminated. The previous trace in the graphical display remains unchanged.
The content of the trace files defines the appearance of the DispConfig panel and the associated
display panel.
The appropriate scan is loaded from the trace file, depending whether "Scan" = "Single" or "Multi" in the
parameter field and whether "Show Min Max" is set.
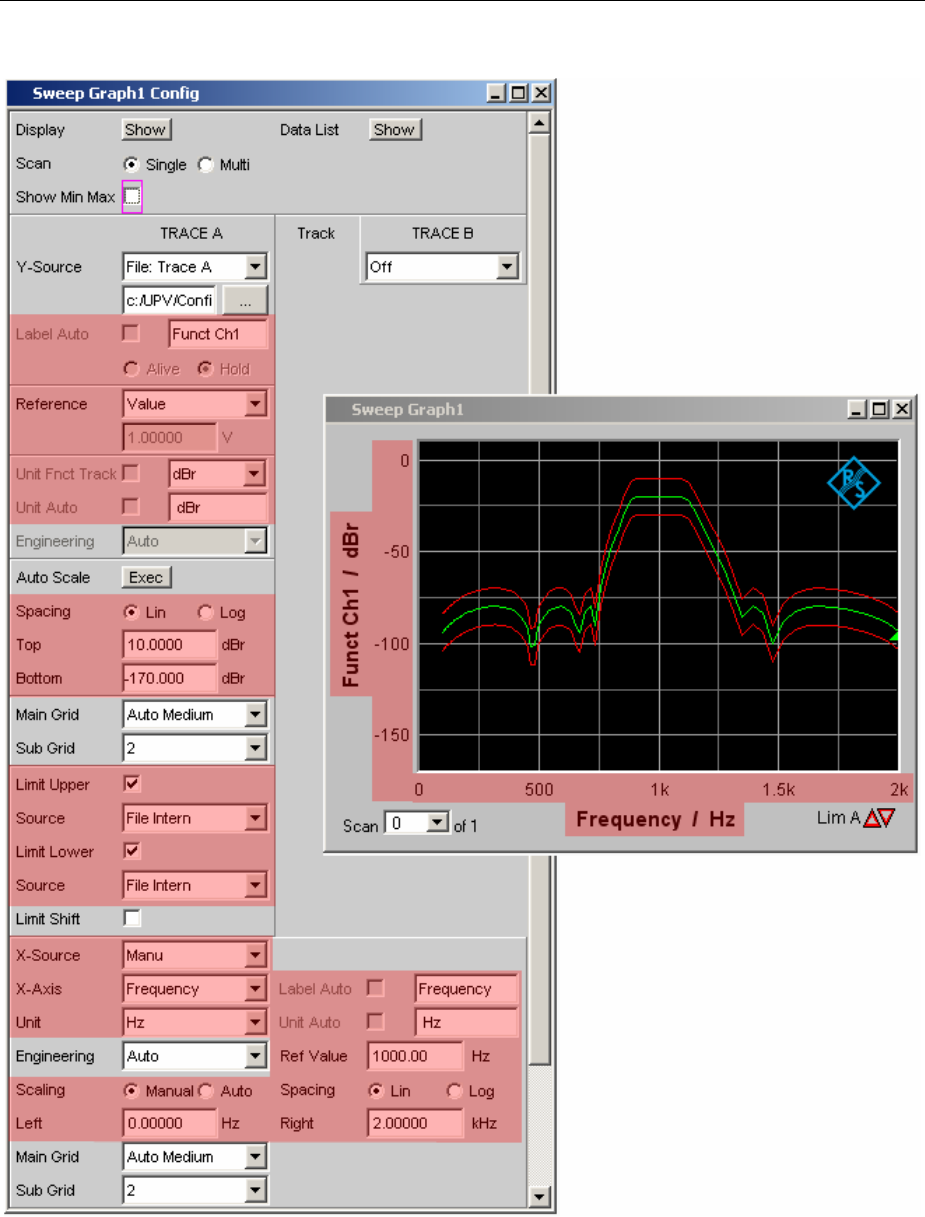
Loading R&S UPV
1146.2084.32 4.584 E-9
The following figure shows the parameter fields and wordings which are influenced by the file content.
If the file contains both reference traces and limit traces, "File Intern"is displayed in the corresponding
parameter fields. "File Intern" means that there is no individual value (for example in the case of a
"Reference", this would be "Limit Upper" or "Limit Lower" with the setting Value) but instead a trace, and
that this trace has been taken from a file loaded at "Y-Source" = "File: Trace A" or "File: Trace B".

R&S UPV Loading
1146.2084.32 4.585 E-9
Furthermore all Auto and Tracking tick boxes such as Label Auto, Unit Func Track, Unit Auto etc. are
deactivated and grayed out so that they cannot be used. All parameter fields that allow Auto settings,
such as "X-Source" or "Scaling", are set to "Manual", since they are preset by the file content.
If "Hold"is selected in the parameter fields "Reference", "Limit Upper" and/or "Limit Lower", the current
settings remain the unchanged and are not altered by loading a trace file.
Switching the Y-Source:
The display and deletion of traces largely depends on switching the "Y-Source", that is, the source of
the traces.
The "Y-Source" parameter field offers two sources for the recording and display of traces:
Traces from measurements are all settings other than "File: Trace A" or "File: Trace B", such as
"Funct CH1", "Level Ch1", "Phase Ch1" etc.
Traces can be loaded from file by means of "File: Trace A" or "File: Trace B".
"Off" deletes the trace.
Deleting traces:
Traces are generally always deleted either by using the Start key or by switching the "Y-Source" to
"Off".
When the "Y-Source" is switched between measurement (e.g. "Funct Ch1") and file (e.g.
"File: Trace A"), a trace is always deleted when the basic unit changes.
Switching measurements in multiscan mode:
The reaction of the R&S UPV depends largely on whether or not the basic unit changes.
Example, basic unit does not change:
The RMS measurement function is set in the analyzer. The selected display unit is dBV. "Funct CH1" is
set in the Sweep Graph Config panel as the "Y-Source", which means that the results of the RMS
measurement are displayed on the Y axis. Also in the analyzer the Level Monitor is set with the
measurement function "Peak" and the display unit "dBu".
If the "Y-Source" is now switched in the Sweep Graph Config panel from "Funct CH1" to "Level Mon
Peak Ch1", the basic unit does not change, since in both cases the basic unit of dBV and dBu is Volt.
The current scan is retained.
If the switch takes place during a measurement, the new scan is linked to the old scan already drawn. If
the measurement was halted, the new scan is drawn after the Single button is pressed.
The scans in the other channel are unaffected.
Example, basic unit changes:
The RMS measurement function is set in the analyzer. The selected display unit is dBV. "Funct CH1" is
set in the Sweep Graph Config panel as the "Y-Source", which means that the results of the RMS
measurement are displayed on the Y axis. Also in the analyzer the phase measurement is set with the
display unit Rad.
If the "Y-Source" is now switched in the Sweep Graph Config panel from "Funct CH1" to Phase, the
basic unit changes, since the basic unit of dBV is Volt and the basic unit of Rad is °.

Loading R&S UPV
1146.2084.32 4.586 E-9
The current scans are deleted.
If the switch takes place during a measurement, the new scan is redrawn in the cleared graphic
window. If the measurement was halted, the new scan is drawn after the Single button is pressed.
The scans in the other channel are unaffected.
The last file that was loaded determines the x-axis
If files with different x-axes are loaded one after the other, the last file always determines the x-axis. If a
sweep with a different x-axis is then loaded, it will determine the x-axis.
Loading a trace file with measurement in progress or halted:
On switching from a measurement to loading a trace from a file (e.g. "Y-Source" from "Funct CH1" to
"File: Trace A"), deletion takes place and the trace from the file is displayed immediately, provided the
basic unit is permitted in the current graphic subsystem and the basic unit is suitable for the X axis. The
panel content changes according to the parameters stored in the trace file, as described above.
Any attempt to load a trace file containing the results of a phase measurement into the Waveform
graphic system would be ignored with an appropriate warning, since a phase measurement result is not
provided for in the Waveform graphic system. The current trace is retained.
Switching from a loaded trace file to measurement:
On switching from a trace loaded from file to measurement (e.g. "Y-Source" from "File: Trace A" to
"FFT Level Ch1"), the current scan is retained, provided the basic unit is suitable. The new scan is
drawn when the Single button is pressed. This reaction is particularly important, since in this way new
measurement value scans can be appended to the scans loaded from a file If the basic unit is not
suitable, the current scans are deleted.
Loading trace files, depending on the single scan or multiscan setting:
Depending whether "Scan = Single" or "Scan = Multi" the appearance changes when loading or
recording scans.
Scan = Multi
If a trace is loaded from a file which contains a multiscan, either all scans are taken from the file or only
as many as the number specified in the "History" parameter field. If the file contains only a single scan,
this scan is interpreted as a multiscan with only one scan. If Show Min Max is ticked and Min/Max scans
are stored in the trace file, these are also loaded.
Scan = Single
If a scan is loaded from a file which contains a multiscan, the first scan is loaded from it. If Show Min
Max is ticked and Min/Max scans are stored in the trace file, these are also loaded. A single scan is
then displayed with a maximum of three scans per channel. If Min/Max scans are stored in the trace file,
"Show Min Max" will be enabled automatically so that these scans will be displayed in the graphic. If
Min/Max scans are stored in the trace file, "Show Min Max" will be enabled automatically so that these
scans will be displayed in the graphic.
If "Y-Source" is switched to "File: Trace A" or "File: Trace B", the "Alive/Hold" parameter field is shown
as not user-accessible and has the setting "Hold", since an Alive/Hold option makes no sense for a
trace loaded from file.
If "Y-Source" is switched to measurement, the "Alive/Hold" parameter field is again accessible and has
the setting "Alive".
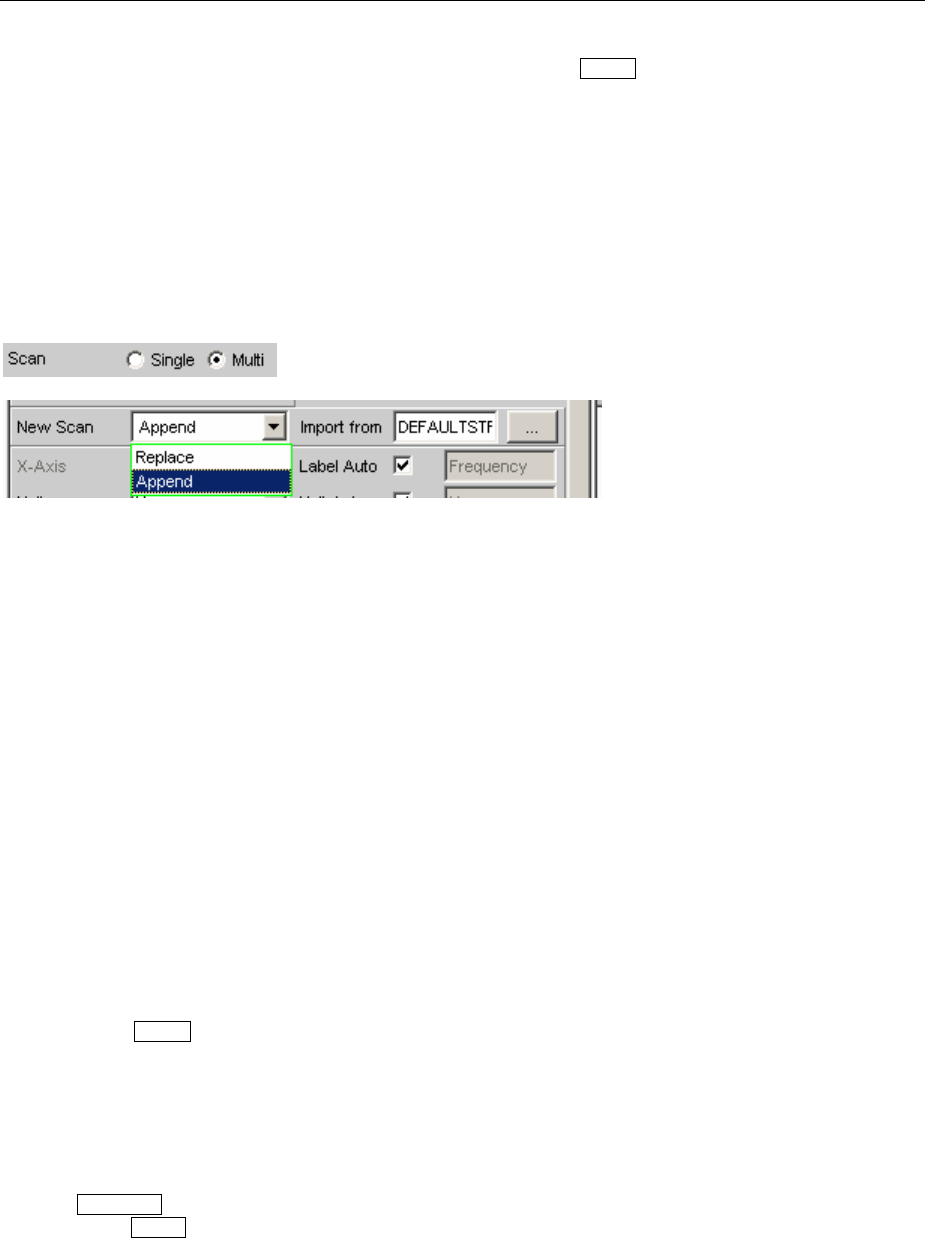
R&S UPV Loading
1146.2084.32 4.587 E-9
On switching from "Scan = Single" to "Scan = Multi" the single scan is retained and "New Scan" is
forced to the Append mode. New scans are added each time the Single button is pressed.
On switching from "Scan = Multi" to "Scan = Single" the last scan of the current multiscan is retained.
Appending or substituting scans
The parameter field "New Scan" = "Append" or "Replace" defines whether scans are appended to
existing scans or whether a single scan replaces another.
The parameter fields "New Scan" and "Import from" are offered only for multiscan ("Scan" = "Multi"),
since new scans can be appended or substituted only in multiscan recording.
The scans to be appended or substituted may come from a measurement or a file. By far the most
frequently used setting is "New Scan" = "Append".
There are a number of options for appending or substituting scans. These options depend on the
following settings and conditions:
Alive/Hold setting
Append or substitute measurement scan
Append or substitute scan from file
Is a measurement in progress or halted?
Which scans and how many scans are stored in a file?
Does the scan from the file suit the current setting?
The following section should cover the most important possibilities.
Appending measurement scans to existing scans
Parameter field "New Scan" = "Append"
Parameter field "Alive/Hold" to "Alive".
Each time the Single button is pressed a measurement is launched and the new measurement scan is
appended to the existing scans.
Measurement scan replaces an existing scan
Parameter field "New Scan" = "Replace"
Parameter field "Alive/Hold" to "Alive".
Use the Next Scan toggle key to select the scan to be replaced.
Each time the Single button is pressed a measurement is launched and replaces the selected scan with
the new measurement scan.
Importing scans from a file and appending them to existing scans
Parameter field "New Scan" = "Append"

Loading R&S UPV
1146.2084.32 4.588 E-9
Parameter field "Alive/Hold" to "Hold".
If the parameter field "Alive/Hold" is on "Alive" and a measurement is in progress (single measurement
not yet finished or continuous measurement), any attempt to import a file is ignored and a message is
issued.
Ifthe parameter field "Alive/Hold" is on "Alive" and a measurement is finished, a scan / multiple scans
can be imported from a file and appended to the existing scans.
If an import is allowed, it largely depends on the content of the source file whether and how the
operation proceeds.
Afile will be imported only if the basic units from the file match the "Y-Source" setting, or.if the unit is
allowed in the graphic subsystem. For example if "Y-Source" = "Funct Ch1" and the set analyzer
measurement function = "RMS", a trace file with the basic unit Volt is suitable. A trace file with the basic
unit % would be ignored and an error message would be issued.
When loading a trace file it must be clearly specified which trace is to be loaded from the file
("File: Trace A" or "File: Trace B").
This choice is not needed when importing. Provided the basic units are suitable for the current setting,
the file content defines what and how much will be imported:
If only Trace A or only Trace B is activated in "Y-Source" and the file to be imported contains only one
trace and it does not matter whether it is Trace A or Trace B, then this trace is imported.
If Trace A and Trace B are both activated and the file to be imported contains only one trace, and it
does not matter whether it is Trace A or Trace B, this trace is imported to Trace A and Trace B.
If only Trace A or only Trace B is activated and the file to be imported contains a stereo trace, that is,
Trace A and Trace B, the corresponding trace is imported, namely A to A or B to B.
If Trace A and Trace B are both activated and the file to be imported contains a stereo trace, then both
traces are imported, namely A to A and B to B.
The following applies to all the cases listed:
All suitable scans from the file are appended. Starting from the first scan, all scans are appended from
the file until the maximum number of 20 scans is reached.
If "Hold"is selected in the parameter fields "Reference", "Limit Upper" and "Limit Lower", the current
settings are not changed by the imported scans.
Importing scans from a file and replacing an existing scan
Parameter field "New Scan" = "Replace"
Parameter field "Alive/Hold" to "Hold".
If the parameter field "Alive/Hold" is on "Alive" and a measurement is in progress (single measurement
not yet finished or continuous measurement), any attempt to import a file is ignored and a message is
issued.
If the parameter field "Alive/Hold" is on "Alive" and a measurement is finished, a scan can be imported
from a file and replace a scan.
If the default settings agree, it largely depends on the content of the import file whether and how the
operation proceeds.
Afile will be imported only if the basic units from the file match the "Y-Source" setting, or.if the unit is
allowed in the graphic subsystem. For example if "Y-Source" = "Funct Ch1" and the set analyzer
measurement function = "RMS", a trace file with the basic unit Volt is suitable. A trace file with the basic
unit % would be ignored and an error message would be issued.

R&S UPV Loading
1146.2084.32 4.589 E-9
When loading a trace file it must be clearly specified which trace is to be loaded from the file
("File: Trace A" or "File: Trace B").
This choice is not needed when importing. Provided the basic units are suitable for the current setting,
the file content defines what and how much will be imported:
Ifonly Trace A or only Trace B is activated in "Y-Source" and the file to be imported contains only one
trace and it does not matter whether it is Trace A or Trace B, then this trace is imported.
If Trace A and Trace B are both activated and the file to be imported contains only one trace, and it
does not matter whether it is Trace A or Trace B, this trace is imported to Trace A and Trace B.
If only Trace A or only Trace B is activated and the file to be imported contains a stereo trace, that is,
Trace A and Trace B, the corresponding trace is imported, namely A to A or B to B.
If Trace A and Trace B are both activated and the file to be imported contains a stereo trace, then both
traces are imported, namely A to A and B to B.
The following applies to all the cases listed:
If the file contains more than one scan a warning is given and the first scan from the file is taken for the
Replace function.
If "Hold"is selected in the parameter fields "Reference", "Limit Upper" and "Limit Lower", the current
settings are not changed by the imported scan.
Equalization Files
The loading of equalization files takes place in the generator; see section "Generator Signals" on page
4.63.
Equalization files from the R&S UPL can still be used.
Sweep Lists
The loading of sweep lists takes place in the generator; see section "Generator Signals" on page 4.63.
Sweep lists from the R&S UPL can still be used. Sweep lists from the R&S UPL have different file name
extensions:
.SPF for frequency values in Hz
.SPV for level values in V, FS or UI
.SPO for on-time values in s
.SPI for interval values in s
.DWL for dwell time values in s
From these file name extensions the R&S UPV recognizes whether the loading procedure is allowed. It
is therefore recommended that the file name extensions of the old R&S UPL files should not be
changed!
Limit Files
The loading of limit files takes place in the DispConfig panels in the parameter fields "Limit Upper",
"Source" = "File" and "Limit Lower", "Source" = "File".
The Y values of the limit files are always interpolated onto the current X axis, so that the desired trace is
always produced regardless of the number of interpolation points in the limit file.
Limit files from the R&S UPL can also be used but, in contrast to limit files from the R&S UPV, there is
no plausibility check as to whether the numerical values in the file match the current setting, since
R&S UPL files do not contain the associated units.

Format R&S UPV
1146.2084.32 4.590 E-9
Format
Trace Files
All trace data is stored in plain text in ASCII format . The format has been selected so that the data can
be processed without a problem in EXCEL (see section “Exporting”on page 4.604).
Structure of the trace file:
Subsystem: UPV FFT TRACE FILE
Title: Titletext
Comment: Commenttext
XAxis; Trace A; Trace B;
XFunction
Frequency
Trace A Function
Funct Ch1
Trace B Function
Funct Ch2
X-Axis-Label:
Frequency
Y1-Axis-Label:
Input RMS analog Ch1
Y2-Axis-Label:
THD+N digital CH2
X-Unit: Hz A-Unit: dBV B-Unit: dB
X-Spacing:
LOG
A-Spacing: LIN B-Spacing: LIN
X-Left: Value A-Bottom: Value B-Bottom: Value
X-Right:
Value
A-Top: Value B-Top: Value
VOID A-LimLow: Value, FILE or VOID B-LimLow: Value, FILE or VOID
VOID A-LimUpp: Value, FILE or VOID B-LimUpp: Value, FILE or VOID
Scan #1A-Comment: Scan Labeltext B-Comment: Scan Labeltext
X-Basic-Unit:
Hz
A-Basic-Unit: V B-Basic-Unit: V
X-Ref: Value A-Ref: Value, FILE or VOID B-Ref: Value, FILE or VOID
A-X/
Data
count
A-Y A-
LimLow
A-
LimUpp
A-RefY
in V
B-X/
datacount
B-Y B-
LimLow
B-
LimUpp
B-RefY in
V
20.0000 0.201 0.2 0.3 1.01 20.0000 -98.8 -98.5 -90 VOID
.. .. .. .. ..
20000.0 0.203 0.25 0.4 2.03 -98.1 -98.5 -90 VOID
Scan #2A-Comment: Scan Labeltext B-Comment: Scan Labeltext
X-Ref:
Value
A-Ref: Value or VOID B-Ref: Value or VOID
X/datacou
nt
A-Y A-
LimLow
A-
LimUpp
A-RefY
in V
B-X/
datacount
B-Y B-
LimLow
B-
LimUpp
B-RefY
in V
20.0000 0.201 0.2 0.3 1.01 20.0000 -98.8 -98.5 -90 VOID
.. .. .. .. ..
20000.0 0.203 0.25 0.4 2.03 -98.1 -98.5 -90 VOID
The individual parameters are TAB separated.
black: Explanation of fields. These explanations are not stored in the trace file.
green: Fixed entries in ASCII format to facilitate assignment of the following data.
red: Entries which change. These entries are depending on the graphic system and the settings in
the corresponding DispConfig panel.
FILE: Not a fixed value, but a trace. Can occur in the case of Limit and Reference.
VOID: No value present because the trace is turned off, or in order to fill a missing range in the event
that Trace A and Trace B have different lengths.
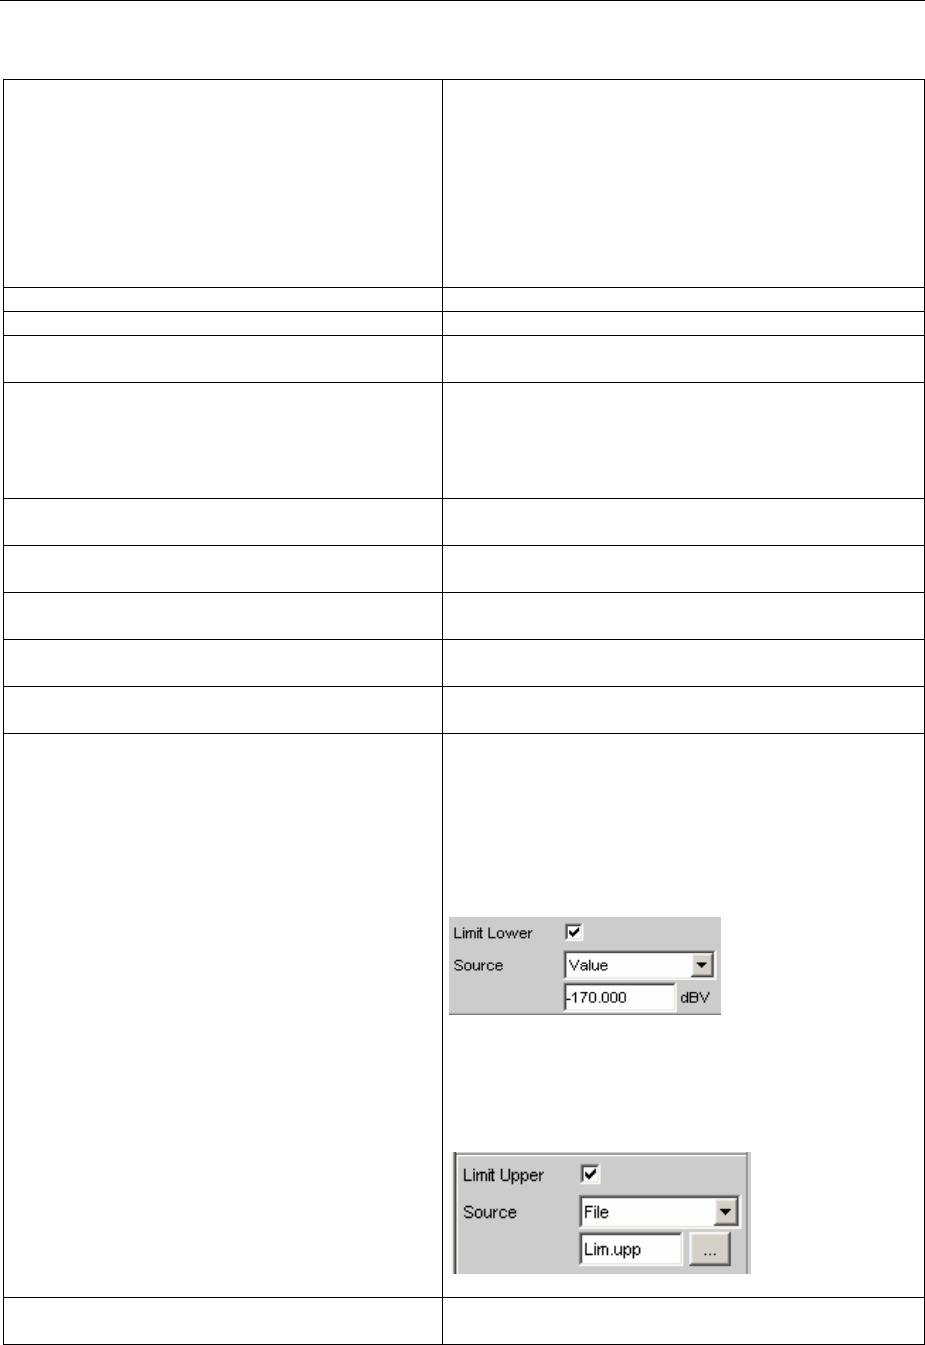
R&S UPV Format
1146.2084.32 4.591 E-9
Explanation of terms:
Subsystem identifier Identifier of the subsystem which was created from
this trace file:
UPV LIMIT FILE
UPV EQUALIZATION FILE
UPV SWEEPLIST FILE
UPV FFT TRACE FILE
UPV WAVEFORM TRACE FILE
UPV BARGRAPH TRACE FILE
UPV PESQ TRACE FILE
Title Reserved for future R&S UPV program versions
Comment Reserved for future R&S UPV program versions
XAxis Trace A Trace B Fixed entries in the trace file in ASCII format to
facilitate assignment of the following data
XFunct Trace A Funct Trace B Funct Measurement function that is set on the
corresponding axis, e.g.
Xaxis: Frequency
Trace A: "Funct CH1"
Trace B: "Funct CH2"
X-Axis-Label Y1-Axis-Label Y2-Axis-Label
Label for the X axis, the left Y axis (Trace A), and
the right Y axis (Trace B) in the graphical display.
X-Unit A-Unit B-Unit Unit for the X axis, the left Y axis (Trace A), and the
right Y axis (Trace B) in the graphical display.
X-Spacing A-Spacing B-Spacing Linear or logarithmic spacing for the X axis, the left
Yaxis (Trace A), and the right Y axis (Trace B).
X-Left A-Bottom B-Bottom Left value for the X axis, lower value for the left
Yaxis (Trace A) and the right Y axis (Trace B).
X-Right A-Top B-Top Right value for the X axis, upper value for the left
Yaxis (Trace A) and the right Y axis (Trace B).
A-LimLow B-LimLow Lower limit for the left Y axis (Trace A) and the right
Yaxis (Trace B).
If the word VOID is entered here, limit monitoring is
turned off.
If a value is entered here, the value from the
configuration panel of the graphic system is used for
limit monitoring:
If the word FILE is entered here, the limit values
come from a limit file. The limit values interpolated
onto the X axis are listed under A-LimLow and
B-LimLow of the scan data sets.
A-LimUpp B-LimUpp Ditto upper limit of the left Y axis (Trace A) and the
right Y axis (Trace B).
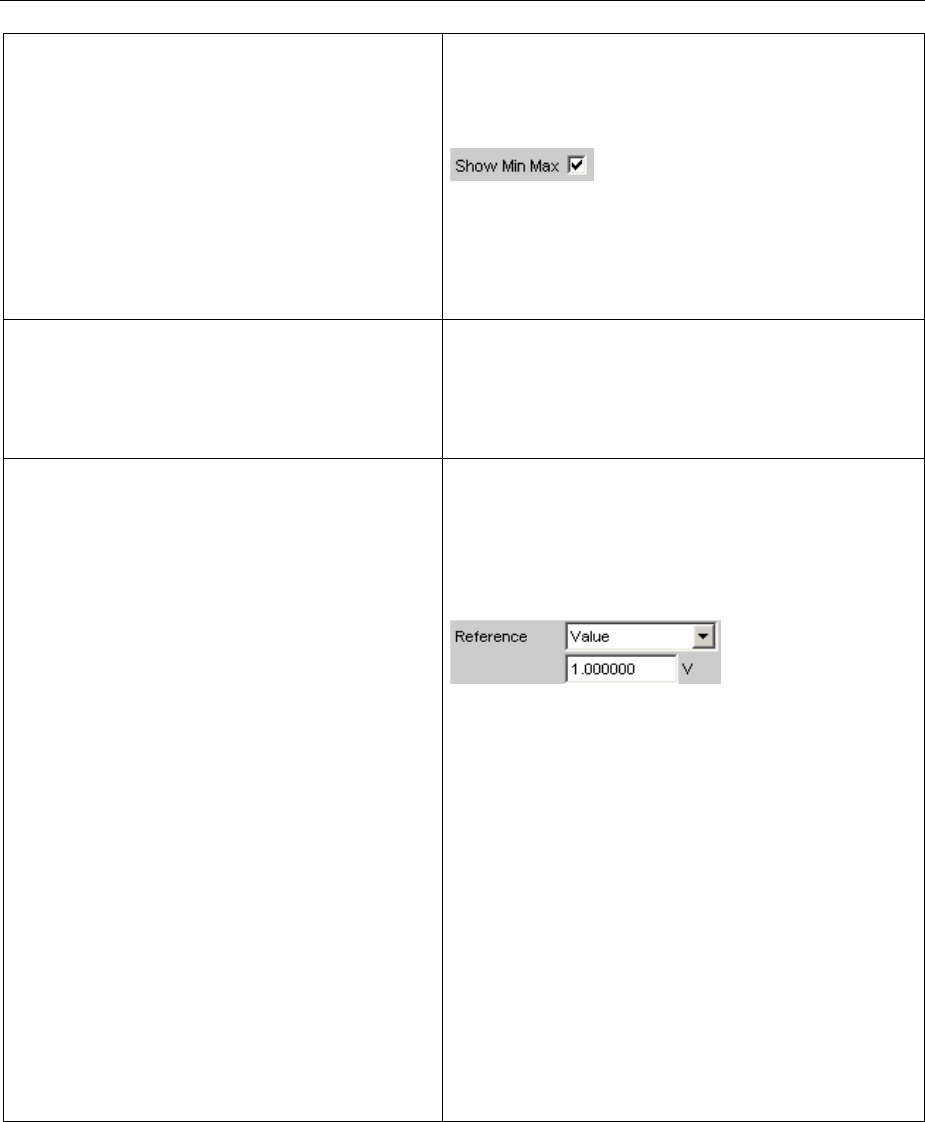
Format R&S UPV
1146.2084.32 4.592 E-9
Scan #Nr A-Comment B-Comment Scan #Nr:Scan number for the following data set,
numbered sequentially 2, 1, 0, -1 to -19.
Scan number 2 designates the maximum scan,
scan number 1 the minimum scan, provided that
is activated. Scan number 0 designates the most
recent scan. The more negative the scan number,
the older the scan.
A-Comment and B-Comment are reserved for future
R&S UPV program versions.
X-Basic-Unit A-Basic-Unit B-Basic-Unit Basic unit of the X axis, the left Y axis (Trace A),
and the right Y axis (Trace B) in the graphical
display.
If the following reference values are present, (that is
!= VOID), these units are identical to the basic unit of
the following reference values.
X-Ref A-Ref B-Ref Reference values for referenced units of the X axis,
the left Y axis (Trace A), and the right Y axis
(Trace B) in the basic unit.
The value entered here is taken into the
configuration panel of the graphic system as a fixed
reference value when the trace file is loaded:
If the word FILE is entered for A-Ref and / or B-Ref,
the reference values come from a reference file or it
is a floating reference value. The reference values
interpolated onto the X axis are listed under "A-RefY
in unit"and "B-RefY in unit"of the scan data sets.
VOID is used as a placeholder for the reference
value of a scan which is turned off.
Special case: If the intention is to display the result
of an intermodulation measurement in % or dB on
the Y axis in the Bargraph graphic system, then no
further reference is possible for this unit since it is
already referenced. The "Reference" parameter field
is displayed as inaccessible. Since no X axis is
offered there is no X reference value either. In such
cases the value 3.402823466385e+038 is entered in
the trace file instead of a reference value and stands
for NaN (Not a Number).

R&S UPV Format
1146.2084.32 4.593 E-9
A-X/datacount
A-Y
A-LimLow
A-LimUpp
A-RefY in unit
B-X/datacount
B-Y
B-LimLow
B-LimUpp
B-RefY in unit
This wording is arranged horizontally in the
trace file.
A-X/datacount:Datacount identifies the number of
following data sets (lines) for this scan. The
number of data sets for Trace A can be different
to the number for Trace B.
A-X: X value in the unit specified at X Unit.
A-Y: Y value of Trace A in the unit specified at
AUnit.
A-LimLow:Lower limit of Trace A from a limit file in
the unit specified at A Unit. If VOID is entered
here, there are no limit values from a file.
A-LimUpp:Likewise upper limit.
A-RefY in unit:Unit of the reference values of
Trace A interpolated onto the X axis from a
reference file, e.g. dBV.
Caution: The reference values themselves are
stored in the basic unit, e.g. V.
A-RefY:Reference values of Trace A in the basic
unit.
B-X/datacount:Datacount identifies the number of
following data sets (lines) for this scan. The
number of data sets for Trace A can be different
to the number for Trace B.
B-Y: Y value of Trace B i in the unit specified at
BUnit.
B-LimLow:Lower limit of Trace B from a limit file in
the unit specified at B Unit. If VOID is entered
here, there are no limit values from a file.
B-LimUpp:Likewise upper limit.
B-RefY in unit:Unit of the reference values of
Trace B interpolated onto the X axis from a
reference file, e.g. dBV.
Caution: The reference values themselves are
stored in the basic unit, e.g. V.
B-RefY:Reference values of Trace B in the basic
unit.
Example of a trace data set:
The trace data set was generated from the FFT Graph subsystem.
UPV FFT TRACE FILE
Heading String
Commenttext
XAxis Trace A Trace B
Frequency FFT Level Ch1 FFT Level Ch2
Frequency / Hz FFT Level Ch1 / dBV FFT Level Ch2 / V
Hz dBV V
LIN LIN LIN
0-170 0
22000 10 1
VOID VOID VOID
VOID VOID VOID
Scan #0 Labeltext Labeltext
Hz V V
1000 1.00e+000 1.00e+000

Format R&S UPV
1146.2084.32 4.594 E-9
A-X/256 A-Y A-LimLow A-LimUpp A-RefY in dBV B-X/256 B-Y B-LimLow B-LimUpp B-
RefY in dBV
0.00e+000 -1.08e+002 VOID VOID 1.00e+000 VOID VOID VOID VOID VOID
9.37e+001 -9.93e+001 VOID VOID 1.00e+000 VOID VOID VOID VOID VOID
1.87e+002 -1.01e+002 VOID VOID 1.00e+000 VOID VOID VOID VOID VOID
:
:
2.37e+004 -1.36e+002 VOID VOID 1.00e+000 VOID VOID VOID VOID VOID
2.38e+004 -1.37e+002 VOID VOID 1.00e+000 VOID VOID VOID VOID VOID
2.39e+004 -1.34e+002 VOID VOID 1.00e+000 VOID VOID VOID VOID VOID
The individual parameters are stored in the original with a considerably greater number of points. Due
to the restricted page width the data set for this display has been reduced in size.
If a data set is subsequently edited manually, comment lines can be inserted at any position ahead of
the data lines. Comment lines must begin with the character '#'.
In no case must a data set be interrupted by comments!
Equalization Files
The equalization data is stored in plain text in ASCII format. The format has been selected so that the
data can be processed without a problem in EXCEL (see section “Exporting”on page 4.604).
Structure of the equalization file:
Identifier UPV EQUALIZATION FILE
Number of following X/Y pairs: 100 #Datacount
Inverted or Not inverted: #Inverted
Norm frequency: # 1000.000000 Hz #Norm frequency
Normalization value: #0.100177 V # Norm value
100.000000000000
103.072242736816
106.238868713379
:
1027.808593750000
:
2000.000000000000
4891.695800781250
4622.376953125000
4368.537597656250
:
1.006141066551
:
4583.853027343750
The individual parameters are TAB separated.
black: Explanation of fields. These explanations are not stored in the equalization file.
green: Fixed entries in ASCII format.
red: Entries which change depending on the settings in the corresponding DispConfig panel.

R&S UPV Format
1146.2084.32 4.595 E-9
Explanation of terms:
Identifier Identifies the file as an equalization file.
During loading this identification is used to decide
whether the file concerned can be loaded.
Number of following X/Y pairs Self-explanatory
Inverted or Not inverted A comment which states whether the equalization
factors have been stored inverted or not inverted.
The effect of inverting the frequency response in the
generator by means of an equalization file created
with the "Invert" setting is that the same DUT - with
the precorrector enabled - now receives an
undistorted frequency response (see section
“Equalization”, on page 4.111).
Norm frequency A comment which states the frequency whose
voltage value has been used for normalization.
Normalization value A comment which states the normalization value
with which the Y values were computed as factors.
X/Y pairs Frequency value in Hz folowed by the normalization
factor.
If the frequency selected on saving the equalization
file was that at which the frequency response curve
is at its maximum, the precorrector file contains only
values from 0.0 to 1.0. If a different frequency is
selected, factors greater than 1.0 also occur.
Example of an equalization data set:
UPV EQUALIZATION FILE
100 # Datacount
#Inverted
#1000.000000 Hz # Norm frequency
#0.100177 V # Norm value
100.000000000000 4891.695800781250
103.072242736816 4622.376953125000
106.238868713379 4368.537597656250
: :
1027.808593750000 1.006141066551
: :
1940.386596679688 2496.481933593750
2000.000000000000 4583.853027343750
If a data set is subsequently edited manually, comment lines can be inserted at any position ahead of
the X/Y pairs. Comment lines must begin with the character '#'.
In no case must a data set be interrupted by comments!
Sweep Lists
The sweep list data is stored in plain text in ASCII format. The format has been selected so that the
data can be processed without a problem in EXCEL (see section “Exporting”on page 4.604).
Sweep points must be specified in ascending or descending order – they must not change direction, for
example due to editing (see section “List Sweep”, on page 4.134).

Format R&S UPV
1146.2084.32 4.596 E-9
Identifier: UPV SWEEPLIST FILE
Number of following X values: 9#Datacount
Basic unit: Hz # Basic unit
16.000000000000
20.000000000000
25.000000000000
31.500000000000
40.000000000000
50.000000000000
63.000000000000
black: Explanation of fields. These explanations are not stored in the sweep list.
green: Fixed entries in ASCII format.
red: Entries which change depending on the settings in the corresponding DispConfig panel.
Explanation of terms:
Identifier Identifies the file as a sweep list.
During loading this identification is used to decide
whether the file concerned can be loaded.
Number of following X values Self-explanatory
Basic unit The X values in the sweep list are always stored in
the basic unit. If for instance the X values in the
trace from which the sweep list was derived are in
jHz, the basic unit is entered as Hz and the X
values are recomputed and stored in Hz.
Basic units can occur as Hz, V, FS, UI, s and
DEG (°).
The R&S UPV uses this entry to recognize whether
the loading operation is allowed for this file having
regard to the current setting.
If for example an attempt was made to load a sweep
list with the basic unit Hz for a voltage list sweep,
such a file would be ignored (see section “List
Sweep”, on page 4.134).
Xvalues X values for a list sweep
Example of a sweep list data set:
UPV SWEEPLIST FILE
9#Datacount
Hz # Basic unit
16.000000000000
20.000000000000
25.000000000000
31.500000000000
40.000000000000
50.000000000000
63.000000000000
80.000000000000
100.000000000000
If a data set is subsequently edited manually, comment lines can be inserted at any position ahead of
the frequency values. Comment lines must begin with the character '#'.
In no case must a data set be interrupted by comments!

R&S UPV Format
1146.2084.32 4.597 E-9
Limit Files
The limit data is stored in plain text in ASCII format. The format has been selected so that the data can
be processed without a problem in EXCEL (see section “Exporting”on page 4.604).
Structure of the limit file:
Identifier: UPV LIMIT FILE
Number of following X/Y pairs: 9#Datacount
Offset ON/OFF: # Offset ON
Offset value: #Offset value = 10 dBV
Xand Y unit: Hz dBV
100
711
789
875
970
1076
1193
1323
2000
-70
-70
-45
-10
-10
-10
-30
-70
-70
black: Explanation of fields. These explanations are not stored in the limit file.
green: Fixed entries in ASCII format.
red: Entries which change depending on the settings in the corresponding DispConfig panel.
Explanation of terms:
Identifier Identifies the file as a limit file.
During loading this identification is used to decide
whether the file concerned can be loaded.
Number of following X/Y pairs Self-explanatory
Offset ON/OFF A comment which states whether, during the
generation of a limit file from a measurement value
sequence, an offset value was added (ON) or not
(OFF) to the Y data (see section “Offset”on page
4.535).
Offset value A comment which states which offset value was
added to the Y data during the generation of a limit
file from a measurement value sequence (see
section “Offset Value”on page 4.535).
Xand Y unit Depending on the selected X axis and the
measurement function, a very diverse range of units
can be entered here for the X / Y values.
Examples for the X values: Hz, °, s, V, FS or UI.
Examples for the Y values: V, dBV, dBr, … V/Vr, °,
s, db, % etc.
X/Y pairs X/Y pairs in the specified units.
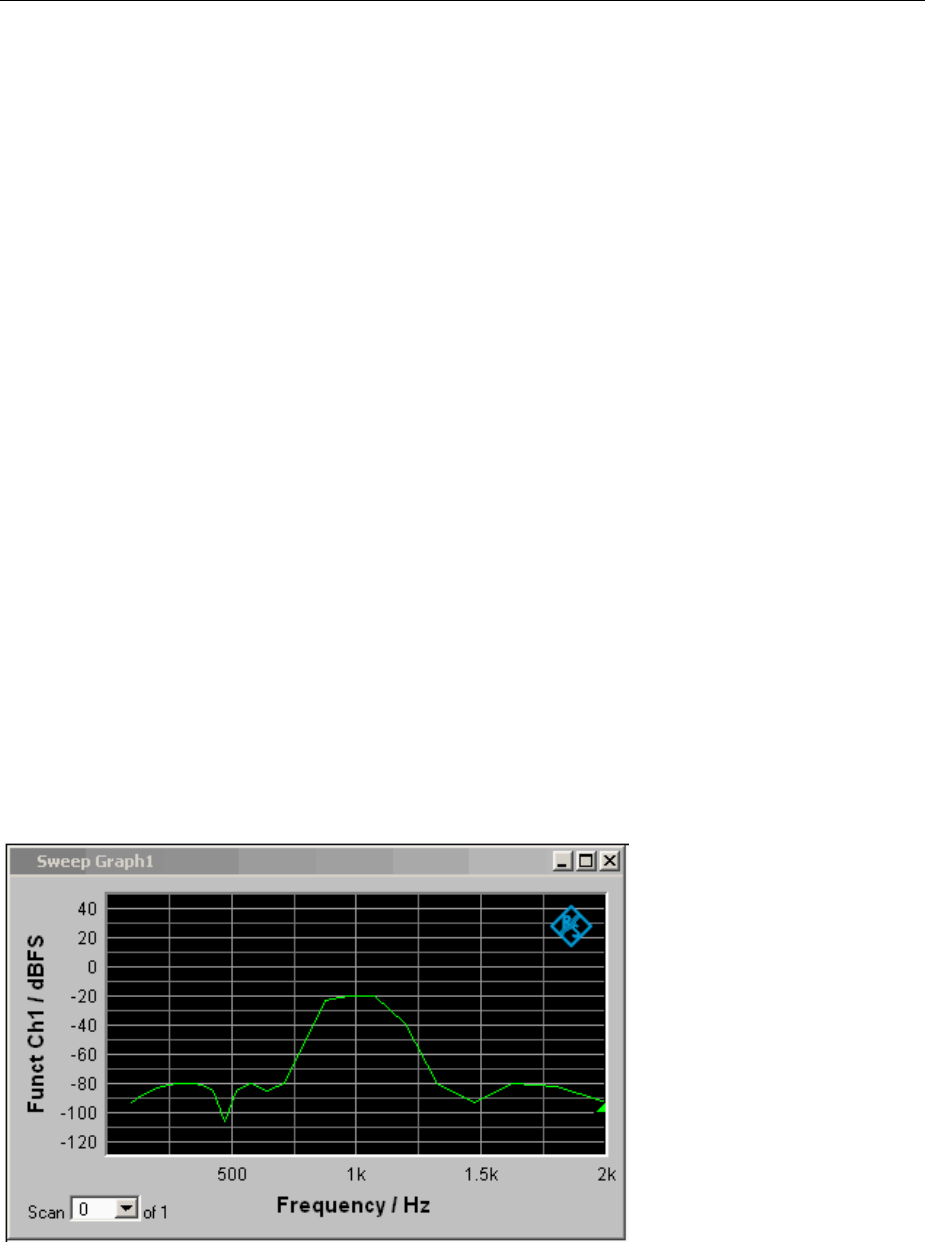
Editing R&S UPV
1146.2084.32 4.598 E-9
Example of a limit data set:
UPV LIMIT FILE
9#Datacount
#Offset ON
#Offset value = 10.0 dBV
Hz dBV
100 -70
711 -70
789 -45
875 -10
970 -10
1076 -10
1193 -30
1323 -70
2000 -70
If a data set is subsequently edited manually, comment lines can be inserted at any position ahead of
the X/Y pairs. Comment lines must begin with the character '#' .
In no case must a data set be interrupted by comments!
Editing
The editing of trace files, equalization files, sweep lists and limit files is always carried out in the same
way and is illustrated by two examples.
The procedure is not explained point by point in the examples – this would be beyond the scope of this
description. The examples are really intended for the trained user.
Example 1:
The intention is to generate a tolerance band from the frequency response of an ideal DUT. This
tolerance band will be compared to the other DUTs.
The measurement value sequence of this ideal DUT is generated by means of a 30 point sweep.
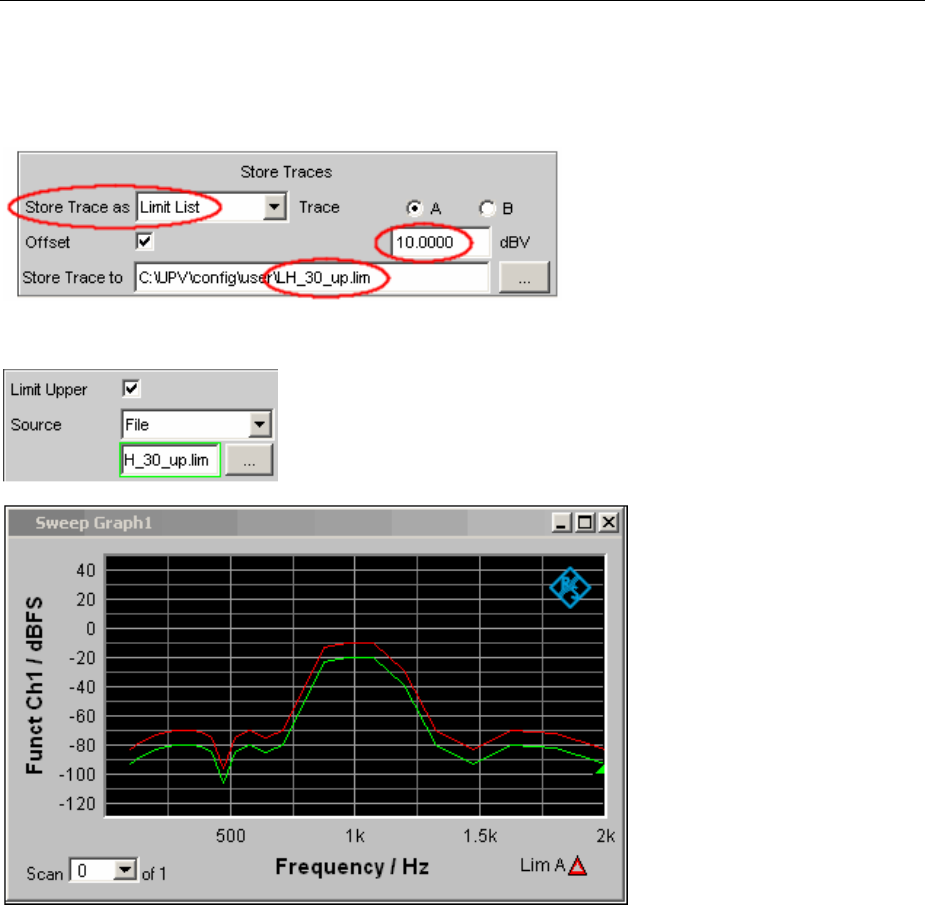
R&S UPV Editing
1146.2084.32 4.599 E-9
Using "Store Trace as" "Limit List", a limit file with 30 pairs of X/Y values is generated from this
measurement value sequence and stored as LH_30_up.lim. The Y values of the limit curve are
provided with an additive offset of 10 dBV, producing a limit curve that is parallel shifted by 10 dBV
compared to the measurement value sequence.
If the limit curve is loaded as Limit Upper, the parallel shift can be seen to be upward.
However, the limit curve derived from a measurement value sequence is unsuitable as the upper limit of
atolerance band, since horizontal lines should appear to left and right of the passband in the bandpass
display. This makes it necessary to modify the limit file.
For this purpose the file named LH_30_up.lim is loaded into an ASCII editor, such as the Windows
Editor, which is present as an accessory on every Windows operating system for the R&S UPV. The
editor displays a data set as shown in the lefthand column below.

Editing R&S UPV
1146.2084.32 4.600 E-9
This data set is then modified as shown in the righthand column.
Original data set from file LH_30_up.lim Modified data set saved to file LH_9_up.lim
UPV LIMIT FILE
30 # Datacount
#Offset ON
#Offset value = 10.000000 dBV
Hz dBV
100.000000000000 -83.702377319336
110.882522583008 -82.031776428223
122.949340820313 -80.389442443848
136.329330444336 -78.784820556641
151.165405273438 -77.228446960449
167.616012573242 -75.734764099121
185.856872558594 -74.320167541504
206.082794189453 -73.010757446289
228.509796142578 -71.841300964355
253.377426147461 -70.862701416016
280.951293945313 -70.152404785156
311.525878906250 -69.837203979492
345.427764892578 -70.144065856934
383.019012451172 -71.554283142090
424.701171875000 -75.466735839844
470.919372558594 -96.235939025879
522.167297363281 -75.033081054688
578.992248535156 -69.949821472168
642.001220703125 -75.313186645508
711.867187500000 -69.820259094238
789.336303710938 -44.014369964600
875.236022949219 -13.052226066589
970.483764648438 -9.946021080017
1076.096923828125 -9.984798431396
1193.203369140625 -28.528638839722
1323.054077148438 -70.569931030273
1467.035766601563 -82.768814086914
1626.686279296875 -70.306480407715
1803.710693359375 -71.739479064941
2000.000000000000 -83.138786315918
UPV LIMIT FILE
9#Datacount
#Offset ON
#Offset value = 10.000000 dBV
Hz dBV
100 -70
711 -70
789 -45
875 -10
970 -10
1076 -10
1193 -30
1323 -70
2000 -70
When altering the number of X/Y values it is important to make sure that the Datacount entry is adapted
accordingly. The identifier UPV LIMIT FILE must not be changed.
If the tabulator (TAB) is used as a separator between various entries in a line, the file can be processed
in EXCEL without any problem. Other separators are also permissible, e.g. ';', '|' or ' '.
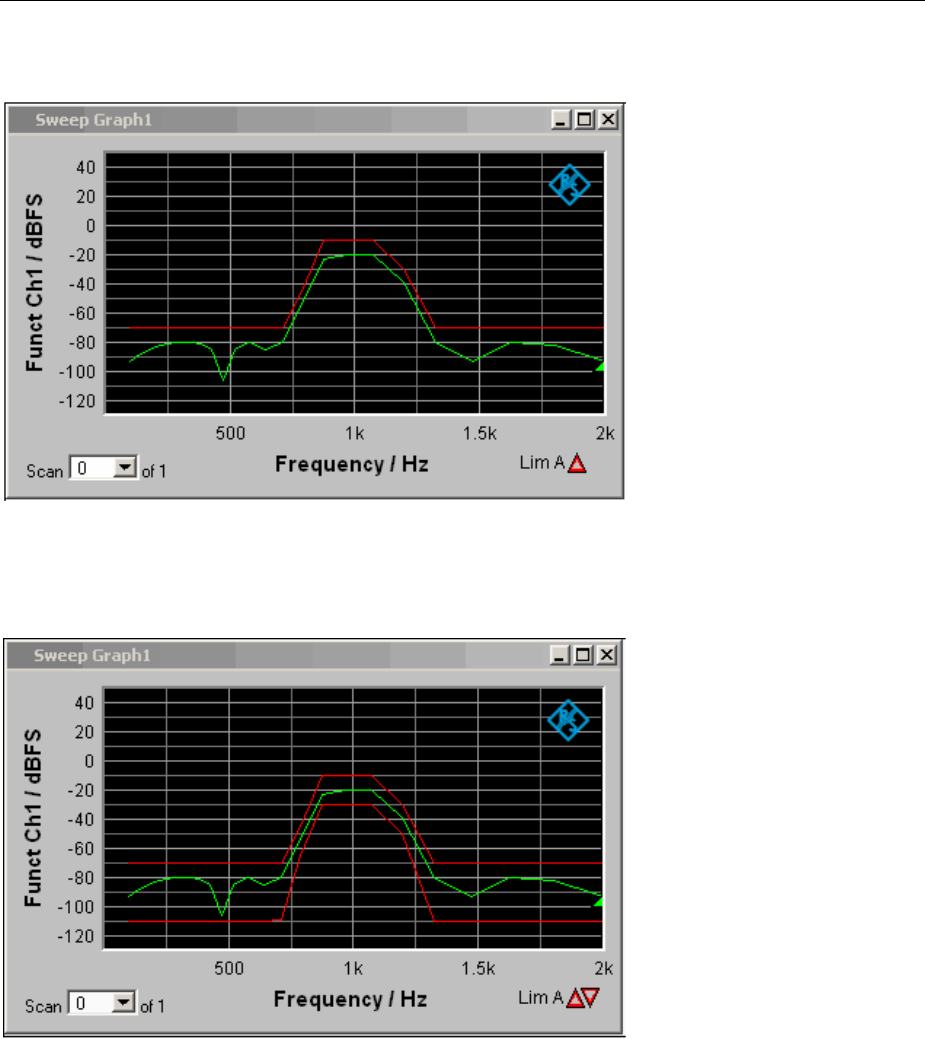
R&S UPV Editing
1146.2084.32 4.601 E-9
If the new limit curve named LH_9_up.lim is then loaded as "Limit Upper", the result of the modification
can be assessed and further processing can be performed if necessary.
Alimit file for the lower limit of a tolerance band can be generated in much the same way as the
procedure for modifying a limit file for the upper limit of a tolerance band. The two limit files together
produce the desired tolerance band.

Editing R&S UPV
1146.2084.32 4.602 E-9
Example 2:
The intention is to create a sweep file from the trace data set of a waveform file. Leave to one side the
matter of whether this serves any purpose. The example is intended to show that any trace file can be
created by editing.
The X values in the waveform trace file are expressed in seconds. But the X axis in the sweep trace file
needs to be displayed in Hz. The level values on the Y axis are to stay unchanged.
Line Original waveform trace file The sweep trace file created by editing
1
2
3
4
5
6
7
8
9
10
11
12
13
14
15
16
17
18
19
20
21
22
UPV WAVEFORM TRACE FILE
Heading String
Commenttext
XAxis Trace A Trace B
Time Level Ch1 VOID
Time / s Level Ch1 / V VOID
sVVOID
LIN LIN VOID
0-0.000273702 VOID
0.0001 0.000946001 VOID
VOID VOID VOID
VOID VOID VOID
Scan #0 Labeltext VOID
sVVOID
11.00e+00 VOID
A-X/6 A-Y
0.00000e+00 1.01179e-004
2.08333e-05 6.25051e-004
4.16666e-05 8.90560e-004
6.25000e-05 7.87767e-004
8.33333e-05 3.59082e-004
1.04166e-04 -2.1826e-004
UPV SWEEP TRACE FILE
Heading String
Commenttext
XAxis Trace A Trace B
Frequency Funct Ch1 VOID
Frequency / Hz Funct Ch1 / V VOID
Hz V VOID
LIN LIN VOID
0-0.000273702 VOID
10 0.000946001 VOID
VOID VOID VOID
VOID VOID VOID
Scan #0 Labeltext VOID
Hz V VOID
11.00e+00 VOID
A-X/6 A-Y
0.00000 1.01179e-004
2.08333 6.25051e-004
4.16666 8.90560e-004
6.25000 7.87767e-004
8.33333 3.59082e-004
10.4166 -2.1826e-004
The data sets are displayed in abbreviated form
Explanation of the changes:
Line Change
1 UPV SWEEP TRACE FILE
The identifier is changed so that the file will be accepted in the sweep graphic system. For
information on identifiers see table entry "Subsystem identifier" in section “Trace Files”, on page
4.590
2 unchanged
3 unchanged
4 unchanged
5 Frequency
The desired function of the X axis is entered here. The wording must be exacty the same as the
entry in the parameter list of the X axis selection field.
Funct Ch1
The desired function of the Y axis is entered here. The wording must be exacty the same as the
entry in the parameter list of the "Y-Source" selection field.

R&S UPV Editing
1146.2084.32 4.603 E-9
6 Frequency / Hz
The desired label for the X axis is entered here:
Funct Ch1 / V
The desired label for the Y axis is entered here:
7Hz
The desired unit for the X axis is entered here. The wording must be exacty the same as the
entry in the parameter list of the Unit selection field.
8unchanged
9 unchanged
10 10
The righthand final value of the X axis is entered here.
11 unchanged
12 unchanged
13 unchanged
14 Hz
The basic unit of the unit selected in line 7 is entered here. If for example jHz had been
entered in line 7, then Hz would still have to be shown here.
15 unchanged
16 unchanged
17
18
19
20
21
22
Modified X values
In order to make the changes, the waveform trace file (e.g. mywav.trc) is loaded into an ASCII editor,
such as the Windows Editor, which is present as an accessory on every Windows operating system for
the R&S UPV. The editor displays a data set as shown in the lefthand column above.
This data set is then modified as shown in the righthand column.
The amended data set is saved with another name (e.g. myswp.trc).
After the new data set is loaded in the Sweep graphic system
atrace identical to that of the waveform must be seen, though its X axis will be totally different.
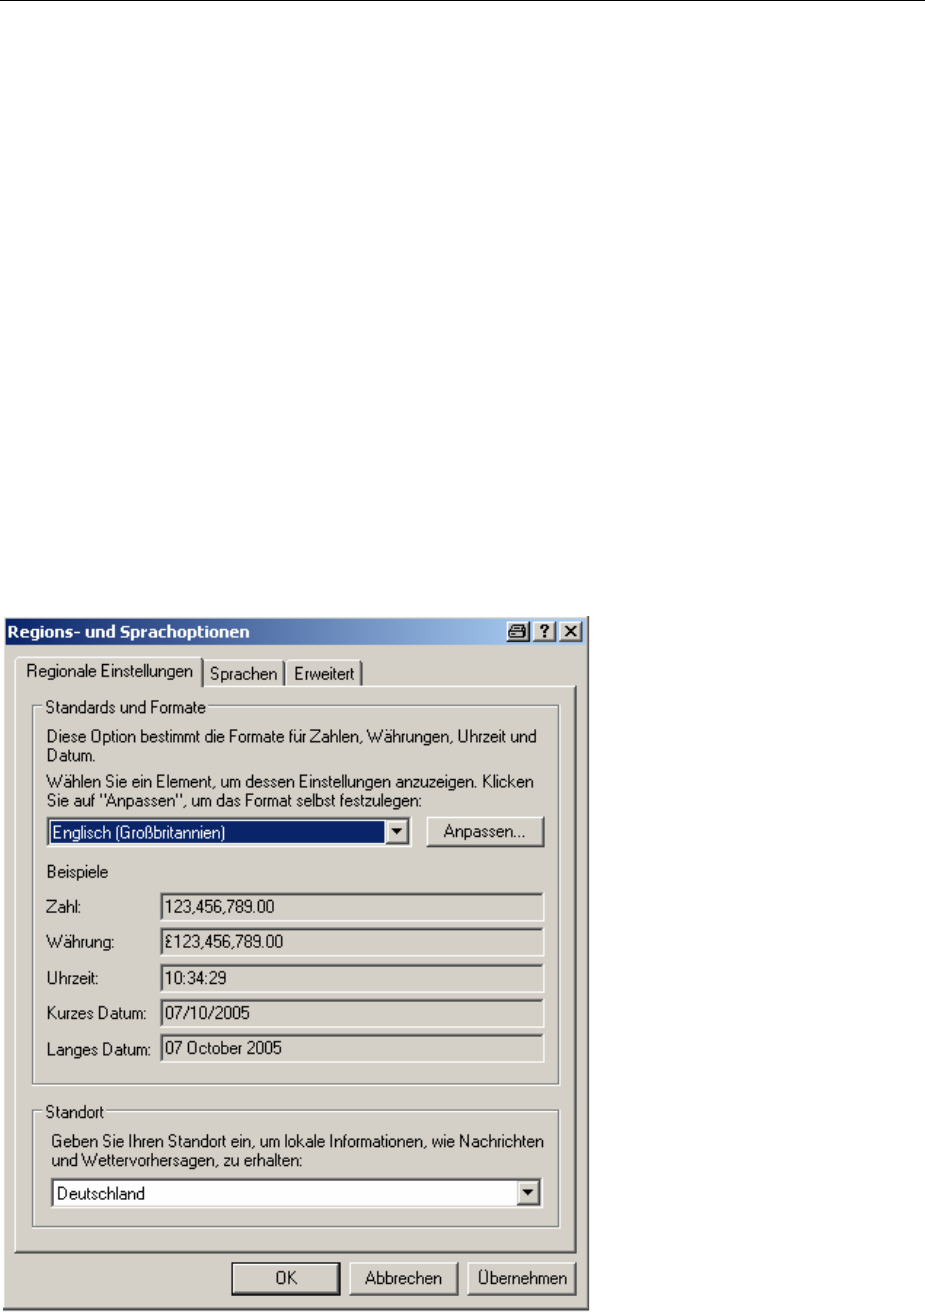
Exporting R&S UPV
1146.2084.32 4.604 E-9
Exporting
The most frequent reason for needing to export trace files, equalization files, sweep lists and limit files is
without doubt so that they can be further processed in Microsoft Excel.
The procedure is explained in broad terms in the following example. The examples are really intended
for the trained user. A point by point description would be beyond the scope of this description.
Changing the language option:
It is a prerequisite that Microsoft Excel is installed on the R&S UPV, or that a PC is available on which
Excel is already installed.
If a PC is to be used, the trace file being exported must be copied to this PC by means of a USB stick,
for example.
The PC must be changed over to the English language option if this has not already been done.
This is usually not necessary in the case of the R&S UPV, since the R&S UPV is delivered with the
language option "English (United Kingdom)".
If it is necessary to change the language option, proceed as follows:
Using the operating menu sequence
Start, Settings, Control Panel, open the window for "Regional and Language Options" and set the
language "English (United Kingdom)".
This conversion ensures that in Excel the decimal separator within numbers is interpreted as the
decimal point.
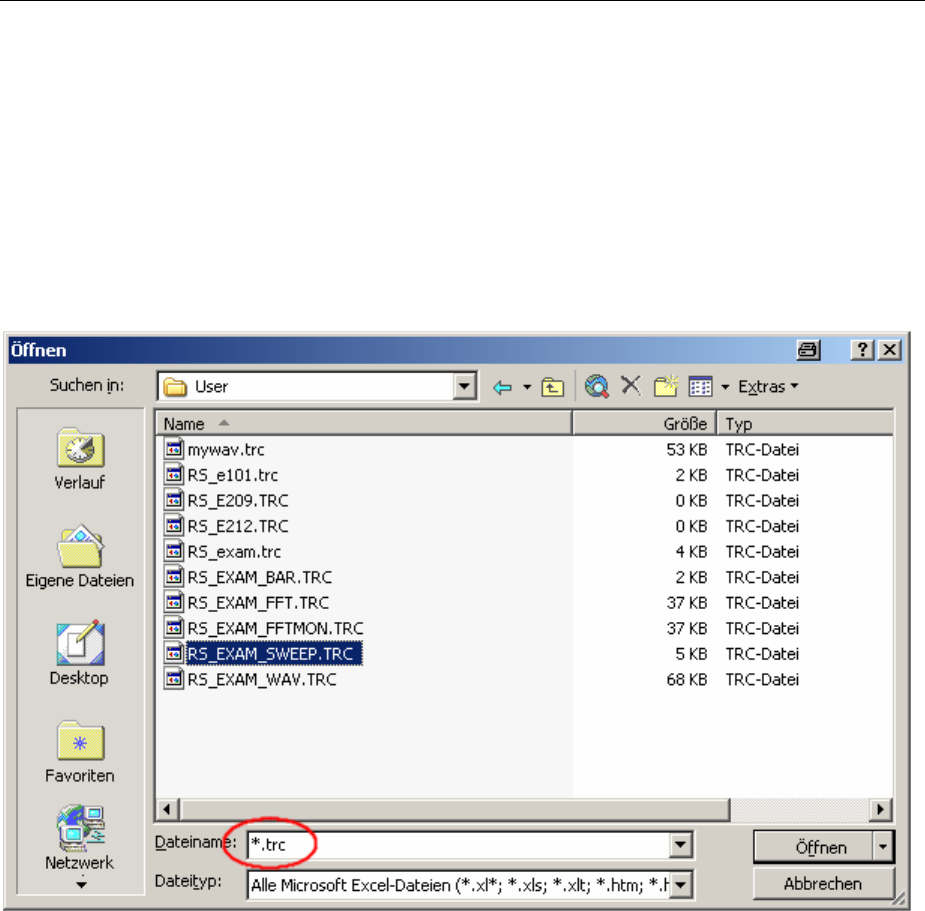
R&S UPV Exporting
1146.2084.32 4.605 E-9
Since the R&S UPV is delivered with an English-language operating system for English-speaking
regions, die trace files are generated within the R&S UPV exclusively in the English number format
(decimal point rather than decimal comma) and can therefore be processed in Excel without the
slightest need for post-processing.
Reading the trace file into Excel:
Open Excel and open the file selector via the menu item File Open.
Go to the directory containing the trace file that is to be exported.
In the File name field type the file name extension *.TRC and all files with the extension *.TRC will
appear.
Select the file that is to be exported.
Adialog box opens in which no changes must be made.
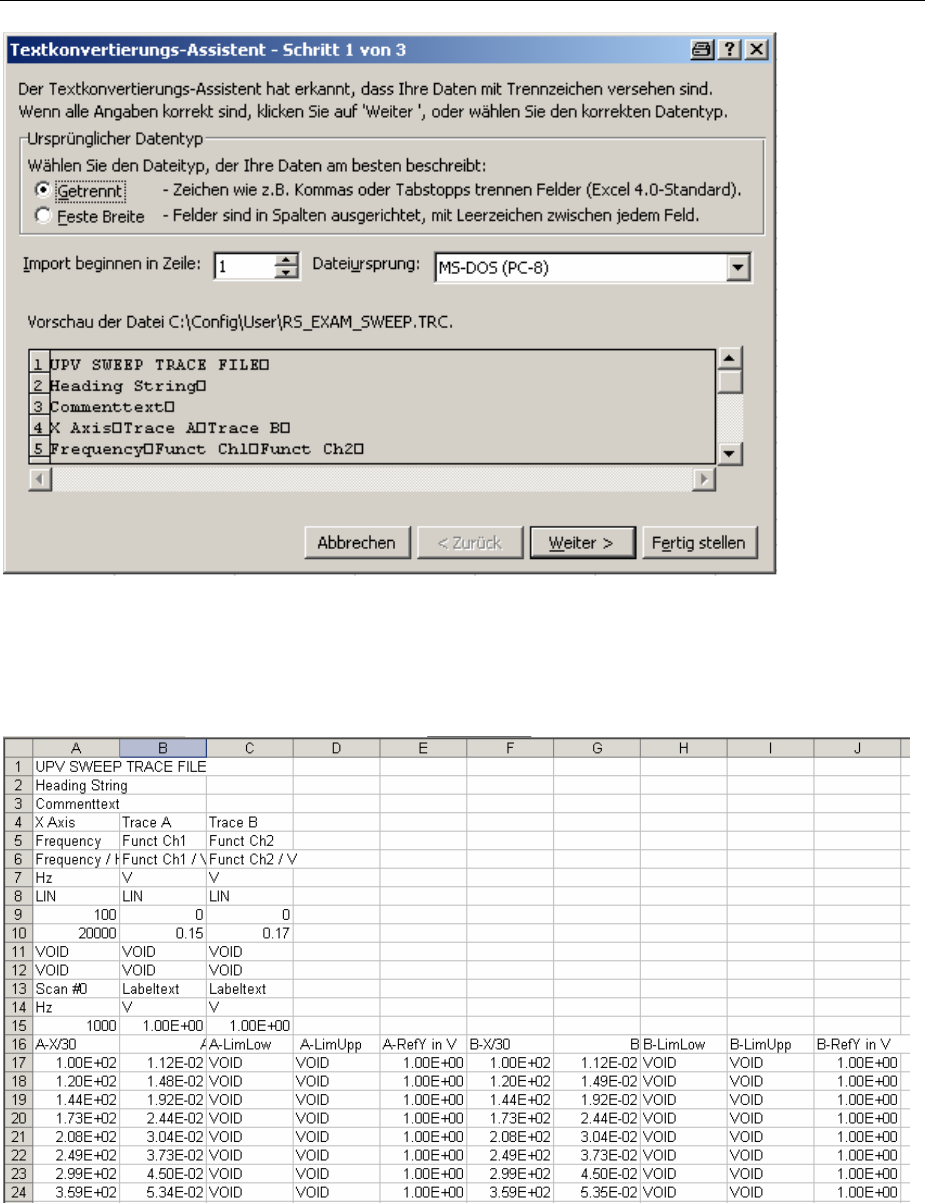
Exporting R&S UPV
1146.2084.32 4.606 E-9
Finish.
The trace files have been dsigned by R&S so that without a single entry the data set appears in Excel
and can be processed further.
If necessary change the number format (number of places after the decimal point).

R&S UPV Loading and Saving
1146.2084.32 4.607 E-9
Loading and Saving
This section tells you how to load and save different kinds of data sets in the R&S UPV. The file name
is chosen through a central file selection box; its type is defined by the extension. The style of the file
selection box can be defined in the configuration menu. The integrated file selection box is set as
standard. It enables front panel control and is described below. Optionally the usual Windows file
selection box can be used.
Integrated File selection box
The file selection box is split into three or four areas. At the top (Recent area) is a list of the file names
last selected. This list will always contain the last ten entries. Below this and split into two is space for
selecting the required directory (Directory area, left) and the required file (File area, right). If a data set
is to be saved, you will also find an entry field at the bottom for the file name.
At the bottom edge of the file selection box are two buttons "Select" and "File Manager". You can work
these buttons either with the rotary knob or the softkey below.
To change between the areas, use the rotary knob or the cursor keys. Each of the areas appears with a
blue frame when you select it with the rotary knob. Pressing the rotary knob or the ENTER key changes
your selection to the content of the selected area, and an entry within this area is selected; the ESC key
takes you back to selection of an area.
Important:
The Directory area and the File area are comprised within the same frame. So to change between the
two areas you use the LEFT and RIGHT cursor keys and not the rotary knob.
If a selection is in the Recent area or File area, the RETURN key or a click of the rotary knob will
complete selection of the file name and execute the required function. When you are storing data sets,
ending entry of the file name with RETURN will complete selection of the file name.
For the creation of new directories when saving or organizing saved data sets during loading, the file
selection box has a "File Manager" button to open a functionality which is similar to Windows Explorer
except that, like the internal file selection box, it is optimized to be operated with no mouse or keyboard.
File manager
The file manager is split into three areas. At the top is a selection of the possible types of data sets.
These are distinguished by their extensions in the file name. Below this and split into two is space for
selecting the required directory (Directory area, left) and the required file (File area, right).
At the bottom edge of the file manager are the buttons "Cut", "Copy", "Paste", "Remove", "Rename" and
"Create Dir". You can work these buttons either with the rotary knob or the softkey below them. These
are a substitute for the popup menu in Windows Explorer on the right mouse key.
To change between the areas, use the rotary knob or the cursor keys. Each of the areas appears with a
blue frame when you select it with the rotary knob. Pressing the rotary knob or the ENTER key changes
your selection to the content of the selected area, and an entry within this area is selected; the ESC key
takes you back to selection of an area.
Loading and Saving Setups R&S UPV
1146.2084.32 4.608 E-9
Important:
The Directory area and the File area are comprised within the same frame. So to change between the
two areas you use the LEFT and RIGHT cursor keys and not the rotary knob.
Once a file is selected, you activate a button at the edge of the dialog to trigger the required function.
If you want to shift a file from one directory to another for example, you first select the source directory
in the Directory area, and then the particular file in the File area. The "Cut" button notes the file to be
shifted. Then you select the destination directory in the Directory area and choose the "Paste" button.
This moves (pastes) the file from the source directory to the destination directory.
Windows file selection box
The Windows file selection box is divided into three areas: On the left is a selection bar of icons which
can be used to jump to different drives and personal directories.
In the upper area are the navigation buttons for such things as changing directories or creating new
directories. Directly below is a list of the displayed files.
In the lower area is the entry field for the file name and the buttons for confirming the selection. If files
have already been selected in previous steps, the file selection box remembers their names and offers
the first matching name from the history as a preselection when a file name is being typed.
As usual in Windows programs, this file selection box is best operated with the mouse only.
Loading and Saving Setups
Setups can be loaded and saved at any time. The front panel keys LOAD and SAVE trigger the
required function, opening the appropriate file selection box.
Note:
Loading and saving setups is also possible through the menu bar. The related entries are in the File
menu.
Saving setups
When saving setups, the R&S UPV distinguishes between two types of setups: complete setups (*.set)
and current setups (*.sac).
Saving a complete setup saves the entire instrument settings, plus the position and size of all windows
in all screens. Saving a current setup, in contrast, only saves the instrument settings. A setup saved in
this way can be loaded much faster, since the panels do not have to be restored.
Complete setups have the file suffix ".set"; current setups have the suffix ".sac".
Remote-control command:
MMEMory:STORe:STATe 'setupfile'

R&S UPV Printing and Saving the Display Screen
1146.2084.32 4.609 E-9
Loading setups
Loading a setup overwrites the settings of the instrument with the settings that were active when setup
was saved. Depending on the type of setup to be loaded, only the current settings are overwritten
("current" setup") or the entire settings, including the position and size of all windows in all screens
("complete" setup). Windows that were open when the setup was saved are opened, and windows that
were closed when the setup was saved are closed again. This is also done for the screens that are not
visible.
Remote-control command:
MMEMory:LOAD:STATe 'setupfile'
Note:
The loading of setups has been considerably optimized as of version 1.4.0 of the R&S UPV software.
Above all, setups with a high-resolution FFT or waveform setting are now loaded much faster.
Printing and Saving the Display Screen
The R&S UPV enables you, at any time, to make and keep an extract of the displayed results for later
use. You do this either by a direct printout or by saving to a file or the Windows clipboard. You make the
necessary settings, e.g. selection of the result to be output (source) and where it is to be output
(destination), in a configuration panel.
Configuring Print and Save Operations
The "Utilities Hardcopy" menu opens a configuration panel for you to specify the output parameters.
Source
Selection of the screen content to be output.
UPV Window (Bitmap) This setting outputs the entire screen of the
R&S UPV as a bitmap. This is the default after
firmware installation.
Remote-control command:
HCOPy:SOURce WINDow
Active Panel (Bitmap) This setting outputs the currently active panel as a
bitmap. It is available for all parameter windows,
measurement value displays and graphical windows.
Remote-control command:
HCOPy:SOURce PANel

Printing and Saving the Display Screen R&S UPV
1146.2084.32 4.610 E-9
Active Graphics (Vector) This setting outputs the momentarily active graphical
window as a vector graphic. This is for the graphics
"FFT Monitor", "FFT Graph", "Waveform",
"Bargraph" and "Sweep Graph".
Remote-control command:
HCOPy:SOURce GRAPhics
Destination
Selection of the destination for the screen content to be output.
Printer The screen content selected under "Source" is output direct to
the printer set as the default printer under Windows XP.
Remote-control command:
HCOPy:DESTination PRINter
File The screen content selected under "Source" is output to a file
specified under "File Name".
Remote-control command:
HCOPy:DESTination FILE
Clipboard The screen content selected under "Source" is output direct to
the Windows clipboard and can be used direct in other
applications.
Remote-control command:
HCOPy:DESTination CLIPboard
Graph Size
Resolution for vector graphs
Achange to the resolution is only provided for the Source = Act. Graphic and
Destination = File | Clipboard settings. These settings produce a vector graph
whose resolution can be specified.
For the Source = UPV Window or Destination = Printer settings, bitmaps are
produced whose resolution cannot be changed without a major loss of quality,
which is the reason why an option to define the resolution is not available.
The setting made here remains unaffected by preset or by loading a setup; it is
therefore bound to the device.
Remote control command:
HCOPy:GSIZe 'string'
string = Auflösung in Pixel z.B. 800x600
Important:
If the instrument is being remotely controlled from the Windows XP Remote Desktop, the "Clipboard"
setting allows you to transport graphics direct between the instrument and the host computer.

R&S UPV Printing and Saving the Display Screen
1146.2084.32 4.611 E-9
Orientation
Selection of the orientation wished on the Windows printer (only if "Destination" is
configured as "Printer").
Portrait Output on the printer is in portrait format.
Remote-control command:
HCOPy:PRINter:ORIentation PORTrait
Landscape Output on the printer is in landscape format.
Remote-control command:
HCOPy:PRINter:ORIentation LANDscape
Header/Footer
Selection of the required header and footer in the output.
On The header and footer are visible.
Remote-control command:
HCOPy:PRINter:ADDition ON
Off The header and footer are not visible.
Remote-control command:
HCOPy:PRINter:ADDition OFF
Define Header
Selection of the required text for the header (only if "Header/Footer" is "On"). This
text forms the title in the middle of the header line.
Remote-control command:
HCOPy:PRINter:HEADer 'text'
Define Footer
Selection of the required text for the footer (only if "Header/Footer" is "On"). This
text forms the legend in the middle of the footer line.
Remote-control command:
HCOPy:PRINter:FOOTer 'text'
Store Mode
Selection of the mode for output to a file (only if "Destination" is configured as
"File").
New Press H Copy to open the file selection box and enter the
name of the destination file. See also section "Saving setups"
on page 4.608.
Remote-control command:
HCOPy:FILE:MODe NEW
Overwrite Output is always to the file of "File Name", which is overwritten
without asking you each time.
Remote-control command:
HCOPy:FILE:MODe OVERwrite

Printing and Saving the Display Screen R&S UPV
1146.2084.32 4.612 E-9
AutoIncrement Output is to a file whose name is composed of two parts: The
beginning of the file name is that name entered as "File
Name", followed by a consecutive number that is incremented
by 1 every time you press H Copy .
Remote-control command:
HCOPy:FILE:MODe INCRement
File Name
Selection of the name of the file for output to a file (only if "Destination" is
configured as "File" and "Store Mode" is not "New"). The file selection box opens
for you to change the file name (see section "Integrated File selection box" on
page 4.607). Enter the file name without an extension; the “File Type“setting in
the file selection box defines the file type.
Remote-control command:
HCOPy:FILE 'filename'
Starting Print and Save Operations
Press the H Copy key to trigger the function for output of measured results. The required action is
immediately executed according to your settings in the configuration panel (see section "Configuring
Print and Save Operations" on page 4.609).
Remote-control command:
HCOPy[:IMMediate]
Important:
If you trigger H Copy during an ongoing measurement, the measurement is first halted and then the
action is executed.

R&S UPV Contents "Remote Control - Fundamentals"
1146.2084.32 I-5.1 E-9
Contents Chapter 5 - Remote Control - Fundamentals
5Remote Control - Fundamentals ...........................................................................................5.1
Introduction - Remote Control Fundamentals...............................................................................5.1
Brief Instructions..............................................................................................................................5.2
IEC/IEEE Bus ...........................................................................................................................5.2
Changing to Remote Control ..........................................................................................................5.3
Remote Control via IEC/IEEE Bus...........................................................................................5.4
Remote Control via LAN Interface ...........................................................................................5.5
Remote control via the USB device interface ........................................................................5.10
Messages ........................................................................................................................................5.13
Interface Messages................................................................................................................5.13
Device-Dependent Messages ................................................................................................5.13
SCPI Command Structure and Syntax .........................................................................................5.14
Structure of a Program Message ...........................................................................................5.17
Responses to Queries............................................................................................................5.17
Parameters.............................................................................................................................5.19
Overview of Syntax Elements ................................................................................................5.20
Device Model and Command Processing ....................................................................................5.21
Input Unit ................................................................................................................................5.21
Command Identification (Parser) ...........................................................................................5.22
Database and Device Hardware ............................................................................................5.22
Command Sequence (IEC/IEEE)...........................................................................................5.22
Status Reporting System .......................................................................................................5.24
Output Unit .............................................................................................................................5.24
Trigggering Measurement or Sweep......................................................................................5.24
Command Synchronization....................................................................................................5.25
Command Recording .....................................................................................................................5.26
Starting Recording .................................................................................................................5.26
Recording Commands ...........................................................................................................5.27
Editing Commands.................................................................................................................5.27

Contents "Remote Control - Fundamentals" R&S UPV
1146.2084.32 I-5.2 E-9
Status Reporting System...............................................................................................................5.28
Structure of SCPI Status Register .........................................................................................5.29
Overview of Status Registers.................................................................................................5.31
Status Byte (STB) and Service Request Enable (SRE) Register ..........................................5.32
IST Flag and Parallel Poll Enable (PPE) Register .................................................................5.34
STATus:EVENt Register (ESR) .............................................................................................5.34
STATus:OPERation Register.................................................................................................5.35
STATus:QUEStionable Register ............................................................................................5.37
STATus:QUEStionable:UNDERrange Register.....................................................................5.38
STATus:QUEStionable:OVERrange Register .......................................................................5.39
STATus:QUEStionable:MEASuring Register.........................................................................5.40
STATus:XQUEstionable Register ..........................................................................................5.41
Use of Status Reporting System............................................................................................5.43
Initializing the Status Reporting System ................................................................................5.46

R&S UPV Introduction - Remote Control Fundamentals
1146.2084.32 5.1 E-9
5Remote Control - Fundamentals
Introduction - Remote Control Fundamentals
In this chapter you will find:
•instructions on starting the Audio Analyzer R&S UPV by remote control,
•ageneral introduction to the remote control of programmable instruments, including details of
command structure and syntax, command processing and the status registers,
•agraphic and tabular presentation of the status registers used in the Audio Analyzer R&S UPV.
The remote control commands of the Audio Analyzer R&S UPV are included in the details of the
instrument functions in Chapter 4.
To standard the instrument comes with the following interfaces for remote control:
-IEC/IEEE bus interface in line with the IEC 625.1/IEEE 488.2 standard.
-LAN interface; the network card uses 100 MHz Ethernet IEEE 802.3u; the protocol is based on the
VXI-11 standard.
-USB interface (device USB)
Acontroller can be connected on the remote control interfaces, either direct or through a network
(LAN). The connectors are located on the rear panel of the instrument.
These connectors are detailed in chapter 8, "Maintenance and Interfaces".
SCPI commands (messages) are used for remote control. Commands not derived from the standard
nevertheless follow SCPI syntax rules. The instrument supports SCPI version 1999 (Standard
Commands for Programmable Instruments). The SCPI standard sets up on the IEEE 488.2 standard,
and aims at standardization of device-specific commands, error handling and status registers. For more
information on the SCPI concept and definitions, refer to the book "Automatic Measurement Control – A
tutorial on SCPI and IEEE 488.2" by John M. Pieper, R&S ordering code 0002.3536.00.
For the purposes of this chapter it is assumed that you are familiar with the programming and operation
of the controller. Refer to the appropriate manuals for details of the interface commands.
The requirements of the SCPI standard in terms of command syntax, error handling and configuration
of status registers are explained in detail in the respective sections. Tables give you a fast overview of
the bit assignments in the status registers. The tables are supplemented by a detailed description of the
status registers.
All program examples for IEC/IEEE bus control are written in Visual Basic. A requisite for Visual Basic
programming is that the modules NIGLOBAL (Niglobal.bas) and VBIB32 (Vbib_32.bas) are added to
the projects.
Note:
Manual control aims at the greatest possible operating ease. The focus in remote control is the
predictability of device status after a command. Consequently, remote control programs should always
produce a default status to start with (e.g. by the *RST command) and then make the required settings.

Brief Instructions R&S UPV
1146.2084.32 E-9
5.2
Brief Instructions
The following short and simple operating sequence allows rapid setup of the instrument on the
IEC/IEEE bus and setting of its basic functions. It is assumed that the IEC/IEEE bus address, factory-
set to 20, has not yet been altered.
IEC/IEEE Bus
Interconnect the instrument and the controller by the IEC/IEEE bus cable and power them on.
Generate and start the following program on the controller:
CALL IBFIND("DEV1", analyzer%) Open channel to device.
CALL IBPAD(analyzer%, 20) Send device address to controller.
CALL IBWRT(analyzer%, "*RST;*CLS") Reset device.
Analog generator is set dual-channel to
1kHz, 0.1 V.
Measurement function of analog analyzer
is set dual-channel to RMS measurement.
CALL IBWRT(analyzer%, "INPut:TYPE GEN1") Connect analyzer input internally to
generator output channel 1.
CALL IBWRT(analyzer%, "INIT:CONT OFF;*WAI") Trigger single measurement result.
CALL IBWRT(analyzer%, "SENS1:DATA1?") Request function measurement result (i.e.
result of RMS measurement) from channel
1.
CALL IBRD (analyzer%, M$) Read in measurement result.
PRINT M$ Output measurement result onscreen.
The screen shows the RMS function measurement result in V of the generator signal measured by
internal coupling.
Return to manual control: Press the LOCAL key on the front panel.
R&S UPV Changing to Remote Control
1146.2084.32 5.3 E-9
Changing to Remote Control
After powering on, the instrument is always in manual control status (LOCAL) and can be controlled
from the front panel or a mouse and external keyboard.
To operate the instrument by remote control via an IEC/IEEE bus, you have to switch it to the REMOTE
mode by sending an addressed command while the REN line is set. Otherwise, the instrument will
remain in the LOCAL mode. If the REN line is cleared while the instrument is in the REMOTE mode, the
instrument automatically resets to LOCAL.
For remote control on an Ethernet (LAN) remote control is not automatically set by sending a command.
Instead, the instrument must be explicitly set to REMOTE status, e.g. by sending the interface
command >R (Go To Remote).
In REMOTE status, instrument control from the front panel or by a mouse and keyboard is disabled. But
the panels can be opened by the mouse and keyboard to verify settings for example. In the Config
Panel (in the menu Utilities) you can choose whether or not panels are to be updated during remote
control.
For reasons of speed this updating should be disabled. The panels then show the device status before
changing to remote control. While generating a remote control program it can be useful to enable
updating so that you can see the effect of the remote control commands.
In the middle of the screen you see the message "Remote Operation Active". On the front panel the
LED labeled REM illuminates over the LOCAL key.
Messages appearing during remote control are shown in the status line over the softkeys.
The instrument remains in REMOTE status until local control is selected either manually with the LOCAL
key on the front panel or by the interface command >L on the remote control interface. Then the
panels are updated.
The interface command &LLO can be used to lock out the LOCAL key.
Changing from manual control to remote control and vice versa does not change the instrument
settings.
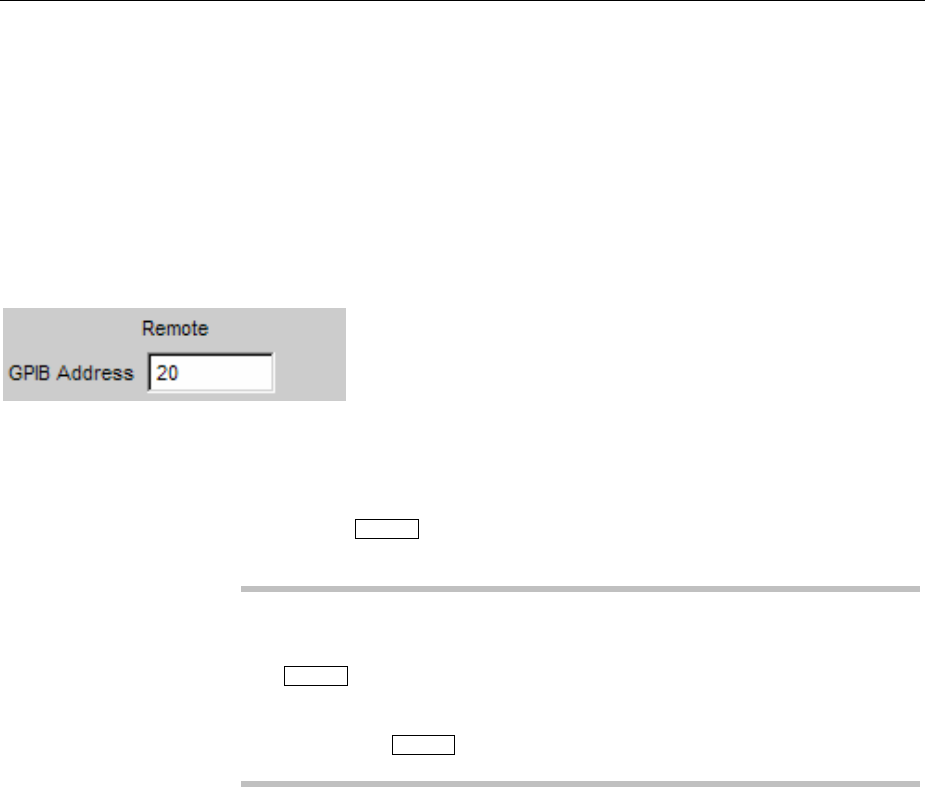
Changing to Remote Control R&S UPV
1146.2084.32 E-9
5.4
Remote Control via IEC/IEEE Bus
Tobe able to control the instrument on the IEC/IEEE bus interface, the instrument and controller must
be linked by an IEC/IEEE bus cable. The controller must have an IEC/IEEE bus card, the card drivers
and the program libraries for the programming language that is used.
The controller must address the instrument by the set IEC/IEEE bus address. The IEC/IEEE bus
address of the instrument is factory-set to 20. It can be altered in the Config Panel (in the Utilities
menu). Addresses from 0 to 30 are permissible. After setting a new address, the device status of the
R&S UPV is saved with the new address. This prevents the R&S UPV from „forgetting“ the new address
if switched OFF with the power switch rather than being properly shut down.
Sending the first command starts remote control.
Returning to manual control is possible from the front panel or on the IEC/IEEE bus.
Manual: Press the LOCAL key.
Notes:
Processing of a command must be completed before changing, otherwise
there is an immediate return to remote control.
The LOCAL key can be locked out by the interface command &LLO (see
section "Instrument Interfaces") to prevent accidental changeover.
Changing to manual control is then only possible on the IEC/IEEE bus.
Lockout of the e LOCAL key can be canceled by deactivating the REN line
of the IEC/IEEE bus (see section "Instrument Interfaces").
Via IEC/IEEE bus: ...
CALL IBLOC(generator%) Set instrument to manual control.
...
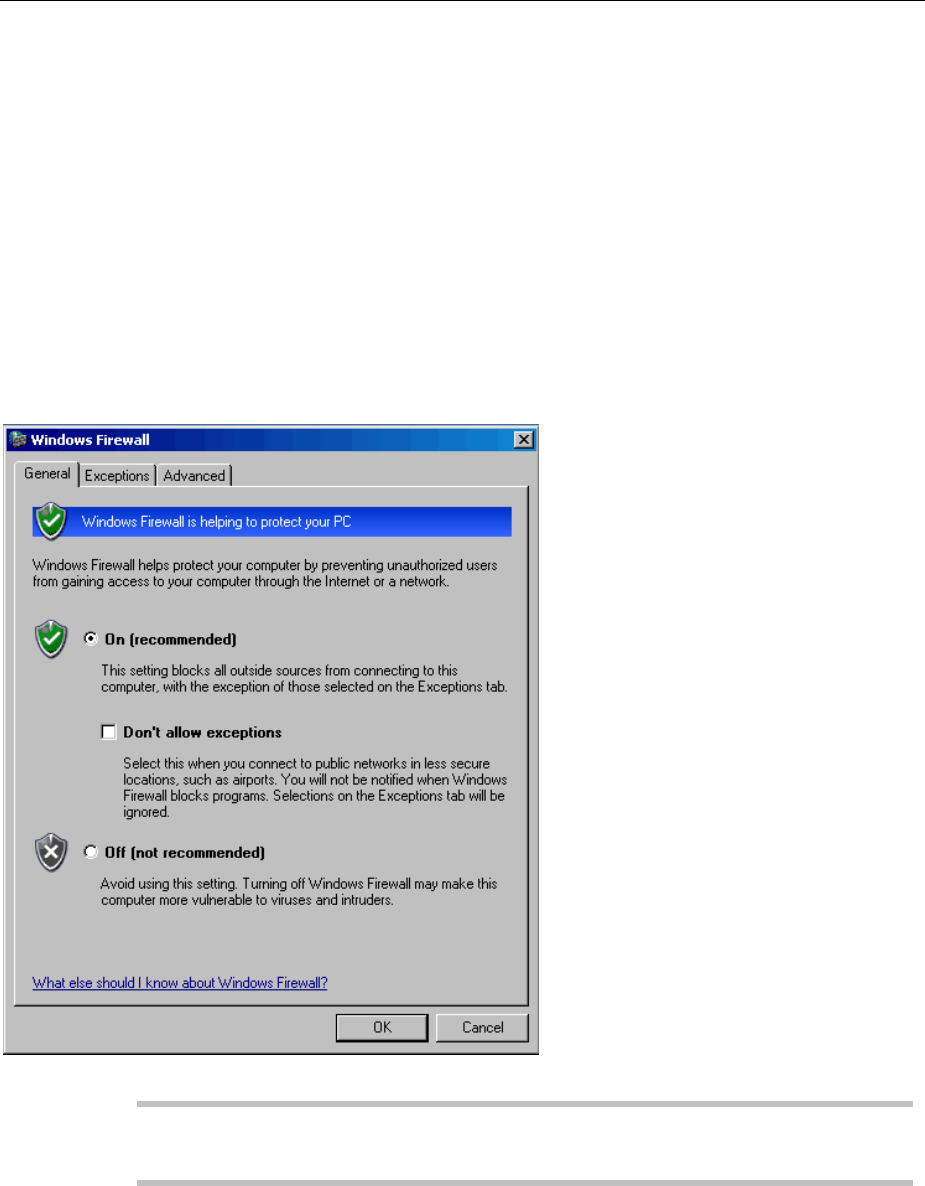
R&S UPV Changing to Remote Control
1146.2084.32 5.5 E-9
Remote Control via LAN Interface
For remote control through a network, the controller and the instrument must be connected via the LAN
interface to a common network with TCP/IP network protocol.
Connection of the R&S UPV to a network and querying of the computer name is explained in section
"Connecting the R&S UPV to a Network (LAN)".
The R&S UPV is supplied with an activated WindowsXPfirewall already installed. In contrast to file
transfer via a LAN or manual remote operation with Remote Desktop, which requires only partial
disablement (exception) in the firewall, remote control via a LAN is possible only if the firewall is
completely deactivated.
Setting remote control:
Start - Programs - Windows Firewall - Off (not recommended):
NOTICE
To protect the instrument from users and programs that can access a computer via the
network, reactivate the Windows XP firewall after you terminate VISA Remote Control
(setting On (recommended)).
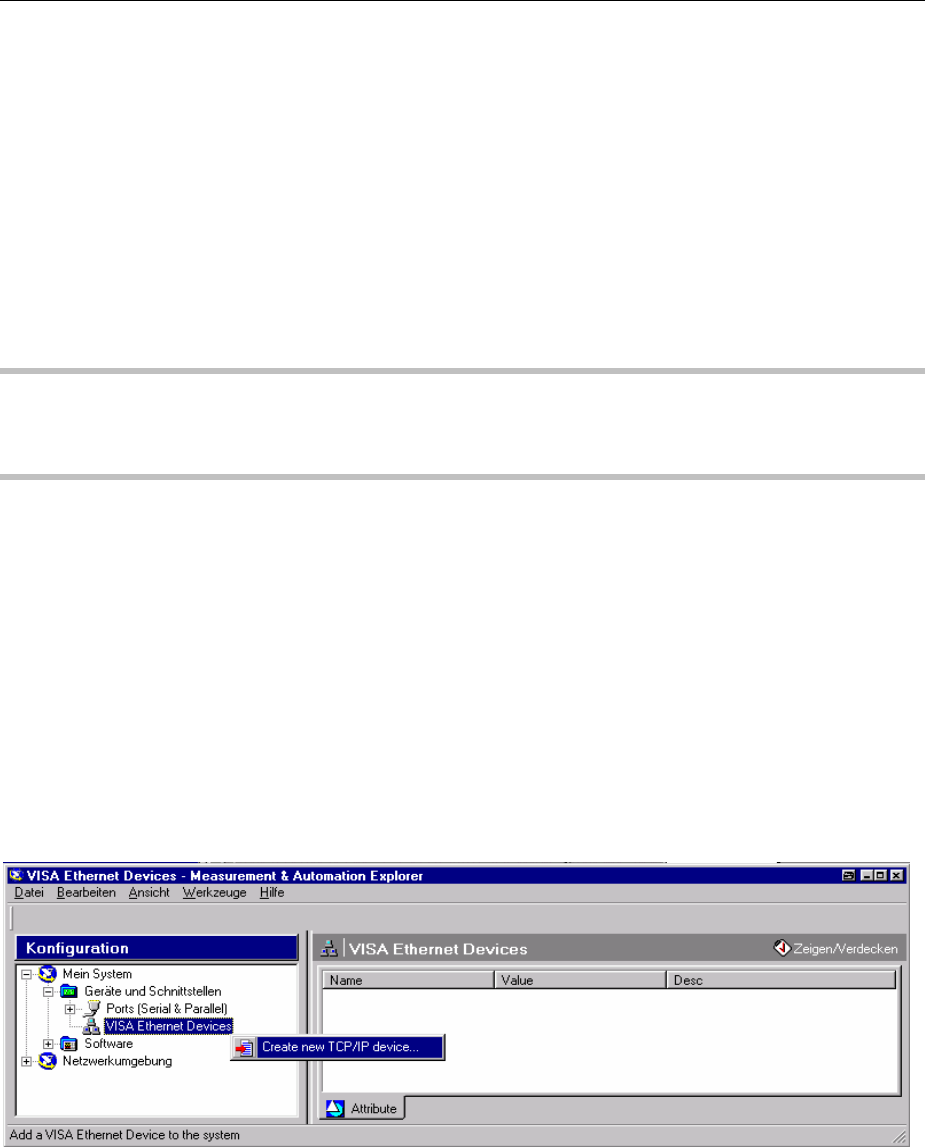
Changing to Remote Control R&S UPV
1146.2084.32 E-9
5.6
Software for instrument control and the VISA program library must be installed on the controller.
Instrument control is by the VXI-11 standard protocol.
Only the IP address or the computer name is required for connection setup. The IP address/computer
name is part of the "resource name" used by programs to identify and control the instrument. The
resource name has the form:
TCPIP::ipaddr::inst0::INSTR
ipaddr has to be replaced by the IP address or the computer name of the instrument. For instance, if
the instrument has the IP address 192.1.2.3, TCPIP::192.1.2.3::inst0::INSTR is the valid resource
name. Specification of inst0 in the resource name is optional. So in this example
TCPIP::192.1.2.3::INSTR is also a valid resource name. A resource name with computer name could
be TCPIP::RSUPV1::INSTR for example.
Note:
The IP address of the instrument can also determined easily by using a Web browser if LXI is installed
(standard with the R&S UPV66, optional with the R&S UPV). For more information, see the
“Configuration via LXI” section in Chapter 1 of the manual.
TCPIP designates the network protocol used and INSTR indicates that the VXI-11 protocol is used. If
several instruments are connected to a network, each instrument has its own IP address and
associated resource name. The controller distinguishes these instruments by their resource name.
In the example below, the Measurement & Automation Explorer program from National Instruments is
used to set up an Ethernet remote control connection. Connection setup with this program is simple and
first tests can be performed. The R&S UPV is ready configured for networks using DHCP (dynamic host
configuration protocol). If this configuration is used, the computer name must be entered at the position
of the IP address. It is also possible to assign the R&S UPV a fixed IP address (see section
"Connecting the R&S UPV to a Network (LAN)").
Configuring control of the R&S UPV in the Measurement & Automation Explorer program
Start the program on the controller.
Open the Create new TCP/IP device menu with the right mouse key.
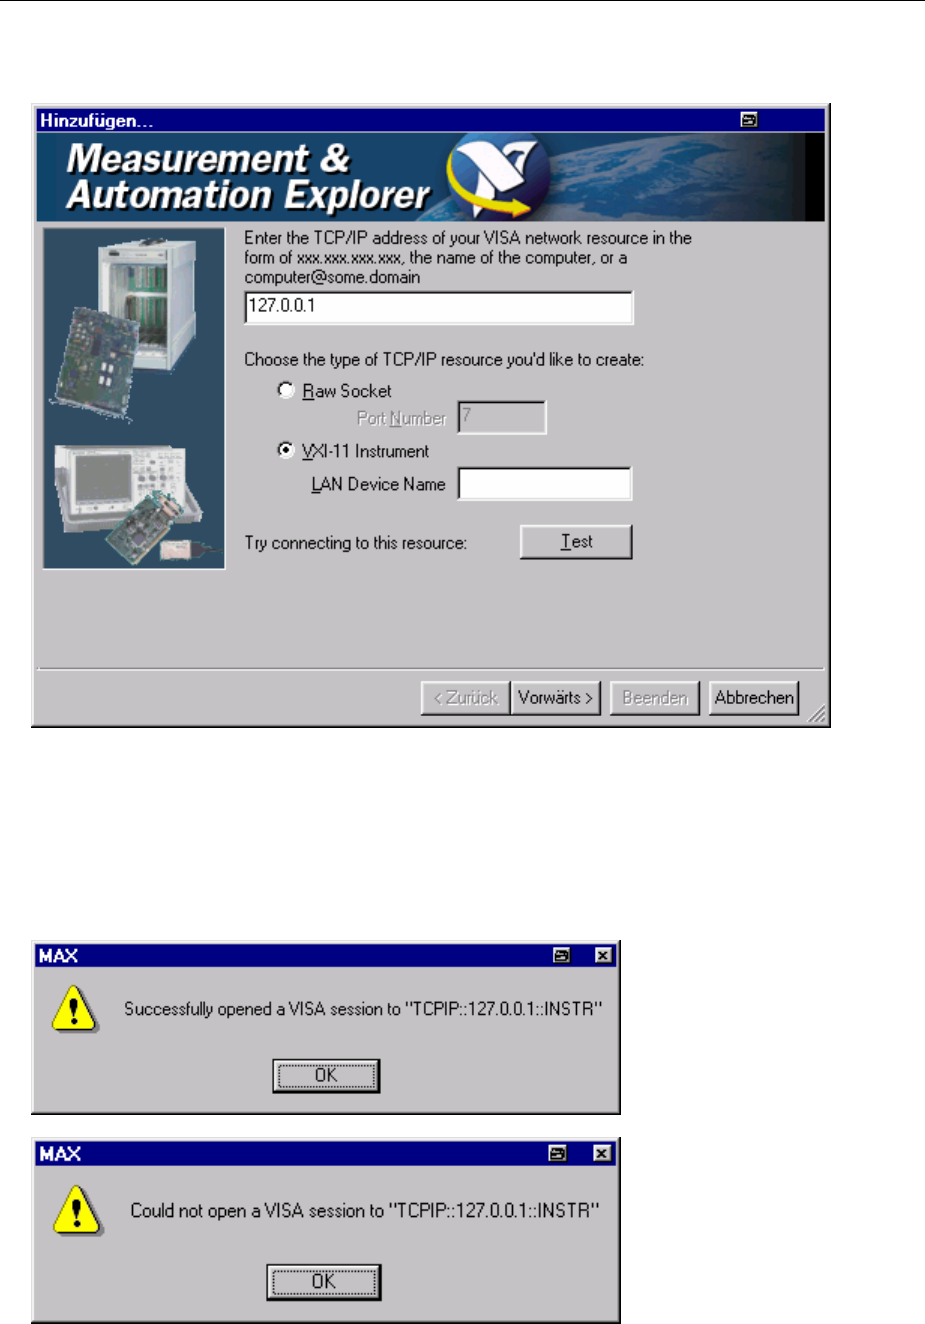
R&S UPV Changing to Remote Control
1146.2084.32 5.7 E-9
Enter the IP address of the R&S UPV and select VXI-11 Instrument.
(You can also enter the computer name.)
Press the Test button.
Amessage indicates whether the connection to the R&S UPV can be set up or not. If a connection
cannot be set up, check whether the controller and the instrument are connected to the network
(network cable) and powered on. Correct spelling of the IP address or the computer name can also
be checked. For further troubleshooting it is advisable to inform the network administrator. Large
networks require specification of additional addresses for connection setup, e.g. gateway and subnet
mask, which are known to the network administrator.
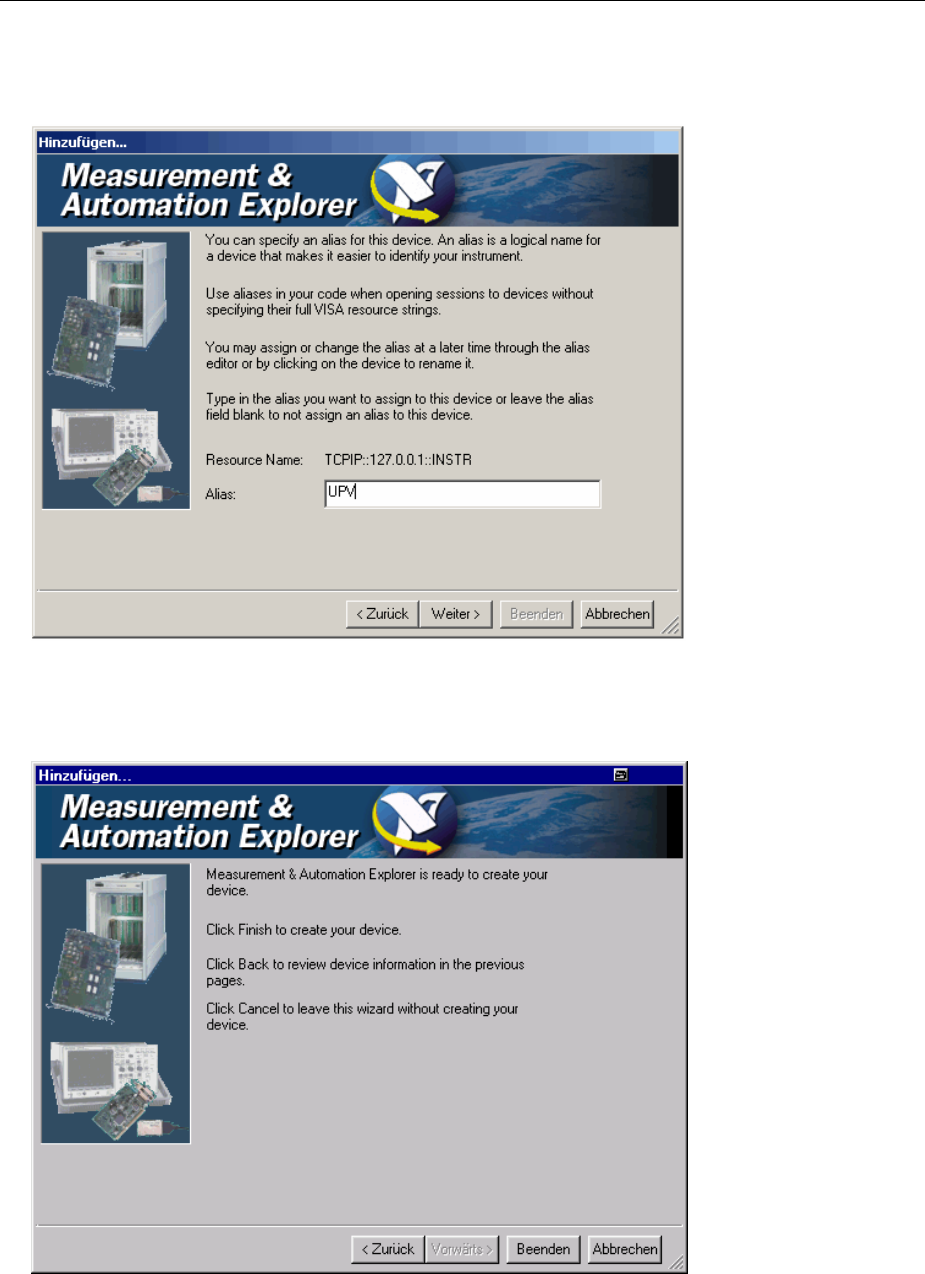
Changing to Remote Control R&S UPV
1146.2084.32 E-9
5.8
Press the Next button. In the next window you can enter an alias for the instrument. This name must
not be mistaken for the computer name. It is only used for instrument identification within the
program and displayed in the menu as an option in case of an Ethernet link.
Press Next and then the Finish button.
The instrument is now configured in the program and can be addressed by the resource name or
alias.

R&S UPV Changing to Remote Control
1146.2084.32 5.9 E-9
Starting the Measurement & Automation Explorer program for remote control of the R&S UPV
Start the program on the controller.
In the Configuration window,open Devices and Interfaces and select R&S UPV (= alias) under
VISA TCP/IP Resources.
Open the Open VISA Session menu with the right mouse key.
On the viWrite tab under Basic I/O,commands can be sent to the instrument; instrument responses
are displayed on the viRead tab
(for further program operation refer to the online help).

Changing to Remote Control R&S UPV
1146.2084.32 E-9
5.10
Returning to manual control is possible from the front panel or on the LAN interface.
Manual: Press the LOCAL key.
Notes:
The LOCAL key can be locked out by the interface command &LLO to
prevent accidental changeover. Changing to manual control is then only
possible by remote control.
Lockout of the LOCAL key can be canceled by the interface command
&NREN.
Via Ethernet: ...
CALL IBLOC(generator%) Set instrument to manual control.
...
Remote control via the USB device interface
For remote control via the USB bus, the control computer and the instrument must be connected by a
USB cable. A program for controlling instruments, such as the VISA program library with USB support
(Version 3.4 or later) must be installed in the control computer. The instrument is controlled via the
standardized USB protocol.
The only information necessary for establishing a link is the USB Vendor ID of Rohde&Schwarz
(0x0AAD), the Class ID of the R&S UPV (0x004D), and the serial number of the instrument. These IDs
form part of the resource name, which the programs use to identify and control the instrument. The
resource name has the following format:
USB::0x0AAD::0x004D::serialnum::INSTR
Here serialnum must be replaced by the serial number of the instrument. For example, if the serial
number of the instrument is 100534, the valid resource name is USB::0x0AAD::0x004D::100534.
USB designates the interface that is used. If multiple instruments are connected to the USB bus, each
instrument has its own serial number and thus its own associated resource name. The controller uses
the resource names to distinguish the individual instruments.
The National Instruments “Measurement & Automation Explorer” program is used in the following
example of USB remote control setup. This program makes it easy to establish a connection and get
started with testing.
Configuring the Measurement & Automation Control program for controlling the R&S UPV
Launch the program on the control computer.
Open “USB Devices” in the “Instruments and Interfaces” window.
Select “UPV”.
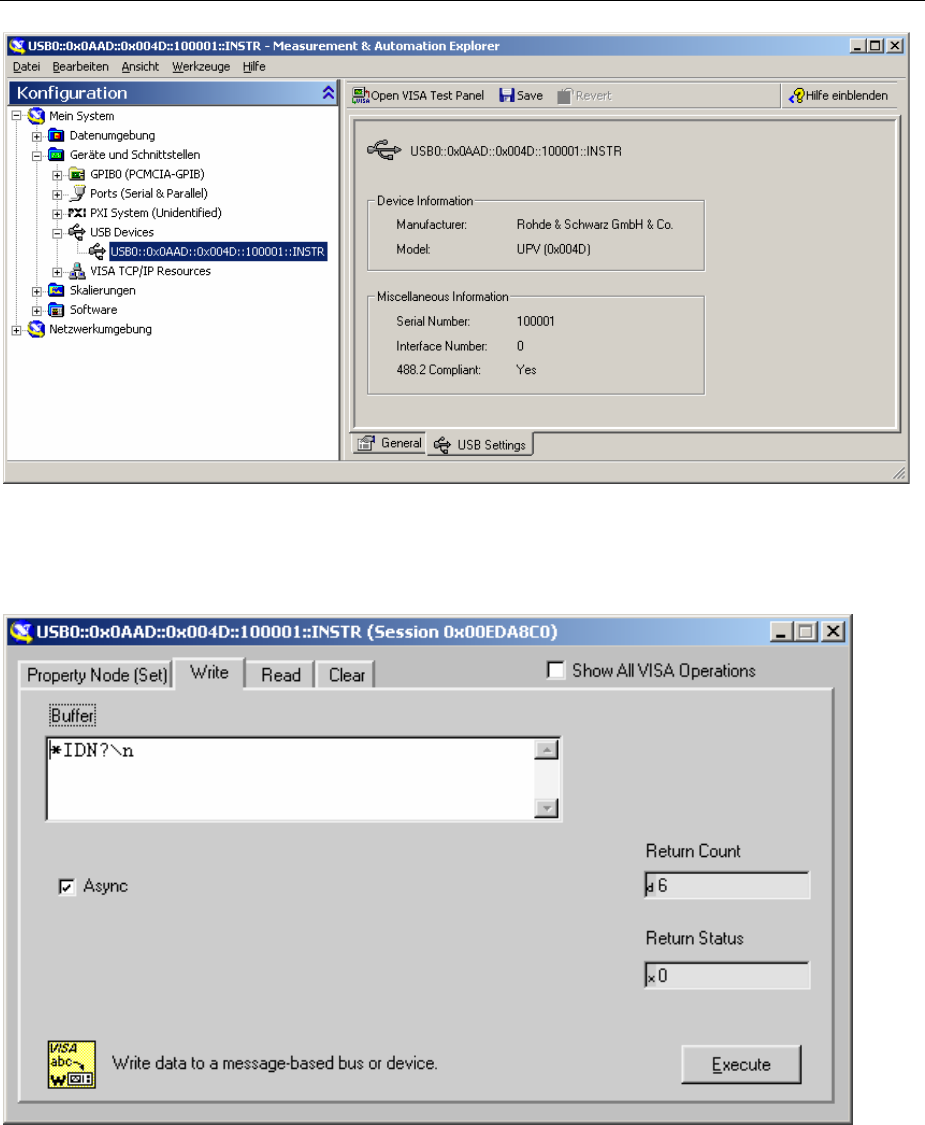
R&S UPV Changing to Remote Control
1146.2084.32 5.11 E-9
Press the Open VISA Test Panel button.
Select the Write tab and press the Execute button.
Select the Read tab and press the Execute button.
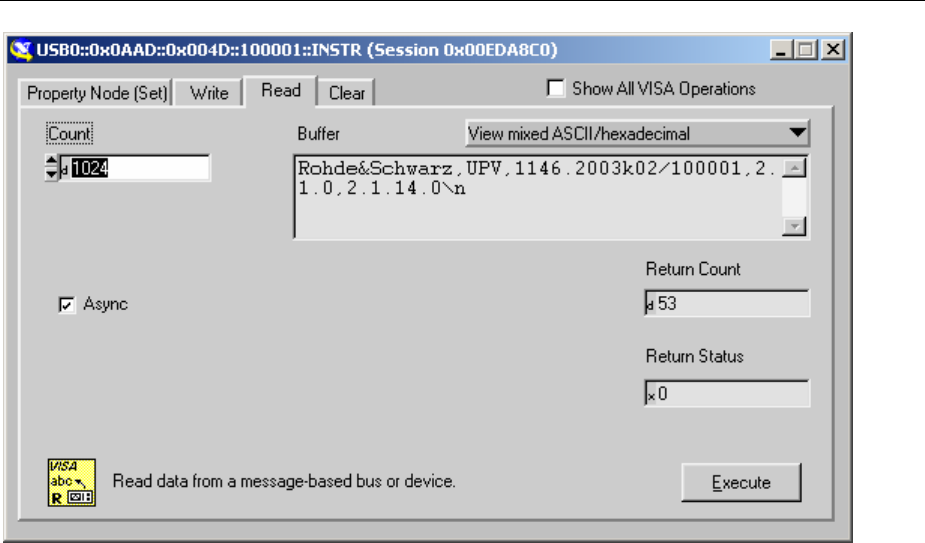
Changing to Remote Control R&S UPV
1146.2084.32 E-9
5.12
If the link is working properly, the identification string of the R&S UPV will be displayed here.

R&S UPV Messages
1146.2084.32 5.13 E-9
Messages
The messages transmitted on the data lines of the IEC/IEEE bus or on a TCP/IP network can be
divided into two groups:
–Interface messages
–Device-dependent messages
Interface Messages
Interface messages are transmitted on the data lines of the IEC/IEEE bus when the ATN control line is
active. They are used for communication between the controller and the instrument and can only be
sent by a controller which has controller functionality on the IEC/IEEE bus.
Interface messages can be further classified as
–Universal commands
–Addressed commands
Universal commands affect all devices connected to the IEC/IEEE bus without requiring an address,
whereas addressed commands only affect devices addressed as a listener. The interface messages
relevant for a device are listed in section "Instrument Interfaces".
If an Ethernet connection is present, signalling on a hardware control line is not required. The IEC/IEEE
bus interface commands are emulated (see section "Instrument Interfaces").
Device-Dependent Messages
Device-dependent messages are transmitted on the data lines of the IEC/IEEE bus when the ATN
control line is not active. ASCII code is used for data transmission.
If an Ethernet connection is present, signalling on a hardware control line is not required.
Device-dependent messages are identical for the two interfaces (IEC/IEEE bus and Ethernet). They are
differentiated by the direction in which they are sent:
Commands
(program
messages)
are messages sent by the controller to a device. They operate device functions
and request information.
These commands are in turn differentiated by two criteria:
1. The effect they have on the device:
Setting commands trigger device settings, e.g. a device reset or setting of the
generator frequency.
Queries cause data to be put in the output queue, e.g. for device
identification or querying a setting. These commands are
formed by adding a question mark to the setting command.

SCPI Command Structure and Syntax R&S UPV
1146.2084.32 E-9
5.14
2. Their definition in the IEEE 488.2 and SCPI standard:
Common commands are precisely defined by the IEEE 488.2 standard
in function and notation. They relate to functions
such as the management of standard status
registers, reset and selftest.
Device-specific commands relate to functions that are dependent on device
properties, e.g. frequency setting. A large number
of these commands are also standardized by the
SCPI consortium. Device-specific extensions
following SCPI rules are permitted by the
standard.
Device
responses
(response
messages and
service request)
are messages sent by a device to the controller after a query. They can include
measurement results, device settings or information about device status (see
section "Responses to Queries" on page 5.17).
The structure and syntax of device-dependent messages are explained in the following section.
SCPI Command Structure and Syntax
Commands consist of a header and usually one or more parameters. The header and parameters are
separated by a "white space" (ASCII code 0 to 9, 11 to 32 decimal, e.g. space). Headers may be
composed of several keywords. Queries are formed by adding a question mark direct to the header.
Note:
The commands used in the following examples are not implemented in the instrument in every case.
Common commands Non-device-specific commands consist of a header preceded by an asterisk
"*" and possibly one or more parameters.
Examples
:
*RST RESET, resets the device.
*ESE 253 EVENT STATUS ENABLE, sets the bits of the Event
Status Enable register.
*ESR? EVENT STATUS QUERY, queries the content of the
Event Status register.
Device-specific
commands
Hierarchy: Device-specific commands have a hierarchic structure (see figure below).
The different levels are represented by compound headers . Headers at the
highest level (root level) have one keyword only. This keyword identifies a
whole command system.
Example: SOURce
This keyword identifies the SOURce command system.
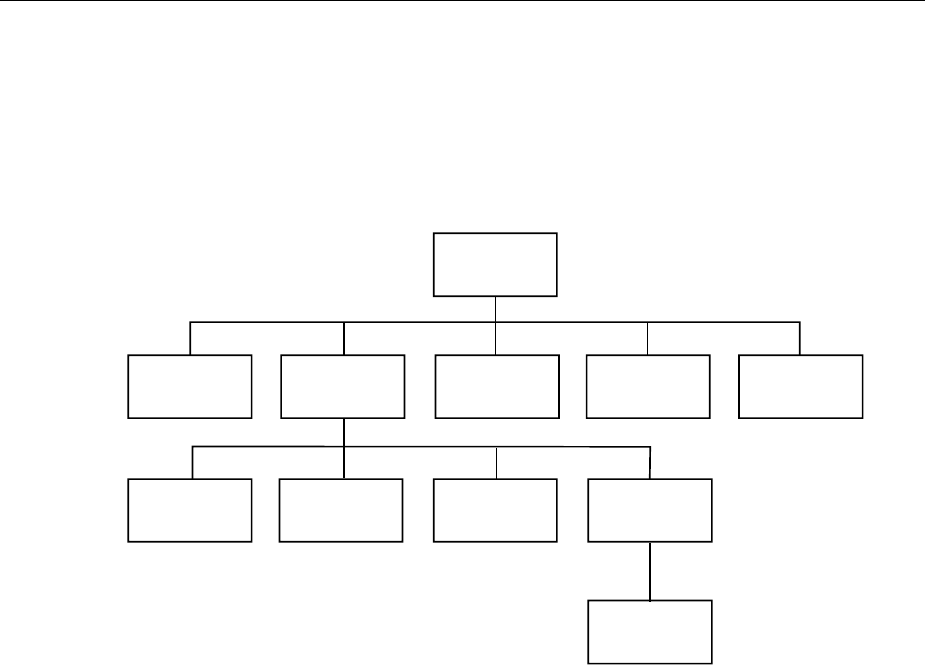
R&S UPV SCPI Command Structure and Syntax
1146.2084.32 5.15 E-9
For commands at lower levels the whole path has to be stated. This starts left
with the highest level, and the individual keywords are separated by a colon
":".
Example: SOURce:VOLTage:OFFSet:STATe ON
This command is on the fourth level of the SOURce system. It sets the DC
offset of the generator signal.
SOURce
VOLTage
OFFSet
STATe
DIGitalFREQuency FUNCtion RANDom
RANGe MAXimum REFerece
Level 1
Level 2
Level 3
Level 4
Fig. 5-1 Tree structure of SCPI command systems taking SOURce system as example (extract)
Some keywords appear at several levels within a command system. Their
effect then depends on the command structure, i.e. where they are inserted in
the command header.
Examples:
SENSe:REFerence:MODE VALue | …
This command contains the keyword REFerence in the second command
level.
It specifies that the reference value for referenced units in the function
measurement system is entered as a value (by a separate command).
SOURce:DIGital:REFerence AZERo | AONE
This command contains the keyword REFerence in the third command level.
It specifies that the data of the digital reference generator are all 0 or 1.
Optional keywords: In some command systems it is possible to insert certain keywords in the
header or omit them. These keywords are identified in the manual by square
brackets. For reasons of compatibility with the SCPI standard, the device
must be able to recognize the full length of the command. Some commands
become considerably shorter when the optional keywords are omitted.
Example:
INSTrument[1][:SELect] ANLG | DIG
This command sets the generator to analog or digital signal generation. The
following command has the same effect:
INSTrument ANLG | DIG

SCPI Command Structure and Syntax R&S UPV
1146.2084.32 E-9
5.16
Note:
An optional keyword cannot be omitted if its effect is specified in more detail
by a numeric suffix. In the R&S UPV this applies to the keyword SENSe for
example, which can always be omitted for the
function measurement = SENSe1,
but must always be entered for the
input measurement = SENSe2,
frequency/phase measurement = SENSe3 and SENSe4,
FFT monitor = SENSe5,
level monitor = SENSe6,
waveform monitor = SENSe7.
Long and short form: The keywords have a long form and a short form. Keywords may be entered
in long or in short form; other abbreviations are not allowed.
Example: SENSe:POWer:REFerence:RESistange <nu> =
SENS:POW:REF:RES <nu>
Note:
Upper- and lower-case letters are only used to identify the long and short
form in the manual; the device itself does not differentiate between the two
types of characters.
Parameters: Parameters must be separated from the header by a "white space". If a
command contains several parameters, they are separated by a comma ",".
Example: OUTPut:SAMPle:FREQuency 48000 HZ
Numeric suffix: If an instrument has several identical functions or features, e.g. inputs, the
desired function can be selected by a suffix to the command. Entries without
asuffix are interpreted as having a suffix 1. Optional keywords must be
specified if they select a function with the suffix.
Example:
SENSe[1]:FUNCtion RMS
SENSe2:FUNCtion IPE
SENSe6:FUNCtion LRMS
These commands activate the measurement functions Function, Input and
Level Monitor. The keyword SENSe and the numeric suffixes 2 and 6 must be
entered in the command.
Note:
In case of remote control, suffix counting may differ from the numbers of the
corresponding selection used in manual control. SCPI prescribes that suffix
counting starts with 1. Suffix 1 is the default state and used when no specific
suffix is stated.

R&S UPV SCPI Command Structure and Syntax
1146.2084.32 5.17 E-9
Structure of a Program Message
Aprogram message can contain one or more commands. It is terminated by a <New Line> (ASCII code
10 decimal) or <EOI> (EOI line active) together with the last useful character of the program message.
Seeing as the <Carriage Return> character (ASCII code 13 decimal) has no effect as a filler before the
end character, the combination <Carriage Return><New Line> is also admissible.
Several commands in a program message are separated by a semicolon ";". If the next command
belongs to a different command system, the semicolon is followed by a colon. A colon ":" at the
beginning of a command marks the root node of the command tree, but can be omitted.
Example: ":SENSe:VOLTage:RANGe:MODE FIX;:INPut:CHANnel CH1"
This program message contains two commands. The first command belongs to the SENSe
system and is used to set a fixed range. The second command belongs to the INPut
system and activates channel 1.
If the successive commands belong to the same system and therefore have one or more common
levels, the program message may be shortened. The second command following the semicolon then
starts at the level below the common levels (Fig. 5-1). The colon after the semicolon must then be
omitted.
Example: ":OUTP:DIG:UNB:OUTP AOUT;:OUTP:DIG:CSIM SIM"
This program message is shown in full length and contains two commands separated by a
semicolon. Both commands belong to the OUTPut system and its DIG subsystem, i.e. they
have two common levels.
In the shortened program message the second command starts at the level below
OUTP:DIG. The colon after the semicolon is omitted.
The shortened form of the program message is:
":OUTP:DIG:UNB:OUTP AOUT;CSIM SIM"
Anew program message always starts with the full path however.
Example: ":OUTP:DIG:UNB:OUTP AOUT"
":OUTP:DIG:CSIM SIM"
Responses to Queries
Unless expressly specified otherwise, a query is defined for each setting command, which returns the
current value.It is formed by adding a question mark to the associated setting command. The question
mark can be supplemented with MIN or MAX to query the current value range of a numeric parameter.
The commands with which measurement results are read out have a special status.These commands
are query only commands which do not permit any settings. The extension of the question mark with
MIN or MAX returns the lowest and highest measurement value which is displayed in the combined
display above the measurement value.
If the MIN and MAX extension is used on text parameters, strings and query only commands which do
not retrieve measurement values a timeout occurs, followed by an error message in the error queue.
Some of the SCPI rules for query responses are stricter than those of the IEEE 488.2 standard:
1. Numeric parameter
Example: :OUTPut:SAMPle:FREQuency?
:OUTPut: SAMPle:FREQuency? MIN
:OUTPut: SAMPle:FREQuency? MAX
Response: 48 KHZ
Response: 30 KHZ
Response: 200 KHZ

SCPI Command Structure and Syntax R&S UPV
1146.2084.32 E-9
5.18
2. Measurement results
Example: :SENSe:DATA?
:SENSe:DATA? MIN
:SENSe:DATA? MAX
Response: -82.341 DBFS
Response: -101.695 DBFS
Response: -19.979 DBFS
3. Strings are returned in single quotation marks.
Extension with MIN AND MAX is not permissible.
Example: :MMEMory:STORe:MON_AB? Response: 'MYTRACE.TRC'
4. Text parameters (character data) are returned in short form.
Extension with MIN AND MAX is not permissible.
Example: :SENSe:FUNCtion? Response (for RMSSelectiv): RMSS

R&S UPV SCPI Command Structure and Syntax
1146.2084.32 5.19 E-9
Parameters
Most commands require the entry of a parameter. Parameters must be separated from the header by a
"white space". Parameters may be numeric values, Boolean parameters, text, character strings or block
data. The type of parameter required for the particular command is stated in the details of the
command.
Numeric values Numeric values may be entered in any customary form, i.e. with sign, decimal
point and exponent. The range of values is -9.9E37 to 9.9E37. The exponent
is denoted by "E" or "e". The exponent alone must not be used.
Numeric strings The format specified under "Numeric values" also applies to the individual
values of a numeric string.
Numeric values are to be separated from each other by means of a comma.
Numeric strings are not entered between quotation marks.
Example:
TRACe:SWEep:STORe:AY 0.1,0.2,0.3,0.4,0.5
Units Physical quantities may be stated with the unit. Permissible prefixes for units
are MA (mega, MOHM and MHZ are also allowed), K (kilo), M (milli), U
(micro) and N (nano). If no unit is specified, the basic unit is assumed.
Example:
SOURce:FREQuency 1.5 kHz = SOURce:FREQuency 1.5E3
Text Text parameters follow the syntax rules for keywords, i.e. they also have a
long and a short form. They must be separated from the header by a "white
space" like any other parameter. A query returns the short form of the text.
If a text parameter is set which is already set in the data basis of the
R&S UPV the internal R&S UPV setting routine is not performed. This
behaviour increases the speed of the IEC bus control program.
Example:
Setting command: :SOURce:SWEep:CONTrol ASWeep
Query: :SOURce:SWEep:CONTrol? Response: ASW
Character strings Character strings must always be entered between single or double quotation
marks. Filenames also count as strings. Normally, however, single quotation
marks are used, as double quotation marks are used to mark the complete
IEC bus command as a string.
String commands can be written via IEC bus command, even if the respective
setting line is not visible in the panel.
Example:
MMEMory:LOAD:STATe 'c:\Config\setup\default.xml'

SCPI Command Structure and Syntax R&S UPV
1146.2084.32 E-9
5.20
Overview of Syntax Elements
The following list gives you an overview of the syntax elements.
:
;
,
?
*
"
#
The colon separates the keywords of a command.
In a command line, the colon following a semicolon identifies
the highest command level.
The semicolon separates two commands in a command line. It does not change the path.
The comma separates several parameters of a command.
The question mark forms a query.
The asterisk identifies a common command.
Quotation marks denote the beginning of a character string and terminate it.
The double cross denotes the beginning of block data.
A"white space" (ASCII code 0 to 9, 11 to 32 decimal, eg space) separates header and
parameter.
Decimal point of numeric values. .
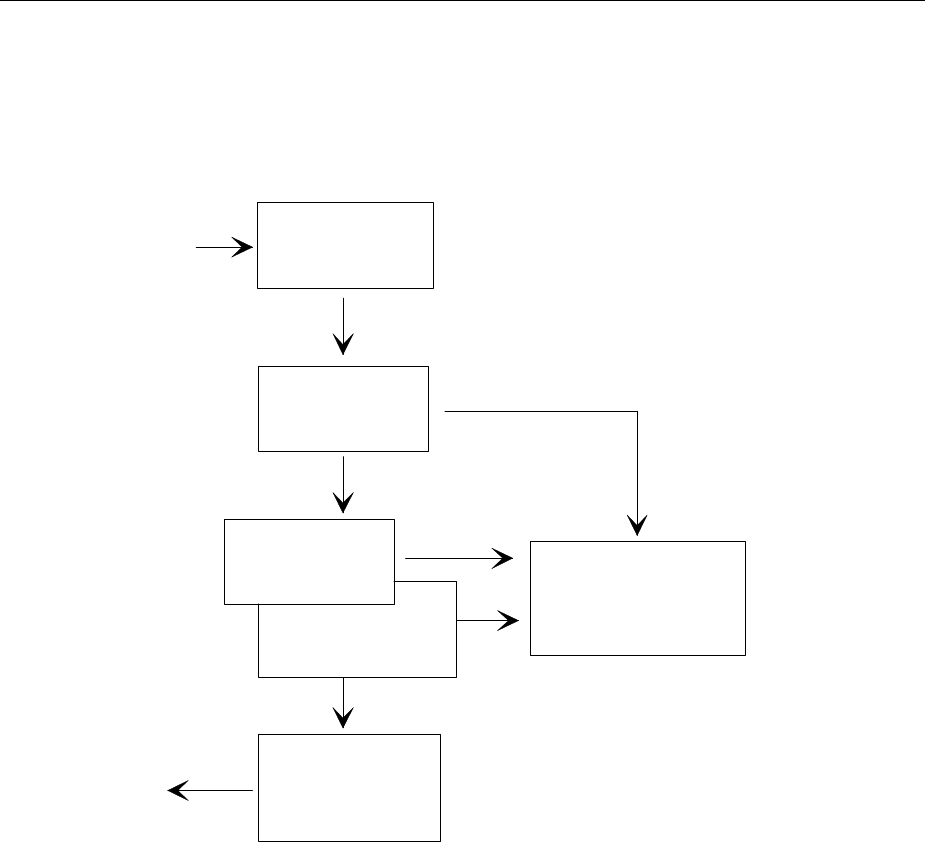
R&S UPV Device Model and Command Processing
1146.2084.32 5.21 E-9
Device Model and Command Processing
The device model shown in the following figure was created from the point of view of processing SCPI
commands. The individual components operate independently of each other and simultaneously. They
communicate with each other by means of messages.
IEC/IEEE bus
Data set
Device hardware
Input unit
with input buffer
Command
identification
(Parser)
Output unit
with
output buffer
IEC/IEEE bus
Status reporting
system
Fig. 5-2 Device model for remote control via IEC/IEEE bus or TCP/IP network
Input Unit
The input unit receives commands in the form of characters from the IEC/IEEE bus or Ethernet and
collects them in the input buffer. The input unit sends a message to the parser as soon as it detects an
end character, <PROGRAM MESSAGE TERMINATOR> according to IEEE 488.2, the interface
message DCL or a full input buffer.
If the input buffer is full, the IEC/IEEE bus or Ethernet transfer is halted and the data received until then
are processed. Then the IEC/IEEE bus or Ethernet transfer is continued. If the buffer is not yet full when
the end character is received however, the input unit can receive the next command while the previous
command is parsed and executed. Reception of a DCL clears the input buffer and immediately triggers
amessage to the parser.

Device Model and Command Processing R&S UPV
1146.2084.32 E-9
5.22
Command Identification (Parser)
The parser analyzes the data received from the input unit. Data are processed in the sequence in which
they were received. Only a DCL is given priority; a GET (Group Execute Trigger) for example is not
processed until after the previously received commands. Every command detected as correct is
immediately forwarded to the database and executed.
Syntax errors are recognized by the parser and forwarded to the status reporting system. The
remainder of a program message after a syntax error is, in as much as possible, further analyzed and
processed. After the syntax test, the value range of the parameter may be checked.
Database and Device Hardware
The term "device hardware" refers to that part of the device which performs the actual instrument
function, e.g. generator setting, analyzer setting. This does not include the controller.
The term "database" denotes a database that manages all the parameters and associated settings
required for setting the device hardware.
Setting commands lead to a change in the data set of the database. The database administration enters
the new values (e.g. frequency) and immediately sets the hardware.
An IEC/IEEE bus program message that may contain several setting commands is sent to the parser,
which examines the IEC/IEEE bus commands for syntax and semantic errors. Once a command is
identified as correct, a check is immediately made with current settings to see whether the command is
admissible. If the command is admissible, it is transferred to the database of the R&S UPV and the
device hardware is set. If existing settings show that the command is illegal, it is rejected, an execution
error is sent to the status reporting system and the device hardware is not set for this command.
Subsequent commands that are admissible on the basis of the existing settings are executed (see
following section).
This strictly hierarchic procedure ensures that no illegal device status can occur at any time.
Command Sequence (IEC/IEEE)
Every IEC/IEEE bus command received by the R&S UPV is immediately checked for its admissibility.
This is only possible if the R&S UPV knows for which instrument or function the command is intended,
i.e. the appropriate instrument or function was activated before.
Example:
For a balanced output it is possible to select an impedance of 600 ohms, but nor for an unbalanced
output.
If these checks and the appropriate error messages were omitted, measurements would be
performed with erroneous settings, or even be impossible, and the user would not know why.

R&S UPV Device Model and Command Processing
1146.2084.32 5.23 E-9
Identical menu items in different instruments or functions are addressed by the same command in
remote control, so they can only be distinguished by reference to the particular instrument or function.
Example:
The command "INPut:SELect CH1" is admissible for all analyzer instruments.
To be able to preset individual parameters of functions that are not yet active, each IEC/IEEE bus
command would have to be told to which instrument and which function it refers. The internally
managed addressing of commands by the R&S UPV would then be the job of the IEC/IEEE bus
programmer, who would have to handle a multiple number of commands.
Amajor feature in operation of the R&S UPV is its ability to note the settings for individual generator
and analyzer functions and to restore all required parameters when one of these functions is selected.
This does away with the need to reset all parameters when a function is changed.
Example:
The generator function Mod Dist is set with frequencies of 400 Hz and 7 kHz. When you switch to the
DFD function, the frequency pair 11 kHz and 12 kHz last used with the DFD function is automatically
restored.
This functionality is also available under IEC/IEE bus control, i.e. even in remote control all
parameters are automatically set when the function is changed. This is much faster and surer than
the user having to set the parameters each time on the IEC/IEEE bus.
If the R&S UPV did not have this ability, the user could overwrite parameters for instruments that are
not active, and the parameters of the function last used would no longer be available.
Since manual and remote control work with the same internal data sets and a mixture of manual and
remote control must be possible, only one uniform method of internal parameter processing can be
used for the two modes. Automatic parameter restoration is indispensable for manual control, so it must
also be used for remote control.
To relieve the user of the need to watch out for relationships that are in part not apparent, the following
applies to both remote control and manual control of the R&S UPV:
Nothing can be set on the R&S UPV that is not admissible.
The disadvantage of this is that sometimes a certain operating sequence has to be adhered to even in
remote control. But this is more than compensated by the fact that possible setting errors are
immediately indicated by the instrument.

Device Model and Command Processing R&S UPV
1146.2084.32 E-9
5.24
Status Reporting System
The status reporting system collects information about the device status and makes it available to the
output unit on request. The structure and function are explained in section "Status Reporting System"
on page 5.28.
Output Unit
The output unit collects the information requested by the controller and which it obtains from database
administration. It processes the information in line with SCPI rules and makes it available in the output
buffer.
If the device is addressed as a talker and the output buffer does not contain any data or expect data
from the database, the output unit sends the error message "Query UNTERMINATED" to the status
reporting system. No data are sent on the IEC/IEEE bus or Ethernet, and the controller waits for the set
time limit. This procedure is prescribed by SCPI.
Trigggering Measurement or Sweep
There are three ways of triggering a measurement or a sweep :
•By the SCPI-specific command "INIT"
•By the common command "*TRG"
•By the addressed command Group Execute Trigger "GET"
All three possibilities are equivalent and similar in the time they take to execute.
There are also three ways of waiting for a triggered measurement result, which are looked at in the next
section. To demonstrate the three trigger possibilities together with singly triggered measurement
results, command synchronization with *WAI is used in what follows.

R&S UPV Device Model and Command Processing
1146.2084.32 5.25 E-9
Command Synchronization
To ensure that commands are executed in a certain sequence, one of the commands *OPC, *OPC? or
*WAI must be used. As a result of these commands, a certain action is not triggered until the hardware
is set and settled. The controller can be forced through appropriate programming to wait for the
appearance of an action.
Table 5-1 Synchronization with *OPC, *OPC? and *WAI
Comman
d
Effect Programming of controller
*OPC Sets the Operation Complete bit in the ESR
after all previous commands have been
executed.
-Set bit 0 in ESE.
-Set bit 5 in SRE.
-Wait for Service Request.
*OPC? Stops further command processing until 1 is
returned. This is not the case until the
Operation Complete bit is set in the ESR. This
bit indicates that the previous setting has been
completed.
Send *OPC? directly after the command whose processing
should be terminated before other commands can be
executed.
*WAI Stops further command processing until all
commands sent before *WAI have been
executed.
Send *WAI directly after the command whose processing
should be terminated before other commands are executed.
In remote control of the R&S UPV it is essential to wait for the end of a measurement or sweep before
the measured results are fetched and the hardware is newly set.
The following table explains the effect of different combinations of measurement or sweep triggering in
conjunction with a synchronization command.
Table 5-2 Trigger command with/without synchronization
Trigger command
with/without synchronization
Description
"INIT:CONT OFF;*WAI" Asingle measurement or sweep is triggered. Subsequent commands are processed after the
measurement or sweep is completed.
Generator and analyzer setting commands do not trigger a new measurement.
Anew measurement must be triggered with
"INIT;*WAI"
This command is the simplest to use and should preferably be used to trigger a measurement.
"INIT:CONT ON;*WAI" Acontinuous measurement or continuous sweep will be triggered. Subsequent commands will
not be processed until the first measurement or the first sweep cycle has been completed.
Generator and analyzer configuration commands immediately trigger a restart of the
continuous measurement.
"INIT:CONT OFF"
without *WAI
When a generator or analyzer setting command is sent during a single measurement,i.e.
before the measurement is completed, the measurement is restarted to avoid incorrect results
(incorrect results could be obtained, for instance, if the generator voltage is varied during the
measurement).
Generator or analyzer setting commands sent after the single measurement has been
terminated will not trigger a new measurement. A new measurement must be triggered with
"INIT".
"INIT:CONT ON"
without *WAI
Each generator or analyzer setting command restarts a measurement to avoid incorrect
measurement results (incorrect results could be obtained, for instance, if the generator voltage
is varied during the measurement).
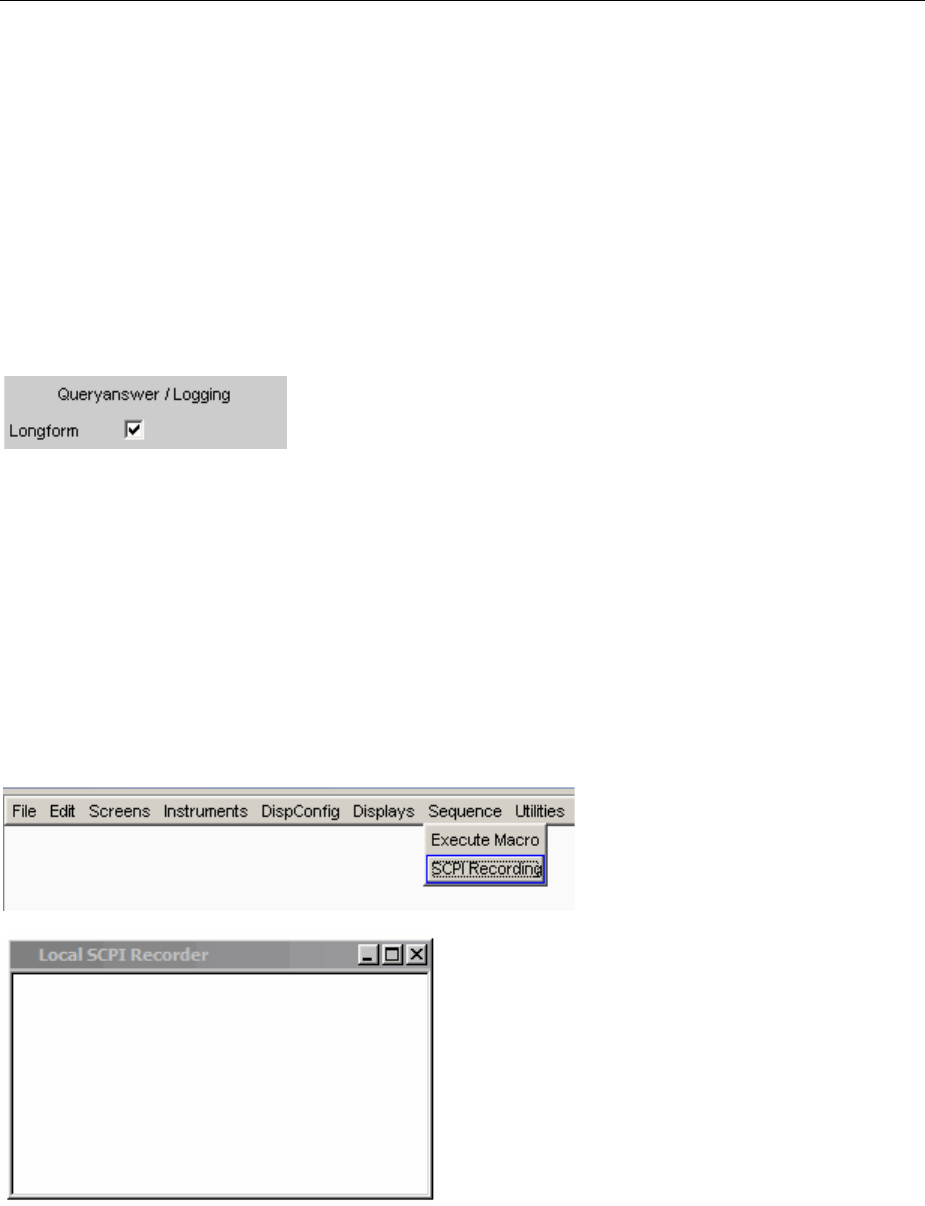
Command Recording R&S UPV
1146.2084.32 E-9
5.26
Command Recording
The R&S UPV offers the possibility of recording the equivalent IEC/IEEE bus commands in a separate
window during manual control. Recording begins as soon as the window has been opened. Recording
continues after the window is closed and until the R&S UPV is powered off. The contents of the window
can be edited (also deleted) and copied to the clipboard.
In this way it is very easy to produce the matching IEC/IEEE bus control program from a manual control
sequence without having to look up the commands in the manual. This also eliminates malfunctions
through the wrong notation.
From the Config Panel (Menu Utilities Config Panel), you can select whether to use the short or
long form of the command parameters when recording commands or querying parameters (Query).
Remote control command:
SYSTem:QLONg ON | OFF
Example:
If the analog generator has been set to "balanced", the query OUTPut:TYPE? will return ’BAL’ in the
short form and ’BALanced’ in the long form.
Starting Recording
Open the window through the menu by Sequence SCPI Recording.
Opening the window starts the recording. The window is visible on all screens.
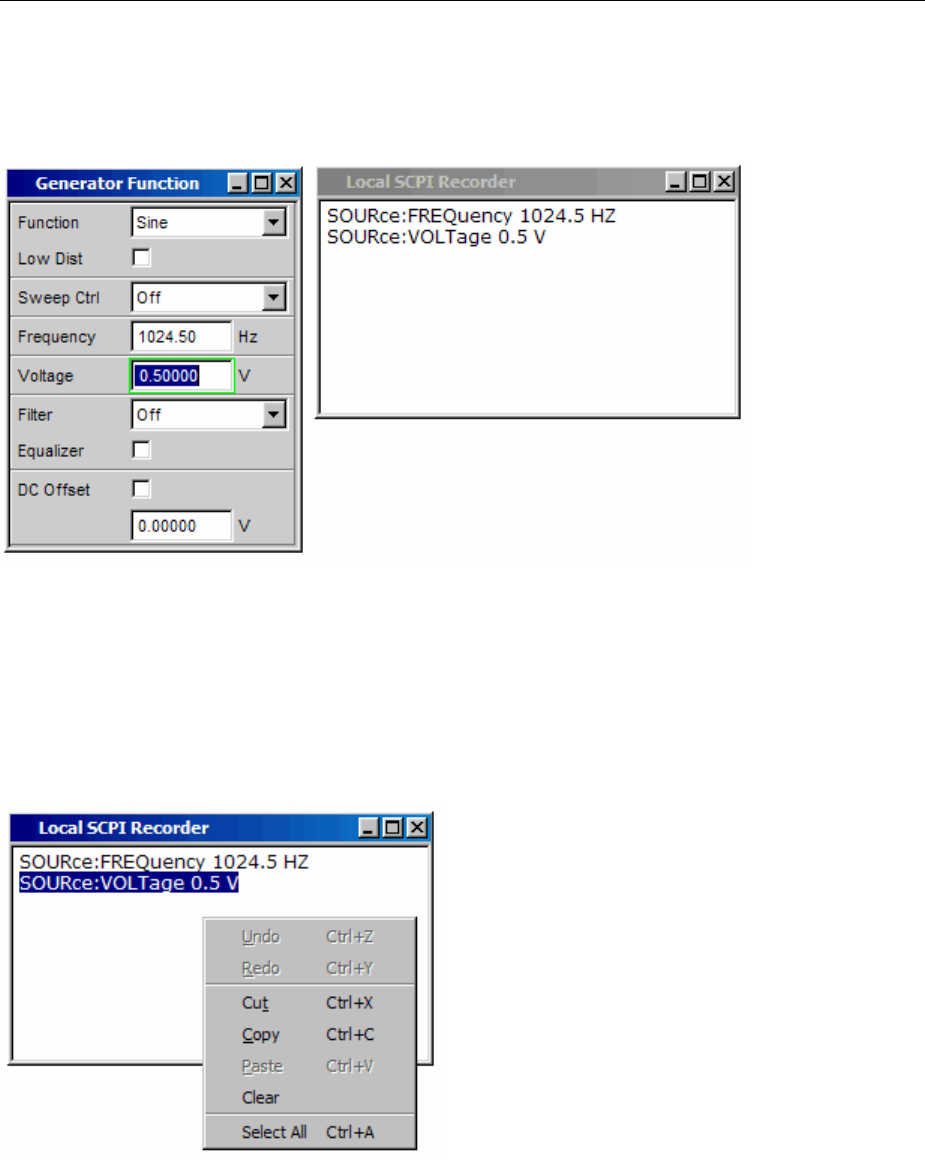
R&S UPV Command Recording
1146.2084.32 5.27 E-9
Recording Commands
As soon as the SCPI Recording window is opened, all settings of manual control are recorded. In this
example the generator frequency was set to 1024.5 Hz and the level to 0.5 V.
Editing Commands
The contents of the SCPI Recording window can be edited and copied through the clipboard into a file.
From the commands in this file it is possible to generate an IEC/IEEE bus control program. Open the
context menu by clicking on the right mouse key. To operate the SCPI Recorder you need an external
keyboard and mouse.

Status Reporting System R&S UPV
1146.2084.32 E-9
5.28
Status Reporting System
The status reporting system stores all information about the current operating status of the device, e.g.
that it is performing system error correction, and about occurred errors. This information is stored in the
status registers and the error queue. The contents of status registers and the error queue can be
queried on the IEC/IEEE bus or via the LAN or USB interface.
Information is hierarchically structured.
The highest level is formed by the
Status Byte (STB) register, defined in IEEE 488.2, and the associated
Service Request Enable (SRE) register.
The STB receives information from the following registers:
Standard Event Status (ESR),also defined in IEEE 488.2, and the associated
Standard Event Status Enable (ESE) register;
from the SCPI-defined registers named
STATus:OPERation and
STATus:QUEStionable;
and from the device-specific registers named
STATus:XQUEstionable,
STATus:QUEStionable:UNDERrange,
STATus:QUEStionable:OVERrange and
STATus:QUEStionable:MEASuring,
which contain detailed information about the device.
The status reporting system also includes the IST (Individual STatus) flag and the Parallel Poll Enable
(PPE) register assigned to it. The IST flag, like the SRQ, combines the complete device status in a
single bit. The PPE has the same function for the IST flag as the SRE has for the service request.
The output buffer contains messages that the device sends back to the controller. It is not part of the
status reporting system but determines the value of the MAV bit in the STB.
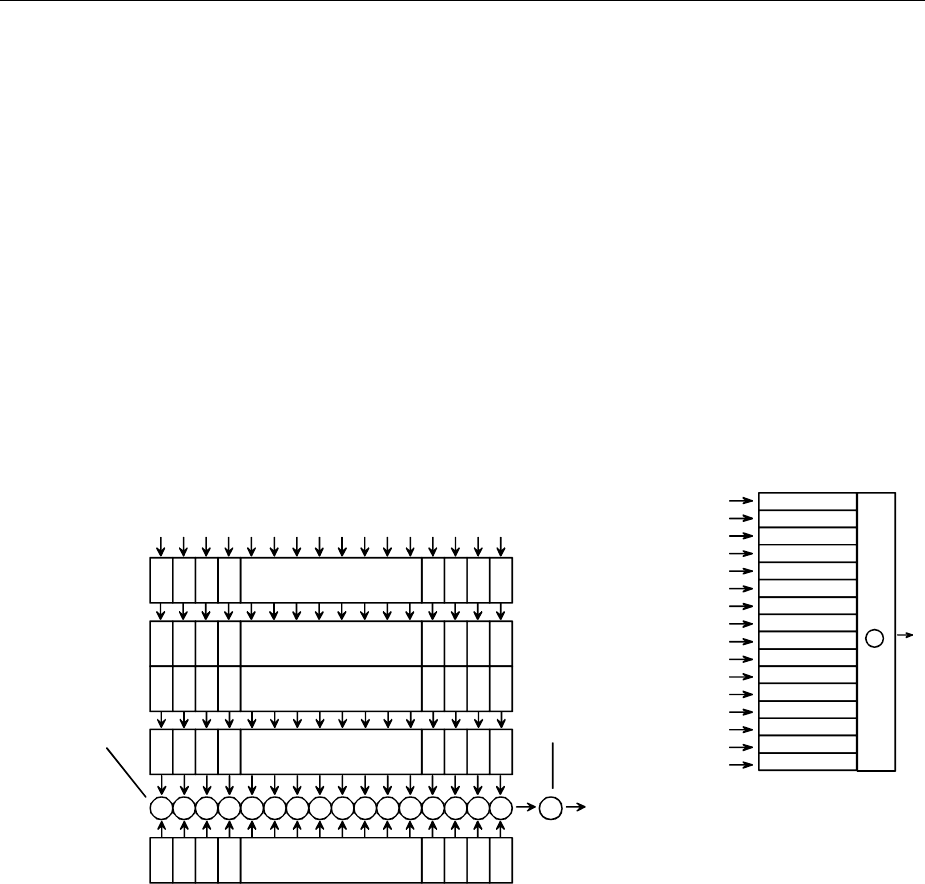
R&S UPV Status Reporting System
1146.2084.32 5.29 E-9
Structure of SCPI Status Register
Each SCPI register consists of five 16 bit parts with different functions (see figure below). The individual
bits are independent of each other, i.e. each hardware status is assigned a bit number that is the same
for all five parts. For instance, bit 5 of the STATus:OPERation register is assigned to the Wait for
Trigger hardware status in all five parts.
Bit 15 (the most significant bit) is set to 0 in all parts for the STATus:OPERation,
STATus:QUEStionable and STATus:XQUEStionable registers, except for the device-specific
registers STATus:QUEStionable:UNDERrange,STATus:QUEStionable:OVERrange and
STATus:QUEStionable:MEASuring.
For these registers, bit 15 may be given a meaning in the future.
Queries return the current value of the particular part register to allow a check of the device status. A
decimal value between 0 and 32767 (= 2^15 V1), or between 0 and 65535 (= 2^16 V1), is returned.
The configuration commands set the respective part register, thus determining which status changes of
the R&S UPV cause a change in status registers. A decimal value between 0 and 32767 (= 2^15 V1),
or between 0 and 65535 (= 2^16 V1), is set.
12
3013141512
PTRansition register
&&&&
+
Sum bit
of SCPI register written
to a bit of the STB or the
CONDition bit of a superordinate register
Logic OR
of all bits
Logic AND of
EVENt and
ENABle bits
&&&&&&&&&&&&
CONDition register 123013141512
NTRansition register 12
3013141512
EVENt register 12
3013141512
ENABle register 123013141512
States, events or sum bits of other registers
bit 0 = 1
bit 1 = 2
bit 2 = 4
bit 3 = 8
bit 4 = 16
bit 5 = 32
bit 6 = 64
bit 7 = 128
bit 8 = 256
bit 9 = 512
bit 10 = 1024
bit 11 = 2048
bit 12 = 4096
bit 13 = 8192
bit 14 = 16384
bit 15 = 32768
+
Simplified diagram
with decimal
value of bits
Fig. 5-3 Standard SCPI status register
CONDition part
The CONDition part is written direct by the hardware or the summary bit of the
subordinate register. Its contents indicate current device status. This register
part can only be read, not written or cleared. Reading the register does not
change its contents.
PTRansitionpart The Positive TRansition part acts as an edge detector. On transition of a bit of
the CONDition part from 0 to 1, the associated PTR bit decides whether the
EVENt bit is set to 1.
PTR bit = 1: the EVENt bit is set.
PTR bit = 0: the EVENt bit is not set.
This part can be written and read. Reading does not change its contents.

Status Reporting System R&S UPV
1146.2084.32 E-9
5.30
NTRansition part The Negative TRansition part also acts as an edge detector. On transition of a
bit of the CONDition part from 1 to 0, the associated NTR bit decides whether
the EVENt bit is set to 1.
NTR bit = 1: the EVENt bit is set.
NTR bit = 0: the EVENt bit is not set.
This part can be written and read. Reading does not change its contents.
These two transition register parts enable you to define the status change of the
CONDition part (none, 0 to 1, 1 to 0 or both) that is to be held in the EVENt part.
EVENt part The EVENt part indicates whether there has been an event since last readout –
it is the "memory" of the CONDition part. It only indicates events passed
through the transition filters. The EVENt part is continuously updated by the
device. This part is read-only. Reading clears its contents. This part is often
equated with the overall register.
ENABle part The ENABle part determines whether the associated EVENt bit contributes to
the summary bit (see below). Each bit of the EVENt part is ANDed (symbol '&')
with the associated ENABle bit. The results of all logical operations of this part
are ORed (symbol '+') and passed on to the summary bit.
ENABle bit = 0:
the associated EVENt bit does not contribute to the summary bit.
ENABle bit = 1:
if the associated EVENT bit is 1, the summary bit is also set to 1.
This part can be written and read as required. Reading does not change its
contents.
Summary bit As stated above, the summary bit for each register is derived from the EVENt
and ENABle parts. The result is then entered into a bit of the CONDition part of
the superordinate register.
The device automatically generates the summary bit for each register. An event,
e.g. a non-locking PLL, can thus produce a service request through all
hierarchical levels.
Note:
The Service Request Enable (SRE) register defined by IEEE 488.2 can be understood as the ENABle
part of the STB if the STB is structured to SCPI. By analogy, the ESE can be understood as the ENABle
part of the ESR.
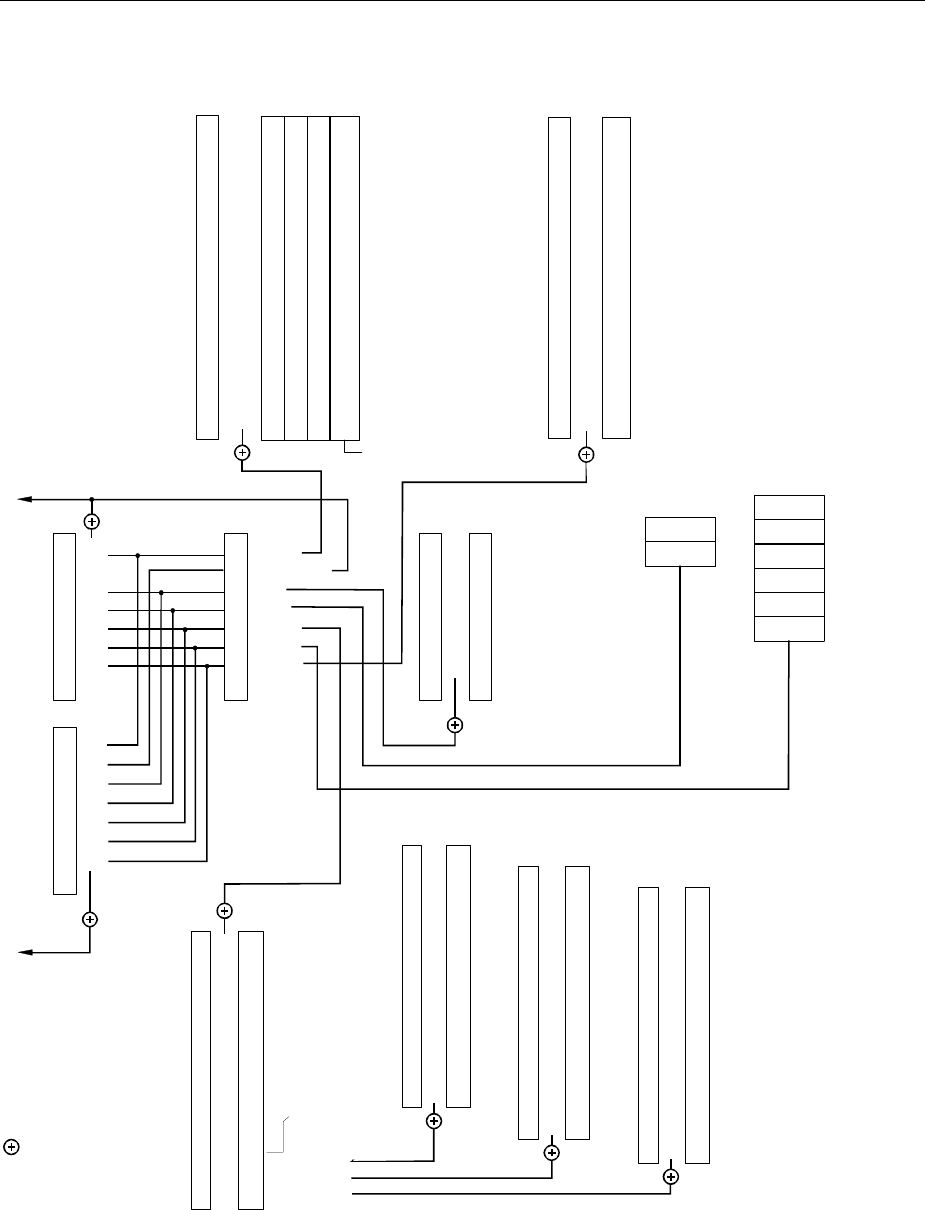
R&S UPV Status Reporting System
1146.2084.32 5.31 E-9
Overview of Status Registers
-&- 15
-&- 14
-&- 13
-&- 12
-&- 11
-&- 10
-&- 9
-&- 8
-&- 7 Ch8
-&- 6 Ch7
-&- 5 Ch6
-&- 4 Ch5
-&- 3 Ch4
-&- 2 Ch3
-&- 1 Ch2
-&- 0 Ch1
STATus:QUEStionable:UNDERrange register
-&- 15
-&- 14
-&- 13
-&- 12
-&- 11
-&- 10
-&- 9
-&- 8
-&- 7 Ch8
-&- 6 Ch7
-&- 5 Ch6
-&- 4 Ch5
-&- 3 Ch4
-&- 2 Ch3
-&- 1 Ch2
-&- 0 Ch1
STATus:QUEStionable:OVERrange register
-&- 15
-&- 14
-&- 13
-&- 12
-&- 11
-&- 10
-&- 9
-&- 8
-&- 7 Ch8
-&- 6 Ch7
-&- 5 Ch6
-&- 4 Ch5
-&- 3 Ch4
-&- 2 Ch3
-&- 1 Ch2
-&- 0 Ch1
STATus:QUEStionable:MEASuring
register
Error Queue
Message
AVailable
Meas-
results
Query
response
-&- 15
-&- 14 HW Opt. adjust
-&- 13
-&- 12
-&- 11
-&- 10 Hcopy in progress
-&- 9
-&- 8
-&- 7
-&- 6
-&- 5 Range Info Ch2
-&- 4 Range Info Ch2
-&- 3 Range Info Ch1
-&- 2 Range Info Ch1
-&- 1 Measuring Ch2
-&- 0 Measuring Ch1
STATus:XQUEstionable register
IST flag
(Response
to parallel
poll)
7-&-
6-&-
5-&-
4-&-
3-&-
2-&-
1-&-
0
7-&- 7 OPER
6 6 RQS/MSS
5-&- 5 ESB
4-&- 4 MAV
3-&- 3 QUES
2-&- 2 ERRQ
1-&- 1 XQUE
0 0
SRQ
SRE STB
PPE
-&- 7
-&- 6 User Request
-&- 5 Command Error
-&- 4 Execution Error
-&- 3 Dev. Depend. Error
-&- 2 Query Error
-&- 1
0 Oper. Complete
STATus:EVENt register
ESE ESR
= logical AND
= logical OR
of all bits
&
-&- 15
-&- 14 Run executable
-&- 13
-&- 12 Multichannel Mode
-&- 11 Analyzer Overrun
-&- 10 Measuring Status
-&- 9 Sweep Status
-&- 8 Sweep Status
-&- 7
-&- 6
-&- 5 Wait. for Trig
-&- 4 Measuring
-&- 3 Sweeping
-&- 2
-&- 1
-&- 0
STATus:OPERation register
NTRansition part
PTRansition part
CONDition part
ENABle part
EVENt part
-&- 15
-&- 14 Overload Inp Ch2
-&- 13 Overload Inp Ch1
-&- 12 Gen Status
-&- 11 Gen Status
-&- 10 Gen Status
-&- 9
-&- 8
-&- 7
-&- 6
-&- 5
-&- 4 Summary of
-&- 3 Multi Channel
-&- 2 UNDerrange
-&- 1 OVERrange
-&- 0 MEASuring
STATus:QUEStionable register
Fig. 5-4 Overview of status registers

Status Reporting System R&S UPV
1146.2084.32 E-9
5.32
Status Byte (STB) and Service Request Enable (SRE) Register
The STB is already defined in IEEE 488.2. It gives a rough overview of the device status, collecting
information from the lower-level registers. So it is comparable with the CONDition part of an SCPI
register and is at the highest level of the SCPI hierarchy. It is special in that bit 6 acts as the summary
bit of all other bits of the status byte.
The status byte is read by the command *STB? or a serial poll.
Associated with the STB is the SRE. The function of the SRE corresponds to that of the ENABle part of
the SCPI registers. Each bit of the STB is assigned a bit in the SRE. Bit 6 of the SRE is ignored. If a bit
is set in the SRE and the associated bit in the STB changes from 0 to 1, a service request (SRQ) will be
generated on the IEC/IEEE bus or Ethernet, which triggers an interrupt in the controller configured for
this purpose, and can be further processed by the controller.
The SRE can be set by the command *SRE and read by the query *SRE?.
Reading the EVENt part of a status register deletes the associated bit in the status byte register (e.g.
"STAT:OPER:EVEN?" deletes the OPER bit (d7) in the OPERation register).
Table 5-3 Meaning of bits in status byte
Bit no. Meaning
0Not used
1XQUEstionable status summary bit
This bit is set if an EVENt bit is set in the XQUEstionable status register and the associated ENABle bit is set to
1.
The register can be read by the queries STATus:XQUEstionable:CONDition? or
STATus:XQUEstionable[:EVENt]?.
2Error queue not empty
The bit is set if the error queue has an entry.
This can be fetched by the command SYSTem:ERRor?.
If this bit is enabled by the SRE, each entry of the error queue will generate a service request. An error can thus
be recognized and specified in more precisely by querying the error queue.
3QUEstionable status summary bit
This bit is set if an EVENt bit is set in the QUEStionable status register and the associated ENABLe bit is set to
1.
Aset bit denotes a questionable device status, which can be specified more precisely by querying the
QUEStionable status register with STATus:QUEStionable:CONDition? or STATus:QUEStionable[:EVENt]?.
4MAV bit (message available)
This bit is set if there is a readable message is in the output buffer. Ameasurement result or response to a query
(i.e. IEC/IEEE bus command with '?') is present and can be read.
5ESB bit
Summary bit of the event status register. This bit is set if one of the bits in the event status register is set and
enabled in the event status enable register.
Aset bit indicates an error or event that can be specified more precisely by querying the event status register by
the command "*ESR?".
6MSS bit (master status summary bit)
This bit is set if the device triggers a service request. This is the case if one of the other bits of this register is set
together with its mask bit in the service request enable register.

R&S UPV Status Reporting System
1146.2084.32 5.33 E-9
Bit no. Meaning
7OPERation status register summary bit
This bit is set if an EVENt bit is set in the OPERation status register and the associated ENABle bit is set to 1.
Aset bit indicates that the device is executing an action. The type of action can be determined by querying the
OPERation status register with STATus:OPERation:CONDition? or STATus:OPERation[:EVENt]?.

Status Reporting System R&S UPV
1146.2084.32 E-9
5.34
IST Flag and Parallel Poll Enable (PPE) Register
Similar to the SRQ, the IST flag combines the complete status information in a single bit. It can be
queried by a parallel poll (see section "Parallel Poll" on page 5.45) or the *IST? command.
The parallel poll enable (PPE) register determines which bits of the STB contribute to the IST flag. The
bits of the STB are ANDed with the corresponding bits of the PPE, bit 6 also being used - in contrast to
the SRE. The IST flag is the product of ORing all results. The PPE can be set by the *PRE command
and read by the *PRE? query.
STATus:EVENt Register (ESR)
The ESR is already defined in the IEEE 488.2 standard. It is comparable to the EVENt part of an SCPI
register. The event status register can be read out by the *ESR? query.
The ESE is the associated ENABle part. It can be set by the *ESE command and read out by the
*ESE? query.
Table 5-4 Meaning of bits in event status register
Bit no. Meaning
7Not used
6User request
This bit is set on pressing the LOCAL key, i.e. when the device is switched to manual control.
5Command error
This bit is set if an undefined command or a command with incorrect syntax is received. An error message
describing the error more precisely is entered in the error queue.
4Execution error
This bit is set if the syntax of a received command is correct but the command cannot be executed due to
various marginal conditions. An error message describing the error more precisely is entered in the error queue.
3Device-dependent error
This bit is set if a device-dependent error occurs. An error message describing the error more precisely is
entered in the error queue.
2Query error
This bit is set in either of the two following cases: the controller wants to read data from the device but has not
sent a query, or it sends new commands to the device before it retrieves existing requested data.
1Not used
0Operation complete
When the *OPC command is received, this bit is set if all previous commands have been executed.

R&S UPV Status Reporting System
1146.2084.32 5.35 E-9
STATus:OPERation Register
The CONDition part of this register contains information about the actions being performed by the
device, and the EVENt part about the actions performed by the device since the last readout. It can be
read by the query STATus:OPERation:CONDition? or STATus:OPERation[:EVENt]?.
Table 5-5 Meaning of bits in STATus:OPERation register
Bit no. Meaning
15 Not used
14 Run executable
If an executable program (*.exe) is started manually or by means of the
SYSTem:PROGramm:EXECute 'filename' command, this bit is set to 1; when the program is completed, this bit
is reset to 0. The change from 10can be checked by means of a Serial poll and Parallel poll, or it can trigger
an SRQ in order to fetch measurement data, for example.
13 Not used
12 Multichannel mode
0 = Two-channel operation
Analyzer Instrument Analog, Digital Audio, I2S Board, USI Dual Chan
1 = Multichannel operation
Analyzer Instrument Analog 8 Chan
11 Analyzer overrun
The sampling rate on the input is too high for the selected digital instrument.
Samples are lost.
10 Measuring status
Together with bit 4, this bit results in the following statuses:
Bit 4, 10
0 0 = Measuring Terminated Single measurement completed
0 1 = Measuring Stopped Measurement is halted
1 0 = Measuring Single Single measurement is being performed
1 1 = Measuring Cont Continuous measurement is being performed
8and 9 Sweep status
Together with bit 3, this bit results in the following statuses:
Bit 3, 9, 8
0 0 0 = Sweep Off No sweep is being performed
0 0 1 = Not used
0 1 0 = Sweep Stopped Sweep was halted and can be continued
0 1 1 = Sweep Waiting Sweep is waiting to (re)start
1 0 0 = Sweep Run Manual Manual sweep is being performed
1 0 1 = Sweep Run Single Single sweep is being performed
1 1 0 = Sweep Run Cont Continuous sweep is being performed
1 1 1 = Not used
7Not used
6Not used
5Waiting for trigger
This bit is set while the R&S UPV waits for a trigger event.

Status Reporting System R&S UPV
1146.2084.32 E-9
5.36
Bit no. Meaning
4Measuring
This bit is set while the R&S UPV is performing a measurement. Bit 10 indicates the measuring status.
Together with bit 10, this results in the following statuses:
Bit 4, 10
0 0 = Measuring Terminated Single measurement completed
0 1 = Measuring Stopped Measurement is halted
1 0 = Measuring Single Single measurement is being performed
1 1 = Measuring Cont Continuous measurement is being performed
Bits 0 and 1 in the STATus:XQUEstionable register indicate which channel this information refers to:
OPPPP Measuring Ch1 (bit 0)
QOPP Measuring Ch2 (bit 1)
0 0 = Not used
0 1 = The information refers only to channel 2
1 0 = The information refers only to channel 1
1 1 = The information refers to both channels
3Sweeping
This bit is set while the R&S UPV is performing a sweep. Bits 8 and 9 indicate the sweep status.
2Not used
1Not used
0Not used

R&S UPV Status Reporting System
1146.2084.32 5.37 E-9
STATus:QUEStionable Register
This register contains information about questionable device statuses. These may occur when the
device is operated beyond its specifications. The register can be read by the query
STATus:QUEStionable:CONDition? or STATus:QUEStionable[:EVENt]?.
Table 5-6 Meaning of bits in STATus:QUEStionable register
Bit no. Meaning
15 Not used
14
13
Analyzer status
for measurement with the two-channel analog instrument
Bit 14, 13
0 0 = No Overload Normal operating status (none of the input channels are overloaded)
0 1 = Anlr1 Overload Input channel 1 is overloaded
1 0 = Anlr2 Overload Input channel 2 is overloaded
1 1 = Anlr1, Anlr2 Overload Both input channels are overloaded
One or both input channels with input impedance 300 or 600 are overloaded.
To protect the analyzer input, the input is switched to high impedance and the generator output is disabled.
Measurement is continued.
Ways to recover from overload:
Remove overvoltage (maximum input voltage on 300 and 600 is 25 V) and reactivate the generator using
the OUTPut ON command. The input impedance is reset to the previous value.
12
11
10
Generator status
Bit 12, 11, 10
0 0 0 = Not used
0 0 1 = Generator Off Both generator channels are off
0 1 0 = Generator Running Generator outputs signal
0 1 1 = Not used
1 0 0 = Not used
1 0 1 = Generator Overrun The sampling rate on the external input is too high for the
selected digital instrument. Samples missing in signal
1 1 0 = Generator Overload Generator overloaded, output disabled
1 1 1 = Output Off Output disabled
9, 8, 7, 6,
5, 4, 3
Not used
2Summary of multichannel UNDerrange
for multichannel operation
Summary bit for the lower-order STATus:QUEStionable:UNDERrange register, which makes the underrange
information for the individual channels available during multichannel operation.
1Summary of multichannel OVERerrange
for multichannel operation
Summary bit for the lower-order STATus:QUEStionable:OVERrange register, which makes the overrange
information for the individual channels available during multichannel operation.
0Summary of multichannel MEASuring
for multichannel operation
Summary bit for the lower-order STATus:QUEStionable:MEASuring register, which returns the activated channels
during multichannel operation.
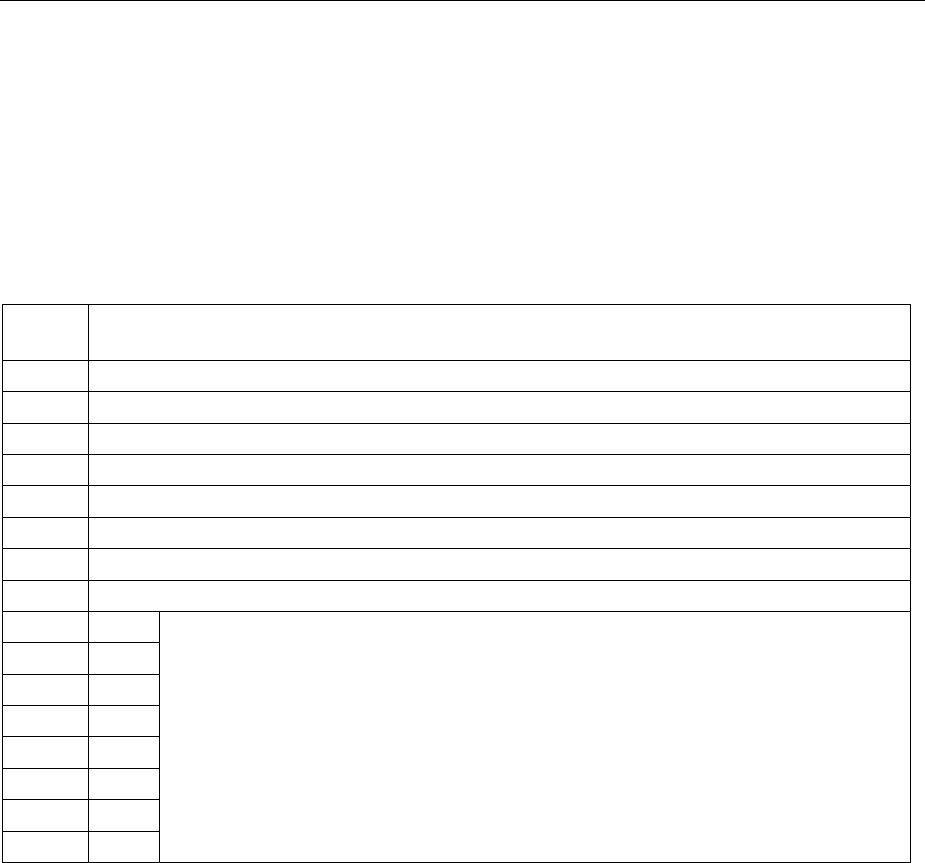
Status Reporting System R&S UPV
1146.2084.32 E-9
5.38
STATus:QUEStionable:UNDERrange Register
This register only contains underrange information concerning the individual channels of multichannel
operation.
The register can be queried with the
STATus:QUEStionable:UNDERrange:CONDition? and
STATus:QUEStionable:UNDERrange[:EVENt]?
commands.
Tabelle 5-7 Meaning of bits in STATus:QUEStionable:UNDERrange register
Bit no. Meaning
15 Not used
14 Not used
13 Not used
12 Not used
10 Not used
9Not used
8Not used
9Not used
7Ch8
6Ch7
5Ch6
4Ch5
3Ch4
2Ch3
1Ch2
0Ch1
0 = The channel in question is not underranged.
1 = The channel in question is underranged; the measurement result is inaccurate and no longer in line
with the specifications of the R&S UPV.
The associated summary bit is in the STATus:QUEStionable register bit 2

R&S UPV Status Reporting System
1146.2084.32 5.39 E-9
STATus:QUEStionable:OVERrange Register
This register only contains overrange information concerning the individual channels of multichannel
operation.
The register can be queried with the
STATus:QUEStionable:OVERrange:CONDition? and
STATus:QUEStionable:OVERrange[:EVENt]?
commands.
Tabelle 5-8 Meaning of bits in STATus:QUEStionable:OVERrange register
Bit no. Meaning
15 Not used
14 Not used
13 Not used
12 Not used
10 Not used
9Not used
8Not used
9Not used
7Ch8
6Ch7
5Ch6
4Ch5
3Ch4
2Ch3
1Ch2
0Ch1
0 = The channel in question is not overranged.
1 = The channel in question is overranged.
If the measurement result of an overranged channel is requested with the SENSx:DATAy?
command, the value "3.40282346639e+038" (represents NaN = Not a Number) is returned.
The associated summary bit is in the STATus:QUEStionable register bit 1

Status Reporting System R&S UPV
1146.2084.32 E-9
5.40
STATus:QUEStionable:MEASuring Register
This register only contains information about which channels are activated or deactivated during
multichannel operation.
It can be queried with the
STATus:QUEStionable:MEASuring:CONDition? and
STATus:QUEStionable:MEASuring[:EVENt]?
commands.
Tabelle 5-9 Meaning of bits in STATus:QUEStionable:MEASuring register
Bit no. Meaning
15 Not used
14 Not used
13 Not used
12 Not used
10 Not used
9Not used
8Not used
9Not used
7Ch8
6Ch7
5Ch6
4Ch5
3Ch4
2Ch3
1Ch2
0Ch1
Returns the setting of channels of
multichannel operation in the Analyzer Config
panel.
0 = The channel in question is deactivated
1 = The channel in question is activated
The associated summary bit is in the
STATus:QUEStionable register bit 0

R&S UPV Status Reporting System
1146.2084.32 5.41 E-9
STATus:XQUEstionable Register
This register contains extra information to the status operation register and seldom occurring status
information. It can be read by the query STATus:XQUEstionable:CONDition? or
STATus:XQUEstionable[:EVENt]?.
Table 5-10 Meaning of bits in STATus:XQUEstionable register
Bit no. Meaning
15 Not used
14 HW option adjust
13 Not used
12 Not used
11 Not used
10 Hardcopy in progress
9Not used
8Not used
7Not used
6Not used
5
4
Range info Ch 2
for the two-channel measurment mode
d3 d2
0 0 = Measurement result valid
0 1 = Not used
1 0 = Underrange (measurement result possibly inaccurate) on channel 2
1 1 = Overrange (measurement result invalid) on channel 2
3
2
Range Info Ch 1
for the two-channel measurment mode
d3 d2
0 0 = Measurement result valid
0 1 = Not used
1 0 = Underrange (measurement result possibly inaccurate) on channel 1
1 1 = Overrange (measurement result invalid) on channel 1
1Measuring Ch2
for the two-channel measurment mode
Bit set: The information of the MEASuring bit (d4) and the measuring status bit (d10) of the
STATus OPERation register refers to Channel 2.
OPPPP Measuring bit (d4) of the STATus OPERation register
QOPP Measuring status bit (d10) of the STATus OPERation register
0 0 = Measuring Terminated Single measurement completed
0 1 = Measuring Stopped Measurement is halted
1 0 = Measuring Single Single measurement is being performed
1 1 = Measuring Cont Continuous measurement is being performed

Status Reporting System R&S UPV
1146.2084.32 E-9
5.42
Bit no. Meaning
0Measuring Ch1
for the two-channel measurment mode
Bit set: The information of the MEASuring bit (d4) and the measuring status bit (d10) of the
STATus OPERation register refers to Channel 1.
OPPPP Measuring bit (d4) of the STATus OPERation register
QOPP Measuring status bit (d10) of the STATus OPERation register
0 0 = Measuring Terminated Single measurement completed
0 1 = Measuring Stopped Measurement is halted
1 0 = Measuring Single Single measurement is being performed
1 1 = Measuring Cont Continuous measurement is being performed

R&S UPV Status Reporting System
1146.2084.32 5.43 E-9
Use of Status Reporting System
For efficient use of the status reporting system, the information it contains has to be transferred to the
controller and further processed. There are various methods, which are described below. Detailed
program examples can be found in Chapter 7, Program Examples.
Service Request, Use of Hierarchical Structure
Under certain conditions the device may send a service request to the controller. This service request
usually triggers an interrupt on the controller to which the control program can respond by suitable
actions. As seen from section "Overview of Status Registers" on page 5.31, an SRQ is always triggered
when one or more of the bits 1, 2, 3, 4, 5 or 7 of the status byte are set and enabled in the SRE. Each
of these bits combines the information from another register, from the error queue or the output buffer. If
the ENABle registers of the status registers are set accordingly, any bit in any status register will be
able to trigger an SRQ.
Example:
Use the *OPC command to generate an SRQ.
CALL IBWRT(analyzer%, "*ESE 1") Set bit 0 (operation complete) in the ESE
CALL IBWRT(analyzer%, "*SRE 32") Set bit 5 (ESB) in the SRE
The device generates an SRQ on completion of its settings.
The SRQ is the only way for the device to become active on its own. Each controller program should
set the device such that a service request is triggered in case of malfunctions. The program should
respond accordingly to the service request. A detailed example of a service request routine can be
found in Chapter 7, Program Examples.
Serial Poll
Serial poll is mainly used for a fast overview of the status of several devices connected to the IEC/IEEE
bus or LAN/USB.
Like the *STB? command, the serial poll is used to query the status byte of a device. Querying is
implemented by interface messages, however, making it much faster. The serial poll method is already
defined in the IEEE 488.1 standard, and used to be the only uniform method of querying the status
byte. This method also works with devices that conform neither to SCPI nor to IEEE 488.2.
The Visual Basic command for executing a serial poll is IBRSP().

Status Reporting System R&S UPV
1146.2084.32 E-9
5.44
Program Example:
Public UPV As Integer
Public Info As Integer
Dim StartT As Single
Dim Response As String * 1000
Private Sub ReadESR(): 'subroutine for readout of ESR
Call ibwrt(UPV, "*ESR?") 'ask for ESR data
Call ibrd(UPV, Response) 'read ESR data
EventList.AddItem "ESR register is: " + Left(Response, ibcntl - 1)
DoEvents
End Sub
'SRQ subroutine in case RQS was set
Private Sub GPIB_Notify(ByVal LocalUPV As Long, ByVal LocalIbsta As Long, ByVal LocalIberr As
Long, ByVal LocalIbcntl As Long, RearmMask As Long)
Call ibrsp(UPV, Info): 'do a serial poll and read STB
EventList.AddItem "SRQ " + " was fired after " + Trim(Str(Timer - StartT)) + " s"
EventList.AddItem "STB register is: " + Trim(Str(Info))
Call ReadESR
ibloc UPV 'switch UPV to local
ibonl UPV, 0 'switch interface offline
End Sub
Private Sub Test_Click(): 'main program
Call ibdev(0, 20, 0, T3s, 1, 0, UPV) 'attach instrument
Call ibconfig(0, IbcAUTOPOLL, 1) 'enable auto serial polling
Call ibconfig(0, IbcEndBitIsNormal, 1 'set END bit on EOS match during read
Call ibconfig(0, IbcEOScmp, 0) ''7 bit EOS char
Call ibconfig(0, IbcEOSrd, 1) 'terminate read by EOS char
Call ibconfig(0, IbcEOSchar, 10) 'EOS character LF as terminator
Call ibclr(UPV) 'device clear
Call ibwrt(UPV, "*IDN?") 'ask for instrument identity
Call ibrd(UPV, Response) 'read query result
EventList.AddItem Left(Response, ibcntl - 1) 'display query result as message box
DoEvents
Call ibwrt(UPV, "*CLS") 'reset registers
Call ibwrt(UPV, "*ESE 1") 'enable operation complete bit to set ESB
Call ibwrt(UPV, "*SRE 32") 'ESB bit generates SRQ
Call ReadESR 'reading clears ESR register
GPIB.SetupMask = RQS 'set notify mask to Service Request
GPIB.SetupNotify UPV 'call and enable notify function
EventList.AddItem "SRQ enabled ..."
DoEvents
EventList.AddItem "sending INIT command ..."
DoEvents
StartT = Timer
Call ibwrt(UPV, "INIT;*OPC") 'trigger measurement, rise OPC when ready
EventList.AddItem "waiting for SRQ ..."
EventList.AddItem "------------------------------------------------------"
DoEvents
'here the program could do anything else until a SRQ is set
End Sub

R&S UPV Status Reporting System
1146.2084.32 5.45 E-9
Parallel Poll
In the case of a parallel poll up to eight devices are simultaneously requested by a command from the
controller to transmit one bit of information on the data lines, i.e. to set the data line assigned to each
device to logic 0 or 1. Analogously to the SRE register, which determines the conditions for generating
an SRQ, a parallel poll enable (PPE) register is present that is ANDed bit-by-bit with the STB (taking
into account bit 6). The results are ORed and the result is then sent (possibly inverted) to the controller
as a response to a parallel poll. The result can also be read without a parallel poll by the command
*IST.
The device must first be set for parallel poll by the Visual Basic command IBPPC().This command
assigns the device a data line and specifies whether the response is to be inverted. The parallel poll
itself is performed with IBRPP().
The parallel poll mode is mainly used to quickly find out which of the many devices connected to the
IEC/IEEE bus or LAN/USB caused an SRQ. For this purpose, SRE and PPE must be set to the same
value.
Queries
Each part of a status register can be read out by queries. The queries are given in the description of the
status commands (STATus subsystem). The queries always yield a number representing the bit pattern
of the queried register. This number is evaluated by the controller program.
Queries are mainly used after the appearance of an SRQ to obtain more information about the cause of
the SRQ.
Error Queue Query
Each error in the device causes an entry in the error queue. The entries in the error queue are detailed
error messages in plain text that can be read out on the IEC/IEEE bus or LAN/USB by the query
SYSTem:ERRor?.Each SYSTem:ERRor? query is answered by an entry from the error queue. If there
are no more error messages in the error queue, the device responds with 0 = "No error".
The error queue should be queried in the controller program after each SRQ since the queue entries
provide a more precise description of the error cause than the status registers. In particular, in the test
phase of a controller program the error queue should be queried at regular intervals since it also
registers faulty commands from the controller to the device.

Status Reporting System R&S UPV
1146.2084.32 E-9
5.46
Initializing the Status Reporting System
The commands *RST,*DCL and SYSTem:PRESet also influence the status reporting system. None of the
commands, except *RST and SYSTem:PRESet,influence functional device settings. *DCL in particular
does not alter device settings.
Table 5-11 Resetting device functions
Event
DCL, SDC
(Device Clear,
Selected Device
Clear)
*RST or
SYSTem:PRESet
SYSTem:PRESet *CLS
Effect
Clear STB, ESR – – – yes
Clear SRE, ESE – – – –
Clear PPE – – – –
Clear EVENt parts of
registers
– – – yes
Clear ENABle parts of all
OPERation and
QUEStionable registers,
fill ENABle parts of all
other registers with "1"
– – yes –
Fill PTRansition parts
with "1",
clear NTRansition parts
– – yes –
Clear error queue – – – yes
Clear output buffer yes 1) 1) 1)
Clear command
processing and input
buffer
yes – – –
1) Any command that is the first in a program message clears the output buffer.

R&S UPV Contents – Remote Control - Commands
1146.2084.32 I-6.1 E-9
Contents - Chapter 6
"Remote Control - Description of Commands"
6Remote Control - Commands .................................................................................................6.1
Notation of Commands....................................................................................................................6.1
Common Commands .......................................................................................................................6.4
Triggering Measurements and Reading Results...........................................................................6.7
Starting Measurements ............................................................................................................6.7
Reading Measurement Results..............................................................................................6.10
Output of trace data sets........................................................................................................6.12
Reading out multi-channel records ........................................................................................6.17
Output of protocol data...........................................................................................................6.18
Output of protocol errors ........................................................................................................6.19
STATus Subsystem........................................................................................................................6.21
SYSTem Subsystem.......................................................................................................................6.29
MMEMory Subsystem ....................................................................................................................6.31
Generation of Protocol Data..........................................................................................................6.36
Softkey commands of the graphical display ...............................................................................6.37
Transferring trace data ..................................................................................................................6.45
User-definable data buffers...........................................................................................................6.47
Hardcopy .........................................................................................................................................6.49

R&S UPV Notation of Commands
1146.2084.32 6.1 E-9
6Remote Control - Commands
Adescription of remote control commands together with the associated manual settings is given in
section “Instrument functions”. The meaning of the parameter setting fields and the effect of the
individual parameters are explained in detail. The parameters shown in the panels can be
unambiguously assigned to the parameters included in the remote control commands.
Moreover, the SCPI recording function (see section
“Command Recording”) offers a very convenient means of
recording manual settings, thus allowing remote control
commands to be assigned to the parameter fields in the
panels. Since the panels do not provide for any settings
relating to the triggering of measurements or reading of
results, these functions are not recorded.
This chapter lists the following commands:
•Commands that are not available during manual operation and thus cannot be recorded, such as
common commands, triggering and output of measurement values
•Commands for using the system, mass memory and status system
•Commands that can only be carried out by using the softkey menu, and thus can also not be
recorded.
In section ”Remote Control - Fundamentals”, you will find a general introduction to remote control as
well as a description of the status registers.
Notation of Commands
Upper/lowercase notation
Upper- and lowercase letters are used to identify the long form and the
short form of the keywords of the commands given in the manual. The
instrument itself does not distinguish between the two types of characters.
Special characters |
For a number of commands a vertical bar between keywords in the
header of an IEC/IEEE bus command characterizes for a number of
commands various choices in the sense of "or" for otherwise identical
IEC/IEEE bus commands.
Example 1:
DISPlay:WAVeform:A|B:TOP <nu>
This notation represents the two following commands:
DISPlay:WAVeform:A:TOP <nu>
DISPlay:WAVeform:B:TOP <nu>
The two commands are basically completely identical; the first command
refers only to trace A, the second one refers to trace B.

Notation of Commands R&S UPV
1146.2084.32 6.2 E-9
Example 2:
DISPlay:SWEep<i>:A|B:MARKer:SETTo:OCURsor|XCURsor ONCE
This notation represents the four following commands:
DISPlay:SWEep<i>:A:MARKer:SETTo:OCURsor ONCE
DISPlay:SWEep<i>:B:MARKer:SETTo:OCURsor ONCE
DISPlay:SWEep<i>:A:MARKer:SETTo:XCURsor ONCE
DISPlay:SWEep<i>:B:MARKer:SETTo:XCURsor ONCE
The four commands are basically completely identical; they differ only in
the trace and cursor.
Avertical line (pipe) in the parameter notation indicates alternative
parameter options and is to be read as an "or". The command has a
different effect depending on the parameter chosen.
Example: Selecting a parameter for the following command:
INPut:COUPling AC | DC
If AC is selected, only the AC component is measured; if DC is
selected, both the DC and the AC component are measured.
[ ]
Keywords in square brackets can be omitted in the header (see section
”SCPI Command Structure and Syntax“). The command is accepted by the
instrument as having the full length for reasons of compatibility with the
SCPI standard.
Likewise, parameters in square brackets can be omitted or entered in the
command.
Example: INSTrument2[:SELect] ANLG | DIG
The second instrument (analyzer) can be selected by either of
the following commands:
INSTrument2 ANLG = INSTrument2:SELect ANLG
Description of parameters
<i>
By using this parameter, you can identify command extensions, such as
different windows for a subsystem.
Example: DISPlay:SWEep<i>:A|B:REFerence VALue
The sweep subsystem includes four independent windows.
These windows are indicated with the numbers 1 to 4. The fourth
window is thus addressed with DISPlay:SWEep4:…
<n>
This argument indicates that an integer value is required.
Example: OUTPut:AUDiobits <n>
Setting command: OUTPut:AUDiobits 24
Query command: OUTPut:AUDiobits? Response: 24

R&S UPV Notation of Commands
1146.2084.32 6.3 E-9
<n,n,n,n>
This argument indicates a numeric string that may consist of integer values
or floating-point values in ASCII form without a unit.
Example: SYST:MEM:DATA<i> <n,n,n,n>
Setting command: SYST:MEM:DATA11
1.2345,2.3456,3.4567,4.5678
Query command: SYST:MEM:DATA11? Response:
1.2345,2.3456,3.4567,4.5678
<nu>
This argument indicates that a numeric parameter is required to which a
unit can be added.
Example: SOURce:FREQuency:REFerence <nu>
Setting command: SOURce:FREQuency:REFerence 1000 Hz
Query command: SOURce:FREQuency:REFerence? Response: 1000 Hz
Text parameters
Text parameters are based on the syntax rules for keywords, i.e. they have
along form and a short form. Like all parameters, they must be separated
from the header by a white space. In command recording (SCPI recording)
or in response to a query command, the short form of the text parameter is
used.
Example:
Setting command: INPut:CHANnel CH1And2
Query command: INPut:CHANnel? Response: CH1A
'Character strings'
Character strings must, in accordance with SCPI, always be given in single
or double quotation marks. Filenames also count as strings. Normally,
single quotation marks are used, since double quotation marks are
employed to identify the entire IEC/IEEE bus command as a string.
Example:
Setting command: MMEMory:LOAD:STATe 'filename'
Query command: MMEMory:LOAD:STATe? Response: 'filename'

Common Commands R&S UPV
1146.2084.32 6.4 E-9
Common Commands
The common commands are taken from the IEEE 488.2 (IEC 625.2) standard. Identical commands
have an identical effect in different instruments. The header of these commands consists of an asterisk
(*) followed by three letters. Many common commands relate to the status reporting system, which is
described in detail in section “Status Reporting System”.
Command Parameters Remarks
*CLS Clear status; no query
*ESE 0 to 255 Event status enable
*ESR? 0 to 255 Standard event status query; query only
*IDN? Identification query; query only
*IST? 0 to 255 Individual status query; query only
*OPC Operation complete
*OPT? Option identification query; query only
*PRE 0 to 255 Parallel poll register enable
*PSC 0 | 1 Power on status clear
*RST Reset; no query
*SRE 0 to 255 Service request enable
*STB? Status byte query; query only
*TRG Trigger; no query
*TST? Self-test query; query only
*WAI Wait to continue; no query
*CLS
CLEAR STATUS sets the status byte (STB), the event status register (ESR) and the EVENt part of
the OPERation, the QUEStionable and the XQUEstionable registers to zero. The command does not
change the mask and transition parts of the registers. It clears the output buffer.
*ESE 0...255
EVENT STATUS ENABLE sets the event status enable register to the specified value. The query
command *ESE? returns the content of the event status enable register in decimal form.
*ESR?
STANDARD EVENT STATUS QUERY returns the content of the event status register in decimal
form (0 to 255) and sets the register to zero.

R&S UPV Common Commands
1146.2084.32 6.5 E-9
*IDN?
IDENTIFICATION QUERY queries the instrument ID. The instrument type, the stock/serial number
and the firmware version number.
Example:
Rohde&Schwarz,UPV,1146.2003k02/100001,2.1.60.0-2.3.0
Rohde&Schwarz,UPV = instrument type
1146.2003k02/100001 = stock/serial number
2.1.60.0 = COMPASS version
2.3.0 = UPV version
*IST?
INDIVIDUAL STATUS QUERY returns the content of the IST flag in decimal form (0 | 1). The IST
flag is the status bit that is sent during a parallel poll query.
*OPC
OPERATION COMPLETE sets bit 0 in the event status register when all previous commands have
been processed. This bit can be used to trigger a service request.
*OPC?
OPERATION COMPLETE QUERY returns a 1 when all previous commands have been processed.
It is important that the timeout set on the IEC/IEEE bus is sufficiently long.
*OPT?
OPTION IDENTIFICATION QUERY queries the options installed on the instrument and returns a list
of the options installed. The options are separated by commas.
*PRE 0... 255
PARALLEL POLL REGISTER ENABLE sets the parallel poll enable register to the specified value.
The query command *PRE? returns the content of the parallel poll enable register in decimal form.
*PSC 0 | 1
POWER ON STATUS CLEAR determines whether the contents of the ENABle registers are
retained or reset on power on.
Parameters: 0The contents of the status registers are retained on power on. With appropriate
configuration of the ESE and SRE status registers, the contents may cause a
service request to be triggered on power on.
1The contents of the status registers are reset on power on.
The query command *PSC? returns the content of the Power On Status Clear flag. The answer
may be either 0 or 1.
*RST
RESET sets the instrument to a defined default state. The command has the same effect as
pressing the PRESET key.

Common Commands R&S UPV
1146.2084.32 6.6 E-9
*SRE 0... 255
SERVICE REQUEST ENABLE sets the service request enable register to the specified value. Bit 6
(MSS mask bit) remains 0. This command determines the conditions under which a service request
is triggered. The query command *SRE? returns the content of the service request enable register in
decimal form. Bit 6 is always 0.
*STB?
READ STATUS BYTE QUERY returns the content of the status byte in decimal form.
*TRG
TRIGGER triggers a measurement or a sweep.
*TST?
SELF TEST QUERY triggers the selftest of the instrument and, if an error is found, outputs an error
code.
*WAI
WAIT-to-CONTINUE does not allow subsequent commands to be processed until all previous
commands have been eXEcuted.

R&S UPV Triggering Measurements and Reading Results
1146.2084.32 6.7 E-9
Triggering Measurements and Reading Results
This chapter describes how to start single measurements or continuous measurements and how to read
results from the instrument by means of remote control commands.
These commands cannot be logged by means of the SCPI recording function.
Starting Measurements
See also section “Starting Measurements“in chapter 4 Instrument Functions.
Command Parameter
Default
unit
Comment
INITiate:CONTinuous ON | OFF | WAIT
INITiate:CONTinuous:TIMeout <nu> s
INITiate:FORCe START | SINGle | STOP |
CONTinuous
INITiate[:IMMediate]
No parameters
ABORt
No parameters
Continuous measurement
This is the standard operating mode of the measurement system to which the R&S UPV is set on
switch-on. All types of measurements that are activated are performed continuously. You can start a
continuous measurement by pressing the START key. The START LED is on to indicate that the
continuous measurement mode is active. In this operation mode, every change in the generator,
analyzer or filter bank triggers a restart of the continuous measurement in progress. This also applies to
the "*RST" command and the loading of setups.
This ensures that the displayed measurement data is not corrupted by internal switching operations of
the analyzer or by a change of the generator signal. The execution time of the setting commands in
question takes a bit longer in comparison to a stopped measurement. To keep setting times as short as
possible, you should execute longer command sequences in the "term"inated or "stop" state, i.e. during
stopped measurements.
Single measurement
The R&S UPV carries out a single measurement for all measurement types activated; then the
measurement system goes to the "Term"inated state. It is not mandatory that valid results be produced
by the measurements: if an error occurs during a measurement, the result is indicated as being invalid.
In such case, "----" rather than the measured value will be displayed in the associated result window.
With remote control, a NAN ("not a number", >1.0e37) value will be returned. You can start a single
measurement by pressing the SINGLE key. The START LED and the SINGLE LED are on to indicate
that the single measurement mode is active. In this operation mode, all setting commands that occur
after the measurement timing are executed without restart and therefore require less time than during a
continuous measurement. This also applies to the "*RST" command and the loading of setups.

Triggering Measurements and Reading Results R&S UPV
1146.2084.32 6.8 E-9
INITiate:CONTinuous ON | OFF | WAIT
Parameters: ON Switches to the "continuous measurement" mode. Any
continuous or single measurement that is already active is
terminated. A new continuous measurement is started. This
parameter changes the "init" presetting to the "continuous"
mode, i.e. every subsequent "Init" command (without parameter)
starts a new continuous measurement and thus has the same
effect as "init:cont on". Identical to the Start keystroke. This
command includes various reset functions: Resets the
MIN/MAX indicator, the MIN/MAX values and the limit violations
of the measurement displays as well as the highlighting of the
protocol analysis. Certain generator signals (burst signals,
playback of WAV files by means of the Play function) are reset
to the initial state. This command is recommended for
continuous result reading.
OFF Switches to the "single measurement" mode. Any in-progress
continuous or single measurement is stopped. A new single
measurement is started. This parameter changes the "init"
presetting to the "Single" mode, i.e. every subsequent "Init"
command (without parameter) starts a new single measurement
and thus has the same effect as "init:cont off". In the case of a
stopped measurement or in-progress single measurement
identical to the Single keystroke (during in-progress continuous
measurement, the Single keystroke switches to single
measurement without stopping the continuous measurement).
Identical to INITiate:FORCe SINGle. This command does not
involve reset functions, which means that the measurement is
started several milliseconds faster. Recommended for single
triggered measurements.
WAIT CONTinous measurement in which the SENSx:DATAy
commands, which are used to query the measurement results,
stop the IEC/IEEE bus until a measurement result is available.
Example: "INIT:CONT ON"
"INIT:CONT OFF"
"INIT:CONT WAIT"
INITiate:CONTinuous:TIMeout <nu>
Parameter: <nu> 0 … 1000 s
0 s corresponds to the INIT:CONT ON setting.
If timeout occurs without a new measurement result being available, the last
measurement result that was read out is returned.
Example: "INIT:CONT:TIM 0.1s"

R&S UPV Triggering Measurements and Reading Results
1146.2084.32 6.9 E-9
INITiate:FORCe STARt | SINGle | STOP | CONTinuous
Parameters: STARt Start of a continuous measurement.
Identical to the Start keystroke.
Identical to INITiate:CONTinuous ON; however, it has to be
changed without the "Init" presetting.
CONTinuous Start of a continuous measurement; however without reset
function.
This retains the MIN/MAX values and limit violations, and
measurement is started several milliseconds faster.
SINGle Start of a single measurement.
In the case of a stopped measurement or an in-progress single
measurement identical to the Single keystroke (during in-
progress continuous measurement the Single keystroke
switches to single measurement without stopping the continuous
measurement).
Identical to INITiate:CONTinuous OFF; however, without
changing the "Init" presetting.
STOP Stops a measurement as if the STOP/CONT key was pressed
while a measurement was in progress.
(Identical to the "ABORt" command).
Example: "INIT:FORC SING"
INITiate[:IMMediate]
Parameter: --- Measurement is started according to the mode preset by
"INITiate:CONTinuous" (continuous or single measurement).
Example: "INIT:IMM"
ABORt
Parameter: --- Identical to INITiate:FORCe STOP
Stops a measurement as if the STOP/CONT key was pressed
while a measurement was in progress.
Example: "ABOR"
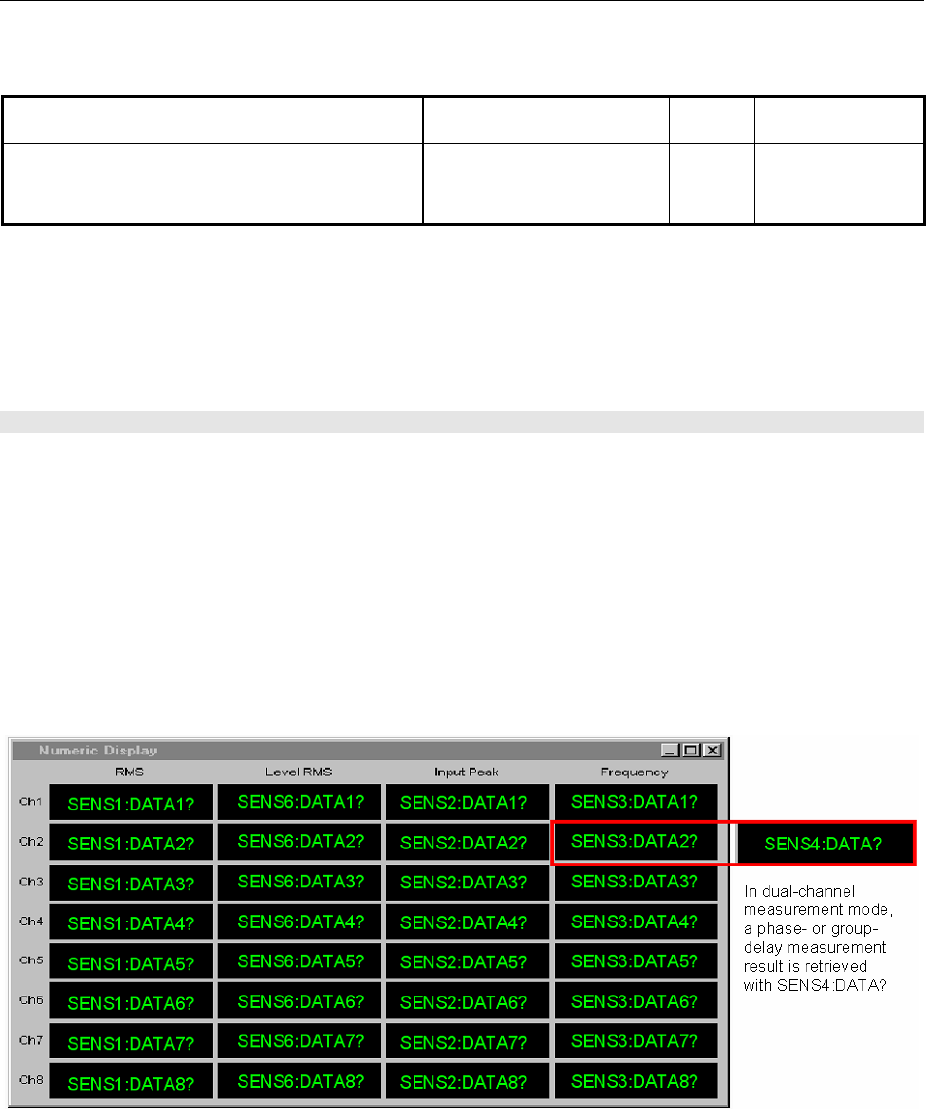
Triggering Measurements and Reading Results R&S UPV
1146.2084.32 6.10 E-9
Reading Measurement Results
Command Parameters
Default
unit
Comment
SENSe<n>:DATA[1]|2, 3,…16?
SENSe<n>:DATA[1]|2, 3,…16? MIN
SENSe<n>:DATA[1]|2, 3,…16? MAX
Current measurement result
Lowest measurement result
Highest measurement result
Query only
Depending on the measurements activated in the Analyzer panel, the R&S UPV indicates up to eight
results in the numeric display in the case of a two-channel instrument and up to 64 results in the case of
amultichannel instrument. The results are also available in buffers from where they can be read by
remote control.
The remote control commands for reading measurement results are in general structured as follows:
SENSe<n>:DATA[1]|2,3,…16?
The parameter <n> specifies the type of measurement whose result is queried.
<n> = 1: Function measurement result from column 1
6: Level-monitor measurement result from column 2
2: Input-monitor measurement result from column 3
3: Frequency, phase or group-delay measurement result from column 4
Data 1, 2, 3, … 16 selects channel 1, 2, 3, … 16
The figure below shows the assignment of remote control commands to the results indicated in the
numeric display for an 8-channel analyzer.
Figure 6-1 Indication of results in the numeric display and associated remote control commands
Aquestion mark extended with MIN and MAX indicates the minimum and maximum measured value
shown in the combi display above the measured value.
The return value comes in the unit (without engineering) in which it is displayed in the numeric display.
If the measurement result of an overranged channel is requested with the SENSx:DATAy? command,
the value "3.40282346639e+038" (represents NaN = Not a Number) is returned.

R&S UPV Triggering Measurements and Reading Results
1146.2084.32 6.11 E-9
Example:
Read out the current frequency measurement result and the respective MIN/MAX values from channel
2:
Display of channel 2’s current
frequency measurement result in
the numeric display.
1
SENS3:DATA2?
Response: 4.8236 KHZ
Display of channel 2’s current
frequency measurement result in
the combined display with min
and max values.
SENS3:DATA2? MIN
Response: 1 KHZ
SENS3:DATA2? MAX
Response: 20 KHZ

Triggering Measurements and Reading Results R&S UPV
1146.2084.32 6.12 E-9
Output of trace data sets
Command Parameters
Default
unit
Comment
FORMat[:DATA] ASCii | REAL
DISPlay:Subsys<i>:SCANoffset <n> <n> = 2, 1, 0, -1 ... -19
TRACe:Subsys<i>:LOAD:AX? Query only
TRACe:Subsys<i>:LOAD:AY? Query only
TRACe:Subsys<i>:LOAD:BX? Query only
TRACe:Subsys<i>:LOAD:BY? Query only
TRACe:Subsys<i>:LOAD:COUNt:AX? Query only
TRACe:Subsys<i>:LOAD:COUNt:AY? Query only
TRACe:Subsys<i>:LOAD:COUNt:BX? Query only
TRACe:Subsys<i>:LOAD:COUNt:BY? Query only
TRACe:Subsys<i>:LDList:AX? Query onl
TRACe:Subsys<i>:LDList:AY? Query only
TRACe:Subsys<i>:LDList:BX? Query only
TRACe:Subsys<i>:LDList:BY? Query only
TRACe:Subsys<i>:LDList:COUNt:AX? Query only
TRACe:Subsys<i>:LDList:COUNt:AY? Query only
TRACe:Subsys<i>:LDList:COUNt:BX? Query only
TRACe:Subsys<i>:LDList:COUNt:BY? Query only
Subsys stands for the following terms: SWEep | FFT | MONitor | WAVeform | BARgraph
For the Subsystem Sweep: <i> = 1 … 4
For the Subsystem FFT: <i> = 1 | 2
For the Subsystem BARgraph: <i> = 1 | 2
For the Subsystems WAVeform: <i> = 1
For the Subsystems PESQ: <i> = 1 | 2
FORMat[:DATA]
Defines the number format for outputting trace data sets.
This setting is not stored in the setup and is set to ASCII each time the R&S UPV is switched on.
Parameters: ASCii Output as an ASCII string, digits with sign, decimal point and any
exponent, e.g. "-57.1647,-6.08881,-32.304,-53.6429 …"
REAL Binary form!
The trace data sets are returned in binary format.
The binary data
block has the following structure:
#<LängeDerLänge><Länge><block_data>
e.g. #234<block_data>
#always introduces the binary block
<LängeDerLänge> indicates how many positions the following
length specification occupies (2 in example)
<Länge> indicates the number of subsequent bytes (34 in
example)
<binary block data> binary block data of specified length
Example: "FORM ASC" Output as ASCII string

R&S UPV Triggering Measurements and Reading Results
1146.2084.32 6.13 E-9
DISPlay:SWEep<i>:SCANoffset <n>
DISPlay:FFT<i>:SCANoffset <n>
DISPlay:WAVeform:SCANoffset <n>
DISPlay:BARgraph<i>:SCANoffset <n>
DISPlay:PESQ<i>:SCANoffset <n>
Defines the desired scan for outputting trace data sets.
Parameters: <n> Scan number 2, 1, 0, -1 to -19
2: max scan
1: min scan
0: latest scan
-1 to -19: the more negative the number, the older the scan.
Example: "DISP:SWE:SCAN 2" Selects max scan for output.
TRACe:SWEep<i>:LOAD:AX?
TRACe:SWEep<i>:LOAD:AY?
TRACe:SWEep<i>:LOAD:BX?
TRACe:SWEep<i>:LOAD:BY?
The following description shows the basic structure for the commands:
TRACe:Subsys<i>:LOAD and
TRACe:Subsys<i>:LDList
<i> = subsystem number 1 to 4
Command for outputting bargraph trace data sets.
AX designates the X-axis of trace A
AY designates the Y-axis of trace A
BX designates the X-axis of trace B
BY designates the Y-axis of trace B
In the case of a multiscan display or single display with min/max traces, the command
DISPlay:SWEep:SCANoffset <n> selects the desired scan.
Example: "TRAC:SWEep1:LOAD:AY?" Outputs the data of the Y-axis of channel A from
the first sweep system.
Response with the setting "FORM ASC":
"-57.1647,-6.08881,-32.304,-53.6429 …"
Response with the setting "FORM REAL":
#<LängeDerLänge><Länge><block_data>
TRACe:FFT<i>:LOAD:AX?
TRACe:FFT<i>:LOAD:AY?
TRACe:FFT<i>:LOAD:BX?
TRACe:FFT<i>:LOAD:BY?
<i> = subsystem numbers 1 and 2
Command for outputting FFT graph trace data sets

Triggering Measurements and Reading Results R&S UPV
1146.2084.32 6.14 E-9
TRACe:WAVeform:LOAD:AX?
TRACe:WAVeform:LOAD:AY?
TRACe:WAVeform:LOAD:BX?
TRACe:WAVeform:LOAD:BY?
Command for outputting waveform trace data sets
TRACe:BARgraph<i>:LOAD:AX?
TRACe:BARgraph<i>:LOAD:AY?
TRACe:BARgraph<i>:LOAD:BX?
TRACe:BARgraph<i>:LOAD:BY?
<i> = subsystem numbers 1 and 2
Command for outputting bargraph trace data sets
TRACe:PESQ<i>:LOAD:AX?
TRACe:PESQ<i>:LOAD:AY?
TRACe:PESQ<i>:LOAD:BX?
TRACe:PESQ<i>:LOAD:BY?
<i> = subsystem number 1 and 2
Command for outputting PESQ trace data records.
TRACe:SWEep<i>:LOAD:COUNt:AX?
TRACe:SWEep<i>:LOAD:COUNt:AY?
TRACe:SWEep<i>:LOAD:COUNt:BX?
TRACe:SWEep<i>:LOAD:COUNt:BY?
<i> = subsystem number 1 to 4
Command for outputting the number of sweep data
The following description shows the basic structure for the following examples:
TRACe:Subsys<i>:LOAD:COUNt and
TRACe:Subsys<i>:LDList:COUN commands.
Example: "TRAC:SWPep1:LOAD:COUNt:AY?"
Outputs the number of data of the Y-axis of
channel A from the first sweep system
Response:
"50"
TRACe:FFT<i>:LOAD:COUNt:AX?
TRACe:FFT<i>:LOAD:COUNt:AY?
TRACe:FFT<i>:LOAD:COUNt:BX?
TRACe:FFT<i>:LOAD:COUNt:BY?
<i> = subsystem number 1 and 2
Command for outputting the number of FFT data
TRACe:WAVeform:LOAD:COUNt:AX?
TRACe:WAVeform:LOAD:COUNt:AY?
TRACe:WAVeform:LOAD:COUNt:BX?
TRACe:WAVeform:LOAD:COUNt:BY?
Command for outputting the number of WAVEFORM data

R&S UPV Triggering Measurements and Reading Results
1146.2084.32 6.15 E-9
TRACe:BARgraph<i>:LOAD:COUNt:AX?
TRACe:BARgraph<i>:LOAD:COUNt:AY?
TRACe:BARgraph<i>:LOAD:COUNt:BX?
TRACe:BARgraph<i>:LOAD:COUNt:BY?
<i> = subsystem number 1 and 2
Command for outputting the number of bargraph data
TRACe:PESQ<i>:LOAD:COUNt:AX?
TRACe:PESQ<i>:LOAD:COUNt:AY?
TRACe:PESQ<i>:LOAD:COUNt:BX?
TRACe:PESQ<i>:LOAD:COUNt:BY?
<i> = subsystem number 1 and 2
Command for outputting the number of PESQ data.
The following IEC/IEEE bus commands are basically identical to the LOAD commands described
above.
They query the data records of filtered trace data and their number.
Filtering is done with the following commands:
DISPlay:SWEep<i>:DLISt:FILTer ALL | LIMUpper | LIMLower | LIMBoth | HARMonics | PEAKs
DISPlay:FFT<i>:DLISt:FILTer ALL | LIMUpper | LIMLower | LIMBoth | HARMonics | PEAKs
DISPlay:WAVeform:DLISt:FILTer ALL | LIMUpper | LIMLower | LIMBoth | HARMonics | PEAKs
DISPlay:BARgraph:DLISt:FILTer ALL | LIMUpper | LIMLower | LIMBoth | HARMonics | PEAKs
TRACe:SWEep<i>:LDList:AX?
TRACe:SWEep<i>:LDList:AY?
TRACe:SWEep<i>:LDList:BX?
TRACe:SWEep<i>:LDList:BY?
TRACe:FFT<i>:LDList:AX?
TRACe:FFT<i>:LDList:AY?
TRACe:FFT<i>:LDList:BX?
TRACe:FFT<i>:LDList:BY?
TRACe:WAVeform:LDList:AX?
TRACe:WAVeform:LDList:AY?
TRACe:WAVeform:LDList:BX?
TRACe:WAVeform:LDList:BY?
TRACe:BARgraph<i>:LDList:AX?
TRACe:BARgraph<i>:LDList:AY?
TRACe:BARgraph<i>:LDList:BX?
TRACe:BARgraph<i>:LDList:BY?
TRACe:PESQ<i>:LDList:AX?
TRACe:PESQ<i>:LDList:AY?
TRACe:PESQ<i>:LDList:BX?
TRACe:PESQ<i>:LDList:BY?
TRACe:SWEep<i>:LDList:COUNt:AX?
TRACe:SWEep<i>:LDList:COUNt:AY?
TRACe:SWEep<i>:LDList:COUNt:BX?
TRACe:SWEep<i>:LDList:COUNt:BY?

Triggering Measurements and Reading Results R&S UPV
1146.2084.32 6.16 E-9
TRACe:FFT<i>:LDList:COUNt:AX?
TRACe:FFT<i>:LDList:COUNt:AY?
TRACe:FFT<i>:LDList:COUNt:BX?
TRACe:FFT<i>:LDList:COUNt:BY?
TRACe:WAVeform:LDList:COUNt:AX?
TRACe:WAVeform:LDList:COUNt:AY?
TRACe:WAVeform:LDList:COUNt:BX?
TRACe:WAVeform:LDList:COUNt:BY?
TRACe:BARgraph<i>:LDList:COUNt:AX?
TRACe:BARgraph<i>:LDList:COUNt:AY?
TRACe:BARgraph<i>:LDList:COUNt:BX?
TRACe:BARgraph<i>:LDList:COUNt:BY?
TRACe:PESQ<i>:LDList:COUNt:AX?
TRACe:PESQ<i>:LDList:COUNt:AY?
TRACe:PESQ<i>:LDList:COUNt:BX?
TRACe:PESQ<i>:LDList:COUNt:BY?

R&S UPV Triggering Measurements and Reading Results
1146.2084.32 6.17 E-9
Reading out multi-channel records
Command Parameter
Default
unit
Remark
DATA:Subsys:X? Query only
DATA:Subsys:COUNt:X? Query only
DATA:Subsys:Y<ch>? Query only
DATA:Subsys:COUNt:Y<ch>? Query only
Subsys Stands for the terms: SWEep | FFT | BARgraph
The DATA command does not exist for the WAVeform and PESQ sub-systems because
these sub-systems are designed with two channels. The TRACe commands from the
previous chapter must be used to read out records from these sub-systems.
<ch>:Channel 1 … 16
The DATA command is mainly used to read in multi-channel records.
Only the traces which were available in the windows of the respective systems could be read out with
the TRACe commands (see previous chapter).
That is not enough for the 16-channel version; that is why the traces for all channels switched on in the
base unit can be read out with the following commands.
DATA:SWEep:X?
DATA:FFT:X?
DATA:BARgraph:X?
Commands for reading out the X axis data of a sweep, an FFT or a bar graph.
To read out the X axis there is no need to specify a channel, as there is only one X axis for all
channels. Specifying a channel is nonetheless accepted as long as it is within the valid range.
The following example is exemplary for the FFT and bar graph sub-systems:
Example: DATA:SWEep:X? Reads out X axis data from the sweep system.
Response with the FORM ASC setting:
100,120.045,144.109,172.997,207.675,249.304,…
Response with the FORM REAL setting:
#<LängeDerLänge><Länge><block_data>
DATA:SWEep:COUNt:X?
DATA:FFT:COUNt:X?
DATA:BARgraph:COUNt:X?
Commands for reading out the number of X axis values of a sweep, an FFT or a bar graph.
Achannel need not be specified for reading out as there is only one X axis for all channels.
Specifying a channel is nonetheless accepted as long as it is within the valid range.
The following example is exemplary for the FFT and bar graph sub-systems
Example: DATA:SWEep:COUNt:X? Reads out the number of X axis values from the
sweep system.
Response:
100

Triggering Measurements and Reading Results R&S UPV
1146.2084.32 6.18 E-9
DATA:SWEep:Y<ch>?
DATA:FFT:Y<ch>?
DATA:BARgraph:Y<ch>?
<ch> = channel 1 …16
Commands for reading out the Y axis values of a sweep, an FFT or a bar graph for the specified
channel.
The following example is exemplary for the FFT and bar graph sub-systems
Example: DATA:SWEep:Y5? Reads out channel 5’s Y axis data from the
sweep system.
Response with the FORM ASC setting:
0.0110738,0.0146608,0.0189856,0.0240953,0.0300301,…
Response with the FORM REAL setting:
#<LängeDerLänge><Länge><block_data>
DATA:SWEep:COUNt:Y<ch>?
DATA:FFT:COUNt:Y<ch>?
DATA:BARgraph:COUNt:Y<ch>?
Commands to read out the number of values on the Y axis of a sweep, an FFT or a bar graph.
The following example is exemplary for the FFT and bar graph sub-systems:
Example: DATA:SWEep:COUNt:Y<ch>? Reads out the number of Y axis values from the
sweep system.
Response:
100
Output of protocol data
Command Parameters Default
unit
Comment
SENSe8:PROTocol:CH<x>:BYTE<y>? Query only
SENSe8:PROTocol:CH<x>:BYTE<y>?
Parameter: <x> and <y> are suffixes
<x> channel 1 or 2
<y> byte 0 to 4
Return value = 0 to 255 (decimal bit equivalent)
Example: "SENS8:PROT:CH1:BYTE2?" Outputs the protocol data of byte 2 (the third
byte) of channel 1.

R&S UPV Triggering Measurements and Reading Results
1146.2084.32 6.19 E-9
Output of protocol errors
Command Parameter Default
Unit
Comment
SENSe8:PROTocol:ERRor? Query only
SENSe8:PROTocol:PCM<i> Query only
SENSe8:PROTocol:PAR<i> Query only
SENSe8:PROTocol:LOC<i> Query only
SENSe8:PROTocol:CRC<i> Query only
SENSe8:PROTocol:INV<i> Query only
SENSe8:PROTocol:ERRor?
Parameter: none
Query only
Response:
0,"No error"
or
<n>,"PCM1,PCM2,PAR1,PAR2,…"
The entire string is not returned in quotation marks, but only the mnemonic range.
<n> represents 10 bits (d0 to d9)
<n> = 0 to 1023
The individual errors are represented by means of bits in the integer value <n>:
d0: PCM1
d1: PCM2
d2: PAR1
d3: PAR2
d4: LOC1
d5: LOC2
d6: CRC1
d7: CRC2
d8: INV1
d9: INV2
Example: "SENS8:PROT:Err?"
Response: "4" Binary equivalent = 0000000100. Thus, d2 is set and
the PAR1 error is output.

Triggering Measurements and Reading Results R&S UPV
1146.2084.32 6.20 E-9
SENSe8:PROTocol:PCM<i>?
SENSe8:PROTocol:PAR<i>?
SENSe8:PROTocol:LOC<i>?
SENSe8:PROTocol:CRC<i>?
SENSe8:PROTocol:INV<i>?
Parameter: <i> 1 or 2 designates Ch1 or Ch2.
Specific query of protocol errors
Query only
Response:
"0" = no error
"1" = error
Example: "SENS8:PROT:PAR2?"
Response: "1" A PAR2 error is present.
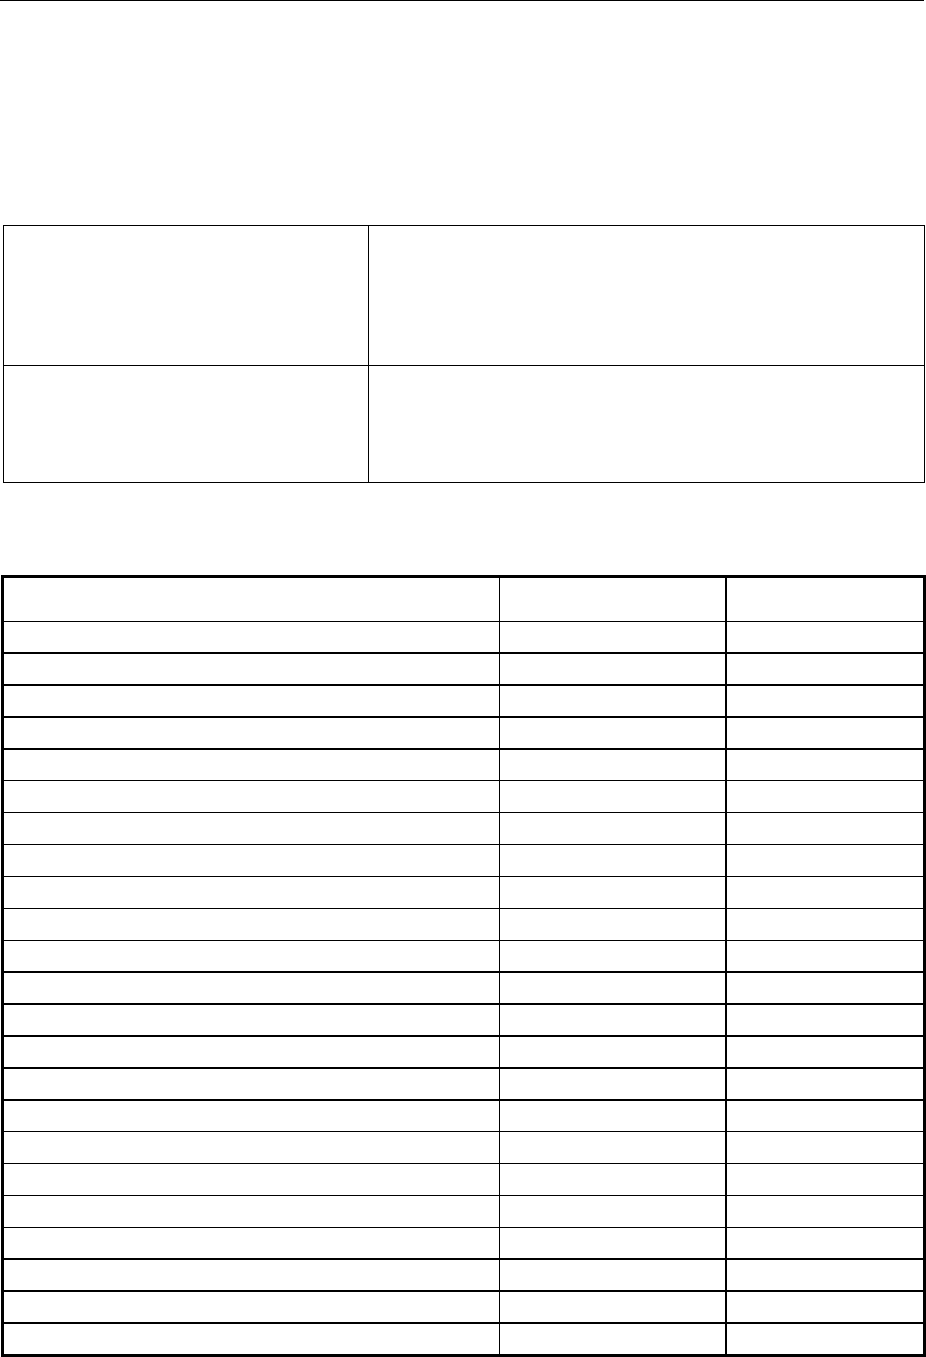
R&S UPV STATus Subsystem
1146.2084.32 6.21 E-9
STATus Subsystem
This system contains the commands for the status reporting system. *RST has no effect on status
registers.
The query commands return the current value of the subregister in question, thus allowing a check of
the device status.
STATus:OPERation
STATus:QUEStionable
STATus:XQUEstionable
Returns and sets a decimal value between 0 and 32767
(= 2^15 Z1).
The most significant bit is set to zero in all registers. The
register content can thus always be interpreted as a positive
integer.
STATus:QUEStionable:UNDERrange
STATus:QUEStionable:OVERrange
STATus:QUEStionable:MEASuring
Returns and sets a decimal value between 0 and 65535
(= 2^16 Z1).
For future applications, the most significant bit d15 may also
be set.
The configuration commands set the subregister in question and thus determine which state changes of
the R&S UPV are to cause a change in the status registers.
Command Parameter Remarks
STATus:PRESet No query
STATus:OPERation:CONDition? Query only
STATus:OPERation:ENABle <n> = 0 to 32767
STATus:OPERation[:EVENt]? Query only
STATus:OPERation:NTRansition <n> = 0 to 32767
STATus:OPERation:PTRansition <n> = 0 to 32767
STATus:QUEStionable:CONDition? Query only
STATus:QUEStionable:ENABle <n> = 0 to 32767
STATus:QUEStionable[:EVENt]? Query only
STATus:QUEStionable:NTRansition <n> = 0 to 32767
STATus:QUEStionable:PTRansition <n> = 0 to 32767
STATus:QUEStionable:UNDERrange:CONDition? Query only
STATus:QUEStionable:UNDERrange:ENABle <n> = 0 to 65535
STATus:QUEStionable:UNDERrange[:EVENt]? Query only
STATus:QUEStionable:UNDERrange:NTRansition <n> = 0 to 65535
STATus:QUEStionable:UNDERrange:PTRansition <n> = 0 to 65535
STATus:QUEStionable:OVERrange:CONDition? Query only
STATus:QUEStionable:OVERrange:ENABle <n> = 0 to 65535
STATus:QUEStionable:OVERrange[:EVENt]? Query only
STATus:QUEStionable:OVERrange:NTRansition <n> = 0 to 65535
STATus:QUEStionable:OVERrange:PTRansition <n> = 0 to 65535
STATus:QUEStionable:MEASuring:CONDition? Query only
STATus:QUEStionable:MEASuring:ENABle <n> = 0 to 65535
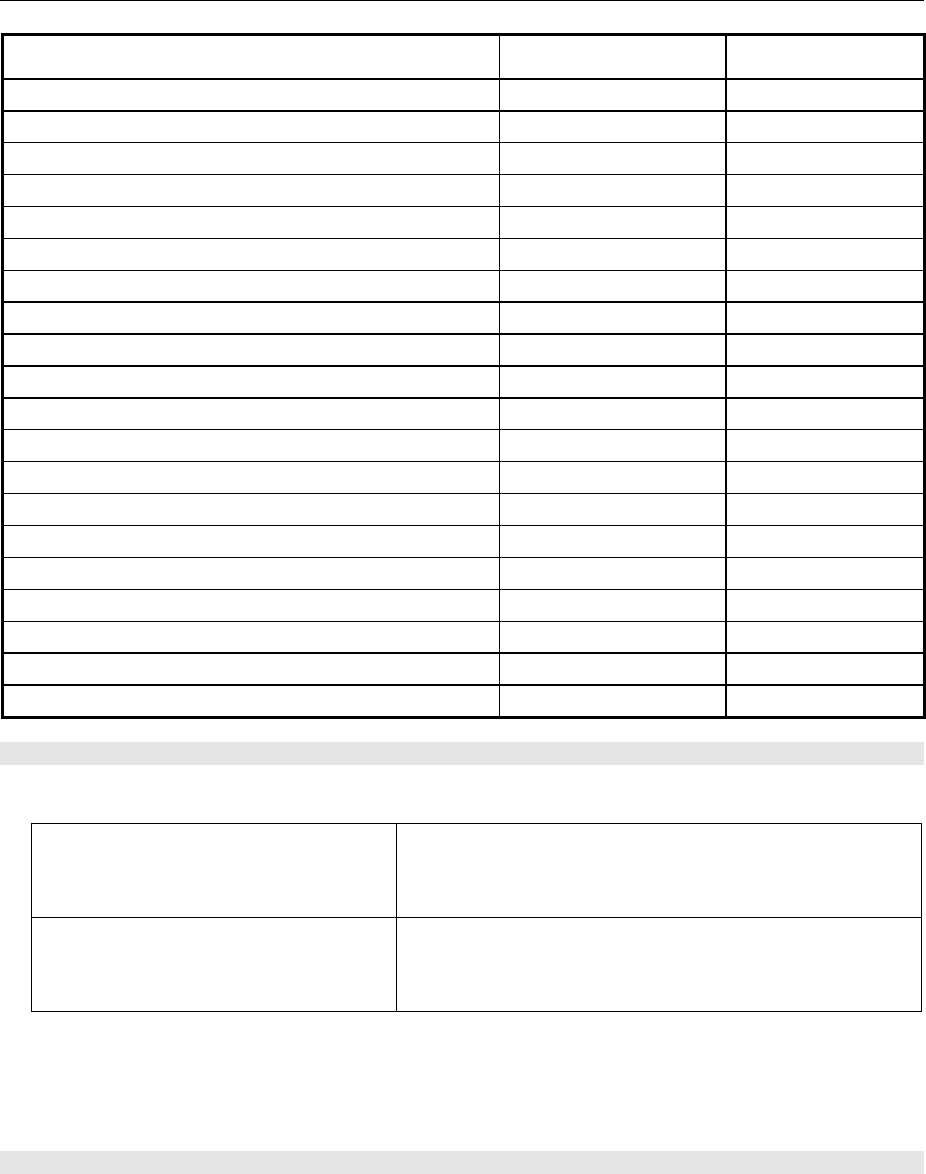
STATus Subsystem R&S UPV
1146.2084.32 6.22 E-9
Command Parameter Remarks
STATus:QUEStionable:MEASuring[:EVENt]? Query only
STATus:QUEStionable:MEASuring:NTRansition <n> = 0 to 65535
STATus:QUEStionable:MEASuring:PTRansition <n> = 0 to 65535
STATus:XQUEstionable:CONDition? Query only
STATus:XQUEstionable:ENABle <n> = 0 to 32767
STATus:XQUEstionable[:EVENt]? Query only
STATus:XQUEstionable:NTRansition <n> = 0 to 32767
STATus:XQUEstionable:PTRansition <n> = 0 to 32767
DIAGnostic:OPERation:BITNo <n> = 0 to 15 No query
DIAGnostic:OPERation:VALue <n> = 0 | 1 No query
DIAGnostic:QUEStionable:BITNo <n> = 0 to 15 No query
DIAGnostic:QUEStionable:VALue <n> = 0 | 1 No query
DIAGnostic:QUEStionable:UNDERrange BITNo <n> = 0 to 15 No query
DIAGnostic:QUEStionable:UNDERrange VALue <n> = 0 | 1 No query
DIAGnostic:QUEStionable:OVERrange BITNo <n> = 0 to 15 No query
DIAGnostic:QUEStionable:OVERrange VALue <n> = 0 | 1 No query
DIAGnostic:QUEStionable:MEASuring BITNo <n> = 0 to 15 No query
DIAGnostic:QUEStionable:MEASuring VALue <n> = 0 | 1 No query
DIAGnostic:XQUestionable:BITNo <n> = 0 to 15 No query
DIAGnostic:XQUestionable:VALue <n> = 0 | 1 No query
STATus:PRESet
The command resets the status registers.
STATus:OPERation
STATus:QUEStionable
STATus:XQUEstionable
All PTRansition parts are set to 7FFFh (32767), i.e. all
transitions from 0 to 1 are detected.
STATus:QUEStionable:UNDERrange
STATus:QUEStionable:OVERrange
STATus:QUEStionable:MEASuring
All PTRansition parts are set to FFFFh (65535) , i.e. all
transitions from 0 to 1 are detected.
The NTRansition parts of all status registers are set to 0, i.e. a transition from 1 to 0 of a CONDition
bit is not detected. The ENABle parts of all status registers are set to 0, i.e. none of the events in
these registers is passed on.
The command triggers an event and therefore has no query form and no *RST value.
STATus:OPERation:CONDition?
The command queries the content of the CONDition part of the STATus:OPERation register. This
part contains the information about the current instrument state.
Reading the information does not clear the register.

R&S UPV STATus Subsystem
1146.2084.32 6.23 E-9
STATus:OPERation:ENABle 0...32767
The command sets the bits of the ENABle part of the STATus:OPERation register. This setting
determines which events of the EVENt part of the STATus:OPERation register are to be passed on
to the summary bit of the status byte. These events can be used to trigger a service request.
Reset value: all bits are reset (0)
STATus:OPERation:EVENt?
The command queries the content of the EVENt part of the STATus:OPERation register. This part
contains the information about the current instrument state since the last readout.
Abit set in the EVENt register indicates a change of the corresponding bit in the CONDition register.
Whether bits in the EVENt register are set due to a bit transition from 0 to 1 or from 1 to 0 depends
on the bits set in the PTRansition and the NTRansition registers.
Reading the information clears the register.
STATus:OPERation:NTRansition 0...32767
The command sets the bits of the NTRansition part of the STATus:OPERation register. A bit set in
the NTRansition register causes a bit transition from 1 to 0 in the CONDition register to produce an
entry in the EVENt register.
Reading the information does not clear the register.
Reset value: all bits are reset (0)
STATus:OPERation:PTRansition 0...32767
The command sets the bits of the PTRansition part of the STATus:OPERation register. A bit set in
the PTRansition register causes a bit transition from 0 to 1 in the CONDition register to produce an
entry in the EVENt register. Reading the information does not clear the register.
Reset value: all bits are set (32767)
STATus:QUEStionable:CONDition?
The command queries the content of the CONDition part of the STATus:QUEStionable register. This
part contains the information about the current instrument state.
Reading the information does not clear the register.
STATus:QUEStionable:ENABle 0...32767
The command sets the bits of the ENABle part of the STATus:QUEStionable register. This setting
determines which events of the EVENt part of the STATus:QUEStionable register are to be passed
on to the summary bit of the status byte. These events can be used to trigger a service request.
Reset value: all bits are reset (0)
STATus:QUEStionable:EVENt?
The command queries the content of the EVENt part of the STATus:QUEStionable register. This
part contains the information about the current instrument state since the last readout.
Abit set in the EVENt register indicates a change of the corresponding bit in the CONDition register.
Whether bits in the EVENt register are set due to a bit transition from 0 to 1 or from 1 to 0 depends
on the bits set in the PTRansition and the NTRansition registers.
Reading the information clears the register.

STATus Subsystem R&S UPV
1146.2084.32 6.24 E-9
STATus:QUEStionable:NTRansition 0...32767
The command sets the bits of the NTRansition part of the STATus:QUEStionable register. A bit set
in the NTRansition register causes a bit transition from 1 to 0 in the CONDition register to produce
an entry in the EVENt register.
Reading the information does not clear the register.
Reset value: all bits are reset (0)
STATus:QUEStionable:PTRansition 0...32767
The command sets the bits of the PTRansition part of the STATus:QUEStionable register. A bit set
in the PTRansition register causes a bit transition from 0 to 1 in the CONDition register to produce
an entry in the EVENt register.
Reading the information does not clear the register.
Reset value: all bits are set (32767)
STATus:QUEStionable:UNDERrange:CONDition?
The command queries the content of the CONDition part of the
STATus:QUEStionable:UNDERrange register. This part contains the information about which
channel of a multichannel instrument is underranged.
Reading the information does not clear the register.
STATus:QUEStionable:UNDERrange:ENABle 0...65535
The command sets the bits of the ENABle part of the STATus:QUEStionable:UNDERrange register.
This setting determines which events of the status-event part are to be passed on to summary bit 2
of the STATus:QUEStionable register. These events can be used to trigger a service request.
Reset value: all bits are reset (0)
STATus:QUEStionable:UNDERrange:EVENt?
The command queries the content of the EVENt part of the STATus:QUEStionable:UNDERrange
register. This part contains the information about the current instrument state since the last readout.
Abit set in the EVENt register indicates a change of the corresponding bit in the CONDition register.
Whether bits in the EVENt register are set due to a bit transition from 0 to 1 or from 1 to 0 depends
on the bits set in the PTRansition and the NTRansition registers.
Reading the information clears the register.
STATus:QUEStionable:UNDERrange:NTRansition 0...65535
The command sets the bits of the NTRansition part of the STATus:QUEStionable:UNDERrange
register. A bit set in the NTRansition part causes a bit transition from 1 to 0 in the CONDition part to
produce an entry in the EVENt part of the register.
Reading the information does not clear the register.
Reset value: all bits are reset (0)

R&S UPV STATus Subsystem
1146.2084.32 6.25 E-9
STATus:QUEStionable:UNDERrange:PTRansition 0...65535
The command sets the bits of the PTRansition part of the STATus:QUEStionable:UNDERrange
register. A bit set in the PTRansition part causes a bit transition from 1 to 0 in the CONDition part to
produce an entry in the EVENt part of the register.
Reading the information does not clear the register.
Reset value: all bits are set (65535)
STATus:QUEStionable:OVERrange:CONDition?
The command queries the content of the CONDition part of the STATus:QUEStionable:OVERrange
register. This part contains the information about which channel of a multichannel instrument is
overranged.
Reading the information does not clear the register.
STATus:QUEStionable:OVERrange:ENABle 0...65535
The command sets the bits of the ENABle part of the STATus:QUEStionable:OVERrange register.
This setting determines which events of the status-event part are to be passed on to summary bit 1
of the STATus:QUEStionable register. These events can be used to trigger a service request.
Reset value: all bits are reset (0)
STATus:QUEStionable:OVERrange:EVENt?
The command queries the content of the EVENt part of the STATus:QUEStionable:OVERrange
register. This part contains the information about the current instrument state since the last readout.
Abit set in the EVENt register indicates a change of the corresponding bit in the CONDition register.
Whether bits in the EVENt register are set due to a bit transition from 0 to 1 or from 1 to 0 depends
on the bits set in the PTRansition and the NTRansition registers.
Reading the information clears the register.
STATus:QUEStionable:OVERrange:NTRansition 0...65535
The command sets the bits of the NTRansition part of the STATus:QUEStionable:OVERrange
register. A bit set in the NTRansition part causes a bit transition from 1 to 0 in the CONDition part to
produce an entry in the EVENt part of the register.
Reading the information does not clear the register.
Reset value: all bits are reset (0)
STATus:QUEStionable:OVERrange:PTRansition 0...65535
The command sets the bits of the PTRansition part of the STATus:QUEStionable:OVERrange
register. A bit set in the PTRansition part causes a bit transition from 1 to 0 in the CONDition part to
produce an entry in the EVENt part of the register.
Reading the information does not clear the register.
Reset value: all bits are set (65535)
STATus:QUEStionable:MEASuring:CONDition?
The command queries the content of the CONDition part of the STATus:QUEStionable:MEASuring
register. This part contains the information about which channel of a multichannel instrument is
activated or deactivated.
Reading the information does not clear the register.

STATus Subsystem R&S UPV
1146.2084.32 6.26 E-9
STATus:QUEStionable:MEASuring:ENABle 0...65535
The command queries the content of the ENABle part of the STATus:QUEStionable:MEASuring
register. This setting determines which events of the status-event part are to be passed on to
summary bit 0 of the STATus:QUEStionable register. These events can be used to trigger a service
request.
Reset value: all bits are reset (0)
STATus:QUEStionable:MEASuring:EVENt?
The command queries the content of the EVENt part of the STATus:QUEStionable:MEASuring
register. This part contains the information about the current instrument state since the last readout.
Abit set in the EVENt register indicates a change of the corresponding bit in the CONDition register.
Whether bits in the EVENt register are set due to a bit transition from 0 to 1 or from 1 to 0 depends
on the bits set in the PTRansition and the NTRansition registers.
Reading the information clears the register.
STATus:QUEStionable:MEASuring:NTRansition 0...65535
The command sets the bits of the NTRansition part of the STATus:QUEStionable:MEASuring
register. A bit set in the NTRansition part causes a bit transition from 1 to 0 in the CONDition part to
produce an entry in the EVENt part of the register.
Reading the information does not clear the register.
Reset value: all bits are reset (0)
STATus:QUEStionable:MEASuring:PTRansition 0...65535
The command sets the bits of the PTRansition part of the STATus:QUEStionable:MEASuring
register. A bit set in the PTRansition part causes a bit transition from 1 to 0 in the CONDition part to
produce an entry in the EVENt part of the register.
Reading the information does not clear the register.
Reset value: all bits are set (65535)
STATus:XQUEstionable:CONDition?
The command queries the content of the CONDition part of the STATus:XQUEStionable register.
This part contains the information about the current instrument state.
Reading the information does not clear the register.
STATus:XQUEstionable:ENABle 0...32767
The command sets the bits of the ENABle part of the STATus:XQUEstionable register. This setting
determines which events of the EVENt part of the STATus:XQUEStionable register are to be passed
on to the summary bit of the status byte. These events can be used to trigger a service request.
Reset value: all bits are reset (0)
STATus:XQUEstionable:EVENt?
The command queries the content of the EVENt part of the STATus:XQUEStionable register. This
part contains the information about the current instrument state since the last readout.
Abit set in the EVENt register indicates a change of the corresponding bit in the CONDition register.
Whether bits in the EVENt register are set due to a bit transition from 0 to 1 or from 1 to 0 depends
on the bits set in the PTRansition and the NTRansition registers.
Reading the information clears the register.

R&S UPV STATus Subsystem
1146.2084.32 6.27 E-9
STATus:XQUEstionable:NTRansition 0...32767
The command sets the bits of the NTRansition part of the STATus:XQUEStionable register. A bit set
in the NTRansition register causes a bit transition from 1 to 0 in the CONDition register to produce
an entry in the EVENt register.
Reading the information does not clear the register.
Reset value: all bits are reset (0)
STATus:XQUEstionable:PTRansition 0...32767
The command sets the bits of the PTRansition part of the STATus:XQUEStionable register. A bit set
in the PTRansition register causes a bit transition from 0 to 1 in the CONDition register to produce
an entry in the EVENt register.
Reading the information does not clear the register.
Reset value: all bits are reset (32767)
DIAGnostic:OPERation:BITNo <n>
DIAGnostic:OPERation:VALue <n>
DIAGnostic:QUEStionable:BITNo <n>
DIAGnostic:QUEStionable:VALue <n>
DIAGnostic:QUEStionable:UNDERrange:BITNo <n>
DIAGnostic:QUEStionable:UNDERrange:VALue <n>
DIAGnostic:QUEStionable:OVERrange:BITNo <n>
DIAGnostic:QUEStionable:OVERrange:VALue <n>
DIAGnostic:QUEStionable:MEASuring:BITNo <n>
DIAGnostic:QUEStionable:MEASuring:VALue <n>
DIAGnostic:XQUestionable:BITNo <n>
DIAGnostic:XQUestionable:VALue <n>
The commands change the bits of the following registers:
STATus:OPERation,
STATus:QUEStionable,
STATus:QUEStionable:UNDERrange,
STATus:QUEStionable:OVERrange,
STATus:QUEStionable:MEASuring and
STATus:XQUEstionable.
Note:
Acompulsory change of the status registers via an external controller can cause the R&S UPV to
malfunction in IEC/IEEE bus operation!

STATus Subsystem R&S UPV
1146.2084.32 6.28 E-9
The…BITNo command specifies the bit position to be changed in the status register; the ...VALue
command enters the value.
Example: In the XQUEstionable r
egister, the additional range information for channel 1 is to
bechanged compulsorily. This information can be found in bits 2 and 3 of the
XQUEstionable register and is thus addressed with BITNo 2. The information
"overrange (measurement result invalid) on channel 1" is to be entered there.
This means that bits 2 and 3 of the XQUEstionable register must be set,
represented by the value 3.
This is done by using the following commands:
DIAGnostic:XQUestionable:BITNo 2
DIAGnostic:XQUestionable:VALue 3

R&S UPV SYSTem Subsystem
1146.2084.32 6.29 E-9
SYSTem Subsystem
This section describes the commands of the SYSTem subsystem.
Command Parameters Remarks
SYSTem:COMMunicate:GTL
SYSTem:COMMunicate:GPIB:ADDRess 1 to 30
SYSTem:ERRor? Query only
SYSTem:PRESet
SYSTem:VERSion? Query only
SYSTem:SHUtdown
SYSTem:SHTDown
No parameters entered
corresponds to time of 0 s
No query form for this
command.
SYSTem:SHUtdown <nu>
SYSTem:SHTDown <nu>
<nu> time in seconds No query form for this
command.
SYSTem:COMMunicate:GTL
This command switches the instrument to local operation.
SYSTem:COMMunicate:GPIB:ADDRess 1... 30
This command sets the IEC/IEEE bus address.
Example: "SYST:COMM:GPIB:ADDR 14" 'Sets IEC/IEEE bus address to 14
SYSTem:ERRor?
The command queries the oldest entry in the error queue and deletes this entry. Positive error
numbers denote device-specific errors, negative error numbers denote error messages defined by
SCPI. If the error queue is empty, 0 ('no error') is returned. The command has the same effect as the
command STATus:QUEue:NEXT?
Example: ":SYST:ERR?" 'Queries the oldest entry in the error queue.
Response: "0, 'No error'" 'No error has occurred since the error queue was last
output.
SYSTem:PRESet
This command triggers an instrument reset. The command has the same effect as the *RST
command or pressing the PRESET key on the instrument front panel.
SYSTem:VERSion?
This command queries the SCPI version with which the instrument is compliant. The SCPI version is
returned in the form of a calendar year.
Example: ":SYST:VERS?" 'Queries the SCPI version.
Response: '1991.0' 'The instrument is compliant with the 1991.0 SCPI
version.

SYSTem Subsystem R&S UPV
1146.2084.32 6.30 E-9
SYSTem:PROGramm:EXECute
The command starts the specified Windows program and passes on additional call parameters. The
command is normally used to remotely start Visual Basic programs in the R&S UPV-K1 software
option (see also the description for the R&S UPV-K9x).
Parameter: "command line" Console command line for Windows
Example: :SYST:PROG:EXEC "'C:\Program Files\test.exe' arg1 arg2
'arg3 and arg4'" starts the "test.exe"
Windows program with the "arg1", "arg2" and "arg3
and arg4" arguments and maintains execution until
the program is ended.
SYSTem:SHUtdown
SYSTem:SHUtdown <nu>
SYSTem:SHTDown
SYSTem:SHTDown <nu>
This command shuts down the R&S UPV by remote control. <nu> is the time until shutdown in
seconds. No entry for <nu> corresponds to a time of 0 seconds, i.e. immediate shutdown.
Parameter: <n> n = time in seconds
Example: "SYST:SHU" Shut down the R&S UPV by remote control.

R&S UPV MMEMory Subsystem
1146.2084.32 6.31 E-9
MMEMory Subsystem
The MMEMory subsystem (Mass Memory) contains the commands for the administration of files and
directories and for loading and storing complete instrument settings in files.
The various drives can be selected via the "mass storage unit specifier" <msus>. The internal hard
drive is selected with "D:", the CD drive with "E:", and a memory stick plugged in at the USB interface
with "F:". The resources of a network can also be selected via <msus> in the syntax of the specific
network, e.g. with the UNC format (Universal Naming Convention): '\\server\share'.
The default drive is defined with the command MMEMory:MSIS <msus>.
Note:
Drive C: is a protected system drive. Do not try to access this drive. Otherwise, the system partition
cannot be reconstructed without the loss of data.
To ensure that files can be used in different file systems, adhere to the following naming conventions:
File names can be of any length, and no distinction is made between uppercase and lowercase letters.
Use a period to separate the file name from any file extension that may be used. All letters and digits
are permitted; however, digits cannot be used as the first character in the file name. Try to avoid using
special characters, particularly the slash characters "\" and "/" since they are used in the path
specification. Some names are reserved by the operating system, e.g. CLOCK$, CON, AUX,
COM1...COM4, LPT1 to LPT3, NUL and PRN.
In the R&S UPV, a characteristic extension is added to all files in which lists and settings are stored. A
period separates the extension from the actual file name.
The two characters * and ? function as wildcards, i.e. as placeholders for selecting multiple files. The
character "?" represents exactly one character that can be anything. The character "*" represents all
characters in the remaining part of the file name. Thus, the combination "*.*" means all files in a
directory.
The parameter <file_name> is specified together with the commands as a string parameter enclosed in
quotation marks. It can indicate either the complete path including the drive, only the path and file
name, or only the file name. The same rule also applies to the parameters <directory_name> and
<path>. Depending on how complete the specification is, either the values specified in the parameter or
the values specified with the commands MMEM:MSIS (default drive) and MMEM:CDIR (default directory)
are used as the path and drive settings of the commands.
In the following example, the current instrument setting is always stored in the file 'test1.set' in the
directory 'user' on the internal hard disk.
MMEM:STOR:STAT 'd:\upv\user\test1.set'
If a complete path specification, including drive designation, is used, the file is stored in the
specified path.
MMEM:MSIS 'D:'
MMEM:STOR:STAT '\user\test1.set'
If the parameter contains only the path and file name, the default drive defined with the
command MMEM:MSIS is used.
MMEM:MSIS 'D:'
MMEM:CDIR 'user'
MMEM:STOR:STAT 'test1.set'
If the parameter contains only the file name, the file is stored on the default drive
MMEM:MSIS and in the default directory that was selected with the command MMEM:CDIR.
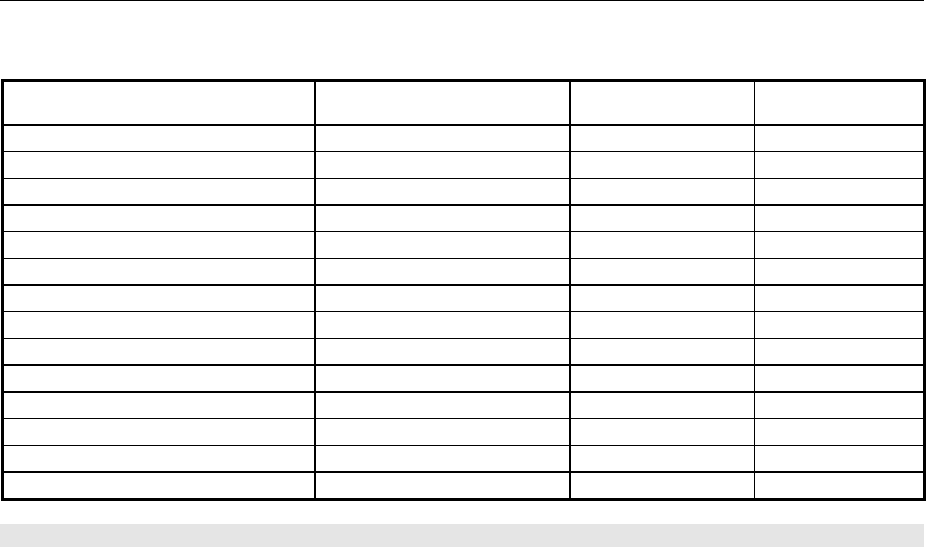
MMEMory Subsystem R&S UPV
1146.2084.32 6.32 E-9
In all commands for data transmission, the data for both paths is always transmitted simultaneously.
Command Parameter Default unit Comment
MMEMory:CATalog? <path> Query only
MMEMory:CATalog:LENGth? Query only
MMEMory:CDIRectory <directory_name>
MMEMory:COPY <file_name>,<file_name> No query
MMEMory:DATA <file_name>[,<block>]
MMEMory:DCATalog? Query only
MMEMory:DCATalog:LENGth? Query only
MMEMory:DELete <file_name> No query
MMEMory:LOAD:STATe <file_name> No query
MMEMory:MDIRectory <directory_name> No query
MMEMory:MOVE <file_name>,<file_name> No query
MMEMory:MSIS <msus>
MMEMory:RDIRectory <directory_name>
MMEMory:STORe:STATe <file_name>
MMEMory:CATalog? <path>
This command outputs the subdirectories and files located in the specified directory. If you do not
specify a directory, the default directory selected with the command MMEM:CDIR and is located on
the default drive selected with the command MMEM:MSIS is output.
The response is output in the following format:
<used_bytes_in_this_directory>,<free_bytes_on_this_disk>,
"<file_name>,<file_type>,<filesize_in_bytes>",
"<file_name>,<file_type>,<filesize_in_bytes>", …
This command is a query command and therefore has no *RST value.
Parameter: <file_name> File or directory name
<file_type> File type. The following file types are available:
DIR (directory), ASCii (ASCII file), BINary (binary
file) and STATe (file with instrument settings).
<filesize_in_bytes> File size. A size of 0 is output for a directory.
Example: "MMEM:CAT? '\\upv\user\*.set'
Outputs the names of all files in \\upv\user that
have the extension ".set"
"MMEM:CAT? 'f:\'" Outputs all files located at the highest directory
level on the memory stick provided that the stick
is mapped to the F:drive.
Response:
"'127145265,175325184,"test,DIR,0","temp,DIR,0","readme.txt,ASC,1324","state
.set,STAT,5327","test.set,BIN, 498399"
'The directory F:\User contains the subdirectories 'test' and
'temp' as well as the files 'readme.txt','state.set' and
'test.set',which have different file types.

R&S UPV MMEMory Subsystem
1146.2084.32 6.33 E-9
MMEMory:CATalog:LENGth? <path>
This command outputs the number of files in the specified directory. If you do not specify a directory,
the default directory selected with the command MMEM:CDIR and located on the default drive
selected with the command MMEM:MSIS is output.
This command is a query command and therefore has no *RST value.
Example: "MMEM:CAT:LENG? 'f:\'" Outputs the number of files at the highest
directory level on the memory stick
Response: "1" The highest directory level on the memory stick
contains one file
MMEMory:CDIRectory <directory_name>
This command changes the default directory. This directory will be used in all subsequent MMEM
commands if no path is specified. You can also change to a higher-level directory by entering two
periods '..'
Example: "MMEM:CDIR 'test'" Changes from the current directory level to the
subdirectory 'test'.
MMEMory:COPY <source>[,<destination>]
This command copies the first specified file to the second specified file. You can also use this
command to copy a complete directory, including all of its files, rather than a single file.
If you do not specify <destination>, <source> will be copied to the MMEM:MSIS drive and to the
MMEM:CDIR directory. Any files in the destination directory that have the same name will be
overwritten without an error message being generated.
You can also enter the path specification by using an additional parameter. The command will then
read as follows:
MMEMory:COPY
<file_source><msus_source>[,<file_destination>,<msus_destination>]
The command triggers an event and therefore has no query form and no *RST value.
Example: "MMEM:COPY 'D:/user/test1.set','F:/'"
Copies the file 'test1.set' located in the
USER directory of the internal hard disk to the
memory stick using the same name
MMEMory:DATA <file_name>[,<binary block data>]
MMEMory:DATA? <file_name>
This command copies the block data <binary block data> to the file designated with <file_name>.
The R&S UPV accepts the line message EOI and/or the ASCII character NL (0Ah) as an indication
that data transmission has been completed.
The binary data stream must be concluded with EOI or NL or EOI followed by NL. If the data stream
is not concluded with either EOI or NL, the R&S UPV will wait for additional data. In the case of a
binary data transmission, the R&S UPV ignores the bit combination NL (0Ah) within the data stream.
The associated query command transmits the specified file from the R&S UPV to the controller via
the IEC/IEEE bus. Make sure that the buffer on the controller is large enough to hold the file.
You can use this command to read stored instrument settings, trace files, waveform files, filter
coefficient files, etc, directly from the R&S UPV or to transmit them directly to the R&S UPV.
The binary data block has the following structure: #<LängeDerLänge><Länge><block_data>.
Example: #234<block_data>
#always introduces the binary block

MMEMory Subsystem R&S UPV
1146.2084.32 6.34 E-9
<LängeDerLänge> specifies how many positions the subsequent length specification occupies
(two in the example)
<Länge> specifies the number of subsequent bytes (34 in the example)
<binary block data> binary block data of the specified length
Example: "MMEM:DATA 'TEST1.WV',#3767<binary data>"
Writes the block data to file 'test1.wv'.
"MMEM:DATA? 'TEST1.WV' Transmits the data in file 'Test1.wv' from the
R&S UPV to the controller in the form of a binary
block.
MMEMory:DCATalog? <path>
This command outputs the subdirectories of the specified directory. If you do not specify a directory,
the default directory that is selected with the command MMEM:CDIR is output. The directories are
output in a comma-separated list.
This command is a query command and therefore has no *RST value.
Example: "MMEM:DCAT? Outputs the subdirectories of the current
directory.
Response: "'test', 'wave', 'digital'" The current directory contains the
subdirectories 'test', 'wave' and 'digital'.
MMEMory:DCATalog:LENGth? <path>
This command outputs the number of subdirectories located in the specified directory. If you do not
specify a directory, the directory selected with the command MMEM:CDIR is output.
Example: "MMEM:DCAT:LENG Outputs the number of subdirectories located in
the current directory.
Response: "3" The current directory conatins three
subdirectories.
MMEMory:DELete <file_name>
This command deletes the specified file.
This command triggers an event and therefore has no query form and no *RST value
Example: "MMEM:DEL 'D:\UPV\USER\TEST1.set'"
Deletes file 'Test1.set' from directory USER
on the internal hard disk.
MMEMory:LOAD:STATe <file_name>
This command loads the specified instrument setting.
MMEMory:MDIRectory <directory_name>
This command creates a new subdirectory for the specified directory. If no directory is specified, a
subdirectory of the default directory is created. A directory tree can also be created by using this
command
This command triggers an event and therefore has no query form and no *RST value
Example: "MMEM:MDIR 'carrier'" Creates subdirectory 'carrier' in the current
directory.

R&S UPV MMEMory Subsystem
1146.2084.32 6.35 E-9
MMEMory:MOVE <file_source>,<file_destination>
This command renames an existing file if <file_destination> does not contain a path specification.
Otherwise, the file is moved to the specified path and stored under the original file name or under a
new file name if one is specified.
You can also enter the path specification by means of an additional parameter; the command then
reads as follows:
MMEMory:MOVE
<file_source><msus_source>[,<file_destination>,<msus_destination>]
This command triggers an event and therefore has no query form and no *RST value
Example: "MMEM:MOVE 'test.set','keep.set"
Renames file 'test.set' to 'keep.set'.
"MMEM:MOVE 'test.set','\user\keep.set"
Moves file 'test.set' to subdirectory 'user'
and stores it there under the name 'keep.set'
MMEMory:MSIS <msus>
This command sets the drive – the network resource in networks – with <msus> (MSIS = Mass
Storage Identification String). This setting applies to all MMEMory commands for which the drive is
not explicitly specified in the parameter.
Example: "MMEM:MSIS 'F:'" Selects the memory stick as the default drive.
MMEMory:RDIRectory <directory_name>
This command removes the specified subdirectory from the specified directory. If a directory is not
specified, the subdirectory with the specified name is deleted from the default directory.
This command triggers an event and therefore has no query form and no *RST value
Example: "MMEM:RDIR 'carrier'" Removes the 'carrier' subdirectory from the
current directory.
MMEMory:STORe:STATe <file_name>
This command stores the current device setting in the specified file.

Generation of Protocol Data R&S UPV
1146.2084.32 6.36 E-9
Generation of Protocol Data
Command Parameters Default
unit
Comment
SOURce:PROTocol:CH<x>:BYTE<y> <n>
SOURce:PROTocol:CH<x>:BYTE<y> <n>
This command combines the following three commands in one
SOURce:PROTocol:NUMerical:CH <x>
SOURce:PROTocol:NUMerical:BYTE <y>
SOURce:PROTocol:NUMerical:VALue <n>
Parameter: <x> and <y> are suffixes
<x> channel 1 or 2
<y> byte 0 to 3
<n> 0 to 255 (decimal bit equivalent)
Example: "SOUR:PROT:CH1:BYTE2 31"
Sets the protocol data of byte 2 (the third byte)
of channel 1 to 31 = 1Fh = 00011111b .

R&S UPV Softkey commands of the graphical display
1146.2084.32 6.37 E-9
Softkey commands of the graphical display
This section includes all commands of the softkey menu of the graphical and list displays. These
commands cannot be recorded.
Only a few commands are allowed in all subsystems. Commands that are not allowed in a subsystem
are not listed here.
In the BARgraph subsystem, for example, there are no markers.
The DISPlay:BARgraph<i>:A|B:MARKer:HARMonics ON | OFF command is thus not allowed, and is
not listed in the following command description.
Command Parameters Default unit Remarks
DISPlay:FFT<i>:A|B:MARKer:HARMonics ON | OFF
DISPlay:Subsys<i>:A|B:MARKer:MODE OFF | FIXed |TRKMax
DISPlay:Subsys<i>:A|B:MARKer:SETTo:
OCURsor| XCURsor
ONCE alias EXEC No query
DISPlay:Subsys<i>:A|B:MARKer:SETTo:
XPOS
<nu>
DISPlay:Subsys<i>:OCURsor|XCURsor:
MODE
VA | VB | VAB | HA | HB
DISPlay:Subsys<i>:OCURsor|XCURsor:P
OSMode
PIXel | POINt | PEAK |
HARMonic
DISPlay:Subsys<i>:OCURsor|
XCURsor:SETTo:MAX
ONCE alias EXEC
No query
DISPlay:Subsys<i>:OCURsor|
XCURsor:SETTo:MIN
ONCE alias EXEC
No query
DISPlay:Subsys<i>:OCURsor|
XCURsor:SETTo:MRKA
ONCE alias EXEC
No query
DISPlay:Subsys<i>:OCURsor|
XCURsor:SETTo:MRKB
ONCE alias EXEC
No query
DISPlay:Subsys<i>:OCURsor|
XCURsor:SETTo:XPOS
<nu>
DISPlay:Subsys<i>:OCURsor|
XCURsor:SETTo:YPOS
<nu>
DISPlay:Subsys<i>:OCURsor|
XCURsor:STATe
OFF | ACTive | INACtive
DISPlay:Subsys<i>:OCURsor|
XCURsor:Y?
Query only
DISPlay:Subsys<i>:DLISt:FILTer
ALL | LIMUpper | LIMLower |
LIMBoth | HARMonics | PEAKs

Softkey commands of the graphical display R&S UPV
1146.2084.32 6.38 E-9
DISPlay:FFT<i>:A|B:MARKer:HARMonics ON | OFF
Corresponds to softkey operation: Marker,
Trace A | Trace B,
Harm
Parameters: ON The harmonics are calculated and displayed, starting from the X
position of the marker.
OFF Display of the harmonics is switched off.
Example: "DISPlay:FFT2:A:MARKer:HARMonics ON"
DISPlay:SWEep<i>:A|B:MARKer:MODE OFF | FIXed |TRKMax
DISPlay:FFT<i>:A|B:MARKer:MODE OFF | FIXed |TRKMax
DISPlay:WAVeform:A|B:MARKer:MODE OFF | FIXed |TRKMax
DISPlay:PESQ<i>:A|B:MARKer:MODE OFF | FIXed |TRKMax
Corresponds to softkey operation: Marker,
Trace A | Trace B,
Off | Track to Max
Parameters: OFF Marker off
FIXed Fix marker on the current X position
TRKMax Set marker to maximum of trace A. Marker changes with
maximum.
Example: "DISPlay:FFT:B:MARKer:MODE TRKMax"
DISPlay:SWEep<i>:A|B:MARKer:SETTo:OCURsor|XCURsor ONCE alias EXEC
DISPlay:FFT<i>:A|B:MARKer:SETTo:OCURsor|XCURsor ONCE alias EXEC
DISPlay:WAVeform:A|B:MARKer:SETTo:OCURsor|XCURsor ONCE alias EXEC
DISPlay:PESQ<i>:A|B:MARKer:SETTo:OCURsor|XCURsor ONCE alias EXEC
Corresponds to softkey operation: Marker,
Trace A | Trace B,
O Cursor | X Cursor
Parameters: ONCE Set marker to position of O cursor | X cursor
EXEC Alias to ONCE.
ONCE or EXEC can also be omitted.
Example: "DISPlay:SWEep:A:MARKer:SETTo:OCURsor"
"DISPlay:SWEep:A:MARKer:SETTo:OCURsor ONCE"
"DISPlay:SWEep:A:MARKer:SETTo:OCURsor EXEC"
"DISPlay:SWEep:A:MARKer:SETTo:XCURsor"
"DISPlay:SWEep:A:MARKer:SETTo:XCURsor ONCE"
"DISPlay:SWEep:A:MARKer:SETTo:XCURsor EXEC"

R&S UPV Softkey commands of the graphical display
1146.2084.32 6.39 E-9
DISPlay:SWEep<i>:A|B:MARKer:SETTo:XPOS <nu>
DISPlay:FFT<i>:A|B:MARKer:SETTo:XPOS <nu>
DISPlay:WAVeform:A|B:MARKer:SETTo:XPOS <nu>
DISPlay:PESQ<i>:A|B:MARKer:SETTo:XPOS <nu>
Corresponds to the softkey operation: Marker,
Trace A | Trace B,
Set to Value
Parameter: <nu> Set marker to a position on the X-axis. The unit for entering the
value depends on the unit of the X-axis.
Example: "DISPlay:FFT2:B:MARKer:SETTo:XPOS 12.345 Hz"
DISPlay:SWEep<i>:OCURsor|XCURsor:MODE VA | VB | VAB | HA | HB
DISPlay:FFT<i>:OCURsor|XCURsor:MODE VA | VB | VAB | HA | HB
DISPlay:WAVeform:OCURsor|XCURsor:MODE VA | VB | VAB | HA | HB
DISPlay:BARgraph<i>:OCURsor|XCURsor:MODE VA | VB | VAB | HA | HB
DISPlay:PESQ<i>:OCURsor|XCURsor:MODE VA | VB | VAB | HA | HB
Corresponds to softkey operation: Cursor
O Cursor
O Vert A | O Vert B | O Vert A-B, O Hor A | O Hor B
Cursor
X cursor,
X Vert A | X Vert B | X Vert A-B, X Hor A | X Hor B
Parameters: VA O cursor becomes vertical cursor on trace A
VB Same on trace B
VAB Same on trace A and trace B and shows difference between Y
values.
HA O cursor becomes horizontal cursor on trace A
HB Same on trace B
Example: "DISPlay:BARgraph:XCURsor:MODE VA"

Softkey commands of the graphical display R&S UPV
1146.2084.32 6.40 E-9
DISPlay:SWEep<i>:OCURsor|XCURsor:POSMode PIXel | POINt | PEAK
DISPlay:FFT<i>:OCURsor|XCURsor:POSMode PIXel | POINt | PEAK | HARMonic
DISPlay:WAVeform:OCURsor|XCURsor:POSMode PIXel | POINt
DISPlay:BARgraph<i>:OCURsor|XCURsor:POSMode POINt
DISPlay:PESQ<i>:OCURsor|XCURsor:POSMode PIXel | POINt
Corresponds to softkey operation: Cursor
Ocursor | X cursor
Movement
Next Pixel | Next Bin | Next Sample | Next
Value | Next Step | Next Peak | Next Harmonic
Parameters: PIXel Pixel-by-pixel cursor movement
POINt Same between reference points.
An easy-to-remember term is offered for each subsystem in the
softkey menu, such as "Next Bin" for FFT, "Next Sample" for
waveform, "Next Value" for bargraph and "Next Step" for sweep;
the generic term POINt is used for IEC/IEEE bus control to
simplify matters.
PEAK Same between partial curve peaks
HARMonic Same in the FFT display between harmonics
Example: "DISPlay:WAVeform:OCURsor:POSMode POINt"
DISPlay:SWEep<i>:OCURsor|XCURsor:SETTo:MAX ONCE alias EXEC
DISPlay:FFT<i>:OCURsor|XCURsor:SETTo:MAX ONCE alias EXEC
DISPlay:WAVeform:OCURsor|XCURsor:SETTo:MAX ONCE alias EXEC
DISPlay:BARgraph<i>:OCURsor|XCURsor:SETTo:MAX ONCE alias EXEC
DISPlay:PESQ<i>:OCURsor|XCURsor:SETTo:MAX ONCE alias EXEC
Corresponds to softkey operation: Cursor
Set O-Cursor | Set X-Cursor,
Max
Parameters: ONCE Sets O cursor | X Cursor to the curve peak.
EXEC Alias to ONCE.
ONCE or EXEC can also be omitted.
Example: "DISPlay:SWEep4:OCURsor:SETTo:MAX"
"DISPlay:SWEep4:OCURsor:SETTo:MAX ONCE"
"DISPlay:SWEep4:OCURsor:SETTo:MAX EXEC"
"DISPlay:SWEep4:XCURsor:SETTo:MAX"
"DISPlay:SWEep4:XCURsor:SETTo:MAX ONCE"
"DISPlay:SWEep4:XCURsor:SETTo:MAX EXEC"

R&S UPV Softkey commands of the graphical display
1146.2084.32 6.41 E-9
DISPlay:SWEep<i>:OCURsor|XCURsor:SETTo:MIN ONCE alias EXEC
DISPlay:FFT<i>:OCURsor|XCURsor:SETTo:MIN ONCE alias EXEC
DISPlay:WAVeform:OCURsor|XCURsor:SETTo:MIN ONCE alias EXEC
DISPlay:BARgraph<i>:OCURsor|XCURsor:SETTo:MIN ONCE alias EXEC
DISPlay:PESQ<i>:OCURsor|XCURsor:SETTo:MIN ONCE alias EXEC
Corresponds to softkey operation: Cursor
Set O cursor | Set X cursor,
Min
Parameters: ONCE Sets O cursor | X cursor to trace maximum
EXEC Alias to ONCE.
ONCE or EXEC can also be omitted.
Example: "DISPlay:SWEep4:OCURsor:SETTo:MIN"
"DISPlay:SWEep4:OCURsor:SETTo:MIN ONCE"
"DISPlay:SWEep4:OCURsor:SETTo:MIN EXEC"
"DISPlay:SWEep4:XCURsor:SETTo:MIN"
"DISPlay:SWEep4:XCURsor:SETTo:MIN ONCE"
"DISPlay:SWEep4:XCURsor:SETTo:MIN EXEC"
DISPlay:SWEep<i>:OCURsor|XCURsor:SETTo:MRKA ONCE alias EXEC
DISPlay:FFT<i>:OCURsor|XCURsor:SETTo:MRKA ONCE alias EXEC
DISPlay:WAVeform:OCURsor|XCURsor:SETTo:MRKA ONCE alias EXEC
DISPlay:PESQ<i>:OCURsor|XCURsor:SETTo:MRKA ONCE alias EXEC
Corresponds to softkey operation: Cursor
Set O cursor | Set X cursor,
Marker A
Parameters: ONCE Sets O cursor | X cursor to the position of marker A
EXEC Alias to ONCE.
ONCE or EXEC can also be omitted.
Example: "DISPlay:SWEep4:OCURsor:SETTo:MRKA"
"DISPlay:SWEep4:OCURsor:SETTo:MRKA ONCE"
"DISPlay:SWEep4:OCURsor:SETTo:MRKA EXEC"
"DISPlay:SWEep4:XCURsor:SETTo:MRKA"
"DISPlay:SWEep4:XCURsor:SETTo:MRKA ONCE"
"DISPlay:SWEep4:XCURsor:SETTo:MRKA EXEC"

Softkey commands of the graphical display R&S UPV
1146.2084.32 6.42 E-9
DISPlay:SWEep<i>:OCURsor|XCURsor:SETTo:MRKB ONCE alias EXEC
DISPlay:FFT<i>:OCURsor|XCURsor:SETTo:MRKB ONCE alias EXEC
DISPlay:WAVeform:OCURsor|XCURsor:SETTo:MRKB ONCE alias EXEC
DISPlay:PESQ<i>:OCURsor|XCURsor:SETTo:MRKB ONCE alias EXEC
Corresponds to softkey operation: Cursor
Set O cursor | Set X cursor,
Marker B
Parameters: ONCE Sets O cursor | X cursor to the position of marker B
EXEC Alias to ONCE.
ONCE or EXEC can also be omitted.
Example: "DISPlay:SWEep4:OCURsor:SETTo:MRKB"
"DISPlay:SWEep4:OCURsor:SETTo:MRKB ONCE"
"DISPlay:SWEep4:OCURsor:SETTo:MRKB EXEC"
"DISPlay:SWEep4:XCURsor:SETTo:MRKB"
"DISPlay:SWEep4:XCURsor:SETTo:MRKB ONCE"
"DISPlay:SWEep4:XCURsor:SETTo:MRKB EXEC"
DISPlay:SWEep<i>:OCURsor|XCURsor:SETTo:XPOS <nu>
DISPlay:FFT<i>:OCURsor|XCURsor:SETTo:XPOS <nu>
DISPlay:WAVeform:OCURsor|XCURsor:SETTo:XPOS <nu>
DISPlay:BARgraph<i>:OCURsor|XCURsor:SETTo:XPOS <nu>
DISPlay:PESQ<i>:OCURsor|XCURsor:SETTo:XPOS <nu>
Corresponds to softkey operation: Cursor
Set O cursor | Set X cursor,
Value
Parameters: <nu> Sets O cursor | X cursor to the defined value if a vertical cursor
is involved.
The unit in which the value is entered depends on the unit of
the X-axis.
Example: "DISPlay:WAVeform:OCURsor:SETTo:XPOS 12.345 Hz"
DISPlay:SWEep<i>:OCURsor|XCURsor:SETTo:YPOS <nu>
DISPlay:FFT<i>:OCURsor|XCURsor:SETTo:YPOS <nu>
DISPlay:WAVeform:OCURsor|XCURsor:SETTo:YPOS <nu>
DISPlay:BARgraph<i>:OCURsor|XCURsor:SETTo:YPOS <nu>
DISPlay:PESQ<i>:OCURsor|XCURsor:SETTo:YPOS <nu>
Corresponds to the softkey operation: Cursor
Set O cursor | Set X cursor,
Value
Parameters: <nu> Sets O cursor | X Cursor to the defined value, if a horizontal
cursor is involved.
The unit in which the value is entered depends on the unit of
the Y-axis.
Example: "DISPlay:WAVeform:XCURsor:SETTo:YPOS -110 DBV"

R&S UPV Softkey commands of the graphical display
1146.2084.32 6.43 E-9
DISPlay:SWEep<i>:OCURsor|XCURsor:STATe OFF | ACTive | INACtive
DISPlay:FFT<i>:OCURsor|XCURsor:STATe OFF | ACTive | INACtive
DISPlay:WAVeform:OCURsor|XCURsor:STATe OFF | ACTive | INACtive
DISPlay:BARgraph<i>:OCURsor|XCURsor:STATe OFF | ACTive | INACtive
DISPlay:PESQ<i>:OCURsor|XCURsor:STATe OFF | ACTive | INACtive
Corresponds to softkey operation: Cursor
Ocursor | X cursor,
O active | X active
Parameter: OFF O cursor | X cursor off
ACTive O cursor | X cursor is visible and is controlled from the rotary
knob
INACtive O cursor | X cursor is visible but is controlled from the rotary
knob
Example: "DISPlay:BARgraph:OCURsor:STATe OFF"
"DISPlay:BARgraph2:XCURsor:STATe ACTive"
DISPlay:SWEep<i>:OCURsor|XCURsor:Y?
DISPlay:FFT<i>:OCURsor|XCURsor:Y?
DISPlay:WAVeform:OCURsor|XCURsor:Y?
DISPlay:BARgraph<i>:OCURsor|XCURsor:Y?
DISPlay:PESQ<i>:OCURsor|XCURsor:Y?
No corresponding function in the softkey menu
Parameters: Query only Reads the current value of the O cursor or X cursor. The return
value is a pure numeric value without unit.The numeric value is
returned in the unit in which the Y-axis is displayed.
Example: "DISPlay:SWEep:OCURsor:Y?"
"DISPlay:SWEep:XCURsor:Y?"
Response:-19.4783
DISPlay:SWEep<i>:DLISt:FILTer ALL | LIMUpper | LIMLower | LIMBoth | HARMonics | PEAKs
DISPlay:FFT<i>:DLISt:FILTer ALL | LIMUpper | LIMLower | LIMBoth | HARMonics | PEAKs
DISPlay:WAVeform:DLISt:FILTer ALL | LIMUpper | LIMLower | LIMBoth | HARMonics | PEAKs
DISPlay:BARgraph<i>:DLISt:FILTer ALL | LIMUpper | LIMLower | LIMBoth | HARMonics | PEAKs
DISPlay:PESQ<i>:DLISt:FILTer ALL | LIMUpper | LIMLower | LIMBoth | HARMonics | PEAKs
Corresponds to the softkey operation in the list editor:
Selection
All | Lim Upper | Lim Lower | Lim upp&low | Harmonics |
Peaks

Softkey commands of the graphical display R&S UPV
1146.2084.32 6.44 E-9
When saving a trace by setting "Store Trace as" to "DataList Select" (MMEMory:Subsys<i>:STAS
DSELect) or when trace data is read in with the following IEC/IEEE bus commands:
TRACe:Subsys<i>:LDList:AX?
TRACe:Subsys<i>:LDList:AY?
TRACe:Subsys<i>:LDList:BX?
TRACe:Subsys<i>:LDList:BY?
The IEC/IEEE bus command specifies which data is saved/read.
Parameters: In the measurement value list the following values are used when saving or
reading in trace data:
All all
Lim Upper Only those values that exceed the upper limit.
Lim Lower Only the values which are below the lower limit value.
Lim upp&low Only those values that exceed the upper limit and fall below the
lower limit.
Harmonics Only harmonics.
Peaks Partial curve peaks.
Example: "DISPlay:FFT:DLISt:FILTer HARMonics"

R&S UPV Transferring trace data
1146.2084.32 6.45 E-9
Transferring trace data
Transferring trace data from a controller via the IEC/IEEE bus to the R&S UPV allows you to display
externally generated or manipulated trace data with the graphical display capabilities of the R&S UPV.
Example:
Assume that a fast frequency response measurement using a multisine signal and an FFT has been
programmed in a K1 macro. The FFT shows different high lines in the multisine frequencies, with a
noise floor between.
This is not the usual display mode of a frequency response curve.
The K1 macro now generates a sweep trace data set from the levels of the individual bins and their
frequency values. This data set is transferred to the R&S UPV and is shown in the graphical display as
asweep trace, and thus as a frequency response curve.
When transferring trace data, pure numeric values without units are transferred. Thus, the presetting of
the graph must precede the data transfer, and it determines the unit in which the values are interpreted.
The number of the transferred X values should also comply with the currently set X-axis of the graphical
display.
The transfer of data for the X-axis (…:AX and …:BX) is reserved exclusively for the sweep
subsystem!
"X source" must be set to "Manual".
The Y-axes (…:AY and …:BY) can be transferred for all subsystems without exception.
Command Parameters Default unit Remarks
TRACe:Subsys<i>:STORe:AX <n,n,n,n>
TRACe:Subsys<i>:STORe:AY <n,n,n,n>
TRACe:Subsys<i>:STORe:BX <n,n,n,n>
TRACe:Subsys<i>:STORe:BY <n,n,n,n>
No query
The command
TRACe:Subsys<i>
:LOAD:AX | AY |
BX | BY?
can be used instead
of a query.
TRACe:SWEep<i>:STORe:AX <n,n,n,n>
TRACe:SWEep<i>:STORe:AY <n,n,n,n>
TRACe:SWEep<i>:STORe:BX <n,n,n,n>
TRACe:SWEep<i>:STORe:BY <n,n,n,n>

Transferring trace data R&S UPV
1146.2084.32 6.46 E-9
The following description provides the basic information used in the following examples of
TRACe:Subsys<i>:STORe commands.
<i> = subsystem number 1 to 4
Command for saving sweep graph trace data sets.
AX designates the X-axis of trace A
AY designates the Y-axis of trace A
BX designates the X-axis of trace B
BY designates the Y-axis of trace B
In the case of a multiscan display or single display with MIN/MAX traces, the command
DISPlay:SWEep:SCANoffset <n> selects the desired scan.
Example: "TRAC:SWEep1:STORe:AY <n,n,n,n>" Saves the data of the Y-axis for
channel A in the first sweep system.
TRACe:FFT<i>:STORe:AX <n,n,n,n>
TRACe:FFT<i>:STORe:AY <n,n,n,n>
TRACe:FFT<i>:STORe:BX <n,n,n,n>
TRACe:FFT<i>:STORe:BY <n,n,n,n>
<i> = subsystem number 1 and 2
Command for saving sweep graph trace data sets.
TRACe:WAVeform:STORe:AX <n,n,n,n>
TRACe:WAVeform:STORe:AY <n,n,n,n>
TRACe:WAVeform:STORe:BX <n,n,n,n>
TRACe:WAVeform:STORe:BY <n,n,n,n>
Command for saving waveform trace data sets.
TRACe:BARgraph<i>:STORe:AX <n,n,n,n>
TRACe:BARgraph<i>:STORe:AY <n,n,n,n>
TRACe:BARgraph<i>:STORe:BX <n,n,n,n>
TRACe:BARgraph<i>:STORe:BY <n,n,n,n>
<i> = subsystem number 1 and 2
Command for saving bargraph trace data sets.
TRACe:PESQ<i>:STORe:AX <n,n,n,n>
TRACe:PESQ<i>:STORe:AY <n,n,n,n>
TRACe:PESQ<i>:STORe:BX <n,n,n,n>
TRACe:PESQ<i>:STORe:BY <n,n,n,n>
<i> = subsystem number 1 and 2
Command for saving PESQ trace data records.

R&S UPV User-definable data buffers
1146.2084.32 6.47 E-9
User-definable data buffers
The available data buffers are mainly used for communicating between K1 macros and IEC/IEEE bus
control programs.
The K1 macro or the IEC/IEEE bus control program saves data in the form of strings or binary data in
the available data buffers, from where it can be collected and further processed by the other program.
However, these buffers can also be used as data buffers within one of the programs.
Command Parameters Default unit Remarks
SYSTem:MEMory:STRing<i>
"String"
SYSTem:MEMory:DATA<i>
or
SYSTem:MEMory:DATA<i>
<n,n,n,n>
or
#<Length><OfTheLength><Binar
ydata as float[]>
SYSTem:MEMory:FREE
STRing | DATA
SYSTem:MEMory:STRing<i> 'String'
<i> = 1 to 1024
Any strings up to a length of 540 bytes can be cached in up to 1024 memory locations.
Parameter: "String" the maximum string length is 540 bytes
Example: SYSTem:MEMory:STRing10 "Store this string in the buffer!"
Query:
SYSTem:MEMory:STRing10?
Response:
"Store this string in the buffer!"

User-definable data buffers R&S UPV
1146.2084.32 6.48 E-9
SYSTem:MEMory:DATA<i> <n,n,n,n>
SYSTem:MEMory:DATA<i> #<LängeDerLänge><Länge><Binärdaten>
<i> = 1 to 16
Stores up to 16 data sets with a length limited only by the storage capacity made available by the
operating system. The available storage capacity cannot be determined exactly but is usually in
the range of 128 Mbytes. Preference should be given to this memory when saving trace data.
Parameters: <n,n,n,n> Numeric strings consisting of floating-point
values without a unit in ASCII format
or
Binary data set of the form
#<LengthOfLength><Length><Binary data>
Example: SYST:MEM:DATA11 1.2345,2.3456,3.4567,4.5678
or
SYST:MEM:DATA11 #212<Binary data set consisting of 12 bytes>
SYSTem:MEMory:FREE STRing | DATA
Returns memory space of the available data buffers to the operating system.
Parameters: STRing Returns the memory space of all string buffers.
DATA Returns the memory space of all data buffers.
Example: SYSTem:MEMory:FREE STRing

R&S UPV Hardcopy
1146.2084.32 6.49 E-9
Hardcopy
Command Parameters Default unit Remarks
HCOPy[:IMMediate]
HCOPy[:IMMediate]
Triggers the function to output measurement value results. Depending on the selected setting in the
configuration panel, the desired action is immediately executed.
Note: If the HCopy function is triggered during an ongoing measurement, first the measurement is
halted and then the set action is executed.
Parameters: None
Example: HCOPy[:IMMediate]

R&S UPV Contents – Maintenance and Interfaces
1146.2084.32 I-8.1 E-9
Contents - Chapter 8 "Maintenance and Interfaces"
8Maintenance and Instrument Interfaces.............................................................................8.1
Introduction - Maintenance and Interfaces....................................................................................8.1
Maintenance......................................................................................................................................8.1
Cleaning the Outside of the Instrument and Storage...............................................................8.1
Changing the AC Supply Fuse.................................................................................................8.2
Instrument Interfaces.......................................................................................................................8.3
IEC/IEEE-Bus Interface (IEC 625 / IEEE 488).........................................................................8.3
Ethernet Interface (LAN) ..........................................................................................................8.7
RS-232-C Interface (COM) ....................................................................................................8.10
USB Connectors (USB)..........................................................................................................8.14
USB Device Port ....................................................................................................................8.14
Printer Connector (LPT).........................................................................................................8.16
Monitor Connector (MONITOR) .............................................................................................8.17

R&S UPV Introduction - Maintenance and Interfaces
1146.2084.32 8.1 E-9
8Maintenance and Instrument Interfaces
Introduction - Maintenance and Interfaces
The following chapter contains information on maintaining the audio analyzer and also describes the
instrument interfaces.
How to change a module and order spare parts is described in the service manual. The service manual
also contains all the ID numbers required for ordering spare parts.
The address of our Support Center and a list of Rohde & Schwarz Service Centers are given at the
beginning of this manual.
More detailed information (especially on troubleshooting, repairing the instrument, changing the
modules and calibration) can also be found in the service manual.
Maintenance
The audio analyzer does not require regular maintenance. Maintenance is essentially restricted to
cleaning the instrument. It is, however, advisable to check the nominal data from time to time.
Cleaning the Outside of the Instrument and Storage
The outside of the instrument should be cleaned using a suitable soft, lint-free cloth. It is important to
make sure that the instrument vents are not obstructed.
NOTICE Instrument damage caused by cleaning agents!
Cleaning agents contain substances that may damage the instrument,
e.g. solvent-containing cleaning agents may damage the front panel
labeling or plastic parts. Never use cleaning agents such as solvents
(thinners, acetone, etc), acids, bases, or other substances. The outside of
the instrument is suitably cleaned using a soft, line-free dust cloth.
The storage temperature range for the audio analyzer is specified in the data sheet. The instrument
must be protected against dust if it is to be stored for a long period.
When transporting or shipping the instrument, it is advisable to use the original packing material
(especially the two protective covers for the front and rear panel).

Maintenance R&S UPV
1146.2084.32 8.2 E-9
Changing the AC Supply Fuse
NOTICE Only fuses of the type IEC 127-T4.0H/250V should be used.
Changing the AC supply fuses:
Make sure that the power cable is disconnected.
Open the flap covering the voltage selector using a small
screwdriver (or similar).
Remove the cylinder labelled with the nominal voltages. Remove
both fuses and fit new ones. Reinsert the cylinder so that the
value visible through the hole in the cover flap is the same
nominal voltage as before.
Close the flap.
Note:
The Audio Analyzer R&S UPV is operated with the same fuses for all of
the specified nominal AC supply voltages.

R&S UPV Instrument Interfaces
1146.2084.32 8.3 E-9
Instrument Interfaces
The following section describes the remote-control interfaces of the audio analyzer and the pin
assignment of the monitor socket. The other interfaces are described in Chapter 1 in the sections "Front
Panel" and "Rear Panel".
IEC/IEEE-Bus Interface (IEC 625 / IEEE 488)
As standard, the instrument is equipped with an IEC/IEEE-bus connector. The connector socket
(conforming to IEEE 488) is at the rear of the instrument. The interface can be used to connect a
controller to allow remote control of the instrument. A shielded cable is used for connection.
Features of the IEC/IEEE-bus interface
•8-bit parallel data transfer
•Bidirectional data transfer
•Three-wire handshake
•High data transfer rate
•Up to 15 instruments can be connected
•Maximum length of connecting cables 15 m (single connection 2 m)
•Wired-Or operation with parallel connection of several instruments
12 1
13
24
SHIELD SRQ NDAC DAV DIO4 DIO2
LOGIC GND GND(10) GND(8) GND(6) DIO8 DIO6
GND(11) GND(9) GND(7) REN DIO7 DIO5
ATN IFC NRFD EOI DIO3 DIO1
Figure 8-1 Pin assignment of IEC/IEEE-bus interface

Instrument Interfaces R&S UPV
1146.2084.32 8.4 E-9
IEC/IEEE-bus lines
1. Data bus with 8 lines DIO 1...DIO 8
Data is transferred parallel by bit and serial by byte in ASCII/ISO code. DIO1 is the bit with the
lowest value and DIO8 the bit with the highest value.
2. Control bus with 5 lines
IFC (Interface Clear) Active LOW resets the interfaces of the connected instruments to their
initial setting.
ATN (Attention) Active LOW signals the transmission of interface messages.
Active HIGH signals the transmission of instrument messages.
SRQ (Service Request) Active LOW allows the connected instrument to send a service request
to the controller.
REN (Remote Enable) Active LOW allows switchover to remote-control mode.
EOI (End or Identify) This has two functions in conjunction with ATN:
ATN = HIGH
Active LOW indicates the end of data transfer.
ATN = LOW
Active LOW triggers a parallel poll.
3. Handshake bus with three lines
DAV (Data Valid) Active LOW signals a valid data byte on the data bus.
NRFD (Not Ready For
Data)
Active LOW signals that one of the connected instruments is not ready
to receive data.
NDAC (Not Data
Accepted)
Active LOW while the connected instrument is receiving the data on
the data bus.
R&S UPV Instrument Interfaces
1146.2084.32 8.5 E-9
IEC/IEEE-bus interface functions
Instruments which can be remote-controlled via the IEC/IEEE bus can be provided with various
interface functions. The table below lists the interface functions which apply to the audio analyzer.
Table 8-1 Interface functions
Control
character
Interface functions
SH1 Source handshake, full capability
AH1 Acceptor handshake, full capability
L4 Listener function, full capability, unaddressing by MTA
T6 Talker function, full capability, capability of responding to serial query, unaddressing by MLA
SR1 Service request function, full capability
PP1 Parallel poll function, full capability
RL1 Remote/local switchover function, full capability
DC1 Reset function (Device Clear), full capability
DT1 Trigger function (Device Trigger), full capability
C0 No controller function

Instrument Interfaces R&S UPV
1146.2084.32 8.6 E-9
IEC/IEEE-bus interface messages
Interface messages are transferred to the instrument on the data lines, whereby the "attention" control
line ("ATN") is active (LOW). They are used for communication between the process controller and the
instrument and can only be sent by a process controller which has the controller functionality at the
IEC/IEEE bus.
Universal commands
The universal commands are in the code range 0x10 to 0x1F. They act on all instruments connected to
the bus without previous addressing.
Table 8-2 Universal commands
Command VISUAL BASIC command Effect on instrument
DCL (Device Clear) IBCMD (controller%, CHR$(20)) Terminates processing of the commands that have
just been received, and sets the command-
processing software to a defined initial state. Does
not change the instrument setup.
IFC (Interface Clear) IBSIC (controller%) Resets the interfaces to their initial setting.
LLO (Local Lockout) IBCMD (controller%, CHR$(17)) The manual LOCAL switchover function is disabled.
SPE (Serial Poll Enable) IBCMD (controller%, CHR$(24)) Ready for serial polling.
SPD (Serial Poll Disable) IBCMD (controller%, CHR$(25)) End of serial polling.
PPU (Par. Poll Unconfigure) IBCMD (controller%, CHR$(21)) End of parallel polling query status.
Addressed commands
The addressed commands are in the code range 0x00 to 0x0F. They only act on instruments which are
addressed as listeners.
Table 8-3 Addressed commands
Command VISUAL BASIC command Effect on instrument
SDC (Sel. Device Clear) IBCLR (device%) Terminates processing of the commands that have
just been received, and sets the command-
processing software to a defined initial state. Does
not change the instrument setup.
GET (Group Exec. Trigger) IBTRG (device%) Initiates a measurement or a sweep.
GTL (Go to Local) IBLOC (device%) Transition to the "Local" state (manual operation).
PPC (Par. Poll Configure) IBPPC (device%, data%) Configure instrument for parallel polling. The
VISUAL BASIC command also executes PPE /
PPD.
R&S UPV Instrument Interfaces
1146.2084.32 8.7 E-9
Ethernet Interface (LAN)
Asstandard, the instrument is equipped with an Ethernet interface. The connector socket is at the rear
of the instrument. Network administrators with the appropriate rights can transfer files across the
network and use network resources such as network directories or printers. The instrument can also be
remote-controlled and manually operated in the network. A commercially available RJ45 cable is used
for connection.
The network card operates with 100-MHz-Ethernet IEEE 802.3u. The TCP/IP network protocol and the
associated network services are preconfigured. TCP/IP provides connection-mode communication
where the sequence of the exchanged messages is retained and interrupted connections are detected.
Furthermore, messages cannot be lost if this protocol is used.
Connection of the R&S UPV is described in Chapter 1 in the section Connection to the Network and
remote control via Ethernet is described in Chapter 5 in the section Remote Control via LAN Interface.
The architecture of a LAN remote-control connection is described in greater detail below.
Remote control of the instrument via a network is based on these standardized protocols which comply
with the OSI reference model (see the figure below).
SCPI
XDR (VXI-11)
ONC-RPC
TCP / UDP
IP
Ethernet/802.3
802.3/10BASE-T
Application
Presentation
Session
Transport
Network
Data Link
Physical
SCPI [3]
RFC 1014 [1,2]
RFC 1057
RFC 793
RFC 791
8802-3
8802-3
Figure 8-2 Example of LAN remote control in compliance with OSI reference model
Based on TCP/UDP, the messages are exchanged between the controller and the instrument by means
of Open Network Computing (ONC) Remote Procedure Calls (RPC). With XDR, the permitted RPC
messages are known as the VXI-11 standard. Messages are exchanged between the controller and the
instrument based on this standard. The messages are identical to the SCPI commands. They can be
divided into four groups: program messages (control commands to the instrument), response messages
(values returned by the instrument), service request (spontaneous requests by the instrument) and low-
level control messages (interface messages).
AVXI-11 connection between a controller and an instrument is based on three channels: core, abort
and interrupt channel. The instrument is controlled mainly via the core channel (program, response and
low-level control messages). The abort channel is used for immediate termination of the core channel,
and the interrupt channel transports spontaneous service requests from the instrument. The actual
connection setup is complex. Further details can be found in the VXI-11 specification ('TCP/IP
Instrument Protocol Specification VXI-11, Revision 1.0 VMEbus Extensions for Instrumentation, VXIbus'
and 'TCP/IP-IEEE 488.2 Instrument Interface Specification VXI-11.3, Draft 0.3 VMEbus Extensions for
Instrumentation, VXIbus').
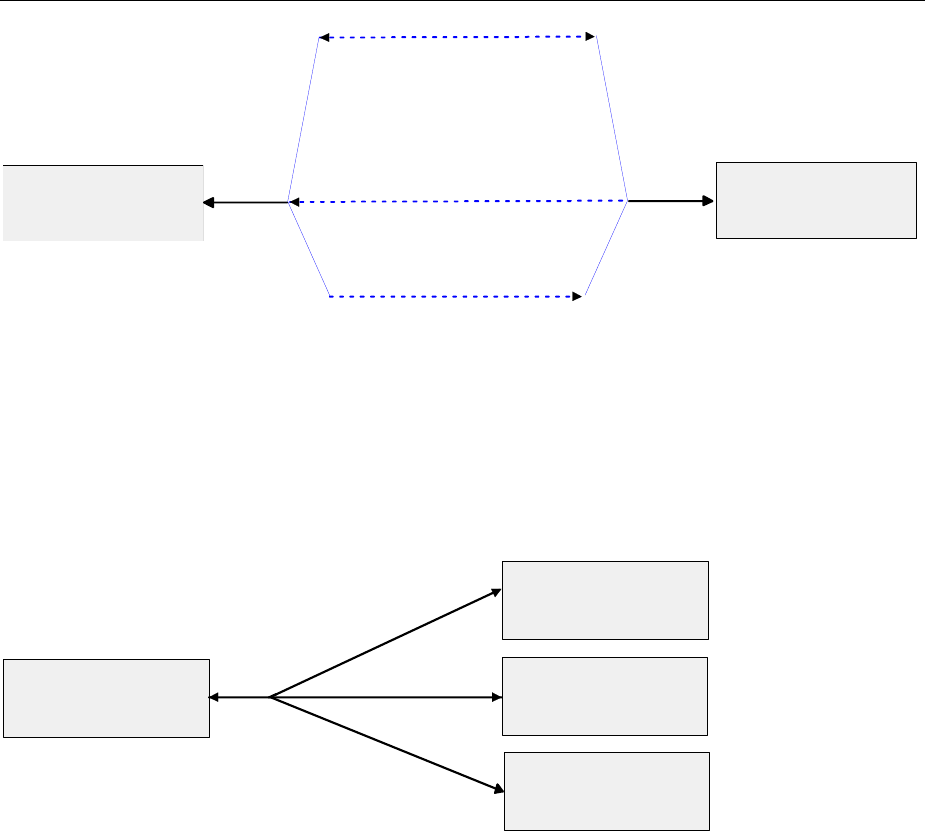
Instrument Interfaces R&S UPV
1146.2084.32 8.8 E-9
Instrument Controller
Interrupt Channel
(Service request)
Abort Channel
(Abort)
Core Channel
(Program, Response,
Control Messages )
Figure 8-3 Channels between instrument and controller with VXI-11
The number of controllers which can access an instrument is virtually unlimited in the network. In the
instrument, a clear distinction is made between the individual controllers. This distinction is continued
down to one controller at application level, i.e. two applications on a PC are regarded as two different
controllers by an instrument.
Instrument Controller
Controller
Controller
Figure 8-4 Remote control via LAN with several controllers
The controllers can lock and unlock the instrument to permit exclusive access. As a result, it is possible
to control access from several controllers.
In the program 'Measurement & Automation Control',this setting is made in the Template panel.
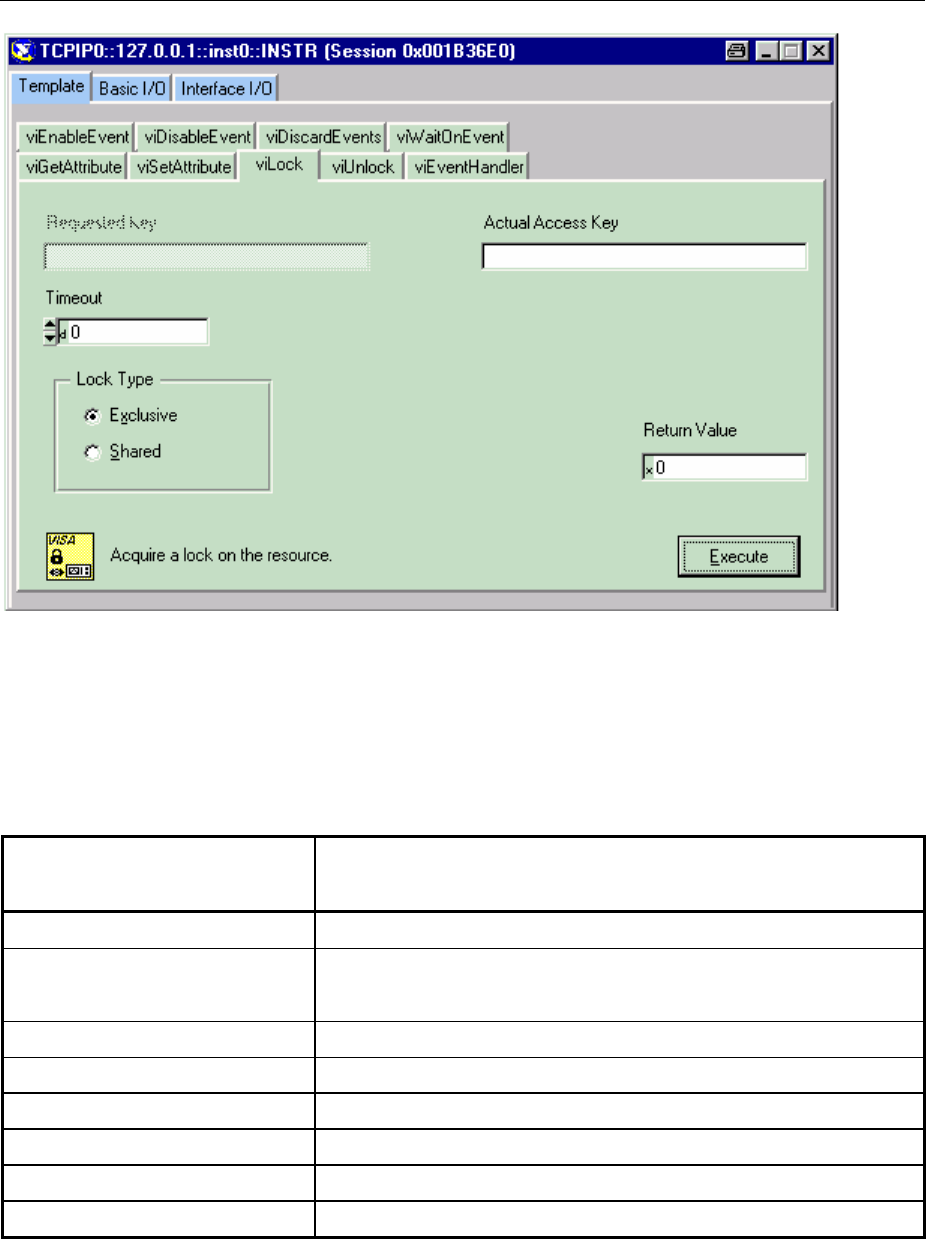
R&S UPV Instrument Interfaces
1146.2084.32 8.9 E-9
VXI-11 interface messages
With Ethernet connections, the interface messages are referred to as low-level control messages. They
can be used to emulate the interface messages of the IEC/IEEE bus.
Table 8-4 VXI-11 interface messages
Comma
nd
Effect on instrument
&ABO (Abort) Terminates processing of the commands that have just been received.
&DCL (Device Clear) Terminates processing of the commands that have just been received, and sets
the command-processing software to a defined initial state. Does not change the
instrument setup.
>L (Go to Local) Transition to the "Local" state (manual operation).
>R (Go to Remote) Transition to the "Remote" state (remote control).
&GET (Group Execute Trigger) Initiates a measurement or a sweep.
&LLO (Local Lockout) The manual LOCAL switchover function is disabled.
&POL (Serial Poll) A serial poll is executed.
&NREN (Not Remote Enable) The manual LOCAL switchover function is enabled.

Instrument Interfaces R&S UPV
1146.2084.32 8.10 E-9
RS-232-C Interface (COM)
Asstandard, the instrument has an RS-232-C interface. The connector socket is at the rear of the
instrument. The interface can be used to connect a controller to allow remote control of the instrument.
Ashielded cable is used for connection.
Features of the interface
•Serial data transfer in asynchronous mode
•Bidirectional data transfer via two separate lines
•Selectable transfer speed from 110 to 19200 Baud
•Logic signal level '0' from +3 V to +15 V
•Logic signal level '1' from -15 V to -3 V
•External device (controller) can be connected
15
6789
234
DCD
RxD
TxD
DTR
SG
DSR
RTS
CTS
RI
Figure 8-5 Pin assignment of RS-232-C interface

R&S UPV Instrument Interfaces
1146.2084.32 8.11 E-9
Signal lines
DCD (Data Carrier Detector)
Not used in the instrument.
Input (log. '0' = active); this signal tells the data terminal that the modem is receiving valid signals
with adequate level from the remote station. DCD is used to disable the receiver in the data terminal
and thus prevent incorrect data from being read in if the modem cannot interpret the signals from the
remote station.
RxD (Receive Data)
Data line; transfer direction: remote station to instrument.
TxD (Transmit Data)
Data line; transfer direction: instrument to remote station.
DTR (Data Terminal Ready)
Output (log. '0' = active); the instrument uses DTR to announce that it is ready to receive data.
GND
Interface ground, connected to the instrument ground.
DSR (Data Set Ready)
Input (log. '0' = active); DSR tells the instrument that the remote station is ready to receive data.
RTS (Request To Send)
Output (log. '0' = active); RTS tells the remote station that the instrument is ready for data transfer.
The RTS line remains active for as long as the serial interface is active.
CTS (Clear To Send)
Input (log. '0' = active); CTS tells the instrument that the remote station is ready to receive data.
RI (Ring Indicator)
Not used by the instrument.
Input; a modem uses RI to announce that a remote station wants to set up a connection with the
modem.

Instrument Interfaces R&S UPV
1146.2084.32 8.12 E-9
Transfer parameters
To ensure error-free and correct data transfer, the set transfer parameters must be identical for both the
instrument and the controller. The R&S UPV is factory-configured with the default settings identified in
the list. These values cannot be changed by the user.
Transfer speed 8 different baud rates can be set in the instrument:
(baud rate) 110, 300, 600, 1200, 2400, 4800, 9600, 19200. The default value is
19200.
Data bits Data is transferred in 7 or 8-bit ASCII code. The LSB (Least
Significant Bit) is the first bit to be transferred. The default value is 8.
Start bit Each data byte begins with a start bit. The falling edge of the start
bit signals the beginning of the data byte.
Parity bit A parity bit can also be transferred to provide error protection. There
are three parity settings: none, even and odd. Additionally, the parity
bit can be set to logic '0' or logic '1'. The default value is no parity.
Stop bits Transfer of a data byte can be ended with 1, 1.5 or 2 stop bits. The
default value is 1 stop bit.
Example:
Transfer of the letter 'A' (41 Hex) in 7-bit ASCII code, with even
parity and two stop bits:
01 02 03 04 05 06 07 08 09 10 11
Bit 01 Bit 02...08 Bit 09 Bit 10...11
Start bit Data bits Parity bit Stop bits

R&S UPV Instrument Interfaces
1146.2084.32 8.13 E-9
Handshake
Software handshake
With the software handshake, data transfer is controlled by the two control characters XON / XOFF:
The instrument signals that it is ready to receive data using the control character XON. If the input
buffer is full, it sends the character XOFF to the controller via the interface. The controller then stops
data output until it receives XON again from the instrument. In the same way, the controller informs the
instrument that it is ready to receive data.
Cable for local computer link for software handshake
With the software handshake, the instrument is connected to a controller by crossing the data lines. The
wiring diagram below applies to a controller with 9-pin or 25-pin connection.
Instrument Computer Instrument Computer
9 pin 9 pin 9 pin 25 pin
1
2
3
4
5
6
7
8
9
------------RxD / TxD---------------
------------TxD / RxD---------------
------------GND / GND-------------
1
3
2
6
5
4
8
7
9
1
2
3
4
5
6
7
8
9
------------RxD / TxD---------------
------------TxD / RxD---------------
------------GND / GND-------------
8
2
3
6
7
20
5
4
22
Figure 8-6 Wiring of data lines for software handshake
Hardware handshake
With the hardware handshake, the instrument signals that it is ready to receive data via the lines DTR
and RTS. A logic '0' on both lines means 'ready' and a logic '1' means 'not ready'. The RTS line is
always active (logic '0') provided that the serial interface is switched on. The DTR line thus controls the
R&S UPV's readiness to receive data.
The instrument is informed of the remote station's readiness to receive data via the lines CTS and DSR.
Alogic '0' on both lines activates the output of data and a logic '1' on both lines stops the output of data
by the instrument. Data is output via the TxD line. This is the default configuration of the R&S UPV.

Instrument Interfaces R&S UPV
1146.2084.32 8.14 E-9
Cable for local computer link for hardware handshake
The instrument is connected to a controller using a "null modem" cable. With this cable, the data,
control and signalling lines must be crossed. The wiring diagram below applies to a controller with 9-pin
or 25-pin connection.
Instrument Computer Instrument Computer
9 pin 9 pin 9 pin 25 pin
1
2
3
4
5
6
7
8
9
------------RxD / TxD---------------
------------TxD / RxD---------------
------------DTR /DSR---------------
------------GND / GND-------------
------------DSR / DTR--------------
------------RTS / CTS--------------
------------CTS / RTS--------------
1
3
2
6
5
4
8
7
9
1
2
3
4
5
6
7
8
9
------------RxD / TxD---------------
------------TxD / RxD---------------
------------DTR /DSR---------------
------------GND / GND-------------
------------DSR / DTR--------------
------------RTS / CTS--------------
------------CTS / RTS--------------
8
2
3
6
7
20
5
4
22
Figure 8-7 Wiring of data, control and signalling lines for hardware handshake
USB Connectors (USB)
As standard, the instrument has four USB interfaces (Universal Serial Bus) of type A (Master USB);
they form a link with the internal processor. They can be used to connect peripherals such as a mouse
and keyboard or to connect a USB stick for transferring files. Two of the USB interfaces are on the front
of the instrument and two are on the rear of the instrument.
USB Device Port
Instruments of the new generation have a Type B USB device connector on the rear panel in addition to
the normal USB connector. The Type B connector is commonly used for hubs and external hard disk
drives. The R&S UPV can also be controlled via this port if the controller has the necessary drivers.
Remote control via USB is described in chapter 5, section "Remote control via the USB interface".
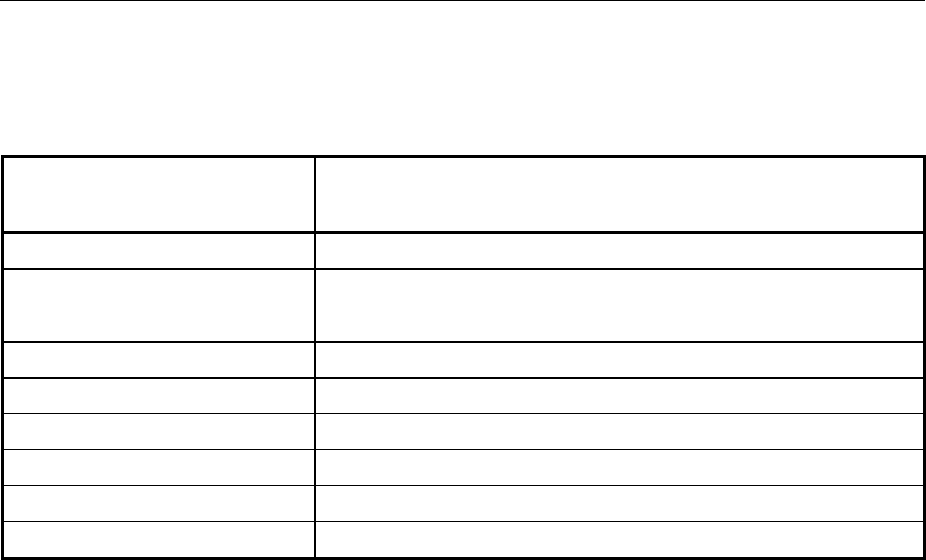
R&S UPV Instrument Interfaces
1146.2084.32 8.15 E-9
USB device interface messages
In the case of a USB device link, the interface messages are called “Low-Level Control Messages”.
They can be used to emulate the interface messages of the IEC/IEEE bus.
Comma
nd
Effect on instrument
&ABO (Abort) Terminates processing of commands that have just been received.
&DCL (Device Clear) Terminates processing of commands that have just been received and restores the
processing software to a defined initial state. Does not modify the instrument
configuration.
>L (Go to Local) Transition to the Local state (manual operation).
>R (Go to Remote) Transition to the Remote state (remote control).
&GET (Group Execute Trigger) Triggers a measurement or a sweep.
&LLO (Local Lockout) Manual switching to Local mode is blocked.
&POL (Serial Poll) A serial poll is executed.
&NREN (Not Remote Enable) Manual switching to Local mode is enabled.
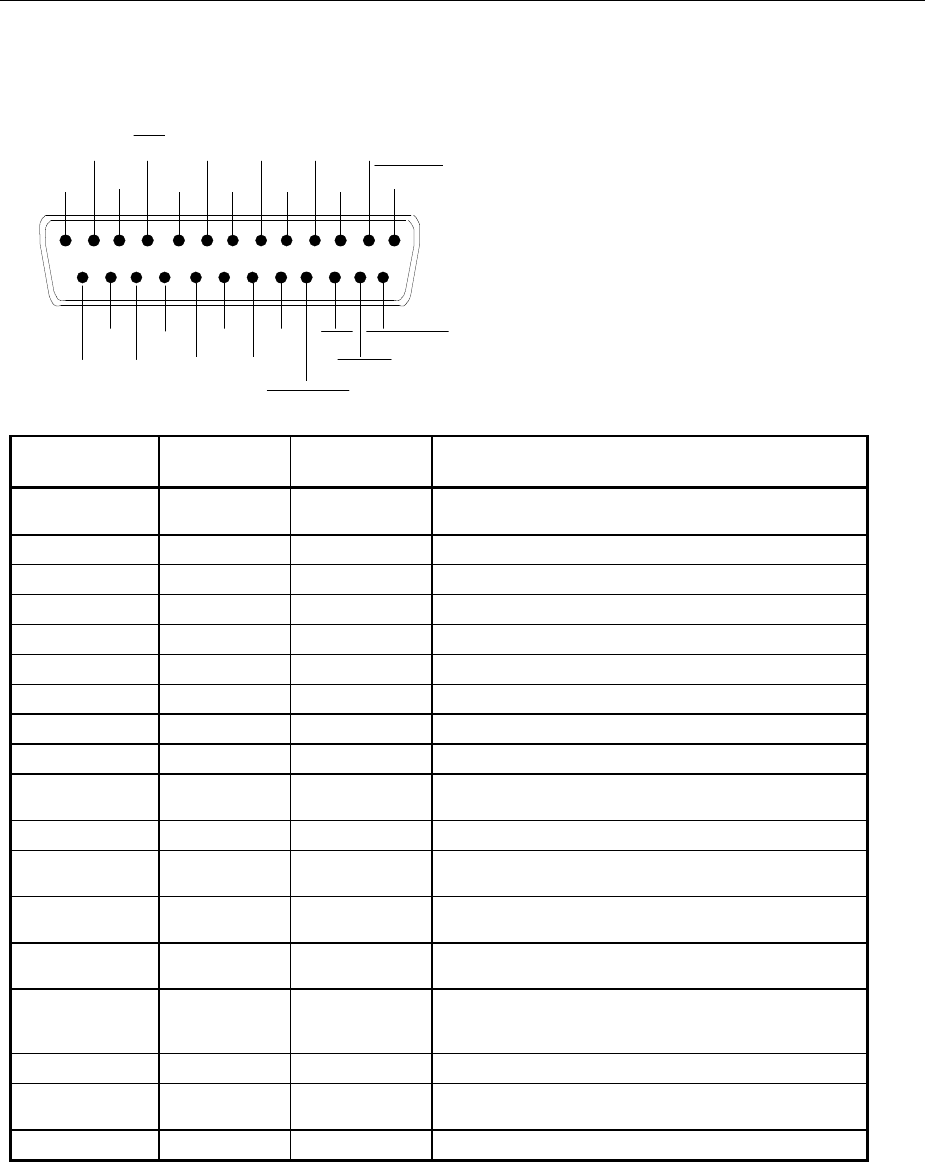
Instrument Interfaces R&S UPV
1146.2084.32 8.16 E-9
Printer Connector (LPT)
The 25-pin connector LPT on the rear panel of the R&S UPV allows a printer to be connected.
1
14
13
25
D0
D1
D2
D3
D4
D5
D6
D7
ACK
BUSY
PE
SELECT STROBE
AUTOFEED
ERROR
INIT
SELECT IN
GND
GND
GND
GND
GND
GND
GND
GND
Connection Signal Input (I) /
Output (O)
Meaning
1STROBE O Pulse for transferring a data byte; min. 1Pspulse width
(active LOW).
2D0 O Data line 0
3D1 O Data line 1
4D2 O Data line 2
5D3 O Data line 3
6D4 O Data line 4
7D5 O Data line 5
8D6 O Data line 6
9D7 O Data line 7
10 ACK I Indicates the printer's readiness to receive the next byte
(active LOW).
11 BUSY I Signal active if the printer cannot receive any data.
12 PE I The signal becomes active if there is no paper in the
printer (active HIGH).
13 SELECT I The signal becomes active if the printer has been selected
(active HIGH).
14 AUTOFEED O If the signal is active, the printer automatically performs a
line feed after each line (active LOW).
15 ERROR I This signal becomes active if there is no paper in the
printer, the printer is not selected or the printer has an
error status (active LOW).
16 INIT O Initialization of the printer (active LOW).
17 SELECt IN O If the signal is active, the codes DC1/DC3 are ignored by
the printer (active LOW).
18 - 25 GND Ground connections
Figure 8-8 Assignment of LPT connector
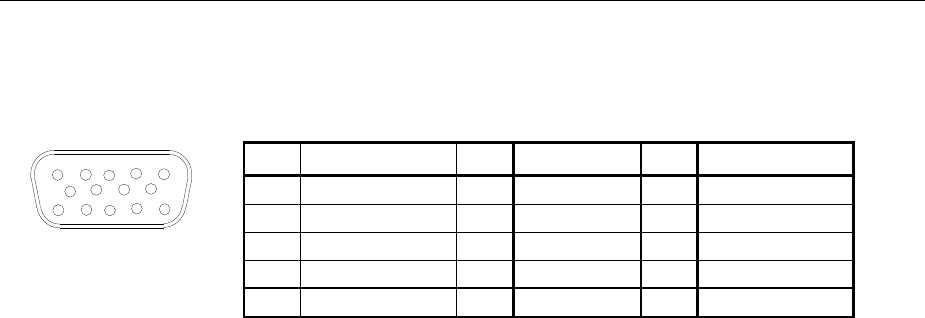
R&S UPV Instrument Interfaces
1146.2084.32 8.17 E-9
Monitor Connector (MONITOR)
The 15-pin connector MONITOR on the rear of the instrument allows a VGA monitor to be connected.
Pin Signal Pin Signal Pin Signal
1Red (output) 6 GND 11 (NC)
2Green (output) 7 GND 12 (NC)
1
5
15 11
6
10
3Blue (output) 8 GND 13 HSYNC (output)
4(NC) 9 GND 14 VSYNC (output)
5GND 10 GND 15 (NC)
Figure 8-9 Assignment of MONITOR connector

R&S UPV Index
1146.2084.32 10.1 E-9
Index
&
>L ............................................................................. 5.3
>R............................................................................. 5.3
&LLO.............................................................................. 5.3
*
*CLS .............................................................................. 6.4
*ESE .............................................................................. 6.4
*ESR .............................................................................. 6.4
*IDN ............................................................................... 6.5
*IST................................................................................ 6.5
*OPC.............................................................................. 6.5
*OPT .............................................................................. 6.5
*PRE .............................................................................. 6.5
*PSC .............................................................................. 6.5
*RST .............................................................................. 6.5
*SRE .............................................................................. 6.6
*STB .............................................................................. 6.6
*TRG.............................................................................. 6.6
*TST............................................................................... 6.6
*WAI............................................................................... 6.6
0
0dB ........................................................................... 4.324
0..2.......................................................................... 4.395
0..360° ....................................................................... 4.395
1
1kHz max .................................................................. 4.296
1/12 Octave................................................................ 4.310
1/24 Octave................................................................ 4.310
1/3 Octave.................................................................. 4.309
1/6 Octave.................................................................. 4.309
12 dB Auto ................................................................. 4.324
-180..180° .................................................................. 4.395
2
240 Hz max ................................................................ 4.296
-2..0 ......................................................................... 4.395
3
30 dB Auto ................................................................. 4.324
-360..0° ...................................................................... 4.395
6
60 Hz max .................................................................. 4.296
A
ABORt............................................................................ 6.9
Abs Peak..........................................................4.268, 4.274
AC coupling...........................................4.242, 4.274, 4.324
AC supply voltage connector........................................ 1.15
According to ............................................................... 4.340
Acoustic coupling ....................................................... 4.335
Acoustical PESQ........................................................ 4.335
Act Curs In button ........................................................ 3.80
Act Curs Out button ......................................................3.80
Activate panel ...............................................................3.22
Activating cursor ...........................................................3.71
Active cursor.................................................................3.71
Additional measurement functions ..............................4.457
Addressed commands ....................................................8.6
Admissibility of commands (IEC/IEEE) .........................5.22
Adopting parameters.....................................................3.44
All di............................................................................4.287
All even di...................................................................4.287
All odd di.....................................................................4.287
Alphanumeric entries ....................................................3.42
Amplitude....................................................................4.343
Analog ............................................................................4.1
Analog analyzer ..........................................................4.140
Analog Aux Out....................................................1.14, 3.96
Analog Auxiliaries Out.................................................4.442
Analyzer amplitude .....................................................4.343
Analyzer filter............................ 4.245, 4.275, 4.298, 4.311,
............................................................. 4.344, 4.353, 4.377
Analyzer ground..........................................................4.149
Analyzer sweep system ..............................................4.256
Anlr Sync ....................................................................4.127
Artificial ear.................................................................4.336
Artificial mouth ............................................................4.336
Asterisk.........................................................................5.20
Audio Monitor................................................................3.94
Audio monitoring channel................................... 3.95, 4.440
Audio monitoring tap...................................................4.438
Audio quality measurements............................ 4.345, 4.348
Audio signal measurement..........................................4.345
Auto................................4.170, 4.175, 4.247, 4.251, 4.264,
.................................................. 4.277, 4.289, 4.296, 4.310
Auto Each...................................................................4.262
Auto Fast ................................... 4.247, 4.250, 4.264, 4.276
Auto List .......................................................... 4.121, 4.256
Auto Scale ....................................................... 4.498, 4.568
Auto Sweep .......................................... 4.121, 4.126, 4.256
Automatic....................................................................4.384
Automatic sweep ........................................................4.126
Autorange........................................................ 4.151, 4.160
Autoscale button..................................................3.70, 3.80
Autotrigger ..................................................................4.362
AUX IN connector .........................................................1.14
AUX OUT connector .....................................................1.14
Auxiliaries panel............................................................3.94
Auxiliaries Panel .............................................. 4.443, 4.445
Auxiliary analog output..................................................3.96
Average ................................................ 4.404, 4.407, 4.410
Average count.............................................................4.328
Average mode ............................................................4.327
Averaging ........................................................ 4.327, 4.328
Avg Count...................................................................4.328
Avg Delay ........................................................ 4.343, 4.352
Avg Mode ...................................................................4.327
B
Band-pass sweep .......................................................4.256
Band-stop sweep ........................................................4.256
Bandwidth........................................................ 4.144, 4.253
Bargraph................................................. 3.58, 4.285, 4.313
Bargraph scaling...........................................................3.53
Basic unit....................................................................4.585
Betw H Curs button.......................................................3.80
Betw V Curs button.......................................................3.80
Between Channels......................................................4.385
Binary .........................................................................4.386
Binary+Text ................................................................4.386
Bins ............................................................................4.316
Blackman Harris window.............................................4.319

Index R&S UPV
1146.2084.32 10.2 E-9
Blue selection frame..................................................... 3.29
Bottom........................................................................ 4.500
BP 1 %....................................................................... 4.253
BP 1/12 Oct................................................................ 4.254
BP 1/3 Oct.................................................................. 4.254
BP 1/3 Oct Fast.......................................................... 4.255
BP 3 %....................................................................... 4.254
BP Fix ........................................................................ 4.255
Brief introduction, operation............................................ 2.4
BS 1 %....................................................................... 4.253
BS 1/12 Oct................................................................ 4.254
BS 1/3 Oct.................................................................. 4.254
BS 1/3 Oct Fast.......................................................... 4.255
BS 3 %....................................................................... 4.254
BS Fix ........................................................................ 4.255
Burst-duration sweep .......................................4.123, 4.125
Burst-duration sweep list............................................ 4.135
Burst-interval sweep.........................................4.124, 4.125
Burst-interval sweep list ............................................. 4.135
C
CD drive......................................................................... 1.8
Chan Status ............................................................... 4.171
Change language option ............................................ 4.604
Changes..................................................................... 4.385
Changing functions....................................................... 3.30
Changing instrument .................................................... 3.30
Changing unit............................................................... 3.39
Channel...................................................4.95, 4.100, 4.480
Channel 1.........................................................4.359, 4.375
Channel 2.........................................................4.359, 4.375
Character strings................................................... 5.19, 6.3
Checkbox ..................................................................... 3.32
Clock frequency ............................................................. 4.6
Close All button............................................................ 3.17
Close button................................................................. 3.84
CLOSE key .................................................................... 1.8
Close panel .................................................................. 3.22
Collecting measurement values.................................. 4.484
Colon............................................................................ 5.20
Combined display......................................................... 3.50
Comma ........................................................................ 5.20
Command
Addressed................................................................ 8.6
Asterisk.................................................................. 5.20
Colon ..................................................................... 5.20
Comma .................................................................. 5.20
Crosshatch............................................................. 5.20
Header................................................................... 5.14
Identification........................................................... 5.22
Long form............................................................... 5.16
Parameter .............................................................. 5.19
Program message.................................................. 5.17
Query..................................................................... 5.17
Question mark........................................................ 5.17
Quotation marks..................................................... 5.20
Semicolon .............................................................. 5.20
Short form.............................................................. 5.16
Structure ................................................................ 5.14
Suffix...................................................................... 5.16
Synchronization...................................................... 5.25
Syntax elements .................................................... 5.20
Universal.................................................................. 8.6
White space ........................................................... 5.20
Command (IEC/IEEE)
Admissibility........................................................... 5.22
Command sequence (IEC/IEEE) .................................. 5.22
Common..................................................................... 4.149
Common commands ...................................................... 6.4
Completing settings...................................................... 3.45
Compressed ...............................................................4.356
Compression factor.....................................................4.331
Compression factors...................................................4.357
Computer name ...................................................1.40, 1.50
CONDition register part.................................................5.29
Consumer ...................................................................4.384
CONT key.......................................................................1.5
Conversion formula for dig. phase meas. results ........3.114
Conversion formula for group delay meas. results ......3.114
Conversion formulae...................................................3.110
Conversion formulae for absolute analog level units ...3.115
Conversion formulae for absolute digital level units ....3.115
Conversion formulae for absolute phase units ............3.117
Conversion formulae for absolute time units ...............3.116
Conversion formulae for analog level meas. results ....3.111
Conversion formulae for digital level meas. results .....3.112
Conversion formulae for distortion meas. results ........3.112
Conversion formulae for frequency meas. results .......3.113
Conversion formulae for jitter measurement results ....3.114
Conversion formulae for phase meas. results .............3.113
Conversion formulae for relative analog level units .....3.115
Conversion formulae for relative digital level units ......3.116
Conversion formulae for relative frequency units ........3.116
Converting units.................................................3.39, 3.110
Copy .............................................................................6.33
Copy to Ch2................................................................4.562
Copy to other Window.................................................4.460
Copying of files .............................................................6.33
Create new directory.....................................................6.34
Create New Directory....................................................6.34
Critical Bands .............................................................4.310
Crossed ......................................................................4.103
Crosshatch ...................................................................5.20
Cursor key ......................................................................1.7
Curve button .................................................................3.70
D
d2 (IEC 118) ...............................................................4.303
d2 (IEC 268) ...............................................................4.302
d3 (IEC 118) ...............................................................4.303
d3 (IEC 268) ...............................................................4.302
Data List .....................................................................4.460
Data List button.............................................................3.83
Data lists.......................................................................3.82
DC ................................................................... 4.271, 4.400
DC coupling .......................................... 4.242, 4.274, 4.323
DC Offset...........................................................4.98, 4.105
DC Suppress ........................................ 4.241, 4.274, 4.323
DC suppression ............................................... 4.241, 4.274
DC voltage....................................................... 4.271, 4.443
DCL ..............................................................................5.22
Default
Status reporting system..........................................5.46
Default instrument settings ...........................................6.29
Default settings - entire instrument................................1.24
Deg Level ........................................................ 4.343, 4.351
Delay Ch1...................................................................4.323
Delay compensation ...................................................4.323
Delay Detect ...............................................................4.352
Delay measurement....................................................4.364
Delay versus time .......................................................4.337
Delayed triggering............................................ 4.153, 4.165
Delete ...........................................................................6.34
Deletion of files .............................................................6.34
Description A ..............................................................4.529
Description B ..............................................................4.529
DFD ............................................................................4.301
DI value ........................................................... 4.346, 4.350
Difference cursor ..........................................................3.72
Dig Inp Amp................................................................4.397

R&S UPV Index
1146.2084.32 10.3 E-9
Digital filter .4.245, 4.275, 4.298, 4.311, 4.344, 4.353, 4.377
DIM ............................................................................ 4.304
Direct mode.................................................3.37, 3.38, 3.45
Disp Config button........................................................ 3.87
Display ...........................................3.12, 3.86, 4.459, 4.561
Display Configuration panel..............................4.457, 4.458
Display fields................................................................ 3.43
Display Mode ............................................................. 4.384
Display window ............................................................ 3.21
TRACk .......................................................4.494, 4.495
USER................................................................... 4.497
SOURce.....................................................4.504, 4.506
USER................................................................... 4.497
Displays button............................................................. 3.88
Distortion..........................................................4.286, 4.287
Distortion measurement ...................................4.280, 4.291
Distortion voltage .............................................4.287, 4.288
Division .................................................4.501, 4.527, 4.570
Downward sweep..................................4.131, 4.134, 4.258
Dropouts versus time ................................................. 4.337
DUT ........................................................................... 4.342
DVD drive....................................................................... 1.8
Dwell File ................................................................... 4.128
Dwell sweep............................................................... 4.126
Dwell time .................................................................. 4.127
Dwell Value ................................................................ 4.127
Dwell-time list............................................................. 4.128
Dynamic intermodulation distortion analysis............... 4.304
Dynamic Mode ........................................................... 4.282
Dynamic response...................................................... 4.282
E
Edge Trig ................................................................... 4.228
Edge Trig Ch1............................................................ 4.228
Edge Trig Ch2............................................................ 4.228
Edit button.................................................................... 3.86
Edit mode............................................................ 3.42, 3.45
Editing trace files........................................................ 4.598
Electrical PESQ ......................................................... 4.335
ENABle register part..................................................... 5.30
Engineering................................ 4.497, 4.521, 4.550, 4.564
ENTER key .................................................................... 1.4
Enter strings (IEC/IEEE)................................................. 6.3
Entering unit................................................................. 3.39
Entries during data output ............................................ 3.46
Entries during measurement......................................... 3.46
Entry field, numeric .....................................3.36, 3.37, 3.38
Entry information.......................................................... 3.44
Equalization
inverted frequency response................................ 4.533
multistage preemphasis ....................................... 4.534
normalization frequency ....................................... 4.533
offset.................................................................... 4.535
offset value .......................................................... 4.535
Equalizer ...............................................4.284, 4.312, 4.326
Error messages............................................................ 3.20
Error queue query ............................................... 5.45, 6.29
ESC key......................................................................... 1.4
ESE (event status enable)............................................ 5.34
ESR (event status register) .......................................... 5.34
Ethernet ....................................................................... 1.36
Evaluating with cursors and markers............................ 3.69
Even Harmonics......................................................... 4.288
EVENt register part ...................................................... 5.30
Example
Measuring frequency response .............................. 2.20
Measuring harmonic distortion ............................... 2.31
Example setups............................................................ 2.38
Examples of Settling for Start Conditions ................... 4.415
Excel .......................................................................... 4.604
Exponential......................4.327, 4.404, 4.407, 4.410, 4.413
Exponential averaging ..................................... 4.327, 4.328
Export .........................................................................4.604
External frequency sweep...........................................4.227
External keyboard.........................................................1.26
External level sweep...................................................4.227
External sweep ................................................ 4.221, 4.231
Externally controlled measurement value recording ....4.221
Extreme values....................................................3.55, 3.65
F
Factor .............................................................. 4.262, 4.266
Falling.............................................................. 4.361, 4.376
Fast ............................................................................4.393
Fast Fourier Transformation........................................4.316
Fast measurement......................................................4.282
FFT
Phase ...................................................................4.473
Phase difference...................................................4.474
FFT analysis ...............................................................4.316
FFT as measurement function ......................... 4.316, 4.321
FFT bandwidth................................................. 4.331, 4.332
FFT graph..........................................................3.57, 4.458
FFT size................................................ 4.315, 4.316, 4.317
FFT span ......................................................... 4.331, 4.332
FFT start.....................................................................4.332
FFT stop .....................................................................4.332
FFT value ...................................................................4.315
File................................................................................4.99
File button.....................................................................3.86
File extensions............................................................3.107
File Length..................................................................4.375
File list ..........................................................................6.32
File management ........................................................3.102
File Select window......................................................3.104
Filename............................................... 4.259, 4.342, 4.351
Filter ......................4.97, 4.105, 4.245, 4.275, 4.298, 4.311,
.................................................. 4.325, 4.344, 4.353, 4.377
Filter button...................................................................3.85
Filter characteristic......................................................4.255
Find Cursor button ........................................................3.84
Firmware version ............................................................6.5
Fix.................................................................... 4.260, 4.265
Fix 1000 ms .....................................................4.269, 4.278
Fix 200 ms.......................................................4.269, 4.278
Fix 3 s.............................................................. 4.271, 4.278
Fix 50 ms .........................................................4.269, 4.278
Fix All Sizes button .......................................................3.17
Fix Size button..............................................................3.17
Fixed range.................................................................4.151
Fixrange......................................................................4.160
Flat ............................................ 4.404, 4.407, 4.410, 4.414
Flat Top window..........................................................4.320
Fnct Settling................................................................4.403
Focus............................................................................3.29
Forever .......................................................................4.386
Format Phase .............................................................4.394
Formula for S/N measurements ..................................3.113
Free Text ......................................................... 4.528, 4.529
Freezing graphic .........................................................4.484
Freq............................................................................4.227
Freq & Grp Del............................................................4.391
Freq & Phase..............................................................4.390
Freq & Samplefreq......................................................4.392
Freq Ch1..........................................................4.227, 4.261
Freq Ch2..........................................................4.227, 4.261
Freq Fast ....................................................................4.227
Freq Fast Ch1.............................................................4.227
Freq Fast Ch2.............................................................4.227
Freq File .....................................................................4.135

Index R&S UPV
1146.2084.32 10.4 E-9
Freq Mode........................................................4.260, 4.265
Freq RefCh................................................................. 4.262
Freq Settling.....................................................4.406, 4.409
Freq/Phase ................................................................ 4.389
Frequency .............................................4.123, 4.125, 4.390
Frequency band analysis ........................................... 4.308
Frequency measurement............................................ 4.389
Frequency range ........................................................ 4.316
Frequency resolution.................................................. 4.317
Frequency sweep.............................................4.123, 4.125
Frequency sweep list .......................................4.135, 4.259
From Output............................................................... 4.385
Frq Lim Low ..........................................4.267, 4.299, 4.313
Frq Lim Upp ..........................................4.267, 4.299, 4.313
Full Screen button........................................................ 3.16
Function ............... 4.307, 4.309, 4.322, 4.339, 4.349, 4.372
Function FFT....................................................4.316, 4.321
Function groups ........................................................... 3.24
Function level................................................................. 3.5
Fundamental ....................................................4.289, 4.296
Fundamental rejection................................................ 4.295
G
Gen Burst................................................................... 4.360
Gen Track ...................... 4.243, 4.249, 4.253, 4.261, 4.265,
........................................ 4.266, 4.277, 4.290, 4.297, 4.325
Generator ground........................................................... 4.5
Generator level control ................................................... 4.6
Generator output ............................................................ 4.4
Generator sweep system ........................................... 4.121
Generator sweeps...................................................... 4.119
GET (Group Execute Trigger) ...................................... 5.22
Gibbs phenomenon.................................................... 4.268
Graphic
Freezing............................................................... 4.484
Graphic system
Bargraph.............................................................. 4.480
FFT Graph ........................................................... 4.472
Histogram ............................................................ 4.477
Sweep Graph....................................................... 4.465
Waveform ............................................................ 4.475
Graphical windows ....................................................... 3.56
Graphs with PESQ..................................................... 4.337
Green selection frame......................................... 3.29, 3.45
Gridlines......................................................3.54, 3.64, 3.67
Ground socket................................................................ 1.8
H
HCOPY key................................................................... 1.6
Hamming window....................................................... 4.319
Hann window.............................................................. 4.318
Hardware options ........................................................... 6.5
Harmonics button ......................................................... 3.79
Header ......................................................................... 5.14
Headlines in panels...................................................... 3.24
Headphone connector .................................................... 1.8
Help button................................................................... 3.89
HELP key ....................................................................... 1.8
Help system ................................................................. 3.99
Help text language ..................................................... 3.100
HIDE key........................................................................ 1.8
Hide panel.................................................................... 3.22
Hiding parameter fields................................................. 3.31
Hiding traces ................................................................ 3.70
Highlight..................................................................... 4.385
Highlighting control elements ....................................... 3.32
Histogram................................................................... 4.458
History........................................................................ 4.463
Horiz Move button ........................................................ 3.16
Horiz Size button...........................................................3.16
Horizontal cursors .........................................................3.72
Hum loops, avoiding .......................................................2.3
I
IEC/IEEE bus
Interface functions ....................................................8.5
IEC/IEEE bus addresse ................................................6.29
IEC/IEEE bus commands
Preset.....................................................................5.22
IEC-bus interface..........................................................1.15
Import from .................................................................4.515
Infinite.........................................................................4.396
Information....................................................................3.19
Infrasound........................................................4.329, 4.379
Infrasound analysis.....................................................4.379
Infrasound signals.......................................................4.379
INIT command (IEC/IEEE)............................................5.25
INIT-Befehl (IEC) ..........................................................5.25
Initializing
Status reporting system..........................................5.46
TIMeout ....................................................................6.8
INPut
SYNCto ................................................................4.187
Input buffer ...................................................................5.21
Input channel ..............................................................4.143
Input configuration ......................................................4.146
Input coupling .................................................. 4.144, 4.158
Input Impedance .........................................................4.148
Input level ............................................................3.5, 4.397
Input Monitor...............................................................4.397
Input resistor...............................................................4.148
Installed options..............................................................6.5
Instrument............................................................4.1, 4.140
Instrument settings - reset .....................................1.24, 6.5
INSTrument2 ..............................................................4.140
Instruments button ........................................................3.87
Integration time...........................................................4.317
Interface - IEC-bus........................................................1.15
Interface functions
IEC/IEEE bus ...........................................................8.5
Interface messages ......................................................5.13
Internal resistor...............................................................4.5
International Telecommunication Union ........... 4.333, 4.345
Interpolation................................................................4.547
Interrupt ........................................................................5.43
Interval............................................................. 4.124, 4.125
Interval File.................................................................4.135
Intv Time..........................................................4.269, 4.271
Invert ..........................................................................4.533
Inverted frequency response.......................................4.533
IP address ...........................................................1.40, 1.50
IST flag ..................................................................5.34, 6.5
ITU...................................................................4.333, 4.345
ITU P.862 ...................................................................4.334
ITU P.862.1 ................................................................4.334
ITU P.862.2 ................................................................4.334
K
Keyboard ......................................................................1.26
L
Label Auto ....................................................... 4.483, 4.521
LAN ..............................................................................1.36
LAN interface................................................................1.13
Leakage......................................................................4.318
Left .................................................................. 4.526, 4.569
Lev Trig.......................................................................4.228

R&S UPV Index
1146.2084.32 10.5 E-9
Lev Trig Ch1............................................................... 4.228
Lev Trig Ch2............................................................... 4.228
Level all di.................................................................. 4.288
Level even di.............................................................. 4.288
Level measurements .................................................. 4.241
Level meter ......................................................4.397, 4.399
Level Monitor.............................................................. 4.399
Level Noise ................................................................ 4.294
Level odd di................................................................ 4.288
Level Select di............................................................ 4.287
Level sweep .....................................................4.123, 4.125
Level sweep list.......................................................... 4.134
Level THD+N ............................................................. 4.294
Limit
parallel shifting..................................................... 4.512
symmetrical shift .................................................. 4.513
Limit curve.................................................................. 4.577
Limit Lower............................................4.507, 4.550, 4.571
Limit Shift ................................................................... 4.511
Limit Upper............................................4.503, 4.550, 4.572
Limit value curve ........................................................ 4.577
Limits .................................................................. 3.54, 3.64
Lin Points .........................................................4.130, 4.257
Lin Steps..........................................................4.130, 4.257
Linear step size ................................................4.133, 4.259
Linear sweep.........................................4.129, 4.130, 4.257
List display ................................................................... 3.82
List sweep.................................................................. 4.134
List-controlled sweep.................................................. 4.134
LOAD key....................................................................... 1.8
Loading and saving traces / scans ............................... 3.68
Loading predefined instrument setups.......................... 2.38
Loading, saving instrument settings ........................... 3.106
LOCAL key......................................................1.6, 5.4, 5.10
Log Points........................................................4.130, 4.257
Log Steps.........................................................4.131, 4.257
Logarithmic step size........................................4.133, 4.259
Logarithmic sweep ..................... 4.129, 4.130, 4.131, 4.257
Long........................................................................... 4.386
Loop Channel............................................................. 4.102
Loop Gain .................................................................. 4.104
Loudspeaker .............................................................. 4.437
Low-distortion generator................................................. 3.2
Lower Limit................................................................. 4.558
M
Macros button .............................................................. 3.88
Magenta selection frame ....................3.29, 3.37, 3.38, 3.45
Main Grid ..............................................4.500, 4.526, 4.569
Maintenance................................................................... 8.1
Manual .............................................................4.360, 4.376
Manual Control
Changing to..................................................... 5.4, 5.10
Manual List................................................................. 4.122
Manual remote operation............................................ 3.109
Manual Sweep ........................................................... 4.122
Marker........................................................................ 4.453
Markers........................................................................ 3.79
Maximum output voltage ................................................ 2.2
Meas Channels .......................................................... 4.157
Meas Mode ...............................4.268, 4.273, 4.286, 4.293,
...................................................4.302, 4.309, 4.341, 4.354
Meas Time ................................ 4.246, 4.250, 4.263, 4.276,
..............................................................4.310, 4.317, 4.393
Measurement
Triggering (IEC/IEEE) ............................................ 5.24
Measurement delay..........................................4.153, 4.165
Measurement displays ................................................. 3.47
Measurement result display in combined fields ............ 3.51
Measurement result display in graphical windows ........ 3.60
Measurement result display in numeric display field .....3.49
Measurement scans
Append.................................................................4.587
Replace ................................................................4.587
Measurement signal versus time.................................4.337
Measurement speed ........................................ 4.295, 4.393
Measurement value sequences ..................................4.580
Measurement value trigger .............................. 4.153, 4.164
Memory depth.............................................................4.358
Menu bar ........................................................................1.3
MENU key ......................................................................1.4
Microsoft Excel ...........................................................4.604
Min Volt ......................................................................4.232
Min/Max curve ............................................................4.454
Min/Max curve display ................................................4.464
Min/Max values.............................................................3.55
MOD DIST ..................................................................4.299
Modify Equ..................................................................4.534
MODIFY key ...................................................................1.8
Monitor
Connecting .............................................................1.27
Connector...............................................................8.17
Monitor connector.........................................................1.13
Monitor level ...................................................................3.5
Mono Left...........................................................4.95, 4.100
Mono Right ........................................................4.95, 4.100
MOS ...........................................................................4.334
MOS LQO...................................................................4.334
MOS P.862.1 ..............................................................4.340
MOS P.862.1 Silence .................................................4.341
MOS P.862.1 Speech .................................................4.341
MOS P.862.2 ..............................................................4.341
MOS P.862.2 Silence .................................................4.341
MOS P.862.2 Speech .................................................4.341
MOS value..................................................................4.334
MOS versus time ........................................................4.337
MOS-value..................................................................4.340
Mouse...........................................................................1.26
Movement button ..........................................................3.72
Moving cursor ...............................................................3.73
Multi scan ...................................................................4.462
Multistage preemphasis ..............................................4.534
N
Narrow........................................................................4.295
Navigating in lists..........................................................3.84
Navigating in panels......................................................3.27
Navigation keys ..............................................................1.4
Neg Peak......................................................... 4.268, 4.273
Network connector........................................................1.36
New Scan ...................................................................4.514
Next Bin button .............................................................3.75
Next Harmonic button ...................................................3.75
Next Peak button .................................................3.74, 3.75
Next Pixel button......................................... 3.74, 3.75, 3.76
Next Sample button ......................................................3.76
Next Step....................................................................4.126
Next Step button...........................................................3.74
Next Value button .........................................................3.77
Noise ..........................................................................4.294
Noise Density .............................................................4.489
Noise factor ................................................................4.294
Norm Freq...................................................................4.533
Normal averaging............................................. 4.327, 4.328
Normalization..............................................................4.492
Normalization frequency .............................................4.533
Normalization value.....................................................4.492
Normalize Value..........................................................4.493
Normalizing trace ........................................................4.492
Notch characteristic ....................................................4.244

Index R&S UPV
1146.2084.32 10.6 E-9
Notch filter.................................. 4.242, 4.243, 4.283, 4.324
Notch Freq .......................................................4.243, 4.324
Notch frequency...............................................4.243, 4.324
Notch gain.................................................................. 4.242
Notch(Gain)......................................................4.242, 4.324
Notch-filter center frequency ...................................... 4.243
Nothing....................................................................... 4.385
Nth octave analysis .................................................... 4.308
NTRansition register part.............................................. 5.30
Number of displayed digits ........................................... 3.55
Numeric display.......................................................... 4.552
Numeric display field .................................................... 3.48
Numeric entry field ......................................3.36, 3.37, 3.38
Numeric value (commands).......................................... 5.19
O
Octave ....................................................................... 4.309
Odd Harmonics .......................................................... 4.289
ODG value .......................................................4.346, 4.350
Off ...4.103, 4.389, 4.397, 4.399, 4.403, 4.407, 4.409, 4.413
Offline ........................................................................ 4.342
Offline measurement .................................................. 4.350
Offset ......................................................................... 4.535
Offset Value ............................................................... 4.535
ON key........................................................................... 1.5
On Time ...........................................................4.123, 4.125
On Time File............................................................... 4.135
One-dimensional sweep...................................4.122, 4.125
Open panel................................................................... 3.22
Opening combined display ........................................... 3.50
Opening graphical window ........................................... 3.59
Opening result list ........................................................ 3.83
Operating cursor .......................................................... 3.71
Operation examples ..................................................... 2.20
Operation with mouse .................................................. 3.10
Out-of-band signals..........................................4.242, 4.283
Output channel............................................................... 4.3
Output impedance.......................................................... 4.5
OUTPUT key.................................................................. 1.6
Output level................................................................ 4.441
Output level limitation..................................................... 4.7
Overload protection.................................................... 4.148
P
PAGE key ...................................................................... 1.4
Panel............................................................................ 3.21
Panel structure............................................................. 3.23
Panel types .................................................................. 3.21
Panels for configuring measured value display............. 3.47
Parallel....................................................................... 4.512
Parallel poll) ................................................................. 5.45
Parallel shifting........................................................... 4.512
Parameter
Character string ..................................................... 5.19
Numeric value........................................................ 5.19
Text........................................................................ 5.19
Parameter fields ........................................................... 3.23
Parameter setting......................................................... 3.28
PC keyboard ................................................................ 3.11
Peak......................................................4.268, 4.397, 4.400
Peak to Peak.............................................................. 4.268
Peak Voltage................................................................ 4.97
PEAQ analogue ......................................................... 4.348
PEAQ Device Under Test........................................... 4.347
PEAQ digital............................................................... 4.348
PEAQ DUT................................................................. 4.347
PEAQ electrical.......................................................... 4.347
PEAQ graphics........................................................... 4.347
PEAQ measurement signal ........................................ 4.345
PEAQ offline ...............................................................4.350
PEAQ reference signal ...............................................4.345
PEAQ waveform .........................................................4.347
Persistence.................................................................4.385
PESQ .........................................................................4.458
PESQ application program..........................................4.336
PESQ Device Under Test ...........................................4.335
PESQ DUT .................................................................4.335
PESQ graph .................................................................3.58
PESQ graphs..............................................................4.337
PESQ measurement signal.........................................4.333
PESQ MOS ................................................................4.334
PESQ Offline ..............................................................4.341
PESQ P.862 ...............................................................4.340
PESQ reference signal ...............................................4.333
PESQ score................................................................4.334
PESQ Silence.............................................................4.340
PESQ Speech ............................................................4.340
PESQ value ..................................................... 4.334, 4.340
PESQ versus time ......................................................4.337
PESQ waveform .........................................................4.337
Phase .............................................................. 4.123, 4.125
Phase display format ..................................................4.394
Phase File...................................................................4.135
Phase sweep list.........................................................4.135
Phase To Ref..............................................................4.397
Phase-Sweep ..................................................4.123, 4.125
Pk to Pk ......................................................................4.274
Play ........................................................ 4.93, 4.342, 4.343
Play Mode..........................................................4.96, 4.100
Play Peak ...................................................................4.104
Play+Anlr ......................................................................4.98
Plot .............................................................................4.561
Points ................................................... 4.132, 4.231, 4.258
Polarity measurement .................................................4.307
Poles ..........................................................................4.425
Pos Peak ......................................................... 4.268, 4.273
Post FFT............................................... 4.314, 4.316, 4.320
Post-FFT.....................................................................4.285
Power supply connection ..............................................1.20
PPE (parallel poll enable)..............................................5.34
Prec............................................................................4.394
Precision.....................................................................4.394
Precision measurement ................................... 4.282, 4.283
Preemphasis
inverted.................................................................4.533
multistage.............................................................4.534
offset ....................................................................4.535
offset value...........................................................4.535
Prefiltering ..................................................................4.159
Preset .............................................................................6.5
PRESET key..........................................................1.8, 1.24
Preset settings.......................................................6.5, 6.29
Presets (IEC/IEEE).......................................................5.22
Pretrigger....................................................................4.377
Printer
Connector...............................................................8.16
Printer interface ............................................................1.13
Professional................................................................4.384
Prot Analysis...............................................................4.383
Protocol analysis.........................................................4.383
Psychoacoustic coding ....................................4.333, 4.345
Psychoacoustic compression........................... 4.333, 4.345
PTRansition register part ..............................................5.29
Q
Quasi Peak ......................................................4.270, 4.273
Query...................................................................5.17, 5.45
Question mark ..............................................................5.17
Quotation marks ...........................................................5.20

R&S UPV Index
1146.2084.32 10.7 E-9
R
Rack installation........................................................... 1.17
Radio button................................................................. 3.33
Random sweep .......................................................... 4.134
Range ........................................................................ 4.151
Rapid deactivation of outputs ..................................... 4.148
Rear audio monitoring output ..................................... 4.442
Record File................................................................. 4.373
Record Length.......................................4.343, 4.351, 4.374
Recording length ........................................................ 4.358
Rectangular window.........................................4.318, 4.319
Ref Level..........................................................4.343, 4.351
Ref Voltage .................................................................. 4.26
Reference ........................................................4.485, 4.565
Reference channel ................................4.222, 4.262, 4.389
Reference File............................................................ 4.492
Reference frequency............................4.8, 4.27, 4.28, 4.37
Reference impedance ......................................4.153, 4.163
Reference level ....................................4.8, 4.26, 4.28, 4.37
Reference resistance .......................................4.153, 4.163
Reference signal versus time ..................................... 4.337
Reference value ............ 3.40, 3.53, 3.63, 3.66 4.485, 4.565
Reference voltage .........................................4.8, 4.28, 4.37
Reject Bandw............................................................. 4.295
Rejection.................................................................... 4.295
Remote Control - Changing to........................................ 5.3
Remote Control - Ethernet/LAN...................................... 5.5
Remote control - IEC/IEEE bus ...................................... 5.4
Rename ....................................................................... 6.35
Renaming of files ......................................................... 6.35
Reset
Status reporting system ......................................... 5.46
Reset - instrument settings........................................... 1.24
Reset – Instrument settings............................................ 6.5
Resetting Min/Max curves .......................................... 4.464
Resolution.......................... 3.55, 3.68, 4.317, 4.405, 4.408,
........................................ 4.411, 4.415, 4.536, 4.551, 4.564
Restart Min/Max, Lim Violation button.......................... 3.81
Result lists.................................................................... 3.83
Rife Vincent 1............................................................. 4.319
Rife Vincent 2............................................................. 4.319
Rife Vincent 3............................................................. 4.319
Right ................................................................4.526, 4.569
Rising...............................................................4.361, 4.376
RMS......................................................4.246, 4.273, 4.399
RMS measurement .................................................... 4.246
RMS measurement, selective..................................... 4.249
RMS Selective ........................................................... 4.249
RMS, broadband ........................................................ 4.246
RMS, selective ........................................................... 4.249
Rotary knob............................................................. 1.7, 3.9
RS-232-C interface....................................................... 1.13
Rub & Buzz Measurement.......................................... 4.263
S
S/N measurements..................................................... 4.272
S/N Sequence............................................................ 4.279
Sample Freq............................................................... 4.392
Samples ..................................... 4.405, 4.408, 4.410, 4.414
SAVE key....................................................................... 1.8
Scale for audio quality................................................ 4.345
Scale Pk to FS ...................................................4.94, 4.343
Scaling ....................................................................... 4.524
Scaling graph ...................................................... 3.70, 3.80
Scan.................................................................4.460, 4.538
Index.................................................................... 4.546
SCAN key ...................................................................... 1.4
Scan number.............................................................. 4.538
Scans
Append.................................................................4.587
Import ...................................................................4.587
Importing ..............................................................4.588
Replace ................................................................4.587
SCPI
Version .....................................................................5.1
SCREEN key ..................................................................1.4
Screens ........................................................................3.12
Screens buttons............................................................3.86
SDG value ..................................................................4.345
Select di......................................................................4.286
Selection field ...............................................................3.34
Selftest ...........................................................................6.6
Semicolon.....................................................................5.20
Serial interface..............................................................8.10
Serial poll).....................................................................5.43
Service request (SRQ).................................. 5.32, 5.43, 6.6
Set cursor .....................................................................3.71
Set to Cursors button....................................................3.79
Setting AC supply voltage......................................1.20, 8.2
Setting parameters........................................................3.28
Settings in menu bar.....................................................3.86
Settings in operating system.........................................3.94
Settings in the Toolbar..................................................3.91
Settling .......................................................................4.413
Settling algorithms ......................................................4.402
Settling Applications ...................................................4.401
Settling for Frequency Measurements ........................4.406
Settling for Measurement Functions............................4.403
Settling for Phase Measurements ...............................4.409
Settling for Start Conditions ........................................4.412
Settling Methods.........................................................4.401
Several individual scans ......................................3.78, 3.85
Shape File ....................................................................4.94
Short...........................................................................4.386
Show ...............................................................4.354, 4.383
Show A .......................................................................4.528
Show A button ..............................................................3.70
Show B .......................................................................4.528
Show B button ..............................................................3.70
Show Min/Max ................................................. 4.464, 4.574
Showing traces .............................................................3.70
SHUT-DOWN key...........................................................1.6
Signal delay time axis .................................................4.343
Signal source..............................................................4.438
Signal Source field........................................................3.95
Signal to noise measurements....................................4.272
SINAD .............................................................4.291, 4.293
SINGLE key....................................................................1.5
Single scan...................................................... 4.461, 4.544
Slope of bell-shaped curve..........................................4.319
Softkey bar ............................................................1.3, 3.14
Softkey menu
Combi display.......................................................4.574
Softkeys.................................................................1.3, 3.14
Software options.............................................................6.5
Source .................................................... 3.62, 4.503, 4.507
Source Filename..............................................4.506, 4.511
Source Value ................................................... 4.506, 4.510
Spacing............................4.129, 4.257, 4.498, 4.525, 4.568
Speaker ......................................................................4.437
Spectral display ..........................................................4.316
Spectral range ............................................................4.316
Spectrum ....................................................................4.316
Speech quality measurements ......................... 4.333, 4.338
Speech quality scale...................................................4.333
Speech signal measurement.......................................4.333
SRE (service request enable) .......................................5.32
SRQ (service request) ....................................................6.6
Standard.....................................................................4.355
Start........................................... 4.131, 4.233, 4.258, 4.332

Index R&S UPV
1146.2084.32 10.8 E-9
START key..................................................................... 1.5
Start of measurement.......................................4.153, 4.164
Status displays............................................................. 3.19
Status register
CONDition part....................................................... 5.29
ENABle part ........................................................... 5.30
ESE ....................................................................... 5.34
ESR ....................................................................... 5.34
EVENt part............................................................. 5.30
NTRansition part .................................................... 5.30
Overview................................................................ 5.31
PPE ....................................................................... 5.34
PTRansition part .................................................... 5.29
SRE ....................................................................... 5.32
STATus OPERation ............................................... 5.35
STATus QUEStionable ................5.37, 5.38, 5.39, 5.40
STB........................................................................ 5.32
Status reporting system....................................... 5.28, 6.21
Initializing ............................................................... 5.46
STATus\:OPERation register........................................ 5.35
STATus\:QUEStionable register .........5.37, 5.38, 5.39, 5.40
STATus\:XQUEstionable register ................................. 5.41
STB (status byte) ......................................................... 5.32
Step ...........................................4.133, 4.259, 4.527, 4.570
Step size ..........................................................4.133, 4.259
Step size of cursor........................................................ 3.73
Steps.......................................................................... 4.501
Stereo .....................................................4.96, 4.100, 4.103
Stop ...........................................4.131, 4.233, 4.258, 4.332
STOP key....................................................................... 1.5
Store trace ................................................................. 4.530
Store Trace as............................................................ 4.530
Store Trace to ............................................................ 4.536
Store WAV .......................................................4.342, 4.351
Structure
Command .............................................................. 5.14
Program message.................................................. 5.17
SCPI Status Register ............................................. 5.29
Sub Grid................................................4.501, 4.528, 4.570
Suffix............................................................................ 5.16
Summary bit................................................................. 5.30
Suppression of far-off interference ............................. 4.319
Sweep........................................................................ 4.458
Sweep (IEC/IEEE)
Triggering............................................................... 5.24
Sweep Ctrl .......................................................4.121, 4.256
Sweep direction.....................................4.129, 4.131, 4.258
Sweep graph................................................................ 3.56
Sweep speed ............................................................. 4.135
Sweep stepping.......................................................... 4.126
Sweep system............................................................ 4.120
Sweeps ...................................................................... 4.119
Symmetrical ............................................................... 4.513
Symmetrical shift........................................................ 4.513
SYNC IN connector...................................................... 1.14
SYNC OUT connector.................................................. 1.14
Synchronization (IEC/IEEE) ......................................... 5.25
Synchronous sweep................................................... 4.126
Syntax elements
Command .............................................................. 5.20
T
Termination event.............................................4.216, 4.235
Text entry field ............................................................. 3.42
Text parameter............................................................. 5.19
THD ........................................................................... 4.285
THD measurement value............................................ 4.286
THD+N.............................................................4.291, 4.293
THD+N measurement method.................................... 4.293
Time........................................................4.97, 4.102, 4.230
Time Chart..................................................................4.226
Time Cont ..........................................................4.96, 4.101
Time delays of signals ................................................4.343
Time Single........................................................ 4.96, 4.101
Time Tick....................................................................4.225
Time-controlled measurement value recording............4.221
Timeout................................................. 4.406, 4.409, 4.411
Time-triggered sweep .................................................4.126
Title bar.........................................................................3.24
Tolerance.............................................. 4.405, 4.408, 4.414
Top .............................................................................4.499
Tot Volt File ................................................................4.134
Total Cont.......................................................... 4.96, 4.101
Total distortion factor ..................................................4.293
Total distortion voltage................................................4.294
Total harmonic distortion + noise ................................4.291
Total Single........................................................4.96, 4.101
Trace ..........................................................................4.532
Equalization list
Format ...............................................................4.594
Loading..............................................................4.589
Save ..................................................................4.581
Format..................................................................4.590
Limit list
Format ...............................................................4.597
Loading..............................................................4.589
Save ..................................................................4.582
load ......................................................................4.583
save......................................................................4.580
Sweep list
Format ...............................................................4.595
Loading..............................................................4.589
Save ..................................................................4.581
Trace File....................................................................4.480
Trace Length...............................................................4.358
Track ..........................................................................4.481
Track box......................................................................3.44
Track to Max button ......................................................3.79
Tracking......................................................................4.481
Transferring settings ...................................................4.481
Transmission function.................................................4.425
Trig In Out.....................................................................3.97
Trigger channel..................................... 4.223, 4.359, 4.360
Trigger command (IEC/IEEE) .......................................5.25
Trigger input.............................................. 1.14, 3.97, 4.445
Trigger level.....................................................4.361, 4.376
Trigger output ........................................... 1.14, 3.97, 4.443
Trigger slope.................................................... 4.361, 4.376
Trigger source.................................................. 4.359, 4.375
Trigger time.................................................................4.362
Two-dimensional sweep .............................................4.124
U
Undersample ................................................... 4.355, 4.380
Undersample FFT.......................................................4.329
Undersampling............................................................4.380
Undo button ..................................................................3.80
UNDO key ......................................................................1.4
Unit....................................................... 4.495, 4.549, 4.562
Unit Auto.................................... 4.496, 4.522, 4.550, 4.562
Unit Funct Track .............................................. 4.493, 4.549
Unit of measurement result ...........................................3.53
Unit User String ............................................... 4.497, 4.523
Units ...........................................................................3.110
Units for X-axis .............................................................3.66
Units of measured values .............................................3.63
Universal commands ......................................................8.6
Universal generator.........................................................3.2
Unzoom button..............................................................3.80
Upward sweep...................................... 4.131, 4.134, 4.258

R&S UPV Index
1146.2084.32 10.9 E-9
USB
Connectors ............................................................ 8.14
USB interface........................................................ 1.7, 1.13
User-defined unit designation..................................... 4.497
Utilities button .............................................................. 3.89
V
Valid value range ......................................................... 3.19
Value range.................................................................. 3.44
Variation..................................................................... 4.234
Version....................................................................... 4.350
Vert Move button.......................................................... 3.16
Vert Size button............................................................ 3.17
Vertical cursors ............................................................ 3.72
View Mode ................................................................. 4.386
Virus-protection software.............................................. 1.36
Volt............................................................................. 4.227
Volt Ch1 ..................................................................... 4.227
Volt Ch2 ..................................................................... 4.227
Voltage.............................................................4.123, 4.125
Volume...............................................................3.96, 4.441
Volume key ........................................................... 1.5, 3.96
W
Warnings...................................................................... 3.20
Waveform................................................3.57, 4.354, 4.458
Waveform monitor............................................4.223, 4.354
Weighting filter .......................... 4.245, 4.275, 4.298, 4.311,
..............................................................4.344, 4.353, 4.377
White space ................................................................. 5.20
Wide........................................................................... 4.295
WINBAR................................................................ 1.3, 3.15
Window ............................................................4.315, 4.318
Window function...............................................4.315, 4.318
WINDOW key................................................................. 1.4
Windows button............................................................ 3.89
WindowsXP access...................................................... 1.25
Wordwidth
Digital analyzer..................................................... 4.172
X
XAxis...............................................................4.123, 4.518
X-axis........................................................................... 3.66
X-axis scaling............................................................... 3.67
X-Source .................................................................... 4.515
Y
Y-axis........................................................................... 3.62
Y-axis scaling............................................................... 3.63
Y-Source ......................... 4.465, 4.472, 4.475, 4.477, 4.478
Bargraph.............................................................. 4.480
Z
ZAxis......................................................................... 4.124
Zeros.......................................................................... 4.425
Zoom button................................................................. 3.80
Zooming graph ............................................................. 3.80

R&S UPV Alphabetical List of Commands
1146.2084.32 11.1 E-9
Alphabetical List of Commands
A
ARM:FREQuency:STARt ........................................................................................................................................................4.236
ARM:FREQuency:STOP.........................................................................................................................................................4.236
ARM:LEVel:MIN......................................................................................................................................................................4.235
ARM:VOLTage:STARt ............................................................................................................................................................4.236
ARM:VOLTage:STOP .............................................................................................................................................................4.236
AUXiliaries: AUDMonitor .........................................................................................................................................................4.443
AUXiliaries: PHONe ................................................................................................................................................................4.444
AUXiliaries: PHPermanent ......................................................................................................................................................4.444
AUXiliaries:AAUXout...............................................................................................................................................................4.449
AUXiliaries:DCValue ...............................................................................................................................................................4.450
AUXiliaries:SPEaker ...............................................................................................................................................................4.444
AUXiliaries:SPEaker:CHANnel................................................................................................................................................4.447
AUXiliaries:SPEaker:SOURce.................................................................................................................................................4.445
AUXiliaries:SPEaker:VOLume.................................................................................................................................................4.448
AUXiliaries:TRIGger:INPut:ENABle.........................................................................................................................................4.451
AUXiliaries:TRIGger:INPut:MODE...........................................................................................................................................4.452
AUXiliaries:TRIGger:OUTPut:EDGE .......................................................................................................................................4.451
AUXiliaries:TRIGger:OUTPut:ENABle.....................................................................................................................................4.450
AUXiliaries:TRIGger:OUTPut:FREQuency ..............................................................................................................................4.451
AUXiliaries:TRIGger:OUTPut:MODE.......................................................................................................................................4.450
D
DIAGnostic:OPERation:BITNo ..................................................................................................................................................6.24
DIAGnostic:OPERation:VALue..................................................................................................................................................6.24
DIAGnostic:QUEStionable:BITNo .............................................................................................................................................6.24
DIAGnostic:QUEStionable:MEASuring:BITNo...........................................................................................................................6.24
DIAGnostic:QUEStionable:MEASuring:VALue..........................................................................................................................6.24
DIAGnostic:QUEStionable:OVERrange:BITNo..........................................................................................................................6.24
DIAGnostic:QUEStionable:OVERrange:VALue.........................................................................................................................6.24
DIAGnostic:QUEStionable:UNDERrange:BITNo.......................................................................................................................6.24
DIAGnostic:QUEStionable:UNDERrange:VALue ......................................................................................................................6.24
DIAGnostic:QUEStionable:VALue.............................................................................................................................................6.24
DIAGnostic:XQUestionable:BITNo ............................................................................................................................................6.24
DIAGnostic:XQUestionable:VALue............................................................................................................................................6.24
DISPlay:BARgraph<i>:A|B:BOTTom.......................................................................................................................................4.504
DISPlay:BARgraph<i>:A|B:LIMLower......................................................................................................................................4.512
DISPlay:BARgraph<i>:A|B:LIMLower:SOURce...................................................................................... 4.513, 4.514, 4.515, 4.516
DISPlay:BARgraph<i>:A|B:LIMShift .................................................................................................................. 4.516, 4.517, 4.518
DISPlay:BARgraph<i>:A|B:LIMUpper......................................................................................................................................4.507
DISPlay:BARgraph<i>:A|B:NORMalize ...................................................................................................................................4.495
DISPlay:BARgraph<i>:A|B:NORMalize:VALue........................................................................................................................4.496
DISPlay:BARgraph<i>:A|B:REFerence .............................................................................4.489, 4.490, 4.491, 4.492, 4.493, 4.495
DISPlay:BARgraph<i>:A|B:REFerence:VALue........................................................................................................................4.494
DISPlay:BARgraph<i>:A|B:SPACing.......................................................................................................................................4.503
DISPlay:BARgraph<i>:A|B:TOP..............................................................................................................................................4.504
DISPlay:BARgraph<i>:A|B:UNIT.................................................................................................................................. 4.499, 4.500
DISPlay:BARgraph<i>:A|B:UPDate.............................................................................................................................. 4.487, 4.488
DISPlay:BARgraph<i>:A|B:YSOurce............................................................................................................................ 4.481, 4.482
DISPlay:BARgraph<i>:DLISt:FILTer..........................................................................................................................................6.38
DISPlay:BARgraph<i>:OCURsor|XCURsor:MODE ...................................................................................................................6.34
DISPlay:BARgraph<i>:OCURsor|XCURsor:POSMode..............................................................................................................6.35
DISPlay:BARgraph<i>:OCURsor|XCURsor:SETTo:XPOS ........................................................................................................6.37
DISPlay:BARgraph<i>:OCURsor|XCURsor:SETTo:YPOS ........................................................................................................6.37
DISPlay:BARgraph<i>:OCURsor|XCURsor:STATe...................................................................................................................6.38
DISPlay:BARgraph<i>:OCURsor|XCURsor:Y?..........................................................................................................................6.38
DISPlay:BARgraph<i>:SCANoffset .........................................................................................................................................4.541
DISPlay:BARgraph<i>:TRACk:LIMit.............................................................................................................................4.485, 4.486
DISPlay:FFT<i>:A|B:CHANnel ................................................................................................................................................4.484
DISPlay:FFT<i>:A|B:LIMLower ...............................................................................................................................................4.512
DISPlay:FFT<i>:A|B:LIMLower:SOURce................................................................................................ 4.513, 4.514, 4.515, 4.516
DISPlay:FFT<i>:A|B:LIMShift............................................................................................................................ 4.516, 4.517, 4.518
DISPlay:FFT<i>:A|B:LIMUpper ...............................................................................................................................................4.507

Alphabetical List of Commands R&S UPV
1146.2084.32 11.2 E-9
DISPlay:FFT<i>:A|B:MARKer:HARMonics................................................................................................................................6.33
DISPlay:FFT<i>:A|B:MARKer:MODe ........................................................................................................................................6.33
DISPlay:FFT<i>:A|B:MARKer:SETTo:XPOS.............................................................................................................................6.34
DISPlay:FFT<i>:A|B:NORMalize .............................................................................................................................................4.495
DISPlay:FFT<i>:A|B:NORMalize:VALue .................................................................................................................................4.496
DISPlay:FFT<i>:A|B:REFerence .......................................................................................4.489, 4.490, 4.491, 4.492, 4.493, 4.495
DISPlay:FFT<i>:A|B:REFerence:VALue..................................................................................................................................4.494
DISPlay:FFT<i>:A|B:SPACing.................................................................................................................................................4.503
DISPlay:FFT<i>:A|B:UNIT............................................................................................................................................4.499, 4.500
DISPlay:FFT<i>:A|B:UPDate........................................................................................................................................4.487, 4.488
DISPlay:FFT<i>:A|B:YSOurce........................................................................................................................... 4.477, 4.478, 4.479
DISPlay:FFT<i>:DLISt:FILTer ...................................................................................................................................................6.38
DISPlay:FFT<i>:OCURsor|XCURsor:MODE .............................................................................................................................6.34
DISPlay:FFT<i>:OCURsor|XCURsor:POSMode .......................................................................................................................6.35
DISPlay:FFT<i>:OCURsor|XCURsor:SETTo:XPOS..................................................................................................................6.37
DISPlay:FFT<i>:OCURsor|XCURsor:SETTo:YPOS..................................................................................................................6.37
DISPlay:FFT<i>:OCURsor|XCURsor:STATe.............................................................................................................................6.38
DISPlay:FFT<i>:OCURsor|XCURsor:Y? ...................................................................................................................................6.38
DISPlay:FFT<i>:SCANoffset ..........................................................................................................................................4.541, 6.13
DISPlay:FFT<i>:TRACk:LIMit ...................................................................................................................................... 4.485, 4.486
DISPlay:FFT<i>:X:LEFT..........................................................................................................................................................4.530
DISPlay:FFT<i>:X:REFerence:VALue.....................................................................................................................................4.528
DISPlay:FFT<i>:X:RIGHt ........................................................................................................................................................4.530
DISPlay:FFT<i>:X:SCALing ....................................................................................................................................................4.529
DISPlay:FFT<i>:X:SPACing.........................................................................................................................................4.529, 4.530
DISPlay:FFT<i>:X:UNIT..........................................................................................................................................................4.525
DISPlay:FFT<i>:X:UNIT:AUTO .................................................................................................................................... 4.527, 4.528
DISPlay:FFT<i>:X:UNIT:USER ...............................................................................................................................................4.528
DISPlay:FFT:A|B:BOTTom......................................................................................................................................................4.504
DISPlay:FFT:A|B:TOP.............................................................................................................................................................4.504
DISPlay:PESQ<i>:A|B:BOTTom .............................................................................................................................................4.504
DISPlay:PESQ<i>:A|B:LIMLower ............................................................................................................................................4.512
DISPlay:PESQ<i>:A|B:LIMLower:SOURce ............................................................................................ 4.513, 4.514, 4.515, 4.516
DISPlay:PESQ<i>:A|B:LIMUpper ............................................................................................................................................4.507
DISPlay:PESQ<i>:A|B:MARKer:MODe .....................................................................................................................................6.33
DISPlay:PESQ<i>:A|B:MARKer:SETTo:XPOS .........................................................................................................................6.34
DISPlay:PESQ<i>:A|B:SPACing .............................................................................................................................................4.503
DISPlay:PESQ<i>:A|B:TOP ....................................................................................................................................................4.504
DISPlay:PESQ<i>:A|B:UPDate ....................................................................................................................................4.487, 4.488
DISPlay:PESQ<i>:A|B:YSOurce .................................................................................................................................. 4.482, 4.483
DISPlay:PESQ<i>:DLISt:FILTer................................................................................................................................................6.38
DISPlay:PESQ<i>:OCURsor|XCURsor:MODE..........................................................................................................................6.34
DISPlay:PESQ<i>:OCURsor|XCURsor:POSMode....................................................................................................................6.35
DISPlay:PESQ<i>:OCURsor|XCURsor:SETTo:XPOS ..............................................................................................................6.37
DISPlay:PESQ<i>:OCURsor|XCURsor:SETTo:YPOS ..............................................................................................................6.37
DISPlay:PESQ<i>:OCURsor|XCURsor:STATe .........................................................................................................................6.38
DISPlay:PESQ<i>:SCANoffset.......................................................................................................................................4.541, 6.13
DISPlay:PESQ:X:LEFT...........................................................................................................................................................4.530
DISPlay:PESQ:X:RIGHt..........................................................................................................................................................4.530
DISPlay:PESQ:X:SCALing......................................................................................................................................................4.529
DISPlay:PESQ:X:SPACing ..........................................................................................................................................4.529, 4.530
DISPlay:Subsys<i>:DLISt:FILTer ............................................................................................................................................4.535
DISPlay:SWEep<i>:A|B:BOTTom ...........................................................................................................................................4.504
DISPlay:SWEep<i>:A|B:CHANnel...........................................................................................................................................4.484
DISPlay:SWEep<i>:A|B:LIMLower..........................................................................................................................................4.512
DISPlay:SWEep<i>:A|B:LIMLower:SOURce.......................................................................................... 4.513, 4.514, 4.515, 4.516
DISPlay:SWEep<i>:A|B:LIMShift ...................................................................................................................... 4.516, 4.517, 4.518
DISPlay:SWEep<i>:A|B:LIMUpper..........................................................................................................................................4.507
DISPlay:SWEep<i>:A|B:MARKer:MODe...................................................................................................................................6.33
DISPlay:SWEep<i>:A|B:MARKer:SETTo:XPOS .......................................................................................................................6.34
DISPlay:SWEep<i>:A|B:NORMalize........................................................................................................................................4.495
DISPlay:SWEep<i>:A|B:NORMalize:VALue............................................................................................................................4.496
DISPlay:SWEep<i>:A|B:REFerence..................................................................................4.489, 4.490, 4.491, 4.492, 4.493, 4.495
DISPlay:SWEep<i>:A|B:REFerence:VALue............................................................................................................................4.494
DISPlay:SWEep<i>:A|B:SPACing ...........................................................................................................................................4.503
DISPlay:SWEep<i>:A|B:TOP ..................................................................................................................................................4.504
DISPlay:SWEep<i>:A|B:UNIT ......................................................................................................................................4.499, 4.500
DISPlay:SWEep<i>:A|B:UPDate .................................................................................................................................. 4.487, 4.488
DISPlay:SWEep<i>:A|B:YSOurce .....................................................................................4.471, 4.472, 4.473, 4.474, 4.475, 4.476
DISPlay:SWEep<i>:DLISt:FILTer..............................................................................................................................................6.38
DISPlay:SWEep<i>:OCURsor|XCURsor:MODE .......................................................................................................................6.34
DISPlay:SWEep<i>:OCURsor|XCURsor:POSMode..................................................................................................................6.35

R&S UPV Alphabetical List of Commands
1146.2084.32 11.3 E-9
DISPlay:SWEep<i>:OCURsor|XCURsor:SETTo:XPOS ............................................................................................................6.37
DISPlay:SWEep<i>:OCURsor|XCURsor:SETTo:YPOS ............................................................................................................6.37
DISPlay:SWEep<i>:OCURsor|XCURsor:STATe .......................................................................................................................6.38
DISPlay:SWEep<i>:OCURsor|XCURsor:Y?..............................................................................................................................6.38
DISPlay:SWEep<i>:SCANoffset.....................................................................................................................................4.541, 6.13
DISPlay:SWEep<i>:TRACk:LIMit.................................................................................................................................4.485, 4.486
DISPlay:SWEep<i>:X:AXIS............................................................................................................................... 4.523, 4.524, 4.525
DISPlay:SWEep<i>:X:LEFT....................................................................................................................................................4.530
DISPlay:SWEep<i>:X:REFerence:VALue ...............................................................................................................................4.528
DISPlay:SWEep<i>:X:RIGHt...................................................................................................................................................4.530
DISPlay:SWEep<i>:X:SCALing...............................................................................................................................................4.529
DISPlay:SWEep<i>:X:SOUrce ..................................................................................................................................... 4.521, 4.522
DISPlay:SWEep<i>:X:SPACing ................................................................................................................................... 4.529, 4.530
DISPlay:SWEep<i>:X:UNIT ....................................................................................................................................................4.525
DISPlay:SWEep<i>:X:UNIT:AUTO............................................................................................................................... 4.527, 4.528
DISPlay:SWEep<i>:X:UNIT:USER..........................................................................................................................................4.528
DISPlay:WAVeform:[A|B]:YSOurce.........................................................................................................................................4.480
DISPlay:WAVeform:A|B:BOTTom...........................................................................................................................................4.504
DISPlay:WAVeform:A|B:CHANnel...........................................................................................................................................4.484
DISPlay:WAVeform:A|B:LIMLower..........................................................................................................................................4.512
DISPlay:WAVeform:A|B:LIMLower:SOURce................................................................................................................ 4.513, 4.515
DISPlay:WAVeform:A|B:LIMShift ...................................................................................................................... 4.516, 4.517, 4.518
DISPlay:WAVeform:A|B:LIMUpper..........................................................................................................................................4.507
DISPlay:WAVeform:A|B:MARKer:MODe...................................................................................................................................6.33
DISPlay:WAVeform:A|B:MARKer:SETTo:XPOS .......................................................................................................................6.34
DISPlay:WAVeform:A|B:REFerence ............................................................................................................................4.490, 4.493
DISPlay:WAVeform:A|B:REFerence:VALue............................................................................................................................4.494
DISPlay:WAVeform:A|B:SPACing...........................................................................................................................................4.503
DISPlay:WAVeform:A|B:TOP..................................................................................................................................................4.504
DISPlay:WAVeform:A|B:UNIT......................................................................................................................................4.499, 4.500
DISPlay:WAVeform:A|B:UPDate..................................................................................................................................4.487, 4.488
DISPlay:WAVeform:A|B:YSOurce................................................................................................................................4.479, 4.480
DISPlay:WAVeform:DLISt:FILTer..............................................................................................................................................6.38
DISPlay:WAVeform:OCURsor|XCURsor:MODE .......................................................................................................................6.34
DISPlay:WAVeform:OCURsor|XCURsor:POSMode..................................................................................................................6.35
DISPlay:WAVeform:OCURsor|XCURsor:SETTo:XPOS............................................................................................................6.37
DISPlay:WAVeform:OCURsor|XCURsor:SETTo:YPOS............................................................................................................6.37
DISPlay:WAVeform:OCURsor|XCURsor:STATe.......................................................................................................................6.38
DISPlay:WAVeform:OCURsor|XCURsor:Y?..............................................................................................................................6.38
DISPlay:WAVeform:SCANoffset .................................................................................................................................... 4.541, 6.13
DISPlay:WAVeform:TRACk:LIMit................................................................................................................................. 4.485, 4.486
DISPlay:WAVeform:X:LEFT....................................................................................................................................................4.530
DISPlay:WAVeform:X:REFerence:VALue ...............................................................................................................................4.528
DISPlay:WAVeform:X:RIGHt...................................................................................................................................................4.530
DISPlay:WAVeform:X:SCALing...............................................................................................................................................4.529
DISPlay:WAVeform:X:SPACing ................................................................................................................................... 4.529, 4.530
DISPlay:WAVeform:X:UNIT ....................................................................................................................................................4.525
DISPlay:WAVeform:X:UNIT:AUTO ..............................................................................................................................4.527, 4.528
DISPlay:WAVeform:X:UNIT:USER .........................................................................................................................................4.528
F
FORMat[:DATA]........................................................................................................................................................................6.12
H
HCOPy[:IMMediate] ................................................................................................................................................................4.616
HCOPy:DESTination....................................................................................................................................................4.614, 4.615
HCOPy:FILE ...........................................................................................................................................................................4.616
HCOPy:FILE:MODe ................................................................................................................................................................4.616
HCOPy:PRINter:ADDition .......................................................................................................................................................4.615
HCOPy:PRINter:FOOTer ........................................................................................................................................................4.615
HCOPy:PRINter:HEADer ........................................................................................................................................................4.615
HCOPy:PRINter:ORIentation ..................................................................................................................................................4.615
HCOPy:SOURce.....................................................................................................................................................................4.614
I
INIT:CONT .............................................................................................................4.220, 4.221, 4.222, 4.240, 4.241, 4.242, 4.243

Alphabetical List of Commands R&S UPV
1146.2084.32 11.4 E-9
INIT:FORCe ................................................................................................ 4.220, 4.221, 4.222, 4.223, 4.240, 4.241, 4.242, 4.243
INITiate[:IMMediate]....................................................................................................................................................................6.9
INITiate:CONTinuous..................................................................................................................................................................6.8
INITiate:FORCe ..........................................................................................................................................................................6.9
INPut[1]
2:COUPling ..............................................................................................................................................................4.148
INPut[1]|2:COMMon................................................................................................................................................................4.153
INPut[1]|2:IMPedance .............................................................................................................................................................4.152
INPut[1]|2:TYPE......................................................................................................................................................................4.150
INPut<n>:COUPling ..................................................................................................................................................... 4.160, 4.161
INPut:AUDiobits ..................................................................................................................................... 4.174, 4.181, 4.190, 4.207
INPut:BANDwidth:MODE ............................................................................................................................................. 4.149, 4.173
INPut:BCLk:FREQuency? ............................................................................................................................................4.194, 4.211
INPut:BSLope ................................................................................................................................................... 4.195, 4.212, 4.213
INPut:CHANnel ................................................................................................................................................. 4.147, 4.170, 4.176
INPut:CLOCk ............................................................................................................................................................... 4.185, 4.203
INPut:CODing .............................................................................................................................................................. 4.197, 4.214
INPut:COUPling ........................................................................................................................................................... 4.148, 4.160
INPut:COUPling:CHANnels.....................................................................................................................................................4.160
INPut:FBIT ................................................................................................................................................................... 4.190, 4.207
INPut:FILTer .......................................................................................................... 4.149, 4.161, 4.173, 4.179, 4.198, 4.215, 4.421
INPut:FOFFset.............................................................................................................................................................4.195, 4.212
INPut:FORMat.........................................................................................................................................................................4.180
INPut:FSLope.................................................................................................................................................... 4.180, 4.195, 4.212
INPut:FSYNc:FREQuency? .........................................................................................................................................4.194, 4.211
INPut:FWIDth............................................................................................................................................................... 4.194, 4.211
INPut:FWIDth:VALue ..............................................................................................................................................................4.212
INPut:INPut.............................................................................................................................................................................4.179
INPut:LBITs.............................................................................................................................................................................4.191
INPut:LOGVoltage ............................................................................................................................................ 4.196, 4.197, 4.214
INPut:MCHannels ...................................................................................................................................................................4.159
INPut:MCHannels[1]................................................................................................................................................................4.185
INPut:MCHannels[2]................................................................................................................................................................4.185
INPut:MCHannels<n> .............................................................................................................................................................4.203
INPut:MCHSource...................................................................................................................................................................4.187
INPut:MCHSource<n>.............................................................................................................................................................4.204
INPut:MCHSource2.................................................................................................................................................................4.188
INPut:MRATio .............................................................................................................................................................. 4.196, 4.213
INPut:MSAMplefrequency .......................................................................................................................................................4.186
INPut:NOCHannels .................................................................................................................................................................4.204
INPut:NOSLots........................................................................................................................................................................4.186
INPut:RANGe:CHANnels ........................................................................................................................................................4.162
INPut:RATio ............................................................................................................................................................................4.186
InPut:RESYnc ........................................................................................................................................ 4.156, 4.175, 4.199, 4.217
INPut:SAMPle:FREQuency.......................................................................................................................................... 4.172, 4.179
INPut:SAMPle:FREQuency:MODE ............................................................. 4.172, 4.173, 4.178, 4.179, 4.192, 4.193, 4.209, 4.210
INPut:SDELay..............................................................................................................................................................4.196, 4.213
INPut:SLOTs................................................................................................................................................................ 4.187, 4.205
INPut:SLOTs2.........................................................................................................................................................................4.188
INPut:SLTLength..........................................................................................................................................................4.190, 4.207
INPut:SPFRame........................................................................................................................................................... 4.186, 4.204
INPut:SYNCto .............................................................................................................................................................. 4.189, 4.206
INPut:TIMeout.............................................................................................................................................................. 4.191, 4.208
INPut:TYPE.............................................................................................................................................................................4.174
INPut:WLENgth............................................................................................................................................................ 4.176, 4.177
INPut:WOFFset.......................................................................................................................................................................4.181
INSTrument[1][:SELect] .......................................................................................................................................................4.1, 4.2
INSTrument2[:SELect] ............................................................................................................................................................4.144
M
MMEMory: STORe:STATe......................................................................................................................................................4.613
MMEMory:BARgraph<i>:EQUalization:INVert .........................................................................................................................4.536
MMEMory:BARgraph<i>:EQUalization:MODify .......................................................................................................................4.537
MMEMory:BARgraph<i>:EQUalization:NORMfrequency.........................................................................................................4.536
MMEMory:BARgraph<i>:LIMit:OFFSet ...................................................................................................................................4.538
MMEMory:BARgraph<i>:LIMit:OFFSet:VALue........................................................................................................................4.538
MMEMory:BARgraph<i>:STAS ......................................................................................................................... 4.533, 4.534, 4.535
MMEMory:BARgraph<i>:STORe.............................................................................................................................................4.539
MMEMory:BARgraph<i>:TRACe.............................................................................................................................................4.535
MMEMory:CATalog?.................................................................................................................................................................6.28
MMEMory:CATalog:LENGth? ...................................................................................................................................................6.29

R&S UPV Alphabetical List of Commands
1146.2084.32 11.5 E-9
MMEMory:CDIRectory ..............................................................................................................................................................6.29
MMEMory:COPY.......................................................................................................................................................................6.29
MMEMory:DATA .......................................................................................................................................................................6.29
MMEMory:DCATalog? ..............................................................................................................................................................6.30
MMEMory:DCATalog:LENGth?.................................................................................................................................................6.30
MMEMory:DELete.....................................................................................................................................................................6.30
MMEMory:FFT<i>:EQUalization:INVert...................................................................................................................................4.536
MMEMory:FFT<i>:EQUalization:MODify .................................................................................................................................4.537
MMEMory:FFT<i>:EQUalization:NORMfrequency...................................................................................................................4.536
MMEMory:FFT<i>:LIMit:OFFSet .............................................................................................................................................4.538
MMEMory:FFT<i>:LIMit:OFFSet:VALue..................................................................................................................................4.538
MMEMory:FFT<i>:STAS................................................................................................................................... 4.533, 4.534, 4.535
MMEMory:FFT<i>:STORe ......................................................................................................................................................4.539
MMEMory:FFT<i>:TRACe.......................................................................................................................................................4.535
MMEMory:LOAD:ARBitrary............................................................................................................................................4.96, 4.102
MMEMory:LOAD:ARBitrary ’filename’ .......................................................................................................................................4.93
MMEMory:LOAD:FILE.............................................................................................................................................................4.263
MMEMory:LOAD:FREQuency.................................................................................................................................................4.139
MMEMory:LOAD:IEQualize............................................................................................................................... 4.288, 4.317, 4.333
MMEMory:LOAD:INTerval.......................................................................................................................................................4.139
MMEMory:LOAD:LIST...............................................................................................................................................................4.90
MMEMory:LOAD:OEQualize ’filename’ .........................................................................................4.67, 4.71, 4.75, 4.78, 4.85, 4.92
MMEMory:LOAD:ONTime.......................................................................................................................................................4.139
MMEMory:LOAD:PHASe ........................................................................................................................................................4.139
MMEMory:LOAD:PWAVeform.................................................................................................................................................4.350
MMEMory:LOAD:STATe................................................................................................................................................4.613, 6.30
MMEMory:LOAD:VOLTage.....................................................................................................................................................4.138
MMEMory:MDIRectory..............................................................................................................................................................6.30
MMEMory:MOVE ......................................................................................................................................................................6.31
MMEMory:MSIS........................................................................................................................................................................6.31
MMEMory:PESQ<i>:LIMit:OFFSet..........................................................................................................................................4.538
MMEMory:PESQ<i>:LIMit:OFFSet:VALue ..............................................................................................................................4.538
MMEMory:PESQ<i>:STAS................................................................................................................................ 4.533, 4.534, 4.535
MMEMory:PESQ<i>:STORe ...................................................................................................................................................4.539
MMEMory:PESQ<i>:TRACe ...................................................................................................................................................4.535
MMEMory:RDIRectory ..............................................................................................................................................................6.31
MMEMory:STORe:PWAVeform ..............................................................................................................................................4.349
MMEMory:STORe:STATe.........................................................................................................................................................6.31
MMEMory:SWEep<i>:EQUalization:INVert .............................................................................................................................4.536
MMEMory:SWEep<i>:EQUalization:MODify ...........................................................................................................................4.537
MMEMory:SWEep<i>:EQUalization:NORMfrequency .............................................................................................................4.536
MMEMory:SWEep<i>:LIMit:OFFSet........................................................................................................................................4.538
MMEMory:SWEep<i>:LIMit:OFFSet:VALue ............................................................................................................................4.538
MMEMory:SWEep<i>:STAS ............................................................................................................................. 4.533, 4.534, 4.535
MMEMory:SWEep<i>:STORe.................................................................................................................................................4.539
MMEMory:SWEep<i>:TRACe .................................................................................................................................................4.535
MMEMory:WAVeform:STAS ...................................................................................................................................................4.533
MMEMory:WAVeform:STORe.................................................................................................................................................4.539
O
OUTPut: FSHape ......................................................................................................................................................................4.37
OUTPut: POLarity ............................................................................................................................................................4.37, 4.38
OUTPut:AUDiobits .................................................................................................................................................. 4.25, 4.36, 4.47
OUTPut:AUXiliary ............................................................................................................................................................4.20, 4.21
OUTPut:BANDwidth:MODE .................................................................................................................................................4.6, 4.7
OUTPut:BCLk:FREQuency? .....................................................................................................................................................4.50
OUTPut:BCLock:JITAmplitude..................................................................................................................................................4.54
OUTPut:BCLock:JITFrequency.................................................................................................................................................4.54
OUTPut:BSLope .......................................................................................................................................................................4.52
OUTput:CHANnel.................................................................................................................................... 4.3, 4.4, 4.17, 4.30, 4.185
OUTPut:CLOCk ........................................................................................................................................................................4.44
OUTPut:CODing .......................................................................................................................................................................4.56
OUTPut:CSIMulator ..................................................................................................................................................................4.26
OUTPut:FBIT ............................................................................................................................................................................4.47
OUTPut:FOFFset ......................................................................................................................................................................4.51
OUTPut:FORMat..............................................................................................................................................................4.36, 4.37
OUTPut:FSHape .......................................................................................................................................................................4.37
OUTPut:FSLope........................................................................................................................................................................4.52
OUTPut:FSYNc:FREQuency?...................................................................................................................................................4.50
OUTPut:FWIDth........................................................................................................................................................................4.51

Alphabetical List of Commands R&S UPV
1146.2084.32 11.6 E-9
OUTPut:FWIDth:VALue .................................................................................................................................................4.51, 4.194
OUTPut:IMPedance ....................................................................................................................................................................4.5
OUTPut:INTClockfreq ...............................................................................................................................................................4.19
OUTPut:LBITs................................................................................................................................................................4.48, 4.208
OUTPut:LOGVoltage.................................................................................................................................................................4.55
OUTPut:LOW..............................................................................................................................................................................4.6
OUTPut:MCLKratio ..........................................................................................................................................................4.35, 4.36
OUTPut:MCLock:JITAmplitude .................................................................................................................................................4.55
OUTPut:MCLock:JITFrequency ................................................................................................................................................4.54
OUTPut:MRATio .......................................................................................................................................................................4.54
OUTPut:MSAMplefrequency .....................................................................................................................................................4.44
OUTPut:NOSLots......................................................................................................................................................................4.45
OUTPut:RATio ..........................................................................................................................................................................4.45
OUTPut:SAMPle:FREQuency...................................................................................................................... 4.24, 4.33, 4.50, 4.211
OUTPut:SAMPle:MODE........................................................................................................................ 4.24, 4.32, 4.33, 4.49, 4.50
OUTPut:SIGNal:BALanced:LEVel.............................................................................................................................................4.25
OUTPut:SIGNal:LEVel ..............................................................................................................................................................4.25
OUTPut:SLCOffset....................................................................................................................................................................4.53
OUTPut:SLCSlope ....................................................................................................................................................................4.53
OUTPut:SLCWidth ....................................................................................................................................................................4.53
OUTPut:SLCWidth:VALue ........................................................................................................................................................4.53
OUTPut:SLTLength...................................................................................................................................................................4.47
OUTPut:SPFRame....................................................................................................................................................................4.45
OUTPut:SYNC:OUTPut ...................................................................................................................................................4.18, 4.19
OUTPut:SYNC:TYPE................................................................................................................................................................4.20
OUTPut:TXData........................................................................................................................................................................4.45
OUTPut:TXData2 ......................................................................................................................................................................4.45
OUTPut:TXData3 ......................................................................................................................................................................4.45
OUTPut:TXData4 ......................................................................................................................................................................4.46
OUTPut:TYPE......................................................................................................................................................................4.4, 4.5
OUTPut:UNBalanced:OUTPut ..................................................................................................................................................4.26
OUTPut:WLENgth.....................................................................................................................................................................4.31
OUTPut:WOFFset.....................................................................................................................................................................4.38
S
SENS[1]e:FUNCtion:PESQ:ACCording...................................................................................................................................4.347
SENSe[1]:BANDwidth .............................................................................................................................................................4.258
SENSe[1]:BANDwidth:MODE.......................................................................................................................................4.257, 4.258
SENSe[1]:CHANnel:DELay.....................................................................................................................................................4.329
SENSe[1]:FILTer.....................................................................................................................................................................4.304
SENSe[1]:FILTer[1]...........................................................................................................4.248, 4.279, 4.316, 4.332, 4.379, 4.422
SENSe[1]:FILTer2.............................................................................................................4.248, 4.279, 4.316, 4.332, 4.379, 4.422
SENSe[1]:FILTer3.............................................................................................................4.248, 4.279, 4.316, 4.332, 4.379, 4.422
SENSe[1]:FREQuency:LIMit:LOWer ................................................................................................................. 4.271, 4.304, 4.318
SENSe[1]:FREQuency:LIMit:UPPer.................................................................................................................. 4.271, 4.304, 4.318
SENSe[1]:FUNCtion........................................ 4.249, 4.253, 4.267, 4.272, 4.274, 4.277, 4.290, 4.296, 4.305, 4.306, 4.310, 4.312,
.....................................................................................................................................................4.314, 4.329, 4.340, 4.346, 4.373
SENSe[1]:FUNCtion:APERture:MODE ......................4.250, 4.251, 4.252, 4.253, 4.254, 4.255, 4.256, 4.268, 4.269, 4.280, 4.281,
.....................................................................................................................................................4.282, 4.300, 4.301, 4.315, 4.316
SENSe[1]:FUNCtion:DCSuppression ................................................................................................................ 4.245, 4.278, 4.330
SENSe[1]:FUNCtion:DISTortion<i> <i> designates the harmonic 2, 4, 6, 8.............................................................................4.292
SENSe[1]:FUNCtion:DISTortion<i> <i> designates the harmonic 3, 5, 7, 9.............................................................................4.293
SENSe[1]:FUNCtion:DMODe.......................................................................................................................................4.286, 4.287
SENSe[1]:FUNCtion:FFT:AVERage........................................................................................................................................4.335
SENSe[1]:FUNCtion:FFT:AVERage:MODE ............................................................................................................................4.334
SENSe[1]:FUNCtion:FFT:MTIMe? ..........................................................................................................................................4.322
SENSe[1]:FUNCtion:FFT:RESolution?....................................................................................................................................4.322
SENSe[1]:FUNCtion:FFT:Size......................................................................................................................................4.320, 4.322
SENSe[1]:FUNCtion:FFT:STARt?...........................................................................................................................................4.339
SENSe[1]:FUNCtion:FFT:STATe .................................................................................................................................4.319, 4.326
SENSe[1]:FUNCtion:FFT:STOP?............................................................................................................................................4.339
SENSe[1]:FUNCtion:FFT:WINDow ................................................................................................................... 4.324, 4.325, 4.326
SENSe[1]:FUNCtion:MMODe..................................................................................................................................................4.349
SENSe[1]:FUNCtion:MMODe................ 4.272, 4.277, 4.278, 4.290, 4.291, 4.292, 4.297, 4.298, 4.307, 4.308, 4.314, 4.315, 4.349
SENSe[1]:FUNCtion:PESQ:ACCording...........................................................................................................................4.347, 348
SENSe[1]:FUNCtion:PESQ:AVGDelay? .................................................................................................................................4.351
SENSe[1]:FUNCtion:PESQ:DEGLevel?..................................................................................................................................4.351
SENSe[1]:FUNCtion:PESQ:REFLevel? ..................................................................................................................................4.350
SENSe[1]:FUNCtion:REC:LENGth?........................................................................................................................................4.350
SENSe[1]:FUNCtion:SNSequence..........................................................................................................................................4.283

R&S UPV Alphabetical List of Commands
1146.2084.32 11.7 E-9
SENSe[1]:NOTCh .................................................................................................................................. 4.245, 4.246, 4.330, 4.331
SENSe[1]:NOTCh:FREQuency ....................................................................................................................................4.246, 4.331
SENSe[1]:NOTCh:FREQuency:MODE ............................................................................................................. 4.246, 4.247, 4.331
SENSe[1]:POWer:REFerence:RESistance ..................................................................................................................4.156, 4.164
SENSe[1]:THDN:REJection ....................................................................................................................................................4.299
SENSe[1]:UFILter<i>...............................................................................................................................................................4.425
SENSe[1]:UFILter<i>:ATTenuation .........................................................................................................................................4.432
SENSe[1]:UFILter<i>:CENTer.................................................................................................................................................4.428
SENSe[1]:UFILter<i>:DELay ...................................................................................................................................................4.432
SENSe[1]:UFILter<i>:DELay? .................................................................................................................................................4.432
SENSe[1]:UFILter<i>:FNAMe..................................................................................................................................................4.430
SENSe[1]:UFILter<i>:PASSb ..................................................................................................................................................4.425
SENSe[1]:UFILter<i>:PASSb:LOWer......................................................................................................................................4.427
SENSe[1]:UFILter<i>:PASSb:UPPer.......................................................................................................................................4.427
SENSe[1]:UFILter<i>:STOPb?................................................................................................................................................4.426
SENSe[1]:UFILter<i>:STOPb:LOWer?......................................................................................................................... 4.427, 4.428
SENSe[1]:UFILter<i>:STOPb:UPPer?..........................................................................................................................4.427, 4.428
SENSe[1]:UFILter<i>:WIDTh...................................................................................................................................................4.428
SENSe[1]:UFILter<i>:WIDTh?.................................................................................................................................................4.428
SENSe[1]:VOLTage:APERture ....................................................................................................4.251, 4.255, 4.268, 4.282, 4.316
SENSe[1]:VOLTage:EQUalize .......................................................................................................................... 4.288, 4.317, 4.333
SENSe[1]:VOLTage:FUNDamental..............................................................................................................................4.293, 4.301
SENSe[1]:VOLTage:FUNDamental:MODE ............................................................................................ 4.293, 4.294, 4.301, 4.302
SENSe[1]:VOLTage:INTVtime ..................................................................................................................................... 4.274, 4.275
SENSe[1]:VOLTage:INTVtime:MODE............................................................................................................... 4.273, 4.274, 4.275
SENSe[1]:VOLTage:RANGe[1]|2:MODE...................................................................................................................... 4.154, 4.155
SENSe[1]:VOLTage:RANGe[1]|2:VALue.................................................................................................................................4.154
SENSe[1]:VOLTage:RANGe<n>:VALue .................................................................................................................................4.163
SENSe<n>:DATA[1]|2,3,…8? ...................................................................................................................................................6.10
SENSe:DMODe ........................................................................................................................................................... 4.168, 4.169
SENSe:FREQuency:FACTor........................................................................................................................................4.266, 4.270
SENSe:FREQuency:SELect ........................................................................................................4.264, 4.265, 4.266, 4.269, 4.270
SENSe:FREQuency:SETTling:COUNt ....................................................................................................................................4.411
SENSe:FREQuency:SETTling:MODE..........................................................................................................................4.410, 4.411
SENSe:FREQuency:SETTling:RESolution..............................................................................................................................4.412
SENSe:FREQuency:SETTling:TOLerance..............................................................................................................................4.412
SENSe:FREQuency:SETTling:TOUT......................................................................................................................................4.412
SENSe:FUNCtion:BARGraph............................................................................................................................ 4.289, 4.318, 4.319
SENSe:FUNCtion:FFT:CMPFactor .........................................................................................................................................4.338
SENSe:FUNCtion:FFT:USAMple ................................................................................................................................. 4.337, 4.338
SENSe:FUNCtion:RECord:FILe ..............................................................................................................................................4.374
SENSe:FUNCtion:RECord:LENGth.........................................................................................................................................4.375
SENSe:FUNCtion:RECord:TRIGger:LEVel .............................................................................................................................4.377
SENSe:FUNCtion:RECord:TRIGger:PRE ...............................................................................................................................4.378
SENSe:FUNCtion:RECord:TRIGger:SLOPe ...........................................................................................................................4.377
SENSe:FUNCtion:RECord:TRIGger:SOURce.............................................................................................................. 4.376, 4.377
SENSe:FUNCtion:SETTling:COUNt........................................................................................................................................4.408
SENSe:FUNCtion:SETTling:MODE..............................................................................................................................4.406, 4.407
SENSe:FUNCtion:SETTling:RESolution..................................................................................................................................4.408
SENSe:FUNCtion:SETTling:TOLerance..................................................................................................................................4.408
SENSe:FUNCtion:SETTling:TOUT..........................................................................................................................................4.409
SENSe:JITTer:REFerence ......................................................................................................................................................4.171
SENSe:PHASe:SETTling:COUNt............................................................................................................................................4.414
SENSe:PHASe:SETTling:MODE .................................................................................................................................4.413, 4.414
SENSe:PHASe:SETTling:RESolution .....................................................................................................................................4.415
SENSe:PHASe:SETTling:TOUT .............................................................................................................................................4.415
SENSe:REFerence:CHANnel....................................................................................................................................... 4.165, 4.216
SENSe:SWEep:CONTrol ............................................................................................................................................. 4.259, 4.260
SENSe:SWEep:POINts...........................................................................................................................................................4.262
SENSe:SWEep:SPACing........................................................................................................................................................4.261
SENSe:SWEep:STARt............................................................................................................................................................4.262
SENSe:SWEep:STEP.............................................................................................................................................................4.263
SENSe:SWEep:STOP ............................................................................................................................................................4.262
SENSe:TRIGger:SETTling:COUNt..........................................................................................................................................4.418
SENSe:TRIGger:SETTling:MODE................................................................................................................................4.417, 4.418
SENSe:TRIGger:SETTling:RESolution ...................................................................................................................................4.419
SENSe:TRIGger:SETTling:TOLerance....................................................................................................................................4.418
SENSe:UFILter<i>:ORDer.......................................................................................................................................................4.425
SENSe:VOLTage:RANGe<n>:MODE ..........................................................................................................................4.163, 4.164
SENSe:VOLTage:RANGe:MODE ...........................................................................................................................................4.163
SENSe2:FUNCtion....................................................................................................................................................... 4.400, 4.401
SENSe3:FREQuency:APERture:MODE.......................................................................................................................4.396, 4.397

Alphabetical List of Commands R&S UPV
1146.2084.32 11.8 E-9
SENSe3:FUNCtion................................................................................................................................. 4.392, 4.393, 4.394, 4.395
SENSe3:PHASe:FORMat ............................................................................................................................................4.398, 4.399
SENSe6:FUNCtion....................................................................................................................................................... 4.402, 4.403
SENSe7:CMPFactor ...............................................................................................................................................................4.356
SENSe7:FUNCtion..................................................................................................................................................................4.352
SENSe7:MMODe.............................................................................................................................................. 4.353, 4.354, 4.355
SENSe7:TRIGger:AUTO.........................................................................................................................................................4.362
SENSe7:TRIGger:LEVel .........................................................................................................................................................4.360
SENSe7:TRIGger:PRE ...........................................................................................................................................................4.361
SENSe7:TRIGger:SLOPe .......................................................................................................................................................4.360
SENSe7:TRIGger:SOURce..........................................................................................................................................4.358, 4.359
SENSe7:TRIGger:TRCLength.................................................................................................................................................4.357
SENSe8:FUNCtion....................................................................................................................................................... 4.385, 4.386
SENSe8:PROTocol:CH<x>:BYTE<y>.......................................................................................................................................6.16
SENSe8:PROTocol:CRC<i>? ...................................................................................................................................................6.17
SENSe8:PROTocol:ERRor? .....................................................................................................................................................6.16
SENSe8:PROTocol:HIGHlight.................................................................................................................................................4.387
SENSe8:PROTocol:INV<i>? .....................................................................................................................................................6.17
SENSe8:PROTocol:LOC<i>?....................................................................................................................................................6.17
SENSe8:PROTocol:MODE .....................................................................................................................................................4.386
SENSe8:PROTocol:PAR<i>?....................................................................................................................................................6.17
SENSe8:PROTocol:PCM<i>? ...................................................................................................................................................6.17
SENSe8:PROTocol:PERSistence ...........................................................................................................................................4.388
SENSe8:PROTocol:VIEW.......................................................................................................................................................4.388
SOURce:AM:MODE..................................................................................................................................................... 4.112, 4.113
SOURce:BANDwidth........................................................................................................................................................4.86, 4.87
SOURce:DIGital:SYNC:TO .......................................................................................................................................................4.31
SOURce:DIM ............................................................................................................................................................................4.86
SOURce:FILTer .............................................................................................................................................................4.67, 4.422
SOURce:FRAMephase .............................................................................................................................................................4.22
SOURce:FREQuency[1]..........................................................................................4.66, 4.70, 4.76, 4.79, 4.82, 4.84, 4.109, 4.110
SOURce:FREQuency<i>...........................................................................................................................................................4.73
SOURce:FREQuency:AM .......................................................................................................................................................4.113
SOURce:FREQuency:CH2Stereo .............................................................................................................................................4.71
SOURce:FREQuency:DIFFerence............................................................................................................................................4.84
SOURce:FREQuency:MEAN ...........................................................................................................................................4.84, 4.91
SOURce:FREQuency:REFerence........................................................................................................... 4.8, 4.27, 4.29, 4.39, 4.56
SOURce:FREQuency:SELect ...................................................................................................................................................4.69
SOURce:FREQuency2...................................................................................................................................................4.82, 4.110
SOURce:FUNCtion[:SHAPe]................. 4.65, 4.68, 4.72, 4.76, 4.78, 4.81, 4.83, 4.86, 4.87, 4.93, 4.95, 4.101, 4.109, 4.110, 4.112
SOURce:FUNCtion:MODE.................................................................................................................................... 4.73, 4.83, 4.110
SOURce:IMPairment.................................................................................................................................................................4.16
SOURce:INTerval ................................................................................................................................................. 4.77, 4.79, 4.113
SOURce:LOOP:CHANnel .......................................................................................................................................................4.106
SOURce:LOOP:GAIN .............................................................................................................................................................4.107
SOURce:LOWDistortion............................................................................................................................................................4.65
SOURce:MULTisine:COUNt......................................................................................................................................................4.73
SOURce:ONTime.................................................................................................................................................. 4.77, 4.79, 4.113
SOURce:ONTime:DELay ...................................................................................................................................... 4.77, 4.80, 4.113
SOURce:PHASe .......................................................................................................................................................................4.70
SOURce:PHASe<i> ..................................................................................................................................................................4.73
SOURce:PLAY:CHANnel ...................................................................................................................................... 4.97, 4.98, 4.103
SOURce:PLAY:MODE ............................................................................................................................... 4.98, 4.99, 4.103, 4.104
SOURce:PLAY:SCALepktofs ...........................................................................................................................................4.96, 4.97
SOURce:PLAY:TIME .....................................................................................................................................................4.99, 4.105
SOURce:PROTocol:CH<x>:BYTE<y> ......................................................................................................................................6.32
SOURce:PROTocol:CHANnels ...............................................................................................................................................4.119
SOURce:PROTocol:CRC........................................................................................................................................................4.116
SOURce:PROTocol:MODE.....................................................................................................................................................4.115
SOURce:PROTocol:NUMerical ....................................................................................................................................4.116, 4.117
SOURce:PROTocol:VALidity...................................................................................................................................................4.116
SOURce:PTORef ......................................................................................................................................................................4.22
SOURce:RANDom:DOMain ......................................................................................................................................................4.88
SOURce:RANDom:FREQuency:LOWer....................................................................................................................................4.91
SOURce:RANDom:FREQuency:UPPer ....................................................................................................................................4.91
SOURce:RANDom:PDF........................................................................................................................ 4.66, 4.68, 4.81, 4.84, 4.89
SOURce:RANDom:SHAPe .......................................................................................................................................................4.90
SOURce:RANDom:SPACing:FREQuency .......................................................................................................................4.72, 4.91
SOURce:RANDom:SPACing:MODE ................................................................................................................................4.72, 4.91
SOURce:REFerence.................................................................................................................................................................4.21
SOURce:RESYnc .....................................................................................................................................................................4.56
SOURce:SINusoid:DITHer ............................................................................................................................. 4.66, 4.68, 4.81, 4.84

R&S UPV Alphabetical List of Commands
1146.2084.32 11.9 E-9
SOURce:SINusoid:DITHer:STATe ................................................................................................................. 4.66, 4.68, 4.81, 4.84
SOURce:SRCMode...................................................................................................................................................................4.28
SOURce:SWEep:CONTrol......................................................................................................................................................4.123
SOURce:SWEep:DWELl.........................................................................................................................................................4.130
SOURce:SWEep:FREQuency:POINts ....................................................................................................................................4.136
SOURce:SWEep:FREQuency:SPACing ......................................................................................................................4.133, 4.134
SOURce:SWEep:FREQuency:STARt .....................................................................................................................................4.135
SOURce:SWEep:FREQuency:STEP ......................................................................................................................................4.137
SOURce:SWEep:FREQuency:STOP......................................................................................................................................4.135
SOURce:SWEep:INTerval:POINts ..........................................................................................................................................4.136
SOURce:SWEep:INTerval:SPACing ............................................................................................................................4.133, 4.134
SOURce:SWEep:INTerval:STARt ...........................................................................................................................................4.135
SOURce:SWEep:INTerval:STEP ............................................................................................................................................4.137
SOURce:SWEep:INTerval:STOP............................................................................................................................................4.135
SOURce:SWEep:NEXTstep.............................................................................................................................. 4.129, 4.130, 4.131
SOURce:SWEep:ONTime:POINts ..........................................................................................................................................4.136
SOURce:SWEep:ONTime:SPACing ............................................................................................................................4.133, 4.134
SOURce:SWEep:ONTime:STARt ...........................................................................................................................................4.135
SOURce:SWEep:ONTime:STEP ............................................................................................................................................4.137
SOURce:SWEep:ONTime:STOP ............................................................................................................................................4.135
SOURce:SWEep:PHASe:POINts............................................................................................................................................4.136
SOURce:SWEep:PHASe:SPACing.........................................................................................................................................4.133
SOURce:SWEep:PHASe:STARt.............................................................................................................................................4.135
SOURce:SWEep:PHASe:STEP..............................................................................................................................................4.137
SOURce:SWEep:PHASe:STOP..............................................................................................................................................4.135
SOURce:SWEep:VOLTage:POINts ........................................................................................................................................4.136
SOURce:SWEep:VOLTage:SPACing ..........................................................................................................................4.133, 4.134
SOURce:SWEep:VOLTage:STARt .........................................................................................................................................4.135
SOURce:SWEep:VOLTage:STEP ..........................................................................................................................................4.137
SOURce:SWEep:VOLTage:STOP ..........................................................................................................................................4.135
SOURce:SWEep:XAXis ............................................................................................................................................... 4.124, 4.125
SOURce:SWEep:ZAXis ............................................................................................................................................... 4.126, 4.127
SOURce:SYNC:TO ................................................................................................................................................. 4.17, 4.18, 4.46
SOURce:VOLTage[1]................................................................................................................4.67, 4.70, 4.76, 4.79, 4.109, 4.110
SOURce:VOLTage<i>...............................................................................................................................................................4.74
SOURce:VOLTage:AM ...........................................................................................................................................................4.113
SOURce:VOLTage:CH2Stereo .................................................................................................................................................4.71
SOURce:VOLTage:CREStfactor:MODE....................................................................................................................................4.73
SOURce:VOLTage:EQUalize:STATe............................................................................................4.67, 4.71, 4.75, 4.78, 4.85, 4.92
SOURce:VOLTage:LOWLevel ..................................................................................................................................................4.77
SOURce:VOLTage:MAXimum.....................................................................................................................................................4.8
SOURce:VOLTage:OFFSet ....................................................... 4.68, 4.72, 4.75, 4.78, 4.82, 4.85, 4.93, 4.94, 4.100, 4.109, 4.111
SOURce:VOLTage:OFFSet:STATe ........................................... 4.68, 4.72, 4.75, 4.78, 4.82, 4.85, 4.93, 4.94, 4.100, 4.109, 4.111
SOURce:VOLTage:RANGe.........................................................................................................................................................4.7
SOURce:VOLTage:RATio................................................................................................................................................4.71, 4.82
SOURce:VOLTage:REFerence............................................................................................................... 4.8, 4.27, 4.29, 4.38, 4.56
SOURce:VOLTage:RMS..................................................................................................................................................4.92, 4.94
SOURce:VOLTage:RMS?.........................................................................................................................................................4.74
SOURce:VOLTage:SELect .......................................................................................................................................................4.69
SOURce:VOLTage:TOTal.......................................................................................4.82, 4.85, 4.87, 4.92, 4.94, 4.99, 4.108, 4.112
SOURce:VOLTage:TOTal?............................................................................................................................................4.74, 4.109
SOURce:VOLTage:TOTal:GAIN ...............................................................................................................................................4.74
SOURce:VOLTage2................................................................................................................................................................4.111
STATus:OPERation:CONDition?...............................................................................................................................................6.19
STATus:OPERation:ENABle.....................................................................................................................................................6.20
STATus:OPERation:EVENt?.....................................................................................................................................................6.20
STATus:OPERation:NTRansition..............................................................................................................................................6.20
STATus:OPERation:PTRansition..............................................................................................................................................6.20
STATus:QUEStionable:CONDition?.................................................................................................................................6.20, 6.23
STATus:QUEStionable:ENABle .......................................................................................................................................6.20, 6.23
STATus:QUEStionable:EVENt?.......................................................................................................................................6.20, 6.23
STATus:QUEStionable:MEASuring:CONDition?.......................................................................................................................6.22
STATus:QUEStionable:MEASuring:ENABle .............................................................................................................................6.22
STATus:QUEStionable:MEASuring:EVENt? .............................................................................................................................6.23
STATus:QUEStionable:MEASuring:NTRansition ......................................................................................................................6.23
STATus:QUEStionable:MEASuring:PTRansition.......................................................................................................................6.23
STATus:QUEStionable:NTRansition ................................................................................................................................6.21, 6.23
STATus:QUEStionable:OVERrange:CONDition?......................................................................................................................6.22
STATus:QUEStionable:OVERrange:ENABle ............................................................................................................................6.22
STATus:QUEStionable:OVERrange:EVENt? ............................................................................................................................6.22
STATus:QUEStionable:OVERrange:NTRansition .....................................................................................................................6.22
STATus:QUEStionable:OVERrange:PTRansition .....................................................................................................................6.22

Alphabetical List of Commands R&S UPV
1146.2084.32 11.10 E-9
STATus:QUEStionable:PTRansition ................................................................................................................................6.21, 6.24
STATus:QUEStionable:UNDERrange$EVENt?.........................................................................................................................6.21
STATus:QUEStionable:UNDERrange:NTRansition...................................................................................................................6.21
STATus:QUEStionable:UNDERrange:PTRansition...................................................................................................................6.21
STATus:QUEStionable:UNDERrangeCONDition? ....................................................................................................................6.21
STATus:QUEStionable:UNDERrangeENABle...........................................................................................................................6.21
SWITcher:INPA.......................................................................................................................................................................4.456
SWITcher:INPB.......................................................................................................................................................................4.457
SWITcher:OFFSet...................................................................................................................................................................4.456
SWITcher:OUTA .....................................................................................................................................................................4.457
SWITcher:OUTB .....................................................................................................................................................................4.457
SWITcher:STATe....................................................................................................................................................................4.455
SWITcher:TRACking...............................................................................................................................................................4.456
SYSTem:COMMunicate:GPIB:ADDRess ..................................................................................................................................6.25
SYSTem:COMMunicate:GTL ....................................................................................................................................................6.25
SYSTem:ERRor? ......................................................................................................................................................................6.25
SYSTem:MEMory:DATA...........................................................................................................................................................6.42
SYSTem:MEMory:FREE..................................................................................................................................................6.43, 6.44
SYSTem:MEMory:STRing.........................................................................................................................................................6.42
SYSTem:PRESet......................................................................................................................................................................6.25
SYSTem:SHTDown...................................................................................................................................................................6.26
SYSTem:SHUtdown..................................................................................................................................................................6.26
SYSTem:VERSion? ..................................................................................................................................................................6.25
T
TRACe:BARgraph<i>:LDList:AX? .............................................................................................................................................6.15
TRACe:BARgraph<i>:LDList:AY? .............................................................................................................................................6.15
TRACe:BARgraph<i>:LDList:BX? .............................................................................................................................................6.15
TRACe:BARgraph<i>:LDList:BY? .............................................................................................................................................6.15
TRACe:BARgraph<i>:LDList:COUNt:AX? .................................................................................................................................6.16
TRACe:BARgraph<i>:LDList:COUNt:AY? .................................................................................................................................6.16
TRACe:BARgraph<i>:LDList:COUNt:BX? .................................................................................................................................6.16
TRACe:BARgraph<i>:LDList:COUNt:BY? .................................................................................................................................6.16
TRACe:BARgraph<i>:LOAD:AX?..............................................................................................................................................6.14
TRACe:BARgraph<i>:LOAD:AY?..............................................................................................................................................6.14
TRACe:BARgraph<i>:LOAD:BX?..............................................................................................................................................6.14
TRACe:BARgraph<i>:LOAD:BY?..............................................................................................................................................6.14
TRACe:BARgraph<i>:LOAD:COUNt:AX? .................................................................................................................................6.15
TRACe:BARgraph<i>:LOAD:COUNt:AY? .................................................................................................................................6.15
TRACe:BARgraph<i>:LOAD:COUNt:BX? .................................................................................................................................6.15
TRACe:BARgraph<i>:LOAD:COUNt:BY? .................................................................................................................................6.15
TRACe:BARgraph<i>:STORe:AX..............................................................................................................................................6.40
TRACe:BARgraph<i>:STORe:AY..............................................................................................................................................6.40
TRACe:BARgraph<i>:STORe:BX..............................................................................................................................................6.40
TRACe:BARgraph<i>:STORe:BY..............................................................................................................................................6.40
TRACe:FFT<i>:LDList:AX? .......................................................................................................................................................6.15
TRACe:FFT<i>:LDList:AY? .......................................................................................................................................................6.15
TRACe:FFT<i>:LDList:BX? .......................................................................................................................................................6.15
TRACe:FFT<i>:LDList:BY? .......................................................................................................................................................6.15
TRACe:FFT<i>:LDList:COUNt:AX?...........................................................................................................................................6.15
TRACe:FFT<i>:LDList:COUNt:AY?...........................................................................................................................................6.16
TRACe:FFT<i>:LDList:COUNt:BX?...........................................................................................................................................6.16
TRACe:FFT<i>:LDList:COUNt:BY?...........................................................................................................................................6.16
TRACe:FFT<i>:LOAD:AX?........................................................................................................................................................6.13
TRACe:FFT<i>:LOAD:AY?........................................................................................................................................................6.13
TRACe:FFT<i>:LOAD:BX?........................................................................................................................................................6.13
TRACe:FFT<i>:LOAD:BY?........................................................................................................................................................6.13
TRACe:FFT<i>:LOAD:COUNt:AX? ...........................................................................................................................................6.14
TRACe:FFT<i>:LOAD:COUNt:AY? ...........................................................................................................................................6.14
TRACe:FFT<i>:LOAD:COUNt:BX? ...........................................................................................................................................6.14
TRACe:FFT<i>:LOAD:COUNt:BY? ...........................................................................................................................................6.14
TRACe:FFT<i>:STORe:AX .......................................................................................................................................................6.40
TRACe:FFT<i>:STORe:AY .......................................................................................................................................................6.40
TRACe:FFT<i>:STORe:BX .......................................................................................................................................................6.40
TRACe:FFT<i>:STORe:BY .......................................................................................................................................................6.40
TRACe:PESQ<i>:LDList:AX?....................................................................................................................................................6.15
TRACe:PESQ<i>:LDList:AY?....................................................................................................................................................6.15
TRACe:PESQ<i>:LDList:BX?....................................................................................................................................................6.15
TRACe:PESQ<i>:LDList:BY?....................................................................................................................................................6.15
TRACe:PESQ<i>:LDList:COUNt:AX? .......................................................................................................................................6.16

R&S UPV Alphabetical List of Commands
1146.2084.32 11.11 E-9
TRACe:PESQ<i>:LDList:COUNt:AY? .......................................................................................................................................6.16
TRACe:PESQ<i>:LDList:COUNt:BX? .......................................................................................................................................6.16
TRACe:PESQ<i>:LDList:COUNt:BY? .......................................................................................................................................6.16
TRACe:PESQ<i>:LOAD:AX? ....................................................................................................................................................6.14
TRACe:PESQ<i>:LOAD:AY? ....................................................................................................................................................6.14
TRACe:PESQ<i>:LOAD:BX? ....................................................................................................................................................6.14
TRACe:PESQ<i>:LOAD:BY? ....................................................................................................................................................6.14
TRACe:PESQ<i>:LOAD:COUNt:AX?........................................................................................................................................6.15
TRACe:PESQ<i>:LOAD:COUNt:AY?........................................................................................................................................6.15
TRACe:PESQ<i>:LOAD:COUNt:BX?........................................................................................................................................6.15
TRACe:PESQ<i>:LOAD:COUNt:BY?........................................................................................................................................6.15
TRACe:PESQ<i>:STORe:AX....................................................................................................................................................6.41
TRACe:PESQ<i>:STORe:AY....................................................................................................................................................6.41
TRACe:PESQ<i>:STORe:BX....................................................................................................................................................6.41
TRACe:PESQ<i>:STORe:BY....................................................................................................................................................6.41
TRACe:SWEep<i>:LDList:AX?..................................................................................................................................................6.15
TRACe:SWEep<i>:LDList:AY?..................................................................................................................................................6.15
TRACe:SWEep<i>:LDList:BX?..................................................................................................................................................6.15
TRACe:SWEep<i>:LDList:BY?..................................................................................................................................................6.15
TRACe:SWEep<i>:LDList:COUNt:AX? .....................................................................................................................................6.15
TRACe:SWEep<i>:LDList:COUNt:AY? .....................................................................................................................................6.15
TRACe:SWEep<i>:LDList:COUNt:BX? .....................................................................................................................................6.15
TRACe:SWEep<i>:LDList:COUNt:BY? .....................................................................................................................................6.15
TRACe:SWEep<i>:LOAD:AX?..................................................................................................................................................6.13
TRACe:SWEep<i>:LOAD:AY?..................................................................................................................................................6.13
TRACe:SWEep<i>:LOAD:BX?..................................................................................................................................................6.13
TRACe:SWEep<i>:LOAD:BY?.........................................................................................................................................6.13, 6.40
TRACe:SWEep<i>:LOAD:COUNt:AX?......................................................................................................................................6.14
TRACe:SWEep<i>:LOAD:COUNt:AY?......................................................................................................................................6.14
TRACe:SWEep<i>:LOAD:COUNt:BX?......................................................................................................................................6.14
TRACe:SWEep<i>:LOAD:COUNt:BY?......................................................................................................................................6.14
TRACe:SWEep<i>:STORe:AX..................................................................................................................................................6.40
TRACe:SWEep<i>:STORe:AY..................................................................................................................................................6.40
TRACe:SWEep<i>:STORe:BX..................................................................................................................................................6.40
TRACe:SWEep<i>:STORe:BY..................................................................................................................................................6.40
TRACe:WAVeform:LDList:AX? .................................................................................................................................................6.15
TRACe:WAVeform:LDList:AY? .................................................................................................................................................6.15
TRACe:WAVeform:LDList:BX? .................................................................................................................................................6.15
TRACe:WAVeform:LDList:BY? .................................................................................................................................................6.15
TRACe:WAVeform:LDList:COUNt:AX? .....................................................................................................................................6.16
TRACe:WAVeform:LDList:COUNt:AY? .....................................................................................................................................6.16
TRACe:WAVeform:LDList:COUNt:BX? .....................................................................................................................................6.16
TRACe:WAVeform:LDList:COUNt:BY? .....................................................................................................................................6.16
TRACe:WAVeform:LOAD:AX?..................................................................................................................................................6.14
TRACe:WAVeform:LOAD:AY?..................................................................................................................................................6.14
TRACe:WAVeform:LOAD:BX?..................................................................................................................................................6.14
TRACe:WAVeform:LOAD:BY?..................................................................................................................................................6.14
TRACe:WAVeform:LOAD:COUNt:AX?......................................................................................................................................6.14
TRACe:WAVeform:LOAD:COUNt:AY?......................................................................................................................................6.14
TRACe:WAVeform:LOAD:COUNt:BX?......................................................................................................................................6.14
TRACe:WAVeform:LOAD:COUNt:BY?......................................................................................................................................6.14
TRACe:WAVeform:STORe:AX..................................................................................................................................................6.40
TRACe:WAVeform:STORe:AY..................................................................................................................................................6.40
TRACe:WAVeform:STORe:BX..................................................................................................................................................6.40
TRACe:WAVeform:STORe:BY..................................................................................................................................................6.40
TRIGger:CHANnel........................................................................................................................................................4.166, 4.216
TRIGger:COUNt......................................................................................................................................................................4.234
TRIGger:DELay............................................................................................................................................................4.167, 4.232
TRIGger:FREQuency:VARiation .............................................................................................................................................4.237
TRIGger:SOURce .............................................................................................................4.166, 4.228, 4.229, 4.230, 4.230, 4.231
TRIGger:TIMer........................................................................................................................................................................4.233
TRIGger:VOLTage:VARiation .................................................................................................................................................4.237
