Rubrik Splunk Add On Installation And Setup Guide
User Manual:
Open the PDF directly: View PDF ![]() .
.
Page Count: 12
Rubrik Splunk Add-On
Installation and Setup Guide
Installing the Add-On
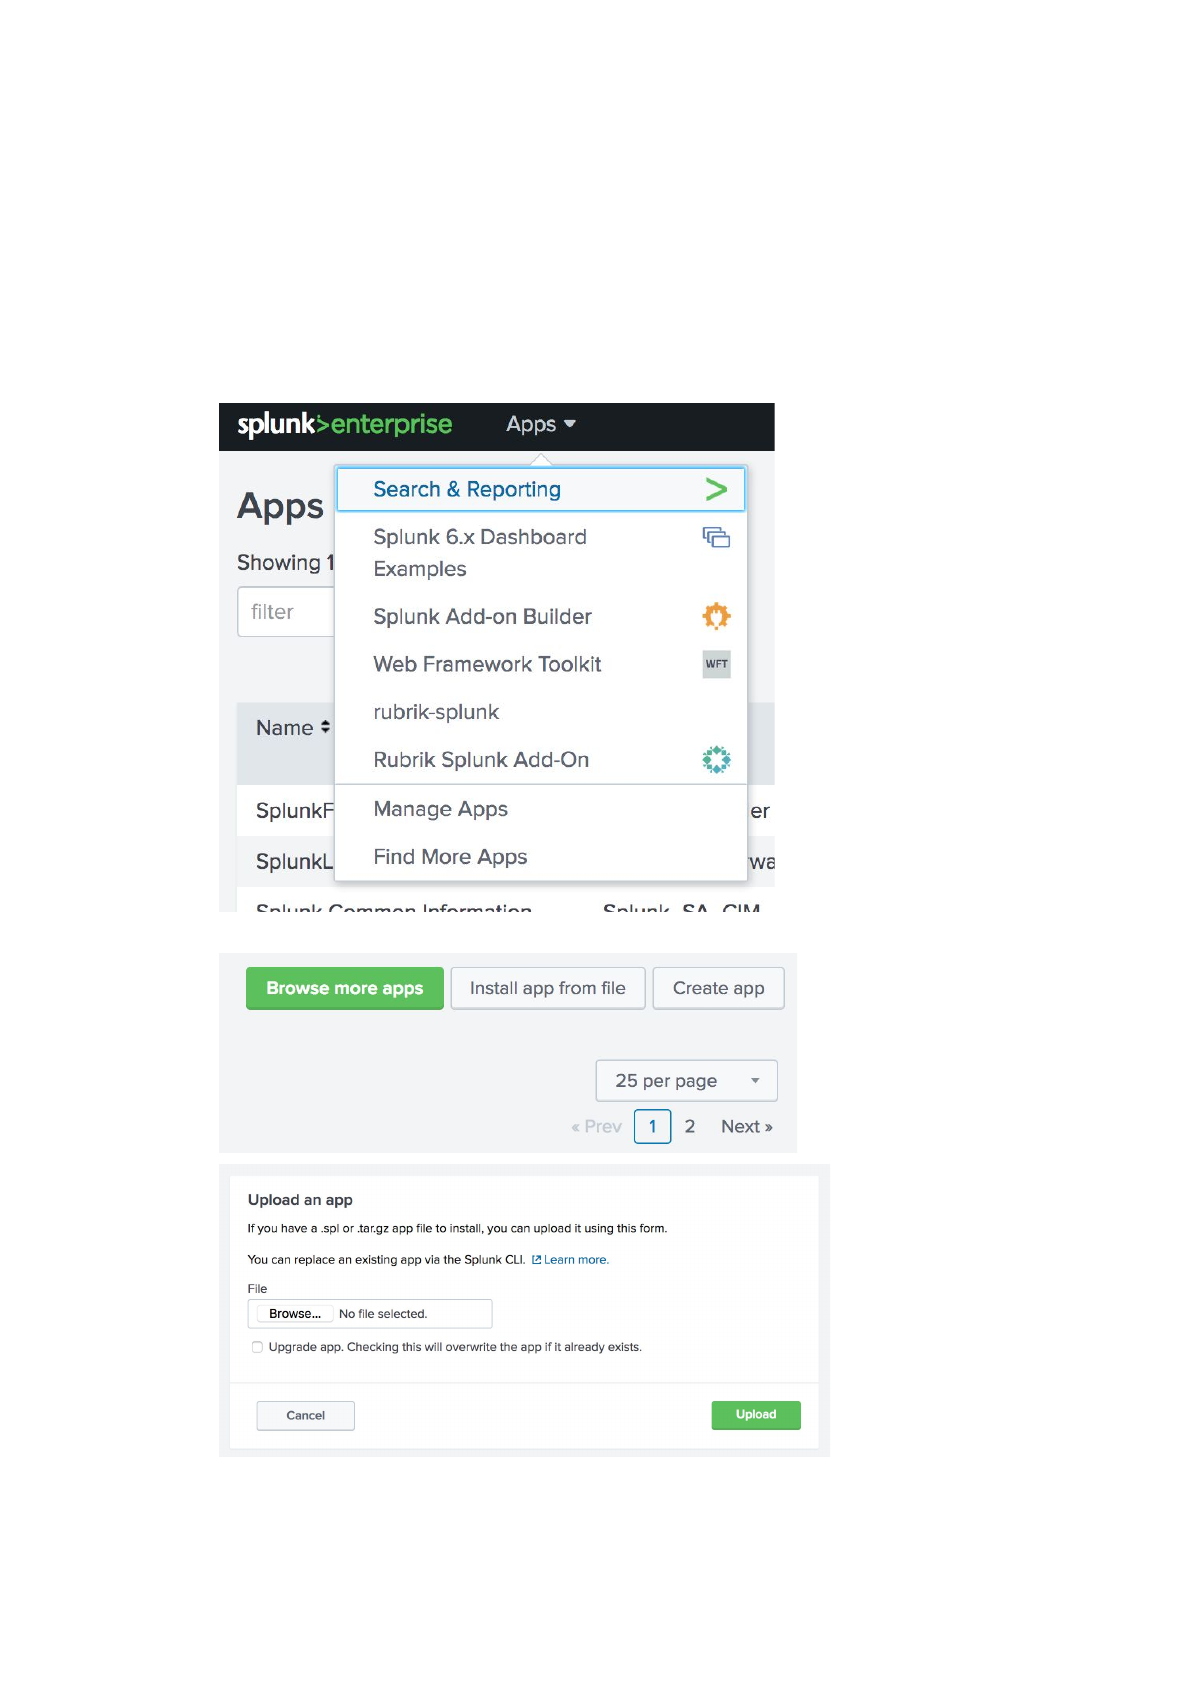
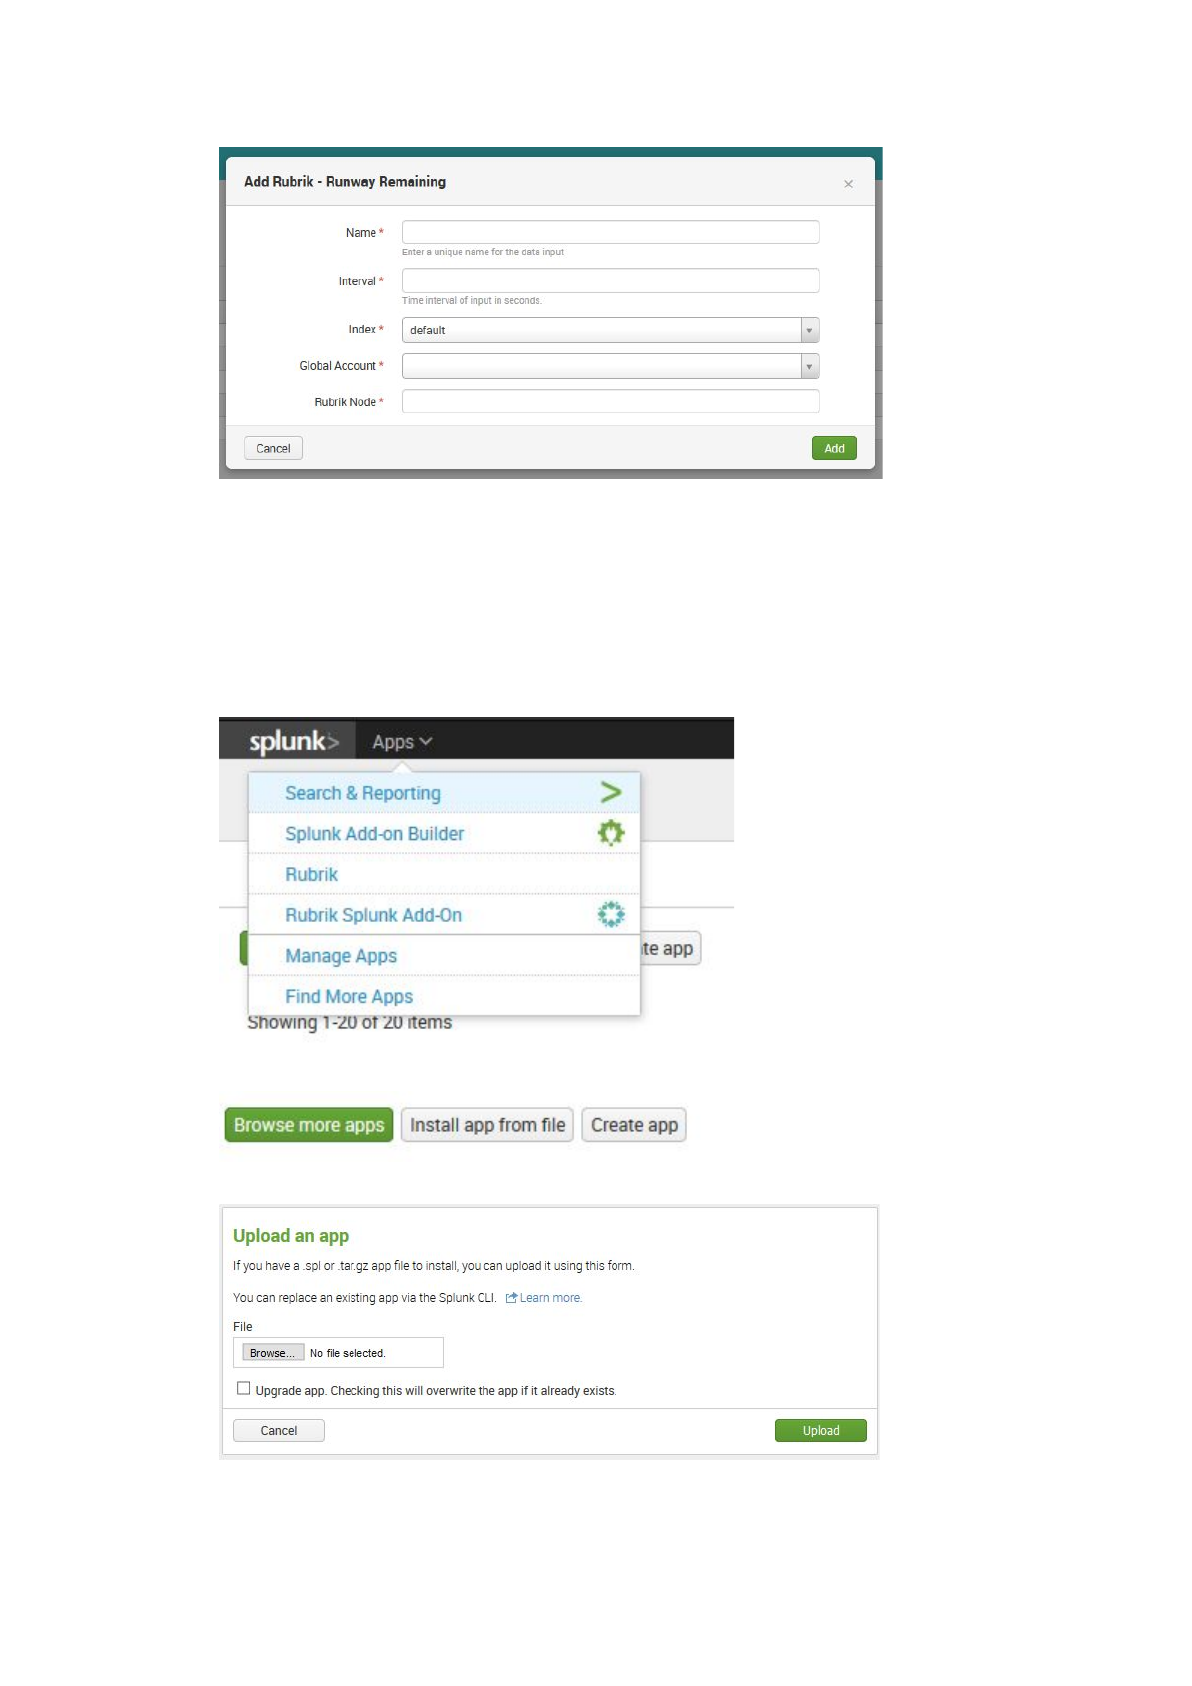
1. Go to the ‘Manage Apps’ page in Splunk:
2. Select ‘Install app from File’:
3. Click ‘Browse’ and browse to the location of the exported add-on. Select the file and
click ‘Upload’. Splunk may ask to be restarted after upload.
Credentials and Logging
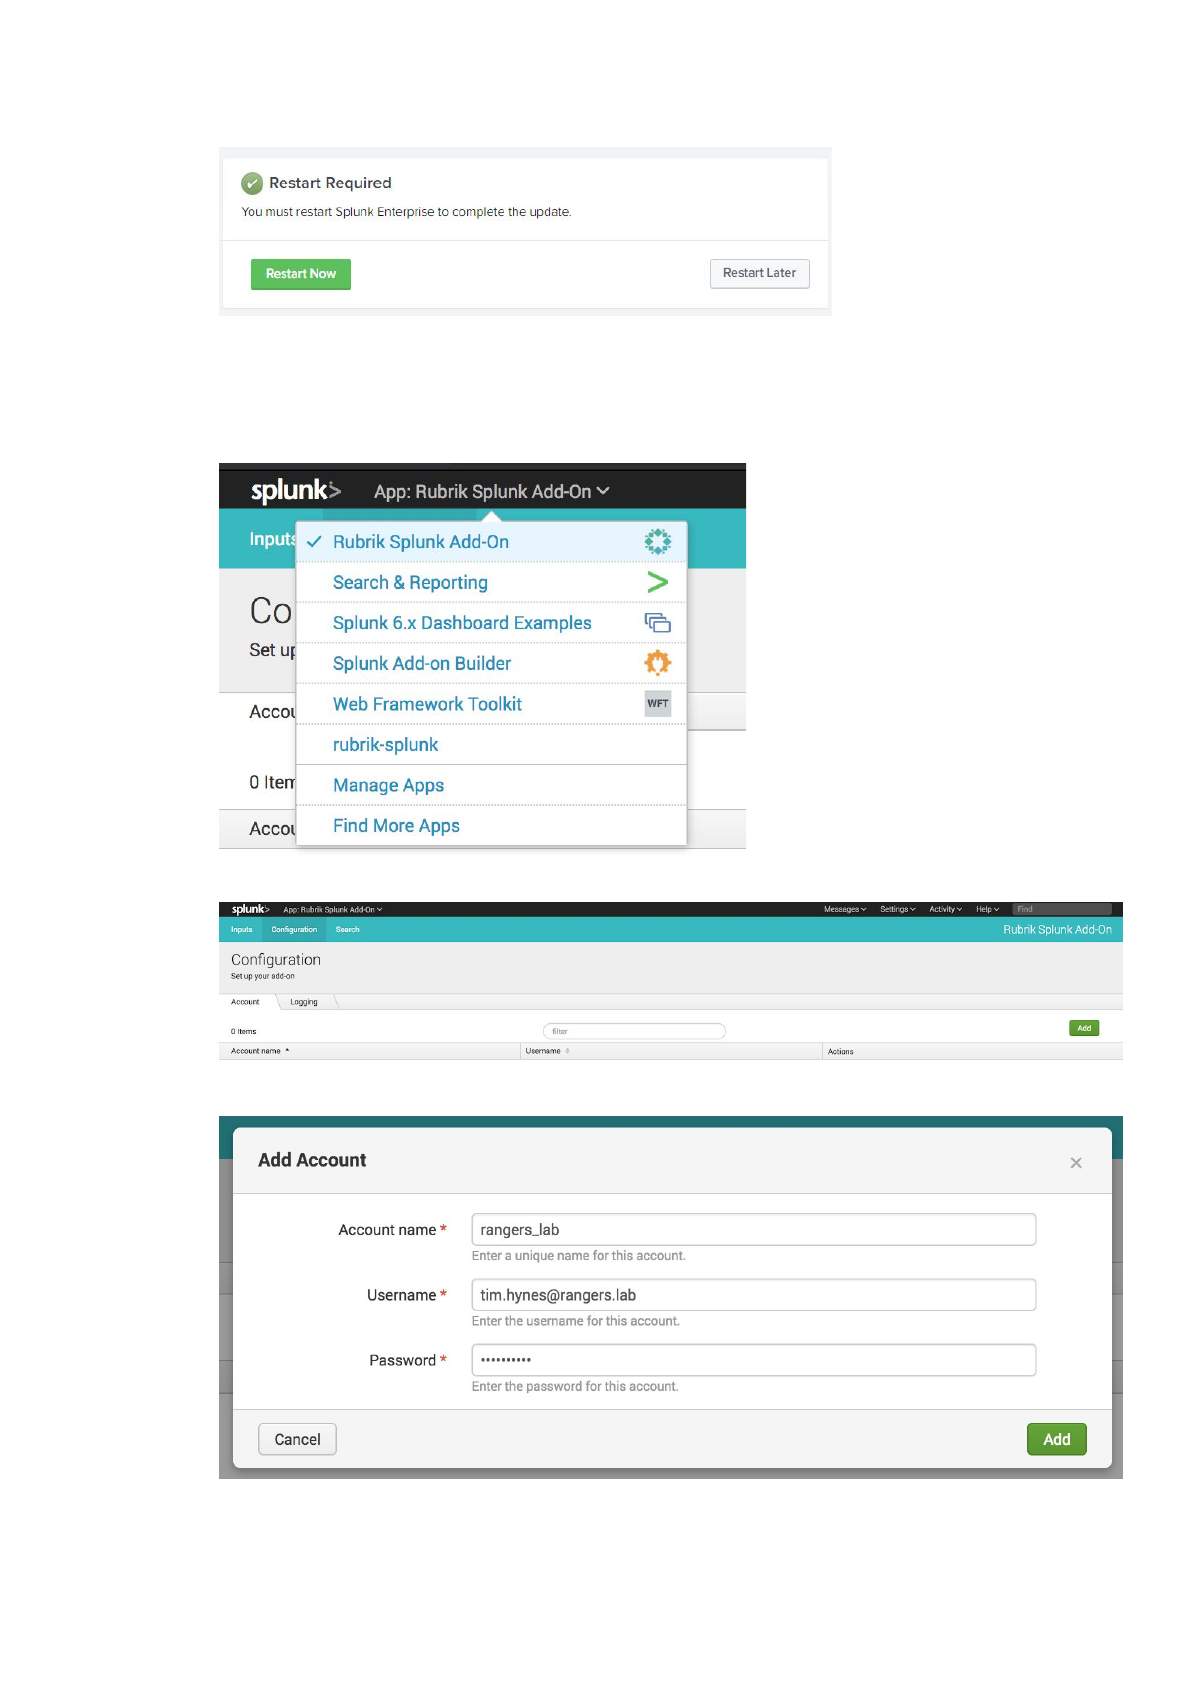
1. Go to the ‘Rubrik Splunk Add-On’ application:
2. Click the ‘Configuration tab, and click the ‘Add’ button:
3. Enter a name for the credential, and the username and password:
4. Press Add.
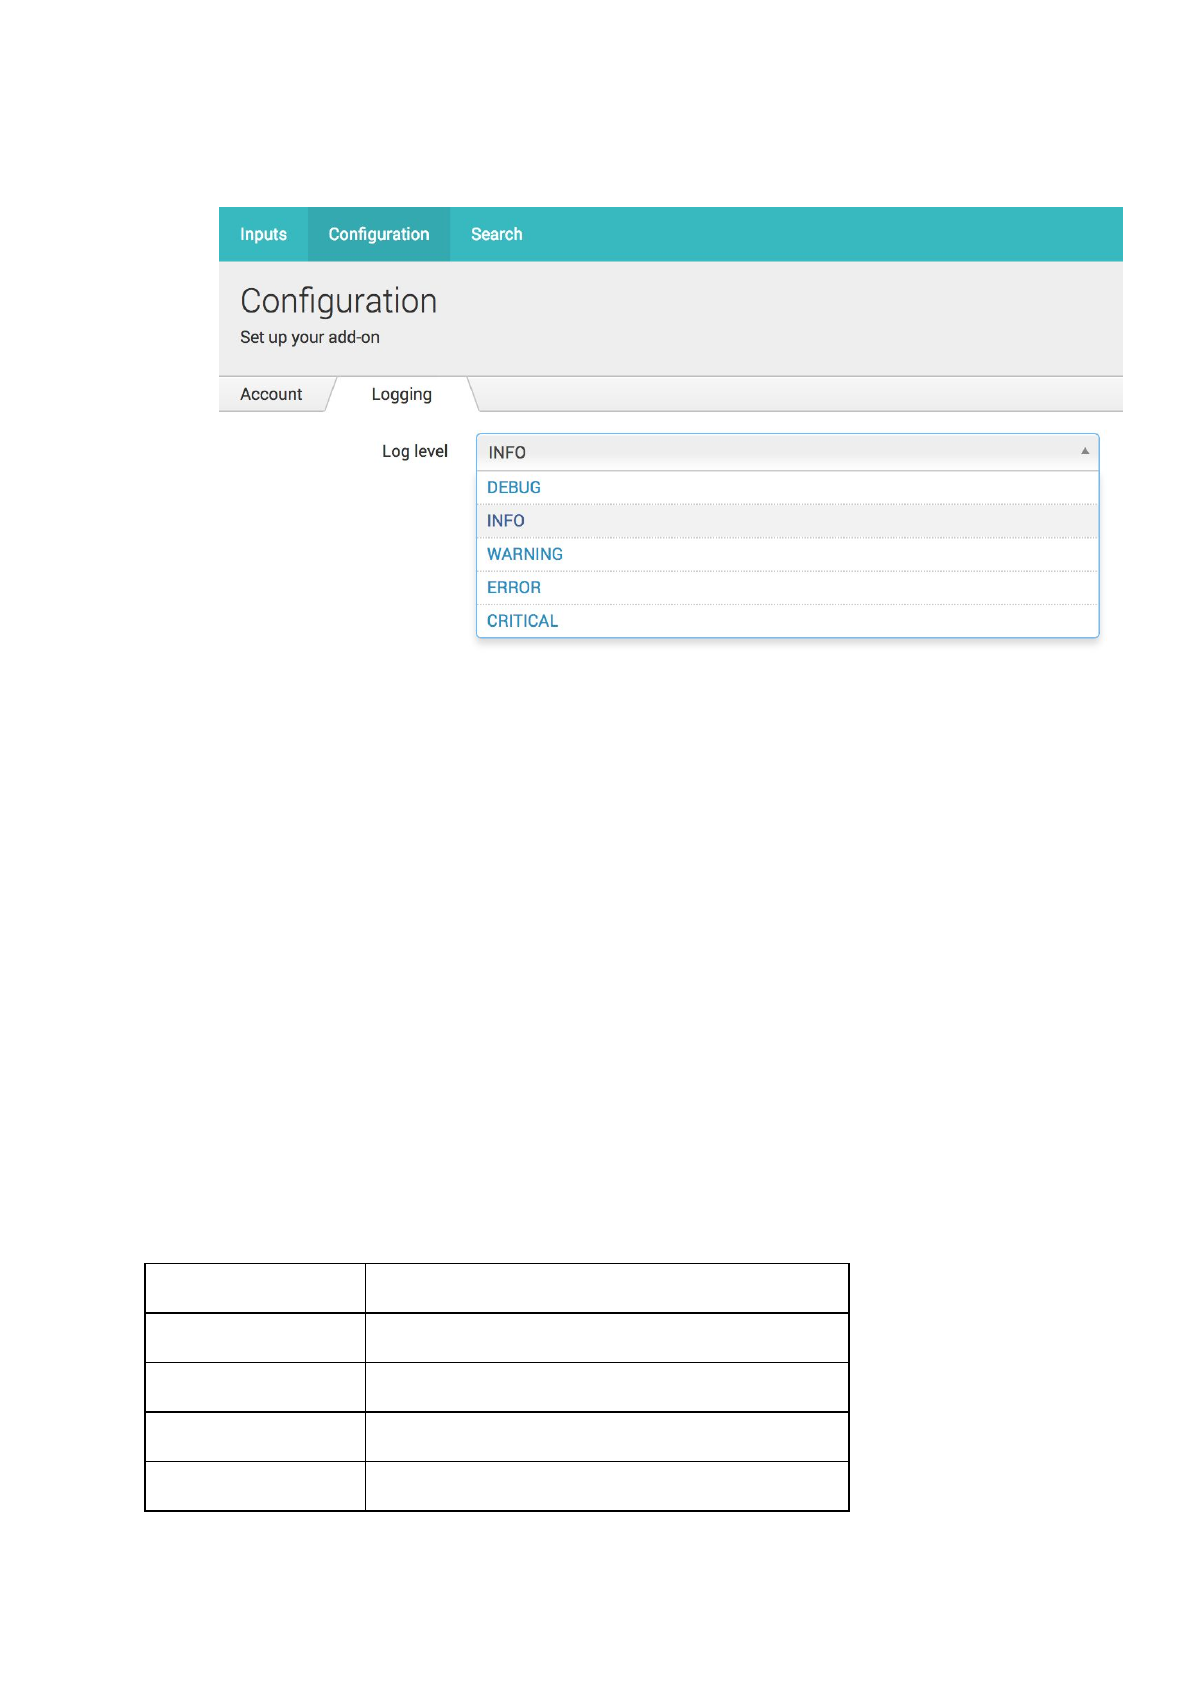
5. Click on the ‘Logging’ tab, and set the desired log level (INFO is the default, and
should be fine for most use cases)
Creating Inputs
Inputs will be created for each of the input types, for each cluster to be monitored, these will
define the systems to collect data from using the REST API.
There are four inputs required for the Rubrik Splunk application, the specifications for these
are detailed below, followed by instructions on how to create an input:
Required Inputs
NOTE: If you are adding multiple Rubrik clusters, then it is a good idea to include a short
version of the cluster name in the ‘Name’ field, in this case, replace ‘rubrik’ with the short
name of your cluster.
NOTE: It is a good idea to use a floating IP address for the ‘Rubrik Node’ value - this will
ensure that in the case of a node being unavailable, the data points can still be gathered.
Instructions on setting up floating IPs can be found in the Rubrik User Guide.
Name
rubrik_runway_remaining
Interval
3600
Index
main
Global Account
<as defined in previous section>
Rubrik Node
<node or floating ip as desired>

Input Type
Rubrik - Runway Remaining
Name
rubrik_storage_summary
Interval
600
Index
main
Global Account
<as defined in previous section>
Rubrik Node
<node or floating ip as desired>
Input Type
Rubrik - Storage Summary
Name
rubrik_event_feed
Interval
60
Index
main
Global Account
<as defined in previous section>
Rubrik Node
<node or floating ip as desired>
Input Type
Rubrik - Event Feed
Name
rubrik_cluster_io_stats
Interval
60
Index
main
Global Account
<as defined in previous section>
Rubrik Node
<node or floating ip as desired>
Input Type
Rubrik - Cluster IO Stats
How to create an Input
1. Go to the ‘Rubrik Splunk Add-On’ in the application picker
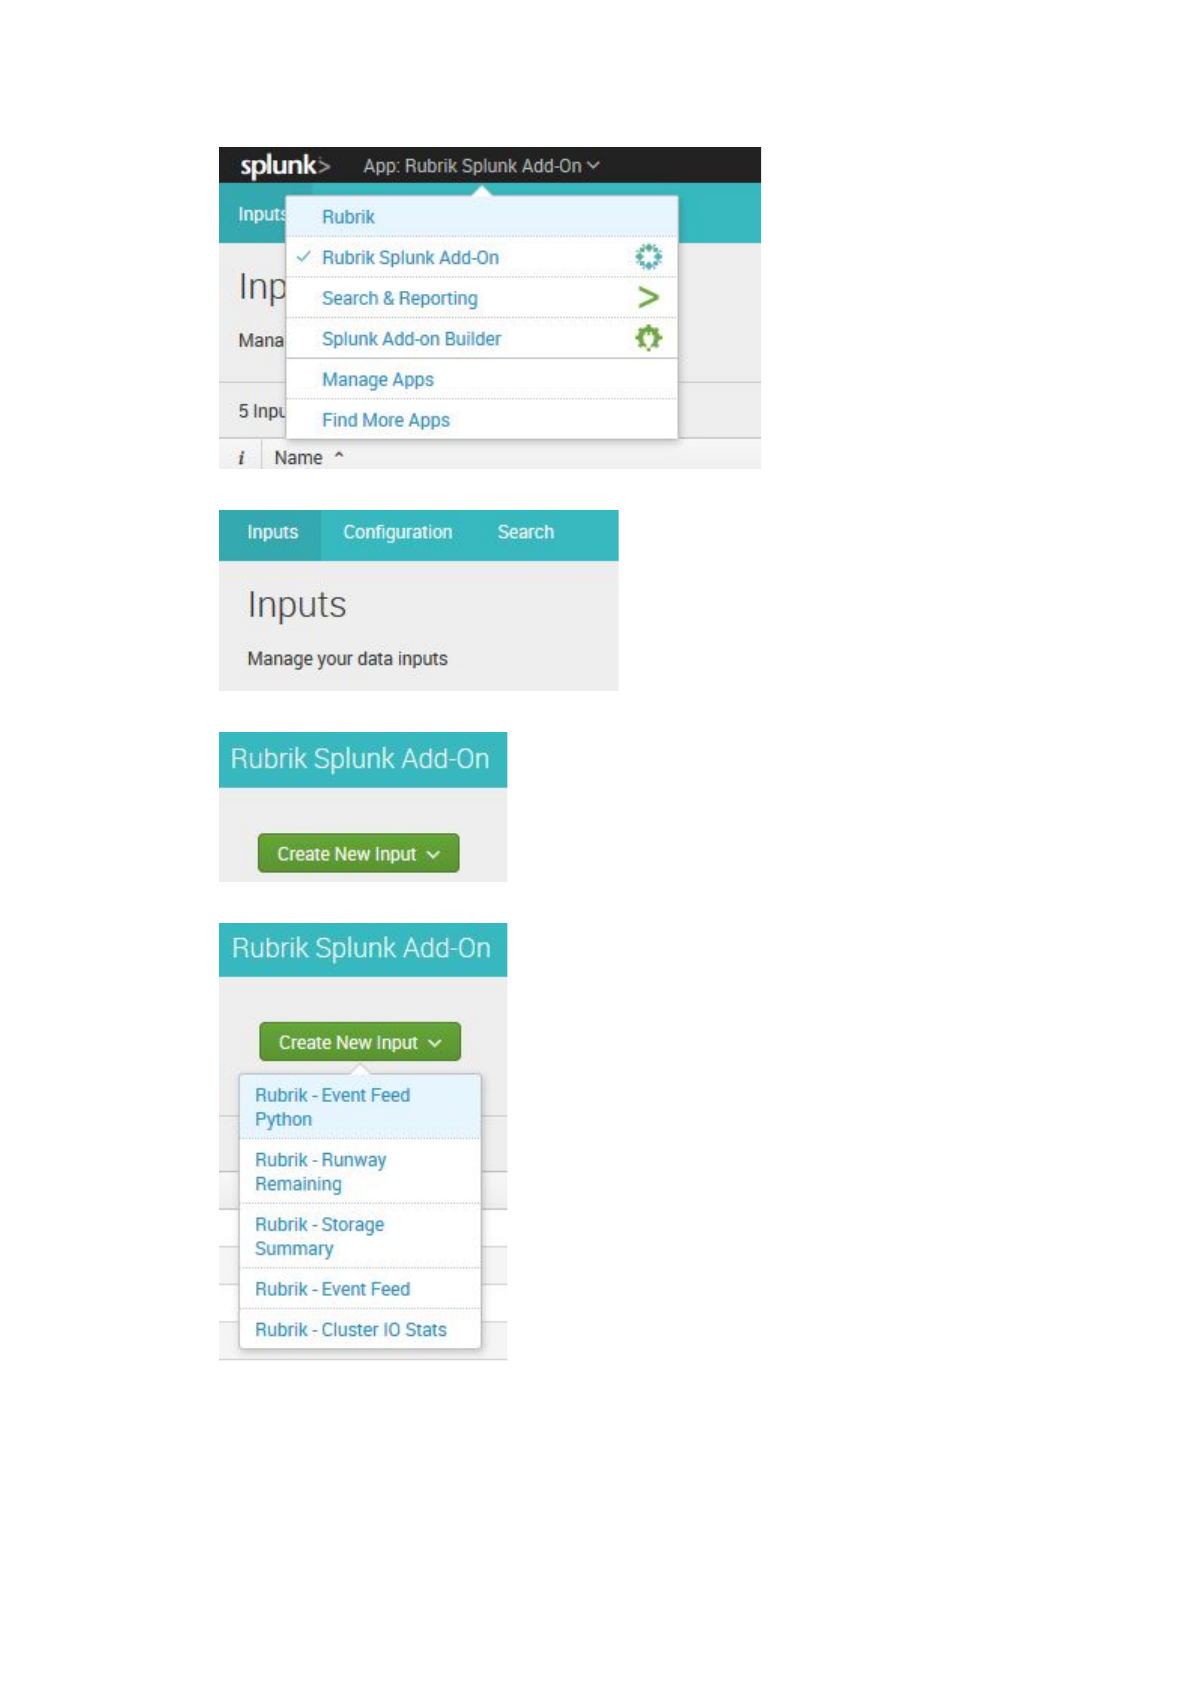
2. Ensure you are on the ‘Inputs’ tab
3. Click ‘Create New Input’
4. Select the input type, as defined in the table in the last section, from the dropdown
5. Enter the details as defined in the last section, and click Add
Importing the Rubrik application
The Rubrik application will be used to contain the datasets and dashboards imported
through the Rubrik Add-On. The steps below detail how to import the application file.
1. Go to ‘Manage Apps’ under the application picker
2. Click the ‘Install app from file’ button
3. Click ‘Browse’ and select the ‘Rubrik.spl’ file, click ‘Upload’

Creating Datasets
Datasets are used to store the gathered data in a table in Splunk. These need to be created
once the add-on and application have been imported so that the dashboards can consume
the filtered data.
There are five datasets required for the Rubrik Splunk application, the specifications for
these are detailed below, followed by instructions on how to create a dataset:
Required Datasets
The following datasets are required:
Table Title
Rubrik - Backup Job Events
Search String
(index="main") (sourcetype="rubrik_rest_event_feed") | where
eventType="Backup" and (eventStatus="Success" or
eventStatus="Failure") | dedup id
Table ID
rubrik_dataset_backup_job_events
Fields
_time
eventInfo
eventStatus
objectId
objectName
objectType
time
_raw
Table Title
Rubrik - Runway Remaining
Search String
(index="main") (sourcetype="rubrik_rest_runway_remaining")
Table ID
rubrik_dataset_runway_remaining
Fields
_time
remaining_days
_raw
Table Title
Rubrik - Security Audit Events
Search String
(index="main") (sourcetype="rubrik_rest_event_feed") | where
eventType="Audit" | table

time,id,eventInfo,eventStatus,eventType,objectName,objectType | sort 0
+ time | dedup id
Table ID
rubrik_dataset_security_audit_events
Fields
eventInfo
eventStatus
eventType
id
objectName
objectType
time
Table Title
Rubrik - Storage Summary
Search String
(index="main") (sourcetype="rubrik_rest_storage_summary")
Table ID
rubrik_dataset_storage_summary
Fields
available
lastUpdateTime
total
used
_raw
Table Title
Rubrik - Cluster IO Stats
Search String
(index="main") (sourcetype="rubrik_rest_cluster_io_stats") | rename
iops.readsPerSecond{}.stat AS iopsRead, iops.writesPerSecond{}.stat
AS iopsWrite, ioThroughput.readBytePerSecond{}.stat AS tpRead,
ioThroughput.writeBytePerSecond{}.stat AS tpWrite | table
_time,iopsRead,iopsWrite,tpRead,tpWrite
Table ID
rubrik_dataset_cluster_io_stats
Fields
_time
iopsRead
iopsWrite
tpRead
tpWrite
How to create a Dataset
1. If you do not have the ‘Splunk Datasets Add-on’ installed or enabled, you will need to
install this from the app store in Splunk and enable it, or download and install it from
here.
2. Go to the ‘Datasets’ tab under the ‘Rubrik’ application
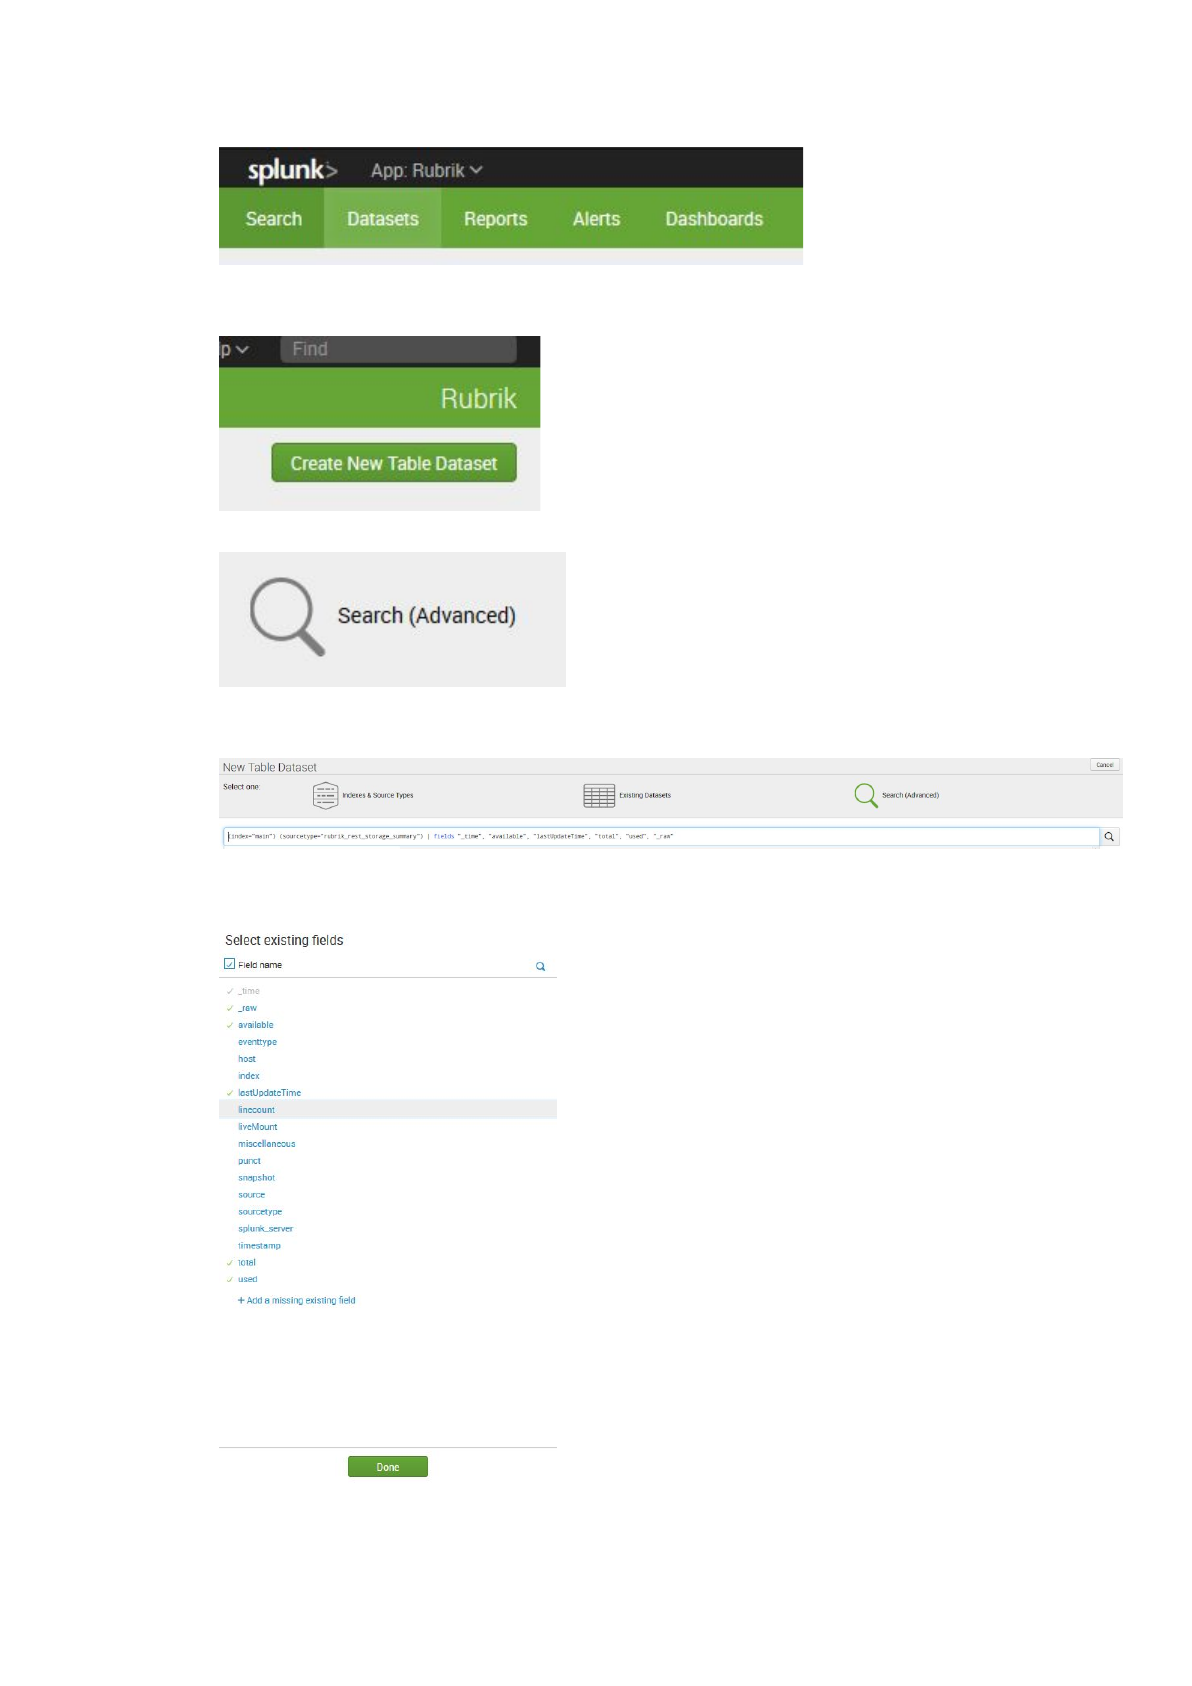
3. Click the ‘Create New Table Dataset’ button (if you do not have the Splunk Datasets
Add-on enabled or installed you will not see this button)
4. Click the ‘Search (Advanced)’ link
5. Enter the search string as defined in the tables in the last section, and hit the search
button on the far right
6. Select the fields as defined in the ‘Fields’ section of the tables in the last section, click
‘Done’
7. Click the ‘Save As’ button in the top right hand side
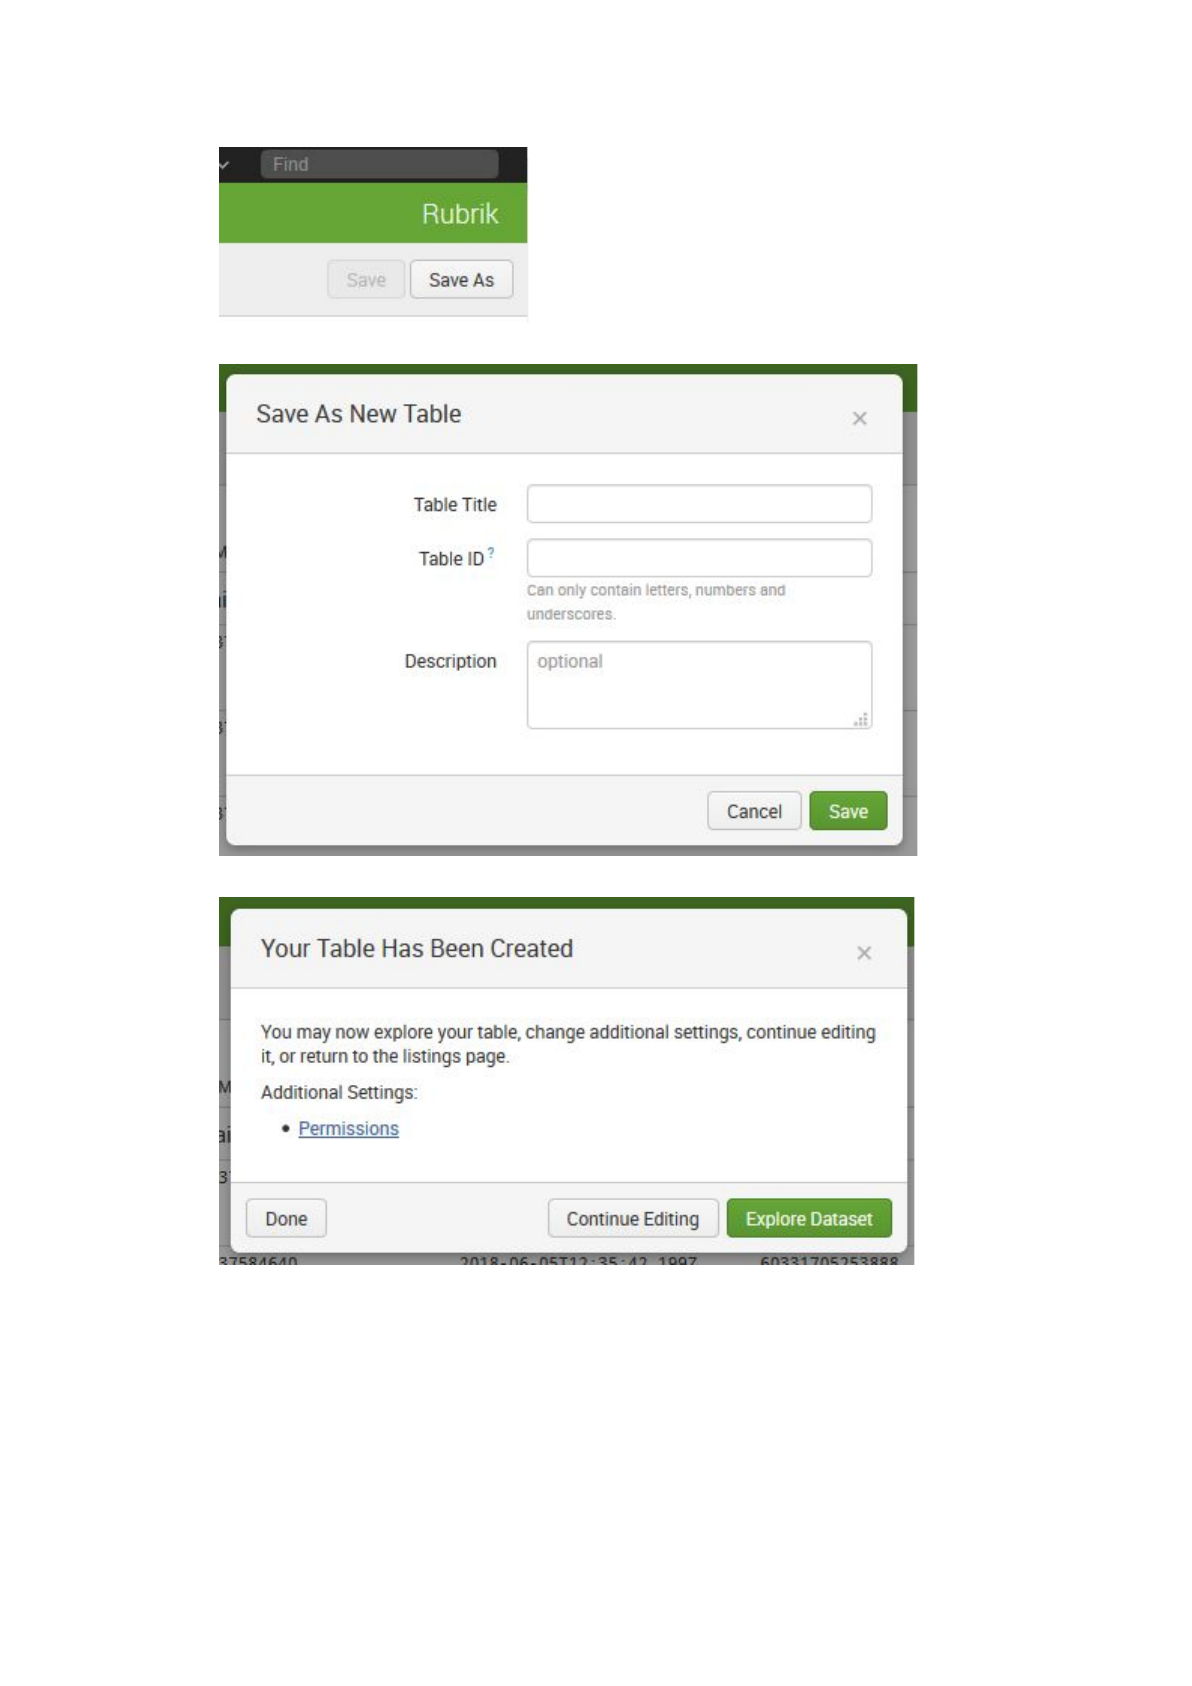
8. Enter the title and ID as defined in the table in the last section, and click ‘Save’
9. Click ‘Done’
Dashboards
There are three dashboards which should now be populated in the Rubrik application, these
are as follows:
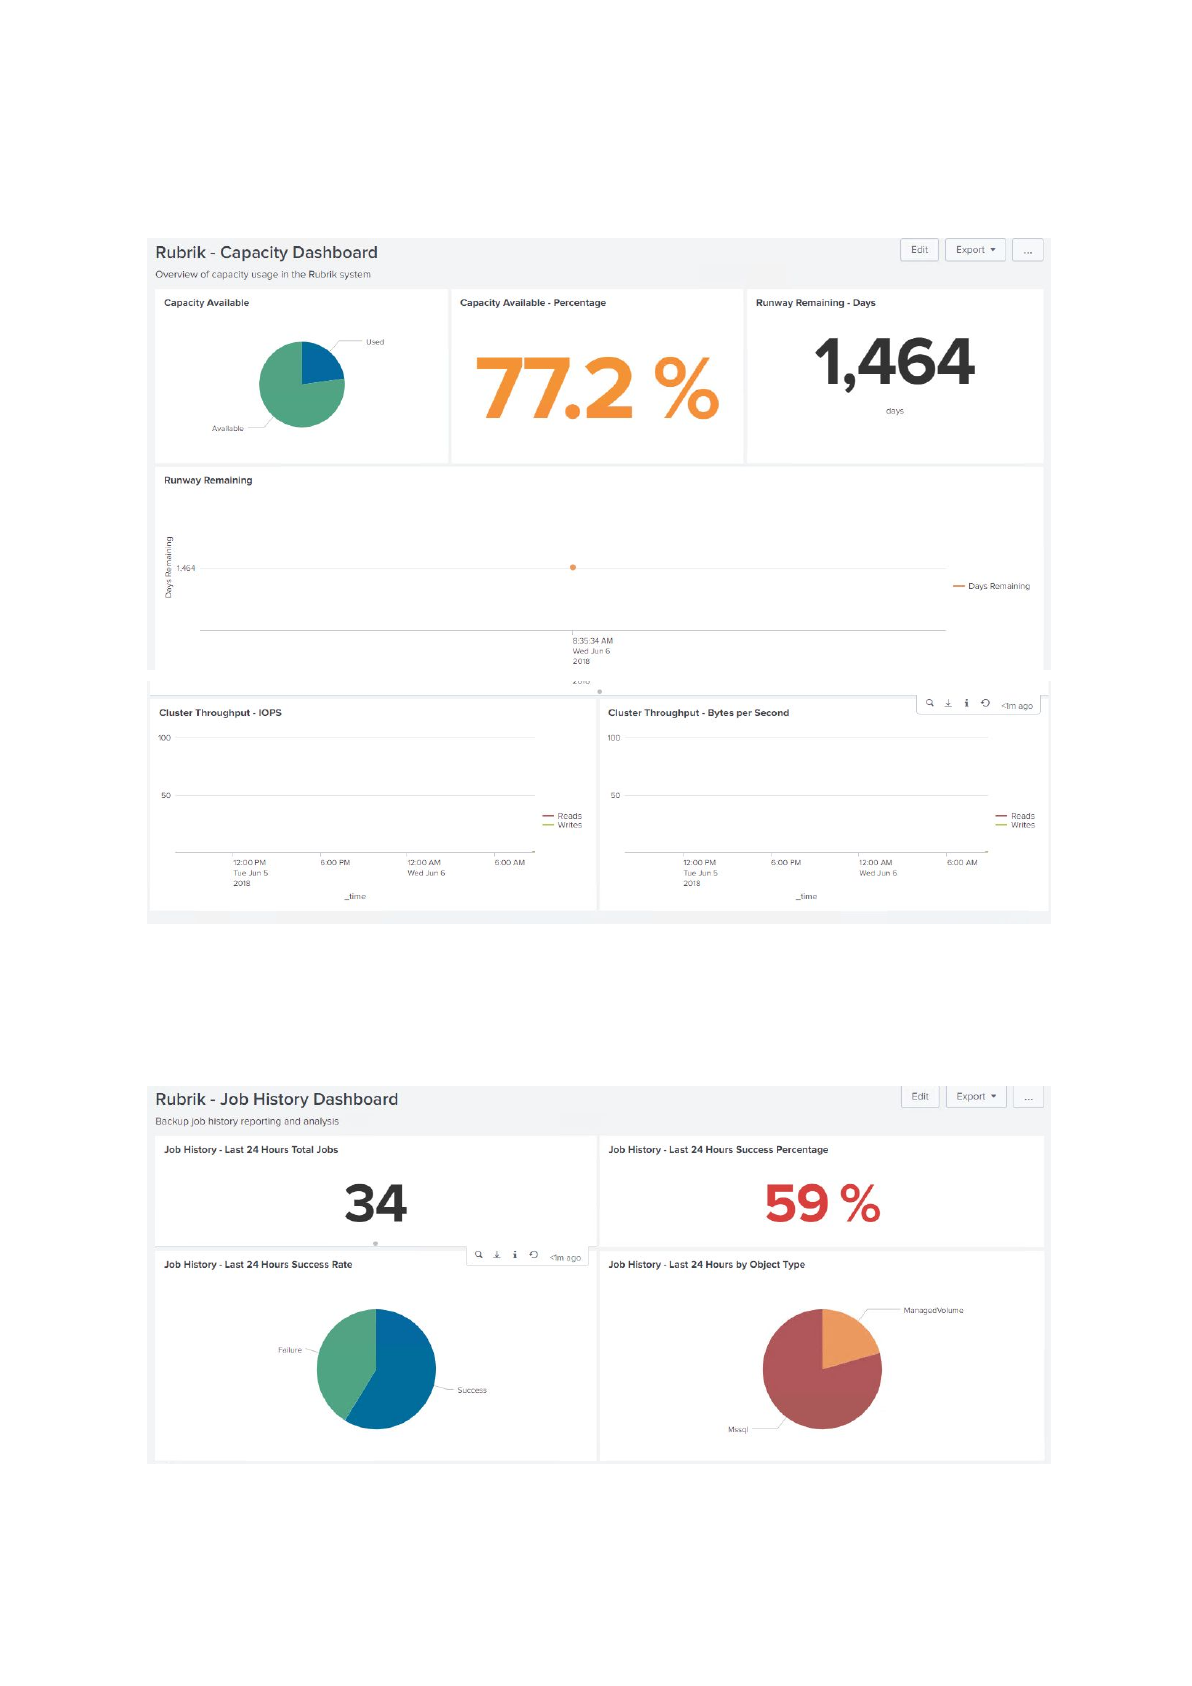
Capacity Dashboard
This dashboard shows capacity and throughput statistics for the cluster.
Job History Dashboard
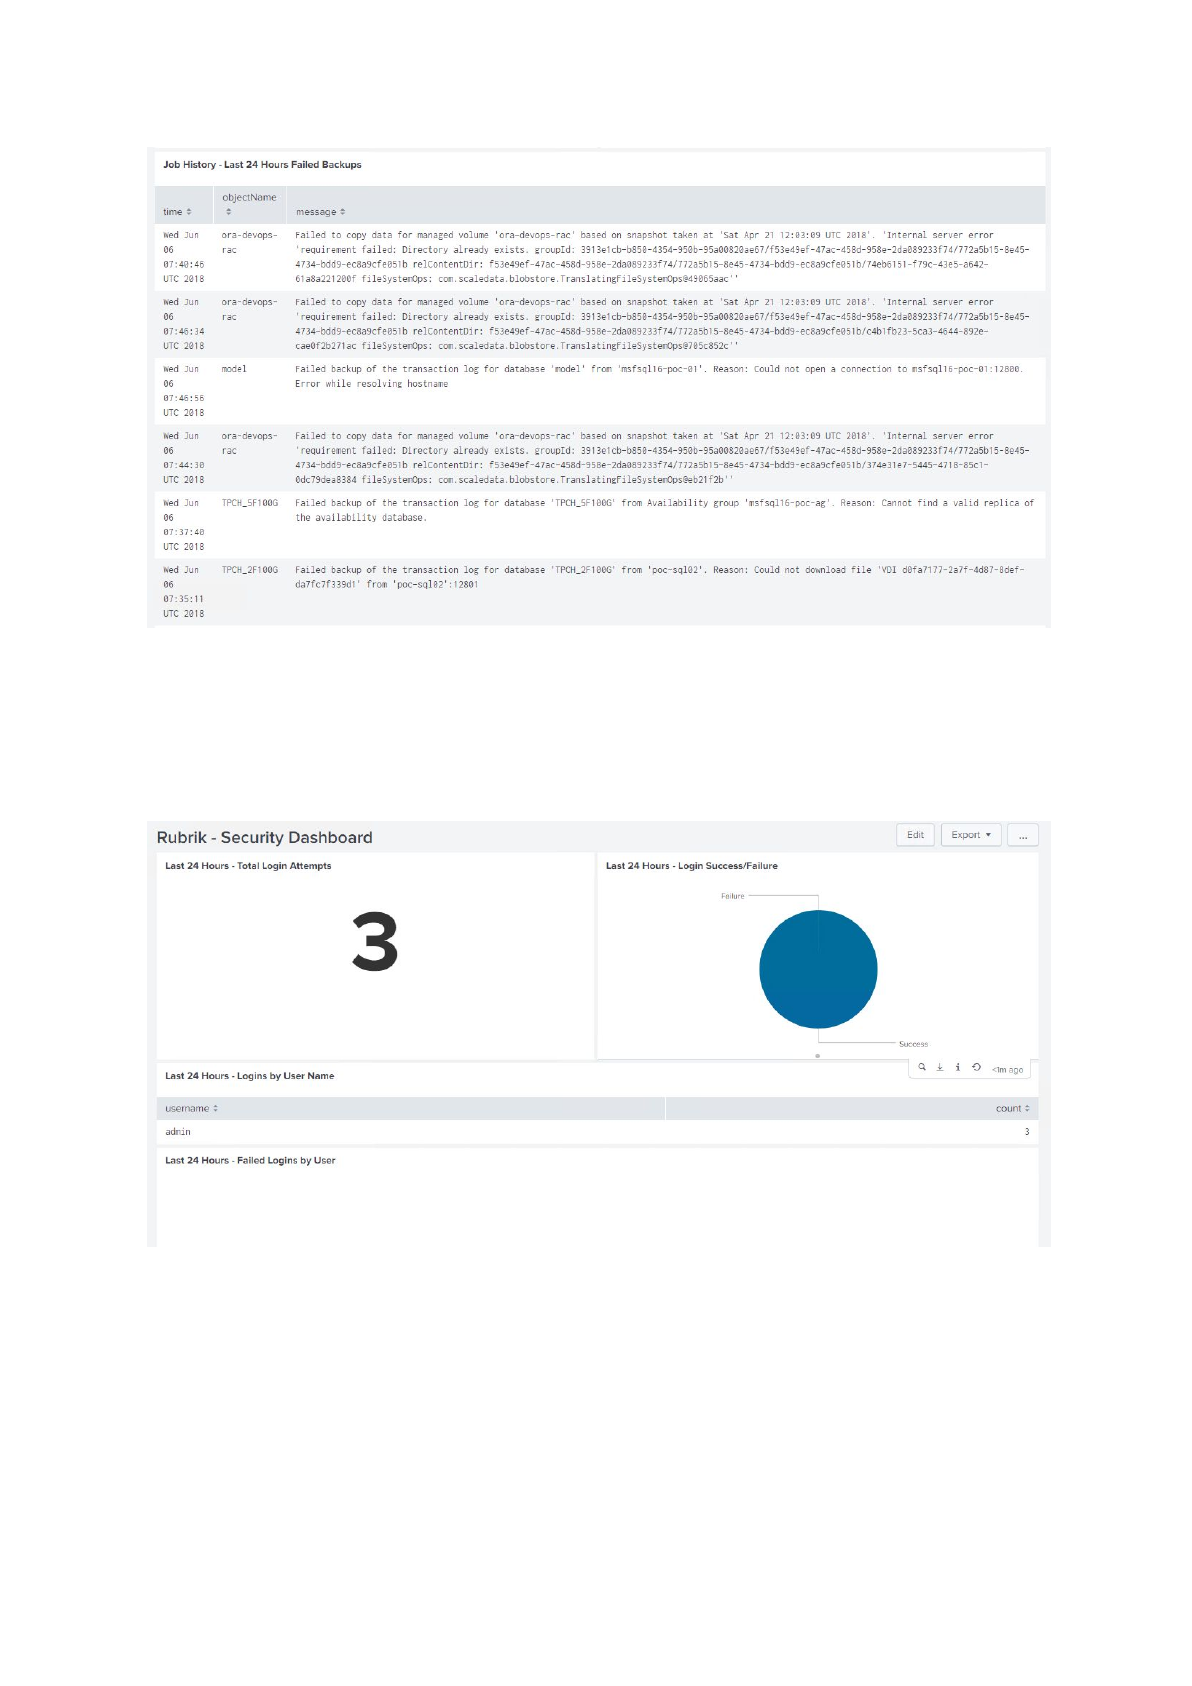
This shows the last 24 hours of backup histories, breaking them down by succeeded and
failed, and by object type, as well as showing failure logs for any missed backup jobs.
Security Dashboard
This dashboard shows the last 24 hours of login information, breaking down the top 10
logins by name and count, and the top 10 failed logins by name and count
