Saleae+Users+Guide
User Manual:
Open the PDF directly: View PDF ![]() .
.
Page Count: 69
Page 2 of 69
Table of Contents
Product Summary .................................................................................................................................... 3
Safety Summary & Warranty ................................................................................................................. 6
Software Download & Installation ..................................................................................................... 11
Navigating the Software ....................................................................................................................... 13
Connecting the Logic Hardware ........................................................................................................ 20
Device Calibration .................................................................................................................................. 21
Connecting Accessories ...................................................................................................................... 24
Collecting Data & Device Settings ..................................................................................................... 28
Using the Trigger ................................................................................................................................... 32
Real-Time View (In beta) ....................................................................................................................... 36
Navigating Your Data - Zooming, Panning, Rearranging, & Resizing...................................... 37
Measurements, Timing Markers, and Bookmarks ......................................................................... 42
Saving, Loading, and Exporting Data ............................................................................................... 49
Saving and Loading Software Settings ............................................................................................ 54
Using Protocol Analyzers .................................................................................................................... 55
Simulation Data & Demo Mode ........................................................................................................... 61
Capture Settings Configuration Guide ............................................................................................. 62
Time & Memory Saving Tools ............................................................................................................. 65
Keyboard Shortcuts .............................................................................................................................. 67
Connector Dimensions ......................................................................................................................... 68
Page 3 of 69
Product Summary
Saleae Logic Analyzers consists of the products listed in this section. The 2nd Generation of products
have the capability of recording both digital and analog signals, while the 1st Generation of products have
digital recording capability only.
1st Generation:
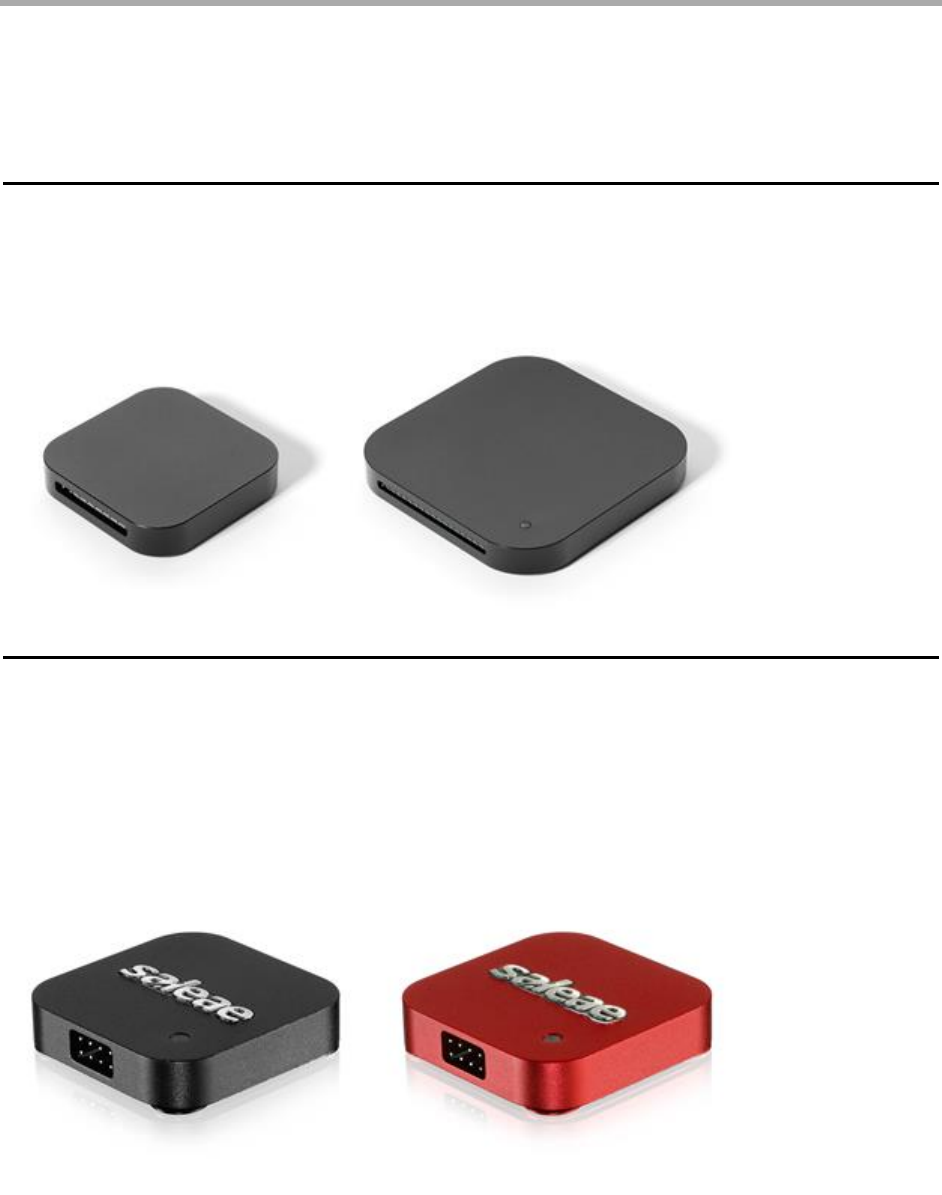
• SALEAE001 Logic (Discontinued)
• SALEAE009 Logic16 (Discontinued)
2nd Generation:
Note: "Red" or "Black" is not written on the device. This refers to the color of the device enclosure. The
specific device model is written on the bottom of the device enclosure.
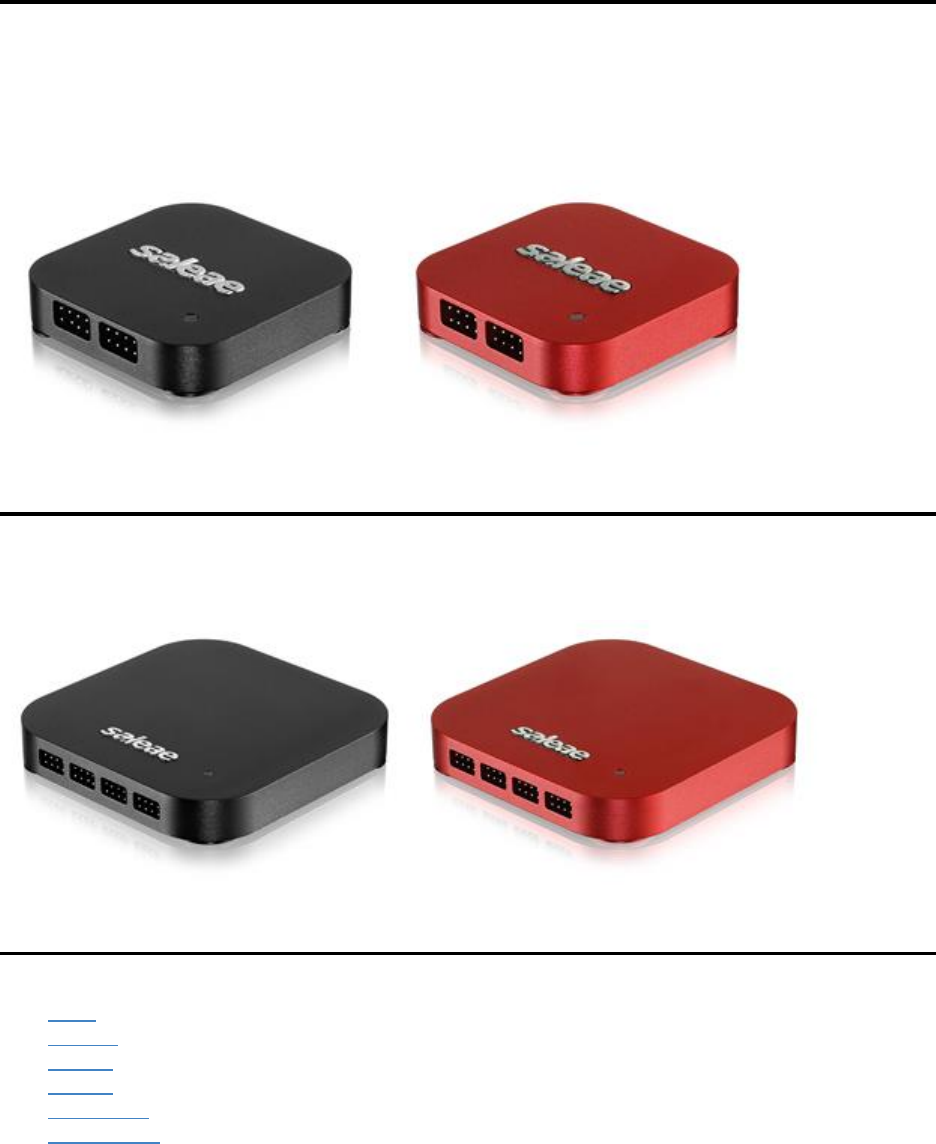
• SAL-00109 Logic 4 Black (Discontinued)
• SAL-00110 Logic 4 Red (Discontinued)

Page 5 of 69
What's In the Box?
• Logic 8 includes: Saleae Logic 8 USB Logic Analyzer, 2x 4-Channel Wire Harnesses, 16x Micro-
Gripper Hooks, Saleae Carrying Case, USB 2.0 Micro Cable, & the Getting Started Card
• Logic Pro 8 includes: Saleae Logic Pro 8 USB Logic Analyzer, 2x 4-Channel Wire Harnesses, 16x
Micro-Gripper Hooks, Saleae Carrying Case, USB 3.0 Cable, & the Getting Started Card
• Logic Pro 16 includes: Saleae Logic Pro 16 USB Logic Analyzer, 4x 4-Channel Wire Harnesses, 32x
Micro-Gripper Hooks, Saleae Carrying Case, USB 3.0 Cable, & the Getting Started Card
Purchasing Additional Accessories
Several additional accessories, which are not included in the box, can be purchased via the Saleae
Accessories store.
Page 6 of 69
Safety Summary & Warranty
Before operating your Saleae Logic product for the first time, please carefully review the safety
guidelines below to avoid any injury and damage.
Electrical Isolation
The input channels on Saleae Logic analyzers are not electrically isolated from each other. The Saleae
Logic is also not electrically isolated from the PC.
High Voltage Safety
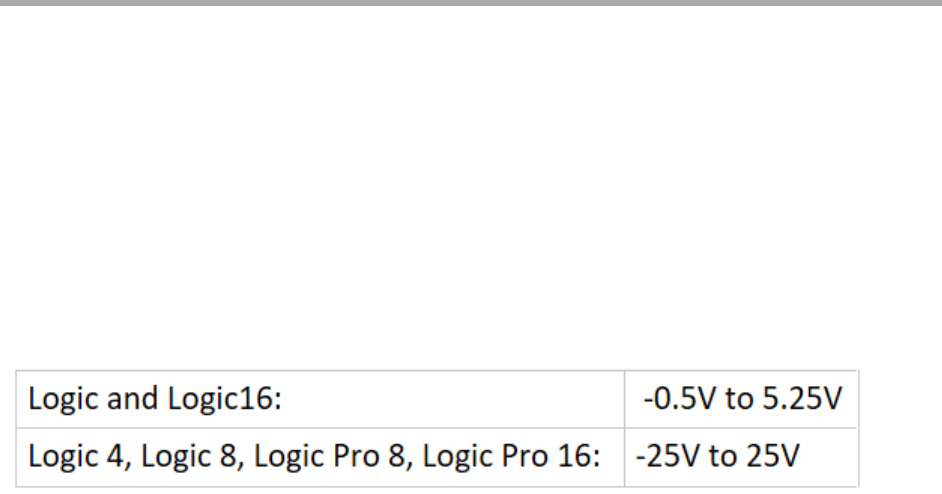
Absolute Maximum Voltage Range:
Caution: Connecting one of the input channels to voltages outside this range, even for a very short time,
can result in damage to the device.
Safety Tip: If you're working with high voltages near the absolute maximum limit, first ensure that the wire
harnesses are securely attached to your DUT and you've done some basic testing to make sure the clips
won't pop off your connections. Afterwards, you can connect the wire harnesses to the logic analyzer.
Ground Current Safety
Specifically, this is when a high current flows from the ground pin on the logic analyzer to the ground on
the USB port of your computer, or vice versa. This current can easily damage the logic analyzer, your PC,
and your DUT. All Saleae logic analyzers have fuses in their ground return paths, but these are not
always fast enough to protect the unit from damage.
The user should be cautious of this when the logic analyzer is used in the presence of a ground loop.
Specifically, this means that the logic analyzer is not the only ground path between your DUT and the
host PC. Ground loops by themselves are not necessarily bad, but requires extra caution from the user.
Common Ways a Ground Loop Can Exist:
• Other USB devices (such as programmers) are connected to the DUT, or the DUT itself is plugged
into the USB port on your computer. In addition to the logic analyzer's ground connection, the DUT's
ground is also connected to the PC's ground through another USB port.
Page 7 of 69
• Non-isolated power supplies Most AC power supplies with 3-prong plugs will short the MAINS earth
ground pin to the power supply ground output. That includes your PC's ground. If your DUT is
powered from a 3-prong wall power supply and your PC is also plugged in, that will form another
ground path. Keep in mind that if you're using a laptop that's not plugged in, even an attached
external monitor or printer will create a ground loop.
Common Ways Damage Can Occur:
• When connecting or disconnecting probes, one of the ground probes from the logic analyzer is
accidentally brushed against a power supply pin on the DUT, such as +5V. If there are no other
ground paths between the DUT and the PC, nothing will happen. However, if there is a ground path,
then current will flow from that voltage supply through the logic analyzer's ground pin, through the
USB cable and the host PC, and then through the secondary ground connection—either MAIN earth
ground or another USB port, back to the ground on the DUT. Basically, that is the same as shorting
out the voltage supply on your DUT, but it uses the logic analyzer and your host PC as the short
circuit, which could damage all components in the loop.
• What if the DUT's ground reference isn't at the same voltage as the ground loop connection? For
instance, if your circuit is powered by a bipolar power supply used to produce +10 volts and -10
volts, and then your circuit uses the -10 volt rail as its ground voltage, but there exists a ground loop
through MAINS earth ground to the power supply's 0 volt output, then effectively the ground on your
DUT is actually -10 volts relative to the host PC. Connecting Logic will immediately short out the
DUT power supply and potentially damage all devices present in the loop.
Testing Multiple DUTs
In some cases, you need to record signals from multiple devices under test simultaneously with the same
logic analyzer. This can be done safely, but it is important to review how both devices are powered before
connecting the logic analyzer.
Since the channels in each Saleae logic analyzer are not electrically isolated from each other, all devices
will need to share a common ground. If the devices under test already share a common ground, then
you're all set. However, if they are floating relative each other (meaning their grounds are not directly or
indirectly connected to each other), or if there is a common mode voltage setup between them, then the
additional steps below are required:
Page 8 of 69
• If one or both of the devices under test are floating, do they need to be floating? In order to record
with a logic analyzer, they will need to be common grounded to each other AND to the PC to which
the logic analyzer is connected. This also means MAINS earth ground in most cases.
• If one of the boards is powered from another with a ground difference such as a large negative
voltage supply, then it is NOT safe to connect the logic analyzers to both devices. In addition, it is
not sufficient to isolate the USB connection or the test PC from the devices. The inputs themselves
need to be isolated between the device under test and the logic analyzer for at least one of the two
devices under test. Please see the SI labs isolation development kit at the bottom of this article for
input channel isolation.
• If the devices are already common grounded to each other, then there are no special steps to follow.
Just review the general ground loop information above.
Identifying if a Ground Loop is Present
To identify a potential ground loop between the Logic device and the DUT, you could check the
resistance between the DUT ground and the Saleae Logic ground. While the Saleae Logic is connected
to the PC, if the resistance reads infinite on a multi-meter, then the grounds are isolated. Otherwise, they
are connected, and a ground loop exists.
Caution: If a ground loop is present, extra care should be taken, as highlighted below, before connecting
the logic analyzer ground to the DUT ground.
If you believe there is a ground loop between the DUT and the host PC but you are uncertain if the
grounds on both sides you plan to use are at the same potential, there is a quick test you can perform
with a multi-meter. If you happen to have a large resistor (> 10K ohm), there is an additional test you can
perform.
1. Connect the logic analyzer to the PC but not the DUT.
2. Measure the voltage between the ground pin on the logic analyzer and the ground pin on the DUT.
• If there is a ground loop and you measure a voltage greater than about +/- 100mV, then a common
mode ground current may occur when they are connected, damaging your equipment.
• If there is a ground loop and you measure a voltage smaller than about +/- 100mV, then it is safe to
connect the ground pins.
• If there is not a ground loop or you are not sure there is a ground loop, then the voltage may drift
significantly. If you are SURE there is no ground loop, then it is safe to connect the grounds.
If you are not sure there is a ground loop or would like to perform another test anyway, connect the
resistor (~10K) between the two grounds and then measure the voltage across the resistor.

Page 9 of 69
• If you see a voltage that indicates a noticeable current, then there is a ground loop between devices
and you should not connect the grounds together.
• If you see an insignificant voltage across the resistor, then either there is no ground loop or there is
a ground loop, but both grounds are at the same reference. It is safe to connect the logic analyzer.
Identifying if the DUT is Isolated from the PC
The DUT's local ground is isolated from the host PC when one of the following is true:
• The DUT is battery-powered and has no other electrical connections to the host PC or devices
powered from MAINS power.
• The DUT is powered from an isolated power supply that does NOT short MAINS earth ground to the
output ground. Bench top supplies with a separate green earth ground terminal do this. USB wall
adapters also do this. Common AC power adapters (chargers, "wall warts") with 2-prong plugs are
also isolated. Most power supplies do have transformers that can provide isolation if implemented
properly.
• The Host PC is a laptop running from a battery or is plugged into an instrumentation isolation
transformer. Note that normal isolation transformers connect earth ground for human safety
reasons.
Warning: When working in an electrically isolated state, keep in mind that floating grounds can be
dangerous to the operator. When operating with equipment with a floating ground, please review and
follow appropriate safety measures.
Using an Isolated Wall Adapter to Power the DUT
Using isolated wall adapters such as USB wall adapters to power the DUT will isolate its ground from
MAINS ground, although that does not always eliminate ground loops. For example, if the DUT was
connected to the same computer that the Logic device is connected to, then a ground loop is formed.
Is the Logic Device Safe to Use in the Presence of Ground Loops?
Yes, it is completely safe to use the Logic device as long as both grounds are at the same voltage level
and as long as you only connect the Logic ground to the ground of the DUT.
Isolation: There Is a Ground Loop and a Difference in Potential Between Grounds
What do you do if the grounds are related but not at the same potential? You will need to fully isolate the
DUT from the PC. You can do this on either side of the logic analyzer.
To isolate the digital input side of the logic analyzer, you can consider using the SI84XXISO Evaluation
Kit
To isolate the USB 2.0 high-speed connection, you can consider using the Intona High Speed USB
Isolator. We recently purchased this isolator and will be performing an evaluation soon. This is the first

Page 10 of 69
true high-speed USB 2.0 isolator on the market. All other USB 2.0 isolators are only full speed and low
speed, which is insufficient for our products to operate.
Warranty Coverage
Saleae products are covered by a 3-year warranty, regardless of where you purchased the product. For
more information, see: 180-Day Return Policy and 3-Year Warranty
If you believe your Logic hardware is broken, please follow the troubleshooting steps in the article
here: Saleae Warranty & RMA Testing Procedure
Afterwards, if the device continues to fail, write a message to us with the detailed results of the
troubleshooting steps, as well as any relevant information that is requested in that article.

Page 11 of 69
Software Download & Installation
Downloading the Latest Software
The Saleae Logic software is available free of charge, and can be installed on as many machines as you
like.
The latest stable release of the Saleae Logic software can be downloaded below:
• Latest Stable Release
The latest Saleae Logic Beta software can be downloaded below. We've started releasing beta versions
of the software to test new features and bug fixes. Once we can verify its stability, we will make it
available as a stable release download.
• Latest Beta Release
Installing for Windows
Simply download and run the installer. It is the same as other software you have installed in the past.
During the installation, you will be prompted if you want to trust software from Saleae (you do). That is
because we install a driver for the Logic hardware.
If the Installer fails with an Error on Windows
You can try running the standalone version of the software (download link here), which does not need to
be installed. Simply extract it and run Logic.exe. Since the installer normally handles driver installation,
you may need to manually install the driver if you use the standalone version. The driver files are included
with the standalone download.
Installing for Mac
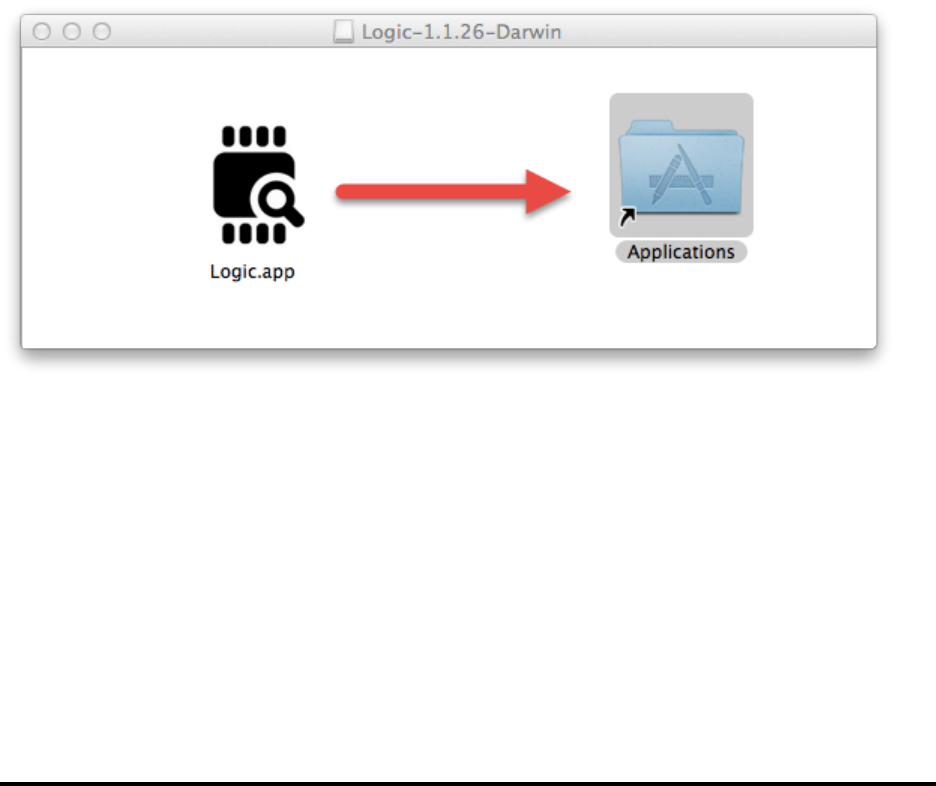
Simply download, double-click, and drag the Logic software into the Application folder. It is the same as
other Mac software you have installed in the past.
Page 12 of 69
Installing for Linux
Download the zip file and extract it. The software will run from this folder. You can leave this folder on
your desktop or move it anywhere that has write permissions. Launch the Logic software by opening the
folder and double-clicking the Logic executable. You may want to make a shortcut to this executable for
more convenient access.
Installing for Linux – Driver
Before using the software with Logic hardware, you'll need to give the application permission to access
the device (otherwise you'll have to launch the application with sudo). To do this, unplug any attached
Logic device(s). From the command line, navigate to the Driver folder and run the script installdriver.sh.
Page 13 of 69
Navigating the Software
This section will guide you through the features of the Logic software. This is a great first step to take to
familiarize yourself with the features of the software. When no Logic device is connected, the software will
work in demo mode, which is virtually identical to how it will function when a device is connected. The
demo will help you become familiar with the software before your Logic device arrives.
Navigating the Logic Software
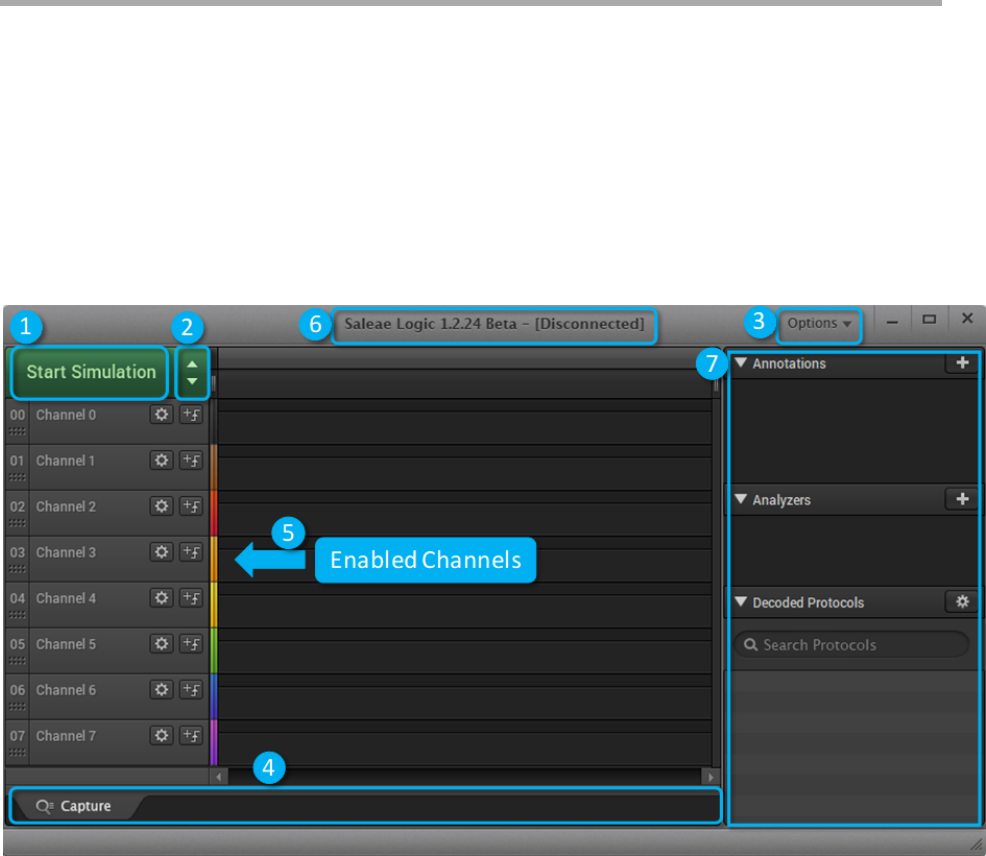
The Logic software user interface consists of the following basic sections.
1. The Start Simulation or Start Button Generates simulation data, as if the logic analyzer was
collecting real world data. If a Saleae Logic was connected to the PC, then this button would say
Start. More information on simulation data can be found in _______. After the capture has started,
you can stop it before it finishes, which will retain the data to that point. If the Start button is gray and
cannot be clicked, that means you are not on the capture tab (See #4). Ensure you are on the
capture tab so you can take a capture.
2. Device Settings Button Opens the Device Settings window. This window allows you to modify
capture settings, such as sampling rate, capture duration, enabled channels (digital and analog),
voltage, and performance.
Page 14 of 69
3. Options Button Opens system-wide settings for the Logic software, which allows you to save
captures, export data, and modify various settings for the Logic software.
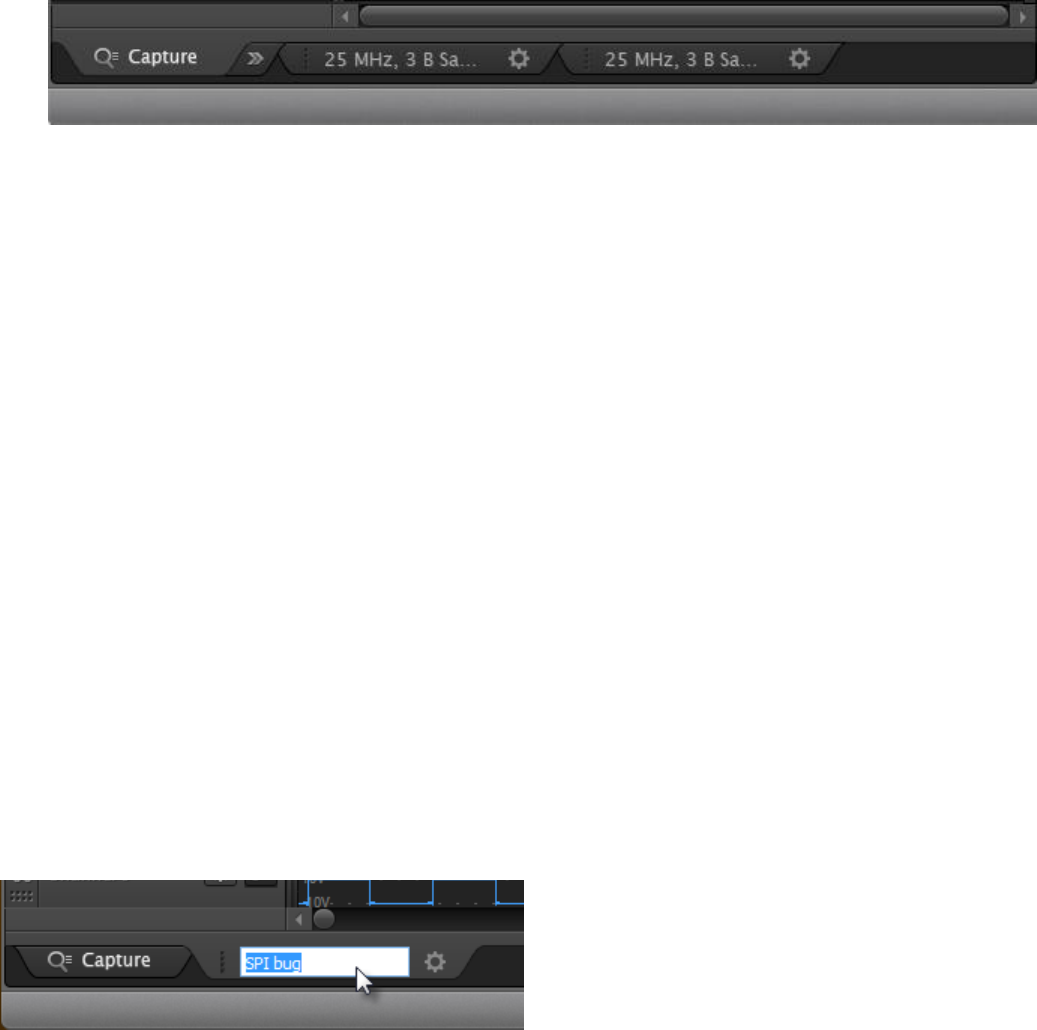
4. Capture tab You can save previous captures so you can refer to it later. The example image below
shows 3 tabs (the current capture tab on the left, and 2 previously saved capture
tabs).
o The Capture tab is your current capture.
o The >> button allows you to save the current capture into a new tab.
o The gear icon on the previously saved capture tabs allow you to close or copy the tab.
5. Enabled Channels Currently enabled channels are shown here. Use the Device Settings button to
enable and disable channels (See #2). If a channel is enabled but cannot be seen, it may be hidden.
Click the gear icon on any of the channels and click Reset All Channels to reset all channel settings
and bring them all back into view.
6. Software Version and Logic connection status
o If status is [Disconnected], the green button will display Start Simulation
o If status is [Connected], the green button will display Start
7. Annotations, Analyzers, and Decoded Protocols
o The Annotations window lets you add bookmarks, timing markers, and various measurements
to your capture.
o The Analyzers window lets you add one of our many protocol analyzers to your digital
channels. The + icon will only be clickable if there are digital channels enabled.
o The Decoded Protocols window shows the decoded results of the protocol analyzers once the
capture is complete and the data has been processed.
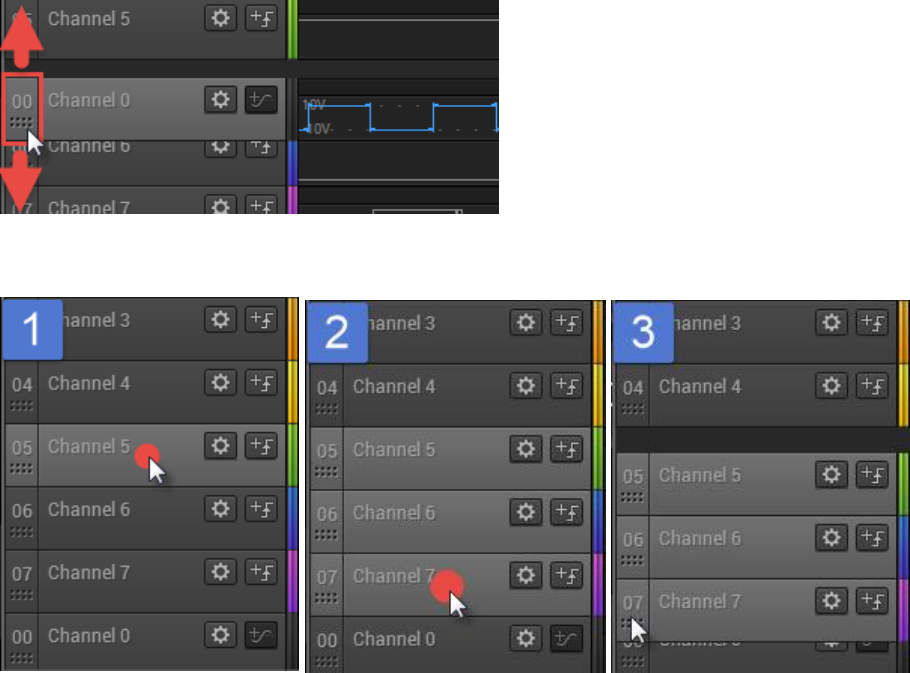
Renaming Tabs
To edit the text shown on a tab, click the text.
Page 15 of 69
Rearranging Channels
To rearrange channels, drag them by their grip icon at the far left of the channel.
To drag more than one channel, select the first channel by clicking anywhere in the channel label area.
Then control-click additional channels, selecting them as well. You can use shift-select to select a range
of channels.
Then drag one of the channels by its grip icon. All the selected channels will move together.
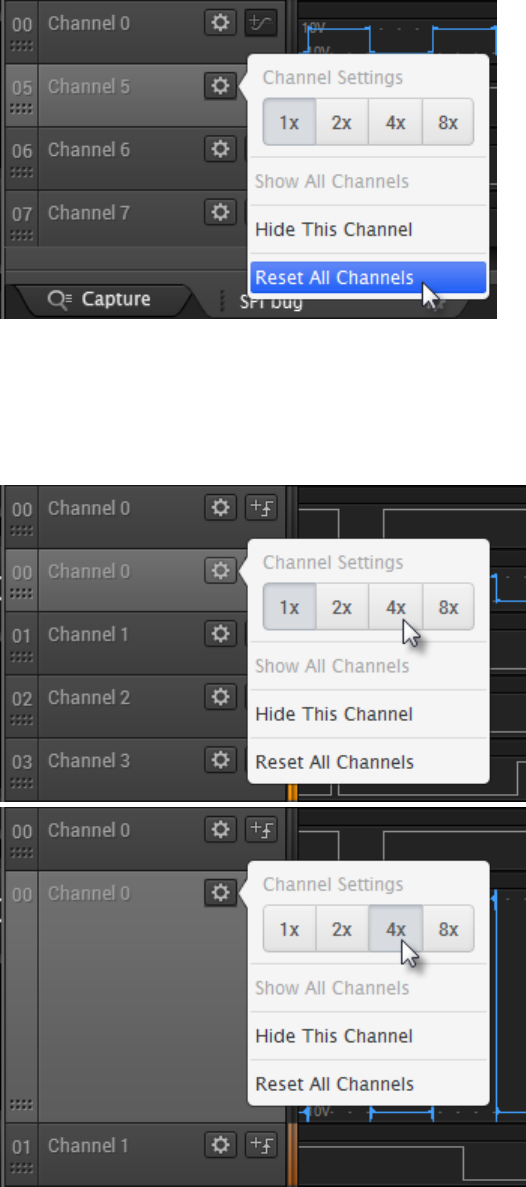
To reset the channel order, click the channel settings icon (gear) on any channel and select Reset All
Channels.
Page 16 of 69
Changing Channel Size
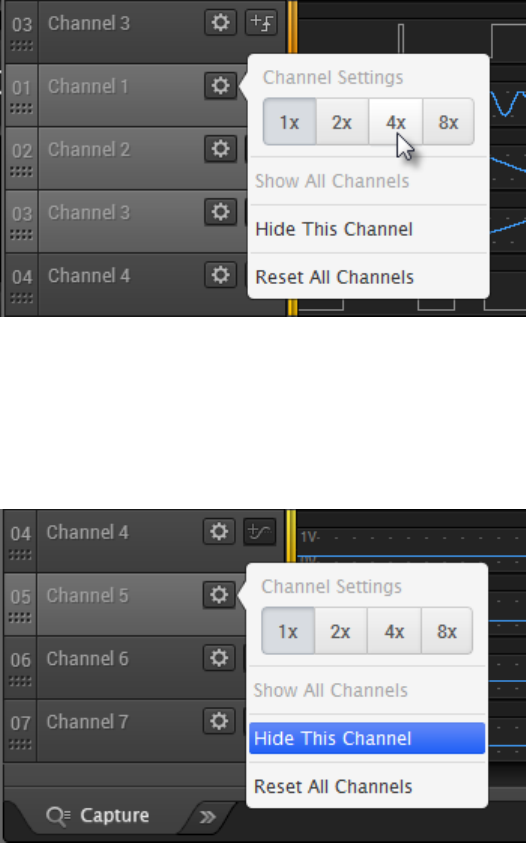
To change the channel size, click the channel settings icon (gear) on the desired channel and select a
new size.
To change multiple channels to the same size, select them (control-click) and then set one of the selected
channel's size. All the selected channels will change their size.
Page 17 of 69
To select all channels, select one and then press CTRL-A.
Hiding Channels
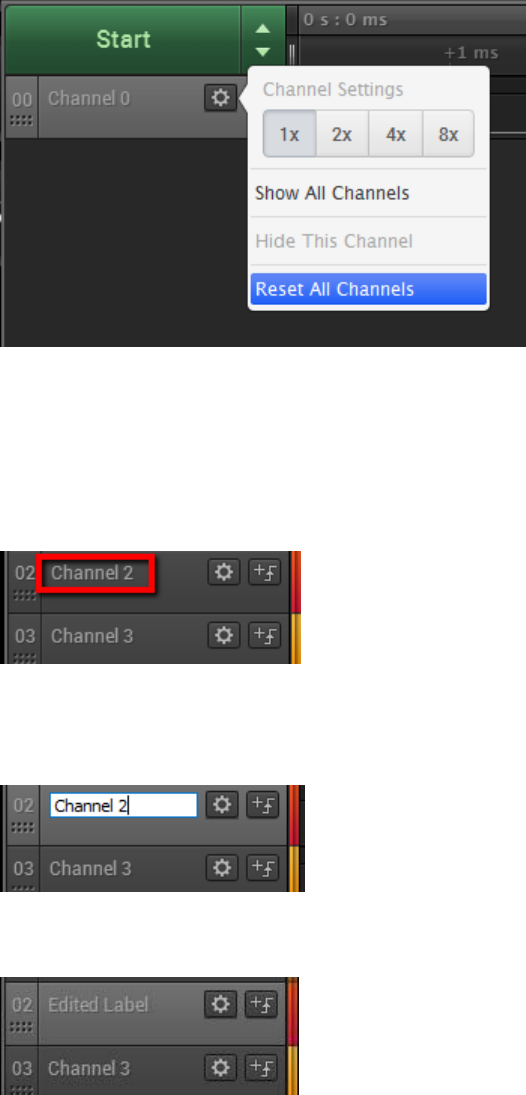
To hide a channel, click the channel settings icon (gear) and select Hide Channel.
You can hide multiple channels at the same time by selecting multiple channels and then selecting Hide
Channel on one of them.
To restore this and other hidden channels, click on a channel's settings icon and select Reset All
Channels.
Page 18 of 69
Editing Channel Labels
By default, channels are labeled Channel N where N is the channel number. To make it easier to
remember which channel is connected to what, these labels are user-editable.
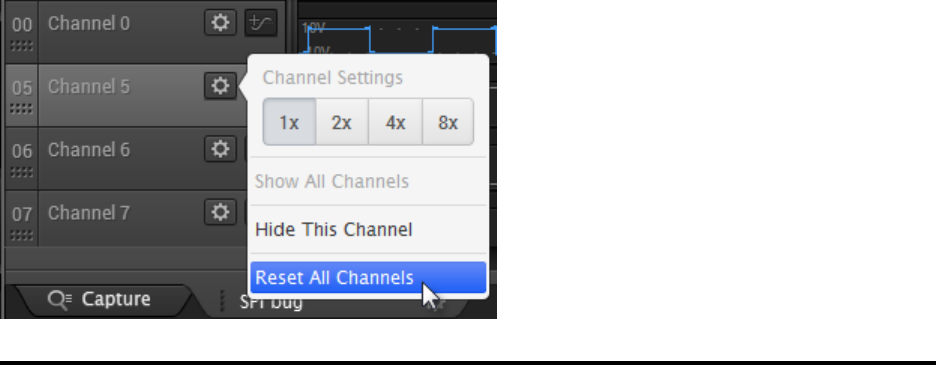
To change a channel label, first click anywhere over the existing label name.
This will switch the label into the editing mode. Use the next box to change the channel label to whatever
text you prefer.
Once finished, simply click somewhere else on the software or press Enter.
Done! You can repeat the process for each label. To reset the label names and other settings to default,
use the same Reset All Channels menu item. This also resets channel visibility, ordering, and size
settings.
Page 19 of 69
Page 20 of 69
Connecting the Logic Hardware
Connecting Logic to the PC
1. Open the Logic software
2. Connect one end of the included USB cable to the Logic analyzer
3. Connect the other end of the USB cable to the PC's USB port. Ensure that the proper USB port is
used for the specific device. Due to the amount of bandwidth required, it is recommended to directly
connect to the PC's USB port rather than through a docking station or a USB hub.
o Original Logic, Logic16, Logic 4, and Logic 8 requires at least a USB 2.0 port.
o Logic Pro 8 and Logic Pro 16 requires at least a USB 3.0 port. If connecting these
products to a USB 2.0 port, please see: Limitations of Using Logic Pro 8 and Logic Pro
16 on USB 2.0 Ports
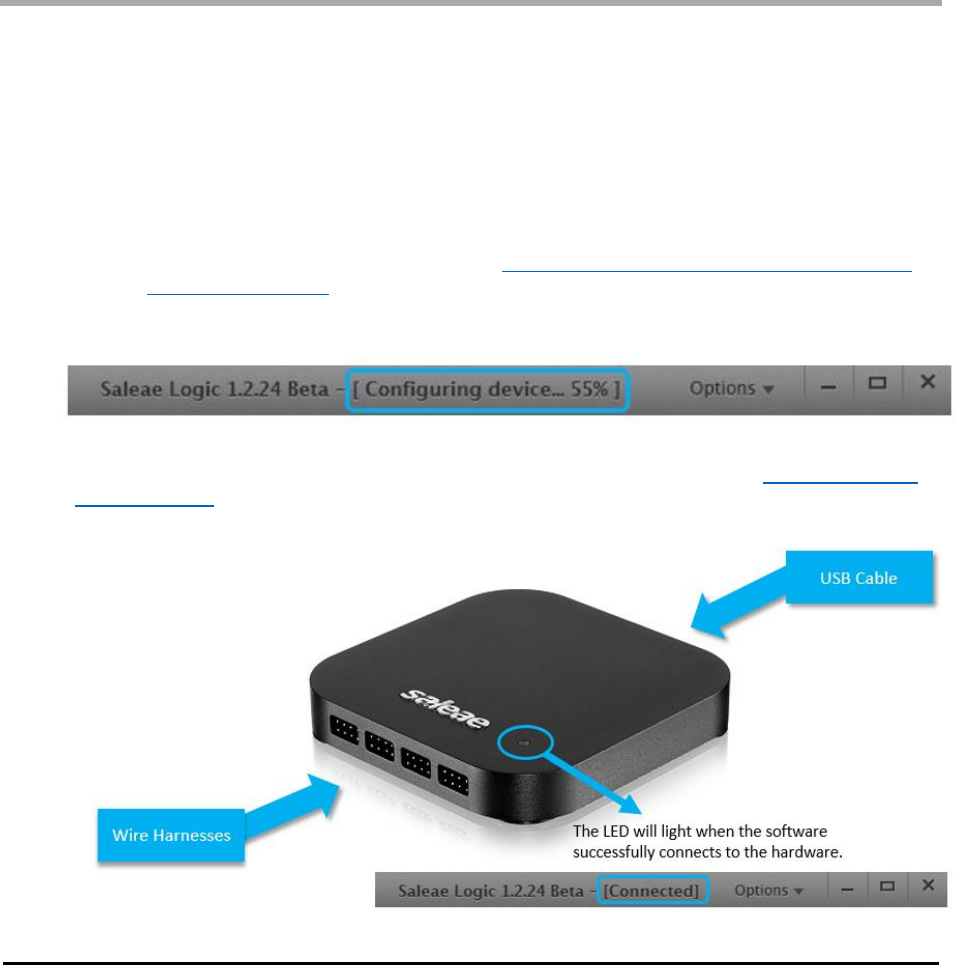
4. Once connected to the PC, the software will begin configuring the
device.
5. Once the Device is fully configured and connected, the software will display [Connected] at the
top and the LED on Logic should turn on (assuming the LED is set to on. See Collecting Data &
Device Settings to check LED
settings.
Page 21 of 69
Device Calibration
When connected to the internet, the Logic software will automatically handle downloading the calibration
file.
The 2nd Generation of Saleae products (Logic 4, Logic 8, Logic Pro 8, & Logic Pro 16) use calibration
data generated at Saleae to display accurate AC and DC values. The 1st Generation (Original Logic and
Logic16) do not require any form of calibration.
This calibration data is not stored on the device. Instead, it is stored on our servers, and the software
automatically downloads this calibration data as well as checks for updates when a device is connected.
Check Calibration Status
1. Open the latest version of the software.
2. Connect the Logic device and wait for the software to connect to it.
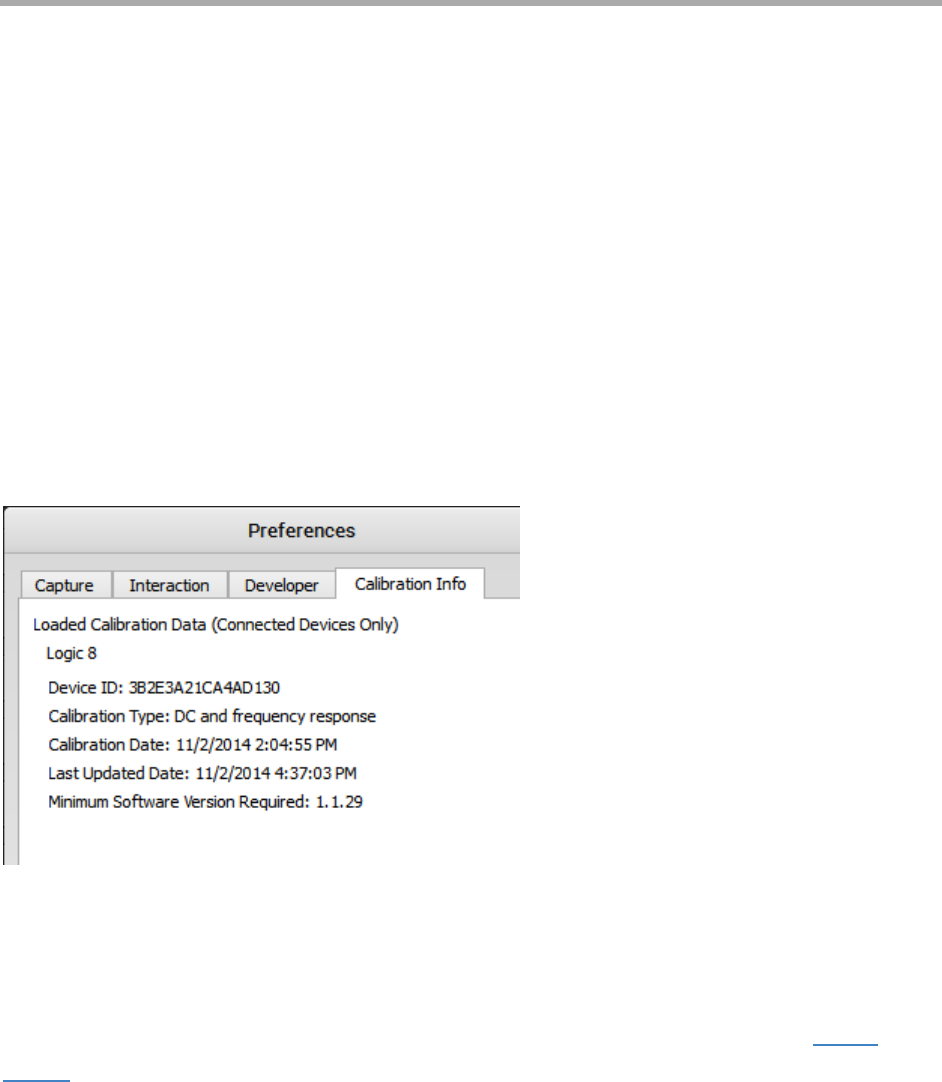
3. Click Options -> Preferences -> Calibration tab
All physically connected devices will be displayed here, calibrated or not.
The device ID is the unique 64-bit ID of your device.
Calibration Type should read DC and frequency response. If you see DC Only here, please contact
support as this is an error. A Calibration Type of DC and frequency response indicates that the DC
voltages will be correct. The frequency response will be flat with a smooth falloff at the bandwidth for any
particular sample rate.
Page 22 of 69
The calibration date is the last time the captures created from your device were processed to produce the
calibration data sets. As you may notice, that date can be after your product arrived. That’s just because
whenever we make a change to the calibration constant generation code, we have to reprocess the
captures we took from every device we’ve ever shipped.
The last updated date is the date we uploaded your calibration file to the Web. It’s also how our software
determines if there is a newer calibration file available for your device.
There is a minimum software version required with a calibration file. Please keep your software up to
date.
Manually Download the Calibration File
The Logic software will automatically handle downloading the calibration file. In rare cases, users may
need to download the file manually if the software is not able to download it on its own. Follow the steps
below.
1. Enter the link below in your browser and add your Device ID.
o downloads.saleae.com/calibration/{Insert Device ID here}.cal
o Note: Device ID must be entered in lowercase.
o For example: downloads.saleae.com/calibration/3b2e3a21ca4ad130.cal
2. Place the .cal file in the software’s calibration folder.
o Windows 10/8/7/Vista: C:\Users\YourUserName\AppData\Roaming\Saleae
LLC\Logic\Calibration
o Windows XP: C:\Documents and Settings\YourUserName\Application Data\Saleae
LLC\Logic\Calibration
o OSX: /Users/YourUserName/Library/Preferences/Saleae/Calibration
o Linux: Calibration folder alongside Logic executable
3. Check your Calibration Status (steps above), to ensure the calibration loaded properly.
Transferring the Calibration File from One PC to Another
1. Install the latest Logic software on a machine with Internet access.
2. Open the software and connect the Logic device.
3. Wait for the device to fully connect to the software.

Page 23 of 69
4. Check preferences dialog to be sure the calibration data is loaded.
5. Close the software.
6. Copy all *.cal files from the calibration folder of that computer to the computer without Internet
access.
Each .cal file is specific to a single device, but the .cal files are saved with the device ID in decimal and
not hex, making it hard to tell which is which. If only one device has ever been connected, there will only
be one .cal file.
Is Periodic Recalibration Required?
Our devices do not require periodic recalibration.
Having Trouble?
If you are having trouble manually downloading the calibration file, we can send it to you. Please contact
support, and we can make sure your calibration data gets updated.
Page 24 of 69
Connecting Accessories
Wire Harness
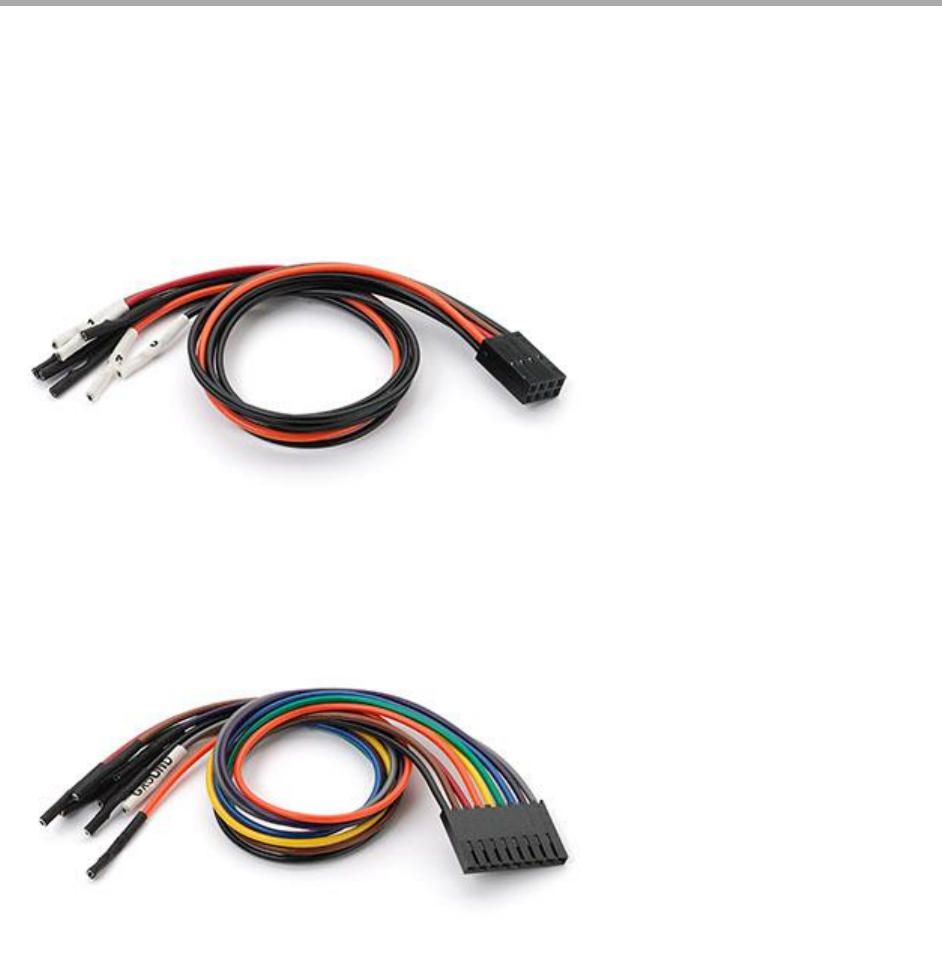
There are two types of wire harnesses. A 1x9 wire harness is used by Logic and Logic 16 (1st-generation
products). A 2x4 wire harness is used by Logic 4, Logic 8, Logic Pro 8, and Logic Pro 16 (2nd-generation
products).
Generation 2: 2x4 Wire Harness
Generation 1: 1x9 Wire Harness
Connecting the 2x4 Harness
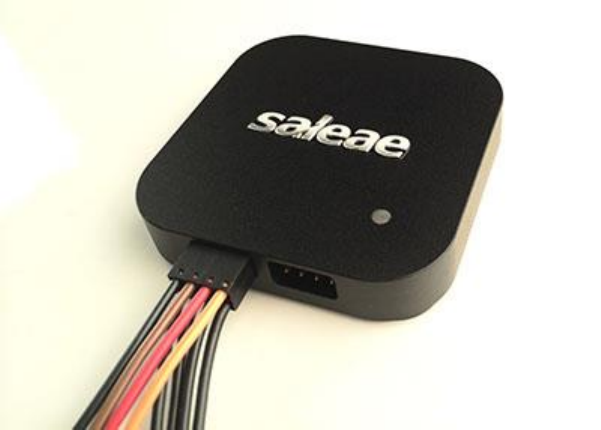
If you have Logic 4, Logic 8, or Logic Pro 8/16, then you have one or more 2x4 wire harnesses. The four
black leads are ground and should be on the bottom. The four colored leads are the signal inputs and
should be on the top. There is an indication of this orientation on the back of the device.
Page 25 of 69
Note that the test lead color matches the channels in the software. The colors reflect the resistor color
code for numbers 0–7. The numerical channel number is on the white heat shrink at the ends of the
leads. The lead ends are terminated with a Molex 0016020086 crimp connector for connection to typical
.100-inch spaced headers/pins. The 2x4 plastic housing is Molex 0022552081.
Signal Integrity with the 2x4 Harness
The 2x4 harness has a ground lead for each signal. When signal integrity is a concern (e.g., working with
high-speed digital or analog in the presence of cross-talk sources), connect a ground for each signal.
Connect noisy digital inputs to leads as far as possible from leads connected to sensitive analog
measurements.
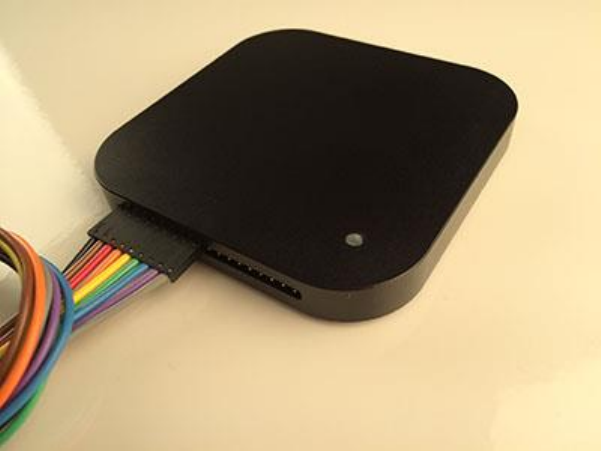
Connecting the 1x9 Harness
If you have the original Logic or Logic 16, then you have one or more 1x9 wire harnesses. These
harnesses are colored according to the resistor color code for 0–7. The colors match the channel colors
in the software. The ground wire is grey and has a GROUND label on the white heat shrink. Turn the
device over for a ground symbol, and make sure the grey test lead aligns with this symbol.
Page 26 of 69
Signal Integrity with the 1x9 Harness
When using Logic16 with more than 8 inputs, we recommend connecting the second ground line—
especially if using higher voltages (5V). That will help reduce cross-talk during any simultaneous
switching events.
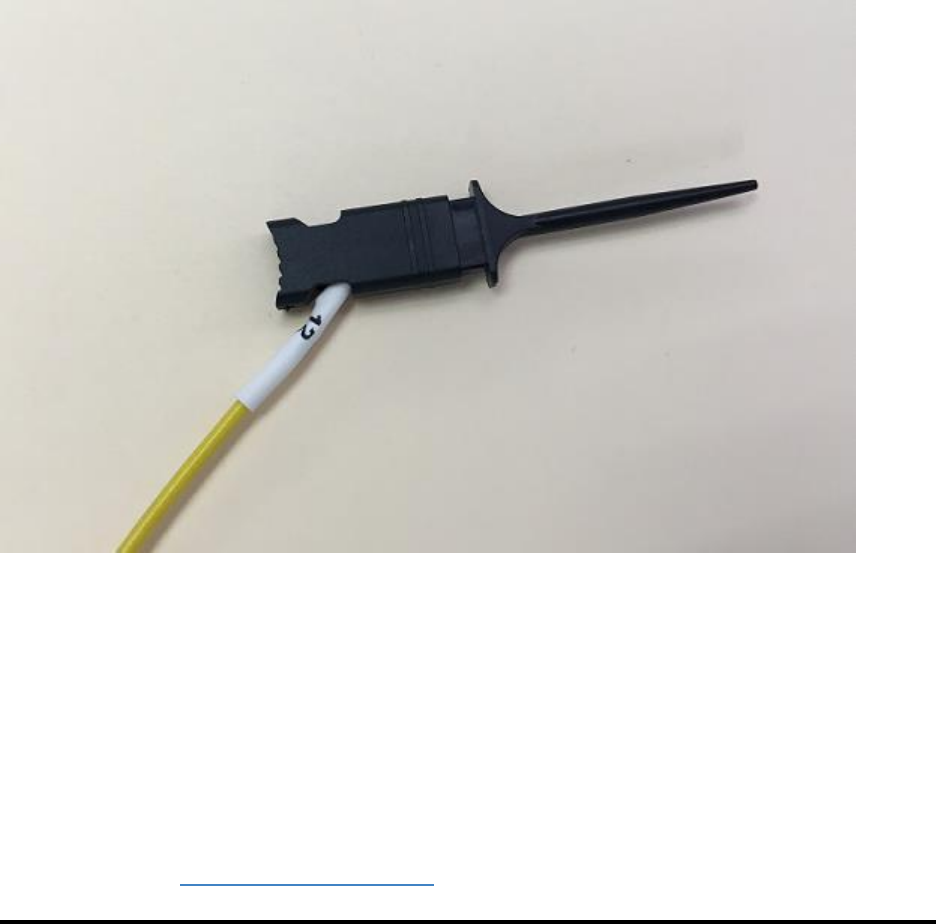
Test Clips
All Logic products come with enough test clips for every test lead. These test clips have two metal pins
that can be inserted into the connector at the end of each test lead. Only one of the metal pins needs to
be connected to a single test lead connector.
Page 27 of 69
Connecting to Headers
If your PCB has .100-inch headers that break out signals you need to examine, you can connect the test
leads directly to these pins.
Ultra-Fine Pitch and Other Difficulties
In many situations, it may be difficult to connect Logic directly to your signal. Generally, in these
situations, you'll want to solder a wire (typically wire-wrap wire) to an exposed pin, trace, or via, and then
use Logic's test clip to connect to that wire. Alternately, you can invest in some extremely small pitch test
clips such as these: Test clips - Grabbers, Hooks
Page 28 of 69
Collecting Data & Device Settings
Collecting Data
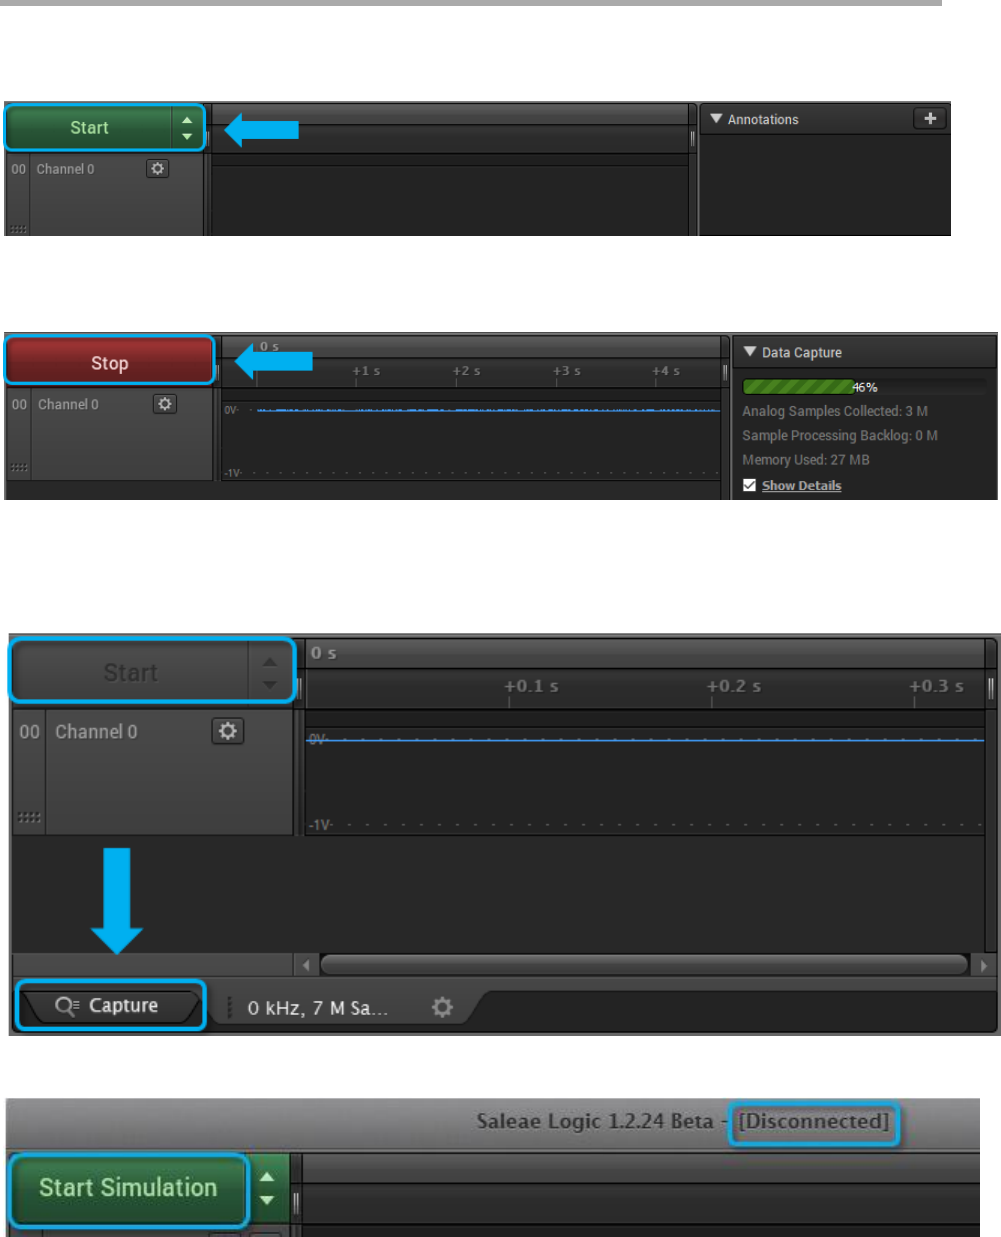
To start collecting data, press
the Start button.
After the capture has started you can stop it before it finishes if you like - this will retain the data to that
point.
If the Start button is gray and cannot be clicked, that means you are not on the capture tab. Look at the
bottom of the window, and on the left, you should see the capture tab. Click that tab and then take your
capture.
If the Start Simulation appears instead of Start, it means the Logic hardware is disconnected.
Page 29 of 69
If the software incorrectly reports Disconnected, please follow this troubleshooting guide: Troubleshooting
Device Connection 2: Software Connection to the Device
Device Settings
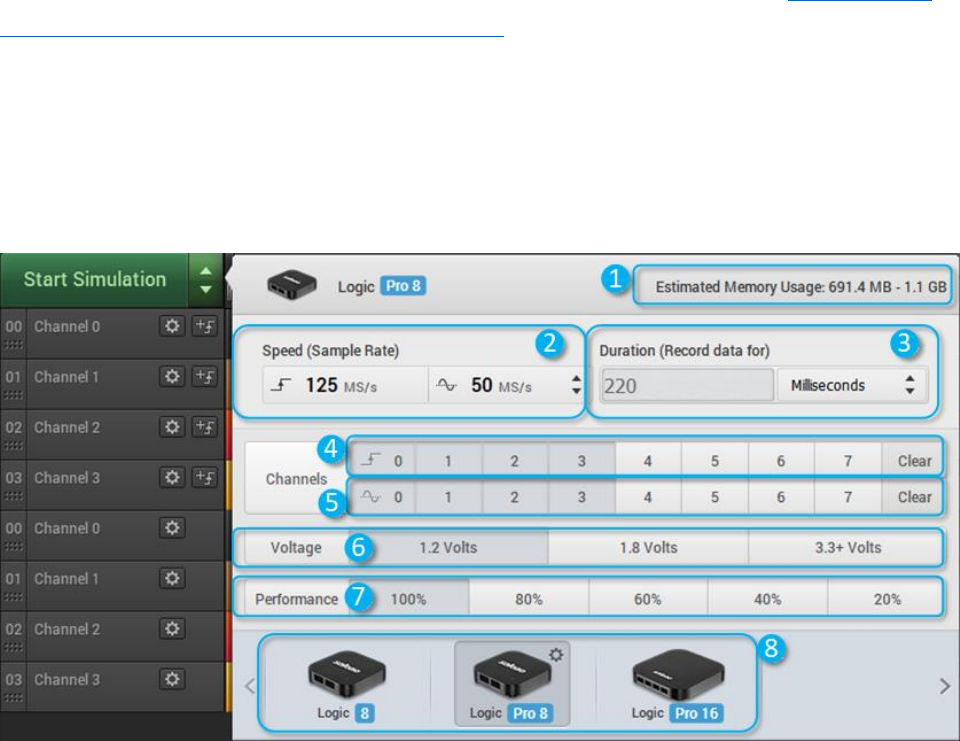
To access device settings, click the up or down arrow in the top-left of the software. To close the Device
Settings, click on something outside the popover. The Device Settings pop-up consists of the following
sections.
1. Estimated Memory Usage This will be displayed when more than 1 GB of RAM is expected to be
used by the software. This will depend on the capture settings below. Digital data is compressed
and no additional memory is used when using a faster sampling rate. Rather, memory usage is
proportional to the number of transitions in the digital data. Analog data is not compressed and
consumes roughly 4 bytes per sample. At 50Msps, that’s 200MB per second, per channel.
2. Speed (Sample Rate) The sample rate dropdown lets you select how fast to sample data—how
many times per second your signal is measured. The available options depend on your device, the
channels being used, and the performance level selected.
3. Duration Enter the duration of your capture.
4. Digital Channels Enable and disable the digital channels you would like. You can click and drag over
the control to change a number of channels at the same time.

Page 30 of 69
5. Analog Channels Enable and disable the digital channels you would like. You can click and drag
over the control to change a number of channels at the same time.
Note: Not all devices have selectable channels. The original Logic does not have selectable
channels, and Logic 4 only allows you to enable or disable the analog input. The digital channels are
always enabled. You can switch the analog channel on and off by selecting sample rate options with
and without analog sample rates.
6. Voltage Edit the voltage level of your digital signals. This affects the voltages at which an input is
considered a one or a zero.
Note: Logic Pro 8, Logic Pro 16, and the original Logic16 are the only devices with adjustable
thresholds. See the PDF Users Guide, Specifications, and Data Sheets to find what voltage options
are available for each device.
7. Performance Not all computers or USB host controllers will be able to capture at top speed. If that
happens, you can throttle back the performance setting with this control. It will update the sample
rates that are available.
Note: The performance control is only available when analog and digital channels are enabled at the
same time. When sampling digital only or analog only, slower sample rates will be available from the
sample rate dropdown, which will reduce USB throughput.
Note: Logic 4 is the exception to this. It will not display a performance selector even when recording
analog and digital channels at once. All possible sample rates are always available in the dropdown.
8. Device While no Logic hardware is connected, you can select a device to simulate. There is no
option to simulate our discontinued products. If you have more than one Logic attached, you can
toggle between them here. You also can control the LED color by clicking the gear icon.
LED Settings and Color
You can enable/disable the LED, or change its color, here - just click the gear icon.
Closing the Device Settings Popover
To close the Device Settings, click on something outside the popover.
Page 31 of 69
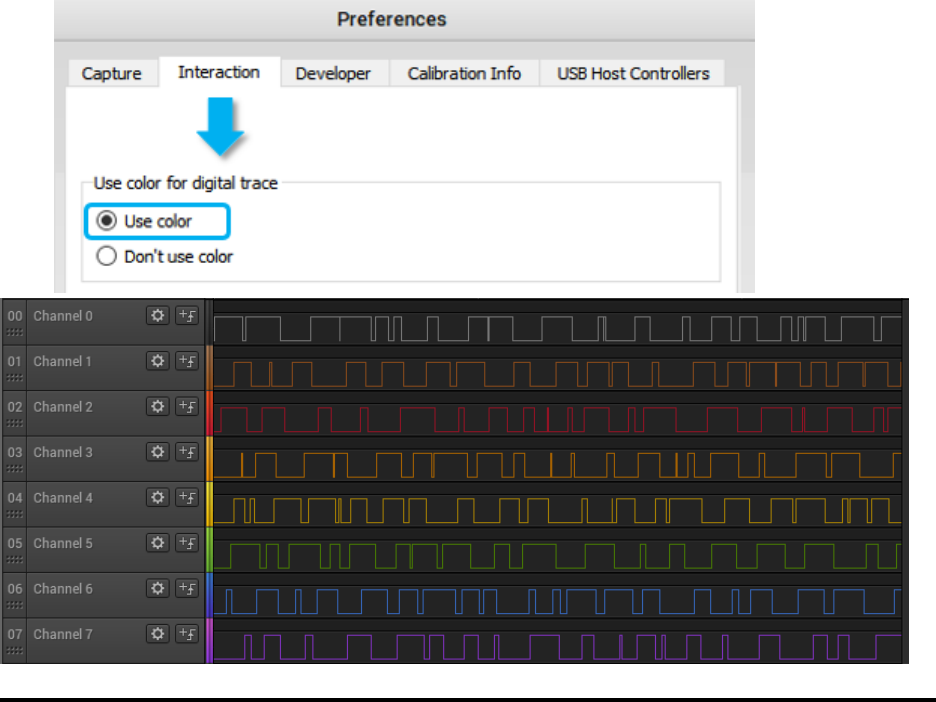
Digital Trace Colors
For easy of readability, the digital trace color can match the channel color. To set this, click Options ->
Preferences -> Interaction tab -> Use
color.
Page 32 of 69
Using the Trigger
Using the Trigger
The trigger can be used to start capturing data after a specified digital event occurs.
Two types of triggers are supported: Trigger on Edge and Trigger on Pulse Width.
The trigger can be used to trigger on an event from any channel. To move the event trigger to a different
channel, first remove it using the steps at the bottom of this page, and then add it to a different channel.
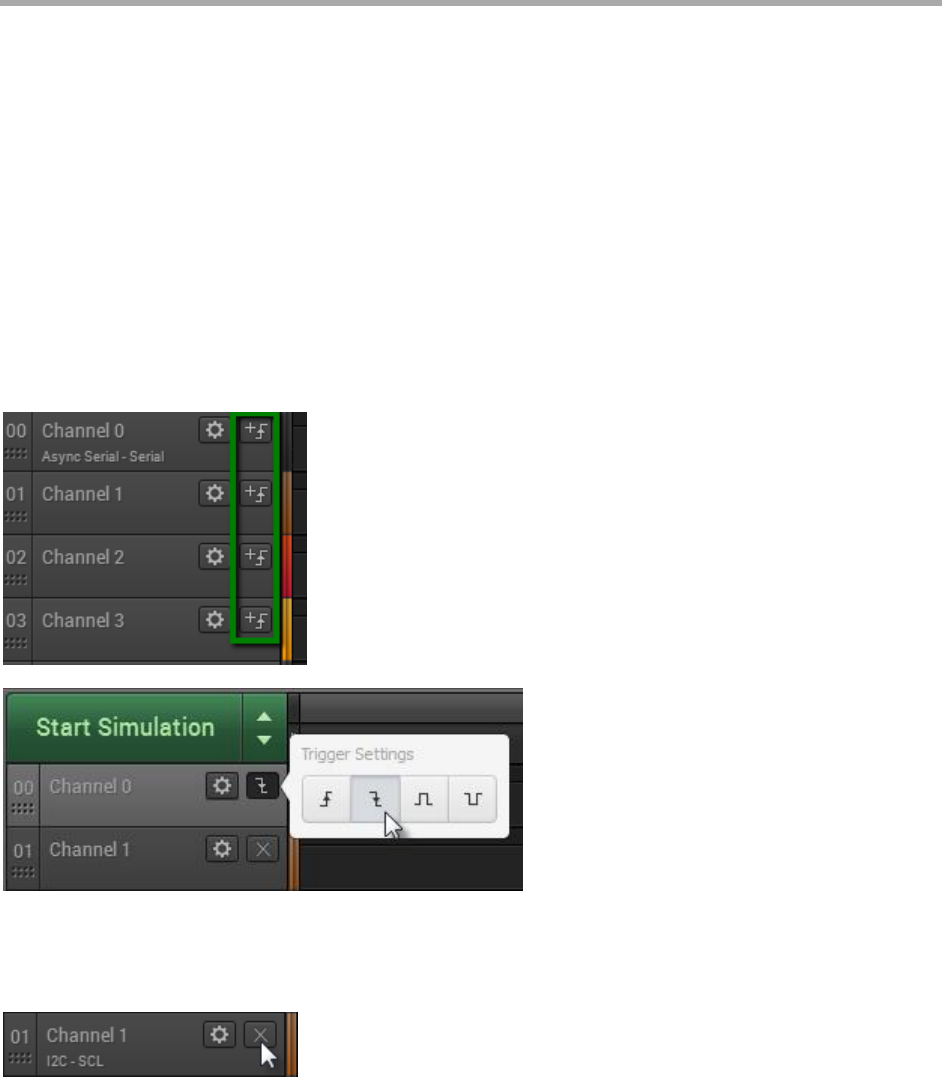
Trigger on Edge
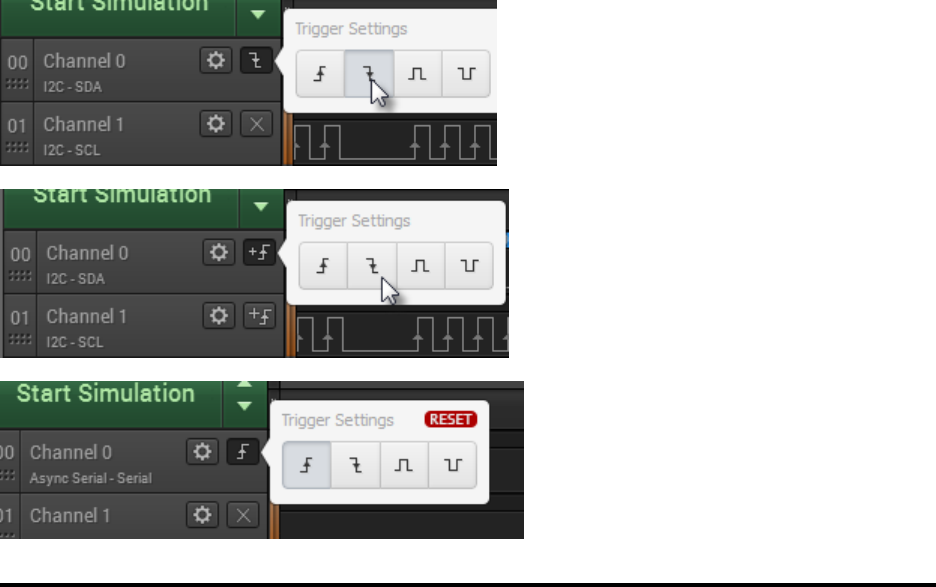
To trigger on an edge (high to low, or low to high digital transition), click the +Trigger button on the
desired channel and select the positive or negative edge.
If desired, you can also require other channels to be either high or low during a previously selected edge.
After selecting an edge, note that other channels will display a button with an "X" (indicates "don't care").
To require a high or low, click this button and select high or low.
Page 33 of 69
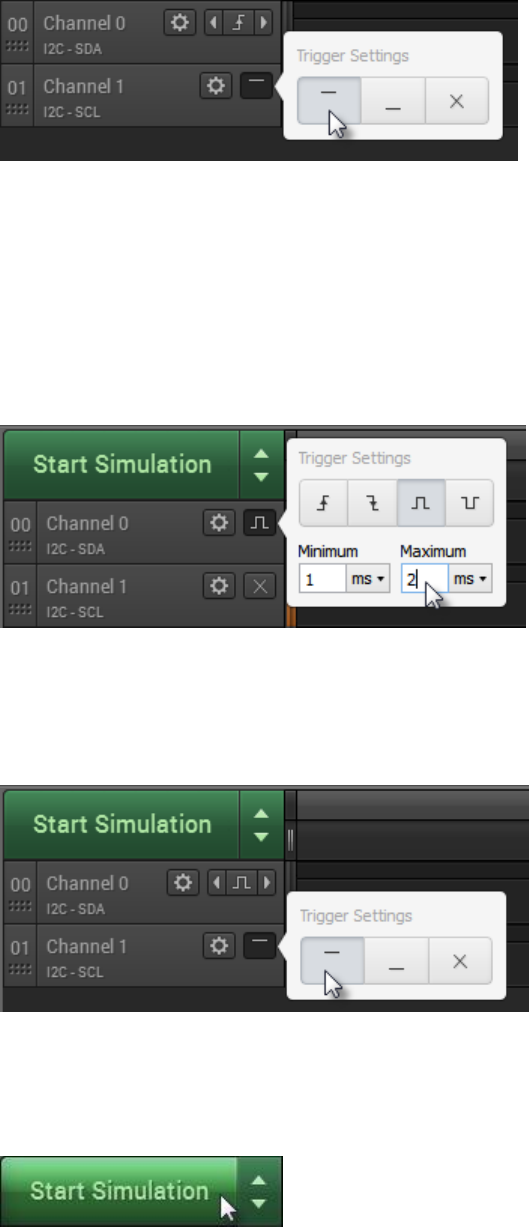
Trigger on Pulse Width
You can also trigger on a pulse width condition where a particular channel is high or low for a specified
amount of time.
To add a pulse width trigger, click the +Trigger button on the desired channel and select the positive or
negative edge. Next, enter the desired time range to search for.
If desired, you can also require other channels to be either high or low during a previously selected pulse.
After selecting an edge, note that other channels will display a button with an "X" (indicates "don't care").
To require a high or low, click this button and select high or low.
Start Searching for the Trigger
After setting the trigger, you can click the Start or Start Simulation button to begin searching for the
trigger. If and when the trigger condition is identified, data collection will start.
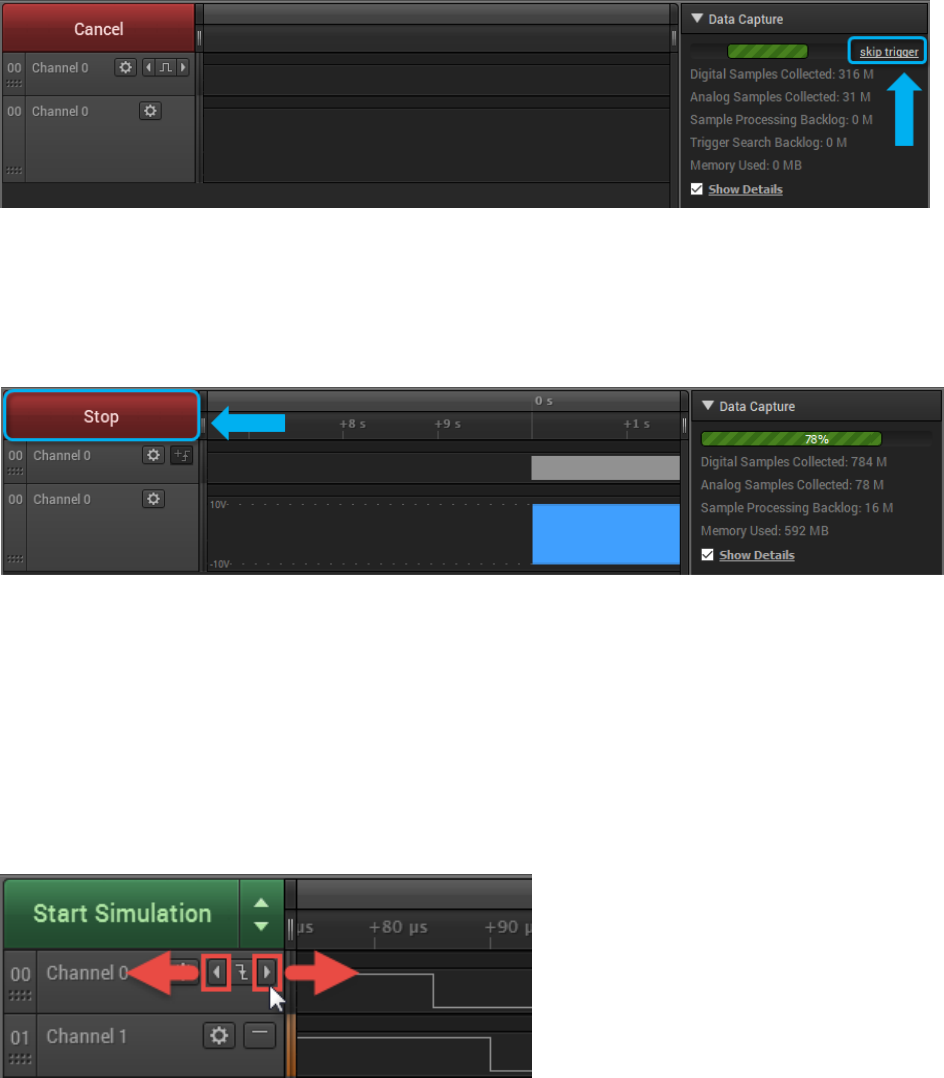
Skipping the Trigger
Page 34 of 69
You can skip the trigger by clicking "skip trigger" if you would like to force the capture to begin without the
trigger condition being met.
Stopping the Capture
If the trigger condition is identified, data collection will start. You can stop the capture at any point in time
by clicking "Stop". This will stop the recording and will keep any data that has already been
recorded.
Searching with a Trigger
After data have been collected, you can search for events within the data using the trigger. The trigger
can be added or modified after data have been collected.
After the trigger has been set up (see above) and data have been collected, left and right arrows will
appear next to the trigger button on the channel used for the edge or pulse width condition. Click these
arrows to advance to sections of the data that satisfy the trigger condition.
Turning Off the Trigger
To remove the trigger, deselect the trigger type button, or use the reset button.
Page 35 of 69

Page 36 of 69
Real-Time View (In beta)
Real-Time View
We're excited to announce the release of an early version of real-time view! This is currently an early
beta, and we will be continuously adding more features to it.
You can try it out in the latest version of our beta software below:
• Latest Beta Release
To understand how it works, and to keep up with the latest features, you can read more about it in
the Saleae Blog.
More updates to come, so stay tuned!
Page 37 of 69
Navigating Your Data - Zooming, Panning, Rearranging, &
Resizing
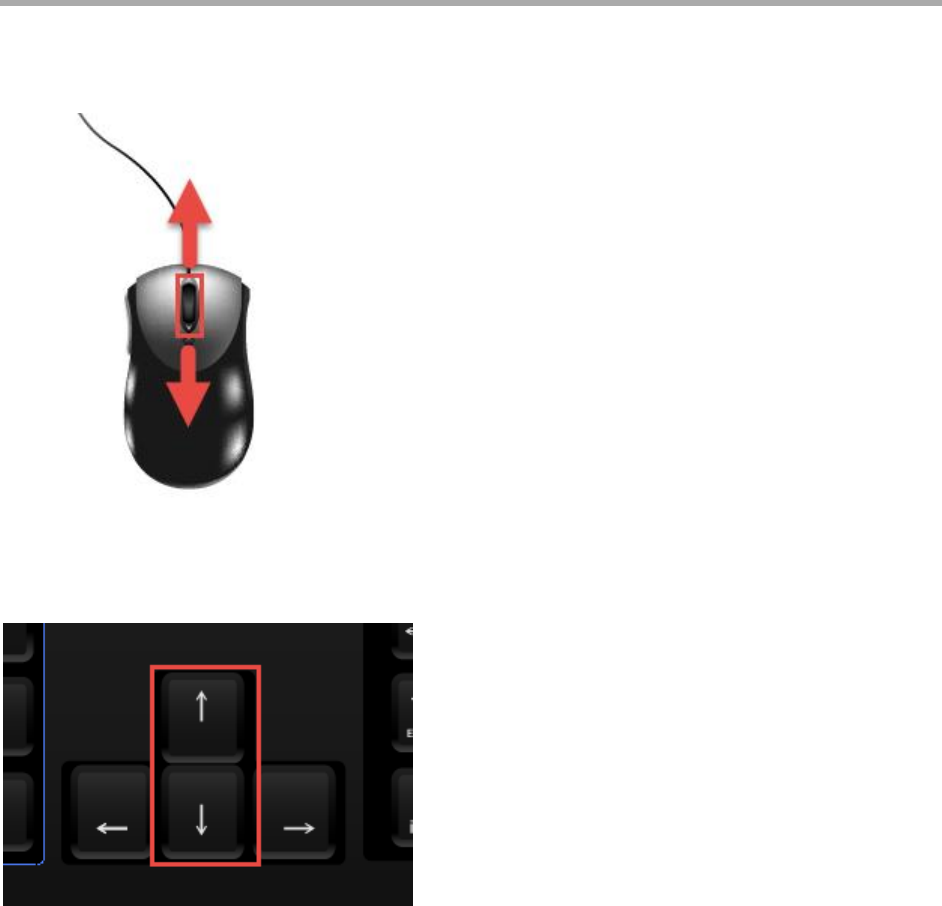
Zooming In and Out
To zoom in and out, use your mouse wheel.
You can also use the up/down arrow keys or the plus/minus keys.
Panning Left and Right
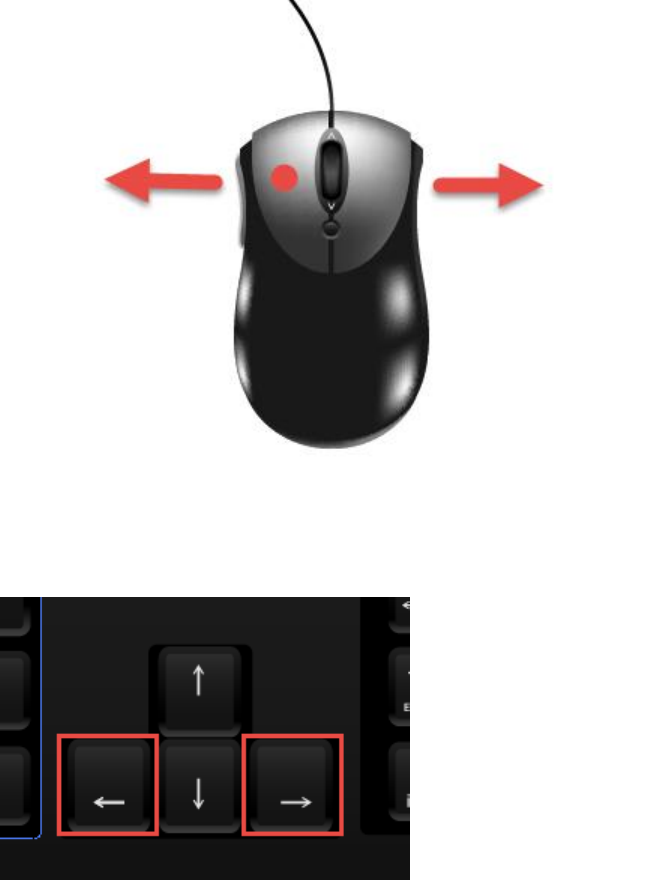
To pan left and right, click and drag the display.
Page 38 of 69
You can also use the left/right arrow keys or the scroll bar at the bottom of the display.
Jumping between Digital Edges
Sometimes digital data come in packets with long periods of idle in between.
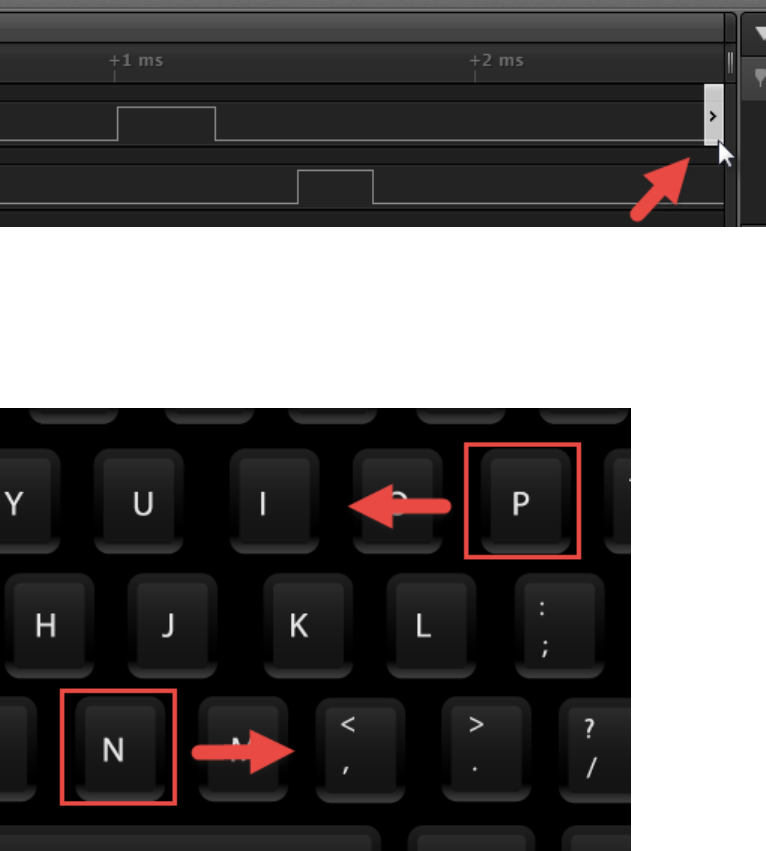
To jump over idle periods, move your mouse to the far right or far left of a particular channel. A jump
button will appear. Note that these buttons are not visible until you move your mouse cursor over the area
where they are located. They will also only appear when you have captured data. They will not appear
when the graph area is blank before a capture is taken.
Page 39 of 69
Click this button to jump to the next digital transition on that channel.
You can also use the keyboard shortcuts N and P ("next" and "previous"). The keyboard shortcut applies
to the channel whose jump button was last pressed.
Scrolling through Channels
Sometimes you may have more channels displayed than can fit on the screen at the same time.
Move your mouse over the channel labels on the left side of the software and scroll up and down with
your mouse wheel.
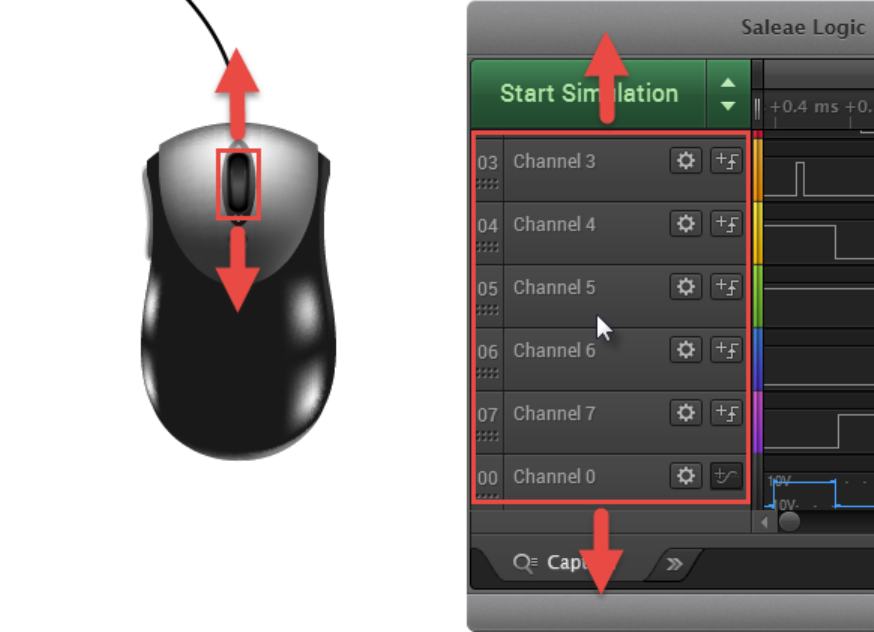
Page 40 of 69
Alternatively, there is a slider bar at the right side of the channel graphs.
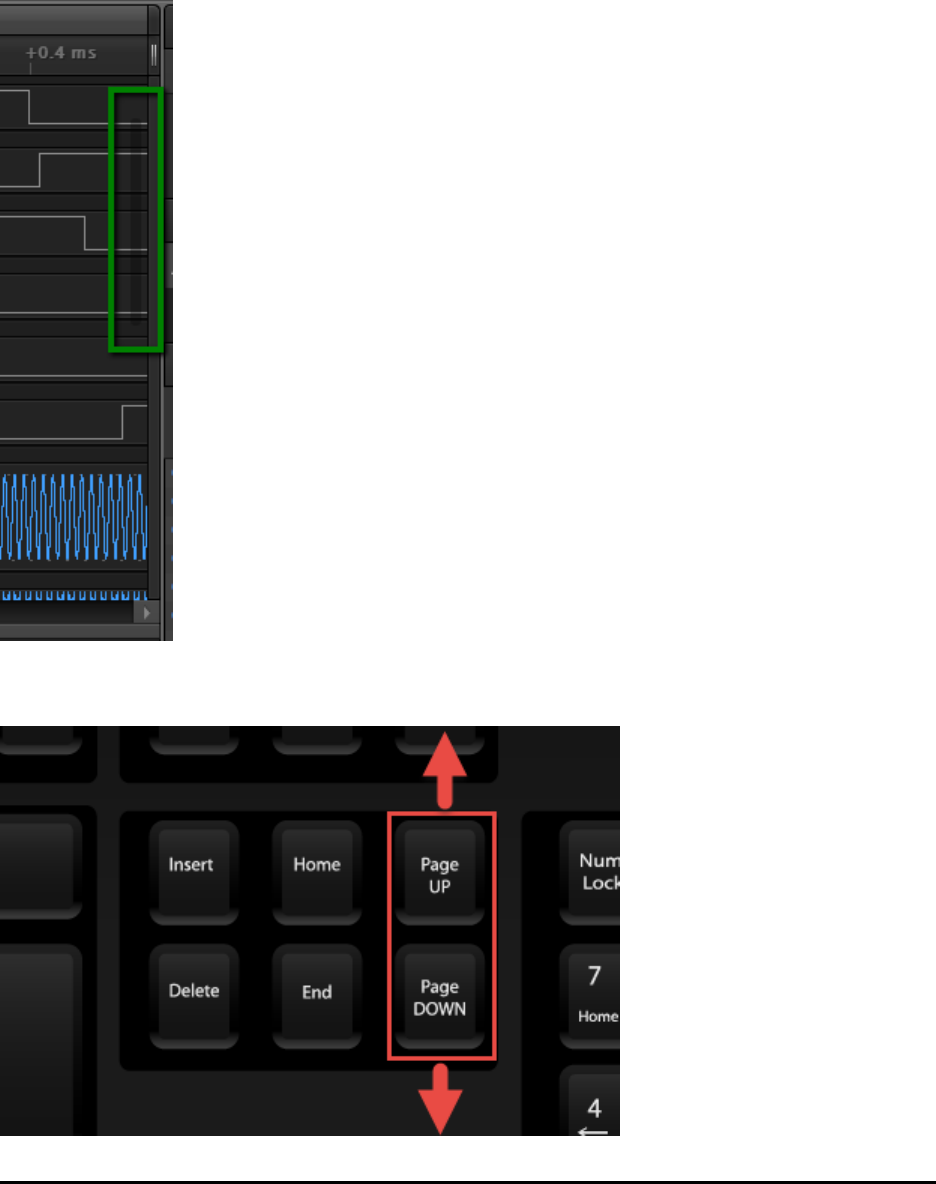
Page 41 of 69
You can also use the Page Up and Page Down keys.
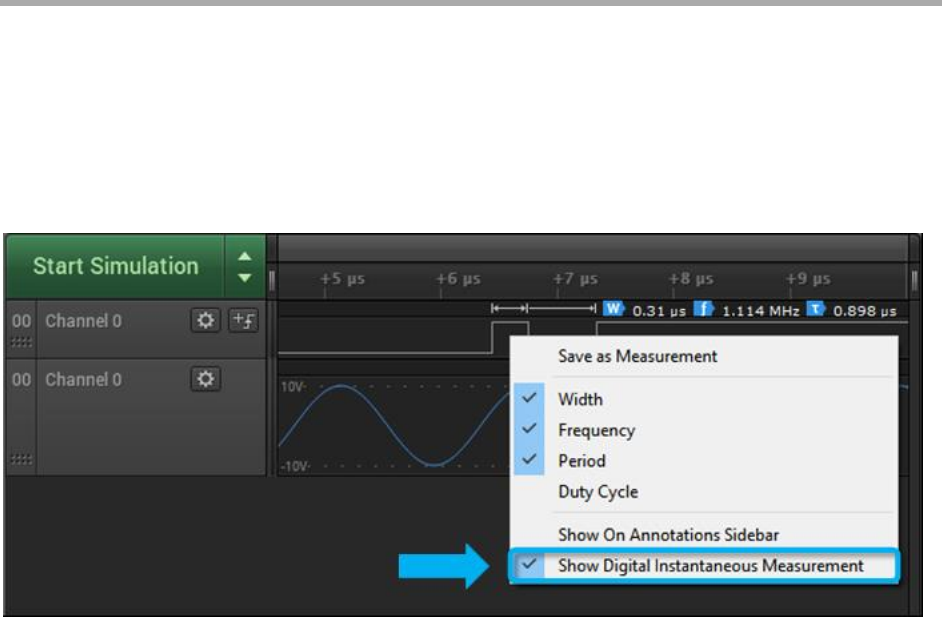
Page 42 of 69
Measurements, Timing Markers, and Bookmarks
Digital Instantaneous Measurements
To see instantaneous measurements while hovering over a digital channel recording, right-click the digital
waveform and make sure "Show Digital Instantaneous Measurement" is checked. You can also select
which measurements are made, and you can save the measurement so it stays persistent on the
waveform, even when the mouse is not hovering over
it.
Analog Instantaneous Measurements
To see instantaneous measurements while hovering over an analog channel recording, right-click the
analog waveform and make sure "Show Analog Instantaneous Measurement" is checked. You can also
select which measurements are made, and you can save the measurement so it stays persistent on the
waveform, even when the mouse is not hovering over
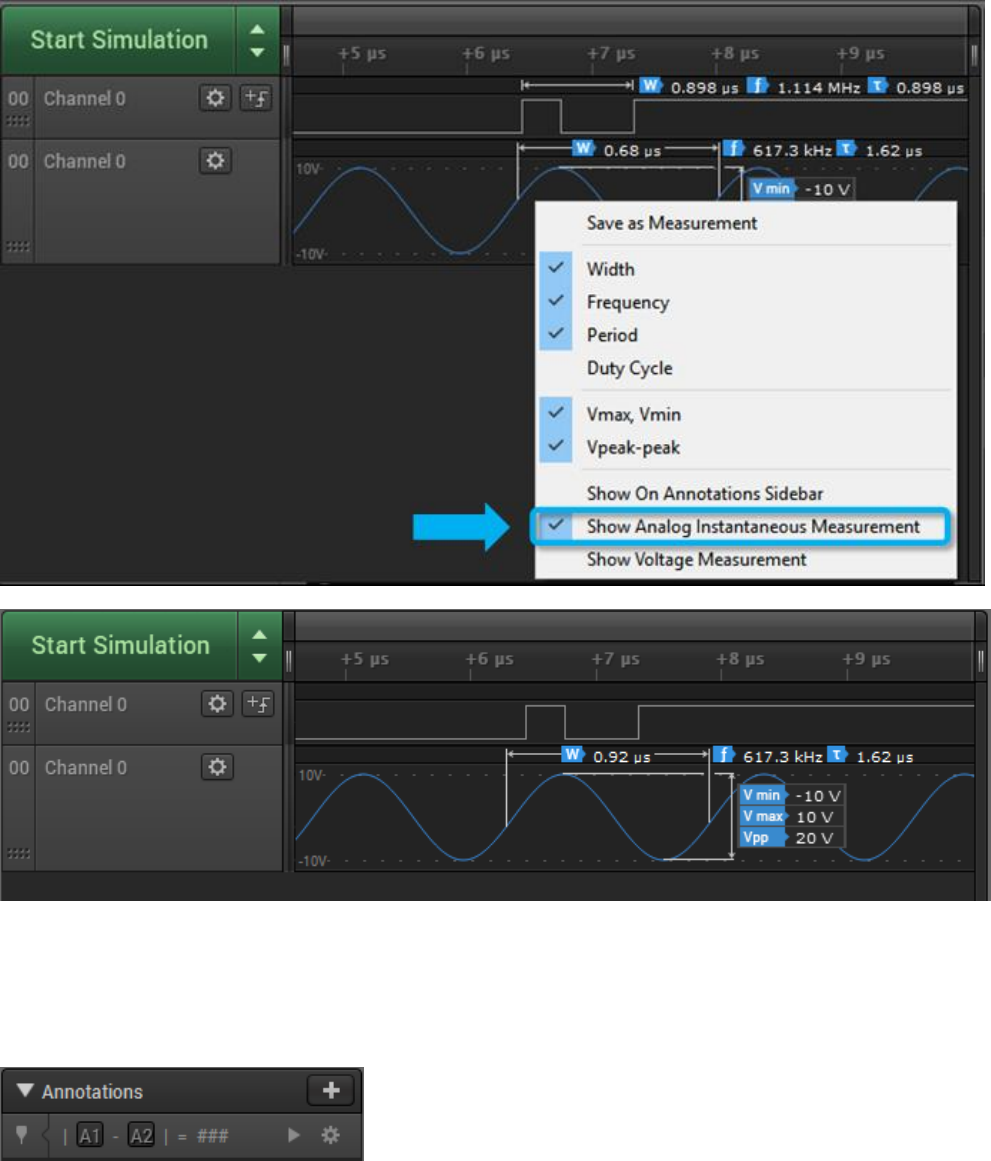
Page 43 of 69
it.
Using Annotations
All annotations are listed in the Annotations sidebar at the top right of the software. By default, the
Annotations sidebar will contain a Timing Marker annotation.
Using Timing Markers
Page 44 of 69
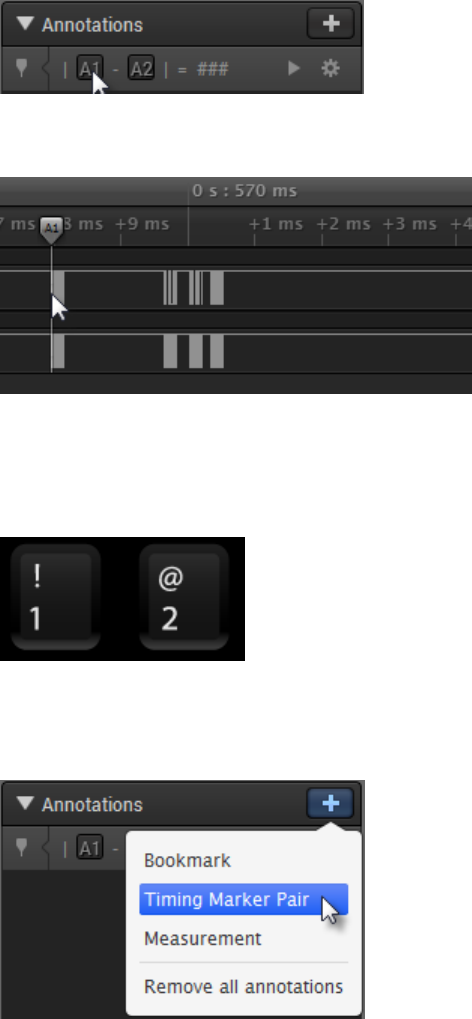
Timing markers can be used to measure elapsed time between any two locations in your data. By default,
the Annotations sidebar will contain a Timing Marker annotation.
To place a timing marker, first press the A1 or A2 buttons.
Move your mouse to the desired location and click to place the marker.
To cancel placing a timing marker, right-click.
You can also place timing markers with the keyboard's 1 and 2 keys.
To place additional markers, click the Plus button on the Annotations panel and select Timing Marker
Pair.
To zoom to a particular timing marker pair, click its icon, which appears at the left side of the Annotation
panel.

Page 45 of 69
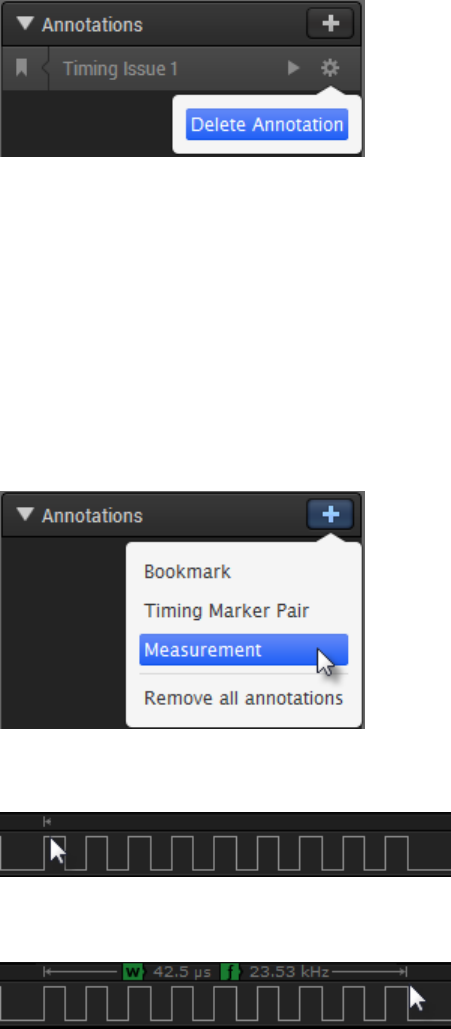
To delete a timing marker, select its settings icon (gear) and choose Delete Annotation.
Using Bookmarks
A Bookmark is simply a recording of your exact position and zoom level in your data. By making a
bookmark, you can quickly zoom back to this area again later.
To add a Bookmark, click the Plus button on the Annotations panel and select Bookmark.
To edit the name of the bookmark, click the Bookmark's label, which by default is "Bookmark").
To zoom to a Bookmark, click its icon at the left side of the Annotations panel.
Page 46 of 69
To delete a bookmark, select its settings icon (gear) and choose Delete Annotation.
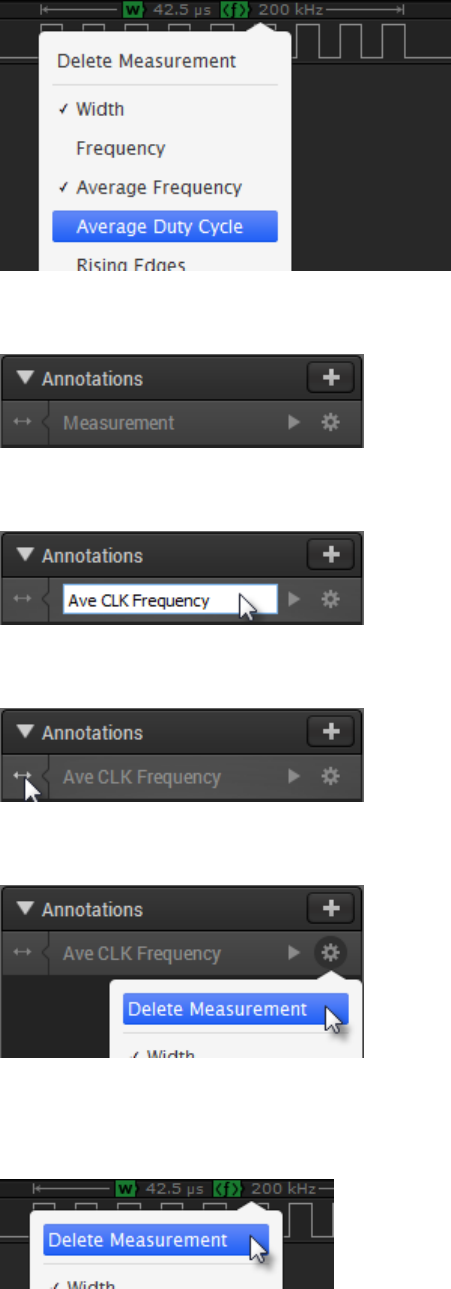
Using Measurements (Persistent)
Adding a Measurement allows you to add a permanent annotation to your data for later reference. In
addition, Measurement Annotations allow for more sophisticated computations than the temporary
measurements that always appear at the mouse cursor. For example, you can compute the average duty
cycle across thousands of pulses.
To add a Measurement Annotation, click the Plus button on the Annotations panel and select
Measurement.
Use your mouse to click the starting point of your measurement.
Next, click the desired ending point.
To change which measurements are displayed, right-click anywhere inside the measurement area.
Page 47 of 69
The Measurement appears in the Annotations sidebar at the right of the software.
Click on the text to edit the name of the Measurement.
To zoom in on the measurement, click its icon on the left side.
To delete a measurement, click on its gear button and select Delete Annotation.
You can also delete a Measurement by right-clicking anywhere in the Measurement area and selecting
Delete Measurement.

Page 48 of 69
Supported digital measurement calculations:
• Width (for persistent measurements, this is the time span of the measurement)
• Frequency (this is just 1/width)
• Average Frequency (average frequency of all complete cycles inside the range)
• Average Duty Cycle (average duty cycle of all complete cycles inside the range)
• Count of Rising Edges
• Count of Falling Edges
• Count of Positive Pulses
• Count of Negative Pulses
• Minimum Positive Pulse Width
• Maximum Positive Pulse Width
• Minimum Negative Pulse Width
• Maximum Negative Pulse Width
• Period (for persistent measurements, this is the time span of the measurement)
• Average Period (average period of each complete cycle in the range)
• Count of Complete Periods (Cycles)
Supported analog measurement calculations:
• Width (for persistent measurements, this is the time span of the measurement)
• Frequency (this is just 1/width)
• Period (this is the same as the width for persistent measurements)
• Min-Max Voltage (displays both the minimum voltage and the maximum voltage in a range)
• Start Voltage (the voltage at the start of the span)
• End Voltage (the voltage at the end of the span)
• Delta Voltage (Abs (Start-End))
• Peak to Peak Voltage (Max-Min)
Page 49 of 69
Saving, Loading, and Exporting Data
Saving Captures
Note: Saving a capture only saves the currently selected tab.
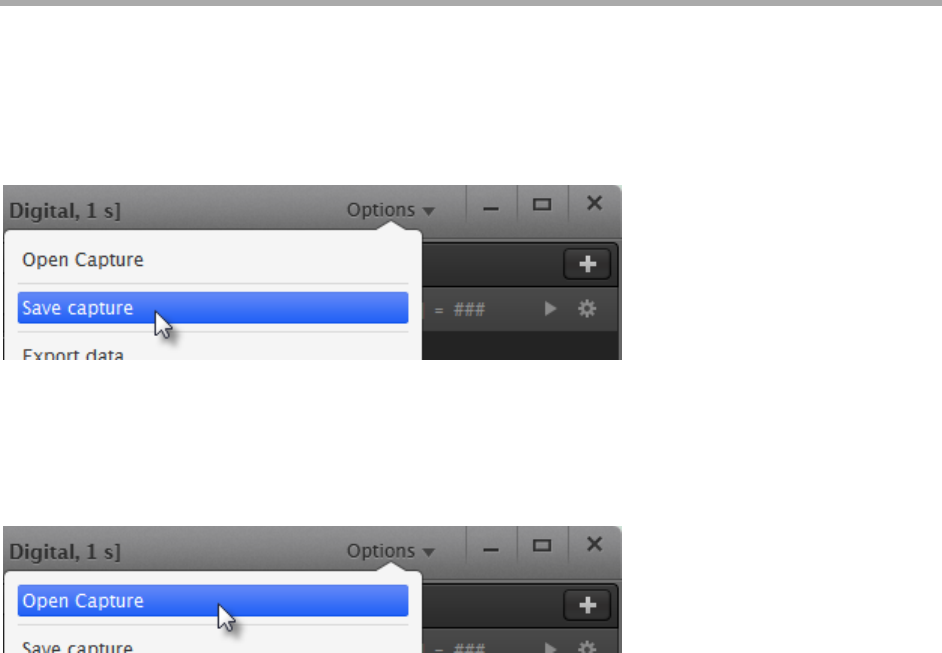
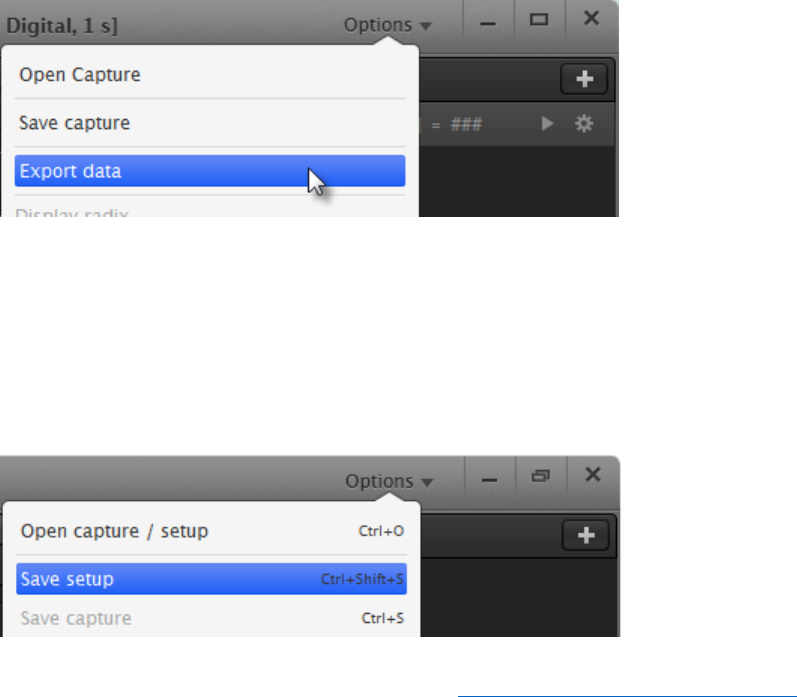
To save your current capture, click the Options menu on the top right of the software and select Save
capture. You can also press CTRL-S.
Opening Captures
To open a previously saved capture, click the Options menu on the top right of the software and select
Open Capture. You can also press CTRL-O.
You can also drag a capture file into the Logic software.
On Windows, you can double-click a capture file to open it in the Logic software.
Exporting Data
If you need to view, manipulate, or process data in another application, you can export it.
To begin exporting, click the Options button at the top right of the software and select Export data. When
exporting data, you can select which channels to export and over what time period. Finally, you can select
the format of the exported data.
Page 50 of 69
Note: For exporting protocol analyzer data, see the Protocol Analyzer section.
Export Settings
To export your setting, click the Options button at the top right and select Save Setup. From there, you
will be prompted to save a .logicsettings file. The .logicsettings file will save the settings associated with
the current active tab. You can find the tabs at the bottom of the software UI.
More details on saving settings are described here: Saving and Loading Software Settings
Exporting in CSV Format
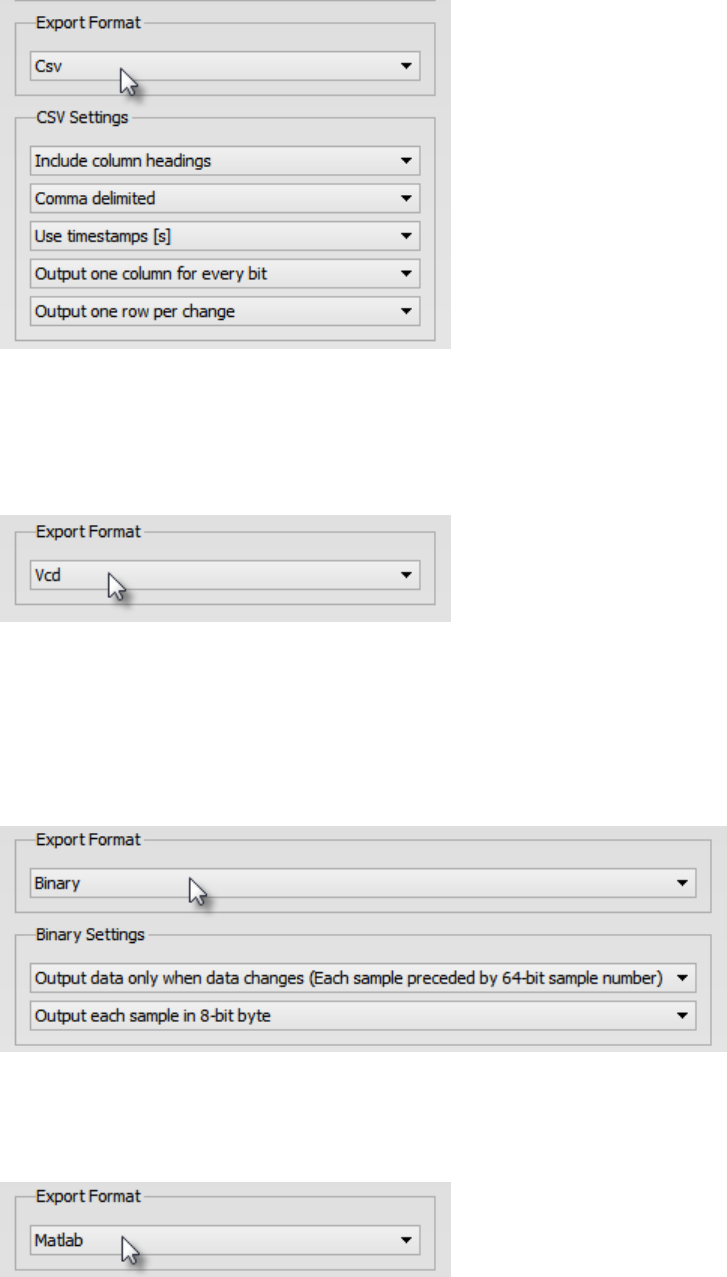
CSV format is a text format suitable for opening in a spreadsheet application or loading from a script. You
can choose to include column headings and choose commas or tabs as the delimiter.
When exporting digital data only, you can choose to use timestamps or sample numbers to output the
digital as a single value or as a bit per column. You can choose to record only when the value changes or
record every sample.
Page 51 of 69
Exporting in VCD Format
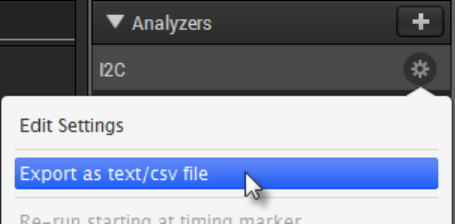
VCD stands for value change dump. It is a text-based format used for saving digital data (it can't be used
with analog data).
Exporting in Binary Format
A binary format is provided primarily for those interested in loading data into a script or custom
application. You can choose to export every sample or only record when the value changes. You can also
select the number of bytes used per sample.
Exporting in MATLAB Format
To use data in MATLAB, you can export a .mat file, which can be loaded by MATLAB.
Page 52 of 69
Additional Data Export Notes
Some export formats have different options when exporting a mix of digital and analog channels or
exporting only analog channels. Not all export options are available in some cases.
CSV can be used to export digital channels, analog channels, or a mix of digital and analog channels.
Different options are available for each of these cases, and the format varies slightly. For instance, when
exporting just digital channels with CSV and in one row per change mode, there will only be one set of
timestamps in the file. When exporting digital and analog data, one row per change mode is the only
format for the digital component, but timestamps are created for each channel individually instead of
being shared between all digital channels. This special "mixed mode" export feature is not available
unless at least one analog channel is present in the export. The only way to accomplish this for digital-
only exports is to export each channel, one at a time, to separate files.
Binary export can be used for digital exports and analog exports, but it cannot be used to export a mix of
analog and digital channels in the same file.
VCD only supports digital channels.
Matlab supports exporting digital channels, analog channels, and a mix of analog and digital channels.
Exporting Analyzer Results
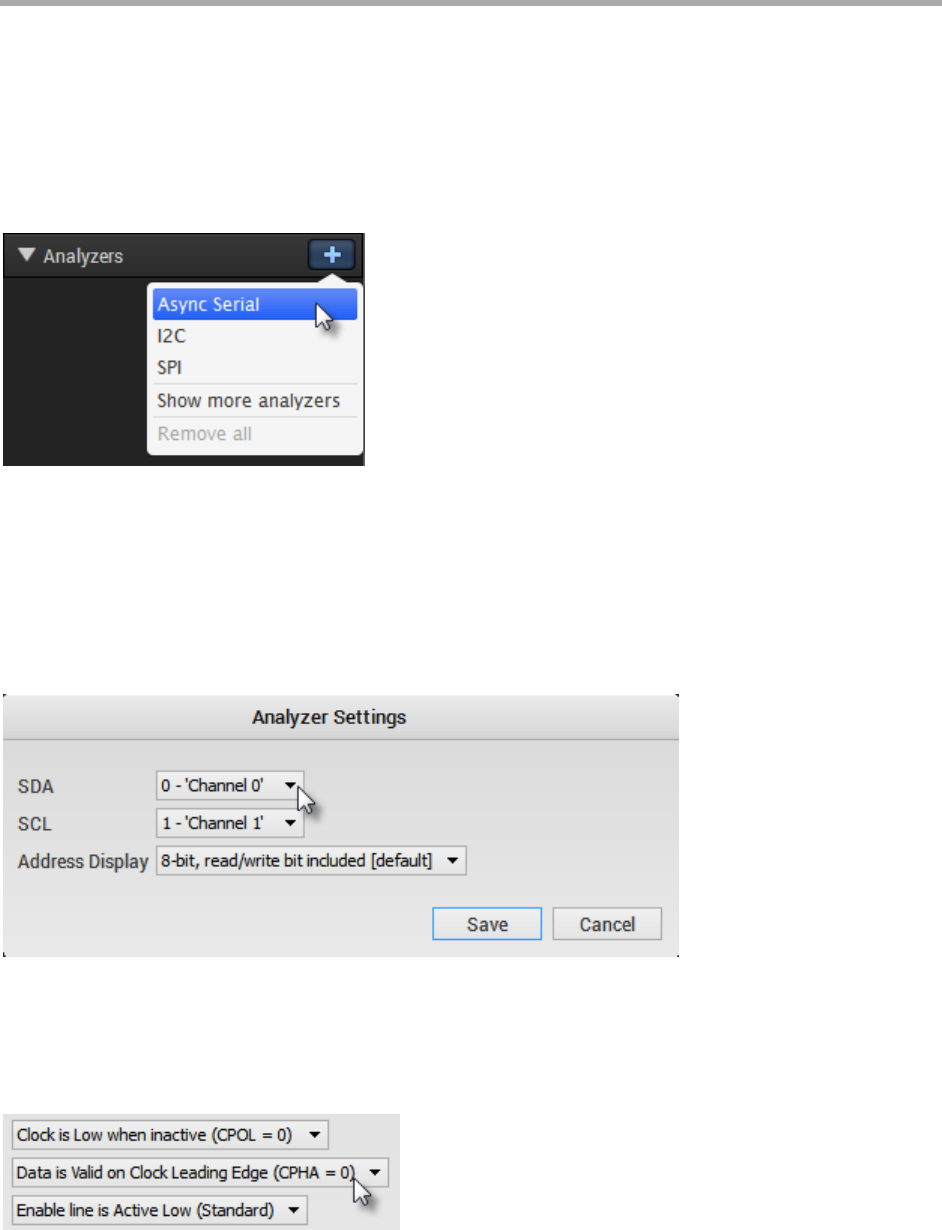
To export the results of a particular protocol analyzer, click the gear button on that analyzer and select
Export as text/csv file.
To export more than one protocol analyzer or only results that match your search, click the gear button on
the Decoded Protocols panel and select Export search results.

Page 53 of 69

Page 54 of 69
Saving and Loading Software Settings
The Saleae software includes two features to save and reload your work. The first is the ability to save
and reload the entire capture, complete with settings, analyzers, and the captured data. The second is the
ability to save the setup without captured data.
The saved setup file contains the following information:
• capture settings, including sample rate, active channels, etc.
• trigger settings
• channel settings, including channel labels, order, display size, and visibility
• display radix (binary, decimal, hex, etc.)
• analyzers and their settings
When saving a setup, the active tab's settings will be saved. When loading a setup, the settings will only
be applied to the active tab.
Also, when loading a setup, if the setup was saved when a different type of device other than the current
one was active, some settings, such as the sample rate and active channels, will not load. However,
channel settings, analyzers, and other settings will still load properly.
Troubleshooting Issues when Loading a Logic Setup File
If a saved setup file does not appear to be loading, it could be a bug. However, please check the following
first:
• Make sure the tab into which you would like to load the settings is open when you load the setup
file.
• Try changing a channel label and then reloading the file. Did the channel label change back? If so,
the setup file is probably loading, but it does not contain the settings you're looking for.
If nothing is happening at all, please report this and include the information requested here: The Software
Has Crashed, or I Have Discovered a Bug
Page 55 of 69
Using Protocol Analyzers
Protocol Analyzers decode data that have been encoded according to a particular protocol such as SPI or
I2C. The Logic software currently offers 23 protocol analyzers.
Adding Protocol Analyzers
To add a Protocol Analyzer, click the Plus button on the Analyzers sidebar on the right of the software.
Analyzer Settings
Different analyzers require different settings.
All protocol analyzers require you to specify which channels should be used for specific inputs used by
the protocol.
If, after running a protocol analyzer, you notice that it doesn't work or doesn't display correctly, you may
want to try editing the settings. For example, the SPI Analyzer must be set up to match the data exactly
for correct decoding.
Page 56 of 69
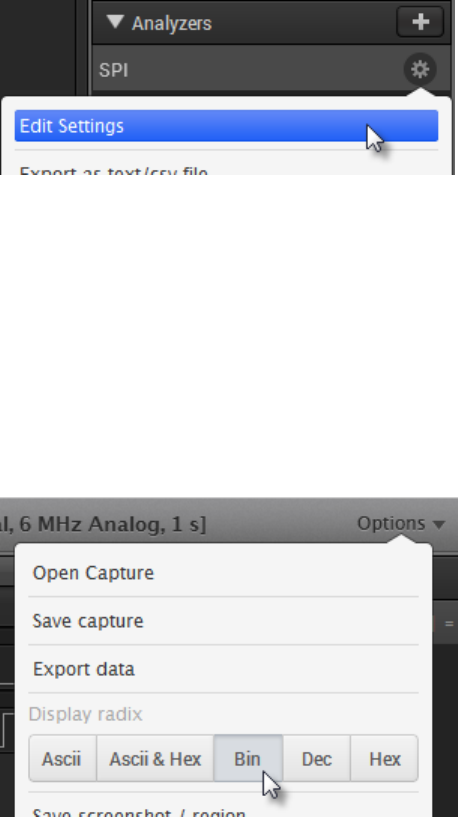
To edit the settings for an existing analyzer, find that analyzer in the Analyzers panel on the right of the
software. Click the gear button and select Edit Settings.
After editing your analyzer settings, the analyzer will rerun against any data you have collected and will
update all results.
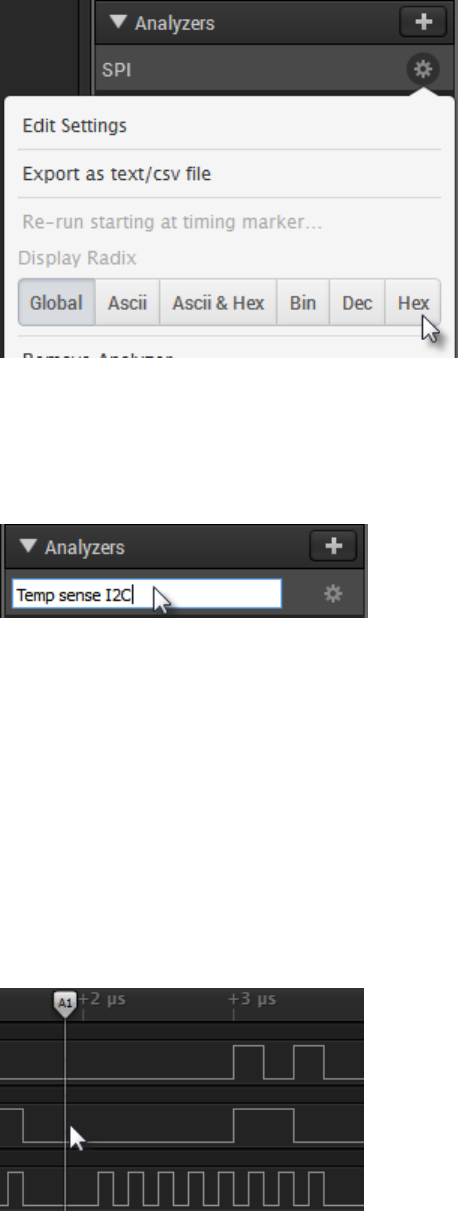
Changing the Global Radix (Hex, Decimal, etc)
By default, all protocol analyzers will use the global radix settings.
To change the global radix, click the Options button at the top right of the software and then click the
desired radix: Ascii, Ascii & Hex, Binary, Decimal, or Hexadecimal.
You can also use the keyboard shortcuts CTRL-A, CTRL-B, CTRL-D, or CTRL-H for Ascii, Binary,
Decimal, or Hexadecimal, respectively.
Changing Analyzer-Specific Radix (Hex, Decimal, etc.)
Sometimes you need to specify a different radix for different analyzers. To do that, locate the analyzer
you would like to change in the Analyzers panel on the right of the software. Click the gear button and
select the desired radix button.
Page 57 of 69
Edit the Analyzer Name
If you like, you can edit the name of the analyzer to help keep track of what it is connected to. On the
desired analyzer, click on the text to rename.
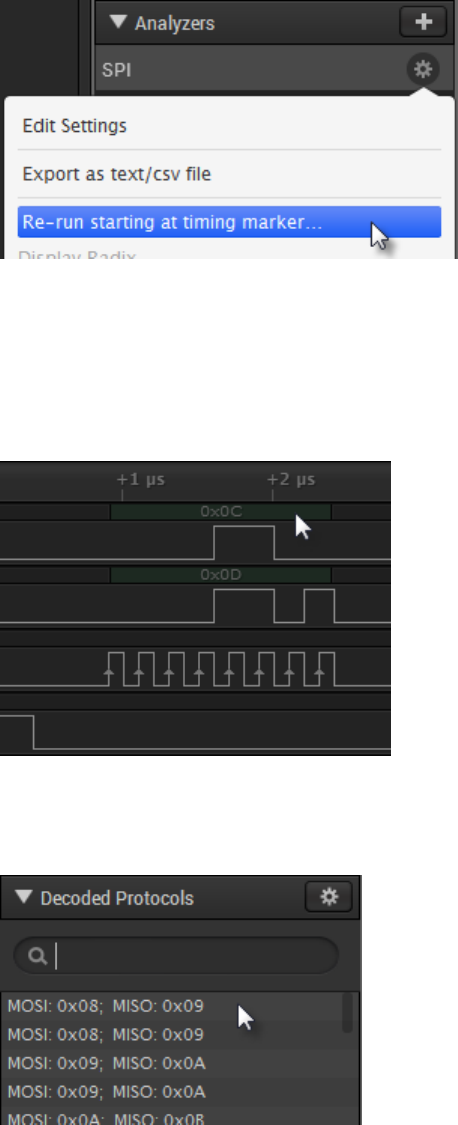
Starting an Analyzer at a Specific Point in the Software
Sometimes it is desirable to start the analyzer only at a specified location in your data. A common use for
this is if you are using SPI without an enable line. A transition on the enable line is normally required to
synchronize the analyzer and allow it to start decoding.
When using SPI with no enable line (and in other desired instances), it is possible that the capture will
start in the middle of a byte transition, and it will not have a means to properly find the beginning of a
byte. In this case, you can manually set the starting location by first setting the A1 timing marker at the
desired starting location.
Then click the Analyzer's gear button and select Re-run starting at the timing marker.
Page 58 of 69
Viewing Protocol Analyzer Results
When a protocol analyzer successfully decodes data, colored regions will appear above the digital
waveform where a byte or other bit-field is transmitted. Be sure to zoom in far enough to see the
transitions making up a particular byte or bit-field.
In addition to displaying results over the digital waveform (in context), results are displayed in a list in the
Decoded Protocols panel on the right of the software.
Clicking an individual item in this list will zoom to that location in the digital waveform.
Searching Analyzer Results
Page 59 of 69
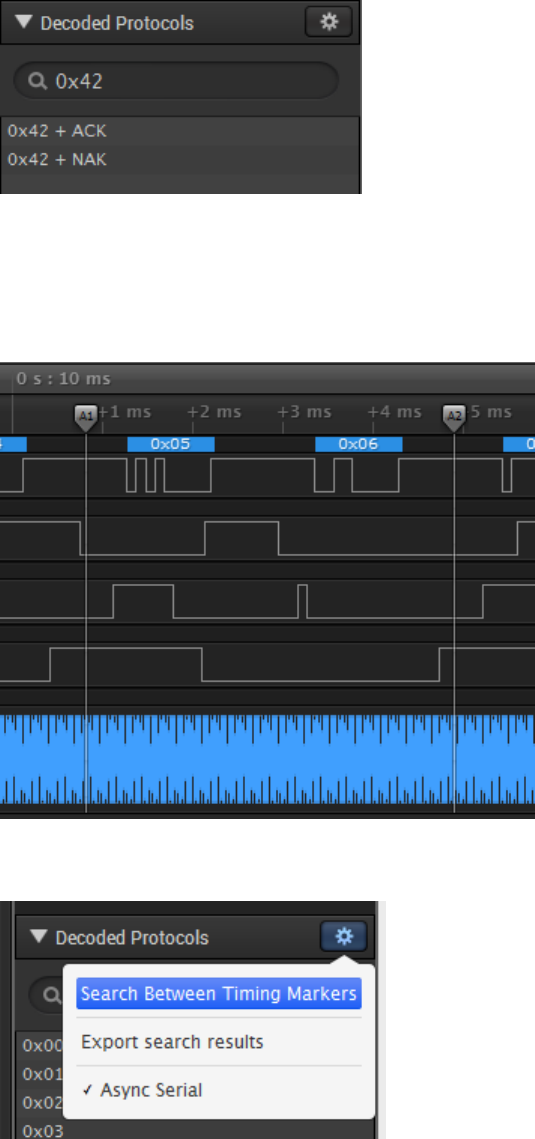
To search for a specific result, type the exact text you would like to match. For example, if you would like
to find transactions involving the I2C address 0x42, type 0x42 (assuming the display radix is
hexadecimal).
Filter Analyzer Results to a Specific Range
To limit the protocol results to a specific range, first add a timing marker pair with marker 1 and marker 2
placed at the beginning and end of the area on the graph you would like to search.
Then open the settings menu for the protocol search panel and select Search Between Timing Markers.
Page 60 of 69
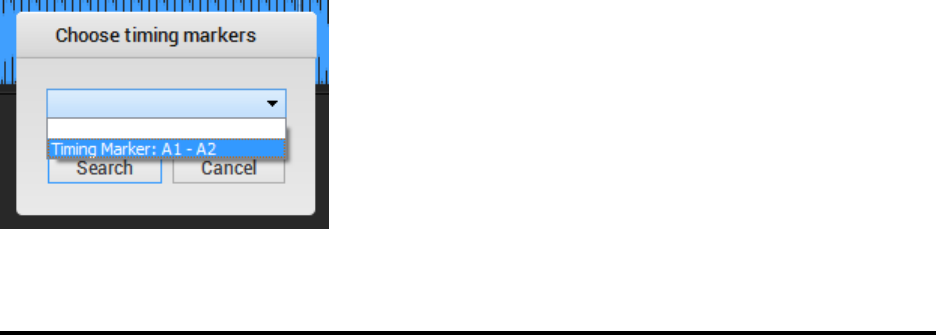
Then, from the "Choose timing markers" dialog, select the pair that you have just placed around the
activity and click Search.
The results are now filtered to all enabled analyzers within that time range.
Page 61 of 69
Simulation Data & Demo Mode
Demo Mode
When the software is not connected to a Saleae Logic device, it switches into demo mode so potential
users can explore the features of the software before deciding to buy the unit.
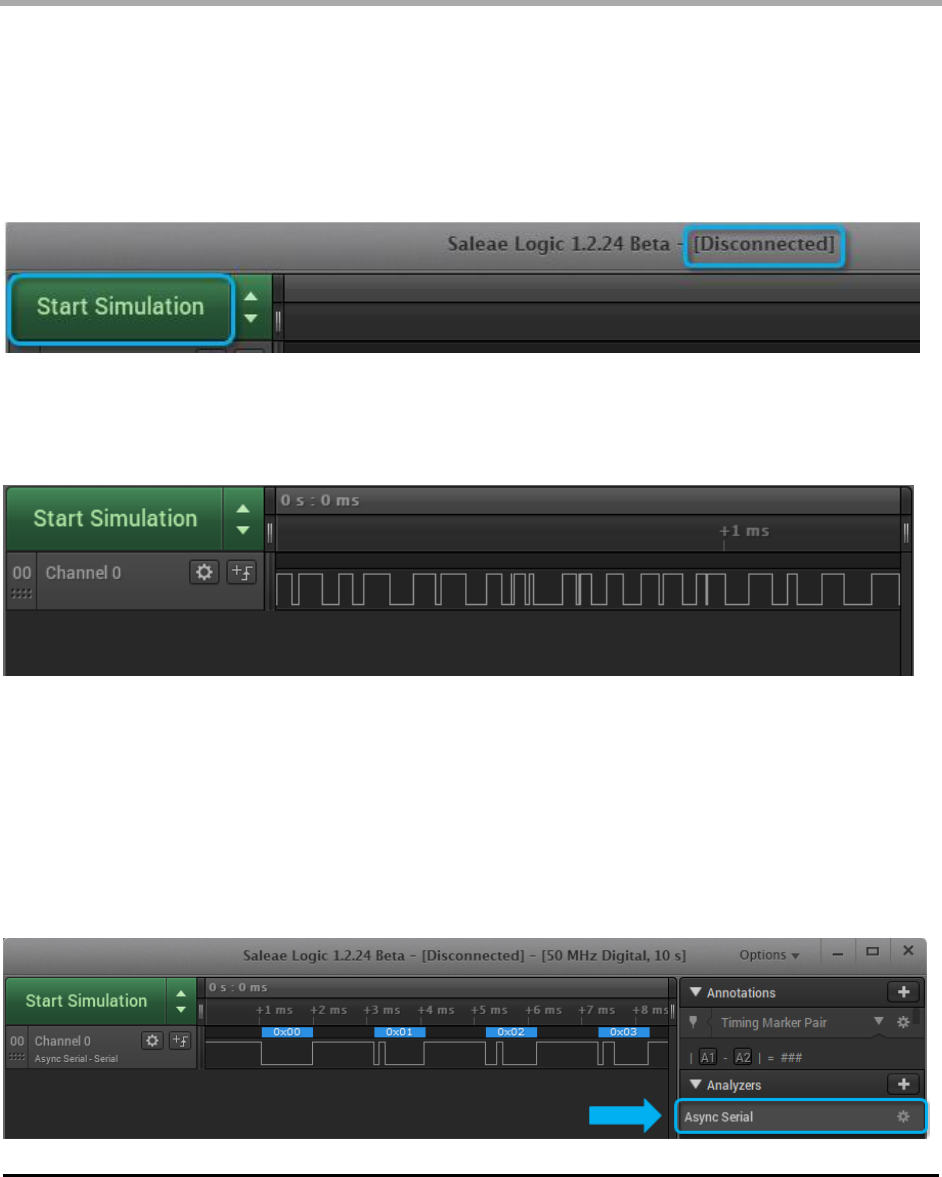
In demo mode, the title bar will say [Disconnected] and the green button will say Start
Simulation.
When you click Start Simulation, the capture will proceed, and the results will contain data that appear to
transition
randomly.
Simulating Protocol Analyzer Data
If any protocol analyzers were added to the session before the simulation mode was run, then
clicking Start Simulation will generate valid protocol data. This is useful to demonstrate the functionality of
each protocol analyzer, without having to record real protocol data using the Logic hardware. In the
example below, we have added an the Async Seria' Analyzer to Channel 0. Afterwards, clicking 'Start
Simulation' will generate serial data as
shown.

Page 62 of 69
Capture Settings Configuration Guide
The new Saleae devices are considerably more capable than the first generation (Logic and Logic16).
The new products have inputs that can be used to record analog, digital, or both. On all but Logic 4, this
is applicable to every channel on the device. That leads to many more sample rate options, which can be
confusing. In some cases, it makes it harder to decide the optimal capture configuration for your
application.
Because if this, we get a fair number of customer support questions about how to choose the optimal
capture configuration for an application. To help users determine the best setup for them, we're creating
this guide. The guide also contains a number of tips for recording with more complex requirements.
Please first review the Getting Started section, including the article on device settings:
Collecting Data & Device Settings
Generally, when starting a capture, make sure you record all the channels you have connected in the
correct mode (analog or digital). You also need to make sure you record sufficiently fast in order to
accurately record the signal and record long enough to locate the event(s) you are interested in.
However, meeting all of these requirements at the same time might not be easy or even possible in all
situations.
The devices are designed to stream the recorded data over USB in real time, to be recorded and
processed on a PC. That means that no matter what, the USB bandwidth limits the maximum sample rate
of the capture. However, you can make compromises. You can trade unused channels for faster sample
rates on the remaining channels, and you can sacrifice higher analog sample rates for faster digital
sample rates. Optimizing these trade-offs is required whenever you need to push the limits of the device.
Over USB 2.0, the maximum possible bandwidth for most of our products is 300 Mbps. For our USB 3.0
products, it's 2 Gbps. Each digital sample for each channel consumes 1 bit. The analog samples are
either 8 bit for Logic 4 or 12 bit for the new Logic 8, Logic Pro 8, and Logic Pro 16. (Although Logic 8 is
advertised as a 10-bit product, we maintain 12-bit samples through the entire process. The effective
number of bits, however, is closer to 10).
In addition to the limit of USB throughput, the installed RAM in the host PC is a limiting factor for how long
our software can record. To optimize for a long recording length, it's important to reduce the number of
Page 63 of 69
active analog channels and reduce the sample rate to the minimum required for the remaining active
channels.
In general, there is no benefit to sampling with lower digital sample rates. Our software run length
encodes the data as it arrives so that memory usage is directly proportional to data density and unrelated
to the sample rate.
Here are several factors to keep in mind when selecting the device capture settings:
• When recording for long durations, minimize the number of analog channels and reduce analog
sample rates to the minimum to conserve RAM. Analog samples consume considerably more
memory than digital samples and can reduce maximum recording times from hours to mere
seconds. One channel of 50 MSPS analog data will consume 750 MB.
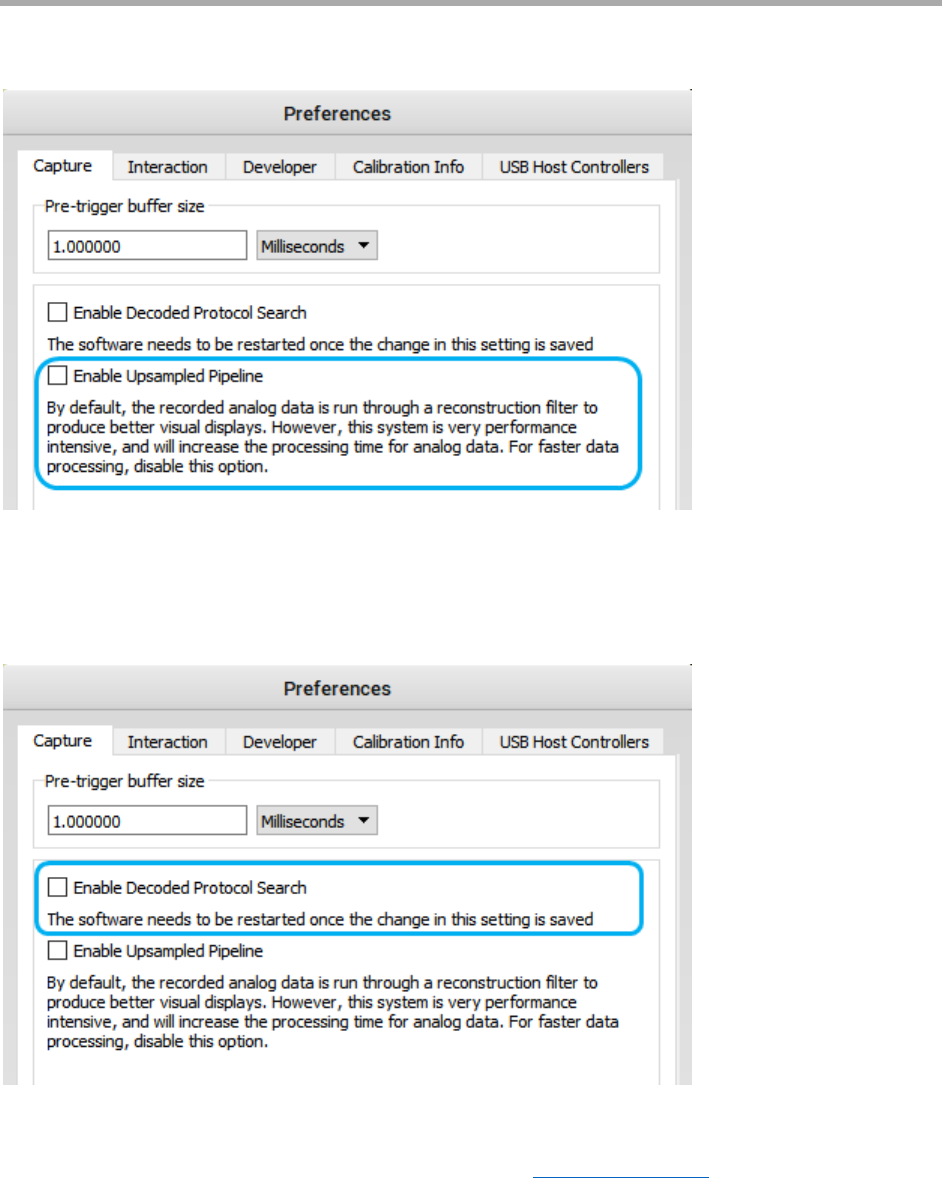
• You can save memory while recording analog data by disabling the up-sampled pipeline in the
software preferences. That will reduce the memory usage of analog data by about 50%.
• The "performance" setting in the capture settings limits the maximum USB bandwidth by the device.
It can be used on systems with poor USB performance to increase reliability by sampling at lower
speeds (i.e., reduce the number of "can't keep up" errors). It can also be used to select lower
sample rates.
• Digital channels only consume memory when their state changes. That makes the memory
consumption of digital channels proportional to the number of transitions and not the sample rate or
number of samples recorded. It makes it possible to record low-speed signals like I2C or serial for
hours, where 10 MHz SPI can only record for several minutes.
• The memory usage estimator on the capture settings popover shows the estimated memory usage
for a capture as a range. The range covers no digital activity to the maximum digital activity.
• A capture will consume memory until its tab is closed. When working with long captures, we
recommend keeping only one capture open in the software at a time. Save the capture, move it to a
new tab if it is not already, and then use the tab's menu to close it. That will free up memory for the
next capture.
• Analyzers will also consume memory directly proportional to the number of generated results. The
software uses about 40 bytes per result. Keep this in mind when recording high-speed parallel, SPI,
or I2S traffic. This memory usage is not reported in our software. We recommend tracking the
software's memory usage in task manager or equivalent.
• The capture progress dialog, which is displayed when a capture is in progress, can show several
statistics. It will show the number of samples collected as well as the processing backlog and
memory used. That is just the memory used by the analog and digital channels exclusively and does
not include the overhead of the software or the memory used by Analyzers or other tabs.
• When using a trigger, the capture progress dialog will also show the trigger processing backlog. For
correct operation, it's important that the processing backlog and the trigger search backlog stay as
close to 0 as possible. If either of these numbers steadily increases during a capture, it may cause
the memory usage to increase dramatically, and it also may result in a much longer capture than
requested. That can be solved by lowering the digital sampling rate or removing unused channels.
There is also an issue with version 1.1.34 and older that prevents the trigger from operating properly
when one or more analog channels are used. Until 1.1.35/1.2.0 is released, please disable the
trigger while using analog channels.
• The current software does not safely handle running out of memory. If the software fails to allocate
additional memory, the current version will crash. We are working on a solution that will be

Page 64 of 69
introduced in a future version. In the meantime, try to keep the memory usage below the installed
RAM amount. Some systems with high-performance hard drives may be able to page RAM in real
time for some period of time after RAM is exhausted.
• Keep in mind that in order to successfully capture a signal, you must sample faster than that signal.
That is due to the nature of asynchronous sampling and is described by the Nyquist-Shannon
sampling theorem. With our products, in order to accurately sample a digital signal, you must
sample at least 4 times faster than that signal.
• To accurately record an analog signal, you must sample at least 10 times faster than that signal.
That is due to the filter response of our down-sampling filter as well as the hardware anti-aliasing
filter that defines the maximum analog bandwidth of the device.
• Captures can always be ended early. If you are watching memory usage during a capture and
decide that it's not safe to allow the capture to complete, or if you are sure that the event of interest
has already been captured, you can end the capture by pressing the Stop button.
• The software does not have an automatic trigger and re-arm feature like an oscilloscope with real-
time display. Our software requires each trace to be started manually with the Start button.
• If you are not able to record long enough for your application due to memory limits, you may want to
take a look at the socket API. Several customers have used it to automatically start, save, and
restart captures to allow much longer recordings with only small (<1 second) gaps between very
long captures.
• Some devices, including Logic Pro 8, Logic Pro 16, and the original Logic16, support multiple
selectable voltage thresholds. In addition to being required to correctly record digital data at different
IO threshold standards, voltage thresholds are important for rejecting noise near ground and
avoiding double edge hits.
• You may be recording at too slow of a digital sample rate or using the wrong voltage standard if you
find one or more pulses in the digital data that are only 1 sample wide (1/sample rate). In these
cases, you may want to review your sample rate settings, review this guide, or contact support.
Page 65 of 69
Time & Memory Saving Tools
Faster post-processing of analog captures
After a capture, analog data can be processed faster if Upsampled Pipeline is disabled.
Faster post-processing of decoded protocols
You can disable the Decoded Protocols search window located on the bottom-right of the software. This
will disable software indexing of the decoded protocols and will remove the ability to search protocol
results. This allows for faster post-processing of decoded protocols when using a protocol analyzer.
Keyboard Shortcuts
The software includes various keyboard shortcuts to set up and start captures, add measurements, and
utilize other functions that will help save the user time. See: Keyboard Shortcuts
Page 66 of 69
Saving and Loading Software Settings
The software settings can be saved and loaded at a later time, allowing the user to recall a particular
setup. This is especially useful when jumping back and forth between multiple test setups. See: Saving
and Loading Software Settings
Reducing Capture File Disk Usage
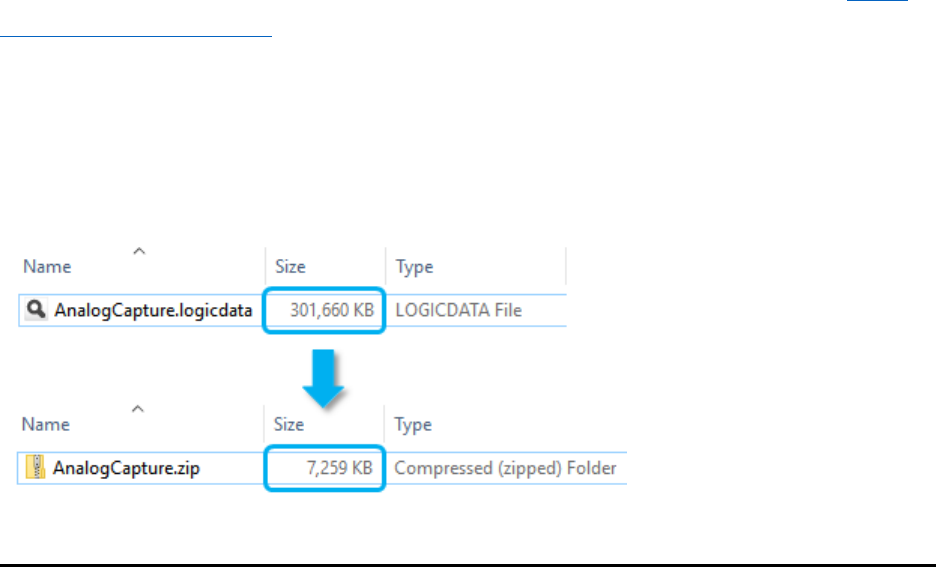
The file size of a capture file (.logicdata file) can be significantly reduced by zipping it to a compressed
folder. This is especially useful when sending your capture file over the network.

Page 67 of 69
Keyboard Shortcuts
(On OSX, CTRL is replaced by Command)
Start a Capture: CTRL-R
Stop a Capture: ESC or Enter (presses the Stop button)
Move Right/Left: Right/Left Arrow Keys (Add CTRL to move faster)
Zoom In/Out: Up/Down Arrow Keys (Add CTRL to move faster). Also Plus and Minus (+/-)
Zoom to Region: Shift+Click and drag over region to zoom
Zoom All the Way Out: Ctrl+0
Place Timing Markers: All numbers 1=A1, 2=A2, 3=B1, and so on
Add measurement: "M" and then click twice to place both ends of the measurement
Add bookmark: "B" and then type the name for that bookmark
Jump to Next/Previous Bookmark: CTRL+N/CTRL+P
Open Options Menu: ALT-O
Save Session: CTRL-S
Save Session, Settings Only: CTRL-SHIFT-S
Open Session: CTRL-O
Export Data: CTRL-E
Take Screenshot: CTRL-I
Change Radix: SHIFT-A (Ascii), CTRL-H (Hex), CTRL-B (Binary), CTRL-D (Decimal), CTRL+SHIFT+A
(Ascii and Hex). Note: This changes the global radix.
Jump Left/Right to Next Edge: N (Next), P (Previous). Note: This applies to the channel where you last
clicked the Next/Previous button (appears at the beginning/end of a channel).
Jump to Next/Previous Trigger Event: SHIFT+N/SHIFT+P
Jump to Trigger Location (Time 0): Home
Jump to End of Capture: End
Scroll Channels Up/Down: Page Up/Page Down. Note: This applies when more channels are viable
than fit vertically on the screen. Use CONTROL to scroll to top or bottom.
Resize Selected Channels: CTRL-1, CTRL-2, CTRL-3, CTRL-4 for each of the four channel sizes.
Select All Channels: CTRL-A
Page 68 of 69
Connector Dimensions
Below are several recommendations for integrating the Saleae devices into new designs.
1) Add 4x2 male headers to your PCB and use the Saleae accessory cable "Logic-to-2x4 Header (Gen
2)" to connect any of the current Saleae logic analyzers to your circuit. Accessories can be purchased
here.
The Gen 2 accessories are compatible with these devices:
• Logic 4
• Logic 8
• Logic Pro 8
• Logic Pro 16
The Gen 1 accessories are compatible with these devices:
• original Logic (discontinued)
• original Logic16 (discontinued)
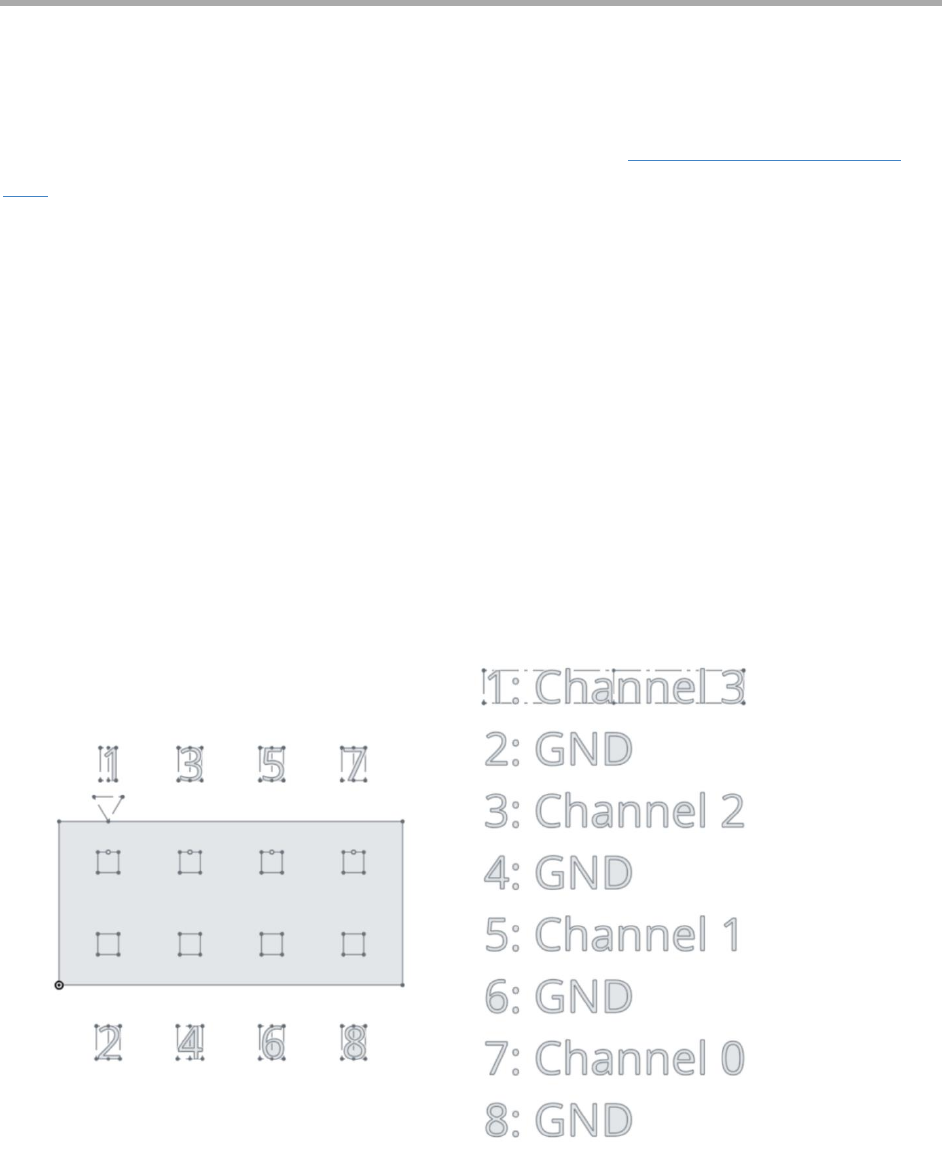
When using the Gen 2 Logic-to-2x4 header adapters, please use this pin out on your board (top view):
Page 69 of 69
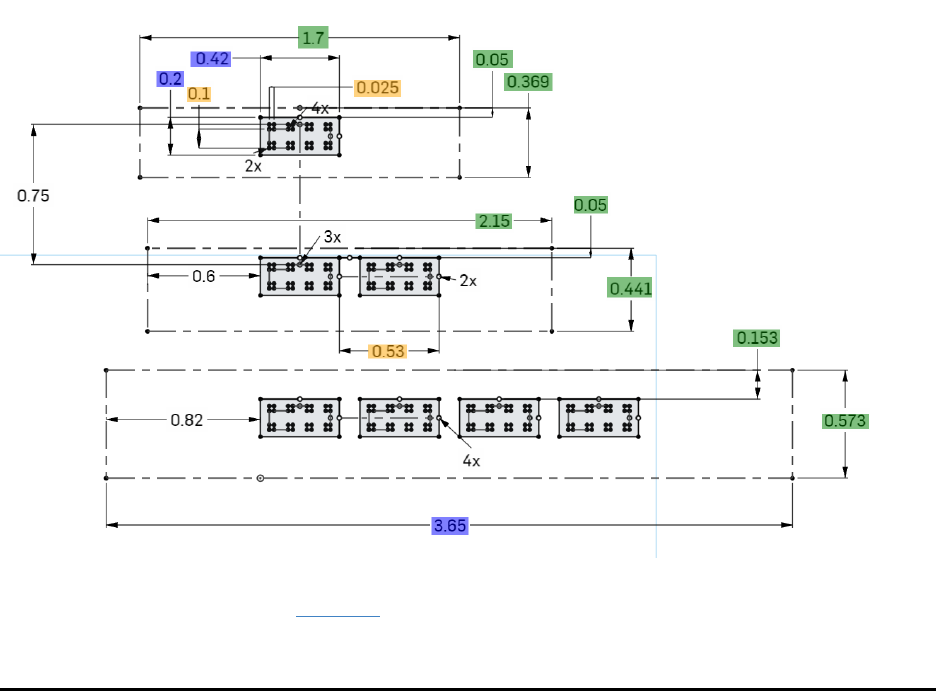
2) Add female right-angle headers to the edge of your board, or vertical headers to mount the logic
analyzer vertically to your board.
Below are diagrams of the connectors on the new Saleae logic analyzers. Note that Logic 8 and Logic
Pro 8 have the same dimensions.
These diagrams are available on OnShape, named "Saleae Pinout Gen2." A free account is required with
OnShape to view them.
