Instructionsx Settlement Instructions
User Manual:
Open the PDF directly: View PDF ![]() .
.
Page Count: 2

REsurety, Inc
Settlement Investigation
Instructions: Please answer the following questions and submit your answers to jtraurig@resurety.com. This
assignment is intended to take 2-3 hours or less. Submit all code/analysis with your answers.
Introduction: You are analyzing a site in the Midwest region of the US to build a small (10 turbines) wind farm.
The turbines will be erected on 80m towers as shown below.
Data: You have been given two sources of data to help answer the questions below.
•wind.csv – This contains meteorological measurements from the site taken from a 60m tower that has been
erected at the site. The columns in the file are:
oTime – timestamp, hour beginning, in UTC
oWindSpeed60.ms – Wind speed measured by a cup anemometer at 60m height, in m/s
oWindSpeed30.ms – Wind speed measured by a cup anemometer at 30m height, in m/s
oDir.degree – Wind direction, in degrees
oTemp.C – Temperature, in degrees Celsius
•PowerCurve.csv – The power curve for the wind turbine being considered. Note: the power curve is defined
for hub-height wind speeds (80m in this case). The columns in the file are:
oWindSpeed.ms – The hub-height wind speed, in m/s
oPower.kw – The expected power output for the corresponding wind speed, in kW
Questions:
1. What is the average wind speed at 80m (hub height) in 2011? What are the monthly averages?
2. If there were 10 turbines at this site, how much energy do you expect they would have produced in
September 2011? Please state all of your assumptions.
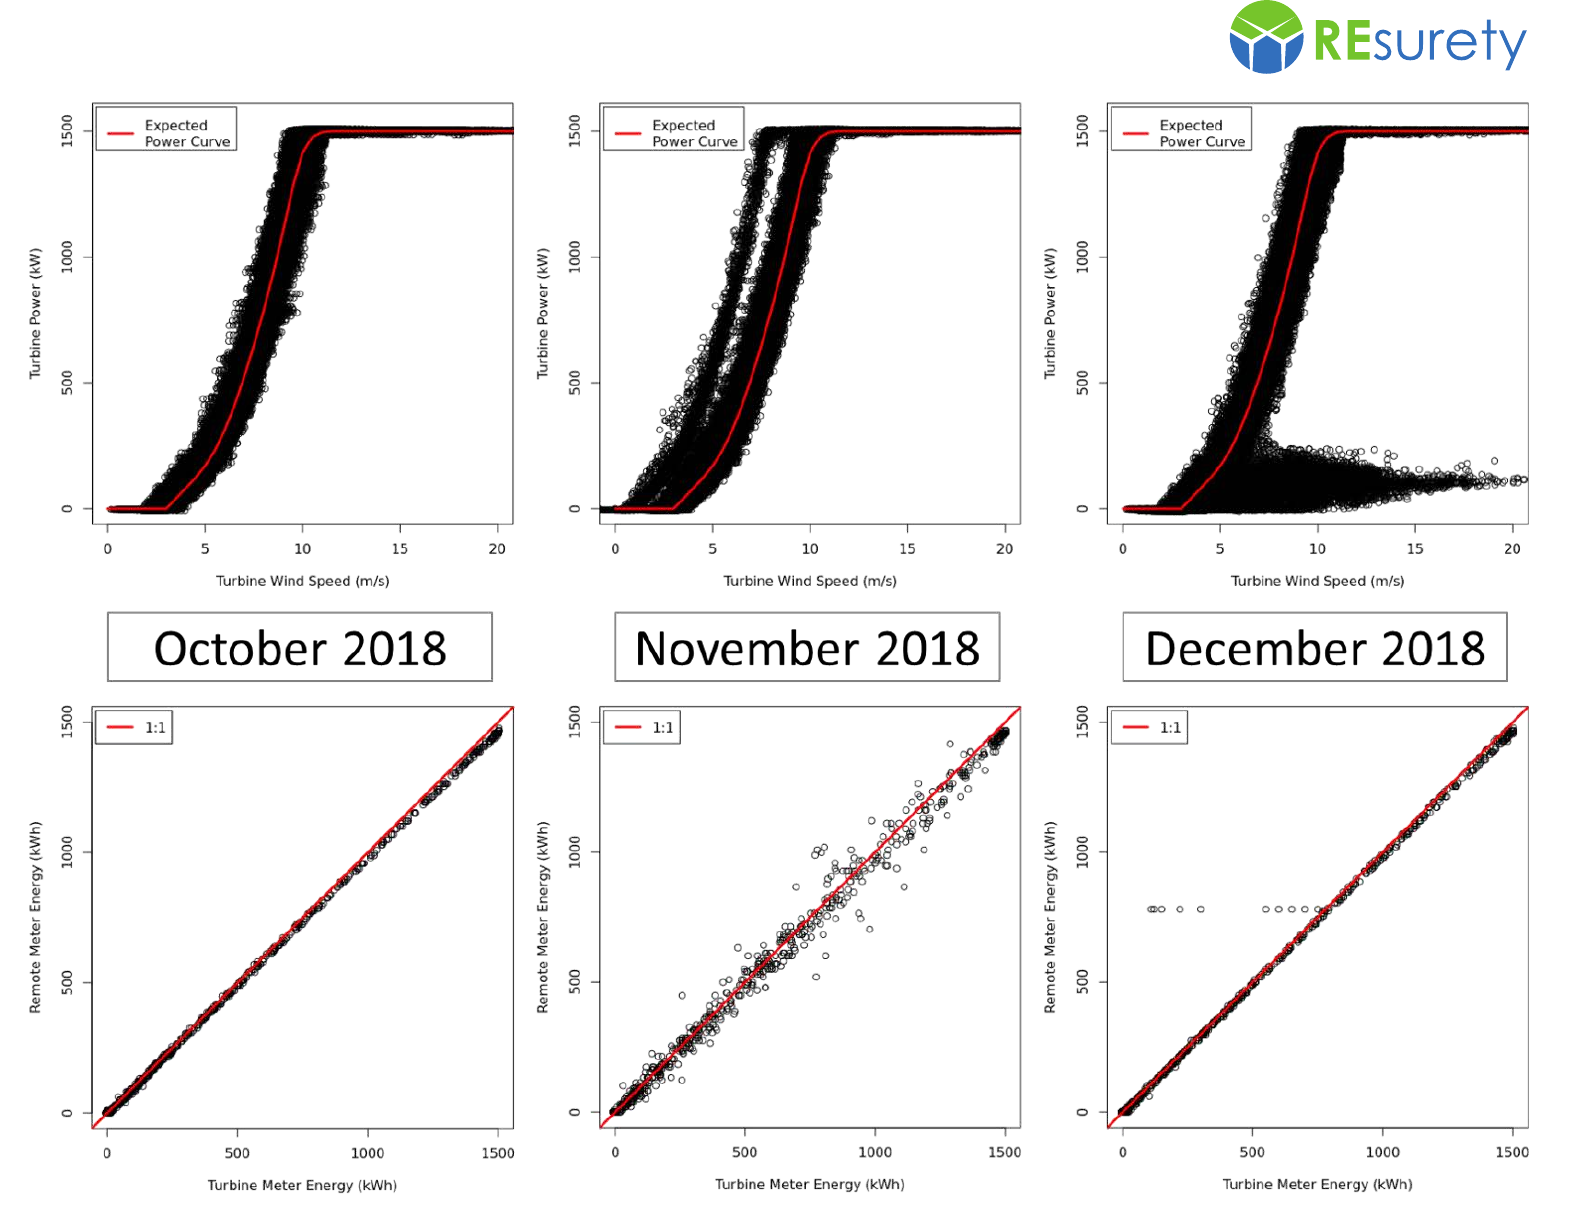
3. Suppose that the 10-turbine wind farm has been constructed. The operational power curves for all
10 turbines can be seen in the first set of plots. Can you draw any conclusions about the wind
farm’s operation over the three-month period highlighted?
4. The second set of plots compares the generation measured by a sensor at one of the turbines to
the generation for the same turbine as reported by a remote meter. What are some possible
explanations for the discrepancies seen between the data sets for the three months?
80m
The next questions are associated with the plots on the following page: