Print Preview C:\TEMP\Apdf_2541_3068\home\AppData\Local\PTC\Arbortext\Editor\.aptcache\ae2n4tr7/tf2n4uhl Simulink Report Generator User's Guide
User Manual:
Open the PDF directly: View PDF ![]() .
.
Page Count: 430 [warning: Documents this large are best viewed by clicking the View PDF Link!]
- toc
- User's Guide
- Getting Started
- Examples
- Generate System Design Description Reports
- Creating Simulink Reports
- Create a Simulink Report Generator Report
- Report Options
- Add Components to the Report Setup File
- Report Components
- Add MATLAB Code
- Add a Title Page
- Open the Simulink Model
- Add Logical Then and Logical Else Components
- Error If Model Cannot Be Opened
- Create the Body of the Report
- Process with a Model Loop Component
- Add a Paragraph for Each Model
- Insert a Snapshot of the Model
- Add a Loop for Processing the Model
- Block Parameter Value from a MATLAB Expression
- Create a Section for Each Iteration
- Insert the Block Value
- Set a Parameter Value
- Check Value Using a Logical If Component
- Simulate the Model Using a Model Simulation Component
- Create a Post-Test Analysis Section
- Error Handling for MATLAB Code
- Generate the Report
- Generate a Report
- Generate a Report
- Set Report Output Options
- Change Report Locale
- Convert XML Documents
- Create a Log File
- Generate MATLAB Code from Report Setup File
- Generate Reports from MATLAB Files
- Legacy Report Setup Files
- Troubleshooting Report Generation Issues
- Export Simulink Models to Web Views
- Add Content with Components
- Components
- Report Structure Components
- Table Formatting Components
- Property Table Components
- About Property Table Components
- Open the Example Report Template
- Examine the Property Table Output
- Select Object Types
- Display Property Name/Property Value Pairs
- Edit Table Titles
- Enter Text into Table Cells
- Add, Replace, and Delete Properties in Tables
- Format Table Columns, Rows, and Cells
- Zoom and Scroll
- Select a Table
- Summary Table Components
- Dynamic Reporting Components
- Compare Simulink Model XML Files
- Compare Simulink Model XML Files
- Explore the XML Comparison Report for Simulink Models
- Export, Print, and Save XML Comparison Results
- Compare XML from Models Managed with Subversion
- Component Reference
- Components — Alphabetical List
- Function Reference
- Functions – Alphabetical List
- Examples
- Index

Simulink®Report Generator™
User’s Guide
R2012b

How to Contact MathWorks
www.mathworks.com Web
comp.soft-sys.matlab Newsgroup
www.mathworks.com/contact_TS.html Technical Support
suggest@mathworks.com Product enhancement suggestions
bugs@mathworks.com Bug reports
doc@mathworks.com Documentation error reports
service@mathworks.com Order status, license renewals, passcodes
info@mathworks.com Sales, pricing, and general information
508-647-7000 (Phone)
508-647-7001 (Fax)
The MathWorks, Inc.
3 Apple Hill Drive
Natick, MA 01760-2098
For contact information about worldwide offices, see the MathWorks Web site.
Simulink®Report Generator™ User’s Guide
© COPYRIGHT 1999–2012 by The MathWorks, Inc.
The software described in this document is furnished under a license agreement. The software may be used
or copied only under the terms of the license agreement. No part of this manual may be photocopied or
reproduced in any form without prior written consent from The MathWorks, Inc.
FEDERAL ACQUISITION: This provision applies to all acquisitions of the Program and Documentation
by, for, or through the federal government of the United States. By accepting delivery of the Program
or Documentation, the government hereby agrees that this software or documentation qualifies as
commercial computer software or commercial computer software documentation as such terms are used
or defined in FAR 12.212, DFARS Part 227.72, and DFARS 252.227-7014. Accordingly, the terms and
conditions of this Agreement and only those rights specified in this Agreement, shall pertain to and govern
theuse,modification,reproduction,release,performance,display,anddisclosureoftheProgramand
Documentation by the federal government (or other entity acquiring for or through the federal government)
and shall supersede any conflicting contractual terms or conditions. If this License fails to meet the
government’s needs or is inconsistent in any respect with federal procurement law, the government agrees
to return the Program and Documentation, unused, to The MathWorks, Inc.
Trademarks
MATLAB and Simulink are registered trademarks of The MathWorks, Inc. See
www.mathworks.com/trademarks for a list of additional trademarks. Other product or brand
names may be trademarks or registered trademarks of their respective holders.
Patents
MathWorks products are protected by one or more U.S. patents. Please see
www.mathworks.com/patents for more information.
Revision History
January 1999 First printing New (Release 11)
December 2000 Second printing Revised (Release 12)
June 2004 Third printing Revised for Version 2.02 (Release 14)
August 2004 Online only Revised for Version 2.1
October 2004 Online only Revised for Version 2.1.1 (Release 14SP1)
December 2004 Online only Revised for Version 2.2 (Release 14SP1+)
April 2005 Online only Revised for Version 2.2.1 (Release 14SP2+)
September 2005 Online only Revised for Version 2.3.1 (Release 14SP3)
March 2006 Online only Revised for Version 3.0 (Release 2006a)
September 2006 Online only Revised for Version 3.1 (Release 2006b)
March 2007 Fourth printing Revised for Version 3.2 (Release 2007a)
September 2007 Fifth printing Revised for Version 3.2.1 (Release 2007b) This
publication was previously for MATLAB®and
Simulink®.ItisnowforSimulink
®only.
March 2008 Online only Revised for Version 3.3 (Release 2008a)
October 2008 Online only Revised for Version 3.4 (Release 2008b)
October 2008 Online only Revised for Version 3.5 (Release 2008b+)
March 2009 Online only Revised for Version 3.6 (Release 2009a)
September 2009 Online only Revised for Version 3.7 (Release 2009b)
March 2010 Online only Revised for Version 3.8 (Release 2010a)
September 2010 Online only Revised for Version 3.9 (Release 2010b)
April 2011 Online only Revised for Version 3.10 (Release 2011a)
September 2011 Online only Revised for Version 3.11 (Release 2011b)
March 2012 Online only Revised for Version 3.12 (Release 2012a)
September 2012 Online only Revised for Version 3.13 (Release 2012b)

Contents
User’s Guide
Getting Started
1
Product Description ............................... 1-2
Key Features ..................................... 1-2
System Design Documentation and Results
Reporting ....................................... 1-3
Types of Reports .................................. 1-3
System Design Documentation ...................... 1-3
Results Reporting ................................. 1-4
Interactive Model Exploration ...................... 1-6
Simulink Report Generator Tools .................... 1-6
Simulink Model Exploration Tools .................... 1-7
Report Creation Workflow ......................... 1-9
Report Components ................................ 1-10
About Report Components .......................... 1-10
Report Structure Components ....................... 1-11
System-Based Components ......................... 1-11
User-Supplied Information Components ............... 1-13
Dynamic Reporting Components ..................... 1-14
Format Control at the Component Level ............... 1-14
Report Explorer ................................... 1-15
About the Report Explorer .......................... 1-15
v

How Simulink Report Generator and Simulink
Software Interact ................................ 1-18
Supported Report Formats ......................... 1-20
Browser Requirements for Web Views ............... 1-21
Examples
Creating Reports .................................. 2
Generating Reports from MATLAB Files ............. 3
Creating Web Views ............................... 4
Working with Components ......................... 5
Generate System Design Description Reports
2
System Design Description ......................... 2-2
Predefined Standard Reports ........................ 2-2
What Is the System Design Description? ............... 2-3
What You Can Do with the Report ................... 2-3
Report Contents .................................. 2-3
Generate a System Design Description .............. 2-7
Open the System Design Description Dialog Box ........ 2-7
Choose System Design Description Options ............ 2-7
Customize the System Design Description ........... 2-10
Using the Report Explorer to Customize the Report ..... 2-10
Building a Dialog Box for a Custom Report Setup File ... 2-11
vi Contents

Creating Simulink Reports
3
Create a Simulink Report Generator Report ......... 3-2
Report Options .................................... 3-3
Add Components to the Report Setup File ........... 3-5
Report Components ................................ 3-5
Add MATLAB Code ................................ 3-7
Add a Title Page .................................. 3-13
Open the Simulink Model ........................... 3-15
Add Logical Then and Logical Else Components ........ 3-18
Error If Model Cannot Be Opened .................... 3-19
Create the Body of the Report ....................... 3-22
Process with a Model Loop Component ................ 3-23
Add a Paragraph for Each Model ..................... 3-25
Insert a Snapshot of the Model ...................... 3-27
Add a Loop for Processing the Model .................. 3-28
Block Parameter Value from a MATLAB Expression ..... 3-30
Create a Section for Each Iteration ................... 3-32
Insert the Block Value ............................. 3-33
Set a Parameter Value ............................. 3-34
Check Value Using a Logical If Component ............ 3-36
Simulate the Model Using a Model Simulation
Component .................................... 3-39
Create a Post-Test Analysis Section .................. 3-45
Error Handling for MATLAB Code .................. 3-53
Generate the Report ............................... 3-55
Generate a Report
4
Generate a Report ................................. 4-2
Run a Report ..................................... 4-2
Report Output Options ............................. 4-2
vii

SetReportOutputOptions ......................... 4-4
Report Output Format and Stylesheet ................ 4-4
PDF Stylesheets .................................. 4-7
Web Stylesheets .................................. 4-8
RTF (DSSSL Print) and Word Stylesheets ............. 4-9
Report Generation Processing ....................... 4-9
Output File Location ............................... 4-12
Regenerate Images ................................ 4-13
Add Description of Report Setup ..................... 4-14
Change Report Locale ............................. 4-15
Convert XML Documents ........................... 4-16
Why Convert XML Documents? ...................... 4-16
Convert XML Documents Using the Report Explorer .... 4-16
Convert XML Documents Using the Command Line ..... 4-18
Edit XML Source Files ............................. 4-18
Create a Log File .................................. 4-19
Generate MATLAB Code from Report Setup File ..... 4-20
Legacy Report Setup Files .......................... 4-23
What Are Legacy Report Setup Files? ................. 4-23
Enable Legacy Interface ............................ 4-23
Use Legacy Interface ............................... 4-24
Troubleshooting Report Generation Issues .......... 4-25
Memory Usage .................................... 4-25
HTML Report Display on UNIX Systems .............. 4-25
Export Simulink Models to Web Views
5
Web Views ........................................ 5-2
Export Models to the Web .......................... 5-3
viii Contents

Open the Export Interface .......................... 5-3
SetExportOptions ................................ 5-3
Generate and Review Web Views ..................... 5-5
Navigate Web Views ............................... 5-7
Display Web Views ................................ 5-7
View the Current Layer ............................ 5-7
View Layers Below the Top Layer .................... 5-8
View All Layers ................................... 5-9
Create Web Views of Simulink Models ............... 5-11
About This Tutorial ................................ 5-11
Specify Web View Export Options .................... 5-11
Export Models .................................... 5-13
Navigate Web Views ............................... 5-14
Troubleshooting Web Views ........................ 5-21
Web View Display Issues ........................... 5-21
Add Content with Components
6
Components ....................................... 6-2
Control Format with Stylesheets ..................... 6-3
Control Format at the Component Level ............... 6-3
Report Structure Components ...................... 6-4
Table Formatting Components ...................... 6-5
Property Table Components ........................ 6-6
About Property Table Components ................... 6-6
Open the Example Report Template .................. 6-8
Examine the Property Table Output .................. 6-8
Select Object Types ................................ 6-9
Display Property Name/Property Value Pairs .......... 6-9
Edit Table Titles .................................. 6-12
EnterTextintoTableCells ......................... 6-12
ix

Add, Replace, and Delete Properties in Tables .......... 6-13
Format Table Columns, Rows, and Cells ............... 6-14
Zoom and Scroll ................................... 6-16
Select a Table .................................... 6-16
Summary Table Components ....................... 6-17
About Summary Table Components .................. 6-17
Open the Example Report Template .................. 6-19
Select Object Types ................................ 6-19
Add and Remove Properties ......................... 6-19
Set Relative Column Widths ........................ 6-20
SetObjectRowOptions ............................ 6-20
Dynamic Reporting Components .................... 6-22
Logical and Looping Components .................... 6-22
Edit Figure Loop Components ....................... 6-22
Compare Simulink Model XML Files
7
Compare Simulink Model XML Files ................. 7-2
Introduction ...................................... 7-2
Overview of XML Comparison ....................... 7-3
Select Files to Compare ............................ 7-5
Choose a Comparison Type .......................... 7-7
Compare XML Files from Models with Identical Names .. 7-7
Examples of XML Comparison ....................... 7-8
Explore the XML Comparison Report for Simulink
Models ......................................... 7-10
Navigate the Simulink XML Comparison Report ........ 7-10
Display Items in Original Models .................... 7-14
Filter Out Differences .............................. 7-17
Merge Simulink Models From the Comparison Report ... 7-18
Understand the Report ............................. 7-20
Work with Referenced Models and Library Links ....... 7-22
Export, Print, and Save XML Comparison Results .... 7-24
Export Printable Report ............................ 7-24
xContents

Export Results to the Workspace ..................... 7-24
Save Comparison Log Files in a Zip File ............... 7-26
Compare XML from Models Managed with
Subversion ...................................... 7-27
Work with Subversion .............................. 7-27
Create file_comparison_driver Function ............... 7-28
Configure TortoiseSVN ............................. 7-28
Test TortoiseSVN Setup ............................ 7-30
Example file_comparison_driver Code ................. 7-31
Component Reference
8
Simulink Coder Components ....................... 8-2
Requirements Management Interface Components ... 8-3
Simulink Components .............................. 8-4
Simulink Blocks Components ....................... 8-7
Simulink Fixed Point Components .................. 8-8
Stateflow Components ............................. 8-9
xi

Components — Alphabetical List
9
Function Reference
10
GUI .............................................. 10-2
Report Generation ................................. 10-3
Web Views ........................................ 10-4
Functions – Alphabetical List
11
Examples
A
Creating Reports .................................. A-2
Generating Reports from MATLAB Files ............. A-3
Creating Web Views ............................... A-4
Working with Components ......................... A-5
Index
xii Contents

_
User’s Guide
Chapter 1, Getting Started (p. 1-1) Overview of Simulink®Report
Generator™ product
Chapter 2, Generate System Design
Description Reports (p. 2-1)
How to create a System Design
Description report for a Simulink
model
Chapter 3, Creating Simulink
Reports (p. 3-1)
A step-by-step example that creates
a Simulink report
Chapter 4, Generate a Report (p. 4-1) How to format and generate reports
Chapter 5, Export Simulink Models
to Web Views (p. 5-1)
How to create interactive renditions
of Simulink models that you can
view in Web browsers
Chapter6,AddContentwith
Components (p. 6-1)
Examples of building report setup
files with various components
Chapter 7, Compare Simulink Model
XML Files (p. 7-1)
Introduces XML comparison
Appendix A, Examples (p. A-1)

1
Getting Started
•“Product Description” on page 1-2
•“System Design Documentation and Results Reporting” on page 1-3
•“Interactive Model Exploration” on page 1-6
•“Report Creation Workflow” on page 1-9
•“Report Components” on page 1-10
•“Report Explorer” on page 1-15
•“How Simulink®Report Generator™ and Simulink Software Interact” on
page 1-18
•“Supported Report Formats” on page 1-20
•“Browser Requirements for Web Views” on page 1-21

1Getting Started
Product Description
Generate documentation for Simulink and Stateflow®models
The Simulink Report Generator product can automatically create
documentation from Simulink and Stateflow models. It lets you document
software requirements and design specifications and produce reports from
your models, all in a standard format.
Key Features
•Lets you create interactive renditions of your Simulink and Stateflow
modelsthatcanbeviewedinawebbrowser
•Enables push-button documentation of Simulink and Stateflow models
and simulation results
•Simulates models and executes MATLAB®commands within reports
•Enables conditional documentation generation via logical template
components, such as IF, THEN, ELSE, and WHILE
•Lets you create and distribute documentation templates using customized
style sheets
•Provides extensible components and style sheets
•Creates reports in multiple formats, including HTML, PDF, RTF,
Microsoft®Word, and XML
1-2

System Design Documentation and Results Reporting
System Design Documentation and Results Reporting
In this section...
“Types of Reports” on page 1-3
“System Design Documentation” on page 1-3
“Results Reporting” on page 1-4
Types of Reports
Two common user goals for reports are:
•System design documentation — Capture information about the design
decisions, structure, implementation, and operational details of a system.
•Results reporting — Present results of running a system.
You use a very similar workflow for creating and generating both kinds of
reports. However, some components are particularly useful for one or the
other kind of report.
System Design Documentation
System documentation has many uses, including:
•Capturing design decisions
•Recording implementation details
•Communicating the system design and interfaces among groups
You can view information about a system without creating a report. For more
information, see “Interactive Model Exploration” on page 1-6.
When you create a Simulink Report Generator report to provide system
design documentation, the report captures information about the system
design directly from the model. Each time that you generate the report, you
see up-to-date documentation for the design.
1-3
1Getting Started
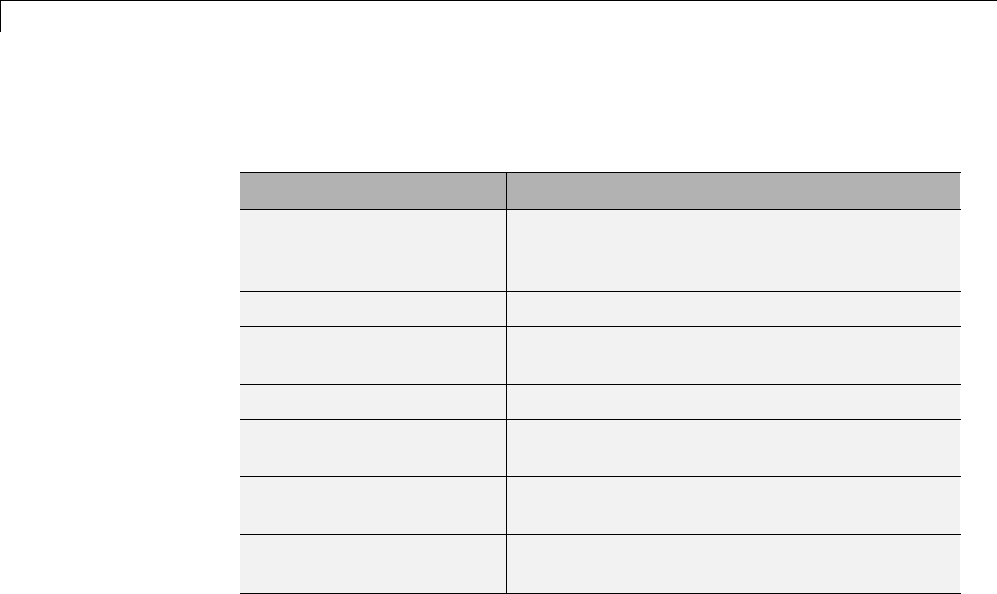
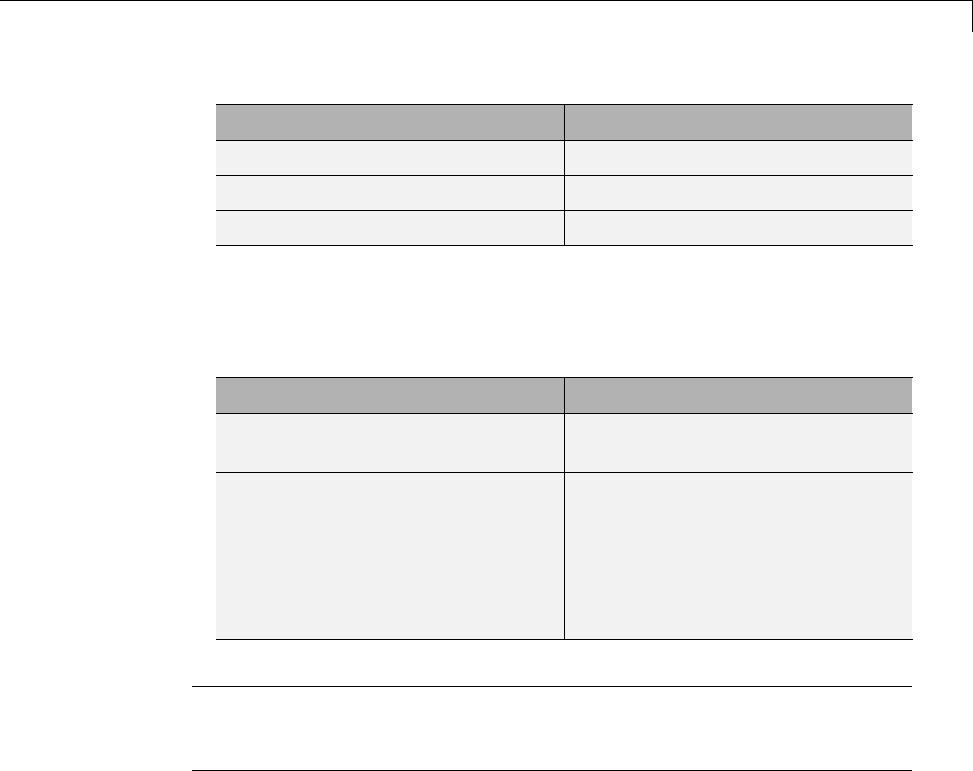
The following table includes some examples of components that are useful for
system design documentation reports.
System Information Examples of Components to Use
Requirements Requirements Summary Table (for
requirements specified with Simulink
Verification and Validation™)
System layout System Hierarchy,System Snapshot
Model configuration Model Configuration Set,Model Advisor
Report
Block parameter settings Simulink Dialog Snapshot,Block Loop
Properties Simulink Property Table,Simulink
Summary Table
Variables Variable Table,Simulink Workspace
Variable
System documentation
included in a model
Documentation,Simulink Name
Results Reporting
Results reporting has many uses, including:
•Model regression testing
•Verifying and validating designs
•Exploring design alternatives
•Optimizing designs
Simulink provides several tools for examining the results of a simulation.
Simulation data includes signal, time, output, state, and data store logging
data. You can set up your model to export simulation data to the MATLAB
workspace during simulation for later retrieval, analysis, and postprocessing.
You can use several approaches to explore the simulation data. For details,
see “Export Simulation Data” in the Simulink documentation.
1-4
System Design Documentation and Results Reporting
You can report on results without creating a report. For more information,
see “Interactive Model Exploration” on page 1-6.
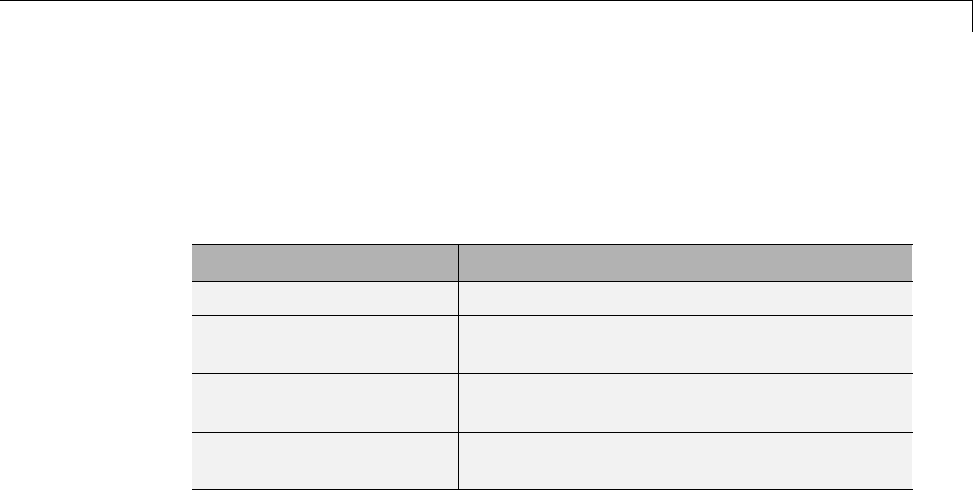
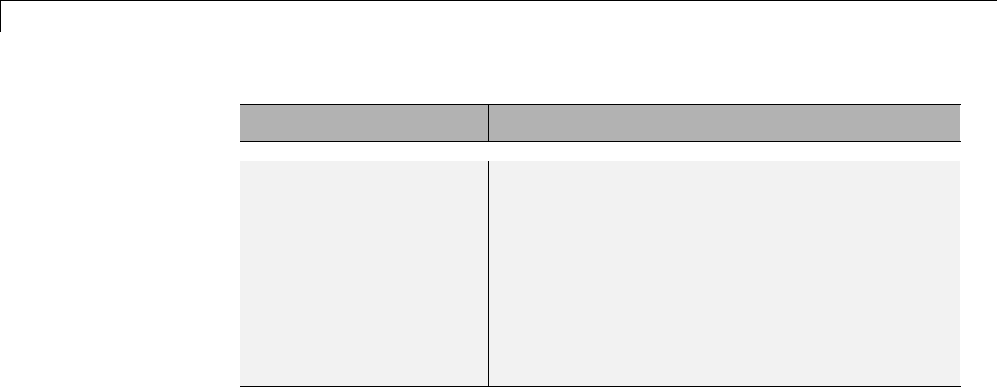
The following table includes some examples of components that are useful
results reports.
Results Information Examples of Components to Use
Signal values Scope Snapshot,Block Loop
Simulation processing Model Simulation,Model Configuration
Set,Fixed-Point Logging Options
Figures generated with
MATLAB
Figure Snapshot,To Workspace Plot
Generated code Code Generation Summary,Import
Generated Code
You can use components such as the Model Simulation component to control
how the model simulates. Other components, such as the Scope Snapshot,
show the results of the simulation.
1-5
1Getting Started
Interactive Model Exploration
In this section...
“Simulink®Report Generator™ Tools” on page 1-6
“Simulink Model Exploration Tools” on page 1-7
Simulink Report Generator Tools
The Simulink Report Generator provides tools that you can use to obtain
information about models, without creating report setup files:
•Predefined standard reports
•Web View
•XML Comparison report
Predefined Standard Reports
From the Simulink Model Editor, you can access two predefined, standard
Simulink Report Generator reports:
•System Design Description
•Design Requirements (requires Simulink Verification and Validation)
The System Design Description report provides summary or detailed
information about a system design represented by a model. You can choose
report options with the report dialog box, or you can create a customized
version using the Report Explorer. For details, see “Generate a System
Design Description” on page 2-7.
You can use the System Design Description report setup file as a starting
point for creating a setup file for your own report.
You can also generate an HTML model report for Stateflow charts.
You must have the Simulink Verification and Validation product installed
to use the Design Requirements report. The Design Requirements report
includes information about all the requirements associated with the model
1-6

Interactive Model Exploration
and its objects. For details, see “Creating and Customizing a Requirements
Report” in the Simulink Verification and Validation documentation.
Web View
A Web view is an interactive rendition of a model that you can view in a
Web browser. You can use Web views to navigate hierarchically to specific
subsystems and see properties of blocks, signals, and scopes. You can zoom
in and out, pan, and fit your model to your view using the same keyboard
shortcuts that you use in Simulink and Stateflow editors.
Web views are useful for presenting models to audiences and for sharing
models with colleagues who do not have MathWorks®products installed.
For details, see “Export Models to the Web” on page 5-3.
XML Comparison Report
You can use Simulink Report Generator software to compare XML text
renditions of different versions of a Simulink model and to compare the XML
renditions to explore differences between versions of the model. You can also
compare the XML text renditions of two different models.
For details, see “Model Comparison”.
Simulink Model Exploration Tools
You can generate a model report, which is an HTML document that describes
the structure and content of a model. The model report includes block
diagrams of the model and its subsystems and the settings of its block
parameters. To generate the report, from the Simulink Model Editor, select
File > Print Details. For more information, see “Generate a Model Report”.
To interactively focus on specific elements of a model (for example, blocks,
signals, and properties) without navigating through the model diagram or
chart, using the Model Explorer. To open the Model Explorer, in the Simulink
Model Editor, select View > Model Explorer. For details, see “Model
Explorer Overview”.
1-7

1Getting Started
To generate a report that lists the suboptimal conditions or settings in
a model, with suggestions for better model configuration settings where
appropriate, use the Model Advisor. To open the Model Advisor, in the
Simulink Model Editor, select Analysis > Model Advisor. For details, see
“Consult the Model Advisor”
To navigate a model hierarchically, open systems in a model, and determine
the blocks contained in a model, you can use the Simulink Model Browser. To
open the Model Browser, select View > Model Browser Options > Model
Browser. For details, see “Model Browser”.
Simulink provides several tools for examining the results of a simulation.
Simulation data includes signal, time, output, state, and data store logging
data. You can set up your model to export simulation data to the MATLAB
workspace during simulation for later retrieval, analysis, and postprocessing.
You can use several approaches to explore the simulation data. For example,
you can use the Simulation Data Inspector to generate a report with plots
of simulation data. For details, see “Export Runtime Information” in the
Simulink documentation.
1-8
Report Creation Workflow
Report Creation Workflow
1Open the Report Explorer. In the menu bar on the Simulink model window,
click Tools > Report Generator.
2Create a new report setup file. For more information about report setup
files, see “Report Setup”.
3Add existing Simulink or Stateflow components to the report setup file,
or create your own custom components. For more information on using
components, see “Add Components”.
4Choose an existing stylesheet or create a custom stylesheet to apply styles
and standards to the report setup file. For more information, see “Layout
Stylesheets”.
5Generate the report.
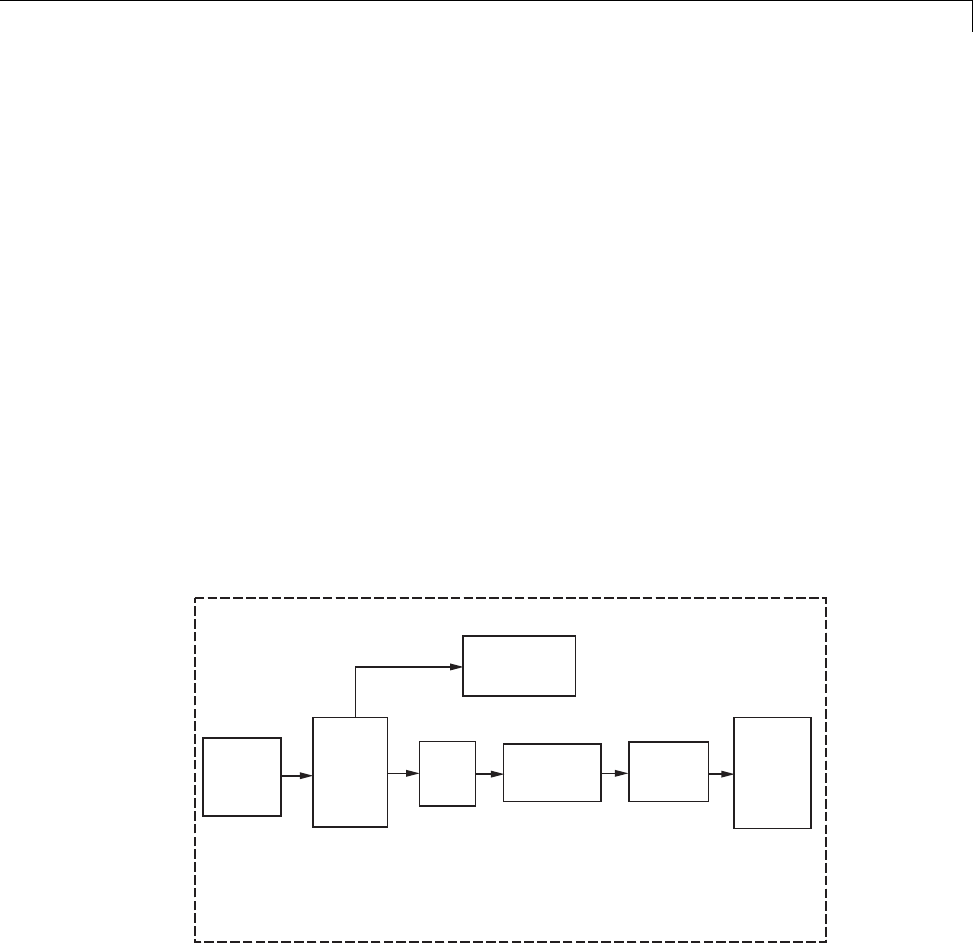
The following figure illustrates a typical Simulink Report Generator workflow.
Open
Report
Explorer
(GUI)
Report Generator
Create
setup
file
Apply
stylesheet
Generate
report
Add
components
Export
Simulink
Web View
Create
Simulink
model
1-9
1Getting Started
Report Components
In this section...
“About Report Components” on page 1-10
“Report Structure Components” on page 1-11
“System-Based Components” on page 1-11
“User-Supplied Information Components” on page 1-13
“Dynamic Reporting Components” on page 1-14
“Format Control at the Component Level” on page 1-14
About Report Components
Components are modules that you include in a report setup file to insert
elements, such as tables, lists, and figures, into a report. You also can use
components to control report generation processing.
Many components have parent-child relationships with other components. For
example, a child components of a Paragraph component include components
such as Text, Image, and Insert Variable.
Use a combination of the following types of components in your report setup
file.
Component Type Description
“Report Structure Components” on
page 1-11
Include a title page, sections, and
other components to organize the
content of a report.
“System-Based Components” on
page 1-11
Include components that
automatically obtain information
directly from a model to include in
a report.
1-10
Report Components
Component Type Description
“User-SuppliedInformation
Components” on page 1-13
Include text and graphics that you
supply, independent of a model.
“Dynamic Reporting Components”
on page 1-14
Set up dynamic control for when
to include components and what
information to report on for a
component, based on data from a
model or on other conditions that
you specify.
Use the Report Explorer to add components to a report and to specify
component properties.
Report Structure Components
To add a title page, use a Title Page component. You can include an abstract
and legal notice information. For an example, see “Add a Title Page” on page
3-13.
To organize a report into sections, use Chapter/Subsection components. For
an example, see “Create a Section for Each Iteration” on page 3-32.
System-Based Components
The Simulink Report Generator includes many components that obtain
information directly from a model and include that information in a report.
Using system-based components allows your report to reflect the current state
of a model. You can generate the report whenever you want to capture the
latest version of a model, without changing the report setup file.
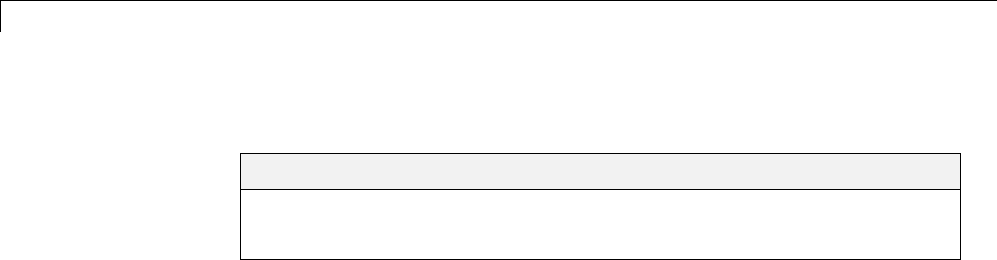
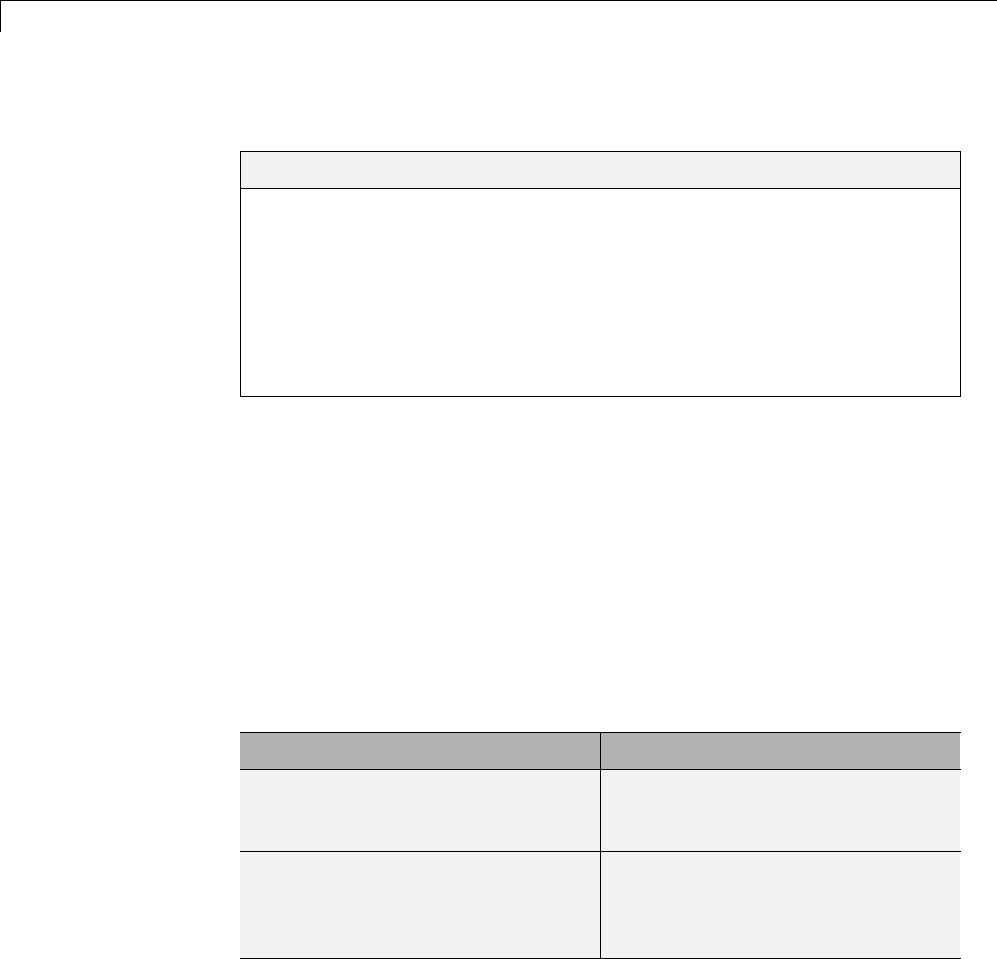
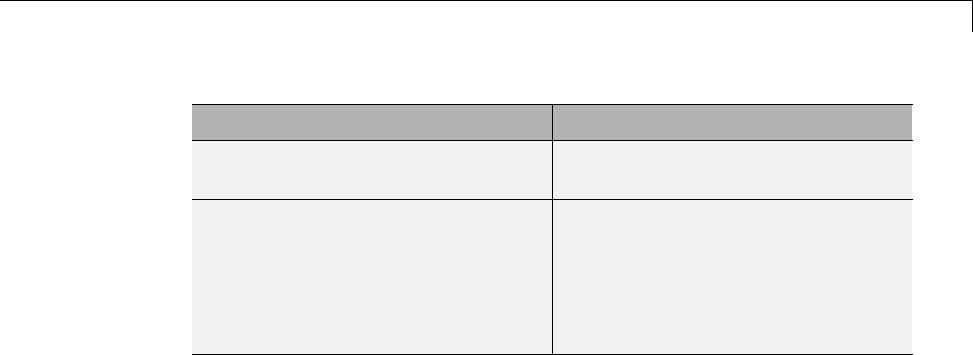
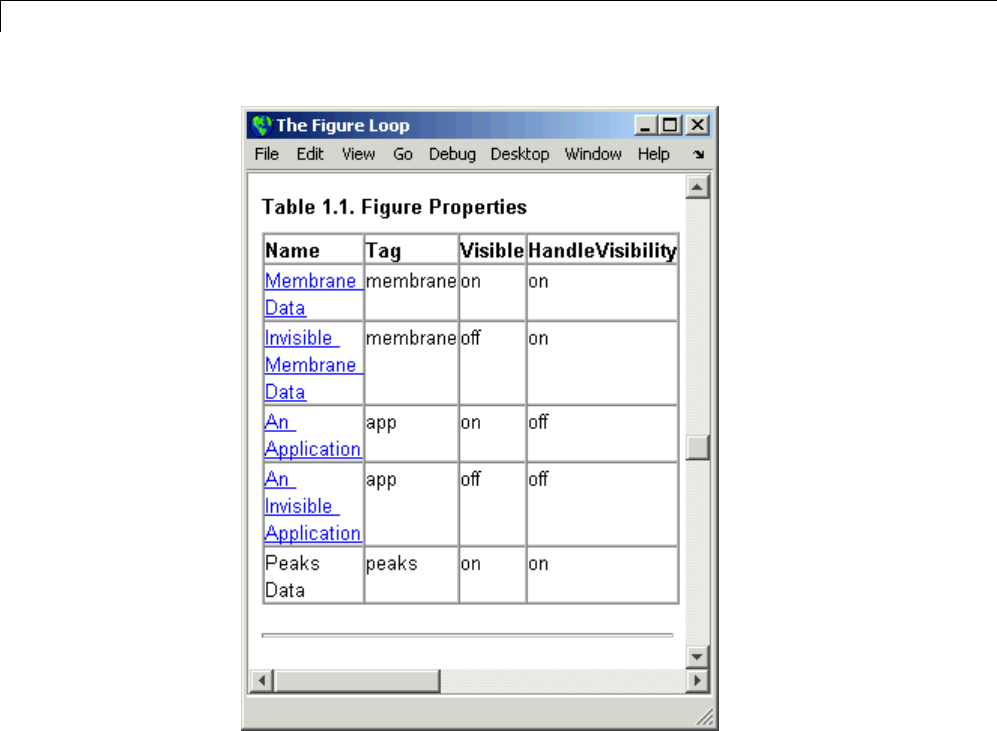
Property table components display property name/property value pairs for
objects in tables. Summary table components insert tables that include
specified properties for objects into generated reports. The tables contain one
object per row, with each object property appearing in a column, as shown in
the following summary table.
1-11
1Getting Started
To use descriptive information from DocBlock blocks, use the Documentation
component.
A few examples of system-based components include:
•MATLAB Property Table
•Simulink Workspace Variable
•System Hierarchy
•Simulink Summary Table
•Simulink Dialog Snapshot
1-12

Report Components
•Block Execution Order List
•Model Loop
•Model Configuration Set
•Scope Snapshot
For examples of using system-based components, see:
•“Property Table Components” on page 6-6
•“Summary Table Components” on page 6-17
•“Create the Body of the Report” on page 3-22
The Simulink Report Generator also includes system-based components that
contain model elements from the following Simulink products:
•Stateflow
•Simulink Fixed Point™
•Simulink Coder™
•Simulink Verification and Validation
User-Supplied Information Components
In addition to using system-based components to extract data from a system
and insert that information into a report, you can also add content that you,
or others, supply. For example, to include text, use the Paragraph and Text
components.
To insert a graphic from a file, use an Image component. To insert ASCII
text, use an Import File component.
To include notes about the report source files, use a Comment component.
For an example, see “Add Introductory Text to the First Chapter”.
1-13

1Getting Started
Dynamic Reporting Components
Dynamic reporting components execute conditionally, enabling you to decide
when a child component executes or how many times a child component
executes. To control the report generation flow, use logical and flow
components such as Logical If,Logical Then,While Loop,orFor Loop.
A looping component runs its child components a specified number of times.
There are several looping components, including logical loops, Handle
Graphics®loops, and model and chart loops. For model and chart loops, you
can control aspects such as the order in which the report sorts blocks.
For examples, see:
•“Add Logical Then and Logical Else Components” on page 3-18
•“Create the Body of the Report” on page 3-22
Format Control at the Component Level
The output format and stylesheet that you select for a report determines most
aspects of the generated report formatting. For details, see “Report Output
Format and Stylesheet” on page 4-4.
In addition to stylesheets that control the format and layout of the report,
for some components you can set properties to specify formatting details
for that specific instance of a component. For example, for the Simulink
Property Table, you can specify whether to display table borders or specify
the alignment of text in table cells.
1-14

Report Explorer
Report Explorer
About the Report Explorer
The Report Explorer is the MATLAB Report Generator and Simulink Report
Generator graphical user interface (GUI). It allows you to:
•Create and modify report setup files.
•Apply stylesheets to format the generated report.
•Specify the report file format.
•Generate reports.
To open the Report Explorer, enter report in the MATLAB Command
Window.
1-15
1Getting Started
Library pane
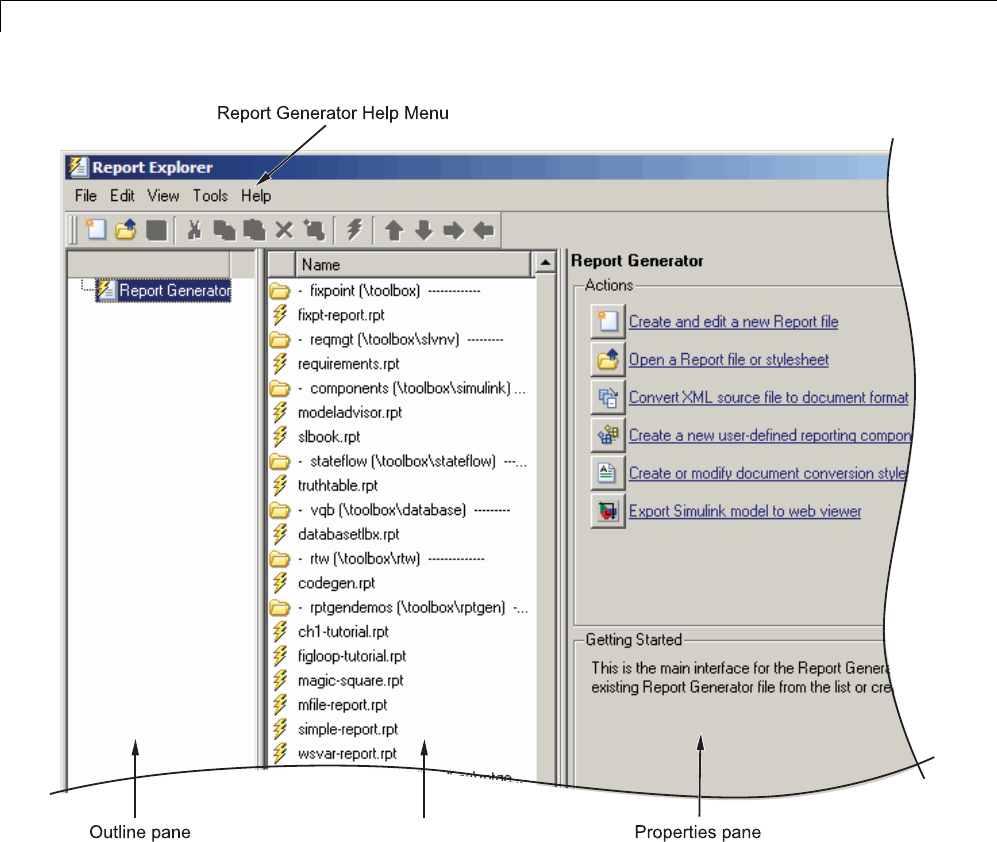
The Report Explorer has three panes:
•The Outline pane on the left shows the hierarchy of components in
currently opened report setup files. Report components can reside within
other report components, creating parent, child, and sibling relationships.
•The Library pane in the middle lists the objects available in the context
of the Outline pane.
1-16
Report Explorer
Outline Pane Context Library Pane Contents
No report setup file is open. Reports
Report setup file is open. Components
Stylesheet is open. Stylesheet attributes
•The Properties pane contents depend on the Outline pane context. If no
report setup file is open, on the right displays tasks the Report Explorer
can perform. If a report setup file is open, the Properties pane displays the
properties for the item that is currently selected in the Library pane.
OutlinePaneContext Properties Pane Contents
No report setup file is open. Tasks that the Report Explorer can
perform
Report setup file is open. Properties for the item that is
currently selected
After you create a report setup
file, the Properties pane initially
displays properties for the report
setup file as a whole.
Tip If the Report Explorer window opens with only two panes, one of the
panesishidden. Youcanmovetheverticalboundariesbetweenthepanesto
reveal any hidden pane, or to make visible panes wider or narrower.
1-17
1Getting Started
How Simulink Report Generator and Simulink Software
Interact
The Simulink and Simulink Report Generator software interact to create
reports and Web views. The following table describes these interactions.
User
Interface
Interaction with Simulink Report
Generator software Description
Report
Explorer
The Report Explorer is the Simulink
Report Generator graphical user
interface (GUI). For more information,
see “Report Explorer” on page 1-15.
Use the Report Explorer to edit
existing report setup files, components,
stylesheets, and attributes, or to
customize your own.
Simulink
model
window
Use Simulink model window to:
•Export the model to a Web view
•Generate a System Design
Description report
•Start the Report Explorer to export
the model to a Web view or create
and generate a report
Use the Simulink model window to:
•Create reports that incorporate the
current Simulink model
•Export the model to a Web view
For more information, see “Web
Display of Model Information”
and “Generate a System Design
Description” on page 2-7.
Simulink Report Generator software also interacts with Simulink Coder and
Stateflow software.
Use report generation capabilities with the Simulink Coder software to:
•Create Adobe®Acrobat®PDF and Microsoft Word documents for generated
code.
Use report generation capabilities with the Stateflow software to:
•Take snapshots of charts.
•Describe truth tables.
•Document chart hierarchy.
1-18

How Simulink®Report Generator™ and Simulink®Software Interact
•Document object properties.
1-19

1Getting Started
Supported Report Formats
When the report generation process first creates a report, it generates
a DocBook XML source file. You can customize this XML as
needed. For more information, see the OASIS DocBook TC Web
page at http://www.oasis-open.org/committees/docbook and
http://www.docbook.org/tdg/en/html/docbook.html.
Next, the report generation process converts the XML source to one of these
user-specified report formats:
•Rich Text Format (RTF)
•Hypertext Markup Language (HTML)
•Microsoft Word (.doc)
•Adobe Acrobat PDF
Note PDF reports only support bitmap (.bmp), jpeg (.jpg), and Scalable
Vector Graphics (.svg)images.
1-20

Browser Requirements for Web Views
Browser Requirements for Web Views
Web views require a Web browser that supports Scalable Vector Graphics
(SVG). Web views use SVG to render and navigate models.
MathWorks recommends the following Web browsers:
•Mozilla Firefox Version 1.5 or later, which has native support for SVG. To
download the Firefox browser, see http://www.mozilla.com/.
•The Microsoft Internet Explorer®Web browser with the Adobe SVG
Viewer plug-in. To download the Adobe SVG Viewer plug-in, see
http://www.adobe.com/svg/.
Note The MicrosoftInternet Explorer Web browser on Japanese systems
does not support web views.
1-21

1Getting Started
1-22

_
Examples
Use this list to find examples in the documentation.


Working with Components
Working with Components
“Property Table Components” on page 6-6
“Summary Table Components” on page 6-17
“Dynamic Reporting Components” on page 6-22
Generating Reports on Specified Systems and their Subsystems on page
9-60
Temporarily Omitting a Model from a Loop on page 9-65
Examples-5

2Generate System Design Description Reports
System Design Description
In this section...
“Predefined Standard Reports” on page 2-2
“What Is the System Design Description?” on page 2-3
“WhatYouCanDowiththeReport”onpage2-3
“Report Contents” on page 2-3
Predefined Standard Reports
From the Simulink Model Editor, you can access two predefined, standard
Simulink Report Generator reports called:
•System Design Description
•Design Requirements
The System Design Description report provides summary or detailed
information about a system design represented by a model. You can choose
report options using the report dialog, or you can create a customized version
using the Report Explorer. For details, see “Generate a System Design
Description” on page 2-7.
You can use the System Design Description report setup file as a starting
point for creating a setup file for your own report.
You can also generate an HTML model report for Stateflow charts. For
details, see “Generate a Model Report”.
The Design Requirements report requires that you have the Simulink
Verification and Validation product installed. The Design Requirements
report includes information about all the requirements associated with
the model and its objects. For details, see “Creating and Customizing
a Requirements Report” in the Simulink Verification and Validation
documentation.
2-2

System Design Description
What Is the System Design Description?
The System Design Description is a prebuilt Simulink Report Generator
report that describes the system design represented by a Simulink model.
By default, the Simulink Report Generator generates the report for the model
from which you invoke the System Design Description report option.
What You Can DowiththeReport
You can use the System Design Description to
•Review a system design without having the model open
•Generate summary and detailed descriptions of the design
•Assess compliance with design requirements
•Archive the system design in a format independent of the modeling
environment
•Build a customized version of the report, using the Report Explorer
Note To view step-by-step tutorials for creating and generating a report, see
the Introduction to System Design Description Reports example.
Report Contents
You can specify what kinds of information to include in the report, in terms of:
•What elements of a model to include in the report (for example, whether to
include subsystems from custom libraries)
•Whether to generate a summary version or a detailed version of the System
Design Description report.
For details, see “Generate a System Design Description” on page 2-7.
2-3

2Generate System Design Description Reports
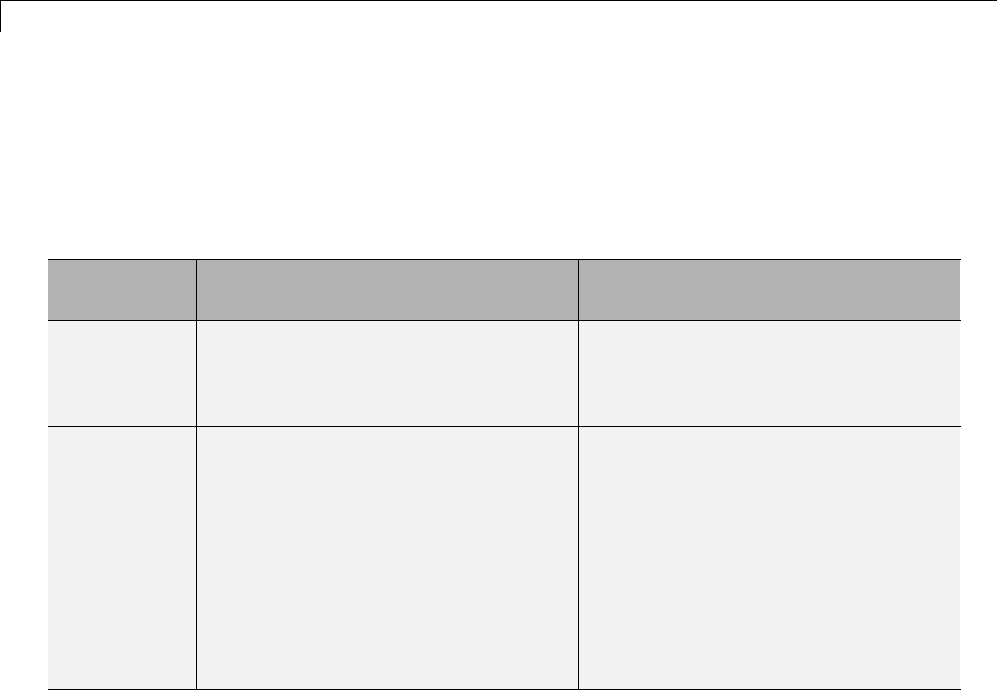
Summary Version
Section Information
Report Overview Model version
Root System •Block diagram representing the algorithms
that compute root system outputs
•Description (if available from model)
•Interface: name, data type, and other
properties of the system input and output
signals
•Subsystems: the path and a block diagram for
each subsystem
•State charts
•Requirements (optional)
Subsystems •Path
•Block diagram
System Design Variables •Design variables
•Functions in design variable expressions
Detailed Version
The detailed version of the report includes all the information that is in the
summary form of the report, as well as more information about the system
components. The atomic subsystem information is more detailed than virtual
subsystem information.
2-4

System Design Description
Section Information
Report Overview Model version
Root system •Block diagram representing the algorithms
that compute root system outputs
•Description (if available from model)
•Interface: name, data type, and other
properties of the root system input and output
signals
•Block parameters
-Includes detailed information about
MATLAB Function blocks
•Block execution order for root system and
atomic subsystems
•Look-up tables
•Simulink workspace variables
•Model configuration sets
•State charts
•Requirements (optional)
Subsystems Thesametypeofinformationastheinformation
for the root system, as well as:
•Path of the subsystem in the model
•(For atomic subsystems) Checksum that
indicates whether the version of an atomic
subsystem that generates the report differs
from other versions of the subsystem
•Referenced models (optional)
•Subsystems from custom libraries (optional)
State Charts •State chart
•States
2-5
2Generate System Design Description Reports
Section Information
•Transitions between the states
•Junctions
•Events that trigger state transitions
•Data types
•Targets
•Truth tables
Report Captures Documentation Included in a Model
The System Design Description reports documentation included in a model,
including:
•The model description (from the model properties)
•The block property Description
•DocBlock model documentation blocks
To enrich the generated System Design Description, consider adding
descriptive information in a model in these ways listed above.
2-6
Generate a System Design Description
Generate a System Design Description
In this section...
“OpentheSystemDesignDescriptionDialogBox”onpage2-7
“Choose System Design Description Options” on page 2-7
Open the System Design Description Dialog Box
To open the System Design Description dialog box:
1Open the model or subsystem for which you want to generate a report.
2From the Simulink Model Editor File menu, select Reports > System
Design Description. The System Design Description dialog box opens
3Specify layout and content options for the report. For details, see “Choose
System Design Description Options” on page 2-7.
4Click the Generate
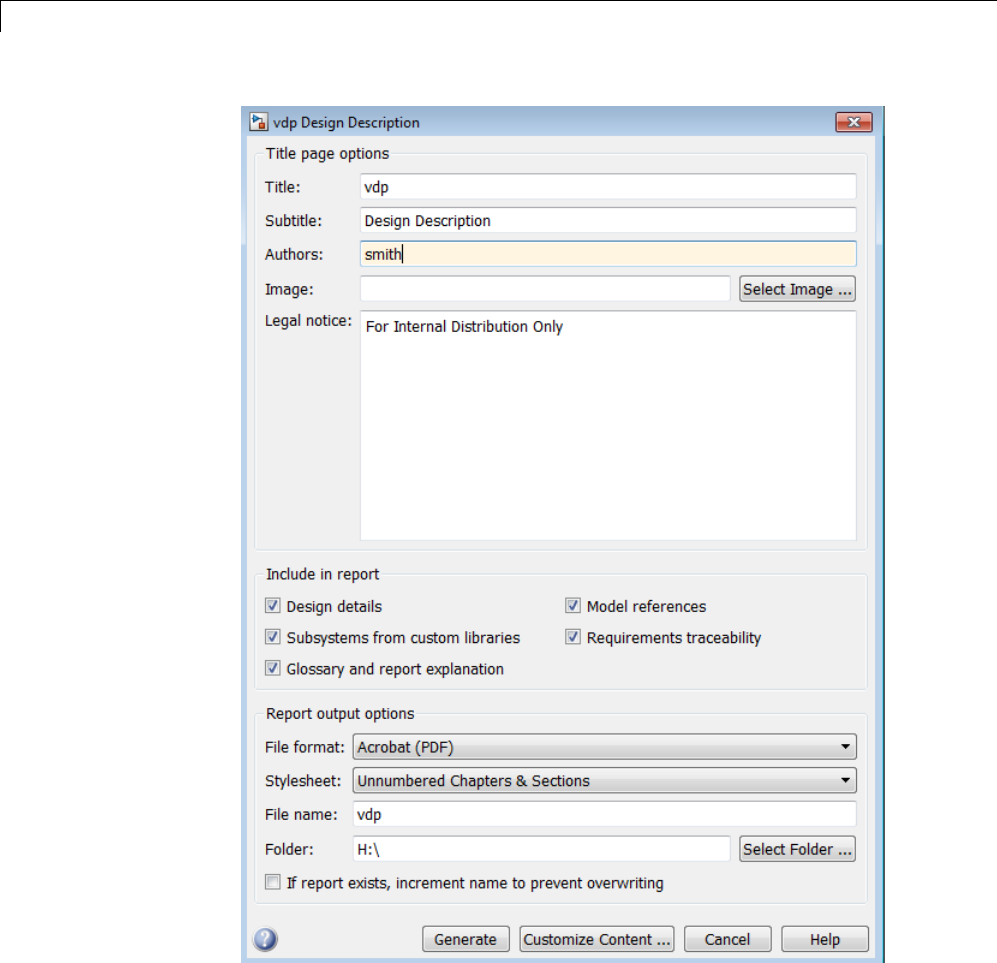
Choose System Design Description Options
You can specify options for layout and content, for the following items:
•Title page contents
•Report content
•Report file format and storage location
2-7
2Generate System Design Description Reports
In the dialog box, to display detailed information about each option, right-click
on the option prompt and select the What’s This context-sensitive help.
2-8

2Generate System Design Description Reports
Customize the System Design Description
In this section...
“Using the Report Explorer to Customize the Report” on page 2-10
“Building a Dialog Box for a Custom Report Setup File” on page 2-11
You can create customized versions of the System Design Description report
by using the Report Explorer and, optionally the MATLAB tools for building
graphical user interfaces.
Bydefault,whenyouopenacustomized version of the report, the System
Design Description dialog box does not open.
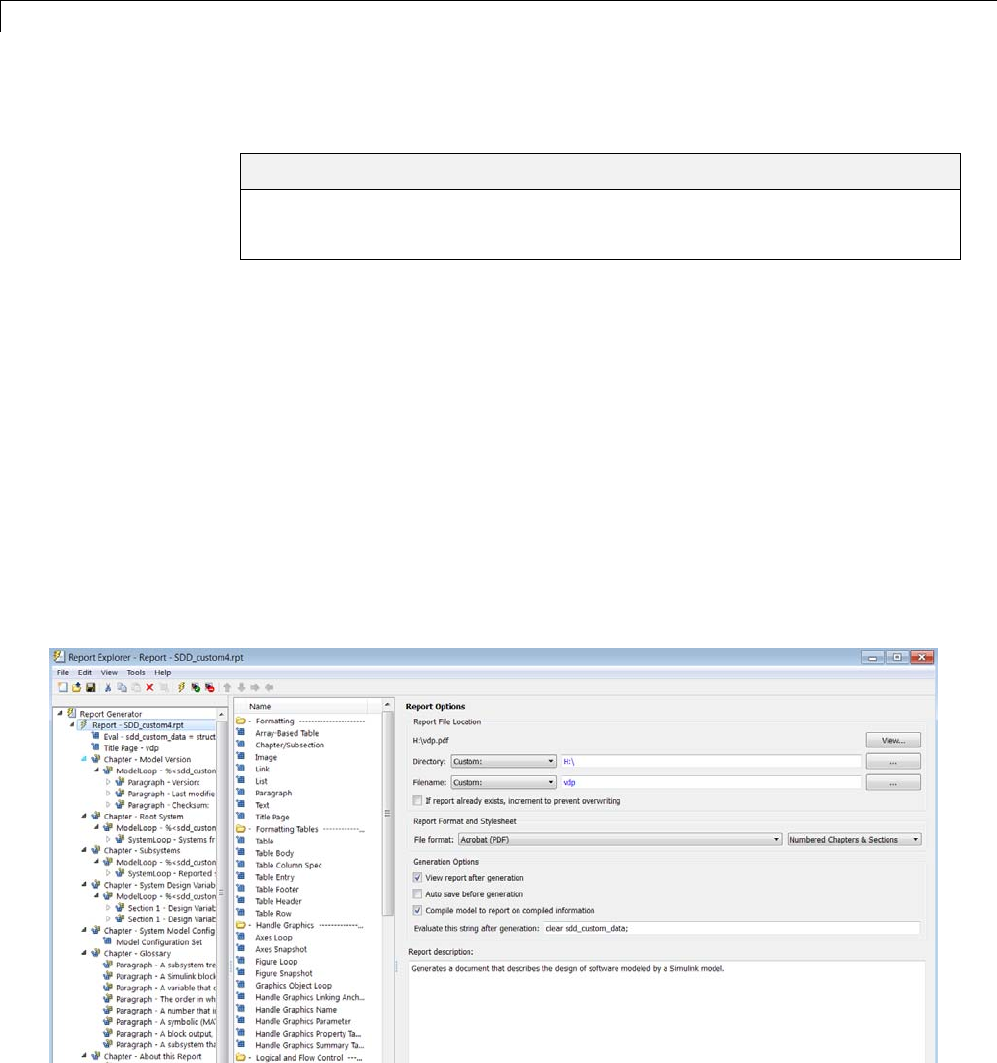
Using the Report Explorer to Customize the Report
To customize the System Design Description setup file in the Simulink Report
Generator using the Report Explorer:
1In the System Design Description dialog box, click the Customize Content
button to open the Report Explorer.
2-10

Customize the System Design Description
The Report Explorer reflects any changes (for example, a different report
name) that you made in the System Design Description dialog box.
2In the Report Explorer, add or modify components. See “Add Components”
and “Information Components”.
•Do not remove the sdd_custom_data structure, which is defined as:
sdd_custom_data = struct('model',bdroot,'rootSystem',gcs);
You can modify the model argument, which is the model for which
you generated the report and the rootSystem argument, which is the
system level in the model at which, and below which, you want to use to
generate the report.
•Do not remove or modify functions that begin with StdRpt,suchas
%StdRpt.getChecksum
3Optionally modify a style sheet (see “Layout Stylesheets”).
4Save the customized report with a name other than SDD_custom.rpt.
Building a Dialog Box for a Custom Report Setup File
To provide options for your custom report, you can create a dialog box, like
the System Design Description dialog box. The dialog box that you create for
your custom report can allow others to adapt the report to meet their needs,
without their having to use the Report Explorer.
2-11

2Generate System Design Description Reports
2-12


3Creating Simulink®Reports
Create a Simulink Report Generator Report
This example involves the following tasks:
•Inserting models and scopes into reports
•Creating tables in reports using workspace data
•Evaluating MATLAB expressions
•Inserting values of workspace variables into reports
•Creating reports with chapters and subsections
•Running loops and flow control
•Handling errors
It shows you how to use the Report Explorer to design a report setup file and
generate a report that does the following:
•Opens a Simulink model for the van der Pol equation, called the vdp model.
•Sets the Gain parameter for the Mu block to five different values.
•Simulates the model each time the Gain parameter is set.
•Collects the results. Results that fall within a specified range appear in a
table in the generated report.
You do not need to know MATLAB or Simulink software to run this tutorial.
However, knowledge of these products might be helpful for understanding the
MATLAB code and model simulation that executes.
This tutorial includes separate sections for different kinds of report creation
and generation task. Each section builds on the previous sections. However,
if you want to work through a later section without having done the previous
sections, in MATLAB you can view the completed report setup file: open
Dynamic Simulink Report. The report is for the vdp model.
Note For another set of step-by-step tutorials for creating and generating a
report, see theIntroduction to System Design Description Reports example.
3-2

Report Options
Report Options
To create and configure the report setup file:
1Start a Simulink software session.
2Open the Report Explorer by clicking Tools > Report Generator in the
Simulink model window menu bar.
3Select File > New to create a report setup file.
4Save the report setup file.
In the Properties pane:
aSpecify where to save the report setup file. To save it in the current
working folder, select Present Working Directory from the Directory
selection list.
bSpecify the report format. In the File format selection list, select
Acrobat (PDF).
cEnter a description for the report. In the Report description text box,
replace the existing contents with the following text.
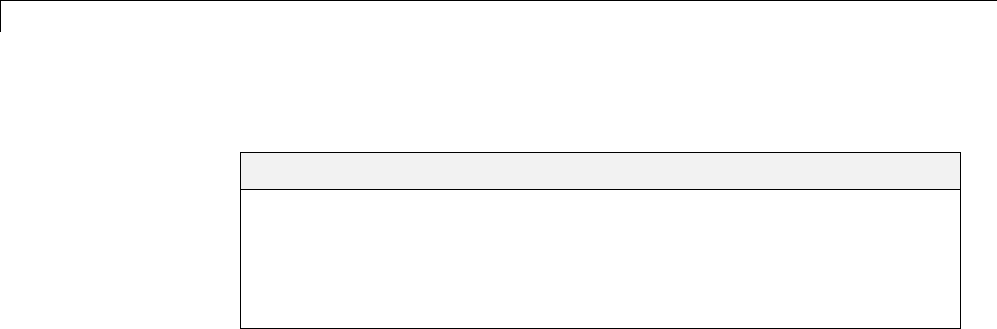
Tip Copy and paste this code from the HTML documentation into the
Report Explorer.
Simulink Dynamic Report
This report opens up a model, sets a block parameter
several times, simulates the model, and collects the
results. Results that fall within a specified range are
displayed in a table after the test is complete.
The report is configured to test the vdp model only.
By selecting the Eval String component immediately
below the Report component, you can modify
* model
* block
3-3

3Creating Simulink®Reports
* parameter
* tested values
5Click File > Save As to save the report setup file as
simulink_tutorial.rpt.
The Outline pane on the left displays the new file name.
3-4

Add Components to the Report Setup File
Add Components to the Report Setup File
In this section...
“Report Components” on page 3-5
“Add MATLAB Code” on page 3-7
“Add a Title Page” on page 3-13
“Open the Simulink Model” on page 3-15
“Add Logical Then and Logical Else Components” on page 3-18
“Error If Model Cannot Be Opened” on page 3-19
“Create the Body of the Report” on page 3-22
“Process with a Model Loop Component” on page 3-23
“Add a Paragraph for Each Model” on page 3-25
“Insert a Snapshot of the Model” on page 3-27
“Add a Loop for Processing the Model” on page 3-28
“Block Parameter Value from a MATLAB Expression” on page 3-30
“Create a Section for Each Iteration” on page 3-32
“Insert the Block Value” on page 3-33
“Set a Parameter Value” on page 3-34
“Check Value Using a Logical If Component” on page 3-36
“Simulate the Model Using a Model Simulation Component” on page 3-39
“Create a Post-Test Analysis Section” on page 3-45
Report Components
Report components specify what information to include in the report.
Components are self-contained, modular MATLAB objects that control the
report-generation process and insert elements, such as tables, lists, and
figures, into a report setup file. Use components to customize the appearance
and output of reports.
For more information, see “Report Components” on page 1-10.
3-5
3Creating Simulink®Reports
The following figure shows a sample page from the report you create in this
tutorial, and which components you use to produce this output.
Note Do not deactivate report components that you add to the report setup
file.
Chapter/Subsection
component
Paragraph
component
System Snapshot
component
Chapter/Subsection
component
Insert Variable
component
Scope
Snapshot
component
3-6
Add Components to the Report Setup File
Add MATLAB Code
Note This section builds on the step-by-step tutorial presented in “Create a
Simulink®Report Generator™ Report” on page 3-2.
To see the completed report setup file, open Simulink Dynamic Report.The
report is for the vdp model.
The first component to add is the Evaluate MATLAB Expression component,
which evaluates MATLAB commands in the workspace. The code in this
component assigns initial values to variables used in this tutorial.
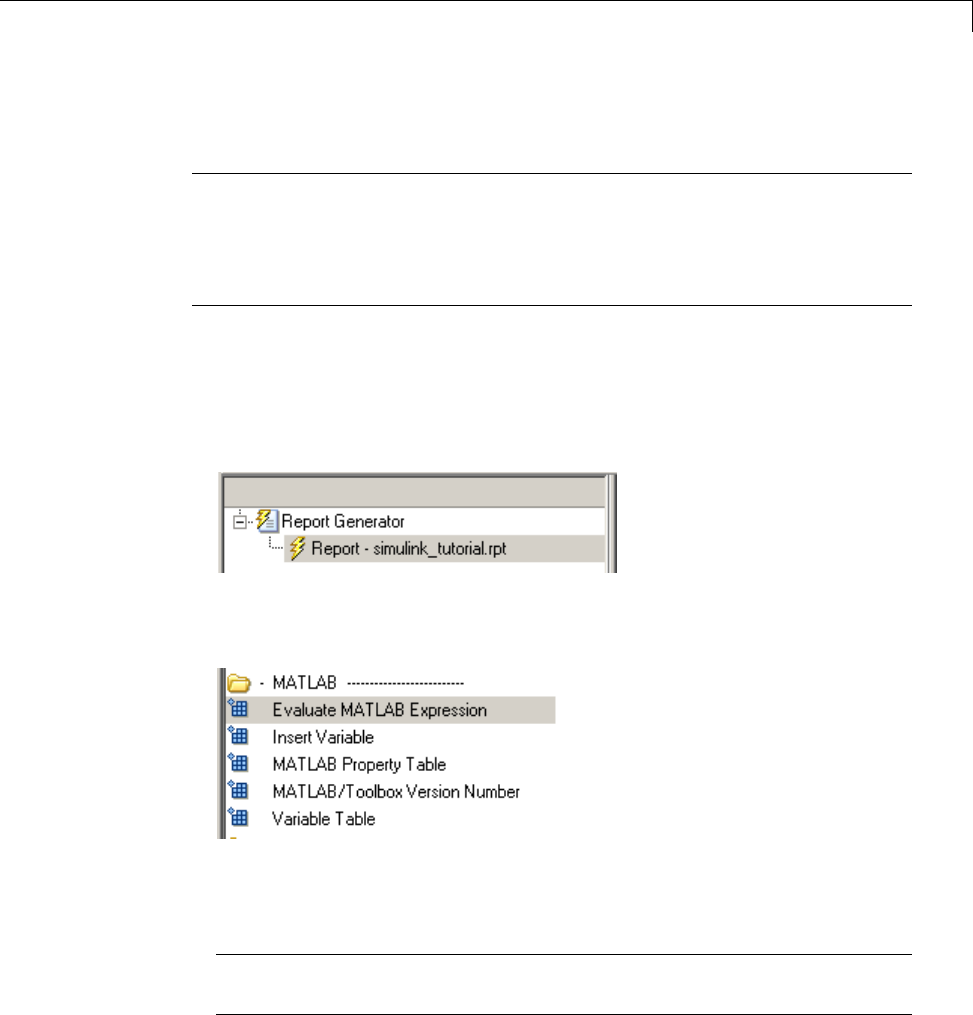
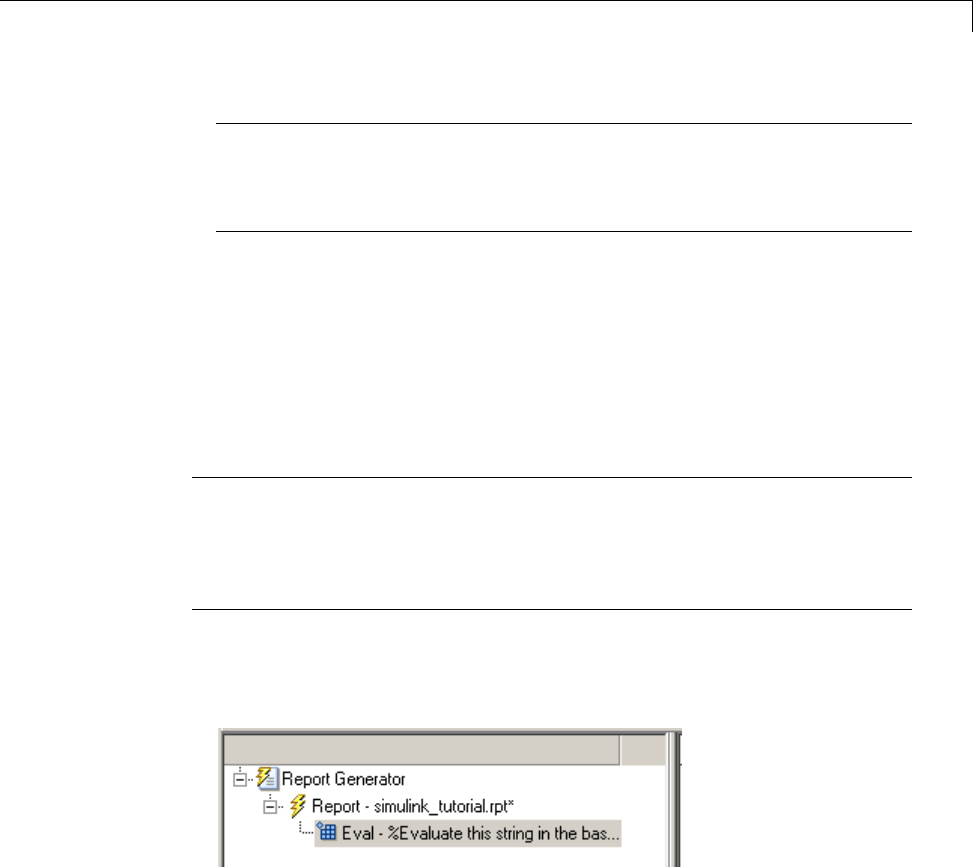
1In the Outline pane on the left, select simulink_tutorial.rpt.
2In the Library pane in the middle, under the MATLAB category, select
Evaluate MATLAB Expression.
3In the Properties pane on the right, click the icon next to Add component
to current report to insert the component into the report.
Note You cannot edit the component information in the Properties pane
on the right until you add the component to the report.
3-7
3Creating Simulink®Reports
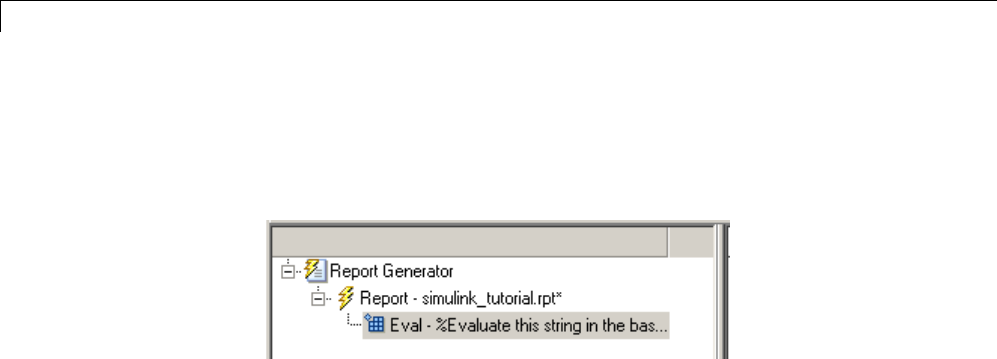
In the Outline pane on the left, the Evaluate MATLAB Expression
component appears under the simulink_tutorial report setup file. The
Simulink Report Generator software abbreviates the component name
to Eval.
The icon in the upper-left corner of the Eval component’s icon indicates
that this component cannot have child components. By default, any
components you add while the Eval component is selected are siblings of
this component.
The options for the Evaluate MATLAB Expression component appear in
the Properties pane on the right.
3-8
Add Components to the Report Setup File
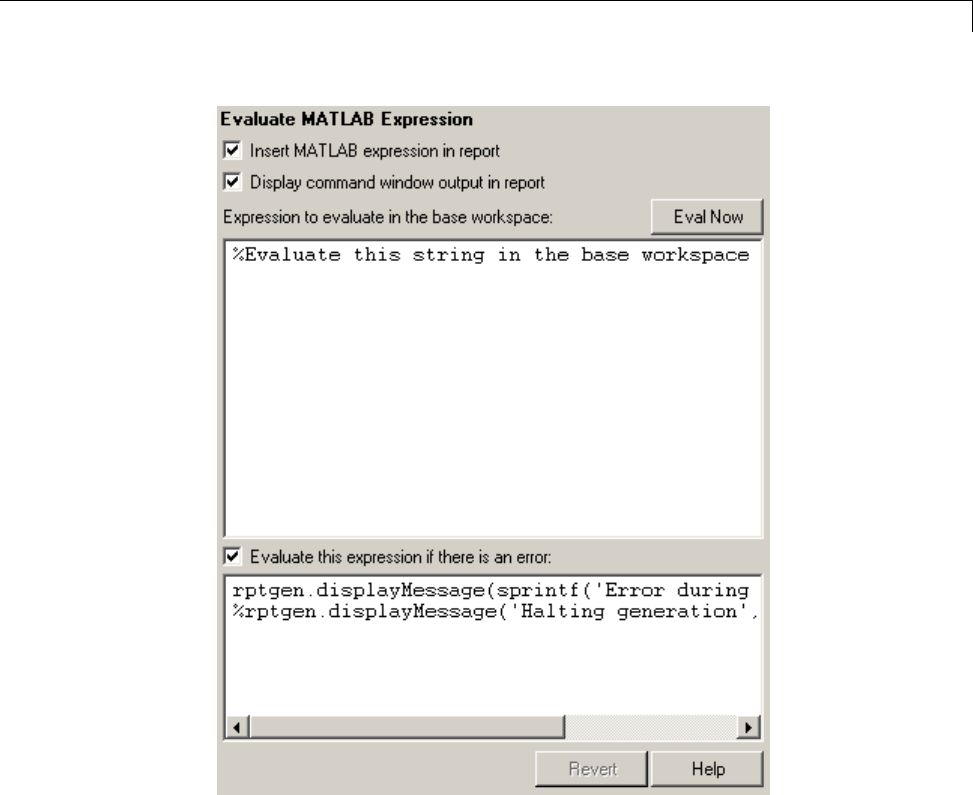
4Clear the Insert MATLAB expression in report and the Display
command window output in report check boxes so you do not include
MATLAB code or output in this report.
5Add MATLABcodetotheExpression to evaluate in the base
workspace text box to specify the following values:
•The model name
•The block name
•The block parameter
3-9

3Creating Simulink®Reports
•Parameter values
•Other initial values required for processing the vdp model
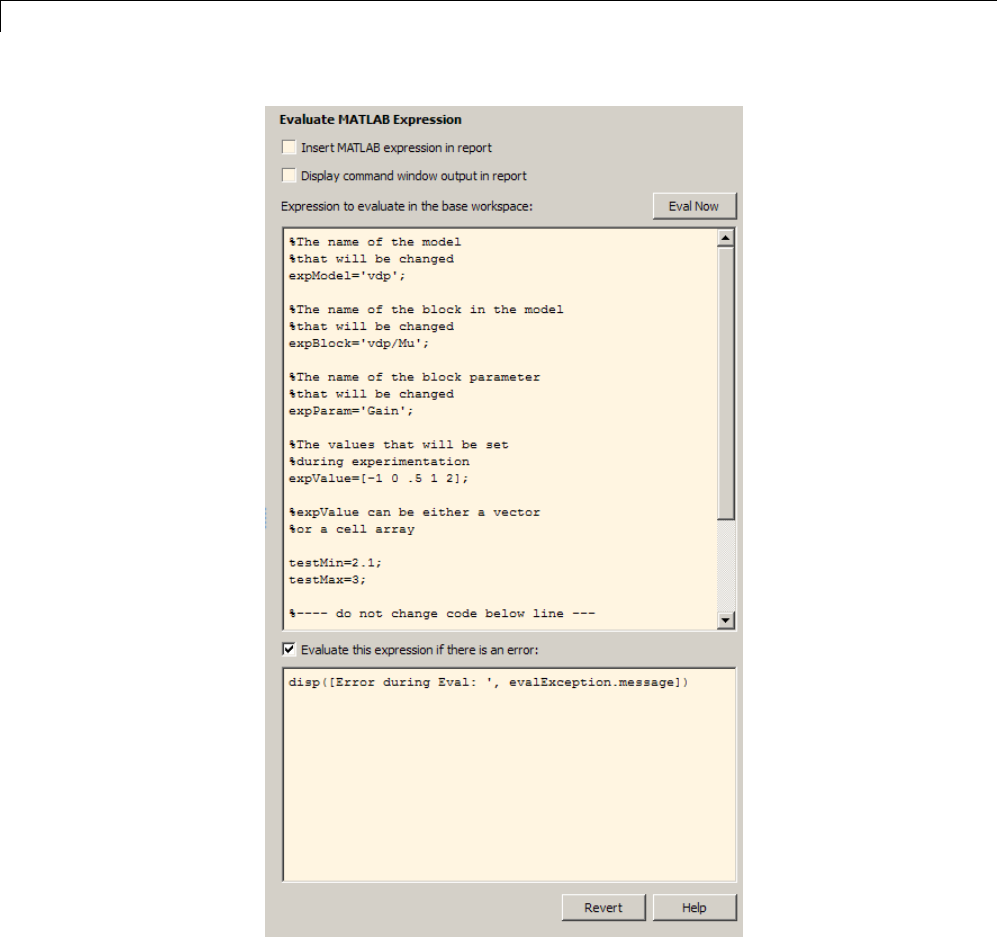
Replace the existing text with the following MATLAB code.
%The name of the model
%that will be changed
expModel='vdp';
%The name of the block in the model
%that will be changed
expBlock='vdp/Mu';
%The name of the block parameter
%that will be changed
expParam='Gain';
%The values that will be set
%during experimentation
expValue=[-1 0 .5 1 2];
%expValue can be either a vector
%or a cell array
testMin=2.1;
testMax=3;
%---- do not change code below line ---
try
open_system(expModel);
end
expOkValues=cell(0,2);
3-10

Add Components to the Report Setup File
Note When you change a field in the Properties pane on the right, the
fieldbackgroundchangescolor(thedefault is a cream color), indicating
that there are unapplied changes to that field. As soon as you perform
operations on another component, the Simulink Report Generator software
applies the changes, and the background color becomes white again.
6Select the Evaluate this expression if there is an error check box.
7In the field under the check box, replace the existing text with the following
text:
disp(['Error during eval: ', evalException.message])
The Report Explorer window now looks as follows.
3-11
3Creating Simulink®Reports
3-12
Add Components to the Report Setup File
Tip To run the commands that you specified in your MATLAB expression,
click the Eval Now button. This button is located at the upper-right corner
of the Report Explorer. This is an easy way to ensure that your commands
are correct and will not cause report generation problems.
8Click File > Save to save the report setup file.
For information about handling error conditions, see “Error Handling for
MATLAB Code” on page 3-53.
Add a Title Page
Note This section builds on the step-by-step tutorial presented in “Create a
Simulink®Report Generator™ Report” on page 3-2.
To see the completed report setup file, open Simulink Dynamic Report.The
report is for the vdp model.
Create a custom title page for your report using the Title Page component.
1In the Outline pane on the left, select the Eval component.
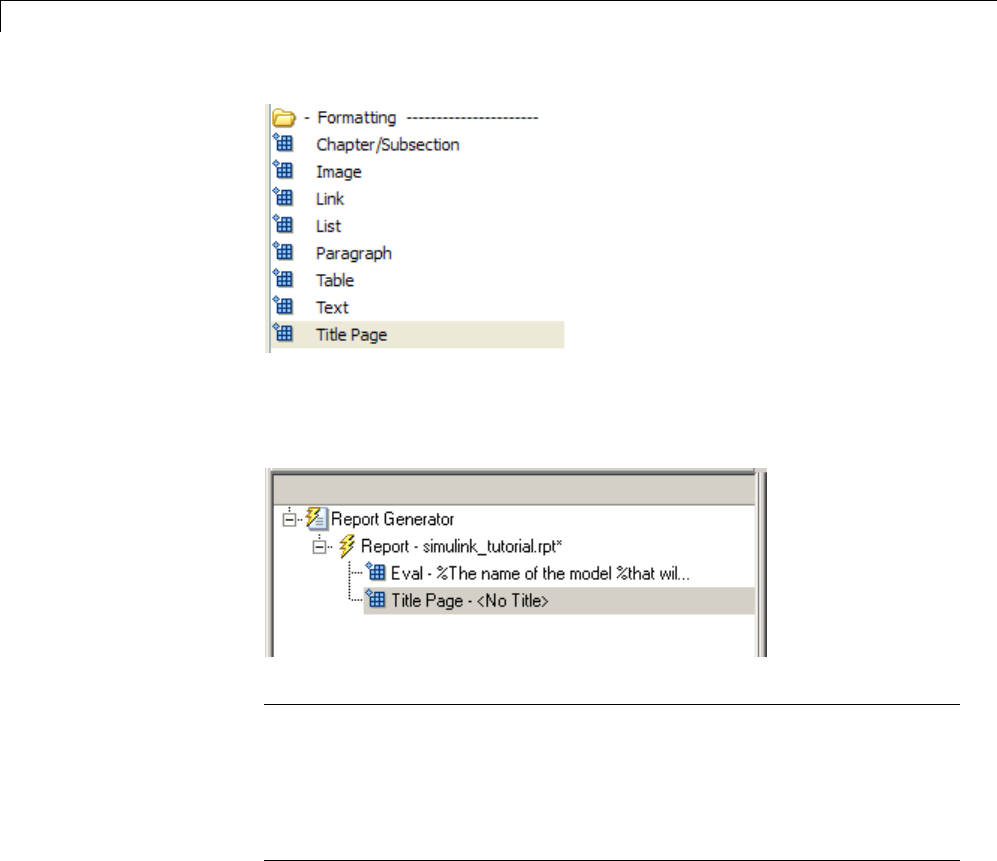
2In the Library pane in the middle, under the Formatting category, click
Title Page.
3-13
3Creating Simulink®Reports
3Click the iconnexttoAdd component to current report.
The Title Page component appears in the Outline pane.
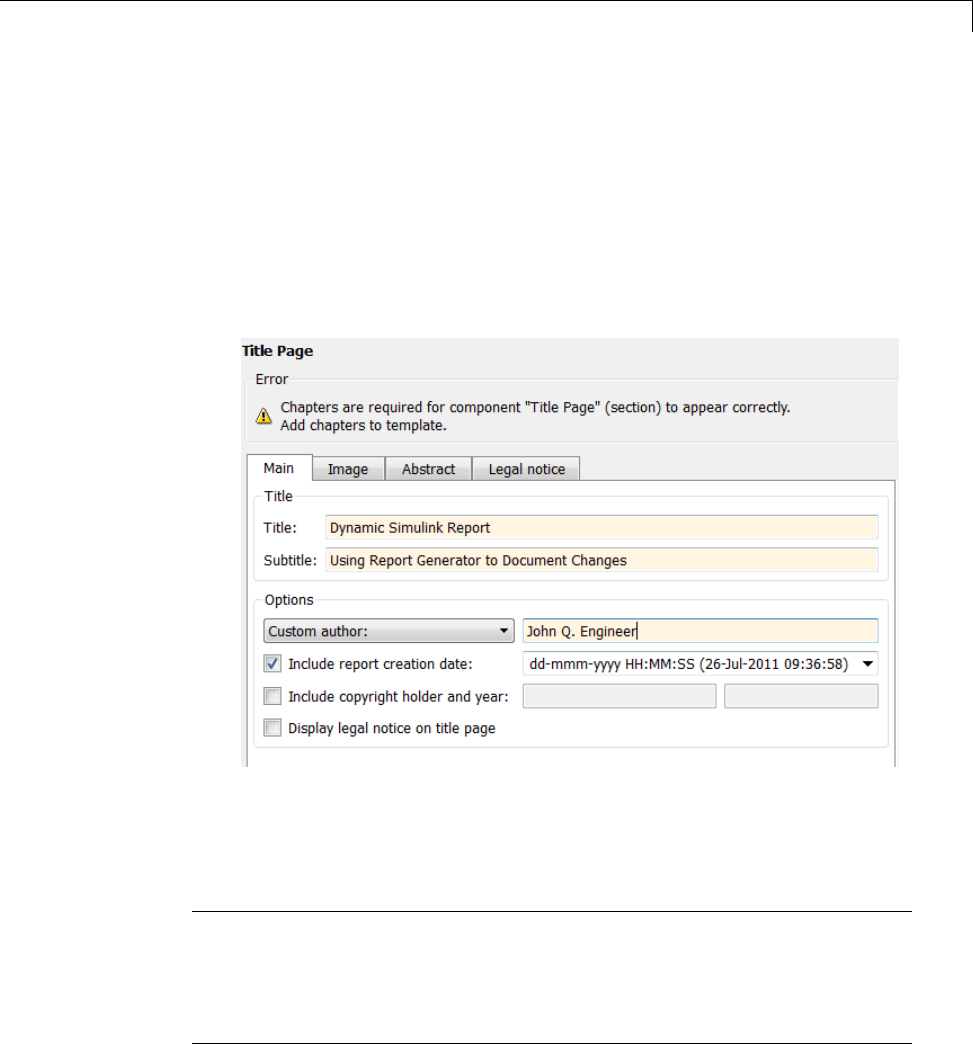
Note To use the Title Page component, you need to have a Chapter
component in your report . You have not yet added a Chapter component,
so the Properties pane displays a message indicating that chapters are
required for the Title Page component to appear correctly. Because later
in this tutorial you add Chapter components to this report, you can ignore
that message.
4In the Properties pane on the right:
aIn the Title text box, enter:
Dynamic Simulink Report
bIn the Subtitle text box, enter:
3-14
Add Components to the Report Setup File
Using Simulink Report Generator to Document Changes
cIn the Options section, choose Custom Author from the selection list.
dEnteryournameinthetextbox.
eSelect the Include report creation date check box.
fSelect the default date and time format from the selection list. The
Properties pane on the right looks as follows.
5Save the report setup file.
Open the Simulink Model
Note This section builds on the step-by-step tutorial presented in “Create a
Simulink®Report Generator™ Report” on page 3-2.
To see the completed report setup file, open Simulink Dynamic Report.The
report is for the vdp model.
3-15
3Creating Simulink®Reports
The following statement in the Evaluate MATLAB Expression component
thatyoucreatedin“AddMATLABCode”onpage3-7triestoopenthevdp
model:
try
open_system(expModel);
end
Tip Select the Eval component in the Outline pane on the left to look at
this code again.
To see if the vdp model was successfully opened, test the result of the
open_system command using a Logical If component.
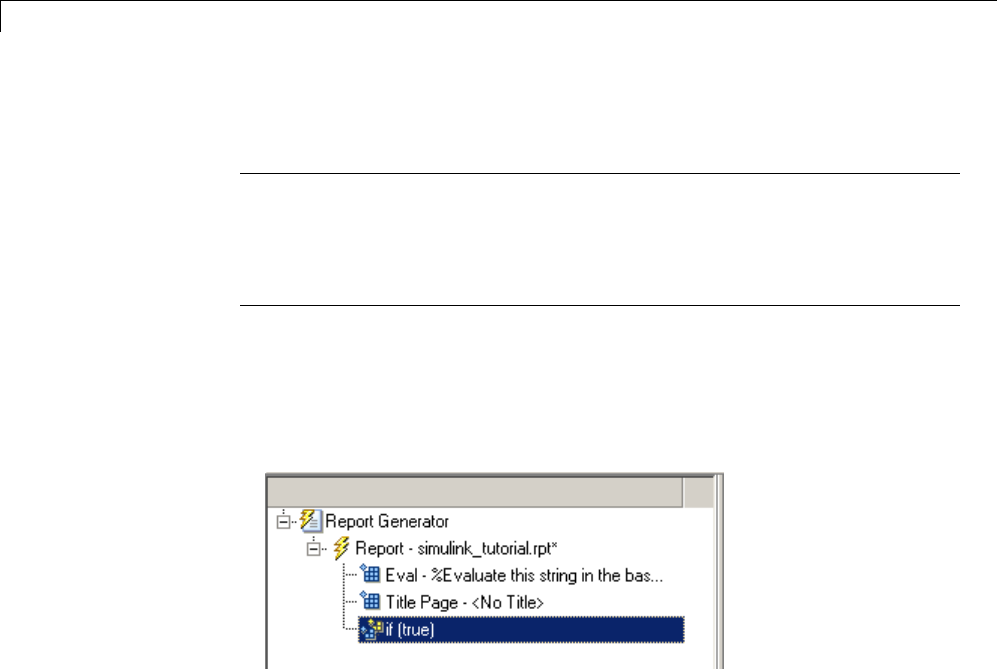
1In the Outline pane on the left, select the Title Page component.
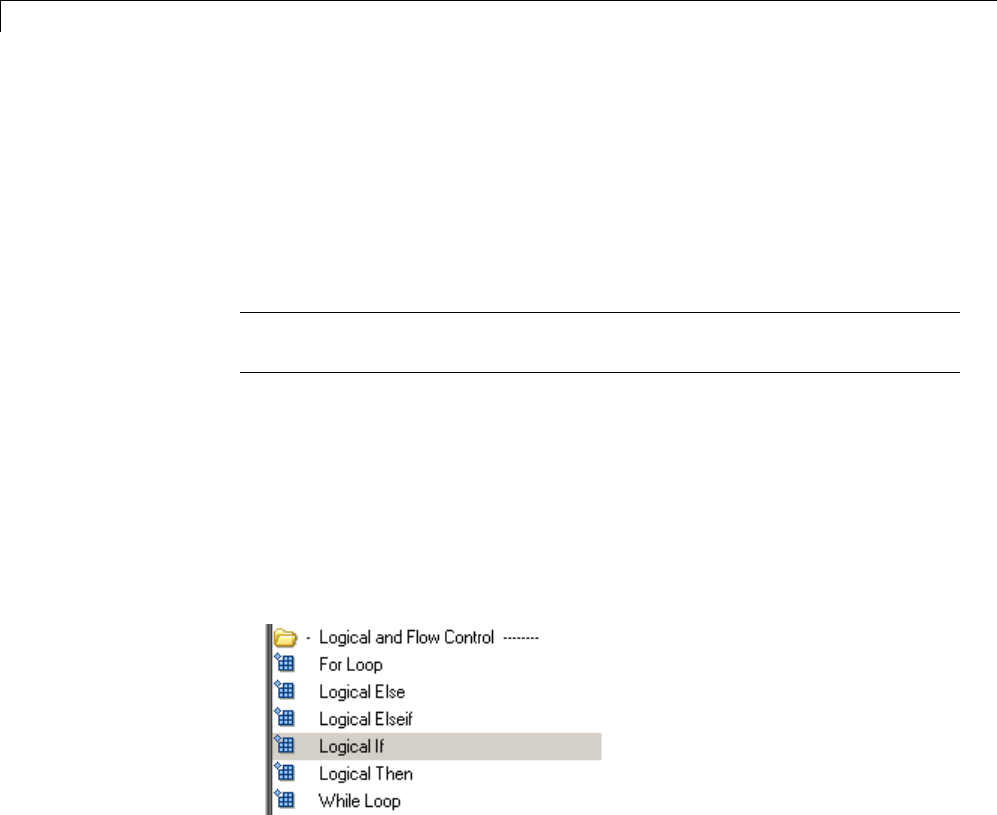
2In the Library pane in the middle, under the Logical and Flow Control
category, select Logical If. This component checks to see if a given
condition is true or false; in this case, if the model opened successfully.
3In the Properties pane on the right, click the icon next to Add component
to current report.The
Logical If component appears as if in the
Outline pane.
3-16
Add Components to the Report Setup File
These components are child components of the report and siblings of one
another. Components can have parent, child, and sibling relationships.
This component can have child components. “Add Logical Then and Logical
Else Components” on page 3-18 explainshowtoaddtwochildcomponents
to the if component.
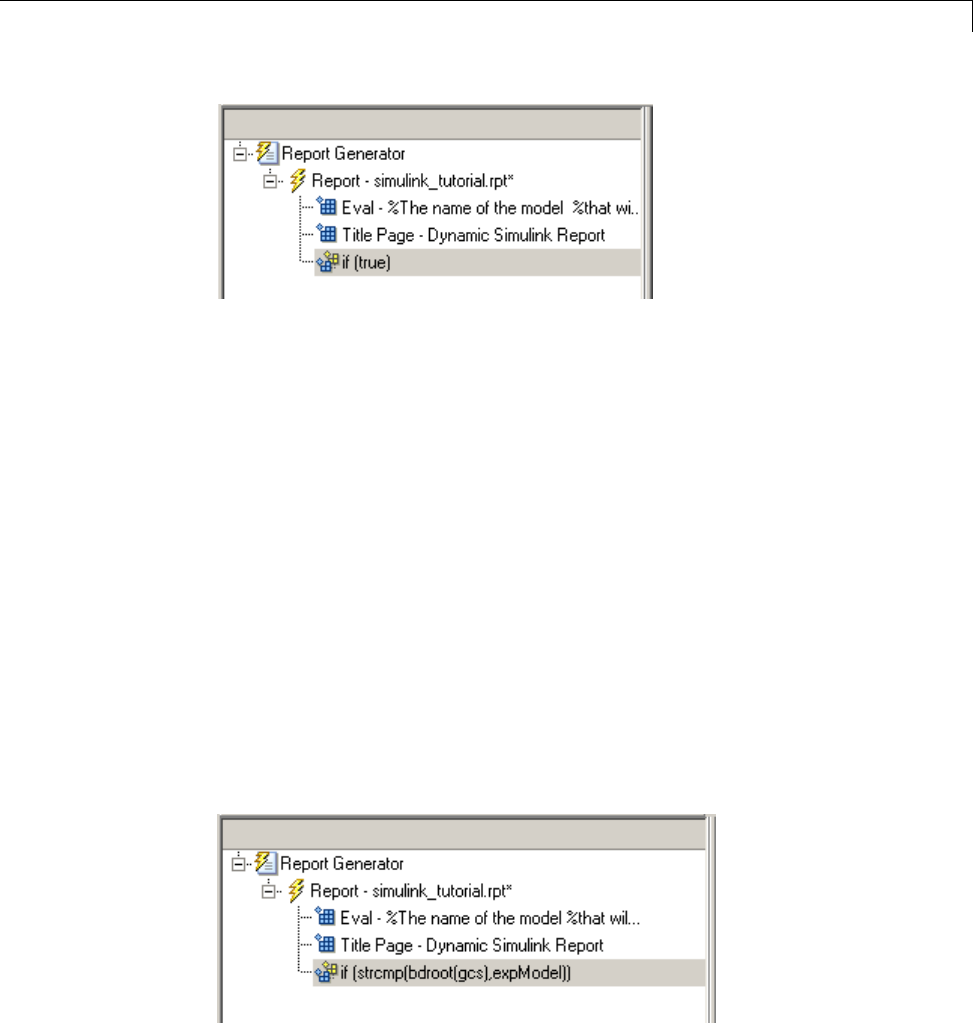
4In the Properties pane on the right, in the Test expression text box,
replace thedefaulttext,true, with the following text:
strcmp(bdroot(gcs),expModel)
The strcmpfunction compares the name of the open Simulink model and
the value of expModel,whichwassetto'vdp'.Itteststoseeifthevdp
model opened successfully. strcmp returns 1(true)ifthetwostrings
match, and 0(false)ifnot.
5Save the report setup file.
The if componentnameintheOutlinepanechangestoincludethe
expression that you added.
3-17
3Creating Simulink®Reports
Add Logical Then and Logical Else Components
Note This section builds on the step-by-step tutorial presented in “Create a
Simulink®Report Generator™ Report” on page 3-2.
To see the completed report setup file, open Simulink Dynamic Report.The
report is for the vdp model.
The if strcmp(bdroot(gcs), expModel)) component has two possible
results. Add two child components to the report setup file to process these
cases.
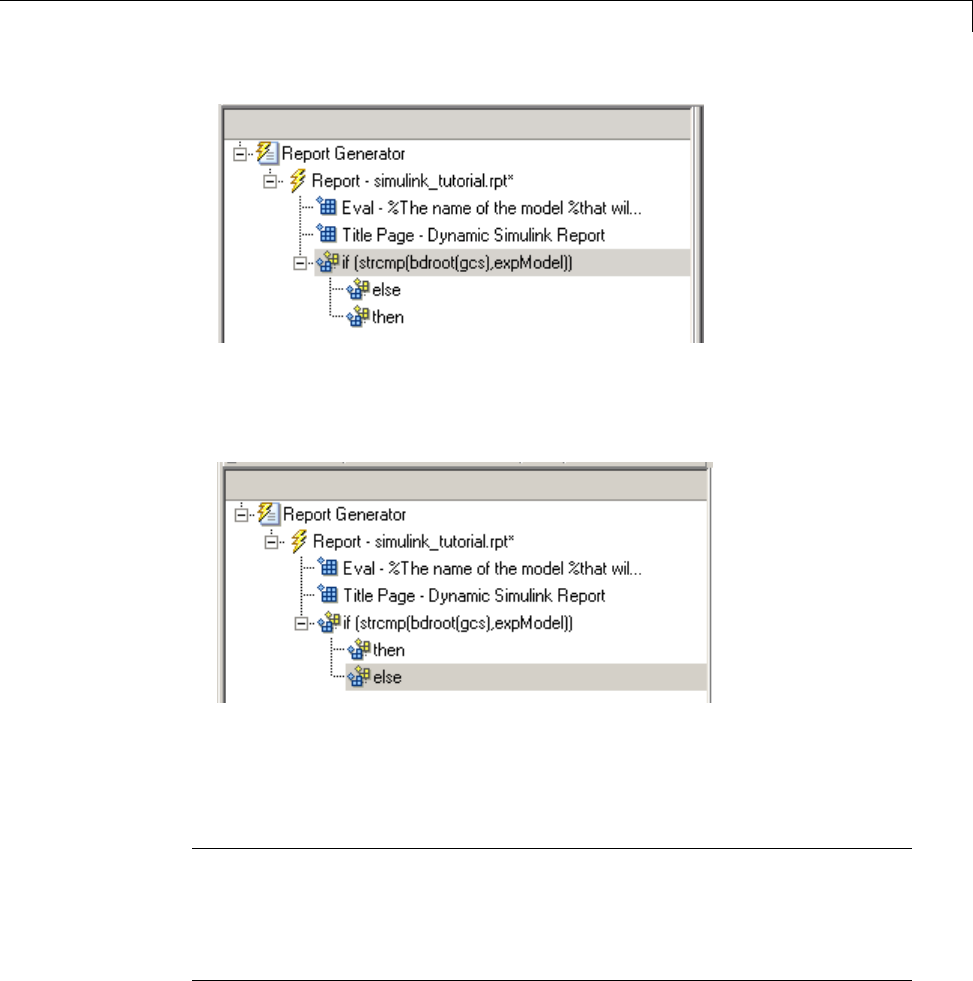
1In the Outline pane on the left, select the if component.
2In the Library pane in the middle, under the Logical and Flow Control
category, double-click Logical Then.
3In the Outline pane on the left, select the if component again.
4In the Library pane in the middle, under the Logical and Flow Control
category, double-click Logical Else.
Both elements are added as child components to the if component, as
shown in the Outline pane.
3-18
Add Components to the Report Setup File
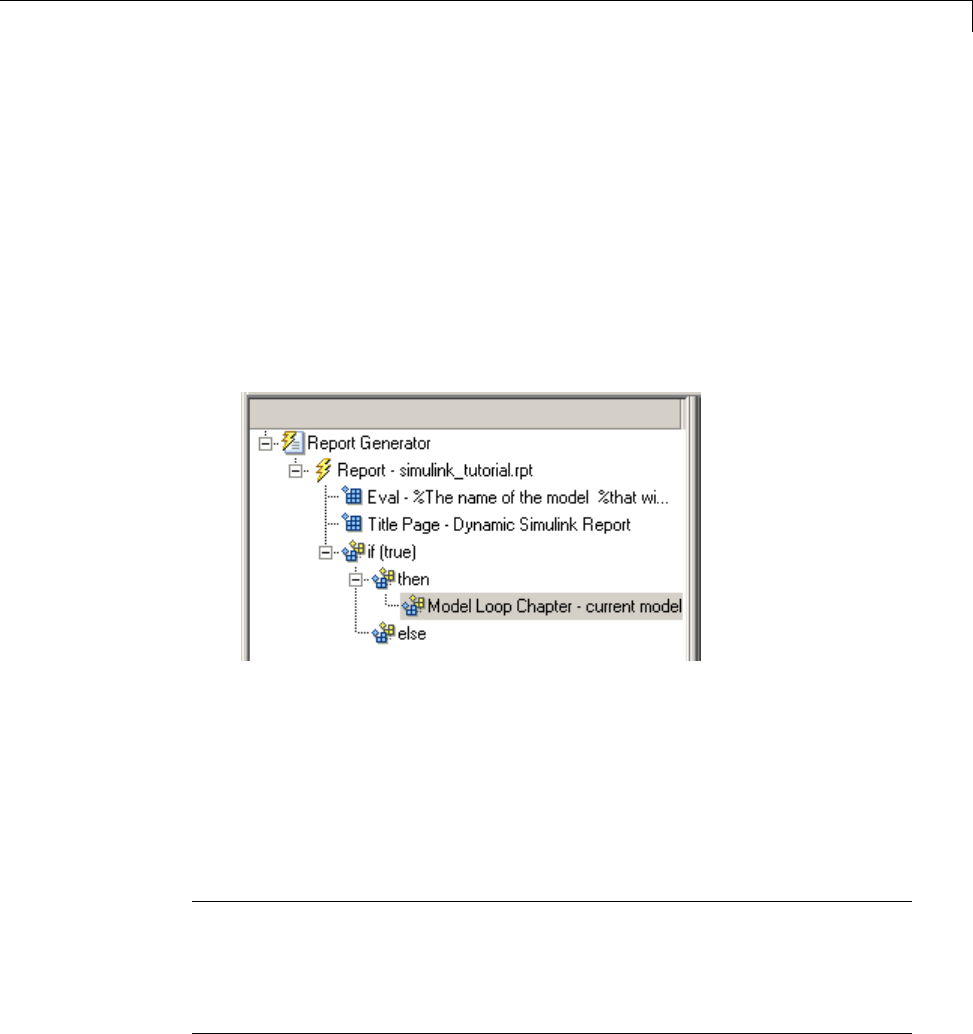
5To move the else component under the then component, select the else
component and click the down arrow on the toolbar once. The Outline
pane on the left looks as follows.
6Save the report setup file.
Error If Model Cannot Be Opened
Note This section builds on the step-by-step tutorial presented in “Create a
Simulink®Report Generator™ Report” on page 3-2.
To see the completed report setup file, open Simulink Dynamic Report.The
report is for the vdp model.
3-19
3Creating Simulink®Reports
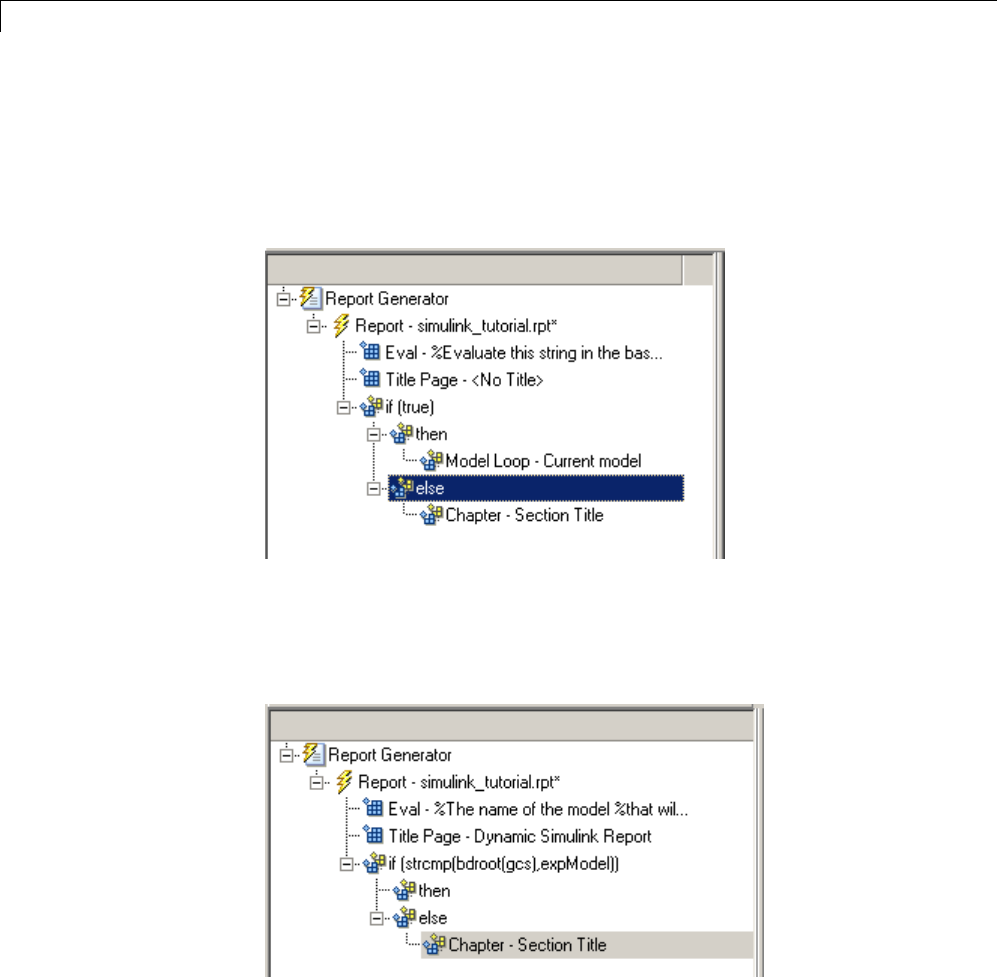
If the if strcmp(bdroot(gcs), expModel)) component fails (the vdp model
cannot open), the else component executes. Display an error message in the
report using the Chapter/Subsection component.
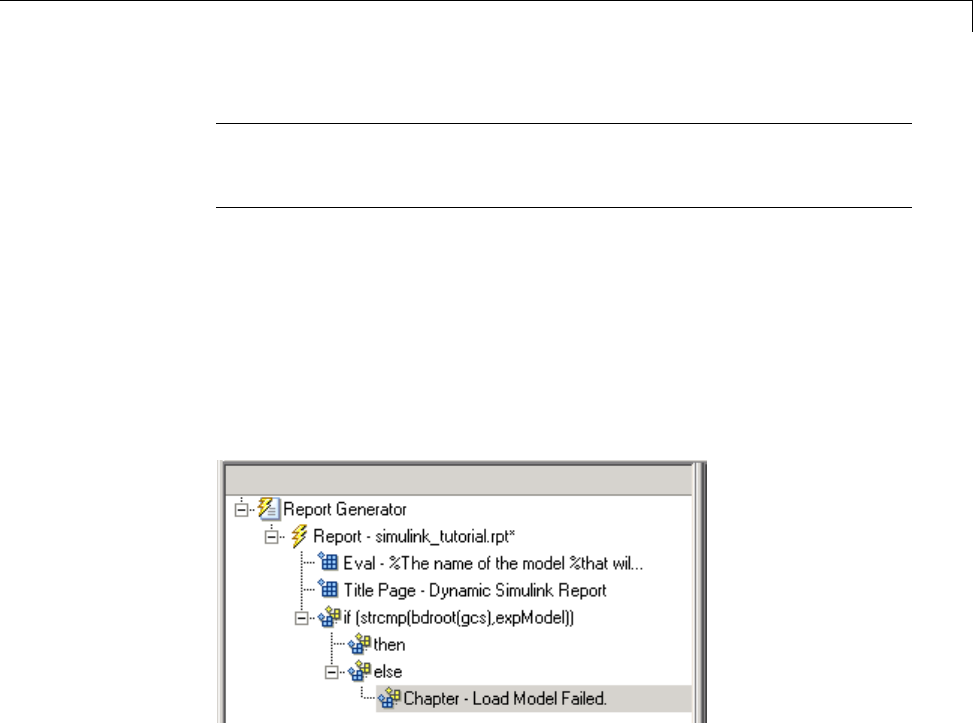
1In the Outline pane on the left, select the else component.
2In the Library pane in the middle, under the Formatting category,
double-click Chapter/Subsection toadditasachildoftheelse
component. This component displays an error message if an error occurs
when opening the vdp model.
3-20
Add Components to the Report Setup File
Note When you add a component to a report, it is added by default
as a child component unless the selected component cannot have child
components.
3In the Properties pane on the right, choose Custom from the Title selection
list, and then enter the following text in the text box:
Load Model Failed.
Save the report file.
The Outline pane looks as follows.
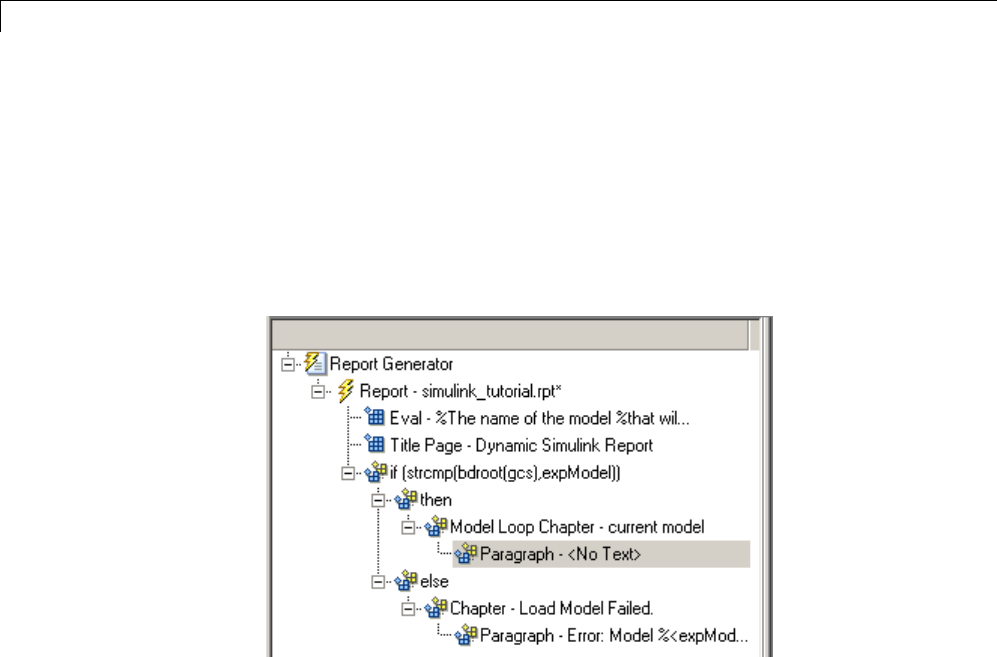
4In the Outline pane on the left, select the Chapter component.
5In the Library pane in the middle, under Formatting, double-click
Paragraph.
6In the Properties pane on the right, enter the following text in the
Paragraph Text text box to display the following error message:
Error: Model %<expModel> could not be opened.
The expression %<expModel> indicates that the value of the workspace
variable expModel is inserted into the text, as in the following example.
Error: Model vdp could not be opened.
3-21

3Creating Simulink®Reports
7In the Outline pane on the left, select the Chapter/Section component.
8Save the report setup file.
The Outline pane looks as follows.
Create the Body of the Report
Note This section builds on the step-by-step tutorial presented in “Create a
Simulink®Report Generator™ Report” on page 3-2.
To see the completed report setup file, open Simulink Dynamic Report.The
report is for the vdp model.
Creating the body of the report involves setting up components and code for
dynamic execution of report components. In this example, you perform the
following tasks:
•“Process with a Model Loop Component” on page 3-23
•“Add a Paragraph for Each Model” on page 3-25
•“Insert a Snapshot of the Model” on page 3-27
•“Add a Loop for Processing the Model” on page 3-28
•“Block Parameter Value from a MATLAB Expression” on page 3-30
3-22

Add Components to the Report Setup File
•“Create a Section for Each Iteration” on page 3-32
•“Insert the Block Value” on page 3-33
•“Set a Parameter Value” on page 3-34
•“Check Value Using a Logical If Component” on page 3-36
•“Simulate the Model Using a Model Simulation Component” on page 3-39
•“Create a Post-Test Analysis Section” on page 3-45
Each action requires a separate component under the then component. For
information about the then component in this report, see “Add Logical Then
and Logical Else Components” on page 3-18.
Process with a Model Loop Component
Note This section builds on the step-by-step tutorial presented in “Create a
Simulink®Report Generator™ Report” on page 3-2.
To see the completed report setup file, open Simulink Dynamic Report.
The report changes the Gain parameter for the Mu block in the vdp model
several times. This task requires a Model Loop component.
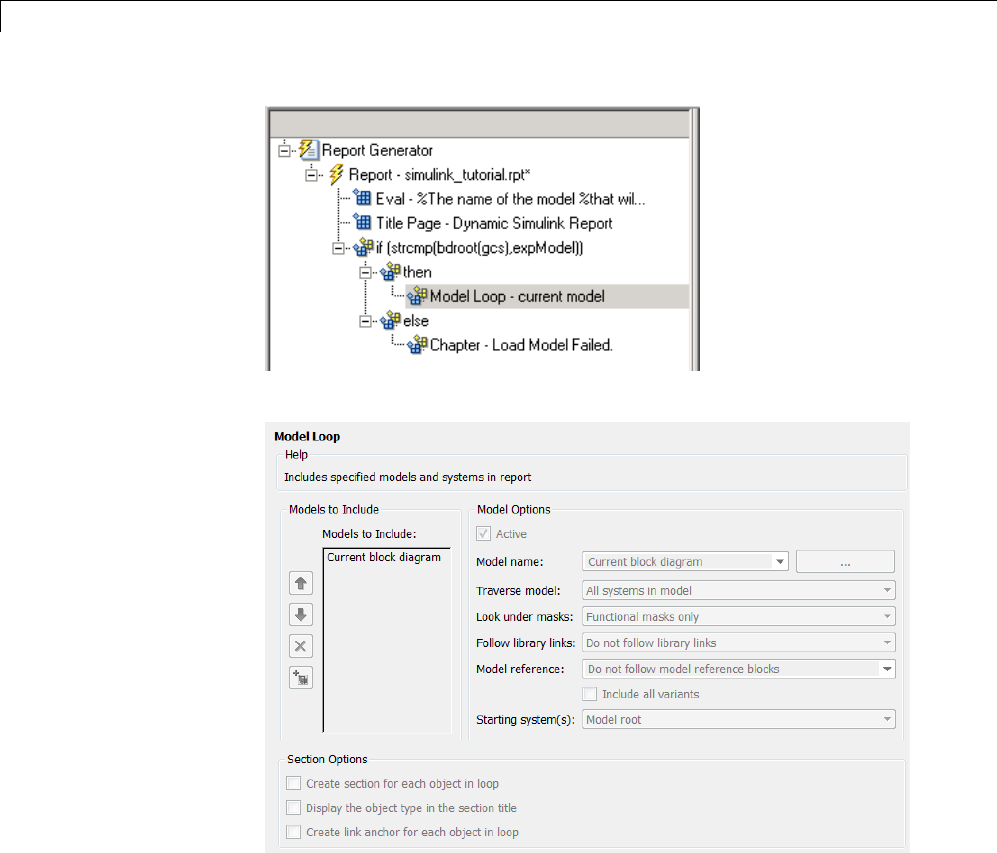
1In the Outline pane on the left, select the then component.
2In the Library pane in the middle, scroll down to the Simulink category,
and then double-click Model Loop.Itisaddedasachildofthethen
component.
3-23
3Creating Simulink®Reports
The Properties pane on the right looks as follows.
3-24
Add Components to the Report Setup File
3In the Properties pane on the right:
aSelect the Active check box to process the vdp model.
bIn the Traverse model selection list, select Selected system(s) only
to traverse only the vdp model.
cSelect Model root from the Starting system(s) selection list.
dAt the bottom of the Properties pane on the left, select the Create
section for each object in loop check box to create a chapter or section
for each model. When you select this check box, the component name in
the Outline pane on the left changes to Model Loop Chapter.
eSelect the Display the object type in the section title check box to
include the object type (in this example, model) in the title name.
fClear the Create link anchor for each object in loop check box.
4Save the report setup file.
Add a Paragraph for Each Model
Note This section builds on the step-by-step tutorial presented in “Create a
Simulink®Report Generator™ Report” on page 3-2.
To see the completed report setup file, open Simulink Dynamic Report.The
report is for the vdp model.
3-25
3Creating Simulink®Reports
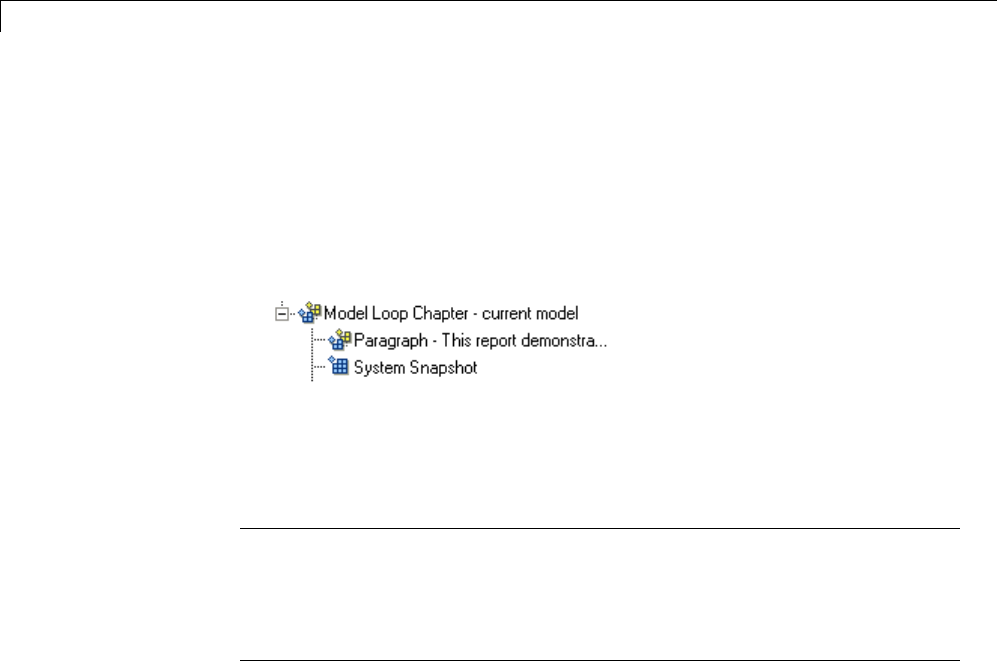
In each Model Loop Chapter, add an explanation using the Paragraph
component.
1In the Outline pane on the left, select the Model Loop Chapter component.
2In the Library pane in the middle, scroll up to the Formatting category,
and then double-click Paragraph.TheParagraph component is added as
achildoftheModel Loop Chapter component.
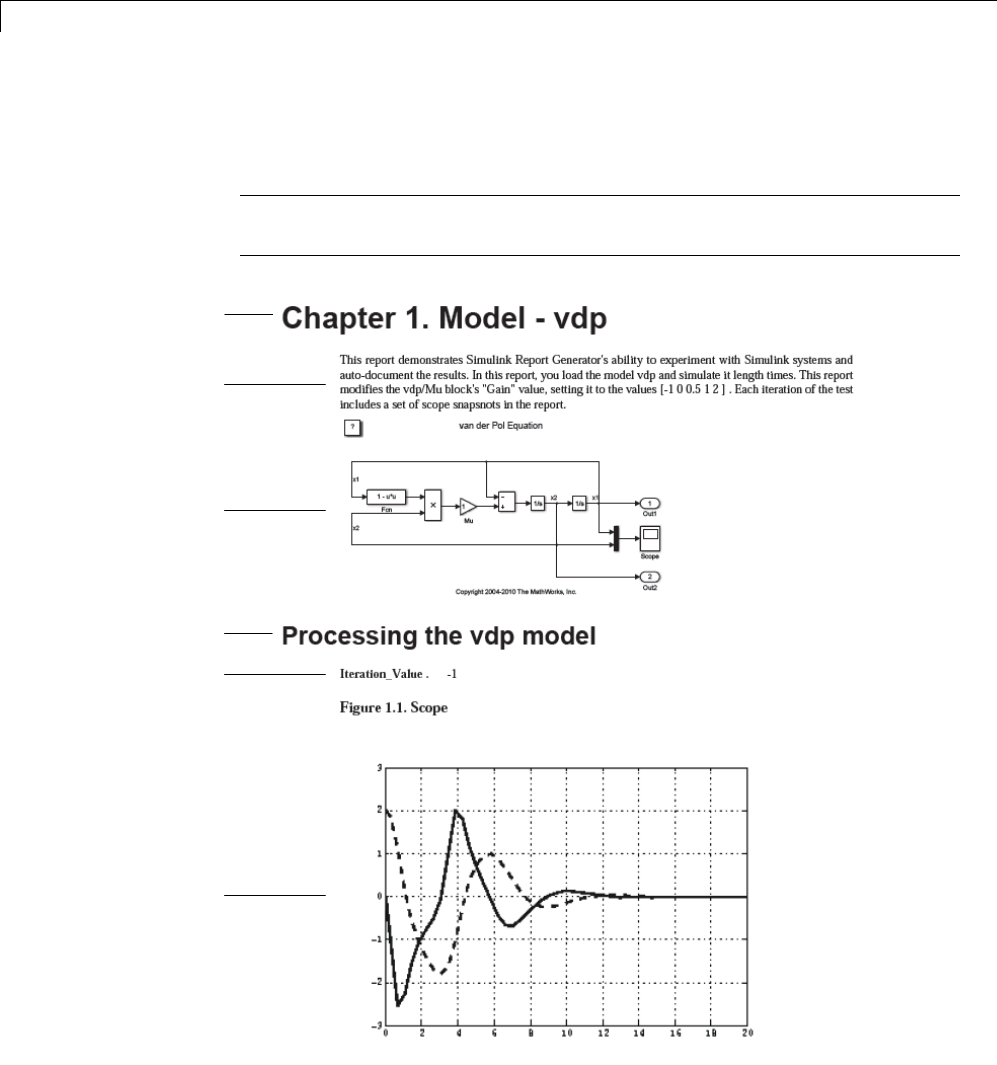
3In the Properties pane on the right, in the Paragraph Text text box, enter
the following text:
This report demonstrates Simulink Report Generator's ability
to experiment with Simulink systems and auto-document
the results. In this report, you load the model %<expModel>
and simulate it %<length> times. This report modifies the
%<expBlock> block's "%<expParam>" value, setting it to the
values %<expValue>. Each iteration of the test includes
a set of scope snapsnots in the report.
When this report is generated, the variable names preceded by percent
signs (%) and enclosed in brackets (<>) are replaced with the values of those
variables in the MATLAB workspace.
4Save the report setup file.
3-26
Add Components to the Report Setup File
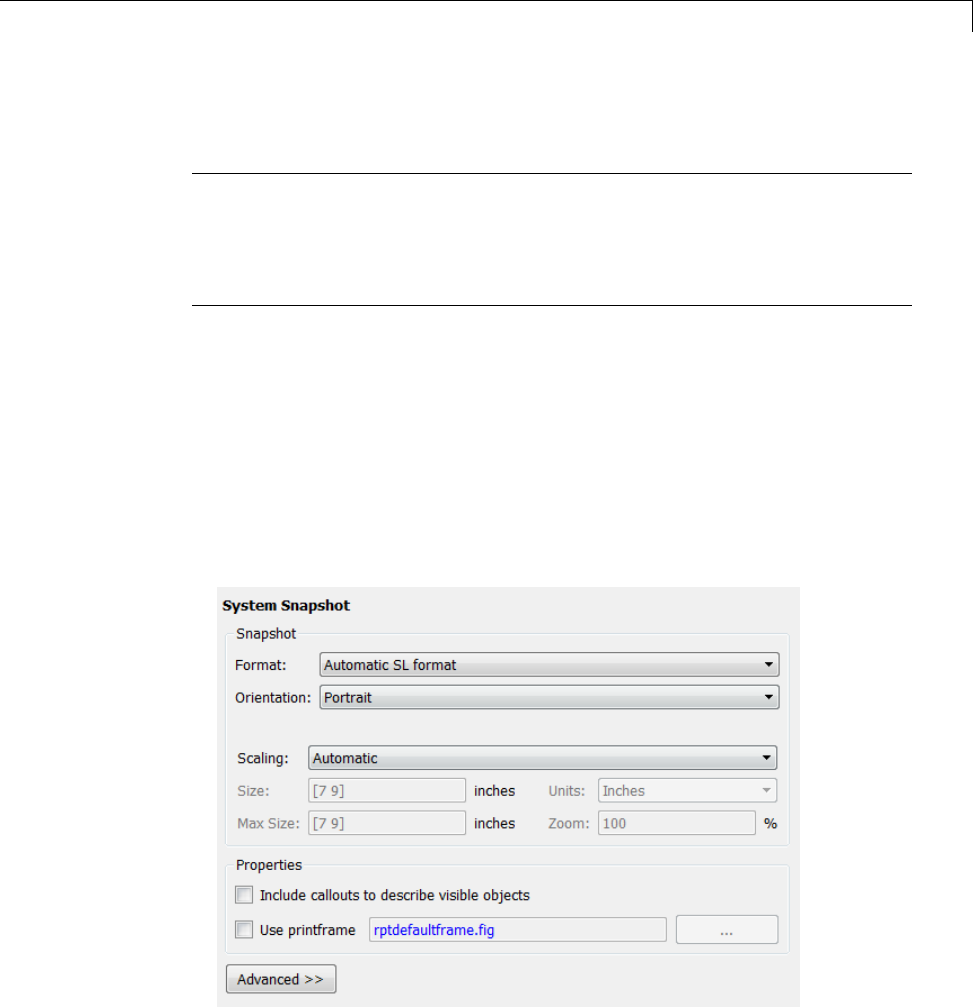
Insert a Snapshot of the Model
Note This section builds on the step-by-step tutorial presented in “Create a
Simulink®Report Generator™ Report” on page 3-2.
To see the completed report setup file, open Simulink Dynamic Report.The
report is for the vdp model.
Inside each Model Loop Chapter component, include a snapshot of the
current model using the System Snapshot component.
1In the Outline pane on the left, select the Model Loop Chapter component.
2In the Library pane in the middle, scroll down to the Simulink category,
and then double-click the System Snapshot component.
This component inserts an image of the current model into your report.
The Properties pane on the right looks as follows.
3In the Properties pane on the right:
3-27
3Creating Simulink®Reports
aSelect Zoom from the Scaling selection list.
bEnter 70 as the %value.
4In the Outline pane on the left, select the System Snapshot component.
5Click the down arrowonthetoolbaroncetomoveitundertheParagraph
component.
6Save the report setup file.
Add a Loop for Processing the Model
Note This section builds on the step-by-step tutorial presented in “Create a
Simulink®Report Generator™ Report” on page 3-2.
To see the completed report setup file, open Simulink Dynamic Report.The
report is for the vdp model.
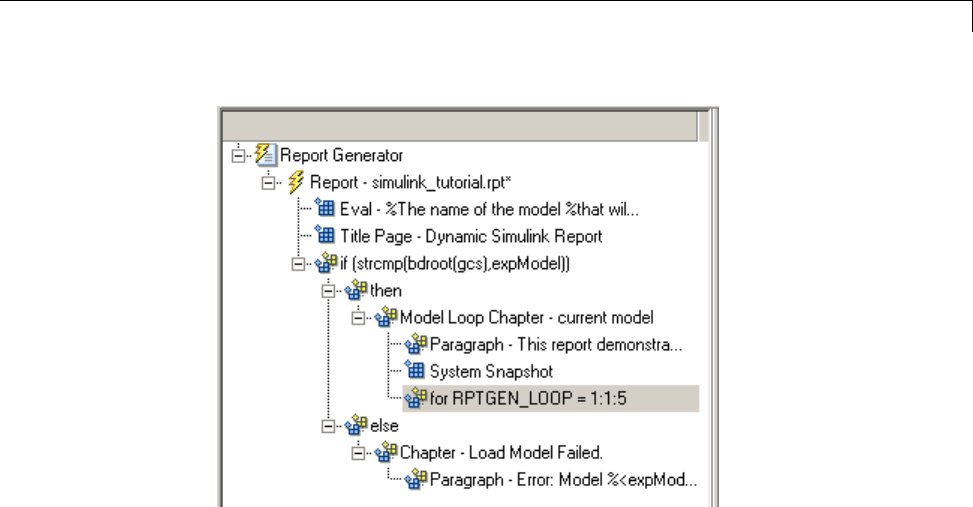
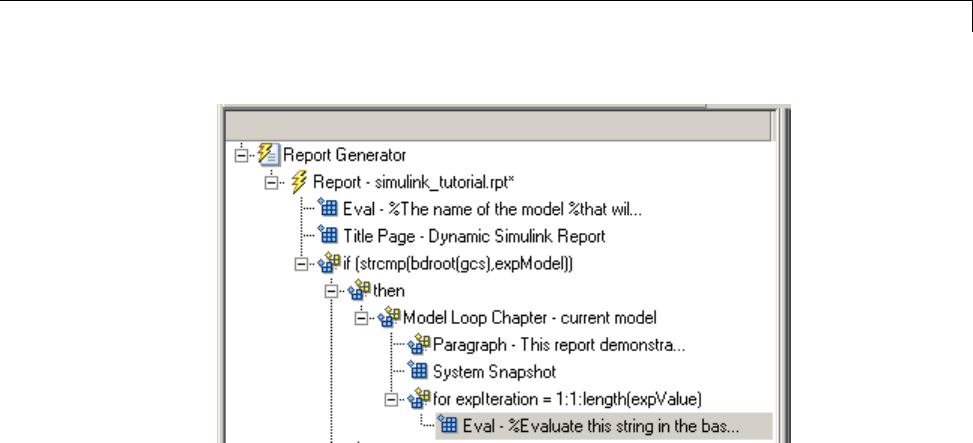
Create a loop to process the model %length times using the For Loop
component.
1In the Outline pane on the left, select the System Snapshot component.
2In the Library pane in the middle, under the Logical and Flow Control
category, double-click For Loop.TheFor Loop component is added as a
sibling of the System Snapshot component.
3-28
Add Components to the Report Setup File
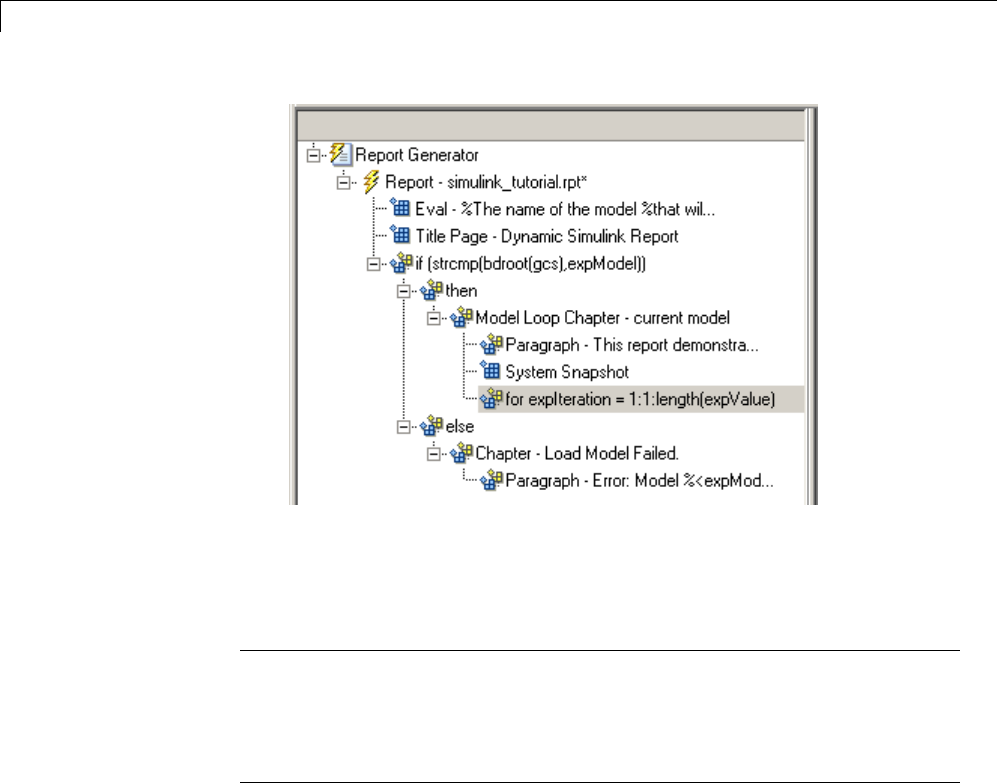
3In the Properties pane on the right:
aIn the End text box, replace the existing text with the following text:
length(expValue)
expValue is the array of Gain parameter values assigned in the Eval
component with the command expValue=[-1 0 0.5 1 2];.The
expression length(expValue) evaluates to 5in this example.
bIn the Variable name text box, replace the existing text with the name
of the for loop variable. Enter the following text:
expIteration
ThenameoftheFor component in the Outline pane on the left changes
to reflect the loop variable and the termination value.
3-29
3Creating Simulink®Reports
4Save the report setup file.
Block Parameter Value from a MATLAB Expression
Note This section builds on the step-by-step tutorial presented in “Create a
Simulink®Report Generator™ Report” on page 3-2.
To see the completed report setup file, open Simulink Dynamic Report.The
report is for the vdp model.
For each iteration, get a value from the expValue array to use as the Gain
parameter value. This task requires an Evaluate MATLAB Expression
component.
1In the Outline pane on the left, select the for component.
2In the Library pane in the middle, under the MATLAB category, double-click
Evaluate MATLAB Expression. In the Outline pane, the component name
is shortened to Eval.
3-30
Add Components to the Report Setup File
3On the Properties pane on the right:
aClear the Insert MATLAB expression in report and Display
command window output in report check boxes.
bEnter the following text in the Expression to evaluate in the base
workspace text box:
%Evaluate this string in the base workspace
if iscell(expValue)
Iteration_Value=expValue{expIteration};
else
Iteration_Value=...
num2str(expValue(expIteration));
end
The Iteration_Value variable represents the designated array element.
cClear the Evaluate expression if there is an error check box.
4Save the report setup file.
3-31
3Creating Simulink®Reports
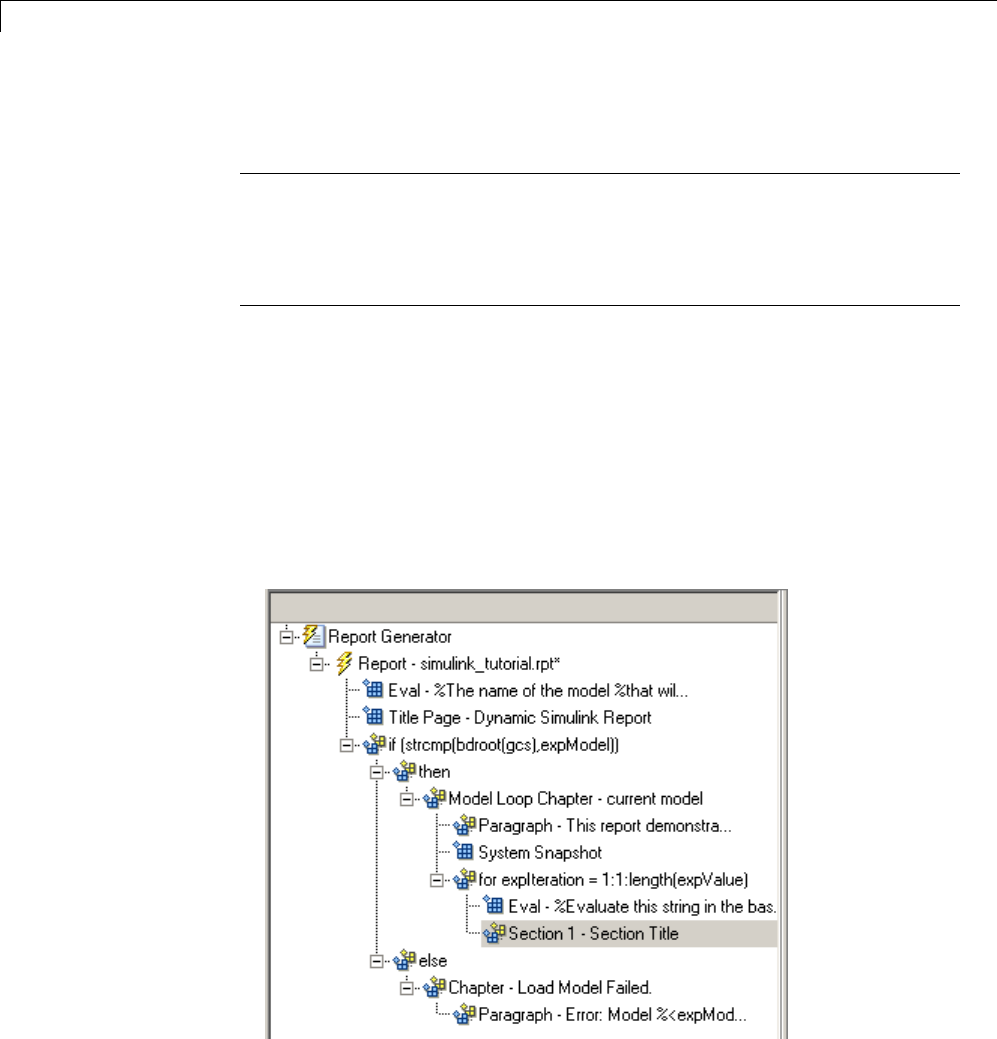
Create a Section for Each Iteration
Note This section builds on the step-by-step tutorial presented in “Create a
Simulink®Report Generator™ Report” on page 3-2.
To see the completed report setup file, open Simulink Dynamic Report.The
report is for the vdp model.
Create a separate section for each iteration of the loop that includes the data
using the Chapter/Subsection component.
1In the Outline pane on the left, under the for component, select the Eval
component.
2In the Library pane in the middle, under the Formatting category,
double-click the Chapter/Subsection component to add it as a sibling.
This component is automatically added as Section 1 because it is inside a
Chapter component (the Model Loop Chapter component).
3-32

Add Components to the Report Setup File
3In the Properties pane on the right:
aIn the Title selection list, select Custom.
bIn the text box, enter the following title:
Processing the vdp model
This indicates that the section title comes from the first child component.
Do not change any other properties.
4Save the report setup file.
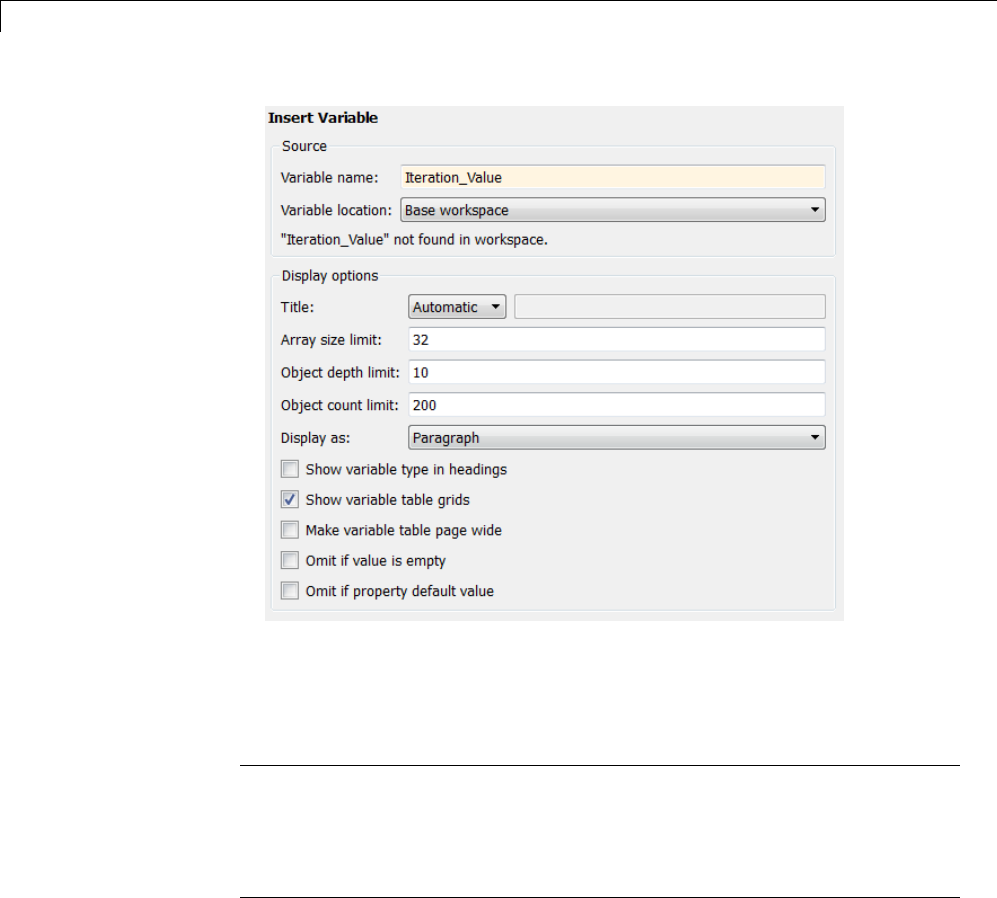
Insert the Block Value
Note This section builds on the step-by-step tutorial presented in “Create a
Simulink®Report Generator™ Report” on page 3-2.
To see the completed report setup file, open Simulink Dynamic Report.The
report is for the vdp model.
Insert the Gain value that is used for each simulation.
1In the Outline pane on the left, select the Section 1 component.
2In the Library pane in the middle, under the MATLAB category, double-click
Insert Variable.
3In the Properties pane on the right:
aIn the Variable name text box, enter Iteration_Value.
bIn the Display as selection list, select Paragraph.
The Properties pane on the right looks as follows.
3-33
3Creating Simulink®Reports
4Save the report setup file.
Set a Parameter Value
Note This section builds on the step-by-step tutorial presented in “Create a
Simulink®Report Generator™ Report” on page 3-2.
To see the completed report setup file, open Simulink Dynamic Report.The
report is for the vdp model.
For each iteration, set the Gain parameter to the value that you extracted
from the expValue array.
1In the Outline pane on the left, select the Variable component.
3-34

Add Components to the Report Setup File
2In the Library pane in the middle, under the MATLAB category, double-click
Evaluate MATLAB Expression. This component is added as a sibling of
the Variable component.
3In the Properties pane on the right, clear the Insert MATLAB expression
in report and Display command window output in report check
boxes.
4In the Expression to evaluate in the base workspace text box, replace
the existing text with the following text.
set_param(expBlock,expParam,Iteration_Value);
okSetValue=(1);
The set_param command sets the value of the Gain parameter for the Mu
block in the vdp model to the value of Iteration_Value.
5Make sure you select Evaluate expression if there is an error.Enter
the following text into the text box:
okSetValue=logical(0);
If the set_param command works, okSetValue is set to 1. If an error
occurs, okSetValue is set to 0. The next component then reports the error
and terminates processing.
6Save the report setup file.
The Outline pane on the left looks as follows.
3-35
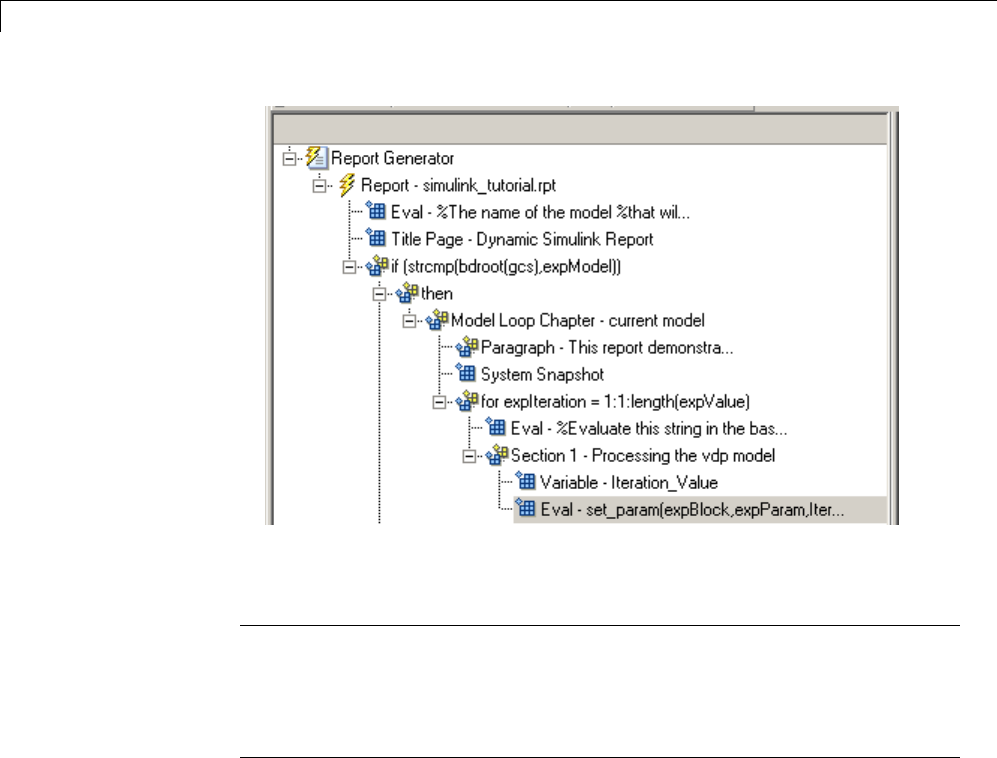
3Creating Simulink®Reports
CheckValueUsingaLogicalIfComponent
Note This section builds on the step-by-step tutorial presented in “Create a
Simulink®Report Generator™ Report” on page 3-2.
To see the completed report setup file, open Simulink Dynamic Report.The
report is for the vdp model.
Check the value of okSetValue using a Logical If component. If the value is
0, the simulation cannot proceed because the Gain parameter could not be set.
1In the Outline pane on the left, select the Eval component for the
set_param command.
2In the Library pane in the middle, under the Logical and Flow Control
category, double-click Logical If. The component is added as a sibling
of Eval.
3-36

Add Components to the Report Setup File
3In the Properties pane on the right, in the Test expression text box,
replace true with okSetValue.
okSetValue canbe1(true)or0(false), so insert two components —
Logical Then and Logical Else — to process those conditions:
1In the Outline pane on the left, select the if(okSetValue) component.
2To insert Logical Then and Logical Else in the correct order:
aIn the Library pane in the middle, double-click the Logical Else
component.
bSelect the if(okSetValue) component again.
cDouble-click the Logical Then component. The Outline pane on the
left looks as follows.
3-37

3Creating Simulink®Reports
3In the Outline pane on the right, select the else component.
4In the Library pane in the middle, double-click Paragraph.
If okSetValue =0,theGain parameter value is not set and the report
displays an error.
5In the Properties pane on the right:
aChoose Custom title from the Title Options selection list.
bEnter Error in the text box next to the selection list.
cEnter the following text into the Paragraph Text text box:
Could not set %<expBlock> "%<expParam>" to value
%<Iteration_Value>.
6Save the report.
3-38

Add Components to the Report Setup File
Simulate the Model Using a Model Simulation
Component
Note This section builds on the step-by-step tutorial presented in “Create a
Simulink®Report Generator™ Report” on page 3-2.
To see the completed report setup file, open Simulink Dynamic Report.The
report is for the vdp model.
Now that the model is open and the Gain parameter is set, use the Model
Simulation component to simulate the vdp model.
1In the Outline pane on the left, select the then component under the if
(okSetValue) component.
2In the Library pane, under the Simulink category, double-click Model
Simulation. In the Outline pane on the left, this component is renamed
Simulate model.
3-39
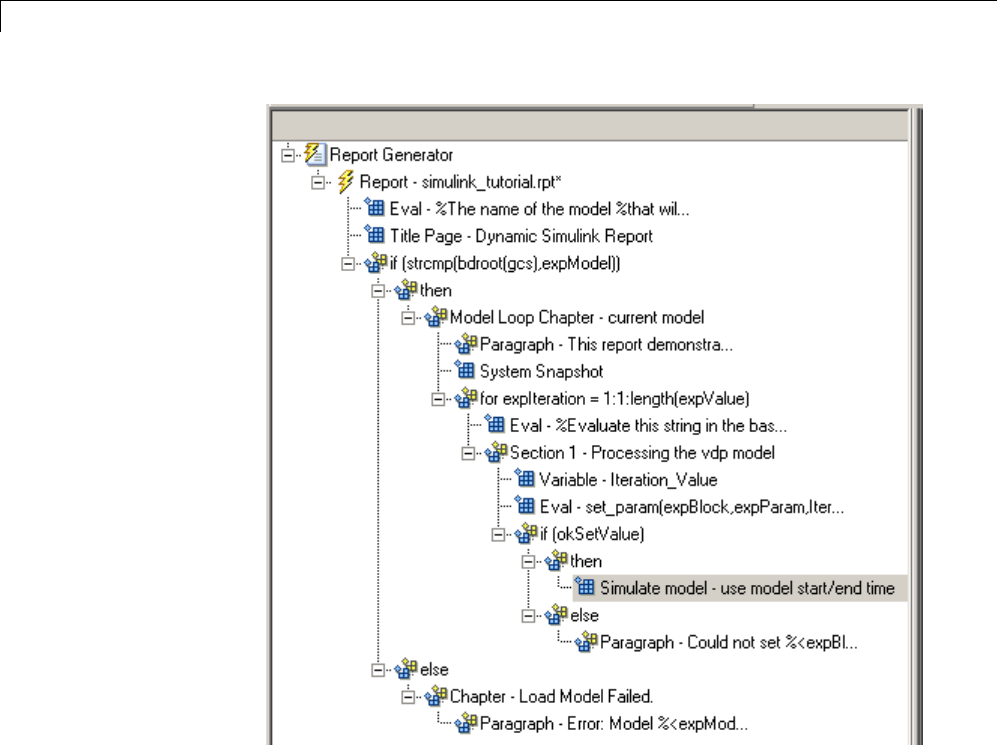
3Creating Simulink®Reports
3In the Properties pane on the right:
aClear the Use model’s workspace I/O variable names check box.
bIn the Time text box, enter dynamicT.
cIn the States text box, enter dynamicX.
dIn the Output text box, enter dynamicY.
The Properties pane on the right looks as follows.
3-40
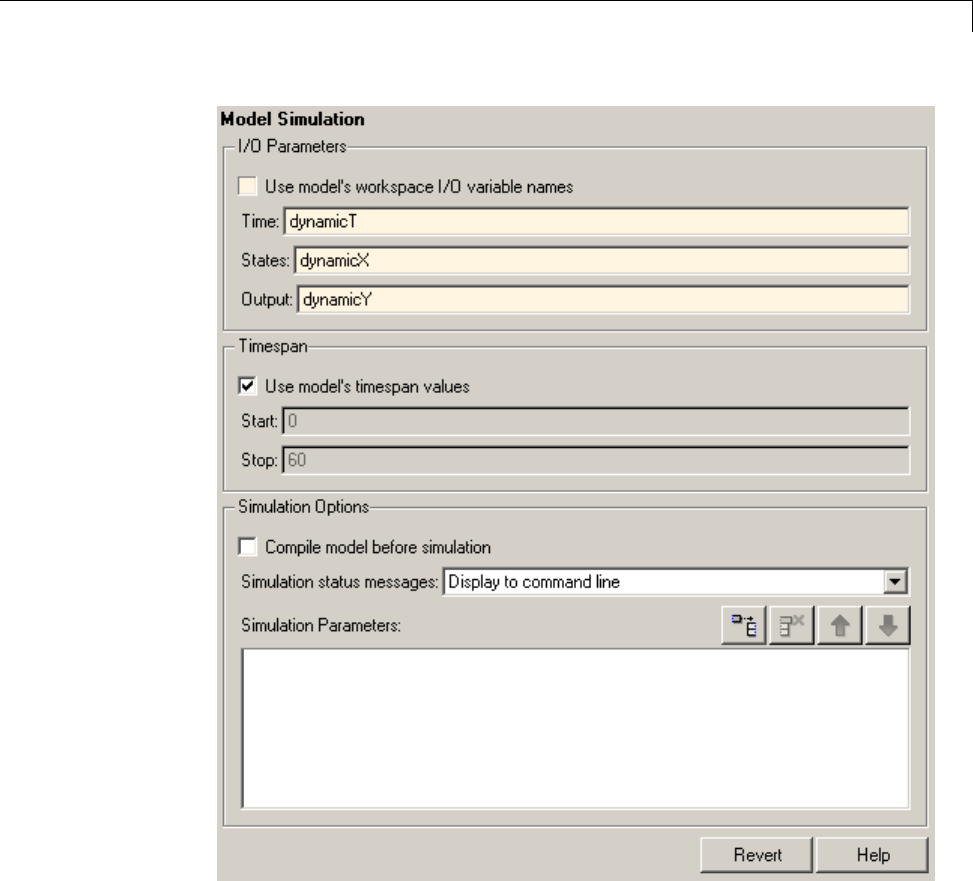
Add Components to the Report Setup File
4In the Outline pane on the left, select the Simulate model component.
5In the Library pane in the middle:
aScroll down to the Simulink Blocks category.
bDouble-click Scope Snapshot to add it as a sibling of the Simulink
Model component.
3-41
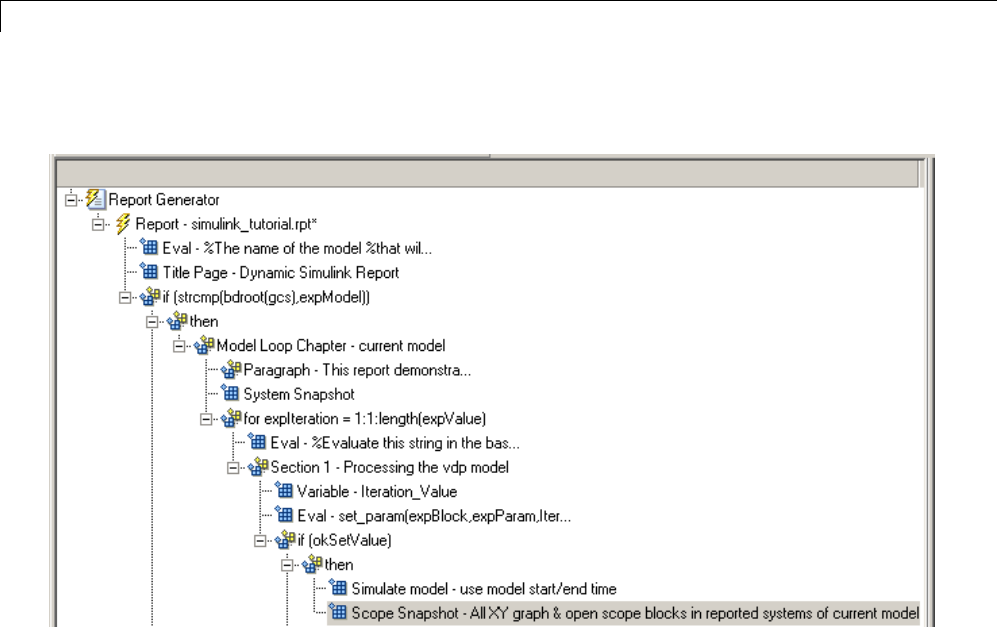
3Creating Simulink®Reports
This component captures the scope for each iteration.
6In the Properties pane on the right:
aIn the Paper orientation selection list, select Portrait.
bFor the Image size,enter[5 4].
cIn the Scaling selection list, select Zoom.
dEnter 75 for the %value.
7Save the report setup file.
8To test to see if the signal data falls within a specified range, add another
Logical If component:
aIn the Outline pane on the left, select the Scope Snapshot component.
bIn the Library pane in the middle, scroll up to the Logical and Flow
Control category.
cDouble-click the Logical If component.
3-42
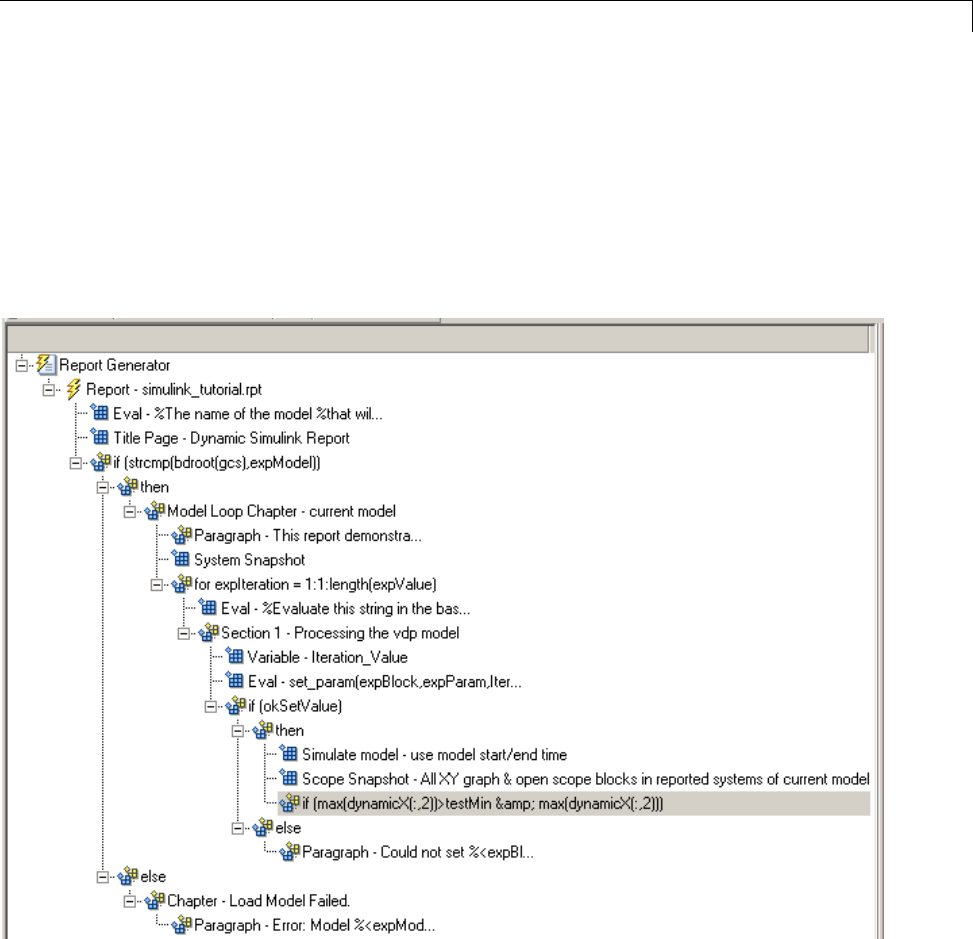
Add Components to the Report Setup File
9To test the signal data, replace true in the Test expression text box with
the following in the Properties pane on the right:
max(dynamicX(:,2))>testMin & max(dynamicX(:,2))
10 Save the report.
The Outline pane looks as follows:
11 If this condition is true, the signal data falls within the desired range.
Add aParagraph component to print information about the signal data
in the report.
aIn the Outline pane on the left, select the if component you just added.
3-43
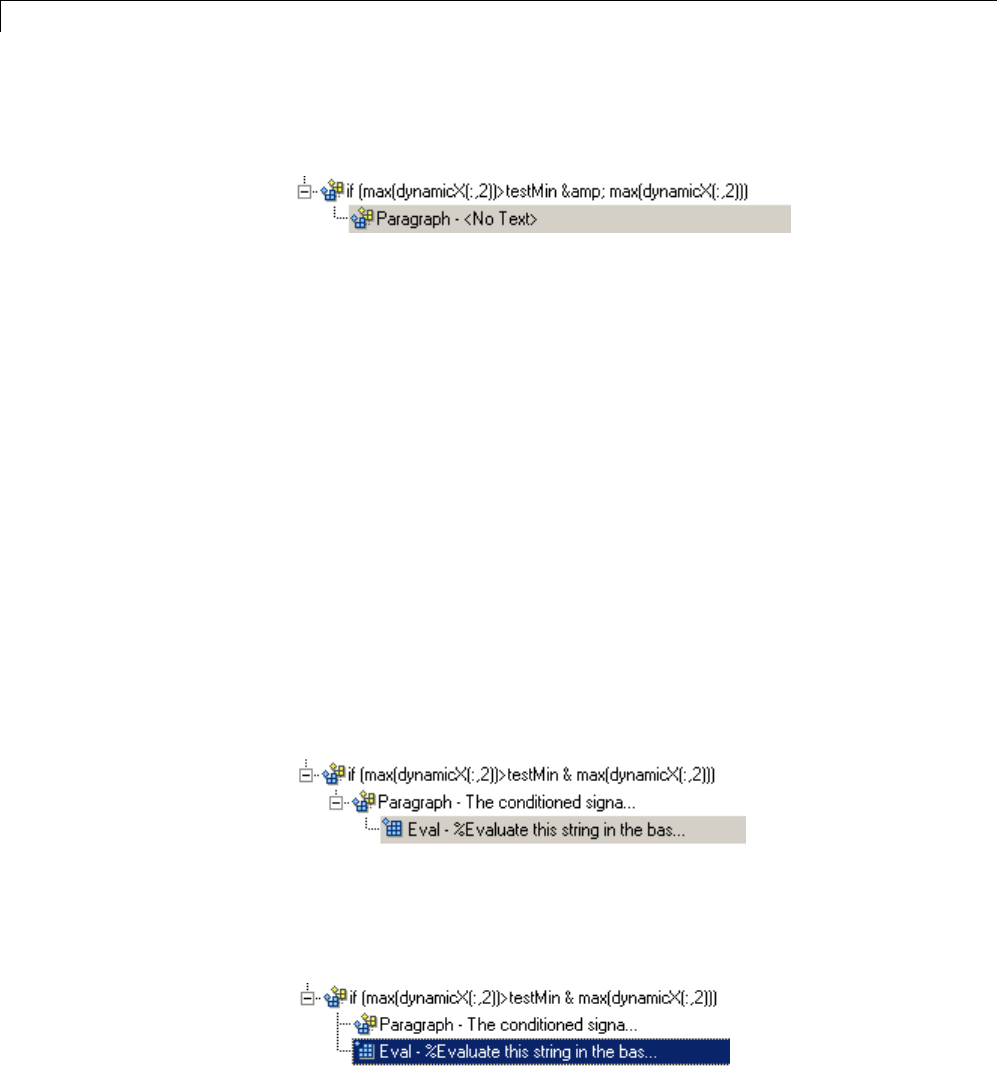
3Creating Simulink®Reports
bIn the Library pane in the middle, under the Formatting category,
double-click Paragraph so that it becomes a child of the if component.
cIn the Properties pane on the right:
iFrom the Title Options selection list, select Custom title.
ii Type Success in the text box.
iii Enter the following text in the Paragraph text text box.
The conditioned signal has a maximum value
of %<max(dynamicX(:,2))>, which lies in the
desired range of greater than %<testMin> and
less than %<testMax>.
12 To save the success values to insert into a table at the end of the iterations,
use an Evaluate MATLAB Expression component.
aIn the Outline pane on the left, select the Paragraph component.
bIn the Library pane in the middle, under the MATLAB category,
double-click Evaluate MATLAB Expression.
An unintended result occurs: the new component is a child of the
Paragraph component.
cTo make the new component a sibling of the Paragraph component, in
the Outline pane on the left, select the Eval component, and then Click
the left arrow on the toolbar. The Eval component becomes a sibling of
the Paragraph component.
3-44

Add Components to the Report Setup File
13 In the Properties pane on the right, for the Eval component:
aClear the Insert MATLAB expression in report and Display
command window output in report check boxes.
bIn the Expression to evaluate in the base workspace text box, enter
the following to save the desired signal values in the expOkValues array:
expOkValues=[expOkValues;...
{Iteration_Value,max(dynamicX(:,2))}];
cMake sure you select Evaluate this expression if there is an error.
Insert the following text in the text box:
disp(['Error during eval: ', evalException.message])
14 Save the report setup file.
Create a Post-Test Analysis Section
Note This section builds on the step-by-step tutorial presented in “Create a
Simulink®Report Generator™ Report” on page 3-2.
To see the completed report setup file, open Simulink Dynamic Report.The
report is for the vdp model.
Now that you have collected all the desired values, create the post-test
analysis section by creating a table and inserting it into your report at the
end of this chapter.
1In the Outline pane on the left, select the Model Loop Chapter component.
3-45
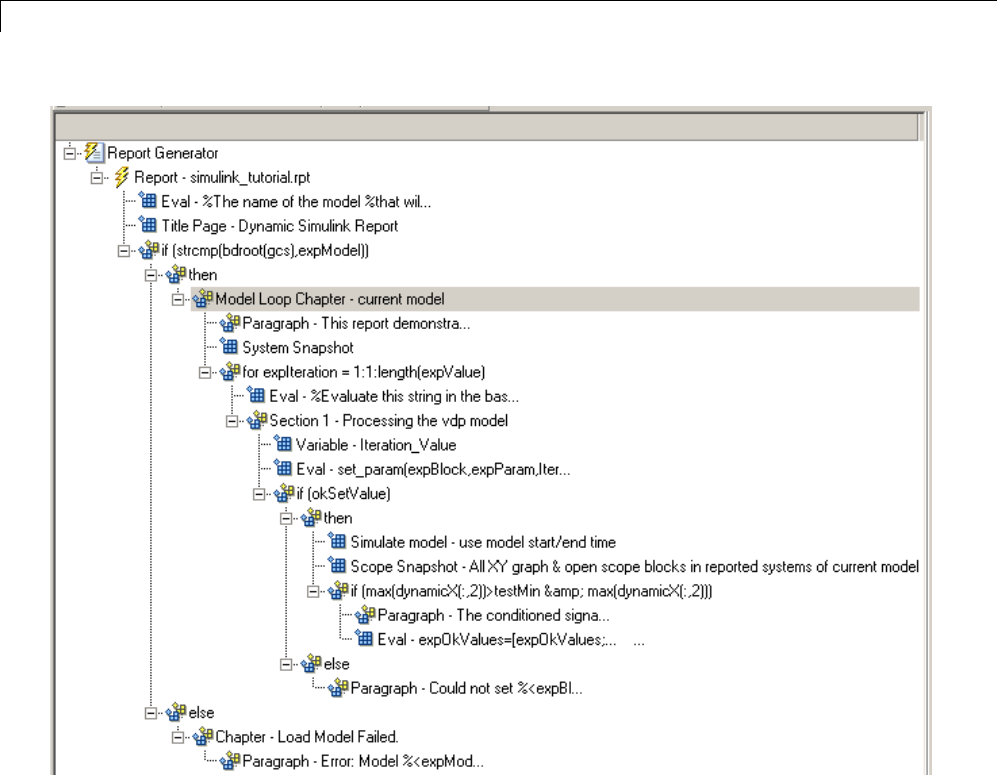
3Creating Simulink®Reports
2In the Library pane in the middle, under the Formatting category,
double-click Chapter/Subsection.
The new section appears at the beginning of the chapter.
3-46
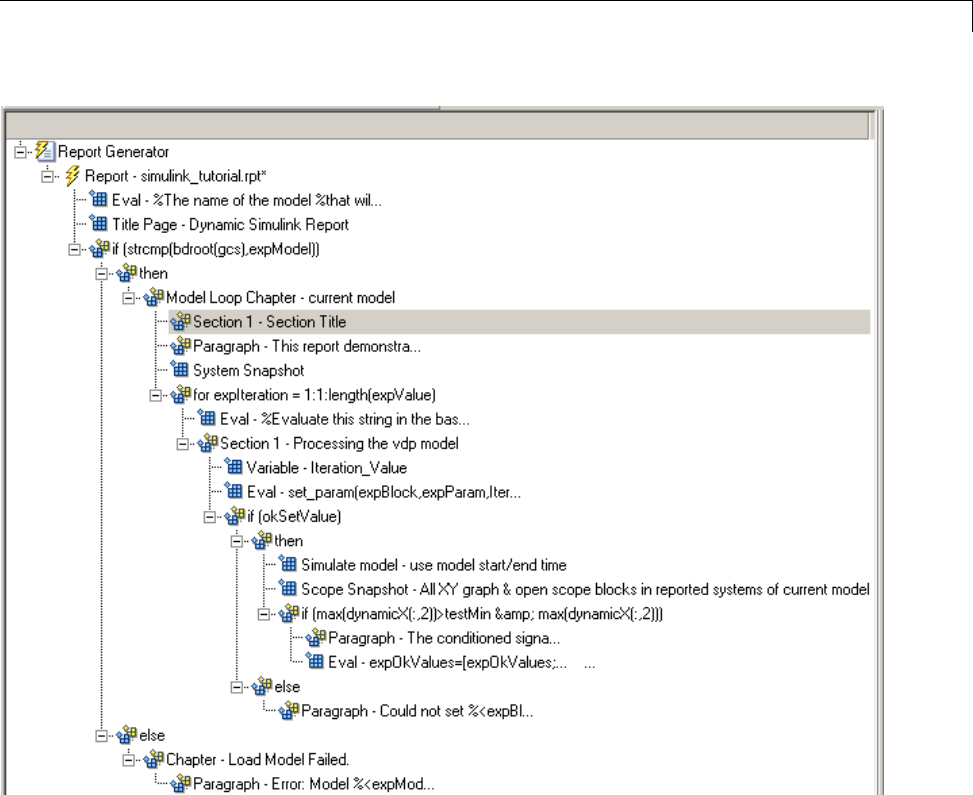
Add Components to the Report Setup File
Click the down arrow three times so Section 1 moves to the end of the
Model Loop Chapter component.
3-47

3Creating Simulink®Reports
3In the Properties pane on the right:
aSelect Custom in the Title selection list.
bEnter Post-Test Analysis in the text box.
4In the Outline pane on the left, select the new Section 1 component.
5In the Library pane in the middle, under the Formatting category,
double-click Paragraph. Do not change its properties.
3-48
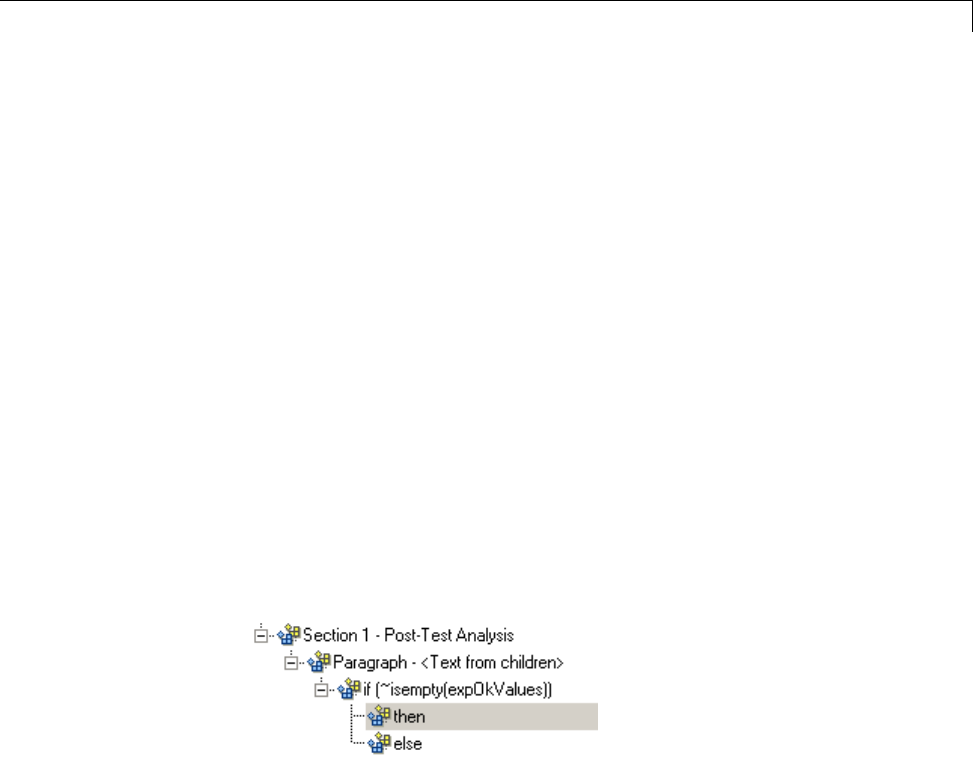
Add Components to the Report Setup File
6To check whether there are any signal values within the desired
range, check the array expOkValues with a Logical If component. If
expOkValues is empty, there are no signal values in the desired range.
Report the result of this check.
aIn the Outline pane on the left, select the Paragraph component and
add a Logical If child component.
bIn the Properties pane on the right, enter the expression to evaluate
in the Test expression text box:
~isempty(expOkValues)
This expression evaluates to 0(false)ifexpOkValues is empty;
otherwise, it evaluates to 1(true).
cIn the Outline pane on the left, select the if(~isempty(expOkValue))
component and add the Logical Else component as a child.
dSelect the if(~isempty(expOkValue)) component again and add the
Logical Then component as a child.
ThetwocomponentsaresiblingsintheOutlinepaneontheleft.
7Save the report setup file.
8Now, insert report components to handle the case where expOkValues is
empty; that is, where no signal values fall within the designated range.
aIn the Outline pane on the left, select the else component.
bIn the Library pane in the middle, double-click the Text component to
add it as a child of the else component.
cIn the Properties pane on the right, in the Text to include in report
text box, enter the following:
None of the selected iteration values had
3-49

3Creating Simulink®Reports
a maximum signal value between %<testMin> and %<testMax>.
9Now handle the case where expOkValues is not empty and you want to
insert a table of the acceptable signal values.
aIn the Outline pane on the left, select the then component.
bAdd a Text component as a child to the then component.
cIn the Properties pane on the right, in the Text to include in report
text box, enter the following text.
%<size(expOkValues, 1)> values for %<expBlock> were
found that resulted in a maximum signal value greater
than %<testMin> but less than %<testMax>. The following
table shows those values and their resulting signal maximum.
dIn the Outline pane on the left, select the Text component under the
then component of the if(~isempty(expOkValues) component.
10 To create an array for use when formatting the table, use the Evaluate
MATLAB Expression component.
aIn the Library pane in the middle, double-click Evaluate MATLAB
Expression.
bIn the Properties pane on the right:
iClear the Insert MATLAB expression in report and Display
command window output in report check boxes.
ii The next component of the report uses the strings Mu Value and
Signal Maximum as table header values. Add the strings to the front
of the expOkValues cell array by entering the following text into the
Expression to evaluate in the base workspace text box:
expOkValues=[{'Mu Value','Signal Maximum'} expOkValues];
iii Make sure you select the Evaluate this expression if there is an
error check box. Enter the following text into the text box:
disp(['Error during eval: ', evalExpression.message])
3-50
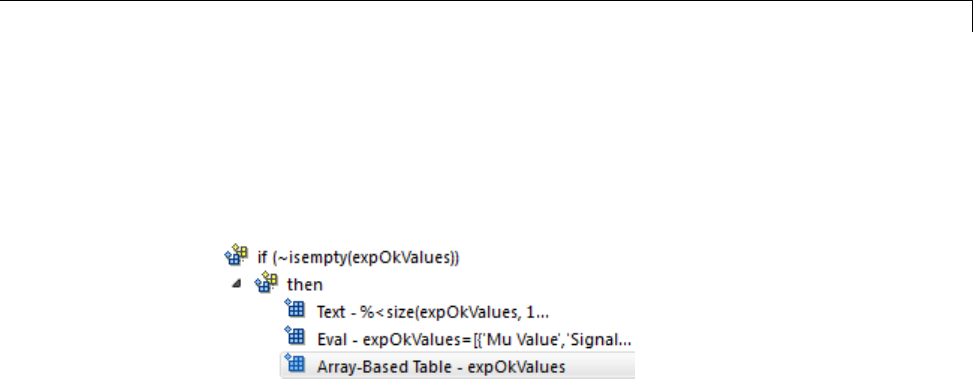
Add Components to the Report Setup File
11 In the Outline pane on the left, select the Eval component.
12 In the Library pane in the middle, under the Formatting category,
double-click the Table component so it becomes a sibling of the Text and
Eval components.
13 In the Properties pane on the right:
aIn the Workspace variable name text box, enter expOkValues.The
Simulink Report Generator software uses the contents of expOkValues
to construct the table.
bIn the Table title text box, enter Valid Iteration Values.
14 Save the report setup file.
The Outline pane on the left looks as follows.
3-51
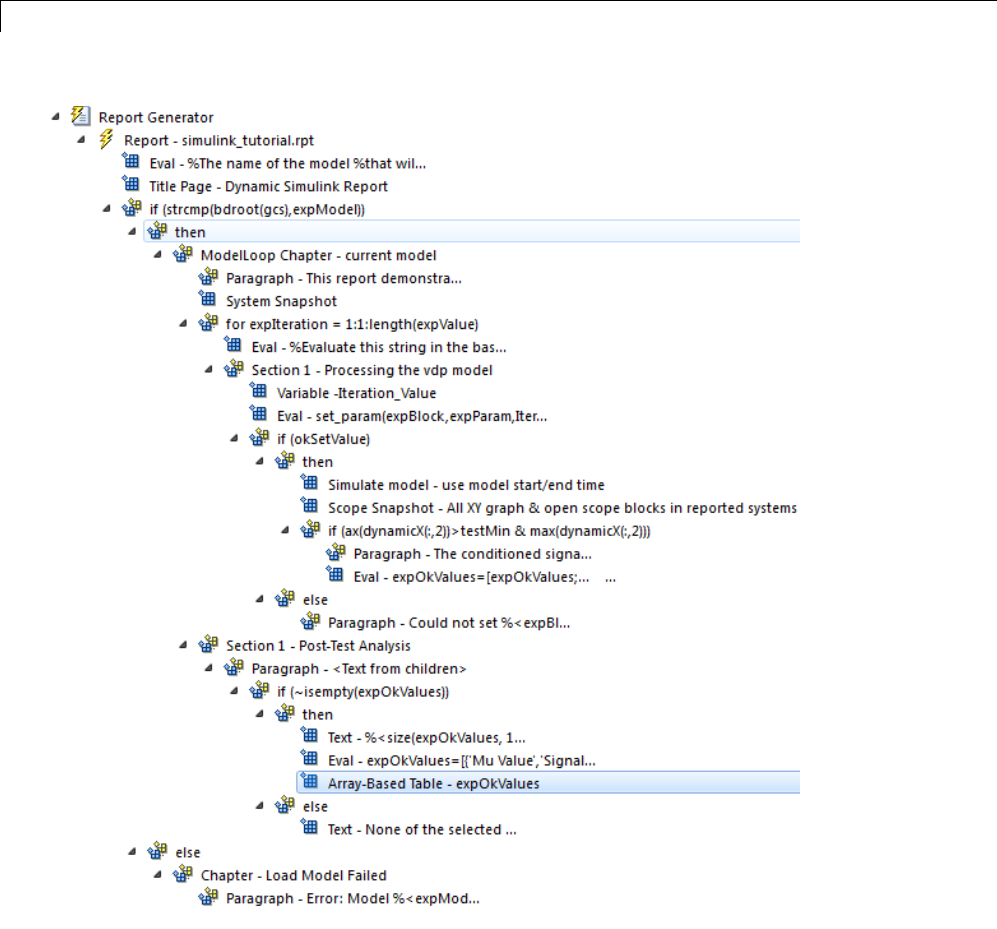
3Creating Simulink®Reports
3-52

Error Handling for MATLAB®Code
Error Handling for MATLAB Code
You can add MATLAB code to a report, by using the Evaluate MATLAB
Expression component (also called the Eval component). See “Add MATLAB
Code” on page 3-7 for details.
TheEvaluateMATLABExpressioncomponent dialog box includes an
Evaluate this expression if there is an error check box. The dialog box
includes default error handling code that you can use, or you can create your
own error handling code.
If you do not change the default error handling code, then when you generate
the report, and there is an error in the MATLAB code that you added:
•If you clear Evaluate this expression if there is an error check box,
then the complete report is generated, without displaying an error message
at the MATLAB command line.
•If you select Evaluate this expression if there is an error check box,
then the complete report is generated and an error message appears at
the MATLAB command line.
To stop report generation when an error occurs in the MATLAB code that
you added, change the second and third lines of the following default error
handling code, as described below:
warningMessageLevel = 2;
displayWarningMessage = true;
failGenerationWithException = false;
failGenerationWithoutException = false;
To stop report generation and display an exception, change the default code to:
displayWarningMessage = false;
failGenerationWithException = true;
To stop report generation without displaying an exception, change the default
code to:
displayWarningMessage = false;
failGenerationWithoutException = true;
3-53

3Creating Simulink®Reports
If you want to completely replace the default error handling code, use the
evalException.message variable in your code to return information for the
exception.
3-54
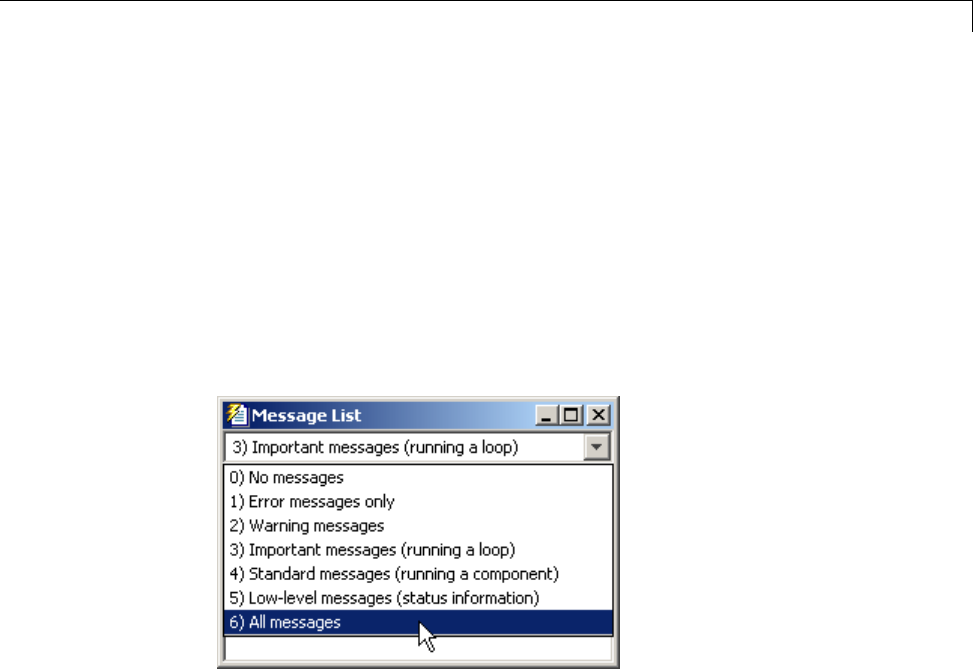
Generate the Report
Generate the Report
Now the report includes all required components. To generate the report,
click the Report icon on the toolbar. The following occurs:
1A Message List window appears, displaying informational and error
messages as the report is processed. Specify the level of detail you would
like the Message List window to display while the report is being generated.
Options range from 0(least detail) to 6(most detail). Click the selection
list located under the title bar of the Message List window to choose an
option, as shown in the following figure.
Message level 3 (Important messages) is used for the remainder of
this example.
3-55
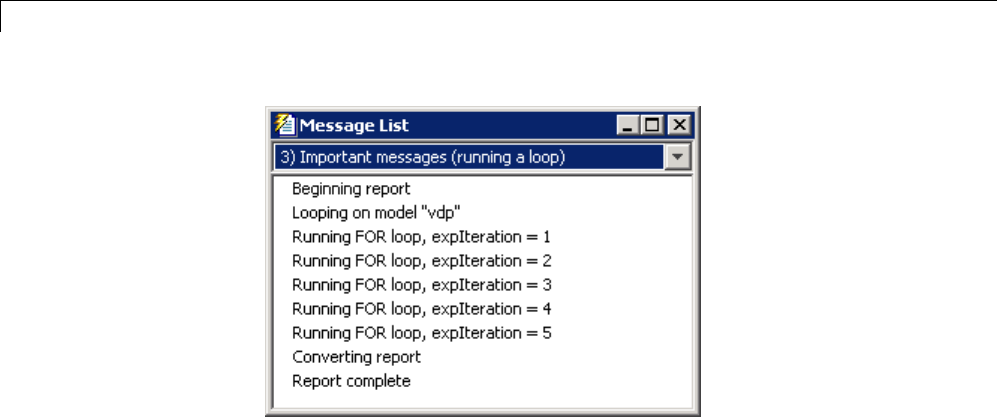
3Creating Simulink®Reports
2The vdp model appears. You can see each time it is simulated.
3The scope window appears. The scope graph changes each time the
parameter value changes.
4Each component of the report is highlighted as it executes, in the Outline
pane on the left in the Report Explorer window.
When the report is complete, Adobe Acrobat Reader opens your report in
PDF format.
3-56
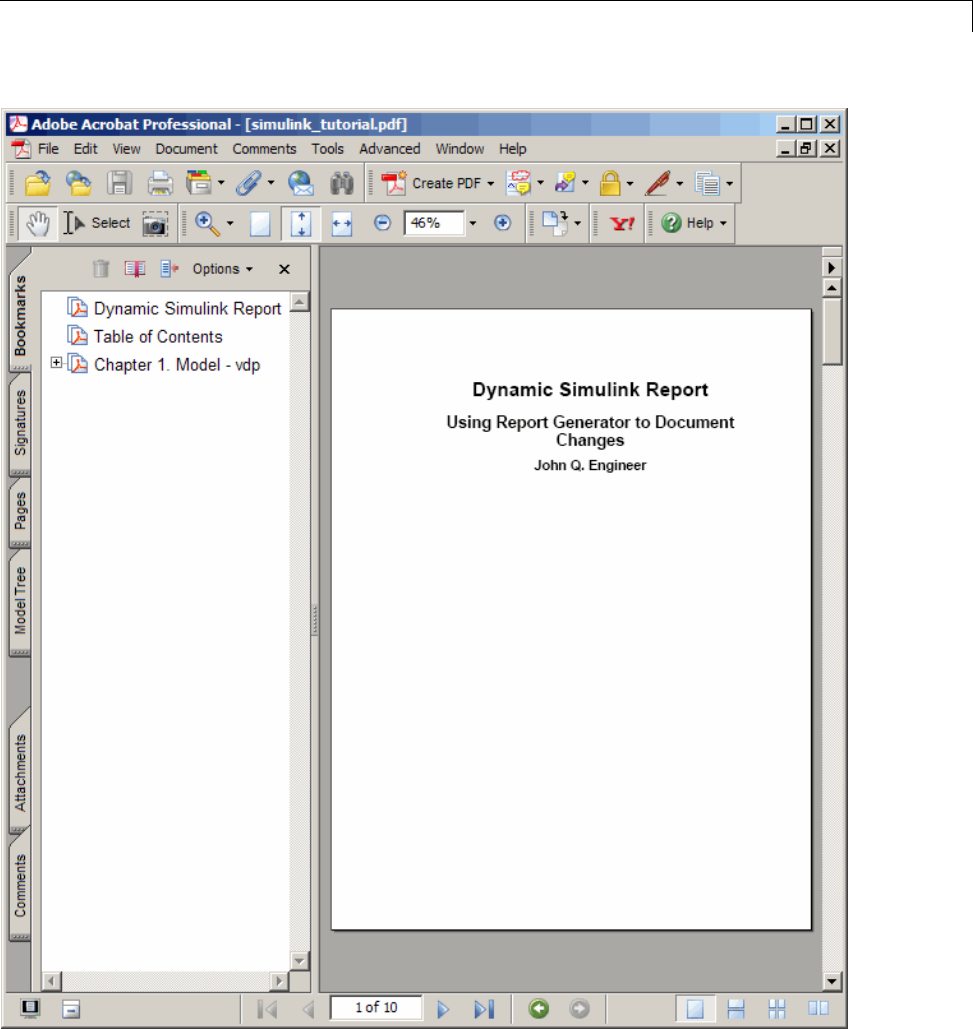
Generate the Report
3-57

3Creating Simulink®Reports
3-58

4
Generate a Report
•“Generate a Report” on page 4-2
•“Set Report Output Options” on page 4-4
•“Change Report Locale” on page 4-15
•“Convert XML Documents” on page 4-16
•“Create a Log File” on page 4-19
•“Generate MATLAB Code from Report Setup File” on page 4-20
•“Legacy Report Setup Files” on page 4-23
•“Troubleshooting Report Generation Issues” on page 4-25
4Generate a Report
Generate a Report
In this section...
“Run a Report” on page 4-2
“Report Output Options” on page 4-2
Run a Report
You can generate a Simulink Report Generator report using one of these
methods:
•In the Report Explorer Outline pane, select a report and do one of the
following actions:
-In the Report Explorer toolbar, click the Report button ( ).
-Press CTL+R.
-Select File > Report.
•From the MATLAB command line, use the report command. For example,
to print the system1_description report in PDF format, use:
report system1_description -fpdf
Report Output Options
Before you generate a report, you can set options to control aspects of report
generation processing such as:
•Output file format (PDF, HTML, or Microsoft Word)
•Stylesheet for the selected output file format, to control the layout of the
report (for example, whether to display a title page, font, and section
numbering)
•Output file location
•Whether to regenerate image files
•Whether to view the generated report automatically
4-2

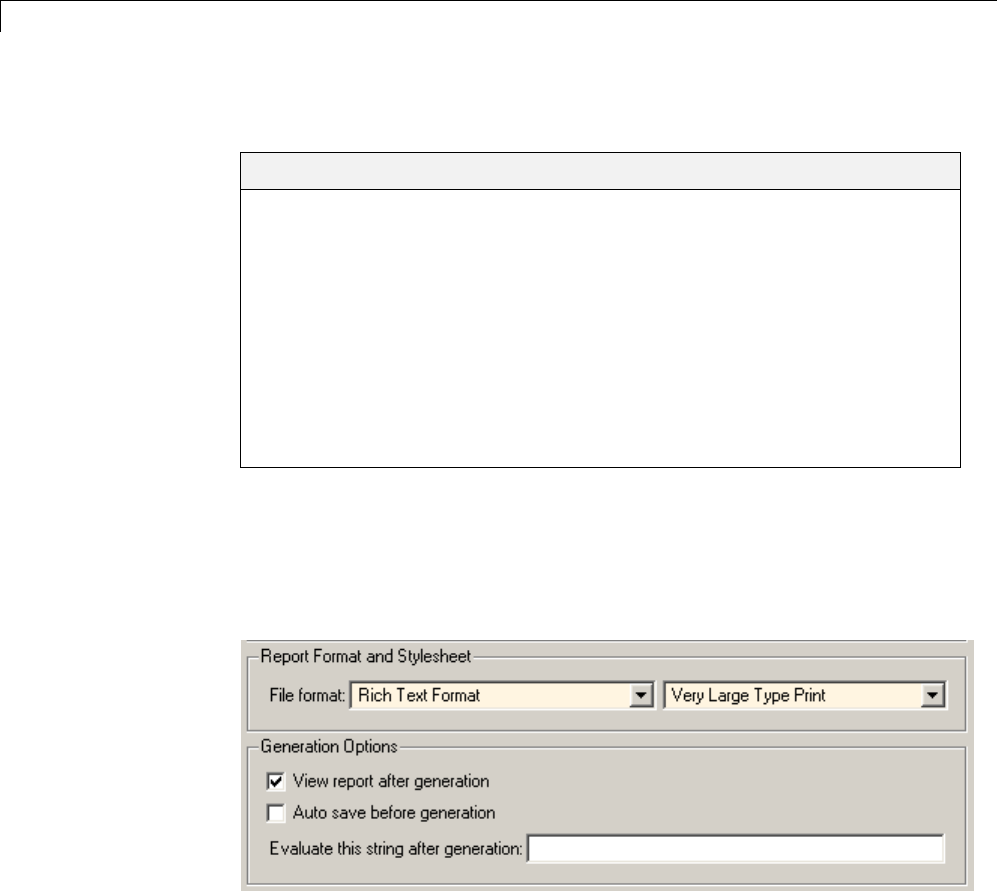
4Generate a Report
SetReportOutputOptions
In this section...
“Report Output Format and Stylesheet” on page 4-4
“PDF Stylesheets” on page 4-7
“Web Stylesheets” on page 4-8
“RTF (DSSSL Print) and Word Stylesheets” on page 4-9
“Report Generation Processing” on page 4-9
“Output File Location” on page 4-12
“Regenerate Images” on page 4-13
“Add Description of Report Setup” on page 4-14
Report Output Format and Stylesheet
In the Report Explorer, in the Report Options pane, choose the report output
format in the File format text box. For example, if you want to use Microsoft
Word, choose Word document or Rich Text Format.
Each output format has a default stylesheet associated with it. Specify the
stylesheet in the text box next to the File format text box.
The following table shows which output format to use with different software,
and which stylesheets you can use with each output format.
4-4

SetReportOutputOptions
Viewer Format Description Stylesheets
Adobe
Acrobat
Reader
Adobe Acrobat
(PDF)
Produces a PDF
that you can
view using Adobe
Acrobat Reader
software
PDF (see “PDF
Stylesheets”)
Web browser Web (HTML)
(default)
Use for
publishing on
the World Wide
Web
Web (see “Web
Stylesheets”)
Word
processor
Rich Text
Format (RTF)
or Word
Document
Compatible
with most
word-processing
packages,
including
Microsoft Word
software
Print (see “RTF
(DSSSL Print) and
Word Stylesheets”)
DocBook DocBook
(XML)
Produces a
report in
DocBook format
N/A
Note For reports that use the Word Document format, you must have
Microsoft Word software installed on the machine that you use to generate
the report.
Tip To create and use customized styles, see “Create a New Stylesheet”.
Change the Default Output Format
In the Report Generator Preferences pane, use the Format ID preference to
specifythedefaultoutputformatforreports.
4-5
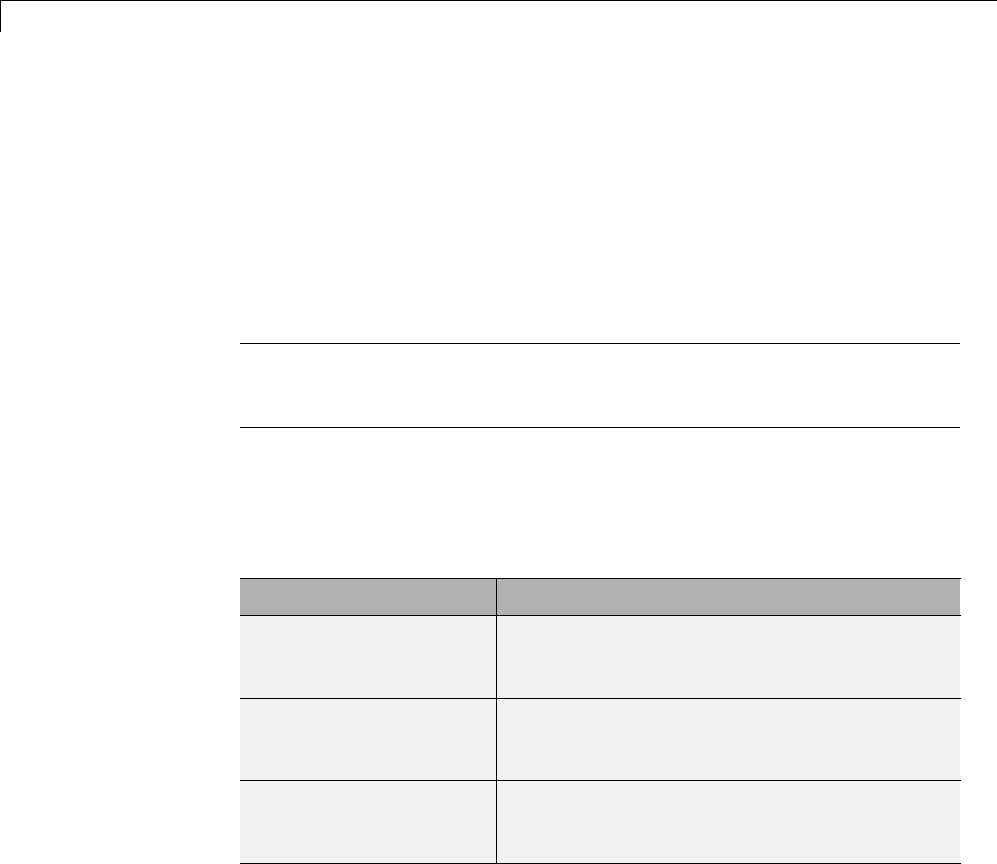
4Generate a Report
Stylesheets
For each output format, you can choose from several stylesheets for each
report output format. For details, see:
•“PDF Stylesheets” on page 4-7
•“Web Stylesheets” on page 4-8
•“RTF (DSSSL Print) and Word Stylesheets” on page 4-9
Note Some Web and Print stylesheets include an automatically generated
list of titles. The list of titles includes a list of table titles and a list of figures
with titles.
Image Format
In the Report Generator Preferences pane, use the following preferences to
specify the default image file format.
Preference Purpose
Simulink Images Specify the format for Simulink images to
include in the report. The default is PNG 24-bit
image.
Stateflow Images Specify the format for Stateflow charts to
include in the report. The default is PNG 24-bit
image.
HG Images Specify the format for Handle Graphics images
to include in the report. The default is PNG
24-bit image.
4-6
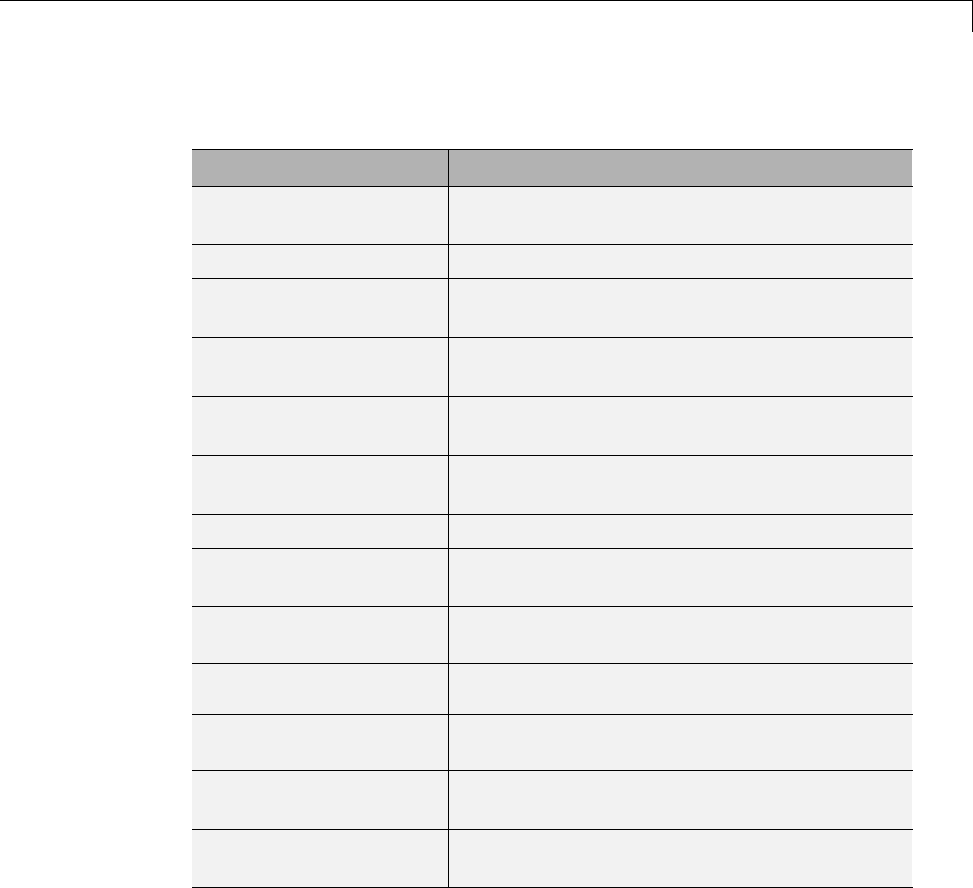
SetReportOutputOptions
PDF Stylesheets
PDF Stylesheet Description
Default print
stylesheet
Displays title page, table of contents, list of titles
Standard Print Displays title page, table of contents, list of titles
Simple Print Suppresses title page, table of contents, list of
titles
Compact Simple Print Minimizes page count, suppresses title, table of
contents, list of titles
Large Type Print Uses 12-point font (slightly larger than
Standard Print)
Very Large Type Print Uses 24-point font and landscape paper
orientation
Compact Print Minimizes white space to reduce page count
Unnumbered Chapters &
Sections
Chapters and sections are not numbered
Numbered Chapters &
Sections
Chapters and sections are both numbered
Paginated Sections Sections are printed with page breaks
Custom Header Lets you specify custom headers and footers
Custom Titlepage Lets you specify custom title page content and
presentation
Verbose Print Lets you specify advanced print options
4-7
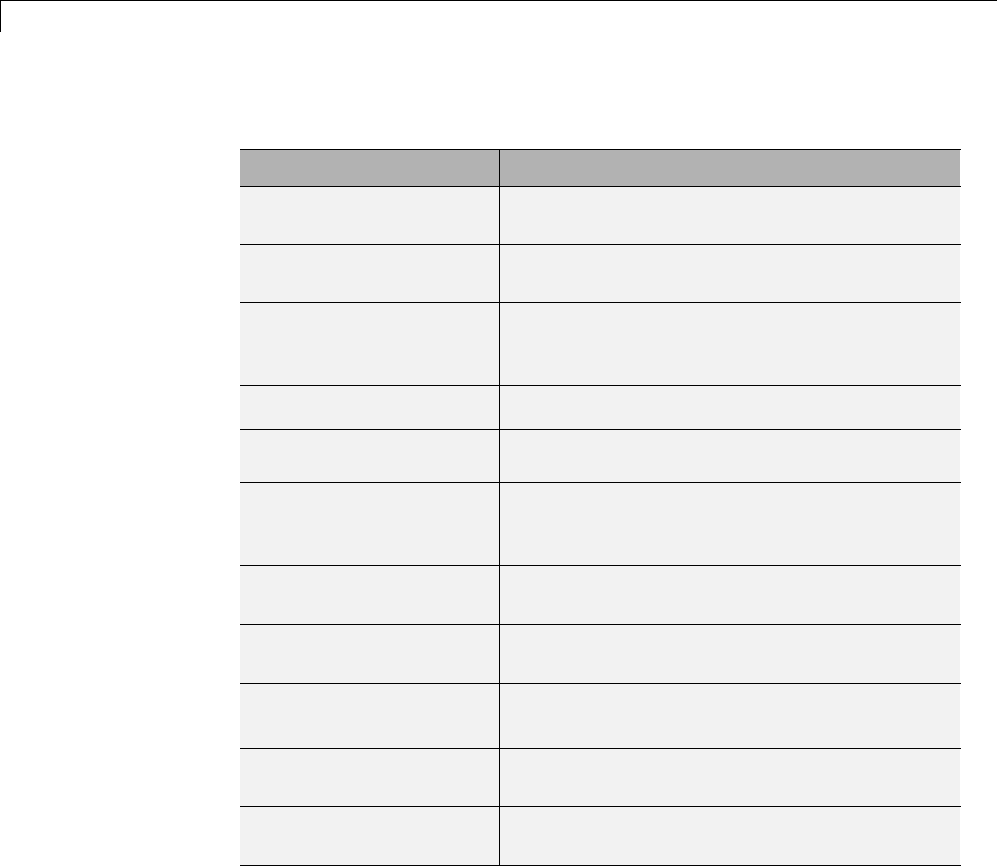
4Generate a Report
Web Stylesheets
Web Stylesheet Description
Default HTML
stylesheet
HTML on a single page
Simulink book HTML
stylesheet
HTML on multiple pages; suppresses chapter
headings and table of contents
Truth Table HTML
stylesheet
HTML on multiple pages; suppresses chapter
headings and table of contents
Multi-page Web HTML, with each chapter on a separate page
Single-page Web HTML on a single page
Single-page
Unnumbered Chapters &
Sections
HTML on a single page; chapters and sections
are not numbered
Single-page Numbered
Chapters & Sections
HTML on a single page; chapters and sections
are numbered
Single-page Simple HTML on a single page; suppresses title page
and table of contents
Multi-page Simple HTML on multiple pages; suppresses title page
and table of contents
Multi-page Unnumbered
Chapters & Sections
HTML on multiple pages; chapters and sections
are not numbered.
Multi-page Numbered
Chapters & Sections
HTML on multiple pages; chapters and sections
are numbered
4-8
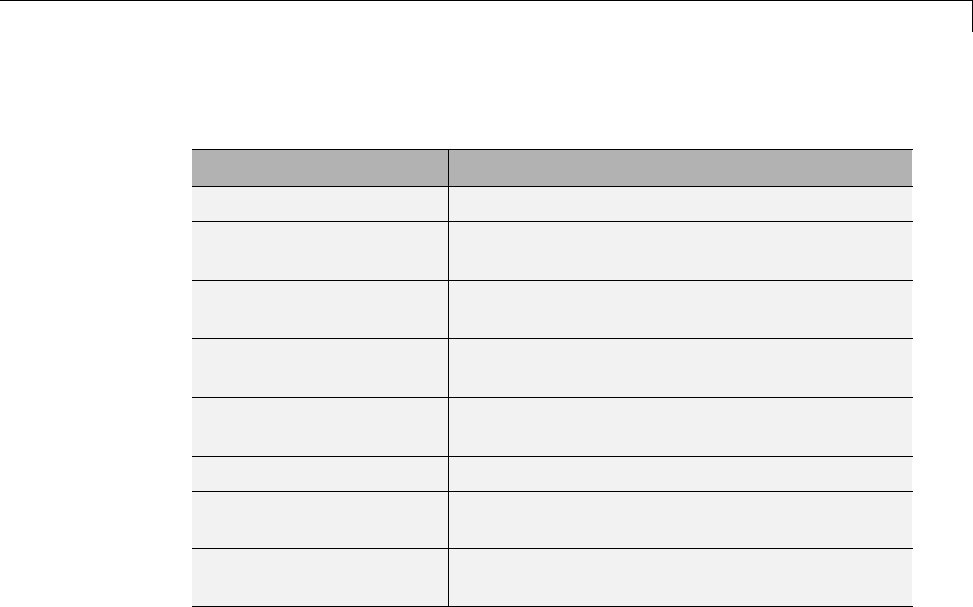
SetReportOutputOptions
RTF (DSSSL Print) and Word Stylesheets
RTF or Word Stylesheet Description
Standard Print Displays title page, table of contents, list of titles
Simple Print Suppresses title page, table of contents, list of
titles
Compact Simple Print Minimizes page count, suppresses title, table of
contents, list of titles
Large Type Print Uses 12-point font (slightly larger than
Standard Print)
Very Large Type Print Uses 24-point font and landscape paper
orientation
Compact Print Minimizes white space to reduce page count
Unnumbered Chapters &
Sections
Chapters and sections are not numbered
Numbered Chapters &
Sections
Chapters and sections are both numbered
Report Generation Processing
Report Explorer Report Options
In the Report Explorer, in the Report Options pane includes several options
for controlling report processing.
4-9
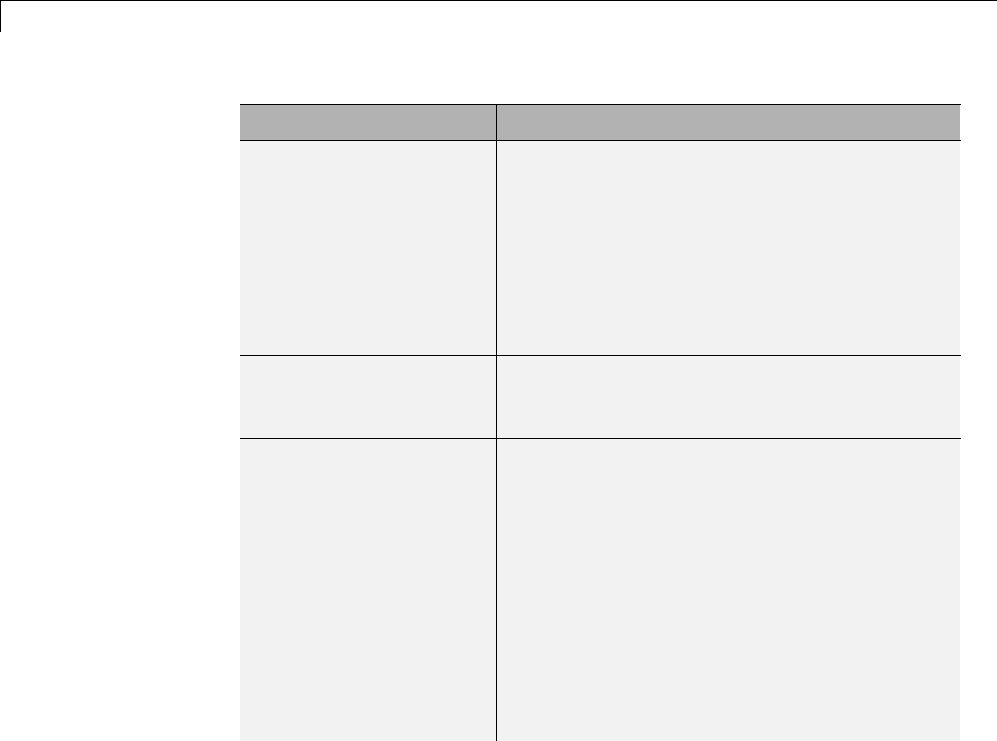
4Generate a Report
Option Purpose
View report after
generation
Select this option to view the report
automatically. When report generation is
complete, the viewer associated with the report
output format displays the report.
To view the report manually, browse to the
location specified in the Report File Location
section in the Properties pane on the right, and
open the file.
Auto save before
generation
To automatically save the report setup file
before you generate a report, select Auto save
before generation.
Compile model to
report on compiled
information
By default, the Simulink Report Generator
reports uncompiled values of Simulink
parameters. The uncompiled values of some
parameters, such as signal data types, can
differ from the compiled values used during
simulation. To ensure that a report reflects
compiled values, select the Compile model to
report on compiled information option. This
option causes the report generator to compile a
model before reporting on model parameters.
After generating the report, the report generator
returns the model to its uncompiled state.
4-10
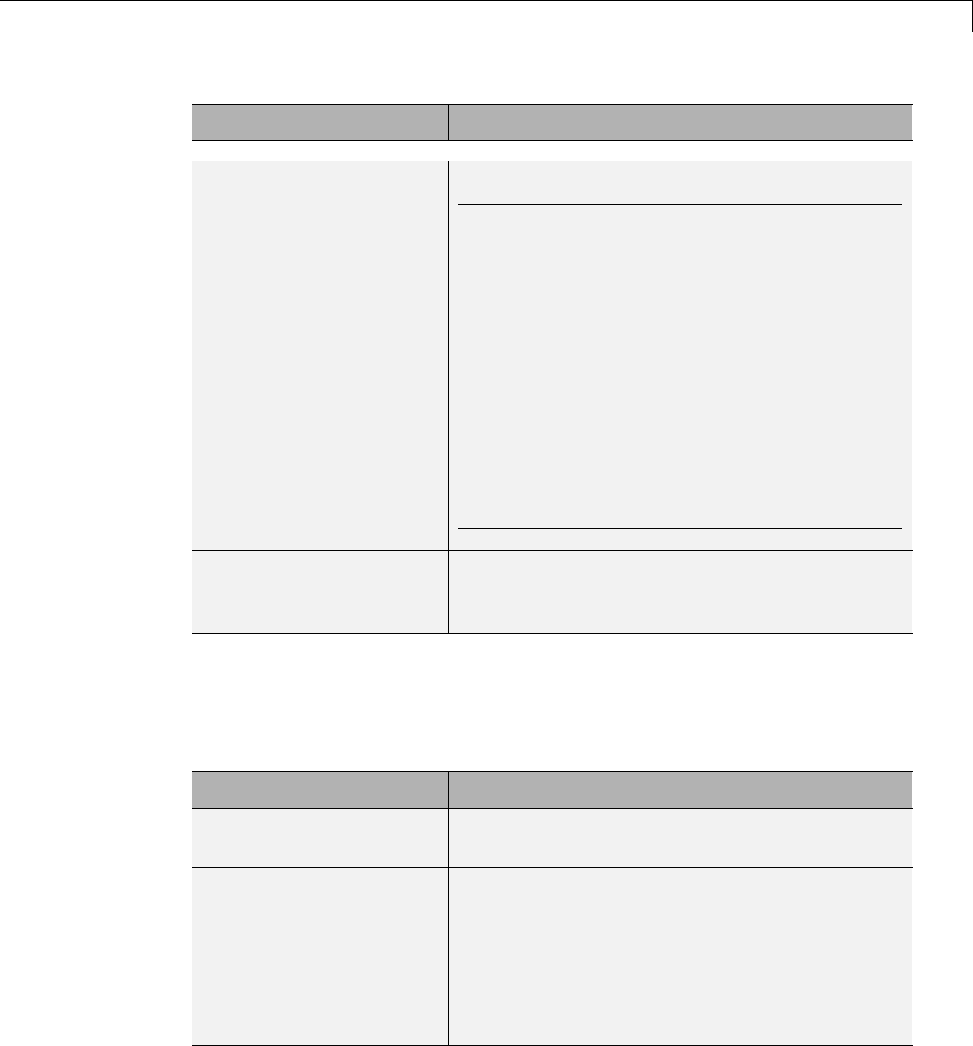
SetReportOutputOptions
Option Purpose
Note When you select this option, whenever
report generation requires simulating the
model (for example, the report includes a Model
Simulation component), the report generator
uncompiles the model and then recompiles the
model, if necessary, to report on model contents.
If a report requires multiple compilations, the
processing can be quite time-consuming.
To minimize compilations, consider using
separate reports to report on the contents of
a model and on the results of simulating that
model.
Evaluate this string
after generation
Specify MATLAB code for processing to occur
after the report is generated. For example, you
could specify to close a model.
Report Processing Preferences
The Report Generator Preferences pane provides several preferences to
control report processing.
Preference Purpose
View command Specify the MATLAB command you want to use
to view the report.
Visible in Report
Explorer
Deselect this check box to make the current
output format unavailable in the Report
Explorer interface. For example, if your
specified report format is Word document and
you deselect this check box, then the Microsoft
Word document format is no longer available for
reports created using the Report Explorer.
4-11
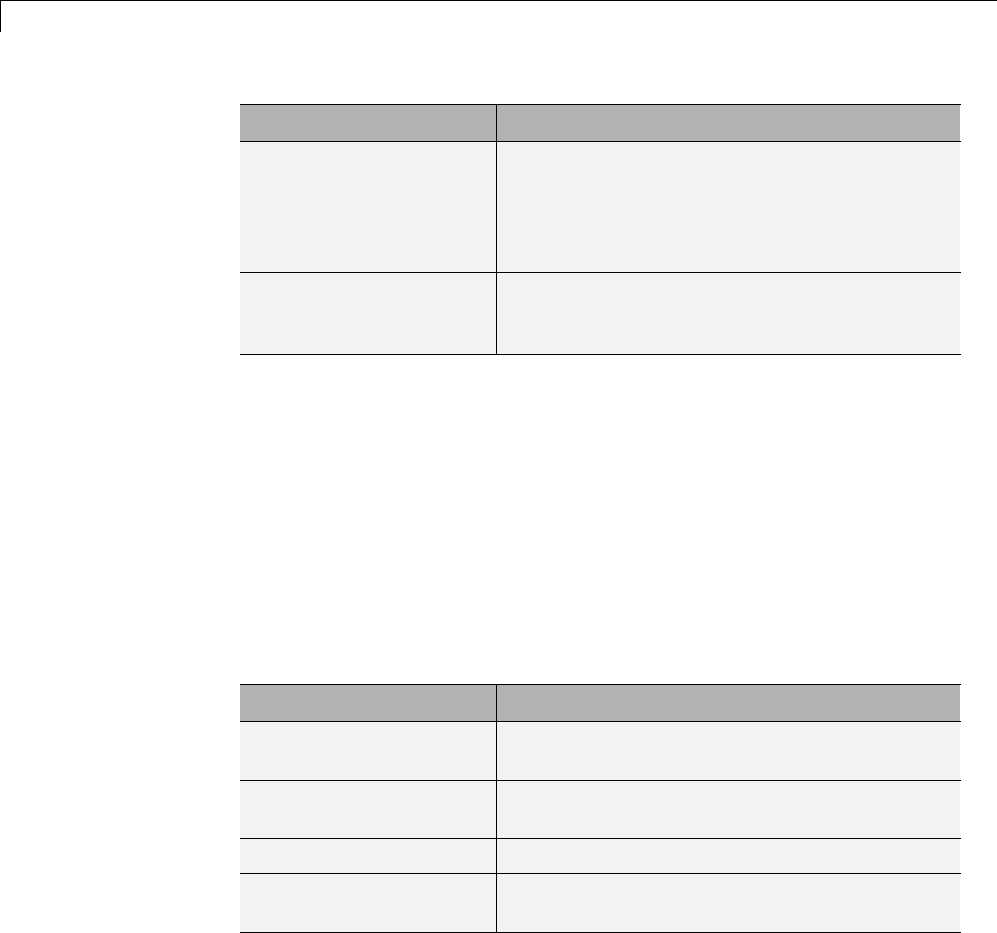
4Generate a Report
Preference Purpose
Use version 1.x
environment
Choose this option to use previous versions
of MATLAB Report Generator and Simulink
Report Generator interfaces. For more
information, see “Use Legacy Interface” on page
4-24.
Animate Report
Explorer when
generating reports
Select this check box if you want components in
the Outline pane to be animated as the report
generates. This box is selected by default.
Output File Location
Choose a folder to which you have write privileges, to store the report file. A
list of options appears in the following table.
Report File Location
In the Report Explorer, in the Report Options pane, use the Directory field
to specify the name of the folder in which to store the generated report file.
Specify a folder to which you have write privileges.
The following table summarizes the report file location options.
Folder Option
Thesamefolderasthe
report setup file
Same as setup file
The current working
folder
Present working directory
Temporary folder Temporary directory
Another folder Custom.UsetheBrowse button (...) to select
from a list of directories.
You can use %<VariableName> notation to specify a folder in the Custom text
box. For more information, see “% Notation” on the Text component reference
page in the MATLAB Report Generator documentation.
4-12
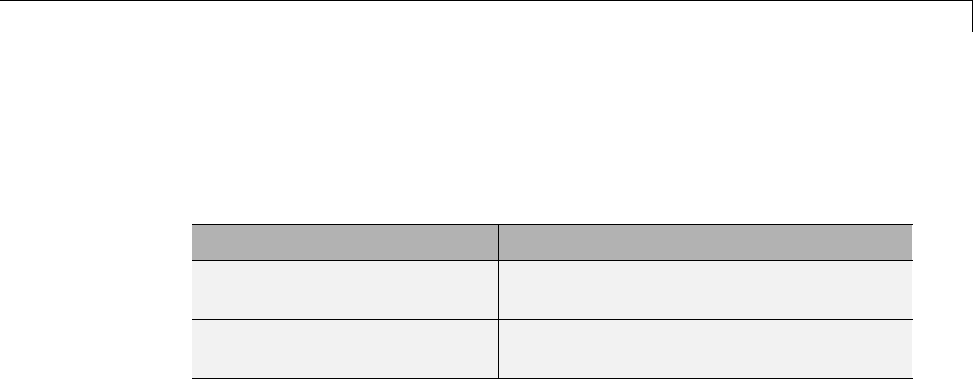
SetReportOutputOptions
Report File Name
In the Report Explorer, in the Report Options pane, use the Filename field to
specify a file name for the report file. Select one of the options listed in the
following table.
File Name Option
Thesamefilenameasthe
report setup file
Same as setup file (default)
Afilenamedifferentfromthe
report setup file name
Custom. Enter the name of the report.
Use %<VariableName> notation to specify a file name in the Custom text box.
For more information, see “% Notation” on the Text component reference page
in the MATLAB Report Generator documentation.
Report File Extension
Be default, the report file extension reflects the output format for the report.
For example, if you specify Web (HTML) output, the default extension for
the report file is .html.
To change the default extension, in the Report Generator Preferences pane,
select a Format ID and in the Extension preference, specify an extension.
Image Output File Location
Imagesareplacedinafolderwiththesamenameasthereportfile.
For example, testreport.html images are placed in a folder named
testreport_files.
Regenerate Images
By default, the Regenerate Simulink and Stateflow Images option in the
Generation Options section of the Properties pane on the right is cleared.
As a result, previously generated images are not regenerated each time you
generate a report, so reports generate faster. If you make changes that affect
a generated image, select this option.
4-13

4Generate a Report
Add Description of Report Setup
Use the Report Description field in the Properties pane on the right to
record notes and comments about your report setup. This text appears in the
Properties pane on the right when you select a report setup file in the Outline
pane on the left.
4-14

Change Report Locale
Change Report Locale
Versions 2.0 and later of the MATLAB Report Generator and Simulink Report
Generator software use the locale (system language settings) through the
Sun™ Java™ interface; therefore, they should use the language specified
on your system.
Alternatively, you can change the language directly in Java from the
MATLAB command line. The following example sets the language to Italian:
java.util.Locale.setDefault(java.util.Locale.ITALY)
Alternatively, you can set the preferred language directly in your .rpt file:
1Right-click the Report component and select Send to Workspace.
This displays the properties of the report, which are stored in the variable
ans. Access the report’s Language property from the command line through
this variable. By default, Language is auto, which indicates that the
system’s default language is in use.
2Override thedefaultvalueofLanguage by setting this property to your
desired language; for example, en for English or it for Italian.
4-15
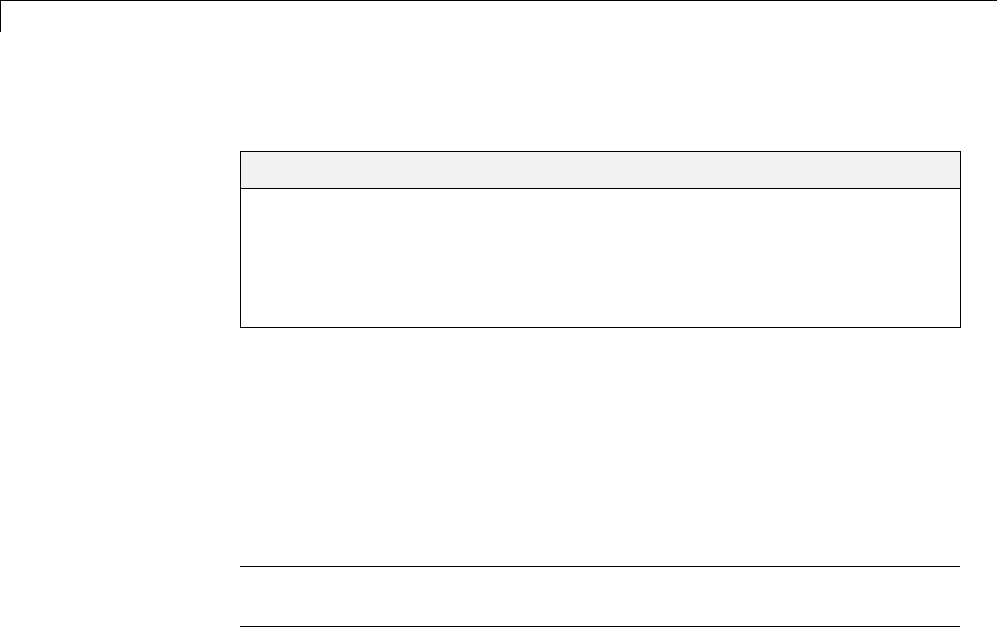
4Generate a Report
Convert XML Documents
In this section...
“Why Convert XML Documents?” on page 4-16
“Convert XML Documents Using the Report Explorer” on page 4-16
“Convert XML Documents Using the Command Line” on page 4-18
“Edit XML Source Files” on page 4-18
Why Convert XML Documents?
You can generate a report in a different output file format without
regenerating it by using either the Report Explorer File Converter or the
rptconvert command. These utilities convert DocBook XML source files
created by the report-generation process into formatted documents such as
HTML,RTF,orPDF.
Note The report-generation process can only convert XML source files
created by the latest version of the software.
Convert XML Documents Using the Report Explorer
To open the Convert Properties pane:
1In the Report Explorer, select Tools > Convert source file.
The Convert Source File Properties pane appears. All XML files in your
current folder appear in the Options pane in the middle.
4-16
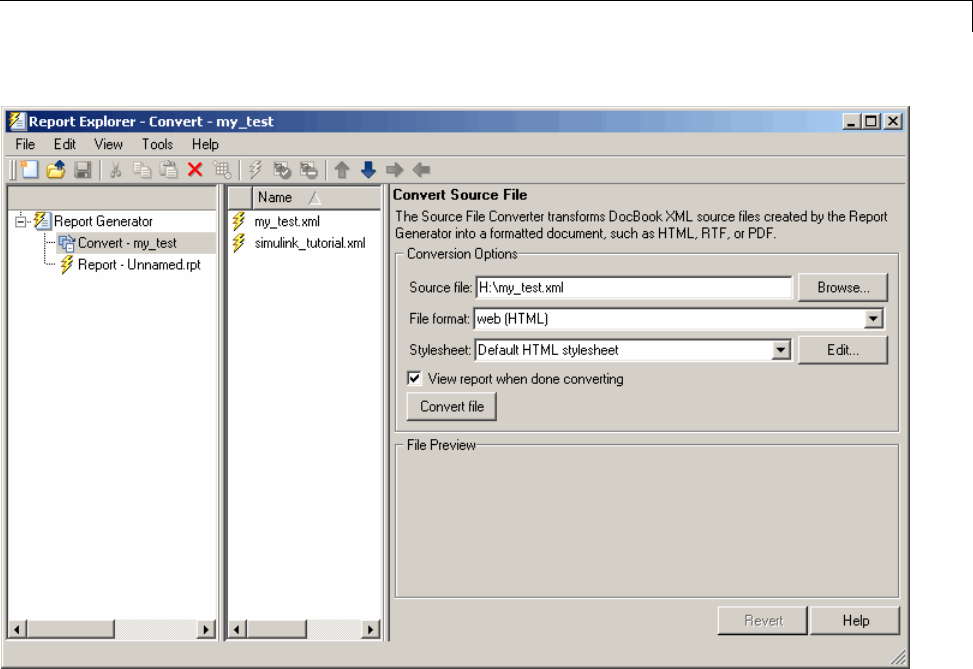
Convert XML Documents
2Select your XML source file using one of the following options:
•Click Browse inthePropertiespaneontherighttobrowsetothe
location of your XML source.
•Double-clickafilenameintheOptionspaneinthemiddleto
automatically enter it into the Source file field in the Properties pane.
3Select your output format and stylesheet:
aIn theFile format text box, select an output format.
bIn theStylesheet text box, select a stylesheet. The stylesheet choice
depends on the specified output format. You can use a predefined or
customized stylesheet.
For more information about available formats and predefined
stylesheets, see “Report Output Format and Stylesheet”.
4-17

4Generate a Report
For more information about customizing stylesheets, see “Create a New
Stylesheet”.
4Use the View Report when done converting check box to indicate
whether you want to view the report after it has conversion.
5To begin the conversion, click Convert file.
Convert XML Documents Using the Command Line
To convert files using the command line, use the rptconvertfunction.
Edit XML Source Files
Before you send a source file to the converter, edit it as text in the Report
Explorer:
1In the Outline pane on the left, open the File Converter.
2Right-click MATLAB Report Generator and select Convert source file.
3In the Options pane in the middle, select the source file to edit.
4In the Properties pane on the right, click Edit as text.
5Use the MATLAB Editor to edit and save the text.
4-18

Create a Log File
Create a Log File
A log file describes the report setup file report-generation settings and
components. A log file can be used for many purposes, including:
•As a debugging tool
•As a reference to a report setup file
•To share information about a report setup file through email
A log file includes the following information:
•Report setup file outline
•Components and their attributes
•Generation status messages currently displayed in the Generation
Status tab
To generate a log file, click File > Log File. An HTML version of the log file
with the name <report_template_file_name_log>.html is saved in the
same folder as the report setup file.
4-19

4Generate a Report
Generate MATLAB Code from Report Setup File
You can generate MATLAB code versions of report setup files in the form
of a MATLAB file (*.m). AMATLABfileofareportsetupfileisusefulfor
various purposes, including generating reports and modifying report setup
files programmatically.
To generate a MATLAB file, load a report setup file into the Report Explorer
and click File > Generate MATLAB File. After the MATLAB file generates,
it opens in the MATLAB Editor. The filename for the generated file is the file
name of the report setup file , preceded by “build.”
Generate Reports from MATLAB Files
This example generates a MATLAB file from the figloop_tutorial.rpt
report setup file, which is part of the MATLAB Report Generator software.
The example then uses the report function to generate a report from the
MATLAB file. For more information about this function, see the report
reference page.
1Start the Report Explorer by entering report in the MATLAB Command
Window.
2In the Options pane in the middle, double-click figloop_tutorial.rpt
to open its report setup file.
3In the Outline pane on the left, click Report - figloop_tutorial.rpt
to select it.
4In the Report Explorer menu bar, click File > Generate MATLAB File.
The MATLAB Report Generator software generates MATLAB code for
the figloop_tutorial.rpt report setup file. It saves this code in the
buildfigloop_tutorial.m file in the folder you specify. Part of this file
appears in the following figure.
4-20
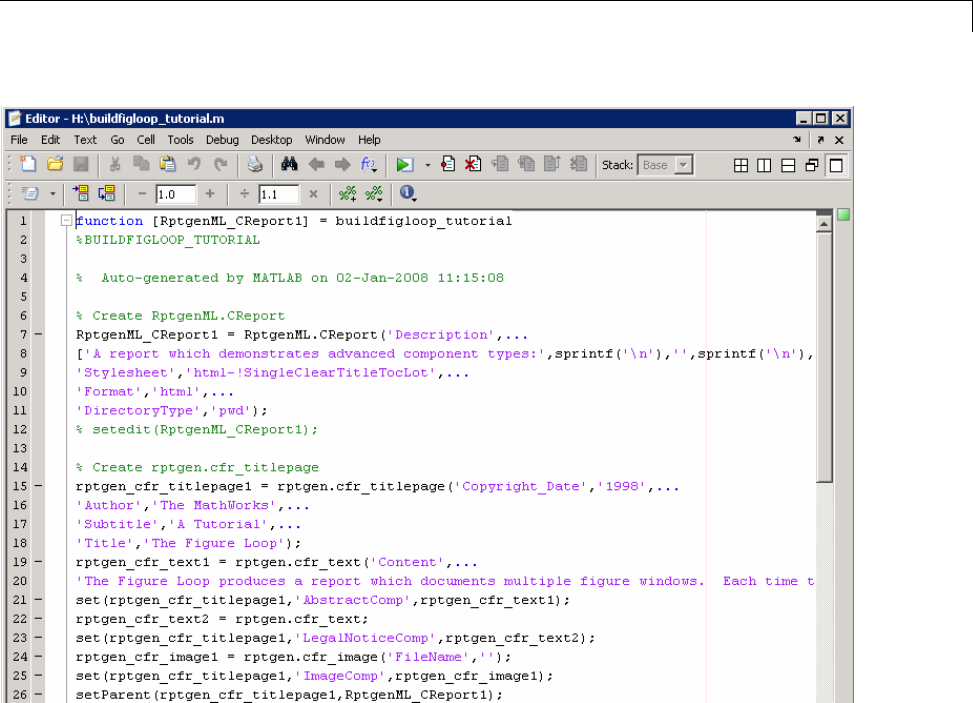
Generate MATLAB®Code from Report Setup File
5To generate the figloop_tutorial report from this MATLAB file, run the
following command in the MATLAB Command Window:
report(buildfigloop_tutorial);
The MATLAB Report Generator software runs and displays the report.
4-21
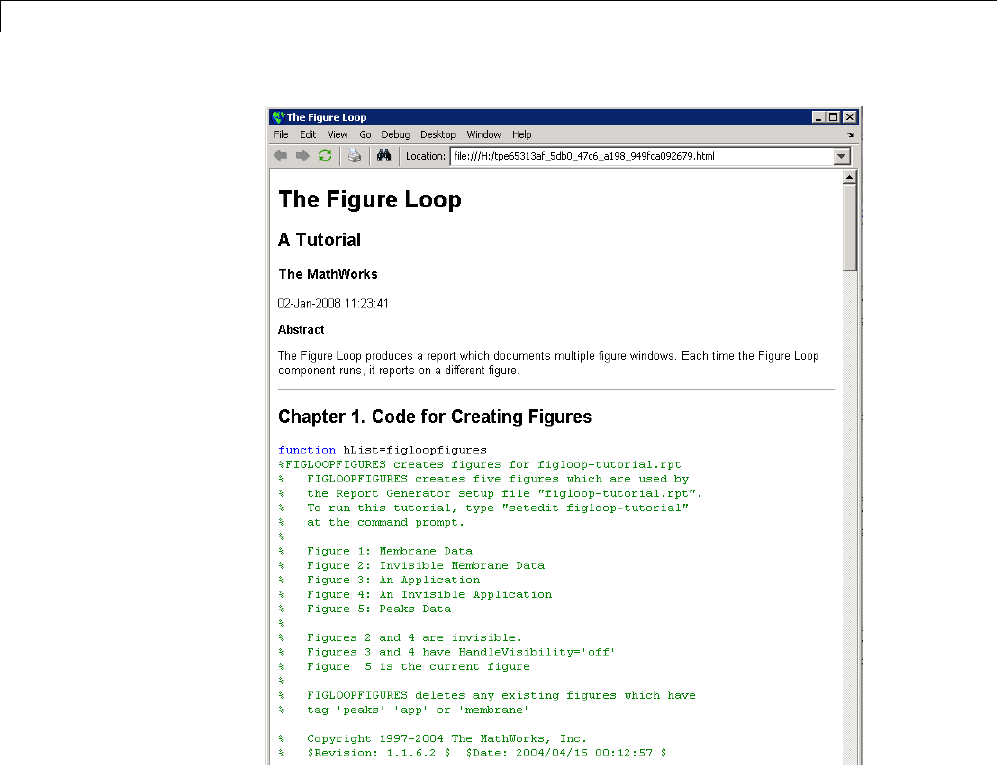
4Generate a Report
4-22
Legacy Report Setup Files
Legacy Report Setup Files
In this section...
“What Are Legacy Report Setup Files?” on page 4-23
“Enable Legacy Interface” on page 4-23
“Use Legacy Interface” on page 4-24
What Are Legacy Report Setup Files?
Legacy report setup files are files that you created in previous versions of the
MATLAB Report Generator or Simulink Report Generator software. You can
load legacy report setup files in the current version of the Report Explorer.
Alternatively, you can use earlier versions of the product interfaces to work
with legacy report setup files.
Enable Legacy Interface
Enable the previous versions of the interfaces at the MATLAB command line:
RptgenML.v1mode(true)
The result is:
ans =
1
Alogical1indicates that Version 1 mode is on. To turn off Version 1 mode,
enter:
RptgenML.v1mode(false)
The result is:
ans =
0
Alogical0indicates that Version 1 mode is off.
4-23

4Generate a Report
Use Legacy Interface
When you enable Version 1 mode, you can use previous versions of MATLAB
Report Generator or Simulink Report Generator interfaces.
When using earlier versions of these interfaces, the following restrictions
apply:
•You cannot use a report setup file created in the latest version of the
MATLAB Report Generator or Simulink Report Generator software with
earlier interfaces. If you save a legacy report setup file in the latest version
of the software, you can no longer work with the same report setup file
in the old interface.
•You cannot use the old interfaces with the latest version of the MATLAB
Report Generator or Simulink Report Generator software. The Report
Template Editor can coexist with the Report Explorer, but MathWorks does
not recommend using these interfaces together.
4-24
Troubleshooting Report Generation Issues
Troubleshooting Report Generation Issues
In this section...
“Memory Usage” on page 4-25
“HTML Report Display on UNIX Systems” on page 4-25
Memory Usage
By default, the MATLAB software sets a limit of 100 MB on the amount of
memory the Sun Java Virtual Machine (JVM™) software can allocate. The
memory that the report generation process uses to build a document must fit
within this limit. If you are having trouble processing large reports, it might
be helpful to increase the amount of memory that MATLAB Report Generator
and Simulink Report Generator software can allocate. See the following
sections for more information.
Run the MATLAB Software Without a Desktop
One way to increase the amount of JVM memory available to the MATLAB
Report Generator and Simulink Report Generator software is to run the
MATLAB software with -nodesktop mode enabled.
Note This option is available on UNIX®platformsonly.(UNIXisaregistered
trademark of The Open Group in the United States and other countries.)
Increase the MATLAB JVM Memory Allocation Limit
To increase the amount of JVM memory available by increasing the MATLAB
JVM memory allocation limit, from the MATLAB Toolstrip, in the Home tab,
in the Environment section, select Preferences.UsetheGeneral > Java
Heap Memory dialog box.
HTML Report Display on UNIX Systems
HTML reports may not automatically display on some UNIX platforms. To
work around this issue, configure the MATLAB Report Generator software to
launch an external browser:
4-25

4Generate a Report
1In the Report Explorer, click File > Preferences.
2Enter the following text in the View command field:
web(rptgen.file2urn('%file name'), '-browser')
Where file name is the name of your report setup file.
4-26


5Export Simulink®Models to Web Views
Web Views
A Web view is an interactive rendition of a model that you can view in a
Web browser. You can use Web views to navigate hierarchically to specific
subsystems and see properties of blocks, signals, and scopes. You can zoom
in and out, pan, and fit your model to your view using the same keyboard
shortcuts that you use in Simulink and Stateflow editors.
You need the Simulink Report Generator software to create Web views. Web
views require that your Web browser support Adobe SVG, implemented
natively or through a plug-in. You do not have to install MathWorks products
to use Web views. Therefore, Web views are useful for presenting models to
audiences and for sharing models with colleagueswhodonothaveMathWorks
products installed. The MATLAB Web browser does not support Web views.
5-2
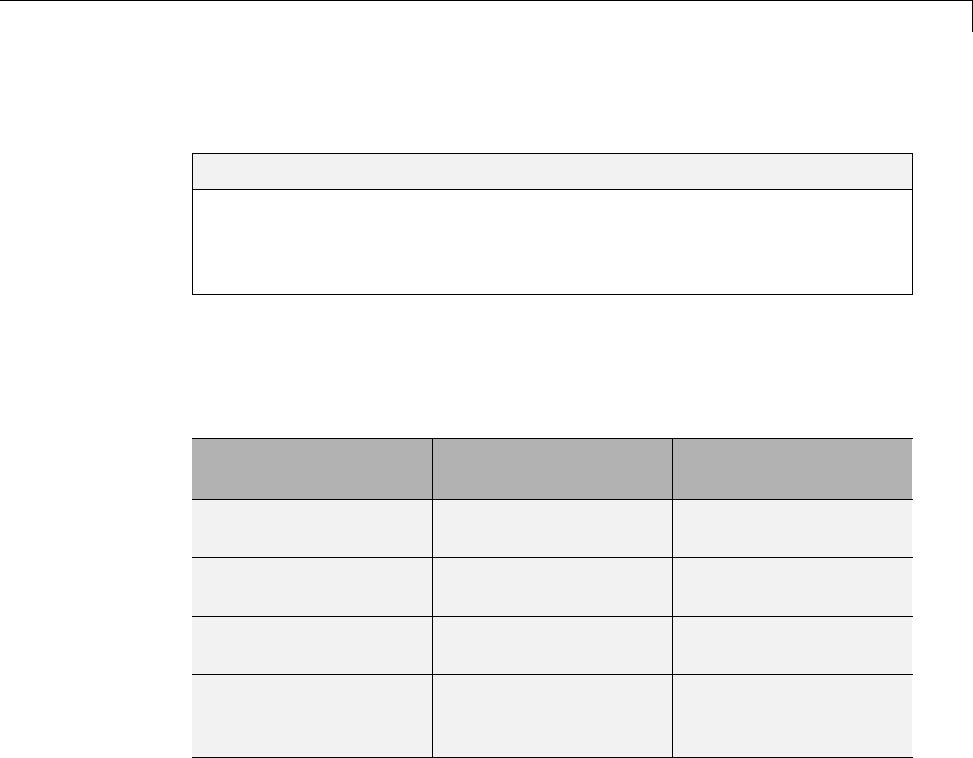
Export Models to the Web
Export Models to the Web
In this section...
“Open the Export Interface” on page 5-3
“Set Export Options” on page 5-3
“Generate and Review Web Views” on page 5-5
OpentheExportInterface
You can export a model to a Web view using either a Simulink Report
Generator dialog box or a Report Explorer pane.
To Open the export
interface from ... Use ...
Export interface
opens as...
Report Explorer Tools > Export
Simulink to Web
Report Explorer
Simulink Editor File > Export > Export
Model to Web
Dialog box
Stateflow Editor File > Export > Export
Model to Web
Dialog box
Command line The slwebview
function, with no
arguments
Report Explorer
SetExportOptions
You can set options that specify which Simulink systems or Stateflow charts
to export to a Web view, including:
•Whether to export Simulink systems or Stateflow charts that include (or
are children of) the current system or chart. For more information, see
“Include Systems” on page 5-4.
•Which masked blocks, if any, to include. For more information, see “Look
Under Masks” on page 5-4.
5-3
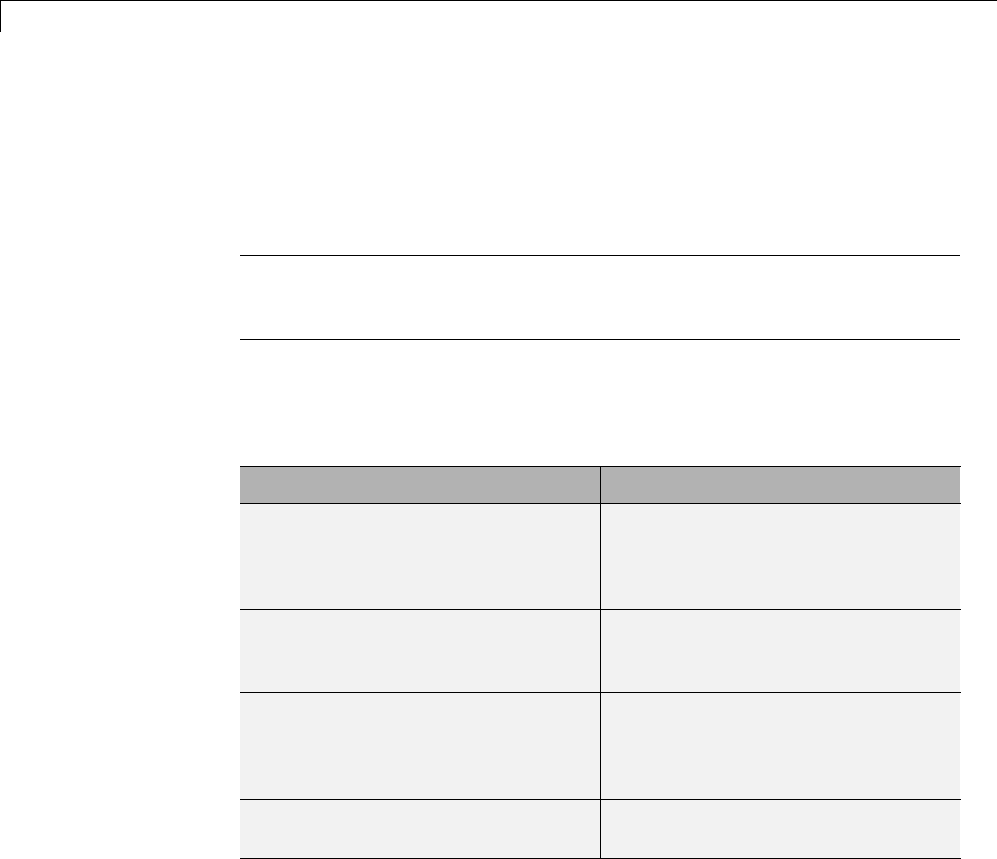
5Export Simulink®Models to Web Views
•Whether to follow links to library blocks. For more information, see “Follow
Library Links” on page 5-5.
•Whether to follow model reference blocks. For more information, see
“Follow Model Reference Blocks” on page 5-5.
Tip This section describes how to specify Web view export options using the
Web Views dialog box. For information about how to specify these options
using the command line, see the slwebview function reference page.
Include Systems
Specifies which Simulink systems or Stateflow charts to export.
Include Systems Option Value Meaning
Current Export only the Simulink system
that is open in the model window or
the Stateflow chart that is open in
the diagram editor
Current and above Export the current Simulink system
or Stateflow chart and all systems or
charts that contain it
Current and below Export the current Simulink
system or Stateflow chart and all
subsystems or subcharts that it
contains
All (Default) Export all Simulink systems or
Stateflow charts in the model
Look Under Masks
This option is available only when you choose Current and below or All for
Include Systems. It specifies which masked blocks, if any, to export from
Simulink subsystems or Stateflow subcharts.
5-4
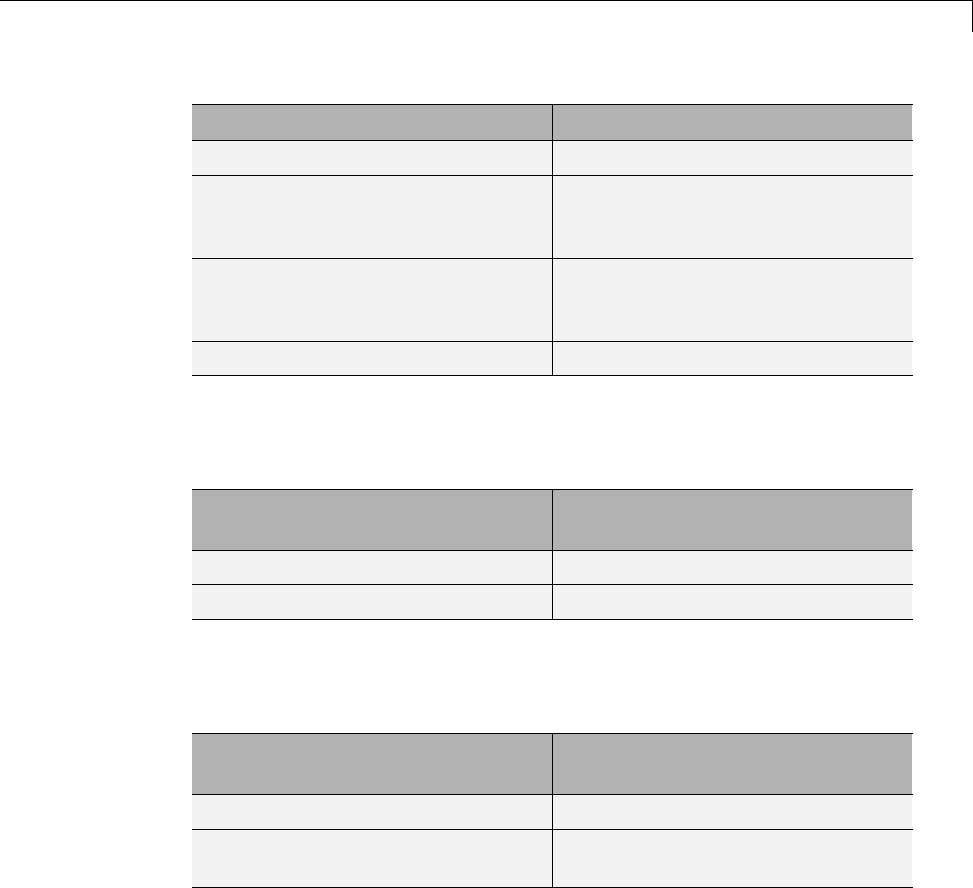
Export Models to the Web
Look Under Masks Option Value Meaning
No masked blocks Donotexportanymaskedblocks
Masks with no workspace and no
dialog (Default )
Export only graphical masked
blocks—those that have no
workspaces and no dialog boxes
Masks with no dialog Export only functional masked
blocks—those that have no dialog
boxes
All masked blocks Export all masked blocks
Follow Library Links
Specifies whether to follow links into library blocks.
Follow Library Links Option
Value Meaning
Selected Follow links into library blocks
Unselected (Default) Do not follow links into library blocks
Follow Model Reference Blocks
Specifies whether to follow links into referenced models.
Follow model reference blocks
Option Value Meaning
true Follow links into referenced models
false (Default) Do not follow links into referenced
models
Generate and Review Web Views
The Web view export process exports the system or chart that is visible at the
time you click Export Model. If you change the visible system or chart while
the Report Explorer Web view export pane is visible, the Report Explorer
5-5

5Export Simulink®Models to Web Views
pane does not automatically change to show information about the newly
visible system. To update the Report Explorer pane, click Refresh.
The Web view export dialog box or the Report Explorer displays a list of
layers — that is, Simulink systems or Stateflow charts—to export. The list of
layers depends on the export options you specify, as described in “Set Export
Options” on page 5-3.
To generate a Web view of all layers in the model, click OK in the Web View
dialog box, or click Export Model in the Report Explorer pane. This action
generates two sets of files in the current MATLAB folder:
•An HTML file to appear in a Web browser.
•A folder with the same name as the HTML file. This folder contains
supporting files, such as svg and png files.
To send the Web view to another computer, include both the HTML file and
the folder of supporting files. Package these items into a zip file for transfer.
When you generate a Web view, it appears in a Web browser by default. You
can suppress the display by setting the 'ViewFile' option to false.
5-6

Navigate Web Views
Navigate Web Views
In this section...
“Display Web Views” on page 5-7
“View the Current Layer” on page 5-7
“View Layers Below the Top Layer” on page 5-8
“View All Layers” on page 5-9
Display Web Views
To display Web views, you need a Web browser with support for Scalable
Vector Graphics (SVG), implemented natively or through a plug-in. For
detailed information on software requirements and limitations for using Web
views, see the Simulink Report Generator Release Notes.
A Web view display consists of:
•A graphical display of the current layer (Simulink system or Stateflow
chart)
•A hierarchical treeview browser for easy navigation through layers
•Four navigation buttons at top left
•Menu of navigation commands, which appears when you move the mouse
over the leftmost button
•Shortcut menu, which appears in some browsers when you right-click the
current layer
View the Current Layer
Display an example Web view of the Simulink Automatic Climate Control
System model by typing the following commands at the MATLAB command
prompt:
sldemo_auto_climatecontrol;
slwebview(gcs)
5-7
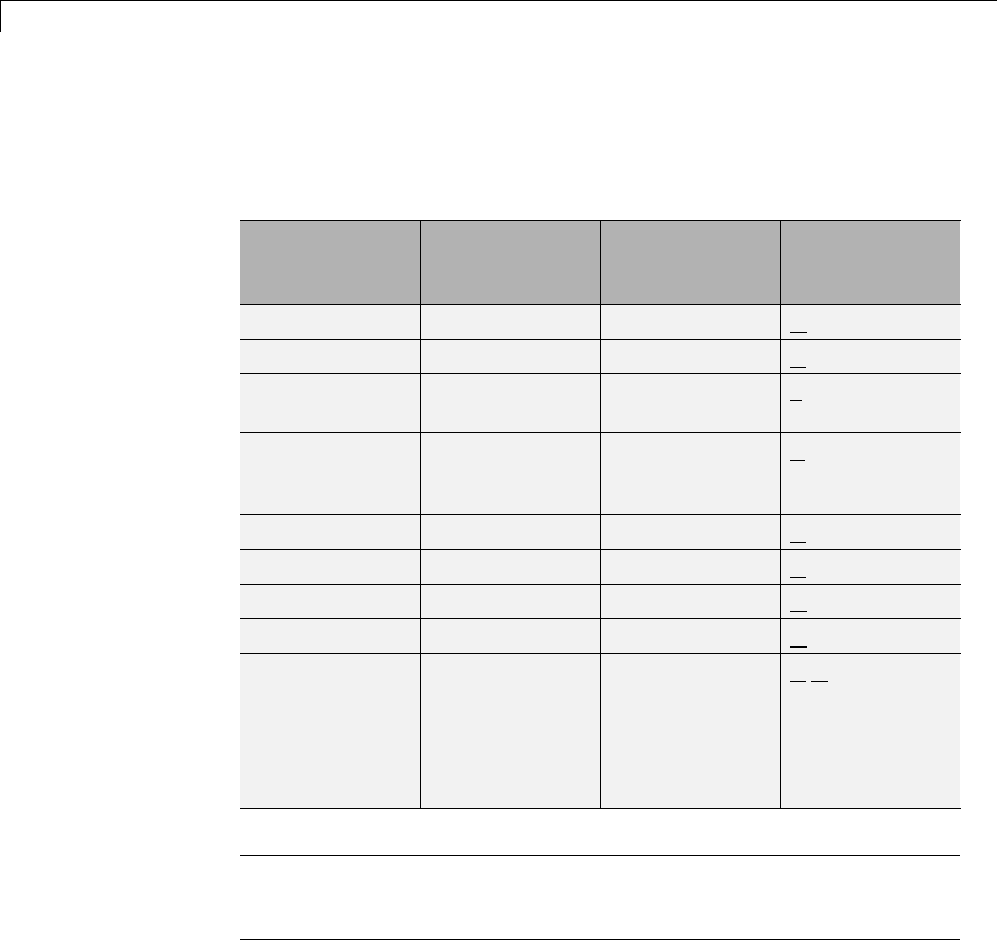
5Export Simulink®Models to Web Views
As you move the mouse over the current layer, parameter names and
values appear for each system, chart, block, and line. Use the mouse, menu
commands, keyboard accelerators, and the arrow keys on your keyboard to
pan and zoom within the current layer.
Action
Navigation
Menu
Command
Shortcut Menu
Command
Keyboard
Accelerator
Zoom in Zoom in Zoom in R
Zoom out Zoom out Zoom out V
Zoom to normal
size (100%)
Zoom to 100% None 1
Zoom to largest
size that fits in
browser window
Zoom to full
screen
Zoom to full
screen
F
Pan up Pan up E
Pan down Pan down C
Pan left Pan left D
Pan right Pan right G
Pan with mouse
(drag layer while
in panning mode)
Pan with
mouse (click
to toggle panning
mode)
Pan with
mouse (click
to toggle panning
mode)
P,Q,or
SPACEBAR
(press to enter
panning mode;
releasetoexit
panning mode)
Note The shortcut menu command Find text searches for a text string in
the current layer. This command is only available in the Microsoft Internet
Explorer Web browser.
View Layers Below the Top Layer
Click a particular layer’s subsystem or subchart to make it the current layer.
The current layer is also selected in the treeview browser, and its subsystems
5-8
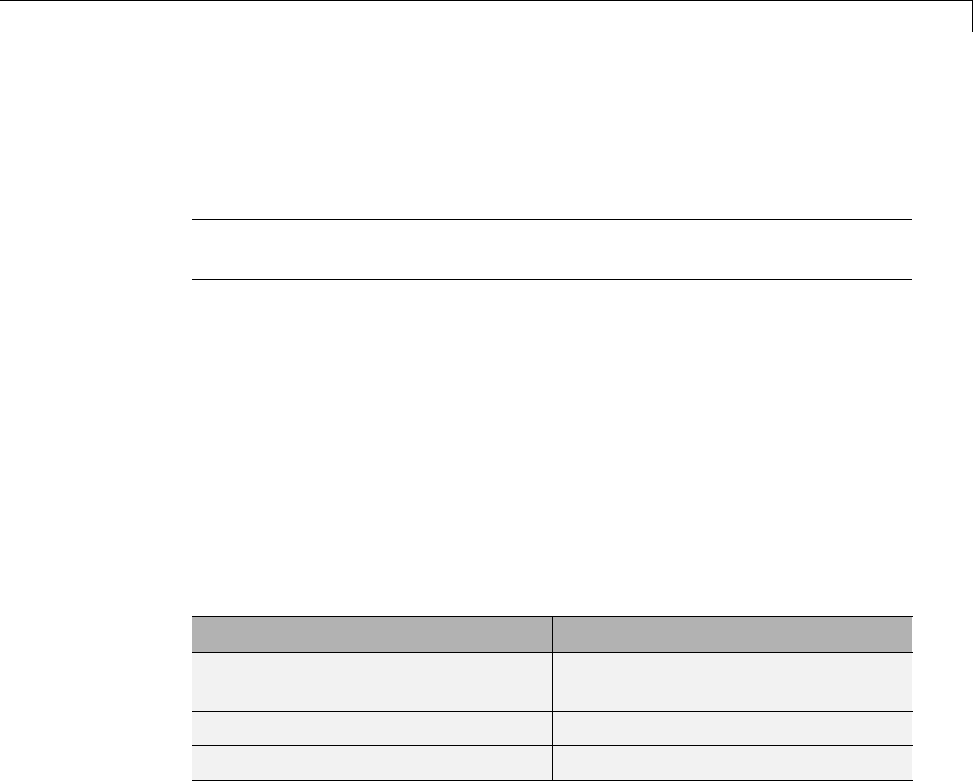
Navigate Web Views
or subcharts appear in the treeview browser hierarchically.Ifblocksinyour
current layer are linked to libraries, the Web view shows to which libraries
they belong.
Note If your current layer has no subsystems or subcharts, it does not
appear in the treeview browser.
As you move the mouse over an exported subsystem or subchart, it is
highlighted or the cursor changes, depending on which Web browser you are
using. You also see the following visual cues that enable you to assess your
location in the model quickly:
•The subsystem or subchart’s corresponding icon in the treeview browser is
also highlighted, showing to where in the hierarchy you have navigated.
•The names of the subsystem or subchart’s parent systems are grayed out
and italicized in the treeview browser.
You can use the navigation buttons at the top left to view other layers.
Action Navigation Button
View the previous layer in the view
history
View previous
View the top-level layer View home
View all layers in one window View all layers
View All Layers
Click the View all layers navigation button to view all layers in one window.
The layers appear in the Web browser as thumbnail images. You can click
a given layer to view details about it. Clicking the View all layers button
again returns to the previous view.
5-9

5Export Simulink®Models to Web Views
Tip You can also view all layers by selecting the Show all layers command
on the navigation and shortcut menus, and by using the Xkeyboard
accelerator.
5-10
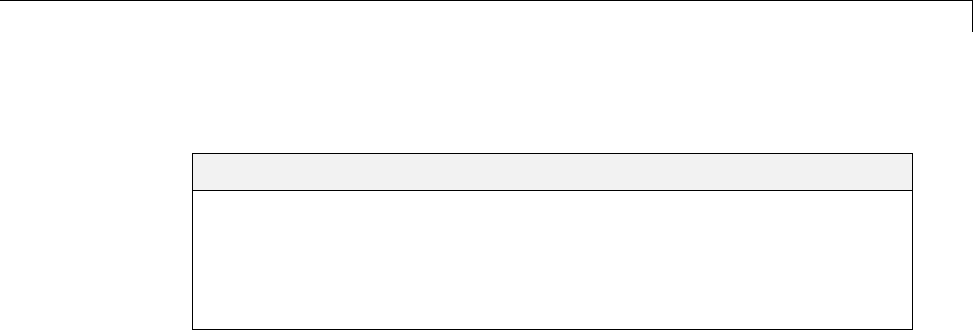
Create Web Views of Simulink®Models
Create Web Views of Simulink Models
In this section...
“About This Tutorial” on page 5-11
“Specify Web View Export Options” on page 5-11
“Export Models” on page 5-13
“Navigate Web Views” on page 5-14
About This Tutorial
This tutorial takes you through the steps required to export a Simulink model
to a Web view. If you have a detailed model of your own, you can use it for
this example. Otherwise, use the example provided in this section.
There are several ways to create a Simulink model Web view. This
tutorial creates a Web view from the Simulink model window using the
sldemo_auto_climatecontrol model, which is provided with the Simulink
software. This model simulates the working of an automatic climate control
system in a car.
You do not need to know the Simulink product to follow this tutorial.
Specify Web View Export Options
Before creating the Web view, specify export options:
1Start a MATLAB software session.
2At the command prompt, enter sldemo_auto_climatecontrol to open
the Simulink model.
3Click File > Export > Export Model to Web.
A Web view window that includes data about the current model appears.
5-11
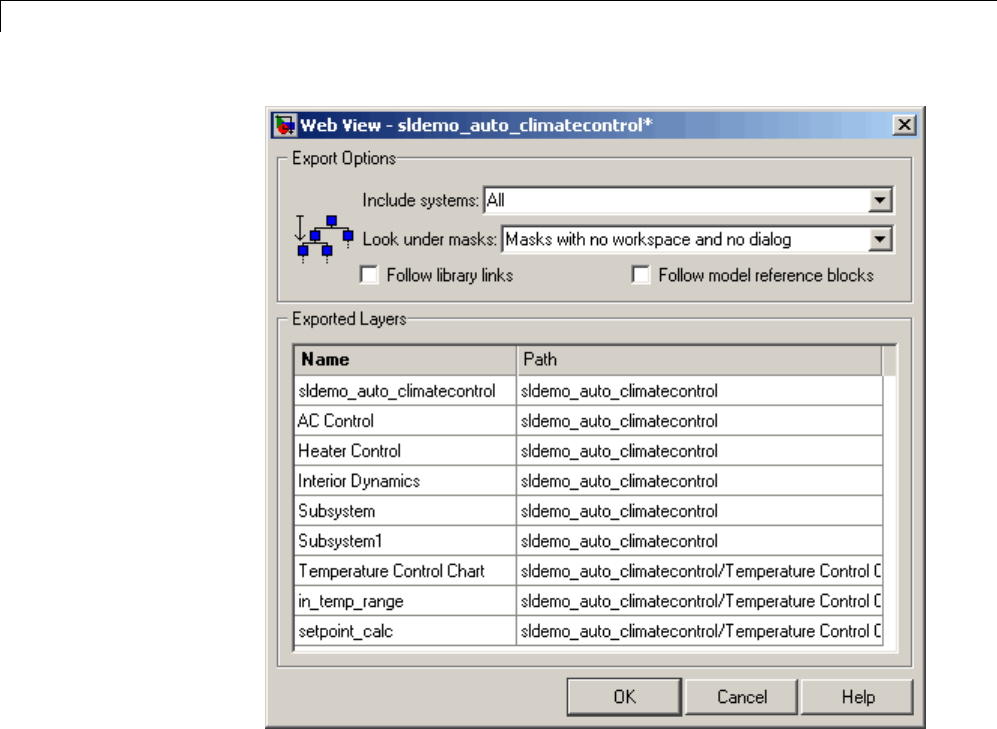
5Export Simulink®Models to Web Views
4In the Include systems selection list, select All to export all systems in
this model.
5In the Look under masks selection list, select Masks with no workspace
and no dialog to export only graphically masked blocks.
6Leave the Follow library links and Follow model reference blocks
check boxes cleared.
Exported Layers appears in the lower part of the Web View window. This
area lists the names of the systems to export to the Web view, along with their
Simulink paths. Because you selected All in the Include systems selection
list, all layers in the sldemo_auto_climatecontrol model appear.
5-12
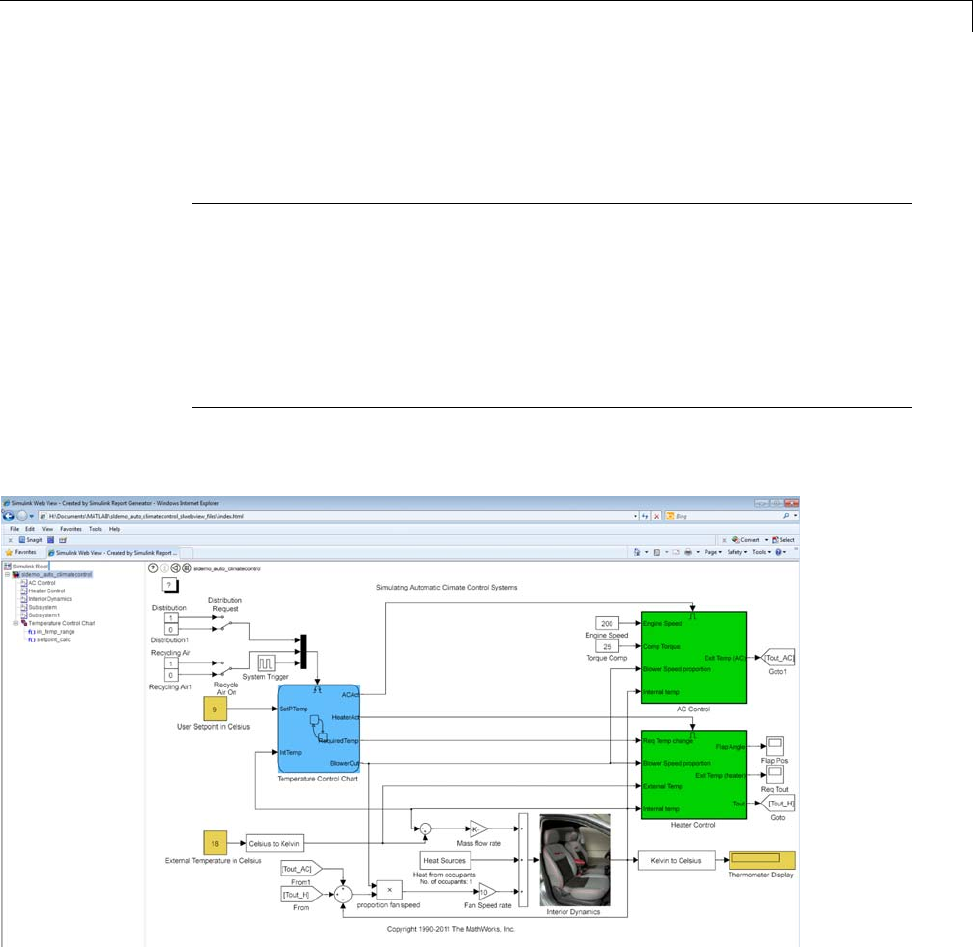
Create Web Views of Simulink®Models
Export Models
To export the model to a Web view, click OK in the Web View window.
Note Scalable Vector Graphics (SVG) is required for Web views. The screen
shotsinthist
utorial use Microsoft Internet Explorer Web browser with the
SVG plug-in installed. Mozilla®Firefox®has native support for SVG. For
details on SVG, see “Browser Requirements for Web Views” on page 1-21.
If you do not have an SVG plug-in installed, then a dialog box appears with
instructions for installing an SVG plug-in. Complete the installation and
click OK in the Web View window.
The Web view of the model appears in the browser window.
5-13
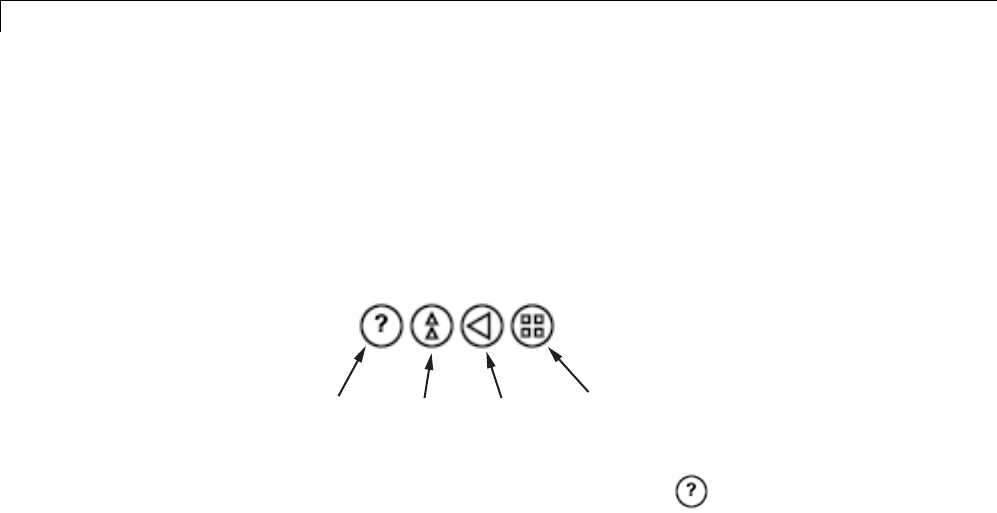
5Export Simulink®Models to Web Views
Navigate Web Views
You can navigate Web views in ways similar to how you navigate models in
the Simulink GUI. The following steps help you experiment with the types of
navigation that are available.
1Notice the four navigation icons in the upper-left corner of the browser
window.
Navigation
commands
View
home
View
previous
Show all
layers
2Hover over the Navigation Commands icon to see a list of keyboard
shortcuts that allow you to move around the current window.
5-14
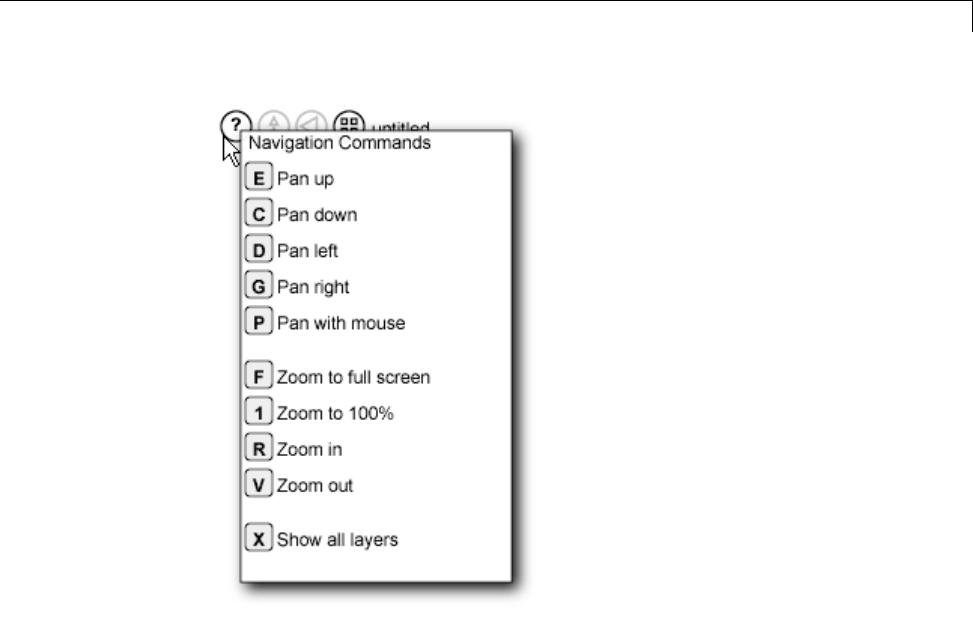
Create Web Views of Simulink®Models
3Press some of the keyboard keys listed here to see how the model in the
Web view reacts.
4Hover over the Temperature Control Chart diagram.
5-15
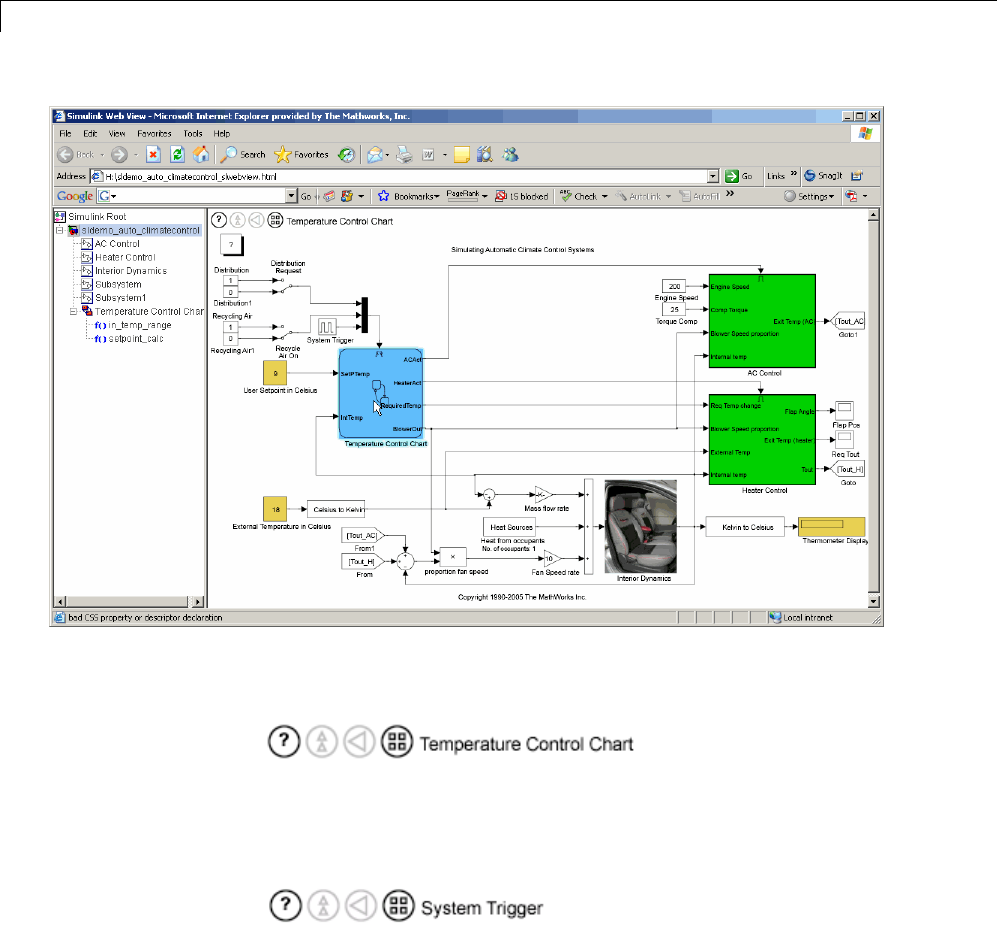
5Export Simulink®Models to Web Views
The name next to the navigation icons becomes Temperature Control
Chart.
5HoverovertheSystemTriggerblock.
The name next to the navigation icons changes to System Trigger.
In addition, the block parameter values for the System Trigger block
appear.
5-16
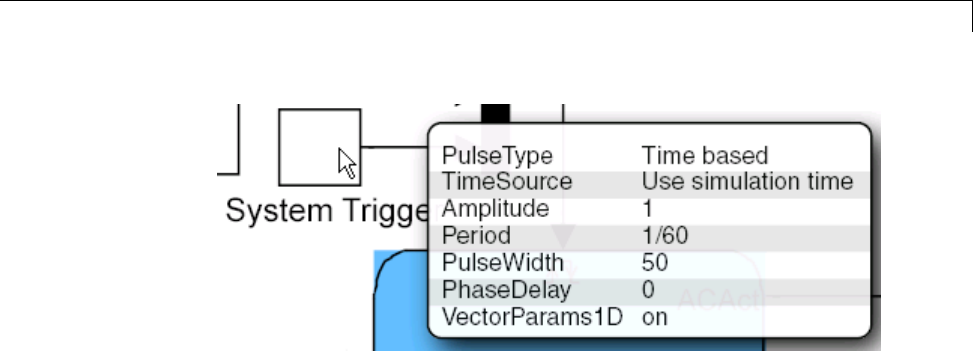
Create Web Views of Simulink®Models
6Hover over other blocks and subsystems in the model and observe the
results.
7Click the Temperature Control Chart.
The details of this Stateflow chart appear, and the middle two navigation
icons are now enabled:
•The View Home icon takes you up to the top level of the model.
•The View Previous icon takes you back to the previously displayed
level in the model.
5-17
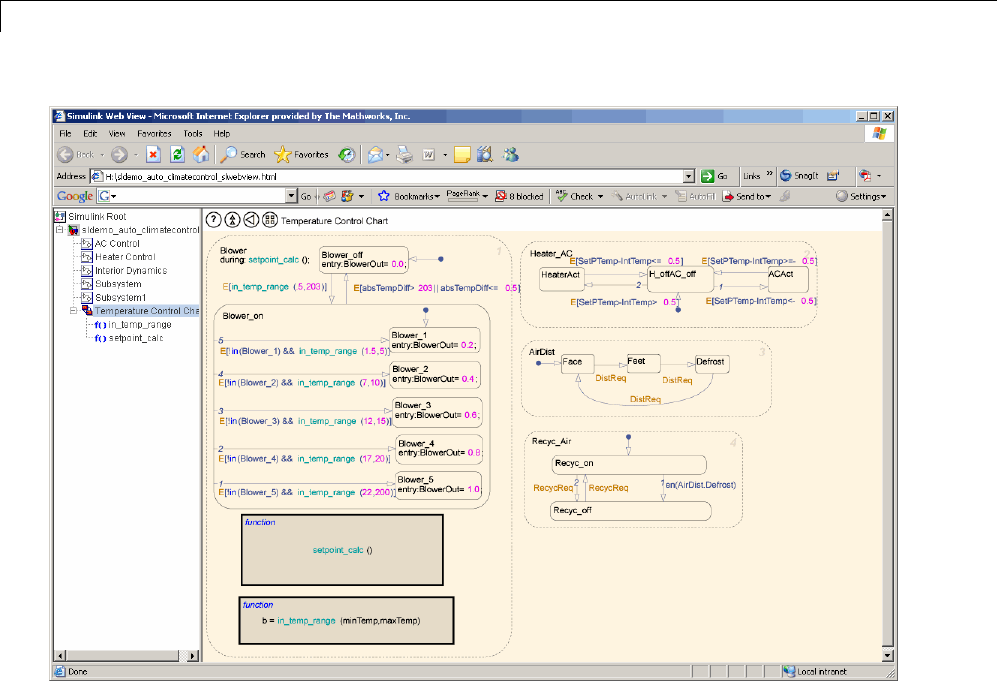
5Export Simulink®Models to Web Views
8Click the setpoint_calc box in the Stateflow chart to see the details of
that block.
5-18
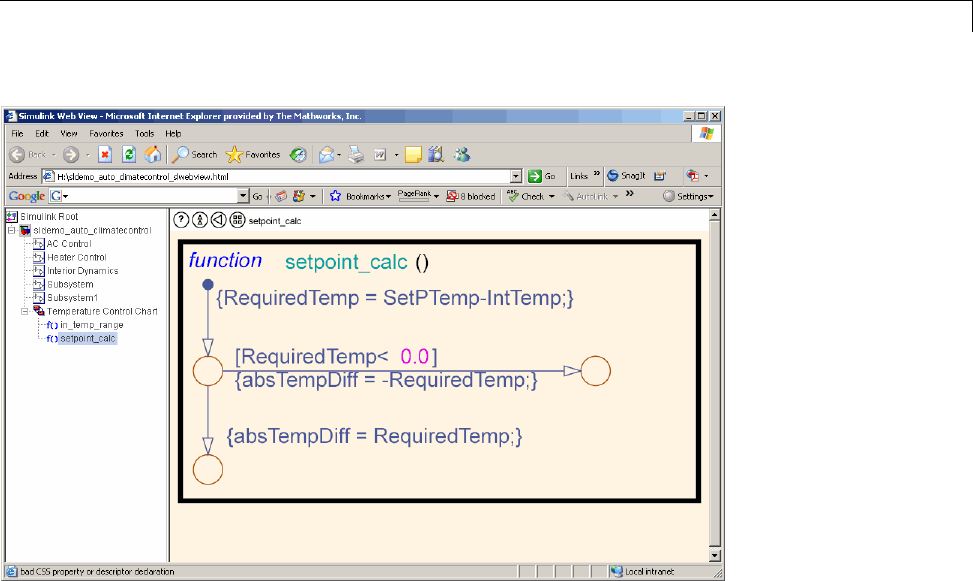
Create Web Views of Simulink®Models
9Click the View home icon to return to the model’s top layer.
10 Click the Show all layers icon. An overall view of the model appears.
5-19
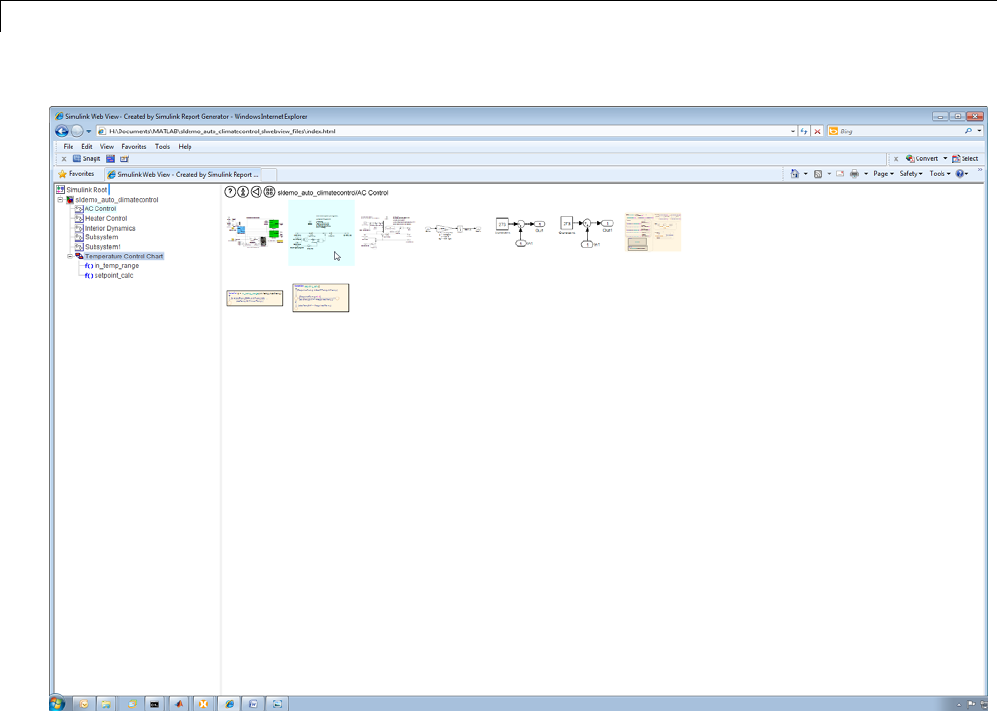
5Export Simulink®Models to Web Views
This high-level view of the model shows all layers of the model. In this
figure, the arrow is hovering over the AC Control layer.
Try opening other Simulink models and exporting them to Web views, and
experiment with the results.
5-20

Troubleshooting Web Views
Troubleshooting Web Views
Web View Display Issues
Exporting a Simulink model to a Web view may produce the following error:
[Thu Aug 23 15:20:04 2007] [alert] [client 127.0.0.1]
/webserver/mydir/simulink_model_slwebview_files/.htaccess:
IndexIgnore not allowed here
This results in your Web browser failing to display the Web view.
This issue occurs because of settings specified in the .htaccess file in your
Web browser’s root folder. This file contains the Apache Web Server settings
for your Web server host. To fix this problem, delete this file or remove the
IndexIgnore * line from it.
5-21

5Export Simulink®Models to Web Views
5-22


6Add Content with Components
Components
Components are MATLAB objects that specify the content of a report. Add
components to specify the types of content that commonly occur in reports.
The MATLAB Report Generator provides a set of components for specifying
the types of content that commonly occur in MATLAB-based reports. The
Simulink Report Generator provides additional components to facilitate
generation of reports from Simulink models. You can also create custom
components to handle content specifictoyourapplication.
Using the Report Explorer, you can interactively combine components to
create a report setup that specifies the content of a particular report or type of
report. For general information about working with components, see:
•“Insert Components”
•“Set Component Properties”
Use a combination of the following types of components in your report setup
file, based on your goals for the report.
Type of Component Description
“Report Structure Components” on
page 6-4
Include a title page, chapters,
sections, paragraphs, lists, tables,
and other standard document
structure elements.
“Table Formatting Components” on
page 6-5
Organize generated content into
tables.
“Property Table Components” on
page 6-6
Display tables with property
name/property value pairs for
objects.
“Summary Table Components” on
page 6-17
Display tables with specified
properties for objects.
“Dynamic Reporting Components”
on page 6-22
Run child components a specified
number of times. There are several
looping components, including
logical loops and Handle Graphics
loops.
6-2

Components
Control Format with Stylesheets
When you generate a report, a stylesheet formats the content specified by
these componentstoreflectthedocumentorganization. For example, a report
stylesheet typically uses different font sizes for chapter titles and section
titles.
In the report setup, specify the stylesheet to use to format your report . You
can change the format of your report by modifying the specified stylesheet
or selecting another stylesheet. For details, see “Report Output Format and
Stylesheet”.
Control FormatattheComponentLevel
The output format and the stylesheet that you select for a report determines
most aspects of the formatting of the generated report. For details, see
“Report Output Format and Stylesheet”.
Several components include properties that you can set to specify formatting
details for that specific instance of a component. For example, for the MATLAB
Property Table, you can specify formatting such as whether to display table
borders or the alignment of text in table cells.
6-3
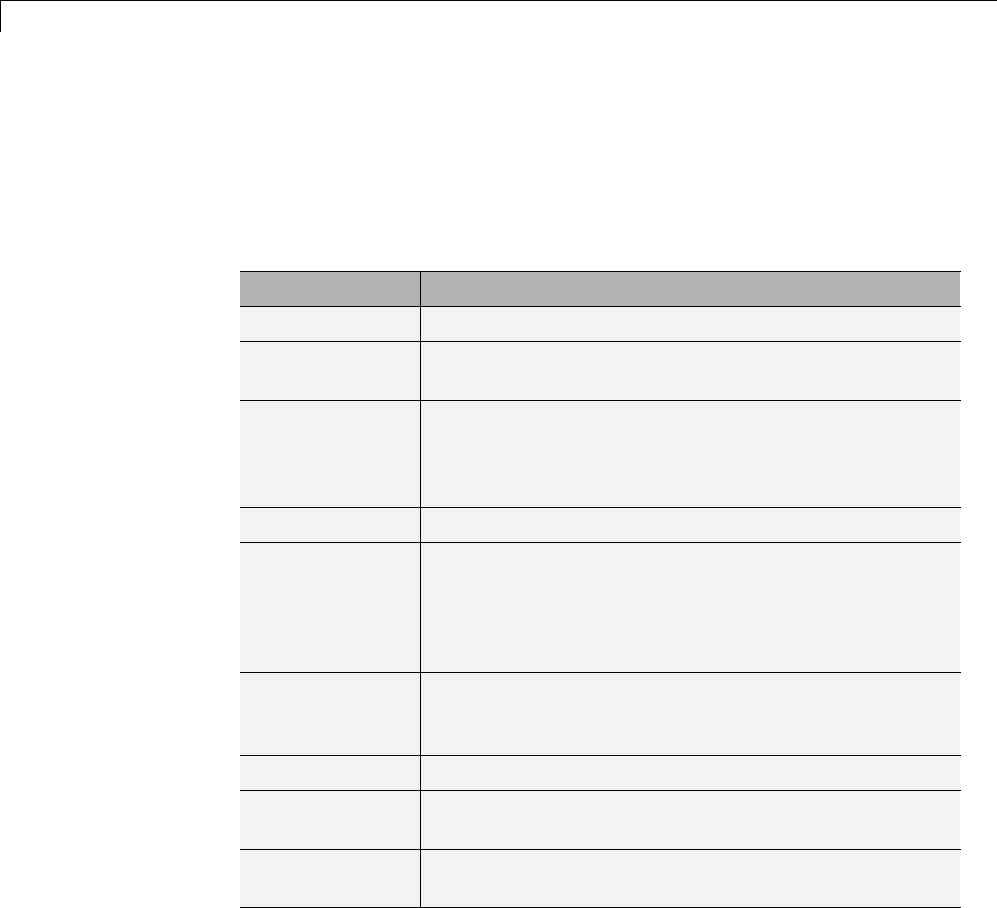
6Add Content with Components
Report Structure Components
Use report structure components to organize the content of your report into
chapters, sections, paragraphs, lists, tables, and other standard document
structure elements. The following table summarizes the report structure
components.
Component Usage
Title Page Generate a title page for a report.
Chapter/SubsectionParent components that generate the content of a
chapter or chapter subsection.
Paragraph Specify the content and text format of a paragraph
of text. Can serve as the parent of one or more text
components, enabling use of multiple text formats (for
example, bold, regular, or italic) in the same paragraph.
Text Format strings of generated text.
List Generate a list from a cell array of numbers or
strings or parent components (for example, Paragraph
components) that specify the items in a list. You can
create multilevel lists by embedding list components
within list components.
Link Generate a hyperlink from one location in a report to
another or to an external location on the user’s file
system or the Worldwide Web.
Image Insert an image into a report.
Array-Based
Table
Generate a table from a cell array of numbers or strings.
Table Parent a table body component. See “Table Formatting
Components”.
6-4
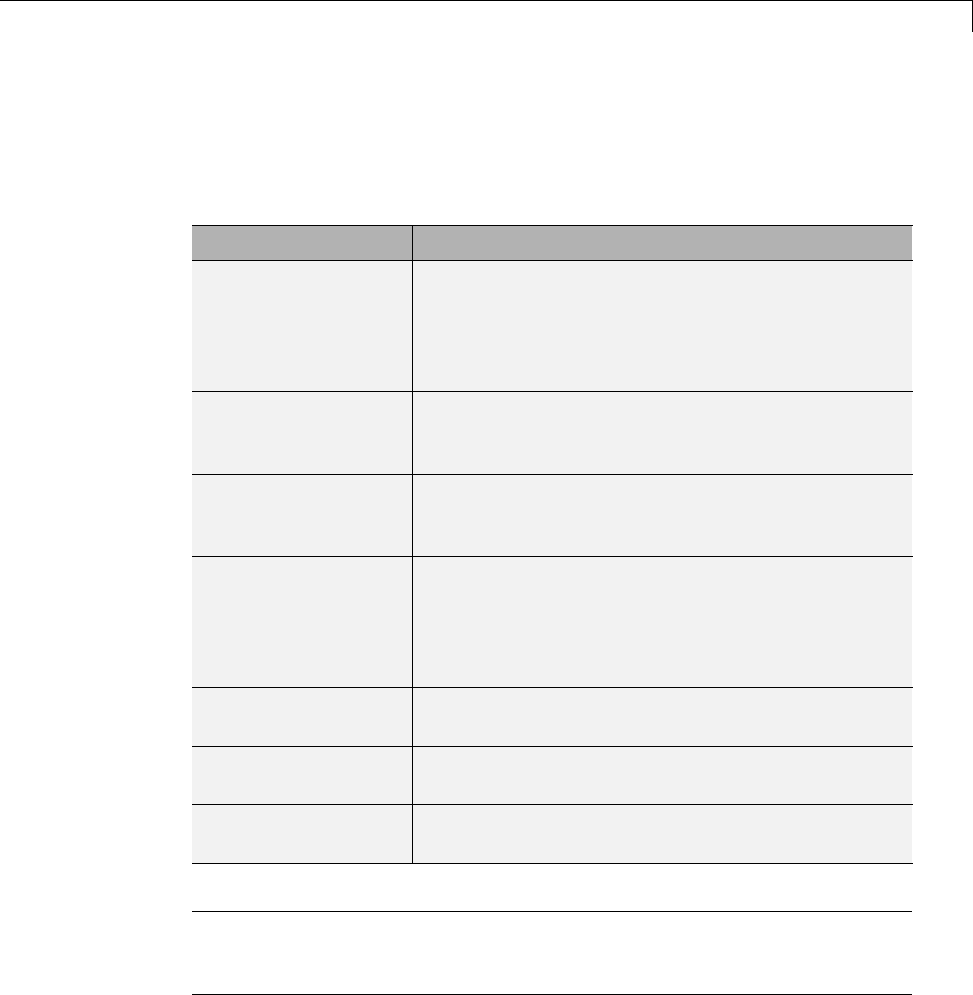
Table Formatting Components
Table Formatting Components
Use table formatting components to organize generated content into tables.
The following table summarizes the table formatting components.
Component Usage
Table Parent a table body component. Can also parent
column specification components and a table header
and a table footer component. Specifies properties of
thetableasawhole(forexample,itstitle,number
of columns, and border).
Table Body Parent the rows that make up the table body.
Specifies the default vertical alignment of entries
in a table body.
Table Column
Specification
Specify attributes of a table column, such as its
width and borders and the default horizontal
alignment of column entries.
Table Entry Parent a component that determines a table entry’s
content, such as a paragraph, image, list, or another
table component. Specifies attributes of a table
entry, such as the number of rows and columns that
it spans.
Table Footer Parent the row components that generate the
content of a table footer.
Table Header Parent the row components that generate the
content of a table header.
Table Row Parent the table entry components that generate
the content of a table row.
TipInserting a Table component into a setup also inserts all the descendant
components required to generate a 2x2 table, creating a table template. Edit
this template to create a table that suits your needs.
6-5
6Add Content with Components
Property Table Components
In this section...
“About Property Table Components” on page 6-6
“Open the Example Report Template” on page 6-8
“Examine the Property Table Output” on page 6-8
“SelectObjectTypes”onpage6-9
“Display Property Name/Property Value Pairs” on page 6-9
“Edit Table Titles” on page 6-12
“Enter Text into Table Cells” on page 6-12
“Add, Replace, and Delete Properties in Tables” on page 6-13
“Format Table Columns, Rows, and Cells” on page 6-14
“Zoom and Scroll” on page 6-16
“Select a Table” on page 6-16
About Property Table Components
Property Table components display property name/property value pairs for
objects in tables. The following example shows a property table from the
figloop-tutorial report.
6-6
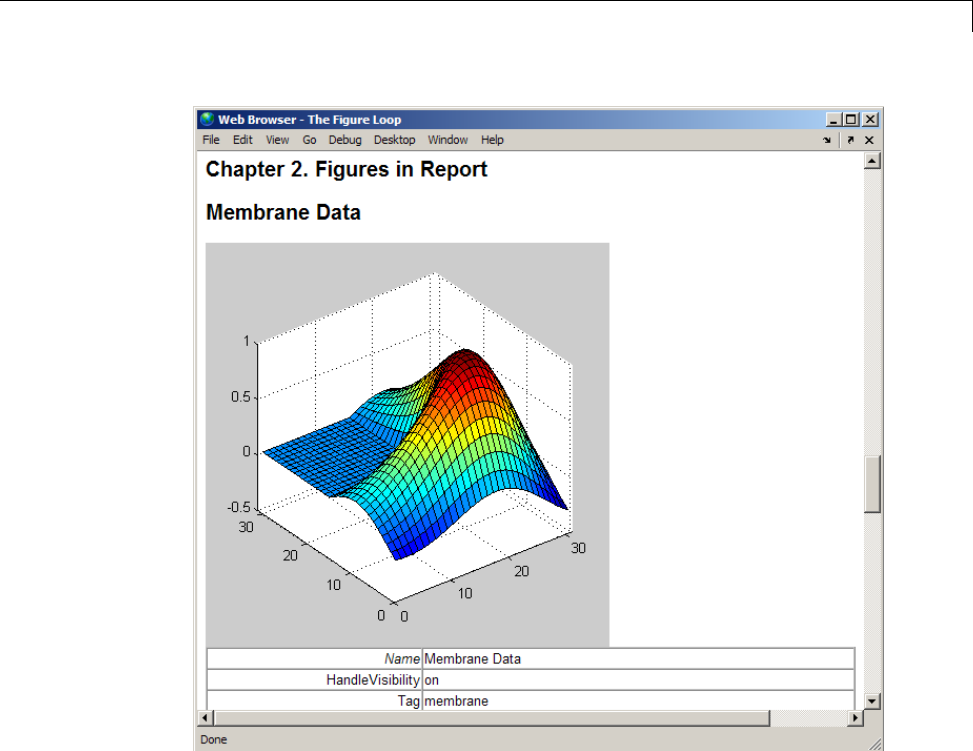
Property Table Components
Many types of property table components are available, including:
•MATLAB Property Table
•Simulink Property Table (requires Simulink Report Generator)
•Stateflow Property Table (requires Simulink Report Generator)
The component used in this example represents MATLAB Report Generator
property table components, all of which exhibit similar behavior.
6-7
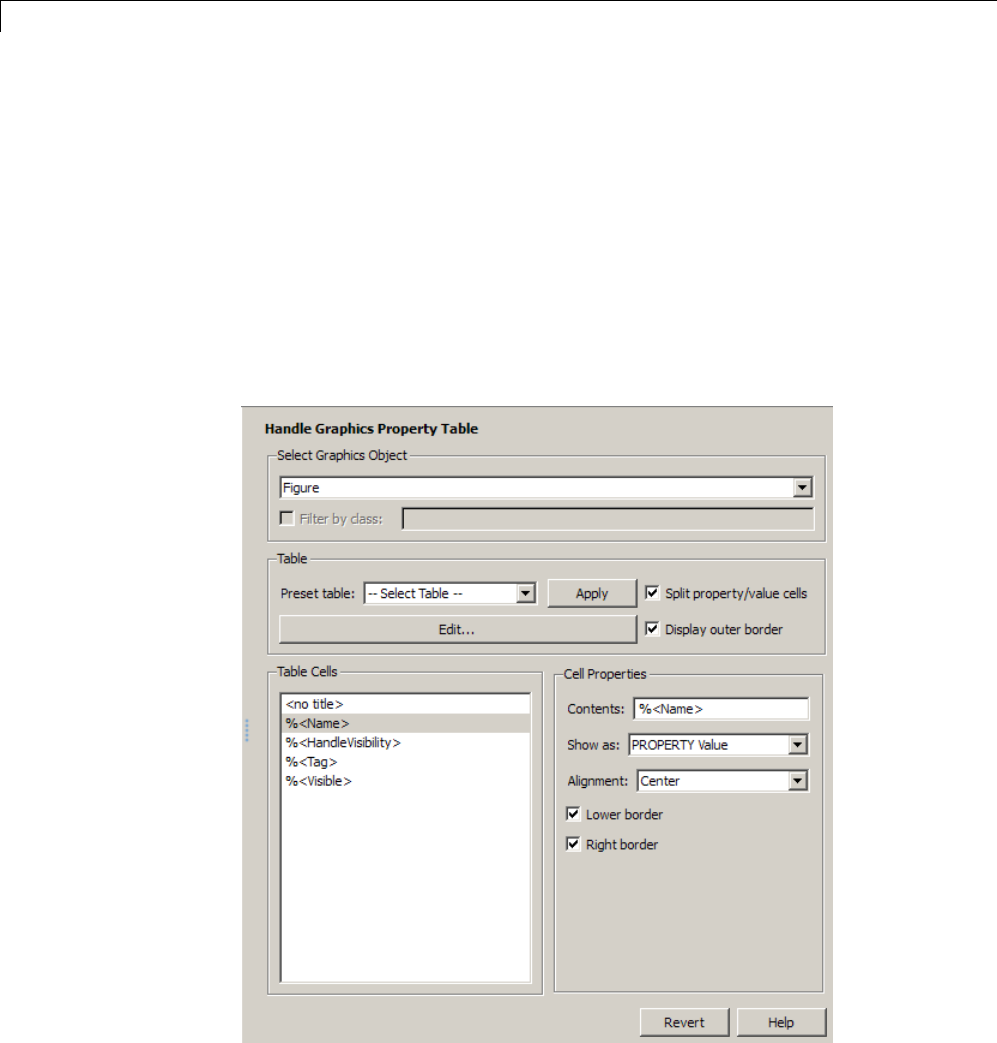
6Add Content with Components
Open the Example Report Template
This example usesthefigloop-tutorial report template. To open the figure
loop tutorial report template, at the MATLAB command line enter:
setedit figloop-tutorial
Examine the Property Table Output
Property pages for all property table components are similar in form. In the
Outline pane,selecttheFigure Prop Table component. To modify table
settings, in the Handle Graphics Property Table dialog box, click the Edit...
button.
6-8
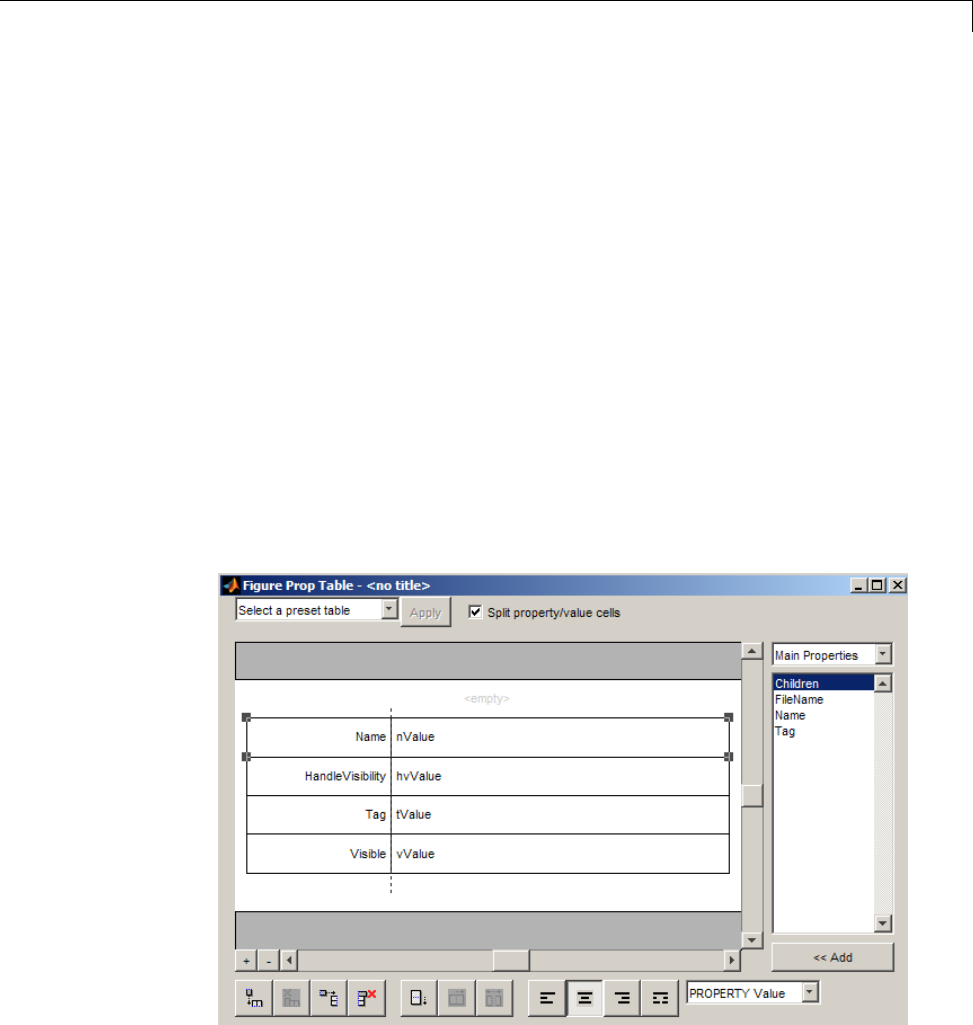
Property Table Components
Select Object Types
Property table components offer multiple object types on which to report. For
example, the Handle Graphics Property Table lets you report on a figure, an
axes object, or a Handle Graphics object.
You can select a different object type on which to report in the Object type
list in the Propertiespaneforthecomponent.
Display Property Name/Property Value Pairs
Split Property/Value Cells
1InthePropertiespanefortheHandleGraphics Property Table component,
clear the Split property/value cells check box.
2Click Edit.Thetableisnowinnonsplit mode. Nonsplit mode supports
more than one property name/property value pair per cell and text.
6-9
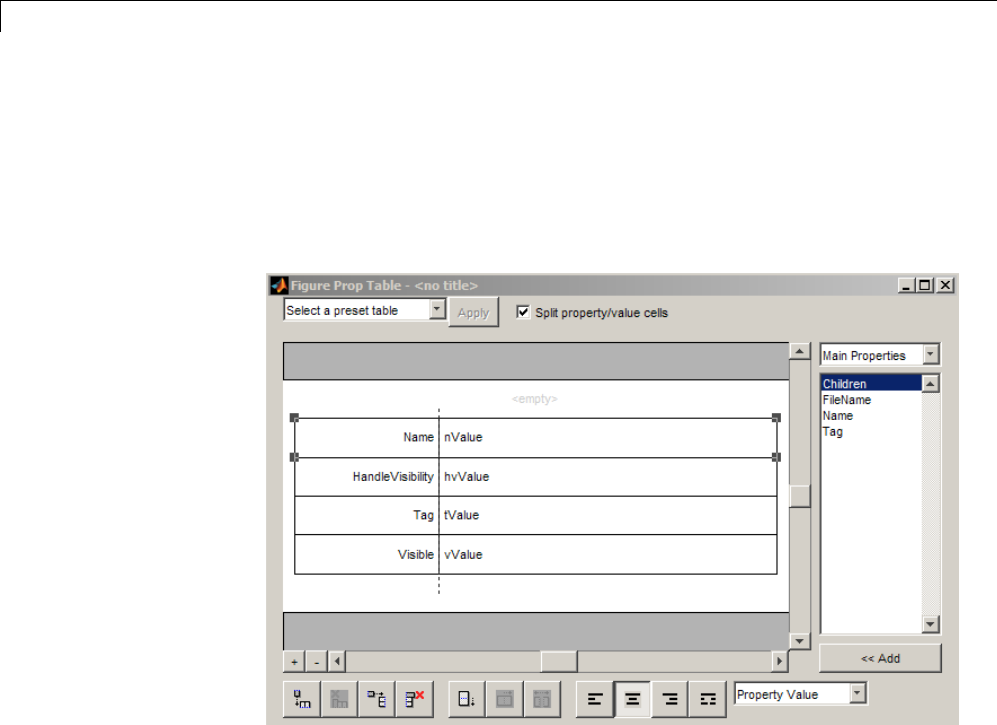
6Add Content with Components
3For the property name and property value to appear in adjacent horizontal
cells in the table, select the Split property/value cells check box.
The table is now in split mode. Split mode supports only one property
name/property value pair per cell. If more than one property pair appears
in a cell, only the first pair appears in the report; all subsequent pairs
are ignored.
Display Options
Property name/property value pairs can appear in cells in several ways. To
specify how a given property name/property value pair appears in a cell, select
that field in the table (for this tutorial, select the Name property). Choose
Valuefrom the display options drop-down list at the bottom of the dialog box.
In the selected table row, only the value appears.
6-10
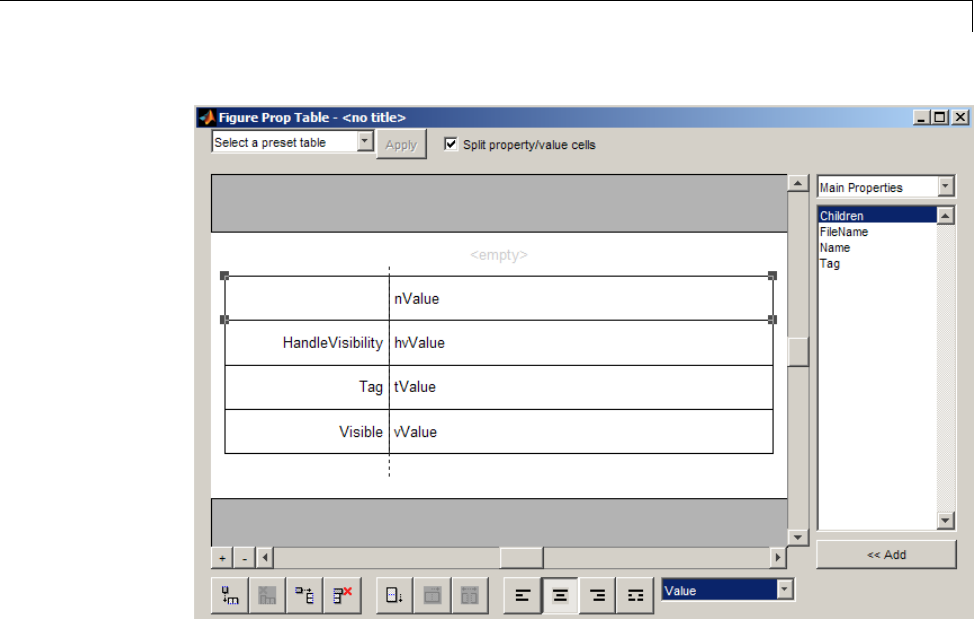
Property Table Components
Format Options
To specify alignment for text in a given cell, in the toolbar at the bottom of
the dialog box use the four justification buttons.
Select the HandleVisibility table row. Then select the double-justify button
(the last button to the right).
6-11
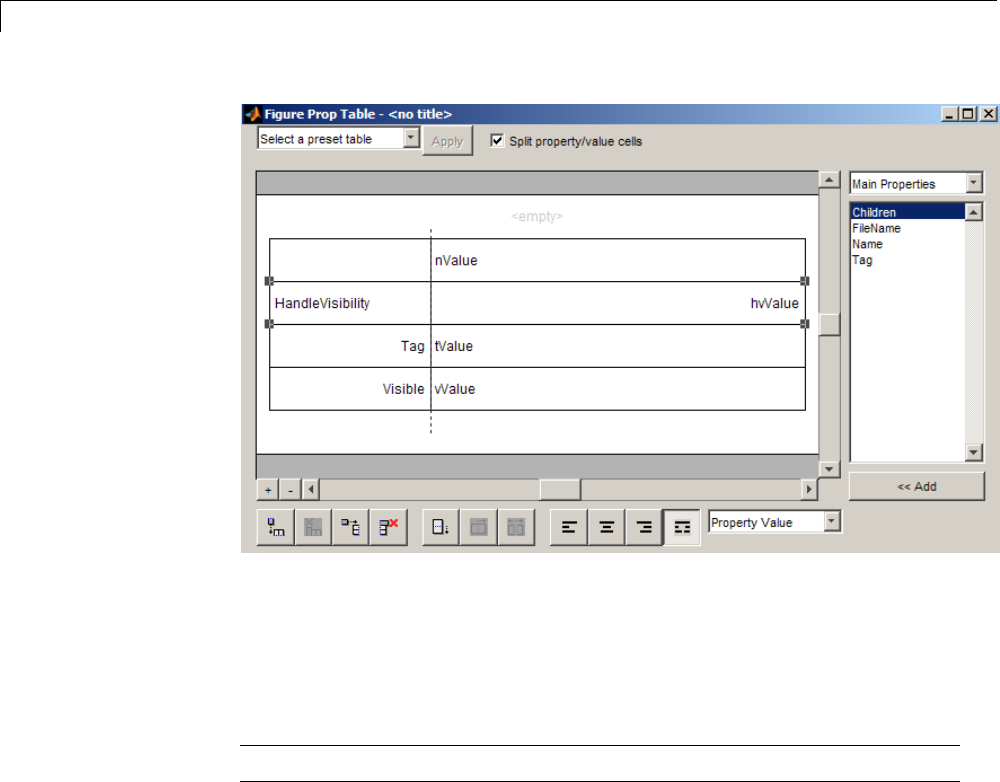
6Add Content with Components
Edit Table Titles
Table titles can contain properties and text. By default, the title of a table is
thesameasthevalueofthe%<Name> property. You can modify this property
to modify the table title.
Note Table titles are always in nonsplit mode.
Enter Text into Table Cells
For the text to be visible, the table must be in nonsplit mode. Clear Split
property/value cells.
To enter text into the HandleVisibility table cell, double-click the cell. A
gray box appears with the label for the cell property.
6-12
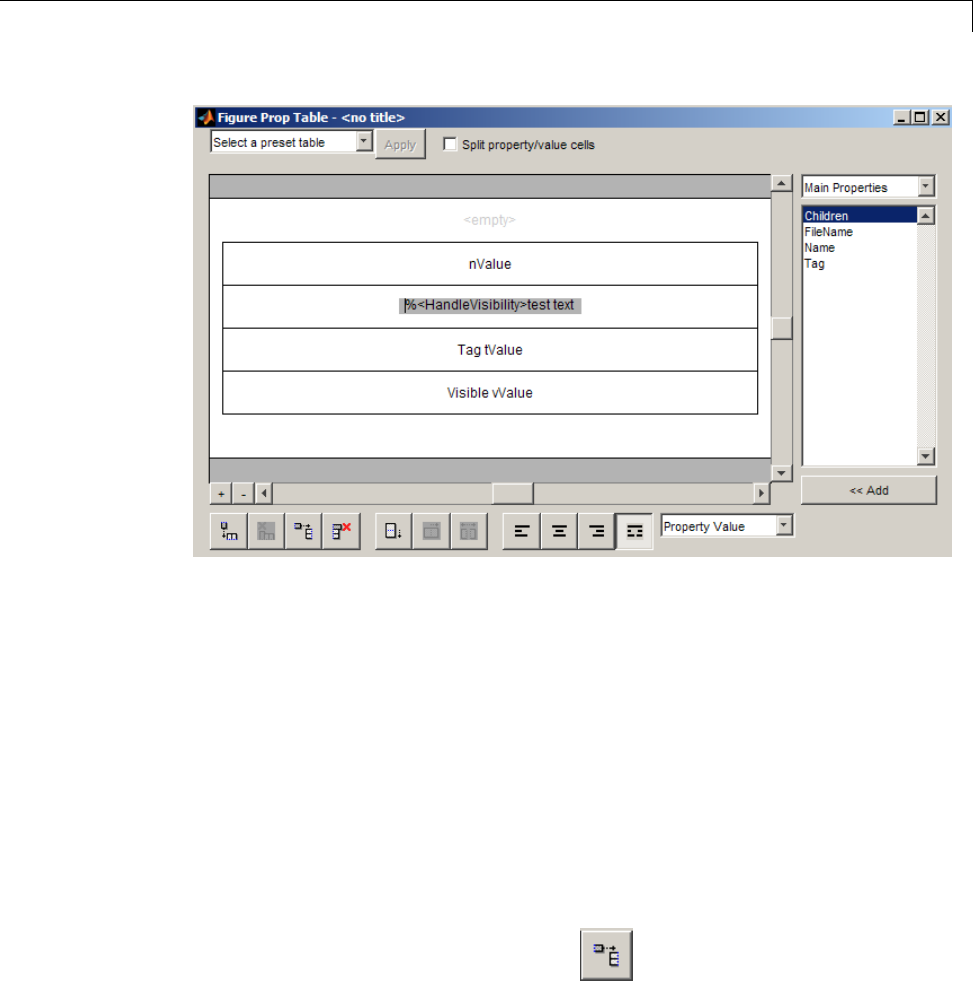
Property Table Components
Ifyoutypetextoutsidetheanglebrackets,thetextappearsasisinthe
report. Text inside the table brackets must specify a valid property name. If
you enter an invalid property name, the property name appears in the report
without a property value.
Add, Replace, and Delete Properties in Tables
Adding Table Properties
To add a Handle Graphics property to a table, use the following steps.
1In the Figure Property Table window, select a table row above which you
want add a new property.
2Click the Add Row Above Current Cell button
A new row appears above the current row.
6-13

6Add Content with Components
3Add the property to the new table row.
aSelect the new table row.
bIn the Properties Type drop-down list at the upper-right of the dialog
box, select a property type.
cIn the Properties list, select the property you want to add.
dClick the << Add button, or double-click the property name. The
property appears in the table row.
Alternatively, if you know the name of the property you want to add, enter
thepropertynamedirectlyintothecell as described in “Enter Text into
Table Cells”. For information about adding new table rows, see “Add and
Delete Columns and Rows”.
Replace Table Properties
To replace a property in a cell of a table in split mode, follow the instructions
in “Adding Table Properties” on page 6-13.
Note You cannot use these steps to delete a property in a cell when the
table is in nonsplit mode.
Delete Table Properties
Delete a property by backspacing over it or using the Delete key.
Format Table Columns, Rows, and Cells
Add and Delete Columns and Rows
To add or delete a column or row, select a cell and then click one of the buttons
described in the following table.
Note You cannot delete a row or column when it is the only row or column
in the table.
6-14
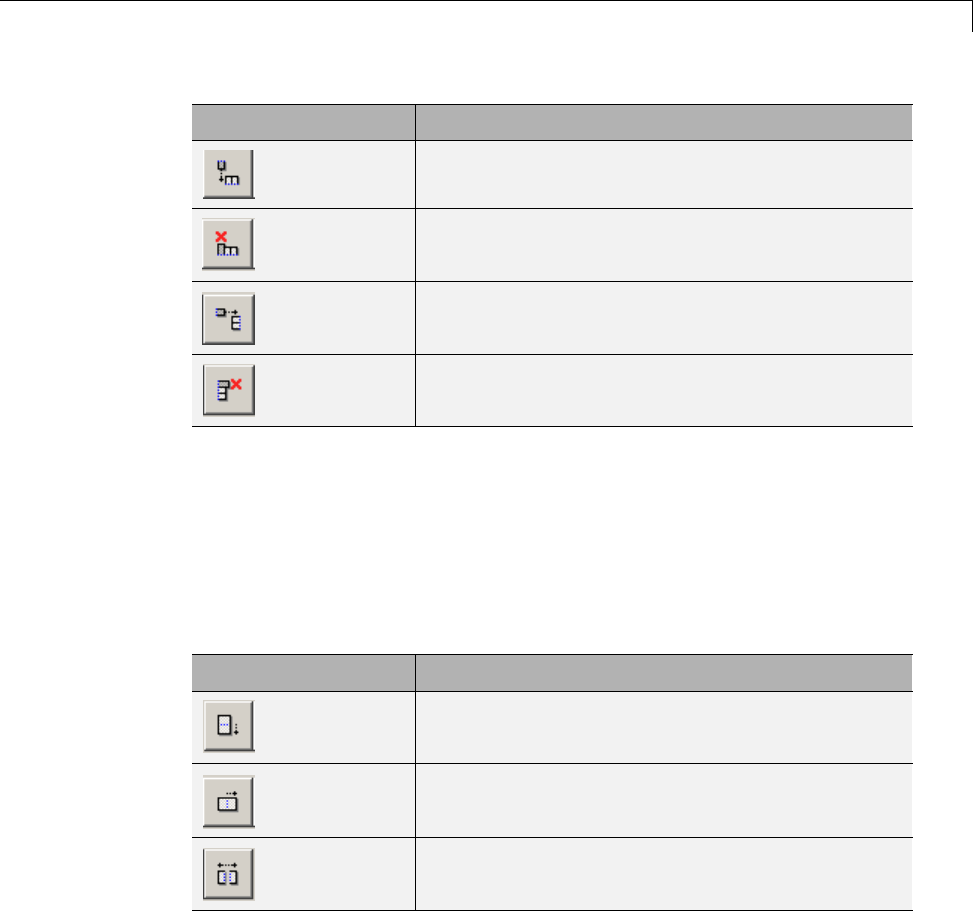
Property Table Components
Button Action
Addcolumn(addedtotheleftoftheselected
column)
Delete selected column
Add row (added above the selected row)
Delete selected row
Resize Columns
To resize the width of a column, click and drag its vertical borders as needed.
Merge and Split Cells
To merge or split table cells, select a row and then click one of the buttons
described in the following table.
Button Action
Merge cells downward
Merge cells to the right
Split cells
Display or Hide Cell Borders
To toggle cell borders on and off:
1Place your cursor in a cell and right-click to invoke its context menu.
6-15
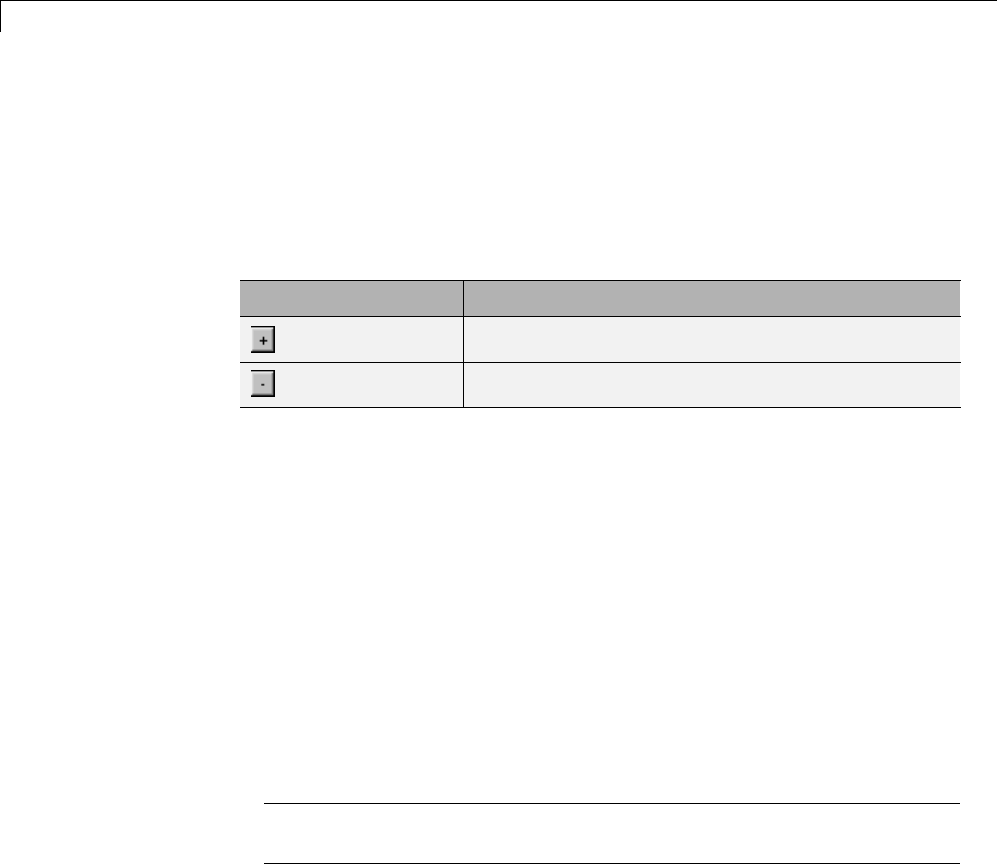
6Add Content with Components
2Choose Cell borders > Top,Bottom,Right,orLeft to toggle the
specified border on or off.
Zoom and Scroll
You can zoom in and out of the table with the zoom buttons, which are located
to the left of the horizontal scroll bar.
Button Action
Zoom in
Zoom out
You can scroll vertically and horizontally using the table scroll bars.
Select a Table
To display property name/property value pairs, you can select a preset table
or use a custom table.
•A preset table is built-in and formatted. You can select a preset table in the
preset table selection list in the upper-left of the Figure Prop Table window.
To apply a preset table, select the table and click Apply.
•To create a custom table, select a preset table and modify it to fit your
needs by adding and/or deleting rows and properties. You may want to
start with the Blank 4x4 preset table.
Note You cannot save a custom table as a preset table. If you do so, you
lose all changes to the custom table.
6-16
Summary Table Components
Summary Table Components
In this section...
“About Summary Table Components” on page 6-17
“Open the Example Report Template” on page 6-19
“Select Object Types” on page 6-19
“Add and Remove Properties” on page 6-19
“Set Relative Column Widths” on page 6-20
“Set Object Row Options” on page 6-20
About Summary Table Components
Summary table components insert tables that include specified properties for
objects into generated reports. Summary tables contain one object per row,
with each object property appearing in a column, as shown in the following
summary table in the figloop-tutorial report.
6-17

6Add Content with Components
Many types of summary table components are available, including:
•Handle Graphics Summary Table
•Simulink Summary Table (requires Simulink Report Generator)
•Stateflow Summary Table (requires Simulink Report Generator)
The component used in this example represents MATLAB Report Generator
summary table components, all of which exhibit similar behavior
6-18
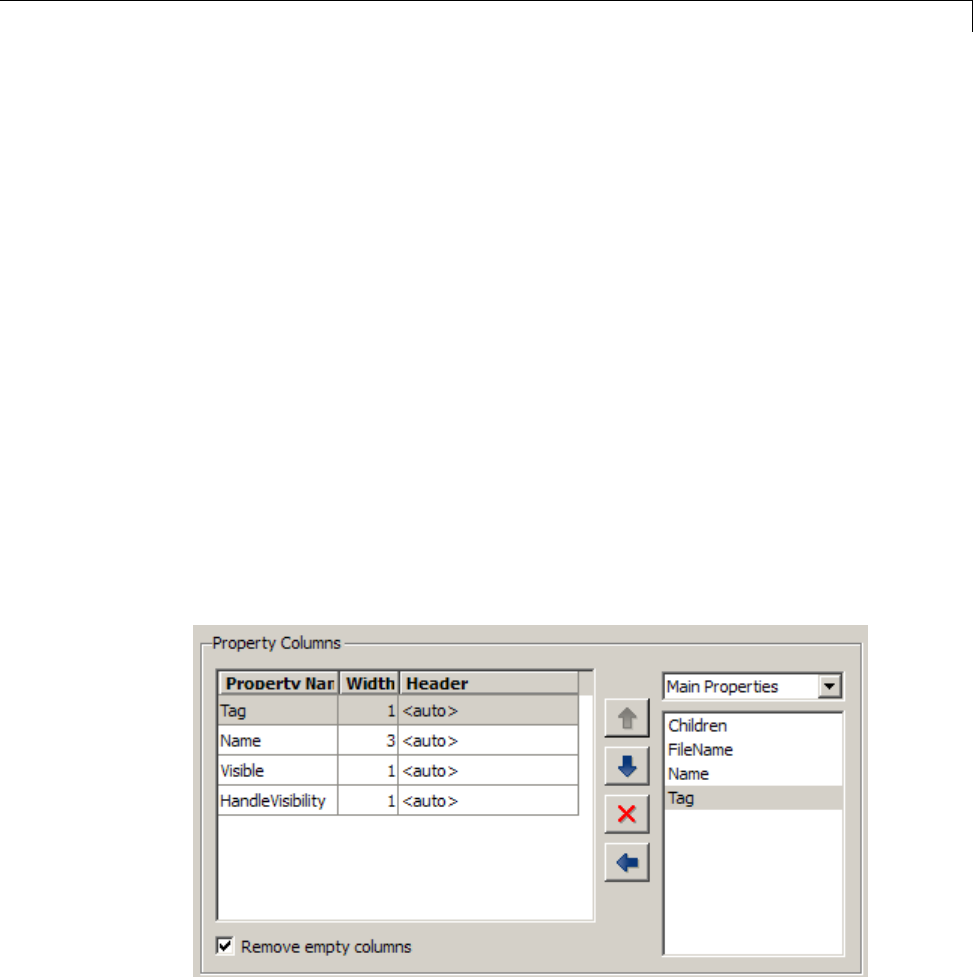
Summary Table Components
Open the Example Report Template
This example usesthefigloop-tutorial report template. To open the figure
loop tutorial report template, enter the following at the MATLAB command
line:
setedit figloop-tutorial
Select Object Types
You can use theObject type selectionlisttochooseHandleGraphicsobject
types for the summary table, including blocks, signals, systems, and models.
The figloop-tutorial reports on figure objects.
Add and Remove Properties
You can select object properties to appear in the summary table from the
Property Columns pane. To add a property to the summary table, select the
property category from the property category drop-down box to the right of
the Property columns table. Each property category has its own list of
properties, which appear in the field under the box. The following figure
shows Main Properties as the selected category.
To add a property:
6-19
6Add Content with Components
1Select the category from the property category drop-down box.
2Select a property in the properties list.
3Click the Add property button.
The property appears in the Property columns table.
To remove a property from the table:
1Select the property in the Property columns table.
2Click the Delete property button.
The property name is removed from the Property columns table.
Note After making changes in the Report Explorer interface, click Apply to
make the changes take effect.
You can define your own properties by entering their names into the Property
columns table using valid variable notation. For more information, see “%
Notation” on the Text component reference documentation.
SetRelativeColumnWidths
To apply a relative column width to the summary table columns in the
generated report, double-click on the Width column of a row in the Property
columns table . If you do not specify a value for this field, column widths
automatically set.
Set Object Row Options
You can use the Object Rows pane to set options for table rows, including
anchor, filtering, and sorting options. Select Insert anchor for each row to
placeananchorineachtablerowinthereport.UsetheInclude figures list
to specify what objects to include in the summary table.
6-20

Summary Table Components
Summary table components in figloop-tutorial report on figure objects.
For more information on options for these figure objects, see the following
sections:
•“Loop on the Current Figure” on page 6-25
•“Loop on Visible Figures” on page 6-25
•“Loop on Figures with Tags” on page 6-25
6-21

6Add Content with Components
Dynamic Reporting Components
In this section...
“Logical and Looping Components” on page 6-22
“Edit Figure Loop Components” on page 6-22
Logical and Looping Components
Logical and looping components execute conditionally, enabling you to decide
when a child component executes or how many times a child component
executes.
Alooping component runs its child components a specified number of times.
There are several looping components, including logical loops and Handle
Graphics loops.
Alooping component runs its child components a specified number of times.
There are several looping components, including logical loops, Handle
Graphics loops, and model and chart loops. For model and chart loops, you
can control aspects such as the order in which the report sorts blocks.
The following example uses the Figure Loop, which is representative of many
types of loops. The Figure Loop component runs its child components several
times. In each iteration, it applies its child components to Handle Graphics
figures. The figloop-tutorial report setup file, included with the MATLAB
Report Generator software, creates a report that documents multiple Handle
Graphics figures.
Edit Figure Loop Components
1Open an example report setup file that illustrates using looping
components. At the MATLAB command prompt, enter:
setedit figloop-tutorial
2To display the Handle Graphics figures, enter the following at the MATLAB
command line:
6-22

Dynamic Reporting Components
figloopfigures
The figures Membrane Data,An Application,andPeaks Data appear
on the screen because their visible property is 'on'.TheInvisible
Membrane Data and An Invisible Application figures do not appear on
screen because their visible property is 'off'. These invisible figures
exist, but they are hidden.
“Figure Properties” on page 6-24 describes the properties of figures used
in this tutorial.
3In the Report Explorer, in the Outline pane on the left, select the Figure
Loop component called Figure Loop Section 1.
The Properties pane for the Figure Loop component appears.
6-23
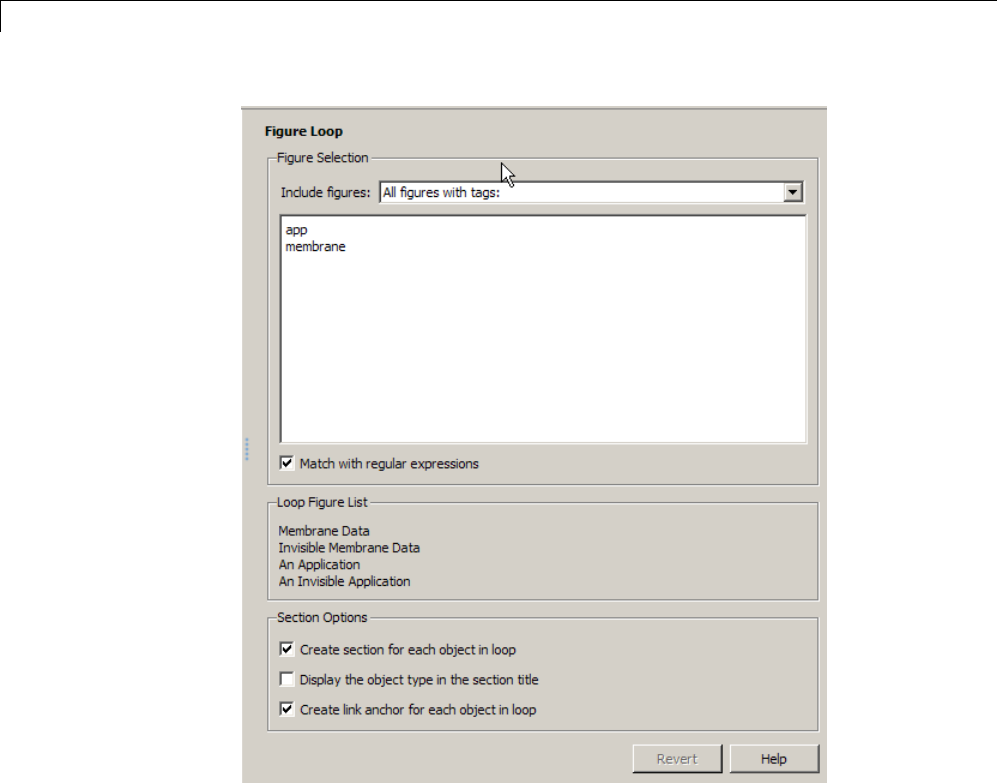
6Add Content with Components
FigureProperties
You can control what figures get displayed in the report, based on the
properties of each figure.
Table 1.1 of the figloop-tutorial report includes a summary of the
properties of the figures used in this tutorial.
6-24
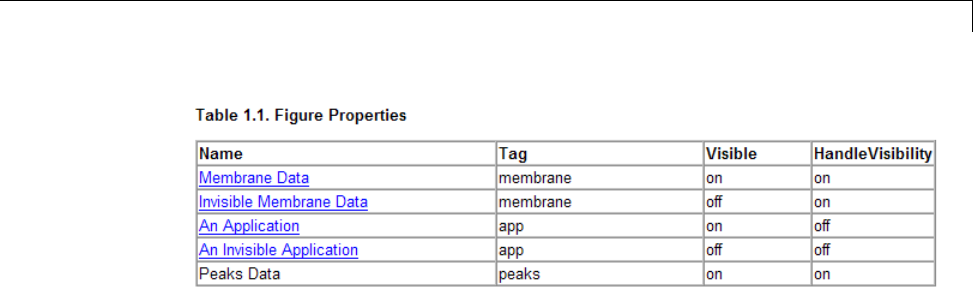
Dynamic Reporting Components
For this tutorial, you do not change these properties. For background
information, see “Setting and Querying Property Values” in the MATLAB
documentation.
Loop on the Current Figure
To include only the current figure in the report, select Current figure only
from the Include figures selection list. In this case, “current figure” refers
to the figure that is current when the report generates. This may not be the
same figure you selected as the current figure in the Report Explorer before
report generation. For example, if the report generation process creates
figures in your report, the last figure created with HandleVisibility set
to 'on' is the current figure.
Loop on Visible Figures
To include snapshots of all visible figures in your report, select Visible
figures in the Include figures selection list. This option inserts a snapshot
and Property Table for all figures that are currently open and visible.
1Select the Data figures only (Exclude applications) option to exclude
figures from the loop whose HandleVisibility parameter is 'off'.
2To generate the report, in the Report Explorer toolbar click the Report
button .
In the generated report, scroll down to “Chapter 2 Figures in Report.” The
Membrane Data and Peaks Data figures appear in the generated report.
Loop on Figures with Tags
To include figures with specified tags in the report:
6-25

6Add Content with Components
1Select the All figures with tags option in the Include figures
selection list.
2In the list of tags, delete membrane.
3Click Report to generate the report.
The An Application and An Invisible Application figures appear in the
report. They both have an app tag.
Modify Loop Section Options
In a loop, a section refers to a space in the generated report in which
information, including text, images, and tables, appears. You can alter the
appearance of sections in each loop appear in the report by using the options
in the Figure Loop component’s Section Options pane.
Create Section for Each Object in Loop. With this option selected, the loop
automatically creates an individual section for each object found in the loop. It
uses the object title as the section title. This option is useful when a loop does
not contain a Chapter/Subsection component that organizes the loop results.
Display the Object Type in the Section Title. Enable this option by
selecting Create section for each object in loop. The generated report
precedes section titles with object titles.
1Enter membrane back in the list of tags.
2Generate the figloop-tutorial report.
The figures produced by the loop are:
Membrane Data
Invisible Membrane Data
An Application
An Invisible Application
3Enable the Display the Object Type in the Section Title option.
4Generate the figloop-tutorial report.
6-26

Dynamic Reporting Components
The figures produced are now:
Figure - Membrane Data
Figure - Invisible Membrane Data
Figure - An Application
Figure - An Invisible Application
The figures produced are now:
Figure - Membrane Data
Figure - Invisible Membrane Data
Figure - An Application
Figure - An Invisible Application
Create a Link Anchor for Each Object in Loop. Selecting this option
creates a hyperlink to the object in the generated report.
6-27

6Add Content with Components
6-28

7Compare Simulink®Model XML Files
Compare Simulink Model XML Files
In this section...
“Introduction” on page 7-2
“Overview of XML Comparison” on page 7-3
“Select Files to Compare” on page 7-5
“Choose a Comparison Type” on page 7-7
“Compare XML Files from Models with Identical Names” on page 7-7
“Examples of XML Comparison” on page 7-8
Introduction
You can use Simulink Report Generator software to compare XML text files
from Simulink models.
You can select a pair of Simulink models to compare their XML files. The
XML comparison tool produces a comparison report based on the SLX files.
You can use the report to explore the differences and view the changes
highlighted in the original models.
You can access the XML comparison tool from:
•The MATLAB Current Folder browser context menu
•The MATLAB Comparison Tool
•The MATLAB command line
•The Simulink Model Editor Tools menu
•The Simulink Project Modified Files view
The XML comparison tool compares the XML files using the “Chawathe”
algorithm, as described in the paper:
Change Detection in Hierarchically Structured Information, Sudarshan
Chawathe, Anand Rajaraman, and Jennifer Widom; SIGMOD Conference,
Montreal, Canada, June 1996, pp. 493-504.
7-2

Compare Simulink®Model XML Files
This conference paper is based upon work published in 1995: see
http://dbpubs.stanford.edu:8090/pub/1995-45.
The Simulink Report Generator XML comparison functionality is an extension
of the MATLAB Report Generator XML comparison feature.
You can use the XML comparison tool with both model file formats, SLX and
MDL. If the selected files are .mdl files, the XML comparison tool first exports
the .mdl files to SLX files in a temporary directory. The XML comparison tool
then produces a comparison report based on the SLX files.
Overview of XML Comparison
You can display XML comparison reports in the MATLAB Comparison Tool.
The comparison tool processes the output of the XML comparison into an
interactive report with links that you can click to reverse annotate from
the XML tag comparison to the corresponding Simulink models. “Reverse
annotation” means when you click items in the report, Simulink Report
Generator displays the corresponding items highlighted in the original
models, as shown in the following example.
7-3
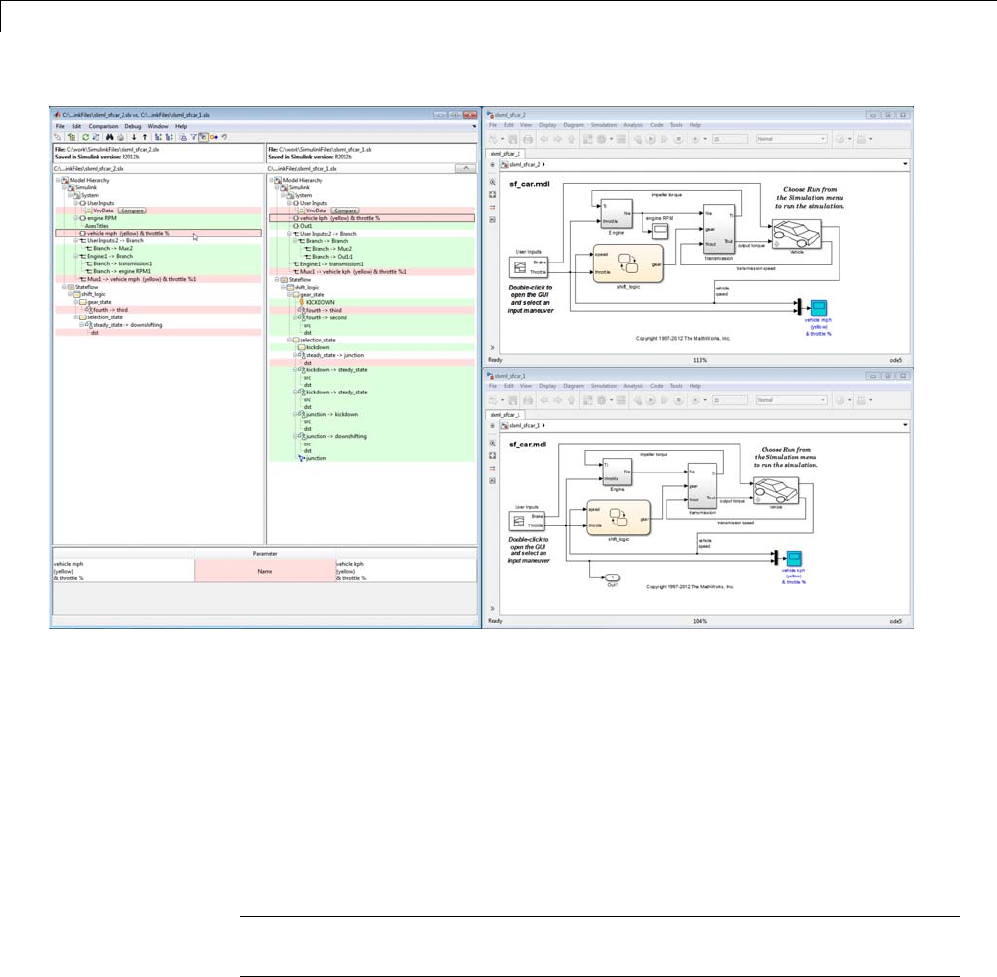
7Compare Simulink®Model XML Files
The XML comparison report shows a hierarchical view of the portions of the
two XML files that differ. The report does not show sections of the files that
are identical.
If the files are identical you see a message reporting there are no differences.
If files have not been saved, you see an error message informing you that
you must save modified or newly created models before running an XML
comparison.
Note It might not be possible for the analysis to detect matches between
previously corresponding sections of files that have diverged too much.
Change detection in the Chawathe analysis is based on a scoring algorithm.
Items match if their Chawathe score is above a threshold. The Simulink
7-4

Compare Simulink®Model XML Files
Report Generator implementation of Chawathe’s algorithm uses a comparison
pattern that defines the thresholds assigned to particular node types (e.g.,
“block”). For more information, see “How the Matching Algorithm Works” in
the MATLAB Report Generator documentation.
For more information on the display of special cases, see “Understand the
Report” on page 7-20.
For more information about the Comparison Tool, see “Comparing Files and
Folders” in the MATLAB documentation.
Select Files to Compare
•“From the Simulink Editor” on page 7-5
•“From the Current Folder Browser” on page 7-5
•“From the Comparison Tool” on page 7-6
•“From a Simulink Project” on page 7-6
•“From the Command Line” on page 7-6
From the Simulink Editor
To compare files using the Simulink Editor:
1Select Analysis > Compare Simulink XML Files.
The Compare Simulink XML Files dialog box opens.
2If the Editor currently displays a model, the current model name and path
appear automatically selected in the Left model file edit box. Use the
browse buttons to locate and select files for the left and right model files.
3When you click OK, the XML comparison tool performs the analysis, and
displays the resulting report in the Comparison Tool.
From the Current Folder Browser
To compare two files from the Current Folder browser:
7-5

7Compare Simulink®Model XML Files
•For two files in the same folder, select the files, right-click and select
Compare Selected Files/Folders.
•To compare files in different folders:
1Select a file, right-click and select Compare Against
2Select the second file to compare in the Select Files or Folders for
Comparison dialog box.
3Leave the default Comparison type,Simulink XML text comparison.
4Click Compare.
If the selected files are XML or model files, the XML text comparison tool
performs a Chawathe analysis and displays a report in the Comparison Tool.
For more information about comparisons of other file types (e.g., text, MAT,
or binary) with the Comparison Tool, see “Comparing Files and Folders” in
the MATLAB documentation.
From the Comparison Tool
To compare files using the Comparison Tool, from the MATLAB Toolstrip, in
the File section, select the Compare button. In the dialog box select files
to compare.
If the selected files are XML or model files, the XML text comparison tool
performs a Chawathe analysis and displays a report in the Comparison Tool.
From a Simulink Project
If you have a Simulink Project using source control, you can create an XML
comparison report from the Modified Files view of the Simulink Project Tool.
For details, see “Simulink Projects”.
From the Command Line
To compare XML files from the command line, enter
visdiff(filename1, filename2)
where filename1 and filename1 are XML files or Simulink models.
7-6

Compare Simulink®Model XML Files
If the files are models, the XML comparison tool performs the comparison on
the XML files. This XML comparison functionality is an extension to the
MATLAB visdiff function. visdiff produces a report in the Comparison
Tool
To create an xmlcomp.Edits object at the command line without opening
the Comparison Tool, enter:
Edits = slxmlcomp.compare(modelname_A,modelname_B)
See “Export Results to the Workspace” on page 7-24 for information about
the xmlcomp.Edits object.
Choose a Comparison Type
If you specify two XML or model files to compare using either the Current
Folder Browser or the visdiff function, then the Comparison Tool
automatically performs the default comparison type. The defaults are XML
text comparison for XML files and Simulink XML text comparison for
model files.
To change comparison type, either create a new comparison from the
Comparison Tool, or use the Compare Against option from the Current
Folder browser. You can change comparison type in the Select Files or
Folders for Comparison dialog box. For example, if you want the MATLAB
text differences report for XML or model files, change the comparison type to
Text comparison in the dialog before clicking Compare.
Compare XML Files from Models with Identical
Names
You can compare XML text from files of the same name. To complete the
operation, the XML comparison tool copies one of the models to a temporary
folder, because Simulink cannot have two models of the same name in
memory at the same time. The XML comparison tool creates a read-only
copy of one model named modelname_TEMPORARY_COPY,andcomparesthe
resulting XML files.
7-7

7Compare Simulink®Model XML Files
Warning When you use reverse annotation from the report, one
of the models displayed is a temporary copy with a new name. The
temporary copy is read-only, to avoid making changes that can be
lost.
Alternatively, you can run the comparison by renaming or copying one of
the files.
All merge operations merge from left to right, so you cannot accidentally
mergetoatemporarycopy. Mergeoperationsonmodelswithidenticalnames
copy changes from the left (temporary copy) model to the right model. If
you swap sides, the report always places a new temporary copy on the left
side of the report, so any merges change the original model file and never a
temporary copy.
If one of the models is open when you try to compare XML files, a dialog box
appears where you can click Yes to close the file and proceed, or No to abort.
You must close open models before the XML comparison tool can compare
XML files from two models with the same name. The problem requiring
you to close the loaded model is called “shadowed files”. In some cases,
another model with the same name might be in memory, but not visible. See
“Shadowed Files” in the Simulink documentation for more information.
If you want to automatically close open models of the same name when
comparing XML files and not see the dialog box again, run these commands:
opt = slxmlcomp.options
opt.setCloseSameNameModel(true)
This is persistent across MATLAB sessions. To revert to default behavior and
be prompted whether or not to close the open model every time, enter:
opt = slxmlcomp.options
opt.setCloseSameNameModel(false)
Examples of XML Comparison
For examples with instructions, see:
•slxml_radar_matlab_function
7-8

7Compare Simulink®Model XML Files
Explore the XML Comparison Report for Simulink Models
In this section...
“Navigate the Simulink XML Comparison Report” on page 7-10
“Display Items in Original Models” on page 7-14
“Filter Out Differences” on page 7-17
“Merge Simulink Models From the Comparison Report” on page 7-18
“Understand the Report” on page 7-20
“Work with Referenced Models and Library Links” on page 7-22
Navigate the Simulink XML Comparison Report
The XML Comparison report shows changes only, not the entire XML text
file contents. The report shows a hierarchical view of the portions of the two
XML files that differ. The report does not show sections of the files that are
identical.
To step through differences, use the toolbar or the Comparison menu. To
move to the next or previous group of differences, either:
•Click the toolbar buttons Next or Previous .
•Select Comparison > Next or Comparison > Previous.See“Step
Through Changes” on page 7-13.
You can also click to select items in the hierarchical trees and observe the
following display features:
•Selected items appear highlighted in a box.
•If the selected item is part of a matched pair it is highlighted in a box in
both left and right trees.
•When you select an item, the original model displays and the corresponding
item is highlighted. See “Display Items in Original Models” on page 7-14.
7-10
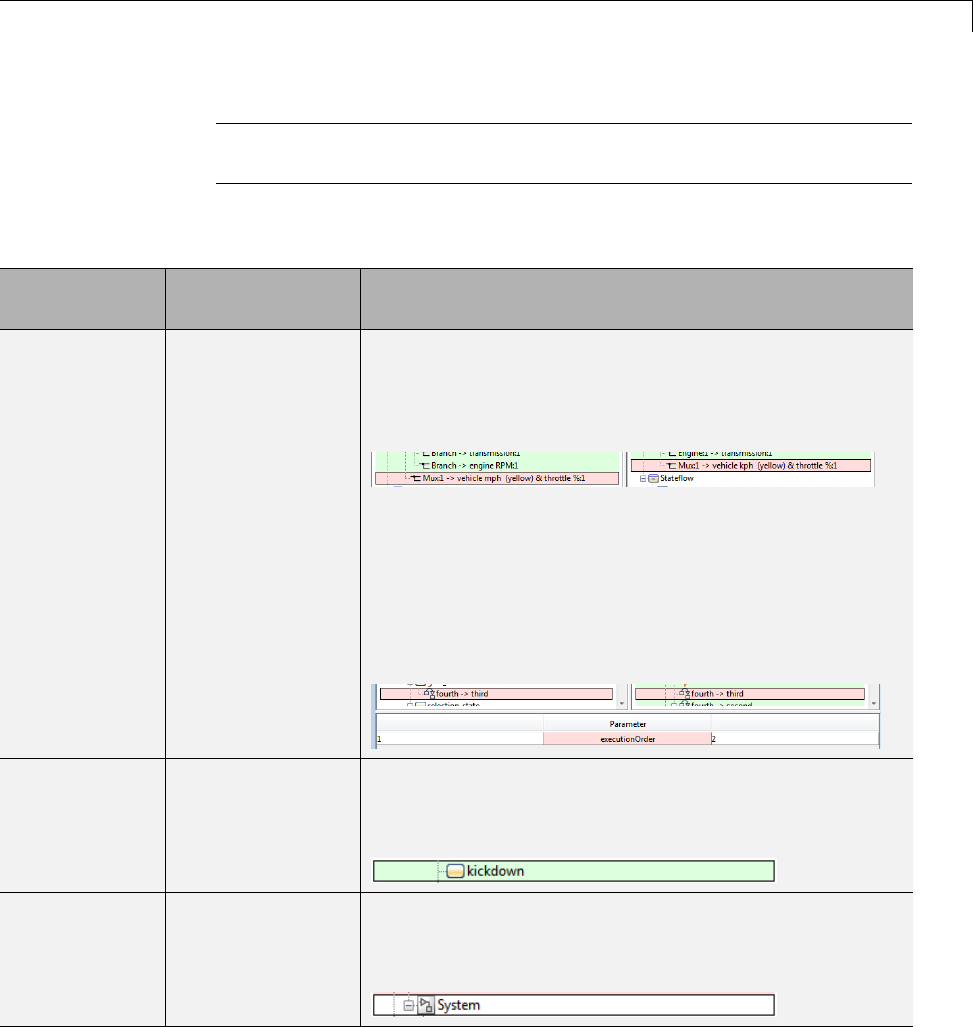
Explore the XML Comparison Report for Simulink®Models
Tip Click a Subsystem contents node to see the report highlight all visible
modified objects in the subsystem.
Report item highlighting indicates the nature of each difference as follows:
Type of report
item
Highlighting Notes
Modified Pink Modified items are matched pairs that differ between
the two files. When you select a modified item it is
highlightedinaboxinbothtrees.
Example of a modified pair of nodes:
Changed parameters for the selected pair are displayed
in a separate Parameters panel for review. If strings are
toolongtodisplayintheParameters table, right-click
and select Compare as Text to open a new comparison
of the parameters.
Example of modified parameters:
Unmatched Green When you select an unmatched item it is highlighted in a
box in one tree only.
Example of an unmatched node:
Container None Rows with no highlighting indicate a container item that
contains other modified or unmatched items.
Example of a container node:
7-11
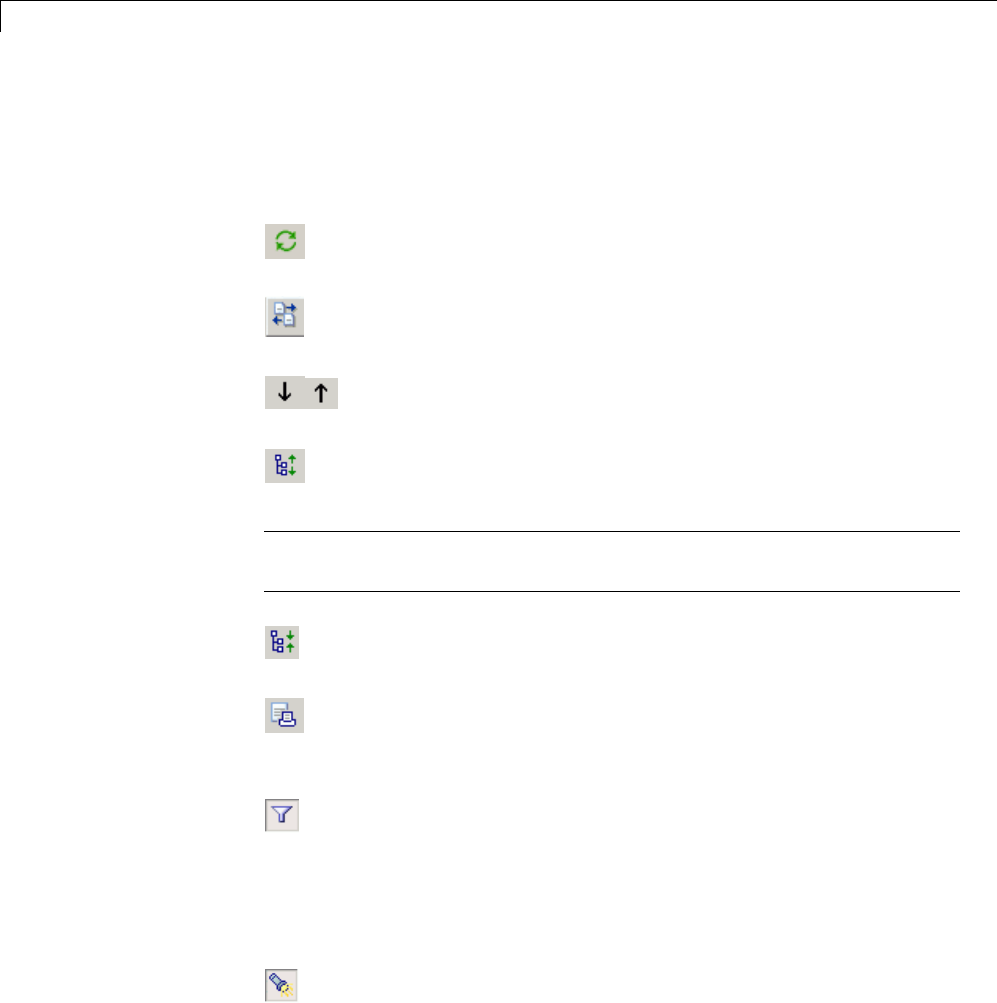
7Compare Simulink®Model XML Files
Icons indicate the category of item, for example: model, subsystem, Stateflow
machine or chart, block, line, parameter, etc.
Use the toolbar buttons or the Comparison menu for the following functions:
•Refresh —RunC
hawathe analysis again to refresh the comparison
report.
•Swap Sides — Swap sides and rerun comparison. Runs the Chawathe
analysis again.
•Next and Previous — Select the next or previous group of
differences. See “Step Through Changes” on page 7-13.
•Expand All — Expands every item in the tree.
Tip Right-click to expand or collapse the hierarchy within the selected
tree node.
•Collapse All — Collapses all items in the tree to the most compact
view possible.
•Printable Report — Opens the Export Printable Report dialog box,
whereyoucanchoosetosaveaprintableversionoftheXMLcomparison
report. See “Export Printable Report” on page 7-24.
•Filter — Opens the Filter Current Comparison dialog box. Select
check boxes to enable or disable display of categories of changes in the
report. Use the filters to show only the changes you are interested in. By
default the report hides all nonfunctional changes, such as repositioning
of items. Turn off filters to explore all differences including nonfunctional
changes. See “Filter Out Differences” on page 7-17.
•Highlight — Enable or disable highlighting of items in original
models. See “Display Items in Original Models” on page 7-14.
7-12
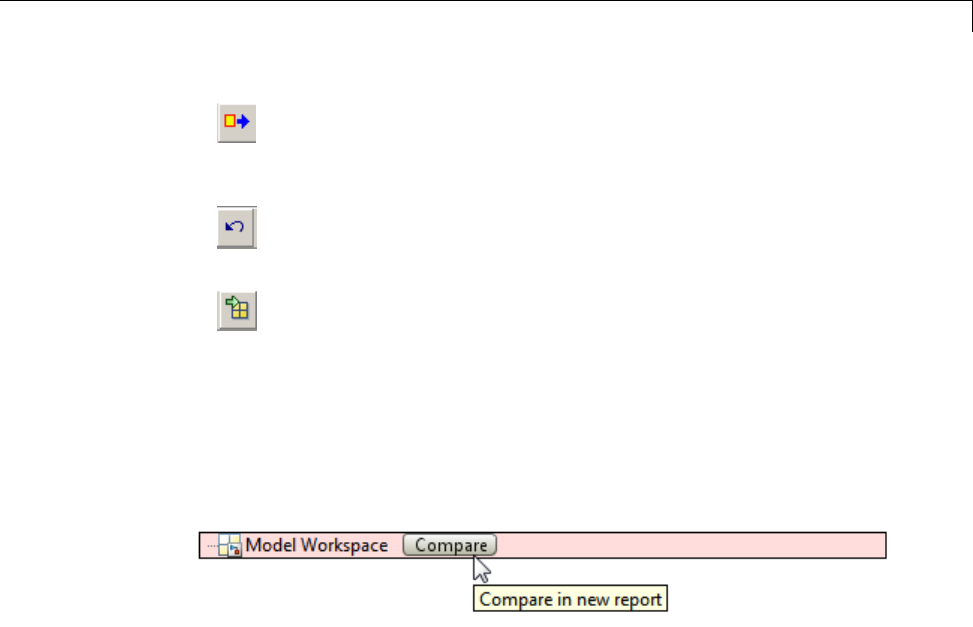
Explore the XML Comparison Report for Simulink®Models
•Merge Node — Merge the selected node from the left side of the
report to the right. See “Merge Simulink Models From the Comparison
Report” on page 7-18.
•Undo Merge Operations — Revert all merge operations (also in
the Edit menu).
•Export to Workspace — Export XML comparison results to
workspace (also in the File menu). See “Export Results to the Workspace”
on page 7-24.
If additional comparisons are available for particular nodes, you see a
Compare button to open a report for that pair of nodes. For example, if there
are differences in the Model Workspace, you can click Compare to open a
new report to explore differences in variables.
For examples with instructions, see also “Examples of XML Comparison”
on page 7-8 .
Step Through Changes
If you click Next repeatedly, you can step through every group of changes
in the report, in the following order:
1First you step through each group of changes in the left tree. When selected
items have a match in the right tree then they are also highlighted.
2Whenyoureachthelastiteminthelefttree,thenNext steps through the
remaining unmatched items in the right tree.
3When you have stepped through all changes, Next returns to the beginning
of the left tree.
7-13

7Compare Simulink®Model XML Files
If you click an item in the report, the Next/Previous controls will step
through changes from the point you selected.
Display Items in Original Models
When you compare the XML text files from Simulink models, you can choose
to display the corresponding items in the original models when you select
report items. You can use this reverse annotation function to explore the
changes in the original models. When you select an item, the report invokes
reverse annotation to the original model and highlights the corresponding
item in the model.
Tip If you click a Subsystem contents node, the report highlights all visible
modified objects in the subsystem.
Click a report entry to view the highlighted item (or its parent) in the model:
•If the item occurs in both models, they both appear with highlighting.
•If there is no match for the item, the unmatched report item row is green.
It is considered unique and appears highlighted by itself. An appropriate
system in the other model also displays to show the context of the missing
item.
•If the XML comparison tool cannot highlight an item directly (e.g.,
configuration parameters), then it highlights the nearest ancestor of the
selected node.
•If you change a block parameter value from the default, you only see the
new parameter in the report. Use reverse annotation to view both blocks.
•To maximize screen space the models display with the status bar, menu
bar, and model browser turned off.
The following screenshots show reverse annotation of Simulink and Stateflow
items in original models using the example slxml_sfcar.
7-14
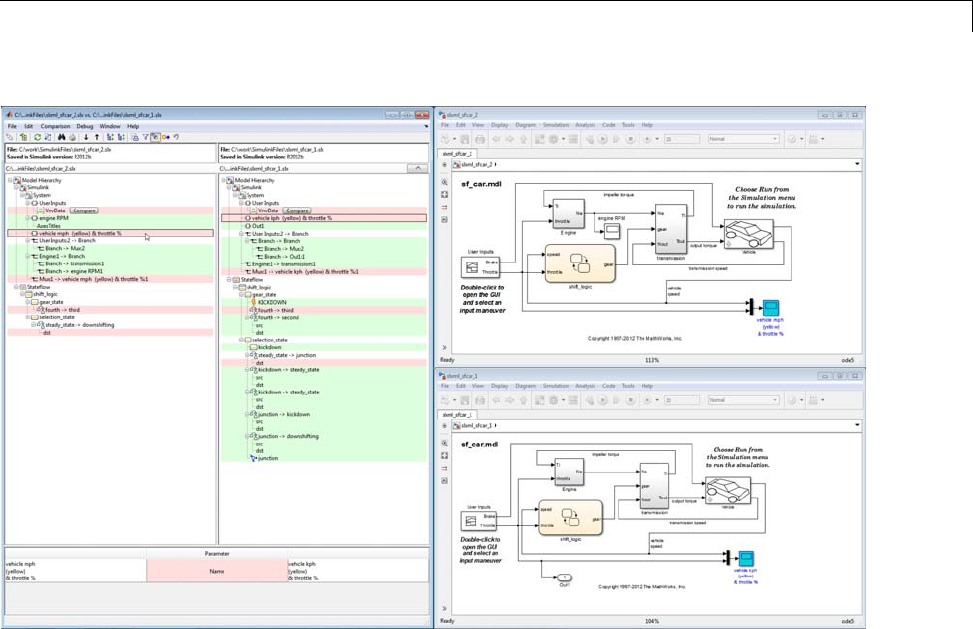
Explore the XML Comparison Report for Simulink®Models
7-15
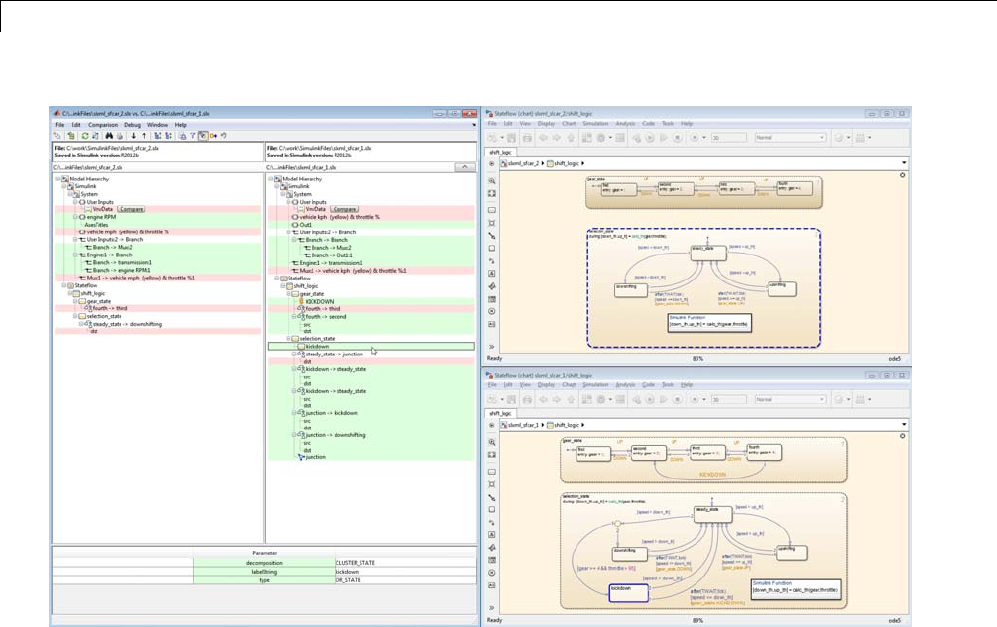
7Compare Simulink®Model XML Files
View Changes in Model Configuration Parameters
You can use the report to explore differences in the model Configuration
Parameters. If you select a Configuration Parameter item, the report displays
the appropriate root node pane, if possible, of both Configuration Parameters
dialog boxes.
The Parameters pane of the report displays the label text from the dialog
controls (or the parameter name if it is command line only), and the parameter
values. Some configuration parameters have a different hierarchy in the XML
file and the dialog box. You can right-click to merge a selected parameter
value in the Parameters pane.
Control Reverse Annotation
You can toggle reverse annotation on and off by clicking the Highlight
toolbar button in the Comparison Tool.
7-16

Explore the XML Comparison Report for Simulink®Models
By default, models display to the right of the comparison report, with the
model corresponding to the left side of the report on top, and the right below.
If you move or resize the models your position settings are respected by
subsequent reverse annotation operations within the same session. The tool
remembers your window positions.
If you want to preserve window positions across sessions, position the window,
and then enter:
slxmlcomp.storeWindowPositions
This preserves the placement of any Simulink windows, Stateflow windows,
and truth table windows.
To stop storing window positions and return to the defaults, enter:
slxmlcomp.clearWindowPositions
Filter Out Differences
You can use the Filter button or Comparison menu item to control display
of categories of changes. Turn off filtering to view all identified changes.
Categories for filtering include:
•Nonfunctional changes. The report processing identifies certain items in
the XML file as nonfunctional, for example, tags representing parameters
such as block, system, chart or label positions, font and color settings
for blocks and lines, and system print and display settings. The report
processing tries to identify “consequential” changes as nonfunctional
(that is, changes as a consequence of another change). For example, if a
block name changes from block_A to block_B, a line emerging from that
block has a change in its source block parameter. This change in the line
parameters is considered nonfunctional. Lines are highly functional, but
line changes can be very noisy because of changes in blocks they connect to.
•Line changes. Hide all changes to signal lines including functional
changes.
•Changes in block parameter defaults. Hiding changes in defaults can
avoid duplication in the report, as any changes in blocks are also reported
as functional changes where you can use reverse annotation. Block
parameter defaults are an undocumented part of the Simulink XML file
7-17

7Compare Simulink®Model XML Files
that store the default parameters for the blocks used in a model. See also
“Changes to Parameter Defaults Appear As New Parameters” on page 7-22.
•Changes in the graphical interface. This information is a summary of
inports and outports at the top level of the model. Filter graphical interface
changes to avoid duplication in the report, as any changes in root ports are
also reported as functional changes where you can use reverse annotation.
Exceptions
The report does not filter out changes to Block and System names,
annotations, and Stateflow Notes as nonfunctional, even though changes
to these items do not affect the outcome of simulation. The report always
displays these changes to facilitate review of code changes, because they can
contain important information about users’ intentions.
In certain rare cases the report filters out changes that can impact the
behavior of the design. By default moves are filtered as nonfunctional, but in
the following cases moves can change design behavior:
•Moving blocks can in some cases change the execution order.
•In a Stateflow chart, if you move states or junctions so that they intersect,
the model fails to simulate.
To view these types of changes in the report, turn off the filter for
nonfunctional changes.
Merge Simulink Models From the Comparison Report
You can merge Simulink models from the XML text comparison report. You
can merge individual parameters, blocks or entire subsystems.
The merge feature enables you to merge two versions of a design modeled in
Simulink. You can merge from the left model to the right model using the
XML text files. Use swap sides if necessary. You can click Undo to revert
all merge operations. You can merge modified, added or deleted nodes in
the report as follows:
7-18
Explore the XML Comparison Report for Simulink®Models
1Select a report item and click the Merge Node toolbar button , or select
Comparison > Merge Node. Merge is disabled when you cannot merge
the selected node. For example, you cannot merge the top level model
nodes, data nodes, or nodes within configuration settings.
2View the results in the report and the models.
The report merges the selected node from the left side of the report to the
right. Merged report nodes have gray row highlighting, and a green merge
arrow if the node has an icon, e.g., .
The merge copies the change (a modified, added or deleted item) from
the left model to the right model. If the node exists only in the left tree,
then the merge inserts it into the right tree. Simulink Report Generator
attempts to connect all lines to blocks after the merge, but you may need
to manually connect some blocks.
3To merge individual parameters, right-click an item in the Parameters
pane and select Merge Selected Parameter.
You cannot insert or delete parameters, and not all parameters can
be merged. For example, you cannot merge Simulink Identifier (SID)
parameters. You can merge parameters that have changed from the default
(only found on one side of the report), as long as the parameter exists in
both blocks and is writeable. See “Changes to Parameter Defaults Appear
As New Parameters” on page 7-22.
If you merge all possible parameters for a node then the report marks
that node as merged, e.g., . If you partially merge some
parameters of a node, the report marks the node as partially merged with a
green merge arrow icon and no gray row highlighting.
4(Optional) To revert all merge operations, click the Undo Merge Operations
toolbar button or select Edit > Undo. A dialog prompts you to confirm
you want to throw away all merge operations and revert the report and
models to their original state.
You will lose your merge changes if you change filter settings after any
merge operations. A dialog prompts you to confirm you want to throw away
7-19

7Compare Simulink®Model XML Files
all merge operations and revert the report and models to their original
state. If you click Yes to continue, the Chawathe analysis runs again and
you see a new report with the new filtering applied.
Merging tips:
•You must merge blocks before lines in the Simulink part of the report,
and in the Stateflow section you must merge states and junctions before
merging transitions, or the report cannot make the connections.
For an example showing how to merge a change involving multiple nodes,
see slxml_sfcar.
•If you want to merge subsystems, be aware that in XML text files,
subsystems are represented by two nodes, the container and the contents.
The two nodes have the same name but different properties, for example,
name changes are a property of the container node. You can merge the
container parameters and contents independently. If you want to merge
a subsystem and all its properties, merge both the container and the
contents nodes.
•For information on merging between models with identical names, see
“Compare XML Files from Models with Identical Names” on page 7-7.
Understand the Report
To understand the report, it is helpful to understand how the Chawathe
results from the XML text files relate to the original models. Some special
features of the report include:
•Hierarchical node tags (such as subsystem tags in the .xml file) appear
twice in the tree as nested nodes. This is because the container node and
the contents can have separate differences in their properties.
This feature of the XML report allows you to distinguish between property
differences of the node itself, and differences contained within nodes nested
inside.
•Simulink software adds new parameters when the value of that parameter
differs from the default, for example, rotating a block adds a new "rotated"
parameter.
7-20

Explore the XML Comparison Report for Simulink®Models
•If the original models contain MATLAB Function block components, and if
differences are found, the XML comparison tool lists them in the Stateflow
section of the report. Click the Compare button at the end of the MATLAB
Function block report items to open new comparisons in the Comparison
Tool, showing the text difference reports for the MATLAB Function block
components. See the example slxml_radar_matlab_function.
•If the original models contain truth tables, and if differences are found, the
XML comparison tool lists them in the Stateflow section of the report.
-Click the Compare button at the end of the MATLAB Function node
to see a summary of all changes.
-Click the truthtable node to reverse annotate and display both
truthtable editors.
-Click the Compare button at the end of the Condition Table node to
open a new text comparison showing only Condition differences.
-Similarly click the Compare button for Action Table to view only
Action changes.
See the example slxml_truthtables.
Unexpected Results
If you see unexpected results within an XML comparison report, see
“How the Matching Algorithm Works” in the MATLAB Report Generator
documentation.
Note It might not be possible for the analysis to detect matches between
previously corresponding sections of files that have diverged too much.
If you cannot see changes you expected to see in the report, click the Filter
button to turn off filters and see all identified changes. See “Filter Out
Differences” on page 7-17.
7-21

7Compare Simulink®Model XML Files
Changes to Parameter Defaults Appear As New Parameters. If
you change a block parameter value from the default, you only see the new
parameter in the report. Use reverse annotation to view both blocks. You see
only the new parameter in the report because Simulink adds new parameters
when the value of that parameter differs from the default. For example,
rotating a block adds a new "rotated" parameter.
Work with Referenced Models and Library Links
The XML comparison report applies only to the currently selected models,
and does not include changes to any referenced models or linked libraries. For
compatibility with source control and peer review workflows, the comparison
report shows only changes in the files selected for comparison.
Tip If you want to examine your whole hierarchy instead, try using a
Simulink Project, where you can examine modified files and dependencies
across your whole project, and compare to selected revisions. See “Simulink
Projects”.
If you are creating an XML comparison report for models that contain
referenced models, and you have more than one referenced model with the
same name, then your MATLAB path can affect the results. For example, this
canhappenifyougenerateanXMLcomparison report for the current version
of your model and a previous baseline. To avoid seeing unexpected changes
in model reference blocks, make sure that your referenced models are not on
your MATLAB path before you generate the report.
The reason why results can change is that Simulink records information in
the top model about the interface between the top model and the child model.
This interface information in the top model enables incremental loading and
diagnostic checks without any need to load child models.
When you load a model (for example, to compare XML) then Simulink
refreshes the interface information for referenced models if it can find the
child model. Simulink can locate the child model if it is on the path. If another
model of the same name is higher on the path, Simulink updates the interface
information for that other model before comparing XML. This can produce
entries for model reference blocks in the comparison report that you did not
7-22

Explore the XML Comparison Report for Simulink®Models
expect. If you make sure your referenced models are not on your path before
you generate the report, then you can avoid these unexpected results. If both
model versions are off the path, the interface information in the top model
is not refreshed during the XML comparison process. Instead the cached
information is used, resulting in a valid XML comparison report.
With library links, Simulink does not update the cached interface information
when comparing XML, and so the report correctly captures library interfaces.
However with both referenced models and library links, Simulink updates
the information when displaying the model. When displaying report items
in original models, you may see unexpected results because Simulink may
find a model or library that is higher in the path. To obtain the clearest
results, make sure that the models and associated libraries are temporarily
removed from the path. By removing the files from the path you will see
unresolved library links and referenced models when you view the original
models, but their interfaces will be correct and will correctly align with the
comparison report.
7-23
7Compare Simulink®Model XML Files
Export, Print, and Save XML Comparison Results
In this section...
“Export Printable Report” on page 7-24
“Export Results to the Workspace” on page 7-24
“Save Comparison Log Files in a Zip File” on page 7-26
Export Printable Report
To save a printable version of an XML comparison report,
1Select Comparison > Printable Report or click the toolbar button.
The Export Printable Report dialog box opens.
2Selectafilenameandlocationtosavethereport.
The report is a noninteractive HTML document of the differences detected
by the Chawathe algorithm for printing, sharing, or archiving a record of
the comparison. If you have applied filters, your filtered results appear in
theprintablereport.
Export Results to the Workspace
To export the XML comparison results to the MATLAB base workspace,
click the toolbar button Export to Workspace, or select File > Export
to Workspace. Specify a name for the export object in the dialog and
click OK. This action exports the results of the XML comparison to an
xmlcomp.Edits object in the workspace. The xmlcomp.Edits object contains
information about the XML comparison including file names, filters applied,
and hierarchical nodes that differ between the two XML files.
To create an xmlcomp.Edits object at the command line without opening
the Comparison Tool, enter:
Edits = slxmlcomp.compare(modelname_A,modelname_B)
7-24
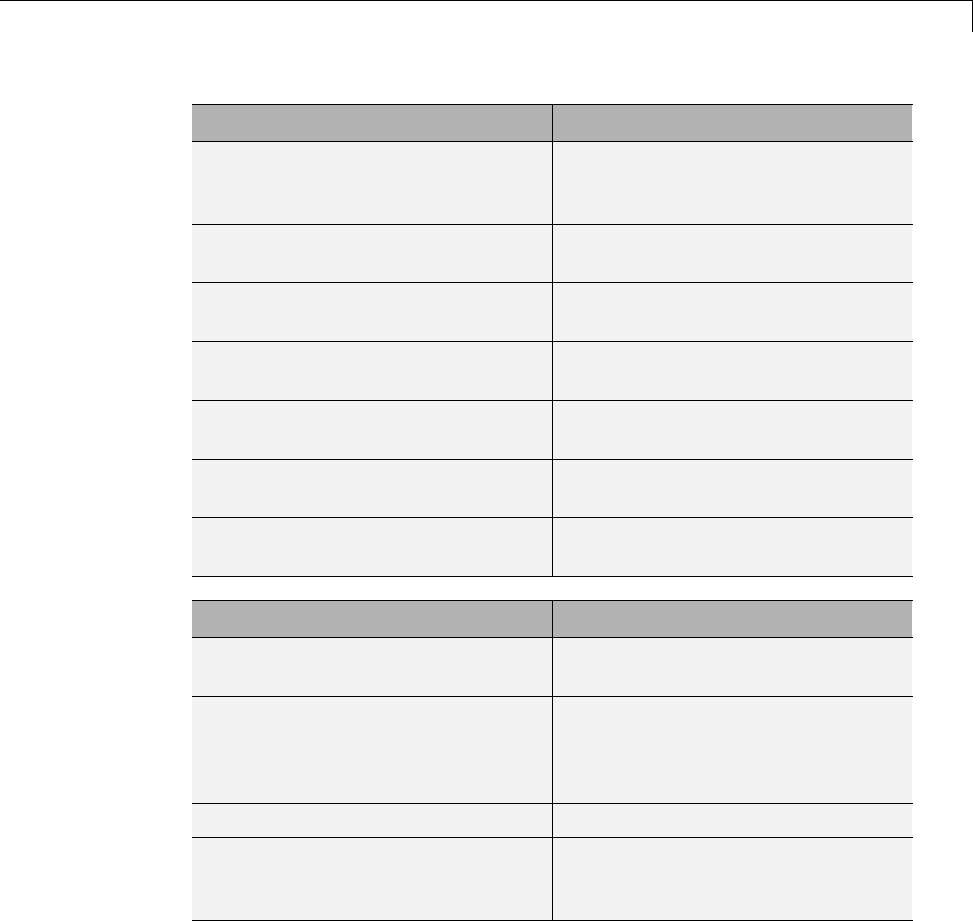
Export, Print, and Save XML Comparison Results
Property of xmlcomp.Edits Description
Filters Array of filter structure arrays.
Each structure has two fields, Name
and Value.
LeftFileName File name of left model exported to
XML.
LeftRoot xmlcomp.Node object that references
the root of the left tree.
RightFileName File name of right model exported to
XML.
RightRoot xmlcomp.Node object that references
therootoftherighttree.
TimeSaved Time when results exported to the
workspace.
Version MathWorks release-specific version
number of xmlcomp.Edits object.
Property of xmlcomp.Node Description
Children Array of xmlcomp.Node references to
child nodes, if any.
Edited Boolean — If Edited = true then
the node is either inserted (green)
or part of a modified matched pair
(pink).
Name Name of node.
Parameters Array of parameter structure arrays.
Each structure has two fields, Name
and Value.
7-25
7Compare Simulink®Model XML Files
Property of xmlcomp.Node Description
Parent xmlcomp.Node reference to parent
node, if any.
Partner If matched, Partner is an
xmlcomp.Node reference to the
matched partner node in the other
tree. Otherwise empty [].
Save ComparisonLogFilesinaZipFile
Temporary comparison files accumulate in
tempdir/MatlabComparisons/XMLComparisons/TempDirs/.These
temporary files are deleted when you close the related comparison report.
You can zip the temporary files (such as log files) created during XML text
comparisons for sharing or archiving. While the comparison report is open,
enter:
xmlcomp.zipTempFiles('c:\work\myexportfolder')
The destination folder must exist. The output reports the zip file name:
Created the zipfile "c:\work\myexportfolder\20080915T065514w.zip"
To view the log file for the last comparison in the MATLAB Editor, enter:
xmlcomp.showLogFile
7-26
Compare XML from Models Managed with Subversion
Compare XML from Models Managed with Subversion
In this section...
“Work with Subversion” on page 7-27
“Create file_comparison_driver Function” on page 7-28
“Configure TortoiseSVN” on page 7-28
“Test TortoiseSVN Setup” on page 7-30
“Example file_comparison_driver Code” on page 7-31
Work with Subversion
Simulink Projects provide built-in Subversion source control integration. You
can create an XML comparison report from the Modified Files view of the
Simulink Project Tool. See “Simulink Projects”.
Alternatively, you can customize your external Configuration Management
tools to call the XML comparison functionality in the Simulink Report
Generator, as described on this page.
Comparing two versions of the same file is a common workflow when using
Configuration Management tools. If your Configuration Management tool
is configurable, you can customize your Diff operations on Simulink model
files from your Configuration Management tool to call the XML comparison
functionality in the Simulink Report Generator. This allows you to compare
two versions of the XML from the same model file and generate a report of
the differences.
TortoiseSVN and Subversion are a popular suite of open-source version
control tools. The following example describes how to configure TortoiseSVN
to use the Simulink Report Generator XML comparison. You can register the
XML comparison function with TortoiseSVN as an extension-specific diff
program to use for model files. When you perform a TortoiseSVN diff on a
model file, TortoiseSVN uses the XML comparison to generate a report. This
workflow describes a typical usage of Subversion on a Windows®PC.
There are two steps:
7-27

7Compare Simulink®Model XML Files
•Create and save a MATLAB function file_comparison_driver that opens
the Comparison Tool and invokes the XML comparison function for model
files. For an example, see “Example file_comparison_driver Code” on page
7-31.
•Configure TortoiseSVN to use the file_comparison_driver function for
model files.
Optionally, you can also configure TortoiseSVNtousethesamefunctionto
call the MATLAB Comparison Tool for .mat files and for Simulink manifest
files (.smf files).
Create file_comparison_driver Function
Create and save a MATLAB function that invokes the Comparison Tool as
follows:
1Usetheexamplecodetocreateyourfilecomparisonfunction. Copythe
code in the section “Example file_comparison_driver Code” on page 7-31
into a new file in the MATLAB Editor.
2Savethefileasfile_comparison_driver.m.
3MakesurethefileisontheMATLABpath.
4Test your function by calling it within MATLAB with two model files. For
example:
file_comparison_driver( which('f14'),which('f14c') )
Configure TortoiseSVN
This example is compatible with Release 2008b+ onwards and was tested
with Subversion 1.6.2 on Windows XP.
Configure TortoiseSVN to use the XML comparison tool for model files, as
follows:
1Right-click a file in Windows Explorer and select TortoiseSVN > Settings.
2In the TortoiseSVN Settings dialog box, click Diff Viewer under External
Programs in the tree, then click the Advanced button.
7-28

Compare XML from Models Managed with Subversion
3In the Advanced Diff settings dialog box, add an entry to specify what to
do with model files.
aClick Add.
bIn the Add extension specific diff program dialog box, enter .mdl or .slx
for the Extension and enter the following command in the External
Program edit box:
"matlabroot\bin\matlab.exe" -r
file_comparison_driver("'%base'","'%mine'") -nosplash
Replace matlabroot with the path to the specific location on your
computer for your MATLAB installation, for example, C:\Program
files\MATLAB\R2009a.
The following example shows this setup on an Release 2009a installation.
7-29
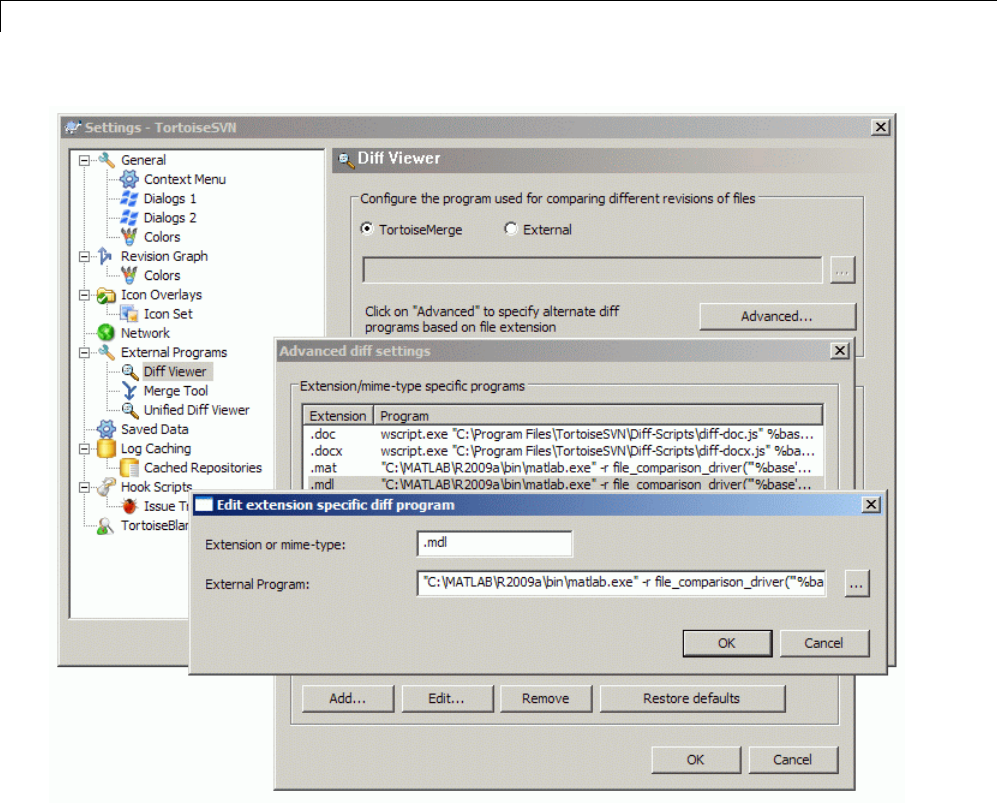
7Compare Simulink®Model XML Files
4Click OK to apply your changes and close all the Tortoise SVN dialog boxes.
5IfyoualsowanttousetheMATLABComparisonToolfor.mat files and for
Simulink manifest files (.smf files) you can repeat the steps to add exactly
the same External Program command for .mat files and .smf files.
Test TortoiseSVN Setup
To test your setup, follow these steps:
7-30

Compare XML from Models Managed with Subversion
1Start MATLAB and open, modify, and save a Simulink model that is
managed in a Subversion archive. This creates a local working copy that is
different to the head repository copy.
2In Windows Explorer, right-click your modified file, and select
TortoiseSVN > Diff.
TortoiseSVN runs a new instance of MATLAB. MATLAB loads and runs the
file_comparison_driver.m file. The file_comparison_driver function
performs these steps:
1Creates temporary copies of the current working version of the Simulink
model and the previously stored version of the model.
2Compares the XML text files from both models and generates a comparison
report displayed in the MATLAB Comparison Tool.
Thefunctionmustpreprocessthefilenames by creating renamed temporary
copies because Subversion uses a temporary file naming convention that is
not compatible with Simulink because of invalid delimiting characters. The
branch and version information is embedded in the temporary model names.
Seealso“CompareXMLFilesfromModelswithIdenticalNames”onpage7-7
for information about using the report and a warning to avoid losing work in
the temporary models.
Other TortoiseSVN workflows using Diff operations are also supported, such
as comparing two versions in an archive.
Example file_comparison_driver Code
Use the following example code to create your file comparison function, as
described in “Create file_comparison_driver Function” on page 7-28.
function file_comparison_driver(base, mine)
%FILE_COMPARISON_DRIVER
%
%
% Use this function to call the MATLAB Comparison Tool
% from external tools such as the diff
% function of Subversion.
7-31

7Compare Simulink®Model XML Files
% If you have Simulink Report Generator version 3.5 or later
% installed, then the XML Comparison feature is called if you
% use this function with model files.
%
% Typical use:
% "c:\matlab\R2009a\bin\matlab.exe" -r file_comparison_driver
% ("'%base'","'%mine'") -nosplash
%
% This example is compatible with Release 2008b+ onwards and
% was tested with Subversion 1.6.2 on Windows XP Professional.
% Copyright 2008-2012 The MathWorks, Inc.
% Confirm inputs:
error(nargchk(2, 2, nargin, 'struct'))
% Uncomment the following line if using a release before R2009b.
% slxmlcomp.register;
% Create a new temporary folder:
new_folder = tempname;
mkdir(new_folder)
% Create a temporary copy of the base file that uses a
% valid MATLAB file name:
new_base = create_temp_locations(base, new_folder);
new_mine = create_temp_locations(mine, new_folder);
% Use "visdiff" function to open MATLAB Comparison Tool:
visdiff(new_base, new_mine)
end
% -----------------------------------------------
function new = create_temp_locations(old, new_dir)
% Names may have unsupported characters due to Subversion
% conventions. Change them to underscores.
[~, old_name, ext] = fileparts(old);
new_name = replace_unsupported_characters(old_name);
7-32

Compare XML from Models Managed with Subversion
% If no characters needed replacing then there is no
% need to create a temporary copy
if strcmp(old_name,new_name)
new = old;
return
end
% Create new target location for this file:
new = fullfile(new_dir, [new_name ext]);
% Copy files to the temporary location:
ok = copyfile(old, new, 'f');
assert(ok, 'Failed to copy files to temporary location');
end
% ------------------------------------------------
function new = replace_unsupported_characters(old)
firstLetterIndex = regexp(old,'[a-z_A-Z]','start','once');
new = old(firstLetterIndex:end);
new = strrep(new,'.','_');
new = strrep(new,'-','_');
end
7-33

7Compare Simulink®Model XML Files
7-34

8
Component Reference
Simulink Coder Components (p. 8-2) Report on code generated by
Simulink Coder software
Requirements Management
Interface Components (p. 8-3)
Report block requirements data
Simulink Components (p. 8-4) Report on Simulink models
Simulink Blocks Components (p. 8-7) Report on specified Simulink block
types
Simulink®Fixed Point™
Components (p. 8-8)
Report on Simulink Fixed Point
blocks
Stateflow Components (p. 8-9) Report on Stateflow models
This chapter describes Simulink Report Generator components. For
information about MATLAB Report Generator components, see the MATLAB
Report Generator documentation.

8Component Reference
Simulink Coder Components
Code Generation Summary Insert version number information,
list of generated files, tables
summarizing code generation
configuration information, and
subsystem maps into report
Import Generated Code Import source and header files
generated by Simulink Coder
software, and custom files specified
as part of model
8-2

Requirements Management Interface Components
Requirements Management Interface Components
Missing Requirements Block Loop Apply all child components to blocks
that do not have requirements
Missing Requirements System Loop Loop only on systems and
subsystems that do not have
associated requirements
Requirements Block Loop Apply child components to blocks
with requirements
Requirements Documents Table Insert table of linked requirements
documents
Requirements Signal Loop Apply all child components to signal
groups with requirements
Requirements Summary Table Properties of blocks, systems, or
Stateflow objects with associated
requirements
Requirements System Loop Apply child components to systems
with requirements
Requirements Table Requirements links for current
context
8-3

8Component Reference
Simulink Components
Annotation Loop Run child components multiple
times for each Simulink annotation
in current context
Block Execution Order List Create a list or table of all nonvirtual
blocks in the model, showing order
in which they execute
Block Loop Runchildcomponentsforeachblock
in the current system, model, or
signal
Block Type Count Count number of each block type in
the current model or system
MATLAB Function Insert information about MATLAB
Function block contents
Model Advisor Report Insert Model Advisor report or link
to Model Advisor report for current
model
Model Change Log Construct model history table that
displays model revision information
Model Configuration Set Insert active configuration set of a
model into a report
Model Loop Loop on Simulink models and
systems, as specified by child
components
Model Simulation Run current model with specified
simulation parameters
Signal Loop Run child components for each signal
contained in current system, model,
or block
Simulink Automatic Table Insert two-column table with
information on selected model,
system, signal, or block
8-4

Simulink®Components
Simulink Dialog Snapshot Insert snapshots of Simulink editor
dialog boxes
Simulink Functions and Variables Create table that displays workspace
variables and MATLAB functions
used by reported blocks in Simulink
models
Simulink Library Information Insert table that lists library links in
the current model, system, or block
Simulink Linking Anchor Designate locations to which links
point
Simulink Name Insert name of a Simulink model,
system,block,orsignalintoreport
Simulink Property Insert property name/property value
pair for current Simulink model,
system,block,orsignal
Simulink Property Table Insert table that reports on
model-level property name/property
value pairs
Simulink Sample Time Insert title of Simulink sample time
into report
Simulink Summary Table Properties or parameters of specified
Simulink models, systems, blocks, or
signals in table
Simulink Workspace Variable Report information about MATLAB
and model workspace variables that
model uses
Simulink Workspace Variable Loop Reports on Simulink workspace
variable objects
System Filter Run child components if current
system meets specified conditions
System Hierarchy Create nested list that shows
hierarchy of specified system
8-5


8Component Reference
Simulink Fixed Point Components
Fixed Point Block Loop Run child components for the
Simulink model, system, or signal
defined by parent component
Fixed Point Logging Options Set fixed-point options like in Fixed
Point Tool
Fixed Point Property Table Insert table that reports on
Simulink Fixed Point block property
name/property value pairs
Fixed Point Summary Table Table of specified fixed-point block
properties or parameters
8-8

Stateflow®Components
Stateflow Components
Chart Loop Run child components for specified
Stateflow charts
Machine Loop Run child components for specified
Stateflow machines
Object Loop Run child components for Stateflow
objects, and then insert table into
report
Simulink Function System Loop Report on Simulink functions
specified in a Stateflow loop
State Loop Run child components for all states
in current context
Stateflow Automatic Table Insert table with properties of
current Stateflow object
Stateflow Count Count number of Stateflow objects
in current context
Stateflow Dialog Snapshot Insert snapshots of Stateflow editor
dialog boxes
Stateflow Filter Run child components only if current
object type matches specified object
type
Stateflow Hierarchy Provide visual representation of the
hierarchy of a Stateflow object
Stateflow Hierarchy Loop Run child components on Stateflow
object hierarchy
Stateflow Linking Anchor Designate locations to which links
point
Stateflow Name Insert into report name of Stateflow
object specified by parent component
Stateflow Property Insert into report table, text, or
paragraphwithinformationon
selected Stateflow object property
8-9

8Component Reference
Stateflow Property Table Insert into report property-value
table for Stateflow object
Stateflow Snapshot Insert into report snapshot of
Stateflow object
Stateflow Summary Table Table of properties or parameters of
specified Stateflow object
Truth Table Report on truth tables in Simulink
and Stateflow models
8-10

9
Components — Alphabetical
List
For a list of MATLAB Report Generator components, see the MATLAB Report
Generator documentation.
Annotation Loop
Block Execution Order List
Block Loop
Block Type Count
Bus
Chart Loop
Code Generation Summary
Documentation
Fixed Point Block Loop
Fixed Point Logging Options
Fixed Point Property Table
Fixed Point Summary Table
Import Generated Code
Look-Up Table
Machine Loop
Missing Requirements Block Loop
MATLAB Function
Missing Requirements System Loop
Model Advisor Report
Model Change Log
Model Configuration Set
Model Loop
Model Simulation

9Components — Alphabetical List
Object Loop
Requirements Block Loop
Requirements Documents Table
Requirements Signal Loop
Requirements Summary Table
Requirements System Loop
Requirements Table
Scope Snapshot
Signal Loop
Simulink Automatic Table
Simulink Dialog Snapshot
Simulink Function System Loop
Simulink Functions and Variables
Simulink Library Information
Simulink Linking Anchor
Simulink Name
Simulink Property
Simulink Property Table
Simulink Sample Time
Simulink Summary Table
Simulink Workspace Variable
Simulink Workspace Variable Loop
State Loop
Stateflow Automatic Table
Stateflow Count
Stateflow Dialog Snapshot
Stateflow Filter
Stateflow Hierarchy
Stateflow Hierarchy Loop
Stateflow Linking Anchor
Stateflow Name
Stateflow Property
Stateflow Property Table
Stateflow Snapshot
Stateflow Summary Table
System Filter
System Hierarchy
9-2


Annotation Loop
Purpose Run child components multiple times for each Simulink annotation in
current context
Description This component runs its child components multiple times for each
Simulink annotation in the current context. The parent component
determines the context.
•Model Loop: Reports on all annotations inside the reported portion
of the reported model.
•System Loop: Reports on all annotations inside the current system.
•Block Loop or Signal Loop: Does nothing.
Loop
Options
The Loop Options pane displays information about the current context.
You can sort Alphabetically by text or In traversal order.
Child components of the Annotation Loop consider their context to be
annotations when the report is running.
For example, the following components report on the looped annotation:
•Simulink Automatic Table
•Simulink Linking Anchor
•Simulink Name
•Simulink Property
•Simulink Property Table
Use a Summary Table component to show annotation objects in reports.
Each Summary Table component creates a single table with each
reported annotation on a single row of the table.
Section
Options
•Create section for each object in loop: Inserts a section in the
generated report for each object found in the loop.
•Display the object type in the section title: Inserts the object
type automatically into the section title in the generated report.
9-4

Annotation Loop
•Create link anchor for each object in loop:Createsahyperlink
to each object in the loop, the generated report.
See Also Block Loop,Model Loop,Signal Loop,System Loop,Simulink
Linking Anchor,Simulink Name,Simulink Property,Simulink
Property Table,Simulink Summary Table
9-5

Block Execution Order List
Purpose Create a list or table of all nonvirtual blocks in the model, showing
order in which they execute
Description This component creates a list or table of all nonvirtual blocks in the
model, showing the order in which they execute.
For more information about virtual and nonvirtual blocks, see “About
Blocks” in the Simulink documentation.
Properties •List Title:
-Automatic: Generates a list or table title automatically.
-Custom: Enables you to enter a title.
•Include block type information: Include each block’s BlockType
property in the list or table.
•Look under nonvirtual subsystems:Thedefaultis
Automatic
(On for models, Off for systems).SetittoOn or Off.
Insert
Anything
into
Report?
Yes. List.
Class rptgen_sl.csl_blk_sort_list
See Also Block Loop
9-6

Block Loop
Purpose Run child components for each block in the current system, model, or
signal
Description This component runs its child components for each block contained in
the current system, model, or signal.
For more information on working with looping components, see
“Dynamic Reporting Components” on page 6-22.
Report On This pane describes the type of object on which this component operates.
•Automatic list from context: Report on all blocks in the current
context. The parent component of the Block Loop determines its
context. If this component does not have the Model Loop,System
Loop,Signal Loop,orBlock Loop as its parent, selecting this option
causes this component to report on all blocks in all models.
-Model Loop: Reports on all blocks in the current model.
-System Loop: Reports on all blocks in the current system.
-Signal Loop: Reports on all blocks connected to the current signal.
•Custom - use block list: Enables you to specify a list of blocks on
which to report. Enter the full path of each block.
Loop
Options
Choose block sorting options and reporting options in this pane.
•Sort blocks:
Use this option to select how to sort blocks (applied to each level
in a model):
-Alphabetically by block name. Sorts blocks alphabetically by
their names.
-Alphabetically by system name. Sorts systems alphabetically.
The report lists blocks in each system, but in no particular order.
-Alphabetically by full Simulink path. Sorts blocks
alphabetically by Simulink path.
9-7

Block Loop
-By block type. Sorts blocks alphabetically by block type.
-By block depth. Sorts blocks by their depth in the model.
-By layout (left to right): Sorts blocks by their location in the
model layout, by rows. The block appearing the furthest toward
the left top corner of the model is the anchor for the row. The row
contains all other blocks that overlap the horizontal area defined
by the top and bottom edges of the anchor block. The other rows
use the same algorithm, using as the anchor the next unreported
block nearest the left top of the model.
-By layout (top to bottom): Sorts blocks by their location in the
model layout, by columns. The block appearing the furthest toward
the left top corner of the model is the anchor for the column. The
column contains all other blocks that overlap the vertical area
defined by the left and right edges of the anchor block. The other
columns use the same algorithm, using as the anchor the next
unreported block nearest the left top of the model.
-By traversal order. Sorts blocks by traversal order.
-By simulation order. Sorts blocks by execution order.
-%<VariableName>: Inserts the value of a variable from the
MATLAB workspace. The %<> notation can denote a string or cell
array. The following example reports on the theta dot integrator
9-8

Block Loop
block and the theta integrator block in the model simppend,using
the variable Z={ 'simppend/theta'}:
simppend/theta dot
%<Z>
The generated report includes information about the following
blocks:
•simppend/theta dot
•simppend/theta
For more information, see %<VariableName> Notation on the
Text component reference page in the MATLAB Report Generator
documentation.
•Search for Simulink property name/property value
pairs: Reports only on Simulink blocks with specified property
name/property value pairs.
Section
Options
•Create section for each object in loop: Inserts a section in the
generated report for each block found in the loop.
•Display the object type in the section title: Automatically
inserts the object type into the section title in the generated report.
•Create link anchor for each object in loop: Create a hyperlink
to the block in the generated report.
Insert
Anything
into
Report?
Yes, inserts a section if you select the Create section for each object
in loop option.
Class rptgen_sl.csl_blk_loop
9-9

Block Loop
See Also Model Loop,Signal Loop,System Loop,Simulink Linking Anchor,
Simulink Name,Simulink Property,Simulink Property Table,
Simulink Summary Table
9-10

Block Type Count
Purpose Count number of each block type in the current model or system
Description This component counts the number of each block type in the current
model or system. Within a model, this component counts blocks
underneath masks and inside library links.
For more information about block types, see “About Blocks” in the
Simulink documentation.
Count
Types
The parent of this component determines where to count block types:
•Model Loop: Reports all block types in the current model:
-All blocks in model: Counts block types in the entire model.
-All blocks in reported systems: Countsblocktypesonlyin
systems that appear in the report.
•System Loop: Reports all block types in the current system.
Table
Content
•Table title: Allows you to enter the table title.
•Show block names in table: Includes a column that displays all
block names in the table.
•Sort table:
-Alphabetically by block type: Sorts blocks alphabetically by
block type.
-By number of blocks: Sorts by decreasing number of occurrences.
•Show total count: Displays total number of block types.
Insert
Anything
into
Report?
Yes. Table.
Class rptgen_sl.csl_blk_count
9-11

Block Type Count
See Also Block Loop,Model Loop,System Loop
9-12

Bus
Purpose Create list of signals exiting from Bus Selector block
Description This component creates a list of signals exiting a Bus Selector block.
The list contains signals leaving from the reported block or downstream
buses and signals.
The parent of this component determines which buses appear in the
report:
•Model Loop: Includes all buses in the current model.
•System Loop: Includes all buses in the current system.
•Block Loop : If the current block is a bus block, then the report
includes that block.
•Signal Loop: Includes all buses connected to the current signal.
If the Bus component does not have a looping component as its parent,
it reports on all buses in all open models.
Properties •Show Bus Hierarchy: Specifies whether the list displays
downstream buses hierarchically.
•Insert linking anchor for bus blocks: Inserts a linking anchor for
each bus block. This property designates the list item as the location
to which other links for that block point. (For more information, see
the Simulink Linking Anchor or Link component reference pages.)
Do not use this option if you have already specified an anchor location
for the bus block with an Object Linking Anchor component.
•Insert linking anchor for signals: Inserts a linking anchor for
each signal. This property designates the list item as the location to
which other links for that signal point. For more information, see the
Simulink Linking Anchor or Link component reference pages.) Do
not use this option if you have already specified an anchor location
for the signal with an Object Linking Anchor component.
•Title: Inserts a title before each list. This attribute supports the
%<varname> notation. For more information, see %<VariableName>
9-13

Bus
Notation on the Text component reference page in the MATLAB
Report Generator documentation.
Insert
Anything
into
Report?
Yes. List.
Class rptgen_sl.csl_blk_bus
See Also Block Loop,Model Loop,Signal Loop,Simulink Linking Anchor,
System Loop,
9-14

Chart Loop
Purpose Run child components for specified Stateflow charts
Description This component runs its children for specified Stateflow charts.
Report On •Automatic list from context: Report on all chart blocks in the
context set by the parent of this component.
-Model Loop: Reports on all Stateflow chart blocks in the current
model.
-System Loop: Reports on all Stateflow chart blocks in the current
system.
-Signal Loop: Reports on all Stateflow chart blocks connected to
the current signal.
-Machine Loop: Reports on the current block if it is in a Stateflow
chart.
If the Chart Loop component has any other type of component as
its parent, selecting this option causes it to report on all Stateflow
chart blocks.
•Custom - use block list: Reports on a specified list of Stateflow
chart blocks.
Loop Options
Choose chart block sorting options and reporting options in this pane.
•Sort blocks: Specifies how to sort blocks (applied to each level in a
model). This option is available if you select Automatic list from
context in the Report On section, or if you select Custom - use
block list and the Sort blocks option.
-Alphabetically by block name. Sorts blocks alphabetically by
name.
-Alphabetically by system name. Sorts systems alphabetically
by name. Lists blocks in each system, but in no particular order.
-Alphabetically by full Simulink path.Sortsmodels
alphabetically by their full paths.
9-15
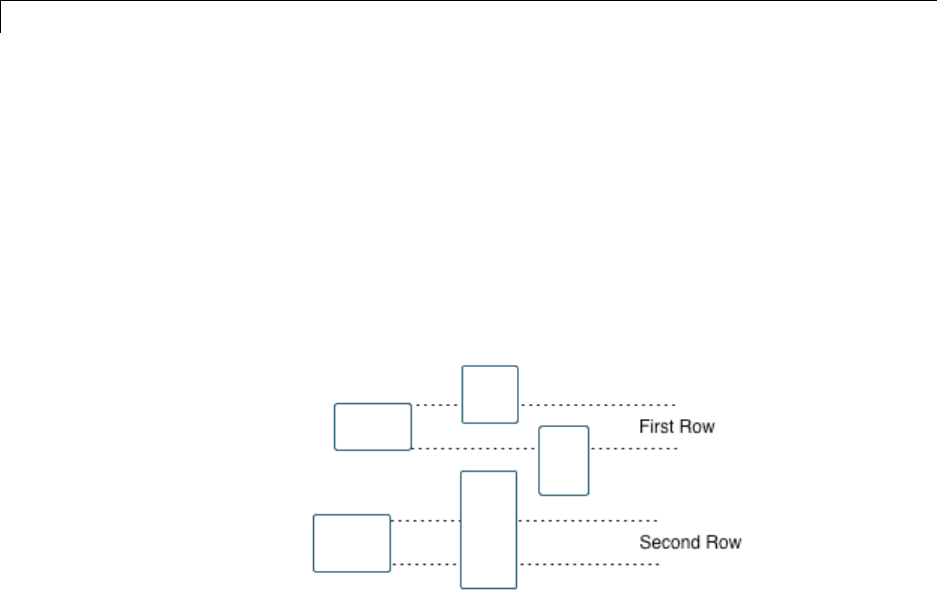
Chart Loop
-By block type. Sorts blocks alphabetically by block type.
-By depth. Sorts blocks by their depth in the model.
-By layout (left to right): Sorts blocks by their location in the
model layout, by rows. The block appearing the furthest toward
the left top corner of the model is the anchor for the row. The row
contains all other blocks that overlap the horizontal area defined
by the top and bottom edges of the anchor block. The other rows
use the same algorithm, using as the anchor the next unreported
block nearest the left top of the model.
-By layout (top to bottom): Sorts blocks by their location in the
model layout, by columns. The block appearing the furthest toward
the left top corner of the model is the anchor for the column. The
column contains all other blocks that overlap the vertical area
defined by the left and right edges of the anchor block. The other
columns use the same algorithm, using as the anchor the next
unreported block nearest the left top of the model.
-By simulation order. Sorts blocks by execution order.
-%<VariableName>: Inserts the value of a variable from the
MATLAB workspace. The %<> notation can denote a string or cell
array. For more information, see %<VariableName> Notation
on the Text component reference page in the MATLAB Report
Generator documentation.
9-16

Chart Loop
•Search for Simulink property name/property value pairs:
Reports on Simulink blocks with specified property name/property
value pairs.
•Search Stateflow: Reports on Stateflow charts with specified
property name/property value pairs.
Section
Options
•Create section for each object in loop: Inserts a section in the
generated report for each object found in the loop.
•Display the object type in the section title: Inserts the object
type automatically into the section title in the generated report.
•Create link anchor for each object in loop:Createsahyperlink
to the object in the generated report
Insert
Anything
into
Report?
Yes, inserts a section if you select the Create section for each object
in loop option.
Class rptgen_sf.csf_chart_loop
See Also Block Loop,Machine Loop,Model Loop,Signal Loop,System Loop,
Simulink Function System Loop
9-17

Code Generation Summary
Purpose Insert version number information, list of generated files, tables
summarizing code generation configuration information, and subsystem
maps into report
Description This component reports the following information:
•Version number information
•List of generated files
•Code generation configuration information
•Subsystem map
Summary •General information: Includes the following information in the
report:
-Model name and version
-Simulink Coder version number
-List of full paths of generated files
•Configuration settings: Includes tables that list optimization and
Simulink Coder target selection and build process Configuration
Parameter settings.
•Subsystem map: Includes in the report a unique mapping between
subsystem numbers and subsystem labels in the model.
Traceability
Report
Use settings from model: When you select this option, the report
uses all of the following configuration settings, as specified in your
model. Deselecting this option allows you to turn off one or more of
these settings as needed:
•Eliminated/virtual blocks
•Traceable blocks
•Traceable StateFlow Objects
•Traceable MATLAB Function Blocks
9-18

Code Generation Summary
For more information on these configuration settings, see “Code
Generation Pane: Report” in the Simulink Coder documentation.
Insert
Anything
into
Report?
Yes. Tables and list.
Class RptgenRTW.CCodeGenSummary
See Also Import Generated Code
9-19

Documentation
Purpose Insert text extracted from DocBlock blocks in Simulink models
Description This component inserts text extracted from DocBlock blocks in Simulink
models. It can have the following components as its parent:
•Model Loop
•System Loop
•Block Loop
The specified report format determines the format of the DocBlock
block data inserted into the report:
•HTML: Imports HTML data into the report.
Note For non-English HTML DocBlock text that you want to include
in a Documentation component, use UTF-8 file encoding. Use a
simple text editor to create the HTML code.
•RTF: Imports RTF data into the report.
Properties •Import file as: Specifies how to format the imported information.
Thefollowingexampleshowshoweachoptionworks,usingthe
following text as input:
First row.
Second row.
Third row follows blank line.
-Plain text (ignore line breaks). Imports plain text without
any line breaks (no paragraphs), as in this example:
First row. Second row. Third row follows blank line.
9-20

Documentation
-Paragraphs defined by line breaks. Imports the text
contained in paragraphs defined by line breaks (hard returns or
carriage returns), as in this example:
First row.
Second row.
Third row follows blank line.
-Paragraphs defined by empty rows. Imports text contained in
paragraphs defined by empty rows (rows that do not contain text),
as in this example:
First row. Second row.
Third row follows blank line.
-Text (retain line breaks). Imports plain text, including line
breaks, as in this example:
First row.
Second row.
Third row follows blank line.
-Fixed-width text (retain line breaks).Importsfixed-width
text (all letters have the same width or size) including line breaks,
as in this example:
First row.
Second row.
Third row follows blank line.
Tip This option is useful for importing MATLAB files.
9-21

Documentation
•Insert linking anchor for blocks: Inserts a linking anchor for
each DocBlock block that designates the location where other links
for that block point. (See the Simulink Linking Anchor or Link
component reference pages for more help.) Do not use this option if
you have already specified an anchor location for a DocBlock block
with an Object Linking Anchor component.
Insert
Anything
into
Report?
Yes. Text, paragraph, or external RTF/HTML data.
Class rptgen_sl.csl_blk_doc
See Also Block Loop,Model Loop,Simulink Linking Anchor,System Loop
9-22

Fixed Point Block Loop
Purpose Run child components for the Simulink model, system, or signal defined
by parent component
Description This component runs its children for the Simulink model, system, or
signal that its parent defines. Options for the parent component are:
•Model Loop
•System Loop
•Signal Loop
Report On •Automatic list from context: Reports on all fixed-point blocks
in the context of the parent of this component. For example, if the
parent component is the System Loop, then this component reports
on all fixed-point blocks in the current system. If this component does
not have a looping component as its parent, then selecting this option
causes the component to report on all fixed-point blocks in all models.
•Custom - use block list:: Reports on a specified list of blocks.
Loop
Options
Choose block sorting options and reporting options in this pane.
•Sort blocks: Specifies how to sort blocks (applied to each level in
a model). This option is available if you select the Automatic list
from context option in the Report On section, or if you select
Custom - use block list and the Sort blocks options.
-Alphabetically by block name. Sorts blocks alphabetically by
name.
-Alphabetically by system name. Sorts systems alphabetically.
Lists blocks in each system, but in no particular order.
-Alphabetically by full Simulink path. Sorts blocks
alphabetically by Simulink path.
-By block type. Sorts blocks alphabetically by block type.
-By block depth. Sorts blocks by their depth in the model.
9-23
Fixed Point Block Loop
-By layout (left to right): Sorts blocks by their location in the
model layout, by rows. The block appearing the furthest toward
the left top corner of the model is the anchor for the row. The row
contains all other blocks that overlap the horizontal area defined
by the top and bottom edges of the anchor block. The other rows
use the same algorithm, using as the anchor the next unreported
block nearest the left top of the model.
-By layout (top to bottom): Sorts blocks by their location in the
model layout, by columns. The block appearing the furthest toward
the left top corner of the model is the anchor for the column. The
column contains all other blocks that overlap the vertical area
defined by the left and right edges of the anchor block. The other
columns use the same algorithm, using as the anchor the next
unreported block nearest the left top of the model.
-By traversal order. Sorts blocks by traversal order.
-By simulation order. Sorts blocks by execution order.
-%<VariableName>: Inserts the value of a variable from the
MATLAB workspace. For more information, see %<VariableName>
Notation on the Text component reference page in the MATLAB
Report Generator documentation.
•Search for Simulink name/property value pairs: Reports only
on blocks with the specified property name/property value pairs. To
enable searching, click the check box. In the first row of the property
9-24

Fixed Point Block Loop
name and property value table, click inside the edit box, delete the
existing text, and type the property name and value. To add a row,
use the Add row button ( ).
For information about subsystem property names and values, in
“Block-Specific Parameters”, see the “Ports & Subsystems Library
Block Parameters” section.
Section
Options
•Create section for each object in loop: Inserts a section in the
generated report for each object found in the loop.
•Display the object type in the section title: Inserts the object
type automatically into the section title in the generated report.
•Create link anchor for each object in loop:Createsahyperlink
to the object in the generated report.
Insert
Anything
into
Report?
Yes, inserts a section if you select the Create section for each object
in loop option.
Class rptgen_fp.cfp_blk_loop
See Also Block Loop,Model Loop,Signal Loop,Simulink Linking Anchor,
System Loop
9-25

Fixed Point Logging Options
Purpose Set fixed-point options like in Fixed Point Tool
Description This component sets fixed-point options like those set in the Fixed Point
Tool (invoked by running the fxptdlg function).
This component must be a child of the Model Loop component. Use this
component to set the following options on the current model:
•Data type override
•Fixed-point instrument mode
•Logging type
This component can have child components. It is a good practice to
use this component with a Model Simulation component as its child.
This approach sets fixed-point properties for the model for the purpose
of the simulation, and then restores them to their original values after
the simulation is complete.
Data Type
Override
•Use local settings: Overrides data types according to the value of
this parameter set for each subsystem. Otherwise, settings for parent
systems override those of child systems.
•Scaled double: Overrides the output data type of all blocks in the
current system or subsystem with doubles. However, this option
maintains the scaling and bias specified in the mask of each block.
•Doubles: Overrides the output data type of all blocks in the current
system or subsystem with doubles. The overridden values have no
scaling or bias.
•Singles: Overrides the output data type of all blocks in the current
system or subsystem with singles. The overridden values have no
scaling or bias.
•Off: Does not perform any data type override on any block in the
current system or subsystem.
9-26

Fixed Point Logging Options
Fixed-Point
Instrumentation
Mode
Specify logging options in this section. For logged blocks, minimum and
maximumsimulationvaluesarewrittentotheworkspace.
•Use local settings: Logs data according to the value of this
parametersetforeachsubsystem. Otherwise, settings for parent
systems always override those of child systems.
•Min, max, and overflow: Logs minimum value, maximum value,
and overflow data for all blocks in the current system or subsystem.
•Overflow only:Logsonlyoverflowdatafor all blocks in the current
system or subsystem.
•Force off: Logs no data for any block in the current system or
subsystem. Use this selection to work with models containing fixed
point-enabled blocks, if you do not have a Simulink Fixed Point
license.
For more information on logging simulation results, see “Propose
Fraction Lengths Using Simulation Range Data” in the Simulink Fixed
Point documentation.
Logging
Type
Specify how to record logs in this section:
•Overwrite log: Clears information in the logs before new logging
data is entered.
•Merge log: Merges new logging data with previously logged
information.
Insert
Anything
into
Report?
No.
Class rptgen_fp.cfp_options
See Also Model Simulation
9-27

Fixed Point Property Table
Purpose Insert table that reports on Simulink Fixed Point block property
name/property value pairs
Description This component inserts a table that reports on Simulink Fixed Point
block property name/property value pairs.
Table Select a preset table, which is already formatted and configured, in the
preset table list in the upper-left corner of the attributes page.
•preset table
Specifies the type of object property table.
-Default
-Mask properties
-Block limits
-Out-of-range errors
-All fixed-point properties
-Blank 4x4
To apply the specified table, select the table and click Apply.
•Split property/value cells: Split property name/property value
pairs into separate cells. For the property name and property value
to appear in adjacent horizontal cells in the table, select the Split
property/value cells check box. In this case, the table is in split
mode, so there only one property name/property value pair can exist
in a cell. If there is more than one name/property pair in a cell, only
the first pair appears in the report. The report ignores all subsequent
pairs.
For the property name and property value to appear together in one
cell, clear the Split property/value cells check box. That option
specifies nonsplit mode. Nonsplit mode supports more than one
property name/property value pair and text.
Before switching from nonsplit mode to split mode, make sure that
there is only one property name/property value pair per table cell. If
9-28

Fixed Point Property Table
you have more than one property name/property value pair or text in
one cell, only the first value pair appears in the report. Subsequent
pairs and text are omitted.
•Display outer border: Display the outer border of the table in the
generated report.
Table Cells Select table properties to modify. The selection in this pane affects the
available fields in the Cell Properties pane.
Cell
Properties
•Contents
Modify the contents of the table cell selected in the Table Cells pane.
•Show as: Specifies the format for the contents of the table cell.
-PROPERTY Value
-Value
-Property Value
-Property: Value
-PROPERTY: Value
-Property - Value
-PROPERTY - Value
•Alignment: Aligns the contents of the table cell.
-Center
-Left
-Right
-Double justified
•Lower border: Displays the lower border of the table in the
generated report.
•Right border: Displays the right border of the table in the generated
report.
9-29

Fixed Point Property Table
Creating Custom Tables
To create a custom table, edit a preset table, such as the Blank 4x4
table. Add and delete rows and add properties. To open the Edit Table
dialog box, click Edit.
For details about creating custom property tables, see “Property Table
Components” on page 6-6.
Insert
Anything
into
Report?
Yes. Table.
Class rptgen_fp.cfp_prop_table
See Also Fixed Point Summary Table
9-30

Fixed Point Summary Table
Purpose Table of specified fixed-point block properties or parameters
Description This component displays propertiesorparametersofspecified
fixed-point blocks in a table.
Properties Table title
Choose a table title in the generated report:
•Automatic: Generates a title automatically from the parameter.
•Custom:Specifiesacustomtitle.
Property
Columns
Property name
This field displays the object properties to include in the Summary
Table in the generated report.
•To add a property:
1Select the appropriate property level in the menu
2Select the property to add from the selection list and click Add.
•To delete a property, select the property name and click the Delete
button.
•To move properties up and down in the list, click the Up and Down
buttons.
Note Some entries in the list of available properties (such as Depth)
are “virtual” properties that you cannot access using the get_param
command. The properties used for property/value filtering in the block
and system loop components must be retrievable by the get_param.
Therefore, you cannot configure your Summary Table to report on all
blocks of Depth == 2.
Transpose table
9-31

Fixed Point Summary Table
Enabling this check box changes the summary table rows into columns
in the generated report, putting the property names in the first column
and the values in the other columns.
Object
Rows
•Insert anchor for each row: Inserts an anchor for each row in
the summary table.
•Report On: Specifies blocks on which to report:
-Automatic list from context. Reports on all blocks in the
current context.
-Custom - use block list. Reports on a specified list of blocks.
To include a given block in the report, specify its full path.
Loop
Options
•Sort blocks: Specifies how to sort blocks (applied to each level in a
model):
-Alphabetically by block name. Sorts blocks alphabetically by
name.
-Alphabetically by system name. Sorts systems alphabetically.
Listsblocksineachsystem,butinnoparticularorder.
-Alphabetically by full Simulink path. Sorts blocks
alphabetically by Simulink path.
-By block type. Sorts blocks alphabetically by block type.
-By block depth. Sorts blocks by their depth in the model.
-By layout (left to right): Sorts blocks by their location in the
model layout, by rows. The block appearing the furthest toward
the left top corner of the model is the anchor for the row. The row
contains all other blocks that overlap the horizontal area defined
by the top and bottom edges of the anchor block. The other rows
use the same algorithm, using as the anchor the next unreported
block nearest the left top of the model.
9-32
Fixed Point Summary Table
-By layout (top to bottom): Sorts blocks by their location in the
model layout, by columns. The block appearing the furthest toward
the left top corner of the model is the anchor for the column. The
column contains all other blocks that overlap the vertical area
defined by the left and right edges of the anchor block. The other
columns use the same algorithm, using as the anchor the next
unreported block nearest the left top of the model.
-By traversal order. Sorts blocks by traversal order.
-By simulation order. Sorts blocks by execution order.
•Search for Simulink property name/property value
pairs: Reports only on Simulink blocks with specified property
name/property value pairs.
Insert
Anything
into
Report?
Yes. Table.
Class rptgen_fp.cfp_summ_table
See Also Fixed Point Property Table
9-33

Import Generated Code
Purpose Import source and header files generated by Simulink Coder software,
and custom files specified as part of model
Description This component imports source and header files generated by Simulink
Coder software. It also imports custom files that you specify as part
of your model.
Properties •Source files (auto-generated): Includes the following files in the
report:
-.c and .cpp source files generated by Simulink Coder software.
-Simulink Coder source files, such as the setup file and supporting
files in the build folder.
This check box is selected by default. Clear it to omit source files.
•Header files (auto-generated): Includes the following files in the
report:
-.h and .hpp header files generated by Simulink Coder software.
-Simulink Coder header files in the build folder.
This check box is selected by default. Clear it to omit source files.
•Custom files: Includes custom source files that you specify in the
Code Generation > Custom Code pane of the Configuration
Parameters dialog box. This check box is deselected by default.
Insert
Anything
into
Report?
Yes. Generated code listings.
Class RptgenRTW.CImportCode
See Also Code Generation Summary
9-34

Look-Up Table
Purpose Report on lookup table blocks
Description The Look-Up Table component reports on the following lookup table
blocks:
•1-D Lookup Table
•2-D Lookup Table
•n-D Lookup Table
It inserts a figure and/or table into the report. The table contains input
and output numeric values; a figure plots these values.
Look-Up
Table
Options
Thispaneallowsyoutospecifythetypesoflookuptableblocksto
include in the report and how they appear. If you select none of the
check boxes in this pane, the component does not insert anything into
the report.
•The Look-Up Table displays results according to the type of its
parent component:
-Model Loop: Includes all lookup tables in the current model.
-System Loop.: Includes all lookup tables in the current system.
-Block Loop.: If the current block is a lookup table, the reports
that block.
-Signal Loop: Includes all lookup tables connected to the current
signal.
-IftheLook-UpTabledoesnothaveany of the looping components
as its parent, it includes all lookup tables in all open models.
•Plot 1-D data: Plots data from a 1-D Lookup Table block. Choose
the plot type, Line plot or Bar plot, from the corresponding list.
The input data appears on the horizontal or x-axis, and the output
data appears on the vertical or y-axis.
9-35

Look-Up Table
For more information on line and bar plots, see “2-D and 3-D Plots”
in the MATLAB Graphics documentation.
•Create table for 1-D data: Creates a table that contains numeric
data values from the 1-D Lookup Table block.
•Plot 2-D data:Createsaplotof2-D Lookup Table blocks. You can
specify whether the data appears as a surface plot or a line plot. The
line plot is best for small data sets, and the surface plot for larger
tables. For more information on surface and line plots, see “2-D and
3-D Plots” in the MATLAB Graphics documentation.
Note This option creates a 2-D slice through n-D data.
•Create table for 2-D data: Creates a table that contains numeric
data values from the 2-D Lookup Table block.
•Create table for N-D data: Creates a table that contains numeric
data values from the n-D Lookup Table block.
Print
Options
•Image file format: Specifies the image file format. Select Automatic
HG Format (the default) to choose automatically the format best
suited for the output format that you chose in the Report component.
Otherwise, choose an image format that your output viewer can read.
-Automatic SL Format (Uses the Simulink file format selected
in the Preferences dialog box)
-Bitmap (16m-color)
-Bitmap (256-color)
-Black and white encapsulated PostScript
-Black and white encapsulated PostScript (TIFF)
-Black and white encapsulated PostScript2
-Black and white encapsulated PostScript2 (TIFF)
9-36

Look-Up Table
-Black and white PostScript
-Black and white PostScript2
-Color encapsulated PostScript
-Color encapsulated PostScript (TIFF)
-Color encapsulated PostScript2
-Color encapsulated PostScript2 (TIFF)
-Color PostScript
-Color PostScript2
-JPEG high quality image
-JPEG medium quality image
-JPEG low quality image
-PNG 24-bit image
-TIFF - compressed
-TIFF - uncompressed
-Windows metafile
•Paper orientation:
-Landscape
-Portrait
-Rotated
-Use figure orientation: Uses the orientation for the figure,
which you set with the orient command.
-Full page image (PDF only): In PDF reports, scales images to
fit the full page, minimizes page margins, and maximizes the size
of the image by using either a portrait or landscape orientation.
For more information about paper orientation, see the orient
command in the MATLAB documentation.
9-37

Look-Up Table
•Image size: Allows you to specify the image size in the report by
selecting Use figure PaperPositionMode setting and setting the
PaperPositionMode property of the Handle Graphics figure.
-Automatic (same size as on screen):
-Custom: Specifies a custom image size. Set the image size using
the Size field and Units list.
For more information on paper position mode, see orient in the
MATLAB documentation.
•Size: Allows you to enter the size of the Handle Graphics figure
snapshot in the format wxh(width times height). This field is active
only if you choose Custom in the Image size list box.
•Units: Allows you to enter for the size of the Handle Graphics figure
snapshot. This field is active only if you choose Custom in the Image
size list box.
•Invert hardcopy: Causes the Handle Graphics InvertHardcopy
property to invert colors for printing. In other words, this option
changes dark colors to light colors and light colors to dark colors. To
change colors in your image, choose one of the following options:
-Automatic: Automatically changes a dark axes colors to light
axes colors. If the axes color is a light color, this option does not
invert the color.
-Invert: Changes dark axes colors to light axes colors, and light
axes colors to dark axes colors.
-Don't invert: Does not change the colors in the image that
appears on the screen for printing.
-Use figure's InvertHardcopy setting:Usesthe
InvertHardcopy property set in the Handle Graphics image.
-Make figure background transparent:Makestheimage
background transparent.
9-38

Look-Up Table
Display
Options
•Scaling:
-Fixed size: Specifies the number and type of units.
-Zoom: Specifies the percentage, maximum size, and units of
measure.
-Use image size: Sets the size of the image in the report to the
same size as it is on screen.
•Size: Specifiesthesizeofthesnapshotintheformwh(width,
height) format. This field is active only if you choose Fixed size in
the Scaling selection list.
•Max size: Specifies the maximum size of the snapshot in the form
wh(width, height). This field is active only if you choose Zoom from
the Scaling selection list.
•Units: Allows you to enter units for the size of the snapshot. This
field is active only if you choose Zoom or Fixed size in the Image
size list box.
•Alignment: Only reports in PDF or RTF format support this property.
-Auto
-Right
-Left
-Center
•Title: Enter text to appear above the snapshot.
•Caption: Enter text to appear under the snapshot.
Insert
Anything
into
Report?
Yes. Figure and/or table.
Class rptgen_sl.csl_blk_lookup
9-39

Look-Up Table
See Also Block Loop,Model Loop,Signal Loop,System Loop
9-40

Machine Loop
Purpose Run child components for specified Stateflow machines
Description This component runs its child components for selected Stateflow
machines. The behavior of this component depends on its parent
component. If it has no parent, the Machine Loop runs its child
components for all machines. If it has the Model Loop is its parent, it
runs its child components for all machines in the model.
Loop
Options
Search Stateflow
If selected, searches states that you specify in the field that appears
under the check box.
Section
Options
•Create section for each object in loop: Inserts a section in the
generated report for each object in the loop.
•Display the object type in the section title: Inserts the object
type automatically into the section title in the generated report.
•Create link anchor for each object in loop:Createsahyperlink
to each object in the loop.
Insert
Anything
into
Report?
Yes, inserts a section if you select the Create section for each object
in loop option.
Class rptgen_sf.csf_machine_loop
See Also Model Loop
9-41

Missing Requirements Block Loop
Purpose Apply all child components to blocks that do not have requirements
Description This component runs its child components for each block in the current
system, model, or signal that do not have associated requirements.
For more information on working with looping components, see
“Dynamic Reporting Components” on page 6-22.
Report On This pane describes the type of object on which this component operates.
•Automatic list from context: Report on all blocks in the current
context that do not have associated requirements. The parent
component of the Block Loop component determines its context. If
this component does not have the Model Loop,System Loop,Signal
Loop,orBlock Loop as its parent, selecting this option causes this
component to report on all blocks in all models that do not have
associated requirements.
-Model Loop: Reports on all blocks in the current model with no
associated requirements.
-System Loop: Reports on all blocks in the current system with no
associated requirements.
-Signal Loop: Reports on all blocks connected to the current signal
with no associated requirements.
•Custom - use block list: Enables you to specify a list of blocks on
which to report. Enter the full path of each block.
Loop
Options
Choose block sorting options and reporting options in this pane.
•Sort blocks:
Use this option to select how to sort blocks (applied to each level
in a model):
-Alphabetically by block name: Sorts blocks alphabetically by
their names.
9-42
Missing Requirements Block Loop
-Alphabetically by system name: Sorts systems alphabetically.
Lists the blocks in each system, but in no particular order.
-Alphabetically by full Simulink path: Sorts blocks
alphabetically by Simulink path.
-By block type: Sorts blocks alphabetically by block type.
-By block depth: Sorts blocks by their depth in the model.
-By layout (left to right): Sorts blocks by their location in the
model layout, by rows. The block appearing the furthest toward
the left top corner of the model is the anchor for the row. The row
contains all other blocks that overlap the horizontal area defined
by the top and bottom edges of the anchor block. The other rows
use the same algorithm, using as the anchor the next unreported
block nearest the left top of the model.
-By layout (top to bottom): Sorts blocks by their location in the
model layout, by columns. The block appearing the furthest toward
the left top corner of the model is the anchor for the column. The
column contains all other blocks that overlap the vertical area
defined by the left and right edges of the anchor block. The other
columns use the same algorithm, using as the anchor the next
unreported block nearest the left top of the model.
-By traversal order. Sorts blocks by traversal order.
-By simulation order. Sorts blocks by execution order.
9-43

Missing Requirements Block Loop
-%<VariableName>: Inserts the value of a variable from the
MATLAB workspace. The %<> notation can denote a string or cell
array. The following example reports on the theta dot integrator
block and the theta integrator block in the model simppend,using
the variable Z={ 'simppend/theta'}:
simppend/theta dot
%<Z>
The generated report includes information about the following
blocks:
•simppend/theta dot
•simppend/theta
For more information, see %<VariableName> Notation on the
Text component reference page in the MATLAB Report Generator
documentation.
•Search for Simulink property name/property value
pairs: Reports only on Simulink blocks with specified property
name/property value pairs that do not have associated requirements.
Section
Options
•Create section for each object in loop: Inserts a section in the
generated report for each block found in the loop.
•Display the object type in the section title: Automatically
inserts the object type into the section title in the generated report.
•Create link anchor for each object in loop: Create a hyperlink
to the block in the generated report.
Insert
Anything
into
Report?
Yes, inserts a section if you select the Create section for each object
in loop option.
9-44

Missing Requirements Block Loop
Class
Name
RptgenRMI.NoReqBlockLoop
See Also Block Loop,Missing Requirements System Loop,Requirements
Block Loop,Requirements Documents Table,Requirements Signal
Loop,Requirements Summary Table,Requirements System Loop,
Requirements Table
9-45

MATLAB Function
Purpose Insert information about MATLAB Function block contents
Description This component displays tables with information about MATLAB
code included in MATLAB Function blocks. You specify which of the
following kinds of information to include in the report:
•Function properties — Parameter settings for the MATLAB Function
block
•Argument properties — Properties of the function arguments (for
example, complexity)
•The function script — MATLAB code of the function
•Supporting functions — User-defined functions and, optionally,
MATLAB functions that are included in the MATLAB Function
block function.
For details about MATLAB Function blocks, see the MATLAB Function
block reference page.
Use the MATLAB Function component within a section, paragraph,
or table.
Note To view the contents of a MATLAB Function block in a Web
viewer, use the Web view feature of the Simulink Report Generator. In
the Web view, hover your cursor over the MATLAB Function block. For
details, see “Web Display of Model Information”.
Function
Properties
Table
•Include function properties: Generates a table with function
property information.
•Table title: Insert a title for the function properties table.
-Automatic: Use the default title for the table.
-Custom: Use the title that you specify for the table.
9-46

MATLAB Function
•You can change the header text for property and value columns of
the function properties table. In the Header column, double-click to
change the header text. The Width column indicates the relative
width, in relative terms, based on the smallest width you specify. For
example, for a three-column table, if the first column width is 1,and
the column width of the other two columns is 3, then the second and
third columns is three times wider than the first column.
•Grid lines: Show grid lines for the table.
•Spans page width:Makethetableaswideasthepage.
Argument
Summary
Table
•Include argument summary table: Generate a table with
summary information about the MATLAB Function block function
arguments.
•Table title: Insert a title for the argument summary table.
-Automatic: Use the default title for the table.
-Custom: Use the title that you specify for the table.
•Argument Summary Table Options: Specify the property columns
to include in the table.
-To add a property column:
1In the table on the right, select a property near where you want
to insert the new property column.
2From the list of properties to the left of the table, select a
property that you want to add to the table.
3Click the left-arrow button.
4If necessary, use the up or down arrow button to position the
new column.
-To delete a property column, select the property in the table and
click the right-arrow button
-You can change the header text for property and value columns of
the table. In the Header column, double-click to change the header
9-47

MATLAB Function
text. The Width column indicates the relative width, in relative
terms, based on the smallest width you specify. For example, for a
three-column table, if the first column width is 1, and the column
width of the other two columns is 3, then the second and third
columnsisthreetimeswiderthanthefirstcolumn.
•Grid lines: Show grid lines for the table.
•Spans page width:Makethetableaswideasthepage.
•Column alignment: Align the text in each column:
-Left
-Center
-Right
-Double justified
Detailed
Argument
Report
•Include detailed argument report: Generate a table with detailed
information about the MATLAB Function block function arguments.
•Argument Property Table Format Options:Specifythe
argument property columns to include in the table.
-Table title: Insert a title for the argument properties table.
•Automatic: Use the default title for the table.
•Custom: Use the title that you specify for the table.
-You can change the header text for property and value columns
of the table. In the Header column, double-click to change the
header text.
-Grid lines: Show grid lines for the table.
-Spans page width:Makethevariabletableaswideasthepage
on which the table appears.
•Include function script: Include the script for the function.
•Highlight script syntax: Use colors to highlight syntax keywords.
9-48

MATLAB Function
•Include supporting functions: Include a list of functions invoked
directly or indirectly by the function script. If you specify to include
supporting functions in the report, also specify whether to include
both MATLAB and user-defined functions or just user-defined
functions.
•Supporting Function Table Format Options:
-Table title: Insert a title for the supporting functions table.
•Automatic: Use the default title for the table.
•Custom: Use the title that you specify for the table.
-You can change the header text for property and value columns of
the table. In the Header column, double-click to change the header
text. The Width column indicates the relative width, in relative
terms, based on the smallest width you specify. For example, for a
three-column table, if the first column width is 1, and the column
width of the other two columns is 3, then the second and third
columnsisthreetimeswiderthanthefirstcolumn.
-Grid lines: Show grid lines for the table.
-Spans page width:Makethetableaswideasthepage.
Insert
Anything
into
Report?
Yes. Tables and, optionally, code.
Class rptgen_sl.csl_emlfcn
See Also Stateflow Property
9-49

Missing Requirements System Loop
Purpose Loop only on systems and subsystems that do not have associated
requirements
Description This component runs its child components for each system or subsystem
defined by the parent component that does not have associated
requirements. Insert this component as the child of a Model Loop
component to include systems and subsystems that do not have any
associated requirements in the report.
Report On •Loop on Systems:
-Select systems automatically: Reports on all systems in the
current context that do not have associated requirements.
•Model Loop: Reports on systems in the current model.
•System Loop: Reports on the current system.
•Signal Loop: Reports on the parent system of the current
signal.
•Block Loop: Reports on the parent system of the current block.
If this component does not have any of these components as its
parent, selecting this option reports on all systems in all models
that do not have associated requirements.
•Custom - use system list: Reports on a list of specified systems.
Specify the full path of each system.
•%<VariableName>: Inserts the value of a variable from the MATLAB
workspace. The %<> notation can denote a string or cell array. For
more information, see %<VariableName> Notation on the Text
component reference page.
Loop
Options
•Sort Systems: Specifies how to sort systems.
-Alphabetically by system name (default): Sorts systems
alphabetically by name.
-By number of blocks in system: Sorts systems by number of
blocks. The list shows systems by decreasing number of blocks. In
9-50

Missing Requirements System Loop
other words, it shows the system with the largest number of blocks
that do not have requirements appears first in the list.
-By system depth: Sorts systems by their depth in the model.
-By traversal order: Sorts systems in the traversal order.
•Search for: Reports only on blocks with the specified property
name/property value pairs. To enable searching, click the check box.
In the first row of the property name and property value table, click
inside the edit box, delete the existing text, and type the property
name and value. To add a row, use the Add row button ( ).
For information about subsystem property names and values, in
“Block-Specific Parameters”, see the “Ports & Subsystems Library
Block Parameters” section.
Section
Options
•Create section for each object in loop: Inserts a section in the
generated report for each object found in the loop.
•Display the object type in the section title: Inserts the object
type automatically into the section title in the generated report.
•Number sections by system hierarchy: Hierarchically numbers
sections in the generated report. Requires that Sort Systems be set
to By traversal order.
•Create link anchor for each object in loop:Createsahyperlink
to the object in the generated report.
Insert
Anything
into
Report?
Yes, inserts a section if you select the Create section for each object
in loop option.
Class RptgenRMI.NoReqSystemLoop
9-51

Missing Requirements System Loop
See Also Block Loop,Missing Requirements Block Loop,Requirements
Block Loop,Requirements Documents Table,Requirements Signal
Loop,Requirements Summary Table,Requirements System Loop,
Requirements Table,System Loop
9-52

Model Advisor Report
Purpose Insert Model Advisor report or link to Model Advisor report for current
model
Description This component inserts a Model Advisor report for the current model
into the report if the report is in HTML format. For other report
formats, it inserts a link to a Model Advisor report for the current
model. For more information about Model Advisor reports, see “About
the Model Advisor” in the Simulink documentation.
Properties Use existing report: Includes an existing Model Advisor report in
the report. This check box is selected by default. Clearing this option
generates a new Model Advisor report.
Insert
Anything
into
Report?
Yes, a Model Advisor report.
Class rptgen_sl.CModelAdvisor
See Also Model Change Log
9-53

Model Change Log
Purpose Construct model history table that displays model revision information
Description Run this component before you run the Model Simulation component.
It uses a reported model’s ModifiedHistory parameter to construct a
model history table that displays information about each logged revision
to the model. This model history table includes:
•The author of each change
•The model version of the change
•The time and date of the change
•A description of the change
For more information on model history, see “Log Comments History”
in the Simulink documentation.
Tip If your model has a long revision history, consider limiting the
number of revisions reported.
Table
Columns
Choose the information displayed in the model revision table in this
section:
•Author name: Includes the name of the person who last revised
the model.
•Version: Includes the version number of the model.
•Date changed: Includes the revision date of the model.
•Description of change: Includes a description of the revision to
the model.
9-54

Model Change Log
Table
Rows
•Limit displayed revisions to: Limits the number of revisions that
appears in the report.
•Show revisions since date: Limits the number of revisions that
appears in the report by date. Enter the date in the corresponding
text field. This field supports %<varname> notation. For example,
the default value, %<datestr(now-14)>, returns revision history for
the last two weeks.
Table
Display
Choose how the model revision history table appears in this section.
•Table title: Specifies the title of the table.
•Sort order: Sorts the table entries from most recent to oldest, or
from oldest to most recent.
•Date format: Specifies a preferred date format for the date/time
stamps in the table.
Insert
Anything
into
Report?
Yes. Table.
Class rptgen_sl.csl_mdl_changelog
See Also Model Advisor Report
9-55

Model Configuration Set
Purpose Insert active configuration set of a model into a report
Description This component displays a table with the active configuration set for
the model.
For information about configurations sets, see “Manage a Configuration
Set”.
Display
Options
•Title: Specifies a title for the table in the generated report.
-Automatic: Generates a title automatically from the parameter.
-Custom:Specifiesacustomtitle.
-None:Usesnotitle.
•Show configuration set table grids: Show grid lines for the table.
•Make configuration set tables page wide: Make the table as
wide as the page.
Insert
Anything
into
Report?
Yes. Table.
Class rptgen_sl.csl_mdl_cfgset
See Also Model Loop,System Loop
9-56
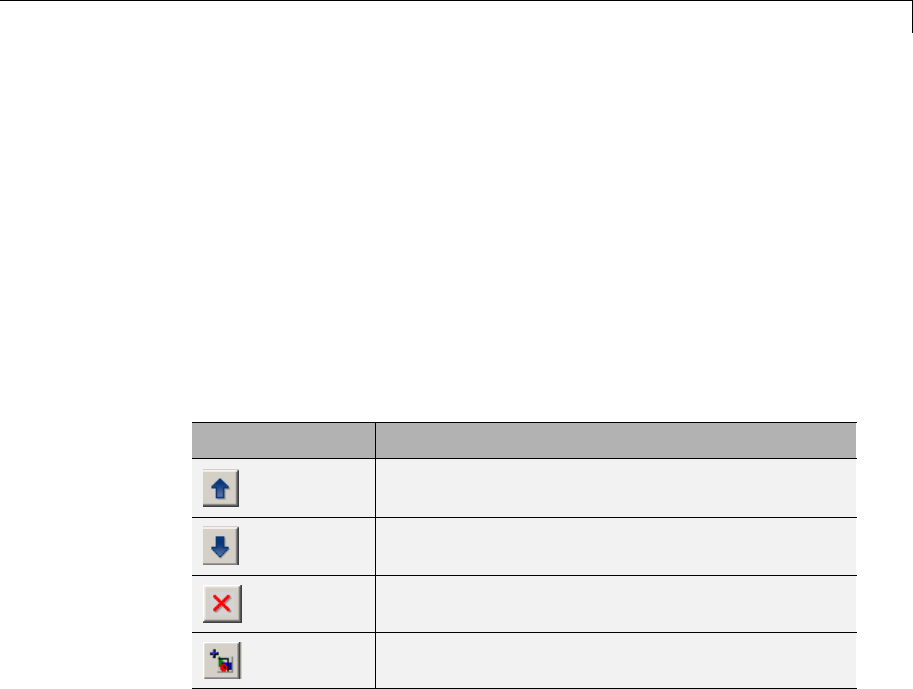
Model Loop
Purpose Loop on Simulink models and systems, as specified by child components
Description This component loops on Simulink models and systems, as specified by
child components. For example, you can use a Model Loop with a child
System Loop to report on the subsystems of the specified system.
Consider making these components children of the Model Loop
(although the Model Loop not necessarily required to be the immediate
parent of a given component).
Models to
Include
You can add a model to the list by clicking Add New Model to List.
The following table shows the buttons you can use to move a model up
or down in the list, or to add or delete a model.
Button Action
Move a model up in the list.
Move a model down in the list.
Remove a model from the list.
Add a new model to the list.
Model
Options
•Active: Includes a given model in the loop. This option is selected by
default. Clearing this option omits the model from the loop.
This option allows you to temporarily omit one or more models from a
report.
•Model name: Specifies the model name.
-Current block diagram
-All open models
-All open libraries
9-57

Model Loop
-Block diagrams in current directory
-Custom block diagram: Selecting this option automatically sets
the Starting system(s) field $top to start in the model root
system.
-%<VariableName>: For more information, see %<VariableName>
Notation on the Text component reference page in the MATLAB
Report Generator documentation.
•Traverse model: Specifies the systems to traverse.
-All systems in model
-Selected system(s) only
-Selected system(s) and ancestors
-Selected system(s) and children
•Look under masks: Specifieshowtohandlemasks.
-Functional masks only
-No masks
-All masks
-Graphical masks only
For more information, see “Masking” in the Simulink documentation.
•Follow library links: Specifies library links to include.
-Do not follow library links
-Include library links
-Include unique library links
For more information, see “Create a Linked Block” in the Simulink
documentation.
•Model reference: Specifies whether to report on models referenced
by a Model block. If you want to report on referenced models, then
you can control the depth of the model referencing hierarchy and
whether to report on model reference variants.
9-58

Model Loop
-Do not follow model reference blocks: Do not report on
blocks contained in referenced models.
-Follow all model reference blocks: Report on blocks
contained in all models that any part of the model hierarchy
references.
-Follow model reference blocks defined in current model:
Report on blocks in models that the currently selected model
references.
-<Custom model reference depth>: Report on blocks in models
that your specified level in the model reference hierarchy
references.
•Include all variants: Report on all model reference variants. To
enable this option, set the Model reference option to report on
blocks in referenced models.
•Starting system(s): Specifies the system in which to start the loop.
Available options depend on the value that you select in the Traverse
model option. Selecting any option other than All systems in
model for Traverse model activates the Starting system(s) option.
If you do not enter a model name in the Model name option, then
select either Root model or Current to specify where to start the loop.
If you specify a model name in the Model name option, then the
Starting system(s) option provides an edit box in which you can
enter:
-The full path of a subsystem or subsystems
-$top to start the loop in the model root system
-$current to start the loop in the currently selected system
Section
Options
•Create section for each object in loop: Inserts a section in the
generated report for each object found in the loop.
•Display the object type in the section title: Inserts the object
type automatically into the section title in the generated report.
9-59

Model Loop
•Create link anchor for each object in loop:Createsahyperlink
to the object in the generated report.
Examples Generating Reports on Specified Systems and their Subsystems
This example shows how to loop over a specified system and its
subsystems in the sample model sldemo_auto_climate_elec,which
the Simulink software includes.
1(Optional) To open the sldemo_auto_climate_elec model, at the
MATLAB command prompt, enter the following command:
sldemo_auto_climate_elec
Explore the model to familiarize yourself with its subsystems.
2Open the Report Explorer.
3Create a report setup file by clicking File > New.
4Save the report setup file by clicking File > Save As.Giveitthe
name sldemo_auto_report.
5Add a Chapter/Subsection component to the report setup file to
include information about model subsystems:
aIn the Library pane in the middle, double-click
Chapter/Subsection to add it to the report setup
file.
bFor Title,chooseCustom. In the title field, enter Description
of subsystems.
6Add a Model Loop as a child of the Chapter/Subsection component.
This loops over the ClimateControlSystem system and its
subsystems in the sldemo_auto_climate_elec model:
aIn the Library pane in the middle, double-click Model Loop to add
it to the report setup file. By default, the Report Explorer adds
that component as a child of the Chapter/Subsection component.
9-60

Model Loop
bIn the Model Loop properties pane, from the Model name
selection list, select <Custom block diagram> .
cIn the Model name field, delete the text <Custom block
diagram>,andthenentersldemo_auto_climate_elec.slx.Click
any component in the report setup file to add this model to the
Models to include list.
dIn the Traverse model selection list, select Selected system(s)
and children.
eIn the Look under masks selection list, select All masks.
fIn the Model reference selection list, select Do not follow
model reference blocks.
gIn the Starting system(s) field, enter
sldemo_auto_climate_elec/ClimateControlSystem.
Because you selected Selected system(s) and children
for Traverse model,theModel Loop loops over
sldemo_auto_climate_elec/ClimateControlSystem and its
subsystems.
hUnder Section Options, select the Create section for each
object in loop check box. Selecting this option creates separate
sections in the generated report for each model over which the
component loops.
The Model Loop properties pane looks as follows.
9-61
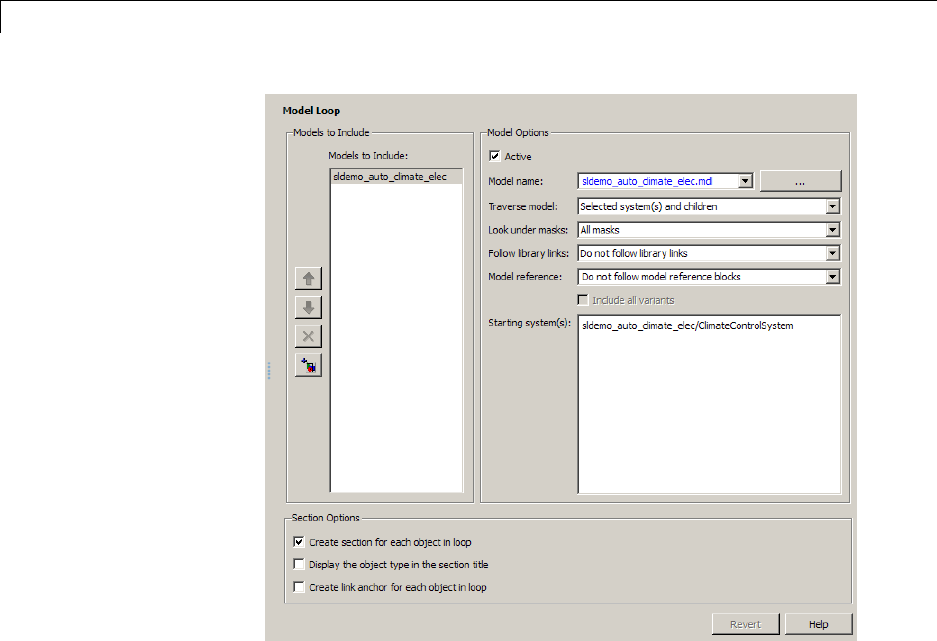
Model Loop
7Save the report by clicking File > Save.
9-62
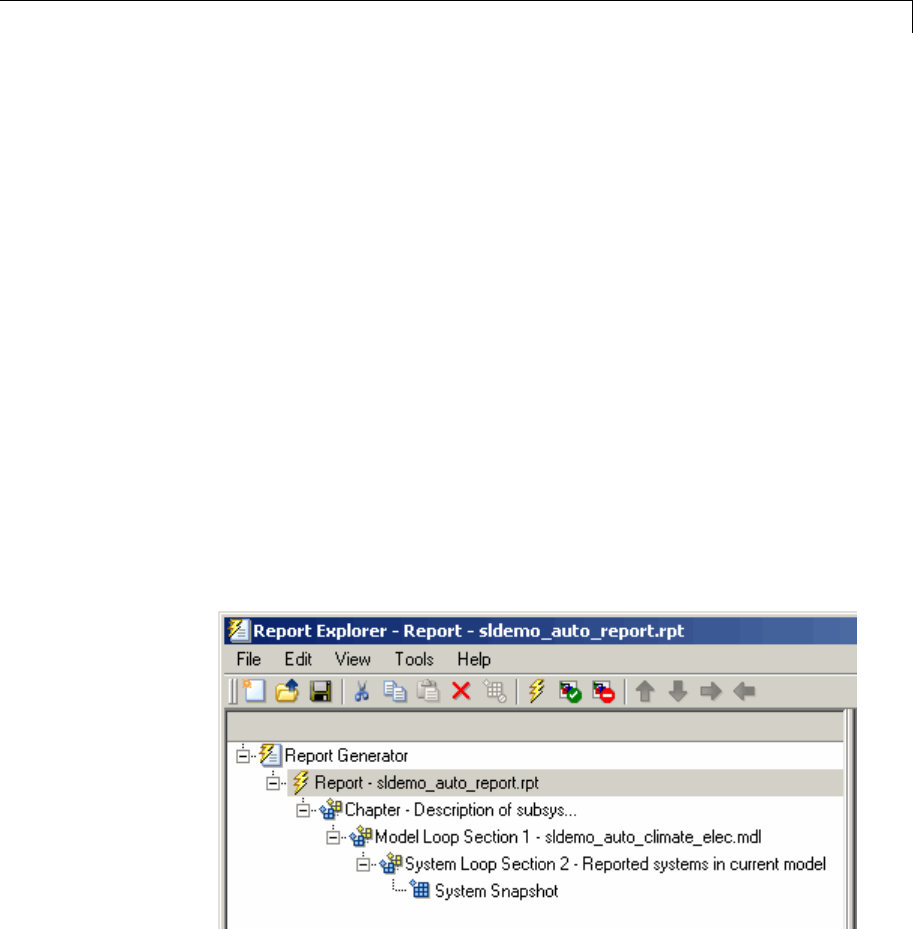
Model Loop
8Add a System Loop as a child of the Model Loop component.
aIn the Library pane in the middle, double-click System Loop to
add it to the report setup file. By default, Model Explorer adds this
component as a child of the Model Loop component.
bIn the System Loop properties pane, under Section Options,
select the Create section for each object in loop check box.
Selecting this option creates a section in the generated report for
each subsystem on which the component loops. Accept the default
values for all other fields.
9Add a System Snapshot component as a child of the System Loop
component. This step creates snapshots of all the subsystems of
ClimateControlSystem in the generated report. In the Library
pane in the middle, double-click System Snapshot.Bydefault,
Model Explorer adds this component as a child of the System Loop
component.
10 Save the report.
The report setup file hierarchy now looks as follows.
11 Run the report by clicking File > Report.
9-63
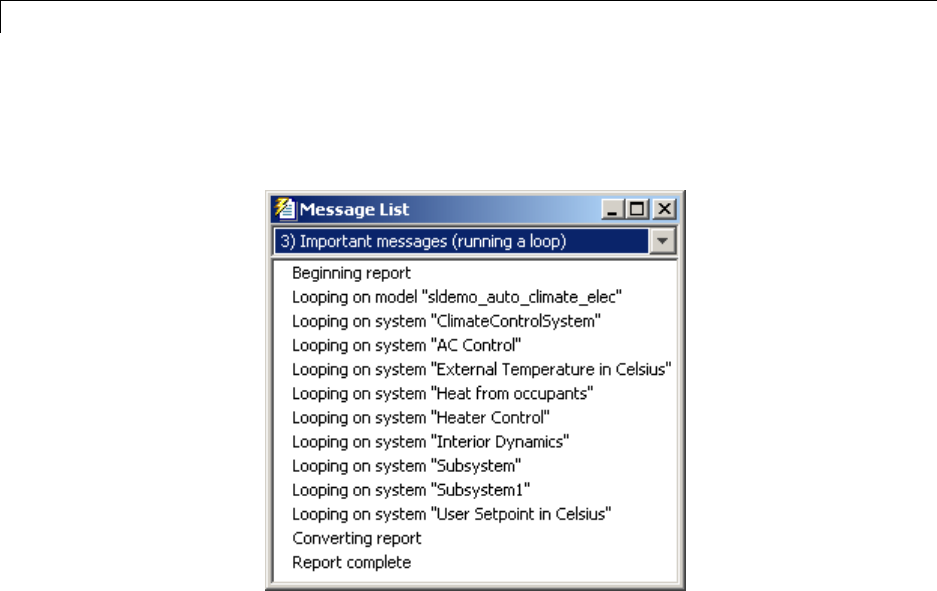
Model Loop
The report loops on the system ClimateControlSystem of the
sldemo_auto_climate_elec modelandallofitssubsystems,as
showninthefollowingMessageList.
Below is an excerpt from the generated report.
9-64
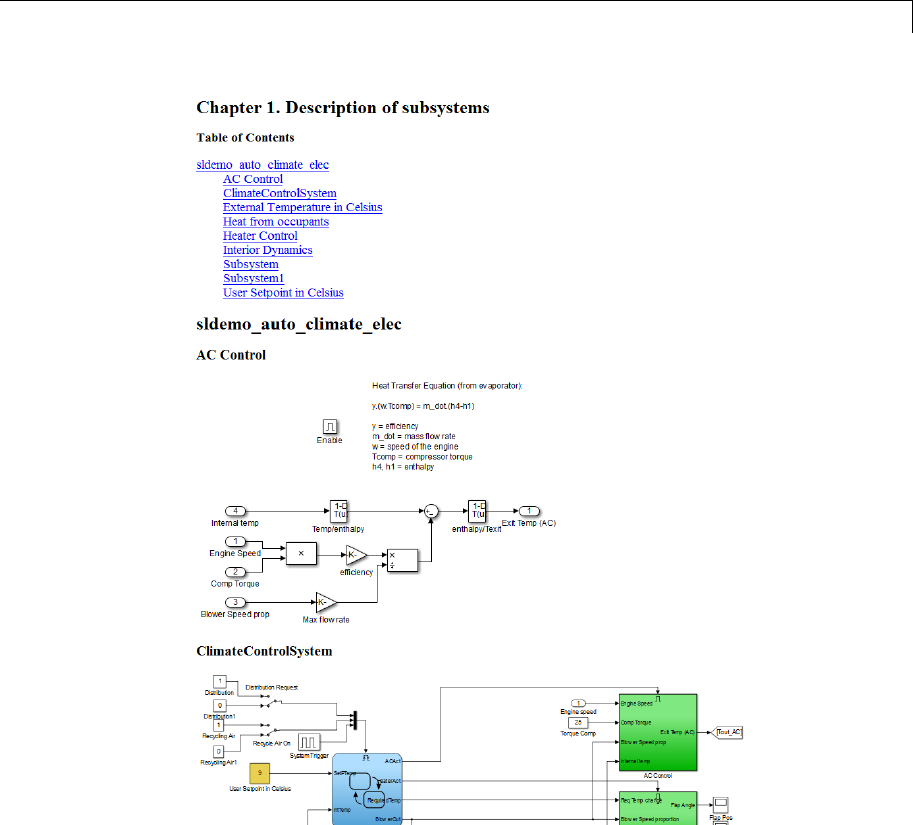

Model Loop
and their Subsystems, sldemo_auto_report.rpt, and the model f14,
which the Simulink software includes.
1In the Report Explorer, click File > Open, and then open
sldemo_auto_report.rpt by double-clicking it.
2In the Outline pane on the left, click Model Loop Section 1 -
sldemo_auto_climate_elec.
3In the Model Loop properties pane, click the button to add a
model to the Models to include list.
4In the Model Loop properties pane, from the Model name selection
list, select <Custom block diagram>.
5In the Model name field, delete the text <Custom block diagram>
and enter f14.mdl.
The Model Loop properties pane now looks as follows.
9-66
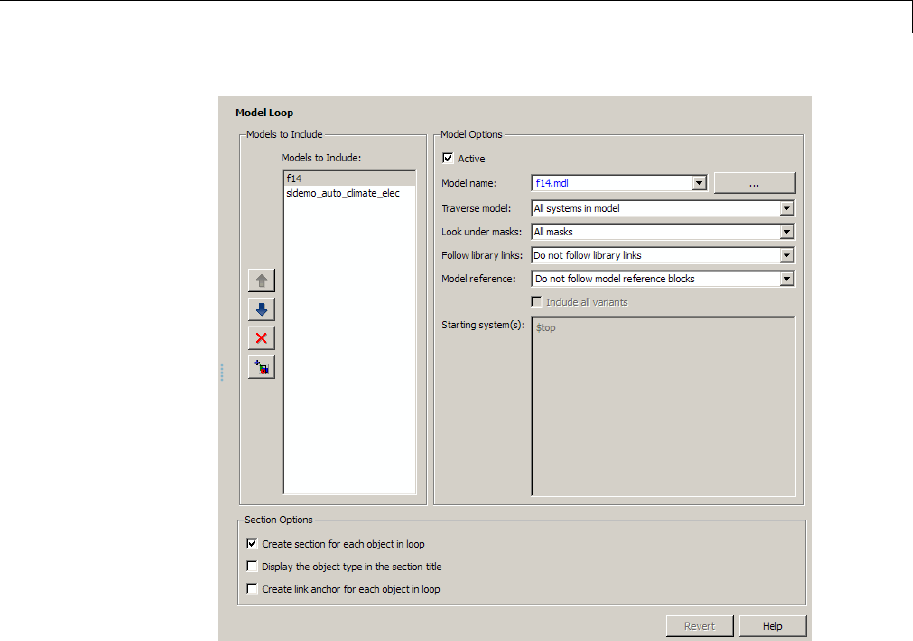
Model Loop
6Save the report setup file.
7Generate the report.
The report generation process loops over the specified systems in
the f14 and sldemo_auto_climate_elec models, as shown in the
following message box.
9-67
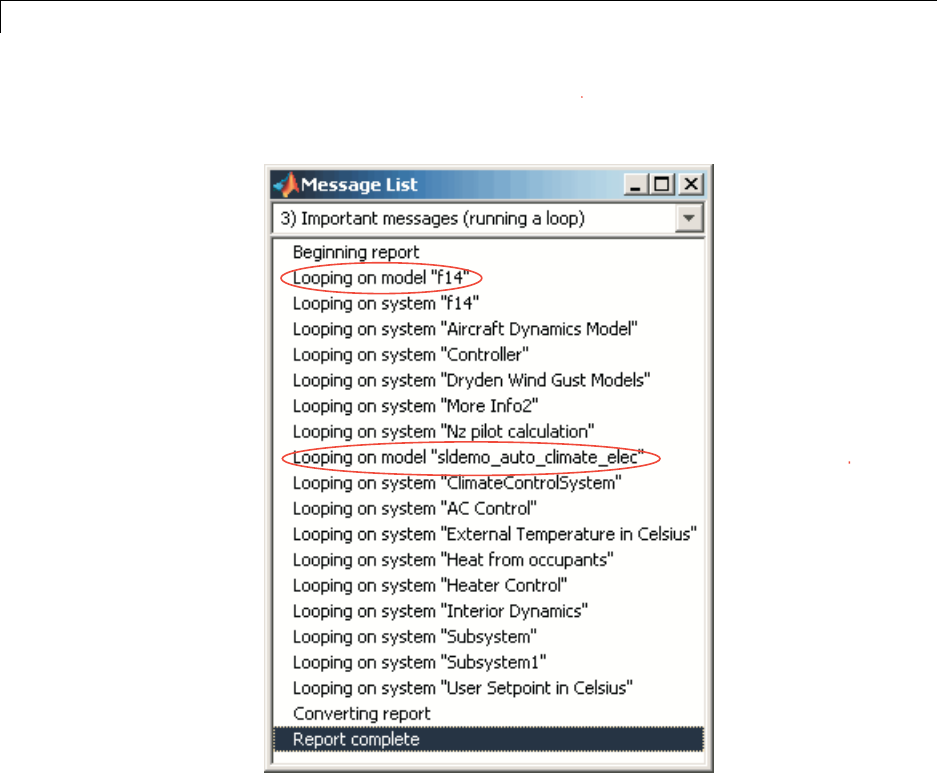
Model Loop
Below is an excerpt from the generated report.
9-68
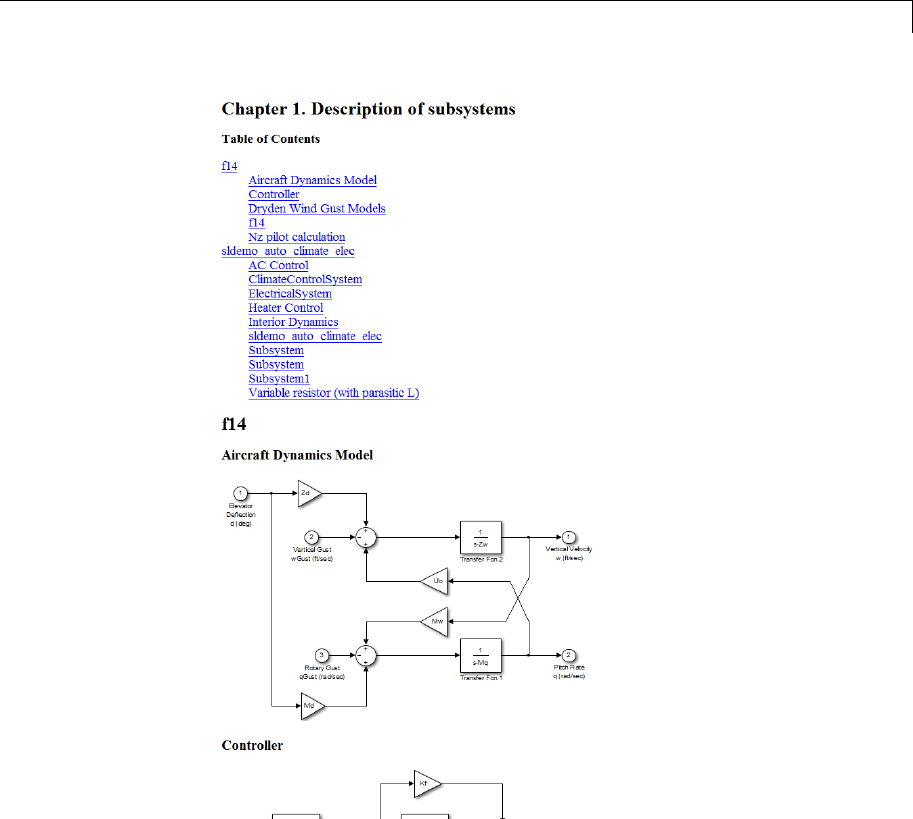
Model Loop
9-69

Model Loop
8In the Models to include list, click f14 to select it.
9Clear the Active check box to omit f14 model information from the
generated report.
10 Rerun the report.
The report now includes information only on the
sldemo_auto_climate_elec model, as shown at the end of
the previous example, Generating Reports on Specified Systems and
their Subsystems.
11 To reactivate the f14 model, in the Model Loop Models to include
list, select the f14 model and then select the Active check box.
Insert
Anything
into
Report?
Yes, inserts a section if you select the Create section for each object
in loop option.
Class rptgen_sl.csl_mdl_loop
See Also Block Loop,System Loop
9-70

Model Simulation
Purpose Run current model with specified simulation parameters
Description This component runs the current model using specified simulation
parameters. Ensure that this component has the Model Loop
component as its parent.
For more information on simulation parameters, see “Configure
Simulation” in the Simulink documentation.
I/O
Parameters
Usemodel’sworkspaceI/Ovariablenames
Use the names of the parameters specified in the Simulation
Parameters dialog box.
The following options are available if you do not select the Use model’s
workspace I/O variable names option:
•Time : Specifies a new variable name for the Time parameter.
•States: Specifies a new variable name for the States parameter.
•Output: Specifies a new variable name for the Output parameter.
Timespan Use model’s timespan values: Use the model’s Start time and
Stop time values, as specified in the Solver tab in the Simulation
Parameters dialog box.
The following options are available if you do not select the Use model’s
timespan values option:
•Start: Specifies a simulation starting time.
•Stop: Specifies a simulation ending time.
9-71

Model Simulation
Note If you set the stop time of your model to inf (infinity) in
Simulink or on this component attribute page, Simulink Report
Generator terminates the model simulation after 60 seconds.
Terminating the report prevents the report generation process from
entering an infinite loop.
Simulation
Options
•Compile model before simulation: Compiles the model before
simulating, preserving scope content. Select this option if:
-You use Simulink Coder Summary properties.
-You sort systems or blocks by simulation order.
-You use scope snapshots.
•Simulation status messages: Displays simulation status messages,
or inserts them into the report.
-Display to command line: Sends messages to a command-line
window.
-Display to Report Generator Message List: Sends messages
to the Simulink Report Generator message window.
-Insert into report: Includes messages in the report.
•Simulation parameters: Specifies simulation parameters.
Insert
Anything
into
Report?
No.
Class rptgen_sl.csl_mdl_sim
See Also Model Loop
9-72

Object Loop
Purpose Run child components for Stateflow objects, and then insert table into
report
Description This component runs its child components for each Stateflow object and
inserts a table into the generated report.
Object
Types
•Report on “Data” objects: Includes Stateflow data objects in the
loop.
•Report on “Event” objects: Includes Stateflow event objects in
the loop.
•Report on “Transition” objects: Includes Stateflow transition
objects in the loop.
•Report on “Junction” objects: Includes Stateflow junction objects
in the loop.
•Report on “Target” objects: Includes Stateflow target objects in
the loop.
•Report on “Note” objects: Includes Stateflow note objects in the
loop.
Loop
Options
•Report depth: Specifies the level at which to loop:
-Local children only (Default). Reports only on children one
level down.
-All objects. Reports on all Stateflow objects.
•Skip autogenerated charts under truth tables:Excludes
autogenerated charts under truth tables from the report.
•Remove objects which do not contain more information than
asnapshot: Excludes objects that contain only a snapshot.
•Search Stateflow: Reports on Stateflow charts with specified
property name/property value pairs.
9-73

Object Loop
Section
Options
•Create section for each object in loop: Inserts a section in the
generated report for each object found in the loop.
•Display the object type in the section title: Automatically
inserts the object type into the section title in the generated report.
•Create link anchor for each object in loop:Createsahyperlink
to the Stateflow object in the generated report.
Insert
Anything
into
Report?
Yes, inserts a section if you select the Create section for each object
in loop option.
Class rptgen_sf.csf_obj_loop
See Also Stateflow Filter,Stateflow Hierarchy,Stateflow Hierarchy
Loop,Simulink Function System Loop
9-74

Requirements Block Loop
Purpose Apply child components to blocks with requirements
Description This component applies its child components to blocks with associated
requirements.
Report On •Automatic list from context: If selected, this option reports on all
blocks in the current context. The parent of the Requirements Block
Loop component determines its context.
-Model Loop: Reports on all blocks with requirements in the
current model.
-System Loop: Reports on all blocks with requirements in the
current system.
-Signal Loop: Reports on all blocks with requirements connected
to the current signal.
If the Requirements Block Loop does not have the Model Loop,
System Loop,Signal Loop,orBlock Loop component as its parent,
it reports on all blocks in all models.
•Custom - use block list: Reports on a list of blocks with specified
requirements. Enter the full paths of each block into this field.
Loop
Options
•Sort blocks
Specify how to sort blocks (applied to each level in a model):
-Alphabetically by block name: Sorts blocks alphabetically by
name.
-Alphabetically by system name: Sorts systems and subsystems
alphabetically by name. (Blocks in each system do not appear in
alphabetical order).
-Alphabetically by full Simulink path: Sorts blocks
alphabetically by Simulink path.
-By block type: Sorts blocks alphabetically by block type.
-By block depth: Sorts blocks by their depth in the model.
9-75

Requirements Block Loop
-By layout (left to right): Sorts blocks by their location in the
model layout, by rows. The block appearing the furthest toward
the left top corner of the model is the anchor for the row. The row
contains all other blocks that overlap the horizontal area defined
by the top and bottom edges of the anchor block. The other rows
use the same algorithm, using as the anchor the next unreported
block nearest the left top of the model.
-By layout (top to bottom): Sorts blocks by their location in the
model layout, by columns. The block appearing the furthest toward
the left top corner of the model is the anchor for the column. The
column contains all other blocks that overlap the vertical area
defined by the left and right edges of the anchor block. The other
columns use the same algorithm, using as the anchor the next
unreported block nearest the left top of the model.
-By traversal order: Sorts blocks by traversal order.
-By simulation order: Sorts blocks by execution order.
•Search for Simulink property name/property value pairs:
Reports on Simulink blocks with specified property name/property
value pairs that have associated requirements.
Section
Options
•Create section for each object in loop: Inserts a section in the
generated report for each block found in the loop that has associated
requirements.
9-76

Requirements Block Loop
•Display the object type in the section title: Inserts the object
type automatically into the section title in the generated report.
•Create link anchor for each object in loop:Createsahyperlink
to the block in the generated report.
Insert
Anything
into
Report?
Yes, inserts a section if you select the Create section for each object
in loop option.
Class RptgenRMI.CBlockLoop
See Also Missing Requirements Block Loop,Missing Requirements System
Loop,Model Loop,Requirements Block Loop,Requirements
Documents Table,Requirements Signal Loop,Requirements
Summary Table,Requirements System Loop,Requirements Table
9-77

Requirements Documents Table
Purpose Insert table of linked requirements documents
Description This component creates a table that lists all requirements documents
linked to model objects.
Table
Options
•Show documents linked to
-Simulink and Stateflow objects: Inserts requirements
documents linked to both Simulink and Stateflow objects in the
model.
-Simulink objects: Inserts requirements documents linked only
to Simulink objects in the model.
-Stateflow objects: Inserts requirements documents linked only
to Stateflow objects in the model.
•Table title: Specifies a title for the table.
-No title
-Model name (Default)
-Custom
Table
Columns
•Replace document paths with links: Inserts links to requirements
documents when possible.
•When replacing with links, note absolute vs. relative file
path: Indicates absolute or relative file paths when including links
to requirements documents.
•Include document modification time: Includes the document
modification information.
•Count # references to each document: Includes a count of the
number of references to the requirements document in the model.
Document
References
•Replace file names with document IDs in the main body of the
report: Includes shortened IDs to identify requirements documents
to simplify the requirements documents table.
9-78

Requirements Documents Table
•Retrieve full module path for DOORS links (requires login):
This option applies only to DOORS®requirements. Append the
DOORS module ID to the module path in the DOORS database if the
module information is not stored with the model.
Insert
Anything
into
Report?
Yes. Table.
Class RptgenRMI.ReqDocTable
See Also ,Requirements Summary Table,Requirements Table
9-79

Requirements Signal Loop
Purpose Apply all child components to signal groups with requirements
Description The Requirements Signal Loop component applies all child components
to signal groups that have requirements in Signal Builder blocks.
Properties •Create link anchor for each object in loop:Createsahyperlink
to each object with requirements in the loop.
•Display the object type in the section title: Inserts the object
name with requirements into the section title.
•Create section for each object in loop:Createsahyperlinkto
each object with requirements in the loop.
•Section Type: Specifies the section type to insert. If you choose
Automatic, the Simulink Report Generator software determines the
appropriate section type:
-Book
-Chapter
-Section 1
-Section 2
-Section 3
-Section 4
-Section 5
-Simple Section
-Automatic
Report On Loops on signal groups in systems:
•Collect all Signal Builders: Processes all Signal Builder blocks,
looking for signal groups with requirements.
9-80

Requirements Signal Loop
•Custom - use list: Processes all subsystems in the user-defined
list. If a subsystem on the list does not have requirements, the
Simulink Report Generator software does not include it in the report.
Insert
Anything
into
Report?
Yes, inserts a section if you select the Create section for each object
in loop option.
Class RptgenRMI.CSystemLoop
See Also Missing Requirements Block Loop,Missing Requirements
System Loop,Requirements Block Loop,Requirements Documents
Table,Requirements Summary Table,Requirements System Loop,
Requirements Table,Signal Loop
9-81

Requirements Summary Table
Purpose Properties of blocks, systems, or Stateflow objects with associated
requirements
Description This component displays properties of blocks, systems, or Stateflow
objects with associated requirements.
Object
Type
Choose the object type to display in the generated report.
•Block (Default)
•System
•Stateflow
The selected object type affects the options available in the Property
Columns pane.
Table Title Specify a table title in the generated report.
•Automatic: Generates a title automatically from the parameter.
•Custom:Specifiesacustomtitle.
Property
Columns
•Object properties to include in the Requirements Summary Table
appear in a list.
-To add a property:
1Select the appropriate property levelinthetextboxontheleft.
2In the text box on the right, select the property that you want to
add and click Add.
-To delete a property, select the property name and click Delete.
%<SplitDialogParameters> is a unique property that you can
specify for Requirements Summary Tables where the object type is
Block. This property generates multiple summary tables, grouped
9-82

Requirements Summary Table
by block type. Each Summary Table group contains the dialog box
parameters for that block.
Some entries in the list of available properties (such as Depth)are
“virtual” properties that you cannot access using the get_param
command. The properties used for property/value filtering in the
block and System Loop components must be retrievable by the
get_param. Therefore, you cannot configure your Requirements
Summary Table to report on all blocks of Depth == 2.
•Remove empty columns: Removes empty columns from the table.
•Transpose table: Changes the summary table rows into columns in
the generated report, putting the property names in the first column
and the values in the other columns.
Object
Rows
•Insert anchor for each row: Inserts an anchor for each row in the
Requirements Summary Table.
•Report On
-Automatic list from context: Reports on all blocks in the
current context. The parent of this component determines its
context.
-Custom - use block list: Reports on a list of blocks that you
specify, and enters the block names in the corresponding field.
Specify the full path of each block.
Loop
Options
Choose block sorting options and reporting options in this pane.
•Sort blocks: Use this option to select how to sort blocks (applied
to each level in a model):
-Alphabetically by block name: Sorts blocks alphabetically by
name.
-Alphabetically by system name. Sorts systems alphabetically.
Lists blocks in each system, but in no particular order.
9-83
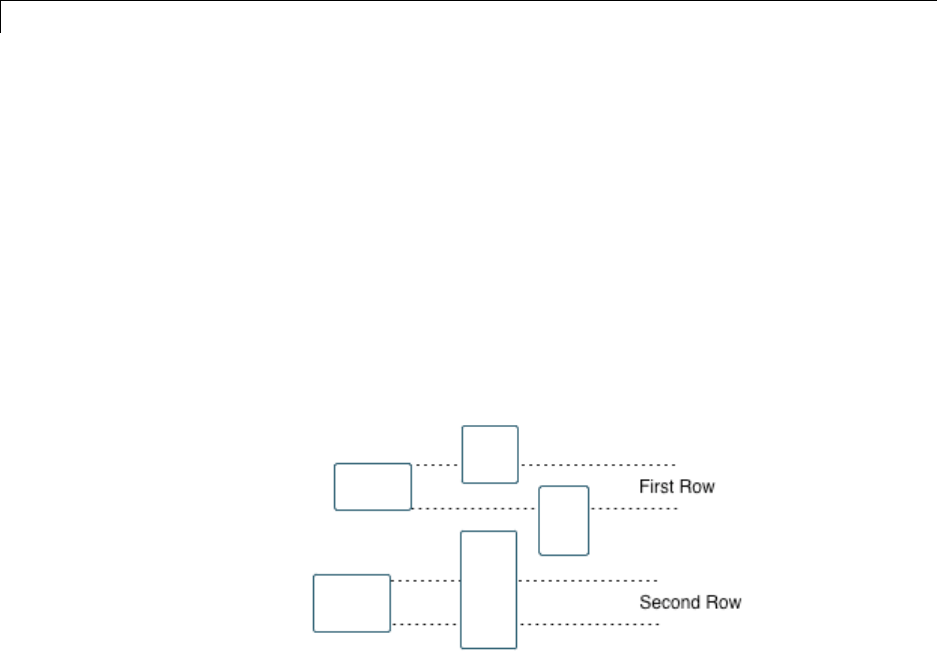
Requirements Summary Table
-Alphabetically by full Simulink path: Sorts blocks
alphabetically by Simulink path.
-By block type: Sorts blocks alphabetically by block type.
-By block depth: Sorts blocks by their depth in the model.
-By layout (left to right): Sorts blocks by their location in the
model layout, by rows. The block appearing the furthest toward
the left top corner of the model is the anchor for the row. The row
contains all other blocks that overlap the horizontal area defined
by the top and bottom edges of the anchor block. The other rows
use the same algorithm, using as the anchor the next unreported
block nearest the left top of the model.
-By layout (top to bottom): Sorts blocks by their location in the
model layout, by columns. The block appearing the furthest toward
the left top corner of the model is the anchor for the column. The
column contains all other blocks that overlap the vertical area
defined by the left and right edges of the anchor block. The other
columns use the same algorithm, using as the anchor the next
unreported block nearest the left top of the model.
-By traversal order: Sorts blocks by traversal order.
-By simulation order: Sorts blocks by execution order.
•Search for Simulink property name/property value pairs:
Reports on blocks with specified property name/property value pairs.
9-84

Requirements Summary Table
Insert
Anything
into
Report?
Yes. Table.
Class RptgenRMI.CSummaryTable
See Also Block Loop,Missing Requirements Block Loop,Missing
Requirements System Loop,Requirements Block Loop,
Requirements Documents Table,Requirements Signal Loop,
Requirements System Loop,Requirements Table
9-85

Requirements System Loop
Purpose Apply child components to systems with requirements
Description This component applies its child components to systems with associated
requirements.
Report On •Loop on systems
-Select systems automatically: If selected, this option reports
on all systems in the current context. The parent of the component
determines the context of this setting:
•Model Loop: Reports on systems in the current model.
•System Loop: Reports on the current system.
•Signal Loop: Reports on the parent system of the current
signal.
•Block Loop: Reports on the parent system of the current block.
If the Requirement System Loop does not have any of these
components as its parent, selecting this option reports on all
systems with requirements in all models.
-Custom - use system list: Reports on a list of specified
systems. Enter the full path of each system.
Loop
Options
•Sort Systems:
-Alphabetically by system name (default): Sorts systems
alphabetically by name.
-By number of blocks in system: Sorts systems by the number
of blocks in the system. The list displays systems by decreasing
number of blocks; the system with the largest number of blocks
appears first in the list.
-By system depth: Sorts systems by their depth in the model.
-By traversal order: Sorts systems in the traversal order .
9-86

Requirements System Loop
•Search for: Reports on Simulink blocks with specified property
name/property value pairs.
Section
Options
•Create section for each object in loop: Inserts a section in the
generated report for each object found in the loop.
•Display the object type in the section title: Inserts the object
type automatically into the section title in the generated report.
•Number sections by system hierarchy: Numbers sections in the
generated report hierarchically. Requires that Sort Systems be set
to By traversal order.
•Create link anchor for each object in loop:Createsahyperlink
to the object in the generated report.
Insert
Anything
into
Report?
Yes, inserts a section if you select the Create section for each object
in loop option.
Class RptgenRMI.CSystemLoop
See Also Missing Requirements Block Loop,Missing Requirements
System Loop,Requirements Block Loop,Requirements Documents
Table,Requirements Signal Loop,Requirements Summary Table,
Requirements Table,System Loop
9-87

Requirements Table
Purpose Requirements links for current context
Description This component creates a table that contains information from the
Simulink Verification and Validation software. Objects can have
multiple requirements. Each requirement is a row in the table.
Table
Options
•Show requirements for current: Specifies the object type to
display.
-Simulink object
-Stateflow object
•Table title: Specifies a title for the table.
-No title
-Object name (Default)
-Custom
Table
Columns
•Description: Includes the object description in the table.
•Document name: Includes the report name in the table.
•Locations within document: Includes the locations of the object
within the document in the table.
•Requirement keyword: Includes the requirement keyword for the
object in the table.
Insert
Anything
into
Report?
Yes. Table.
Class RptgenRMI.CReqTable
See Also Missing Requirements Block Loop,Missing Requirements
System Loop,Requirements Block Loop,Requirements Documents
9-88

Requirements Table
Table,Requirements Signal Loop,Requirements Summary Table,
Requirements System Loop,Stateflow Automatic Table,Stateflow
Name
9-89

Scope Snapshot
Purpose Insert images of Simulink scopes and XY graphs
Description This component inserts images of Simulink scopes and XY graphs.
If the model has not been simulated, scopes are empty. For more
information, see the Model Simulation reference page.
The parent component of the Scope Snapshot determines its behavior.
•Model Loop or no Simulink looping component:IncludesallXY
graphs and scopes in the current model.
•System Loop: Includes all XY graphs and scopes in the current
system.
•Block Loop: Includes the current block when it is an XY graph or
scope.
•Signal Loop: Includes all XY graphs and scopes connected to the
current signal.
If the Scope Snapshot does not have any of the Simulink looping
components as its parent, it includes all XY graphs and scopes in
all open models.
Scope
Options
•Report on closed scopes: Takes a snapshot of all scopes in context.
This option forces closed scopes to open when the report is generating.
•Autoscaletimeaxis: Scales the Simulink scope time axis to include
the entire log.
Print
Options
•Image file format: Specifies the image file format (for example,
JPEG, TIFF, etc.). Select Automatic HG Format (the default)
to choose the format best suited for the specified output format
automatically. Otherwise, choose an image format that your output
viewer can read.
-Automatic HG Format (uses the Simulink file format selected in
the Preferences dialog box)
-Bitmap (16m-color)
9-90

Scope Snapshot
-Bitmap (256-color)
-Black and white encapsulated PostScript
-Black and white encapsulated PostScript (TIFF)
-Black and white encapsulated PostScript2
-Black and white encapsulated PostScript2 (TIFF)
-Black and white PostScript
-Black and white PostScript2
-Color encapsulated PostScript
-Color encapsulated PostScript (TIFF)
-Color encapsulated PostScript2
-Color encapsulated PostScript2 (TIFF)
-Color PostScript
-Color PostScript2
-JPEG high quality image
-JPEG medium quality image
-JPEG low quality image
-PNG 24-bit image
-TIFF - compressed
-TIFF - uncompressed
-Windows metafile
•Paper orientation:
-Landscape
-Portrait
-Rotated
9-91

Scope Snapshot
-Use figure orientation: Uses the orientation for the figure,
which you set with the orient command.
-Full page image (PDF only): In PDF reports, scales images to
fit the full page, minimizes page margins, and maximizes the size
of the image by using either a portrait or landscape orientation.
For more information about paper orientation, see the orient
reference page in the MATLAB documentation.
•Image size: Specifies the size of the Handle Graphics figure
snapshot in the form [w h] (width, height). In the units text box,
select one of the following options:
-Inches
-Centimeters
-Points
-Normalized
•Invert hardcopy: Inverts colors for printing; changes dark colors
to light colors and light colors to dark colors.
-Automatic: Automatically changes dark axes colors to light axes
colors. If the axes color is a light color, this option does not invert
the color.
-Invert: Changes dark axes colors to light axes colors and light
axes colors to dark axes colors.
-Don't invert: Does not change the colors in the image on the
screen for printing.
-Use figure's InvertHardcopy setting:Usesthe
InvertHardcopy property set in the Handle Graphics image.
-Make figure background transparent:Makestheimage
background transparent.
Display
Options
•Scaling:
-Fixed size: Specifies the number and type of units.
9-92

Scope Snapshot
-Zoom: Specifies the percentage, maximum size, and units of
measure.
-Use image size: Causes the image to appear the same size in
the report as on screen.
•Size: Specifiesthesizeofthesnapshotintheformwh(width,
height). This field is active only if you choose Fixed size from the
Scaling selection list.
•Max size: Specifies the maximum size of the snapshot in the form
wh(width, height). This field is active only if you choose Zoom from
the Scaling selection list.
•Units: Specifies the units for the size of the snapshot. This field
is active only if you choose Zoom or Fixed size in the Image size
list box.
•Alignment: Only reports in PDF or RTF format support this property.
-Auto
-Right
-Left
-Center
•Title: Specifies a title for the snapshot figure.
-Block name: Uses the block name as the title.
-Full Simulink path name: Uses the Simulink path as the title.
-Custom:Specifiesacustomtitle.
•Caption: Select or enter a short text description for the snapshot
figure.
-No caption
-Automatic (use block description).UsestheSimulinkblock
description as the caption.
-Custom. Specifies a short text description for the snapshot figure.
9-93

Scope Snapshot
Insert
Anything
into
Report?
Yes. Image.
Class rptgen_sl.csl_blk_scope
See Also Block Loop,Model Loop,Signal Loop,System Loop
9-94

Signal Loop
Purpose Run child components for each signal contained in current system,
model, or block
Description The Signal Loop component runs its child components for each signal
contained in the current system, model, or block. The parent component
determines the behavior of this component.
•Model Loop: Loops on all signals in the current model.
•System Loop: Loops on all signals in the current system. Choose
not to report on the following types of signals by clearing the
corresponding option in the Section options area:
-System input signals
-System output signals
-System internal signals
•Signal Loop: Loops on the current signal.
•Block Loop : Loops on all signals connected to the current block.
Choose not to report on the following types of signals by clearing the
corresponding option in the Section options area:
-Block input signals
-Block output signals
•If the Signal Loop does not have a looping component as its parent,
it loops on all signals in all models. Choose not to report on the
following types of signals by clearing the corresponding option in
the Section options area:
-Block input signals
-Block output signals
-System input signals
-System output signals
-System internal signals
9-95

Signal Loop
Select
Signals
•Include block input signals: Loops on signals that feed into
blocks. This option is valid only when the parent component of this
component is aBlock Loop.
•Include block output signals: Loops on signals that leave the
block. This option is valid only when the parent component of this
component is aBlock Loop.
•Include system input signals: Loops on signals coming from
inports. This option is valid only when the parent component of this
component is aSystem Loop.
•Include system internal signals: Loops on system internal
signals. This option is valid only when the parent component of this
component is aSystem Loop.
•Include system output signals: Loops on signals going to
outports. This option is valid only when the parent component of
this component is aSystem Loop.
•Sort signals: Specifies how to sort signals:
-Alphabetically by signal name: Sorts signals alphabetically
by name.
-Alphabetically by signal name (exclude empty):Sorts
signals alphabetically by name.
-Alphabetically by system name: Sorts alphabetically by parent
system names. Lists signals in each system, but in no particular
order.
-By signal depth: Sorts signals by their depth in the model.
Section
Options
•Create section for each object in loop: Inserts a section in the
generated report for each object found in the loop.
•Display the object type in the section title: Automatically
inserts the object type into the section title in the generated report.
•Create link anchor for each object in loop:Createsahyperlink
to the object in the generated report.
9-96

Signal Loop
Insert
Anything
into
Report?
Yes, inserts a section if you select the Create section for each object
in loop option.
Class rptgen_sl.csl_sig_loop
See Also Block Loop,Model Loop,System Loop
9-97

Simulink Automatic Table
Purpose Insert two-column table with information on selected model, system,
signal, or block
Description This component inserts a two-column table that contains details for the
selected model, system, signal, or block into a generated report.
Options •Show current: Includes a specified Simulink software feature in
the generated report.
-Automatic: Uses the context of the parent loop.
-Model
-System
-Block
-Annotation
-Signal
•Properties list: Specifies whether to select properties manually or
automatically.
-Determine properties automatically:Usesblocksanddialog
box properties.
-Show properties: Enables you to specify properties manually.
•Show full path name: Displays the full path of the selected
Simulink model.
•Display property names as prompts: Displays property names as
prompts in the generated report. The report includes the dialog box
string instead of the underlying code property.
Display
Options
•Table title: Displays a table title in the generated report.
-Name: Automatically generates a title from the parameter.
-Custom:Specifiesacustomtitle.
-No title: Does not include a title.
9-98

Simulink Automatic Table
•Header row: Select a header row for the table in the generated
report.
-No header: Includes no header row.
-Type and Name: Includes a header row with columns for name
and object type.
-Custom: Includes a custom header.
•Don’t display empty values: Excludes empty parameters in the
generated report.
Insert
Anything
into
Report?
Yes. Table.
Class rptgen_sl.csl_auto_table
See Also Block Loop,Model Loop,Signal Loop,System Loop
9-99

Simulink Dialog Snapshot
Purpose Insert snapshots of Simulink editor dialog boxes
Description This component takes snapshots of Simulink editor dialog boxes. You
use it to display the current settings associated with an object or
document the appearance of your custom mask dialog boxes.
The parent component of this component determines the behavior of
this component.
•Block Loop: Documents the dialog box of the current reported block.
•System Loop: Documents the dialog box of the current reported
system.
Format •Image file format: Specifies the format for the snapshot image
file. The automatic format chooses BMP format for PDF files, and
PNG for other formats.
•Show all tabs: Automatically generates images for all the tabs
for the dialog box. If you clear this check box, Simulink Report
Generator creates an image of only the first tab.
Display
Options
•Scaling:
-Fixed size: Specifies the number and type of units.
-Zoom: Specifies the percentage, maximum size, and units of
measure.
-Use image size: Causes the image to appear the same size in
the report as on screen.
•Size: Specifiesthesizeofthesnapshotintheformatwh(width,
height). This field is active only if you choose Fixed size from the
Scaling selection list.
•Max size: Specifies the maximum size of the snapshot in the format
wh(width, height). This field is active only if you choose Zoom from
the Scaling selection list.
9-100

Simulink Dialog Snapshot
•Units: Specifies the units for the size of the snapshot. This field
is active only if you choose Zoom or Fixed size in the Image size
list box.
•Alignment: Only reports in PDF or RTF format support this property.
-Auto
-Right
-Left
-Center
•Title:Specifiestexttoappear above the snapshot.
•Caption: Specifies text to appear under the snapshot.
Insert
Anything
into
Report?
Yes. Snapshot.
Class rptgen_sl.CDialogSnapshot
See Also Block Loop,System Loop
9-101

Simulink Function System Loop
Purpose Report on Simulink functions specified in a Stateflow loop
Description This component runs its child components for each Simulink function
system defined by the parent component. For example, to include
Simulink functions within a given model in the report, you can include
this component as the child of a Stateflow Object Loop or Object Loop
component, each of which in turn is usually a child of a Chart Loop
component.
Report On Include subsystems in nested Simulink functions:Specifies
whether to include subsystems in nested Simulink functions. By
default, this option is enabled.
Loop
Options
•Sort Systems: Specifies how to sort systems.
-Alphabetically by system name (default): Sorts systems
alphabetically by name.
-By number of blocks in system: Sorts systems by number of
blocks. The list shows systems by decreasing number of blocks;
that is, the system with the largest number of blocks appears first
in the list.
-By system depth: Sorts systems by their depth in the model.
-By traversal order: Sorts systems in traversal order.
•Search for: Reports only on Subsystem blocks with the specified
property name/property value pairs. To enable searching, click the
check box. In the first row of the property name and property value
table, click inside the edit box, delete the existing text, and type the
property name and value.
For information about subsystem property names and values, in
“Block-Specific Parameters”, see the “Ports & Subsystems Library
Block Parameters” section.
9-102

Simulink Function System Loop
Section
Options
•Create section for each object in loop: Inserts a section in the
generated report for each object found in the loop.
•Display the object type in the section title: Inserts the object
type automatically into the section title in the generated report.
•Number sections by system hierarchy: Hierarchically numbers
sections in the generated report. Requires that Sort Systems be set
to By traversal order.
•Create link anchor for each object in loop:Createsahyperlink
to the object in the generated report.
Insert
Anything
into
Report?
Yes, inserts a section if you select the Create section for each object
in loop option.
Class rptgen_sl.csl_sys_loop
See Also Object Loop,State Loop,Chart Loop,System Loop,Block Loop,
Model Loop,Signal Loop
9-103

Simulink Functions and Variables
Purpose Create table that displays workspace variables and MATLAB functions
used by reported blocks in Simulink models
Description This component creates a table that displays workspace variables and
MATLAB functions used by blocks in a Simulink model. The Model
Loop component specifies the current model and systems in which the
blocks appear. For example, suppose a Simulink Gain block has a string
cos(x) instead of a number. The Simulink software looks for a variable
xin the workspace and uses the cos function.
Functions •Include table of functions: Includes a table of Simulink functions
in the generated report.
•Table Title: Specifies a title for the table in the generated report:
-Automatic: Generates a title automatically from the parameter.
-Custom:Specifiesacustomtitle.
•Parent block: Includes a column in the table that includes the name
of the block, which contains the reported variable.
•Calling string: Includes the MATLAB code that calls the reported
variable.
•Include fixed-point functions (sfix, ufix, ...):Includes
Fixed-Point Toolbox™ functions in the report.
Variables •Include table of variables: Includes a table of Simulink variables
in the generated report.
•Table title: Specifies a title for the table in the generated report.
-Automatic: Generates a title automatically from the parameter.
-Custom:Specifiesacustomtitle.
•Include Workspace I/O parameters: Reports on variables that
contain parameters with time vectors and state matrices. Set
these parameters in the Workspace I/O pane in the Simulation
Parameters dialog box in a Simulink model.
9-104
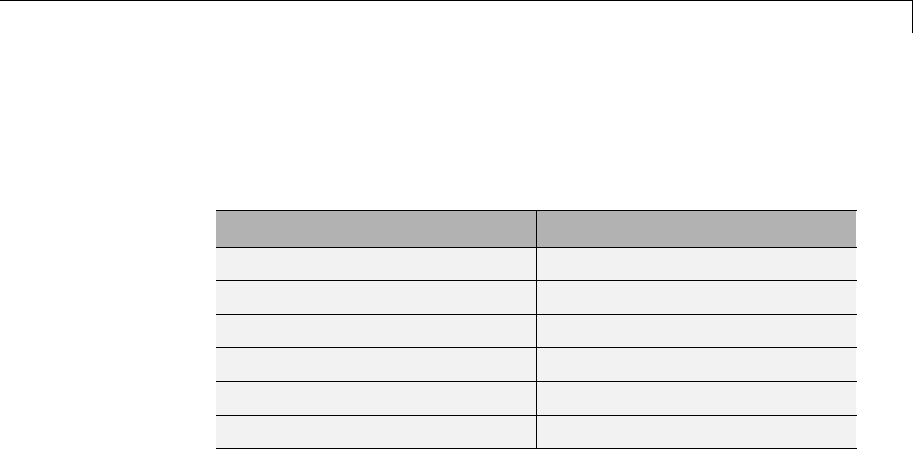
Simulink Functions and Variables
In the following table, if any of the entries in the first column are on,
thecomponentlooksforthevariablelistedinthesecondcolumn.If
the component finds the variable in the workspace, it includes it in
the report.
Parameter name Variable name
LoadExternalInput ExternalInput
SaveTime TimeSaveName
SaveState StateSaveName
SaveOutput OutputSaveName
LoadInitialState InitialState
SaveFinalState FinalStateName
•Parent block: Includes the name of the block that contains the
reported variable.
•Calling string: Includes the MATLAB code that calls the reported
variable.
•Size of variable: Includes the size of the reported variable.
•Class of variable: Includes the variable class to which the reported
variable belongs.
•Memory size: Includes the amount of memory in bytes that the
reported variable needs.
•Value in workspace: Includes the value of the reported variable.
Large arrays may appear as [MxN CLASS]. For example, if you have
a 300-by-200 double array, it appears in the report as [300x200
DOUBLE].
•Storage class: Include the storage class of the reported variable.
The title of this column is Storage Class. This option looks
at the model’s TunableVars property to see if any of the model
variables specify their storage class. If you specify the storage class,
9-105
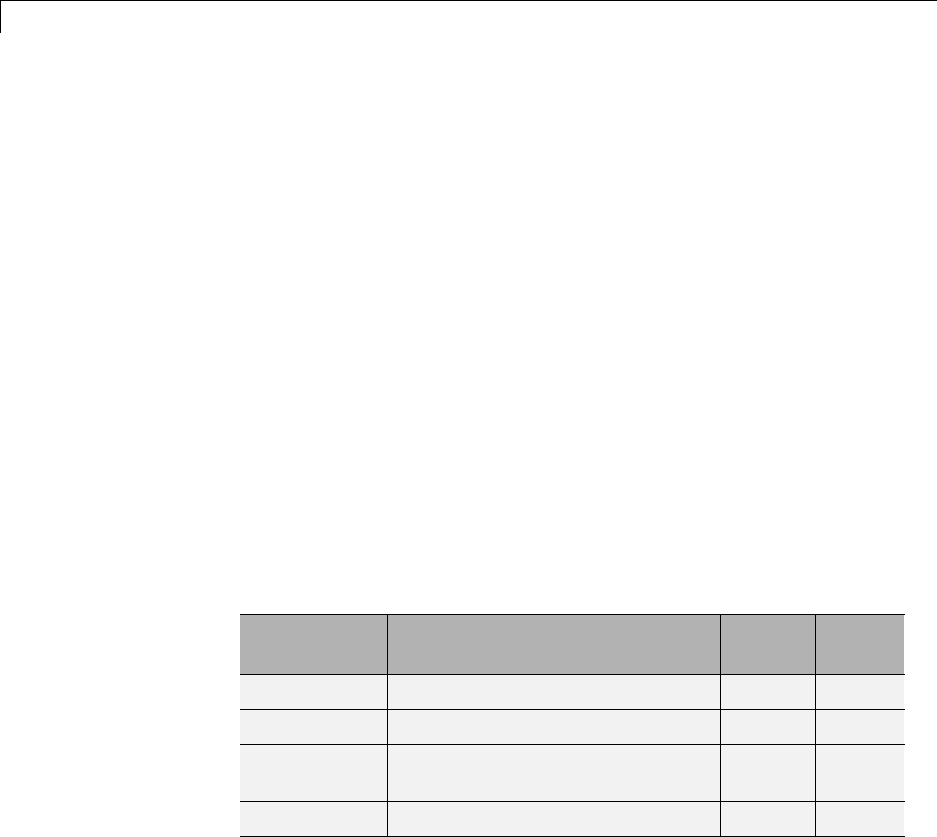
Simulink Functions and Variables
TunableVarsStorageClass and TunableVarsTypeQualifier appear
in a table column in the model variables table.
The column entries are TunableVarsStorageClass
(TunableVarsTypeQualifier) when TunableVarsTypeQualifier
is not empty. If TunableVarsTypeQualifier is empty, the column
entry is TunableVarsStorageClass.
Values for TunableVarsStorageClass include:
-Exported Global
-Auto
-ImportedExtern
-ImportedExtern Pointer
•Data object properties: Reports on data object properties.
Example
This table is an example of a table created by the Model Variables
component. This Property Table reports on the variables in the
Controller in the F14 model.
Variable
Name Parent Blocks
Calling
String Value
Ka f14/Controller/Gain3 Ka 0.677
Kf f14/Controller/Gain Kf -1.746
Ki f14/Controller/Proportional
plus integral compensator
[Ki] -3.864
Kq f14/Controller/Gain2 Kq 0.8156
9-106

Simulink Functions and Variables
Insert
Anything
into
Report?
Yes. Table.
Class rptgen_sl.csl_obj_fun_var
See Also Block Loop,Model Loop,Signal Loop,System Loop
9-107

Simulink Library Information
Purpose Insert table that lists library links in the current model, system, or block
Description This component inserts a table that lists library links in the current
model, system, or block.
Table
Columns
•Block: Includes the Simulink block name in the generated table.
•Library: Includes the Simulink library root name in the generated
table.
•Reference block: Includes the Simulink reference block name in
the generated table.
•Link status: Includes the link status in the generated table.
Display
Options
•Title: Specifies a title for the generated report.
•Sort table by:
-Block: Sorts the table by block name.
-Library: Sortsthetablebylibraryname.
-Reference Block: Sorts the table by reference block name.
-Link Status: Sorts the table by link status.
•Merge repeated rows: Merges sorted rows in the generated table.
Example
The following table sorts based on Reference Block column. The
Report Explorer uses the aero_guidance model with Merge repeated
rows deselected to generate the table.
Block Library Reference Block Status
Equations
of Motion
(Body Axes)
Aerospace Equations of
Motion (Body
Axes)
resolved
Incidence &
Airspeed
Aerospace Incidence &
Airspeed
resolved
9-108
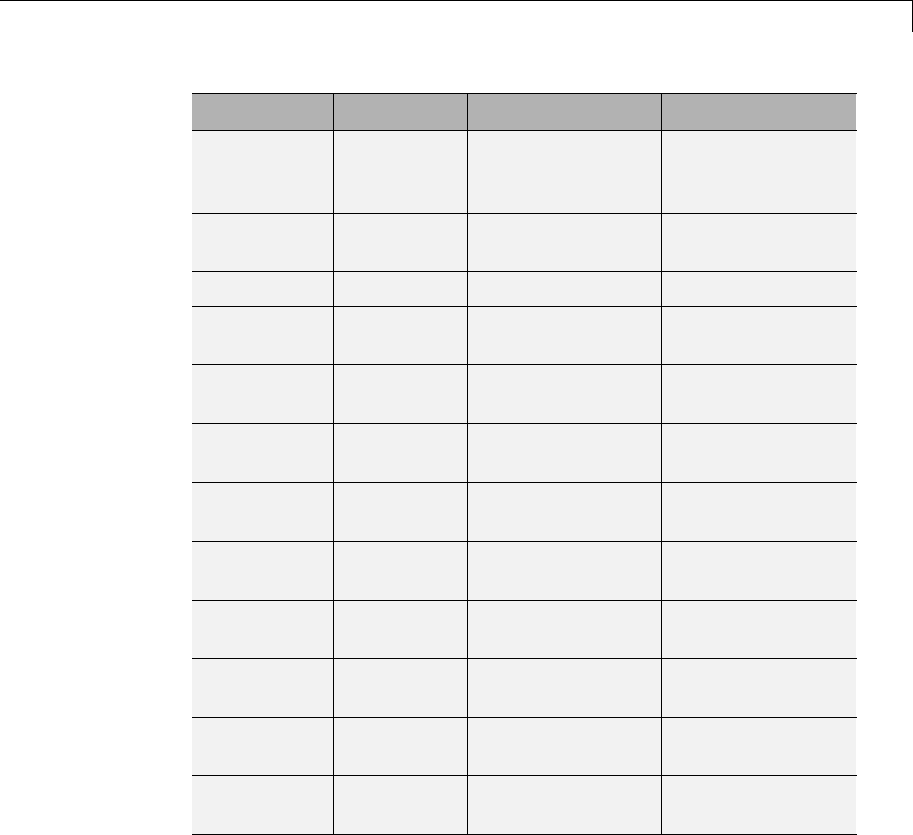
Simulink Library Information
Block Library Reference Block Status
Fin Actuator Aerospace 2nd Order
Nonlinear
Actuator
resolved
3DoF
Animation
Aerospace 3DoF Animation resolved
Atmosphere Aerospace Atmosphere model resolved
Cm Simulink Interpolation (n-D)
using PreLookup
resolved
Cx Simulink Interpolation (n-D)
using PreLookup
resolved
Cz Simulink Interpolation (n-D)
using PreLookup
resolved
Kg Simulink Interpolation (n-D)
using PreLookup
resolved
Ki Simulink Interpolation (n-D)
using PreLookup
resolved
Alpha Index Simulink PreLookup Index
Search
resolved
Mach Index Simulink PreLookup Index
Search
resolved
Mach Index Simulink PreLookup Index
Search
resolved
|Alpha|
Index
Simulink PreLookup Index
Search
resolved
When you select Merge repeated rows, the generated table collapses
rows in the Block column. Each row in the Reference Block column is
unique, as shown in the following table.
9-109

Simulink Library Information
Block Library Reference Block Status
Equations
of Motion
(Body Axes)
Aerospace Equations of
Motion (Body
Axes)
resolved
Incidence &
Airspeed
Aerospace Incidence &
Airspeed
resolved
Fin Actuator Aerospace 2nd Order
Nonlinear
Actuator
resolved
3DoF
Animation
Aerospace 3DoFAnimation resolved
Atmosphere Aerospace Atmosphere
model
resolved
Cm
Cx
Cz
Kg
Ki
Simulink Interpolation
(n-D) using
PreLookup
resolved
Alpha Index
Mach Index
Mach Index
|Alpha|
Index
Simulink PreLookup Index
Search
resolved
Insert
Anything
Into
Report?
Yes. Table.
9-110

Simulink Library Information
Class rptgen_sl.CLibinfo
See Also Block Loop,Model Loop,System Loop
9-111

Simulink Linking Anchor
Purpose Designate locations to which links point
Description This component designates a location to which links point. Use the
Model Loop,System Loop,Block Loop,orSignal Loop component as
the parent component for this component.
Properties •Insert text: Specifies text to appear after the linking anchor.
•Link from current: Sets the current model, system, block, or signal
as the linking anchor.
-Automatic: Automatically selects the appropriate model, system,
block, or signal as a linking anchor. If the Model Loop component
is the parent component, the linking anchor is set on the current
model. Similarly, if the Block Loop or Signal Loop is the parent
component, the linking anchor is inserted for the current system,
block, or signal, respectively.
-Model: Sets the linking anchor to the current model.
-System: Sets the linking anchor to the current system.
-Block: Sets the linking anchor to the current block.
-Annotation: Sets the linking anchor to the current annotation.
-Signal: Sets the linking anchor to the current signal.
Note Use only one anchor per report each object. For more
information, see the Simulink Summary Table component
reference page.
Insert
Anything
into
Report?
Yes. A link, and possibly text, depending on attribute choices.
9-112

Simulink Linking Anchor
Class rptgen_sl.csl_obj_anchor
See Also Block Loop,Model Loop,Signal Loop,System Loop
9-113

Simulink Name
Purpose Insert name of a Simulink model, system, block, or signal into report
Description This component inserts the name of a Simulink model, system, block,
or signal into the report.
Using this component as the first child component of a
Chapter/Subsection component allows the current Simulink model,
system block, or signal name to be the chapter or section title.
Properties •Object type
-Automatic: Automatically selects the appropriate model, system,
block, or signal name as the Simulink object name to include in the
report. If the Model Loop component is the parent component, the
object name is the current model name. If the System Loop, Block
Loop, or Signal Loop is the parent component, then the object name
is the name of the current system, block, or signal, respectively.
-Model: Includes the current model name in the report.
-System: Includes the current system name in the report.
-Block: Includes the current block name in the report.
-Signal: Includes the current signal name in the report. If the
signal name is empty, the signal <handle>,whichisaunique
numerical identifier to that signal, appears in the report.
-Annotation: Includes the current annotation name in the report.
•Display name as: Display the Simulink object name in the report.
-Name: For example, f14
-Type Name: For example, Model f14
-Type - Name: For example, Model - f14
-Type: Name: For example, Model: f14
•Show full path name: Displays the full path of a system or block.
Choosing this option for a block causes the Simulink block name to
appear as <Model Name>/<System Name>/<Block Name>.
9-114

Simulink Name
Note This option is not available for models or signals.
Insert
Anything
into
Report?
Yes. Text.
Class rptgen_sl.csl_obj_name
See Also Chapter/Subsection
9-115

Simulink Property
Purpose Insert property name/property value pair for current Simulink model,
system, block, or signal
Description This component inserts a single property name/property value pair for
the current Simulink model, system, block, or signal.
Simulink
Object
and
Parameter
•Object type: Specifies the Simulink object type to include in the
report.
-System
-Model
-Block
-Signal
-Annotation
•System parameter name: Specifies a Simulink parameter name to
include in the generated report:
-If you select Model for Object type,thisoptionappearsasModel
parameter name.
-If you select Block for Object type,thisoptionappearsasBlock
parameter name.
-If you select Signal for Object type, this option appears as
Signal parameter name.
Display
Options
•Title:Chooseatitletodisplayinthegeneratedreport:
-Automatic: Usestheparameternameasthetitle.
-Custom:Specifiesacustomtitle.
-None:Usesnotitle.
•Size limit: Limits the width of the display in the generated report.
Units are in pixels. The size limit for a given table is equal to the
hypotenuse of the table width and height [sqrt(w^2+h^2)]. The size
limit for text is the number of characters squared. If you exceed the
9-116

Simulink Property
size limit, the variable appears in condensed form. Setting a size limit
of zero always causes the variable to display, regardless of its size
•Display as: Specifies a display style.
-Auto table/paragraph: Displays as a table or paragraph based
on the information.
-Table: Displays as a table.
-Paragraph: Displays as a text paragraph.
-Inline text: Displaysasinline,whichfitsinlinewiththe
surrounding text.
•Ignore if value is empty: If the parameter is empty, the report
excludes the parameter from the generated report.
Insert
Anything
into
Report?
Yes. Text.
Class rptgen_sl.csl_property
See Also Block Loop,Model Loop,System Loop
9-117

Simulink Property Table
Purpose Insert table that reports on model-level property name/property value
pairs
Description This component inserts a table that reports on model-level property
name/property value pairs.
Properties Select Object: Choose the object for the Property Table in the
generated report.
•Model
•System
•Block
•Signal
•Annotation
For more information about selecting object types in Property Table
components, see “Select Object Types” on page 6-9.
Table Select a preset table, which is already formatted and set up, in the
preset table list in the upper-left corner of the attributes page.
•Preset table: Specifies the type of the object property table.
-Default
-Simulation parameters
-Version information
-Simulink Coder information
-Summary (req. Simulink Coder)
-Blank 4x4
To apply a preset table, select the table and click Apply.
•Split property/value cells: Split property name/property value
pairsintoseparatecells.Forthepropertynameandpropertyvalueto
9-118

Simulink Property Table
appear in adjacent horizontal cells, select the Split property/value
cells check box. In this case, the table is in split mode, so there is
only one property name/property value pair per cell. If there is more
than one name/property pair in a cell, only the first pair appears in
the report. All subsequent pairs are ignored.
For the property name and property value to appear together in one
cell, clear the Split property/value cells check box. That setting
specifies nonsplit mode. Nonsplit mode supports more than one
property name/property value pair and text per cell.
Before switching from nonsplit mode to split mode, make sure that
there is only one property name/property value pair per table cell. If
there is more than one property name/property value pair or text per
cell, only the first property name/property value pair appears in the
report. The report omits subsequent pairs and text.
•Display outer border: Displays the outer border of the table in
the generated report.
•Table Cells: Specifies table properties to modify. The selection in
this pane affects available fields in the Cell Properties pane.
Cell
Properties
The options in this pane depend on the object selected in the Table
Cells pane. If you select %<Name> Information,onlyContents and
Show appear. If you select any other object in the Table Cells pane,
Lower border and Right border display.
•Contents: Enables you to change the contents of the table cell
selected in the Table Cells pane.
•Show as: Specifies the format for the contents of the table cell.
-Value
-Property Value
-PROPERTY Value
-Property: Value
-PROPERTY: Value
9-119

Simulink Property Table
-Property - Value
-PROPERTY - Value
•Alignment: Specifies the alignment of the contents of the selected
table cell in the Table Cells pane.
-Left
-Center
-Right
-Double justified
•Lower border: Displays the lower border of the table in the
generated report.
•Right border: Displays the right border of the table in the generated
report.
Creating Custom Tables
To create a custom table, edit a preset table, such as the Blank 4x4
table. Add and delete rows and add properties. To open the Edit Table
dialog box, click Edit.
For more information on creating custom property tables, see “Property
Table Components” on page 6-6.
If the Simulink Coder software is not installed, Summary (req
Simulink Coder) does not appear in this list. If you are using a report
setup file that contains a summary property, the property name appears
in the report, but the property value does not.
Example
The following report displays information on the F14 model using the
Simulation Parameters preset table.
Solver ode45 ZeroCross on StartTime 0.0
StopTime 60
RelTol 1e-4 AbsTol 1e-6 Refine 1
9-120

Simulink Property Table
InitialStep auto FixedStep auto MaxStep auto
LimitMaxRows off MaxRows 1000 Decimation 1
Insert
Anything
into
Report?
Yes. Table.
Class rptgen_sl.csl_prop_table
See Also Model Loop,Signal Loop,System Loop
9-121

Simulink Sample Time
Purpose InserttitleofSimulinksampletimeintoreport
Description This component inserts a title for a Simulink sample time into the
report.
Properties •Table Options
-Title: Specifies a title for the table in the generated report.
-Grid lines: Show grid lines for the table.
Insert
Anything
into
Report?
Yes. Table.
Class rptgen_sl.CSampleTime
See Also Chapter/Subsection
9-122

Simulink Summary Table
Purpose Properties or parameters of specified Simulink models, systems, blocks,
or signals in table
Description This component displays properties or parameters of selected Simulink
models, systems, blocks, or signals in a table.
Object
type
Choose the object type to display in the generated report.
•Block (Default)
•Model
•System
•Signal
•Annotation
The selected object type affects the options available in the Property
Columns pane.
Table title Choose a title to appear in the generated report:
•Automatic: Automatically generates a title from the parameter.
•Custom:Specifiesacustomtitle.
Property
Columns
This pane displays object properties to include in the Summary Table in
the generated report.
•To add a property:
1select the appropriate property level in the text box on the left.
2In the text box on the right, select the property that you want to
add and click Add.
•To delete a property, select the property name and click Delete.
9-123

Simulink Summary Table
%<SplitDialogParameters> is a unique property for Simulink
Summary Tables, where the object type is Block. This property
generates multiple summary tables, organized by block type. Each
Summary Table group contains the dialog box parameters for that block.
Some entries in the list of available properties (such as Depth)are
“virtual” properties that you cannot access using the get_param
command. The properties used for property/value filtering in the block
and System Loop components must be retrievable by the get_param.
Therefore, you cannot configure your Summary Table to report on all
blocks of Depth == 2.
Youcancreatemultiplevaluesfora property in a Simulink Summary
Table. For example, to report on blocks of type Inport,Outport and
Constant:
1Check the Search for Simulink property name/property value
pairs box.
2Make sure that you set Property Name to BlockType.
3Type the following text into the Property Value field:
\<(Inport|Outport|Constant)\>
Remove empty columns: Removes empty columns from the table.
Transpose table: Changes the summary table rows into columns in
the generated report, putting the property names in the first column
and the values in the other columns.
Object
Rows
•Insert anchor for each row: Inserts an anchor for each row in
the summary table.
•Report On:
-Automatic list from context: Reports on all blocks in the
current context, as set by the parent component.
9-124
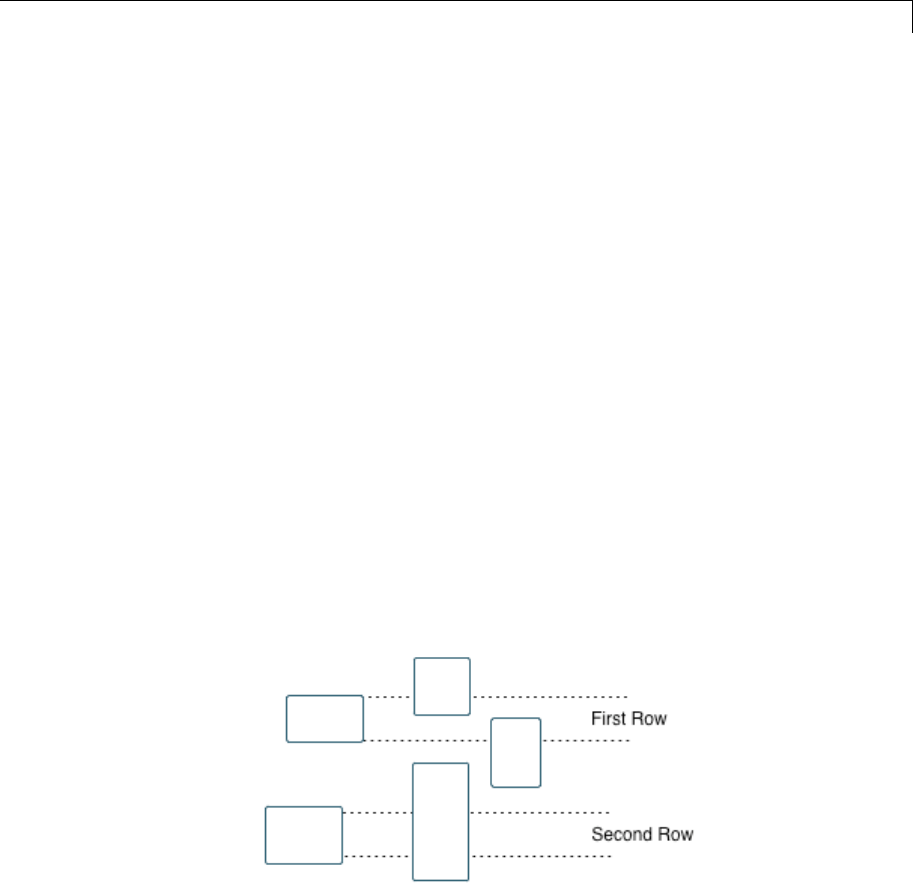
Simulink Summary Table
-Custom - use block list: Reports on a list of specified blocks.
Specify the full path of each block.
Loop
Options
•Sort blocks
-Alphabetically by block name: Sorts blocks alphabetically by
name.
-Alphabetically by system name: Sorts systems alphabetically
by name. Lists blocks in each system, but in no particular order.
-Alphabetically by full Simulink path: Sorts blocks
alphabetically by Simulink path.
-By block type: Sorts blocks alphabetically by block type.
-By block depth: Sorts blocks by their depth in the model.
-By layout (left to right): Sorts blocks by their location in the
model layout, by rows. The block appearing the furthest toward
the left top corner of the model is the anchor for the row. The row
contains all other blocks that overlap the horizontal area defined
by the top and bottom edges of the anchor block. The other rows
use the same algorithm, using as the anchor the next unreported
block nearest the left top of the model.
-By layout (top to bottom): Sorts blocks by their location in the
model layout, by columns. The block appearing the furthest toward
the left top corner of the model is the anchor for the column. The
9-125
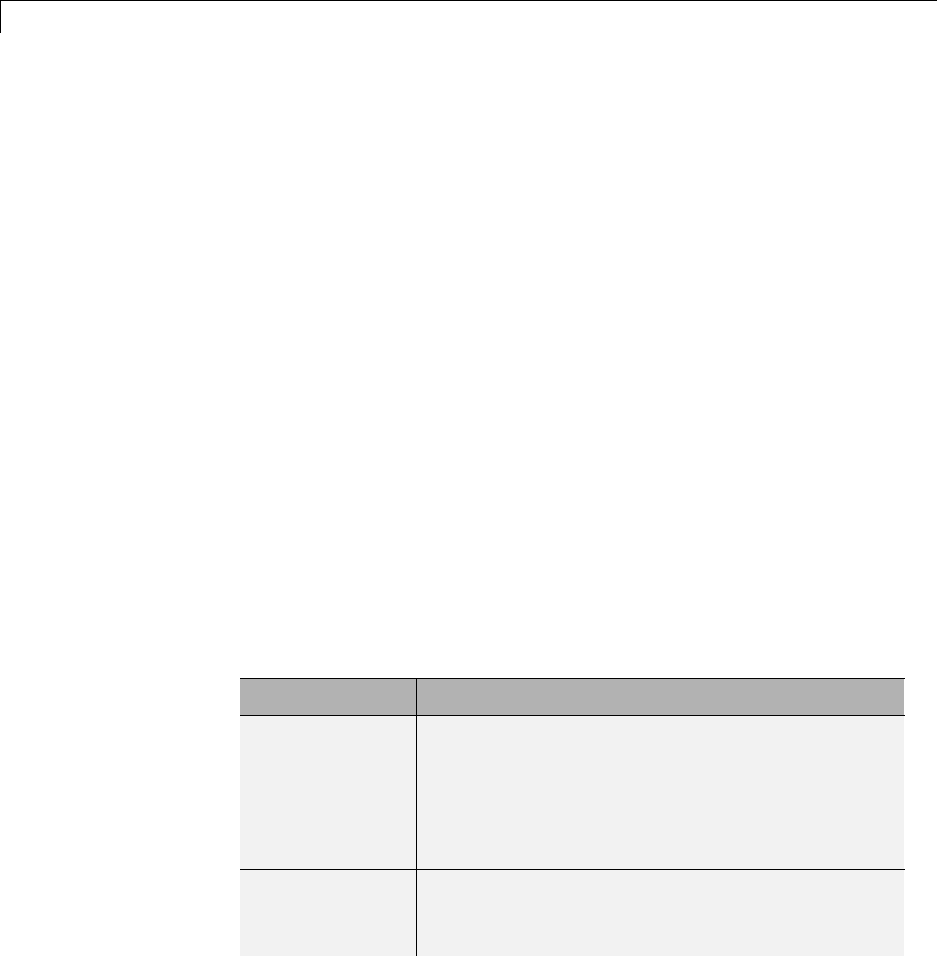
Simulink Summary Table
column contains all other blocks that overlap the vertical area
defined by the left and right edges of the anchor block. The other
columns use the same algorithm, using as the anchor the next
unreported block nearest the left top of the model.
-By traversal order: Sorts blocks by traversal order.
-By simulation order: Sorts blocks by execution order.
-%<VariableName>: Inserts the value of a variable from the
MATLAB workspace. The %<> notation can denote a string or cell
array. For more information, see %<VariableName> Notation on
the Text component reference page.
•Search for Simulink property name/property value pairs:
Reports on blocks with specified property name/property value pairs.
Example
Specify the following options to generate a Summary Table in a report
for on the model F14:
•Sort on systems by system depth.
•Include the system parameters Name and Block in the table.
Thefollowingtableappearsinthereport.
Name Blocks
f14 u, Actuator Model, Aircraft Dynamics Model,
Angle of Attack, Controller, Dryden Wind Gust
Models, Gain, Gain1, Gain2, Gain5, More Info,
More Info1, Nz pilot calculation, Pilot, Pilot G
force Scope, Stick Input, Sum, Sum1, alpha (rad),
Nz Pilot (g)
Aircraft
Dynamics Model
Elevator Deflection d (deg), Vertical Gust wGust
(ft/sec), Rotary Gust qGust (rad/sec), Gain3, Gain4,
Gain5, Gain6, Sum1, Sum2, Transfer Fcn.1,
9-126
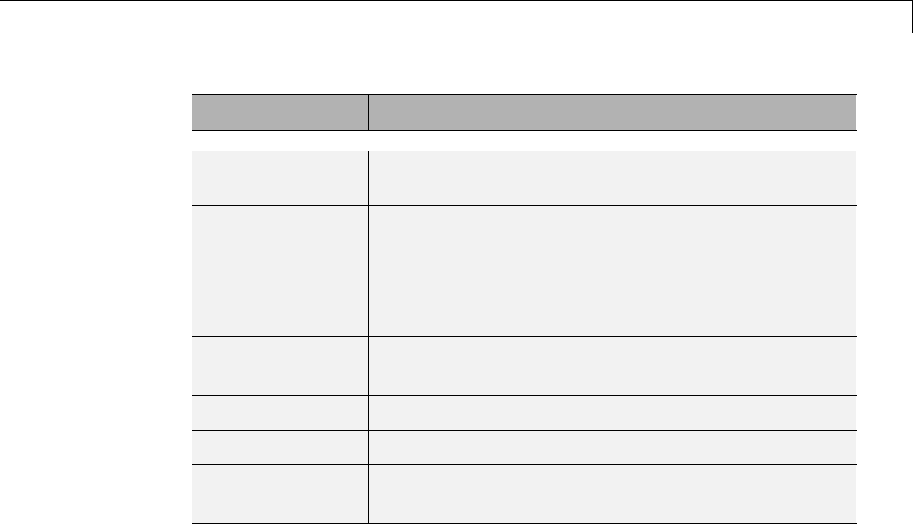
Simulink Summary Table
Name Blocks
Transfer Fcn.2, Vertical Velocity w (ft/s), Pitch
Rate q (rad/s)
Controller Stick Input (in), alpha (rad), q (rad/s),
Alpha-sensor Low-pass Filter, Gain, Gain2, Gain3,
Pitch Rate Lead Filter, Proportional plus integral
compensator, Stick Prefilter, Sum, Sum1, Sum2,
Elevator Command (deg)
Dryden Wind
Gust Models
Band-Limited White Noise, Q-gust model, W-gust
model, Wg, Qg
More Info None
More Info1 None
Nz pilot
calculation
w, q, Constant, Derivative, Derivative1, Gain1,
Gain2, Product, Sum1, Pilot g force (g)
Insert
Anything
into
Report?
Yes. Table.
Class rptgen_sl.csl_summ_table
See Also Block Loop,Model Loop,Signal Loop,System LoopSimulink
Function System Loop
9-127

Simulink Workspace Variable
Purpose Report information about MATLAB and model workspace variables
that model uses
Description This component provides information about variables in the MATLAB
(base) workspace and the model workspaces that a model uses. The
report includes the value of each variable. Optionally, you can include
the following information for each variable:
•Workspace where the variable is located
•Blocks that use the variable
For variables that are Simulink data objects (for example, a
Simulink.Parameter object), the report includes the properties of the
object. You can filter out properties to streamline the report.
Options Thefollowingtwooptionsspecifyadditional information that the report
can include about each variable:
•Show workspace: Report whether each variable is in the MATLAB
workspace or in a model workspace.
•Show blocks that use variable: Report the blocks that use each
variable.
For variables whose values are Simulink data objects, you can filter
which properties to include in the report, using one of the following
approaches:
•Use the Filter Properties area of the dialog box to specify a
standard filter.
The standard filter options apply to all variables whose values are
instances of the class or classes that you specify. For example, you
can use a standard filter to filter out the Description property for all
variables used by the model whose values use a Simulink.Parameter
object.
9-128

Simulink Workspace Variable
•Select the Use custom property filter option and write MATLAB
code for filtering.
Writing custom filtering code allows you to do kinds of filtering that
the standard filter does not perform. Some common examples of
custom filters that you might want to create are filters that filter out:
-A property for some, but not all, instances of a class
-Properties that match a regular expression
The Filter Properties area of the dialog box, where you specify a
standard filter, has these fields:
•Class name (* for all classes): Specify the class of the variables for
which you want to filter out specific properties. You can specify one
class at a time, or enter an asterisk (*) to specify all classes. After
youentertheclassname,movethecursoroutsideoftheeditbox.
•Available Properties: If the class that you entered in Class name
(* for all classes) is on the MATLAB path, then this list displays
the properties of that class.
•Filtered Properties: Displays the properties to filter out. Use
the right-arrow button to add to the Filtered Properties list the
properties that you selected in the Available Properties list.
•If the class that you enter is not on the MATLAB path, then a
Comma-separated list of properties to be filtered edit box
appears. Enter the names of properties to use for filtering.
•Convert to Custom: Generate custom MATLAB code that
implements your Filter Properties standard filter settings.
Note Selecting the Convert to Custom button overwrites any
existing MATLAB custom filtering code for this component.
9-129

Simulink Workspace Variable
To create and apply custom filtering MATLAB code, select the Use
custom property filter check box. Selecting this check box opens an
edit box where you define a MATLAB function for filtering properties.
The edit box includes a sample function (commented out) that you can
use as a starting point for your filtering function. Use the isFiltered
variable for the output of your function. For example:
•To filter out the Owner and testProp properties, in the edit box enter:
isFiltered = strcmpi(propertyName, 'Owner')||...
strcmpi(propertyName, 'testProp');
•To filter out all properties except for the CoderInfo property, in the
edit box, enter:
isFiltered = ~strcmpi(propertyName, 'CoderInfo');
If you clear the Use custom property filter check box, Simulink
Report Generator saves your custom MATLAB filtering code, but does
not use that code to filter properties.
Insert
Anything
into
Report?
Yes. List.
Class rptgen_sl.csl_ws_variable
See Also Simulink Workspace Variable Loop,Bus,Simulink Functions and
Variables
9-130

Simulink Workspace Variable Loop
Purpose Reports on Simulink workspace variable objects
Description This component displays all variables in the Simulink workspace
(base workspace and model workspaces). You can limit the variables
displayed to those variables that match property name and property
value pairs that you specify.
Loop
Options
•Sort
-Alphabetically by text: Sorts variables alphabetically by
name.
-By data type: Sorts variables alphabetically by data type.
•Search for Simulink property name/property value pairs:
Reports on variables with specified property name/property value
pairs.
Section
Options
•Create section for each object in loop: Creates a separate section
in the output for each variable.
-If you specify to create a section for each variable, you can select
the Display the object type in the section title to insert a
variable name in each section title.
•Create link anchor for each object in loop:Specifiesacustom
title.
Insert
Anything
into
Report?
Yes, inserts sections if you select the Create section for each object
in loop option
Class rptgen_sl.csl_ws_var_loop
See Also Simulink Workspace Variable,Bus,Simulink Functions and
Variables
9-131

State Loop
Purpose Run child components for all states in current context
Description This component runs its children for all states in its context. The parent
component of this component determines the context.
•Model Loop: Includes all states in the models.
•System Loop: Includes all states in the systems.
•Machine Loop: Includes all states in the machines.
•Chart Loop: Includes all states in the charts.
•State Loop: Includes all states in the current state.
State
Types
•Include “and” and “or” states:IncludesAND and OR states in the
loop.
•Include “box” states: Includes “box” states in the loop.
•Include functions: Includes “function” states in the loop.
•Include truth tables: Includes truth tables in the loop.
•Include MATLAB functions: Includes MATLAB functions in the
loop.
Loop
Options
•Report depth: Specifies the level on which to loop.
-Local children only
-All objects
•Skip autogenerated charts under truth table:Keeps
autogenerated state objects under truth tables from appearing in
the report.
•Search Stateflow: Indicates specific states to include in the loop.
9-132

State Loop
Section
Options
•Create section for each object in loop: Inserts a section in the
generated report for each object found in the loop.
•Display the object type in the section title: Inserts the object
type automatically into the section title in the generated report.
•Create link anchor for each object in loop:Createsahyperlink
to the object in the generated report.
Insert
Anything
into
Report?
Yes, section, if you select the Create section for each object in loop
option.
Class rptgen_sf.csf_state_loop
See Also Chart Loop,Machine Loop,Model Loop,State Loop,System Loop,
Simulink Function System Loop
9-133

Stateflow Automatic Table
Purpose Insert table with properties of current Stateflow object
Description The Stateflow Automatic Table component inserts a table that contains
the properties of the current Stateflow object. Parents of this component
can be:
•Machine Loop
•State Loop
•Chart Loop
•Graphics Object Loop
Display
Options
•Table title: Specifies a title for the table in the generated report.
-No title: Includes no title.
-Custom: Includes a custom title.
-Name (default): Uses an object name as the title.
•Object name
•Object name with Stateflow path
•Object name with Simulink and Stateflow path
•Header row: Selects a header row for the table in the generated
report.
-No header: Includes no header row.
-Type and Name: Includes a header row with columns for name and
object type. When selected, this option creates a header row for
the table with object name and type.
-Custom: Includes a custom header.
•Don’t display empty values: Excludes empty values from the
generated report.
9-134

Stateflow Automatic Table
Insert
Anything
into
Report?
Yes. Table.
Class rptgen_sf.csf_auto_table
See Also Chart Loop,Graphics Object Loop,Machine Loop,State Loop
9-135

Stateflow Count
Purpose Count number of Stateflow objects in current context
Description This component counts the number of Stateflow objects in the current
context.
Properties •Search depth: Specifies the search depth for the count.
-Immediate children only (default): Searches only children one
level under the Stateflow object.
-All descendants: Searches all children of the Stateflow object.
•Sort results: Specifies the sort method for the count results.
-Numerically decreasing by object count (Default)
-Alphabetically increasing by object type
•Include a list of objects in table: Inserts a column containing
the counted objects.
•Show total count: Displays a total of counted objects.
Insert
Anything
into
Report?
Yes. Table.
Class rptgen_sf.csf_count
See Also State Loop
9-136

Stateflow Dialog Snapshot
Purpose Insert snapshots of Stateflow editor dialog boxes
Description This component reports on the current reported Stateflow dialog box
object, depending on its context. If this component is the child of a State
Loop, for example, the report includes information about the dialog box
of the current State. Display the current settings associated with an
object or document the appearance of your custom mask dialog boxes.
Format •Image file format: Specifies the format for the snapshot image file.
The Automatic format uses BMP format for PDF files and PNG for
other formats.
•Show all tabs: Automatically generates images for all the tabs
for the dialog box. If you clear this check box, the Simulink Report
Generator software creates an image of only the first tab.
Display
Options
•Scaling:
-Fixed size: Specifies the number and type of units.
-Zoom: Specifies the percentage, maximum size, and units of
measure.
-Use image size: Causes the image to appear the same size in
the report as on screen.
•Size: Specifiesthesizeofthesnapshotintheformwh(width,
height). This field is active only if you choose Fixed size in the
Scaling selection list.
•Max size: Specifies the maximum size of the snapshot in the form
wh(width, height). This field is active only if you choose Zoom in
the Scaling selection list.
•Units: Specifies the units for the size of the snapshot. This field
is active only if you choose Zoom or Fixed size in the Image size
list box.
•Alignment: Aligns your snapshot. Only reports in PDF or RTF format
support this property.
9-137

Stateflow Dialog Snapshot
-Auto
-Right
-Center
-Left
•Title:Specifiestexttoappear above the snapshot.
•Caption: Specifies text to appear under the snapshot.
Insert
Anything
into
Report?
Yes. Snapshot.
Class rptgen_sl.Cdialog boxesnapshot
See Also State Loop
9-138

Stateflow Filter
Purpose Run child components only if current object type matches specified
object type
Description This component runs its children only if the current object type, as
set by its parent Stateflow Hierarchy Loop, matches the selected
object type.
Properties •Object type: Specifies the Stateflow object type to include in the
report.
•Run only if Stateflow object has at least the following number
of Stateflow children: Specifies a minimum number of children
that a Stateflow object must have to include in the report.
•Automatically insert linking anchor: Inserts a linking anchor
before the reported object. If an anchor for this object exists, this
option does not create a second anchor.
Insert
Anything
into
Report?
No.
Class rptgen_sf.csf_obj_filter
See Also Stateflow Hierarchy Loop
9-139

Stateflow Hierarchy
Purpose Provide visual representation of the hierarchy of a Stateflow object
Description This component inserts a tree that shows the hierarchy of a given
Stateflow object.
Tree
Options
•Construct tree from: Specifies the object to use for the tree
representation.
-Current object
-Root of current object: Starts reporting from the top of the
hierarchy.
•Emphasize current object in tree: Highlights the current object
inthetreerepresentation.
•Show number of parents: Specifies the number of parents to
include in the tree representation.
•Show siblings: Displays siblings in the tree representation.
•Show children to depth: Specifies the depth of children to display
for each object in the tree representation.
Children •Show junctions: Specifies the level of junction detail to display
in the generated report.
-All
-Non-redundant
-None
•Show transitions: Specifies the level of transition detail to display
in the generated report.
-All
-Labeled or non-redundant
-Non-redundant
-Labeled
9-140

Stateflow Hierarchy
-None
•Skip autogenerated charts under truth tables:Excludes
autogenerated charts under truth tables.
List
Formatting
•List style:
-Bulleted list
-Numbered list: Allows you to specify numbering options in the
Numbering style section.
•Numbering style: Allows you to specify a numbering style.
This setting supports only the RTF/DOC report format.
•1,2,3,4...
•a,b,c,d...
•A,B,C,D...
•i,ii,iii,iv...
•I,II,III,IV...
To show the parent number in each list entry, select Show
parent number in nested list (1.1.a). To show only the
current number or letter, select Show only current list
value (a).
Insert
Anything
into
Report?
Yes. Tree graphic.
Class rptgen_sf.csf_hier
See Also Stateflow Hierarchy Loop
9-141

Stateflow Hierarchy Loop
Purpose Run child components on Stateflow object hierarchy
Description This component runs its child components on the Stateflow object
hierarchy.
Loop
Options
•Minimum legible font size: Specifies the minimum font size to use
in the report. The default font size, 8, is the smallest recommended
font size.
•Skip autogenerated charts under truth tables;Excludes
autogenerated charts under truth tables in the report.
•Search Stateflow: Reports on Stateflow charts with specified
property name/property value pairs.
Section
Options
•Create section for each object in loop: Inserts a section in the
generated report for each object found in the loop.
•Display the object type in the section title: Inserts the object
type automatically into the section title in the generated report.
•Create link anchor for each object in loop:Createsahyperlink
to the object in the generated report.
Insert
Anything
into
Report?
No.
Class rptgen_sf.csf_hier_loop
See Also Stateflow Hierarchy
9-142

Stateflow Linking Anchor
Purpose Designate locations to which links point
Description This component designates a location to which other links point. The
linking anchor is set to the current object, as defined by the parent
component.
ThiscomponentmusthavetheChart Loop,State Loop,Machine
Loop,orStateflow Filter component as its parent.
Properties Insert text: Specifies text to appear after the linking anchor.
Insert
Anything
into
Report?
Yes. A link, and possibly text, depending on attribute choices.
Class rptgen_sf.csf_obj_anchor
See Also Chart Loop,Machine Loop,State Loop,Stateflow Filter,
9-143

Stateflow Name
Purpose Insert into report name of Stateflow object specified by parent
component
Description This component inserts the name of the Stateflow object, as defined
by its parent component, into the report. This component must have
the State Loop,Chart Loop,orStateflow Filter component as its
parent.
Using this component as the first child component of a
Chapter/Subsection component allows the current Stateflow object
name to be the chapter or section title.
Properties •Display name as: Displays the Stateflow object name in the report.
-Name: For example, Object
-Type Name: For example, Object <ObjectName>
-Type - Name: For example, Object - <ObjectName>
-Type: Name: For example, Object: <ObjectName>
•Display name as: Specifies the level of detail with which the
Stateflow object name displays the report.
-Object name
-Object name with Stateflow path
-Object name with Simulink and Stateflow path
Insert
Anything
into
Report?
Yes. Text.
Class rptgen_sf.csf_obj_name
See Also Chapter/Subsection,Chart Loop,State Loop,Stateflow Filter
9-144

Stateflow Property
Purpose Insert into report table, text, or paragraph with information on selected
Stateflow object property
Description This component inserts a table, text, or paragraph that contains details
of the selected Stateflow object property.
Property
to Display
Property name: Specifies the Stateflow property name to display.
Display
Options
•Title: Specifies a title to display in the generated report.
-Automatic: Usestheparameternameasthetitle.
-Custom:Specifiesacustomtitle.
-None: Specifies no title.
•Size limit: Specifies the width of the display in the generated report.
Units are in pixels. The size limit for a given table is the hypotenuse
of the width and height of the table, sqrt(w^2+h^2).Thesizelimit
for text is the number of characters squared. If you exceed the size
limit, the variable appears in condensed form.
Setting a size limit of 0always displays the variable in long form,
regardless of its size.
•Display as: Specifies a display style from the menu.
-Auto table/paragraph (default): Displays as a table or paragraph
based on the information.
-Table: Displays as a table.
-Paragraph: Displays as a text paragraph.
-Inline text: Displays in line with the surrounding text.
•Ignore if value is empty: Excludes empty parameters from the
generated report.
9-145

Stateflow Property
Insert
Anything
into
Report?
Yes. Text, paragraph, or table.
Class rptgen_sf.csf_property
See Also Paragraph,Table,Text,Stateflow Name
9-146

Stateflow Property Table
Purpose Insert into report property-value table for Stateflow object
Description This component inserts a property-value table for a Stateflow object
into the report. Use the Stateflow Filter component as the parent
of this component.
For more information on working with Property Table components, see
“Property Table Components” on page 6-6.
Table Select a preset table, which is already formatted and set up, in the
preset table list in the upper-left corner of the attributes page.
•preset table: Specifies a type of table to display the object property
table.
-Default
-Machine
-Chart
-State
-Truth table
-EM function
-Data
-Event
-Junction
To apply a preset table, select the table and click Apply.
•Split property/value cells: Splits property name/property value
pairs into separate cells.
-For the property name and property value to appear in adjacent
horizontal cells, select the Split property/value cells check
box. In this case, the table is in split mode, there is only one
property name/property value pair per cell. If there is more than
9-147

Stateflow Property Table
one name/property pair in a cell, only the first pair appears in the
report. The report ignores all subsequent pairs.
-For the property name and property value to appear together in
one cell, clear the Split property/value cells check box. This
setting is nonsplit mode. Nonsplit mode supports more than one
property name/property value pair and text.
-Beforeswitchingfromnonsplitmodetosplitmode,makesurethat
there is only one property name/property value pair per table cell.
When there is more than one property name/property value pair
or any text in a given cell, only the first property name/property
value pair appears in the report. The report omits subsequent
pairs and text.
•Display outer border: Displays the outer border of the table in
the generated report.
•Table Cells: Specifies table properties to modify. The selection in
this pane affects the available fields in the Cell Properties pane.
Cell
Properties
The options in the Title Properties pane depend on the object selected
in the Table Cells pane. If you select %<Name>,onlyContents and
Show appear. If you select any other object in the Table Cells pane,
Lower border and Right border appear.
•Contents: Modifies the contents of the table cell selected in the
Table Cells pane.
•Alignment: Justifies the contents of the selected table cell in the
Table Cells pane.
-Left
-Center
-Right
-Double justified
•Show As: Specifies the format for the contents of the table cell.
9-148

Stateflow Property Table
-Value
-Property Value
-PROPERTY Value
-Property: Value
-PROPERTY: Value
-Property - Value
-PROPERTY - Value
•Lower border: Displays the lower border of the table in the
generated report.
•Right border: Displays the right border of the table in the generated
report.
Creating Custom Tables
You can edit a preset table, such as the Blank 4x4 table, to create a
custom table. Add and delete rows and add properties. To open the
Edit Table dialog box, click Edit.
For details about creating custom property tables, see “Property Table
Components” on page 6-6.
Insert
Anything
into
Report?
Yes. Table.
Class rptgen_sf.csf_prop_table
See Also Stateflow Filter
9-149

Stateflow Snapshot
Purpose Insert into report snapshot of Stateflow object
Description This component inserts a snapshot of a Stateflow object, defined by the
Stateflow Filter parent component, into the report.
This component only executes if the selected object in the Stateflow
Filter component is a graphical object, such as Chart,State,
Transition,andFrame.
Snapshot •Image file format: Specifies the image file format (for example, JPEG
or TIFF). Select Automatic SF Format (default) to choose the format
best suited for the specified report output format automatically.
Otherwise, choose an image format that your output viewer can read.
-Automatic SF Format (uses the file format selected in the
Preferences dialog box)
-Bitmap (16m-color)
-Bitmap (256-color)
-Black and white encapsulated PostScript
-Black and white encapsulated PostScript (TIFF)
-Black and white encapsulated PostScript2
-Black and white encapsulated PostScript2 (TIFF)
-Black and white PostScript
-Black and white PostScript2
-Color encapsulated PostScript
-Color encapsulated PostScript (TIFF)
-Color encapsulated PostScript2
-Color encapsulated PostScript2 (TIFF)
-Color PostScript
-Color PostScript2
9-150

Stateflow Snapshot
-JPEG high quality image
-JPEG medium quality image
-JPEG low quality image
-PNG 24-bit image
-Scalable vector graphics (SVG)
-TIFF - compressed
-TIFF - uncompressed
-Windows metafile
•Paper orientation:
-Portrait
-Landscape
-Rotated
-Largest dimension vertical: Positions the image so that its
largest dimension is vertical.
-Use Chart PaperOrientation setting:Usesthepaper
orientation setting for the chart. Use the Simulink
PaperOrientation parameter to specify the orientation.
-Full page image (PDF only): In PDF reports, scales images to
fit the full page, minimizes page margins, and maximizes the size
of the image by using either a portrait or landscape orientation.
For more information about paper orientation, see the orient
command in the MATLAB documentation.
•Image sizing:
-Shrink image to minimum font size specified in
Stateflow Hierarchy Loop: Resizes the image so that the text
label font size is the minimum font size.
-Fixed and Zoom: Specifiesthesizeoftheimage.
9-151

Stateflow Snapshot
•Scaling:Specifiesthepercentageoftheimagesizetowhichtoscale
it.
•Maximum size: Specifies the maximum size for the snapshot in
the generated report in the selected units. Use [width, height]
format. In the units text box, select Inches,Centimeters,Points,
or Normalized.
•Use printframe: Inserts a frame around your image. Use the
default frame or create a custom one.
•Use printframe paper settings: Uses the dimensions and
parameters as set by the specified printframe to size your image.
If you choose this option, all other options (except for Image file
format) become inactive.
Properties •Include callouts to describe visible objects: Displays descriptive
callouts for visible objects.
•Insert anchors for transitions and junctions: Inserts anchors
for transitions and junctions into the report.
-None
-Redundant children only
-All
•Run only if Stateflow object has at least the following number
of children: Specifies the minimum number of children that the
currentStateflowobjectmusthavetoincludeinthereport. This
option is inactive unless the selected object in the parent Stateflow
Filter component is a graphical object.
Tip This option allows you to exclude certain images to decrease the
size of the report for large models.
9-152

Stateflow Snapshot
Display
Options
•Scaling:
-Use image size: Uses the image size that you specify in the
snapshot option.
-Zoom and Fixed size: Allows you to specify the size of the image.
•Size: Specifies a size in inches for your image. The default is 7-by-9.
•Max size: Specifies the maximum size of the snapshot in the format
wh(width, height). This field is active only if you choose Zoom from
the Scaling selection list.
•Units: Specifies the units for the size of the snapshot. This field is
active only if you choose Zoom or Fixed size in the Image size
list box.
•Alignment: Only reports in PDF or RTF format support this property.
-Auto
-Right
-Center
-Left
•Image title:
-None(Default).
-Object name: Uses the object name as the title.
-Full Stateflow name: Specifies the Stateflow path and the name
of the object.
-Full Simulink + Stateflow name: Specifies the Simulink path
and name of the object.
-Custom: Enter a different title.
•Caption: Specifies a caption for your image.
-None(Default).
-Custom:Specifiesacustomcaption.
9-153

Stateflow Snapshot
-Description: Sets the caption to the value of the object
Description property.
Insert
Anything
into
Report?
Yes. Image.
Class rptgen_sf.csf_obj_snap
Class rptgen_sf.csf_prop_table
See Also Stateflow Filter
9-154

Stateflow Summary Table
Purpose Table of properties or parameters of specified Stateflow object
Description This component displays a table of propertiesorparametersofspecified
Stateflow objects. It can have the following parents:
•Any Stateflow looping component
•Any Simulink looping component (Model Loop,System Loop,Block
Loop,orSignal Loop)
Properties •Object type:Specifiestheobjecttypetodisplayinthegenerated
report. This value affects the options available in the Property
Columns pane.
•Table title: Specifies a title for the Summary Table in the generated
report.
-Automatic: Generates a title automatically from the parameter.
-Custom:Specifiesacustomtitle.
Property
Columns
•Property columns: Displays the object properties to include in the
Summary Table in the generated report.
-To add a property:
•Select the appropriate property level in the text box.
•In the context list under the text box, select the property that
you want to add and click Add.
-To delete a property, select the property name and press the
Delete key.
Some entries in the list of available properties (such as Depth)are
“virtual” properties that you cannot access using the get_param
command. The properties used for property/value filtering in the
block and System Loop components must be retrievable by the
get_param. Therefore, you cannot configure your Summary Table to
report on all blocks of Depth == 2.
9-155

Stateflow Summary Table
•Remove empty columns: Removes empty columns from the
Summary Table in the generated report.
•Transpose table: Changes the summary table rows into columns in
the generated report, putting the property names in the first column
and the values in the other columns.
Object
Rows
Insert anchor for each row: Inserts an anchor for each row in the
summary table.
Report On •Automatic list from context: Reports on all blocks in the current
context, as set by the parent component.
•Custom - use block list: Reports on a specified list of blocks.
Specify the full path of each block.
Loop
Options
Choose block sorting options and reporting options in this pane.
•Sort blocks: Specifies how to sort blocks (applied to each level in a
model):
-Alphabetically by block name: Sorts blocks alphabetically by
name.
-Alphabetically by system name: Sorts systems alphabetically
by name. Lists blocks in each system, but in no particular order.
-Alphabetically by full Simulink path: Sorts blocks
alphabetically by Simulink path.
-By block type: Sorts blocks alphabetically by block type.
-By block depth: Sorts blocks by their depth in the model.
-By layout (left to right): Sorts blocks by their location in the
model layout, by rows. The block appearing the furthest toward
the left top corner of the model is the anchor for the row. The row
contains all other blocks that overlap the horizontal area defined
by the top and bottom edges of the anchor block. The other rows
9-156
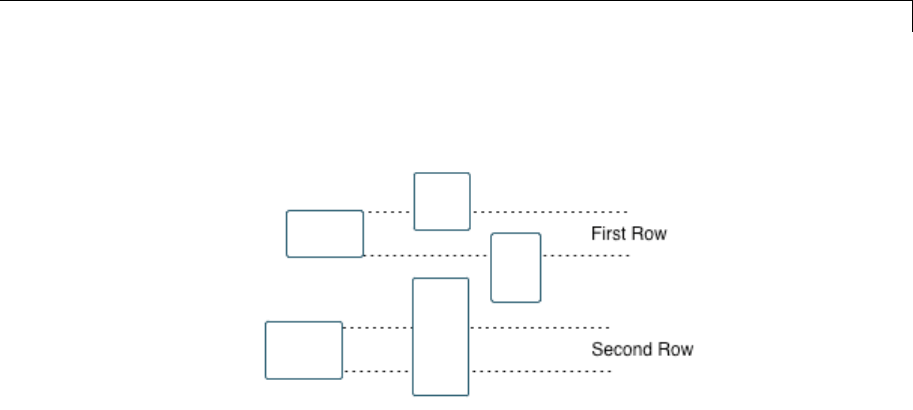
Stateflow Summary Table
use the same algorithm, using as the anchor the next unreported
block nearest the left top of the model.
-By layout (top to bottom): Sorts blocks by their location in the
model layout, by columns. The block appearing the furthest toward
the left top corner of the model is the anchor for the column. The
column contains all other blocks that overlap the vertical area
defined by the left and right edges of the anchor block. The other
columns use the same algorithm, using as the anchor the next
unreported block nearest the left top of the model.
-By traversal order: Sorts blocks by traversal order.
-By simulation order: Sorts blocks by execution order.
•Search for Simulink property name/property value pairs:
Reports on blocks with specified property name/property value pairs.
•Search Stateflow: Reports on Stateflow charts with specified
property name/property value pairs.
Insert
Anything
into
Report?
Yes. Table.
Class rptgen_sf.csf_summ_table
9-157

Stateflow Summary Table
See Also Block Loop,Chart Loop,Model Loop,Object Loop,Signal Loop,
State Loop,Stateflow Hierarchy Loop,System Loop
9-158

System Filter
Purpose Run child components if current system meets specified conditions
Description This component runs its child components if the current system meets
the conditions that you specify with this component.
Properties •Report only if system has at least N blocks:Specifiesthe
minimum number of blocks that the system must include for any of
the child components to run. If you enter 0, child components run
regardless of the number of blocks in the system.
•Report only if system has at least N subsystems:Specifiesthe
minimum number of subsystems that the system must include for
the child components to run. If you enter 0, child components run
regardless of the number of subsystems in the system.
•Report only if system mask type is:Specifieswhichmasksto
include in the generated report.
-Either masked or unmasked
-Masked
-Unmasked
•Custom filtering MATLAB code: Specifies custom MATLAB
filtering code that the System Filter applies when determining which
systems and subsystems to report on in a System Loop component.
The edit box includes a sample function (commented out) that you
can use as a starting point for your own filtering function. Use the
isFiltered variable for the output of your function. For example, to
filter out systems and subsystems whose names start with engine,
enter:
isFiltered = strncmpi( currentSystem, 'engine', 6);
Insert
Anything
into
Report?
No.
9-159

System Filter
Class rptgen_sf.csf_obj_filter
See Also System Loop
9-160

System Hierarchy
Purpose Create nested list that shows hierarchy of specified system
Description This component creates a nested list that shows the hierarchy of a
specified system. The list can display all systems in a model, or the
parents and children of the current system.
Starting
System
•Build list from: Specifies the system or model from which to build
the list.
-Current system
-Current model
•Emphasize current system: Highlights the current system or
model in the generated report.
Display
Systems
•Show number of parents: Specifies the number of parents to list.
•Display peers of current system: Shows the peers of the current
system in the generated report.
•Show children to depth: Specifies the depth of children to list.
List
Formatting
•List style:
-Bulleted list
-Numbered list: Allows you to select numbering options in the
Numbering style section.
•Numbering style: Allows you to select a numbering style in the
selection list, by setting List style to Numbered List. Only the
RTF/DOC report format supports this option.
-1,2,3,4,...
-a,b,c,d,...
-A,B,C,D,...
-i,ii,iii,iv,...
-I,II,III,IV,...
9-161

System Hierarchy
Insert
Anything
into
Report?
Yes. List.
Class rptgen_sl.csl_sys_list
See Also Model Loop,System Loop
9-162

System Loop
Purpose Specify systems and subsystems on which to loop, as defined by parent
component
Description This component runs its child components for each system defined by
the parent component. For example, to include systems and subsystems
within a given model in the report, you can include this component as
the child of a Model Loop component.
Report On •Loop on Systems:
-Select systems automatically: Reports on all systems in the
current context as set by the parent component.
•Model Loop: Reports on systems in the current model.
•System Loop: Reports on the current system.
•Signal Loop: Reports on the parent system of the current
signal.
•Block Loop: Reports on the parent system of the current block.
If this component does not have any of these components as its
parent, selecting this option reports on all systems in all models.
•Custom - use system list: Reports on a list of specified systems.
Specify the full path of each system.
•%<VariableName>: Inserts the value of a variable from the MATLAB
workspace. The %<> notation can denote a string or cell array. For
more information, see %<VariableName> Notation on the Text
component reference page.
•Include subsystems in Simulink functions: Specifies whether
to include subsystems in Simulink functions. By default, this option
is enabled.
Loop
Options
•Sort Systems: Specifies how to sort systems.
-Alphabetically by system name (default): Sorts systems
alphabetically by name.
9-163

System Loop
-By number of blocks in system: Sorts systems by number of
blocks. The list shows systems by decreasing number of blocks;
that is, the system with the largest number of blocks appears first
in the list.
-By system depth: Sorts systems by their depth in the model.
-By traversal order: Sorts systems in traversal order.
•Search for: Reports only on blocks with the specified property
name/property value pairs. To enable searching, click the check box.
In the first row of the property name and property value table, click
inside the edit box, delete the existing text, and type the property
name and value. To add a row, use the Add row button ( ).
For information about subsystem property names and values, in
“Block-Specific Parameters”, see the “Ports & Subsystems Library
Block Parameters” section.
Section
Options
•Create section for each object in loop: Inserts a section in the
generated report for each object found in the loop.
•Display the object type in the section title: Inserts the object
type automatically into the section title in the generated report.
•Number sections by system hierarchy: Hierarchically numbers
sections in the generated report. Requires that Sort Systems be set
to By traversal order.
•Create link anchor for each object in loop:Createsahyperlink
to the object in the generated report.
Examples For an example of how to use this component with a Model Loop as
its parent, see Model Loop.
9-164

System Loop
Insert
Anything
into
Report?
Yes, inserts a section if you select the Create section for each object
in loop option.
Class rptgen_sl.csl_sys_loop
See Also Block Loop,Model Loop,Signal Loop,System Loop
9-165

System Snapshot
Purpose Insert snapshot of the current system into report
Description This component inserts a snapshot of the current system into the
report. The Snapshot options control how the image file is stored.
The Properties options control whether the image display includes
callouts and a print frame. The Display options control how the image
is displayed in a browser.
Snapshot
Options
•Format: Specifies the image file format (for example, JPEG or TIFF).
Select Automatic SL Format (the default) to choose the format
best suited for the specified report output format automatically.
Otherwise, choose an image format that your output viewer can read.
-Automatic SL Format (uses file format selected in the Preferences
dialog box)
-Bitmap (16m-color)
-Bitmap (256-color)
-Black and white encapsulated PostScript
-Black and white encapsulated PostScript (TIFF)
-Black and white encapsulated PostScript2
-Black and white encapsulated PostScript2 (TIFF)
-Black and white PostScript
-Black and white PostScript2
-Color encapsulated PostScript
-Color encapsulated PostScript (TIFF)
-Color encapsulated PostScript2
-Color encapsulated PostScript2 (TIFF)
-Color PostScript
-Color PostScript2
-JPEG high quality image
9-166

System Snapshot
-JPEG low quality image
-JPEG medium quality image
-PNG (screenshot)
-PNG 24-bit image
-Scalable Vector Graphics
-Windows metafile
•Orientation:
-Largest dimension vertical: Positions the image so that its
largest dimension is vertical.
-Landscape
-Portrait
-Use system orientation: Uses the paper orientation setting for
the system. Use the Simulink PaperOrientation parameter to
specify the orientation.
-Full page image (PDF only): In PDF reports, scales images to
fit the full page, minimizes page margins, and maximizes the size
of the image by using either a portrait or landscape orientation.
•Scaling: Controls the size of the image in the image file.
-Automatic (default): Automatically scales the image to output
dimensions.
-Custom:Specifiesimagesize.
-Zoom: Enlarges or reduces the image size to the percent that you
specify. Use Max Size to specify the maximum size other than
the default for the image.
9-167

System Snapshot
Note Selecting the Use printframe deactivates the Custom and
Zoom options and automatically scales the image to the print frame
size.
Properties
Options
•Include callouts to describe visible objects: Displays descriptive
callouts for visible objects
•Use printframe: Prints a frame around the image. You can use
the default frame, rptdefaultframe.fig,orusetheFrameEditor
to build a custom frame. For more information, see the frameedit
function in Simulink documentation.
The default frame is five inches wide and four inches high. It includes
the name of the system and the model folder. This frame is optimized
for use with a portrait paper orientation. The Flight Control Model
in the f14 Simulink model appears here with the default Simulink
Report Generator frame option.
9-168
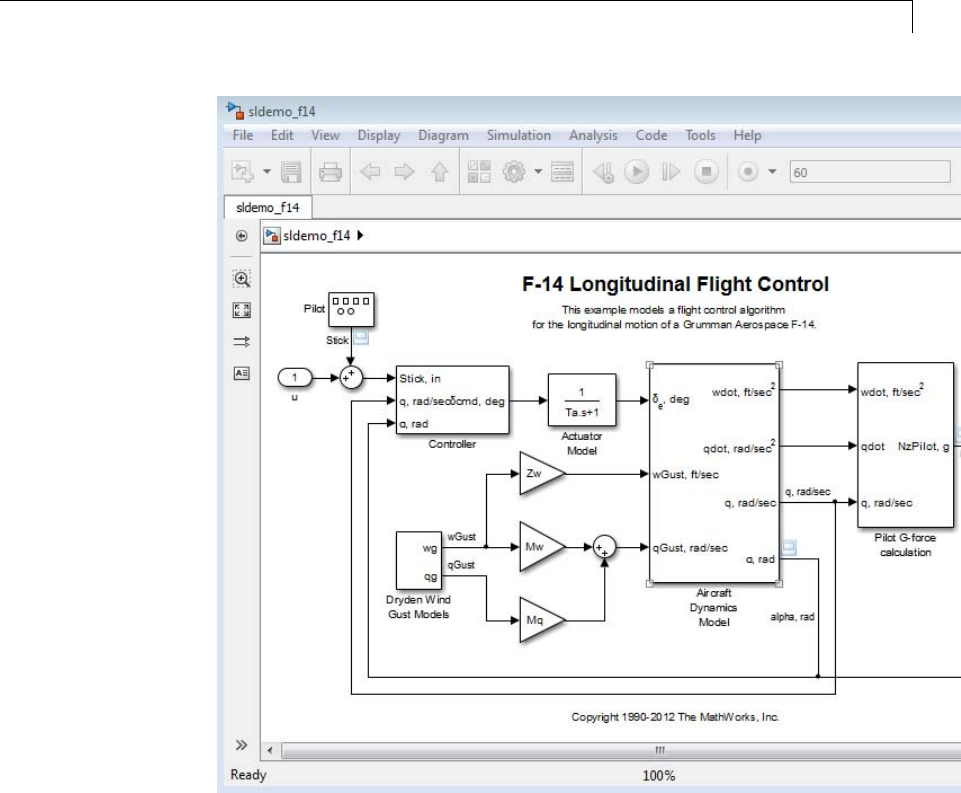
System Snapshot
Display
Options
To access the display options, click the Advanced button.
•Scaling: Controls size of the image, as displayed in a browser.
Making an image larger using this option does not affect the storage
size of the image, but the quality of the displayed image decreases as
you increasethesizeofthedisplayedimage.
9-169

System Snapshot
-Fixed size: Specifies the number and type of units.
-Zoom: Specifies the percentage, maximum size, and units of
measure.
-Use image size: Causes the image to appear the same size in
the report as on screen.
•Size: Specifies the size of the snapshot in a browser, using the format
wh(width, height). This field is active only if you choose Fixed
size in the Scaling selection list.
•Max size: Specifies the maximum size of the snapshot in a browser,
using the format wh(width, height). This field is active only if you
choose Zoom in the Scaling selection list.
•Units: Specifies the units for the size of the snapshot in a browser.
This field is active only if you choose Fixed size in the Image size
list box.
•Alignment: Only reports in PDF or RTF format support this property.
-Auto
-Right
-Left
-Center
•Image title:
-None (Default)
-System name: Uses the system name as the image name.
-Full system name: Uses the system name, with path information,
as the image name.
-Custom:Specifiesacustomtitle.
•Caption:
-None (Default)
-Description (use system description)
9-170

System Snapshot
-Custom:Specifiesacustomcaption.
Insert
Anything
into
Report?
Yes. Image.
Class rptgen_sl.csl_sys_snap
See Also System Loop
9-171

To Workspace Plot
Purpose CaptureplotfigurecreatedintheMATLABworkspace
Description This component captures a plot figure created in the MATLAB
workspace, and then inserts one or both of the following into the report:
•A table that includes input and output numeric values.
•A figure that plots the values included in the table.
Print
Options
•Image file format: Specifies the image file format (for example,
JPEG or TIFF) from this list. Select Automatic HG Format (the
default) to choose the format best suited for the specified report
output format automatically. Otherwise, choose an image format
that your output viewer can read. Other options are:
-Automatic HG Format (Uses the file format selected in the
Preferences dialog box)
-Bitmap (16m-color)
-Bitmap (256-color)
-Black and white encapsulated PostScript
-Black and white encapsulated PostScript (TIFF)
-Black and white encapsulated PostScript2
-Black and white encapsulated PostScript2 (TIFF)
-Black and white PostScript
-Black and white PostScript2
-Color encapsulated PostScript
-Color encapsulated PostScript (TIFF)
-Color encapsulated PostScript2
-Color encapsulated PostScript2 (TIFF)
-Color PostScript
-Color PostScript2
9-172

To Workspace Plot
-JPEG high quality image
-JPEG medium quality image
-JPEG low quality image
-PNG 24-bit image
-TIFF - compressed
-TIFF - uncompressed
-Windows metafile
•Paper orientation:
-Landscape
-Portrait
-Rotated
-Use figure orientation: Uses the orientation for the figure,
which you set with the orient command.
-Full page image (PDF only): In PDF reports, scales images to
fit the full page, minimizes page margins, and maximizes the size
of the image by using either a portrait or landscape orientation.
For more information about paper orientation, see the orient
command in the MATLAB documentation.
•Image size:
-Use figure PaperPositionMode setting:Usesthe
PaperPositionMode property of the Handle Graphics figure to
set the image size in the report. For more information about
paper position mode, see the orient command in the MATLAB
documentation.
-Automatic (same size as on screen): Sets the image in the
report to the same size as it appears on the screen.
-Custom:Specifiesacustomimagesize. Specify the image size in
the size and units fields.
9-173

To Workspace Plot
•Size: SpecifiesthesizeoftheHandle Graphics figure snapshot in
the format wxh (width times height). This field is active only if you
choose Custom in the Image size list box.
•Units: Specifies units for the size of the Handle Graphics figure
snapshot. This field is active only if you choose Set image size
in the Custom list box.
•Invert hardcopy: Uses the Handle Graphics figures
InvertHardcopy property, which inverts colors for printing; it
changes dark colors to light colors, and light colors to dark colors.
-Automatic: Automatically changes dark axes colors to light axes
colors. If the axes color is a lightcolor,itisunchanged.
-Invert: Changes dark axes colors to light axes colors, and light
axes colors to dark axes colors.
-Don't invert: Retains image colors displayed on screen in the
printed report.
-Use figure's InvertHardcopy setting:Usesthe
InvertHardcopy property set in the Handle Graphics image.
-Make figure background transparent:Makestheimage
background transparent.
Display
Options
•Scaling
-Fixed size: Specifies the number and type of units.
-Zoom: Specifies the percentage, maximum size, and units of
measure.
-Use image size: Causes the image to appear the same size in
the report as on screen.
•Size: Specifiesthesizeofthesnapshotintheformatwh(width,
height). This field is active only if you choose Fixed size in the
Scaling list.
9-174

To Workspace Plot
•Max size: Specifies the maximum size of the snapshot in the format
wh(width, height). This field is active only if you choose Zoom from
the Scaling list.
•Units: Specifies units for the size of the snapshot. This field is active
only if you choose Zoom or Fixed size in the Image size list box.
•Alignment: Only reports in PDF or RTF format support this property.
-Auto
-Right
-Left
-Center
•Title:Specifiestexttoappear above the snapshot.
•Caption: Specifies text to appear under the snapshot.
Insert
Anything
into
Report?
Yes. Figure.
Class rptgen_sl.csl_blk_toworkspace
See Also Figure Loop
9-175

Truth Table
Purpose Report on truth tables in Simulink and Stateflow models
Description The Truth Table component reports on truth tables in Simulink and
Stateflow models. It displays both the condition table and the action
table. The parent component of the Truth Table determines its behavior.
•Model Loop: Reports on all truth tables in the current model.
•System Loop: Reports on all truth tables in the current system.
•Block Loop : Reports on all truth tables in the current block.
•Signal Loop: Reports on all truth tables in the current signal.
Title Title: Specifies a title for the truth table.
•No title
•Use Stateflow name
•Custom
Condition
Table
Specify display parameters for the condition table.
•Show header: Displays the column headers in the table.
•Show number: Displays the condition number column in the table.
•Show condition: Displays the condition column in the table.
•Show description: Displays the description column in the table.
•Wrap if column count: Specifies how many columns to display
before creating a table continuation. If the specified number is
greater than the number of columns that can appear on the page,
some columns do not appear in the report.
Action
Table
•Show header: Displays the column headers in the table.
•Show number: Displays the condition number column in the table.
•Show condition: Displays the condition column in the table.
9-176

Truth Table
•Show description:Displaysthedescriptioncolumninthetable.If
you do not select this option, no action table appears in the report.
Insert
Anything
into
Report?
Yes. Table.
Class rptgen_sf.csf_truthtable
See Also Block Loop,Model Loop,Signal Loop,System Loop
9-177

Truth Table
9-178


report
Purpose Generate report from specified Simulink system
Syntax report (system_name)
Description report (system_name) generates a report from the specified Simulink
system. If the specified system’s ReportName property is empty, the
ReportName property of its parent system is used instead.
See Also report
How To • “Report Generation”
11-2

rptlist
Purpose Return list of all report s in MATLAB path
Syntax rptlist ('system_name')
Description rptlist ('system_name') opens the Report Explorer with the
Simulink system’s ReportName property selected.
See Also report |setedit
11-3

slwebview
Purpose Export Simulink models to Web views
Syntax slwebview
filename = slwebview(system_name)
... = slwebview(system_name, 'option1', value1, ...)
Description This function creates an interactive Web view of a Simulink model.
For more information about Web views, see “Web Display of Model
Information”.
•slwebview with no arguments starts the Web View dialog box in
the Report Explorer.
•filename = slwebview(system_name) exports the subsystem
system_name anditschildsystemstothefilefilename.
You can specify system_name as:
-Astring
-AhandletoaSimulinksubsystemorblockdiagram
-A handle to a Stateflow chart or subchart
•... = slwebview(system_name, 'option1', value1, ...) sets
Web view export options. For more information, see “Export Options”
on page 11-4.
Export Options
The first argument passed to the slwebview commandisthename(a
string) or a handle identifying the Simulink system or Stateflow chart
to export. Remaining arguments are alternating name and value pairs
(strings) that set export options.
SearchScope
Specifies which Simulink systems or Stateflow charts to export.
11-4
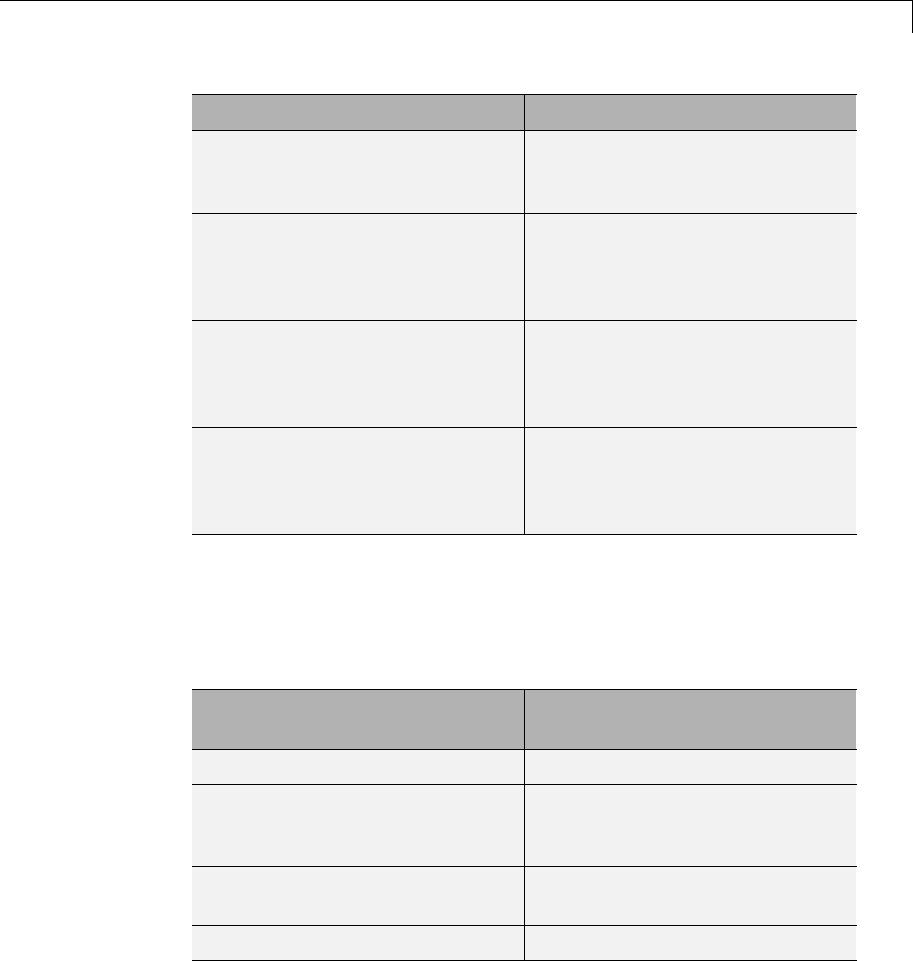
slwebview
’SearchScope’ Option Value Meaning
Current Export only the Simulink system
or the Stateflow chart specified
by the first argument
CurrentAndAbove Export the Simulink system or
the Stateflow chart specified
by the first argument and all
systems or charts that contain it
CurrentAndBelow (Default) Export the Simulink system or
the Stateflow chart specified
by the first argument and all
systems or charts that it contains
All Export all Simulink systems or
Stateflow charts in the model
that contains the system or chart
specified by the first argument
LookUnderMasks
This option is relevant only when you are exporting Simulink
subsystems or Stateflow subcharts that the specified system or chart
contains. It specifies which masked blocks, if any, in subsystems or
subcharts to export.
’LookUnderMasks’ Option
Value Meaning
None Do not export any masked blocks
Graphical (Default) Export only masked blocks that
have no workspaces and no dialog
boxes
Functional Export only masked blocks that
have no dialog boxes
All Export all masked blocks
11-5
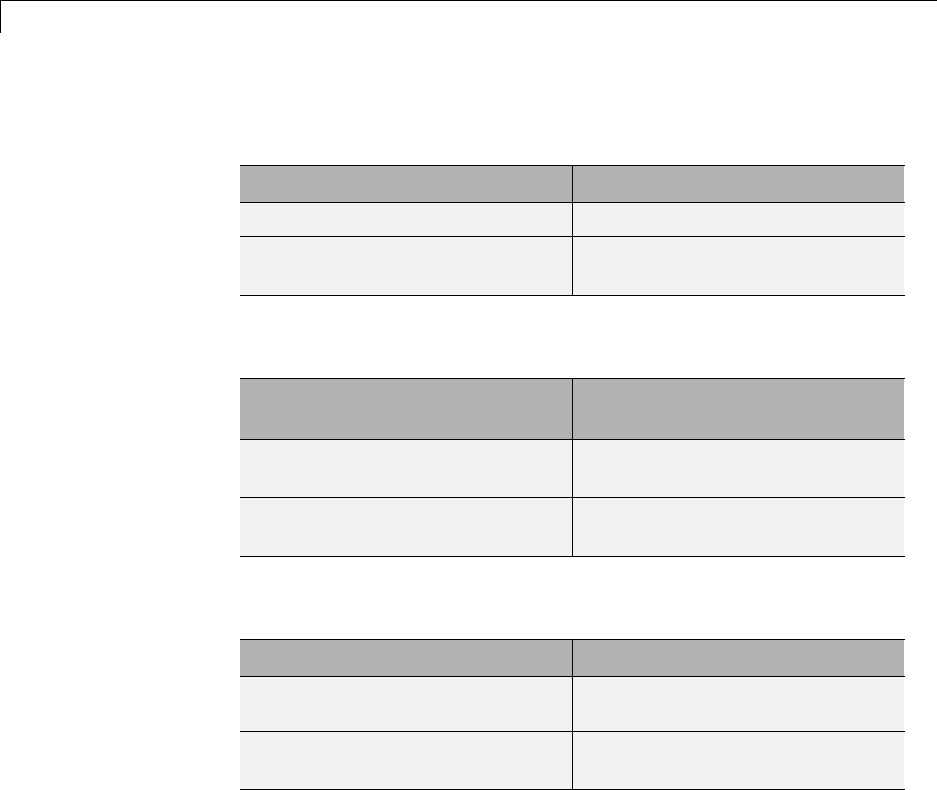
slwebview
FollowLinks
Specifies whether to follow links into library blocks.
’FollowLinks’ Option Value Meaning
On Follow links into library blocks
Off (Default) Do not follow links into library
blocks
FollowModelReference
Specifies whether to follow links into referenced models.
’FollowModelReference’
Option Value
Meaning
On Follow links into referenced
models
Off (Default) Do not follow links into referenced
models
ViewFile
Specifies whether to display the Web view in a Web browser.
’ViewFile’ Option Value Meaning
true (Default) Display the Web view in a Web
browser
false Do not display the Web view in a
Web browser
How To • “Web Display of Model Information”
11-6

A
Examples
Use this list to find examples in the documentation.


AExamples
A-6

Index
IndexA
Annotation Loop component 9-4
B
Block Execution Order List component 9-6
Block Loop component 9-7
Block Type Count component 9-11
Bus component 9-13
C
Chart Loop component 9-15
Code Generation Summary component 9-18
component
Stateflow Name 9-144
components
about 6-2
Annotation Loop 9-4
Block Execution Order List 9-6
Block Loop 9-7
Block Type Count 9-11
Bus 9-13
Chart Loop 9-15
Code Generation Summary 9-18
Documentation 9-20
Fixed Point Logging Options 9-26
Fixed Point Property Table 9-28
Fixed Point Summary Table 9-31
Import Generated Code 9-34
Look-Up Table 9-35
looping components
about 6-22
MATLAB Function 9-23 9-46
Missing Requirements Block Loop 9-42
Missing Requirements System Loop 9-50
Model Advisor Report 9-53
Model Change Log 9-54
Model Configuration Set 9-56 to 9-57
Model Simulation 9-71
Object Loop 9-73
Requirements Block Loop 9-75
Requirements Documents Table 9-78
Requirements Management Interface
components 8-3
Requirements Signal Loop 9-80
Requirements Summary Table 9-82
Requirements System Loop 9-86
Requirements Table 9-88
Scope Snapshot 9-90
Signal Loop 9-95
Simulin Function System Loop 9-102
Simulink Automatic Table 9-98
Simulink Blocks components 8-7
Simulink Coder 8-2
Simulink components 8-4
Simulink Dialog Snapshot 9-100
Simulink Fixed Point components 8-8
Simulink Functions and Variables 9-104
Simulink Library Information 9-108
Simulink Linking Anchor 9-112
Simulink Name 9-114
Simulink Property 9-116
Simulink Property Table 9-118
Simulink Sample Time 9-122
Simulink Summary Table 9-123
Simulink Workspace Variable 9-128
Simulink Workspace Variable Loop 9-131
State Loop 9-132
Stateflow Automatic Table 9-134
Stateflow components 8-9
Stateflow Count 9-136
Stateflow Dialog Snapshot 9-137
Stateflow Filter 9-139
Stateflow Hierarchy 9-140
Stateflow Hierarchy Loop 9-142
Stateflow Linking Anchor 9-143
Stateflow Property 9-145
Stateflow Property Table 9-147
Stateflow Snapshot 9-150
Index-1

Index
Stateflow Summary Table 9-155
System Filter 9-159
System Hierarchy 9-161
System Loop 9-163
System Snapshot 9-166
To Workspace Plot 9-172
Truth Table 9-176
components,
Machine Loop 9-41
converting English strings to other
languages 4-15
converting XML documents
using Report Explorer 4-16
using the command line 4-18
converting XML documents to different
format 4-16
D
DocBook SGML report 4-4
Documentation component 9-20
F
Fixed Point Logging Options component 9-26
Fixed Point Property Table component 9-28
Fixed Point Summary Table component 9-31
flow object tree (XML) 4-4
functions
report 11-2
rptlist 11-3
slwebview 11-4
H
Handle Graphics
figure property table 6-6
HTML report
stylesheets 4-4
I
Import Generated Code component 9-34
L
legacy report setup files
working with 4-23
localization 4-15
log files
creating 4-19
Look-Up Table component 9-35
looping components
about 6-22
M
Machine Loop component 9-41
MATLAB code
generating from report setup files 4-20
MATLAB Function component 9-23 9-46
Microsoft Word report 4-4
Missing Requirements Block Loop
component 9-42
Missing Requirements System Loop
component 9-50
Model Advisor Report component 9-53
Model Change Log component 9-54
Model Configuration set component 9-56
Model Configuration Set component 9-57
Model Simulation component 9-71
O
Object Loop component 9-73
P
property tables
adding and deleting columns and rows 6-14
creating custom tables 6-16
Index-2

Index
displaying or hiding table and cell
borders 6-15
editing table titles 6-12
entering text into table cells 6-12
modifying properties in a table 6-13
property name/property value pairs 6-9
R
Report Explorer
About 1-15
report formats 1-20
report function 11-2
reports
descriptions 4-14
generating 4-1
setting output options 4-4
Requirements Block Loop component 9-75
Requirements Documents Table component 9-78
Requirements Management Interface
components 8-3
Requirements Signal Loop component 9-80
Requirements Summary Table component 9-82
Requirements System Loop component 9-86
Requirements Table component 9-88
rich text format 4-4
rptlist function 11-3
S
Scope Snapshot component 9-90
SGML report 4-4
Signal Loop component 9-95
Simulink Automatic Table component 9-98
Simulink Blocks components 8-7
Simulink Coder components 8-2
Simulink components 8-4
Simulink Dialog Snapshot component 9-100
Simulink Fixed Point components 8-8
Simulink Function System Loop
component 9-102
Simulink Functions and Variables
component 9-104
Simulink Library Information component 9-108
Simulink Linking Anchor component 9-112
Simulink Name component 9-114
Simulink Property component 9-116
Simulink Property Table component 9-118
Simulink Report Generator software
components
definition 3-5
creating reports 3-1
generating reports 4-1
interaction with MATLAB and
Simulink 1-18
report formats 1-20
report setup files
adding components to 3-5
setting report options 3-3
tutorial 3-1
workflow 1-9
Simulink Sample Time component 9-122
Simulink Summary Table component 9-123
Simulink Workspace Variable component 9-128
Simulink Workspace Variable Loop
component 9-131
slwebview function 11-4
State Loop component 9-132
Stateflow Automatic Table component 9-134
Stateflow components 8-9
Stateflow Count component 9-136
Stateflow Dialog Snapshot component 9-137
Stateflow Filter component 9-139
Stateflow Hierarchy component 9-140
Stateflow Hierarchy Loop component 9-142
Stateflow Linking Anchor component 9-143
Stateflow Name component 9-144
Stateflow Property component 9-145
Stateflow Property Table component 9-147
Index-3

Index
Stateflow Snapshot component 9-150
Stateflow Summary Table component 9-155
stylesheets 4-4
HTML 4-8
PDF 4-7
RTF (DSSSL Print) and Word 4-9
Web 4-8
Summary Table components
working with 6-17
System Filter component 9-159
System Hierarchy component 9-161
System Loop component 9-163
System Snapshot component 9-166
T
To Workspace Plot component 9-172
troubleshooting 4-25
Truth Table component 9-176
W
Web stylesheet 4-4
Web views
browser requirements 1-21
exporting Simulink models 5-3
setting export options 5-3
generating 5-5
navigating 5-7
overview 5-2
tutorial 5-11
viewing 5-5
X
XML comparison
introduction 7-2
report 7-10
reverse annotation 7-14
selecting files 7-5
XML documents
converting to different format 4-16
converting to different formats
using Report Explorer 4-16
using the command line 4-18
XML report 4-4
XML source files
editing 4-18
Index-4
