Splunk User Guide With For Clients
User Manual:
Open the PDF directly: View PDF ![]() .
.
Page Count: 60

This User Guide will define Splunk and the basic
operation of the tool.
19h April 2013
Version 2.0
Prepared by: Maria Krings
© 2013 Hybris GmbH, Munich, Germany. All rights reserved.
Splunk
Client User Guide
Version 2, 19 April 2013

Page 2 of 60
Introduction .......................................................................................................................................... 4
Welcome to the Splunk Tutorial! ........................................................................................................................... 4
What is Splunk?........................................................................................................................................................ 4
Who uses Splunk? ................................................................................................................................................... 4
Splunk User Guide .............................................................................................................................. 5
An overview of Splunk ....................................................................................................................... 5
Index new data .......................................................................................................................................................... 5
Search and investigate ............................................................................................................................................ 5
Capture knowledge .................................................................................................................................................. 6
Automate monitoring ............................................................................................................................................... 6
Analyze and report ................................................................................................................................................... 6
Search and search language ............................................................................................................ 6
About this chapter .................................................................................................................................................... 6
The search app ......................................................................................................................................................... 6
Find the Search app ........................................................................................................................................... 7
The Summary dashboard .................................................................................................................................. 7
Kick off a search ................................................................................................................................................. 8
The Search dashboard ....................................................................................................................................... 9
Start searching ....................................................................................................................................................... 11
Keyword searches ............................................................................................................................................ 11
Use the timeline ...................................................................................................................................................... 14
About timeline options ...................................................................................................................................... 14
Investigate with the timeline ............................................................................................................................. 14
Use fields to search ............................................................................................................................................... 17
Briefly, about fields............................................................................................................................................ 18
The fields sidebar and dialog ........................................................................................................................... 18
Use fields to run more targeted searches ....................................................................................................... 21
Use the search language ................................................................................................................................. 23
Construct a search with search assistant ........................................................................................................ 24
Drill down into search results ........................................................................................................................... 26
Reformat the search results ............................................................................................................................. 27
Save a search .......................................................................................................................................................... 28
About saving a search ...................................................................................................................................... 28
Save a search tutorial ....................................................................................................................................... 29
About managing and scheduling searches ..................................................................................................... 29
Use a subsearch ............................................................................................................................................... 30
Use field lookups .............................................................................................................................................. 31
More search examples ..................................................................................................................................... 37
Create reports and dashboards ..................................................................................................... 42

Page 3 of 60
About reports and dashboards ............................................................................................................................ 42
Reporting examples.......................................................................................................................................... 42
Dashboard examples ....................................................................................................................................... 49
View and print dashboards ............................................................................................................................... 54
Further Help / Contact Details ......................................................................................................... 58
Index .................................................................................................................................................... 59

Page 4 of 60
Introduction
Welcome to the Splunk Tutorial!
What is Splunk?
Splunk is software that indexes IT data from any application, server or network device that makes up your IT
infrastructure. It is a powerful and versatile search and analysis engine that lets you investigate, troubleshoot,
monitor, alert, and report on everything that is happening in your entire IT infrastructure from one location in
real time.
1
Who uses Splunk?
Splunk is versatile and thus has many uses and many different types of users. System administrators,
network engineers, security analysts, developers, service desk, and support staff -- even Managers, VPs,
and CIOs -- use Splunk to do their jobs better and faster. Application support staff use Splunk for end-to-end
investigation and remediation across the application environment and to create alerts and dashboards that
proactively monitor performance, availability, and business metrics across an entire service. They use roles
to segregate data access along lines of duties and give application developers and Tier One support access
to the information they need from production logs without compromising security. System administrators and
IT staff use Splunk to investigate server problems, understand their configurations, and monitor user activity.
Then, they turn the searches into proactive alerts for performance thresholds, critical system errors, and load.
Senior network engineers use Splunk to troubleshoot escalated problems, identify events and patterns that
are indicators of routine problems, such as misconfigured routers and neighbor changes, and turn searches
for these events into proactive alerts. Security analysts and incident response teams use Splunk to
investigate activity for flagged users and access to sensitive data, automatically monitor for known bad
events, and use sophisticated correlation via search to find known risk patterns such as brute force attacks,
data leakage, and even application-level fraud. Managers in all solution areas use Splunk to build reports
and dashboards to monitor and summarize the health, performance, activity, and capacity of their IT
infrastructure and businesses.
1
http://docs.splunk.com/Documentation/Splunk/latest/Tutorial/WelcometotheSplunkTutorial
“

Page 5 of 60
Splunk User Guide
If you are new to Splunk, this tutorial will teach you what you need to know to start using Splunk, from a first-
time download to creating rich, interactive dashboards.
An overview of Splunk
Splunk is powerful and versatile IT search software that takes the pain out of tracking and utilizing the
information in your data center. If you have Splunk, you will not need complicated databases, connectors,
custom parsers or controls—all that is required is a web browser and your imagination. Splunk handles the
rest. Use Splunk to:
Continually index all of your IT data in real time.
Automatically discover useful information embedded in your data, so you do not have to identify it
yourself.
Search your physical and virtual IT infrastructure for literally anything of interest and get results in
seconds.
Save searches and tag useful information, to make your system smarter.
Set up alerts to automate the monitoring of your system for specific recurring events.
Generate analytical reports with interactive charts, graphs, and tables and share them with others.
Share saved searches and reports with fellow Splunk users, and distribute their results to team
members and project stakeholders via email.
Proactively review your IT systems to head off server downtimes and security incidents before they
arise.
Design specialized, information-rich views and dashboards that fit the wide-ranging needs of your
enterprise.
Index new data
Splunk offers a variety of flexible data input methods to index everything in your IT infrastructure in real time,
including live log files, configurations, traps and alerts, messages, scripts, performance data, and statistics
from all of your applications, servers, and network devices. Monitor file systems for script and configuration
changes. Enable change monitoring on your file system or Windows registry. Capture archive files and
SNMP trap data. Find and tail live application server stack traces and database audit tables. Connect to
network ports to receive syslog and other network-based instrumentation. No matter how you get the data,
or what format it is in, Splunk indexes it the same way--without any specific parsers or adapters to write or
maintain. It stores both the raw data and the rich index in an efficient, compressed, filesystem-based
datastore--with optional data signing and auditing if you need to prove data integrity.
Search and investigate
Now that you have all that data in your system...what do you want to do with it? Start by using Splunk's
powerful search functionality to look for anything, not just a handful of predetermined fields. Combine time
and term searches. Find errors across every tier of your IT infrastructure and track down configuration
changes in the seconds before a system failure occurs. Splunk identifies fields from your records as you
search, providing flexibility unparalleled by solutions that require setup of rigid field mapping rulesets ahead
of time. Even if your system contains terabytes of data, Splunk enables you to search across it with
precision.

Page 6 of 60
Capture knowledge
Freeform searching on raw data is just the start. Enrich that data and improve the focus of your searches by
adding your own knowledge about fields, events, and transactions. Tag high-priority assets, and annotate
events according to their business function or audit requirement. Give a set of related server errors a single
tag, and then devise searches that use that tag to isolate and report on events involving that set of errors.
Save and share frequently-run searches. Splunk surpasses traditional approaches to log management by
mapping knowledge to data at search time, rather than normalizing the data up front. It enables you to share
searches, reports, and dashboards across the range of Splunk apps being used in your organization.
Automate monitoring
Any search can be run on a schedule, and scheduled searches can be set up to trigger notifications or when
specific conditions occur. This automated alerting functionality works across the wide range of components
and technologies throughout your IT infrastructure--from applications to firewalls to access controls. Have
Splunk send notifications via email or SNMP to other management consoles. Arrange for alerting actions to
trigger scripts that perform activities such as restarting an application, server, or network device, or opening a
trouble ticket. Set up alerts for known bad events and use sophisticated correlation via search to find known
risk patterns such as brute force attacks, data leakage, and even application-level fraud.
Analyze and report
Splunk's ability to quickly analyze massive amounts of data enables you to summarize any set of search
results in the form of interactive charts, graphs, and tables. Generate reports on-the-fly that use statistical
commands to trend metrics over time, compare top values, and report on the most and least frequent types
of conditions. Visualize report results as interactive line, bar, column, pie, scatterplot and heat-map charts.
Splunk offers a variety of ways to share reports with team members and project stakeholders. You can
schedule reports to run at regular intervals and have Splunk send each report to interested parties via email,
print reports, save them to community collections of commonly-run reports, and add reports to specialized
dashboards for quick reference.
Search and search language
About this chapter
Now you are ready to start searching the data. This chapter of the Splunk Tutorial:
Introduces the Search app.
Walks you through searching in Splunk, beginning with keywords and phrases, before moving on to
specifying time ranges, fields, and using the search language.
Discusses how to save a search and access it again.
Provides more search examples, including how to write a subsearch, enrich events with events with
field lookups, etc.
First, let's learn about the Search app.
The search app
This topic assumes you have just added the sample data for the online Flower & Gift shop. If you have not,
go back to the add data tutorial to get it before proceeding. Once you have the sample data in Splunk, you
are ready to start searching. This topic introduces you to the Search app, which is Splunk's default interface
for searching and analyzing data. If you are already familiar with the search interface, you can skip ahead
and start searching.
Page 7 of 60
Find the Search app
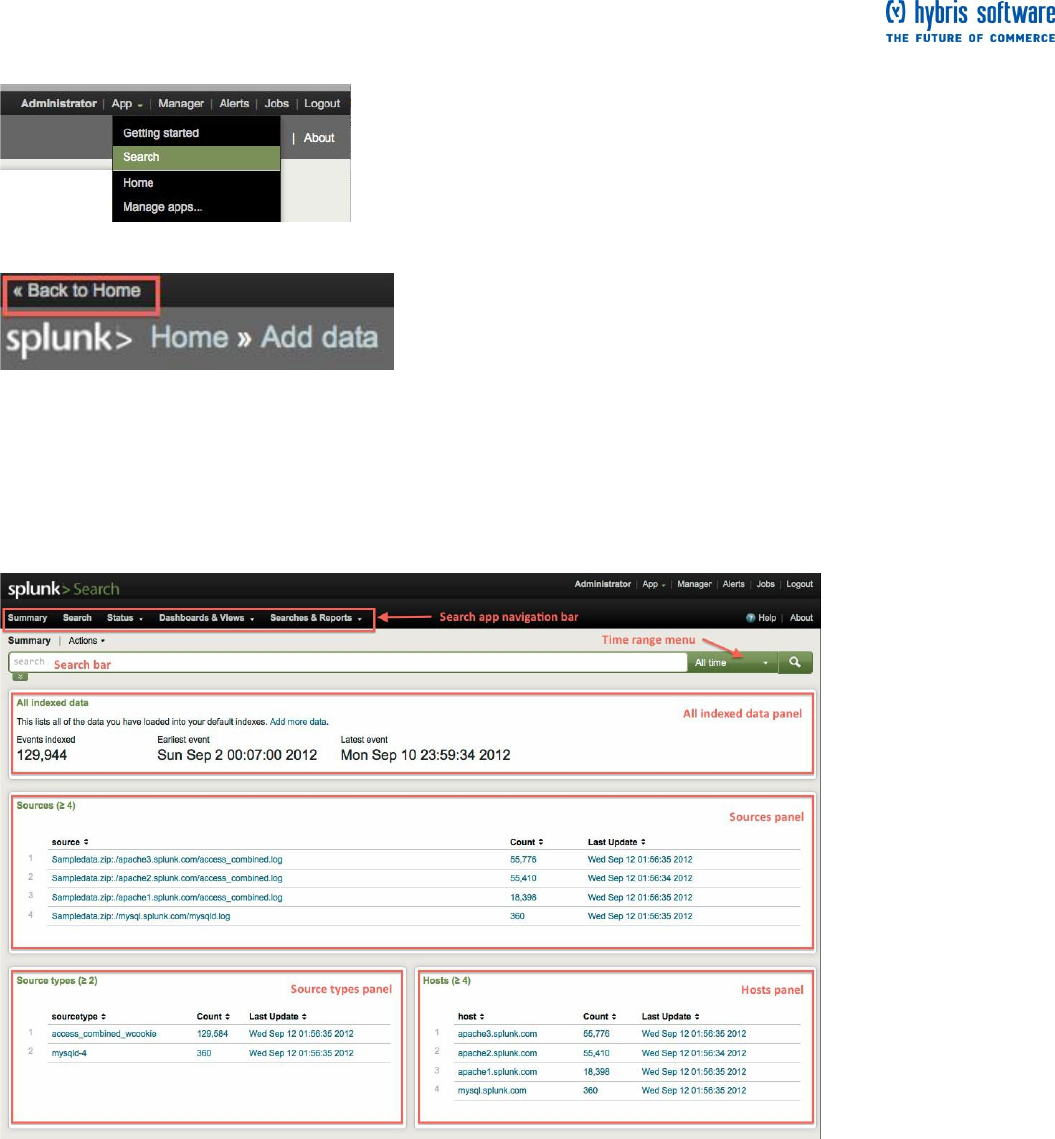
Access the Search app from anywhere in Splunk from the App list in the system navigation bar located at the
upper right corner.
If the App list is not available, click the << Back to Home link at the top left corner of the page:
Once you are back in Home, select Search from the App list. The first view that you see in the Search app is
the Summary dashboard.
The Summary dashboard
The Summary dashboard displays information about the data that you just uploaded to this Splunk server
and gives you the means to start searching this data.
The metrics displayed on this dashboard are generated by saved searches that run behind-the-scenes
whenever you access and reload this page. (By the end of this tutorial, you will be able to run searches, save
them, and use them to build your own dashboard, much like this one.)

Page 8 of 60
What is in this dashboard?
Use the Search app navigation bar to locate and access the different dashboards in the Search app,
including Summary (where you are now) and Search (where you will do most of your searching). When you
click on the links, Splunk takes you to the respective dashboards or refreshes the page if you are already
there.
Menu items in the navigation bar:
Status: Use this menu to access dashboards that monitor the status of index and server activities
on your Splunk instance.
Dashboards & Views: Use this menu to access other dashboards in the Search app.
Searches & Reports: Use this menu to access and manage all of your saved searches and
reports.
Other items in the dashboard:
Search bar Use the search bar to type in your search string.
Time range selector: Select a time range over which to retrieve events.
All indexed data panel: Displays metrics about your indexed event data which include the total
number of events you have in your Splunk index(es) and the timestamps of the earliest and latest
indexed event. It also tells you when this data was last refreshed (or when you last reloaded this
dashboard).
Sources panel: Displays the top sources from the data on your Splunk server.
Sourcetypes panel: Displays the top source types from your Splunk server's data.
Hosts: Displays the top hosts from your Splunk server's data.
Kick off a search
If you are using a freshly installed Splunk server for this tutorial, you will only see the sample data files that
you just uploaded. Because it is a one-time upload of a file, this data will not change. When you add more
data, there will be more information on this dashboard. If you add data inputs that point to sources that are
not static (such as log files that are being written to by applications), the numbers on the Summary page will
change as more data comes in from your source(s).
If you are using a shared or pre-installed Splunk server that is deployed in an enterprise environment, you will
probably see much more information on this dashboard.
Page 9 of 60
1. Take a closer look at the Summary dashboard.
In the Sources panel, you should see three Apache Web server logs and a mySQL database log for the
online Flower & Gift shop data that you just uploaded. If you are familiar with Apache Web server logs, you
might recognize the access_combined_wcookie Source type as one of the log formats associated with Web
access logs. All the data for this source type should give you information about people who access the
Flower & Gift shop website.
Searching in Splunk is very interactive. Although you have a search bar in the Summary dashboard, you do
not need to type anything into it just yet. Each of the sources, sourcetypes, and hosts listed in the Summary
dashboard is a link that will kick off a search when you click on them.
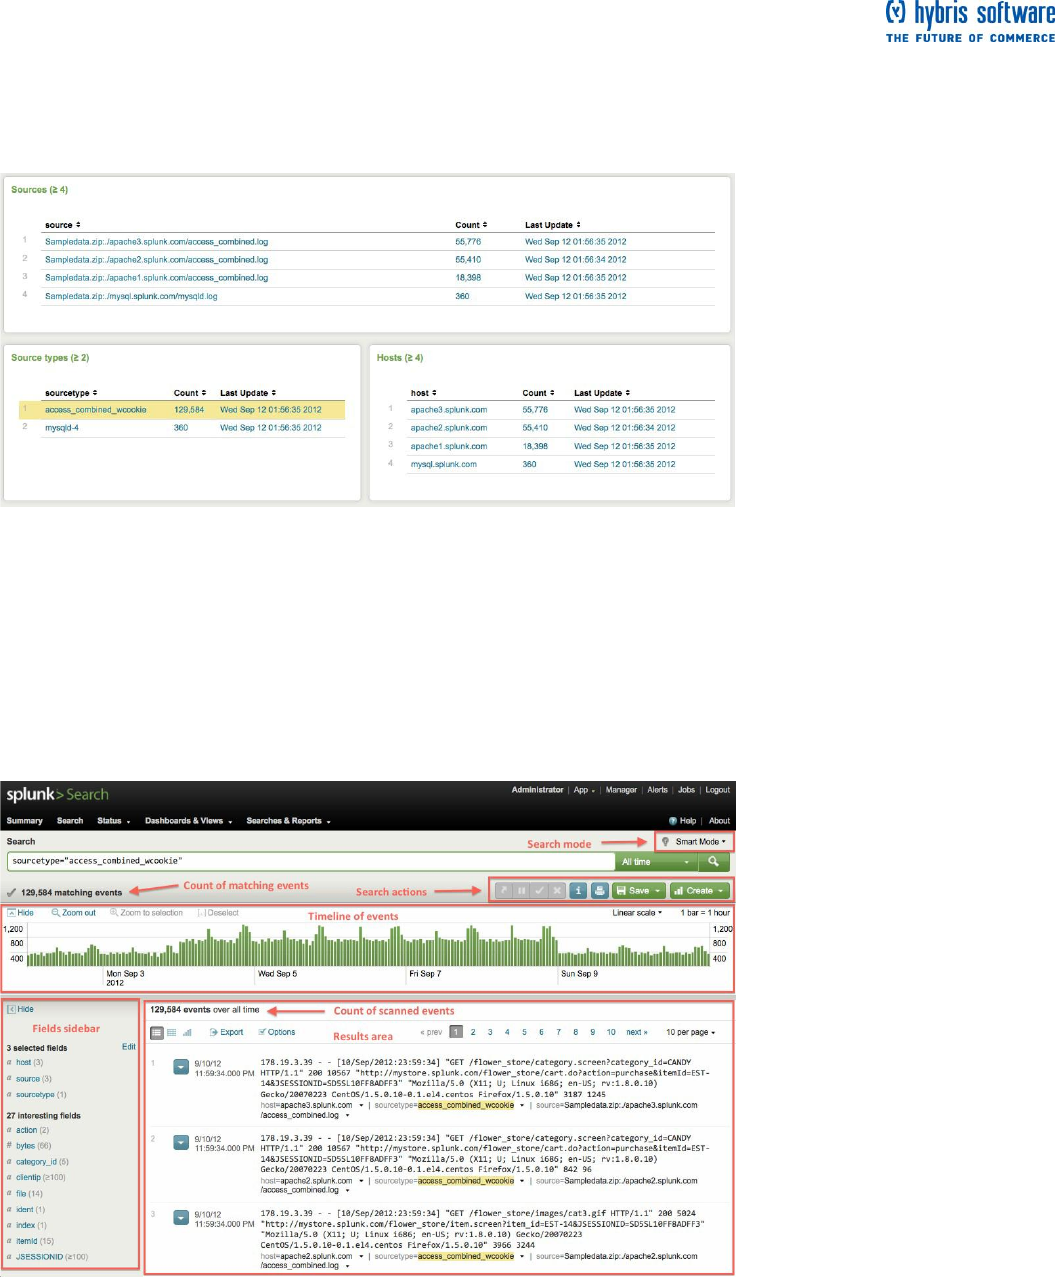
2. In the Sourcetypes panel, click access_combined_wcookie. Splunk takes you to the Search dashboard,
where it runs the search and shows you the results.
The Search dashboard
There are a lot of components to this view, so let's take a look at them before continuing to search.

Page 10 of 60
What is in this Search dashboard?
The search bar and time range picker should be familiar to you -- it was also in the Summary dashboard. But,
now you also see a count of events, the timeline, the fields menu, and the list of retrieved events or search
results.
Search mode: Use Search mode to control the search experience. You can set it to speed up
searches by cutting down on the event data it returns (Fast mode), or you can set it to return as
much event information as possible (Verbose mode). In Smart mode (the default setting) it
automatically toggles search behavior based on the type of search you are running. See "Set
search mode to adjust your search experience" in the Search Manual for more information.
Search actions: Use these buttons to control the search job before the search completes, or
perform actions on the results after the search completes. If the button is not available, it will be
inactive and greyed out.
o If you are running a search that takes a long time to complete, you might want to: Send to
background, Pause, Finalize, Cancel, or Inspect.
o After the search completes you can Print the results.
o Use the Save menu to access save options for the search and search results.
o Use the Create menu to create dashboards, alerts, reports, etc.
Count of matching and scanned events: As the search runs, Splunk displays two running counts
of the events as it retrieves them: one is a matching event count and the other is the count of
events scanned. When the search completes, the count that appears above the timeline displays
the total number of matching events. The count that appears below the timeline and above the
events list, tells you the number of events during the time range that you selected. As we will see
later, this number changes when you drill down into your investigations.
Timeline of events: The timeline is a visual representation of the number of events that occur at
each point in time. As the timeline updates with your search results, you might notice clusters or
patterns of bars. The height of each bar indicates the count of events. Peaks or valleys in the
timeline can indicate spikes in activity or server downtime. Thus, the timeline is useful for
highlighting patterns of events or investigating peaks and lows in event activity. The timeline options
are located above the timeline. You can zoom in, zoom out, and change the scale of the chart.
Fields sidebar: When you index data, Splunk by default automatically recognizes and extracts
information from your data that is formatted as name and value pairs, which we call fields. When
you run a search, Splunk lists all of the fields it recognizes in the fields sidebar next to your search
results. You can select other fields to show in your events. Also, you can hide this sidebar and
maximize the results area.
o selected fields are fields that are set to be visible in your search results. By default, host,
source, and sourcetype are shown.
o interesting fields are other fields that Splunk has extracted from your search results.
Results area: The results area, located below the timeline, displays the events that Splunk
retrieves to match your search.
o By default, the results are displayed as a list of events, ordered from most recent. You
can use the icons at the upper left of the panel to view the results as a table (click on the
Table icon) or chart (click on the Chart icon).
o If you want to export the search results, use the Export button. You can specify the output
format as CSV, raw events, XML, or JSON.
o Select Options to change how the events display in the results area, for example: wrap
results, show or hide row numbers, etc.
Page 11 of 60
Start searching
This topic walks you through simple searches using the Search interface. If you are not familiar with the
search interface, go back to the search app tutorial before proceeding. The Backstory: You are a member
of the Customer Support team for the online Flower & Gift shop. This is your first day on the job. You want
to learn some more about the shop. Some questions you want answered are:
What does the store sell? How much does each item cost?
How many people visited the site? How many bought something today?
What is the most popular item that is purchased each day?
It is your first day of work with the Customer Support team for the online Flower & Gift shop. You are just
starting to dig into the Web access logs for the shop, when you receive a call from a customer who complains
about trouble buying a gift for his girlfriend--he keeps hitting a server error when he tries to complete a
purchase. He gives you his IP address, 10.2.1.44.
Keyword searches
Everything in Splunk is searchable. You do not have to be familiar with the information in your data because
searching in Splunk is free-form and as simple as typing keywords into the search bar and hitting Enter (or
clicking that green arrow at the end of the search bar).
Type ahead, or Search assistant
In the previous topic, you ran a search from the Summary dashboard by clicking on the Web access source
type (access_combined_wcookie). Use that same search to find this customer's recent access history at the
online Flower & Gift shop.
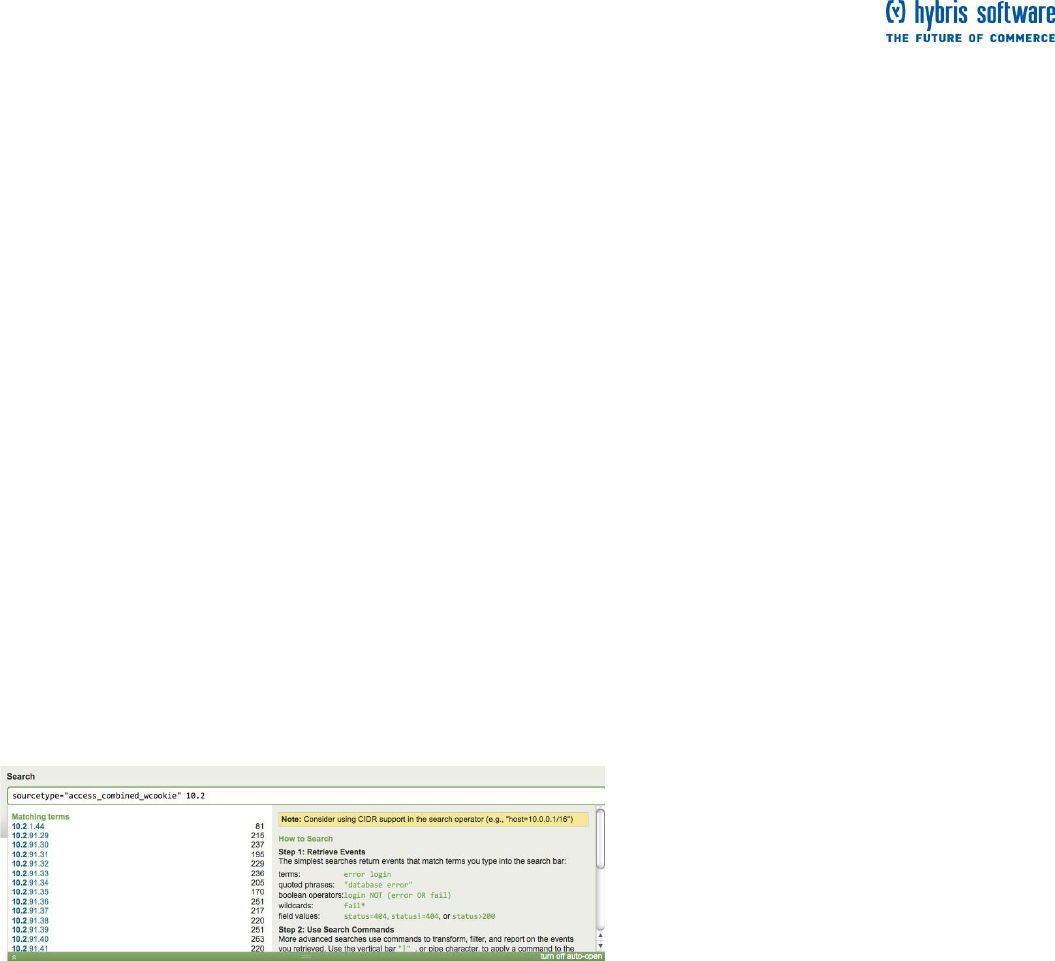
1. Type the customer's IP address into the search bar:
sourcetype="access_combined_wcookie" 10.2.1.44
As you type into the search bar, Splunk's search assistant opens.
Search assistant shows you typeahead, or contextual matches and completions for each keyword as you
type it into the search bar. These contextual matches are based on what is in your data. The entries under
matching terms update as you continue to type because the possible completions for your term change as
well.
Search assistant also displays the number of matches for the search term. This number gives you an idea of
how many search results Splunk will return. If a term or phrase does not exist in your data, you will not see it
listed in search assistant.
For now, ignore everything on the right panel next to the contextual help. Search assistant has more uses
once you start learning the search language, as you will see later. And, if you do not want search assistant to
open, click "turn off auto-open" and close the window using the green arrow below the search bar.
Page 12 of 60
More keyword searches
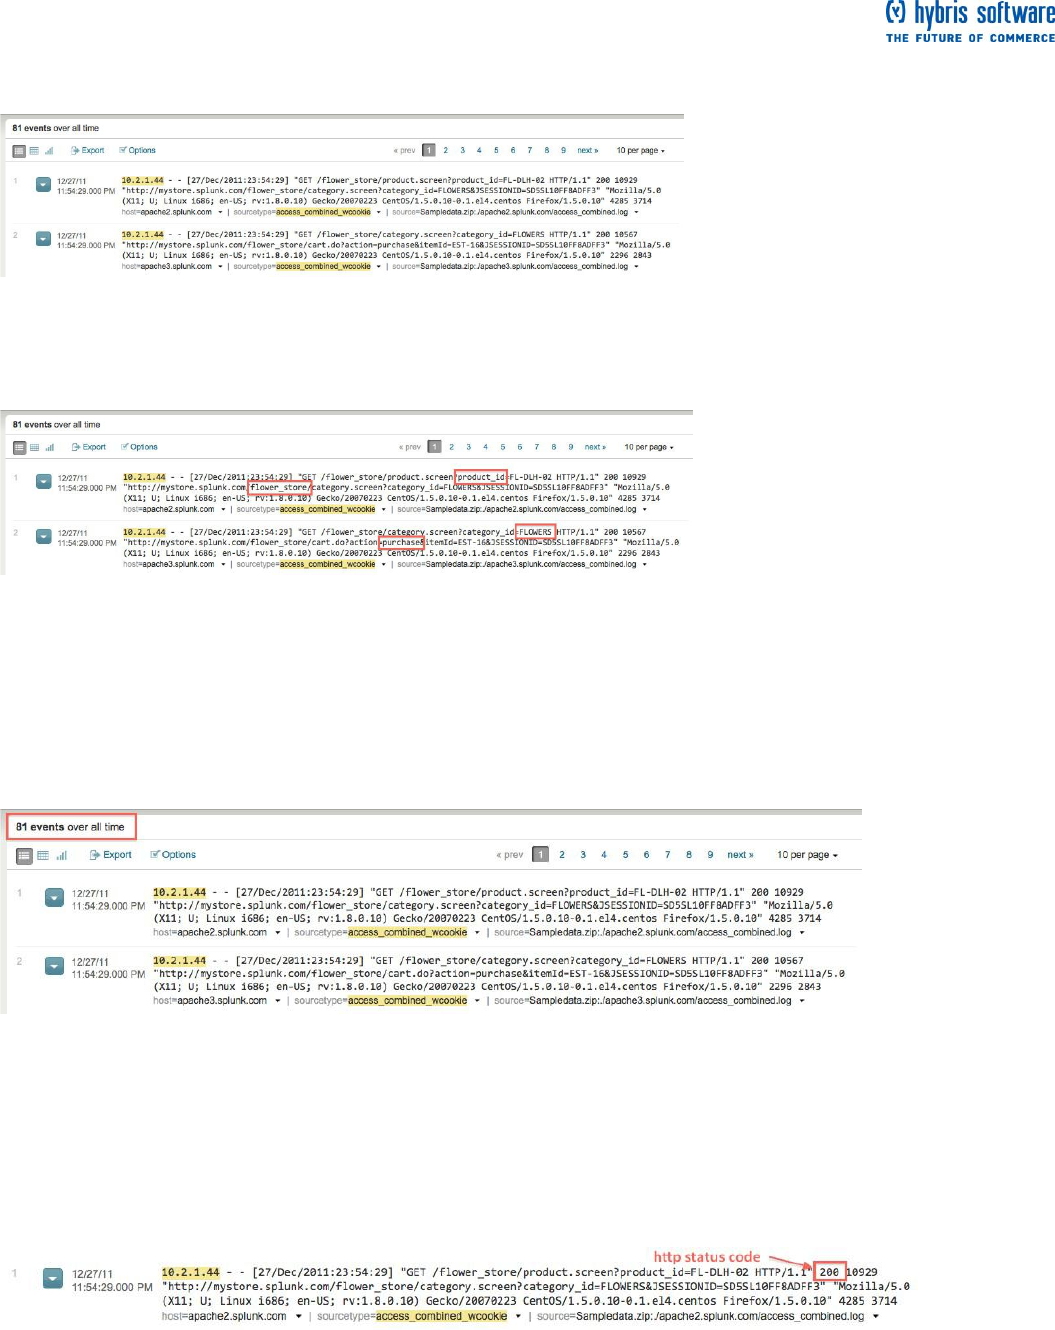
2. If you did not already, run the search for the IP address. (Hit Enter.) Splunk retrieves the customer's
access history for the online Flower & Gift shop. The timeline also updates, but we will get to that later. For
now, let's just take a look at the search results.
Each time you run a search, Splunk highlights in the search results what you typed into the search bar.
3. Skim through the search results. You should recognize words and phrases in the events that relate to the
online shop (flower, product, purchase, etc.).
The customer mentioned that he was in the middle of purchasing a gift, so let's see what we find by
searching for "purchase".
4. Type purchase into the search bar and run the search:
sourcetype="access_combined_wcookie" 10.2.1.44 purchase
When you search for keywords, your search is not case-sensitive and Splunk retrieves the events that
contain those keywords anywhere in the raw text of the event's data.
Among the results that Splunk retrieves are events that show each time the customer tried to buy something
from the online store. Looks like he is been busy!
Use Boolean operators
If you are familiar with Apache server logs, in this case the access_combined format, you will notice that most
of these events have an HTTP status of 200, or Successful. These events are not interesting for you right
now, because the customer is reporting a problem.
Splunk supports the Boolean operators: AND, OR, and NOT. When you include Boolean expressions in
your search, the operators have to be capitalized.
Page 13 of 60
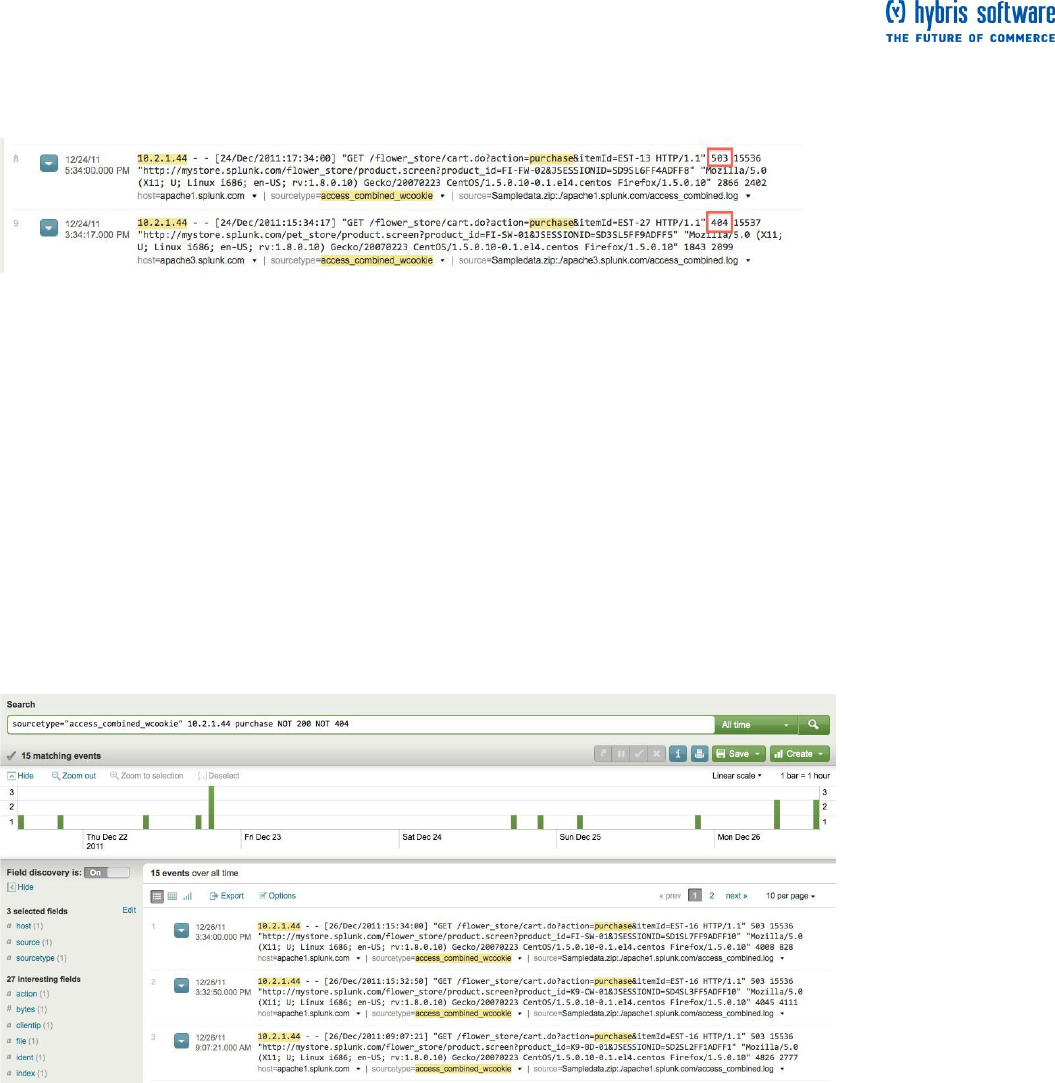
5. Use the Boolean NOT operator to quickly remove all of these Successful page requests. Type in:
sourcetype="access_combined_wcookie" 10.2.1.44 purchase NOT 200
The AND operator is always implied between search terms. So the search in Step 5 is the same as:
sourcetype="access_combined_wcookie" AND 10.2.1.44 AND purchase NOT 200
You notice that the customer is getting HTTP server (503) and client (404) errors. But, he specifically
mentioned a server error, so let's quickly remove events that are irrelevant.
Another way to add Boolean clauses quickly and interactively to your search is to use your search results.
Splunk lets you highlight and select any segment from within your search results to add, remove, and exclude
them quickly and interactively using your keyboard and mouse:
To add more search terms, highlight and click the word or phrase you want from your search
results. (This is demonstrated in Step 6.)
To remove a term from your search, click a highlighted instance of that word or phrase in your
search results.
To exclude events from your search results, alt-click (for Windows, use ctrl-click) on the term you do
not want Splunk to match.
6. Mouse-over an instance of "404" in your search results and alt-click.
This updates your search string with "NOT 404" and filters out all the events that contain the term.
From these results, you see each time that the customer attempted to complete a purchase and received the
server error. Now that you have confirmed what the customer reported, you can continue to drill down to find
the root cause.
Read more about searching
When you run a search, you are implicitly using the search command to retrieve events from a Splunk
index(es). The search command enables you to use keywords, phrases, fields, boolean expressions, and
comparison expressions to specify exactly which events you want to retrieve. This topic discussed searching
with keywords and boolean expressions. Later topics in the tutorial will go over using time, fields, and the
search language.
What is not discussed in this tutorial is using comparison expressions and operators for exact phrase
matching, TERM() and CASE(). Read more about these methods in "Use the search command" in the
Retrieve events chapter of the Search Manual.
Page 14 of 60
Next steps
When you are ready to proceed, go to the next topic to learn how to investigate
and troubleshoot interactively using the timeline in Splunk.
Use the timeline
This topic assumes that you are comfortable running simple searches to retrieve events. If you are not sure,
go back to the last topic where you searched with keywords, wildcards, and Booleans to pinpoint an error.
About timeline options
The timeline is located below the search bar and time range selector. At the top of the timeline are options
which you can use to
Hide the timeline.
Zoom out to see more events in the timeline (this changes the time range displayed in the
timeline).
Zoom to selection if you selected a subset of the events (this also changes the time range
displayed in the timeline).
Change the scale of the timeline from the default Linear scale to Log scale.
Next to the timeline scale is a legend that tells you the span of each bar displayed on the timeline. The span
will depend on the time range of the search; for example, if you searched over 24 hours, the span might be 1
bar = 1 hour. And then, if you Zoom out, time timeline displays more events, with a span of 1 bar = 1 day.
Investigate with the timeline
Back at the Flower & Gift shop, let's continue with the customer (10.2.1.44) you were assisting. He reported
an error while purchasing a gift for his girlfriend. You confirmed his error, and now you want to find the cause
of it.
Continue with the last search, which showed you the customer's failed purchase attempts.
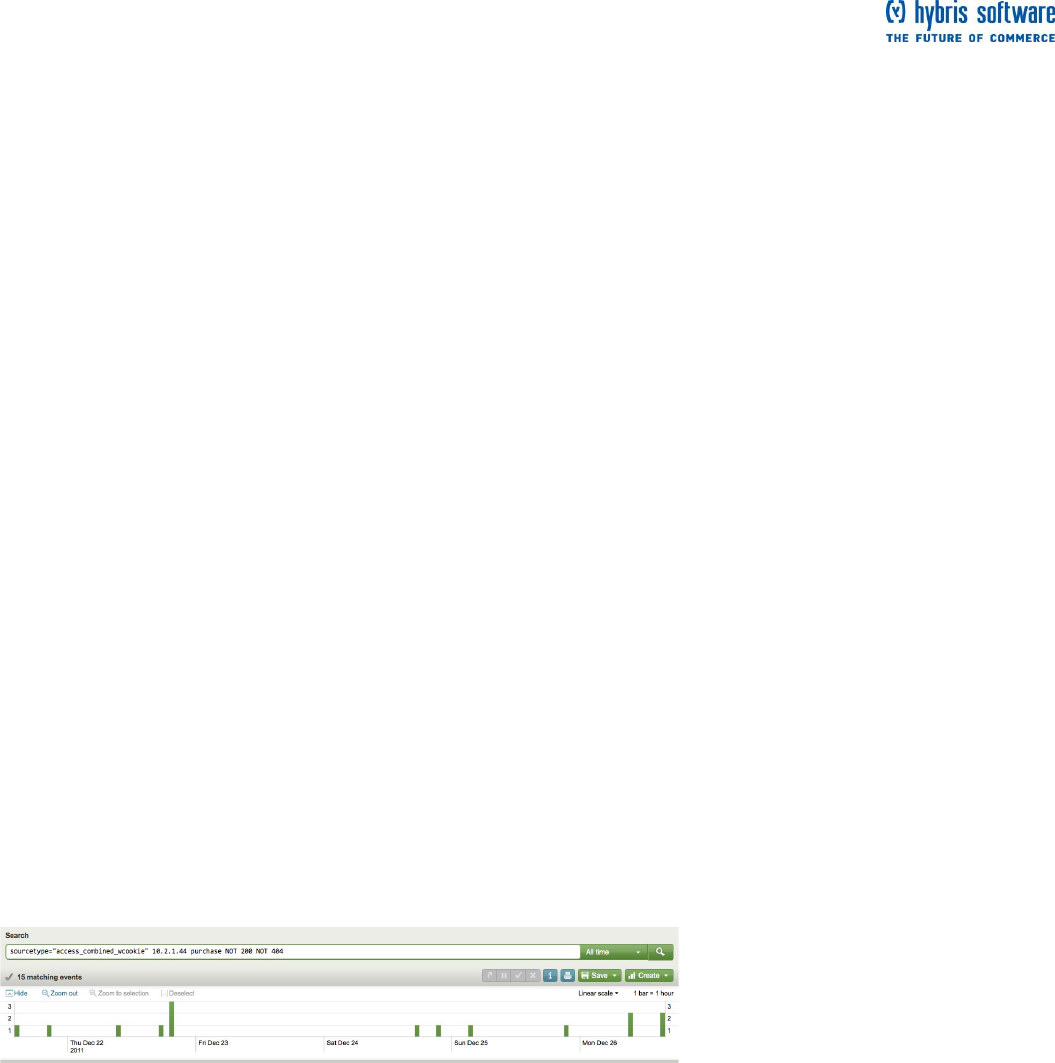
1. Search for:
sourcetype="access_combined_wcookie" 10.2.1.44 purchase NOT 200 NOT 404
In the last topic, you really just focused on the search results listed in the events viewer area of this
dashboard. Now, let's take a look at the timeline.
The location of each bar on the timeline corresponds to an instance when the events that match your search
occurred. If there are no bars at a time period, no events were found then.
Page 15 of 60
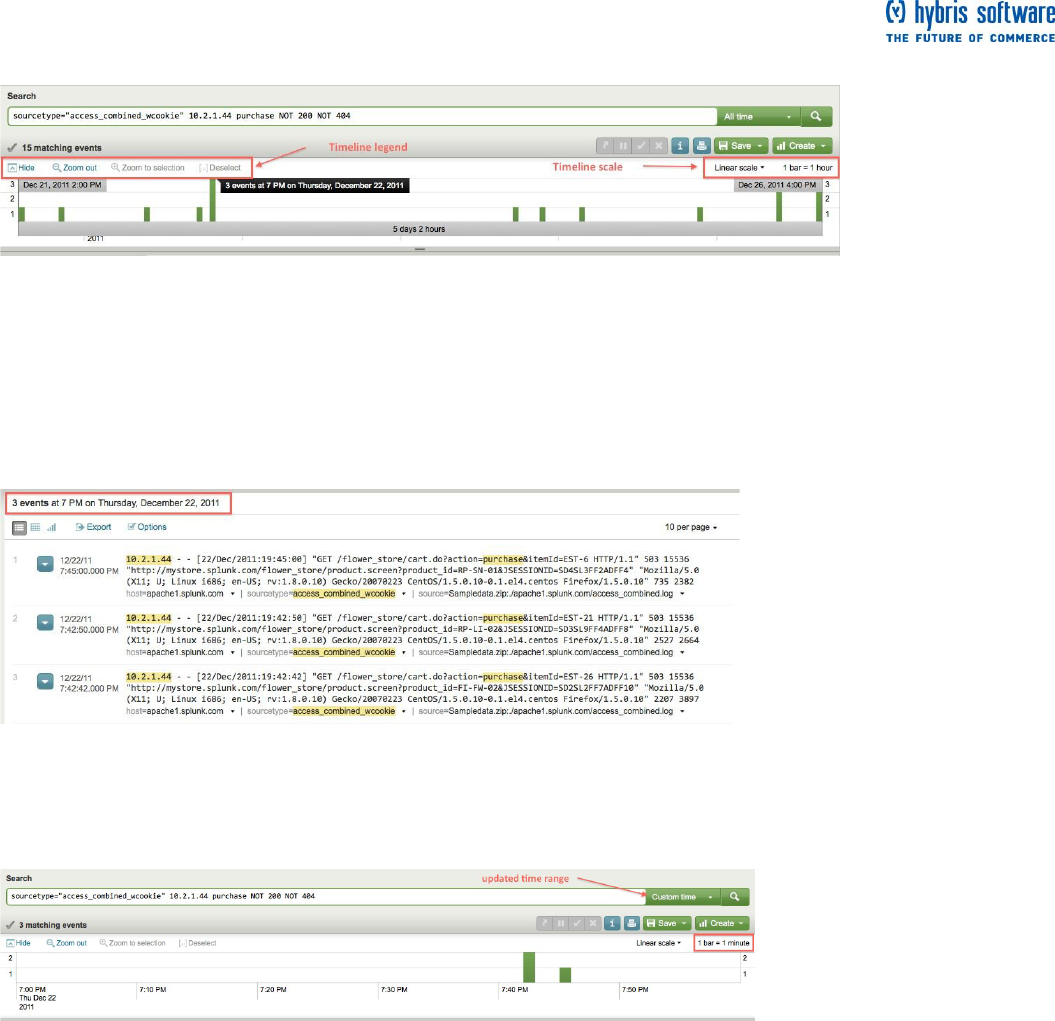
2. Mouse over one of the bars.
A tooltip pops up and displays the number of events that Splunk found during the time span of that bar (1 bar
= 1 hour).
The taller the bar, the more events occurred at that time. Often seeing spikes in the number of events or no
events is a good indication that something has happened.
3. Click one of the bars, for example the tallest bar.
This updates your search results to show you only the events at the time span. Splunk does not run the
search when you click on the bar. Instead, it gives you a preview of the results zoomed-in at the time range.
You can still select other bars at this point.
One hour is still a wide time period to search, so let's narrow the search down more.
4. Double-click on the same bar.
Splunk runs the search again and retrieves only events during that one hour span you selected.
You should see the same search results in the Event viewer, but, notice that the search overrides the time
range picker and it now shows "Custom time". (You will see more of the time range picker later.) Also, each
bar now represents one minute of time (1 bar = 1 min).
Page 16 of 60
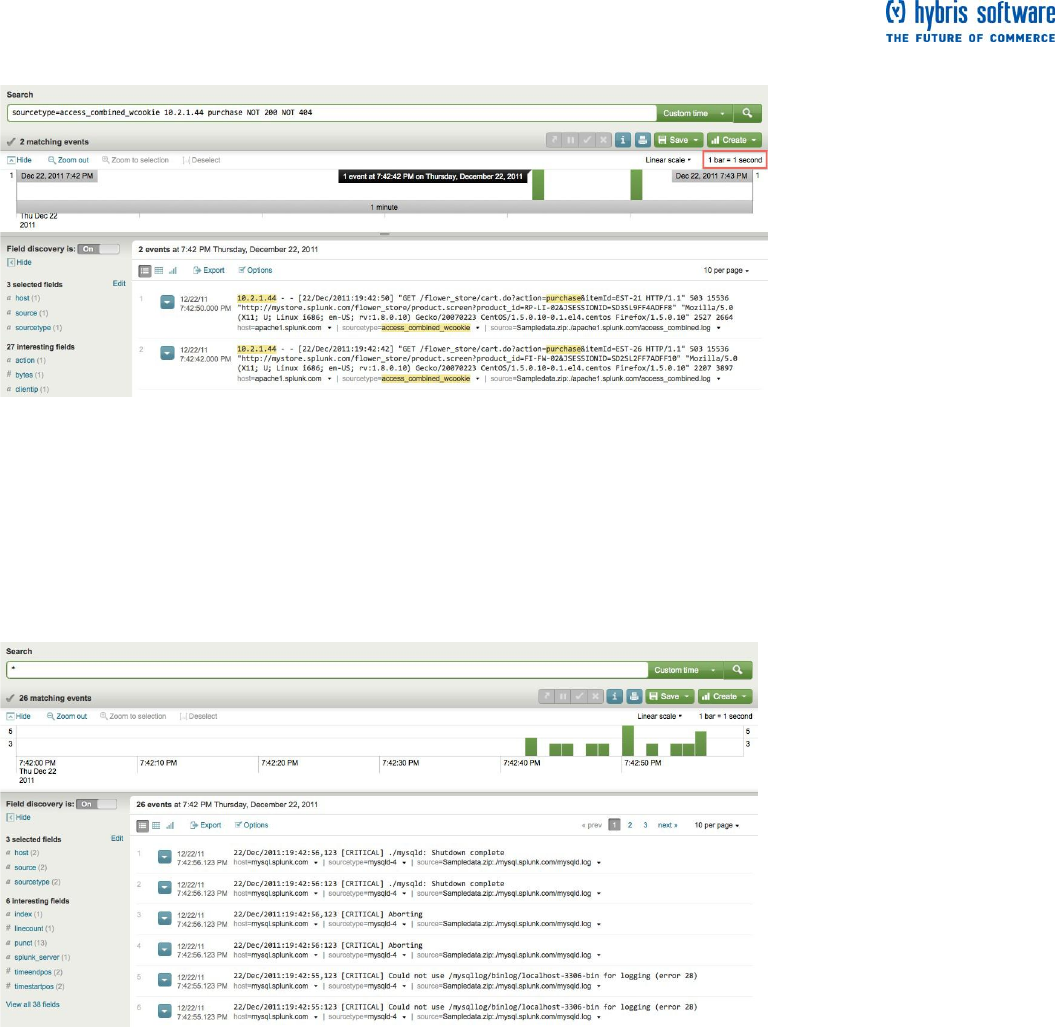
5. Double-click another bar.
Once again, this updates your search to now retrieve events during that one minute span of time. Each bar
represents the number of events for one second of time.
Now, you want to expand your search to see everything else, if anything, that happened during this second.
6. Without changing the time range, replace your previous search in the search bar with:
*
Splunk supports using the asterisk (*) wildcard to search for "all" or to retrieve events based on parts of a
keyword. Up to now, you have just searched for Web access logs. This search tells Splunk that you want to
see everything that occurred at this time range:
This search returns events from all the logs on your server. You expect to see other user's Web activity--
perhaps from different hosts. But instead you see a cluster of mySQL database errors. These errors were
causing your customer's purchases to fail. Now, you can report this issue to someone in the IT Operations
team.
Next steps
When you are ready, proceed to the next topic to learn about searching over
different time ranges.


Page 18 of 60
Start searching.
You can learn a lot about your data from just running ad hoc searches, using nothing more than keywords
and the time range. But you cannot take full advantage of Splunk's more advanced searching and reporting
features without understanding what fields are and how to use them. This part of the tutorial will familiarize
you with:
default fields and other fields that Splunk automatically extracts
using the fields menu and fields picker to find helpful fields
searching with fields
Let's return to the happenings at the online Flower and Gift shop. You spent the morning investigating some
general issues and reporting the problems you found to other teams. You feel pretty good about what you
have learned about the online shop and its customers, but you want to capture this and share it with your
team.
The best way to do this is to use fields.
Briefly, about fields
What are fields
Fields exist in machine data in many forms. Often, a field is a value (with a fixed, delimited position on the
line) or a name and value pair, where there is a single value to each field name. A field can also be
multivalued; that is, it appears more than once in an event and has a different value for each appearance.
In Splunk, fields are searchable name/value pairings that distinguish one event from another because not all
events will have the same fields and field values. Fields enable you to write more tailored searches to
retrieve the specific events that you want. Fields also enable you to take advantage of the search language,
create charts, and build reports.
Some examples of fields are clientip for IP addresses accessing your Web server, _time for the timestamp of
an event, and host for domain name of a server. One of the more common examples of multivalue fields is
email address fields. While the "From" field will contain only a single email address, the "To" and "Cc" fields
may have one or more email addresses associated with them.
For more information (and there is a lot more), read About fields in the Knowledge Manager Manual.
Extracted fields
Splunk extracts fields from event data twice. It extracts default and other indexed fields during event
processing when that data is indexed. And it extracts a different set of fields at search time, when you run a
search.
At index time, Splunk automatically finds and extracts default fields for each event it processes. These fields
include host, source, and sourcetype (which you should already be familiar with).
Splunk also extracts certain fields at search time--when you run a search. You will see some examples of
these searches later. For more information, read the "Overview of search-time field extractions" in the
Knowledge Manager Manual.
The fields sidebar and dialog
1. Go back to the Search dashboard and search for web access activity. Select Other > Yesterday from the
time range picker:
sourcetype="access_*"
You were actually using fields all along! Each time you searched for sourcetype=access_*, you told Splunk
to only retrieve events from your web access logs and nothing else.
To search for a particular field, specify the field name and value:
fieldname="fieldvalue"
Page 19 of 60
sourcetype is a field name and access_combined_wcookie is a field value. Here, the wildcarded value is
used to match all field values beginning with access_ (which would include access_common,
access_combined, and access_combined_wcookie).
Note: Field names are case sensitive, but field values are not!
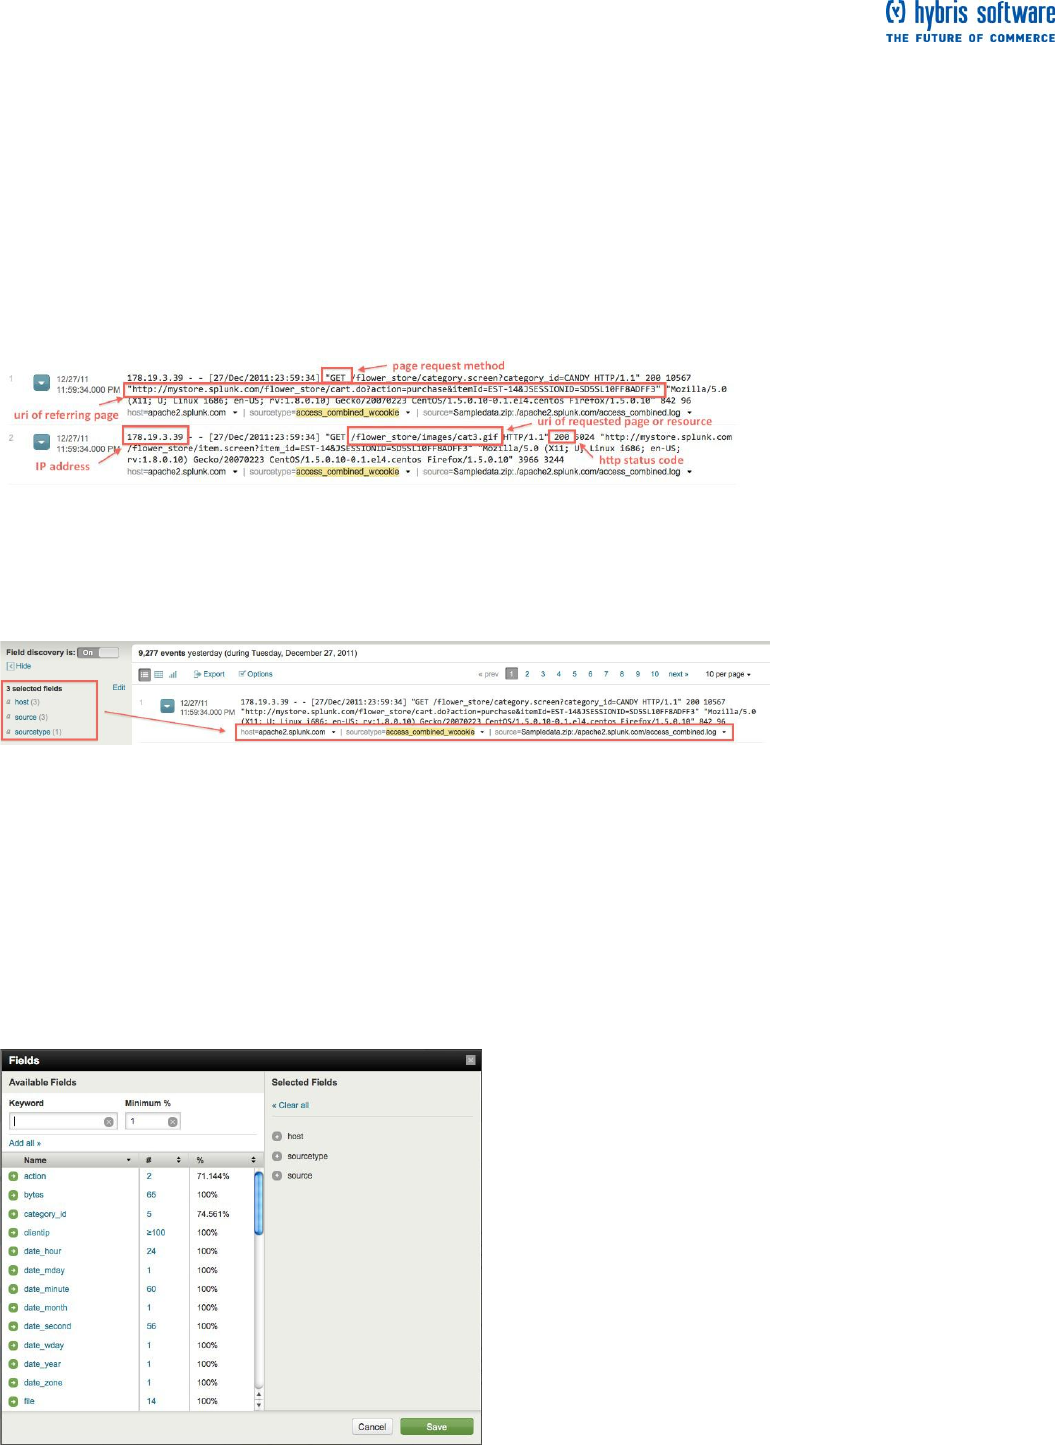
2. Scroll through the search results.
If you are familiar with the access_combined format of Apache logs, you will recognize some of the
information in each event, such as:
IP addresses for the users accessing the website.
URIs and URLs for the page request and referring page.
HTTP status codes for each page request.
Page request methods.
As Splunk retrieves these events, the Fields sidebar updates with selected fields and interesting fields.
These are the fields that Splunk extracted from your data.
Notice that default fields host, source, and sourcetype are selected fields and are displayed in your search
results:
3. Scroll through interesting fields to see what else Splunk extracted. You should recognize the field names
that apply to the Web access logs. For example, there's clientip, method, and status. These are not default
fields; they have (most likely) been extracted at search time.
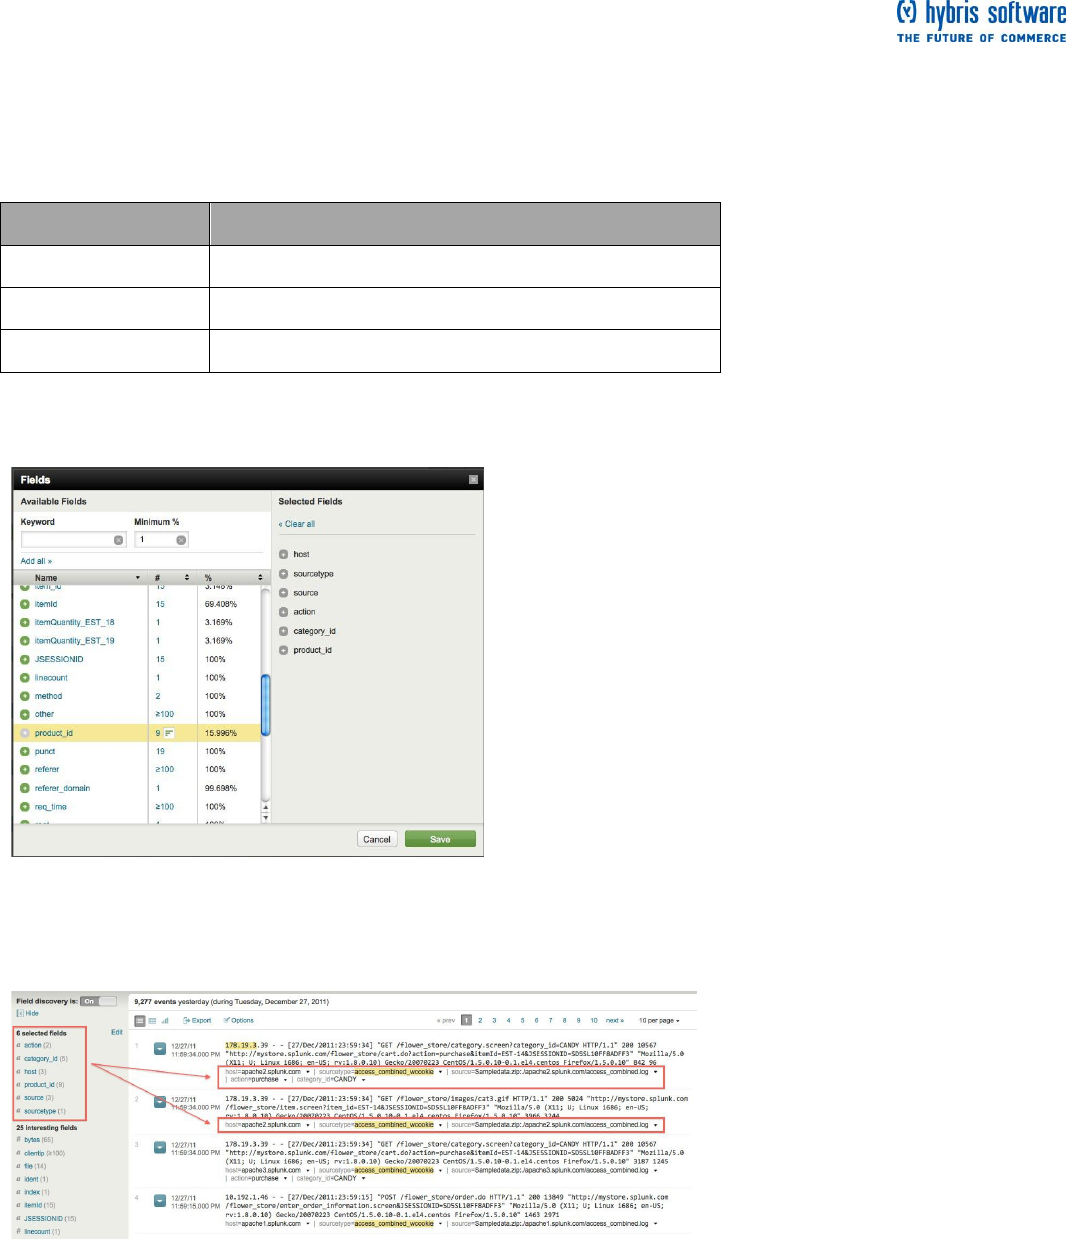
4. Click the Edit link in the fields sidebar.
The Fields dialogue opens and displays all the fields that Splunk extracted.
Available Fields are the fields that Splunk identified from the events in your current search (some of
these fields were listed under interesting fields).
Selected Fields are the fields you picked (from the available fields) to show in your search results
(by default, host, source, and sourcetype are selected).
Page 20 of 60
5. Scroll through the list of Available Fields.
You are already familiar with the fields that Splunk extracted from the Web access logs based on your
search. You should also see other default fields that Splunk defined--some of these fields are based on each
event's timestamp (everything beginning with date_*), punctuation (punct), and location (index). But, you
should also notice other extracted fields that are related to the online store. For example, there are action,
category_id, and product_id. From conversations with your coworker, you may know that these fields are:
Field name
Description
action
what a user does at the online shop.
category_id
the type of product a user is viewing or buying.
product_id
the catalog number of the product the user is viewing or buying.
6. From the Available fields list, select action, category_id, and product_id.
7. Click Save.
When you return to the Search view, the fields you selected will be included in your search results if they
exist in that particular event. Different events will have different fields.
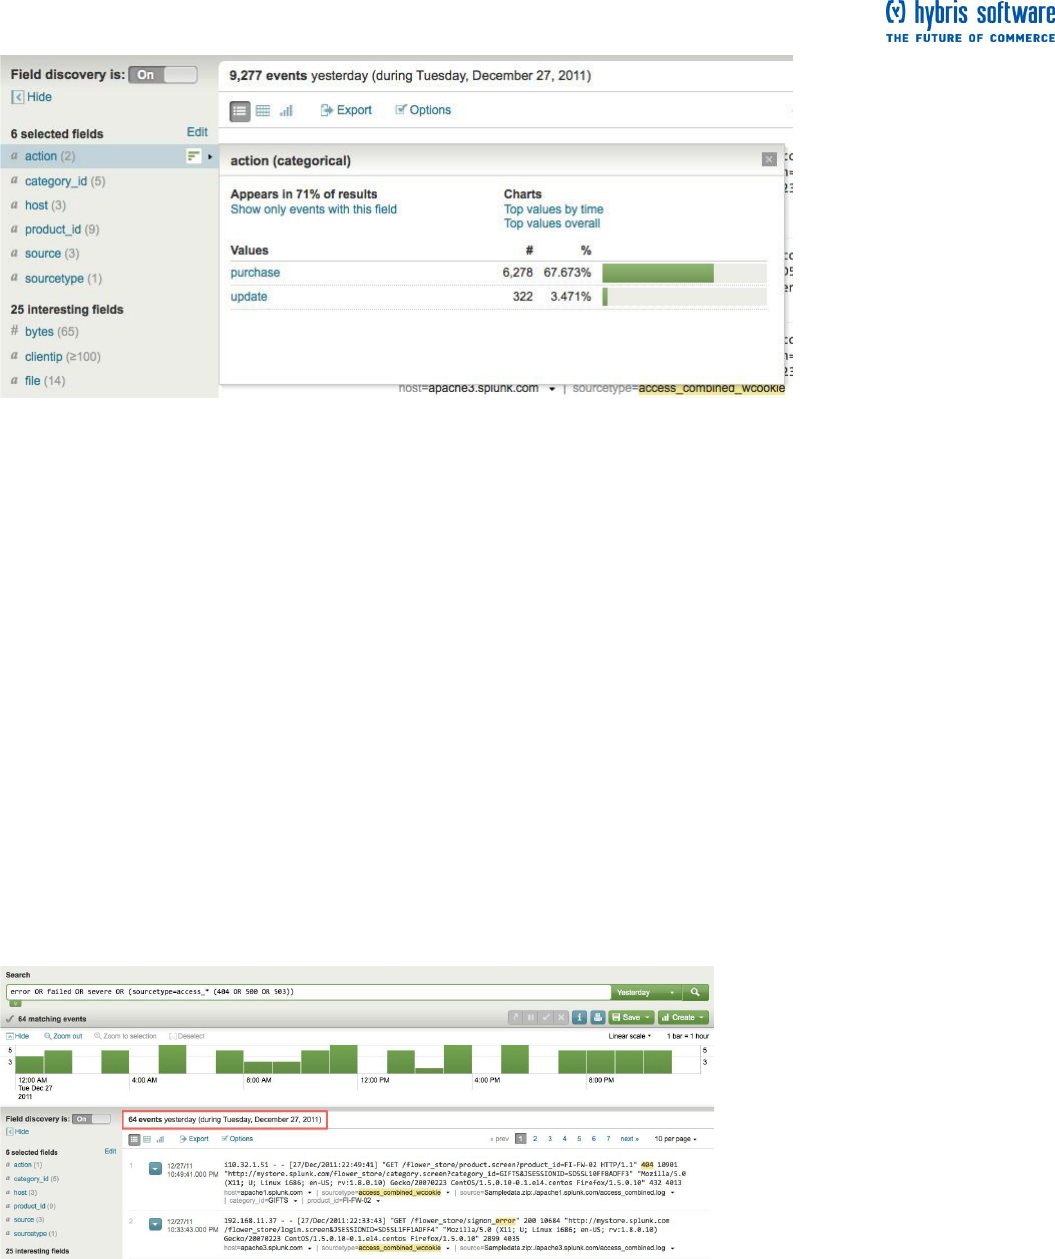
The fields sidebar does not just show you what fields Splunk has captured from your data. It also displays
how many values exist for each of these fields. For the fields you just selected, there are 2 for action, 5 for
category_id, and 9 for product_id. This does not mean that these are all the values that exist for each of the
fields--these are just the values that Splunk knows about from the results of your search.
What are some of these values?
Page 21 of 60
8. Under selected fields, click action for the action field.
This opens the field summary for the action field.
This window tells you that, in this set of search results, Splunk found two values for action and they are
purchase and update. Also, it tells you that the action field appears in 71% of your search results. This
means that three-quarters of the Web access events are related to the purchase of an item or an update (of
the item quantity in the cart, perhaps).
9. Close this window and look at the other two fields you selected, category_id (what types of products the
shop sells) and product_id (specific catalog names for products).
Now you know a little bit more about the information in your data relating to the online Flower and Gift shop.
The online shop sells a selection of flowers, gifts, plants, candy, and balloons. Let's use these fields,
category_id and product_id, to see what people are buying.
Use fields to run more targeted searches
These next two examples compares the results when searching with and without fields.
Example 1
Return to the search you ran to check for errors in your data. Select Other >
Yesterday from the time range picker:
error OR failed OR severe OR (sourcetype=access_* (404 OR 500 OR 503))
Page 22 of 60
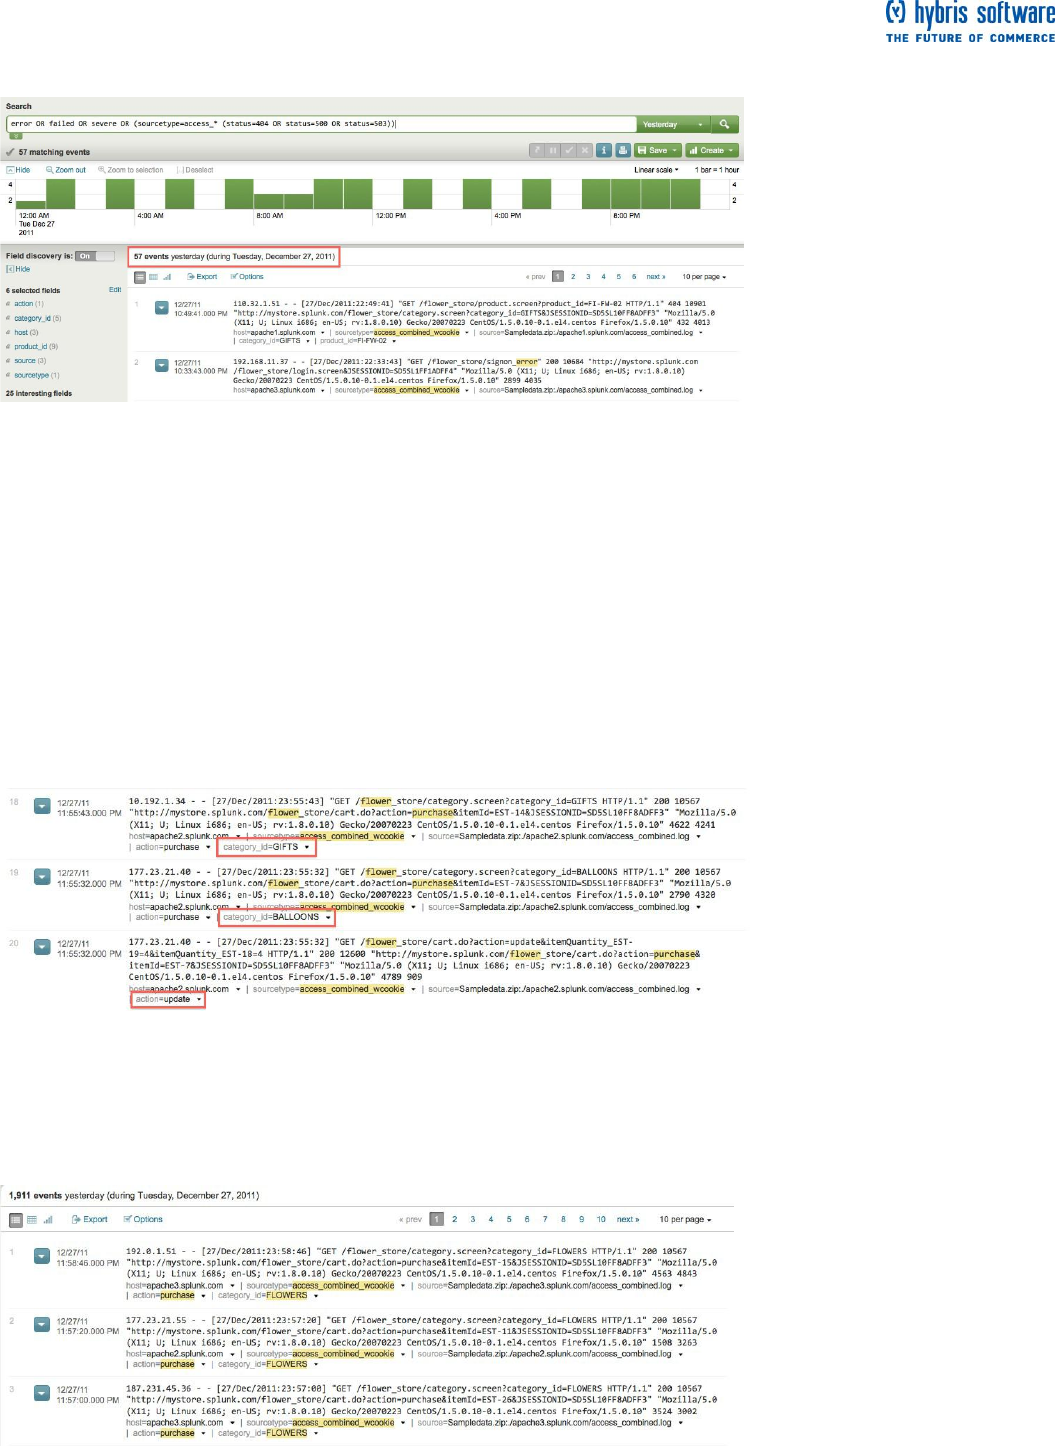
Run this search again, but this time, use fields in your search.
The HTTP error codes are values of the status field. Now your search looks like this:
error OR failed OR severe OR (sourcetype=access_* (status=404 OR status=500 OR status=503))
Notice the difference in the count of events between the two searches—because it is a more targeted search,
the second search returns fewer events.
When you run simple searches based on arbitrary keywords, Splunk matches the raw text of your data.
When you add fields to your search, Splunk looks for events that have those specific field/value pairs.
Example 2
Before you learned about the fields in your data, you might have run this search to see how many times
flowers were purchased from the online shop:
sourcetype=access_* purchase flower*
As you typed in "flower", search assistant shows you both "flower" and "flowers” in the typeahead. Since you
do not know which is the one you want, you use the wildcard to match both.
If you scroll through the (many) search results, you will see that some of the events have action=update and
category_id that have a value other than flowers. These are not events that you wanted!
Run this search instead. Select Other > Yesterday from the time range picker:
sourcetype=access_* action=purchase category_id=flower*
For the second search, even though you still used the wildcarded word "flower*", there is only one value of
category_id that it matches (FLOWERS).

Page 23 of 60
Notice the difference in the number of events that Splunk retrieved for each search; the second search
returns significantly fewer events. Searches with fields are more targeted and retrieves more exact matches
against your data.
Next steps
Now that you know how to use fields, you can start using the search language to filter, modify, reorder, and
group your search results. When you are ready, proceed to the next topic and learn how to use the search
language.
Use the search language
This topic assumes that you are familiar with running simple searches using keywords and field/value pairs. If
you are not sure, go back and read "
Page 24 of 60
Use fields to search".
Back at the online Flower & Gift shop Customer Support office, the searches you have run to this point have
only retrieved matching events from your Splunk index. For example, in a previous topic, you ran this search
for to see the purchases of flowers:
sourcetype=access_* action=purchase category_id=flowers
The search results told you approximately how many flowers were bought. But, this does not help you
answer questions, such as:
What items were purchased most at the online shop?
How many customers bought flowers? How many flowers did each customer buy?
To answer these questions, you need to use Splunk's search language, which includes an extensive library of
commands, arguments, and functions that enables you to filter, modify, reorder, and group your search
results. For this tutorial you will only use a few of them.
Construct a search with search assistant
Example 1. What items were purchased most at the online shop?
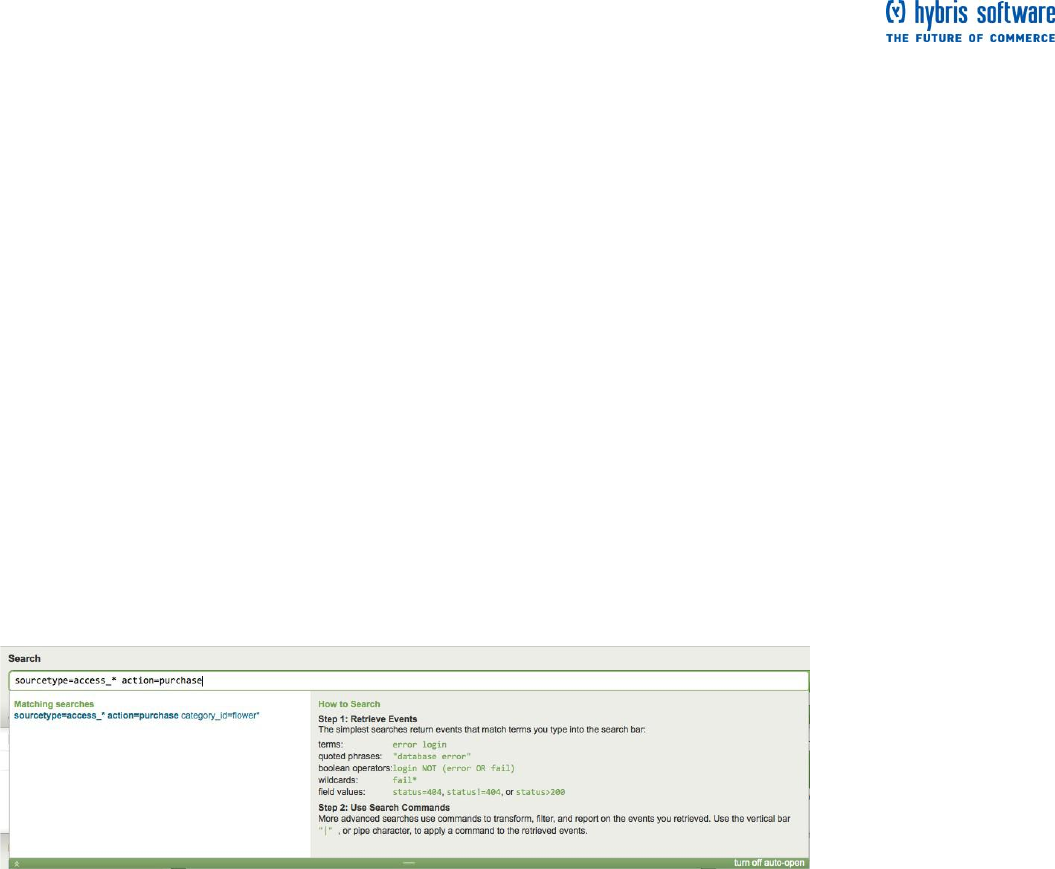
1. Return to the search dashboard and restrict your search to purchases over Yesterday:
sourcetype=access_* action=purchase
As you type in the search bar, search assistant opens with syntax and usage information for the search
command (on the right side). If search assistant does not open, click the green arrow under the left side of
the search bar.
You have seen before that search assistant displays typeahead for keywords that you type into the search
bar. It also explains briefly how to search. We have already gone through retrieving events. Now, let's start
using the search commands.
Page 25 of 60
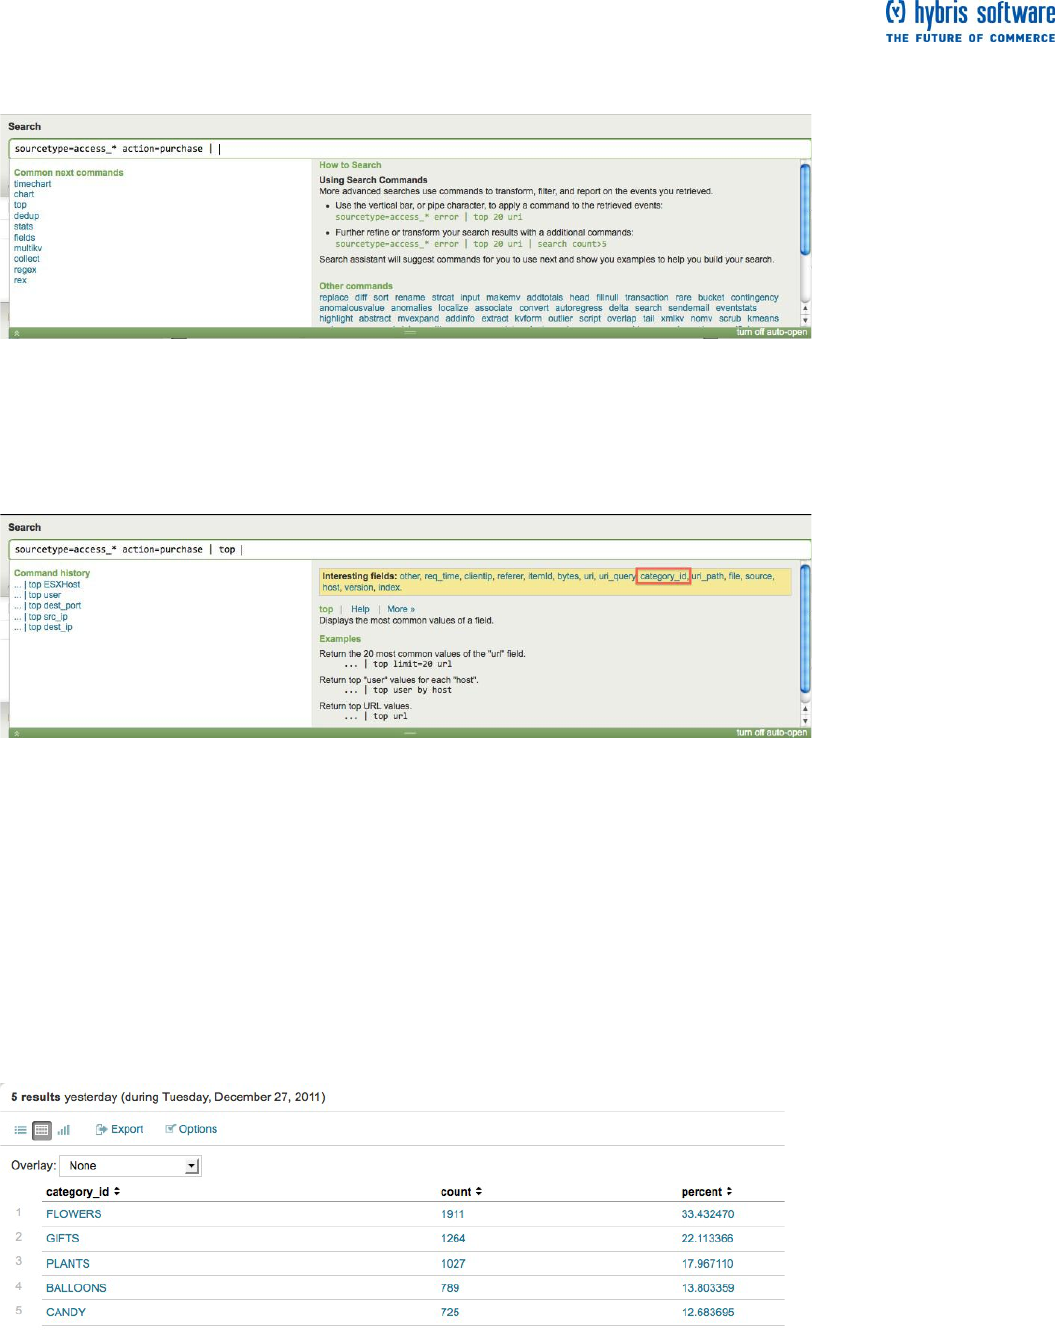
2. Type a pipe character, " | ", into the search bar.
The pipe indicates to Splunk that you are about to use a command, and that you want to use the results of
the search to the left of the pipe as the input to this command. You can pass the results of one command
into another command in a series, or pipeline, of search commands.
You want Splunk to give you the most popular items bought at the online store--from this list, the top
command looks promising.
3. Under common next commands, click top.
Splunk appends the top command to your search string.
According to search assistant's description and usage examples, the top command "displays the most
common values of a field"--exactly what you wanted.
You wanted to know what types of items were being bought at the online shop, not just flowers. It also shows
you interesting fields that you can click on to add to the search.
4. Either click the category_id field in the list or type it into the search bar to complete your search:
sourcetype=access_* action=purchase | top category_id
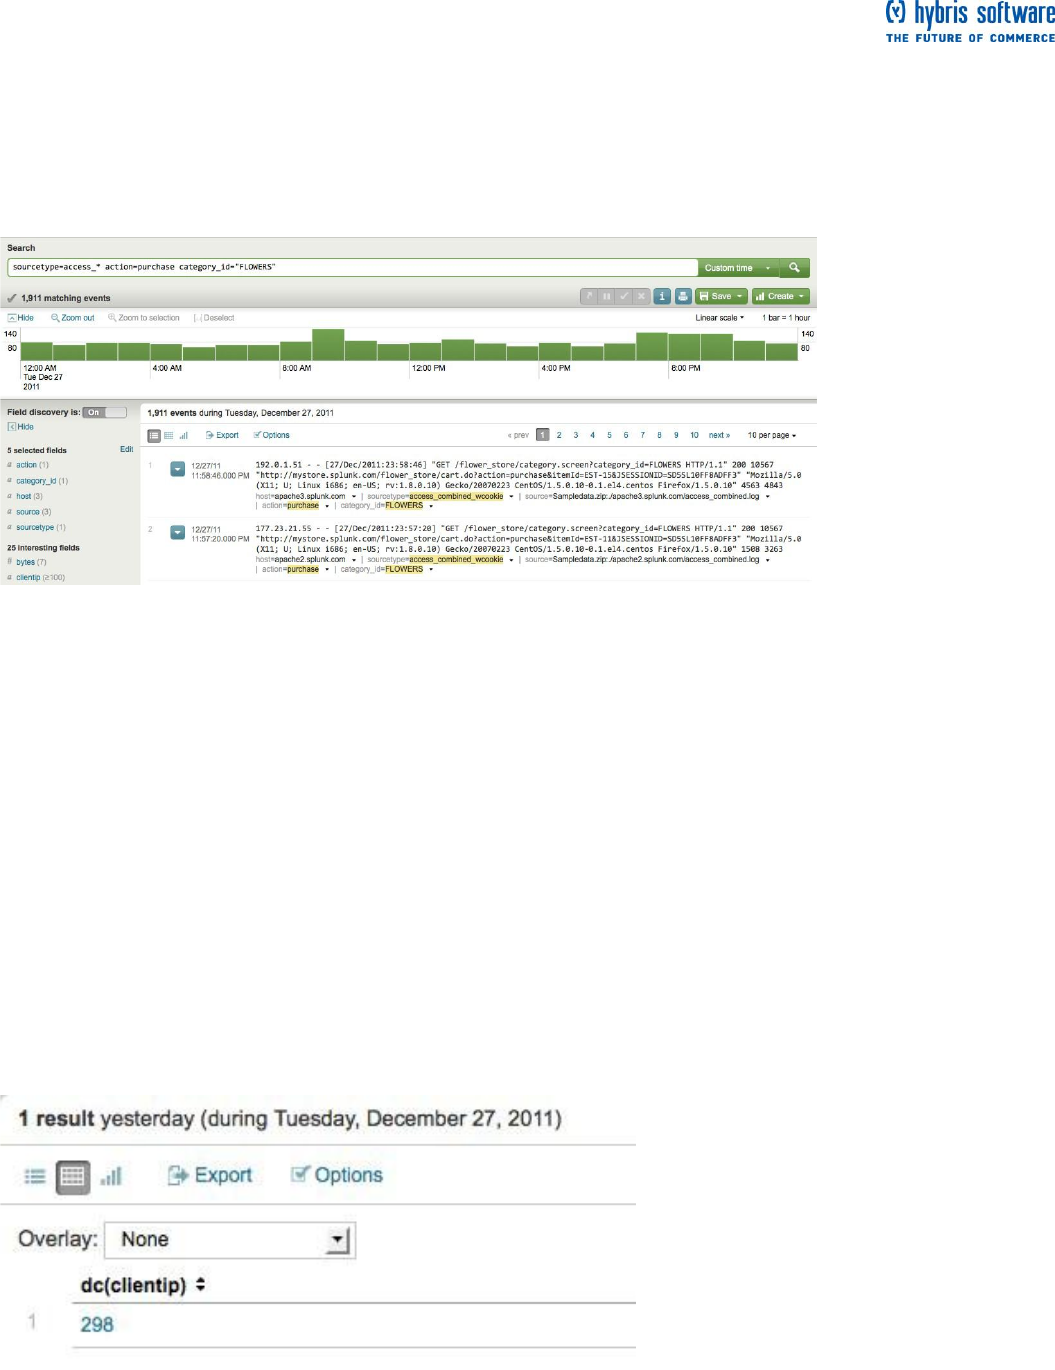
This gives you a table of the top or most common values of category_id. By default, the top command
returns ten values, but you only have five different types of items. So, you should see all five, sorted in
descending order by the count of each type:
The top command also returns two new fields: count is the number of times each value of the field occurs,
and percent is how large that count is compared to the total count. Read more about the top command in the
Search reference manual.
Page 26 of 60
Drill down into search results
The last search returned a table that showed you what items the online shop sells and how many of those
items were purchased. But, you want to know more about an individual item, for example, flowers.
Example 2: How many flowers were bought?
1. Click the row in the result table for Flowers.
This kicks off a new search. Splunk updates your search, to include the filter for the field/value pair
category=flowers, which was the row item you clicked in the result table from the search in Example 2.
Splunk's drilldown actions enable you to delve deeper into the details of the information presented to you in
the tables and charts that result from your search.
The number of events returned tells you how many times flowers were purchased.
Example 3: How many different customers purchased the flowers?
1. You are looking specifically for the purchase of flowers, so continue with the search from the previous
example:
sourcetype=access_* action=purchase category_id=flowers
The customers who access the Flower & Gift shop are distinguished by their IP addresses, which are values
of the clientip field.
2. Use the stats command and the distinct_count() or dc() function:
sourcetype=access_* action=purchase category_id=flowers | stats dc(clientip)
You piped the search results into the stats command and used the distinct_count() function to count the
number of unique clientip values that it finds in those events. This returns a single value:
This tells you that there were approximately 300 different people who bought flowers from the online shop.
Example 4a: How many flowers that each customer buy?
Page 27 of 60
In the last example, you calculated how many different customers bought flowers. Let's build on that search.
1. Use the stats command:
sourcetype=access_* action=purchase category_id=flowers | stats count
The count() function returns a single value, the count of your events. (This should match your result from
Example 2.)
Now, break this count down to see how many flowers each customer bought.
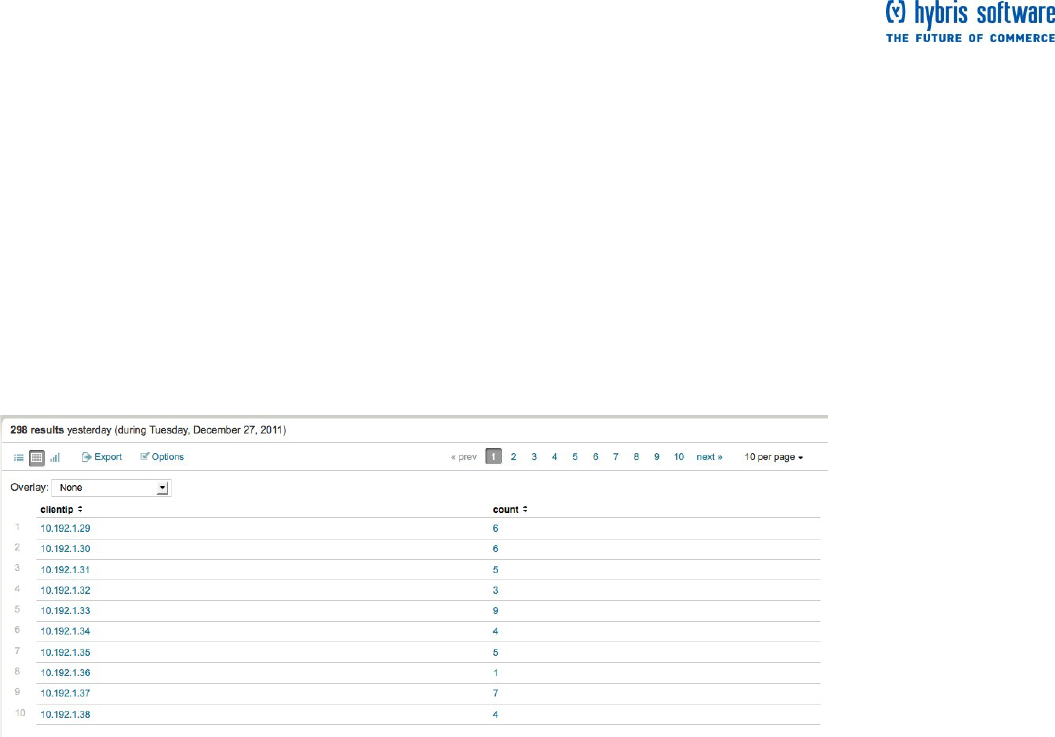
2. Add a by clause to the stats command:
sourcetype=access_* action=purchase category_id=flowers | stats count
BY clientip
This search gives you a table of the different customers (clientip) and the number
of flowers purchased (count).
Reformat the search results
You might know what the header for this table represents, but anyone else would not know at a glance. You
want to show off your results to your boss and other members of your team.
Example 4b: How can you improve the presentation of the results to 4a?
Let's continue with Example 4a and reformat the results a little.
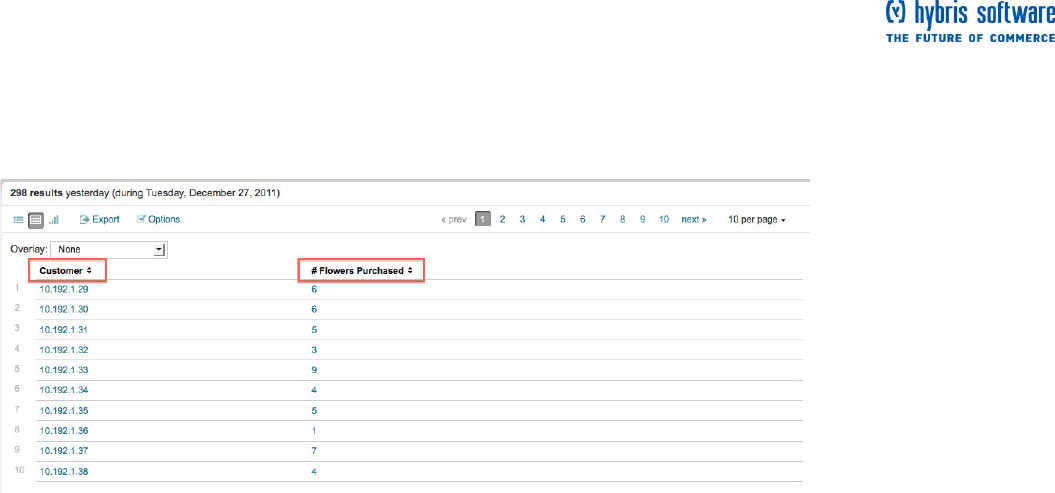
1. First, let's rename the count field:
sourcetype=access_* action=purchase category_id=flowers | stats count
AS "# Flowers Purchased" by clientip
The syntax for the stats command enables you to rename the field inline using an "AS" clause. If your new
field name is a phrase, use double quotes. The syntax for the stats command does not allow field renaming
in the "by" clause.
For that, you will have to use another command. For more information about the stats command and its
usage, arguments, and functions, see the stats command in the Search Reference Manual and the list of
stats functions.
Page 28 of 60
2. Use the rename command to change the clientip name:
sourcetype=access_* action=purchase category_id=flowers | stats count
AS "# Flowers Purchased" by clientip | rename clientip AS Customer
This formats the table to rename the headers, clientip and count, with Customer
and # Flowers purchased:
For more information about the rename command, see the rename command in the Search Reference
Manual.
Next steps
As you run more searches, you want to be able to save them and reuse them or
share them with your teammates. When you are ready, proceed to the next topic
to learn how to save your search and share it it with others.
Save a search
This topic assumes you are comfortable running searches with fields. If you are not,
go back to the previous topic and review how to "Use fields to search".
About saving a search
Splunk provides a variety of options for saving your search or search results using the Save menu. You can
save a search while it is running or after it is completed or finalized. This topic briefly discusses the Save
options before it walks you through the basics of manually saving a search using Splunk Web and accessing
that search again later.
Save options include:
Save search: Saves the search, so you can easily run the search again without having to retype
the search string. For more information, see "Save searches and share search results" in the
Knowledge Manager Manual.
Save results: Saves the results of the search and enables you to retrieve them from the Jobs
manager.
Save & share results: Saves the results of the search and provides a URL that enables you to
share the results. For more information, see "Save searches and share search results".
Page 29 of 60
Save a search tutorial
Back at the Flower & Gift shop, you just ran a search to see if there were any errors yesterday. This is a
search you will run every morning. Rather than type it in manually every day, you decide to save this search.
Example 1. Run the search for all errors seen yesterday:
error OR failed OR severe OR (sourcetype=access_* (status=404 OR
status=500 OR status=503))
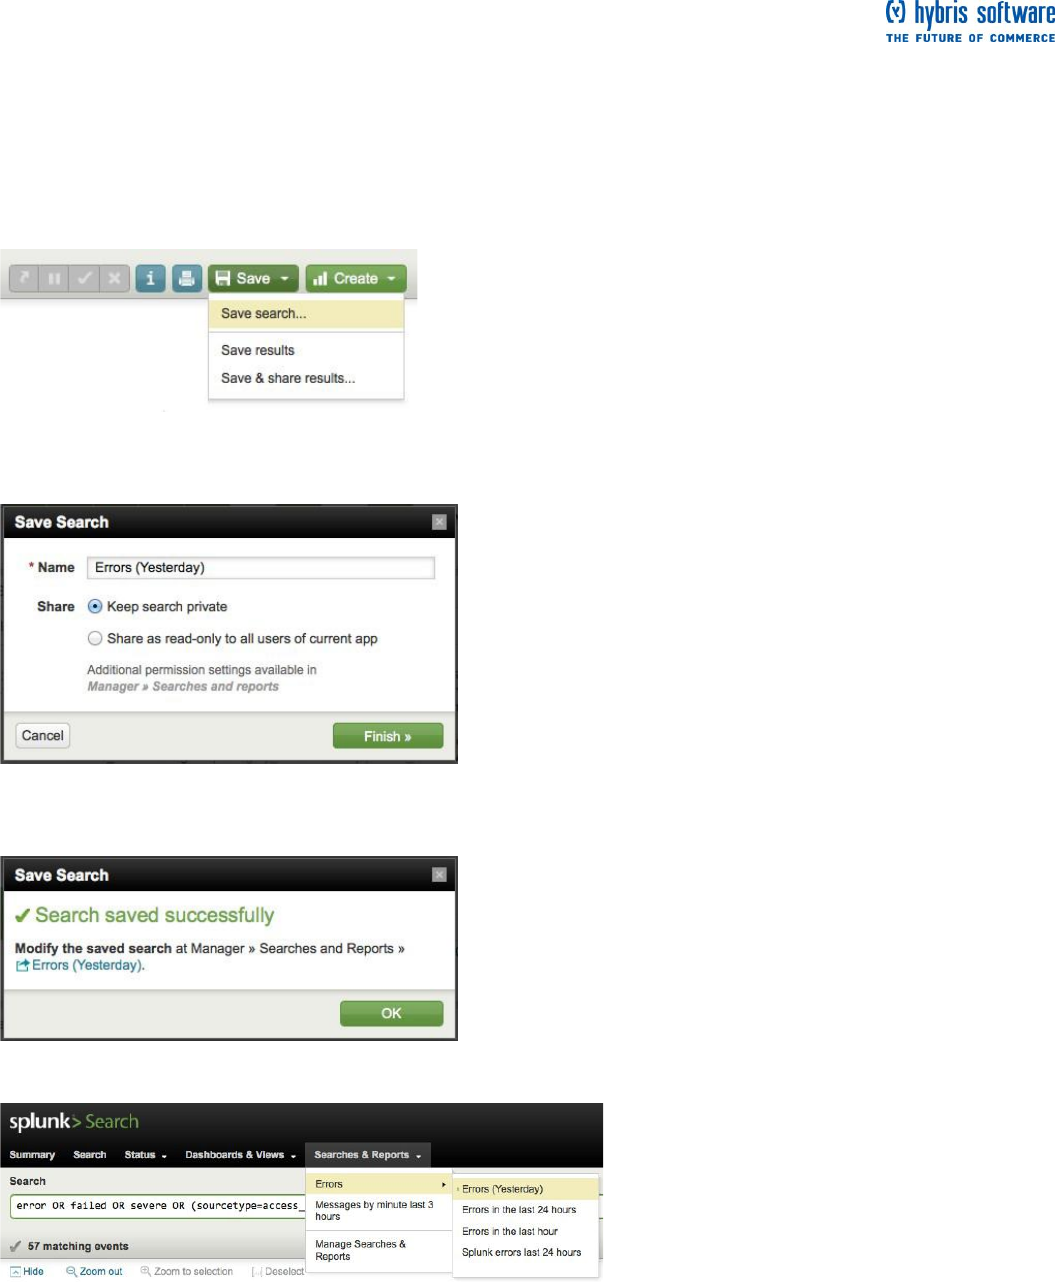
1. Click Save under the search bar.
2. Select Save search... from the list.
The Save search dialog opens.
3. Name the search, Errors (Yesterday)
4. Click Finish. Splunk confirms that your search was saved:
5. Find your saved search in the Searches & Reports list:
Because the saved search's name included the word "Error," Splunk lists it in the saved search submenu for
Errors. The green dot next to your saved search means that it is local to your Splunk account; right now you
are the only one that is authorized to access this saved search. Since this is a search that others on your
team may want to run, you can set it as a global saved search that they can access. To do this, read more
about saving searches and sharing search results in the Knowledge Manager Manual.
About managing and scheduling searches
Manage searches and reports
Page 30 of 60
If you want to modify a search that you saved, use the Searches & Reports menu to select Manage
Searches & Reports. This takes you the Splunk Manager page for all the searches and reports you are
allowed to access (if you are allowed to access them). From here you can select your search from the list.
This takes you to the searches edit window where you can then change or update the search string,
description, time range, and schedule options. Read more about managing saved searches in this topic of
the Knowledge Manager Manual.
Schedule saved searches and alerts
If you have an Enterprise license, Splunk also lets you configure the searches you saved to run on a
schedule and to set alerts based off the scheduled searches. When you download Splunk for the first time,
you are given an Enterprise trial license that expires after 60 days. If you are using the Free license, you do
not have the capability to schedule a saved search. Read more about scheduling saved searches and
setting alerts in the Alerting Manual.
Next steps
From this point forward, you will save the searches after you run them. Previously, you found how many
flowers each customer to the online shop bought. But what if you were looking for the one customer who
buys the most items on any given day? When you are ready, continue on to the next topic to learn another
way to search, this time using subsearches.
Use a subsearch
The last topic, "Use the search language", introduced search commands, the search pipeline, and drilldown
actions.
This topic walks you through a search to find the most frequent shopper and his purchases. It shows you two
approaches to getting the results that you want: without a subsearch and with a subsearch.
A subsearch is a search with a search pipeline as an argument. Subsearches are contained in square
brackets and evaluated first. The result of the subsearch is then used as an argument to the primary, or
outer, search. Read more about how subsearches work in the Search manual.
Example 1: Without a subsearch
Back at the Flower & Gift shop, your boss asks you to put together a report that shows the customer who
bought the most items yesterday and what he or she bought. It is not easy to get this result with just a
straightforward search--Let's break it down.
First, search for the customer who accessed the online shop the most yesterday.
1. Use the top command and limit the search to Yesterday:
sourcetype=access_* action=purchase | top limit=1 clientip
Limit the top command to return only one result for the clientip. If you wanted to see more than one "top
purchasing customer", change this limit value. For more information about usage and syntax, refer to the
"top" command's page in the Search Reference Manual.
This search returns one clientip value, which we will use to identify our VIP customer.
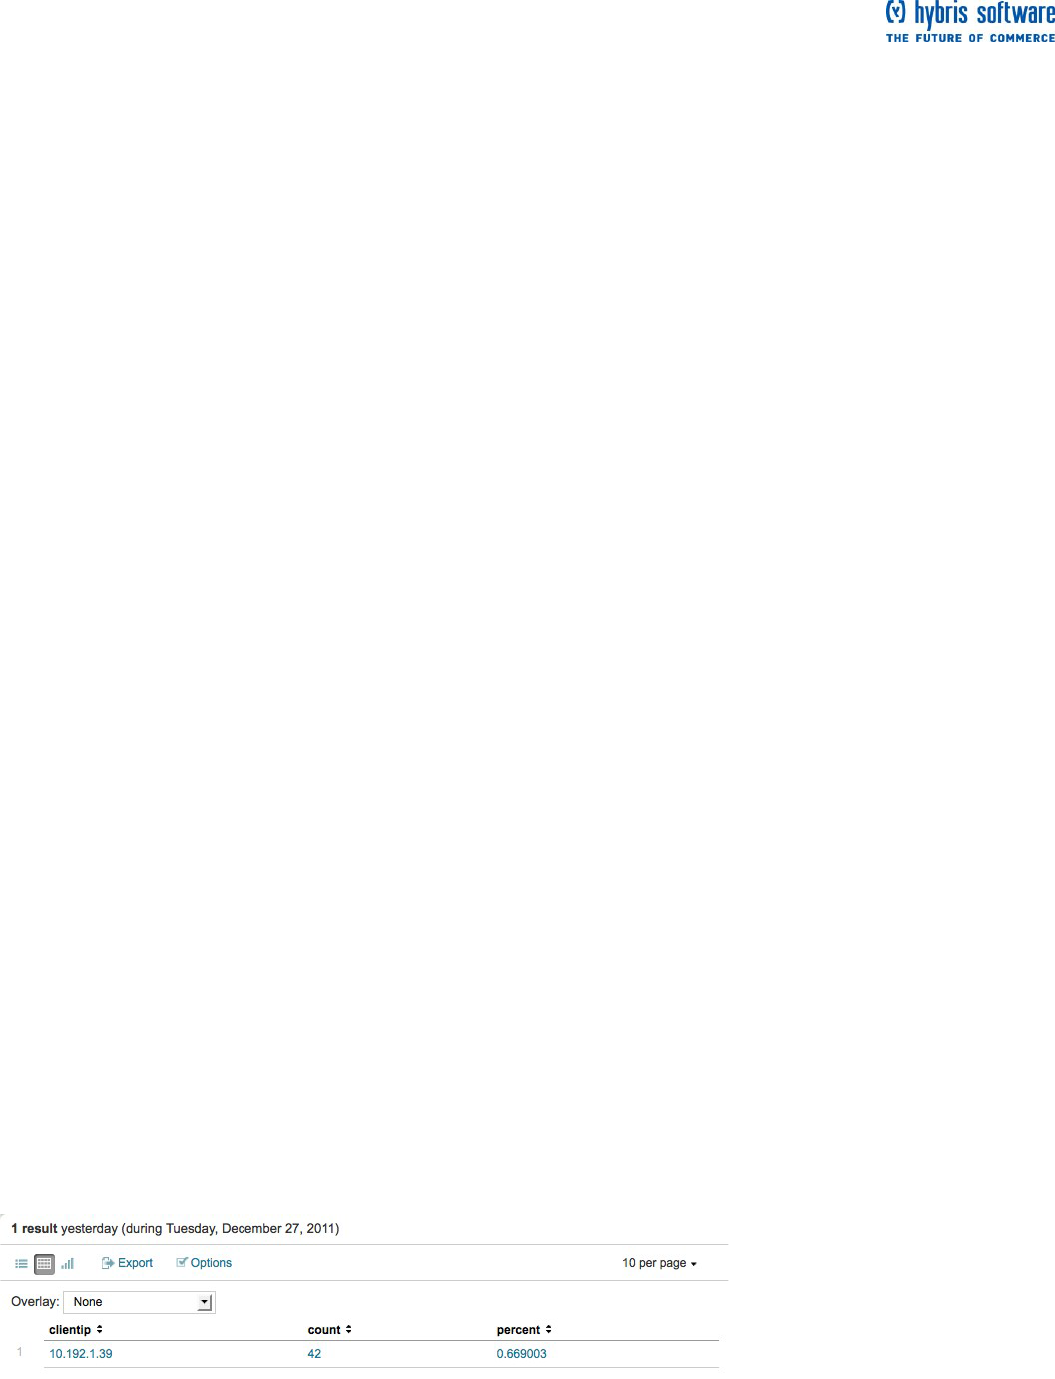
2. Use the stats command to count this VIP customer's purchases:
sourcetype=access_* action=purchase clientip=10.192.1.39 | stats count by clientip
Page 31 of 60
This search used the count() function which only returns the count of purchases for the clientip. You also
want to know what he bought, so let's use another stats function.
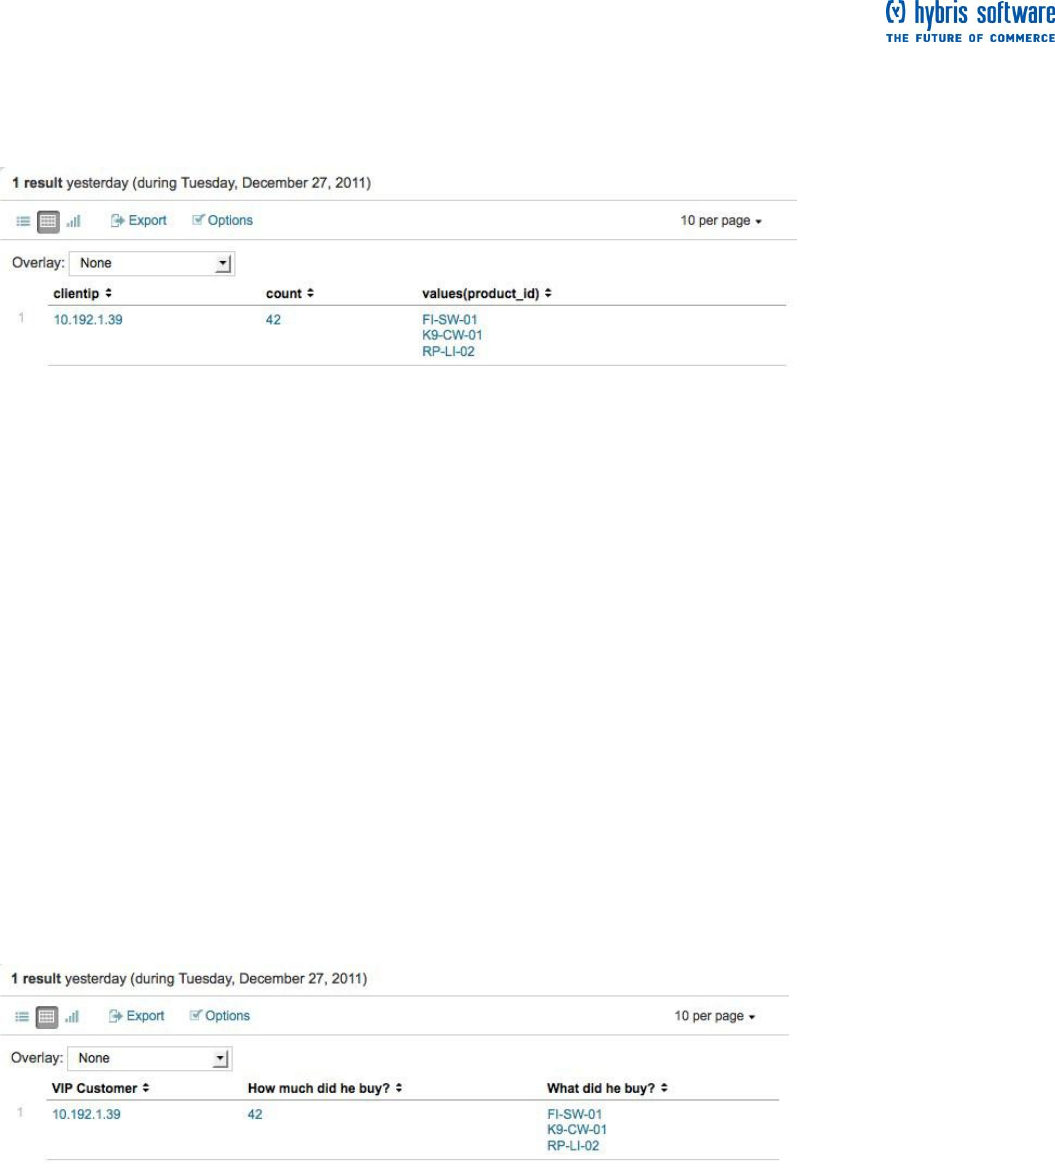
3. One way to do this is to use the values() function:
sourcetype=access_* action=purchase clientip=10.192.1.39 | stats count, values(product_id) by clientip
This adds a column to the table that lists what he bought by product ID.
The drawback to this approach is that you have to run two searches each time you want to build this table.
The top purchaser is not likely to be the same person at any given time range. For more information about
usage and syntax, refer to the the "stats" command's page in the Search Reference Manual. Also, for the list
of other stats functions, refer to the "List of stats functions" in the Search Reference Manual.
Example 2: With a subsearch
1. Use a subsearch to run the searches from Part 1 inline. Type or copy/paste in:
sourcetype=access_* action=purchase [search sourcetype=access_* action=purchase | top limit=1 clientip |
table clientip] | stats count, values(product_id) by clientip
Because the top command returns count and percent fields as well, you use the table command to keep only
the clientip value.
These results should match the previous result, if you run it on the same time range. But, if you change the
time range, you might see different results because the top purchasing customer will be different!
2. Reformat the results so that it is easier to read:
sourcetype=access_* action=purchase [search sourcetype=access_* action=purchase | top limit=1 clientip |
table clientip] | stats count, values(product_id) as product_id by clientip | rename count AS "How much did he
buy?", product_id AS "What did he buy?", clientip AS "VIP Customer"
Next steps
While this report is perfectly acceptable, you want to make it better. For example, you do not expect your
boss to know the shop items by their product ID numbers. You want to display the VIP customer's purchases
by the product names, rather than the cryptic product ID. When you are ready continue on to the next topic
to learn about adding more information to your events using field lookups.
Use field lookups
The last topic walked you through using a subsearch. If you are not familiar with it, go back and review how
to "Use a subsearch".
This topic walks you through using field lookups to add new fields to your events.
Page 32 of 60
What are field lookups?
Field lookups enable you to reference fields in an external CSV file that match fields in your event data.
Using this match, you can enrich your event data by adding more meaningful information and searchable
fields to them.
For an example that shows you how to use field lookups to add HTTP status code descriptions to your Web
access event data, see this Knowledge Manager Manual topic.
In the previous example, you created a report table that listed how many items the top purchasing customer
bought and which items they were. The items were listed by a product ID number that, on its own, is pretty
meaningless because you do not know what it refers to. Before you show this report to your boss and
coworkers, you want to add the actual product name. This information does not exist in your data, but you
can add it from an external file using field lookups.
To proceed, download and uncompress this CSV file:
product_lookup.csv.zip
Important: To complete the rest of the tutorial, you have to follow the procedures in this topic. If you do not
follow this topic, the searches in the following topics will not produce the correct results.
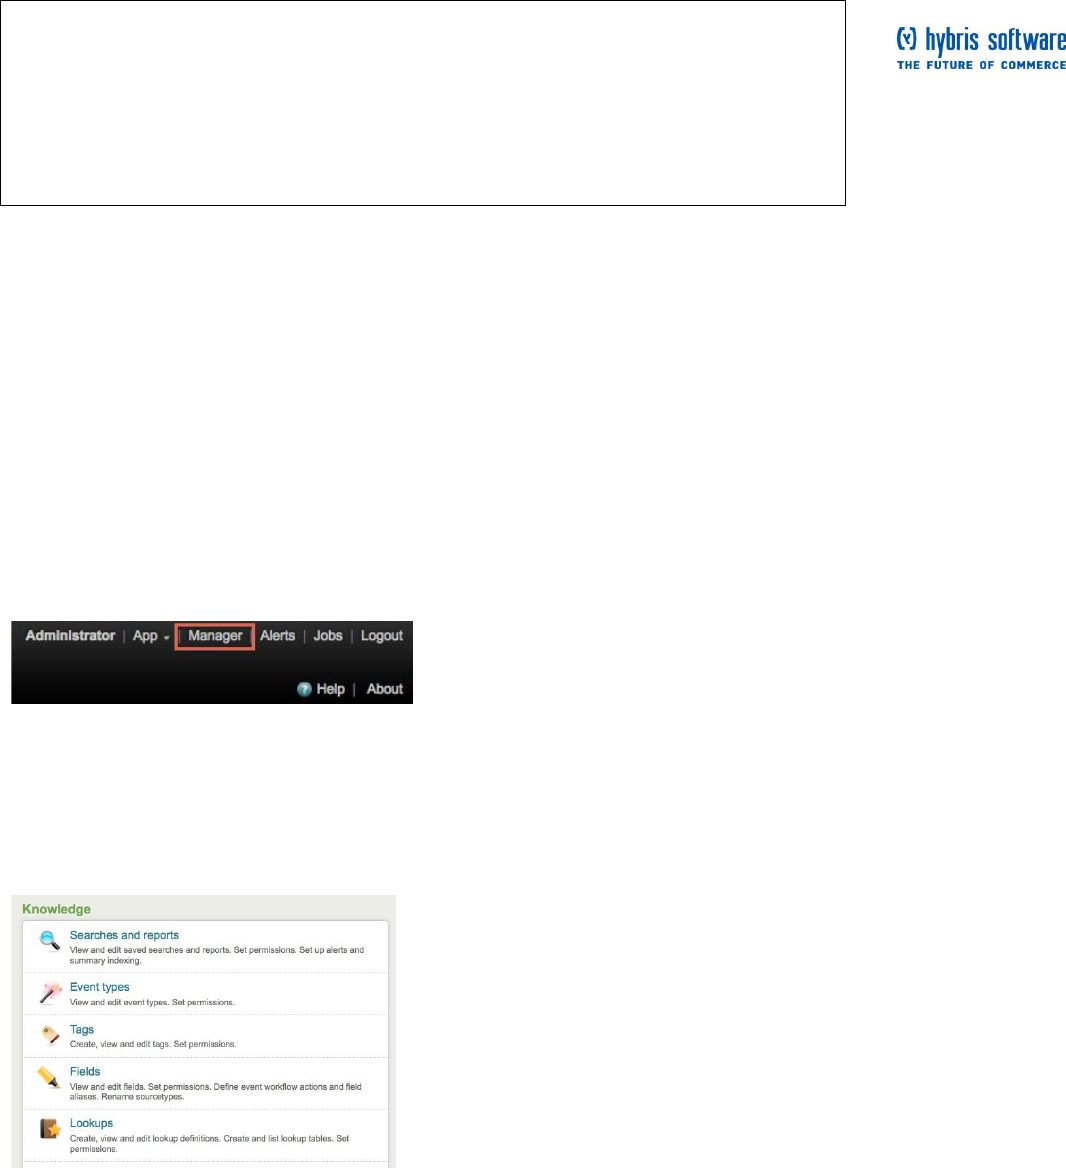
Find the Lookups manager
1. In the Splunk navigation menus, on the upper right corner, click on Manager.
This takes you to Splunk Manager, which enables you to access and configure your Splunk server's apps,
knowledge objects, and other settings such as system, data, deployment, and authentication settings. If you
do not see some of these options, it just means that you do not have the permissions to view or edit them.
For now, we are only interested in the Knowledge configurations.
2. Under Knowledge, click Lookups.
Page 33 of 60
This takes you to the Manager > Lookups view.
This view enables you to edit existing lookups by clicking on the links in the table for Lookup table files,
Lookup definitions, and Automatic lookups. If you want to add new lookups, just click Add new under
actions for that lookup item.
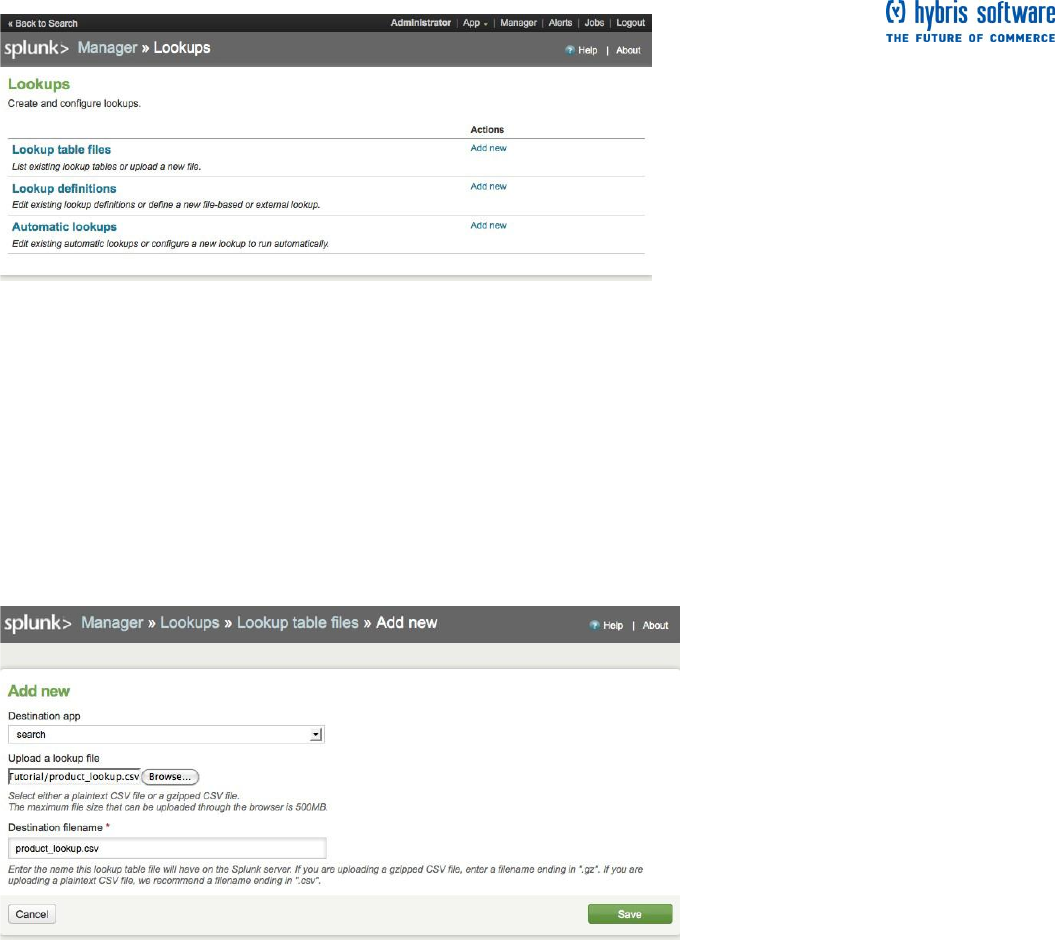
Upload the lookup file
In the Manager > Lookups view:
1. Under Actions for Lookup table files, click Add New.
This takes you to the Manager > Lookups > Lookup table files view where you upload CSV files to use in
your definitions for field lookups.
2. Leave the Destination app as search.
This tells Splunk to save your lookup table file in the Search app.
3. Under Upload a lookup file, browse for the CSV file (product_lookup.csv) to upload.
4. Under Destination filename, name the file product_lookup.csv.
This will be the name you use to refer to the file in a lookup definition.
5. Click Save.
This uploads your lookup file to Splunk to the Search app, but now you need to define the type of lookup you
want to set up.
Note: Splunk does not recognize or cannot upload the file, check that it was uncompressed before you
attempt to upload it again.
Page 34 of 60
6. Return to Manager > Lookups by clicking the breadcrumb:
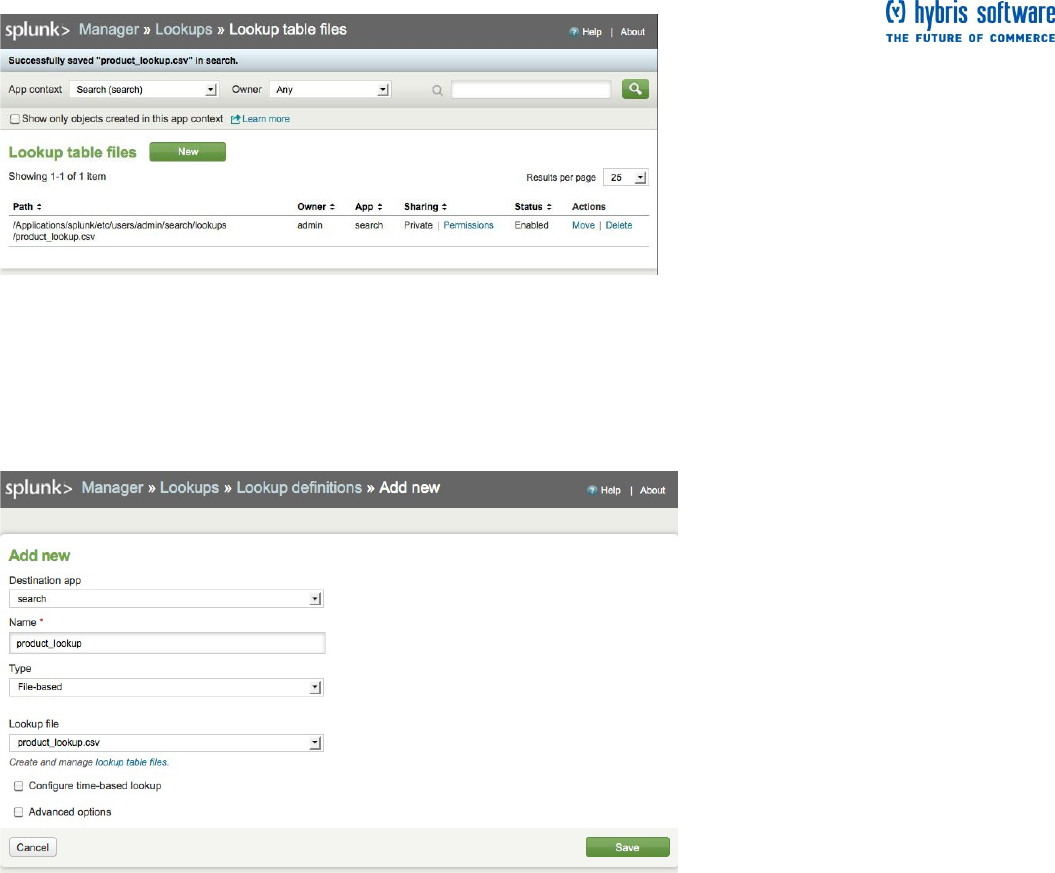
Define the field lookup
In the Manager > Lookups view:
1. Under Actions for Lookup definitions, click Add New.
This takes you to the Manager > Lookups > Lookup table files view where you define your field lookup.
2. Leave the Destination app as search.
3. Name your lookup product_lookup.
4. Under Type, select File-based.
5. Under Lookup file, select product_lookup (the name of your lookup table).
6. Leave Configure time-based lookup and Advanced options unchecked.
7. Click Save.
Now Splunk knows that product_lookup is a file-based lookup.
Page 35 of 60
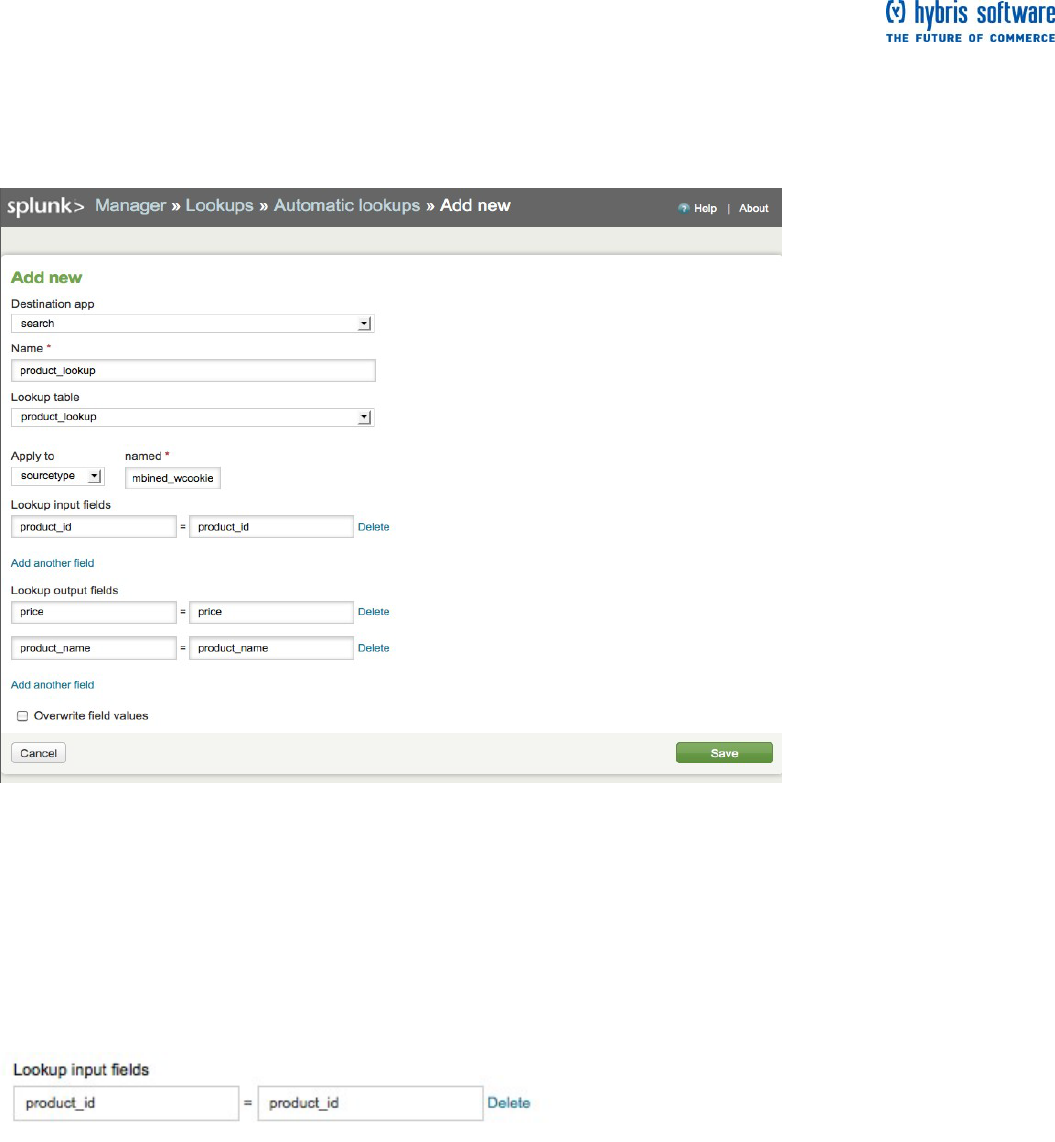
Make the lookup automatic
In the Manager > Lookups view:
1. Under Actions for Automatic lookups, click Add New.
This takes you to the Manager > Lookups > Automatic lookups >> Add New
view where you configure the lookup to run automatically.
2. Leave the Destination app as search.
3. Name your automatic lookup product_lookup.
4. Under Lookup table, select product_lookup.
5. Under Apply to and named, select sourcetype and type in
access_combined_wcookie.
6. Under Lookup input fields type in:
The input field is the field in your event data that you are using to match the field in the lookup table.
Page 36 of 60
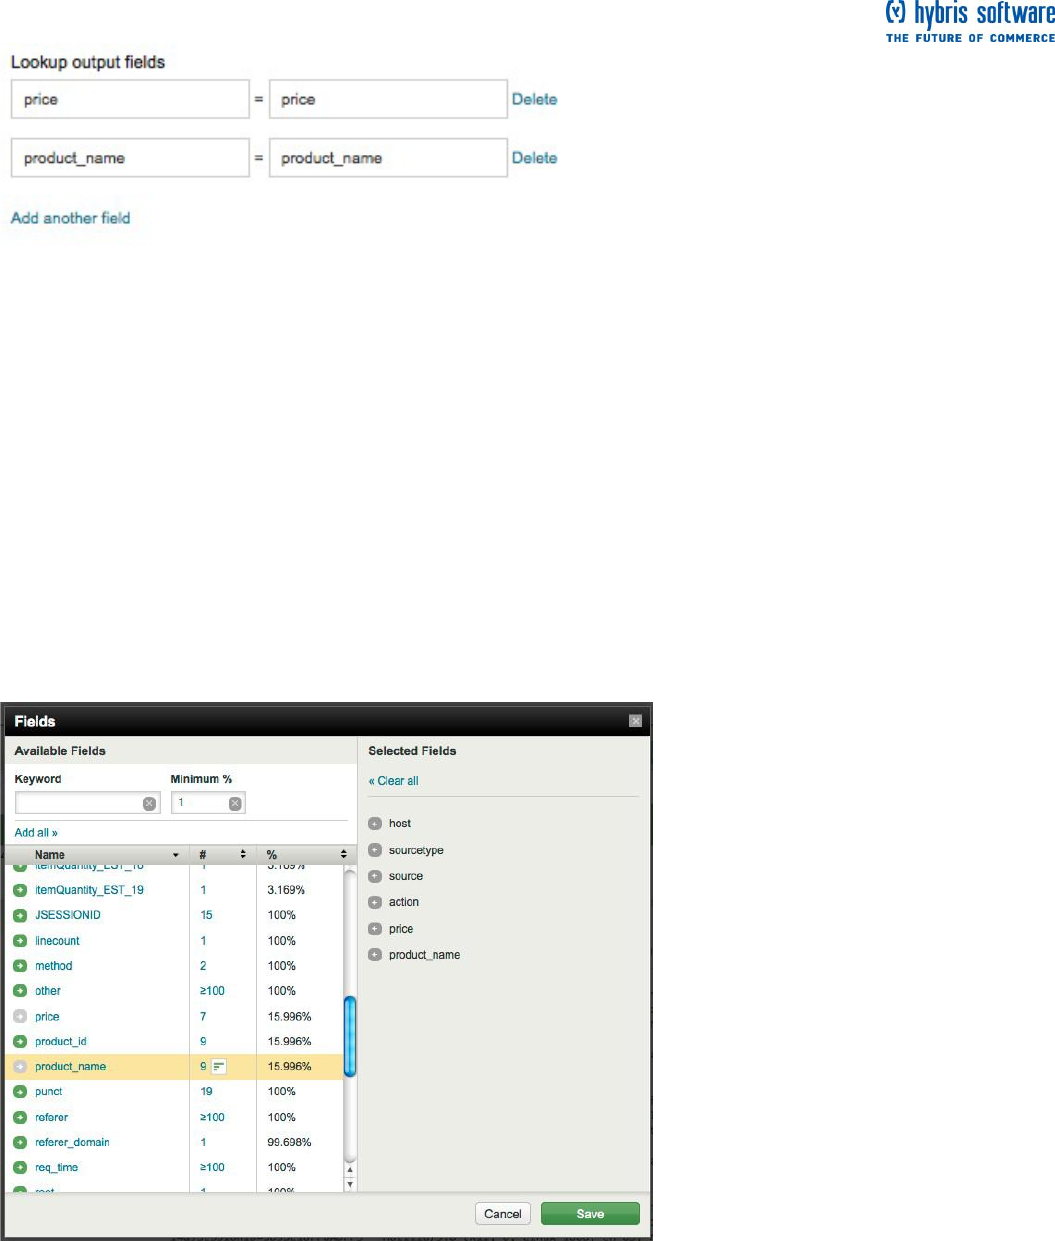
7. Under Lookup output fields, type in the following. Use the Add another field link to add more fields after
the first one:
The output fields are the field(s) in the lookup table that you want to add to your event data based on the
input field matching. Here, you are adding the fields: price, which contains the price for each product_id, and
product_name, which contains the descriptive name for each product_id.
8. Leave Overwrite field values unchecked.
If you check this box, Splunk will overwrite any fields that exist in your event data with values from the
corresponding field that you map to it from the lookup table. Since you are adding two new fields, you do not
need to worry about this option.
9. Click Save.
Return to the Search dashboard (click << Back to Search) and run the search for Web access activity over
the time range, Yesterday:
sourcetype=access_*
When you scroll through the Fields menu or Fields picker, you should see the new fields that you added.
Search with the new lookup fields
Now you can run the previous subsearch example to see what the VIP customer bought. This time, replace
the product_id field with the more readable product_name:
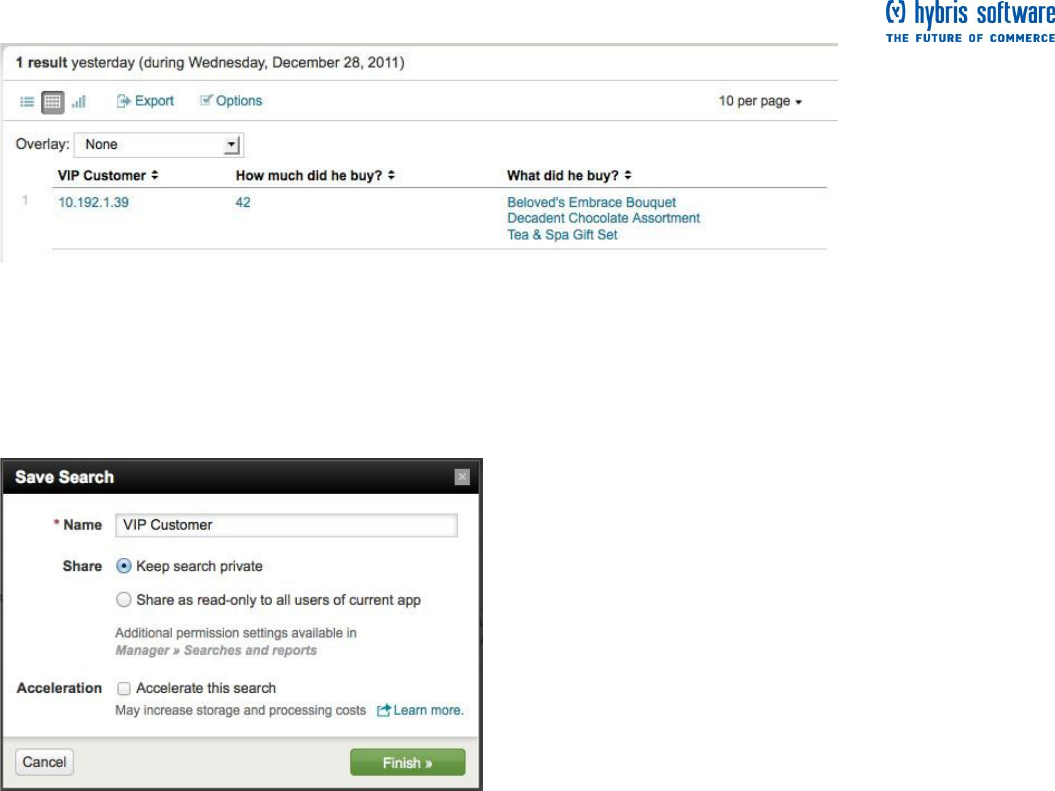
sourcetype=access_* action=purchase [search sourcetype=access_* action=purchase | top limit=1 clientip |
table clientip] | stats count, values(product_name) AS product_name by clientip | sort - count | rename count
AS "How much did he buy?", product_name AS "What did he buy?", clientip AS "VIP Customer"
Page 37 of 60
The result is exactly the same as in the previous subsearch example, except that the VIP customer's
purchases are more meaningful.
Save this search as "VIP Customer".
Search acceleration
When you saved the "VIP Customer" search, the save dialog included a new
option: Acceleration.
If your search has a large number of events and is slow to complete, you may be able to accelerate it so it
completes faster when you run the search again in the future. This option is only available when your search
qualifies for acceleration. This search does because it is a reporting search.
The sample data used in this tutorial is limited in volume and the searches throughout are run against data
for one day (Yesterday). Checking this box will not have a noticeable effect on the speed of this search and
all upcoming searches you will save in this Tutorial.
Read more search acceleration and the searches that qualify in the "Save searches and share search
results" topic in the Knowledge Manager Manual.
Next steps
When you are ready, proceed to the next topic where you will run more searches.
More search examples
In the last topic, you added two new fields to the online shop event data using a lookup table. If you did not
add those fields, go back and review how to use field lookups and follow the procedure to add the fields.
Without them, the searches below will not return the correct results.
Back at the Flower & Gift shop, you are asked to gather information to build a report for your boss about
yesterday's purchase records:
How many page views were requested?
What was the difference between page views and purchases made?
What was purchased and how much was made?
How many purchase attempts failed?
This topic uses what you learned from previous topics to write the searches to answers these questions.
Page 38 of 60
The Search Reference Manual
These examples use only a handful of the search commands and functions available to you. For complete
syntax and descriptions of usage of all the search commands, see the Search Reference Manual.
The complete list of search commands
The list of functions for the eval command
The list of functions for the stats command
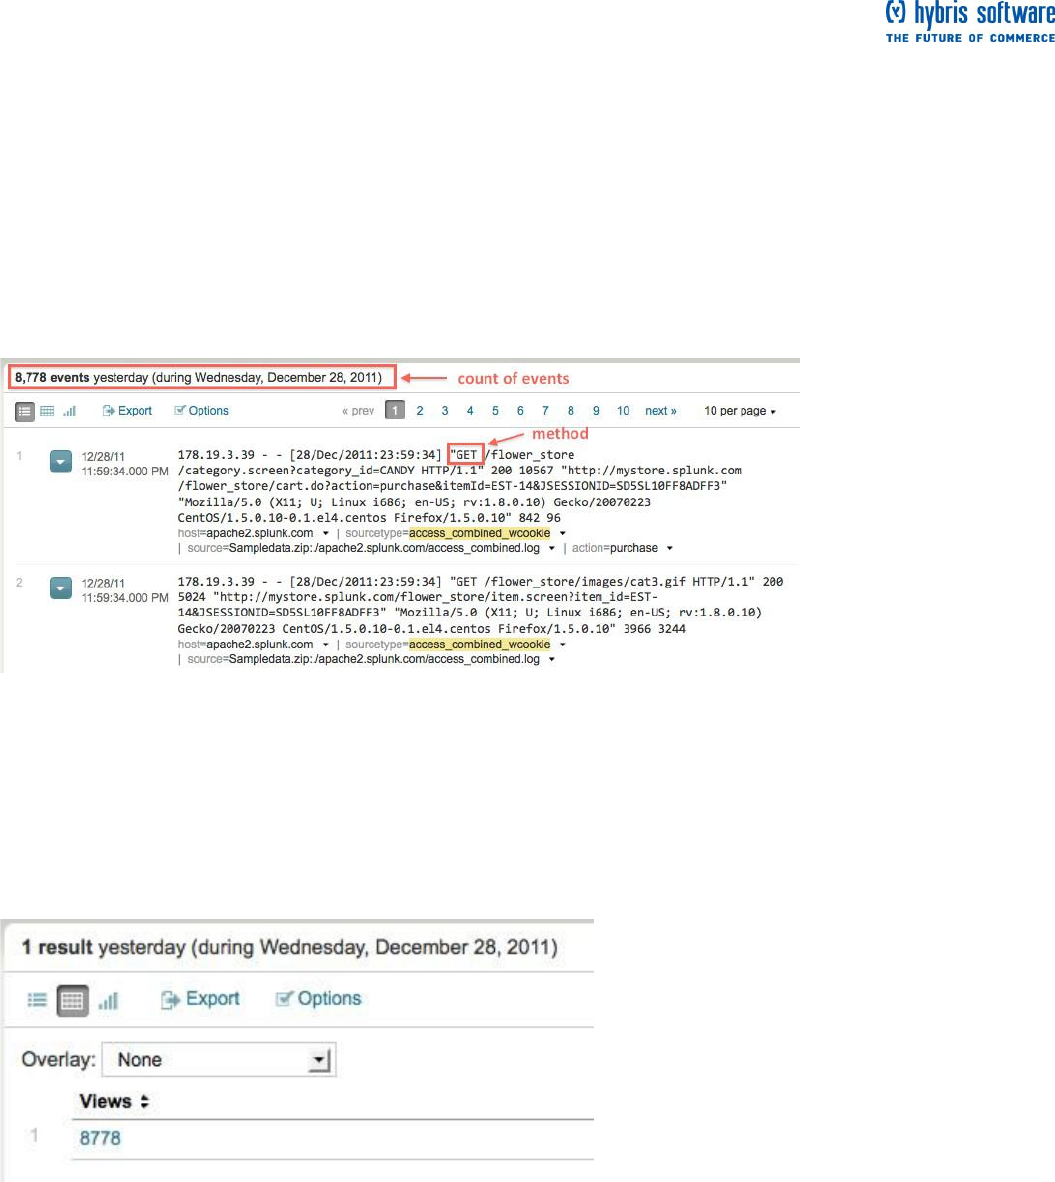
Example 1 - How many page views were requested?
How many times did someone view a page on the website, yesterday?
1. Start with a search for all page views. Select the time range, Other > Yesterday:
sourcetype=access_* method=GET
Next you want to count the number of page views (characterized by the method field).
2. Use the stats command:
sourcetype=access_* method=GET | stats count AS Views
Here, you use the stats command's count() function to count the number of "GET" events in your Web access
logs. This is the total number of events returned by the search, so it should match the count of retrieved
events. This search essentially captures that count and saves it into a field that you can use.
Here, renaming the count field as Views is not necessary, but you are going to use it again later and this
helps to avoid confusion.
3. Save this search as Pageviews (Yesterday).
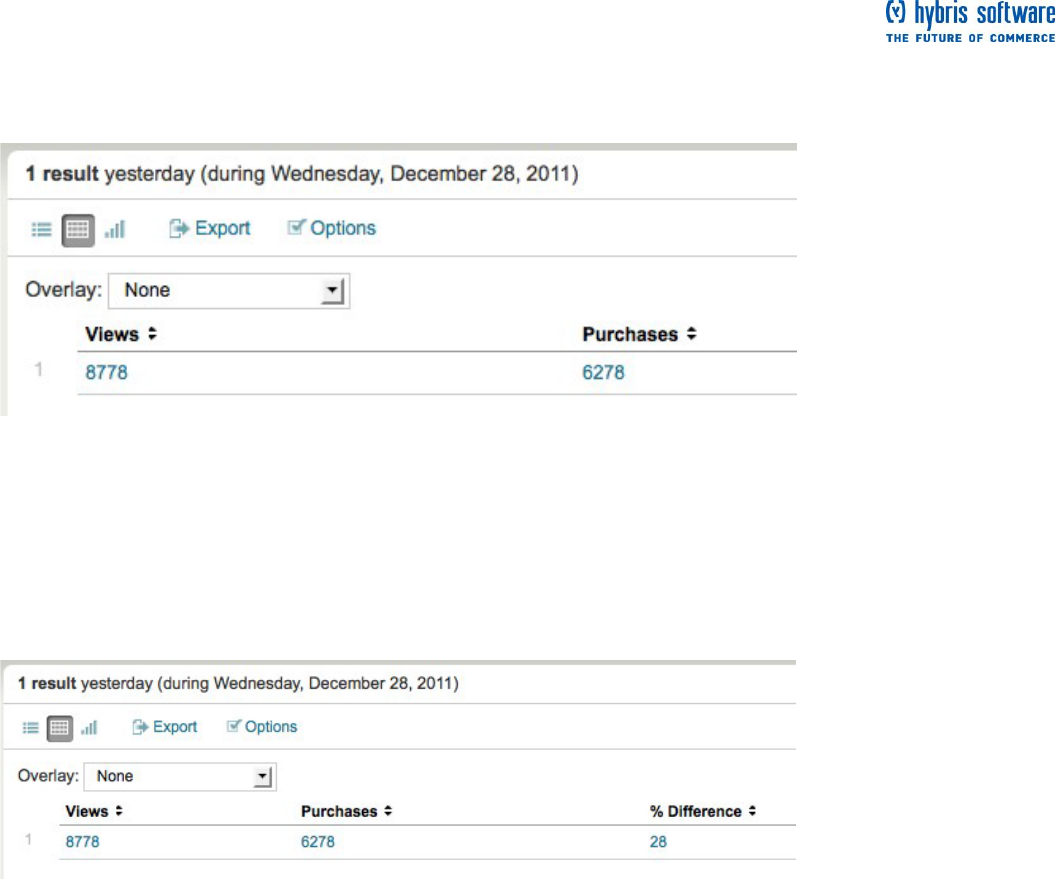
Example 2 - What was the difference between page views and purchases made?
From Example 1, you have the total number of views. How many visitors who viewed the site
purchased an item? What is the percentage difference between views and purchases?
1. Start with the search from Example 1. Select the Other > Yesterday from the time range picker:
sourcetype=access_* method=GET | stats count AS views
Page 39 of 60
2. Use stats to count the number of purchases (characterized by the action field):
sourcetype=access_* method=GET | stats count AS Views, count(eval(action="purchase")) AS Purchases
You also use the count() function again, this time with an eval() function, to count the number of purchase
actions and rename the field as Purchases. Here, the renaming is required--the syntax for using an eval()
function with the stats command requires that you rename the field.
Now you just need to calculate the percentage, using the total views and the purchases.
3. Use the eval command and pipe the results to rename:
sourcetype=access_* method=GET | stats count AS Views, count(eval(action="purchase")) as Purchases |
eval percentage=round(100-(Purchases/Views*100)) | rename percentage AS "% Difference"
The eval command enables you to evaluate an expression and save the result into a field. Here, you use the
round() function to round the calculated percentage of Purchases to Views to the nearest integer.
4. Save your search as "% Difference Purchases/Views".
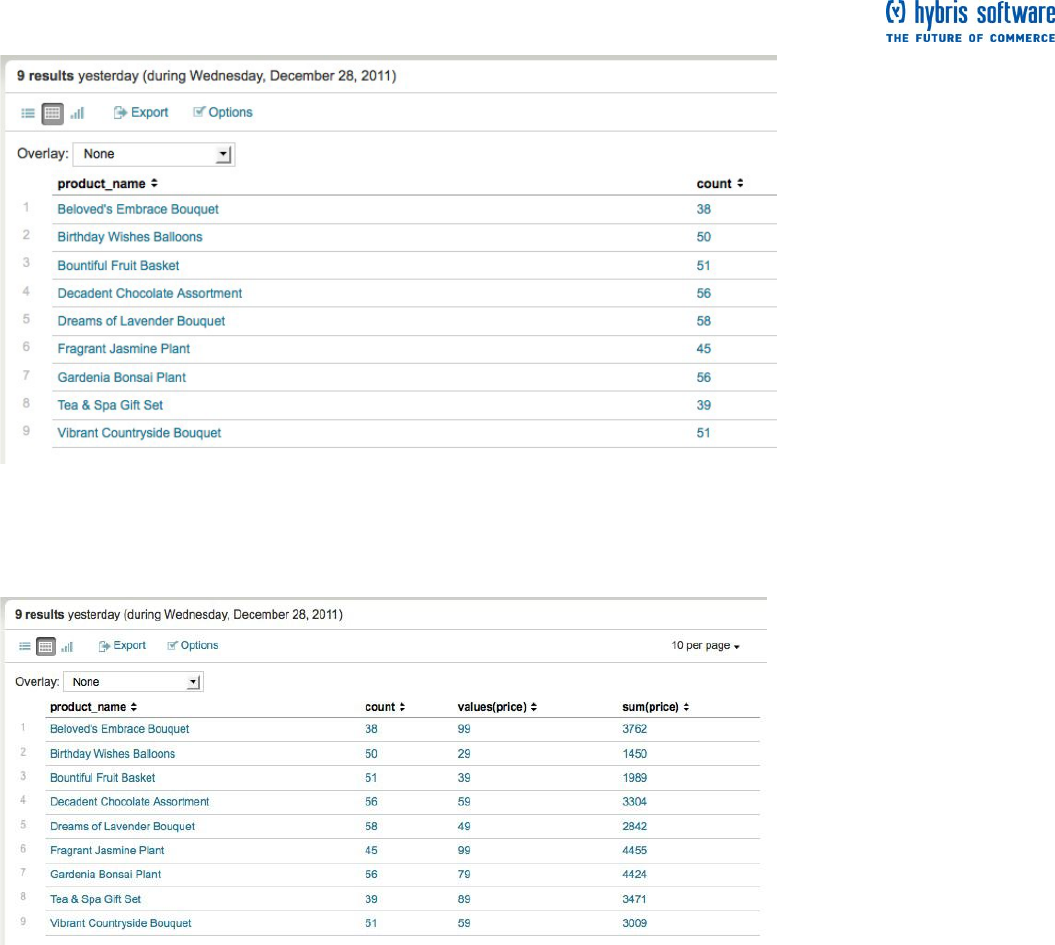
Example 3 - What was purchased and how much was made?
This example requires the two fields, product_name and price, added in the fields lookup example. If
you did not add them, refer to that example and follow the procedure.
Build a table to show what products were purchased yesterday, how many of each item was bought, and the
calculated revenue for each product.
Page 40 of 60
1. Start with a search for all purchases by the product name. Change the time range to Other > Yesterday:
sourcetype=access_* action=purchase | stats count by product_name
2. Use stats functions to include the count of products purchased, price of each product, and the total
revenue made for each product.
sourcetype=access_* action=purchase | stats count, values(price), sum(price) by product_name
The count() function counts the number of events. The values() function returns the value of price for each
product_name. And the sum() function adds together all the values of price for each product_name.
Page 41 of 60
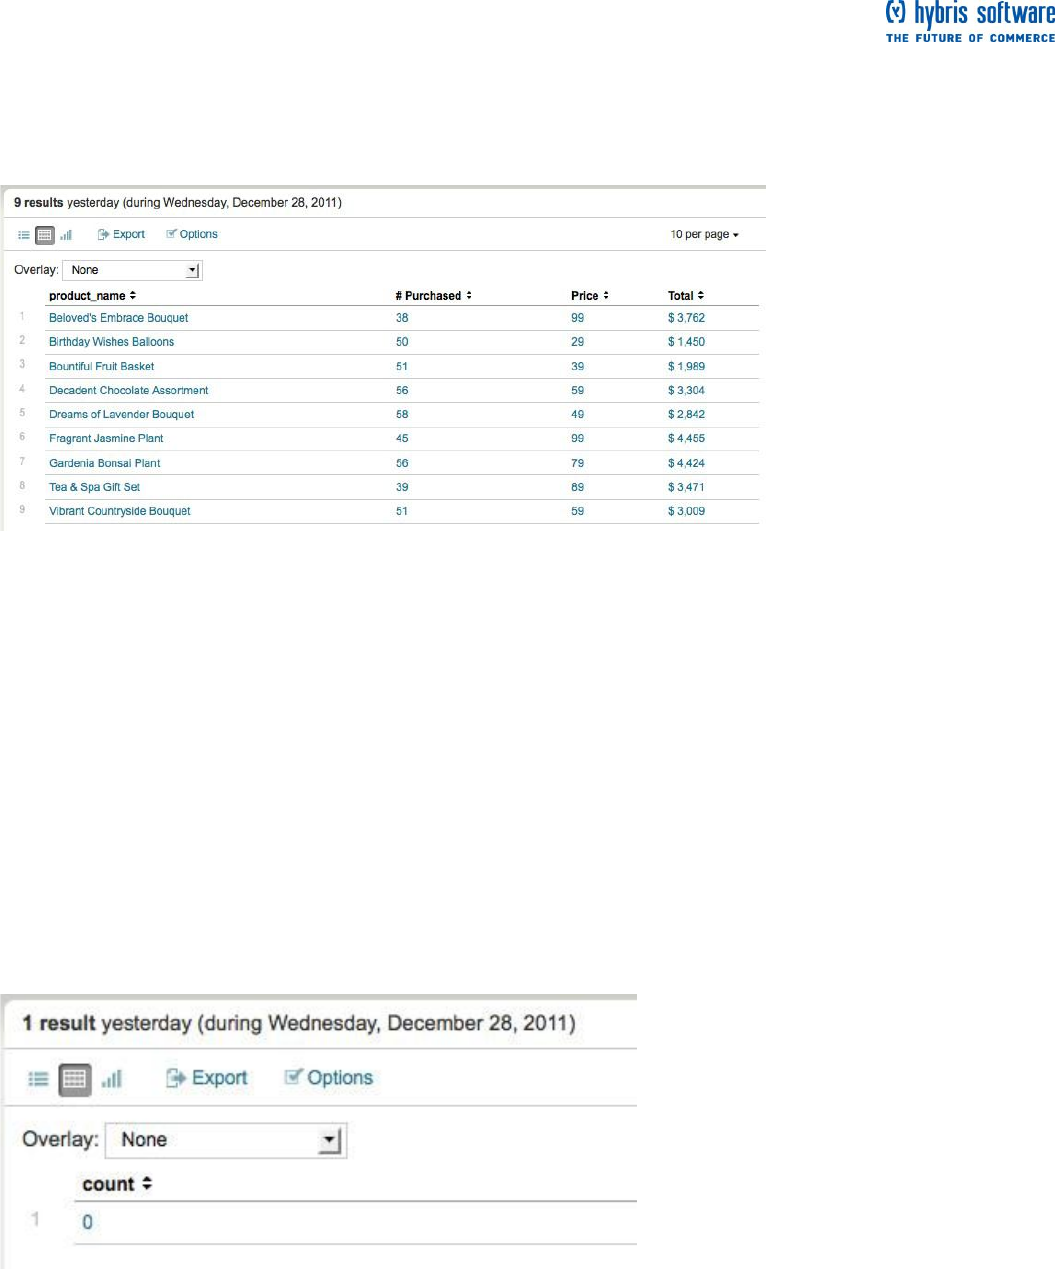
3. Now, you just need to rename the fields to make the table more readable:
sourcetype=access_* action=purchase | stats count AS "# Purchased", values(price) AS Price, sum(price) AS
Total by product_name | eval Total="$ ".tostring(Total, "commas")
Here, 'AS' is used to rename the table headers. Also, you used the eval command's tostring() function to
convert the calculated total price values to a string and reformat them to include a dollar sign "$" and
commas. (The dot '.' is a shortcut notation for string concatenation.)
5. Save your search as Purchases and Revenue (Yesterday).
Example 4 - How many purchase attempts failed?
In the previous examples you searched for successful purchases, but you also want to know the count of
purchase attempts that failed!
1. Run the search for failed purchase attempts, selecting Yesterday from the time range picker:
sourcetype=access_* action=purchase status=503
(You should recognize this search from the "Start searching" topic, earlier in this tutorial.)
This search returns the events list, so let's count the number of results.
2. Use the stats command:
sourcetype=access_* action=purchase status=503 | stats count
This returns a single value:
This means that there were no failed purchases yesterday!
3. Save this search as Failed purchases (Yesterday).
Next steps
Now you should be comfortable using the search language and search commands. When you are ready,
proceed to the next topic to learn about reports and dashboards.

Page 42 of 60
Create reports and dashboards
About reports and dashboards
This chapter walks you through using Splunk Web to create reports and dashboards from the searches you
saved throughout this tutorial.
The Splunk Report Builder makes it easy to generate sophisticated reports using the results from any
completed or finalized search. It offers a wide range of reporting options, both in terms of reporting
parameters and chart types.
Splunk makes it just as easy to create and edit simple dashboards using Splunk Web. You can add a search
you have just run to a new or existing dashboard, or use the Dashboard Editor to create dashboards and
populate them with dashboard panels.
When you are ready, continue to the next topic to run reporting searches.
Reporting examples
This topic builds on the searches that you ran and saved in the previous search examples to walk you
through creating charts and building reports. Back at the Flower & Gift shop, you are still building your
reports. The previous searches you ran returned either a single value (for example, a count of failed errors)
or a table of results (a table of products that were purchased). Now, you want to also add some
visualizations to your reports of yesterday's activities:
The count of purchases and views for each product category
The count of products purchased over time
A trend of the count of products purchased over time
Using Report builder
Splunk can dynamically update generated charts as it gathers search results. When you initiate a search,
you can start building your report before the search completes. You can use the fields menu to quickly build
simple pre-defined reports or use the Report Builder, which lets you define, generate and fine-tune the
format of your report, from the type of chart you want to create to the contents you want to display on this
chart.
If you are dealing with a long search and do not want to wait until the search completes to start
defining a report based on it, click Create and select Report... to launch the Report Builder. The
search continues running after the Report Builder is launched, and the finished report covers the full
range of the event data returned.
If your search string includes reporting commands, you access the Report Builder by clicking Show
report. Splunk will jump you directly to the formatting stage of the report-building process, since
your reporting commands have already defined the report.
You do not need to have a strong understanding of reporting commands to use the Report Builder, but if you
do have this knowledge the range of things you can do with the Report builder is increased.
To learn more about using the report builder to define basic report parameters, format charts, and export or
print finished reports, see "Define reports and generate charts" in this manual.
Chart of purchases and views for each product
In this example, chart the number of views and number of purchases for each type of product. Recall that
you saved a similar search in a previous topic.
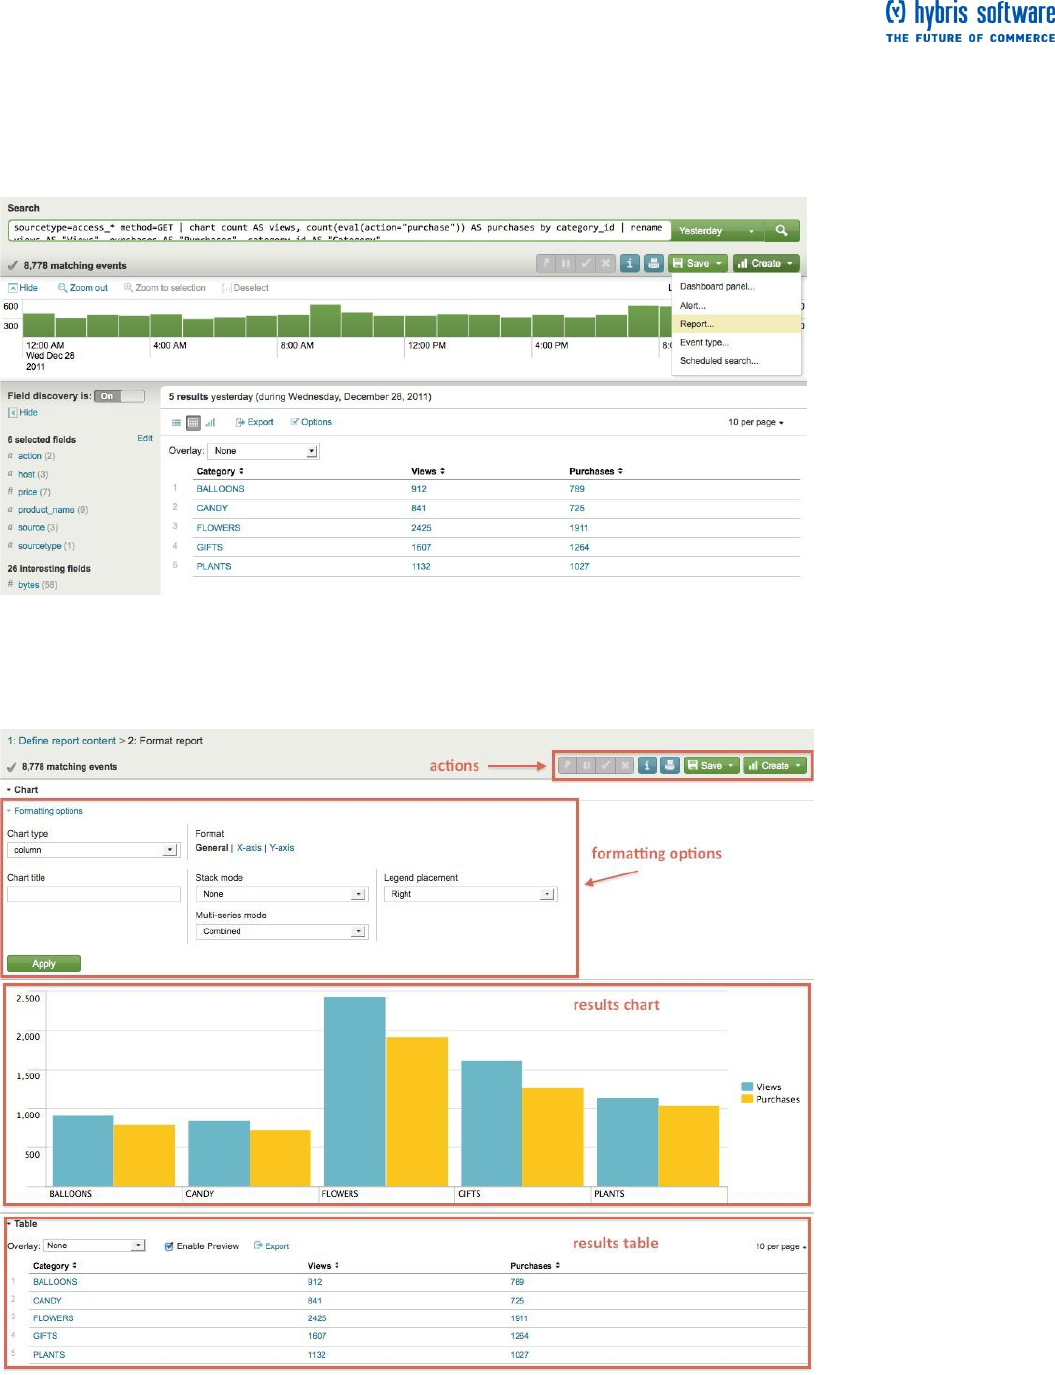
Page 43 of 60
Let's modify it a little.
1. Run this search over the time range, Yesterday:
sourcetype=access_* method=GET | chart count AS views, count(eval(action="purchase")) AS purchases by
category_id | rename views AS "Views", purchases AS "Purchases", category_id AS "Category"
Here, you use the chart command instead of the stats command. The chart command enables you to create
charts and specify the x-axis with the by clause.
2. Click on Create, and select Report... from the list.
Because you use the chart command and have already defined your report, this opens the Format report
page of the Report Builder.
If you see something different in this window, for example a different chart type, it is probably because you
are not looking at the default settings. You do not need to worry about this though.
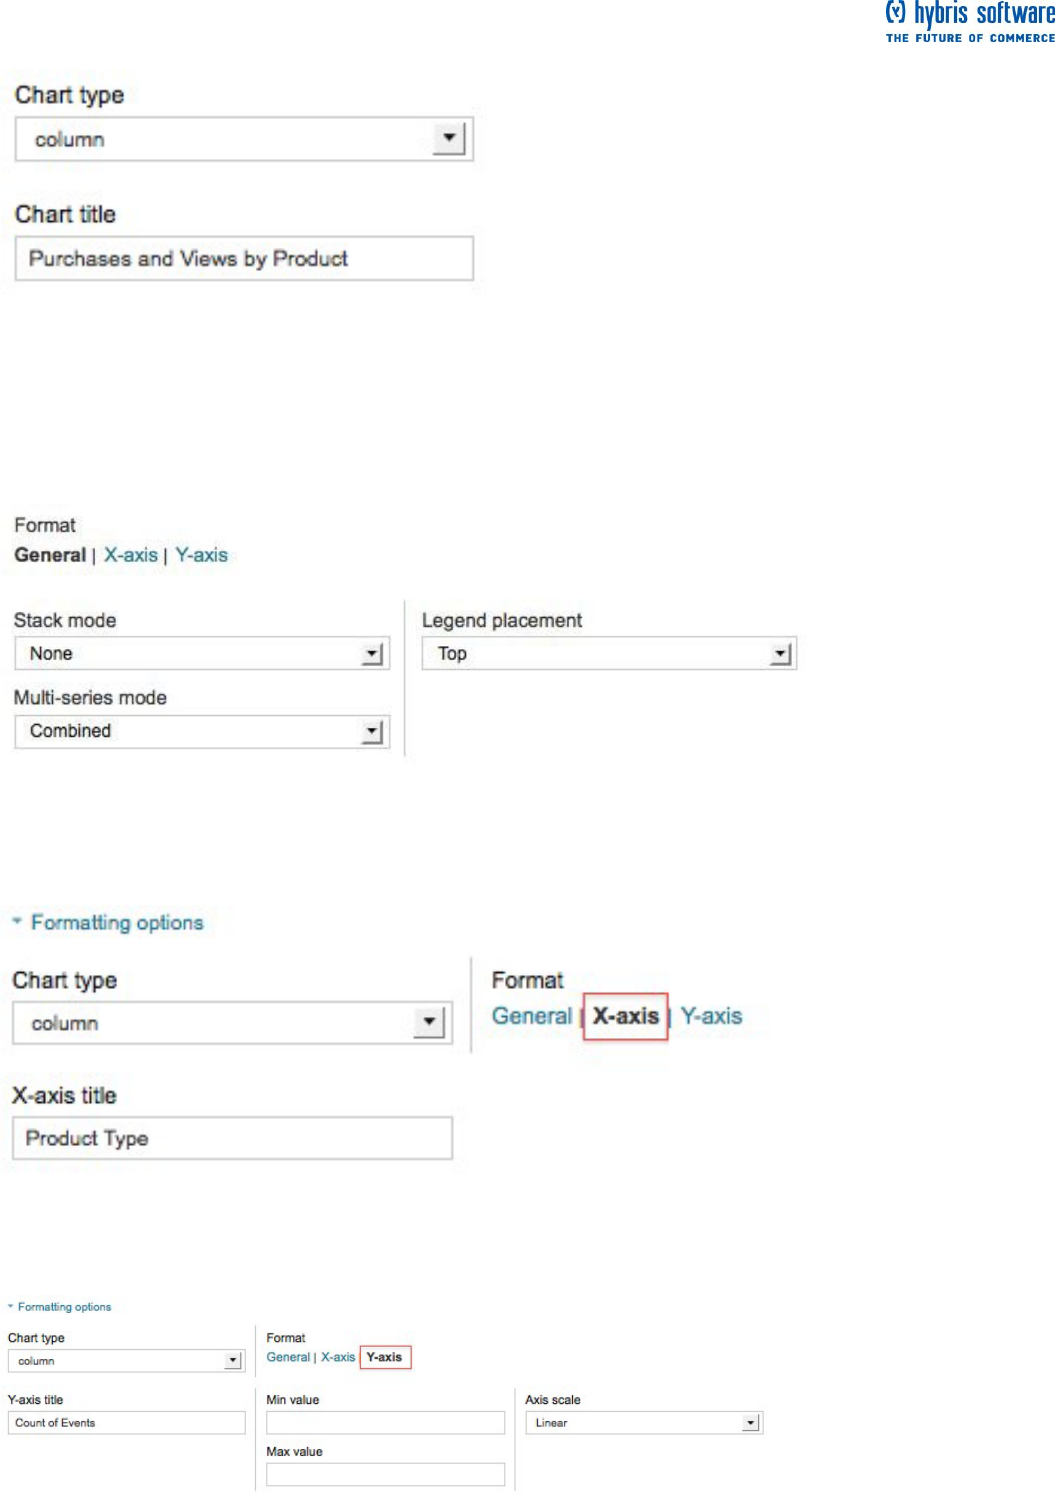
Page 44 of 60
3. Under Formatting options:
Leave the chart type set to column.
Name the chart, Purchases and Views by Product Type.
Because you are using the chart command, you have to define the axes of the chart.
4. Under General, change the Legend placement to Top.
5. Under Format, click X-axis:
Type in "Product type" for the X-axis title.
6. Under Format, click Y-axis:
Type in "Count of events" for the y-axis title.
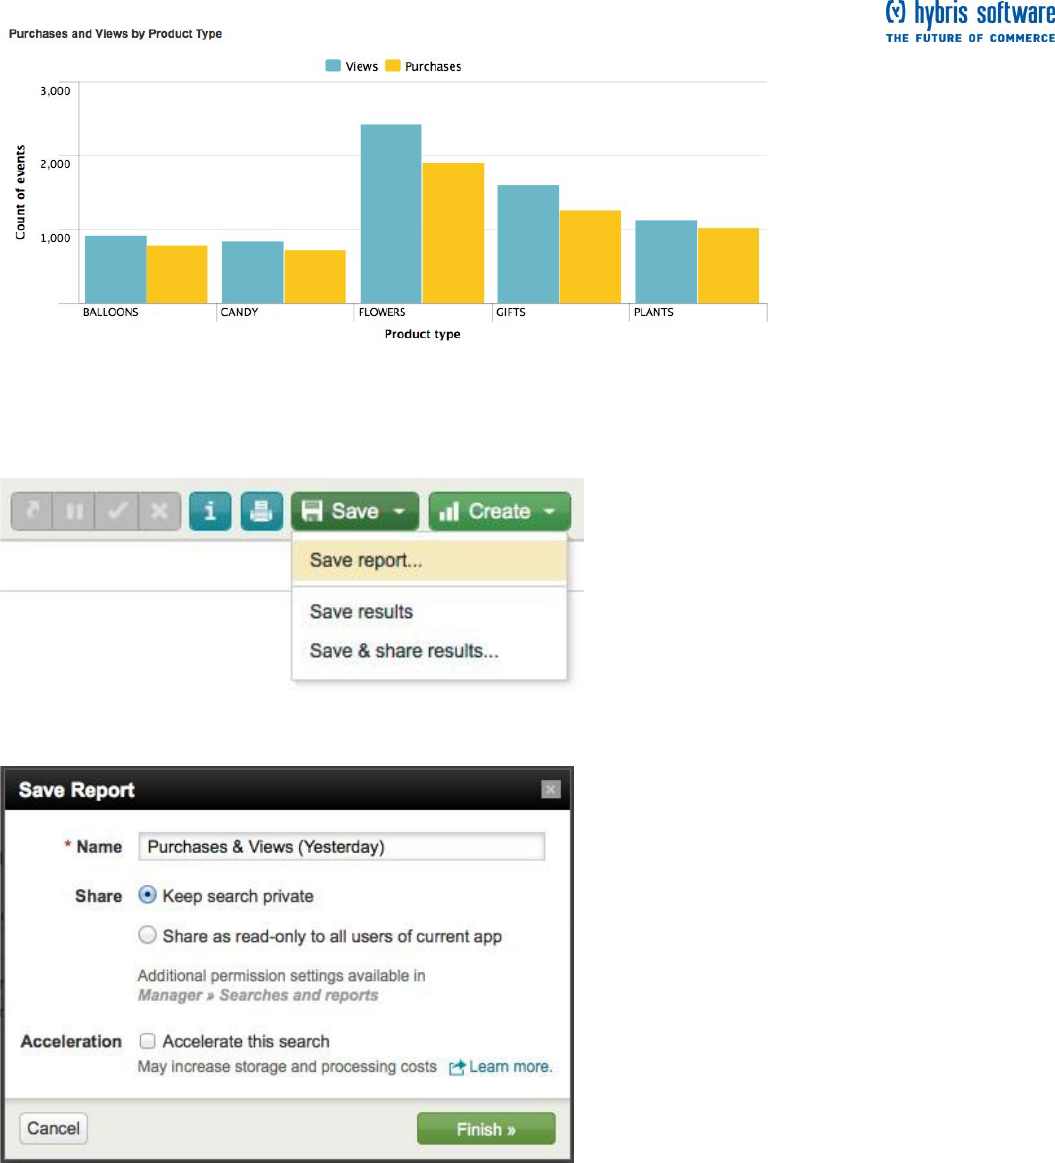
Page 45 of 60
7. Click Apply.
Now you should see your chart of purchases and views formatted as a column chart with the types of
products on the X-axis.
8. Click Save and select Save report... from the list.
The Save report dialog window opens:
Name your report Purchases & Views (Yesterday).
Click Finish >>
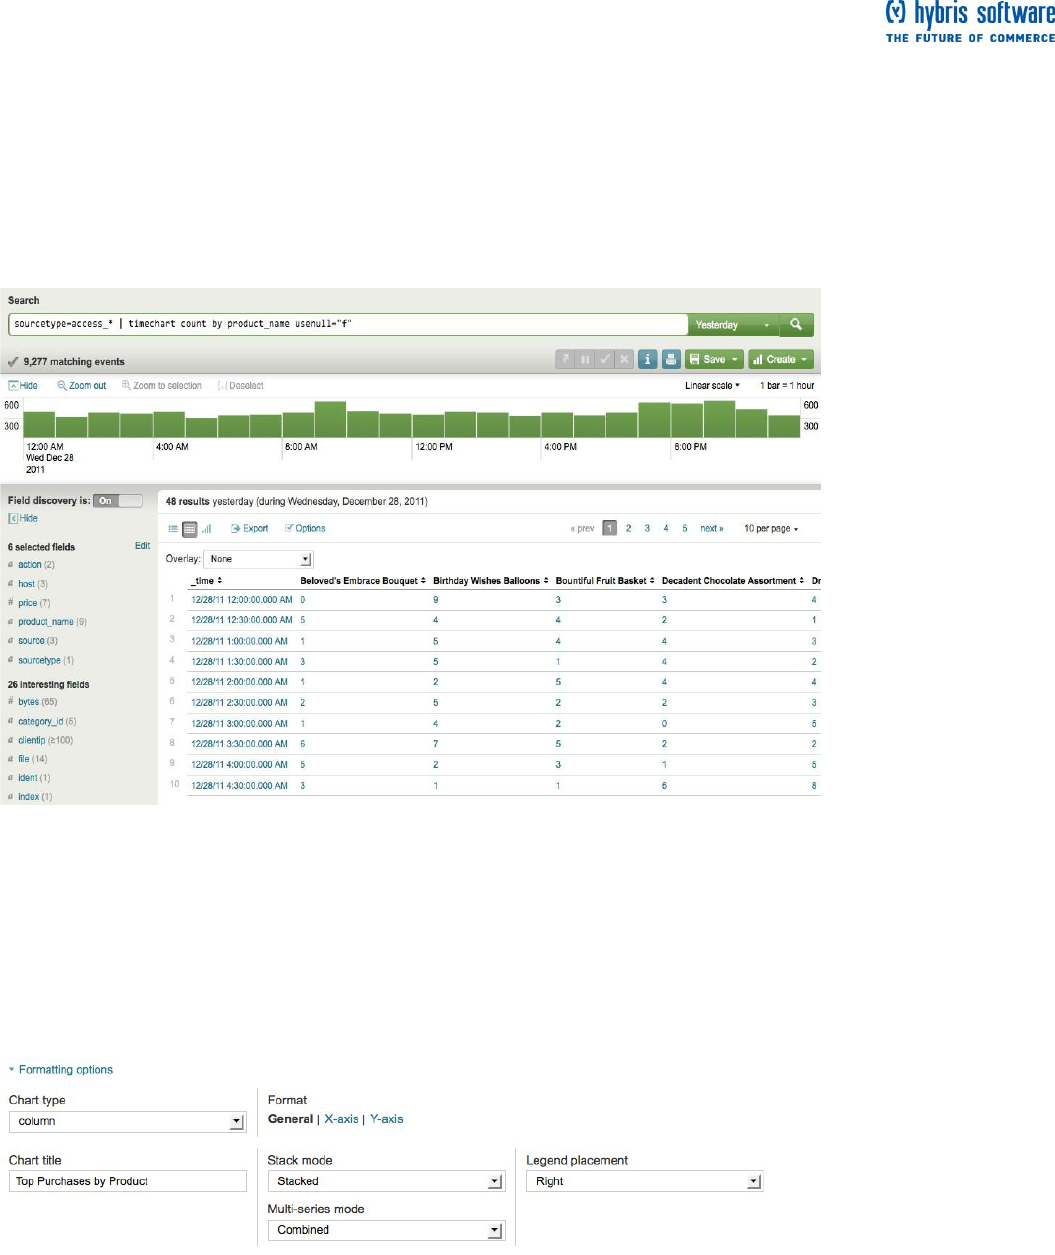
Page 46 of 60
Top purchases by product name
This report requires the product_name field from the Use field lookups. If you did not add the lookup,
refer to that example and follow the procedure.
For this report, chart the number of purchases that were completed for each item yesterday.
1. Search for:
sourcetype=access_* | timechart count(eval(action="purchase")) by product_name usenull="f"
Once again, use the count() function. But also, use the usenull argument to make sure the chart only counts
events that have a value for product_name.
2. Click Create and select Report....
Because you used the timechart command in your search string, this takes you directly to Step 2 of report
builder, where you Format your report.
3. Under Formatting options:
Change the chart type to column.
Name the chart, Top purchases by Product.
Change the Stack mode to Stacked.
Because you used the timechart command, the axes are already named: the x-axis is time and the y-axis is
count of events. Rename the axes to "Time" and "Count of purchases"
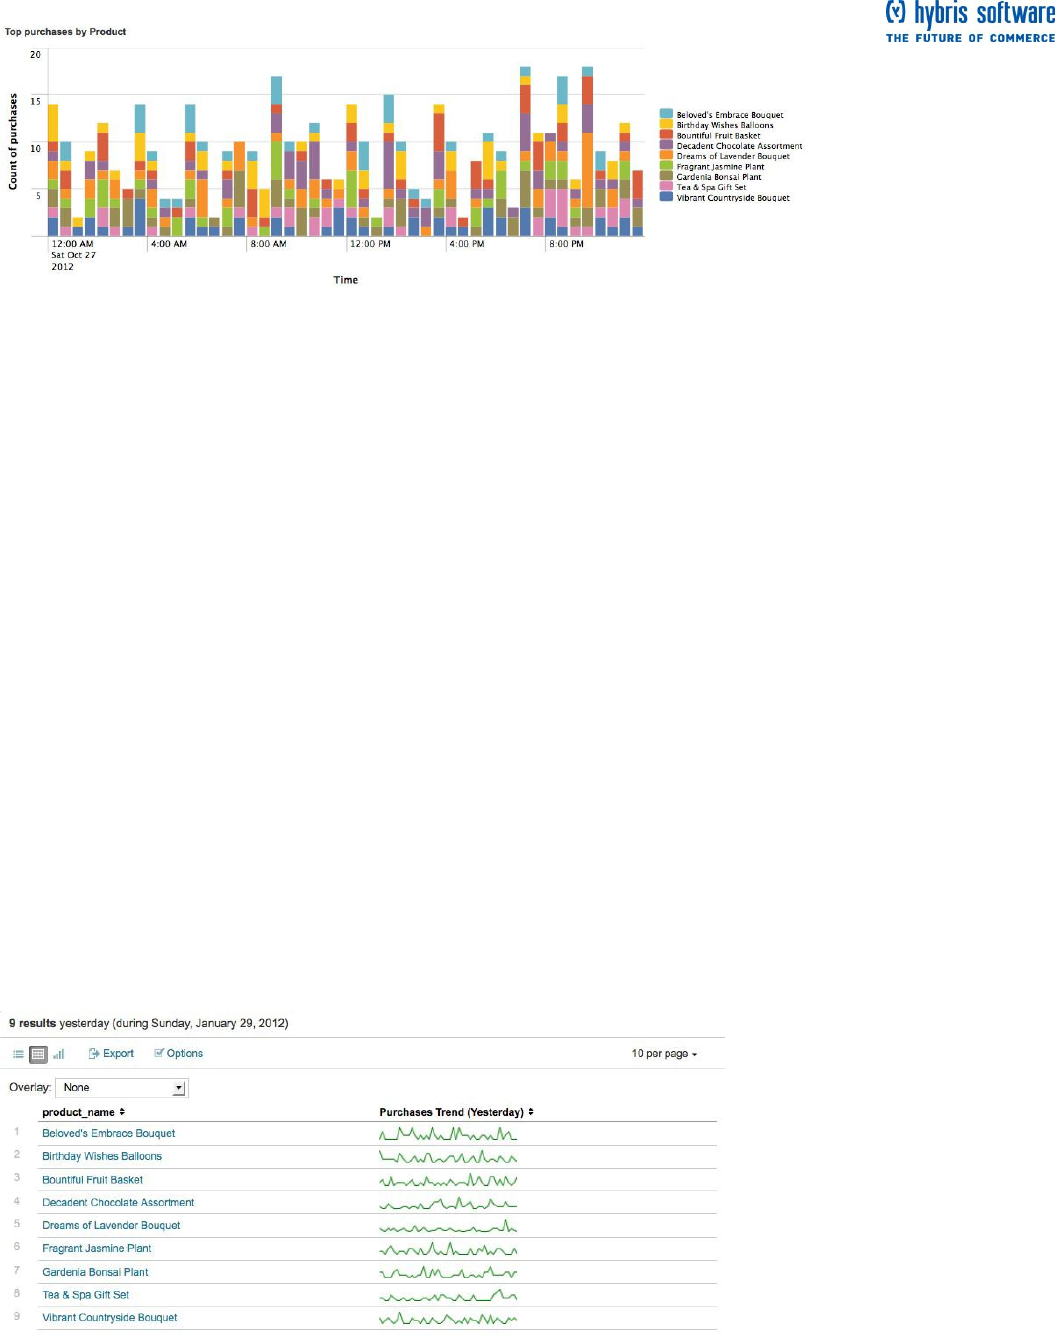
Page 47 of 60
4. Click Apply.
Each of the columns represents the different products bought in that half-hour period.
5. Click Save and select Save report...
Name your report Products Purchased (Yesterday).
Click Finish >>
Top purchases trend
For stats and chart searches, you can add sparklines to their results tables. Sparklines are inline charts that
appear within the search results table and are designed to display time-based trends associated with the
primary key of each row. For more information, read "Add sparklines to your search results" in the Search
Manual.
This example uses sparklines to trend the count of purchases made yesterday.
This example requires the product_name field from the Use field lookups example. If you did not add
the lookup, refer to that example and follow the procedure.
Run this search over the time range "Yesterday":
sourcetype=access_* | chart sparkline(count(eval(action="purchase"))) AS "Purchases Trend (Yesterday)" by
product_name
This search is similar to the last two searches you just ran to build reports. It uses the chart command to
count the number of purchases, count(eval(action="purchase")), made for each product, product_name. The
difference here is that the count of purchases is now an argument of the sparkline() function. (Also, the
results are renamed to "Purchases Trend (Yesterday)" to indicate that you are trending the count of
purchases made throughout the day, yesterday.)
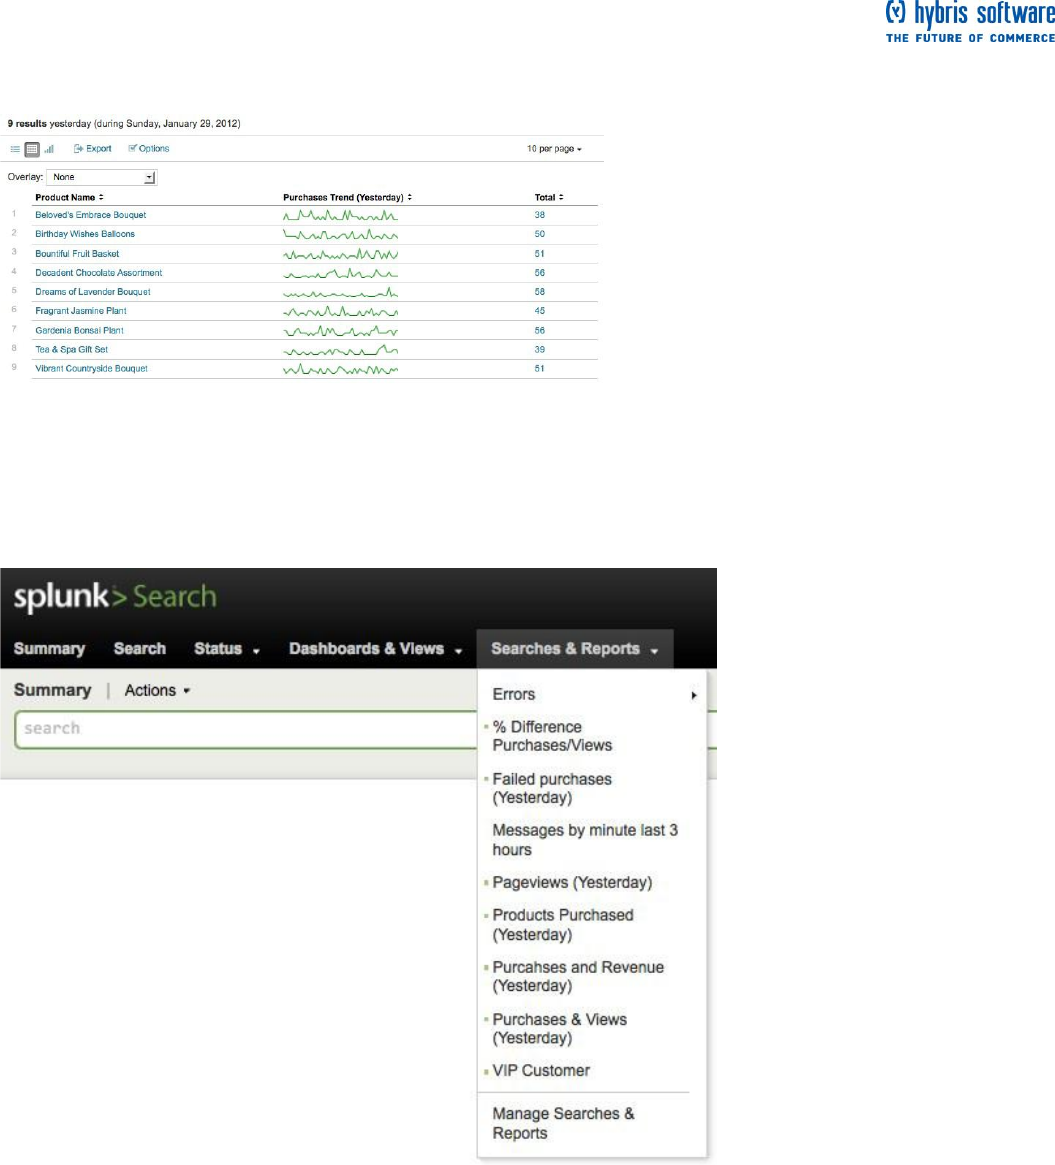
Page 48 of 60
Let's add this to a report to display, not only the total purchases made yesterday, but a trend of the purchases
throughout the day:
sourcetype=access_* | chart sparkline(count(eval(action="purchase"))) AS "Purchases Trend (Yesterday)"
count(eval(action="purchase")) AS Total by product_name | rename product_name AS "Product Name"
Save this search as, Top Purchases Trend (Yesterday).
Access saved reports
After you save a report, go << back to Search. Splunk lists all your saved reports in the Searches &
Reports menu on the search dashboard:
Generating reports faster
This tutorial uses a relatively small sample data set, so these reporting searches were relatively quick.
Splunk can generate reports on massive amounts of data, but it can take a lot of time to report on very large
data sets. If you are running these reports on a regular schedule, it is more efficient to summarize the data
each time the search runs and create reports against these summaries.
Searches that use reporting commands--searches that generate reports in the form of tables and charts--
are eligible for Report acceleration. Setting this up for a large dataset search is as easy as clicking a
checkbox and setting a time range. Future runs of the search should run faster as long as they're run (at
least partially) within this time range.
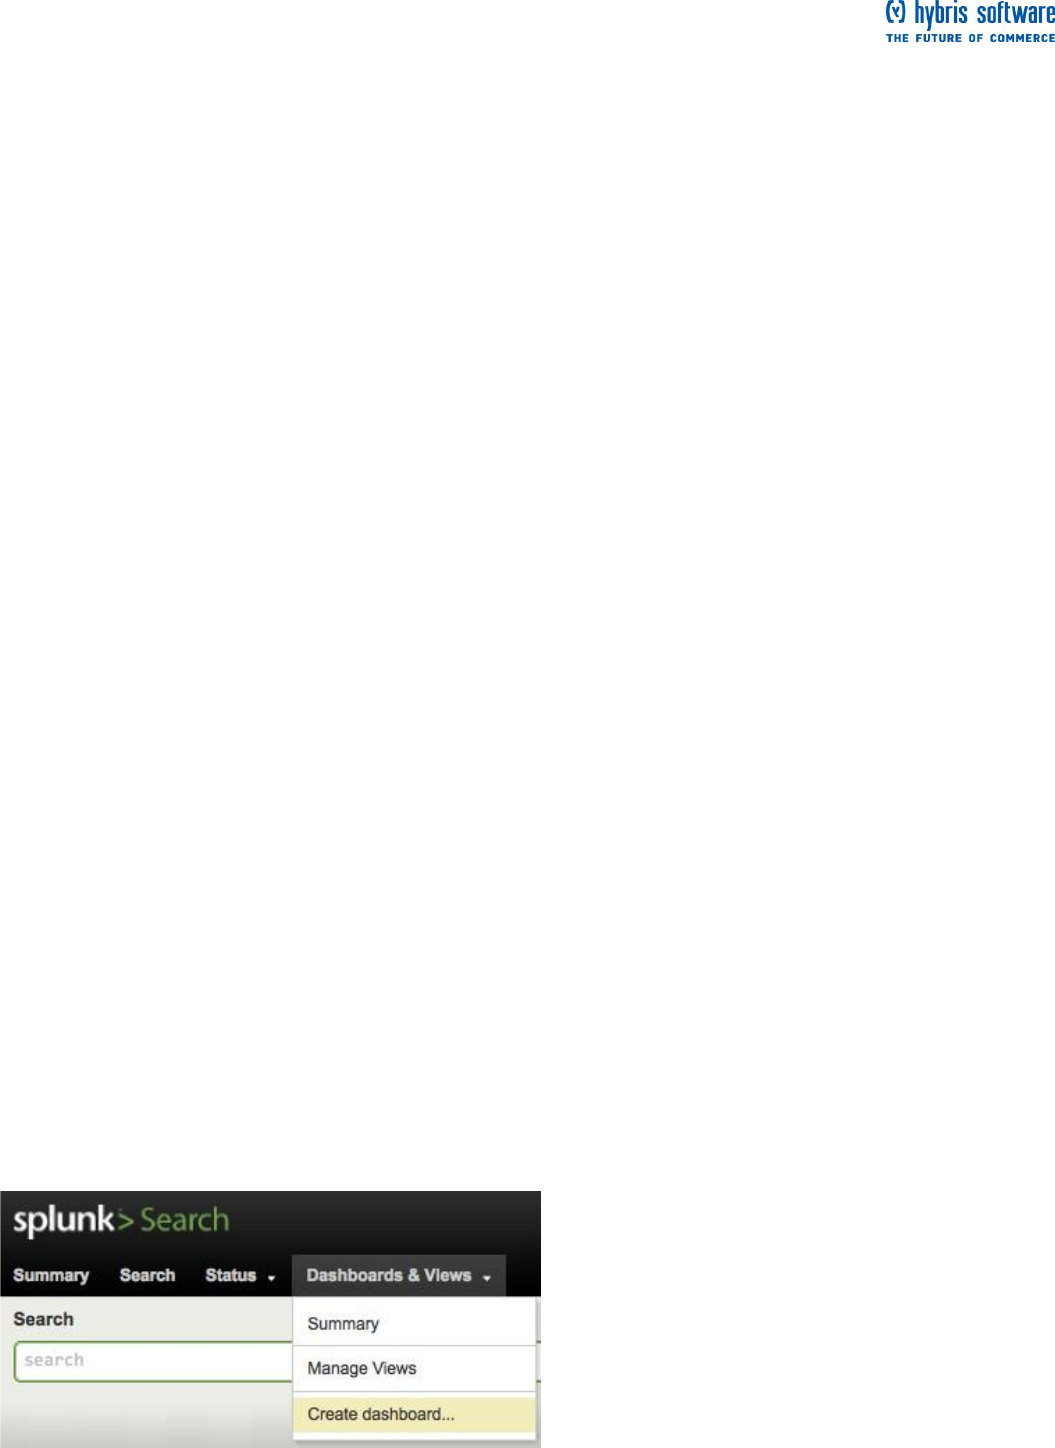
Page 49 of 60
Report acceleration is good for just about any slow-completing search that has 100k or more hot bucket
events and which meets the qualifying conditions outlined in "About report acceleration and summary
indexing" in the Knowledge Manager Manual.
For more information and examples of qualifying and non-qualifying searches see "Manage report
acceleration" in the Knowledge Manager Manual.
Next steps
When you are happy with the report you have created, you have a number of options for saving it and
sharing it with others. To review these options, read "Saving searches and sharing search results"
You can also create dashboards from your searches and reports. Dashboards can be made up of multiple
panels that each display charts, lists, and other data that are generated by hidden, predefined searches.
When you are ready, proceed to the next topic which walks you through creating dashboard panels.
Dashboard examples
Before you proceed with this topic you should review Reporting examples, where you have already built and
saved a few reports. This topic walks you through creating simple dashboards that use the same searches
and reports that you saved in the previous topics.
Back at the Flower & Gift Shop, your boss asks you to put together a dashboard to show metrics about the
products sold at the online shop. You also decide to build yourself a dashboard to help you or another
member of the IT team find and troubleshoot problems with the online shop.
Creating dashboard panels
All dashboard panels are based on searches. To generate a dashboard panel based on your search and
add it to a new or existing dashboard, click Create and select Dashboard panel from the menu. Then, use
the Create Dashboard Panel dialog to create a new panel for a new or preexisting dashboard, Splunk
automatically saves the search that powers the panel as well.
Learn more about dashboards in "Create and edit dashboards via the UI" in the Splunk Data Visualizations
Manual.
Dashboard 1: Flower & Gift Shop Products
The first dashboard will show metrics related to the day-to-day purchase of different products at the Flower &
Gift shop. For this dashboard, you will use the saved searches:
Products Purchased (Yesterday)
Products & Revenue (Yesterday)
Purchases & Views (Yesterday)
Top Purchases Trends (Yesterday)
To start, make sure you are in the Search app.
1. Click Dashboards & Views and select Create dashboard... from the list.
This opens the Create new dashboard dialogue which enables you to define a new dashboard.
2. To create the new dashboard:
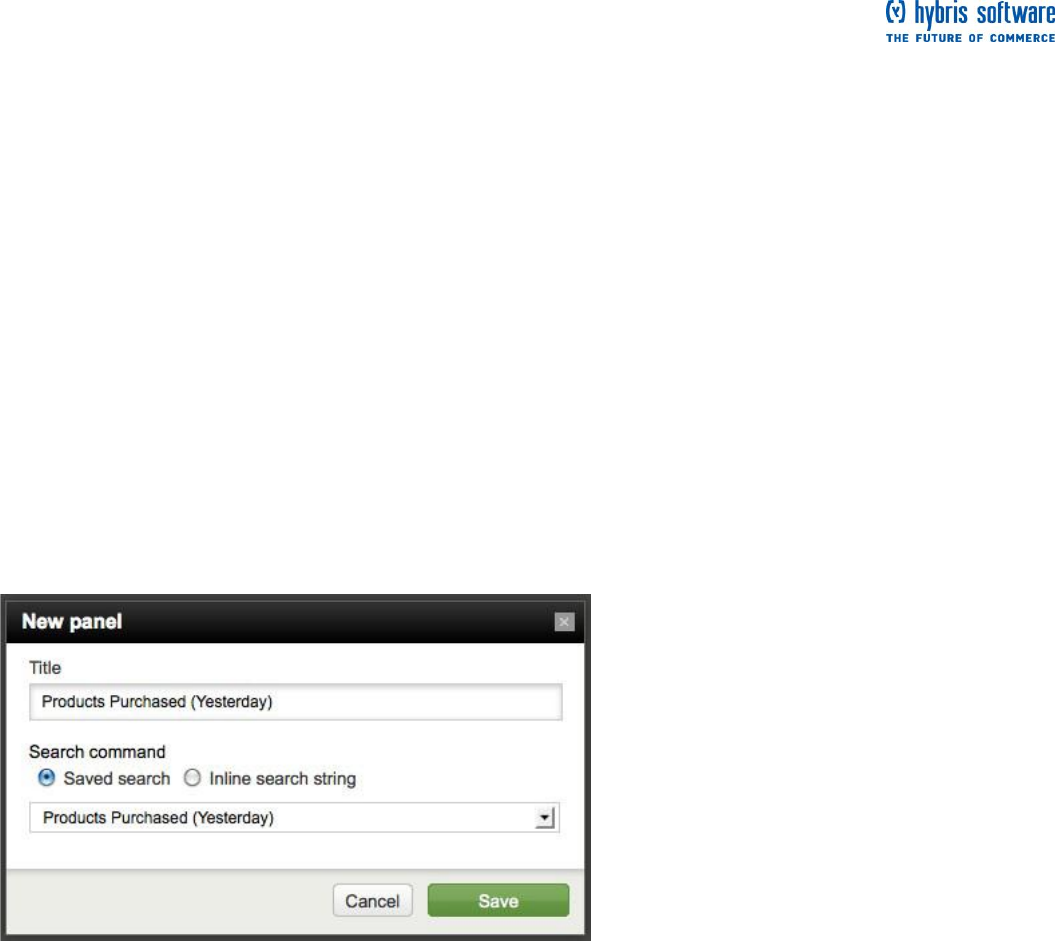
Page 50 of 60
2a. Designate the unique ID for this dashboard as "Products". This ID is the name you use to refer to the
dashboard from other objects within Splunk.
2b. Name the dashboard, Flower & Gift Shop - Products. This name is the label that you will see listed in
the navigation menus and at the top of your dashboard.
2c. Click Create.
This takes you to your new dashboard, which is currently empty. Let's start filling it with panels.
3. At the top of the dashboard, next to its name, are dashboard options. When Edit is turned off, you will see
options for printing the dashboard and PDF delivery.
Let's not worry about these options right now. You can read more about them later.
3a. To start editing the dashboard, toggle the Edit switch to ON.
When Edit is turned ON, you will see three options:
New panel enables you to add panels to the dashboard.
Edit XML enables you to edit the XML code for the dashboard.
Edit permissions enables you to control who has access to the dashboard.
3b. To add a panel to the dashboard, click New panel.
This opens the New panel dialogue which enables you to define properties for the panel.
4. To add a new panel to the dashboard, give it a name and specify the search to associate with it:
4a. Under Title, name the panel "Products Purchased (Yesterday)". This is the label for the panel.
4b. Under Search command, select "Saved search".
All dashboard panels are associated with searches. You can specify whether a panel runs off of a
predefined, saved search, or whether it uses a search that has been specifically designed for the panel and
associated with it in an "inline" manner. For these dashboards, you will just use saved searches and reports.
4c. From the list, select the saved search named "Products Purchased (Yesterday)".
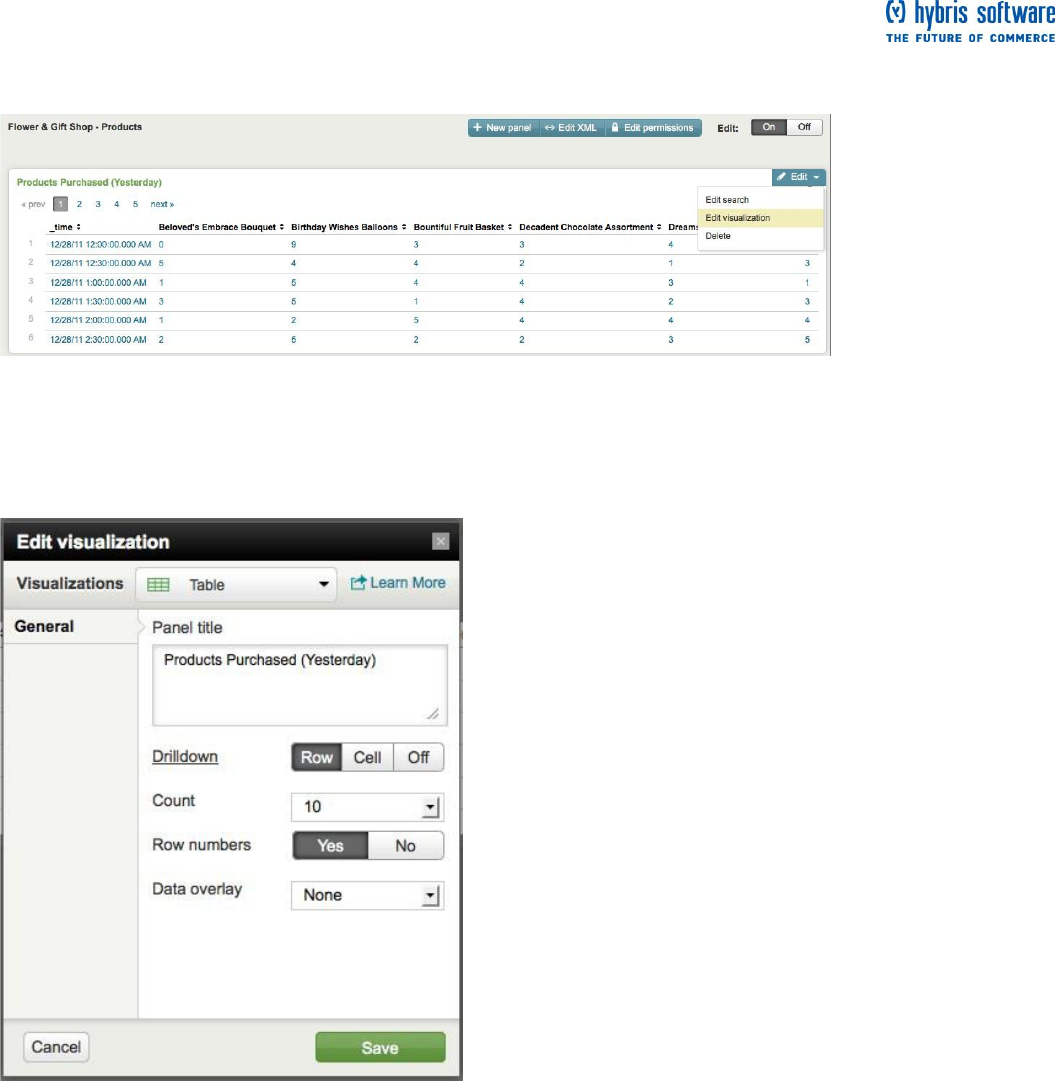
Page 51 of 60
4d. Click Save.
Now you have added a new panel to the "Flower & Gifts Shop - Products" dashboard. Here, by default, the
search results are displayed as a table. This is not the visualization you want for this panel, though, so let's
change it.
5. For the panel, click Edit and select Edit visualization... from the list.
This opens the Edit visualization dialogue which enables you to modify how the search results are
represented in the panel: data table, events list, charts, single value panels and gauges. For more
information about visualization options, read the Data Visualizations Manual.
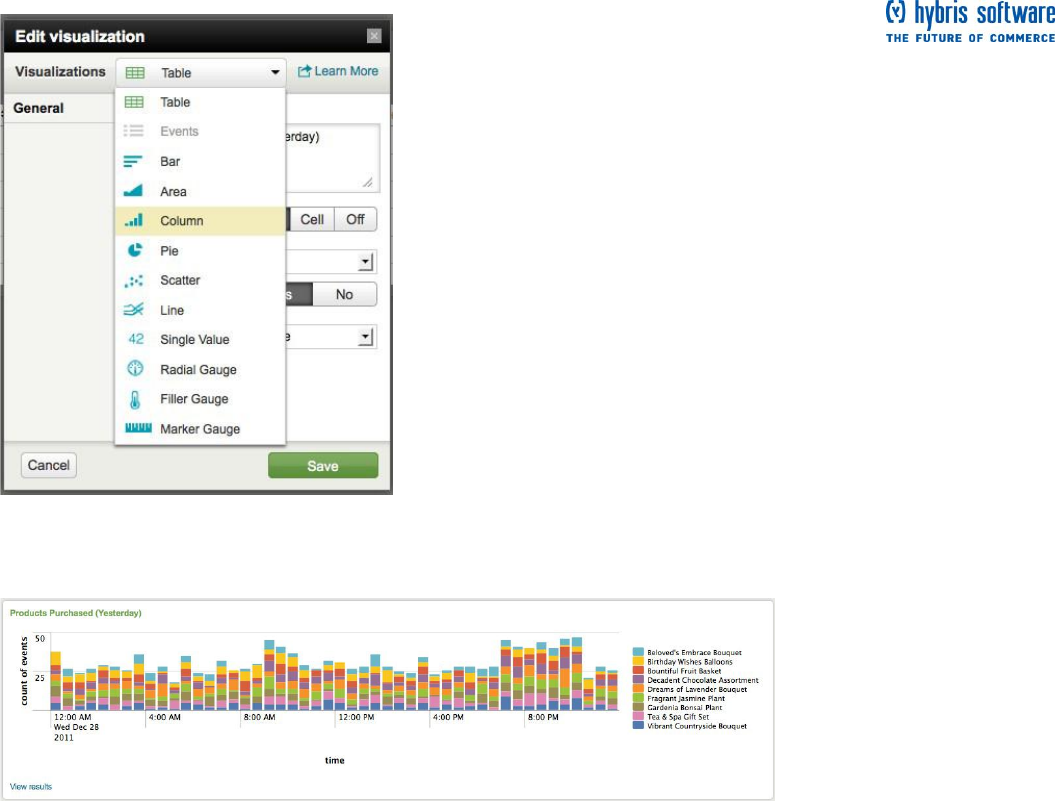
Page 52 of 60
6. From the list of "Visualizations", select Column to display your results in a stacked column chart.
7. Click Save.
Now, the panel should look like this:
8. Add two more new panels to the dashboard:
8a. Add panel named Purchases & Views (Yesterday) for the count of purchases and views made
yesterday (# Purchases & Views). Edit the visualization type to display a column chart.
8b. Add panel named Products & Revenue (Yesterday) to list the products that were sold yesterday and
the revenue made from the sales (Purchases and Revenue (Yesterday). Edit the visualization type to display
a data table.
8c. Add panel named Top Purchases Trends (Yesterday) to list the products that were sold yesterday with
sparklines to show the purchasing trend throughout the day. Edit the visualization type to display a data table.
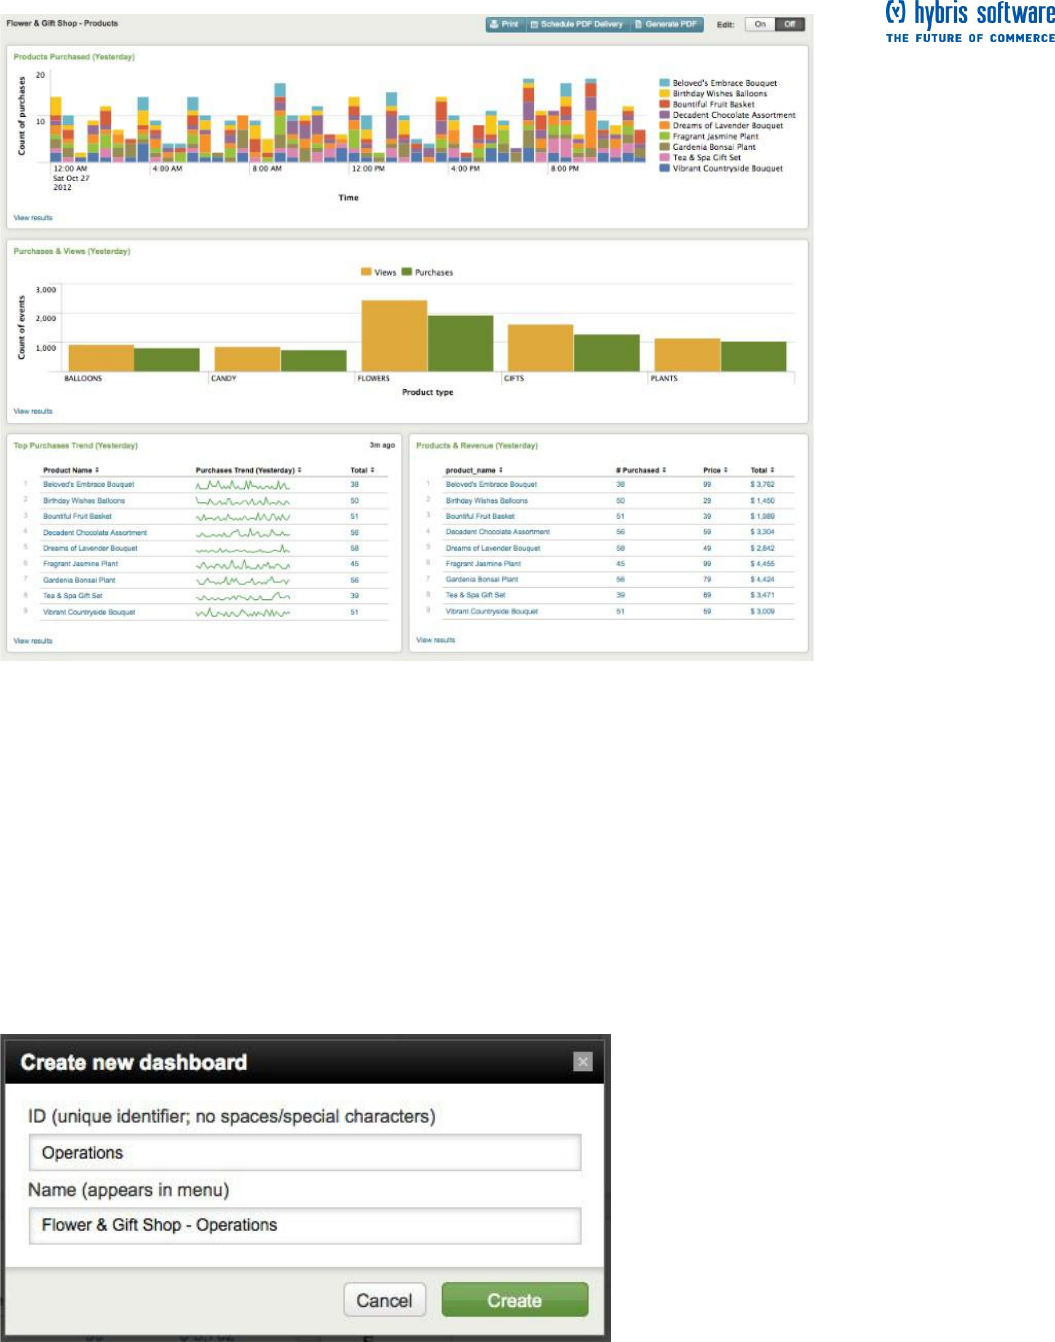
Page 53 of 60
8d. Once you have added the new panels, drag the panels to rearrange them so that they display like this:
This is your products dashboard. Now let's follow the same steps to create an operations dashboard.
Dashboard 2: Flower & Gift Shop Operations
The second dashboard includes simple reports that you can view at the start of your day to give you some
information about recent web access activity. For this dashboard, you will use the saved searches:
Total views (Yesterday)
Failed purchases (Yesterday)
Errors (Yesterday)
To start, return to the Search app.
1. Click Dashboards & Views and select Create dashboard... from the list and define a new dashboard for
Flower & Gift Shop - Operations.
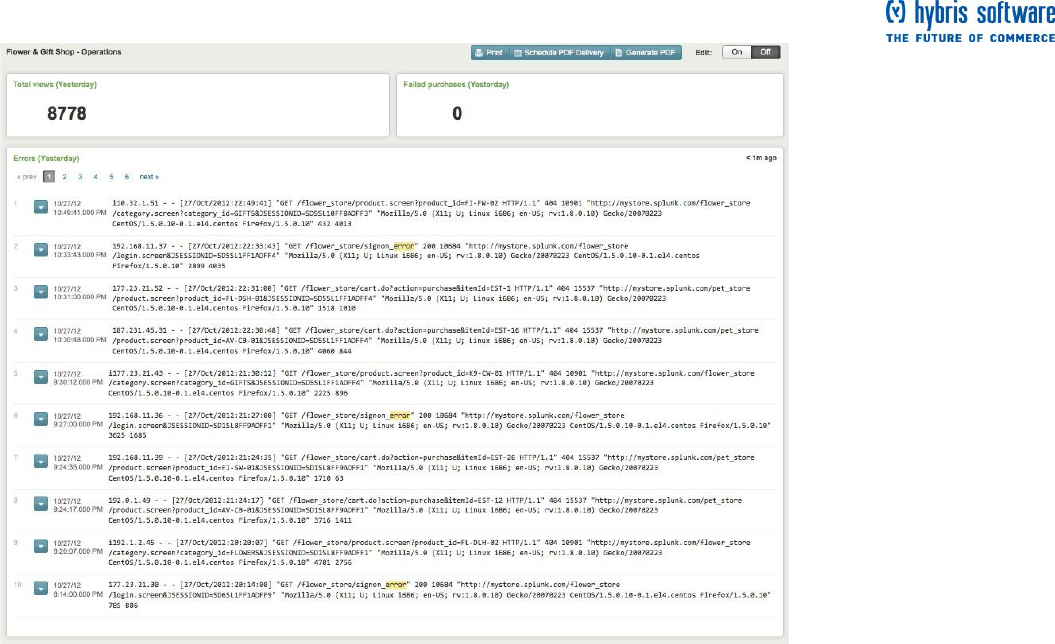
Page 54 of 60
2. For this dashboard, you will add three panels: two single value panels and an events list panel. It will look
like this:
2a. The first panel uses the saved search Total views (Yesterday) and is a single value panel.
2b. The second panel uses the saved search Failed purchases (Yesterday) and is a single value panel.
2c. The third panel uses the saved search Errors (Yesterday) and is an events list panel.
3. Once you have added the new panels, drag the panels to rearrange them as you see in the above
screenshot.
This is your Flower & Gift Shop Operations dashboard.
Next steps
Now that you have created and saved dashboards, you can print the dashboard, generate a PDF file of the
dashboard panels, and schedule delivery of the PDF.
Proceed to the next topic for more information!
View and print dashboards
In the previous topic, you created and saved two dashboards using the searches and reports you ran
throughout this tutorial.
Splunk enables you to generate PDFs of your dashboards at the click of a button. You can also arrange to
have Splunk generate PDFs on a regular schedule and send them to project stakeholders on a regular
schedule.
This topic, discusses your options for viewing, printing, and generating PDFs of the dashboards.
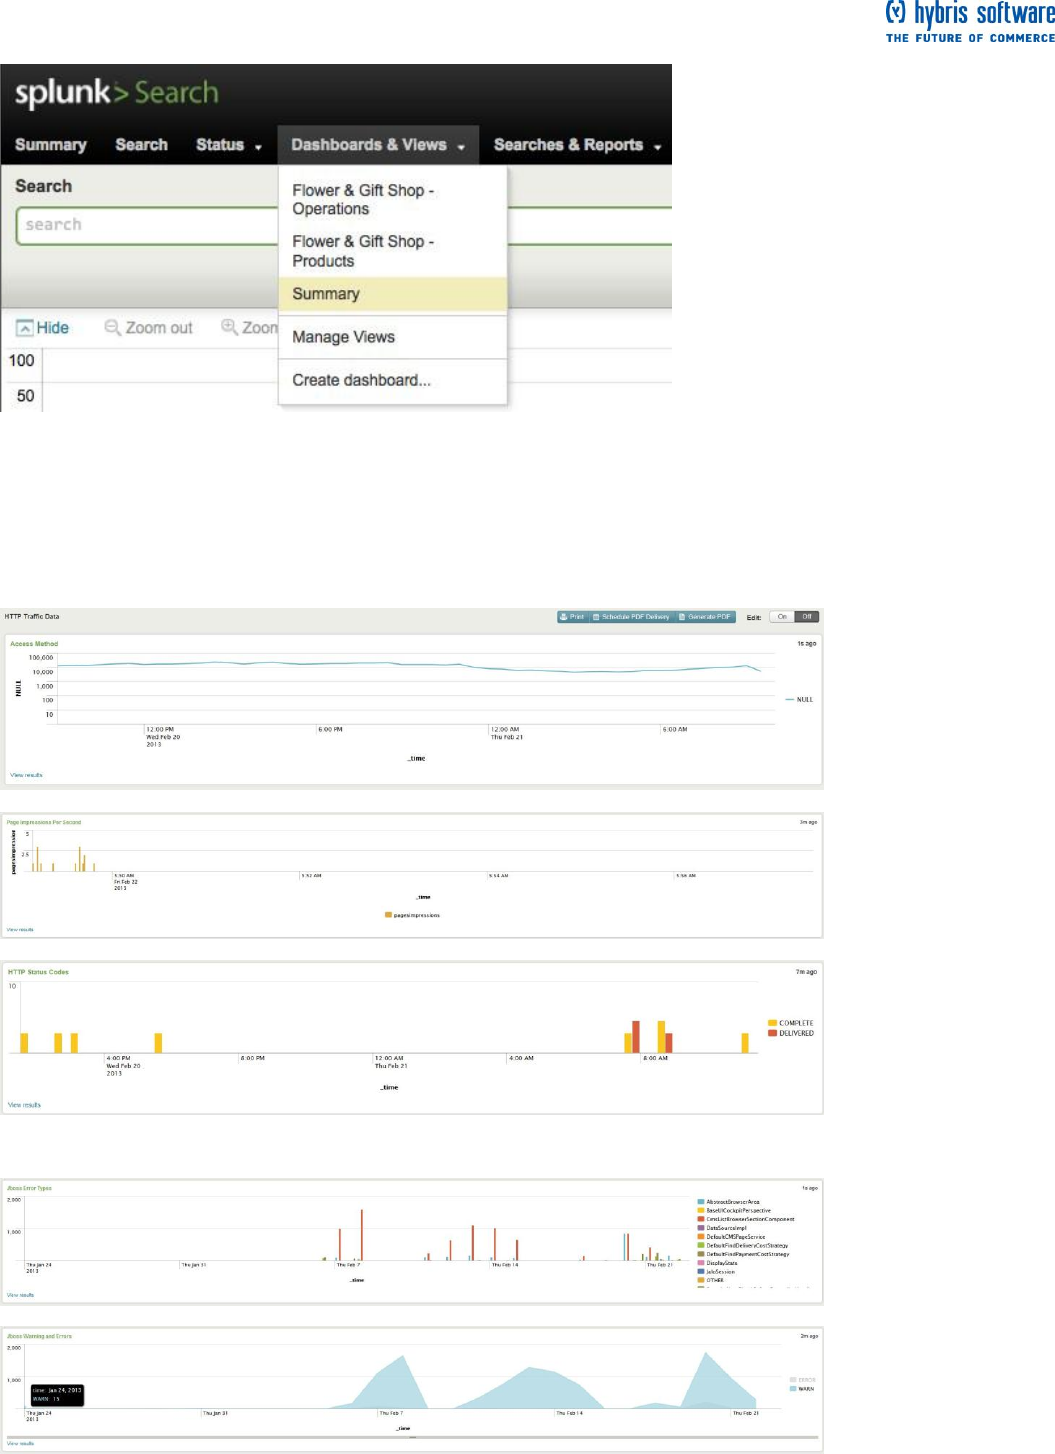
Page 55 of 60
View saved dashboards
Find your saved dashboards in the Search app under Dashboards & Views:
From this list, you can also edit or manage existing dashboards. Let's just view one.
Select, "Flower & Gift Shop - Products" from the list.
Available dashboards
Web
hybris Application

Page 56 of 60
Dashboard print and PDF options
At the top of the Flower & Gift Shop - Products dashboard, you should see the print and PDF options:
(Remember, you will see these options when Edit is turned off.)
Print dashboard
The Print option is straightforward--just like printing a web page. Select it when you want to print the contents
of your dashboard window. It displays your dashboard in a printable format and your browser's print dialog
with open.
Generate dashboard PDF
When you are viewing a dashboard in Splunk, click Generate PDF to generate a PDF that you can view
through your browser or a PDF viewer application. The resulting PDF will appear in your browser window or
open in a PDF viewer application, displaying results that are accurate up to the moment that the button
was clicked.
Note: If your chart title includes an ampersand character, that panel will not be included in the PDF. You can
edit your panel to change the title name. For more information about this feature, see "Generate dashboard
PDFs" in the Data Visualizations Manual.
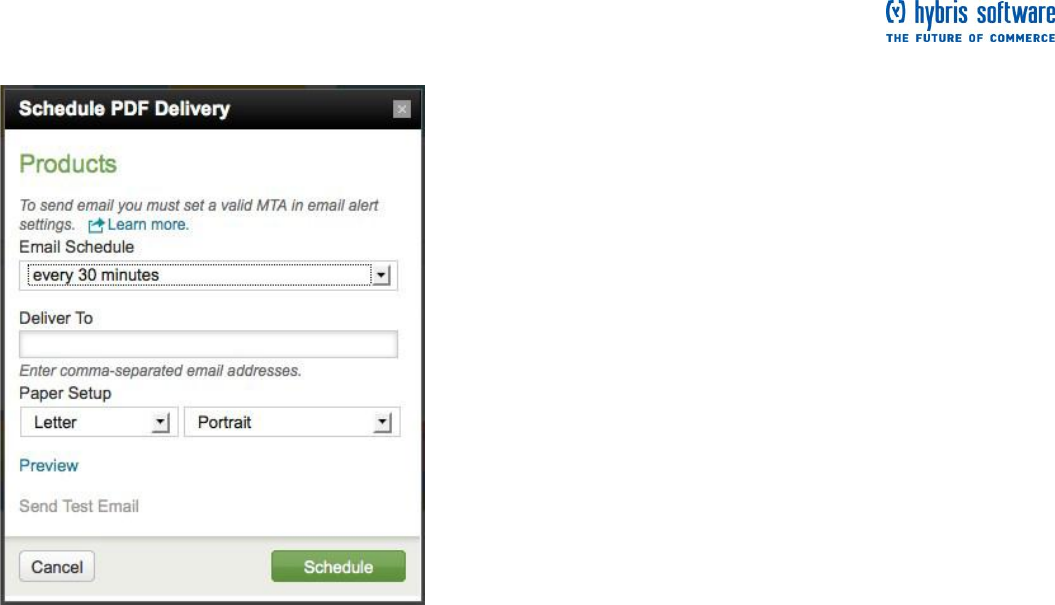
Page 57 of 60
Schedule dashboard PDF delivery via email
1. To set up a scheduled dashboard PDF delivery via email, click Schedule PDF delivery at the top of the
dashboard to open the Schedule PDF delivery dialog.
2. Select a predefined email delivery schedule from the Email Schedule list, or define one of your own using
standard cron notation. When you select the Cron...option from the list, a field appears in which you can enter
the cron schedule.
3. Under Deliver To, enter one or more email addresses, separated by commas, and under Paper Setup
choose the paper size and orientation for the PDF that Splunk will generate.
4. You can test your settings. Click Preview to see a preview of the PDF as your recipients will see it. Click
Send Test Email to verify that the email settings work correctly.
5. When everything is filled out, click Schedule.
When the email is sent, each dashboard PDF will display results that are correct for the moment that the
dashboard was generated.
For more information about this feature, see "Generate dashboard PDFs" in the Data Visualizations Manual.
More about integrated PDF generation
PDF functionality in Splunk Web no longer requires you to install the (now deprecated) PDF Report Server
App. In addition, non-UI PDF reporting functionality uses this new integrated PDF generation. There are
exceptions involving forms, dashboards that are built with advanced XML, and simple XML dashboards that
have panels that are rendered in Flash rather than JavaScript. For more information about requirements for
this feature, review "Upgrade PDF printing for Splunk Web" in the Installation Manual.
Next steps
Now that you have completed the tutorial, you are ready for More Splunk!

Page 58 of 60
Further Help / Contact Details
Fill in info when available. It will be provided by Helene Montarou

Page 59 of 60
Index
About managing and scheduling searches ......... 29
About reports and dashboards ................................ 42
About saving a search................................................... 28
About this chapter............................................................. 6
About timeline options ................................................ 14
Access saved reports .................................................... 48
All indexed data panel ................................................. 8
An overview of Splunk .................................................... 5
Analyze and report ........................................................... 6
Automate monitoring ...................................................... 6
Automatic lookups ...................................................... 33
Available dashboards ................................................... 55
Boolean operators ...................................................... 12
Capture knowledge........................................................... 6
Chart of purchases and views for each product
............................................................................................ 42
Concatenation .................................................................. 41
Construct a search with search assistant ............ 24
Copyright ............................................................................... 1
Count of matching and scanned events .... 10
Create reports and dashboards ............................... 42
Creating dashboard panels ........................................ 49
Dashboard 1: Flower & Gift Shop Products ....... 49
Dashboard 2: Flower & Gift Shop Operations... 53
Dashboard examples .................................................... 49
Dashboard print and PDF options .......................... 56
Dashboards & Views ..................................................... 8
Define the field lookup ................................................. 34
Drill down into search results .................................. 26
Extracted fields .............................................................. 18
field lookups ................................................................... 32
Fields sidebar ............................................................... 10
Find the Search app .......................................................... 7
Further Help Contact Details .................................... 58
Generate dashboard PDF ......................................... 56
Generating reports faster ........................................... 48
Hide ...................................................................................... 14
Hosts ....................................................................................... 8
Index ..................................................................................... 59
Index new data ................................................................... 5
Integrated PDF generation ........................................ 57
Introduction ......................................................................... 4
Investigate with the timeline .................................... 14
Keyword searches .......................................................... 11
Kick off a search ................................................................. 8
Knowledge ....................................................................... 32
Linear scale to Log scale ...................................... 14
Lookup definitions ...................................................... 33
Lookup table files ......................................................... 33
Lookups .............................................................................. 33
Make the lookup automatic ........................................ 35
Manage searches and reports ................................... 29
Manager .............................................................................. 33
More search examples .................................................. 37
Print dashboard ............................................................. 56
Purpose .................................................................................. 1
Reformat the search results ....................................... 27
Report acceleration .................................................... 48
reporting commands.................................................. 48
Reporting examples ....................................................... 42
Results area .................................................................... 10
Save & share results ................................................. 28
Save a search ..................................................................... 28
Save a search tutorial .................................................... 29
Save options ...................................................................... 28
Save results .................................................................... 28
Save search ..................................................................... 28
Schedule dashboard PDF delivery via email . 57
Schedule saved searches and alerts ....................... 30
Search acceleration ........................................................ 37
Search actions .............................................................. 10
Search and investigate .................................................... 5
Search and search language ......................................... 6
Search assistant ............................................................. 11
Search bar ........................................................................... 8
Search dashboard ......................................................... 10
Search mode .................................................................. 10
Search with the new lookup fields .......................... 36
Searches & Reports ....................................................... 8
Sources panel .................................................................... 8
Sourcetypes panel .......................................................... 8
Splunk User Guide ............................................................ 5
Start searching .................................................................. 11
Status: .................................................................................... 8
string Concatenation ..................................................... 41
subsearch ............................................................................ 30
The fields sidebar and dialog..................................... 18
The search app ................................................................... 6
The Search dashboard .................................................... 9
The Summary dashboard .............................................. 7
Time range selector ...................................................... 8
Timeline of events ...................................................... 10
Top purchases by product name ............................. 46
Top purchases trend ...................................................... 47

Page 60 of 60
tostring() function ......................................................... 41
Type ahead ....................................................................... 11
Upload the lookup file .................................................. 33
Use a subsearch ............................................................... 30
Use Boolean operators ............................................. 12
Use field lookups ............................................................. 31
Use fields to run more targeted searches ........... 21
Use fields to search ........................................................ 17
Use the search language .............................................. 23
Use the timeline .............................................................. 14
Using Report builder..................................................... 42
View and print dashboards ........................................ 54
View saved dashboards ................................................ 55
Welcome to the Splunk Tutorial ................................ 4
What are fields ................................................................ 18
What is Splunk? .................................................................. 4
Who uses Splunk? ............................................................. 4
With a subsearch .......................................................... 31
Without a subsearch ................................................... 30
Zoom out ........................................................................... 14
Zoom to selection ....................................................... 14
