Student Manual Determination Of Wavelength LEDs Using A Grating Spectrometer Anguluan & Po
User Manual:
Open the PDF directly: View PDF ![]() .
.
Page Count: 12
Determination of wavelength of LEDs
using a grating spectrometer
Objectives
At the end of this activity, you should be able to:
1. learn to use a grating spectrometer
2. understand the concept behind a diffraction grating
3. determine the wavelengths of different LEDs
Introduction
A spectrometer is an instrument that separates light into its various component
wavelengths using either a diffraction grating or a prism to do so.
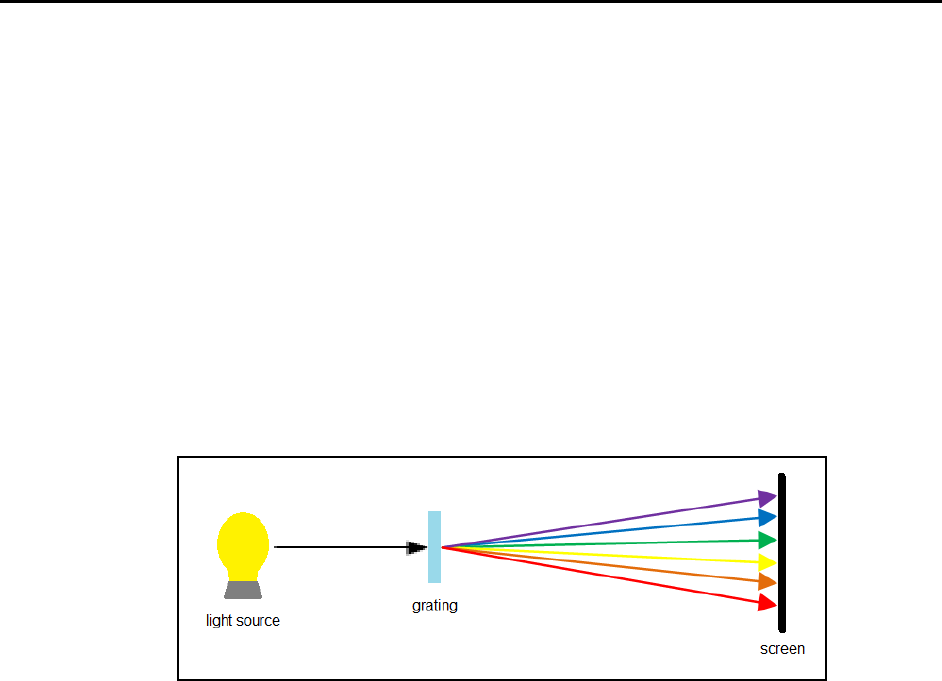
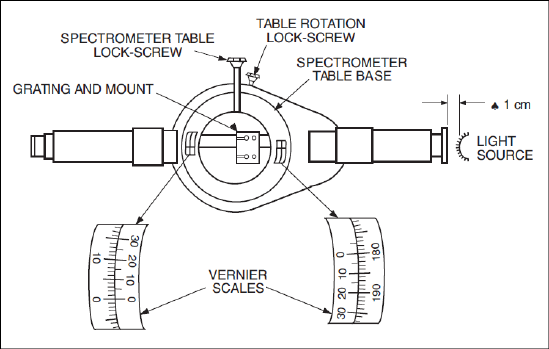
Figure 1. Schematic diagram of a spectrometer. A spectrometer works by focusing a light
source into a dispersing medium (a grating or prism) which separates it into its
component wavelengths, which can be viewed on a screen or through a telescope.
In this experiment, you will determine the wavelength of various Light Emitting Diodes
(LED). LEDs are manufactured with a variety of colors. Some LEDs can even change
color depending on the voltage supplied. However, LEDs are not really monochromatic
light sources but instead produce light over a certain range with peaks at a specific
wavelength. By the use of a grating spectrometer, we will be able to see the different
color produced by LEDs that seem to emit only one color.
E Anguluan & M Poral, 2012
Theory
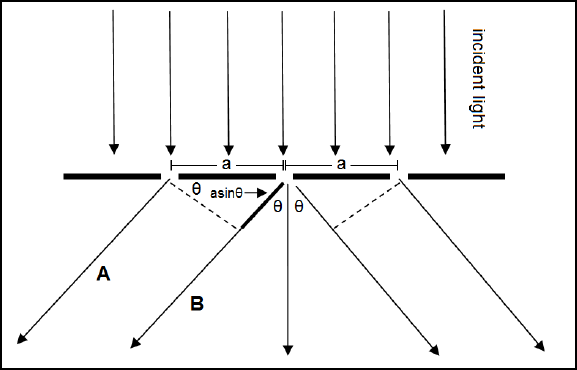
Figure 2. Schematic diagram of light passing through a diffraction grating.
A diffraction grating is an optical component which is basically a series of slits separated
by a distance
a
. Figure 2 shows how a diffraction grating works. Consider the two rays
A and B which both emerge from the grating at an angle
θ
. By a straightforward
geometric calculation, it can be shown that the path difference between the two rays is
given by
sina
θ
. Constructive interference, which is the overlapping of waves that
results in a more amplified wave or in the present case a bright fringe (see Figure 3), can
only occur if the path difference is an integral multiple of the wavelength of the emerging
light. This can be mathematically represented by,
sinna
λθ
=
(1)
where
=1,2,3,...n
and
λ
is the wavelength of the light. In this experiment,
3
3.3 10 mma−
= ×
for the
300 lines/mm
grating and 3
1.66 10 mma
−
= × for the
600 lines/mm
grating.
E Anguluan & M Poral, 2012
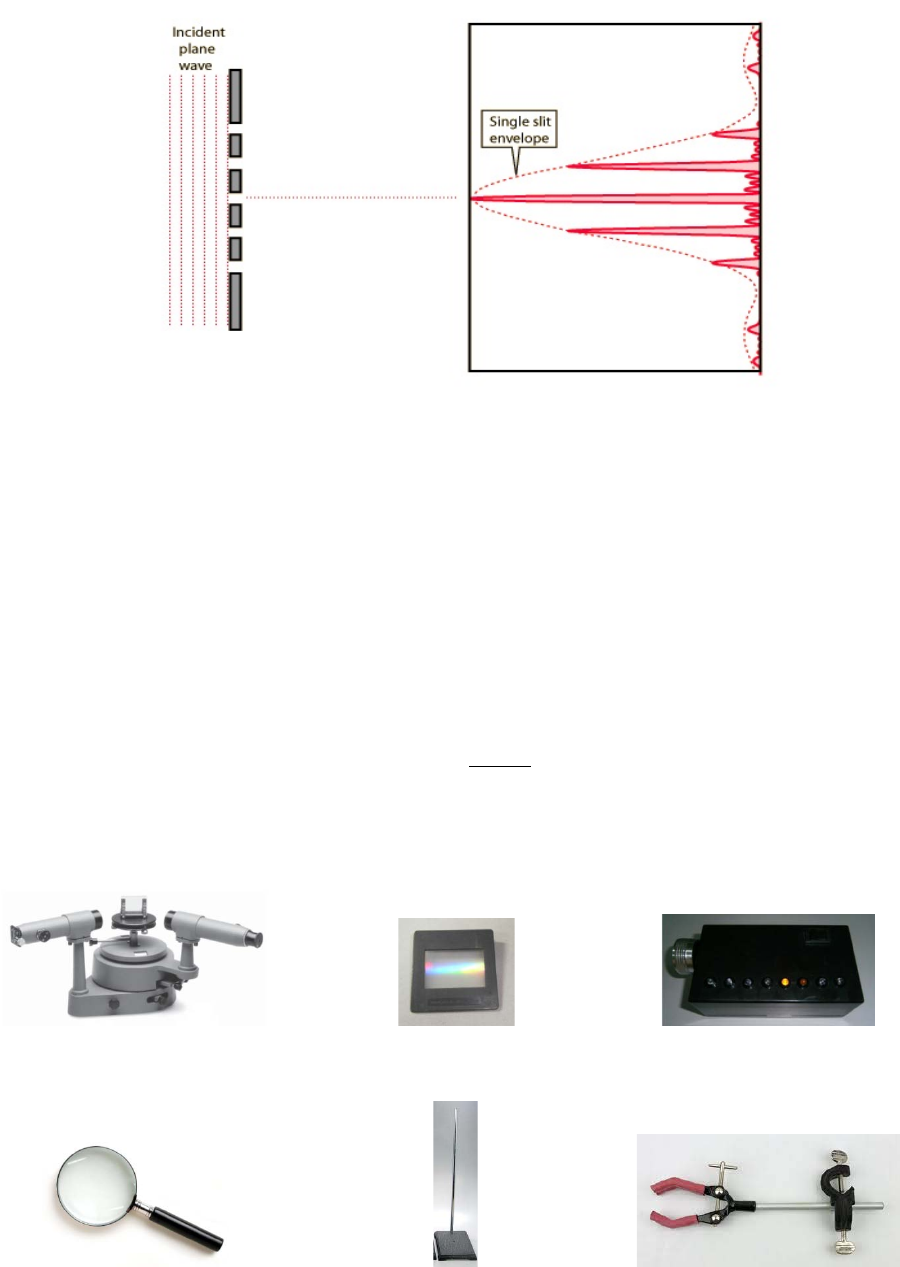
Figure 3. Interference pattern formed on a viewing screen by multiple slits. The
intensity peaks are the points where constructive interference occurred. (Image
taken from: http://hyperphysics.phy-astr.gsu.edu/hbase/phyopt/imgpho/muls5.gif)
The consequence of this is that light with a certain wavelength will be bent at a
specific angle upon emergence from the grating. As such, if the diffraction grating
is illuminated by a light source that is composed of various wavelengths, the
component wavelengths will be separated or bent into specific angles resulting in
a spectrum of wavelengths. The grating spectrometer is used to scan through
these possible angles of diffraction and to get the wavelength of the emerging
light by using the more explicit equation given by:
sina
n
θ
λ
=
(2)
Materials
spectrometer
diffraction grating
(300 or 600 lines/mm)
LED box
magnifying glass
iron rod
clamps
E Anguluan & M Poral, 2012
Procedure
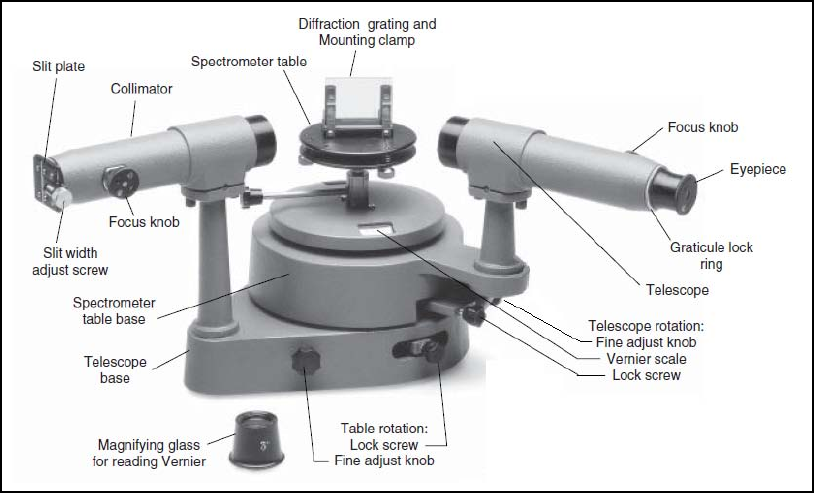
Figure 4. Parts of the spectrometer. (Image taken from: Instruction Manual and
Experiment Guide for the PASCO scientific Model SP-9268A)
A. Preparing the Spectrometer for Use
IMPORTANT: Stray light can obscure the images. Use the spectrometer in a semi-darkened
room or drape a sheet of opaque material over the spectrometer.
1. Place the spectrometer on a flat surface. Loosen the eyepiece by rotating the
graticular lock ring. Rotate the graticule until the cross-hairs are focused and one of
the cross-hairs is vertical.
2. Focus the telescope at infinity. Loosen the telescope rotation lock screw to be able to
move the telescope. Focus the telescope on a distant object by adjusting the
telescope focus knob.
3. Align the telescope directly opposite the collimator. Use the slit width adjust screw to
partially open the slit aperture. Look through the eyepiece and find the slit aperture.
Focus the collimator at slit aperture by adjusting the collimator focus knob or
changing the rotation of the telescope if necessary. Do not change the focus of the
telescope.
E Anguluan & M Poral, 2012
4. Tighten the telescope rotation lock screw. Align the vertical cross-hair with a fixed
edge of the slit aperture by adjusting the telescope rotation fine adjust knob. The slit
width can be adjusted for a clear, bright image.
5. Setup the light source and diffraction grating as shown in the figure below. Place the
diffraction grating on the mounting clamp. Loosen the table rotation lock screw and
align the lines on the spectrometer table with the telescope and collimator. Using the
iron rod and clamps, position the light source (LED box) approximately 1 cm away
from the slit plate. Align the light source with the center of the slit aperture.
6. Make the zero diffraction angle reading. Look through the eyepiece and find a bright
slit image (undiffracted beam). Align the edge of the slit image with the vertical cross-
hair. Measure the angle of diffraction (see below, How to Measure Angles of
Diffraction). This is the zero diffraction angle, θ0. To check if the image that you see
is of zero diffraction, slightly tilt the telescope to the left or right, you must be able to
see identical spectra on either side. Note: Every time the spectrometer table is
rotated or moved, the zero diffraction angles changes, and have to be
measured again.
7. Make sure that the grating is perfectly aligned. A perfectly aligned grating would give
the same diffraction angles for corresponding slit images on both sides of the
undiffracted beam. Look for images of the same color on both sides of the
undiffracted beam and align the edge with the vertical cross-hair. Measure the angle
of diffraction for both images and compare. If the angles are different, use the table
rotation fine adjustment knob to align the diffraction grating perpendicular to the
collimator beam. Repeat steps 6 & 7 until the angle readings are correct to within
one minute of arc. Note: Actual angle of diffraction = θ - θ0, where θ is the angle
reading for the diffracted image.
8. Note the final zero diffraction angle reading on Data Table 1.
E Anguluan & M Poral, 2012
B. Determination of Wavelength
1. Now that the grating is aligned and zero diffraction angle reading has been made,
you can now determine the wavelength of an LED. Rotate the telescope to a side
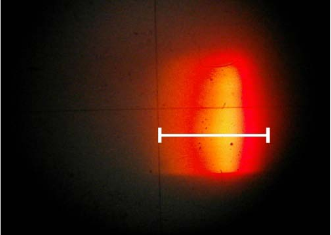
and look for the first order diffraction spectrum. Measure the angles of diffraction for
the start and end of a high intensity spectrum (see figure below). Repeat this step for
the second and third order spectrum. Record angle measurements in Data Table 1.
2. Get the approximate peak for each order n = 1, 2, 3, by solving for the midpoint of
each pair of angle measurements and recording this in Data Table 2. Get the
average peak and compare with the wavelength range for each LED taken from
literature.
Measure the angles of diffraction for the start and end
of a high intensity spectrum as shown
with a white line
in the figure.
How to Measure Angles of Diffraction
1. Align vertical cross-hair with the edge of an image. Use a magnifying glass to read
the Vernier scales.
2. Find where the zero-point of the Vernier scale aligns with the degree scale. If the
zero point is in between two lines on the degree scale, choose the smaller reading.
Record this as the degree reading.
3. Find the line on the Vernier scale aligned most closely to any line on the degree
scale. This corresponds to the number of minutes of a degree (1/60). Add this to the
degree reading. Refer to the image below.
E Anguluan & M Poral, 2012
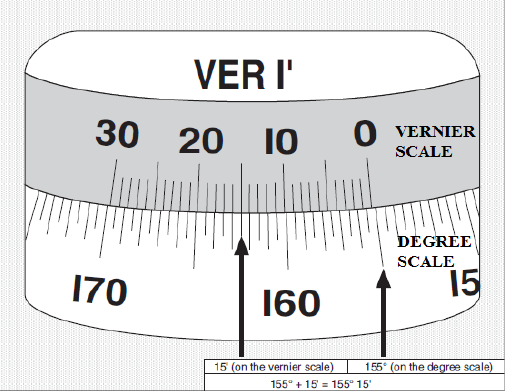
(Image taken from: Instruction Manual and Experiment Guide
for the PASCO scientific Model SP-9268A)
References
Student Spectrometer: Instruction Manual and Experiment Guide for the PASCO scientific
Model SP-9268A (January 1991)
E Anguluan & M Poral, 2012
Name Date
Submitted Date
Performed Score
Group Members
Instructor
Section
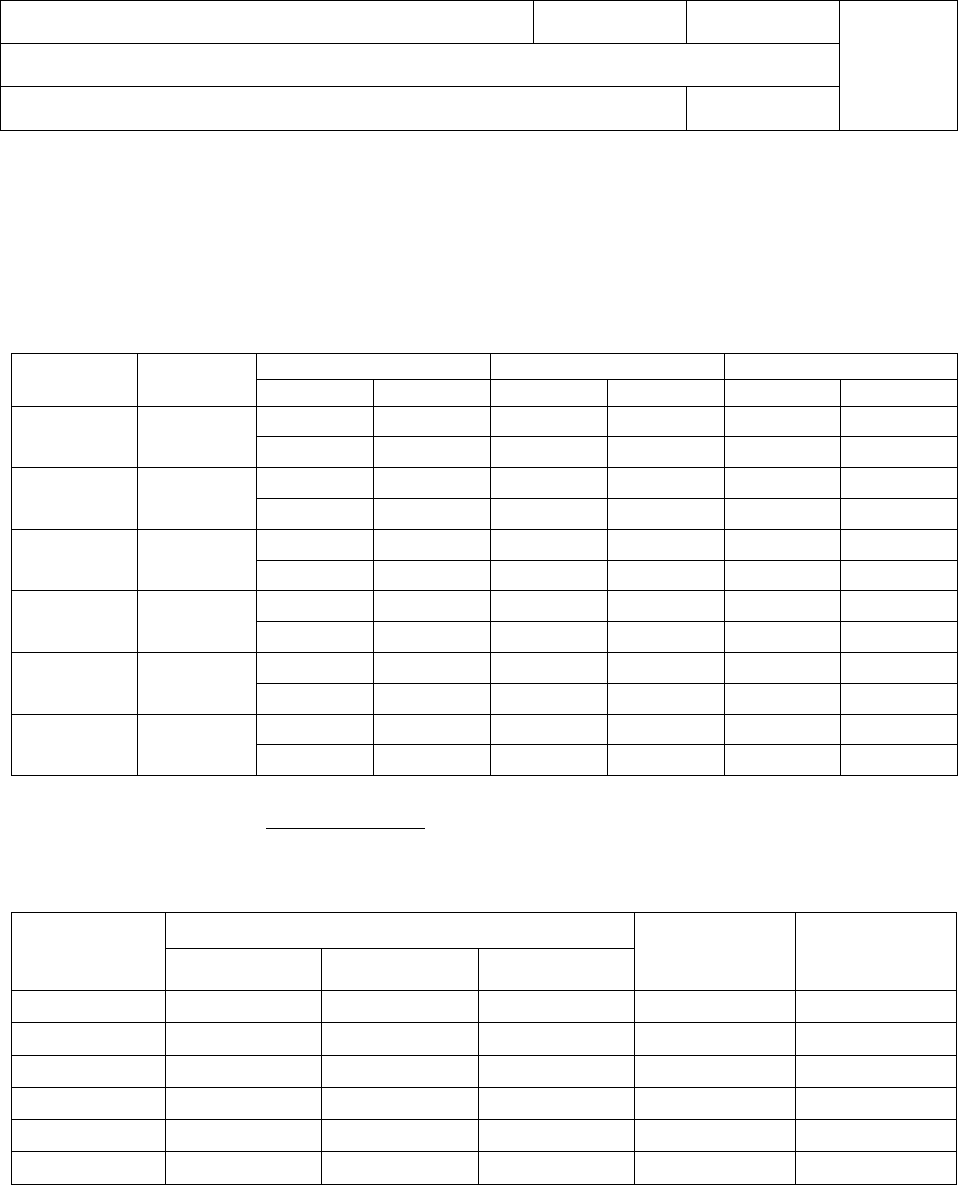
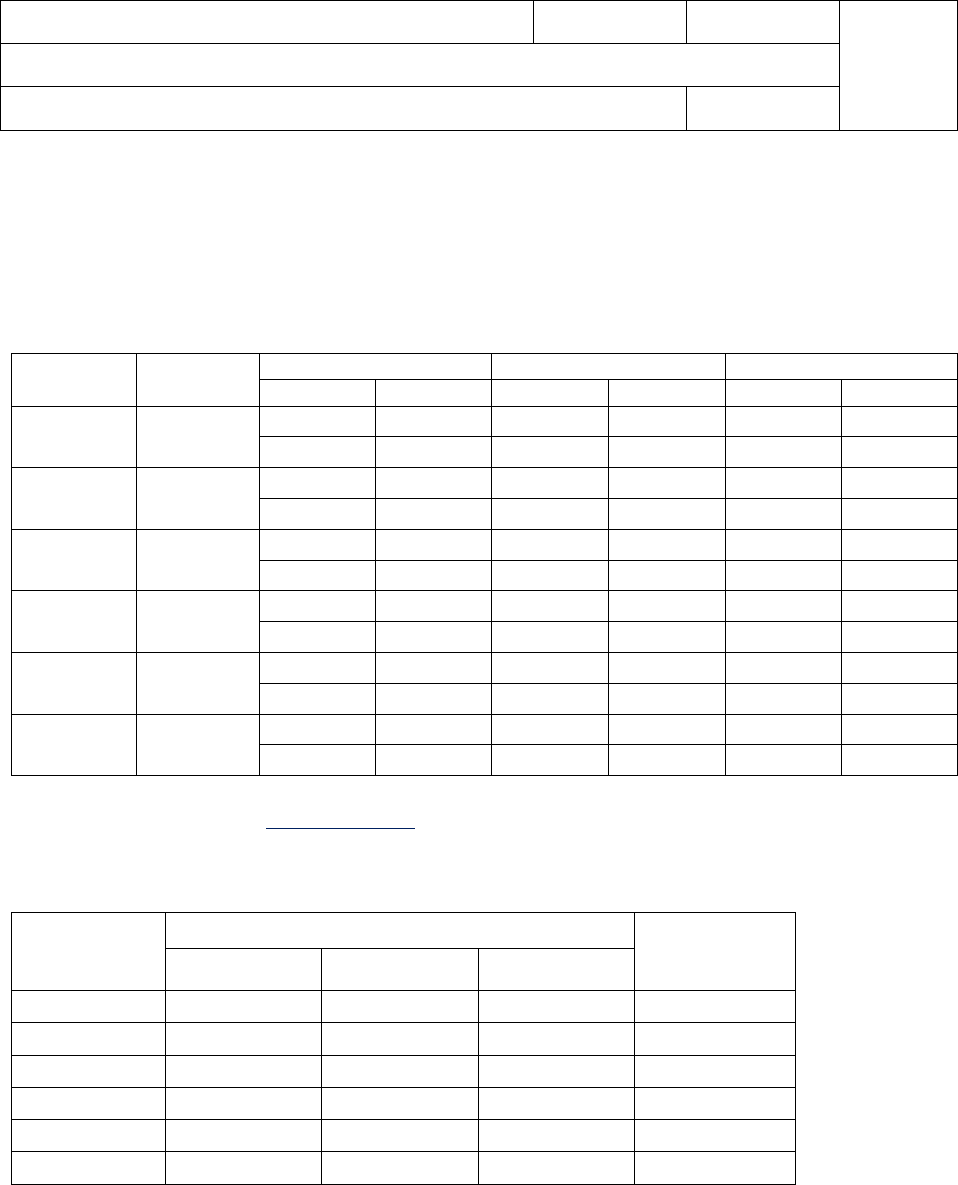
WORKSHEET: Determination of Wavelength of LEDs
Data Summary
Data Table 1. Diffraction angles for different LEDs
LED no.
observed
color
n = 1
n = 2
n = 3
θ - θ0
λ (nm)
θ - θ0
λ (nm)
θ - θ0
λ (nm)
1
2
3
4
5
6
zero diffraction angle, θ0 : _____________
Data Table 2. Average peak wavelengths of different LEDs.
LED no. peaks (nm) Average
peak Expected
range of λ
n = 1 n = 2 n = 3
1
2
3
4
5
6
E Anguluan & M Poral, 2012
Questions
1. Justify taking the average/midpoint when computing for the peak. How does the
spectrum of an LED look like?
2. In the computation of wavelength, the slits in the diffraction grating are assumed to have
no width. In reality, the slits have a finite width. Discuss the effect of this theoretical
consideration in your results.
3. A 600 lines/mm diffraction grating is illuminated by a yellow light from a sodium vapor
lamp. This light contains two closely spaced lines (the well-known sodium doublet) of
wavelengths 589 nm and 589.59 nm. At what angles will the first order maxima occur for
these wavelengths?
4. A light which is known to be composed of red light (632.8 nm) and blue light (420 nm) is
used to illuminate a 300 lines/mm diffraction grating. If a viewing screen is placed 1
meter from the diffraction grating, what is the separation distance between the second
order red and blue fringes formed at the screen?
E Anguluan & M Poral, 2012
Name TEST RUN & INSTRUCTOR’S REFERENCE Date
Submitted Date
Performed Score
Group Members
Instructor
Section
WORKSHEET: Determination of Wavelength of LEDs
Data Summary
Data Table 1. Diffraction angles for different LEDs
LED no.
Observed
color
n = 1
n = 2
n = 3
θ - θ0
λ (nm)
θ - θ0
λ (nm)
θ - θ0
λ (nm)
1 Violet 6° 29’ 372.617 13° 29’ 384.718 21° 7’ 396.295
7° 48’ 447.861 15° 30’ 440.943 22° 38’ 423.316
2 Blue 7° 11’ 412.647 15° 10’ 431.686 24° 8’ 449.748
9° 17’ 532.345 16° 59’ 481.9543 25° 3’ 465.750
3 Yellow 9° 33’ 547.497 19° 44’ 557.111 28° 59’ 533.011
10° 4’ 582.490 20° 38’ 581.437 29° 55’ 548.614
4 Orange 9° 34’ 548.444 20° 16’ 571.543 31° 29’ 574.476
10° 7’ 579.655 21° 7’ 594.443 32° 30’ 591.030
5 Orange-
yellow
10° 4’ 576.820 19° 59’ 590.859 29° 33’ 542.501
10° 30’ 601.377 21° 24’ 602.047 30° 9’ 552.492
6 Red 10° 32’ 603.265 21° 59’ 617.656 29° 36’ 546.116
11° 7’ 636.264 22° 52’ 641.170 31° 10’ 569.282
zero diffraction angle, θ0 : ____0° 32’____
Data Table 2. Average peak wavelengths of different LEDs.
LED no. peaks (nm) Average
peak (nm)
n = 1 n = 2 n = 3
1 410.239 412.831 409.805 410.958
2 472.496 456.820 457.749 462.355
3 564.994 569.274 540.812 558.360
4 564.050 582.993 582.753 576.598
5 589.099 596.453 547.497* 592.776
6
619.765 629.413 557.700* 624.589
*not included in computation of average peak; third order spectra very faint
E Anguluan & M Poral, 2012
Error.
LED no.
Observed
color
Average peak
(nm)
Expected range
of λ (nm)
Actual peak
(nm)
% error
1 Violet 410.958 384 – 421 402.7 2.051
2
Blue 462.355 436 – 472 454.3 1.773
3
Yellow 558.360 567 – 587 577.4 3.298
4 Orange 576.598 590 – 606 598.6 3.676
5 Orange-yellow 592.776 605 – 624 614.4 3.520
6
Red 624.589 645 – 669 657.2 4.962
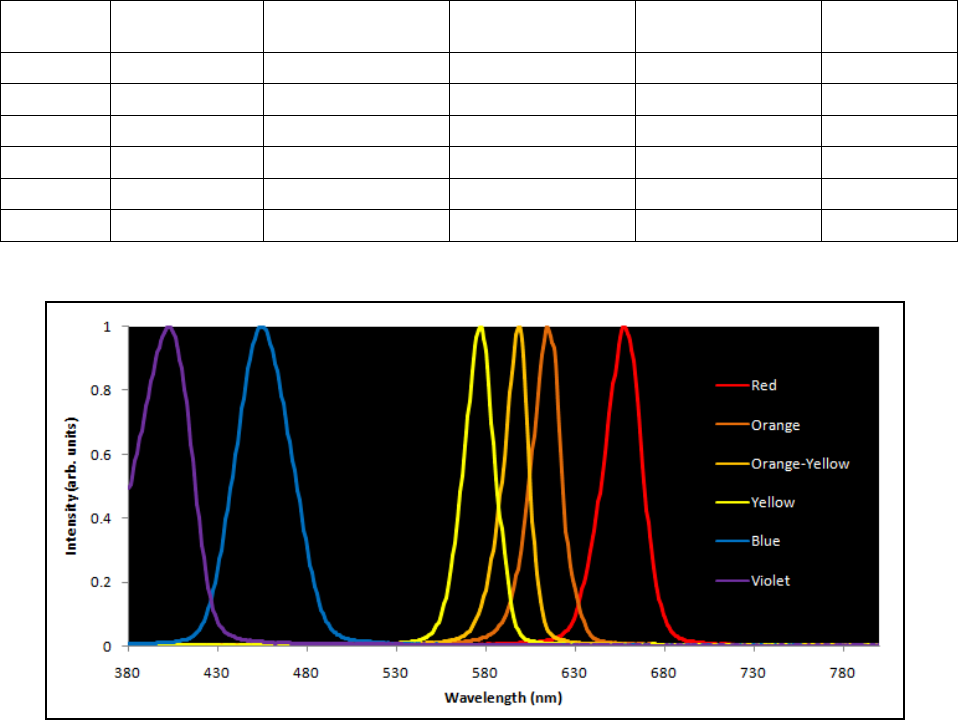
Emission spectra of the LEDs used in the experiment.
Possible sources of error include: imperfect alignment of grating and other optical elements; and
inconsistent alignment of vertical cross-hair with image.
E Anguluan & M Poral, 2012
Answers to Questions:
1. Justify taking the average/midpoint when computing for the peak. How does the
spectrum of an LED look like?
See figure above, Emission spectra of LEDs used in the experiment.
2. In the computation of wavelength, the slits in the diffraction grating are assumed to have
no width. In reality, the slits have a finite width. Discuss the effect of this theoretical
consideration in your results.
The finite width of the slits is the reason why the observed light is a broad spectrum. If
the slit width is narrower, the spectrum produced will be narrower also.
3. A 600 lines/mm diffraction grating is illuminated by a yellow light from a sodium vapor
lamp. This light contains two closely spaced lines (the well-known sodium doublet) of
wavelengths 589 nm and 589.59 nm. At what angles will the first order maxima occur for
these wavelengths?
( )( ) ( )( )
11
12
33
589 1 589.59 1
sin 20.78 sin 20.82
1.66 10 1.66 10mm mm
θθ
−−
−−
= =°= =°
××
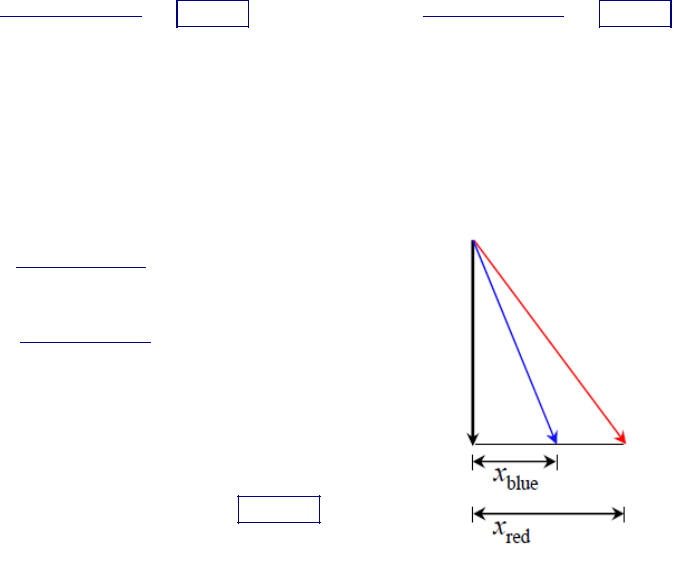
4. A light which is known to be composed of red light (632.8 nm) and blue light (420 nm) is
used to illuminate a 300 lines/mm diffraction grating. If a viewing screen is placed 1
meter from the diffraction grating, what is the separation distance between the second
order red and blue fringes formed at the screen?
( )( )
( )( )
( ) ( )
( ) ( )
1
3
1
3
632.8 2
sin 22.55
3.3 10
420 2
sin 14.75
3.3 10
1 tan 0.415
1 tan 0.263
separation distance 0.152
red
blue
red red
blue blue
red blue
mm
mm
xm m
xm m
xx m
θ
θ
θ
θ
−
−
−
−
= = °
×
= = °
×
= =
= =
=−=
E Anguluan & M Poral, 2012
