Supplemental Security Income 5395 8531
User Manual: 5395 8531
Open the PDF directly: View PDF ![]() .
.
Page Count: 3
Supplemental Security Income
January 2012 Baseline
2009 2010 2011 2012 2013 2014 2015 2016 2017 2018 2019 2020 2021 2022
act act est proj proj proj proj proj proj proj proj proj proj proj
CALENDAR YEAR
Federal Beneficiaries (December)
Aged 1,101 1,099 1,100 1,112 1,127 1,145 1,165 1,186 1,210 1,236 1,263 1,291 1,320 1,347
Blind and Disabled Adults 5,124 5,319 5,487 5,615 5,710 5,755 5,780 5,787 5,796 5,807 5,819 5,832 5,846 5,859
Blind and Disabled Children 1,198 1,238 1,279 1,314 1,336 1,346 1,349 1,348 1,348 1,349 1,351 1,354 1,357 1,361
Total 7,423 7,656 7,866 8,041 8,174 8,246 8,294 8,322 8,355 8,392 8,432 8,476 8,523 8,567
Awards of Federally Administered Benefits
Aged 107 105 109 120 124 128 132 136 140 144 148 152 156 156
Blind and Disabled Adults 696 734 721 710 690 650 635 620 623 625 628 630 633 633
Blind and Disabled Children 197 204 202 208 200 190 185 181 182 183 184 185 186 187
Total 1,000 1,043 1,032 1,038 1,014 968 952 937 945 952 960 967 975 976
"Exits"
Aged -107 -107 -108 -108 -109 -110 -112 -114 -116 -119 -121 -124 -126 -129
Blind and Disabled Adults -540 -538 -553 -582 -595 -605 -610 -613 -613 -614 -616 -617 -618 -620
Blind and Disabled Children -150 -165 -161 -173 -177 -180 -182 -182 -182 -182 -182 -182 -183 -183
Total -796 -810 -822 -862 -882 -896 -904 -909 -912 -915 -919 -923 -927 -932
Average Federal Benefit (December)
Aged $359 $359 $360 $373 $379 $385 $391 $398 $407 $416 $427 $437 $448 $459
Blind and Disabled Adults $523 $526 $528 $547 $555 $563 $571 $581 $593 $606 $620 $634 $649 $664
Blind and Disabled Children $614 $619 $619 $642 $650 $659 $668 $680 $694 $709 $726 $742 $759 $777
Total $514 $517 $519 $539 $546 $554 $562 $571 $582 $595 $608 $621 $635 $649
Memo:
Maximum Monthly Benefit (Individual) $674 $674 $674 $698 $707 $717 $727 $741 $755 $772 $790 $808 $827 $846
Percentage Change 5.8% 0.0% 0.0% 3.6% 1.3% 1.4% 1.4% 1.8% 2.0% 2.2% 2.3% 2.3% 2.3% 2.3%
Effective Date Jan 09 Jan 10 Jan 11 Jan 12 Jan 13 Jan 14 Jan 15 Jan 16 Jan 17 Jan 18 Jan 19 Jan 20 Jan 21 Jan 22
(continued)
January 27, 2012
Caseloads in 1000s. Outlays in billions of dollars.
Supplemental Security Income
January 2012 Baseline
2009 2010 2011 2012 2013 2014 2015 2016 2017 2018 2019 2020 2021 2022
act act est proj proj proj proj proj proj proj proj proj proj proj
January 27, 2012
Caseloads in 1000s. Outlays in billions of dollars.
FISCAL YEAR
Average Caseload, Federal Beneficiaries
Aged 1,106 1,105 1,105 1,109 1,122 1,137 1,155 1,176 1,198 1,223 1,249 1,276 1,305 1,334
Blind and Disabled Adults 5,031 5,204 5,395 5,547 5,667 5,750 5,790 5,811 5,818 5,828 5,839 5,851 5,865 5,879
Blind and Disabled Children 1,167 1,213 1,256 1,294 1,326 1,345 1,353 1,356 1,355 1,355 1,356 1,358 1,361 1,365
Total 7,304 7,522 7,756 7,949 8,115 8,233 8,299 8,342 8,372 8,406 8,444 8,486 8,531 8,577
Average Federal Benefit
Aged $352 $358 $358 $369 $375 $381 $387 $394 $403 $412 $422 $432 $442 $454
Blind and Disabled Adults $513 $525 $524 $538 $547 $555 $563 $573 $585 $598 $610 $624 $639 $654
Blind and Disabled Children $607 $620 $620 $631 $641 $650 $659 $671 $685 $699 $714 $731 $748 $765
Total $503 $516 $516 $529 $539 $547 $554 $564 $575 $587 $599 $612 $626 $640
Number of Months 12 12 13 11 12 12 12 13 12 11 12 12 12 13
Benefit Outlays
Aged 4.666 4.749 5.141 4.496 5.050 5.199 5.364 6.025 5.795 5.543 6.316 6.613 6.928 7.863
Blind and Disabled Adults 30.954 32.799 36.785 32.807 37.196 38.295 39.141 43.292 40.849 38.307 42.758 43.833 44.945 49.951
Blind and Disabled Children 8.499 9.019 10.122 8.985 10.206 10.499 10.710 11.823 11.134 10.426 11.626 11.911 12.210 13.572
Adjustments 0.731 0.634 0.596 0.335 0.708 0.729 0.745 1.125 0.790 0.423 0.819 0.842 0.865 1.264
Subtotal 44.850 47.202 52.643 46.623 53.160 54.722 55.960 62.266 58.568 54.698 61.519 63.199 64.948 72.650
Vocational Rehabilitation, Research,
and Demonstration Projects 0.083 0.084 0.074 0.078 0.081 0.083 0.085 0.088 0.089 0.091 0.094 0.096 0.099 0.102
Total, SSI Mandatory Outlays 44.933 47.286 52.717 46.700 53.241 54.805 56.045 62.353 58.657 54.789 61.612 63.296 65.047 72.752
(continued)
Supplemental Security Income
January 2012 Baseline
2009 2010 2011 2012 2013 2014 2015 2016 2017 2018 2019 2020 2021 2022
act act est proj proj proj proj proj proj proj proj proj proj proj
January 27, 2012
Caseloads in 1000s. Outlays in billions of dollars.
TABLES
NOTES
Details may not add to totals because of rounding.
Outlays omit administrative costs, which are discretionary and thus subject to appropriation. Federal SSI statistics omit state supplementation, whether administered by the states
or the Social Security Administration.
Exits represent suspensions and terminations caused by death or loss of SSI eligibility. Loss of eligibility can occur if an individual no longer meets the non-medical criteria
for eligibility or if an individual no longer meets the Social Security Act's definition of disabled.
The maximum monthly benefit, known as the Federal Benefit Rate (FBR), increases with the automatic cost-of-living adjustment that applies to Social Security benefits. However,
because of rounding in the FBR formula, sometimes the effective FBR cost-of-living adjustment differs from the Social Security cost-of-living adjustment.
0
1
2
3
4
5
6
7
8
9
1980
1985
1990
1995
2000
2005
2010
2015
2020
Millions
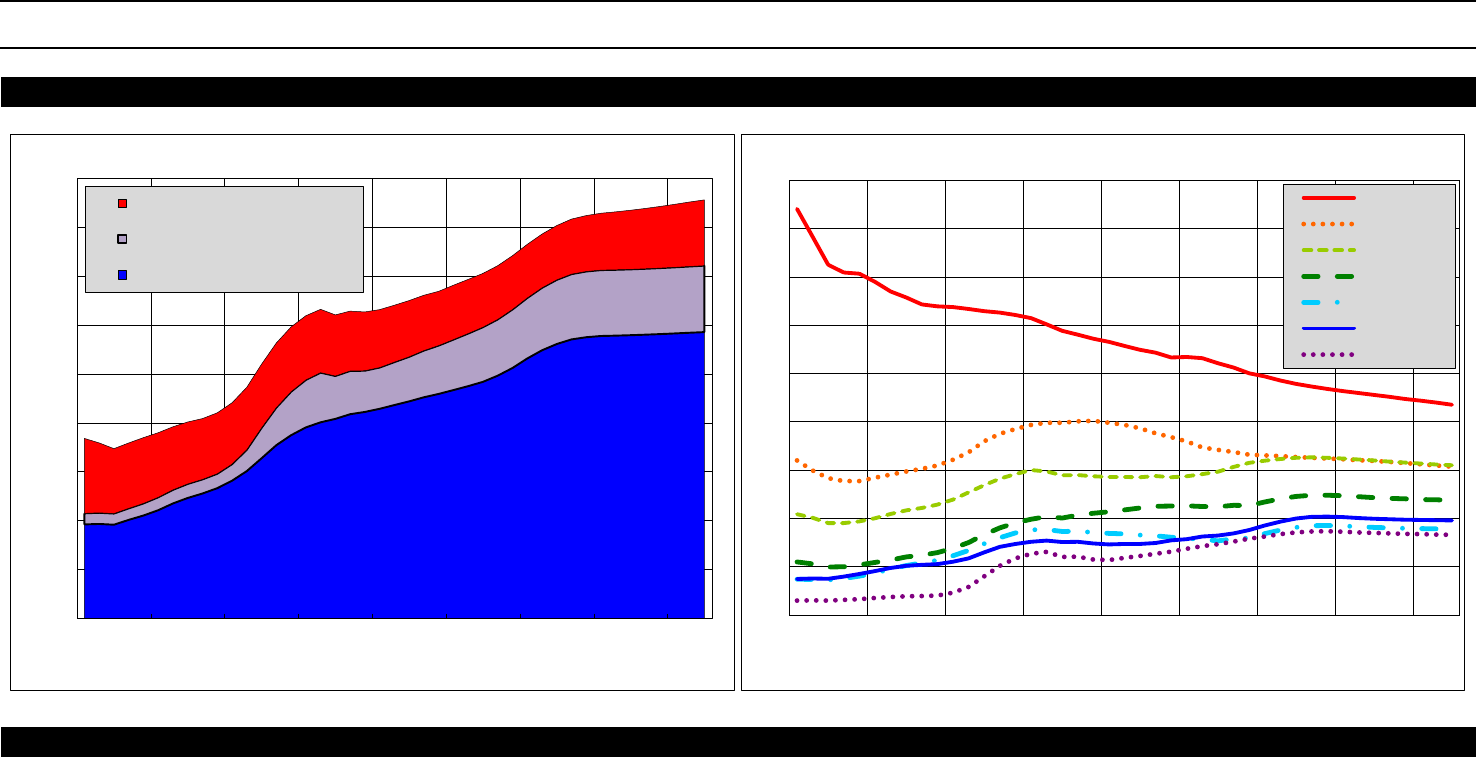
SSI Caseloads at End of Calendar Year
Aged
Blind & Disabled Children
Blind & Disabled Adults
0%
1%
2%
3%
4%
5%
6%
7%
8%
9%
1980
1985
1990
1995
2000
2005
2010
2015
2020
SSI Recipients as a Percentage of Population
65+
60 to 64
50 to 59
40 to 49
30 to 39
18 to 29
Under 18
