Syslog And SNMP Monitoring Guide
User Manual:
Open the PDF directly: View PDF ![]() .
.
Page Count: 102 [warning: Documents this large are best viewed by clicking the View PDF Link!]
- Overview
- How to Use this Document
- Caveat Lector
- Applicability
- Conventions & Style Used in this Document
- Syslog Introduction
- Structure of a syslog Message
- lunalogs
- hsm.log
- Audit Logs
- Interpreting Logs
- Configuring syslog
- Open Source Components
- IPMI
- Threshold Events
- Discrete Events
- CPU Sensor
- VRD, PCH and Inlet Sensors
- IPMI Implementation
- Significant Log Messages
- Insignificant Log Messages
- Unlikely Log Messages
- No ipmievd Messages in Log File
- Kernel Panic
- OEM Record
- Sensor Record without Description
- Full Sensor Record for Discrete and OEM Events
- Compact Sensor Record With No Event Direction
- Sensor Record With Only Sensor Number
- BMC Event Message Buffer Failure
- No Event Data
- Not An Event
- Unable to Read from IPMI Device
- Get SEL Info Command Failed
- SEL Buffer Use
- SEL Buffer Overflow
- Unable to Retrieve SEL Data
- SEL Overflow on Check for Waiting Events
- PID File Already Exists
- Failed to Open PID File
- Unable to Open SDR File
- Malloc Failure
- IPMI Event Setup Failed
- Error Waiting For Events
- Unable to Load Event Interface
- Invalid Interface
- Debug Messages
- SMART
- SMART Attributes
- Significant Expected Log Messages
- Unexpected Log Messages
- Configuration File not in Expected Location
- Cannot Open Configuration File
- Configuration File Format Errors
- Cannot Register Device
- Force Scan For Devices
- Could Not Scan For Devices or No Devices To Scan
- Out of Memory
- Exception
- Received Hang Up or Interrupt Signal
- Continue on Error
- Unable to Monitor Devices
- Mail-Related Messages
- One Check
- Ignore Device or Duplicate Device
- Could Not Detect Device, Unsupported Device, Not a ATA/SCSI Device or Device Cannot be Registered
- Could Not Open Device
- Could Not Fork Into Background Process
- Writing PID File
- Help for Configuration File Directives
- Write State File
- Cannot Unlink PID File
- Close Failed
- Code Bug
- ATA Error Log Read Failure
- ATA Device Scan Messages
- SCSI Device Scan Messages
- Log Self-Test Progress & Errors
- Test Schedule
- Check Pending Sector Count Identifier
- Critical Attribute Change
- Critical Prefailure Change
- Sector Count Change
- Temperature Change
- Attribute Error
- Check ATA Device Health
- Check SCSI Device Health
- Auto Standby Feature
- Sleep and Wakeup
- Offline Log Collection Status
- SNMP
- NTP
- SSH
- Privileged Services
- Kernel
- IPMI
- SafeNet Components
- sysstat
- HSM Callback Service
- OAMP
- Network Trust Link Service
- Datapath: Expected Log Messages
- Datapath: Unexpected Log Messages
- NTLS Terminating
- Failed to Load SSL Engine
- Skip C_Initialize
- Configured for RSA Operations
- Failed to Pre-Load SSL Engine
- Failed to Enable SSL Engine for RSA Operations
- Failed to Initialize
- No Command Processor Module Configured
- Fail to Accept Connections
- Fail to Create Client Connection
- Cache Monitor Failed
- Connection Instance Failures
- Non-Luna Client Connect Attempt
- Command Process Unloaded
- SSL Certificates Problems
- Client Authentication Failures
- Port Monitoring Failures
- Could Not Initialize Command Processor
- Datapath Debug Messages
- NTLS Crash and Burn
- Luna SA Command Processor: Expected Log Messages
- Luna SA Command Processor: Unexpected Log Messages
- Keep-alive Timer Failures
- Startup and Operational Failures
- Fail to Initialize Appliance Statistics
- HTL Required
- HTL Failure
- Client Credentials Cannot be Verified
- Client Terminating
- Unsupported Command
- Failure to Retrieve Container List
- Luna SA Command Processor Debug Messages
- Virtual Token Create and Add Failures
- Host Trust Link
- Network Bus Service
- Remote Backup Service
- Luna Administrative Shell: State and Status
- Luna Shell: Command Logging
- cron & crontab
- Certificate Monitoring Daemon
- Luna SNMP Trap Agent
- Admin API
- Other Appliance Logging
- Client Logging
- SNMP Introduction
- Traps
Luna SA
Syslog and SNMP
Monitoring Guide

Luna Monitoring
Syslog & SNMP
Luna Syslog and SNMP Monitoring Guide 007-012417-001 Rev V22 Copyright 2016, Gemalto NV. 2 of 102
Table of Contents
Overview .....................................................................................................................................................................6
How to Use this Document .........................................................................................................................................6
Caveat Lector ..............................................................................................................................................................6
Applicability ................................................................................................................................................................6
Conventions & Style Used in this Document ..............................................................................................................6
Syslog Introduction .....................................................................................................................................................7
Structure of a syslog Message ....................................................................................................................................7
lunalogs ......................................................................................................................................................................9
hsm.log .................................................................................................................................................................... 10
Audit Logs ................................................................................................................................................................ 11
Interpreting Logs ..................................................................................................................................................... 11
Configuring syslog .................................................................................................................................................... 11
Open Source Components ....................................................................................................................................... 12
IPMI ..................................................................................................................................................................... 12
Threshold Events ............................................................................................................................................. 16
Discrete Events ................................................................................................................................................ 18
CPU Sensor ...................................................................................................................................................... 18
VRD, PCH and Inlet Sensors ............................................................................................................................. 19
IPMI Implementation ...................................................................................................................................... 19
Significant Log Messages ................................................................................................................................. 19
Insignificant Log Messages .............................................................................................................................. 21
Unlikely Log Messages ..................................................................................................................................... 21
Debug Messages .............................................................................................................................................. 25
SMART ................................................................................................................................................................. 26
SMART Attributes ............................................................................................................................................ 27
Significant Expected Log Messages ................................................................................................................. 28
Unexpected Log Messages .............................................................................................................................. 31

Luna Monitoring
Syslog & SNMP
Luna Syslog and SNMP Monitoring Guide 007-012417-001 Rev V22 Copyright 2016, Gemalto NV. 3 of 102
SNMP ................................................................................................................................................................... 45
Expected Log Messages ................................................................................................................................... 45
Unexpected Log Messages .............................................................................................................................. 46
NTP ...................................................................................................................................................................... 46
SSH ....................................................................................................................................................................... 46
Expected Log Messages ................................................................................................................................... 46
Unexpected Log Messages .............................................................................................................................. 47
Privileged Services ............................................................................................................................................... 48
Expected Log Messages ................................................................................................................................... 48
Unexpected Log Messages .............................................................................................................................. 49
Kernel................................................................................................................................................................... 50
Expected Log Messages ................................................................................................................................... 50
SafeNet Components ............................................................................................................................................... 50
sysstat .................................................................................................................................................................. 51
Expected Log Messages ................................................................................................................................... 51
Unexpected Log Messages .............................................................................................................................. 52
HSM Callback Service .......................................................................................................................................... 53
OAMP ................................................................................................................................................................... 53
Unexpected Log Messages .............................................................................................................................. 54
Network Trust Link Service .................................................................................................................................. 54
Datapath: Expected Log Messages ................................................................................................................. 54
Datapath: Unexpected Log Messages ............................................................................................................ 58
Luna SA Command Processor: Expected Log Messages ................................................................................. 64
Luna SA Command Processor: Unexpected Log Messages ............................................................................ 66
Host Trust Link ..................................................................................................................................................... 70
Expected Log Messages ................................................................................................................................... 70
Unexpected Log Messages .............................................................................................................................. 71
Network Bus Service ............................................................................................................................................ 74

Luna Monitoring
Syslog & SNMP
Luna Syslog and SNMP Monitoring Guide 007-012417-001 Rev V22 Copyright 2016, Gemalto NV. 4 of 102
Remote Backup Service ....................................................................................................................................... 74
Luna Administrative Shell: State and Status ....................................................................................................... 74
Expected Log Messages ................................................................................................................................... 74
Unexpected Log Messages .............................................................................................................................. 75
Luna Shell: Command Logging ............................................................................................................................ 76
Expected Log Messages ................................................................................................................................... 76
Unexpected Log Messages .............................................................................................................................. 76
cron & crontab ..................................................................................................................................................... 77
Expected Log Messages ................................................................................................................................... 77
Unexpected Log Messages .............................................................................................................................. 78
Certificate Monitoring Daemon .......................................................................................................................... 79
Expected Log Messages ................................................................................................................................... 79
Unexpected Log Messages .............................................................................................................................. 80
Luna SNMP Trap Agent ........................................................................................................................................ 82
Expected Log Messages ................................................................................................................................... 82
Unexpected Log Messages .............................................................................................................................. 82
Admin API ............................................................................................................................................................ 84
Expected Log Messages ................................................................................................................................... 84
Unexpected Log Messages .............................................................................................................................. 85
Other Appliance Logging ......................................................................................................................................... 86
hsm information show ........................................................................................................................................ 86
Client Logging .......................................................................................................................................................... 88
cklog ..................................................................................................................................................................... 88
HA log .................................................................................................................................................................. 88
SNMP Introduction .................................................................................................................................................. 89
Traps ........................................................................................................................................................................ 89
Configuring and Enabling Traps on Luna Appliance ............................................................................................ 89
Configuring Trap Notification .............................................................................................................................. 90

Luna Monitoring
Syslog & SNMP
Luna Syslog and SNMP Monitoring Guide 007-012417-001 Rev V22 Copyright 2016, Gemalto NV. 5 of 102
Install net-snmp ............................................................................................................................................... 90
Create a Trap Handler ..................................................................................................................................... 91
Configure snmptrapd.conf .............................................................................................................................. 91
Add the SafeNet MIBs ..................................................................................................................................... 92
Enable Trap Packets Through the Firewall ...................................................................................................... 92
Disable SELinux ................................................................................................................................................ 92
Start the SNMP Trap Daemon ......................................................................................................................... 93
Testing Trap Events on Luna Appliance ............................................................................................................... 93
Using the Examples ......................................................................................................................................... 94
Luna Appliance Trap Events ................................................................................................................................ 94
Appliance MIB Overview ..................................................................................................................................... 94
Sub-System Log Reference .................................................................................................................................. 95
Fan Failure ....................................................................................................................................................... 96
Power Supply Failure ....................................................................................................................................... 97
Motherboard Failure ....................................................................................................................................... 98
Disk Drive Failure ............................................................................................................................................. 99
NTLS Failure ..................................................................................................................................................... 99
Crypto Failure .................................................................................................................................................. 99
Clock Failure .................................................................................................................................................. 100
Caveats .............................................................................................................................................................. 100

Luna Monitoring
Syslog & SNMP
Luna Syslog and SNMP Monitoring Guide 007-012417-001 Rev V22 Copyright 2016, Gemalto NV. 6 of 102
Overview
Monitoring a Luna HSM is an operational requirement for mission critical systems. SafeNet makes
monitoring available through two principle facilities: the system log (syslog) and simple network
management protocol (SNMP). This document describes the syslog facility and provides details for what
various messages mean, the probability of observing them and what action to take if observed. It goes on
to describe the SNMP traps supported by Luna appliances.
How to Use this Document
SafeNet prepared this document for two primary purposes. Firstly, the information within should provide
sufficient guidance for an administrator to review log messages and determine a course of action for
significant events. Secondly, the contents of this document should provide sufficient information for a
developer to create or configure a service to scan log messages for significant events and automate action
based on the message.
Caveat Lector
SafeNet reserves the right to revise log messages with each new release. Consequently, do not hard code
pattern matching strings to parse log files. If you intend to match on specific text, create a solution that
enables you to easily configure pattern strings.
Applicability
SafeNet updated this document for the Luna SA 6.2 product release (HSM firmware 6.23.0). Much of the
material also applies to all previous product releases (i.e., 5.0.x, 5.1.x, 5.2.x, 5.3.x, 5.4.x and 6.0.x).
A companion document –Monitoring for Luna IS –describes log messages for SafeNet’s Luna IS 6.x product.
Conventions & Style Used in this Document
So far, one author has developed this guide. It is far from complete. Over time, others will participate to
extend and update the contents. This section describes the conventions and style the author set for this
document. This section is important to you, the reader, so that you understand the format herein. Equally
important, this section is for maintainers of the document to ensure consistency for future revisions.
Luna Monitoring
Syslog & SNMP
Luna Syslog and SNMP Monitoring Guide 007-012417-001 Rev V22 Copyright 2016, Gemalto NV. 7 of 102
The following conventions apply throughout the document.
• Use the same date and time in all examples unless the time is relevant to the example (e.g., a cron
entry). For this version of the document, the date and time are: 2012 Feb 29 12:05:01.
• Use myLuna for the hostname of the Luna appliance.
• Use 192.168.0.xxx for example IP addresses. These values maintain consistency in the
examples and ensures that no customer- or SafeNet-specific network configuration shows in an
example.
• Use [1234] for the process identifier.
• Organize log messages into two distinct groups with the following headings: “Expected Log
Messages” and “Unexpected Log Messages.”
• Use a table like this example to identify the facility
keyword, software process and log file for each new component to be described.
• Use prose – not a bullets or tables – to describe log messages. Try to maintain the established
introductory pre-amble, “This message indicates …” The document uses this structure so that parts
can be extracted and provided electronically (e.g., via email) for customer assistance.
• Use greater-than-less-than signs to delimit variable text in log messages (e.g., <user name>).
• Developers or editors of this document, please review “Appendix A – Guidance for Maintainers of
this Document” for additional information.
Syslog Introduction
Syslog is a standard logging facility, standardized within the Syslog working group of the IETF. Software
processes use an API to generate messages that the syslog facility writes to organized log files. If
configured, syslog can also send messages to remote syslog servers.
IMPORTANT: Luna appliances use rsyslog. This facility provides the same features as syslog with the
addition of reliable transport using TCP. Unless relevant to the accuracy of a point being made, this
document uses the term syslog rather than rsyslog.
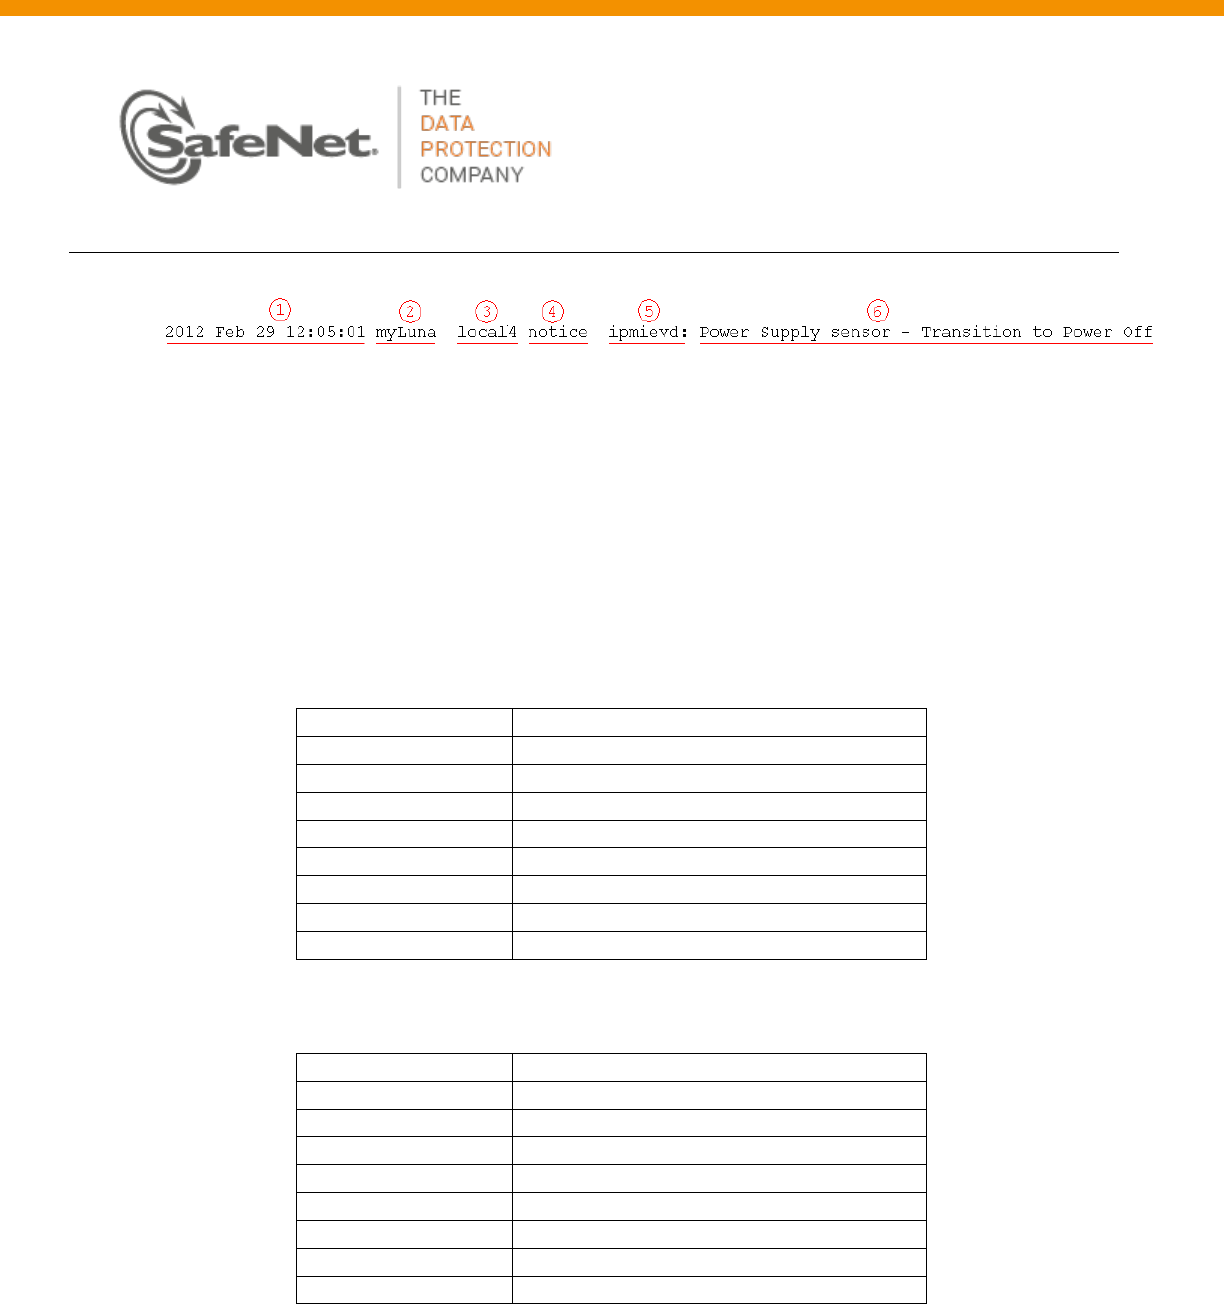
Structure of a syslog Message
Figure 1 shows an example of a syslog message.
Luna Monitoring
Syslog & SNMP
Luna Syslog and SNMP Monitoring Guide 007-012417-001 Rev V22 Copyright 2016, Gemalto NV. 8 of 102
Figure 1: Example syslog Message
1. This field is the date and time.
2. This field is the system host name.
3. This field is the facility keyword, explained below.
4. This field is the log severity level, explained below.
5. This field is the software process that generated the log message.
6. This field is a process-specific log message.
Table 1 summarizes the facility keywords applicable for the Luna appliance.
Facility Keyword
Facility Description
kern
kernel messages
user
user-level messages
daemon
system daemons
auth
security/authorization messages
syslog
messages generated internally by syslogd
authpriv
security/authorization messages
cron
clock daemon
local#
local use #, where # is 0 to 7
Table 1: syslog Facility Keywords
Table 2 summarizes the log severity levels.
Severity Keyword
Severity Description
emerg/panic
System is unusable
alert
Action must be taken immediately
critical
Critical condition
err/error
Error condition
warn/warn
Warning condition
notice
Normal but significant condition
info
Informational message
debug
Debug-level message
Table 2: syslog Severity Levels
The primary log file is messages but the Luna appliance also creates two other significant log files:
lunalogs and hsm.log.
Luna Monitoring
Syslog & SNMP
Luna Syslog and SNMP Monitoring Guide 007-012417-001 Rev V22 Copyright 2016, Gemalto NV. 9 of 102
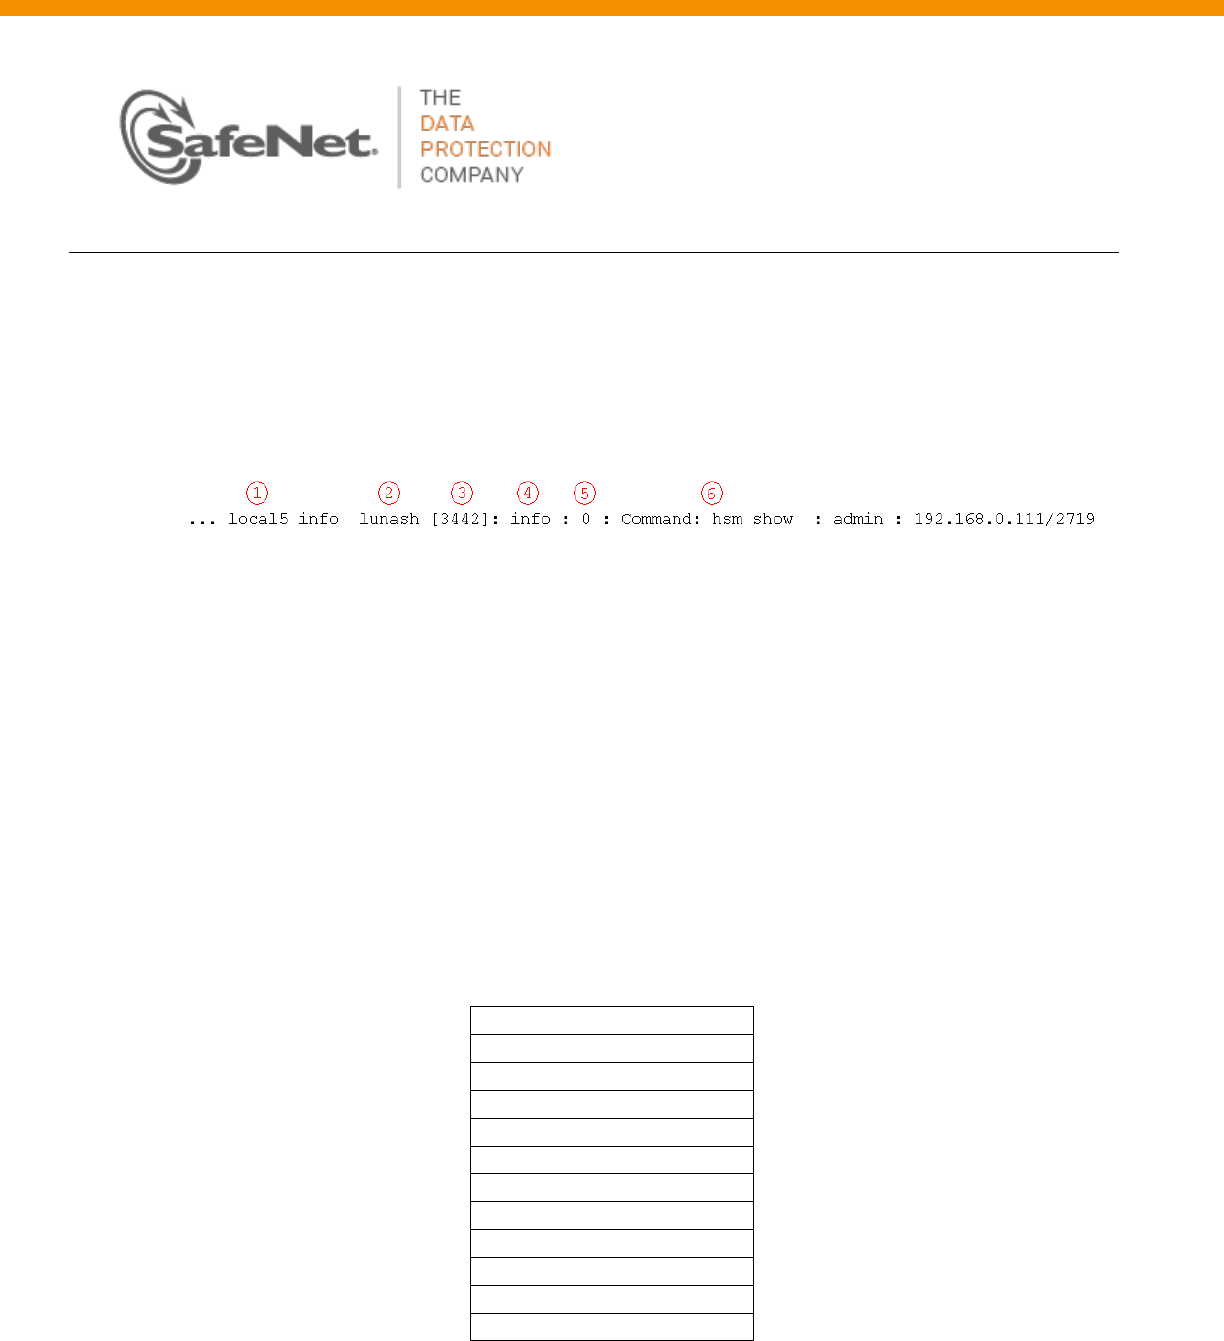
lunalogs
lunalogs log messages follow a similar format as standard syslog messages with some slight differences.
Figure 2 shows an example segment of a lunalogs message. The format up to the second field is identical to
that for a syslog message.
Figure 2: Example lunalogs Message
1. The facility keyword for lunalogs varies. A table in relevant sections identifies the facility keyword
for the component that writes log messages to lunalogs.
2. This field is the application string, itemized below.
3. This field is the process identifier, if available.
4. lunalogs has a subsidiary severity level, itemized below.
5. This field is the Luna-specific error code associated with the lunalog entry.
6. This field is the description, the format and contents determined by the application identifier of the
lunalogs message. In most cases, the description is a concise statement of the issue that led to the
log entry (e.g., oamp – “Cobra SQL service online.”). In other cases, the description comprises
multiple fields of information, described below in Table 5.
Table 3 summarizes the application identifiers available in a lunalogs message.
Application Identifier
oamp
Recover
NTLS
lunash
cluster
Luna PED Client
hsm_login
certmonitord
pam_swift
sysstatd
AdminAPI
Table 3: lunalogs Application Identifiers
Table 4 summarizes the subsidiary log severity levels of lunalogs.
Luna Monitoring
Syslog & SNMP
Luna Syslog and SNMP Monitoring Guide 007-012417-001 Rev V22 Copyright 2016, Gemalto NV. 10 of 102
Severity Keyword
critical
error
warning
audit
info
debug
Table 4: lunalogs Severity Levels
Table 5 shows the application-specific description for the more comprehensive lunalogs messages.
Application
Description Field
NTLS
<message> : <IP address of client> /<application identifier of client>
Example #1:
Client opened session 18478 : HSM1:Part171 :
192.168.0.100/40847
Example #2:
Received a command LUNA_DESTROY_OBJECT and object handle
20262 : 192.168.0.100/40847
lunash
<command> : <account> : <IP address>/<application identifier>
Example #1:
Lush user login : monitor : 192.168.0.100/40847
Example #2:
Command: log show : monitor : 192.168.0.100/40847
Table 5: Application-Specific Description
hsm.log
hsm.log log messages are similar to syslog messages. The following example shows an hsm.log message.
2012 Feb 29 12:05:01 myLuna local6 err oamp[1962]: ERR: RTC: tamper 2 signal
The facility keyword is local6.
hsm.log has only three severity levels:
• crit
• err
• info.
The application responsible for generating hsm.log messages is oamp.
The description field is the severity level followed by a string read directly from the HSM.

Luna Monitoring
Syslog & SNMP
Luna Syslog and SNMP Monitoring Guide 007-012417-001 Rev V22 Copyright 2016, Gemalto NV. 11 of 102
One log message varies slightly from the above description. The following message marks the beginning of
a new log section on power up of the HSM.
2012 Feb 29 12:05:01 myLuna local6 info oamp[1962]: ----- HSM Logging started
Audit Logs
See the “Overview - Security Audit Logging and the Audit Role” section of the Luna product documentation
for a description of audit logs.
Interpreting Logs
No hard and fast rules exist for how to parse and interpret logs for significant events. For example, a
“notice” severity from the IPMI daemon could be significant (e.g., PSU failed) or simply status information
(e.g., reading sensors). The following bullets provide some guidance on how to parse log messages.
• Scan for “critical” severity log entries. These logs represent significant events.
• Scan for “error” severity log entries. In most cases, these logs represent significant events.
• Scan for “notify” severity log entries from the ipmievd process and look for “Failure detected
asserted”, “Lower Critical going low”, “Upper Critical going high”, “Lower Non-Recoverable going
low” and “Upper Non-Recoverable going high.”
• Scan for “crit” severity logs entries for smartd. Look for "Temperature changed" to track internal
appliance temperature measured at the hard drive. Look for excessive conditions with the string
"reached critical limit" (e.g., temperature).
• Scan for “CRASH AND BURN” in the logs. An instance of this string indicates a programming or logic
error.
Configuring syslog
See the “syslog Commands” reference section of the Luna product documentation for details on how to
configure syslog messages in the Luna appliance.
Luna Monitoring
Syslog & SNMP
Luna Syslog and SNMP Monitoring Guide 007-012417-001 Rev V22 Copyright 2016, Gemalto NV. 12 of 102
Open Source Components
SafeNet uses several open source components that leverage the syslog facility. Notable open source
components are:
• IPMI
• SMART
• NTP
• SNMP
• SSH
• Privileged services.
Sections that follow describe syslog messages that each of these open source components can generate.
IPMI
The Intelligent platform monitoring interface (IPMI) is a hardware-level specification for monitoring the
operation of a computer system. In the case of the Luna appliance, IPMI monitors sensors within the
appliance. Broad categories of these sensors are fans, power supplies and the system motherboard.
Table 6 identifies: the specific sensors; their locations; the specific text string that represents each sensor;
the thresholds for a sensor; threshold values; and the unit of measure for each threshold. Subsequent
subsections of this document delve into each of the columns of the table.
Sensor & Location Sensor Text Threshold Threshold Value Measure & Hysteresis
Cooling fan; left-most of
three fans, rear-most
blade within fan unit. Fan1A .
LNR assert 1000 Speed RPM
LC assert 2000 Negative 500
LNR deassert Positive 500
LC deassert
Cooling fan; left-most of
three fans, front-most
blade within fan unit. Fan1B .
LNR assert 1000 Speed RPM
LC assert 2000 Negative 500
LNR deassert Positive 500
LC deassert
Cooling fan; center of
three fans, rear-most
blade within fan unit. Fan2A .
LNR assert 1000 Speed RPM
LC assert 2000 Negative 500
LNR deassert Positive 500
LC deassert
Cooling fan; center of
three fans, front-most
blade within fan unit. Fan2B . LNR assert 1000 Speed RPM
LC assert 2000 Negative 500

Luna Monitoring
Syslog & SNMP
Luna Syslog and SNMP Monitoring Guide 007-012417-001 Rev V22 Copyright 2016, Gemalto NV. 13 of 102
Sensor & Location Sensor Text Threshold Threshold Value Measure & Hysteresis
LNR deassert Positive 500
LC deassert
Cooling fan; right-most of
three fans, rear-most
blade within fan unit. Fan3A .
LNR assert 1000 Speed RPM
LC assert 2000 Negative 500
LNR deassert Positive 500
LC deassert
Cooling fan; right-most of
three fans, front-most
blade within fan unit. Fan3B .
LNR assert 1000 Speed RPM
LC assert 2000 Negative 500
LNR deassert Positive 500
LC deassert
CPU temperature
measured at the
geometric center of the
CPU package; located
approximately center of
appliance, offset to right-
hand side.
CPU .
UNR assert 89
Temperature Degrees
C
UC assert 72 Negative 3
UNR deassert Positive 3
UC deassert
Voltage Regulator Down;
located approximately
3cm toward front from
CPU.
VRD .
UNR assert 100
Temperature Degrees
C
UC assert 90 Negative 3
UNR deassert Positive 3
UC deassert
Platform Controller Hub;
located approximately
center of appliance, 10cm
from rear.
PCH .
UNR assert 100
Temperature Degrees
C
UC assert 90 Negative 3
UNR deassert Positive 3
UC deassert
Located approximately
center of appliance, 20
cm from front. Inlet .
UNR assert 45
Temperature Degrees
C
UC assert 39 Negative 3
UNR deassert Positive 3
UC deassert
Centered DIMM of six
sockets; approximately
center of chassis, left of
CPU.
CHA DIMM 0 .
UNR assert 97
Temperature Degrees
C
UC assert 87 Negative 3
UNR deassert Positive 3
UC deassert
Luna appliances do not
have memory installed for
this device. “ns” readings
result for this sensor.
CHA DIMM 1 .
UNR assert 97
Temperature Degrees
C
UC assert 87 Negative 3
UNR deassert Positive 3
UC deassert

Luna Monitoring
Syslog & SNMP
Luna Syslog and SNMP Monitoring Guide 007-012417-001 Rev V22 Copyright 2016, Gemalto NV. 14 of 102
Sensor & Location Sensor Text Threshold Threshold Value Measure & Hysteresis
Luna appliances do not
have memory installed for
this device. “ns” readings
result for this sensor.
CHA DIMM 2 .
UNR assert 97
Temperature Degrees
C
UC assert 87 Negative 3
UNR deassert Positive 3
UC deassert
Left-most DIMM,
approximately center of
chassis, right of power
supplies.
CHB DIMM 0 .
UNR assert 97
Temperature Degrees
C
UC assert 87 Negative 3
UNR deassert Positive 3
UC deassert
Luna appliances do not
have memory installed for
this device. “ns” readings
result for this sensor.
CHB DIMM 1 .
UNR assert 97
Temperature Degrees
C
UC assert 87 Negative 3
UNR deassert Positive 3
UC deassert
Luna appliances do not
have memory installed for
this device. “ns” readings
result for this sensor.
CHB DIMM 2 .
UNR assert 97
Temperature Degrees
C
UC assert 87 Negative 3
UNR deassert Positive 3
UC deassert
More information on this
sensor is forthcoming in a
future revision RAM TMax .
UNR assert 97
Temperature Degrees
C
UC assert 87 Negative 3
UNR deassert Positive 3
UC deassert
CPU core voltage. CPU_VCORE .
UC assert 1.44 Voltage Volts
LC assert 0.63 No hysteresis
UC deassert
LC deassert
Motherboard battery. VBAT . LC assert 2.796 Voltage Volts
LC deassert No hysteresis
3V supply used by south
bridge chip. 3VSB .
UC assert 3.492 Voltage Volts
LC assert 3.092 No hysteresis
UC deassert
LC deassert
+3.3 volt rail. 3VMain .
UC assert 3.492 Voltage Volts
LC assert 3.092 No hysteresis
UC deassert
LC deassert

Luna Monitoring
Syslog & SNMP
Luna Syslog and SNMP Monitoring Guide 007-012417-001 Rev V22 Copyright 2016, Gemalto NV. 15 of 102
Sensor & Location Sensor Text Threshold Threshold Value Measure & Hysteresis
+5 volt rail. +5V .
UC assert 5.304 Voltage Volts
LC assert 4.692 No hysteresis
UC deassert
LC deassert
+12 volt rail. +12V .
UC assert 12.740 Voltage Volts
LC assert 11.284 No hysteresis
UC deassert
LC deassert
+12 volt monitor of right
power supply unit. PSU1_+12V_value.
UNR assert 13.392 Voltage Volts
LNR assert 11.232 No hysteresis
UNR deassert
LNR deassert
Temperature of right
power supply unit. PSU1 Temp_value.
UNR assert 115
UNR deassert
Temperature Degrees
C
Negative 1
Positive 1
Fan speed of right power
supply unit. PSU1 FAN_value .
LNR assert 300 Speed RPM
LNR deassert Negative 100
Positive 100
+12 volt monitor of left
power supply unit. PSU2_+12V_value.
UNR assert 13.392 Voltage Volts
LNR assert 11.232 No hysteresis
UNR deassert
LNR deassert
Temperature of left power
supply unit. PSU2 Temp_value.
UNR assert 115
Temperature Degrees
C
UNR deassert Negative 1
Positive 1
Fan speed of left power
supply unit. PSU2 FAN_value .
LNR assert 300 Speed RPM
LNR deassert Negative 100
Positive 100
Right power supply status
– presence detected
PSU1_Status .
Left power supply status –
presence detected
PSU2_Status .

Luna Monitoring
Syslog & SNMP
Luna Syslog and SNMP Monitoring Guide 007-012417-001 Rev V22 Copyright 2016, Gemalto NV. 16 of 102
Sensor & Location Sensor Text Threshold Threshold Value Measure & Hysteresis
Key to Threshold
UNR
Upper Non-Recoverable Threshold
UC
Upper Critical Threshold
LNR
Lower Non-Recoverable Threshold
LC
Lower Critical Threshold
Table 6: Luna Appliance Sensors
Threshold Events
Here is an example sensor log.
2012 Feb 29 12:05:01 myLuna local4 notice ipmievd: Fan sensor Fan3B . Lower Critical
going low (Reading 0 < Threshold 2000 RPM)
Most of the sensors monitored by IPMI on the Luna appliance generate threshold-based events. Threshold
events occur when a sensor reading changes by an amount that crosses a configured boundary defined in
the sensor data repository. THE IPMI specification defines six thresholds; the Luna appliance generates log
messages on four of them. The four thresholds, each with a short mnemonic, are:
1. Upper Non-Recoverable (UNR)
2. Upper Critical (UC)
3. Lower Non-Recoverable (LNC)
4. Lower Critical (LC).
Upper and lower critical thresholds are ‘fatal’ and mean that the hardware is exceeding above or below a
specified rating respectively. Upper and lower non-recoverable thresholds are ‘potential damage’ and
mean that the hardware is in jeopardy or damaged.
A sensor value can change in one of two ways. It can go to an active state which IPMI calls asserted. The
second state is inactive or de-asserted.
IPMI also allows for a sensor to have a hysteresis. The importance of having a hysteresis is to reduce the
chance of a “flood” of events as the sensor hovers around a threshold. For example, if a fan sensor has a
going-low threshold of 1000 RPM and the reading goes slightly above and below this value repeated, IPMI
will generate an event for every assertion and de-assertion as the reading crosses the 1000 RPM threshold.
With a hysteresis of 100, for example, the event would assert at 1000 RPM but not de-assert until the
reading was 1100 RPM or greater.
Luna Monitoring
Syslog & SNMP
Luna Syslog and SNMP Monitoring Guide 007-012417-001 Rev V22 Copyright 2016, Gemalto NV. 17 of 102
Combining the thresholds, hysteresis and state changes, IPMI has a means to create an event to describe
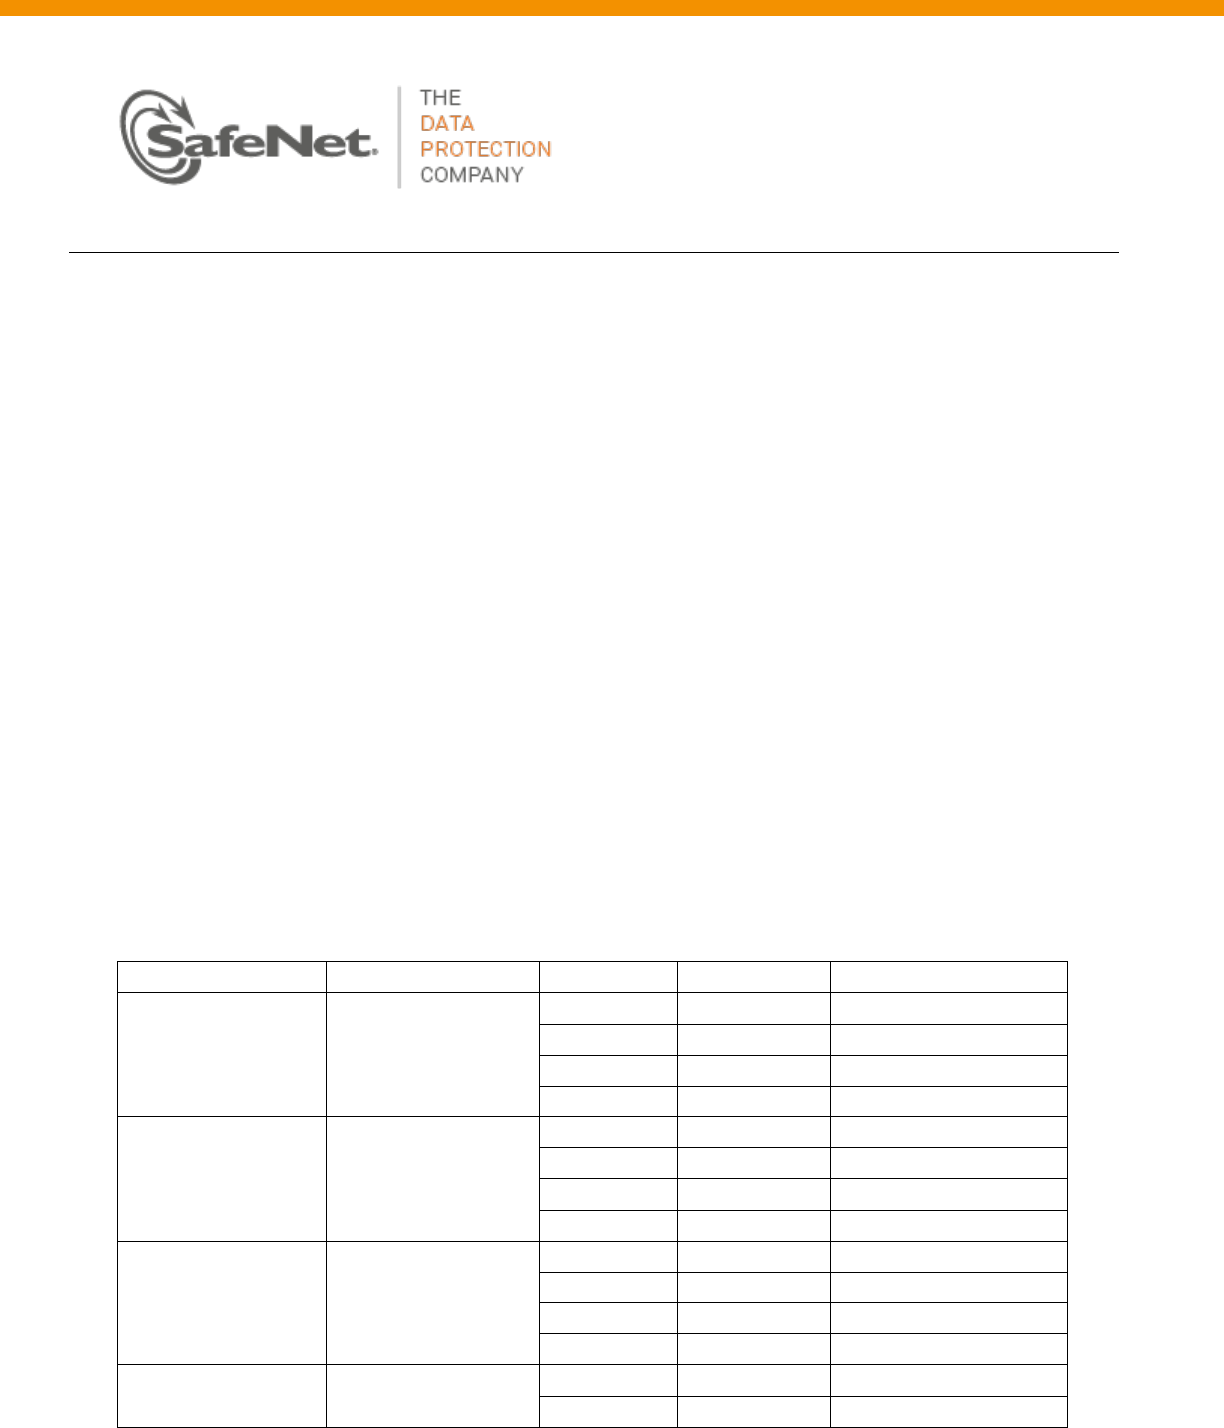
what a sensor is doing. Figure 3 from the IPMI specification illustrates event assertion and desertion at
different thresholds.
Figure 3: Event Assertion/Desertion Thresholds
To apply the meaning of thresholds, hysteresis and states, consider a real sensor on the Luna appliance: a
cooling fan. A normal fan speed varies but generally ranges between 4000 RPM and 6000 RPM. The fan
speed can fall below a threshold (e.g., when it fails) or rise above a threshold (e.g., when the ambient air
temperature rises and more cooling is necessary). By way of an example, assume that someone impedes
the propeller of a fan blade to slow it down but not stop it entirely. After ten seconds, our antagonist
impedes the fan blade so that it is barely turning. This sequence of events results in two log messages.
The first represents a lower critical assertion going low; the second, a lower non-recoverable assertion
going low.
2012 Feb 29 12:05:01 myLuna local4 notice ipmievd: Fan sensor Fan3B . Lower Critical
going low (Reading 1600 < Threshold 2000 RPM)
2012 Feb 29 12:05:11 myLuna local4 notice ipmievd: Fan sensor Fan3B . Lower
Non-recoverable going low (Reading 500 < Threshold 1000 RPM)
Correlating the information in these two log messages with the data in third, fourth and fifth columns of
Table 6, note that the first log message results because the fan speed has dropped below 2000 RPM to a
reading of 1600 RPM ( ). The second message results because the fan speed has now
crossed the non-recoverable threshold of 1000 RPM().
After some period, with one less fan to cool the appliance, it begins to heat up, leading to the baseboard
management controller to command the remaining fans to speed up. At this time, our antagonist

Luna Monitoring
Syslog & SNMP
Luna Syslog and SNMP Monitoring Guide 007-012417-001 Rev V22 Copyright 2016, Gemalto NV. 18 of 102
discontinues impeding the fan blade. It immediately begins to spin and joins the other five at a higher-
than-normal RPM. When the BMC detects the temperature back at a normal value, the BMC commands
the fans to return to their normal speeds. The following log message records this event, the sensor de-
asserting the last threshold change. Note that several seconds have elapsed after the fan threshold
deserted the LNR event and IPMI detected the change and read the sensor. Hence, the reading of 15900
represents a sensor value when the fans are at maximum revolutions .
2012 Feb 29 12:05:21 myLuna local4 notice ipmievd: Fan sensor Fan3B . Lower Non-
recoverable going low (Reading 15900 < Threshold 1000 RPM)
Upon examining log messages, you might also observe instances where two messages similar to the
following examples occur in close proximity:
2012 Feb 29 12:05:01 myLuna local4 notice ipmievd: Fan sensor Fan3B . Lower Critical
going low (Reading 0 < Threshold 2000 RPM)
2012 Feb 29 12:05:51 myLuna local4 notice ipmievd: Fan sensor Fan3B . Lower Non-
recoverable going low (Reading 15900 < Threshold 1000 RPM)
The first message is the event of the fan stopping. The second message is the fan speed going from very
fast back to a normal range after it has become freed to spin again and join the other five fans to cool the
overheating appliance. This second log message represents the de-assert LNR event: by the time IPMI has
scanned and read the sensors, the fan has asserted the LNR event and subsequently de-asserted it. IPMI
only generates the log message for the more recent of the two events.
Discrete Events
The Luna appliance reports three discrete events.
1. OEM #0xa1. Because the IPMI specification does not define a power reset function, an OEM sensor
serves this purpose. This OEM sensor links to a system reset function. The BMC records an event
in the event log for a system reset: by pushing the power button; through a BMC reset; or via an
operating system reset.
2. Power Supply PSU1_Status . This event reports the presence (asserted) or absence (de-asserted) of
the right power supply.
3. Power Supply PSU2_Status . This event reports the presence (asserted) or absence (de-asserted) of
the left power supply.
CPU Sensor
The CPU temperature reflects the use of the platform environment control interface (PECI) specification
used for thermal management in the Intel Core 2 Duo microprocessor. PECI reports a negative value that
expresses the difference between the current temperature and the thermal throttle point at which the CPU
takes action to reduce speed or shut down to prevent damage. In other words, the PECI value is a relative
and not an absolute temperature. The value reported by IPMI is calculated as the measured PECI value + an
Luna Monitoring
Syslog & SNMP
Luna Syslog and SNMP Monitoring Guide 007-012417-001 Rev V22 Copyright 2016, Gemalto NV. 19 of 102
offset + a margin. As an example, if the PECI value is -89, the offset is 92 and the margin is 0, the IPMI
reported temperature is 11 degrees C. This value is representative of a Luna appliance operating in a
climate controlled data center. The important point is to monitor the CPU value in relation to the upper
critical threshold of 72 degrees C and not as an absolute measure of the temperature of this sensor.
VRD, PCH and Inlet Sensors
The VRD, PCK and Inlet sensor values reported by IPMI reflect real-time temperature values. They differ in
readings because of the heat generated at the different locations within the chassis (e.g., inlet near fans,
PCH consumes considerable power).
IPMI Implementation
The principal entity responsible for reporting IPMI events within the Luna appliance is a daemon called
ipmievd. This daemon listens for events from the baseboard management controller (BMC) sent to the
system event log (SEL). ipmievd polls the contents of the SEL for new events. When it receives a new
event, the daemon logs it to syslog. ipmievd is a standard Linux component, used unchanged by SafeNet.
The daemon is based on the ipmitool utility and it shares the same IPMI support and session setup
options: some of the potential log messages from ipmievd originate from the ipmitool utility.
ipmievd can potentially generate hundreds of different log messages. Of these potential messages, some
are sensor-specific. Other messages are unlikely but, because SafeNet uses the Linux component
unchanged, are possible. The first subsection that follows describes the sensor events of most interest.
The succeeding three subsections show insignificant messages, followed by the unlikely ones and debug
messages.
Significant Log Messages
The log messages described in this subsection are the ones that report pertinent sensor events. The IPMI
daemon reports on the sensor types shown in Table 7.
Sensor Type
Fan
Temperature
Voltage
Power Supply
OEM
Table 7: Luna Appliance Sensor Types
Luna Monitoring
Syslog & SNMP
Luna Syslog and SNMP Monitoring Guide 007-012417-001 Rev V22 Copyright 2016, Gemalto NV. 20 of 102
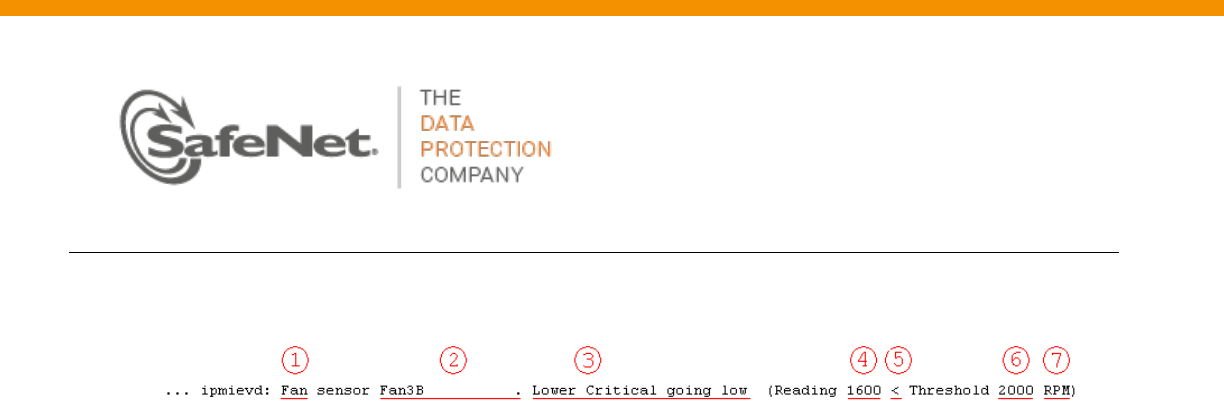
Full Sensor Record Threshold Reading
Figure 4: Threshold Event Message
A full sensor record threshold reading message consists of the fields shown in Figure 4.
1. This field is the sensor type, one of values from Table 7.
2. This field is the specific sensor from column 2 of Table 6.
3. This field is the description, formed from the threshold of column 3 of Table 6 combined with the
direction of the threshold.
4. This field is the trigger reading as reported by the BMC for the sensor.
5. This field is the comparison that resulted in the event.
6. This field is the threshold value of column 4 of Table 6 for the applicable threshold.
7. This field is the unit of measure from column 5 of Table 6.
Reproducing all possible threshold messages within this document is impractical. Rather, a more
reasonable solution is to provide guidance for how to parse threshold messages.
1. Parse for ipmievd and Threshold in the log message.
2. Determine whether the event is an assertion or de-assertion. Use fields 4, 5 and 6 for this step.
The event is an assertion if the logical evaluation of the statement formed from these three fields
is true (e.g., (Reading 1600 < Threshold 2000 RPM). Otherwise, the event is a de-assertion (e.g.,
Reading 15900 < Threshold 1000 RPM).
3. Parse the remaining fields to obtain the sensor type, specific sensor affected, the trigger reading,
the threshold, the threshold value and the unit of measure.
With the information of the above list, you have the information available to create custom messages
and/or take specific actions for threshold events.
Compact Sensor Record Asserted/Deasserted
2012 Feb 29 12:05:01 myLuna local4 notice ipmievd: Power Supply sensor PSU2_Status . - Failure
detected Asserted
2012 Feb 29 12:05:01 myLuna local4 notice ipmievd: Power Supply sensor PSU2_Status . - Failure
detected Deasserted
The first field after “ipmievd:” is the sensor type: see Table 7. The text after “sensor” is the specific sensor
from column 2 of Table 6. The text after the dash is the description of the event with a specific indication
of either Asserted or De-asserted at the end of the message.

Luna Monitoring
Syslog & SNMP
Luna Syslog and SNMP Monitoring Guide 007-012417-001 Rev V22 Copyright 2016, Gemalto NV. 21 of 102
You should review these messages within the context of any administrative or maintenance activities
carried out on the Luna appliance. The severity and action depends upon what is reported. In the two
examples above, the first log message indicates that PSU2 failed (e.g., A/C lost) while the second message
indicates that PSU2 once again became operational.
Non-Specific Sensor Record with Description
2012 Feb 29 12:05:01 myLuna local4 notice ipmievd: Power Supply sensor - Transition to Power Off
2012 Feb 29 12:05:01 myLuna local4 notice ipmievd: OEM sensor - OEM Specific
2012 Feb 29 12:05:01 myLuna local4 notice ipmievd: Power Unit sensor - Failure detected*
* Reported by BMC firmware on older Luna appliances.
These messages represent log entries for non-specific sensor records as per the IPMI specification. The first
field after “ipmievd:” is the sensor type: see Table 7. The text after the dash is the description of the event.
Like the compact sensor records, the context of any administrative or maintenance activities carried out on
the Luna appliance as well as the description affects the action appropriate for the log message.
Insignificant Log Messages
The following log messages represent start up notices for ipmievd.
Reading Sensors
2012 Feb 29 12:05:01 myLuna local4 notice ipmievd: Reading sensors...
This message indicates that the IPMI monitoring daemon successfully started just prior to setting up the
event handler.
Waiting For Events
2012 Feb 29 12:05:01 myLuna local4 notice ipmievd: Waiting for events...
This message indicates that the IPMI monitoring daemon successfully established communication with the
IPMI device driver to relay events.
Unlikely Log Messages
Under normal circumstances, you should not see any of these log messages. If you do so, please contact
SafeNet technical support to report the message and seek guidance on what to do next.
No ipmievd Messages in Log File
If you do not see any ipmievd messages in the messages log file, check to see if rsyslogd is running.
Kernel Panic
2012 Feb 29 12:05:01 myLuna local4 alert ipmievd: Linux kernel panic: mod xyz fai

Luna Monitoring
Syslog & SNMP
Luna Syslog and SNMP Monitoring Guide 007-012417-001 Rev V22 Copyright 2016, Gemalto NV. 22 of 102
A “panic” is an unrecoverable system error detected by the Linux kernel. A panic can result from
unhandled processor exceptions such as references to invalid memory addresses. In the case of an IPMI-
reported panic, the likely cause is a hardware failure such as a failed RAM cell, errors in the arithmetic
functions of the processor or an overheating/damaged processor. If you find this message in the log files,
review other messages around it for an indication of what might have failed. Power up the appliance again
and monitor for similar events.
OEM Record
2012 Feb 29 12:05:01 myLuna local4 notice ipmievd: IPMI Event OEM Record 0xa1
SafeNet knows of no OEM records for the Luna appliance.
Sensor Record without Description
2012 Feb 29 12:05:01 myLuna local4 notice ipmievd: Power Supply sensor 0xa2
Sensor records with description should be all that the daemon reports. Note that the difference between a
sensor record with a description versus one without is the dash after the word “sensor” in the message.
See the subsection “Full Sensor Record Threshold Reading“ for a discussion of the records you should be
most interested in.
Full Sensor Record for Discrete and OEM Events
2012 Feb 29 12:05:01 myLuna local4 notice ipmievd: Power Supply sensor PSU1_Status .
2012 Feb 29 12:05:01 myLuna local4 notice ipmievd: Power Supply sensor PSU1_Status . some
status message
A “full sensor record” is one formatted as <sensor name> “sensor” <full sensor name> <description>. This
formatting is for discrete and OEM sensor events for which the Luna appliance reports none of these types.
Compact Sensor Record With No Event Direction
2012 Feb 29 12:05:01 myLuna local4 notice ipmievd: Power Supply sensor PSU2_Status . - Failure
detected
This formatting is for compact sensor records with no direction reported for the threshold change. SafeNet
is not aware of any events that report a message according to this format.
Sensor Record With Only Sensor Number
2012 Feb 29 12:05:01 myLuna local4 notice ipmievd: Fan sensor 16
SafeNet is not aware of any events that report a message according to this format.
BMC Event Message Buffer Failure
2012 Feb 29 12:05:01 myLuna local4 err ipmievd: Get BMC Global Enables command failed
2012 Feb 29 12:05:01 myLuna local4 err ipmievd: Get BMC Global Enables command failed: 71
2012 Feb 29 12:05:01 myLuna local4 err ipmievd: Set BMC Global Enables command failed

Luna Monitoring
Syslog & SNMP
Luna Syslog and SNMP Monitoring Guide 007-012417-001 Rev V22 Copyright 2016, Gemalto NV. 23 of 102
2012 Feb 29 12:05:01 myLuna local4 err ipmievd: Set BMC Global Enables command failed: 23
Before the IPMI daemon can log messages, it must first open the BMC event message buffer. Under normal
circumstances, this operation succeeds.
Unable to Receive IPMI Message
2012 Feb 29 12:05:01 myLuna local4 err ipmievd: Unable to receive IPMI message
The Luna appliance loads the IPMI device drivers before starting the IPMI daemon. This message means
that the request to the device driver for an IPMI event message failed.
No Event Data
2012 Feb 29 12:05:01 myLuna local4 err ipmievd: No data in event
All IPMI messages for the Luna appliance have well-formed event data. This message means that the IPMI
daemon read an event from the IPMI message buffer but the event had no data associated with it.
Not An Event
2012 Feb 29 12:05:01 myLuna local4 err ipmievd: Type 9 is not an event
Only the asynchronous event receive type should be available in the BMC event message buffer. This
message means that the IPMI daemon read an event from the IPMI message buffer that was not the
expected asynchronous receive type.
Unable to Read from IPMI Device
2012 Feb 29 12:05:01 myLuna local4 critical ipmievd: Unable to read from IPMI device
This message means that the IPMI daemon failed to read from the event message buffer while polling for
events.
Get SEL Info Command Failed
2012 Feb 29 12:05:01 myLuna local4 err ipmievd: Get SEL Info command failed
2012 Feb 29 12:05:01 myLuna local4 err ipmievd: Get SEL Info command failed: 80
These messages indicate that the IPMI daemon was unable to get the system event log information for the
storage network function.
SEL Buffer Use
2012 Feb 29 12:05:01 myLuna local4 warning ipmievd: SEL buffer used at 85%, please consider
clearing the SEL buffer
This message means that the sensor event log buffer is filling faster than events can be processed by the
IPMI daemon.

Luna Monitoring
Syslog & SNMP
Luna Syslog and SNMP Monitoring Guide 007-012417-001 Rev V22 Copyright 2016, Gemalto NV. 24 of 102
SEL Buffer Overflow
2012 Feb 29 12:05:01 myLuna local4 alert ipmievd: SEL buffer overflow, no SEL message can be
logged until the SEL buffer is cleared
This message means that the sensor event log buffer is full and no new messages can be queued.
Unable to Retrieve SEL Data
2012 Feb 29 12:05:01 myLuna local4 err ipmievd: Unable to retrieve SEL data
This message means that the IPMI daemon was unable to receive sensor event log data when it should
have.
SEL Overflow on Check for Waiting Events
2012 Feb 29 12:05:01 myLuna local4 notice ipmievd: SEL overflow is cleared
2012 Feb 29 12:05:01 myLuna local4 alert ipmievd: SEL buffer overflow, no new SEL message will be
logged until the SEL buffer is cleared
2012 Feb 29 12:05:01 myLuna local4 warning ipmievd: SEL buffer is 85% full, please consider
clearing the SEL buffer
The IPMI daemon should process sensor event log messages in a timely fashion. These messages mean that
the daemon is falling behind in doing so.
PID File Already Exists
2012 Feb 29 12:05:01 myLuna local4 err ipmievd: PID file '/var/run/ipmievd.pid0' already exists.
2012 Feb 29 12:05:01 myLuna local4 err ipmievd: Perhaps another instance is already running.
These messages suggest: a failure of the operating system or file structure within the appliance; or a
configuration error within a SafeNet-provided component.
Failed to Open PID File
2012 Feb 29 12:05:01 myLuna local4 err ipmievd: Failed to open PID file '/var/run/ipmievd.pid0'
for writing. Check file permission.
This message suggests a failure of the operating system or file structure within the appliance.
Unable to Open SDR File
2012 Feb 29 12:05:01 myLuna local4 err ipmievd: Unable to open SDR for reading
This message suggests a failure in the IPMI subsystem.
Malloc Failure
2012 Feb 29 12:05:01 myLuna local4 err ipmievd: ipmitool: malloc failure
This message indicates that the system is low on virtual memory while attempting to create a cache for the
sensor data repository.

Luna Monitoring
Syslog & SNMP
Luna Syslog and SNMP Monitoring Guide 007-012417-001 Rev V22 Copyright 2016, Gemalto NV. 25 of 102
IPMI Event Setup Failed
2012 Feb 29 12:05:01 myLuna local4 err ipmievd: Could not enable event message buffer
2012 Feb 29 12:05:01 myLuna local4 err ipmievd: Could not enable event receiver
2012 Feb 29 12:05:01 myLuna local4 err ipmievd: Error setting up Event Interface open
These messages indicate a failure of the ipmievd daemon to establish the interface via the IPMI device
driver to relay events.
Error Waiting For Events
2012 Feb 29 12:05:01 myLuna local4 err ipmievd: Error waiting for events!
This message indicates a failure by the daemon to wait for events relayed via the IPMI device driver.
Unable to Load Event Interface
2012 Feb 29 12:05:01 myLuna local4 err ipmievd: Unable to load event interface
This message indicates a failure by the daemon to establish the IPMI event interface.
Invalid Interface
2012 Feb 29 12:05:01 myLuna local4 err ipmievd: Invalid Interface for OpenIPMI Event Handler:
<xxxxx>
This message suggests a corrupted disk system or a configuration error: the only potential value for
<xxxxx> is “open.”
Debug Messages
SafeNet does not enable logging of debug messages from the IPMI daemon. If in future SafeNet does
enable this level of log messages, this subsection describes the possible messages you might find in the log
files.
BMC Event Message Buffer Opened
2012 Feb 29 12:05:01 myLuna local4 debug ipmievd: BMC Event Message Buffer enabled
This message indicates that the IPMI daemon successfully opened the BMC event message buffer.
BMC Event Message Debug
2012 Feb 29 12:05:01 myLuna local4 debug ipmievd: netfn:6 cmd:5 ccode:80
This message shows the network function code, command and completion code of the raw IPMI message.
SEL Watch Debug
2012 Feb 29 12:05:01 myLuna local4 debug ipmievd: SEL count is 3
2012 Feb 29 12:05:01 myLuna local4 debug ipmievd: SEL freespace is 1502
2012 Feb 29 12:05:01 myLuna local4 debug ipmievd: SEL Percent Used: 80%
2012 Feb 29 12:05:01 myLuna local4 debug ipmievd: SEL Overflow: false

Luna Monitoring
Syslog & SNMP
Luna Syslog and SNMP Monitoring Guide 007-012417-001 Rev V22 Copyright 2016, Gemalto NV. 26 of 102
2012 Feb 29 12:05:01 myLuna local4 debug ipmievd: SEL Next ID: 00da
2012 Feb 29 12:05:01 myLuna local4 debug ipmievd: SEL lastid is 00d9
2012 Feb 29 12:05:01 myLuna local4 debug ipmievd: Current SEL count is 4
2012 Feb 29 12:05:01 myLuna local4 debug ipmievd: Current SEL lastid is 00ac
2012 Feb 29 12:05:01 myLuna local4 debug ipmievd: SEL count is 0 (old=3), resetting lastid to 0
2012 Feb 29 12:05:01 myLuna local4 debug ipmievd: SEL count lowered, new SEL lastid is 0112
2012 Feb 29 12:05:01 myLuna local4 debug ipmievd: SEL Read ID: 023f
2012 Feb 29 12:05:01 myLuna local4 debug ipmievd: New Events
These messages show details of the sensor event log at various processing points within the daemon.
Sensors Cached
2012 Feb 29 12:05:01 myLuna ipmievd: Getting 8 bytes from SDR at offset 64
2012 Feb 29 12:05:01 myLuna ipmievd: SDR reservation cancelled. Sleeping a bit and retrying...
2012 Feb 29 12:05:01 myLuna ipmievd: Sensors cached
These messages indicate that the IPMI daemon successfully generated a fast lookup cache for the sensor
data repository.
IPMI Event Setup
2012 Feb 29 12:05:01 myLuna ipmievd: Enabling event message buffer
2012 Feb 29 12:05:01 myLuna ipmievd: Enabling event receiver
2012 Feb 29 12:05:01 myLuna ipmievd: Getting 8 bytes from SDR at offset 64
These messages log the process to set up the IPMI event interface.
SMART
Self-Monitoring, Analysis and Reporting Technology – SMART – is a technology built into modern hard
drives to monitor the health of the drive and anticipate failures. The two classes of failures are:
predictable and unpredictable. Examples of predicable failures are increased number of bad sectors and
increased temperature from wear; they typically occur from slow processes. Unpredictable failures occur
without warning and suddenly; for example, a hard drive dropped may report more than a normalized
number of read errors.
The hard drives within Luna appliances implements SMART. A background process called the smart control
daemon – smartd – starts automatically at power up and is responsible for monitoring the hard drive via
the SMART technology in it. The daemon records its findings via syslog.
Facility Keyword
Software Process
Log File
daemon
smartd[pid]
messages

Luna Monitoring
Syslog & SNMP
Luna Syslog and SNMP Monitoring Guide 007-012417-001 Rev V22 Copyright 2016, Gemalto NV. 27 of 102
SMART Attributes
From the Luna shell, you can query the SMART attributes (Luna SA/SP: status disk; Luna IS: system
disk). Figure 5 shows the SMART attributes reported from the shell command.
ID# ATTRIBUTE_NAME FLAG VALUE WORST THRESH TYPE UPDATED WHEN_FAILED RAW_VALUE
1 Raw_Read_Error_Rate 0x002f 200 200 051 Pre-fail Always - 0
3 Spin_Up_Time 0x0027 154 152 021 Pre-fail Always - 1300
4 Start_Stop_Count 0x0032 100 100 000 Old_age Always - 601
5 Reallocated_Sector_Ct 0x0033 200 200 140 Pre-fail Always - 0
7 Seek_Error_Rate 0x002e 200 200 000 Old_age Always - 0
9 Power_On_Hours 0x0032 099 099 000 Old_age Always - 1383
10 Spin_Retry_Count 0x0032 100 100 000 Old_age Always - 0
11 Calibration_Retry_Count 0x0032 100 100 000 Old_age Always - 0
12 Power_Cycle_Count 0x0032 100 100 000 Old_age Always - 601
192 Power-Off_Retract_Count 0x0032 200 200 000 Old_age Always - 138
193 Load_Cycle_Count 0x0032 200 200 000 Old_age Always - 462
194 Temperature_Celsius 0x0022 115 092 000 Old_age Always - 28
196 Reallocated_Event_Count 0x0032 200 200 000 Old_age Always - 0
197 Current_Pending_Sector 0x0032 200 200 000 Old_age Always - 0
198 Offline_Uncorrectable 0x0030 200 200 000 Old_age Offline - 0
199 UDMA_CRC_Error_Count 0x0032 200 200 000 Old_age Always - 1
200 Multi_Zone_Error_Rate 0x0008 200 200 000 Old_age Offline - 0
Figure 5: SMART Attributes
The ID# and ATTRIBUTE NAME columns are the SMART attribute defined by the drive vendor. Note that
vendors have generally standardized on the attributes and their meaning. The FLAG column indicates the
main purpose of each attribute; correlating to the text in the TYPE and UPDATED columns. Only the last
two bits are of any significance. Bit 0 identifies whether the attribute is an advisory (0) or a pre-fail
notification (1). An advisory means that the disk has exceeded its intended design life while a pre-fail
notification means that the disk is predicated to fail within 24 hours. Bit 1 indicates whether attribute
monitoring occurs strictly offline (0) or during offline and normal operations (1).
The RAW_VALUE, VALUE, WORST and THRESH columns report on the specific attribute. The drive
controller reports the RAW_VALUE. VALUE is normalized where a higher value is better. As VALUE drops
(i.e., becomes worse), it approaches a threshold. THRESH is the value at which SMART reports a ‘threshold
exceeded’ event. WORST is the most extreme reading recorded for the attribute. A VALUE of 100 is an
initial default value. Consider attribute #174 (Temperature) as an example to put these four values in
context. Figure 5 shows the current temperature reading of the drive as 28 degrees Celsius. Normalized,
this reading is 115. A value of 100 therefore is 43 degrees Celsius. The worst reading recorded is a
normalized value of 092 which translates to 51 degrees Celsius. This attribute has no threshold as it
represents an advisory.
Assume that the smart control daemon generated the following log message:

Luna Monitoring
Syslog & SNMP
Luna Syslog and SNMP Monitoring Guide 007-012417-001 Rev V22 Copyright 2016, Gemalto NV. 28 of 102
2012 Feb 29 12:05:01 myLuna daemon info smartd[1234]: Device: /dev/sda, SMART Prefailure
Attribute: 1 Raw_Read_Error_Rate changed from 200 to 92
The next query of the SMART attributes might report the following information for attribute #1:
ID# ATTRIBUTE_NAME FLAG VALUE WORST THRESH TYPE UPDATED WHEN_FAILED RAW_VALUE
1 Raw_Read_Error_Rate 0x002f 092 092 051 Pre-fail Always - 37767785
If the drive controller reads a value that, once normalized, is less than or equal to the THRESH value, the
daemon generates a critical log message and a query of the SMART attributes reports a VALUE less than or
equal to THRESH as the following example shows.
2012 Feb 29 12:05:01 myLuna daemon crit smartd[1234]: Device: /dev/sda, SMART Prefailure
Attribute: 1 Raw_Read_Error_Rate changed from 92 to 51
ID# ATTRIBUTE_NAME FLAG VALUE WORST THRESH TYPE UPDATED WHEN_FAILED RAW_VALUE
1 Raw_Read_Error_Rate 0x002f 051 051 051 Pre-fail Always FAILING_NOW 4528445
The WHEN_FAILED column indicates that the attribute has reached the THRESH value.
Significant Expected Log Messages
Banner at Start Up
2012 Feb 29 12:05:01 myLuna daemon info smartd[1234]: smartd version 5.38 [i686-redhat-linux-gnu]
Copyright (C) 2002-8 Bruce Allen
2012 Feb 29 12:05:01 myLuna daemon info smartd[1234]: Home page is
http://smartmontools.sourceforge.net/#012
These two messages are the first log entries written by the smart control daemon. When SafeNet updates
the smart control daemon to a more recent version, the following messages more closely resemble the
startup banner.
2012 Feb 29 12:05:01 myLuna daemon info smartd[1234]: 1411:smartd 6.2 2013-07-26 r3841 [i686-
linux-2.6.18-164.el5] (local build)
2012 Feb 29 12:05:01 myLuna daemon info smartd[1234]: Copyright (C) 2002-13, Bruce Allen,
Christian Franke, www.smartmontools.org
Read Configuration File
2012 Feb 29 12:05:01 myLuna daemon info smartd[1234]: Opened configuration file /etc/smartd.conf
2012 Feb 29 12:05:01 myLuna daemon info smartd[1234]: Configuration file /etc/smartd.conf parsed.
These messages indicate that the smart control daemon successfully opened and read the contents of the
configuration file that contains the directives for how the daemon is to operate. When SafeNet updates the
daemon to a newer release, the location of the configuration file will change as represented in the follow
examples.
2012 Feb 29 12:05:01 myLuna daemon info smartd[1234]: Opened configuration file
/usr/local/etc/smartd.conf
2012 Feb 29 12:05:01 myLuna daemon info smartd[1234]: Configuration file
/usr/local/etc/smartd.conf parsed.

Luna Monitoring
Syslog & SNMP
Luna Syslog and SNMP Monitoring Guide 007-012417-001 Rev V22 Copyright 2016, Gemalto NV. 29 of 102
Monitoring Devices at Start Up
2012 Feb 29 12:05:01 myLuna daemon info smartd[1234]: Device: /dev/sda, opened
2012 Feb 29 12:05:01 myLuna daemon info smartd[1234]: Device /dev/sda: using '-d sat' for ATA disk
behind SAT layer.
2012 Feb 29 12:05:01 myLuna daemon info smartd[1234]: Device: /dev/sda, opened
2012 Feb 29 12:05:01 myLuna daemon info smartd[1234]: Device: /dev/sda, not found in smartd
database.
2012 Feb 29 12:05:01 myLuna daemon info smartd[1234]: Device: /dev/sda, enabled SMART Attribute
Autosave.
2012 Feb 29 12:05:01 myLuna daemon info smartd[1234]: Device: /dev/sda, enabled SMART Automatic
Offline Testing.
2012 Feb 29 12:05:01 myLuna daemon info smartd[1234]: Device: /dev/sda, is SMART capable. Adding
to "monitor" list.
2012 Feb 29 12:05:01 myLuna daemon info smartd[1234]: Monitoring 0 ATA and 1 SCSI devices
These messages indicate that the smart control daemon was successful in starting up and identifies the
type and number of each device the daemon is monitoring. For Luna appliances, only one serial ATA device
applies. The daemon opens the device to query its capabilities [the first message in the examples above].
The daemon uses SCSI/ATA Translation (SAT) to enable communication with the drive [the second
message]. In SAT mode, the daemon reopens the device [third message] and looks for it in an internal
database [fourth message] but does not find an entry for the device. The smart.conf file sets the directives
for the daemon and these directives include attribute autosave (-S on) and automatic offline testing (-o on)
[fifth and sixth messages]. Turning on attribute autosave instructs the disk drive to use non-volatile
storage for attributes such as error counters, power-up hours and other useful data so that these values do
not get reset to zero the next time the device is power-cycled. Turning on automatic offline testing
instructs the drive to update certain S.M.A.R.T. attributes every four hours. The disk used in the Luna
appliance is SMART-capable [seventh message] so the daemon monitors it [eighth message].
In preparing this document, SafeNet reviewed the source code of a newer version of the smart control
daemon. SafeNet plans to update the daemon at some future date. The next set of messages show the
messages this new daemon outputs at start up.
2012 Feb 29 12:05:01 myLuna daemon info smartd[1234]: Device: /dev/sda, type changed from 'scsi'
to 'sat'
2012 Feb 29 12:05:01 myLuna daemon info smartd[1234]: Device: /dev/sda [SAT], opened
2012 Feb 29 12:05:01 myLuna daemon info smartd[1234]: Device: /dev/sda [SAT], WDC WD2500BHTZ-
04JCPV0, S/N:WD-WX11EC1TE568, WWN:5-0014ee-058a177e6, FW:04.06A00, 250 GB
2012 Feb 29 12:05:01 myLuna daemon info smartd[1234]: Device: /dev/sda [SAT], not found in smartd
database.
2012 Feb 29 12:05:01 myLuna daemon info smartd[1234]: Device: /dev/sda [SAT], enabled SMART
Attribute Autosave.
2012 Feb 29 12:05:01 myLuna daemon info smartd[1234]: Device: /dev/sda [SAT], enabled SMART
Automatic Offline Testing.

Luna Monitoring
Syslog & SNMP
Luna Syslog and SNMP Monitoring Guide 007-012417-001 Rev V22 Copyright 2016, Gemalto NV. 30 of 102
2012 Feb 29 12:05:01 myLuna daemon info smartd[1234]: Device: /dev/sda [SAT], is SMART capable.
Adding to "monitor" list.
2012 Feb 29 12:05:01 myLuna daemon info smartd[1234]: Monitoring 1 ATA and 0 SCSI devices
2012 Feb 29 12:05:01 myLuna daemon info smartd[1234]: Device: /dev/sda [SAT], initial Temperature
is 28 Celsius (Min/Max ??/28)
The smart control daemon opens the device [third message] and successfully queries it for device-specific
information [fourth message]. Similar messages follow in the output. The newer daemon reports the
initial temperature reading from a sensor built into the disk [tenth message].
Fork Into Background Process
2012 Feb 29 12:05:01 myLuna daemon info smartd[1234]: smartd has fork()ed into background mode.
New PID=23509.
This message indicates that the startup sequence for the smart control daemon completed successfully,
leading to the daemon to fork into a background mode process as exhibited if you query the process list.
root 23509 1 0 11:04 ? 00:00:00 /usr/sbin/smartd -q never
Self Tests
2012 Feb 29 12:05:01 myLuna daemon info smartd[1234]: Device: /dev/sda, starting scheduled Short
Self-Test.
2012 Feb 29 12:05:01 myLuna daemon info smartd[1234]: Device: /dev/sda, starting scheduled Long
Self-Test.
These messages record that the smart-enabled drive ran a short and/or long self-test. The short self-test
runs daily; the long self-test runs weekly, an hour after the short test. These tests usually run early in the
morning.
Attribute Change
2012 Feb 29 12:05:01 myLuna daemon info smartd[1234]: Device: /dev/sda, SMART Usage Attribute: 7
Seek_Error_Rate changed from 100 to 200
2012 Feb 29 12:05:01 myLuna daemon info smartd[1234]: Device: /dev/sda, SMART Usage Attribute: 9
Power_On_Hours changed from 100 to 99
2012 Feb 29 12:05:01 myLuna daemon info smartd[1234]: Device: /dev/sda, SMART Usage Attribute:
200 Multi_Zone_Error_Rate changed from 100 to 200
These messages show changes in SMART attributes. The log severity of info means that the new values
are still within acceptable ranges.
Prefailure Change
2012 Feb 29 12:05:01 myLuna daemon info smartd[1234]: Device: /dev/sda, SMART Prefailure
Attribute: 1 Raw_Read_Error_Rate changed from 100 to 200
Messages such as this example show changes in SMART pre-failure attributes.

Luna Monitoring
Syslog & SNMP
Luna Syslog and SNMP Monitoring Guide 007-012417-001 Rev V22 Copyright 2016, Gemalto NV. 31 of 102
Temperature Change
2012 Feb 29 12:05:01 myLuna daemon info smartd[1234]: Device: /dev/sda, Temperature changed +5
Celsius to 37 Celsius (Min/Max 26/37)
This message is common in the log file and indicates a change in temperature measured at the hard disk
sensor. The smart control daemon monitors the sensor once every 30 minutes and logs the temperature if
it has changed from the last reading.
Temperature Limit Reached
2012 Feb 29 12:05:01 myLuna daemon crit smartd[1234]: Device: /dev/sda, Temperature 45 Celsius
reached limit of 44 Celsius (Min/Max 31/49)
This message indicates that the temperature measured at the hard disk drive reached an upper limit for
normally expected readings.
Critical Temperature Change
2012 Feb 29 12:05:01 myLuna daemon crit smartd[1234]: Device: /dev/sda, Temperature 49 Celsius
reached critical limit of 48 Celsius (Min/Max 31/49)
This message indicates that the temperature measured at the hard disk drive exceeds the critical upper
limit.
Received Exit Signal
2012 Feb 29 12:05:01 myLuna daemon info smartd[1234]: smartd received signal 15: Terminated
2012 Feb 29 12:05:01 myLuna daemon info smartd[1234]: smartd received signal 3: Quit
2012 Feb 29 12:05:01 myLuna daemon crit smartd[1234]: smartd received signal <#>: <Xxxxxxx>
These messages indicate that the smart control daemon received an exit signal. info severity messages
are normal and expected; crit severity messages are not. In the latter case, the signal number is <#> and
the text translation of this signal is <Xxxxxx>.
Unexpected Log Messages
Under normal circumstances, you should not see any of these log messages. If you do so, please contact
SafeNet technical support to report the message and seek guidance on what to do next.
Configuration File not in Expected Location
2012 Feb 29 12:05:01 myLuna daemon info smartd[1234]: No configuration file
/usr/local/etc/smartd.conf found, scanning devices
At start up, the smart control daemon expects to find the configuration file for its directives in the
/usr/local/etc directory.

Luna Monitoring
Syslog & SNMP
Luna Syslog and SNMP Monitoring Guide 007-012417-001 Rev V22 Copyright 2016, Gemalto NV. 32 of 102
Cannot Open Configuration File
2012 Feb 29 12:05:01 myLuna daemon crit smartd[1234]: <error message>: Unable to open
configuration file /usr/local/etc/smartd.conf
This message indicates that although the smart control daemon located the configuration file, the daemon
was unable to open it for the reason cited by <error message> in the log message.
Configuration File Format Errors
2012 Feb 29 12:05:01 myLuna daemon crit smartd[1234]: Error: line 14 of file
/usr/local/etc/smartd.conf is more than MAXLINELEN=256 characters.
2012 Feb 29 12:05:01 myLuna daemon crit smartd[1234]: Error: continued line 44 (actual line 14) of
file /usr/local/etc/smartd.conf is more than MAXCONTLINE=1023 characters.
2012 Feb 29 12:05:01 myLuna daemon crit smartd[1234]: File /usr/local/etc/smartd.conf line 1
(drive DEVICESCAN): unknown Directive: /dev/sd4
2012 Feb 29 12:05:01 myLuna daemon crit smartd[1234]: Run smartd –D to print a list of valid
Directives.
2012 Feb 29 12:05:01 myLuna daemon crit smartd[1234]: File /usr/local/etc/smartd.conf line 15
(drive /dev/sda): -s argument "(" is INVALID extended regular expression. Unmatched ( or \(.
2012 Feb 29 12:05:01 myLuna daemon info smartd[1234]: File /usr/local/etc/smartd.conf line 15
(drive /dev/sda): ignoring previous Test Directive -s (S/../.././02)
2012 Feb 29 12:05:01 myLuna daemon info smartd[1234]: File /usr/local/etc/smartd.conf line 15
(drive /dev/sda): warning, character 4 (x) looks odd in extended regular expression (S/x./.././02)
2012 Feb 29 12:05:01 myLuna daemon info smartd[1234]: File /usr/local/etc/smartd.conf line 15
(drive /dev/sda): ignoring previous Address Directive -m john@email.com
2012 Feb 29 12:05:01 myLuna daemon crit smartd[1234]: Configuration file
/usr/local/etc/smartd.conf has fatal syntax errors.
2012 Feb 29 12:05:01 myLuna daemon crit smartd[1234]: Configuration file
/usr/local/etc/smartd.conf parsed but has no entries (like /dev/hda)
2012 Feb 29 12:05:01 myLuna daemon crit smartd[1234]: File /usr/local/etc/smartd.conf line 16
(drive /dev/sda): Directive -M 'exec' argument: missing closing quote
2012 Feb 29 12:05:01 myLuna daemon crit smartd[1234]: File /usr/local/etc/smartd.conf line 16
(drive /dev/sda): Directive -M 'exec' argument must be followed by executable path.
2012 Feb 29 12:05:01 myLuna daemon info smartd[1234]: File /usr/local/etc/smartd.conf line 16
(drive /dev/sda): ignoring previous mail Directive -M exec /usr/local/smtp
2012 Feb 29 12:05:01 myLuna daemon crit smartd[1234]: File /usr/local/etc/smartd.conf line %18
(drive /dev/sda): unknown Directive: -b
2012 Feb 29 12:05:01 myLuna daemon crit smartd[1234]: File /usr/local/etc/smartd.conf line %19
(drive /dev/sda): Missing argument to -W Directive
2012 Feb 29 12:05:01 myLuna daemon crit smartd[1234]: File /usr/local/etc/smartd.conf line %20
(drive /dev/sda): Invalid argument to -M Directive: yearly
2012 Feb 29 12:05:01 myLuna daemon crit smartd[1234]: Valid arguments to -n Directive are:
never[,N][,q], sleep[,N][,q], standby[,N][,q], idle[,N][,q] *
2012 Feb 29 12:05:01 myLuna daemon info smartd[1234]: Drive: /dev/sda, implied '-a' Directive on
line 21 of file /usr/local/etc/smartd.conf
2012 Feb 29 12:05:01 myLuna daemon crit smartd[1234]: Drive: /dev/sda, -M Directive(s) on line 22
of file /usr/local/etc/smartd.conf need -m ADDRESS Directive

Luna Monitoring
Syslog & SNMP
Luna Syslog and SNMP Monitoring Guide 007-012417-001 Rev V22 Copyright 2016, Gemalto NV. 33 of 102
2012 Feb 29 12:05:01 myLuna daemon crit smartd[1234]: Drive: /dev/sda, -m <nomailer> Directive on
line 23 of file /usr/local/etc/smartd.conf needs -M exec Directive
2012 Feb 29 12:05:01 myLuna daemon crit smartd[1234]: File /usr/local/etc/smartd.conf line 35
(drive /dev/sda): Directive: -i takes integer argument from 1 to 255.
2012 Feb 29 12:05:01 myLuna daemon crit smartd[1234]: File /usr/local/etc/smartd.conf line 36
(drive /dev/sda): Directive: -I has argument: on; needs integer from 1 to 255.
2012 Feb 29 12:05:01 myLuna daemon crit smartd[1234]: File /usr/local/etc/smartd.conf line 37
(drive /dev/sda): Directive: -W takes 1-3 integer argument(s) from 0 to 255.
2012 Feb 29 12:05:01 myLuna daemon crit smartd[1234]: File /usr/local/etc/smartd.conf line 38
(drive /dev/sda): Directive: -W has argument: off; needs 1-3 integer(s) from 0 to 255.
These messages indicate format errors in the smartd.conf file. Depending upon the version of the
smart control daemon, the configuration file might be /etc/smartd.conf or
/usr/local/etc/smartd.conf.
* This text is an example. See ‘man smartd.conf’ for a complete list and description of directives and
arguments.
Cannot Register Device
2012 Feb 29 12:05:01 myLuna daemon crit smartd[1234]: Unable to register scsi device /dev/sda at
line 17 of file /usr/local/etc/smartd.conf
2012 Feb 29 12:05:01 myLuna daemon info smartd[1234]: Unable to register scsi device /dev/sda
These messages indicate that the smart control daemon was unable to register the device specified in the
smartd.conf file.
Force Scan For Devices
2012 Feb 29 12:05:01 myLuna daemon info smartd[1234]: Configuration file
/usr/local/etc/smartd.conf was parsed, found DEVICESCAN, scanning devices
This message indicates that the configuration file specified that that the smart control daemon was to scan
for devices rather than rely on entries in the file.
Could Not Scan For Devices or No Devices To Scan
2012 Feb 29 12:05:01 myLuna daemon crit smartd[1234]: Problem creating device name scan list
2012 Feb 29 12:05:01 myLuna daemon crit smartd[1234]: In the system's table of devices NO devices
found to scan
The first message indicates that the configuration file specified that that the smart control daemon was to
scan for devices but that the scan failed. The second message indicates that daemon has no SMART-
enabled devices to scan.
Out of Memory
2012 Feb 29 12:05:01 myLuna daemon crit smartd[1234]: Smartd: Out of memory
This message indicates that the smart control daemon did not have sufficient memory on start up.

Luna Monitoring
Syslog & SNMP
Luna Syslog and SNMP Monitoring Guide 007-012417-001 Rev V22 Copyright 2016, Gemalto NV. 34 of 102
Exception
2012 Feb 29 12:05:01 myLuna daemon crit smartd[1234]: Smartd: Exception: <xxxxxx>
This message indicates that the smart control daemon encountered an exception <xxxxxx> on startup
and exited.
Received Hang Up or Interrupt Signal
2012 Feb 29 12:05:01 myLuna daemon info smartd[1234]: Signal HUP - rereading configuration file
/etc/smartd.conf
2012 Feb 29 12:05:01 myLuna daemon info smartd[1234]: Signal INT - rereading configuration file
/etc/smartd.conf ("SIGQUIT_KEYNAME" quits)
These messages indicate that the smart control daemon was instructed via a signal to reread the
configuration file normally read on start up.
Continue on Error
2012 Feb 29 12:05:01 myLuna daemon info smartd[1234]: Reusing previous configuration
This message indicates that while rereading the configuration file, the daemon encountered an error and
reverted to the previously-read configuration settings instead.
Unable to Monitor Devices
2012 Feb 29 12:05:01 myLuna daemon info smartd[1234]: Unable to monitor any SMART enabled devices.
Try debug (-d) option. Exiting...
This message indicates that the smart control daemon did not find any SMART-enabled devices to monitor.
Mail-Related Messages
2012 Feb 29 12:05:01 myLuna daemon info smartd[1234]: Mail can't be enabled together with --
capabilities. All mail will be suppressed.
2012 Feb 29 12:05:01 myLuna daemon info smartd[1234]: Sending a mail was suppressed. Mails can't
be send when capabilites [sic] are enabled
2012 Feb 29 12:05:01 myLuna daemon crit smartd[1234]: internal error in MailWarning():
cfg.mailwarn->emailfreq=0
2012 Feb 29 12:05:01 myLuna daemon crit smartd[1234]: Contact smartmontools-
support@lists.sourceforge.net; internal error in MailWarning(): which=-1, size=88
2012 Feb 29 12:05:01 myLuna daemon info smartd[1234]: Sending warning via <mail> to <nomailer> ...
2012 Feb 29 12:05:01 myLuna daemon info smartd[1234]: Executing test of <mail> to <nomailer> ...
2012 Feb 29 12:05:01 myLuna daemon crit smartd[1234]: Warning via <mail> to <nomailer>: failed
(fork or pipe failed, or no memory) <error string>
2012 Feb 29 12:05:01 myLuna daemon crit smartd[1234]: Warning via <mail> to <nomailer> produced
unexpected output (here truncated to 1024 bytes) to STDOUT/STDERR:
<unexpected output>
2012 Feb 29 12:05:01 myLuna daemon crit smartd[1234]: Warning via <mail> to <nomailer>: flushed
remaining STDOUT/STDERR

Luna Monitoring
Syslog & SNMP
Luna Syslog and SNMP Monitoring Guide 007-012417-001 Rev V22 Copyright 2016, Gemalto NV. 35 of 102
2012 Feb 29 12:05:01 myLuna daemon crit smartd[1234]: Warning via <mail> to <nomailer>: more than
1 MB STDOUT/STDERR flushed, breaking pipe
2012 Feb 29 12:05:01 myLuna daemon crit smartd[1234]: Warning via <mail> to <nomailer>: pclose(3)
failed <error string>
2012 Feb 29 12:05:01 myLuna daemon crit smartd[1234]: Warning via <mail> to <nomailer>: failed
(32-bit/8-bit exit status: 255/133) perhaps caught signal 5 [Trace/breakpoint trap]
2012 Feb 29 12:05:01 myLuna daemon crit smartd[1234]: Warning via <mail> to <nomailer>: failed
(32-bit/8-bit exit status: 255/133)
2012 Feb 29 12:05:01 myLuna daemon info smartd[1234]: Warning via <mail> to <nomailer>: successful
2012 Feb 29 12:05:01 myLuna daemon info smartd[1234]: Warning via <mail> to <nomailer>: exited
because of uncaught signal 5 [Trace/breakpoint trap]
2012 Feb 29 12:05:01 myLuna daemon crit smartd[1234]: Warning via <mail> to <nomailer>: process
STOPPED because it caught signal 5 [Trace/breakpoint trap]
2012 Feb 29 12:05:01 myLuna daemon info smartd[1234]: Device: /dev/sda, Read SMART Self-Test Log
worked again, warning condition reset after 16 emails
SafeNet does not compile the smart control daemon with libcap-ng enabled to send mail. The first two
messages indicate that the daemon is compiled this way and that the settings in the configuration file are
incompatible with libcap-ng settings. The latter messages indicate problems with how mail is configured to
be sent and/or status of sending mail.
One Check
2012 Feb 29 12:05:01 myLuna daemon info smartd[1234]: Started with '-q onecheck' option. All
devices successfully [sic] checked once.
smartd is exiting (exit status 0)
The message indicates that the smartd.conf file contains a directive for the smart control daemon to
start and terminate with only a check of any SMART-enabled devices.
Ignore Device or Duplicate Device
2012 Feb 29 12:05:01 myLuna daemon info smartd[1234]: Device: /dev/sda[auto], ignored
2012 Feb 29 12:05:01 myLuna daemon info smartd[1234]: Device: /dev/sda, duplicate, ignored
The first message indicates that the smartd.conf file identifies a device but directs the smart control
daemon to ignore the device for monitoring. The second message indicates that the device is specified
more than once in the smartd.conf file.
Could Not Detect Device, Unsupported Device, Not a ATA/SCSI Device or Device Cannot be
Registered
2012 Feb 29 12:05:01 myLuna daemon info smartd[1234]: Device: /dev/sda, unable to autodetect
device type
2012 Feb 29 12:05:01 myLuna daemon info smartd[1234]: Device: /dev/sda, unsupported device type
'auto'
2012 Feb 29 12:05:01 myLuna daemon info smartd[1234]: Device: /dev/sda, neither ATA nor SCSI
device
2012 Feb 29 12:05:01 myLuna daemon info smartd[1234]: Device: /dev/sda, not available

Luna Monitoring
Syslog & SNMP
Luna Syslog and SNMP Monitoring Guide 007-012417-001 Rev V22 Copyright 2016, Gemalto NV. 36 of 102
2012 Feb 29 12:05:01 myLuna daemon crit smartd[1234]: Unable to register device /dev/sda (no
Directive -d removable). Exiting.
The first message indicates that the smart control daemon was unable to interrogate the device specified in
the smartd.conf file. The second message indicates that the device is not SMART-enabled. The third
message indicates that the device is not ATA or SCSI. The fourth message is a warning that the daemon
could not detect the device but is continuing while the fifth message indicates that the daemon is stopping
because it could not detect the device and the smartd.conf file contains a directive to do so under this
circumstance.
Could Not Open Device
2012 Feb 29 12:05:01 myLuna daemon info smartd[1234]: Device: /dev/sda, open() failed: <xxxxxx>
If debug is enabled or scanning is not, this message indicates that the smart control daemon was unable to
open the device for monitoring: <xxxxxx>is the reason why.
Could Not Fork Into Background Process
2012 Feb 29 12:05:01 myLuna daemon crit smartd[1234]: smartd unable to fork daemon process!
2012 Feb 29 12:05:01 myLuna daemon crit smartd[1234]: PID file /var/run/smartd.pid0 didn't show
up!
2012 Feb 29 12:05:01 myLuna daemon crit smartd[1234]: unable to write PID file
/var/run/smartd.pid0 - exiting.
These messages indicate that the startup sequence for the smart control daemon was unable to complete
successfully because the daemon could not properly fork a new process.
Writing PID File
2012 Feb 29 12:05:01 myLuna daemon info smartd[1234]: file /var/run/smartd.pid0 written containing
PID 1729
This message identifies the process identifier and process identifier file for the background smart control
daemon process.
Help for Configuration File Directives
2012 Feb 29 12:05:01 myLuna daemon info smartd[1234]:Configuration file
(/usr/local/etc/smartd.conf) Directives (after device name):
-d TYPE Set the device type: auto, ignore, removable
...
-T TYPE Set the tolerance to one of: normal, permissive
-o VAL Enable/disable automatic offline tests (on/off)
-S VAL Enable/disable attribute autosave (on/off)
-n MODE No check if: never, sleep[,N][,q], standby[,N][,q], idle[,N][,q]
-H Monitor SMART Health Status, report if failed
-s REG Do Self-Test at time(s) given by regular expression REG
-l TYPE Monitor SMART log or self-test status:

Luna Monitoring
Syslog & SNMP
Luna Syslog and SNMP Monitoring Guide 007-012417-001 Rev V22 Copyright 2016, Gemalto NV. 37 of 102
error, selftest, xerror, offlinests[,ns], selfteststs[,ns]
-l scterc,R,W Set SCT Error Recovery Control
-e Change device setting: aam,[N|off], apm,[N|off], lookahead,[on|off],
security-freeze, standby,[N|off], wcache,[on|off]
-f Monitor 'Usage' Attributes, report failures
-m ADD Send email warning to address ADD
-M TYPE Modify email warning behavior (see man page)
-p Report changes in 'Prefailure' Attributes
-u Report changes in 'Usage' Attributes
-t Equivalent to -p and -u Directives
-r ID Also report Raw values of Attribute ID with -p, -u or -t
-R ID Track changes in Attribute ID Raw value with -p, -u or -t
-i ID Ignore Attribute ID for -f Directive
-I ID Ignore Attribute ID for -p, -u or -t Directive
-C ID[+] Monitor [increases of] Current Pending Sectors in Attribute ID
-U ID[+] Monitor [increases of] Offline Uncorrectable Sectors in Attribute ID
-W D,I,C Monitor Temperature D)ifference, I)nformal limit, C)ritical limit
-v N,ST Modifies labeling of Attribute N (see man page)
-P TYPE Drive-specific presets: use, ignore, show, showall
-a Default: -H -f -t -l error -l selftest -l selfteststs -C 197 -U 198
-F TYPE Use firmware bug workaround:
...
Attribute ID is a decimal integer 1 <= ID <= 255
Use ID = 0 to turn off -C and/or -U Directives
Example: /dev/sda -a
This text is the help information for configuring the smartd.conf file.
Write State File
2012 Feb 29 12:05:01 myLuna daemon info smartd[1234]: Device: /dev/ada, state written to
/var/log/devstate
This message indicates that the smart control daemon wrote the state(s) of monitored device(s) to a file.
Cannot Unlink PID File
2012 Feb 29 12:05:01 myLuna daemon crit smartd[1234]: Can't unlink PID file /var/run/smartd.pid0
(<error string>).
This message indicates that the smart control daemon was unable to delete a process identifier file because
of the error reported: <error string>.
Close Failed
2012 Feb 29 12:05:01 myLuna daemon info smartd[1234]: Device: /dev/ada, <error string>, close()
failed

Luna Monitoring
Syslog & SNMP
Luna Syslog and SNMP Monitoring Guide 007-012417-001 Rev V22 Copyright 2016, Gemalto NV. 38 of 102
This message indicates that the smart control daemon was unable to close a monitored device because of
the error reported: <error string>.
Code Bug
2012 Feb 29 12:05:01 myLuna daemon crit smartd[1234]: Please inform smartmontools-
support@lists.sourceforge.net, including output of smartd -V.
2012 Feb 29 12:05:01 myLuna daemon crit smartd[1234]: smartd is exiting (exit status 10)
These messages indicate a coding error in the smart control daemon.
ATA Error Log Read Failure
2012 Feb 29 12:05:01 myLuna daemon info smartd[1234]: Device: /dev/ada, Read Summary SMART Error
Log failed
2012 Feb 29 12:05:01 myLuna daemon info smartd[1234]: Device: /dev/ada, Read Extended
Comprehensive SMART Error Log failed
2012 Feb 29 12:05:01 myLuna daemon info smartd[1234]: Device: /dev/ada, Read SMART Self Test Log
Failed
These messages indicate a failure to read the error log(s) of ATA devices.
ATA Device Scan Messages
2012 Feb 29 12:05:01 myLuna daemon info smartd[1234]: Device: /dev/sda, not ATA, no IDENTIFY
DEVICE Structure
2012 Feb 29 12:05:01 myLuna daemon info smartd[1234]: Device: /dev/sda, packet devices [this
device CD/DVD] not SMART capable
2012 Feb 29 12:05:01 myLuna daemon info smartd[1234]: Device: /dev/ada, smartd database not
searched (Directive: -P ignore).
2012 Feb 29 12:05:01 myLuna daemon info smartd[1234]: Device: /dev/ada, found in smartd database.
2012 Feb 29 12:05:01 myLuna daemon crit smartd[1234]: Device: /dev/sda, WARNING: <warning text>i
2012 Feb 29 12:05:01 myLuna daemon info smartd[1234]: Device: /dev/ada, presets are: ...
2012 Feb 29 12:05:01 myLuna daemon info smartd[1234]: Device: /dev/ada, lacks SMART capability
2012 Feb 29 12:05:01 myLuna daemon info smartd[1234]: Device: /dev/ada, ATA IDENTIFY DEVICE words
82-83 don't specify if SMART capable.
2012 Feb 29 12:05:01 myLuna daemon info smartd[1234]: Device: /dev/ada, proceeding since '-T
permissive' Directive given.
2012 Feb 29 12:05:01 myLuna daemon info smartd[1234]: Device: /dev/ada, to proceed anyway, use '-
T permissive' Directive.
2012 Feb 29 12:05:01 myLuna daemon info smartd[1234]: Device: /dev/ada, could not enable SMART
capability
2012 Feb 29 12:05:01 myLuna daemon info smartd[1234]: Device: /dev/ada, could not disable SMART
Attribute Autosave.
2012 Feb 29 12:05:01 myLuna daemon info smartd[1234]: Device: /dev/ada, disabled SMART Attribute
Autosave.
2012 Feb 29 12:05:01 myLuna daemon info smartd[1234]: Device: /dev/ada, could not enable SMART
Attribute Autosave.

Luna Monitoring
Syslog & SNMP
Luna Syslog and SNMP Monitoring Guide 007-012417-001 Rev V22 Copyright 2016, Gemalto NV. 39 of 102
2012 Feb 29 12:05:01 myLuna daemon info smartd[1234]: Device: /dev/ada, not capable of SMART
Health Status check
2012 Feb 29 12:05:01 myLuna daemon info smartd[1234]: Device: /dev/ada, Read SMART Values failed
2012 Feb 29 12:05:01 myLuna daemon info smartd[1234]: Device: /dev/ada, Read SMART Thresholds
failed, ignoring -f Directive
2012 Feb 29 12:05:01 myLuna daemon info smartd[1234]: Device: /dev/ada, can't monitor
Temperature, ignoring -W 3,44,48
2012 Feb 29 12:05:01 myLuna daemon info smartd[1234]: Device: /dev/ada, no Attribute 279,
ignoring -r 279!
2012 Feb 29 12:05:01 myLuna daemon info smartd[1234]: Device: /dev/ada, not monitoring Prefailure
Attributes, ignoring -r 196!
2012 Feb 29 12:05:01 myLuna daemon info smartd[1234]: Device: /dev/ada, could not disable SMART
Automatic Offline Testing.
2012 Feb 29 12:05:01 myLuna daemon info smartd[1234]: Device: /dev/ada, SMART Automatic Offline
Testing unsupported...
2012 Feb 29 12:05:01 myLuna daemon info smartd[1234]: Device: /dev/ada, enable SMART Automatic
Offline Testing failed.
2012 Feb 29 12:05:01 myLuna daemon info smartd[1234]: Device: /dev/ada, no SMART Self-test Log,
ignoring -l selftest (override with -T permissive)
2012 Feb 29 12:05:01 myLuna daemon info smartd[1234]: Device: /dev/ada, no SMART Self-test Log,
ignoring -l selftest
2012 Feb 29 12:05:01 myLuna daemon info smartd[1234]: Device: /dev/ada, no SMART Error Log,
ignoring -l error (override with -T permissive)
2012 Feb 29 12:05:01 myLuna daemon info smartd[1234]: Device: /dev/ada, no SMART Error Log,
ignoring -l error
2012 Feb 29 12:05:01 myLuna daemon info smartd[1234]: Device: /dev/ada, no Extended Comprehensive
SMART Error Log, ignoring -l xerror (override with -T permissive)
2012 Feb 29 12:05:01 myLuna daemon info smartd[1234]: Device: /dev/ada, no Extended Comprehensive
SMART Error Log, ignoring -l xerror
2012 Feb 29 12:05:01 myLuna daemon info smartd[1234]: Device: /dev/ada, SMART Error Logs report
different error counts: 12 != 143
2012 Feb 29 12:05:01 myLuna daemon info smartd[1234]: Device: /dev/ada, no SMART Offline Data
Collection capability, ignoring -l offlinests (override with -T permissive)
2012 Feb 29 12:05:01 myLuna daemon info smartd[1234]: Device: /dev/ada, no SMART Self-test
capability, ignoring -l selfteststs (override with -T permissive)
2012 Feb 29 12:05:01 myLuna daemon crit smartd[1234]: Device: /dev/ada, no ATA CHECK POWER STATUS
support, ignoring -n Directive
2012 Feb 29 12:05:01 myLuna daemon crit smartd[1234]: Device: /dev/ada, CHECK POWER STATUS
returned 17, not ATA compliant, ignoring -n Directive
2012 Feb 29 12:05:01 myLuna daemon info smartd[1234]: Device: /dev/ada, ATA settings applied:
<settings string>
2012 Feb 29 12:05:01 myLuna daemon info smartd[1234]: Device: /dev/ada, no SCT Error Recovery
Control support, ignoring -l scterc
2012 Feb 29 12:05:01 myLuna daemon info smartd[1234]: Device: /dev/ada, set of SCT Error Recovery
Control failed
2012 Feb 29 12:05:01 myLuna daemon info smartd[1234]: Device: /dev/ada, SCT Error Recovery
Control set to: Read: 7, Write: 7

Luna Monitoring
Syslog & SNMP
Luna Syslog and SNMP Monitoring Guide 007-012417-001 Rev V22 Copyright 2016, Gemalto NV. 40 of 102
2012 Feb 29 12:05:01 myLuna daemon info smartd[1234]: Device: /dev/ada, state read from
/var/lib/smartmontools/smartd.ST3500620AS-5QM2644Q.ata.state
These messages indicate the status or a failure of a scan of an ATA device. The Luna appliance does not use
ATA devices.
SCSI Device Scan Messages
2012 Feb 29 12:05:01 myLuna daemon info smartd[1234]: Device: /dev/sda, Both 36 and 64 byte
INQUIRY failed; skip device
2012 Feb 29 12:05:01 myLuna daemon info smartd[1234]: Device: /dev/sda, INQUIRY response less
than 36 bytes; skip device
2012 Feb 29 12:05:01 myLuna daemon info smartd[1234]: Device: /dev/sda, not a disk like device
[PDT=0x7], skip
2012 Feb 29 12:05:01 myLuna daemon info smartd[1234]: Device: /dev/sda, WDC WD2500JS-60NCB1
2012 Feb 29 12:05:01 myLuna daemon info smartd[1234]: Device: /dev/sda, NOT READY (e.g. spun
down); skip device
2012 Feb 29 12:05:01 myLuna daemon info smartd[1234]: Device: /dev/sda, NO MEDIUM present; skip
device
2012 Feb 29 12:05:01 myLuna daemon info smartd[1234]: Device: /dev/sda, BECOMING (but not yet)
READY; skip device
2012 Feb 29 12:05:01 myLuna daemon crit smartd[1234]: Device: /dev/sda, failed Test Unit Ready
[err=-22]
2012 Feb 29 12:05:01 myLuna daemon info smartd[1234]: Device: /dev/sda, Bad IEC (SMART) mode
page, err=-5, skip device
2012 Feb 29 12:05:01 myLuna daemon info smartd[1234]: Device: /dev/sda, IE (SMART) not enabled,
skip device
Try 'smartctl -s on /dev/sda' to turn on SMART features
2012 Feb 29 12:05:01 myLuna daemon info smartd[1234]: Device: /dev/sda, unexpectedly failed to
read SMART values
2012 Feb 29 12:05:01 myLuna daemon info smartd[1234]: Device: /dev/sda, can't monitor
Temperature, ignoring -W 3,44,48
2012 Feb 29 12:05:01 myLuna daemon info smartd[1234]: Device: /dev/sda, does not support SMART
Self-Test Log.
2012 Feb 29 12:05:01 myLuna daemon info smartd[1234]: Device: /dev/sda, could not disable
autosave (set GLTSD bit).
2012 Feb 29 12:05:01 myLuna daemon info smartd[1234]: Device: /dev/sda, disabled autosave (set
GLTSD bit).
2012 Feb 29 12:05:01 myLuna daemon info smartd[1234]: Device: /dev/sda, could not enable autosave
(clear GLTSD bit).
2012 Feb 29 12:05:01 myLuna daemon info smartd[1234]: Device: /dev/sda, enabled autosave (cleared
GLTSD bit).
2012 Feb 29 12:05:01 myLuna daemon info smartd[1234]: Device: /dev/sda, state read from
/var/lib/smartmontools/smartd.ST3500620AS-5QM2644Q.ata.state
These messages indicate the status or a failure of a scan of a SCSI or SCSI-like device. The Luna appliance
uses a serial ATA device which SMART considers SCSI-like. However, the messages in this section are
unexpected in the logs.

Luna Monitoring
Syslog & SNMP
Luna Syslog and SNMP Monitoring Guide 007-012417-001 Rev V22 Copyright 2016, Gemalto NV. 41 of 102
Log Self-Test Progress & Errors
2012 Feb 29 12:05:01 myLuna daemon info smartd[1234]: Device: /dev/sda, previous self-test
completed without error
2012 Feb 29 12:05:01 myLuna daemon info smartd[1234]: Device: /dev/sda, previous self-test was
aborted by the host
2012 Feb 29 12:05:01 myLuna daemon info smartd[1234]: Device: /dev/sda, previous self-test was
interrupted by the host with a reset
2012 Feb 29 12:05:01 myLuna daemon info smartd[1234]: Device: /dev/sda, previous self-test could
not complete due to a fatal or unknown error
2012 Feb 29 12:05:01 myLuna daemon crit smartd[1234]: Device: /dev/sda, previous self-test
completed with error (unknown test element)
2012 Feb 29 12:05:01 myLuna daemon crit smartd[1234]: Device: /dev/sda, previous self-test
completed with error (electrical test element)
2012 Feb 29 12:05:01 myLuna daemon crit smartd[1234]: Device: /dev/sda, previous self-test
completed with error (servo/seek test element)
2012 Feb 29 12:05:01 myLuna daemon crit smartd[1234]: Device: /dev/sda, previous self-test
completed with error (read test element)
2012 Feb 29 12:05:01 myLuna daemon crit smartd[1234]: Device: /dev/sda, previous self-test
completed with error (handling damage?)
2012 Feb 29 12:05:01 myLuna daemon info smartd[1234]: Device: /dev/sda, self-test in progress,
80% remaining
2012 Feb 29 12:05:01 myLuna daemon info smartd[1234]: Device: /dev/sda, unknown self-test status
0x1f
2012 Feb 29 12:05:01 myLuna daemon crit smartd[1234]: Device: /dev/sda, Self-Test Log error count
increased from 12 to 13
2012 Feb 29 12:05:01 myLuna daemon crit smartd[1234]: Device: /dev/sda, new Self-Test Log error
at hour timestamp 7202
2012 Feb 29 12:05:01 myLuna daemon info smartd[1234]: Device: /dev/sda, Self-Test Log error count
decreased from 27 to 26
2012 Feb 29 12:05:01 myLuna daemon crit smartd[1234]: Device: /dev/sda, does not support Self-
Tests
2012 Feb 29 12:05:01 myLuna daemon info smartd[1234]: Device: /dev/sda, skip since Self-Test
already in progress
2012 Feb 29 12:05:01 myLuna daemon crit smartd[1234]: Device: /dev/sda, not capable of L Self-
Test
2012 Feb 29 12:05:01 myLuna daemon crit smartd[1234]: Device: /dev/sda, not capable of Long Self-
Test
2012 Feb 29 12:05:01 myLuna daemon crit smartd[1234]: Device: /dev/sda, execute Long Self-Test
failed (err: -1)
2012 Feb 29 12:05:01 myLuna daemon crit smartd[1234]: Device: /dev/ada, not capable of Offline or
Self-Testing.
2012 Feb 29 12:05:01 myLuna daemon crit smartd[1234]: Device: /dev/ada, not capable of Offline or
Self-Testing.
2012 Feb 29 12:05:01 myLuna daemon crit smartd[1234]: Device: /dev/ada, not capable of Offline
Immediate Test
2012 Feb 29 12:05:01 myLuna daemon crit smartd[1234]: Device: /dev/ada, not capable of Conveyance
Self-Test

Luna Monitoring
Syslog & SNMP
Luna Syslog and SNMP Monitoring Guide 007-012417-001 Rev V22 Copyright 2016, Gemalto NV. 42 of 102
2012 Feb 29 12:05:01 myLuna daemon crit smartd[1234]: Device: /dev/ada, not capable of Short
Self-Test
2012 Feb 29 12:05:01 myLuna daemon crit smartd[1234]: Device: /dev/ada, not capable of Long Self-
Test
2012 Feb 29 12:05:01 myLuna daemon crit smartd[1234]: Device: /dev/ada, not capable of Selective
Self-Test
2012 Feb 29 12:05:01 myLuna daemon info smartd[1234]: Device: /dev/ada, will not skip scheduled
Offline Immediate Test despite unclear Self-Test byte (SAMSUNG Firmware bug).
2012 Feb 29 12:05:01 myLuna daemon info smartd[1234]: Device: /dev/ada, skip scheduled Offline
Immediate Test; 20% remaining of current Self-Test.
2012 Feb 29 12:05:01 myLuna daemon crit smartd[1234]: Device: /dev/ada, prepare Offline Immediate
Test failed
2012 Feb 29 12:05:01 myLuna daemon info smartd[1234]: Device: /dev/ada, next test span at LBA
1256500 - 1460000 2500000 sectors, 50% - 58% of disk).
2012 Feb 29 12:05:01 myLuna daemon crit smartd[1234]: Device: /dev/ada, execute Offline Immediate
Test failed.
These messages indicate the status of an in-progress self-test, a failure to log self-tests or a self-test error.
Test Schedule
2012 Feb 29 12:05:01 myLuna daemon info smartd[1234]: Device: /dev/sda, old test of type S not
run at Wed Feb 29 02:00:00 2012 GMT, starting now.
2012 Feb 29 12:05:01 myLuna daemon info smartd[1234]: Next scheduled self tests (at most 5 of
each type per device):
2012 Feb 29 12:05:01 myLuna daemon info smartd[1234]: Device: /dev/sda, will do test 1 of type S
at Wed Feb 29 02:00:00 2012 GMT
2012 Feb 29 12:05:01 myLuna daemon info smartd[1234]: Totals [Wed Feb 29 12:05:00 2012 GMT - Wed
Feb 29 02:00:00 2012 GMT]:
2012 Feb 29 12:05:01 myLuna daemon info smartd[1234]: Device: /dev/sda, will do 050 tests of type
S
These messages indicate status of scheduled tests.
Check Pending Sector Count Identifier
2012 Feb 29 12:05:01 myLuna daemon info smartd[1234]: Device: /dev/sda, can't monitor Current
Pending Sector count - no Attribute 197
2012 Feb 29 12:05:01 myLuna daemon info smartd[1234]: Device: /dev/sda, ignoring Current Pending
Sector count - bogus Attribute 197 value 3442 (0xd72)
These messages indicate an error on the sector count identifier for a SMART attribute.
Critical Attribute Change
2012 Feb 29 12:05:01 myLuna daemon crit smartd[1234]: Device: /dev/sda, SMART Usage Attribute: 7
Seek_Error_Rate changed from 10000 to 20000
Messages such as this example, show critical changes in SMART attributes, possibly indicating impending
disk failure.

Luna Monitoring
Syslog & SNMP
Luna Syslog and SNMP Monitoring Guide 007-012417-001 Rev V22 Copyright 2016, Gemalto NV. 43 of 102
Critical Prefailure Change
2012 Feb 29 12:05:01 myLuna daemon crit smartd[1234]: Device: /dev/sda, SMART Prefailure
Attribute: 1 Raw_Read_Error_Rate changed from 92 to 51
Messages such as this example, show critical changes in SMART pre-failure attributes, possibly indicating
impending disk failure
Sector Count Change
2012 Feb 29 12:05:01 myLuna daemon crit smartd[1234]: Device: /dev/sda, 1237505 Currently
unreadable (pending) sectors
2012 Feb 29 12:05:01 myLuna daemon crit smartd[1234]: Device: /dev/sda, 1237505 Total unreadable
(pending) sectors
2012 Feb 29 12:05:01 myLuna daemon crit smartd[1234]: Device: /dev/sda, 1237505 Offline
uncorrectable sectors
2012 Feb 29 12:05:01 myLuna daemon crit smartd[1234]: Device: /dev/sda, 1237505 Total offline
uncorrectable sectors
These messages indicate sector attribute changes. Any one of these messages may include additional
information at the end of the message to indicate the change from the last measure, [e.g., (changed
57500)].
Temperature Change
2012 Feb 29 12:05:01 myLuna daemon info smartd[1234]: Device: /dev/sda, failed to read
Temperature
2012 Feb 29 12:05:01 myLuna daemon info smartd[1234]: [trip Temperature is 65 Celsius]
The first message indicates that the smart control daemon was unable to obtain a measure of the
temperature attribute. The second message indicates the temperature at which the drive shuts down if it
measures this value.
Attribute Error
2012 Feb 29 12:05:01 myLuna daemon crit smartd[1234]: Device: /dev/sda, Failed SMART usage
Attribute: 185 Head Stability.
2012 Feb 29 12:05:01 myLuna daemon info smartd[1234]: Device: /dev/sda, same Attribute has
different ID numbers: 185 = 200
These messages indicate errors by the smart control daemon to interpret SMART attributes.
Check ATA Device Health
2012 Feb 29 12:05:01 myLuna daemon info smartd[1234]: Device: /dev/ada, open() failed: No such
device or address
2012 Feb 29 12:05:01 myLuna daemon info smartd[1234]: Device: /dev/ada, opened ATA device
2012 Feb 29 12:05:01 myLuna daemon info smartd[1234]: Device: /dev/ada, CHECK POWER STATUS spins
up disk (0x00 -> 0xff)
2012 Feb 29 12:05:01 myLuna daemon crit smartd[1234]: Device: /dev/ada, CHECK POWER STATUS
returned 1, not ATA compliant, ignoring -n Directive

Luna Monitoring
Syslog & SNMP
Luna Syslog and SNMP Monitoring Guide 007-012417-001 Rev V22 Copyright 2016, Gemalto NV. 44 of 102
2012 Feb 29 12:05:01 myLuna daemon info smartd[1234]: Device: /dev/ada, is in STANDBY mode,
suspending checks
2012 Feb 29 12:05:01 myLuna daemon info smartd[1234]: Device: /dev/ada, IDLE mode ignored due to
reached limit of skipped checks (15 checks skipped)
2012 Feb 29 12:05:01 myLuna daemon info smartd[1234]: Device: /dev/ada, is back in ACTIVE or IDLE
mode, resuming checks (1 check skipped)
2012 Feb 29 12:05:01 myLuna daemon crit smartd[1234]: Device: /dev/ada, not capable of SMART
self-check
2012 Feb 29 12:05:01 myLuna daemon crit smartd[1234]: Device: /dev/ada, FAILED SMART self-check.
BACK UP DATA NOW!
2012 Feb 29 12:05:01 myLuna daemon crit smartd[1234]: Device: /dev/ada, failed to read SMART
Attribute Data
2012 Feb 29 12:05:01 myLuna daemon crit smartd[1234]: Device: /dev/ada, ATA error count increased
from 15 to 16
These messages provide health status of ATA device attributes.
Check SCSI Device Health
2012 Feb 29 12:05:01 myLuna daemon info smartd[1234]: Device: /dev/sda, open() failed: No such
device or address
2012 Feb 29 12:05:01 myLuna daemon info smartd[1234]: Device: /dev/sda, opened SCSI device
2012 Feb 29 12:05:01 myLuna daemon info smartd[1234]: Device: /dev/sda, failed to read SMART
values
2012 Feb 29 12:05:01 myLuna daemon crit smartd[1234]: Device: /dev/sda, SMART Failure: <failure
string>
2012 Feb 29 12:05:01 myLuna daemon info smartd[1234]: Device: /dev/sda, self-test in progress
2012 Feb 29 12:05:01 myLuna daemon info smartd[1234]: Device: /dev/sda, non-SMART asc,ascq: 4,26
2012 Feb 29 12:05:01 myLuna daemon info smartd[1234]: Device: /dev/sda, SMART health: passed1
These messages provide health status of SCSI device attributes.
Auto Standby Feature
2012 Feb 29 12:05:01 myLuna daemon crit smartd[1234]: Device: /dev/sda, System auto standby
enable failed: <failure string>
2012 Feb 29 12:05:01 myLuna daemon info smartd[1234]: Device: /dev/sda, Disable auto standby not
supported, ignoring ',ns' from -l offlinests,ns and -l selfteststs,ns
2012 Feb 29 12:05:01 myLuna daemon crit smartd[1234]: Device: /dev/sda, Self-test(s) completed,
system auto standby enable failed: <failure string>
2012 Feb 29 12:05:01 myLuna daemon info smartd[1234]: Device: /dev/sda, Self-test(s) completed,
system auto standby enabled
2012 Feb 29 12:05:01 myLuna daemon info smartd[1234]: Device: /dev/sda, Self-test(s) in progress,
system auto standby disable rejected: <failure string>
2012 Feb 29 12:05:01 myLuna daemon info smartd[1234]: Device: /dev/sda, Self-test(s) in progress,
system auto standby disabled
1 If debug mode enabled.
Luna Monitoring
Syslog & SNMP
Luna Syslog and SNMP Monitoring Guide 007-012417-001 Rev V22 Copyright 2016, Gemalto NV. 45 of 102
These messages indicate failures of the auto standby feature of the hard disk.
Sleep and Wakeup
2012 Feb 29 12:05:01 myLuna daemon crit smartd[1234]: System clock time adjusted to the past.
Resetting next wakeup time.
2012 Feb 29 12:05:01 myLuna daemon info smartd[1234]: Sleep time was 10 seconds too long,
assuming wakeup from standby mode.
2012 Feb 29 12:05:01 myLuna daemon info smartd[1234]: Signal USR1 - checking devices now rather
than in 30 seconds.
These messages indicate failures in the mechanism to sleep and wake up the smart control daemon at
prescribed intervals to query and report on SMART attributes.
Offline Log Collection Status
2012 Feb 29 12:05:01 myLuna daemon info smartd[1234]: Device: /dev/sda, offline data collection
was never started (auto:on)
2012 Feb 29 12:05:01 myLuna daemon info smartd[1234]: Device: /dev/sda, offline data collection
was completed without error (auto:on)
2012 Feb 29 12:05:01 myLuna daemon info smartd[1234]: Device: /dev/sda, offline data collection
is in progress (auto:on)
2012 Feb 29 12:05:01 myLuna daemon info smartd[1234]: Device: /dev/sda, offline data collection
was suspended by an interrupting command from host (auto:on)
2012 Feb 29 12:05:01 myLuna daemon info smartd[1234]: Device: /dev/sda, offline data collection
was aborted by an interrupting command from host (auto:on)
2012 Feb 29 12:05:01 myLuna daemon info smartd[1234]: Device: /dev/sda, offline data collection
was aborted by the device with a fatal error (auto:on)
2012 Feb 29 12:05:01 myLuna daemon info smartd[1234]: Device: /dev/sda, unknown offline data
collection status 0x78
These messages indicate failures to perform offline data collection. Depending upon the status, the smart
control daemon logs these messages as either crit or info; the examples above show info only.
SNMP
Luna appliances support monitoring via the simple network management protocol. A daemon, snmp, runs
in the background on the appliance for this purpose.
Facility Keyword
Software Process
Log File
user
root
messages
Expected Log Messages
This revision of Luna Monitoring identifies only one expected log message.
Starting Daemon
2012 Feb 29 12:05:01 myLuna user notice root: Starting snmpd
Luna Monitoring
Syslog & SNMP
Luna Syslog and SNMP Monitoring Guide 007-012417-001 Rev V22 Copyright 2016, Gemalto NV. 46 of 102
This message indicates that the SNMP daemon is being started.
Unexpected Log Messages
A future revision of Luna Monitoring will describe unexpected log messages.
NTP
Network Time Protocol is an optional service of Luna appliances to synchronize the system clock to a
coordinated universal time. A future revision of Luna Monitoring will describe NTP log messages.
SSH
Secure Shell or SSH is the process that offers secure, trusted connection to a restricted shell on the Luna
appliance for administrative purposes.
Facility Keyword
Software Process
Log File
authpriv
sshd[pid]
secure
This version of Luna Monitoring shows some examples of log messages you might find for SSH but is not a
comprehensive account of all possible messages.
Expected Log Messages
2012 Feb 29 12:05:01 myLuna authpriv info ssdh[1234]: Server listening on 0.0.0.0 port 22.
2012 Feb 29 12:05:01 myLuna authpriv info ssdh[1234]: Received signal 15; terminating.
2012 Feb 29 12:05:01 myLuna authpriv info ssdh[1234]: Accepted password for <user name> from
192.168.10.100 port 51286 ssh2
2012 Feb 29 12:05:01 myLuna authpriv info ssdh[1234]: Received disconnect from 192.168.10.100: 11:
disconnected by user
2012 Feb 29 12:05:01 myLuna authpriv info ssdh[1234]: Did not receive identification string from
192.168.0.100
2012 Feb 29 12:05:01 myLuna authpriv info ssdh[1234]: Received disconnect from 192.168.0.100: 11:
The user disconnected the application
2012 Feb 29 12:05:01 myLuna authpriv info ssdh[1234]: Accepted publickey for <admin | monitor>
from 192.168.0.100 port 2299 ssh2
2012 Feb 29 12:05:01 myLuna authpriv info ssdh[1234]: pam_unix(ssdh[1234]:session): session opened
for user admin by (uid=0)
2012 Feb 29 12:05:01 myLuna authpriv info ssdh[1234]: pam_unix(ssdh[1234]:session): session closed
for user admin
2012 Feb 29 12:05:01 myLuna authpriv info ssdh[1234]: Received disconnect from 192.168.0.100: 2:
disconnected by server request
2012 Feb 29 12:05:01 myLuna authpriv info ssdh[1234]: Connection closed by 192.168.0.100 [preauth]
These messages indicate normal SSH activity. <user name> is “admin”, “operator”, “monitor”, “audit” or a
customer-defined name.

Luna Monitoring
Syslog & SNMP
Luna Syslog and SNMP Monitoring Guide 007-012417-001 Rev V22 Copyright 2016, Gemalto NV. 47 of 102
Unexpected Log Messages
Under normal circumstances, you should not see any of these log messages. If you do so, please contact
SafeNet technical support to report the message and seek guidance on what to do next.
2012 Feb 29 12:05:01 myLuna authpriv err ssdh[1234]: error: Bind to port 22 on 0.0.0.0 failed:
Address already in use.
2012 Feb 29 12:05:01 myLuna authpriv crit ssdh[1234]: fatal: Cannot bind any address.
2012 Feb 29 12:05:01 myLuna authpriv crit ssdh[1234]: fatal: Read from socket failed: Connection
reset by peer [preauth]
2012 Feb 29 12:05:01 myLuna authpriv info ssdh[1234]: Disconnecting: Too many authentication
failures for <user name> [preauth]
2012 Feb 29 12:05:01 myLuna authpriv info ssdh[1234]: Invalid user <user name> from 192.168.0.100
2012 Feb 29 12:05:01 myLuna authpriv info ssdh[1234]: input_userauth_request: invalid user <user
name> [preauth]
2012 Feb 29 12:05:01 myLuna authpriv notice ssdh[1234]: pam_unix(ssdh[1234]:auth): authentication
failure; logname= uid=0 euid=0 tty=ssh ruser= rhost=192.168.0.100 user=admin
2012 Feb 29 12:05:01 myLuna authpriv info ssdh[1234]: Failed password for admin from 192.168.0.100
port 1615 ssh2
2012 Feb 29 12:05:01 myLuna authpriv info ssdh[1234]: subsystem request for sftp
2012 Feb 29 12:05:01 myLuna authpriv info ssdh[1234]: subsystem request for sftp failed, subsystem
not found
2012 Feb 29 12:05:01 myLuna authpriv info ssdh[1234]: syslogin_perform_logout: logout() returned
an error
2012 Feb 29 12:05:01 myLuna authpriv alert ssdh[1234]: pam_unix(ssdh[1234]:auth): check pass; user
unknown
2012 Feb 29 12:05:01 myLuna authpriv crit ssdh[1234]: pam_succeed_if(ssdh[1234]:auth): error
retrieving information about user <user name>
2012 Feb 29 12:05:01 myLuna authpriv info ssdh[1234]: User root from 192.168.0.100 not allowed
because not listed in AllowUsers
2012 Feb 29 12:05:01 myLuna authpriv info ssdh[1234]: Bad protocol version identification 'id'
from 10.168.64.4
2012 Feb 29 12:05:01 myLuna authpriv warn ssdh[1234]: Deprecated pam_stack module called from
service "ssdh[1234]"
2012 Feb 29 12:05:01 myLuna authpriv notice ssdh[1234]: PAM 4 more authentication failures;
logname= uid=0 euid=0 tty=ssh ruser= rhost=10.101.18.32 user=admin
2012 Feb 29 12:05:01 myLuna authpriv alert ssdh[1234]: PAM service(ssdh[1234]) ignoring max
retries; 5 > 3
2012 Feb 29 12:05:01 myLuna authpriv info ssdh[1234]: Received request to connect to host
127.0.0.1 port 3306, but the request was denied.
2012 Feb 29 12:05:01 myLuna authpriv err ssdh[1234]: error: Received disconnect from
192.168.0.100: 3: com.jcraft.jsch.JSchException: Auth fail [preauth]
2012 Feb 29 12:05:01 myLuna authpriv crit ssdh[1234]: fatal: Access denied for user admin by PAM
account configuration [preauth]
2012 Feb 29 12:05:01 myLuna authpriv info ssdh[1234]: Setting tty modes failed: Invalid argument
2012 Feb 29 12:05:01 myLuna authpriv crit ssdh[1234]: fatal: PAM: pam_chauthtok(): Authentication
token manipulation error
Luna Monitoring
Syslog & SNMP
Luna Syslog and SNMP Monitoring Guide 007-012417-001 Rev V22 Copyright 2016, Gemalto NV. 48 of 102
2012 Feb 29 12:05:01 myLuna authpriv info ssdh[1234]: syslogin_perform_logout: logout() returned
an error
2012 Feb 29 12:05:01 myLuna authpriv info ssdh[1234]: Received SIGHUP; restarting.
These messages indicate abnormal SSH activity. A future revision of Luna Monitoring will provide more
details of what each message means.
Privileged Services
Facility Keyword
Software Process
Log File
authpriv
See list that follows
secure
The following privileged services log messages to the secure log file with a software process identifier if
shown.
• useradd[pid]
• chage[pid]
• passwd
• usermod[pid]
• login
• groupadd[pid]
Expected Log Messages
useradd
2012 Feb 29 12:05:01 myLuna authpriv info useradd[1234]: new user: name=recover, UID=0, GID=0,
home=/home/recover, shell=/usr/lunasa/bin/recover
2012 Feb 29 12:05:01 myLuna authpriv info useradd[1234]: new user: name=<admin | monitor |
operator>, UID=0, GID=0, home=/home/admin, shell=/usr/lunasa/lush/lush
2012 Feb 29 12:05:01 myLuna authpriv info useradd[1234]: new user: name=mysql, UID=500, GID=500,
home=/usr/local/mysql, shell=/sbin/nologin
These messages indicate that the Linux utility useradd(1) successfully created accounts for the
identified user (e.g., recover, admin, monitor, operatory or mysql).
chage
2012 Feb 29 12:05:01 myLuna authpriv info chage[1234]: changed password expiry for <user name>
This message indicates that the Linux utility chage(1) successfully changed the number of days between
password changes and the date of the last password change for <username>. <username> is one of
“admin”, “operator”, “monitor” or a user created by an administrator.

Luna Monitoring
Syslog & SNMP
Luna Syslog and SNMP Monitoring Guide 007-012417-001 Rev V22 Copyright 2016, Gemalto NV. 49 of 102
passwd
2012 Feb 29 12:05:01 myLuna authpriv notice passwd: pam_unix(passwd:chauthtok): password changed
for admin
This message indicates that the Linux utility passwd(1) successfully updated the admin user’s
authentication token.
usermod
2012 Feb 29 12:05:01 myLuna authpriv info authpriv info usermod[1234]: change user `<user name>'
password
This message indicates that the Linux utility usermod(1) successfully updated the login information for
<user name>. <user name> is one of “admin”, “operator”, “monitor” or “audit.”
login
2012 Feb 29 12:05:01 myLuna authpriv authpriv info login: pam_unix(login:session): session opened
for user < admin | recover> by LOGIN(uid=0)
2012 Feb 29 12:05:01 myLuna authpriv authpriv info login: pam_unix(login:session): session closed
for user <admin | recover>
2012 Feb 29 12:05:01 myLuna authpriv authpriv info login: DIALUP AT ttyS0 BY <admin | recover>
The first two messages indicate that the Linux utility login(1) successfully established a new session
with the Luna appliance or terminated a session. The third message indicates that the session is via the
serial port on the front console of the Luna appliance.
groupadd
2012 Feb 29 12:05:01 myLuna authpriv authpriv info groupadd[2558]: new group: name=<uucp | mysql>,
GID=<14 | 500>
This message indicates that the Linux utility groupadd(1) successfully created a new group definition
with the GID shown. The <gid> for uucp is 14; for mysql, 500.
Unexpected Log Messages
Under normal circumstances, you should not see any of these log messages. If you do so, please contact
SafeNet technical support to report the message and seek guidance on what to do next.
login
2012 Feb 29 12:05:01 myLuna authpriv authpriv alert login: pam_unix(login:auth): check pass; user
unknown
2012 Feb 29 12:05:01 myLuna authpriv authpriv notice login: pam_unix(login:auth): authentication
failure; logname=LOGIN uid=0 euid=0 tty=ttyS0 ruser=<user name> rhost=192.168.0.100
2012 Feb 29 12:05:01 myLuna authpriv authpriv crit login: pam_succeed_if(login:auth): error
retrieving information about user <user name>
2012 Feb 29 12:05:01 myLuna authpriv authpriv notice login: FAILED LOGIN 1 FROM (null) FOR <user
name>, User not known to the underlying authentication module

Luna Monitoring
Syslog & SNMP
Luna Syslog and SNMP Monitoring Guide 007-012417-001 Rev V22 Copyright 2016, Gemalto NV. 50 of 102
2012 Feb 29 12:05:01 myLuna authpriv authpriv alert login: PAM service(login) ignoring max
retries; 4 > 3
2012 Feb 29 12:05:01 myLuna authpriv authpriv err login: Authentication failure
These messages indicate failure on the part of an administrator to login to the Luna appliance. The first
four messages indicate that the login attempt was with a username unknown to the Luna appliance. The
fifth message indicates that the threshold number of failed login attempts has been reached or exceeded.
The last message is the Luna IS-specific message in place of the second message above.
Kernel
Facility Keyword
Software Process
Log File
kern
kernel
messages
Expected Log Messages
Shutting Down Watchdog Timer
2012 Feb 29 12:05:01 myLuna kern info kernel: iTCO_wdt: Unexpected close, not stopping watchdog.
2012 Feb 29 12:05:01 myLuna kern info kernel: iTCO_wdt: Watchdog Module Unloaded.
These messages indicate that the kernel shutdown the hardware watchdog timer, likely a result of the Lush
“sysconf appliance watchdog disable” command.
SafeNet Components
SafeNet has developed a number of services that run within the Luna appliance. Some of these services use
syslog to record significant actions and events. The following list identifies the SafeNet services that use
syslog.
• sysstat – system status and monitoring (including LCD)
• cbs – HSM callback service (and remote PED)
• oamp – automatic monitoring of environment, detecting and determining faults
• ntls – Network trust link service
• htl – Host trust link service
• nbs – Network bus service
• rbs – Remote backup service
• Luna Administrative Shell (Lush)
• cron and crontab
• Certmonitord – NTLS certificate expiration monitoring
Luna Monitoring
Syslog & SNMP
Luna Syslog and SNMP Monitoring Guide 007-012417-001 Rev V22 Copyright 2016, Gemalto NV. 51 of 102
sysstat
The system status daemon reports on the health of the Luna appliance via syslog and the LCD on the front
panel of the appliance.
Facility Keyword
Software Process
Log File
user
sysstatd
messages
Expected Log Messages
The following log messages are normal and expected entries in the log files.
Service Started
2012 Feb 29 12:05:01 myLuna user info sysstatd: ------------ Luna System State Server - Started.
This message indicates that the system status daemon is running, normal for a Luna appliance power up
operation.
Service Stopped
2012 Feb 29 12:05:01 myLuna user info sysstatd: ------------ Luna System State Server - Stopped.
This message indicates that the system status daemon is stopped, normal for a Luna appliance shutdown
operation.
System Status
2012 Feb 29 12:05:01 myLuna user info sysstatd: Luna System State Server - OOS Errors: 15,100,60!
2012 Feb 29 12:05:01 myLuna user info sysstatd: Luna System State Server - OFL Errors:
50,15,20,100,55,60!
2012 Feb 29 12:05:01 myLuna user info sysstatd: Luna System State Server - InSrvTrb Errors: 1!
Messages formatted like these examples represent normal reporting of Luna appliance health when it is not
“in service.” The specific error codes indicate one or more potential problems with specific services of the
Luna appliance operation. For details of their meaning, refer to the description of the error codes in the
section “Front-panel Display” of the Luna product documentation.
Up Time
2012 Feb 29 04:02:01 myLuna syslog info logger: uptime: 04:02:01 up 6:50, 2 users, load average:
0.38, 0.14, 0.04
This message indicates the uptime for the Luna appliance. cron is responsible for the message on a daily
basis, usually early in the morning. Note that the facility keyword and software process are not the same as
those for the system status daemon but is included in this section given its relationship to status
monitoring.

Luna Monitoring
Syslog & SNMP
Luna Syslog and SNMP Monitoring Guide 007-012417-001 Rev V22 Copyright 2016, Gemalto NV. 52 of 102
Unexpected Log Messages
Under normal circumstances, you should not see any of these log messages. If you do so, please contact
SafeNet technical support to report the message and seek guidance on what to do next.
Cannot Open Files Needed to Identify Product
2012 Feb 29 12:05:01 myLuna user err sysstatd: Cannot open PRODUCT file.
2012 Feb 29 12:05:01 myLuna user err sysstatd: Cannot open VERSION file.
2012 Feb 29 12:05:01 myLuna user err sysstatd: Cannot open RELEASE file.
These messages indicate a missing or corrupted file necessary to identify the product on the LCD and/or via
a Lush command. A PRODUCT:VERSION:RELEASE example is SA:5.3.0:5.
Cannot Set Signal Handler
2012 Feb 29 12:05:01 myLuna user info sysstatd: Cannot set sighandler for SIGTERM.
2012 Feb 29 12:05:01 myLuna user info sysstatd: Cannot set sighandler for SIGINT.
These messages indicate that the system status daemon was unable to set up signal handling for the
SIGTERM and/or SIGINT signals.
Failed to Detach
2012 Feb 29 12:05:01 myLuna user err sysstatd: Failed to detach sysstatd from console.
This message indicates that the startup procedure for the system status daemon failed, specifically that the
daemon did not launch into a background process.
Unknown Error
2012 Feb 29 12:05:01 myLuna user info sysstatd: unknown error while trying to obtain the system
state.
This message indicates that the system status daemon was unable to determine health of the Luna
appliance and represents a logic error within how the daemon was instrumented.
Failed to Open Device
2012 Feb 29 12:05:01 myLuna user info sysstatd: Failed to open the LCD device.
This message indicates that the system status daemon was unable to open the TTY device that maps to the
LCD on the front of the Luna appliance.
Failed to Open or Read File
2012 Feb 29 12:05:01 myLuna user info sysstatd: Did NOT find a system state error file
here:/usr/lunasa/sysstat/statuserror.txt.
2012 Feb 29 12:05:01 myLuna user info sysstatd: Did NOT find a system status file here:
/usr/lunasa/sysstat/statusoutput.txt.
2012 Feb 29 12:05:01 myLuna user info sysstatd: The SysStat service failed while reading the
file: /usr/lunasa/sysstat/statusoutput.txt. It appears to be empty.
Luna Monitoring
Syslog & SNMP
Luna Syslog and SNMP Monitoring Guide 007-012417-001 Rev V22 Copyright 2016, Gemalto NV. 53 of 102
2012 Feb 29 12:05:01 myLuna user info sysstatd: The SysStat service cannot determine the system
state. Missing the status script: /usr/lunasa/sysstat/statusscript.sh.
2012 Feb 29 12:05:01 myLuna user info sysstatd: The SysStat service failed while trying to open
the file:/usr/lunasa/sysstat/ethip.txt.
2012 Feb 29 12:05:01 myLuna user info sysstatd: The SysStat service failed while reading the
file: /usr/lunasa/sysstat/ethip.txt. It appears to be empty.
These messages indicate a failure to find and/or open status files used by the system state daemon to
determine the health of the Luna appliance. statuserror.txt shows the error codes, status codes and
explanations for the different health status items reported for the Luna appliance. statusoutput.txt
contains the current status of the Luna appliance. statusscript.sh is a shell script that creates the
statusoutput.txt file by running several other scripts and utilities to collect the state of the Luna
appliance. ethip.txt contains the details of the Ethernet ports (whether configured, IP address, host
name and link status).
Failed to Determine IP Address
2012 Feb 29 12:05:01 myLuna user info sysstatd: The SysStat service failed while trying to obtain
the ethernet IP addresses.
This message indicates that the script used to determine the IP address of the Luna appliance failed to
execute successfully.
HSM Callback Service
The callback service is a SafeNet daemon that communicates with the cryptographic keycard (i.e., the PCI-e
expansion card) within the Luna appliance. This service supports audit logging and remote PED features.
Facility Keyword
Software Process
Log File
local5
Luna PED Client [pid]
lunalogs
There are hundreds of callback service messages. A future version of Luna Monitoring will attempt to
document callback service messages. If you encounter any and you would like more information, please
contact SafeNet technical support for assistance.
OAMP
The oamp process monitors the cryptographic keycard and cryptographic operations within the Luna
appliance.
Facility Keyword
Software Process
Log File
local5
oamp[pid]
lunalogs1
1 See Database Service for details of messages in lunalogs.
Luna Monitoring
Syslog & SNMP
Luna Syslog and SNMP Monitoring Guide 007-012417-001 Rev V22 Copyright 2016, Gemalto NV. 54 of 102
Facility Keyword
Software Process
Log File
local6
oamp[pid]
hsm.log2
2 A previous section in Luna Monitoring details log messages to hsm.log.
Facility Keyword
Software Process
Log File
user
logger
messages
Expected Log Messages
The following log messages are normal and expected entries in the log files.
OAMP Started
2012 Feb 29 12:05:01 myLuna user notice logger: oamp started.
This message indicates that the oamp process started successfully.
Unexpected Log Messages
There are no unexpected log messages. If you find any other entries in messages with the facility
keyword user and software process logger, please contact SafeNet technical support to report the
message and seek guidance on what to do next.
Network Trust Link Service
The network trust link service – NTLS – is the cryptographic services dispatcher of the Luna appliance. On
system start up, NTLS runs as a daemon and listens for incoming connection requests on TCP/IP sockets.
Using Secure Sockets Layer, NTLS secures communication between the appliance and a client, each party
authenticating the other with certificates and encrypting data exchanged.
SafeNet has architected NTLS into two principal components and the organization of NTLS log messages in
this document reflects this architecture. A generic datapath engine manages the socket communications.
This engine is common across Luna appliances (e.g., Luna SA, Luna SP and Luna IS use the same engine). A
product-specific command processor parses and responds to the messages NTLS receives from and sends
back to the client. The datapath engine underwent significant change for the Luna SA 5.2.2 release with
many syslog message changes. This document makes explicit note for older messages; otherwise, assume
that the descriptions apply for more current product releases.
Facility Keyword
Software Process
Log File
Local5
NTLS [pid]
lunalogs
Datapath: Expected Log Messages
The following log messages are normal and expected entries in the log files from the datapath engine of
NTLS.

Luna Monitoring
Syslog & SNMP
Luna Syslog and SNMP Monitoring Guide 007-012417-001 Rev V22 Copyright 2016, Gemalto NV. 55 of 102
Startup
2012 Feb 29 12:05:01 myLuna local5 info NTLS [1234]: info : 0 : Starting up NTLS........
2012 Feb 29 12:05:01 myLuna local5 info NTLS [1234]: info : 0 : luna_engine_preload: SUCCESSFULLY
loaded
2012 Feb 29 12:05:01 myLuna local5 info NTLS [1234]: info : 0 : 1 =
ENGINE_ctrl_cmd_string(...SO_PATH...
2012 Feb 29 12:05:01 myLuna local5 info NTLS [1234]: info : 0 : 1 =
ENGINE_ctrl_cmd_string(...ID...)
2012 Feb 29 12:05:01 myLuna local5 info NTLS [1234]: info : 0 : 1 =
ENGINE_ctrl_cmd_string(...LOAD...
2012 Feb 29 12:05:01 myLuna local5 info NTLS [1234]: info : 0 : luna_engine_load: SUCCESSFULLY
enabled for ALL ops
2012 Feb 29 12:05:01 myLuna local5 info NTLS [1234]: info : 0 : HSM crypto support for data path2
SSL operations enabled3
2012 Feb 29 12:05:01 myLuna local5 info NTLS [1234]: info : 0 : "Luna SA 5.0 Command Processor"
module version 1.0 loaded
2012 Feb 29 12:05:01 myLuna local5 info NTLS [1234]: info : 0 : NTLS data path configured with 5
inbound worker threads and 5 outbound worker threads
2012 Feb 29 12:05:01 myLuna local5 info NTLS [1234]: info : 0 : NTLS is online and operational.
2012 Feb 29 12:05:01 myLuna local5 info NTLS [1234]: info : 0 : Data path TCP keep alive is
configured as : TCP_KEEPIDLE = 10 sec : TCP_KEEPINTVL = 10 sec : TCP_KEEPCNT = 2 retries
2012 Feb 29 12:05:01 myLuna local5 info NTLS [1234]: info : 0 : Data path TCP keep alive is
configured as : TCP_KEEPIDLE = 10 sec : SSL cipher list set to AES256-GCM-SHA384
The first message indicates that NTLS is starting up. The next five messages trace the progress of the SSL
start up sequence. The remaining messages show the progress through to a successful startup.
Failed to Enable SSL Engine for All Operations
2012 Feb 29 12:05:01 myLuna local5 info NTLS [1234]: info : 0 : luna_engine_load: failed to
ENGINE_set_default for ALL ops
This message indicates that the SSL engine was unable to initialize properly.
Client Connections
2012 Feb 29 12:05:01 myLuna local5 info NTLS [1234]: info : 0 : Incoming connection request... :
192.168.0.100/40847
2012 Feb 29 12:05:01 myLuna local5 info NTLS [1234]: info : 0xc0000002 : Connection accepted
from: 192.168.0.100/40847
2012 Feb 29 12:05:01 myLuna local5 info NTLS [1234]: info : 0xc0000002 : Handshake result from:
192.168.0.100/40847, result: Success
2012 Feb 29 12:05:01 myLuna local5 info NTLS [1234]: info : 0xc0000002 : NTLS Client
"192.168.0.100" connected and authenticated : 192.168.0.100/40847.
2 “NTLS” in older implementations.
3 Or “disabled” or “NOT enabled” if the keys-in-hardware option is enabled but the SSL engine failed to load
(“luna_engine_load: failed to ENGINE_set_default for ALL ops”).

Luna Monitoring
Syslog & SNMP
Luna Syslog and SNMP Monitoring Guide 007-012417-001 Rev V22 Copyright 2016, Gemalto NV. 56 of 102
2012 Feb 29 12:05:01 myLuna local5 info NTLS [1234]: info : 0xc0000002 : Connection terminating:
192.168.0.100/40847
2012 Feb 29 12:05:01 myLuna local5 info NTLS [1234]: info : 0 : NTLA client "192.168.0.100" has
disconnected: 192.168.0.100/40847
2012 Feb 29 12:05:01 myLuna local5 info NTLS [1234]: info : 0 : Receive timer expired for client
"192.168.0.100". Terminate client connection: 192.168.0.100/408474
2012 Feb 29 12:05:01 myLuna local5 info NTLS [1234]: info : 0 : Receive timer expired for client
"192.168.0.100" : 192.168.0.100/408475
These messages indicate connect establishment and termination by NTLS. You should find pairs of
connection accepted and disconnected messages in the logs. The last two messages result when a client
connects but is inactive for a period configured for NTLS.
Client Credentials Cannot be Verified
2012 Feb 29 12:05:01 myLuna local5 info NTLS [1234]: info : 0xc0000002 : Client credentials
cannot be verified. Connection terminated : 192.168.0.100/40847
This message indicates that the client connection request could not be completed. A possible root cause is
that the client’s certificate is invalid (e.g., has a wrong IP address or hostname).
Cache Monitor
2012 Feb 29 12:05:01 myLuna local5 info NTLS [1234]: info : 0 : Client certificate verify
location monitor started
2012 Feb 29 12:05:01 myLuna local5 info NTLS [1234]: info : 0 : Detected client certificate
removed from verify location. Flush verify location cache
2012 Feb 29 12:05:01 myLuna local5 info NTLS [1234]: info : 0 : Client certificate verify
location monitor terminated
These messages indicate that NTLS has started to monitor client certificates registered with the process.
Connection Instance Added and Removed
2012 Feb 29 12:05:01 myLuna local5 info NTLS [1234]: info : 0 : NTLA Client "192.168.0.100"
Connection instance removed : 192.168.0.100/40847
2012 Feb 29 12:05:01 myLuna local5 info NTLS [1234]: info : 0 : NTLA Client "192.168.0.100"
connected and authenticated : 192.168.0.100/40847
2012 Feb 29 12:05:01 myLuna local5 info NTLS [1234]: info : 0 : NTLA Client "192.168.0.100" has
disconnected: 192.168.0.100/40847
2012 Feb 29 12:05:01 myLuna local5 info NTLS [1234]: info : 0 : NTLA Client "192.168.0.100" has
disconnected: 192.168.0.100/40847
These messages indicate NTLS’s action to add and remove connection instances.
4 This message results if the timeout is for a scheduled cleanup.
5 This message results if the timeout is not for a scheduled cleanup.

Luna Monitoring
Syslog & SNMP
Luna Syslog and SNMP Monitoring Guide 007-012417-001 Rev V22 Copyright 2016, Gemalto NV. 57 of 102
Client Credentials Cannot be Verified
2012 Feb 29 12:05:01 myLuna local5 info NTLS [1234]: info : 0 : Client credentials cannot be
verified. Connection terminated : 192.168.0.100/40847
This message indicates that an application connected to NTLS but did not provide the SSL credentials to
complete authentication.
Handshake Failed
2012 Feb 29 12:05:01 myLuna local5 info NTLS [1234]: info : 0xc0000711 : Fail to establish a
secure channel with client : 192.168.0.100/40847 : RC_SSL_FAILED_HANDSHAKE
This message indicates that an application attempted to connect with SSL credentials that did not conform
to the algorithms and/or cryptographic strength expected by NTLS.
Unable to Initialize Server Socket
2012 Feb 29 12:05:01 myLuna local5 crit NTLS [1234]: critical : 0xc0000500 : NTLS listening port
could not Bind : RC_SOCKET_ERROR
2012 Feb 29 12:05:01 myLuna local5 err NTLS [1234]: error : 0xc0000500 : Unable to initialize data
path6 server socket : RC_SOCKET_ERROR
2012 Feb 29 12:05:01 myLuna local5 err NTLS [1234]: error : 0xc0000500 : NTLS initialization
failed : RC_SOCKET_ERROR
These messages indicate that NTLS was unable to initialize the server socket. A possible root cause is that
the network interface is not properly configured.
Connected to Server
2012 Feb 29 12:05:01 myLuna local5 info NTLS [1234]: info : 0xc0000002 : 192.168.0.100 connected
to server : 192.168.0.100/40847
This message indicates that NTLS has successfully established an outgoing connection with a peer or
remote server.
Shutting Down
2012 Feb 29 12:05:01 myLuna local5 info NTLS [1234]: info : 0 : Shutting down NTLS....
2012 Feb 29 12:05:01 myLuna local5 info NTLS [1234]: info : 0 : Intiating [sic] dispatch
termination.
2012 Feb 29 12:05:01 myLuna local5 info NTLS [1234]: info : 0 : Dispatching has been terminated.
2012 Feb 29 12:05:01 myLuna local5 info7 NTLS [1234]: info : 0 : Terminating.
2012 Feb 29 12:05:01 myLuna local5 info NTLS [1234]: info : 0 : "Luna SA 5.0 Command Processor"
shut downed
2012 Feb 29 12:05:01 myLuna local5 info NTLS [1234]: info : 0 : NTLS terminated
6 “NTLS” in older implementations.
7 For Luna SA 5.2.2 and Luna SA 5.3 releases, the severity level is “critical” but is “info” in the Luna SA 5.4 release.

Luna Monitoring
Syslog & SNMP
Luna Syslog and SNMP Monitoring Guide 007-012417-001 Rev V22 Copyright 2016, Gemalto NV. 58 of 102
These messages show the progression of steps as NTLS terminates.
Datapath: Unexpected Log Messages
Under normal circumstances, you should not see any of these log messages. If you do so, please consult
the user documentation to seek guidance on how to correct the problem.
NTLS Terminating
2012 Feb 29 12:05:01 myLuna local5 crit NTLS [1234]: critical : 0xc0000102 : Terminating.
2012 Feb 29 12:05:01 myLuna local5 crit NTLS [1234]: critical : 0xc0000102 : Failed to start as
daemon. Terminating.
2012 Feb 29 12:05:01 myLuna local5 crit NTLS [1234]: critical : 0xc0000102 : Failed to initialize
application. Terminating.
2012 Feb 29 12:05:01 myLuna local5 crit NTLS [1234]: critical : 0xc0000102 : Failed to create
server. Terminating.
These messages indicate that NTLS failed at startup. Possible root causes for the first message are a failure
to create internal data structures needed by NTLS or a failure to generate the private key and certificate
needed by NTLS.
Failed to Load SSL Engine
2012 Feb 29 12:05:01 myLuna local5 info NTLS [1234]: info : 0 : luna_engine_load: failed to
ENGINE_by_id
This message indicates that OpenSSL was unable to load the specified engine. A possible root cause is the
wrong engine identifier specified in the OpenSSL configuration file.
Skip C_Initialize
2012 Feb 29 12:05:01 myLuna local5 info NTLS [1234]: info : 0 : 1 =
ENGINE_ctrl_cmd_string(...SKIP_C_INITIALIZE...)
This message indicates that the OpenSSL engine for LunaCA3 skipped the call the C_Initialize . Luna
appliances do not use the LunaCA3 engine.
Configured for RSA Operations
2012 Feb 29 12:05:01 myLuna local5 info NTLS [1234]: info : 0 : luna_engine_load: SUCCESSFULLY
enabled for RSA ops
This message indicates that the SSL engine used by NTLS is configured only for RSA operations.
Failed to Pre-Load SSL Engine
Feb 29 12:05:01 myLuna local5 info NTLS [1234]: info : 0 : luna_engine_preload: failed to load
This message indicates that the SSL engine was unable to preload. A possible root cause is the wrong
engine identifier configured on the Luna appliance.

Luna Monitoring
Syslog & SNMP
Luna Syslog and SNMP Monitoring Guide 007-012417-001 Rev V22 Copyright 2016, Gemalto NV. 59 of 102
Failed to Enable SSL Engine for RSA Operations
2012 Feb 29 12:05:01 myLuna local5 info NTLS [1234]: info : 0 : luna_engine_load: failed to
ENGINE_set_default for RSA ops
This message indicates that the SSL engine was unable to initialize properly for RSA operations.
Failed to Initialize
2012 Feb 29 12:05:01 myLuna local5 info NTLS [1234]: info : 0 : Missing command processor library
for NTLS.
2012 Feb 29 12:05:01 myLuna local5 crit NTLS [1234]: critical : 0xc0000102 : Command processor
module not found : "Luna SA 5.0 Command Processor" : RC_GENERAL_ERROR
2012 Feb 29 12:05:01 myLuna local5 crit NTLS [1234]: critical : 0xc0000105 :
cp_get_supported_versions function not found in command processor "Luna SA 5.0 Command Processor" :
RC_FUNCTION_NOT_SUPPORTED
2012 Feb 29 12:05:01 myLuna local5 crit NTLS [1234]: critical : 0xc0000105 : cp_initialize_p
function not found in command processor "Luna SA 5.0 Command Processor" : RC_FUNCTION_NOT_SUPPORTED
2012 Feb 29 12:05:01 myLuna local5 crit NTLS [1234]: critical : 0xc0000105 :
cp_get_processor_name_p function not found in command processor "Luna SA 5.0 Command Processor" :
RC_FUNCTION_NOT_SUPPORTED
2012 Feb 29 12:05:01 myLuna local5 crit NTLS [1234]: critical : 0xc0000105 : cp_shutdown function
not found in command processor "Luna SA 5.0 Command Processor" : RC_FUNCTION_NOT_SUPPORTED
2012 Feb 29 12:05:01 myLuna local5 crit NTLS [1234]: critical : 0xc0000105 :
cp_client_registration_observer function not found in command processor "Luna SA 5.0 Command
Processor" : RC_FUNCTION_NOT_SUPPORTED
2012 Feb 29 12:05:01 myLuna local5 crit NTLS [1234]: critical : 0xc0000105 : cp_configure
function not found in command processor "Luna SA 5.0 Command Processor" : RC_FUNCTION_NOT_SUPPORTED
2012 Feb 29 12:05:01 myLuna local5 err NTLS [1234]: error : 0xc0000002 : Failed to initialize
"Luna SA 5.0 Command Processor" module version 1.0 for data path module version 1.0 :
RC_GENERAL_ERROR
2012 Feb 29 12:05:01 myLuna local5 err NTLS [1234]: error : 0xc0000102 : Failed to initialize
"Luna SA 5.0 Command Processor" module version 1.0 : RC_GENERAL_ERROR8
2012 Feb 29 12:05:01 myLuna local5 err NTLS [1234]: error : 0xc0000105 : "Luna SA 5.0 Command
Processor" module version 1.0 is incompatable [sic] with data path : RC_FUNCTION_NOT_SUPPORTED
2012 Feb 29 12:05:01 myLuna local5 err NTLS [1234]: error : 0xc0000500 : Unable to initialize
openssl library : RC_SOCKET_ERROR
2012 Feb 29 12:05:01 myLuna local5 err NTLS [1234]: error : 0xc0000500 : Unable to initialize
openssl server context : RC_SOCKET_ERROR
2012 Feb 29 12:05:01 myLuna local5 crit NTLS [1234]: critical : 0xc0000102 : Application specific
initialization failed for NTLS.
2012 Feb 29 12:05:01 myLuna local5 crit NTLS [1234]: critical : 0xc0000102 : Unable to initialize
dispatcher.
2012 Feb 29 12:05:01 myLuna local5 crit NTLS [1234]: critical : 0xc0000402 : Chrystoki
configuration client certificate file name invalid: RC_FILE_NAME_INVALID
2012 Feb 29 12:05:01 myLuna local5 crit NTLS [1234]: critical : 0xc0000402 : Chrystoki
configuration client private key file name invalid: RC_FILE_NAME_INVALID
8 For older implementations.

Luna Monitoring
Syslog & SNMP
Luna Syslog and SNMP Monitoring Guide 007-012417-001 Rev V22 Copyright 2016, Gemalto NV. 60 of 102
2012 Feb 29 12:05:01 myLuna local5 crit NTLS [1234]: critical : 0xc0000402 : Chrystoki
configuration ssl configuration file name invalid: RC_FILE_NAME_INVALID
2012 Feb 29 12:05:01 myLuna local5 crit NTLS [1234]: critical : 0xc0000102 : Failed to create
private key/certificate: RC_GENERAL_ERROR, error: -1
These messages indicate a failure of the datapath component to initialize itself at NTLS startup.
No Command Processor Module Configured
2012 Feb 29 12:05:01 myLuna local5 info NTLS [1234]: info : 0 : Data path is not configured with a
command processor module. Use default command processor setting
This message indicates an error in how NTLS is configured.
Fail to Accept Connections
2012 Feb 29 12:05:01 myLuna local5 err NTLS [1234]: error : 0xc0000002 : Unable to create a new
connection.
2012 Feb 29 12:05:01 myLuna local5 err NTLS [1234]: error : 0xc0000002 : Accept failed. Reason:
RC_GENERAL_ERROR
These messages indicate an NTLS failure to establish the TCP/IP socket necessary to listen for and accept
connections from clients.
Fail to Create Client Connection
2012 Feb 29 12:05:01 myLuna local5 err NTLS [1234]: error : 0xc0000500 : Fail to create connection
instance : 192.168.0.100/40847 : RC_SOCKET_ERROR
2012 Feb 29 12:05:01 myLuna local5 warn NTLS [1234]: warning : 0xc0000500 : Fail to accept a
client TCP connection : RC_SOCKET_ERROR
These messages indicate a failure to create a client connection on an incoming request.
Cache Monitor Failed
2012 Feb 29 12:05:01 myLuna local5 err NTLS [1234]: error : 0xc0000002 : CA cache monitor fail to
initialize : RC_GENERAL_ERROR
This message indicates that the thread spawned to monitor client certificates failed to initialize.
Connection Instance Failures
2012 Feb 29 12:05:01 myLuna local5 err NTLS [1234]: error : 0xc0000002 : Fail to create timer
object for connection instance : 192.168.0.100/40847 : RC_GENERAL_ERROR
2012 Feb 29 12:05:01 myLuna local5 err NTLS [1234]: error : 0xc0000004 : Fail to create ssl
object for connection instance : 192.168.0.100/40847 : RC_UNEXPECTED
2012 Feb 29 12:05:01 myLuna local5 crit NTLS [1234]: critical : 0xc0000102 : Client request
header malformed : 192.168.0.100/40847 : RC_DATA_INVALID
2012 Feb 29 12:05:01 myLuna local5 info NTLS [1234]: info : 0xc0000001 : Fail to allocate command
buffer : 192.168.0.100/40847 : RC_MEMORY_ALLOCATION
2012 Feb 29 12:05:01 myLuna local5 err NTLS [1234]: error : 0xc0000002 : Fail to forward client
request to command processor module : 192.168.0.100/40847 : RC_GENERAL_ERROR

Luna Monitoring
Syslog & SNMP
Luna Syslog and SNMP Monitoring Guide 007-012417-001 Rev V22 Copyright 2016, Gemalto NV. 61 of 102
These messages indicate a failure of NTLS to add or remove a client connection instance.
Non-Luna Client Connect Attempt
2012 Feb 29 12:05:01 myLuna local5 info NTLS [1234]: info : 0xc0000004 : Connection attempt from
non-Luna client : 192.168.0.100/40847 : RC_UNEXPECTED
This message indicates that an application attempted to connect to the Luna appliance via NTLS but did not
provide the proper SSL message exchange expected.
Command Process Unloaded
2012 Feb 29 12:05:01 myLuna local5 info NTLS [1234]: info : 0 : Command Processor module unloaded
This message indicates that NTLS unloaded its command processor module (a shared object library).
SSL Certificates Problems
2012 Feb 29 12:05:01 myLuna local5 crit NTLS [1234]: critical : 0xc0000701 : Bad SSL handle while
determining hostname: RC_SSL_CTX_ERROR
2012 Feb 29 12:05:01 myLuna local5 crit NTLS [1234]: critical : 0xc000070a : Failed to get
current certificate while determining hostname: RC_SSL_INVALID_CERT_STRUCTURE
2012 Feb 29 12:05:01 myLuna local5 crit NTLS [1234]: critical : 0xc000070a : Failed to get
certificate text while determining hostname: RC_SSL_INVALID_CERT_STRUCTURE
2012 Feb 29 12:05:01 myLuna local5 crit NTLS [1234]: critical : 0xc000070a : Invalid client
certificate while determining hostname: RC_SSL_INVALID_CERT_STRUCTURE
2012 Feb 29 12:05:01 myLuna local5 crit NTLS [1234]: critical : 0xc0000701 : Unable to retrieve
native SSL CTX handle: RC_SSL_CTX_ERROR
2012 Feb 29 12:05:01 myLuna local5 crit NTLS [1234]: critical : 0xc0000702 : SSL error setting
cipher list: RC_SSL_CIPHER_LIST_ERROR
2012 Feb 29 12:05:01 myLuna local5 crit NTLS [1234]: critical : 0xc0000402 : Chrystoki
configuration client certificate path invalid: RC_FILE_NAME_INVALID
2012 Feb 29 12:05:01 myLuna local5 crit NTLS [1234]: critical : 0xc0000703 : Load verify
locations failed for: CACert.pem, RC_SSL_CERT_VERIFICATION_LOCATION_ERROR
2012 Feb 29 12:05:01 myLuna local5 crit NTLS [1234]: critical : 0xc0000703 : Load verify
locations failed for single client: CACert.pem, RC_SSL_CERT_VERIFICATION_LOCATION_ERROR
2012 Feb 29 12:05:01 myLuna local5 crit NTLS [1234]: critical : 0xc0000402 : Chrystoki
configuration server certificate filename invalid: RC_FILE_NAME_INVALID
2012 Feb 29 12:05:01 myLuna local5 crit NTLS [1234]: critical : 0xc0000704 : Chrystoki using
server certificate failed: /usr/lunasa/vts/server/server.pem, RC_SSL_LOAD_SERVER_CERT_ERROR
2012 Feb 29 12:05:01 myLuna local5 crit NTLS [1234]: critical : 0xc0000402 : Chrystoki
configuration server private key filename invalid: RC_FILE_NAME_INVALID
2012 Feb 29 12:05:01 myLuna local5 crit NTLS [1234]: critical : 0xc0000705 : Error loading the
server private key: RC_SSL_LOAD_SERVER_PRIVATE_KEY_ERROR
2012 Feb 29 12:05:01 myLuna local5 crit NTLS [1234]: critical : 0xc0000706 : Error checking the
server private key: RC_SSL_VALIDATE_SERVER_PRIVATE_KEY_ERROR
2012 Feb 29 12:05:01 myLuna local5 crit NTLS [1234]: critical : 0xc0000406 : Fail to retrieve
host IP Address : RC_SOCKET_ADDRESS_INVALID

Luna Monitoring
Syslog & SNMP
Luna Syslog and SNMP Monitoring Guide 007-012417-001 Rev V22 Copyright 2016, Gemalto NV. 62 of 102
2012 Feb 29 12:05:01 myLuna local5 crit NTLS [1234]: critical : 0xc0000406 : Fail to retrieve
host port : RC_SOCKET_ADDRESS_INVALID
2012 Feb 29 12:05:01 myLuna local5 crit NTLS [1234]: critical : 0xc0000406 : Unable to create
context. : RC_SOCKET_ADDRESS_INVALID
2012 Feb 29 12:05:01 myLuna local5 crit NTLS [1234]: critical : 0xc0000002 : Failed to initialize
server for address 192.168.0.100/40847 : RC_GENERAL_ERROR
2012 Feb 29 12:05:01 myLuna local5 crit NTLS [1234]: critical : 0xc0000002 : Chrystoki
configuration client certificate filename invalid: RC_GENERAL_ERROR
2012 Feb 29 12:05:01 myLuna local5 crit NTLS [1234]: critical : 0xc0000708 : Chrystoki using
client certificate failed: CACert.pem, RC_SSL_LOAD_CLIENT_CERT_ERROR
2012 Feb 29 12:05:01 myLuna local5 crit NTLS [1234]: critical : 0xc0000402 : Chrystoki
configuration client private key filename invalid: RC_FILE_NAME_INVALID
2012 Feb 29 12:05:01 myLuna local5 crit NTLS [1234]: critical : 0xc000070b : Error loading the
client private key: RC_SSL_LOAD_CLIENT_PRIVATE_KEY_ERROR
2012 Feb 29 12:05:01 myLuna local5 crit NTLS [1234]: critical : 0xc0000402 : Chrystoki
configuration server certificate authority filename invalid: RC_FILE_NAME_INVALID
2012 Feb 29 12:05:01 myLuna local5 crit NTLS [1234]: critical : 0xc0000703 : Error loading server
certificate authorities: RC_SSL_CERT_VERIFICATION_LOCATION_ERROR
2012 Feb 29 12:05:01 myLuna local5 crit NTLS [1234]: critical : 0xc0000002 : Unable to update
context. : RC_GENERAL_ERROR
These messages indicate a failure of the underlying communication mechanism NTLS uses to exchange
messages between a client application and the Luna appliance.
Client Authentication Failures
2012 Feb 29 12:05:01 myLuna local5 info NTLS [1234]: info : 0xc0000002 : Failed writing identity
string. Reason: RC_GENERAL_ERROR
2012 Feb 29 12:05:01 myLuna local5 info NTLS [1234]: info : 0xc0000002 : Failed connect. Reason:
RC_GENERAL_ERROR
2012 Feb 29 12:05:01 myLuna local5 info NTLS [1234]: info : 0xc0000002 : Failed handshake.
Reason: RC_GENERAL_ERROR
2012 Feb 29 12:05:01 myLuna local5 info NTLS [1234]: info : 0xc0000002 : Identify result from:
192.168.0.100/40847, result: RC_GENERAL_ERROR
2012 Feb 29 12:05:01 myLuna local5 info NTLS [1234]: info : 0xc0000002 : Failed reading identity
string. Reason: RC_GENERAL_ERROR
2012 Feb 29 12:05:01 myLuna local5 err NTLS [1234]: error : 0xc0000002 : Fail to forward
dataless client request to command processor module : 192.168.0.100/40847 : RC_GENERAL_ERROR
2012 Feb 29 12:05:01 myLuna local5 crit NTLS [1234]: critical : 0xc0000102 : Client request
header malformed : 192.168.0.100/40847 : RC_DATA_INVALID
2012 Feb 29 12:05:01 myLuna local5 crit NTLS [1234]: critical : 0xc0000001 : Fail to allocate
command buffer : 192.168.0.100/40847 : RC_MEMORY_ALLOCATION
2012 Feb 29 12:05:01 myLuna local5 info NTLS [1234]: info : 0xc0000002 : Failed reading command
buffer. Reason: RC_GENERAL_ERROR
2012 Feb 29 12:05:01 myLuna local5 err NTLS [1234]: error : 0xc0000002 : Fail to forward client
request to command processor module : 192.168.0.100/40847 : RC_GENERAL_ERROR
2012 Feb 29 12:05:01 myLuna local5 info NTLS [1234]: info : 0xc0000002 : Failed writing to client
Reason: RC_GENERAL_ERROR

Luna Monitoring
Syslog & SNMP
Luna Syslog and SNMP Monitoring Guide 007-012417-001 Rev V22 Copyright 2016, Gemalto NV. 63 of 102
2012 Feb 29 12:05:01 myLuna local5 info NTLS [1234]: info : 0xc0000002 : Last write before
reinitializing failed. Reason: RC_GENERAL_ERROR
2012 Feb 29 12:05:01 myLuna local5 info NTLS [1234]: info : 0xc0000002 : Expected cancelled
operation, actual: RC_GENERAL_ERROR
2012 Feb 29 12:05:01 myLuna local5 info NTLS [1234]: info : 0xc0000002 : Reinitializing
connection for: 192.168.0.100/40847
2012 Feb 29 12:05:01 myLuna local5 err NTLS [1234]: error : 0xc0000002 : Fail to get response
buffer: 192.168.0.100/40847 : RC_GENERAL_ERROR
2012 Feb 29 12:05:01 myLuna local5 err NTLS [1234]: error : 0xc0000002 : Expecting client
certificate. None received.
2012 Feb 29 12:05:01 myLuna local5 info NTLS [1234]: info : 0xc0000002 : Unable to retrieve
client certificate.: 192.168.0.100/40847
2012 Feb 29 12:05:01 myLuna local5 info NTLS [1234]: info : 0xc0000002 : cp_server_connected
failed : 192.168.0.100/40847
These messages indicate a failure of NTLS to verify the client requesting to connect to the Luna appliance.
Port Monitoring Failures
2012 Feb 29 12:05:01 myLuna local5 crit NTLS [1234]: critical : 0xc0000406 : Fail to retrieve
host IP Address : RC_SOCKET_ADDRESS_INVALID
2012 Feb 29 12:05:01 myLuna local5 crit NTLS [1234]: critical : 0xc0000406 : Fail to retrieve
host port : RC_SOCKET_ADDRESS_INVALID
2012 Feb 29 12:05:01 myLuna local5 crit NTLS [1234]: critical : 0xc0000500 : Fail to set socket
linger option : RC_SOCKET_ERROR
2012 Feb 29 12:05:01 myLuna local5 crit NTLS [1234]: critical : 0xc0000500 : Fail to set socket
reuse option : RC_SOCKET_ERROR
2012 Feb 29 12:05:01 myLuna local5 crit NTLS [1234]: critical : 0xc0000500 : Data path listening
port could not Bind : RC_SOCKET_ERROR
2012 Feb 29 12:05:01 myLuna local5 crit NTLS [1234]: critical : 0xc0000500 : Fail to set socket
non-blocking option : RC_SOCKET_ERROR
2012 Feb 29 12:05:01 myLuna local5 crit NTLS [1234]: critical : 0xc0000002 : Data path listening
port not listening
These messages indicate a failure of NTLS to set up the port upon which the process will listen for incoming
connection requests.
Could Not Initialize Command Processor
2012 Feb 29 12:05:01 myLuna local5 err NTLS [1234]: error : 0xc0000002 : Failed to initialize
"Luna SA 5.0 Command Processor" module version 1.0 : RC_GENERAL_ERROR
2012 Feb 29 12:05:01 myLuna local5 err NTLS [1234]: error : 0xc0000002 : Failed to initialize
command processor cleanup mechanism.
2012 Feb 29 12:05:01 myLuna local5 err NTLS [1234]: error : 0xc0000002 : Failed to create
Appliance Handler for NTLS: RC_GENERAL_ERROR.
2012 Feb 29 12:05:01 myLuna local5 err NTLS [1234]: error : 0xc0000002 : Failed to initialize
Appliance Handler for NTLS: RC_GENERAL_ERROR.
2012 Feb 29 12:05:01 myLuna local5 err NTLS [1234]: error : 0xc0000002 : Failed to create server
for NTLS: RC_GENERAL_ERROR.

Luna Monitoring
Syslog & SNMP
Luna Syslog and SNMP Monitoring Guide 007-012417-001 Rev V22 Copyright 2016, Gemalto NV. 64 of 102
2012 Feb 29 12:05:01 myLuna local5 err NTLS [1234]: error : 0xc0000002 : Failed to create thread
pool for NTLS: RC_GENERAL_ERROR.
These messages indicate a failure to initialize the command processor, a shared library module within the
Luna appliance.
Datapath Debug Messages
2012 Feb 29 12:05:01 myLuna local5 debug NTLS [1234]: debug : 0 : Data path is using OpenSSL
0.9.5a 1 Apr 2000
2012 Feb 29 12:05:01 myLuna local5 debug NTLS [1234]: debug : 0xc0000002 Unexpected connect
response in <state string>
2012 Feb 29 12:05:01 myLuna local5 debug NTLS [1234]: debug : 0xc0000002 Unexpected client
response in <state string>
2012 Feb 29 12:05:01 myLuna local5 debug NTLS [1234]: debug : 0xc0000002 Unexpected handshake
response in <state string>
2012 Feb 29 12:05:01 myLuna local5 debug NTLS [1234]: debug : 0xc0000002 Unexpected read
response in <state string>
2012 Feb 29 12:05:01 myLuna local5 debug NTLS [1234]: debug : 0xc0000002 Unexpected write
response in <state string>
SafeNet does not enable logging of debug messages for NTLS. If in future SafeNet does enable this level of
log messages, the messages above show examples of what you might find in the log files. In the examples
above, <state string> is one of the following set: [IDENTITY STATE | HANDSHAKE STATE | PROCESSING
STATE | HEADER STATE | COMMAND STATE | CONNECTING STATE | IDENTIFYING STATE | OUT OF SERVICE
STATE | REINITIALIZING STATE].
NTLS Crash and Burn
2012 Feb 29 12:05:01 myLuna local5 crit NTLS [1234]: info : 0 : NTLS CRASH AND BURN! Stack dump
saved to /var/log/ntls_bt_2012-02-29_12:05:01
2012 Feb 29 12:05:01 myLuna local5 crit NTLS [1234]: info : 0 : NTLS CRASH AND BURN and unable to
dump the stack!
These messages indicate a programming error. The first message indicates that NTLS terminated
abnormally (on one of SIGSEGV, SIGILL or SIGBUS signals), generating a stack trace file in the process. An
example stack trace file is: ntls_bt_2012-02-29_12:05:01 found in the logs directory. Forwarding
this file to SafeNet product engineering may assist a developer to isolate the reason for the abnormal
termination. The second message indicates an abnormal termination but with no resulting stack trace
created.
Luna SA Command Processor: Expected Log Messages
The following log messages are normal and expected entries in the log files from the Luna SA command
processor of NTLS.

Luna Monitoring
Syslog & SNMP
Luna Syslog and SNMP Monitoring Guide 007-012417-001 Rev V22 Copyright 2016, Gemalto NV. 65 of 102
Configured with Worker Threads
2012 Feb 29 12:05:01 myLuna local5 info NTLS [1234]: info : 0 : SA command processor configured
with 50 worker threads
This message indicates that NTLS has successfully started its command processor.
HTL Configured
2012 Feb 29 12:05:01 myLuna local5 info NTLS [1234]: info : 0 : Listening for HTL kill requests
This message indicates that host trust link (HTL) is configured and started.
USB Backup and PKI Bundle Device
2012 Feb 29 12:05:01 myLuna local5 info NTLS [1234]: USB token: Backup1 with serial number: 123456
has been undeployed!
2012 Feb 29 12:05:01 myLuna local5 info NTLS [1234]: Re-deployed the USB token: Backup1 with
serial number: 123456 to Virtual token list
2012 Feb 29 12:05:01 myLuna local5 info NTLS [1234]: Added USB token: Backup1 with serial number:
123456 at slot: 4 and container id: 8 to Virtual token list
2012 Feb 29 12:05:01 myLuna local5 info NTLS [1234]: Deployed token Backup1 with Serial Number
123456 inserted into slot 4!
2012 Feb 29 12:05:01 myLuna local5 info NTLS [1234]: NON Deployed token Backup1 with Serial Number
123456 inserted into slot 4!
2012 Feb 29 12:05:01 myLuna local5 info NTLS [1234]: NON Deployed token with no label and Serial
Number 123456 inserted into slot 4!
2012 Feb 29 12:05:01 myLuna local5 info NTLS [1234]: Deployed token Backup1 with Serial Number
123456 ejected from slot 4!
2012 Feb 29 12:05:01 myLuna local5 info NTLS [1234]: NON Deployed token Backup1 with Serial Number
123456 ejected from slot 4!
2012 Feb 29 12:05:01 myLuna local5 info NTLS [1234]: NON Deployed token with no label and Serial
Number 123456 ejected from slot 4!
2012 Feb 29 12:05:01 myLuna local5 info NTLS [1234]: info : 0 : Waited to find PKI token: PKIToken
with serial number: 123456 at slot: 4
These messages indicate actions associated with devices connected to the USB port on the Luna appliance.
Luna SA supports secure backup from the internal HSM to a USB-attached backup device. Luna SA also
supports a “PKI bundle” feature for root keys stored and accessed on a USB-attached device (e.g., Luna G5).
The examples above show “Backup1” for the label name of the USB-attached device but this label could be
PKI bundle-centric (e.g., “RootCA1”) – the messages are common for both use cases.
Command Processor Instance Removed
2012 Feb 29 12:05:01 myLuna local5 info NTLS [1234]: Command processor instance for client
192.168.0.100 removed : 192.168.0.100/40847
This message indicates that a client connection terminated and NTLS removed the command processor
instance allocated for this client.

Luna Monitoring
Syslog & SNMP
Luna Syslog and SNMP Monitoring Guide 007-012417-001 Rev V22 Copyright 2016, Gemalto NV. 66 of 102
HTL Kill Request
2012 Feb 29 12:05:01 myLuna local5 info NTLS [1234]: info : 0 : Received NTLS kill request from
HTL for client 192.168.0.100
This message indicates that the host trust link was forcibly terminated for the specified client.
Shutdown
2012 Feb 29 12:05:01 myLuna local5 info NTLS [1234]: info : 0 : "Luna SA 5.0 Command Processor"
shut downed
This message indicates an orderly shutdown of the Luna SA command processor.
Luna SA Command Processor: Unexpected Log Messages
Under normal circumstances, you should not see any of these log messages. If you do so, please consult
the user documentation to seek guidance on how to correct the problem.
Keep-alive Timer Failures
2012 Feb 29 12:05:01 myLuna local5 warn NTLS [1234]: warning : 0xc0000002 : Fail to create client
command keepalive timer : 192.168.0.100/40847 : RC_GENERAL_ERROR
2012 Feb 29 12:05:01 myLuna local5 warn NTLS [1234]: warning : 0 : Client command keepalive
function is disabled : 192.168.0.100/40847
These messages indicate a failure to start the keep-alive timer that monitors for inactive client connections.
Startup and Operational Failures
2012 Feb 29 12:05:01 myLuna local5 err NTLS [1234]: error : 0xc0000002 : Fail to allocate
connection request response buffer [size = 100] : 192.168.0.100/40847 :RC_GENERAL_ERROR
2012 Feb 29 12:05:01 myLuna local5 err NTLS [1234]: error : 0xc0000002 : Fail to allocate
connection request response buffer [size = 100] : 192.168.0.100/40847 :RC_GENERAL_ERROR
2012 Feb 29 12:05:01 myLuna local5 err NTLS [1234]: error : 0xc0000002 : Fail to allocate
termination response buffer [size = 100] : 192.168.0.100/40847 :RC_GENERAL_ERROR
2012 Feb 29 12:05:01 myLuna local5 err NTLS [1234]: error : 0xc0000002 : Fail to allocate slot
state response buffer [size = 100] : 192.168.0.100/40847 :RC_GENERAL_ERROR
2012 Feb 29 12:05:01 myLuna local5 err NTLS [1234]: error : 0xc0000002 : Fail to allocate response
message buffer [type = 7] [size = 100] : 192.168.0.100/40847 :RC_GENERAL_ERROR
2012 Feb 29 12:05:01 myLuna local5 err NTLS [1234]: error : 0xc0000002 : Fail to allocate response
message buffer [type = 7] [size = 100] : 192.168.0.100/40847 :RC_GENERAL_ERROR
2012 Feb 29 12:05:01 myLuna local5 err NTLS [1234]: error : 0xc0000002 : Fail to allocate a keep
alive message buffer [size = 100] : 192.168.0.100/40847 :RC_GENERAL_ERROR
2012 Feb 29 12:05:01 myLuna local5 err NTLS [1234]: error : 0xc0000002 Fail to initialize token
interface : RC_GENERAL_ERROR
2012 Feb 29 12:05:01 myLuna local5 err NTLS [1234]: error : 0xc0000002 Fail to initialize App ID
mapping object : RC_GENERAL_ERROR
2012 Feb 29 12:05:01 myLuna local5 err NTLS [1234]: error : 0xc0000002 Failed to initialize remote
PED support.

Luna Monitoring
Syslog & SNMP
Luna Syslog and SNMP Monitoring Guide 007-012417-001 Rev V22 Copyright 2016, Gemalto NV. 67 of 102
2012 Feb 29 12:05:01 myLuna local5 err NTLS [1234]: error : 0xc0000002 Fail to initialize client
registration database : RC_GENERAL_ERROR
2012 Feb 29 12:05:01 myLuna local5 err NTLS [1234]: error : 0xc0000002 Fail to populate client
registration database : RC_GENERAL_ERROR
2012 Feb 29 12:05:01 myLuna local5 err NTLS [1234]: error : 0xc0000002 Fail to reset client
registration entries flags : RC_GENERAL_ERROR
2012 Feb 29 12:05:01 myLuna local5 err NTLS [1234]: error : 0xc0000002 Fail to create token
manager object : RC_GENERAL_ERROR
2012 Feb 29 12:05:01 myLuna local5 err NTLS [1234]: error : 0xc0000002 Fail to Initialize VToken
Manager : RC_GENERAL_ERROR
2012 Feb 29 12:05:01 myLuna local5 err NTLS [1234]: error : 0xc0000105 Version 5.0 is not
supported by command processor version 1.0 : RC_FUNCTION_NOT_SUPPORTED
2012 Feb 29 12:05:01 myLuna local5 err NTLS [1234]: error : 0xc0000002 : Connection count is not
incremented for APP ID [b43 : 0 : 1] : [5 : 1] 192.168.0.100/40847 :RC_GENERAL_ERROR
2012 Feb 29 12:05:01 myLuna local5 err NTLS [1234]: error : 0xc0000002 : Out of Memory Error in
ConnectionClass::AttachResponseBuffer SetResponseBuffer : RC_GENERAL_ERROR
2012 Feb 29 12:05:01 myLuna local5 err NTLS [1234]: error : 0xc0000001 Fail to create command
processor instance for client 192.168.0.100 : 192.168.0.100/40847 : RC_MEMORY_ALLOCATION
2012 Feb 29 12:05:01 myLuna local5 err NTLS [1234]: error : 0xc0000002 Invalid client registration
observer.
2012 Feb 29 12:05:01 myLuna local5 err NTLS [1234]: error : 0xc0000002 Invalid client registration
observer operation: 9.
2012 Feb 29 12:05:01 myLuna local5 err NTLS [1234]: error : 0xc0000002 Fail to return a command
response to 192.168.0.100 : 192.168.0.100/40847 : RC_GENERAL_ERROR
These messages indicate a failure of NTLS to start the component responsible for managing connection
queues and for processing HSM-specific requests for service from clients.
Fail to Initialize Appliance Statistics
2012 Feb 29 12:05:01 myLuna local5 warn NTLS [1234]: warning : 0xc0000002 : Fail to initialize
appliance statistic object : RC_GENERAL_ERROR
This message indicates a failure of the Luna SA command processor to initialize data structures necessary to
compile operational statistics. NTLS continues to operate.
HTL Required
2012 Feb 29 12:05:01 myLuna local5 info NTLS [1234]: info : 0 : Client 192.168.0.100 requires HTL;
HTL status is 5
This message indicates that the client is configured to use HTL but the host trust link is not up.
HTL Failure
2012 Feb 29 12:05:01 myLuna local5 err NTLS [1234]: error : 0 : Exception in HTL kill listener:
<exception string>
This message indicates a failure of the HTL component of the Luna SA 5 command processor.

Luna Monitoring
Syslog & SNMP
Luna Syslog and SNMP Monitoring Guide 007-012417-001 Rev V22 Copyright 2016, Gemalto NV. 68 of 102
Client Credentials Cannot be Verified
2012 Feb 29 12:05:01 myLuna local5 info NTLS [1234]: info : 0 : Client credentials cannot be
verified : 192.168.0.100/40847
This message indicates that the client credentials cannot be verified. A possible root cause is an
inconsistent entry in the client certificate for IP address or host name.
Client Terminating
2012 Feb 29 12:05:01 myLuna local5 info NTLS [1234]: info : 0 : Client 192.168.0.100 requested
termination : 192.168.0.100/40847
This message indicates that the client is terminating under normal (i.e., graceful) circumstances.
Unsupported Command
2012 Feb 29 12:05:01 myLuna local5 info NTLS [1234]: Client attempted unsupported command
0x00000000.
This message indicates that the command request received by NTLS is unexpected. A possible root cause is
from an application that calls a PKCS#11 function that NTLS is not programmed to either accept or ignore.
Failure to Retrieve Container List
2012 Feb 29 12:05:01 myLuna local5 err NTLS [1234]: error : 0x300000 : Fail to retrieve container
list : LUNA_RET_DEVICE_ERROR
2012 Feb 29 12:05:01 myLuna local5 crit NTLS [1234]: critical : 0x300000 : Unable to load system
containers! : LUNA_RET_DEVICE_ERROR
These messages indicate that NTLS was unable to retrieve from the internal HSM its representation of how
cryptographic objects are segregated from one another. A possible root cause is a loss of communication
between the internal HSM and its associated device driver.
Luna SA Command Processor Debug Messages
2012 Feb 29 12:05:01 myLuna local5 debug NTLS [1234]: debug : 0 : Transient APP ID Mapping [5 / 5
: 1] removed :192.168.0.100/40847
2012 Feb 29 12:05:01 myLuna local5 debug NTLS [1234]: debug : 0 : Open session : [1 / 0 : 1 : 20]
: [5 : 1] : 192.168.0.100/40847
2012 Feb 29 12:05:01 myLuna local5 debug NTLS [1234]: debug : 0 : Open session APP ID major [b43]
doesn't have 0x80000000 set : [5 : 1] : 192.168.0.100/40847
2012 Feb 29 12:05:01 myLuna local5 debug NTLS [1234]: debug : 0 : Create transient APP ID mapping
for open session : [b43 : 0 : 1] : [5 : 1] : 192.168.0.100/40847
2012 Feb 29 12:05:01 myLuna local5 debug NTLS [1234]: debug : 0 : APP ID mapping already exist :
[b43 : 0 : 1] : [5 : 1] : 192.168.0.100/40847
2012 Feb 29 12:05:01 myLuna local5 debug NTLS [1234]: debug : 0 : Open session get APP ID : [b43 :
0 : 1] : [5 : 1] : 192.168.0.100/40847
2012 Feb 29 12:05:01 myLuna local5 debug NTLS [1234]: debug : 0 : Close all sessions : [b43 : 0 :
1] : [5 : 1] : 192.168.0.100/40847

Luna Monitoring
Syslog & SNMP
Luna Syslog and SNMP Monitoring Guide 007-012417-001 Rev V22 Copyright 2016, Gemalto NV. 69 of 102
2012 Feb 29 12:05:01 myLuna local5 debug NTLS [1234]: debug : 0 : Open Access : b43 : 0 : 1]
:192.168.0.100/40847 1] : 192.168.0.100/40847
2012 Feb 29 12:05:01 myLuna local5 debug NTLS [1234]: debug : 0 : Create persistent APP ID mapping
for [b43 : 0 : 1] : [5 : 1] : 192.168.0.100/40847
2012 Feb 29 12:05:01 myLuna local5 debug NTLS [1234]: debug : 0 : Change existing APP ID mapping
for [5 : 1] to persistent state : [80000005 : 1] : 192.168.0.100/40847
2012 Feb 29 12:05:01 myLuna local5 debug NTLS [1234]: debug : 0 : Closing Access for [b43 : 0 : 1]
: 192.168.0.100/40847
2012 Feb 29 12:05:01 myLuna local5 debug NTLS [1234]: debug : 0 : Close Access APP ID major [b43]
doesn't have 0x80000000 set : [5 : 1] : 192.168.0.100/40847
2012 Feb 29 12:05:01 myLuna local5 debug NTLS [1234]: debug : 0 : APP ID Mapping [b43 : 0 : 1] :
[5 : 1] removed :192.168.0.100/40847
2012 Feb 29 12:05:01 myLuna local5 debug NTLS [1234]: debug : 0 : Bypassed LUNA_SEED_RANDOM
command : 192.168.0.100/40847
2012 Feb 29 12:05:01 myLuna local5 debug NTLS [1234]: debug : 0 : Closed Session : [5 : 1 : 266]
2012 Feb 29 12:05:01 myLuna local5 debug NTLS [1234]: debug : 0 : Closed All Sessions : [5 / 5 :
1]
2012 Feb 29 12:05:01 myLuna local5 debug NTLS [1234]: debug : 0 : Removed All Sessions : [5 / 5 :
1 : 20]
2012 Feb 29 12:05:01 myLuna local5 debug NTLS [1234]: debug : 0 : Opened Session : [5 / 5 : 1 : 20
: 266]
2012 Feb 29 12:05:01 myLuna local5 debug NTLS [1234]: debug : 0 : Created VToken for 4/8.
2012 Feb 29 12:05:01 myLuna local5 debug NTLS [1234]: debug : 0 : viper slot = 1
2012 Feb 29 12:05:01 myLuna local5 debug NTLS [1234]: debug : 0 : Found 20 partitions on HSM.
2012 Feb 29 12:05:01 myLuna local5 debug NTLS [1234]: debug : 0 : Looking for index for token with
S/N 123456 amount 4 tokens.
2012 Feb 29 12:05:01 myLuna local5 debug NTLS [1234]: debug : 0 : Token 4 has S/N 123456.
2012 Feb 29 12:05:01 myLuna local5 debug NTLS [1234]: debug : 0 : Token 4 is dirty.
2012 Feb 29 12:05:01 myLuna local5 debug NTLS [1234]: debug : 0 : Entering
USBSlotHandler::MonitorSlot for slot 4
2012 Feb 29 12:05:01 myLuna local5 debug NTLS [1234]: debug : 0 : Leaving
USBSlotHandler::MonitorSlot for slot 4
2012 Feb 29 12:05:01 myLuna local5 debug NTLS [1234]: debug : 0 : Entering
USBSlotHandler::MonitorConfig for slot 4
2012 Feb 29 12:05:01 myLuna local5 debug NTLS [1234]: debug : 0 : Leaving
USBSlotHandler::MonitorConfig for slot 4
SafeNet does not enable logging of debug messages for NTLS. If in future SafeNet does enable this level of
log messages, the messages above show examples of what you might find in the log files. These messages
are for developer testing and hence are undocumented.
Virtual Token Create and Add Failures
2012 Feb 29 12:05:01 myLuna local5 err NTLS [1234]: error : 0xc0000002 : Unable to add VToken 4/8
to table : RC_GENERAL_ERROR
2012 Feb 29 12:05:01 myLuna local5 err NTLS [1234]: error : 0xc0000002 : Unable to start VToken
4/8 : RC_GENERAL_ERROR
Luna Monitoring
Syslog & SNMP
Luna Syslog and SNMP Monitoring Guide 007-012417-001 Rev V22 Copyright 2016, Gemalto NV. 70 of 102
2012 Feb 29 12:05:01 myLuna local5 err NTLS [1234]: error : 0xc0000002 : Unable to initialize
VToken 4/8 : RC_GENERAL_ERROR
These messages indicate a failure to complete an intended operation on a virtual token within NTLS.
Host Trust Link
Host Trust Link or HTL is an optional service to tightly bind communication between a client application and
the Luna appliance. HTL offers protection of appliance/client registrations for cloud solutions. HTL
operates as a process within the Luna appliance (htld).
Facility Keyword
Software Process
Log File
Local5
HTLD[pid]
lunalogs
Expected Log Messages
Normal Startup
2012 Feb 29 12:05:01 myLuna local5 info HTLD[1234]: info : 0 : NBSD loaded a PCI HSM at physical
slot 2
2012 Feb 29 12:05:01 myLuna local5 info HTLD[1234]: info : 0 : Network Bus Command Processor
configured with 50 worker threads
2012 Feb 29 12:05:01 myLuna local5 info HTLD[1234]: info : 0 : Listening for HTL status queries
2012 Feb 29 12:05:01 myLuna local5 info HTLD[1234]: info : 0 : Listening for OTT expiry events
2012 Feb 29 12:05:01 myLuna local5 info HTLD[1234]: info : 0 : "Luna Network Bus 1.0 Command
Processor" module version 2.0 loaded
These messages indicate normal startup of the HTL process.
Client Connection
2012 Feb 29 12:05:01 myLuna local5 info HTLD[1234]: info : 0 : Connection accepted from:
192.168.0.100/40847
2012 Feb 29 12:05:01 myLuna local5 info HTLD[1234]: info : 0 : Identify result from:
192.168.0.100/40847, result: Success
2012 Feb 29 12:05:01 myLuna local5 info HTLD[1234]: info : 0 : Handshake result from:
192.168.0.100/40847, result: Success
2012 Feb 29 12:05:01 myLuna local5 info HTLD[1234]: info : 0 : Starting connection processing
2012 Feb 29 12:05:01 myLuna local5 info HTLD[1234]: info : 0 : HTLD Client "192.168.0.100"
connected and authenticated : 192.168.0.100/40847.
2012 Feb 29 12:05:01 myLuna local5 info HTLD[1234]: info : 0 : One-time token validated
successfully
2012 Feb 29 12:05:01 myLuna local5 info HTLD[1234]: info : 0 : Sending dynamic certificate and
private key sent to client
2012 Feb 29 12:05:01 myLuna local5 info HTLD[1234]: info : 0 : Reinitializing connection for:
192.168.0.100/40847
2012 Feb 29 12:05:01 myLuna local5 info HTLD[1234]: info : 0 : Handshake result from:
192.168.0.100/40847, result: Success

Luna Monitoring
Syslog & SNMP
Luna Syslog and SNMP Monitoring Guide 007-012417-001 Rev V22 Copyright 2016, Gemalto NV. 71 of 102
2012 Feb 29 12:05:01 myLuna local5 info HTLD[1234]: info : 0 : Starting connection processing
2012 Feb 29 12:05:01 myLuna local5 info HTLD[1234]: info : 0 : Client connection exists; resuming
: 192.168.0.100/40847
2012 Feb 29 12:05:01 myLuna local5 info HTLD[1234]: info : 0 : HTLD Client "192.168.0.100"
connected and authenticated : 192.168.0.100/40847.
2012 Feb 29 12:05:01 myLuna local5 info HTLD[1234]: info : 0 : Initial counter information sent to
client
2012 Feb 29 12:05:01 myLuna local5 info HTLD[1234]: info : 0 : Client acknowledged counter data;
HTL link is up
These messages indicate successful HTL establishment between the HTL service and a client.
Connection Removed
2012 Feb 29 12:05:01 myLuna local5 info HTLD[1234]: info : 0 : Grace period expired for client
192.168.0.100; cleaning up
2012 Feb 29 12:05:01 myLuna local5 info HTLD[1234]: info : 0 : Terminated 1 NTLS connections for
user 192.168.0.100
2012 Feb 29 12:05:01 myLuna local5 info HTLD[1234]: info : 0 : Command processor instance for
client 192.168.0.100 removed : 192.168.0.100/40847
These messages indicate that the HTL service terminated a host trust link with a client.
Instance Wrapped
2012 Feb 29 12:05:01 myLuna local5 info HTLD[1234]: info : 0 : Unique command processor instance
ID wrapped around.
This message indicates that the internal counter that maps HTL identifiers reached its limit and reset to 1.
Shutdown
2012 Feb 29 12:05:01 myLuna local5 info9 HTLD[1234]: info : 0 :: Terminating.
2012 Feb 29 12:05:01 myLuna local5 info HTLD[1234]: info : 0 : "Luna Network Bus 1.0 Command
Processor" shutting down.
These messages indicate an orderly shutdown of the HTL service.
Unexpected Log Messages
Incompatible Components
2012 Feb 29 12:05:01 myLuna local5 err HTLD[1234]: error : 0xc0000105 : Version 2.0 is not
supported by HTL command processor : RC_FUNCTION_NOT_SUPPORTED
This message indicates an incompatibility between the datapath and command processor components of
the HTL service.
9 On Luna SA 5.2.2 and Luna SA 5.3 releases, the severity is “critical” but this message is only informational.

Luna Monitoring
Syslog & SNMP
Luna Syslog and SNMP Monitoring Guide 007-012417-001 Rev V22 Copyright 2016, Gemalto NV. 72 of 102
Client Connection Failures
2012 Feb 29 12:05:01 myLuna local5 err HTLD[1234]: error : 0xc0000002 : Fail to return a command
response to 192.168.0.100 : 192.168.0.100/40847 : RC_GENERAL_ERROR
2012 Feb 29 12:05:01 myLuna local5 err HTLD[1234]: error : 0xc0000001 : Fail to create command
processor instance for client 192.168.0.100 : 192.168.0.100/40847 : RC_MEMORY_ALLOCATION
2012 Feb 29 12:05:01 myLuna local5 err HTLD[1234]: error : 0xc0000002 : Invalid client
registration observer.
2012 Feb 29 12:05:01 myLuna local5 err HTLD[1234]: error : 0xc0000002 : Invalid client
registration observer operation: 9.
These messages indicate a failure of the HTL service to complete the host trust link for a client.
Client Connection in Progress
2012 Feb 29 12:05:01 myLuna local5 info HTLD[1234]: info : 0 : Client connection already in
progress : 192.168.0.100/40847
This message indicates that the HTL service detected a connection request in an unexpected state.
Invalid Client Credentials
2012 Feb 29 12:05:01 myLuna local5 info HTLD[1234]: info : 0 : Client credentials cannot be
verified : 192.168.0.100/40847
This message indicates that the HTL service did not receive valid client credentials.
One-Time Token Expiry Handler
2012 Feb 29 12:05:01 myLuna local5 err HTLD[1234]: error : 0 : Exception in OTT expiry handler:
<exception string>
2012 Feb 29 12:05:01 myLuna local5 err HTLD[1234]: error : 0 : Error accepting connection in OTT
expiry handler: <error string>
2012 Feb 29 12:05:01 myLuna local5 err HTLD[1234]: error : 0 : Cannot get OTT expiry: client
config file invalid
2012 Feb 29 12:05:01 myLuna local5 info HTLD[1234]: info : 0 : OTT expiry timer fired for client
192.168.0.100; removing OTT
These messages indicate a problem with the one-time token that is integral to the HTL service.
HTL Status
2012 Feb 29 12:05:01 myLuna local5 err HTLD[1234]: error : 0 : Exception in HTL status query
handler: <exception string>
This message indicates a failure to get the status of the HTL service.
Memory Errors
2012 Feb 29 12:05:01 myLuna local5 err HTLD[1234]: error : 0xc0000001 : Failed to allocate
connection request response buffer [size = 100] : 192.168.0.100/40847 : RC_MEMORY_ALLOCATION
2012 Feb 29 12:05:01 myLuna local5 err HTLD[1234]: error : 0xc0000001 : Failed to allocate auth
response buffer [size = 100] : 192.168.0.100/40847 : RC_MEMORY_ALLOCATION

Luna Monitoring
Syslog & SNMP
Luna Syslog and SNMP Monitoring Guide 007-012417-001 Rev V22 Copyright 2016, Gemalto NV. 73 of 102
2012 Feb 29 12:05:01 myLuna local5 err HTLD[1234]: error : 0xc0000001 : Failed to allocate key
exchange response buffer [size = 100] : 192.168.0.100/40847 : RC_MEMORY_ALLOCATION
2012 Feb 29 12:05:01 myLuna local5 err HTLD[1234]: error : 0xc0000001 : Failed to allocate counter
init response buffer [size = 100] : 192.168.0.100/40847 : RC_MEMORY_ALLOCATION
2012 Feb 29 12:05:01 myLuna local5 err HTLD[1234]: error : 0xc0000001 : Failed to allocate sync
beacon response buffer [size = 100] : 192.168.0.100/40847 : RC_MEMORY_ALLOCATION
These messages indicate a failure to allocate memory within the HTL service.
Client Setup Errors
2012 Feb 29 12:05:01 myLuna local5 err HTLD[1234]: error : 0xc0000002 : Fail to initialize token
interface : RC_GENERAL_ERROR
2012 Feb 29 12:05:01 myLuna local5 err HTLD[1234]: error : 0xc0000002 : Fail to initialize client
registration database : RC_GENERAL_ERROR
2012 Feb 29 12:05:01 myLuna local5 err HTLD[1234]: error : 0xc0000002 : Fail to populate client
registration database : RC_GENERAL_ERROR
2012 Feb 29 12:05:01 myLuna local5 err HTLD[1234]: error : 0xc0000002 : Fail to reset client
registration entry's flags : RC_GENERAL_ERROR
2012 Feb 29 12:05:01 myLuna local5 err HTLD[1234]: error : 0xc0000002 : Fail to create token
manager object : RC_GENERAL_ERROR
2012 Feb 29 12:05:01 myLuna local5 err HTLD[1234]: error : 0xc0000002 : Fail to Initialize VToken
Manager : RC_GENERAL_ERROR
These messages indicate that the HTL service failed to set up the host trust link with an intended client.
Connection Errors
2012 Feb 29 12:05:01 myLuna local5 info HTLD[1234]: info : 0xc0000002: Backup OTT matched in grace
period
2012 Feb 29 12:05:01 myLuna local5 info HTLD[1234]: info : 0xc0000002: One-time token validated
successfully
2012 Feb 29 12:05:01 myLuna local5 info HTLD[1234]: info : 0xc0000002: Unable to validate one-time
token
2012 Feb 29 12:05:01 myLuna local5 info HTLD[1234]: info : 0xc0000002: Unable to derive shared
secret for dynamic certificate exchange
2012 Feb 29 12:05:01 myLuna local5 info HTLD[1234]: info : 0xc0000002: Unable to create dynamic
certificate and private key
2012 Feb 29 12:05:01 myLuna local5 info HTLD[1234]: info : 0xc0000002: Unable to register dynamic
certificate
2012 Feb 29 12:05:01 myLuna local5 info HTLD[1234]: info : 0xc0000002: Sending dynamic certificate
and private key sent to client
2012 Feb 29 12:05:01 myLuna local5 info HTLD[1234]: info : 0xc0000002: Initial counter information
sent to client
2012 Feb 29 12:05:01 myLuna local5 info HTLD[1234]: info : 0xc0000002: Received counter is not
aligned with increment steps
2012 Feb 29 12:05:01 myLuna local5 info HTLD[1234]: info : 0xc0000002: Counter is outside
allowable drift range
2012 Feb 29 12:05:01 myLuna local5 info HTLD[1234]: info : 0xc0000002: Client acknowledged counter
data; HTL link is up
Luna Monitoring
Syslog & SNMP
Luna Syslog and SNMP Monitoring Guide 007-012417-001 Rev V22 Copyright 2016, Gemalto NV. 74 of 102
2012 Feb 29 12:05:01 myLuna local5 info HTLD[1234]: info : 0xc0000002: HTL message timer expired.
Terminating HTL link.
2012 Feb 29 12:05:01 myLuna local5 info HTLD[1234]: info : 0xc0000002: Client disconnected.
Entering grace period.
2012 Feb 29 12:05:01 myLuna local5 info HTLD[1234]: info : 0xc0000002: Client disconnected.
Cleaning up.
2012 Feb 29 12:05:01 myLuna local5 info HTLD[1234]: info : 0xc0000002: Server closed HTL
connection. Entering grace period.
2012 Feb 29 12:05:01 myLuna local5 info HTLD[1234]: info : 0xc0000002: Server closed HTL
connection. Cleaning up.
These messages indicate a failure in the HTL service’s ability to establish and maintain a connection with a
client.
Random Number Generator
2012 Feb 29 12:05:01 myLuna local5 crit HTLD[1234]: critical : 0 : Unable to find HSM for RNG
This message indicates that the HTL service was unable to connect to the internal HSM for the service’s
source of random number data.
Network Bus Service
Network Bus Service – NBS – is unreleased and undocumented at this time.
Remote Backup Service
Remote backup service – RBS – is a client-side component of the Luna product line. A future version of
Luna Monitoring will describe log messages generated by RBS.
Luna Administrative Shell: State and Status
The Luna administrator shell – aka lunash (Luna SA) and lush (Luna IS) – is a secure shell for
administering the Luna appliance.
Facility Keyword
Software Process
Log File
syslog or user
lush
messages
Expected Log Messages
The following log messages are normal and expected entries in the log files from various lush commands.
Uptime
2012 Feb 29 12:05:01 myLuna syslog info lush: uptime before poweroff: 12:05:01 up 4 min, 1 user,
load average: 0.08, 0.05, 0.01

Luna Monitoring
Syslog & SNMP
Luna Syslog and SNMP Monitoring Guide 007-012417-001 Rev V22 Copyright 2016, Gemalto NV. 75 of 102
2012 Feb 29 12:05:01 myLuna syslog info lush: uptime before reboot: 12:05:01 up 8 min, 1 user,
load average: 0.09, 0.04, 0.01
These messages record how long the system had been up before an administrator restarted the Luna
appliance via sysconf appliance poweroff or sysconf appliance reboot.
Log Cleanup
2012 Feb 29 12:05:01 myLuna syslog info lush: Running the 'syslog cleanup' command, creating
tarlogs then deleting all log files except hsm.log ...
2012 Feb 29 12:05:01 myLuna user notice lush: Running the 'syslog cleanup' command; created
"logs_cleanup_20120229_0234.tgz" in the scp directory.
2012 Feb 29 12:05:01 myLuna user notice lush: The tar file containing logs is now available via
scp as filename "logs_cleanup_20120229_0234.tgz".
2012 Feb 29 12:05:01 myLuna syslog info lush: Executed the 'syslog cleanup' command. Deleted all
the log files except hsm.log.
2012 Feb 29 12:05:01 myLuna user notice lush: Executed the 'syslog cleanup' command. Created
"logs_cleanup_20120229_0234.tgz" in the scp directory.
2012 Feb 29 12:05:01 myLuna user notice lush: The tar file containing logs is now available via
scp as filename "logs_cleanup_20120229_0234.tgz".
These messages record that an administrator initiated a log compression and archival operation via
syslog cleanup. The first three messages log initiation of the action and the last three messages log
completion in the new messages file.
Change SSH Port
2012 Feb 29 12:05:01 myLuna user notice Lush: Changing the SSHD listen port number from 22 to 23.
This message records that an administrator changed the SSH listening port via sysconf ssh port.
Disabled Watchdog Timer
2012 Feb 29 12:05:01 myLuna user info wdt_heartbeat10: Disabled the WDT heartbeat program.
This message records that an administrator disabled the hardware watchdog timer via sysconf
appliance watchdog disable.
Unexpected Log Messages
Under normal circumstances, you should not see any of these log messages. If you do so, please contact
SafeNet technical support to report the message and seek guidance on what to do next.
Failed to Create Log Archive
2012 Feb 29 12:05:01 myLuna syslog info lush: Failed to create logs_cleanup_20120229_0234.tgz: -1.
10 Note that lush executes a utility to disable the watchdog timer. This utility creates the log entry under its process
name.
Luna Monitoring
Syslog & SNMP
Luna Syslog and SNMP Monitoring Guide 007-012417-001 Rev V22 Copyright 2016, Gemalto NV. 76 of 102
This message indicates that the syslog cleanup command failed to create the backup file: the tar
utility returned an error, the last number in the log message.
Invalid Signature Mechanism
2012 Feb 29 12:05:01 myLuna user notice lush: ERROR - The current client certificate specifies
md5WithRSAEncryption as the signature mechanism. This certificate is no longer useable and must be
replaced in order to register the client. Please regenerate the client certificate.
This message indicates that the signature of the client certificate found while executing the client
register command uses an insecure mechanism.
Luna Shell: Command Logging
Command logging records administrator actions in a log file.
Facility Keyword
Software Process
Log File
local5
lunash [pid]
lunalogs
Expected Log Messages
The following log messages are normal and expected entries in the log files for all lush commands.
2012 Feb 29 12:05:01 myLuna local5 info lunash [1234]: info : 0 : Command: hsm show : admin :
Console
2012 Feb 29 12:05:01 myLuna local5 info lunash [1234]: info : 0 : Command: my file list : monitor
: 192.168.0.100/40847
Every administrative command executed within the secure Luna shell results in a log message to lunalogs.
This message records the command return code (e.g., 0), the command (e.g., hsm show and my file
list), the user account (e.g., admin and monitor) and the connection of the secure shell (e.g.,
Console and 192.168.0.100/40847 – the IP address and outgoing port number on client system).
2012 Feb 29 12:05:01 myLuna local5 info lunash [1234]: info : 0 : Lush user login : admin :
Console
2012 Feb 29 12:05:01 myLuna local5 info lunash [1234]: info : 0 : Lush user login : monitor :
192.168.0.100/40847
A slightly different formatted log message records the login action.
Unexpected Log Messages
Under normal circumstances, you should not see any of these log messages. If you do so, please consult
the user documentation to seek guidance on how to correct the problem.
Luna Monitoring
Syslog & SNMP
Luna Syslog and SNMP Monitoring Guide 007-012417-001 Rev V22 Copyright 2016, Gemalto NV. 77 of 102
Token State and Login Errors
2012 Feb 29 12:05:01 myLuna local5 warn lunash [1234]: HSM Admin Login: incorrect password or PED
key
2012 Feb 29 12:05:01 myLuna local5 warn lunash [1234]: HSM Admin Login: HSM Zeroized due to three
consecutive bad login attempts.
2012 Feb 29 12:05:01 myLuna local5 warn lunash [1234]: Backup Token Admin Login: incorrect
password or PED key
2012 Feb 29 12:05:01 myLuna local5 warn lunash [1234]: Backup Token Admin Login: HSM Zeroized due
to three consecutive bad login attempts.
On backup and restore operations, these messages indicate failure to successfully authenticate because of
either incorrect credentials or the HSM/token being in a state that disallows authentication (i.e., zeroized).
Configuration File Error
2012 Feb 29 12:05:01 myLuna local5 info lunash [1234]: Config file for overriding hsm slot exists,
but there is a problem reading it..
This message indicates that a lush utility was unable to read the slot number from a configuration file used
to define a specific HSM slot identifier. This message is unexpected: contact SafeNet technical support for
guidance on what to do next.
Node Not Loaded
2012 Feb 29 12:05:01 myLuna local5 err lunash [1234]: Node not loaded: hsm ped set
This message indicates that the lush interpreter was unable to load the logged node on start up. This
message is unexpected: contact SafeNet technical support for guidance on what to do next.
cron & crontab
The Luna appliance relies upon the cron process to perform regular operations.
Facility Keyword
Software Process
Log File
syslog
crontab
messages
Facility Keyword
Software Process
Log File
cron
anacron[pid]
cron-yyyy-mm-dd
Facility Keyword
Software Process
Log File
auth
crond(pam_unix)[pid]
secure
Expected Log Messages
The following log messages are normal and expected entries in the log files from cron activities.

Luna Monitoring
Syslog & SNMP
Luna Syslog and SNMP Monitoring Guide 007-012417-001 Rev V22 Copyright 2016, Gemalto NV. 78 of 102
Updated Timestamp
2012 Feb 29 04:02:01 myLuna cron notice anacron[1234]: Updated timestamp for job `cron.monthly'11
to 2012-02-29
This message indicates that the cron process ran the scheduled monthly (or daily or weekly) cron job.
Login and Logout
2012 Feb 29 12:05:01 myLuna auth info crond(pam_unix)[1234]: session opened for user root by
(uid=0)
2012 Feb 29 12:05:01 myLuna auth info crond(pam_unix)[1234]: session closed for user root
These messages record that cron opened a session to complete any scheduled activities and closed the
session when done.
Unexpected Log Messages
Under normal circumstances, you should not see any of these log messages. If you do so, please contact
SafeNet technical support to report the message and seek guidance on what to do next.
Disk Filling
75% - 89%
2012 Feb 29 12:00:00 myLuna syslog warn crontab: DISK FULL: WARNING! First log threshold reached
75%. Please clean up the logs using the "syslog cleanup" command
90% - 94%
2012 Feb 29 12:00:00 myLuna syslog alert crontab: DISK FULL: 90%. All log files except hsm.log
deleted.
2012 Feb 29 12:00:00 myLuna syslog alert crontab: DISK FULL: Second log threshold reached 90%.
Created logs_diskFull_20120229_1234.tgz and deleted all log files.12
2012 Feb 29 12:00:00 myLuna syslog alert crontab: DISK FULL: WARNING! Second log threshold reached
90% policy: tarlogs_cleanup.13
2012 Feb 29 12:00:00 myLuna syslog alert crontab: DISK FULL: Second log threshold reached 90%.
Created logs_diskFull_20120229_1234.tgz and deleted all log files.14
2012 Feb 29 12:00:00 myLuna syslog alert crontab: DISK FULL: The tar file containing logs is now
available via scp as filename "logs_diskFull_20120229_1234.tgz15
2012 Feb 29 12:00:00 myLuna syslog alert crontab: DISK FULL: Second log threshold reached
$percent%. Failed to create "logs_diskFull_20120229_1234.tgz16
11 Or `cron.daily' or `cron.weekly'.
12 Message written before syslog rotates logs.
13 Message written before syslog rotates logs.
14 Message written after syslog rotates logs.
15 Message written before and after syslog rotates logs.
16 Message written if tar command failed to create file.

Luna Monitoring
Syslog & SNMP
Luna Syslog and SNMP Monitoring Guide 007-012417-001 Rev V22 Copyright 2016, Gemalto NV. 79 of 102
95% & >
2012 Feb 29 12:00:00 myLuna syslog emerg crontab: DISK FULL: EMERGENCY! Third log threshold
reached 95%. Please clean up the logs using the "syslog cleanup" command
2012 Feb 29 12:00:00 myLuna syslog emerg crontab: DISK FULL: EMERGENCY! Third log threshold
reached 95%. Stopping NTLS
2012 Feb 29 12:00:15 myLuna syslog emerg crontab: DISK FULL: EMERGENCY! Third log threshold
reached 95%. Stopping syslog soon
These messages indicate that disk use is reaching thresholds that require intervention to remove files.
Read-Only File System
2012 Feb 29 04:02:01 myLuna cron err anacron[1234]: Cannot exclusively create
/var/run/anacron.pid: Read-only file system
2012 Feb 29 04:02:01 myLuna cron err anacron[1234]: Cannot run in daemon mode - anacron already
running.: Resource deadlock avoided
2012 Feb 29 04:02:01 myLuna cron err anacron[1234]: Aborted
These messages indicate that the file system is read-only. A possible root cause is a Linux journaling error
or a failing hard drive.
Certificate Monitoring Daemon
The certificate monitoring daemon watches for an impending expiry of the NTLS certificate and sends a trap
when the lifetime of the certificate falls within a configurable threshold number of days remaining.
Facility Keyword
Software Process
Log File
local5
certmonitord[pid]
lunalogs
Expected Log Messages
The following log messages are normal and expected entries in the log files when NTLS certificate
monitoring is enabled.
Daemon Started
2012 Feb 29 12:05:01 myLuna local5 info certmonitord[1234]: info : 0 : NTLS certificate expiry
monitor started
2012 Feb 29 12:05:01 myLuna local5 info certmonitord[1234]: info : 0 : NTLS certificate expiry
monitor is configured to send SNMP trap 5 day(s) before the NTLS certificate expires and on every 12
hour(s)
These messages indicate that the certificate monitoring daemon is running. The daemon does not run by
default. Rather, an administrator must configure and start it from the Luna administrative shell. The
number of days and hours in the message reflects the configuration set via Lush.

Luna Monitoring
Syslog & SNMP
Luna Syslog and SNMP Monitoring Guide 007-012417-001 Rev V22 Copyright 2016, Gemalto NV. 80 of 102
Daemon Stopping
2012 Feb 29 12:05:01 myLuna local5 info certmonitord[1234]: info : 0 : Shutting down NTLS
certificate expiry monitor....
2012 Feb 29 12:05:01 myLuna local5 info certmonitord[1234]: info : 0 : NTLS certificate expiry
monitor terminated
These messages indicate that the certificate monitoring daemon gracefully shut down as a result of a signal
(SIGINT, SIGTERM, SIGABRT) outside of a normal system shutdown (e.g., Lush ntls certificate
monitor disable).
Impending Certificate Expiry
2012 Feb 29 12:05:01 myLuna local5 info certmonitord[1234]: info : 0 : NTLS certificate will be
expire on Jul 26 16:32:48 2023 GMT
2012 Feb 29 12:05:01 myLuna local5 info certmonitord[1234]: info : 0 : NTLS certificate expiry
SNMP trap sent to trap host 192.168.0.115
These messages indicate that the NTLS certificate is set to expire and that the certificate monitoring
daemon successfully sent a trap to the configured host.
Certificate Missing
2012 Feb 29 12:05:01 myLuna local5 warn certmonitord[1234]: warning : 0 : NTLS certificate is
missing
This message indicates that the daemon failed to find the server.pem file for NTLS in the expected
location on the hard drive. However, the daemon remains running in the event that an administrator
creates the necessary server certificate in a subsequent operation. On a new Luna appliance from the
factory, this message is normal. An administrator must create the NTLS certificate (sysconf
regenCert).
New NTLS Certificate
2012 Feb 29 12:05:01 myLuna local5 info certmonitord[1234]: info : 0 : New NTLS certificate
detected and the expiry date of this new certificate is Jul 26 16:32:48 2033 GMT
This message indicates that an administrator created a new NTLS certificate that is sufficiently far into the
future such that a trap is no longer necessary. The daemon will continue to monitor for the certificate
expiry window.
Unexpected Log Messages
Under normal circumstances, you should not see any of these log messages. If you do so, please contact
SafeNet technical support to report the message and seek guidance on what to do next.
Failed to Detach
2012 Feb 29 12:05:01 myLuna local5 err certmonitord[1234]: error : 0 : Failed to detach from
console

Luna Monitoring
Syslog & SNMP
Luna Syslog and SNMP Monitoring Guide 007-012417-001 Rev V22 Copyright 2016, Gemalto NV. 81 of 102
This message indicates that the startup procedure for the certificate monitoring daemon failed, specifically
that the daemon did not launch into a background process.
Running in Console Mode
2012 Feb 29 12:05:01 myLuna local5 info certmonitord[1234]: info : 0 : NTLS certificate expiry
monitor running in console mode
This message indicates that the certificate monitoring daemon is running in console mode rather than as a
background process.
SNMP V3 Not Properly Configured
2012 Feb 29 12:05:01 myLuna local5 info certmonitord[1234]: info : 0 : SNMP v3 trap is not
properly configured
This message indicates that either the engine identifier and/or the host IP address configured and stored in
the snmp.conf is/are invalid. Lush command(s) that create these entries include the necessary
processing checks to ensure the operation(s) writes valid entries to the configuration file.
Failed to Allocate Memory Buffers
2012 Feb 29 12:05:01 myLuna local5 err certmonitord[1234]: error : 0 : Failed to allocate memory
buffers
This message indicates that the daemon was unable to allocate the requisite buffers for file handling and
string manipulation.
Failed to Send Trap
2012 Feb 29 12:05:01 myLuna local5 err certmonitord[1234]: error : 0 : Failed to send NTLS
certificate expiry SNMP trap to trap host 192.168.0.100
This message indicates that the certificate monitoring daemon was unable to execute a system call with a
pre-formed command to send a trap. The daemon relies upon the Linux utility snmptrap() to complete
this action. An invalid host IP address for example, would cause the system call to fail (e.g.,
192.168.0.1004).
certmonitord Crash and Burn
2012 Feb 29 12:05:01 myLuna local5 crit certmonitord[1234]: info : 0 : certmonitord CRASH AND
BURN! Stack dump saved to /var/log/certmonitord_bt_2012-02-29_12:05:01
2012 Feb 29 12:05:01 myLuna local5 crit certmonitord[1234]: info : 0 : certmonitord CRASH AND BURN
and unable to dump the stack!
These messages indicate a programming error. The first message indicates that the certificate monitoring
daemon terminated abnormally (on one of SIGSEGV, SIGILL or SIGBUS signals), generating a stack trace file
certmonitord_bt_2012-02-29_12:05:01 in the process. Forwarding this file to SafeNet product
Luna Monitoring
Syslog & SNMP
Luna Syslog and SNMP Monitoring Guide 007-012417-001 Rev V22 Copyright 2016, Gemalto NV. 82 of 102
engineering may assist a developer to isolate the reason for the abnormal termination. The second
message indicates an abnormal termination but with no resulting stack trace created.
Luna SNMP Trap Agent
Luna SNMP Trap Agent or lsta looks for significant events within the Luna appliance. When it sees a
worthy event, lsta formats a trap notification and sends it to the configured user.
Facility Keyword
Software Process
Log File
local5
lsta
lunalogs
Expected Log Messages
The following log messages are normal and expected entries in the log files when lsta monitoring is
enabled and started.
Agent Starting
2012 Feb 29 12:05:01 myLuna local5 info lsta: Starting Luna SNMP Trap Agent
This message indicates that lsta is starting. The agent does not run by default. Rather, an administrator
must configure and start it from the Luna administrative shell.
Creating Named Pipe
2012 Feb 29 12:05:01 myLuna local5 info lsta: Created /home/admin/syslog.pipe as a named pipe
This message indicates that lsta created the necessary named pipe for interprocess communication with
the syslog facility. This message results the first time lsta is started on a new Luna appliance.
Termination
2012 Feb 29 12:05:01 myLuna local5 info lsta: Luna SNMP Trap Agent terminated: Interrupted system
call
This message indicates that lsta caught a SIGINT, SIGABRT or SIGTERM signal and terminated.
Unexpected Log Messages
Under normal circumstances, you should not see any of these log messages. If you do so, please contact
SafeNet technical support to report the message and seek guidance on what to do next.
SNMP Data Logged
2012 Feb 29 12:05:01 myLuna local5 info lsta: fanAttentionNotify for [myLUT:192.168.0.58 /
messages / 2012 Feb 29 12:05:00 / ipmievd / 1]
When trace level debugging is enabled, this message records the SNMP trap notification data sent by lsta.
Trace level debugging is off in Luna SA so this message is unexpected.

Luna Monitoring
Syslog & SNMP
Luna Syslog and SNMP Monitoring Guide 007-012417-001 Rev V22 Copyright 2016, Gemalto NV. 83 of 102
Missing SNMP Parameters
2012 Feb 29 12:05:01 myLuna local5 err lsta: Error opening /usr/local/share/snmp/snmp.conf
This message indicates that the SNMP parameters needed by lsta are missing. A likely root cause is that
an administrator has not yet set the parameters via the sysconf snmp trap set command.
snmptrap Failed
2012 Feb 29 12:05:01 myLuna local5 err lsta: snmptrap failed: 256
This message indicates that lsta was unable to send a formatted trap notification to the intended user. A
possible root cause is an out-of-date SAFENET-APPLIANCE-MIB on the appliance or a parameter
defined by the sysconf snmp trap set command in error (e.g., invalid IP address).
Interprocess Communication Failures
2012 Feb 29 12:05:01 myLuna local5 err lsta: Pipe file disappeared, stopping lsta
2012 Feb 29 12:05:01 myLuna local5 err lsta: Cannot read from pipe /home/admin/syslog.pipe: 5
2012 Feb 29 12:05:01 myLuna local5 err lsta: Will not overwrite /home/admin/syslog.pipe
2012 Feb 29 12:05:01 myLuna local5 err lsta: Cannot mknod /home/admin/syslog.pipe: 13
These messages indicate failure with the named pipe used for interprocess communication with the syslog
facility. The first two messages represent failures during lsta operation; the last two on start up.
Unknown Sub-system
2012 Feb 29 12:05:01 myLuna local5 err lsta: Unknown/unsupported sub-system: xxx
This message indicates a programming error. lsta should have logic for all sub-systems defined in the
SAFENET-APPLIANCE-MIB.
Log Record Parsing
2012 Feb 29 12:05:01 myLuna local5 info lsta: Could not parse log record: <log record>
This message indicates that lsta could not properly parse a log record for the fields expected. <log record>
is the log message received by lsta from rsyslogd.
Could Not Close Parameters File
2012 Feb 29 12:05:01 myLuna local5 err lsta: Error closing /usr/local/share/snmp/snmp.conf
This message indicates that lsta could not properly close the SNMP parameters file.
Could Not Close Pipe
2012 Feb 29 12:05:01 myLuna local5 err lsta: Error closing /home/admin/syslog.pipe
This message indicates that lsta could not properly close the named pipe used by rsyslog to communicate
log records.
Luna Monitoring
Syslog & SNMP
Luna Syslog and SNMP Monitoring Guide 007-012417-001 Rev V22 Copyright 2016, Gemalto NV. 84 of 102
chdir Failed
2012 Feb 29 12:05:01 myLuna local5 err lsta: Could not chdir
This message indicates that lsta could not properly change working directories.
umask Failed
2012 Feb 29 12:05:01 myLuna local5 err lsta: Could not umask
This message indicates that lsta could not properly determine the umask file settings.
Could Not Open stdin
2012 Feb 29 12:05:01 myLuna local5 err lsta: Error opening stdin
This message indicates that lsta could not properly open standard input.
Could Not Open stderr
2012 Feb 29 12:05:01 myLuna local5 err lsta: Error opening stderr
This message indicates that lsta could not properly open standard error.
Admin API
Admin API is the process that supports administration for the appliance via REST.
Facility Keyword
Software Process
Log File
local5
AdminAPI
lunalogs
Expected Log Messages
The following log messages are normal and expected entries in the log files when the webserver for the
REST API is running.
Web Server Started
2012 Feb 29 12:05:01 myLuna local5 info AdminAPI[1234]: info : 0 : Server is setting up on
192.168.0.79:8443
2012 Feb 29 12:05:01 myLuna local5 info AdminAPI[1234]: info : 0 : Server cipher set:
2012 Feb 29 12:05:01 myLuna local5 info AdminAPI[1234]: info : 0 : Server is using TLS1.2 only
2012 Feb 29 12:05:01 myLuna local5 info AdminAPI[1234]: info : 0 : Server is loading key file:
ssl_key.pem
2012 Feb 29 12:05:01 myLuna local5 info AdminAPI[1234]: info : 0 : Server is loading cert file:
ssl_cert.pem
2012 Feb 29 12:05:01 myLuna local5 info AdminAPI[1234]: info : 0 : Server is loading dh file
dh2048.pem
2012 Feb 29 12:05:01 myLuna local5 info AdminAPI[1234]: info : 0 : Server is using
NID_X9_62_prime256v1 named curve
2012 Feb 29 12:05:01 myLuna local5 info AdminAPI[1234]: info : 0 : Server finished setting up

Luna Monitoring
Syslog & SNMP
Luna Syslog and SNMP Monitoring Guide 007-012417-001 Rev V22 Copyright 2016, Gemalto NV. 85 of 102
2012 Feb 29 12:05:01 myLuna local5 info AdminAPI[1234]: info : 0 : Request hashing set:
hmac_sha256
2012 Feb 29 12:05:01 myLuna local5 info AdminAPI[1234]: info : 0 : Asymmetric encryption set:
rsa_pkcs1
2012 Feb 29 12:05:01 myLuna local5 info AdminAPI[1234]: info : 0 : Symmetric encryption set:
aes_256_cfb
These messages indicate that web server started successfully. The web server does not run by default.
Rather, an administrator must configure and start it from the Luna administrative shell.
Client Connected
2012 Feb 29 12:05:01 myLuna local5 info AdminAPI[1234]: info : 0 : Client 192.168.0.120:52500
connected
2012 Feb 29 12:05:01 myLuna local5 info AdminAPI[1234]: info : 0 : Parsed client 192.168.0.120's
request
2012 Feb 29 12:05:01 myLuna local5 info AdminAPI[1234]: info : 0 : Client 192.168.0.120-
SESSION_ID=413ef8fe-3667-4083-ae2f-44e66e1ac70e requested POST:/lunasa/services/ntls/clients
2012 Feb 29 12:05:01 myLuna local5 info AdminAPI[1234]: info : 0 : 192.168.0.120 successfully
logged in as admin with session id of 413ef8fe-3667-4083-ae2f-44e66e1ac70e
These messages indicate that a client connected without issue to the web server and that the web server
was able to fulfill the client’s request.
Unexpected Log Messages
Under normal circumstances, you should not see any of these log messages. If you do so, please contact
SafeNet technical support to report the message and seek guidance on what to do next.
Web Server Busy
2012 Feb 29 12:05:01 myLuna local5 err AdminAPI[1234]: error : 0 : Client 192.168.0.120 connection
refused because server is busy
This message indicates that the queue of client connections is full and the web server is unable to respond
to any additional request.
Client Session Problems
2012 Feb 29 12:05:01 myLuna local5 err AdminAPI[1234]: error : 0 : Client 192.168.0.120 submitted
a request without a session token
2012 Feb 29 12:05:01 myLuna local5 err AdminAPI[1234]: error : 0 : Client 192.168.0.120 submitted
a bad cookie
2012 Feb 29 12:05:01 myLuna local5 err AdminAPI[1234]: error : 0 : Client 192.168.0.120 has no
session
2012 Feb 29 12:05:01 myLuna local5 err AdminAPI[1234]: error : 0 : Client 192.168.0.120-7e33c7bb-
54a0-4a92-a031-4e08fc90cfa5 session keys do not match an active session
2012 Feb 29 12:05:01 myLuna local5 err AdminAPI[1234]: error : 0 : Client 192.168.0.120-7e33c7bb-
54a0-4a92-a031-4e08fc90cfa5 requested access to GET:/api/lunasa/hsms/4343343 and access was denied
2012 Feb 29 12:05:01 myLuna local5 err AdminAPI[1234]: error : 0 : Client 192.168.0.120-7e33c7bb-
54a0-4a92-a031-4e08fc90cfa5 failed to decrypt packet

Luna Monitoring
Syslog & SNMP
Luna Syslog and SNMP Monitoring Guide 007-012417-001 Rev V22 Copyright 2016, Gemalto NV. 86 of 102
2012 Feb 29 12:05:01 myLuna local5 err AdminAPI[1234]: error : 0 : Client 192.168.0.120-7e33c7bb-
54a0-4a92-a031-4e08fc90cfa5 requested a non-existent resource
2012 Feb 29 12:05:01 myLuna local5 err AdminAPI[1234]: error : 0 : Client 192.168.0.120-7e33c7bb-
54a0-4a92-a031-4e08fc90cfa5 sent a bad payload
2012 Feb 29 12:05:01 myLuna local5 err AdminAPI[1234]: error : 0 : Client 192.168.0.120-7e33c7bb-
54a0-4a92-a031-4e08fc90cfa5 failed to include authentication token
2012 Feb 29 12:05:01 myLuna local5 err AdminAPI[1234]: error : 0 : Client 192.168.0.120:52500
failed to establish SSL connection
2012 Feb 29 12:05:01 myLuna local5 err AdminAPI[1234]: error : 0 : 192.168.0.120 login attempt
failed
2012 Feb 29 12:05:01 myLuna local5 err AdminAPI[1234]: error : 0 : Session 7e33c7bb-54a0-4a92-
a031-4e08fc90cfa5 timed out
2012 Feb 29 12:05:01 myLuna local5 err AdminAPI[1234]: error : 0 : Session 7e33c7bb-54a0-4a92-
a031-4e08fc90cfa5 logged out
These messages indicate problems with the client session.
Unknown Resource
2012 Feb 29 12:05:01 myLuna local5 err AdminAPI[1234]: error : 0 : Internal action requested a
non-existent resource
This message indicates that the REST framework could not find the resource requested.
Blacklisted Clients
2012 Feb 29 12:05:01 myLuna local5 warn AdminAPI[1234]: warning : 0 : Added 192.168.0.120 to the
blacklist
2012 Feb 29 12:05:01 myLuna local5 crit AdminAPI[1234]: critical : 0 : Blacklisted user
192.168.0.120 attempted to connect
These messages indicates that the REST server has blacklisted a client. The first indicates the action of
adding a client to the black list; the second indicates a subsequent attempt by a blacklisted client to
connect.
Other Appliance Logging
hsm information show
Output from the Lush hsm information show command includes additional log data as shown in the
following example.
[local_host] lunash:>hsm information show
HSM Event Counters:
Operation Requests: 21998
Operation Errors: 1707
Crypto Operation Requests: 0
Crypto Operation Errors: 0
Critical Events: 0

Luna Monitoring
Syslog & SNMP
Luna Syslog and SNMP Monitoring Guide 007-012417-001 Rev V22 Copyright 2016, Gemalto NV. 87 of 102
Non-Critical Events: 34
sysstatd, snmp and ntls periodically make calls to the HSM and these calls result in incremented
counters for Operation Requests and Operation Errors. luna-snmp polls the HSM every minute and
increments these two counters by 49 and 1 respectively. sysstatd polls the HSM with each rotation of
the LCD messages (~15 to 20 seconds) and increments these two counters by 25 and 3 respectively. ntls
polls the HSM repeatedly and increments the Operation Requests counter by more than 600 per minute.
Crypto Operation Requests and Crypto Operation Errors reflect counts from client application requests to
the HSM.
Critical Events are catastrophic failure of the HSM firmware as reported by the HSM itself. An increment in
this counter also results in a crash log file and a syslog message (messages) similar to the following
example:
2012 Feb 22 03:15:13 LunaSA5 local6 crit oamp[2318]: CRIT: Fatal error 0x00300203
2012 Feb 22 03:15:13 LunaSA5 local6 info oamp[2318]: info : 0 : HSM critical event detected. Dual
port dump generated : hsm_dump_20120222031513
Non-Critical Events are either ERR or INFO messages logged to hsm.log. A count the INFO and ERR
messages in the following excerpt reflects the 34 reported in the example above.
2014 Aug 21 07:18:14 local_host local6 info oamp[2100]: ----- HSM Logging started
2014 Aug 21 07:18:14 local_host local6 info oamp[2100]: INFO: Warm boot
2014 Aug 21 07:18:14 local_host local6 info oamp[2100]: INFO: FW Rev 6.2.1-10
2014 Aug 21 07:18:14 local_host local6 info oamp[2100]: INFO: File:
SOURCE/LUNA2/MAIN_MOD/main.c
2014 Aug 21 07:18:14 local_host local6 info oamp[2100]: INFO: Date: Jul 29 2011, Time:
16:53:13
2014 Aug 21 07:18:14 local_host local6 info oamp[2100]: INFO: POWER-UP LOG DUMP START
2014 Aug 21 07:18:14 local_host local6 info oamp[2100]: INFO: Power-up log created
2014 Aug 21 07:18:14 local_host local6 info oamp[2100]: INFO: Appending power-up log...
2014 Aug 21 07:18:14 local_host local6 info oamp[2100]: INFO: HSM is powered-up
2014 Aug 21 07:18:14 local_host local6 info oamp[2100]: INFO: HSM time: 0 min
(YYYY:MM:DD:hh:mm:ss = 0000:01:01:00:00:05.04)
2014 Aug 21 07:18:14 local_host local6 err oamp[2100]: ERR: RTC: lost all power
2014 Aug 21 07:18:14 local_host local6 err oamp[2100]: ERR: RTC: zeroized on power loss
2014 Aug 21 07:18:14 local_host local6 info oamp[2100]: INFO: RTC: re-configuring...passed.
Clock restarted.
2014 Aug 21 07:18:14 local_host local6 info oamp[2100]: INFO: Zeroizing HSM after
decommission...LOG(INFO): POWER-UP LOG DUMP END
2014 Aug 21 07:18:14 local_host local6 info oamp[2100]: INFO: Erasing power-up log
2014 Aug 21 07:18:14 local_host local6 info oamp[2100]: INFO: HSM time: 0 min
(YYYY:MM:DD:hh:mm:ss = 0000:01:01:00:00:53.21)

Luna Monitoring
Syslog & SNMP
Luna Syslog and SNMP Monitoring Guide 007-012417-001 Rev V22 Copyright 2016, Gemalto NV. 88 of 102
2014 Aug 21 07:18:14 local_host local6 info oamp[2100]: INFO: MM_Init OK
2014 Aug 21 07:18:14 local_host local6 info oamp[2100]: INFO: PM_Init OK
2014 Aug 21 07:18:14 local_host local6 info oamp[2100]: INFO: I2C_Init OK
2014 Aug 21 07:18:14 local_host local6 info oamp[2100]: INFO: RTC_Init OK
2014 Aug 21 07:18:14 local_host local6 info oamp[2100]: INFO: NVRAM_Init OK
2014 Aug 21 07:18:14 local_host local6 info oamp[2100]: INFO: CGX Ver: 0xC0020802 HA Mode:
0x00000000 KeyStatus: 0x10000000 0x0000006D ES Flags: 0x00000002
2014 Aug 21 07:18:14 local_host local6 info oamp[2100]: INFO: CGX_Init OK
2014 Aug 21 07:18:14 local_host local6 err oamp[2100]: ERR: MTK: security function was zeroized
for unknown reason
2014 Aug 21 07:18:14 local_host local6 info oamp[2100]: INFO: MTK_Init OK
2014 Aug 21 07:18:14 local_host local6 info oamp[2100]: INFO: sxl_init OK
2014 Aug 21 07:18:14 local_host local6 info oamp[2100]: INFO: PE1746_Init OK
2014 Aug 21 07:18:14 local_host local6 info oamp[2100]: INFO: RN_Init OK
2014 Aug 21 07:18:14 local_host local6 info oamp[2100]: INFO: OH_Init OK
2014 Aug 21 07:18:14 local_host local6 info oamp[2100]: INFO: CA_AlgorithmSelfTest(): HW
disabled, skipping all self tests
2014 Aug 21 07:18:14 local_host local6 info oamp[2100]: INFO: CA_Init OK
2014 Aug 21 07:18:14 local_host local6 info oamp[2100]: INFO: UM_Init OK
2014 Aug 21 07:18:14 local_host local6 info oamp[2100]: INFO: SM_Init OK
2014 Aug 21 07:18:14 local_host local6 info oamp[2100]: INFO: Supported callback I/O v.1
2014 Aug 21 07:18:14 local_host local6 info oamp[2100]: INFO: Supported callback protocol v.1
Client Logging
To this point, the logs described apply to the Luna appliance. The Luna client also generates log files. This
section describes client-side logging, specifically, logs generated by the following facilities:
• cklog
• HA log.
cklog
A future version of Luna Monitoring will identify and describe these messages.
HA log
A future version of Luna Monitoring will identify and describe these messages.

Luna Monitoring
Syslog & SNMP
Luna Syslog and SNMP Monitoring Guide 007-012417-001 Rev V22 Copyright 2016, Gemalto NV. 89 of 102
SNMP Introduction
Simple Network Management Protocol provides a procedure to collect information from devices in a
network. Luna appliances support SNMP through queries (e.g., “walking” managed information base trees)
and through asynchronous notification of events (i.e., traps). This version of Luna Monitoring describes the
support for traps in Luna appliances.
Traps
For the purpose of making the examples that follow easier to describe,
assume that your name is Pete. While it may not be evident just yet, the
subject of traps and the preceding text that describes syslog messages are
related. On the appliance is the Luna SNMP Trap Agent or lsta. When you
configure and enable traps, lsta runs as a background process and uses the
named pipe feature of the system logging facility (rsyslog) to receive
messages directed to log files. Thus, lsta receives a copy of all log
messages. Using some of the rules for interpreting log messages described
in the “Interpreting Logs” section above, lsta generates traps for significant
events.
The section below, “Luna Appliance Trap Events” describes the significant events for which the Luna
appliance generates traps.
Configuring and Enabling Traps on Luna Appliance
The following list identifies the steps to configure and enable traps on a Luna appliance. Each step
corresponds to an administrative command via the Luna shell.
1. Add an SNMP user to the system: sysconf snmp user add.
2. Set the SNMP trap parameters for the user created in the preceding step: sysconf snmp trap
set.
3. Enable and disable SNMP traps: sysconf snmp traps enable/disable.
4. Restart the system logging service: service restart syslog –force.
5. Enable SNMP traps once again.
Refer to the reference material for details of the parameters to each of the Lush commands to perform
these steps.
Luna SA uses a version of
rsyslogd that supports logging
output to named pipes (fifos).
While the man pages for
rsyslog states that "this is
handy for debugging," nothing
restricts the feature for other
uses and SafeNet has leveraged
it for SNMP trap generation.
lsta creates the fifo the first
time the process starts up.

Luna Monitoring
Syslog & SNMP
Luna Syslog and SNMP Monitoring Guide 007-012417-001 Rev V22 Copyright 2016, Gemalto NV. 90 of 102
Assuming that you use Pete as the snmp user, here are text strings that you can cut-and-paste directly into
a Lush session to configure and enable traps. You need to make one adjustment: the IP address for
sysconf snmp trap set must match the target for SNMP notifications. The examples use
192.168.0.100.
sysconf snmp user add -secName pete -authPassword PASSWORD -authProtocol
SHA -privPassword PASSWORD -privProtocol AES
sysconf snmp trap set -h 192.168.0.100 -secName pete -e 1234567890 -
authpr SHA -authpw PASSWORD -privPr AES -privPw PASSWORD
sysconf snmp trap enable
sysconf snmp trap disable
service restart syslog -force
sysconf snmp trap enable
Configuring Trap Notification
Once you have traps configured and enabled on a Luna appliance, you probably want to test that you can
successfully receive a trap notification. The description that follows explains how to configure a CentOS
Linux virtual machine to test trap notifications. Although your test environment is likely different, these
instructions should provide enough information to assist you in your efforts.
Install net-snmp
You need an SNMP trap daemon to receive trap notifications if you follow the same test process used
herein. Use yum to install net-snmp:
yum install net-snmp
If you intend to do development, you should also install:
yum install net-snmp-utils
yum install net-snmp-devel

Luna Monitoring
Syslog & SNMP
Luna Syslog and SNMP Monitoring Guide 007-012417-001 Rev V22 Copyright 2016, Gemalto NV. 91 of 102
Create a Trap Handler
When you receive a trap notification, you should do something with it. Consider the shell script example
from the net-snmp tutorial to create a trap handler. Here is the URL for the tutorial:
http://www.net-snmp.org/tutorial/tutorial-5/commands/snmptrap.html
And here is an example shell script trap handler. You can cut-and-paste this text into a file that you save as
/etc/snmp/traps to align with subsequent instructions.
#!/bin/sh
read host
read ip
vars=
count=1
while read oid val
do
count=$[count+1]
if [ "$vars" = "" ]
then
vars="$oid = $val"
else
vars="$vars, $oid = $val"
fi
done
echo a $1 trap from host=$host at IP $ip vars=$vars>>/var/log/traplogs
Configure snmptrapd.conf
Navigate to /etc/snmp and you should find a file there: snmptrapd.conf. Use your favorite editor to
modify this file. Cut and paste in the following lines after the commented out traphandle. Note that the
example assumes that you are using “pete” for the SNMP user and that it only supports three of the SNMP
trap types of lsta.
traphandle SAFENET-APPLIANCE-MIB::fanAttentionNotify /etc/snmp/traps Fan
traphandle SAFENET-APPLIANCE-MIB::powerSupplyAttentionNotify /etc/snmp/traps PSU
traphandle SAFENET-APPLIANCE-MIB::motherboardAttentionNotify /etc/snmp/traps Motherboard
###########################################################################
# SECTION: Runtime options

Luna Monitoring
Syslog & SNMP
Luna Syslog and SNMP Monitoring Guide 007-012417-001 Rev V22 Copyright 2016, Gemalto NV. 92 of 102
#
# Runtime options
disableAuthorization no
createUser -e 1234567890 pete SHA "PASSWORD" AES "PASSWORD"
authUser log,execute,net pete
Add the SafeNet MIBs
Navigate to /usr/share/snmp/mibs and securely copy (scp) the following MIBs to this directory:
CHRYSALIS-UTSP-MIB.txt
SAFENET-APPLIANCE-MIB.txt
SAFENET-GLOBAL-MIB.txt
SAFENET-HSM-MIB.txt
SNMPv2-SMI.txt
Enable Trap Packets Through the Firewall
On your Linux virtual machine, iptables may block SNMP trap packets by default. Perform the following
steps to overcome this restriction.
Stop iptables: /etc/init.d/iptables stop
Edit /etc/sysconfig/iptables and add the following two lines before the first REJECT directive in
the file:
######## Allow SNMP trap packets.
-A INPUT -p udp --dport 162 -j ACCEPT
You do not need to include the comment. For reference, the first REJECT directive in the file on the
example VM is:
-A INPUT -j REJECT --reject-with icmp-host-prohibited
Note that the order of specification is important.
Start iptables: /etc/init.d/iptables start
Disable SELinux
SELinux may be enabled on your Linux virtual machine. You need to disable SELinux to start the snmptrapd
in a subsequent step. To disable SELinux, type the following at a terminal prompt:
echo 0 >/selinux/enforce
Luna Monitoring
Syslog & SNMP
Luna Syslog and SNMP Monitoring Guide 007-012417-001 Rev V22 Copyright 2016, Gemalto NV. 93 of 102
Start the SNMP Trap Daemon
Start the SNMP trap daemon in debug mode to see the packets received: snmptrapd -Dusm -d -f
-Le. Generate a trap on the appliance – details of how to do that shortly – and receive the trap packet and
a message logged to /var/log/traplogs.
Stop the daemon and start it again, this time as a service: service snmptrapd start. Generate a
trap on the appliance and note a message written to /var/log/traplogs as an indication of a
successful trap notification.
NOTE: If you choose not to start snmptrapd in debug mode, you must start snmptrapd twice (i.e.,
start, stop, start). This first invocation constructs the snmptrapd.conf file on the appliance; the
second invocation opens and uses this configuration file.
NOTE: Either the snmptrap command on the appliance or snmptrapd appears to compress multiple
spaces to a single space. If you attempt to do exact pattern matching in a script, keep this point in mind.
By way of an example, the following appliance message:
2014 Apr 3 15:47:30 myLUT daemon notice ipmievd: ***TEST : SEQNO_10000 : Fan sensor Fan1A
. Lower Critical going low (Reading 2000 .lt Threshold 2000 RPM)
results in a traplog message:
a Fan trap from host=<UNKNOWN> at IP UDP: [xxx.xxx.xxx.xxxx]:47478->[xxx.xxx.xxx.xxx]:162
vars=system.sysUpTime.sysUpTimeInstance = 0:0:28:12.33,
.iso.org.dod.internet.snmpV2.snmpModules.snmpMIB.snmpMIBObjects.snmpTrap.snmpTrapOID.0 =
enterprises.safenet-inc.safenetRoot.luna.appliance.ssTraps.fanAttentionNotify, enterprises.safenet-
inc.safenetRoot.luna.appliance.ssTraps.ssLogReference = [myLUT:xxx.xxx.xxx.xxx / messages / 2014 Apr
3 15:47:30 / ipmievd / 1]
Only a single space separates “Apr” and ‘3’ in the latter message while two spaces do so in the former
message.
Testing Trap Events on Luna Appliance
In all likelihood, your Luna appliance is in a rack in a secure room somewhere relatively far away from
where you sit. If locally available, you can generate traps by disconnecting power to one of the two
supplies. Short of this action, you have no way to initiate the events that result in traps. That leaves you
with little to develop and test a monitoring facility for SNMP traps.
To test that you have configured everything successfully to generate and receive trap notifications, SafeNet
added a Lush command for this purpose: sysconf snmp trap test. The command takes several
parameters – refer to the reference material for details of the parameters

Luna Monitoring
Syslog & SNMP
Luna Syslog and SNMP Monitoring Guide 007-012417-001 Rev V22 Copyright 2016, Gemalto NV. 94 of 102
NOTE: This command writes a test message to the applicable system log file. The command neither checks
nor reports the status of lsta. If lsta is not running, the appliance does not generate a trap. Before running
the command sysconf snmp trap test, ensure that you have started lsta using the sysconf
snmp trap enable command.
Using the Examples
In the section that follows, the text includes a fully-formed Lush command that you can copy and paste into
a Lush session to initiate a trap notification. Use any one of these examples to test that you have
successfully configured the Luna appliance and your trap handler.
NOTE for Mozilla Firefox Users: Firefox 19 introduced its own integrated PDF viewer, which contains a bug
that adds extra line feeds to any text that you copy and paste from the viewer. Any examples you attempt
to copy and paste into Lush from the integrated PDF viewer will fail. To fix this issue, you need to configure
Firefox to use the Acrobat plug-in instead of the integrated viewer:
1. Open the Firefox menu and click on Options to display the Options dialog.
2. Click on the Applications tab in the Options dialog.
3. Change the action for the Portable Document Format (PDF) from Preview in Firefox to either Use
Acrobat Reader (in Firefox) or Use Adobe Reader.
Luna Appliance Trap Events
To avoid covert channel attacks via SNMP traps, the Luna appliance generates categories of traps.
Contained within the trap notification is sufficient information for an administrator to query the Luna
appliance for the specific event that led to the trap.
Appliance MIB Overview
The SAFENET-APPLIANCE-MIB.txt file defines the management information base for Luna appliance traps.
Here is a segment of the MIB:
ssTraps OBJECT IDENTIFIER ::= { appliance 2 }
ssLogReference OBJECT-TYPE
SYNTAX DisplayString (SIZE (0..256))
MAX-ACCESS read-only
STATUS current
DESCRIPTION
"This object indicates the log record pertaining to the sub-system trap."
::= { ssTraps 1 }

Luna Monitoring
Syslog & SNMP
Luna Syslog and SNMP Monitoring Guide 007-012417-001 Rev V22 Copyright 2016, Gemalto NV. 95 of 102
fanAttentionNotify NOTIFICATION-TYPE
OBJECTS { ssLogReference }
STATUS current
DESCRIPTION "Notify that a fan needs attention."
::= { ssTraps 2}
fanAttentionNotify is the notification type for a fan-related event. Corresponding
<subsystem>AttentionNotify notification types define the other sub-systems for which a Luna appliance
reports significant events.
The relevant information reported by a notification is the ssLogReference object. Specifically, this
object provides: the hostname and IP address of the appliance; the log file that contains the event; the
date and time of the event; the process that reported the event in the log; and a boolean value that
indicates whether the event is an assert (1) or de-assert condition. With these data, an administrator can
login to the Luna appliance and query the appropriate log file for the details of the trap event.
Sub-System Log Reference
An example might help to explain the sub-system log reference object of the appliance MIB. Assume a
power supply fails. Via the intelligent platform monitoring interface, the ipmievd process learns of this
failure and generates a log message. ipmievd sends the message to the rsyslogd process. In addition
to writing a record to the messages log file, rsyslogd writes the record to the named pipe at which
lsta is listening. lsta determines that this event is trap-worthy. The agent formats the necessary
parameters and uses the net-snmp snmptrap command to send a notification for a SAFENET-
APPLIANCE-MIB::powerSupplyAttentionNotify notification with a SAFENET-APPLIANCE-
MIB::ssLogReference object to the configured SNMP V3 user.
The trap handler receives the notification in a packet that includes the following example segment:
SAFENET-APPLIANCE-MIB::powerSupplyAttentionNotify, SAFENET-APPLIANCE-MIB::ssLogReference =
[myLuna:192.168.0.101 / 2012 Feb 29 12:05:01 / messages / ipmievd[1234] / 1]
where
• myLuna is the hostname of the Luna appliance
• 192.168.0.101 is the IP address of the first Ethernet interface on the appliance
• messages is the log file that contains the event leading to the trap notification
• 2012 Feb 29 12:05:01 is the date and timestamp recorded in the log file
• ipmievd[1234] is the process that logged the message.
• 1 is a boolean that indicates whether the trap is for an assertion (1) or de-assertion (0) event.

Luna Monitoring
Syslog & SNMP
Luna Syslog and SNMP Monitoring Guide 007-012417-001 Rev V22 Copyright 2016, Gemalto NV. 96 of 102
This information gives you what is needed to identify the specific log entry that led to the trap. If you log
into the appliance and look at the messages log file:
[myLuna] lunash:>syslog tail -logname messages
you see the following entry:
2012 Feb 29 12:05:01 myLuna local4 notice ipmievd[1234]: ***TEST : Power Supply sensor
PSU2_Status . - Failure detected Asserted
From this log message, you know that the second power supply unit has failed and you can dispatch a
technician to investigate.
Note that the Luna appliance tags log messages generated by the sysconf snmp trap test
command with a ***TEST designator. This designator allows you to determine legitimate events from
test events.
Fan Failure
lsta generates a trap for a fan failure based on the following conditions for the ipmievd process and with
any of { “Fan1A”, “Fan1B”, “Fan2A”, “Fan2B”, “Fan3A”, “Fan3B”} in the body of the message:
• Body of log message contains the text “'Lower Critical going low” and the threshold reported
represents an assert condition
• Body of log message contains the text “'Lower Non-recoverable going low” and the threshold
reported represents an assert condition.
Recall from “Threshold Events” in this document that IPMI reports assert and de-assert conditions. A
“true” relationship to the “Reading xxxx < Threshold yyyy RPM)” segment of the log message represents an
assert event. A “false” relationship represents a de-assert event.
Fan failures correspond to the fanAttentionNotify NOTIFICATION-TYPE of the SAFENET-
APPLIANCE-MIB.
Note that the Luna administrative shell prohibits the ‘<’ and ‘>’ characters as parameters. But some traps
key off threshold readings that rely on this arithmetic comparator. To enable test log messages of this sort,
use a “.lt” or “.gt” string in place of the ‘<’ or ‘>’ character in the formatted Lush command.
You can cut-and-paste the following examples in a Lush session to create test log messages that generate
fan traps (the first, second, fourth and fifth examples create assert events; the third and sixth examples, de-
assert events) :

Luna Monitoring
Syslog & SNMP
Luna Syslog and SNMP Monitoring Guide 007-012417-001 Rev V22 Copyright 2016, Gemalto NV. 97 of 102
sysconf snmp trap test -logfacility local4 -loglevel notice -process ipmievd -message "Fan sensor
Fan3B . Lower Critical going low (Reading 0 .lt Threshold 2000 RPM)"
sysconf snmp trap test -logfacility local4 -loglevel notice -process ipmievd -message "Fan sensor
Fan3B . Lower Critical going low (Reading 2000 .lt Threshold 2000 RPM)"
sysconf snmp trap test -logfacility local4 -loglevel notice -process ipmievd -message "Fan sensor
Fan3B . Lower Critical going low (Reading 21000 .lt Threshold 2000 RPM)"
sysconf snmp trap test -logfacility local4 -loglevel notice -process ipmievd -message "Fan sensor
Fan3B . Lower Non-recoverable going low (Reading 500 .lt Threshold 1000 RPM)"
sysconf snmp trap test -logfacility local4 -loglevel notice -process ipmievd -message "Fan sensor
Fan3B . Lower Non-recoverable going low (Reading 1000 .lt Threshold 1000 RPM)"
sysconf snmp trap test -logfacility local4 -loglevel notice -process ipmievd -message "Fan sensor
Fan3B . Lower Non-recoverable going low (Reading 5100 .lt Threshold 1000 RPM)"
Power Supply Failure
lsta generates a trap for a power supply failure based on the following conditions for the ipmievd process
and with any of {” PSU1_Status”, "PSU1_+12V_value", "PSU1 Temp_value", "PSU1 FAN_value",
“PSU2_Status”, "PSU2_+12V_value", "PSU2 Temp_value", "PSU2 FAN_value", “Power Supply”} in the body
of the message:
• Body of log message contains the text “Failure detected Asserted”
• Body of log message contains the text “Failure detected Deasserted”
• Body of log message contains the text “Presence detected Asserted”
• Body of log message contains the text “Presence detected Deasserted”
• Body of log message contains the text “- Transition to Power Off”
• Body of log message contains the text “'Lower Non-recoverable going low” and the threshold
reported represents an assert condition
• Body of log message contains the text “'Upper Non-recoverable going high” and the threshold
reported represents an assert condition.
Power supply failures correspond to the powerSupplyAttentionNotify NOTIFICATION-TYPE of
the SAFENET-APPLIANCE-MIB.
Here is text you can use to create power supply traps:
sysconf snmp trap test -logfacility local4 -loglevel notice -process ipmievd -message "Power Supply
sensor PSU2_Status . - Failure detected Asserted"
sysconf snmp trap test -logfacility local4 -loglevel notice -process ipmievd -message "Power Supply
sensor PSU1_Status . - Presence detected Deasserted"
sysconf snmp trap test -logfacility local4 -loglevel notice -process ipmievd -message "Power Supply
sensor - Transition to Power Off"
sysconf snmp trap test -logfacility local4 -loglevel notice -process ipmievd -message "Voltage
sensor PSU2_+12V_value. Upper Non-recoverable going high (Reading 14.538 .gt Threshold 13.392
Volts)"

Luna Monitoring
Syslog & SNMP
Luna Syslog and SNMP Monitoring Guide 007-012417-001 Rev V22 Copyright 2016, Gemalto NV. 98 of 102
sysconf snmp trap test -logfacility local4 -loglevel notice -process ipmievd -message "Voltage
sensor PSU2_+12V_value. Upper Non-recoverable going high (Reading 12.538 .gt Threshold 13.392
Volts)"
sysconf snmp trap test -logfacility local4 -loglevel notice -process ipmievd -message "Voltage
sensor PSU2_+12V_value. Lower Non-recoverable going low (Reading 10.548 .lt Threshold 11.232
Volts)"
sysconf snmp trap test -logfacility local4 -loglevel notice -process ipmievd -message "Voltage
sensor PSU2_+12V_value. Lower Non-recoverable going low (Reading 12.548 .lt Threshold 11.232
Volts)"
sysconf snmp trap test -logfacility local4 -loglevel notice -process ipmievd -message "PSU1
Temp_value. Upper Non-recoverable going high (Reading 117 .gt Threshold 115 Degrees)"
Motherboard Failure
lsta generates a trap for a motherboard failure based on the following conditions for the ipmievd process
and with any of { "CPU", "VRD", "PCH", "Inlet", "CHA DIMM 0", "CHA DIMM 1", "CHA DIMM 2", "CHB
DIMM 0", "CHB DIMM 1", "CHB DIMM 2", "RAM TMax", "CPU_VCORE", "VBAT", "3VSB", "3VMain",
"+5V", "+12V"} in the body of the message:
• Body of log message contains the text “'Lower Critical going low” and the threshold reported
represents an assert condition
• Body of log message contains the text “Upper Critical going high” and the threshold reported
represents an assert condition
• Body of log message contains the text “Upper Non-recoverable going high” and the threshold
reported represents an assert condition.
Motherboard failures correspond to the motherboardAttentionNotify NOTIFICATION-TYPE of
the SAFENET-APPLIANCE-MIB.
Here are examples to generate motherboard traps:
sysconf snmp trap test -logfacility local4 -loglevel notice -process ipmievd -message "Voltage
sensor VBAT . Lower Critical going low (Reading 1.63 .lt Threshold 2.80 Volts)"
sysconf snmp trap test -logfacility local4 -loglevel notice -process ipmievd -message "Voltage
sensor VBAT . Lower Critical going low (Reading 3.30 .lt Threshold 2.80 Volts)"
sysconf snmp trap test -logfacility local4 -loglevel notice -process ipmievd -message "Temperature
sensor CPU . Upper Critical going high (Reading 75 .gt Threshold 72 Degrees)"
sysconf snmp trap test -logfacility local4 -loglevel notice -process ipmievd -message "Temperature
sensor CPU . Upper Critical going high (Reading 70 .gt Threshold 72 Degrees)"
sysconf snmp trap test -logfacility local4 -loglevel notice -process ipmievd -message "Temperature
sensor CPU . Upper Non-recoverable going high (Reading 92 .gt Threshold 89 Degrees)"
sysconf snmp trap test -logfacility local4 -loglevel notice -process ipmievd -message "Temperature
sensor CPU . Upper Non-recoverable going high (Reading 85 .gt Threshold 89 Degrees)"

Luna Monitoring
Syslog & SNMP
Luna Syslog and SNMP Monitoring Guide 007-012417-001 Rev V22 Copyright 2016, Gemalto NV. 99 of 102
Disk Drive Failure
lsta generates a trap for a disk drive failure based on the following conditions for the smartd process:
• Severity of the message is “crit”.
Disk drive failures correspond to the diskDriveAttentionNotify NOTIFICATION-TYPE of the
SAFENET-APPLIANCE-MIB.
Use the following text to create a disk drive trap:
sysconf snmp trap test -logfacility daemon -loglevel crit -process smartd -message "Device:
/dev/sda, Temperature 45 Celsius reached limit of 44 Celsius (Min/Max 31/49)" -pid
NTLS Failure
lsta generates a trap for an NTLS failure based on the following conditions for the NTLS process:
• Severity of the message is “err”.
• Severity of the message is “crit”.
NTLS failures correspond to the ntlsAttentionNotify NOTIFICATION-TYPE of the SAFENET-
APPLIANCE-MIB.
Here are examples to create NTLS traps:
sysconf snmp trap test -logfacility local5 -loglevel crit -process NTLS -message "error :
0xc0000002 : Unable to create a new connection. " -pid
sysconf snmp trap test -logfacility local5 -loglevel crit -process NTLS -message "info : 0 : NTLS
CRASH AND BURN! Stack dump saved to /var/log/ntls_bt_2012-02-29_12:05:01" -pid
Crypto Failure
lsta generates a trap for a crypto failure – the internal HSM for Luna appliances – based on the following
conditions:
• For the kernel process, body of log message contains the text “HSM crashed:”
• For the sysstatd process, body of log message contains the text “30”
Crypto failures correspond to the cryptoAttentionNotify NOTIFICATION-TYPE of the
SAFENET-APPLIANCE-MIB.
Use the following examples to simulate a crypto failure:

Luna Monitoring
Syslog & SNMP
Luna Syslog and SNMP Monitoring Guide 007-012417-001 Rev V22 Copyright 2016, Gemalto NV. 100 of 102
sysconf snmp trap test -logfacility kern -loglevel info -process kernel -message "NOTE: viper0: hsm
log: LOG(CRITICAL) HSM crashed:"
sysconf snmp trap test -logfacility user -loglevel info -process sysstatd -message "Luna System
State Server - OOS Errors: 30,100,60!"
Clock Failure
lsta generates a trap for an appliance clock failure based on the following conditions:
• For the cron process, the year timestamp in any message is prior to 2014.
Clock failures correspond to the clockAttentionNotify NOTIFICATION-TYPE of the SAFENET-
APPLIANCE-MIB.
To create a clock failure trap, use the following commands to set the date back in time and create a
condition that results in lsta processing a message:
sysconf time 12:05 20120229
sysconf snmp trap test -logfacility authpriv -loglevel debug -process crond -message
"pam_unix(crond:account): account root has password changed in future"
Remember to set the date and time back to a current value after creating the test message.
NOTE: An adjusted clock setting also results in a smartd critical log message that results in a trap:
2012 Feb 29 12:09:29 myLUT daemon crit smartd[2478]: System clock time adjusted to the past.
Resetting next wakeup time.
Also note that leaving the clock in this state eventually results in real trap events (i.e., no need to use the
Lush command to initiate the trap):
2012 Feb 29 12:18:01 myLUT authpriv debug crond[25062]: pam_unix(crond:account): account root has
password changed in future
Caveats
With this release of the Luna appliance, be aware of the following caveats.
1. SafeNet has implemented only a sub-set of possible traps. More will come with subsequent
product releases.
2. Enabling traps is an “all-or-nothing” choice. The product does not allow you to configure trap
generation for some events at the exclusion of others.
3. NTLS certificate monitoring for expiry is unchanged: the certmonitord process continues to
monitor for this event.
4. Only IPMI events (i.e., sensors) support both assert and de-assert events with this release of lsta.

Luna Monitoring
Syslog & SNMP
Luna Syslog and SNMP Monitoring Guide 007-012417-001 Rev V22 Copyright 2016, Gemalto NV. 101 of 102

Luna Monitoring
Syslog & SNMP
Luna Syslog and SNMP Monitoring Guide 007-012417-001 Rev V22 Copyright 2016, Gemalto NV. 102 of 102
i Example: ATA error count 9 inconsistent with error log pointer 5
