TAPES Manual
User Manual:
Open the PDF directly: View PDF ![]() .
.
Page Count: 14
1
TAPES - INSTRUCTION MANUAL
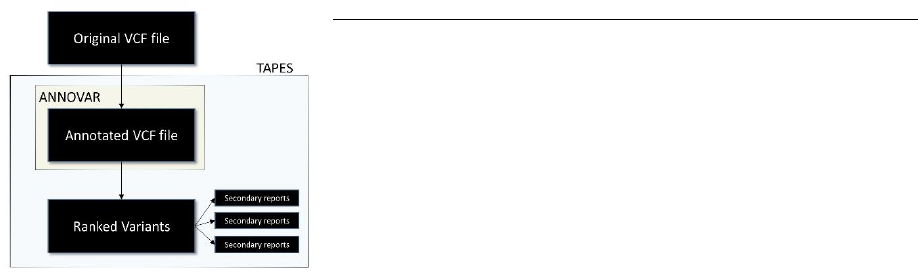
TAPES: a Tool for Assessment and Prioritisation in Exome Studies, is a script
written in python 3.7 which serves three purposes:
1. Be a simplified interface to ANNOVAR
(http://annovar.openbioinformatics.org/en/latest/) with easy database
management and easy commands for annotation.
2. Prioritize variants using the ACMG 2015 (DOI: 10.1038/gim.2015.30)
criteria and probability of pathogenicity to classify variants from pathogenic to
benign.
3. Create appropriate reports for researcher based on relevant criteria.
TAPES focuses on multi-sample VCFs files and disease cohorts but any file annotated with ANNOVAR can be
used.
COMPATIBILITY
TAPES main function: sort will work on both UNIX and Windows.
The ANNOVAR interface will only work on UNIX due to ANNOVAR compatibility.
TAPES was written and tested on python3.7 and will work on any python3 version.
Table of Contents
INSTALLATION .............................................................................................................................................................. 2
RUNNING A PRIORITISATION JOB .............................................................................................................................. 2
Prioritise the annotated file ................................................................................................................................... 2
FOLDER MODE ................................................................................................................................................................. 3
CSV/TXT+XLSX MODE ....................................................................................................................................... 3
Sorting and reporting options .............................................................................................................................. 3
Output explained ................................................................................................................................................... 4
ANNOVAR INTERFACE ................................................................................................................................................. 6
First Use ................................................................................................................................................................. 6
Simplified ................................................................................................................................................................ 6
DOWNLOADING DATABASES ...................................................................................................................................... 6
ANNOTATING VCF FILE .................................................................................................................................................. 7
Advanced ............................................................................................................................................................... 7
DATABASE MANAGMENT ............................................................................................................................................... 7
ANNOTATION ..................................................................................................................................................... 8
ANNOTATION OPTIONS .................................................................................................................................... 8
DECOMPOSING VCF .................................................................................................................................................... 8
RE-ANALYSING TAPES OUTPUTS ................................................................................................................................. 8
APPENDIX .................................................................................................................................................................... 9
KEGG Pathways keys ............................................................................................................................................. 9
EnrichR Libraries .................................................................................................................................................... 11
ACMG Criteria assignment .................................................................................................................................... 13

2
1) INSTALLATION
TAPES does not require installation, just download the repository at https://github.com/a-xavier/tapes
and extract it to any convenient location.
If pip is not installed on your system you can install it easily:
Install PIP On Debian/Ubuntu
apt install python3-pip
Install PIP on Fedora
dnf install python3-pip
Install PIP on Arch Linux
pacman -S python-pip
Install PIP on Windows
First install python3 from https://www.python.org/downloads/ and add python and pip to your path in the
environment variable menu.
(On windows 7 : Control Panel -> System - > Advanced System Settings -> Environment variables then
under System Variables double click on path and add the python installation path separated by a
semicolon “ ; ” )
Then use either cmd.exe or Windows Powershell to use TAPES.
Using pip you can install all the requirement with:
cd path/to/TAPES
pip install --upgrade -r requirements.txt
This will install all the required python modules.
Note that since TAPES is written in python 3, you might need to run it using python3 instead of python
depending on your system.
If you plan on using TAPES as an ANNOVAR wrapper, please download ANNOVAR first here :
http://annovar.openbioinformatics.org/en/latest/
2) RUNNING A PRIORITISATION JOB
1) Prioritise the annotated file
To prioritise your variant use the sort option.
There is two main output mode: FOLDER and CSV/TXT+XLSX
When writing the output, just specify a folder or a csv file to choose the mode (see examples below).
In both mode, the flag --acmg can be added.

3
Using the --acmg tag will ensure all the main annotations for ACMG classification are present
before the sorting process. If you are not sure your annotated file in fully compliant with TAPES,
you can remove the –acmg tag.
If the --acmg tag is not present, TAPES will annotate as much as it can based on the present
annotation. This ensures that even older files annotated with ANNOVAR can be prioritised to a
certain extent.
a) FOLDER MODE
This mode will output a folder with different csv files and figures based on the options:
python tapes.py sort -i /path/to/annotated/file.csv –o/path/to/output/folder/
Will output csv files
python tapes.py sort -i /to/annotated/file.csv –o /to/output/folder/ --tab
Will output tab-separated files
The output must be either an empty folder or a non-existent folder.
b) CSV/TXT+XLSX MODE
This mode will output a csv file and an xlsx report containing different spreadsheets based on the
options:
python tapes.py sort -i /path/to/annotated/file.csv -o /path/to/output.csv
will output csv + xlsx files
python tapes.py sort -i /path/to/annotated/file.csv -o /path/to/output.txt
will output a tab-separated txt + xlsx files (.tsv also works)
2) Sorting and reporting Options
Option
Type
Description
Default
--acmg
flag
Perform check for main annotations
before sorting
--trio
Path to txt file
A trio text file (see specification)
--by_sample
flag
Create output with the 5 most
pathogenic variants per sample
--enrichr
str
Use enrichr to analayse the pathways
impacted by pathogenic variants
GO_Biological_Process_2018
--disease
str
Check in the ‘disease’ column the
presence of a term
cancer
--list
str or path to
txt file
A list of gene of interest (in quotes
separated by a space) or a text file with
one gene symbol per line
--kegg
str
Similar to list but when you do not know
all genes of interest. Select a pathways
and a report will be created with only
genes involved in that pathway (see
Appendix for the full list of available
pathways)
--by_gene
flag
Create output ranking each gene based
on a simple Gene-burden metrics
4
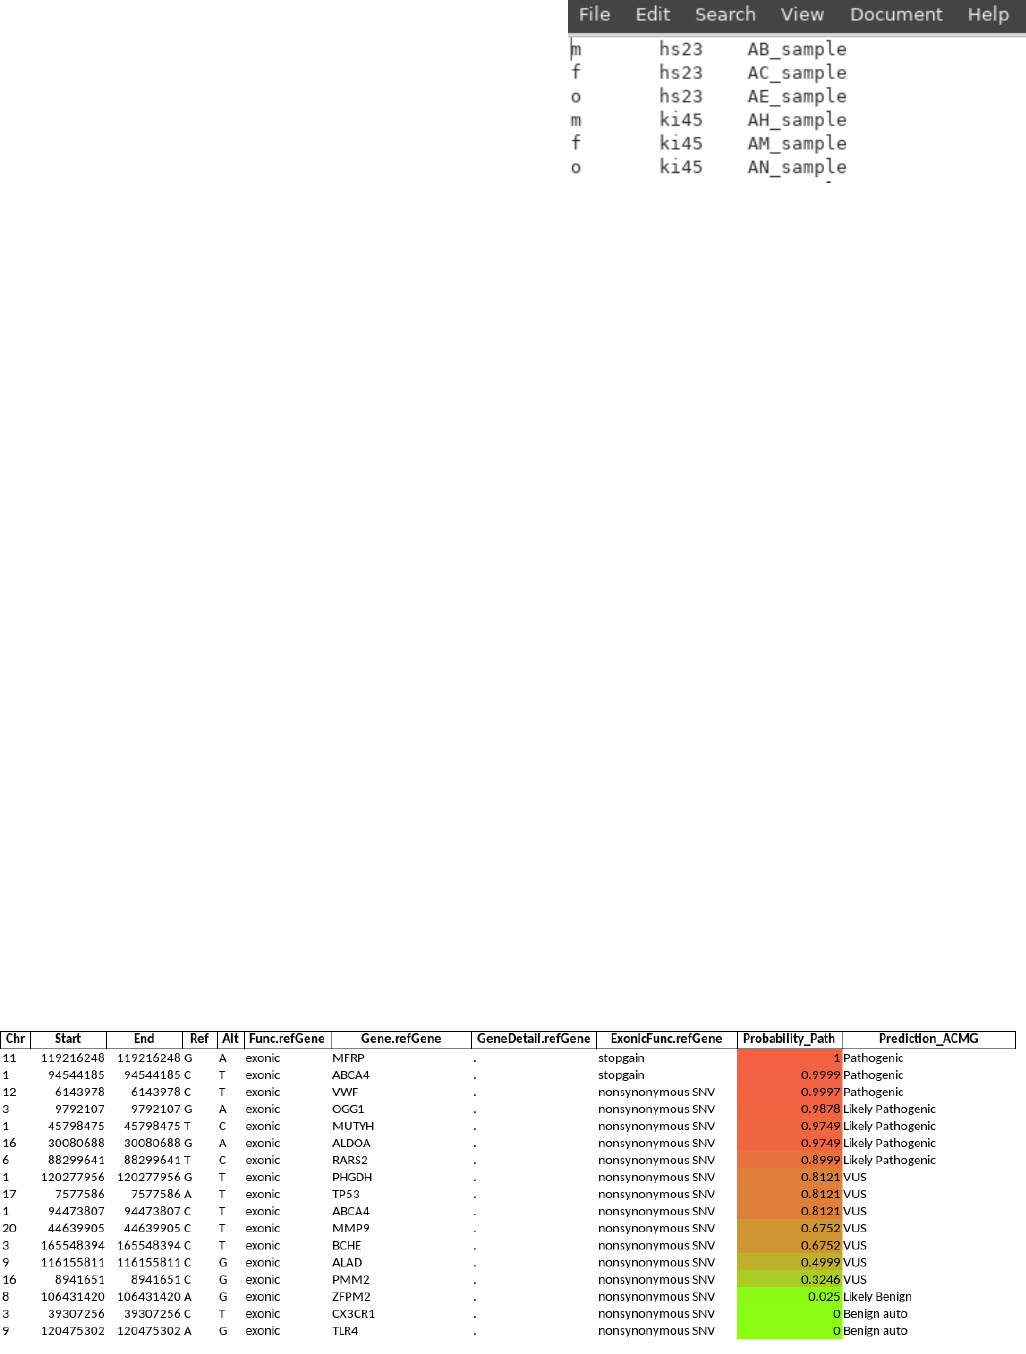
Notes on --trio :
The trio file must be a tab delimited file with the following
info:
Role in family: m f o in no particular order for mother,
father and offspring
Trio id: any string without space
Sample name: as they appear on the original vcf file
Only use UNIQUE trio IDs; if there are several trios in one family, use different IDs or the result will be
incorrect.
Note on --by_gene flag:
The --by_gene flag will create a report grouping all variants that are predicted to be
pathogenic contained in a single gene. The metrics used to measure gene burden is quite simple:
where
is the probability for a variant to be pathogenic and
the number of Sample affected by this variant.
Since this score does not account for several other parameters, a number of warnings are also present:
- Number of sample warning: If more than half of the variant of each gene are present in more than
half of the samples. It means that the number of sample affected is suspiciously high. This can
happened in misaligned reads in X and Y homologous regions for example.
- Long gene warning: If the gene is long (more than 250,000 bp), more variants are expected.
- FLAGS Gene: FLAGS genes are the most frequently mutated genes in Exome sequencing. See
https://doi.org/10.1186/s12920-014-0064-y for more details.
3) Output Explained
a) Main Output
The ouptut files will always be sorted csv/txt/tsv or xlsx files. The variants are sorted from most
pathogenic to most benign. Apart from the classical ACMG classification (see original paper for infos, S
Richards et al - 2015), TAPES will also provide an estimated probability of pathogenicity calculated
based on S.V. Tavtigian et al 2018. To be simple it outputs the probability that this particular variant is
pathogenic based on the ACMG criteria.
The default of Prior_P = 0.1, exponent X = 2 and OPVST=350 are used.
b) By-Sample report
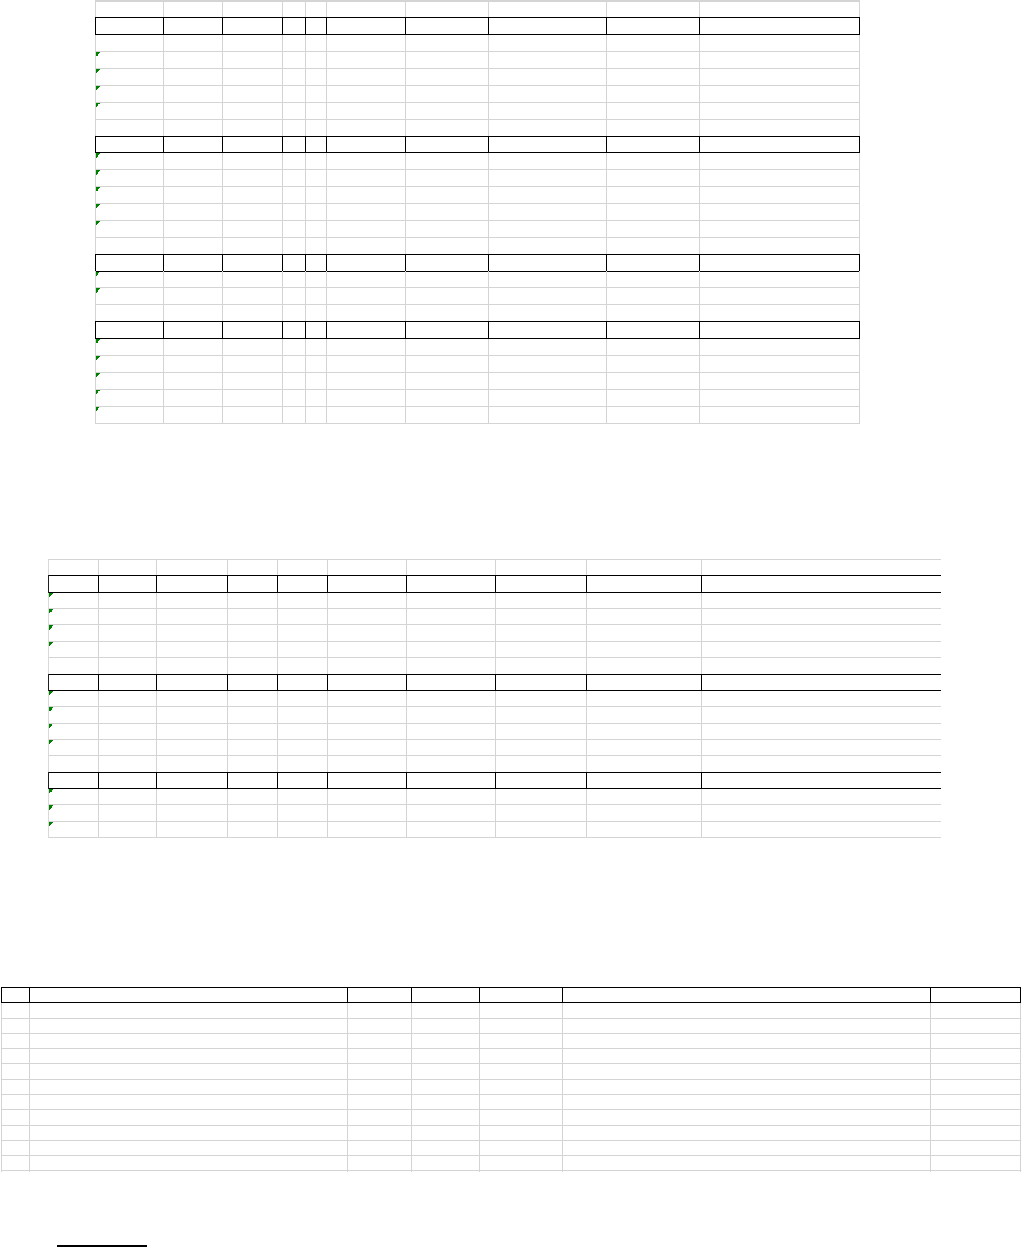
5
This report will contain the 5 most pathogenic variants per sample.
Eg.
. c) By-Gene report
Every table has, above the header, the name of the gene, the gene burden score and, in certain
cases, a warning.
d) EnrichR report
The 11 most relevant pathway will be in the EnrichR report. Only pathways with significant
adjusted p-values should be considered
Sample 1
Chr Start End Ref Alt Func.refGene Gene.refGene ExonicFunc.refGene Probability_Path Prediction_ACMG
11 119216248 119216248 G A exonic MFRP stopgain 0.9971 Pathogenic
17 59152382 59152382 G T splicing BCAS3 . 0.9971 Pathogenic
9139324777 139324777 C T exonic INPP5E nonsynonymous SNV 0.9941 Pathogenic
254040161 54040161 A C exonic ERLEC1 nonsynonymous SNV 0.9749 Likely Pathogenic
11 16863238 16863238 T C exonic PLEKHA7 nonsynonymous SNV 0.9492 Likely Pathogenic
Sample 2
Chr Start End Ref Alt Func.refGene Gene.refGene ExonicFunc.refGene Probability_Path Prediction_ACMG_freesome
271351575 71351575 G A exonic MCEE stopgain 0.9986 Pathogenic
1197072867 197072867 A T exonic ASPM stopgain 0.9878 Likely Pathogenic
17 76525627 76525627 G A exonic DNAH17 nonsynonymous SNV 0.9492 Likely Pathogenic
81874564 1874564 C A exonic ARHGEF10 nonsynonymous SNV 0.8999 Likely Pathogenic
16 333220 333220 G A exonic PDIA2 synonymous SNV 0.8999 Likely Pathogenic
Sample 3
Chr Start End Ref Alt Func.refGene Gene.refGene ExonicFunc.refGene Probability_Path Prediction_ACMG_freesome
17 7125591 7125591 T C exonic ACADVL nonsynonymous SNV 0.9941 Pathogenic
6114379184 114379184 G A exonic HS3ST5 nonsynonymous SNV 0.9749 Likely Pathogenic
Sample 4
Chr Start End Ref Alt Func.refGene Gene.refGene ExonicFunc.refGene Probability_Path Prediction_ACMG_freesome
1200549381 200549381 C T splicing KIF14 . 0.9971 Pathogenic
17 7129566 7129566 C T exonic DVL2 nonsynonymous SNV 0.9492 Likely Pathogenic
11 16863238 16863238 T C exonic PLEKHA7 nonsynonymous SNV 0.9492 Likely Pathogenic
170881670 70881670 C T exonic CTH nonsynonymous SNV 0.8999 Pathogenic
7128845521 128845521 G A exonic SMO nonsynonymous SNV 0.8999 Likely Pathogenic
TTN 7.9087 LONG GENE
Chr Start End Ref Alt Func.refGene Gene.refGene Probability_Path Prediction_ACMG Samples
2179411522 179411522 G A exonic TTN 0.9749 Likely Pathogenic BE_sample, BK_sample
2179396978 179396978 G A exonic TTN 0.9492 Likely Pathogenic BE_sample, BK_sample
2179590714 179590714 T A exonic TTN 0.8121 Likely Pathogenic BA_sample
2179605212 179605212 C T exonic TTN 0.8121 Likely Benign BE_sample, BK_sample, BY_sample, T_sample
MUTYH 6.7496
Chr Start End Ref Alt Func.refGene Gene.refGene Probability_Path Prediction_ACMG Samples
145798627 45798627 C T exonic MUTYH 0.9986 Pathogenic BE_sample
145797228 45797228 C T exonic MUTYH 0.9878 Pathogenic BR_sample, T_sample
145798475 45798475 T C exonic MUTYH 0.9878 Pathogenic BR_sample, T_sample
145796257 45796257 C T intronic MUTYH 0.8999 Likely Pathogenic BE_sample, BF_sample
DNAH17 5.6738
Chr Start End Ref Alt Func.refGene Gene.refGene Probability_Path Prediction_ACMG Samples
17 76486850 76486850 G A exonic DNAH17 0.9878 Likely Pathogenic BE_sample, BK_sample
17 76525627 76525627 G A exonic DNAH17 0.9492 Likely Pathogenic AH_sample, BV_sample
17 76498689 76498689 T C exonic DNAH17 0.8999 Likely Pathogenic BE_sample, BK_sample
Rank Name P-value Z-score Combined score genes adjusted p-values
1 intraciliary retrograde transport (GO:0035721) 1.54409E-07 -2.680773475 42.04434394 ['ICK', 'DYNC2LI1', 'IFT43', 'TTC21B', 'IFT122', 'TTC21A', 'WDR35'] 0.000492719
2 DNA strand elongation involved in DNA replication (GO:0006271) 7.06476E-06 -2.485462184 29.47855495 ['GINS1', 'RFC4', 'LIG1', 'PARP2', 'LIG4', 'LIG3', 'POLE'] 0.008710093
3 short-chain fatty acid catabolic process (GO:0019626) 0.000536672 -3.426835601 25.80449662 ['MCEE', 'PCCB', 'MUT', 'PCK2'] 0.159775968
4 base-excision repair (GO:0006284) 8.18874E-06 -1.893262125 22.17530614 ['WRN', 'LIG1', 'NTHL1', 'OGG1', 'POLL', 'LIG3', 'ERCC6', 'POLE', 'TP53', 'MUTYH'] 0.008710093
5 carbohydrate catabolic process (GO:0016052) 3.64323E-05 -2.144171463 21.91354774 ['HK3', 'PKLR', 'MAN2B2', 'NAGA', 'MAN2C1', 'PGK2', 'ENO2', 'PFKM', 'PGM1'] 0.029063896
6 protein deglycosylation (GO:0006517) 0.001301574 -3.128363521 20.78541288 ['MAN2A2', 'MAN2B2', 'MAN2C1', 'ENGASE'] 0.188745456
7 myosin filament assembly (GO:0031034) 0.00014685 -2.308310721 20.37337836 ['MYBPC2', 'MYBPHL', 'MYBPH', 'MYOM2', 'TTN'] 0.078099737
8 striated muscle myosin thick filament assembly (GO:0071688) 0.000342639 -2.480528447 19.79172169 ['MYBPC2', 'MYBPHL', 'MYBPH', 'MYOM2', 'TTN'] 0.156194492
9 lagging strand elongation (GO:0006273) 0.000536672 -2.355809806 17.7395397 ['LIG1', 'PARP2', 'LIG4', 'LIG3'] 0.159775968
10 mannose metabolic process (GO:0006013) 0.005072831 -3.293923071 17.4046157 ['MAN2A2', 'MAN2B2', 'MAN2C1'] 0.370626972
11 sarcomere organization (GO:0045214) 0.000652493 -2.289434136 16.792337 ['MYBPC2', 'MYBPHL', 'MYBPH', 'CAPN3', 'MYOM2', 'MYH6', 'TTN'] 0.159775968
6
e) Kegg, List and Disease reports
Kegg, list and Disease report will look very similar to the main output. Kegg and list will only show
variant that belong to either a determined keg pathway (see list in appendix) or a list of user-
provided genes.
The disease report will only show variant that have a certain term in the Disease column of the
annotation. Eg. “Autosomal dominant”, “cancer”, “Colorectal”
3) ANNOVAR INTERFACE
Note that TAPES accepts for annotation: vcf files, bcf files, bgzipped vcf files and gzipped bcf
files. They will automatically converted to vcf files prior to annotation.
Users should also have downloaded ANNOVAR first (free for non-commercial use) :
http://www.openbioinformatics.org/annovar/annovar_download_form.php
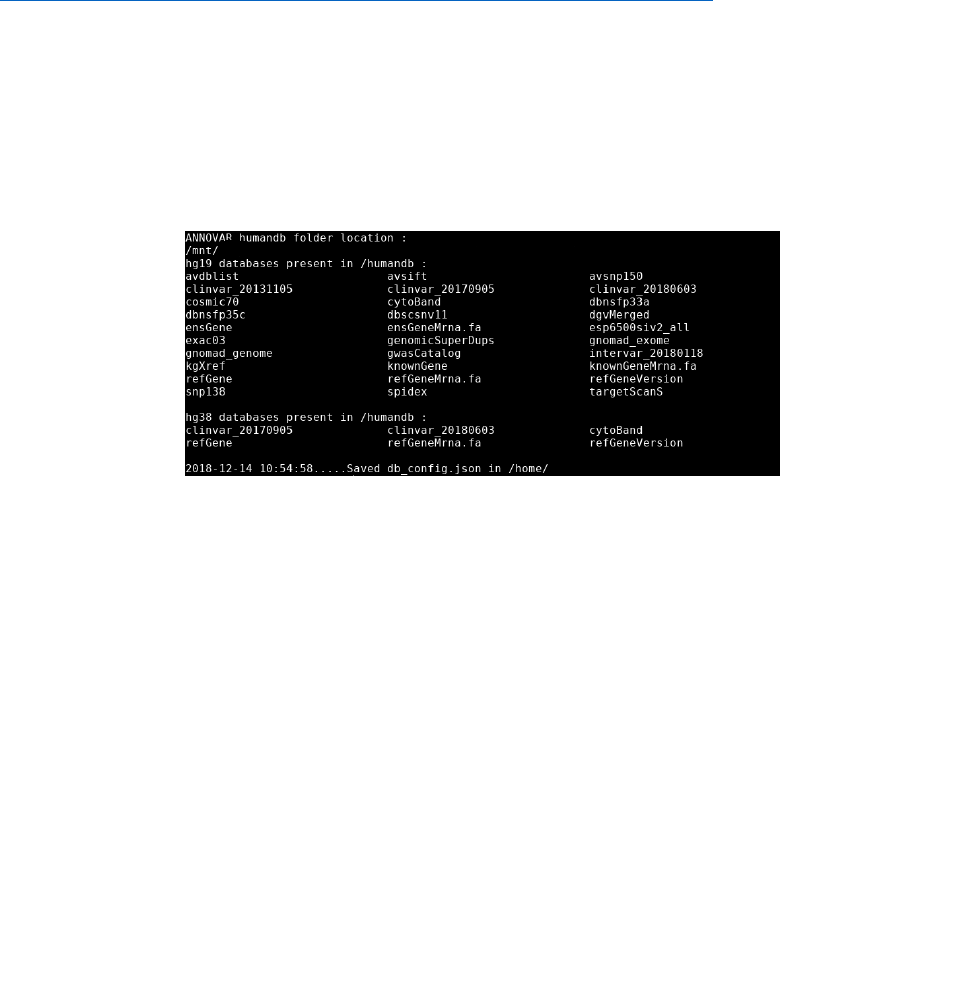
1) First Use
When using TAPES for the first time, you need to indicate the location of your local ANNOVAR folder:
python tapes.py db -s -A /path/to/annovar/
The -s stands for --see-db, a tag used to see all databases present on your system. The output should
look like this:
2) Simplified database management and annotation: Using the --acmg tag
a) DOWNLOADING DATABASES
Use db -b --acmg or db --build_db --acmg to start downloading the necessary databases for
the ACMG criteria assignment. You can specify the assembly to use (either hg19 or hg38) with the --
assembly option (default is hg19)
The necessary databases for all possible criteria assignment are:
gnomad_genome
gnomad_exome or exac03 (gnomad_exome is the default)
avsnp150
clinvar_20180603
dbnsfp35c
one of the genome annotation : refGene, ensGene, knownGene
python tapes.py db -b --acmg --assembly hg19

7
This command will download the databases in the /humandb directory located in the ANNOVAR folder.
You can then check that all the databases have been downloaded using:
python tapes.py db –s
b) ANNOTATING VCF FILE
To annotate a VCF file, use the annotate option with --acmg tag to easily annotate your vcf with all the
relevant databases for ACMG classification. One again use --assembly to specify the assembly version
python tapes.py annotate -i /path/to/file.vcf -o /path/to/output.csv --acmg –
assembly hg19
This will produce the annotated file output.csv and if the vcf is multi-sample, the file
output_with_samples.csv will also be created.
python tapes.py annotate -i /path/to/file.vcf -o /path/to/output.txt --acmg –
assembly hg19
This will produce the annotated file output.txt and if the vcf is multi-sample, the file
output_with_samples.txt will also be created.
python tapes.py annotate -i /path/to/file.vcf -o /path/to/output.vcf --acmg –
assembly hg19
This will produce the annotated file output.vcf.
3) Advanced database management and annotation
a) DATABASE MANAGMENT
TAPES provides two files to easily manage databases and ANNOVAR annotations.
db_config.json is an easily readable json file which shows all (most of the) available ANNOVAR
databases.
Those files are generated after the first use.
Missing databases are flagged “MISSING”, downloaded databases are flagged OK.
To flag a database for download, replace ”MISSING” by ”DOWNLOAD” or ”DOWN”.
Then run:
python tapes.py db -b
This will download all databases flagged for download.
b) ANNOTATION
db_vcf.json is an easily readable json file which shows all downloaded databases and which databases
are used to annotate vcf_files.
Databases flagged ”YES” will be used for annotation and databases flagged ”NO” will be ignored.
Flag ”YES” for all databases you want to use for annotation then run:
python tapes.py annotate -i /path/to/file.vcf -o /path/to/output.csv
This will output two file: a standard annotated output.csv file and an output_with_samples.csv containing
sample genotyping data.

8
python tapes.py annotate -i /path/to/file.vcf -o /path/to/output.txt
This will output two file: a standard annotated output.txt file and an output_with_samples.txt containing
sample genotyping data.
python tapes.py annotate -i /path/to/file.vcf -o /path/to/output.vcf
This will produce the annotated file output.vcf
c) ANNOTATION OPTIONS
Option
Type
Description
Default
--assembly
str
Assembly version : either hg19 or hg38
hg19
--ref_anno
str
Genome annotation : either refGene for RefSeq,
ensGene for ENSEMBL qnd knownGene for UCSC
refGene
4) DECOMPOSING VCF
TAPES will automatically decompose VCFs files before annotation. But TAPES can decompose a VCF
file without annotating it using:
python tapes.py decompose –i /original.vcf –o /decomposed.vcf
5) RE-ANALYSING TAPES OUTPUTS
If you want to generate a report from previously sorted file. You can use the analyse (or
analyze) option.
For example:
python tapes.py analyse -i /path/to/sorted_output.txt -o /path/to/output_report.txt
--by_sample
Will output a by-sample report
python tapes.py analyse -i /path/to/sorted_output.txt -o /path/to/output_report.txt
--by_gene
Will output a by-gene report
Please note that you can only output one report at a time. For example
python tapes.py analyse -i /path/to/sorted_output.txt -o /path/to/output_report.txt –
--by_gene –by-sample –enrichr –list “MLH1 MSH2 APC”
will not work.
9
APPENDIX
KEGG Pathways keys
2-oxocarboxylic acid
metabolism
abc transporters
acute myeloid leukemia
adherens junction
adipocytokine signaling
pathway
adrenergic signaling in
cardiomyocytes
african trypanosomiasis
age-rage signaling pathway in
diabetic complications
alanine, aspartate and
glutamate metabolism
alcoholism
aldosterone synthesis and
secretion
aldosterone-regulated sodium
reabsorption
allograft rejection
alpha-linolenic acid metabolism
alzheimer disease
amino sugar and nucleotide
sugar metabolism
aminoacyl-trna biosynthesis
amoebiasis
amphetamine addiction
ampk signaling pathway
amyotrophic lateral sclerosis
antifolate resistance
antigen processing and
presentation
apelin signaling pathway
apoptosis
apoptosis - multiple species
arachidonic acid metabolism
arginine and proline
metabolism
arginine biosynthesis
arrhythmogenic right ventricular
cardiomyopathy
ascorbate and aldarate
metabolism
asthma
autoimmune thyroid disease
autophagy - animal
autophagy - other
axon guidance
b cell receptor signaling
pathway
bacterial invasion of epithelial
cells
basal cell carcinoma
basal transcription factors
base excision repair
beta-alanine metabolism
bile secretion
biosynthesis of amino acids
biosynthesis of unsaturated
fatty acids
biotin metabolism
bladder cancer
breast cancer
butanoate metabolism
c-type lectin receptor
signaling pathway
caffeine metabolism
calcium signaling pathway
camp signaling pathway
carbohydrate digestion and
absorption
carbon metabolism
cardiac muscle contraction
cell adhesion molecules
cell cycle
cellular senescence
central carbon metabolism in
cancer
cgmp-pkg signaling pathway
chagas disease
chemical carcinogenesis
chemokine signaling pathway
cholesterol metabolism
choline metabolism in cancer
cholinergic synapse
chronic myeloid leukemia
circadian entrainment
circadian rhythm
citrate cycle
cocaine addiction
collecting duct acid secretion
colorectal cancer
complement and coagulation
cascades
cortisol synthesis and
secretion
cushing syndrome
cysteine and methionine
metabolism
cytokine-cytokine receptor
interaction
cytosolic dna-sensing
pathway
d-arginine and d-ornithine
metabolism
d-glutamine and d-glutamate
metabolism
dilated cardiomyopathy
dna replication
dopaminergic synapse
drug metabolism -
cytochrome p450
drug metabolism - other
enzymes
ecm-receptor interaction
egfr tyrosine kinase inhibitor
resistance
endocrine and other factor-
regulated calcium
reabsorption
endocrine resistance
endocytosis
endometrial cancer
epithelial cell signaling in
helicobacter pylori infection
epstein-barr virus infection
erbb signaling pathway
estrogen signaling pathway
ether lipid metabolism
fanconi anemia pathway
fat digestion and absorption
fatty acid biosynthesis
fatty acid degradation
fatty acid elongation
fatty acid metabolism
fc epsilon ri signaling pathway
fc gamma r-mediated
phagocytosis
ferroptosis
fluid shear stress and
atherosclerosis
focal adhesion
folate biosynthesis
foxo signaling pathway
fructose and mannose
metabolism
gabaergic synapse
galactose metabolism
gap junction
gastric acid secretion
gastric cancer
glioma
glucagon signaling pathway
glutamatergic synapse
glutathione metabolism
glycerolipid metabolism
glycerophospholipid
metabolism
glycine, serine and threonine
metabolism
glycolysis / gluconeogenesis
glycosaminoglycan
biosynthesis - chondroitin
sulfate / dermatan sulfate
glycosaminoglycan
biosynthesis - heparan sulfate /
heparin
glycosaminoglycan
biosynthesis - keratan sulfate
glycosaminoglycan degradation
glycosphingolipid biosynthesis -
ganglio series
glycosphingolipid biosynthesis -
globo and isoglobo series
glycosphingolipid biosynthesis -
lacto and neolacto series
glycosylphosphatidylinositol
glyoxylate and dicarboxylate
metabolism
gnrh signaling pathway
graft-versus-host disease
hedgehog signaling pathway
hematopoietic cell lineage
10
hepatitis b
hepatitis c
hepatocellular carcinoma
herpes simplex infection
hif-1 signaling pathway
hippo signaling pathway
hippo signaling pathway -
multiple species
histidine metabolism
homologous recombination
human cytomegalovirus
infection
human immunodeficiency virus
1 infection
human papillomavirus infection
human t-cell leukemia virus 1
infection
huntington disease
hypertrophic cardiomyopathy
il-17 signaling pathway
inflammatory bowel disease
inflammatory mediator
regulation of trp channels
influenza a
inositol phosphate metabolism
insulin resistance
insulin secretion
insulin signaling pathway
intestinal immune network for
iga production
jak-stat signaling pathway
kaposi sarcoma-associated
herpesvirus infection
legionellosis
leishmaniasis
leukocyte transendothelial
migration
linoleic acid metabolism
lipoic acid metabolism
long-term depression
long-term potentiation
longevity regulating pathway
longevity regulating pathway -
multiple species
lysine degradation
lysosome
malaria
mannose type o-glycan
biosynthesis
mapk signaling pathway
maturity onset diabetes of the
young
measles
melanogenesis
melanoma
metabolic pathways
metabolism of xenobiotics by
cytochrome p450
micrornas in cancer
mineral absorption
mismatch repair
mitophagy - animal
morphine addiction
mrna surveillance pathway
mtor signaling pathway
mucin type o-glycan
biosynthesis
n-glycan biosynthesis
natural killer cell mediated
cytotoxicity
necroptosis
neomycin, kanamycin and
gentamicin biosynthesis
neuroactive ligand-receptor
interaction
neurotrophin signaling
pathway
nf-kappa b signaling pathway
nicotinate and nicotinamide
metabolism
nicotine addiction
nitrogen metabolism
nod-like receptor signaling
pathway
non-alcoholic fatty liver
disease
non-homologous end-joining
non-small cell lung cancer
notch signaling pathway
nucleotide excision repair
olfactory transduction
one carbon pool by folate
oocyte meiosis
osteoclast differentiation
other glycan degradation
other types of o-glycan
biosynthesis
ovarian steroidogenesis
oxidative phosphorylation
oxytocin signaling pathway
p53 signaling pathway
pancreatic cancer
pancreatic secretion
pantothenate and coa
biosynthesis
parathyroid hormone
synthesis, secretion and
action
parkinson disease
pathogenic escherichia coli
infection
pathways in cancer
pentose and glucuronate
interconversions
pentose phosphate pathway
peroxisome
pertussis
phagosome
phenylalanine metabolism
phenylalanine, tyrosine and
tryptophan biosynthesis
phosphatidylinositol signaling
system
phospholipase d signaling
pathway
phosphonate and
phosphinate metabolism
phototransduction
pi3k-akt signaling pathway
platelet activation
platinum drug resistance
porphyrin and chlorophyll
metabolism
ppar signaling pathway
primary bile acid biosynthesis
primary immunodeficiency
prion diseases
progesterone-mediated oocyte
maturation
prolactin signaling pathway
propanoate metabolism
prostate cancer
proteasome
protein digestion and
absorption
protein export
protein processing in
endoplasmic reticulum
proteoglycans in cancer
proximal tubule bicarbonate
reclamation
purine metabolism
pyrimidine metabolism
pyruvate metabolism
rap1 signaling pathway
ras signaling pathway
regulation of actin cytoskeleton
regulation of lipolysis in
adipocytes
relaxin signaling pathway
renal cell carcinoma
renin secretion
renin-angiotensin system
retinol metabolism
retrograde endocannabinoid
signaling
rheumatoid arthritis
riboflavin metabolism
ribosome
ribosome biogenesis in
eukaryotes
rig-i-like receptor signaling
pathway
rna degradation
rna polymerase
rna transport
salivary secretion
salmonella infection
selenocompound metabolism
serotonergic synapse
shigellosis
signaling pathways regulating
pluripotency of stem cells
small cell lung cancer
snare interactions in vesicular
transport
sphingolipid metabolism
sphingolipid signaling pathway
spliceosome
staphylococcus aureus infection
starch and sucrose metabolism
steroid biosynthesis
steroid hormone biosynthesis
sulfur metabolism
sulfur relay system
synaptic vesicle cycle
11
synthesis and degradation of
ketone bodies
systemic lupus erythematosus
t cell receptor signaling
pathway
taste transduction
taurine and hypotaurine
metabolism
terpenoid backbone
biosynthesis
tgf-beta signaling pathway
th1 and th2 cell differentiation
th17 cell differentiation
thermogenesis
thiamine metabolism
thyroid cancer
thyroid hormone signaling
pathway
thyroid hormone synthesis
tight junction
tnf signaling pathway
toll-like receptor signaling
pathway
toxoplasmosis
transcriptional misregulation
in cancer
tryptophan metabolism
tuberculosis
type i diabetes mellitus
type ii diabetes mellitus
tyrosine metabolism
ubiquinone and other
terpenoid-quinone
biosynthesis
ubiquitin mediated proteolysis
valine, leucine and isoleucine
biosynthesis
valine, leucine and isoleucine
degradation
vascular smooth muscle
contraction
vasopressin-regulated water
reabsorption
vegf signaling pathway
vibrio cholerae infection
viral carcinogenesis
viral myocarditis
vitamin b6 metabolism
vitamin digestion and
absorption
wnt signaling pathway
EnrichR Libraries
Genes_Associated_with_NIH_Grants
Cancer_Cell_Line_Encyclopedia
Achilles_fitness_decrease
Achilles_fitness_increase
Aging_Perturbations_from_GEO_down
Aging_Perturbations_from_GEO_up
Allen_Brain_Atlas_down
Allen_Brain_Atlas_up
ARCHS4_Cell-lines
ARCHS4_IDG_Coexp
ARCHS4_Kinases_Coexp
ARCHS4_TFs_Coexp
ARCHS4_Tissues
BioCarta_2013
BioCarta_2015
BioCarta_2016
BioPlex_2017
ChEA_2013
ChEA_2015
ChEA_2016
Chromosome_Location
Chromosome_Location_hg19
CORUM
Data_Acquisition_Method_Most_Popular_G
enes
dbGaP
Disease_Perturbations_from_GEO_down
Disease_Perturbations_from_GEO_up
Disease_Signatures_from_GEO_down_20
14
Disease_Signatures_from_GEO_up_2014
Drug_Perturbations_from_GEO_2014
Drug_Perturbations_from_GEO_down
Drug_Perturbations_from_GEO_up
DrugMatrix
DSigDB
ENCODE_and_ChEA_Consensus_TFs_fro
m_ChIP-X
ENCODE_Histone_Modifications_2013
ENCODE_Histone_Modifications_2015
ENCODE_TF_ChIP-seq_2014
ENCODE_TF_ChIP-seq_2015
Enrichr_Libraries_Most_Popular_Genes
Enrichr_Submissions_TF-
Gene_Coocurrence
Epigenomics_Roadmap_HM_ChIP-seq
ESCAPE
GeneSigDB
Genome_Browser_PWMs
GO_Biological_Process_2013
GO_Biological_Process_2015
GO_Biological_Process_2017
GO_Biological_Process_2017b
GO_Biological_Process_2018
GO_Cellular_Component_2013
GO_Cellular_Component_2015
GO_Cellular_Component_2017
GO_Cellular_Component_2017b
GO_Cellular_Component_2018
GO_Molecular_Function_2013
GO_Molecular_Function_2015
GO_Molecular_Function_2017
GO_Molecular_Function_2017b
GO_Molecular_Function_2018
GTEx_Tissue_Sample_Gene_Expression
_Profiles_down
GTEx_Tissue_Sample_Gene_Expression
_Profiles_up
HMDB_Metabolites
HomoloGene
Human_Gene_Atlas
Human_Phenotype_Ontology
HumanCyc_2015
HumanCyc_2016
huMAP
Jensen_COMPARTMENTS
Jensen_DISEASES
Jensen_TISSUES
KEA_2013
KEA_2015
KEGG_2013
KEGG_2015
KEGG_2016
Kinase_Perturbations_from_GEO_down
Kinase_Perturbations_from_GEO_up
Ligand_Perturbations_from_GEO_down
Ligand_Perturbations_from_GEO_up
LINCS_L1000_Chem_Pert_down
LINCS_L1000_Chem_Pert_up
LINCS_L1000_Kinase_Perturbations_do
wn
LINCS_L1000_Kinase_Perturbations_up
LINCS_L1000_Ligand_Perturbations_down
LINCS_L1000_Ligand_Perturbations_up
MCF7_Perturbations_from_GEO_down
MCF7_Perturbations_from_GEO_up
MGI_Mammalian_Phenotype_2013
MGI_Mammalian_Phenotype_2017
MGI_Mammalian_Phenotype_Level_3
MGI_Mammalian_Phenotype_Level_4
Microbe_Perturbations_from_GEO_down
Microbe_Perturbations_from_GEO_up
miRTarBase_2017
Mouse_Gene_Atlas
MSigDB_Computational
MSigDB_Oncogenic_Signatures
NCI-60_Cancer_Cell_Lines
NCI-Nature_2015
NCI-Nature_2016
NURSA_Human_Endogenous_Complexom
e
Old_CMAP_down
Old_CMAP_up
OMIM_Disease
OMIM_Expanded
Panther_2015
Panther_2016
Pfam_InterPro_Domains
Phosphatase_Substrates_from_DEPOD
PPI_Hub_Proteins
Reactome_2013
Reactome_2015
Reactome_2016
RNA-
Seq_Disease_Gene_and_Drug_Signatures_f
rom_GEO
SILAC_Phosphoproteomics
Single_Gene_Perturbations_from_GEO_do
wn
Single_Gene_Perturbations_from_GEO_up
SysMyo_Muscle_Gene_Sets
TargetScan_microRNA
TargetScan_microRNA_2017
TF-LOF_Expression_from_GEO
TF_Perturbations_Followed_by_Expression
Tissue_Protein_Expression_from_Human_
Proteome_Map
12
Tissue_Protein_Expression_from_Proteomi
csDB
Transcription_Factor_PPIs
TRANSFAC_and_JASPAR_PWMs
Virus_Perturbations_from_GEO_down
Virus_Perturbations_from_GEO_up
VirusMINT
WikiPathways_2013
WikiPathways_2015
WikiPathways_2016

13
ACMG Criteria assignment (refer to S Richards et al - 2015 for a description of the criteria)
Pathogenic Criteria
PVS1
Will be assigned to a variant if it is a stopgain or frameshift deletion/insertion located 50 bp further than
the end of the final exon. (Based on the ExonicFunc column anf the REK_canon library)
Will be assigned to a splicing variant with a dbscSNV score of more than 0.6 (ADA or RF) (Based on the
Func column and the dbscSNV score annotation)
PS1
Will be assigned if a variant have the same AA ref and AA alt as a known pathogenic variant.
Using all known pathogenic variants from clinvar
PS2
Will be assigned if a variant is assumed de novo and parents are disease free. This requires trio data.
PS3
Will be assigned if clinvar classifies the variant as Pathogenic or drug reponse and the level of evidence
is either ‘practice guideline’ or ‘reviewed by expert panel’
PS4
Will be assigned if a variant is enriched in the samples provided. Requires either
‘output_with_samples.csv’ from the annotation to keep sample genotyping data or an annotated multi-
sample vcf. PS4 will take the affected individuals with the mutations and the total number of individuals in
the disease cohort and compare it to the data from gnomad_genome and gnomad_exome.
The number of individuals with and without variants in public data is extrapolated with the following
formula:
Minor allele frequency in control population (MAF) =
Number of individuals with the variant in control population =
Total number of individuals in control population =
Then a fisher’s exact test is performed to calculate the odd ratios, the confidence interval and the p
value.
PS4 will only be considered if at least 2 samples are affected by a variant. Otherwise, Intervar PS4
database, based on GWAS database will be used.
PS4 will be assigned if the Odd Ratio is superior to 20, the confidence interval does not cross one and
the p value is under 0.01
PM1
Will be assigned if the variant is a Missense variant (nonsynonymous SNV) and is located in a in a
domain without benign variants (Using Intervar db) for benign domains
PM2
Will be assigned if the variant is in a recessive gene and has a frequency under 0.005 or is in a dominant
gene and has no frequency data available. Recessive and Dominant/Haploinsufficient genes were
infered using Pli and Prec scores computed by Lek et al, 2016. A gene is considered dominant dominant
with a pli >0.85 and recessive if prec >0.85
PM4
Will be assigned if the variant is an in-frame deletion/insertion in a non-repeat region of the gene. Using
the repeat_dict database.
PM5
Will be assigned if a variant have the same AA ref and a different AA alt as a known pathogenic variant.
Using all known pathogenic variants from clinvar
14
PP2
Will be assigned if the variant is Missense (nonsynonymous SNV) in a gene where missense variants
represents at least 80 percent of all known pathogenic variants (using PP2_BP1 database)
PP3
Will be assigned if the variant is predicted to be pathogenic using various in-silico prediction tools (sift,
lrt, mutationtaster, mutation assessor, fathmm, provean, meta svm, meta lr, mcap, mkl, genocanyon,
gerp)
PP5
Will be assigned the variant is classified as pathogenic or likely pathogenic by clinvar but the evidence is
limited.
Benign criteria
BA1
Will be assigned to a variant if its frequency in gnomad_exome/exac or gnomad_genome is superior to
0.05
BS1
Will be assigned to a variant if its frequency is superior to a cutoff (0.005) for a rare disease.
BS2
Will be assigned if the variant was observed in a healthy individual as homozygous for a recessive
disease and heterozygous for a dominant disease. (Using Intervar db BS2_hom_het)
BS3
Will be assigned if clinvar classifies the variant as Benign or likely benign and the level of evidence is
either ‘practice guideline’ or ‘reviewed by expert panel’
BP1
Will be assigned if the variant is Missense (nonsynonymous SNV) in a gene where missense variants
represents at most 10 percent of all known pathogenic variants (using PP2_BP1 database).
BP3
Will be assigned if the variant is an in-frame deletion/insertion in a repeat region of the gene. (Using the
repeat_dict database).
BP4
Will be assigned if the variant is predicted to be benign using various in-silico prediction tools (sift, lrt,
mutationtaster, mutation assessor, fathmm, provean, meta svm, meta lr, mcap, mkl, genocanyon, gerp)
BP6
Will be assigned the variant is classified as Benign or likely benign by clinvar but the evidence is limited.
BP7
Will be assigned if a variant if synonymous and no splicing impact is predicted by dbscSNV (score under
0.6)
