GDC Data Portal User's Guide TCGA User
User Manual:
Open the PDF directly: View PDF ![]() .
.
Page Count: 114 [warning: Documents this large are best viewed by clicking the View PDF Link!]
- Getting Started
- Projects
- Exploration
- Repository
- Genes and Mutations
- Custom Set Analysis
- Annotations
- Advanced Search
- Authentication
- File Cart
- Legacy Archive
- Release Notes
GDC Data Portal User’s Guide
NCI Genomic Data Commons (GDC)
Contents
1 Getting Started 7
GettingStarted.......................................................... 7
TheGDCDataPortal:AnOverview.............................................. 7
AccessingtheGDCDataPortal................................................. 7
Navigation ............................................................ 8
Views ............................................................ 8
Toolbar ........................................................... 9
Tables ............................................................ 10
TableSort...................................................... 10
TableArrangement................................................. 11
TableSize...................................................... 11
TableExport .................................................... 11
FilteringandSearching .................................................. 11
FacetFilters .................................................... 11
QuickSearch .................................................... 13
AdvancedSearch.................................................. 16
ManageSets .................................................... 16
2 Projects 19
Projects.............................................................. 19
Summary ............................................................. 19
ProjectsPage........................................................... 19
Visualizations........................................................ 20
Top Mutated Cancer Genes in Selected Projects . . . . . . . . . . . . . . . . . . . . . . . . . . . . . . . . 21
CaseDistributionperProject........................................... 21
ProjectsTable ....................................................... 21
ProjectsGraph ....................................................... 22
FacetsPanel......................................................... 22
ProjectSummaryPage...................................................... 24
MostFrequentlyMutatedGenes ............................................. 24
SurvivalAnalysis...................................................... 26
1
MostFrequentMutations ................................................. 27
MostAffectedCases .................................................... 28
3 Exploration 30
Exploration............................................................ 30
Filters/Facets.......................................................... 30
CaseFilters......................................................... 31
UploadCaseSet .................................................. 33
GeneFilters......................................................... 35
UploadGeneSet.................................................. 37
MutationFilters ...................................................... 37
UploadMutationSet................................................ 39
Results .............................................................. 41
Cases ........................................................ 41
Genes ........................................................ 43
Mutations...................................................... 44
OncoGrid ...................................................... 46
OncoGridOptions ................................................. 48
FileNavigation....................................................... 48
4 Repository 50
Repository ............................................................ 50
Summary ............................................................. 50
Filters/Facets.......................................................... 50
FacetsPanel......................................................... 51
AddingCustomFacets................................................... 53
FilesList .......................................................... 54
CasesList.......................................................... 56
Navigation ............................................................ 57
CaseSummaryPage....................................................... 58
ClinicalandBiospecimenInformation .......................................... 59
BiospecimenSearch .................................................... 60
MostFrequentSomaticMutations ............................................ 61
FileSummaryPage ....................................................... 62
BAMSlicing ........................................................ 63
2
5 Genes and Mutations 64
GeneandMutationSummaryPages .............................................. 64
GeneSummaryPage....................................................... 64
Summary .......................................................... 64
ExternalReferences .................................................... 65
CancerDistribution .................................................... 65
ProteinViewer ....................................................... 66
MostFrequentMutations ................................................. 66
MutationSummaryPage .................................................... 67
Summary .......................................................... 67
ExternalReferences ................................................ 67
Consequences........................................................ 67
CancerDistribution .................................................... 68
ProteinViewer ....................................................... 70
6 Custom Set Analysis 71
CustomSetAnalysis....................................................... 71
GeneratingaCohortforAnalysis................................................ 71
AnalysisPage........................................................... 72
AnalysisPage:SetOperations ................................................. 72
AnalysisTab:CohortComparison ............................................... 73
AnalysisPage:Results...................................................... 74
7 Annotations 76
Annotations............................................................ 76
AnnotationsView ........................................................ 76
FacetsPanel......................................................... 77
Annotation Categories and Classification . . . . . . . . . . . . . . . . . . . . . . . . . . . . . . . . . . . . 77
AnnotationDetailPage ..................................................... 77
8 Advanced Search 79
AdvancedSearch ......................................................... 79
Overview:GQL.......................................................... 79
Switching between Advanced Search and Facet Filters . . . . . . . . . . . . . . . . . . . . . . . . . . . . . . . . . 80
UsingtheAdvancedSearch ................................................... 81
Auto-complete ....................................................... 81
FieldAuto-complete ................................................ 81
ValueAuto-complete.................................................... 81
SettingPrecedenceofOperators ................................................ 82
Keywords ............................................................. 82
3
ANDKeyword ....................................................... 82
ORKeyword ........................................................ 83
Operators............................................................. 83
ListofOperatorsandQueryformat ........................................... 83
“=”operator-EQUAL .................................................. 83
“!=”operator-NOTEQUAL............................................... 83
“>”operator-GREATERTHAN ............................................ 84
“>=” operator - GREATER THAN OR EQUALS . . . . . . . . . . . . . . . . . . . . . . . . . . . . . . . . . . . 84
“<”operator-LESSTHAN................................................ 84
“<=”operator-LESSTHANOREQUALS ...................................... 84
“IN”Operator ....................................................... 84
“EXCLUDE”Operator................................................... 85
“ISMISSING”Operator.................................................. 85
“NOTMISSING”Operator ................................................ 85
SpecialCases ........................................................... 85
Dateformat......................................................... 85
UsingQuotes ........................................................ 86
AgeatDiagnosis-UnitinDays.............................................. 86
FieldsReference ......................................................... 86
Files ............................................................. 86
Cases ............................................................ 87
9 Authentication 89
Authentication .......................................................... 89
Overview ............................................................. 89
LoggingintotheGDC...................................................... 89
UserProfile............................................................ 91
GDCAuthenticationTokens................................................... 91
LoggingOut ........................................................... 92
10 File Cart 93
CartandFileDownload..................................................... 93
Overview ............................................................. 93
GDCCart............................................................. 93
CartSummary ....................................................... 93
CartItems ......................................................... 94
DownloadOptions ........................................................ 94
GDCDataTransferTool ................................................. 95
IndividualFilesDownload................................................. 95
ControlledFiles.......................................................... 95
4
11 Legacy Archive 97
LegacyArchive.......................................................... 97
Overview ............................................................. 97
FilePage .......................................................... 98
Archive ....................................................... 99
Metadatafiles.................................................... 99
FileCart .......................................................... 99
12 Release Notes 100
DataPortalReleaseNotes.................................................... 100
Release1.11.0........................................................... 100
NewFeaturesandChanges ................................................ 100
BugsFixedSinceLastRelease .............................................. 100
KnownIssuesandWorkarounds.............................................. 100
Release1.10.0........................................................... 101
NewFeaturesandChanges ................................................ 101
BugsFixedSinceLastRelease .............................................. 101
KnownIssuesandWorkarounds.............................................. 102
Release1.9.0 ........................................................... 102
NewFeaturesandChanges ................................................ 102
BugsFixedSinceLastRelease .............................................. 102
KnownIssuesandWorkarounds.............................................. 103
Release1.8.0 ........................................................... 103
NewFeaturesandChanges ................................................ 103
BugsFixedSinceLastRelease .............................................. 104
KnownIssuesandWorkarounds.............................................. 104
Release1.6.0 ........................................................... 105
NewFeaturesandChanges ................................................ 105
BugsFixedSinceLastRelease .............................................. 105
KnownIssuesandWorkarounds.............................................. 105
Release1.5.2 ........................................................... 106
NewFeaturesandChanges ................................................ 106
BugsFixedSinceLastRelease .............................................. 106
KnownIssuesandWorkarounds.............................................. 106
Release1.4.1 ........................................................... 107
NewFeaturesandChanges ................................................ 107
BugsFixedSinceLastRelease .............................................. 107
KnownIssuesandWorkarounds.............................................. 108
Release1.3.0 ........................................................... 108
5
NewFeaturesandChanges ................................................ 108
BugsFixedSinceLastRelease .............................................. 109
KnownIssuesandWorkarounds.............................................. 109
Release1.2.0 ........................................................... 109
NewFeaturesandChanges ................................................ 110
BugsFixedSinceLastRelease .............................................. 110
Release1.1.0 ........................................................... 111
NewFeaturesandChanges ................................................ 111
BugsFixedSinceLastRelease .............................................. 111
KnownIssuesandWorkarounds.............................................. 111
Release1.0.1 ........................................................... 112
NewFeaturesandChanges ................................................ 112
BugsFixedSinceLastRelease .............................................. 112
KnownIssuesandWorkarounds.............................................. 112
6
Chapter 1
Getting Started
Getting Started
The GDC Data Portal: An Overview
The Genomic Data Commons (GDC) Data Portal provides users with web-based access to data from cancer genomics studies.
Key GDC Data Portal features include:
•Open, granular access to information about all datasets available in the GDC
•Advanced search and visualization-assisted filtering of data files
•
Data visualization tools to support the analysis and exploration of data (including on a gene and mutation level from
Open-Access MAF files)
•Cart for collecting data files of interest
•Authentication using eRA Commons credentials for access to controlled data files
•Secure data download directly from the cart or using the GDC Data Transfer Tool
For more information about available datasets, see the GDC Website.
Accessing the GDC Data Portal
The GDC Data Portal is accessible using a web browser such as Chrome, Internet Explorer, and Firefox at the following URL:
https://portal.gdc.cancer.gov
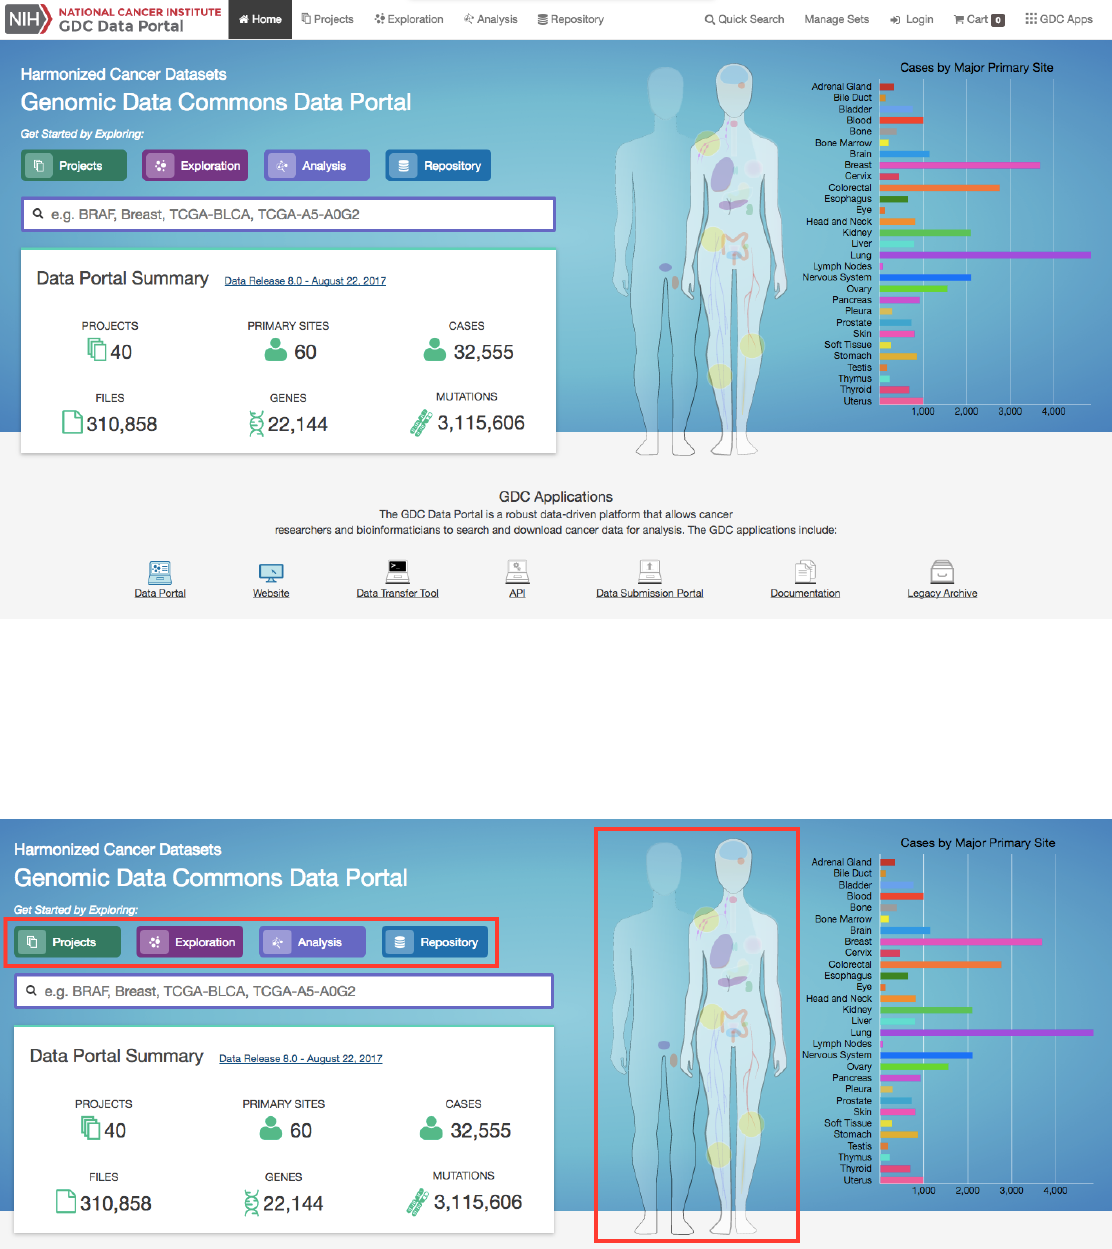
The front page displays a summary of all available datasets:
7
Navigation
Views
The GDC Data Portal provides five navigation options (Views) for browsing available harmonized datasets:
•Projects
: The Projects link directs users to the Projects Page, which gives an overall summary of project-level information,
including the available data for each project.
•Exploration
: The Exploration link takes users to the Exploration Page, which allows users to explore data by utilizing
various case, genes and mutation filters.
8
•Analysis
: The Analysis link directs users to the Analysis Page. This page has features available for users to compare
different cohorts. These cohorts can either be generated with existing filters (e.g. males with lung cancer) or through custom
selection.
•Repository
: The Repository link directs users to the Repository Page. Here users can see the data files available for
download at the GDC and apply file/case filters to narrow down their search.
•Human Outline
: The home page displays a human anatomical outline that can be used to refine their search. Choosing
an associated organ will direct the user to a listing of all projects associated with that primary site. For example, clicking
on the human brain will show only cases and projects associated with brain cancer (TCGA-GBM and TCGA-LGG). The
number of cases associated with each primary site is also displayed here and separated by project.
Each view provides a distinct representation of the same underlying set of GDC data and metadata. The GDC also provides
access to certain unharmonized data files generated by GDC-hosted projects. These files and their associated metadata are not
represented in the views above; instead they can be found in the GDC Legacy Archive.
The Projects, Exploration, Analysis and Repository pages can be accessed from the GDC Data Portal front page and from the
toolbar (see below). The annotations view is accessible from Repository view. A link to the GDC Legacy Archive is available on
the GDC Data Portal front page and in the GDC Apps menu (see below).
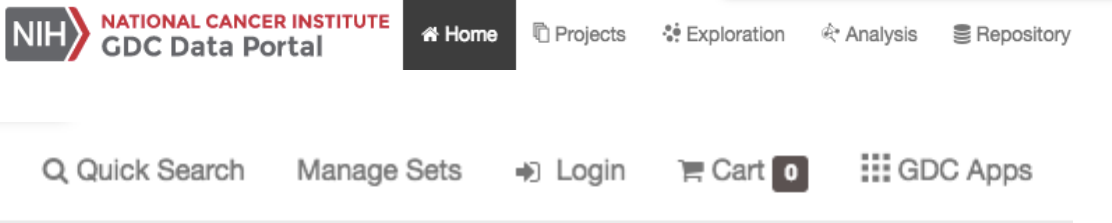
Toolbar
The toolbar available at the top of all pages in the GDC Data Portal provides convenient navigation links and access to
authentication and quick search.
The left portion of this toolbar provides access to the Home Page,
Projects Page
,
Exploration Page
,
Analysis Page
, and a
link to Repository Page:
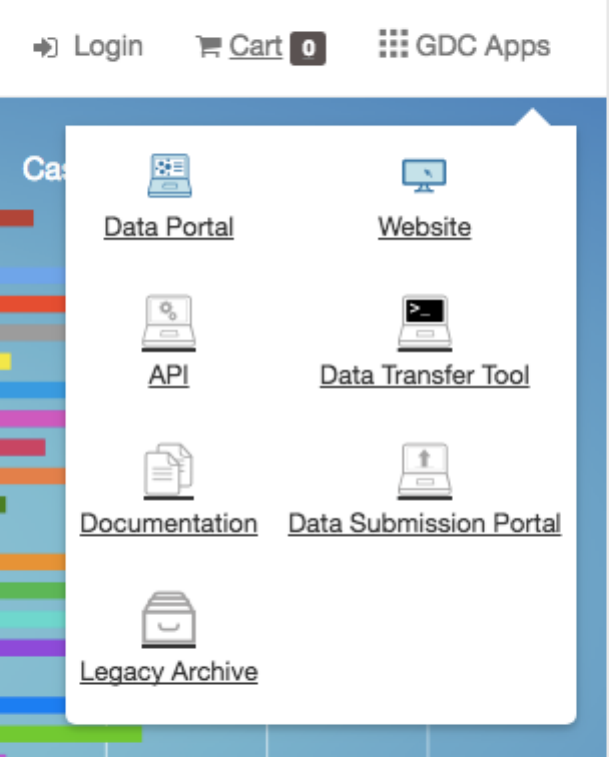
The right portion of this toolbar provides access to quick search, the cart, and the GDC Apps menu:
The GDC Apps menu provides links to all resources provided by the GDC, including the GDC Legacy Archive.
9
Tables
Tabular listings are the primary method of representing available data in the GDC Data Portal. Tables are available in all views
and in the file cart. Users can customize each table by specifying columns, size, and sorting.
Table Sort
The sort table button is available in the top right corner of each table. To sort by a column, place a checkmark next to it and
select the preferred sort direction. If multiple columns columns are selected for sorting, data is sorted column-by-column in the
order that columns appear in the sort menu: the topmost selected column becomes the primary sorting parameter; the selected
column below it is used for secondary sort, etc.
10
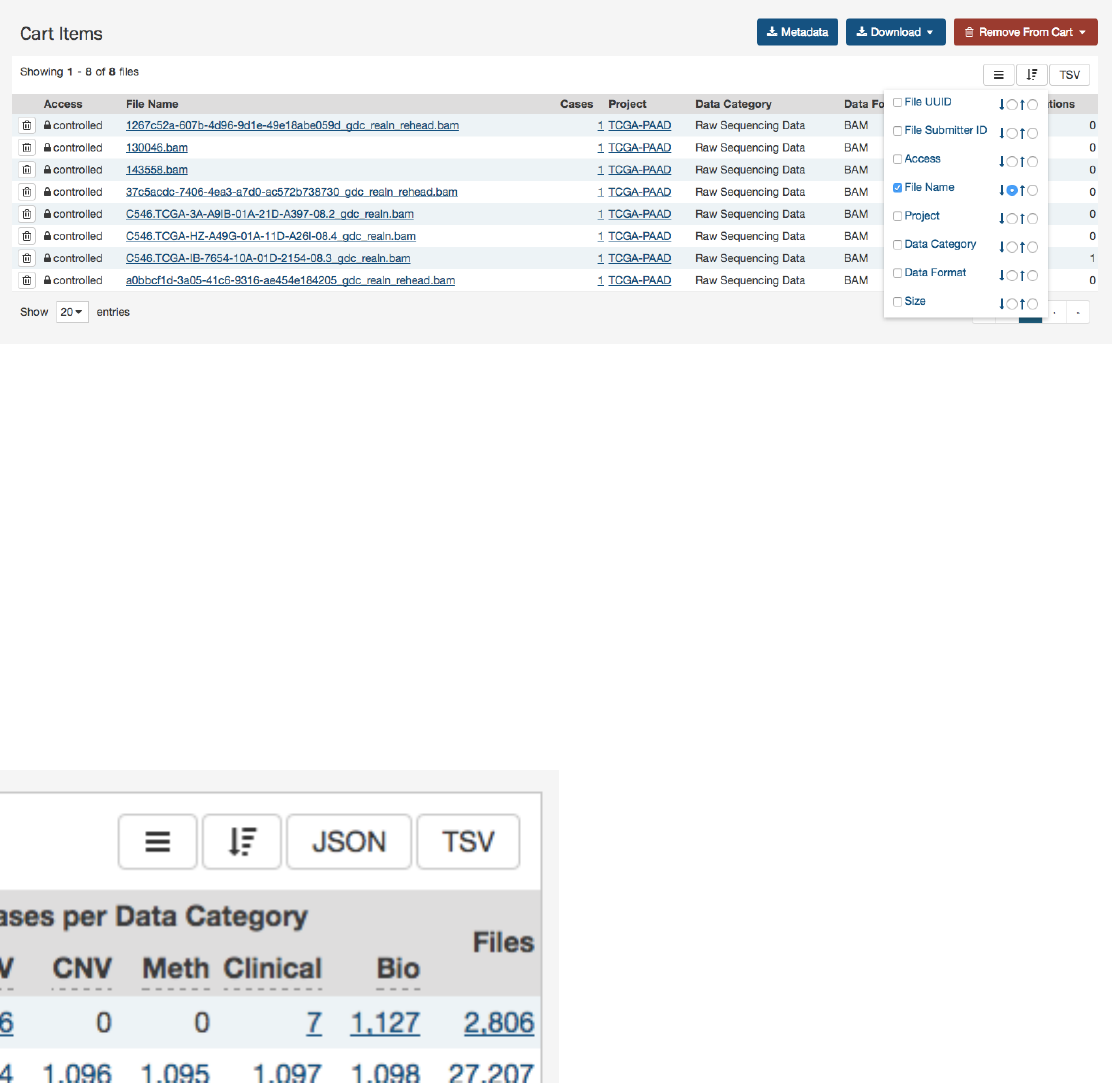
Table Arrangement
The arrange columns button allows users to adjust the order of columns in the table and select which columns are displayed.
Table Size
Table size can be adjusted using the menu in the bottom left corner of the table. The menu sets the maximum number of rows to
display. If the number of entries to be displayed exceeds the maximum number of rows, then the table will be paginated, and
navigation buttons will be provided in the bottom right corner of the table to navigate between pages.
Table Export
In the Repository, Projects, and Annotations views, tables can be exported in either a JSON or TSV format. The JSON button
will export the entire table’s contents into a JSON file. The
TSV
button will export the current view of the table into a TSV file.
Filtering and Searching
The GDC Data Portal offers three different means of searching and filtering the available data: facet filters, quick search, and
advanced search.
Facet Filters
Facets on the left of each view (Projects, Exploration, and Repository) represent properties of the data that can be used for
filtering. Some of the available facets are project name, disease type, patient gender and age at diagnosis, and various data
11
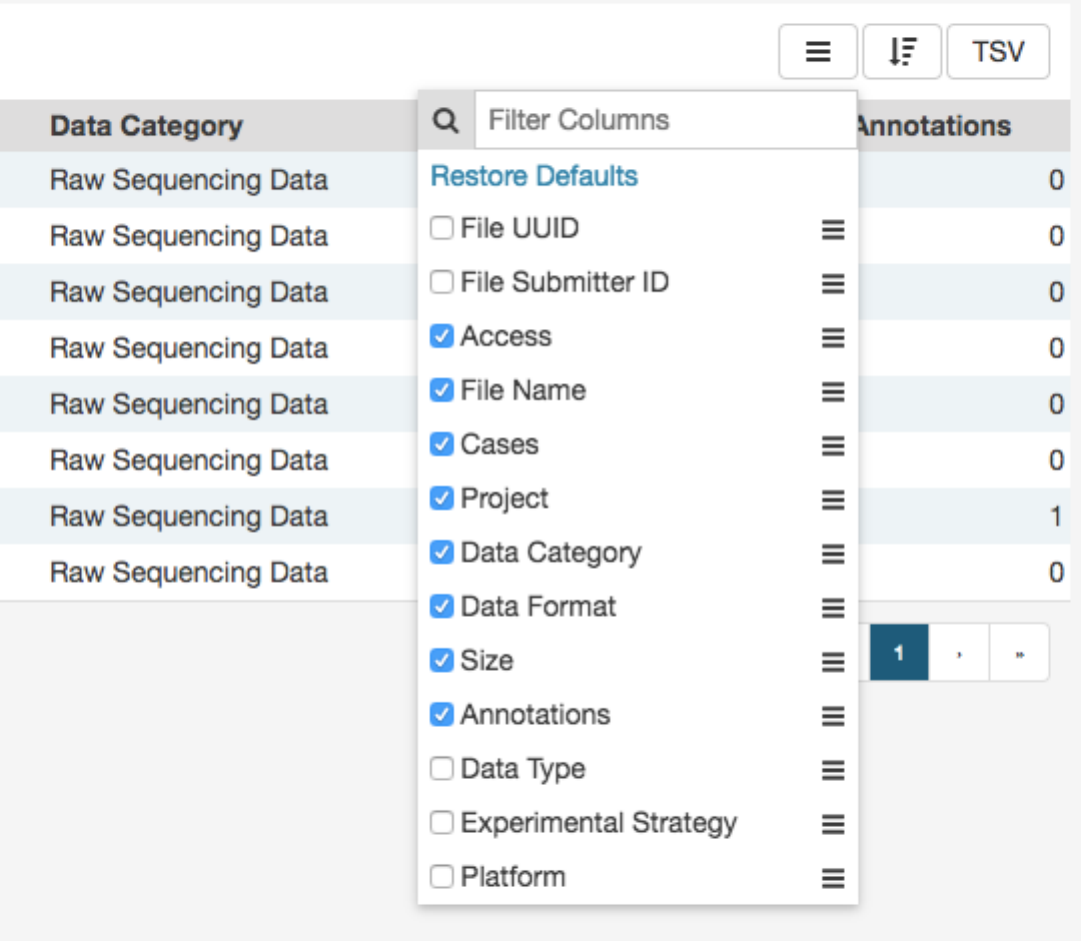
Figure 1.1: Selecting table columns
12
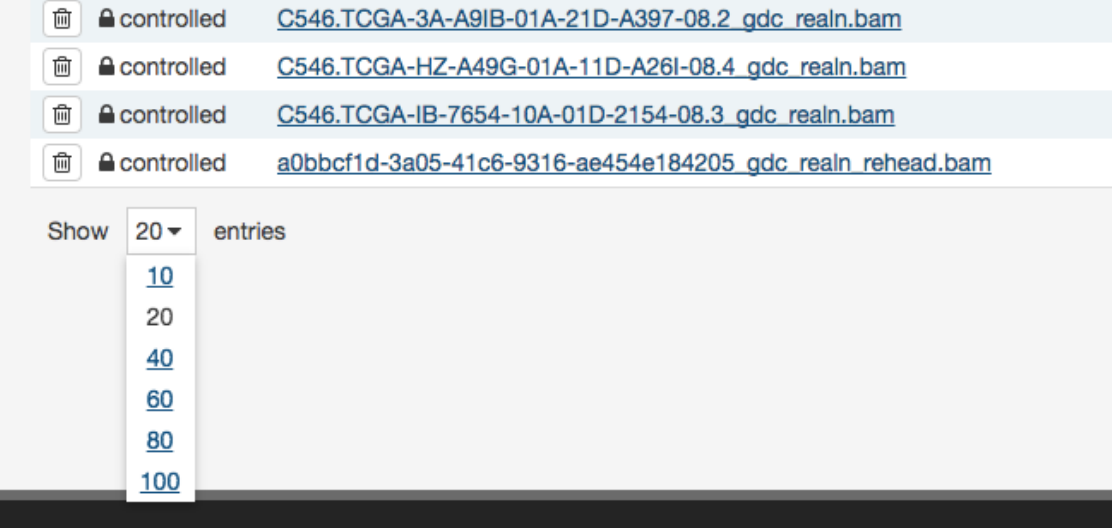
Figure 1.2: Specifying table size
formats and categories. Each facet displays the name of the data property, the available values, and numbers of matching entities
for each value (files, cases, mutations, genes, annotations, or projects, depending on the context).
Below are two file facets available in the Repository view. A Data Type facet filter is applied, filtering for “Aligned Reads” files.
Multiple selections within a facet are treated as an “OR” query: e.g. “Aligned Reads” OR “Annotated Somatic Mutation”.
Selections in different facets are treated as “AND” queries: e.g. Data Type: “Aligned Reads” AND Experimental Strategy:
“RNA-Seq”.
The information displayed in each facet reflects this: in the example above, marking the “Aligned Reads” checkbox does not
change the numbers or the available values in the Data Type facet where the checkbox is found, but it does change the values
available in the Experimental Strategy facet. The Experimental Strategy facet now displays only values from files of Data Type
“Aligned Reads”.
Custom facet filters can be added in Repository View to expand the GDC Data Portal’s filtering capabilities.
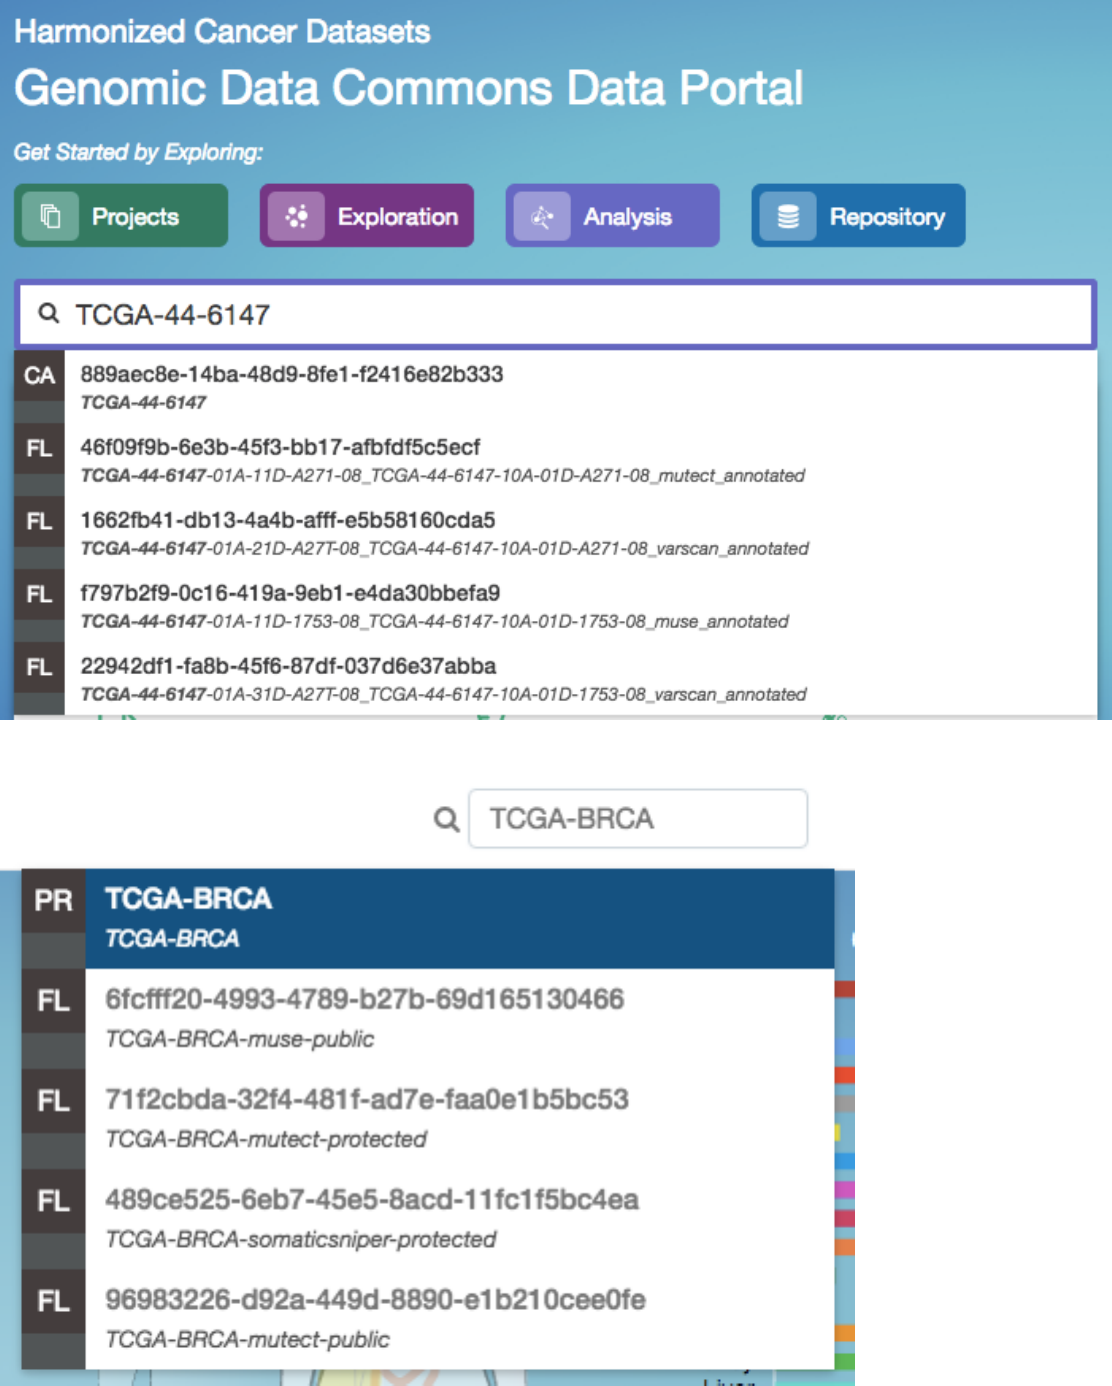
Quick Search
The quick search feature allows users to find cases, files, mutations, or genes using a search query (i.e. UUID, filename, gene
name, DNA Change, project name, id, disease type or primary site). Quick search is available by clicking on the magnifier in the
right section of the toolbar (which appears on every page) or by using the search bar on the Home Page.
13
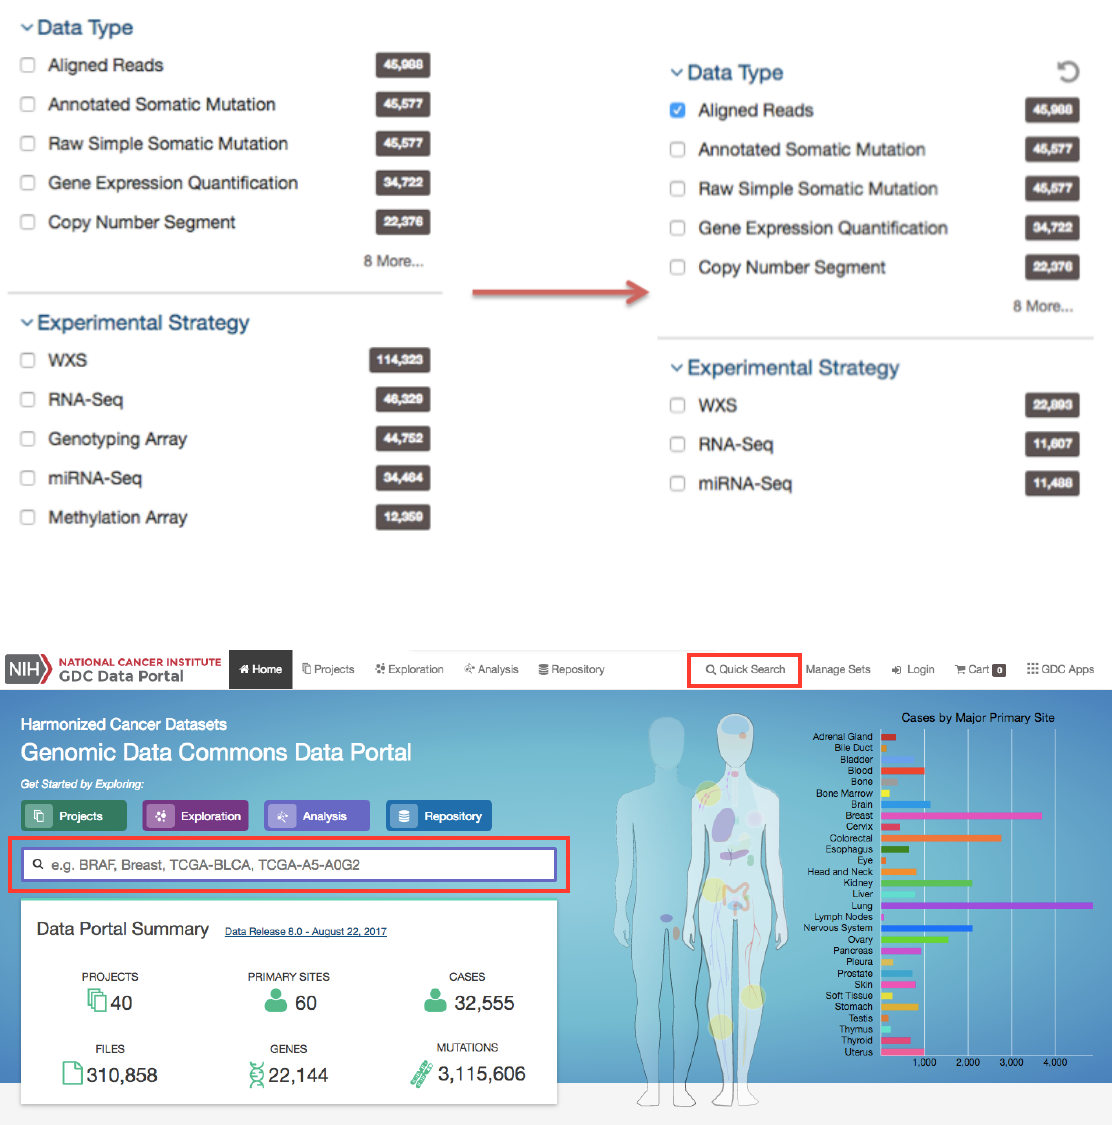
Figure 1.3: Facets (no filter applied)
Search results are displayed as the user is typing, with labels indicating the type of each search result in the list (project, case,
or file). Users users will see a brief description of the search results, which may include the UUID, submitter ID, or file name.
Clicking on a selected result or pressing enter will open a detail page with additional information.
Home Page Quick Search:
14
Advanced Search
Advanced Search is available in Repository View. It allows users to construct complex queries with a custom query language and
auto-complete suggestions. See Advanced Search for details.
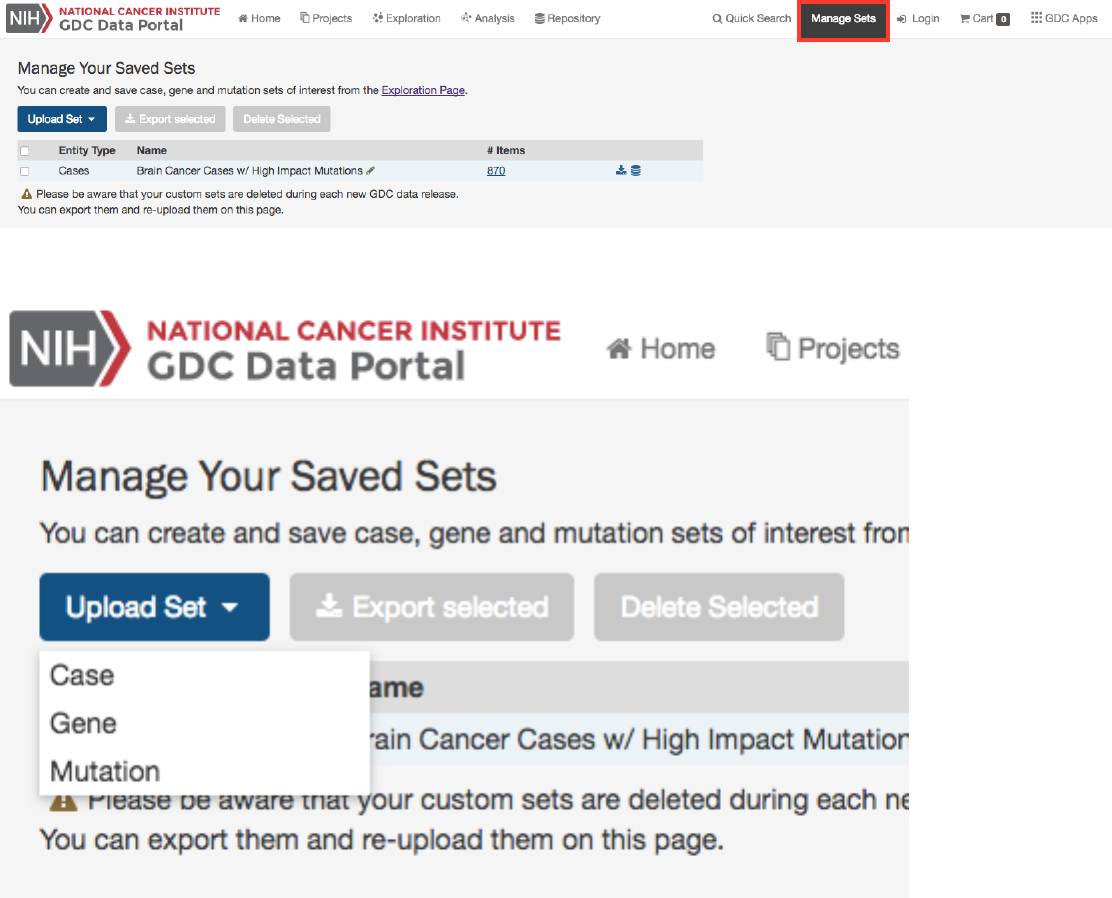
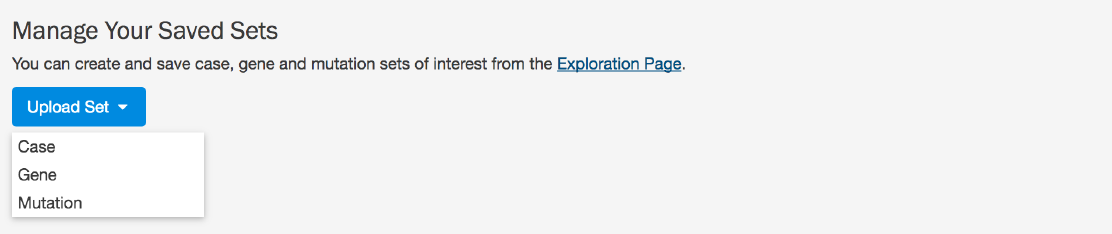
Manage Sets
The
Manage Sets
button at the top of the GDC Portal stores sets of cases, genes, or mutations of interest. On this page, users
can review the sets that have been saved as well as upload new sets and delete existing sets.
Upload Sets Clicking the Upload Set button shows options for creating Case, Gene, or Mutation sets.
Upon clicking one of the menu items, users are shown a dialog where they can enter unique identifiers (i.e. UUIDs, TCGA
Barcodes, gene symbols, mutation UUIDs, etc.) that describe the set.
16
A text file containing the UUID of each case, gene or mutation is downloaded after clicking this button.
Review Sets There are a few buttons in the list of sets that allows a user to get further information about each one.
•
__ Items__: Clicking the link under the Items column navigates the user to the Exploration page using the set as a filter.
•Download/View: To the right of the Items column are buttons that will download the list as a tsv or open the cases in
the Repository page.
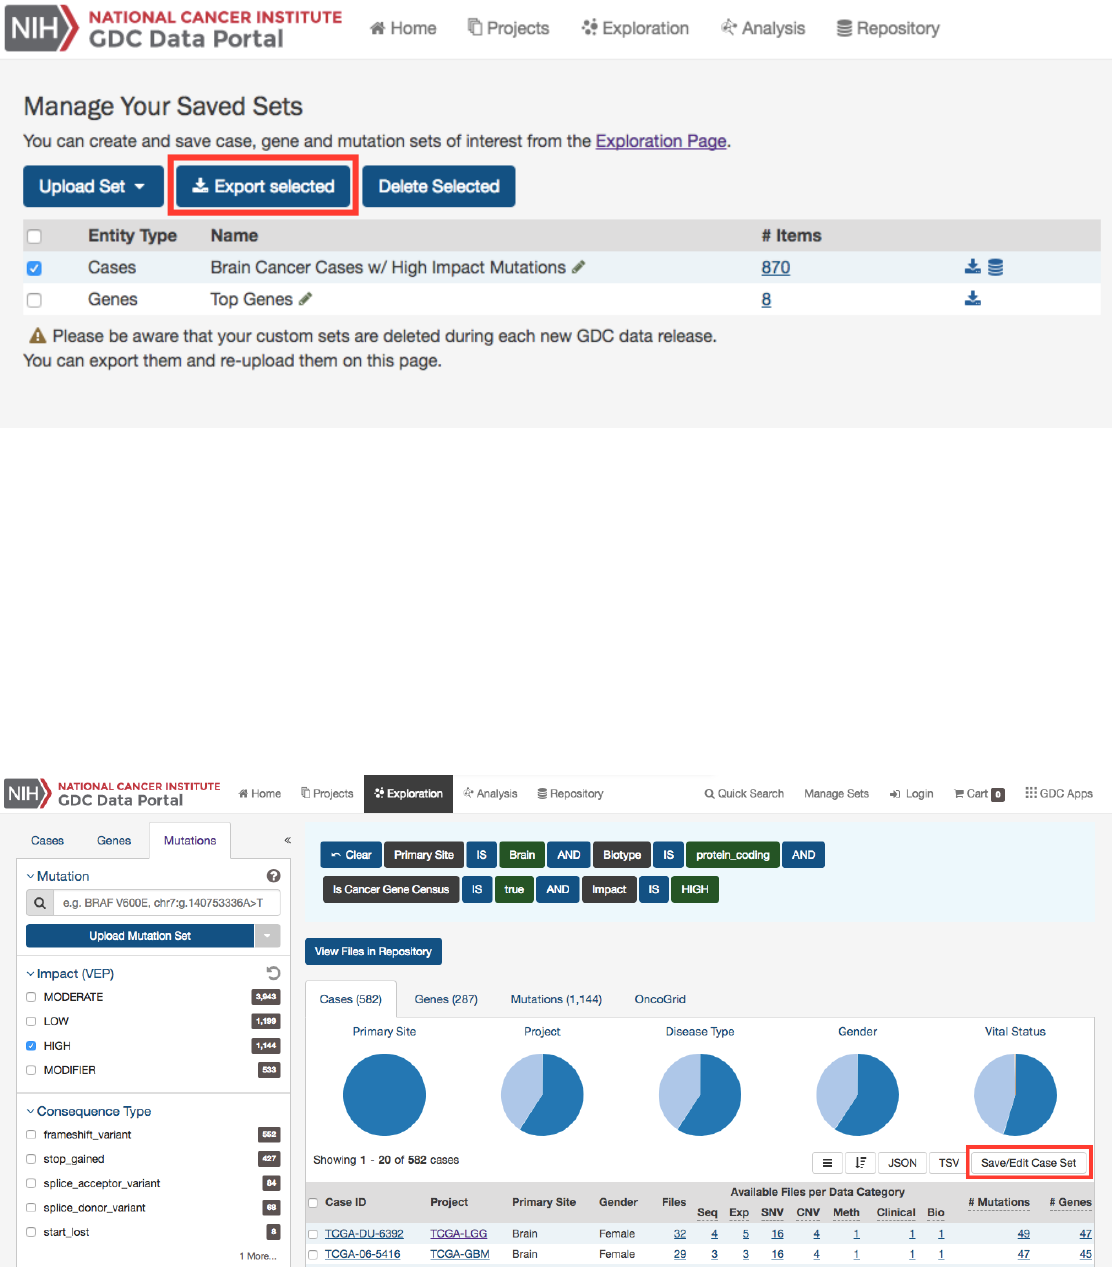
Creating Sets from GDC Portal Filters
Many pages on the GDC Portal have an option called
Save Sets
that allows
users to save a group of cases, mutations, or genes for further analysis. After using the filtering options on the
Exploration
page
as an example, users can click the Save Case/Gene/Mutation Set button to save this set.
18
Chapter 2
Projects
Projects
Summary
At a high level, data in the Genomic Data Commons is organized by project. Typically, a project is a specific effort to look at
particular type(s) of cancer undertaken as part of a larger cancer research program. The GDC Data Portal allows users to access
aggregate project-level information via the Projects Page and Project Summary pages.
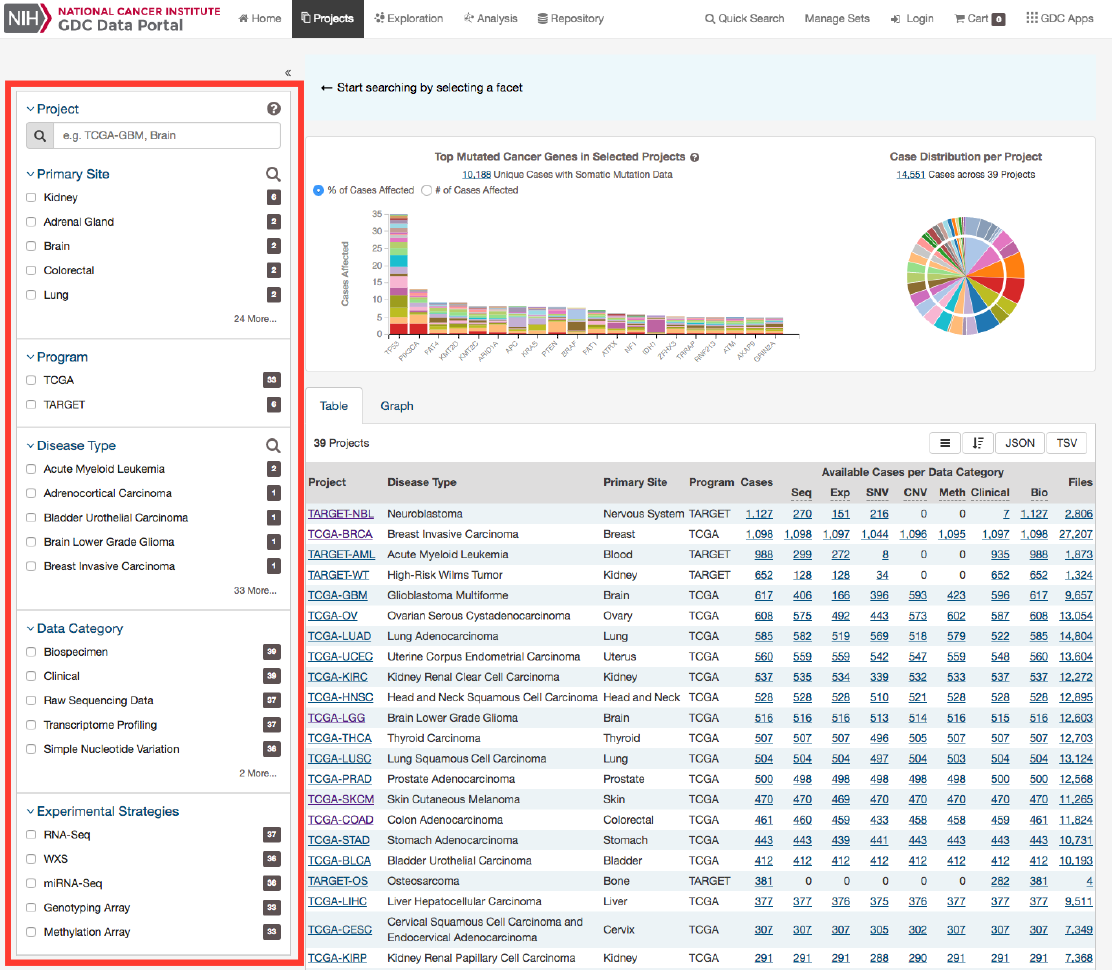
Projects Page
The Projects Page provides an overview of all harmonized data available in the Genomic Data Commons, organized by project.
It also provides filtering, navigation, and advanced visualization features that allow users to identify and browse projects of
interest. Users can access Projects Page from the GDC Data Portal Home page, from the Data Portal toolbar, or directly at
https://portal.gdc.cancer.gov/projects.
On the left, a panel of facets allow users to apply filters to find projects of interest. When facet filters are applied, the table
and visualizations on the right are updated to display only the matching projects. When no filters are applied, all projects are
displayed.
The right side of this page displays a few visualizations of the data (Top Mutated Genes in Selected Projects and Case Distribution
per Project). Below these graphs is a table that contains a list of projects and select details about each project, such as the
number of cases and data files. The Graph tab provides a visual representation of this information.
19
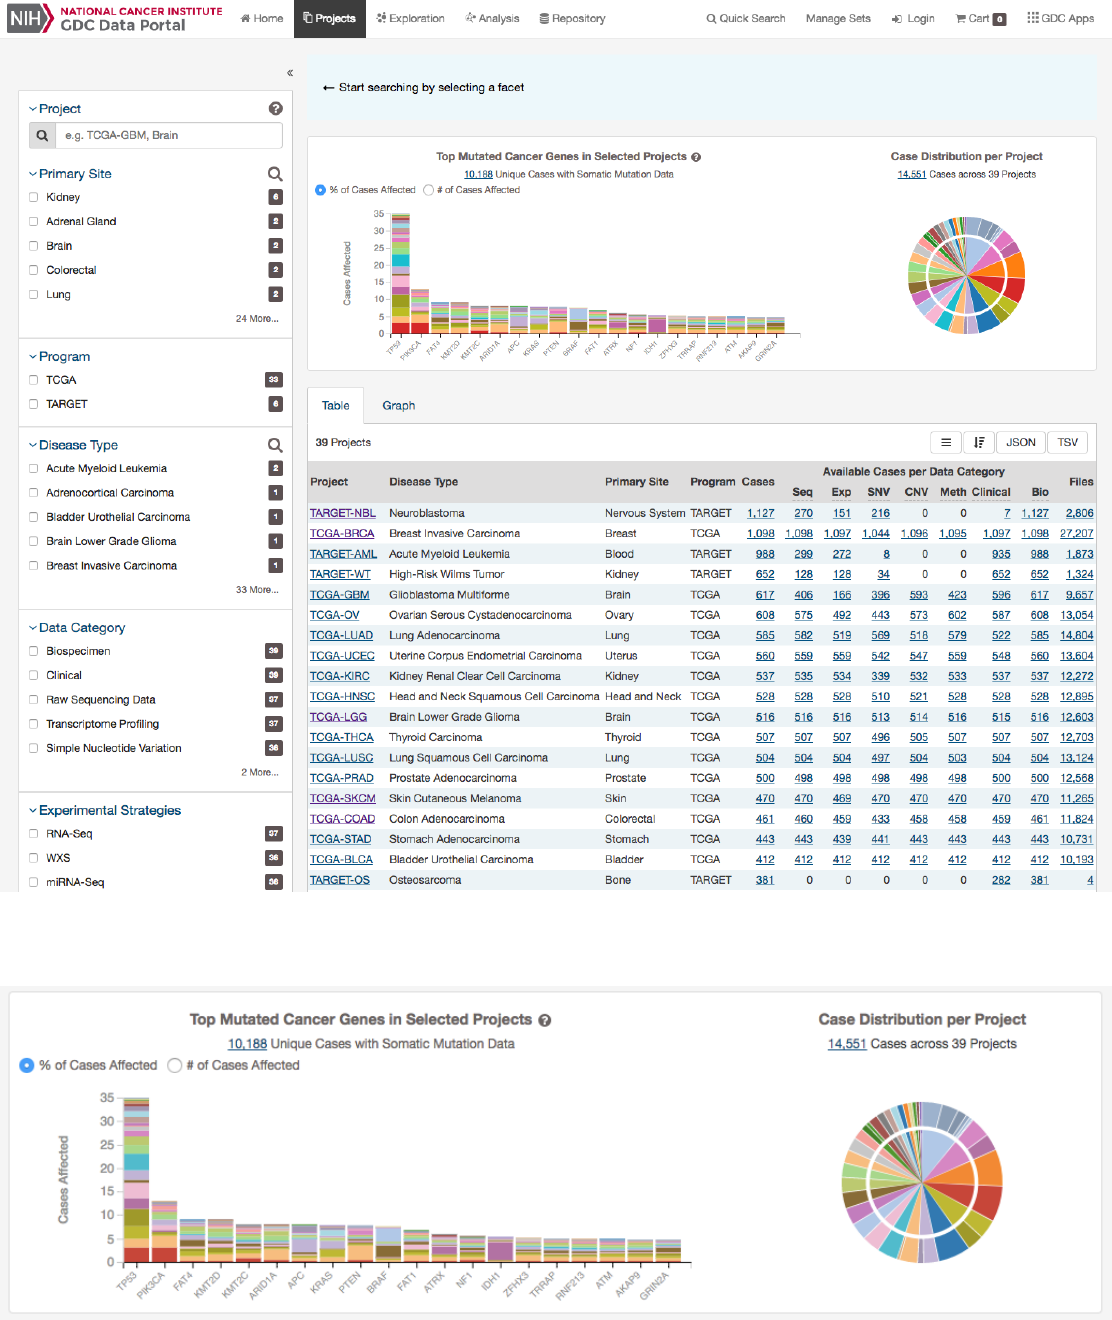
Top Mutated Cancer Genes in Selected Projects
This dynamically generated bar graph shows the 20 genes with the most mutations across all projects. The genes are filtered
by those that are part of the Cancer Gene Census and that have the following types of mutations:
missense_variant,
frameshift_variant, start_lost, stop_lost, initiator_codon_variant, and stop_gained
. The bars represent the fre-
quency of each mutation and is broken down into different colored segments by project and disease type. The graphic is updated
as filters are applied for projects, programs, disease types, and data categories available in the project. Note, that due the these
filters the number of cases displayed here will be less that the total number of cases per project.
Hovering the cursor over each bar will display information about the number of cases affected by the disease type and clicking on
each bar will launch the Gene Summary Page page for the gene associated with the mutation.
Users can toggle the Y-Axis of this bar graph between a percentage or raw number of cases affected.
Case Distribution per Project
A pie chart displays the relative number of cases for each primary site (inner circle), which is further divided by project (outer
circle). Hovering the cursor over each portion of the graph will display the primary site or project with the number of associated
cases. Filtering projects at the left panel will update the pie chart.
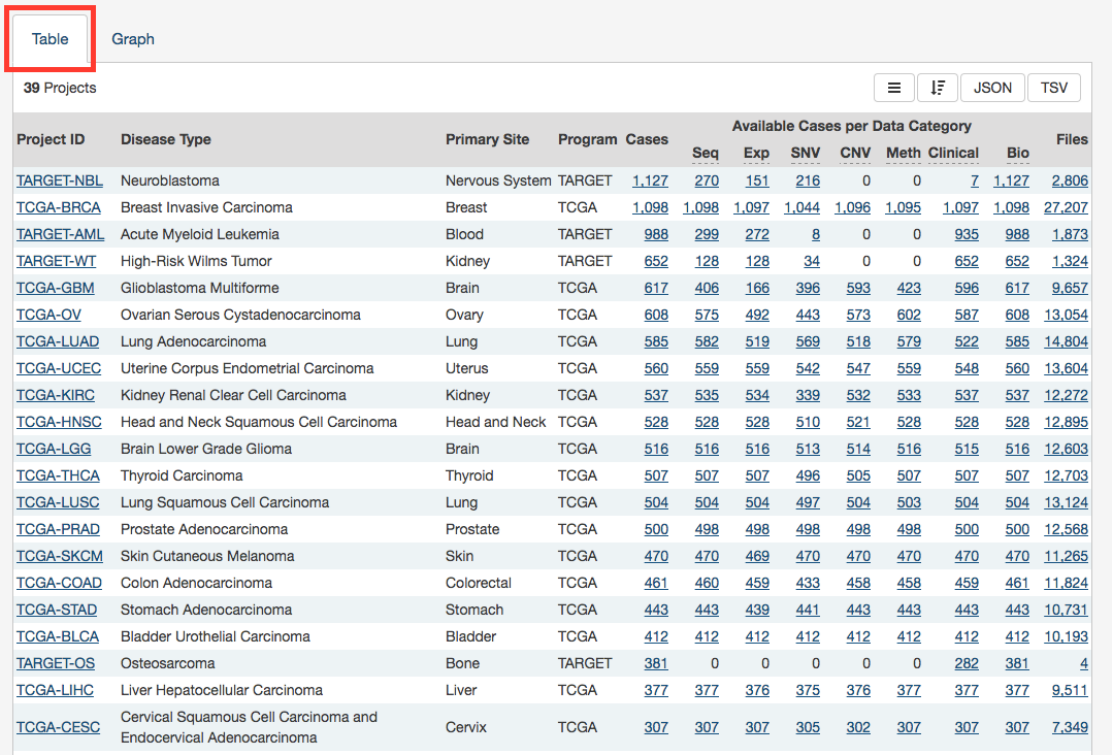
Projects Table
The
Table
tab lists projects by Project ID and provides additional information about each project. If no facet filters have been
applied, the table will display all available projects; otherwise it will display only those projects that match the selected criteria.
21
The table provides links to Project Summary pages in the Project ID column. Columns with file and case counts include links to
open the corresponding files or cases in Repository Page.
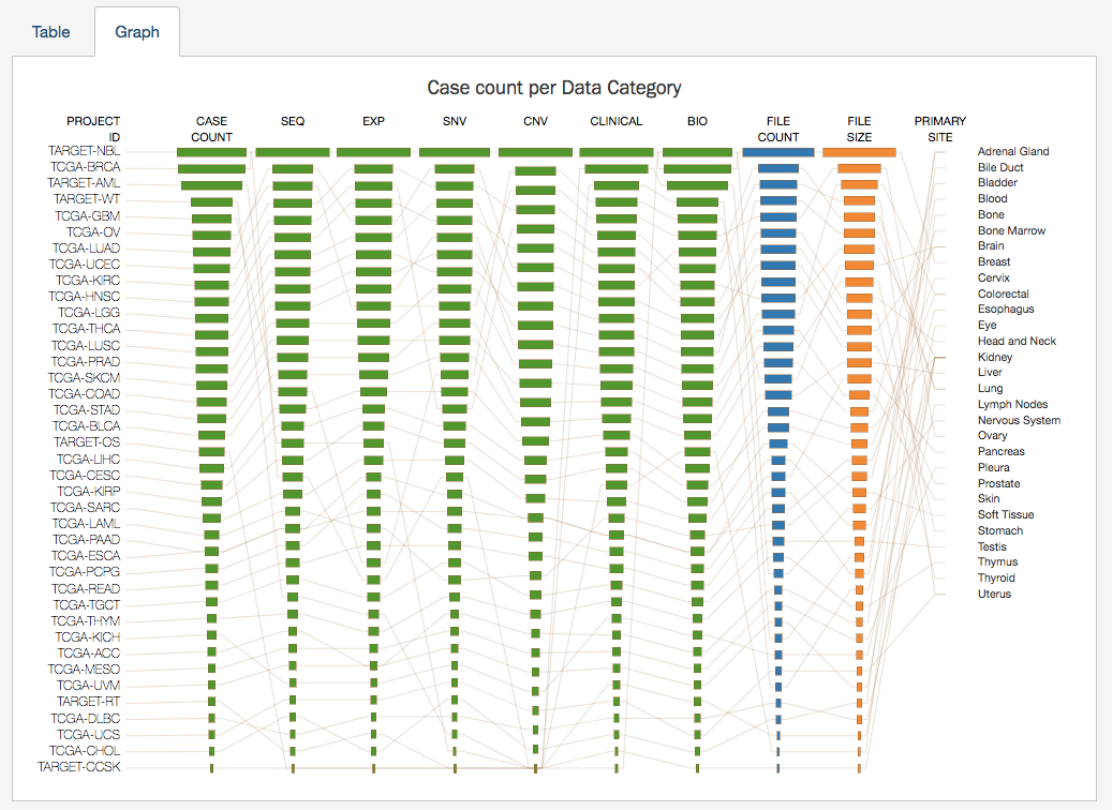
Projects Graph
The
Graph
tab contains an interactive view of information in the Table tab. The numerical values in Case Count, File Count,
and File Size columns are represented by bars of varying length according to size. These columns are sorted independently in
descending order. Mousing over an element of the graph connects it to associated elements in other columns, including Project ID
and Primary Site
Most elements in the graph are clickable, allowing the user to open the associated cases or files in Repository Page.
Like the projects table, the graph will reflect any applied facet filters.
Facets Panel
Facets represent properties of the data that can be used for filtering. The facets panel on the left allows users to filter the projects
presented in the Table and Graph tabs as well as visualizations.
22
Users can filter by the following facets:
•Project: Individual project ID
•Primary Site: Anatomical site of the cancer under investigation or review
•Program: Research program that the project is part of
•Disease Type: Type of cancer studied
•Data Category: Type of data available in the project
•Experimental Strategy: Experimental strategies used for molecular characterization of the cancer
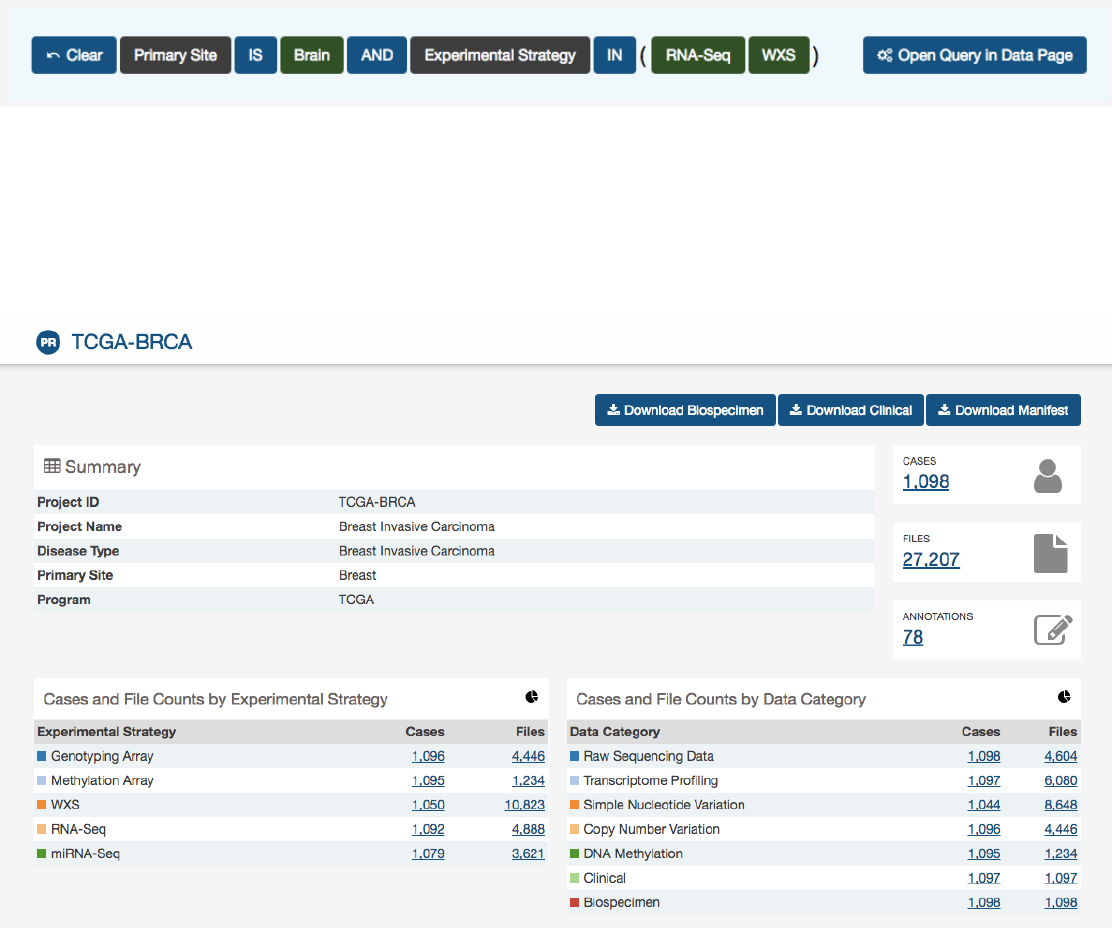
Filters can be applied by selecting values of interest in the available facets, for example “WXS” and “RNA-Seq” in the
“Experimental Strategy” facet and “Brain” in the “Primary Site” facet. When facet filters are applied, the Table and Graph tabs
are updated to display matching projects, and the banner above the tabs summarizes the applied filters. The banner allows the
user to click on filter elements to remove the associated filters, and includes a link to view the matching cases and files.
23
For information on how to use facet filters, see Getting Started.
Project Summary Page
Each project has a summary page that provides an overview of all available cases, files, and annotations available. Clicking on the
numbers in the summary table will display the corresponding data.
Three download buttons in the top right corner of the screen allow the user to download the entire project dataset, along with
the associated project metadata:
•Download Biospecimen: Downloads biospecimen metadata associated with all cases in the project.
•Download Clinical: Downloads clinical metadata about all cases in the project.
•Download Manifest
: Downloads a manifest for all data files available in the project. The manifest can be used with the
GDC Data Transfer Tool to download the files.
Most Frequently Mutated Genes
The Project Summary page also reports the genes that have somatic mutations in the greatest numbers of cases in a graphical
and tabular format.
24
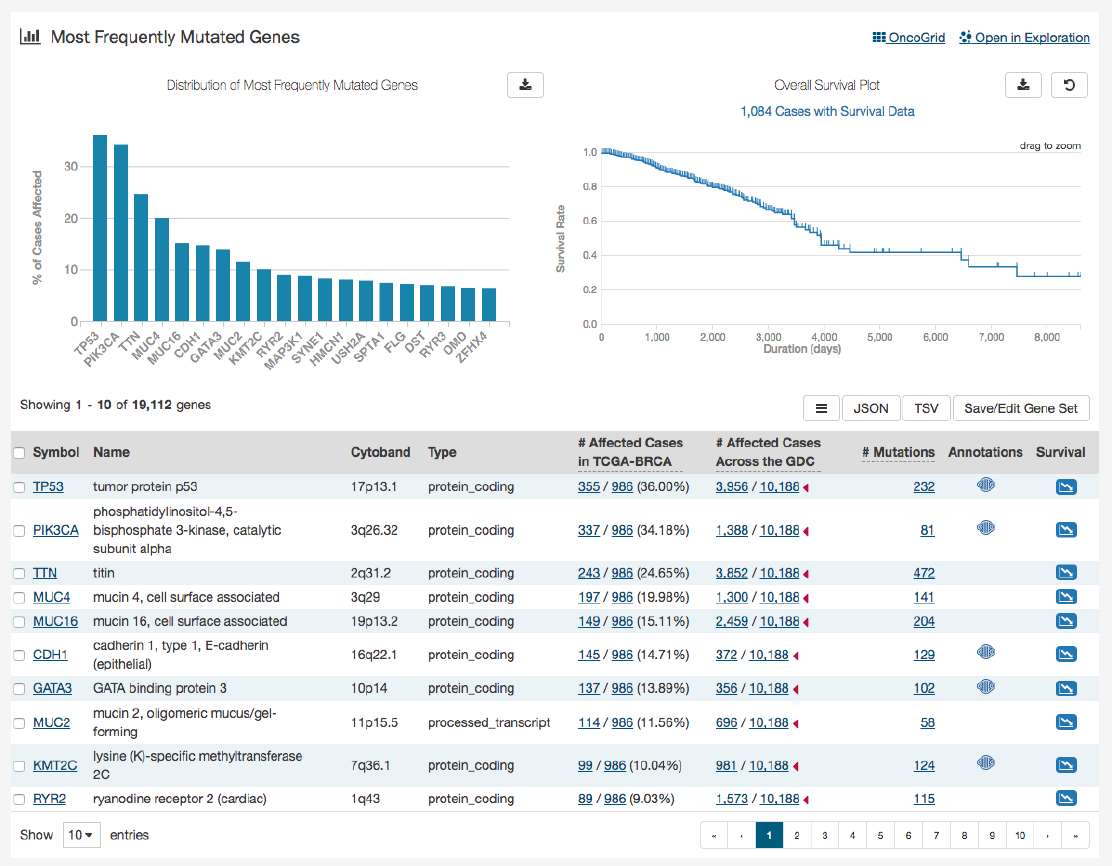
The top of this section contains a bar graph of the most frequently mutated genes as well as a survival plot of all the cases within
the specified project. Hovering over each bar in the plot will display information about the number of cases affected. Users may
choose to download the underlying data in JSON or TSV format or an image of the graph in SVG or PNG format by clicking the
download icon at the top of each graph.
Also at the top of this section are two links:
OncoGrid
and
Open in Exploration
. The
OncoGrid
button will take the user to
the OncoGrid.
Open in Exploration
will take the user to the Exploration page with this filters applied for the current project
selected.
Below these graphs is a tabular view of the genes affected, which includes the following information:
•Symbol: The gene symbol, which links to the Gene Summary Page
•Name: Full name of the gene
•Cytoband: The location of the mutation on the chromosome in terms of Giemsa-stained samples.
•
__ Affected Cases in Project:__ The number of cases within the project that contain a mutation on this gene, which links
to the Cases tab in the Exploration Page
•
__ Affected Cases Across the GDC:__ The number of cases within all the projects in the GDC that contain a mutation on
this gene. Clicking the red arrow will display the cases broken down by project
•
__ Mutations:__ The number of SSMs (simple somatic mutations) detected in that gene, which links to the Mutation tab
in the Exploration Page
•Annotations: Includes a COSMIC symbol if the gene belongs to The Cancer Gene Census
25
•Survival Analysis:
An icon that, when clicked, will plot the survival rate between cases in the project with mutated and
non-mutated forms of the gene
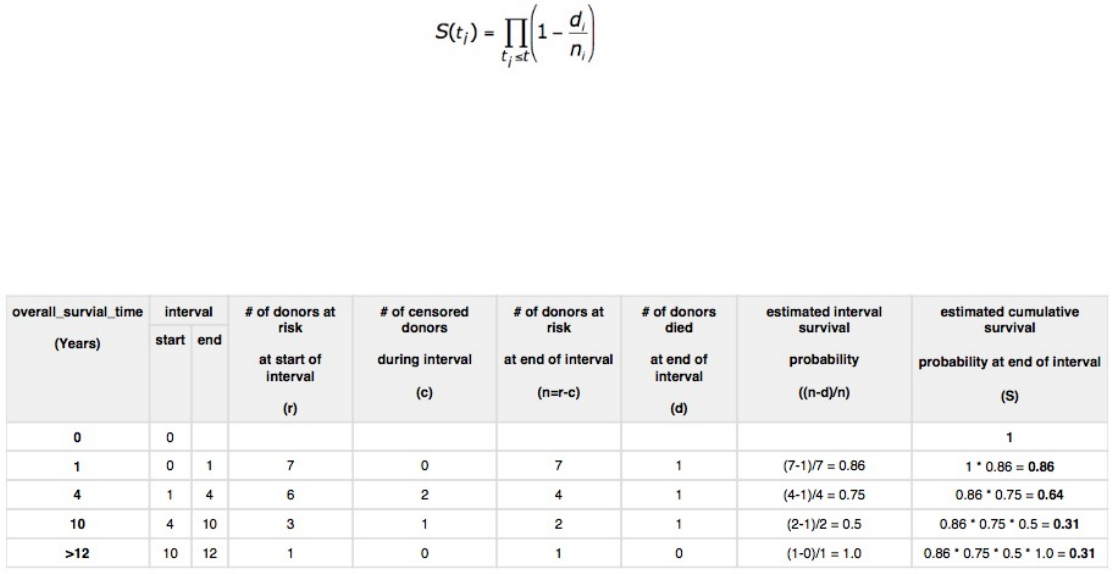
Survival Analysis
Survival analysis is used to analyze the occurrence of event data over time. In the GDC, survival analysis is performed on the
mortality of the cases. Survival analysis requires:
•Data on the time to a particular event (days to death or last follow up)
–Fields: diagnoses.days_to_death and diagnoses.days_to_last_follow_up
•Information on whether the event has occurred (alive/deceased)
–Fields: diagnoses.vital_status
•Data split into different categories or groups (i.e. gender, etc.)
–Fields: demographic.gender
The survival analysis in the GDC uses a Kaplan-Meier estimator:
Where:
•S(ti) is the estimated survival probability for any particular one of the t time periods
•ni is the number of subjects at risk at the beginning of time period ti
•and di is the number of subjects who die during time period ti
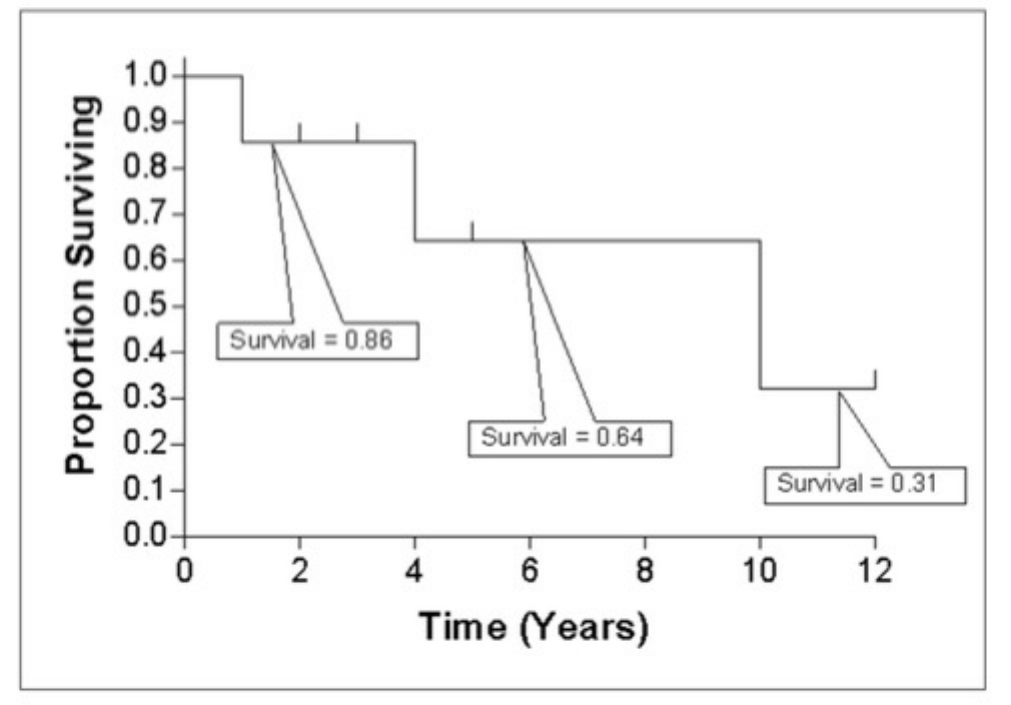
The table below is an example data set to calculate survival for a set of seven cases:
The calculated cumulated survival probability can be plotted against the interval to obtain a survival plot like the one shown
below.
26
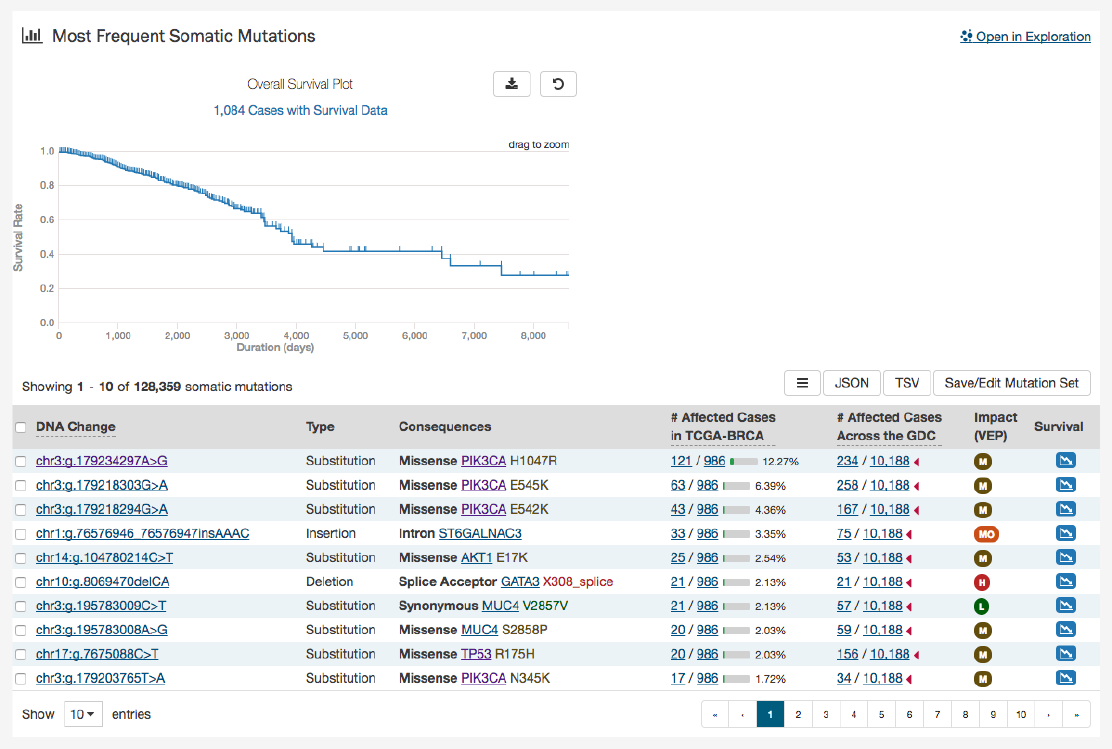
A table is displayed below that lists information about each mutation:
•Mutation ID:
A UUID for the mutation assigned by the GDC, when clicked will bring a user to the Mutation Summary
Page
•DNA Change:
The chromosome and starting coordinates of the mutation are displayed along with the nucleotide
differences between the reference and tumor allele
•Type: A general classification of the mutation
•Consequences:
The effects the mutation has on the gene coding for a protein (i.e. synonymous, missense, non-coding
transcript). A link to the Gene Summary Page for the gene affected by the mutation is included
•__ Affected Cases in Project:__ The number of affected cases in the project expressed as a fraction and percentage
•
__ Affected Cases in Across the GDC:__ The number of affected cases, expressed as number across all projects. Choosing
the arrow next to the percentage will display a breakdown of each affected project
•Impact:
A subjective classification of the severity of the variant consequence. This determined using Ensembl VEP,
PolyPhen, and SIFT. The categories are outlined here.
•Survival Analysis:
An icon that when clicked, will plot the survival rate between the gene’s mutated and non-mutated
cases
Most Affected Cases
The final section of the Project Summary page is a display of the top 20 cases in a specified project, with the greatest number of
affected genes.
28
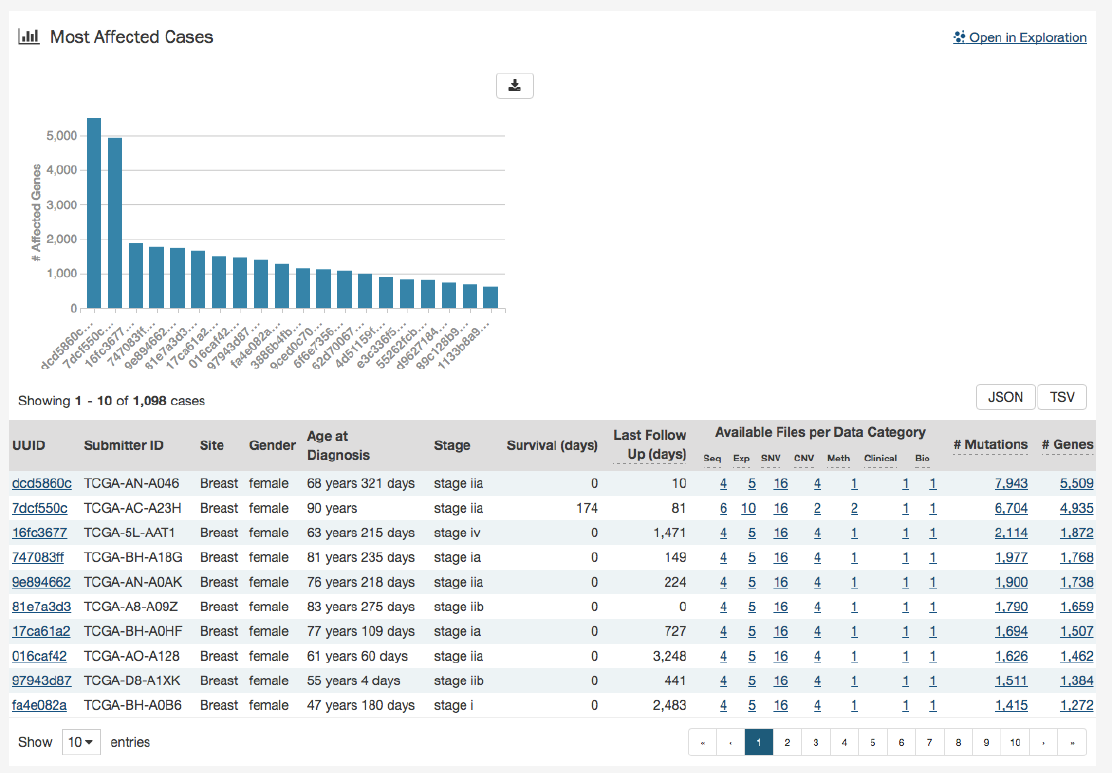
Below the bar graph is a table contains information about these cases:
•UUID: The UUID of the case, which links to the Case Summary Page
•Submitter ID: The Submitter ID of the case (i.e. the TCGA Barcode)
•Site: The anatomical location of the site affected
•Gender:
Text designations that identify gender. Gender is described as the assemblage of properties that distinguish
people on the basis of their societal roles
•Age at Diagnosis: Age at the time of diagnosis expressed in number of days since birth
•Stage:
The extent of a cancer in the body. Staging is usually based on the size of the tumor, whether lymph nodes contain
cancer, and whether the cancer has spread from the original site to other parts of the body. The accepted values for
tumor_stage depend on the tumor site, type, and accepted staging system
•Survival (days): The number of days until death
•Last Follow Up (days):
Time interval from the date of last follow up to the date of initial pathologic diagnosis, represented
as a calculated number of days
•Available Files per Data Category:
Five columns displaying the number of files available in each of the five data
categories. These link to the files for the specific case.
•__ Mutations:__ The number of mutations for the case
•__ Genes:__ The number of genes affected by mutations for the case
29
Chapter 3
Exploration
Exploration
The Exploration page allows users to explore data in the GDC using advanced filters/facets, which includes those on a gene and
mutation level. Users choose filters on specific
Cases
,
Genes
, and/or
Mutations
on the left of this page and then can visualize
these results on the right. The Gene/Mutation data for these visualizations comes from the Open-Access MAF files on the GDC
Portal.
Filters / Facets
On the left of this page, users can create advanced filters to narrow down results to create synthetic cohorts.
30
Case Filters
The first tab of filters is for cases in the GDC.
31
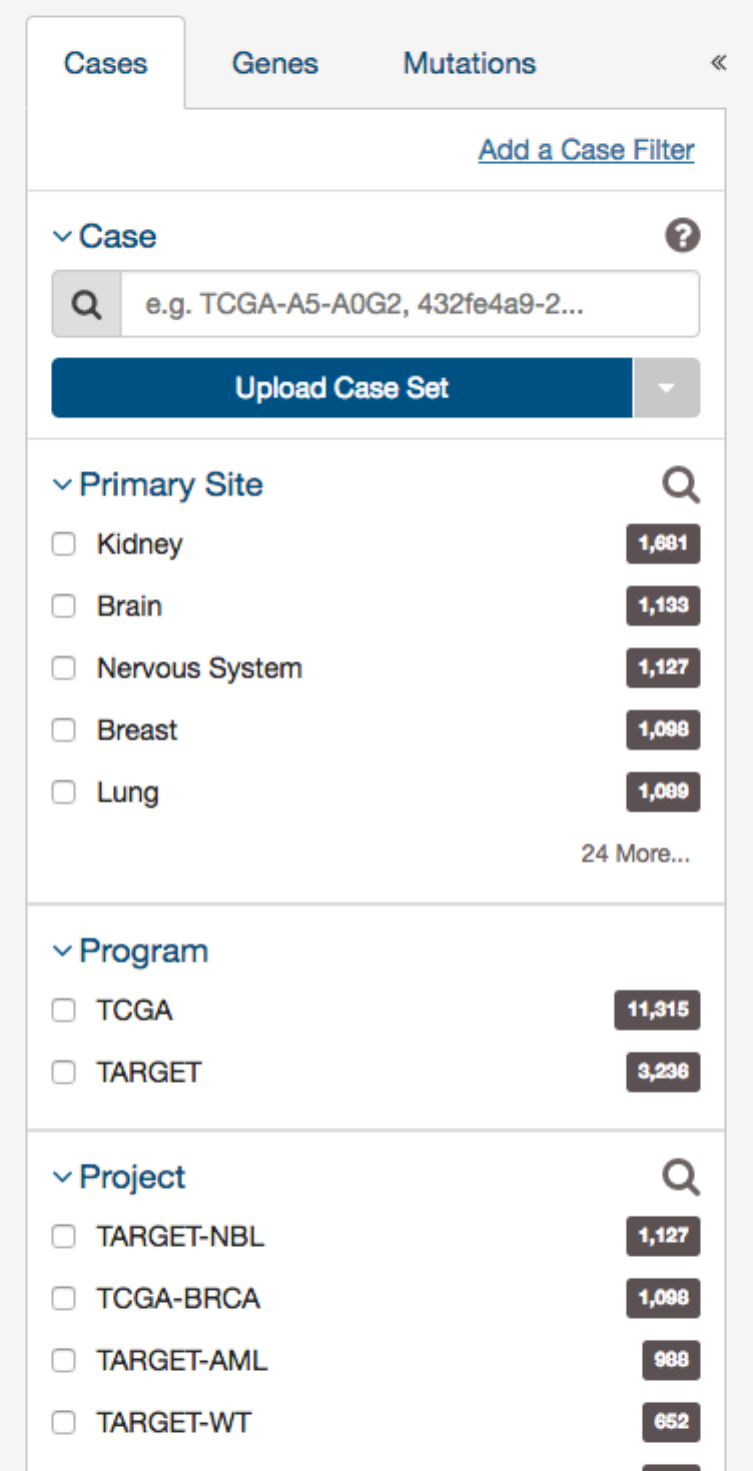
These criteria limit the results only to specific cases within the GDC. The default filters available are:
•Case: Specify individual cases using submitter ID (barcode), UUID, or list of Cases (‘Case Set’)
•Case Submitter ID: Search for cases using a part (prefix) of the submitter ID (barcode).
•Primary Site: Anatomical site of the cancer under investigation or review.
•Program: A cancer research program, typically consisting of multiple focused projects.
•Project: A cancer research project, typically part of a larger cancer research program.
•Disease Type: Type of cancer studied.
•Gender: Gender of the patient.
•Age at Diagnosis: Patient age at the time of diagnosis.
•Vital Status: Indicator of whether the patient was living or deceased at the date of last contact.
•Days to Death: Number of days from date of diagnosis to death of the patient.
•Race: Race of the patient.
•Ethnicity: Ethnicity of the patient.
In addition to the defaults, users can add additional case filters by clicking on the link titled ‘Add a Case Filter’
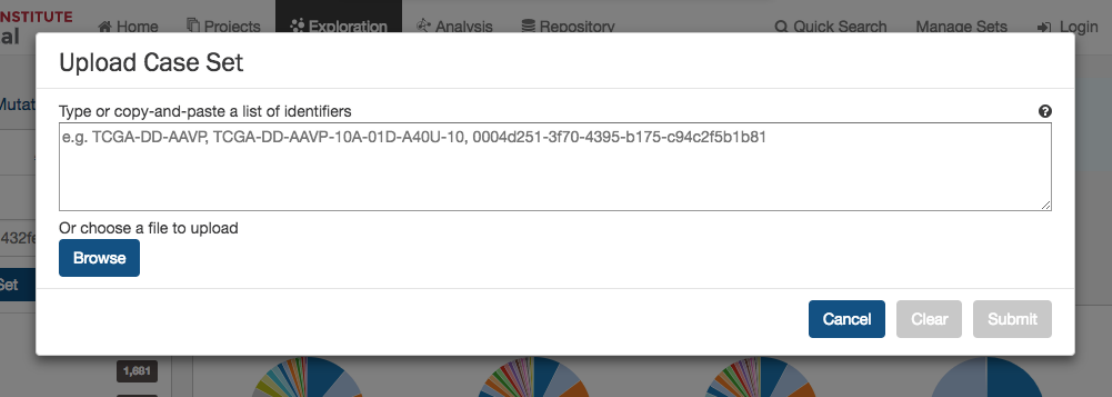
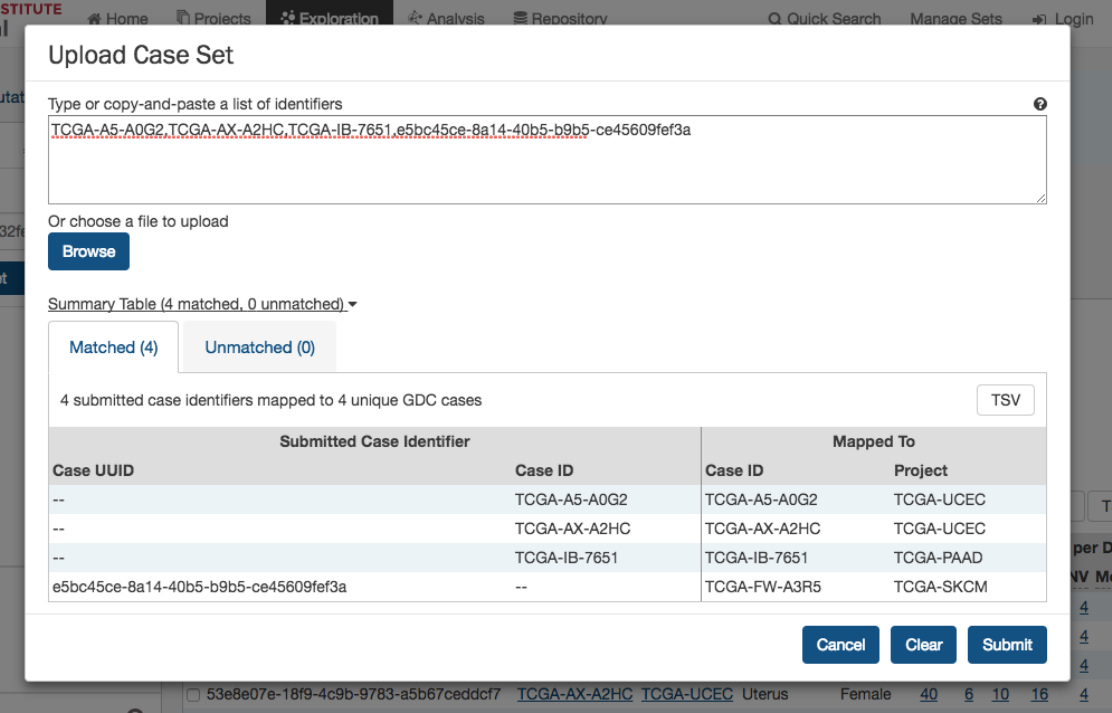
Upload Case Set
In the
Cases
filters panel, instead of supplying cases one-by-one, users can supply a list of cases. Clicking on the
Upload Case Set
button will launch a dialog as shown below, where users can supply a list of cases or upload a comma-separated text file of cases.
After supplying a list of cases, a table below will appear which indicates whether the case was found.
33
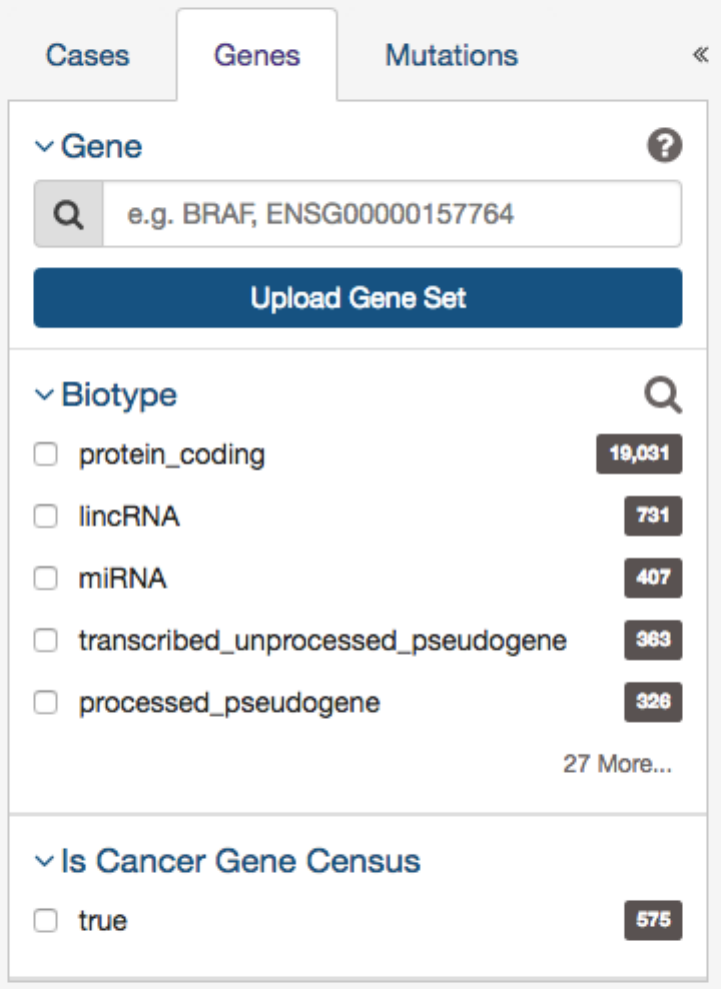
The second tab of filters are for specific genes. Users can filter by:
•Gene - Entering in a specific Gene Symbol, ID, or list of Genes (‘Gene Set’)
•Biotype
- Classification of the type of gene according to Ensembl. The biotypes can be grouped into protein coding,
pseudogene, long noncoding and short noncoding. Examples of biotypes in each group are as follows:
– Protein coding
: IGC gene, IGD gene, IG gene, IGJ gene, IGLV gene, IGM gene, IGV gene, IGZ gene, nonsense
mediated decay, nontranslating CDS, non stop decay, polymorphic pseudogene, TRC gene, TRD gene, TRJ gene.
– Pseudogene
: disrupted domain, IGC pseudogene, IGJ pseudogene, IG pseudogene, IGV pseudogene, processed
pseudogene, transcribed processed pseudogene, transcribed unitary pseudogene, transcribed unprocessed pseudogene,
translated processed pseudogene, TRJ pseudogene, unprocessed pseudogene
– Long noncoding
: 3prime overlapping ncrna, ambiguous orf, antisense, antisense RNA, lincRNA, ncrna host, processed
transcript, sense intronic, sense overlapping
– Short noncoding
: miRNA, miRNA_pseudogene, miscRNA, miscRNA pseudogene, Mt rRNA, Mt tRNA, rRNA,
scRNA, snlRNA, snoRNA, snRNA, tRNA, tRNA_pseudogene
•Is Cancer Gene Census - Whether or not a gene is part of The Cancer Gene Census
36
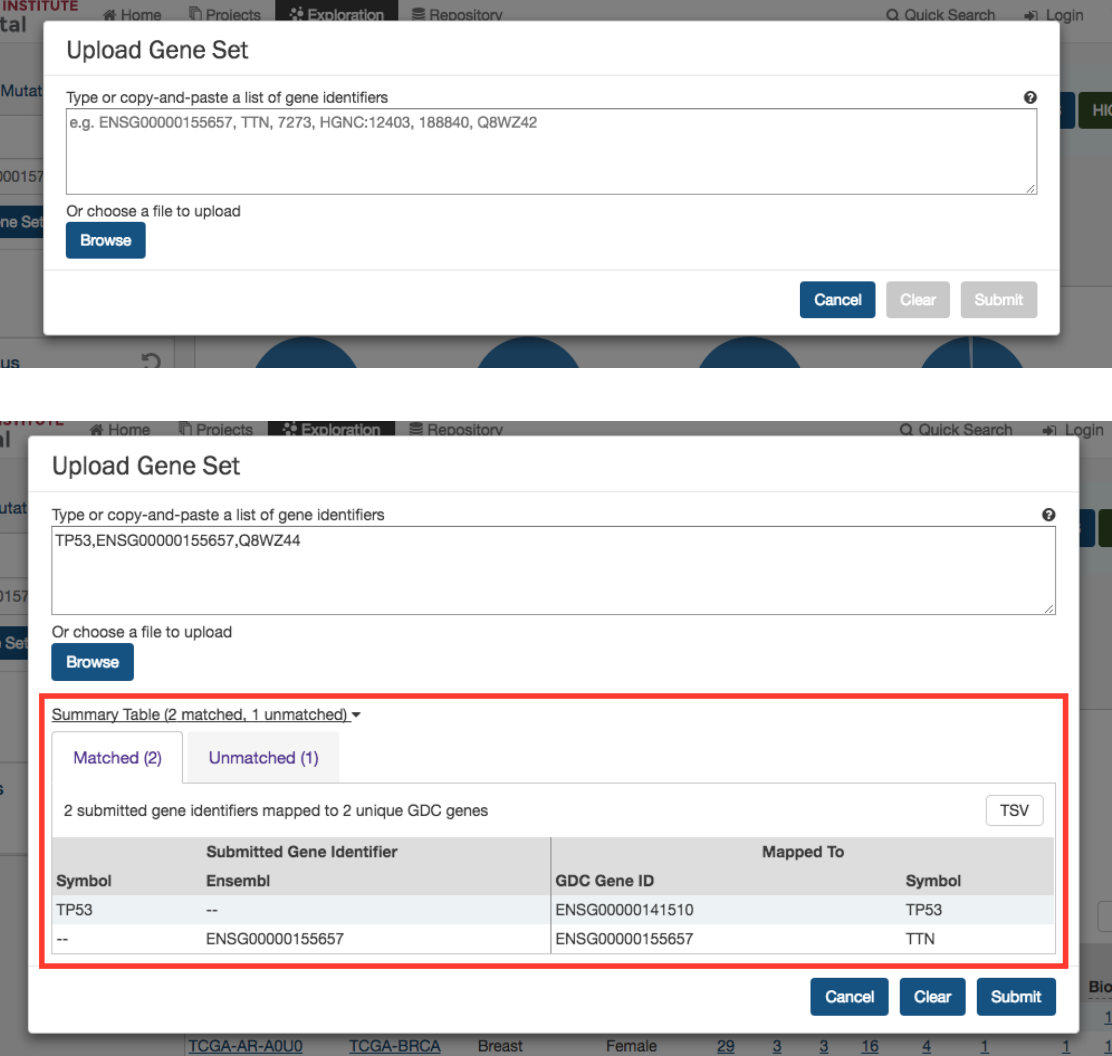
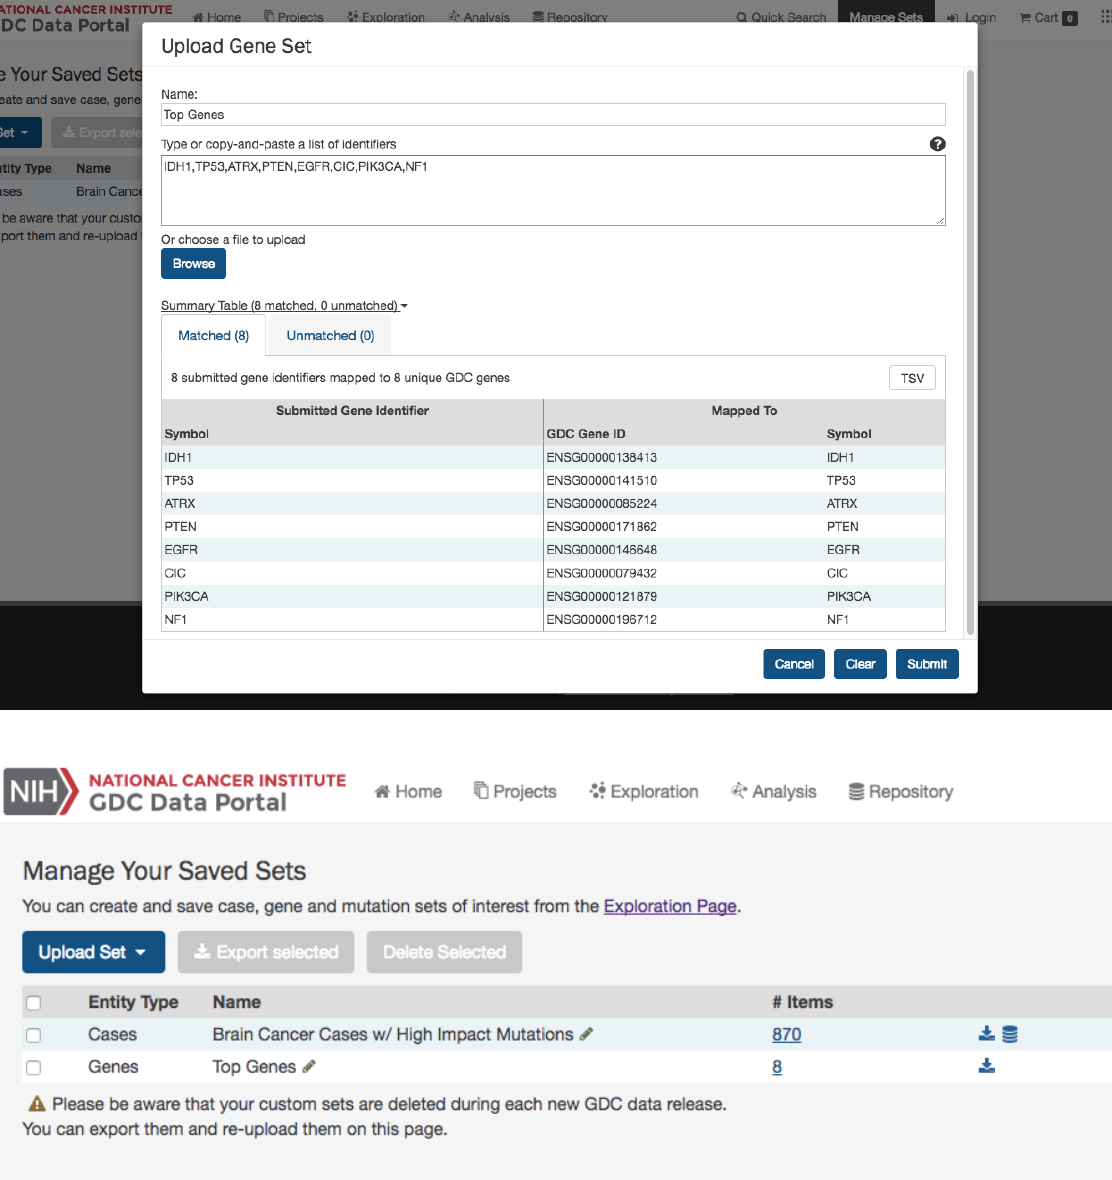
Upload Gene Set
In the
Genes
filters panel, instead of supplying genes one-by-one, users can supply a list of genes. Clicking on the
Upload Gene Set
button will launch a dialog as shown below, where users can supply a list of genes or upload a comma-separated text file of genes.
After supplying a list of genes, a table below will appear which indicates whether the gene was found.
Clicking on Submit will filter the results in the Exploration Page by those genes.
Mutation Filters
The final tab of filters is for specific mutations.
37
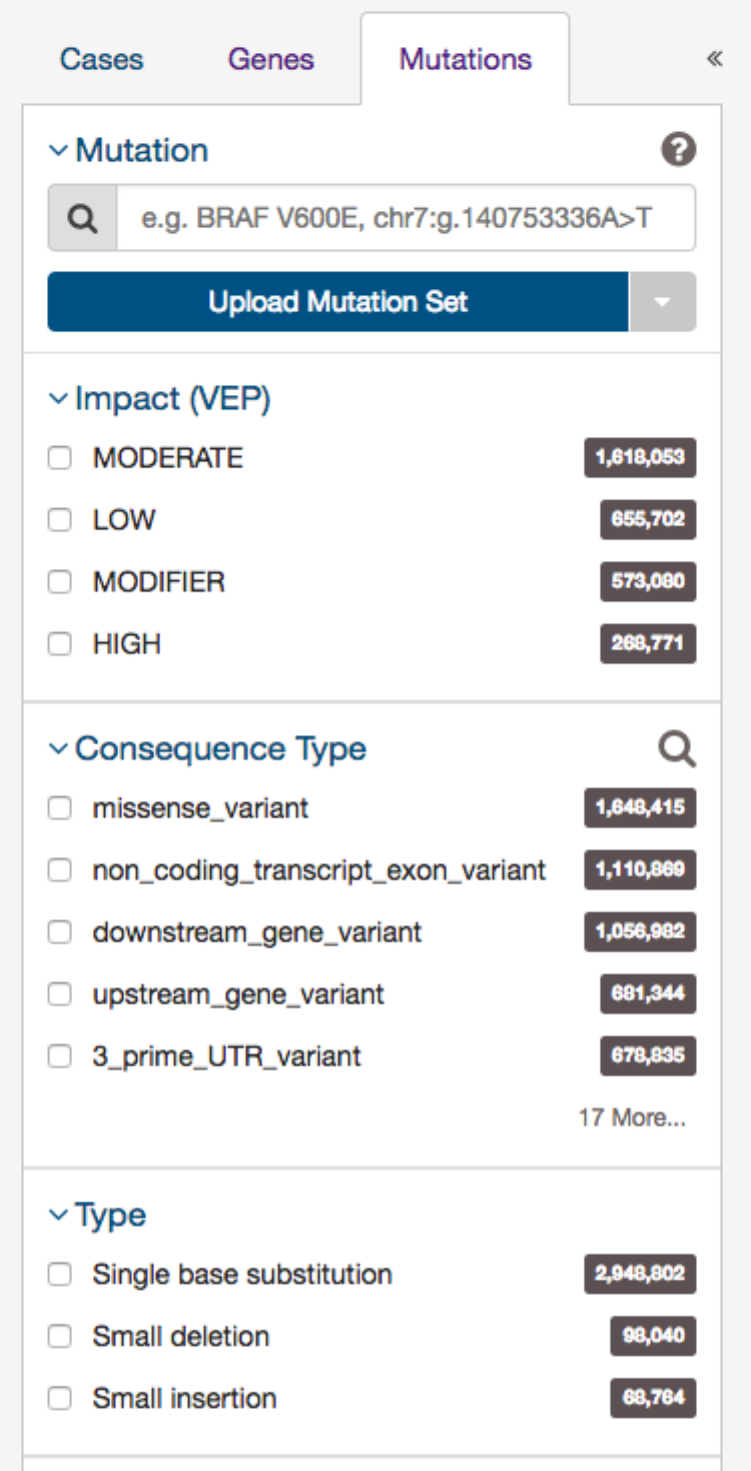
Users can filter by:
•Mutation - Unique ID for that mutation. Users can use the following:
–UUID - c7c0aeaa-29ed-5a30-a9b6-395ba4133c63
–DNA Change - chr12:g.121804752delC
–COSMIC ID - COSM202522
–List of any mutation UUIDs or DNA Change id’s (‘Mutation Set’)
•Consequence Type - Consequence type of this variation; sequence ontology terms
•Impact
- A subjective classification of the severity of the variant consequence. This information comes from the Ensembl
VEP.
•Type - A general classification of the mutation
•Variant Caller - The variant caller used to identify the mutation
•COSMIC ID
- The identifier of the gene or mutation maintained in COSMIC, the Catalogue Of Somatic Mutations In
Cancer
•dbSNP rs ID - The reference SNP identifier maintained in dbSNP
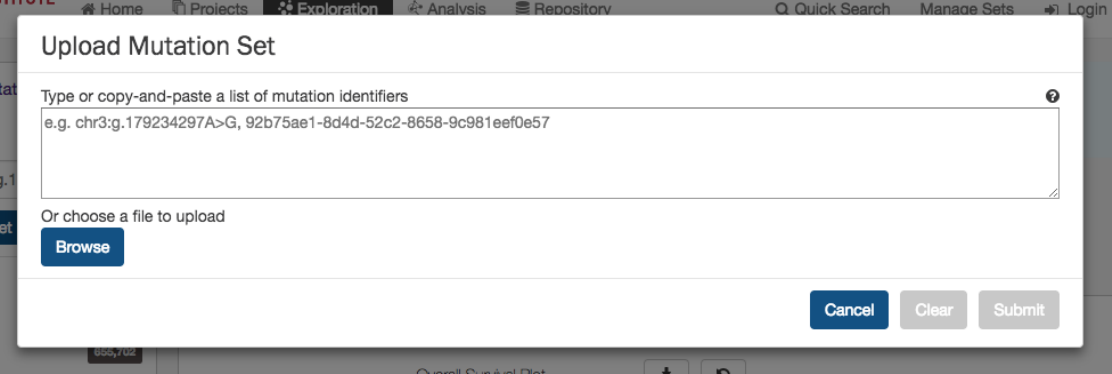
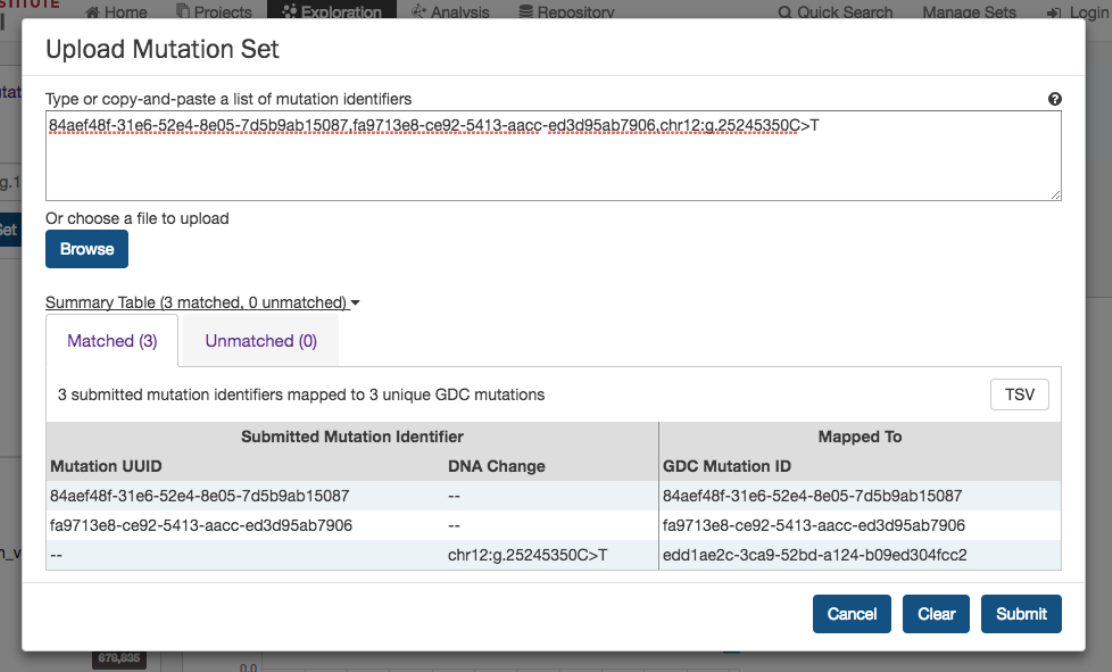
Upload Mutation Set
In the
Mutations
filters panel, instead of supplying mutation id’s one-by-one, users can supply a list of mutations. Clicking on
the
Upload Mutation Set
button will launch a dialog as shown below, where users can supply a list of mutations or upload a
comma-separated text file of mutations.
After supplying a list of mutations, a table below will appear which indicates whether the mutation was found.
39
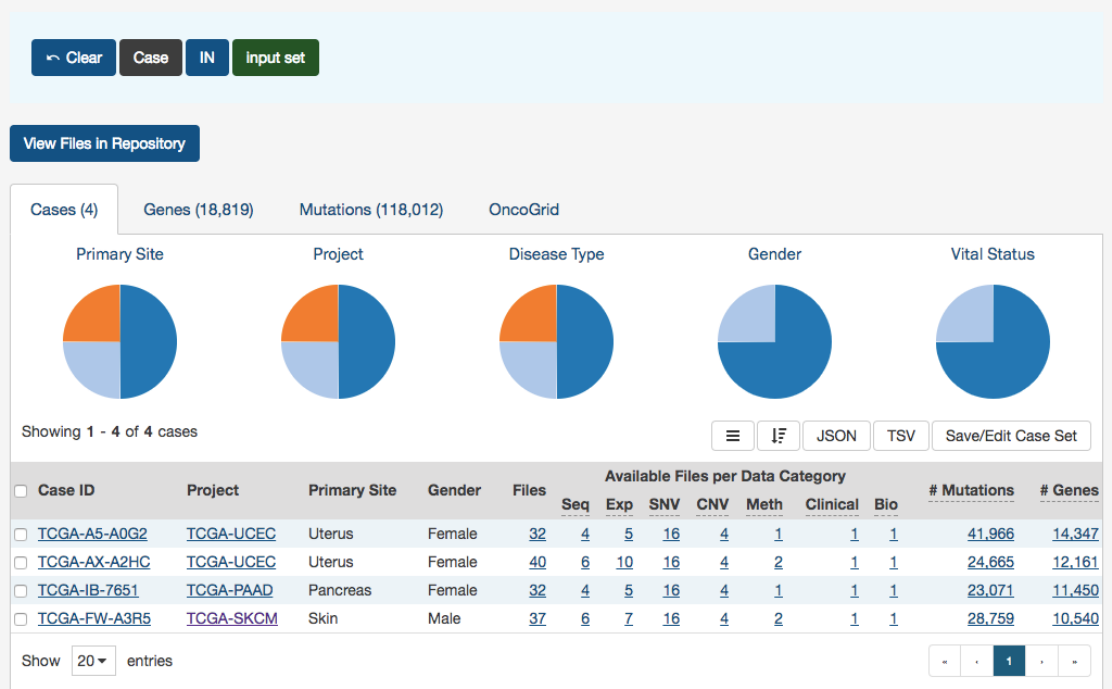
Results
As users add filters to the data on the Exploration Page, the Results section will automatically be updated. Results are divided
into different tabs: Cases,Genes,Mutations, and OncoGrid.
To illustrate these tabs, Case, Gene, and Mutation filters have been chosen ( Genes in the Cancer Gene Census, that have HIGH
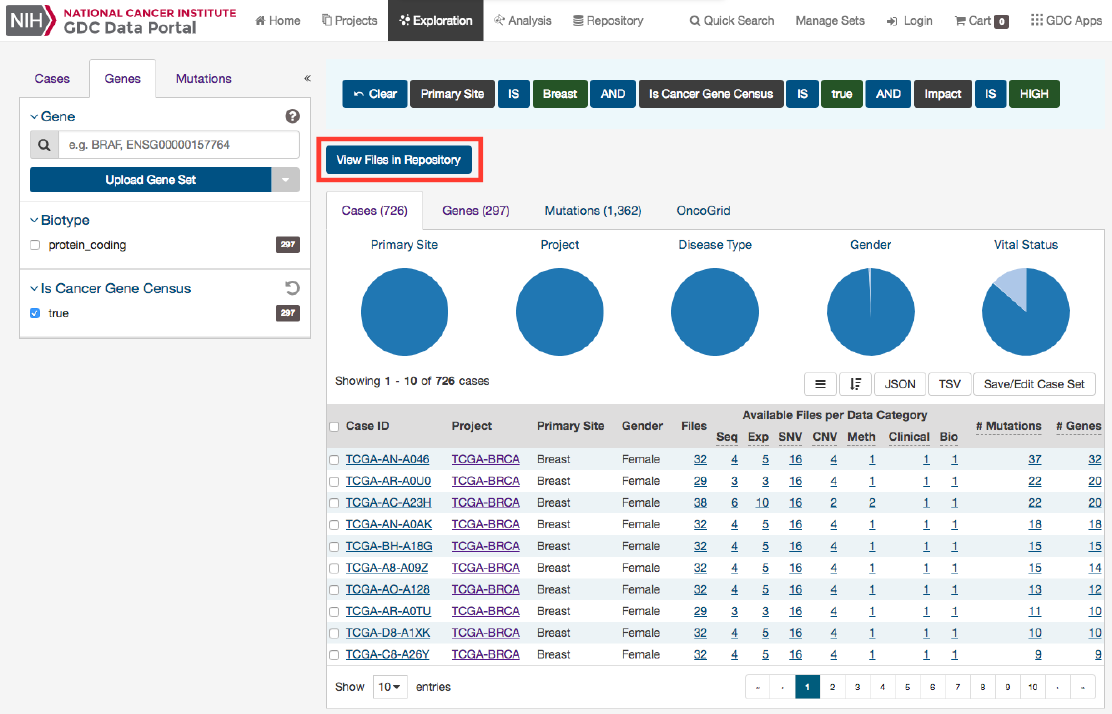
Impact for the TCGA-BRCA project) and a description of what each tab displays follows.
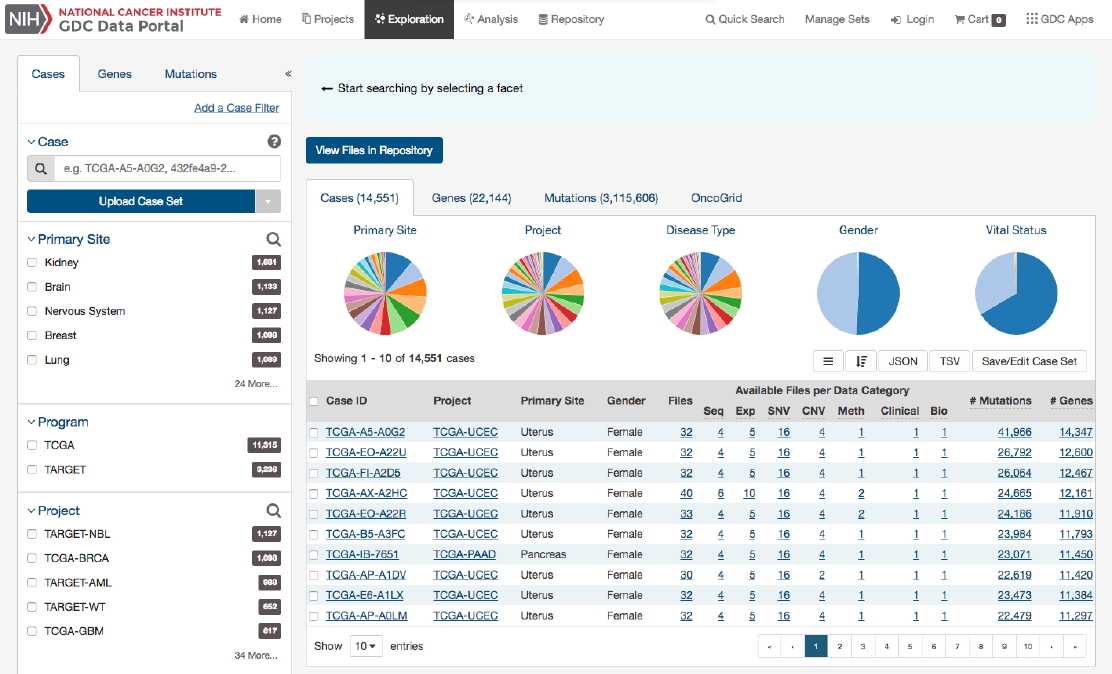
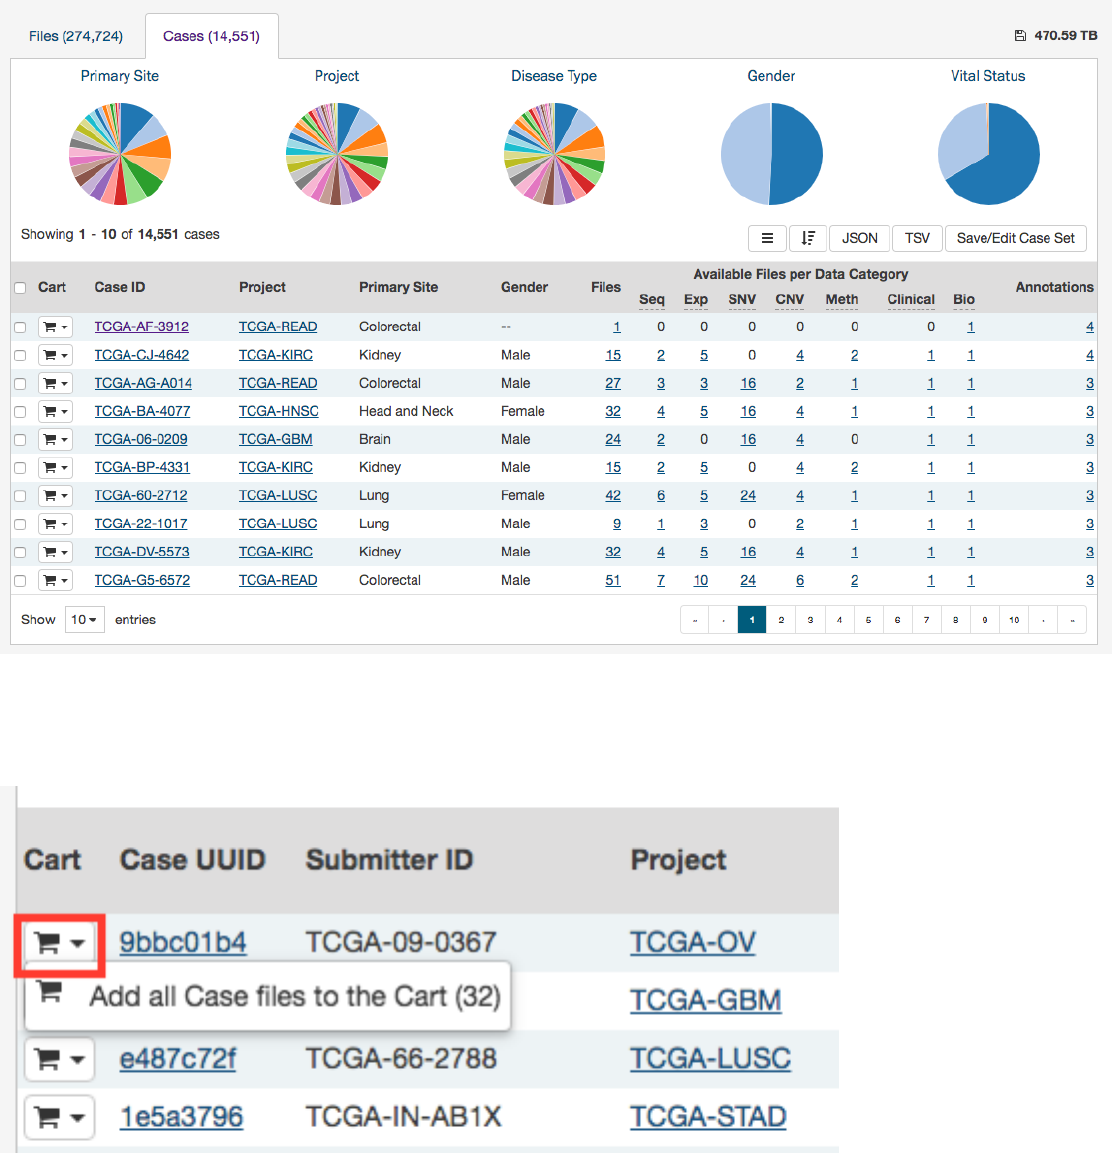
Cases
The Cases tab gives an overview of all the cases/patients who correspond to the filters chosen (Cohort).
41
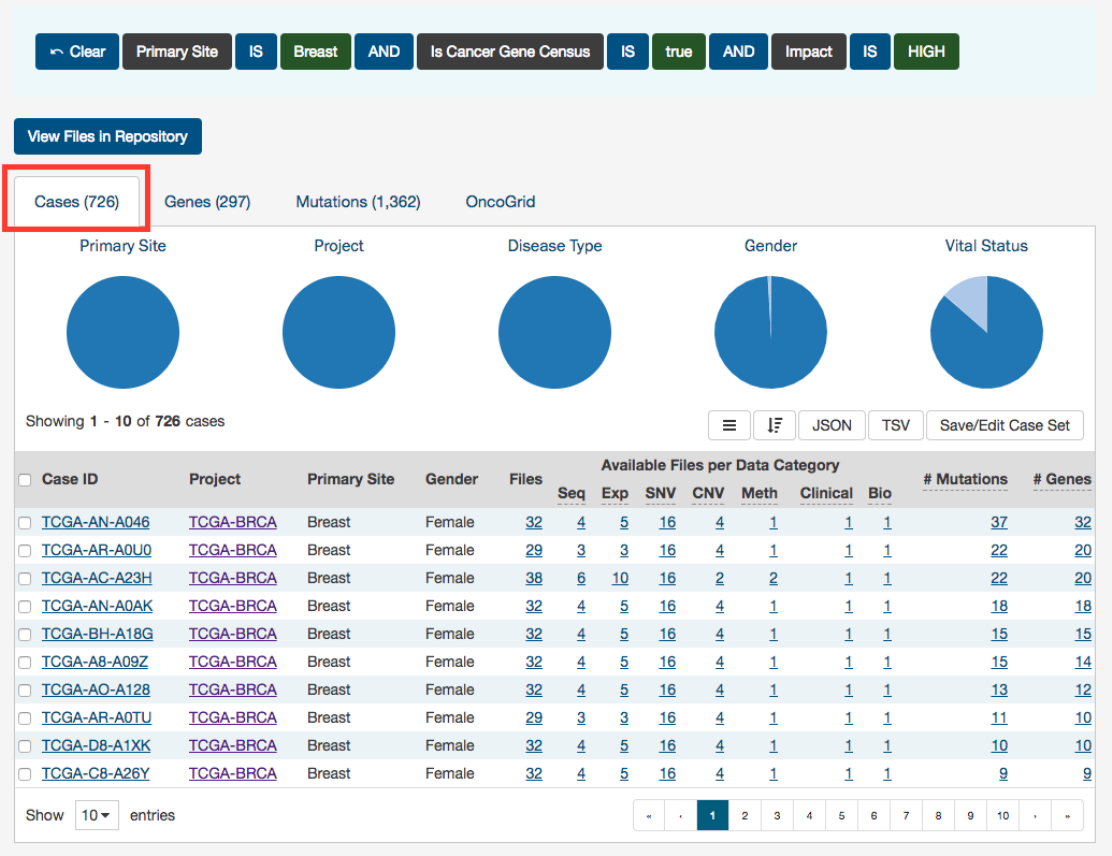
The top of this section contains a few pie graphs with categorical information regarding the Primary Site, Project, Disease Type,
Gender, and Vital Status.
Below these pie charts is a tabular view of cases (which can be exported, sorted and saved using the buttons on the right), that
includes the following information:
•Case ID (Submitter ID): The Case ID / submitter ID of that case/patient (i.e. TCGA Barcode)
•Project: The study name for the project for which the case belongs
•Primary Site: The primary site of the cancer/project
•Gender: The gender of the case
•Files: The total number of files available for that case
•Available Files per Data Category:
Five columns displaying the number of files available in each of the five data
categories. These link to the files for the specific case.
•__ Mutations:__ The number of SSMs (simple somatic mutations) detected in that case
•__ Genes:__ The number of genes affected by mutations in that case
Note: By default, the Case UUID is not displayed. You can display the UUID of the case, but clicking on the icon with 3 parallel
lines, and choose to display the Case UUID
42
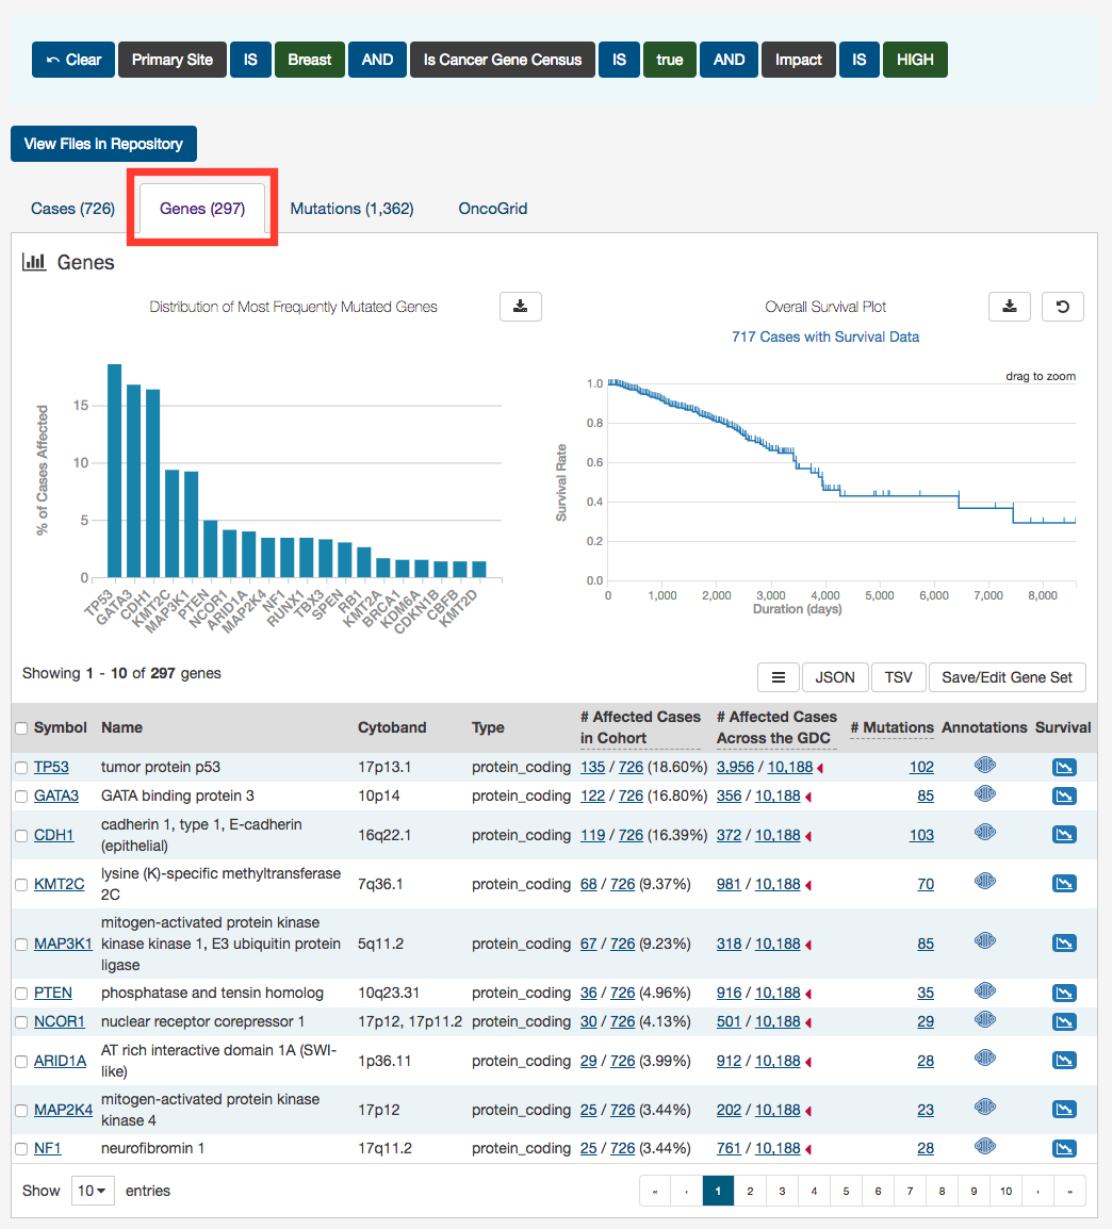
Genes
The Genes tab will give an overview of all the genes that match the criteria of the filters (Cohort).
The top of this section contains a survival plot of all the cases within the specified Exploration page search, in addition to a bar
graph of the most frequently mutated genes. Hovering over each bar in the plot will display information about the percentage of
43
cases affected. Users may choose to download the underlying data in JSON or TSV format or an image of the graph in SVG or
PNG format by clicking the download icon at the top of each graph.
Below these graphs is a tabular view of the genes affected, which includes the following information:
•Symbol: The gene symbol, which links to the Gene Summary Page
•Name: Full name of the gene
•Cytoband: The location of the mutation on the chromosome in terms of Giemsa-stained samples.
•Type: The type of gene
•__ Affected Cases in Cohort:__ The number of cases affected in the Cohort
•
__ Affected Cases Across all Projects:__ The number of cases within all the projects in the GDC that contain a mutation
on this gene. Clicking the red arrow will display the cases broken down by project
•__ Mutations:__ The number of SSMs (simple somatic mutations) detected in that gene
•Annotations: Includes a COSMIC symbol if the gene belongs to The Cancer Gene Census
•Survival Analysis:
An icon that, when clicked, will plot the survival rate between cases in the project with mutated and
non-mutated forms of the gene
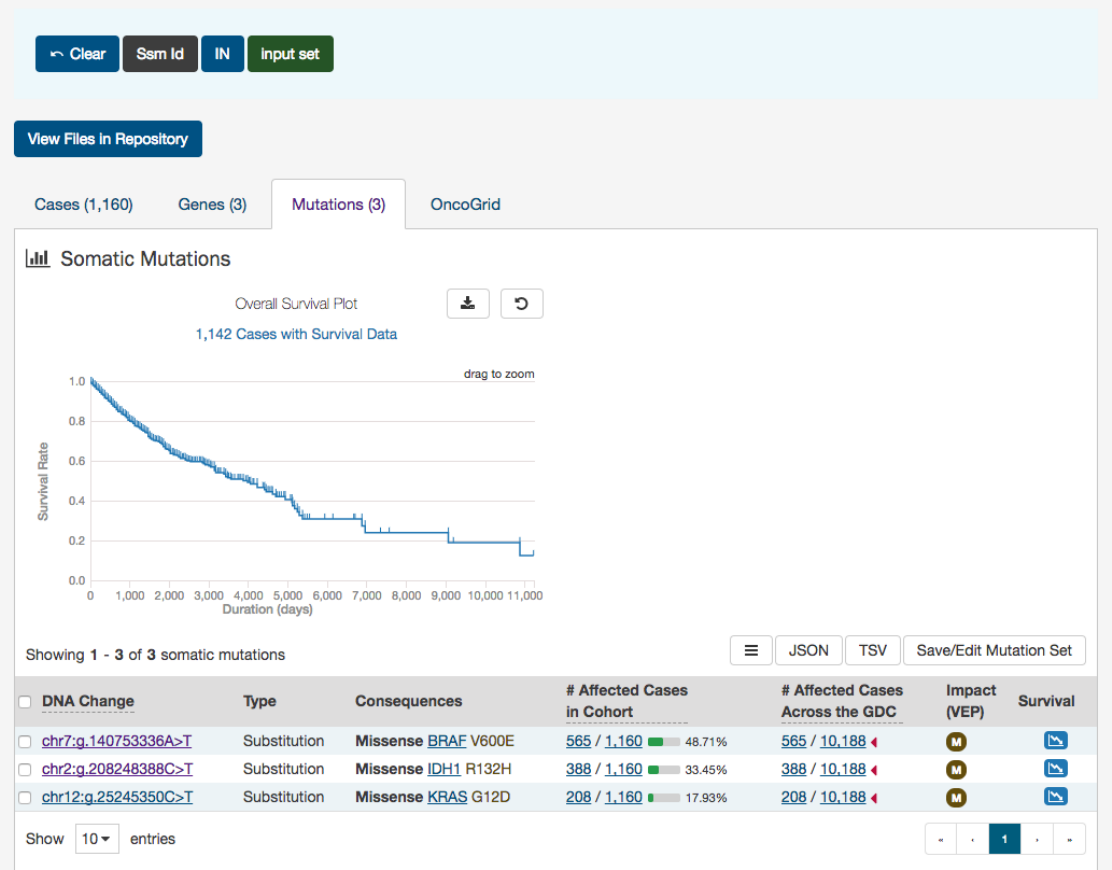
Mutations
The Mutations tab will give an overview of all the mutations who match the criteria of the filters (Cohort).
44
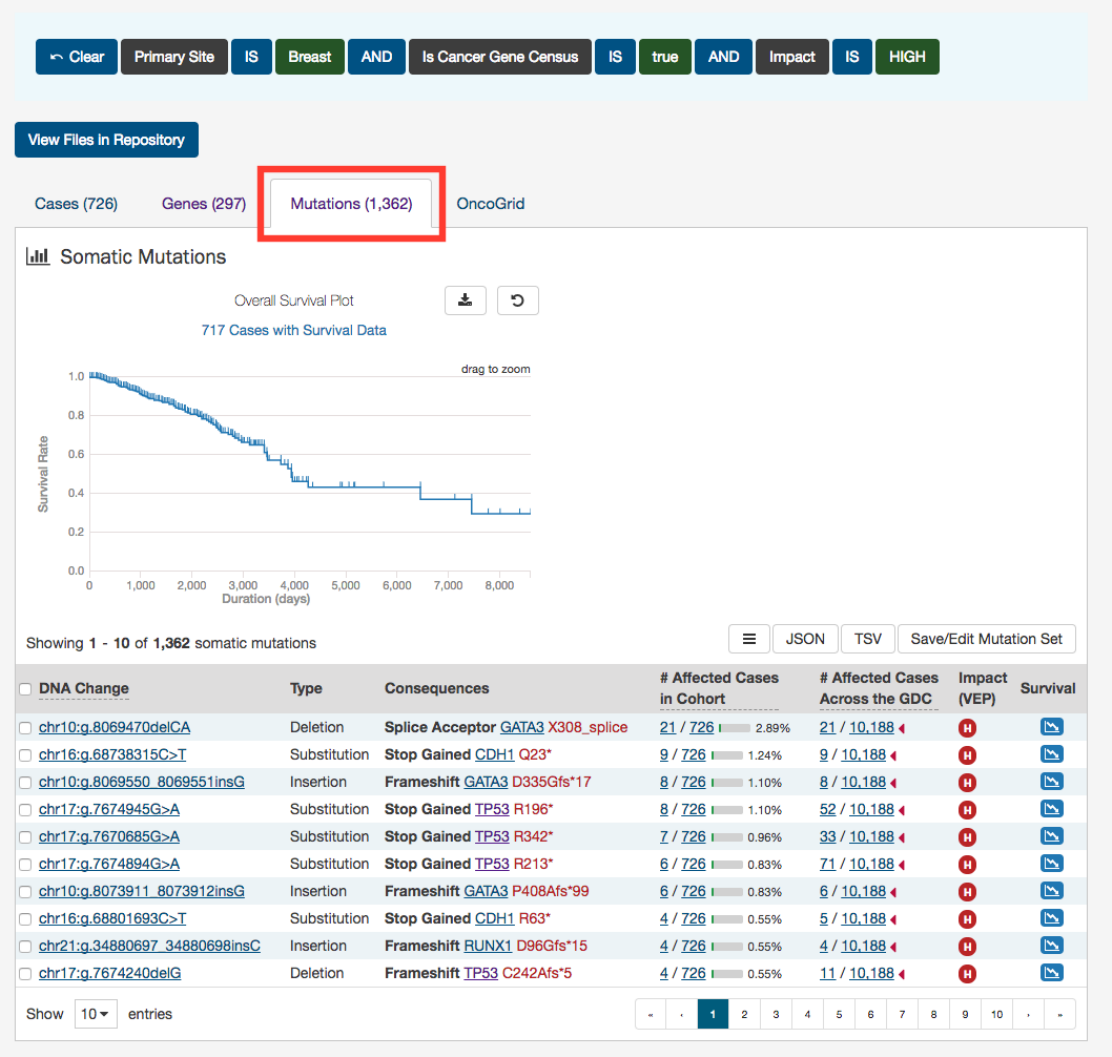
At the top of this tab is a survival plot of all the cases within the specified exploration page filters.
A table is displayed below that lists information about each mutation:
•DNA Change:
The chromosome and starting coordinates of the mutation are displayed along with the nucleotide
differences between the reference and tumor allele
•Type: A general classification of the mutation
•Consequences:
The effects the mutation has on the gene coding for a protein (i.e. synonymous, missense, non-coding
transcript). A link to the Gene Summary Page for the gene affected by the mutation is included
•__ Affected Cases in Cohort:__ The number of affected cases in the Cohort as a fraction and as a percentage
•
__ Affected Cases in Across all Projects:__ The number of affected cases, expressed as number across all projects. This
information comes from the Ensembl VEP. Choosing the arrow next to the percentage will display a breakdown of each
affected project
45
•Impact (VEP): A subjective classification of the severity of the variant consequence. The categories are:
– HIGH (H)
: The variant is assumed to have high (disruptive) impact in the protein, probably causing protein
truncation, loss of function, or triggering nonsense mediated decay
– MODERATE (M): A non-disruptive variant that might change protein effectiveness
– LOW (L): Assumed to be mostly harmless or unlikely to change protein behavior
– MODIFIER (MO)
: Usually non-coding variants or variants affecting non-coding genes, where predictions are difficult
or there is no evidence of impact
•Survival Analysis:
An icon that when clicked, will plot the survival rate between the gene’s mutated and non-mutated
cases
Note: By default, the Mutation UUID is not displayed. You can display the UUID of the case, but clicking on the icon with 3
parallel lines, and choose to display the Mutation UUID
OncoGrid
The Exploration page includes an OncoGrid plot of the cases with the most mutations, for the top 50 mutated genes affected by
high impact mutations. Genes displayed on the left of the grid (Y-axis) correspond to individual cases on the bottom of the grid
(X-axis).
46
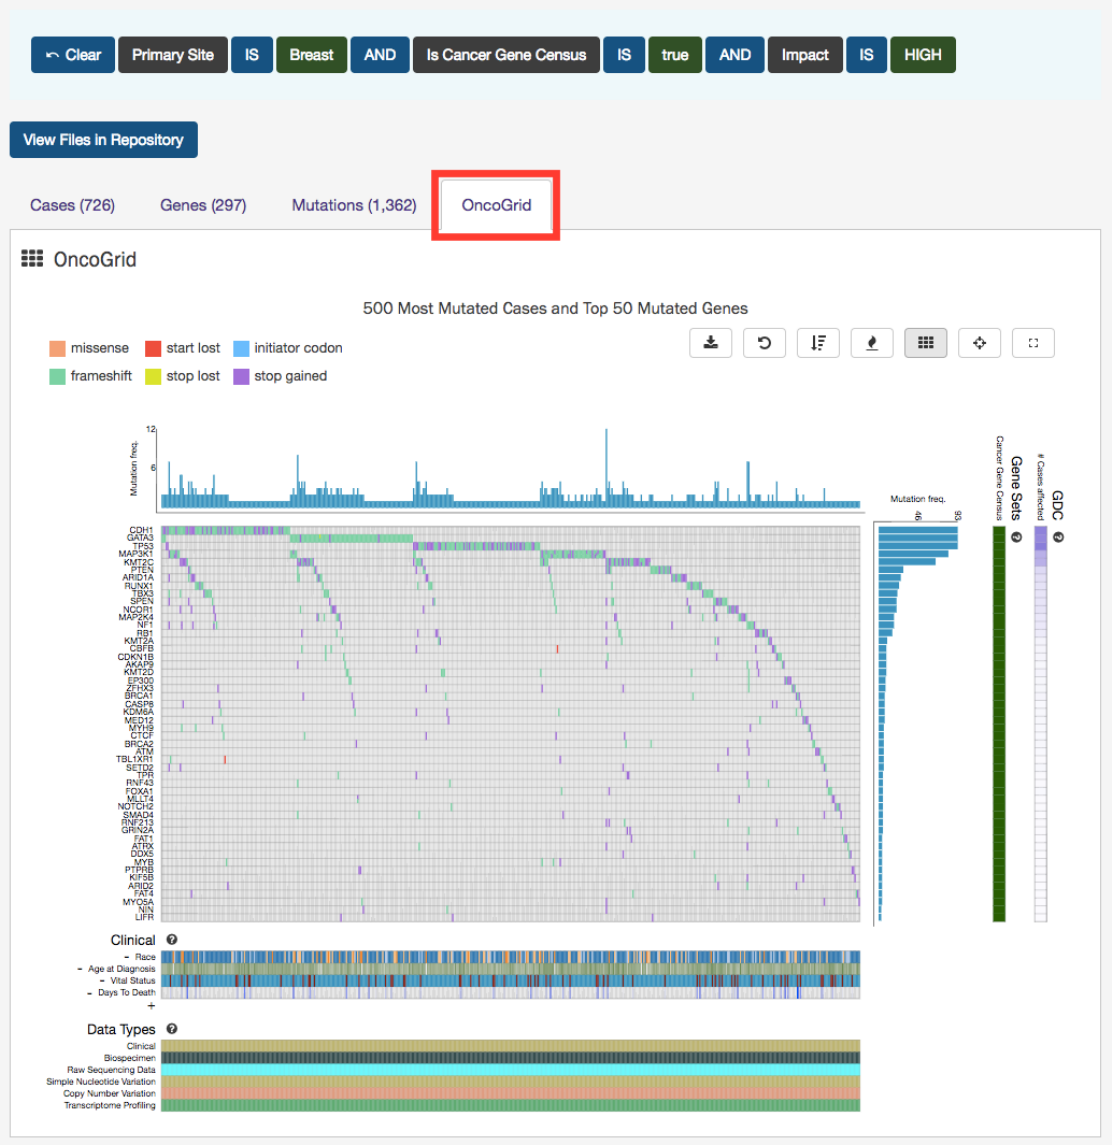
The grid is color-coded with a legend at the top left which describes what type of mutation consequence is observed for each
gene/case combination. Clinical information and the available data for each case are available at the bottom of the grid.
The right side of the grid displays additional information about the genes:
•Gene Sets:
Describes whether a gene is part of The Cancer Gene Census. (The Cancer Gene Census is an ongoing effort
to catalogue those genes for which mutations have been causally implicated in cancer)
•GDC: Identifies all cases in the GDC affected with a mutation in this gene
47
OncoGrid Options
To facilitate readability and comparisons, drag-and-drop can be used to reorder the gene rows. Double clicking a row in the "
Cases Affected" bar at the right side of the graphic launches the respective Gene Summary Page page. Hovering over a cell will
display information about the mutation such as its ID, affected case, and biological consequence. Clicking on the cell will bring
the user to the respective Mutation Summary page.
A tool bar at the top right of the graphic allows the user to export the data as a JSON object, PNG image, or SVG image. Seven
buttons are available in this toolbar:
•Download:
Users can choose to export the contents either to a static image file (PNG or SVG format) or the underlying
data in JSON format
•Reload Grid: Sets all OncoGrid rows, columns, and zoom levels back to their initial positions
•Cluster Data:
Clusters the rows and columns to place mutated genes with the same cases and cases with the same
mutated genes together
•Toggle Heatmap:
The view can be toggled between cells representing mutation consequences or number of mutations in
each gene
•Toggle Gridlines: Turn the gridlines on and off
•Toggle Crosshairs: Turns crosshairs on, so that users can zoom into specific sections of the OncoGrid
•Fullscreen: Turns Fullscreen mode on/off
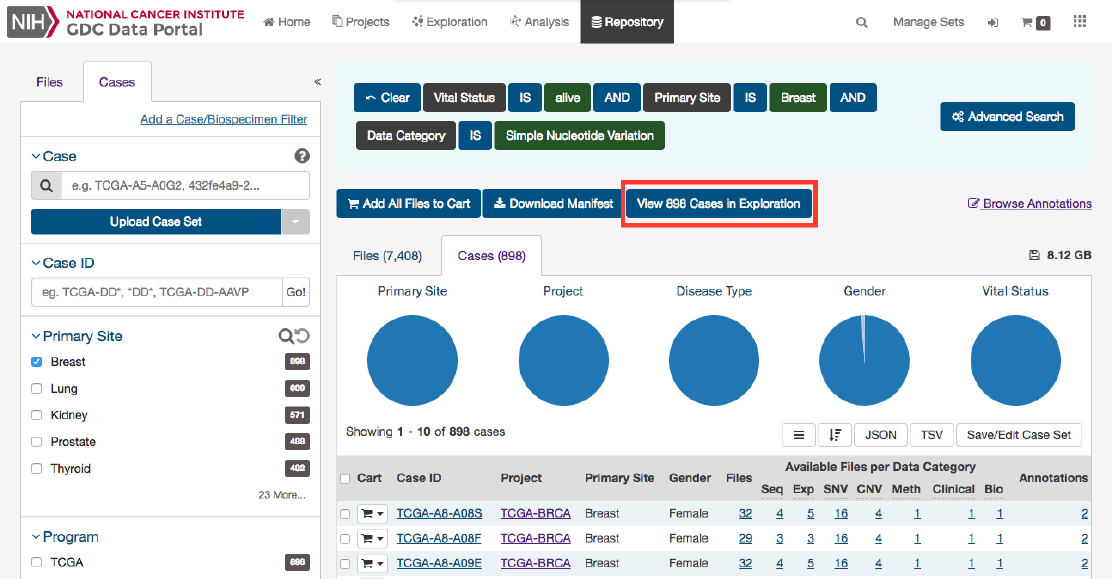
File Navigation
After utilizing the Exploration Page to narrow down a specific cohort, users can find the specific files that relate to this group by
clicking on the View Files in Repository button as shown in the image below.
Clicking this button will navigate the users to the Repository Page, filtered by the cases within the cohort.
48
Chapter 4
Repository
Repository
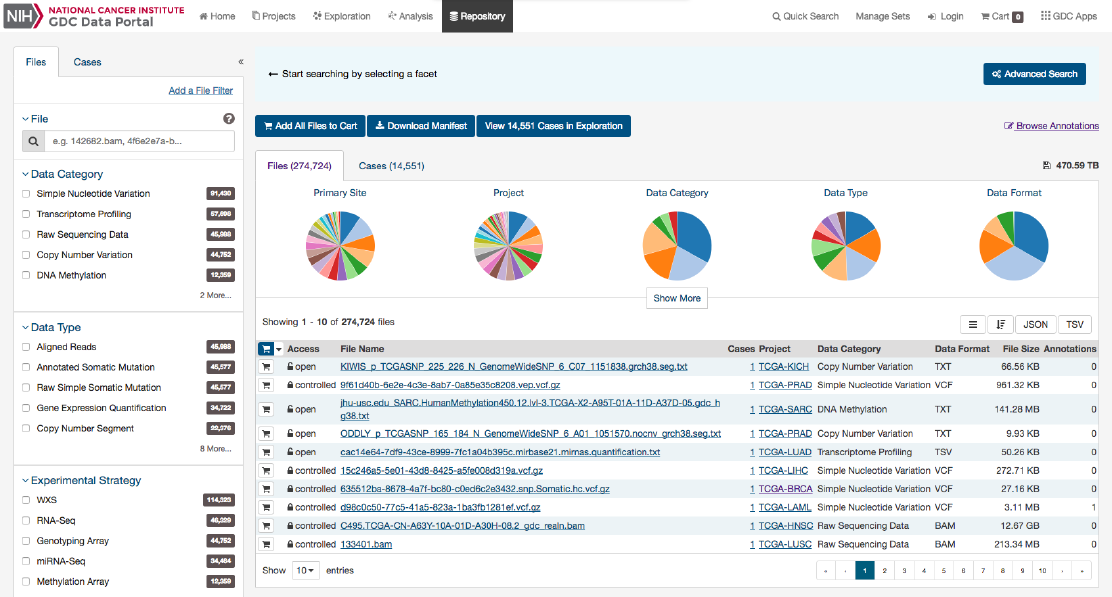
Summary
The Repository Page is the primary method of accessing data in the GDC Data Portal. It provides an overview of all cases
and files available in the GDC and offers users a variety of filters for identifying and browsing cases and files of interest.
Users can access the Repository Page from the GDC Data Portal front page, from the Data Portal toolbar, or directly at
https://portal.gdc.cancer.gov/repository.
Filters / Facets
On the left, a panel of data facets allows users to filter cases and files using a variety of criteria. If facet filters are applied, the
tabs on the right will display information about matching cases and files. If no filters are applied, the tabs on the right will
display information about all available data.
On the right, two tabs contain information about available data:
•Files tab provides a list of files, select information about each file, and links to individual file detail pages.
•Cases tab provides a list of cases, select information about each case, and links to individual case summary pages
The banner above the tabs on the right displays any active facet filters and provides access to advanced search.
The top of the Repository Page contains a few summary pie charts for Primary Sites, Projects, Disease Type, Gender, and Vital
Status. These reflect all available data or, if facet filters are applied, only the data that matches the filters. Clicking on a specific
slice in a pie chart, or on a number in a table, applies corresponding facet filters.
50
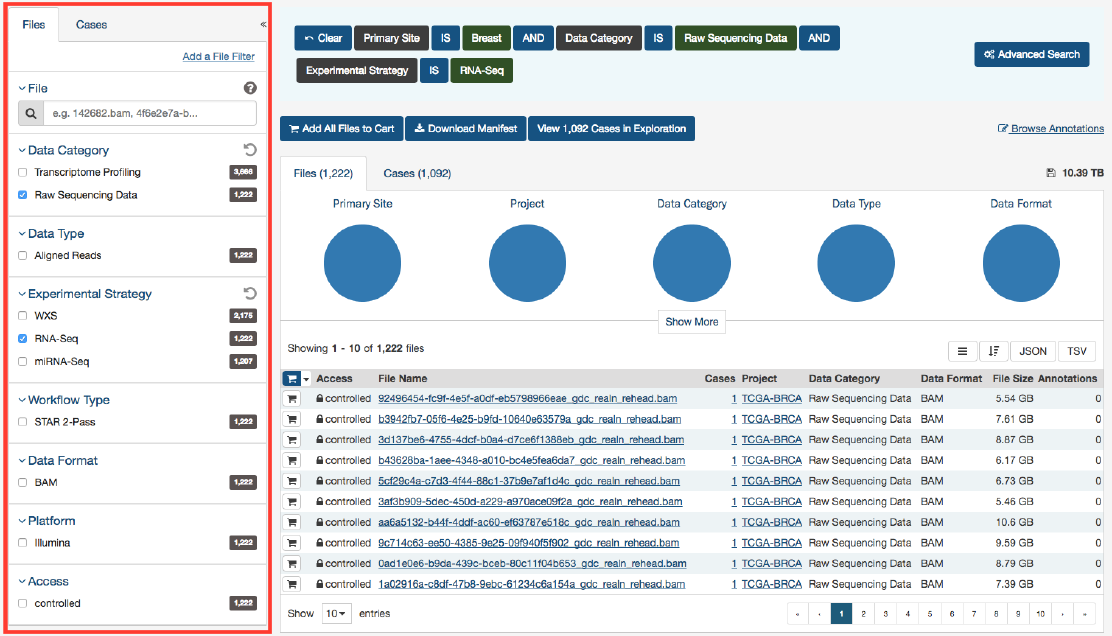
Facets Panel
Facets represent properties of the data that can be used for filtering. The facets panel on the left allows users to filter the cases
and files presented in the tabs on the right.
The facets panel is divided into two tabs, with the Files tab containing facets pertaining to data files and experimental strategies,
while the Cases tab containing facets pertaining to the cases and biospecimen information. Users can apply filters in both tabs
simultaneously. The applied filters will be displayed in the banner above the tabs on the right, with the option to open the filter
in Advanced Search to further refine the query.
The Getting Started section provides instructions on using facet filters. In the following example, a filter from the Cases tab
(“primary site”) and filters from the Files tab (“data category”, “experimental strategy”) are both applied:
51
The default set of facets is listed below.
Files facets tab:
•File: Specify individual files using filename or UUID.
•Data Category: A high-level data file category, such as “Raw Sequencing Data” or “Transcriptome Profiling”.
•Data Type
: Data file type, such as “Aligned Reads” or “Gene Expression Quantification”. Data Type is more granular
than Data Category.
•Experimental Strategy: Experimental strategies used for molecular characterization of the cancer.
•Workflow Type: Bioinformatics workflow used to generate or harmonize the data file.
•Data Format: Format of the data file.
•Platform: Technological platform on which experimental data was produced.
•Access Level: Indicator of whether access to the data file is open or controlled.
Cases facets tab:
•Case: Specify individual cases using submitter ID (barcode) or UUID.
•Case Submitter ID Prefix: Search for cases using a part (prefix) of the submitter ID (barcode).
•Primary Site: Anatomical site of the cancer under investigation or review.
•Cancer Program: A cancer research program, typically consisting of multiple focused projects.
•Project: A cancer research project, typically part of a larger cancer research program.
•Disease Type: Type of cancer studied.
•Gender: Gender of the patient.
•Age at Diagnosis: Patient age at the time of diagnosis.
•Vital Status: Indicator of whether the patient was living or deceased at the date of last contact.
•Days to Death: Number of days from date of diagnosis to death of the patient.
•Race: Race of the patient.
•Ethnicity: Ethnicity of the patient.
52
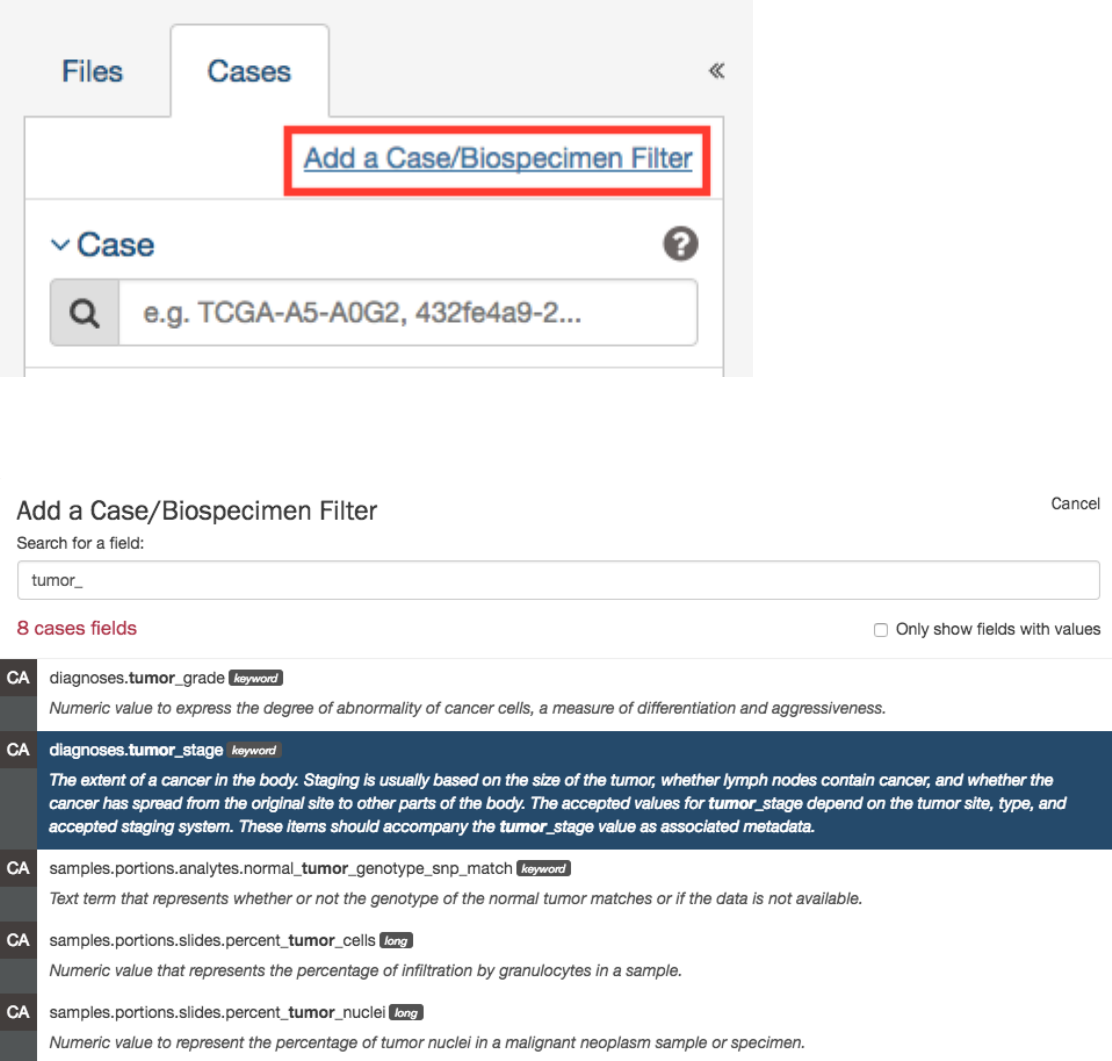
Adding Custom Facets
The Repository Page provides access to additional data facets beyond those listed above. Facets corresponding to additional
properties listed in the GDC Data Dictionary can be added using the “add a filter” links available at the top of the Cases and
Files facet tabs:
The links open a search window that allows the user to find an additional facet by name or description. Not all facets have values
available for filtering; checking the “Only show fields with values” checkbox will limit the search results to only those that do.
Selecting a facet from the list of search results below the search box will add it to the facets panel.
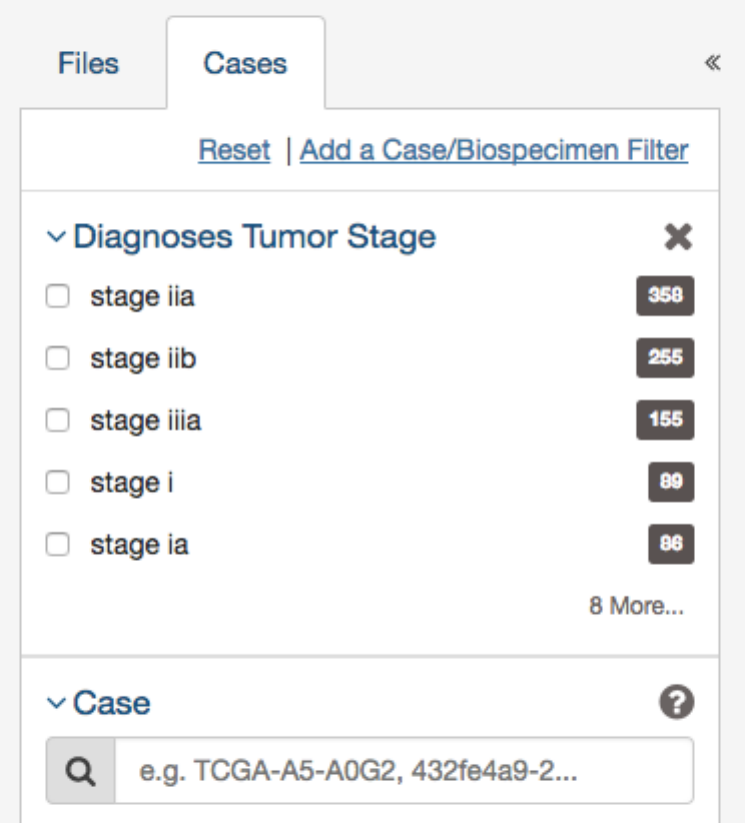
Newly added facets will show up at the top of the facets panel and can be removed individually by clicking on the red cross to
the right of the facet name. The default set of facets can be restored by clicking “Reset”.
53
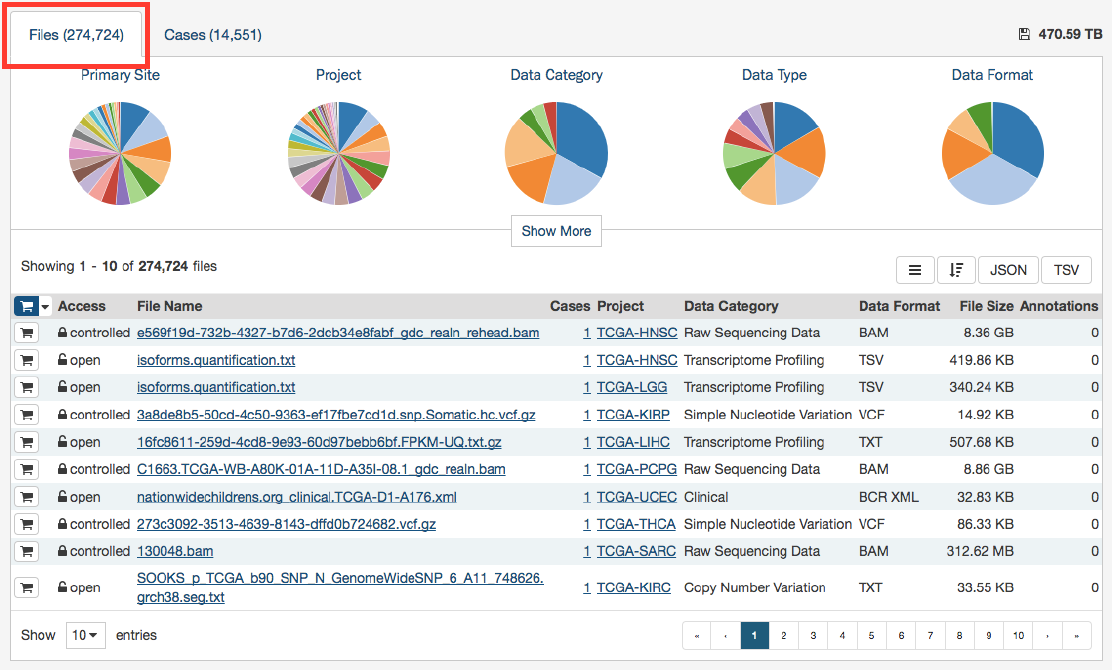
The File Name column includes links to file detail pages where the user can learn more about each file.
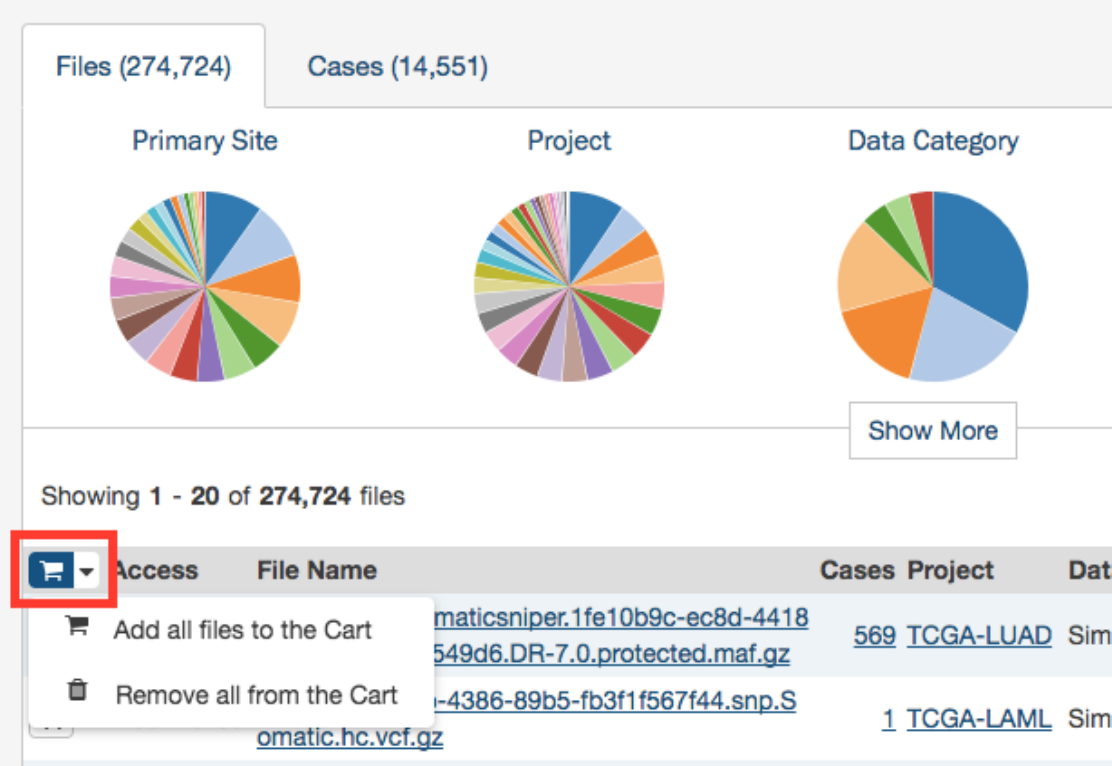
Users can add individual file(s) to the file cart using the cart button next to each file. Alternatively, all files that match the
current facet filters can be added to the cart using the menu in the top left corner of the table:
55
The list includes links to case summary pages in the Case UUID column, the Submitter ID (i.e. TCGA Barcode), and counts of
the available file types for each case. Clicking on a count will apply facet filters to display the corresponding files.
The list also includes a shopping cart button, allowing the user to add all files associated with a case to the file cart for downloading
at a later time:
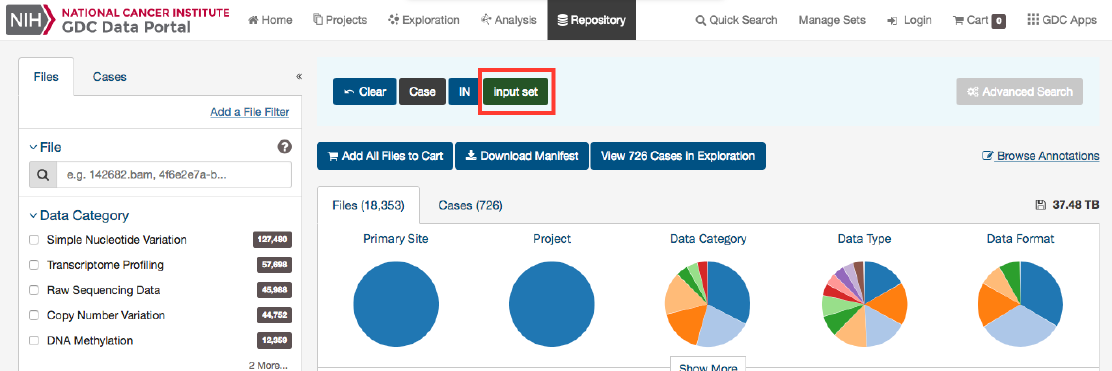
Navigation
After utilizing the Repository Page to narrow down a specific set of cases, users can continue to explore the mutations and genes
affected by these cases by clicking the View Files in Repository button as shown in the image below.
57
Clicking this button will navigate the users to the Exploration Page, filtered by the cases within the cohort.
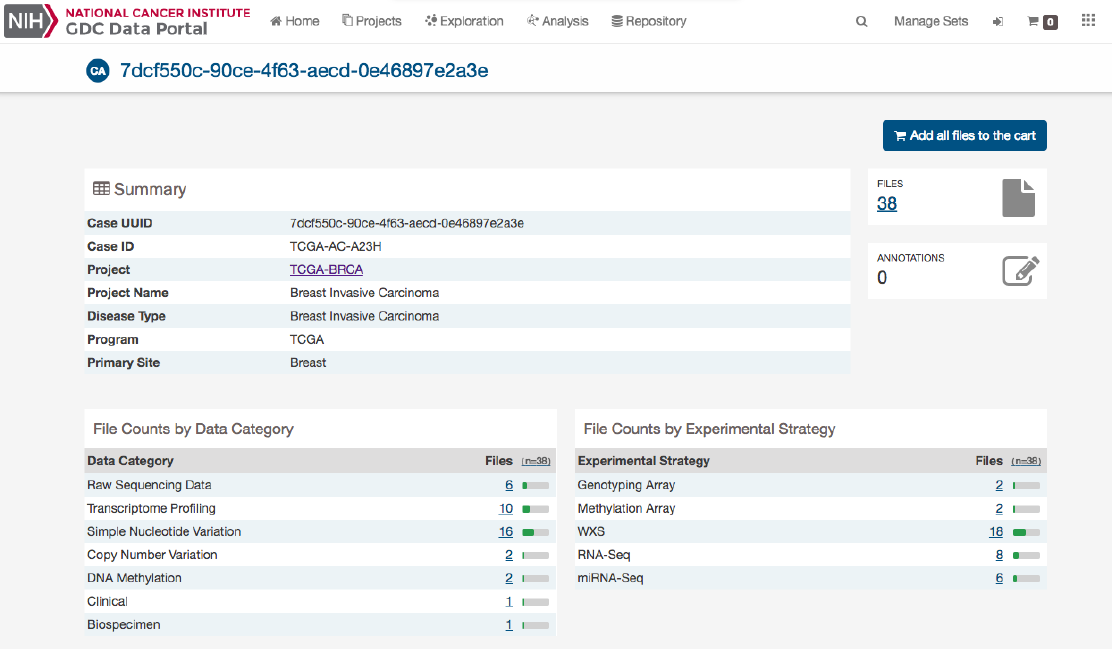
Case Summary Page
The Case Summary page displays case details including the project and disease information, data files that are available for that
case, and the experimental strategies employed. A button in the top-right corner of the page allows the user to add all files
associated with the case to the file cart.
58
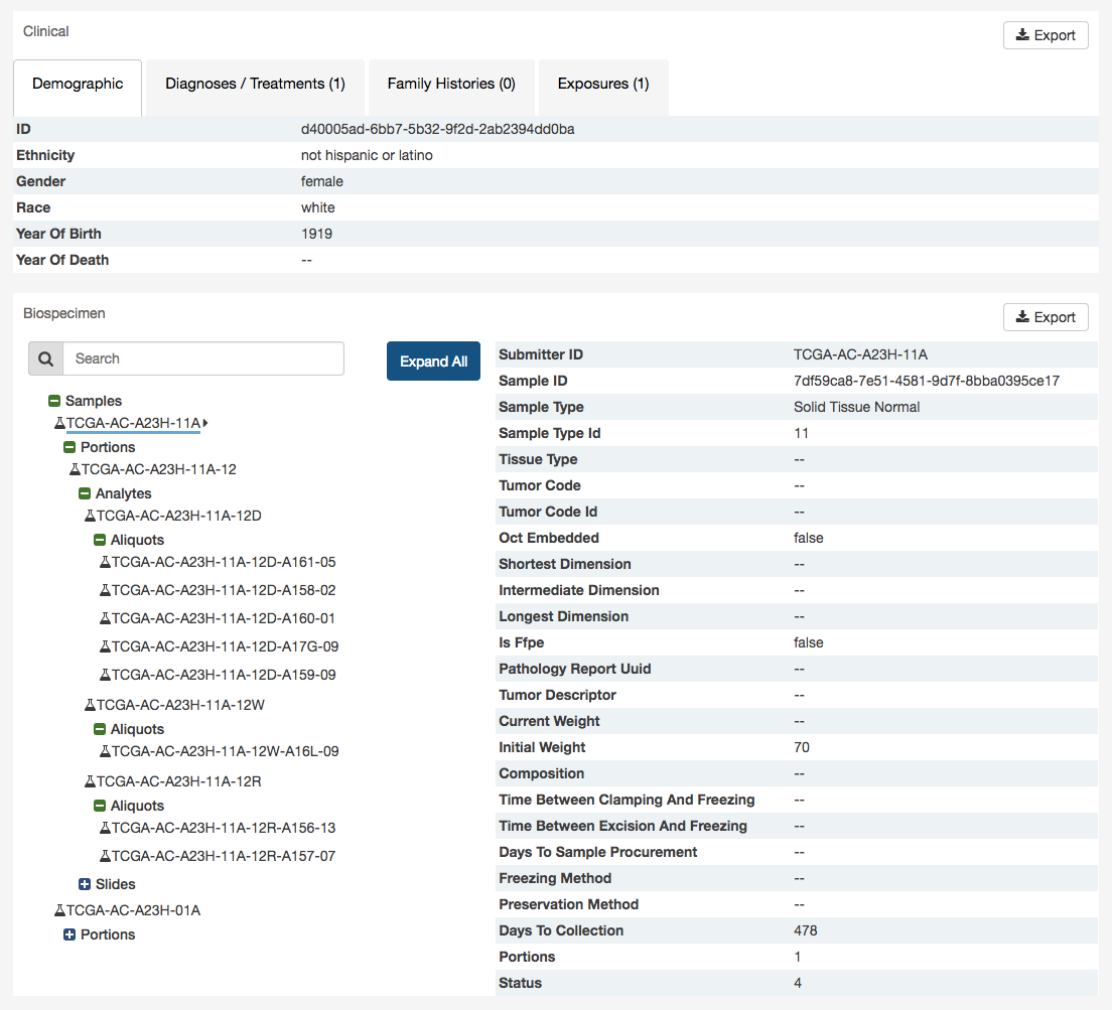
For clinical records that support multiple records of the same type (Diagnoses, Family Histories, or Exposures), a UUID of the
record is provided on the left hand side of the corresponding tab, allowing the user to select the entry of interest.
Biospecimen Search
A search filter just below the biospecimen section can be used to find and filter biospecimen data. The wildcard search will
highlight entities in the tree that match the characters typed. This will search both the case submitter ID, as well as the additional
metadata for each entity. For example, searching ‘Primary Tumor’ will highlight samples that match that type.
60
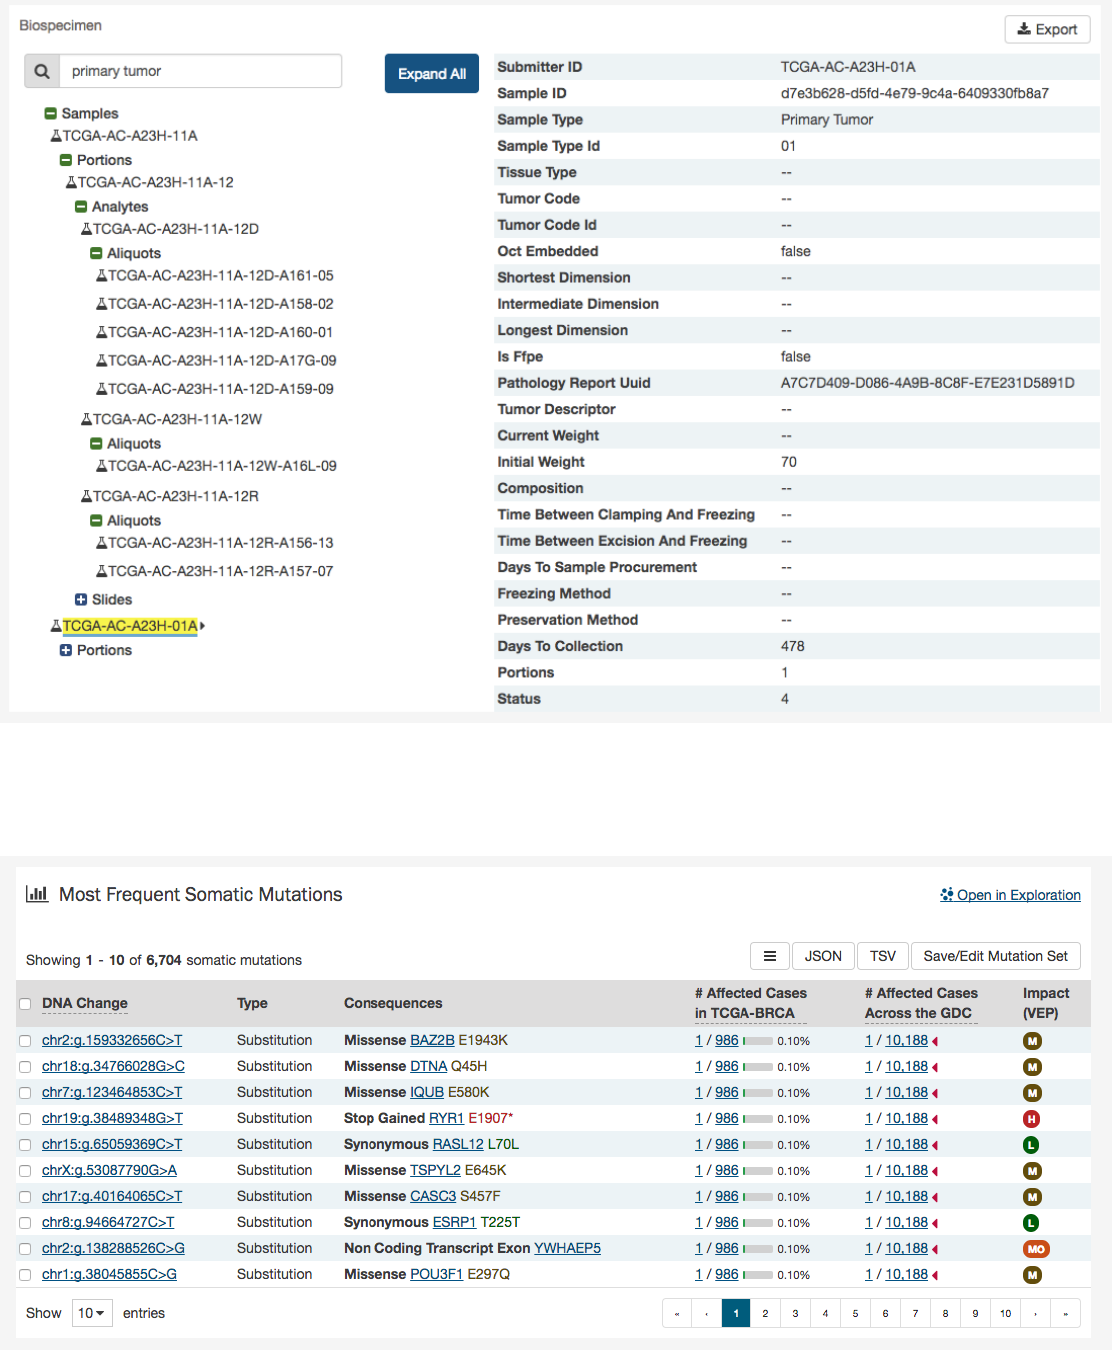
•DNA Change:
The chromosome and starting coordinates of the mutation are displayed along with the nucleotide
differences between the reference and tumor allele
•Type: A general classification of the mutation
•Consequences:
The effects the mutation has on the gene coding for a protein (i.e. synonymous, missense, non-coding
transcript)
•
__ Affected Cases in Project:__ The number of affected cases, expressed as number across all mutations within the Project
•
__ Affected Cases Across GDC:__ The number of affected cases, expressed as number across all projects. Choosing the
arrow next to the percentage will expand the selection with a breakdown of each affected project
•Impact (VEP):
A subjective classification of the severity of the variant consequence. This information comes from the
Ensembl VEP. The categories are:
•HIGH (H)
: The variant is assumed to have high (disruptive) impact in the protein, probably causing protein truncation,
loss of function or triggering nonsense mediated decay
•MODERATE (M): A non-disruptive variant that might change protein effectiveness
•LOW (L): Assumed to be mostly harmless or unlikely to change protein behavior
•MODIFIER (MO)
: Usually non-coding variants or variants affecting non-coding genes, where predictions are difficult or
there is no evidence of impact
Clicking on the
Open in Exploration
button at the top right of this section will navigate the user to the Exploration page,
filtered on this case.
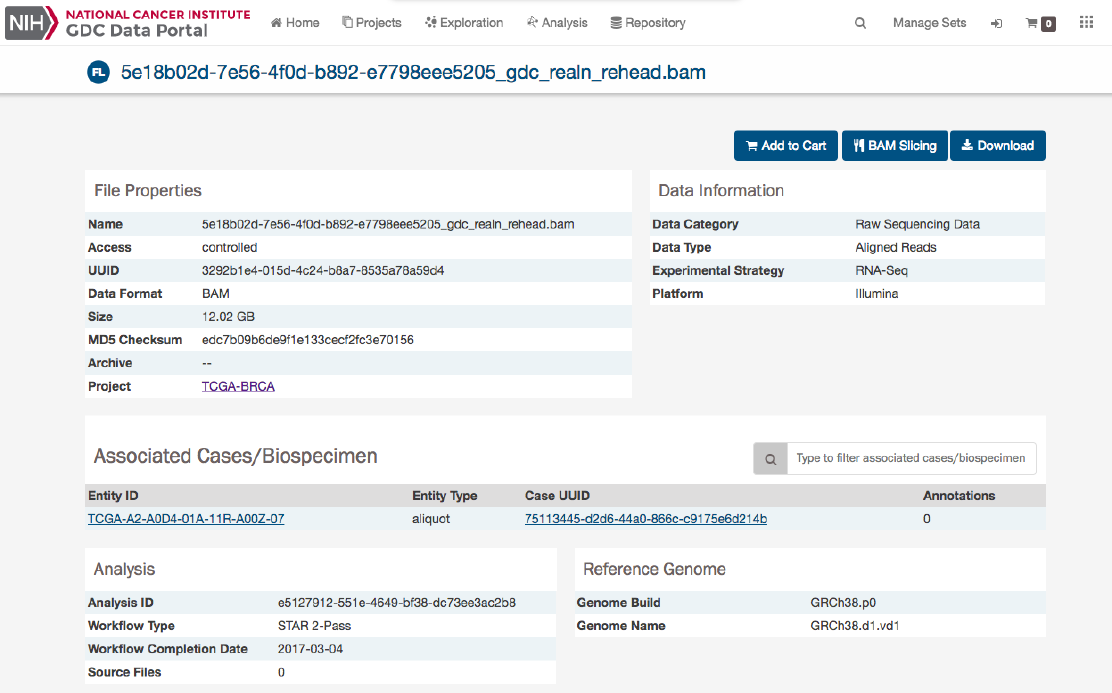
File Summary Page
The File Summary page provides information a data file, including file properties like size, md5 checksum, and data format;
information on the type of data included; links to the associated case and biospecimen; and information about how the data file
was generated or processed.
The page also includes buttons to download the file, add it to the file cart, or (for BAM files) utilize the BAM slicing function.
62
In the lower section of the screen, the following tables provide more details about the file and its characteristics:
•Associated Cases / Biospecimen: List of Cases or biospecimen the file is directly attached to.
•Analysis and Reference Genome: Information on the workflow and reference genome used for file generation.
•Read Groups: Information on the read groups associated with the file.
•Metadata Files: Experiment metadata, run metadata and analysis metadata associated with the file
•Downstream Analysis Files: List of downstream analysis files generated by the file
Note
:The Legacy Archive will not display “Workflow, Reference Genome and Read Groups” sections (these sections are applicable
to the GDC harmonization pipeline only). However it may provide information on Archives and metadata files like MAGE-TABs
and SRA XMLs. For more information, please refer to the section Legacy Archive.
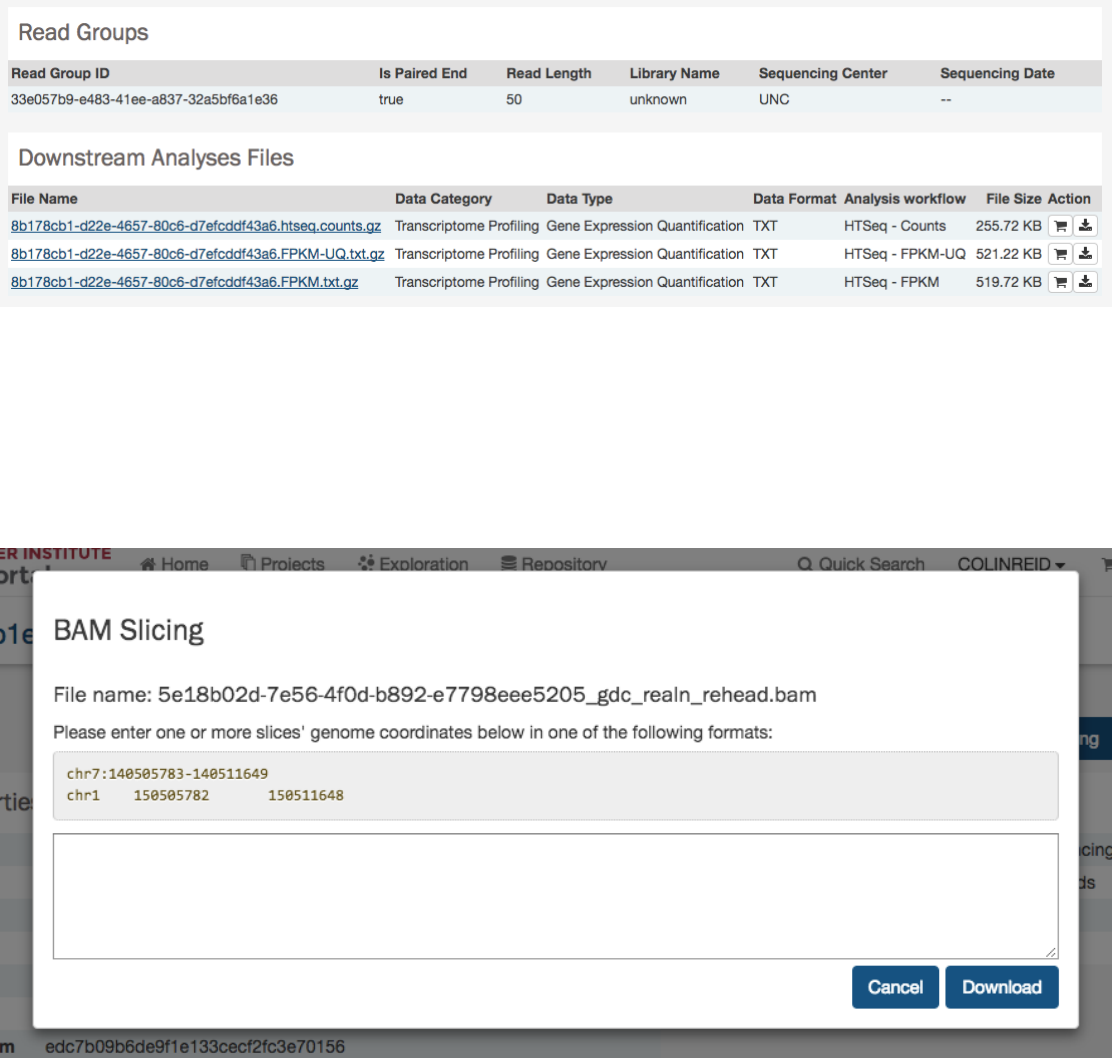
BAM Slicing
BAM file detail pages have a “BAM Slicing” button. This function allows the user to specify a region of a BAM file for download.
Clicking on it will open the BAM slicing window:
During preparation of the slice, the icon on the BAM Slicing button will be spinning, and the file will be offered for download to
the user as soon as ready.
63
Chapter 5
Genes and Mutations
Gene and Mutation Summary Pages
Many parts of the GDC website contain links to Gene and Mutation summary pages. These pages display information about
specific genes and mutations, along with visualizations and data showcasing the relationship between themselves, the projects,
and cases within the GDC. The gene and mutation data that is visualized on these pages are produced from the Open-Access
MAF files available for download on the GDC Portal.
Gene Summary Page
Gene Summary Pages describe each gene with mutation data and provides results related to the analyses that are performed on
these genes.
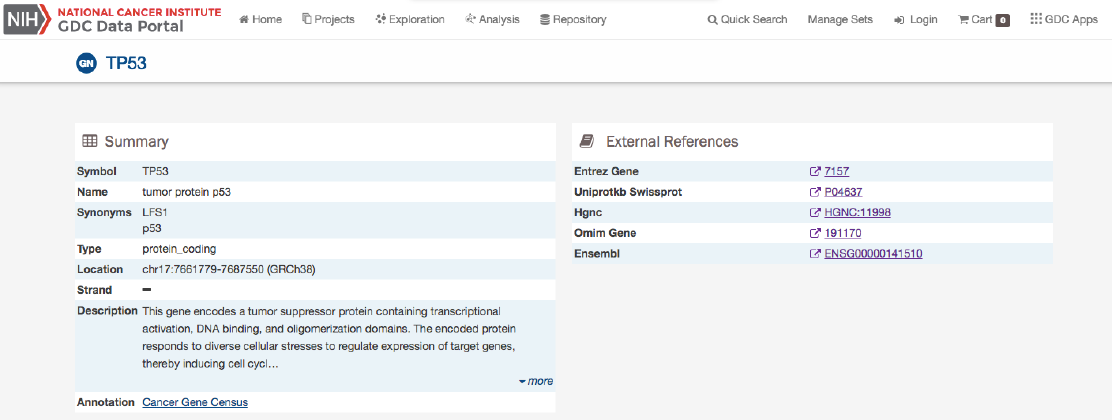
Summary
The summary section of the gene page contains the following information:
•Symbol: The gene symbol
•Name: Full name of the gene
•Synonyms: Synonyms of the gene name or symbol, if available
•Type: A broad classification of the gene
64
•Location: The chromosome on which the gene is located and its coordinates
•Strand: If the gene is located on the forward (+) or reverse (-) strand
•Description: A description of gene function and downstream consequences of gene alteration
•Annotation: A notation/link that states whether the gene is part of The Cancer Gene Census
External References
A list with links that lead to external databases with additional information about each gene is displayed here. These external
databases include: Entrez,Uniprot,Hugo Gene Nomenclature Committee,Online Mendelian Inheritance in Man, and Ensembl.
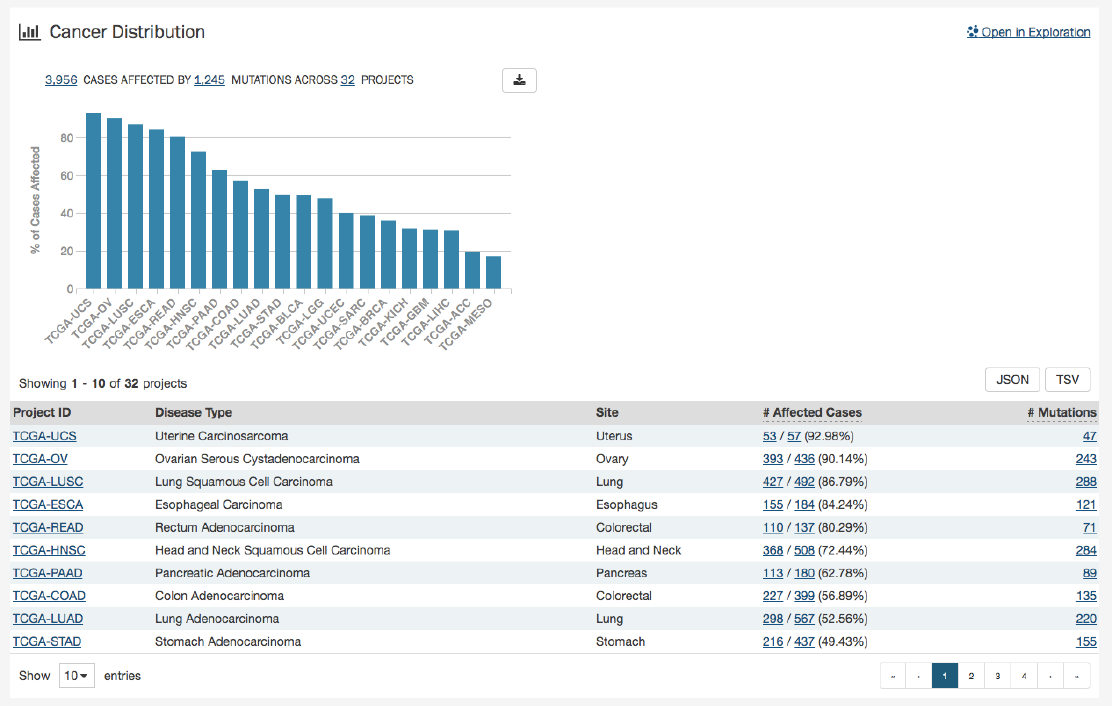
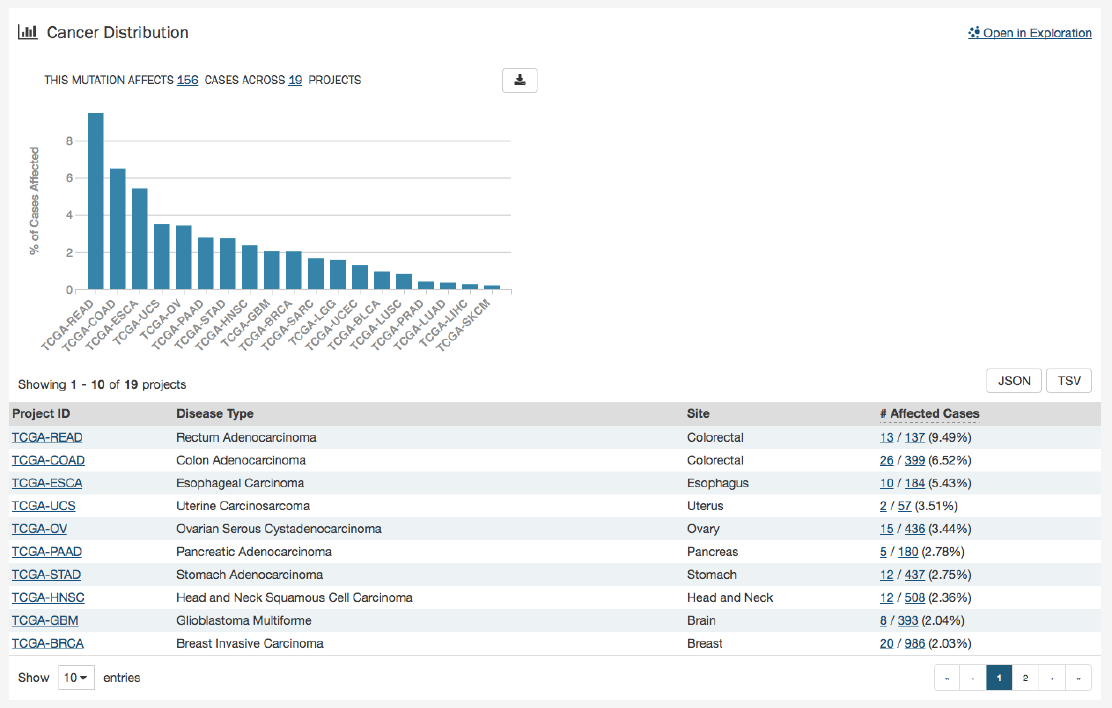
Cancer Distribution
A table and bar graph show how many cases are affected by mutations within the gene as a ratio and percentage. Each row/bar
represents the number of cases for each project. The final column in the table lists the number of unique mutations observed on
the gene for each project.
65
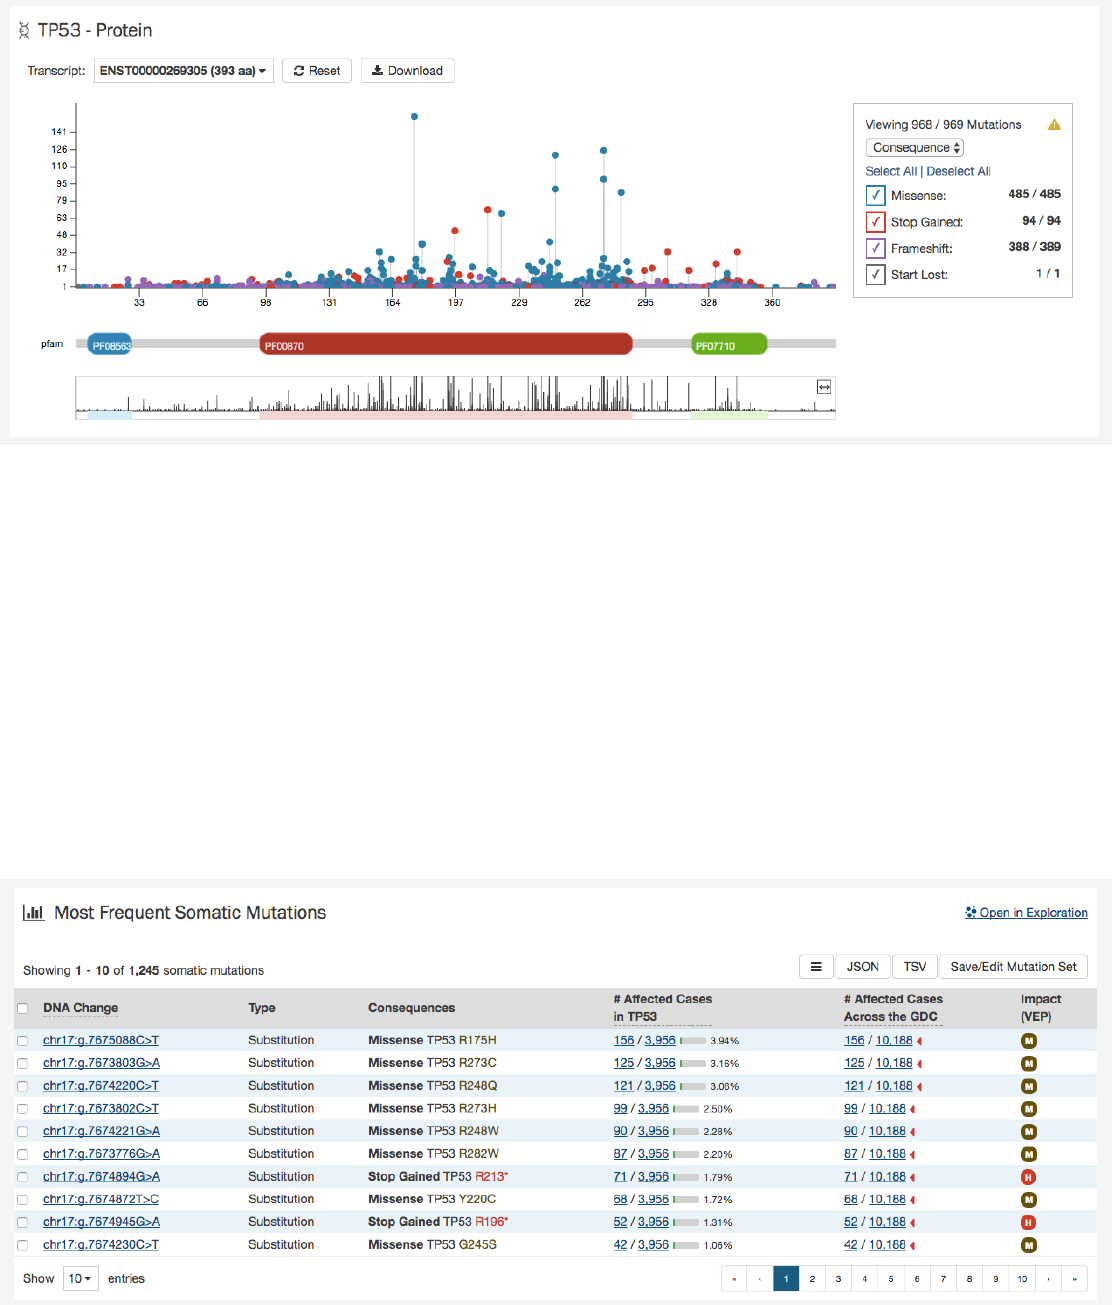
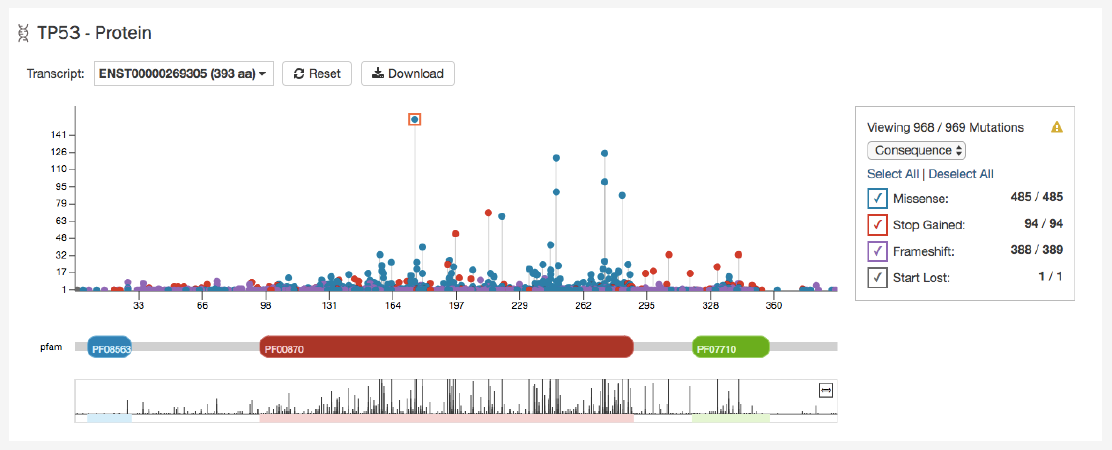
Protein Viewer
Mutations and their frequency across cases are mapped to a graphical visualization of protein-coding regions with a lollipop
plot. Pfam domains are highlighted along the x-axis to assign functionality to specific protein-coding regions. The bottom track
represents a view of the full gene length. Different transcripts can be selected by using the drop-down menu above the plot.
The panel to the right of the plot allows the plot to be filtered by mutation consequences or impact. The plot will dynamically
change as filters are applied. Mutation consequence and impact is denoted in the plot by color.
Note: The impact filter on this panel will not display the annotations for alternate transcripts.
The plot can be viewed at different zoom levels by clicking and dragging across the x-axis, clicking and dragging across the
bottom track, or double clicking the pfam domain IDs. The
Reset
button can be used to bring the zoom level back to its original
position. The plot can also be exported as a PNG image, SVG image or as JSON formatted text by choosing the
Download
button above the plot.
Most Frequent Mutations
The 20 most frequent mutations in the gene are displayed as a bar graph that indicates the number of cases that share each
mutation.
A table is displayed below that lists information about each mutation including:
66
•DNA Change:
The chromosome and starting coordinates of the mutation are displayed along with the nucleotide
differences between the reference and tumor allele
•Type: A general classification of the mutation
•Consequences:
The effects the mutation has on the gene coding for a protein (i.e. synonymous, missense, non-coding
transcript)
•__ Affected Cases in Gene:__ The number of affected cases, expressed as number across all mutations within the Gene
•
__ Affected Cases Across GDC:__ The number of affected cases, expressed as number across all projects. Choosing the
arrow next to the percentage will expand the selection with a breakdown of each affected project
•Impact:
A subjective classification of the severity of the variant consequence. This determined using Ensembl VEP,
PolyPhen, and SIFT. The categories are outlined here.
Note: The Mutation UUID can be displayed in this table by selecting it from the drop-down represented by three parallel lines
Clicking the
Open in Exploration
button will navigate the user to the Exploration page, showing the same results in the table
(mutations filtered by the gene).
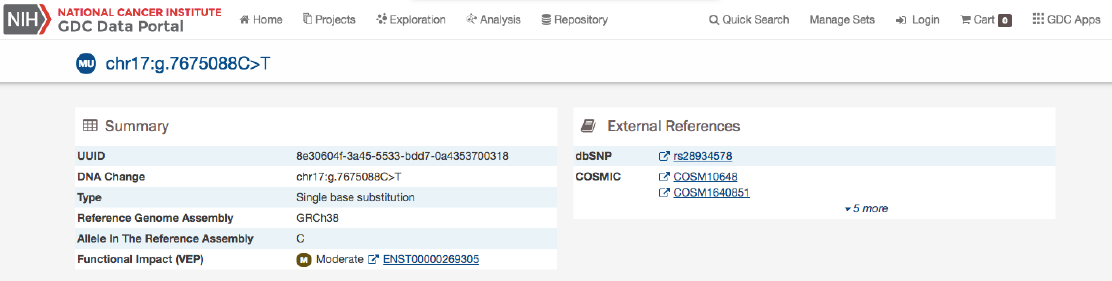
Mutation Summary Page
The Mutation Summary Page contains information about one somatic mutation and how it affects the associated gene. Each
mutation is identified by its chromosomal position and nucleotide-level change.
Summary
•ID: A unique identifier (UUID) for this mutation
•DNA Change: Denotes the chromosome number, position, and nucleotide change of the mutation
•Type: A broad categorization of the mutation
•Reference Genome Assembly: The reference genome in which the chromosomal position refers to
•Allele in the Reference Assembly: The nucleotide(s) that compose the site in the reference assembly
•Functional Impact: A subjective classification of the severity of the variant consequence.
External References
A separate panel contains links to databases that contain information about the specific mutation. These include dbSNP and
COSMIC.
Consequences
The consequences of the mutation are displayed in a table. The set of consequence terms, defined by the Sequence Ontology.
67
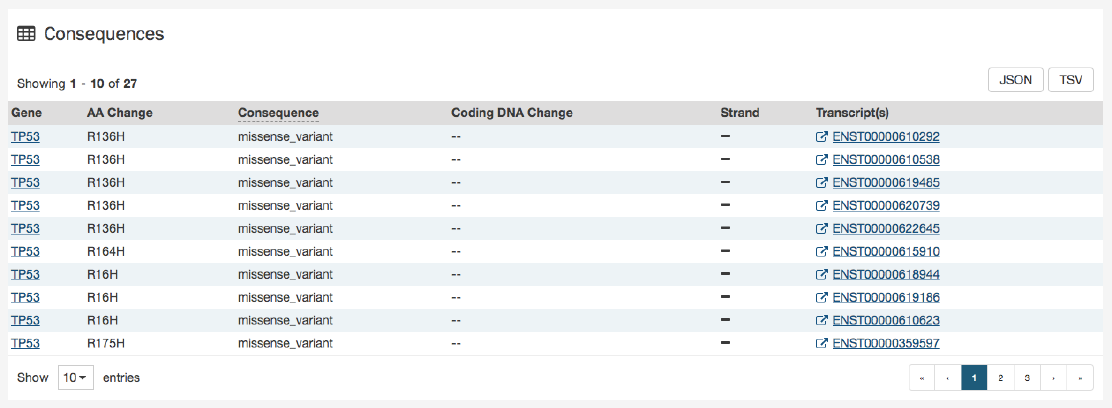
The fields that describe each consequence are listed below:
•Gene: The symbol for the affected gene
•AA Change: Details on the amino acid change, including compounds and position, if applicable
•Consequence: The biological consequence of each mutation
•Coding DNA Change: The specific nucleotide change and position of the mutation within the gene
•Strand: If the gene is located on the forward (+) or reverse (-) strand
•Transcript(s): The transcript(s) affected by the mutation. Each contains a link to the Ensembl entry for the transcript
Cancer Distribution
A table and bar graph shows how many cases are affected by the particular mutation. Each row/bar represents the number of
cases for each project.
68
Protein Viewer
The protein viewer displays a plot representing the position of mutations along the polypeptide chain. The y-axis represents the
number of cases that exhibit each mutation, whereas the x-axis represents the polypeptide chain sequence. Pfam domains that
were identified along the polypeptide chain are identified with colored rectangles labeled with pfam IDs. See the Gene Summary
Page for additional details about the protein viewer.
The panel to the right of the plot allows the plot to be filtered by mutation consequences or impact. The plot will dynamically
change as filters are applied. Mutation consequence and impact is denoted in the plot by color.
Note: The impact filter on this panel will not display the annotations for alternate transcripts.
The plot can be viewed at different zoom levels by clicking and dragging across the x-axis, clicking and dragging across the
bottom track, or double clicking the pfam domain IDs. The
Reset
button can be used to bring the zoom level back to its original
position. The plot can also be exported as a PNG image, SVG image or as JSON formatted text by choosing the
Download
button above the plot.
70
Chapter 6
Custom Set Analysis
Custom Set Analysis
In addition to the Exploration page, the GDC Data Portal also has features used to save and compare sets of cases, genes, and
mutations. These sets can either be generated with existing filters (e.g. males with lung cancer) or through custom selection
(e.g. a user-generated list of case IDs).
Note that saving a set only saves the type of entity included in the set. For example, a saved case set will not include filters that
were applied to genes or mutations. Please be aware that your custom sets are deleted during each new GDC data release. You
can export them and re-upload them in the “Manage Sets” link at the top right of the Portal.
Generating a Cohort for Analysis
Cohort sets are completely customizable and can be generated for cases, genes, or mutations using the following methods:
Upload ID Set:
This feature is available in the “Manage Sets” link at the top right of the Portal. Choose “Upload Set” and
then select whether the set comprises cases, genes, or mutations. A set of IDs (IDs* or UUIDs) can then be uploaded in a text file
or copied and pasted into the list of identifiers field along with a name identifying the set. Once the list of identifiers is uploaded,
they are validated and grouped according to whether the identifier matched an existing GDC ID or did not match (“Unmatched”).
* This is referred to as a submitter_id in the GDC API, which is a non-UUID identifier such as a TCGA barcode.
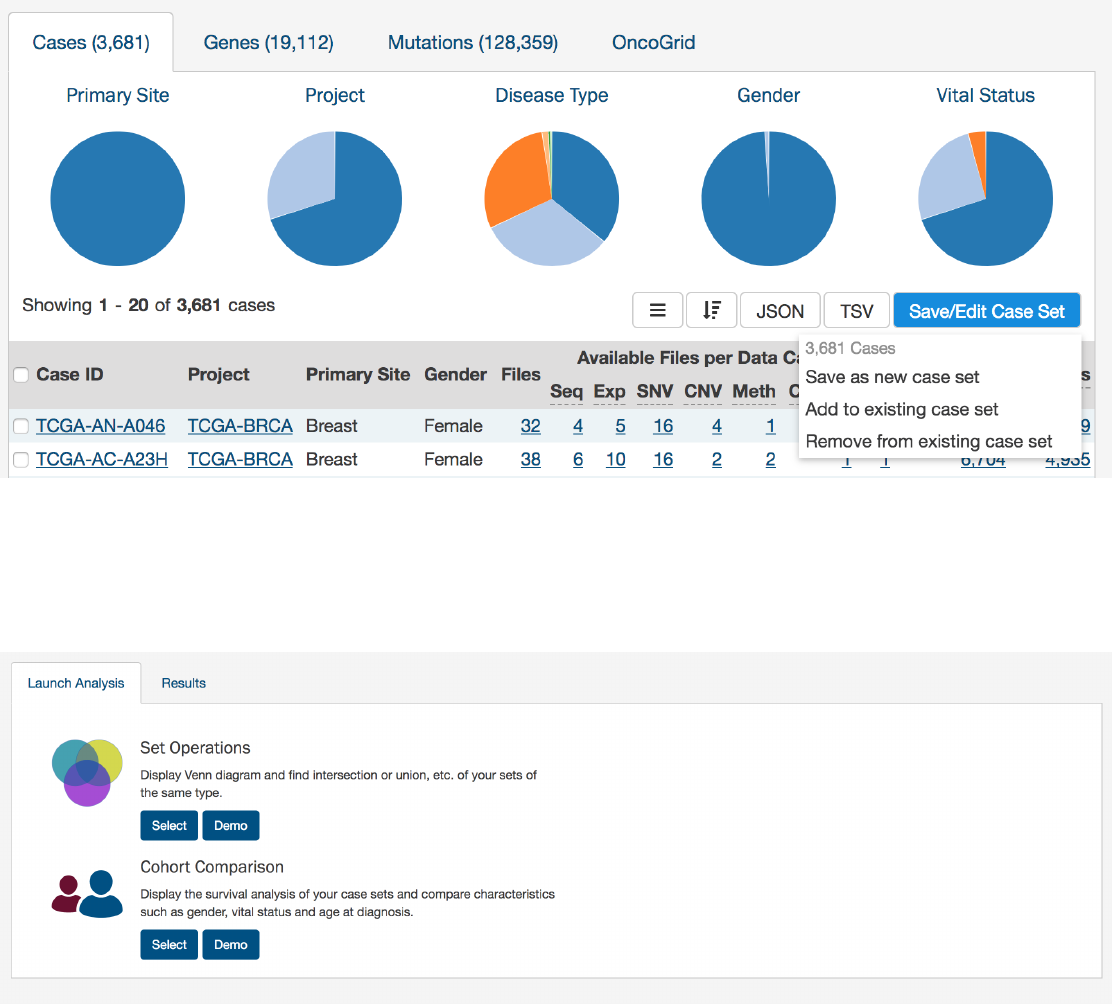
Apply Filters in Exploration:
Sets can be assembled using the existing filters in the Exploration page. They can be saved by
choosing the “Save/Edit Case Set” button under the pie charts for case sets. This will prompt a decision to:
•Save as new case set
•Add to existing case set
•Remove from existing case set
Similarly, gene and mutation filters can be applied and saved in the Exploration page in the Genes and Mutations tab, respectively.
71
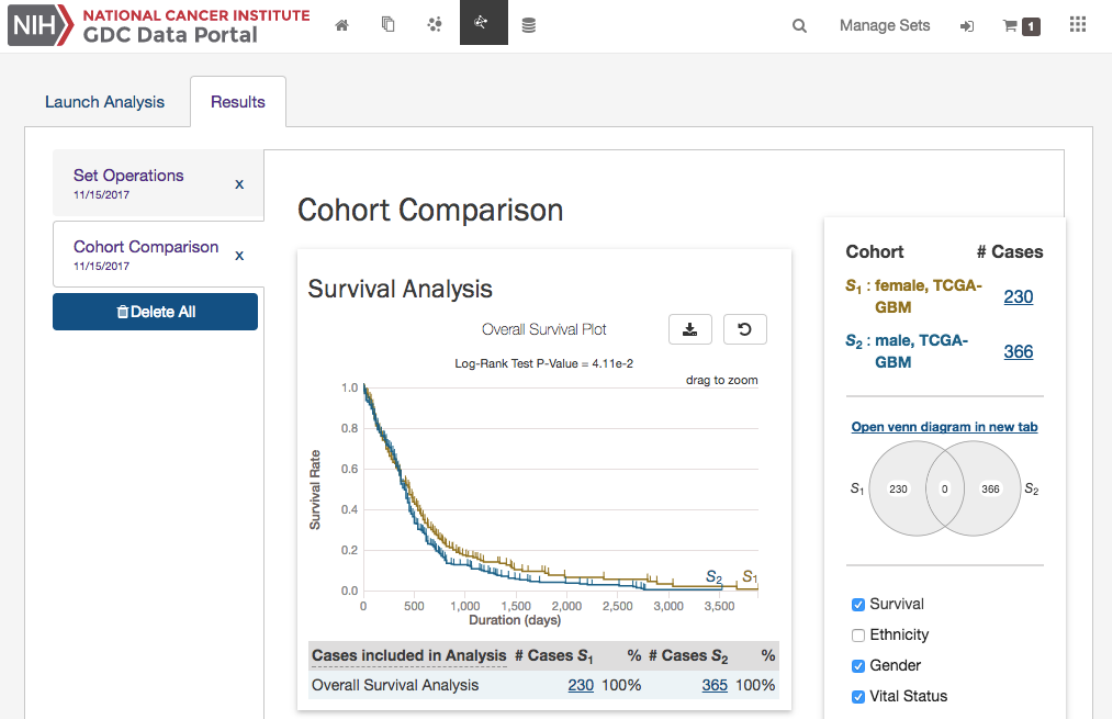
Analysis Page
Clicking on the
Analysis
button in the top toolbar will launch the Analysis Page which displays the various options available for
comparing saved sets.
There are two tabs on this page:
•Launch Analysis: Where users can select either to do Set Operations or Cohort Comparison
•Results: Where users can view the results of current or previous set analyses
Analysis Page: Set Operations
Up to three sets of the same set type can be compared and exported based on complex overlapping subsets. The features of this
page include:
72
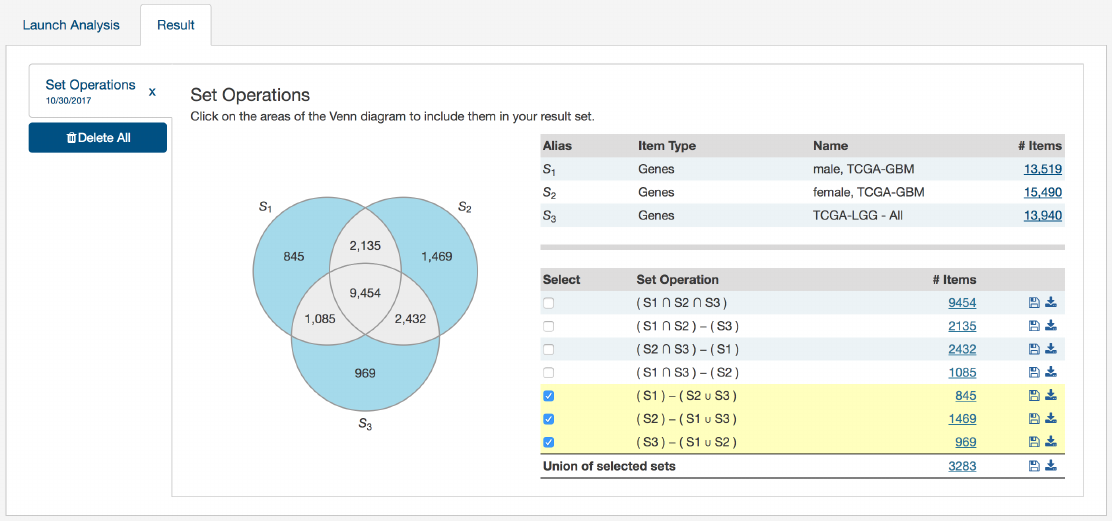
•Venn Diagram:
Visually displays the overlapping items included within the three sets. Subsets based on overlap can be
selected by clicking one or many sections of the Venn diagram. As sections of the Venn Diagram become highlighted in
blue, their corresponding row in the overlap table becomes highlighted.
•Summary Table: Displays the alias, item type, and name for each set included in this analysis
•Overlap Table:
Displays the number of overlapping items with set operations rather than a visual diagram. Subsets can
be selected by checking boxes in the “Select” column, which will highlight the corresponding section of the Venn Diagram.
As rows are selected, the “Union of selected sets” row is populated. Each row has an option to save the subset as a new set,
export the set as a TSV, or view files in the repository. The links that correspond to the number of items in each row will
open the cohort in the Exploration page.
Analysis Tab: Cohort Comparison
The “Cohort Comparison” analysis displays a series of graphs and tables that demonstrate the similarities and differences between
two case sets. The following features are displayed for each two sets:
•A key detailing the number of cases in each cohort and the color that represents each (blue/gold)
•
A Venn diagram, which shows the overlap between the two cohorts. The Venn diagram can be opened in a ‘Set Operations’
tab by choosing “Open venn diagram in new tab”
•A selectable survival plot that compares both sets with information about the percentage of represented cases
73
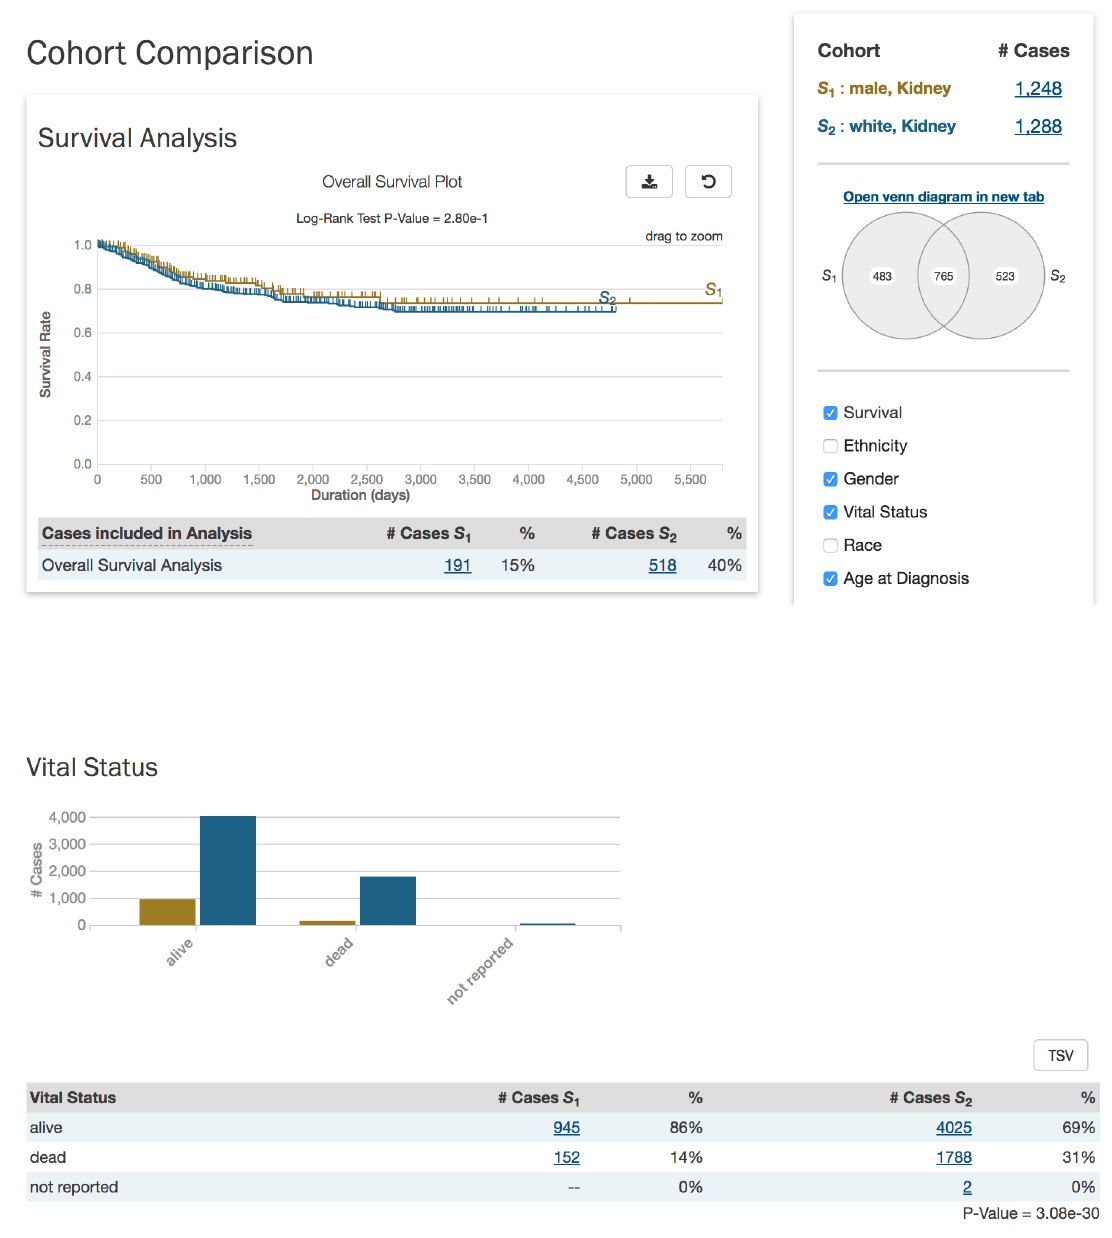
•
A breakdown of each cohort by selectable clinical facets with a bar graph and table. Facets include
vital_status
,
gender
,
race
,
ethnicity
, and
age_at_diagnosis
. A p-value (if it can be calculated from the data) that demonstrates whether the
statuses are proportionally represented is displayed for the vital_status,gender, and ethnicity facets.
Analysis Page: Results
The results of the previous analyses are displayed on this page.
74
Chapter 7
Annotations
Annotations
Annotations are notes added to individual cases, samples or files.
Annotations View
The Annotations View provides an overview of the available annotations and allows users to browse and filter the annotations
based on a number of annotation properties (facets), such as the type of entity the annotation is attached to or the annotation
category.
The view presents a list of annotations in tabular format on the right, and a facet panel on the left that allows users to filter the
annotations displayed in the table. If facet filters are applied, the tabs on the right will display only the matching annotations. If
no filters are applied, the tabs on the right will display information about all available data.
Clicking on an annotation ID in the annotations list will take the user to the Annotation Detail Page.
76
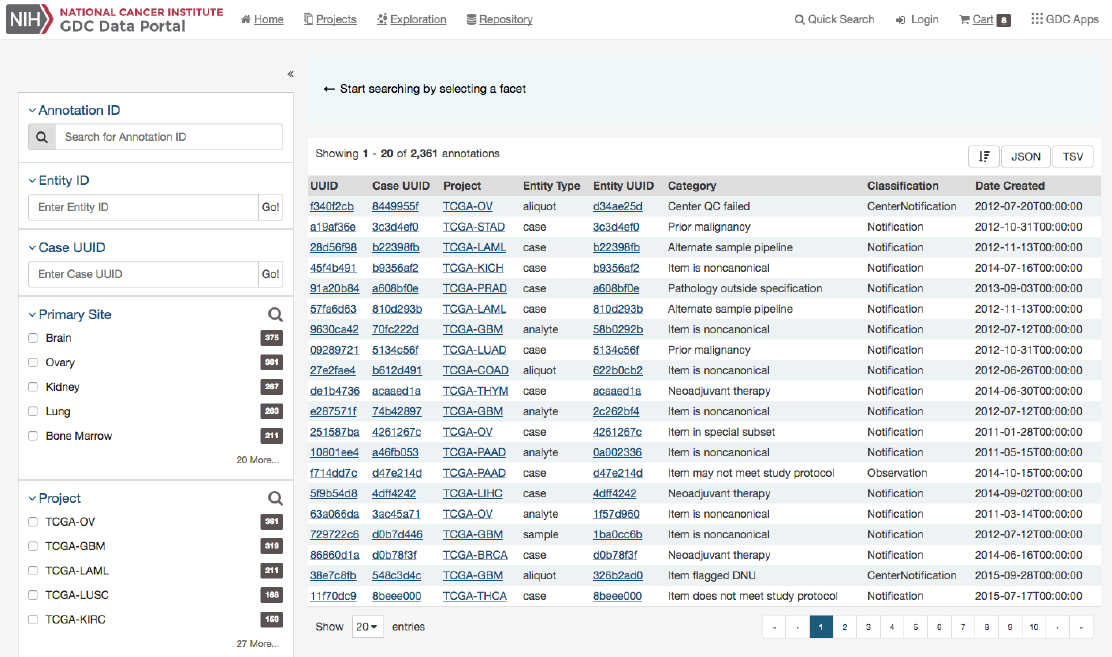
Facets Panel
The following facets are available to search for annotations:
•Annotation ID: Seach using annotation ID
•Entity ID: Seach using entity ID
•Case UUID: Seach using case UUID
•Primary Site: Anatomical site of the cancer
•Project: A cancer research project, typically part of a larger cancer research program
•Entity Type: The type of entity the annotation is associated with: Patient, Sample, Portion, Slide, Analyte, Aliquot
•Annotation Category: Search by annotation category.
•Annotation Created: Search for annotations by date of creation.
•Annotation Classification: Search by annotation classification.
Annotation Categories and Classification
For more details about categories and classifications please refer to the TCGA Annotations page on NCI Wiki.
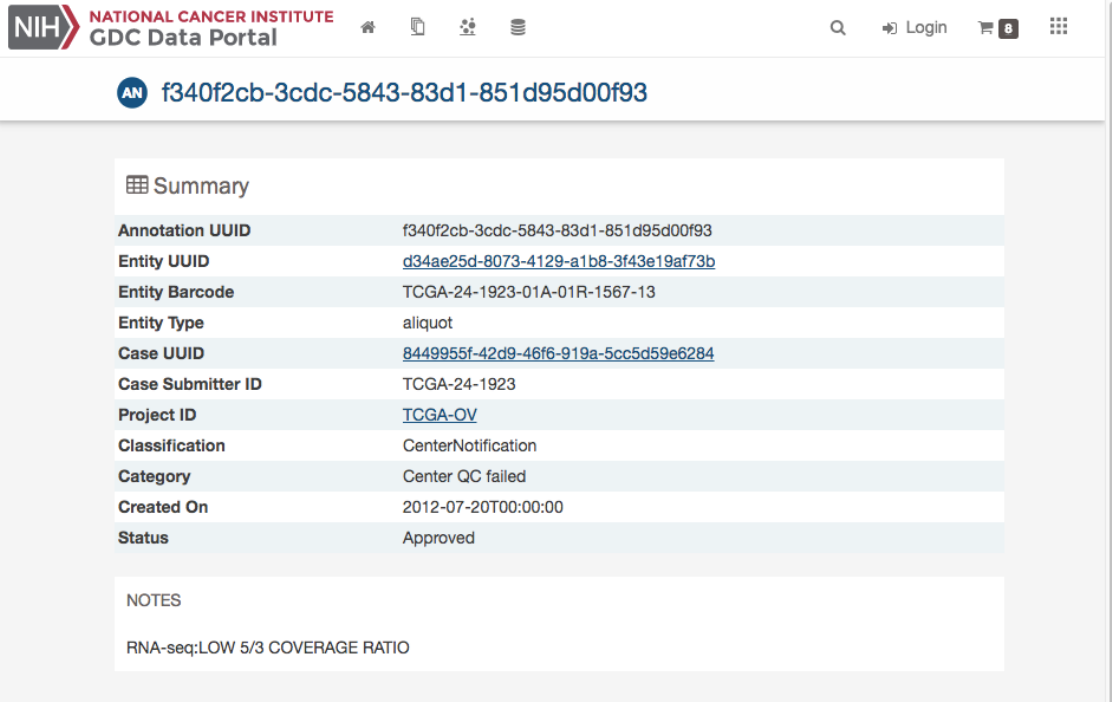
Annotation Detail Page
The annotation entity page provides more details about a specific annotation. It is available by clicking on an annotation ID in
Annotations View.
77
Chapter 8
Advanced Search
Advanced Search
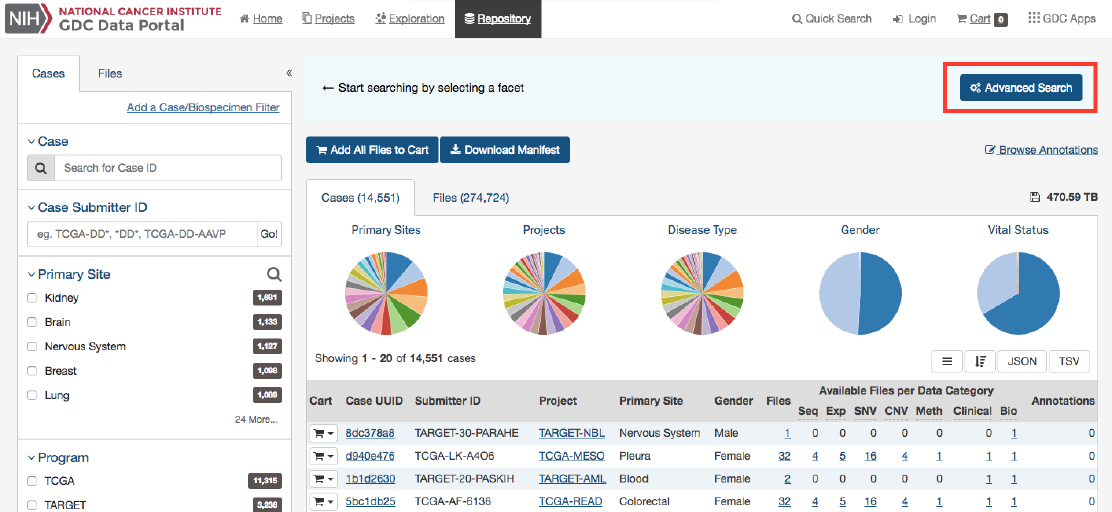
Only available in the Repository view, the Advanced Search page offers complex query building capabilities to identify specific set
of cases and files.
Overview: GQL
Advanced search allows, via Genomic Query Language (GQL), to use structured queries to search for files and cases.
79
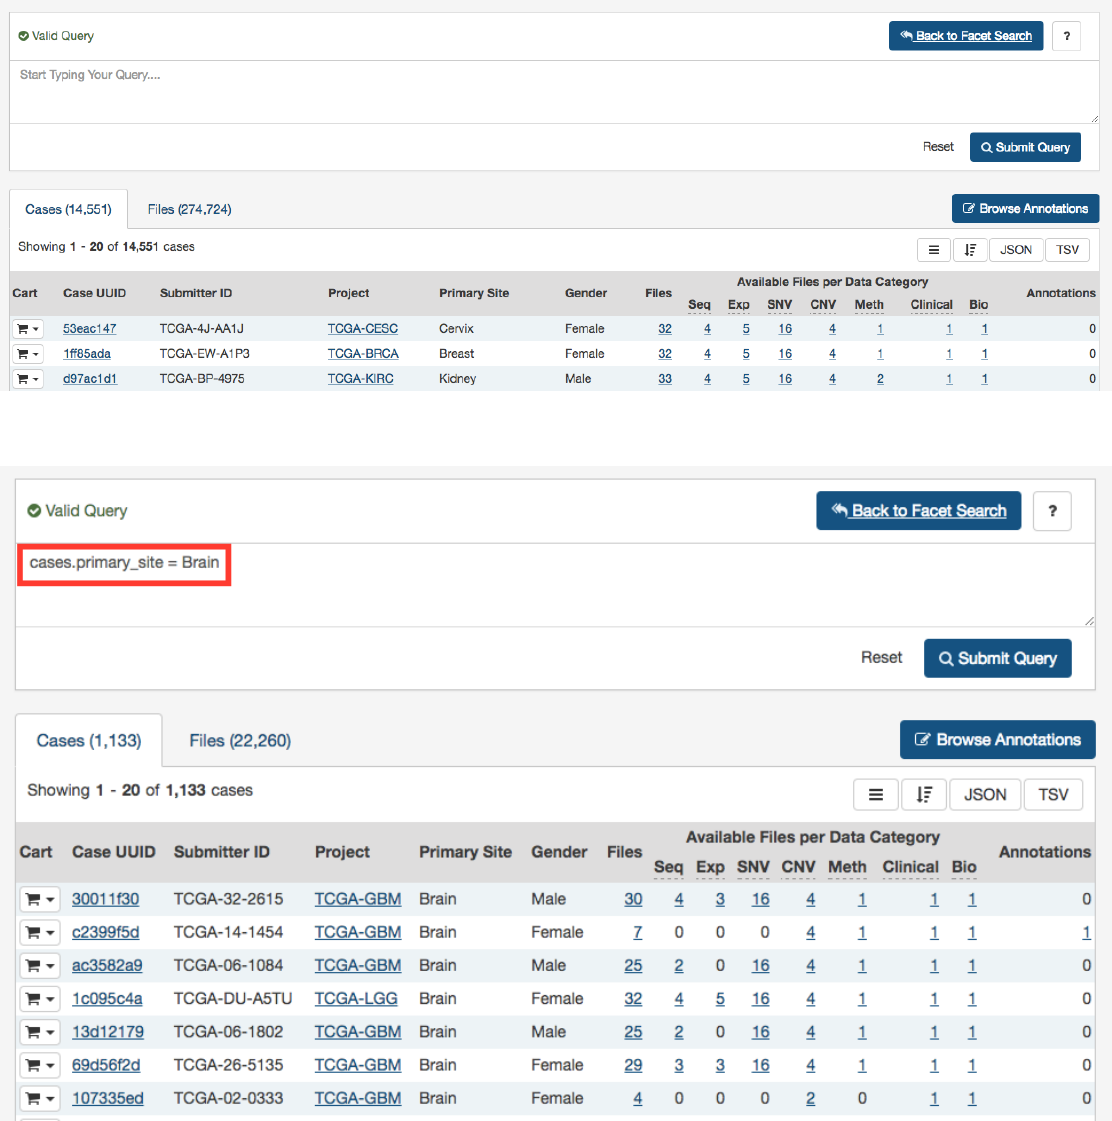
A simple query in GQL (also known as a ‘clause’) consists of a
field
, followed by an
operator
, followed by one or more
values
.
For example, the simple query cases.primary_site = Brain will find all cases for projects in which the primary site is Brain:
Note that it is not possible to compare two fields (e.g. disease_type = project.name).
Note: GQL is not a database query language. For example, GQL does not have a “SELECT” statement.
Switching between Advanced Search and Facet Filters
When accessing Advanced Search from Repository View, a query created using facet filters in Repository View will be automatically
translated to an Advanced Search GQL Query.
A query created in Advanced Search is not translated back to facet filters. Clicking on “Back to Facet Search” will return the
user to Data View and reset the filters.
80
Using the Advanced Search
When opening the advanced search page (via the Repository view), the search field will be automatically populated with facets
filters already applied (if any).
This default query can be removed by pressing “Reset”.
Once the query has been entered and is identified as a “Valid Query”, click on “Search” to run your query.
Auto-complete
As a query is being written, the GDC Data Portal will analyze the context and offer a list of auto-complete suggestions.
Auto-complete suggests both fields and values as described below.
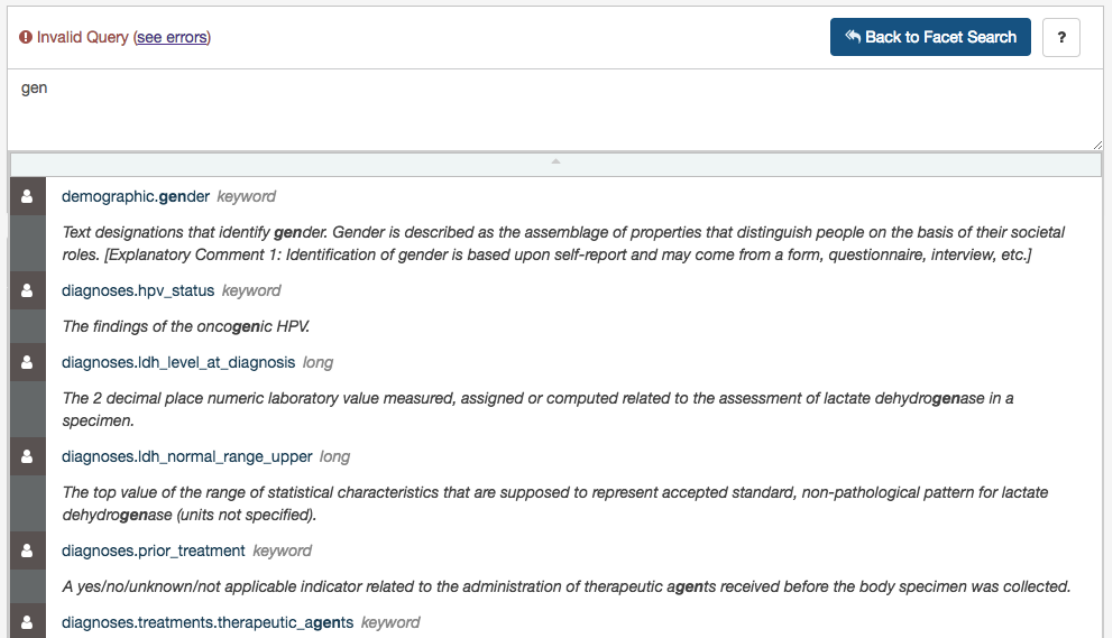
Field Auto-complete
The list of auto-complete suggestions includes
all
available fields matching the user text input. The user has to scroll down to see
more fields in the dropdown:
Value Auto-complete
The list of auto-complete suggestions includes top 100 values that match the user text input. The user has to scroll down to see
more values in the dropdown.
The value auto-complete is not aware of the general context of the query, the system will display all available values in GDC for
the selected field. It means the query could return 0 results depending of other filters.
81
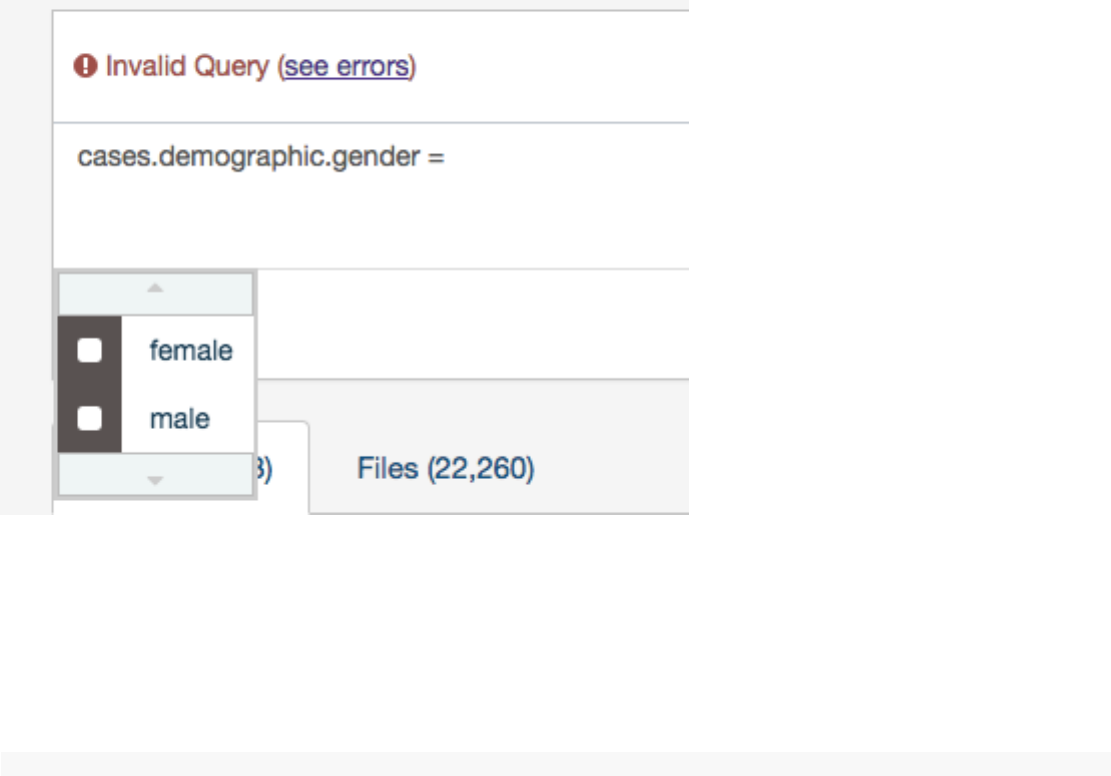
Note: Quotes are automatically added to the value if it contains spaces.
Setting Precedence of Operators
You can use parentheses in complex GQL statements to enforce the precedence of operators.
For example, if you want to find all the open files in TCGA program as well as the files in TARGET program, you can use
parentheses to enforce the precedence of the boolean operators in your query, i.e.:
1(files.access = open and cases.project.program.name = TCGA) or cases.project.program.name = TARGET
Note: Without parentheses, the statement will be evaluated left-to-right.
Keywords
A GQL keyword is a word that joins two or more clauses together to form a complex GQL query.
List of Keywords:
•AND
•OR
Note: parentheses can be used to control the order in which clauses are executed.
AND Keyword
Used to combine multiple clauses, allowing you to refine your search.
Examples:
•Find all open files in breast cancer
cases.project.primary_site = Breast and files.access = open
•Find all open files in breast cancer and data type is copy number variation
cases.project.primary_site = Breast and files.access = open and files.data_type = “Copy number variation”
82

OR Keyword
Used to combine multiple clauses, allowing you to expand your search.
Note:IN keyword can be an alternative to OR and result in simplified queries.
Examples:
•Find all files that are raw sequencing data or raw microarray data:
files.data_type = “Raw microarray data” or files.data_type = “Raw sequencing data”
•Find all files where donors are male or vital status is alive:
cases.demographic.gender = male or cases.diagnoses.vital_status = alive
Operators
An operator in GQL is one or more symbols or words comparing the value of a field on its left with one or more values on its
right, such that only true results are retrieved by the clause.
List of Operators and Query format
Operator Description
= Field EQUAL Value (String or Number)
!= Field NOT EQUAL Value (String or Number)
< Field LOWER THAN Value (Number or Date)
<= Field LOWER THAN OR EQUAL Value (Number or Date)
> Field GREATER THAN Value (Number or Date)
>= Field GREATER THAN OR EQUAL Value (Number or Date)
IN Field IN [Value 1, Value 2]
EXCLUDE Field EXCLUDE [Value 1, Value 2]
IS MISSING Field IS MISSING
NOT MISSING Field NOT MISSING
“=” operator - EQUAL
The “=” operator is used to search for files where the value of the specified field exactly matches the specified value.
Examples:
•Find all files that are gene expression:
files.data_type = “Gene expression”
•Find all cases whose gender is female:
cases.demographic.gender = female
“!=” operator - NOT EQUAL
The “!=” operator is used to search for files where the value of the specified field does not match the specified value.
83
The “!=” operator will not match a field that has no value (i.e. a field that is empty). For example, ‘gender != male’ will only
match cases who have a gender and the gender is not male. To find cases other than male or with no gender populated, you
would need to type gender != male or gender is missing.
Example:
•Find all files with an experimental different from genotyping array:
files.experimental_strategy != “Genotyping array”
“>” operator - GREATER THAN
The “>” operator is used to search for files where the value of the specified field is greater than the specified value.
Example:
•Find all cases whose number of days to death is greater than 60:
cases.diagnoses.days_to_death > 60
“>=” operator - GREATER THAN OR EQUALS
The “>=” operator is used to search for files where the value of the specified field is greater than or equal to the specified value.
Example:
•Find all cases whose number of days to death is equal or greater than 60:
cases.diagnoses.days_to_death >= 60
“<” operator - LESS THAN
The “<” operator is used to search for files where the value of the specified field is less than the specified value.
Example:
•Find all cases whose age at diagnosis is less than 400 days:
cases.diagnoses.age_at_diagnosis < 400
“<=” operator - LESS THAN OR EQUALS
The “<=” operator is used to search for files where the value of the specified field is less than or equal to the specified value.
Example:
•Find all cases with a number of days to death less than or equal to 20:
cases.diagnoses.days_to_death <= 20
“IN” Operator
The “IN” operator is used to search for files where the value of the specified field is one of multiple specified values. The values
are specified as a comma-delimited list, surrounded by brackets [ ].
Using “IN” is equivalent to using multiple ‘EQUALS (=)’ statements, but is shorter and more convenient. That is, typing
‘project IN [ProjectA, ProjectB, ProjectC]’ is the same as typing ‘project = “ProjectA” OR project = “ProjectB” OR project =
“ProjectC” ’.
Examples:
84

•Find all files in breast, breast and lung and cancer:
cases.project.primary_site IN [Brain, Breast,Lung]
•Find all files tagged with exon or junction or hg19:
files.data_type IN [“Aligned reads”, “Unaligned reads”]
“EXCLUDE” Operator
The “EXCLUDE” operator is used to search for files where the value of the specified field is not one of multiple specified values.
Using “EXCLUDE” is equivalent to using multiple ‘NOT_EQUALS (!=)’ statements, but is shorter and more convenient. That is,
typing ‘project EXCLUDE [ProjectA, ProjectB, ProjectC]’ is the same as typing ‘project != “ProjectA” OR project != “ProjectB”
OR project != “ProjectC” ’
The “EXCLUDE” operator will not match a field that has no value (i.e. a field that is empty). For example, ‘experimental
strategy EXCLUDE [“WGS”,“WXS”]’ will only match files that have an experimental strategy
and
the experimental strategy is
not “WGS” or “WXS”. To find files with an experimental strategy different from than “WGS” or “WXS”
or is not assigned
,
you would need to type: files.experimental_strategy in [“WXS”,“WGS”] or files.experimental_strategy is missing.
Examples:
•Find all files where experimental strategy is not WXS, WGS, Genotyping array:
files.experimental_strategy EXCLUDE [WXS, WGS, “Genotyping array”]
“IS MISSING” Operator
The “IS” operator can only be used with “MISSING”. That is, it is used to search for files where the specified field has no value.
Examples:
•Find all cases where gender is missing:
cases.demographic.gender is MISSING
“NOT MISSING” Operator
The “NOT” operator can only be used with “MISSING”. That is, it is used to search for files where the specified field has a value.
Examples:
•Find all cases where race is not missing:
cases.demographic.race NOT MISSING
Special Cases
Date format
The date format should be the following: YYYY-MM-DD (without quotes).
Example:
1files.updated_datetime > 2015-12-31
85
Using Quotes
A value must be quoted if it contains a space. Otherwise the advanced search will not be able to interpret the value.
Quotes are not necessary if the value consists of one single word.
•Example: Find all cases with primary site is brain and data type is copy number variation:
cases.project.primary_site = Brain and files.data_type = “Copy number variation”
Age at Diagnosis - Unit in Days
The unit for age at diagnosis is in days. The user has to convert the number of years to number of days.
The conversion factor is 1 year = 365.25 days
•Example: Find all cases whose age at diagnosis > 40 years old (40 * 365.25)
cases.diagnoses.age_at_diagnosis > 14610
Fields Reference
The full list of fields available on the GDC Data Portal can be found through the GDC API using the following endpoint:
https://api.gdc.cancer.gov/gql/_mapping
Alternatively, a static list of fields is available below (not exhaustive).
Files
•files.access
•files.acl
•files.archive.archive_id
•files.archive.revision
•files.archive.submitter_id
•files.center.center_id
•files.center.center_type
•files.center.code
•files.center.name
•files.center.namespace
•files.center.short_name
•files.data_format
•files.data_subtype
•files.data_type
•files.experimental_strategy
•files.file_id
•files.file_name
•files.file_size
•files.md5sum
•files.origin
•files.platform
•files.related_files.file_id
•files.related_files.file_name
•files.related_files.md5sum
•files.related_files.type
86
•files.state
•files.state_comment
•files.submitter_id
•files.tags
Cases
•cases.case_id
•cases.submitter_id
•cases.diagnoses.age_at_diagnosis
•cases.diagnoses.days_to_death
•cases.demographic.ethnicity
•cases.demographic.gender
•cases.demographic.race
•cases.diagnoses.vital_status
•cases.project.disease_type
•cases.project.name
•cases.project.program.name
•cases.project.program.program_id
•cases.project.project_id
•cases.project.state
•cases.samples.sample_id
•cases.samples.submitter_id
•cases.samples.sample_type
•cases.samples.sample_type_id
•cases.samples.shortest_dimension
•cases.samples.time_between_clamping_and_freezing
•cases.samples.time_between_excision_and_freezing
•cases.samples.tumor_code
•cases.samples.tumor_code_id
•cases.samples.current_weight
•cases.samples.days_to_collection
•cases.samples.days_to_sample_procurement
•cases.samples.freezing_method
•cases.samples.initial_weight
•cases.samples.intermediate_dimension
•cases.samples.is_ffpe
•cases.samples.longest_dimension
•cases.samples.oct_embedded
•cases.samples.pathology_report_uuid
•cases.samples.portions.analytes.a260_a280_ratio
•cases.samples.portions.analytes.aliquots.aliquot_id
•cases.samples.portions.analytes.aliquots.amount
•cases.samples.portions.analytes.aliquots.center.center_id
•cases.samples.portions.analytes.aliquots.center.center_type
•cases.samples.portions.analytes.aliquots.center.code
•cases.samples.portions.analytes.aliquots.center.name
•cases.samples.portions.analytes.aliquots.center.namespace
•cases.samples.portions.analytes.aliquots.center.short_name
•cases.samples.portions.analytes.aliquots.concentration
•cases.samples.portions.analytes.aliquots.source_center
•cases.samples.portions.analytes.aliquots.submitter_id
•cases.samples.portions.analytes.amount
87
•cases.samples.portions.analytes.analyte_id
•cases.samples.portions.analytes.analyte_type
•cases.samples.portions.analytes.concentration
•cases.samples.portions.analytes.spectrophotometer_method
•cases.samples.portions.analytes.submitter_id
•cases.samples.portions.analytes.well_number
•cases.samples.portions.center.center_id
•cases.samples.portions.center.center_type
•cases.samples.portions.center.code
•cases.samples.portions.center.name
•cases.samples.portions.center.namespace
•cases.samples.portions.center.short_name
•cases.samples.portions.is_ffpe
•cases.samples.portions.portion_id
•cases.samples.portions.portion_number
•cases.samples.portions.slides.number_proliferating_cells
•cases.samples.portions.slides.percent_eosinophil_infiltration
•cases.samples.portions.slides.percent_granulocyte_infiltration
•cases.samples.portions.slides.percent_inflam_infiltration
•cases.samples.portions.slides.percent_lymphocyte_infiltration
•cases.samples.portions.slides.percent_monocyte_infiltration
•cases.samples.portions.slides.percent_necrosis
•cases.samples.portions.slides.percent_neutrophil_infiltration
•cases.samples.portions.slides.percent_normal_cells
•cases.samples.portions.slides.percent_stromal_cells
•cases.samples.portions.slides.percent_tumor_cells
•cases.samples.portions.slides.percent_tumor_nuclei
•cases.samples.portions.slides.section_location
•cases.samples.portions.slides.slide_id
•cases.samples.portions.slides.submitter_id
•cases.samples.portions.submitter_id
•cases.samples.portions.weight
88
Chapter 9
Authentication
Authentication
Overview
The GDC Data Portal provides granular metadata for all datasets available in the GDC. Any user can see a listing of all available
data files, including controlled-access files. The GDC Data Portal also allows users to download open-access files without logging
in. However, downloading of controlled-access files is restricted to authorized users and requires authentication.
Logging into the GDC
To login to the GDC, users must click on the Login button on the top right of the GDC website.
After clicking Login, users authenticate themselves using their eRA Commons login and password. If authentication is successful,
the eRA Commons username will be displayed in the upper right corner of the screen, in place of the “Login” button.
Upon successful authentication, GDC Data Portal users can:
•see which controlled-access files they have access to;
•download controlled-access files directly from the GDC Data Portal;
•download an authentication token for use with the GDC Data Transfer Tool or the GDC API.
Controlled-access files are identified using a “lock” icon:
89
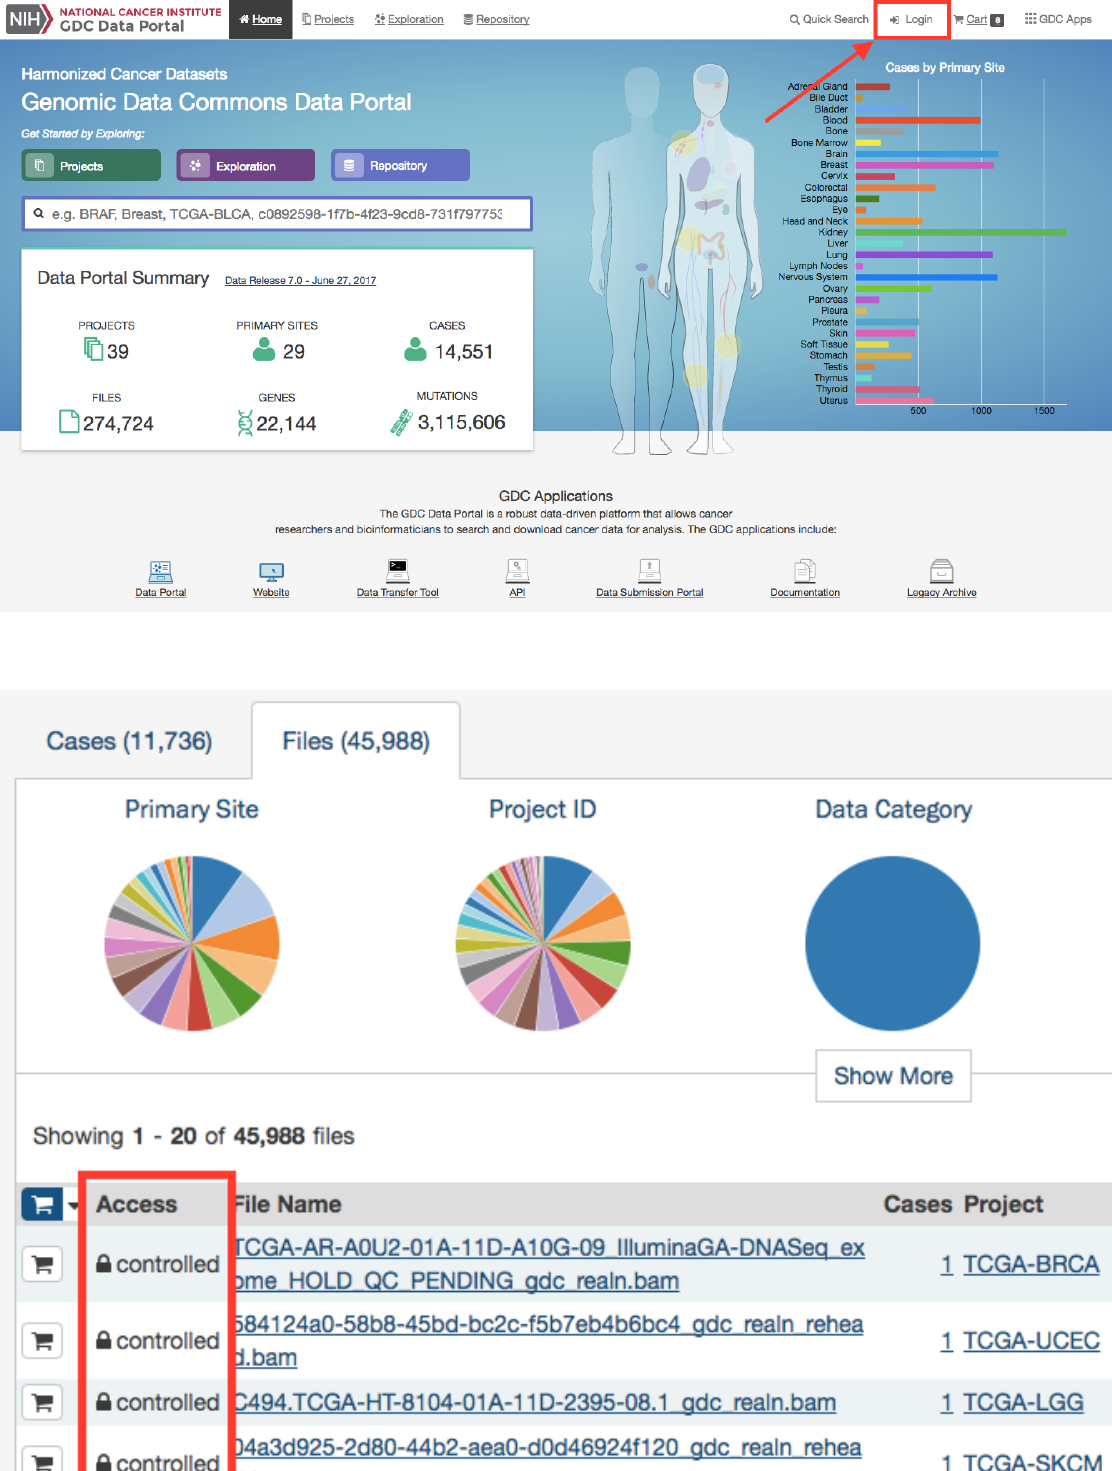
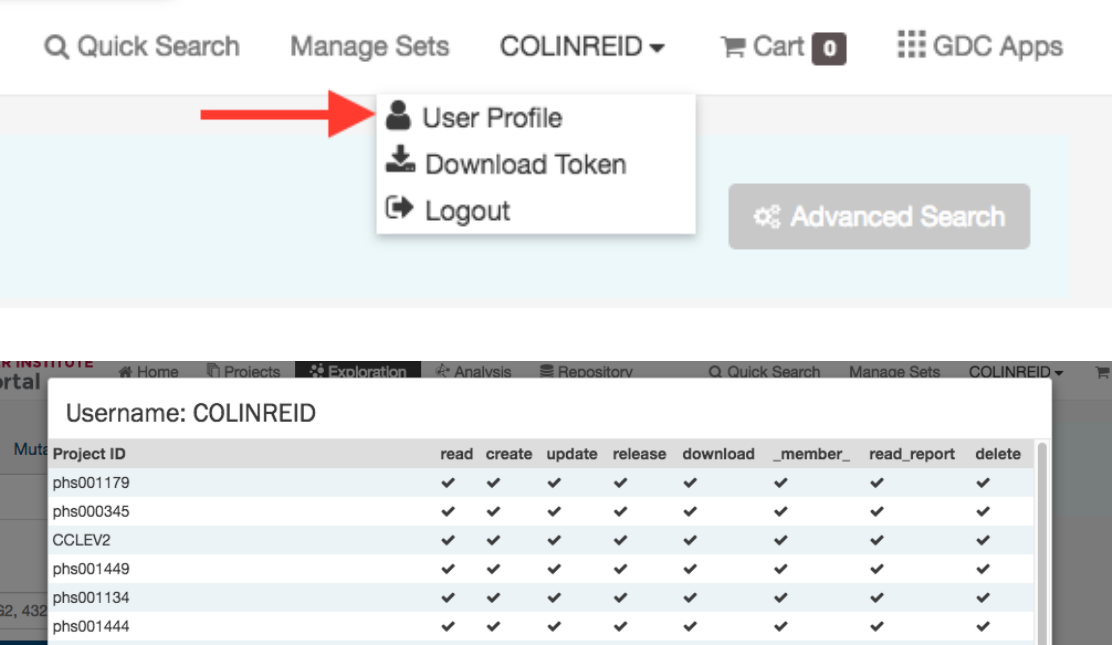
The rest of this section describes controlled data access features of the GDC Data Portal available to authorized users. For more
information about open and controlled-access data, and about obtaining access to controlled data, see Data Access Processes and
Tools.
User Profile
After logging into the GDC Portal, users can view which projects they have access to by clicking the
User Profile
section in the
dropdown menu in the top corner of the screen.
Clicking this button shows the list of projects.
GDC Authentication Tokens
The GDC Data Portal provides authentication tokens for use with the GDC Data Transfer Tool or the GDC API. To download a
token:
1. Log into the GDC using your eRA Commons credentials
2. Click the username in the top right corner of the screen
3. Select the “Download token” option
A new token is generated each time the Download Token button is clicked.
For more information about authentication tokens, see Data Security.
NOTE:
The authentication token should be kept in a secure location, as it allows access to all data accessible by the associated
user account.
91
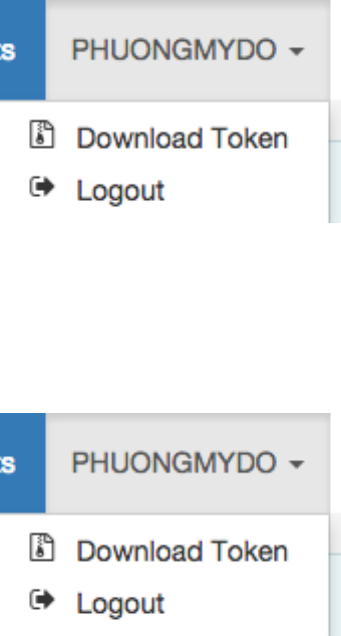
Figure 9.2: Token Download Button
Logging Out
To log out of the GDC, click the username in the top right corner of the screen, and select the Logout option.
Figure 9.3: Logout link
92
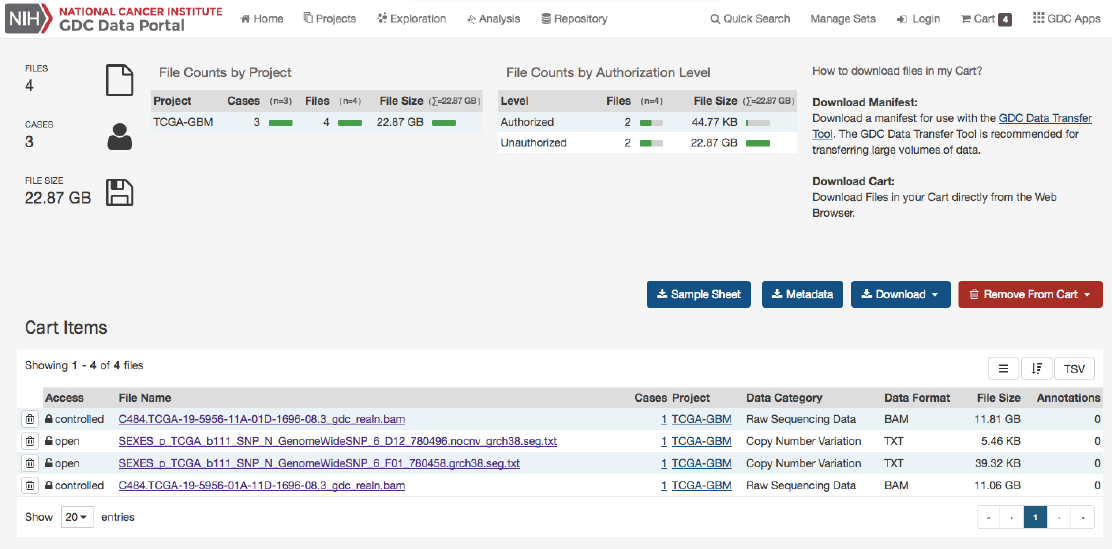
Chapter 10
File Cart
Cart and File Download
Overview
While browsing the GDC Data Portal, files can either be downloaded individually from file detail pages or collected in the file
cart to be downloaded as a bundle. Clicking on the shopping cart icon that is next to any item in the GDC will add the item to
your cart.
GDC Cart
Cart Summary
The cart page shows a summary of all files currently in the cart:
93
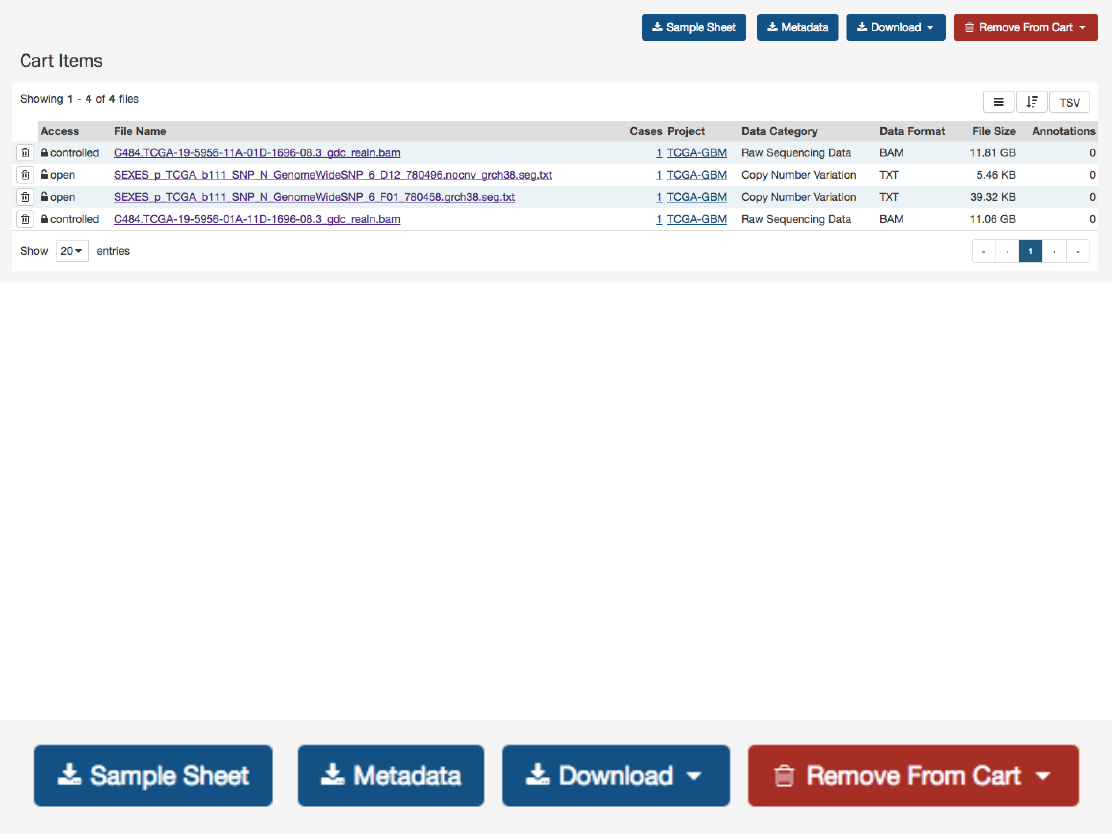
•Number of files
•Number of cases associated with the files
•Total file size
The Cart page also displays two tables:
•File count by project: Breaks down the files and cases by each project
•File count by authorization level
: Breaks down the files in the cart by authorization level. A user must be logged into
the GDC in order to download ‘Controlled-Access files’
The cart also directs users how to download files in the cart. For large data files, it is recommended that the GDC Data Transfer
Tool be used.
Cart Items
The Cart Items table shows the list of all the files that were added to the Cart. The table gives the folowing information for each
file in the cart:
•Access
: Displays whether the file is open or controlled access. Users must login to the GDC Portal and have the appropriate
credentials to access these files.
•File Name: Name of the file. Clicking the link will bring the user to the file summary page.
•Cases: How many cases does the file contain. Clicking the link will bring the user to the case summary page.
•Project: The Project that the file belongs to. Clicking the link will bring the user to the Project summary page.
•Category: Type of data
•Format: The file format
•Size: The size of the file
•Annotations: Whether there are any annotations
Download Options
There are a few buttons on the Cart page that allow users to download files. The following download options are available:
•Sample Sheet
: Downloads a tab-separated file which contains the associated case/sample IDs and sample type for each
file in the cart.
•Metadata: GDC harmonized clinical, biospecimen, and file metadata associated with the files in the cart.
94

•Download Manifest
: Download a manifest file for use with the GDC Data Transfer Tool to download files. A manifest
file contains a list of the UUIDs that correspond to the files in the cart.
•Download Cart
: Download the files in the Cart directly through the browser. Users have to be cautious of the amount of
data in the cart since this option will not optimize bandwidth and will not provide resume capabilities.
•SRA XML, MAGE-TAB
: This option is available in the GDC Legacy Archive only. It is used to download metadata
files associated with the files in the cart.
The cart allows users to download up to 5 GB of data directly through the web browser. This is not recommended for downloading
large volumes of data, in particular due to the absence of a retry/resume mechanism. For downloads over 5 GB we recommend
using the GDC Data Transfer Tool.
Note: when downloading multiple files from the cart, they are automatically bundled into one single Gzipped (.tar.gz) file.
GDC Data Transfer Tool
The
Download Manifest
button will download a manifest file that can be imported into the GDC Data Transfer Tool. Below is
an example of the contents of a manifest file used for download:
1id filename md5 size state
24ea9c657-8f85-44d0-9a77-ad59cced8973 mdanderson.org_ESCA.MDA_RPPA_Core.mage-tab.1.1.0.tar.gz
2516051 live
3b8342cd5-330e-440b-b53a-1112341d87db mdanderson.org_SARC.MDA_RPPA_Core.mage-tab.1.1.0.tar.gz
4523632 live
4c57673ac-998a-4a50-a12b-4cac5dc3b72e mdanderson.org_KIRP.MDA_RPPA_Core.mage-tab.1.2.0.tar.gz
4195746 live
53f22dd8d-59c8-43a4-89cf-3b595f2e5a06 14-3-3_beta-R-V_GBL1112940.tif 56df0e4b4fc092fc3643bd2e316ac05b
6257840 live
67ce05059-9197-4d38-830f-04356f5f851a 14-3-3_beta-R-V_GBL11066140.tif 6abfee483974bc2e61a37b5499ae9a07
6261580 live
78e00d22a-ca6f-4da8-a1c3-f23144cb21b7 14-3-3_beta-R-V_GBL1112940.tif 56df0e4b4fc092fc3643bd2e316ac05b
6257840 live
896487cd7-8fa8-4bee-9863-17004a70b2e9 14-3-3_beta-R-V_GBL1112940.tif 56df0e4b4fc092fc3643bd2e316ac05b
6257840 live
The Manifest contains a list of the file UUIDs in the cart and can be used together with the GDC Data Transfer Tool to download
all files.
Information on the GDC Data Transfer Tool is available in the GDC Data Transfer Tool User’s Guide.
Individual Files Download
Similar to the files page, each row contains a download button to download a particular file individually.
Controlled Files
If a user tries to download a cart containing controlled files and without being authenticated, a pop-up will be displayed to
offer the user either to download only open access files or to login into the GDC Data Portal through eRA Commons. See
Authentication for details.
95
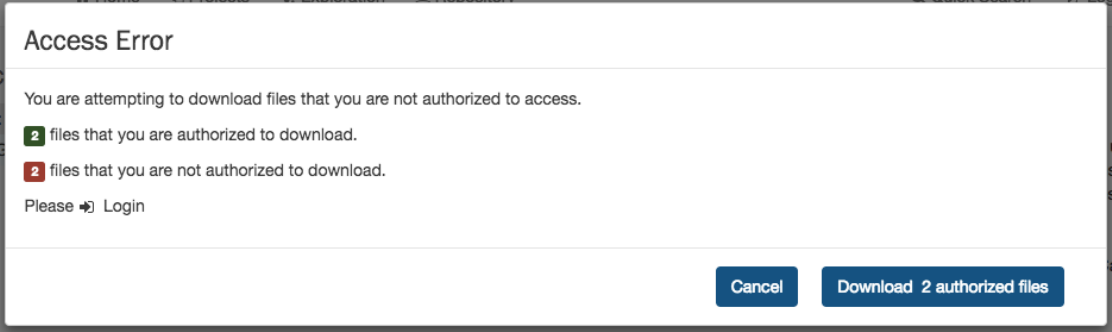
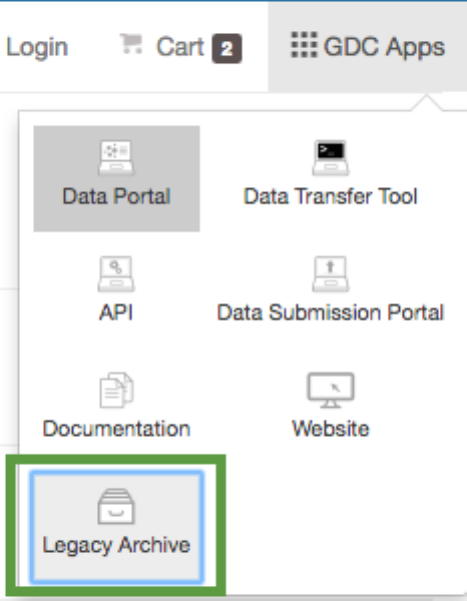
Chapter 11
Legacy Archive
Legacy Archive
The GDC Legacy Archive hosts unharmonized legacy data from repositories that predate the GDC (e.g. CGHub). Legacy data is
not actively maintained, processed, or harmonized by the GDC. Legacy users are encouraged to migrate to harmonized datasets.
The GDC Legacy Archive can be accessed from the GDC Data Portal front page as well as from the “GDC Apps” menu.
Overview
The GDC Legacy Archive contains a limited set of features of the GDC Data Portal:
•Facet search: Ability to look for legacy files or legacy annotations based on case, file and annotation facets.
•File and Annotation tables: List of all the legacy files and list of all the legacy annotations.
•File and Annotation detail pages: Information page for each legacy file and annotation.
97
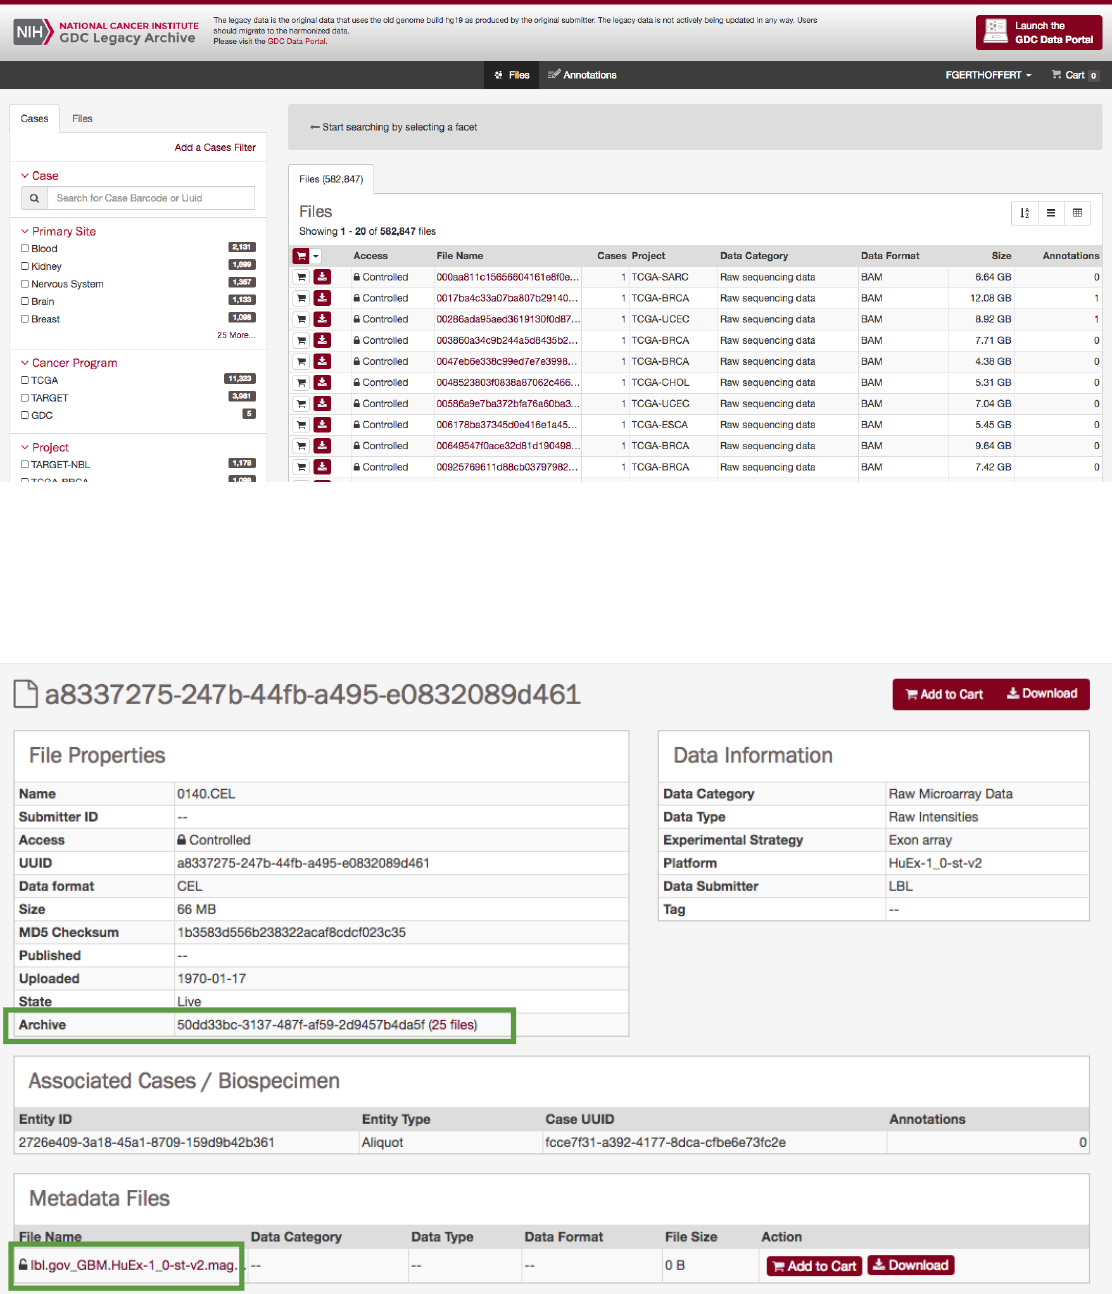
•Cart: The GDC Legacy Archive and the GDC Data Portal are separate systems with separate download carts.
File Page
The file page of the GDC Legacy Archive is similar to the file page of the GDC Data Portal. It does not include the Workflow,
Reference Genome, and Read Groups sections as these are only applicable to harmonized data available in the GDC Data Portal.
The Legacy Archive includes additional archive information as described below.
98
Archive
If a file was originally produced as part of an archive containing other files, the archive information (Archive ID and number of
files in the archive) is displayed in the file properties and, if selected, the user will see a list of files containing all other files in
that archive.
Metadata files
If a file has any associated MAGE-TAB or SRA XML metadata files, these files will be listed at the bottom of the page. These
files will can be downloaded directly from here. Alternatively, metadata files can be downloaded from the file cart.
File Cart
The file cart in the GDC Legacy Archive is analogous to the file cart of the GDC Data Portal. It provides an additional button to
download any SRA-XML and MAGE-TAB metadata files associated with the files in the cart.
99
Chapter 12
Release Notes
Data Portal Release Notes
Release 1.11.0
•GDC Product: GDC Data Portal
•Release Date: December 21, 2017
New Features and Changes
•Updated UI to support SIFT and Polyphen annotations
•
A
Sample Sheet
can now be created which allows easy association between file names and the case and sample submitter_id
•
Updated Advanced Search page to include options to
Add All Files to Cart
,
Download Manifest
, and
View X Cases
in Exploration
•Provide clear message rather than blank screen if survival plots cannot be calculated for particular cohort comparison
•Display sample_type on associated entities section on file page
•Allows for special characters in case, gene, and mutation set upload (-, :, >, .)
Bugs Fixed Since Last Release
•Fixed error when trying to download large number of files from the Legacy Archive cart
•Fixed number of annotations displayed in Legacy Archive for particular entities
•
Replaced missing bars to indicate proportion of applicable files and cases on project entity page in Cases and File Counts
by Data Category table
•Fixed project page display when projects are selected that contain no mutation data in the facet panel
•Fixed error where exporting case sets as TSV included fewer cases than the total
•
Fixed error in exploration section when adding custom facets. Previously selecting ‘Only show fields with values’ did not
result in the expected behavior
•Fixed error where number of associated entities for a file was showing an incorrect number
Known Issues and Workarounds
•
Sample sheet will download with a file name including the date duplicated (e.g. gdc_sample_sheet_YYYY-MM-DD_HH-
MM.tsv.YYYY-MM-DD_HH-MM.tsv)
•Custom facet filters
–Definitions are missing from the property list when adding custom facet file or case filters
100
•Visualizations
–
Data Portal graphs cannot be exported as PNG images in Internet Explorer. Graphs can be exported in PNG or SVG
format from Chrome or Firefox browsers . Internet Explorer does not display chart legend and title when re-opening
previously downloaded SVG files, the recommendation is to open downloaded SVG files with another program.
–
In the protein viewer there may be overlapping mutations. In this case mousing over a point will just show a single
mutation and the other mutations at this location will not be apparent.
•Entity page
–
On the mutation entity page, in the Consequences Table, the “Coding DNA Change” column is not populated for rows
that do not correspond to the canonical mutation.
•Repository and Cart
–
The annotation count in File table of Repository and Cart does not link to the Annotations page anymore. The user
can navigate to the annotations through the annotation count in Repository - Case table.
•Legacy Archive
–
Downloading a token in the GDC Legacy Archive does not refresh it. If a user downloads a token in the GDC Data
Portal and then attempts to download a token in the GDC Legacy Archive, an old token may be provided. Reloading
the Legacy Archive view will allow the user to download the updated token.
–
Exporting the Cart table in JSON will export the GDC Archive file table instead of exporting the files in the Cart only.
•Web Browsers
–
Browsers limit the number of concurrent downloads, it is generally recommended to add files to the cart and download
large number of files through the GDC Data Transfer Tool, more details can be found on GDC Website.
–
The GDC Portals are not compatible with Internet Explorer running in compatibility mode. Workaround is to disable
compatibility mode.
Release details are maintained in the GDC Data Portal Change Log.
Release 1.10.0
•GDC Product: GDC Data Portal
•Release Date: November 16, 2017
New Features and Changes
•Support for uploading Case and Mutation sets in Exploration page
•Support for saving, editing, removing Case, Gene and Mutation sets in the Exploration page
•Added a Managed Sets menu where the user can see their saved sets
•Added an Analysis menu with two analyses: Set Operation and Cohort Comparison
•
Added a User Profile page that shows all the projects and permissions assigned to the user: available in the username
dropdown after the user logs in
Bugs Fixed Since Last Release
•Project page
–
On the project page, the Summary Case Count link should open the case tab on the Repository page - instead it opens
the file page
101
Known Issues and Workarounds
•Custom facet filters
–Definitions are missing from the property list when adding custom facet file or case filters
–
Selecting ‘Only show fields with values’ will show some fields without values in the Repository section. This works
correctly under the Exploration section.
•Visualizations
–
Data Portal graphs cannot be exported as PNG images in Internet Explorer. Graphs can be exported in PNG or SVG
format from Chrome or Firefox browsers . Internet Explorer does not display chart legend and title when re-opening
previously downloaded SVG files, the recommendation is to open downloaded SVG files with another program.
–
In the protein viewer there may be overlapping mutations. In this case mousing over a point will just show a single
mutation and the other mutations at this location will not be apparent.
•Entity page
–
On the mutation entity page, in the Consequences Table, the “Coding DNA Change” column is not populated for rows
that do not correspond to the canonical mutation.
•Repository and Cart
–
The annotation count in File table of Repository and Cart does not link to the Annotations page anymore. The user
can navigate to the annotations through the annotation count in Repository - Case table.
•Legacy Archive
–
Downloading a token in the GDC Legacy Archive does not refresh it. If a user downloads a token in the GDC Data
Portal and then attempts to download a token in the GDC Legacy Archive, an old token may be provided. Reloading
the Legacy Archive view will allow the user to download the updated token.
–
Exporting the Cart table in JSON will export the GDC Archive file table instead of exporting the files in the Cart only.
•Web Browsers
–
Browsers limit the number of concurrent downloads, it is generally recommended to add files to the cart and download
large number of files through the GDC Data Transfer Tool, more details can be found on GDC Website.
–
The GDC Portals are not compatible with Internet Explorer running in compatibility mode. Workaround is to disable
compatibility mode.
Release details are maintained in the GDC Data Portal Change Log.
Release 1.9.0
•GDC Product: GDC Data Portal
•Release Date: October 24, 2017
New Features and Changes
•Support for projects with multiple primary sites per project
•Support for slides that are linked to sample rather than portion
Bugs Fixed Since Last Release
None
102
Known Issues and Workarounds
•Visualizations
–
Data Portal graphs cannot be exported as PNG images in Internet Explorer. Graphs can be exported in PNG or SVG
format from Chrome or Firefox browsers . Internet Explorer does not display chart legend and title when re-opening
previously downloaded SVG files, the recommendation is to open downloaded SVG files with another program.
–
In the protein viewer there may be overlapping mutations. In this case mousing over a point will just show a single
mutation and the other mutations at this location will not be apparent.
•Project page
–
On the project page, the Summary Case Count link should open the case tab on the Repository page - instead it opens
the file page
•Entity page
–
On the mutation entity page, in the Consequences Table, the “Coding DNA Change” column is not populated for rows
that do not correspond to the canonical mutation.
•Repository and Cart
–
The annotation count in File table of Repository and Cart does not link to the Annotations page anymore. The user
can navigate to the annotations through the annotation count in Repository - Case table.
•Legacy Archive
–
Downloading a token in the GDC Legacy Archive does not refresh it. If a user downloads a token in the GDC Data
Portal and then attempts to download a token in the GDC Legacy Archive, an old token may be provided. Reloading
the Legacy Archive view will allow the user to download the updated token.
–
Exporting the Cart table in JSON will export the GDC Archive file table instead of exporting the files in the Cart only.
•Web Browsers
–
Browsers limit the number of concurrent downloads, it is generally recommended to add files to the cart and download
large number of files through the GDC Data Transfer Tool, more details can be found on GDC Website.
–
The GDC Portals are not compatible with Internet Explorer running in compatibility mode. Workaround is to disable
compatibility mode.
Release details are maintained in the GDC Data Portal Change Log.
Release 1.8.0
•GDC Product: GDC Data Portal
•Release Date: August 22, 2017
New Features and Changes
Major features/changes:
•A feature that links the exploration and repository pages was added. For example:
–
In the exploration page, cases with a specific mutation could be selected. This set could then be linked to the repository
page to download the data files associated with these cases.
–
In the repository menu, the user can select cases associated with specific files. The set could then be linked to
exploration page to view the variants associated with this set of cases.
•
Users can now upload a custom gene list to the exploration page and leverage the GDC search and visualization features for
cases and variants associated with the gene set.
•Filters added for the gene entity page. For example:
103
–
Clicking on a mutated gene from the project page will display mutations associated with the gene that are present in
this project (filtered protein viewer, etc.).
–
Clicking on a mutated gene from the exploration page will display the mutations associated with the gene filtered by
additional search criteria, such as “primary site is Kidney and mutation impact is high”.
•
UUIDs are now hidden from tables and charts to simplify readability. The UUIDs can still be exported and viewed in the
tables using the “arrange columns” feature. In the mutation table, UUIDs are automatically exported.
•
Mutation entity page - one consequence per transcript is shown (10 rows by default) in the consequence table. The user
should display all rows before exporting the table.
Bugs Fixed Since Last Release
•Exploration
–
Combining “Variant Caller” mutation filter with a case filter will display incorrect counts in the mutation facet. The
number of mutations in the resulting mutation table is correct.
–
Mutation table: it is difficult to click on the denominator in “#Affected Cases in Cohort” column displayed to the
left side of the bar. The user should click at a specific position at the top of the number to be able to go to the
corresponding link.
Known Issues and Workarounds
•Visualizations
–
Data Portal graphs cannot be exported as PNG images in Internet Explorer. Graphs can be exported in PNG or SVG
format from Chrome or Firefox browsers . Internet Explorer does not display chart legend and title when re-opening
previously downloaded SVG files, the recommendation is to open downloaded SVG files with another program.
–
In the protein viewer there may be overlapping mutations. In this case mousing over a point will just show a single
mutation and the other mutations at this location will not be apparent.
•Project page
–
On the project page, the Summary Case Count link should open the case tab on the Repository page - instead it opens
the file page
•Entity page
–
On the mutation entity page, in the Consequences Table, the “Coding DNA Change” column is not populated for rows
that do not correspond to the canonical mutation.
•Repository and Cart
–
The annotation count in File table of Repository and Cart does not link to the Annotations page anymore. The user
can navigate to the annotations through the annotation count in Repository - Case table.
•Legacy Archive
–
Downloading a token in the GDC Legacy Archive does not refresh it. If a user downloads a token in the GDC Data
Portal and then attempts to download a token in the GDC Legacy Archive, an old token may be provided. Reloading
the Legacy Archive view will allow the user to download the updated token.
–
Exporting the Cart table in JSON will export the GDC Archive file table instead of exporting the files in the Cart only.
•Web Browsers
–
Browsers limit the number of concurrent downloads, it is generally recommended to add files to the cart and download
large number of files through the GDC Data Transfer Tool, more details can be found on GDC Website.
–
The GDC Portals are not compatible with Internet Explorer running in compatibility mode. Workaround is to disable
compatibility mode.
Release details are maintained in the GDC Data Portal Change Log.
104
Release 1.6.0
•GDC Product: GDC Data Portal
•Release Date: June 29, 2017
New Features and Changes
There was a major new release of the GDC Data Portal focused on Data Analysis, Visualization, and Exploration (DAVE). Some
important new features include the following:
•
New visual for the Homepage: a human body provides the number of Cases per Primary Site with a link to an advanced
Cancer Projects search
•The Projects menu provides the Top 20 Cancer Genes across the GDC Projects and the Case Distribution per Project
•
A new menu “Exploration” is an advanced Cancer Projects search which provides the ability to apply Case, Gene, and
Mutation filters to look for:
–List of Cases with the largest number of Somatic Mutations
–The most frequently mutated Genes
–The most frequent Variants
–Oncogrid view of mutation frequency
•Visualizations are provided across the Project, Case, Gene and Mutation entity pages:
–List of most frequently mutated genes and most frequent variants
–Survival plots for patients with or without specific variants
–Survival plots for patients with or without variants in specific genes
–Lollipop plots of mutation frequency across protein domains
•Links to external databases (COSMIC, dbSNP, Uniprot, Ensembl, OMIM, HGNC)
•Quick Search for Gene and Mutation entity pages
•The ability to export the current view of a table in TSV
•Retired GDC cBioPortal
For detailed updates please review the Data Portal User Guide.
Bugs Fixed Since Last Release
•
BAM Slicing dialog box does not disappear automatically upon executing the BAM slicing function. The box can be closed
manually.
•
Very long URLs will produce a 400 error. Users may encounter this after clicking on “source files” on a file page where the
target file is derived from hundreds of other files such as for MAF files.
•If bam slicing produces an error pop-up message it will be obscured behind the original dialog box.
–Internet Explorer users are not able to use the “Only show fields with no values” when adding custom facets
–
Exporting large tables in the Data Portal may produce a 500 error. Filtering this list to include fewer cases or files
should eliminate the error
Known Issues and Workarounds
•New Visualizations
–
Cannot export Data Portal graphs in PNG in Internet Explorer. Graphs can be exported to PNG or SVG from
Chrome or Firefox browsers . Internet would not display chart legend and title when re-opening previously downloaded
SVG files, recommendation is to open downloaded SVG files with another software.
–
In the protein viewer there may be overlapping mutations. In this case mousing over a point will just show a single
mutation and the other mutations at this location will not be apparent.
105
•Exploration
–
Combining “Variant Caller” mutation filter with a case filter will display wrong counts in the mutation facet. The
number of mutations in the result mutation table is correct.
–
Mutation table: it is difficult to click on the denominator in “#Affected Cases in Cohort” column displayed to the
left side of the bar. The user should click at a specific position at the top of the number to be able to go to the
corresponding link.
•Entity page
–
On the mutation entity page, in the Consequences Table, the “Coding DNA Change” column is not populated for rows
that do not correspond to the canonical mutation.
•Repository and Cart
–
The annotation count in File table of Repository and Cart does not link to the Annotations page anymore. The user
can navigate to the annotations through the annotation count in Repository - Case table.
•Legacy Archive
–
Downloading a token in the GDC Legacy Archive does not refresh it. If a user downloads a token in the GDC Data
Portal and then attempts to download a token in the GDC Legacy Archive, an old token may be provided. Reloading
the Legacy Archive view will allow the user to download the updated token.
–
Exporting the Cart table in JSON will export the GDC Archive file table instead of exporting the files in the Cart only.
•Web Browsers
–
Browsers limit the number of concurrent downloads, it is generally recommended to add files to the cart and download
large number of files through the GDC Data Transfer Tool, more details can be found on GDC Website.
–
The GDC Portals are not compatible with Internet Explorer running in compatibility mode. Workaround is to disable
compatibility mode.
Release details are maintained in the GDC Data Portal Change Log.
Release 1.5.2
•GDC Product: GDC Data Portal
•Release Date: May 9, 2017
New Features and Changes
•Removed link to Data Download Statistics Report
•Updated version numbers of API, GDC Data Portal, and Data Release
Bugs Fixed Since Last Release
•None
Known Issues and Workarounds
•General
–
Exporting large tables in the Data Portal may produce a 500 error. Filtering this list to include fewer cases or files
should eliminate the error
–
After successful authentication, the authentication popup does not close for Internet Explorer users running in
“Compatibility View”. Workaround is to uncheck “Display Intranet sites in Compatibility View” in Internet Explorer
options. Alternatively, refreshing the portal will correctly display authentication status.
106

–
BAM Slicing dialog box does not disappear automatically upon executing the BAM slicing function. The box can be
closed manually.
–
Due to preceding issue, If bam slicing produces an error pop-up message it will be obscured behind the original dialog
box.
–
Very long URLs will produce a 400 error. Users may encounter this after clicking on “source files” on a file page where
the target file is derived from hundreds of other files such as for MAF files. To produce a list of source files an API call
can be used with the search parameter “fields=analysis.input_files.file_name”.
∗
Downloading a token in the GDC Legacy Archive does not refresh it. If a user downloads a token in the GDC
Data Portal and then attempts to download a token in the GDC Legacy Archive, an old token may be provided.
Reloading the Legacy Archive view will allow the user to download the updated token.
Example
1https://api.gdc.cancer.gov/files/455e26f7-03f2-46f7-9e7a-9c51ac322461?pretty=true&fields=analysis.input_files.file_name
•Cart
–
Counts displayed in the top right of the screen, next to the Cart icon, may become inconsistent if files are removed
from the server.
•Web Browsers
–
Browsers limit the number of concurrent downloads, it is generally recommended to add files to the cart and download
large number of files through the GDC Data Transfer Tool, more details can be found on GDC Website.
–Internet Explorer users are not able to use the “Only show fields with no values” when adding custom facets
–
The GDC Portals are not compatible with Internet Explorer running in compatibility mode. Workaround is to disable
compatibility mode.
Release details are maintained in the GDC Data Portal Change Log.
Release 1.4.1
•GDC Product: GDC Data Portal
•Release Date: October 31, 2016
New Features and Changes
•Added a search feature to help users select values of interest in certain facets that have many values.
•Added support for annotation ID queries in quick search.
•Added a warning when a value greater than 90 is entered in the “Age at Diagnosis” facet.
•Added Sample Type column to file entity page.
•Authentication tokens are refreshed every time they are downloaded from the GDC Data Portal.
•Buttons are inactive when an action is in progress.
•Improved navigation features in the overview chart on portal homepage.
•Removed State/Status from File and Case entity pages
•Removed the “My Projects” feature.
•Removed “Created” and “Updated” dates from clinical and biospecimen entities.
Bugs Fixed Since Last Release
•Advanced search did not accept negative values for integer fields.
•Moving from facet search to advanced search resulted in an incorrect advanced search query.
•Some facets were cut off in Internet Explorer and Firefox.
107

Known Issues and Workarounds
•General
–
Exporting large tables in the Data Portal may produce a 500 error. Filtering this list to include fewer cases or files
should eliminate the error
–
After successful authentication, the authentication popup does not close for Internet Explorer users running in
“Compatibility View”. Workaround is to uncheck “Display Intranet sites in Compatibility View” in Internet Explorer
options. Alternatively, refreshing the portal will correctly display authentication status.
–
BAM Slicing dialog box does not disappear automatically upon executing the BAM slicing function. The box can be
closed manually.
–
Due to preceding issue, If bam slicing produces an error pop-up message it will be obscured behind the original dialog
box.
–
Very long URLs will produce a 400 error. Users may encounter this after clicking on “source files” on a file page where
the target file is derived from hundreds of other files such as for MAF files. To produce a list of source files an API call
can be used with the search parameter “fields=analysis.input_files.file_name”.
∗
Downloading a token in the GDC Legacy Archive does not refresh it. If a user downloads a token in the GDC
Data Portal and then attempts to download a token in the GDC Legacy Archive, an old token may be provided.
Reloading the Legacy Archive view will allow the user to download the updated token.
Example
1https://api.gdc.cancer.gov/files/455e26f7-03f2-46f7-9e7a-9c51ac322461?pretty=true&fields=analysis.input_files.file_name
•Cart
–
Counts displayed in the top right of the screen, next to the Cart icon, may become inconsistent if files are removed
from the server.
•Web Browsers
–
Browsers limit the number of concurrent downloads, it is generally recommended to add files to the cart and download
large number of files through the GDC Data Transfer Tool, more details can be found on GDC Website.
–Internet Explorer users are not able to use the “Only show fields with no values” when adding custom facets
–
The GDC Portals are not compatible with Internet Explorer running in compatibility mode. Workaround is to disable
compatibility mode.
Release details are maintained in the GDC Data Portal Change Log.
Release 1.3.0
•GDC Product: GDC Data Portal
•Release Date: September 7, 2016
New Features and Changes
•
A new “Metadata” button on the cart page to download merged clinical, biospecimen, and file metadata in a single
consolidated JSON file. May require clearing browser cache
•Added a banner on the Data Portal to help users find data
•Added support for “Enter” key on login button
•On the Data page, the browser will remember which facet tab was selected when hitting the “Back” button
•In file entity page, if there is a link to one single file, redirect to this file’s entity page instead of a list page.
108

Bugs Fixed Since Last Release
•Adding a mix of open and controlled files to the cart from any Case entity pages was creating authorization issues
•Opening multiple browser tabs and adding files in those browser tabs was not refreshing the cart in other tabs.
•When user logs in from the advanced search page, the login popup does not automatically close
•
When removing a file from the cart and clicking undo, GDC loses track of permission status of the user towards this file
and will ask for the user to log-in again.
•
Download File Metadata button produces incomplete JSON output omitting such fields as file_name and submitter_id.
The current workaround includes using the API to return file metadata.
•
Annotations notes do not wrap to the next line at the beginning or the end of a word, some words might be split in two lines
•Sorting annotations by Case UUID causes error
Known Issues and Workarounds
•General
–
When no filters are engaged in the Legacy Archive or Data Portal, clicking the Download Manifest button may produce
a 500 error and the message “We are currently experiencing issues. Please try again later.”. To avoid this error the
user can first filter by files or cases to reduce the number files added to the manifest.
–
After successful authentication, the authentication popup does not close for Internet Explorer users running in
“Compatibility View”. Workaround is to uncheck “Display Intranet sites in Compatibility View” in Internet Explorer
options. Alternatively, refreshing the portal will correctly display authentication status.
–
BAM Slicing dialog box does not disappear automatically upon executing the BAM slicing function. The box can be
closed manually.
–
Due to preceding issue, If bam slicing produces an error pop-up message it will be obscured behind the original dialog
box.
–
Very long URLs will produce a 400 error. Users may encounter this after clicking on “source files” on a file page where
the target file is derived from hundreds of other files such as for MAF files. To produce a list of source files an API call
can be used with the search parameter “fields=analysis.input_files.file_name”.
–
On the Legacy Archive, searches for “Case Submitter ID Prefix” containing special characters are not displayed
correctly above the result list. The result list is correct, however.
Example
1https://api.gdc.cancer.gov/files/455e26f7-03f2-46f7-9e7a-9c51ac322461?pretty=true&fields=analysis.input_files.file_name
•Cart
–
Counts displayed in the top right of the screen, next to the Cart icon, may become inconsistent if files are removed
from the server.
•Web Browsers
–
Browsers limit the number of concurrent downloads, it is generally recommended to add files to the cart and download
large number of files through the GDC Data Transfer Tool, more details can be found on GDC Website.
–Internet Explorer users are not able to use the “Only show fields with no values” when adding custom facets
–
The GDC Portals are not compatible with Internet Explorer running in compatibility mode. Workaround is to disable
compatibility mode.
Release details are maintained in the GDC Data Portal Change Log.
Release 1.2.0
•GDC Product: GDC Data Portal
•Release Date: August 9th, 2016
109
New Features and Changes
•Added a retry (1x) mechanism for API calls
•Added support for ID fields in custom facets
•Added Case Submitter ID to the Annotation entity page
•Added a link to Biospeciment in the Case entity page
Bugs Fixed Since Last Release
•General.
–Not possible to use the browser’s back button after hitting a 404 page
–404 page missing from Legacy Archive Portal
–Table widget icon and export JSON icon should be different
–Download SRA XML files from the legacy archive portal might not be possible in some context
•Data and facets
–Default values for age at diagnosis is showing 0 to 89 instead of 0 to 90
–
Biospecimen search in the case entity page does not highlight (but does bold and filter) results in yellow when title
case is not followed
–Table sorting icon does not include numbers
–
‘–’ symbol is missing on empty fields (blank instead), additional missing fields identified since last release. ###
Known Issues and Workarounds
•General
–
When no filters are engaged in the Legacy Archive or Data Portal, clicking the Download Manifest button may produce
a 500 error and the message “We are currently experiencing issues. Please try again later.”. To avoid this error the
user can first filter by files or cases to reduce the number files added to the manifest.
–
After successful authentication, the authentication popup does not close for Internet Explorer users running in “Com-
patibility View”. This only impact users at the NIH. Workaround is to uncheck “Display Intranet sites in Compatibility
View” in Internet Explorer options. Alternatively, refreshing the portal will correctly display authentication status.
–When user login from the advanced search page, the login popup does not automatically close
•Cart
–
When removing a file from the cart and clicking undo, GDC looses track of permission status of the user towards this
file and will ask for the user to log-in again.
–
Counts displayed in the top right of the screen, next to the Cart icon, might get inconsistent if files are removed from
the server.
–
Download File Metadata button produces incomplete JSON output omitting such fields as file_name and submitter_id.
The current workaround includes using the API to return file metadata.
•Annotations
–
Annotations notes do not wrap to the next line at the beginning or the end of a word, some words might be split in
two lines
–Sorting annotations by Case UUID causes error
•Web Browsers
–
Browsers limit the number of concurrent downloads, it is generally recommended to add files to the cart and download
large number of files through the GDC Data Transfer Tool, more details can be found on GDC Website.
–Internet Explorer users are not able to use the “Only show fields with no values” when adding custom facets
–
The GDC Portals are not compatible with Internet Explorer running in compatibility mode. Workaround is to disable
compatibilty mode
Release details are maintained in the GDC Data Portal Change Log.
110
Release 1.1.0
•GDC Product: GDC Data Portal
•Release Date: June 1st, 2016
New Features and Changes
•This is a bug-fixing release, no new features were added.
Bugs Fixed Since Last Release
•General
–Fixed 508 compliance issues.
–Disabled download manifest action on projects without files.
–
Updated the portal to indicate to the user that his session expired when he tries to download the authentication token.
–Unselected “My project” filter after user logs-in.
–Fixed missing padding when query includes “My Projects”.
–Enforced “Add to cart” limitation to 10,000 files everywhere on the Data Portal.
•Tables
–Improved usability of the “Sort” feature
–
Updated the “Add all files to cart” button to add all files corresponding to the current query (and not only displayed
files).
–Fixed an issue where Platform would show “0” when selected platform is “Affymetrix SNP 6.0”.
•Data
–Corrected default values populated when adding a custom range facet.
–Fixed an issue preventing the user to sort by File Submitter ID in data tables.
•File Entity Page
–Improved “Associated Cases/Biospecimen” table for files associated to a lot of cases.
–Fixed an error when performing BAM Slicing.
Known Issues and Workarounds
•General.
–
After successful authentication, the authentication popup does not close for Internet Explorer users running in “Com-
patibility View”. This only impact users at the NIH. Workaround is to uncheck “Display Intranet sites in Compatibility
View” in Internet Explorer options. Alternatively, refreshing the portal will correctly display authentication status.
–Download SRA XML files from the legacy archive portal might not be possible in some context
–Not possible to use the browser’s back button after hitting a 404 page
–404 page missing from Legacy Archive Portal
–Table widget icon and export JSON icon should be different
•Data and facets
–Default values for age at diagnosis is showing 0 to 89 instead of 0 to 90
–
Biospecimen search in the case entity page does not highlight (but does bold and filter) results in yellow when title
case is not followed
–Table sorting icon does not include numbers
–‘–’ symbol is missing on empty fields (blank instead), additional missing fields identified since last release.
•Cart
111
–
When removing a file from the cart and clicking undo, GDC looses track of permission status of the user towards this
file and will ask for the user to log-in again.
–
Counts displayed in the top right of the screen, next to the Cart icon, might get inconsistent if files are removed from
the server.
•Annotations
–
Annotations notes do not wrap to the next line at the beginning or the end of a word, some words might be split in
two lines
•Web Browsers
–
Browsers limit the number of concurrent downloads, it is generally recommended to add files to the cart and download
large number of files through the GDC Data Transfer Tool, more details can be found on GDC Website.
–Internet Explorer users are not able to use the “Only show fields with no values” when adding custom facets
–
The GDC Portals are not compatible with Internet Explorer running in compatibility mode. Workaround is to disable
compatibilty mode
Release details are maintained in the GDC Data Portal Change Log.
Release 1.0.1
•GDC Product: GDC Data Portal
•Release Date: May 18, 2016
New Features and Changes
•This is a bug-fixing release, no new features were added.
Bugs Fixed Since Last Release
•Tables and Export
–Restore default table column arrangement does not restore to the default but it restores to the previous state
•Cart and Download
–Make the cart limit warning message more explanatory
–In some situations, adding filtered files to the cart might fail
•Layout, Browser specific and Accessibility
–When disabling CSS, footer elements are displayed out of order
–If javascript is disabled html tags are displayed in the warning message
–Layout issues when using the browser zoom in function on tables
–Cart download spinner not showing at the proper place
–Not all facets are expanded by default when loading the app
Known Issues and Workarounds
•General
–
If a user has previously logged into the Portal and left a session without logging out, if the user returns to the Portal
after the user’s sessionID expires, it looks as if the user is still authenticated. The user cannot download the token and
gets an error message that would not close. The user should clear the cache to properly log out.
–‘–’ symbol is missing on empty fields (blank instead)
–Download manifest button is available for TARGET projects with 0 files, resulting in error if user clic on button
112
–
After successful authentication, the authentication popup does not close for Internet Explorer users running in “Com-
patibility View”. This only impact users at the NIH. Workaround is to uncheck “Display Intranet sites in Compatibility
View” in Internet Explorer options. Alternatively, refreshing the portal will correctly display authentication status.
•Data
–When adding a custom range facet, default values are incorrectly populated
–
The portal might return incorrect match between cases and files when using field cases.samples.portions.created_datetime
(custom facet or advanced search). Note: this is not a UI issue.
–Sorting File Submitter ID option on the file tab result in a Data Portal Error
•Tables and Export
–Table sorting icon does not include numbers
•
Browsers limit the number of concurrent downloads, it is generally recommended to add files to the cart and download
large number of files through the GDC Data Transfer Tool, more details can be found on GDC Website.
Release details are maintained in the GDC Data Portal Change Log.
113
