Interim Report January June 2011 TL 2020 TL2020 AR14 ENG 150324 2
User Manual: TL 2020
Open the PDF directly: View PDF ![]() .
.
Page Count: 72

Annual
REPORT
2014

Calendar 2015
Annual General Meeting
2015
Stockholm
May 19
Interim Report
January – March 2014
Financial Reports
Interim Report
January – March
2015
Full year Report
January – December
2014
Interim Report
January – June
2015
Interim Report
January – September
2015
Jan 30
Jul 21 Oct 21
Mar 30 Apr 21
Annual Report
2014

Financial statements – Group Page
Consolidated income statement 25
Consolidated comprehensive income 26
Consolidated balance sheet 27
Consolidated cash flow statement 29
Change in consolidated equity 30
Financial statements – parent company Page
The parent company’s income statement 61
The parent company’s comprehensive income 61
The parent company’s balance sheet 61
The parent company’s cash flow statement 62
Change in the parent company’s equity 62
Notes – Group
Note 1 Accounting principles and other information 31
Note 2 Financial risk management and financial instruments 38
Note 3 Exchange rate effects 39
Note 4 Segment reporting 40
Note 5 Net sales and number of customers 41
Note 6 EBITDA and EBIT as well as depreciation/
amortization and impairment 42
Note 7 Result from shares in joint ventures and associated companies 43
Note 8 Other operating income 43
Note 9 Other operating expenses 43
Note 10 Interest income 44
Note 11 Interest costs 44
Note 12 Other financial items 44
Note 13 Taxes 44
Note 14 Intangible assets 45
Note 15 Tangible assets 47
Note 16 Acquisitions and divestments 48
Note 17 Shares in joint ventures and associated companies 49
Note 18 Other financial assets 49
Note 19 Inventories 49
Note 20 Accounts receivable 49
Note 21 Other current receivables 49
Note 22 Prepaid expenses and accrued income 49
Note 23 Current investments 49
Note 24 Cash and cash equivalents and unutilized overdraft facilities 50
Note 25 Equity, number of shares and earnings per share 50
Note 26 Financial liabilities 51
Note 27 Provisions 53
Note 28 Accrued expenses and deferred income 53
Note 29 Pledged assets 53
Note 30 Contingent liabilities and other commitments 53
Note 31 Leases 54
Note 32 Supplementary cash flow information 54
Note 33 Number of employees 54
Note 34 Personnel costs 55
Note 35 Fees to the appointed auditor 58
Note 36 Discontinued operations 58
Note 37 Joint operations and other related parties 59
Note 38 Corporate Responsibility results 60
Notes – parent company
Note 1 Accounting principles and other information 63
Note 2 Net sales 63
Note 3 Result of shares in group companies 63
Note 4 Other interest revenue and similar income 63
Note 5 Interest expense and similar costs 63
Note 6 Taxes 63
Note 7 Tangible assets 63
Note 8 Shares in group companies 64
Note 9 Receivables from group companies 64
Note 10 Other financial assets 64
Note 11 Cash and cash equivalents and unutilized overdraft facilities 64
Note 12 Financial liabilities 64
Note 13 Accrued expenses and deferred income 64
Note 14 Contingent liabilities and other commitments 65
Note 15 Supplementary cash flow information 65
Note 16 Number of employees 65
Note 17 Personnel costs 65
Note 18 Fees to the appointed auditor 65
Note 19 Legal structure 65
Contents
CEO Word 2
Board of Directors 4
Leadership Team 6
Administration report 8
Financial statements 25
Auditor’s report 67
Definitions 68
Contacts 69
Tele2 – Annual Report 2014 1
In just a few years, the mobile device has become our most
beloved asset, even more dear to us than our wallets. Did
you know that around 80 percent of the smartphone users
check their mobile phones within the first 15 minutes of
when they wake up? Moreover, did you know that we look
at our phones on average 125-150 times per day? And we,
Tele2, make the expensive device you hold in your hand
worth something. Because without the connectivity that
we provide, it is just pieces of glass, metal and plastic.
Hence, I feel confident that our mobile focus is spot on.
The year has been vibrant in many ways. I have had the pleasure of
welcoming several new members to the Leadership Team - new
faces bringing new ideas and perspectives to the table. Also the
Tele2 Group saw some change to the set-up as we sold our Norwe-
gian business. The sale has been completed during 2015 after
approval by regulatory authorities, and is beneficial for both Tele2,
our Norwegian customers and the buyer – although it was a big step
away from the original plan that we had for our Norwegian opera-
tions. Moreover, on the operational side we have seen good devel-
opment in for example Sweden, where we are really hitting it off
when it comes to monetizing data. The prepaid to postpaid migra-
tion has slowed down and instead the voice to data transition is
really picking up speed. And we are only seeing the beginning of
that journey.
Everything starts with a good trend, someone said. I really think
that is true and in our business that trend is data growth. The differ-
ence between winners and losers will be the ability to monetize
data and take good care of the customer, I know that we at Tele2 can
do both.
Hitting change before change hits us
Last year, I said that 2014 would be the year when we were going to
remove uncertainty around Tele2. To a large extent we have man-
aged to do that. We have a clear path forward and now it is just con-
tinued hard work that is needed to get our Rockets in the Nether-
lands, Kazakhstan and Croatia to bear fruit. Adding to the clarity,
wecommunicated our renewed strategy to the Board, our employ-
ees and the market during the year. Our strategic process landed in
four strategic choices, or Way2Win, as we call it; Value Champion,
Focused Technology Choices, Step Change Productivity and
Winning People & Culture. If we manage to excel in each of these
areas, we will be unbeatable. Within Step Change Productivity, we
announced the Challenger Program as an initiative. It is a program
to increase efficiency across the whole Group by doing what we do
even smarter and better. It will lead to productivity improvements
amounting to around SEK 1 billion annually as of 2018.
In Sweden, we fully transitioned to becoming Value Champions
during 2014 when we introduced a new commercial concept which
we refer to as Tele2.0. Putting the customers first and abolishing old
truths like binding periods and expiry dates for top-ups. Instead, we
introduced things like a one-subscription-solution for everyone and
trial periods for both B2C and B2B customers. The purpose of the
concept is to improve customer satisfaction and build the Tele2
brand. It is a bold move but the industry needs to change and in
Sweden we are in a position of strength, giving us the courage to
take these steps. During the year, Sweden maintained its status as
the leader in mobile data for the Group.
In the Netherlands, we are continuing one of the Group’s most
exciting projects at full speed. In the beginning of 2015, some of our
base stations started to radiate and by pushing on with the network
2014 – yet another dynamic and
successful year! Perfect for us at Tele2
who see change as the only constant
Everything starts with a good trend, someone said.
I really think that is true and in our business that trend
is data growth. The difference between winners and
losers will be the ability to monetize data and take good
care of the customer, I know that we at Tele2 can do both.
“
”
2 Tele2 – Annual Report 2014
CEO Word
build-out we expect to have a full coverage by Q1 2016. As far as I
know, it will be the first 4G-only full covering operation in the world.
In the year, we have seen geopolitical developments that affected
our value in Kazakhstan, as it brought monetary instability with it.
Businesswise, on the contrary, we saw more stability in our coun-
tries neighboring Russia. In Kazakhstan, we are back at a strong
positive customer intake. We have increased the number of points of
sales, applied a more regional approach to our business and saw the
revenue sharing retail model continue to yield results. We main-
tained our successful network roll-out and at the end of the year, we
had 30 percent of our revenues coming from data. The voice to data
transition is present everywhere.
I am glad to see that Tele2 Croatia continues its positive trajectory
after last year’s turn-around. Once again I would like to emphasize
the strong management team and employees that are really giving it
all to make that happen. In 2014 we secured 15 MHz in the 1800
MHz spectrum which puts us in a strong position for future data
growth.
Estonia went from a very tough position, to a tough one. A dawn-
ing improvement which I hope will continue. Lithuania continues to
stand out as one of the stars of the Group with a number one position
(no matter how you count) and with impressive EBITDA-margins.
Latvia focused on customer service and managed to reach beyond
world class levels, hitting 86 percent customer satisfaction during
the year.
Germany continued on its present path and in Austria we took the
decision to invest in B2B whilst also launching mobility (through an
MVNO agreement) as a complement to our fixed operations.
2014 was also the year when our M2M business got some traction
in its partnership strategy. That strategy gives us the right tools to
take our M2M business further at a great tempo. The Tele2 M2M
Global Solution organization feels solid and I am hopeful that 2015
will be even more of a springboard year for our M2M activities.
If you are not paranoid,
you do not have enough information
Sustainability and Corporate Responsibility remains a clear focus
for us at Tele2. By providing our customers with great products and
offerings that give access to society’s full range of services and com-
munication, we feel that we are contributing to a better tomorrow at
our very core. However, we are well aware that there are plenty of
challenges along the way in order to get that done in a cautious and
responsible way across our footprint. Our strategy for Corporate Sus-
tainability described in two words would be: transparent action. We
take action when we see wrongdoings within our operational con-
trol. We discuss human rights and ethical dilemmas in our Board.
I,myself, have worked hard to increase transparency around our
business in Kazakhstan towards investors and relevant stakehold-
ers. We try to be as open as we can possibly be about our challenges
(e.g. reporting incidents in our Annual Reports and on our corporate
website, organizing Corporate Responsibility round-tables, drafting
public White Papers etc.) and when things go bad (because they do)
we act upon it. Fulfilling the company’s responsibility to respect
human rights as defined by the United Nations in the best possible
way. This needs to be done to maintain our customers’ trust and
generate maximum shareholder value – and to allow me to sleep
well at night. We follow political and macro-economic trends which
could influence performance and delivery and we are disciplined
when it comes to risk appetite, culture, values and challenger spirit.
We, and our owners, will continue to have tough expectations on
ourselves for the coming years.
The Tele2 Way or the highway
Internally, we have had a continued focus on our unique and price-
less set of values. It is important not to feel satisfied and relaxed
even though employee engagement levels (a combination of clarity
and energy) at Tele2 are world class. In the year, we therefore rolled
out a new Tele2 Way training. Everyone in the Leadership Team are
teachers and all managers have attended the updated training ses-
sions. We have a strong culture and DNA that needs to be taken care
of. Winning People & Culture is one of the Way2Win areas in the
renewed strategy because it is the people at Tele2 that makes us
who we are and defines who we will be.
Just do it
In 2015, we will roll-up our sleeves even further (at Tele2 they are
well above the elbows at any given time) because we have a lot of
work to do. I sometimes say that we are more or less “fully booked”
for 2015. It will be a year of investments and setting up the company
for future continued success. The Netherlands remains a clear focus
and we need to get that right. We are also rolling out networks in
Kazakhstan and Sweden to cater for future needs. Moreover, we
have kick-started the Challenger Program and need to get good
traction from that in 2015.
Mats Granryd
President and CEO
Tele2 – Annual Report 2014 3
CEO Word

Board of Directors
Mike Parton
Chairman of the Board,
elected in 2007
Born: 1954
Nationality: British citizen
Independence: Independent in
relation to the company and
management as well as in
relation to the company’s major
shareholders
Holdings in Tele2: 17,825
Bshares
Committee work: Member of
the Remuneration Committee
Mike Parton is a member of the
Chartered Institute of
Management Accountants.
Furthermore, he is a member of
the Advisory Board of a UK
charity called Youth at Risk.
He was CEO and Chairman of
Damovo Group Ltd, an
international IT company
between 2007 and 2014 and
CEO and Executive member of
Marconi plc between 2001 and
2006.
Trained as Chartered
Management Accountant.
Lorenzo Grabau
Non-Executive Director,
elected in 2014
Born: 1965
Nationality: Italian citizen
Independence: Independent in
relation to the company and
management but not
independent in relation to the
company’s major shareholders
Holdings in Tele2: -
Committee work: Member of the
Audit Committee and the
Remuneration Committee
Lorenzo Grabau is President and
CEO of Investment AB Kinnevik
since 2014. He is also Chairman of
Rocket Internet AG and Avito AB
since 2014 and in Global Fashion
Holding SA since 2015. In addition
he is deputy Chairman of Zalando
SE since 2013, as well as Non-
Executive Director of Millicom
International Cellular S.A., since
2013, Modern Times Group MTG
AB since 2011, Qliro Group AB and
Secure Value EEIG since 2014.
During 2013 and 2014 he was
Non-Executive Director of
Investment AB Kinnevik, CTC
Media, Inc. and Softkinetic BV. He
was a Partner and Managing
Director at Goldman Sachs Inter-
national in London until 2011. He
joined the Investment Banking
division of Goldman Sachs in 1994
and during his 17years at the firm
held various leadership positions
within the Consumer/Retail and
Media/Online industry practices,
and the Financial Sponsors Group.
He began his career in Investment
Banking in 1990 when he joined
Merrill Lynch, where he remained
for five years working in the
Mergers & Acquisitions depart-
ment in London and NewYork.
Dottore in Economia e
Commercio, from Università degli
Studi di Roma, La Sapienza, Italy.
Lars Berg
Non-Executive Director,
elected in 2010
Born: 1947
Nationality: Swedish citizen
Independence: Independent in
relation to the company and
management as well as in
relation to the company’s major
shareholders
Holdings in Tele2: 2,000
Bshares
Committee work: Chairman of
the Remuneration Committee
Lars Berg is the European
venture partner of Constellation
Growth Capital since 2006. He is
non-executive Chairman of Net
Insight AB since 2001 (a Board
member since 2000), a non-
executive Board member of
Ratos AB since 2000 and of
OnePhone Holding since 2009
as well as a non-executive
supervisory Board member of
NORMA Group AG, Frankfurt
since 2011.
He was a member of the
executive Board of Mannesmann
AG as Head of its telecommuni-
cations business from 1999 until
the Vodafone takeover of
Mannesmann in 2000. From
1994 until 1999, he was Chief
Executive Officer of the Telia
Group and President of Telia AB.
Between 1970 and 1994 he held
various executive positions in
the Ericsson Group and was a
member of the Ericsson
Corporate Executive Committee
for ten years, as well as
President of the subsidiaries
Ericsson Cables AB and Ericsson
Business Networks AB.
M.Sc. in Business
Administration and Economics,
Gothenburg School of
Economics.
Mia Brunell Livfors
Non-Executive Director,
elected in 2006
Born: 1965
Nationality: Swedish citizen
Independence: Not
independent in relation to the
company and management (due
to engagement as a Board
member of Transcom Worldwide
AB) and not independent in
relation to the company’s major
shareholders
Holdings in Tele2: 1,000
Bshares
Committee work: -
Mia Brunell Livfors is a member
of the Board of Millicom
International Cellular S.A.,
Modern Times Group MTG AB,
Qliro Group AB, Transcom
Worldwide AB, Stena AB and
Efva Attling Stockholm AB. She
also works as an advisor for Axel
Johnson AB and has been
appointed as a Board member of
Axel Johnson AB from March 25,
2015.
She was President and CEO of
Investment AB Kinnevik
between 2006 and 2014 and
she held several managerial
positions within the Modern
Times Group MTG AB from 1992
to 2001 and was Chief Financial
Officer between 2001 and 2006.
Studies in Economics and
Business Administration,
Stockholm University.
4 Tele2 – Annual Report 2014
Board of Directors

Carla Smits-Nusteling
Non-Executive Director,
elected in 2013
Born: 1966
Nationality: Dutch citizen
Independence: Independent in
relation to the company and
management as well as in
relation to the company’s major
shareholders
Holdings in Tele2: -
Committee work: Chairman of
the Audit Committee and
member of the Remuneration
Committee
Carla Smits-Nusteling is a Non-
Executive Director at ASML. She
is also a member of the
management board of the
Foundation Unilever NV Trust
Office since February 2015.
She has over 10 years’
experience from Koninklijke KPN
N.V., and was KPN’s Chief
Financial Officer between 2009
and 2012. She joined KPN in
2000 and held various financial
positions, whereof three years
as Director of Corporate Control.
During 1990–2000, she worked
at TNT Post Group N.V., an
international express and mail
delivery service, and held
various managerial positions
before her appointment as
Regional Director in 1999.
M.Sc. Business Economics,
Erasmus University, Rotterdam.
Mario Zanotti
Non-Executive Director,
elected in 2013
Born: 1962
Nationality: Italian citizen
Independence: Independent in
relation to the company and
management but not
independent in relation to the
company’s major shareholders
Holdings in Tele2: -
Committee work: -
Mario Zanotti is Senior Executive
VP Operations at Millicom
International Cellular S.A
He has over 20 years of
experience in the Telecom
Service Industry. In 1992 he
founded Telecel in Paraguay and
was also the Managing Director
of the company during 1992–
1998. He was Managing Director
of Tele2 Italy during 1998–2000
and of YXK Systems during
2001–2002. After 2002 he has
held several other managerial
positions within Millicom,
starting as Head of Central
America for Millicom before
becoming Head of Latin America
and later COO of Categories &
Global Sourcing.
M.Sc. in Electrical
Engineering from the Pontificia
Universidade Catolica in Porto
Alegre (Brazil), MBA from INCAE
and the Universidad Catolica de
Asuncion (Paraguay).
Erik Mitteregger
Non-Executive Director,
elected in 2010
Born: 1960
Nationality: Swedish citizen
Independence: Independent in
relation to the company and
management but not
independent in relation to the
company’s major shareholders
Holdings in Tele2: 10,000
Bshares
Committee work: Member of
the Audit Committee
Erik Mitteregger is member of
the Board of Investment AB
Kinnevik since 2004 and of
Rocket Internet AG and Avito AB
since 2014. He is also chairman
of the Boards of Firefly AB and
Wise Group AB.
Previously, he was member of
the Board of Invik & Co. AB
2004–2007 and Metro
International SA 2009–2013. He
was founding partner and Fund
Manager of Brummer & Partners
Kapitalförvaltning AB 1995–
2002. In 1989–1995, he was
Head of Equity Research and
member of the Management
Board at Alfred Berg
Fondkommission.
B.Sc. in Economics and
Business Administration at
Stockholm School of Economics.
Irina Hemmers
Non-Executive Director,
elected in 2014
Born: 1972
Nationality: Austrian citizen
Independence: Independent in
relation to the company and
management as well as in
relation to the company’s major
shareholders
Holdings in Tele2: -
Committee work: Member of
the Audit Committee
Irina Hemmers is Investment
Managing Director at Moonray
Investors, the Principal Investing
Arm of Fidelity International.
She was Non-Executive
Director of Trader Corporation,
Trader Media Group and Top
Right Group until 2013, of Hit
Entertainment until 2012,
Incisive Media/American
Lawyer Media until 2009 and
SULO Group until 2007.
Previously, she was a Partner
with private equity firm Apax
Partners from 2001 to 2013.
During her 12 years with Apax
Partners, she worked in Munich,
Hong Kong and London. She
began her career at McKinsey &
Company in Vienna 1996.
M.Sc. in International
Business and Economic Studies
from University of Innsbruck,
Austria, and an MPA from John F.
Kennedy School of Government,
Harvard University, USA.
Tele2 – Annual Report 2014 5
Board of Directors

Leadership Team
Mats Granryd
President and CEO Tele2 Group
Joined the company in 2010
Born 1962
M.Sc. in Mechanical Engineering,
KTH Royal Institute of Technology
Holdings in Tele21)
57,725 B shares
56,000 share rights (LTI 2012)
56,000 share rights (LTI 2013)
56,000 share rights (LTI 2014)
Joachim Horn
Executive Vice President /
Group CTIO
Joined the company in 2011
Born 1960
M.Sc. in Informatics, Fachhochschule Wedel
Holdings in Tele21)
12,000 B shares
24,000 share rights (LTI 2012)
24,000 share rights (LTI 2013)
24,000 share rights (LTI 2014)
Lars Torstensson
Executive Vice President / Group
Communication & Strategy
Joined the company in 2007
Born 1973
M.Sc. in Business Administration,
Jönköping University
Holdings in Tele21)
16,000 B shares
24,000 share rights (LTI 2012)
24,000 share rights (LTI 2013)
24,000 share rights (LTI 2014)
Allison Kirkby
Executive Vice President /
Group CFO
Joined the company in 2014
Born 1967
FCMA, Fellow of the Chartered Institute
of Management Accountants, SHND in
Accounting, University of Caledonia
Holdings in Tele21)
4,000 B shares
24,000 share rights (LTI 2014)
Anders Olsson
Executive Vice President /
Group CCO
Joined the company in 1997
Born 1969
M.Sc. in Business Administration
and Economics, Uppsala University
Holdings in Tele21)
30,000 B shares
24,000 share rights (LTI 2012)
24,000 share rights (LTI 2013)
24,000 share rights (LTI 2014)
Caroline Fellenius-Omnell
Executive Vice President /
Group General Counsel
Joined the company in 2014
Born 1968
LL.M. College of Europe and LL.M.,
Stockholm University
Holdings in Tele21)
4,000 B shares
24,000 share rights (LTI 2014)
6 Tele2 – Annual Report 2014
Leadership Team
1) Share rights = allocated share rights at grant date, before compensation for dividend
Thomas Ekman
Executive Vice President /
CEO Tele2 Sweden
Joined the company in 2006
Born 1969
M.Sc. in Business administration and
Economics, Stockholm University
Holdings in Tele21)
12,012 B shares
24,000 share rights (LTI 2012)
24,000 share rights (LTI 2013)
24,000 share rights (LTI 2014)
Jeff Dodds
Executive Vice President /
CEO Tele2 Netherlands
Joined the company in 2014
Born 1973
MBA, University of Westminster and M.Sc. in
Marketing Management, Aberdeen Business
School
Holdings in Tele21)
4,000 B shares
24,000 share rights (LTI 2014)
Elinor Skogsfors
Executive Vice President /
Group Human Resources
Joined the company in 2013
Born 1963
B.Sc. in Political Administration major in
HR, Stockholm University
Holdings in Tele21)
3,000 B shares
18,000 share rights (LTI 2014)
Niklas Sonkin
Executive Vice President / Central Europe
and Eurasia
Joined the company in 2009
Born 1967
M.Sc. in Engineering, Helsinki University
of Technology
Holdings in Tele21)
14,500 B shares
24,000 share rights (LTI 2012)
24,000 share rights (LTI 2013)
24,000 share rights (LTI 2014)
In addition, not received 8,307
B shares for LTI 2011
Tele2 – Annual Report 2014 7
Leadership Team

Financial overview
With 14 million customers in nine countries, Tele2 is one of Europe’s
leading telecom operators. We offer mobile services, fixed broad-
band and telephony, data network services and content services.
Ever since Jan Stenbeck founded the company in Sweden in 1993,
Tele2 has been a tough challenger to the former government
monopolies and other established providers.
Our mission is to always offer our customers what they need for
less, and ultimately our vision is to be the champions of customer
value in everything we do.
Mobile services is Tele2’s primary focus and most important
growth segment. In 2014, revenue from mobile operation accounted
for 74 (68) percent of Tele2’s net sales.
In 2014, the Group generated net sales of SEK 26 billion and
reported an operating profit (EBITDA) of SEK 5.9 billion.
Net customer intake
In 2014, the total customer base increased to 13,594,000
(13,582,000) customers. Net customer intake, excluding one-time
adjustments, was 397,000 (253,000) customers. The customer
intake in mobile services amounted to 598,000 (594,000) custom-
ers. The increase was mainly driven by positive customer intake
through Tele2 Kazakhstan, Tele2 Netherlands, Tele2 Germany and
Tele2 Croatia. The fixed broadband base lost –45,000 (–86,000)
customers in 2014, attributable to Tele2’s operation in Sweden,
Austria, Germany and the Netherlands. As expected, the number
offixed telephony customers fell during the year.
Net sales
Tele2’s net sales amounted to SEK 25,955 (25,757) million corre-
sponding to a positive growth of 1 percent including, or –1 percent
decline excluding, exchange rate effects. The net sales development
was mainly a result of strong usage of mobile services increasing 8
percent, however hampered by the negative net sales development
within consumer fixed broadband and fixed telephony.
EBITDA
EBITDA amounted to SEK 5,926 (5,891) million, equivalent to an
EBITDA margin of 22.8 (22.9) percent. This corresponding to an
increase in EBITDA of 1 percent including, or –2 percent excluding,
exchange rate effects. The EBITDA growth was mainly a result of a
strong development in mobile services, and monetising of data.
However, it was also affected by expansion costs in mobile services.
EBIT
Operating profit, EBIT amounted to SEK 3,216 (2,982) million exclud-
ing one-off items. Including one-off items and including the capital
gain from the sale of the Swedish residential cable and fiber opera-
tion, EBIT amounted to SEK 3,490 (2,548) million. The EBIT margin
was 13.4 (9.9) percent.
Profit before tax
Net interest expense and other financial items amounted to SEK 10
(–551) million. Exchange differences of SEK –27 (–28) million were
reported under other financial items. The average interest rate on
outstanding liabilities was 5.0 (5.2) percent. Profit after financial
items, EBT, amounted to SEK 3,500 (1,997) million.
Net profit
Profit after tax amounted to SEK 2,626 (968) million. Earnings per
share amounted to SEK 5.86 (2.15) after dilution. Income tax
expenses for the year amounted to SEK –874 (–1,029) million. Tax
payments for continuing operations affecting cash flow amounted to
SEK –327 (–302) million.
Cash flow
For continuing operations, cash flow from operating activities
amounted to SEK 4,661 (4,983) million and cash flow after paid
CAPEX to SEK 1,162 (799) million.
CAPEX
During 2014, Tele2 made investments of SEK 3,450 (4,399) million
in tangible and intangible assets, driven mainly by further network
expansion in Netherlands, Sweden, Kazakhstan and the Baltics.
Net debt
Net debt amounted to SEK 9,061 (8,007) million on December 31,
2014, or 1.51 times EBITDA in 2014. Tele2’s available liquidity
amounted to SEK 8,224 (9,306) million.
Challenger program
A group-wide program focused on increasing productivity was
launched in the end of 2014. The program will be implemented over
the next 3 years and reap full benefits of SEK 1 billion per annum
starting in 2018. The investment required will be SEK 1 billion,
phased over the next 3 years. In 2014 EBIT was impacted by
SEK–10 million by the program, which was reported as one-off
items (Note 6).
Administration report
The Board of Directors and the CEO herewith present the annual
report and consolidated financial statements for Tele2 AB (publ),
corporate reg. no. 556410-8917 for the financial year 2014.
The figures shown in parentheses correspond to the comparable period last year and continuing operations unless otherwise stated.
8 Tele2 – Annual Report 2014
Administration report

Five-year summary
SEK million 2014 2013 2012 2011 2010
CONTINUING OPERATIONS
Net sales 25,955 25,757 25,993 26,219 27,361
Number of customers (by thousands) 13,594 13,582 14,229 12,392 11,845
EBITDA 5,926 5,891 6,040 6,755 6,880
EBIT 3,490 2,548 2,190 3,613 4,088
EBT 3,500 1,997 1,668 3,074 3,664
Net profit 2,626 968 1,158 2,169 3,986
Key ratios
EBITDA margin, % 22.8 22.9 23.2 25.8 25.7
EBIT margin, % 13.4 9.9 8.4 13.8 14.9
Value per share (SEK)
Net profit 5.89 2.17 2.61 4.88 9.03
Net profit, after dilution 5.86 2.15 2.59 4.85 9.00
TOTAL
Equity 22,682 21,591 20,429 21,452 28,875
Total assets 39,848 39,855 49,189 46,864 42,085
Cash flow from operating activities 4,578 5,813 8,679 9,690 9,966
Cash flow after CAPEX 432 572 4,070 4,118 6,008
Available liquidity 8,224 9,306 12,933 9,986 13,254
Net debt 9,061 8,007 15,745 13,518 3,417
Investments in intangible and tangible assets, CAPEX 3,976 5,534 5,294 6,095 4,094
Investments in shares and other financial assets –439 –17,235 215 1,563 1,424
Average number of employees 5,484 6,143 8,379 7,539 7,402
Key ratios
Equity/assets ratio, % 57 54 42 46 69
Debt/equity ratio, multiple 0.40 0.37 0.77 0.63 0.12
Return on equity, % 10.0 69.5 15.6 18.9 24.0
ROCE, return on capital employed, % 10.1 48.0 15.4 20.5 22.2
Average interest rate, % 5.0 5.2 6.7 6.2 7.3
Value per share (SEK)
Net profit 4.96 32.77 7.34 10.69 15.67
Net profit, after dilution 4.93 32.55 7.30 10.63 15.61
Equity 50.90 48.49 45.95 48.33 65.44
Cash flow from operating activities 10.27 13.06 19.53 21.83 22.59
Dividend, ordinary 4.851) 4.40 7.10 6.50 6.00
Extraordinary dividend 10.001) – – 6.50 21.00
Redemption – 28.00 – – –
Market price at closing day 94.95 72.85 117.10 133.90 139.60
1) Proposed dividend.
Tele2 – Annual Report 2014 9
Administration report
Where we operate
Overview by country
Tele2’s footprint includes both emerging and mature markets,
where cultural, economic and competitive differences are signifi-
cant. However, the trend towards mobility and mobile data is uni-
versal, and is clearly evident in all our countries of operation.
While mobile communication services are fairly standardized
across different countries, the level of maturity differs widely. Tele2
is present in nine countries, of which three are considered larger
markets for Tele2: Sweden, the Netherlands and Kazakhstan. These
three markets comprise 75 percent of the total net sales. Sweden is
the home turf and test bed for new products and services. The Neth-
erlands has its origin in fixed communication services but is now
pursuing a unique mobile opportunity as a 4G only operator.
Kazakhstan is in many ways still virgin territory. However, during
2014 Tele2 Kazakhstan started to deliver positive EBITDA and the
customer intake is accelerating, Tele2 Kazakhstan is the main com-
petitor for other operators in the country, delivering affordable com-
munication services.
Tele2’s position and priorities vary across its footprint. Local
market characteristics differ in many ways, even within the same
country.
Looking forward, Tele2 remains confident in its strategy and ability
to monetize a great customer experience throughout its footprint.
Sweden will maintain its leadership in 4G/LTE, and the company will
take its learning from Sweden to the Baltics and of course the Nether-
lands. 2015 will be another exciting year of investments in the com-
pany’s future ‘Rockets’ of Kazakhstan, Croatia and the Netherlands,
supported by continued strength in Sweden and the Baltics.
While there are important local differences, Tele2 has established
it’s ‘How we win choices’ going into 2015, supporting the overall
objective for the Group. These areas go beyond the local context and
are common to all the regions and countries where Tele2 operates.
How we win choices
• Value Champion – Tele2 aim to be the leader within the transi-
tion from voice to data and go from a discounter to a champion of
value for our customers.
• Focused technology choices – Tele2 shall increase quality
where it matters for the customers, drive down technology costs
continuously in all areas and selectively push for new technolo-
gies and innovations.
• Step change our productivity – Tele2 is in a position of strength
and has therefore invested in a multi-year program to find ways
to become the number one in effectiveness. This will be done by
simplification, discipline, consolidation and transformation.
• Winning people and culture – Tele2 is and will continue to be
an organisation that is driven by our values. We are today also an
organisation with highly engaged employees, something that we
aim to leverage upon.
Objectives
• Happiest customers – Tele2 shall be the operator of choice. By
providing the best value for money we shall be the operator of
choice and grow our market share.
• Engaged employees – We shall be considered a great place to
work. By being a great place to work we shall attract and retain
the best people who can deliver on our vision and mission.
• Profitable growth – We shall have the best Total Shareholder
Return (TSR). By having the happiest customers, engaged employ-
ees and work to become as effective as possible, we shall deliver
profitable growth and the best TSR within our peer group.
These fundamental priorities and objectives will continue to guide
the company’s regional activities moving forward.
10 Tele2 – Annual Report 2014
Administration report
2014 in brief
Despite high level of competition, Tele2 Sweden managed to dem-
onstrate solid results in 2014, driven by strong demand for mobile
data. Mobile end-user service revenue grew by SEK 302 million and
the EBITDA contribution for mobile services was SEK 3,224 (2,971)
million in 2014, representing a growth of 9 percent compared to last
year. Total mobile net intake amounted to –51,000 (38,000) in 2014.
In the end of 2013, Tele2 announced the sale of its Swedish resi-
dential cable and fiber operations to Telenor for SEK 793 million.
The sale was completed on January 2, 2014, after approval by regu-
latory authorities and the capital gain in 2014 amounted to SEK 258
million.
In 2014, Tele2 Sweden prioritised four areas:
• brand repositioning Tele2.0
• upselling of data
• cost efficiency from operating joint-operation networks and
further roll-out of 4G network
• market share gain in the business segment
Brand repositioning Tele2.0
In November 2014, Tele2 Sweden launched its new game changing
commercial concept, Tele2.0, including changes such as no binding
periods, a one-subscription solution, trial periods for both B2C and
B2B customers as well as removed expiry date for all top-ups. This is
expected to improve customer satisfaction, and through this the long
term positioning of Tele2 Sweden’s brands. The reaction from cus-
tomers and media was very positive.
Upselling of data
2014 was characterized by a strong demand for mobile data. Within
the consumer segment the request for mobile data shifted sales
towards higher data buckets. Also, the revenue from data-top ups
increased with about 327 percent compared to 2013, proving that
the consumer behavior has shifted from voice to data services. The
demand for 4G enabled smartphones maintained during the year,
and now stands for 98 percent of total sales.
Further roll-out of 4G network
During the year, Tele2 Sweden continued the rollout of the com-
bined 2G and 4G networks in the joint operation Net4Mobililty, with
aggressive geographic coverage targets. With this rollout, Tele2
Sweden will improve the coverage in all areas of Sweden with the
aim of reaching 90 percent geographic coverage in 2016. Through
this rollout, Tele2 Sweden will cement its position as the operator
offering the best mobile 4G coverage in Sweden while further
future-proofing its network.
Moreover, Tele2 Sweden continued the roll-out of both LTE 800
and LTE 1800, which will further strengthen the network in terms
of 4G capacity and coverage in order to cater for customers’ increas-
ing demand for data.
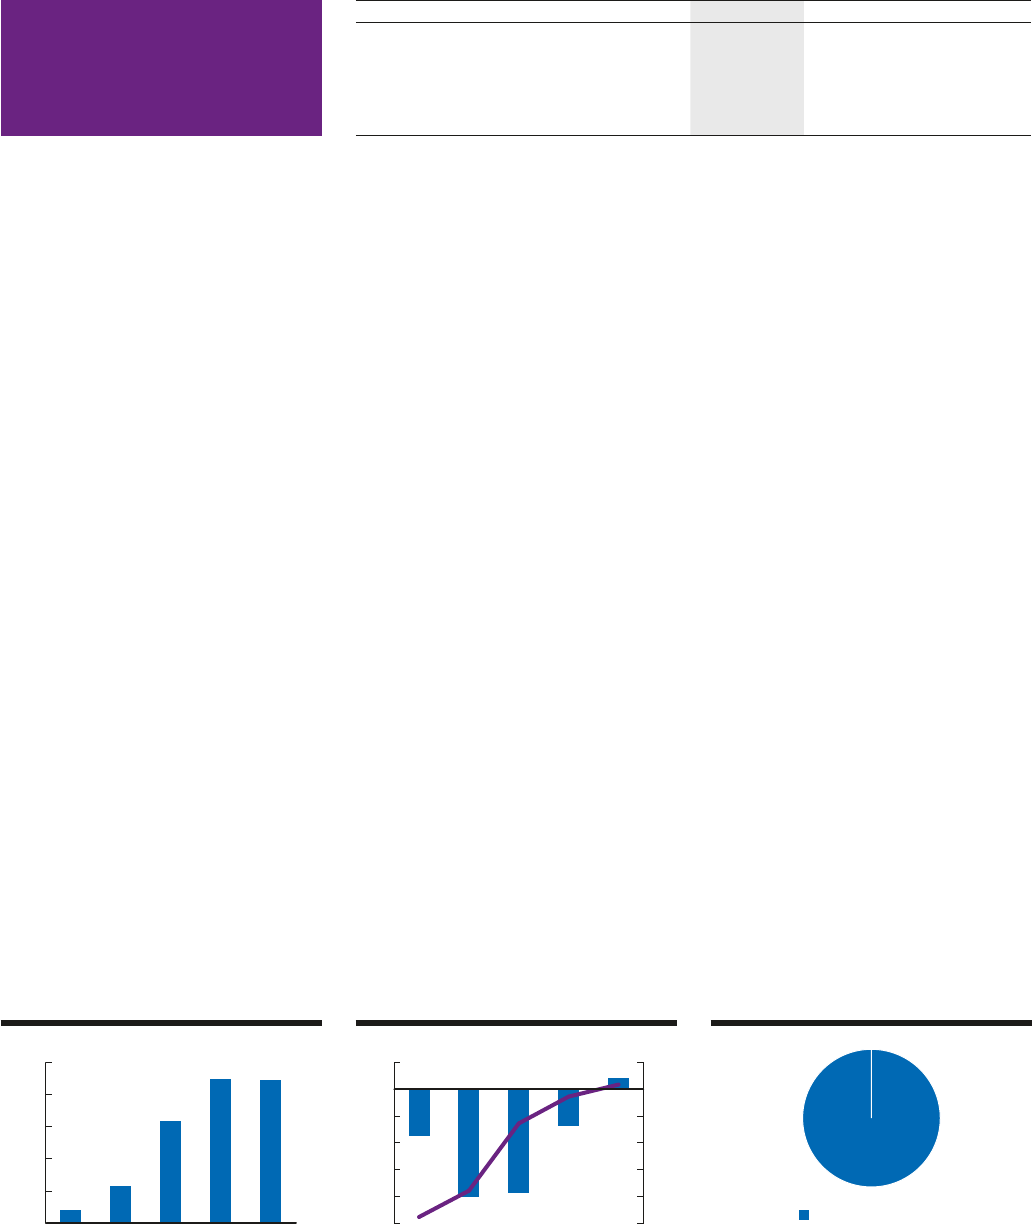
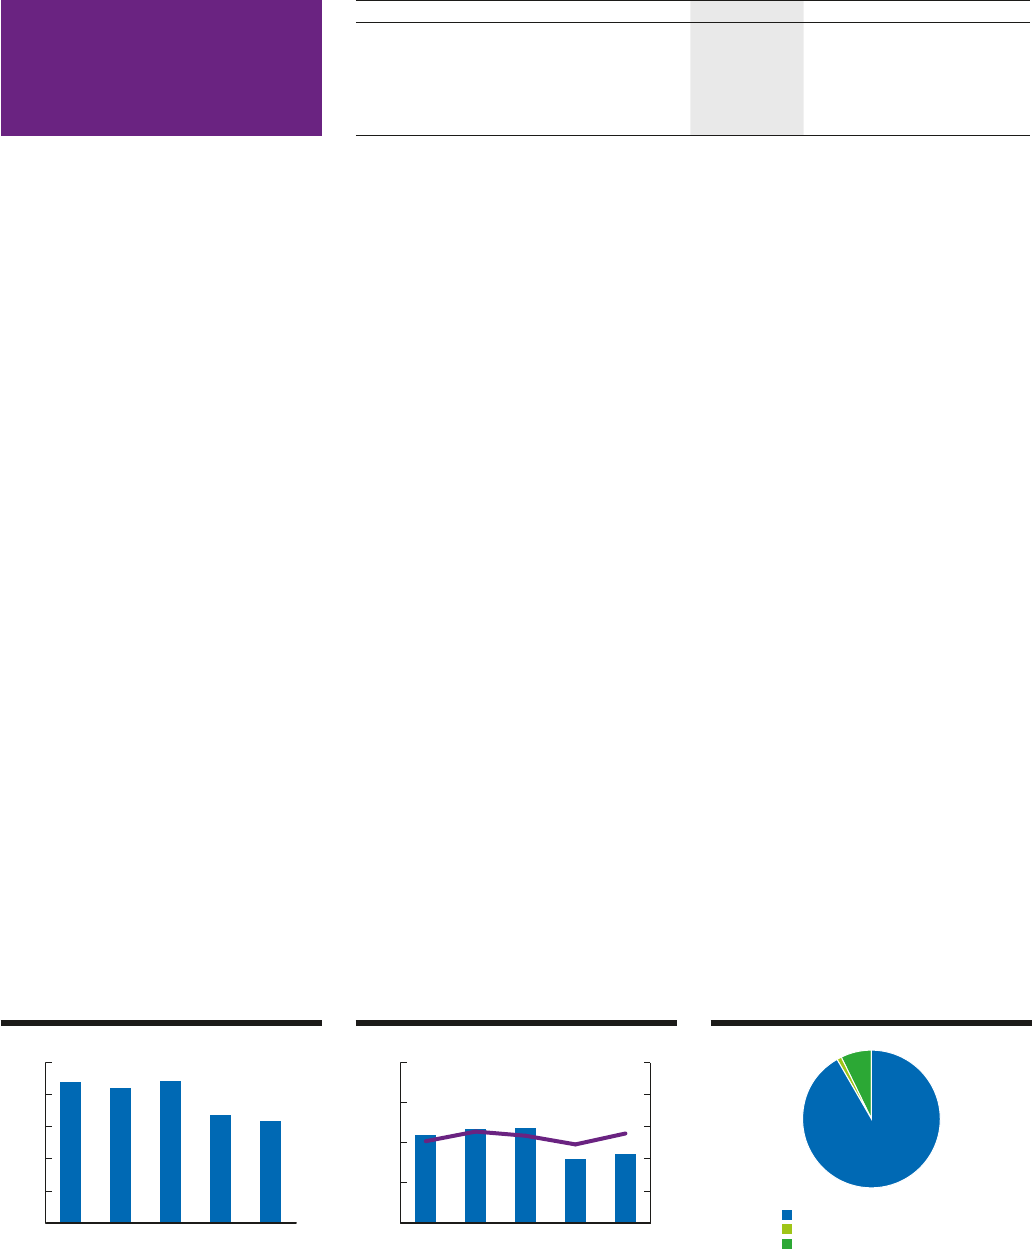
Net sales
0
3,000
6,000
9,000
12,000
15,000
20142013201220112010
SEK million
EBITDA & EBITDA margin
0
1,000
2,000
3,000
4,000
20142013201220112010
0
10
20
30
40
50
SEK million Percent
Net sales per service
Mobile SEK , million
Fixed broadband SEK million
Fixed telephony SEK million
Other operations SEK million
SEK million 2014 2013 Growth
Number of customers (in thousands) 3,976 4,476 –11%
Net sales 12,629 12,453 1%
of which mobile end-user service revenue 7,252 6,950 4%
EBITDA 3,612 3,448 5%
EBIT1) 2,371 2,063
1) excluding one-off items (Note 6)
Sweden
Tele2 – Annual Report 2014 11
Administration report
Market share gain in the business segment
The business segment saw continued strong mobile revenue
growth, driven by an increased customer stock as well as continued
strong intake within cloud PBX. Only 18 months after its launch, the
PBX service was number two in the market. The latest PTS report
(Post- och Telestyrelsen – National Regulatory Authority in Sweden)
showed that Tele2 Business gained most mobile market share dur-
ing the first half of 2014 with an increase of 1 percentage unit, lead-
ing to an estimated total mobile market share of 18 percent. Simi-
larly the Swedish Quality Index for the business market showed that
the customer satisfaction has improved substantially over the year
with Tele2 taking the number one position for broadband and the
number two position for mobile.
The company acquired significant new and extended contracts
such as NCC, Bonnier, Åklagarmyndigheten and Kriminalvården.
Also, the segment continued to see an increased market demand for
communication as a service, driven by the new Kammarkollegiet
frame agreement for the Public sector.
Challenges to address in 2015
Tele2 Sweden will continue its dual brand strategy, positioning
Comviq as the modern mobile price fighter and Tele2 as the full suite
value proposition to meet the different customer needs and follow
the Tele2.0 strategy by continuously aim to see things from the cus-
tomers’ perspective.
The company expects mobile data demand to keep growing as
customers become more and more mobile. Consequently, Tele2
Sweden will increase its focus on the upsell of data, optimizing the
network, and drive sales towards high speed data offerings, thereby
increasing customer value and lowering production cost.
Tele2 Sweden will also keep improving coverage and capacity
throughout the network and continue the roll-out of the 800 MHz
frequency complemented by 1800 MHz in order to enhance its 4G
network.
In summary, Tele2 Sweden aims to continue to deliver good
profitability during 2015 through:
• Leverage increased data consumption among our customers,
mainly driven by upsell of data and transition towards larger
data buckets
• Effective use of distribution channels
• Continue to lever on efficiency in joint operation set-up
• Steering towards online activities and self-service
• Continued cost efficiency in all areas within Tele2 Sweden
operations
Continued Sweden
12 Tele2 – Annual Report 2014
Administration report
2014 in brief
In 2014 Tele2 Netherlands continued to further strengthen its abili-
ties to be able to deliver on the Group’s mission, to offer what our
customers need, for less. This by expanding and improving its
nationwide fiber network, rolling out its LTE-advanced 4G network
and developing products and services for both consumer and B2B
customers.
EBITDA amounted to SEK 903 (1,251) million, reflecting the
investment in the MNO rollout as well as maintained price pressure
in the fixed broadband market.
Mobile
During the year Tele2 noted a positive customer base development.
Since the fourth quarter 2014 Tele2 only offers 4G enabled devices,
to ensure that these customers are able to benefit from the new
4G-network. 2014 ended with the thirteenth consecutive quarter of
customer growth bringing the total mobile customer base to
813,000 (694,000).
Announcing commercial launch of its 4G network
In 2014 Tele2 Netherlands executed successfully on its 4G rollout
and in the end of 2014 the company announced that it would open
its 4G network for commercial services in the beginning of 2015.
This announcement marked an important milestone for the rollout,
which began when Tele2 obtained a frequency license in the
beginning of 2013.
From launch, the network will be LTE-advanced and will cover an
area stretching from Rotterdam to Amsterdam and Utrecht, covering
2,100 square kilometres. Tele2 expects to reach nationwide cover-
age in the beginning of 2016, only three years after the frequency
license was awarded.
Fixed broadband
Tele2 Netherlands has focused on improving its fixed service port-
folio during 2014. This by further improving the quality of its TV
product, adding popular channels like HBO and expanding the
amount of channels that can be watched in high definition. The
upgrade of the TV product in the beginning of 2014 was combined
with a new pricing strategy titled; ‘what you need for less’, shifting
the company’s position from a price fighter to a communications pro-
vider that offers a balance of great price and good quality.
As a result of this focus, Tele2 Netherlands managed to once again
grow its residential customer base after a 36 month period of
decline. On December 31, 2014, the total residential broadband base
was 369,000 (374,000).
Expansion of the business portfolio
The Dutch business sales team managed during the year to add sev-
eral new big clients to its already impressive customer list. Among
these were companies like; Royal Dutch Airlines KLM, the Dutch
Salvation Army and the Vattenfall Group.
Challenges to address in 2015
Tele2 Netherlands will continue during 2015 to expand its 4G net-
work. Throughout the year the rollout will continue to spread across
the entire country at a pace that ensures the best possible user
experience for the customers. Tele2 Netherlands is the first provider
in the world in the process of building and launching a nationwide
4G only network.
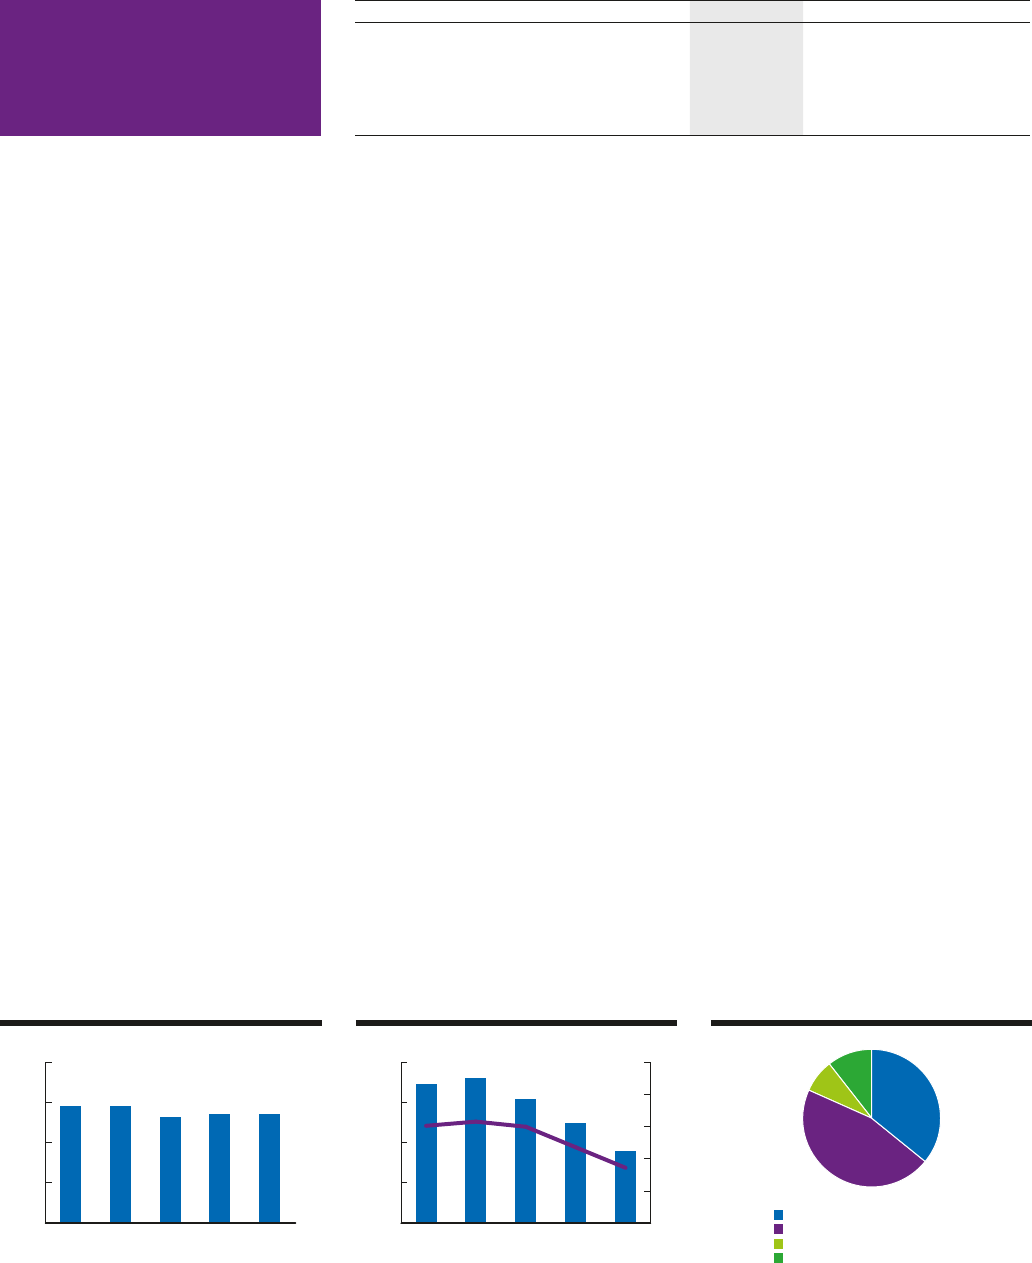
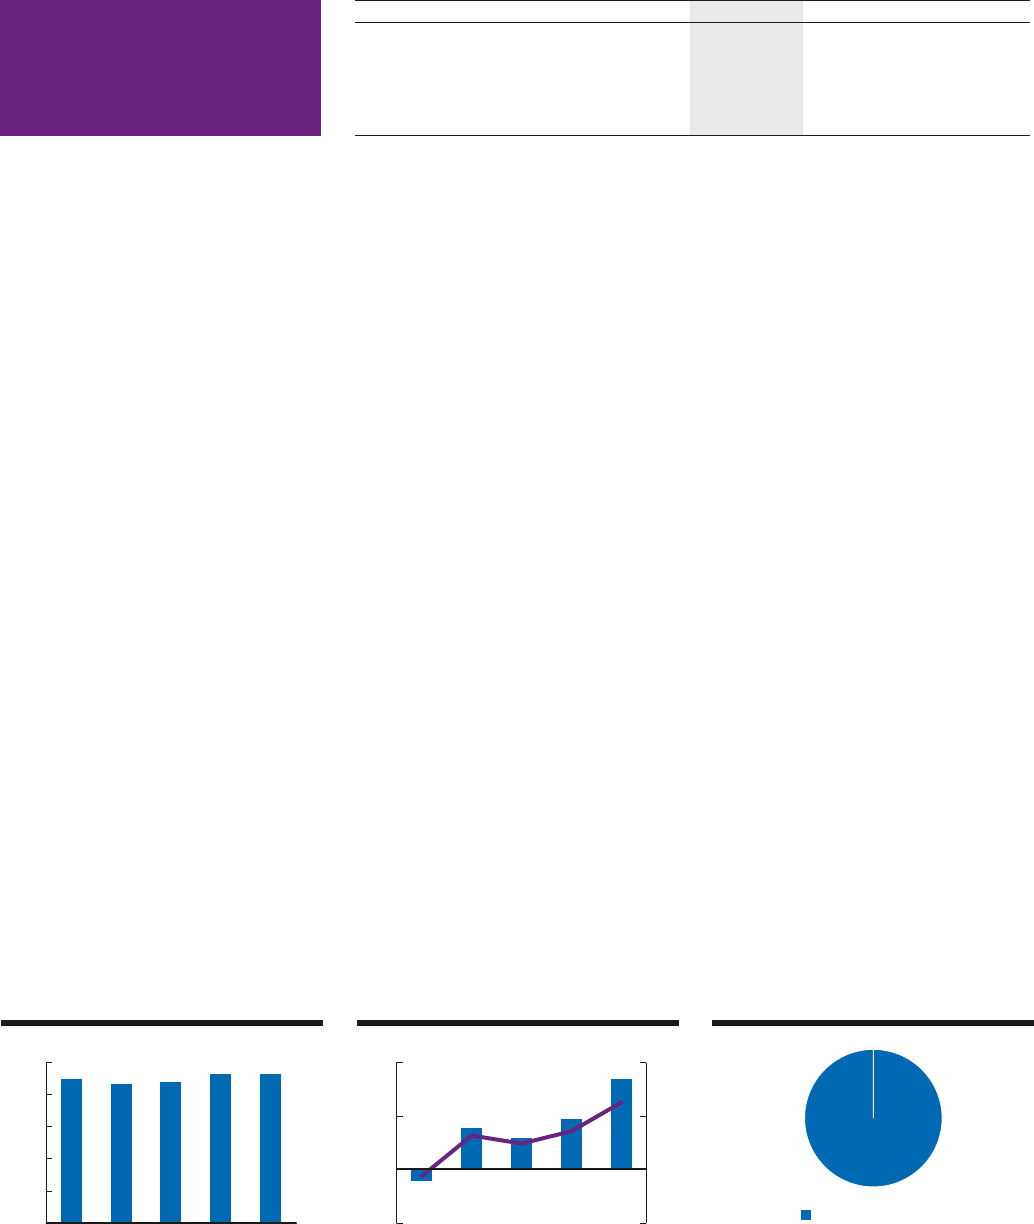
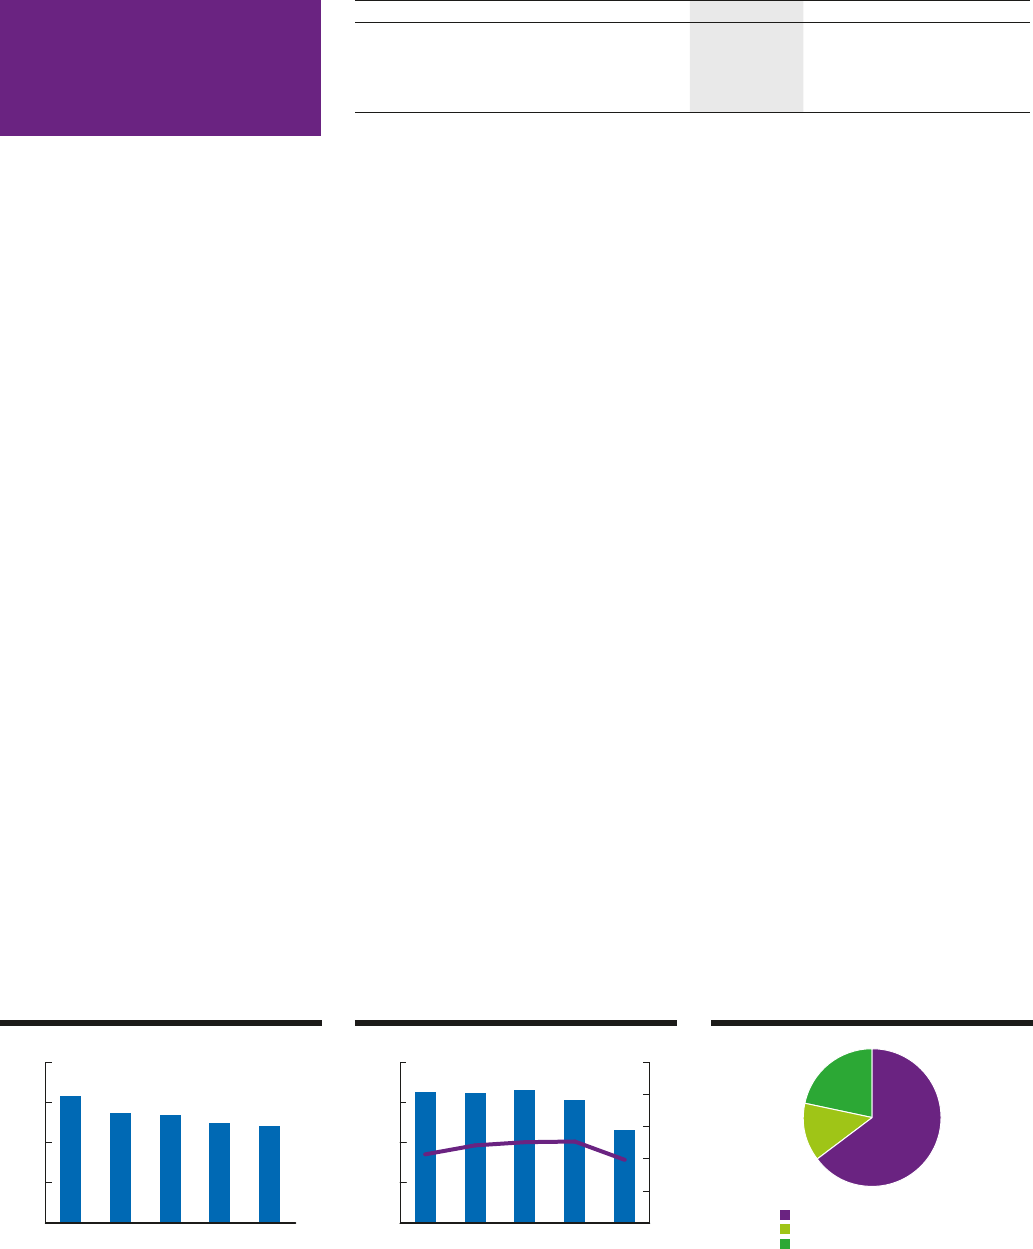
SEK million 2014 2013 Growth1)
Number of customers (in thousands) 1,257 1,175 7%
Net sales 5,439 5,435 –5%
of which mobile end-user service revenue 1,203 944 21%
EBITDA 903 1,251 –32%
EBIT2) 237 650
1) less exchange rate fluctuations
2) excluding one-off items (Note 6)
Netherlands
Net sales
0
2,000
4,000
6,000
8,000
20142013201220112010
SEK million
EBITDA & EBITDA margin
0
500
1,000
1,500
2,000
20142013201220112010
0
10
20
30
40
50
SEK million Percent
Net sales per service
Mobile SEK , million
Fixed broadband SEK , million
Fixed telephony SEK million
Other operations SEK million
Tele2 – Annual Report 2014 13
Administration report
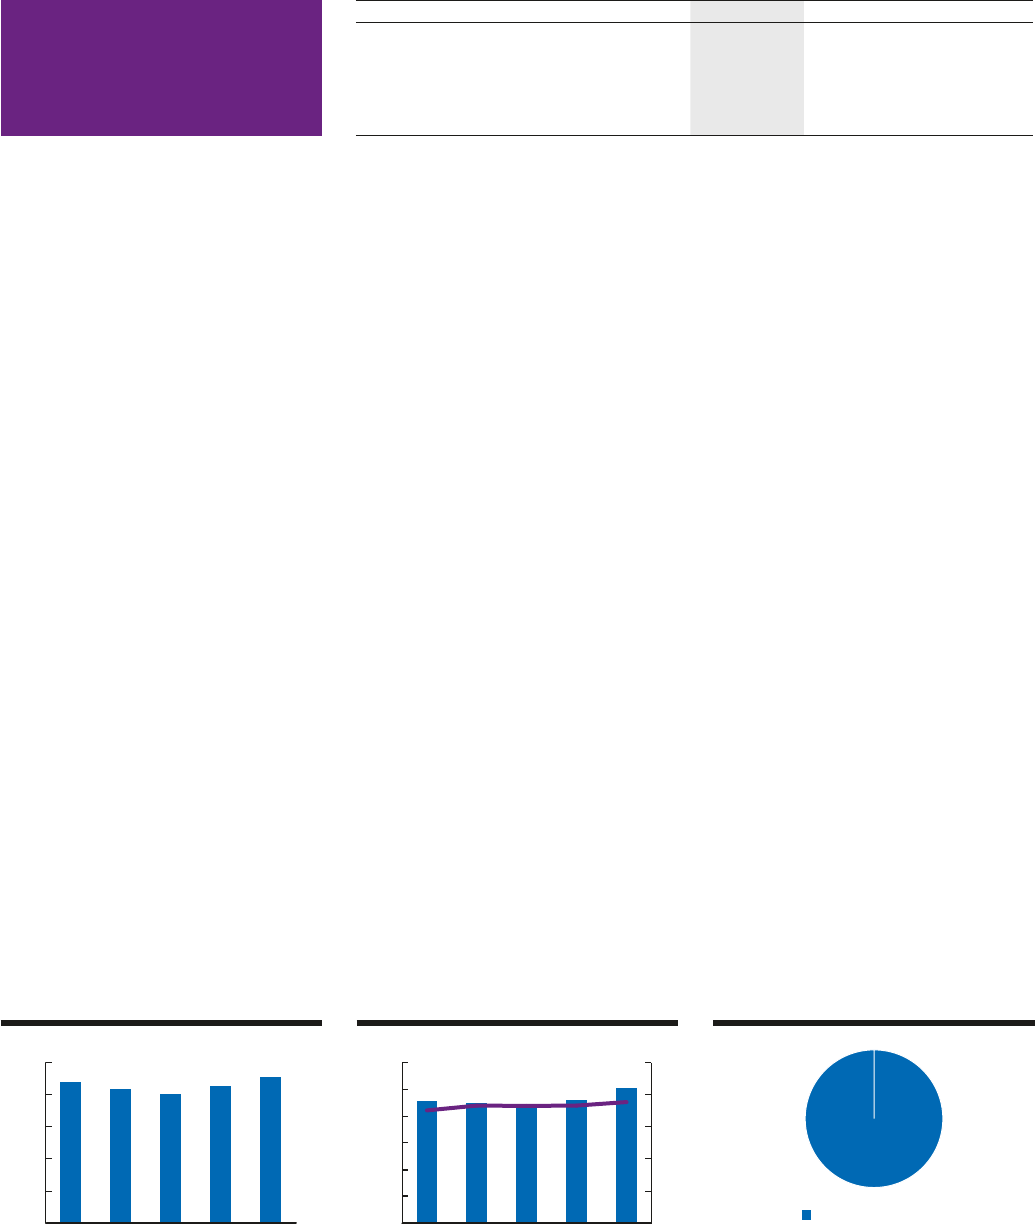
Net sales
0
300
600
900
1,200
1,500
20142013201220112010
SEK million
EBITDA & EBITDA margin
-500
-400
-300
-200
-100
0
100
20142013201220112010 -150
-120
-90
-60
-30
0
30
SEK million Percent
2014 in brief
2014 was a successful year for Tele2 Kazakhstan and the company
delivered its first positive EBITDA results since commercial launch.
Starting from January 1, 2014 the interconnect level in the country
was lowered by 15 percent leading to an improved gross margin for
Tele2 Kazakhstan. This, together with better economies of scale,
were the main reasons for improved operational results in 2014.
Most affordable telecom operator
Increased competition on the telecom market resulted in a move
from pay as you go price plans to bucket price plans. As a result,
Tele2 further increased its price leadership in the market. The new
bucket price plan offers unlimited on-net voice, limited amount of
off-net calls and large amount of data. The plan has attracted a lot of
attention and customers to Tele2.
Earlier in the year Tele2 launched an unlimited on-net tariff plan,
which also attracted new subscribers. Furthermore, the first online
re-registration of a mobile number was launched by Tele2 Kazakh-
stan in June 2014.
The “ComNews Research” agency conducted a comparative
research on all mobile operators’ tariff plans in Kazakhstan (Febru-
ary 2013 - February 2014). The results of this research confirmed
that Tele2 Kazakhstan offers the best value proposition for custom-
ers in the market and Tele2 Kazakhstan was acknowledged to be
the most affordable mobile operator in the country.
Network expansion to improve quality
During the year, Tele2 Kazakhstan continued to invest in the mobile
network to improve the quality perception in the market. Most
efforts were concentrated on expanding the geographical coverage,
increasing capacity and improving quality.
Challenges to address in 2015
The company will continue to work toward increasing customer
market share through improved customer intake quality, leading to
revenue growth and expanding EBITDA level.
The competitive environment is expected to intensify as the mar-
ket has gone from three to four mobile operators. The main chal-
lenge for Tele2 Kazakhstan will be to defend its customer base
through maintained price leadership.
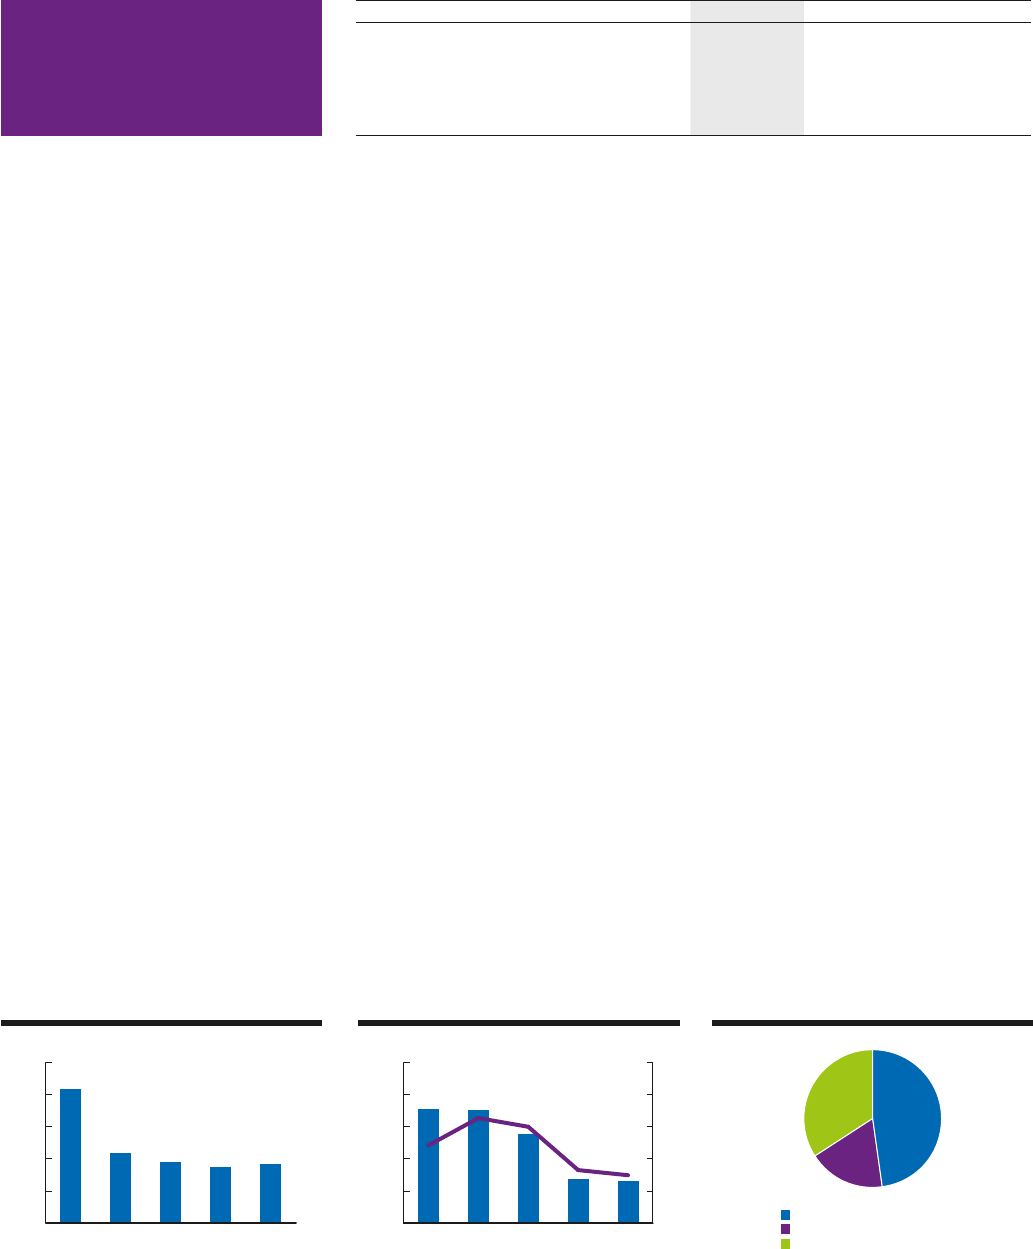
SEK million 2014 2013 Growth1)
Number of customers (in thousands) 3,297 2,751 20%
Net sales 1,334 1,344 11%
of which mobile end-user service revenue 978 909 20%
EBITDA 43 –138
EBIT2) –178 –450
1) less exchange rate fluctuations
2) excluding one-off items (Note 6)
Net sales per service
Mobile SEK , million
Kazakhstan
14 Tele2 – Annual Report 2014
Administration report
2014 in brief
2014 was an important milestone for Tele2 Croatia and the company
made significant operational progress during the year. The
increased profitability was delivered through a combination of solid
subscriber growth and operational cost efficiency. This was man-
aged despite a tough environment with declining market revenues.
Tele2’s subscriber growth came through strong campaigns and
value for money based offers. This was acknowledged by ICERTIAS
(International Certification Association), who awarded Tele2 Croatia
the “Best Buy award 2014” for offering the best value among tele-
communications operators overall. Tele2 also launched a new data
offer within the prepaid segment, which generated great traction in
the market. Another success was the summer tourist season where
Tele2 had highly competitive offers, both for tourist SIMs and visitor
roaming.
In the end of 2014, Tele2 secured 15 MHz of additional spectrum
in the 1800 MHz band in order to continue to improve the network
quality.
Increased prices due to frequency fees
During 2014 the regulatory environment became more uncertain as
the local government unexpectedly announced the increase of radio
frequency fees in the country by three times by December 2014. As
a proactive measure Tele2 Croatia increased its prices from July 1 for
all its customers to cover the increased cost for frequencies.
Challenges to address in 2015
Tele2 Croatia will continue to have a good balance between cus-
tomer intake and improving profitability. The good momentum in
postpaid residential sales is expected to continue and the company
will further develop the business customer segment.
Continuous improvement of Tele2 voice and data network quality
is an imperative, as well as the overall customer experience. How-
ever, to do so the company emphasizes the need for regulatory and
legislative stability in Croatia.
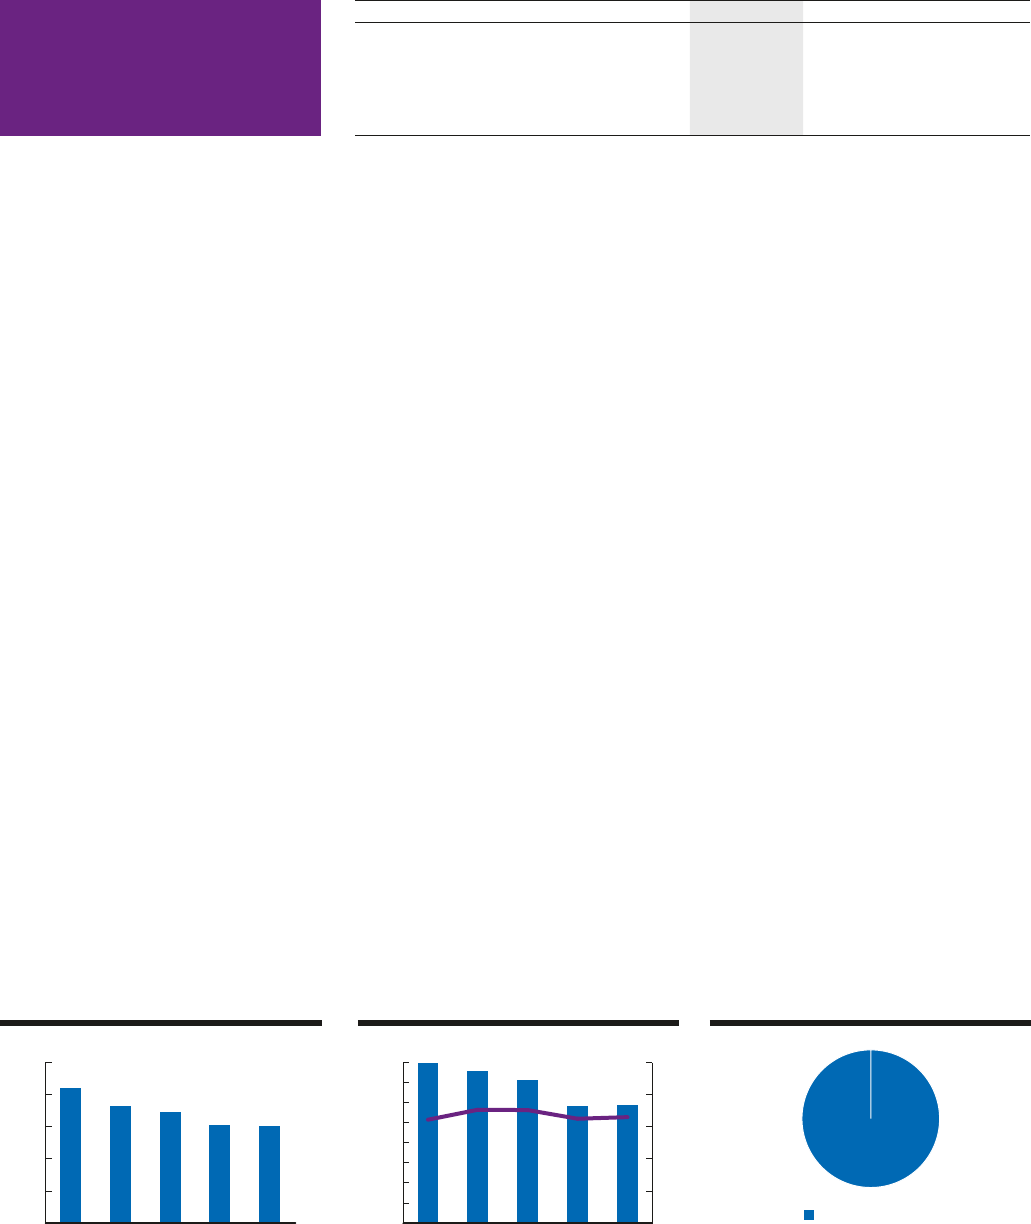
Net sales
0
300
600
900
1,200
1,500
20142013201220112010
SEK million
EBITDA & EBITDA margin
-100
0
100
200
20142013201220112010
-10
0
10
20
SEK million Percent
SEK million 2014 2013 Growth1)
Number of customers (in thousands) 823 793 4%
Net sales 1,390 1,397 –5%
of which mobile end-user service revenue 803 749 3%
EBITDA 169 95 71%
EBIT2) 87 –6
1) less exchange rate fluctuations
2) excluding one-off items (Note 6)
Net sales per service
Mobile SEK , million
Croatia
Tele2 – Annual Report 2014 15
Administration report
2014 in brief
In 2014 the mobile market was increasingly competitive in the Lith-
uanian market. However Tele2 Lithuania managed to maintain a
stable operational performance. In the beginning of the year the
company successfully upgraded its mobile network and the upgrade
enabled Tele2 Lithuania to provide all network services including
2G, 3G and 4G. Throughout the year the company has focused on
the 4G rollout and successfully achieved the plan to cover 47 per-
cent of the population by year end 2014.
Market leading
In 2014, Tele2 Lithuania reported the highest mobile revenue among
all three operators in the country and in Q3 2014 the company’s
mobile revenue market share was at an all-time high at 40 percent.
Challenges to address in 2015
The key priority for Tele2 Lithuania in 2015 is to continue with the
LTE rollout to achieve the target to cover 90 percent of the popula-
tion by the end of the year.
The company will also continue to aggressively grow its market
share in the business segment.
Net sales
0
300
600
900
1,200
1,500
20142013201220112010
SEK million
EBITDA & EBITDA margin
0
100
200
300
400
500
600
20142013201220112010
0
10
20
30
40
50
SEK million Percent
Net sales per service
Mobile SEK , million
SEK million 2014 2013 Growth1)
Number of customers (in thousands) 1,810 1,851 –2%
Net sales 1,364 1,280 1%
of which mobile end-user service revenue 847 843 –5%
EBITDA 506 461 5%
EBIT 430 342
1) less exchange rate fluctuations
Lithuania
16 Tele2 – Annual Report 2014
Administration report
2014 in brief
The mobile market was characterized by price competition, how-
ever Tele2 Latvia was able to keep a robust revenue profile and sta-
ble operational development. This was achieved through successful
customer base management, upselling and data revenue growth.
Successful efforts
In the beginning of 2014, Tele2 Latvia launched several new initia-
tives in the customer service area and deployed market leading bill-
ing and customer care solutions. Furthermore, Tele2 Latvia finalized
its network swap and commercially introduced LTE technology to its
mobile broadband services, combined with a new price plan port-
folio. The company also achieved a significant gain in reputation
and trust as a result of ongoing attention to service excellence and
performance.
During the second half of 2014, Tele2 Latvia also launched roaming
data buckets for EU countries, making it more convenient for cus-
tomers to use mobile data abroad. Also new data tariff plans for
domestic use was introduced during the year.
Challenges to address in 2015
The key focus in 2015 is the aggressive LTE rollout as the LTE 800
MHz license allows the company to deploy LTE 800 network rollout
from mid–2015. The target is to cover 90 percent of the population
by year end 2015.
Tele2 Latvia will also continue to strengthen its market position
through focus on revenue growth, customer satisfaction and inno-
vation.
Net sales
0
300
600
900
1,200
1,500
20142013201220112010
SEK million
EBITDA & EBITDA margin
0
50
100
150
200
250
300
350
400
20142013201220112010
0
10
20
30
40
50
SEK million Percent
SEK million 2014 2013 Growth1)
Number of customers (in thousands) 975 1,031 –5%
Net sales 907 915 –6%
of which mobile end-user service revenue 551 533 –2%
EBITDA 294 292 –4%
EBIT 187 188
1) less exchange rate fluctuations
Net sales per service
Mobile SEK million
Latvia
Tele2 – Annual Report 2014 17
Administration report
2014 in brief
2014 was characterized by high competitive pressure on the Estonia
mobile market and especially through telemarketing initiatives.
However, Tele2 Estonia has, under these circumstances, managed
to obtain a satisfactory financial performance throughout 2014 and
achieved a record high Customer Satisfaction score.
Modernisation
In the beginning of 2014 Tele2 Estonia secured two mobile licenses
in the 800 MHz and 2100 MHz frequency bands. The company also
completed a network modernization through a network swap of old
equipment in order to provide the best voice and data service qual-
ity. The upgrade enabled Tele2 Estonia to provide all network ser-
vices including 2G, 3G and 4G to its customers.
In the second half of 2014, Tele2 Estonia introduced data centric
bundled subscriptions with unlimited voice and SMS, to stimulate
further growth of data usage.
In 2014, the EBITDA for mobile in Estonia was positively impacted
by SEK 20 million as a result of the sales of a mobile license in the
2600 MHz frequency band.
Challenges to address in 2015
The key priorities for Tele2 Estonia in 2015 is to continue with the
LTE rollout, monetize increasing data usage and focus on selling
more carrier services with the infrastructure the company has after
the acquisition of Televõrgu.
SEK million 2014 2013 Growth1)
Number of customers (in thousands) 491 507 –3%
Net sales 634 674 –11%
of which mobile end-user service revenue 382 391 –7%
EBITDA 173 161 2%
EBIT 55 55
1) less exchange rate fluctuations
Estonia
Net sales
0
200
400
600
800
1,000
20142013201220112010
SEK million
EBITDA & EBITDA margin
0
100
200
300
400
20142013201220112010
0
10
20
30
40
50
SEK million Percent
Net sales per service
Mobile SEK million
Fixed telephony SEK million
Other operations SEK million
18 Tele2 – Annual Report 2014
Administration report
2014 in brief
Tele2 Austria’s result were impacted by effective marketing activi-
ties, a steady performance within the business segment and a good
contribution from the wholesale data business.
During the year, Tele2 Austria had its strategic focus on growth
and innovation in the business and residential segments, building
on existing areas of operational excellence. Tele2 Austria also con-
centrated its efforts on retaining high value customers across all
segments. The level of customer satisfaction was as a result very
high.
Challenges to address in 2015
In 2015, Tele2 Austria’s growth focus will concentrate on the launch
of mobile B2B services based on an MVNO setup. With the high-
speed broadband and TV products launched in 2014, the residential
segment will continue the focus on retention and selective growth.
Net sales
0
500
1,000
1,500
2,000
20142013201220112010
SEK million
EBITDA & EBITDA margin
0
100
200
300
400
20142013201220112010
0
10
20
30
40
50
SEK million Percent
Net sales per service
Fixed broadband SEK million
Fixed telephony SEK million
Other operations SEK million
SEK million 2014 2013 Growth1)
Number of customers (in thousands) 256 285 –10%
Net sales 1,209 1,244 –8%
EBITDA 231 308 –28%
EBIT 94 183
1) less exchange rate fluctuations
Austria
Tele2 – Annual Report 2014 19
Administration report
2014 in brief
During 2014 Tele2 Germany saw positive effects of its transforma-
tion from a fixed operator to a fixed and mobile service provider.
Despite the tough competition on the market, Tele2 Germany kept its
good balance between profitability and growth within the mobile
segment, supported by a solid performance in the fixed and broad-
band segments.
Going mobile
The mobile segment had a steady accelerated growth during the
year. The results reflect partly the improved sales channels setup
during Q2 2014 and partly the transformation to a fixed and mobile
provider. Within fixed services both the fixed telephony (CPS: Carrier
Pre-Selection and OCBC: Open Call-by-Call) and the fixed broad-
band followed the general declining market trend. However the
segments generated cash contributions above plan and provided a
source for cross-sale to mobile services - both regular mobile ser-
vices and higher ARPU fixed-via mobile services.
Challenges to address in 2015
In the fixed business, Tele2 Germany will aim to defend its position
in CPS and OCBC and continue to maximize profits from those
declining segments.
SEK million 2014 2013 Growth1)
Number of customers (in thousands) 709 713 –1%
Net sales 916 867 0%
of which mobile end-user service revenue 439 316 32%
EBITDA 131 138 –9%
EBIT 78 99
1) less exchange rate fluctuations
Germany
Net sales
0
500
1,000
1,500
2,000
2,500
20142013201220112010
SEK million
EBITDA & EBITDA margin
0
100
200
300
400
500
20142013201220112010
0
10
20
30
40
50
SEK million Percent
Net sales per service
Mobile SEK million
Fixed broadband SEK million
Fixed telephony SEK million
20 Tele2 – Annual Report 2014
Administration report

Acquisitions and divestments
On February 5, 2015 the Norwegian competition authorities
announced that they have approved Tele2’s divestment of its Nor-
wegian operations to TeliaSonera announced in July 2014. The Nor-
wegian operation was sold for SEK 4.8 billion and resulted in a capi-
tal gain in 2015 of SEK 1.7 billion, including costs for central support
system for the Norwegian operation and other transaction costs. The
capital gain include a positive effect of SEK 143 million related to
exchange rate differences previously reported in other comprehen-
sive income which will be recycled over the income statement but
with no effect on total equity. The divested operations have been
reported separately under discontinued operations in the income
statement, with a retrospective effect on previous periods, and as
assets held for sale in the balance sheet on December 31, 2014. Fur-
ther information can be found in Note 36.
On October 23, 2013 Tele2 announced the sale of its Swedish res-
idential cable and fiber operations to Telenor for SEK 793 million.
The sale was completed on January 2, 2014 after approval by regu-
latory authorities and the capital gain in 2014 amounted to SEK 258
million. Further information can be found in Note 16.
No material operations were acquired during 2014.
Events after the end of the financial year
The sale of the Norwegian operation was completed in February
2015 after approval by regulatory authorities. Further information
can be found in Note 36. As a result of the transaction, the Board of
Tele2 has decided to recommend an extraordinary dividend pay-
ment of SEK 10.00 per ordinary A and B shares to the Annual Gen-
eral Meeting in May 2015, in addition to the proposed dividend pay-
ment of SEK 4.85 per ordinary A and B shares.
In February 2015, Tele2 delivered 26,032 B shares in own cus-
tody as a result of share rights in the incentive program LTI 2011
being exercised.
Risks and uncertainty factors
At Tele2, we believe that every risk also presents an opportunity.
Tele2 works proactively to identify and monitor the most important
risks through an enterprise risk management process for the pur-
pose of minimizing surprises, improved decision making, reduced
losses and increased reward.
Strategic risks
Risks and uncertainties which could threaten Tele2’s ability to
achieve its strategic objectives are assessed by the senior executives
as well as the Board of Directors. Summaries of some of these risks
are presented below.
Availability of frequencies and telecom licences
Tele2’s ability to retain customers may be hampered by not obtain-
ing required licences or frequencies, at all or, at a reasonable price.
Hence, Tele2 has put in place processes to ensure compliance with
licence requirements, increase changes for renewal and extension
of existing licences and for obtaining adjacent and new licences.
Tele2 also works in close contact with regulators and industry asso-
ciations to become aware of upcoming licence distributions or redis-
tributions but the outcome of such distributions is coupled with
uncertainty.
Integration of new business models
Tele2’s business environment is experiencing continuous changes
which may affect our position in the market. These include new
forms of connectivity (e.g. VoIP and SoftSIM), new market segments
(e.g. machine-to-machine) and changed customer behaviour (such
as revenue migration from voice to data). Tele2’s senior executives
closely monitors technological advances and market changes to
adapt its strategies to be able to benefit from their possibilities.
Changes in regulatory legislation
Changes in legislation, regulations and decisions from authorities
for telecommunications services can have a considerable effect on
Tele2’s business operations and the competitive situation in its
operating markets. Price regulation, in the area of access and inter-
connect, have great impact on Tele2, and could also result in a risk
for disputes with other operators. Access regulation, which ensures
access to incumbents copper and fibre networks, must ensure and
protect a well-balanced competition in each market. Tele2 works
actively with telecom regulators and industry associations, in order
to promote sufficient regulation which supports fair competition in
its operating markets.
Data privacy
Another area where European regulation is increasing is data pri-
vacy where breaches of customer’s personal information could
potentially result in major fines and significant reputational damage.
Tele2 works actively to be able to comply with any such require-
ment and continuously works to strengthen its procedures to ensure
that our customer’s personal data is secured and protected.
Dependency on suppliers and business partners
Tele2 is dependent on handset manufacturers such as for example
Apple and Samsung for attracting customers. Tele2 is also depen-
dent on equipment and network suppliers for rolling out networks
and be able to offer good quality access services. In Sweden and the
Netherlands, Tele2 has reached agreements with other telecom
operators to build and operate common network infrastructures. In
some other countries, Tele2 depends on agreements with other net-
work operators to provide mobile services. Any of these third party
agreements impose risks, be it in the form of delays in roll-out, limi-
tations for customised development or limitations on operating prof-
itability. Tele2 continuously evaluates existing agreements and the
form of its co-operations in dialogue with its partners.
Operation in Kazakhstan
The political, economic, regulatory and legal environment as well as
the tax system in Kazakhstan is still developing and is less predict-
able than in countries with more mature institutional structures.
This also applies to prevailing corporate governance codes, busi-
ness practices and the reporting and disclosure standards. The mar-
ket and the operations in Kazakhstan therefore represent a different
risk from those associated with investments in other countries and
can affect Tele2’s abilities to operate and develop its operation in
this market. Tele2 continuously monitors the development in this
market and has contact with relevant authorities. Tele2 also contin-
uously monitors its internal operation in Kazakhstan through inter-
nal audits and other central oversight functions.
Geopolitical risks
Depending on how the situation evolves the changed geopolitical
situation following the Crimea crisis could potentially affect some of
Tele2’s operations, particularly in the countries bordering Russia.
Tele2 – Annual Report 2014 21
Administration report

Tele2 is therefore closely monitoring the development and world
events and is kept informed by local management, government offi-
cials and independent sources.
Financial Risk Management
Through its operations, the Tele2 Group is exposed to various finan-
cial risks such as currency risk, interest risk, liquidity risk and credit
risk. Financial risk management is mainly centralized to the Group
treasury function. The aim is to control and minimize the Group’s
financial risks as well as financial costs, and optimize the relation
between risk and cost. Further information on financial risk man-
agement can be found in Note 2.
Employees
On December 31, 2014, the number of employees in Tele2 was 5,387
(4,945) excluding Norway. Please refer to Note 33 and Note 34 for
additional information regarding Number of employees, split per
gender and age groups, and Personnel costs.
Tele2 is a growth-oriented organization. The aim of Tele2’s
human resources management is to prepare and grow our employ-
ees in order to meet the requirements and future needs of the busi-
ness. Tele2’s employees should be highly engaged and motivated
and experience a great sense of pride and identification with the
corporate values of the company and its overall strategy. To attract
and retain the right people is vital to our growth strategy; being
considered a great place to work is a prioritised goal for Tele2 in the
area of people management.
Focus areas
Our main focus areas are stated below.
Leadership and Tele2 Way
Exemplary leadership behaviours are primarily based on the corpo-
rate values, the Tele2 Way. Managers are meant to be the culture
role models that lead by example and truly “walk the talk”. The
Tele2 Way, along with the Code of Conduct, provides a framework
and guides employees in their professional behaviour and decision
making every day. All managers are trained in the Tele2 Way;
which includes refreshment courses every second year.
Performance and Talent management
Tele2 has a common performance management process for the
whole Group, which provides a consistent way of setting goals and
assessing performance. It also serves as a foundation to deal with
talent management. All employees are assessed in two dimensions:
what and how, i.e. goal completion as well as professional behav-
iour based on Tele2’s corporate values, the Tele2 Way.
When it comes to managing talent, Tele2 strongly supports and
encourages internal promotions, both horizontal and vertical. A
greater emphasis has been put on diversity, the aim being that the
percentage of female managers and leaders reflects the percentage
of female employees within the company.
The mapping of top performers, top talents and key roles are con-
ducted every year via the Talking Talent sessions. The purpose of the
talent management process is to ensure long-term succession to man-
agerial and key roles, develop the company’s existing workforce and
minimise business risk if key position holders leave the company.
Tele2 use Tele2 People, an online tool for managing performance
and talent. The tool provides our managers and the organisation
with more accurate and reliable data and serves as base for sound
decision making.
Learning and Development
Tele2 has a common framework for learning and development
based on 70:20:10 principles. According to these principles 70 per-
cent of learning comes from experience, such as learning by doing,
job rotation, participation in cross-functional projects and challeng-
ing work tasks; 20 percent comes from learning from relationships,
such as mentoring, coaching and networking; and 10 percent comes
from official training programs such as academic courses, e-learn-
ing, books/periodicals and media.
Reward and Recognition
Tele2 offers competitive compensation and benefit packages in
order to attract, retain and motivate employees. Tele2’s packages are
determined by the local market and Tele2 participates in local sal-
ary surveys annually to ensure that its offerings remain competitive
in terms of base salary, short-term incentives, long-term incentives
and benefits. The company believes in pay for performance; high-
performing individuals should be rewarded well.
Engagement
Every year, Tele2 conducts an employee survey called ‘My Voice’.
The survey measures:
• Managers´ leadership capabilities by means of the Leadership
Index (LSI);
• Employee engagement;
• Tele2’s internal attractiveness as an employer by means of the Net
Promoter Score (NPS);
• Tele2 Way Index (TWI), assessing how well we live our corporate
values.
A total of 93 percent of all employees participated in the 2014 sur-
vey. My Voice showed that a total of 47 (43) percent of Tele2’s
employees are fully engaged with high energy and high clarity, a
result which is significantly higher compared to 37 percent for the
benchmarked companies. One reason for such good result is that all
managers and organizational units each year identify engagement-
related goals to work with. Tele2 is very proud of its results and will
continue focusing on engagement as engaged employees perform
well, walk the extra mile and are personally motivated to make
Tele2 an even better place to work.
Employer branding
Tele2 has a common global employer branding standard which con-
sists of employer brand offer, guidance for implementation, career
web page, employer branding movie, image library as well as
LinkedIn account. The implementation of the concept is localized,
i.e. each country defines which channels and activities to use based
on local needs and requirements.
Corporate responsibility (CR)
Tele2’s strategic CR-efforts are focused on potential risks and areas
where the Group can contribute positively. Tele2’s CR strategy
defines the areas where added value can be created, the areas that
requires compliance and identifies aspects that do not have material
impact for the operations. Being explicit internally and externally
about the priorities fit in with being the responsible challenger.
Thereby resources are dedicated to the areas where they are best
utilized, something that works well from the Board to employees.
Tele2’s prioritized focus areas are privacy and integrity, child pro-
tection and greenhouse gases.
Issues related to privacy and integrity have continued to dominate
this years’ work. Tele2 deals with questions on data protection and
22 Tele2 – Annual Report 2014
Administration report

authorities’ requests for lawful interception in all countries of opera-
tion on a regular basis. This requires continuous monitoring of law
amendments and to confirm that there are always legal basis for
interception, through for example court decisions. Situations when
local laws diverge from the principles in the company’s Code of Con-
duct need careful considerations to ensure Tele2 does not compro-
mise with integrity and judgment. One example is in April 2014,
when Tele2 Sweden ceased the storage of data in accordance with
the Swedish law on electronic communication (LEK). The company
deemed that there was no legal grounds after the law had been
invalidated by the EC Court of Justice. The Court’s judgment claimed
that the law was in conflict with international proclaimed human
rights. After the Swedish Post and Telecom Authority (PTS) filed an
injunction against Tele2 Sweden in June, to resume storage of data
in accordance with LEK, the company complied. As an operator
Tele2 Sweden is obliged to comply with the regulatory authority’s
injunction, which is in accordance with the associated UN guiding
principles.
These issues will continue to require evaluation, analysis and
active standpoints in all countries where Tele2 operates. Tele2 is
committed to being transparent and to challenge. Since more than
two years, Tele2 has a clear process to assess requests for shut
downs of for instance networks.
Review of the Board
The CR advisory group (CRAG) is composed of Board members Mia
Brunell Livfors, Lars Berg and Carla Smits-Nusteling, who succeeded
John Shakeshaft after the annual general meeting. Participating
from Leadership team is CEO Mats Granryd, and Caroline Fellenius-
Omnell, General Counsel. In addition, Tele2’s Head of CR is part of
the group. In the four ordinary CRAG meetings during the year, the
discussions involved anti-corruption, human rights due diligences,
regulatory compliance, development of stakeholder dialogues as
well as privacy and data protection. An extra CRAG meeting also
took place, to which the entire board was invited.
CRAG works close to the board’s audit committee, chaired by
Carla Smits-Nusteling, in matters related to data and integrity. Dur-
ing the year, Tele2 conducted internal audits of compliance with the
data protection regulation in five of Tele2’s markets.
The work to integrate CR in all the company’s processes, gover-
nance and control measures has continued. Tele2’s long-term
objective is for the CR dimension to be taken into account in all deci-
sions, this is a priority and Tele2 deems the progress as positive.
The responsible challenger
In 2013, Tele2 arranged Sweden’s first CR Capital Market Day. Dur-
ing late spring in 2014, a number of stakeholders participated in
dialogue on highly relevant subjects with managers, Board mem-
bers as well as members of Tele2’s Leadership team, at the Tele2
premises in Kista, Sweden. Themes included how the machine-to-
machine (M2M/IoT) technique contribute to climate benefits, hand-
ling of requests for lawful interception, child protection measures,
anti-corruption and Tele2’s Code of Conduct for Business Partners.
Tele2 has a zero-tolerance stance against corruption and has
internal control measures to detect deviations. An intense focus on
anti-corruption combined with effective control routines have
shown positive results, with rare corruption incidents. During the
year, one of Tele2’s largest shareholders, Nordea, visited the opera-
tions in Almaty, Kazakhstan, among other things to observe the
anti-corruption work on site. Tele2 values engaged investors and
stakeholders, and site visits are an important measure of transpar-
ency in Tele2’s CR work. Additional visits to the operations for inves-
tors are planned during first half of 2015.
No picnic, just hard work
It is Tele2’s responsibility to always be up to date within relevant CR
matters. During 2014, Tele2’s Code of Conduct has been amended to
include the Grandfather principle and the Four eyes principle to fur-
ther limit the risk of for example conflicts of interest in contract
agreements.
In April 2014, Tele2 received top ranking for the work with child
protection in a study conducted by Boston Consulting Group on
behalf of Global Child Forum. In a population of one thousand com-
panies, Tele2 was among the fourteen to receive full score in the
assessment. This is a welcomed testimony on Tele2’s work. The
Tele2 Group continues to comply with the objectives on blocking
Child Sexual Abuse Images (CSAI) for customers and employees, and
works systematically to detect such material internally.
Telecom operators have a relatively limited direct environmental
impact. Tele2 can however be an enabler of environmental gains for
customers through, among other things, machine-to-machine. This
is a growth area that has received several new partnerships and
customers during the year. One of the environmental benefits with
M2M/IoT is that customers can automate, standardize and install
their procedures and systems remotely which reduce energy con-
sumption and physical travel.
Compliance with tax law is another area highlighted by NGO’s
and investors during the year. Tele2 comply with local tax laws and
the OECD’s Guidelines for Multinational Enterprises, as well as
Tele2’s Code of Conduct.
Do you want to challenge us?
GRI G4 Indicators, presented in Note 38, are the ones assessed to be
most relevant for Tele2’s stakeholders and are based on reporting
from each reporting entity. The reported G4 Indicators are Diversity
& equal opportunities, Environmental regulations, Corruption, Anti-
competitive behaviour, anti-trust & monopoly practices, Laws &
regulations, Products & services health & safety impacts, Marketing
communication, advertising & sponsorship, Customer privacy &
losses of customer data and Use of products & services. For addi-
tional information please refer to Note 38.
Tele2 will continue to include CR results and key performance
indicators in the annual report as the information, criteria and reli-
ability is evolving and maturing to par with financial data and infor-
mation. For additional reporting and information about Tele2’s CR
work, see the corporate website for the 2014 GRI-index, in accor-
dance with G4 from Global Reporting Initiative.
Work of the board of directors
The Board of Directors is appointed by the Annual General Meeting
for terms extending until the next Annual General Meeting. At the
Annual General Meeting in May 2014, Irina Hemmers and Lorenzo
Grabau were appointed as new Board members, John Hepburn and
John Shakeshaft left the Board, while the other Board members
were re-elected. In addition, Mike Parton was re-elected as Chair-
man of the Board of Directors.
The Board is responsible for the company’s organization and
management, and is composed in such a way as to enable it to effec-
tively support and manage the work of the company’s senior execu-
tives. The Board makes decisions on overall strategies, organiza-
tional matters, acquisitions, divestments, corporate transactions,
major investments, and establishes the framework of Tele2’s opera-
tions by defining the company’s financial goals and guidelines. In
2014, the Board convened 6 times at different locations in Europe. In
addition, 8 per capsulam meetings and 13 telephone conference
meetings were held.
Tele2 – Annual Report 2014 23
Administration report

In order to carry out its work more effectively, the Board has
appointed members for a Remuneration Committee and an Audit
Committee with special tasks. These committees are the Board’s
preparatory bodies and do not reduce the Board’s overall and joint
responsibility for the handling of the company and the decisions
made. Furthermore, where needed, the Board appoints members to
form preparatory working groups on topics of special interest, such
as questions regarding dividends and capital structure and the
Corporate Responsibility Advisory Group for questions regarding
corporate responsibility related risks and opportunities.
The Remuneration Committee’s main work includes presenting
recommendations to the Board regarding remuneration and terms of
employment for CEO and other senior executives. The recommenda-
tions, including recommendations for long-term incentive pro-
grammes are submitted by the Board to the AGM for adoption.
The Audit Committee has the primary task of assisting the Board
in its supervision and review of the internal and external audit pro-
cesses, and reviewing and ensuring the quality of the company’s
external financial reporting. Furthermore, the Audit Committee
supervises the internal control functions of the company.
Additional information is stated in Tele2’s separate Corporate
Governance Report available on Tele2’s website www.tele2.com.
Remuneration to the Board is stated in Note 34.
Proposal of remuneration guidelines
for senior executives
The Board proposes the following guidelines for determining remu-
neration for senior executives for 2015, to be approved by the
Annual General Meeting in May 2015.
The objectives of Tele2’s remuneration guidelines are to offer
competitive remuneration packages to attract, motivate, and retain
key employees within the context of an international peer group.
The aim is to create incentives for the management to execute stra-
tegic plans and deliver excellent operating results, and to align
management’s incentives with the interests of the shareholders.
Senior executives covered by the proposed guidelines include the
CEO and members of the Leadership Team (“senior executives”). At
present, Tele2 has ten senior executives.
Remuneration to the senior executives should comprise annual
base salary, and variable short-term incentive (STI) and long-term
incentive (LTI) programs. The STI shall be based on the performance
in relation to established objectives. The objectives shall be related
to the company’s overall result and the senior executives’ individual
performance. The STI can amount to a maximum of 100 percent of
the annual base salary.
Over time, it is the intention of the Board to increase the propor-
tion of variable performance-based compensation as a component
of the senior executives’ total compensation.
The Board is continually considering the need of imposing restric-
tions in the STI program regarding making payments, or a propor-
tion thereof, of such variable compensation conditional on whether
the performance on which it was based has proved to be sustain-
able over time, and/or allowing the company to reclaim components
of such variable compensation that have been paid on the basis of
information which later proves to be manifestly misstated.
Other benefits may include e.g. company cars and for expatriated
senior executives e.g. housing benefits for a limited period of time.
The senior executives may also be offered health care insurances.
The senior executives are offered defined contribution pension
plans. Pension premiums for the CEO can amount to a maximum of
25 percent of the annual salary (base salary and STI). For the other
senior executives pension premiums can amount to a maximum of
20 percent of the annual salary (base salary and STI).
The maximum period of notice of termination of employment shall
be 12 months in the event of termination by the CEO and six months
in the event of termination by any of the other senior executives. In
the event of termination by the company, the maximum notice
period during which compensation is payable is 18 months for the
CEO and 12 months for any of the other senior executives.
Under special circumstances, the Board may deviate from the
above guidelines. In such a case, the Board is obligated to give
account of the reason for the deviation during the following Annual
General Meeting.
Board Members, elected at General Meetings, may in certain
cases receive a fee for services performed within their respective
areas of expertise, outside of their Board duties. Compensation for
these services shall be paid at market terms and be approved by the
Board of Directors.
There are no deviations during 2014 compared with the remuner-
ation guidelines for senior executives approved by the Annual
General Meeting in May 2013 and May 2014.
The guidelines for 2014 as proposed by the Board and approved
by the Annual General Meeting in May 2014 are stated in Note 34
Personnel costs.
Parent company
Tele2 AB’s shares are listed on the NASDAQ Stockholm Large Cap list
under the ticker symbols TEL2 A and TEL2 B. Tele2’s fifteen largest
shareholders on December 31, 2014 hold shares corresponding to
53 percent of the capital and 64 percent of the voting rights, of
which Investment AB Kinnevik owns 30 percent of the capital and
48 percent of the voting rights. No other shareholder owns, directly
or indirectly, more than 10 percent of the shares in Tele2.
The Board of Directors received authorization from the Annual
General Meeting in May 2014 to purchase up to 10 percent of the
shares in the company, which the Board has not made use of.
For further information on the number of shares and their condi-
tions and important agreements which cease to apply if control over
the company is changed, see Note 25 Equity, numbers of shares and
earnings per share.
The parent company performs Group functions and conducts cer-
tain Group wide development projects. In 2014, the parent company
paid to its shareholders an ordinary dividend of SEK 4.40 per share
for 2013 corresponded to a total of SEK 1,960 million.
Proposed appropriation of profit
The Board propose that, from the SEK 12,076,636,623 at the dis-
posal of the Annual General Meeting, an ordinary dividend of SEK
4.85 per share and an extraordinary dividend of SEK 10.00 per
share should be paid to shareholders, corresponding on December
31, 2014 to SEK 2,161,756,419 and SEK 4,457,229,730 respectively,
resulting in a total dividend of SEK 6,618,986,149, and that the
remaining amount, SEK 5,457,650,474, should be carried forward.
Based on this annual report, the consolidated financial statements
and other information which has become known, the Board has
considered all aspects of the parent company’s and the Group’s
financial position. This evaluation has led the Board to the conclu-
sion that the dividend is justifiable in view of the requirements that
the nature and scope of and risks involved in Tele2’s operations have
on the size of the company’s and the Group’s equity as well as on its
consolidation needs, liquidity and financial position in general.
24 Tele2 – Annual Report 2014
Administration report

Consolidated income statement
SEK million Note 2014 2013
CONTINUING OPERATIONS
Net sales 4, 5 25,955 25,757
Cost of services sold 6 –15,054 –15,441
Gross profit 10,901 10,316
Selling expenses 6 –5,298 –5,541
Administrative expenses 6 –2,518 –2,321
Result from shares in joint ventures and associated companies 7 –14 –17
Other operating income 8 647 206
Other operating expenses 9 –228 –95
Operating profit 4, 6 3,490 2,548
Interest income 10 18 49
Interest costs 11 –396 –417
Other financial items 12 388 –183
Profit after financial items 3,500 1,997
Income tax 13 –874 –1,029
NET PROFIT FROM CONTINUING OPERATIONS 2,626 968
DISCONTINUED OPERATIONS
Net profit/loss from discontinued operations 36 –415 13,622
NET PROFIT 42,211 14,590
ATTRIBUTABLE TO
Equity holders of the parent company 2,211 14,590
Earnings per share, SEK 25 4.96 32.77
Earnings per share, after dilution, SEK 25 4.93 32.55
FROM CONTINUING OPERATIONS
ATTRIBUTABLE TO
Equity holders of the parent company 2,626 968
Earnings per share, SEK 5.89 2.17
Earnings per share, after dilution, SEK 5.86 2.15
Tele2 – Annual Report 2014 25
Financial statements

Consolidated comprehensive income
SEK million Note 2014 2013
NET PROFIT 2,211 14,590
OTHER COMPREHENSIVE INCOME
COMPONENTS NOT TO BE RECLASSIFIED TO NET PROFIT
Pensions, actuarial gains/losses 34 –82 203
Pensions, actuarial gains/losses, tax effect 13 18 –45
Total components not to be reclassified to net profit –64 158
COMPONENTS THAT MAY BE RECLASSIFIED TO NET PROFIT
Exchange rate differences
Translation differences in foreign operations 1,137 272
Tax effect on above 13 –179 –20
Reversed cumulative translation differences from divested companies 16 –3 1,719
Translation differences 955 1,971
Hedge of net investments in foreign operations 4 –6
Tax effect on above 13 –1 2
Reversed cumulative hedge from divested companies 16 – –3
Hedge of net investments 3 –7
Total exchange rate differences 958 1,964
Cash flow hedges
Gain/loss arising on changes in fair value of hedging instruments 2, 9 –172 33
Reclassified cumulative loss to income statement 2 61 49
Tax effect on cash flow hedges 13 25 –18
Total cash flow hedges –86 64
Total components that may be reclassified to net profit 872 2,028
TOTAL OTHER COMPREHENSIVE INCOME FOR THE YEAR, NET OF TAX 808 2,186
TOTAL COMPREHENSIVE INCOME FOR THE YEAR 3,019 16,776
ATTRIBUTABLE TO
Equity holders of the parent company 3,019 16,776
26 Tele2 – Annual Report 2014
Financial statements

SEK million Note Dec 31, 2014 Dec 31, 2013
ASSETS
NONCURRENT ASSETS
Intangible assets
Goodwill 14 9,503 9,537
Other intangible assets 14 4,913 5,183
Total intangible assets 14,416 14,720
Tangible assets
Machinery and technical plant 15 8,442 9,079
Other tangible assets 15 2,696 2,668
Total tangible assets 11,138 11,747
Financial assets
Shares in joint ventures and associated companies 17 13 28
Other financial assets 18 518 337
Total financial assets 531 365
Deferred tax assets 13 2,062 2,753
TOTAL NONCURRENT ASSETS 28,147 29,585
CURRENT ASSETS
Inventories 19 500 471
Current receivables
Accounts receivable 20 2,480 3,317
Current tax receivables 25 127
Other current receivables 21 422 321
Prepaid expenses and accrued income 22 4,252 4,183
Total current receivables 7,179 7,948
Current investments 23 38 55
Cash and cash equivalents 24, 32 151 1,348
TOTAL CURRENT ASSETS 7,868 9,822
ASSETS CLASSIFIED AS HELD FOR SALE 16, 36 3,833 448
TOTAL ASSETS 439,848 39,855
Consolidated balance sheet
Tele2 – Annual Report 2014 27
Financial statements

SEK million Note Dec 31, 2014 Dec 31, 2013
EQUITY AND LIABILITIES
EQUITY
Attributable to equity holders of the parent company
Share capital 25 561 561
Other paid-in capital 4,985 4,985
Reserves 1,413 541
Retained earnings 15,721 15,502
Total attributable to equity holders of the parent company 22,680 21,589
Non-controlling interest 25 2 2
TOTAL EQUITY 22,682 21,591
NONCURRENT LIABILITIES
Interest-bearing
Liabilities to financial institutions and similar liabilities 26 4,263 5,302
Provisions 27 760 584
Other interest-bearing liabilities 26 330 396
Total interest-bearing liabilities 5,353 6,282
Non-interest-bearing
Deferred tax liability 13 358 441
Total non-interest-bearing liabilities 358 441
TOTAL NONCURRENT LIABILITIES 5,711 6,723
CURRENT LIABILITIES
Interest-bearing
Liabilities to financial institutions and similar liabilities 26 2,495 1,535
Provisions 27 47 95
Other interest-bearing liabilities 26 1,295 1,518
Total interest-bearing liabilities 3,837 3,148
Non-interest-bearing
Accounts payable 26 2,848 3,140
Current tax liabilities 291 80
Other current liabilities 26 467 516
Accrued expenses and deferred income 28 3,263 4,604
Total non-interest-bearing liabilities 6,869 8,340
TOTAL CURRENT LIABILITIES 10,706 11, 4 88
LIABILITIES DIRECTLY ASSOCIATED WITH ASSETS
CLASSIFIED AS HELD FOR SALE 16, 36 749 53
TOTAL EQUITY AND LIABILITIES 439,848 39,855
Continued Consolidated balance sheet
28 Tele2 – Annual Report 2014
Financial statements

SEK million Note 2014 2013
OPERATING ACTIVITIES
Cash flow from operations before changes in working capital
Operating profit from continuing operations 3,490 2,548
Operating profit from discontinued operations –388 13,791
Operating profit 3,102 16,339
Adjustments for non-cash items in operating profit
Depreciation and amortization 6 3,097 3,545
Impairment 6 25 536
Result from shares in joint ventures and associated companies 7 15 17
Gain/loss on sale of fixed assets and operations 8-9 –257 –13,253
Incentive program 29 14
Interest received 26 55
Interest paid –306 –429
Finance items paid 34 –82
Dividend received – 1
Taxes paid 13 –327 –479
Cash flow from operations before changes in working capital 32 5,438 6,264
Changes in working capital
Materials and supplies 19 –22 –17
Operating assets 261 152
Operating liabilities –1,099 –586
Changes in working capital 32 –860 –451
CASH FLOW FROM OPERATING ACTIVITIES 4,578 5,813
INVESTING ACTIVITIES
Acquisition of intangible assets 32 –726 –2,195
Sale of intangible assets 32 24 7
Acquisition of tangible assets 32 –3,476 –3,142
Sale of tangible assets 32 32 89
Acquisition of shares in group companies 16 6 –
Sale of shares in group companies 16 677 17,252
Acquisition of shares in associated companies 16 –4 –
Capital contribution to/repayment from associated companies 16 –5 –25
Dividend from associated companies 16 – 1
Other financial assets, lending –255 –
Other financial assets, received payments 20 7
Cash flow from investing activities –3,707 11,994
CASH FLOW AFTER INVESTING ACTIVITIES 871 17,807
FINANCING ACTIVITIES
Proceeds from credit institutions and similar liabilities 26 1,365 755
Repayment of loans from credit institutions and similar liabilities 26 –1,542 –3,165
Repayment of other interest-bearing lending 26 –23 –23
Dividends 25 –1,960 –3,163
Redemption of shares 25 – –12,474
Purchase of non-controlling interests 25 – –94
Cash flow from financing activities –2,160 –18,164
NET CHANGE IN CASH AND CASH EQUIVALENTS –1,289 –357
Cash and cash equivalents at beginning of the year 24 1,348 1,673
Exchange rate differences in cash and cash equivalents 24 92 32
CASH AND CASH EQUIVALENTS AT END OF THE YEAR 24, 32 151 1,348
For cash flow from discontinued operations, please refer to Note 36.
For additional cash flow information, please refer to Note 32.
Consolidated cash flow statement
(total operations)
Tele2 – Annual Report 2014 29
Financial statements

Change in consolidated equity
Attributable to equity holders of the parent company
SEK million Note Share
capital
Other
paid-in
capital
Hedge
reserve
Translation
reserve
Retained
earnings Total
Non-
controlling
interests Total equity
Equity at January 1, 2013 561 4,980 –414 –1,073 16,372 20,426 3 20,429
Net profit – – – – 14,590 14,590 – 14,590
Other comprehensive income for the year, net of tax – – 57 1,971 158 2,186 – 2,186
Total comprehensive income for the year – – 57 1,971 14,748 16,776 – 16,776
OTHER CHANGES IN EQUITY
Share-based payments 34 – – – – 14 14 – 14
Share-based payments, tax effect 34 – – – – 10 10 – 10
Sale of own shares 25 – 5 – – –5 – – –
Dividends 25 – – – – –3,163 –3,163 – –3,163
Redemption of shares 25 –280 – – – –12,194 –12,474 – –12,474
Bonus issue 25 280 – – – –280 – – –
Purchase of non-controlling interests 16 – – – – – – –1 –1
EQUITY AT DECEMBER 31, 2013 561 4,985 –357 898 15,502 21,589 2 21,591
Equity at January 1, 2014 561 4,985 –357 898 15,502 21,589 2 21,591
Net profit – – – – 2,211 2,211 – 2,211
Other comprehensive income for the year, net of tax – – –83 955 –64 808 – 808
Total comprehensive income for the year – – –83 955 2,147 3,019 – 3,019
OTHER CHANGES IN EQUITY
Share-based payments 34 – – – – 29 29 – 29
Share-based payments, tax effect 34 – – – – 3 3 – 3
Dividends 25 – – – – –1,960 –1,960 – –1,960
EQUITY AT DECEMBER 31, 2014 561 4,985 –440 1,853 15,721 22,680 2 22,682
30 Tele2 – Annual Report 2014
Financial statements

Notes to the consolidated
financial statements
NOTE 1 ACCOUNTING PRINCIPLES
AND OTHER INFORMATION
The consolidated financial statements are prepared in accordance with
International Financial Reporting Standards (IFRS) and interpretations
of the International Financial Reporting Interpretations Committee (IFRIC)
as endorsed by the EU at the date of publication of this annual report.
The Group also applies the Swedish Financial Reporting Board recom-
mendation RFR 1 Supplementary Accounting Rules for groups which
specifies additional disclosures required under the Swedish Annual
Accounts Act.
The financial reports are prepared on the basis of historical cost, apart
from financial instruments which are normally carried at amortized cost,
with the exception of other non-current securities and derivatives which
are carried at fair value.
Change in accounting principles
From 2014 the new standards, amendments and interpretations presented
below are applied.
New and amended IFRS standards and IFRIC interpretations
The new and amended IFRS standards and IFRIC interpretations (IFRS
10 Consolidated Financial Statements, IFRS 11 Joint Arrangements, IFRS
12 Disclosures of Interests in Other Entities, IAS 27 Separate Financial
Statements, IAS 28 Investments in Associates and Joint Ventures, IAS 32
Offsetting Financial Assets and Financial Liabilities, IAS 36 Recoverable
Amount Disclosures for Non-Financial Assets and IAS 39 Novation of
Derivatives and Continuation of Hedge Accounting ), which became effec-
tive January 1, 2014, have had no material effect on the consolidated
financial statements.
Already in 2013 Tele2 chose to in advance apply the amended IAS 36.
The introduction of IFRS 10 resulted in the definition of controlling
interest was changed, which had no effect for Tele2.
IFRS 11 covers the accounting for joint arrangements. The joint arrange-
ments that Tele2, under the previously effective standard, reported as
joint ventures according to the proportionate method are viewed as joint
operations according to the new standard. The introduction of IFRS 11
has therefore not had any material effects on the consolidated financial
statements.
New regulations
The following new and revised standards have been issued by the Inter-
national Accounting Standards Board (IASB) and endorsed by the EU:
• Amendments to IAS 19 Defined Benefit Plans: Employee Contribu-
tions and Improvements to IFRSs 2010-2012 and 2011-2013 (effec-
tive for annual periods beginning on or after July 1, 2014) and
• IFRIC 21 Levies (effective for annual periods beginning on or after
June 17, 2014).
IASB has also issued, which have not yet been endorsed by the EU:
• IFRS 14 Regulatory Deferral Accounts (effective for annual periods
beginning on or after January 1, 2016),
• Amendments to: IFRS 10 and IAS 28 Sale or Contribution of Assets
between an Investor and its Associate or Joint Venture, IFRS 10,
IFRS12 and IAS 28 Investment Entities: Applying the Consolidation
Exception, IFRS 11 Accounting for Acquisitions of Interests in Joint
Operations, IAS 1 Disclosure Intiative, IAS 16 and IAS 38 Clarifica-
tion of Acceptable Methods of Depreciation and Amortisation, IAS 16
and IAS 41 Bearer Plants, IAS 27 Equity Method in Separate
Financial Statements and Improvements to IFRSs 2012-2014 (effec-
tive for annual periods beginning on or after January 1, 2016),
• IFRS 15 Revenue from Contracts with Customers (effective for annual
periods beginning on or after January 1, 2017) and
• IFRS 9 Financial Instruments (effective for annual periods begin-
ning on January 1, 2018).
IFRS 15 replaces all previously published standards and interpretations
concerning revenue recognition and provides detailed guidance for
example for bundled offers and expenses directly associated with signing
a customer contract as well as additional disclosures. Tele2’s current
preliminary opinion is that the existing accounting principles concerning
revenue recognition of bundled offers related to the allocation between
equipment and services is in line with IFRS 15. The model that Tele2
applies today may need to be somewhat adjusted to completely fulfil the
requirements in the new standard. Expenses directly associated with
the signing of customer contracts may include retailer sales provisions
and subsidies of equipment given to retailers for specific contracts. These
initial expenses shall be activated and amortized over the contract length
if they are recoverable. If the contract period is less than one year the
expenses may be recognized as cost when incurred. Today these initial
expenses are recognized as cost in the period in which they occur. The
effects to the financial statements will be further analysed and presented
before the new standard becomes effective.
The other new and revised standards are estimated to have no material
effect for Tele2.
Consolidation
Subsidiaries
The consolidated accounts include the parent company and companies
in which the parent company directly or indirectly holds more than 50
percent of the voting rights or in any other way has control. Control is
achieved when Tele2 is exposed, or has rights, to variable returns from
its involvement with an entity and has the ability to affect those returns
through its power over the entity.
The consolidated accounts are prepared in accordance with the acqui-
sition method. This means that consolidated equity only includes the
subsidiary’s equity that has arisen after the acquisition and the consoli-
dated income statements only include earnings from the date of acquisi-
tion until the date of divestment, if the subsidiary is sold. The Group’s
acquisition value of the shares in subsidiaries consists of the total of the
fair value at the time of the acquisition of what was paid in cash, incurred
liabilities to former owners or emitted shares, the value of the non-
controlling interests in the acquired subsidiary and the fair value of the
previously owned share. Contingent consideration is included in the
acquisition value and is reported at its fair value at the time of the acquisi-
tion. Subsequent effects from the revaluation of contingent consideration
are reported in the income statement. Acquired identifiable assets and
assumed liabilities are reported initially at their fair value at the time of
the acquisition. Exemptions from this principle are made for acquired
tax assets/liabilities, employee benefits, share-based payment awards
and assets held for sale which are measured according to the principles
described below for each item. Exemptions are also made for indemnity
assets and reacquired rights. Indemnity rights are valued according to
the same principle as the indemnified item. Reacquired rights are valued
based on the remaining contractual period even if other market partici-
pants would consider the possibilities for contract renewal when doing
the valuation. Reported goodwill is measured as the difference between
on the one hand the total purchase price for the shares in the subsidiary,
Tele2 – Annual Report 2014 31
Notes
the value of the non-controlling interests in the acquired subsidiary and
the fair value of the previously owned share and on the other hand the
Group’s reported value of acquired assets and assumed liabilities. Acqui-
sition related costs (transaction costs) are recognized as expenses in the
period in which they arise.
Non-controlling interest is reported at the time of the acquisition either
at its fair value or at its proportional share of the Group’s reported value
of the acquired subsidiary’s identified assets and liabilities. The choice
of valuation method is made for each business combination. Subsequent
profit or loss and other comprehensive income that are related to the
non-controlling interests are allocated to the non-controlling interest
even if it leads to a negative value for the non-controlling interest.
The acquisition of a non-controlling interest is accounted for as a trans-
action between the equity holders of the parent company and the non-
controlling interest. The difference between paid purchase price and
the proportional share of the acquired net assets is reported in equity.
Thus no goodwill arises in connection with such transactions.
When the Group loses control of a subsidiary, a gain or loss is calculated
as the difference between:
• the aggregate of the fair value of the consideration received and the
fair value of any retained interests and
• the previous carrying amount of the assets (including goodwill), and
liabilities and any non-controlling interests
Any gain or loss is recognised in profit or loss. All amounts previously
recognised in other comprehensive income in relation to that subsidiary
are reclassified to profit or loss.
Joint arrangements
Joint arrangements are arrangements of which two or more parties have
a joint control. Joint arrangements are classified either as joint operation
or joint venture. For joint operations Tele2 reports its part of assets, liabili-
ties, revenues and expenses and its share of joint assets, liabilities, rev-
enues and expenses line by line in the consolidated financial statements.
Sales and other transactions with joint operations are eliminated in the
consolidated financial statements. For Tele2 joint operations consists of
jointly owned companies. Joint ventures are arrangements where Tele2
has right to the net assets and are accounted for under the equity method.
This means that the Group’s carrying amount of the shares in the joint
venture corresponds to the Group’s share of equity as well as any residual
value of consolidated surplus values after application of the Group’s
accounting principles. The Group’s share of the joint venture’s profit or
loss after tax is reported under “Operating profit”, along with depreciation
of the acquired surplus value.
At the acquisition of a share in a joint arrangement a purchase price
allocation is prepared at the acquisition date. The acquisition date is the
date when the Group becomes a part to and jointly shares the control of
the joint arrangement. The starting-point for the purchase price alloca-
tion consists of the acquisition value of the share in the joint arrangement.
The acquisition value is allocated on the Group’s share of the acquisition
date fair values of acquired assets and assumed liabilities including
related deferred taxes and any goodwill.
Associated companies
Associated companies are companies in which Tele2 has a voting power
of between 20 percent and 50 percent or has significant influence in
some other way.
Associated companies are accounted for in accordance with the equity
method. This means that the Group’s carrying amount of the shares in
the company corresponds to the Group’s share of equity as well as any
residual value of consolidated surplus values after application of the
Group’s accounting principles. The share of the company’s profit or loss
after tax is reported under “Operating profit”, along with depreciation of
the acquired surplus value.
Foreign currency
The accounts of all foreign group companies, joint arrangements and
associated companies are prepared in the currency used in the primary
economic environment of each company, i.e. the functional currency
which is normally the local currency.
The assets and liabilities of foreign group companies, joint arrange-
ments and associated companies are translated into Tele2’s reporting
currency (SEK) at the closing exchange rates, while revenues and
expenses are translated at the period’s average exchange rates. Exchange
rate differences arising from translation are reported in other compre-
hensive income. When foreign group companies, joint arrangements and
associated companies are divested, the accumulated exchange rate dif-
ference attributable to the sold operation is recognized in the income
statement.
Goodwill and adjustments at fair value that are made in connection
with the acquisition of a foreign operation are treated as assets and liabili-
ties in the functional currency of the acquired operation.
Discontinued operations
A discontinued operation is a component of the Group which either has
been disposed of or is classified as held for sale, and represents a separate
line of business or geographical area of operation. A discontinued opera-
tion is reported separately from continuing operations, and comparable
information for prior periods is re-presented.
Assets classified as held for sale and associated liabilities are presented
separately on the face of the balance sheet. Prior periods are not affected.
Assets classified as held for sale are valued at the lower of carrying value
and fair value less costs to sell (Note 36).
Revenue recognition
Net sales include customer related revenue from services within mobile
and fixed telephony, broadband and cable TV, such as connection charges,
subscription charges, call charges, data and information services and
other services. Net sales also include interconnect revenue from other
operators and income from the sale of products such as mobile phones
and modems. Revenues are reported at fair value which usually is the
selling value, less discounts and VAT.
Connection charges are recognized at the time of the sale to the extent
that they cover the connection costs. Any excess is deferred and amortized
over the estimated contract period. Subscription charges for mobile and
fixed telephony services, cable TV, ADSL, dial-up internet, leased capacity
and internet connection for direct access customers are recognized in
the period covered by the charge. Call charges and interconnect revenue
are recognized in the period during which the service is provided. Rev-
enue from the sale of products is recognized at the time the product is
supplied to the customer. Revenue from the sale of cash cards is recog-
nized based on the actual use of the card or at the expiry date.
Revenue from data and information services such as text messages and
ring tones is recognized when the service is provided. When Tele2 acts
as an agent for another supplier, the revenue is reported net, i.e. only the
part of the revenue that is allocated to Tele2 is reported as revenue.
Revenue recognition for agreements containing
multiple deliverables
For customer agreements containing multiple deliverables or parts, rev-
enue is allocated to each part, based on its relative fair value to the total
contracted revenue. Services invoiced based on usage are not included
in the allocation. Revenues for each part are recognized in the period
the component is delivered to the customer. If functionally important
parts have not been delivered and the fair value of any of these is not
available, revenue recognition is postponed until all important parts
have been delivered and the fair value of non-delivered parts has been
determined.
Continued Note 1
32 Tele2 – Annual Report 2014
Notes
Operating expenses
Operating expenses are classified according to function, as described
below. Depreciation and amortization and personnel costs are stated by
function. Total costs for depreciation and amortization are presented in
Note 6 and total personnel costs are presented in Note 34.
Cost of services sold
Cost of services sold consists of costs for renting networks and capacity,
interconnect charges as well as costs for equipment sold (e.g. hand-sets)
to the extent the costs are covered by recognized revenues. The cost of
services sold also includes the part of the cost for personnel, premises,
purchased services and depreciation and amortization of non-current
assets attributable to the production of sold services.
Selling expenses
Selling expenses include costs for the internal sales organization, pur
-
chased services, personnel costs, rental costs, bad debt losses as well as
depreciation and amortization of non-current assets attributable to sales
activities. Advertising and other marketing activities as well as costs for
discounts and subsidies for equipment sold are also included and are
expensed as incurred.
Administrative expenses
Administrative expenses consist of the part of the personnel costs, rental
costs, purchased services as well as depreciation and amortization of
non-current assets attributable to the other joint functions. Costs associ-
ated with the Board of Directors, executive management and corporate
functions are included in administrative expenses.
Other operating income and other operating expenses
Other operating income and other operating expenses include secondary
activities, exchange rate differences in operating activities and gain/loss
on the sale of tangible and intangible assets.
Employee benefits
The average number of employees (Note 33) as well as salaries and
remuneration (Note 34) in companies acquired during each year are
reported in relation to how long the company has been part of the Tele2
Group.
Share-based payments
Tele2 grants share-based instruments to certain employees.
Share-based payments are mainly settled with the company’s own
shares. The costs for share-based payments are based on the fair value
of the share rights calculated by an independent party at the date of
grant. These payments are reported as employee costs during the vesting
period with a corresponding increase in equity. To the extent the vesting
conditions in the program are linked to market conditions (TSR) and
non-vesting conditions (investment in Tele2 shares), these factors are
taken into consideration when determining the fair value of the share
rights. Performance conditions (return on capital employed) and service
conditions (being employed) are affecting the employee cost during the
vesting period by the change in the number of shares that are expected
to finally vest.
Tele2 records a liability for social security expenses, at each reporting
period, for all outstanding share-based payments. The liability for social
security expenses is calculated according to UFR 7 IFRS 2 and social
security contributions for listed enterprises. The liability is revalued at
the end of each reporting period and is based on the share-based pay-
ment’s fair value at the end of the reporting date distributed over the
vesting period.
Post-employment benefits
The Group has a number of pension schemes. The main part of Tele2’s
pension plans consist of defined-contribution plans (Note 34) for which
the Group makes payments to public and private pension institutions.
Fees with regard to defined-contribution pension plans are reported as
an expense during the period in which the employees perform the ser-
vices to which the contribution relates. The defined-contribution plans
ensure a certain predefined payment of premiums and negative changes
in the value of investments are not compensated by Tele2. Therefore
Tele2 does not bear the risk at the time of pension payment. Only a small
part of the Group’s pension commitments relate to defined benefit plans.
The net present value of the obligation for these are calculated separately
for each defined benefit plan on the basis of assumptions of the future
benefits earned during previous and currents periods. The obligation is
reported in the balance sheet as the net present value of the obligation
less the fair value of any plan assets.
The cost for the defined-benefit plans are calculated by application of
the so called Projected Unit Credit Method, which means that the cost is
distributed over to the employee’s period of service. The calculation is
performed annually by an independent actuary. The obligation is valued
at the net present value of the expected future payments, taking into
account assumptions such as expected future increases in salaries, infla-
tion, health expenses and life span. Expected future payments are dis-
counted with an interest rate that is effective on the closing day for first
class commercial bonds or government bonds considering the estimated
remaining tenor for each obligation. Actuarial gains and losses are
reported in other comprehensive income.
Termination benefits
A cost for termination benefits is recognized only if the Group is commit-
ted by a formal plan to prematurely terminate an employee’s employment
without any possibility of withdrawing the commitment.
Income tax
Income taxes consist of current and deferred tax. Income tax is reported
in the income statement except when the underlying transaction is
reported in other comprehensive income or in equity. In those cases the
related tax effect is also reported in other comprehensive income or in
equity.
Current tax is tax that is to be paid or received in respect of the taxable
profit (tax loss) for the year including any adjustment of current tax related
to previous periods and tax on dividends from subsidiaries.
When accounting for deferred taxes, the balance sheet method is
applied. The method implies that deferred tax liabilities and assets are
recognized for all temporary differences between the carrying amount
of an asset or liability and its tax base, as well as other tax-related deduc-
tions or deficits. The following temporary differences are not considered:
temporary difference that arises at the initial recognition of goodwill
and the initial recognition of assets and liabilities that are not part of a
business combination and at the time of the transaction affect neither
accounting nor taxable profit/loss. An item which alters the time when
an item is taxable or deductible is considered a temporary difference.
Deferred tax liabilities and assets are measured at the tax rates that are
expected to apply to the period when the asset is realized or the liability
settled, based on the tax rates (and tax laws) that have been enacted or
substantially enacted by the end of the reporting period.
The recognition of deferred tax assets takes into account tax loss carry-
forwards and temporary differences where it is probable that losses and
temporary differences will be utilized against future taxable profits. In
cases where a company reports losses, an assessment is made of whether
there is any convincing evidence that there will be sufficient future
profits.
Valuation and accounting of deferred taxes in connection with business
combinations is made as part of the measurement of assets and liabilities
at the time of acquisition. In these circumstances, the deferred tax assets
are assessed at a value corresponding to what the Group expects to utilize.
Deferred income tax liabilities are recognized on temporary differences
related to subsidiaries, joint arrangements and associates, except when
the timing of the reversal of the temporary difference is controlled by the
Group and it is probable that the temporary difference will not reverse
in the foreseeable future.
Continued Note 1
Tele2 – Annual Report 2014 33
Notes
If a deferred tax liability exists and unvalued tax loss carry-forwards
exist, a deferred tax asset is reported to the extent it can be netted against
the deferred tax liability.
Current and deferred tax assets and liabilities are netted only among
group companies within the same tax jurisdiction. This form of reporting
is only applied when Tele2 intends to offset tax assets and liabilities.
Non-Current Assets
Intangible assets (Note 14) and tangible assets (Note 15) with a finite
useful life are reported at acquisition value with deductions for accumu-
lated depreciation and amortization. Depreciation and amortization are
based on the acquisition value of the assets less estimated residual value
at the end of the useful life and are recognized on a straight-line basis
throughout the asset’s estimated useful life. Useful lives and residual
values are subject to annual assessments. Useful lives for fixed assets
are presented below.
Intangible assets
Licences, utilization rights and software 2–25 years
Customer agreements 3–5 years
Trademarks 4–5 years
Tangible assets
Buildings 5–15 years
Modems 1.5–3 years
Machinery and technical plant 2–30 years
Equipment and installations 2–10 years
At the end of each reporting period an assessment is made of whether
there is any indication of impairment of any of the Group’s assets over
and above the depreciation according to plans. If there is any indication
that a non-current asset has declined in value, a calculation of its recov-
erable amount is made.
The recoverable amount is the higher of the asset’s value in use and
its fair value less costs to sell, which is the value that is obtainable from
the sale of the asset to an independent party less costs of disposal. The
value in use consists of the present value of all cash flows from the asset
during the utilization period as well as the addition of the present value
of the fair value less costs to sell at the end of the utilization period. If the
estimated recoverable amount is less than the carrying amount, the asset
is written down to its recoverable amount.
Impairments are reported in the income statement. Impairments that
have been recorded are reversed if changes are made in the assumptions
that led to the original impairment. The impairment reversal is limited
to the carrying amount, net of depreciation according to plan, had the
original impairment not occurred. A reversal of impairment is reported
in the income statement. Impairment of goodwill is not reversed.
Intangible assets
Tele2 holds a number of licences entitling it to conduct telephony opera-
tions. The expenses related to the acquisition of these licences are rec-
ognized as an asset and amortized on a straight-line basis through the
duration of the licence agreements.
Goodwill is measured as the difference between on the one hand the
total purchase price for the shares in the subsidiary alternatively the
acquired assets and liabilities, the value of the non-controlling interest
in the acquired subsidiary and the fair value of the previously owned
share, and on the other hand the Group’s reported value of acquired
assets and assumed liabilities less any write-downs.
Goodwill is allocated to the cash generating units that are expected to
obtain benefits as a result of the acquisition and is, along with the intan-
gible assets with indefinite lives and intangible assets that are not yet
ready to use, subject to annual impairment testing even if there is no
indication of a decline in value. Impairment testing of goodwill is at the
lowest level at which goodwill is monitored for internal management
purposes and for which there are separately identifiable cash flows (cash
generating units). The recoverable value of the respective cash generating
unit is based on the higher of estimated value in use and fair value less
costs to sell. The most important factors that have influenced this year’s
impairment testing are presented in Note 14.
In the case of reorganization or divestment involving a change in the
composition of cash generating units to which goodwill has been allo-
cated, the goodwill is allocated to the relevant units. The allocation is
based on the relative value of the part of the cash generating unit to
which the reorganization or divestment relates, and the part that remains
after the reorganization or the divestment.
Customer agreements are valued at fair value in conjunction with busi-
ness combinations. Tele2 applies a model where the average historical
customer acquisition cost or, alternatively, the present value of expected
future cash flows, is applied to value customer agreements.
Tele2 capitalizes direct development expenses for software which are
specific to its operations if the recognition criteria are fulfilled. These
expenses are amortized over the utilization period, which begins when
the asset is ready for use. Expenses relating to the planning phase of the
projects as well as expenses of maintenance and training are expensed
as incurred. Other expenses relating to development work are expensed
as they arise, since they do not meet the criteria for being reported as an
asset. Tele2 doesn’t conduct own research activities.
Tangible assets
Buildings relate to assets intended for use in operations. The acquisition
value includes the direct costs attributable to the building.
Machinery and technical plant include equipment and machinery
intended for use in operations, such as network installations. The acquisi-
tion value includes the direct costs attributable to the construction and
installation of networks.
Additional costs for extension and value-increasing improvements are
reported as an asset, while additional costs for repairs and maintenance
are expensed during the period in which they arise.
Equipment and installations comprise assets used in administration,
sales and operations.
Costs for modems that are rented to or used for free by customers are
capitalized.
Borrowing costs
Borrowing costs which are directly attributable to the acquisition, con-
struction or production of an asset which requires considerable time to
complete for its intended use are included in the acquisition value of the
asset. Other borrowing costs are expensed in the period in which they
arise.
Leases
Leases are classified as finance or operating leases.
Tele2 as finance lessee
A lease is classified as a finance lease if it transfers substantially all the
economic risks and rewards of ownership of an asset to the lessee. When
reporting a financial lease in the consolidated accounts, the leased object
is recognized as a tangible asset at the lower of its fair value and the
present value of the minimum lease payments, and a corresponding
amount is recognized as a lease obligation under financial liabilities
(Note 15, Note 26 and Note 31). The asset is depreciated on a straight-line
basis over the shorter of the lease term and its useful life, with the esti-
mated residual value deducted at the end of the utilization period. Lease
payments are apportioned between interest and repayment of the out-
standing liability.
Tele2 as operating lessee
A lease is classified as an operating lease if substantially all the economic
risks and rewards of ownership of an asset remain with the leasing
company. Payments are expensed in the income statement on a straight-
line basis over the leasing period.
Tele2 as operating lessor
Rental revenues from operating leases are recognized on a straight-line
basis over the term of the relevant lease. The leased asset is kept on the
balance sheet and depreciated over its estimated useful life.
Continued Note 1
34 Tele2 – Annual Report 2014
Notes
Dismantling costs
When there is a legal or constructive obligation to a third party, the
estimated cost of dismantling and removing the asset and restoring the
site/area is included in the acquisition value. Any change to the estimated
cost of dismantling and removing an asset and restoring the site is added
to or subtracted from the carrying amount of the particular asset.
Inventories
Inventories of materials and supplies are valued in accordance with the
first-in, first-out principle at the lower of acquisition value and net realiz-
able value. Tele2’s inventories essentially consist of telephones, SIM
cards and modems held for sale.
Financial assets and liabilities
Financial assets recognized in the balance sheet include other financial
assets, accounts receivable, other current receivables, current invest-
ments and cash and cash equivalents. Financial liabilities recognized
in the balance sheet include liabilities to credit institutions and similar
liabilities, other interest-bearing liabilities, accounts payable and other
current liabilities.
Acquisitions and sales of financial assets are reported on the trade
date, which is the date that the Group has an undertaking to acquire or
sell the asset. Financial liabilities are recognized in the balance sheet
when Tele2 becomes a party to the contractual provisions of the
instrument.
A financial asset is derecognized when the rights to receive benefits
have been realized, expired or the company loses control over the asset.
The same applies to components of a financial asset. A financial liability
is derecognized when the contractual obligation is discharged or extin-
guished in some other way. The same applies to components of a financial
liability.
Financial instruments are initially recognized at the acquisition date
fair value and subsequently to either fair value or amortized cost based
on the initial categorization. The categorization reflects the purpose of
the holding and is determined on initial recognition.
Measurement of the fair value of financial instruments
Various measurement methods are used to estimate the fair value of
financial instruments not traded on an active market. When determining
the fair value of interest swaps and currency derivatives official market
listings are used as input in calculations of discounted cash flows. The
fair value of loan liabilities is measured using generally accepted methods,
such as discounting expected future cash flows at prevailing interest
rates.
Calculation of amortized cost of financial instruments
Amortized cost is calculated by using the effective interest method, which
means that any premiums or discounts and directly attributable costs or
income are recognized on an accrual basis over the life of the contract
using the calculated effective interest rate. The effective interest rate is
the rate which gives the instrument’s cost of acquisition as a result when
discounting the future cash flows.
Offsetting financial assets and liabilities
Financial assets and liabilities are offset and the net amount is presented
in the balance sheet when a legal right of set-off exists and the Group
intends to settle on a net basis or to realize the asset and settle the liability
simultaneously.
Financial assets
Tele2’s other non-current securities mainly consist of holdings of unlisted
shares, and these are classified as “Assets at fair value through profit or
loss”. Assets in this category are initially reported at acquisition value,
i.e. fair value at the time of acquisition, and valued thereafter on a con-
tinuous basis at fair value. Transaction costs are recognized in the income
statement. The fair value change is reported in the income statement
among other financial items. If Tele2 has not been able to determine a
reliable fair value, the securities are valued at cost.
Tele2’s accounts receivables and other receivables are categorized as
“Loans and receivables” initially reported at fair value and subsequently
at amortized cost, which corresponds to their nominal amounts as the
duration is short. On each closing day, an impairment assessment of these
assets is made based on the time each individual accounts receivable
has been overdue. Any impairment loss is reported as an operating
expense.
Cash and cash equivalents are categorized as “Loans and receivables”
initially reported at fair value and subsequently at amortized cost. Cash
and cash equivalents consist of cash and bank balances as well as cur-
rent investments with a maturity of less than three months from the time
of acquisition.
Restricted cash and cash equivalents are reported as current invest-
ments if they may be released within 12 months and as non-current
financial assets if they are to be restricted for more than 12 months.
Financial liabilities
Financial liabilities are categorized as “Financial liabilities valued at
amortized cost”. These are initially measured at fair value and then at
amortized cost using the effective interest method. Direct costs related
to the origination of loans are included in the acquisition value. For
accounts payables and other financial debts, with a short maturity, the
subsequent valuation is done at the nominal amount.
Derivatives and hedge accounting
Exchange rate fluctuations on loans in foreign currency and changes in
value of other financial instruments (currency derivatives) that meet the
hedge accounting requirements of net investment in foreign operations
are reported on a continuous basis in other comprehensive income. The
ineffective portion of the exchange rate fluctuation and the change in
value are reported in the income statement under other financial items.
When divesting foreign operations, the previously recognized accumu-
lated exchange rate difference attributable to the divested operation is
recycled to the income statement.
Cash flow hedges are reported in the same way as hedges of net invest-
ments in foreign operations. This means that the effective portion of the
gain or loss on an interest swap which meets the criteria for cash-flow
hedge accounting is recognized in other comprehensive income and the
ineffective portion is recognized in profit or loss within financial items.
When cash flows relating to the hedged item are reported in profit or loss,
amounts are transferred from equity to offset them. For more information
regarding cash flow hedges, please refer to Note 2 and Note 26.
When a hedging instrument related to future cash flows is due, sold,
divested or settled or the Group discontinues the hedge relation before
the hedged transaction has occurred and the forecasted transaction is
still expected to occur, the accumulated reported gain or loss remains in
the hedge reserve in equity and is reported in the income statement
when the transaction occurs. If the hedged transaction is no longer
expected to occur, the hedging instrument’s accumulated gain or loss is
immediately reported in the income statement.
Other derivatives are measured at their fair value through profit or loss.
Receivables and liabilities in foreign currency
Receivables and liabilities of the Group denominated in foreign currencies
are translated into Swedish kronor by applying the period-end rates.
Gains or losses on foreign exchanges relating to regular operations are
included in the income statement under Other operating income/
expenses. Gains or losses on foreign exchanges in financial assets and
liabilities are reported within profit/loss from financial items.
When long-term lending to/borrowing from Tele2’s foreign operations
is regarded as a permanent part of the parent company’s financing of/
borrowing from foreign operations, and thus as an expansion/reduction
of the parent company’s investment in the foreign operations, the
exchange rate changes of these intra-group balances are reported in
Other comprehensive income.
A summary of the exchange rate differences reported in other compre-
hensive income is presented in the statement of comprehensive income
Continued Note 1
Tele2 – Annual Report 2014 35
Notes
and the differences which affected profit or loss for the year are presented
in Note 3.
Equity
Equity consists of registered share capital, other paid-in capital, hedge
reserve, translation reserve, retained earnings, profit/loss for the year
and non-controlling interests.
Other paid-in capital relates to share premiums from the issues of new
shares. Additional direct costs attributable to the issue of new shares
are reported directly against equity as a reduction, net after taxes, of
proceeds from the share issue.
The hedge reserve includes translation differences on external loans
in foreign currencies and changes in values of financial instruments
(currency derivatives) which are used to hedge net investments in foreign
operations and the effective portion of gains or losses on interest swaps
used to hedge future interest payments.
Translation reserve includes translation differences attributable to the
translation of foreign operations into Tele2’s reporting currency as well
as translation differences on intra-group balances which are considered
an expansion/reduction of the parent company’s net investment in foreign
operations.
Non-controlling interests represent the value of minority shares in
subsidiaries included in the consolidated accounts. The reporting and
valuation of non-controlling interests are presented in the section regard-
ing consolidation above.
Number of shares and earnings per share
Earnings per share before dilution are calculated by dividing the profit
or loss of the year attributable to the parent company’s owners by the
weighted average number of outstanding shares during the period. To
calculate earnings per share after dilution the weighted average numbers
of outstanding shares are adjusted for the dilutive effect of the total
potential number of shares consisting of share based instruments settled
with shares. The shared based instruments have a dilutive effect if the
exercise price plus the fair value of future services is below the quoted
price and the dilutive effect increases when the size of this difference
increases (Note 25).
Provisions
Provisions are reported when a company within the Group has a legal
or constructive obligation as a result of past events, and it is probable
that payments, which can be reliably estimated, will be required in order
to settle the obligation.
Provisions are measured at the present value of the expenditures
expected to be required to settle the obligation using a pre-tax rate that
reflects current market assessments of the time value of money and the
risks specific to the obligation. The increase in the provision due to pas
-
sage of time is recognized as interest expense.
Contingent liabilities
A contingent liability exists if there is a possible obligation related to a
past event and whose existence is confirmed only by one or several
uncertain future events, and when there is an obligation that is not
reported as a liability or a provision because it is not probable that an
outflow of resources will be required, or the amount of the obligation
cannot be calculated with sufficient reliability. Disclosure is presented
unless the probability of an outflow of resources is remote.
Segment reporting
Segment
Since the risks in Tele2’s operations are mainly linked to the various
markets in which the company operates, Tele2 follows up and analyses
its business on country level. Hence each country represents Tele2’s
operating segments apart from the segment Other. The segment reporting
is in line with the internal reporting to the chief operating decision maker,
which is Tele2’s “Leadership Team” (LT).
The segment Other mainly includes the parent company Tele2 AB,
central functions and Procure IT Right, and other minor operations.
Tele2 Sweden is split into core operations and central group functions.
Core operations is reported in the segment Sweden and central functions
are included in the segment Other. The core operations of Tele2 Sweden
comprise the commercial activities within Sweden, including the com-
munications services of mobile, fixed telephony, fixed broadband, and
domestic carrier business. The central functions of Tele2 Sweden com-
prise the activities which provide services for the benefit of Tele2 AB’s
shareholders, other group companies (including the core operations of
Sweden), and to divested operations. These services are provided for
example from group-wide departments such as group finance, legal,
product development, sales & marketing, billing, information technology,
international network, and international carrier.
Assets in each segment include all operating assets that are utilized
by the segment and consist mainly of intangible and tangible assets,
shares in associated companies, inventories, accounts receivable, other
receivables, prepaid expenses and accrued revenues. Goodwill is dis-
tributed among the Group’s cash generating units, identified in accor-
dance with Note 14.
Liabilities in each segment include all operating liabilities that are
utilized by the segment and consist mainly of accounts payable, other
non-interest-bearing liabilities, accrued expenses and deferred income.
Assets and liabilities not allocated to segments include current and
deferred taxes and items of a financial nature.
Segment information is presented in Note 4.
The same accounting principles are applied to the segments and the
Group.
Internal pricing
The sales of services in the Tele2 Group are made on market terms.
Group-wide costs are invoiced to operations that have used the
services.
Services
Services that are offered within the segments are mobile telephony, fixed
broadband and fixed telephony.
The mobile service comprises various types of subscriptions for resi-
dential and business customers as well as prepaid cards. Mobile also
includes mobile broadband, fixed telephony via mobile network (FVM),
machine-to-machine communication (M2M) and mobile carrier. Tele2
either owns the networks or rents them from other operators a set-up
called MVNO.
Fixed broadband includes direct access & LLUB, i.e. our own services
based on access via copper cable, and other forms of access, such as fibre
networks, wireless broadband and metropolitan area networks. Fixed
broadband also includes resold broadband. The product portfolio within
direct access & LLUB includes telephony services (including IP telephony),
internet access services (including Tele2’s own ADSL and fibre) and TV
services.
Fixed telephony includes resold products within fixed telephony. The
product portfolio within resold fixed telephony consists of prefix tele-
phony, pre-selection (dial the number without a prefix) and
subscriptions.
Other operations mainly include carrier operations and wholesale.
Choice of accounting principles
When choosing and applying Tele2’s accounting principles, the Board
and the President have made the following choices:
Choice of accounting principle for put options
Put options issued or received by Tele2 in connection with business
combinations, where the put options give the minority owner a right to
sell its shares or part of its shares to Tele2, are initially, at the acquisition
date, recognized as a non-controlling interest. The non-controlling inter-
est is then immediately reclassified as a financial liability. The financial
liability is subsequently recognized at its fair value at each reporting
date, with the fair value changes reported within financial items in profit
or loss.
Continued Note 1
36 Tele2 – Annual Report 2014
Notes
An alternative method, not chosen by Tele2, would be to initially report
both a non-controlling interest and a financial liability with opposite
booking of the liability directly to equity and the following changes in
the liability’s fair value reported in profit or loss. Another alternative is
to report on a current basis a non-controlling interest which is reclassi-
fied as a financial liability at each reporting period. The difference
between the reclassified non-controlling interest and the fair value of
the financial liability would be reported as a change of the non-control-
ling interest within equity.
Customer acquisition costs
Customer acquisition costs are normally expensed in profit or loss.
When companies and operations are acquired, customer agreements
and customer contacts acquired as part of the acquisition are fair valued
and capitalized as intangible assets.
Goodwill – choice of level for goodwill impairment testing
Goodwill arising from business combinations is allocated to the cash-
generating units which are expected to receive future economic benefits,
in the form of synergies, for example, from the acquired operation. Ifsepa-
rate cash-generating units cannot be identified, goodwill is allocated to
the lowest level at which the operation and its assets are monitored for
internal management purposes, which is the operating segment.
Estimates and judgments
As part of preparing the consolidated financial statements management
is required to make certain estimates and judgments. The estimates and
judgments are based on historical experience and a number of other
assumptions aimed at providing a decision regarding the value of the
assets or liabilities which cannot be determined in any other way. The
actual outcome may vary from these estimates and judgments.
The most crucial assessments and estimates used in preparing the
Group’s financial reports are as follows:
Joint arrangements
Tele2 is in Sweden part of two joint arrangements concerning mobile
networks that are classified as joint operations, Svenska UMTS-nät AB
(together with TeliaSonera) and Net4Mobility HB (together with Telenor).
Tele2 has chosen to classify these two joint arrangements as joint opera-
tions as Tele2 is considered through agreements between the parties to
have the rights to the assets and obligations for the liabilities as well as
corresponding revenues and expenses related to each arrangement. As
basis for the classification additional decisive factors are that the parties
in each arrangement have the rights to substantially all of the economic
benefits from the assets in each operation and the jointly owned com-
panies are dependent on its owners for settling its liabilities on a continu-
ous basis.
Revenue recognition
Revenue recognition in Tele2 requires management to make judgments
and estimates in a number of cases, mainly to determine fair values and
the period in which the revenue should be recognized. Many agreements
bundle products and services into one customer offering which for
accounting purposes require allocating revenue to each part based on
its relative fair value using accounting estimates. Determining whether
revenues should be recognized immediately or be deferred require man-
agement to make judgments as to when the services and equipment have
been provided, the fair value of each part as well as estimates regarding
the remaining contract period. Please refer to Note 22 concerning accrued
revenues.
Valuation of acquired intangible assets
When acquiring businesses, intangible assets are measured at fair value.
If there is an active market for the acquired assets, the fair value is mea-
sured based on the prices on this market. Since there are often no active
markets for these assets, valuation models have been developed to esti-
mate the fair value. Examples of valuation models are discounted cash
flows models and estimates of Tele2’s historical costs of acquiring equiva-
lent assets. Please refer to Note 16 for acquisitions during the year.
Valuation of goodwill
When estimating the recoverable amount of cash generating units for
goodwill impairment purposes the Group makes assumptions regarding
future events and key parameters. The assumptions made and sensitivity
analyses are disclosed in Note 14. These kinds of assessments include
some uncertainty. Should the actual outcome for a specific period differ
from the expected outcome, the expected future cash flows may need to
be reconsidered, which could lead to a write-down.
Valuation of non-current assets with a finite useful life
If the recoverable amount falls below the book value, an impairment loss
is recognized. At each balance sheet date, a number of factors are ana-
lysed in order to assess whether there is any indication of impairment.
If such indication exists, an impairment test is prepared based on man-
agement’s estimate of future cash flows including the applied discount
rate. Please refer to Note 14 and Note 15.
Useful lives of non-current assets
When determining the useful life of groups of assets, historical experi-
ence and assumptions about future technical development are taken into
account. Depreciation rates are based on the acquisition value of the
non-current assets and the estimated utilization period less the estimated
residual value at the end of the utilization period. If technology develops
faster than expected or competition, regulatory or market conditions
develop differently than expected, the company’s evaluation of utilization
periods and residual values will be influenced.
Valuation of deferred income tax receivables
Recognition of deferred income tax takes into consideration temporary
differences and unutilized loss carry-forwards. Deferred tax assets are
reported for deductible temporary differences and loss carry-forwards
only to the extent that it is considered probable that they can be utilized
to offset future taxable profits. Management updates its assessments at
regular intervals. The valuation of deferred tax assets is based on expec-
tations of future results and market conditions, which are naturally sub-
jective. The actual outcome may differ from the assessments, partly as a
result of future changes in business circumstances, which were not
known at the time of the assessments, changes in tax laws or interpreta-
tions or the result of the taxation authorities’ or courts’ final examination
of submitted tax returns. See further Note 13.
Provisions for disputes and damages
Tele2 is party to a number of disputes. For each separate dispute an
assessment of the most likely outcome is made, and reported in the
financial statements accordingly, see Note 27 and Note 30.
Valuation of accounts receivable
Accounts receivables are valued on a current basis and reported at amor-
tized cost. Reserves for doubtful accounts are based on various assump-
tions as well as historical experience, see Note 20.
Other information
Tele2 AB (publ) is a limited company, with its registered office in Stock-
holm, Sweden. The company’s registered office (phone +46 8 5620 0060)
is at Skeppsbron 18, Box 2094, 103 13 Stockholm, Sweden. The annual
report was approved by the Board of Directors on March 17, 2015. The
balance sheet and income statement are subject to adoption by the Annual
General Meeting on May 19, 2015.
Continued Note 1
Tele2 – Annual Report 2014 37
Notes

million, derivatives to SEK –2 (19) million and financial assets and liabili-
ties at fair value through profit/loss to SEK 422 (–166) million.
The Group has derivative contracts which are covered by master netting
agreements. That means a right exists to set off assets and liabilities with
the same party, which is not reflected in the accounting where gross
accounting is applied. The value of reported derivatives at December 31,
2014 amounted on the asset side to SEK 47 (8) million and on the liabilities
side to SEK 294 (146) million of which SEK 28 (-) million can be netted
against the asset side.
Through its operations, the Group is exposed to various financial risks
such as currency risk, interest risk, liquidity risk and credit risk. Financial
risk management is mainly centralized to the Group treasury function.
The aim is to control and minimize the Group’s financial risks as well as
financial costs, and optimize the relation between risk and cost.
Capital structure management
The Tele2 Group’s view on capital structure management incorporates
several inputs, of which the main items are listed below.
• Tele2 will adopt a progressive ordinary dividend policy which aims
to deliver 10 percent growth per annum in the coming 3 years.
Authorization to pay extraordinary dividends will be sought when
the company has excess capital. Pursuant to the approval received
at the 2014 AGM, Tele2 has the authorization to repurchase up to 10
percent of its share capital.
• Tele2 believes the financial leverage should be in line with both the
industry and the markets in which it operates and reflect the status
of its operations, future strategic opportunities and obligations. This
would imply a target net debt to EBITDA ratio of 1.5-2.0 times (ear-
lier 1.25-1.75 times) over the medium term.
• On a continuous basis, Tele2 will diversify its financing both in
terms of duration and funding sources. A stable financial position is
important in order to minimize refinancing risk.
The Board of Directors reviews the capital structure annually and as needed.
Net debt amounted to SEK 9,061 (8,007) million on December 31, 2014,
or 1.51 (1.34) times EBITDA. Tele2’s available liquidity amounted to SEK
8,224 (9,306) million. For additional information please refer to Note 26.
Currency risk
Currency risk is the risk of changes in exchange rates having a negative
impact on the Group’s result and equity. Currency exposure is associated
with payment flows in foreign currency (transaction exposure) and the
translation of foreign subsidiaries’ balance sheets and income statements
to SEK (translation exposure).
The Group does not generally hedge transaction exposure. When con-
sidered appropriate, the translation exposure related to some investments
in foreign operations is hedged by issuing debt or entering into derivative
transactions in the currencies involved. In the hedge reserve in equity the
total amount related to net investment hedges amounts to SEK –255 (–258)
million. During the year SEK - (3) million related to divested companies were
reclassified to profit/loss. Outstanding currency swaps designated for net
investment hedging amounted to EUR 270 (270) million and NOK 2,440 (-)
million of which NOK 640 (-) million is used to swap external loans to NOK
and NOK 1,800 (-) million is used to hedge the net investment in NOK. The
reported fair value on the currency swaps amounted to SEK –51 (–2) million
and SEK 42 (-) million respectively. Outstanding currency swaps designated
to swap loans in NOK to EUR, amounted to NOK - (939) million and reported
fair value to SEK - (–9) million.
After taking into account currency swaps, the borrowings in SEK mil-
lion are carried in the following currencies (equivalent SEK amounts):
Dec 31, 2014 Dec 31, 2013
SEK1, 2) 1,129 3,154
EUR1) 3,493 3,210
NOK2) 2,103 378
USD 33 84
LVL – 11
Total loans 6,758 6,837
1) Including adjustment for currency swaps designated to swap loans in SEK to EUR of
SEK2,569 (2,415)
2) Including adjustment for currency swaps designated to swap loans in SEK to NOK of
SEK673million (p y NOK to SEK of SEK –993 million)
NOTE 2 FINANCIAL RISK MANAGEMENT
AND FINANCIAL INSTRUMENTS
Tele2’s financial assets consist mainly of receivables from end customers,
other operators and resellers and cash and cash equivalents. Tele2’s
financial liabilities consist mainly of loans, bonds and accounts payables.
Classification of financial assets and liabilities including their fair value
is presented below.
Dec 31, 2014
Assets and
liabilities
at fair value
through
profit/loss
Loans and
receivables
Derivative
instruments
designated
for hedge
accounting
Financial
liabilities
at
amortized
cost
Total
reported
value
Fair
value
Other financial assets 81) 465 – – 473 473
Accounts receivables – 2,480 – – 2,480 2,480
Other current receivables – 375 473) – 422 422
Current investments – 38 – – 38 38
Cash and cash equivalents – 151 – – 151 151
Assets classified as held for sale 1 337 338 338
Total financial assets 9 3,846 47 – 3,902 3,902
Liabilities to financial institu-
tions and similar liabilities – – – 6,758 6,758 7,0853)
Other interest-bearing liabilities 8872) – 2943) 444 1,625 1,5533)
Accounts payable – – – 2,848 2,848 2,848
Other current liabilities – – – 467 467 467
Liabilities directly associated
with assets classified as held for
sale – – – 249 249 249
Total financial liabilities 887 – 294 10,766 11,947 12,202
Dec 31, 2013
Assets and
liabilities
at fair value
through
profit/loss
Loans and
receivables
Derivative
instruments
designated
for hedge
accounting
Financial
liabilities
at
amortized
cost
Total
reported
value
Fair
value
Other financial assets 141) 233 – – 247 247
Accounts receivables – 3,317 – – 3,317 3,317
Other current receivables – 313 83) – 321 321
Current investments – 55 – – 55 55
Cash and cash equivalents – 1,348 – – 1,348 1,348
Total financial assets 14 5,266 8 – 5,288 5,288
Liabilities to financial institu-
tions and similar liabilities – – – 6,837 6,837 7,0213)
Other interest-bearing liabilities 1,3502) – 1463) 418 1,914 1,8893)
Accounts payable – – – 3,140 3,140 3,140
Other current liabilities – – – 516 516 516
Total financial liabilities 1,350 – 146 10,911 12,407 12,566
For the determination of fair values on financial assets and liabilities the
following levels and inputs have been used:
1)
Level 3: measured at fair value through profit/loss, which on initial
recognition were designated for this type of measurement. Discounted
future cash flow models are used to estimate the fair value.
2)
Level 3: put option Tele2 Kazakhstan. Fair value determined on the
basis of future discounted cash flows to determine the exercise price
on the put option owned by the minority owner in Tele2 Kazakhstan.
The valuation is based on the same assumptions that been used for the
impairment test of goodwill, please refer to Note 14 and Note 26.
3)
Level 2: observable market data have been used as input to determine
the fair value of interest- and foreign exchange rate derivatives, loans
with fixed interest rate and other non-current non-interest bearing
liabilities valued at fair value at initial recognition with subsequent
measurement at amortized cost.
Since accounts receivables, accounts payables and other current liabilities
are short-term, discounting of cash flows does not cause any material
differences to their carrying amount.
During the period no reclassification of financial instruments between
the different categories has been made.
Net gains/losses on financial instruments amounted to SEK 426 (–211)
million, of which loan and trade receivables amounted to SEK 6 (–64)
38 Tele2 – Annual Report 2014
Notes

In 2014, 49 (49) percent of net sales is related to SEK and 35 (32) percent
to EUR. For other currencies please refer to Note 3. During the year, Tele2’s
results were foremost affected by fluctuations in EUR and devaluation in
Kazakhstan of KZT.
The Group’s total net assets on December 31, 2014 of SEK 22,682 (21,591)
million were distributed by currency in SEK million as follows (including
loan and currency derivatives designated for hedge accounting):
Dec 31, 2014 Dec 31, 2013
SEK 7,025 6,913
EUR1) 10,854 7,866
NOK2) 984 2,394
KZT 1,742 1,102
HRK 557 409
LTL 1,579 1,321
LVL – 1,703
USD –59 –117
Total 22,682 21,591
1) Loans and derivatives denominated in EUR designated for net investment hedging are
included by SEK 3,276 (3,080) million
2) Loans and derivatives denominated in NOK designated for net investment hedging are
included by SEK 2,040 (382) million
A five percent currency fluctuation against the Swedish krona would
affect the Group’s total net assets by SEK 783 (734) million.
Interest rate risk
Tele2 keeps a close watch on interest market trends and decisions to
change the interest duration strategy are assessed regularly. Of interest-
bearing financial liabilities as of December 31, 2014, SEK 4,531 (4,834)
million, corresponding to 54 (55) percent, were carried at a variable
interest rate. Calculated at variable interest-bearing liabilities at Decem-
ber 31, 2014 and assuming that these loans were traded per January 1,
2015 to 1 percent higher interest rate, this would result in an additional
interest expense for 2015 of SEK 45 (48) million, and affect profit/loss
after tax by SEK 37 (41) million. For additional information please refer
to Note 26.
The capital amount of outstanding interest rate derivatives on December
31, 2014 amounts to SEK 2.5 billion converting variable interest rate to
fixed interest rate. The cash flows related to outstanding interest rate
derivative is expected to affect the income statement during the remain-
ing duration of the interest rate swaps. Official market listings have been
used to determine the fair value of interest rate derivatives. The Group
will settle the difference between the fixed and floating interest rate on
a net basis.
Outstanding interest rate derivatives for cash flow hedging on December
31, 2014 are shown below.
Dec 31, 2014 Dec 31, 2013
Currency
Fixed interest
rate terms % Maturity
Capital
amount,
nominal
Reported
fair value
Capital
amount,
nominal
Reported
fair value
SEK 3.865 2018 1,400 –166 1,400 –109
SEK 2.7225 2018 300 –25 300 –8
SEK 2.5050 2016 300 –11 300 –8
SEK 2.6950 2018 200 –17 200 –5
SEK 2.1575 2020 250 –19 250 3
Total outstanding interest rate
derivatives 2,450 –238 2,450 –127
The total change in fair values on the interest rate derivatives amounted
to SEK –172 (33) million and are recognized in other comprehensive
income as cash flow hedges. Of the total change in fair value SEK 61 (49)
million was reclassified to the income statement and included in interest
costs for the year.
Liquidity risk
The Group’s excess liquidity is invested on a short-term basis or used for
loan repayments. Liquidity reserves consist of available cash, undrawn
committed credit facilities and committed overdraft facilities. At the end
of 2014, the Group had available liquidity of SEK 8.2 (9.3) billion. For
additional information please refer to Note 24.
Tele2 has entered into an EUR 0.8 billion credit facility with a syndicate
of 11 banks. The facility has maturity in May 2018. On December 31, 2014
and 2013 the facility was unutilized. Tele2 AB’s EUR 3 billion Euro
Medium-Term Note (EMTN) Program forms the basis for Tele2’s medium
and long term debt issuance in both international and domestic bond
markets. On December 31, 2014 issued bonds under the Program
amounted to SEK 3,797 (4,295) million. For additional information please
refer to Note 26.
Undiscounted contractual commitments are presented below.
Dec 31, 2014
Note
Within
1 year 1–3 years 3–5 years
After
5 years Total
Financial liabilities1) 26 7,535 4,007 576 461 12,579
Commitments, other 30 1,171 509 41 80 1,801
Operating leases 31 1,442 1,246 657 1,023 4,368
Total contractual commitments 10,148 5,762 1,274 1,564 18,748
Dec 31, 2013
Note
Within
1 year 1–3 years 3–5 years
After
5 years Total
Financial liabilities1) 26 6,912 1,712 4,036 649 13,309
Commitments, other 30 2,325 1,926 71 100 4,422
Operating leases 31 1,489 1,360 770 1,117 4,736
Total contractual commitments 10,726 4,998 4,877 1,866 22,467
1) Including future interest payments
Credit risk
Tele2’s credit risk is mainly associated with accounts receivables, receiv-
ables related to handsets and cash and cash equivalents. The Group
regularly assesses its credit risk arising from accounts receivables. As
the customer base is highly diversified and includes individuals and
companies, the exposure and associated overall credit risk is limited.
Whenever favourable, companies within the Group are entitled to sell
overdue receivables to debt collection agencies either as a one-time
occasion or on ongoing basis. The Group makes provisions for expected
credit losses.
Maximum credit exposure for accounts receivables amounts to
SEK2,480 (3,317) million.
NOTE 3 EXCHANGE RATE EFFECTS
The consolidated balance sheet and income statement are affected by
fluctuations in subsidiaries’ currencies against the Swedish krona. Net
sales and EBITDA are distributed among the following currencies.
Net sales EBITDA
2014 2013 2014 2013
SEK 12,762 49% 12,601 49% 3,471 59% 3,322 56%
EUR 9,105 35% 8,220 32% 1,737 29% 1,857 32%
KZT 1,334 5% 1,344 5% 43 1% –138 –2%
HRK 1,390 6% 1,397 5% 169 3% 95 1%
LTL 1,364 5% 1,280 5% 506 8% 461 8%
LVL – – 915 4% – – 294 5%
Total 25,955 100% 25,757 100% 5,926 100% 5,891 100%
A five percent currency movement against the Swedish krona affects the
Group’s net sales and EBITDA on an annual basis by SEK 660 (658) million
and SEK 123 (128) million, respectively.
Tele2’s operating profit for the year was mainly affected by fluctuations
in EUR and devaluation in Kazakhstan of KZT. Last year’s net sales as
well as EBITDA have been affected negatively by SEK –456 million and
SEK –154 million, as opposed to if this year’s exchange rates had been
used also for last year. Profit for last year have been affected positively
by SEK 58 million. Assets and liabilities per country is presented in Note
4 and net assets per currency is presented in Note 2.
The annual change of net sales and EBITDA was –1 (–0) and –2 (–2)
percent respectively, excluding exchange rate differences.
Exchange rate differences which arise in operations are reported in
the income statements and totals to the following amounts.
2014 2013
Other operating income 52 52
Other operating expenses –59 –53
Other financial items –27 –28
Total exchange rate differences in income statement –34 –29
Continued Note 2
Tele2 – Annual Report 2014 39
Notes

The segment reporting is based on country level. Services offered within
the segments are mobile telephony, fixed broadband and fixed telephony.
Additional information regarding split on services per sergment is pre-
sented in Note 5, Note 6 and Note 15.
The segment Other mainly includes the parent company Tele2 AB,
central functions and Procure IT Right, as well as other minor operations.
Tele2 Sweden has been split into core operations and central group
functions. Core operations are reported in segment Sweden and central
functions are included in the segment Other. For additional information
please refer to section Segment reporting in Note 1.
2014
Sweden Netherlands Kazakhstan Croatia Lithuania Latvia Estonia Austria Germany Other
Undistributed
and internal
elimination Total
INCOME STATEMENT
Net sales
External 12,629 5,439 1,334 1,390 1,364 907 634 1,209 916 133 – 25,955
Internal 12 2 – – 11 9 – – – 2 –36 –
Net sales 12,641 5,441 1,334 1,390 1,375 916 634 1,209 916 135 –36 25,955
EBITDA 3,612 903 43 169 506 294 173 231 131 –136 – 5,926
Depreciation/amortization and other impairment –1,228 –666 –221 –82 –76 –107 –118 –136 –53 –9 – –2,696
Result from shares in joint ventures and associated companies –13 – – – – – – –1 – – – –14
One-off items (Note 6)
Sale of operations 258 – – – – – – – – 3 – 261
Other one-off items 41 –4 –18 – – – – – – –6 – 13
Operating profit 2,670 233 –196 87 430 187 55 94 78 –148 – 3,490
Interest income – – – – – – – – – – 18 18
Interest costs – – – – – – – – – – –396 –396
Other financial items – – – – – – – – – – 388 388
Income tax – – – – – – – – – – –874 –874
NET PROFIT/LOSS FROM CONTINUING OPERATIONS 2,670 233 –196 87 430 187 55 94 78 –148 –864 2,626
OTHER INFORMATION
CONTINUING OPERATIONS
CAPEX 622 1,527 319 116 107 82 138 62 15 462 – 3,450
Non-cash-generating profit/loss items
Depreciation/amortization and impairments –1,228 –666 –221 –82 –76 –107 –118 –136 –53 –9 – –2,696
Sales of fixed assets and operations 255 –1 – – – 22 – –1 – –1 – 274
Incentive program – – – – – – – – – –29 – –29
Dec 31, 2014
BALANCE SHEET
Assets 10,196 10,726 3,535 1,140 1,868 2,016 1,688 463 201 1,779 6,236 39,848
Liabilities 2,747 1,731 734 598 287 216 144 353 185 393 9,778 17,166
Instead of only reporting non-current assets by segment, total assets by segment have beeen reported as this is more relevant for Tele2.
2013
Sweden Netherlands Kazakhstan Croatia Lithuania Latvia Estonia Austria Germany Other
Undistributed
and internal
elimination Total
INCOME STATEMENT
Net sales
External 12,453 5,435 1,344 1,397 1,280 915 674 1,244 867 148 – 25,757
Internal 7 1 – – 9 11 – – – 4 –32 –
Net sales 12,460 5,436 1,344 1,397 1,289 926 674 1,244 867 152 –32 25,757
EBITDA 3,448 1,251 –138 95 461 292 161 308 138 –125 – 5,891
Depreciation/amortization and other impairment –1,367 –601 –312 –101 –119 –104 –106 –126 –39 –17 – –2,892
Result from shares in joint ventures and associated companies –18 – – – – – – 1 – – – –17
One-off items (Note 6)
Impairment of goodwill and other assets – – – –457 – – – – – – – –457
Sale of operations – – – – – – – – – 23 – 23
Operating profit 2,063 650 –450 –463 342 188 55 183 99 –119 – 2,548
Interest income – – – – – – – – – – 49 49
Interest costs – – – – – – – – – – –417 –417
Other financial items – – – – – – – – – – –183 –183
Income tax – – – – – – – – – – –1,029 –1,029
NET PROFIT/LOSS FROM CONTINUING OPERATIONS 2,063 650 –450 –463 342 188 55 183 99 –119 –1,580 968
OTHER INFORMATION
CONTINUING OPERATIONS
CAPEX 965 2,067 464 62 93 103 65 80 24 476 – 4,399
Non-cash-generating profit/loss items
Depreciation/amortization and impairments –1,367 –601 –312 –558 –119 –104 –106 –126 –39 –17 – –3,349
Sales of fixed assets and operations –12 –3 –1 – – – – – – 28 – 12
Incentive program – – – – – – – – – –12 – –12
Dec 31, 2013
BALANCE SHEET
Assets 10,777 9,178 3,382 926 1,649 1,912 1,577 504 187 2,932 6,831 39,855
Liabilities 3,305 1,670 818 535 320 198 130 343 165 473 10,307 18,264
NOTE 4 SEGMENT REPORTING
40 Tele2 – Annual Report 2014
Notes
Net sales
Net sales Internal sales
2014 2013 2014 2013
Sweden
Mobile 11,113 10,075 12 7
Fixed broadband 728 1,411 – –
Fixed telephony 660 841 – –
Other operations 140 133 – –
12,641 12,460 12 7
Netherlands
Mobile 1,957 1,682 – –
Fixed broadband 2,496 2,632 – –
Fixed telephony 421 551 – –
Other operations 567 571 2 1
5,441 5,436 2 1
Kazakhstan
Mobile 1,334 1,344 – –
1,334 1,344 – –
Croatia
Mobile 1,390 1,397 – –
1,390 1,397 – –
Lithuania
Mobile 1,375 1,289 11 9
1,375 1,289 11 9
Latvia
Mobile 916 926 9 11
916 926 9 11
Estonia
Mobile 582 606 – –
Fixed telephony 7 10 – –
Other operations 45 58 – –
634 674 – –
Austria
Fixed broadband 783 811 – –
Fixed telephony 165 190 – –
Other operations 261 243 – –
1,209 1,244 – –
Germany
Mobile 440 321 – –
Fixed broadband 164 171 – –
Fixed telephony 312 375 – –
916 867 – –
Other
Other operations 135 152 2 4
135 152 2 4
TOTAL
Mobile 19,107 17,640 32 27
Fixed broadband 4,171 5,025 – –
Fixed telephony 1,565 1,967 – –
Other operations 1,148 1,157 4 5
25,991 25,789 36 32
Internal sales, elimination –36 –32
TOTAL NET SALES AND
INTERNAL SALES 25,955 25,757 36 32
In 2014, the net sales in Sweden was positively impacted by SEK 73
million as a result of decisions by the Swedish Post and Telecom
Authority (PTS) regarding termination rates for previous periods, of
which mobile amounted to SEK 78 million and fixed broadband to
SEK –5 million.
In 2014, the net sales in Lithuania was positively impacted by SEK 15
million as a result of expired prepaid balances.
NOTE 5 NET SALES AND NUMBER OF CUSTOMERS
Net sales from external customers are comprised of the following
categories.
2014 2013
Equipment revenue, mobile 3,818 3,129
Equipment revenue, fixed broadband 22 46
Equipment revenue 3,840 3,175
Sales of service 22,115 22,582
Total net sales 25,955 25,757
Mobile external net sales can be split into additional categories of
revenues, which is presented below.
2014 2013
Sweden, mobile
End-user service revenue 7,252 6,950
Operator revenue 955 982
Service revenue 8,207 7,932
Equipment revenue 2,258 1,535
Other revenue 636 601
11,101 10,068
Netherlands, mobile
End-user service revenue 1,203 944
Operator revenue 149 131
Service revenue 1,352 1,075
Equipment revenue 605 607
1,957 1,682
Kazakhstan, mobile
End-user service revenue 978 909
Operator revenue 338 402
Service revenue 1,316 1,311
Equipment revenue 18 33
1,334 1,344
Croatia, mobile
End-user service revenue 803 749
Operator revenue 274 298
Service revenue 1,077 1,047
Equipment revenue 313 350
1,390 1,397
Lithuania, mobile
End-user service revenue 847 843
Operator revenue 183 145
Service revenue 1,030 988
Equipment revenue 334 292
1,364 1,280
Latvia, mobile
End-user service revenue 551 533
Operator revenue 203 225
Service revenue 754 758
Equipment revenue 153 157
907 915
Estonia, mobile
End-user service revenue 382 391
Operator revenue 64 65
Service revenue 446 456
Equipment revenue 136 150
582 606
Germany, mobile
End-user service revenue 439 316
Service revenue 439 316
Equipment revenue 1 5
440 321
TOTAL, MOBILE
End-user service revenue 12,455 11,635
Operator revenue 2,166 2,248
Service revenue 14,621 13,883
Equipment revenue 3,818 3,129
Other revenue 636 601
TOTAL MOBILE EXTERNAL NET SALES 19,075 17,613
In 2014, equipment revenue in Sweden was positively impacted by
SEK445 (-) million as a result of sale to other than end-users.
Tele2 – Annual Report 2014 41
Notes

Number of customers
Number of customers Net customer intake
by thousands Note Dec 31, 2014 Dec 31, 2013 2014 2013
Sweden
Mobile 3,687 3,738 –51 38
Fixed broadband 57 465 –23 –19
Fixed telephony 232 273 –41 –68
3,976 4,476 –115 –49
Netherlands
Mobile 813 694 119 224
Fixed broadband 369 374 –5 –47
Fixed telephony 75 107 –32 –34
1,257 1,175 82 143
Kazakhstan
Mobile 3,297 2,751 546 154
3,297 2,751 546 154
Croatia
Mobile 823 793 30 40
823 793 30 40
Lithuania
Mobile 1,810 1,851 –41 81
1,810 1,851 –41 81
Latvia
Mobile 975 1,031 –56 –9
975 1,031 –56 –9
Estonia
Mobile 488 503 –15 –
Fixed telephony 3 4 –1 –1
491 507 –16 –1
Austria
Fixed broadband 108 118 –10 –9
Fixed telephony 148 167 –19 –24
256 285 –29 –33
Germany
Mobile 242 176 66 66
Fixed broadband 64 71 –7 –11
Fixed telephony 403 466 –63 –128
709 713 –4 –73
TOTAL
Mobile 12,135 11,537 598 594
Fixed broadband 598 1,028 –45 –86
Fixed telephony 861 1,017 –156 –255
TOTAL NUMBER OF CUSTOMERS
AND NET CUSTOMER INTAKE 13,594 13,582 397 253
Divested companies 16 –385 –
Changed method of calculation – –900
TOTAL NUMBER OF CUSTOMERS
AND NET CHANGE 13,594 13,582 12 –647
In 2014, the fixed broadband customer stock in Sweden decreased with
–385,000 customers as a result of the sale of the Swedish residential
cable and fiber operations.
In 2013, the mobile customer stock was negatively impacted by a one-
time adjustment of –811,000 customers in Kazakhstan as a result of a
changed method for calculating the number of customers so that a cus-
tomer with only incoming calls to its voicemail is no longer counted as
an active customer.
In 2013, the definition for an active customer in the customer stock was
changed to exclude Machine-to-Machine subscriptions (M2M). The one
time effect on the customer stock in each segment is presented below.
Sweden –57,000
Netherlands –8,000
Kazakhstan –4,000
Croatia –1,000
Lithuania –13,000
Latvia –3,000
Estonia –3,000
Total mobile –89,000
No customer represent 10 percent or more of net sales.
Continued Note 5
NOTE 6 EBITDA AND EBIT AS WELL AS DEPRECIATION/
AMORTIZATION AND IMPAIRMENT
EBITDA EBIT
Note 2014 2013 2014 2013
Sweden
Mobile 3,224 2,971 2,139 1,937
Fixed broadband 85 143 –13 –134
Fixed telephony 195 243 178 219
Other operations 108 91 67 41
3,612 3,448 2,371 2,063
Netherlands
Mobile –182 –20 –244 –52
Fixed broadband 693 854 178 371
Fixed telephony 142 137 126 121
Other operations 250 280 177 210
903 1,251 237 650
Kazakhstan
Mobile 43 –138 –178 –450
43 –138 –178 –450
Croatia
Mobile 169 95 87 –6
169 95 87 –6
Lithuania
Mobile 506 461 430 342
506 461 430 342
Latvia
Mobile 294 292 187 188
294 292 187 188
Estonia
Mobile 149 124 47 32
Fixed telephony 4 4 3 3
Other operations 20 33 5 20
173 161 55 55
Austria
Mobile –2 – –2 –
Fixed broadband 119 184 37 109
Fixed telephony 95 106 61 74
Other operations 19 18 –2 –
231 308 94 183
Germany
Mobile –27 –30 –61 –52
Fixed broadband 22 13 16 4
Fixed telephony 136 155 123 147
131 138 78 99
Other
Other operations –136 –125 –145 –142
–136 –125 –145 –142
TOTAL
Mobile 4,174 3,755 2,405 1,939
Fixed broadband 919 1,194 218 350
Fixed telephony 572 645 491 564
Other operations 261 297 102 129
5,926 5,891 3,216 2,982
One-off items 4, 6 274 –434
TOTAL EBITDA AND EBIT 5,926 5,891 3,490 2,548
In 2014, the EBITDA in Sweden was positively impacted by SEK 8 million
as a result of decisions by PTS, as stated in Note 5, regarding termination
rates for previous periods, of which mobile amounted to SEK 35 million,
fixed broadband to SEK –15 million and fixed telephony to SEK –12
million.
In 2014, the EBITDA for fixed telephony in Netherlands was positively
impacted by SEK 48 million as a result of settled disputes regarding
wholesale line rental.
In 2014, the EBITDA for mobile in Estonia was positively impacted by
SEK 20 million as a result of the sales of a mobile license in the 2600 MHz
frequency band.
42 Tele2 – Annual Report 2014
Notes
Continued Note 6
Depreciation/amortization and impairment
By function
2014 2013
Depreciation/amortization
Cost of service sold –2,002 –2,189
Selling expenses –190 –248
Administrative expenses –479 –376
Total depreciation/amortization –2,671 –2,813
Impairment
Cost of service sold –13 –463
Administrative expenses –12 –73
Total impairment –25 –536
TOTAL DEPRECIATION/AMORTIZATION
AND IMPAIRMENT FOR THE YEAR –2,696 –3,349
By type of asset
2014 2013
Depreciation/amortization
Utilization rights and software –298 –271
Licenses (frequency) –239 –223
Customer agreements –78 –82
Buildings –9 –8
Machinery and technical plant –1,863 –2,073
Equipment and installations –184 –156
Total depreciation/amortization –2,671 –2,813
Impairment
Utilization rights and software –12 –3
Licenses (frequency) – –111
Machinery and technical plant –13 –417
Equipment and installations – –5
Total impairment –25 –536
TOTAL DEPRECIATION/AMORTIZATION
AND IMPAIRMENT FOR THE YEAR –2,696 –3,349
Impairment losses
In 2013, Kazakhstan was negatively affected by SEK 89 million, related
to an impairment loss of SEK 73 million due to change to a new billing
system, and an extra depreciation of SEK 16 million. In addition, an
impairment loss on non-current assets was recognized in 2013 of the
cash generating unit Croatia amounting to SEK 457 million. The impair-
ment loss was based on an estimated value in use of SEK 400 million by
using pre-tax discount rate of 10 percent. Due to unsatisfactory develop-
ment, Tele2 assessed that the estimated future profit levels did not support
the previous book value. The negative effect was reported as a one-off
item for segment reporting purposes. Additional information is presented
in Note 14.
Specification of items between EBITDA and EBIT
Note 2014 2013
EBITDA 5,926 5,891
Impairment of non-current assets 6 – –457
Sale of operations 8, 16 261 23
Challenger program: restructuring costs 6 –10 –
Other one-off items 6, 9 23 –
Total one-off items 274 –434
Depreciation/amortization and other impairment –2,696 –2,892
Result from shares in joint ventures
and associated companies 7 –14 –17
EBIT 3,490 2,548
Other one-off items for segment reporting
In 2014, Tele2 announced its Challenger Program, which is a program
to step change productivity in the Tele2 Group. The program will
strengthen the organization further and enable it to continue to challenge
the industry. The costs associated with the program are reported as
one-off items, and amount to SEK –10 million for 2014. Additional infor-
mation is presented in the Administration report.
In 2014, Sweden has been positively affected by SEK 41 million, due to
the counterparty withdrew its claim concerning the ruling from the
Administrative Court of Appeal in June 2010 regarding price on whole
and split copper cable. The positive effect was reported as a one-off item.
In 2014, other operating expenses was negatively affected by SEK 18
million, related to the devaluation in Kazakhstan. The negative effect
has been reported as a one-off item. Additional information is presented
in Note 9.
NOTE 7 RESULT FROM SHARES IN JOINT VENTURES AND
ASSOCIATED COMPANIES
Holding
Dec 31, 2014 Dec 31, 2013 2014 2013
4T Sverige AB, Sweden 25.0% 25.0% –13 –18
Adworx Internetservice GmbH, Austria 47.4% 47.4% –1 1
Total result of shares in joint ven-
tures and associated companies –14 –17
Extracts from the income statements of joint
ventures and associated companies
2014 2013
Net sales 86 96
Operating loss –51 –70
Loss before tax –51 –69
Net loss –52 –70
Additional information is presented in Note 17.
NOTE 8 OTHER OPERATING INCOME
2014 2013
Sale of residential cable and fiber operations, Sweden (Note 16) 258 –
Service level agreements, for sold operations 198 21
Sale to joint operations 102 95
Exchange rate gains from operations 52 52
Sale of non-current assets 23 9
Settlements of previous years' divestments – 23
Liquidation of Versapoint, Germany 3 –
Other income 11 6
Total other operating income 647 206
In 2014, the EBITDA for mobile in Estonia was positively impacted by SEK
20 million as a result of the sales of a mobile license in the 2600 MHz
frequency band.
NOTE 9 OTHER OPERATING EXPENSES
2014 2013
Service level agreements, for sold operations –156 –20
Exchange rate loss from operations –41 –53
Devaluation in Kazakhstan –18 –
Sale/scrapping of non-current assets –9 –20
Other expenses –4 –2
Total other operating expenses –228 –95
In 2014, other operating expenses was negatively affected by SEK 18
million, related to the devaluation in Kazakhstan. The negative effect
has been reported as a one-off item. The total foreign exchange rate effect
on assets and liabilities in Kazakhstan was reported in other compre-
hensive income and amounted at the time for the devaluation to SEK –117
million. Please refer to Note 26 regarding effects on change in fair value
of put option Kazakhstan.
Tele2 – Annual Report 2014 43
Notes

In 2014, net taxes were negatively affected by SEK 36 million due to a
write down of expected expired tax loss carry-forwards in the Nether-
lands and in 2013, net taxes were positively affected by a valuation of
deferred tax assets in Austria of SEK 10 million.
The weighted average tax rate was 22.8 (28.6) percent. The decrease
on the previous year’s figure was mainly due to the fact that countries
with a higher tax rate, such as Netherlands, having a relatively lower
impact on the result than countries with lower tax rate, such as the Baltics
and Kazakhstan.
Deferred tax assets and liabilities
Deferred tax assets and liabilities are attributable to the following items.
Dec 31, 2014 Dec 31, 2013
Deferred tax assets
Unutilized loss carry-forwards 2,055 2,725
Tangible assets 68 95
Receivables 2 13
Liabilities 67 71
Pensions 12 8
Total deferred tax assets 2,204 2,912
Netted against deferred liabilities –142 –159
Total deferred tax assets according to the balance sheet 2,062 2,753
Deferred tax liabilities
Intangible assets –30 –91
Tangible assets –293 –385
Other –177 –124
Total deferred tax liabilities –500 –600
Netted against deferred assets 142 159
Total deferred tax liabilities according to the balance sheet –358 –441
TOTAL DEFERRED TAX ASSETS AND TAX LIABILITIES 1,704 2,312
The movement in deferred income tax assets and liabilities during the
year is as follows.
Dec 31, 2014 Dec 31, 2013
Deferred tax assets/-liabilities as of January 1 2,312 3,330
Reported in income statement –406 –704
Reported in income statement, discontinued operations –31 67
Reported in other comprehensive income 29 –81
Reported in equity 3 10
Divested companies – –356
Assets classified as held for sale –313 –
Exchange rate differences 110 46
Deferred tax assets/-liabilities as of December 31 1,704 2,312
Tax loss carry-forwards
The Group’s total tax loss carry-forwards (LCF) as of December 31, 2014
were 12,392 (13,564) million of which SEK 7,711 (10,315) million were
recognized as a deferred tax asset and the remaining part, SEK 4,681
(3,249) million, were not recognized. Total tax loss carry-forwards expire
according to below.
Recognized Not recognized Total
Dec 31, 2014 Dec 31, 2013 Dec 31, 2014 Dec 31, 2013 Dec 31, 2014 Dec 31, 2013
Expires in five
years – 212 939 1,403 939 1,615
Expires after five
years 327 404 1,472 692 1,799 1,096
With expiration
date 327 616 2,411 2,095 2,738 2,711
No expiration
date 7,384 9,699 2,270 1,154 9,654 10,853
Total tax loss
carry-forwards 7,711 10,315 4,681 3,249 12,392 13,564
Dec 31, 2014 Dec 31, 2013
Deferred tax assets
Companies reported a profit this year and previous year 2,062 2,383
Companies reported a loss this year – 370
Total deferred tax assets 2,062 2,753
Deferred tax assets were reported for deductible temporary differences
and tax loss carry-forwards to the extent convincing evidence showed
that these can be utilized against future taxable profits.
NOTE 10 INTEREST INCOME
2014 2013
Interest, bank balances 11 43
Interest, penalty interest 7 6
Total interest income 18 49
All interest income is for financial assets reported at amortized cost.
Interest income related to impaired financial assets, such as accounts
receivable, are not significant.
NO T E 11 INTEREST COSTS
2014 2013
Interest, financial institutions and similar liabilities –288 –327
Interest, other interest-bearing liabilities –73 –63
Interest, penalty interest –18 –8
Other finance expenses –17 –19
Total interest costs –396 –417
All interest costs are for financial instruments not valued at fair value
through the income statement.
NOTE 12 OTHER FINANCIAL ITEMS
2014 2013
Change in fair value, put option Kazakhstan 427 –166
Exchange rate differences –27 –28
EUR net investment hedge, interest component 9 17
NOK net investment hedge, interest component –11 2
Impairment of shares in Modern Holding Inc –5 –
Other finance expenses –5 –8
Total other financial items 388 –183
For information regarding the put option in Kazakhstan as well as EUR
and NOK net investment hedges please refer to Note 2 and Note 26.
NOTE 13 TAXES
Tax expense/income
2014 2013
Current tax expense, on profit current year –469 –329
Current tax income, on profit prior periods 1 4
Current tax expense –468 –325
Deferred tax expense –406 –704
Total tax on profit for the year –874 –1,029
Theoretical tax expense
The difference between recorded tax expense for the Group and the tax
expense based on prevailing tax rates in each country consists of the
below listed components.
2014 2013
Profit before tax 3,500 1,997
Tax expense/income
Theoretic tax according to prevailing tax
rate in each country –798 –22.8% –572 –28.6%
Tax effect of
Sales of shares in subsidiaries, non-taxable 96 2.7% – –
Result from associated companies –3 –0.1% –4 –0.2%
Other non-deductible expenses/ non-taxable revenue –23 –0.7% –264 –13.2%
Valuation of tax assets relating to tax
loss carry-forwards from previous years – – 11 0.6%
Adjustment due to changed tax rate 5 0.1% – –
Expired tax loss carry-forwards –36 –1.0% – –
Adjustment of tax assets from previous years 33 0.9% –4 –0.2%
Change of not valued loss-carry forwards –148 –4.2% –196 –9.8%
Tax expense/income and
effective tax rate for the year –874 –25.0% –1,029 –51.5%
44 Tele2 – Annual Report 2014
Notes

NOTE 14 INTANGIBLE ASSETS
Dec 31, 2014
Note
Utilization rights
and software
Licenses
(frequency)
Customer
agreements
Construction
in progress
Total other
intangible assets Goodwill Total
Acquisition value
Acquisition value at January 1 3,262 4,409 3,027 668 11,366 13,522 24,888
Acquisition value for assets classified as held for sale 16, 36 –320 –60 – –50 –430 –495 –925
Acquisition value in divested companies 16 – – – –2 –2 – –2
Investments 50 110 – 610 770 – 770
Sales and scrapping –35 –90 – –5 –130 – –130
Reclassification 520 57 – –628 –51 – –51
Exchange rate differences 39 133 121 2 295 692 987
Total acquisition value 3,516 4,559 3,148 595 11,818 13,719 25,537
Accumulated amortization
Accumulated amortization at January 1 –1,914 –1,150 –2,688 –5,752 –5,752
Accumulated amortization for assets classified
as held for sale 16, 36 172 22 – 194 194
Amortization –346 –245 –258 –849 –849
Sales and scrapping 23 88 – 111 111
Exchange rate differences –30 –29 –108 –167 –167
Total accumulated amortization –2,095 –1,314 –3,054 –6,463 –6,463
Accumulated impairment
Accumulated impairment at January 1 –273 –114 –44 –431 –3,985 –4,416
Impairment –12 – – –12 – –12
Sales and scrapping 12 – – 12 – 12
Exchange rate differences – –8 –3 –11 –231 –242
Total accumulated impairment –273 –122 –47 –442 –4,216 –4,658
TOTAL INTANGIBLE ASSETS 1,148 3,123 47 595 4,913 9,503 14,416
In 2014, Tele2 Estonia acquired two mobile licenses in the 800 MHz and 2100 MHz frequency bands for SEK 54 million and sold a mobile license in
the 2600 MHz frequency band for SEK 24 million.
Tele2 does not have any capitalized research and development or any intangible assets from internal work.
CAPEX per service within each country is presented in Note 15.
Dec 31, 2013
Utilization rights
and software
Licenses
(frequency)
Customer
agreements
Construction
in progress
Total other
intangible assets Goodwill Total
Acquisition value
Acquisition value at January 1 4,360 3,646 3,076 515 11,597 14,028 25,625
Acquisition value for assets classified as held for sale – – – – – –9 –9
Acquisition value in divested companies –1,436 –766 –40 –69 –2,311 –792 –3,103
Investments 104 1,449 – 653 2,206 – 2,206
Sales and scrapping –60 –34 – –57 –151 – –151
Reclassification 331 95 – –370 56 – 56
Exchange rate differences –37 19 –9 –4 –31 295 264
Total acquisition value 3,262 4,409 3,027 668 11,366 13,522 24,888
Accumulated amortization
Accumulated amortization at January 1 –2,105 –1,255 –2,385 –5,745 –5,745
Accumulated amortization in divested companies 510 322 40 872 872
Amortization –375 –246 –327 –948 –948
Sales and scrapping 52 23 – 75 75
Reclassification –1 – – –1 –1
Exchange rate differences 5 6 –16 –5 –5
Total accumulated amortization –1,914 –1,150 –2,688 –5,752 –5,752
Accumulated impairment
Accumulated impairment at January 1 –270 – –42 –312 –3,854 –4,166
Impairment –3 –111 – –114 – –114
Exchange rate differences – –3 –2 –5 –131 –136
Total accumulated impairment –273 –114 –44 –431 –3,985 –4,416
TOTAL INTANGIBLE ASSETS 1,075 3,145 295 668 5,183 9,537 14,720
In 2013, Tele2 Netherlands acquired two mobile licenses (2x10 MHz spectrum) in the 800 MHz band for SEK 1,391 million. With the acquired
spectrum in the 800 MHz band and earlier obtained spectrum in the 2600 MHz band, the roll out is ongoing for the next generation 4G network.
In2014 Tele2 Netherlands executed successfully on its 4G rollout and in the end of 2014 the company announced that it will open its 4G network for
commercial services in the beginning of 2015.
Tele2 – Annual Report 2014 45
Notes

Goodwill
In connection with the acquisition of operations, goodwill is allocated
to the cash generating units that are expected to receive future financial
benefits such as for example synergies as a result of the acquired
operations. In the event that separate cash generating units cannot be
identified, goodwill is allocated to the lowest level at which the opera-
tion and its assets are controlled and monitored internally, which is
on country level.
Dec 31, 2014 Dec 31, 2013
Sweden 1,091 1,091
Netherlands 4,744 4,458
Norway – 498
Kazakhstan 818 809
Lithuania 803 755
Latvia 1,152 1,083
Estonia 867 816
Austria 9 8
Other 19 19
Total goodwill 9,503 9,537
Allocation of goodwill and test for goodwill impairment
Tele2 tests goodwill for impairment annually by calculating the recover-
able value for the cash-generating units to which goodwill are allocated.
The recoverable value of the respective cash generating unit is based on
the higher of estimated value in use and fair value less costs to sell.
The most important criteria in the calculations of values in use are
growth rates, profit margins, investment levels and discount rates. The
expected revenue growth rate, profit margin and investment level are
based on sector data as well as management’s assessment of market-
specific risks and opportunities, including expected changes in competi-
tion, the business model used by Tele2 and the regulatory environment.
Management’s assessment of the range of revenues, profits and invest-
ments are limited to Tele2’s current telecom licences and assets. The
discount rate takes into account the prevailing interest rates and specific
risk factors in a particular cash-generating unit. The discount rate before
tax varies between 10 and 16 (9 and 24) percent.
Tele2 calculates future cash flows based on the most recently to the
Board presented three-year plan. In two (two) cases we extend the busi-
ness case for an additional seven (seven) years until the forecasted cash
flow growth is considered more stable. For the period after this, annual
growth of up to 2 (up to 1) percent is assumed. They do not exceed the
average long-term growth for the sector as a whole nor do they exceed
the expected long term GDP growth rates in the markets. In 2014, Tele2
recognized no goodwill impairment (2013: recognized impairment loss
in Croatia, however with no goodwill impairment). For additional infor-
mation see Note 6.
Changes to important assumptions
For cash-generating units to which goodwill have been allocated Tele2
assesses that reasonable possible changes in the major assumptions
should not have such significant effects that they individually would
reduce the value in use to a value that is lower than the carrying value
on the cash generating units, except for Estonia for which a negative
deviation from the assumptions used could trigger an impairment.
The value in use calculations are based on the following assumptions
per country.
WACC pre tax Forecast period, in year
Growth rate after the
forecast period
2014 2013 2014 2013 2014 2013
Sweden 11% 11% 3 3 0% 0%
Netherlands 15% 16% 10 10 0% 0%
Kazakhstan 16% 24% 10 10 2% 0%
Lithuania 10% 10% 3 3 2% 1%
Latvia 10% 12% 3 3 2% 1%
Estonia 10% 10% 3 3 2% 1%
Austria 10% 9% 3 3 0% –4%
This year’s reduction of the WACC in Kazakhstan is related to lower
execution risk in the 2014 financial plan. Following the devaluation and
increased competition in the market we have reassessed the Kazakh
business during the year. As a result the fair value of the put option has
been reduced correspondently, please refer to Note 26.
Other non-current assets
For impairment of other non-current assets, please refer to Note 6.
Continued Note 14
46 Tele2 – Annual Report 2014
Notes

NOTE 15 TANGIBLE ASSETS
Dec 31, 2014
Note Buildings
Equipment and
installations
Construction
in progress
Total other
tangible assets
Machinery and
technical plant
of which
finance leases Total
Acquisition value
Acquisition value at January 1 192 1,584 2,273 4,049 31,805 569 35,854
Acquisition value for assets classified as held for sale 16, 36 – –35 –497 –532 –2,012 ––2,544
Acquisition value in divested companies 16 – – –4 –4 –7 ––11
Investments 8 57 2,906 2,971 235 –3,206
Dismantling costs – – – – 226 –226
Sales and scrapping –5 –148 – –153 –2,709 –8 –2,862
Reclassification 30 297 –2,647 –2,320 2,371 551
Exchange rate differences 16 72 71 159 700 13 859
Total acquisition value 241 1,827 2,102 4,170 30,609 579 34,779
Accumulated depreciation
Accumulated depreciation at January 1 –129 –1,242 –1,371 –21,725 –414 –23,096
Accumulated depreciation at January 1, assets classified as held for sale 16, 36 – 20 20 415 –435
Depreciation –9 –191 –200 –2,048 –30 –2,248
Sales and scrapping 6 145 151 2,682 82,833
Exchange rate differences –8 –55 –63 –443 –12 –506
Total accumulated depreciation –140 –1,323 –1,463 –21,119 –448 –22,582
Accumulated impairment
Accumulated impairment at January 1 –3 –7 –10 –1,001 – –1,011
Impairment – – – –13 – –13
Sales and scrapping – – – 7 –7
Exchange rate differences –1 – –1 –41 – –42
Total accumulated impairment –4 –7 –11 –1,048 – –1,059
TOTAL TANGIBLE ASSETS 97 497 2,102 2,696 8,442 131 11,138
Machinery and technical plant in Kazakhstan of SEK 30 (142) million is pledged for loan in Kazakhstan according to Note 26. Finance leases relate
to the expansion of transmission capacity in Sweden and Austria, please refer to Note 31.
Dec 31, 2013
Buildings
Equipment and
installations
Construction in
progress
Total other
tangible assets
Machinery and
technical plant
of which
finance leases Total
Acquisition value
Acquisition value at January 1 250 1,854 2,216 4,320 39,501 714 43,821
Acquisition value for assets classified as held for sale – –31 – –31 –1,760 ––1,791
Acquisition value in divested companies –111 –427 –384 –922 –8,196 –152 –9,118
Investments 3 100 2,271 2,374 954 26 3,328
Dismantling costs – 18 – 18 306 –324
Sales and scrapping –4 –45 –14 –63 –597 –23 –660
Reclassification 50 93 –1,762 –1,619 1,563 ––56
Exchange rate differences 4 22 –54 –28 34 46
Total acquisition value 192 1,584 2,273 4,049 31,805 569 35,854
Accumulated depreciation
Accumulated depreciation at January 1 –144 –1,354 –1,498 –23,649 –410 –25,147
Accumulated depreciation at January 1, assets classified as held for sale – 31 31 1,331 –1,362
Accumulated depreciation in divested companies 26 237 263 2,656 11 2,919
Depreciation –12 –180 –192 –2,405 –31 –2,597
Sales and scrapping 4 47 51 512 22 563
Reclassification – –1 –1 2 –1
Exchange rate differences –3 –22 –25 –172 –6 –197
Total accumulated depreciation –129 –1,242 –1,371 –21,725 –414 –23,096
Accumulated impairment
Accumulated impairment at January 1 –3 –1 –4 –591 – –595
Accumulated impairment in divested companies – – – 16 – 16
Impairment – –5 –5 –417 ––422
Sales and scrapping – – – 6 –6
Exchange rate differences – –1 –1 –15 – –16
Total accumulated impairment –3 –7 –10 –1,001 – –1,011
TOTAL TANGIBLE ASSETS 60 335 2,273 2,668 9,079 155 11,747
Tele2 – Annual Report 2014 47
Notes

NOTE 16 ACQUISITIONS AND DIVESTMENTS
Acquisitions and divestments of shares and participations affecting cash
flow were as follows:
2014 2013
ACQUISITIONS
Acquisitions of group companies 6 –
Total group companies 6 –
Capital contributions to joint ventures –9 –25
Repayment capital contribution joint ventures 4 –
Dividend from associated companies – 1
Acquisitions of associated companies –4 –
Total joint ventures and associated companies –9 –24
TOTAL ACQUISITION OF SHARES AND PARTICIPATIONS –3 –24
DIVESTMENTS
Residential cable and fiber operations, Sweden 709 –
Tele2 Russia – 17,252
Settlements of previous years' divestment of Tele2 Russia –32 –
TOTAL SALE OF SHARES AND PARTICIPATIONS 677 17,252
TOTAL CASH FLOW EFFECT 674 17,228
Acquisitions
In November, 2014 Tele2 Lithuania acquired 100 percent in a company
with independent dealers in order to strengthen the quality perception
and the customer satisfaction, and as a result the company added 50
shops to the Tele2 distribution network. The acquired company held
liquid funds of SEK 6 million.
In June, 2014 Tele2 Norway acquired 33.3 percent in the joint venture,
Strex AS for SEK 4 million. The company holds a license to perform
financial services.
Divestments
Tele2 Norway
On July 7, 2014 Tele2 announced the divestment of its Norwegian opera-
tions to TeliaSonera Group. The sale was completed in February 2015
after approval by regulatory authorities. The divested operation has been
reported separately under discontinued operations in the income state-
ment, with a retrospective effect on previous periods. Additional informa-
tion are presented in Note 36.
Residential cable and fiber operations, Sweden
On October 23, 2013 Tele2 announced the sale of its Swedish residential
cable and fiber operations to Telenor for SEK 793 million. The sale was
completed on January 2, 2014 after approval by regulatory authorities
and the capital gain amounted to SEK 258 million. In 2013, the operation
affected Tele2’s net sales by SEK 564 million and EBITDA by SEK –9
million.
Assets, liabilities and contingent liabilities included in the divested
operation at the time of divestment is stated below:
Goodwill 9
Other intangible assets 2
Tangible assets 440
Prepaid expenses and accrued income 10
Deferred tax liabilities –18
Accrued expenses and deferred income –35
Divested net assets 408
Capital gain 258
Tax income 18
Sales price, net sales costs 684
Unpaid sales costs etc 25
TOTAL CASH FLOW EFFECT 709
Continued Note 15
CAPEX
Dec 31, 2014 Dec 31, 2013
Intangible assets 770 2,206
Tangible assets 3,206 3,328
Total CAPEX 3,976 5,534
Less intangible assets in discontinued operations –70 –191
Less tangible assets in discontinued operations –456 –944
TOTAL CAPEX IN CONTINUING OPERATIONS 3,450 4,399
The difference between CAPEX and paid CAPEX is presented in Note 32.
CAPEX
Dec 31, 2014 Dec 31, 2013
Sweden
Mobile 553 766
Fixed broadband 46 165
Fixed telephony 8 7
Other operations 15 27
622 965
Netherlands
Mobile 1,042 1,648
Fixed broadband 426 379
Fixed telephony 15 8
Other operations 44 32
1,527 2,067
Kazakhstan
Mobile 319 464
319 464
Croatia
Mobile 116 62
116 62
Lithuania
Mobile 107 93
107 93
Latvia
Mobile 82 103
82 103
Estonia
Mobile 133 62
Other operations 5 3
138 65
Austria
Fixed broadband 30 38
Fixed telephony 23 29
Other operations 9 13
62 80
Germany
Mobile 13 19
Fixed broadband 2 3
Fixed telephony – 2
15 24
Other
Other operations 462 476
462 476
TOTAL
Mobile 2,365 3,217
Fixed broadband 504 585
Fixed telephony 46 46
Other operations 535 551
TOTAL CAPEX ACCORDING TO BALANCE SHEET 3,450 4,399
48 Tele2 – Annual Report 2014
Notes

NOTE 17 SHARES IN JOINT VENTURES
AND ASSOCIATED COMPANIES
Company
Holding
(capital/votes) Dec 31, 2014 Dec 31, 2013
4T Sverige AB, Sweden 25% 3 6
MPayment AS, Norway 33.3% – 11
SNPAC Swedish Nr Portability Adm.Centre AB,
Sweden 20% 3 3
Adworx Internetservice GmbH, Austria 47.4% 4 5
GH Giga Hertz HB as well as 15 other trading
companies with licenses, Sweden 33.3% 3 3
Total shares in joint ventures
and associated companies 13 28
Dec 31, 2014 Dec 31, 2013
Acquisition value
Acquisition value at January 1 28 22
Opening balance in assets held for sale –11 –
Investments 9 23
Share of loss for the year –13 –17
Total shares in joint ventures and associated companies 13 28
None of the associated companies are listed on stock exchanges.
Extracts from the balance sheets of associated
companies
Dec 31, 2014 Dec 31, 2013
Intangible assets 2 8
Tangible assets 1 1
Financial assets 1 1
Current assets 114 146
Total assets 118 156
Equity 39 84
Current liabilities 79 72
Total equity and liabilities 118 156
Additional information is presented in Note 7.
NOTE 18 OTHER FINANCIAL ASSETS
Dec 31, 2014 Dec 31, 2013
Prepayment T-Mobile Netherlands, Mobile site access 243 –
VAT receivable, Kazakhstan 200 215
Pension funds 45 90
Non-current holdings of securities 8 14
Restricted bankdeposits – 10
Other receivables 22 8
Total other financial assets 518 337
As part of the Network Sharing Agreement, Tele2 Netherlands has agreed
with T-Mobile to prepay part of the mobile site access rent cost to finance
the investments of T-Mobile to modernize their network.
Non-current securities consist of shares in the companies listed below.
Company
Holding
(capital/votes) Dec 31, 2014 Dec 31, 2013
Modern Holdings Inc, US 11.88% 6 11
Radio National Skellefteå AB, Sweden 5.5% 1 1
Telering AS, Norway 10% – 1
Estonian Broadband Development Foundation,
Estonia 13% 1 1
Total non-current securities 8 14
NOTE 19 INVENTORIES
Dec 31, 2014 Dec 31, 2013
Finished products & goods for resale 497 462
Other 3 9
Total inventories 500 471
Tele2’s inventories consist of mainly telephones, but also SIM cards and
modems held for sale. In 2014 inventories was expensed by SEK 4,255
(3,532) million, of which SEK 10 (12) million was related to write-down.
NOTE 21 OTHER CURRENT RECEIVABLES
Dec 31, 2014 Dec 31, 2013
VAT receivable 124 126
Receivable from Net4Mobility, joint operation in Sweden 128 113
Derivatives 47 8
Receivable from Svenska UMTS-nät, joint operation in Sweden 38 29
Prepayment T-Mobile Netherlands, Mobile site access (Note 18) 20 –
Receivable from suppliers 14 13
Receivable from insurance companies 11 –
Receivable from credit card companies, prepaid 9 8
Receivable from 4T, associated company in Sweden 6 8
Receivable related to divestment of operations 4 –
Other 21 16
Total other current receivables 422 321
Derivatives consists of interest swaps and currency swaps, valued at fair
value. The effective part of the swaps were reported in the hedge reserve
in other comprehensive income and the ineffective part were reported
as interest costs and other financial items, respectively, in the income
statement. The Group has derivative contracts which are covered by
master netting agreements. That means a right exists to set off assets
and liabilities with the same party, which is not reflected in the account-
ing where gross accounting is applied. For additional information please
refer to Note 2.
NOTE 20 ACCOUNTS RECEIVABLE
Dec 31, 2014 Dec 31, 2013
Accounts receivable 3,059 3,914
Reserve for doubtful accounts –579 –597
Total accounts receivable, net 2,480 3,317
Dec 31, 2014 Dec 31, 2013
Reserve for doubtful accounts
Reserve for doubtful accounts at January 1 597 582
Reserve for doubtful accounts for assets classified as held for sale –42 –
Reserves in companies divested during the year – –57
Provisions 116 134
Recovery of previous provisions –122 –70
Exchange rate differences 30 8
Total reserve for doubtful accounts 579 597
Dec 31, 2014 Dec 31, 2013
Accounts receivable, overdue with no reserve
Overdue between 1–30 days 429 456
Overdue between 31–60 days 90 75
Overdue more than 60 days 169 108
Total accounts receivable, overdue with no reserve 688 639
NOTE 22 PREPAID EXPENSES AND ACCRUED INCOME
Dec 31, 2014 Dec 31, 2013
Revenues from sold equipment 2,807 2,595
Traffic revenues, from other telecom operators 362 536
Traffic revenues, from end-users 332 388
Subscription fees etc, from end-users 146 132
Accrued income, other 110 96
Rental cost 217 268
Frequency usage 127 49
Fixed subscription charges 34 42
Retailers' commissions, prepaid cards 15 15
Prepaid expenses, other 102 62
Total prepaid expenses and accrued revenues 4,252 4,183
SEK 818 (1,076) million of the balance sheet item is estimated to be paid
more than 12 months after the closing date, of which SEK 802 (1,062)
million is attributable to revenues from equipment.
NOTE 23 CURRENT INVESTMENTS
Dec 31, 2014 Dec 31, 2013
Restricted funds 38 55
Total current investments 38 55
Tele2 – Annual Report 2014 49
Notes
NOTE 24 CASH AND CASH EQUIVALENTS AND UNUTILIZED OVERDRAFT FACILITIES
Available liquidity
Dec 31, 2014 Dec 31, 2013
Cash and cash equivalents 151 1,348
Unutilized overdraft facilities and credit lines 8,073 7,958
Total available liquidity 8,224 9,306
Dec 31, 2014 Dec 31, 2013
Unutilized overdraft facilities and credit lines
Overdraft facilities granted 1,143 826
Overdraft facilities utilized –682 –22
Total unutilized overdraft facilities 461 804
Unutilized credit lines 7,612 7,154
TOTAL UNUTILIZED OVERDRAFT FACILITIES
AND CREDIT LINES 8,073 7,958
Tele2’s share of liquid funds in joint operations, for which Tele2 has
limited disposal rights, amounted at December 31, 2014 to SEK 4 (11)
million and was included in the Group’s cash and cash equivalents.
No specific collateral is provided for overdraft facilities or unutilized
credit lines.
Exchange rate difference in cash and cash
equivalents
Dec 31, 2014 Dec 31, 2013
Exchange rate differences in cash and
cash equivalents at January 1 3 71
Exchange rate differences in cash flow for the year 89 –39
Total exchange rate differences in cash and
cash equivalents for the year 92 32
NOTE 25 EQUITY, NUMBER OF SHARES AND EARNINGS PER SHARE
Number of shares
A shares B shares C shares Total
Change Total Change Total Change Total
As of January 1, 2013 20,987,981 423,746,358 4,049,000 448,783,339
Reclassification of A shares to B shares –15 20,987,966 15 423,746,373 – 4,049,000 448,783,339
Reclassification of C shares to B shares – 20,987,966 900,000 424,646,373 –900,000 3,149,000 448,783,339
Share split 2:1 20,987,966 41,975,932 424,646,373 849,292,746 3,149,000 6,298,000 897,566,678
Redemption of shares –20,987,966 20,987,966 –424,646,373 424,646,373 –3,149,000 3,149,000 448,783,339
Reclassification of A shares to B shares –726,650 20,261,316 726,650 425,373,023 – 3,149,000 448,783,339
As of December 31, 2013 20,261,316 425,373,023 3,149,000 448,783,339
Reclassification of A shares to B shares –406 20,260,910 406 425,373,429 – 3,149,000 448,783,339
Reclassification of C shares to B shares – 20,260,910 150,000 425,523,429 –150,000 2,999,000 448,783,339
Total number of shares as of December 31, 2014 20,260,910 425,523,429 2,999,000 448,783,339
2014 2013
Number of outstanding shares 445,722,973 445,497,600
Number of shares in own custody 3,060,366 3,285,739
Number of shares, weighted average 445,594,010 445,228,097
Number of shares after dilution 448,799,576 448,465,420
Number of shares after dilution, weighted average 448,606,438 448,181,516
The share capital in Tele2 AB is divided into three classes of shares: Class
A, B and C shares. All types of shares have a quota value of SEK 1.25 per
share and Class A and B shares have the same rights in the company’s
net assets and profits while Class C shares are not entitled to dividend.
Shares of Class A entitle the holder to 10 voting rights per share and Class
B and C shares to one voting right per share.
There are no limitations regarding how many votes each shareholder
may vote for at general meetings of shareholders. The Articles of Associa-
tion make no stipulation that limits the right to transfer the shares.
In the case of a bid for all shares or a controlling part of the shares in
Tele2, the financing facility may be accelerated and due for immediate
repayment. In addition, some interconnect agreements and some other
agreements may be terminated.
In 2014, 406 A shares and 150,000 C shares were reclassified to B
shares.
Shares in own custody
B shares C shares Total
Change Total Change Total
As of January 1, 2013 73,128 4,049,000 4,122,128
Reclassification of C shares
to B shares 900,000 973,128 –900,000 3,149,000 4,122,128
Delivery of own shares under
LTI program –836,389 136,739 – 3,149,000 3,285,739
As of December 31, 2013 136,739 3,149,000 3,285,739
Reclassification of C shares
to B shares 150,000 286,739 –150,000 2,999,000 3,285,739
Delivery of own shares
under LTI program –225,373 61,366 – 2,999,000 3,060,366
Total number of shares
in own custody as of
December 31, 2014 61,366 2,999,000 3,060,366
Shares in own custody amount to 0.7 (0.7) percent of the share capital.
As a result of share rights in the LTI 2011 (2010) being exercised during
2014, Tele2 delivered 225,373 (836,389) B-shares in own custody to
share right holders.
Outstanding share rights
Dec 31, 2014 Dec 31, 2013
Incentive program 2014–2017 1,117,168
Incentive program 2013–2016 1,029,026 1,132,228
Incentive program 2012–2015 896,070 968,263
Incentive program 2011–2014 34,339 867,329
Total number of outstanding share rights 3,076,603 2,967,820
Further information is provided in Note 34.
Number of shares after dilution
Dec 31, 2014 Dec 31, 2013
Number of shares 448,783,339 448,783,339
Number of shares in own custody –3,060,366 –3,285,739
Number of outstanding shares, basic 445,722,973 445,497,600
Number of outstanding share rights 3,076,603 2,967,820
Total number of shares after dilution 448,799,576 448,465,420
50 Tele2 – Annual Report 2014
Notes

NOTE 26 FINANCIAL LIABILITIES
Dec 31, 2014 Dec 31, 2013
Liabilities to financial institutions and similar liabilities 6,758 6,837
Other interest-bearing liabilities 1,625 1,914
Total interest-bearing financial liabilities 8,383 8,751
Accounts payable 2,848 3,140
Other current liabilities 467 516
Total non-interest-bearing financial liabilities 3,315 3,656
TOTAL FINANCIAL LIABILITIES 11,698 12,407
Financial risk management and financial instruments are presented in
Note 2.
Financial liabilities fall due for payment according to below.
Dec 31, 2014 Dec 31, 2013
Nominal
value
Recorded
value
Nominal
value
Recorded
value
Within 3 months 5,655 5,655 5,001 5,001
Within 3–12 months 1,450 1,450 1,719 1,708
Within 1–2 years 140 106 1,221 1,186
Within 2–3 years 3,586 3,554 161 103
Within 3–4 years 325 281 3,599 3,541
Within 4–5 years 202 202 312 241
Within 5–10 years 450 450 627 627
Total financial liabilities 11,808 11,698 12,640 12,407
Interest-bearing financial liabilities
Interest-bearing financial liabilities fall due for payments as follows:
Within
1 year
Within
1-2 years
Within
2-3 years
Within
3-4 years
Within
4-5 years
Within
5-15 years Total
Variable interest rates 2,777 15 1,164 173 202 200 4,531
Fixed interest rates 1,013 91 2,390 108 – 250 3,852
Total interest-bearing
liabilities 3,790 106 3,554 281 202 450 8,383
Collateral provided
Dec 31, 2014 Dec 31, 2013
Fixed assets 30 142
Total collateral provided for own liabilities 30 142
Earnings per share
Earnings per share Earnings per share, after dilution
2014 2013 2014 2013
Net profit attributable to equity
holders of the parent company 2,211 14,590 2,211 14,590
Weighted average
number of shares 445,594,010 445,228,097 445,594,010 445,228,097
Incentive program 2014–2017 665,045 –
Incentive program 2013–2016 1,071,624 670,041
Incentive program 2012–2015 930,283 1,026,452
Incentive program 2011–2014 345,476 942,657
Incentive program 2010–2013 314,269
Weighted average number
of share rights 3,012,428 2,953,419
Weighted average number of
outstanding shares after dilution 448,606,438 448,181,516
EARNINGS PER SHARE, SEK 4.96 32.77 4.93 32.55
Dividend and redemption
In respect of the financial year 2014, the Board of Tele2 AB has decided
to recommend to the Annual General Meeting (AGM) in May 2015, a total
dividend payment of SEK 14.85 (4.40) per ordinary A and B share, to be
comprised of an ordinary dividend of SEK 4.85 (4.40) and an extraordinary
dividend of SEK 10.00 (0). At December 31, 2014 this correspond to a total
of SEK 6,619 (1,960) million, of which ordinary dividend SEK 2,162 (1,960)
million and extraordinary dividend SEK 4,457 (0) million.
As a result of the sale of Tele2 Russia in April 2013 a mandatory share
redemption program of SEK 28 per share was issued in 2013, equivalent
to SEK 12,474 million. The redemption program implied a share split
where each share was split into two shares, of which one was a redemp-
tion share. Retirement of redemption shares in own custody of SEK 92
million was transferred to unrestricted equity. A bonus issue was per-
formed in order to increase the share capital to its prior level, SEK 561
million, through a transfer of SEK 280 million from unrestricted equity.
Thereafter, the quota value of each share amounts to SEK 1.25, the same
as prior to the share redemption program. In total SEK 15,637 million
was paid to the shareholders in 2014 as dividend and redemption.
For information regarding dividend policy please refer to Note 2.
Purchase of non-controlling interest
In 2013, Tele2 acquired the remaining 7.76 percent of the shares in the
subsidiary Officer AS in Norway for SEK 1 million.
In 2009 and 2010, Tele2 acquired the remaining 25.5 and 12.5 percent
respectively of the shares in Tele2 Izhevsk and Tele2 Rostov in Russia.
The final purchase price of SEK 3 and 90 million respectively was paid
in 2013.
Subsidiaries with material non-controlling interests
Tele2 owns 51 percent of the shares in Tele2 Kazakstan with a call option
to buy the remaining 49 percent. The non-controlling shareholder has
a put option to sell its shares to Tele2. Tele2 Kazakhstan is accounting-
wise treated as a wholly-owned subsidiary to Tele2 and Tele2 account
for the put option held by the other owner as a liability at fair value (please
refer to Note 1 and Note 26). Through agreements the other owner has
protective rights in matters such as changes in the ownership structure,
approval of dividends and other shareholder-related matters.
The tables below shows summarized financial information for Tele2
Kazakhstan before intra-group eliminations. No other material non-
controlling interests exist.
Tele2 Kazakhstan
2014 2013
Income statement
Net sales 1,334 1,344
Operating loss –196 –450
Loss before tax –590 –879
Net loss –590 –879
Tele2 Kazakhstan
Dec 31, 2014 Dec 31, 2013
Balance sheet
Intangible assets 1,336 1,385
Tangible assets 1,959 1,775
Financial assets 200 215
Current assets 240 222
Total assets 3,735 3,597
Non-current liabilities 5,178 3,757
Current liabilities 1,678 2,274
Total liabilities 6,856 6,031
Net assets –3,121 –2,434
Tele2 Kazakhstan
2014 2013
Cash flow statement
Cash flow from operations before changes in working capital –170 –288
Changes in working capital –5 –43
CASH FLOW FROM OPERATING ACTIVITIES –175 –331
Cash flow from investing activities –370 –511
CASH FLOW AFTER INVESTING ACTIVITIES –545 –842
Cash flow from financing activities 564 805
NET CHANGE IN CASH AND CASH EQUIVALENTS 19 –37
Cash and cash equivalents at beginning of the year 9 47
Exchange rate differences in cash and cash equivalents 3 –1
CASH AND CASH EQUIVALENTS AT END OF THE YEAR 31 9
Continued Note 25
Tele2 – Annual Report 2014 51
Notes

Liabilities to financial institutions and similar liabilities
Dec 31, 2014 Dec 31, 2013
Creditors
(collateral provided)
Interest
rate terms
Maturity
date
Current
liabilities
Non-
current
liabilities
Current
liabilities
Non-
current
liabilities
Bonds NOK NIBOR +1.7% 2015 315 – – 316
Bonds NOK NIBOR +2.35% 2017 – 1,049 – 1,055
Bonds SEK STIBOR +2.85% 2017 – 1,498 – 1,497
Bonds SEK fixed: 4.875% 2017 – 799 – 798
Bonds SEK STIBOR +1.1% 2015 750 – – 750
Bonds SEK – – 500 –
Bonds SEK STIBOR +2.45% 2020 – 250 – 250
Bonds SEK variable interest
rates
2020 500 – 500 –
Total Bonds 1,565 3,596 1,000 4,666
Commercial paper fixed: 0.504%–
0.9310%
2015 215 – 325 –
Nordic Investment
Bank (NIB)
variable
interest rates
2017-
2020
– 705 – 663
Syndicated loan
facilities
variable
interest rates
2018 – –38 – –55
Kazkommertsbank
(collateral: fixed assets
in Tele2 Kazakhstan)
variable
interest rates
2014-
2015
33 – 188 28
Utilized bank
overdraft facility
variable
interest rates
682 – 22 –
2,495 4,263 1,535 5,302
Total liabilities to financial institutions
and similar liabilities 6,758 6,837
Tele2 has entered into a EUR 0.8 billion credit facility with a syndicate
of 11 banks. The facility has maturity in May 2018. The loans can be
drawn in several currencies and the interest base is the relevant IBOR
for that currency. On December 31, 2014, the syndicated loan facility was
unutilized and prepaid upfront fees to be recognized in profit/loss over
the remaining contract period amounted to SEK –38 (–55) million. The
facility is conditioned by covenant requirements which Tele2 expects to
fulfil.
Tele2 AB has NOK 1.3 billion bonds issued in the Norwegian bond
market. The amount is split between a bond issue of NOK 300 million
and a bond issue of NOK 1 billion. The bonds are listed on Oslo børs.
Tele2 AB’s Euro Medium-Term Note (EMTN) Program forms the basis
for Tele2’s medium and long term debt issuance in both international
and domestic bond markets. The program enables Tele2 to issue bonds
and notes up to a total aggregate amount of EUR 3 billion. On December
31, 2014 issued bonds under the program amounted to SEK 3,797 (4,295)
million.
Tele2 AB’s established Swedish commercial paper program enables
to issue commercial papers up to a total amount of SEK 5 billion. Com-
mercial papers can be issued with a tenor up to 12 months under the
program. The commercial paper program is a complement to Tele2’s core
funding. On December 31, 2014 outstanding commercial papers amounted
to SEK 215 (325) million.
As a further step towards the diversification of Tele2’s funding sources,
Tele2 AB has an 8-year-maturity loan agreement with Nordic Investment
Bank (NIB) totalling EUR 74 million.
Since the acquisition in 2010, Tele2 holds 51 percent of the shares in
Tele2 Kazakhstan. The company had, at the time of acquisition, existing
liabilities to several financial institutions. The interest base is LIBOR. On
December 31, 2014 these liabilities amounted to EUR 0 (15) million and
USD 4 (13) million.
The average interest rate on loans during the year was 5.0 (5.2)
percent.
Other interest-bearing liabilities
Dec 31, 2014 Dec 31, 2013
Current
liabilities
Non-
current
liabilities
Current
liabilities
Non-
current
liabilities
Put option, Kazakhstan 887 – 1,350 –
Kazakhtelecom 98 292 – 347
Derivatives 294 – 146 –
Finance leases 16 38 21 49
Supplier financed, Silver Server in Austria – – 1 –
1,295 330 1,518 396
Total other interest-bearing liabilities 1,625 1,914
Tele2 owns 51 percent of the shares in Tele2 Kazakhstan with a call
option to buy the remaining 49 percent from December 14, 2014 to April
14, 2015. The non-controlling shareholder, Asianet Holding BV, has a put
option to sell its shares to Tele2. The exercise price of both options is the
fair market value of the shares at the date of exercise. The put option is
reported at its estimated fair value at the balance sheet date, determined
on the basis of expected future discounted cash flows. The change in
value consists of changes in fair value reported as other financial items
in the income statement of SEK 427 (166) million and exchange rate dif-
ferences of SEK –36 (–30) million recognized in other comprehensive
income. Following the devaluation and increased competition in the
market Tele2 has reassessed the Kazakh business during the year. As a
result the fair value of the put option has been reduced correspondently.
Additional information is presented in Note 25.
At the time of the acquisition of Tele2 Kazakhstan the company had
an existing interest free liability to the former owner. On December 31,
2014 that reported debt amounted to SEK 390 (347) million and the
nominal value to SEK 500 (495) million.
Derivatives consists of interest swaps and currency swaps, valued at
fair value. The effective part of the swaps were reported in the hedge
reserve in other comprehensive income and the ineffective part were
reported as interest costs and other financial items, respectively, in the
income statement. The Group has derivative contracts which are covered
by master netting agreements. That means a right exists to set off assets
and liabilities with the same party, which is not reflected in the account-
ing where gross accounting is applied. For additional information please
refer to Note 2.
For information on finance leases please refer to Note 31.
Other current liabilities
Dec 31, 2014 Dec 31, 2013
VAT liability 173 182
Liability to Net4Mobility, joint operation in Sweden 103 107
Liability to Svenska UMTS-nät, joint operation in Sweden 73 73
Employee withholding tax 64 70
Debt to customers 17 46
Debt to other operators 16 16
Customer deposit 12 8
Debt to content suppliers 3 6
Other 6 8
Total current liabilities 467 516
Continued Note 26
52 Tele2 – Annual Report 2014
Notes

NOTE 27 PROVISIONS
2014
Dis mant-
ling
costs
Rented
buildings
and
cables
Legal
disputes
Claims and
guarantees
for
divested
operations
Pension
and
similar
commit-
ments Total
Provisions as of January 1 488 56 51 39 45 679
Provisions directly associated
with assets classified as held
for sale –105 – – – – –105
Additional provisions 226 10 – – 22 258
Utilized/paid provisions –10 –9 – –3 – –22
Reversed unused provisions –26 – –41 – – –67
Present value adjustment 45 – – – – 45
Exchange rate differences 16 – 1 2 – 19
Total provisions as of
December 31 634 57 11 38 67 807
Dec 31, 2014 Dec 31, 2013
Provisions, current 47 95
Provisions, non-current 760 584
Total provisions 807 679
Provisions are expected to fall due for payment according to below:
Dec 31, 2014 Dec 31, 2013
Within 1 year 47 95
Within 1–3 years 81 78
Within 3–5 years 23 20
More than 5 years 656 486
Total provisions 807 679
Dismantling costs refer to dismantling and restoration of mobile and fixed
network sites. Remaining provision as of December 31, 2014 is expected
to be fully utilized during the coming 30 years.
For additional information on finance leases please refer to Note 31.
NOTE 28 ACCRUED EXPENSES AND DEFERRED INCOME
Dec 31, 2014 Dec 31, 2013
Traffic expenses to other telecom operators 500 1,171
Investments in non-current assets 558 728
External service expenses 509 527
Personnel-related expenses 486 562
Leasing and rental expenses 95 174
Expenses for dealers 86 146
Interest costs 43 63
Other accrued expenses 55 113
Deferred income, prepaid cards 337 383
Deferred income, other 594 737
Total accrued expenses and deferred income 3,263 4,604
NOTE 29 PLEDGED ASSETS
Dec 31, 2014 Dec 31, 2013
Fixed assets 30 142
Current investments, bank deposits 38 55
Other non-current receivables, bank deposits – 10
Total pledged assets 68 207
The opposite parties can only take over the pledged items in case Tele2
neglects its duty to pay its debts according to the agreements.
NOTE 30 CONTINGENT LIABILITIES AND
OTHER COMMITMENTS
Contingent liabilities
Dec 31, 2014 Dec 31, 2013
Asset dismantling obligation 137 126
Disputes 83 220
Total contingent liabilities 220 346
Tele2 has obligations to dismantle assets and restore premises within
fixed telephony and fixed broadband in the Netherlands as well as in
Austria. Tele2 assesses the dismantling of these sites as unlikely and
consequently only reports this obligation as contingent liabilities.
Tele2 Netherlands is, in the ordinary course of its business, involved
in several regulatory complaints and disputes pending with the appropri-
ate governmental authorities. In a specific case regarding the rental fees
of copper lines, which Tele2 Netherlands uses as part of its fixed opera-
tions, the regulator (ACM) has determined that the rental fees are to be
adjusted with retroactive effect from 2009. This has resulted in a claim
from KPN amounting to EUR 8.7 million (SEK 83 million) and is subject
to pending appeals and court cases. Our assessment is that it is unlikely
that Tele2 will have to pay these fees and consequently no provision has
been made. We estimate that the Administrative Court will give its ruling
in 2015.
The tax authorities in Russia are currently performing tax audits on
several of Tele2’s former subsidiaries in Russia. Per the sales agreement
with the VTB-Group Tele2 is liable for any additional taxes payable as
result of the tax audits. During 2014, Tele2 has won tax disputes of SEK
124 million, of which the Russian tax authorities has appealed disputes
of SEK 86 million, and lost tax disputes of SEK –25 million, of which Tele2
has appealed one dispute of SEK –22 million. Even though it cannot be
ruled out that Tele2 may be liable to certain costs, Tele2 assesses that it
is not likely that any additional taxes will be paid and consequently no
provision has been made.
On December 31, 2013 Tele2 Sweden was defendant in a dispute with
Verizon Sweden AB of SEK 220 million. In 2014, the District court issued
its award and ruled in favor of Tele2 after which the case was settled
where the parties agreed to pay for their own litigation costs.
Other contractual commitments
Dec 31, 2014 Dec 31, 2013
Commitments, investments 610 704
Commitments, other 1,191 3,718
Total future fees for other contractual commitments 1,801 4,422
Other commitments mainly relate to commitments for ordered and con-
tracted goods and services that can not be cancelled without economic
effects. During the year a large portion of contractual commitments have
been fulfilled through purchase of goods.
Tele2 – Annual Report 2014 53
Notes
NOTE 31 LEASES
Finance leases
Finance leases relate to the expansion of transmission capacity in Sweden
and Austria. The carrying value of the lease assets is stated in Note 15.
The contracts span over periods ranging from 5 to 25 years. Contracts
with shorter lease periods contain purchase or extension options. Some
of the agreements contain index clauses.
Total future minimum lease payments and their present value amount to:
Dec 31, 2014 Dec 31, 2013
Present
value
Nominal
value
Present
value
Nominal
value
Within 1 year 18 18 24 25
Within 1–2 years 15 17 16 17
Within 2–3 years 13 15 13 15
Within 3–4 years 7 8 11 13
Within 4–5 years 1 1 6 7
Total loan liability and interest 59 77
Less interest portion –5 –7
TOTAL FINANCE LEASES 54 54 70 70
Operating leases
2014 2013
Leased capacity 1,304 1,326
Other operating leases 786 738
Annual leasing expenses for operating leases 2,090 2,064
The cost of operating leases relates mainly to leased capacity. Other assets
that are held under operating leases relate to rented premises, machines
and office equipment. Tele2 has a multitude of agreements relating to
leased lines. The majority of these involve some type of initiation fee and
thereafter monthly or quarterly fees. Most of the agreements have terms
ranging from six months to three years with the option of extending the
terms. Generally these agreements have no index clauses or possibilities
to acquire the asset.
Contractual future lease expenses are stated below:
Dec 31, 2014 Dec 31, 2013
Within 1 year 1,442 1,489
Within 1–2 years 736 819
Within 2–3 years 510 541
Within 3–4 years 355 430
Within 4–5 years 302 340
Within 5–10 years 606 682
Within 10–15 years 199 205
More than 15 years 218 230
Total future lease expenses for operating leases 4,368 4,736
Operating leases with Tele2 as the lessor
Leasing income during the year amount to SEK 75 (60) million and relates
mainly to rent from other operators placing equipment on Tele2 sites as
well as leased equipment (mainly modems) to customers. Contract periods
range from 3 to 25 years.
Contractual future lease income are stated below:
Dec 31, 2014 Dec 31, 2013
Within 1 year 70 50
Within 1–2 years 17 21
Within 2–3 years 16 17
Within 3–4 years 16 16
Within 4–5 years 14 15
Within 5–10 years 59 57
Within 10–15 years 49 47
More than 15 years 59 57
Total future lease income for operating leases 300 280
NOTE 32 SUPPLEMENTARY CASH FLOW INFORMATION
Cash flow from operating activities based
on the net result (total operations)
2014 2013
OPERATING ACTIVITIES
Net profit 2,211 14,590
Adjustments for non-cash items in operating profit
Depreciation/amortization and impairment 3,122 4,081
Result from shares in joint ventures and associated companies 15 17
Gain/loss on sale of fixed assets –13 8
Gain/loss on sale of operations –244 –13,261
Incentive program 29 14
Unpaid financial items –261 260
Income tax 142 –82
Deferred tax expense 437 637
Cash flow from operations before changes in working capital 5,438 6,264
Changes in working capital –860 –451
CASH FLOW FROM OPERATING ACTIVITIES 4,578 5,813
CAPEX
The difference between investments in intangible and tangible assets
(CAPEX) in the balance sheet and paid CAPEX, net, in the cash flow
statement is stated below.
2014 2013
CAPEX –3,976 –5,534
This year’s unpaid CAPEX and paid CAPEX from previous year –226 186
Received payment of sold non-current assets 56 107
CAPEX paid –4,146 –5,241
Of the year’s investment in intangible and tangible assets, SEK 101 (469)
million is unpaid on December 31, 2014 and has therefore not been
reported as investments in the cash flow statement. Payment of the previ
-
ous year’s investment of SEK –327 (–283) million has been reported as
investment in the cash flow for 2014. These items amount to a net of SEK
–226 (186) million.
CAPEX per service within each segment are presented in Note 15.
NOTE 33 NUMBER OF EMPLOYEES
Average number of employees
2014 2013
Note Total
of whom
women
of whom
men Total
of whom
women
of whom
men
Sweden 1,474 32% 68% 1,505 32% 68%
Netherlands 963 26% 74% 904 26% 74%
Kazakhstan 735 53% 47% 664 54% 46%
Croatia 123 43% 57% 120 43% 58%
Lithuania 140 54% 46% 105 44% 56%
Latvia 231 60% 40% 250 61% 39%
Estonia 249 58% 42% 255 60% 40%
Austria 274 22% 78% 283 22% 78%
Germany 121 31% 69% 80 30% 70%
Other 788 34% 66% 730 33% 67%
5,098 37% 63% 4,896 37% 63%
Discontinued
operations 36 386 36% 64% 1,247 47% 53%
Total average number
of employees 5,484 37% 63% 6,143 39% 61%
54 Tele2 – Annual Report 2014
Notes
Continued Note 33
NOTE 34 PERSONNEL COSTS
2014 2013
Note
Board of
Directors
and CEO
of which
bonus
Other
employees
Board of
Directors
and CEO
of which
bonus
Other
employees
Sweden 5 2756 6 1716
Netherlands 3 2568 11 2495
Kazakhstan 3 289 3 187
Croatia 5 343 4 341
Lithuania 3 139 3 130
Latvia 2 143 3 139
Estonia 2 –44 1 –45
Austria 4 1158 3 1150
Germany 4 165 3 144
Other 30 7461 27 7414
61 20 2,266 64 18 2,061
Discontinued
operations 36 6 2282 10 2481
Total salaries and
remuneration 67 22 2,548 74 20 2,542
2014 2013
Note
Salaries
and
remune-
rations
Social
security
expenses
of which
pension
expenses
Salaries
and
remune-
rations
Social
security
expenses
of which
pension
expenses
Board and President 61 22 964 19 6
Other employees 2,266 768 177 2,061 727 189
2,327 790 186 2,125 746 195
Discontinued
operations 36 288 57 13 491 110 15
Total 2,615 847 199 2,616 856 210
Pensions
2014 2013
Defined-benefit plans, retirement pension 24 42
Defined-benefit plans, survivors' and disability pension 2 4
Defined-contribution plans 160 149
Total pension expenses 186 195
The defined benefit plans essentially relates to Sweden. Additional infor-
mation regarding defined-benefit retirement plans is shown in the table
below.
2014 2013
Income statement
Current service costs –19 –45
Net interest cost –6 –2
Curtailments/settlements 1 5
–24 –42
Special employer's contribution –2 –2
Net cost recognized in the income statement –26 –44
Numbers of employees
On December 31, 2014, the number of employees in Tele2 was 5,387
(4,945) excluding Norway of which 42 (37) percent women and 58 (63)
percent men. A breakdown per gender and age group etc is presented
below.
Dec 31, 2014 Dec 31, 2013 Dec 31, 2014 Dec 31, 2013
Total Total Women Men Women Men
Managers
< 30 years 1% 1% 7% 5% 4% 7%
30–50 years 9% 11% 25% 55% 24% 58%
> 50 years 1% 1% 2% 6% 2% 5%
Total managers 11% 13% 34% 66% 30% 70%
Other employees
< 30 years 29% 32% 17% 16% 18% 19%
30–50 years 49% 50% 19% 36% 19% 38%
> 50 years 11% 5% 8% 4% 2% 4%
Total other employees 89% 87% 44% 56% 39% 61%
TOTAL 100% 100%
2014-12-31 2013-12-31
Women Men Women Men
For all group companies
Board members 32% 68% 19% 81%
Senior executives 34% 66% 33% 67%
Total 33% 67% 25% 75%
Dec 31, 2014 Dec 31, 2013
Balance sheet
Present value of funded obligations –228 –140
Fair value of plan assets 217 194
Net –11 54
Special employer’s contribution –11 –9
Net asset (+) / obligation (–) in balance sheet –22 45
of which assets 45 90
of which liabilities –67 –45
2014 2013
Net asset (+) / obligation (–) at beginning of year 45 –152
Assets/liabilities classified as held for sale 2 –3
Net cost –26 –44
Payments 39 41
Actuarial gains/losses in other comprehensive income –82 203
Net asset (+) / obligation (–) in balance sheet at end of year –22 45
The defined benefit pension obligation in Sweden is calculated using a
discount rate based on interest on mortgage bonds. The Swedish covered
mortgage bonds are considered high-quality bonds, the market is con-
sidered deep and the bonds are issued by large banks, thereby meeting
IAS19 requirements. There are no outstanding commitments for retired
and resigned employees no longer employed by Tele2, since their future
pensions are limited by the return on paid fees. Consequently, these
persons are not included in the reported pension liability.
Dec 31, 2014 Dec 31, 2013
Important actuarial assumptions
Discount rate 2.5% 4.0%
Annual salary increases 3.0% 3.0%
Annual pension increases 3.0% 3.0%
Average expected remaining years of employment 9 years 9 years
Remuneration for senior executives
2014
Basic
salary
Variable
remune-
ration
Share-
based
payment
costs
Other
benefits
Other
remune-
ration
Pension
expenses
Total
remune-
ration
CEO and President,
Mats Granryd 9.2 5.0 1.8 1.0 – 4.0 21.0
Other senior executives 28.7 13.6 5.0 6.4 7.41) 7.1 68.2
Total salaries and
remuneration to
senior executives 37.9 18.6 6.8 7.4 7.4 11.1 89.2
1) Remunerations during notice period
The group Other senior executives comprises 10 (10) persons.
2013
Basic
salary
Variable
remune-
ration
Share-
based
payment
costs
Other
benefits
Other
remune-
ration
Pension
expenses
Total
remune-
ration
CEO and President,
Mats Granryd, 9.1 8.3 1.3 1.6 – 3.9 24.2
Other senior executives 27.6 29.01) 2.2 3.7 6.92) 8.9 78.3
Total salaries and
remuneration to
senior executives 36.7 37.3 3.5 5.3 6.9 12.8 102.5
1) Variable remuneration include a transaction incentive of SEK 9.9 million paid to the former
CEO of Tele2 Russia, related to the divestement of Tele2 Russia
2) Remuneration during notice period
During 2014 the senior executives received 290,000 (272,000) share
rights in the 2014 incentive program and 16,101 (127,886) share rights
in the 2012 and 2013 (2011 and 2012) incentive programs as compensa-
tion for dividend. The market value of the share rights at the time of issue
was SEK 3.7 (5.6) million for the CEO and SEK 14.8 (19.3) million for other
senior executives. No premium was paid for the share rights.
Tele2 – Annual Report 2014 55
Notes

Continued Note 34
LTI 2014 LTI 2013
Number of share rights CEO
Other senior
executives CEO
Other senior
executives
Outstanding as of January 1, 2013 56,000 192,000
Allocated 56,000 234,000
Allocated, compensation for dividend – – 2,117 5,448
Forfeited – – – –48,000
Total outstanding rights as of
December 31, 2014 56,000 234,000 58,117 149,448
LTI 2012 LT I 2011
Number of share rights CEO
Other senior
executives CEO
Other senior
executives
Outstanding as of January 1, 2013 71,832 184,710 77,544 166,155
Allocated, compensation for dividend 2,716 5,820 – –
Forfeited – –30,785 – –
Adjustments for outcome of
the performance conditions – – –59,819 –124,620
Exercised – – – –24,921
Total outstanding rights as of
December 31, 2014 74,548 159,745 17,725 16,614
Remuneration guidelines for senior executives 2014
The following guidelines for determining remuneration for senior executives
for 2014 were approved by the Annual General Meeting in May 2014.
The objectives of Tele2’s remuneration guidelines are to offer competi-
tive remuneration packages to attract, motivate, and retain key employees
within the context of an international peer group. The aim is to create
incentives for the management to execute strategic plans and deliver
excellent operating results, and to align management’s incentives with
the interests of the shareholders. Senior executives covered by the guide-
lines include the CEO and members of the Leadership Team (“senior
executives”). In May 2014 Tele2 had eleven senior executives.
Remuneration to the senior executives should comprise annual base
salary, and variable short-term incentive (STI) and long-term incentive
(LTI) programs. The STI shall be based on the performance in relation to
established objectives. The objectives shall be related to the company’s
overall result and the senior executives’ individual performance. The STI
can amount to a maximum of 100 percent of the annual base salary.
Over time, it is the intention of the Board to increase the proportion of
variable performance-based compensation as a component of the senior
executives’ total compensation.
The Board is continually considering the need of imposing restrictions
in the STI program regarding making payments, or a proportion thereof,
of such variable compensation conditional on whether the performance
on which it was based has proved to be sustainable over time, and/or
allowing the company to reclaim components of such variable compensa-
tion that have been paid on the basis of information which later proves
to be manifestly misstated.
Other benefits may include e.g. company cars and for expatriated senior
executives e.g. housing benefits for a limited period of time. The senior
executives may also be offered health care insurances.
The senior executives are offered defined contribution pension plans.
Pension premiums for the CEO can amount to a maximum of 25 percent
of the annual salary (base salary and STI). For the other senior executives
pension premiums can amount to a maximum of 20 percent of the annual
salary (base salary and STI).
The maximum period of notice of termination of employment shall be
12 months in the event of termination by the CEO and six months in the
event of termination by any of the other senior executives. In the event
of termination by the company, the maximum notice period during which
compensation is payable is 18 months for the CEO and 12 months for any
of the other senior executives.
Under special circumstances, the Board may deviate from the above
guidelines. In such a case, the Board is obligated to give account of the
reason for the deviation during the following Annual General Meeting.
Board Members, elected at General Meetings, may in certain cases
receive a fee for services performed within their respective areas of
expertise, outside of their Board duties. Compensation for these services
shall be paid at market terms and be approved by the Board of
Directors.
Board of directors
Total fees to the Board of Directors amount to SEK 5,729 (5,829) thousand
following a decision by the Annual General Meeting in May 2014.
Fees to the board
Fees to the board
committees Total fees
SEK 2014 2013 2014 2013 2014 2013
Mike Parton 1,365,000 1,365,000 38,000 38,000 1,403,000 1,403,000
Lars Berg 525,000 525,000 75,000 100,000 600,000 625,000
Mia Brunell Livfors 525,000 525,000 – 38,000 525,000 563,000
Lorenzo Grabau 525,000 – 138,000 – 663,000 –
Irina Hemmers 525,000 – 100,000 – 625,000 –
John Hepburn – 525,000 – 75,000 – 600,000
Erik Mitteregger 525,000 525,000 100,000 100,000 625,000 625,000
John Shakeshaft – 525,000 – 200,000 – 725,000
Carla Smits-
Nusteling 525,000 525,000 238,000 138,000 763,000 663,000
Mario Zanotti 525,000 525,000 – 100,000 525,000 625,000
Total fee to board
members 5,040,000 5,040,000 689,000 789,000 5,729,000 5,829,000
Share-based payments
The objective of the long-term incentive programs (LTI) is to create condi-
tions for retaining competent employees in the Tele2 Group. The plan
has been designed based on the view that it is desirable that senior
executives and other key employees within the group are shareholders
in Tele2 AB. By offering an allotment of retention rights and performance
rights which are based on profits and other retention and performance-
based conditions, the participants are rewarded for increasing share-
holder value. Furthermore, the Plan rewards employees’ loyalty and
long-term growth in the Group. In that context, the Board of Directors is
of the opinion that the Plan will have a positive effect on the future
development of the Tele2 Group and thus be beneficial to both the com-
pany and its shareholders.
Number of
participants
at grant date Measure period Dec 31, 2014 Dec 31, 2013
LTI 2014 198 Apr 1, 2014–Mar 31, 2017 1,117,168 –
LTI 2013 204 Apr 1, 2013–Mar 31, 2016 1,029,026 1,132,228
LTI 2012 304 Apr 1, 2012–Mar 31, 2015 896,070 968,263
LTI 2011 283 Apr 1, 2011–Mar 31, 2014 34,339 867,329
Total number of outstanding share rights 3,076,603 2,967,820
34,339 share rights were exercisable at the end of the year.
Cost before tax for outstanding incentive programs and liability is stated
below.
Actual costs before tax Estimated cumulative cost Liability
2014 2013 2014 2013 Dec 31, 2014 Dec 31, 2013
LTI 2014 12 – 56 – 4 –
LTI 2013 18 10 52 54 6 2
LTI 2012 11 5 32 21 12 5
LTI 2011 –2 2 39 62 1 10
LTI 2010 – 6 – 75 – –
Total 39 23 179 212 23 17
of which cash
based programs 1 – 1 –
During the Annual General Meeting held on May 12, 2014, the sharehold-
ers approved a performance-based incentive program (the Plan) for senior
executives and other key employees in the Tele2 Group. The plan has
the same structure as last year’s incentive program.
In general, the participants in the Plan are required to own shares in
Tele2. Thereafter, the participants were granted retention rights and
performance rights free of charge. As a consequence of market conditions,
employees in Kazakhstan were offered to participate in the Plan without
being required to hold shares in Tele2. In such cases, the number of
allotted rights has been reduced, and corresponds to 37.5 percent of the
number of rights allotted for participation with a personal investment.
Subject to the fulfilment of certain retention and performance-based
conditions during the period April 1, 2014 - March 31, 2017 (the measure
period), the participant maintaining employment within the Tele2 Group
at the release of the interim report January - March 2017 and subject to
56 Tele2 – Annual Report 2014
Notes

Continued Note 34
the participant maintaining the invested shares (where applicable) dur-
ing the vesting period,each right entitles the employee to receive one
Class B share in the company. Dividends paid on the underlying share
will increase the number of shares that each retention and performance
right entitles to in order to treat the shareholders and the participants
equally.
In the event delivery of shares under the plan cannot be achieved at
reasonable costs, with reasonable administrative efforts or due to market
conditions, participants may instead be offered a cash-based settlement.
Outstanding share rights that will be settled in cash are remeasured to
fair value in each period and the obligation is reported as a liability.
The rights are divided into Series A, Series B and Series C. The number
of shares the participant will receive depends on which category the
participant belongs to and on the fulfilment of the following defined
conditions:
Series A Tele2’s total shareholder return on the Tele2 shares (TSR) during
the measure period exceeding 0 percent as entry level.
Series B Tele2’s average normalized return of capital employed (ROCE)
during the measurement period being at least 9 percent as entry
level and at least 12 percent as the stretch target.
Series C Tele2’s total shareholder return on the Tele2 shares (TSR) during
the measure period being equal to the average TSR for a peer
group including Elisa, Iliad, Millicom International Cellular,
TalkTalk Telecom Group, Telenor, TeliaSonera and TDC as entry
level, and exceeding the average TSR for the peer group with
10 percentage points as the stretch target.
The determined levels of the conditions include an entry level and a
stretch target with a linear interpolation applied between those levels
as regards the number of rights that vests. The entry level constitutes
the minimum level which must be reached in order to enable the vesting
of the rights in that series. If the entry level is reached, the number of
rights that vests is proposed to be 100 percent for Series A and 20 percent
for Series B and C. If the entry level is not reached, all rights to retention
and performance shares (as applicable) in that series lapse. If a stretch
target is met, all retention rights or performance rights (as applicable)
vest in that series.
The Plan comprised a total number of 273,192 shares, of which 259,692
related to employees who invested in Tele2 shares and 13,500 related
to employees in Kazakhstan who chose not to invest in Tele2 shares. In
total this resulted in an allotment of 1,180,268 share rights, of which
267,556 Series A, 546,356 Series B and 546,356 Series C. The partici-
pants were divided into different categories and were granted the fol-
lowing number of share rights for the different categories:
Share right
No of
participants
Maximum
no of shares
per Series Total
allotment At grant date ABCTotal
CEO 1 8,000 1 3 3 7 56,000
Other senior executives
and other key employees 11 4,000 1 2.5 2.5 6 258,000
Category 1 42 2,000 1 1.5 1.5 4 315,400
Category 2 39 1,500 1 1.5 1.5 4 196,212
Category 2, no investment 2 1,500 0.375 0.5625 0.5625 1.5 4,500
Category 3 97 1,000 1 1.5 1.5 4 341,156
Category 3, no investment 6 1,000 0.375 0.5625 0.5625 1.5 9,000
Total 198
1,180,268
Total costs before tax for outstanding rights in the incentive program are
expensed over the three-year vesting period.
The participant’s maximum profit per share right in the Plan is limited
to SEK 355, five times the average closing share price of the Tele2 Class
B shares during February 2014 with deduction for the dividend paid in
May 2014.
The estimated average fair value of the granted rights was SEK 54 on
the grant date, June 2, 2014. The calculation of the fair value was carried
out by an external expert. The following variables were used:
Series A Series B Series C
Expected annual turnover of personnel 7.0% 7.0% 7.0%
Weighted average share price SEK 79.39 SEK 79.39 SEK 79.39
Expected life 2.90 years 2.90 years 2.90 years
Expected value reduction parameter market condition 70% – 35%
Estimated fair value SEK 55.60 SEK 79.40 SEK 27.80
To ensure the delivery of Class B shares under the Plan, the Annual
General Meeting decided to authorise the Board of Directors to resolve
on a directed issue of a maximum of 1,700,000 Class C shares and sub-
sequently to repurchase the Class C shares. The Class C-shares will then
be held by the company during the vesting period, after which the appro-
priate number of Class C shares will be reclassified into Class B shares
and delivered to the participants under the Plan. In 2014, the Board of
Directors did not make use of the authorization from the Extraordinary
General Meeting.
LTI 2014 LTI 2013
Number of rights 2014 Cumulative 2014 Cumulative
Allocated at grant date 1,180,268 1,180,268 1,204,128
Outstanding as of January 1, 2014 1,132,228
Allocated, compensation for dividend – – 39,922 39,922
Forfeited –63,100 –63,100 –143,124 –215,024
Total outstanding rights
as of December 31, 2014 1,117,168 1,117,168 1,029,026 1,029,026
of which will be settled in cash 12,000 11,690
LTI 2012 LT I 2011
Number of rights 2014 Cumulative 2014 Cumulative
Allocated at grant date 1,132,186 1,056,436
Outstanding as of January 1, 2014 968,263 867,329
Allocated, compensation for dividend 34,986 274,177 – 294,579
Cancelled, Russia – –163,660 – –92,041
Exercised, Russia – – – –44,156
Forfeited –107,179 –346,633 –3,807 –351,296
Adjustments for outcome of
the performance conditions – – –602,796 –602,796
Exercised, cash settled – – –1,014 –1,014
Exercised, share settled – – –225,373 –225,373
Total outstanding rights as of
December 31, 2014 896,070 896,070 34,339 34,339
of which will be settled in cash 4,995 –
Corresponding principles and conditions have been used for 2012 and
2013 year incentive program except for the measure period and levels
for retention and performance based conditions.
Retention and performance based conditions
Maximum
profit/right
Series A
TSR
Series B
ROCE
Series C
TSR peer group
LTI 20121) SEK 590 > 0% 19%–23%/8%–12.5% > 10%
LTI 2013 SEK 347 > 0% 8–12.5% > 10%
1) The targets are split into two parts; before and after the divestment of Tele2 Russia
The exercise of the share rights in LTI 2011 was conditional upon the
fulfilment of certain retention and performance based conditions, mea-
sured from April 1, 2011 until March 31, 2014. The outcome of these
decided performance conditions was in accordance with below and the
outstanding share rights were exchanged for shares or cash in Tele2
during 2014, except for a limited number that is expected to be settled
with shares in 2015.
Tele2 – Annual Report 2014 57
Notes
Continued Note 34
Series Retention and performance based conditions
Minimum
hurdle
(20%)
Stretch
target
(100%)
Perfor-
mance
outcome Allotment
ATotal Shareholder Return Tele2 (TSR) ≥ 0% 9.7% 100%
BAverage normalised Return on Capital
Employed (ROCE)1) 20%/8%
24%/
12.5%
20.5%/
7.2% 20%
CTotal Shareholder Return Tele2 (TSR)
compared to a peer group > 0% ≥ 10% –5.6% 0%
1) The targets are split into two parts; before and after the divestment of Tele2 Russia
Weighted average share price for share rights at date of exercise amounted
to SEK 88.50 during 2014.
NOTE 35 FEES TO THE APPOINTED AUDITOR
Total fees to the appointed auditor (Deloitte) during the year related to
continued operations amounted to SEK 14 (15) million of which audit fees
amounted to SEK 9 (9) million, audit-related fees amounted to SEK 1 (1)
million and other consultation fees amounted to SEK 4 (5) million. There
was no tax-related consultation fees. In addition, audit fees for discon-
tinued operations amounted to SEK 2 (4) million.
Audit fees consisted of fees expensed for the annual audit of the statu-
tory financial statements and statutory audits of subsidiaries.
Audit-related fees consisted of fees expensed for assurance and other
services which were closely related to the audit of the company’s financial
statements or which are normally performed by the appointed auditor,
and consultations concerning financial accounting and reporting stan-
dards. Examples are limited reviews of quarterly reports, comfort letters
and opinions.
All other fees included fees expensed for all other consultations, such
as costs of investigations and analyses in conjunction with corporate
acquisitions (due diligence).
NOTE 36 DISCONTINUED OPERATIONS
On February 5, 2015 the Norwegian competition authorities announced
that they have approved Tele2’s divestment of its Norwegian operations
to TeliaSonera announced in July 2014. The Norwegian operation was
sold for SEK 5.1 billion and resulted in a capital gain in 2015 of SEK 1.7
billion, including costs for central support system for the Norwegian
operation and other transaction costs. The capital gain include a positive
effect of SEK 89 million related to exchange rate differences previously
reported in other comprehensive income which will be recycled over the
income statement but with no effect on total equity.
On April 4, 2013 Tele2 completed the divestment of its Russian
operations.
The Norweigan and Russian operations reported as discontinued opera-
tions are stated below.
Income statement
2014 2013
Net sales 4,009 7,375
Cost of services sold –3,115 –4,822
Gross profit 894 2,553
Selling expenses –932 –1,459
Administrative expenses –332 –546
Result from shares in joint ventures and associated companies –1 –
Other operating income –14 13,246
Other operating expenses –3 –3
EBIT –388 13,791
Interest income 8 6
Interest costs –4 –151
Other financial items – –19
EBT –384 13,627
Income tax –31 –5
of which from the normal operation –31 –46
of which from the capital gain – 41
NET PROFIT/LOSS –415 13,622
Earnings per share, SEK –0.93 30.60
Earnings per share, after dilution, SEK –0.93 30.40
Balance sheet
Assets held for sale refer to the Norweigan operation.
Dec 31, 2014
ASSETS
NON-CURRENT ASSETS
Goodwill 495
Other intangible assets 236
Intangible assets 731
Tangible assets 2,109
Financial assets 22
Deferred tax assets 313
NON-CURRENT ASSETS 3,175
CURRENT ASSETS
Inventories 4
Current receivables 654
CURRENT ASSETS 658
ASSETS CLASSIFIED AS HELD FOR SALE 3,833
LIABILITIES
NON-CURRENT LIABILITIES
Interest-bearing 109
NON-CURRENT LIABILITIES 109
CURRENT LIABILITIES
Interest-bearing 10
Non-interest-bearing 630
CURRENT LIABILITIES 640
LIABILITIES DIRECTLY ASSOCIATED WITH
ASSETS CLASSIFIED AS HELD FOR SALE 749
Cash flow statement
2014 2013
OPERATING ACTIVITIES
EBIT –388 13,791
Adjustments for non-cash items in operating profit 444 –12,507
Finance items paid 7 –75
Taxes paid – –177
Cash flow from operations before changes in working capital 63 1,032
Changes in working capital –146 –202
CASH FLOW FROM OPERATING ACTIVITIES –83 830
INVESTING ACTIVITIES
CAPEX paid –647 –1,057
Cash flow after CAPEX –730 –227
Acquisition of shares – –8
Sale of shares –32 17,252
Change of non-current receivables 13 2
Cash flow from investing activities –666 16,189
CASH FLOW AFTER INVESTING ACTIVITIES –749 17,019
FINANCING ACTIVITIES
Change of loans, net – –899
Other financing activities – –94
Cash flow from financing activities – –993
NET CHANGE IN CASH AND CASH EQUIVALENTS –749 16,026
Additional information
Net sales EBITDA EBIT
2014 2013 2014 2013 2014 2013
Mobile 3,832 7,135 36 1,280 –402 537
Fixed telephony 198 252 40 24 32 21
Other operations – 6 –20 –19 –1 –5
4,030 7,393 56 1,285 –371 553
Internal sales, elimination –21 –18
Sale of operations –17 13,238
TOTAL 4,009 7,375 56 1,285 –388 13,791
58 Tele2 – Annual Report 2014
Notes

Continued Note 36
NOTE 37 JOINT OPERATIONS AND OTHER RELATED PARTIES
Business relations and pricing between Tele2 and all related parties are
based on commercial terms and conditions. During 2014, Tele2 engaged
in transactions with the following related companies/persons.
Joint operations
Svenska UMTS-nät AB, Sweden
Tele2 is one of two turnkey contractors which plan, expand and operate
the joint operation Svenska UMTS-nät AB’s 3G network. Tele2 and Telia-
Sonera each own 50 percent and both companies have contributed capital
to the 3G company. In addition to this, the build-out has owner financing.
Tele2 and TeliaSonera are technically MVNO’s with the 3G company and
hence act as capacity purchasers. The size of the fee is based on used
capacity.
Net4Mobility HB, Sweden
Net4Mobility is an infrastructure joint operation between Tele2 Sweden
and Telenor Sweden, where each party owns 50 percent. The company’s
mission is to build and operate the combined 2G and 4G network, which
is the most extensive 4G network in Sweden. The network enable Tele2
and Telenor to offer their customers mobile services for data communica
-
tions and voice. The build-out has owner financing. During the year sites
were transferred from the owners to Net4Mobility. The transfer did not
have any material effect to Tele2’s financial statments.
Extracts from the income statements, balance sheets
and cash flow statements of joint operations
Amounts below shows summarized financial information for joint
operations before inter-company eliminations.
2014 2013
Sv UMTS-nät
Sweden
Net4Mobility
Sweden
Sv UMTS-nät
Sweden
Net4Mobility
Sweden
Income statement
Net sales 1,411 983 1,422 838
Operating profit 131 84 110 78
Profit before tax 37 27 –8 26
Net profit 29 27 –7 26
2014 2013
EBITDA 56 1,285
Sale of operations –17 13,238
Total one-off items –17 13,238
Sale of shares in joint ventures and associated companies –1 –
Depreciation/amortization and other impairment –426 –732
EBIT –388 13,791
Number of customers Net intake
In thousands Dec 31, 2014 Dec 31, 2013 2014 2013
Mobile 1,125 1,119 6 186
Fixed telephony 51 63 –12 –18
Number of customers
and net customer intake 1,176 1,182 –6 168
Changed method of calculation – –37
Number of customers and net change 1,176 1,182 –6 131
CAPEX
2014 2013
Mobile 513 1,105
Fixed telephony 13 30
Total 526 1,135
Additional cash flow information:
2014 2013
CAPEX –526 –1,135
This year’s unpaid CAPEX and paid CAPEX from previous year –121 29
Received payment of sold non-current assets – 49
CAPEX paid –647 –1,057
Dec 31, 2014 Dec 31, 2013
Sv UMTS-nät
Sweden
Net4Mobility
Sweden
Sv UMTS-nät
Sweden
Net4Mobility
Sweden
Balance sheet
Intangible assets – 2,479 – 2,679
Tangible assets 3,032 2,059 3,410 1,825
Deferred tax assets 137 – 145 –
Current assets 481 269 506 303
Total assets 3,650 4,807 4,061 4,807
Equity 510 2,131 481 2,104
Non-current liabilities 2,650 1,984 3,147 2,019
Current liabilities 490 692 433 684
Total equity and liabilities 3,650 4,807 4,061 4,807
Dec 31, 2014 Dec 31, 2013
Sv UMTS-nät
Sweden
Net4Mobility
Sweden
Sv UMTS-nät
Sweden
Net4Mobility
Sweden
Cash flow statement
Cash flow from operations before
changes in working capital 616 475 558 394
Changes in working capital 79 16 46 18
CASH FLOW FROM OPERATING
ACTIVITIES 695 491 604 412
Cash flow from investing activities –270 –464 –319 –1,280
Cash flow from financing activities –425 –41 –285 760
NET CHANGE IN CASH AND
CASH EQUIVALENTS – –14 – –108
Cash and cash equivalents at begin-
ning of the year – 22 – 130
CASH AND CASH EQUIVALENTS
AT END OF THE YEAR – 8 – 22
Other related parties
Senior executives and Board members
Information for senior executives and Board members is presented in
Note 34.
Kinnevik Group
Tele2 rents premises from Kinnevik, buys internal audit services from
Audit Value as well as advertising from Metro.
Joint ventures and associated companies
Information for joint ventures and associated companies is presented in
Note 7 and Note 17.
Transactions and balances
Transactions between Tele2 and joint operations are below included to
100 percent. In the consolidated financial statements the joint operations
are however based on Tele2’s share of assets, liabilities, revenues and
expenses (50 percent).
Net sales Operating expenses Interest revenue
2014 2013 2014 2013 2014 2013
Kinnevik – 1 –14 –17 – –
Joint ventures and associated
companies 6 7 –80 –77 – –
Joint operations 296 269 –1,122 –1,057 74 85
Total 302 277 –1,216 –1,151 74 85
Other receivables
Interest-bearing
receivables
Non-interest-bearing
liabilities
Dec 31,
2014
Dec 31,
2013
Dec 31,
2014
Dec 31,
2013
Dec 31,
2014
Dec 31,
2013
Kinnevik 1 – – – 2 2
Joint ventures and associated
companies 8 9 – – – 4
Joint operations 332 284 2,318 2,571 292 300
Total 341 293 2,318 2,571 294 306
Tele2 – Annual Report 2014 59
Notes
NOTE 38 CORPORATE RESPONSIBILITY RESULTS
The 2014 GRI G4 Indicators, presented below, are the ones assessed to
be most relevant for Tele2’s stakeholders. A complete GRI index is pre-
sented on Tele2’s website. Reported facts and figures are based on the
reporting from each reporting entity and each reported case have been
verified in accordance with Tele2’s procedures for internal controls.
GRI G4 Indicator
Diversity and equal opportunities (G4-LA12)
Number of employees split on managers and other employees with break-
down per gender and age are presented in Note 33.
Environmental regulations (G4-EN29)
No significant fines1), non-monetary sanctions or cases associated with
environmental regulations brought through dispute resolution mecha-
nisms has been reported during the year.
Corruption (G4-SO5)
Tele2 has not had any reported cases of corruption during the year.
Furthermore, there has not been any reported concluded public legal
cases related to corruption brought against Tele2 during the year. The
Tele2 definition of corruption exclude pure telecom fraud cases. Tele2’s
definition of corruption is when offering, giving, soliciting, or acceptance
of an inducement or reward which may influence any person to act inap-
propriately. For additional information please refer to Tele2’s website,
CR section.
Anti-competitive behaviour, anti-trust, and monopoly practices
(G4-SO7)
Number of reported legal actions for anti-competitive behaviour, anti-
trust, and monopoly practices, pending or completed, in which Tele2 has
been identified as a participant during the year is stated below.
Country Number Status of legal actions
Latvia 1 Pending case concerning advertisement3)
Estonia 1 Closed, no remarks
Laws and regulations (G4-SO8)
During the year, there were two reported cases of sanctions for non-
compliance with applicable laws and regulations, both in Sweden where
Tele2 Sweden acted in the interest of receiving an interpretation by the
Court of Law. However, there were no reported cases brought through
dispute resolutions.
Products and services health and safety impacts (G4-PR2)
Tele2 has had two reported non-compliance incidents concerning the
products’ and services’ health and safety impacts during their life cycle.
Both were in Kazakhstan and one resulted in a fine2) and one in a warn-
ing. There were no reported non-compliance with voluntary codes during
the year.
Marketing communication, advertising and sponsorship (G4-PR7)
Number of reported incidents of non-compliance regarding marketing
communication, advertising and sponsorship, resulting in fines, penal-
ties, warnings or non-compliance with voluntary codes during the year
are stated below.
Country
Fine or
penalty Warning
Non-compliance
with voluntary
codes Comments
Sweden – 2 –
Kazakhstan 3 3 – 2)
Latvia – 1 –
Estonia 1 – – 2)
Germany 1 5 – 2)
Customer privacy and losses of customer data (G4-PR8)
Number of reported substantiated complaints during the year, regarding
breaches of customer privacy and losses of customer data, from outside
parties and substantiated by Tele2 or from regulatory bodies as well as
reported leaks, thefts or losses of customer data is stated below.
Country
From outside
parties and
substantiated
by Tele2
From
regulatory
bodies
Leaks, thefts,
or losses of
customer data Comments
Sweden – – 4 In addition, Sweden has had a
major incident with a data center
fire, but there was no loss of
customer data
Netherlands 1 – 4
Lithuania – 5 – Two of the cases originated
from customer complaints
Austria – – 3
None of reported issues is considered to be significant.
The use of products and services (G4-PR9)
No significant fines1) have been reported during the year for non-com-
pliance with laws and regulations concerning the use of products and
services.
1) Significant fines are defined as exceeding EUR 250,000 (equivalent to SEK 2.3 million)
2) The fines have not been significant1)
3) If we receive negative outcomes, Tele2 expects the fines to be insignificant
60 Tele2 – Annual Report 2014
Notes

The parent company’s
income statement
SEK million Note 2014 2013
Net sales 2 55 47
Gross profit 55 47
Administrative expenses –122 –95
Operating loss –67 –48
PROFIT/LOSS FROM FINANCIAL INVESTMENTS
Result from shares in group companies 3 967 9,900
Other interest revenue and similar income 4 35 147
Interest expense and similar costs 5 –338 –229
Profit after financial items 597 9,770
Appropriations, group contribution 372 265
Tax on profit for the year 6 – –23
NET PROFIT 969 10,012
The parent company’s
comprehensive income
SEK million Note 2014 2013
Net profit 969 10,012
OTHER COMPREHENSIVE INCOME
COMPONENTS NOT TO BE RECLASSIFIED TO NET PROFIT
Pensions, actuarial gains/losses –1 –
Total components not to be reclassified to net profit –1 –
COMPONENTS THAT MAY BE RECLASSIFIED TO NET PROFIT
Gain/loss arising on changes in fair value
of hedging instruments 12 –172 33
Reclassified cumulative loss to income statement 12 61 49
Tax effect on cash flow hedges 25 –18
Total components that may be reclassified to net profit –86 64
TOTAL OTHER COMPREHENSIVE INCOME FOR THE YEAR,
NET OF TAX –87 64
TOTAL COMPREHENSIVE INCOME FOR THE YEAR 882 10,076
Parent company’s financial statement
The parent company’s balance sheet
SEK million Note Dec 31, 2014 Dec 31, 2013
ASSETS
NONCURRENT ASSETS
Tangible assets
Equipment and installations 7 2 –
Total tangible assets 2 –
Financial assets
Shares in group companies 8 13,520 13,520
Deferred tax assets 6 63 38
Other financial assets 10 34 28
Total finacial assets 13,617 13,586
TOTAL NONCURRENT ASSETS 13,619 13,586
CURRENT ASSETS
Current receivables
Accounts receivables from group companies 11 19
Other receivables from group companies 9 10,392 11,909
Other current receivables 3 4
Prepaid expenses and accrued income 1 1
Total current receivables 10,407 11,933
Cash and cash equivalents 11 3 –
TOTAL CURRENT ASSETS 10,410 11,933
TOTAL ASSETS 24,029 25,519
SEK million Note Dec 31, 2014 Dec 31, 2013
EQUITY AND LIABILITIES
EQUITY
Restricted equity
Share capital 561 561
Restricted reserve 4,985 4,985
Total restricted equity 5,546 5,546
Unrestricted equity
Reserves –185 –99
Retained earnings 11,293 3,213
Net profit 969 10,012
Total unrestricted equity 12,077 13,126
TOTAL EQUITY 17,623 18,672
NONCURRENT LIABILITIES
Interest-bearing
Liabilities to financial institutions and similar liabilities 12 4,263 5,274
Pension and similar commitments 42 34
TOTAL NONCURRENT LIABILITIES 4,305 5,308
CURRENT LIABILITIES
Interest-bearing
Liabilities to financial institutions and similar liabilities 12 1,780 1,325
Other interest-bearing liabilities 12 238 127
Total interest-bearing liabilities 2,018 1,452
Non-interest-bearing
Accounts payable 12 4 4
Other current liabilities 12 3 4
Accrued expenses and deferred income 13 76 79
Total non-interest-bearing liabilities 83 87
TOTAL CURRENT LIABILITIES 2,101 1,539
TOTAL EQUITY AND LIABILITIES 24,029 25,519
PLEDGED ASSETS AND
CONTINGENT LIABILITIES
Pledged assets None None
Contingent liabilities 14 1,120 4,627
Tele2 – Annual Report 2014 61
Parent company’s financial statement

The parent company’s cash flow statement
SEK million 2014 2013
OPERATING ACTIVITIES
Operating loss –67 –48
Adjustments for non-cash items in operating profit
Depreciation/amortization and impairment 1 –
Incentive program 4 3
Interest received – 1
Interest paid –260 –304
Finance items paid –1 –5
Cash flow from operations before changes in working capital –323 –353
Changes in working capital
Operating assets 2 –2
Operating liabilities –1 2
Changes in working capital 1 –
CASH FLOW FROM OPERATING ACTIVITIES –322 –353
INVESTING ACTIVITIES
Acquisition of tangible assets –3 –
Received dividend from group companies 967 9,900
Repayments from group companies 1,958 7,426
Cash flow from investing activities 2,922 17,326
CASH FLOW AFTER INVESTING ACTIVITIES 2,600 16,973
FINANCING ACTIVITIES
Proceeds from credit institutions and similar liabilities – 750
Repayment of loans from credit institutions and similar liabilities –637 –2,088
Dividends –1,960 –3,163
Redemption of shares – –12,474
Cash flow from financing activities –2,597 –16,975
NET CHANGE IN CASH AND CASH EQUIVALENTS 3 –2
Cash and cash equivalents at beginning of the year – 2
CASH AND CASH EQUIVALENTS AT END OF THE YEAR 3 –
For additional cash flow information, please refer to Note 15.
Change in the parent company’s equity
Restricted equity Unrestricted equity
Total equitySEK million Note Share
capital
Restricted
reserve
Hedge
reserve
Retained
earnings
Equity at January 1, 2013 561 4,985 –163 18,833 24,216
Net profit 1 – – – 10,012 10,012
Other comprehensive income
for the year, net of tax – – 64 – 64
Total comprehensive income
for the year – – 64 10,012 10,076
OTHER CHANGES IN EQUITY
Share-based payments 1 – – – 15 15
Share-based payments, tax effect – – – 2 2
Dividends – – – –3,163 –3,163
Redemption of shares –280 – – –12,194 –12,474
Bonus issue 280 – – –280 –
EQUITY AT DECEMBER 31, 2013 561 4,985 –99 13,225 18,672
Equity at January 1, 2014 561 4,985 –99 13,225 18,672
Net profit – – – 969 969
Other comprehensive income
for the year, net of tax – – –86 –1 –87
Total comprehensive income
for the year – – –86 968 882
OTHER CHANGES IN EQUITY
Share-based payments – – – 29 29
Dividends – – – –1,960 –1,960
EQUITY AT DECEMBER 31, 2014 561 4,985 –185 12,262 17,623
62 Tele2 – Annual Report 2014
Parent company’s financial statement
NOTE 1 ACCOUNTING PRINCIPLES AND
OTHER INFORMATION
The parent company’s financial statements have been prepared according
to the Swedish Annual Accounts Act and RFR 2 Reporting for legal enti-
ties and other statements issued by the Swedish Financial Reporting
Board.
The parent company follows the same accounting policies as the Group
(see Group Note 1) with the following exceptions.
Business combination
At a business combination all expenses directly related to the acquisition
are included in the acquisition value.
Financial assets and liabilities and other financial instruments
IFRS 7 Financial Instruments: Disclosures has not been applied to the
parent company’s financial statements, as its disclosures do not deviate
materially from the Group’s disclosures already presented.
Group contributions
Group contributions are reported as appropriations in the income
statement.
Other information
The annual report has been approved by the Board of Directors on March
17, 2015. The balance sheet and income statement are subject to adoption
by the Annual General Meeting on May 19, 2015.
NOTE 2 NET SALES
Net sales relates to sales to other companies in the Group.
NOTE 3 RESULT OF SHARES IN GROUP COMPANIES
2014 2013
Dividend from subsidiary 967 9,900
Total result of shares in group companies 967 9,900
NOTE 4 OTHER INTEREST REVENUE AND SIMILAR INCOME
2014 2013
Interest, Group 36 130
Interest, bank balances – 1
Exchange rate difference on financial current assets –1 16
Total other interest revenue and similar income 35 147
NOTE 5 INTEREST EXPENSE AND SIMILAR COSTS
2014 2013
Interest, credit institutions and similar liabilities –300 –339
Exchange rate difference on financial liabilities –34 118
Other finance expenses –4 –8
Total interest expenses and similar costs –338 –229
NOTE 6 TAXES
2014 2013
Deferred tax expense – –23
Total tax on profit for the year – –23
The difference between recorded tax expense and the tax expense based
on prevailing tax rate consists of the below listed components.
2014 2013
Profit before tax 969 10,035
Tax effect according to tax rate in Sweden –213 –22.0% –2,208 –22.0%
Tax effect of
Non-taxable dividend from group company 213 22.0% 2,178 21.7%
Deductible not recorded expenses – – 7 0.1%
Tax expense/income and effective tax rate – – –23 –0.2%
Deferred tax asset of SEK 63 (38) million is attributable to liabilities of
SEK 54 (31) million and pensions of SEK 9 (7) million.
NOTE 7 TANGIBLE ASSETS
Equipment and installations
Dec 31, 2014 Dec 31, 2013
Acquisition value
Investments 3 –
Total acquisition value 3 –
Accumulated depreciation
Depreciation –1 –
Total accumulated depreciation –1 –
TOTAL TANGIBLE ASSETS 2 –
Notes to the parent company’s financial statements
Tele2 – Annual Report 2014 63
Parent company’s Notes
NOTE 8 SHARES IN GROUP COMPANIES
Company, reg. No., reg’d office
Number
of shares
Total
par value
Holding
(capital/
votes) Dec 31, 2014 Dec 31, 2013
Tele2 Holding AB, 556579-7700,
Stockholm, Sweden 1,000 tSEK 100 100% 13,520 13,520
Total shares in group companies 13,520 13,520
A list of all subsidiaries, excluding dormant companies, is presented in
Note 19.
Dec 31, 2014 Dec 31, 2013
Acquisition value
Acquisition value at January 1 13,520 13,518
Shareholders contribution – 2
Total shares in group companies 13,520 13,520
NOTE 9 RECEIVABLES FROM GROUP COMPANIES
Non-current receivables Current receivables
Dec 31, 2014 Dec 31, 2013 Dec 31, 2014 Dec 31, 2013
Acquisition value at January 1 – 18,698 11,909 224
Lending – – 1,364 10,866
Repayments – – –2,597 –17,676
Reclassification – –18,698 – 18,698
Other changes in cash pool – – –284 –203
Total receivables from group companies – – 10,392 11,909
Current receivables from group companies relate to balances in the cash
pool.
NOTE 10 OTHER FINANCIAL ASSETS
Dec 31, 2014 Dec 31, 2013
Pension funds 34 28
Total other financial assets 34 28
NO T E 11 CASH AND CASH EQUIVALENTS AND
UNUTILIZED OVERDRAFT FACILITIES
Dec 31, 2014 Dec 31, 2013
Cash and cash equivalents 3 –
Unutilized overdraft facilities and credit lines 7,612 7,154
Total available liquidity 7,615 7,154
NOTE 12 FINANCIAL LIABILITIES
Dec 31, 2014 Dec 31, 2013
Liabilities to financial institutions and similar liabilities 6,043 6,599
Other interest-bearing liabilities 238 127
Total interest-bearing financial liabilities 6,281 6,726
Accounts payable 4 4
Other current liabilities 3 4
TOTAL FINANCIAL LIABILITIES 6,288 6,734
Financial liabilities fall due for payment according to below.
Dec 31, 2014 Dec 31, 2013
Within 3 months 2,025 1,460
Within 1–2 years – 1,067
Within 2–3 years 3,447 –
Within 3–4 years 164 3,445
Within 4–5 years 202 135
Within 5–10 years 450 627
Total financial liabilities 6,288 6,734
Interest-bearing financial liabilities
No specific collateral is provided for interest-bearing financial
liabilities.
Liabilities to financial institutions and similar liabilities
Dec 31, 2014 Dec 31, 2013
Liabilities
(collateral provided) Interest rate terms
Maturity
date
Current
liabilities
Non-current
liabilities
Current
liabilities
Non-current
liabilities
Bonds NOK NIBOR +1.7% 2015 315 – – 316
Bonds NOK NIBOR +2.35% 2017 – 1,049 – 1,055
Bonds SEK STIBOR +2.85% 2017 – 1,498 – 1,497
Bonds SEK fixed: 4.875% 2017 – 799 – 798
Bonds SEK STIBOR +1.1% 2015 750 – – 750
Bonds SEK – – 500 –
Bonds SEK STIBOR +2.45% 2020 – 250 – 250
Bonds SEK variable interest rates 2020 500 – 500 –
Total Bonds 1,565 3,596 1,000 4,666
Commercial paper fixed: 0.504%–
0.9310%
2015 215 – 325 –
Nordic Investment
Bank (NIB)
variable
interest rates
2017-
2020
– 705 – 663
Syndicated loan
facilities
variable
interest rates
2018 – –38 – –55
1,780 4,263 1,325 5,274
Total liabilities to financial institutions
and similar liabilities 6,043 6,599
For additional information please refer to Group Note 26.
Other interest-bearing liabilities
Current liabilities
Dec 31, 2014 Dec 31, 2013
Derivatives 238 127
Total other interest-bearing liabilities 238 127
Derivatives consisted of interest swaps, valued at fair value. For additional
information please refer to Group Note 2.
Other current liabilities
Dec 31, 2014 Dec 31, 2013
VAT liability 2 3
Other taxes 1 1
Total current liabilities 3 4
NOTE 13 ACCRUED EXPENSES AND DEFERRED INCOME
Dec 31, 2014 Dec 31, 2013
Interest costs 44 49
Personnel-related expenses 32 27
External services expenses - 3
Total accrued expenses and deferred income 76 79
64 Tele2 – Annual Report 2014
Parent company’s Notes
NOTE 14 CONTINGENT LIABILITIES AND
OTHER COMMITMENTS
Contingent liabilities
Dec 31, 2014 Dec 31, 2013
Guarantee related to group companies 1 120 4 627
Total contingent liabilities 1 120 4 627
Operating leases
The parent company’s operating lease expenses amounted to SEK 2 (1)
million during the year. Future lease expenses amount to SEK 1 (1) million
and these are due for payment during the next year.
NOTE 15 SUPPLEMENTARY CASH FLOW INFORMATION
In 2014, the parent company had interest revenues from other group
companies of SEK 36 (132) million and interest expenses to other group
companies of SEK – (2) million which were capitalized on the loan amount.
NOTE 16 NUMBER OF EMPLOYEES
The average number of employees in the parent company is 7 (6), of whom
2 (2) are women.
NOTE 17 PERSONNEL COSTS
2014 2013
Salaries
and
remune-
rations
Social
security
expenses
of which
pension
expenses
Salaries
and
remune-
rations
Social
security
expenses
of which
pension
expenses
Board and CEO 27 12 524 10 4
Other employees 30 14 422 11 4
Total salaries and remuneration 57 26 946 21 8
The parent company’s pension expenses relate to defined-contribution
plans. Salary and remuneration for the CEO are presented in Group
Note34.
NOTE 18 FEES TO THE APPOINTED AUDITOR
Audit fees to the appointed auditor are SEK 1 (1) million and audit-related
fees are SEK 1 (1) million.
Company, reg. No., reg’d office Note
Holding
(capital/
votes)
NOTE 19 LEGAL STRUCTURE
The table below lists all the subsidiaries, associated companies, joint
ventures and other holdings that are not dormant companies or branches.
SECURE VALUE EEIG, Luxembourg 17 25%
TELE2 HOLDING AB, 556579-7700, Stockholm, Sweden 100%
Tele2 Treasury AB, 556606-7764, Stockholm, Sweden 100%
Tele2 Sverige AB, 556267-5164, Stockholm, Sweden 100%
Triangelbolaget D4 AB, 556007-9799, Stockholm, Sweden 17 25%
Modern Holdings Inc, 133799783, Delaware, US 18 11,88%
e-Village Nordic AB, 556050-1644, Stockholm, Sweden 100%
Radio National Luleå AB, 556475-0411, Stockholm, Sweden 18 5,5%
GH Giga Hertz HB as well as 15 other partnerships with licenses 17 33,3%
Datametrix AB, 556580-2682, Stockholm, Sweden 100%
Tele2Butikerna AB, 556284-7565, Stockholm, Sweden 100%
4T Sverige AB, 556857-8495, Stockholm, Sweden 17 25%
Svenska UMTS-nät Holding AB, 556606-7988, Stockholm, Sweden 100%
Svenska UMTS-nät AB, 556606-7996, Stockholm, Sweden 17 50%
Interloop AB, 556450-2606, Stockholm, Sweden 100%
Net4Mobility HB, 969739-0293, Stockholm, Sweden 17 50%
Procure IT Right AB, 556600-9436, Stockholm, Sweden 100%
SNPAC Swedish Nr Portability Adm.Centre AB,
556595-2925, Stockholm, Sweden 17 20%
Tele2 Netherlands Holding NV, 33272606, Amsterdam, Netherlands 100%
Tele2 Nederlands BV, 33303418, Amsterdam, Netherlands 100%
Tele2 Norge AS, 974534703, Oslo, Norway 100%
Mobile Norway AS, 888 137 122, Oslo, Norway 50%
Tele2 Butikkene AS, 998 894 468, Oslo, Norway 100%
MPayment AS, 999 504 655, Oslo, Norway 17 33,3%
Strex AS, 985 867 569, Oslo, Norway 17 33,3%
Network Norway AS, 983714463, Oslo, Norway 100%
Mobile Norway AS, 888 137 122, Oslo, Norway 50%
Officer AS, 992 898 089, Oslo, Norway 100%
Mobile Telecom Service LLP, 66497-1910-TOO, Almaty, Kazakhstan 51%
Tele2 d.o.o. Za telekomunikacijske usulge, 1849018, Zagreb, Croatia 100%
Tele2 Holding Lithuania AS, 11920703, Tallinn, Estonia 100%
Tele2 Holding Lithuania AS Filialas, 302514793, Vilnius, Lithuania 100%
UAB Tele2, 111471645, Vilnius, Lithuania 100%
UAB Personalo valdymas, 302473332, Vilnius, Lithuania 100%
Viesoji istaiga Numerio perkelimas, 303386211, Vilnius, Lithuania 17 25%
UAB Tele2 Fiksuotas Rysys, 111793742, Vilnius, Lithuania 100%
Tele2 Holding SIA, 40003512063, Riga, Latvia 100%
SIA Tele2, 40003272854, Riga, Latvia 100%
SIA Tele2 Shared Service Center, 40003690571, Riga, Latvia 100%
Tele2 Eesti AS, 10069046, Tallinn, Estonia 100%
Televõrgu AS, 10718810, Tallinn, Estonia 100%
Estonian Broadband Development Foundation, Estonia 17 12,5%
Tele2 Europe SA, R.C.B56944, Luxembourg 100%
Tele2 Austria Holding GmbH, FN178222t, Vienna, Austria 100%
Tele2 Telecommunication GmbH, FN138197g, Vienna, Austria 100%
Tele2 communication GmbH s.r.o., 35820616,
Bratislava, Slovakia 100%
Adworx Internetservice GmbH, FN207118k, Vienna, Austria 17 47,4%
Communication Services Tele2 GmbH, 36232, Düsseldorf, Germany 100%
Collecta Forderungsmanagement GmbH, HRB 67126,
Düsseldorf, Germany 100%
Tele2 International Call GmbH, HRB64239, Düsseldorf, Germany 100%
Tele2 Beteiligungs GmbH, HRB64230, Düsseldorf, Germany 100%
T&Q Netz GmbH Co KB, HRA21263, Düsseldorf, Germany 17 50%
FonExperten GmbH, HRB71231, Düsseldorf, Germany 100%
Tele2 Service GmbH, HRB79647, Düsseldorf, Germany 100%
IntelliNet Holding BV, 34126307, Amsterdam, Netherlands 100%
010033 Telecom GmbH, HRB 48344, Frankfurt, Germany 100%
S.E.C. Luxembourg S.A., R.C. B-84.649, Luxembourg 100%
SEC Finance SA, B104730, Luxembourg 100%
Tele2 Luxembourg AB, 556304-7025, Stockholm, Sweden 100%
Tele2 Finance Luxembourg SARL, RCB112873, Luxembourg 100%
Tele2 – Annual Report 2014 65
Parent company’s Notes
The consolidated financial statements and Annual Report have been prepared in accordance with the interna-
tional financial reporting standards referred to in European Parliament and Council of Europe Regulation (EC) No.
1606/2002 of 19 July 2002, on application of International Financial Reporting Standards and generally accepted
accounting principles, and give a fair overview of the parent company’s and Group’s financial position and results
of operations.
The administration report for the group and parent company gives a fair overview of the Group’s and parent
company’s operations, financial position and results of operations, and describes significant risks and uncertain-
ties that the parent company and companies included in the Group face.
Stockholm March 17, 2015
Mike Parton
Chairman
Lars Berg Mia Brunell Livfors
Lorenzo Grabau Irina Hemmers Erik Mitteregger
Carla Smits-Nusteling Mario Zanotti Mats Granryd
President and CEO
Our auditors' report was submitted on March 17, 2015
Deloitte AB
Thomas Strömberg
Authorized Public Accountant
66 Tele2 – Annual Report 2014
To the annual meeting of the shareholders of Tele2 AB (publ), corporate identity number 556410-8917
Report on the annual accounts and
consolidated accounts
We have audited the annual accounts and consolidated accounts of
Tele2 AB (publ) for the financial year 2014. The annual accounts and
consolidated accounts of the company are included in the printed
version of this document on pages 8-66.
Responsibilities of the Board of Directors and the Managing
Director for the annual accounts and consolidated accounts
The Board of Directors and the Managing Director are responsible
for the preparation and fair presentation of these annual accounts
and consolidated accounts in accordance with International Finan-
cial Reporting Standards, as adopted by the EU, and the Annual
Accounts Act, and for such internal control as the Board of Directors
and the Managing Director determine is necessary to enable the
preparation of annual accounts and consolidated accounts that are
free from material misstatement, whether due to fraud or error.
Auditor’s responsibility
Our responsibility is to express an opinion on these annual accounts
and consolidated accounts based on our audit. We conducted our
audit in accordance with International Standards on Auditing and
generally accepted auditing standards in Sweden. Those standards
require that we comply with ethical requirements and plan and
perform the audit to obtain reasonable assurance about whether the
annual accounts and consolidated accounts are free from material
misstatement.
An audit involves performing procedures to obtain audit evidence
about the amounts and disclosures in the annual accounts and con-
solidated accounts. The procedures selected depend on the auditor’s
judgement, including the assessment of the risks of material mis-
statement of the annual accounts and consolidated accounts,
whether due to fraud or error. In making those risk assessments, the
auditor considers internal control relevant to the company’s prepa-
ration and fair presentation of the annual accounts and consolidated
accounts in order to design audit procedures that are appropriate in
the circumstances, but not for the purpose of expressing an opinion
on the effectiveness of the company’s internal control. An audit also
includes evaluating the appropriateness of accounting policies used
and the reasonableness of accounting estimates made by the Board
of Directors and the Managing Director, as well as evaluating the
overall presentation of the annual accounts and consolidated
accounts.
We believe that the audit evidence we have obtained is sufficient
and appropriate to provide a basis for our audit opinion.
Opinions
In our opinion, the annual accounts have been prepared in accor-
dance with the Annual Accounts Act and present fairly, in all mate-
rial respects, the financial position of the parent company as of 31
December 2014 and of its financial performance and its cash flows
for the year then ended in accordance with the Annual Accounts
Act. The consolidated accounts have been prepared in accordance
with the Annual Accounts Act and present fairly, in all material
respects, the financial position of the Group as of 31 December 2014
and of its financial performance and cash flows for the year then
ended in accordance with International Financial Reporting Stan-
dards, as adopted by the EU, and the Annual Accounts Act. The stat-
utory administration report is consistent with the other parts of the
annual accounts and consolidated accounts.
We therefore recommend that the annual meeting of shareholders
adopt the income statement and balance sheet for the parent com-
pany and the Group.
Report on other legal and regulatory requirements
In addition to our audit of the annual accounts and consolidated
accounts, we have also audited the proposed appropriations of the
company’s profit or loss and the administration of the Board of
Directors and the Managing Director of Tele2 AB (publ) for the finan-
cial year 2014.
Responsibilities of the Board of Directors and the Managing Director
The Board of Directors is responsible for the proposal for appropria-
tions of the company’s profit or loss, and the Board of Directors and
the Managing Director are responsible for administration under the
Companies Act.
Auditor’s responsibility
Our responsibility is to express an opinion with reasonable assur-
ance on the proposed appropriations of the company’s profit or loss
and on the administration based on our audit. We conducted the
audit in accordance with generally accepted auditing standards in
Sweden.
As a basis for our opinion on the Board of Directors’ proposed
appropriations of the company’s profit or loss, we examined the
Board of Directors’ reasoned statement and a selection of supporting
evidence in order to be able to assess whether the proposal is in
accordance with the Companies Act.
As a basis for our opinion concerning discharge from liability, in
addition to our audit of the annual accounts and consolidated
accounts, we examined significant decisions, actions taken and cir-
cumstances of the company in order to determine whether any
member of the Board of Directors or the Managing Director is liable
to the company. We also examined whether any member of the
Board of Directors or the Managing Director has, in any other way,
acted in contravention of the Companies Act, the Annual Accounts
Act or the Articles of Association.
We believe that the audit evidence we have obtained is sufficient
and appropriate to provide a basis for our opinions.
Opinions
We recommend to the annual meeting of shareholders that the profit
be appropriated in accordance with the proposal in the statutory
administration report and that the members of the Board of Directors
and the Managing Director be discharged from liability for the
financial year.
Stockholm March 17, 2015
Deloitte AB
Thomas Strömberg
Authorized Public Accountant
Auditor’s report
Tele2 – Annual Report 2014 67
Auditor's report
Definitions
The figures shown in parentheses correspond to the comparable
period last year
EBITDA
Operating profit/loss before depreciation/amortization and impair-
ments, acquisition costs, one-off items and result from shares in
associated companies and joint ventures
EBIT
Operating profit/loss including depreciation/amortization and
impairments, acquisition costs, one-off items and result from shares
in associated companies and joint ventures
EBT
Profit/loss after financial items
Cash flow from operating activities
Operating transactions affecting cash (cash flow) and change in
working capital
Cash flow after CAPEX
Cash flow after paid net investments in CAPEX and paid dismantling
costs, but before net investment in shares and other financial assets
Available liquidity
Cash and cash equivalents including undrawn borrowing facilities
Net debt
Interest-bearing liabilities less interest-bearing assets
CAPEX
Investments in intangible assets and property, plant and equipment
excluding capitalized dismantling costs
Average number of employees
The average number of employees during the year, in which an
acquired/sold company is reported in relation to the length of time
the company has been a part of the Tele2 Group
Equity/assets ratio
Shareholders’ equity in relation to total assets
Debt/equity ratio
Net debt in relation to shareholders’ equity at the end of the period
Return on equity
Profit/loss after tax attributable to holders of the parent company in
relation to average shareholders’ equity attributable to holders of
the parent company
ROCE (return on capital employed)
The total of EBIT and financial revenues in relation to capital
employed (average total assets reduced with non-interest bearing
liabilities and provision for asset dismantling)
Average interest rate
Interest expense in relation to average interest-bearing liabilities
Earnings per share
Profit/loss for the period attributable to the parent company share-
holders in relation to the weighted average number of shares out-
standing during the fiscal year
Equity per share
Equity attributable to parent company shareholders in relation to
the weighted average number of shares outstanding during the
fiscal year
ARPU (average revenue per user)
Average monthly service revenue (end user service revenue and
operator revenue) for each customer excluding machine-to-machine
revenue
68 Tele2 – Annual Report 2014
TELE2 IS ONE OF EUROPE’S FASTEST GROWING TELECOM OPERATORS, ALWAYS PROVIDING CUSTOMERS WITH WHAT THEY NEED FOR LESS.
We have 14 million customers in 9 countries. Tele2 offers mobile services, fixed broadband and fixed telephony, data network services, and
content services. Ever since Jan Stenbeck founded the company in 1993, it has been a tough challenger to the former government monopolies
and other established providers. Tele2 has been listed on the NASDAQ OMX Stockholm since 1996. In 2014, we had net sales of SEK 26
billion and reported an operating profit (EBITDA) of SEK 5.9 billion.
Mats Granryd
President & CEO
Telephone: + 46 (0)8 5620 0060
Allison Kirkby
CFO
Telephone: + 46 (0)8 5620 0060
Lars Torstensson
EVP, Group Communication & Strategy
Telephone: + 46 (0)8 5620 0042
Tele2 AB
Company registration nr: 556410-8917
Skeppsbron 18
P.O. Box 2094
SE-103 13 Stockholm
Sweden
Tel + 46 (0)8 5620 0060
www.tele2.com
VISIT OUR WEBSITE: www.tele2.com
Contacts

