TME121 Assignment3 Instructions
User Manual:
Open the PDF directly: View PDF ![]() .
.
Page Count: 7

Assignment 3 – Crashworthiness
INSTRUCTIONS
Course
TME 121 – Engineering of Automotive Systems
Chalmers University of Technology
Academic year 2018/19
Course leader
Giulio Piccinini (giulio.piccinini@chalmers.se)
Teaching assistants
Alberto Morando (alberto.morando@chalmers.se)
Ron Schindler (ron.schindler@chalmers.se)
Introduction
This assignment illustrates the basic principles of crash safety by solution of a few simplified
examples. The learning outcome is general knowledge of how crash testing in the laboratory
influences real life safety. Furthermore, the effect of optimization of the protective systems in a
car is to be demonstrated.
Reporting (5 points)
The assignment is performed in groups of two or three students. You should be already assigned
to a group. If not, please, contact the teaching assistants immediately.
To solve the assignment, you are required to write a brief report that contains the solution of
each task. The report must comply with the given template. If you would prefer to use LaTeX,
you can use the basic Article document class, and modify it to match the given template.
For all the computations and graphs, MATLAB should be used. You are given two MATLAB
files that need to be completed: a template script for solving the assignment
(TME121_Assignment3.m) and the function to solve the equations of motion
(solveEquationsOfMotion.m).
Use International System of Units (SI) as primary units. Define abbreviations and acronyms the
first time they are used in the text. Include all values and equations (including derivations).
Insert labels and legend in each graph. Make sure the font size of the graph is large enough.
Proofread spelling and grammar. (5 points are assigned based on the quality of the report)
In the appendix of your report, state the contribution of each student in the group.
A zip folder that includes (1) the report (in PDF format) and the MATLAB source code
(TME121_Assignment3.m and solveEquationsOfMotion.m) should be sent by email to:
alberto.morando@chalmers.se no later than Sunday, November 4th (23:59). The subject of
the email and the folder name should be “TME121_Assignment_3_group_XX”, where XX is
your group number. Please, make sure the naming is correct. We will filter the incoming
emails based on this subject. If the subject is different, your email may pass unread. Please,
include the names of the students in your group in the body of the email and in the script. If
corrections are required, please, submit the second version no later than 1 week after you have
received feedback.

2 of 7
Task 1 (7 points)
The old US frontal impact regulation includes a full width frontal impact into a rigid wall at an
impact speed, v0, of 48 km/h, Figure 1. Figure 2 illustrates a typical force-deformation
characteristic of an older car in a full-frontal impact test. For this task, F0 is the maximum force
allowed, and d0 is the distance from the foremost point of the car to the passenger compartment.
To protect an occupant in a frontal crash, the force and accelerations acting on the occupant
should be kept low to avoid injury, while at the same time large deformations leading to
intrusions into the passenger compartment should be avoided. Ideally, the passenger
compartment should be infinitely stiff, while the front structure consumes a maximum amount
of energy without exceeding d0.
Figure 1. Scenario for the full-frontal impact test.
Figure 2. Typical force-deflection curve for the
full-frontal impact test.
a) Assume that your vehicle front deforms as an ideal linear elastic-plastic structure, with
the maximum force F0 reached at 40% of the maximal deformation d0. Draw (using
Matlab) a simplified graph of the force-displacement curve of the vehicle front.
Assume that after deformation no elastic restitution of the material occurs. Include this
graph in your report. (0.5 point)
b) Complement the ideal force-deflection curve for deformations at and above d0 in order
to keep the deformation of the passenger compartment equal to zero. Include this graph
in your report. (0.5 point)
c) Which design parameters for a vehicle structures could influence the shape of the
force-deflection curve such as drawn here? (0.5 point)
Optimize the maximum front structure forces FA and FB in the test condition for the two vehicles
A and B. The data for vehicle A and B are as follow:
Vehicle
m [kg]
d [m]
A
1700
0.73
B
1050
0.53
where d is the length of the vehicle deformation zone and m is the mass of the vehicle. As above,
assume that your front structure deforms as an ideal elastic-plastic structure with maximum
force reached at 40% of max deformation d. As before, assume that after deformation no elastic
restitution of the material occurs.
F
d
d0
F0
3 of 7
d) Calculate the maximum crash forces and the acceleration levels of each of the two
vehicles in the full-frontal rigid wall impact test. Tabulate the results as shown in the
table below. (4 points)
Vehicle
Fmax [kN]
|amax| [m/s2]
A
B
e) Which one of the cars has the best safety potential? Why? (1 point)
f) Plot the force-displacement curves for vehicle A and B in the same figure and include
it in your report. (0.5 point)
Task 2 (8 points)
For this task, you will consider a driver sitting in vehicle A, optimized for the 48 km/h rigid
wall impact in Task 1 (Use vehicle data and force-deflection characteristics that you used and
computed in Task 1). Model the driver by a mass of md=35 kg and the seat belt to be active over
a ride-down distance of dd=0.35m, as shown in Figure 3. For this task, assume that the driver
does not affect the dynamics of the vehicle in the crash (which can be justified by that md <<
mA).
Figure 3: Schematic of vehicle and driver.
a) Calculate the optimal (minimum) belt force Fd which is needed to restrain the driver
under the assumption that the seat belt force can be represented by an ideal plastic
force-deformation curve. (5 points)
b) Calculate the deceleration of the driver chest and compare to that of the vehicle. Please
comment on this comparison. (2 points)
c) Your design above with a constant belt force can be achieved by a device called a
force-limiter in the belt retractor. Discuss possible advantages and disadvantages of
such a design, for instance in relation to the scenario presented here. (1 point)
Task 3 (15 points)
Calculate what will happen with the two vehicles A and B (disregard the drivers and consider
only the vehicles) if they meet in a head-on-collision (full frontal collision), each at a speed v0
of 48 km/h, Figure 4. The force level in the contact will vary with the deformation of the
vehicles. First, both vehicles will deform as linear elastic springs (Appendix A) and once the
weaker structure is in plastic deformation it will dictate the force level until bottoming out. As
before, assume that there is no elastic restitution of the front structures. Hence, both vehicles
will have the same final velocity, vend.
Figure 4. Vehicle-to-vehicle collision.
dA
md
Fd
FA
mA
dd
v0
v0

4 of 7
a) Solve the equations of motions for vehicle A and B in the impact (see Appendix B).
Plot the force levels, acceleration, and velocity time histories, as shown in Figure 5.
Include this graph in your report. For solving this task, complete the function
solveEquationsOfMotion.m (5 points)
b) Tabulate the times when plastic deformation starts for each structure (ty), the maximum
force (Fmax), and the maximum acceleration level for each vehicle (|amax|), as shown in
the table below. (5 points)
Vehicle
ty
Fmax [kN]
|amax| [m/s2]
A
B
c) Tabulate the change of speed in the collision (ΔV), and the residual speed (vend) for
each vehicle, as shown in the table below. (2 points)
Vehicle
ΔV [m/s]
vend [m/s]
A
B
d) Will both vehicle fronts be fully deformed? If not, what is the proportion of
deformation for each vehicle? (2 points)
e) Discuss how the safety level of the two vehicles was affected on this head-on collision
compared with the rigid wall test in Task 1. Which vehicle is safer in the head-on
collision? (1 point)
Figure 5. Force, acceleration, and velocity time history of vehicle-to-vehicle collision.
Task 4 (25 points)
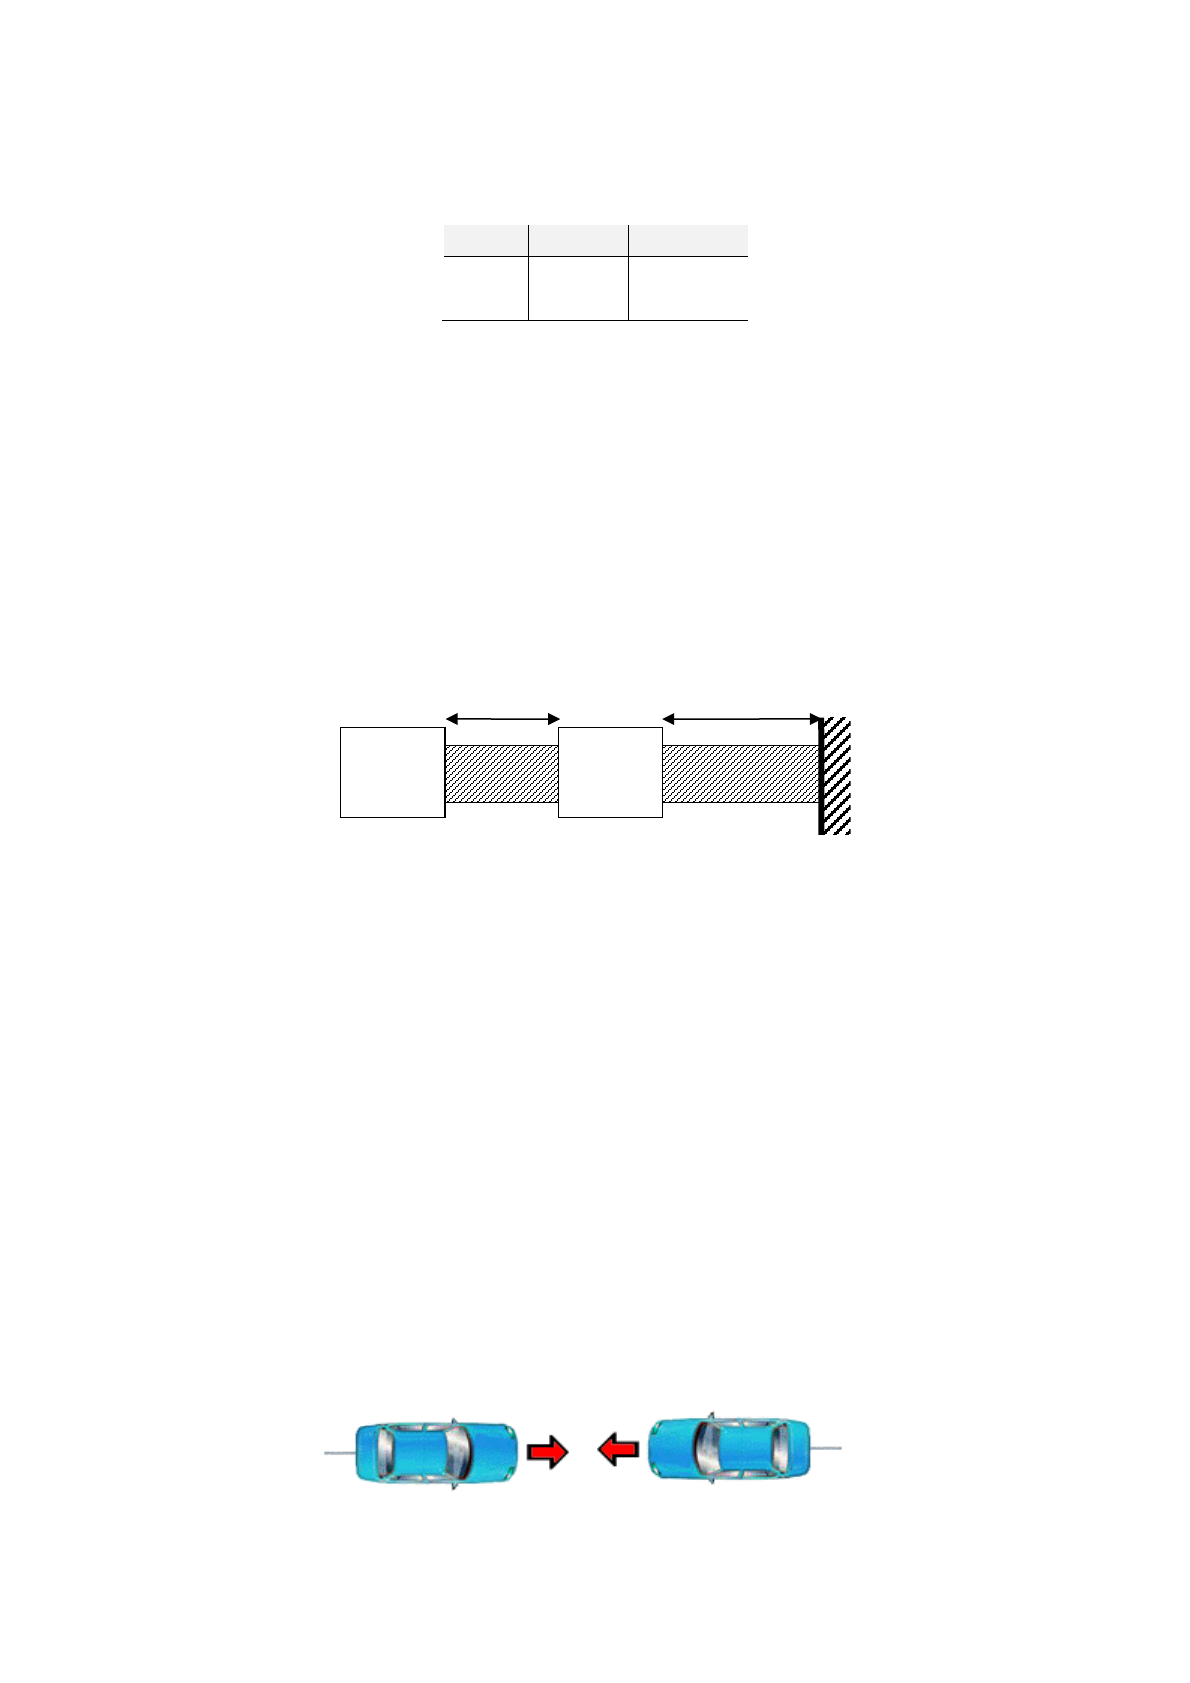
Figure 6 shows the more modern test setup used in the EEVC Frontal Offset Deformable Barrier
ECE R94 (Figure 6). Let us assume that this barrier engages 50% of the width of the vehicle
front structure; thus it engages 50% of the full vehicle deformation force.

5 of 7
Figure 6. Deformable barrier test.
Furthermore, let the barrier represent an ideal plastic structure which deforms at 100 kN applied
to 50% of the vehicle front structure (Figure 7). The available deformation length of the barrier
is 540 mm and for this test the impact speed v0=64 km/h.
Figure 7. Schematic of deformable barrier test.
Based on this new crash setup, redesign the vehicle, that is find the new maximum front structure
forces FA and FB (but keep the given mass, the length of the vehicle deformation zone, and the
yield point):
a) Calculate the maximum crash forces and the acceleration levels of each of the two
vehicles in this impact test configuration. Tabulate the results as shown in the table
below. (5 points)
Vehicle
Fmax [kN]
|amax| [m/s2]
A
B
b) What are the total front structure force levels F for both vehicles? Tabulate the
results as shown in the table below. (5 points)
Vehicle
Ftotal [kN]
A
B
Now, consider that the two cars, with this new modified stiffness, meet in a head-on collision.
Both vehicles travel at 48 km/h. As in Task 3, assume that there is no elastic restitution of the
front structures. Hence, both vehicles will have the same final velocity, vend. Similarly to Task
3:
c) Solve the equations of motions for vehicle A and B in the impact. Plot the force
levels, acceleration, and velocity time histories, as shown in Figure 5. Include this
graph in your report. For solving this task, use the same function
solveEquationsOfMotion.m that you used for Task 3a. (1 point)
d) Tabulate the times when plastic deformation starts for each structure (ty), the
maximum force (Fmax), and the maximum acceleration level for each vehicle
(|amax|), as shown in the table below. (5 points)
Barrier def. zone
dA
540 mm
mA
½*FA
100 kN

6 of 7
Vehicle
ty
Fmax [kN]
|amax| [m/s2]
A
B
e) Tabulate the change of speed in the collision (ΔV), and the residual speed (vend)
for each vehicle, as shown in the table below. (5 points)
Vehicle
ΔV [m/s]
vend [m/s]
A
B
f) Will both vehicle fronts be fully deformed? If not, what is the proportion of
deformation for each vehicle? (2 points)
g) Discuss whether the new stiffness of the cars A and B have increased the crash
safety, compared to what you found in Task 1. (2 point)

7 of 7
Appendix A: Series coupled linear elastic springs
where Lx is the length of the spring at rest, F is the elastic force, kx is the elastic stiffness, and
δx is the displacement.
Appendix B: Numerical solution of the equations of motion
The equations of motion can be discretized as follow:
where x is the deformation, F is the active force, m is the vehicle’s mass and dt is the time step
(e.g. 1e-4)
