119a Manual TOR 18FG User
User Manual:
Open the PDF directly: View PDF ![]() .
.
Page Count: 8

TOR 18FG
X - ray Phantoms
user manual
Leeds Test Objects
www.leedstestobjects.com
1
Test object TOR 18FG is intended to be used routinely by radiographers to check the imaging performance
of conventional image-intensifier fluoroscopy and fluorography systems. This may be done on a week-to
week basis, keeping an on-going record of the test results, which will indicate any deterioration in imaging
performance.
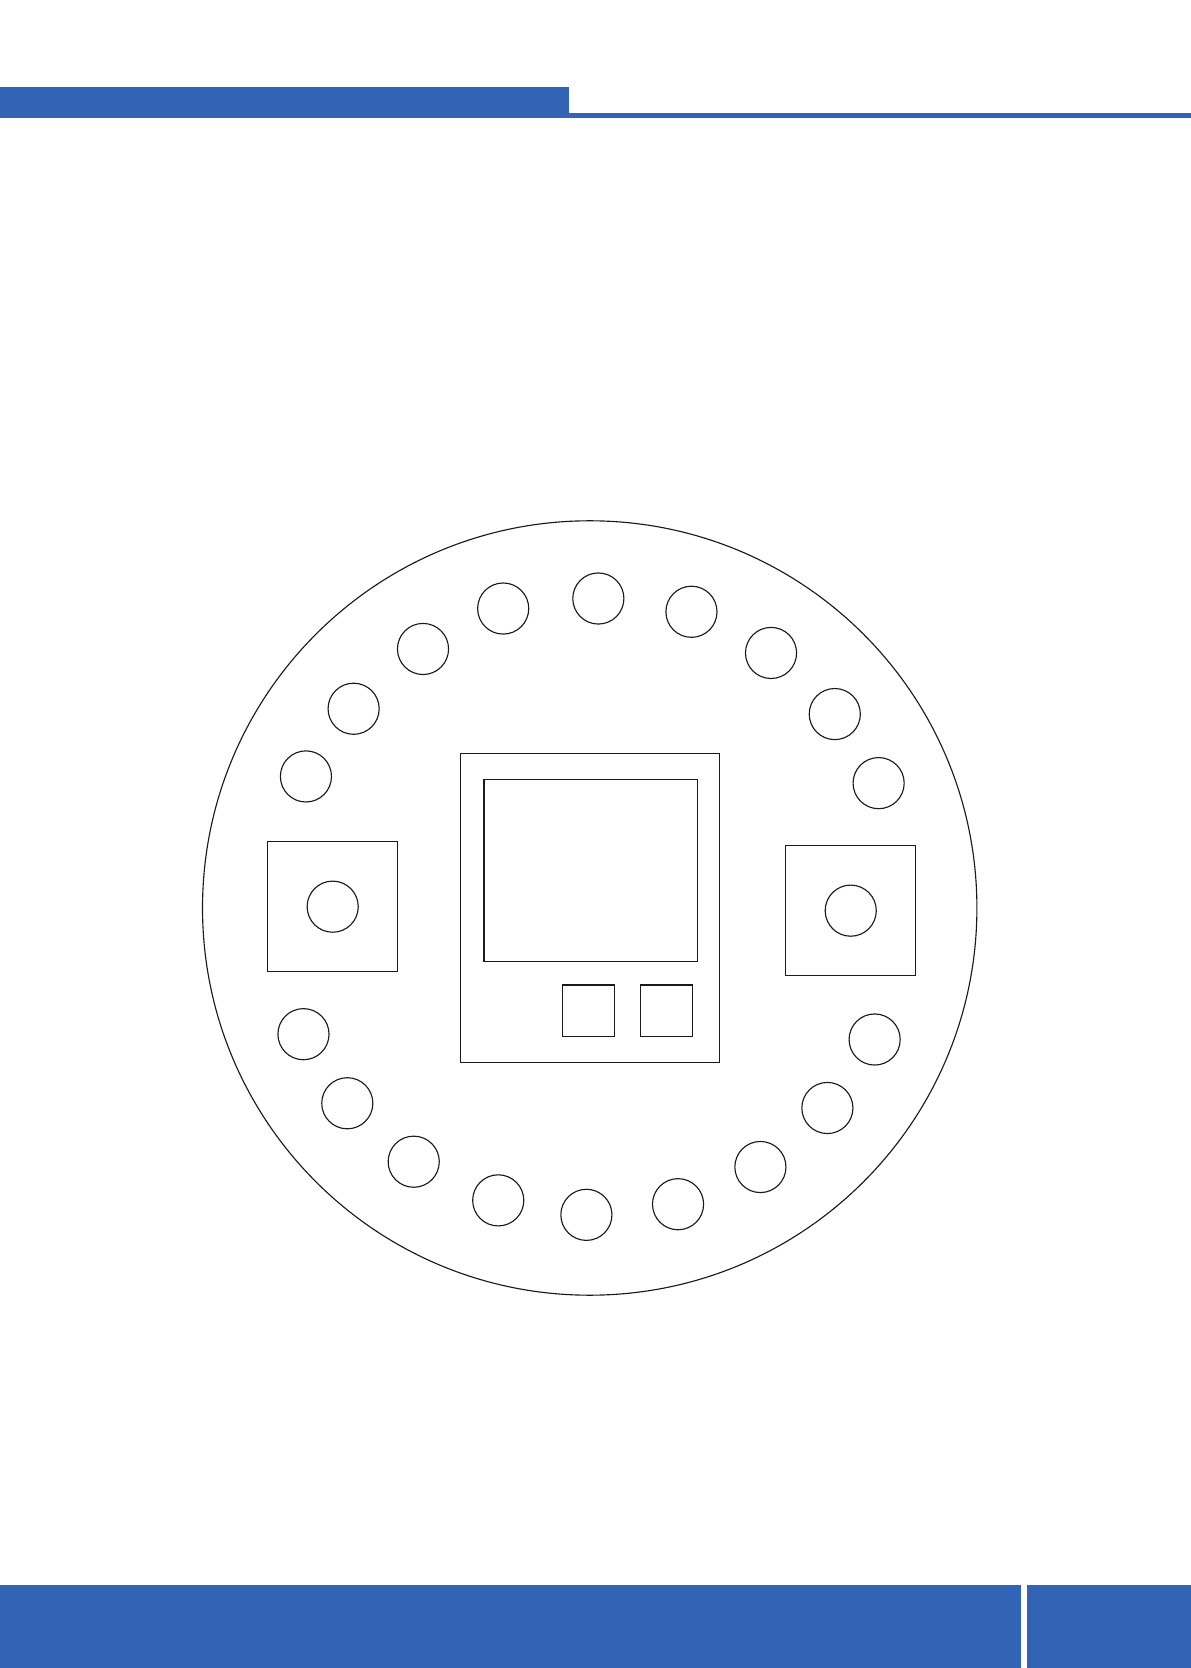
Figure 1 shows the layout of the test details, which enable the following tests to be carried out:
- Brightness and contrast adjustments to the television monitor
- Television scanning linearity (circular geometry)
- Low-contrast sensitivity (finding the threshold contrast)
- Spatial resolution limit
Specifications of the X-ray contrasts and spatial frequencies in the test object are given on page 4.
DESCRIPTION
The test object should be placed centrally, as close to as possible to the entrance plane of the image
intensifier. When the system has no anti-scatter grid, position the test object so that the resolution bar
patterns will be imaged at right angles to the scanning lines of the television monitor. If an anti-scatter grid is
included, turn the test object through 45 degrees to avoid interference from both the scanning lines and the
grid structure.
POSITIONING THE TEST OBJECTS
The recommended beam conditions are 70 kVp with a primary filter of 1 mm copper. Place the supplied
filter as close as possible to the tube head, normally at the diaphragm housing. Select the most suitable
field size for the test image, and use the appropriate exposure rate. If kVp or mA values can not be set
manually, allow the automatic exposure control of the system to produce an acceptable image. The
exposure conditions should be recorded; they must be the same every time, otherwise the test results
can not be compared.
X-RAY BEAM CONDITIONS
Observe the light and dark squares, and set the brightness and contrast controls so that both circles are
clearly visible within the squares. The range between black and white should be as wide as possible,
with a true black level in the dark (Pb) circle, and without peak-white glare. The monitor will then be
correctly adjusted for the following tests, and for most clinical radiological work.
SETTING THE MONITOR CONTROLS
2
The circular rim surrounding the test details should appear perfectly circular on the monitor screen.
If not, it indicates the vertical and/or horizontal time base scans need adjusting. It is unlikely to be
due to geometric distortion in the image intensifier, which is normally 'pincushion' distortion caused by
the curvature of the input screen, although other effects can be caused by external magnetic fields.
CIRCULAR GEOMETRY
Pb Cu
18
17
16
15 14 13
12
11
10
1
2
3
56
7
8
9
4
Circular rim
Figure 1: Layout of test details (not to scale)
Resolution
Test
Pattern
3
The ability of an X-ray system to image low-contrast details depends on the levels of noise and contrast loss
(due to scatter), which can change over a period of time. The 18 circular discs form a series of gradually
decreasing contrasts, and the measurement consists of determining which disc lies at the threshold of
visibility.
The measurement should be made at a fixed distance from the monitor, because viewing distance affects
the perception of image noise. The recommended distance is about four times the diameter of the monitor
circle, although this is not critical.
This type of measurement requires some practice and experience before consistent results are obtained.
As viewing experience is gained, the psycho-physical threshold of an observer should stabilise, and details
of lower contrast may be detected. The least-visible disc is determined simply by counting the number that
can be detected, and the value of the threshold contrast can be found from the specification table. For
modern fluoroscopy systems, an average value of threshold contrast should be about 0.03 (11 or 12 discs
visible) in the 25cm field size.
N.B. to be able to compare test results and so detect system deterioration, the same conditions must be
observed each time the test is carried out. This means not only the same X-ray exposure conditions but
also the same viewing conditions, with a correctly adjusted monitor and a standardised viewing distance.
Room lighting can be at normal levels, although lights should not be seen reflected in the monitor
screen.
MEASURING LOW-CONTRAST SENSITIVITY
The resolution limit is a simple indicator of the sharpness of the system, which depends on optimum focusing
of the image components (intensifier, optical lenses, television camera etc.) and which may deteriorate with
time. Measurement of the resolution limit requires the test pattern to be imaged under conditions of high
contrast and low noise. Remove the 1 mm copper filter, and select a low tube voltage, about 50 kVp.
Increase the exposure rate as much as possible without saturating the camera (seen as 'flaring' on the
monitor); the X-ray quantum noise is then at a minimum. Where exposure conditions are set automatically, it
may be necessary to place some additional light-element material in the beam, which will attenuate the
beam without unduly 'hardening' it. Perspex (PMMA) is such a material. Paper is also suitable, and one or
more telephone directories (for example) placed in the beam close to the tube may be helpful in obtaining the
required beam conditions.
At a comfortable viewing distance, which can be much closer than before, observe the resolution pattern on
the monitor screen, and note those groups where the bars and spaces are all visible. From the specification
table, determine the highest spatial frequency that can be resolved in this way. This should be done for each
available field size. Average values for modern fluoroscopy systems are 1.25 line pairs per mm for 25 cm
field size, 1.6 line pairs per mm for the 15 cm field size.
N.B. the monitor controls should not be altered for these measurements, even though better results may
be obtained by reducing Brightness or increasing Contrast. As noted above, viewing conditions must
always be standardised on each test occasion, if comparable results are to be obtained.
MEASURING THE RESOLUTION LIMIT
4
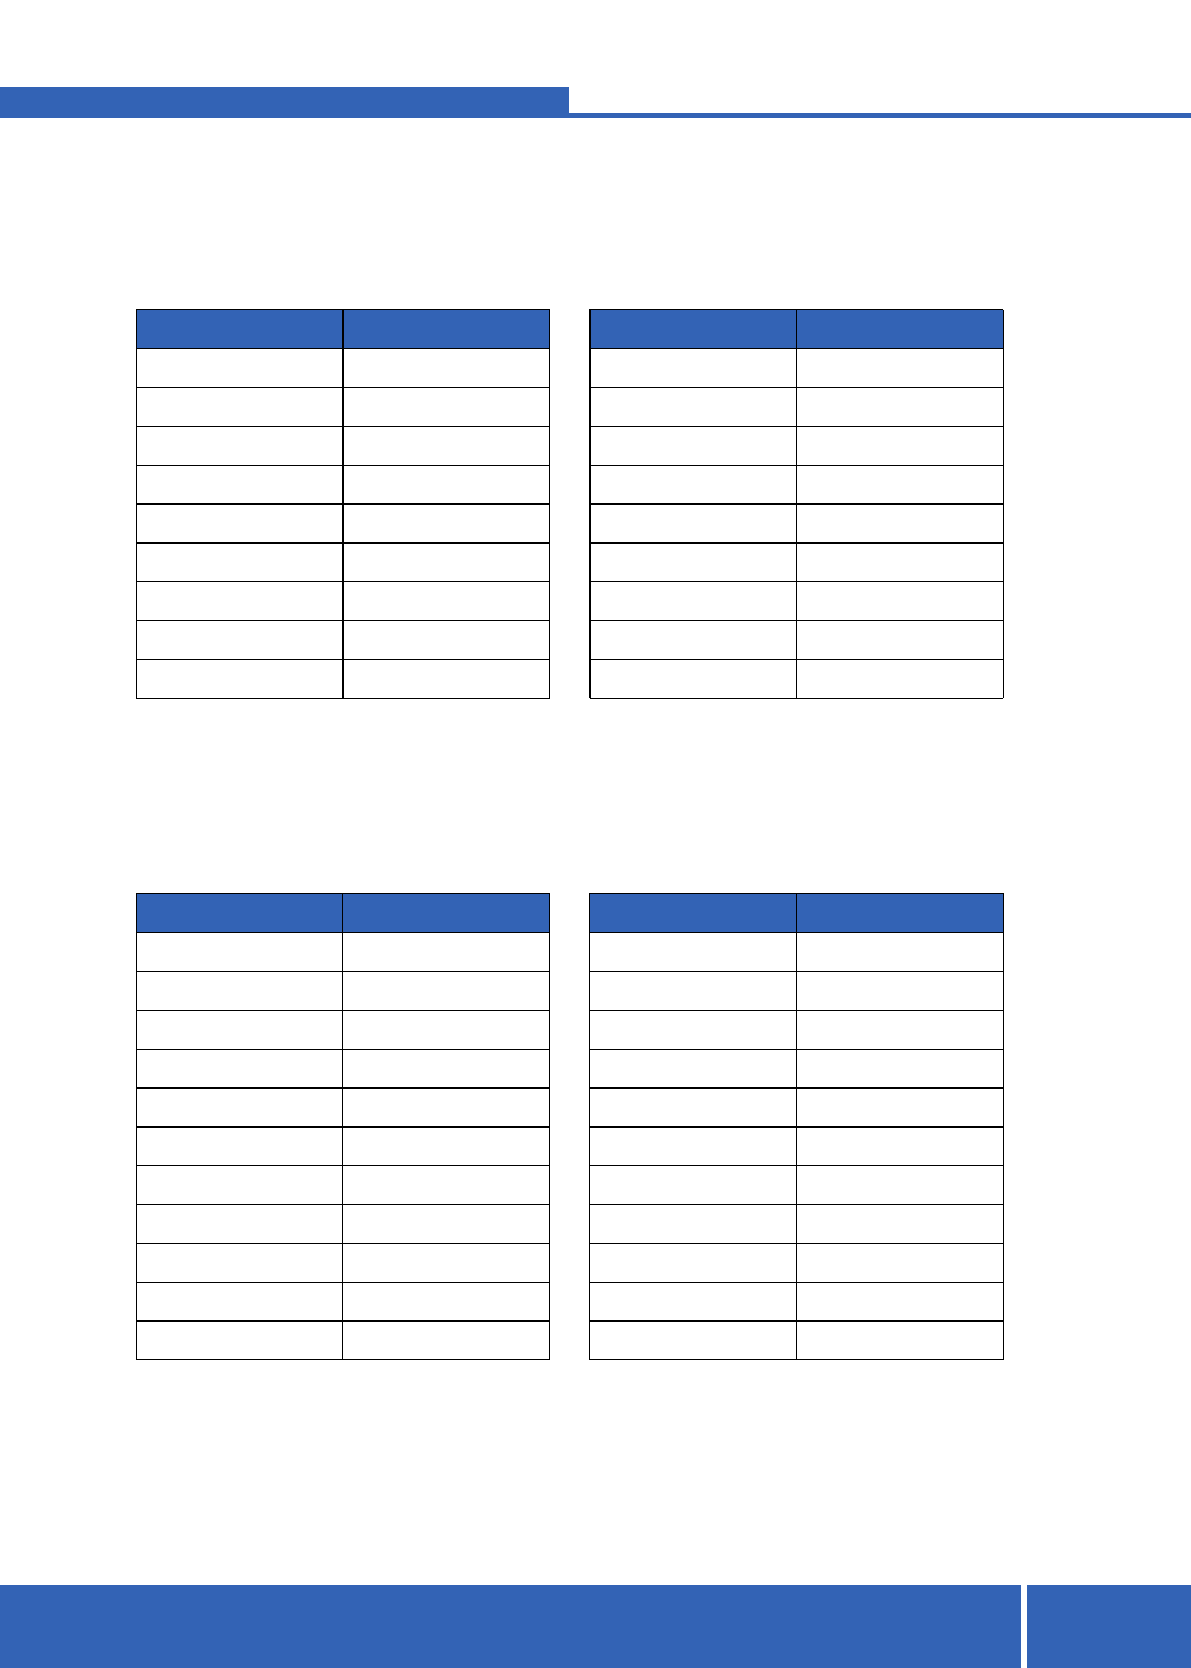
18 circular details, diameter 8 mm. The following table gives the X-ray contrasts of the discs for beam
conditions of 70 kVp (constant potential) with 1 mm copper filtration. These should be regarded as
nominal values; actual contrasts will depend on the kV waveform, etc. They are also subject to
manufacturing tolerances of ±5%.
SPECIFICATIONS OF THE TEST DTAILS
Resolution test Patterns: there are 21 separate groups of bar patterns, each group comprising 5 bars
and 4 spaces, giving 4½ 'line pairs'. The following table gives the spatial frequencies in line pairs per
mm.
Disc Number Contrast
1 0.167
2 0.148
3 0.128
4 0.109
5 0.088
6 0.075
7 0.067
8 0.053
9 0.045
Disc Number Contrast
10 0.039
11 0.032
12 0.027
13 0.022
14 0.017
15 0.015
16 0.013
17 0.011
18 0.009
Group Number Sp.freq.
1 0.5
2 0.56
3 0.63
4 0.71
5 0.8
6 0.9
7 1
8 1.12
9 1.25
Group Number Sp.freq.
11 1.6
12 1.8
13 2
14 2.24
15 2.5
16 2.8
17 3.15
18 3.55
19 4
10 1.40
- -
20 4.50
21 5
5
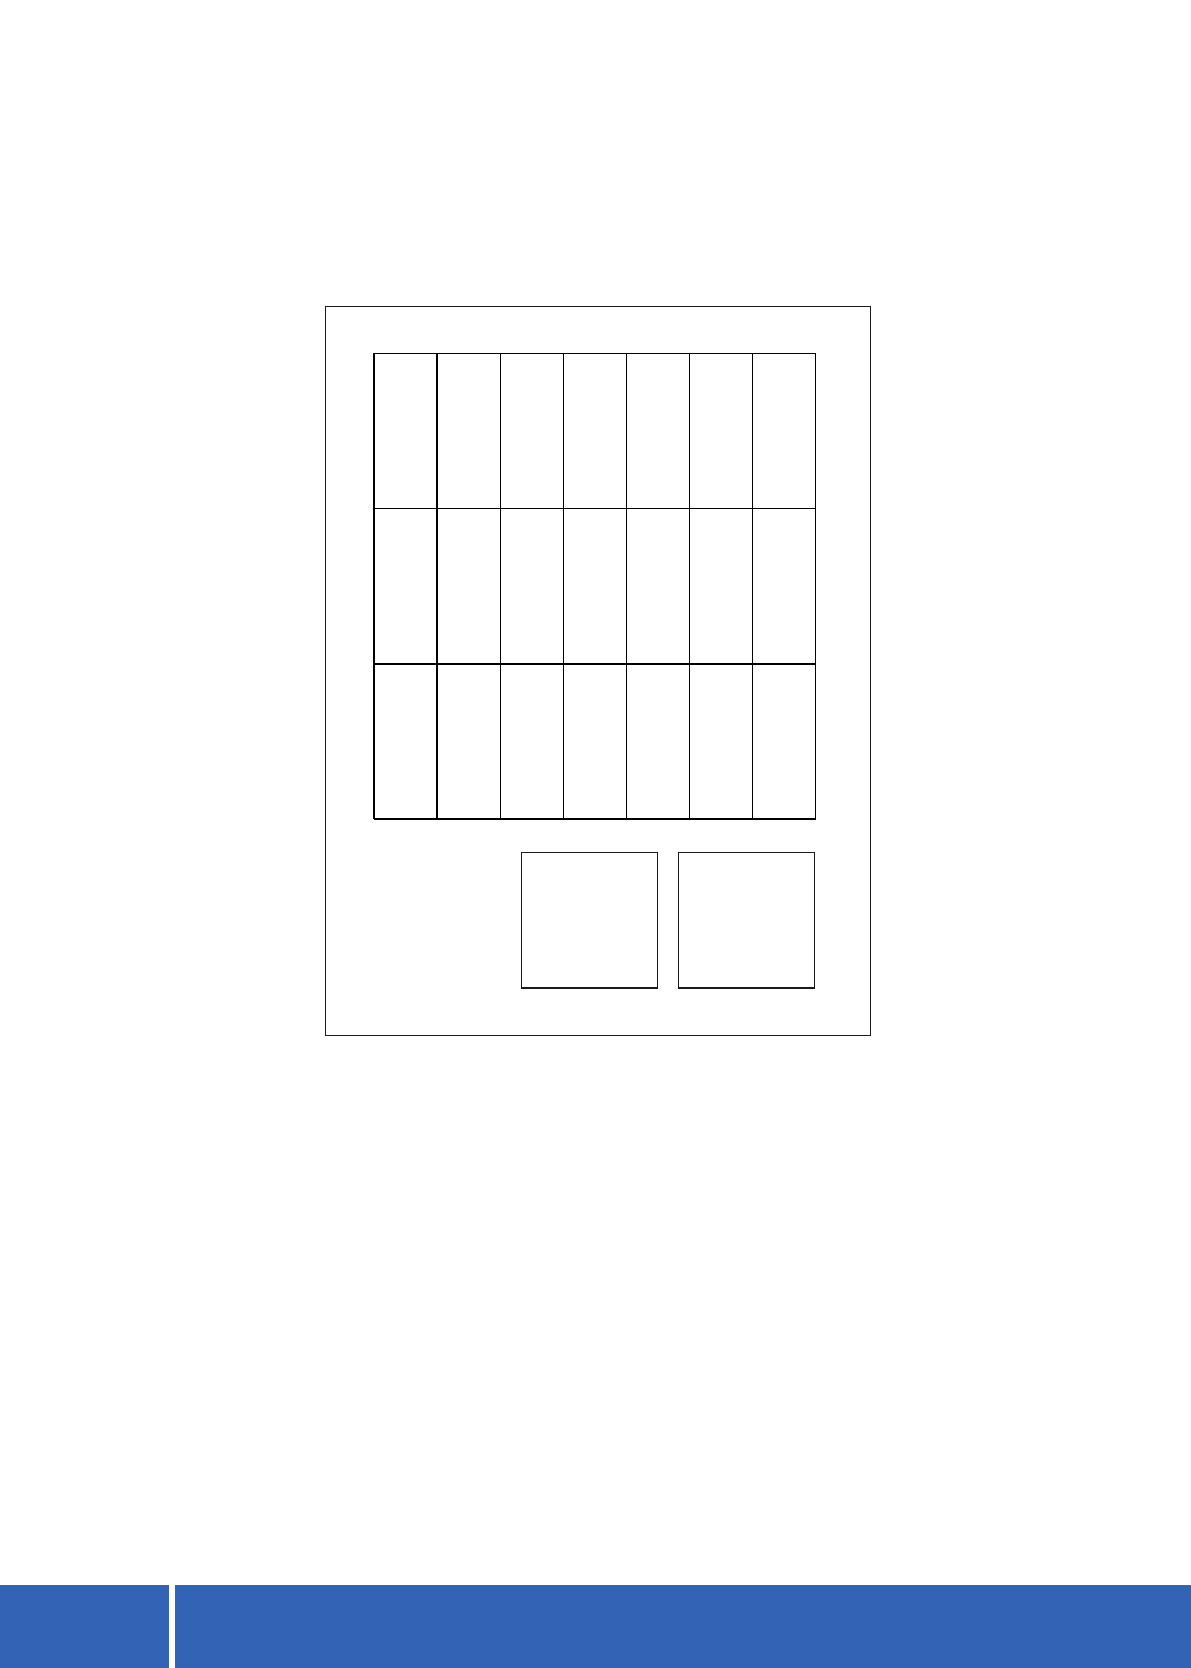
Layout for Type 18 (0.5 – 5.0 LP/mm) Resolution Test Pattern:
No
Lead
+0.5
Lead
0.5
0.71
1
1.4
2
2.8
4
0.56
0.8
1.12
1.6
2.24
3.15
4.5
0.63
0.9
1.25
1.8
2.5
3.55
5
Man 119b 12/07/11
Phone
Fax
Email
Web
+44(0)1423 321102
+44(0)1423 322672
info@leedstestobjects.com
www.leedstestobjects.com
LEEDS TEST OBJECTS LTD
Miro House
Becklands Close
Boroughbridge
North Yorkshire
YO51 9NR