TechnicalPaperOnly_Cover_ReportDoc__Pages TP 100
User Manual: TP 100
Open the PDF directly: View PDF ![]() .
.
Page Count: 14

US Army Corps
of Engineers
Hydrologic Engineering Center
Probable Maximum Flood
Estimation - Eastern United
States
September 1984
Approved for Public Release. Distribution Unlimited. TP-100

Standard Form 298 (Rev. 8/98)
Prescribed by ANSI Std. Z39-18
REPORT DOCUMENTATION PAGE Form Approved OMB No. 0704-0188
The public reporting burden for this collection of information is estimated to average 1 hour per response, including the time for reviewing instructions, searching
existing data sources, gathering and maintaining the data needed, and completing and reviewing the collection of information. Send comments regarding this
burden estimate or any other aspect of this collection of information, including suggestions for reducing this burden, to the Department of Defense, Executive
Services and Communications Directorate (0704-0188). Respondents should be aware that notwithstanding any other provision of law, no person shall be
subject to any penalty for failing to comply with a collection of information if it does not display a currently valid OMB control number.
PLEASE DO NOT RETURN YOUR FORM TO THE ABOVE ORGANIZATION.
1. REPORT DATE (DD-MM-YYYY)
September 1984 2. REPORT TYPE
Technical Paper 3. DATES COVERED (From - To)
5a. CONTRACT NUMBER
5b. GRANT NUMBER
4. TITLE AND SUBTITLE
Probable Maximum Flood Estimation - Eastern United States
5c. PROGRAM ELEMENT NUMBER
5d. PROJECT NUMBER
5e. TASK NUMBER
6. AUTHOR(S)
Paul B. Ely, John C. Peters
5F. WORK UNIT NUMBER
7. PERFORMING ORGANIZATION NAME(S) AND ADDRESS(ES)
US Army Corps of Engineers
Institute for Water Resources
Hydrologic Engineering Center (HEC)
609 Second Street
Davis, CA 95616-4687
8. PERFORMING ORGANIZATION REPORT NUMBER
TP-100
10. SPONSOR/ MONITOR'S ACRONYM(S) 9. SPONSORING/MONITORING AGENCY NAME(S) AND ADDRESS(ES)
11. SPONSOR/ MONITOR'S REPORT NUMBER(S)
12. DISTRIBUTION / AVAILABILITY STATEMENT
Approved for public release; distribution is unlimited.
13. SUPPLEMENTARY NOTES
This is Paper No. 84017, published in Vol. 20, No. 3 of the Water Resources Bulleting in June 1984. (American Water
Resources Association)
14. ABSTRACT
In 1982, the National Weather Service (NWS) published criteria for developing the spatial and temporal precipitation
distribution characteristics of Probable Maximum Storms. The criteria, which are intended for use in the United States east
of the 105th meridian, involve four variables: (1) location of the storm center, (2) storm-area size, (3) storm orientation, and
(4) temporal arrangement of precipitation amounts. A computer program has been developed which applies the NWS
criteria to produce hyetographs for spatially-averaged precipitation for a basin, or for each subbasin if the basin is
subdivided. The basis and operational characteristics of the program are described, and an application if illustrated in
which the program is used in conjunction with a precipitation-runoff simulation program (HEC-1) to compute a Probable
Maximum Flow.
15. SUBJECT TERMS
Probable Maximum Flood, PMF, design storm, National Weather Service, NWS, precipitation, distribution, temporal,
spatial, 105th meridian, storm, hyetographs, basin, subbasin, United States, east, computer program, HEC-1, Probable
Maximum Precipitation, PMP, Probable Maximum Storm, PMS, hydrograph, hydraulic
16. SECURITY CLASSIFICATION OF: 19a. NAME OF RESPONSIBLE PERSON
a. REPORT
U b. ABSTRACT
U c. THIS PAGE
U
17. LIMITATION
OF
ABSTRACT
UU
18. NUMBER
OF
PAGES
14 19b. TELEPHONE NUMBER

Probable Maximum Flood
Estimation - Eastern United
States
September 1984
US Army Corps of Engineers
Institute for Water Resources
Hydrologic Engineering Center
609 Second Street
Davis, CA 95616
(530) 756-1104
(530) 756-8250 FAX
www.hec.usace.army.mil TP-100
Papers in this series have resulted from technical activities of the Hydrologic
Engineering Center. Versions of some of these have been published in
technical journals or in conference proceedings. The purpose of this series is to
make the information available for use in the Center's training program and for
distribution with the Corps of Engineers.
The findings in this report are not to be construed as an official Department of
the Army position unless so designated by other authorized documents.
The contents of this report are not to be used for advertising, publication, or
promotional purposes. Citation of trade names does not constitute an official
endorsement or approval of the use of such commercial products.
PROBABLE MAXIMUM FLOOD ESTIMATION
-
EASTERN UNITED STATES1
Paul
B.
Ely
and
John
C
peters2
ABSTRACT: In 1982, the National Weather Service (NWS) published
criteria for developing the spatial and temporal precipitation distribu-
tion characteristics of Probable Maximum Storms The criteria, which
are intended for use in the United States east of the 105th
me~idian, in-
volve four variables: (1) location of the storm center, (2) storm-area
size,
(3)
storm orientation, and (4) temporal arrangement of precipita-
tion amounts A computer propam has been developed which applies
the NWS criteria to produce hyetographs of spatially-averaged precipita-
tion for a basin, or for each subbasin if the basin is subdivided. The
basis and operational characteristics of the pIogram are described, and
an application is illustrated in which the progam is used in conjunction
with a precipitation-runoff simulation program (HEC-1) to compute a
Probable Maximum Flood
(KEY TERMS: Probable Maximum Flood; design storm
)
INTRODUCTION
In 1978, the United States National Weather Service (NWS)
published estimates for Probable Maximum Precipitation
(PMP) for the eastern part of the country, east of the 105th
meridian (NWS, 1978). The estimates apply to areas of' 10 to
10,000 sq. mi. and durations of' 6 to 72 hours. The National
Weather Service has also published applications criteria (NWS,
1982) that can be used with the PMP estimates to develop
spatial and temporal characteristics of' a Probable Maximum
Storm (PMS).
A
PMS thus developed can be used with a
precipitation-runoff simulation model to calculate a Probable
Maximum Flood (PMF) hydrograph. The PMF is used in the
hydraulic design of project components for which virtually
complete security fiom flood-induced Mlure is desired; for
example, the spillway of' a major dam or protection works for
a nuclear power plant.
The NWS criteria for defining a PMS require that the mag-
nitude of' four variables be established: (1) location of the
storm center, (2) storm-area size,
(3)
sto~m orientation, and
(4)
temporal arrangement of' precipitation amounts. Addi-
tional va~iables that influence the magnitude of'a PMF include
antecedent moisture conditions and the initial state of'a reser-
A
computer program has been developed (HEC, 1983b) for
applying the NWS procedure for defining a PMS The pro-
gram, called HMR52, has an optional capability to pass cal-
culated hyetographs to a data storage system for subsequent
retrieval by computer program HEC-1 (HEC, 1981), with
which runoff is calculated This paper describes the basis for
the new program and describes its application in conjunction
with HEC-1.
COMPUTER PROGRAM HMR52
The NWS criteria define the PMS in terms of a set of ellip-
tical isohyets for a series of 'standard' area sizes
-
10,25, 50,
100, etc
,
up to 60,000 sq mi The basis for, and method of,
assigning precipitation depths to the isohyets are provided in
Hyd~ometeorological Report No 52 (NWS, 1982). For runoff
determination, a watershed is generally divided into subbasins,
and a hyetograph (i e., time distribution) of average precipita-
tion for each subbasin is required. The output from HMR52
consists essentially of a set of subbasin hyetographs.
The sequence of computations in HMR52 is first to calcu-
late a PMS for the total watershed and then to determine the
corresponding subbasin hyetographs Input items for HMR52
include the following:
1.
X-Y
coordinates for the total watershed and for each
subbasin. These could be obtained with a digitizer.
2 Depth-area-duration PMP data from Hydrometeorologi-
cal Report No 51 (NWS, 1978).
3
Preferred storm orientation from Hydrometeorological
Report No 52 (NWS, 1982)
4.
X-Y
coordinates of the storm center.
5. Storm-area size.
6. Storm orientation.
'7.
Temporal arrangement of six-hour depths.
8. Time interval for hyetographs
voir or reservoir system The four PMS variables are generally Although PMS variables are generally based on the pro-
chosen to produce the maximum peak discharge or runoff duction of peak discharge or maximum runoff volume, maxi-
volume at the point of interest It is therefore necessary to mization of the average depth of precipitation over the water-
calculate runoff as a part of the trial and error process of shed is, in many cases, a virtually equivalent criterion. The
establishing the magnitude of the PMS vaxiables. HMR52 program contains an option by which storm area size
'paper No 84017 of the
Water Resources Bulletin.
~~draulic Engineen, Hydrologic Engineering Center, 609 Second Street, Davis, Califo~nia 9561 6.
and/or orientation can be optimized with maximization of
average depth as an objective firnction. Although the program
does not have capability to optimize the location of'the storm
center, the program
will
locate the storm center at the basin
centroid if location of the storm center is not specified. The
programmed optimization procedure is as follows:
1. The major axis of' the storm is oriented such that the
moment of' inertia (second moment of'the basin area about
this axis is a minimum. The depth of basin-average precipita-
tion is determined for an array of storms corresponding to the
standard storm-area sizes.. The storm-area size which produces
the maximum average depth is selected as the critical storm-
area size (i.e., see Table la).
2. Using the critical storm-area size, the depth of basin-
average precipitation is determined for an array of storms for
which storm orientation varies in 10-degree increments over
the range of possible orientations. The orientation producing
the maximum average depth is determined and two additional
storms, with orientations of' 55' from this orientation, are
developed.. The orientation that produces the maximum aver-
age depth is selected as the critical orientation (i..e.., see
Table lb).
Six-hour incremental precipitation amounts for each storm
identified in the optimization process are arranged in order of
decreasing magnitude, as illustrated in Tab6 la and lb. The
time interval for incremental precipitation used for definition
of the optimized (or user-specified) storm is selected by the
user in the range of' five minutes to six hours. Precipitation
is assumed to occur with unifbrm intensity during each six-
hour period outside of the 24-hour period of maximum preci-
pitation.
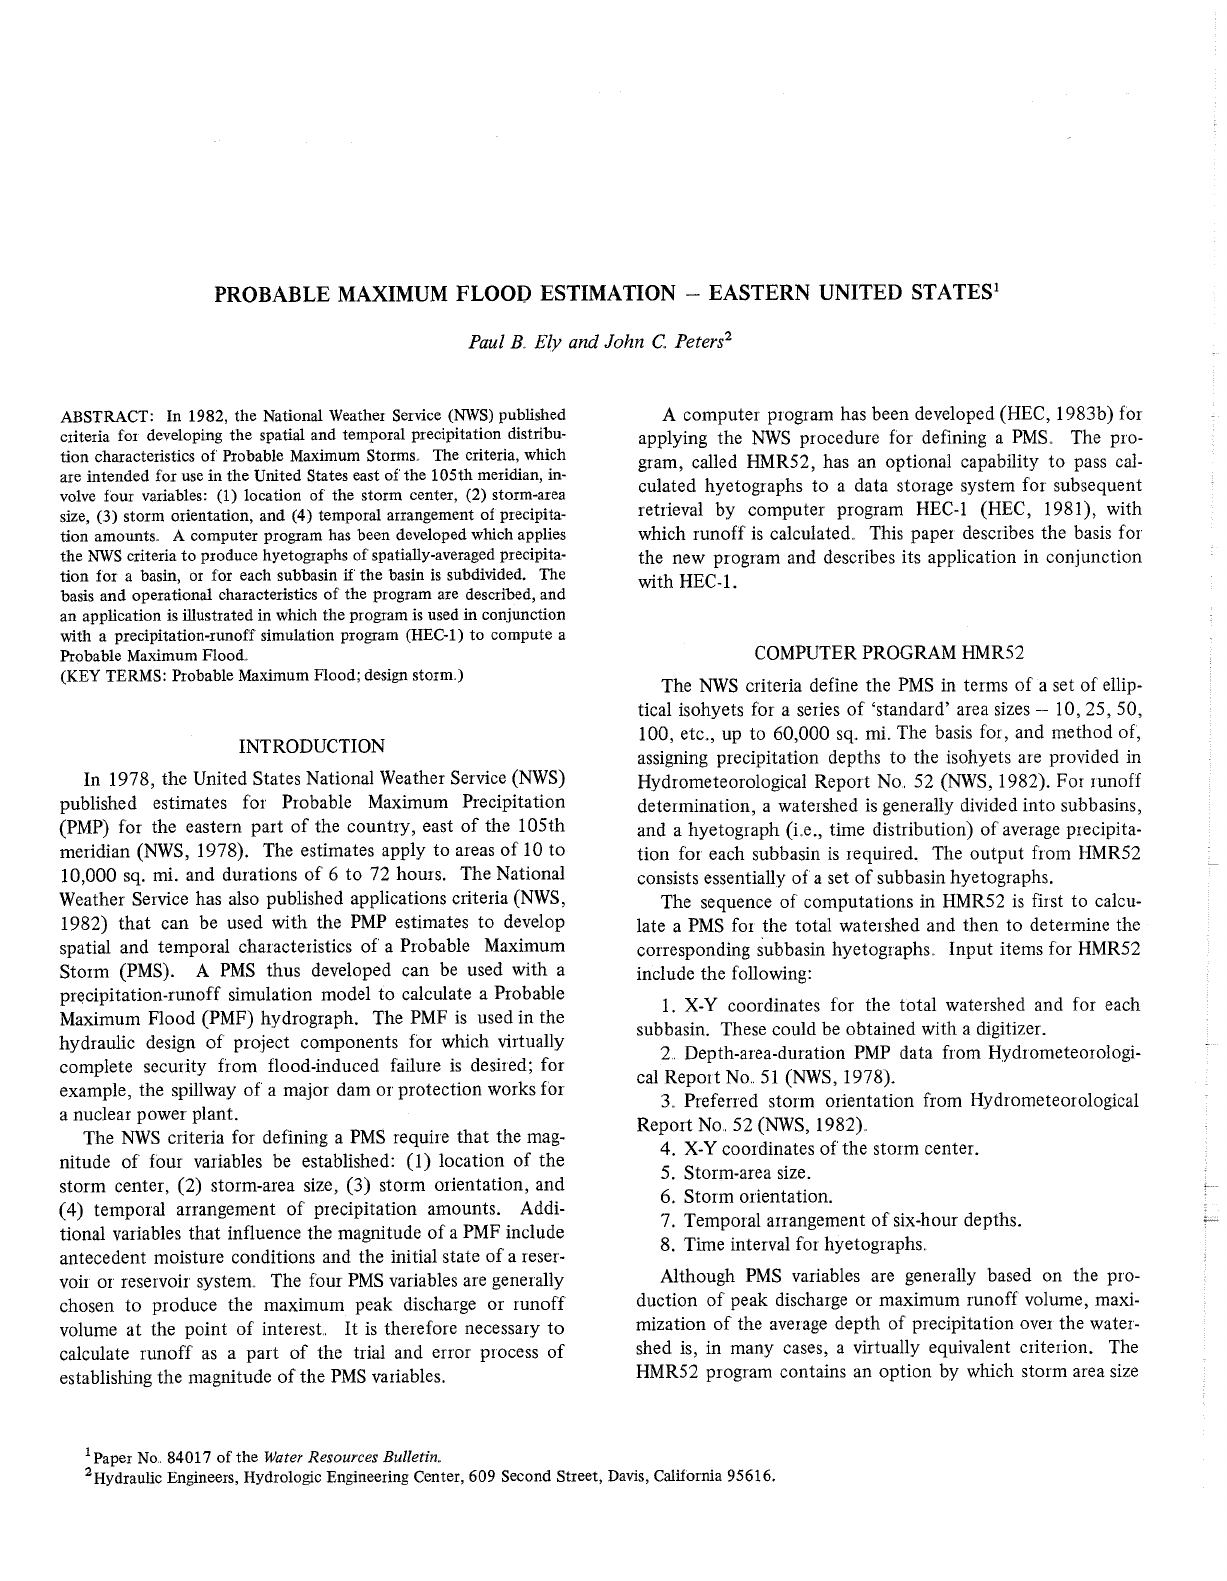
The user can specify the arrangement of six-hour incre-
ments throughout the storm or just the position of the maxi-
mum six-hour increment, which may occur in any position
after the first 24 hours of the storm. If' the position of' the
largest six-hour increment is not specified, it is placed in the
seventh position (hours 37-42) by default. Figure 1 illus-
trates a program-generated hyetograph fbr which At is one
hour. Criteria and guidelines for determining the temporal
arrangement of precipitation are given in Hydrometeorological
Report No. 52 (NWS, 1982).
RUNOFF SIMULATION
The HMR52 program has capability to write subbasin hye-
togsaphs to a disk fie, or to a special Data Storage System
(HEC, 1982), for subsequent runoff simulation with computer
program HEC-1 (HEC, 1981). An advantage of using the Data
Storage System is that a graphics program called DSPLAY
(HEC, 1983a) can be used to plot the precipitation hyeto-
graphs as well as hydrographs calculated with HEC-1.
The HEC-1 program can be used to simulate the runoff'
generation, routing and combining operations required for
complex multi-subbasin watersheds.. Generally the unit hydro-
graph approach to runoff simulation is employed, although
capability to calculate runoff' with kinematic wave methodo-
logy is also available (HEC, 1979).
In addition to the subbasin hyetographs, input items for
HEC-1 would include:
1. Subbasin areas.
2. Unit hydrograph, loss rate, and base flow parameters for
each subbasin.
3.'~treamflow routing parameters fbr each routing reach.
4. Storage-outflow criteria and an initial storage for reser-
voirs, if reservoir routing
is
to
be
performed.
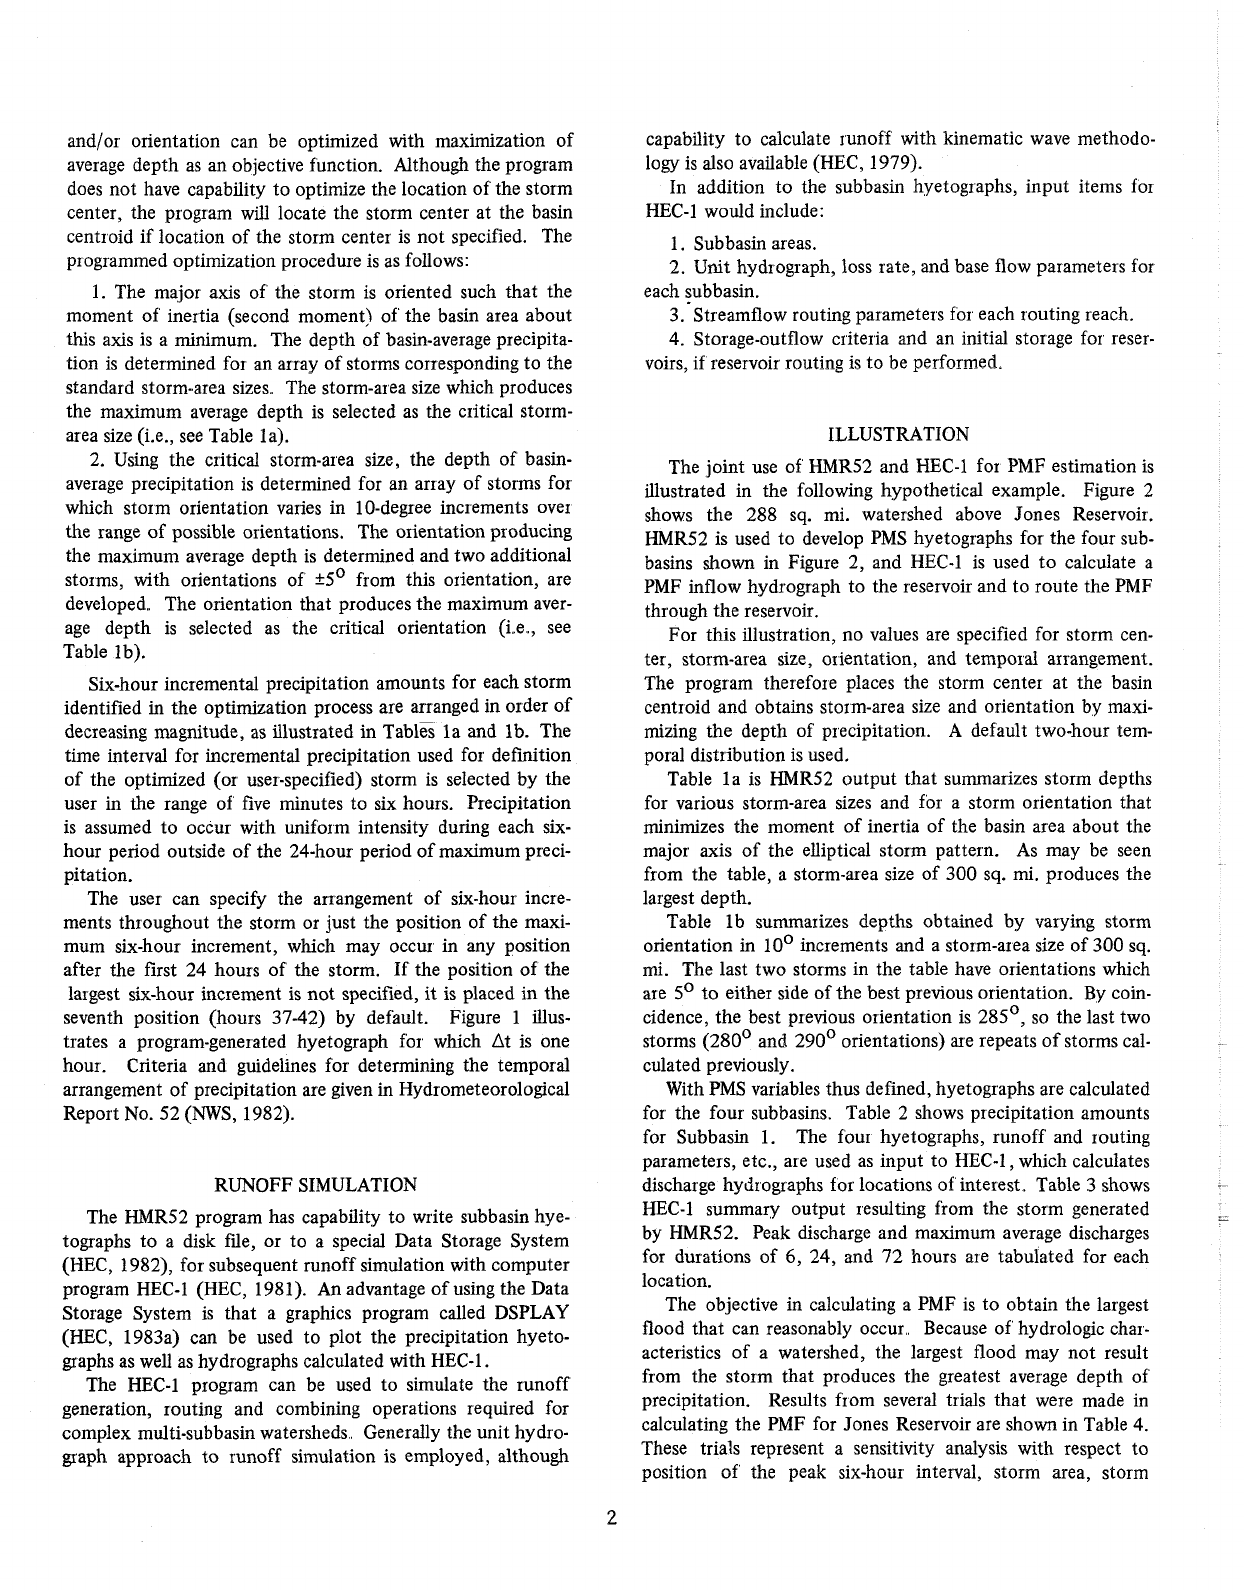
ILLUSTRATION
The joint use of' HMR52 and HEC-1 for PMF estimation is
illustrated in the following hypothetical example. Figure 2
shows the 288 sq. mi. watershed above Jones Reservoir.
HMR52 is used to develop PMS hyetographs for the four sub-
basins shown in Figure 2, and HEC-1 is used to calculate a
PMF inflow hydrograph to the reservoir and to route the PMF
through the reservoir.
For this illustration, no values are specified for storm cen-
ter, storm-area size, o~ientation, and temporal arrangement.
The program therefore places the storm center at the basin
centroid and obtains storm-area size and orientation by maxi-
mizing the depth of' precipitation.
A
default two-hour tem-
poral distribution is used.
Table la is HMR52 output that summarizes storm depths
for various storm-area sizes and fbr a storm orientation that
minimizes the moment of inertia of the basin area about the
major axis of the elliptical storm pattern. As may be seen
from the table, a storm-area size of 300 sq. mi. produces the
largest depth.
Table lb summarizes depths obtained by varying storm
orientation in 10' increments and a storm-a~ea size of 300 sq.
mi. The last two storms in the table have orientations which
are 5' to either side of the best previous orientation. By coin-
cidence, the best previous orientation is 285', so the last two
storms (280' and 290' orientations) are repeats of storms cal-
culated previously.
With PMS variables thus defined, hyetographs are calculated
for the four subbasins. Table 2 shows precipitation amounts
for Subbasin 1. The fbur hyetographs, runoff' and routing
parameters, etc., are used as input to HEC-1, which calculates
discharge hydrographs for locations of' interest.. Table
3
shows
HEC-1 summary output resulting from the storm generated
by HMR52. Peak discharge and maximum average discharges
for durations of
6,
24, and 72 hours are tabulated for each
location.
The objective in calculating a PMF is to obtain the largest
flood that can reasonably occur.. Because of' hydrologic char-
acteristics of a watershed, the largest flood may not result
from the storm that produces the greatest average depth of'
precipitation. Results fiom several trials that were made in
calculating the PMF for Jones Reservoir are shown in Table 4.
These trials represent a sensitivity analysis with respect to
position of' the peak six-hour interval, storm area, storm
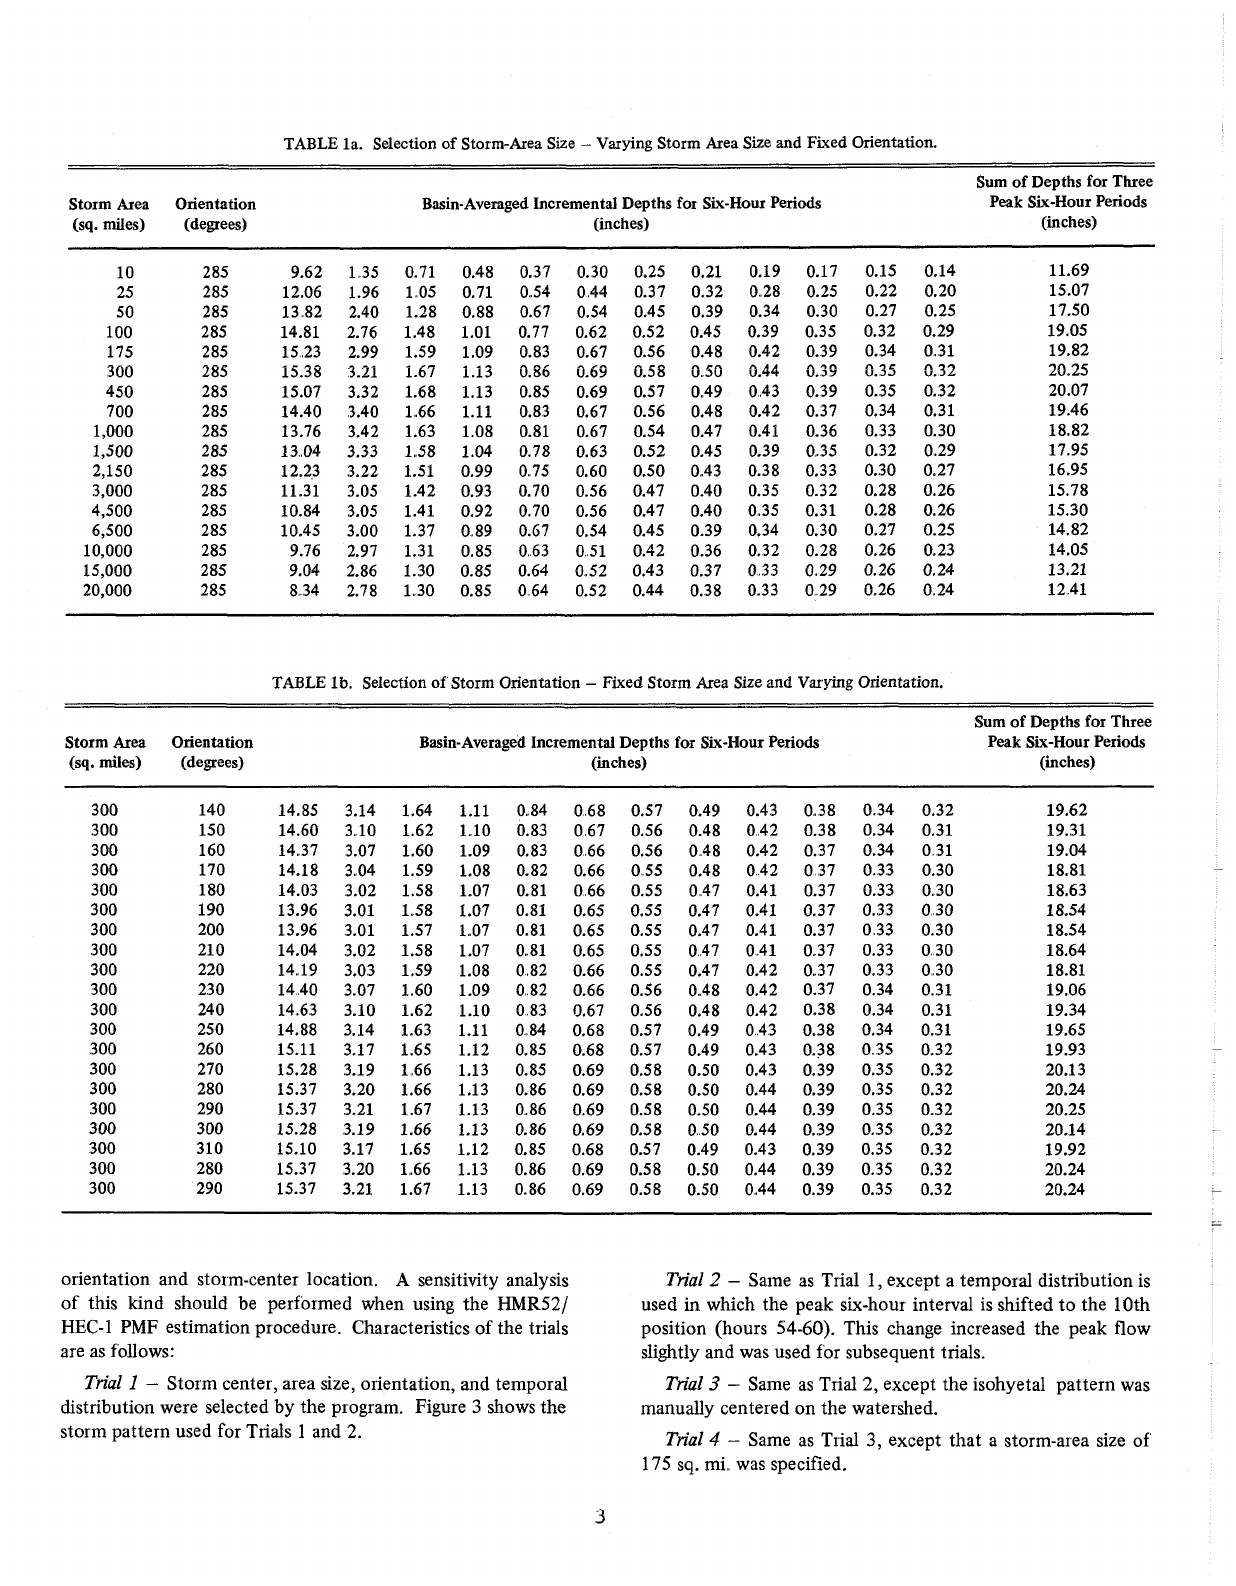
TABLE
la. Selection of Storm-Area Size
-
Varying Storm Area Size and Fixed Orientation.
Sum of Depths for Three
Storm Area Orientation Basin-Averaged Incremental Depths fox Six-Hour Periods Peak Six-Hour Periods
(sq. mites) (degrees) (inches) (inches)
TABLE
lb. Selection of Storm Orientation
-
Fixed Storm Acea Size and
Varying
Orientation.
Sum of Depths for Three
Storm Area Orientation Basin-Averaged Incremental Depths for Six-Hour Periods Peak Six-Hour Periods
(sq. miles) (degrees) (inches) (inches)
orientation and storm-center location.
A
sensitivity analysis
of this kind should be perfbrmed when using the
HMR52/
HEC-1
PMF estimation procedure. Characteristics of the t~ials
are as fbllows:
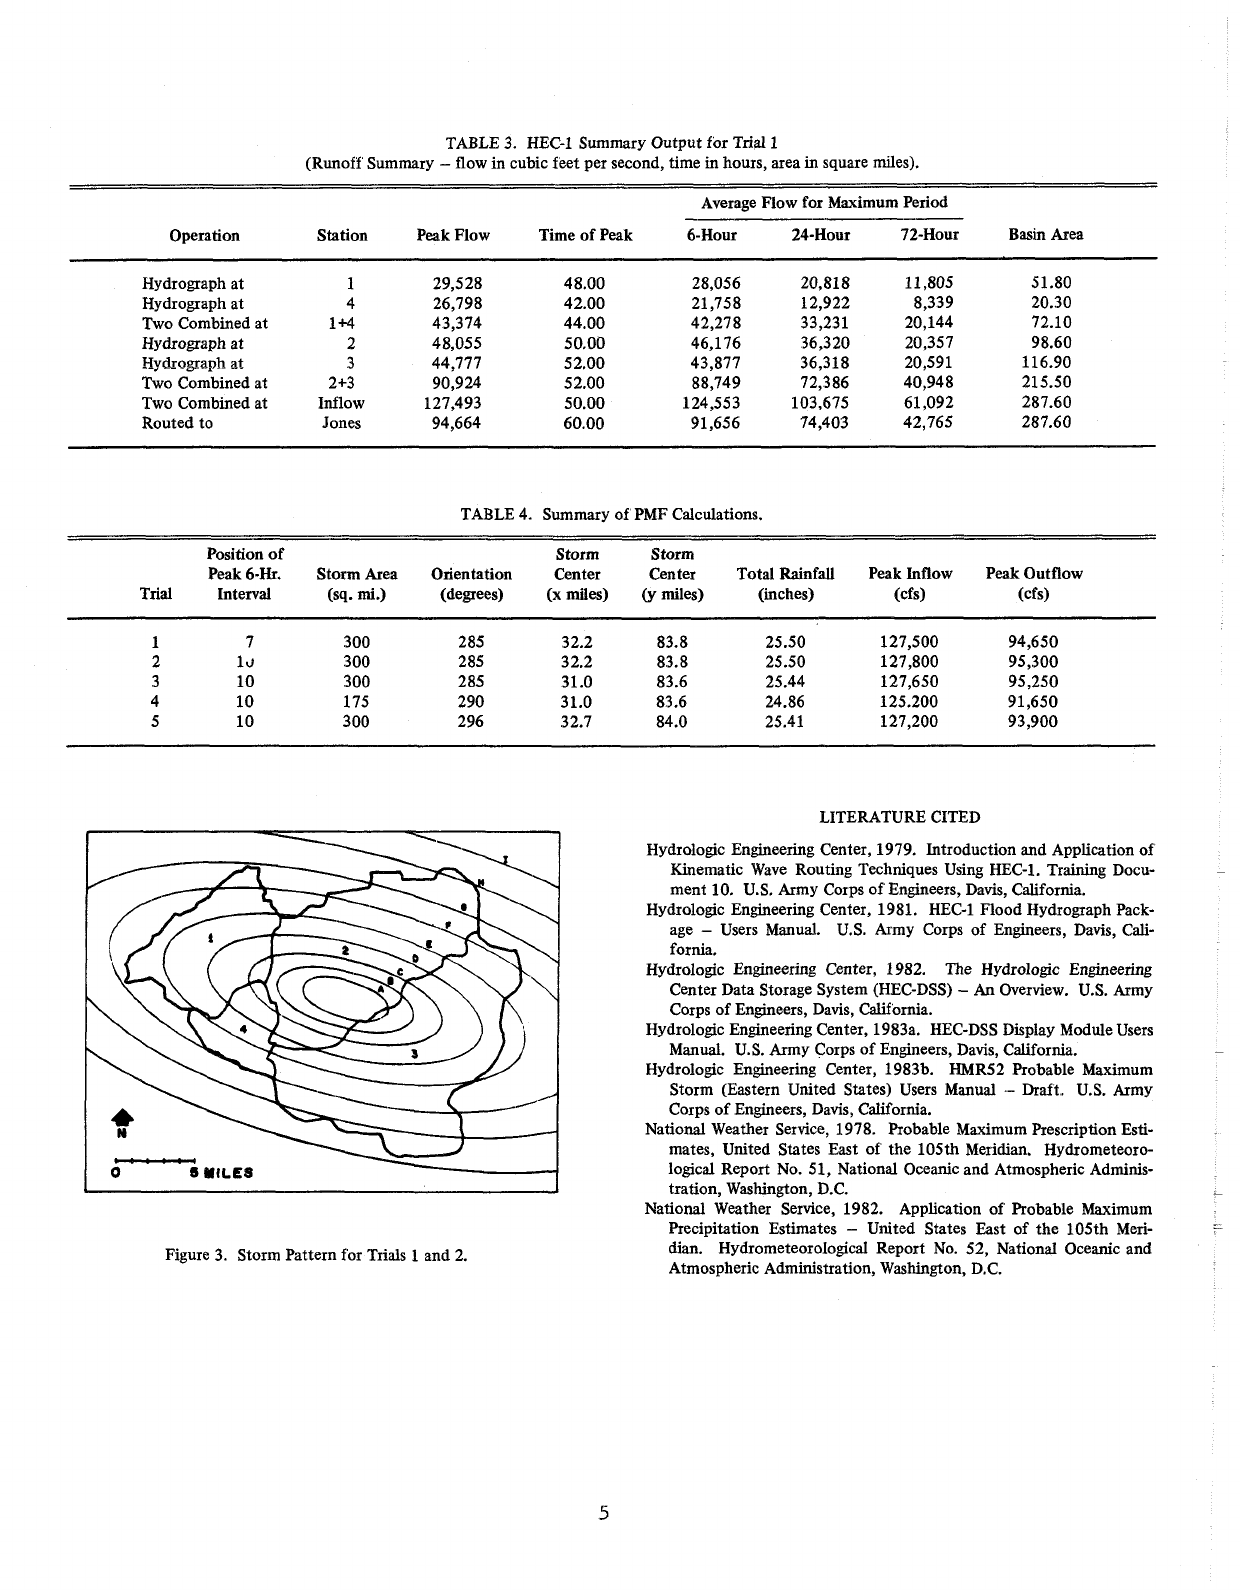
Trial
1
-
Storm center, area size, o~ientation, and temporal
distribution were selected by the program. Figure
3
shows the
storm pattern used for T~ials 1 and
2.
Trial
2
-
Same as T~ial I, except a temporal distribution is
used
in
which the peak six-hour interval is shifted to the 10th
position (hours 54-60). This change increased the peak flow
slightly and was used for subsequent trials.
Trial
3
-
Same as T1ial2, except the isohyetal pattern was
manually centered on the watershed.
Trial
4
-
Same as Trial
3,
except that a storm-area size of'
175
sq. mi.. was specified.
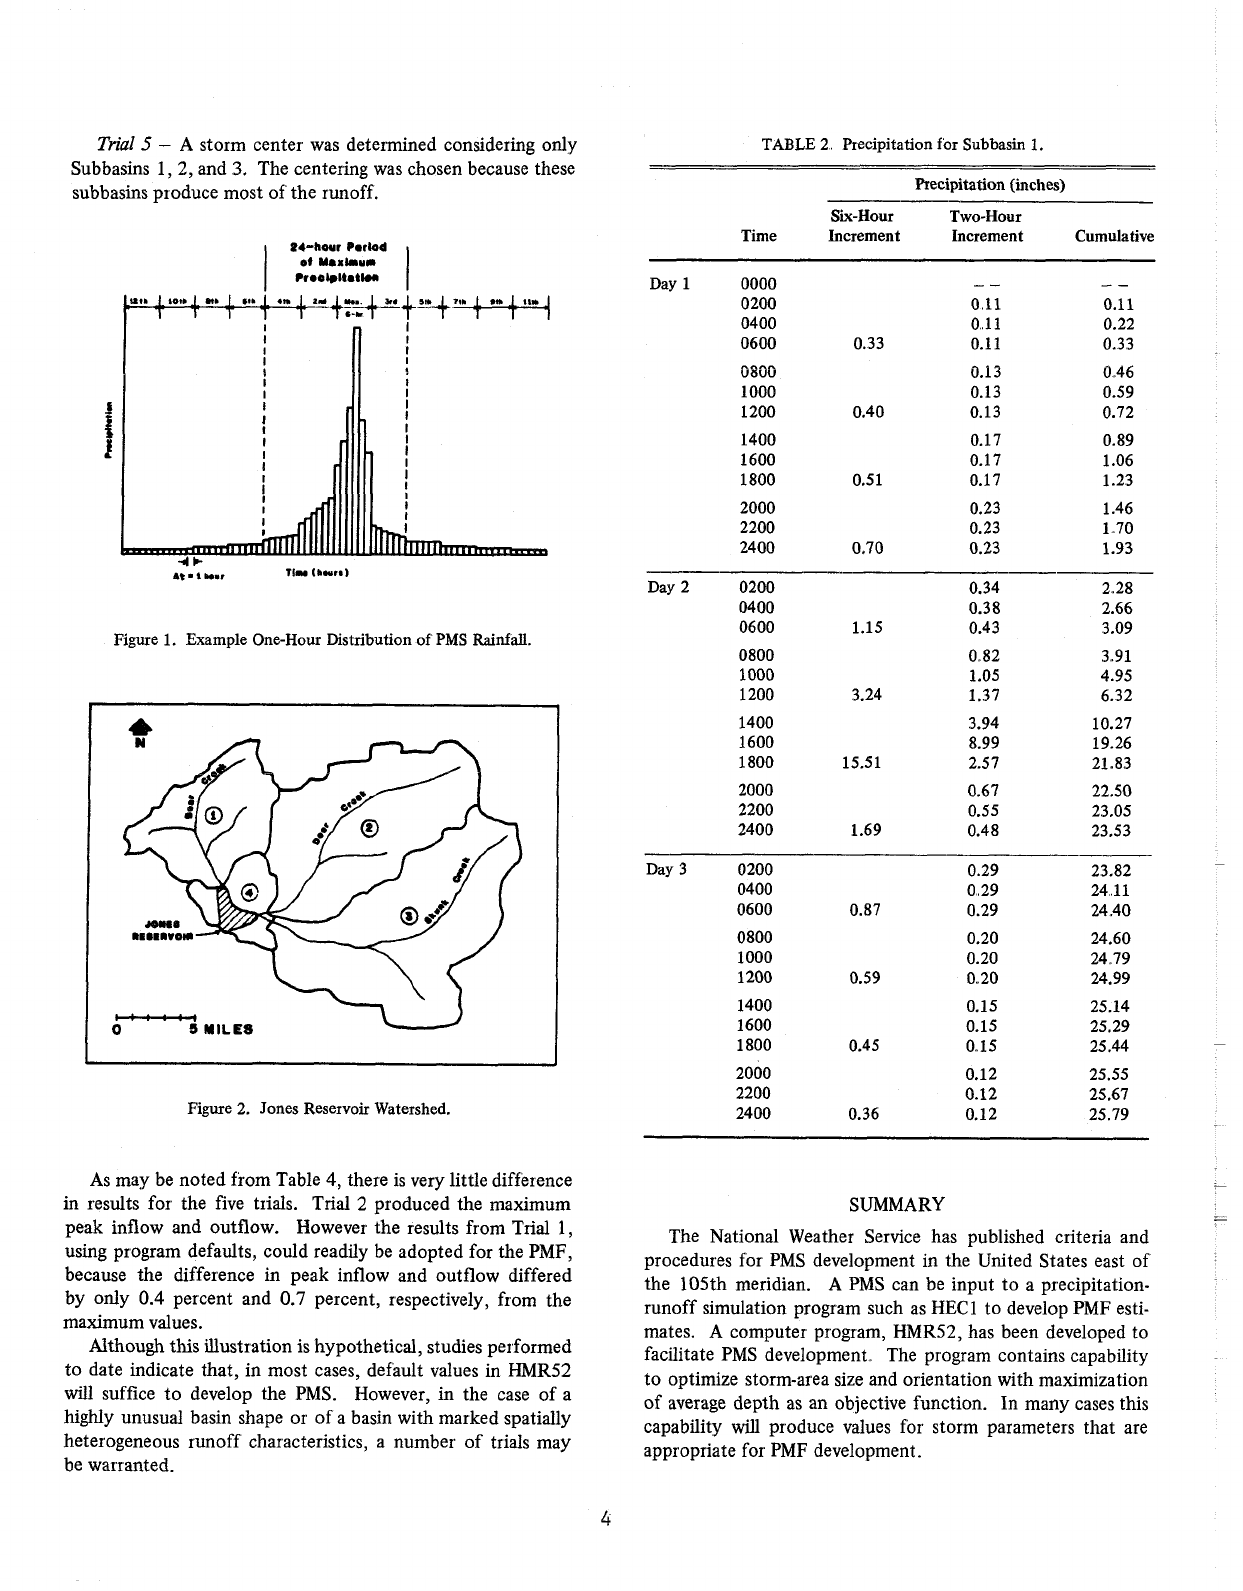
Trial
5
-
A storm center was determined considering only
Subbasins
1,2,
and
3.
The centering was chosen because these
subbasins produce most of the runoff.
Ib
1
10th
1
Mb
I
Slb
1
4lb
1.
Zd
tFntztz3t7*b
9lb
11-
4
TTTTT
S--
Figure
1.
Example One-Hour Distribution of PMS
Rainfall.
Figure
2.
Jones Reservoir Watershed.
TABLE
2
Precipitation for Subbasin
1.
-
-
-
Precipitation (inches)
Six-Hour Two-Hour
Time Increment Increment Cumulative
-
--
-
Day
1
0000
-
- -
-
0200 0
11
0.11
0400 0
11
0.22
0600 0.33 0.11 0.33
0800 0.13
0 46
1000 0.13 0.59
1200 0.40 0.13 0.72
1400 0.17 0.89
1600 0.17 1.06
1800 0.51 0.17 1.23
2000 0.23 1.46
2200 0.23
1
70
2400 0.70 0.23 1.93
--
Day
2 0200 0.34 2 28
0400 0.38 2.66
0600 1.15 0.43 3.09
0800 0 82 3 91
1000 1.05 4.95
1200 3.24 1.37 6.32
1400 3.94 10.27
1600 8.99 19.26
1800 15.51 2.57 21.83
2000 0.67 22.50
2200 0.55 23.05
2400 1.69 0.48 23.53
Day
3 0200
0400
0600 0.87
0800
1000
1200 0.59
As may be noted from Table 4, there is very little difference
in results for the five trials. Trial 2 produced the maximum
peak inflow and outflow. However the results from Trial
1,
using program defaults, could readily be adopted for the PMF,
because the difference in peak inflow and outflow differed
by only 0.4 percent and 0.7 percent, respectively, from the
maximum values.
Although this illustration is hypothetical, studies performed
to date indicate that, in most cases, default values in HMR52
will suffice to develop the PMS. However, in the case of a
highly unusual basin shape or of'a basin with marked spatially
heterogeneous runoff characteristics, a number of trials may
be warranted.
SUMMARY
The National Weather Service has published crite~ia and
procedures for PMS development in the United States east of'
the 105th meridian.
A
PMS can be input to
a
precipitation-
runoff simulation program such as
HEC
1
to develop PMF esti-
mates.
A
computer program, HMR52, has been developed to
facilitate PMS development.. The program contains capability
to optimize storm-area size and orientation with maximization
of average depth as an objective function. In many cases this
capability will produce values fbr storm parameters that are
appropriate for PMF development.
TABLE
3.
HEC-1 Summary Output for Trial
1
(Runoff Summary
-
flow in cubic feet per second, time
in
hours, area in square miles).
--
--
--
-
Average Flow for Maximum Period
--
-
--
Operation Station Peak Flow Time of Peak 6-Hour 24-Hour 72-Hour Basin Area
Hydrograph at
Hydrograph at
Two Combined at
Hydrograph at
Hydrograph
at
Two Combined at
Two Combined at
Routed to
1
4
1
+4
2
3
2
+3
Inflow
Jones
TABLE
4.
Summary of PMF Calculations.
Position of Storm Storm
Peak 6-Hr. Storm Area Orientation Center Center Total Rainfall Peak Inflow Peak Outflow
Trial Interval (sq.
mi.)
(degrees)
(x
miles)
(y
miles) (inches) (cfs) (cfs)
Figure
3.
Storm Pattern for T~ials
1
and 2.
LITERATURE CITED
Hydrologic Engineering Center, 1979. Introduction and Application of
Kinematic Wave Routing Techniques Using HEC-1. Training Docu-
-
ment 10. U.S. Army Co~ps of Engineers, Davis, California.
Hydrologic Engineering Center, 1981. HEC-1 Flood Hydrograph Pack-
age
-
Users Manual. U.S. Army Corps of Engineers, Davis,
Cali-
fornia.
Hydrologic Engineering Center, 1982.
The
Hydrologic Engineering
Center Data Storage System (HEC-DSS)
-
An
Overview. U.S. Army
Corps of Engineers, Davis, California.
Hydrologic Engineering Center, 1983a. HEC-DSS Display Module Users
Manual. U.S. Army Corps of Engineers, Davis, California.
-
Hydrologic Engineering Center, 198313. HMR52 Probable Maximum
Storm (Eastern United States) Users Manual
-
Draft. U.S. Army
Corps of Engineers, Davis, California.
National Weather Se~vice, 1978. Probable Maximum Prescription Esti-
mates, United States East of the 105th Me~idian. Hydrometeoro-
logical Report No. 51, National Oceanic and Atmospheric Adminis-
tration, Washington, D.C.
-
National Weather Service, 1982. Application of' Probable Maximum
Precipitation Estimates
-
United States East of the 105th Meri-
-
dim. Hydrometeorological Report No. 52, National Oceanic and
Atmospheric Administration, Washington, D.C.

Technical Paper Series
TP-1 Use of Interrelated Records to Simulate Streamflow
TP-2 Optimization Techniques for Hydrologic
Engineering
TP-3 Methods of Determination of Safe Yield and
Compensation Water from Storage Reservoirs
TP-4 Functional Evaluation of a Water Resources System
TP-5 Streamflow Synthesis for Ungaged Rivers
TP-6 Simulation of Daily Streamflow
TP-7 Pilot Study for Storage Requirements for Low Flow
Augmentation
TP-8 Worth of Streamflow Data for Project Design - A
Pilot Study
TP-9 Economic Evaluation of Reservoir System
Accomplishments
TP-10 Hydrologic Simulation in Water-Yield Analysis
TP-11 Survey of Programs for Water Surface Profiles
TP-12 Hypothetical Flood Computation for a Stream
System
TP-13 Maximum Utilization of Scarce Data in Hydrologic
Design
TP-14 Techniques for Evaluating Long-Tem Reservoir
Yields
TP-15 Hydrostatistics - Principles of Application
TP-16 A Hydrologic Water Resource System Modeling
Techniques
TP-17 Hydrologic Engineering Techniques for Regional
Water Resources Planning
TP-18 Estimating Monthly Streamflows Within a Region
TP-19 Suspended Sediment Discharge in Streams
TP-20 Computer Determination of Flow Through Bridges
TP-21 An Approach to Reservoir Temperature Analysis
TP-22 A Finite Difference Methods of Analyzing Liquid
Flow in Variably Saturated Porous Media
TP-23 Uses of Simulation in River Basin Planning
TP-24 Hydroelectric Power Analysis in Reservoir Systems
TP-25 Status of Water Resource System Analysis
TP-26 System Relationships for Panama Canal Water
Supply
TP-27 System Analysis of the Panama Canal Water
Supply
TP-28 Digital Simulation of an Existing Water Resources
System
TP-29 Computer Application in Continuing Education
TP-30 Drought Severity and Water Supply Dependability
TP-31 Development of System Operation Rules for an
Existing System by Simulation
TP-32 Alternative Approaches to Water Resources System
Simulation
TP-33 System Simulation of Integrated Use of
Hydroelectric and Thermal Power Generation
TP-34 Optimizing flood Control Allocation for a
Multipurpose Reservoir
TP-35 Computer Models for Rainfall-Runoff and River
Hydraulic Analysis
TP-36 Evaluation of Drought Effects at Lake Atitlan
TP-37 Downstream Effects of the Levee Overtopping at
Wilkes-Barre, PA, During Tropical Storm Agnes
TP-38 Water Quality Evaluation of Aquatic Systems
TP-39 A Method for Analyzing Effects of Dam Failures in
Design Studies
TP-40 Storm Drainage and Urban Region Flood Control
Planning
TP-41 HEC-5C, A Simulation Model for System
Formulation and Evaluation
TP-42 Optimal Sizing of Urban Flood Control Systems
TP-43 Hydrologic and Economic Simulation of Flood
Control Aspects of Water Resources Systems
TP-44 Sizing Flood Control Reservoir Systems by System
Analysis
TP-45 Techniques for Real-Time Operation of Flood
Control Reservoirs in the Merrimack River Basin
TP-46 Spatial Data Analysis of Nonstructural Measures
TP-47 Comprehensive Flood Plain Studies Using Spatial
Data Management Techniques
TP-48 Direct Runoff Hydrograph Parameters Versus
Urbanization
TP-49 Experience of HEC in Disseminating Information
on Hydrological Models
TP-50 Effects of Dam Removal: An Approach to
Sedimentation
TP-51 Design of Flood Control Improvements by Systems
Analysis: A Case Study
TP-52 Potential Use of Digital Computer Ground Water
Models
TP-53 Development of Generalized Free Surface Flow
Models Using Finite Element Techniques
TP-54 Adjustment of Peak Discharge Rates for
Urbanization
TP-55 The Development and Servicing of Spatial Data
Management Techniques in the Corps of Engineers
TP-56 Experiences of the Hydrologic Engineering Center
in Maintaining Widely Used Hydrologic and Water
Resource Computer Models
TP-57 Flood Damage Assessments Using Spatial Data
Management Techniques
TP-58 A Model for Evaluating Runoff-Quality in
Metropolitan Master Planning
TP-59 Testing of Several Runoff Models on an Urban
Watershed
TP-60 Operational Simulation of a Reservoir System with
Pumped Storage
TP-61 Technical Factors in Small Hydropower Planning
TP-62 Flood Hydrograph and Peak Flow Frequency
Analysis
TP-63 HEC Contribution to Reservoir System Operation
TP-64 Determining Peak-Discharge Frequencies in an
Urbanizing Watershed: A Case Study
TP-65 Feasibility Analysis in Small Hydropower Planning
TP-66 Reservoir Storage Determination by Computer
Simulation of Flood Control and Conservation
Systems
TP-67 Hydrologic Land Use Classification Using
LANDSAT
TP-68 Interactive Nonstructural Flood-Control Planning
TP-69 Critical Water Surface by Minimum Specific
Energy Using the Parabolic Method
TP-70 Corps of Engineers Experience with Automatic
Calibration of a Precipitation-Runoff Model
TP-71 Determination of Land Use from Satellite Imagery
for Input to Hydrologic Models
TP-72 Application of the Finite Element Method to
Vertically Stratified Hydrodynamic Flow and Water
Quality
TP-73 Flood Mitigation Planning Using HEC-SAM
TP-74 Hydrographs by Single Linear Reservoir Model
TP-75 HEC Activities in Reservoir Analysis
TP-76 Institutional Support of Water Resource Models
TP-77 Investigation of Soil Conservation Service Urban
Hydrology Techniques
TP-78 Potential for Increasing the Output of Existing
Hydroelectric Plants
TP-79 Potential Energy and Capacity Gains from Flood
Control Storage Reallocation at Existing U.S.
Hydropower Reservoirs
TP-80 Use of Non-Sequential Techniques in the Analysis
of Power Potential at Storage Projects
TP-81 Data Management Systems of Water Resources
Planning
TP-82 The New HEC-1 Flood Hydrograph Package
TP-83 River and Reservoir Systems Water Quality
Modeling Capability
TP-84 Generalized Real-Time Flood Control System
Model
TP-85 Operation Policy Analysis: Sam Rayburn
Reservoir
TP-86 Training the Practitioner: The Hydrologic
Engineering Center Program
TP-87 Documentation Needs for Water Resources Models
TP-88 Reservoir System Regulation for Water Quality
Control
TP-89 A Software System to Aid in Making Real-Time
Water Control Decisions
TP-90 Calibration, Verification and Application of a Two-
Dimensional Flow Model
TP-91 HEC Software Development and Support
TP-92 Hydrologic Engineering Center Planning Models
TP-93 Flood Routing Through a Flat, Complex Flood
Plain Using a One-Dimensional Unsteady Flow
Computer Program
TP-94 Dredged-Material Disposal Management Model
TP-95 Infiltration and Soil Moisture Redistribution in
HEC-1
TP-96 The Hydrologic Engineering Center Experience in
Nonstructural Planning
TP-97 Prediction of the Effects of a Flood Control Project
on a Meandering Stream
TP-98 Evolution in Computer Programs Causes Evolution
in Training Needs: The Hydrologic Engineering
Center Experience
TP-99 Reservoir System Analysis for Water Quality
TP-100 Probable Maximum Flood Estimation - Eastern
United States
TP-101 Use of Computer Program HEC-5 for Water Supply
Analysis
TP-102 Role of Calibration in the Application of HEC-6
TP-103 Engineering and Economic Considerations in
Formulating
TP-104 Modeling Water Resources Systems for Water
Quality
TP-105 Use of a Two-Dimensional Flow Model to Quantify
Aquatic Habitat
TP-106 Flood-Runoff Forecasting with HEC-1F
TP-107 Dredged-Material Disposal System Capacity
Expansion
TP-108 Role of Small Computers in Two-Dimensional
Flow Modeling
TP-109 One-Dimensional Model for Mud Flows
TP-110 Subdivision Froude Number
TP-111 HEC-5Q: System Water Quality Modeling
TP-112 New Developments in HEC Programs for Flood
Control
TP-113 Modeling and Managing Water Resource Systems
for Water Quality
TP-114 Accuracy of Computer Water Surface Profiles -
Executive Summary
TP-115 Application of Spatial-Data Management
Techniques in Corps Planning
TP-116 The HEC's Activities in Watershed Modeling
TP-117 HEC-1 and HEC-2 Applications on the
Microcomputer
TP-118 Real-Time Snow Simulation Model for the
Monongahela River Basin
TP-119 Multi-Purpose, Multi-Reservoir Simulation on a PC
TP-120 Technology Transfer of Corps' Hydrologic Models
TP-121 Development, Calibration and Application of
Runoff Forecasting Models for the Allegheny River
Basin
TP-122 The Estimation of Rainfall for Flood Forecasting
Using Radar and Rain Gage Data
TP-123 Developing and Managing a Comprehensive
Reservoir Analysis Model
TP-124 Review of U.S. Army corps of Engineering
Involvement With Alluvial Fan Flooding Problems
TP-125 An Integrated Software Package for Flood Damage
Analysis
TP-126 The Value and Depreciation of Existing Facilities:
The Case of Reservoirs
TP-127 Floodplain-Management Plan Enumeration
TP-128 Two-Dimensional Floodplain Modeling
TP-129 Status and New Capabilities of Computer Program
HEC-6: "Scour and Deposition in Rivers and
Reservoirs"
TP-130 Estimating Sediment Delivery and Yield on
Alluvial Fans
TP-131 Hydrologic Aspects of Flood Warning -
Preparedness Programs
TP-132 Twenty-five Years of Developing, Distributing, and
Supporting Hydrologic Engineering Computer
Programs
TP-133 Predicting Deposition Patterns in Small Basins
TP-134 Annual Extreme Lake Elevations by Total
Probability Theorem
TP-135 A Muskingum-Cunge Channel Flow Routing
Method for Drainage Networks
TP-136 Prescriptive Reservoir System Analysis Model -
Missouri River System Application
TP-137 A Generalized Simulation Model for Reservoir
System Analysis
TP-138 The HEC NexGen Software Development Project
TP-139 Issues for Applications Developers
TP-140 HEC-2 Water Surface Profiles Program
TP-141 HEC Models for Urban Hydrologic Analysis
TP-142 Systems Analysis Applications at the Hydrologic
Engineering Center
TP-143 Runoff Prediction Uncertainty for Ungauged
Agricultural Watersheds
TP-144 Review of GIS Applications in Hydrologic
Modeling
TP-145 Application of Rainfall-Runoff Simulation for
Flood Forecasting
TP-146 Application of the HEC Prescriptive Reservoir
Model in the Columbia River Systems
TP-147 HEC River Analysis System (HEC-RAS)
TP-148 HEC-6: Reservoir Sediment Control Applications
TP-149 The Hydrologic Modeling System (HEC-HMS):
Design and Development Issues
TP-150 The HEC Hydrologic Modeling System
TP-151 Bridge Hydraulic Analysis with HEC-RAS
TP-152 Use of Land Surface Erosion Techniques with
Stream Channel Sediment Models
TP-153 Risk-Based Analysis for Corps Flood Project
Studies - A Status Report
TP-154 Modeling Water-Resource Systems for Water
Quality Management
TP-155 Runoff simulation Using Radar Rainfall Data
TP-156 Status of HEC Next Generation Software
Development
TP-157 Unsteady Flow Model for Forecasting Missouri and
Mississippi Rivers
TP-158 Corps Water Management System (CWMS)
TP-159 Some History and Hydrology of the Panama Canal
TP-160 Application of Risk-Based Analysis to Planning
Reservoir and Levee Flood Damage Reduction
Systems
TP-161 Corps Water Management System - Capabilities
and Implementation Status
