Tab Jolt Installation Guide
User Manual:
Open the PDF directly: View PDF ![]() .
.
Page Count: 24

TabJolt Installation Guide
TabJolt: A Tableau Server Point and Run Load Testing Tool
Tableau—TabJolt Installation Guide October 2018
2
What is TabJolt? ........................................................................................................................................................... 3
When to use TabJolt ................................................................................................................................................... 3
Prerequisites ................................................................................................................................................................. 3
Tableau Desktop ..................................................................................................................................................... 4
Install and configure TabJolt .................................................................................................................................. 4
Collecting machine stats from Linux .............................................................................................................. 8
Advance Configuration – Collect JMX counters ......................................................................................... 9
Auto discover views ........................................................................................................................................... 13
Set Think Time ..................................................................................................................................................... 13
User Pool ................................................................................................................................................................. 14
Run a TabJolt test ..................................................................................................................................................... 14
Choose your load mix ........................................................................................................................................ 14
Command line execution .................................................................................................................................. 15
Analyze results .......................................................................................................................................................... 16
Upgrading TabJolt .................................................................................................................................................... 17
Customizing workload mix .................................................................................................................................. 18
PostgreSQL Manual Setup .................................................................................................................................... 21
Using Replayer .......................................................................................................................................................... 22
Known Issues and Troubleshooting ................................................................................................................. 23
Additional Resources and Feedback ................................................................................................................ 24

Tableau—TabJolt Installation Guide October 2018
3
What is TabJolt?
TabJolt is a point and run load generator built on top of JMeter that is specifically designed
for Tableau Server. It is available as a free download as-is from GitHub.
Unlike traditional load testing tools, TabJolt can drive load against your Tableau Server
without you having to develop or maintain scripts. TabJolt is optimized for the Tableau
presentation model and can load visualizations and interpret possible interactions during
test execution without the need to write and maintain complex scripts.
TabJolt is a subset of our engineering load testing framework and we are making it available
in hopes that it allows you to accelerate production go-live with Tableau Server, and also to
help you with planning your specific on-site capacity needs.
Of course, running load tests does not replace understanding the Tableau Server
architecture and following best practices for deployment during load testing. Treating
Tableau Server as a black box for load testing is not recommended and will probably yield
unexpected results. For information about the Tableau Server architecture, see the Tableau
Server Administration Guide.
When to use TabJolt
Here are the key questions TabJolt is designed to help you answer:
• I want to deploy a brand-new Tableau Server. How will Tableau Server scale on my
hardware and with my workload?
• I am moving from Tableau Server 8.x to version 9.0. Given my workbooks and
hardware, how will Tableau Server 9.0 scale in my environment?
• With guidance from Tableau, I want to tune my server configuration to suit my
hardware, workbooks and environments. How do I measure and monitor the effects
of configuration changes to select the best configuration?
• I need to complete a load test as part of go-live testing for Tableau Server. How do I
accelerate the time it takes to do a full load test?
Prerequisites
To install and use TabJolt, you need a Windows machine with a minimum of two cores with 8
GB or more RAM. As a best practice, you should monitor this machine for CPU and memory
to ensure that your test runs don’t create a bottleneck on the load injector.
You must also have downloaded the complete package as described above.
Tableau—TabJolt Installation Guide October 2018
4
Tableau Desktop
If you already have Tableau Desktop 9.0 or later, you can simply use that. If you don’t, you
can download a free trial version from this website:
http://www.tableau.com/products/desktop
Install and configure TabJolt
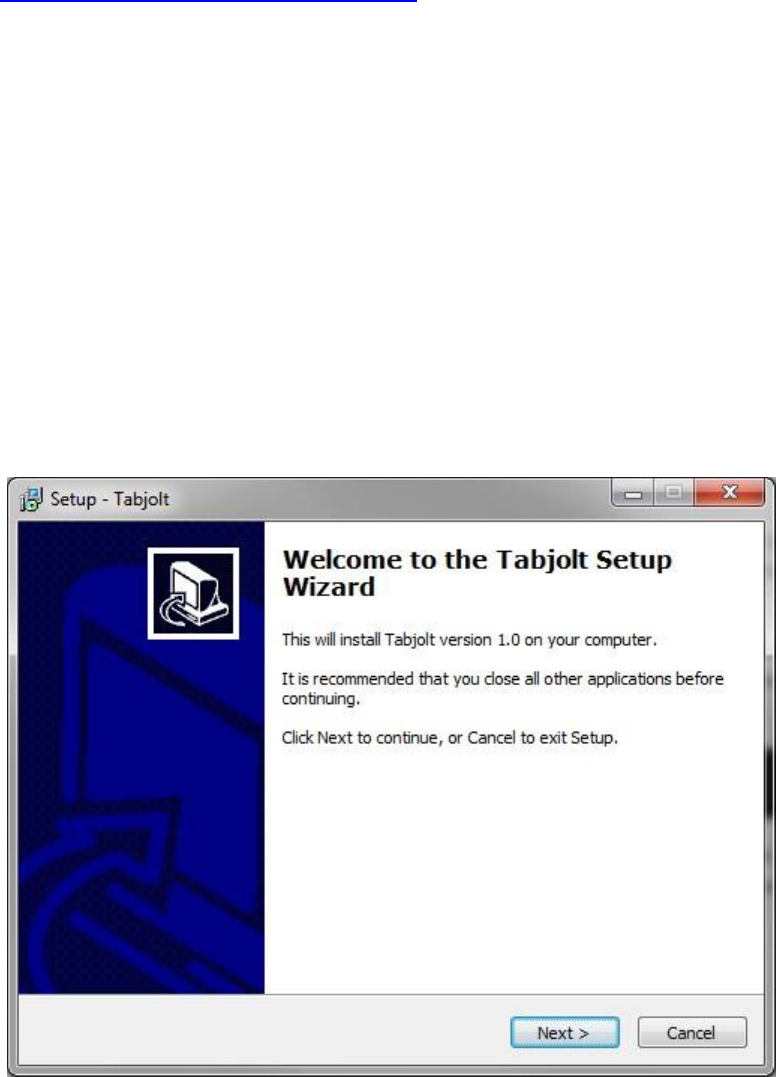
Once you download the project files from GitHub, you start the installation by using the
TabJolt windows installer. If you have a previous installation of TabJolt, the installer will ask
you to first uninstall it. It is a good idea to back up your config directory (C:\TabJolt\config)
since it can be re-used with newer versions.
NOTE: The installer in this update does not support PGSQL upgrades. While it checks for
existing Postgres 9.5 databases (other Postgres versions are OK.) on your machine, the
installer will prompt you to uninstall existing installation of Postgres 9.5. Make a backup of
your test data if you want to preserve it.
Tableau—TabJolt Installation Guide October 2018
5
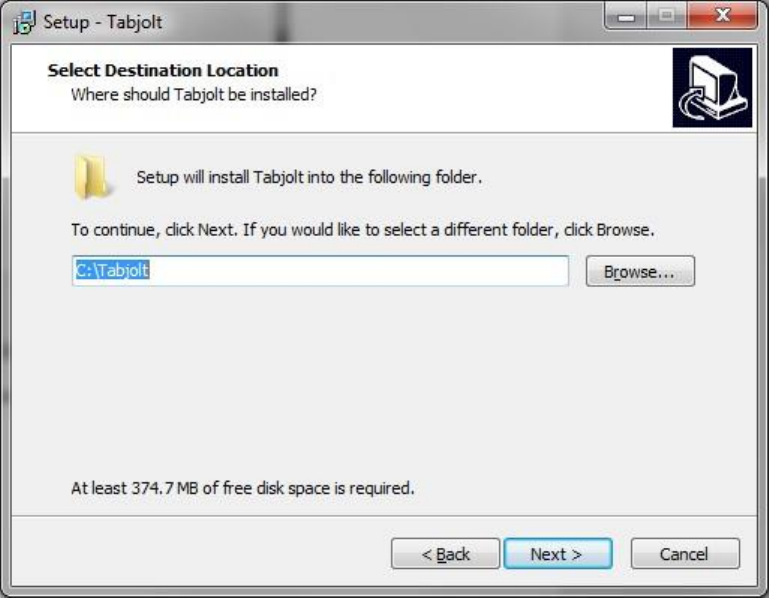
Choose the default folder for your TabJolt installation.
During installation, TabJolt will install its dependency Postgres 9.5 database silently.
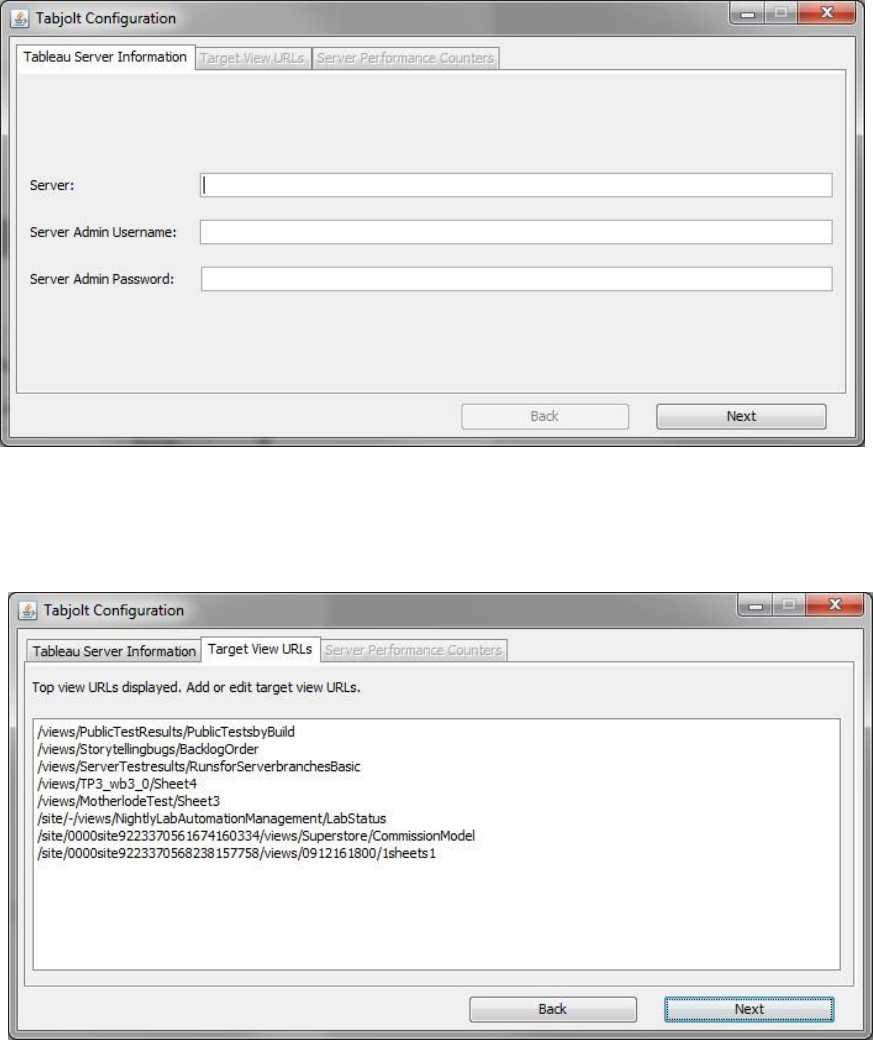
At the end installation, the installer will prompt you to enter necessary configuration
information. On the first tab - Tableau Server Information - you need to enter the URL of
your tableau server, followed by your server administrator user name and password. Note
that your Admin password will be saved in the TabJolt\config\ServerTestConfig.yaml file as
clear text.
Tableau—TabJolt Installation Guide October 2018
6
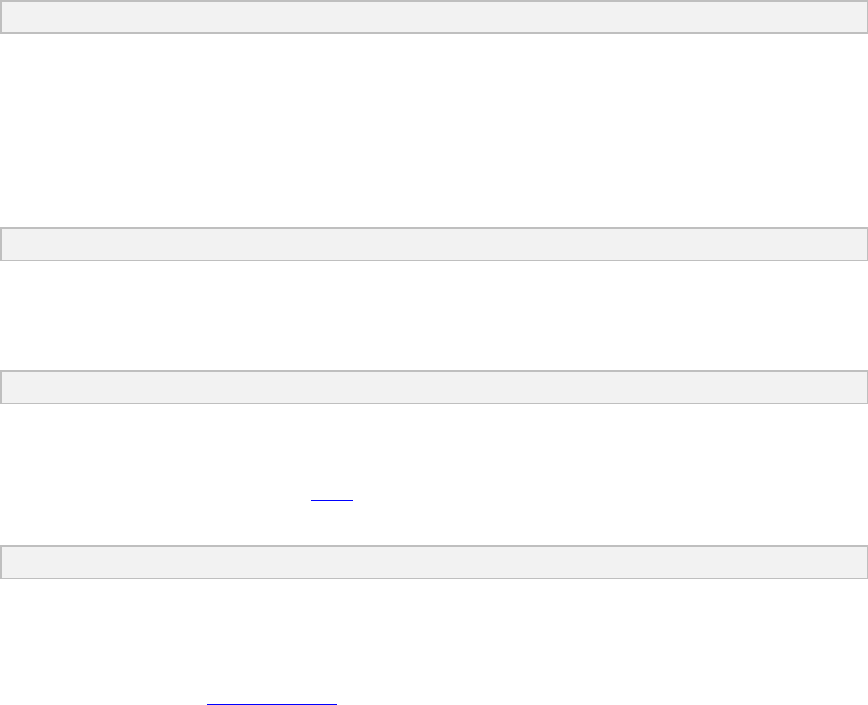
Once you fill in the information, click next. Now, you are at the Target View URLs tab where
you can specify which views in your Tableau will be load tested by TabJolt. We have made it
easy for you by automatically populating this view with the top view URLs from the default
site and 3 other different sites (if your server has multiple sites).
You could then add or edit the target view URLs. The best way to get this link is to manually
navigate to it from the browser and copy the URL to the clipboard, and then paste it in the
text filed.
For example, the default site view URL in the browser looks like this:
http://localhost/#/views/WorldIndicators/GDPpercapita?:iid=1
Tableau—TabJolt Installation Guide October 2018
7
The entry in the Target View URLs text field will be like this:
/views/WorldIndicators/GDPpercapita
As you can see, we removed the http://localhost and the “#” and all the query string
parameters.
The non-default site view URL in the browser looks like this:
http://localhost/#/site/newsite/views/WorldIndicators/GDPpercapita?:iid=1
The entry in the Target View URLs text field will be like this::
/site/newsite/views/WorldIndicators/GDPpercapita
You can now append a query parameter to the Viz Url to force a certain server behavior (You
can find a list of query parameters here). Your vizpool.csv might look something like:
/site/newsite/views/WorldIndicators/GDPpercapita?:render=false&:refresh
IMPORTANT: Before you further scale your load tests, you must ensure that a single user
test on this workbook performs within your expectations. If not, you should optimize the
workbook by following best practices for workbook authoring.
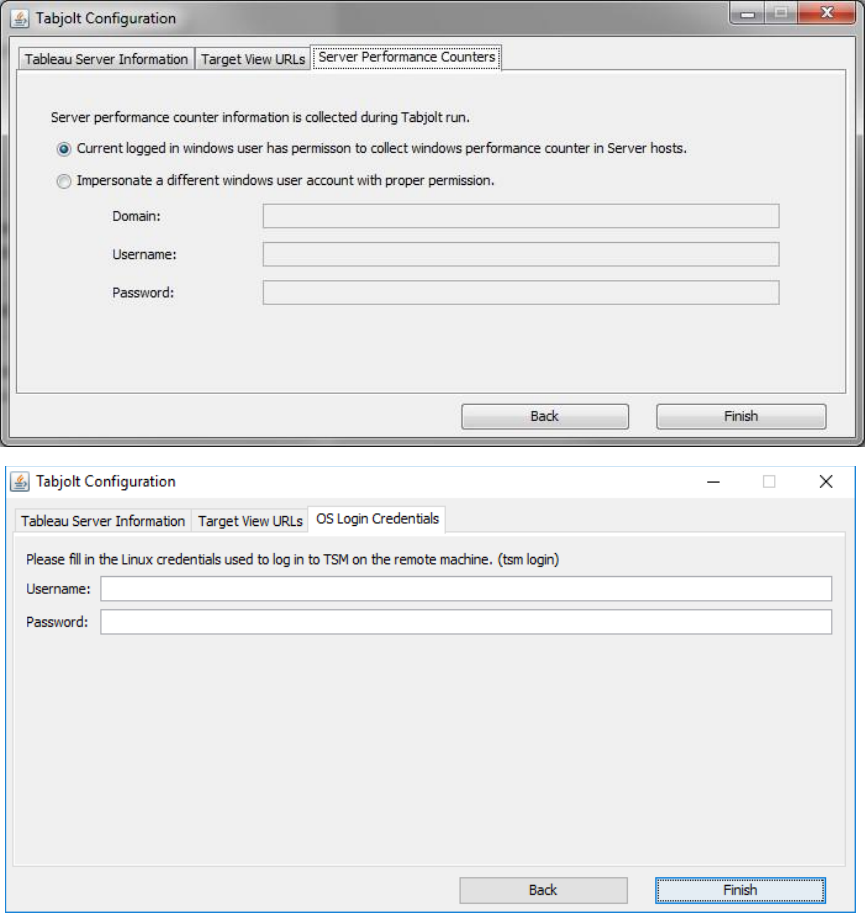
Once you are done entering the target view URLs, click next. Now, you are at the “Server
Performance Counters” tab or the “OS Login Credentials” tab depending on your version.
TabJolt collects windows performance counter from your Tableau server host machines in
the background during the run. If the Windows user account that you use to execute TabJolt
doesn’t have permission to collect windows performance counter from Tableau server host
machines, you will want to provide a Windows user account which has the correct
permissions to do so. Sometimes, this is useful when the Tableau Server you are testing is in
another domain than where your TabJolt load generator machine resides. While testing over
networks is fine, as a best practice consider the implications of having a noisy network with
other traffic on it and/or the bandwidth available between the load generator and the target
Tableau Server. Your results will reflect any degradation caused due to external changes in
the network conditions.
Tableau—TabJolt Installation Guide October 2018
8
Click finish, once you are done. The installation is done at this point. You could kick off a test
run with TabJolt at this point. If you are ready to try it out, please go to “Run a TabJolt test”
test section. Note that not all the configuration settings have been included in the
configuration UI in this update, if you want to fine tune other settings, please continue on to
the next section to read more about customizing your TabJolt configuration.
Collecting machine stats from Linux
The following steps are required if you want TabJolt to collect cpu and memory usage stats
from a Linux deployment. This step requires Git Bash or something you can use to run bash
commands on Windows.
Tableau—TabJolt Installation Guide October 2018
9
1. Download and install git bash. You can alternatively use another implementation of
bash for Windows.
2. Open git bash and enter the following command. Change the path used for the
commands if you installed TabJolt in a different location.
ssh-keygen -f "c:/tabjolt/config/sshUserIdentityFile.txt"
3. Press enter when prompted for a password to make it password-less
4. Use ssh-copy-id to copy the public key to the host(s)
ssh-copy-id -i "c:/tabjolt/config/sshUserIdentityFile.txt.pub" username@servername
5. Now test that it worked by running the following. If it worked it will not prompt you
for a password and you will be logged into the host.
ssh -i "c:/tabjolt/config/sshUserIdentityFile.txt" username@servername
6. Open c:\tabjolt\config\dataretriever.config and fill in your Linux username in the
following line.
<identity userName="FILL_IN_USERNAME" port="22" identityFile="sshUserIdentityFile.txt"/>
7. Make sure your host's applicableCounters contains an entry for "linuxTopOutput"
<hosts>
<host name="remote_host_name">
<applicableCounterGroups>
<applicableCounterGroup>linuxTopOutput</applicableCounterGroup>
Now your runs should pick up data from Linux servers.
Advance Configuration – Collect JMX counters
TabJolt can collect both performance metrics (perfmon) data and JMX data from Tableau
Server very easily. If configured, metrics collection for the server occurs in the background
during a load test. Although optional, metrics collection will help you identify performance
bottlenecks that may happen. If you want to collect JMX counters, you will have to update the
configuration file and enable the JMX counter port in Tableau server.
The configuration settings that control what information to collect are set in
c:\tabjolt\config\dataretriever.config. You only need to update the <hosts>…</hosts>
section (found at the end of the file) to specify which counters are collected from a host.

Tableau—TabJolt Installation Guide October 2018
10
<hosts>
<host name="localhost">
<applicableCounterGroups>
<applicableCounterGroup>machineStatus</applicableCounterGroup>
<applicableCounterGroup>tableauProcess</applicableCounterGroup>
<!--enable the following section only after you jmx counter for
tableau-->
<!--
<applicableCounterGroup>vizqlserver</applicableCounterGroup>
<applicableCounterGroup>dataserver</applicableCounterGroup>
<applicableCounterGroup>vizportal</applicableCounterGroup>
-->
</applicableCounterGroups>
</host>
</hosts>
To specify the host to collect metrics from, update the host element by changing <host
name="localhost"> to <host name="yourhostname">. Then update the
<applicableCounterGroups>…</applicableCoutnerGroups> section within <host>…</host>
to specify which performance counter you are collecting from that host (I.e., you will only
need machineStatus counter groups for the injector machine, but you will need additional
counter groups for the workers running other Tableau processes).
If you need to collect performance counter information from multiple hosts, simply replicate
the <host>…</host> section and update the host name for each additional host.
JMX Counter Group
JMX metrics give you better visibility into the performance of key Tableau Server processes
under load. To activate JMX data collection, you must enable the feature on Tableau Server
(by default it is disabled).
To enable collection of JMX metrics on Tableau Server, run the following tabadmin
commands:
tabadmin stop
tabadmin set service.jmx_enabled true
tabadmin configure
tabadmin start

Tableau—TabJolt Installation Guide October 2018
11
Or if you are using tsm instead of tabadmin (Linux any version or Windows 2018.2 or later),
use the following tsm commands:
tsm stop
tsm configuration set -k service.jmx_enabled -v true
tsm pending-changes apply
tsm start
Once you have enabled JMX counters on your Tableau server, uncomment
<applicableCounterGroup> elements in the <host> section of dataretriever.config to start
collecting information from the processes you are interested in. A quick test to check if the
JMX counters are set properly is done using JConsole, a free java tool. In JConsole, connect to
this URL:
service:jmx:rmi:///jndi/rmi://<hostname>:<portnumber>/jmxrmi
Getting the JMX port numbers depends on what version of Tableau Server you have. If you
are using Tableau server for Linux or Tableau Server for windows version 2018.2 or later
then follow the instructions for “Getting JMX port numbers for tsm”. Otherwise follow the
instructions for “Getting JMX port numbers for tabadmin”.
Getting JMX port numbers for tsm
With tsm, Tableau Server dynamically assigns JMX ports every time the server is restarted.
TabJolt is able to find these values at the start of each test run so you don’t need to keep
reconfiguring the tests for each server restart. The following steps should be done
automatically when installing and configuring a new version. However, if you are copying
configuration from a previous install or if something went wrong during installation, you’ll
need to do these steps.
1. Open c:\tabjolt\config\dataretriever.config and find the jmx section.
2. For each “component” make sure the port number in the URL is “%d” which will be
filled in dynamically by TabJolt.
for example, if the service url looks like this:
serviceURL="service:jmx:rmi:///jndi/rmi://%s:9400/jmxrmi" />
You will need to change it to:
serviceURL="service:jmx:rmi:///jndi/rmi://%s:%d/jmxrmi" />
3. Open c:\tabjolt\config\PerfTestConfig.yaml and make sure there is a line that says
“performJmxPortLookup: true”. If it is set to “false” then change it to “true”.
4. Open c:\tabjolt\config\ServerTestConfig.yaml and add the following lines with your
tsm credentials. Note that your tsm credentials are likely different than your Tableau
Server administrator credentials. To make sure you are using the correct credentials,
sign in to your server and run the command “tsm login”. If you are able to login then
you are using the right username and password.
Tableau—TabJolt Installation Guide October 2018
12
adminUserName: username
adminPassword: password
Getting JMX port numbers for tabadmin
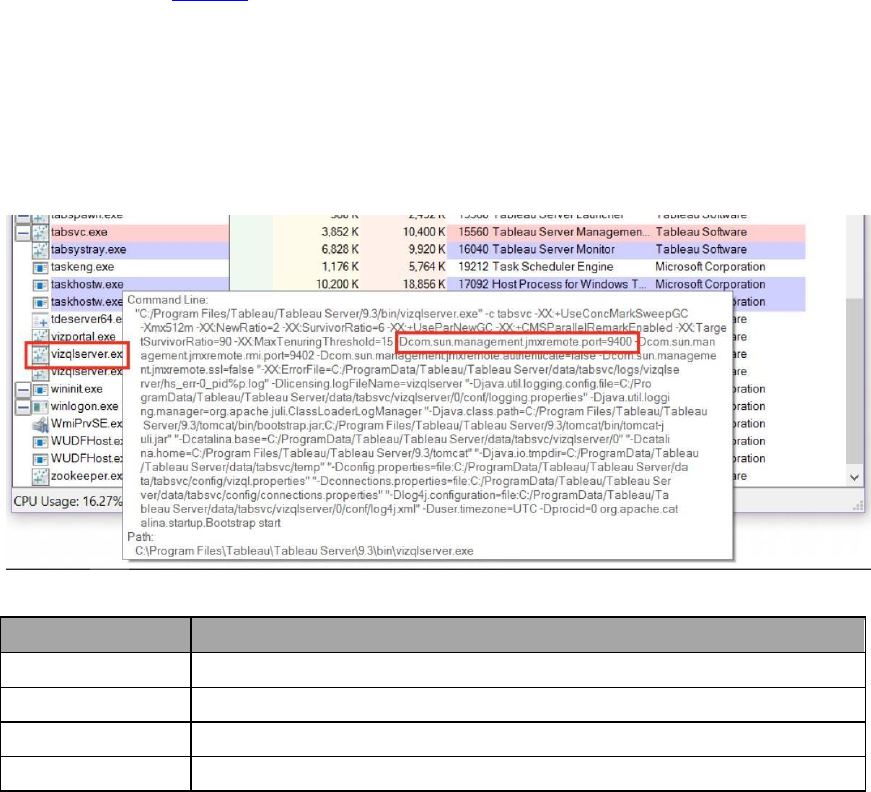
To get JMX port numbers, you can run Process Explorer on your Tableau Server (it can be
downloaded from this link.). When launching Process Explorer, right click the program and
Run as Administrator otherwise you will see “Error Opening Process” messages when
browsing.
After clicking the Process column header to sort processes by name, mouse over each
Tableau server component in the table below and look up the jmx port number (i.e.
Dcom.sun.management.jmxremote.port=9400 for vizqlserver component in the following
screenshot).
Record the JMX port for each of these processes:
Counter Group
Description
vizqlserver
Collects JMX counter information for Vizql process.
dataserver
Collects JMX counter information for data server process.
searchservice
Collects JMX counter information for search and browse process.
vizportal
Collects JMX counter information for application server process.
Note that your Tableau Server may run multiple copies of vizqlserver, dataserver, and
potentially vizportal. Record the JMX port of each and every process. If you have deployed
Tableau Server to multiple machines, repeat this process on each box.
Once you have the information in question, open c:\tabjolt\config\dataretriever.config and
verify that the settings in the jmx/components section match your computer.

Tableau—TabJolt Installation Guide October 2018
13
In the sample below, TabJolt will query:
• Two instances of vizqlserver (on ports 9400 & 9401)
• Two instances of dataserver (ports 10000 & 10001)
• A single instance of searchservice and vizportal
Note that the wgserver process has been commented out in the file above. Beginning in
Tableau 9.3, wgserver is disabled by default – therefore it makes no sense to attempt to
monitor it.
Auto discover views
You may want TabJolt to auto-discover all the available views across all sites on the server.
Instead of specifying each individual view to load, you can set the auto-discover mode to find
them all. This is done by changing the auto-discover mode in
c:\tabjolt\config\PerfTestConfig.yaml from “vizDataSource: csv” to “vizDataSource: web”.
Set Think Time
You can use the think time settings to create a pause between tests or between interaction
operations (for an interact test case). Think time, in milliseconds, is set in the
c:\tabjolt\config\PerfTestConfig.yaml with the following configuration entry:
Note: Think time is reflected in the response time metrics you view in in the console and
PerformanceViz.twb. For example, if the response time on a specific workbook is normally
2500ms and you add 1000ms of think time in PerfTestConfig.yaml, PerformanceViz.twb and
the console will reflect a grand total of 3500ms for viz response time. The viz is still executing
in 2500ms, of course – but think time makes it appear it is executing more slowly. Don’t be
fooled!
Tableau—TabJolt Installation Guide October 2018
14
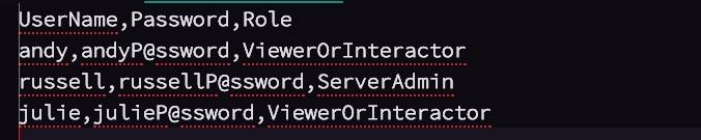
User Pool
You could configure TabJolt to use multiple Tableau server user accounts. To provide test
user names and passwords for login, you should edit c:\tabjolt\config\userpool.csv:
In the file above, three user names (andy, russell, julie) and passwords (andyP@ssword,
russellP@ssword, julieP@ssword) have been specified.
These users can exist in active directory or a local Tableau Server. The users must be valid,
active, and have permissions on the vizzes you wish to test.
A role has also been set for each user. ViewerOrInteractor should be leveraged for “normal
users”, while ServerAdmin tells TabJolt that the particular user has admin permissions on
the server. Users associated with the ServerAdmin role are used to access the Tableau
Server metadata database when TabJolt is placed in “web mode” (see the topic Auto discover
views for more information).
Run a TabJolt test
Choose your load mix
The workload mix that really matters for Tableau Server scale testing is not how many
people are logged into the sever, but how many users are concurrently loading and
interacting with visualizations.
To that end, we have provided the following three load mixes out of the box. Choose the one
that best meets your needs.
• InteractVizLoadTest.jmx
• ViewVizLoadTest.jmx
• ViewInteractVizLoadTest.jmx
These load mixes are located in the testplans directory under the main install location. The
underlying JMeter execution engine uses these files, so don’t add to or change anything in
them.
For the interaction mix, InteractVizLoadTest.jmx, TabJolt selects the URLs for the views (these
views you provide in the vizpool.csv file, based on a uniform distribution). Next, it tries to load
the view. After the viz is loaded, TabJolt checks whether the viz has any elements that allow
Tableau—TabJolt Installation Guide October 2018
15
interaction with the view (such as a slider bar, drop-down menu, and so on). If the view has
interaction elements, TabJolt performs those interactions without requiring script
development. If the view doesn’t have any interactions, TabJolt selects marks on view.
The ViewVizLoadTest.jmx is a simple test and just loads the visualization without doing any
interactions.
The ViewInteractVizLoadTest.jmx will do an interaction test for 50% of the text time and a
view test with the other 50% of the test time.
You can specify the load mix you want on the command line using the --t command line
parameter.
The command line parameter --d is the test run duration in seconds, and --c is the number
of virtual users (clients) that you want TabJolt to use.
Command line execution
Now, you can start your scale test by using a Windows command prompt, navigating to
c:\tabjolt and running the example command below for a short test. The command tells
TabJolt to run the test for 240 seconds (using the –d parameter) and to run a single user
client (--c). You can, of course, change these parameters.
go --t=testplans\InteractVizLoadTest.jmx --d=240 --c=1
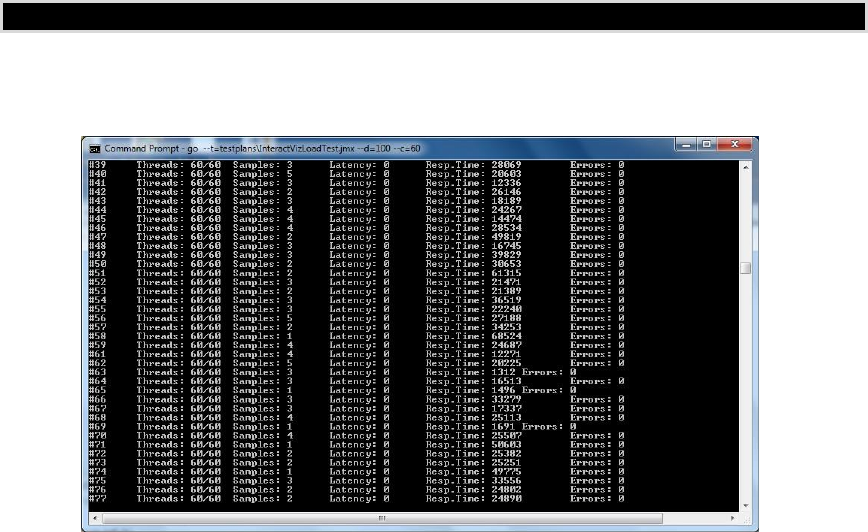
The test will run, and you will see results displayed on the console.
Figure 3: TabJolt running a test.
Tableau—TabJolt Installation Guide October 2018
16
At the end of the run, on the command line, you will get the run ID, which you need to use as
a filter when you analyze your data in Tableau Desktop.
You should explore all the options with the go command. If you expect to do a lot of runs,
you should give your runs a useful description, by using the command --r followed by the
description for the run.
Analyze results
After the run is finished, open the analysis workbook located at
c:\tabjolt\PerformanceViz.twb using Tableau Desktop from the same computer. You will be
prompted to provide the user name and password which is postgres/testresults for TabJolt
Postgres repository.
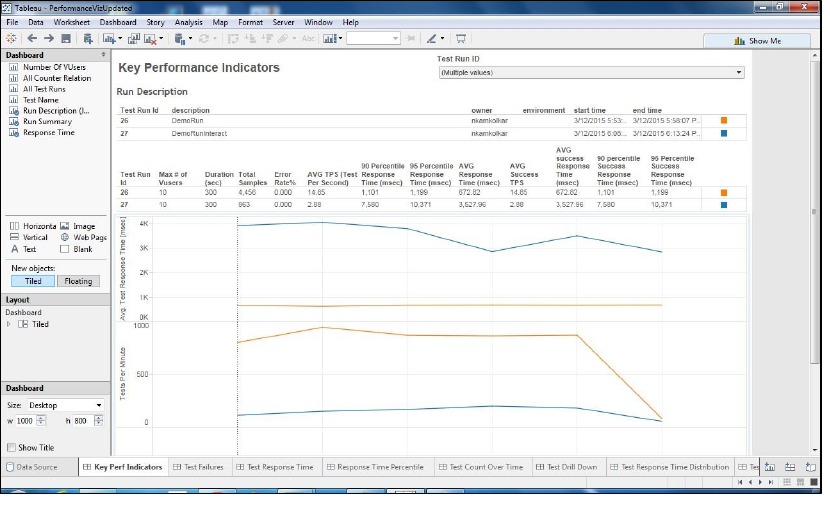
You can view the test results and review each of the worksheets.
Figure 4: Tableau Desktop showing the results captured from a test run.
Analyzing your load test data is as exploratory as working with any data with Tableau.
TabJolt has some key worksheets as starting point. Standard KPI metrics like response
times, test cases per second (TPS), host metrics, and JMX metrics (if configured) appear in
the workbooks automatically.
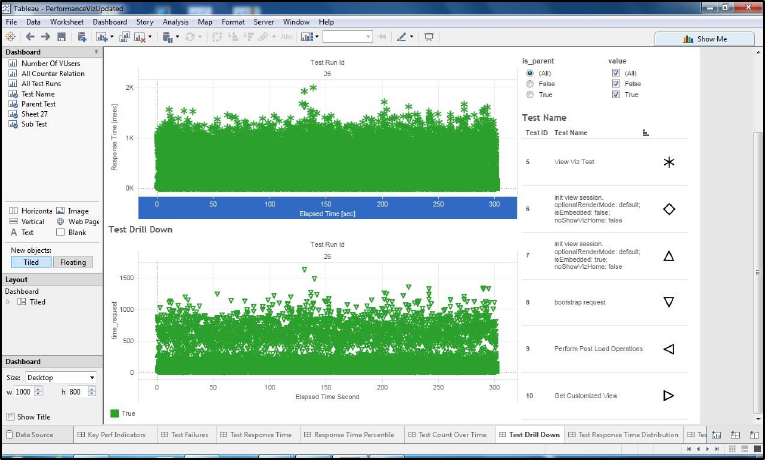
A test case is defined as either a “view” or an “interact” test case as described above. These
parent test cases might have many child test steps to run. For example, as part of loading a
Tableau—TabJolt Installation Guide October 2018
17
new view, we might create a bootstrap session for the view, get a customized view, or
perform operations after the load. These are subtests of the parent test case:
Test Case (Load View)
Boot Strap Request
Get Customized View
Perform Post Load Operations
When you look at these results, you can quickly find patterns and check how your workload
is behaving under load.
Before proceeding with a larger scale test, best practice is to ensure that your workbook is
optimized for a single user. If your workbook takes a very long time just for one user, you
should either follow best practices on how to author workbooks for performance or request
Tableau to help.
Figure 5: Tableau Desktop showing test drill down from a test run.
Upgrading TabJolt
The installer doesn’t support upgrade yet. If you already have TabJolt installed with Postgres
DB version 9.5 (other versions are OK), you will have to uninstall Postgres 9.5 and delete the
data folder C:\Program Files\PostgreSQL\9.5.
Tableau—TabJolt Installation Guide October 2018
18
You must backup your data if you want to retain your previous test run results. , because the
installer will attempt to install Postgres 9.5 with specific port, admin user name and
password and the existing Postgres instance will conflicts with it.
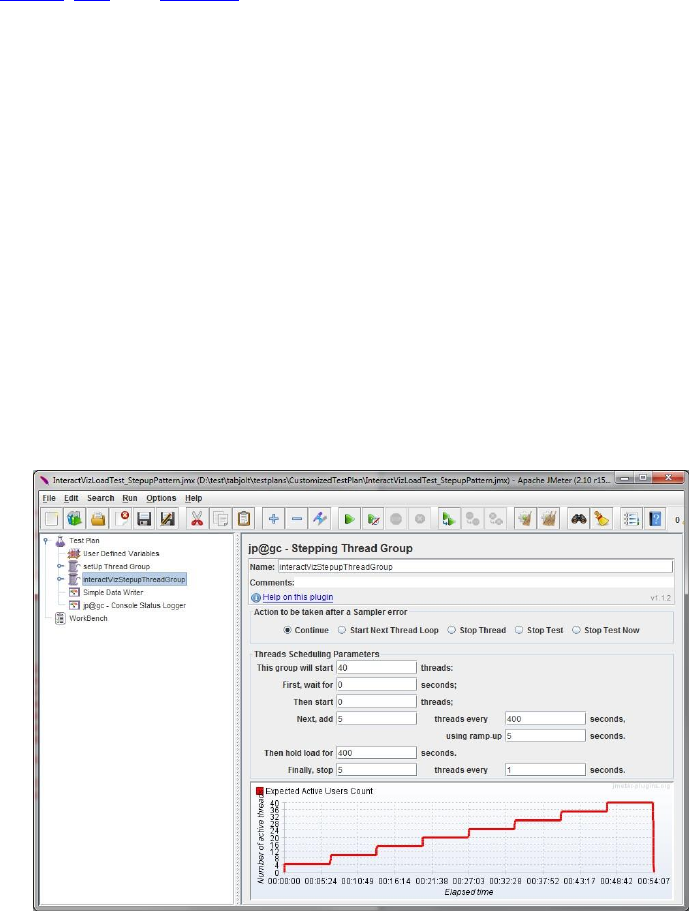
Customizing workload mix
The default workload mix (InteractVizLoadTest.jmx, ViewVizLoadTest.jmx, and
ViewInteractVizLoadTest.jmx) has a constant load pattern which means that the number of
threads stays the same throughout the run. Since TabJolt is built on top of JMeter, it is
possible to customize the workload mix to have other load patterns also supported by
JMeter (stepup, RPS, and ultimate). There are few templates already in
c:\tabjolt\testplans\CustomizedTestPlan. You can start by opening the test plan which has
the load pattern that you want in the JMeter UI. Here the steps to make a custom workload
mix:
1. As an example, we use
c:\tabjolt\testplans\CustomizedTestPlan\InteractVizLoadTest_StepupPattern.jmx.
2. Make a backup of the test plan.
3. To open JMeter UI, type in bin\jmeter.bat from the TabJolt root folder.
4. Once the Jmeter UI is opened, load the test plan
InteractVizLoadTest_StepupPattern.jmx by selecting File->Open and entering the
test plan path.
5. Click on the interactVizStepupThreadGroup.

Tableau—TabJolt Installation Guide October 2018
19
6. You can then change the stepup load pattern to match you want, such as extending
the run duration and the maximum number of threads. Note that the --d and --t
parameters from the go command won’t work anymore if you are using the
customized test plan. However, you still want to set --d to have same time duration
as the test plan so that TabJolt can connect performance counter information on the
background with the same duration as the load generation.
7. To change the test case from interact to view only, expand
interactVizStepupThreadGroup, select interactVizTest, click on the Classname
dropdown, and choose com.tableausoftware.test.server.perfTestSuite.ViewVizTest.
8. If you want to have both the view and interact tests running in the mix, replicate
interactVizStepThreadGroup.
9. Once you are done, save the test plan.
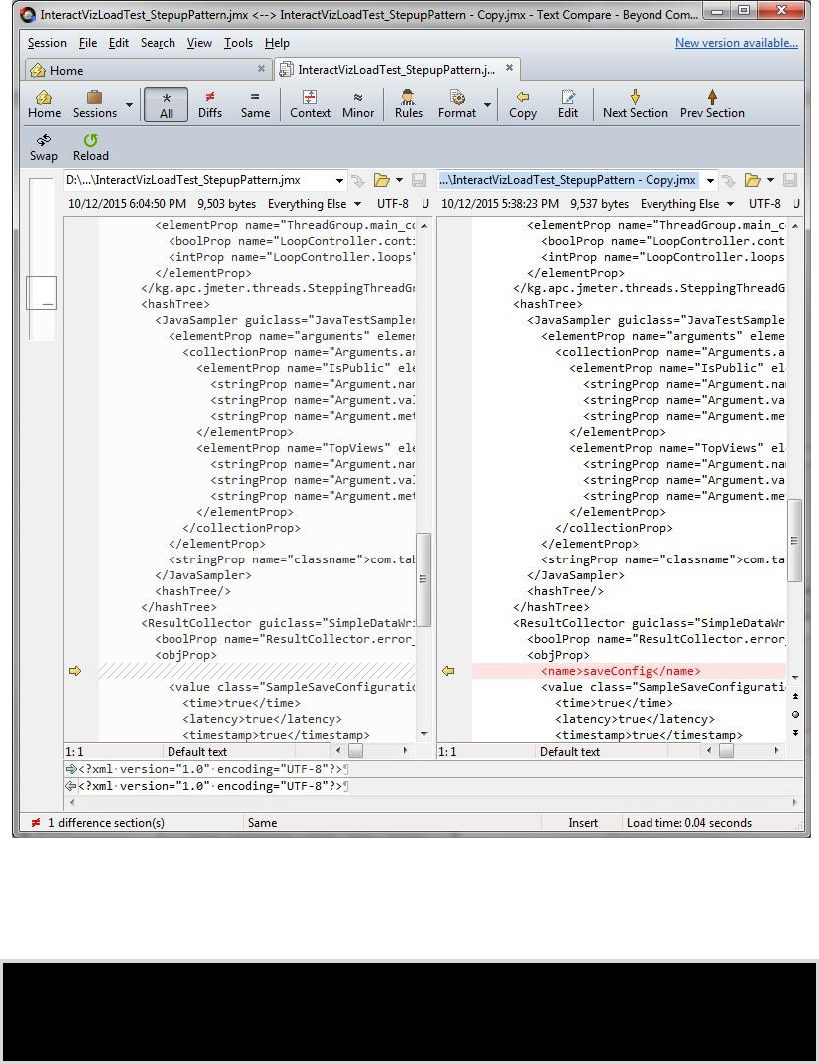
10. There is a bug in JMeter which will give invalid results in the output file. You need to
make a change the test plan to work around the bug. To fix this, load the saved test
plan and the backup test plan in Beyond Compare, or a similar comparison utility,
and find all the instances where <name>saveConfig</name> are missing. Copy over
the entries from the backup file to the file which you have just saved. Then save the
file again with the additional entries.
Tableau—TabJolt Installation Guide October 2018
20
11. Now you can use the customized test plan in the go command:
go --
t=testplans\CustomizedTestPlan\InteractVizLoadTest_StepupPattern.j mx
--d=60 --c=1.
Tableau—TabJolt Installation Guide October 2018
21
Note that the --d and --t parameter from go command won’t work anymore if you
are using the customized test plan. However, you still want to set --d to have same
time duration as the test plan, so that TabJolt can connect performance counter
information on the background with the same duration as the load generation.
PostgreSQL Manual Setup
By default TabJolt will install and setup a local PostgreSQL instance in order to store results.
The installer gives you the option to skip this step if you already have an installation from a
previous version of TabJolt, or if you want to configure it manually. These steps show how to
do the manual configuration.
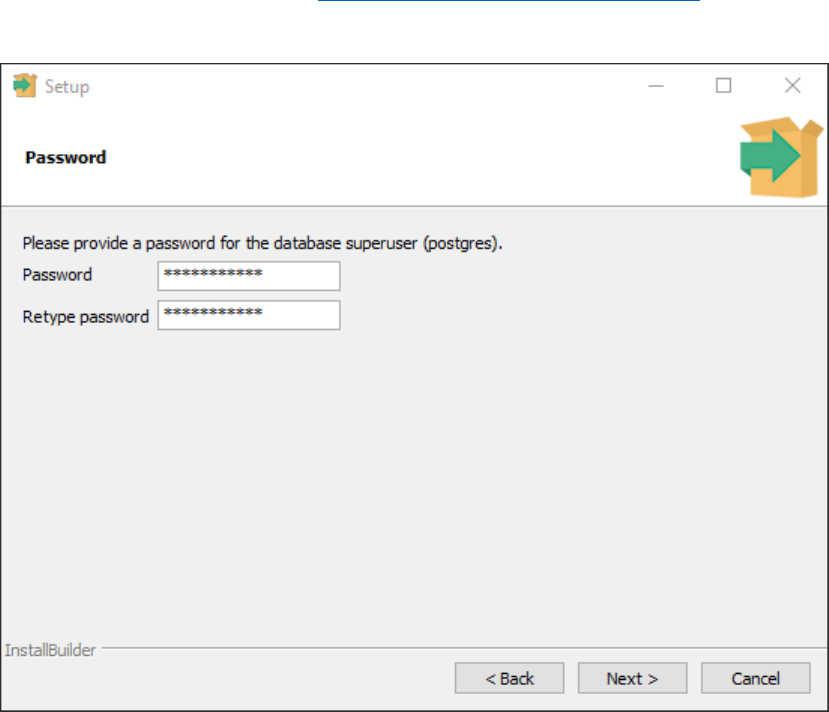
1. Download and install PostgreSQL https://www.postgresql.org/download/
2. On the password screen, enter "testresults" as the password. This is the password
that the TabJolt sql scripts will use when setting up the tables.
Tableau—TabJolt Installation Guide October 2018
22
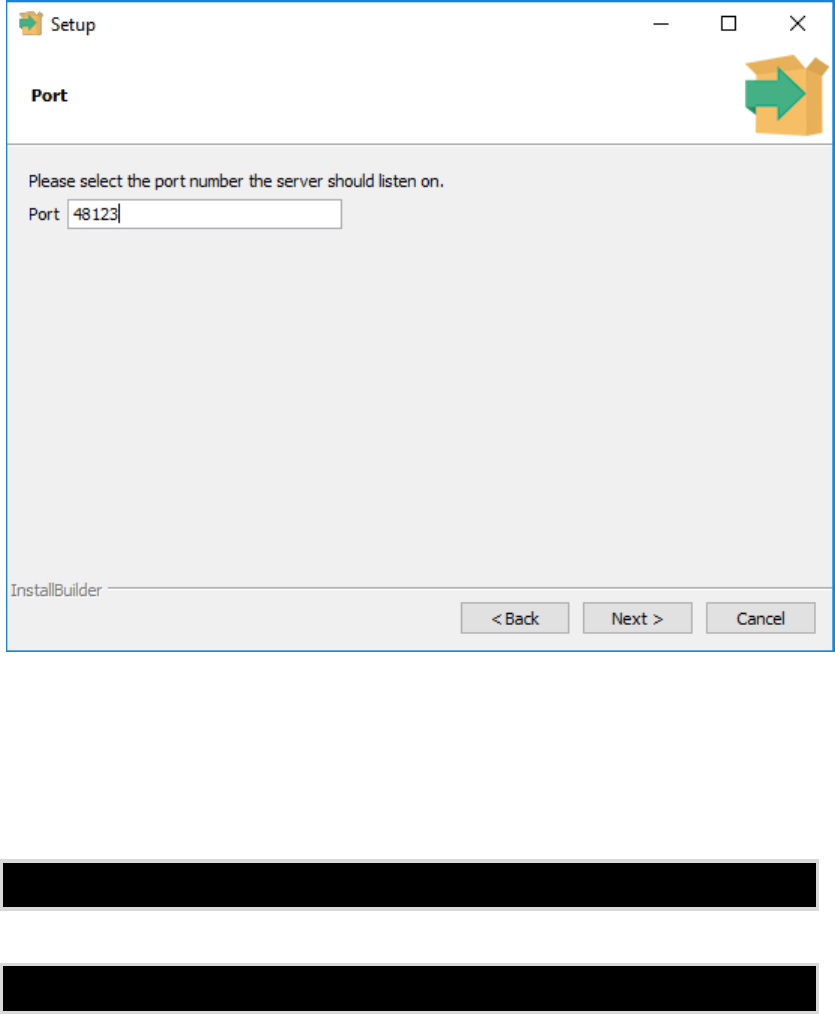
3. On the "Port" screen, set the port to "48123".
Once it is installed, use psql.exe to run the two setup scripts included with TabJolt. This will
create the tables needed for TabJolt to store results. Open a terminal window and enter the
following commands. You might need to change them to reflect the paths where you installed
TabJolt and PostgreSQL.
"C:\Program Files\PostgreSQL\9.5\bin\psql.exe" -U postgres -p 48123 -
-file="C:\TabJolt\postgresDBSchemaPart1.sql"
"C:\Program Files\PostgreSQL\9.5\bin\psql.exe" -d PerfResults -p
48123 -U postgres --file="C:\TabJolt\postgresDBSchemaPart2.sql"
Using Replayer
If you already have established Tableau server and have regular usage and want to do user
acceptance and performance testing then Replayer may help. By processing the tableau
server logs using Logshark an Admin can create a Replay file which would contain traffic info,

Tableau—TabJolt Installation Guide October 2018
23
Replayer which is integrated with TabJolt can play back the user interaction traffic i.e.
opening the viz and interacting on it. The tool replays all the sessions as if it was coming from
real users with same time interval between actions.
During replay runs it opens up the vizzes that were recently accessed as perf the logs, the tool
can be used for user acceptance and also measure performance. It also has functionality to
multiply the traffic by any amount example 1.2, 2,3.5 times the real traffic it can also be used
for capacity planning.
After creating a Replay file using Logshark and filtering to interesting time interval use
TabJolt to run the test. Eg:
go.bat --t=testplans\Replay.jmx --d=5 --c=1 --u=http://tableauserver
--s=false --note=Replaytrial --r=description --w=NA --
z={replayFile:Playback_25_09_-16-43-43.json,refreshCache:no}
More on how to use the Replayer can be found at
https://community.tableau.com/docs/DOC-11048
Known Issues and Troubleshooting
1. Is there source code for download?
TabJolt uses GitHub as a repository for external distribution and you don’t really
need to download or edit source code to use TabJolt.
2. Why does TabJolt cause a heap allocation error at start up?
By design, TabJolt tries to allocate 2GB RAM at startup. If you are NOT running x64
bit version of JAVA or you are running TabJolt on a system that has very low
memory, you may run into an error or warning that says
JavaHotSpot(TM) 64-Bit Server VM warning: ignoring option
PermSize=64m; support was removed in 8.0.
To solve this, you need to either move to an x64 bit JAVA installation, OR increase
RAM in your system, OR update the heap requirement to suit your environment
constraints with an aim to maximize the memory available to TabJolt. Set the HEAP
range in C:\tabjolt\bin\jmeter.bat.
set HEAP=-Xms512m -Xmx2048m

Tableau—TabJolt Installation Guide October 2018
24
3. How do I turn on verbose logging?
By default, TabJolt only logs fatal errors (to reduce the performance impact from
logging itself). Sometimes, you may want to turn on verbose logging to troubleshoot
a problem. To turn on verbose logging, open up the c:\tabjolt\config\log4j.properties
file. Disable the first line by adding # in front of it and enable the second by removing
# in front of it.
#log4j.rootLogger=FATAL, stdout, logfile
log4j.rootLogger=ALL, stdout, logfile
The log is saved in c:\tabjolt\logs\test.log.
Additional Resources and Feedback
TabJolt Overview Video
Getting Started with TabJolt Video
Analyzing TabJolt Results Video
Tweet us @tableau
You can also post questions or comments in the forum for the Server Administration
Community on Tableau.com.
