Technical Manual
User Manual:
Open the PDF directly: View PDF ![]() .
.
Page Count: 60
Table of Contents
1.0. System Background 1
1.1. Brief Discussion of the System 1
1.2. Hardware Specifications 2
1.3. Software Specifications 2
1.4. Installation Instruction 3
2.0. System Conceptual Design 3
2.1. Screen Design 3
2.2. BPMN 9
2.3. Entity-Relationship Diagram (ERD) 10
3.0. System Specifications 11
3.1. Site Map / Screen flow 11
3.2. Screen Specifications 12
3.3. Structure Chart 31
3.4. Module Specifications 34
3.5. Form Specifications 37
3.6. Report Specifications 44
4.0. Architectural Design 56
5.0. Maintenance Plan 57
TEI Project Management System
1.0. System Background
This section provides information regarding the system and the basic requirements
needed for it to function as expected. The section includes a brief discussion of the
system, hardware and software specifications, and simple installation instructions.
1.1. Brief Discussion of the System
Kernel is a web-based project management system especially made for
Taters Enterprises, Inc. (TEI) whose main objective is to serve as a main tool
for monitoring and updating projects in the project management process of
the company. It will be accessible by all seven (7) of TEI’s departments,
Human Resource, Facilities and Administration, Finance, Management
Information Systems, Procurement, Marketing, and Store Operations, as well
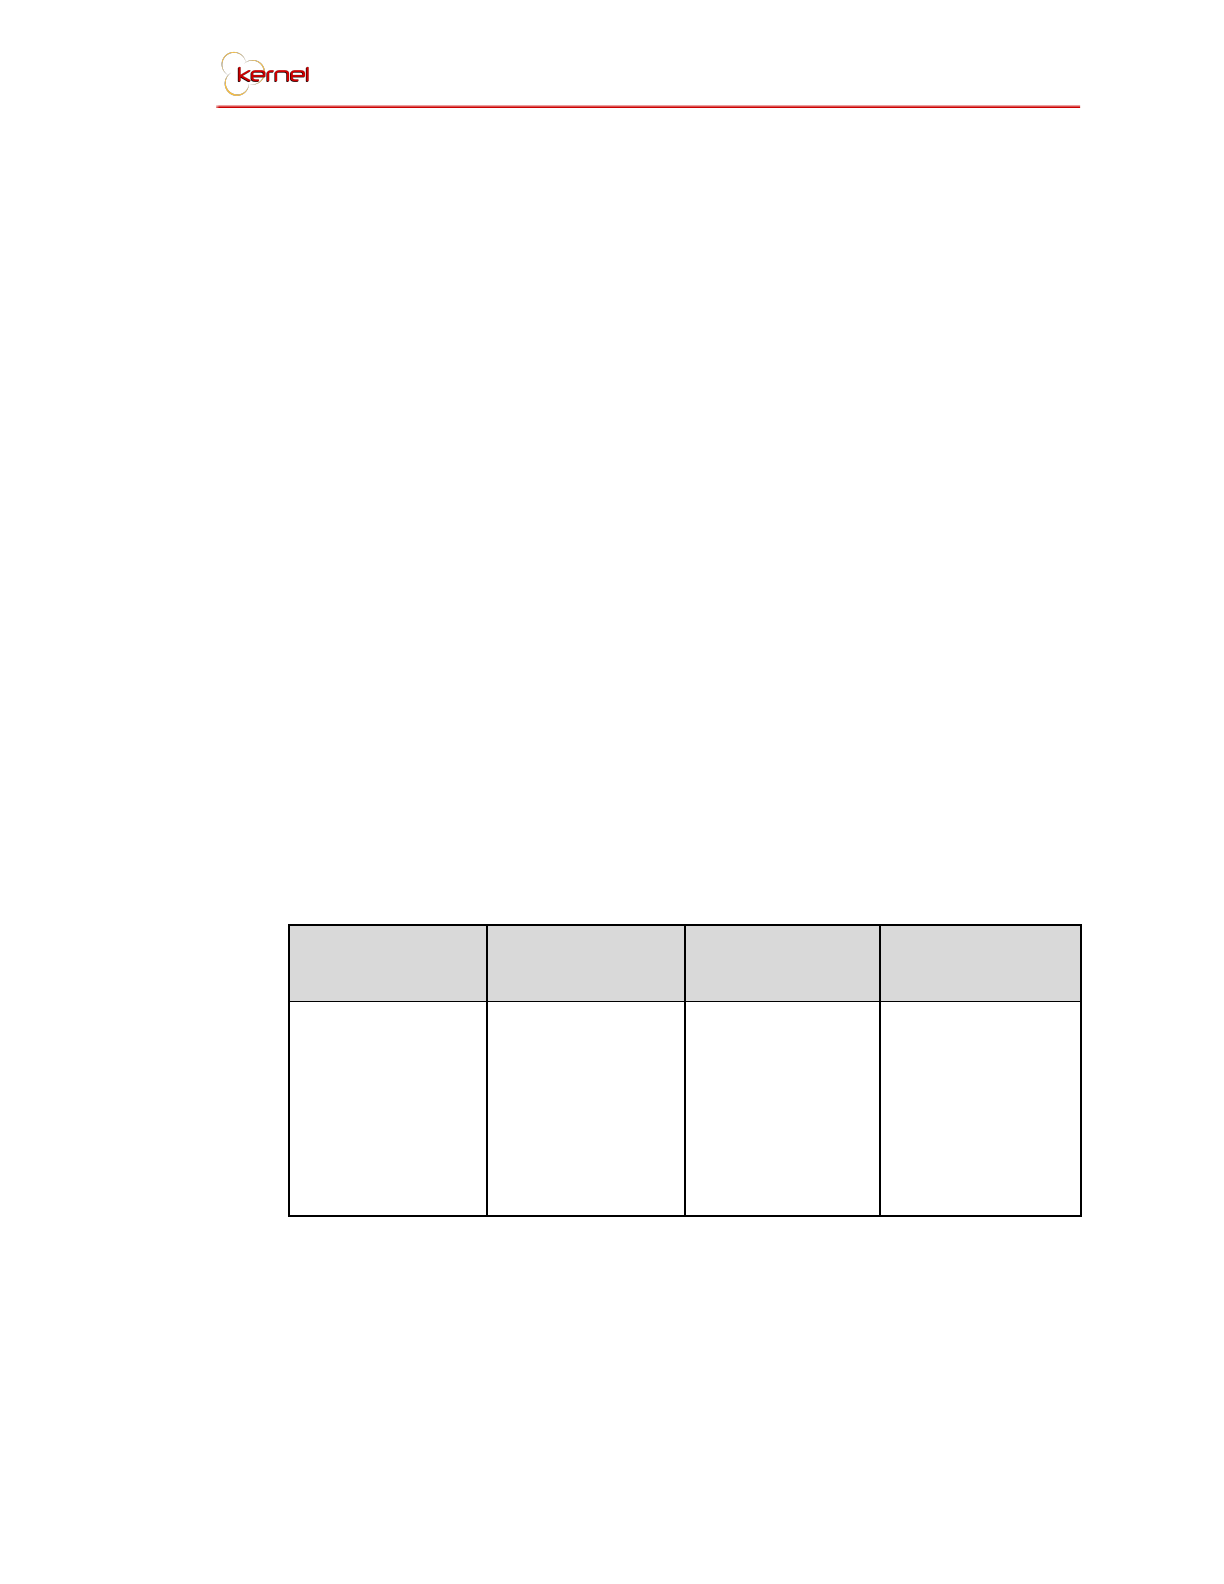
as the company’s Executives. The system has four (4) modules namely,
Project Initiation and Planning, Project Monitoring, Project Control, and Project
Closing. The structure and formation of the modules are modeled to reflect
the project management life cycle. The functions for each module are
segregated as follows:
Project Initiation
and Planning
Project
Monitoring
Project Control
Project Closing
• Project Profile
• Project
Templates
• Scheduling
• RACI Chart
• Gantt Chart
• Workload
Assessment
• Task Prioritization
• Project Progress
• Document
Tracking
• Team Gantt Chart
• Request for
Change
• Performance
Assessment
• Report
Generation
• Project Archives
Kernel Modules and Functions Table
The system was developed using the core web programming languages,
PHP 5, HTML, CSS, and JavaScript. Other various tools used were CodeIgniter
for the MVC framework, Bootstrap for the user interface, MySQL for the
TEI Project Management System 1
database, Atom as the main editor, and GitHub for versioning and
collaboration.
1.2. Hardware Specifications
The minimum requirements in order for the system to run smoothly are as
follows:
User
●Desktop Computer with Keyboard and Mouse / Laptop
●Processor: Dual Core 1 Ghz
●RAM: 1GB
●Disk Space: 1 GB
Server
●Processor: Quad core 2 Gz
●RAM: 5 GB
●Storage: 10GB
1.3. Software Specifications
The system can be accessed through the Internet ensuring that the device
accessing it from has the following requirements in order for the system to
run smoothly:
User
●Operating System
○Windows 7 and above
○MacOS El Capitan and above
○Ubuntu 14.04 and above
●ISP Web Browser
○Internet Explorer 8+
○Safari 9+
TEI Project Management System 2

○Firefox 38+
○Chrome 45+
○Opera 30+
●MySQL Community Server (8.0.13)
○https://dev.mysql.com/downloads/mysql/
●MySQL Workbench (8.0.13)
○https://dev.mysql.com/downloads/workbench/
●XAMPP (5.6.38)
○https://www.apachefriends.org/download.html
1.4. Installation Instruction
Kindly refer to the Installation Manual.
2.0. System Conceptual Design
This section describes the overall design of the system in terms of user interface,
database, and process. It is divided into subsections where the significance of the
various elements and the rationale on designing it in the manner presented will be
discussed.
2.1. Screen Design
Layout Guidelines
The general layout of the system consists of a top navigation bar, a left
collapsible sidebar, the overall working area, as described by the developers,
at the right side of the screen, and a footer at the end of each working area
which is not affixed.
The navigation bar is placed at the top as it is where the basic
elements are placed, such as the name of the company, which also redirects
to the dashboard upon clicking, the list of tasks assigned to the user, the list
TEI Project Management System 3

of notifications tagged to the user, and the user pane where he/she can
either change their password or log out of the system.
The sidebar is located at the left to have balance towards the user
pane’s functionality as to avoid overlapping. Some, two (2) to be exact, sidebar
elements can be expanded to view more categories that fall under the
specific element. Each sidebar element, loads a different working area.
The, so-called, working area is where the different elements of a web
page can be viewed, accessed, and manipulated. It is mainly where all the
user interaction occurs. Each page has the current date affixed at the top right
of the container to aid the users in making date and schedule estimations; this
is also present in every page once the user logs in. The pages have a page
header indicating the current web page the user is in. Alongside the page
header is the tooltip which is placed next to the header, in a smaller and more
unnoticeable style as to not draw too much attention from it, to simply act as
added information on what the user can do in the current page. After the
header, the necessary elements for the sidebar element selected is
displayed. Majority of the data is portrayed in a table which is placed in a box
element for added separation to easily be distinguished. For the table data,
data with constant lengths, such as dates, statuses, and numbers are
center-aligned while data with varying lengths are left-aligned; the table
headers are also affected by the alignment. Each table row that contains task
details have a color at the leftmost side to indicate the status of the task (Each
color will be discussed in the latter section, Color Scheme Guidelines).
All buttons trigger a pop-up window, or a modal as described by the
framework. Each pop-up has a close button, which is identified with an “X”
mark, located at the right if there is no other button present, and to the left if
there is another button in the pop-up. The pop-up title or header can either
be the function of the button or the task’s title and duration.
TEI Project Management System 4
The system alerts appear after every action and is located at the
top-middle area of the working area. The alerts are generally identified by a
successful or failed request, with a green or red background and text
respectively. The text within an alert indicates the action done and whether it
was performed successfully or not.
Font Guidelines
The chosen typeface that was applied all throughout the system is called
“Source Sans Pro”. It is an open-source font family with a sans serif typeface. It
was chosen mainly for its simplicity, readability, and accessibility. A sample of
the typeface is as follows:
A B C D E F G H I J K L M N O P Q R S T U V W X Y Z
a b c d e f g h i j k l m n o p q r s t u v w x y z
0 1 2 3 4 5 6 7 8 9 0 ( ! @ # $ % & * . , ? : ; - + / )
Source Sans Pro Sample
The different font variations of the typeface resemble the use and
importance of the word/phrase on a certain page. Bold fonts with a regular
size is used for table headers. Italicized fonts with a regular size is used as a
section divider. In one instance, a regular sized strikethrough is used in
portraying initial data that is to be overridden. This is illustrated as follows:
Regular
Page Header
Table Header
Section Divider
Previous Data
Font Sample
TEI Project Management System 5
Color Scheme Guidelines
The main color scheme of the system is inspired by the colors from the logo
of Taters Enterprises, Inc. (TEI), which are red, black, and white. The
background of the working area is in a white to light gray shade in order for
the foreground elements to be elevated, instead of a simple white
background. The frame of the system is in red to highlight the essence of TEI,
while the text is mainly in standard black. The main elements of the system
are kept neutral due to the fact that the system utilizes a number of colors
which resemble a status which is present in majority of the web pages. There
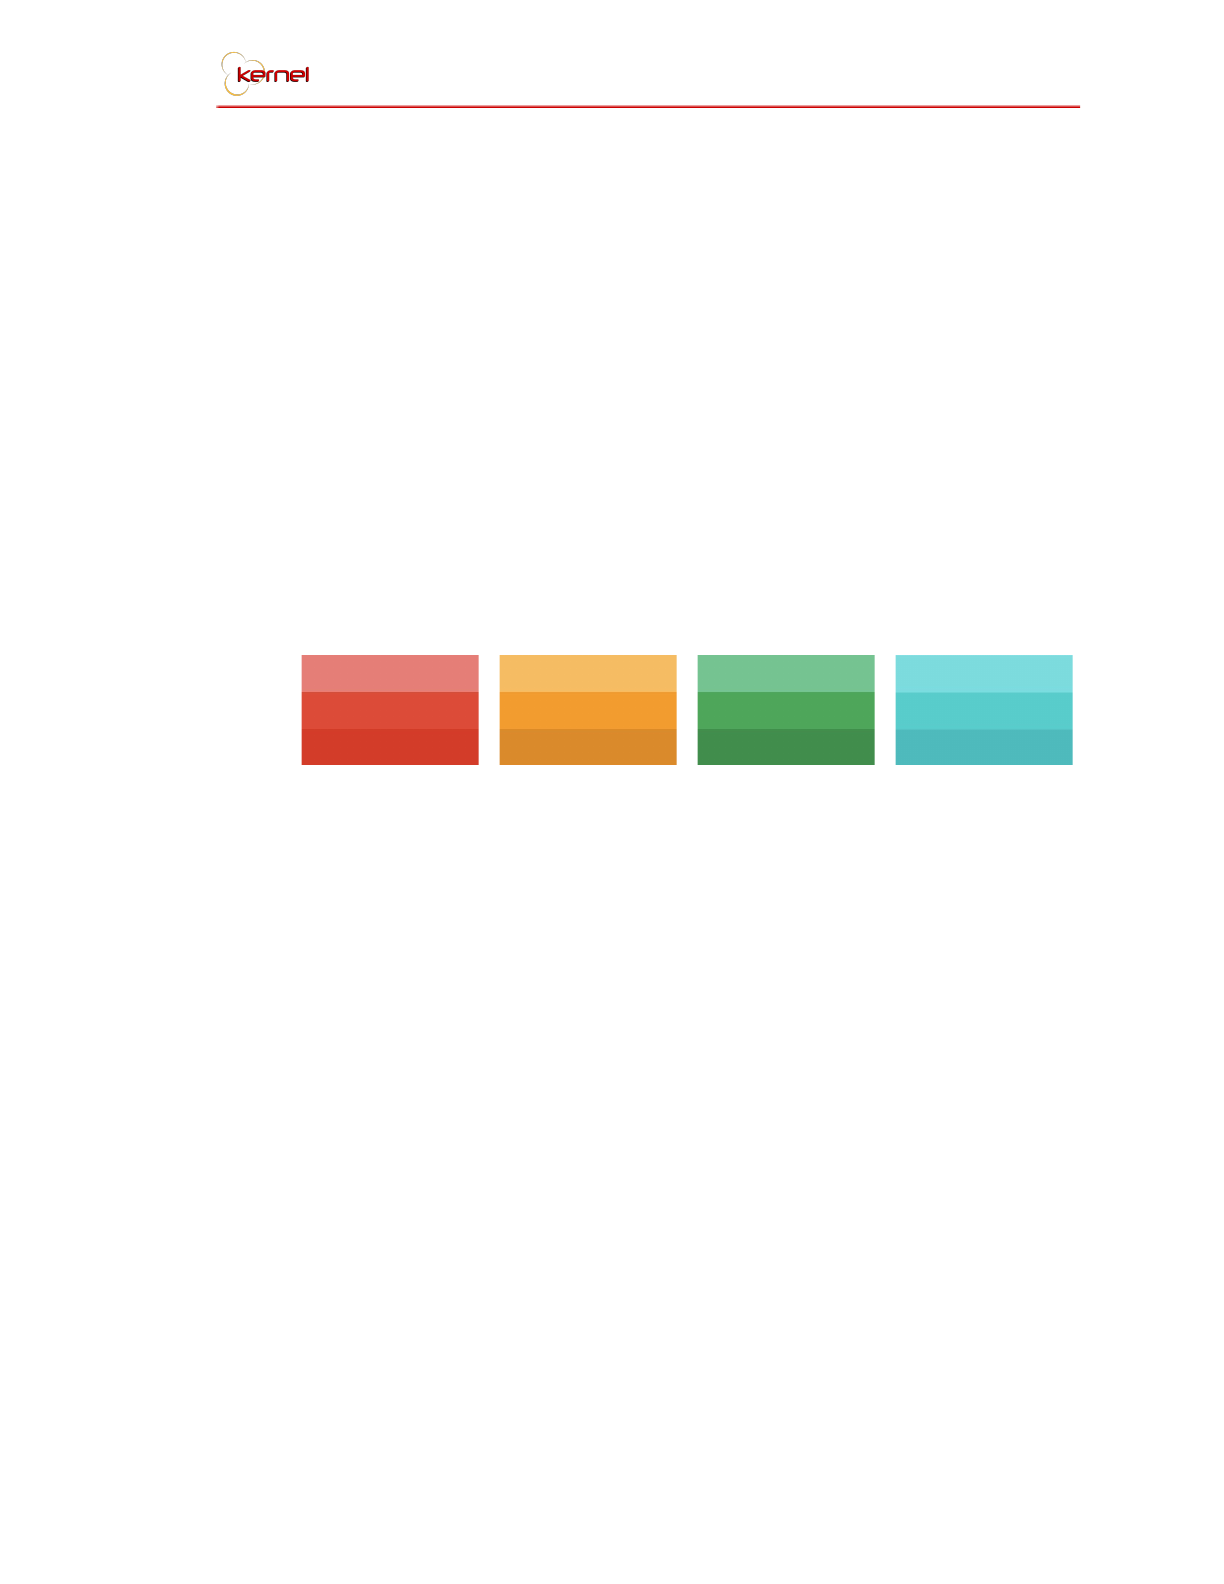
are four (4) status colors spread throughout the system. Aside from the
stoplight colors, red, orange, and green, teal is also used.
Main Status Colors
Red denotes a negative action, which is why it is correlated to the
delays to catch the user’s attention as it is widely known to stand out among
other colors. Orange is used for projects that are in the planning stage or tasks
that have not yet begun. Green is used for positive action, and for ongoing
tasks and projects, as it implies there is no problem occuring and is
happening on schedule. Lastly, teal is used to mark completeness in terms of
projects and tasks as it is a color that represents wholeness and peace, peace
of mind that something has been accomplished.
There are also some accessory colors, such as purple which is used
for templates, as it symbolizes creativity and fulfillment in completing a
project that performed well enough to meet certain standards with the intent
to be modeled after for future projects to come. Different shades of blue are
also used to resemble addition of elements and to symbolize depth.
TEI Project Management System 6
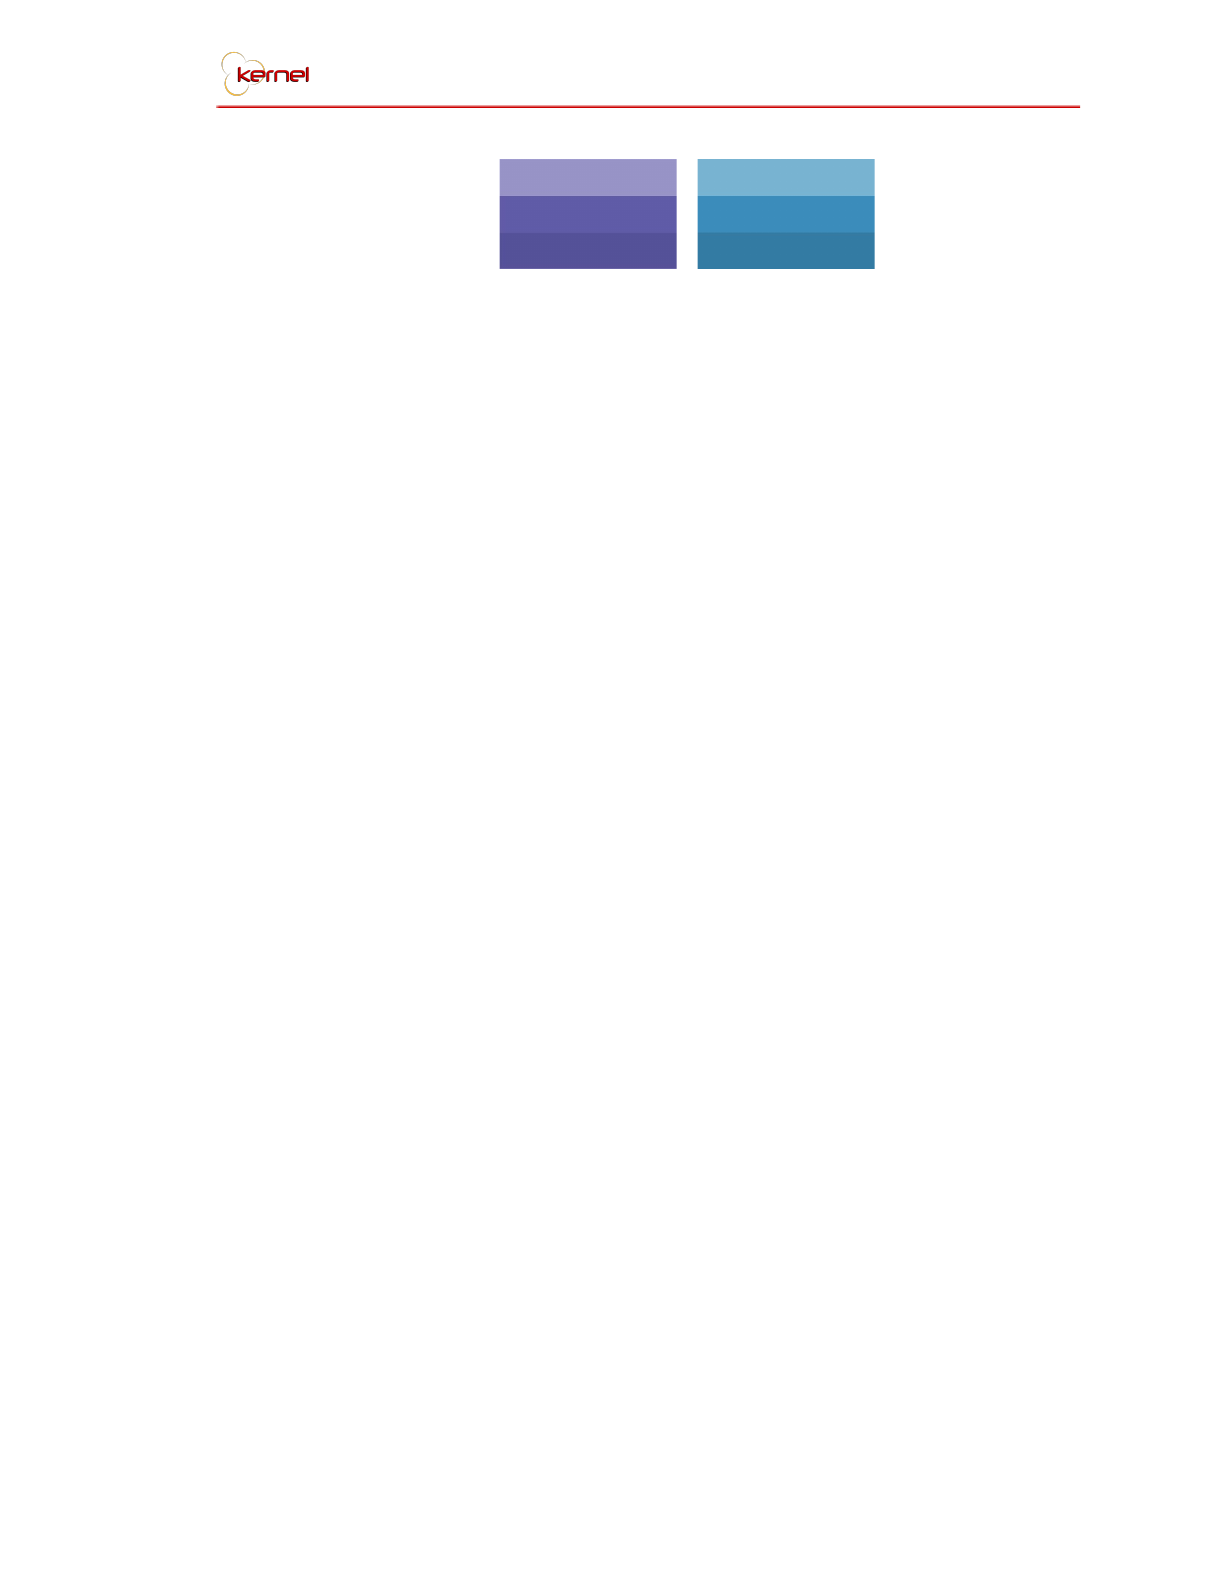
Accessory Colors
Consistency Guidelines
Following the consistency of the general layout of the system, and
accompanied by the colors, affect the overall cleanliness and organization of
the system. There are different aspects wherein screen design consistency
can be identified. To begin, the color scheme is present in all the web pages
which gives the user an impression that he is using a certain system and he is
not bouncing in and out of systems. The system has diminishes the overall
color scheme on pages with restricted access, which would prompt the user
to return to the previous page or log in. Once the user logs in the system,
he/she is greeted by a beaming red to symbolize TEI. The status colors are
also used for projects, tasks, actions, and alerts to be able to leave a lasting
mark on the users which in time they will not have to rely on a legend. The
meaning of the basic stoplight colors are also consistent with its universal
meaning, which makes it easy to understand and remember.
The button sizes, placement, and color generally present consistency,
with a slight differentiation depending on its use. Each button are sized
according to the length of the element within it. Aside from that, they also
have added depth and provide tooltips on mouse hover. Tooltips are only
missing for buttons with text included as it is deemed to be an overkill if
tooltips were still added. The positioning of the buttons on pop-ups are either
right-aligned for single buttons, or balanced on both sides for two (2) buttons.
There is a maximum of two (2) footer buttons per pop-up. The colors are also
applied wherein green is applied to positive actions, red is applied to negative
actions, and orange is applied to risk-causing actions.
TEI Project Management System 7

The typography resemblance, as discussed, applies to all pages, and
the system uses a singular typeface for added uniformity. The text colors
were kept to the standard to give way for the other colors of the system and
to allow the overpowering color of red to resonate through the entire system.
The spacing of the elements are fixed according to the framework’s,
AdminLTE, default classes and styling. The only time it is overridden,
specifically styled with smaller gaps, is in reports to maximize the printable
area.
Navigation Guidelines
The main system navigation is via the sidebar, which is located at the left, as
the users generally read from left to right. With this in mind, the users’ view
flow will always pass by the sidebar as a reminder that there is a variety of
pages one can explore to. The length of the sidebar is fixed to the size of the
web page, while its visibility is upon user preference. It can be collapsed to
allow space for a larger working area, which is can appear/disappear on
button click, with the menu icon of three horizontal lines, or on mouse hover.
The developers made it a point to provide the users the ability to move
forward or backward, as necessary, through the system and not through
browser buttons. There is no forward button denoted by a simple right-facing
arrow because it is expected that each button will either forward to another
page or fulfill an action in the current page. With that being said, only “Back”
buttons, or left-facing arrows can be seen in the system. These navigation
buttons are using the default button color of gray. They also have tooltips
indicating where it leads. Its placements is always on the top left side of the
working area, just above the page header, as one would expect to find it. For
modules with a step-by-step process, the buttons leading to the next step is
placed at the bottom right of the screen or pop-up to create a proper flow.
TEI Project Management System 8
2.2. BPMN
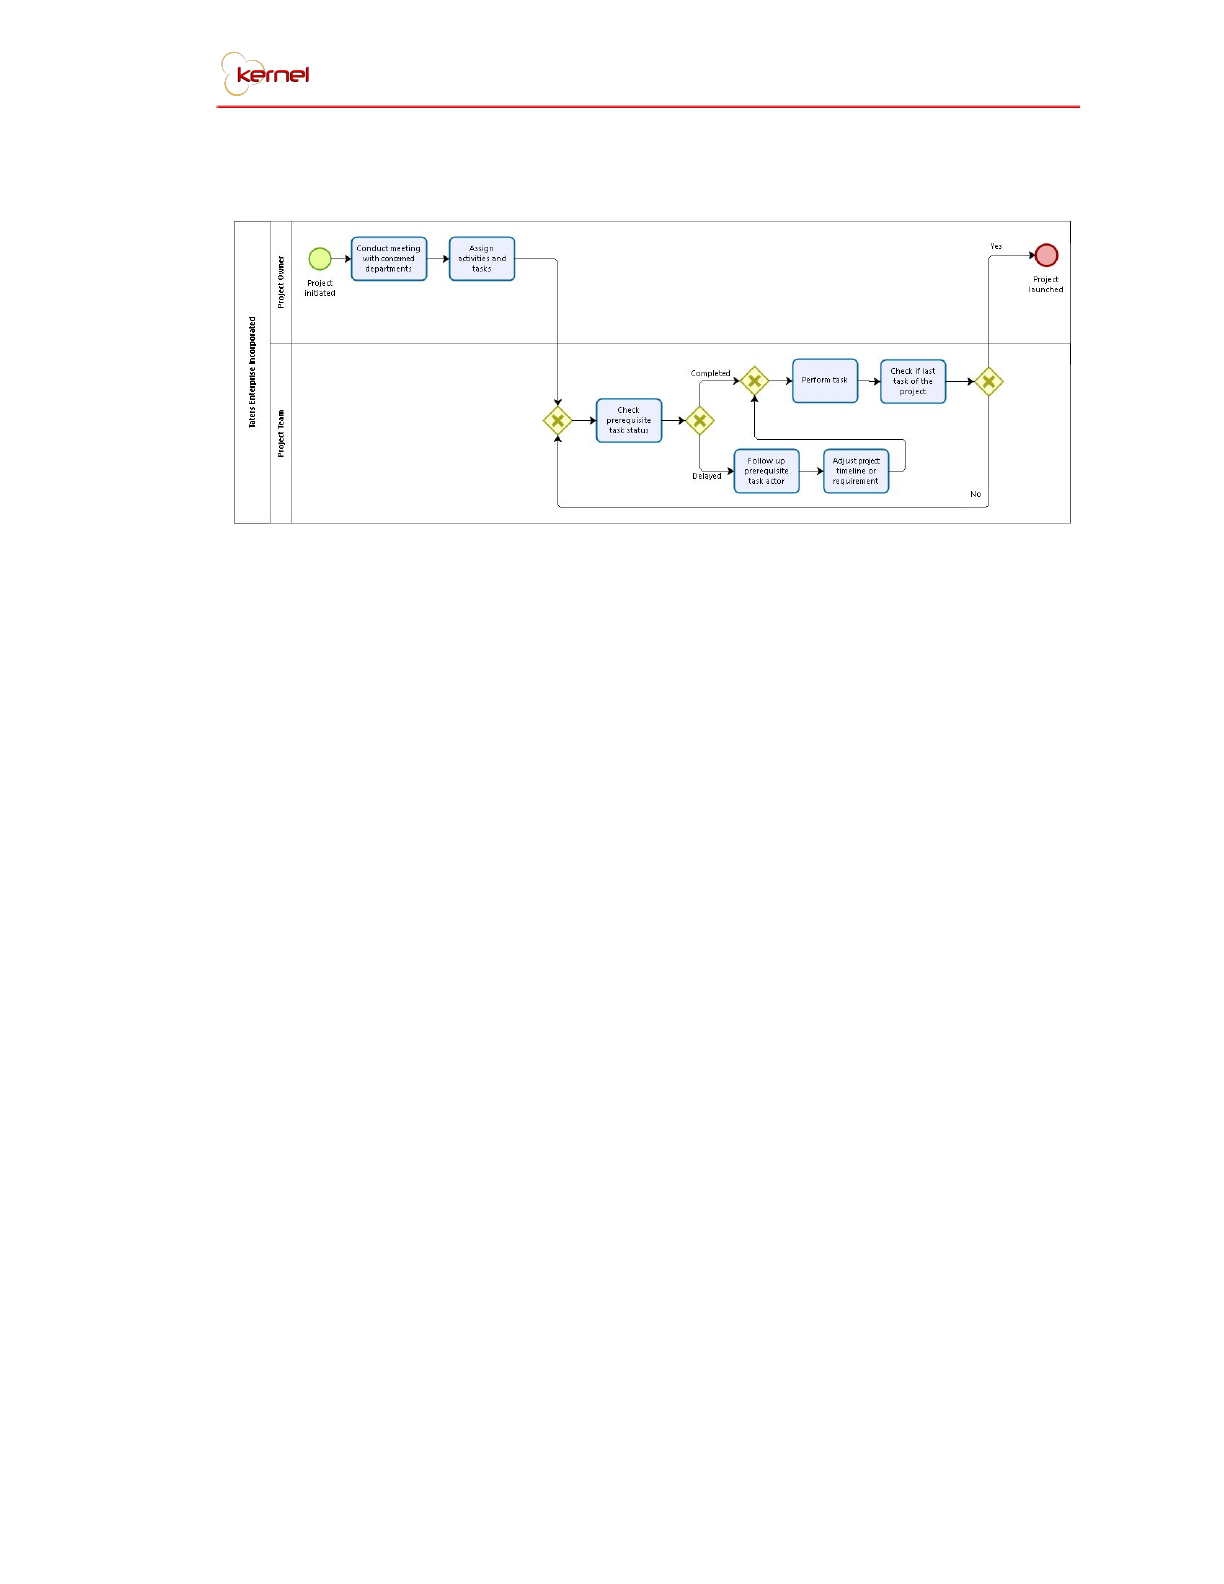
Project Management BPMN
The general project management process is composed of 2 actors, namely
the project owner and the project team. It starts when a project is initiated by
the project owner, which then calls for a meeting with the project team.
During the meeting, they identify which departments should be assigned to
an activity and task. It is then delegated to the team performing the task.
Before performing the task, they first check the status of the pre-requisite
task, if it is delayed, they notify the pre-requisite actor, and adjusts the
timeline and requirement. Once the pre-requisite has been completed, they
then proceed to performing the task. Lastly, it checks if it is the last task of the
project, if it is not, it goes back in a loop until it is. Once the last task is marked
complete, it then marks the project complete as well.
TEI Project Management System 9
2.3. Entity-Relationship Diagram (ERD)
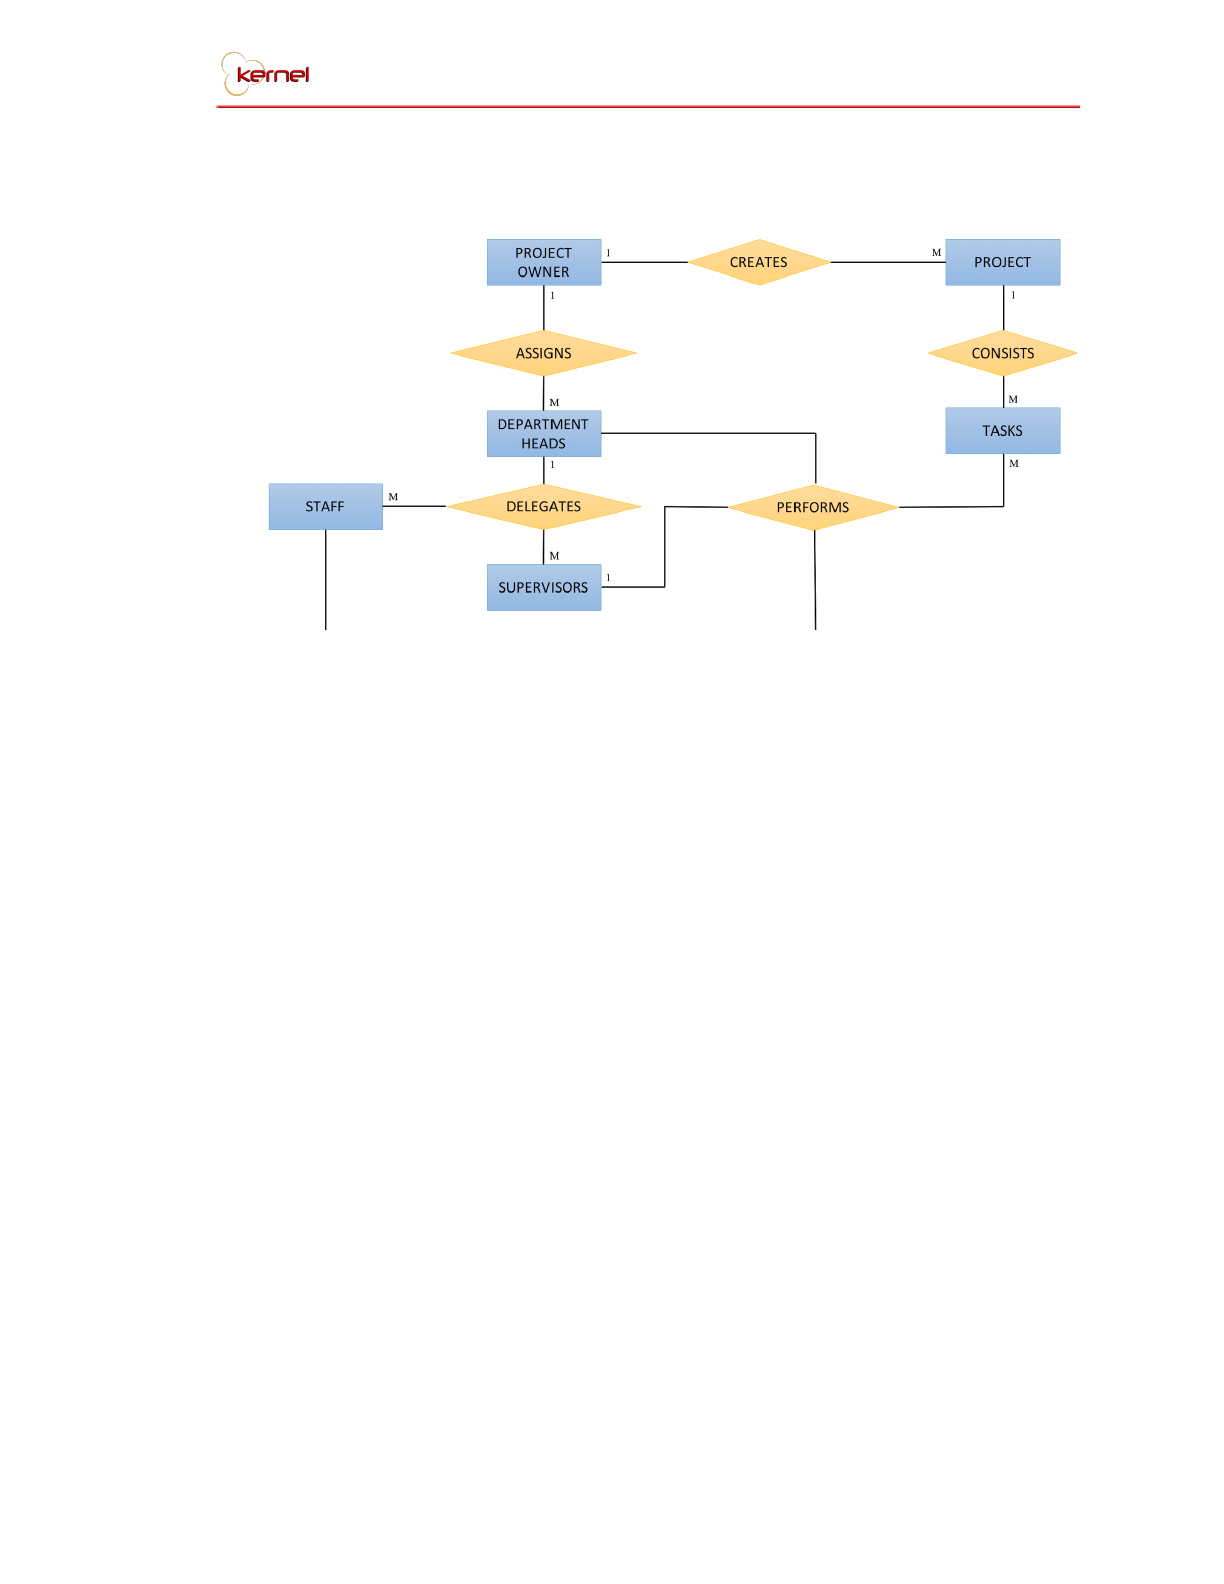
Entity-Relationship Diagram (ERD)
The entity-relationship diagram
mainly portrays the movement of the main
users/actors to kickstart a project. The blue rectangles represent the actors,
the yellow diamonds represent the action being done, the black lines
connecting each element represents the relationship, and the type of the
relationship is determined by the indicator next to the blue rectangle, whether
it is “1” for one entity or “M” for many.
The entities involved are the main users and actors of the system,
namely, the project owner, department heads, supervisors, and staff. Each
user/actor is also related to each other wherein a department head manages
a group of both supervisors and staff, a supervisor manages a group of staff
assigned under him, and a project owner may either be a department head or
a supervisor. The project owner, although may be either of the two
pre-existing actors, is its own element since it has special capabilities and
functions that are specific to a project owner, as compared to that of a
department head or a supervisor.
TEI Project Management System 10
The actions are focused on the creation of the project wherein the
entirety of the monitoring and controlling would depend. The process begins
when a project owner creates a project, a project consisting of tasks,
specifically the main activities, sub activities, and tasks. The project owner
then assigns a department to each activity or task. By selecting a department,
the system forwards it to a department head, which explains the relationship
as portrayed. The department head now has the freedom to further delegate
the task given to him/her by a department head to a staff that he/she
supervises, or to accept the task and perform it himself/herself. The staff
member simply has the ability to accept and perform a task, along with the
department heads and supervisors.
3.0. System Specifications
This section discusses the overall system in terms of structure, screens, modules,
forms, and reports. Through this, one can visualize the system and how it functions
by referring to the screens provided.
3.1. Site map / Screen Flow
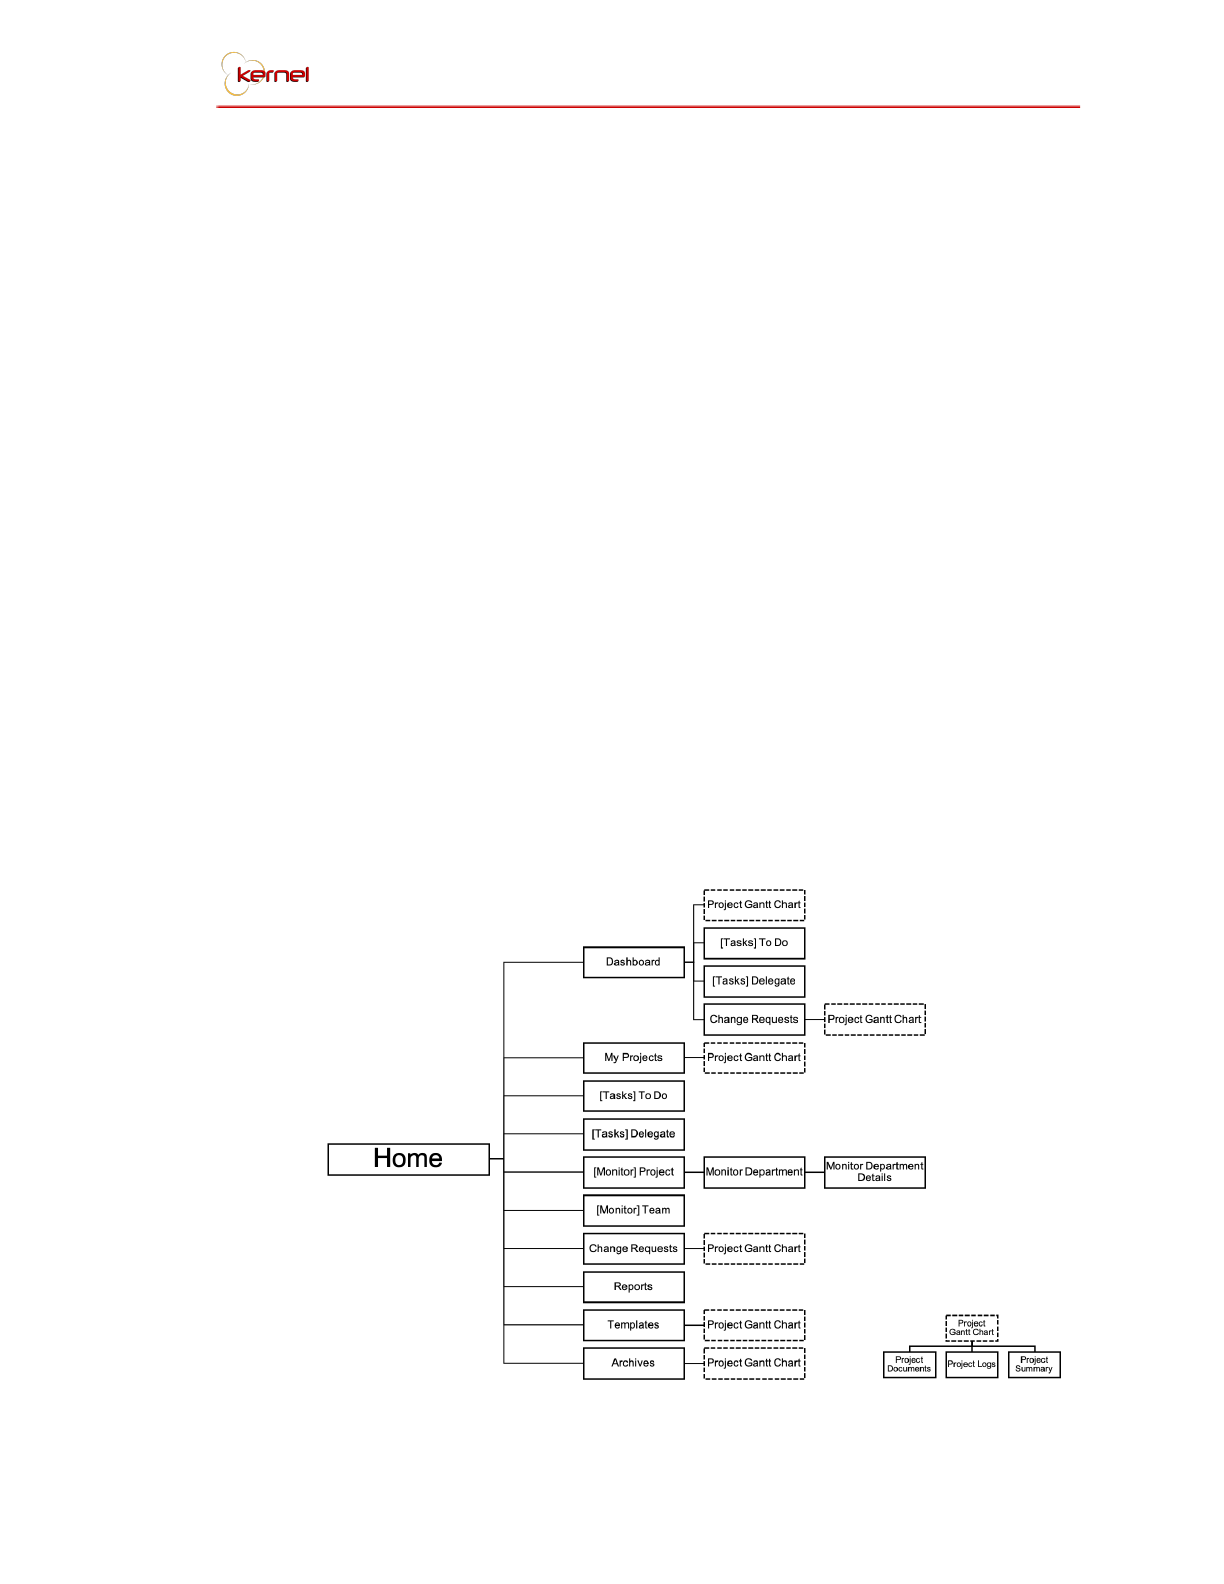
Site Map
TEI Project Management System 11
The system begins at the login page or the “Home” as indicated in the site
map illustrated above. It then leads to the dashboard as default which has a
sidebar that has access to My Projects, Tasks which can contain To Do and
Delegate or simply just To Do, Monitor which can contain Project and Team,
Change Requests, Reports, Templates, Archives, and, again, Dashboard. Half
of the sidebar elements may have access to the Project Gantt Chart which
then opens access to the Project’s Documents, Logs, and Summary Report,
as indicated at the bottom right of the site map. Each page also consists of a
back button to return to the page they came from.
3.2. Screen Specifications
This section identifies the screen details alongside the corresponding
description and use of the web page. The established design strategies can
be seen in each screen.
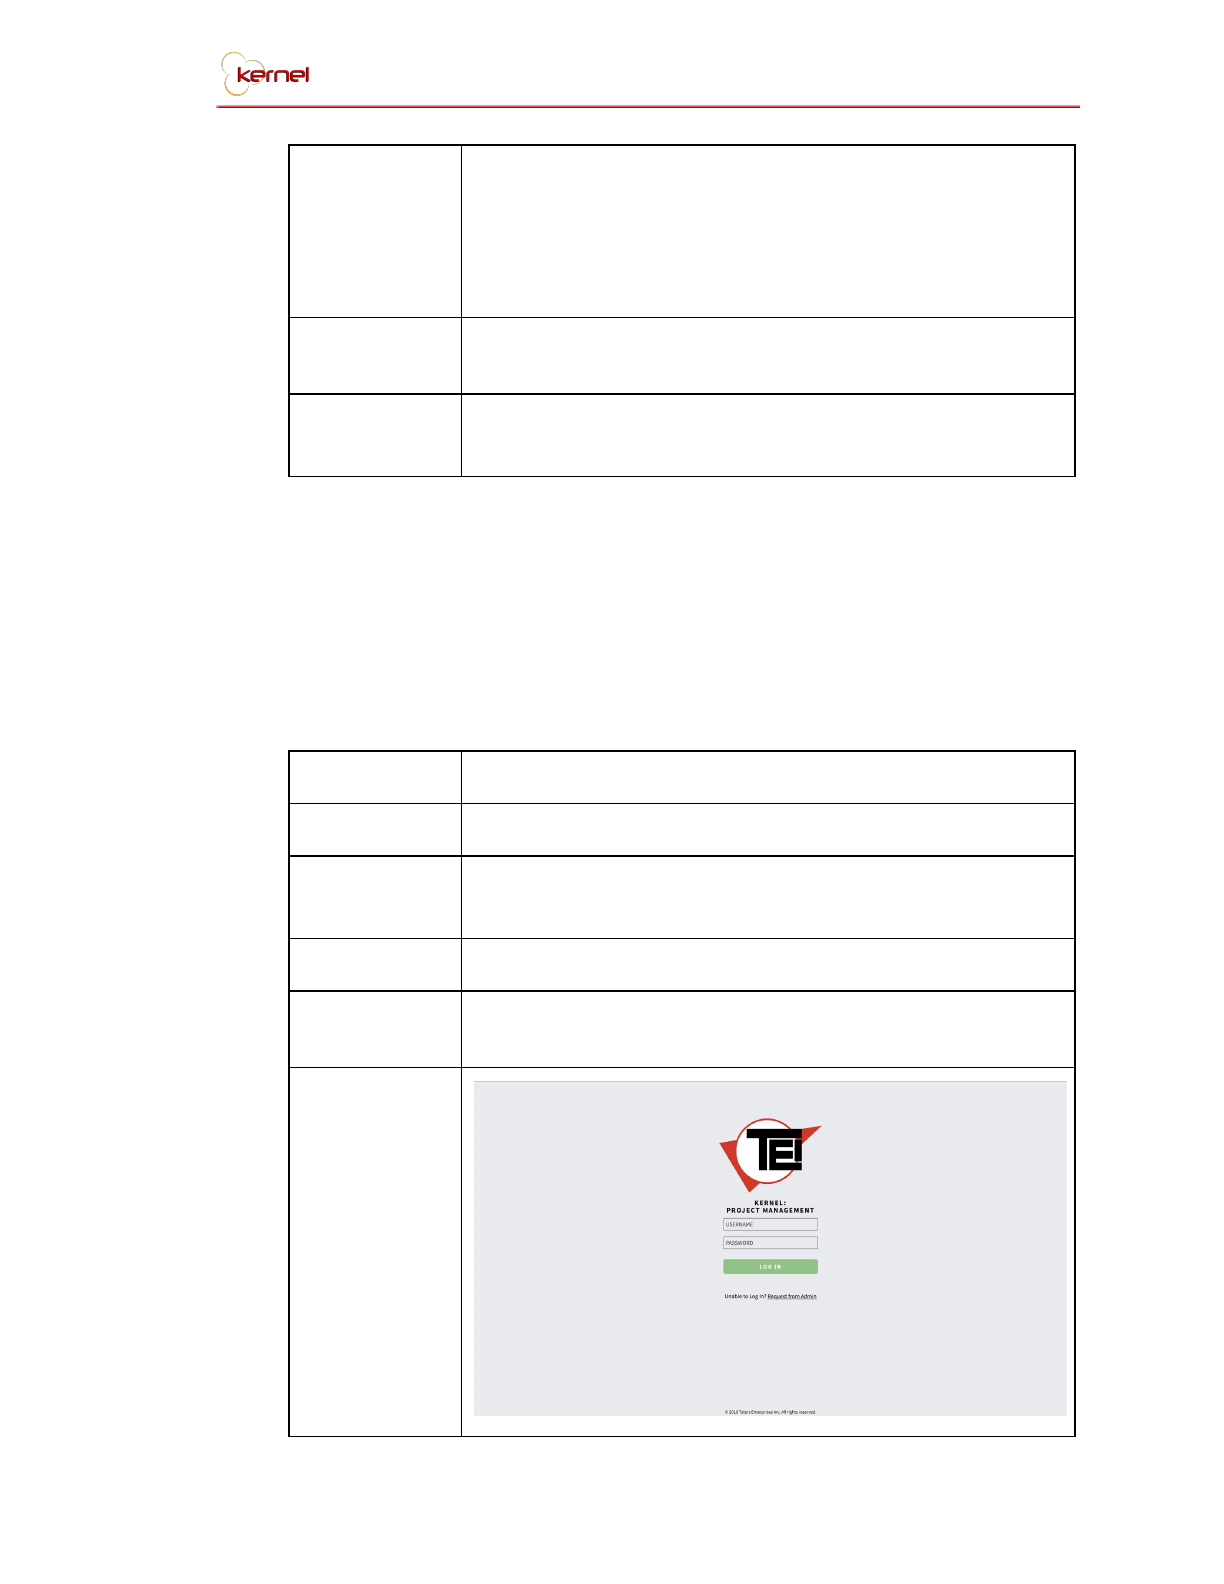
Reference No.
S-00
Name
Login Screen
Description
This screen is for login and it validates the user logging in,
as it checks if the user is providing the correct username
and password for their account. It also checks the
usertype of the person logging in. It redirects to the user’s
home screen once the login was validated.
File Name
login.php
Users
All Users
Elements
Email Textfield, Password Textfield, Login Button,
Request Login Link
Actions
Login
TEI Project Management System 12
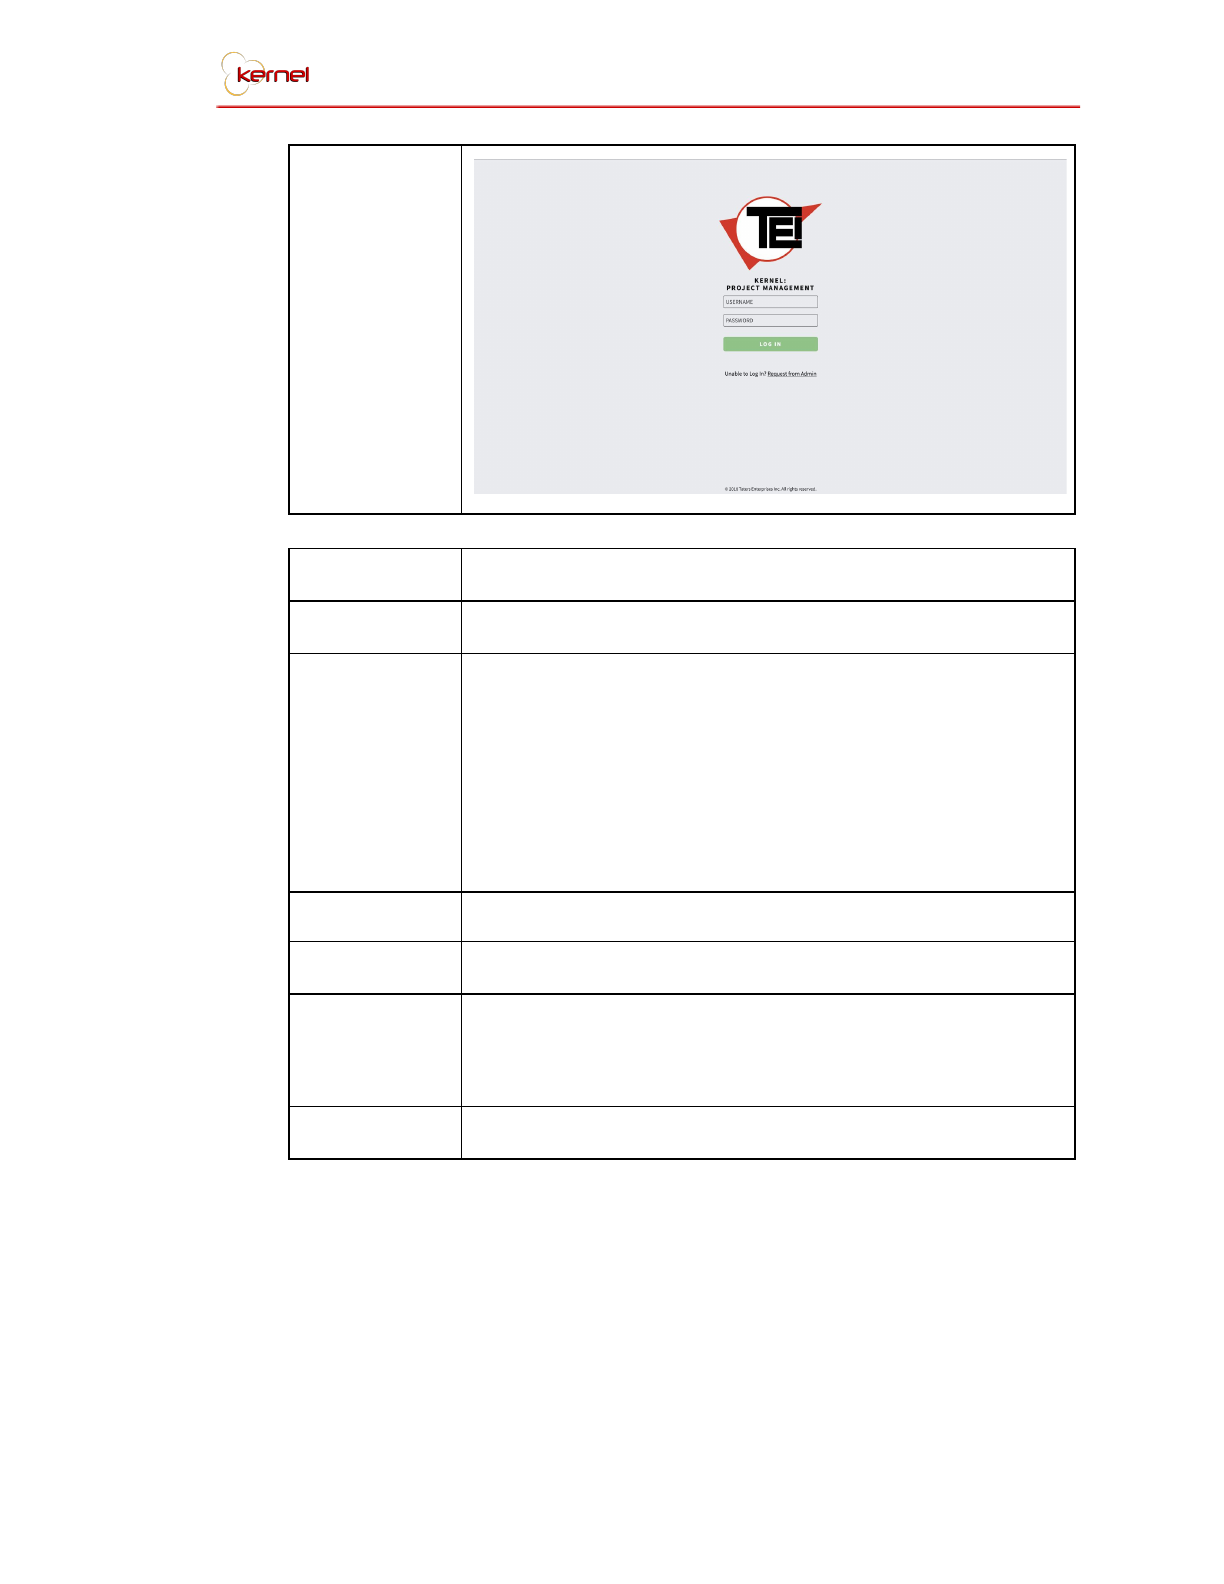
Layouts
Reference No.
S-01
Name
Dashboard Screen
Description
This page will show the user’s performance, as well as,
the performance of the team they belong to. It will also
show all projects that the user is currently working on and
tasks assigned to them that are already delayed and will
end in 2 days. Activities that also needs the user’s action
such as delegating tasks, approving requests, and
acknowledging documents can also be seen in this
screen.
File Name
dashboard.php
Users
All Users
Elements
Personal Performance Div, Department Performance Div,
Ongoing Projects Div, Tasks To Do Div, Tasks to Delegate
Div, RFC Div, Document Acknowledgement Div
Actions
Navigate to different web pages in the system
TEI Project Management System 13
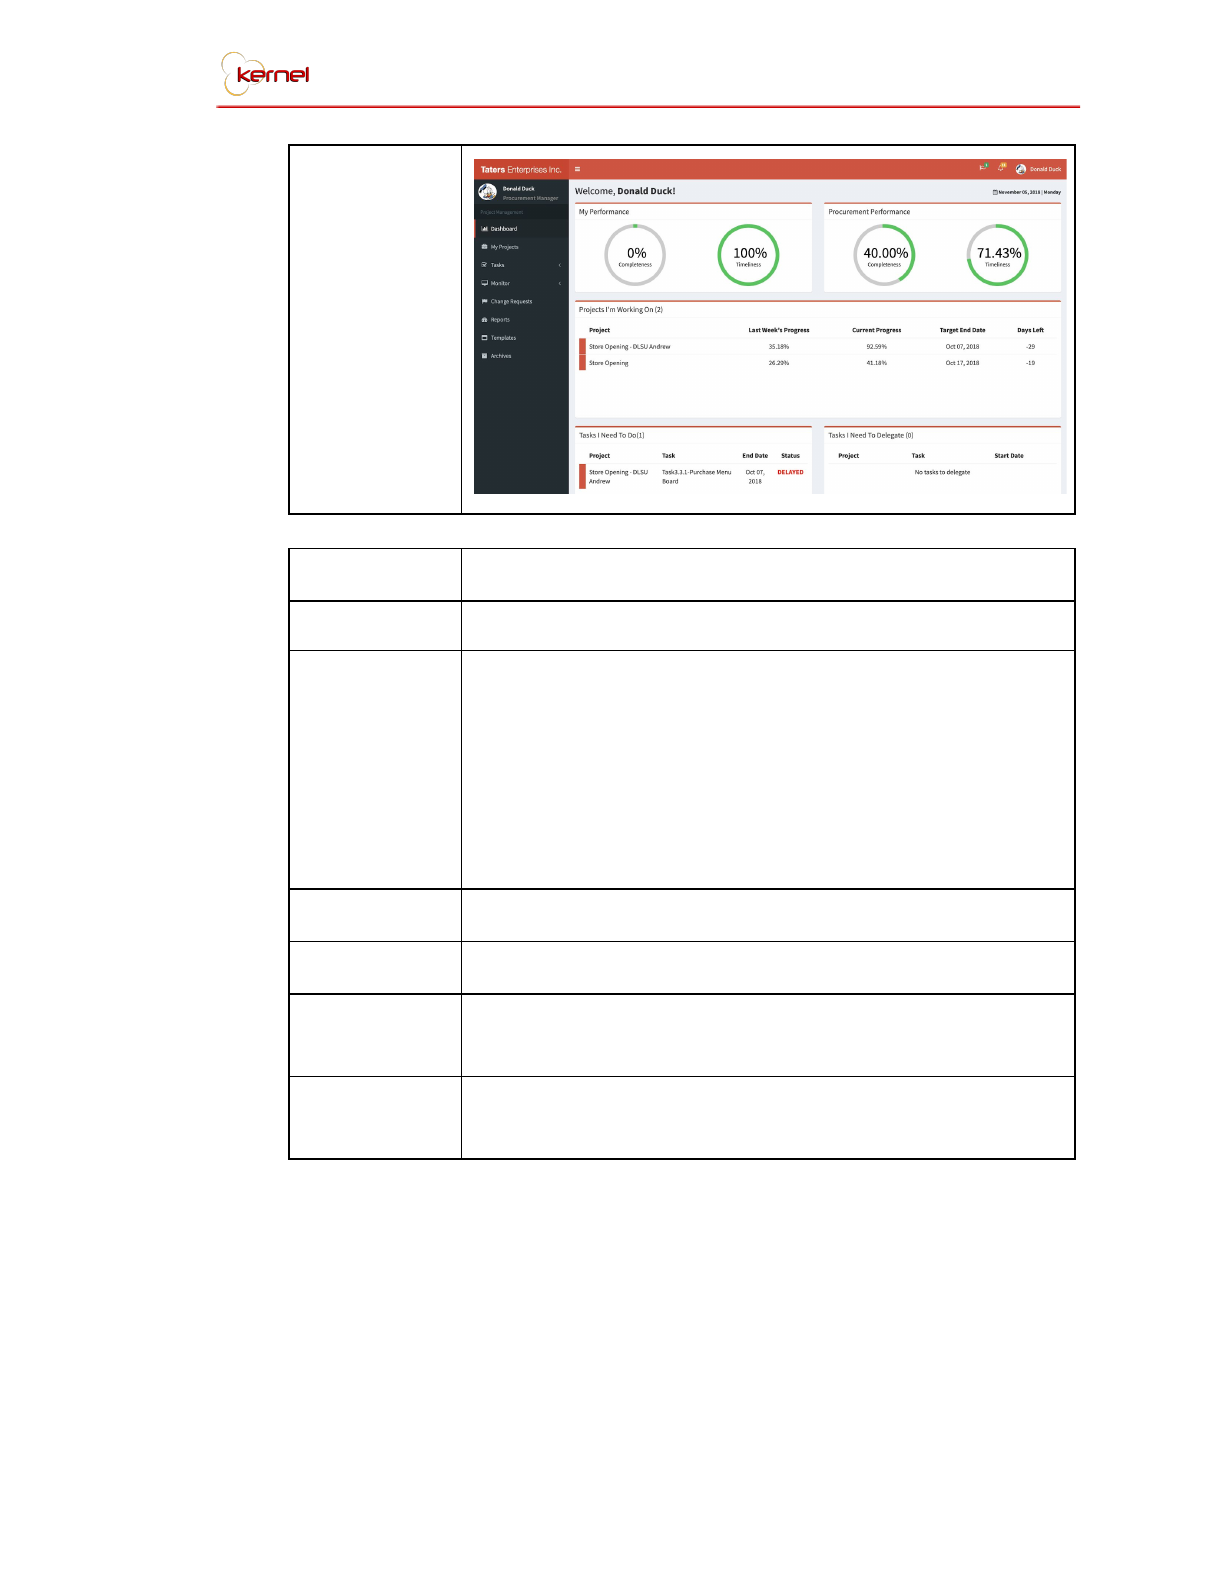
Layouts
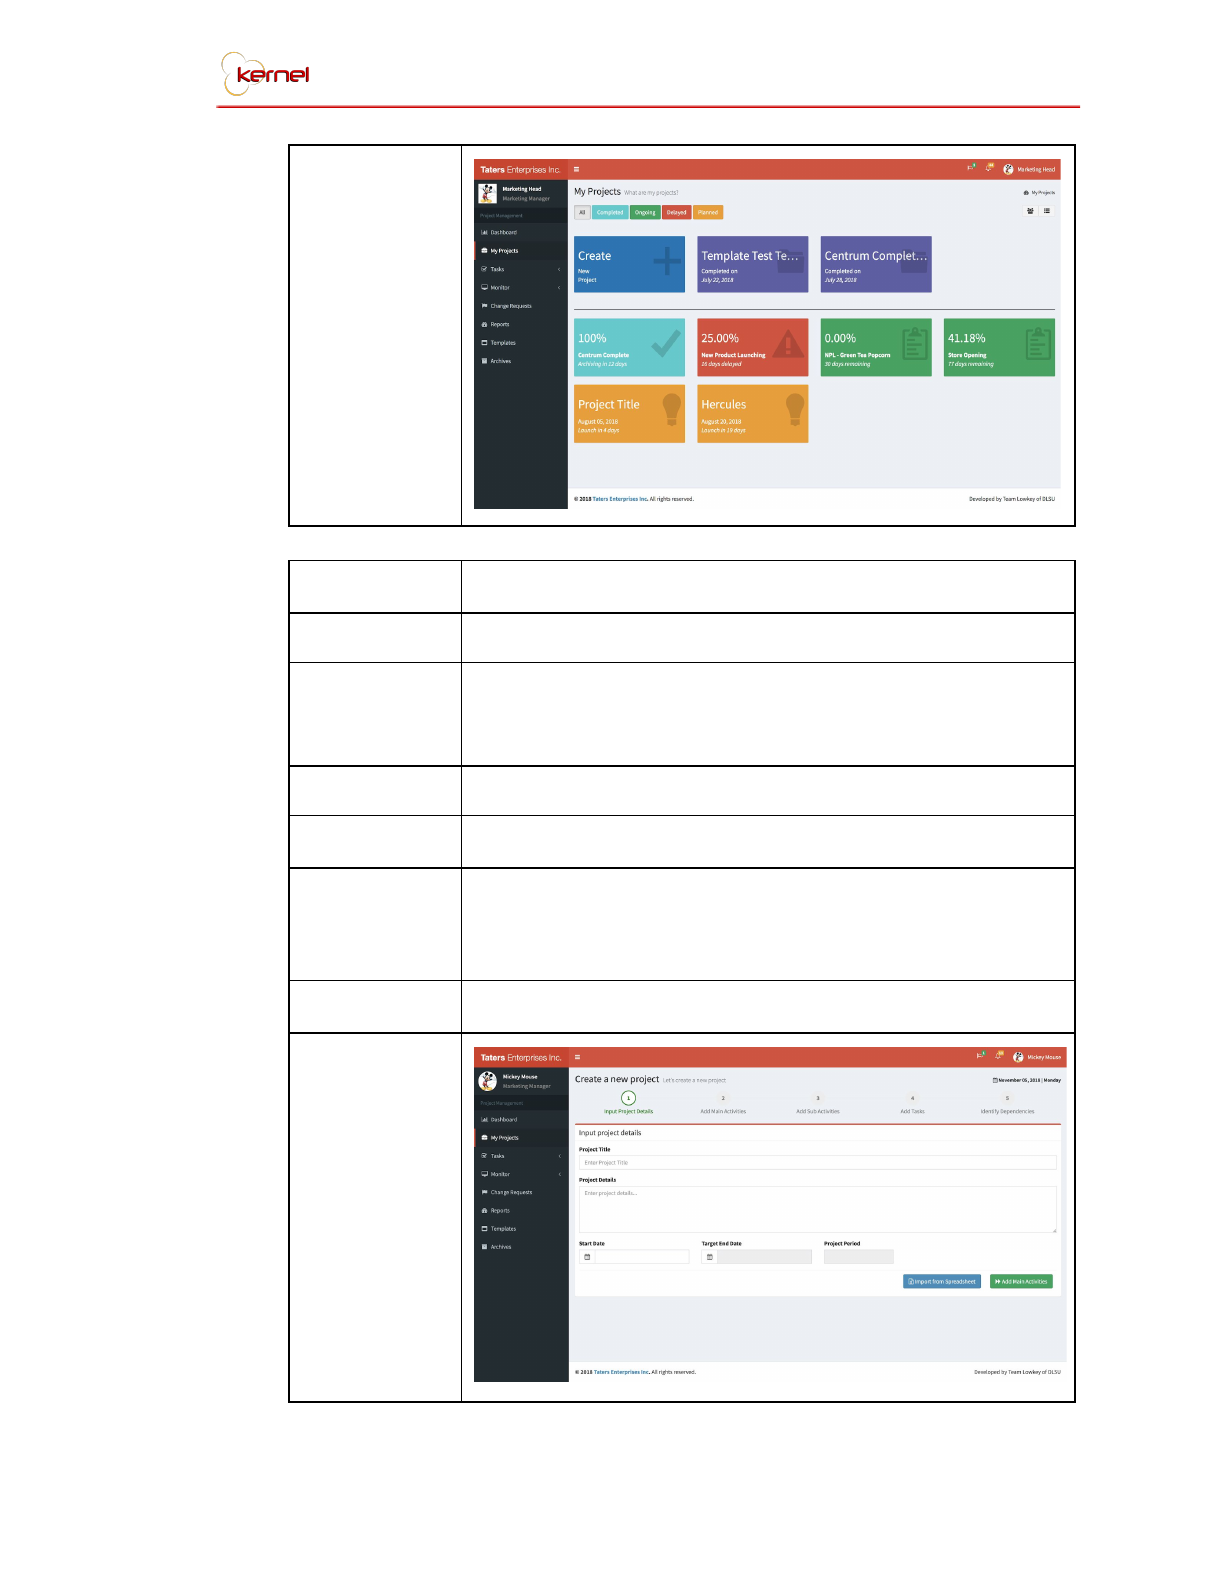
Reference No.
S-02
Name
My Projects Screen
Description
Only projects wherein the user is involved in can be seen
in this screen. Through the different colors, the user can
exactly tell the status of a project. From this screen, the
user can either click on a project, or a project template to
be redirected to the project gantt chart, or to click on
create new project to be redirected to the project creation
form. A list view and grid view are also provided for the
user’s ease of viewing.
File Name
myProjects.php
Users
All Users
Elements
Project Buttons, Project Filter Buttons, List View Button,
Grid View Button, Team View Button, Project View Button
Actions
Navigate to Gantt Chart, Filter Projects, List View, Team
View
TEI Project Management System 14
Layouts
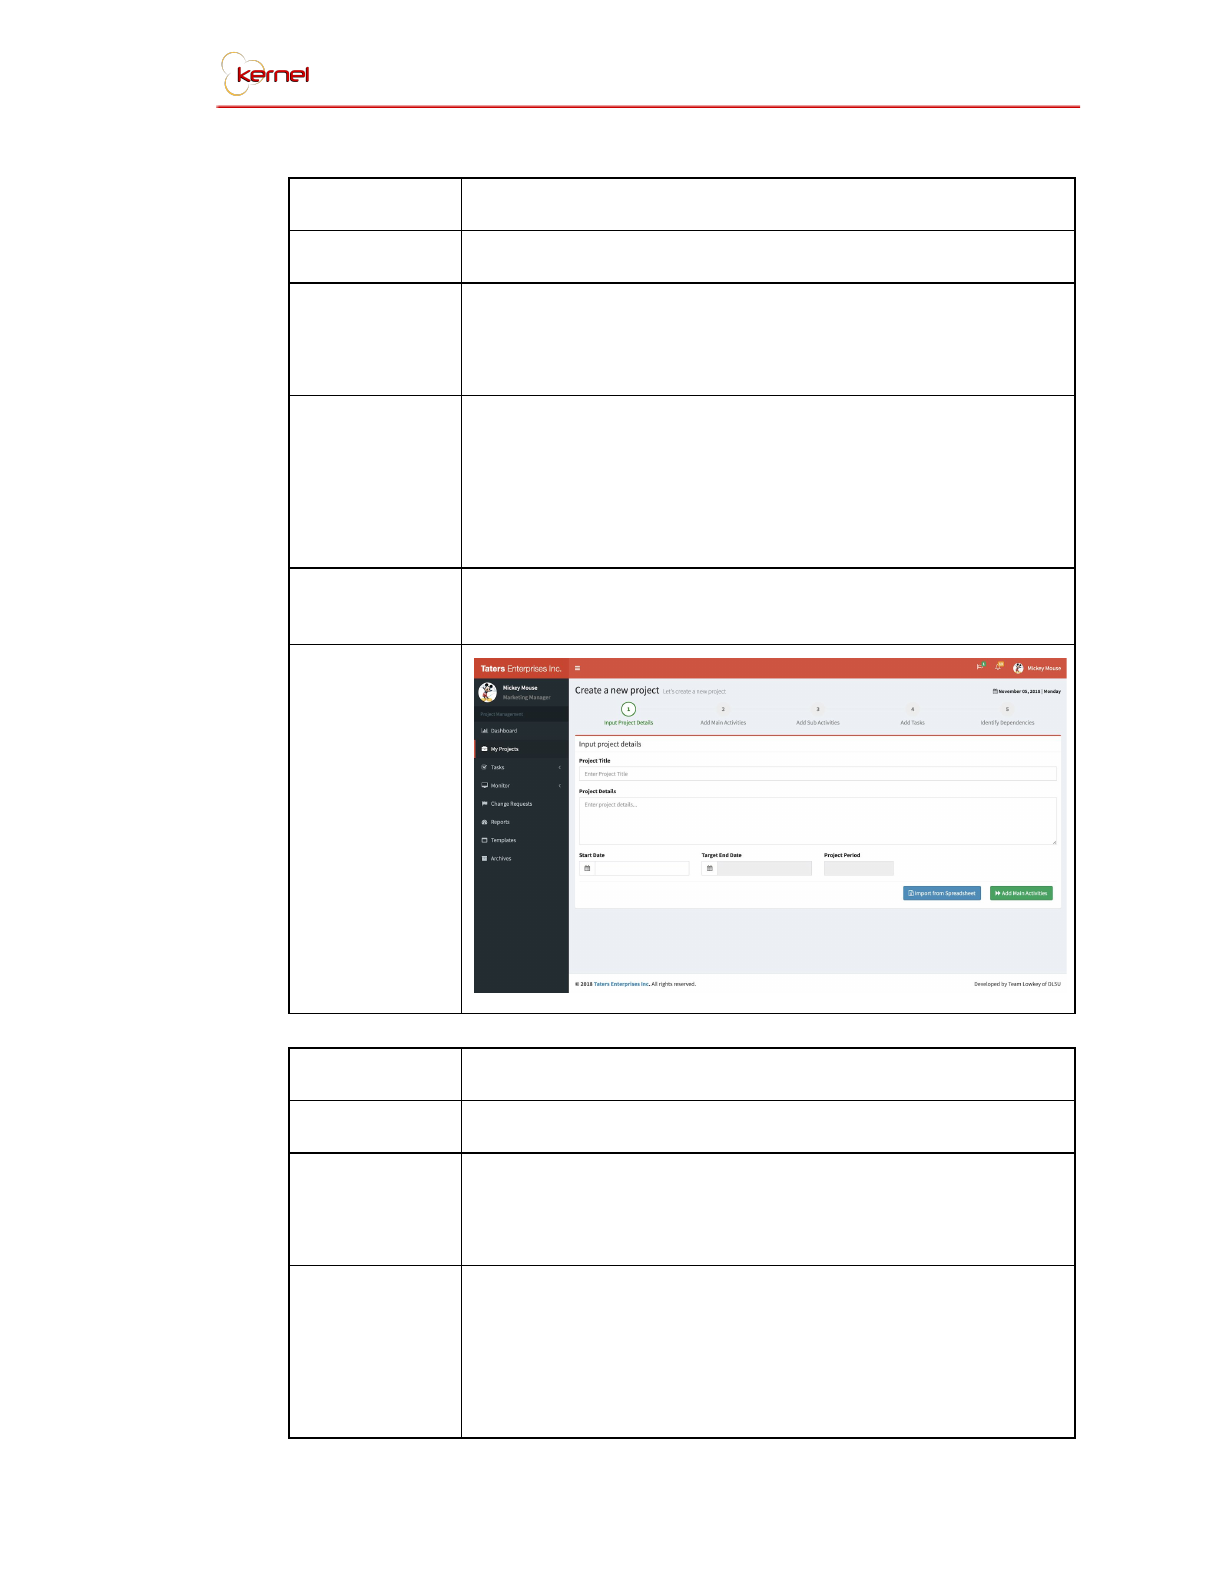
Reference No.
S-03
Name
Create A New Project Screen
Description
Creating a new project can be done through this page. All
fields are required to have an input to be able to proceed
to the next step, which is adding main activities.
File Name
addProjectDetails.php
Users
President, Department Heads, and Supervisors
Elements
Project Title Textfield, Project Details Textfield, Start Date
DatePicker, End Date DatePicker, Add Main Activity
Button
Actions
Import from Spreadsheet, Add Main Activity
Layouts
TEI Project Management System 15
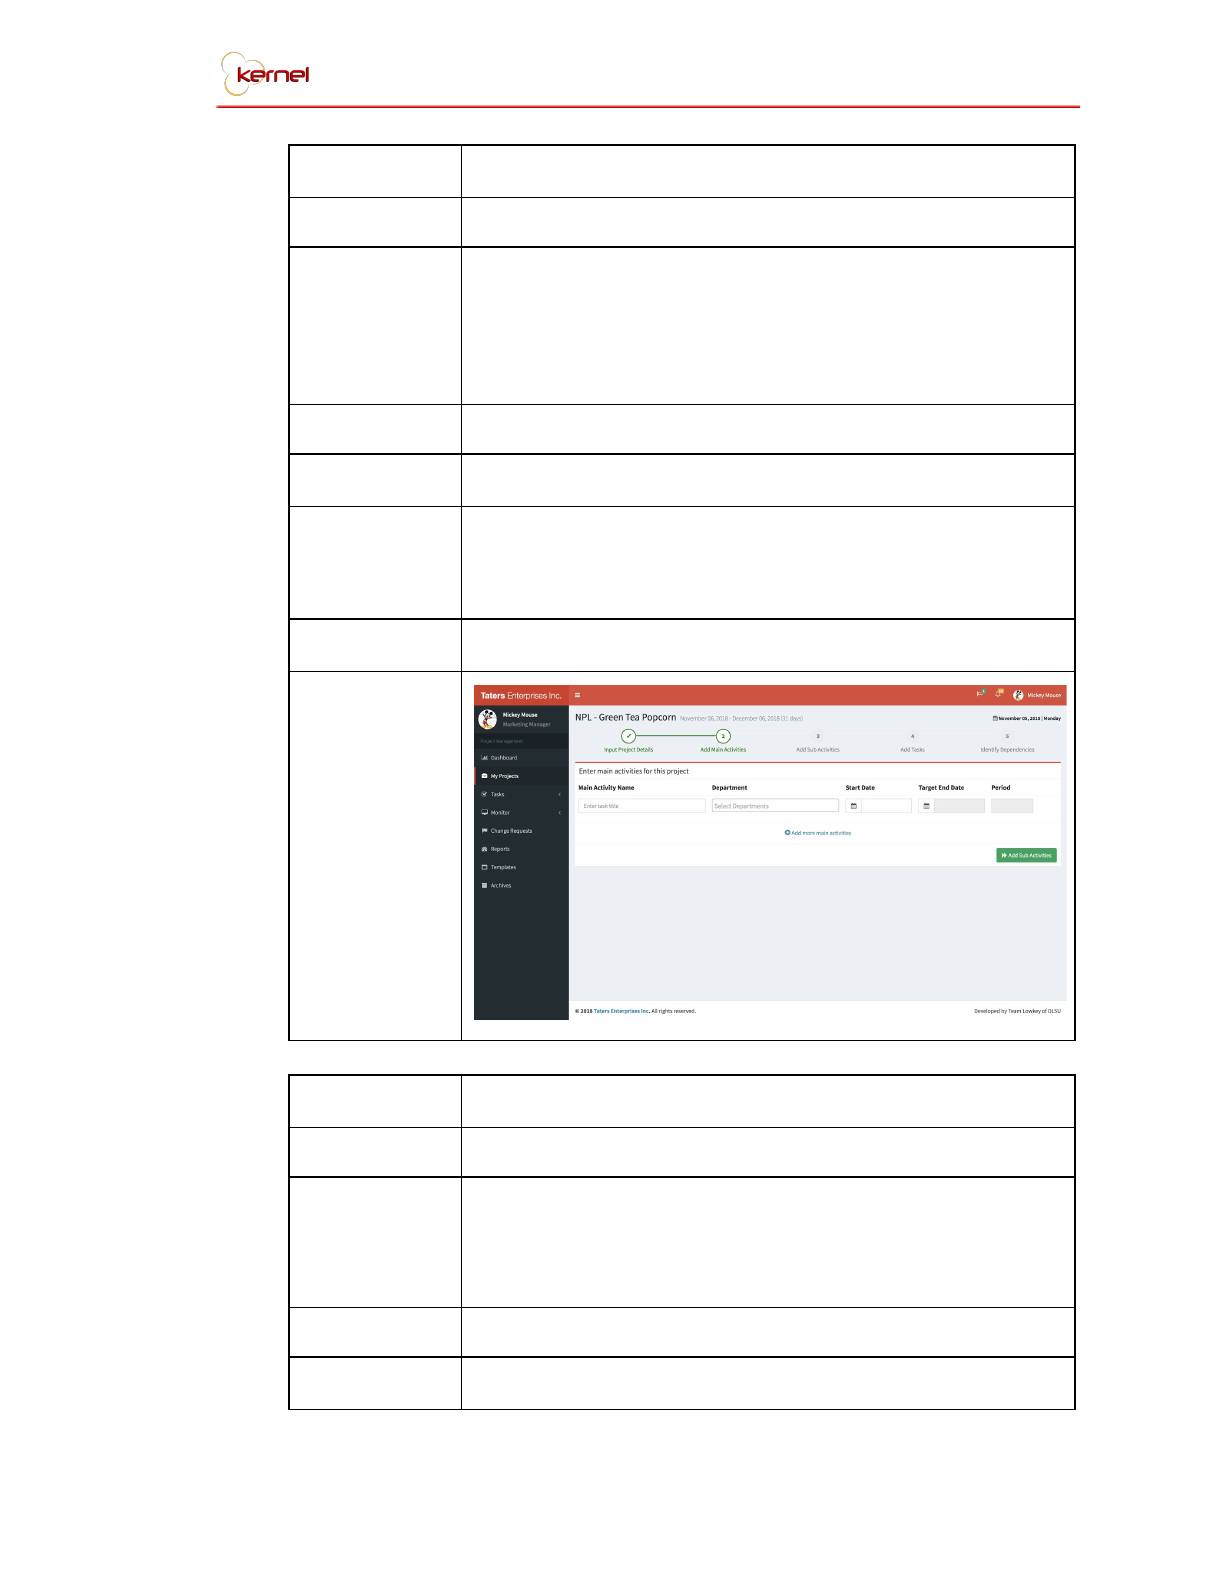
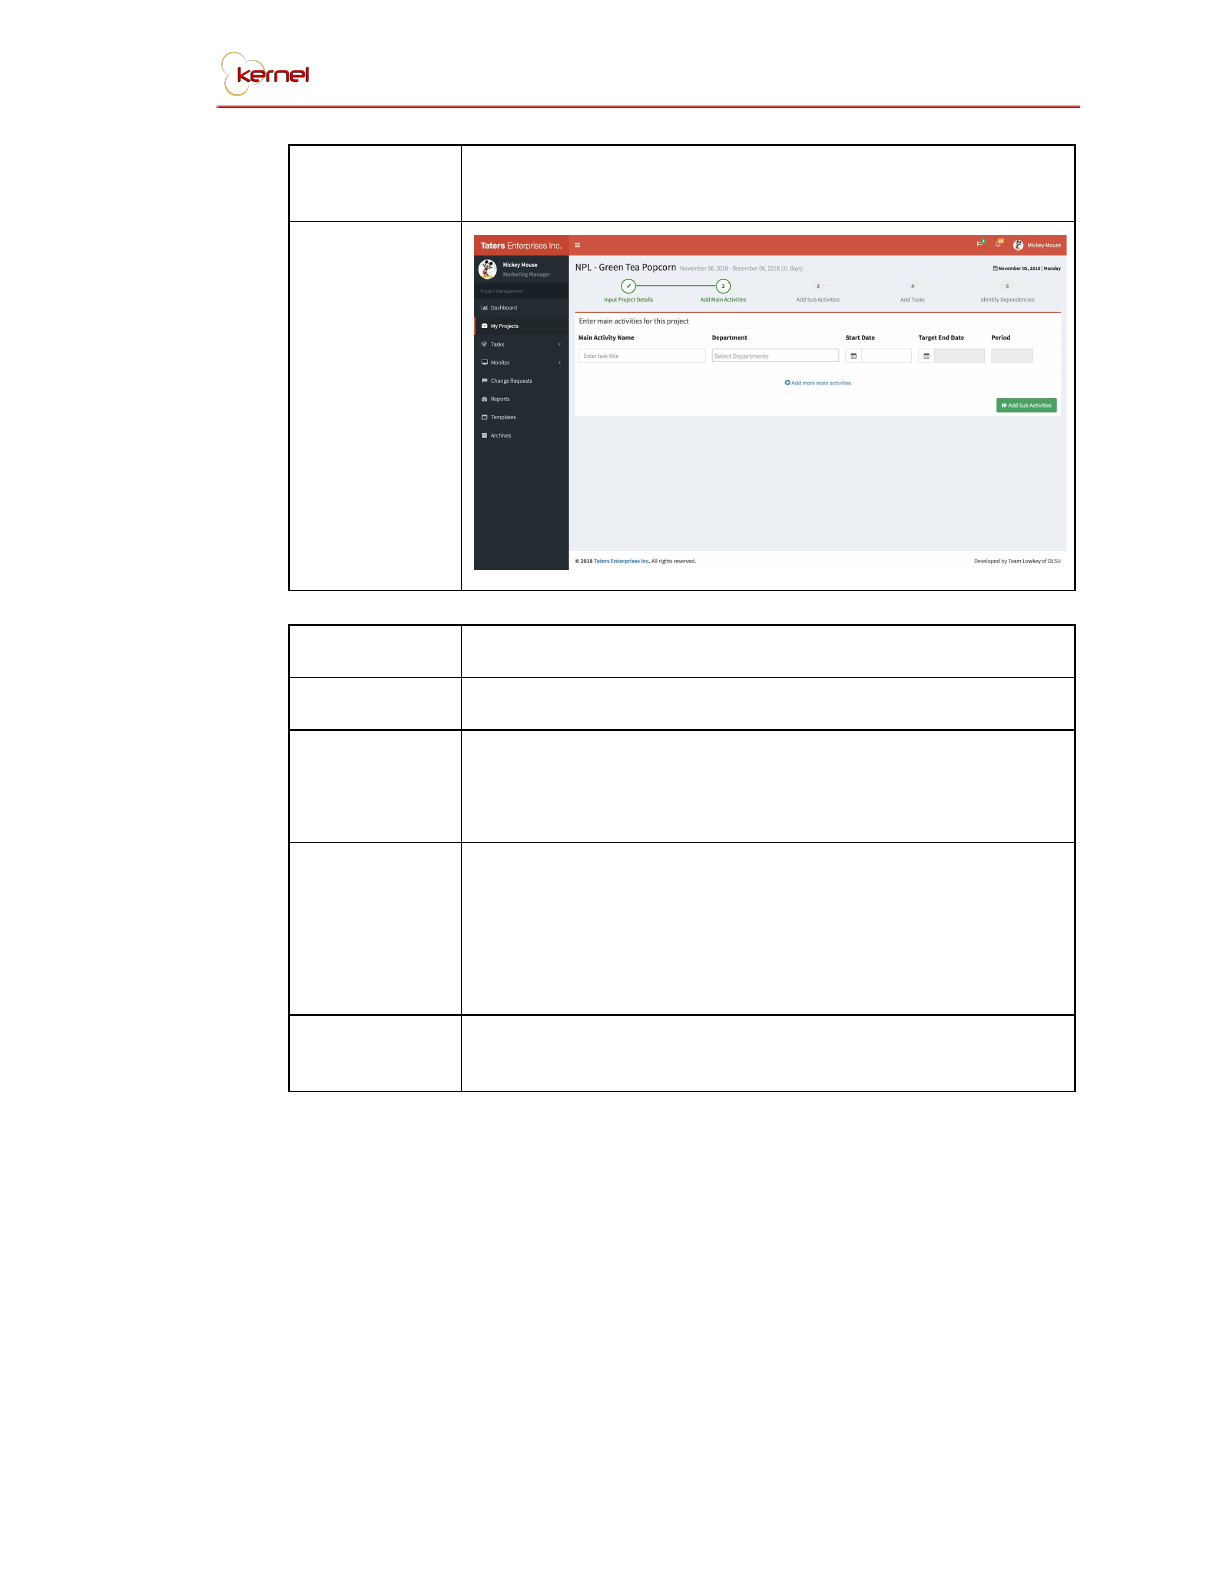
Reference No.
S-03.1
Name
Adding Main Activities Screen
Description
In this screen, main activities of the project will be
inputted here by the user. Details such as, main activity
name, start date, end date, and the department that will
perform the activity should be provided by the user. The
user can then proceed to adding sub activities.
File Name
addMainActivities.php
Users
President, Department Heads, and Supervisors
Elements
Add Button, Task Title TextField, Departments Select,
Start Date DatePicker, End Date DatePicker, Add Sub
Activity Button
Actions
Add Sub Activity
Layouts
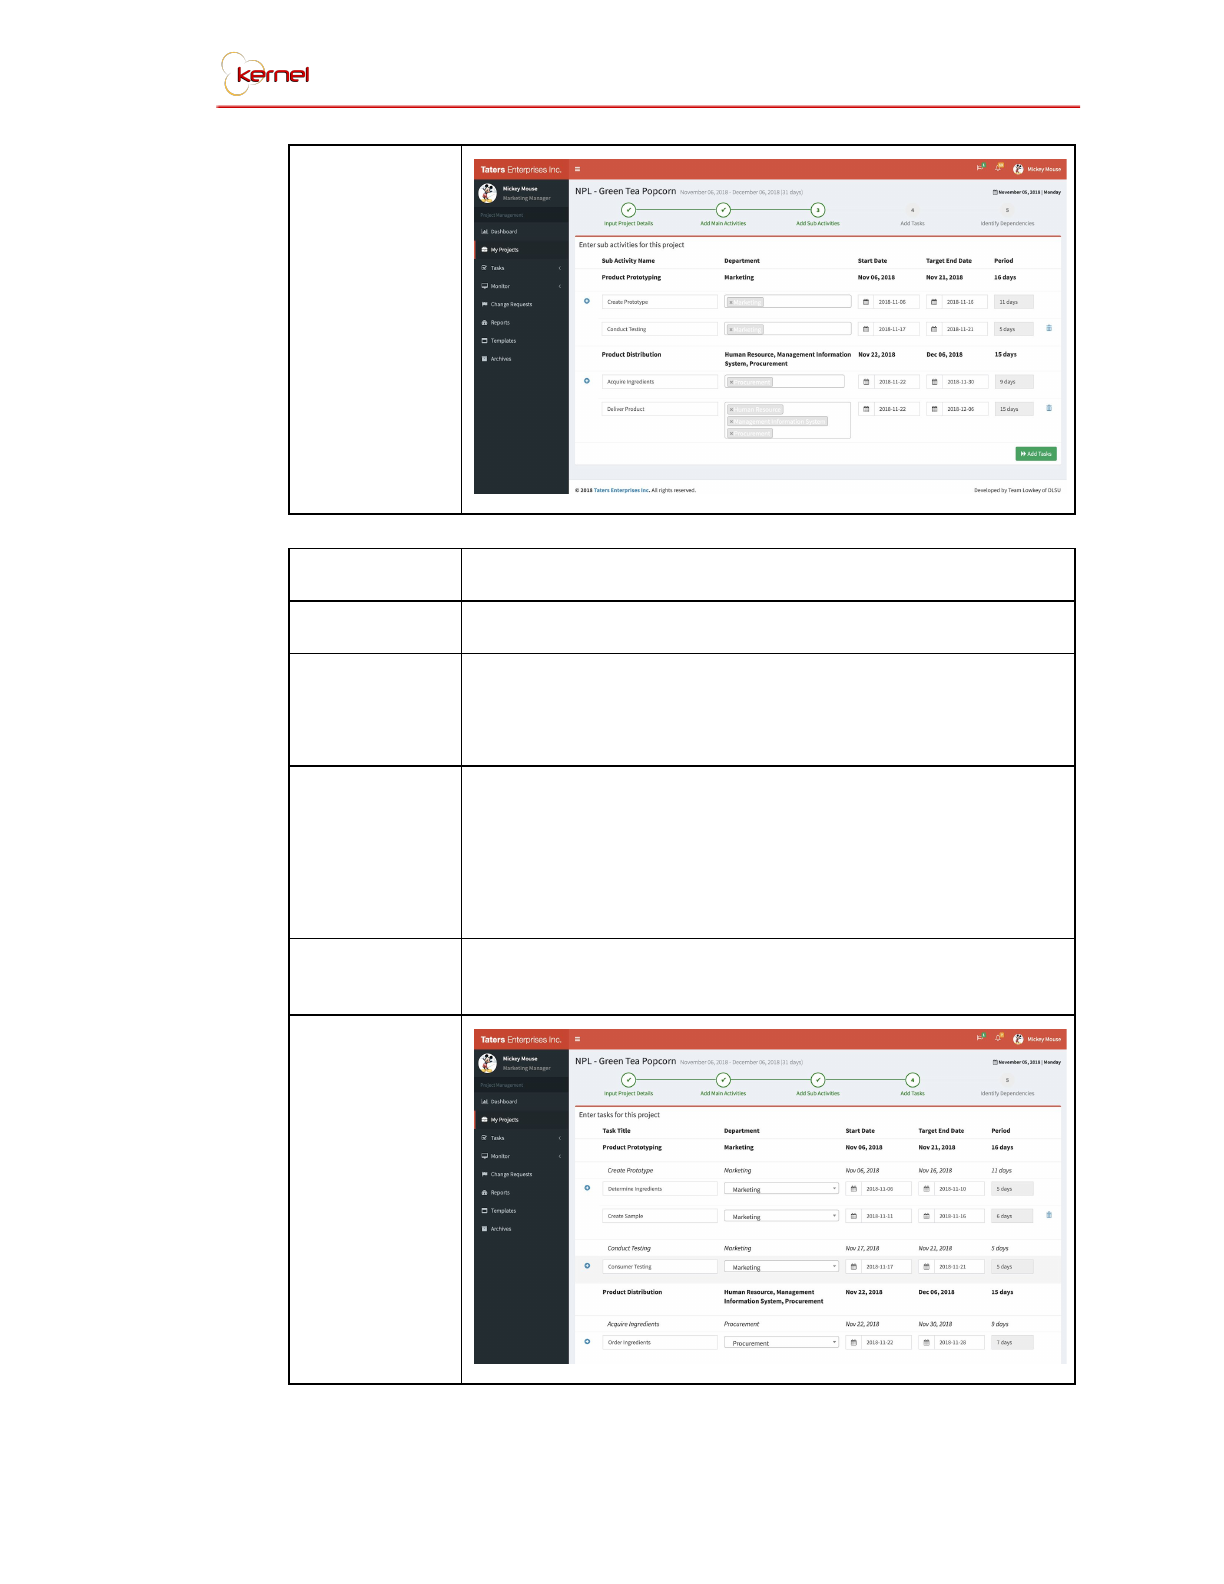
Reference No.
S-03.2
Name
Adding Sub Activities Screen
Description
This page is similar with the previous screen in terms of
user interface, the only difference is that it redirects the
user to the adding tasks screen after filling out the
required fields.
File Name
addSubActivities.php
Users
President, Department Heads, and Supervisors
TEI Project Management System 16
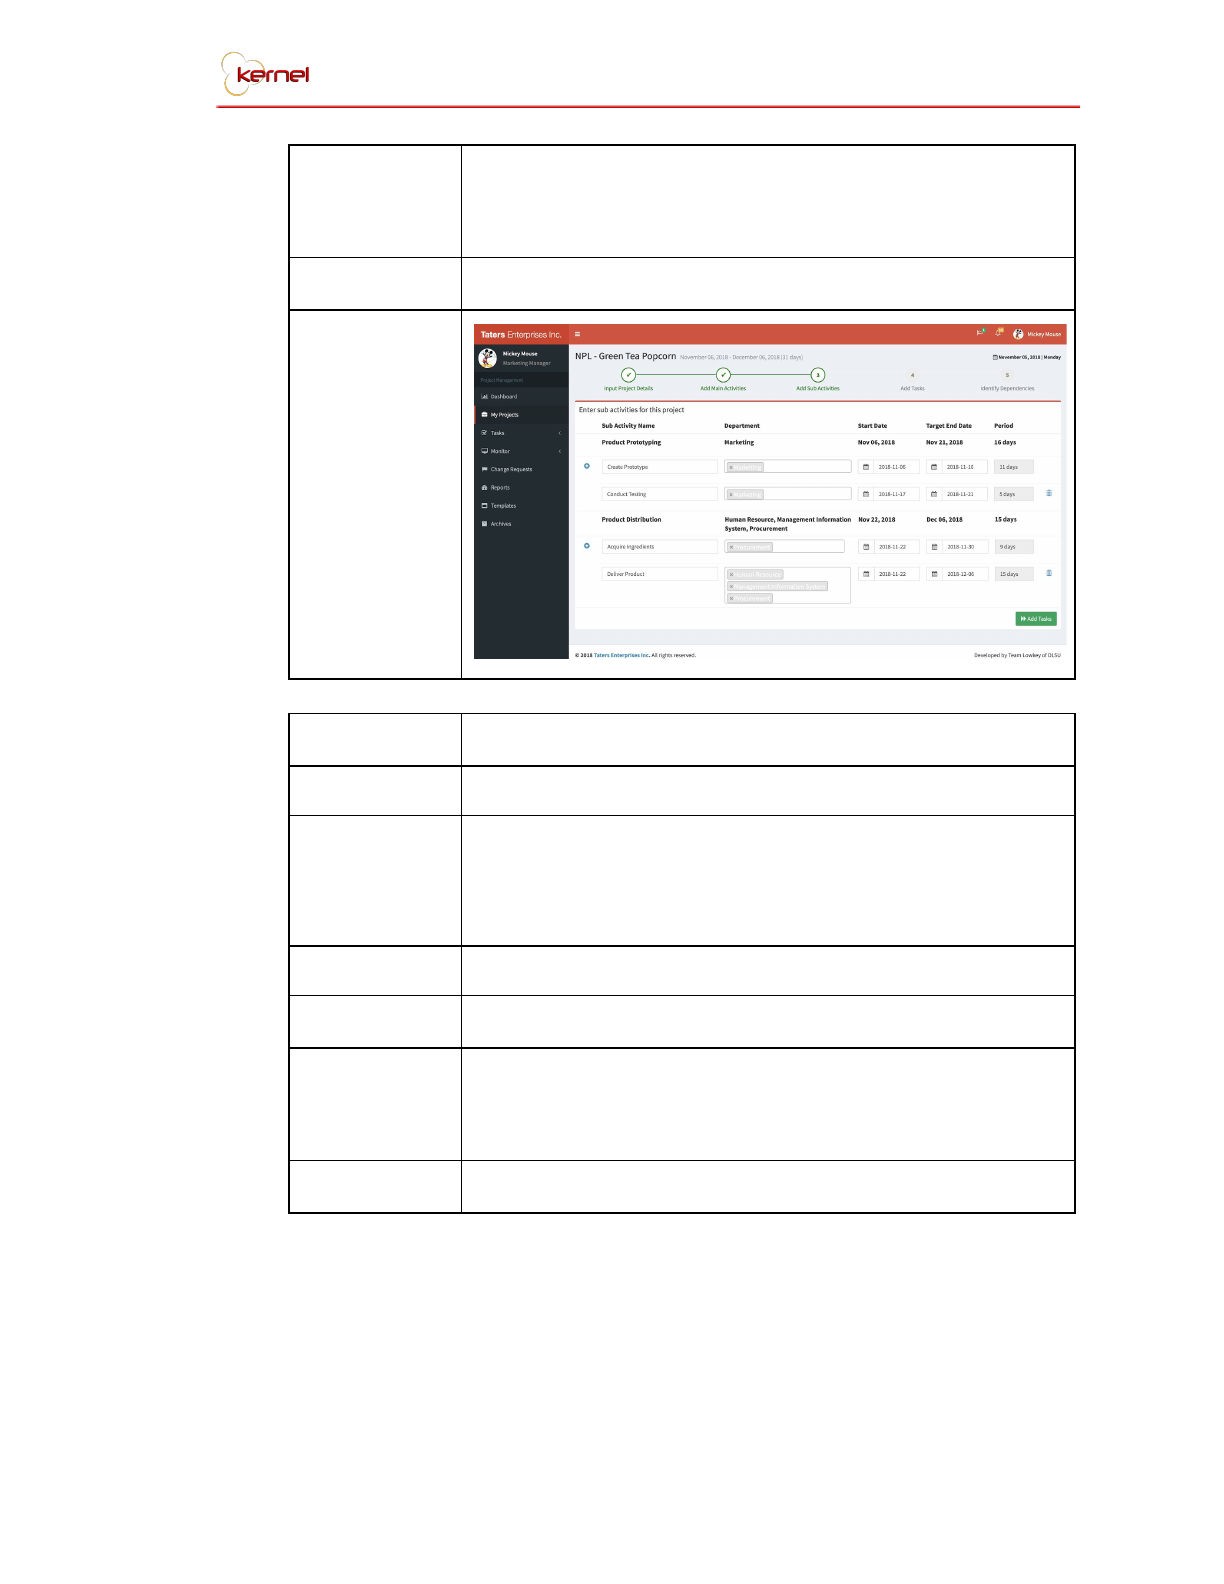
Elements
Add Button, Task Title TextField, Departments Select,
Start Date DatePicker, End Date DatePicker, Add Task
Button
Actions
Add Task
Layouts
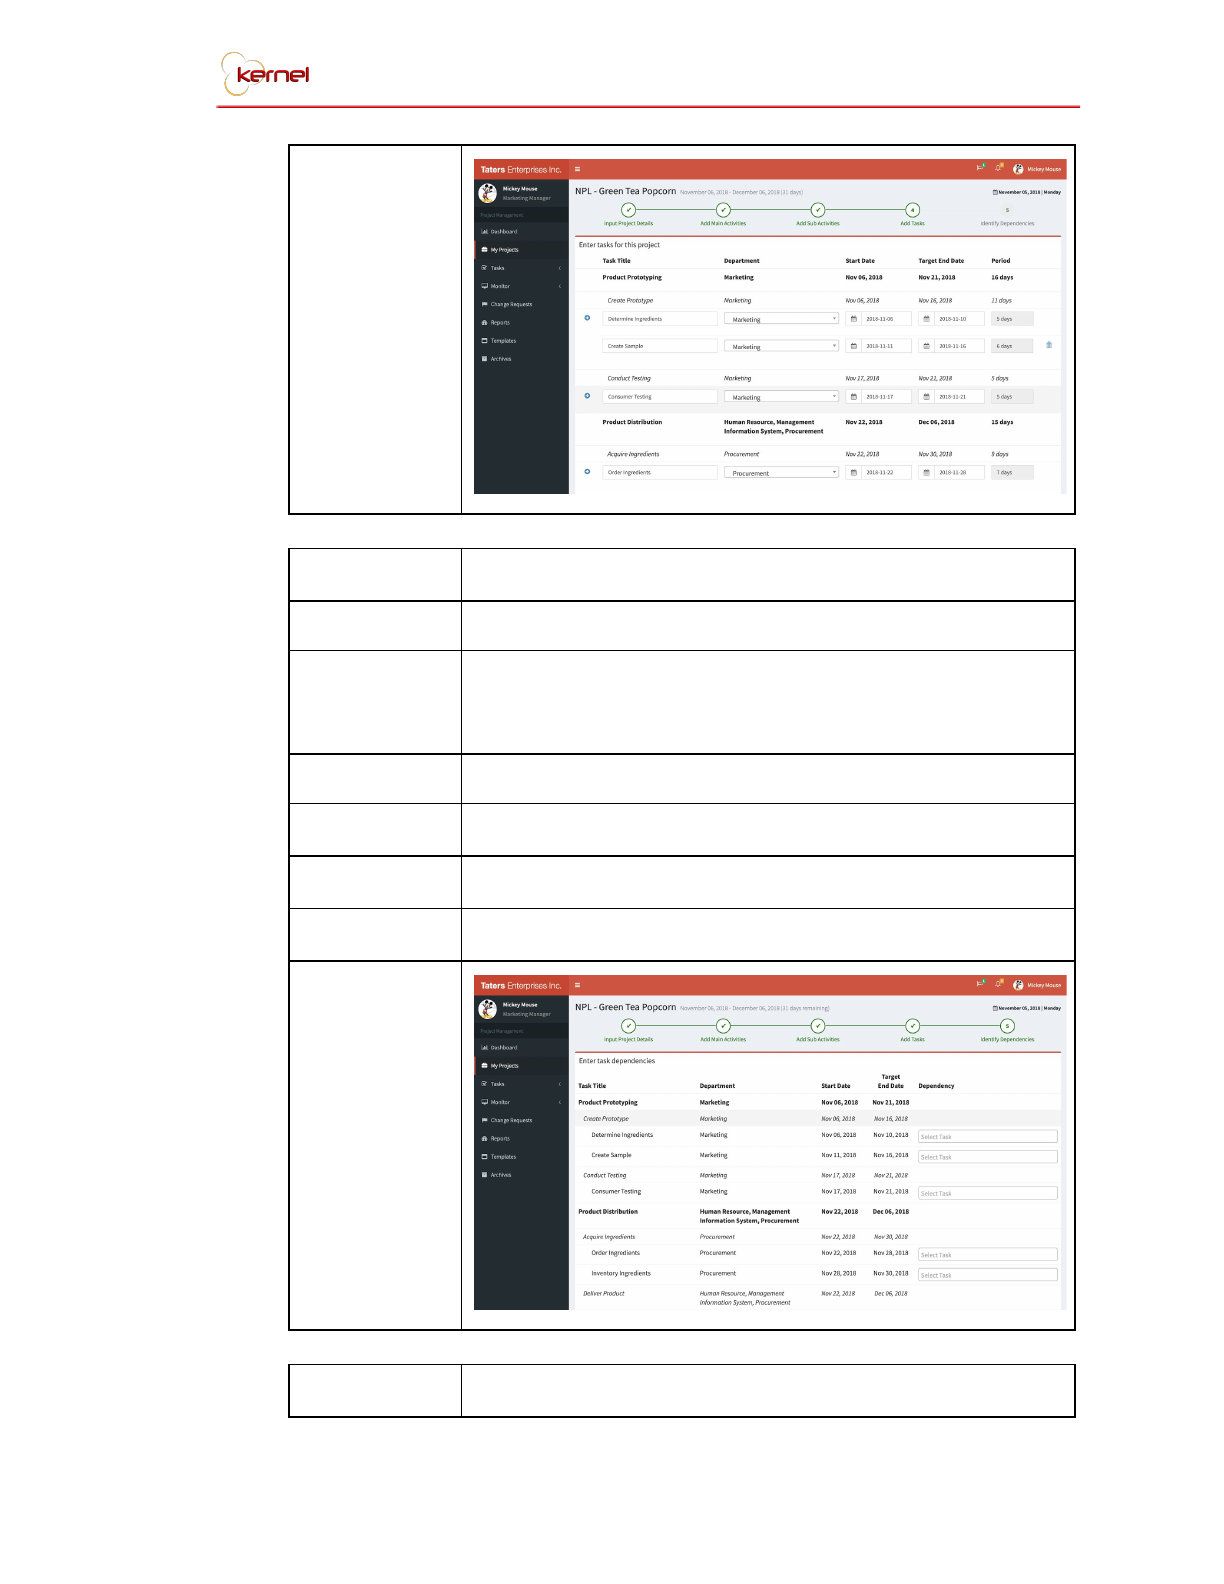
Reference No.
S-03.3
Name
Adding Tasks Screen
Description
The user can add all the tasks under the sub activities
they previously created. Layout wise, it looks the same
with the 2 previous forms. This page navigates to adding
dependencies on the tasks.
File Name
addTasks.php
Users
President, Department Heads, and Supervisors
Elements
Add Button, Task Title TextField, Departments Select,
Start Date DatePicker, End Date DatePicker, Add
Dependency Button
Actions
Add Dependency
TEI Project Management System 17
Layouts
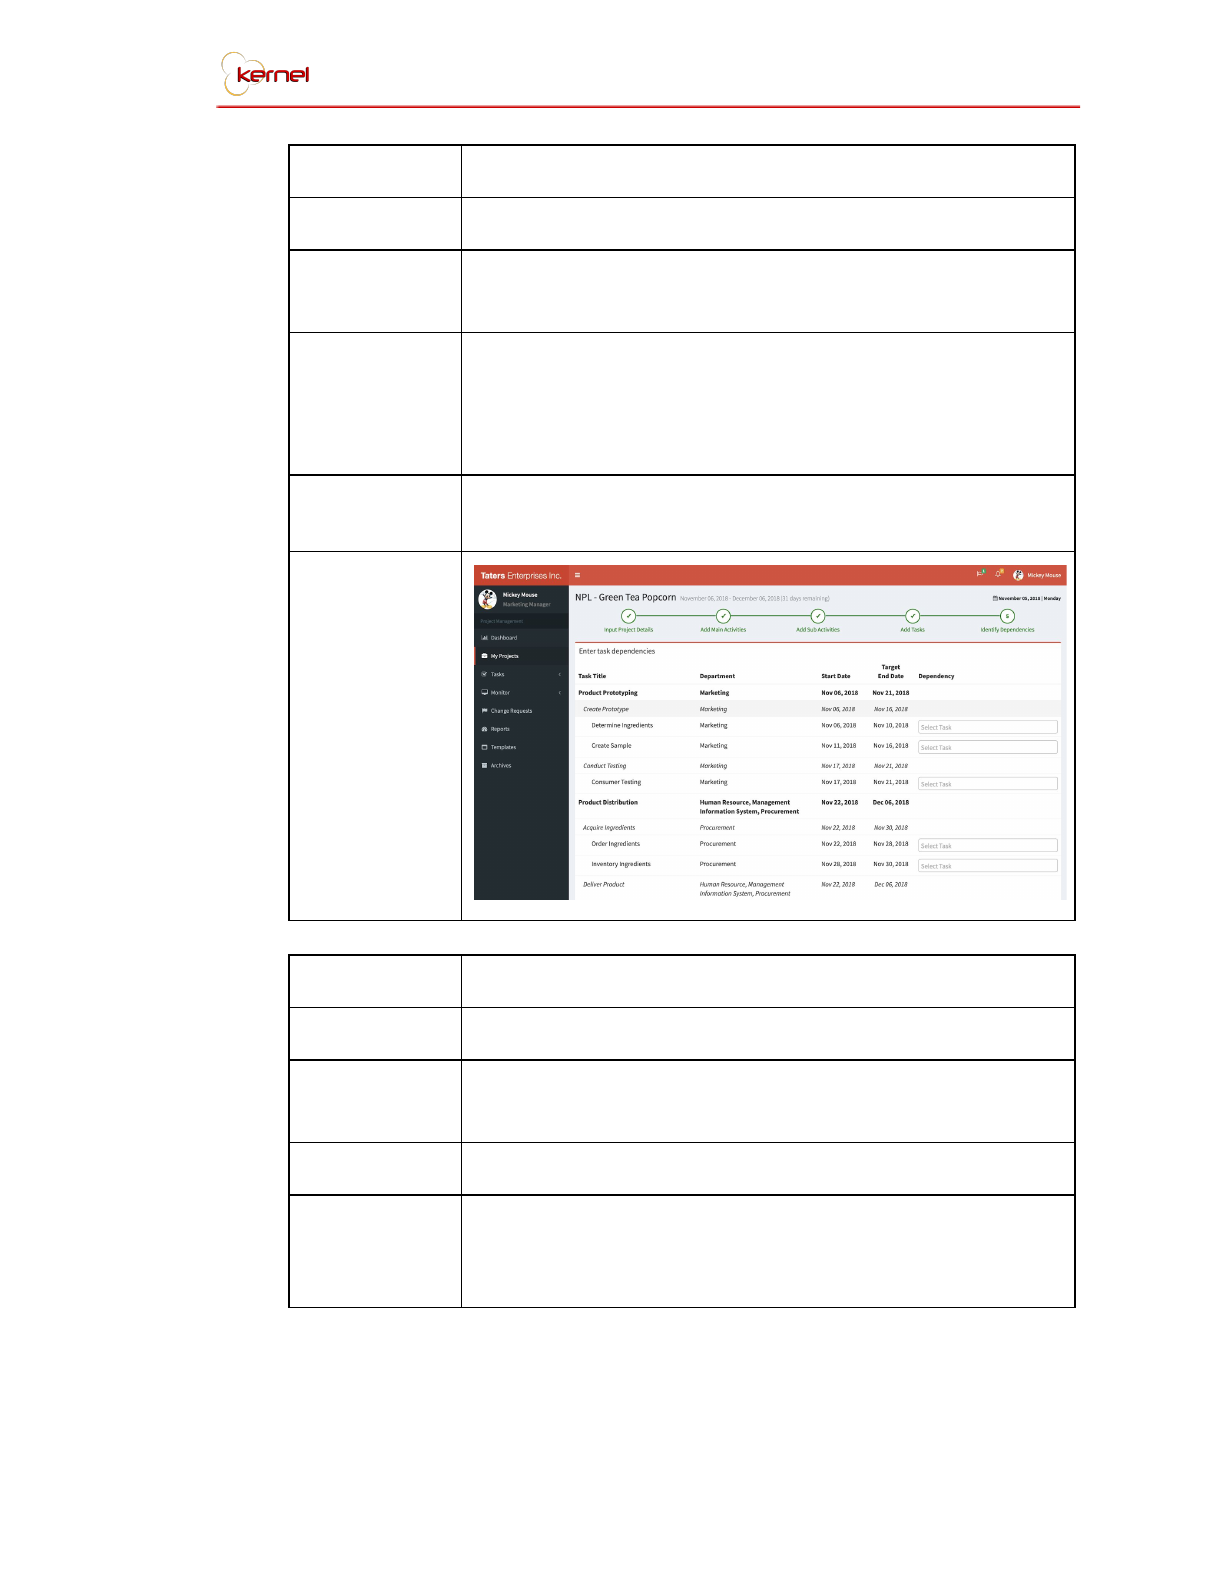
Reference No.
S-03.4
Name
Adding Dependencies Screen
Description
This screen lets the user define the pre-requisites of the
tasks that were made prior. After defining the
pre-requisites, the last step is to generate the gantt chart.
File Name
addDependencies.php
Users
President, Department Heads, and Supervisors
Elements
Dependency Select
Actions
Generate Gantt Chart
Layouts
Reference No.
S-04
TEI Project Management System 18
Name
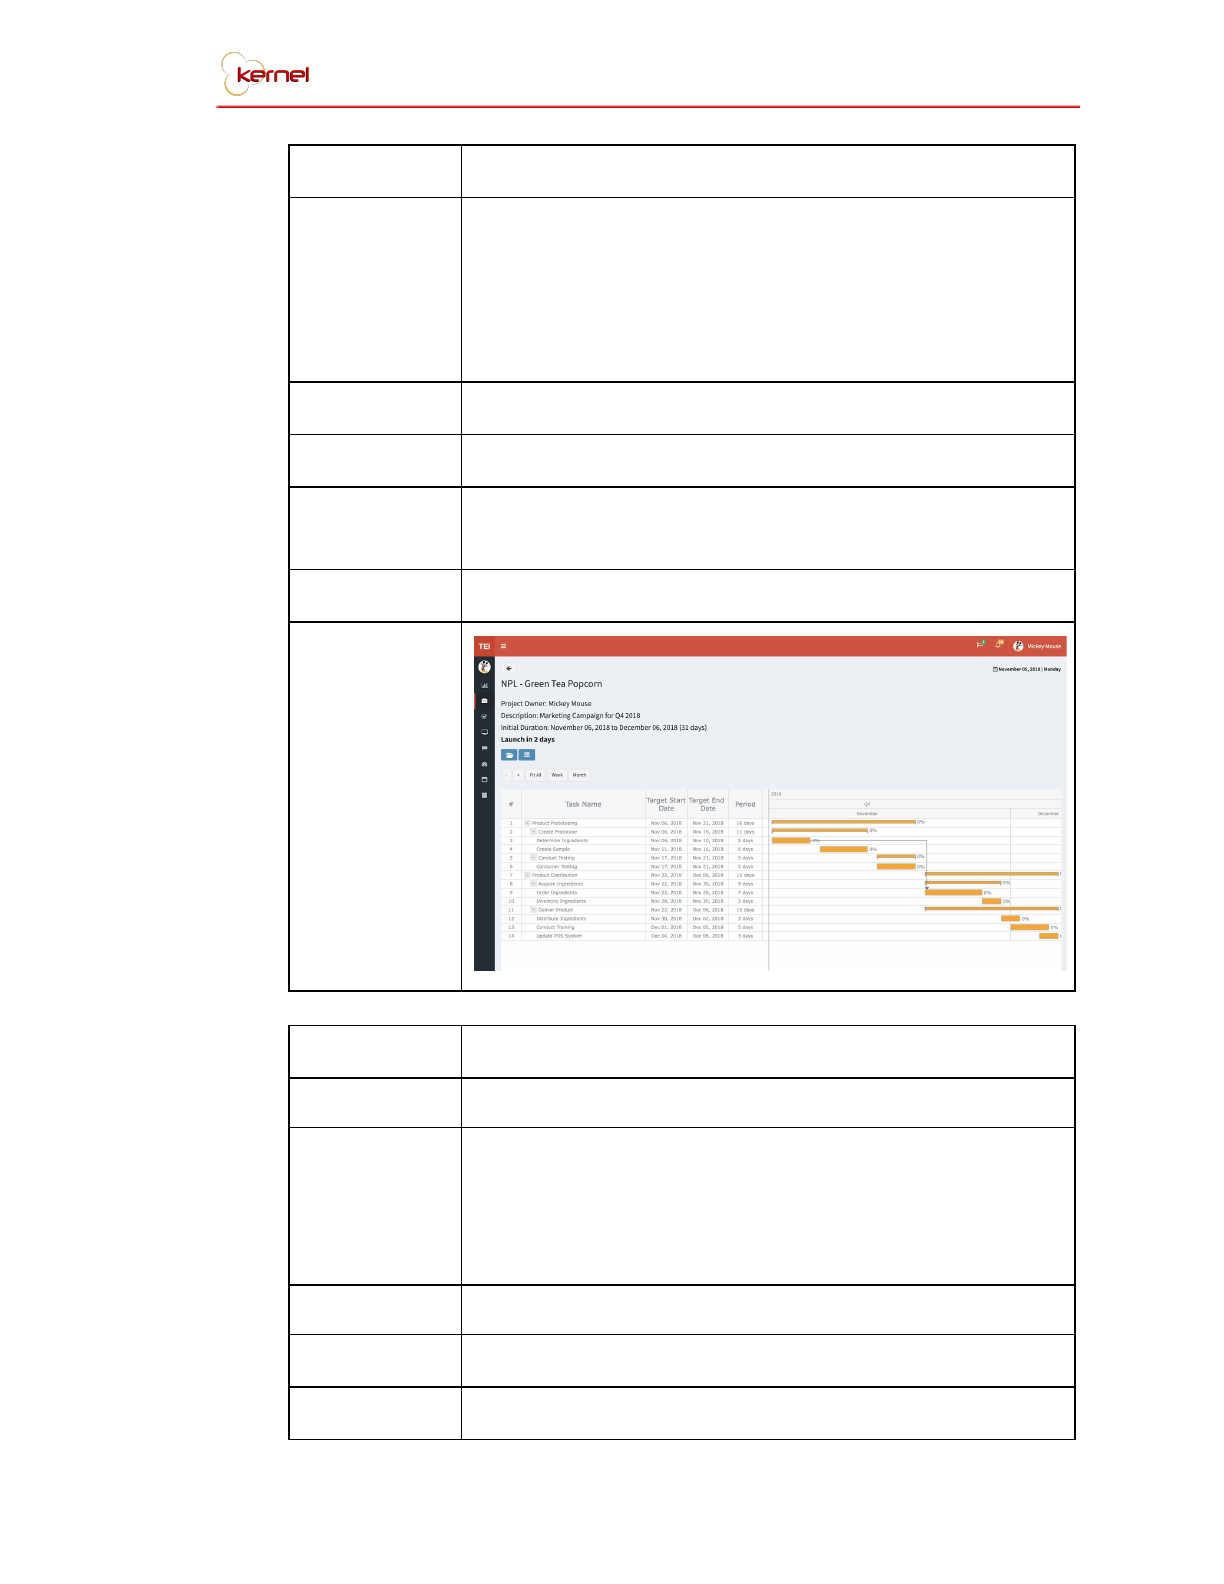
Project Gantt Screen
Description
This page shows the gantt chart, a visual representation of
the schedules of tasks in the project. It also shows the
performance of the user in that project and all overall
performance of the project. From the gantt chart, the user
can be navigated to the project documents or project
logs.
File Name
projectGantt.php
Users
All users involved in a project
Elements
Labels, Project Document Button, Project Logs Button,
RACI Gantt Chart
Actions
Navigate to Project Documents, Navigate to Project Logs
Layouts
Reference No.
S-05
Name
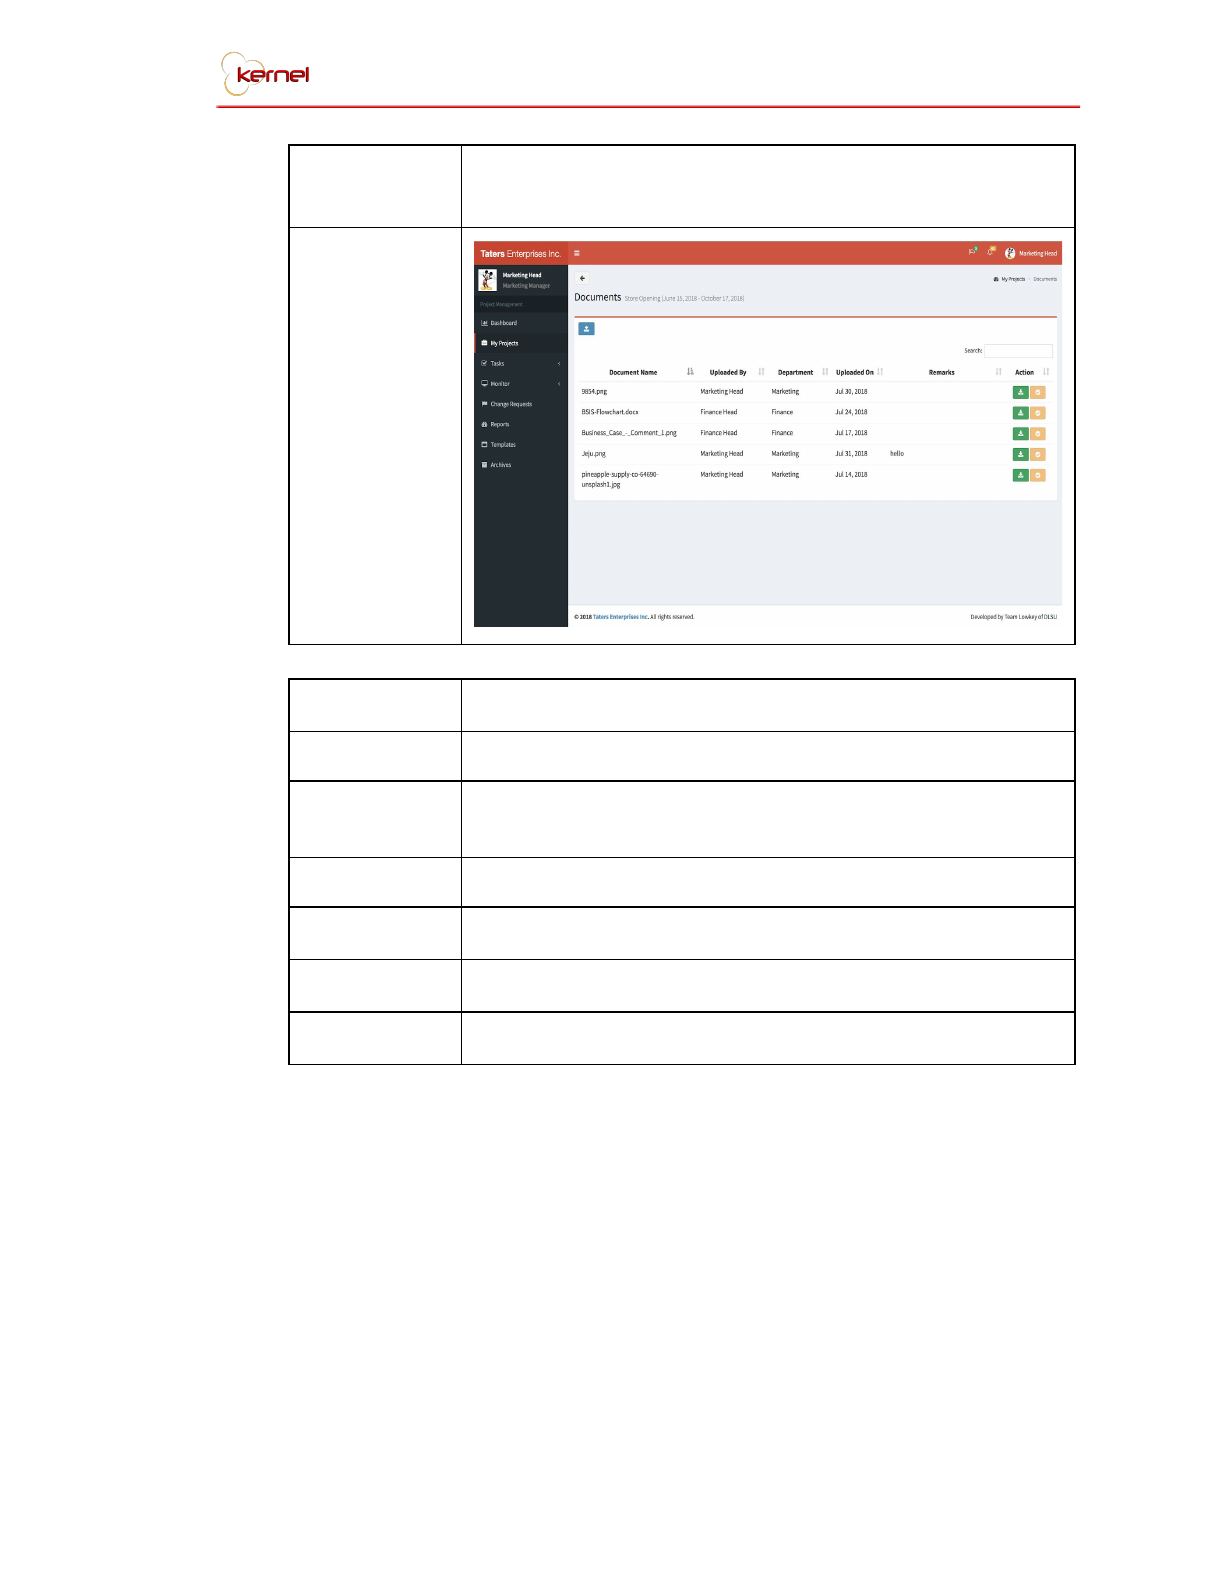
Project Documents Screen
Description
All documents uploaded in that project can be viewed in
this page. Some of the documents can only be seen by
limited people depending on what the uploader chose.
Also in this page the user can acknowledge, download,
and upload document.
File Name
projectDocuments.php
Users
All users involved in a project
Elements
Upload Button, Download Button, Acknowledge Button
TEI Project Management System 19
Actions
Upload Document, Download Document, Acknowledge
Document
Layouts
Reference No.
S-06
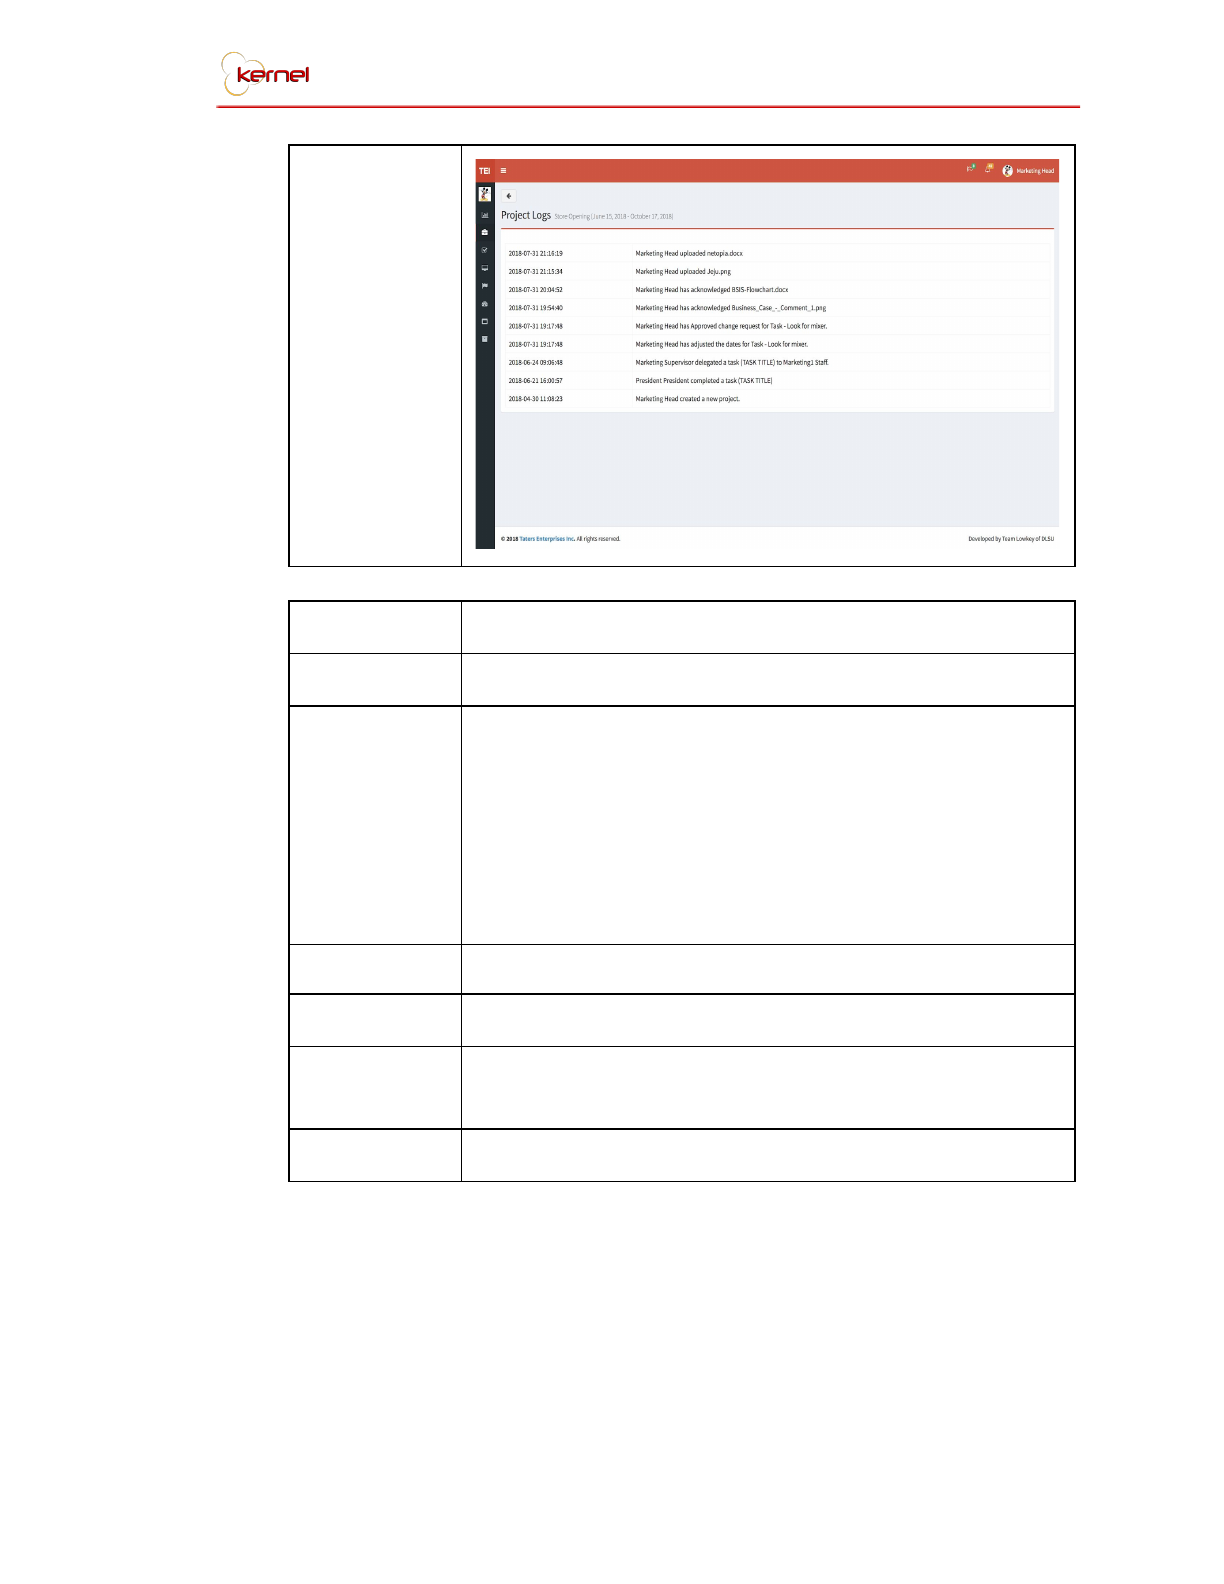
Name
Project Logs Screen
Description
This is the page where the user can view all the actions
that were done in the project.
File Name
projectLogs.php
Users
All users involved in a project
Elements
Timestamp Text, Log Details Text
Actions
Navigate to Project Gantt
TEI Project Management System 20
Layouts
Reference No.
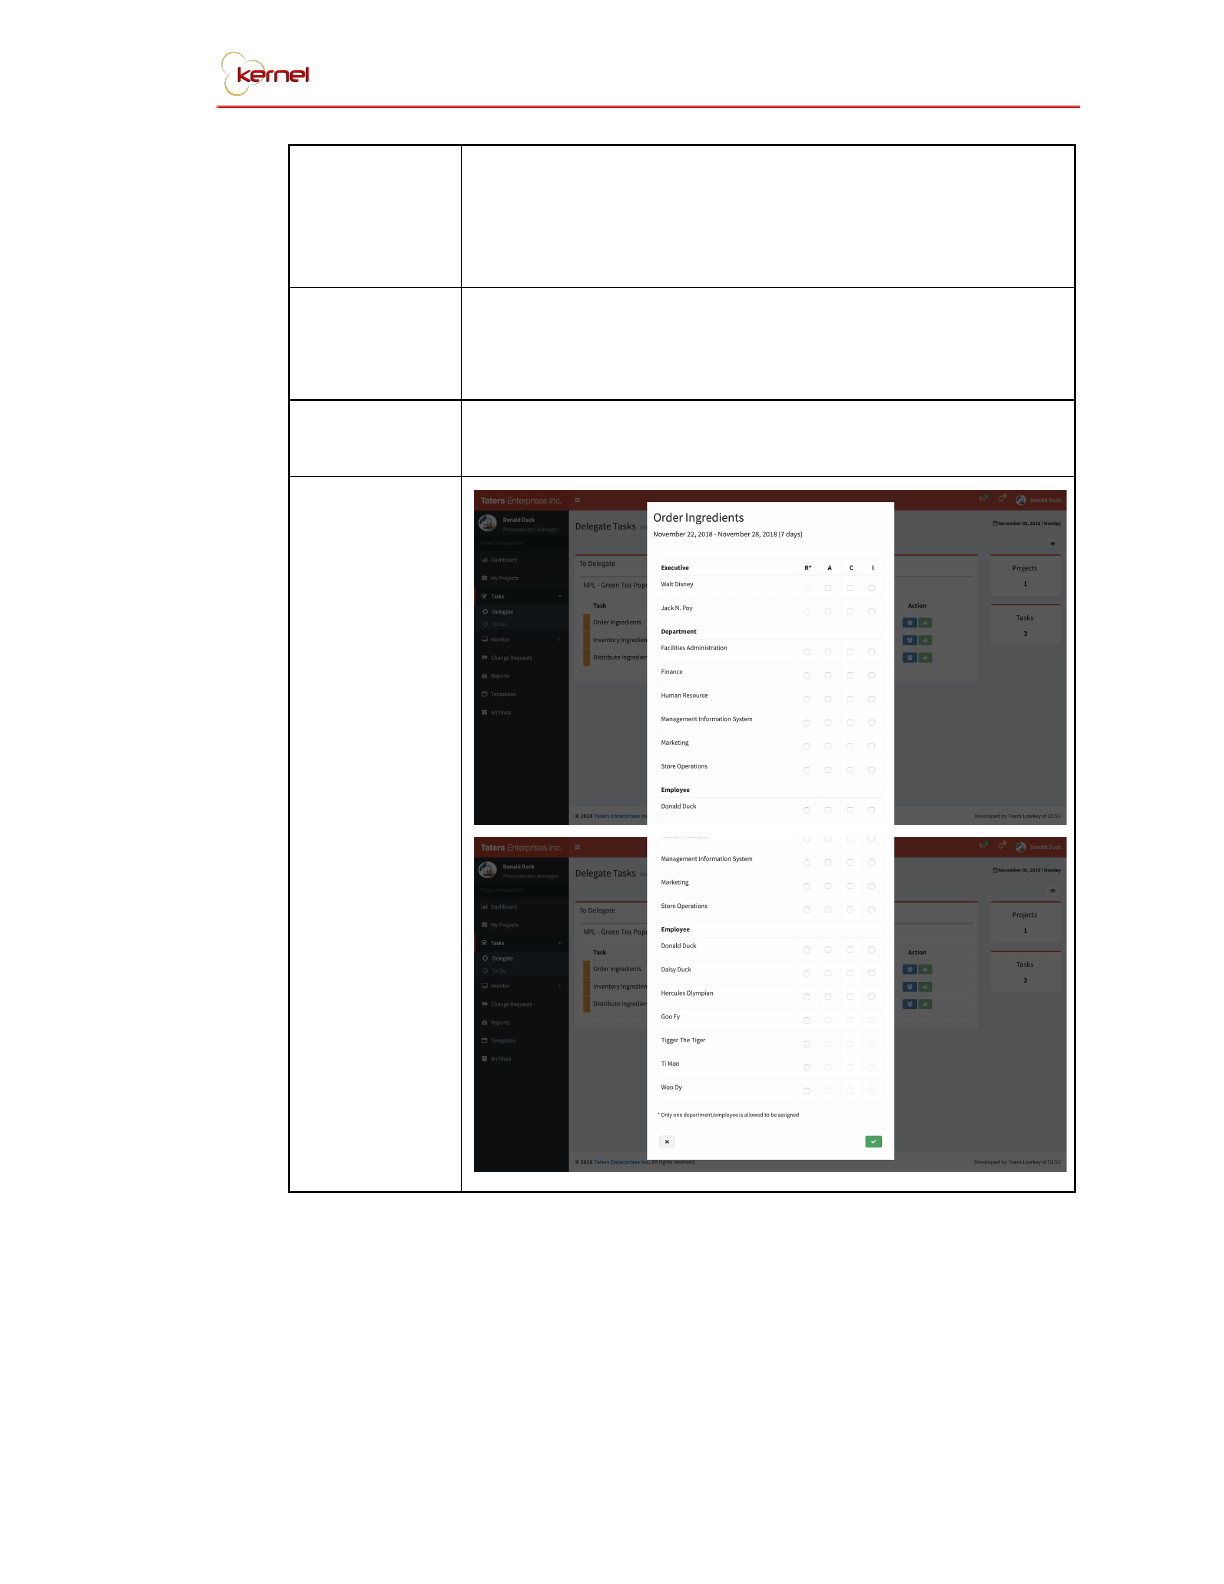
S-07
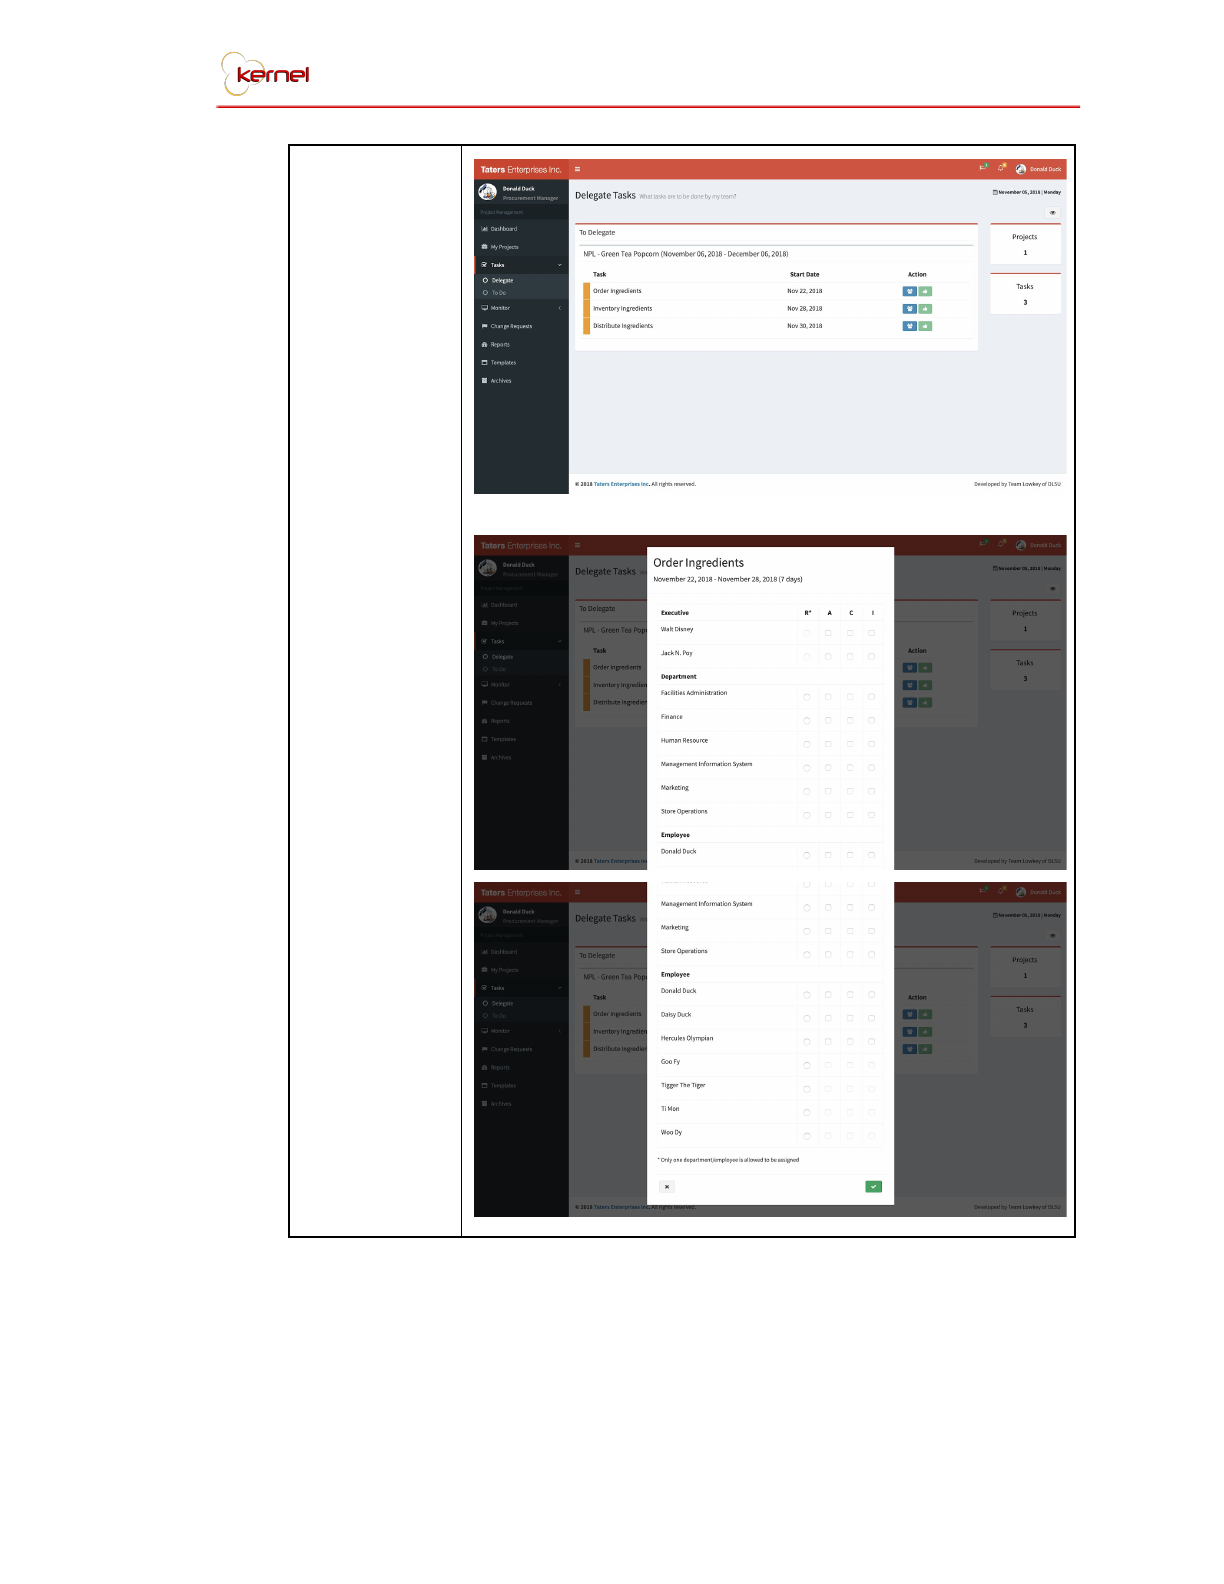
Name
Delegate Task Screen
Description
This screen is where the department heads or the
supervisors can delegate a task that was assigned to
them by the project owner during project creation. When
the delegate button is clicked it will show all the possible
people that they can delegate the task to. To see the
workload assessment of the a person in their team, the
user can simply click on the name of the user and a modal
with the workload assessment will appear.
File Name
taskDelegate.php
Users
Department Heads, and Supervisors
Elements
Delegate Button, Delegate Modal, Accept Task Button,
View All Button, Workload Assessment Modal
Actions
Delegate a task
TEI Project Management System 21
Layouts
TEI Project Management System 22
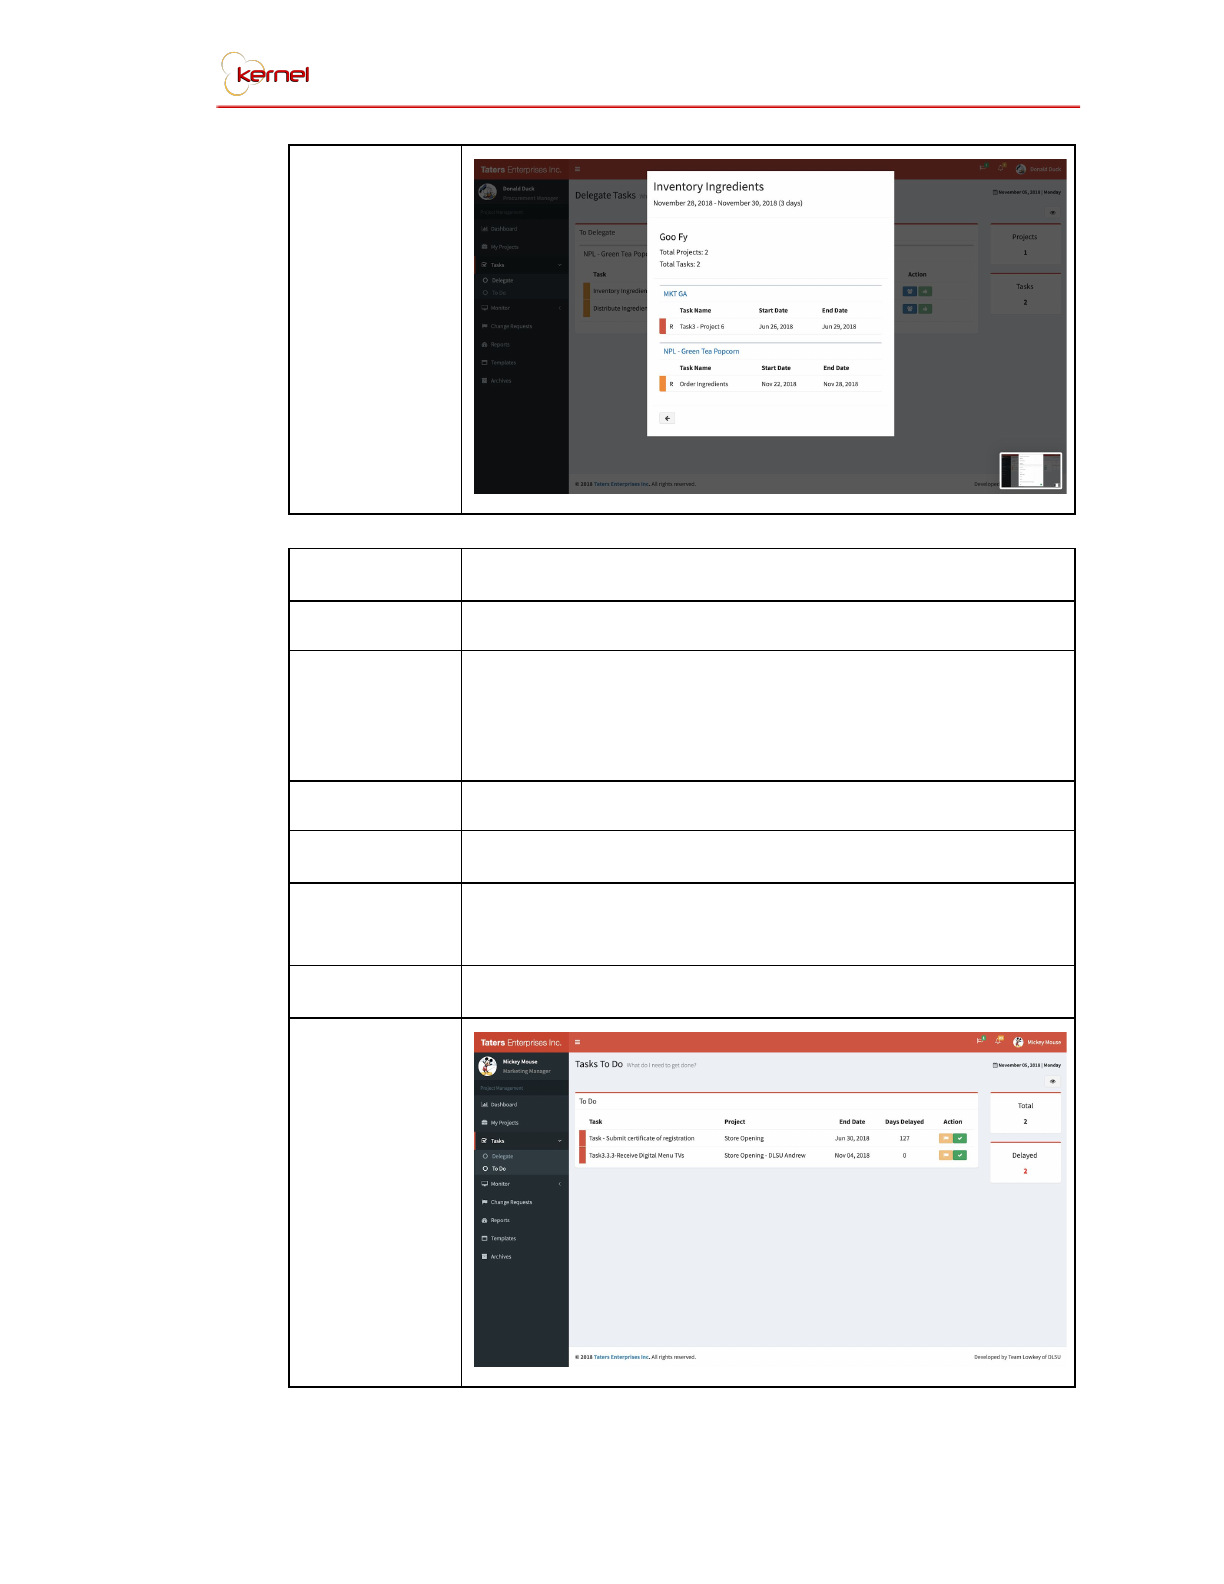
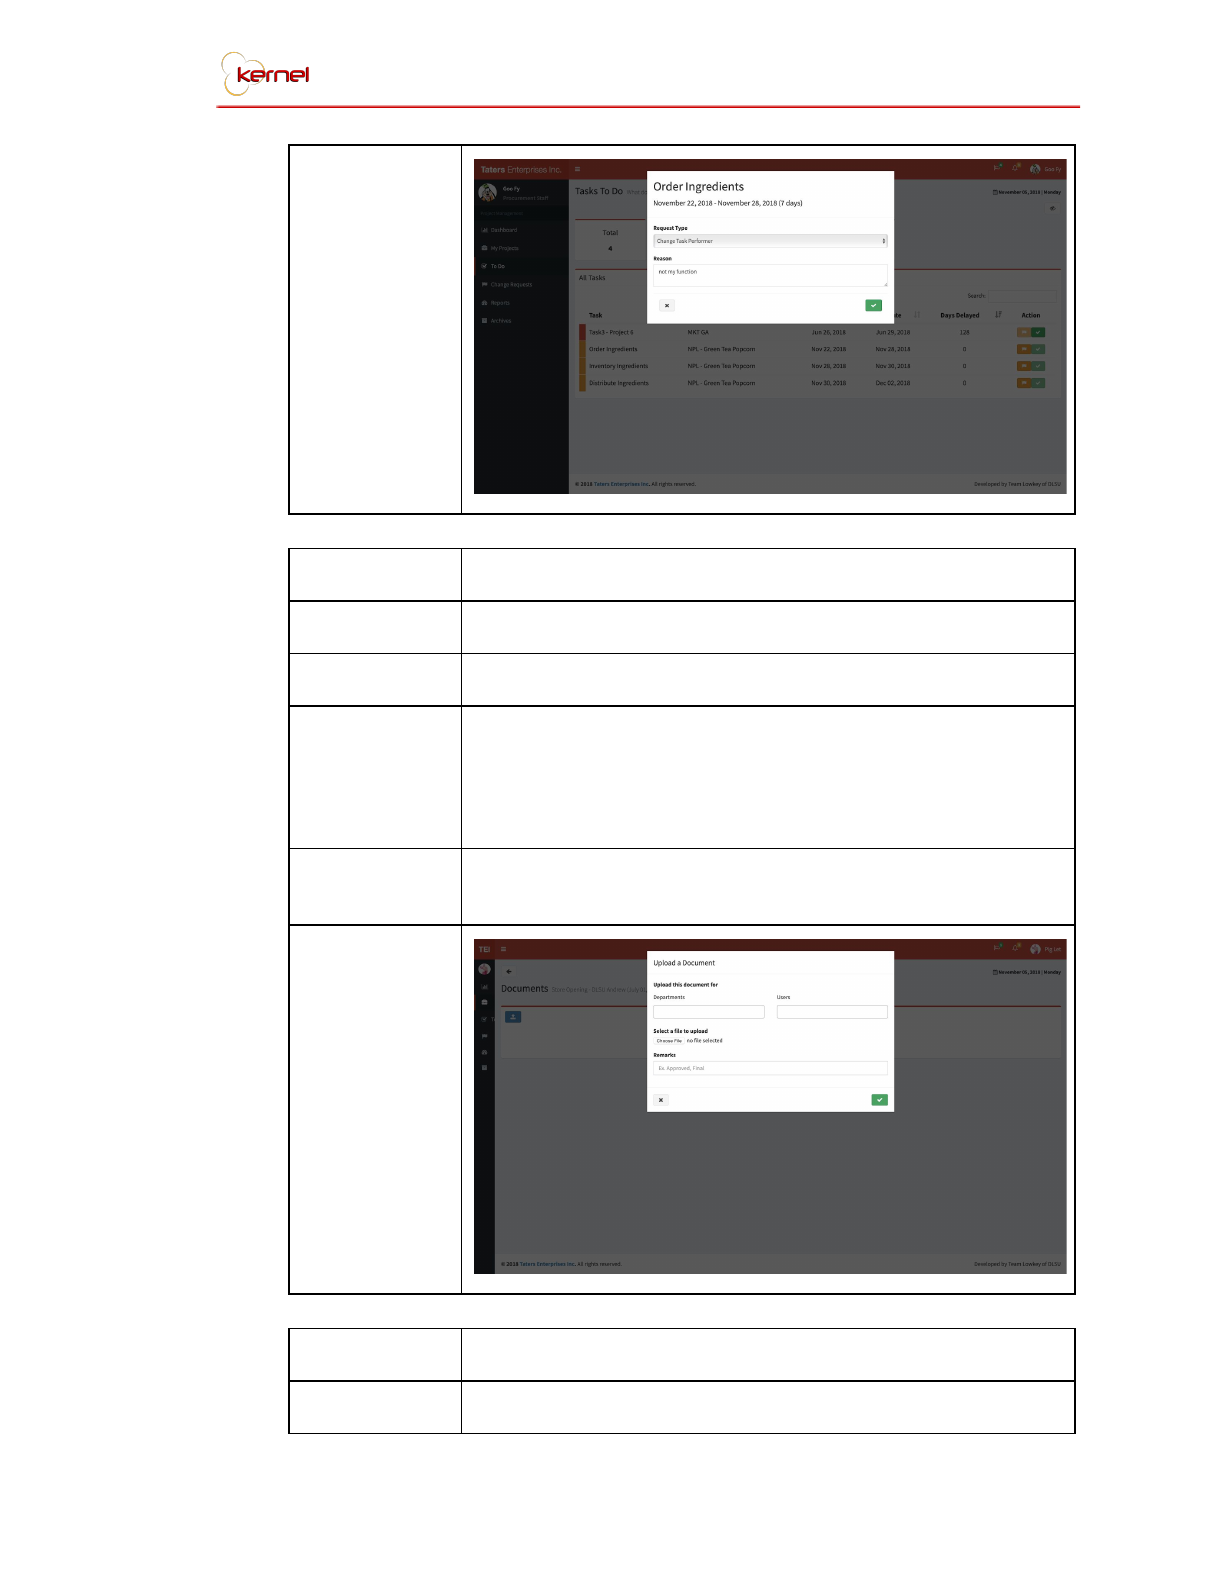
Reference No.
S-08
Name
Tasks To Do Screen
Description
All delayed tasks, and tasks that are assigned to the user
can be viewed in this screen. The user can either mark the
task as done or submit a request for change in performer
or date 2 days before the deadline.
File Name
taskTodo.php
Users
All Users
Elements
Request for Change Button, Done Task Button, Request
for Change Modal
Actions
Submit a change request, mark task as done
Layouts
TEI Project Management System 23
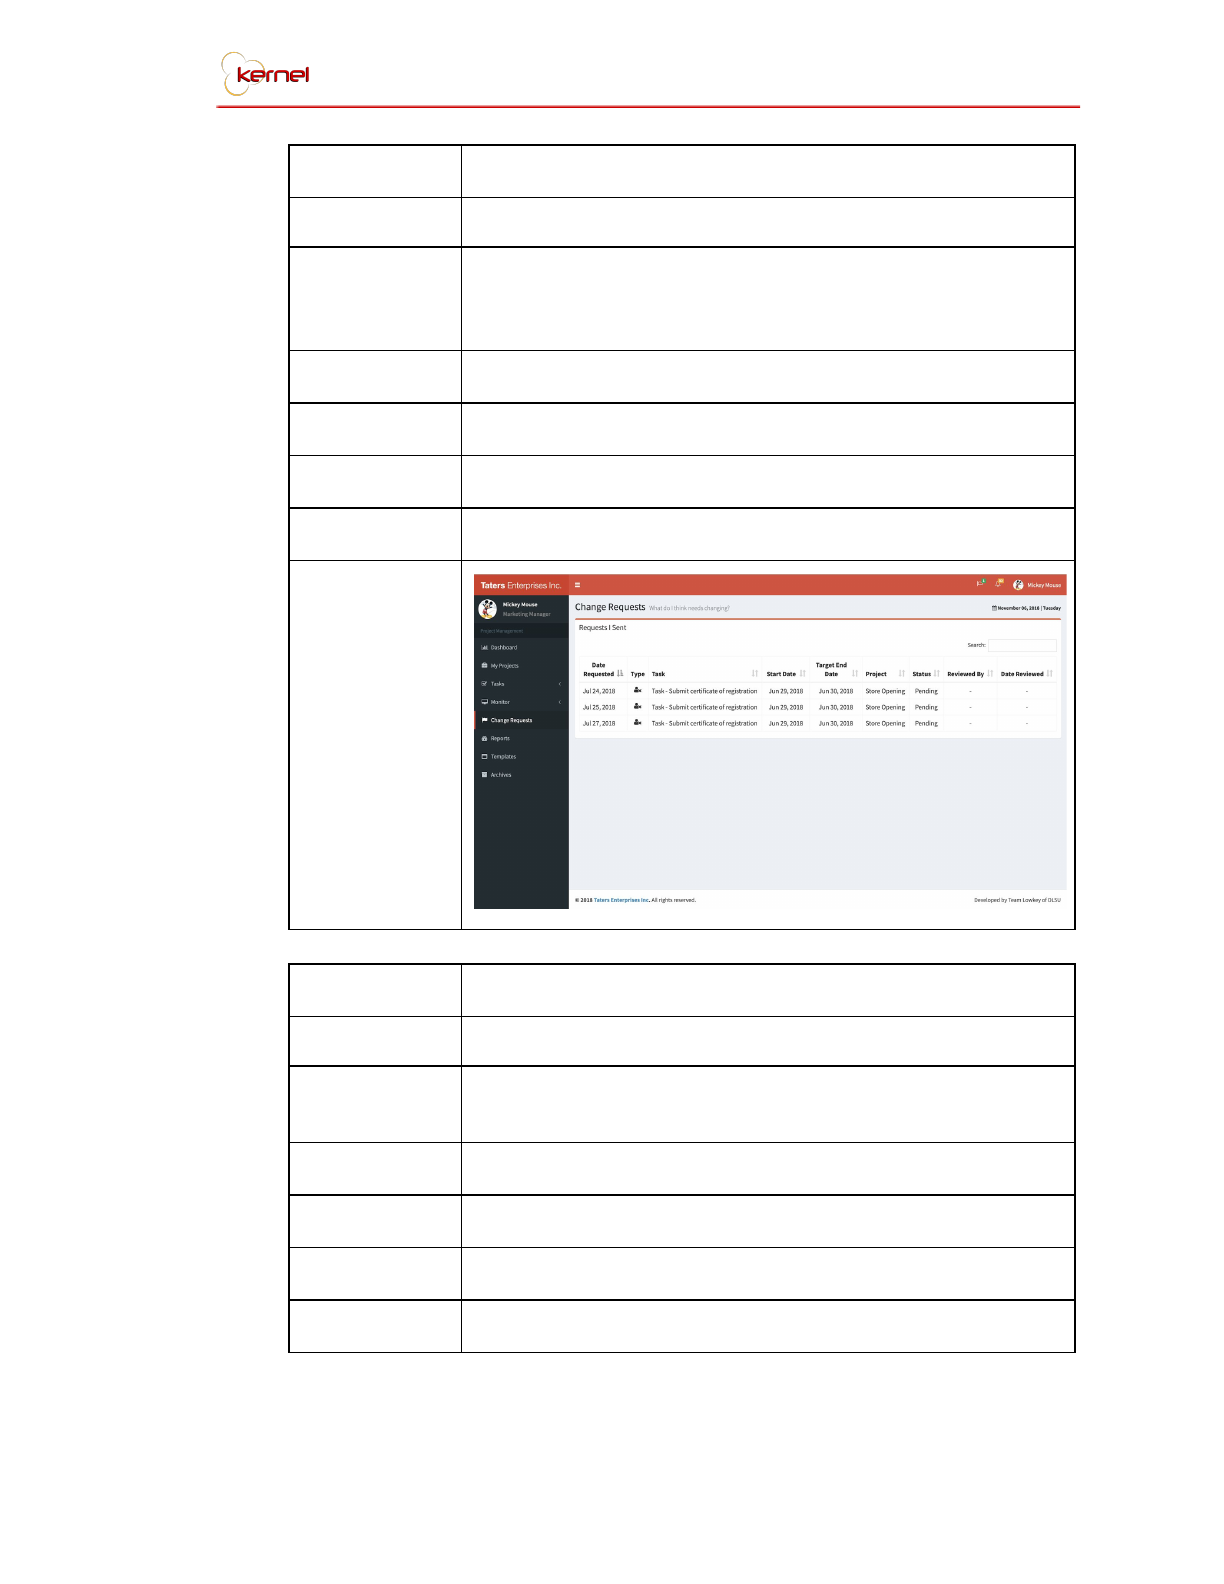
Reference No.
S-09
Name
Change Requests Screen
Description
All change requests that involves the user such as, the
request they submitted or an employee seeking for their
approval can be seen in this page.
File Name
rfc.php
Users
Department Heads and Supervisors
Elements
Change Requests Table
Actions
Navigate to Project Gantt
Layouts
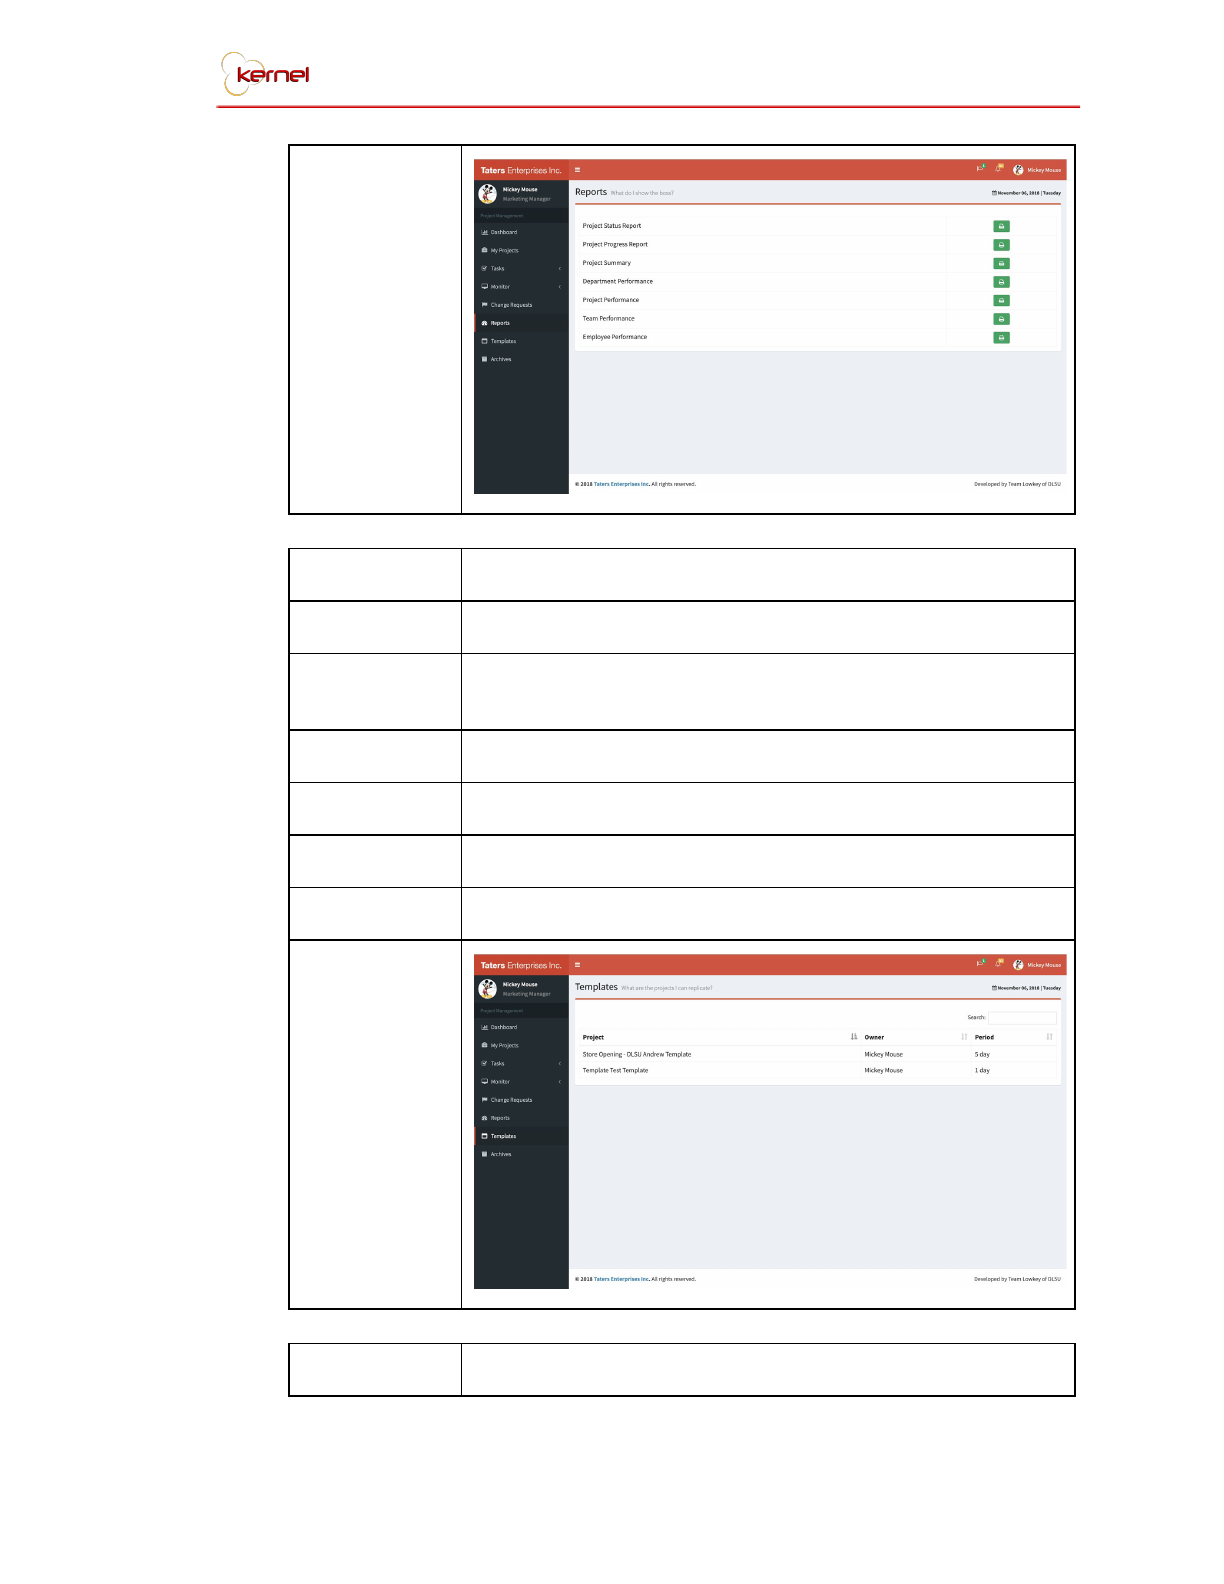
Reference No.
S-10
Name
Reports Screen
Description
This screen shows all reports that the system can
generate for the user.
File Name
reports.php
Users
All Users
Elements
Print Button
Actions
Print Report
TEI Project Management System 24
Layouts
Reference No.
S-11
Name
Templates Screen
Description
All project templates can be seen here and used by a
user.
File Name
templates.php
Users
Department Heads, and Supervisors
Elements
Templates Table
Actions
Navigate to Project Gantt
Layouts
Reference No.
S-12
TEI Project Management System 25
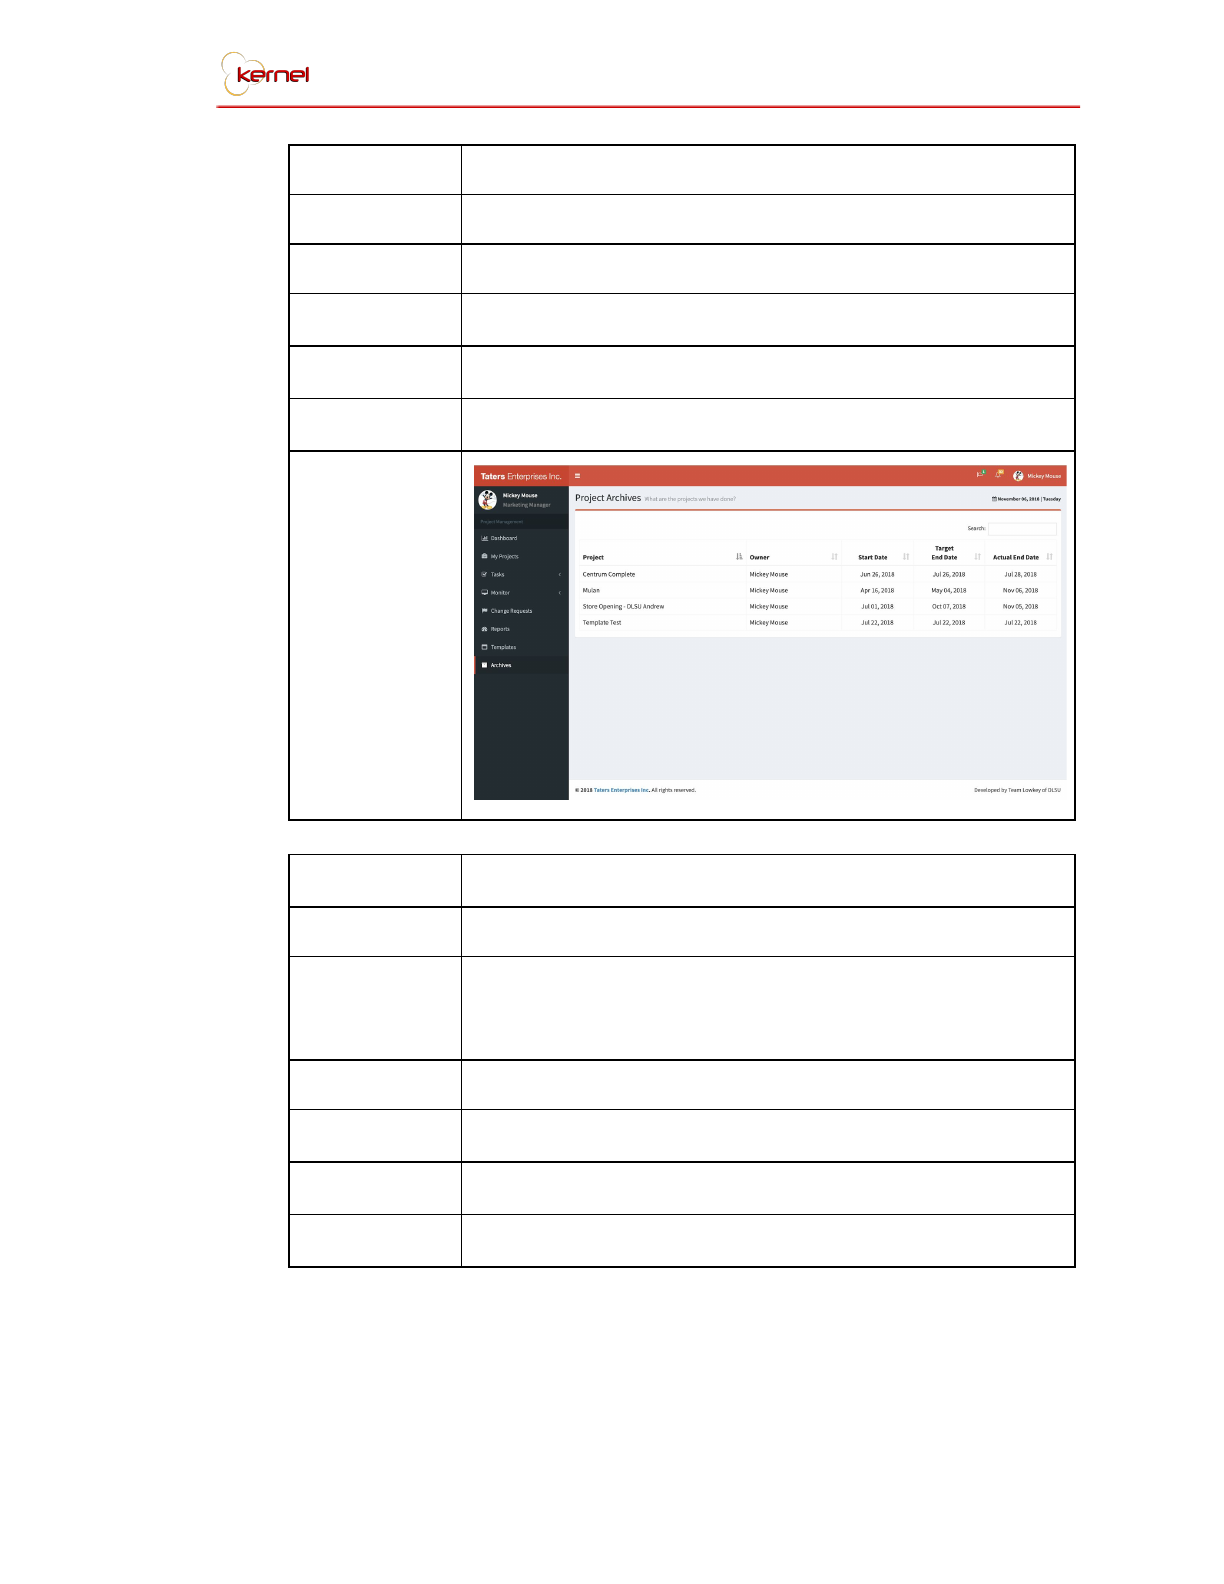
Name
Archives Screen
Description
All archived projects can be seen in the archives page.
File Name
archives.php
Users
Department Heads, and Supervisors
Elements
Archives Table
Actions
Navigate to Project Gantt
Layouts
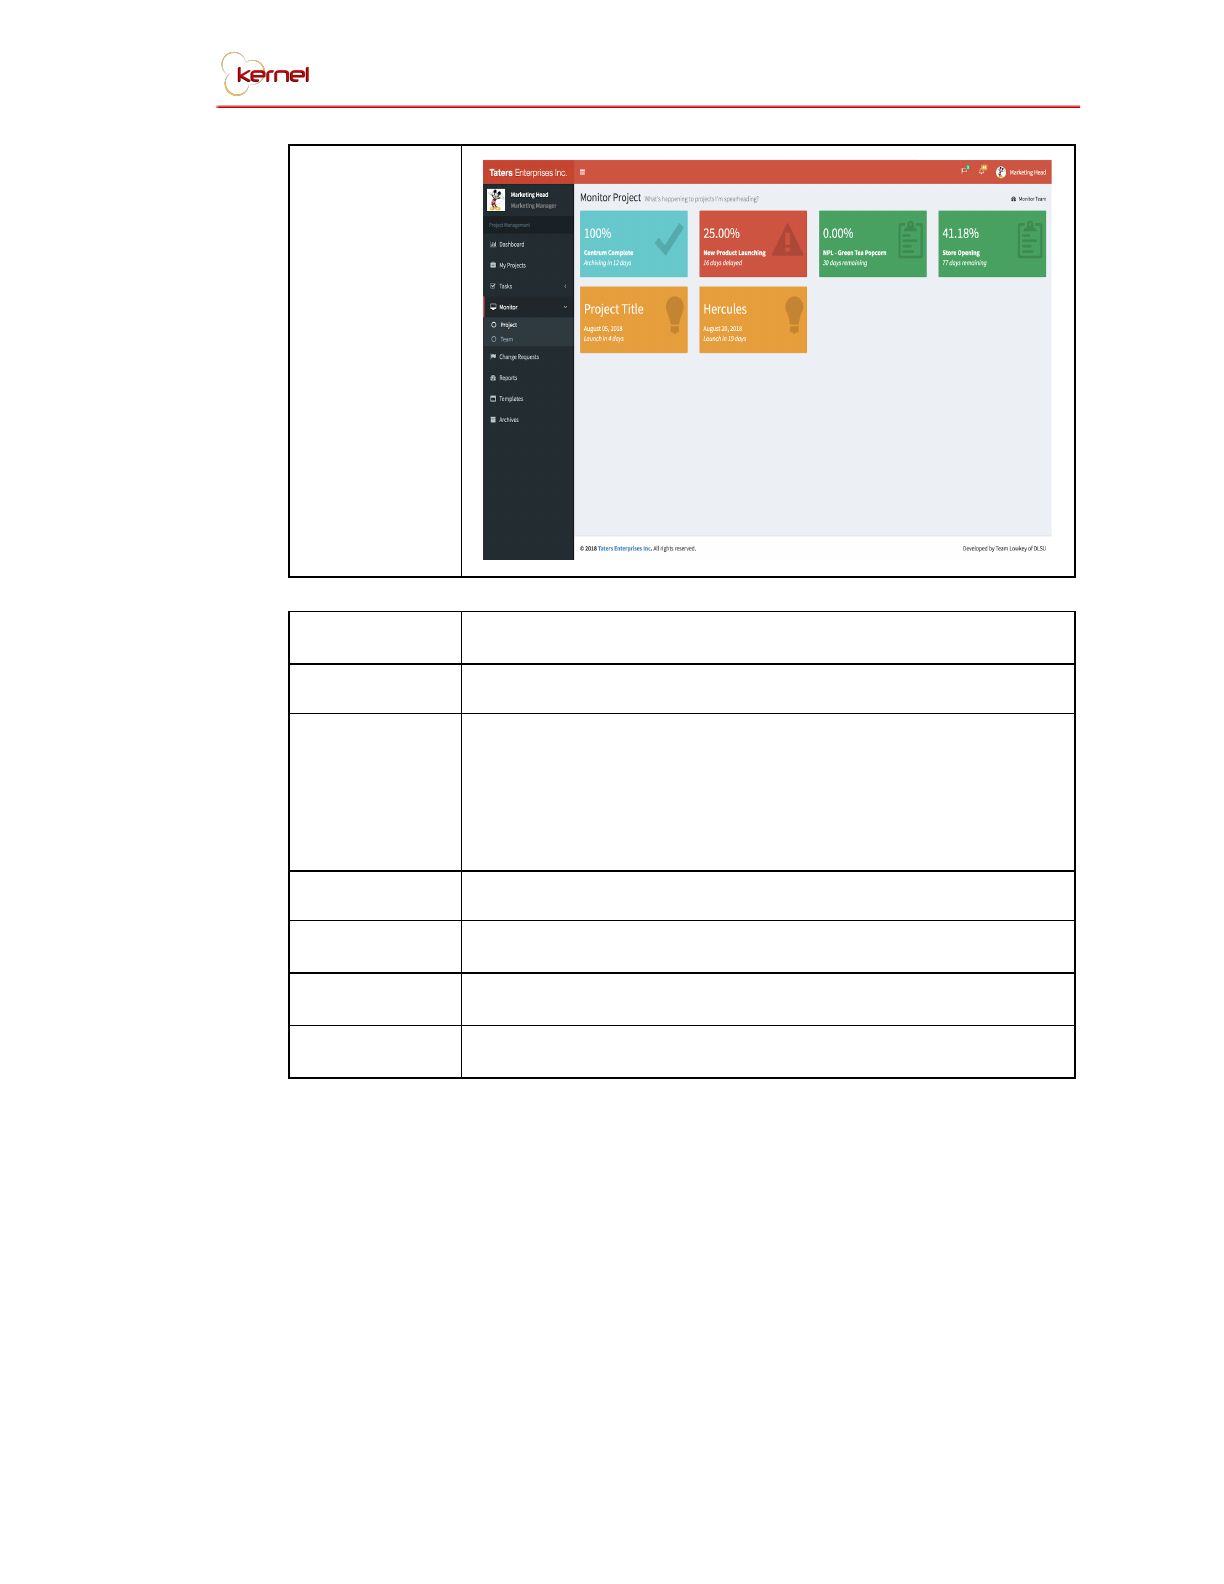
Reference No.
S-13.0
Name
Project Monitor Screen
Description
This page lets the user monitor all projects that he owns.
The user can click on any of the projects in the page and
they will be redirected to the monitor department screen.
File Name
monitorProject.php
Users
Department Heads, and Supervisors
Elements
Project Buttons
Actions
Navigate to Monitor Department Screen
TEI Project Management System 26
Layouts
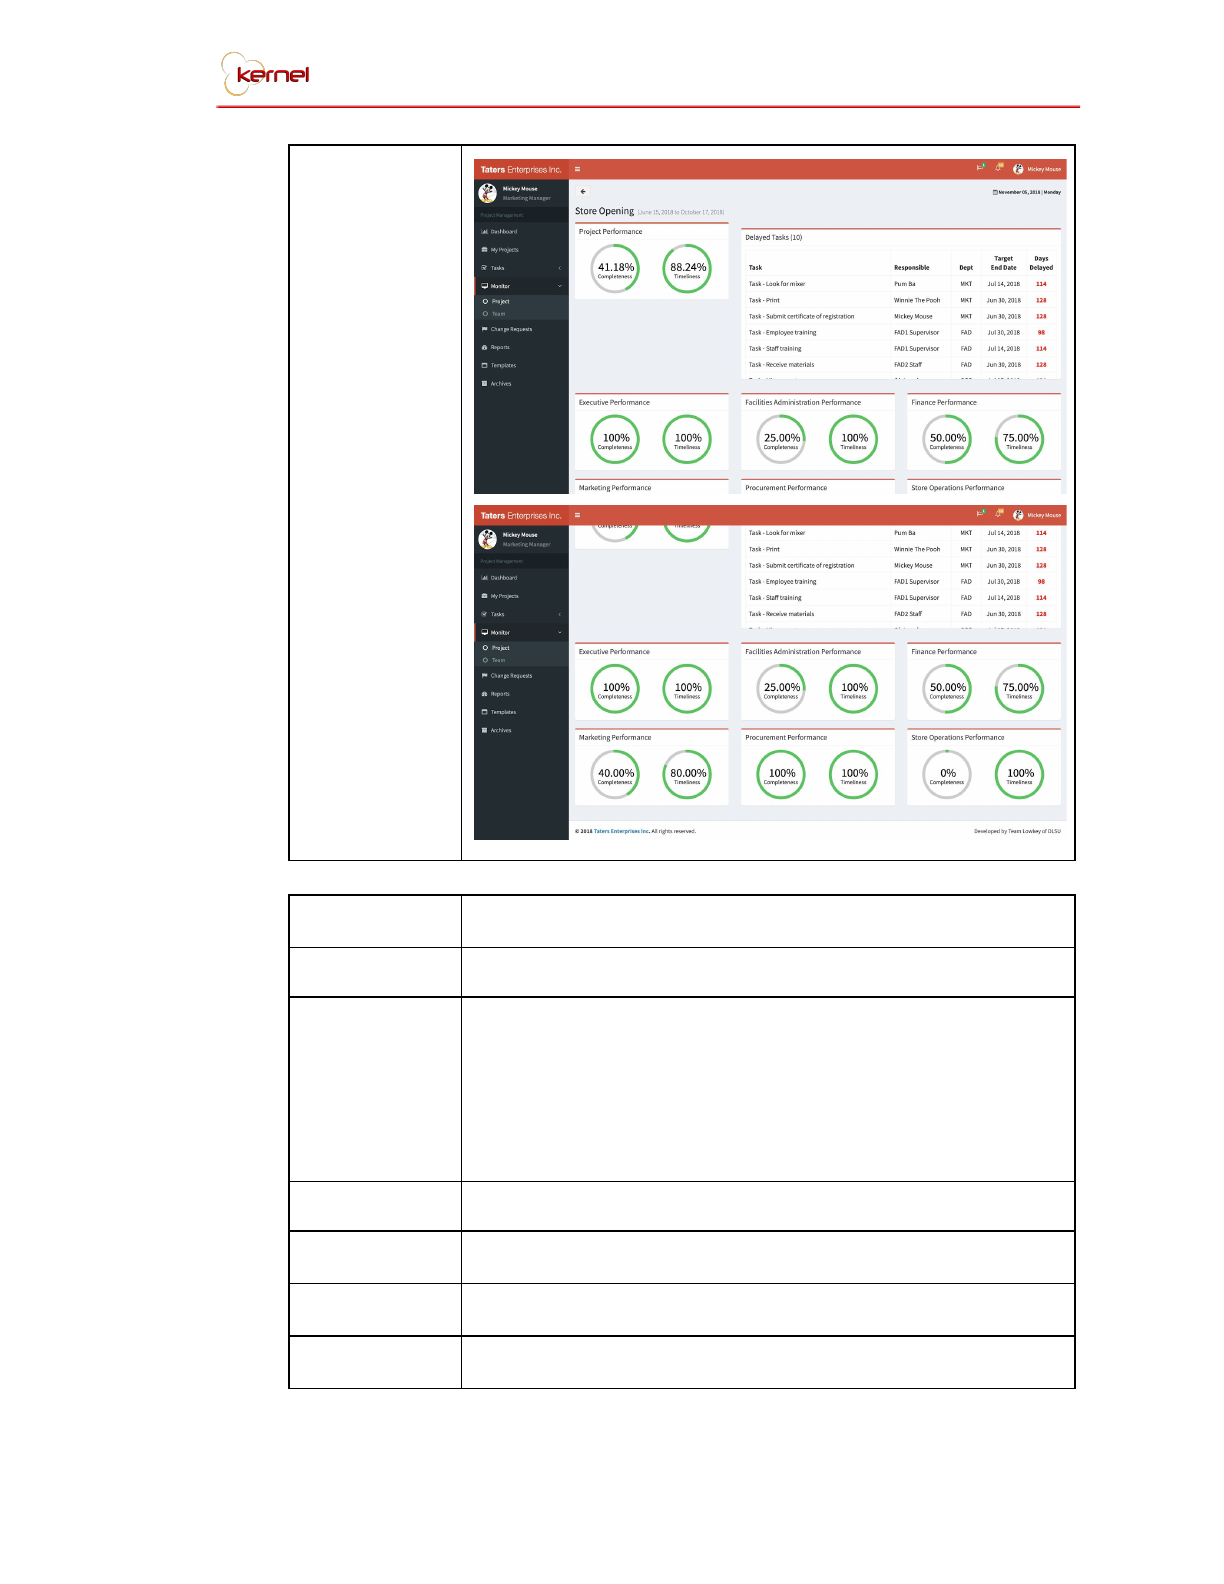
Reference No.
S-13.1
Name
Monitor Department Screen
Description
The monitor department screen shows the overall
progress of the project, tasks that are delayed, and the
departments involved in the project. From this page, it will
navigate the user to the monitor department details
screen.
File Name
monitorDepartment.php
Users
Department Heads, and Supervisors
Elements
Department Buttons
Actions
Navigate to Monitor Department Details Screen
TEI Project Management System 27
Layouts
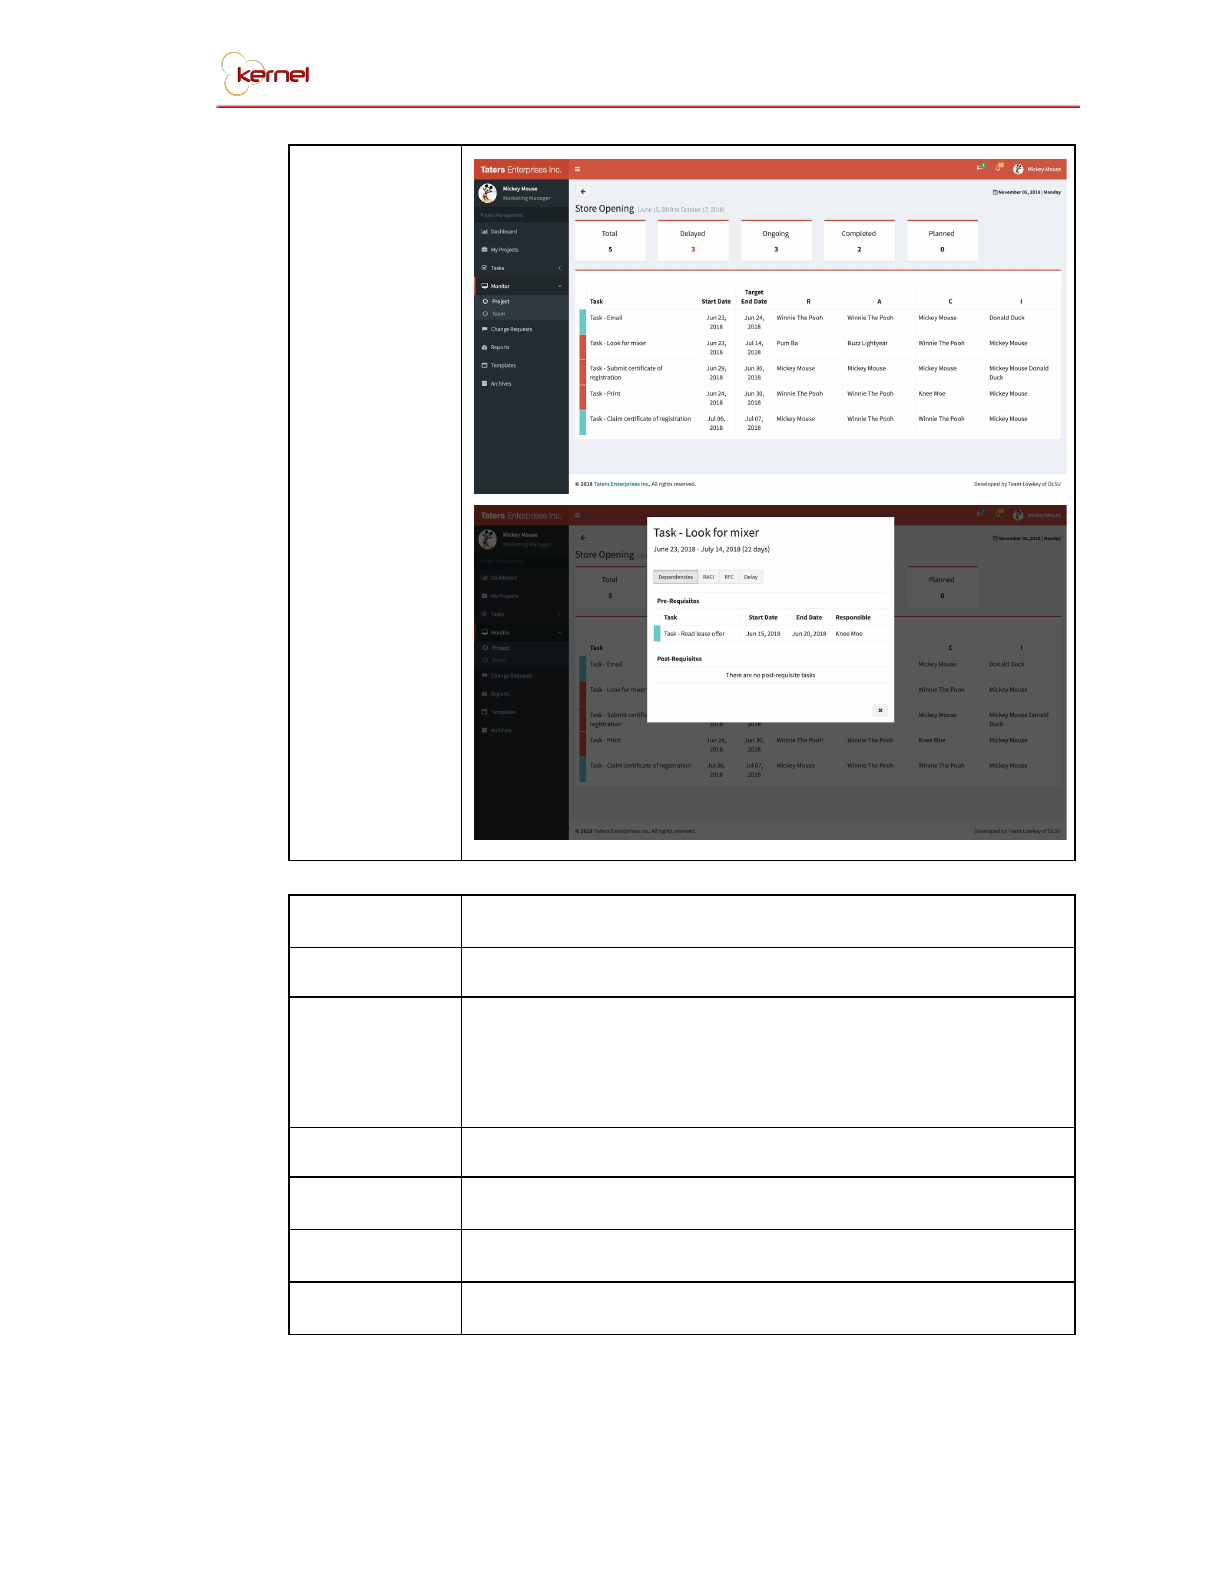
Reference No.
S-13.2
Name
Monitor Department Details Screen
Description
In this screen the user can see all the tasks assigned to
the department he chose in the previous screen. It also
shows the number of delayed, ongoing, completed, and
planned tasks. The user can click on any of the tasks
shown to be able to see the history of that task, such as
the delegate and RFC history.
File Name
monitorDepartmentDetails.php
Users
Department Heads, and Supervisors
Elements
Task Detail Modal
Actions
Show task details modal
TEI Project Management System 28
Layouts
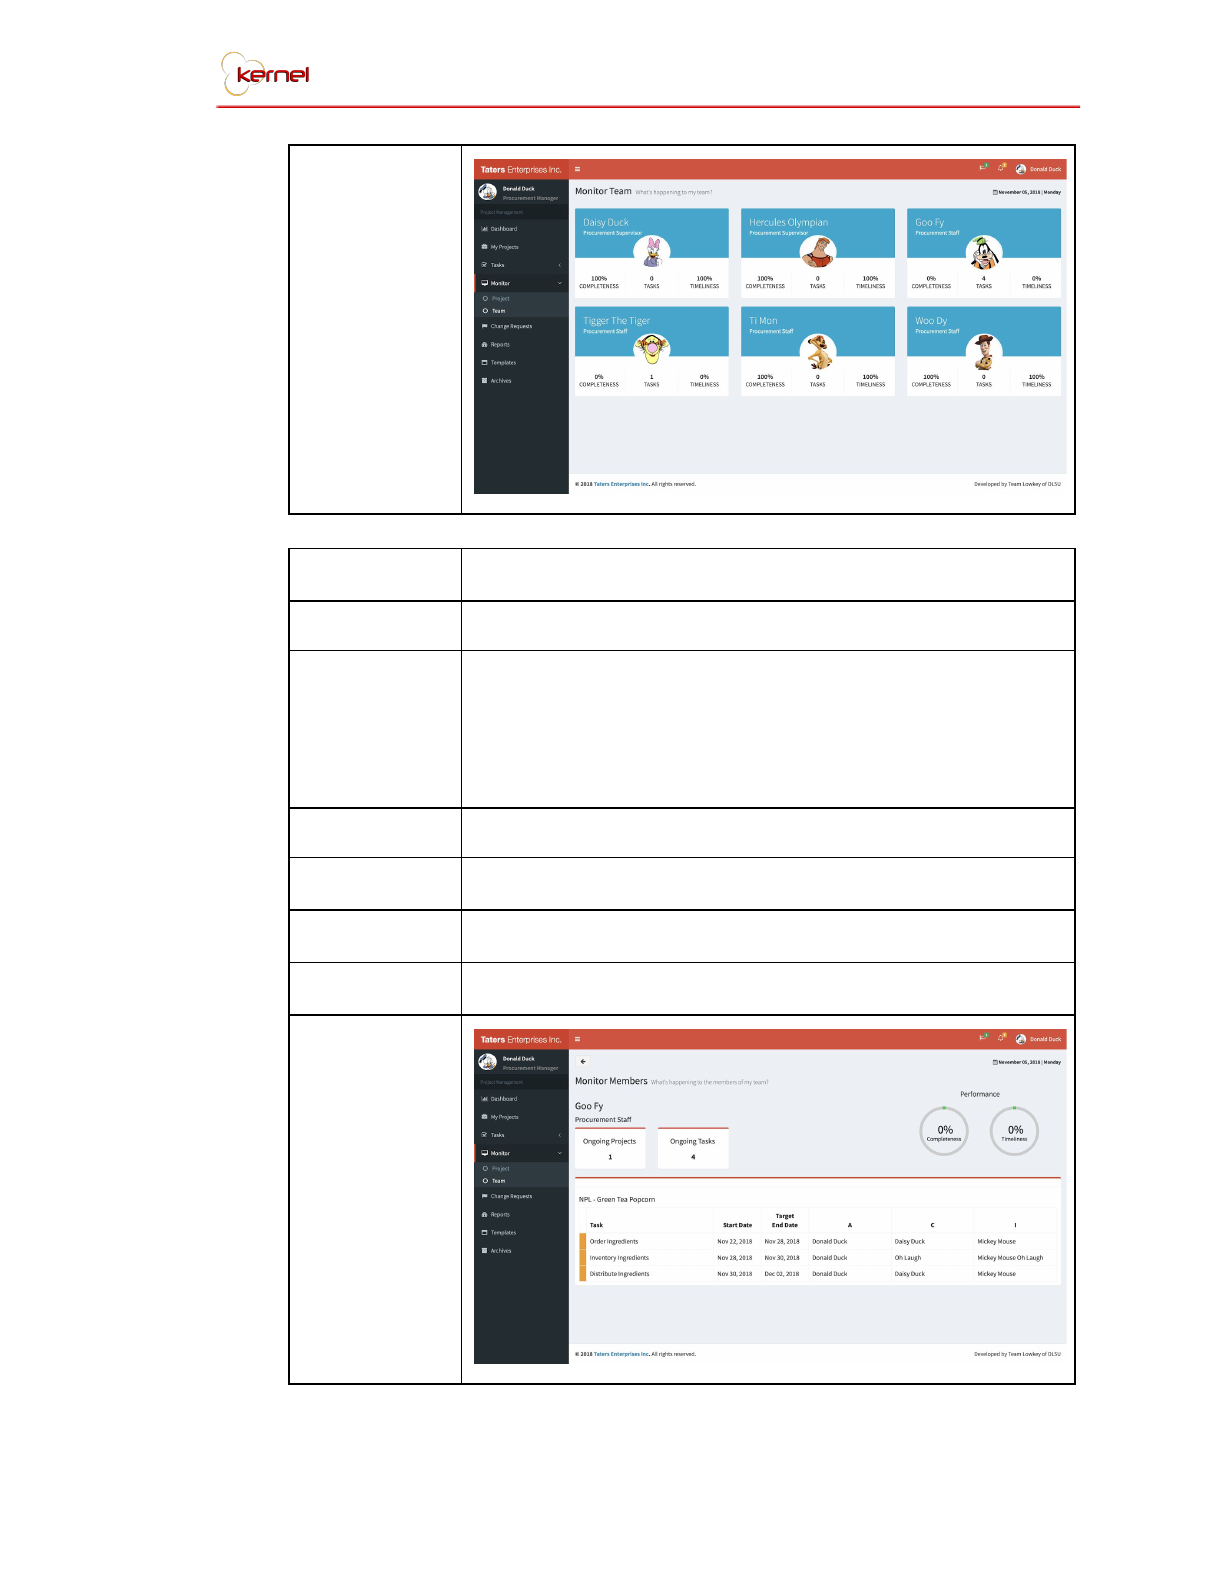
Reference No.
S-14.0
Name
Monitor Team Screen
Description
Monitor team can only be viewed by department head or
the supervisors. It shows all employees directly under
him. The user can choose an employee and they will be
redirected monitor member screen.
File Name
monitorTeam.php
Users
Department Heads, and Supervisors
Elements
Employee Buttons
Actions
Navigate to Monitor Members Screen
TEI Project Management System 29
Layouts
Reference No.
S-14.2
Name
Monitor Members Screen
Description
This screen shows all tasks wherein the chosen employee
is responsible. It also shows the status of those tasks and
also the overall performance of that employee. The user
can click on any of the tasks shown to be able to see the
history of that task, such as the delegate and RFC history.
File Name
monitorMembers.php
Users
Department Heads, and Supervisors
Elements
Task Detail Modal
Actions
Show task details modal
Layouts
TEI Project Management System 30
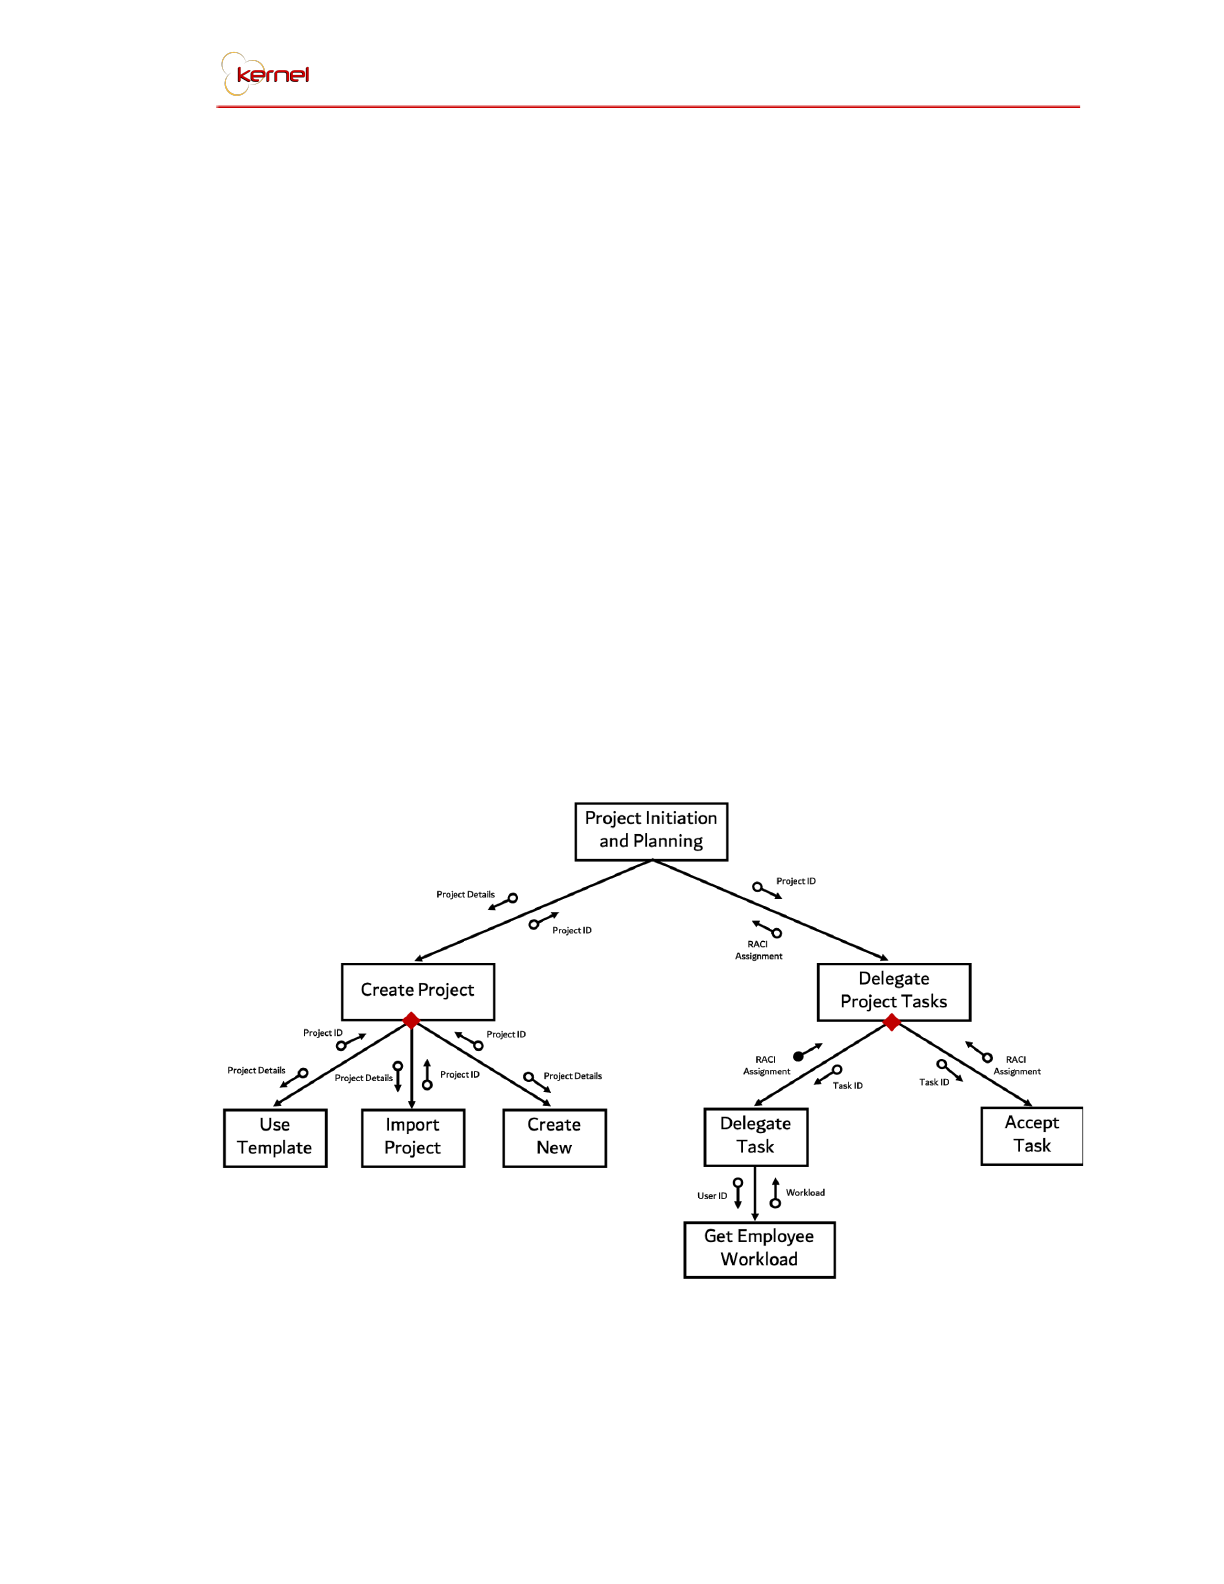
3.3. Structure Chart
To reiterate, the system is composed of four (4) modules modeled after the
project management cycle. The first module could be considered the heart of
the project as without it, the other modules would be useless. The first
module is the Project Initiation and Planning. This module is simply the
creation of the project. Functionalities and methods included are that of
project scheduling, delegating tasks to the project team, viewing the
workload of an employee and generation of the RACI Gantt chart. The
method of creating a project can be done in three ways, thus is symbolized
by the red diamond - using an existing template, importing a project from a
spreadsheet file, and creating a project through the system from scratch.
Once the project is created and scheduled appropriately, project tasks can
now be delegated either by assigning it to one’s team or by accepting a
pre-delegated task. By assigning the task to one’s team, one can also see the
current workload the potential project team member has.
Project Initiation and Planning Structure Chart
TEI Project Management System 31
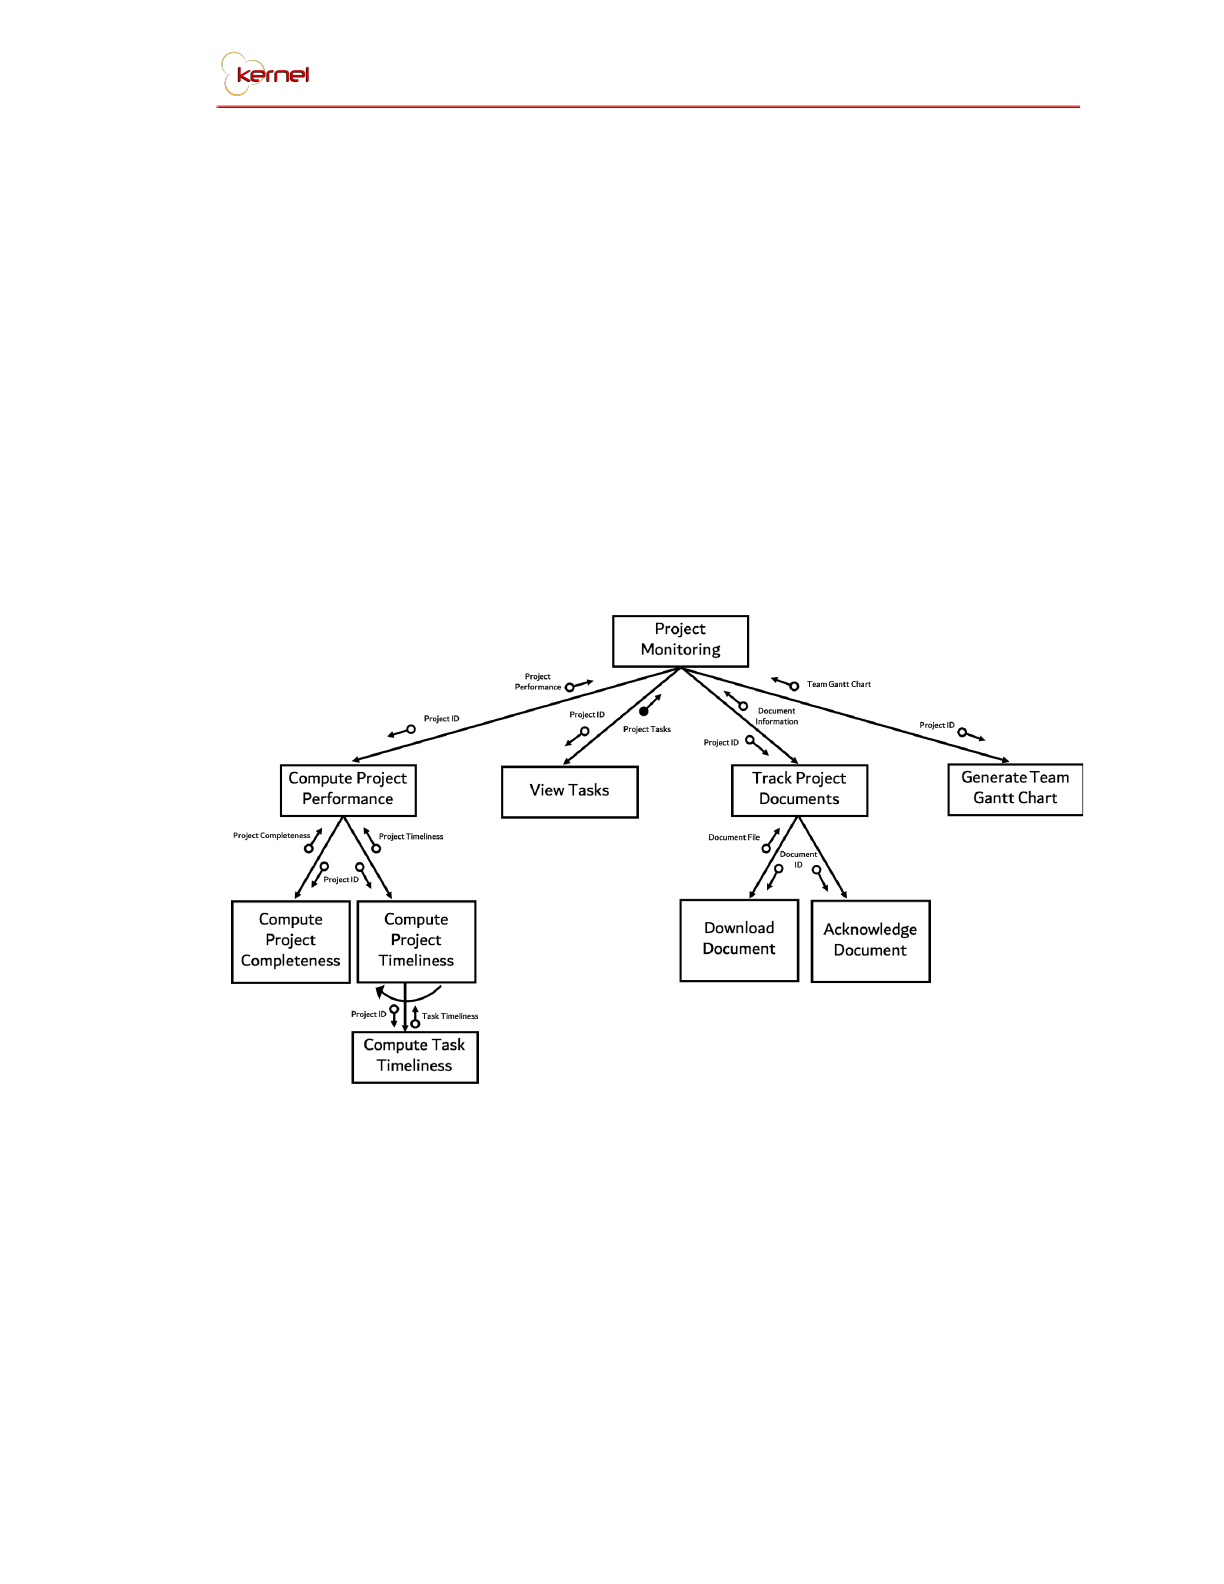
The second module is Project Monitoring. This module is where the
user will interact the most with. This is also where data will come from which
will be used for the succeeding modules. The project tasks and necessary
details is important to be accessible the most in this module as to serve
transparency to the project team. Project Performance is computed by
computing each of the tasks’ performance. Tracking of documents can either
be of downloading a document tagged to a project, and/or acknowledging a
document that a specific user has viewed its contents. The Team Gantt chart
is simply a departmental or team refined version of the initial project RACI
Gantt Chart. The system handles project, task, document, and team
monitoring as illustrated below.
Project Monitoring Structure Chart
The third module is Project Control. This module provides information
for both its preceding and succeeding modules. Mainly, it handles the change
requests, whether submitted, approved, or denied. It applies the changes
necessary and updates the project and tasks involved. This module also
prepares the data for a significant report in a project, which is the project
summary report. This is only done once a project is completed.
TEI Project Management System 32
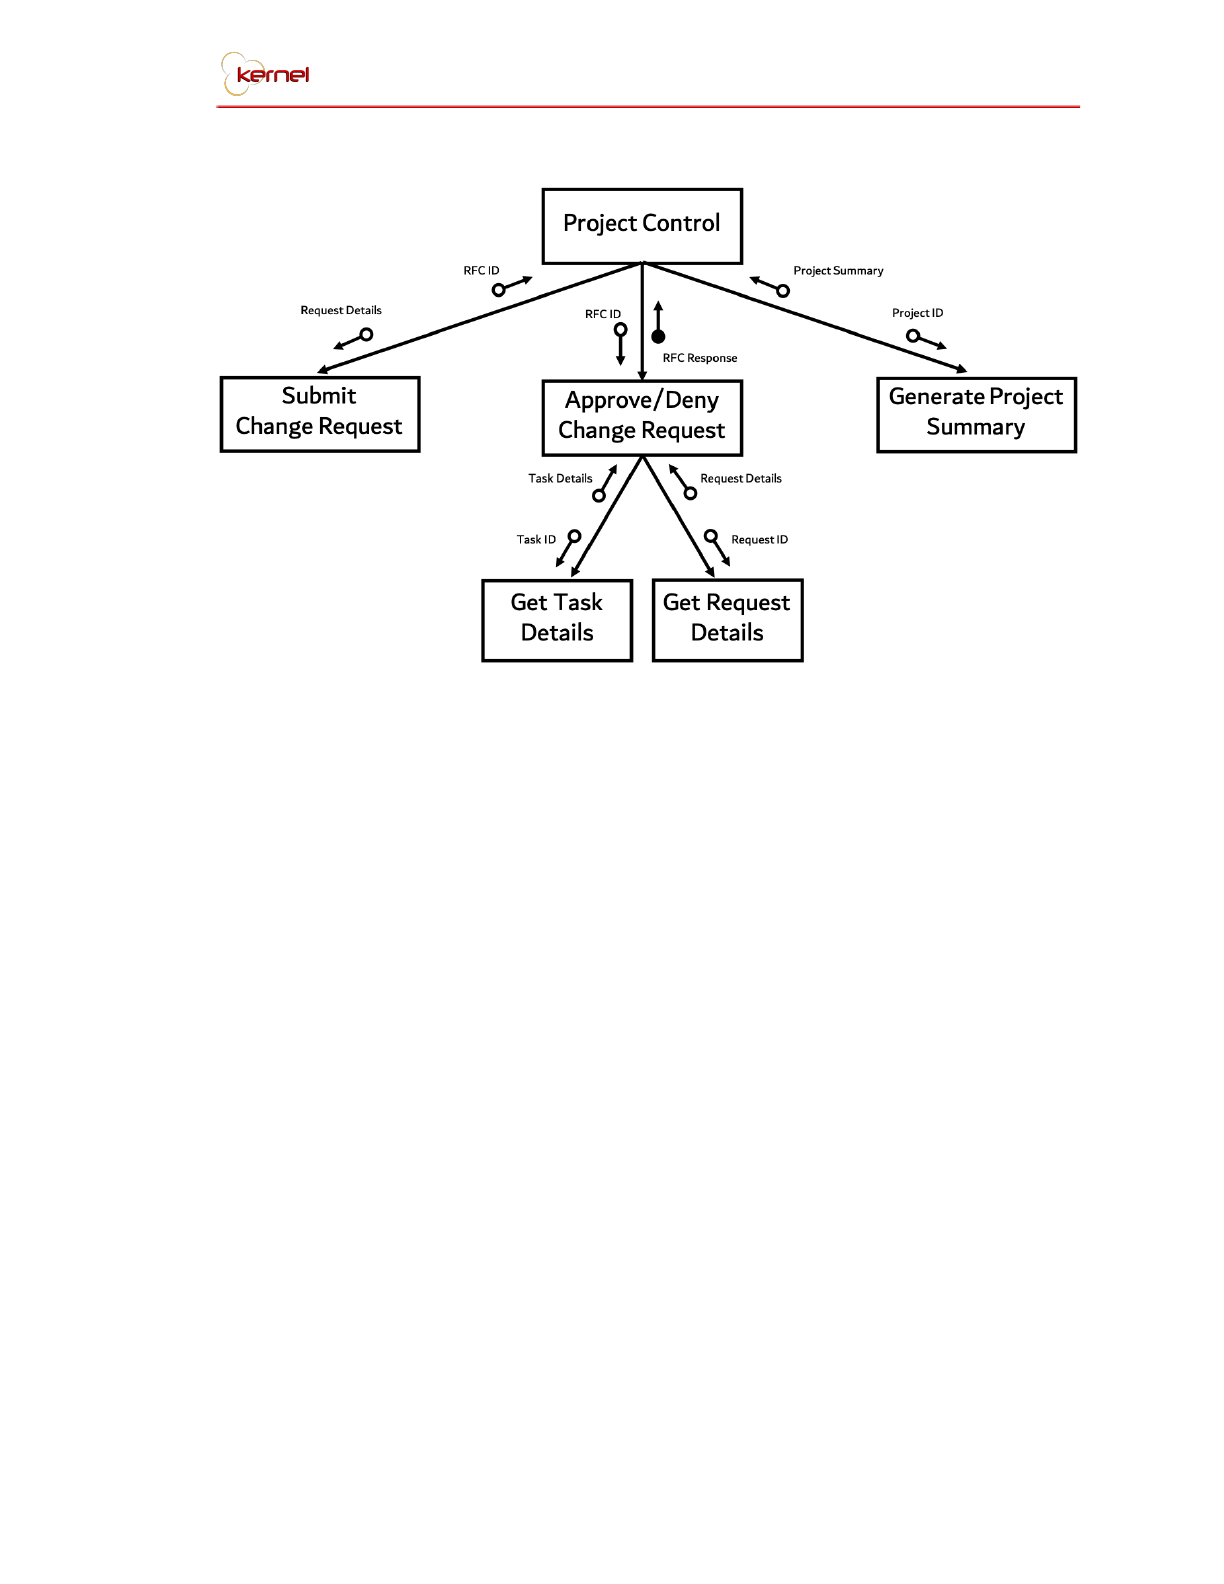
Project Control Structure Chart
The fourth and last module is Project Closing. The methods included
here are that of reports generation and project archiving. Project Archiving will
have a lasting impact on the company, as they do not have a way of
documenting their projects, let alone keeping a record of each and every one
of them including the data it holds. The archiving process will is only
applicable to completed projects, therefore, the system will validate a
project’s completeness before it is archived. Once project is archived, no
change may be made to the project. Various reports can be generated to aid
in project and employee performance.
TEI Project Management System 33
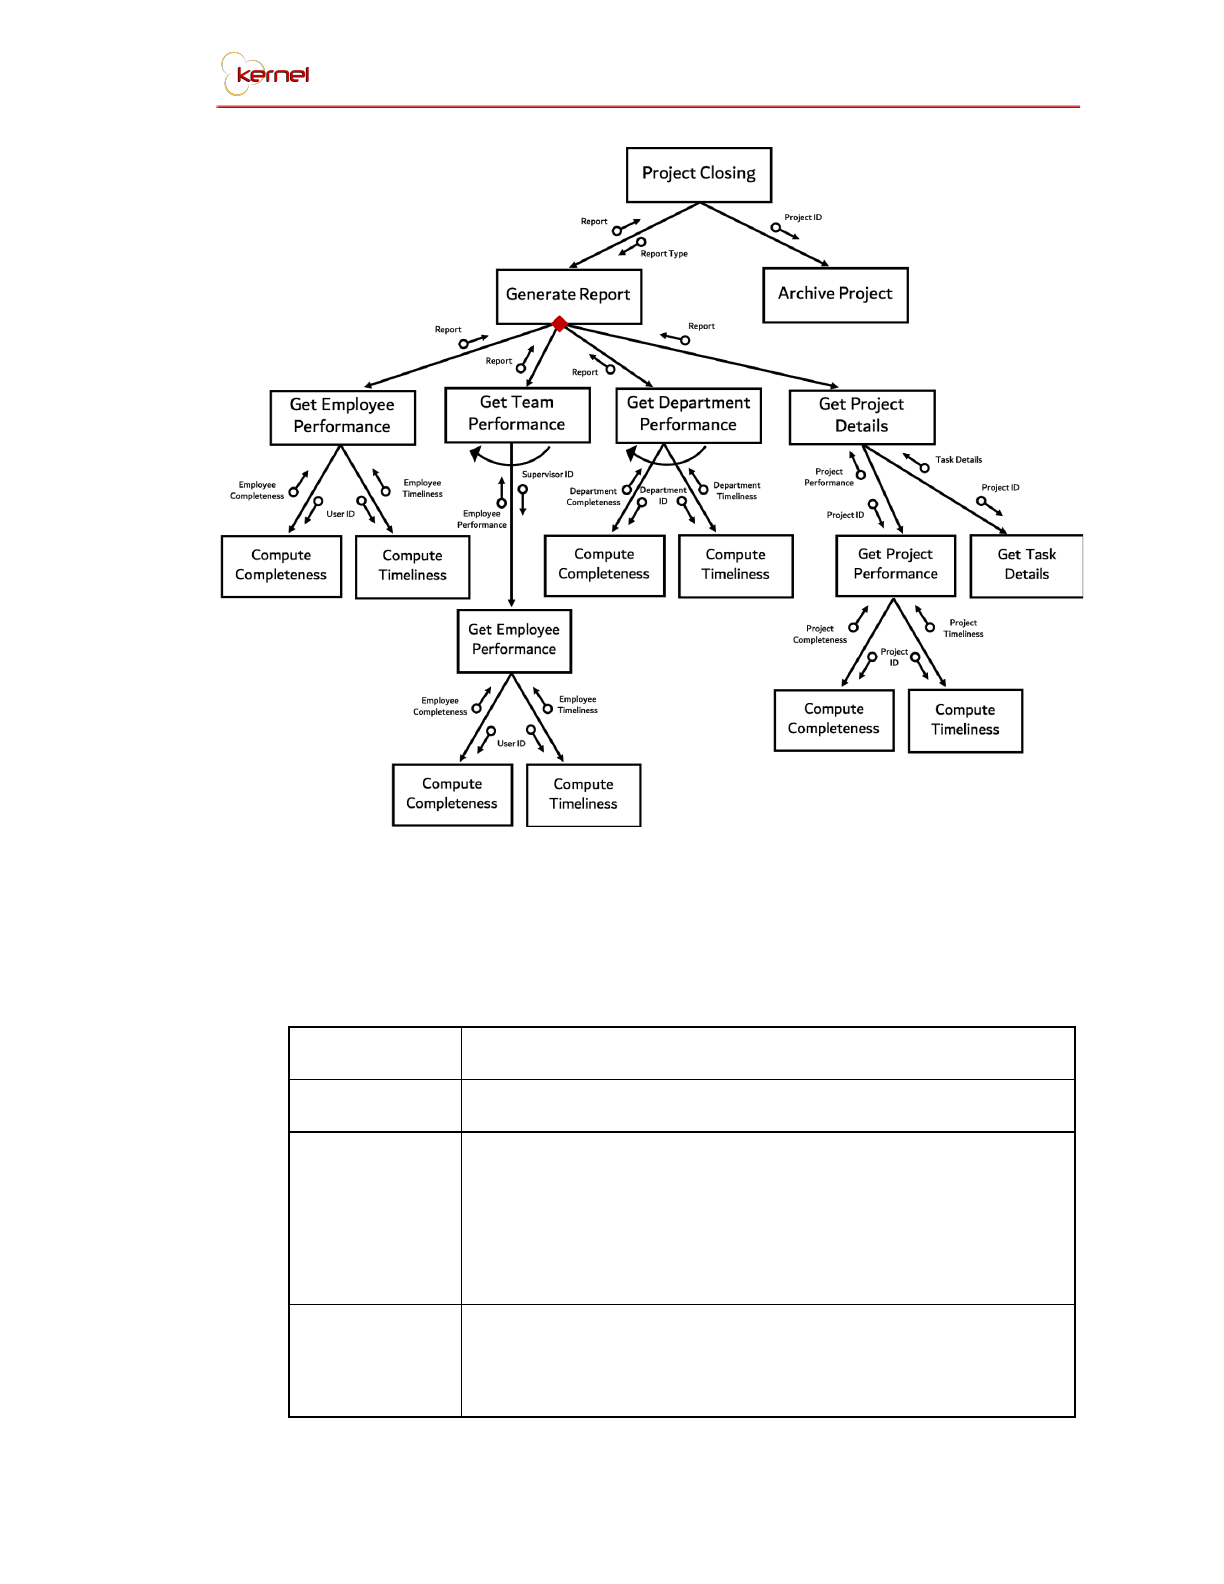
Project Closing Structure Chart
3.4. Module Specifications
Reference No.
M-01
Name
Project Initiation and Planning
Description
This module covers all preparations before the project is
actually implemented, specifically, the project
description, process identification, and role assignment to
project team. In this module, all processes in the system
can be modified.
Inputs
Projects Table
RACI Table
Tasks Table
TEI Project Management System 34
Templates Table
Import Template
Outputs
RACI Gantt Chart
Team Gantt
Workload Assessment
Called
Modules
M-02: Project Monitoring
Calling
Modules
None
Reference No.
M-02
Name
Project Monitoring
Description
This module provides a platform for projects to be
properly tracked based on progress and timeliness. This
also ensures that everyone involved in the project are
informed with the status of the project, and if there are
any adjustments to the target dates. This also provides
insight for succeeding task performers on when they
could initiate their task, and who to follow-up on.
Inputs
Tasks Table
RACI Table
Documents Table
DocumentAcknowledgement Table
AssessmentProject Table
Outputs
Project Status Report
Project Progress Report
Project Summary Report
Project Performance Report
Called
Modules
M-03: Project Control
M-04: Project Closing
Calling
Modules
M-01: Project Initiation and Planning
Reference No.
M-03
TEI Project Management System 35
Name
Project Control
Description
Project control covers the knowledge application and
evaluation of completed projects to provide insights that
will improve business processes and prevent any
problems and delays from reoccurring.
Inputs
changeRequest Table
Tasks Table
RACI Table
AssessmentDepartment Table
AssessmentEmployee Table
AssessmentProject Table
Outputs
Project Assessment
Employee Assessment
Department Assessment
Project SUmmary
Called
Modules
M-03: Project Closing
Calling
Modules
M-02: Project Monitoring
Reference No.
M-04
Name
Project Closing
Description
Project closing covers the handling of completed projects.
This is the accumulation of knowledge acquired from the
project which can be used as reference for future
improvements.
Inputs
changeRequest Table
Tasks Table
RACI Table
Projects Table
AssessmentDepartment Table
AssessmentEmployee Table
AssessmentProject Table
Outputs
Department Performance Report
Project Status Report
TEI Project Management System 36
Project Progress Report
Project Summary Report
Project Performance Report
Team Performance Report
Employee Performance Report
Called
Modules
None
Calling
Modules
M-02: Project Monitoring
M-03: Project Control
3.5. Forms Specifications
This section focuses on the screens wherein a form is present by detailing the
purpose of the form, the data needed to complete a form and a transaction,
the users who may encounter the screen, and how often it is submitted
through the system.
Reference No.
F-01
Name
Login
Description
User has to input their registered username and password
in order to gain access to the system.
Input To
Dashboard Screen
Accomplished
By
Any user who needs to access their account
Layout
TEI Project Management System 37
Reference No.
F-02.1
Name
Create New Project (Project Details)
Description
Creating a new project can be done through this page. All
fields are required to have an input to be able to proceed
to the next step, which is adding main activities.
Input To
Add Main Activities Screen
Projects Table
AssessmentProject Table
Logs Table
Notifications Table
Accomplished
By
Executives, Department Heads, and Supervisors
Layout
Reference No.
F-02.2
Name
Create New Project (Main Activity)
Description
Adding main activities can be done through this page. All
fields are required to have an input to be able to proceed
to the next step, which is adding sub activities.
Input To
Add Sub Activities Screen
Tasks Table
RACI Table
Logs Table
Notifications Table
TEI Project Management System 38
Accomplished
By
Executives, Department Heads, and Supervisors
Layout
Reference No.
F-02.3
Name
Create New Project (Sub Activity)
Description
Adding sub activities can be done through this page. All
fields are required to have an input to be able to proceed
to the next step, which is adding tasks.
Input To
Add Tasks Screen
Tasks Table
RACI Table
Logs Table
Notifications Table
Accomplished
By
Executives, Department Heads, and Supervisors
TEI Project Management System 39
Layout
Reference No.
F-02.4
Name
Create New Project (Tasks)
Description
Adding tasks can be done through this page. All fields are
required to have an input to be able to proceed to the
next step, which is adding dependencies if there are any.
Input To
Add Dependencies Screen
Tasks Table
RACI Table
Logs Table
Notifications Table
Accomplished
By
Executives, Department Heads, and Supervisors
Layout
TEI Project Management System 40
Reference No.
F-02.5
Name
Create New Project (Dependencies)
Description
Setting the prerequisite tasks of each task can be done in
this page.
Input To
Project Gantt Screen
Dependencies Table
Logs Table
Notifications Table
Accomplished
By
Executives, Department Heads, and Supervisors
Layout
Reference No.
F-03
Name
Request for Change
Description
All users in the company can request for a change either
for a performer or for a date.
Input To
ChangeRequests Table
Accomplished
By
All users who needs to submit a request for change
Logs Table
Notifications Table
TEI Project Management System 41
Layout
Reference No.
F-04
Name
Upload Document
Description
Lets the users upload documents in a specific project.
Input To
Documents Table
DocumentAcknowledgement Table
Logs Table
Notifications Table
Accomplished
By
All users who needs to upload a document
Layout
Reference No.
F-05
Name
Delegate Task
TEI Project Management System 42
Description
This form lets either the department head or the
supervisor delegate task to their employees or to another
department as Responsible, Accountable, Consulted or
Informed.
Input To
RACI Table
Logs Table
Notifications Table
Accomplished
By
Department Heads and Supervisors
Layout
TEI Project Management System 43
3.6. Reports Specifications
This section focuses on screens that produce report, specifically the
organization of multiple entries of data into a table. Each report has a name,
description, specific purpose, the users who may encounter the screen, and
how often they may encounter it.
Reference No.
R-01
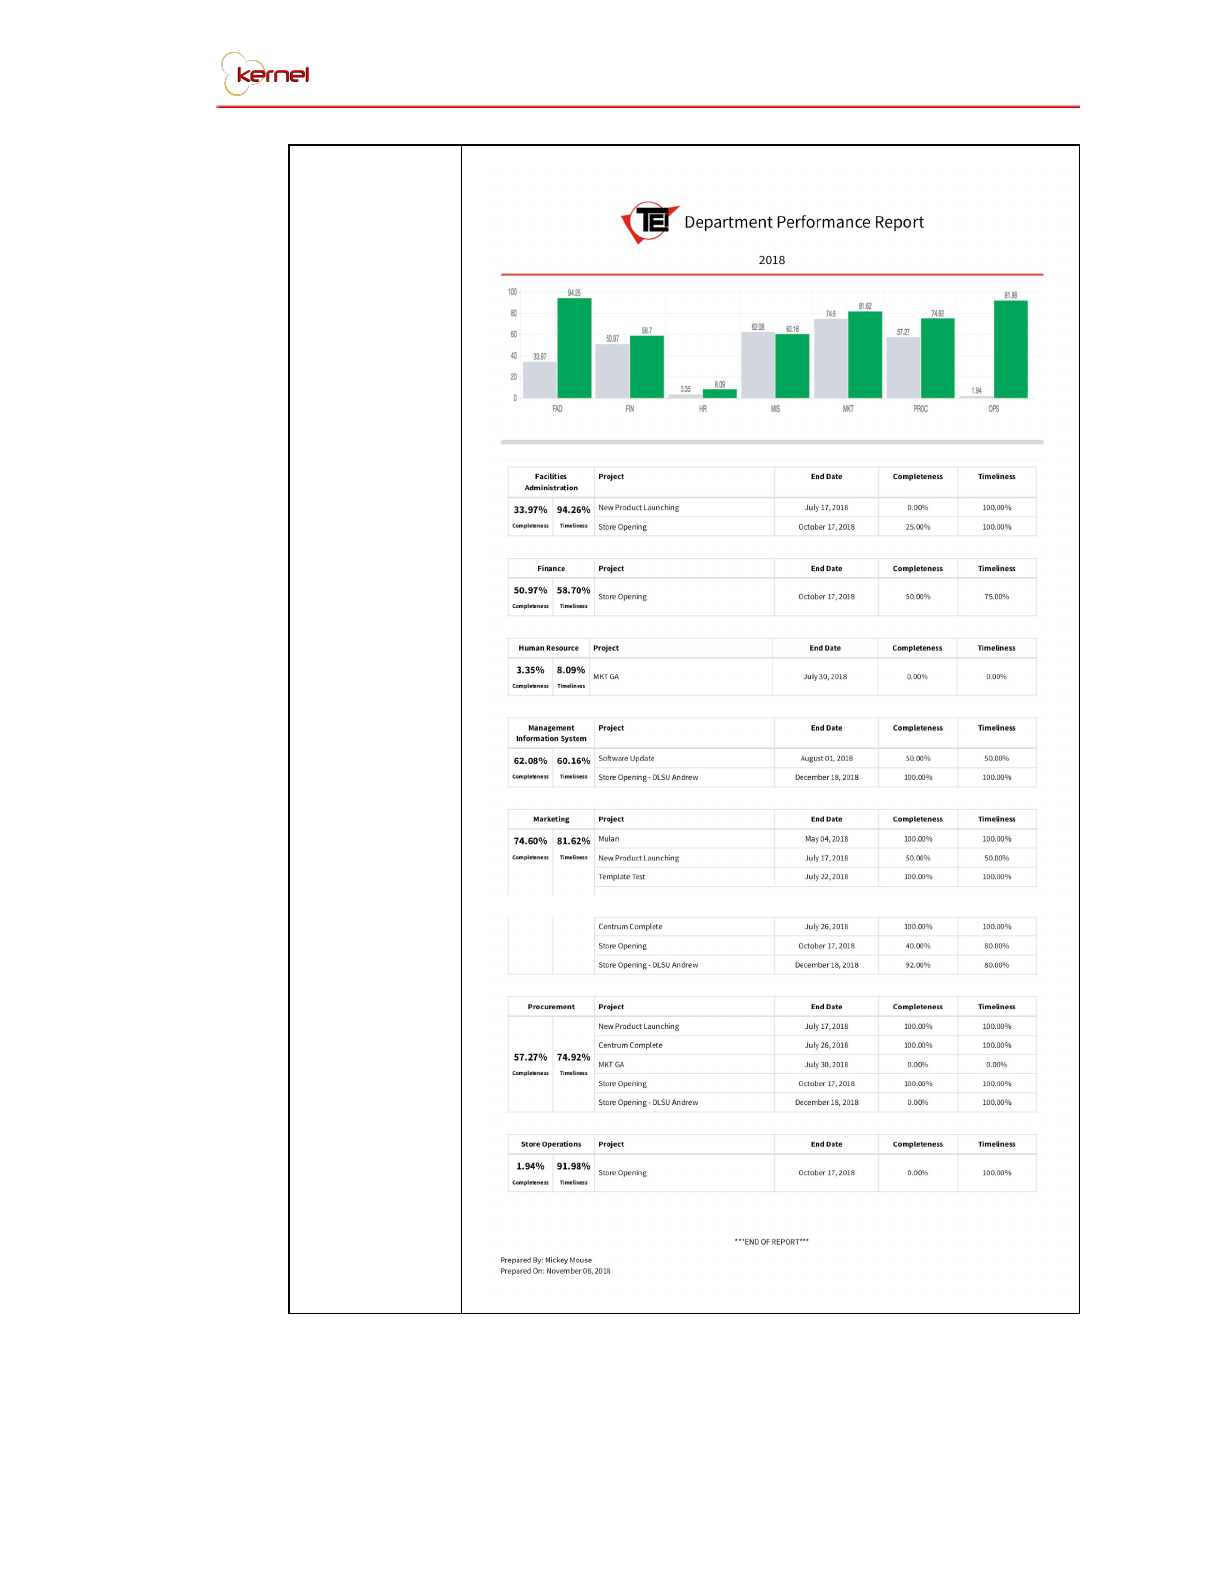
Name
Department Performance Report
Description
This report shows a bar chart of the completeness and
timeliness of each department. It also shows all the
projects that a department is currently doing and its
corresponding target end date, completeness, and
timeliness.
Used and
Prepared By
President
Volume and
Frequency
Once as needed
Purpose
The purpose of this report is for the President to be able to
assess the performance of each department in terms of
their completeness and timeliness.
Tables Used
Users, Departments, Projects, Tasks, RACI
TEI Project Management System 44
Layout
TEI Project Management System 45
Reference No.
R-02
Name
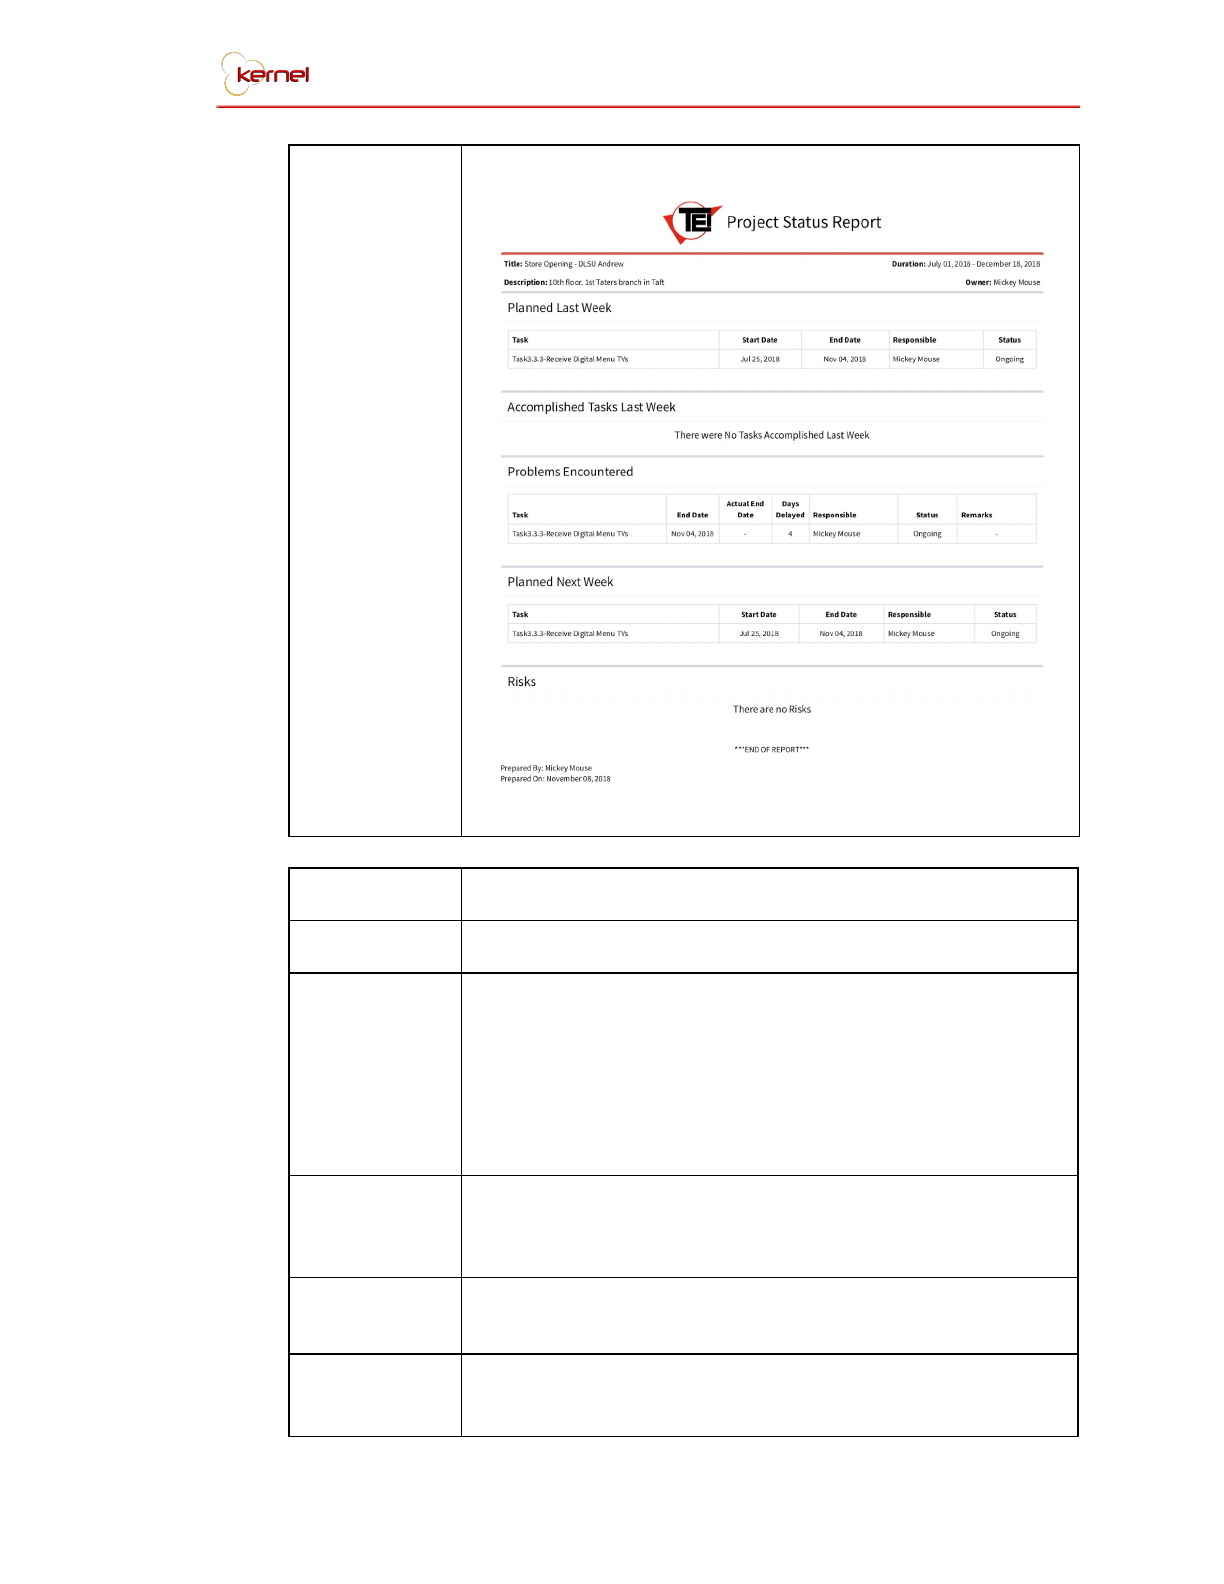
Project Status Report
Description
The Project Status Report shows all tasks that were
planned, tasks that were accomplished either last week or
last month depending on the interval that the user chose,
problems encountered (tasks that are delayed), risks
(pending change requests and tasks that needs to be
delegated), and tasks that are upcoming next week or
month.
Used and
Prepared By
President, and Heads and Supervisors involved in a project
Volume and
Frequency
R-02
Purpose
The purpose of this report is for the project owner to
immediately see the current status of a project and if there
are risks and problems that need their immediate
attention.
Tables Used
Users, Projects, Tasks, RACI, ChangeRequests
TEI Project Management System 46
Layout
Reference No.
R-03
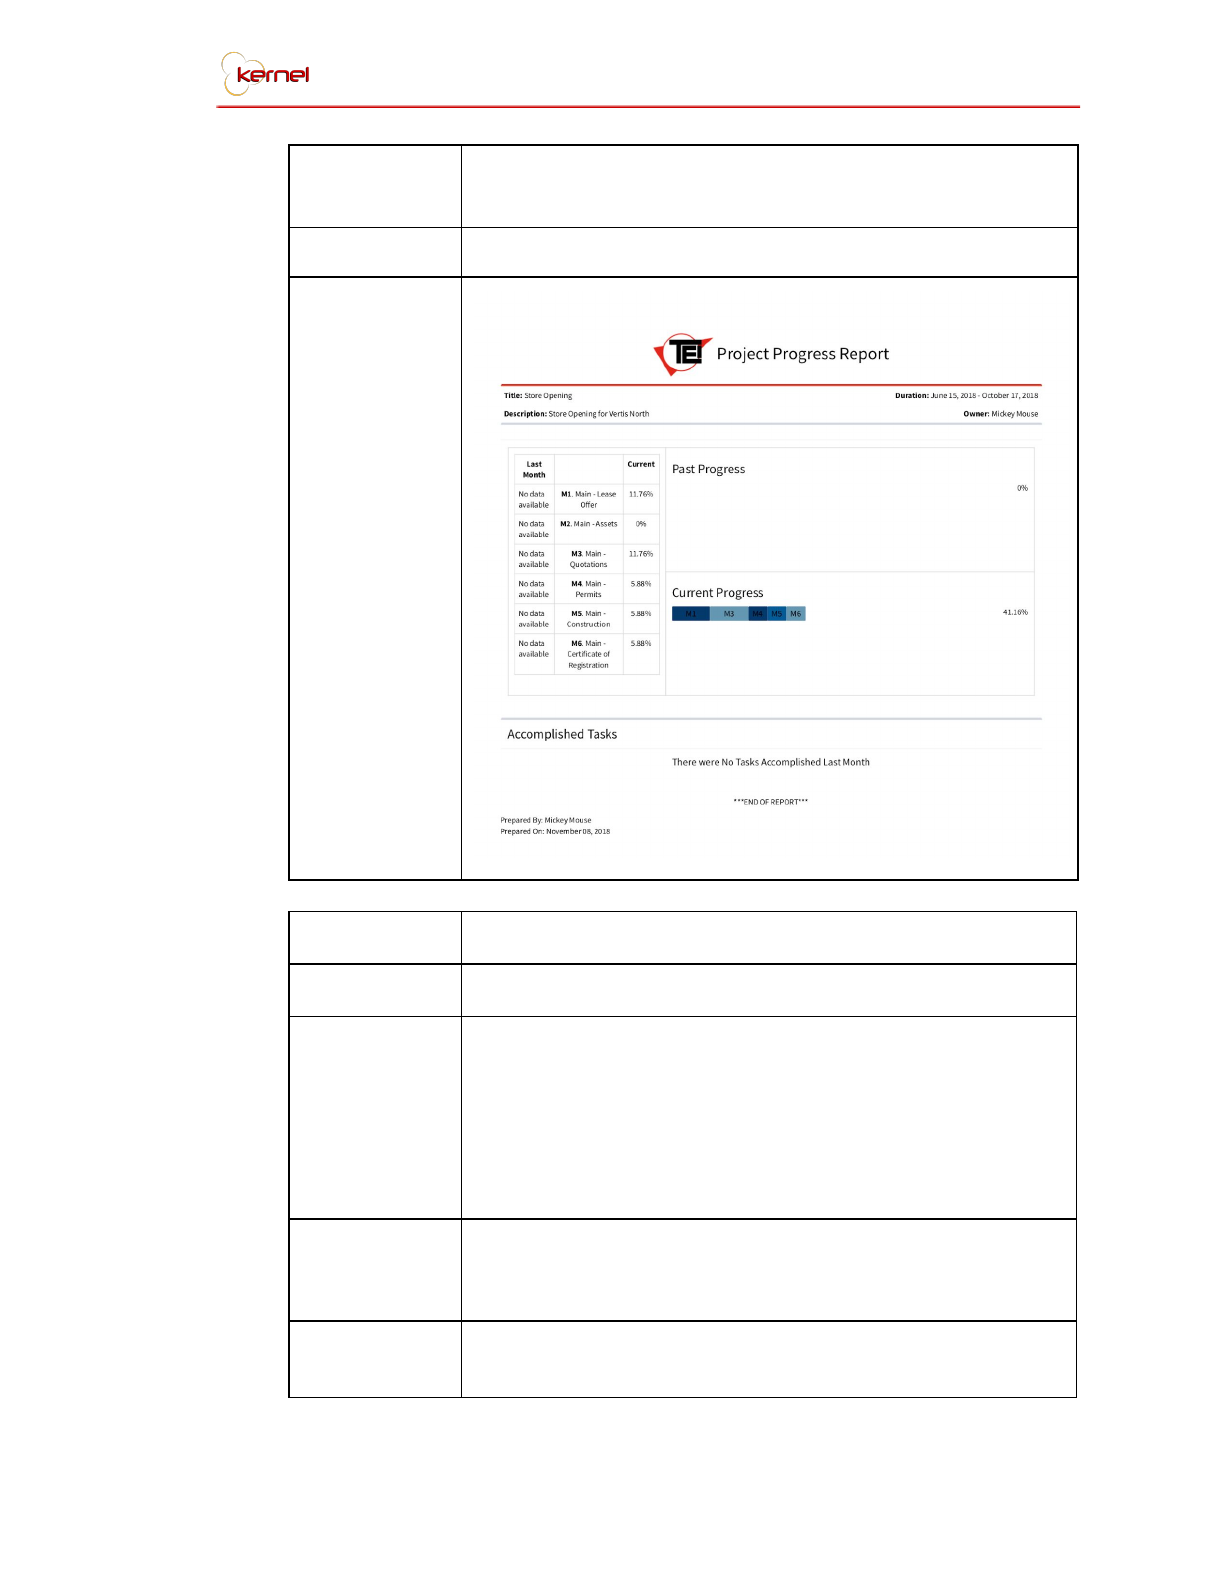
Name
Project Progress Report
Description
Depending on the interval that was chosen, this report will
generate a weekly or monthly progress report of a
specific project. All the main activities will be shown as
well as its current progress and last week or month’s
progress. Tasks accomplished within the week or month
will also be shown in this report.
Used and
Prepared By
President, and Heads and Supervisors involved in a
project
Volume and
Frequency
Once as needed
Purpose
This report is for the project owner to see the progress of
each main activity in a project. It also shows the previous
TEI Project Management System 47
progress for them to see how much a project has
progressed through time.
Tables Used
Users, Tasks, RACI
Layout
Reference No.
R-04
Name
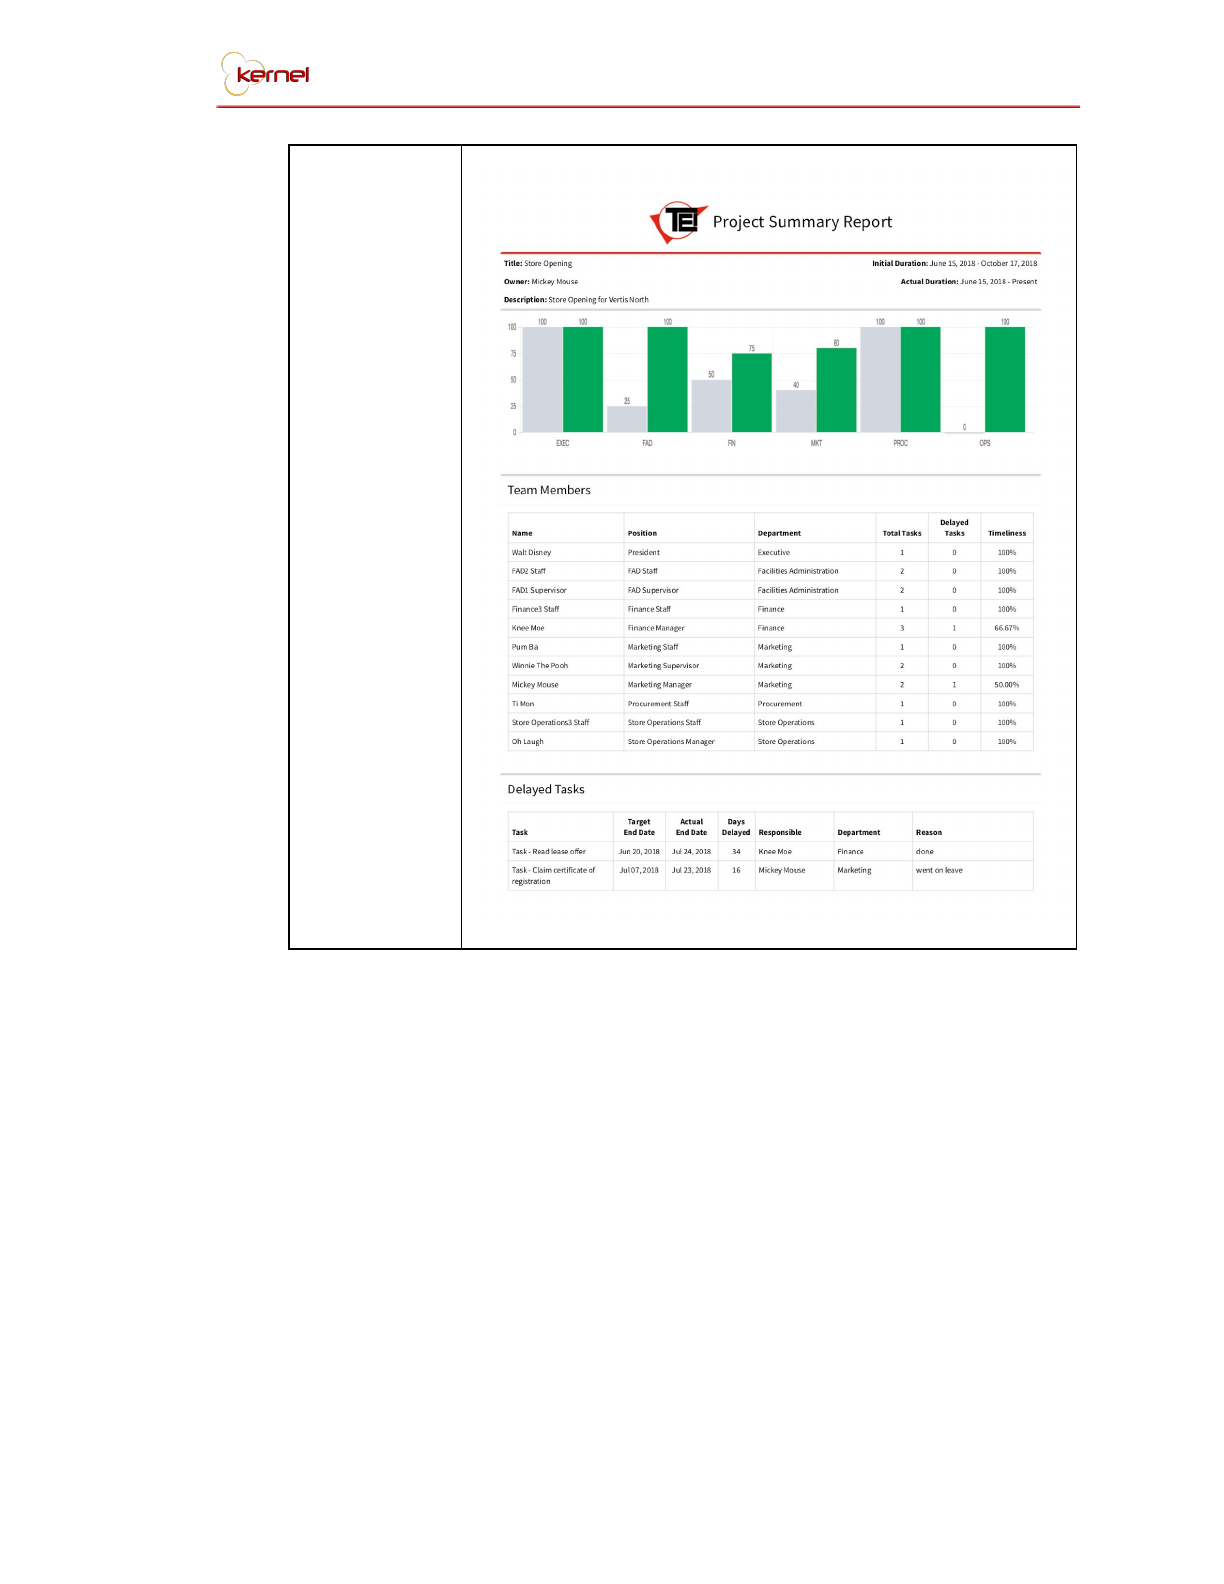
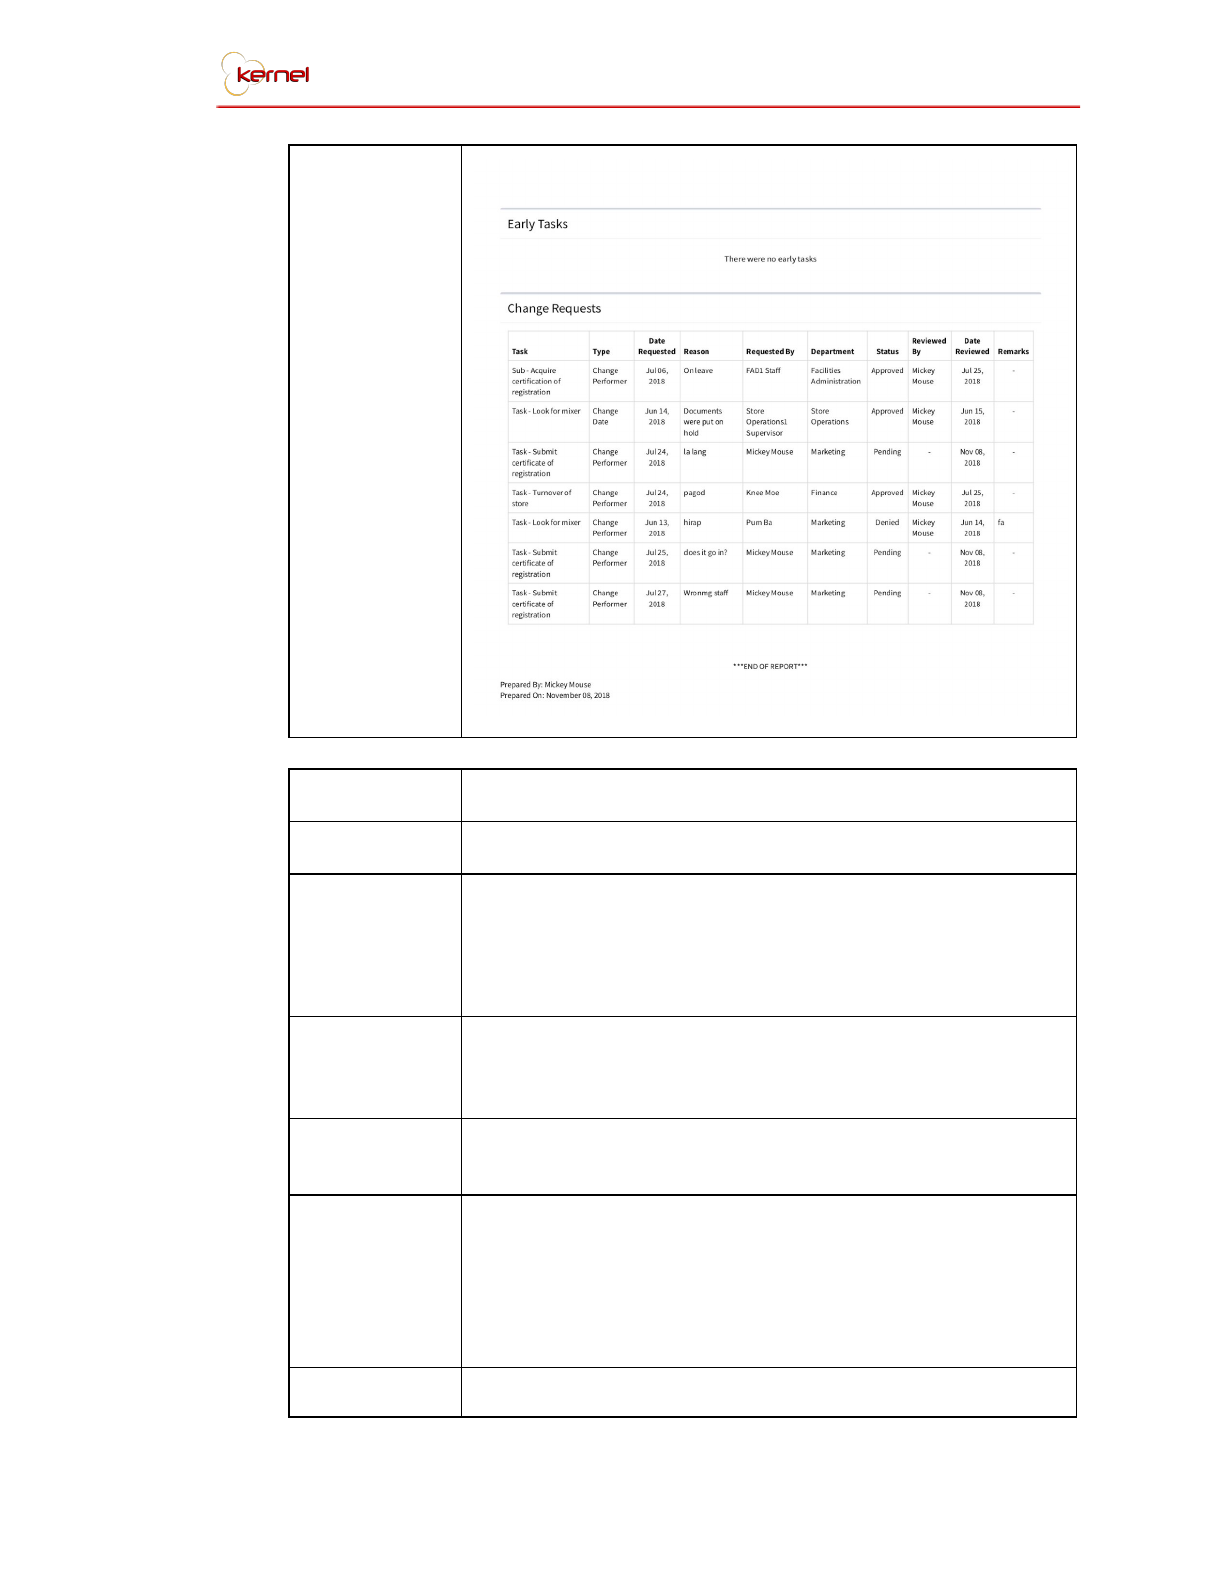
Project Summary Report
Description
This report gives an overview of what happened with the
project. It shows the timeliness of the overall project and
all the departments included in the project. It also
includes the members of the project, their department,
the total number of tasks assigned to them and their
timeliness.
Used and
Prepared By
President, and Heads and Supervisors involved in a
project
Volume and
Frequency
Once as needed
TEI Project Management System 48
Purpose
The Project Summary Report is best generated after a
project has been completed. This report, from the name
itself, gives the project owner a summary of all the things
that has happened to a project.
Tables Used
Users, Tasks, RACI, ChangeRequests
TEI Project Management System 49
Layout
TEI Project Management System 50
Reference No.
R-05
Name
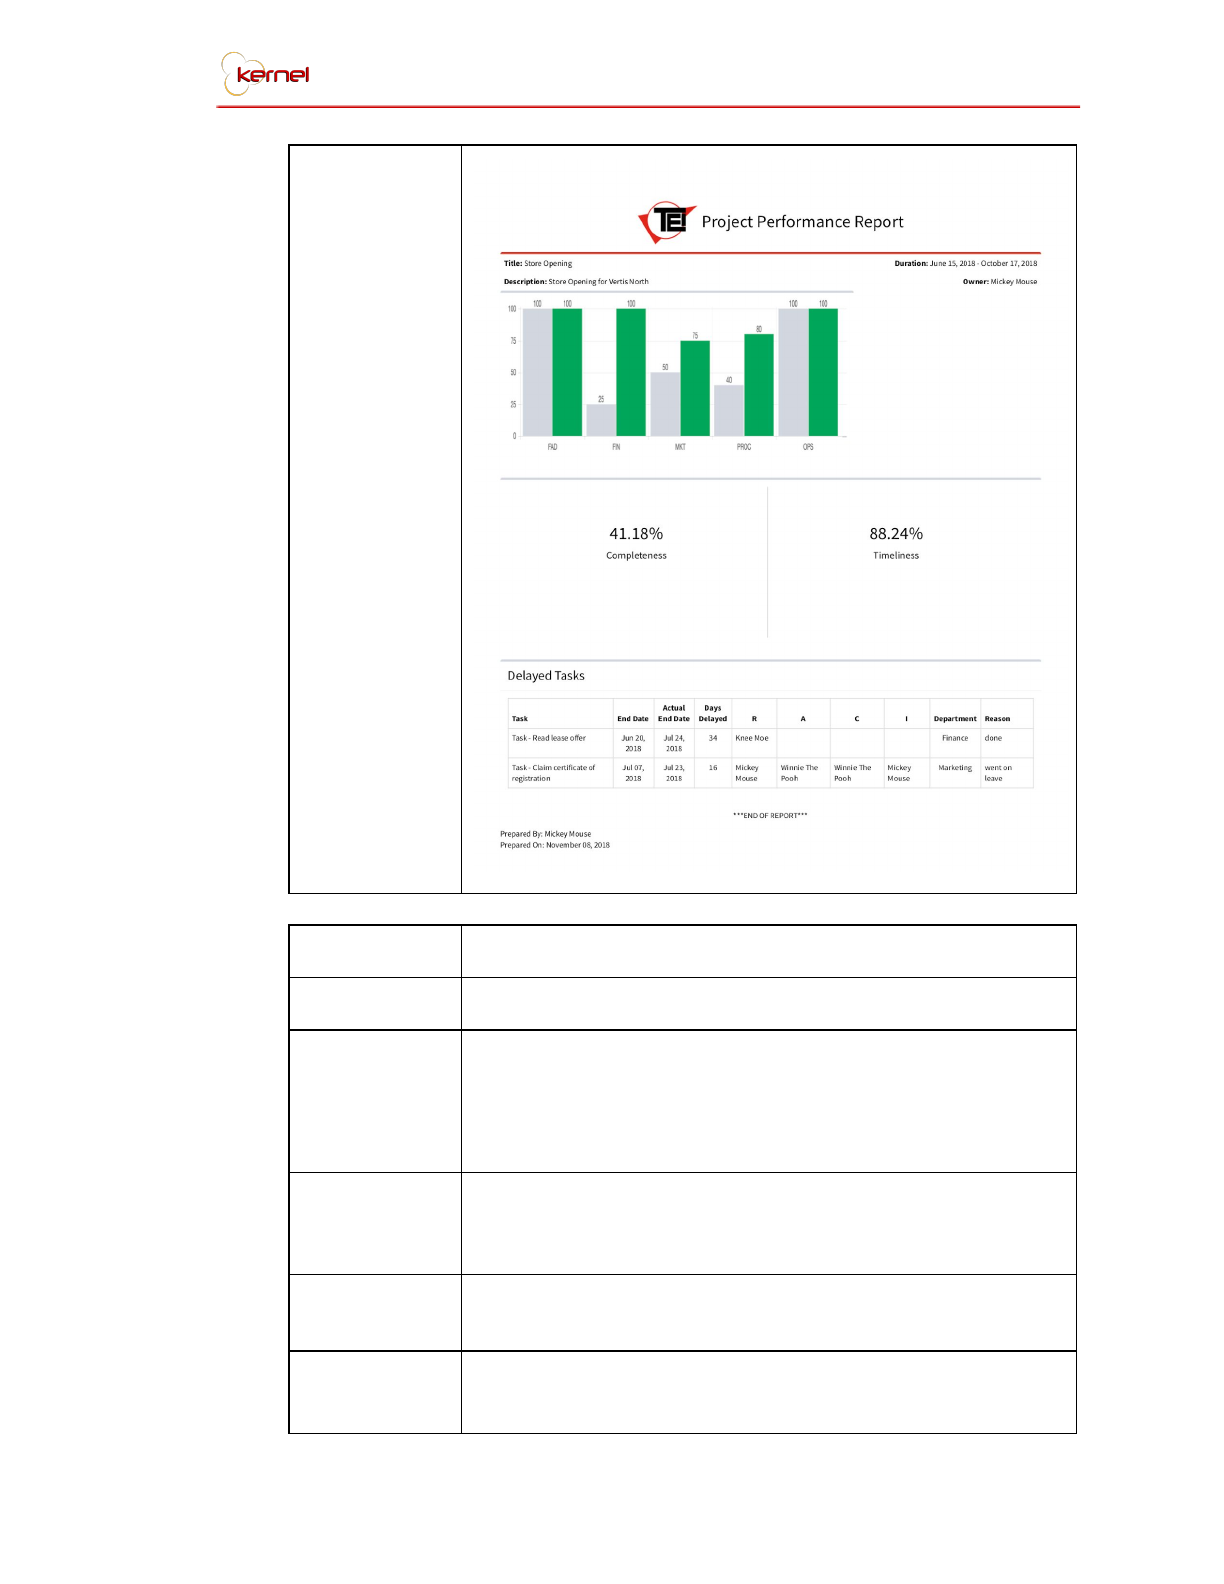
Project Performance Report
Description
This reports generates the performance metrics of a
project and all the departments involved in a project in
terms of its completeness and timeliness. All delayed
tasks are also shown in a table format.
Used and
Prepared By
President, and Heads and Supervisors involved in a
project
Volume and
Frequency
Once as needed
Purpose
The purpose of this report is for the project owner to see
how all the departments involved in their project are
performing. In here, the project owner can determine
which departments are causing the delay, as well as the
task that is delayed.
Tables Used
Users, Tasks, RACI
TEI Project Management System 51
Layout
Reference No.
R-06
Name
Team Performance Report
Description
Team Performance Report shows the performance
metrics of all the user’s subordinates. It also shows the
number of projects and tasks a certain person is currently
handling and also the number of delayed task per user.
Used and
Prepared By
Department Heads and Supervisors
Volume and
Frequency
Once as needed
Purpose
This report is for the department heads and supervisors to
see how their subordinates are performing. It also shows
TEI Project Management System 52
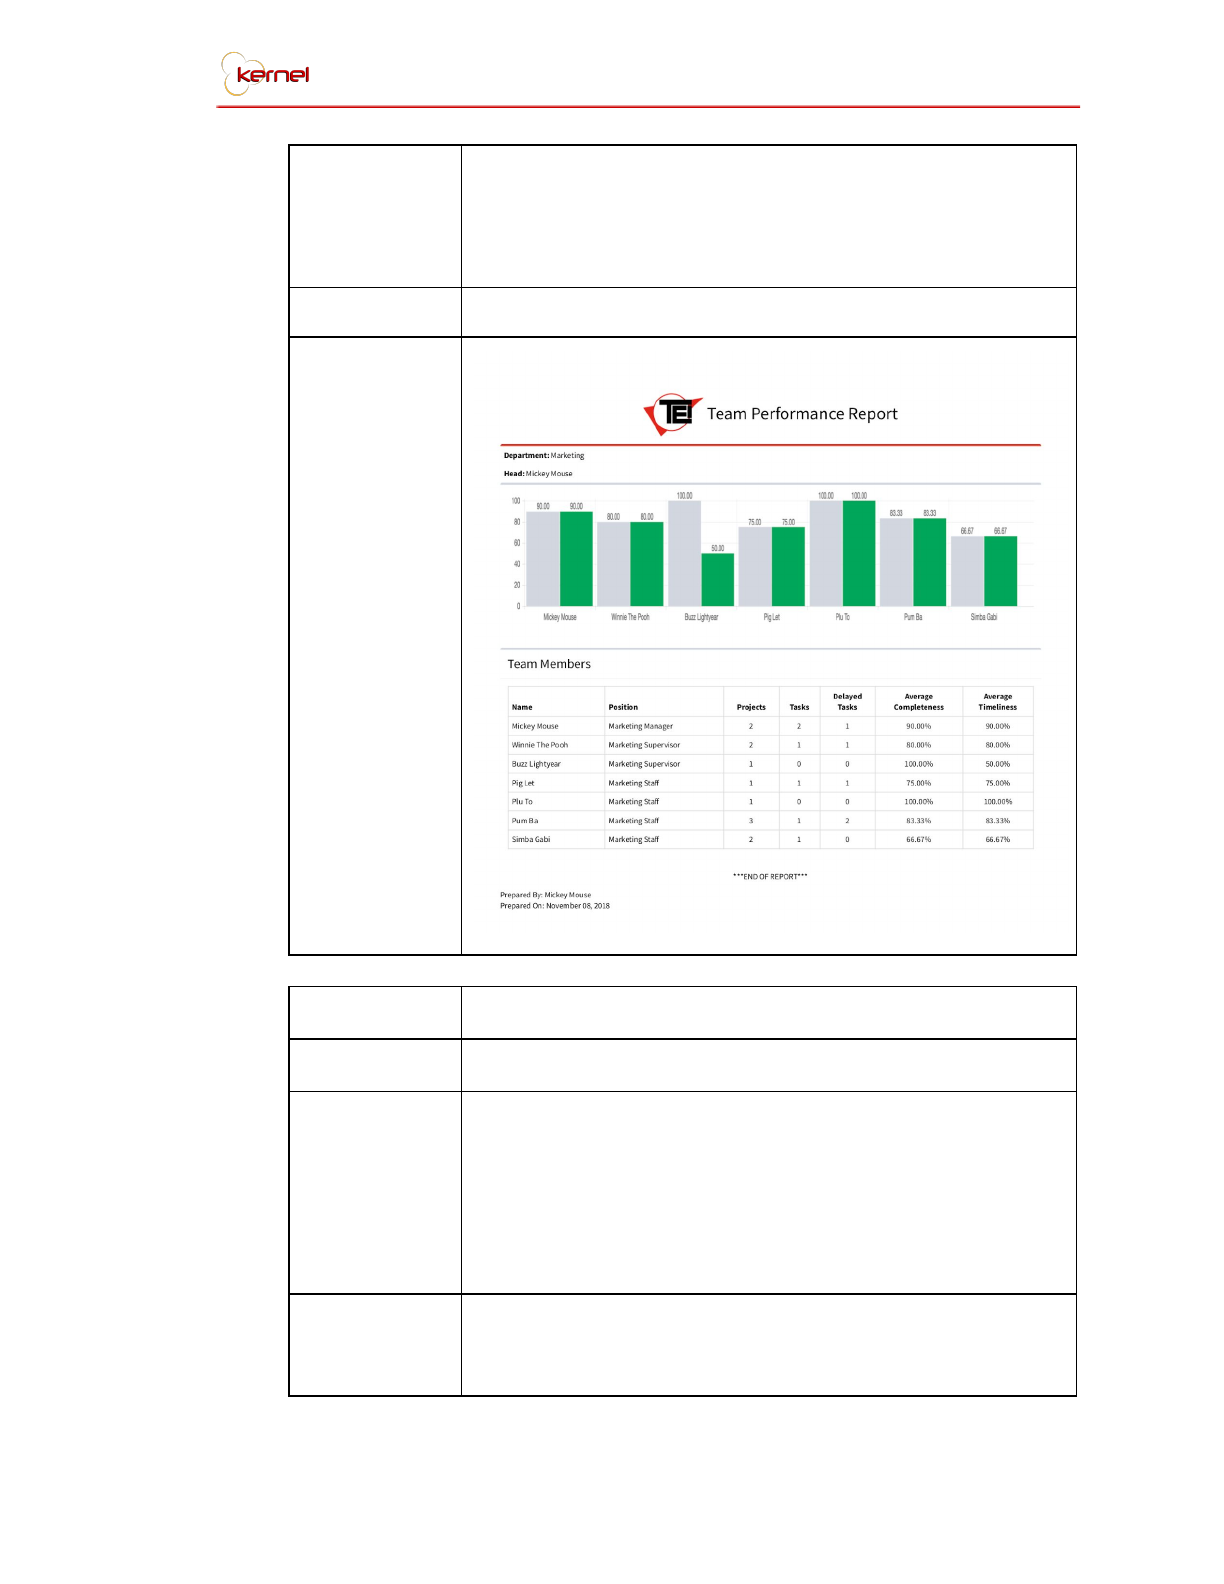
the workload of each person for the user to be able to
determine who can handle more work if need be. The
main purpose of this report is to aid in the appraisal of
employees every year.
Tables Used
Users, Projects, Tasks, RACI
Layout
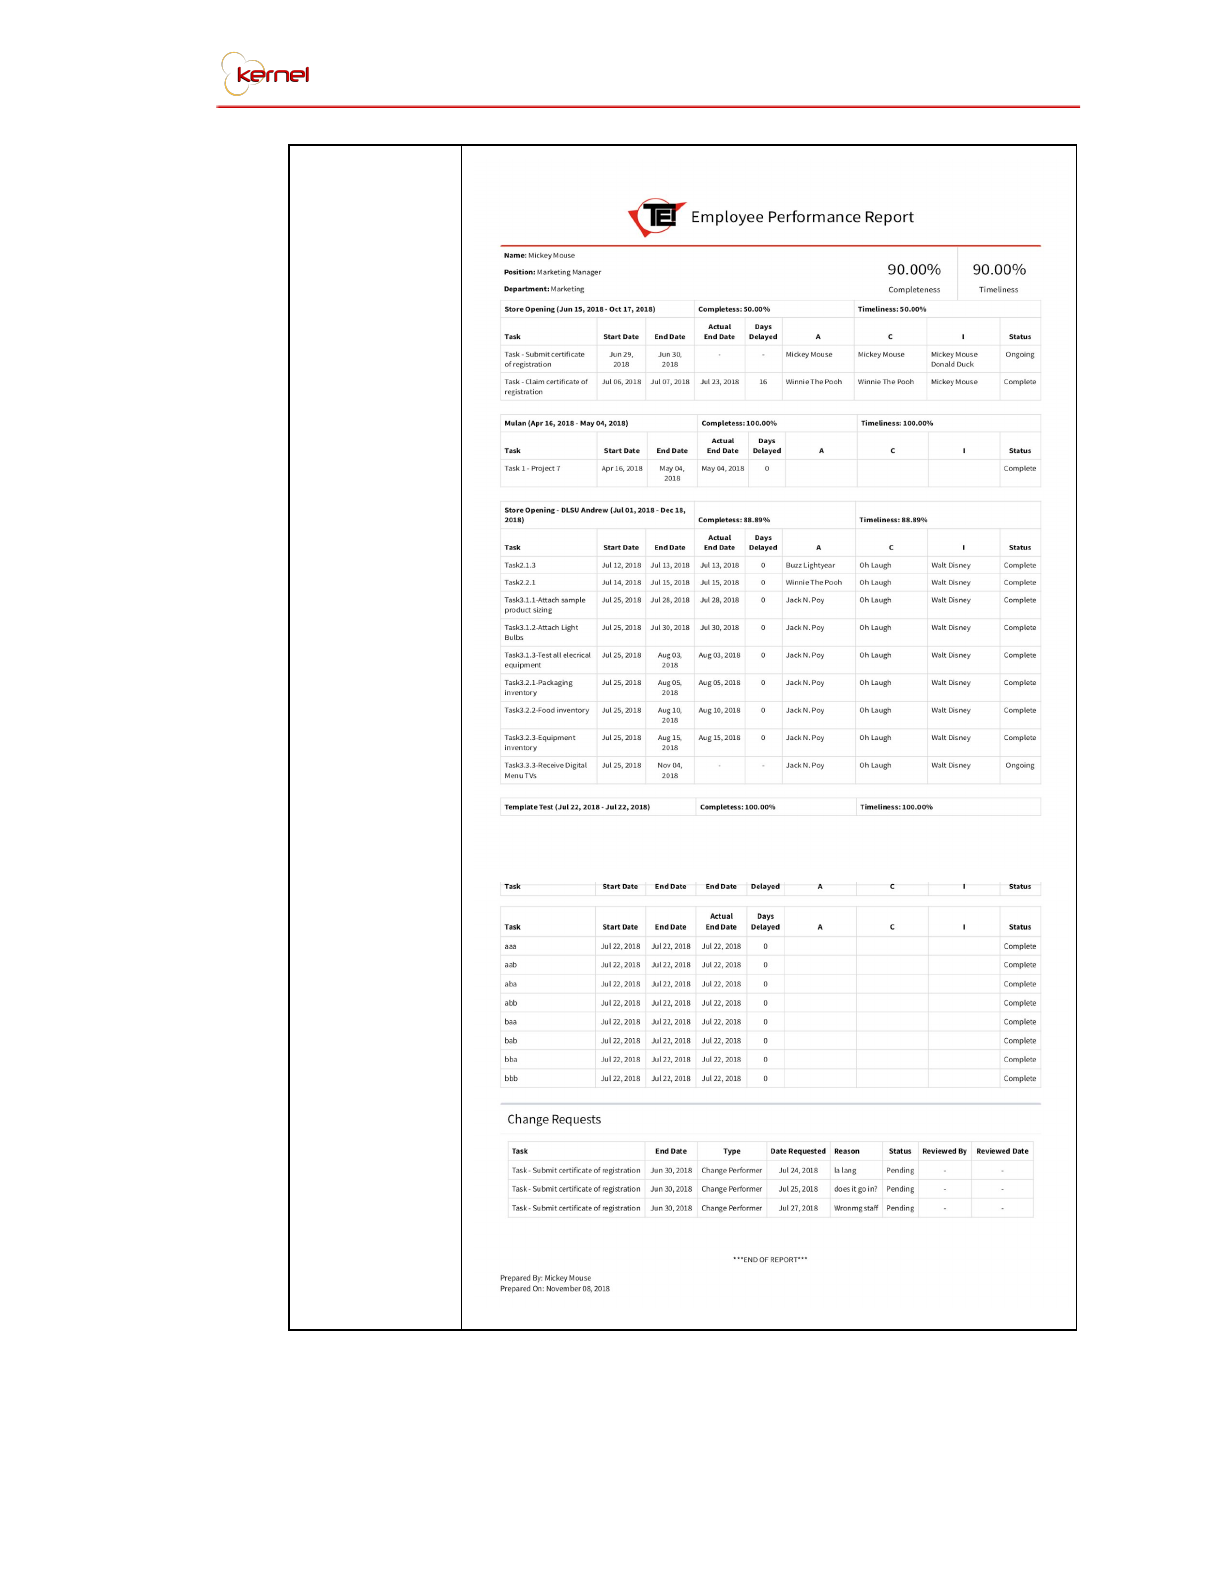
Reference No.
R-07
Name
Employee Performance Report
Description
This report generates all the projects the user is or was
involved for the calendar year. It shows their
completeness and timeliness for each project, and their
overall completeness and timeliness. This report also
generates all change requests that the user has
submitted.
Used and
Prepared By
Anyone
TEI Project Management System 53
Volume and
Frequency
Once as needed
Purpose
The purpose of this report is for the employee to see their
performance in terms of completeness and timeliness.
This is helpful for the employee to know if there’s a need
for them to improve on a certain area.
Tables Used
Users, Projects, Tasks, RACI
TEI Project Management System 54
Layout
TEI Project Management System 55
4.0. Architectural Design
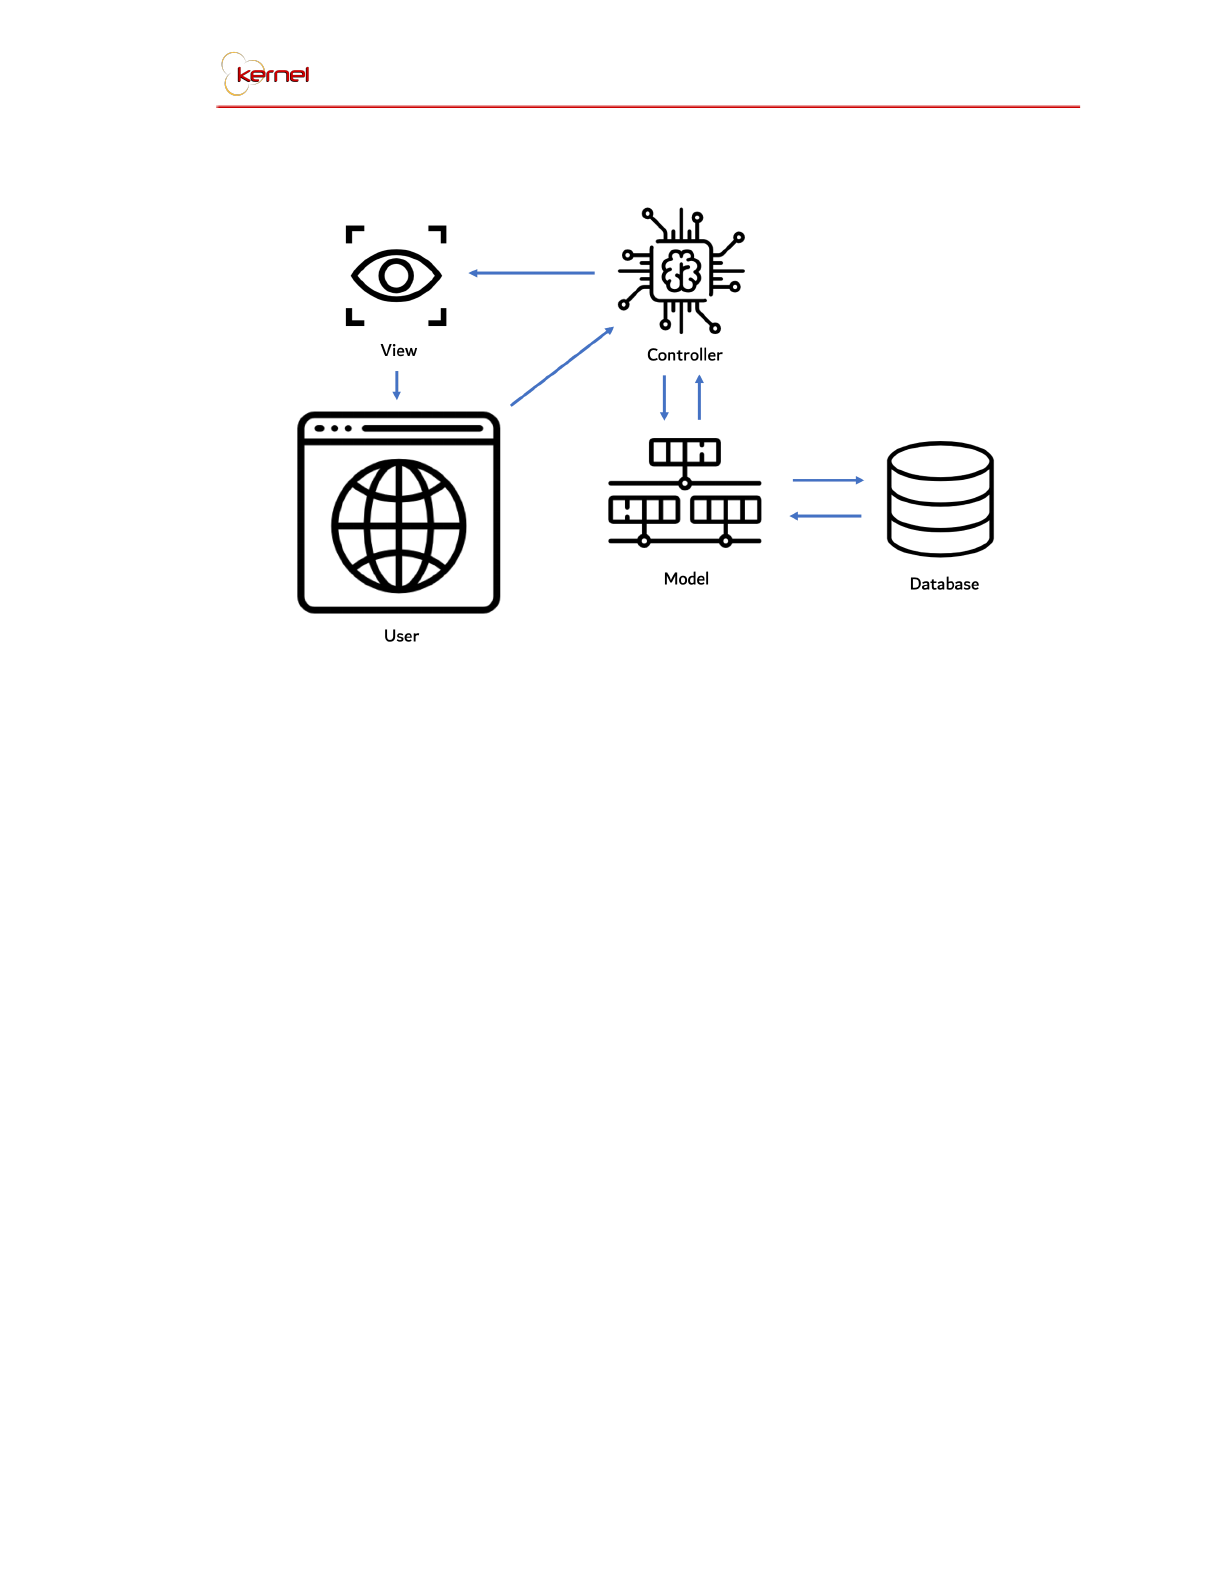
Kernel Architectural Design
The system utilizes the CodeIgniter Model-View-Controller (MVC) framework as
illustrated above. From a user point of view, the user will simply need to access the
system through a web browser and click on different action or navigation buttons.
From the system’s point of view, as the user tries to access the system, the controller
will begin the request cycle. Each action performed that requires data processing or
view manipulating is considered a request.
The controller is responsible for bridging the data and the view together. Data
processing also happens in the controller where it prepares the data for the model to
insert into the database, or for the view to display to the user. The model is the only
access point to and from the database. It handles reading and writing of data through
SQL queries. The database is simply the storage of a collection of data segregated
into tables. The system only makes use of one database. Lastly, the view is the
format of data that the user sees.
The request cycle, as mentioned earlier, begins with an event-trigger to the
controller, which then calls the model to access the database and gather the
TEI Project Management System 56

requested data. The model then returns the data to the controller, and after some
processing, the controller sends the results to the view. The view then organizes the
screen according to the layout set and by inserting the data in their respective
positions.
5.0. Maintenance Plan
System Maintenance and Support activities include, but are not limited to,
diagnosing and correcting bugs/errors, maintaining and updating software and
configuration settings, and continuous improvement and implementation of
significant features to the overall system. These activities may be conducted by
in-house developers present in the company or the original developers of the
system. All system updates and configuration should be recorded for proper
accountability and reference for future updates and developers.
There are various types of maintenance, and it is important to know what they
are and the appropriate approach on tackling each one of them. To name a few,
there are preventive maintenance, controlled maintenance, and corrective
maintenance.
Preventive maintenance can be easily related to the phrase “Prevention is
better than cure”. As the name itself, this type of maintenance focuses on detecting
the possible risks in the system before they develop to a full-blown error. This type
of maintenance can be practiced by doing routine inspections, which will include
testing and adjustments, on the system to ensure that the modules and functions are
performing as expected. A maintenance log sheet may be produced and recorded
to keep track of each preventive maintenance approach as follows:
TEI Project Management System 57
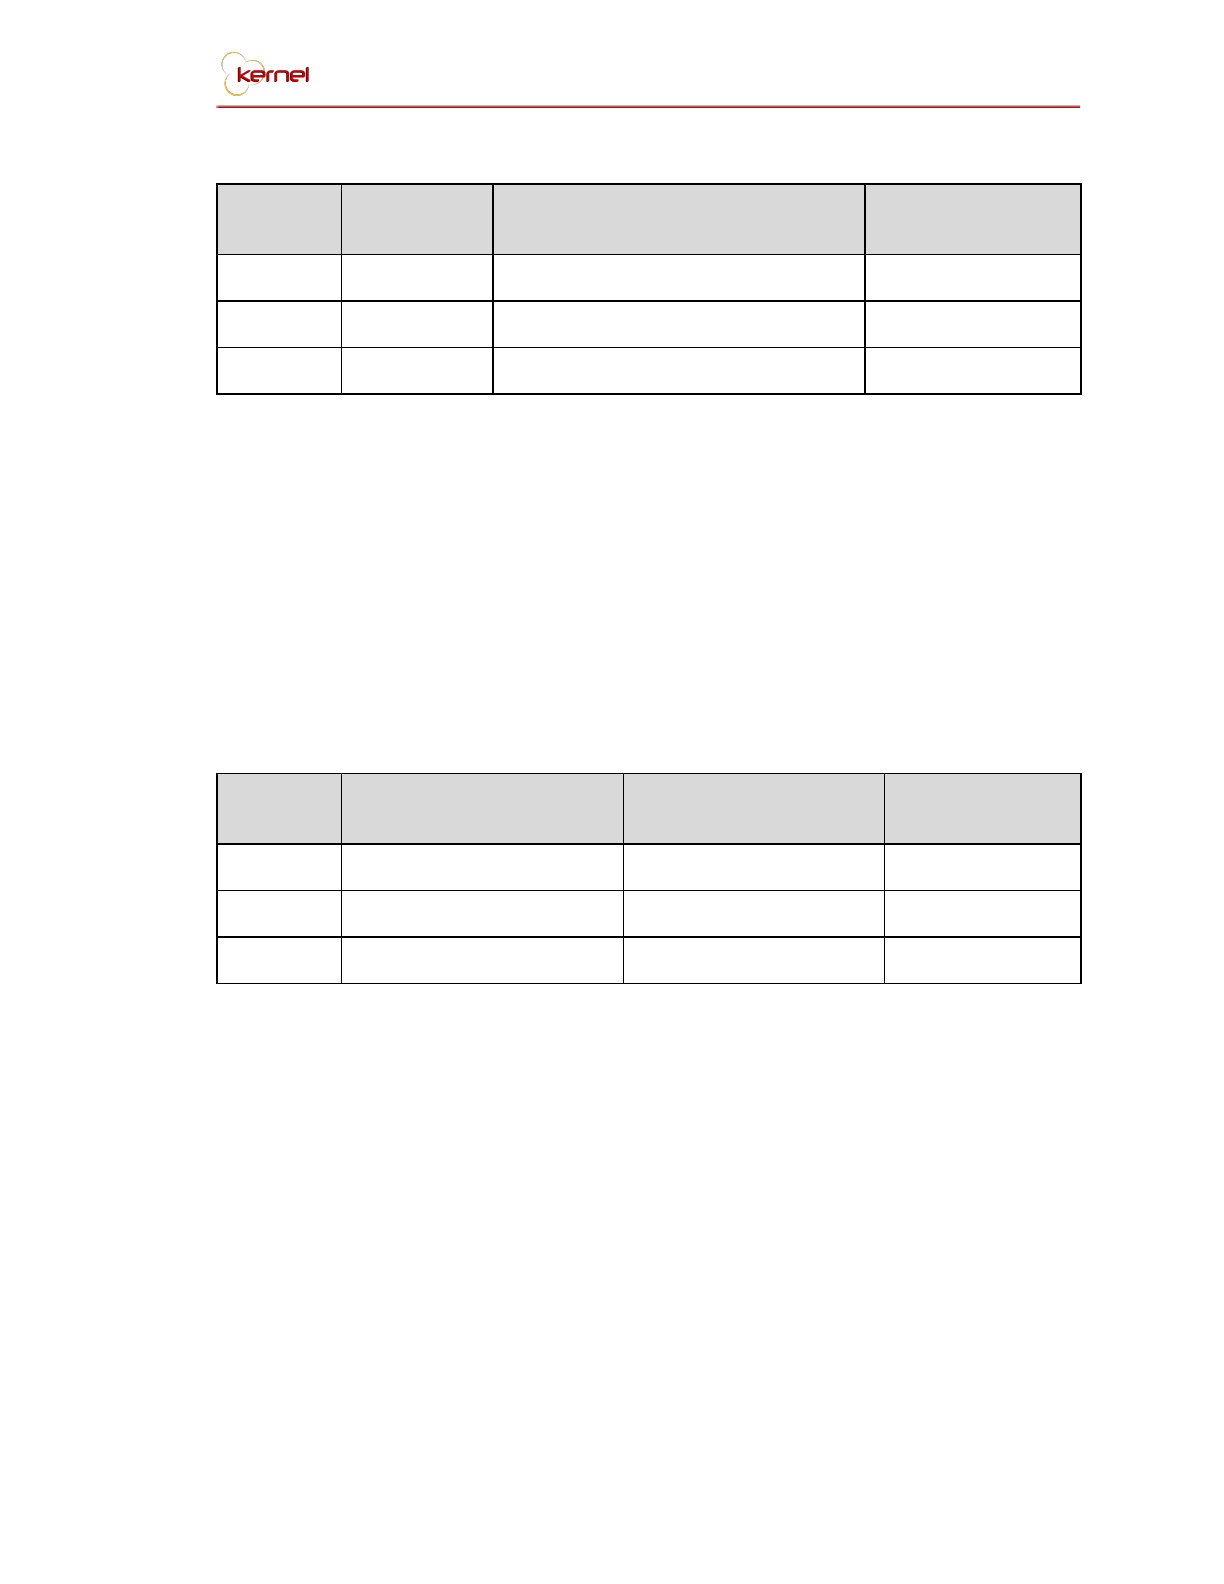
Date
Performed
By
Risks Found
(Description)
Concerned
Module/Function
mm-dd-yyyy
Preventive Maintenance Log Sheet Template
Controlled Maintenance are scheduled and performed according to the
company for the system’s improvement. The controlled maintenance may handle
the new updates of the tools used in the system released by a specific vendor. A
monthly/yearly improvement and system code refactoring may be planned to
continuously better the system and its processes. A fixed maintenance schedule
may be produced given the appropriate information:
Date of
Execution
Update to Address
Concerned
Module/Function
Assigned
Performer
mm-dd-yyyy
Corrective Maintenance Log Sheet Template
Corrective Maintenance is triggered by an error generated by the system or,
in worst cases, when the system crashes entirely. The main goal for this type of
maintenance is to solve the identified bug/problem and get the system restored and
running normally as soon as possible. An error may be reported by a user using the
following form:
TEI Project Management System 58
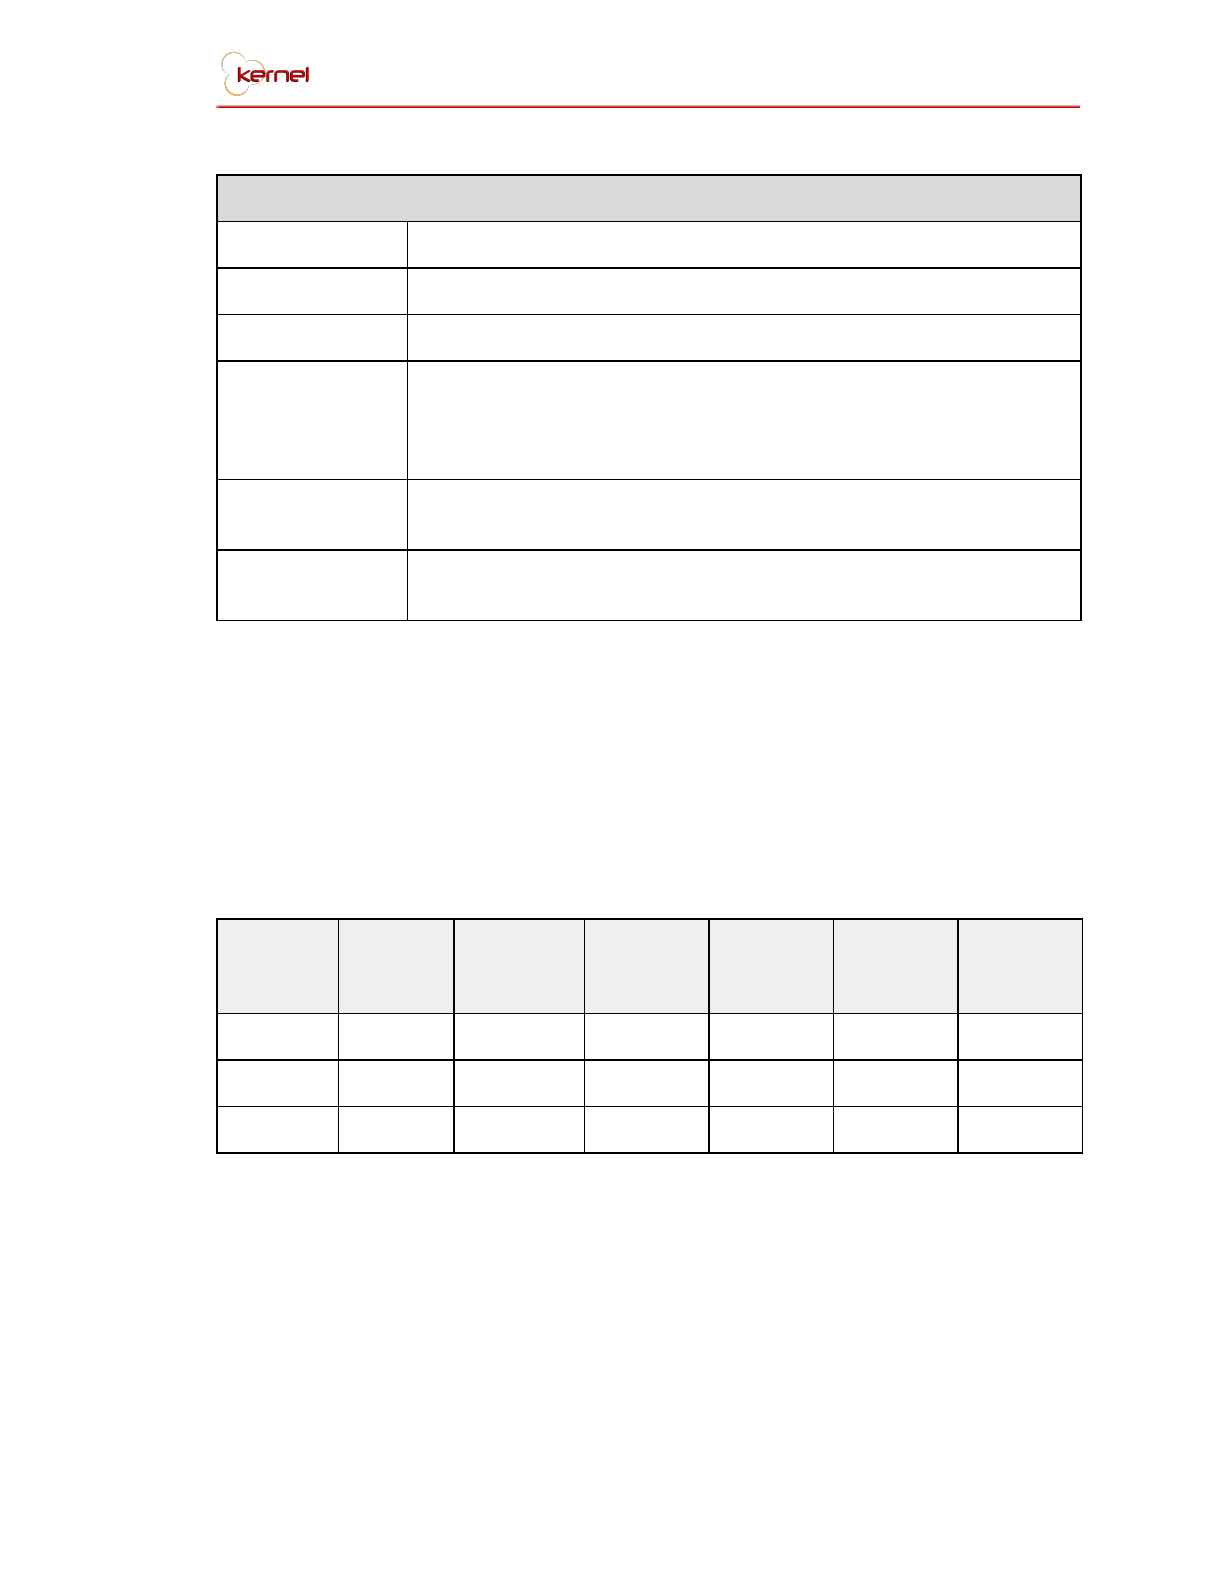
User Report Form
Report Date:
mm-dd-yyyy
Reported By:
Module/Function:
Event Description
/Scenario:
System Behavior:
Comments:
User Report Form Template
Given that the error/problem has surfaced and is brought to the attention to
the developers, the information at hand may be logged in a system errors sheet
which would keep track of the bugs found, as these may not be entirely avoided and
spotted during the development stage. The sheet is formatted as follows:
Report
Date
Reported
By
Problem
Descriptio
n
Expected
Result
Actual
Result
Resolved
Date
Resolved
By
mm-dd-yyyy
mm-dd-yyyy
System Errors Log Sheet Template
TEI Project Management System 59
