Tensorflow Viualization Debugging Manual
User Manual:
Open the PDF directly: View PDF ![]() .
.
Page Count: 17

Manual: Tensorflow Debugging and Visualization Environments
Tensorflow Visualisation
Tensorboard is essentially a visualization toolkit that can be used to track the evolution of various
parameters during training a machine learning system.
The variables that are to be tracked are written into a log directory after having generated summary
data in the form of a summary writer;
le_writer = tf.summary.FileWriter('/path/to/logs', sess.graph)
Once the event files (files where the variables are logged into) are ready, use the command
$ tensorboard –logdir=pth/to/logs –port 6060
(The entire command is important as we’ll be using another instance of tensorboard for debugging
on port 6006)
Also, keep in mind to launch the above command from the Terminal (Linux and Mac OS) or
Command Prompt (Windows). While running either Jupyter notebook or Python script.
Key Concepts:
For the handwritten_digits_recognition_cnn_5layer.ipynb, the different (graph, scalar, histogram)
visualization are illustrated in the following screenshots.
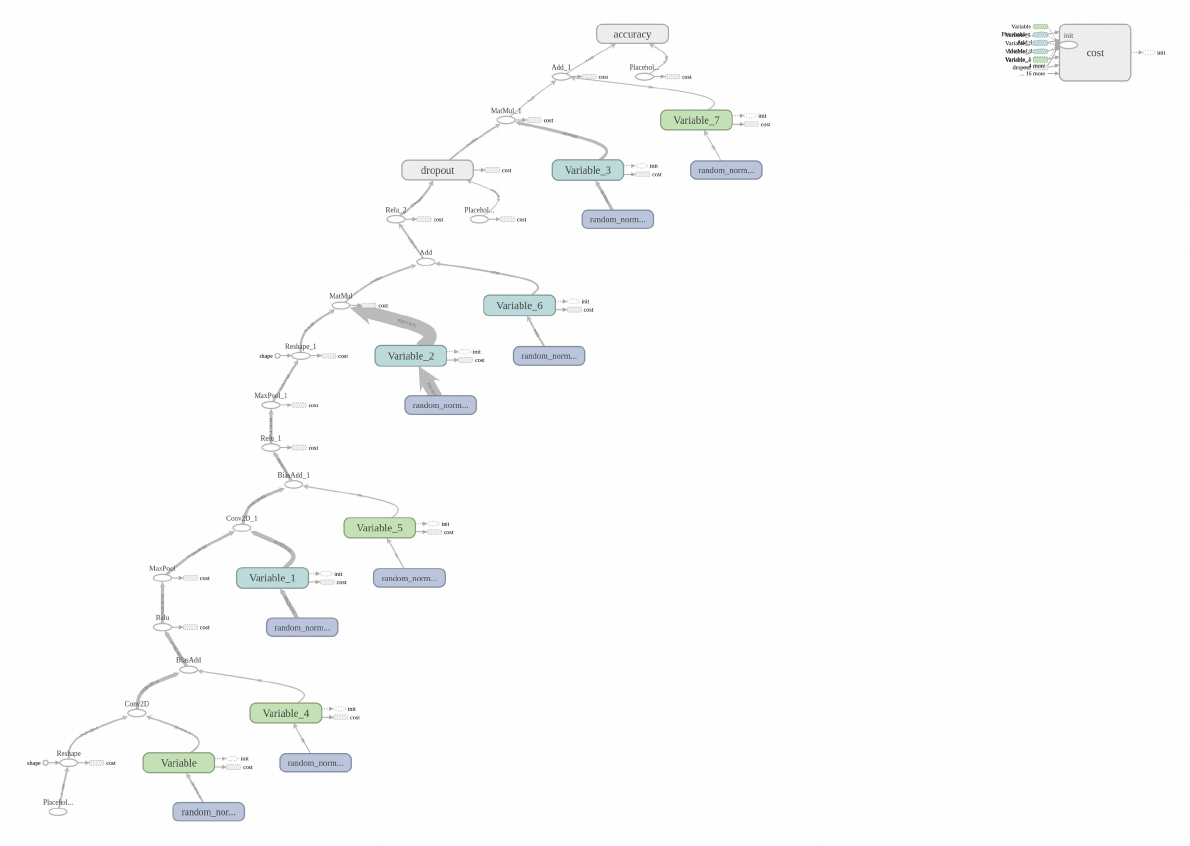
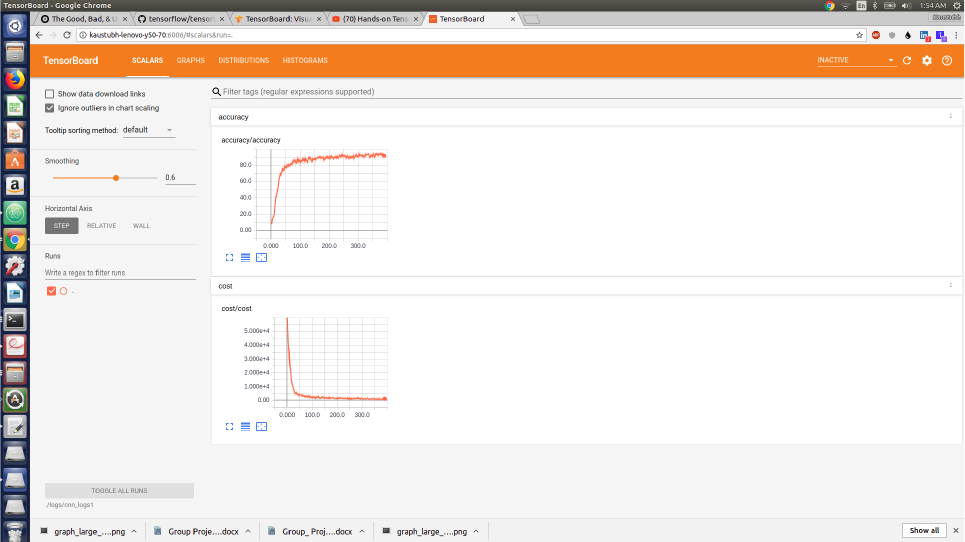
Scalar Dashboard
TensorBoard's Scalar Dashboard visualizes scalar statistics that vary over time; for example, you
might want to track the model's loss or learning rate.
Accuracy and loss have been tracked.
The tf.summary.scalar object is used to log these changes for visualization.
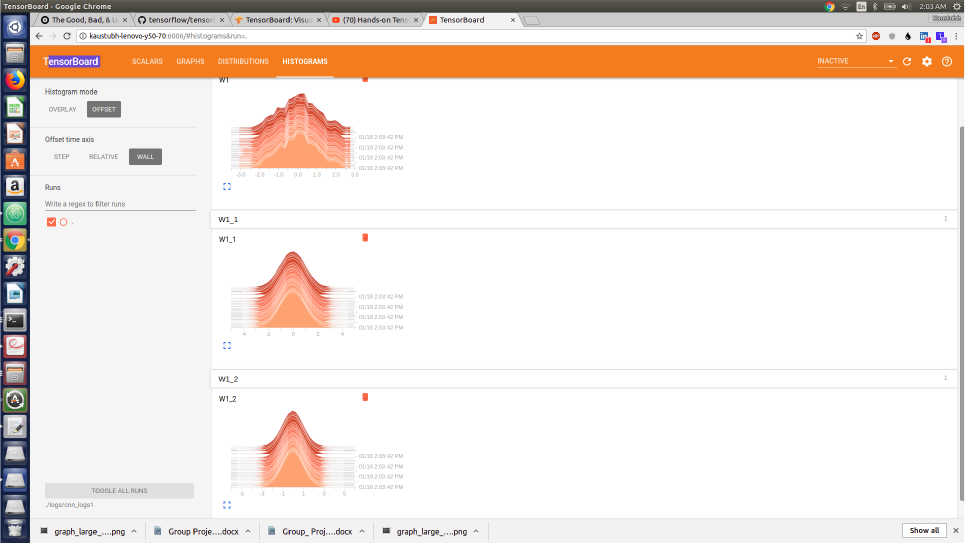
Histogram Dashboard
The HistogramDashboard displays how the statistical distribution of a Tensor has varied over time.
It visualizes data recorded through the tf.summary.histogram object.
Each chart shows temporal "slices" of data, where each slice is a histogram of the tensor at a given
step.
It's organized with the oldest timestep in the back, and the most recent timestep in front.
By changing the Histogram Mode from "offset" to "overlay", the perspective will rotate so that
every histogram slice is rendered as a line and overlaid with one another.
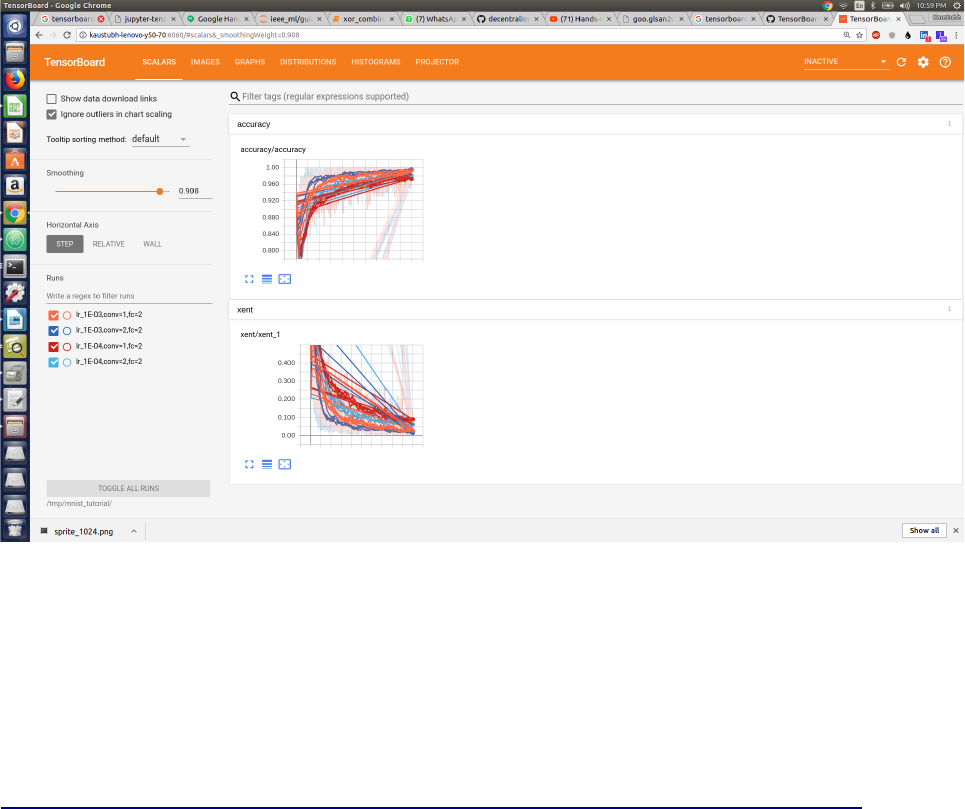
Hyperparameter Search
Tensorboard also provides option to visualize the performance of a model for different choices of
hyperparameters.
This is done on the file mnist_hyperparameters.py
The different color codes correspond to different hyperparameter settings which in this case are
[learning rate, number of convolution_layers, number of fully_connected_layers].
For a more detailed instructions for using various functionalities of tensorboard; go to
https://github.com/tensorflow/tensorflow/blob/r1.2/tensorflow/tensorboard/README.md
Tensorflow Debugger
CLI Debugger
XOR_combined.py
Firstly, the Tensorflow CLI debugger can be used to debug any running computational graph in
Tensorflow very succintly. This is difficult to achieve with standard debuggers like Python’s pdb.
It is best recommended to use TF CLI debugger on .py files.
The tf_debug (TensorflowDebugger) is a debugger built for tensorflow that enables you to view the
internal structure and states of the Tensorflow computational graphs during training and inference.
You will have to wrap TF sessions with the tfdbg as:
sess = tf_debug.LocalCLIDebugWrapperSession(sess)
This wrapper will same interface as Session thus enabling debugging needs no extra code changes.
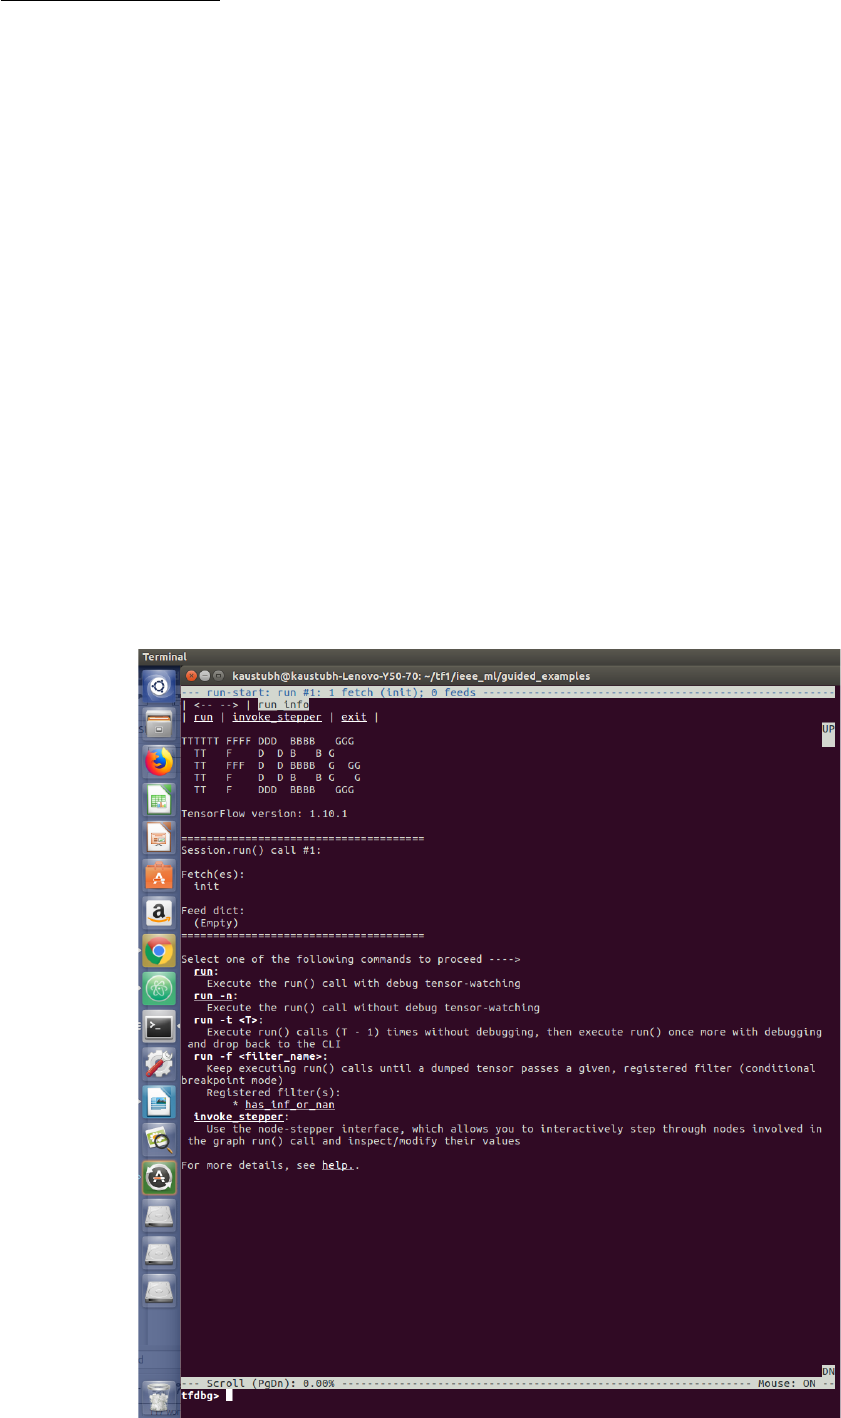
To launch a TF CLI Debugger on the xor_combined.py;
$ python3 xor_combined.py –debug
The debug wrapper session will prompt you before the first Session.run() call is about to be
executed. This is also the run-start CLI. It lists the fetches and the feeds to the current
Session.run()call.
Now enter the run command in the terminal;
tfdbg> run
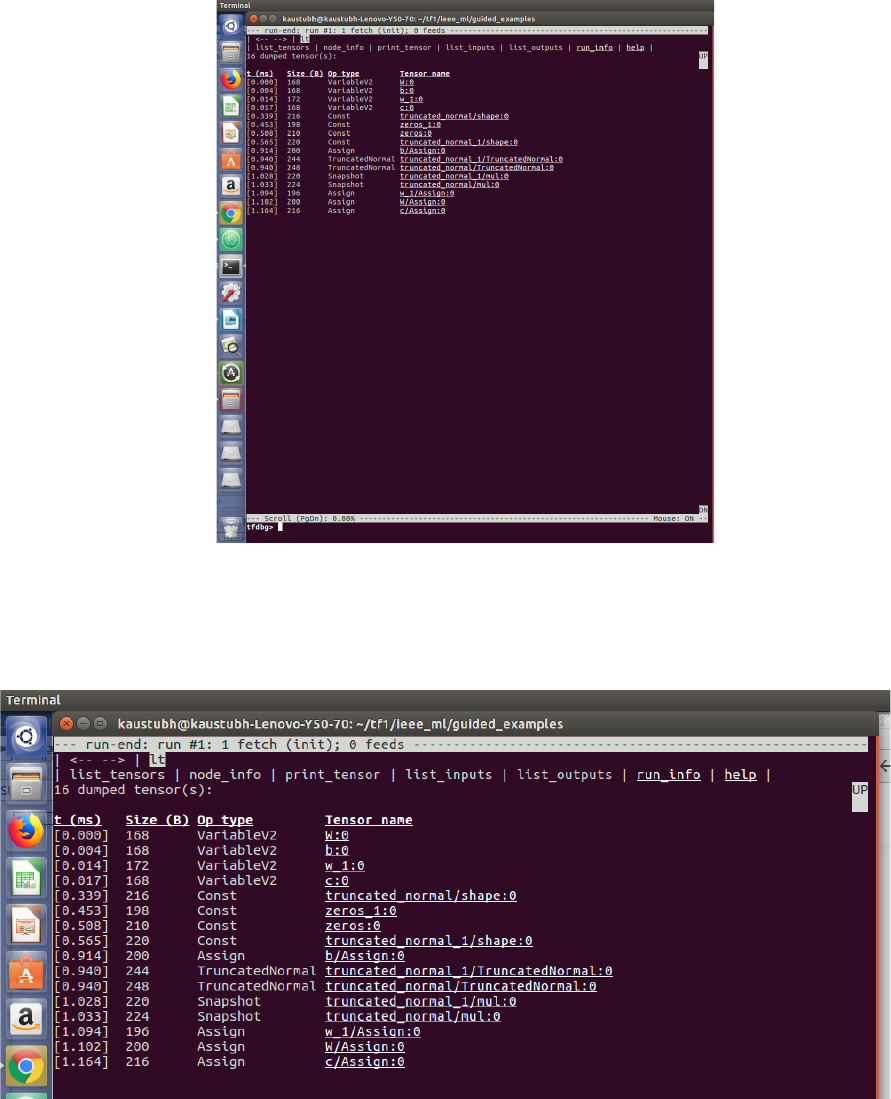
The run command makes the tf_debug execute ntil the end of the next Session.run() call.
The above screenshot shows the intermediate tensors from the previous Session.run() call.
For one such tensor, truncated_normal/mul
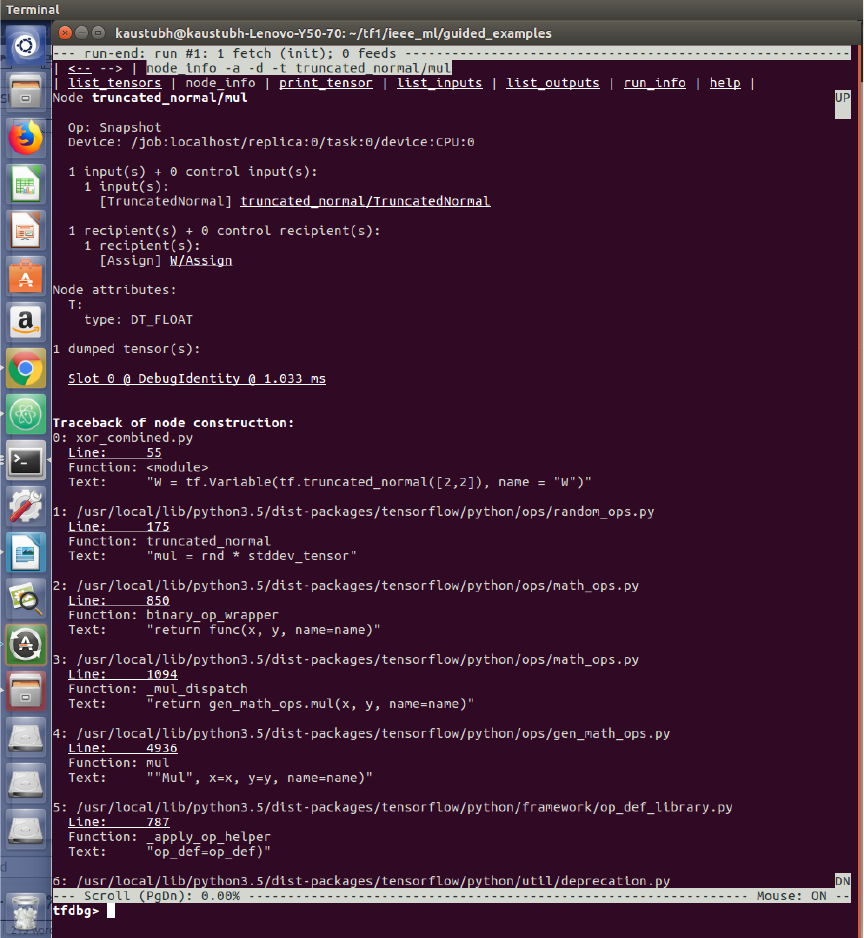
Now, we can use the node_info option to check up the type and attributes of this graph node as
shown
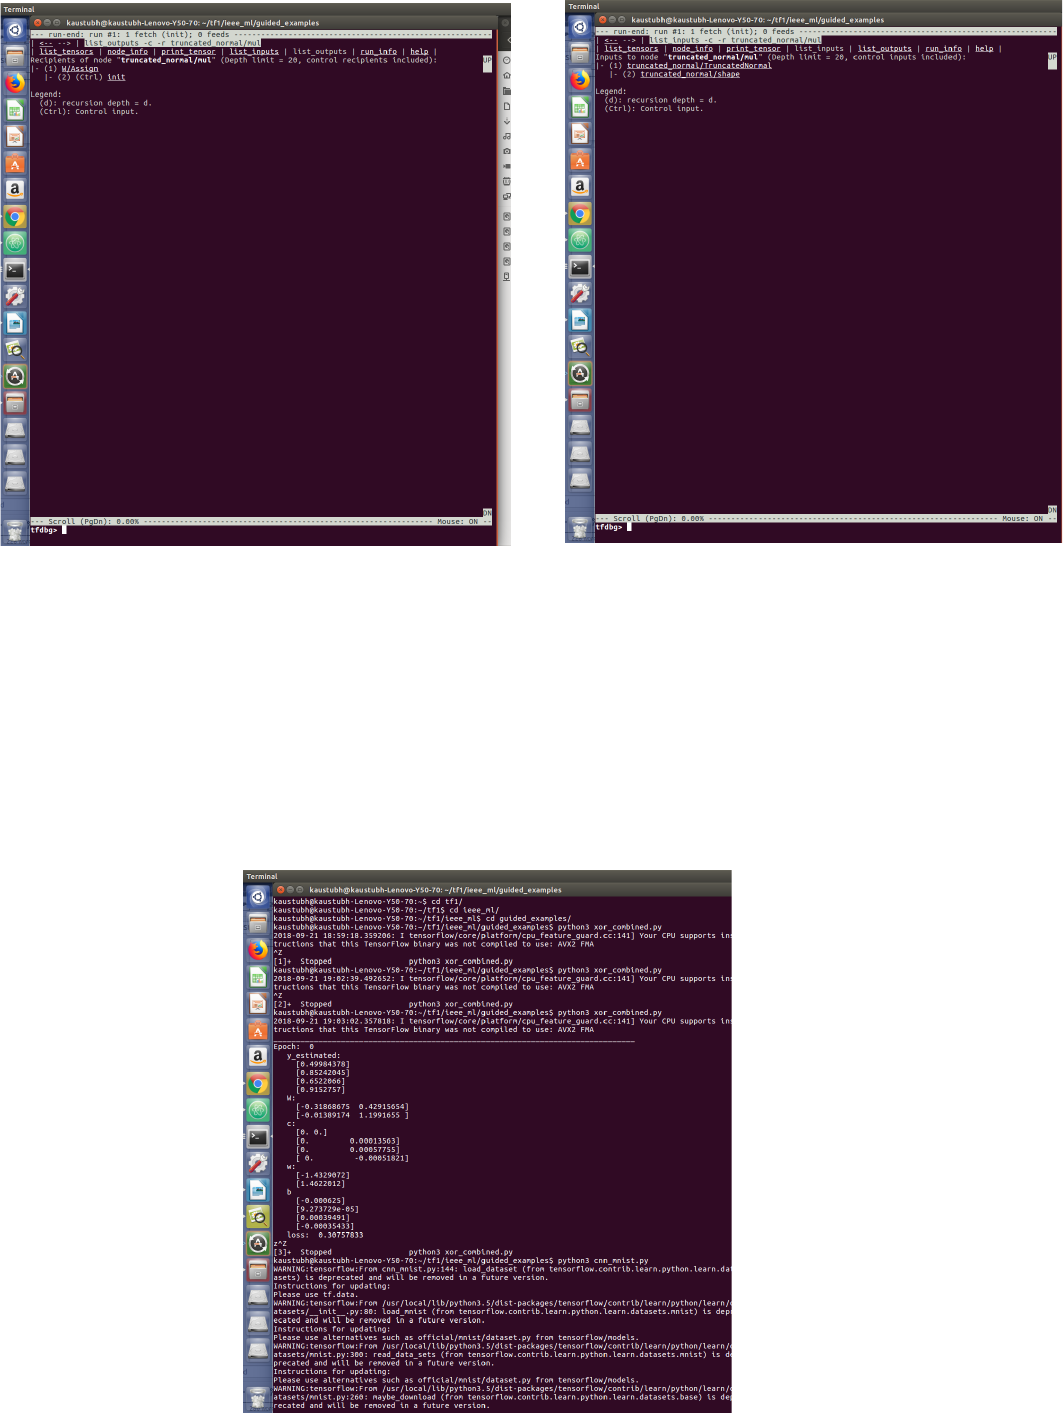
The list_inputs and list_outputs give the transitive inbound and outbound tensors of a given node.
list_inputs list out_puts
Also, conditional breakpoints feature of tf_debug can be used to let code run until certain cases/
conditions are satisfied on the graph.
In this case, let us consider the case the model runs until values like inf and nan are encoutered. For
this, in the command line enter;
tfdbg> run -f has_inf_or_nan
For this example, on xor_combined.py, all the epochs are run as XOR mapping uing an ANN is
relatively simple than image classification tasks and hence did not run into any issues.
We shall see this debugging aspect a little more in detail for the cnn_mnist.py case.
cnn_mnist.py
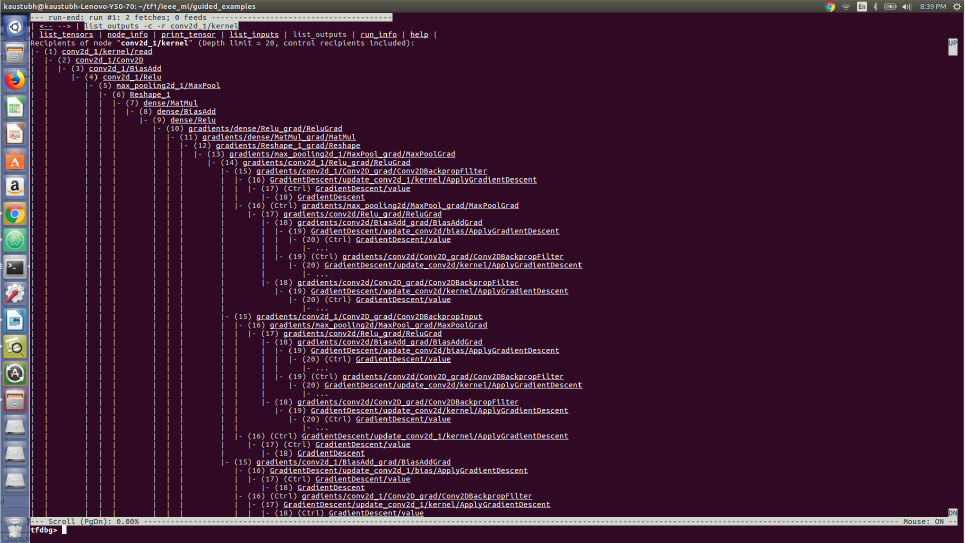
For the node: conv_2d_1 kernel the list_outputs are as follows:
The command:
>tfdbg run -f has_inf_or_nan
was run and there was no such tensor which had these values as the entire training cycle completed
without halting at any Session.run call.
Also, regex search can be used to find desired tensors in the CLI debug window.
In the below window; I have searched for “drop” and all “drop” occurences are highighted.
tfdbg> (drop) ---> Searching for the regular expression “drop”
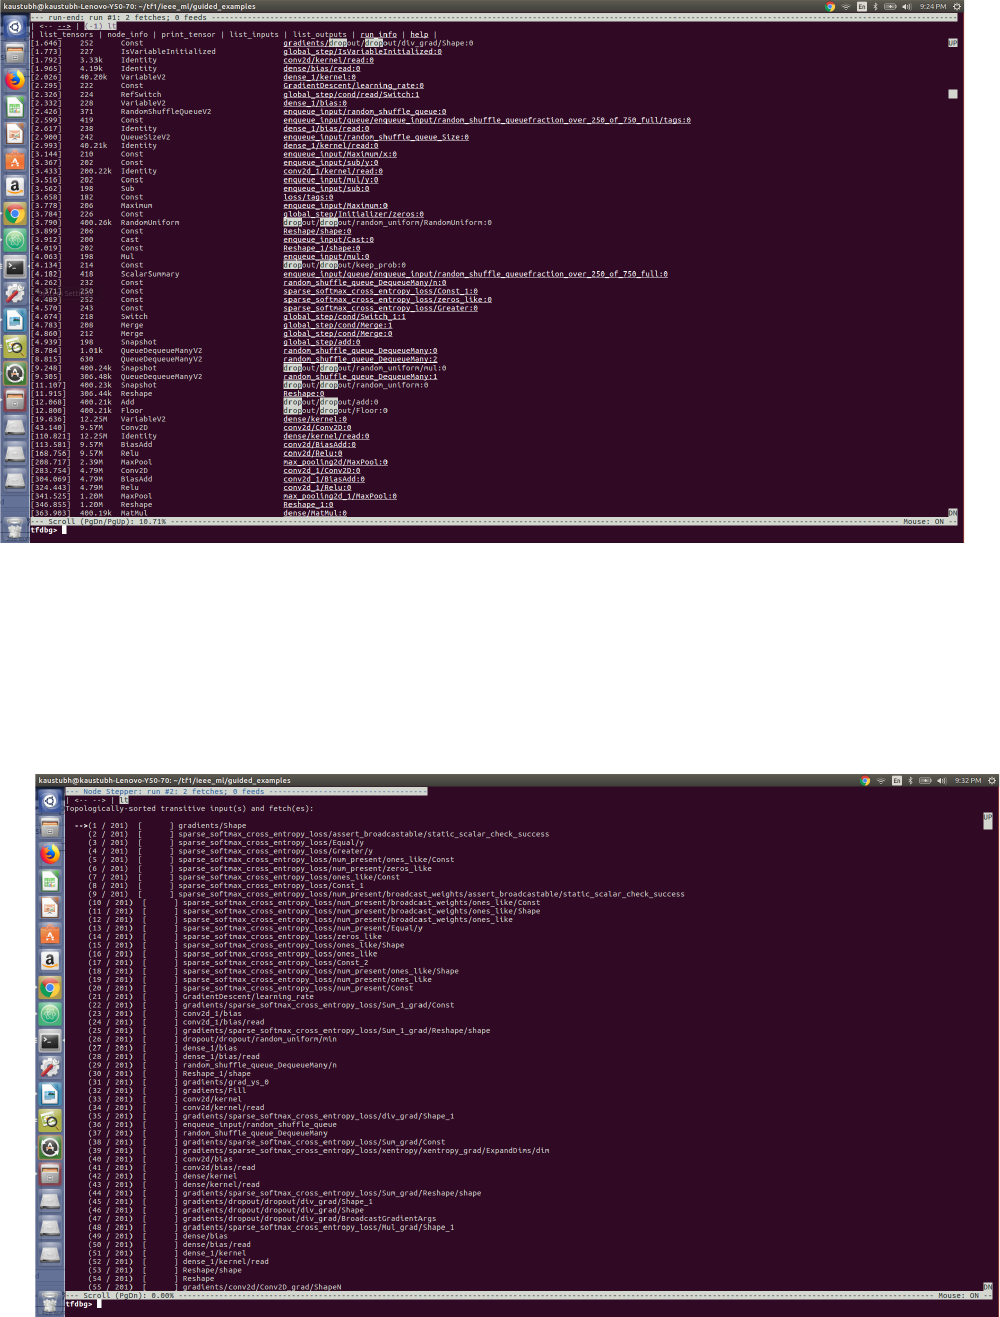
Now we shall see a way to step through the nodes of graph one-by-one in a manner analogous to
procedural languages debuggers like GDB and PDB.
tfdbg> invoke_stepper
tfdbg> s ---> Call once for stepping through each node in the graph.
The above screenshot shows the CLI after running the invoke_stepper.
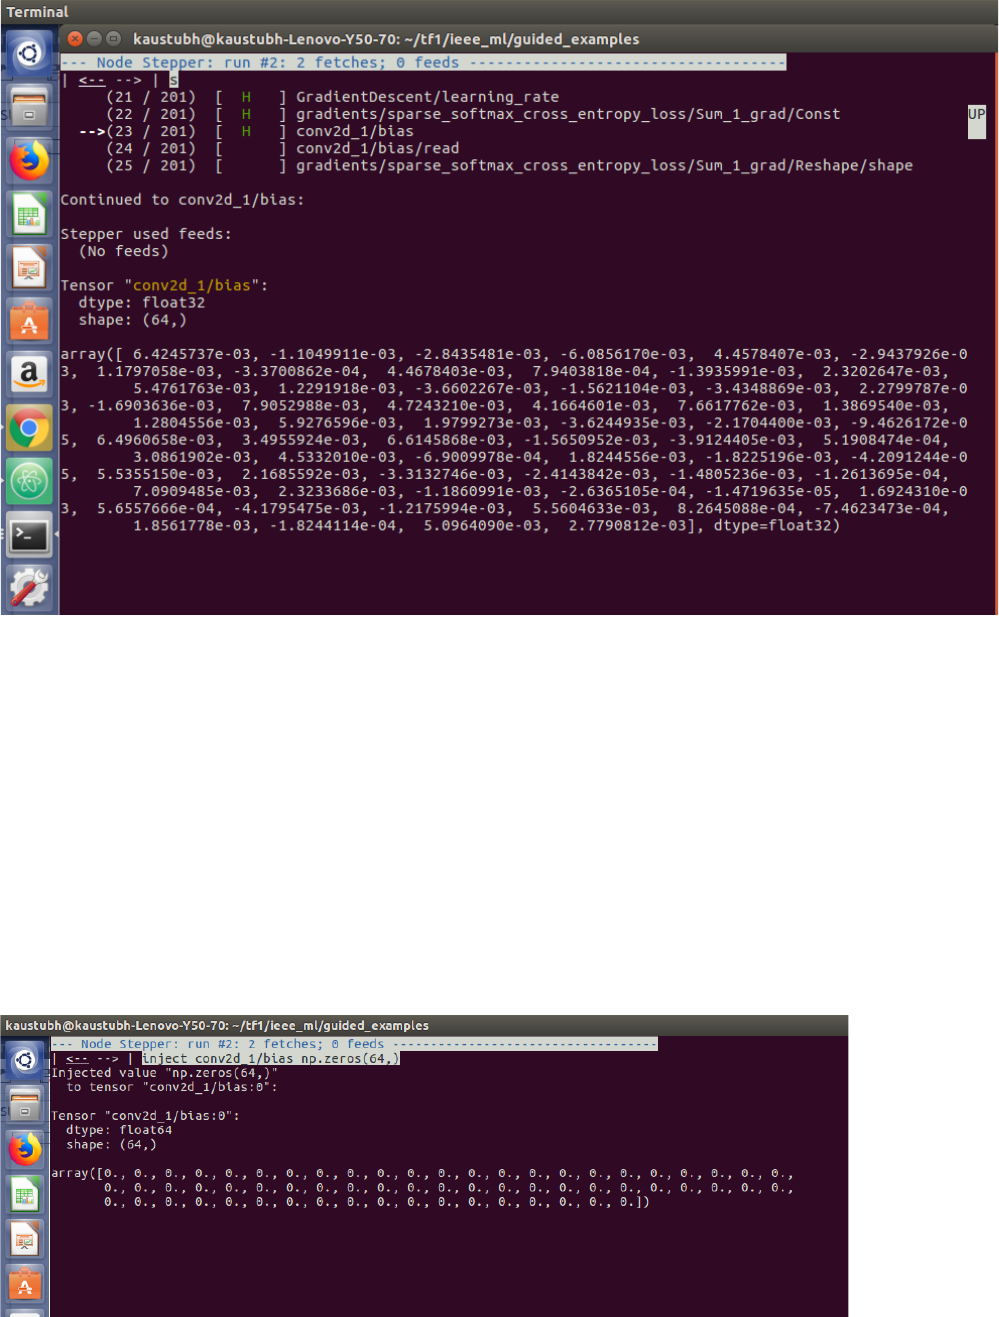
Traversed 23 times to the 23rd tensor (node). Arrived at tensor conv2d_1/bias.
To modify the value of a given tensor at a step stage while preserving the values of all other tensors
we use;
tfdbg> inject “tensor_name” “value_to_be_given”
Executed:
tfdbg> inject conv2d_1/bias np.zeros(64,)
Obtained:
This command can be used to check if any specific tensor causes issues in a specific run, its value
can be changed and set to a meaningful value while leaving all other tensors in the Session.run call
unchanged.
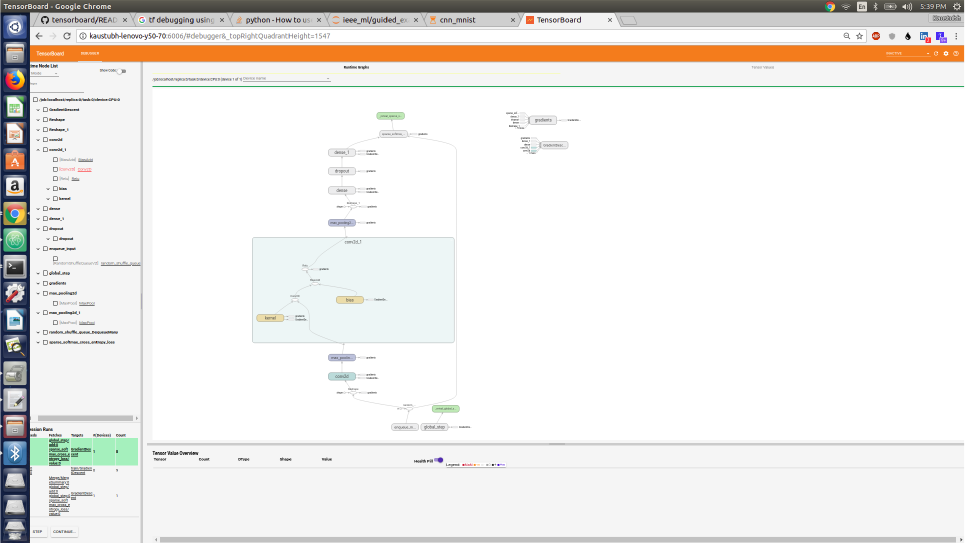
Tensorboard debugger – Not supported on Windows yet!!
Tensorboard offers a GUI plugin for debugging. In the CLI mode, we have to traverse the
computational graph to go to any node of interest.
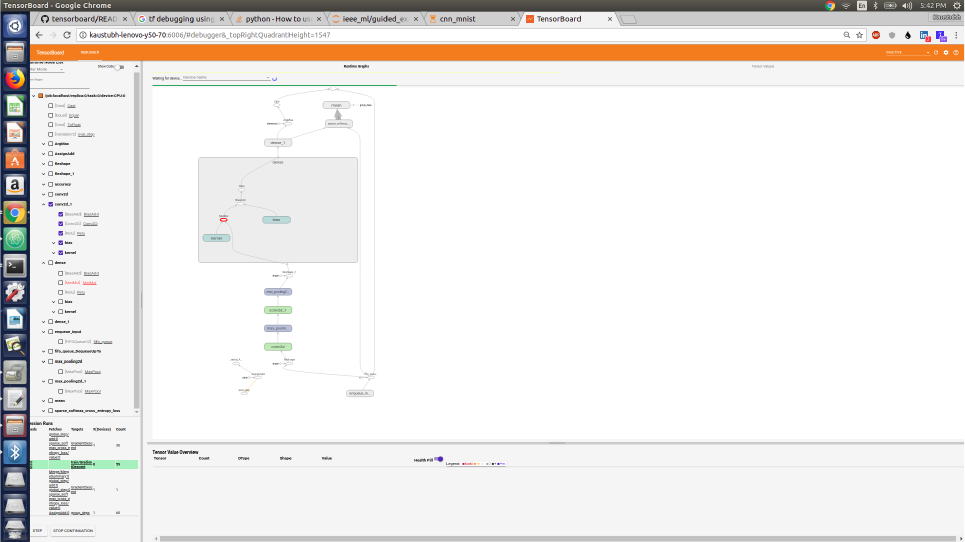
The following screenshot is the layout of the Tensorboard Debugger session for the file
cnn_mnist.py.
On running the file; cnn_mnist.py either on Jupyter notebook or as a .py file, a computatoinal graph
is generated initially. Any node can be double-clicked to magnify and analyse the various elements
of the magnified node. Here, the node dense conv2d_1 is magnified and one can see the convolution
operation, addition of bias in the node.
To move to next node use the STEP button in the bottom-left corner. Also, the CONTINUE button
shall help you to conditionally run the Session calls.
To traverse to a particular node, desired node can be right-clicked and select Continue to, and the
graph computation occur until you reach the desired node.
In the following example, I reached the dense node by clicking Continue to after right-clicking.
Finally, I used the STEP functionality to traverse to the accuracy node and used the Continue to
option for generating the computational graph.
Once the Session.run() call execution is paused, the values of tensors for all the selected nodes is
displayes in the bottom half of the screen. Each tensor is also attributed with a health pill which
visualises the proportion of values within the tensor that fall under each of the six categories noted
in the legend. A user might use health pills to for instance pinpoint nodes that are culprits for
producing undesired values (such as infinity & NaN).
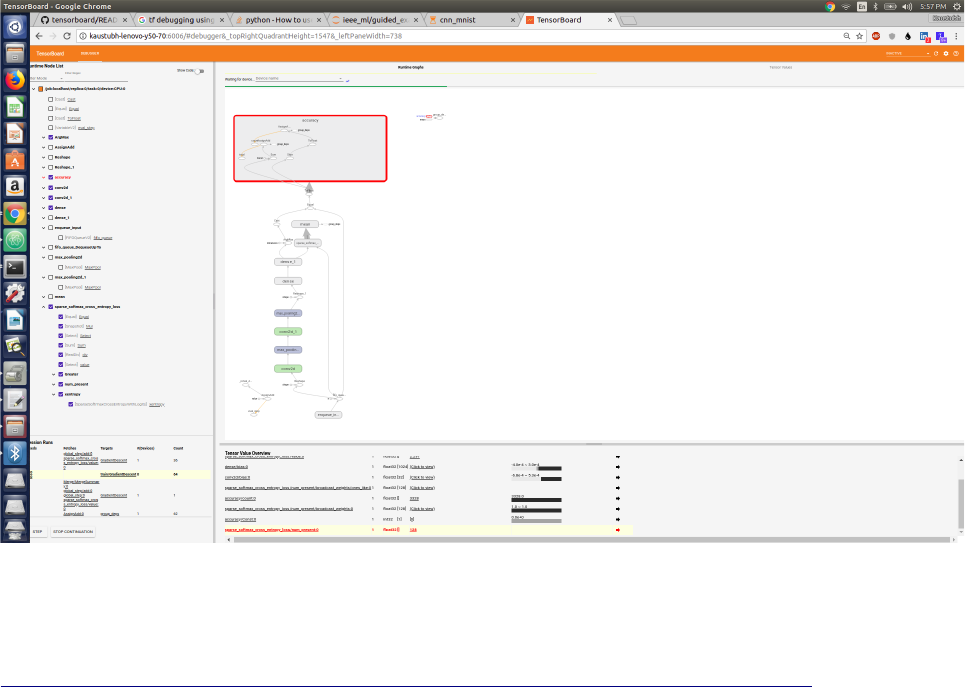
The following screenshot illustrates this.
We have covered debugging on Tensorboard for our example in a brief manner.
However, please refer to the document;
https://github.com/tensorflow/tensorboard/tree/master/tensorboard/plugins/debugger
for detailed instructions for using the Tensorboard debugger.
The below SUMMARY MATRIX gives the Tensorflow functionalites of visualizer and debugger that
are enabled with each file in the ieee_ml directory.

File
./iee_ml/
Tensorboard –
visualization
Tensorboard –
Debugger
CLI Debugger
guided_examples/cnn_
mnist.ipynb
No Yes No
guided_examples/cnn_
mnist_no_debugger.ipy
nb
No No No
guided_examples/kmea
ns.ipynb
No No
guided_examples/neare
st_neighbor.ipynb
No No No
guided_examples/mnist
_hyperparameter.ipynb
Yes – hyperparameter
search
No No
guided_examples/xor_c
ombined.ipynb
Yes No No
guided_examples/cnn_
mnist.py
No Yes Yes
guided_examples/cnn_
mnist_no_debugger.ipy
nb
No No No
guided_examples/kmea
ns.py
No No Yes
guided_examples/neare
st_neighbor.py
No No Yes
guided_examples/mnist
_hyperparameter.py
Yes – hyperparameter
search
No No
guided_examples/xor_c
ombined.py
Yes No Yes
problem_sets/hdr_om/
ALL FILES
No No No
problem_sets/hdr_tf/ha
ndwritten_digits_recog
nition_cnn_5layer.ipyn
b
Yes No No
problem_sets/hdr_tf/ha
ndwritten_digts_recogn
ition_cnn_5layer_soluti
on.ipynb
No No No
problem_sets/hdr_tf/ha
ndwritten_digits_recog
nition_cnn_5layer.py
Yes No No
problem_sets/hdr_tf/ha
ndwritten_digts_recogn
ition_cnn_5layer_soluti
on.py
No No No

basics_directory/ ALL
FILES
No No No
