The Data Science Guide
User Manual:
Open the PDF directly: View PDF ![]() .
.
Page Count: 118 [warning: Documents this large are best viewed by clicking the View PDF Link!]

the
Data Science


And then Data Science came along…

The Data Scientist
Some years ago, a completely new position emerged on the horizon –
the data scientist. It was little known and extremely mysterious as there
was no ‘data’ on it. Quite quickly the laws of economics started governing
the recruitment and the scarcity of supply drove up the price of data
scientists. According to Glassdoor, since 2016 data science is the best
career to pursue.
The Data Scientist position is absolutely fascinating due to the variety of
activities undertaken and the expertise needed to perform the job.
In this guide, we show you the different career paths you can take in
order to end up in the Data Scientist position.

The Rise of Data Science
Data science truly differentiated itself as a field with the emergence of
the first Data Scientists. The pioneers in this field were people ahead of
their time with knowledge in multiple disciplines and incredible
understanding of actual business processes.
Nowadays, we have at our disposal sophisticated software, such as
Google Analytics, Tableau, even the performance revamped Microsoft
Office. There has also been significant development in programming
languages like Python and R, which are easily customized for specific
activities. Furthermore, inferential statistics has thrived due to the
increased computational power. All of these factors combined led to the
establishment of data science.

Which industries use data?
Hint: which industry doesn’t?

Automobile Industry uses data
Aerospace
Industry uses
lots of data
Logistics? Data, data, data

NYSE thrives on data
Every digital
device from
your car to
your watch..
Sometimes bad data is the
most important data…

Even baseball and farming!
Nutrition
Medicine

What does it mean to be in
the business of data?

Opportunities
Data science presents many opportunities for people with different
levels of quant inclination. You could easily imagine how some data
science is, or will be, required for positions like:
✓Marketing Analyst;
✓Business Analyst;
✓Data Analyst;
✓BI Analyst;
✓Data Scientist.
Of course, each of those requires relevant background –either
university education, or work experience. Unfortunately, few institutions
manage to provide sufficient and relevant preparation. That’s where
online courses step in to fill the gap.
We at 365 DataScience have prepared this guide
for four different data science careers that you
may want to pursue.
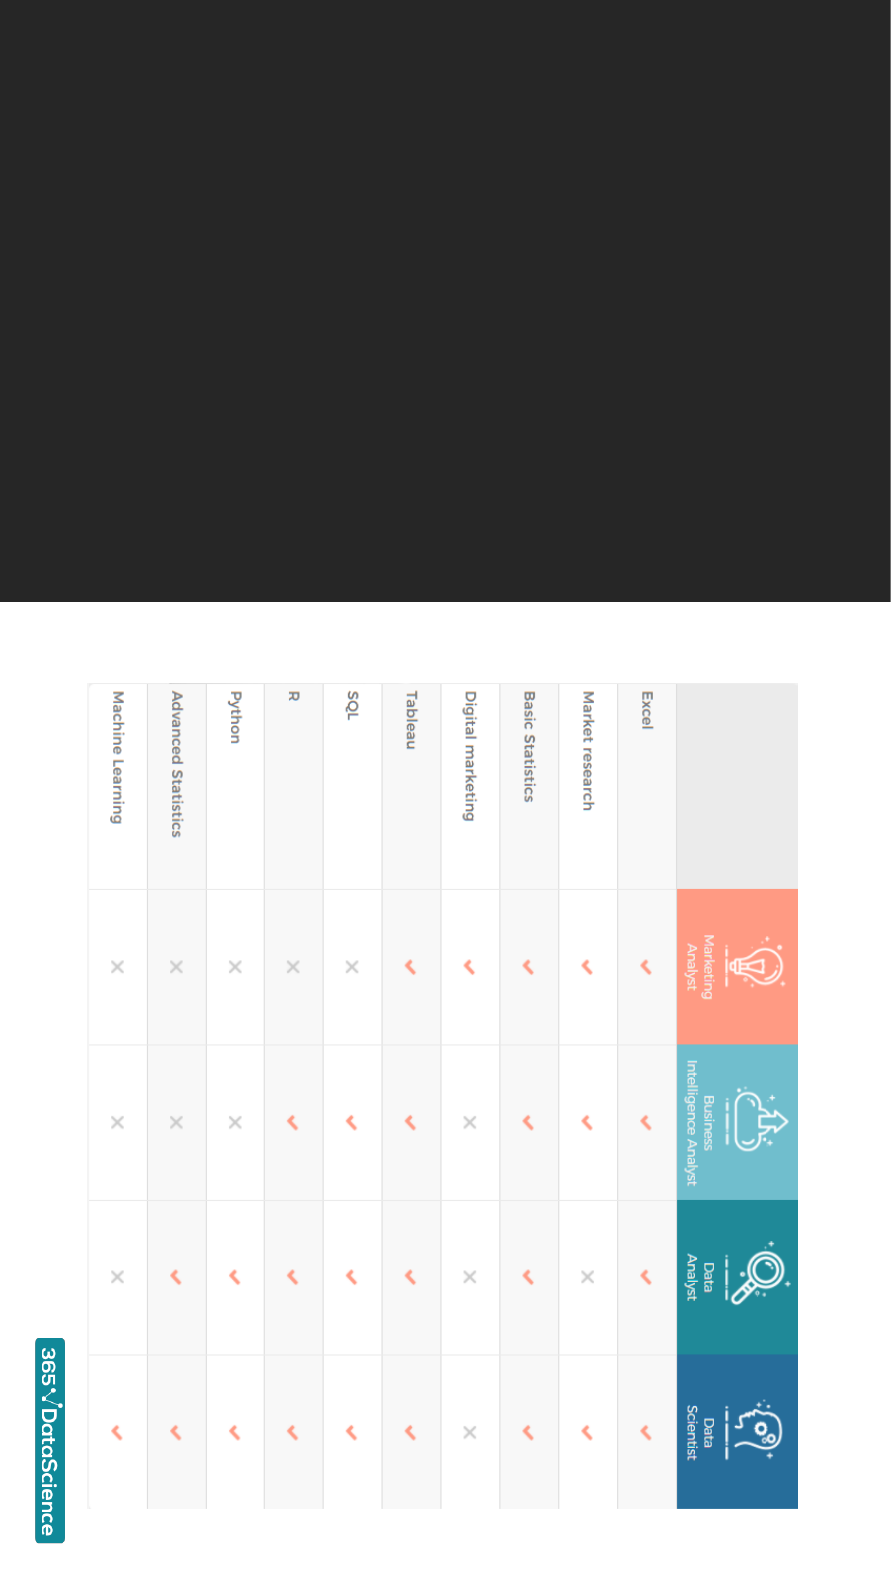
This table summarizes the career
tracks that with the required
competencies for each track. In this
guide, you will find more detailed
information about the positions
and the courses that you may
pursue in order to land a job in the
industry.
The 365 DataScience
Career Tracks

The Marketing Analyst

The Marketing Analyst Track
The Marketing Analyst should not be mistaken with a person who is simply
employed by the marketing department of a company. This is a position
with increasingly quantitative responsibilities.
In the past years, the marketing departments of companies used to employ
statisticians to perform analyses. However, it is more common nowadays to
hire someone with marketing background, knowledge of statistics and
competence in certain software, rather than a full-time statistician.
The main functions of the Marketing Analyst are email & campaign
management, performance evaluation, planning and forecasting, strategy,
and reporting.

The Day of the Marketing Analyst
There is no typical day for a Marketing Analyst. As there are different projects,
there are different tasks involved.
For instance, take a typical activity like campaign management. It has a relatively
short lifespan (usually only a couple of months), after which you hop onto the
next project with completely different goals, trends, insights, anomalies, etc.
Marketing analysis is a remarkable field as it combines data science with
behavioral economics. Moreover, the results from the implementation of the
analysis could be observed in a matter of hours.
In essence, the only truly repetitive activity is reporting, but it may be easily
automated through powerful tools such as Google analytics and Tableau.

What is the required expertise
for a Marketing Analyst?

The Marketing Analyst
We have prepared a summary of the required skills for a Marketing Analyst,
based on the responsibilities that employers assign to the position.
The following list comprises of the main competencies that you may be asked to
have when entering a company. While it is highly recommended that you are
proficient in all of them, responsibilities vary from employer to employer. Two
Marketing Analysts could be asked to perform completely different activities,
even in the same department. In fact this is not all that strange –it is a product
of the specialization of labor that is observed in the current economy.
Regardless of what the job title is, you will be required to have at least
conceptual knowledge of the following activities.

Expertise of a Marketing Analyst
1. TRADITIONAL MARKETING
You should be aware of popular frameworks,
such as The Four Ps, Porter analysis, SWOT
analysis, etc. These concepts have stood the test
of time and are a must.
2. CAMPAIGN MANAGEMENT
Create and manage marketing campaigns.
Analyze data using the appropriate software and
assess the performance. Manage email, PPC
(pay-per-click) and CPA (cost-per-action).
3. MARKETING RESEARCH
Plan the process, gather data, conduct your own
research if needed, and analyze the results. Be
able to make strategic judgments about
expansion or pricing based on it.

Expertise of a Marketing Analyst
4. PAST DATA ANALYSIS
Analyze sales, ROAS (return on ad-spending) and
consumer behavior over time. You will also be
asked to make recommendations, based on your
findings.
5. DIGITALS
You should be able to use some Google
products, such as AdWords and Analytics. Main
activities include keyword research, link building,
Ecommerce and social media presence
management.
6. A/B TESTING
Understand the rationale behind A/B testing and
how to apply it, in order to manage and optimize
product shopping, and compare campaigns.

Expertise of a Marketing Analyst
8. REPORTING
You would be required to prepare reports on a
daily, weekly or monthly basis, usually with focus
on KPI (key performance indicators). You will also
be asked to visualize data and occasionally to
document.
7. STATISTICS
The basics of statistics are essential for any
analyst. You should be able to understand data
models, build them, and identify trends &
patterns. You may also be required to design
surveys and experiments.
9. SUPPORT
The preparation of materials, such as newsletters,
announcements and bulletin boards is within the
marketing department. An analyst is rarely asked
to be involved, but should be prepared to do so.

Expertise of a Marketing Analyst
10. SOFT SKILLS
As anyone employed in the marketing
department, you will be expected to be friendly
and open minded. Creating and maintaining
relationships with vendors and affiliates is a
common responsibility.
11. QUALITY ASSURANCE
Quality assurance is the systematic process of
checking if a product or a service is delivered in
an orderly manner. An analyst may spot such
issues after performing some simple data
analysis.

Main Marketing Processes
A Quick Introduction (or revision)
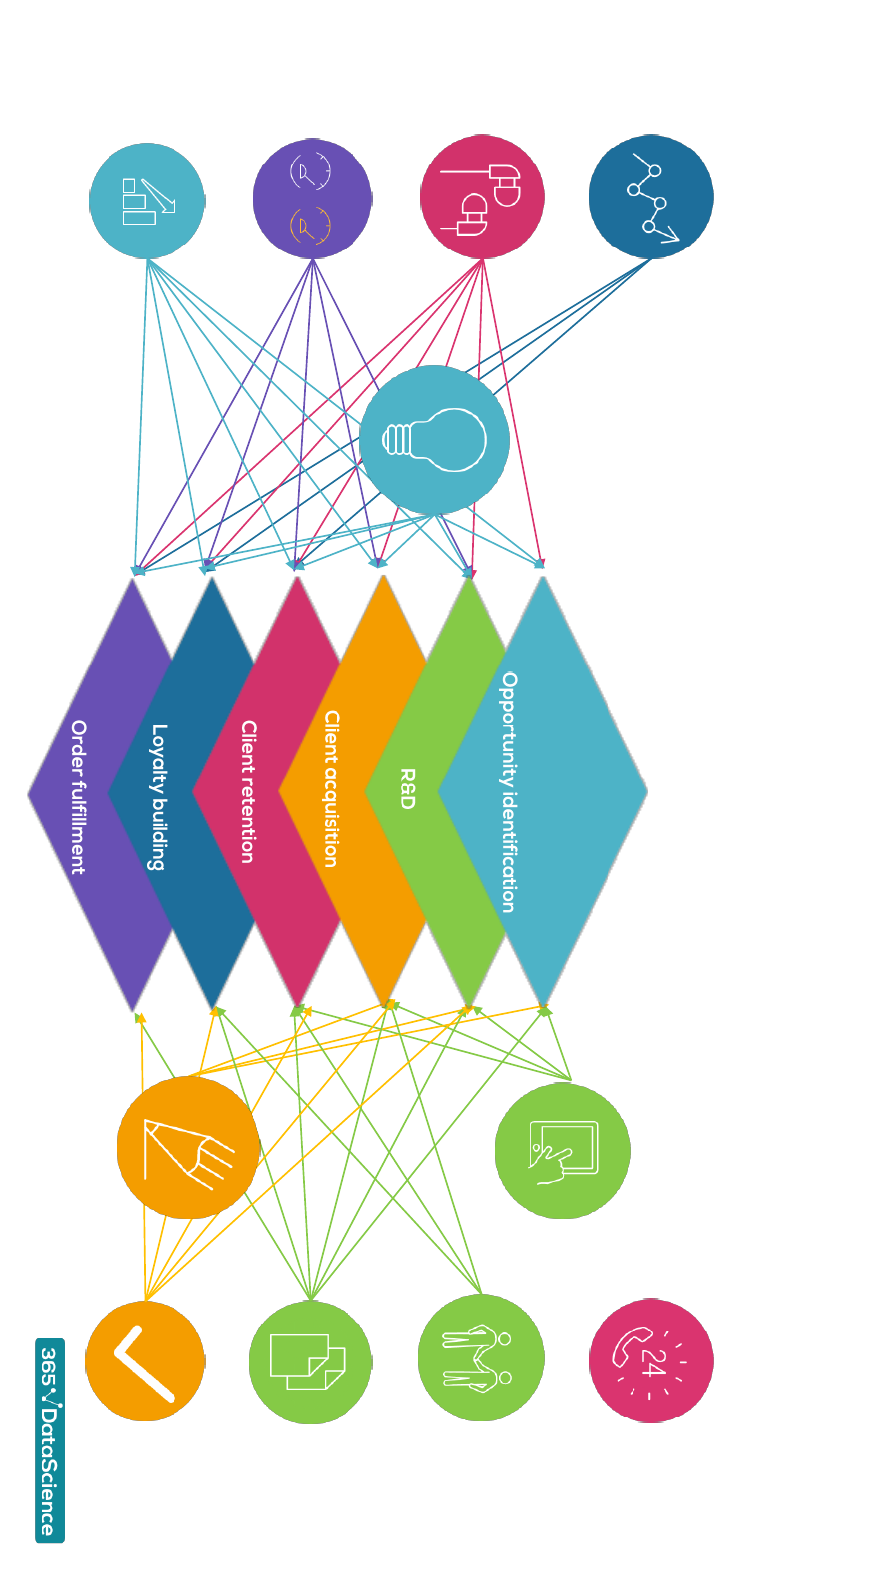
Opportunity Identification. This process takes place during pre-production. A marketing analyst may be assigned the
task to explore whether it is a good idea to enter a new market or introduce a new product.
R&D. When an opportunity is spotted, the ball goes into the yard of the engineers, who are required to design the product
as required by the management. It is the intersection point between the engineering team and the marketing department.
Client acquisition. Depending on the target group and the product itself, clients can be reached through social media,
display ads, TV or even with off-line posters. It is the job of the analyst to identify the correct way to approach these clients.
Client retention. Feedback, feedback, feedback. While businesses understand the value of feedback, it is essential that
satisfaction is measured in a data friendly way (e.g., questionnaires on a scale from 1 to 10). Retention depends on data-
driven improvements.
Loyalty building. Customers that like a brand and see it is responding to their needs are likely to become loyal to the point
of no switching. Even if your competitors are superior, these customers will stick with you due to an emotional connection
with your company.
Order fulfillment. While this may sound like a logistics problem, it is essential for the emotional reception on the
customer's side. Think of Amazon delivery. When there is little uncertainty about the package you are expecting, you are
more likely to repeat your purchase.

So, which skills fit which
processes?
Main Marketing Processes vs Expertise
Past data analysis
Digitals
A/B testing
Statistics
Traditional
marketing
Campaign
management
Marketing
research
Reporting
Soft skills
Support
Quality assurance

So, how should you approach
the Marketing Analyst career?
It seems that the processes are pretty
interconnected with the different
responsibilities.

Microsoft Excel
Market research
Basic Statistics
Digital marketing
Tableau
The responsibilities of a Marketing Analyst may
vary, but 95%of the time, you will be using one
of these 5 skills. You should be extremely familiar,
if not proficient, with Microsoft Excel, Market
research, Basic Statistics and Digital Marketing.
While not essential, some knowledge of Tableau
will considerably increase your chances of landing
the job and help you change careers later, if
desired.
Landing a Marketing Analyst job, depends on these skills

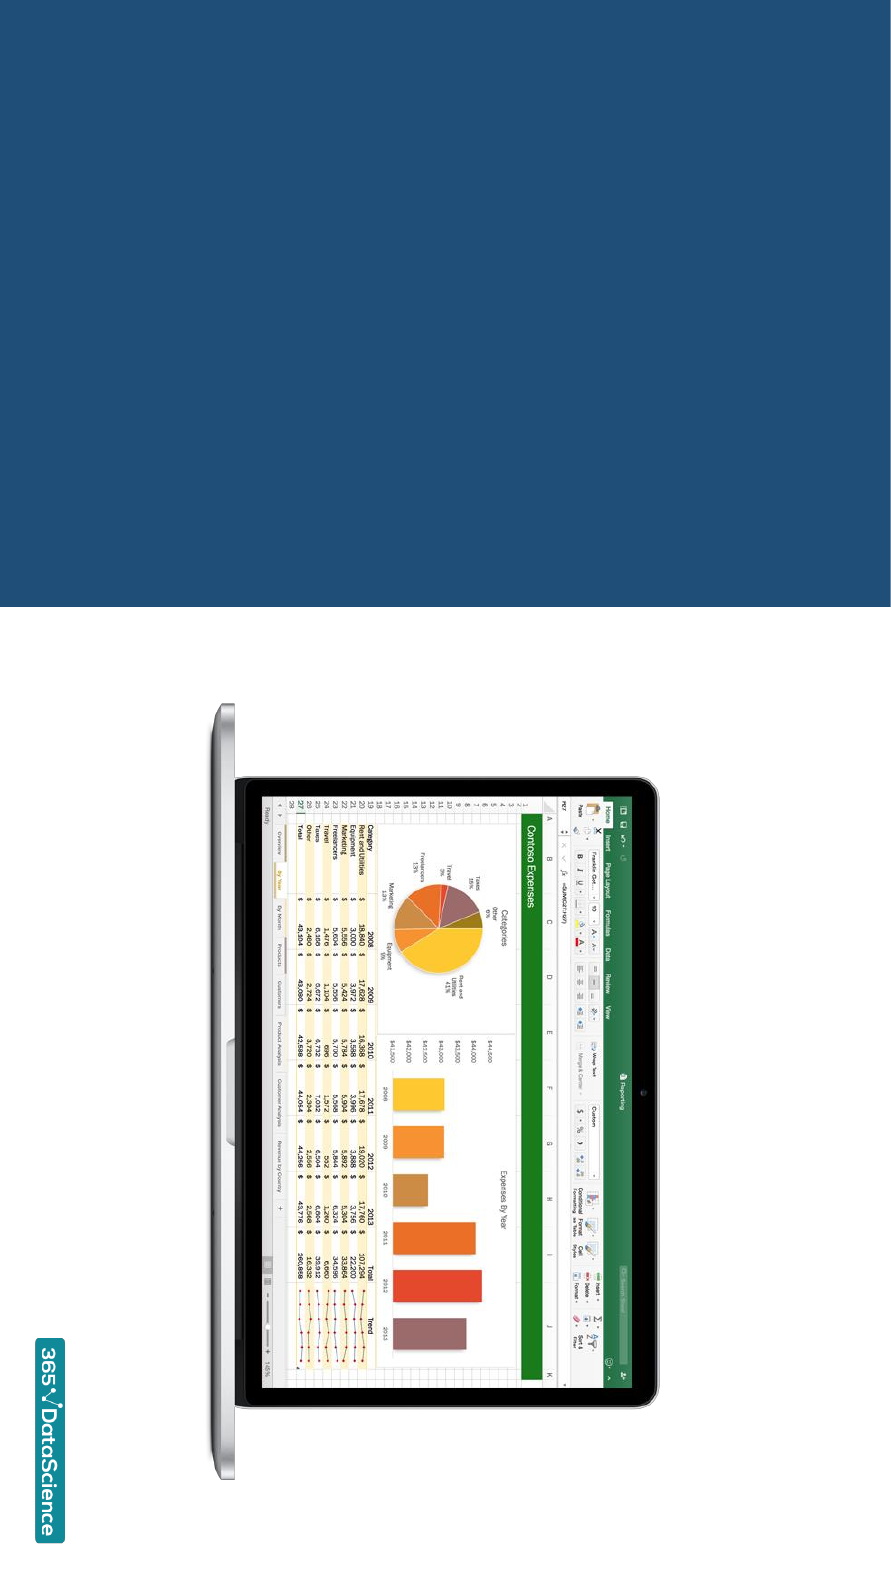
1. Microsoft Excel
Microsoft Excel is a powerful software
and the most widely used
spreadsheet ever. Almost any job
nowadays features Excel and being
truly proficient at it is a must.
Combined with the power of
different plug-ins, you can customize
this software to become more useful
for just about anything –from
statistics to word processing.

•Visualize your data
•Trends, patterns, anomalies
•Create reports
•Customized statistical tests
•Develop tools and data models
•Sales data
•Markets
•Consumer behavior
•Experiments
•Your data
•Custom metrics
Design Analyze
Identify
and
report
Perform
1. Microsoft Excel

2. Market research
Market research is the foundation
of many types of analyses. It is
essential for any analyst to be able
to perform market research and is
an excellent transferable skill –
even if you transition into a
different job, chances are you are
going to need it.If not to perform
it yourself, then to teach your
employees how to do it for you.

2. Market research
Plan
•Define the question
•How to get info
•Make a hypothesis
Gather data
•Industry
•Government
•Academic papers
•White papers
Own research
•Supply and demand
•Survey building
•Defining focus groups
•A/B testing
Analyze
•Answer the research
question
•Identify further topics
Learn the appropriate statistical
methods that will help you in the
planning stage. This will further
help you tailor the strategy of
your company.
Find the best sources of data
according to your needs. Stay
informed about new developments,
both in the industry and academia.
Analyze market dynamics. Define the
focus groups for your study. Profile
your customers. Perform your own
research.
Find the correct pricing strategy.
Plan the development of your
product. Create frameworks for
future analysis.

3. Statistics
Statistics is the basis of all analytics. It is
paramount that an analyst understands
the roots of the tests that are
performed in order to interpret them.
You should be comfortable with the
concepts and ways to implement them
into tests and experiments. Sometimes,
analysts are expected to suggest the
use of new metrics and experience with
statistics is the right way to approach
such problems.

Basic
concepts
Hypothesis
testing
A/B testing
Central limit
theorem
Correlation
p-value
Distributions
Regression
analysis
Confidence
intervals
Statistical
significance
Margin of
error
ANOVA
3. Statistics
At the workplace, a Marketing Analyst is
expected to understand the root causes
of various problems. She should be able
to rapidly identify possible reasons for
both under- and overperformance of
certain metrics. While marketing hunch is
often needed, the respectable data-
driven decisions are formed through
statistical tests.

4. Digital Marketing
Digital Marketing is the non-secret
sauce of modern Marketing Analyst.
Each company uses different software,
but the most common ones are Google
Analytics and Adobe Analytics. They are
highly similar and any competencies
you have in one are easily transferable
to the other. However, caution is
advised: technology in this field is
evolving quite fast; in fact, certifications
last only for one year.

4. Digital Marketing
The digital duties of a Marketing Analyst are very
heterogeneous. Nonetheless, you would usually be on top
of the campaign management, choosing how to distribute
your budget between display ads, pay-per-click ads and
social media.
You will also be in charge of the email lists: growing them,
maintaining them and managing marketing funnels. While
you should have deep understanding of SEO and UX,
more often than not you will not be solely responsible for
them.
Furthermore, social media is one of the biggest
acquisition channels. Facebook & Twitter are not enough
anymore as niche networks fit advertising purposes better.
Campaign management
SEO
Optimize UX
Ecommerce
Social media
Email (funnels)
Display ads, PPC, CPA
Analytics software
Digital marketing

5. Tableau
The best description of Tableau comes
from its creators: ‘Tableau can help
anyone see and understand their data’.
It is the leading software in the
business intelligence and data analytics
field in the recent years. Whenever you
see beautifully visualized data, chances
are that Tableau has something to do
with it.

5. Tableau
Visualize data with customized tools
for just about any purpose. Report
by sales, location, focus group and
much more
Analyze KPIs with new eyes after
seeing what your data actually means
and present it in the most engaging
way.
Segment your audience on any
dimension you can imagine while
Tableau automatically produces the
desired result.
Increase your engagement and
conversion rates through insights
about brand awareness, trends,
patterns and anomalies.
Working with Tableau automatically gives you a competitive advantage as it helps
you navigate through massive amounts of data in seconds

FAQ at interviews
1. Calculate email marketing metrics like subscription costs,
conversion rates, cost of acquisition, channel costs and
effectiveness of channel make-up by geographic region.
2. Determine the maximum amount that our company can afford
to pay to have a potential customer reach our website.
3. Estimate the market for product Y. How many can WE sell it?
4. How would you go about forecasting the sales of a new
product for a company?
5. Calculate the CPA for various social media channels.
6. What is NPV?
7. What is the Myers-Briggs test?

FAQ at interviews
8. In the conversion metric, the revenues are increasing but the
revenue per order is decreasing. What might be the cause?
9. What could we do to attract more customers?
10. If we do an A/B testing, how would you divide the population,
percentage-wise?
11. Explain p-value in a marketing context. Present it as if talking
to a client.
12. What could we do to attract more customers. How are you
going to measure the effect of your actions?
13. What platforms did you use? How did ‘X’ platform help you in
the ecommerce business?

The Business Intelligence Analyst

The Business Intelligence Analyst Track
The business intelligence branch of companies is one of the hottest topics in
recent years. It is one of the jobs that job seekers understand but sometimes
deem out of reach because of the variety skills required.
Let’s first differentiate between a business analyst and a business intelligence
analyst. While the business analyst does work with data and takes data-driven
decisions, a BI analyst would be able to perform much more technical analyses,
based on larger datasets, where at least some programming is a must.
Some of the main duties of aBI analyst are gathering data, structuring
databases, market research, trend analysis, reporting and making
recommendations.

The Day of the BI Analyst
The BI analyst has two defining traits: works with inhouse data and has a
business orientation. These also define the two main skillsets needed -
database and business.
To be more specific, let’s say you have been tasked with preparing a report
about how long computers have been on in the office (uptime). If you are the
first to ever do this, you will need to plan your data journey, design your
metrics, gather the data, and eventually analyze it. You will be expected to
visualize it in a manager-friendly way and tell the story of office computer
uptime.
Becoming a BI analyst combines the worlds of business and data. All the skills
involved are easily transferable into other business or data science positions.

What is the required expertise for a
Business Intelligence Analyst?

The Business Intelligence Analyst
We have prepared a summary of the required skills for a BI Analyst, based on
the responsibilities that employers assign to the position.
The following list comprises of the main competencies that you may be asked
to have when entering a company. While it is highly recommended that you
are proficient in all of them, responsibilities vary from employer to employer.
Two BI Analysts could be asked to perform completely different activities, even
in the same department. This is a product of the specialization of labor that is
observed in the current economy.
No matter the particular job, you will be required to have at least conceptual
knowledge of these activities.

Expertise of a BI Analyst
1. Data
Processing and Analysis
04
03 Model (design) data and metadata and
manipulate variables
Primary support, maintenance
and quality assurance
ETL, data mining, mapping
and retrieval
02
01
Data related responsibilities could be
arranged in four main categories:
Gather, Maintain, Design and Analyze.
Optimize staffing levels, personnel responsibilities.
Automate processes. Forecast 04
03 Prepare financial, operational reports.
Visualize using rich and/or dynamic
dashboards. Tell a story and recommend
Performance, KPI, uptime, user
behavior
Problems, root causes,
risks, primary insights
02
01
Expertise of a BI Analyst
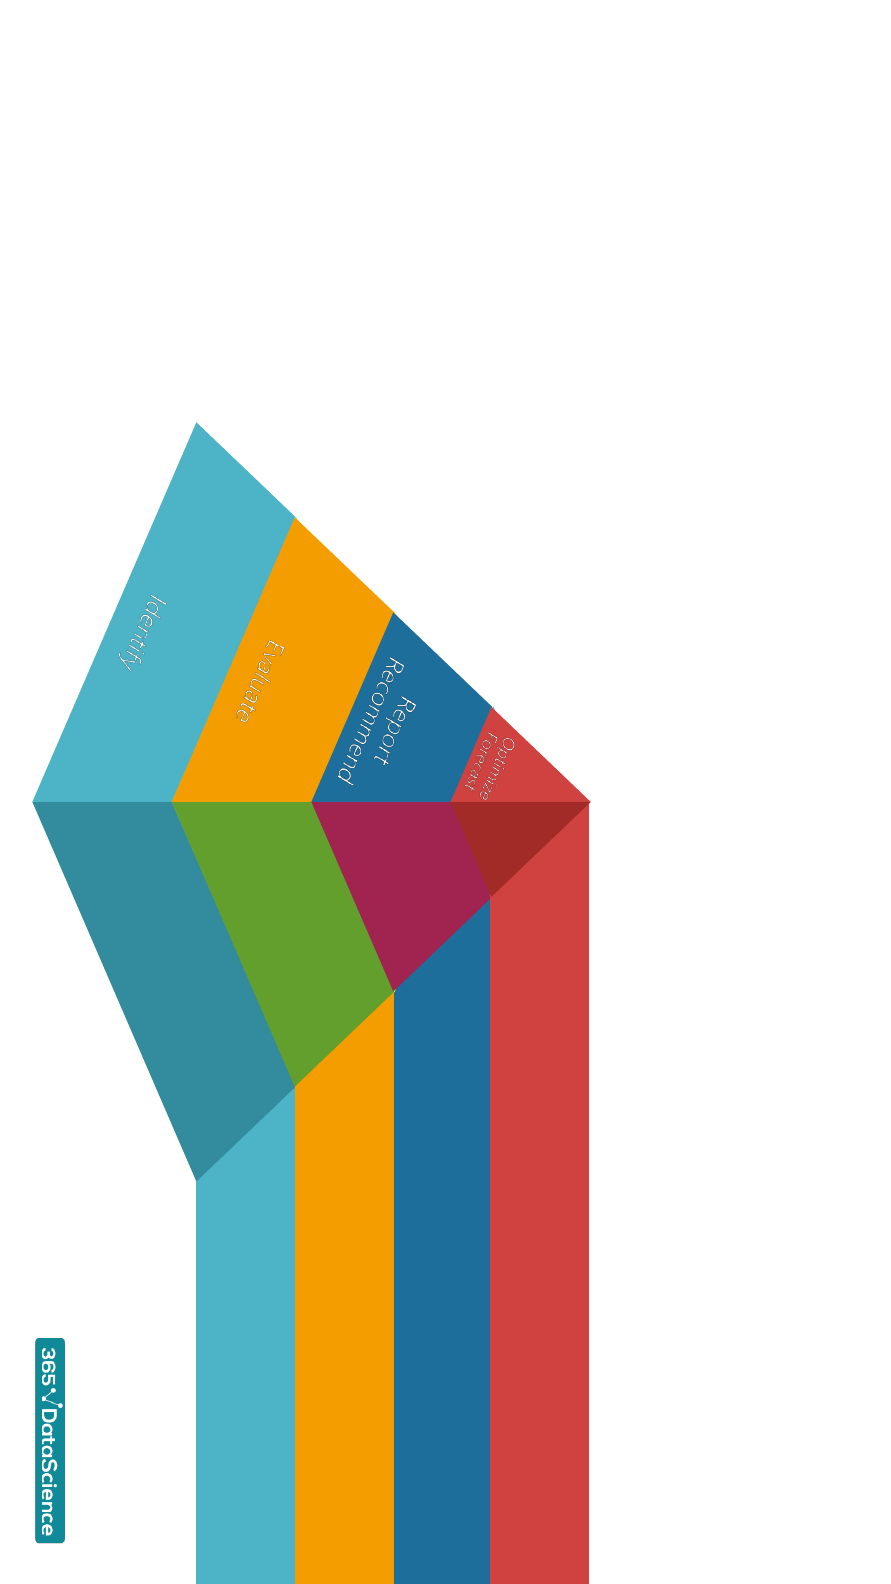
2. Business
Business related responsibilities could also
be arranged in four categories: Identify,
Evaluate, Report and Recommend, and
Optimize and Forecast.

So, how should you approach
the BI Analyst career?

Microsoft Excel
Market research
Basic Statistics
SQL
Tableau
R
The responsibilities of aBI Analyst may vary, but
95%of the time, you will be using one of these 6
skills. You should be extremely familiar, if not
proficient, with Microsoft Excel, Market research,
Basic Statistics, SQL, Tableau and R. While not
essential, knowledge of the software R will
considerably increase your chances of landing the
job and help you change careers later, if desired.
Landing a BI Analyst job depends on these skills
Business Intelligence
Analyst

1. Microsoft Excel
Microsoft Excel is a powerful software
and the most widely used
spreadsheet ever. Almost any job
nowadays features Excel and being
truly proficient at it is a must.
Combined with the power of
different plug-ins, you can customize
this software to become more useful
for just about anything –from
statistics to word processing.

•Customized statistical tests
•Develop tools and data models
•Experiments
•Your data
•Custom metrics
•Visualize your data
•Trends, patterns, anomalies
•Create reports
•Sales data
•Markets
•Consumer behavior
Design Analyze
Identify
and
report
Perform
1. Microsoft Excel

2. Market research
Market research is the foundation
of many types of analyses. It is
essential for any analyst to be able
to perform market research and is
an excellent transferable skill –
even if you transition into a
different job, chances are you are
going to need it.If not to perform
it yourself, then to teach your
employees how to do it for you.

2. Market research
Plan
•Define the question
•How to get info
•Make a hypothesis
Gather data
•Industry, government
•Academic papers
•White papers
•Company
Own research
•Supply and demand
•Survey building
•Defining focus groups
•A/B testing
Analyze
•Answer the research
question
•Identify further topics
Learn the appropriate statistical
methods in order to plan. When
your job is to extract little data
from a huge dataset, planning is
crucial.
Find the best sources for your
needs. Stay informed about new
developments both in the industry
and academia. As a BI Analyst, in-
house data is also relevant.
Analyze the market dynamics. Define
the focus groups for your study. Profile
the customers or products. Perform
your own research
Based on the results, create reports,
optimize processes and suggest
changes. Create frameworks for
future analysis for your colleagues.

3. Statistics
Statistics is the basis of all analytics. It is
paramount that an analyst understands
the roots of the tests that are
performed in order to interpret them.
You should be comfortable with the
concepts and how to implement them
into tests and experiments. Sometimes,
analysts are expected to suggest
metrics to be measured and experience
with statistics is the right way to
approach such problems.

Basic
concepts
Hypothesis
testing
A/B testing
Central limit
theorem
Correlation
p-value
Distributions
Regression
analysis
Confidence
intervals
Statistical
significance
Margin of
error
ANOVA
3. Statistics
At the workplace, a BI Analyst is expected
to understand the root causes of various
problems. She should be able to rapidly
identify possible reasons for both under-
and overperformance of certain metrics.
While business judgement is needed,
data-driven decisions are formed
through statistical tests.
4. SQL
SQL is a relatively simple programming
language that serves the niche of
relational database management. It is
mandatory for anyone employed in
data science to be able to work with
databases and SQL is the way to do it.
Thera are different platforms for SQL,
such as Oracle, MySQL and Microsoft
SQL Server. While they have their own
peculiarities, the underlying language is
virtually the same.
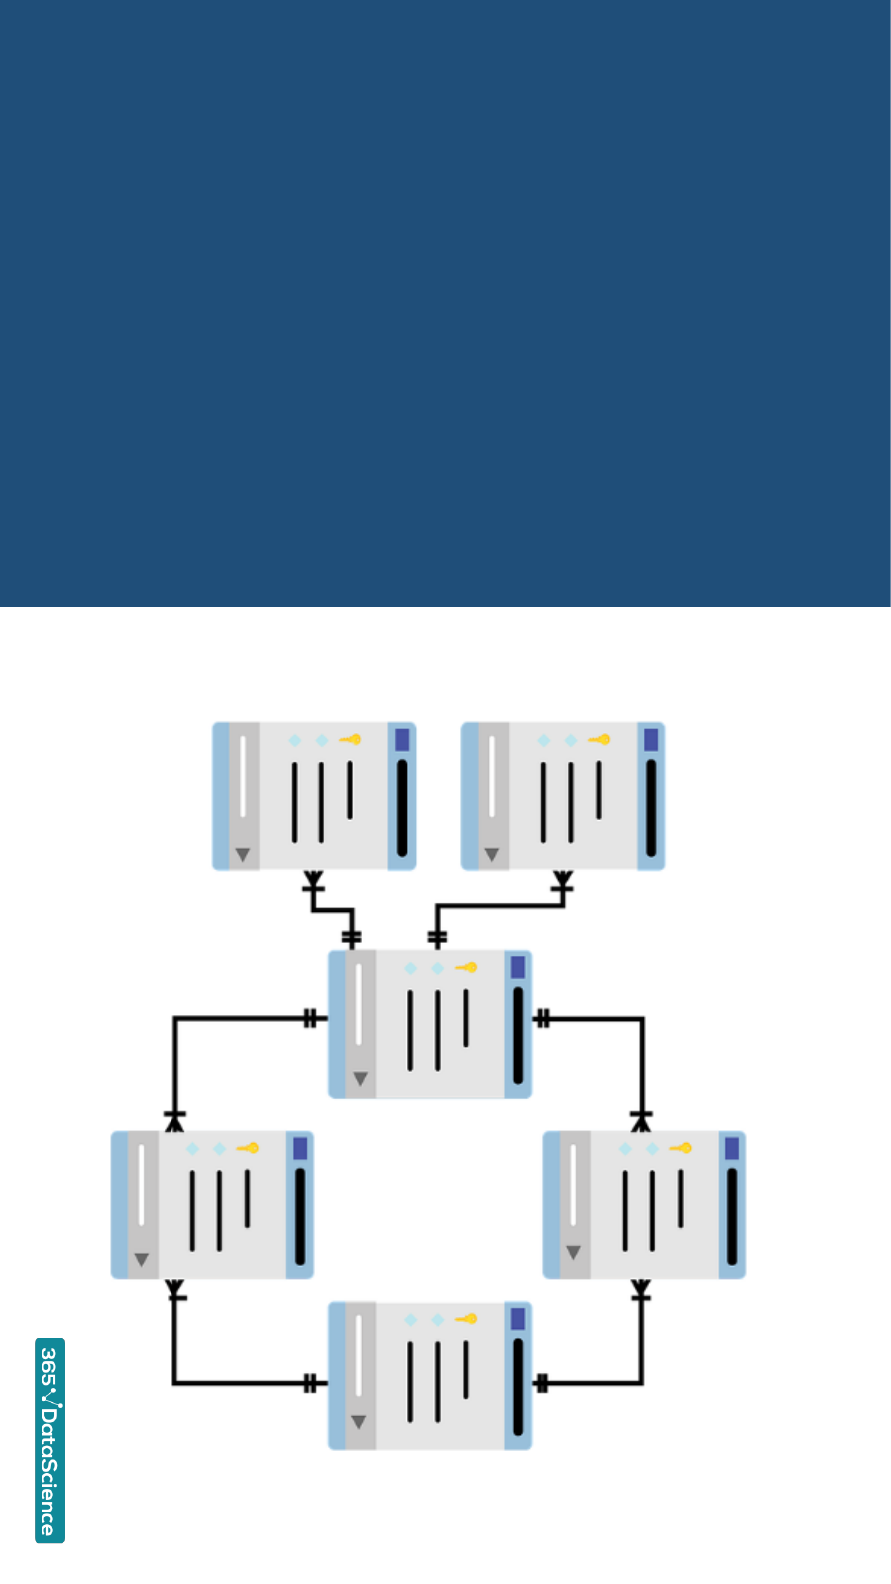
4. SQL
Export
Transform
Load
Design
At the workplace, one often needs some information
from the database. There are two options: extract it on
your own, or contact the IT team. When you are the BI
Analyst, you usually need all data at all times and don’t
want to depend on another person. Apart from utility, it
is also the responsibility of a
BI Analyst to interact with a
database and pull whatever
is needed for her data-
driven decision.

5. Tableau
The best description of Tableau comes
from its creators: ‘Tableau can help
anyone see and understand their data’.
It is the leading software in the
business intelligence and data analytics
field in the recent years. Whenever you
see beautifully visualized data, chances
are that Tableau has something to do
with it.

5. Tableau
Visualize data with customized tools
for just about any purpose. Report
by sales, location, focus group and
much more
Analyze KPIs with new eyes after
seeing what your data actually means
and present it in the most engaging
way.
Segment your audience on any
dimension you can imagine while
Tableau automatically produces the
desired result.
Increase your engagement and
conversion rates through insights
about brand awareness, trends,
patterns and anomalies.
Working with Tableau automatically gives you a competitive advantage as it helps
you navigate through massive amounts of data in seconds
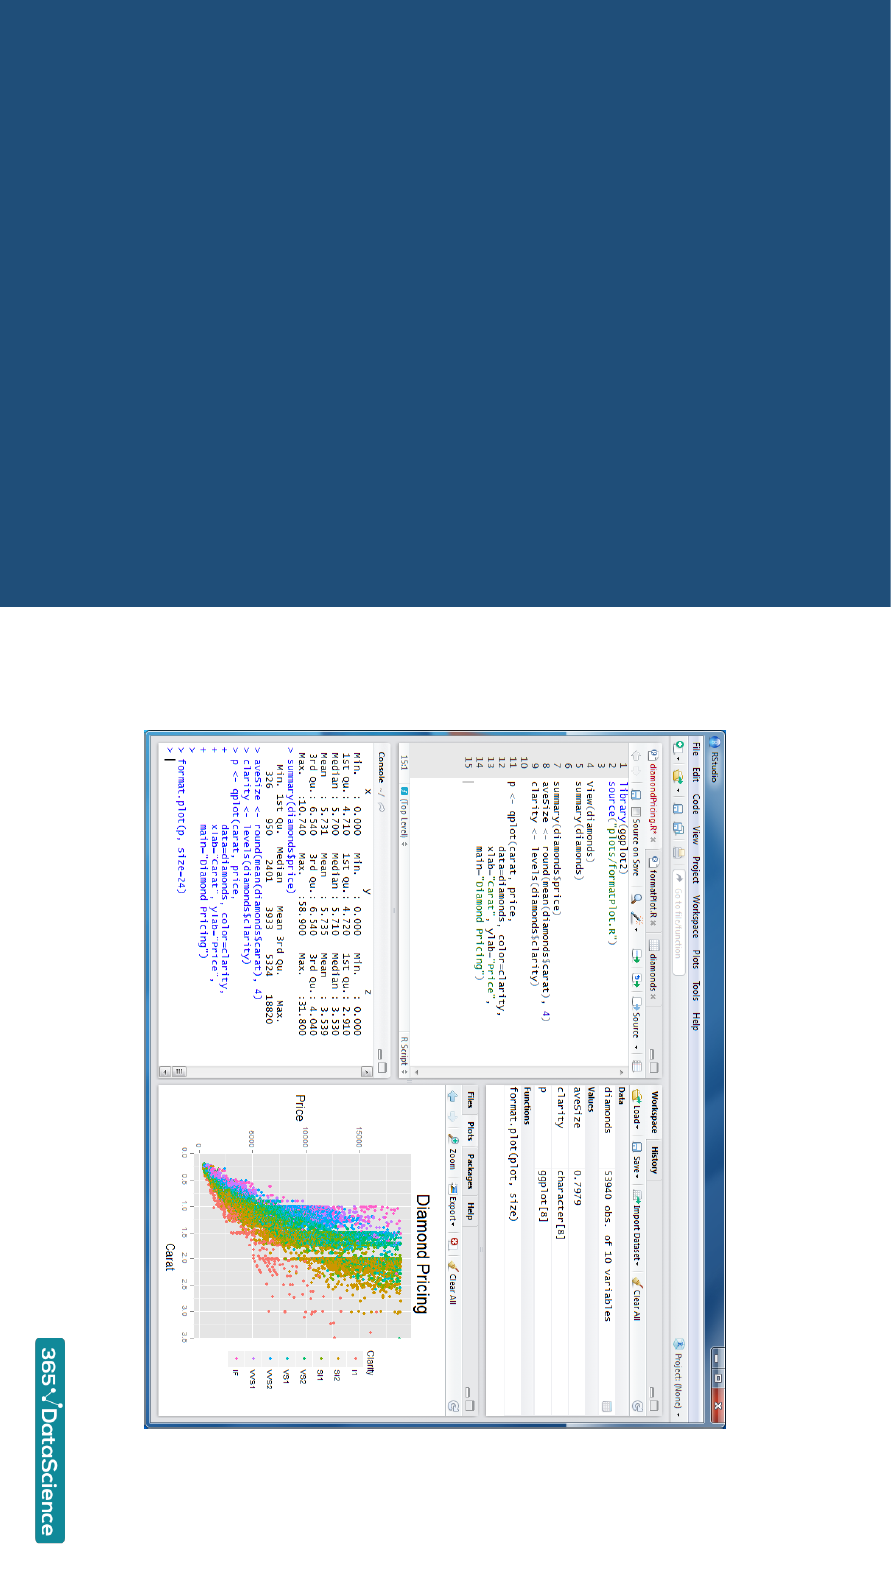
6. R
Ris a programming language
specifically designed for statistics and
graphics. Programming in Ris an
extremely fast and effective way to
perform advanced analyses, including
creating machine learning algorithms.
Since the rise of data science, its
popularity has been increasing by the
day with most data analytics done in R.

6. R
COMPUTATIONAL
ANALYSIS
Enjoy the full computational power of your
computer, increasing exponentially the
speed of the analysis with libraries designed
for just about any analysis you can think of
BIG DATA
Ris designed to handle extremely
big data sets, usually gathered by
medium to big companies, or for
academic research
R has many strong sides that come
from the fact it was designed
specifically for data manipulation. Most
functions you will need in data science
will be just a couple of lines of code
away.
VISUALIZATION
Immediately visualize your data
with functions tailored for any
graphic you will need. R is still
unmatched when it comes to
interactive graphics design
especially for the web

FAQ at interviews
1. Describe the different parts of an SQL query.
2. What is the difference between INNER JOIN and OUTER JOIN?
3. You have a table called with Cust_ID, Order_Date, Order_ID, Tran_Amt. How would
you select the top 100 customers with the highest spend over a year long period?
4. If you were stuck on a desert island with a database that contained all the
knowledge ever created, but you only had 10 SQL statements that you could ever
use, what would they be?
5. What is the difference between DELETE and TRUNCATE? What is the difference
between UNION and UNION ALL? What is the difference between a WHERE
statement and a HAVING clause?
6. The conversion rate for a specific chair is 0.5% for the first 50,000 shoppers that look
at it. The price of the chair is $250. Our company makes 27% profit on the sale. Next,
50,000 shoppers will get a 10% discount. What is the conversion rate we must
achieve to receive the same profits as before?

FAQ at interviews
7. What experience do you have with Tableau? Our BI team is brand new and is
under-financed. We have no standard procedures or training and everything
is ad-hoc. How would you go about this situation?
8. You get X amount of views on a website, Y amount of people click on the ad,
then Z amount of people enter their names after, where X, Y and Z are given.
How much does it cost to acquire a customer? What’s the conversion rate?
Would it make sense to run the campaign comparing the value of customer
acquisition to the revenue gained from conversion rate.
9. You have been asked to send an e-mail campaign to customers that have
made a purchase on Amazon.com in the past but not recently. How you
would go about the process. What query would you use?

FAQ at interviews
10. Our firm is going to send 2 different catalogs to their customers. One of the
catalogs costs 50 cents to make and is 50 pages long. The conversion rate for
the catalog is 5% and each customer brings in 315 dollars. The second catalog
costs 95 cents to make, is 100 pages long and each customer brings in 300
dollars from it. The profit margin is 30%. What should the conversion rate for
the second catalog be to make at least the same amount of profit as the first
one. After you find the conversion rate for the second one, there is a second
part of the problem. Wayfair is planning to make a new catalog which is going
to cost 10 cents more than the 100 page one. The more expensive catalog is
going to be sent out to 20%of the customers while the remaining 80%are
going to get the 100 page one. Assume the same 30% profit margin and $300
profit from each customer. What should the conversion rate for the new
catalog be in order to receive the same profit at the end?

The Data Analyst

The Data Analyst Track
The data analytics department of companies is the most rapidly growing one in
recent years. Many individuals do not know about the position, do not understand
the nature of the work or simply don’t have the skills to perform the job of the Data
Analyst.
The Data Analyst is similar to the BI Analyst. While a BI analyst performs technical
analyses based on large datasets, the data analyst creates and runs complicated
statistical models to extract the best of insights. Ideally, the Data Analyst has deep
statistical knowledge and superior programming skills; this makes her much more
capable than the BI Analyst to work with big data. However, inferior business
knowledge is needed to be a Data Analyst – it’s actually all about the data.
Main functions of the Data Analyst are gathering data, structuring databases, creating
and running models, trend analysis, making recommendations and storytelling.

The Day of the Data Analyst
There are three major activities for a Data Analyst: data cleansing & management,
programming & analysis, and presentation of findings.
Let’s say that you are a Data Analyst and you are asked to explain why profit is declining. How
would you typically approach the task? First, you would run a simple aggregate comparison
and find, for instance, that costs have remained the same, but revenues are falling. Then, you
would code a program that will slice and dice revenue data by consumer segment, region, day
of the week, distribution channel and everything else that may be relevant. Whenever you
have a statistically significant result, you will take note. Finally, you would gather up the
findings and create a presentation tailored to your audience. This usually means manager-
friendly and light on data, and you will explain what you found to be driving profit loss.
Being a Data Analyst equals swimming in data. The more projects a Data Analyst has been
through, the deeper understanding of the business she’ll have and the more valuable she will
become to the employer.

What is the required expertise
for a Data Analyst?

The Data Analyst
We have prepared a summary of the required skills for a Data Analyst, based
on the responsibilities that employers assign to the position.
The following list comprises of the main competencies that you may be asked
to have when entering a company. While it is highly recommended that you
are proficient in all of them, responsibilities vary from employer to employer.
Two Data Analysts, even if they are sitting side by side, may be asked to
perform completely different tasks. This is a product of the specialization of
labor that is observed in the current economy.
No matter the particular job, you will be required to have at least conceptual
knowledge of these activities.
Data cleansing
& database management
Design, implement, map, ETL,
identify weak spots Continually process raw data,
test, optimize, move across
platforms, extract in different
formats
Manipulate your variables, structure
tests, assess quality, find weak spots,
optimize models
Analyze, find trends and patterns,
cluster, predict
Visualize and
tell the story of
the data
Expertise of a Data Analyst
Programming
Sophisticated statistical models
Analysis of the data
Presentation of findings
Filter, profile, assess third
party, acquire new,
control the quality of data

So, how should you approach
the Data Analyst career?

Microsoft Excel
Market research
Basic Statistics
SQL
Tableau
R and/or Python
Advanced Statistics
The responsibilities of a Data Analyst may vary, but
95%of the time, you will be using one of these 8
skills. You should be extremely familiar if not
proficient with Microsoft Excel, Market research,
Advanced Statistics, SQL, Tableau and at least one
programming language (R and/or Python). Excel is
rarely used, but any Data Analyst is proficient with
it. Tableau is only required for specific companies.
Landing a Data Analyst job, depends on these skills
Data analyst

1. Microsoft Excel
Microsoft Excel is a powerful software and
the most widely used spreadsheet ever.
Almost any job nowadays features Excel and
being truly proficient at it is amust.
Combined with the power of different plug-
ins, you can customize this software to
become more useful for just about anything
–from statistics to word processing. While a
Data Analyst does not work with it on a daily
basis, if you are not familiar with Excel, it’s a
nice place to start.

•Experiments
•Your data
•Custom metrics
•Visualize your data
•Trends, patterns, anomalies
•Create reports
•Customized statistical tests
•Develop tools and data models
•Sales data
•Markets
•Consumer behavior
•Office behavior
Design Analyze
Identify
and
report
Perform
1. Microsoft Excel

2. Market research
Market research is the foundation
of many types of analyses. It is
essential for any analyst to be able
to perform market research and is
an excellent transferable skill –
even if you transition into a
different job, chances are you are
going to need it.If not to perform
it yourself, then to teach your
employees how to do it for you.

2. Market research
Plan
•Define the question
•How to get info
•Make a hypothesis
Gather data
•Industry, government
•Academic papers
•White papers
•Company
Own research
•Supply and demand
•Survey building
•Defining focus groups
•A/B testing
Analyze
•Answer the research
question
•Identify further topics
Learn the appropriate statistical
methods in order to plan. When
your job is to extract little data
from a huge dataset, planning is
crucial.
Find the best sources for your
needs. Stay informed about new
developments both in the industry
and academia. Sometimes, in-
bound data is also relevant.
Analyze the market dynamics. Define
the focus groups for your study. Profile
the customers or products. Perform
your own research
Based on the results, create reports,
optimize processes and suggest
changes. Create frameworks for
future analysis for your colleagues.

3. Statistics
Statistics is the basis of all analytics. It is
paramount that an analyst understands
the roots of the tests that are
performed in order to interpret them.
You should be comfortable with the
concepts and how to implement them
into tests and experiments. Sometimes,
analysts are expected to suggest
metrics to be measured and experience
with statistics is the right way to
approach such problems.

Basic
concepts
Hypothesis
testing
A/B testing
Central limit
theorem
Correlation
p-value
Distributions
Regression
analysis
Confidence
intervals
Statistical
significance
Margin of
error
ANOVA
3. Statistics
At the workplace, a Data Analyst is
expected to understand the root causes
of various problems. She should be able
to immediately identify possible reasons
for both under- and overperformance of
certain metrics. It is highly recommended
to be completely proficient with these
terms before furthering your expertise
into Advanced Statistics.

4. SQL
SQL is a relatively simple programming
language that serves the niche of
relational database management. It is
mandatory for anyone employed in
data science to be able to work with
databases and SQL is the way to do it.
Thera are different platforms for SQL,
such as Oracle, MySQL and Microsoft
SQL Server. While they have their own
peculiarities, the underlying language is
virtually the same.

4. SQL
At the workplace, one often needs some information
from the database. There are two options: extract it on
your own, or contact the IT team. When you are the Data
Analyst you usually need all data at all times and don’t
want to depend on another person. Apart from utility, it
is also the responsibility of a
Data Analyst to interact with
a database and pull
whatever is needed for her
data-driven decision.
Export
Transform
Load
Design

5. Tableau
The best description of Tableau comes
from its creators: ‘Tableau can help
anyone see and understand their data’.
It is the leading software in the
business intelligence and data analytics
field in the recent years. Whenever you
see beautifully visualized data, chances
are that Tableau has something to do
with it.

5. Tableau
Visualize data with customized tools
for just about any purpose. Report
by sales, location, focus group and
much more
Analyze KPIs with new eyes after
seeing what your data actually means
and present it in the most engaging
way.
Segment your audience on any
dimension you can imagine while
Tableau automatically produces the
desired result.
Increase your engagement and
conversion rates through insights
about brand awareness, trends,
patterns and anomalies.
Working with Tableau automatically gives you a competitive advantage as it helps
you navigate through massive amounts of data in seconds

6. R
Ris a programming language
specifically designed for statistics and
graphics. Programming in Ris an
extremely fast and effective way to
perform advanced analyses, including
creating machine learning algorithms.
Since the rise of data science, its
popularity has been increasing by the
day with most data analytics done in R.

6. R
COMPUTATIONAL
ANALYSIS
Enjoy the full computational power of your
computer, increasing exponentially the
speed of the analysis with libraries designed
for just about any analysis you can think of
VISUALIZATION
Immediately visualize your data
with functions tailored for any
graphic you will need. R is still
unmatched when it comes to
interactive graphics design
especially for the web
BIG DATA
Ris designed to handle extremely
big data sets, usually gathered by
medium to big companies, or for
academic research
R has many strong sides that come
from the fact it was designed
specifically for data manipulation. Most
functions you will need in data science
will be just a couple of lines of code
away.

7. Python
Python is an open-source, general-
purpose high-level programming
language. It is one of the most widely
used programming languages in the
past few years. The technical
advantages it has over other
programming languages and its
modules for scientific computing
make it a preferred choice while
working in the fields of in finance,
econometrics, economics, data
science and machine learning.

Python
Easy syntax, open-source,
integration, scope
Libraries
NumPy, pandas, matplotlib and scikit-
learn are some of the most widely used
libraries in data science.They combine
the capabilities of many other
programming languages, but let you
use them all at one place in an
environment that just needs to support
Python
BI
DBMS
Machine
learning
Python is compatible with MySQL and is
expected to be integrated in the new version of
the Microsoft SQL Server as well.Thus, giving
you the capability of working with relational
databases. Furthermore, Python can be used to
produce non-relational databases, such as
NoSQL
Leading BI software Tableau launched a beta of
the so called TabPy which is used to integrate
Python within Tableau. In this way, you can
create reports that leverage the real-time
computational power of Python
Python is the leading language used for
machine learning in the field of data science.
This includes data mining, data scraping, social
network analysis and clustering.
7. Python

8. Advanced
Advanced statistics in this framework
refers to the symbiosis between the
computational power, inferential
statistical methods and linear algebra.
This includes datasets of different sizes
and dimensions, defined by various
distributions. Deep knowledge of factor
and cluster analysis is very much
required, especially when interpreting
machine learning output.
Statistics

Advanced
topics
Distributions
Bayesian
inference
Decision
theory
Factor
analysis
Logistic
regression
Cluster
analysis
Transform
Higher
dimensions
Math
methods
8. Advanced Statistics
Basic statistics lays the foundation of the field and
focuses on frequentist inference. Advanced
statistics builds up on it, entering
multidimensional spaces, through knowledge of
mathematical methods, transformations and
distributions. Moreover, more complex means of
analysis are introduced, such as clustering and
factoring. Finally, Bayesian inference and decision
theory allow the Data Analyst to solve problems
of dynamic and/or behavioral nature.

FAQ at interviews
1. If you have a 10x10x10 cube, what is the outside surface area?
2. You have 10 bags with 10 stones each. One of the bags is lighter than the
others. Using a digital scale, how would you figure out which one is it with
just one weighting.
3. What is the sum of numbers from 1 to 100?
4. A snail falls down a well 50ft deep. Each day it climbs up 3ft and each night
falls down 1ft.How many days does it take him to get out?
5. How many SUV’s in the parking lot downstairs?
6. What is the difference between UNION and UNION ALL? What is the
difference between DELETE and TRUNCATE? How would you find median
value for a given columns?
7. Identify the issues in this excel spreadsheet.

FAQ at interviews
8. What kind of RDBMS software do you have experience with?
9. Draw a line that would give our company the same revenue $9 per sale, with
the y-axis (% On Time), and the x-axis ($ off for being late).
10. If a product costs $4.00, with a $800 sunk cost, and we charge X amount of
dollars along with a $10 annual fee, how many do we need to sell to break
even, etc).
11. Sales department increased the selling price of all items by 5%. There are 10
items, all with different price tags. Before the price increase, gross revenue
was $500,000 with an average selling price of $1. After the price increase
Gross revenue was $505,000, with an average selling price of $0.95. Why
hasn't the price increase had the desired impact of increasing revenue and
average selling price?

The Data Scientist

The Data Scientist Track
The data analytics department of companies is the most rapidly growing in recent years.
Many individuals do not know about the position, do not understand the nature of the work,
or simply don’t have the skills to perform the job of the Data Scientist.
The Data Scientist is on top of the data science ladder. However, describing her job gives
everyone a hard time. In fact, the Data Scientist has such a slippery definition, that if you look
at five places, you will find five different definitions of what a Data Scientist is. For us at 365
Data Science, a Data Scientist is a person, who has broad range of knowledge in multiple
disciplines, while specialized in one or two.She understands the business processes of a
company, including marketing, strategy and sales, but also engineering and product
development. Nonetheless, where she truly shines is machine learning and statistics.
Main functions of the Data Scientist are gathering data, structuring databases, creating and
running models & analyses; strategy, marketing, product placement, pricing, making
recommendations, and telling the story of the data.

The Day of the Data Scientist
The day of the Data Scientist depends on many factors. Very broadly, she has four major responsibilities:
database organization, programming for data extraction and machine learning, analysis and storytelling.
An example. Let’s say company A merged with company B recently and you have to assess the synergies.
This is an extremely difficult task in Finance. First, you need to run a simple aggregate comparison and
analyze descriptive metrics such as profitability ratios, productivity, etc. Second, you should come up with
a machine learning algorithm that assesses all your data and look for clusters, factors, trends & patterns
and try to explain them. Third, you need to code a program that will slice and dice data by consumer
segment, region, day of the week, distribution channel and everything else that may be relevant. You will
have to cross-check your findings and probably revise your first algorithm to fit the context. Once you
find an answer, you must test your algorithm on past data or external sources. When you get a working
algorithm with a good fit, you will make predictions and suggest optimizations. Depending on who your
audience is, you will need to make a suitable presentation and explain what drives the synergies.
Given that the Data Scientist swims in data, and data is rarely super nice;she faces challenges at every
turn. But the more projects she goes through, the deeper her understanding of the business and machine
learning becomes, and the more valuable she is to any employer.

What is the required expertise
for a Data Scientist?

The Data Scientist
We have prepared a summary of the required skills for a Data Scientist,
based on the responsibilities that employers assign to the position.
The following list comprises of the main competencies that you may be
asked to have when entering a company. While it is highly recommended
that you are proficient in all of them, responsibilities vary from employer
to employer. Any two Data Scientists are different. This is because each
one of them is formed by her own experience, knowledge and talent.
No matter the particular job, you will be required to have at least
conceptual knowledge of these activities.

Expertise of a Data Scientist
The Data Scientist is a complex professional that has broad expertise in
different topics, while specializing in statistics and machine learning.
She can do everything a Data Analyst can do
She can do everything a BI Analyst can do
She can do everything a Marketing Analyst can do

Expertise of a Data Scientist
01
02
03
Machine learning
Design, execute, and research algorithms
for numbers, text, emotions, images, new
keywords, negative keywords and so on
Advanced Statistics
Develop statistical models based on
internal and external variables, analyze
using predictive multidimensional analysis
Storytelling
Make a story out of the data & the machine
learning outcomes and present it to people
who do not have technical knowledge
As the Data Scientist position includes
everything we’ve talked about so far, we will
focus on its specializations.

So, how should you approach
the Data Scientist career?

Microsoft Excel
Market research
Basic Statistics
SQL
Tableau
R and/or Python
Advanced Statistics
Machine Learning
The responsibilities of a Data Scientist may vary,
you will surely be using one of these 10 skills. You
should be extremely familiar if not proficient with
Microsoft Excel, Market research, Advanced
Statistics, SQL, Tableau, R. Python and Machine
Learning. Excel and Tableau are more rarely used
but may be required for some companies.
Landing a Data Analyst job, depends on these skills
Data scientist
1. Microsoft Excel
Microsoft Excel is a powerful software and
the most widely used spreadsheet ever.
Almost any job nowadays features Excel and
being truly proficient at it is amust.
Combined with the power of different plug-
ins, you can customize this software to
become more useful for just about anything
–from statistics to word processing. While a
Data Scientist does not work with it on a daily
basis, if you are not familiar with Excel, it’s a
nice place to start.

•Experiments
•Your data
•Custom metrics
•Visualize your data
•Trends, patterns, anomalies
•Create reports
•Customized statistical tests
•Develop tools and data models
•Sales data
•Markets
•Consumer behavior
•Office behavior
Design Analyze
Identify
and
report
Perform
1. Microsoft Excel

2. Market research
Market research is the foundation
of many types of analyses. It is
essential for any analyst to be able
to perform market research and is
an excellent transferable skill –
even if you transition into a
different job, chances are you are
going to need it.If not to perform
it yourself, then to teach your
employees how to do it for you.

2. Market research
Plan
•Define the question
•How to get info
•Make a hypothesis
Gather data
•Industry, government
•Academic papers
•White papers
•Company
Own research
•Supply and demand
•Survey building
•Defining focus groups
•A/B testing
Analyze
•Answer the research
question
•Identify further topics
Learn the appropriate statistical
methods in order to plan. When
your job is to extract little data
from a huge dataset, planning is
crucial.
Find the best sources for your
needs. Stay informed about new
developments both in the industry
and academia. Sometimes, in-
bound data is also relevant.
Analyze the market dynamics. Define
the focus groups for your study. Profile
the customers or products. Perform
your own research
Based on the results, create reports,
optimize processes and suggest
changes. Create frameworks for
future analysis for your colleagues.

3. Statistics
Statistics is the basis of all analytics. It is
paramount that an analyst understands
the roots of the tests that are
performed in order to interpret them.
You should be comfortable with the
concepts and how to implement them
into tests and experiments. Sometimes,
analysts are expected to suggest
metrics to be measured and experience
with statistics is the right way to
approach such problems.

Basic
concepts
Hypothesis
testing
A/B testing
Central limit
theorem
Correlation
p-value
Distributions
Regression
analysis
Confidence
intervals
Statistical
significance
Margin of
error
ANOVA
3. Statistics
At the workplace, a Data Scientist is
expected to understand the root causes
of various problems. She should be able
to immediately identify possible reasons
for both under- and overperformance of
certain metrics. It is highly recommended
to be completely proficient with these
terms before furthering your expertise
into Advanced Statistics.

4. SQL
SQL is a relatively simple programming
language that serves the niche of
relational database management. It is
mandatory for anyone employed in
data science to be able to work with
databases and SQL is the way to do it.
Thera are different platforms for SQL,
such as Oracle, MySQL and Microsoft
SQL Server. While they have their own
peculiarities, the underlying language is
virtually the same.

4. SQL
Export
Transform
Load
Design
At the workplace, one often needs some information
from the database. There are two options: extract it on
your own, or contact the IT team. When you are the Data
Scientist you usually need all data at all times and don’t
want to depend on another person. Apart from utility, it
is also the responsibility of a
Data Scientist to interact
with a database and extract
whatever is needed for her
data-driven decision.

5. Tableau
The best description of Tableau comes
from its creators: ‘Tableau can help
anyone see and understand their data’.
It is the leading software in the
business intelligence and data analytics
field in the recent years. Whenever you
see beautifully visualized data, chances
are that Tableau has something to do
with it.

5. Tableau
Visualize data with customized tools
for just about any purpose. Report
by sales, location, focus group and
much more
Analyze KPIs with new eyes after
seeing what your data actually means
and present it in the most engaging
way.
Segment your audience on any
dimension you can imagine while
Tableau automatically produces the
desired result.
Increase your engagement and
conversion rates through insights
about brand awareness, trends,
patterns and anomalies.
Working with Tableau automatically gives you a competitive advantage as it helps
you navigate through massive amounts of data in seconds

6. R
Ris a programming language
specifically designed for statistics and
graphics. Programming in Ris an
extremely fast and effective way to
perform advanced analyses, including
creating machine learning algorithms.
Since the rise of data science, its
popularity has been increasing by the
day with most data analytics done in R.

6. R
COMPUTATIONAL
ANALYSIS
Enjoy the full computational power of your
computer, increasing exponentially the
speed of the analysis with libraries designed
for just about any analysis you can think of
VISUALIZATION
Immediately visualize your data
with functions tailored for any
graphic you will need. R is still
unmatched when it comes to
interactive graphics design
especially for the web
BIG DATA
Ris designed to handle extremely
big data sets, usually gathered by
medium to big companies, or for
academic research
R has many strong sides that come
from the fact it was designed
specifically for data manipulation. Most
functions you will need in data science
will be just a couple of lines of code
away.

7. Python
Python is an
open-source, general-
purpose high-level
programming
language. It is one of the most widely
used programming languages in the
past few years. The technical
advantages it has over other
programming languages and its
modules for scientific computing
make it a preferred choice while
working in the fields of in finance,
econometrics, economics, data
science and machine learning.

Python
7. Python
Easy syntax, open-source,
integration, scope
Libraries
NumPy, pandas, matplotlib and scikit-
learn are some of the most widely used
libraries in data science.They combine
the capabilities of many other
programming languages, but let you
use them all at one place in an
environment that just needs to support
Python
BI
DBMS
Machine
learning
Python is compatible with MySQL and is
expected to be integrated in the new version of
the Microsoft SQL Server as well.Thus, giving
you the capability of working with relational
databases. Furthermore, Python can be used to
produce non-relational databases, such as
NoSQL
Leading BI software Tableau launched a beta of
the so called TabPy which is used to integrate
Python within Tableau. In this way, you can
create reports that leverage the real-time
computational power of Python
Python is the leading language used for
machine learning in the field of data science.
This includes data mining, data scraping, social
network analysis and clustering.

8. Advanced
Advanced statistics in this framework
refers to the symbiosis between the
computational power, inferential
statistical methods and linear algebra.
This includes datasets of different sizes
and dimensions, defined by various
distributions. Deeper knowledge of
factor and cluster analysis is also
required, mainly in the interpretation of
machine learning output.
Statistics

Advanced
topics
Distributions
Bayesian
inference
Decision
theory
Factor
analysis
Logistic
regression
Cluster
analysis
Transform
Higher
dimensions
Math
methods
8. Advanced Statistics
Basic statistics lays the foundation of the field and
focuses on frequentist inference. Advanced
statistics builds up on it, entering
multidimensional spaces, through knowledge of
mathematical methods, transformations and
distributions. Moreover, more complex means of
analysis are introduced, such as clustering and
factoring. Finally, Bayesian inference and decision
theory give allow the Data Scientist to solve
problems of dynamic and/or behavioral nature.

9. Machine learning
Machine learning is often confused with
artificial intelligence. In reality, machine
learning is a revolutionary approach to
developing AI programs, but is not the AI
itself. One of the definitions of machine
learning is:‘extracting knowledge from data”.
In fact machine learning is extremely closely
related to data mining and statistics. In the
context of data science, the Data Scientist will
be looking for ways to analyze the data using
machine learning algorithms, in order to solve
problems that are too complex or
incomprehensibly big for the human brain to
process.

9. Machine Learning
Supervised Unsupervised Reinforcement*
Machine learning is a relatively new field
that is constantly evolving. In order
create and run machine learning
algorithms, one needs solid statistical
knowledge and programming skills. In
the field of data science, most often, it is
divided into three subsets: supervised,
unsupervised, and reinforcement
machine learning. Each of them is based
on different statistical methods, thus has
different strong sides and shortcomings.
In supervised ML, the
algorithm’s goal is to find
the best way to perform
the task given by the
researcher. It ‘learns’ what
is the approach to do it
(mathematically, finds the
perfect fitting function for
the problem).
Common methods:
•Regression analysis
•Classification
In unsupervised ML, the
algorithm’s goal is to
reach a result, which is
unknown to the
researcher. Once an
output is given, the data
scientist is expected to
interpret what the
program has done.
Common methods:
•Clustering
In reinforcement ML, the
goal of the algorithm is to
maximize its reward. It is
inspired by human
behavior and the way
people change their
actions according to
incentives, such as getting
a reward or avoiding
punishment.
Common methods:
•Decision process
•Reward system
*The literature on the topic divides machine learning into supervised and unsupervised. In AI frameworks, reinforcement is typically considered a subset of supervised and/or unsupervised. However, in the
field of data science, it is common to divide it in a distinct subset due to the nature of the methods used. That is also the classification that we have adopted.

FAQ at interviews
1. What does data science mean?
2. What are the assumptions of a linear regression?
3. What is the difference between factor analysis and cluster analysis?
4. What is an iterator generator?
5. Write down an SQL script to return data from two tables.
6. Draw graphs relevant to pay-per-click adverts and ticket purchases.
7. How would you explain Random Forest to a non-technical person
8. How can you prove that an improvement you introduced to a
model is actually working?
9. What is root cause analysis?
10. What is a logistic regression?

FAQ at interviews
11. Explain K-means.
12. What kind of RDBMS software do you have experience with?
What about non-relational databases?
13. Supervised learning vs unsupervised learning.
14. What is overfitting and how to fix it?
15. What is the difference between SQL, MySQL and SQL Server?
16. How would you start cleaning a big dataset?
17. Give examples where a false negative is more important than a
false positive, and vice versa.
18. State some biases that you are likely to encounter when
cleaning a database.