(The Wiley Finance Series) Salvatore Carollo Understanding Oil Prices A Guide To What Drives The Pr
User Manual:
Open the PDF directly: View PDF ![]() .
.
Page Count: 188 [warning: Documents this large are best viewed by clicking the View PDF Link!]

Understanding Oil Prices
For other titles in the Wiley Finance series
please see www.wiley.com/finance

Understanding Oil Prices
A Guide to What Drives the Price of Oil
in Today’s Markets
Salvatore Carollo
A John Wiley & Sons, Ltd., Publicatio
n
This edition first published 2012
© 2012 Salvatore Carollo
Registered office
John Wiley & Sons Ltd, The Atrium, Southern Gate, Chichester, West Sussex, PO19 8SQ,
United Kingdom
For details of our global editorial offices, for customer services and for information about how to
apply for permission to reuse the copyright material in this book please see our website at
www.wiley.com.
The right of the author to be identified as the author of this work has been asserted in accordance
with the Copyright, Designs and Patents Act 1988.
All rights reserved. No part of this publication may be reproduced, stored in a retrieval system, or
transmitted, in any form or by any means, electronic, mechanical, photocopying, recording or
otherwise, except as permitted by the UK Copyright, Designs and Patents Act 1988, without the
prior permission of the publisher.
Wiley publishes in a variety of print and electronic formats and by print-on-demand. Some
material included with standard print versions of this book may not be included in e-books or in
print-on-demand. If this book refers to media such as a CD or DVD that is not included in the
version you purchased, you may download this material at http://booksupport.wiley.com. For
more information about Wiley products, visit us at www.wiley.com.
Designations used by companies to distinguish their products are often claimed as trademarks.
All brand names and product names used in this book are trade names, service marks, trademarks
or registered trademarks of their respective owners. The publisher is not associated with any
product or vendor mentioned in this book. This publication is designed to provide accurate and
authoritative information in regard to the subject matter covered. It is sold on the understanding
that the publisher is not engaged in rendering professional services. If professional advice or other
expert assistance is required, the services of a competent professional should be sought.
Library of Congress Cataloging-in-Publication Data
Carollo, Salvatore.
Understanding oil prices : a guide to what drives the price of oil in today’s markets / Salvatore
Carollo.
p. cm.—(The wiley finance series)
Includes bibliographical references and index.
ISBN 978-1-119-96272-4 (hardback)
1. Petroleum products—Prices. 2. Petroleum industry and trade—History. I. Title.
HD9560.4.C37 2012
338.23282—dc23
2011039266
A catalogue record for this book is available from the British Library.
ISBN 978-1-119-96272-4 (hardback) ISBN 978-1-119-96289-2 (ebk)
ISBN 978-1-119-96290-8 (ebk) ISBN 978-1-119-96291-5 (ebk)
Set in 11/13pt Times by Aptara Inc., New Delhi, India
Printed in Great Britain by TJ International Ltd, Padstow, Cornwall, UK
A Sofia e Riccardo
Parmi d’aver per lunghe esperienze osservato
tale essere la condizione umana
intorno alle cose intellettuali,
che quanto altri meno ne intende e ne sa,
tanto pi`
u risolutamente voglia discorrerne;
e che, all’incontro, la moltitudine delle cose conosciute ed intese
renda pi`
u lento e irresoluto al sentenziare circa qualche novit`
a.
It seems to me, after long experience
in observing the human condition
as regards intellectual matters,
that some persons, the less they understand and know,
all the more forcibly wish to hold forth;
and that, when we encounter something new,
the myriad things known and understood
make any judgement regarding it slower and less conclusive.
Galileo Galilei

Contents
Foreword xiii
Preface xv
Quick Reference Guide xix
List of Figures xxiii
List of Tables xxvii
List of Boxes xxix
1 The World Crude Oil Paradoxes 1
2 The Market Events from 2008 to 2011 7
World Energy Policy 8
The Financial Crisis and the Oil Market 10
Fundamentals or Financial Speculation? 17
Demand/Supply of Gasoline and Gasoil 21
WTI – Brent Differential 24
3 Evolution of the Price of Crude Oil from the 1960s
up to 1999 29
1960–1980: The Oil Monopoly and the Two Crises
in the 1970s 30
The 1980s: The Gradual Disappearance of OPEC 33
The Price War 35

x Contents
1985–2000: From the Introduction of Brent as an
International Benchmark to the Clean Air Act 37
The Suicide of OPEC 40
The Start of the Free Market 41
The Consequences of the Environmental Turnaround 44
4 Changes in the Market for Automotive Fuels 45
Evolution of Environmental Demand 45
Gasoline and its Components 50
Reforming 51
Cracking 52
Alkylation 53
Isomerization 53
Refiners Walk the Tightrope 53
The Fiscal Policy of the Industrialized Countries
Regarding Fuels 55
5 World Oil Flow 63
Transformations in the Downstream 66
World Supply Structure 70
6 The Classical Model of the International Oil Market 73
7 The Short-term Model of the International
Oil Market 81
8 The Brent Market 89
The Sale and Purchase Contract 90
The Forward Market for Brent (15 day Brent Contract) 94
The IPE Brent Market 100
The Divorce Between Oil Price and Oil 102
9 Principal Uses of the Forward and Futures Markets 105
Tax Spinning 105
Benchmarking 105
Hedging the Price Risks 106
Speculations on Operational Flexibilities at Loading 114
Market Structure: Contango and Backwardation 117
Procedures at the Loading Terminals 119

Contents xi
10 Problems of the Brent Forward Market 123
11 The European Refinery Crisis 131
12 Conclusions: We are Ourselves OPEC 155
Bibliography 163
Index 165

Foreword
This book was conceived after a critical re-reading of the lectures I gave
at the Eni Corporate University (ECU) for the Master MEDEA and for
the Annual Seminar on oil marketing.
It is therefore the result not only of my elaborations and market models
developed over the years to interpret the international oil market, but
also of the discussions in the lecture hall with the students of the Master
MEDEA and with the representatives of those producing countries who
have taken part in the various editions of the Annual Seminar.
My thanks are due above all to these persons.
I also wish to thank Prof. Enzo Di Giulio, president of ECU, who
desired to be present in these lectures and encouraged me to put the
content of my presentations in book form.
Finally, I owe particular thanks to Dr Caterina Marmorato who, apart
from helping me with notable professional commitment in the delivery
of the lectures for the Master course, dedicated a good part of her free
time for several months in preparing the technical annexes and in the
task of editing.

Preface
The title of the book you are holding – Understanding Oil Prices: A
Guide to What Drives Oil Prices in Today’s Markets – brings to mind
the telling of a story. Now, we know that for a story to be a good story
it should meet three conditions: a) there are certain events to relate;
b) these events run in order, that is, their sequence has some sense and,
if possible, succeeds in holding the attention of the reader; c) there
is a voice that narrates the story effectively and clearly. We feel that
Salvatore Carollo’s book satisfies all three of these conditions, and it
tells a story of great interest to all of us.
The world of oil seems to be cloaked by a form of disparity in
comprehension. Without oil, our entire existence – as we know it today –
would not be possible. Despite the countless discussions regarding the
oil peak and the end of the oil era, this fuel still represents, by far, the
primary energy source. According to the last World Energy Outlook
of the IEA, the proportion of oil as a source of energy stands at 34%
against the 26% of coal and 21% of gas. According to the IMF’s World
Economic Outlook (WEO) reference scenario, in 2030 it will still be
the primary source: 30% as against the 29% of coal and 22% of gas.
Oil has, and continues to have, a profound influence on the lives of
westerners and perhaps even more so on that of the peoples of the east.
Certainly, it is a non-renewable source and this means that its days, in
the long term, are numbered. But that is not the point here: the heart of
the matter is that we are dealing with a material that shapes, changes,
models, directs and configures the history of the world. And this is
destined to carry on for a long time – true even when the lusty flames
of oil, ephemeral like all the things in this world, fade away in the great
emptiness of time. Just as the Hellenistic or Roman worlds still influence

xvi Preface
our lives despite their decline – consider for a moment our language –
in the same way, oil has given the world a development and geopolitical
model, which is destined to last for the coming centuries. But this is
the future. Today, rather, we are in the midst of the oil era. And yet,
as we said earlier, there is a depressingly inadequate awareness of the
significance of this essential source. This very book has come to your
hands, reader, thanks to oil. Here we are not talking about a technical
knowledge of the complex work of exploration, or oilfield production,
or of the transport of crude oil across the oceans of the globe. Rather,
we refer to those three words that millions, if not billions, of times
stand out in the media: the ‘price of oil’. This expression, the content
of which has such a powerful influence on our lives, is the synthesis of
immense forces – costs, decisions regarding investments and expenses,
use of reserves, operations to cover risks, speculations, transactions, the
policies of contracting companies, the policies of nations, oil companies
and so on – that interact to form it. At the same time, from the price
itself stem innumerable chains of actions that influence variables of
fundamental importance for the entire economy: the quotations of the
dollar and the euro, the balance of payments, the price of gasoline and
gasoil, the cost of electricity, the rate of inflation, employment and so on.
Thus, the price of oil has a vast and forceful impact on our existence.
And despite all this, the issue is not adequately discussed. Rather, it
is mentioned, hinted at and at times journalists try to explain it; but
beyond the inner circle of specialists no one talks much about it. And
this circle, to tell the truth, is very restricted. This is a destiny that oil
shares, unfortunately, with all the sources of energy. Just reflect on the
scarce availability of courses in energy economics in universities across
the world. A similar reflection applies to books on energy economics
that are a rara avis on this planet, particularly if we compare them
with the plethora of texts on environmental economics. Paradoxically,
energy – which represents perhaps the central axle around which the
entire economy rotates – is almost never an issue to dissect in our degree
courses, in particular those regarding economics. Thus, tethered within
the strict boundaries of a territory for specialists, the price of oil remains
an abstruse, esoteric matter. When an attempt is made to pass from the
esoteric to the exoteric, it is often done in a misguided, amateurish way.
The media advances information that evokes horrific scenarios – until
last year some were predicting a price of around $200 per barrel – they
talk of an oil peak and the end of oil. Alternatively, OPEC is indicted as

Preface xvii
being responsible for the high prices, inflating its role disproportionately.
In this way, public opinion tends to form biased opinions based on
explanations that draw attention to just one main force, as the only one
responsible for what happens.
This book by Salvatore Carollo speaks of all this. It tells a story, as
we said, and it does so starting from the end, namely the crude oil price
collapse of last year from almost $150 to under $40 per barrel. Why did
this happen? To what extent can the fundamentals explain it? Starting
from these questions, the book offers an examination of the phenomenon
that takes us nimbly through the essential phases of the evolution of crude
oil price. The volume deals with relevant aspects – some quite technical –
such as purchase contracts, the structure of world supply, the evolution of
environmental regulations and, naturally, the refining process for crude
oil. But at its core remains the key question of the price and its formation.
The various issues discussed serve as fodder for the exploration of the
primary question, as if they were pieces of a jigsaw to be completed.
Certainly, as regards the role of the various forces that drive prices up
or down, the book offers a very clear explanation. In one sense, it tracks
down some of those guilty. We will not reveal them here, so as not to
deprive the readers of the pleasure of discovering them in due course.
We will only declare that the text materializes from the vast experiences
of the author. As we read, we hear the voice of a professional, namely a
man who works in the oil arena and whose main task is, for his part, to
contribute towards the formation of prices, and not explain them. And
yet, the author belongs to that class of professionals that master, thanks
to their deliberation, whatever they do, in this way succeeding to unify
thought with action. Unfortunately, their class is very rare: it is hard to
say whether it is more or less rare than that of the academic who follows
the inverse route, passing from theory to practice. What is certain is
that the marriage of practice and reflection has produced a stimulating
and enjoyable book. Some readers will appreciate its structure, which
alternates the narration with the technical aspects, others the voice, still
others will find it an interesting and nimble introduction to the world
of oil, and others, finally, may see it as a sort of text book. Some will
agree with its propositions, others not: we can be certain of that. But the
function of a book is precisely this: to stimulate reflection and nurture
knowledge with thought. To quote the celebrated words of a troubled
writer of the 1900s, Franz Kafka – as troubled as the oil market! – ‘a
book must be a pickaxe for the frozen sea that resides within us’. And the

xviii Preface
frozen sea is not only the existential and interior one as navigated by the
writer from Prague. Often, the ice on the sea is created by prejudices, the
knowledge fossilized inside us and never seen again, by the ready-made
explanations, by their nebulosity which is never questioned. This book
has the honour and duty to be a robust pickaxe.
Enzo Di Giulio
President, Scuola Enrico Mattei

Quick Reference Guide
To assist the reader a glossary of the technical terms that have been only
briefly considered in the text has been added. Other terms have been
described in some detail in the pertinent chapters.
rASSESSMENT: this term is used in the text to mean estimate and/or
valuation.
rAUTHOR’S SOURCE: when this reference is indicated, the source
of data and graphs should be intended as a personal elaboration of
data available in the market and from public sources.
rBENCHMARK: in the crude oil sector, a benchmark provides a
reference parameter based on which other crudes are evaluated or
priced. Some benchmarks are localized in specific geographic areas
(e.g. Dubai in the Middle East or Tapis in the Asia-Pacific area) while
others have global application, e.g. Brent Dated.
rBLENDING of GASOLINES: final operations in a refinery for mix-
ing semi-finished products arriving from various plants. Actually, with
very few exceptions, for technical/economic reasons, gasoline as a fin-
ished product is not directly obtained in a refinery from one sole plant,
but usually through mixing various components.
rDOWNSTREAM/UPSTREAM: downstream is the part of the oil
cycle that embraces transport, refining and marketing. The preceding
operations, i.e. exploration and production of crude, represent the
upstream.
rDRIVING SEASON: this term indicates the season for gasoline in
America. Normally this phase starts in late May and continues for the
entire summer season; in other words, as a result of summer travel, it
is the period of greatest gasoline consumption in the USA.

xx Quick Reference Guide
rICE: acronym for the Intercontinental Exchange, previously known
as the International Petroleum Exchange (IPE), one of the major
exchange markets for physical products and their derivates. The con-
tracts dealt with on ICE include the following products: exchange
rates, stocks and shares, crude and refined products, natural gas, cof-
fee, cotton, sugar and so on. When reference is made to ICE futures,
this signifies the futures contract for ICE Brent, dealt with in Europe
on the London Exchange.
rIEA: Acronym for the International Energy Agency, an international
organization founded by the Organization for Economic Cooperation
and Development (OECD) with headquarters in Paris.
rJET-FUEL or JET-KERO: aviation fuel.
rJOINT VENTURE: a contract between organizations for the imple-
mentation of a project that involves notable technical and financial
risks. The obligations and responsibilities of each partner are shared
proportionately on the basis of each partner’s participation quota in
the project. Joint ventures between oil companies occur frequently
in the exploration and exploitation of oilfields (in particular offshore
ones).
rOCTANE NUMBER: the index of resistance to detonation of a fuel.
If the octane number is too low the speed of combustion of the gasoline
is too high and this causes shock waves in the combustion chamber
of the engine (‘pinking’) and dispersion of energy.
rNYMEX: acronym for the New York Mercantile Exchange, one of
the biggest commodity markets. Founded in 1872 for trading eggs,
butter and cheese, it is now the reference bourse for oil. When the text
refers to NYMEX futures this means the WTI futures contract.
rOPEC: acronym for the Organization of the Petroleum Exporting
Countries.
rOPEN INTEREST/OPEN POSITIONS: in the futures market, this
indicates the aggregate of the purchase and sale operations that have
not been closed by operations in the opposite side.
rTERMINAL OPERATOR: the body that manages and administers
a production terminal for crude oil (loading tankers, administration of
production data, allocation of barrels). Normally this body coincides
with the partner that has a majority shareholding in the project.
rOSP: Acronym for Official Selling Price. This provides one of the
many ways for determining crude prices. The OSPs are normally fixed
unilaterally and published by the producing countries.

Quick Reference Guide xxi
rSPARE CAPACITY: in general, this refers to the unused capacity
of a refinery (namely the capacity to produce greater quantities of
refined products as compared with those already in production), or
the unused production capacity of an oilfield (namely the capacity to
produce greater quantities of crude oil as compared with those already
in production).
rSWING PRODUCER: a producing country or association of such
countries likely to adjust its offer of crude to the demand so as to
control price movements.
rARMS-LENGTH TRANSACTIONS: those between related par-
ties but whose contractual terms reflect market conditions between
independent and unrelated parties.
rWTI: acronym for West Texas Intermediate, also called Texas Light
Sweet. This crude is used as a benchmark throughout America. The
WTI derived contract is traded on the NYMEX.

List of Figures
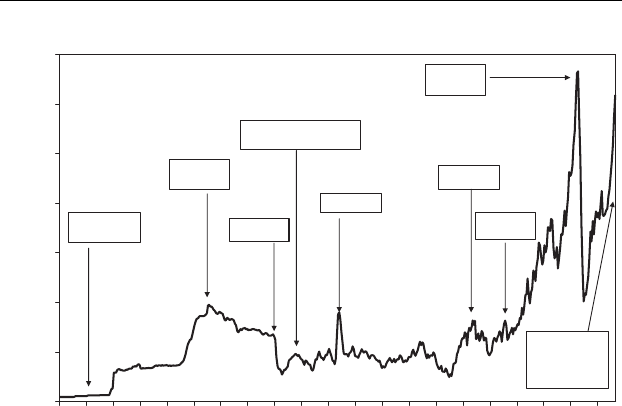
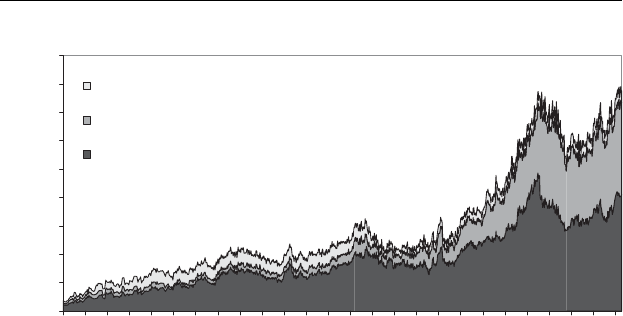
Figure 1.1 Brent Dated 1970–2010 and main historical events 2
Figure 1.2 OPEC production versus Brent 4
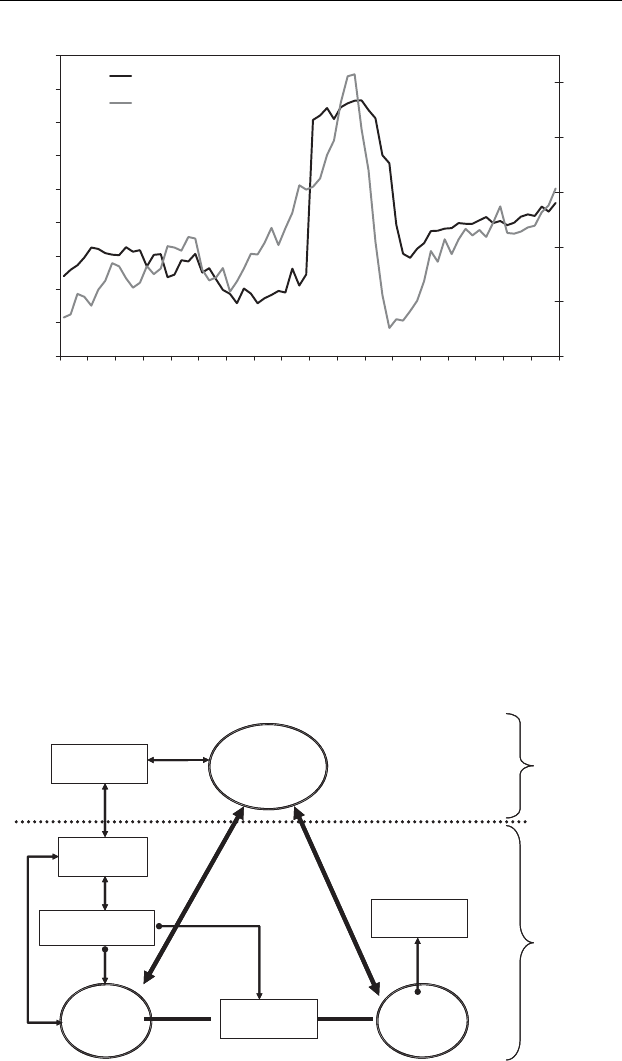
Figure 1.3 Complexity and interdependence in the oil market 4
Figure 1.4 World oil demand (average in 2005–2010),
million barrels per day 6
Figure 2.1 World oil demand versus supply 8
Figure 2.2 NYMEX WTI crude oil futures open interest:
non-commercial versus total traders 14
Figure 2.3 Comparison between volumes of NYMEX and
Brent traded in the futures and physical markets 15
Figure 2.4 Futures: daily trades in 2008–2010 18
Figure 2.5 Provisional and final assessments of stock
changes versus Brent prices 21
Figure 2.6 Price movements during the winter months 25
Figure 2.7 WTI NYMEX–ICE Brent differential 26
Figure 2.8 Brent and inter-monthly volatility (1988–2011) 27
Figure 3.1 Crude oil prices (1970–2011) 30
Figure 3.2 The price of crude with reference to the
benchmark 31
Figure 4.1 USA crude demand by sector (2009) 46
Figure 4.2 Evolution of gasoil specifications 47
Figure 4.3 Evolution of oil demand in the USA, Europe and
Asia-Pacific (1985–2020) 49
Figure 4.4 Per capita oil demand in the USA, Europe and
Asia-Pacific (1985–2010) 49
Figure 4.5 Gasoline and refining plants 51

xxiv List of Figures
Figure 4.6 USA imports: gasoline versus blending
components 54
Figure 4.7 Simplified refinery scheme 56
Figure 4.8 Gasoline prices in the world 60
Figure 4.9 Price (excluding taxes) of gasoline in Europe
and the USA 60
Figure 4.10 Tax burden on diesel fuel in 2010 (Europe
and the USA) 61
Figure 5.1 World oil flow 64
Figure 5.2 Number of refineries versus average refining
capacity 68
Figure 5.3 Refining capacity versus rate of
utilization (USA) 69
Figure 5.4 Destinations guaranteed and destinations
dependent on the price 71
Figure 5.5 Destination of crude (%) 71
Figure 6.1 Variation of stocks versus variation in the
Brent price 75
Figure 6.2 The classical model of demand/supply 76
Figure 6.3 The modern supply/demand model 77
Figure 6.4 The vicious circle in the classical
demand/supply model 78
Figure 6.5 Adjustments to the estimate of the yearly
imbalance between demand and supply 79
Figure 7.1 The classical industrial model 82
Figure 7.2 Refining cycle for a heavy crude to produce
1 tonne of gasoline 84
Figure 7.3 The modern oil industrial cycle 85
Figure 7.4 Relative prices of gasoline, gasoil, jet fuel
and fuel oil 86
Figure 7.5 Relative prices of products in 2008 86
Figure 9.1 Example of price-lock hedging 107
Figure 9.2 Example of integrated price-lock hedging 112
Figure 9.3 Example of operational flexibility effects 115
Figure 10.1 Distorted Brent Dated quotations 125
Figure 10.2 Movement of the benchmark before and after
July 2002 127
Figure 10.3 Relationship between demand and supply of
regional crudes 129

List of Figures xxv
Figure 11.1 USA: number of refineries versus average
refining capacity 133
Figure 11.2 Europe: number of refineries versus distillation
and conversion refining capacity 133
Figure 11.3 NWE and MED refinery margins:
cracking plants 134
Figure 11.4 EUROPE: surplus/deficit in capacity, refining
margins and demand 136
Figure 11.5 EUROPE and USA: surplus/deficit in capacity,
refining capacity and demand 137
Figure 11.6 US import: gasoline and blending components
from Europe 138
Figure 11.7 Alkylate premium to gasoline 139
Figure 11.8 Brent and products prices 2004 143
Figure 11.9 Brent and products prices 2010 144
Figure 11.10 Brent and products prices 2004 (base:
1 January =100) 145
Figure 11.11 Brent and products prices 2010 (base:
1 January =100) 145
Figure 11.12 Gasoline/Brent prices ratio 146
Figure 11.13 Gas oil/Brent prices ratio 147
Figure 11.14 Comparison between a financial refinery and a
real refinery (MED, January 2011) 148
Figure 11.15 NWE: refinery margins (cracking plant)
versus crack spread (seasonal 3–2–1) 149
Figure 11.16 MED: refinery margins (cracking plant)
versus crack spread 149
Figure 11.17 Agricultural and oil demand and prices 150
Figure 11.18 GDP per capita and open interest 151
Figure 11.19 Agricultural and oil futures open interest
on NYMEX 153

List of Tables
Table 2.1 Comparative analysis of the value of NYMEX and
Brent in the financial and physical markets 16
Table 2.2 Total production costs by region 19
Table 2.3 Demand of oil products in OECD Europe and
in the USA 22
Table 4.1 Evolution of gasoline specifications 46
Table 4.2 Evolution of gasoil specifications 47
Table 4.3 World crude oil demand 47
Table 4.4 Gasoline in Europe and the USA: list price and price
at the pump 58
Table 4.5 Price of gasoline and diesel fuel in some
European countries 59
Table 5.1 Italian refineries 67
Table 6.1 Global oil demand and supply 74
Table 9.1 Correlation index between Brent and other
international crudes 106
Table 11.1 EUROPE: surplus/deficit in capacity, refining
margins and demand 135
Table 11.2 USA: surplus/deficit in capacity, refining
margins and demand 137

List of Boxes
Box 2.1 Cost of the Marginal Barrel 18
Box 2.2 Jet Fuel and Gasoil Market 24
Box 3.1 The Netback Value System 36
Box 6.1 Variations in Estimated IEA Stocks 79
Box 8.1 The Principal Clauses in a Sale and
Purchase Contract 90
Box 8.2 The Daisy Chain 95
Box 8.3 15 day Brent Contract 96
Box 8.4 The Price Risk in the 15 day Brent Contract 98
Box 9.1 First Example of Hedging 107
Box 9.2 Second Example of Hedging 110
Box 9.3 Example of Synergies Between Operational
Flexibilities and Hedging 114
Box 9.4 Floating Storages 117
Box 10.1 Market Squeeze 124
Box 10.2 Assessment of Brent Dated (Platts’ Methodology) 128
Box 11.1 Trends in Agricultural Products and Oil Prices 150

1
The World Crude Oil Paradoxes
For some years now, the price of oil has been out of control. None of the
great names of the industry, the production cycle or the oil market is able
to intervene to decide its level or guide its progress. The oil companies,
the OPEC producing countries as well as the non-OPEC, the consuming
countries, the consumers: not one of these has this capability.
The price of oil, in the imagination of western consumers, is still
linked to the equilibrium developed during the 1970s and 1980s, with
the emerging of the Persian Gulf countries and the OPEC nations.
It is still a popular belief that the cartel of the largest oil producing
countries in the world is capable of regulating the volume of production
and using this key raw material to achieve political aims.
Even today, when the price of oil rises beyond any level considered
critical, the vast majority of the oil market analysts turn their eyes
towards Vienna, where the oil ministers of the OPEC countries meet,
imagining, hoping for and analysing decisions which either will not be
taken or, if taken, will turn out to be completely ineffective. Lately, in
some market reports, more sophisticated analyses are merely focused
on the availability of OPEC countries’ spare capacity; linking to this
factor the dynamics of the oil price. When we look at the graph of the
price of crude oil in Figure 1.1 we do not see the result of market forces,
but rather a design traced by the hand of a powerful invisible architect
who, following his own purposes, has established a course along which
the price of oil should travel.
Since the end of 1998 analysts, oil companies and producing countries
have mistaken every forecast of the price of oil, clearly showing not only
that they no longer control the fundamental market mechanisms, but that
they are not even able to comprehend its real dynamics – it is as if the
invisible architect had lost his pencil.
If we take our memory back to December 1998, when the price of
crude oil fell to $9 per barrel, all the respected names of the oil industry,
bar none, forecast that the price would stay for at least one or two decades
under $15 per barrel. It is enough to glance at the investment budgets
of all the oil companies or the financial programmes of the producing
Understanding Oil Prices: A Guide to What Drives the
Price of Oil in Today’s Markets
by Salvatore Carollo
Copyright © 2012, Salvatore Carollo
2 Understanding Oil Prices
0
20
40
60
80
100
120
140
1970
1972
1974
1976
1978
1980
1982
1984
1986
1988
1990
1992
1994
1996
1998
2000
2002
2004
2006
2008
2010
$/bbl
Yom Kippur
War
Iraq/Iran
War
Gulf War
Iraq War
Price War
Financial
Crisis
Clean Air
Act
Brent as International
Benchmark
2011 Unrest in
Middle East and
Earthquake in
Japan
Figure 1.1 Brent Dated 1970–2010 and main historical events
countries to confirm that only the most optimistic among them estimated
maximum price levels between $14 and $15 per barrel in the long run.
Some oil companies, based on this view, hedged their production at
this level of prices and went bankrupt. Yet only a few months later,
in the summer of 2000, the price had already reached $35 per barrel,
taking everyone – market analysts, oil companies, producing countries,
economists, politicians and consumers – by surprise. Rivers of ink were
consumed to explain the nature of this event through analysis where the
causes were sought in transient factors; a sudden storm, nervousness
between two OPEC countries, political uncertainties and so on.
The years of the energy crises were far away and deeply buried in
the collective subconscious. The reappearance of such a thorny question
was regarded, before it raised any anxiety, as almost a nuisance. Still
today, after a decade of price hikes for crude from $9 to more than $140
and then down to $37 and once again above $120 per barrel, most people
limit themselves to reciting a series of clich´
es to try to find justifications
for an incomprehensible phenomenon:
rLimited supply from the producing countries, apparently inadequate
to satisfy the growing demand for oil.
rUnexpected growth in the demand for oil by China and India, appar-
ently upsetting the stability of the oil market.

The World Crude Oil Paradoxes 3
rTensions in the Middle East.
rThe prospect of a decrease in the crude reserves/crude production
ratio and therefore the availability of spare capacity.
rThe excessive taxes on petroleum products (gasoline, diesel, LPG
etc.) imposed by European governments.
This type of analysis has the advantage of being simple and easily
presentable to the public at large, without, however, explaining what
has really happened or is happening. Nevertheless, this approach has
enabled some commentators to exaggerate on the contentious issues
regarding the excessive power of the OPEC countries and the ways to
bring them to reason.
The problem which all serious analysts have to face up to is actually
quite simple. The essence is to explain oil price movements by use of
the classic model of economics, which assumes that price is a function
of the relationship between demand and supply:
Price =f (demand, supply)
This principle of economics seems too valid to allow any space
for querying it. Notwithstanding this, the fundamental classic method
applied tout-court to the oil market does not work. Yes, it is correct to
say that the price is linked to the supply and demand balance, but of
which good? We need to find out the merchandise or commodity whose
supply and demand is determining the dynamics of oil price. For sure,
it is not the physical crude oil.
OPEC has programmed and put into effect increases or cuts in pro-
duction on numerous occasions, but always with scarce results. To every
public announcement of increased production by the OPEC countries,
the markets have responded with an increase in the crude oil price by at
least a couple of dollars per barrel – and vice versa, when they announced
cuts (Figure 1.2).
It is therefore reasonable to question whether the economic model
utilized really works or if it is applied in an incorrect way to the oil
market. Or, rather, that the technological complexity of this market does
not allow it to be modelled on the simple relationship between demand
and supply at a global level. The internal dynamics of this particular
market require a much more detailed and complex model, capable of
describing some of the fundamental dynamics of the system.
Unfortunately, the majority of analysts in this field have exclusively
economic backgrounds and tend to apply general or econometric mod-
els to the crude oil, which are suitable for other commodities (coffee,
4 Understanding Oil Prices
25
26
27
28
29
30
31
32
33
34
Jan-05
May-05
Sep-05
Jan-06
May-06
Sep-06
Jan-07
May-07
Sep-07
Jan-08
May-08
Sep-08
Jan-09
May-09
Sep-09
Jan-10
May-10
Sep-10
million bbl/day
30
50
70
90
110
130
$/bbl
Total OPEC production
Brent Quotation
Figure 1.2 OPEC production versus Brent
Source: International Energy Agency
copper, gold etc.), where the production and technological transforma-
tion processes are less complex.
One starting point should be the recognition that what is commonly
called the oil market is actually the conjunction and interaction of
different markets which operate separately and independently but
which are linked by certain complex forms of correlation and dynamics
(Figure 1.3).
Producing Countries
and Oil Companies
Crude Oil
Market
Financial
Institutions
Trading
Companies
Refineries Final Product
Market
Consumers
ICE/NYMEX
Brent/WTI
Financial
Market
Physical
Market
Figure 1.3 Complexity and interdependence in the oil market

The World Crude Oil Paradoxes 5
We refer now to the crude oil market (raw material), to the finished
products market (gasoline, diesel, jet fuel, fuel oil, chemical feedstocks,
lubricants) and to the financial market for crude and finished products
(futures). We should always remember that in our cars and in airplanes
we do not use crude oil, but finished products, which are increasingly
difficult to produce. We cannot also neglect the dramatic developments
of the futures market and its predominant role in the world economy.
Each and all these markets respond to different behavioural patterns
and they are operated by bodies with differing interests, culture and
business objectives. A model that does not take into account the inter-
relations between these markets and their individual dynamics is inca-
pable of describing what happens to oil prices.
When the analyst is confronted by the unequivocal event of a price
variation, and having only the classic model of the global demand/
supply, he can only create a scenario of probable events (input to the
model), which, when processed, might generate the variation in price
which actually took place. If the price rises it is clear that there must have
been an increase in demand or a reduction in supply. Therefore, one looks
for all the clues which might prove that something like this has taken
place. In the absence of reliable and prompt information there is more
than enough space for these concoctions. It is thus very easy to reach
the mistaken conclusion that China and India (the distant enemy, the
invisible tartars) are becoming the critical factors for our planet. And that
certainly OPEC (the conflict of civilizations) is yet again, for political
and ideological reasons, not producing enough crude. Unquestionably
there is no need to verify the production data of Venezuela under Chavez,
or Iran under Ahmadinejad. It seems highly likely that both would wish
to create problems for the west by raising prices.
The economic and strategic importance of the themes related to the
price of crude oil would require a far more detailed technical analysis.
In this discussion we shall firstly try to examine the structural changes
in the oil industry in recent decades, to see what has changed to make
these dramatic and uncontrollable variations in price possible. And
above all we shall try to understand why, in the space of a few short
weeks (August–November 2008), without having seen even a small vari-
ation in the physical crude oil demand/supply situation the price tumbled
from $144 to $37 per barrel. Then, in a couple of months it climbed
back to $70–80 per barrel, exceeding again $120 per barrel in 2011.
These events have silenced many analysts, who have not been able to
provide consistent answers to the following questions. First of all, why
did the price drop in 2008? What happened in those few weeks? Did the
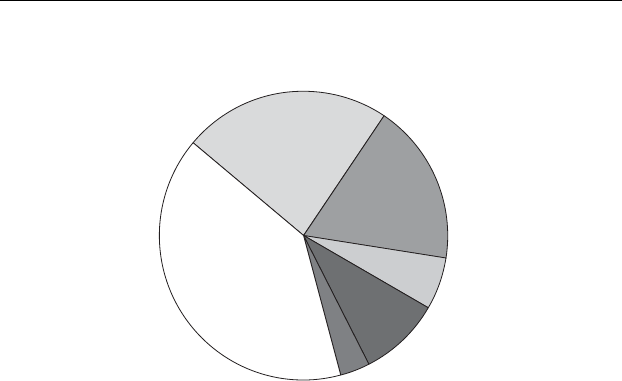
6 Understanding Oil Prices
Others
34.4
India
3.0
China
7.8
Japan
5.0
Europe
15.5
USA 50
19.9
[million barrels per day]
Figure 1.4 World oil demand (average in 2005–2010), million barrels per day
Source: International Energy Agency
demands of China and India dry up or did the tensions in the Middle
East calm down? Was OPEC flooding the markets with crude?
The truth is that OPEC cut production, the data regarding world
demand for oil (see Figure 1.4) showed no reduction in global con-
sumption, and – in the previous weeks – the Middle East lived through
one of the most dramatic crises in recent history. In all this turmoil, the
oil price plunged by almost $110 per barrel.
What is the factor that then pushed the price up again above $120 per
barrel, during a worldwide dramatic economic crisis and stagnation of
oil consumption?
Is there an economic model that can explain these recent events? A
description will be attempted in the following pages.

2
The Market Events from
2008 to 2011
This conversation starts by taking a quick look at what happened in the
international oil market during 2008. Actually, 2008 was the year when
all the contradictions brewing in the previous decade surfaced. Events
as dramatic as the collapse of crude oil to under $40 per barrel after a
surge to more than $140 per barrel had never been seen before in the
history of the oil industry. Not even the impressive crises of 1973 and
1979 were able to cause price swings of this size and speed.
It has already been mentioned that in the last decade, despite the
available supply constantly exceeding the demand, we have witnessed
the continual growth of the crude price.
The upward trend in prices underwent a brisk acceleration in spring
2008 and went on to touch a peak of $144 per barrel in summer (see
Figure 2.1). After this we saw a spectacular nosedive of almost $110 per
barrel. Analysts, economists and commentators have tried in all possi-
ble ways to provide explanations (sometimes far-fetched) for this phe-
nomenon which apparently seemed unexplainable. In fact from the data
available to all, we can safely say that in the passage from the phase of
price increases to the phase of their fall, nothing changed in the physical
oil market. On the contrary, in that very moment there was a seasonal
increase in global demand of around 2 million barrels per day and a
reduction in crude production of about the same amount. These changes
should have worked in the opposite way, that is, an increasing price.
The classic explanations (India, China, Middle East, crude oil reserves
etc.) used by the analysts to explain the upward trend of the market
became obsolete instantaneously and proved insufficient to account for
the subsequent price tumble. The textbook explanations are unable to
pinpoint the real causes behind everything.
Only recently some financial analysts have tried to link the fall of
the price in November 2008 with the lack of financial capacity to open
letters of credit of some traders, when trading their cargoes of oil. It
is true that some banks had problems in issuing a letter of credit for
Understanding Oil Prices: A Guide to What Drives the
Price of Oil in Today’s Markets
by Salvatore Carollo
Copyright © 2012, Salvatore Carollo
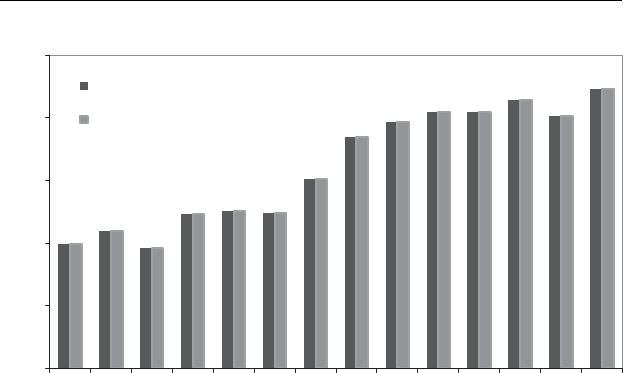
8 Understanding Oil Prices
65
70
75
80
85
90
1997 1998 1999 2000 2001 2002 2003 2004 2005 2006 2007 2008 2009 2010
million bbl/day
WORLD OIL DEMAND
WORLD OIL SUPPLY
Figure 2.1 World oil demand versus supply
Source: International Energy Agency
some traders, but it was just a very marginal phenomenon relative only
to very few cargoes in the market. The oil kept moving from the loading
terminals to the end users, from the producers to the consumers. No
interruption or excess of supply occurred at all and, therefore, nothing
justified the fall of $110 per barrel.
It is not even comparable with the apparently similar events of 1986
and 1988 when the forward Brent market collapsed to $9 per barrel. At
that time the oversupply of OPEC crude oil was real and the level of
stocks evident.
WORLD ENERGY POLICY
It is important to clarify from the beginning that a short cut is not being
sought by using a simplistic model where the financial speculation
is soley responsible for all the chaos in the oil market. The financial
investments are likely just taking advantage of the existing paradoxes
and bottlenecks in the oil industry and in the energy policy worldwide.
The stability will eventually come only when and if these structural
problems are solved.
For the time being we are just observing further additional elements
of crisis arriving and making the scenario even worse. The North Africa

The Market Events from 2008 to 2011 9
crisis (Libya in particular) and the Fukushima nuclear accident are
referred to.
These two events will amplify the structural crisis of the oil market,
accelerating all the processes already in progress since the Chernobyl
accident.
We have already experienced in all the industrialized countries the
lack of an energy policy that is capable of harmonizing the growing
energy demand with the new respect for the environment. The develop-
ment of environmental regulations in the last two decades has created
burdensome (but unchallengeable) limits for the energy and oil com-
panies in particular, but has not driven the bodies concerned to make
the investments necessary to create ‘compliant’ energy and products.
The result of these divergent processes has been the net reduction of
availability of finished products marketable in the western industrial-
ized countries. There is now a shortage of clean gasoline and gasoil.
In total the shortfall in the USA amounts to about 50 million tonnes
per year of gasoline, and about 40 million tonnes per year of gasoil
in Europe. To bridge these gaps it is necessary to import from other
geographical areas, which obviously deprives local consumers of these
products or forces them to pay the higher prices that consumers in the
strong countries can pay to get their hands on the missing products. It is
a real competition where the winners are always the ones who can pay
more.
A glance at the newspapers is enough to discover the limitations
imposed on motorists in Middle Eastern countries (Iran, Egypt etc.) or
all of West Africa.
The deficit of these high-quality finished products has bolstered the
rise in crude oil prices, particularly the light varieties such as those from
the North Sea or North Africa. Somewhat similar to what would happen
if, for some strange reason, a rule were introduced to allow the sale of
only choice cuts of meat (fillet steak, entrecˆ
ote, silverside): the price of
these would rise but so would the price of the cow.
This potential shortage of finished products has spread the feeling
in the trading market that something is at risk and, on a daily basis,
somebody may not be able to get the product he or she is looking for.
The oil market has become nervous and very transient, with the same
level of volatility experienced during the Gulf wars (when the risk of a
shortage of supply was evident).
The recent dramatic events (Fukushima and Libya) will definitely
amplify the already existing concerns and tensions and will spread the

10 Understanding Oil Prices
sensitivity about the environmental issues worldwide and accelerate the
increase of the demand for clean products.
We cannot forget that the only decision taken at the global political
level in one of the G20 meetings, to reduce the impact on the economy
of the increasing price of oil, was to encourage the construction of new
nuclear plants for producing electricity. This decision was inadequate
already when it was taken (less than 10% of the oil is used to produce
electricity) but today, after Fukushima, it appears to be almost obsolete.
We can say without any doubt that there is a lack of energy policy
worldwide, but especially in the industrialized countries; only China
and India are building what they need, despite the apparent general
market indication.
The world oil market is already in the middle of these tensions, but we
have not yet seen the worst. The forthcoming summers will offer some
anticipation of the future developments we can expect in the near future,
with a shortage of supply of high-quality gasoline and clean gasoil and
a significant increase of the price differential between light and heavy
crude oils.
Later the combined impact of the reduction of the sweet light crude
oils (like the ones produced by Libya) and the shortage of clean products
will be examined with more technical detail and analysis. An under-
standing will be gained as to why Saudi Arabia was ready to increase
the production to compensate the reduction of supply from Libya, but,
after a couple of weeks had to stop producing additional barrels of oil.
The quality (more than the quantity) of the crude oils offered to the
market is today a crucial factor for meeting the demand of products
worldwide. With the existing quality of the raw materials, it takes new
technologies and massive investments in the refinery industry. We are
far away from implementing such solutions worldwide.
It is evident that the structural problems for the oil industry will remain
as they are in the next decade and they will keep providing grounds for
financial speculation and therefore for the increase of prices, as has
happened in the last ten years.
THE FINANCIAL CRISIS AND THE OIL MARKET
In December 1988, OPEC decided to adopt as reference for the price of
crude oil (rather than the value of the Arabian light, the Saudi crude of
light quality) the value of the Brent.

The Market Events from 2008 to 2011 11
At that time, everyone thought that this was the value of the crude
produced in the North Sea, the name of which was indeed Brent. No-one
realized that this was a misunderstanding, a case of a homonym. The
Brent in question was not a crude oil, but a financial commodity.
Let us imagine, for a moment and as a game, which OPEC had decided
to adopt, as a reference for fixing the price of oil, the value of a particular
type of cherry tomato, to which the creator and biggest producer gave
the name of ‘Brent’. The reason for the choice could have been the high
energy consumption needed to produce the new ‘Brent’ cherry tomato.
Once the decision was taken, it would become obvious that the price
of oil would depend, almost exclusively, on the supply and demand of
Brent tomatoes on the international market. A plentiful harvest would
equal low prices and a difficult year, high prices. Cherry tomatoes in
fashion means high prices; and so on.
No-one would dream of looking, to analyse the movements of the
price or to make predictions of the future, at the supply and demand of
the physical crude oil.
We have taken the above example as a joke, but one capable, although
with the differentiation needed and analyses concerned, of giving us a
description that is fairly close to reality. These dynamics of the oil market
are slowly beginning to become clear and understandable to the principal
subjects in the oil market, producing countries and oil companies.
What is in fact the Brent market, the true one that defines the price
of oil?
This is a huge game like the ‘Panini football stickers’, those carrying
the picture of football players. The stickers, once printed and sold, create
an exchange market between the children or fans that look for them, and
their value varies according to the demand. Those of the famous and
popular players will go for more than those of unknown or less well-
known players.
Let us imagine that one day, for some reason, the football teams of the
world, with the agreement of UEFA and FIFA, decide that the market
value of the various players is that of the respective stickers or that they
are indexed to that reference.
A double market would be created, that of the football market where
against real money a club recruits a player in flesh and blood, and the
other where everyone can buy or sell stickers without ever becoming
owners of a player. If the market of the stickers should develop massively,
thanks to the ease with which it is possible to buy and sell (online for
example), it could at a certain point become a form of investment in

12 Understanding Oil Prices
itself, with participants that have never been interested in football and
even less in stickers.
If an international bank, for various reasons, should invest significant
amounts of capital in the stickers of a particular player, this would cause
an increase in value, regardless of the performance of the player and the
policy of the club to which the player belongs.
We would say that the football market has slipped through the hands
of the operators of that sport and has become an instrument of financial
speculation with positive and negative effects also for the world of
football (profits or losses for the bodies that ‘own’ the players whose
stickers are the subject of speculation).
Something similar has taken place in the world of oil. In the eighties
a sticker market was created, that of the futures contracts, which is just
like plastic cards (or stickers) on which a barrel of crude is depicted.
Whoever buys these plastic cards buys the drawing of a barrel, but
does not have any possibility of exchanging a plastic card with a real
barrel. The market of the oil stickers is a market that is almost totally
independent from the real oil market, with bodies operating there and
dominating it (controlling it and manipulating it) that normally have no
relationship with or interest in the oil industry.
In December 1988, the OPEC countries decided that the price of
their crude oils would be fixed on the basis of the value of the ‘oil
stickers’. This was an almost unnoticed change of a geo-political nature
that transferred control and management of the international oil market
out of the hands of the OPEC countries into those of the City of London
and, slightly less so, Wall Street. This was the event that overturned
the balance of the power that had been established since the crisis
of 1973.
For years the constant expansion of this parallel market supported
the real market. The value of the ‘drawing of the barrel’ was almost
always higher than the one the physical market would have guaranteed,
bringing benefits to those who invest in this sector and to the various
producing countries. Yes, it is a crazy game, but with a useful purpose.
In the autumn of 2008, the bankruptcy of the principal banks, which
owned massive quantities of oil stickers, obliged them to sell the oil
stickers and therefore cause a slump in the value of such stickers and
hence in the price of oil, the reference value of which derives from these.
From that moment there began talks about the need to review the
mechanism used to set the price of oil, but quietly and without haste.

The Market Events from 2008 to 2011 13
During 2009, the oil price, thanks to the recovery of what we called
the sticker market (where the banks have placed a significant share of
the money received from the governments), started to increase again.
The attitude of the producing countries became: let us discuss,
examine and wait. Any action will eventually be taken if and when
the banks find more profitable ways to invest their money, not in the
Panini stickers anymore but maybe in the real economy. For now, we
carry on this way.
So we have to resign ourselves to seeing the price of oil go up and
down, avoiding having to pretend to be able to explain the correlations
between these fluctuations and the fundamentals of the oil industry or
the non-existing policies of OPEC.
For most of 2009 and 2010, we saw the price fluctuating, in the range
of $70–80 per barrel. Everybody started to announce the new kind
of ideal range of the price of oil, considered sacred by the main OPEC
official representatives. As usual the market, a few months later, deviated
from all these guidelines given by the gurus and by the authorities. We
can say, then, that since December 1988 the global reference for the
price of crude has lost its direct relationship with the physical market.
Initially, the oil futures market had in common with the oil market,
apart from the name Brent, the historic fact that it was born to support
the trading operations of the oil companies, as a financial instrument to
provide risk hedging against oscillations in crude oil prices.
At the start of the year 2000, the oil futures market detached itself
almost completely from its original nature, becoming a market purely
for financial purposes. International banks entered this business without
having any involment in the oil business, just as an opportunity to make
profit, but some oil companies and almost all the oil trading organizations
also started to consider the futures market as an independent business
beyond the hedging purposes. All those analysts who tried to explain
the movements of the crude oil price on the basis of the evolution of the
relationship between demand and supply of physical crude have failed,
simply because the link between the financial market and the crude oil
market has become increasing ephemeral or even non-existent.
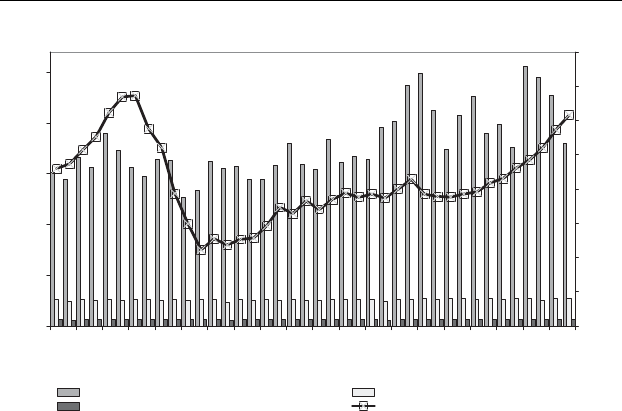
The graph in Figure 2.2 clearly shows how the volume of business on
the crude oil futures market has risen tenfold in the last 10 years, closely
following the entry of the great financial institutions in this field and the
change in the attitude of the traditional oil players. This has caused the
complete disruption of the internal dynamics of the oil market.
14 Understanding Oil Prices
0
200
400
600
800
1000
1200
1400
1600
1800
1986
1987
1988
1989
1990
1991
1992
1993
1994
1995
1996
1997
1998
1999
2000
2001
2002
2003
2004
2005
2006
2007
2008
2009
2010
2011
1000 contracts
NonReportables Average positions
Non-commercial Average positions
Commercial Average positions
Figure 2.2 NYMEX WTI crude oil futures open interest: non-commercial versus
total traders
Source: NYMEX
Brent (on paper, financial) is now traded on the market simply for
investment purposes or financial speculation, to protect capital by park-
ing it in a safe place for a certain period of time (even just for a few
minutes), to profit from a momentary wave of speculation, or to manip-
ulate a market which otherwise would be stable.
To understand better the size of the phenomenon, let us glance at the
numbers of this business (see Figure 2.3), which is almost unknown to
those who complain about the price of gasoline.
During 2008–2010, with world crude production around 86 million
barrels per day, only about 20 million barrels per day were marketed.
The remainder, about 65 million barrels per day, was not put on the
international markets because it was consumed directly by the produc-
ing countries.
If we refer to a valuation made in the period January 2008–December
2010, with an average price for Brent of $80 per barrel, we can easily cal-
culate that the value of the mass of money in movement due to purchases
and sales of physical crude as traded amounts to around $1,900 billion.
If we further assume that all the crude produced (86 million barrels per
day) was traded at market price, the mass of money in play, in the same
period from January 2008 to December 2010, would have been around
$7,600 billion. The balance between demand and supply of physical
crude at world level fluctuates within these values.
The Market Events from 2008 to 2011 15
0
5
10
15
20
25
Jan/08
Mar/08
May/08
Jul/08
Sep/08
Nov/08
Jan/09
Mar/09
May/09
Jul/09
Sep/09
Nov/09
Jan/10
Mar/10
May/10
Jul/10
Sep/10
Nov/10
Jan/11
Mar/11
billion barrels/month
0
20
40
60
80
100
120
140
160
$/bbl
ICE + NYMEX Volume of Transactions World Crude Oil Production
Physical Crude Oil Sales Brent ICE price [right axis]
Figure 2.3 Comparison between volumes of NYMEX and Brent traded in the futures
and physical markets
Sources: NYMEX and International Energy Agency
Now we can look at the volumes traded on the Exchange to dis-
cover that we have a totally different picture and with degrees of mag-
nitude enormously higher. During 2008–2010, about $51,000 billion
were traded on the futures market, that is to say, 27 times more than the
value traded on the physical market and about six to seven times more
than the entire world production of crude.
Table 2.1 shows a situation with daily trades of about $46 billion
(about $4 billion per working hour), just as if on the crude market about
580 million barrels per day were traded on the crude market and not the
20 million actually commercialized or the 86 produced. What are these
580 million barrels per day on paper, which have nothing to do with the
oil market and the demand and supply of oil for energy consumption,
and what influence do they have on the pricing system for petroleum
products? What effect do they have on the price of gasoline for the
poor motorist?
In theory the futures market for Brent was created to stabilize crude
prices after the epic oil crises of the 1970s and 1980s. The daily quotation
for Brent was supposed to permit greater transparency in the transactions
and thus a stabilization of prices in the short and medium term. In the
early years this was the case; the volumes of crude traded on the futures

16 Understanding Oil Prices
Table 2.1 Comparative analysis of the value of NYMEX and Brent in the financial
and physical markets
January 2008–December 2010
Production
of Physical
Crude Oil
Transactions
of Physical
Crude Oil
Transaction of
equivalent oil
in the financial
market
Ratio
Futures/
Physical
Ratio
Physical/
Futures
Volume
(billion barrels) 93.7 23.4 623.1 27 3.8%
Value (billion $) 7,594 1,899 50,806 27 3.7%
Sources: NYMEX and International Energy Agency
market never exceeded the physical quantities produced and sold. This
can only mean that the oil companies operated on the paper market to
stabilize the price of their crudes with hedging operations. Today we
see 580 million barrels of oil equivalent arriving on the market – which
strangely enough we continue to call an oil market – and they are behind
the real dynamics that move the quotation for Brent, which is still called,
for no good reason, the price of crude oil.
Let us give an even more concrete example. At the end of June
2008 the price of Brent touched levels above $140 per barrel. Rivers
of ink flowed to try to explain the reasons behind this increase. There
was discussion of the threats from China and India, the fall in world
oil reserves, geopolitical scenarios, stock variances and so on. But a
simple, crude and dramatic truth was overlooked. The level of prices
above the $140 per barrel number, which in June was used to trade the
commodity called oil, does not derive from the market for this particular
commodity and is not the result of the demand and supply balance of this
merchandise. It has nothing to do with oil. Going back to our previous
example, the crisis was in the cherry tomato (called Brent) market, not
in the market of the crude oil (called also Brent).
Thus, to try to explain its dynamics using models related to the market
for consumption and production of energy will be an exercise carried
out in vain.
During the whole month of June, about 700 million barrels of crude
(the physical kind that dirties your hands if you touch it) were traded.
In the same month on the paper market for Brent up to 20,000 million
equivalent barrels were traded, in other words nearly 30 times more than
the physical market.

The Market Events from 2008 to 2011 17
In the course of 2008, just when the wind seemed to be blow-
ing the prices towards $144 per barrel, the long-awaited event took
place, namely the crash of the banks and the main international
financial institutions, which also burst the oil bubble. Following the
bankruptcy of some banks and the much-reduced liquidity of many
financial institutions, transactions in the Petroleum Exchange quickly
nosedived, at the same time bringing down the price of Brent to under
$40 per barrel.
In this context OPEC, aware of a dramatic curtailment in the revenues
of various member countries, tried to keep up appearances and show a
minimum level of action, announcing and trying to implement cuts in
production to bolster up the crude price which was in free-fall (from
the $144 per barrel of July to the $40 per barrel of December). Such
a collapse had never been seen in the history of the oil industry. As
usual, the result of the cuts announced was the continuation of the fall
in prices, confirming the completely insignificant influence of OPEC on
the dynamics of crude oil prices.
From the data we have seen, it follows that OPEC represents 30% of
a segment of 4% of the business that we call the oil market. This being
so, how can it have a significant influence on price trends?
The great financial crisis has, however, highlighted some important
novelties in the international oil market scenario. In the year 2008, we
saw the downturn in the financial activity on the futures market (see
Figure 2.4). Daily trades of oil contracts on the financial markets fell
from levels of almost $282 billion per day in June to around $75 billion
per day at year-end: a nosedive of almost 4 times.
Fundamentals or financial speculation?
During the second part of 2008 the exclusively financial activities of
the banks disappeared progressively from the crude oil futures market,
leaving mainly the oil companies and the physical market professionals
to operate for the sole purpose of covering the risk of price fluctuations:
in other words, we digressed back to a market structure closer to that
of the late 1990s. The players of the oil market, although for a very
limited period of time, were once again the physical producers, oil
producers and oil companies. The price of crude, although still linked to
the movements of the crude markets of London and New York, during
the last quarter of 2008 and the first one of 2009 seemed more closely
correlated to the balance of demand and supply in the physical market,
18 Understanding Oil Prices
0
50
100
150
200
250
300
Jan/08
Mar/08
May/08
Jul/08
Sep/08
Nov/08
Jan/09
Mar/09
May/09
Jul/09
Sep/09
Nov/09
Jan/10
Mar/10
May/10
Jul/10
Sep/10
Nov/10
BILLION $
0
25
50
75
100
125
150
$/bbl
ICE+NYMEX Open Interest [left axis]
Physical Oil Sales [left axis]
ICE Brent Price, 1st position, $/bbl [right axis]
Figure 2.4 Futures: daily trades in 2008–2010
Source: NYMEX
moving in the range of $40–50 per barrel, which, at that time, seemed
to represent a reasonable and long-lasting point of balance.
Box 2.1 Cost of the Marginal Barrel
The crisis of November 2008 confirmed an important indication about
what price level crude oil would have reached if driven exclusively by
physical balances in the demand and supply of gasoline and gasoil.
Everyone remembers that until the 1990s, whenever there was a crisis
of excess supply in the market, the crude price quickly fell below $10
per barrel. This price represented the production cost in the marginal
fields at that time, namely offshore wells in the North Sea or the
Texas Gulf.
Holding the price at those levels removed the production of part
of such crudes from the market and thus contributed to realigning
supply and demand, or at least it triggered actions on the international
market (or international political decisions), which created stability.
Today the marginal fields are the producing wells borderline from
the technological point of view, such as the tar sands of Canada or
Venezuela, or certain offshore fields in ultra deep waters.
Production costs in these fields are over $40 per barrel. This is,
therefore, the new lower limit to the crude price. Below this there
would be a drastic stoppage in the flow of energy to fundamental

The Market Events from 2008 to 2011 19
areas of the industrialized countries, with severe consequences for
the economy.
Table 2.2 Total production costs by region
2003–2005 2004–2006 Delta
Region $/boe $/boe %
USA
Onshore 14.00 19.46 39
Offshore 50.56 69.75 38
Total USA 16.70 23.16 39
Canada 23.84 26.59 12
Europe 16.43 29.79 81
Africa 22.26 32.13 44
Middle East 9.78 14.31 46
Others
Eastern Hemisphere 14.98 18.76 25
Western Hemisphere 31.06 47.63 53
Worldwide 17.45 24.29 39
Source: International Energy Agency
We therefore have always suggested abandoning scenarios which
contemplate further falls in price down to the levels of the past
and to be realistic with regard to the possibility of increases in the
near future.
During 2009, as it is well known, all the major international banks,
which were saved by the governments, re-started to invest the money
received again in the financial market and in particular in the oil
futures (back to the stickers market). The result has been the increase
of the price of oil during the period of lower consumption. Then, at
the end of 2010 the price of crude reached a level of $90 per barrel
with an average of $10 per barrel above the value of 2009, and in
2011 (the time of writing) is already above $120 per barrel. The
imaginary new equilibrium value, established in the range of $70–80
per barrel, does not exist anymore. It has just gone. This increase of
about $50 per barrel in two years, above the ideal range, was once
again beyond any expectations.
The recent events, after 2009, in the oil market have reopened the dis-
cussion about the real reason for the price uptrend. Many analysts have
concluded that the new trend is firmly supported by strong fundamentals
and the financial ‘investments’ are just following suit.

20 Understanding Oil Prices
Despite some positive signs in the evolution of the oil demand, we do
not think that what has happened in the last three years and the recent
increase of the oil price can be explained simply through the evolution
of the fundamentals.
The analysis of the dynamics of the market has currently become
complex and the distinction between the effects due to the pure financial
activity (speculation) or due to the fundamentals is not so clear.
First of all, we should try to take into account the deep change in the
organization and in the attitude of the financial institutions playing in
the oil futures market.
The financial institutions in the last few years have invested in hiring
experts and traders from the physical oil markets. They normally don’t
move a drop of oil, but they plan their financial operations following
closely the evolution of the fundamentals and every single rumour about
the life of the oil industry. They move their money based on these
elements of information. We have already seen the dimension of the
impact of the movement of this amount of money, which is so massive
to overcome the ‘natural’ dynamics of the physical market. There are
always overreactions due to the enormous flow of money and number of
transactions on the futures market. What in the past would have caused
a price fluctuation of a few cents per barrel, nowadays can produce a
price change of many dollars per barrel.
Sometimes the direction of the financial operations are in line with
the fundamentals, but there are moments where the money is moved to
or from the oil futures market because of the evolution of other com-
modities and with no relationship at all to the dynamics of the oil world.
It looks like the new alignments between finance and fundamentals
materialize in the mind of financial traders.
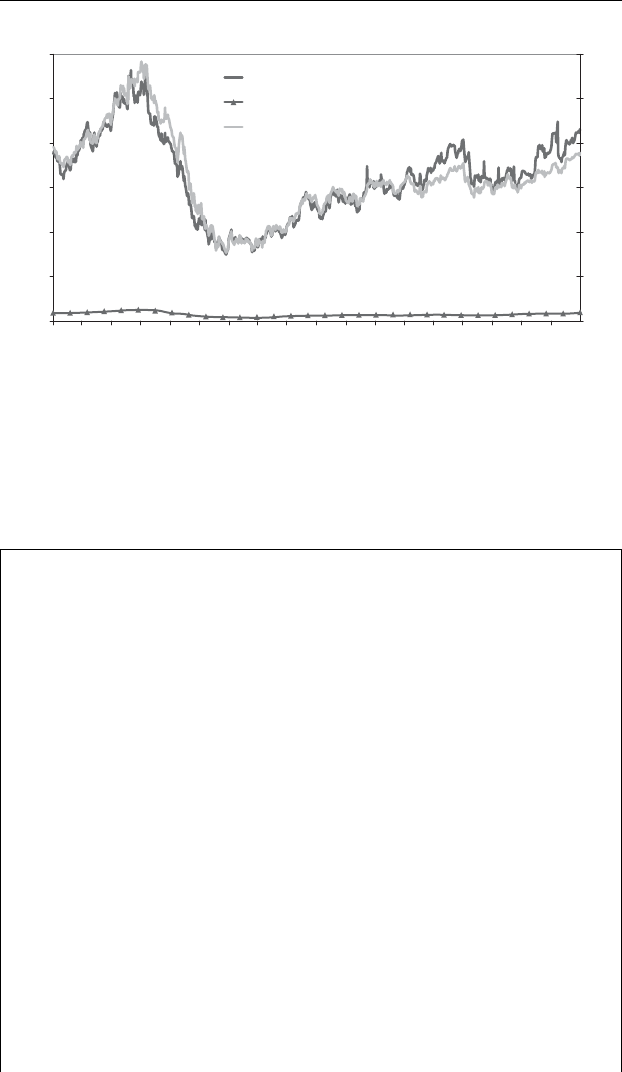
In Figure 2.5 we can see how fragile is the link between the funda-
mentals and the price of oil, taking also into account that the actual data
of the supply and demand become available (and reliable) with delays
of months, when the price is already history.
Of course, the financial analysts are very proud to affirm that all
the financial investments are made only on the basis of the oil market
fundamentals. And the investors seem to trust them.
It seems, however, evident that the real alignment between the funda-
mentals and the financial activity takes place in the minds of the financial
traders.
For this reason it is useful to have a look at the real physical market
since the financial crisis also became an economic crisis. Let’s have a
The Market Events from 2008 to 2011 21
Δ Stock Vs Brent
[provisional and final data]
-2000
-1500
-1000
-500
0
500
1000
1500
2000
Jan-07
Mar-07
May-07
Jul-07
Sep-07
Nov-07
Jan-08
Mar-08
May-08
Jul-08
Sep-08
Nov-08
Jan-09
Mar-09
May-09
Jul-09
Sep-09
Nov-09
Jan-10
Mar-10
May-10
Jul-10
Sep-10
Nov-10
Jan-11
Mar-11
Thousand bbl/day
0
20
40
60
80
100
120
140
$/bbl
Δ Stock (PROVISIONAL)
Δ Stock (FINAL)
Brent Dated
Figure 2.5 Provisional and final assessments of stock changes versus Brent prices
Source: International Energy Agency
look at some relevant phenomena which have affected the evolution of
the prices, and let’s try to understand better the role of the financial
speculation.
DEMAND/SUPPLY OF GASOLINE AND GASOIL
Looking at the actual data, in Table 2.3, about oil consumption in Europe
and the USA, it is evident that we are still facing a downward trend in
oil consumptions in the main western consuming countries, with some
substantial differences between Europe and the USA. During 2010 we
still had a declining trend in Europe, but a quite positive reaction in
the USA.
However, the main element of the analysis is not the direction of the
global consumption in these main market areas, but the evolution of
some critical products.
When the Brent price was at its peak, some signs of the economic
crisis started to show up and all the analysts were looking for a possible
fall in US gasoline demand, a fall considered responsible for triggering
a sort of domino effect inside the world oil market (crash in the demand

Table 2.3 Demand of oil products in OECD Europe and in the USA
OECD Europe [kbbl/day] 2007 2008 2009 2010 2011 2008–2007 2009–2008 2010–2009
LPG and Ethane 993 1,016 924 924 921 23 −92 0
Naphtha 1,283 1,157 1,108 1,208 1,220 −126 −49 100
Motor Gasoline 2,481 2,360 2,287 2,195 2,128 −121 −73 −92
Jet and Kerosene 1,303 1,323 1,267 1,270 1,297 20 −56 3
Gas/Diesel Oil 6,117 6,269 6,021 6,138 6,155 152 −248 117
Diesel 4,273 4,290 4,228 4,334 4,416 17 −62 106
Other Gasoils 1,844 1,979 1,793 1,804 1,739 135 −186 11
Residual Fuels 1,725 1,661 1,434 1,290 1,214 −64 −227 −144
Other Products 1,552 1,572 1,451 1,405 1,451 20 −121 −46
Total Products 15,453 15,357 14,493 14,431 14,387 −96 −864 −62
United States [kbbl/day] 2007 2008 2009 2010 2011 2008–2007 2009–2008 2010–2009
LPG and Ethane 2,091 1,959 2,056 2,113 2,104 −132 97 57
Naphtha 294 248 246 263 241 −46 −217
Motor Gasoline 9,355 9,047 9,055 9,129 9,169 −308 8 74
Jet and Kerosene 1,696 1,587 1,446 1,493 1,526 −109 −141 47
Gas/Diesel Oil 4,277 4,013 3,700 3,852 3,889 −264 −313 152
Diesel 3,520 3,484 3,221 3,345 3,401 −36 −263 124
Other Gasoils 757 529 478 507 489 −228 −51 29
Residual Fuels 818 702 591 642 610 −116 −111 51
Other Products 2,498 2,233 1,971 2,059 2,068 −265 −262 88
Total Products 21,028 19,789 19,065 19,551 19,606 −1,239 −724 486
Source: International Energy Agency

The Market Events from 2008 to 2011 23
for US gasoline, interruption of gasoline imports from Europe, fall in
prices in Europe and, thus, a nosedive in crude prices).
Now we know that the real market evolution was quite different.
Actually, the crude price did fall to around $40 per barrel but the gasoline
demand in the USA did not vary significantly. In fact, in the course
of 2008 there was a reduction of only 3% in gasoline consumption,
far below the level required to significantly reduce the flow of high-
octane components imported from Europe and South America. After
this slowdown of the demand in 2008 the gasoline consumption already
gradually started to rise again in 2009.
There is a structural element in the USA market, too often overlooked
by many analysts, which can keep the price of gasoline at a very high
level, despite any weakness on the demand side.
As we will examine later in detail, the US environmental legislation
has churned out some monstrosities, such as the possibility for each
State to request gasoline specifications differing from the national stan-
dards. About 40 different types of gasoline are thus on sale, distributed
in the various States and counties of the nation, creating immense dif-
ficulties for the productive system to face. Each marketer is forced to
import, or swap with other refiners in neighbouring States, the compo-
nents for blending gasolines (as we will examine later, gasoline is not
a product but a mixture of products and semi-finished products which
together guarantee certain characteristics: octane number, density, a lim-
ited presence of aromatics, olephines etc.) to formulate a product which
is marketable in the particular area.
As of today, the volume of high-octane components imported into the
USA remains close to 1 million barrels per day, keeping a certain level
of tension in the international market, which serves to prop up the crude
prices (remember the example of the price of fillet steak and the cow).
The decrease of the demand was more drastic in Europe both in terms
of gasoline and gasoil, but, because of the flow of the export of gasoline
to the traditional USA market and to other new destinations (Middle
East, West Africa), there was not a dramatic impact on the price system.
This structural strength of the fundamentals, once again, has given
a new progressive confidence to the financial operators that the oil
business was still worth investing in and was still the most reliable and
liquid market among all the other commodities.
A similar phenomenon happened for the gasoil market, where the
decline of the demand has been balanced by the introduction of more
severe quality specifications in the European market (January 2008).

24 Understanding Oil Prices
WTI – BRENT DIFFERENTIAL
A further example of how the financial speculation can thrive on the
basis of some structural constraints of the oil industry is useful here.
Brent and WTI are the two main crude oils used in the futures market:
Brent in London (ICE) and WTI in New York (NYMEX). WTI is a
crude of better quality than Brent and its price has always been higher,
in the range of $1–4 per barrel. In the last years, we have seen the price
of WTI being lower than Brent by up to $18 less per barrel.
Looking at all the crude oils of the worse quality, none of them
is priced with such a discount to Brent. This unbelievable event has
engaged all the analysts in a debate. Analyses and interpretations have
been given, trying to link the dynamics of the prices with the fundamen-
tals of the US market.
Of course, it is very hard to explain why a bottle of high-quality
champagne should be sold at the price of a low-quality carton of red
wine.
Box 2.2 Jet Fuel and Gasoil Market
The only sector that was really hit by the crisis was that of aviation.
The consumption of jet fuel in the USA fell by over 10% and was
accompanied by cuts in the flights of all the main airlines (Continental
reduced its flights by almost 15%). These were the only data that
measured a change of habits in the USA, in both the business and
the private worlds. Obviously, since this is a variation in a limited
segment of US oil demand (jet fuel represents less than 10% of the
total demand), it is not a key factor in determining a change in the
crude price levels. The reduction of jet fuel consumption, however,
had an impact in the evolution of the winter gasoil market. In fact,
kerosene (from which jet fuel is obtained) is also used for mixing
with gasoil to improve its quality.
Both the USA and Europe need to import huge quantities of gasoil
during the winter season. The countries that can supply gasoil in
excess, in relation to their own domestic consumption, are Russia and
the Persian Gulf nations. Unfortunately the quality of the products
from these sources is not in line with the environmental specifications
in the west (excessive sulphur contents) and they, therefore, have to
be processed in refinery desulphurization plants or blended with
semi-finished products of higher quality. Kerosene is one of these.
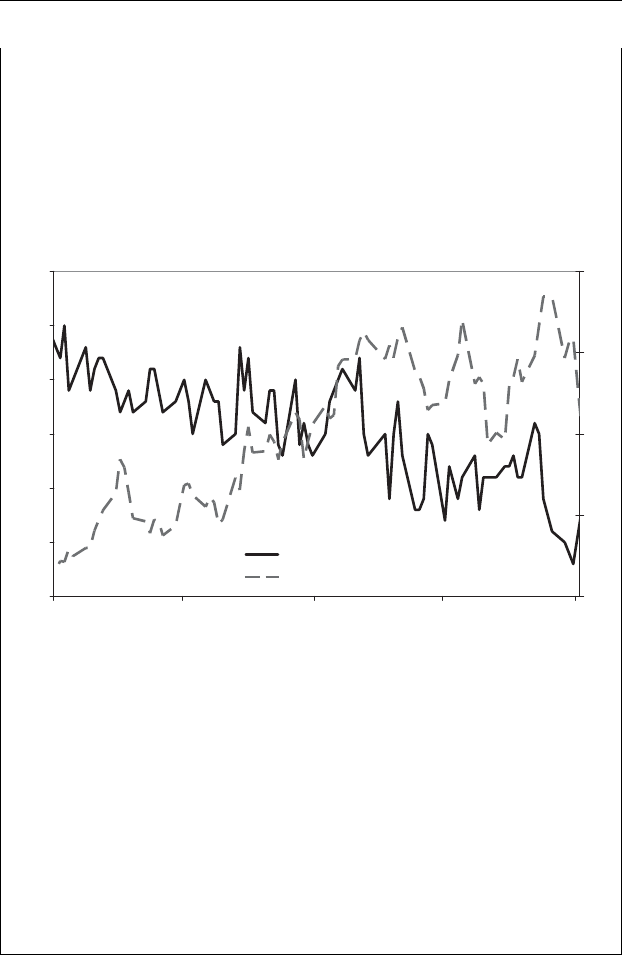
The Market Events from 2008 to 2011 25
This was the key element that affected price movements during
the winter months of 2008–2009: the supply capacity of the western
refining system for clean, high-quality gasoil (see Figure 2.6). If the
winter had been mild, as it was in the 2006–2007 season, the demand
of heating gasoil would have been limited and the production would
have been easily capable of supplying the system without putting any
pressure on the prices.
-10
-5
0
5
10
15
20
Sep-2008 Oct-2008 Nov-2008 Dec-2008 Jan-2009
°
C
1.2
1.3
1.4
1.5
1.6
Germany Min Temperatures [left axis]
Gas Oil/Brent [right axis]
Figure 2.6 Price movements during the winter months
The fact that the winter was colder than any in the previous decade,
once again showed the bottlenecks in the production system, just
as they did in the past, which had powerful effects on both the
gasoil and the crude oil price, giving ground and confidence to the
financial investors putting their money in the oil futures market again.
From November 2008 until March 2009, the thermometer decided
the crude oil price in the major areas of consumption (USA, Europe).
All the other factors (OPEC policy, macro-economic and geopolitical
scenarios etc.) continued to act purely as aesthetic embellishments to
the scenario.
This is a typical example where, unless we take into consideration
the combined action of the financial speculation with the industry con-
straints, we are not be able to understand the dynamic of that anomalous
event.
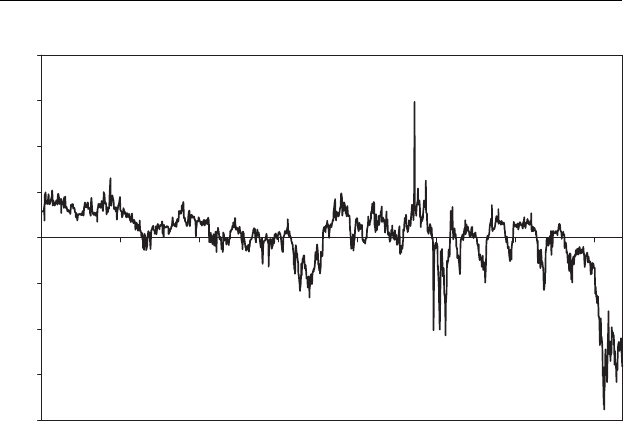
26 Understanding Oil Prices
-20
-15
-10
-5
0
5
10
15
20
2004
2005
2006
2007
2008
2009
2010
2011
$/bbl
Figure 2.7 WTI NYMEX–ICE Brent differential
Source: NYMEX
All the crude oils produced in the south of the USA are collected
in Cushing, Oklahoma and then sent, via pipelines, to the north. All
the pipelines have one direction, south to north. The opposite direction
has never been considered, because it would have been meaningless.
However, it is a matter of fact that it is not possible to move the WTI
from Cushing to the refineries on the east coast of the USA. Based on
this fact, the financial investors started to sell WTI on NYMEX and buy
Brent on ICE, inverting and widening the price spread between the two
crude oils, with WTI becoming cheaper and cheaper (see Figure 2.7).
In order to re-balance the market anomaly it would have been nec-
essary to move WTI to the east coast, where the price of Brent was
$18 per barrel higher, but, as we have seen, there are no pipelines able
to transport the crude in that direction. In other words, we are in the
situation where the market is unable to guarantee any feedback to create
the condition for the re-adjustment of the previous equilibrium. It has
become impossible to limit the action of the financial speculation.
Actually, one of the investors in this specific business, hired all the
railways capacity from Cushing to the Atlantic coast, in advance and
started to transport some WTI, making a lot of profit on the spread
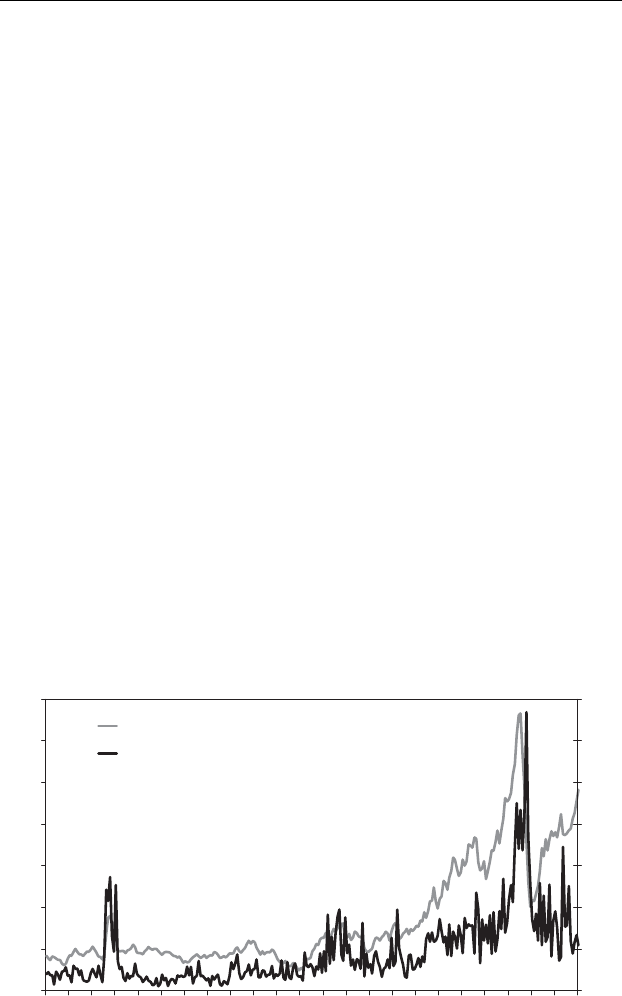
The Market Events from 2008 to 2011 27
artificially created. Just to prove that the event was planned in the fi-
nancial environment many months in advance. Once again, the financial
speculation (or financial investment) operates and thrives on the existing
industry constraints and structural problems of the market. Very often
this massive activity doesn’t allow the market to activate the physiolog-
ical feedbacks to overcome or accelerate the solution of the problems,
which become heavier and therefore encourage an increasing level of
speculation.
It is instructive to observe the graph in Figure 2.8, which shows the
movement of the volatility of the price of Brent from 1988 to 2011.
To simplify, the volatility has been defined as the difference between
the highest and lowest value recorded during the same month. One
can see clearly that historically the volatility index of the crude price
remained between $1 and $2 per barrel until the end of the 1990s. The
only exception was seen in 1981 at the time of the first Gulf War when
the volatility index touched $15 per barrel. These dramatic changes in
price evidently reflected the uncertainty in the market and the continual
changes in the expectations of the trading world. Starting from the
early 2000s, we note that volatility indices over $10 per barrel became a
constant feature in the market, even in the absence of factors engendering
tension in the market comparable to those of times of war in the Persian
Gulf area; as if we were continuously facing a situation of potential
short supply. This graph also tells us that there is a date in the evolution
0
20
40
60
80
100
120
140
1988
1989
1990
1991
1992
1993
1994
1995
1996
1997
1998
1999
2000
2001
2002
2003
2004
2005
2006
2007
2008
2009
2010
$/bbl
0
5
10
15
20
25
30
35
$/bbl
Brent [left axis]
Volatility [right axis]
Figure 2.8 Brent and inter-monthly volatility (1988–2011)

28 Understanding Oil Prices
of the dynamics of the oil market after which the break with the past
takes shape. We believe that a study of the evolution of the price of
crude oil must start out from this observation and try to understand what
happened at the beginning of the year 2000.
The economic crisis may have appeared, in some moments, to have
lessened the impact of the structural bottlenecks of the oil industry
but certainly not to have removed them. The North Africa crisis and
the Fukushima nuclear accident are here to remind us that there is a
structural energy crisis that we shall have to face up to and how large the
lack of awareness is in the political leadership of the main industrialized
countries.
In the following pages we shall try to reconstruct the processes which
have led to the growing divergence between the physical crude oil market
and the dynamics of the crude oil price. In particular we shall consider:
rThe effects deriving from certain historical decisions by the OPEC
producing countries, such as the indexing of the price of their crudes
to the financial market of Brent crude.
rThe distortions created by the new environmental laws, in the context
of the lack of adequate investments in the world refining sector.
These phenomena could have been described in a different order.
However, this one was chosen for its ability to enable the reader to
follow, in a more linear way, the creation of the puzzle, even if the tie-
up between the various aspects is such that only in the end the overall
reasoning will become intelligible, together with the model with which
today the evolution of the oil market can be interpreted.

3
Evolution of the Price of Crude
Oil from the 1960s up to 1999
The structural characteristics of the oil industry that have supported the
rising trend of prices in the past decade have already been mentioned.
They do not explain, however, why the world of finance has managed
to grasp almost complete control of this oil market and the system that
fixes the price of crude, pushing aside producing countries as well as the
oil companies. The process and the mechanisms that have made this
transformation possible will be examined. For this purpose and against
this background we have to revisit the main events in oil history in
the last decades and particularly the suicidal decisions of the OPEC
countries, as well as to analyse the technical mechanisms in the Brent
market (forward and its futures).
Obviously it is not the author’s intention to describe the history of oil,
already told in detail by many prestigious writers, but only to provide a
way of looking at the events just as a plain professional in this field would
have done, living through them and interpreting them, but to whom the
descriptions made by others did not seem convincing and coherent
with what he or she observed day by day in the market. Avoidance is
intentional of a purely political view of the various events – for which
valuable studies and analyses exist – by limiting ourselves to the search
for the appropriate economic model within which the oil market has
moved, in its different historic situations.
The aim is to understand whether prices have evolved in an oligopoly
or in a free market situation. And in this latter case, what has kept it at
price levels higher than the laws of the market would seem to permit?
In particular, the aim is to be able to reply to the question that was put
forth at the start of this story and which comes to mind spontaneously
when we look at Figure 3.1 showing the historical evolution of the price
of crude: is the curve which traces the movements in price a sequence of
values that mark a posteriori the free dynamics of the market, namely
the result of the interaction between demand and supply, or is it the
design that an invisible hand has traced day after day for decades?
Understanding Oil Prices: A Guide to What Drives the
Price of Oil in Today’s Markets
by Salvatore Carollo
Copyright © 2012, Salvatore Carollo
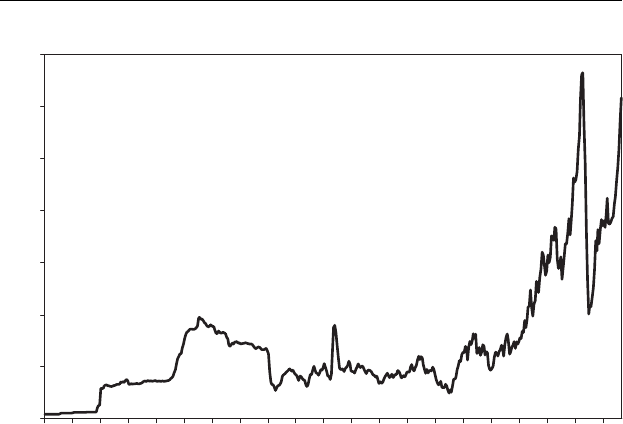
30 Understanding Oil Prices
0
20
40
60
80
100
120
140
1970
1972
1974
1976
1978
1980
1982
1984
1986
1988
1990
1992
1994
1996
1998
2000
2002
2004
2006
2008
2010
$/bbl
Figure 3.1 Crude oil prices (1970–2011)
1960–1980: THE OIL MONOPOLY AND THE TWO
CRISES IN THE 1970s
We could start our tale by saying: ‘once upon a time there was the
price of crude oil’. Actually, the price of crude oil has existed for many
years and it was the amount of money with which one could purchase
a physical cargo of crude to put on a ship and take it to a refinery to
transform it into gasoline, gasoil and other products. Today, however,
when we speak of the price of Brent, it is not clear what we are talking
about; above all it is not clear what we can buy with that amount of
money. But let us take things in order.
In the 1960s and up to 1973, the price of crude was a number, more
or less fixed, established unilaterally by the big US oil companies, who
had a monopoly in the market. The experts in the energy sectors in
charge of forecasting the price of crude oil for the current year used
to describe the model employed for the forecast with the following,
colourful but effective, phrase: ‘take the price used by Exxon, add it
to that used by Shell and divide the sum by two’. Until 1973, there
was no way to mistake the price forecast, it was just a simple average.
The price that was officially fixed and published was one alone, that of
the benchmark (reference price), namely Arabian Light crude, the main

Evolution of the Price of Crude Oil from the 1960s up to 1999 31
Crude Oil
Price Benchmark Price Differential= +/–
Figure 3.2 The price of crude with reference to the benchmark
crude of medium–high-quality produced in Saudi Arabia. The prices of
all the other crudes were established by referring to the benchmark and
fixing a price differential that took account of their price, quality and
marketability (see Figure 3.2).
This was a classic situation of monopoly/oligopoly, featuring perfect
control of the supply by the producers. The prices were completely
stable, since the producers were able to regulate supply according to
any fluctuation in demand.
OPEC (Organization of Petroleum Exporting Countries) was formed
in 1960, with the main objective being to create some form of control in
the oil market by establishing co-ordination between the various coun-
tries regarding the structure of the mineral contracts. However, control
of the price of crude remained firmly in the hands of the multinational
companies until 1973. In fact, only the majors were able to control the
production of crude together with the flow of purchases by the refineries
(almost all of them owned by the same companies).
In 1973, with the Yom Kippur war, we witnessed the first historic over-
turn in the world oil market. The Arab countries, following the Israeli–
Palestine conflict, declared an oil embargo on those countries that
supported Israel, particularly the USA and Holland. OPEC took control
of crude prices and started to publish a price list each year, always based
on Arabian Light as the benchmark. Saudi Arabia, being the principal
producing country, but above all being the producer of the benchmark,
took on the leadership of OPEC. From that moment it became the task
of Saudi Arabia to fine-tune the supply of Arabian Light on the market
to stabilize its price around the value published by OPEC.
Under the control of the OPEC countries, and thanks to the scare
sparked off by the Middle East crisis, the crude price rose from the
$2 per barrel level to $12–15 per barrel. This was the first great oil
crisis that citizens of the main consuming countries witnessed; going
on foot or by bicycle during their weekends and holidays. It was in
this extremely emotional context, characterized by a strong sense of
participation and awareness, that debate was opened concerning the need
for diversification of energy sources; massive investment programmes

32 Understanding Oil Prices
were tabled for the construction of nuclear and mixed-fuel power stations
(oil and gas). The highest level of consensus was reached regarding
development and use of public transport in towns, especially in Europe.
This historic phase was to last 10–15 years and it brought with it pro-
found changes in the world of energy. During this same period, however,
certain events took place, which at the time had little relevance but nev-
ertheless triggered important transformations in the following decades.
In 1974 the International Energy Agency (IEA) was created; an asso-
ciation between the main oil consuming countries with two fundamen-
tal purposes:
rTo mutually assist one another in the case of an embargo (for political
reasons) by the cartel of crude producing countries. No one wished
to see the affair of 1973 repeated.
rTo exchange all possible information regarding national oil data
(demand, supply, stocks, transport etc.), excluding those of a com-
mercial nature (prices, trading activity etc.).
Having overcome the crisis of 1973, the IEA took the general role
of a research bureau for energy issues unprecedented levels with its
headquarters in Paris, countering the similar research bureau of OPEC
headquartered in Vienna. It took some years before the work carried out
proved to be of some use. The collection process for pertinent data from
different countries took time and it was difficult to organize the infor-
mation on efficient databases capable of updating in reasonable times.
Some years later, a new oilfield in the North Sea, named Brent, started
production on 11 November 1976. On the following 13 December the
first oil tanker left the terminal with a cargo of this crude, which would
soon upset the balance of the world oil market.
And so we arrive at the events of 1979 characterized by the seizure
of power by Saddam Hussein in Iraq, the revolution in Iran and the
break-out of the Iran–Iraq war in September 1980. These events, and
their subsequent consequences, mark the history of the oil market in the
two following decades.
The start of the revolution in Iran was immediately seen as a seri-
ous threat to the geopolitical stability of the Persian Gulf area and a
worrisome element of risk for the flow of crude exports towards the
consumer countries.
Almost on tiptoes, all the oil companies in the world began to raise
the level of their stocks in their storage and refineries, thus creating
increased demand for crude precisely at the moment when production

Evolution of the Price of Crude Oil from the 1960s up to 1999 33
difficulties were felt in Iran. In this way a vicious circle was created
which artificially raised the demand (to boost the stocks) and triggered
a rise in prices. When the Iran–Iraq war broke out, in September 1980,
it unleashed a true race for oil. All the bodies involved, among them oil
companies, governments of consumer countries, industries and condo-
miniums, pushed the level of stocks to the highest possible amounts. At
the end of this rush the level of oil stocks in the western consumer coun-
tries had risen from the normal level, that is, what was needed to cover
around 30–50 days’ consumption, to that for 180 days, in other words
five or six times greater than was necessary. One had even gone beyond
the physical storage capacity on land. In the main ports supertankers
were anchored and used as floating storage while waiting for tankage
to become available onshore. Crude prices spiralled upwards, reaching
levels of $40 per barrel for the lightest qualities.
The producing nations pushed their output up to unprecedented
levels. Saudi Arabia reached the level of 11 million barrels per day,
a record unrepeated thereafter. During the months of crisis some new
mechanisms to protect the consumer countries were put into effect.
The IEA, although having no reason to intervene operationally, by
activating the assistance mechanism for countries in difficulty (there
was no embargo or physical limitation on the supplies towards any of
the member countries, but only a generalized rise in prices), began to
make an essential contribution to governments and oil companies. The
collection and examination of the statistical data showed clearly that
the dramatic rise in prices was due to the simultaneous action in the
same direction, without any coordination, of all those involved, causing
a dramatic increase in the level of stocks of crude. Faced with the data
that showed that the production system could function for 180 days
using its stocks, even in the case of a total interruption of crude supplies,
it was clear to everyone that the enormous costs incurred to maintain the
stocks (logistic costs, finance charges) were completely unjustified and
disproportionate. Further, the Iran–Iraq war had stalled and become by
then a regional war, which could in no way affect the flow of oil supplies.
THE 1980s: THE GRADUAL DISAPPEARANCE OF OPEC
During 1982, all the oil companies in the world had drastically cut
down their purchases of crude from the producing nations, particularly
the OPEC ones, which continued to propose very aggressive prices. A
new phase of the market opened up from this point. That phase, begun in

34 Understanding Oil Prices
1973 with the rise of OPEC to leadership of the world oil market, came
to an end and a new one of creeping crisis began: this, throughout the
1980s, led up to the loss of any role for OPEC and its member countries.
Faced with the facts that proved the dramatic excess of stocks, the
OPEC countries were unable to find a common strategy to adjust pro-
duction to the demand. At first they tried to force their customers to
honour the current contracts, obliging them to take the same quantity
of crude as in previous years, and then they began to use every kind of
cunning to try to maintain the maximum levels of production of 1981.
All the crude not purchased by the oil companies at the official prices
(OSP) set by the OPEC conference was sold spot to independent traders
at discounted market prices.
After several months of such practice, two parallel markets were
actually created, one based on official prices and the other on spot prices.
Thus, for the same type of crude there could be two prices, differing by
as much as $10 per barrel. To remedy this situation, an extraordinary
meeting was convened by OPEC, which resolved to reduce the official
price of Arabian Light from $34 to $29 per barrel and to re-establish
lower production quotas for its members. This decision was reached
after furious discussions betweens the hawks (Iran at their head, who
wanted to keep the price high) and the doves (headed by Saudi Arabia,
who wanted to align with the real market).
The three following years were marked by a continuous weakening
of crude prices, due to a combination of factors. After the crisis of 1973
the first effects of energy diversification began to become apparent with:
rThe start-up of the new nuclear power stations, which began to cause
a visible and progressive reduction in the consumption of fuel oil
burned in the thermo-electric power stations, triggering a structural
crisis in the refining system, particularly in Europe.
rAn increase in the supplies of natural gas for electricity production as
well as for domestic heating.
Refining capacity underwent a process of radical re-conversion and
restructuring. The refineries found themselves at a crossroads: should
they build cracking plants to transform fuel oil into gasoline and diesel
fuel (thus improving refining margins), or shut down.
The production of the non-OPEC nations, historically marginal, began
to become relevant and competitive on the international market. In
particular, production in the North Sea began to play a key role in
the political and economic balance in the oil world. These were the

Evolution of the Price of Crude Oil from the 1960s up to 1999 35
years when the prime minister of the United Kingdom was Margaret
Thatcher, who wanted to deal a powerful blow on the excessive power
of the OPEC countries. Thatcher’s government refused any form of
dialogue or cooperation with the OPEC countries tending to regulate
crude prices by adjusting production. Together with the government
of the USA, whose President was then Ronald Reagan, Mrs Thatcher
wanted to reach the objective of having a crude oil price that was the
result of free market transactions and without any political control by
the OPEC cartel.
Finally it was the OPEC countries that, after the euphoria of the rise
in prices during the previous decade, were not aware of the changes in
the global energy and political scenario and continued to pump more
oil into the market than the demand required, obviously violating the
agreements within OPEC and fuelling the spot markets, parallel to the
official ones.
THE PRICE WAR
The sole defence of the dignity of OPEC and the price level of the bench-
mark (Arabian Light) remained in the hands of Saudi Arabia, which in
these years was forced to cut production from a rate of 11 million barrels
per day in 1981 to scarcely 2.5 million in July 1985. A level so low as
not to allow production of the gas associated, which, in turn, fed the
structures of the producing plants. This sort of Babel continued until the
summer of 1985.
One morning in late August 1985, Sheikh Yamani, the historic min-
ister of Saudi Arabia, issued a declaration in which he claimed a fair
market quota for his country, namely a production rate in line with the
official OPEC agreement of about 5–6 million barrels per day. Yamani
declared publicly and officially that the various OPEC countries were
producing about 3 million barrels per day more to the detriment of
Saudi Arabia and urged a return to a cartel regime. To make his message
politically less explosive, two weeks later during a conference in Oxford
regarding the oil market, he tried to draw attention towards the activ-
ities of the non-OPEC countries, particularly in the North Sea. These
countries had hitherto refused any form of coordination of production
levels, although in the meantime they had benefited from the high prices
resulting from the Saudi sacrifices.
Yamani then announced a crude oil price war against the non-OPEC
countries, even if it was clear that the main target was the OPEC countries

36 Understanding Oil Prices
that continued to flout the production quotas. To fight this war, Yamani
informed the oil world that Saudi Arabia would, from that moment,
adopt the following measures:
rCessation of its role as swing producer to protect the benchmark price,
that of Arabian Light.
rRenunciation by Saudi Arabia of the official price system (OSP) and
refusal to publish or agree the price of Arabian Light.
rAdoption of a new price system for all Saudi crudes, based on their
netback value.
This was a real upset in modern oil history, which illustrated all the
hypocrisies that had allowed hitherto the maintenance of the unstable
balance of the market.
Box 3.1 The Netback Value System
Let’s make matters clear. What was the new netback value system
adopted by Yamani?
It was a very simple way of increasing market share by destabiliz-
ing the price system and based on a very simple principle. A Saudi
customer who signed the contract did not know the purchase price at
the time he took away a cargo of crude. The price was established at
the end of the customer’s production and marketing cycle, after he
had sold in the market the finished products obtained from refining
the Saudi crude. The price to pay the Saudis was established with a
calculation of this type:
a. Revenue obtained from sale of finished products 100
b. Costs incurred for transport of crude 5
c. Costs incurred for refining crude 5
d. Finance and other charges 4
e. Guaranteed margin for customer 10
Price to pay for crude (P =a−b−c−d−e) 76
A mechanism was set up by which every purchaser of Saudi crude
who had an integrated downstream system (refining and sale of fin-
ished products) earned a guaranteed fixed margin on every barrel of
crude purchased, apart from the profits derived from the optimum
management of his operations. Thus, the more barrels he managed
to obtain from the producing country, the greater were his profits.

Evolution of the Price of Crude Oil from the 1960s up to 1999 37
No great analysis is needed to understand that, when this mecha-
nism was announced, sales of Saudi crudes increased and a queue of
customers lined up to sign the new contracts.
What about the other producing countries? The OPEC countries
waited just to understand the new mechanism before competing with
the Saudis. Hence, they began to sell their crude with the same pricing
mechanism, perhaps increasing the guaranteed margin for the purchaser.
A situation of total liberty from the production restrictions of OPEC
and the defence of the price level occurred. The euphoria of the petrodol-
lars obscured any powers of analysis and comprehension of the collec-
tive interests of the producing countries. Monopoly conditions no longer
existed in the oil market. The free market had begun to operate in a con-
text of full competition between OPEC and non-OPEC producers. The
market dynamics changed from the so-called oligopoly model, which
obeyed the classical law that links price to supply and quickly, and a
competitive free market was created.
1985–2000: FROM THE INTRODUCTION OF BRENT
AS AN INTERNATIONAL BENCHMARK TO THE
CLEAN AIR ACT
The inevitable arrived unexpectedly quickly. Actually, the process trig-
gered had very precise and inexorable features. Yamani, in his unleashed
war of prices, had brought to his side all the producing countries and
all the refiners in the world, who, unknowingly and in a climate of col-
lective folly, continued to pump crude and finished products into the
market as fast as possible.
The crisis of the mechanism began when the market, flooded with
finished products, was no longer able to absorb further quantities. The
price of these products therefore began to fall and dragged the price
of crude down with it, mathematically linked to that of the prod-
ucts, engendering a climate of confusion and frenetic activity by the
oil professionals.
Right at that time and in that mood of conflict, an alternative solution
for fixing the price of crude in a free market context came from the
North Sea. In July 1986, one year after Yamani’s declaration, Shell UK
published the ‘15 day Brent contract’ (later we shall give a detailed
description of this new market mechanism). For the first time the price
of crude, Brent, was anchored to a sort of petroleum exchange, where
a selected number of professionals (about 100) could operate, helping
to define, day by day, the price level. It was not yet a world reference

38 Understanding Oil Prices
point, only regional and very limited to the north European sphere.
However, in a very short time it became the reference tool in the London
marketplace, where all the oil trading companies, linked to the big oil
companies or independent operators, had their headquarters and carried
out their business activities.
In this complex scenario, each single world event, any form of tension
in the Middle East and any decision by the OPEC countries in the
London atmosphere kindled the expectations of the market and pushed
Brent upwards or downwards, influencing positively or negatively the
crude price levels of the OPEC countries. Specifically, the movements
of the Brent market became very critical for the price levels of Nigerian
crudes, that is, those of the highest quality among the crudes of the
OPEC nations and very similar to Brent. The Nigerian crudes were
caught between two fires:
ron one side the need to keep the price differential vis-`
a-vis Arabian
Light at least $4–5 per barrel higher; and
ron the other, to compete with Brent which was priced at least $1–
2 per barrel lower.
For a country like Nigeria, already saddled with a serious finan-
cial crisis and exposed to massive immigration from the neighbouring
countries, the direct competition with the North Sea was disastrous.
Especially because the two types of crude were competing for the same
profitable US market.
Putting the 15 day Brent contract on the market could not have come
at a worse moment. In fact, it took place when the effects of the price
war unleashed by Yamani were at their most devastating pitch. The
tidal wave of over-full storage tanks was rising from consumer level
(condominiums, industries) to distributor level and finally the refiners;
everyone was convinced to fill up at ultra-convenient prices. When these
levels began to jeopardize the operations and logistics of the refineries,
the crash became inevitable.
At a speed hitherto unknown, prices began to tumble week after week
and then day after day from the level of $30 per barrel down to $11 per
barrel. This was the oil counter-shock. It was too much for everyone
and especially for the heroic supporters of the free market for crude.
As long as there was OPEC to hold the crude price level at around
$28–30 per barrel, to speak of a free market only meant a free fluctuation
of the daily oscillations of a few dollars per barrel on stock markets. But
now the picture was different and dramatic. In London they spoke of a

Evolution of the Price of Crude Oil from the 1960s up to 1999 39
‘blood bath’. Many traders who had bought cargoes of crude only a few
days earlier at prices considered good at the time were forced to sell these
cargoes at $10 or $20 per barrel under the purchase price, with massive
losses in consequence. The big companies honoured commitments in
any case, but many independent traders preferred to declare bankruptcy
and disappeared from the market.
The producing countries witnessed for the first time after more than
a decade the crash of oil revenues and were forced to make drastic cuts
in their investment and expense budgets. The effect of these cuts made
itself felt in the economies of the industrialized countries, who found
themselves missing, from one day to another, contracts and tenders that
were finalized. The oil companies were forced to block their develop-
ment investments in areas where the production costs would have been
higher than the new level of crude prices. Production in a series of
marginal fields had to stop since they were no longer profitable.
In the USA about 2 million barrels per day of crude production
coming from the so-called strippers, those tiny fields in the back garden
that we see in films of that period, disappeared from the national oil
balance sheet.
The North Sea suffered a severe cutback in the development of the
existing fields and a freeze-up of research projects.
In Nigeria the crisis was such as to cause an exodus of biblical dimen-
sions: over 20 million persons returned to the neighbouring countries
they had come from 20 years earlier.
One thing was clear to everyone: the price of crude, left free to move
only on the basis of the laws of the free market, had fallen to a level that
allowed the supply to vary in line with the demand, in other words, to
a level so low as to eliminate all the marginal fields, whose production
cost was higher than the going price. This price level, however, was not
compatible with the equilibrium of the world economy and politics, and
it was also not compatible with the guarantees for future supplies. The
free market was not compatible with the oil market. A solution had to
be found – quickly.
During 1987 meetings were held at various levels between the play-
ers involved, OPEC and non-OPEC countries, governments of consumer
countries and producing countries. Everything pointed in one direction
only, a return to a protected system for crude prices, with OPEC guar-
anteeing stability.
In December 1987, Saudi Arabia agreed to sign the new agreement
between the OPEC countries that envisaged the return to the system

40 Understanding Oil Prices
of official prices with Arabian Light in the role of benchmark, which
was fixed at $28 per barrel. In the space of around three months the
market stabilized and the crude price returned to the levels programmed
by the OPEC countries. Encouraged by this political result and the new
cohesion shown by its member countries, OPEC required that even the
non-OPEC countries should indicate their willingness to make some
contribution towards modulating supply. However, during the meetings
that followed in 1987 and 1988, no significant results were achieved.
On the contrary, a further step was taken in the process of transforming
the physical market for Brent into a purely financial market. The price
crash in 1986 had created a climate of panic in the London petroleum
and financial circles. The 15 day contract had proved not to be fully
adequate to guarantee the economic and financial system and had caused
the bankruptcy of dozens of trading companies declared insolvent. The
biggest companies producing Brent Blend (Shell, Exxon, Chevron and
BP) had had to re-purchase the cargoes of Brent not collected and
abandoned by the traders who were wiped out. The costs of the crisis
turned out to be enormous for the economic and financial system of the
City. The intention had been to create a purely financial Brent market,
in which there was no longer any obligation for the participants to buy
a physical cargo of crude, but only to handle financial paper.
In July 1988, the IPE (International Petroleum Exchange) launched
the Brent Futures contract. The event was hailed as the long-sought
solution finally found, the new frontier of the free oil market vis-`
a-vis
the archaic solutions proposed by OPEC (the return to the system of
official prices).
THE SUICIDE OF OPEC
The lack of agreement on production control and the propaganda at the
point of provocation regarding the unsophisticated economic vision of
the OPEC countries caused a new serious and irreversible crisis in the
government of the international oil market.
In December 1988 OPEC, guided by Saudi Arabia, decided to
accept the challenge of modernity and the free oil market that everyone
desired, abandoning yet again the OSP system and adopting as the new
benchmark Brent itself.
All the crudes produced by the OPEC nations were from that time
to be priced with reference to Brent. The various countries would
limit themselves to setting the price differential to apply to each crude

Evolution of the Price of Crude Oil from the 1960s up to 1999 41
vis-`
a-vis the market value of Brent. For a pure question of national pride,
what was commonly called the price differential vis-`
a-vis the benchmark
was re-named OSP by the OPEC countries, although it was quite clear
that the crude price was no longer published, but only its adjustment vis-
`
a-vis the benchmark, in other words a more or less negligible fraction
of the price of a particular crude.
The event was hailed positively by all the commentators and the mar-
ket operators. It seemed the end of a sort of Middle Ages and a step
towards a much-desired new world. However, all the upsets and imme-
diate consequences that the change would bring were not appreciated.
Neither was it understood, in the euphoria and the desire to proclaim a
political victory, that in fact the OPEC countries had tried to start a new
price war using the Brent market as a tool (leaving aside the net-back
used in 1986).
The OPEC, in turn, did not understand that, having started this war
in the political climate of those times, it did not have great hopes of
victory and in fact its decision turned out to be a real act of suicide.
From that time, OPEC lost any reason to exist. It was transformed into
a cooperative study bureau between the member countries, prestigious
but with no other operational role: a sort of rival project to the IEA.
The truth was that since all the producing nations in the OPEC and
non-OPEC world used the same benchmark, actually they were all
part of the same non-existent cartel. But since this ghostly cartel had
no agreement for regulating supply, there was no way to discipline or
control the prices. The market had become absolutely free, just as Mrs
Thatcher and the City of London had so much desired.
THE START OF THE FREE MARKET
The sequence of market events quickly showed the inconsistency of the
analyses that had convinced the majority to celebrate the OPEC decision.
In the absence of any agreement between the producers, everyone felt
free to produce as much as they could and to try to sell their crude
in competition with the others, simply varying the price differential
vis-`
a-vis Brent (thus, the concept of variable discount was born). What
happened seemed an exact replica of 1986 events. The price of the new
benchmark, Brent, dropped quickly to around $9 per barrel.
It is interesting to read again the remarks of the most important
commentators of the time; after preaching modernity and acceptance of
the principles of the free market by OPEC, after the price crashed down

42 Understanding Oil Prices
to $9 per barrel, they began to criticize the lack of cohesion between
the OPEC countries and their incapacity to control production levels. It
became clear that an oil market only apparently free was desired, but
actually supported by voluntary production cuts by OPEC (which had
committed suicide in December 1988).
The acceleration of the crisis was also aggravated by the end of the
Iran–Iraq war, which took place at this time. The two ex-belligerents,
both in a profound financial crisis, had dire need to increase their produc-
tion and crude oil revenues to reconstruct their countries. They asked
the other Gulf countries to give back their market outlets which had
been taken up during the war by Kuwait, the Emirates, Saudi Arabia
and Venezuela in particular. The reply from the countries concerned
was totally negative (we should not forget the new general context of
the market when this happened), with the result that the newly increased
production from Iran and Iraq contributed to flood the markets.
It was absolutely necessary to reduce world crude production and
therefore to find a swing producer. All attempts to find one, who would
come forward willingly, either as an individual country (as Saudi Arabia
had done between 1982 and 1985) or as a collective entity (OPEC), had
failed. OPEC in fact no longer existed after December 1988, when it had
adopted Brent as benchmark. Political history and the military events in
the Persian Gulf area took charge from that time and for over a decade
chose the swing producer of the international oil market.
This historic phase began in August 1989 with the invasion of Kuwait
by Iraq. Rivers of ink have been used to describe this event and its
aftermath lasting over two decades. This war is still loaded with political
consequences and is far from receiving a historic judgement that is not
interpreted as politically biased. As it affects our tale, let’s show how
the price model worked in that context.
Formally we were, in fact, in a free market system, with the distinc-
tion that reduction of supply was the task of a swing producer imposed
by a real situation and not by the decision of a political–economic cartel.
Above all, it was clear that the nomination of a swing producer was not
made with the agreement of the nominee. The result, from the techni-
cal and economic standpoint, was, however, to lessen the pressure of
supply on the market, allowing prices to be stabilized in the region of
$15–20 per barrel. The first candidate for the role of swing producer was
Kuwait, who, for almost two or three years was no longer able to pro-
duce, thus removing from the market over 2 million barrels per day.

Evolution of the Price of Crude Oil from the 1960s up to 1999 43
We should repeat that from the economic point of view the market had
remained a free market, with an outside limit (stoppage of production
from Kuwait) not programmed by any cartel, and not imposed (even if
not unwelcome) by market forces.
The first Gulf War triggered the next baton change. Kuwait passed
the relay baton to Iraq, which became the swing producer, obliged and
official, of the oil world for almost a decade. During the change of baton,
before the outbreak of the Gulf War, the price reached $40 per barrel. It
was a short-lived peak, more an exchange speculation of the emotional
sort that had no real effect on crude movements, almost a celebration
of the event itself. The same night that the bombardment of Baghdad
began, the price tumbled from $40 to the usual $16–20 per barrel.
The UN embargo on Iraq had the result that the re-start of production
in Kuwait was compensated by the stoppage of exports from Iraq, with
a substantial balancing of the volumes. This equilibrium lasted till 1996,
when growth of demand and the aftermath of the Chernobyl accident
began to nudge the crude price over the $20 per barrel range, finally
touching and exceeding $25 per barrel.
It was right at this moment that the debate over the humanitarian
aspect in Iraq heated up and began to gather a global consensus in the
media. In this new climate, the Security Council of the United Nations
(UN) approved a resolution that permitted Iraq to sell limited quantities
of crude to purchase food and essential goods, the so-called oil for food
programme. The resolution envisaged a duration of six months, with
eventual renewals to decide duration and amount of crude to export.
Without going into the political merit of the matter, we have to note
that – always from the technical and economic standpoints – the flow of
Iraq crude into the market had the effect of maintaining price stability
in the desired range of $16–20 per barrel.
In 1998 there was disagreement between Iraq and the UN inspectors,
who left the country. Iraq declared it was no longer open for dialogue
with the UN unless the cycle of inspections and the sanctions were
terminated. At the same time it began to boost to the maximum possible
(for the state of the plants and the pipeline network) the production and
export of crude, favouring certain marketing channels outside the official
control of the UN. The arrival of these extra barrels came at a critical
time for the market, right at the time when the increased production
from non-OPEC countries (North Sea, Angola and Kazakhstan) and
other OPEC countries (Nigeria, Venezuela, Algeria etc.) was being felt.

44 Understanding Oil Prices
Once again the conditions were created for a fall in the crude price, this
time faster than in the past, bearing in mind that the financial markets
had assumed the role of accelerator to this course of action.
In 1999 the price of Brent stood at $9 per barrel, the lowest in the
last 20 years. This level, however, was no longer considered by all
the analysts, oil companies and producing countries, as a temporary
event or the fruit of a crisis easy to overcome, but rather as a structural
reality, due, in a free market situation, to the constant excess of supply
over demand.
All the budgets of producer nations and oil companies are drawn up
in the shadow of cuts in costs and investments. In this scenario, many
oil companies adopted dramatic rationalization programmes that also
involved mergers with their competitors. The most overt cases were
Exxon-Mobil, Total-Fina-Elf, BP-Amoco-Arco and Chevron-Texaco.
Actually, all these analyses and forecasts, even if they have been
glaringly contradicted by history (only a few months afterwards), were
apparently correct. We were in conditions of an excess of crude supply
over demand for at least two decades and in the absence of any cartel
whatsoever, which might have regulated the offer. The price, therefore,
could only stay low.
THE CONSEQUENCES OF THE
ENVIRONMENTAL TURNAROUND
Nobody foresaw the small (yet big) revolution that the implementation
of the Clean Air Act in the USA, enacted during 1999 to take effect from
1 January 2000, would have sparked off in all the world oil markets. This
measure tore from the hand of the mystical and mysterious architect the
pencil that from the 1960s until then had enabled him to trace the graph
of the price of crude.

4
Changes in the Market for
Automotive Fuels
EVOLUTION OF ENVIRONMENTAL DEMAND
The most notable effect of the Chernobyl accident on 26 April 1986 was
the halt in construction programmes for nuclear power stations across
the entire world. There were, however, other effects deriving from the
emotions aroused by that dramatic event, which were not discussed at
any length but which caused, in the course of time, enormous modifica-
tions in the world energy configuration.
The debate over environmental problems had actually been venti-
lated some time ago in certain countries. We might remember the
success of Rachel Carson’s 1962 book Silent Spring, which revealed
the global effects of the inconsiderate use of DDT (dichlorodiphenyl-
trichloroethane) and the first Earth Day organized in the USA on
22 April 1970.
The primary emotional effect, subsequently removed, was the silence
which fell on the word energy. This word became a sort of taboo in every
political speech and in the programmes of the various governments
of the industrialized nations, and it was completely replaced by the
word environment. The total separation between the two problems has
produced results that we are paying dearly for today. Actually, a sort
of conception has grown up in which the objective of improving the
environment seems to be just a cultural choice desired or rejected for
ideological reasons, independently of technology and economics.
The day after Chernobyl set in motion, among other actions, a legisla-
tive process which imposed on all the industrialized nations, apart from
the nuclear moratorium, a change in fuel specifications, in particular for
automotive fuels.
No measure, however, bothered to check how, if and at what costs the
industry would be able to make an adequate response to the new quality
requirements of the market. No-one raised the problem of how to encour-
age the investments needed and how to make the industry an informed
and motivated protagonist of the environmental changes suggested.
Understanding Oil Prices: A Guide to What Drives the
Price of Oil in Today’s Markets
by Salvatore Carollo
Copyright © 2012, Salvatore Carollo

46 Understanding Oil Prices
Residential &
Commercial;
5%
Electric Power;
1%
Industrial;
22%
Transportation;
72%
Figure 4.1 USA crude demand by sector (2009)
Source: U.S. Energy Information Administration
Figure 4.1 shows crude demand in the USA by sector.
The aftermath of Chernobyl highlighted certain trends in the oil sector
(see Tables 4.1 and 4.2 and Figure 4.2), in particular:
rA massive increase in world oil consumption.
rA tightening of environmental specifications for all fuels, with dire
effects on those for the automotive sector.
rA growing inadequacy of the world refining system vis-`
a-vis the
changes that had taken place.
We shall examine each of these aspects in depth, to grasp how they
are behind the current international energy crisis.
Some 25 years after Chernobyl, the world oil balance has undergone
the transformations shown in Table 4.3.
Table 4.1 Evolution of gasoline specifications
Aromatics Olephines Benzene Sulphur
Europe USA Europe USA Europe USA Europe USA
%%%%%%ppmppm
1995 5 1000/500 320
2000 42 45 18 18 1 4 150 150
2005 35 35 18 1 1 50(10) 30
2010 35 25 18 6 1 1 10 10
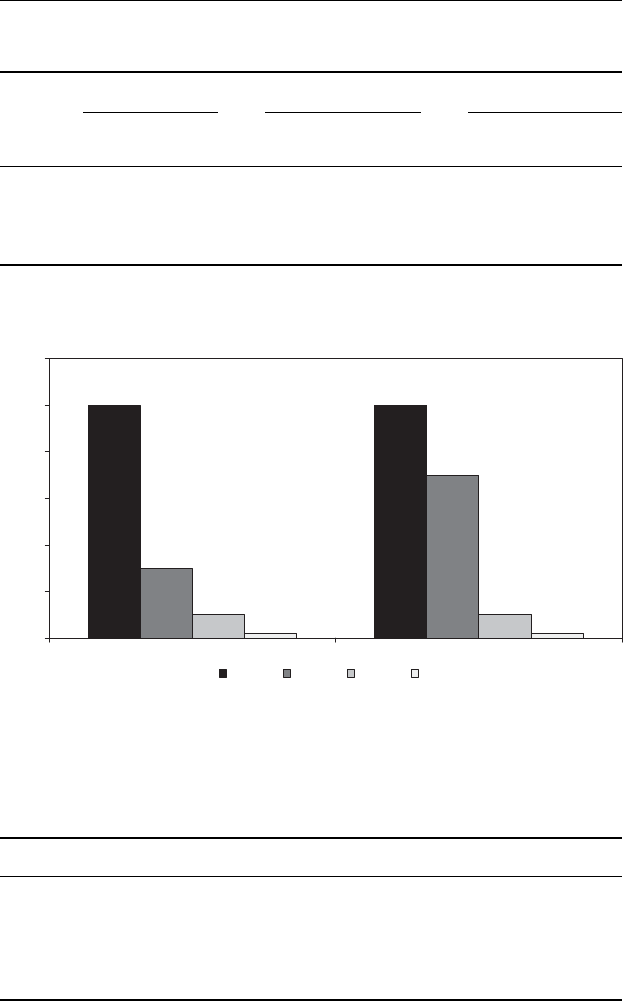
Changes in the Market for Automotive Fuels 47
Table 4.2 Evolution of gasoil specifications
Poliaromatics Sulphur Density
Europe USA Europe USA Europe USA
% % ppm ppm kg/m3kg/m3
1995 2000/500 5000 820–860
2000 11 11 350 500 820–845
2005 11 11 50/10 15/50 820–845
2010 8(6) 10 15 820–845
500
500
350
150
50
50
10
10
0
100
200
300
400
500
600
Gasoline Diesel
ppm
Euro 2 Euro 3 Euro 4 Euro 5
Figure 4.2 Evolution of gasoil specifications
Table 4.3 World crude oil demand
1986 2010 2010−1986
World Oil Demand (million bbl/day) 60.0 87.7 27.7
Of which:
North America 15.7 23.9 8.2
Europe 12.6 14.4 1.8
Asia Pacific 10.4 27.4 17.0
Source: International Energy Agency

48 Understanding Oil Prices
Oil demand has grown by 27.7 million barrels per day, of which
17 million serve to cover the growth of the Asiatic countries, under
2 million for the European nations and 8.2 million for the USA. Table 4.3
shows this distribution in the course of almost 25 years. It can be seen
that while Europe has to some extent stabilized its oil demand, the USA
and the Asian countries continue their process of growth and capture of
the oil reserves available. Moreover the USA must face up to another
structural emergency, namely the continual fall in domestic production
of crude, which has gone from 8.9 to 5.1 million barrels per day, for a net
reduction of 3.8 million barrels per day. It is as if the USA had cut down
its productive capacity by an amount equal to the production of Iran, the
second OPEC producing nation. These data appear to show the extent
of the leadership crisis which has dogged America in the past decade.
There is a mixture of lack of awareness of the data of the problem and
a sort of subjection to the petroleum lobby, which has taken some kind of
revenge against the European countries, free to expand their activities
in areas of the world forbidden to the US companies (e.g. Iran, Iraq,
Libya). In this context few have understood the need to exploit the new
frontiers of technology for both production and consumption of energy.
And so, with these changes, the internal structure of consumption in the
various areas of the world has marked up an incomprehensible growth
in per capita consumption in the USA from 24 to almost 26 barrels per
year in 2007 then brought down to 23 merely due to the contingent
economic crises, while in Europe it has remained steady at the 1985
level at 9.6 barrels per year. The Asian countries are light-years away,
although they have gone from 1.12 to 1.72 barrels per year. Perhaps one
day, in 10 years perhaps, China and India will become a problem for
their competition on the energy and oil market, but today the situation
is very different (and there is plenty of time to get suitably organized).
Analysis of the data in Figures 4.3 and 4.4 is fundamental to
understand the internal dynamics of the oil market and the impact of the
changes in environmental legislation enacted after Chernobyl.
The first actions regarding fossil fuels were taken in almost all the
industrialized nations (including Japan), with the banning of leaded
gasolines (an additive for raising the octane number, but very poi-
sonous and pollutant) and proceeding to the reduction of the sulphur
content. The real jump forward in quality came in 1990 with the
approval in the USA of the Clean Air Act, which introduced a revolution
in the composition of gasolines, with the so-called reformulated types.
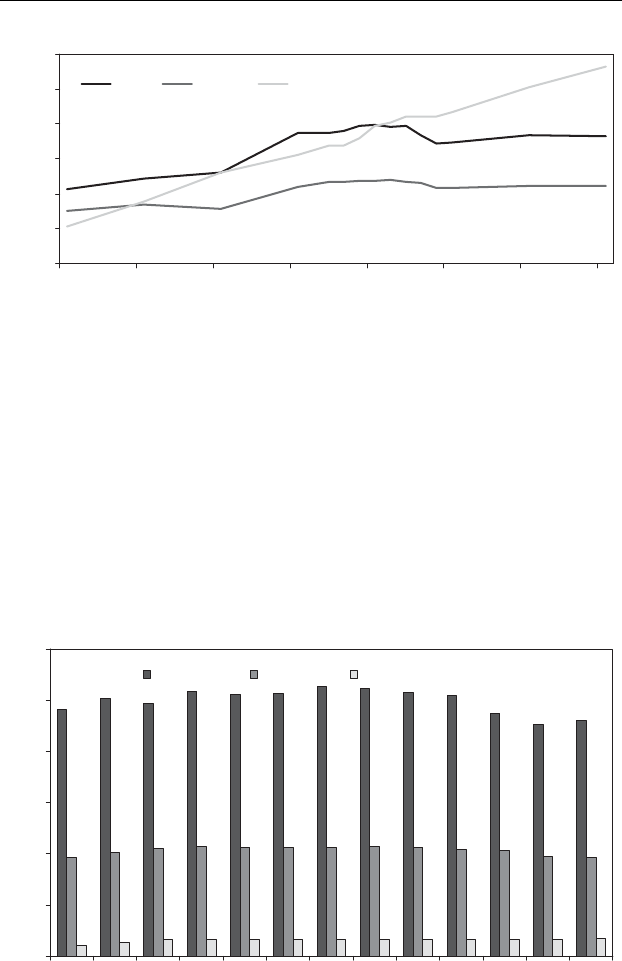
Changes in the Market for Automotive Fuels 49
5
10
15
20
25
30
35
1985 1990 1995 2000 2005 2010 2015 2020
million bbl/day
USA Europe Far East
Figure 4.3 Evolution of oil demand in the USA, Europe and Asia-Pacific (1985–2020)
Source: International Energy Agency
Actually, two types of decisions were taken regarding the quality of
automotive fuels:
rTo continue with the limitation and elimination of contaminant sub-
stances (total banning of lead, continual reduction of sulphur content
and oxygenated compounds).
rTo intervene regarding the molecular composition of the hydrocar-
bons used in fuels, setting the maximum content of those types of
hydrocarbons considered to be health risks.
0
5
10
15
20
25
30
1985 1990 1995 2000 2002 2003 2004 2005 2006 2007 2008 2009 2010
bbl/year per capita
USA EU ASIA-PACIFIC
Figure 4.4 Per capita oil demand in the USA, Europe and Asia-Pacific (1985–2010)
Sources: International Energy Agency, United Nations

50 Understanding Oil Prices
The revolution inherent in these decisions was not immediately
grasped by the industry and the authorities themselves that had pro-
posed them. In fact, the date for implementation of the law was fixed
as from January 1996, giving six years of grace to the operators to
organize themselves. However, the lack of perception of the future
impact on the oil industry gave no clue that powerful incentives would
be required to motivate the companies to invest in the transformation of
their plants. Without incentives and without the start of any industrial
re-conversion process, it became clear that after the six years leading up
to 1996, the American refining industry was not able to respond to the
new specifications imposed by the Clean Air Act; it was therefore neces-
sary to postpone the implementation for a further four years, namely to
January 2000.
In 1999, in the middle of the American presidential election campaign
(Gore versus Bush), the problem was re-proposed in exactly the same
terms as in 1996: that is, American industry was not ready to respond to
the market changes which would derive from application of the new law.
This time, however, the political conditions were not such as to allow
a further postponement. The Greens exerted pressure and furthermore
one independent Green politician from Florida was a candidate for the
Presidency and seemed capable of filching some important votes from
Gore, the democratic candidate who was challenging Bush. A deferment
of the Clean Air Act, passed by the Clinton administration, would have
been fatal for Gore. Thus, the American administration confirmed the
implementation of the new law from the starting date envisaged of 1
January 2000.
The impact on the US and world oil markets was dramatic. A rise in
prices began, which didn’t stop until the financial crisis of autumn 2008.
Actually, a situation arose in which crude prices broke away from the
control of any organ whatever (OPEC, oil companies, nations).
But what made application of the new law impracticable or difficult?
And why was its introduction so momentous for the evolution of crude
oil prices?
To make an adequate reply we have to consider some technical aspects
of the problem in depth.
GASOLINE AND ITS COMPONENTS
What is commonly called gasoline is a mixture of several components,
obtained through the refining process of crude oil. These components,
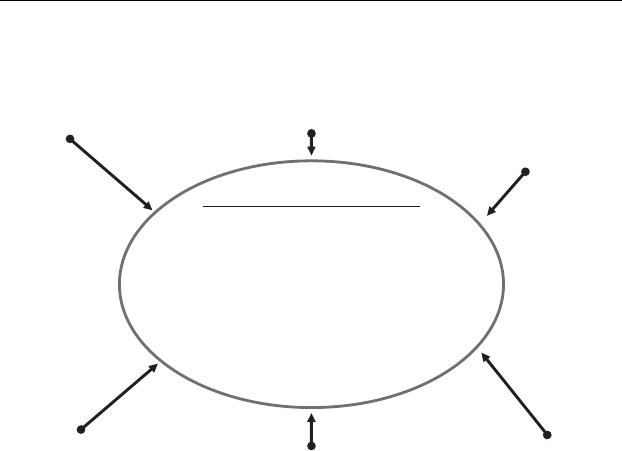
Changes in the Market for Automotive Fuels 51
Gasoline Components
Octane Number 85–95 (+)
Sulphur < 30 ppm
Aromatics < 35%
Olephines < 6%
Benzene < 1%
Density 720–770 kg/m3
Cracking
Olephines: 40%
Sulphur: 400 ppm
Topping
Naphtha
Butane
Reforming
Octane Number: 98
Aromatics: 58%
Benzene: 4.5%
Alkylation
Octane Number: 96
Aromatics: 0%
Benzene: 0%
Additives
MTBE: 118
Ethanol: 130
Isomerization
Aromatics: 0%
Benzene: 0%
Octane Number: 87
Figure 4.5 Gasoline and refining plants
and their quality, vary as a function of the complexity of the techno-
logical cycle and the size of the refinery producing them, as well as the
crude oils (the raw material) available for processing.
This problem will be examined later in more detail. At this stage,
however, we shall confine ourselves to listing the refinery plants dedi-
cated to gasoline production and the characteristics of the components
obtained from each plant (see Figure 4.5).
In the annexed sketch we give an example of a refinery, quite complex,
but more or less in line with the medium–high standards of the oil
industry at present. We see clearly that the components for blending
gasolines come from five separate plants, each one producing a different
component with different characteristics.
Reforming
Reforming is the key plant for producing gasoline and it is present in all
refineries, even the most simple and traditional ones. Its function is to

52 Understanding Oil Prices
transform the molecules of linear hydrocarbons into molecules of more
complex, cyclical form to increase the octane number, which at the end
of the treatment exceeds the limit of 85–95 required for commercial
gasoline. The component produced is called reformed gasoline. The
chemical–physical reactions which permit the increase in octane number
have the undesired effect of increasing the amounts of benzenes and
aromatics well beyond the acceptable limits of the new norms. Thus,
gasoline obtained in a refinery having only this plant could not be
marketed, because although satisfactory as regards octane number it
would contain too much benzene and aromatics.
This is an example where the new norms have made it almost
impossible for a traditional refinery to produce gasoline on specifi-
cation. To formulate an acceptable gasoline these refineries would have
to buy component products elsewhere, to be able to mix them with
the reformed gasoline; alternatively they could focus their purchases of
crude on those types which allow creation of semi-finished products
which permit formulation of acceptable gasoline. This option, however,
is not easy, since it is obvious that all refineries with such problems are
continually trying to get their hands on these crudes, whose availability
is limited and whose prices are very high.
Cracking
Cracking is the plant which enables a significant increase in the volume
of gasoline produced, through a process which converts heavy fractions
of petroleum into light products (gasoline, gasoil). Development of such
plants was accelerated in the 1980s, when the demand for fuel oil from
the power stations was greatly reduced, following the construction of
nuclear power stations and the transformation of oil-burning power
stations into stations burning natural gas (methane). With the refin-
ing systems then in use, about 50% of heavy fuel oil was obtained
from crude oil. When demand for this fell, it became essential to equip
refineries with plants to transform it into other light products, demand
for which was, on the contrary, rising fast. Thus, a series of cracking
plants (with various technologies) were devised, all aimed at increasing
the production of gasoline and gasoil by transforming heavy fuel oil.
Needless to say, these plants are those which guarantee the highest prof-
itability within a refinery. In fact the price ratio between the products
obtained (gasoline and gasoil) and the feedstocks used (heavy fuel oil)
is on average three to one, but it can also reach higher levels.

Changes in the Market for Automotive Fuels 53
Yet, even in this case, there is a problem of quality. These gasolines
have high olephines content (unstable products, therefore dangerous,
obtained by splitting heavy molecules). The new norms limit this content
quite drastically to a maximum of 6%. This puts a strict limit on the
refining process cycle as it has been structured in the last decades.
Alkylation
Obviously, there is a technological answer to this problem. This is the
construction of an alkylation plant downstream of the cracking unit.
Actually, this plant produces, starting from the waste olefinic gases
from the cracking unit, a gasoline of very high quality, with a high
octane number, without benzenes, without sulphur, without aromatics.
This is a costly and dangerous plant. It operates at a pressure of over
40 atmospheres and it is full of sulphuric acid. Any accident could
be fatal. To obtain a permit to insert it in existing refineries, perhaps
close to inhabited centres, is certainly not easy. During the gasoline sea-
son (April–August), the price of alkylate gasoline reaches unbelievable
levels ($100–200 per tonne) above those for reformed gasoline.
Isomerization
Another minor production process is isomerization, which contributes
towards the slight increase in the octane number of the light virgin
naphtha produced by the topping unit. This is, however, a marginal con-
tribution both in quantity and in quality. The octane number of the iso-
merate gasoline is in fact close to the minimum required for marketing.
The plant enables the light virgin naphtha to be used up, particularly
if the amount produced is limited and cannot be commercialized for
other uses (in petrochemicals). On the other hand it does not raise the
octane number enough to ‘absorb’ other products of lower quality in the
mixture of gasolines.
REFINERS WALK THE TIGHTROPE
On the basis of what we have seen so far, we can understand that the
quantity of components for gasoline produced every day in a refinery can
(with difficulty) be mixed together and automatically create a gasoline
ready for sale on the final market (US or European). In fact, the overall
resulting quality is compatible with the technical characteristics required
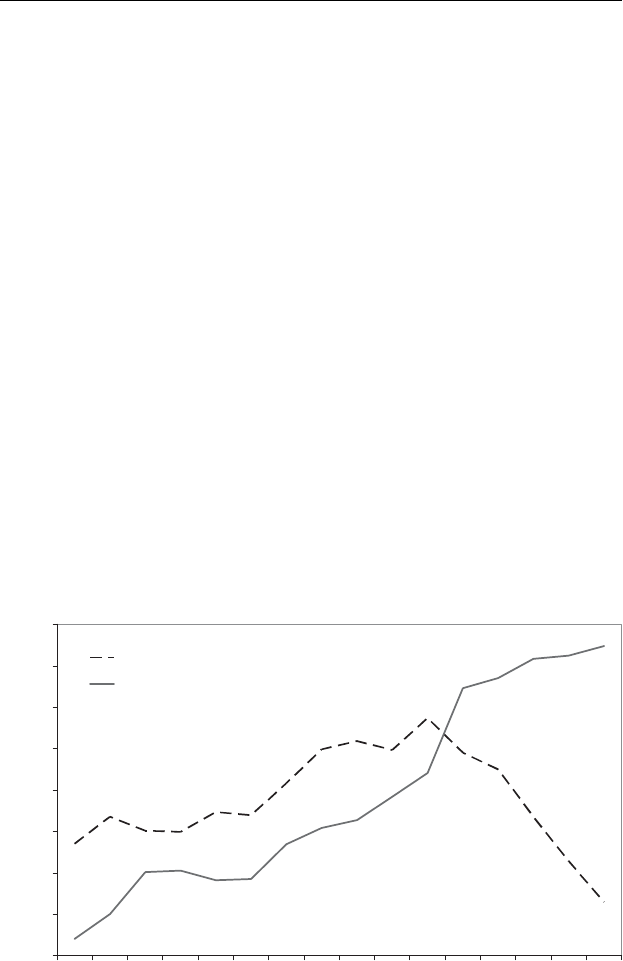
54 Understanding Oil Prices
by the engines (octane number, density) and by environmental norms
(sulphur, aromatics, benzenes and olephines).
Many of the problems in balancing quality were and still are solved by
adding to the mixture certain so-called oxygenated compounds, namely
MTBE (Methyl tert-butyl ether) or other similar products. In the USA,
inclusion of MTBE in gasoline has been prohibited since 2006, making
the life of refiners harder still.
Let us now imagine that a US refinery, with this technology available
and with the environmental norms operative, must be able to supply its
hinterland with a variety of about 40 different types of gasoline, each one
formulated to specifications among the strangest and restrictive possible.
The task becomes a nightmare, which can be faced only through a
frenetic purchase activity for specific components imported from other
international markets (e.g. Europe, South America). Obviously the price
of these components becomes sky-high during the gasoline season and
causes a reduced availability of high-quality product in the markets of
those areas that produce but also export these components. This is why
the price of gasoline in Europe is practically in line with that in the USA
(net of taxes), instead of being much lower, the market having a big
surplus of product (see Figure 4.6).
0
100
200
300
400
500
600
700
800
1995 1996 1997 1998 1999 2000 2001 2002 2003 2004 2005 2006 2007 2008 2009 2010
(1000 bbl/day)
Gasoline Import
Gasoline Blending Components Import
Figure 4.6 USA imports: gasoline versus blending components
Source: U.S. Energy Information Administration

Changes in the Market for Automotive Fuels 55
This mechanism, previously described, might appear to be an irrele-
vant technical detail for the experts concerned. On the contrary, however,
it represents the crux of the problem of understanding today’s dynam-
ics of the international oil market. The need to restock the biggest and
richest world oil market with marginal products creates competition at
global level, a sort of continuous but invisible auction, in which the
product is assigned to the highest bidder, to the person or firm able to
pay the highest price. But with the result that the price of the last barrel
of product sold becomes the market price of that day for the whole
world. The proof of this phenomenon is before our eyes:
rThe gasoline price in the European countries, producers of surplus
gasoline and exporters to the US markets, turns out to be in line with
the very high price in the USA (net of taxes). All the investments made
in the refining sector and the price paid in terms of industrial pollution
do not generate any economic benefit for European consumers.
rThe poorer countries of Africa and the Middle East (often important
crude producing countries but without a significant refining activity)
find themselves, during the US gasoline season, very short of product
and with consequential social problems (e.g. Iran, Nigeria, Egypt,
Angola).
rA dual gasoline market has thus developed a US market and a Euro-
pean market, comprising high-quality gasoline and low-quality gaso-
line made by blending low-specification components not saleable in
industrialized countries.
This is a precarious balance which has been maintained with great dif-
ficulty and which has already shown the potential disasters that financial
speculation can create (starting from this). Action in the refining sector
has now become urgent and inevitable, but unfortunately, as we shall see
later, it will not be taken for some time yet (Figure 4.7 shows a simpli-
fied refinery scheme). We shall, therefore, have to learn how to consider
the oil price with a completely different mental model and leave the
producing countries in peace when things do not work as we would like.
THE FISCAL POLICY OF THE INDUSTRIALIZED
COUNTRIES REGARDING FUELS
It is important to note that, when faced with the structural problems
that we have just mentioned, the governments of the industrialized
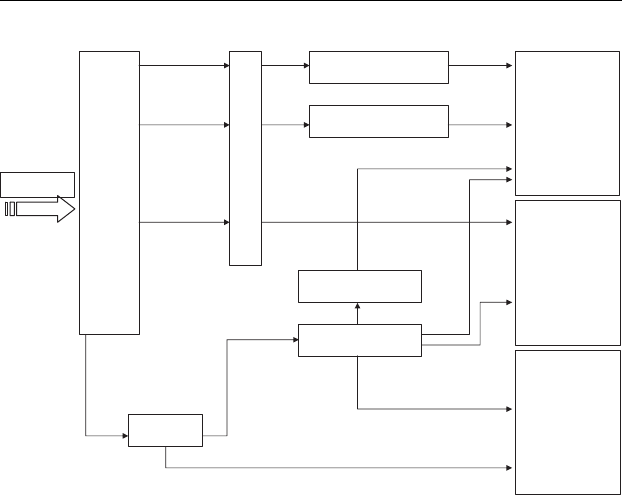
56 Understanding Oil Prices
Topping
(Atmospheric Distillation)
Crude Oil
Heavy
Virgin Naphtha
Light
Virgin Naphtha
Desulfurization
Isomerization
Reforming
Alkylation
Cracking
Vacuum
Gasoline
Mid Distillate (gas
oil, jet kero,...)
Fuel Oil and
Bitumen
Isomerate
Alkylate
Reformate
Fuel Oil
Figure 4.7 Simplified refinery scheme
countries, instead of focusing on the quest for a stable and integrated
solution using policies of incentives for industrial investments and
research projects, have in fact contributed towards amplifying the effect
of the crisis through taxation on fuels so punitive as to justify our saying
that effectively the real automotive fuel is composed of taxes.
This matter is deeply felt by consumers of oil, in particular the
motorists of the various countries who suffer the effects and costs of the
phenomena just examined. It is true that the reactions of the public are
often emotional and based on the well-worn clich´
es, usually for igno-
rance of the real mechanisms that affect the prices of crude and finished
products, and even more regarding the taxation of petroleum products
imposed by the governments of the consumer countries. This in fact con-
stitutes one of the fundamental variables for determining the true cost
afflicting the consumers and the economies of the industrialized nations.
The tax burden is often much greater than the sum of the costs of the
raw material, its transformation and distribution as finished products.
The OPEC countries have always strongly criticized the governments
of the industrialized nations for their fiscal policies, seen as ampli-
fiers and accelerators of the processes that have made crude oil prices

Changes in the Market for Automotive Fuels 57
completely irrational. And the fact that the reactions of the consumer
are often the result of unawareness of the real mechanisms is important.
The taxation of petroleum products imposed by the governments of the
consumer nations is one of the fundamental variables for determining
the true cost afflicting the consumers and the economies of the industri-
alized nations. We may well say that the final consumers have no real
perception of the cost of crude oil, since the major charge affecting them
is the taxation on finished products, which, being a fixed percentage of
their industrial cost, is greatly magnified with every increase in the crude
oil price.
Regarding this issue even the producing nations accuse the govern-
ments of the industrialized countries of adopting a tax policy on oil so
punitive as to make the effective price level of the raw material com-
pletely immaterial. The system of continually putting the blame on the
producing nations is considered unacceptable, when the greater part of
the price increases at the retail level is due in fact to taxation. Perhaps
a better knowledge of the taxation mechanisms on gasoline and diesel,
with a clear statement of the amounts and their effect on consumption,
would avoid concentrating the blame on the producing countries and
the oil companies, but without keeping the governments responsible for
such tax policies out of the picture.
Perhaps it will be useful to give some consideration to the concrete
data in Table 4.4 regarding the oil sector, comparing two different real-
ities – the European and the American – which historically have used
two different philosophies concerning the taxation of automotive fuels.
It is interesting to comment on some of the data which emerge.
The average list price applied by the oil companies in Europe is
higher than that in the USA. This is in clear contrast with the fact that
a significant proportion of US gasoline is imported from Europe. It is
well known that European structure produces excess gasoline, while the
US market has a deficit of over a million barrels per day. Based on
the laws of economics it would be reasonable to expect that gasoline
in the USA would cost more than that in Europe, at least to compen-
sate for the transport cost from the Mediterranean/North Europe to the
Atlantic coast of the USA. Surprisingly, the contrary happens. It is just
as if the price of lemons were higher in Sicily and Spain than in Norway
and Sweden.
The taxation on gasoline in Europe represents around 60% of the
price at the pump and about 136% of the market price, while in the USA
it is only 13% of the price at the pump and 15% of the market price.

Table 4.4 Gasoline in Europe and the USA: list price and price at the pump
Retail premium gasoline prices Retail premium gasoline taxes Retail premium gasoline prices
UE USA UE USA UE USA
(€/liter) %(€/liter) %(€/liter) %(€/liter) %(€/liter) %(€/liter) %
2000 0.35 0.34 0.77 0.13 1.12 0.48
2001 0.32 −9% 0.34 −1% 0.76 −1% 0.14 3% 1.08 −3% 0.48 0%
2002 0.30 −7% 0.30 −12% 0.77 1% 0.13 −5% 1.06 −1% 0.43 −10%
2003 0.30 1% 0.30 1% 0.77 0% 0.11 −17% 1.06 0% 0.41 −4%
2004 0.34 14% 0.33 12% 0.80 4% 0.10 −9% 1.14 7% 0.43 6%
2005 0.42 23% 0.42 27% 0.82 3% 0.10 2% 1.24 9% 0.52 21%
2006 0.48 13% 0.49 15% 0.83 1% 0.10 −3% 1.31 5% 0.59 12%
2007 0.49 4% 0.49 0% 0.85 2% 0.09 −8% 1.34 3% 0.58 −1%
2008 0.57 15% 0.55 12% 0.85 0% 0.09 −4% 1.42 6% 0.64 10%
2009 0.41 −27% 0.37 −32% 0.82 −4% 0.12 38% 1.24 −13% 0.49 −23%
2010 0.53 28% 0.51 37% 0.86 5% 0.09 −22% 1.39 13% 0.60 23%
Source: U.S. Energy Information Administration

Changes in the Market for Automotive Fuels 59
Table 4.5 Price of gasoline and diesel fuel in some European countries
Prices
(excluding taxes) Taxes Pump prices
€/liter
Jan 10–Sept 10 Gasoline Diesel Gasoline Diesel Gasoline Diesel
UK 0.36 0.44 0.87 0.87 1.36 1.38
Netherlands 0.56 0.56 0.96 0.62 1.52 1.18
Italy 0.55 0.57 0.79 0.61 1.34 1.18
France 0.52 0.55 0.84 0.62 1.36 1.17
Germany 0.54 0.56 0.89 0.66 1.42 1.22
Belgium 0.55 0.56 0.85 0.57 1.40 1.13
Luxembourg 0.54 0.54 0.62 0.44 1.15 0.98
Spain 0.55 0.56 0.59 0.50 1.14 1.06
Ireland 0.52 0.55 0.78 0.66 1.31 1.21
Average 0.52 0.54 0.80 0.62 1.33 1.17
Source: UK Petroleum Industry Association Ltd.
The consequence of these two different situations is that the retail
price of gasoline in Europe is on average between two and three times
higher than in the USA.
In Europe there is a heavier tax burden than in the USA, but with
significant differences between one country and another (see Table 4.5).
In 2010, the list price applied by the companies (net of taxes) varied
widely between each country: from €0.36 per litre in the UK to €0.56
per litre in the Netherlands.
In Italy the oil companies applied prices somewhat higher than the
European average, €0.55 against €0.52 per litre, with the tax component
in line with the European average and, thus, with the price at the pump
slightly higher than the average in Europe.
It is not easy to obtain up-to-date and homogeneous data for all the
countries in the world. However, the IEA has provided some important
information regarding the main consuming countries for 2010.
The data shown in Figures 4.8 and 4.9, substantially in line with those
from Europe in 2010, confirm some evident structural facts:
rThe market price of gasoline is lower in the USA, Australia and the
UK, countries which are net importers of finished products and where
competition between the various operators is strong. We may note
the situation in Australia, where, although there is no national oil
company of importance, there is a very competitive system between
the distributors, a high degree of transparency in the markets and a
widespread institutional antitrust culture.
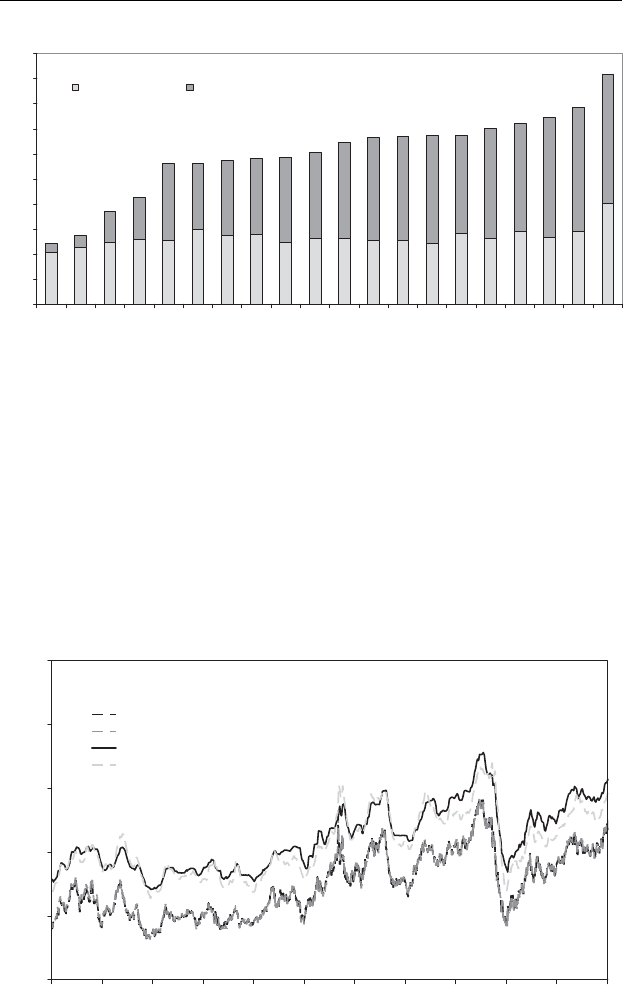
60 Understanding Oil Prices
0
1
2
3
4
5
6
7
8
9
10
Mexico
United States
Canada
Australia
Poland
Japan
Spain
Switzerland
Austria
Hungary
Ireland
France
Sweden
United Kingdom
Italy
Germany
Belgium
Netherlands
Norway
Turkey
$/gallon
price without taxes total tax
Figure 4.8 Gasoline prices in the world
Source: International Energy Agency
rIn Italy, the most important refining country in the Mediterranean and
a gasoline exporter, the consumer pays more for his or her gasoline
than in all the other countries (apart from Norway, Turkey and Hol-
land). Obviously the fragmentation of the distribution system and the
high related costs play their part.
0.0
0.2
0.4
0.6
0.8
1.0
2000 2001 2002 2003 2004 2005 2006 2007 2008 2009 2010 2011
[euro/liter]
Platts: gasoline FOB NWE
Platts: gasoline FOB Med
Italy
USA
Figure 4.9 Price (excluding taxes) of gasoline in Europe and the USA
Sources: U.S. Energy Information Administration and European Commission
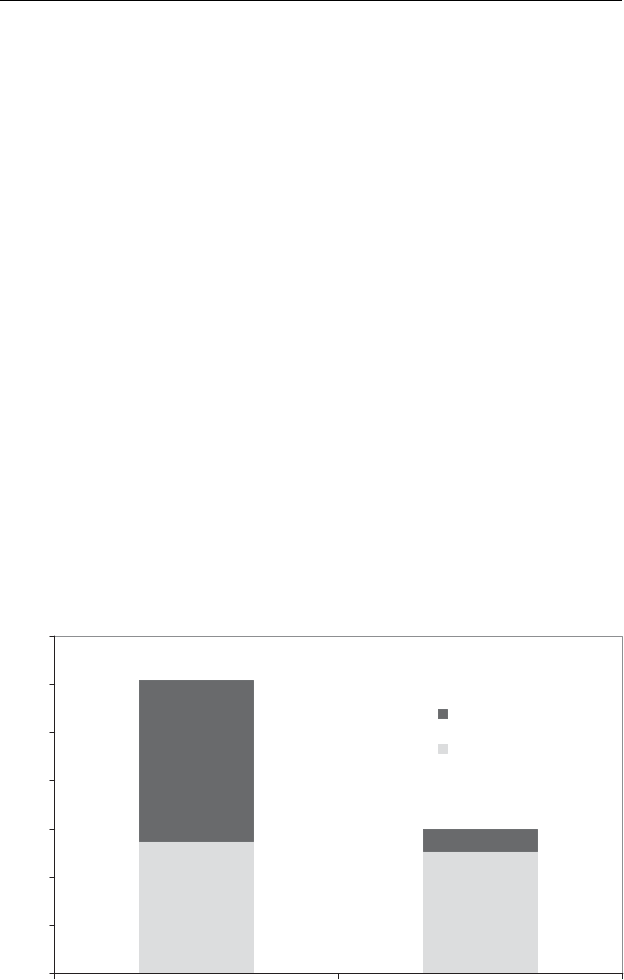
Changes in the Market for Automotive Fuels 61
rThe high taxation level in Europe means that the price of the industrial
product (pre-tax) is low compared with the final price on the market,
making less transparent and, thus, negligible the dynamics of the
industry prices as well as competition between the operators. This
phenomenon tends to worsen in countries where a culture rooted in
transparency and effective antitrust control bodies is lacking.
rIn the USA the gasoline price is closely aligned with the international
market and responds quickly to the demand/supply balance. In 2008
we saw some cooling-off of the price (distance from the international
market), while the price of the companies in Europe stayed at higher
levels. The fall in the dollar/euro exchange rate should have caused
the opposite effect, but actually it provided an additional benefit for
the distributors and the Inland Revenue.
The same analysis can be made for gasoil with results quite similar
to those of gasoline.
It is worthwhile examining the meaning of these differences in tax-
ation policies for automotive fuels (see Figure 4.10). Transport policy
in the USA has always privileged private transport. Not by chance do
nearly 300 million inhabitants consume around 50% of the gasoline
produced in the world. Putting gasoline and gasoil together, the quantity
0
1
2
3
4
5
6
7
Europe USA
($/gallon)
Ta x e s
Diesel Net Price
Figure 4.10 Tax burden on diesel fuel in 2010 (Europe and the USA)
Sources: U.S. Energy Information Administration, European Commission

62 Understanding Oil Prices
reaches nearly 735 billion litres per year. Taxation on fuels provides the
State with around $100 billion a year. This is clearly a political choice,
based on certain principles typical of US culture, which has given posi-
tive results, in economic terms, during the years of low oil prices but is
now showing its weaknesses.
Europe, on the other hand, has always assisted public transport in the
cities as well as outside (e.g. metros, trains, ferries, buses etc.), demoting,
generally speaking, the automobile to residual transport chores, tourism
or individual comfort. The idea of taxing in punitive fashion individual
transport by car started out from here.
In the various European countries, however, taxation on the auto-
mobile – and hence on fuels – is in some way aimed at supply of services
of a certain level for the motoring citizen: a very efficient road network;
well-maintained and safe roads; free, well-policed motorways; and car
parks that are easy to use and with spaces available. Bicycle paths are
also an integral part of the road system.
In certain European countries taxation on vehicles and fuels function
as an additional component, but not openly declared as ordinary taxation.
For example, in Italy, the revenue deriving from taxation on gasoline
and diesel is around €35 billion per year, compared to the value of the
goods taxed of about €20–25 billion. If we also add the taxes on other
petroleum products, apart from gasoline and diesel fuel, the number
arrives at €50 billion per year. This amount is updated continually since
it is linked to the industrial price. As the oil companies’ price list rises,
the taxes increase automatically.
Just to give an idea of the size of this phenomenon in the European
context, we may remember that while the volume of gasoline consumed
in the USA is about 30 times greater than that in Italy, the tax revenue in
America derived from automotive fuels is about three times lower than
that in Italy. Obviously the situation is not very different in the other
European countries.
Let us hope that a significant part of this sum will be used for invest-
ments for a more efficient transport policy.

5
World Oil Flow
Many of the distortions existing today in the world oil market stem from
the loss of control of the processes started in past times to respond to a
vision of economic rationalization.
When we note that the USA, while consuming over 22 million bar-
rels per day of petroleum products, have created a refining capacity that
can produce in continuous regime only about 14–15 million barrels per
day, we can conclude that they decided to depend structurally on pro-
curement of refined products coming from other geographic areas. The
dependence of many industrialized nations on procurement of raw mate-
rial (crude oil) from producing countries is often a necessity imposed by
nature (oil is not found everywhere). However, dependence for finished
products on other refining countries is an economic and strategic choice
that provides benefits if well managed and monitored as time goes by,
but that can also become a heavy burden if it slips out of control and
becomes a strategic limitation. One often has the sensation that many
choices in the oil field were made with a purely economic vision and,
being based only on company ends, thus, short term by necessity. It is
hard to discern any guidelines programmed by national authorities in a
sector so strategic and decisive for the economy of a country.
To understand better what is happening today, we can look at some
historic decisions made in the 1950s and 1960s by the leading US oil
companies. We have to go back to a time when the price of crude at the
origin, at the loading terminals in the various producing countries, was
effectively fixed by the US multi-nationals (the famous Seven Sisters
that Enrico Mattei talked about), and it was so low that the price at the
final destination represented over 50% of the cost of transport. Reduction
of transport costs was therefore a fundamental factor in the economic
strategies of the US companies.
If we look at the movements of oil at that time (see Figure 5.1), we
can clearly see that about 80% of the crude came from the Persian Gulf
and reached the Atlantic basin via the Suez canal. The crude needed
for the growing consumption in the USA, therefore, had to arrive first
Understanding Oil Prices: A Guide to What Drives the
Price of Oil in Today’s Markets
by Salvatore Carollo
Copyright © 2012, Salvatore Carollo
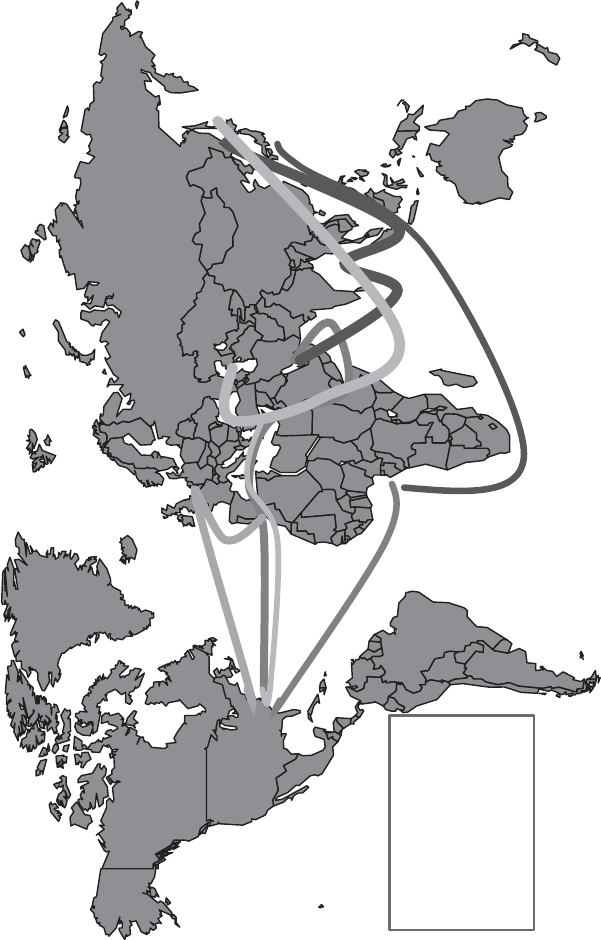
1
2
1
3
4
5
6
7
1. From Gulf to West
2. From N. Sea to the USA
3. From Gulf to F. East
4. From W. Africa to the USA
5. From W. Africa to F. East
6. From Caspian to F. East
7. From Caspian to the USA
Figure 5.1 World oil flow

World Oil Flow 65
in the Mediterranean and proceed accross the Atlantic, with very high
transport costs.
Let us remember yet again that the USA did not require all the
refined products obtainable from crude, but essentially just gasoline.
Construction of further refineries to produce gasoline would have pro-
duced an excess of other products (gasoils, fuels) which would have to be
exported and, thus, be re-transported with high additional costs.
Europe too was going through a phase of economic boom due to post-
war reconstruction and the industrialization of new areas. Europe needed
fuels and electricity. It was possible to satisfy the needs of the two sides
of the Atlantic with an integrated industrial plan, aiming to optimize
everything; by building refineries in Europe that the US market needed,
thus it became able:
rto produce and export gasoline to a privileged market, with good
economic returns, providing availability of hard currency needed to
pay for the raw material;
rto produce at marginal costs the fuel oil for the power stations being
built, to provide energy for the expanding industrial system; and
rto develop the technology for diesel engines (little used in the USA)
to use the gasoil produced and maximize export of gasoline.
This design made sense and offered secure economic returns. There-
fore, the plan took shape and saw the massive construction of refineries
in Italy (at the centre of the Mediterranean) and at Rotterdam, the key
point for supply of gasoil to Germany. Furthermore it was essential to
heavily promote the construction of power stations fed exclusively with
fuel oil (a product considered as refinery waste), if possible located near
the refineries. The newspapers of the time also tell us of the pressure
exerted by the oil industry on the political world to reach its objectives.
This model worked perfectly until the end of the 1960s, but it was met
with many difficulties that worsened with the first oil crises. Firstly, the
closure of the Suez canal in June 1967. All the tankers from the Persian
Gulf were forced to circumnavigate Africa to reach the Mediterranean,
where the refineries were found. Clearly the economies on the transport
costs completely disappeared. To take the crude, after the long circum-
navigation of Africa, into the Mediterranean or to North Europe and
then depart from there to take the gasoline to the USA, added extra
costs as compared with the alternative voyage direct from the Persian
Gulf towards the USA.

66 Understanding Oil Prices
The system managed to resist, thanks to some adjustments to the
transport element. The tankers that carried 60,000–80,000 tonnes of
crude were replaced by supertankers carrying up to 350,000 tonnes. In
this way the unit cost of transport was kept down and all continued as
before. Furthermore, in the meantime, from 1973, OPEC took control of
the prices and imposed a significant increase of around $10 per barrel.
This took the transport cost to an acceptable fraction of the cost of crude
at final destination.
Starting from 1973, two parallel processes got under way:
rEnergy diversification in all the industrialized countries, tending
essentially towards the production of electricity in an alternative way
to that of the oil-fired power stations. In Europe, in the following
decade, the demand for fuel oil fell to about 20% of the total oil
demand.
rConstruction of refineries in the producing countries, with the clear
intention of shifting margins of the oil cycle from the companies
towards the producing countries. These refineries were obviously ori-
ented towards the export of finished products to international markets
and they were built in those countries with huge financial resources
(petrodollars) and with only a modest internal demand for petroleum
products (Saudi Arabia, Kuwait).
TRANSFORMATIONS IN THE DOWNSTREAM
The result of all this was to create a very competitive market for finished
products (the prices applied by the producing countries can be lower) and
consequently, a reduction of the refining margins in all the plants with
a relatively simple technological cycle; oriented towards production of
fuels for power stations (no longer necessary) and marginal quantities
of gasoline for export to the USA. A dramatic process of restructuring
the refining system in the countries on both sides of the Atlantic started
in the 1980s. All the refineries with a simple cycle that did not have a
local pool of consumption (including adjacent power stations) were shut
down. Those more modern and better located to supply the city outskirts
or export gasoline to the USA were restructured with the installation
of conversion plants. To illustrate this, Table 5.1 lists the closures in
Italy, the European country necessarily most affected by this process,
and in the USA, where the liberalization laws introduced by the Reagan
administration accelerated the rationalization process.

World Oil Flow 67
Table 5.1 Italian refineries
Company Location
Technology
complexity Status
Capacity
1973 [1000
bbl/day]
Capacity
2010 [1000
bbl/day]
AGIP
Raffinazione
La Spezia low Closed 85 −
AGIP
Raffinazione
Rho high Closed 80 −
ALMA Ravenna low 4 −
API Falconara mid 80 −
Aquila Trieste low Closed 50 78
Arcola Petr. La Spezia low Closed 20 −
ENI Livorno high 104 −
ENI Porto
Marghera
mid 90 108
ENI Sannazaro high 120 221
ENI Taranto mid 84 118
ERG Genova low Closed 130 −
ERG Melilli mid −255
ERG Priolo high 300 250
Esso Augusta high 182 196
Gaeta IP Gaeta low Closed 80 −
Italiana energia &
servizi
Mantova high 65 58
IPLOM Busalla low 32 38
Kuwait
Petroleum
Naples mid Closed 130 −
Lombarda Petroli Villasanta low Closed 22 −
Milazzo Milazzo high 400 280
Gela Gela high 90 129
Rome Pantano low 86 86
San Quirico San Quirico low Closed 30 −
Saras Sarroch high 360 355
Sardoil Porto Torres low Closed 90 −
Sarni Bertonico low Closed 80 −
Sarom Ravenne low Closed 140 −
Sarpom Trecate high 260 180
Tamoil Cremona mid 80 100
Volpiano Volpiano low Closed 80 −
In the USA an even more extensive and drastic process took effect in
two directions:
rReduction of refining capacity with closure of uneconomic plants and
concentration of ownership in the hands of fewer proprietors (Figure
5.2).
rIncrease of the rate of utilization of existing capacity (higher opera-
tional efficiency) (Figure 5.3).
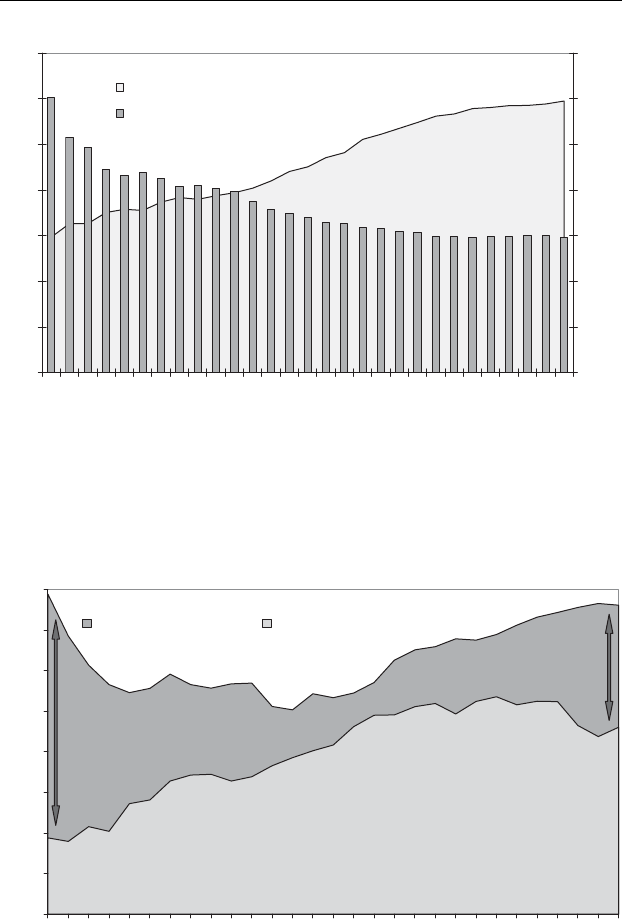
68 Understanding Oil Prices
0
20
40
60
80
100
120
140
1982
1984
1986
1988
1990
1992
1994
1996
1998
2000
2002
2004
2006
2008
2010
1000 bbl/day
0
50
100
150
200
250
300
350
Number of refineries
USA Average Refinery Capacity [left axis]
Number of operable refineries in USA [right axis]
Figure 5.2 Number of refineries versus average refining capacity
Source: U.S. Energy Information Administration
10
11
12
13
14
15
16
17
18
1982
1984
1986
1988
1990
1992
1994
1996
1998
2000
2002
2004
2006
2008
2010
million bbl/day
USA Refineries Capacity USA refinery runs (1000 bbl/day)
Figure 5.3 Refining capacity versus rate of utilization (USA)
Source: U.S. Energy Information Administration

World Oil Flow 69
In this context whatever plan there was for construction of new re-
fineries was shelved. The last new refinery built in the USA dates back
to 1976. In Italy too, the last refinery built was at Melilli (Siracusa) in
1976: since then, only upgrading work has been carried out on some
existing plants.
All the tables of reference and the strategic lines of the past were wiped
out and the oil industry began to live from one day to the next, incapable
of making any overall plan to face the challenges of the future decades. In
a situation of low prices and refining margins at the limits of survival, the
companies limited themselves to closing each year with more or less pos-
itive results rather than make bets on the future. The continuation of this
situation for over two decades created a survival culture in the oil down-
stream, which from that time has remained captive of a business philoso-
phy tied to day-by-day dynamics; without realizing that the famous mole
in the story was burrowing underground tunnels that would have pro-
voked a crisis of capacity and lack of technology in the following decade.
This background explains the variations in the flow of crude supplies
starting from the 1990s. To the prevalent direction of flow from East to
West (Persian Gulf towards Europe and the Americas) an increasingly
important flow towards the Far East was added. At the beginning this was
low-quality, cheaper crude (the environment was not yet a relevant theme
in the Far East), then the demand for light, low-sulphur crudes grew
slowly. Refiners in the Far East turned their gaze on higher-quality crudes
from the Gulf as well as from West Africa, triggering a commercial
conflict with the US market, which hitherto had used them exclusively.
The arrival of Far Eastern operators in West Africa coincided with the
rekindling of civil wars in many of the countries either already producing
crude or with the potential to. This was obviously not an automatic
coincidence, but certainly it would appear to be not unconnected with
the events.
The history of the 2000s to date confirms that the consolidation of the
processes of the previous decade and the new conflicts taking shape con-
tributed towards directing world crude movements to the west or to the
east. West Africa showed it was an area of bitter conflict and competition,
where the game for control of crude oil was played on several fronts:
rpolitical and military support in the local conflicts;
rmassive assistance in building civil works, payment for which was
expected to be made in crude oil in the future;
rpartnerships for interventions in various business areas which could
provide the country with some development also outside the oil sector.

70 Understanding Oil Prices
Then the confrontation, perhaps even more bitter, in the Caspian Sea
area came to the forefront. This area seems to have a potential for
development comparable to that of the Persian Gulf. The area belongs
to a series of member states of the ex-USSR and Iran. After the frag-
mentation of the USSR, the major oil companies raced to obtain mineral
concessions in the area, with some clear-cut successes. From some years
ago, however, the situation seems to have become a little more compli-
cated because of the limitation of the export routes from the Caspian
area towards the international markets, involving the need to resolve the
following problems:
rCrossing Russian or Iranian territory.
rReaching the Mediterranean without disturbing maritime traffic in the
Dardanelles.
rEquipping the Mediterranean, historically an area importing oil, to
export a mass of light crudes to more remunerative markets.
On this front the political, and sometimes military, reports inform
us of growing tensions in the areas of transit, today or tomorrow, of
the pipelines. The stakes in this game are very high and of strategic
consequence: certainly beyond the scope of our present tale.
WORLD SUPPLY STRUCTURE
Another aspect of oil movements concerns the pinpointing of canals via
which the crude, produced in various nations, reaches its final markets
and how much of this crude contributes to support the dynamics of the
oil market through commercial transactions. In the first place we should
split world production into two distinct segments:
rthat of the guaranteed flows, namely the part of world production that,
every day, independently of the price level, is able to reach its final
destination. This part represents about 88% of the production; and
rthat of the flows dependent on the price, namely that part of the
production that reaches any final market whatsoever only if its price
is adequate and competitive. This part represents about 12% of the
production.
It is interesting to look into the two segments defined above and shown
in Figure 5.4, especially the one of the guaranteed flows, to understand
the level of fragility of the physical markets for crude, where only a tiny
fraction of the production is exchanged every day.
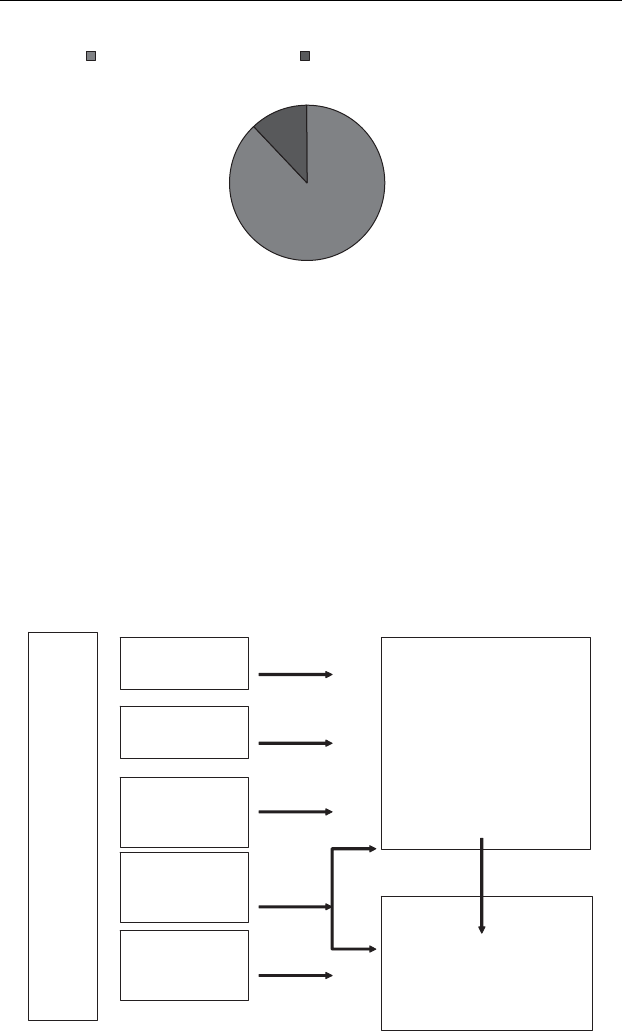
World Oil Flow 71
88%
12%
Destination guaranteed Destination dependent on price
Figure 5.4 Destinations guaranteed and destinations dependent on the price
Therefore, in the oil market a gigantic space for manipulation is
created. By moving only marginal quantities an enormous pressure can
be exerted on the balance of the world market (such as the phenomenon
of the squeeze on Brent).
In greater detail (as shown in Figure 5.5), we may note that:
rAbout 55% of the crude extracted by the producing countries is used
in their internal refining system to cover their domestic needs. A small
percentage of refined products (under 10%), in excess of the domestic
requirement, is exported to other markets.
P
r
o
d
u
c
t
i
o
n
100
Local refinery
54.8
Foreign network
7.5
Oil companies’
equity
9.8
Strategic sale and
purchase
15.9
Destination price
dependent
12
Refinery system of the
oil companies and
producing countries
77.4
Spot market
22.6
Figure 5.5 Destination of crude (%)

72 Understanding Oil Prices
rAbout 7–8% of the crude is transferred to refining and distribution
circuits that some producing countries own in the main areas of con-
sumption (e.g. Saudi Arabia, Venezuela, Kuwait, Libya).
rAbout 10% represents the crude due to the oil companies for the
repayment of their investments (the so-called equity quota) and which
is sent either to their refining system or sold in the international
markets.
rSome 15–16% of the production, historically, is destined by many
countries to repay works and goods of strategic nature (e.g.
major civil works, infrastructures and means of transport, military
expenses).
Only 12% of world production is linked every day to spot or short-
term sales contracts. This segment, plus other fractions of crude from
the preceding segments, for a total never greater than 25%, constitutes
the base of what we call the physical oil market. Out of a production of
around 88 million barrels per day, the crude responding to commercial
transactions does not exceed 20–25 million barrels per day.
From these data it is easy to see how the market forces do not affect
the overall mass of demand and world oil supply but only a very limited
segment in the hands of just a few operators. This fragile and critical
balance is rocked today by the power of speculative finance which
upsets the precarious equilibrium of what was formerly the international
oil market.

6
The Classical Model of the
International Oil Market
When analysts speak of the price of oil they are normally referring to
the classical model of demand and supply. There is, however, a specific
complexity in the technological model of the oil market, which when
the model is applied tout-court leads to completely mistaken and para-
doxical results. Not only are we unable to find an instrument that allows
us to forecast the evolution of the price of oil (which any respectable
model should do, at least in terms of revealing overall tendencies), but
we cannot even manage to give a logical interpretation of events past and
present. Many analysts in veneration of the model they use are forced to
make far-fetched readings of the input data, so as to make them coherent
with the facts of the market.
In the oil market there is only one incontrovertible fact, namely the
evolution of the price of oil. Every day purchases and sales are completed
on the basis of a price accepted by the buyer and the seller. On the basis
of this figure physical transactions and payments take place. Price is
therefore an incontrovertible fact. The price used one day differs from
that of the day before or the day after. The reason for these variations is
the mystery we need to unravel. The dynamics of demand and supply
applied in the classical way are of little use. Let us try to see why.
When we examine the data regarding world oil demand and supply
we normally refer to the International Energy Agency (IEA).
Table 6.1 is nothing more than the materialization of an interpretative
model in which a forcible comparison of two dissimilar sets of data
is made as if they were homogeneous and related to the same market
dynamics we wish to understand. Actually, the comparison is made
between:
rthe world oil supply from the producing countries (OPEC and non-
OPEC); and
roil demand as the aggregate of finished products (e.g. gasoline, gasoil,
fuel oil etc.).
Understanding Oil Prices: A Guide to What Drives the
Price of Oil in Today’s Markets
by Salvatore Carollo
Copyright © 2012, Salvatore Carollo

Table 6.1 Global oil demand and supply
Global Oil Supply and Demand (MB/D)
2010 2011
Source: IEA 18/01/2011 1 Q 2 Q 3 Q 4 Q 2010 1 Q 2 Q 3 Q 4 Q 2011
World Oil Demand 86.3 86.9 88.6 88.9 87.7 88.6 88.4 89.8 89.7 89.1
OECD 45.9 45.2 46.6 46.7 46.1 46.3 45.0 46.1 46.3 45.9
Non OECD 40.4 41.7 42.0 42.2 41.6 42.3 43.4 43.7 43.4 43.2
of Which ex FSU 4.2 4.1 4.4 4.3 4.3 4.4 4.2 4.5 4.4 4.4
World Oil Supply 86.5 87.1 87.4 88.2 87.3 88.3 88.4 88.9 89.4 88.7
Non OPEC Supply 52.4 52.8 52.8 53.3 52.8 53.1 53.1 53.5 53.9 53.4
OPEC Crude (X) 29.1 29.1 29.3 29.5 29.2 29.5 29.5 29.5 29.5 29.5
OPEC NGLs 5.1 5.2 5.4 5.5 5.3 5.7 5.8 5.9 6.0 5.8
Stock Change 0.2 0.2 −1.2 −0.7 −0.4 −0.3 0.0 −0.9 −0.3 −0.4
Source: International Energy Agency
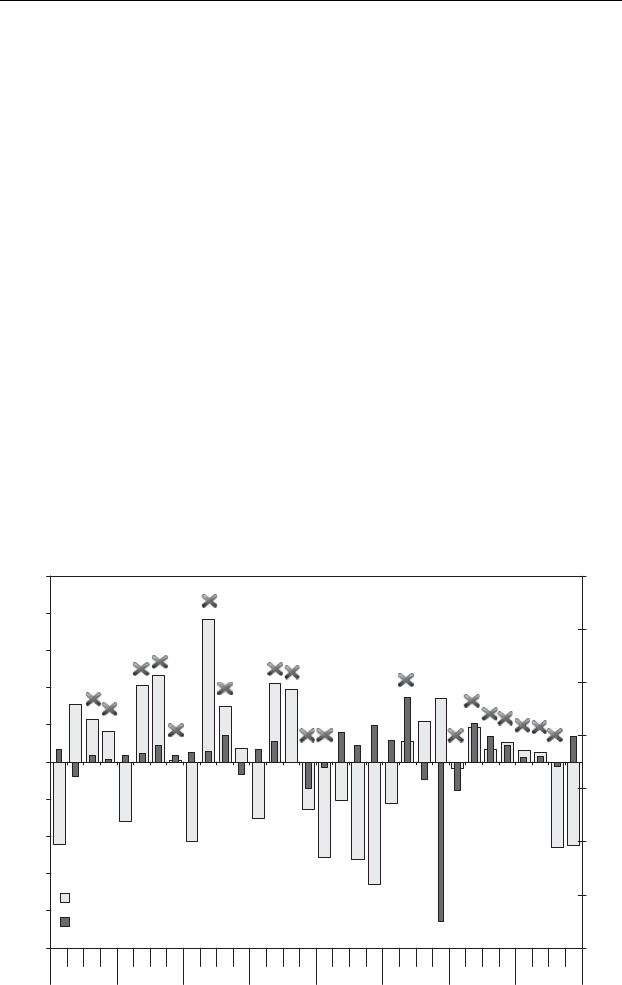
The Classical Model of the International Oil Market 75
From the figures we can deduce, at various times, the level of relative
imbalance, namely, the excess or deficit of supply vis-`
a-vis demand.
We are therefore able to estimate the effect on the available level of
stocks among the sectors’ market players (e.g. producers, refiners, dis-
tributors and transporters). Subsequently, an indication of the move-
ment of the price of oil can be derived from the fluctuation of stocks
levels. An increase of the stocks may project a fall in prices while a
fall in stocks may forecast a rise in prices. In practice, however, the
application of this model is of no help. The indications obtained are sys-
tematically contradicted by the market, which seems to obey other fac-
tors. The reason, apparently mysterious, does, on the contrary, follow a
rigorous logic.
In Figure 6.1, covering the same quarterly periods starting from 2003,
the variation in the level of stocks with the corresponding variation
in the price of Brent are depicted. It is clear that in about 50% of the
cases the formula
Price =f (supply −demand)
-2.5
-2.0
-1.5
-1.0
-0.5
0.0
0.5
1.0
1.5
2.0
2.5
1Q 2Q 3Q 4Q 1Q 2Q 3Q 4Q 1Q 2Q 3Q 4Q 1Q 2Q 3Q 4Q 1Q 2Q 3Q 4Q 1Q 2Q 3Q 4Q 1Q 2Q 3Q 4Q 1Q 2Q 3Q 4Q
2003 2004 2005 2006 2007 2008 2009 2010
million bbl/day
-70
-50
-30
-10
10
30
50
70
$/bbl
Supply/Demand (left axis)
Delta Brent Price (Quarter versus Quarter) (right axis)
Figure 6.1 Variation of stocks versus variation in the Brent price
Source: International Energy Agency

76 Understanding Oil Prices
SUPPLY
OF
CRUDES
(Sweet/Light
and
Heavy Sour)
OIL DEMAND
(FINISHED
PRODUCTS)
UNLIMITED
AND
FLEXIBLE
REFINERY
SYSTEM
Spare capacity of
Sweet/sour crudes Spare capacity
Figure 6.2 The classical model of demand/supply
does not provide any assistance. The crosses indicate each instance
where the classical model of demand/supply is unable to explain the
market rules. In fact, it is often that a rise in price corresponds erro-
neously to an increase in supply, when – on the contrary – economic
theory tells us that the exact opposite should take place. The data for
stocks are the final ones, published with around a year’s delay vis-`
a-vis
the market situation at the time. They are, thus, not influenced, as we
shall see later, by the margin of error that exists due to uncertainties in
the flow of data. Using the available data in each specific period, the
correlation would be still unreliable.
The apparently mysterious reason for these results follows a simple
and strict logic.
It has just been mentioned that the global model in practice compares
two dissimilar elements, the supply of crude, that is, the raw material,
with the demand for finished products (obtained by the refining process
of the raw material). This is assuming that the world refining system is,
on a daily basis, capable of transforming the raw material produced and
sold by producing countries, into the array of finished products required
by the market.
Figure 6.2 outlines the classical model for interpreting the encounter
between demand and supply.
The classical model was amply justified and gave reasonable expla-
nations for the movement of the market, as long as it was possible to
make the following assumptions:

The Classical Model of the International Oil Market 77
rThe potential availability of raw material is always greater than the
level of demand for finished products. In other words, there is always
spare capacity in the productive system for processing high-quality
light crudes as well as low-quality heavy crudes.
rThe world refining system is characterized by spare capacity for the
transforming units, whether they use simple or complex technology.
In actual fact, the structural changes in recent years have been such
that both these hypotheses are no longer valid. The model of the world
oil market has mutated into a new scheme (Figure 6.3) in which:
rthe unused availability of raw material is limited exclusively to the
availability of low-quality heavy crudes; and
rthe spare capacity in the refining system has fallen drastically and is
limited to a few plants of simple technology (where the possibility of
obtaining high-quality gasoline from heavy crudes is very slender).
The change in productive systems has made it necessary to modify
the interpretative models of the oil market. To continue to try to explain
the market scene through the old models is simply useless. Even more
is any attempt to make price forecasts using these models.
Yet, it is still the continuous and widespread practice of the major
international analysts in using this model that, in the end, they are
forced to deform the model’s input data in a totally irrational way. To
LIMITED
AND
Not FLEXIBLE
REFINERY
SYSTEM
Spare capacity
sour crudes
SUPPLY
OF
CRUDES
(Sweet/ Light
and
Heavy Sour)
OIL DEMAND
FINISHED
PRODUCTS
WITH NEW
SPECIFICATIONS
Shortage of
High-quality products
spare capacity
of sweet and
Figure 6.3 The modern supply/demand model

78 Understanding Oil Prices
obtain the evolution of prices, data considered definitive and not subject
to interpretation, as an output of the interpretative model, analysts are
obliged to work on the input data, that is, on the movements of demand
and supply. The unavailability of objective data in real time makes this
manipulation of subjective estimates by analysts possible and hard to
contest. It is, thus, possible to reconstruct the events of the recent past
and above all to describe the present in an arbitrary way, particularly in
such a way as to succeed in justifying, if used as an input of the model,
the movement of price levels. If, for example, the price of oil has risen,
on the basis of the model there can only have been a combination of a
reduction in supply or an increase in demand.
Analysts, in the absence of available information, are often forced
to derive their data through econometric models which allow them to
be inferred. These are models which often have as their fundamental
variable the sole irrefutable piece of data on the oil market, namely, the
price of crude oil itself. They are, therefore, models of the type:
Demand =f (P Brent)
Supply =f (P Brent)
It is not difficult to imagine that such models can create vicious
circles that often circulate in the market (see Figure 6.4). Rising prices
generate forecasts of increasing demand and falling supply, and hence
expectations of further rise in prices. These mechanisms thrive for what
may be long periods, with sudden and unjustified collapses. But, above
all, the tendency of analysts who make use of this model is to envisage
the future as an exact copy of the present, with some insignificant
cosmetic touches.
Brent
Price
Supply
Deman
d
Brent
Price
Supply
Deman
d
Stocks
Estimation
Figure 6.4 The vicious circle in the classical demand/supply model
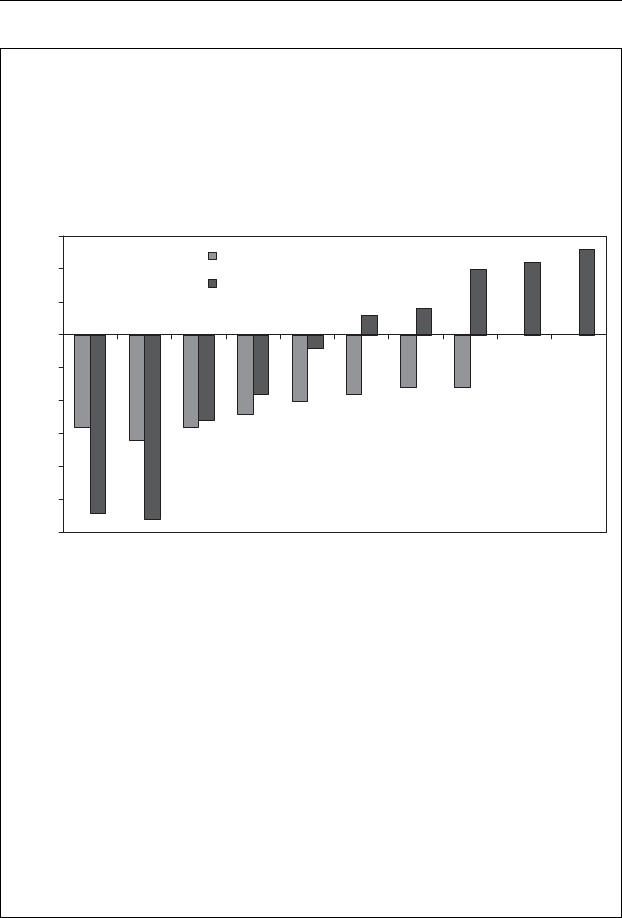
The Classical Model of the International Oil Market 79
Box 6.1 Variations in Estimated IEA Stocks
To illustrate this, Figure 6.5 shows an example of the adjustments
made to the estimate of the yearly imbalance between demand and
supply, concerning the same time period, in the course of the various
updates as the confirmed data become available from time to time.
-3.0
-2.5
-2.0
-1.5
-1.0
-0.5
0.0
0.5
1.0
1.5
Dec 99 Jan 00 Mar 00 Apr 00 May 00 Jun 00 Aug 00 Sep 00 Dec 00 Feb 01
million bbl/day
1999
2000
Figure 6.5 Adjustments to the estimate of the yearly imbalance between demand
and supply
Source: International Energy Agency
It is important to spotlight these structural data, which are un-
fortunately still considered an irrelevant point of detail. Generally
speaking, the classic market model derives its indications regarding
the crude oil price trend on the basis of imbalances between demand
and supply: under one million barrels per day. Such data are often the
grounds for a violent debate on expectations for future months. But
the error contained in the data under debate is far greater, 4/5 million
barrels per day, than the stock imbalance, at most 1 million barrels
per day. This analysis is what forecasts are based on.
We can certainly conclude that the global analysis and forecasts based
on the classic models of demand and supply are only expressions of
subjective opinions propped up by partial items of information lacking
in objectivity. The problem of information in the oil market is very

80 Understanding Oil Prices
critical and features levels of transparency and availability that are very
different, depending on the nature of the data in question:
rHigh level of transparency and availability in real time of prices and
futures in the markets. The data can be accessed on line, minute by
minute, from the various specialized sources.
rPartial level of transparency of the prices of physical transactions in
crude oil. Much of this information, of a confidential nature since
it concerns transactions between private parties, is estimated with
varying levels of reliability by the specialized sources using particular
criteria, accepted in oil industry practices.
rMedium level of reliability of the data concerning estimates of pro-
duction in the main producing countries. The trustworthiness of the
data is inversely proportional to the political control exercised over
the level of oil production.
rLow level of reliability of the data regarding demand, with particular
uncertainty between consumption and variation of the stocks of fin-
ished products in the various market areas. The only data available are
those published monthly by the IEA, which itself either gathers them
from the member countries (with average delays of 6–9 months), or
estimates them for the non-member countries.
In particular, the uncertainties in estimates of demand and supply
levels may arrive at quantities of 4 or 5 million barrels per day, as much
as 5–7% of the total. We can certainly conclude that the analysis and
forecasts based on the classical models of demand and supply at the
global level are only expressions of subjective opinions propped up by
partial items of information lacking in objectivity.

7
The Short-term Model of the
International Oil Market
It is not easy to describe in detail how the oil market’s model should be
structured in such a way that it faithfully reflects the price dynamics as
they relate to the fluctuations in the demand and supply balance. It is also
necessary to take into account some essential features of the technolog-
ical model of the oil industry together with the qualitative composition
of both demand and supply. A functional model for industrial use can
even contain over five thousand variables. In our case, we shall limit
ourselves to the bare essentials, always trying, however, to identify the
internal dynamics of the model and, thus, of the market itself.
For instructional purposes, we shall refer to the sketch of the model
shown in Figure 7.1.
The sketch revisits the themes examined in the previous chapters, but
describes in more detail – even if schematically – the segments of the
oil cycle. In particular, the following points are considered:
rThe supply of raw material, crude oil, is not just a homogeneous
quantity, which can fluctuate with changes in production as decided
by producing countries, but an aggregate of different qualities of crude
extracted and put on the market. At least four families of crudes are
on offer:
– light crudes without sulphur (sweet light) – much sought after and
specialized for production of high-quality products, both gasoline
and gasoil;
– light crudes with sulphur (sour light) – always sought after but
which require additional refining processes to eliminate the sulphur
(or other contaminating elements);
– heavy crudes without sulphur (sweet heavy) – very useful for cat-
alytic conversion processes (cracking plants); and
– heavy crudes with sulphur and metals (sour heavy) – namely, the
worst quality crudes that require vigorous refining and transforming
processes to obtain marketable products.
Understanding Oil Prices: A Guide to What Drives the
Price of Oil in Today’s Markets
by Salvatore Carollo
Copyright © 2012, Salvatore Carollo

82 Understanding Oil Prices
SWEET
Light
SOUR
Heavy
CONVERSION
HYDROSKIMMING
GASOLINE
GAS OIL
GASOLINE
FUEL OIL
GAS OIL
FUEL OIL
REFINERY
SYSTEM
CRUDE
SUPPLY
PRODUCTS
SUPPLY
PRODUCTS
DEMAND
STANDARD
FLOW
Hydroskimming
Market
Sweet
Light Conversion
UNLIMITED
SPARE
CAPACITY
Sour
heavy
Seasonal
product
Associated
Production Stocks
Figure 7.1 The classical industrial model
rThe world refining system can be split into at least two large cate-
gories:
– refineries with a high conversion level, where the hydrocarbon
molecules undergo profound transformations and light products
can be obtained even from the heavy fractions of the raw materials
available; and
– refineries with a simple cycle (hydroskimming), where the crude is
subjected only to a distillation process, with treatment of the virgin
naphtha at the reforming unit for production of a minimum amount
of gasoline.
rThe reference markets of the model are two in number:
– the crude oil market, where refiners purchase crude from the pro-
ducing countries and the oil companies; and
– the finished products market, where the consumers (primary and
secondary, namely simple citizens or industrial organizations) buy
products from the refiners.
rIn the crude oil market the price is the outcome of exchanges
between producers and refiners, in the products market the price
derives from the dynamics of the exchanges between consumers and
refiners.
rThe refiners represent the linkage between the two markets. Through
the refining system the alignment or divergence of the two markets
takes place. A model of the oil market which does not contain the
description of the dynamics of the refining system is absolutely

The Short-term Model of the International Oil Market 83
inadequate for any representation, even the simplest one, of these
markets.
rFor a simplified representation we have considered the possibility
of producing and marketing the three fundamental products in the
marketplace, namely gasoline, gasoil and fuel oil.
We shall now see how the use of a model, even an extremely simplified
one, but one which contains descriptions of the minimum variables,
enables us to describe some of the phenomena regarding the distortions
of the market. This has been witnessed in the last decade.
Let us give an example – theoretical for its level of simplification
but sufficiently close to the phenomenology of the market. Suppose we
are at the beginning of July, right in the middle of the gasoline season
(the so-called driving season). Referring to the model just described, we
have a situation in which:
rThe producers of light crudes will have already committed their pro-
ductive capacity and probably already sold their production of the
summer months (July and August). Thus, there is no longer any ad-
ditional availability of light crudes on the market.
rThe refiners, who have already bought the crudes most suitable for
gasoline production, have also programmed the maximum use of all
the conversion plants, to produce the greatest volume of gasoline ob-
tainable from those crudes in those plants. Thus, there is no additional
capacity available for sophisticated refining.
Let us suppose that in this situation there is additional demand for
gasoline and hence a substantial increase in its price. What can a refiner
do to meet market needs and exploit a possibility to earn more? Certainly
he will try to act with all the means he has at hand, namely:
rThe refiner will go to the crude market to buy marginal additional
quantities. But, seeing that there is no longer any availability of
light crudes, he will be forced to buy volumes of heavy crudes, the
only ones with some spare capacity, normally from producers in the
Persian Gulf.
rHe will have to process these crudes in the only plants that are not
completely utilized in his refinery (which is already working at 100%
with the most sophisticated plants to produce gasoline), namely the
technologically simple plants (hydroskimming).
rFrom processing the heavy crudes purchased in the simple refining
plants the refiner will get around 10% of gasoline and around 90%
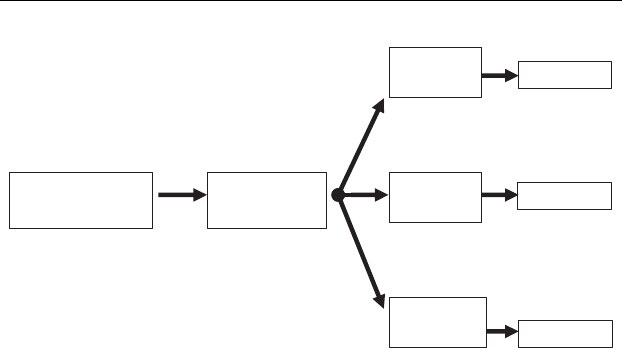
84 Understanding Oil Prices
10 TONNES
HEAVY CRUDE
SIMPLE
REFINERY
1 TONNE
GASOLINE
4 TONNES
GAS OIL
5 TONNES
FUEL OIL
MARKET
STOCK
STOCK
Figure 7.2 Refining cycle for a heavy crude to produce 1 tonne of gasoline
of other products (gasoil, fuel oil), which are high in sulphur content
and are of very poor quality.
This means that to obtain a tonne of gasoline with this marginal cycle,
our refiner has to buy and process about 10 tonnes of heavy crude, much
more than he really needs (see Figure 7.2).
What impact will this marginal activity have on the market? Let us
examine the main effects:
rThe market will notice an increase in the demand for crude oil (raw
material) nine times greater than the consumer market effectively
needs, concentrated in the heavy crudes segment, whose relative price
will rise in mid-summer (during the gasoline season), in total contra-
diction to the normal expectations of industry professionals. In this
season, one expects the light crudes to be the most expensive and
sought after.
rThe stocks of gas oil and fuel oil will increase (their production
is linked to the processing of heavy crudes for the additional pro-
duction of gasoline) and their price will fall. This will make the
increase in price of heavy crudes, rich in fuel oil and gas oil,
incomprehensible.
In conclusion, the market will have gasoline prices sky-high, gas oil
and fuel oil prices low, but the price of heavy crudes, the raw material for
production of fuel oil and gas oil, relatively higher. No classical model
can provide an explanation.
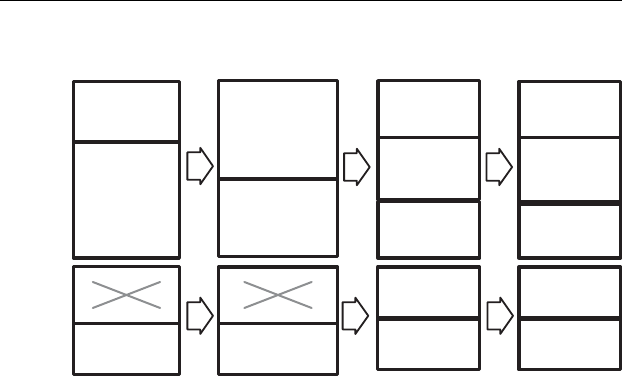
The Short-term Model of the International Oil Market 85
SWEET
Light
SOUR
Heavy
CONVERSION
HYDROSKIMMING
GASOLINE
GAS OIL
GASOLINE
FUEL OIL
GAS OIL
FUEL OIL
REFINERY
SYSTEM
CRUDE
SUPPLY
PRODUCTS
SUPPLY
PRODUCTS
DEMAND
STANDARD
FLOW
Hydroskimming
Market
Sweet
Light Conversion
UNLIMITED
SPARE
CAPACITY
Sour
Heavy
Seasonal
product
Associated
production Stocks
Figure 7.3 The modern oil industrial cycle
All this appears quite logical if we glance at the model illustrated
in Figure 7.2 adapting it to the system in question, that is, a market
without spare capacity for light crudes and without spare capacity for
high-conversion refining plants (see Figure 7.3).
This type of model enables us to understand why the concept of
seasonality has gone haywire as regards prices of petroleum products
and qualities of crude.
The price peaks of the various products and the more specialized
crudes for their production no longer take place regularly in the tra-
ditional season of maximum consumption, but in the phase when the
productive system has the greatest difficulty to produce, for whatever
reason (peak demand, plant production problem), the marginal quantity
of an individual product.
Historically, the relative prices for petroleum products (formulated
as indices vis-`
a-vis the unit value of the crude price) fluctuated in an
orderly way during the various seasons of the year (see Figure 7.4):
rGasoline started from winter levels of 1.2, to reach average levels of
1.4 in summer and fell to levels around 1.1 in late autumn.
rGas oil, starting from levels of 1.3 in winter (above those of gasoline),
could fall in late spring down to 1.0 (a level at which there was no
sense in producing it, the finished product price being equal to the
raw material price).
rSimilar progressions can be found for the other products.
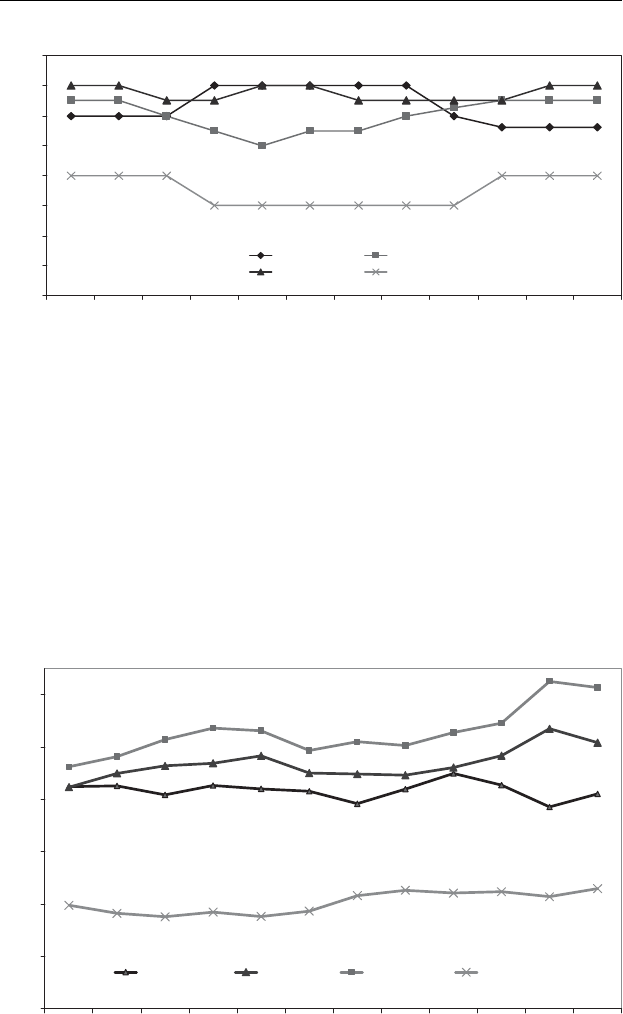
86 Understanding Oil Prices
0.0
0.2
0.4
0.6
0.8
1.0
1.2
1.4
1.6
Jan Feb Mar Apr May Jun Jul Aug Sep Oct Nov Dec
Ratio versus Brent
Gasoline Gas Oil
Jet Kero Fuel Oil
Figure 7.4 Relative prices of gasoline, gasoil, jet fuel and fuel oil
If we look at what happened, for example, during 2008 (see Fig-
ure 7.5), it is clear that:
rthe price of jet fuel was continually above that of all other products;
rthe price of gas oil was always above that of gasoline and had its
relative maximum in May (1.28), well above the historic level of 1.0;
and
rthe gasoline price fell to its minimum level (1.07) both in July and
November, without any apparent market logic.
0.3
0.5
0.7
0.9
1.1
1.3
1.5
Jan Feb Mar Apr May Jun Jul Aug Sep Oct Nov Dec
Ratio versus Brent
Gasoline Gasoil Jet Fuel Fuel Oil
Figure 7.5 Relative prices of products in 2008

The Short-term Model of the International Oil Market 87
All this analysis demonstrates that in a market system in which the
limits of the refining system create a decisive bottleneck, the price of
crude is linked to the ones of the products. This is just the opposite of
the assumption made in the classical model, where the fundamental role
is attributed to the entry of raw materials in the crude oil market.
The crisis in the technological refining system has brought a new key
factor in determining the level of petroleum prices: this is no longer
a relationship between supply and demand of the raw material, but
between high-quality finished products made available by the produc-
tive system and the level of demand for these same products in the
various markets. The principle that the demand and supply relationship
determines the price is, therefore, always valid, but it has to be applied
to the correct relationship, namely to that regarding finished products.
It is at this point that we see the narrowing between demand and supply,
not at the raw material level. It is this technological aspect that usually
escapes those analysts with a purely economic background. This is why,
in the real world of the marketplace, the critical factors that determine
prices are:
rthe lack of US gasolines from March to August; and
rthe lack of gasoil in Europe from October to February.
The balance within the international oil market at the various moments
of the year hinges on these two variables. All the other factors are only
a consequence, sometimes with an aesthetic effect, while at other times
exercising a magnifying influence.
The role of finance has infiltrated these mechanisms and manipulated
them in an exaggerated and speculative manner. Financial analysts, for
their activities on the stock exchange, use algorithms based on statistic
functions and they are, therefore, able to detect the repetition of cyclic
phenomena, which every year, spanning a decade by now, are seen on
the oil market. We are talking about a speculation that, in a free market
regime, can in no way be stopped, at least until the current structural
gap between productive systems and the level of demand for clean fuels
is modified. Unfortunately, not only is there no plan for a solution on
the horizon, but there is no sign yet of any awareness of the size of
the problem.
Before ending this discussion on the structure of the current oil market
model, we should clarify a fundamental concept. It’s normal to affirm
that speculative factors and unforeseen events in operational practice
may make the use of the classical model based on supply and demand

88 Understanding Oil Prices
difficult, but that in the long run the dynamics of the fundamentals will
prevail. This affirmation is certainly understandable making clear that
short term corresponds to a period of time in which the bottlenecks of
the industrial refining system will be overcome. In our case, we have
seen that for nearly ten years we are in a systematic short-term context
with the refining limits that we have already examined. Unfortunately,
it is unclear when they can be removed from the scenario.

8
The Brent Market
Brent and the market for Brent have been mentioned several times. The
features of this market will be outlined without going into technical
specifics which concern the professionals. It will be explained why the
adoption of Brent as a benchmark triggered a revolution that pushed
both the producing countries and the oil companies out of the game
regarding the control of the price of oil.
Brent is an offshore crude extracted off the Shetland Islands, part of
the UK. It was the centre of one of the first oil strikes in the North Sea and
certainly the most important, historically and politically. Shell UK, the
field operator together with Exxon, gave the crude the name of a typical
goose found in the region, namely the Brent goose. The discovery of
Brent dates back to July 1971 but it was only on 13 December 1976 that
the first oil tanker sailed from the loading terminal with a cargo of Brent
crude. Initially, the production was exported from the offshore terminal
of Spar, and subsequently, since November 1979, from the terminal of
Sullum Voe. This terminal also receives, apart from Brent, Ninian, a
crude discovered and extracted by the BP/Chevron consortium. In this
way the exported crude became the Brent blend, which collected the
production of around 15 fields in the North Sea operated by the two
consortia, Shell UK-Exxon and BP-Chevron.
The Sullom Voe terminal, with its four jetties for export, allowed the
simultaneous loading of four tankers of each type for whatever tonnage
and size. It was the biggest and more flexible oil terminal of the time. It
could handle whatever requirements of the customers, supplying wide
flexibilities in loading dates. North European refiners could consider it
almost an extension of their storage capacity and dispose of a cargo of
Brent blend in 2–3 days.
Brent is considered a light sweet crude with its features of API (38
degrees) and sulphur content of 0.45%. The Blend crude is typically
refined in North-West Europe and, by processing it, mainly gasoline
and medium distillates are obtained. It soon became clear that Brent had
no difficulties in competing with crudes of similar quality from OPEC
Understanding Oil Prices: A Guide to What Drives the
Price of Oil in Today’s Markets
by Salvatore Carollo
Copyright © 2012, Salvatore Carollo

90 Understanding Oil Prices
countries like Nigeria, where the services are certainly poorer – so, for
the same quality and price one would choose Brent.
The winning move, however, came in July 1986, when Shell UK, as
the operator of Brent, decided to publish the 15 days Brent Contract. To
understand what ‘to publish a contract’ means, and specifically for crude,
some background information necessary to understand the mechanism
involved will be provided.
THE SALE AND PURCHASE CONTRACT
We first have to explain what the structure of a purchase contract for a
cargo of crude is. From the technical, commercial, administrative and
legal standpoints, this is a very complicated document, and in order for it
to be finalized, it needs the work of qualified international professionals.
In fact, it is not enough to simply have financial resources and business
acumen to enter the world of crude trading. A very specific professional
competence is required. For the purpose of illustrating the complexity
of the issues and hence the effects of the notable changes caused by
Shell UK’s introduction of the standard for Brent (15 days), we have
briefly summarized the series of fundamental clauses that make up the
structure of a contract in Box 8.1.
Box 8.1 The Principal Clauses in a Sale and Purchase Contract
The main clauses of a purchase contract for a cargo of crude oil are
as follows:
1. Detail of the Parties: clear descriptions of the seller and the pur-
chaser (name, address, company details).
2. Grade: descriptions of the essential features of the crude oil/object
of the transaction, not to allow any ambiguity.
3. Quantity: the exact definition of the size of the cargo in terms of
barrels and indication of the flexibility guaranteed at the moment
of loading, namely the possibility that the ship is loaded with
more or fewer barrels than the quantity envisaged in the contract.
Normally, the purchaser may request a variation of +/−5%, but
he can obtain this only if the terminal operator agrees.
4. Delivery: defines the conditions and manner with which the seller
delivers the crude to the purchaser (Incoterms), such as:

The Brent Market 91
rFOB (FREE ON BOARD): the purchaser receives the crude at
the terminal where he must present himself with his ship on the
agreed day, and he becomes immediately its owner. This defines
the classic purchase model for goods, when the purchaser enters
the seller’s shop, buys, pays, becomes owner and takes away the
goods purchased;
rCFR (COST AND FREIGHT): the seller arranges on behalf of
the purchaser the transport of the crude from the loading terminal
until the point of delivery, obviously passing on the pertinent
costs. The title of the goods transported is of the buyer. Here
too we may refer to the model of a shop, where the purchaser
buys, pays, becomes owner (for example, of a movable object)
and requests the seller to arrange the transport (paid apart) to
his own residence;
rCIF (COST, INSURANCE AND FREIGHT): as in the previous
case, but with the addition of the insurance for the value of the
cargo transported. We may refer to the previous example, where
an insurance policy is requested against damage suffered during
transport;
rDES (DELIVERED EX SHIP): the seller, whether he has not
yet found a buyer or whether he wants to wait before selling,
loads the crude on a ship and tries to sell it during the voyage.
Obviously, delivery takes place at destination, likewise for the
transfer of ownership. An example from everyday life could be
that of the itinerant salesman who travels around with his goods
which he owns, and meets the purchaser on his front doorstep.
5. Price: the formula for calculating the price of the cargo must be
described unequivocally, indicating:
rthe reference benchmark (Arabian light, Brent)
rthe days considered for calculating the average value of the
benchmark (the pricing period, that is the average of the month
of loading, 5 days around the loading date), the price difference
to apply to the benchmark (premium or discount) for the specific
crude/object of the contract, automatic price adjustments in case
of variation in the quality of the crude delivered vis-`
a-vis the
contractual standard.
6. Invoicing Quantity: the seller’s invoice must show the quantity
that will be advised by the operator in the official document that
accompanies the cargo, the so-called Bill of Lading (B/L). The

92 Understanding Oil Prices
purchaser will be required to effect payment on the basis of this
quantity. In case of dispute, the purchaser may complain but cannot
reduce the amount of the payment.
7. Payment: in the oil industry, this clause is sufficiently standardized
and envisages that the payment:
rmust correspond exactly with the clauses of price and quantity,
without any discount, deduction or compensation for any reason
whatsoever;
rit’s normally effected in USD;
rmust take place by telegraphic transfer available to the seller on
the same day;
rmust be effected within 30 days, as of the date of issue of the
Bill of Lading;
rafter the buyer receives a commercial invoice and the original
copy of the B/L or an LOI (Letter of Indemnity).
The clause also defines other aspects, such as:
rthe opening of a letter of credit (or other documents of credit)
by the purchaser, before loading;
rwhat to do if the day of payment falls on a day when the banking
system is closed (payment due the day before or after such
closure);
rhow to compensate the seller in case of delayed payment: nor-
mally payment of interest (at 2% above LIBOR) is required.
8. Property and Risk: as defined in the delivery clause, the time and
place where the transfer of property takes place and consequently
every risk that is passed to the owner will be specified (loss of
cargo, pollution of the surrounding environment).
9. Independent Inspection: both contracting parties are entitled to
appoint an independent inspector who can superintend all the
loading operations and certify the quantity and quality of the
cargo. Normally the parties agree on the name of the inspector
and share the costs.
10. Tankship Nomination: the owner of the cargo (buyer or seller,
depending on the delivery conditions) must:
rarrange and ensure the arrival of a ship at the loading terminal at
the date envisaged for loading, advising in good time the name
of the ship;
radvise the terminal operator at least 72 hours before and sub-
sequently updating the estimate 48 hours and 24 hours before

The Brent Market 93
the date and hour of arrival of the ship at the terminal (ETA =
Expected Time of Arrival);
radvise the terminal operator who to contact regarding any
operational action to be taken;
rbe certain that the owner of the chartered ship is a member of the
ITOPF (International Tanker Owners Pollution Federation Ltd),
so as to give the terminal every guarantee in case of accident
and pollution, and ensure respect of all the international norms
regarding insurance, transport of alcohol and drugs, as well as
safety and maintenance.
In the absence of these requisites the access of the ship to the
terminal may be refused.
11. Confidentiality: all the information contained in a commercial oil
contract is strictly confidential between the parties and cannot be
divulged to anyone without the prior approval of the other party.
The only exceptions envisaged are:
rin cases of legal disputes and limited to that specific use;
rin cases of specific request by the tax authorities of the country
of the seller/producer of the crude.
12. Measurement and Claims: this clause sets out the rules in force at
the terminal, the measuring systems to be used and the procedures
to adopt in case of claims made by the purchaser in instances
of non-conformity with the standards prescribed by the contract,
including appeal to an independent inspector.
13. Laytime: this defines the number of hours available to the terminal
to load a ship of given size.
14. Demurrage: for any time exceeding that allowed for loading, the
compensation for the purchaser (who has to await the ship for
longer than planned) is established.
15. Governing Law and Jurisdiction: one of the key clauses in an
international contract is the definition of the jurisdiction to refer
to and the law to be applied. Normally in oil contracts reference
is made to English law.
It is also necessary to state whether, in case of dispute, arbi-
tration or the High Court will be submitted to, and to agree on
which one.
16. Force Majeure: this clause defines the list of all the exceptional
events deemed sufficient to suspend the obligations of the con-
tracting parties (for example, interruption of production in the

94 Understanding Oil Prices
oilfield and therefore the impossibility for the seller to deliver the
cargo, documented breakdown of the ship and impossibility to
reach the terminal in good time).
17. Letter of Indemnity: this states that in case of loss or delay of the
Bill of Lading, before payment, the buyer must receive the letter
of indemnity which can replace the original documents while they
are being searched for or re-issued.
18. Assignment: the parties can assign the ongoing contract to another
subject (affiliated or otherwise) who will assume all the obligations
and rights deriving from the contract itself.
19. Liability: this defines the terms and limits of criminal and civil
responsibility of the parties.
20. Other clauses.
21. Contact addresses of seller and buyer.
As can be clearly seen, to finalize a purchase contract for a cargo of
crude oil is a very delicate and complex matter requiring very specific
professional competences.
THE FORWARD MARKET FOR BRENT
(15 DAY BRENT CONTRACT)
The revolution introduced by Shell UK consisted of the total standard-
ization of the purchase and sale contract for a cargo of Brent crude. All
the clauses had already been defined in detail and could not be either
re-negotiated or modified. Anyone who wanted to buy or sell a cargo
of Brent blend only had to use the standard contract, without getting
involved in any of the complicated legal and administrative aspects of
the commercial negotiation.
The only items to state in the contractual document were:
rnames of the contracting parties, seller and buyer; and
rpurchase price per barrel.
As already mentioned, for all the other clauses, reference was made
to the standard contract published by Shell UK. In particular, the stan-
dardizations concerned:
rthe quantity, fixed at 500,000 barrels for each cargo; and
rthe acceptance date of the cargo by the buyer, namely 15 days before
the loading date, hence the name given to the contract: 15 days Brent.

The Brent Market 95
It was moreover to buy and sell cargoes of Brent which were to be
produced and delivered in the following six months. This simplification
of the negotiating process immediately amplified the possibilities of
taking part in the business, even for those not strictly linked to the oil
and related markets. Anyone with financial resources and a certain feel
for the oil market (perhaps with the help of a qualified consultant) could
enter the Brent market game. It was not yet the petroleum exchange and
the pure financial market, but this was the first splinter from the historic
confines of the petroleum elite.
Box 8.2 The Daisy Chain
Let us try to explain the mechanism of the 15 day Brent market with
an example.
Suppose we are in January with the Brent market rather weak (as
happened in 2009) and above all with prospects that are even more
negative. A trader (B) decides to bet on a market recovery in April.
He tries then, in January, to buy a cargo of Brent for the month of
April. He believes that, amid the general pessimism, he will be able
to buy in January the April cargo at a lower price than he would be
able to buy in the future. He goes into the marketplace and tries to
find someone who will sell him an April cargo. Suppose the going
price for Brent on 18 January (the day when he entered the market)
was $45 per barrel and for an April cargo his seller (A) asks for a
price of $43 per barrel.
Suppose now that (A) and (B) close the deal in the morning of
18 January and that, later the same day, something happens (such as
a burst pipeline in the Middle East, new maintenance programmes
in the North Sea production fields) which causes an immediate rise
in prices. Trader (B) sees that the April cargo, which he had bought
at 10:00 a.m. for $43 per barrel, by mid-day, only two hours later,
is worth $47 per barrel and he thus decides to sell it to (C) who in
competition with others has already offered him as much as $47.50
per barrel. He has registered a profit of $4.50 per barrel, just with two
phone calls (and a good understanding of the market).
These deals, which began on 18 January for a specific April cargo,
can continue almost to the infinite, up to a certain date in March. We
are describing the creation of a chain of transactions inside which
hundreds of different subjects can participate. It may even happen
that the same cargo passes through the hands of the same subject
several times. If we try to draw on a sheet of paper the succession

96 Understanding Oil Prices
of transactions inside the same chain, with the passage of the cargo
into the hands of the same subject, then we shall see that the sketch
recalls the petals of a daisy. It is for this reason that the chains are
known as daisy chains in petroleum slang. Naturally we are referring
to what happens for one cargo, but every day the chains behind
these transactions are dozens and dozens for each of the six months
following the current one (in our example of January, all the cargoes
up to the month of July in the same year can be negotiated). It is clear
that every day, starting from a single physical cargo of Brent that will
be available on a certain date as yet unknown, a number of cargoes of
Brent will be bought and sold, simply on paper, with contracts that
will not give rise, almost certainly, to the physical delivery of all the
barrels effectively exchanged.
In our example, (B) has on the same day bought from (A) and
sold to (C), earning $4.50 per barrel, without receiving or delivering
any cargo of crude. The aggregate of the transactions can reach an
enormous amount. For this specific market of 15 days Brent, peaks of
dealings have reached around 50 million barrels per day, in contrast
with a physical production of Brent blend of 700,000 barrels per day
in the good times. Today the field produces only 200,000 barrels
per day – 15 days Brent contract has a volume of business 70 times
greater than its physical production.
Now the strategic objectives of the creation of the 15 days Brent
contract become clearer:
rCreation of a benchmark whose apparent production, in terms of daily
trading volume, was by far greater than any other benchmark proposed
and applied by OPEC.
rMake available a benchmark beyond OPEC’s control, supervised and
regulated to a large extent by the oil companies that produced Brent.
Box 8.3 15 day Brent Contract
Let us return again to the previous example. The chain was formed
on 18 January and up to March had involved thousands of subjects
within itself.
It is clear that at a certain point, the April cargo, the subject of the
deals between all these traders, will materialize and someone will
have to take his ship to the terminal at Sullom Voe and collect the

The Brent Market 97
cargo. If the person who has to collect the cargo is a refiner, there
will be no problem. If, however, the cargo finishes up in the hands of
someone who entered the chain just to speculate, then there will be
a problem to resolve. This person will have to handle the placing of
the cargo in the market and find a refiner who needs it (obviously at
a suitable price).
Let us see how the process of assigning a specific physical cargo
to a person in the chain operates. We refer to the historic procedure,
the one that gave origin to the name 15 days Brent. Recently some
changes have been introduced and we shall examine them later.
For clarity we refer to the April cargo. On 13 March, BP, the
terminal operator at Sullom Voe, will publish the programme of all
the cargoes to be lifted during the month of April. This means that
for each separate cargo (in all about 25 cargoes) the following are
made known:
rthe loading date; and
rthe name of the producer (BP, Shell UK, Exxon, Chevron), owner
of the cargo as a mineral right. Obviously each of these cargoes
has been sold to other purchasers through the 15 days contracts.
Once the lifting programme has been published, the owner of each
separate cargo must, 15 days before the estimated loading date, advise
the terminal operator that he accepts the obligations (nomination of
the cargo) and guarantees the dispatch of a ship in good time to collect
the cargo. As previously explained, the obligation to nominate the
cargo 15 days before the loading date has given this contract the
name of 15 days Brent. But who is the owner of the cargo of Brent
that will load, for example, on 5 April? Pinpointing the owner takes
place with a particular mechanism. The mineral partner, the first
owner of the cargo (as published by the operator) will telephone the
person to whom the cargo was sold, passing on to him the obligation
to nominate the cargo to the operator. The telephone used must be
totally and exclusively dedicated to this service. It must never happen
that a participant in the chain does not answer a call. Moreover,
this telephone is connected to the services of British Telecom, who
records and informs the exact time of the calls.
Every person who receives a call must decide whether to accept
the nomination or pass it on to the next person in the chain. Clearly

98 Understanding Oil Prices
all those who entered the chain for speculative purposes will try to
exit quickly, passing the nomination along to their purchaser.
If we consider the number of those in the chain, the number of tele-
phone calls could go ahead ad infinitum. But there is a limit set by the
conditions of the contract. The person who receives the nomination
by 17:00 hours London time and does not succeed in passing it on to
the successive trader or purchaser always before 17:00 hours London
time, is obliged to nominate the cargo. If this person has suffered
the nomination, in slang he is said to have been ‘five o’clocked’.
Once the physical cargo is assigned to a person in the chain, all the
other participants must, in any case, settle their commitments. This
means that the person who takes the physical cargo must, however,
purchase a paper cargo (of the same month) to deliver to the person
after him in the chain. The natural solution of the mechanism would
be for the physical cargo to go to the last person in the chain. But this
rarely happens.
The market in which the physical cargoes of Brent are traded, whose
loading date is already known, is called the Brent Dated Market. This
price, published by specialized sources, establishes on a daily basis, the
market reference since the time when Brent became used as benchmark.
Participation in the 15 day Brent therefore offers the risk that, statisti-
cally, one may become the owner of a physical cargo of crude that must
be handled, something that is certainly not easy for anyone who is not
a producing company or a consumer of crude.
Box 8.4 The Price Risk in the 15 day Brent Contract
The example we have seen, an April cargo bought in January, is useful
to comprehend the size of the potential risk for one who speculates
with this contract.
We supposed that (B) bought the April cargo at $43 per barrel
from (A) and sold it to (C) at $47.50 per barrel. Suppose now that
(B) is the ‘five o’clocked’ trader, obliged to nominate the cargo and
market it on the physical crude market. If for some reason the April
market has crashed to $20 per barrel, our trader (B) will be forced
to sell at $20 per barrel what he bought at $43 per barrel, risking an
enormous loss. Furthermore, he will be obliged to buy a paper cargo
for his purchaser (C).

The Brent Market 99
This is exactly what happened on the London market in 1987, with the
famous ‘blood bath’. Many traders, facing certain bankruptcy, preferred
to refuse the nominations and abandon the activity.
In these cases, the Brent producers (BP, Shell UK, Exxon and
Chevron) had to take the place of the traders who were missing in
the chain and take responsibility for the collection of the so-called dis-
tressed cargoes. These occurrences showed that Brent forward, another
name for 15 days Brent, was not a perfect financial instrument, both
because it showed it was not able to censure the functioning of the
mechanism in cases of crisis with big falls in price levels, and because
it limited the number of participants to those who could:
rshoulder financial commitments at least equal to the value of a cargo
of 500,000 barrels;
rguarantee the handling of a physical cargo should the need arise; and
rhonour their commitments in every market situation.
For these reasons, those participating in the Brent game, although
numerous, could be considered as qualified members of an exclusive
club. Structurally, however, it was regarded that the system’s fragility
was elevated at the moment when a forward contract for paper crude
became a physical contract for Brent crude. This step in the chain’s
mechanism could become ‘traumatic’ creating anomalies in the system
and substantially modifying price levels.
With some similarities to other markets, which we hope will not take
offence, one could assert that the 15 days Brent constituted a market
d’elite, a sort of high fashion atelier of the oil market, where:
revery contract was between two parties identified with names and
surnames;
rthe price was the outcome of free negotiations between these two
parties; and
ra high-level professional and financial profile was required of the
participants.
It became clear that the objective of a totally liquid and transparent
market, with a daily trading volume equal to at least the oil production
of the globe, had not been achieved. Yet, the creation of this benchmark
has, in terms of dimensions and flexibility, outclassed the old Arabian
Light crude.

100 Understanding Oil Prices
THE IPE BRENT MARKET
What was needed was a mass-market Brent, a supermarket type Brent,
an off-the-peg for the oil market. With this intent, in 1988 a new Brent
market, purely financial, of a stock exchange type was created – the
International Petroleum Exchange, IPE.
The features of this market were and continue to be:
rNominal cargo (lot) reduced to 1000 barrels (no longer 500,000 bar-
rels), a size which, at the prevailing prices, made it comparable to the
value of similar financial operations on the stock exchange, such as
the purchase or sale of company shares. It is a much more popular
size, one that allowed the grocer or the barber (as one used to say)
to get involved in the dynamics of the oil market, to have an opinion
about OPEC and to feel him or herself adequately informed after
reading the news.
rNo delivery of physical oil was possible or envisaged (except for one
precise case, more theoretical than practical). In this way, the critical
and fragile passage, inherent in the 15 days Brent, was eliminated from
the paper contract at the nomination of the physical cargo. Anyone
could play around in this market without running the risk, one fine
day at 5:00 p.m., of hearing that they had become the owner of a
physical cargo of crude which had to be handled.
rThe transactions no longer took place between single parties, a buyer
and a seller, but between any party whatsoever and a clearing house
(the Exchange). It was like going to the supermarket, a particular
supermarket where one could buy and sell products, but where the
price was not negotiated, but only read, made known on an electronic
screen second by second with the fluctuation of purchases and sales.
rEvery trader could sell or buy short what he or she did not yet possess.
Every operation conducted on this market had to be closed within a
certain time, as with the stock market. One could buy a lot of crude on
day five, when the price was, for example, $50 per barrel, and resell
it on day seven, when the price had become $52 per barrel. Or vice
versa one could sell a cargo at $52 per barrel and re-buy it when the
price was lower.
It was precisely here that the revolution in the international oil market
took place. This market had no longer any connection with the phys-
ical crude oil market opening it up to the participation of any person

The Brent Market 101
capable of investing through normal banking channels, just as one does
in the stock market. It was initially the oil markets’ institutional bod-
ies, companies, trading houses and banks acting on their clients’ behalf
that turned their attention to this new financial product. At a certain
point, particularly after the start of the 21st century, when the market’s
volatility reached very high levels, thus, allowing those who traded
in the market to make enormous profits, the main protagonists then
became the banks and financial institutions who together with various
US and international funds, started to operate the market as a pure
financial venture, totally independent of the dynamics of the oil market.
Enormous movements of capital were seen, thousands of billions of
dollars were rapidly shifted from various commodities and from the
stock market towards the financial market of Brent, causing the price
to rise, or fall, in the case of operations in the other direction. Price
variations of $2–5 per barrel in one day became normal. This in itself
became a big incentive for other parties to enter the business. So, at one
point, a kind of fever enveloped the banks to hire experts in oil trading
(poaching them from oil companies) to start and develop this business.
Quite clearly, we are talking about Brent, but we could extend all the
concepts discussed to the analogous NYMEX market, the petroleum
exchange of New York, where the WTI (West Texas Intermediate), the
other crude comparable to Brent, is traded.
OPEC’s decision to use Brent as a benchmark came soon after the
birth of this market, effectively handing over total control of the oil
price to international finance. Not everyone understood immediately
the extent and consequences of what happened in 1988. There were
many misunderstandings and perhaps the lack of a full perception of
the mechanics of the commodity and stock exchanges in the decision
adopted by OPEC. From the documents of the time and the declara-
tions of the main players, it stands out clearly that the wish of OPEC
was to link its crude prices to that of physical Brent crude in offshore
UK, thus, pressuring that government to force it to negotiate its level
of production.
One presumed a new edition of the price war that was declared two
years earlier by Sheikh Yamani. No-one understood that a financial
indicator was being adopted as a benchmark, outside the control of the
UK government and the companies producing Brent. It was an easy
mistake to make as the chosen benchmark was the value of Brent Dated,
which officially represented the price of physical cargoes of Brent whose
loading date was already known.

102 Understanding Oil Prices
The price of a physical cargo sold by one party in the chain (perhaps
forced by circumstances to nominate the cargo) to a refiner is normally
not known. Neither of the two parties that sign a contract for Brent wishes
to inform the market of the damage suffered or the advantage obtained
and, thus, the value published by the sources is simply estimated on the
basis of the indications coming from the parallel financial market of that
day. Likewise, once the Brent IPE market was developed, it became a
fact that dealings on the 15 days Brent market were influenced by what
was read on the electronic screen of the Brent exchange. It therefore
came about that the value of the financial Brent IPE generated all the
other intermediate values that lead to the price of all the physical cargoes
of crude sold in the world. Brent IPE generates the Brent 15 days, from
which Brent Dated is derived, which in its turn is the basis for setting
the price for all the crudes of the world.
THE DIVORCE BETWEEN OIL PRICE AND OIL
This bond was made official and duly sanctified by the decisions taken
in 2002 by Saudi Arabia and Iran not to refer to the value of Brent Dated
to set the price for their crudes, but rather to directly use the Brent IPE.
They wanted to eliminate the intermediate step in the assessment of the
value of Brent Dated by the specialized sources, whom they accused of
being insufficiently neutral. It was in this new context that the divorce
between the oil price and oil itself came about.
Let us suppose that on one fine day, because of financial operations
by hedge funds, there was a massive purchase in the exchange of Brent
contracts and that its price went up several dollars per barrel. That same
day, the price variation would be reflected along the entire chain of
the various types of Brent; the Brent 15 days and the Brent Dated.
Consequently, this would have an impact on all crudes sold which
use it as benchmark. If an analyst tried to relate the variation in the
Brent price on that particular day to changes in the dynamics of offer
and supply of crude, he would need a flight of fantasy to imagine
events and their impossible and illusory correlations. The only link
remaining between the financial markets of Brent and the physical one
for crude is that of a certain sharing between financial professionals and
oil traders of the market analyses as published by specialized firms. It
should be noted that the studies and analyses published by the research
departments of various international banks involved in this business
have become predominant in recent times. The remarkable rise in the

The Brent Market 103
price of Brent to $147 per barrel in July 2008 was preceded by a series of
analyses published by Merrill Lynch and other banks, which predicted
(influencing the market?) an escalation of the price up to $250 per barrel.
As from May 2000, the ICE platform (Intercontinental Exchange) was
created, and this subsequently assimilated the IPE and other institutions
present in the sector. The scope was to create a sole platform that would
allow professionals all over the world the opportunity to operate online
in the oil futures markets, 24 hours a day.

9
Principal Uses of the Forward
and Futures Markets
The two markets, 15 days Brent and the financial ICE, have continued
to co-exist, simultaneously working in the price setting process, whilst
still responding to the different needs of traders.
TAX SPINNING
The first activity of the crude oil producers of the United Kingdom was
to optimize the taxation burden (tax spinning). The taxes due to the
department of Inland Revenue were set as a fixed percentage (40–50%)
of the value of each single cargo. The lower the price, the lower the
taxes to be paid. The price had to be advised by each producer within
48 hours from completion of loading. This allowed the producing com-
panies, in the two days following the loading, to intensify their trad-
ing operations on physical cargoes, and to attribute the lowest of the
prices obtained to the cargo just taken and to declare it to the Inland
Revenue with evident and sizeable tax advantages. This practice was
tolerated by the British authorities, as a form of incentive to invest in
offshore activities. Recent years have, however, seen limitations and
restrictions being gradually imposed on this tax flexibility, forcing com-
panies operating in the UK to pay taxes corresponding to the prices
actually obtained.
BENCHMARKING
Brent Dated has been and continues to be used as the benchmark for
more than 60% of the crudes sold worldwide (look back to Figure 3.2
which shows the price of crude with reference to the benchmark). All the
crudes linked directly to Brent were valued by establishing a differential
vis-`
a-vis the assessment as published in Platts on a given day.
For example, on 20 July a cargo of Bonny Light (a Nigerian crude) is
valued on the market as Dated Brent +$1.50 per barrel. The valuation
Understanding Oil Prices: A Guide to What Drives the
Price of Oil in Today’s Markets
by Salvatore Carollo
Copyright © 2012, Salvatore Carollo

106 Understanding Oil Prices
Table 9.1 Correlation index between Brent and other
international crudes
Crude Origin Correlation
Es Sider Libya 1.000
Suez Egypt 0.995
Escravos Nigeria 0.998
Ekofisk North Sea 0.995
Ural Khazakstan 0.997
Kirkuk Iraq 0.995
Cabinda Angola 0.996
Iranian Light SK Iran 0.986
Source: eprm
of the crude for that day, 20 July, will reflect the value of Brent of that
day plus $1.50 per barrel. That is, if Brent stands at $75.00, the value of
the cargo of Bonny Light will be $76.50 per barrel.
Table 9.1 shows the index of correlation between Brent and crudes
from around the world since 1990.
One can understand how the assessment process affected by the spe-
cialized sources may represent a critical element in defining the value
of a crude and, thus, the oil revenues of each single producing country.
The main sources of information, Platts, Argus, LOR and Reuters, are
continuously criticized by the producing countries for their activities
being slanted towards protecting the interests of the oil companies. To
avoid repeated discussions on the matter, in defining the value of Brent
it is often preferred to cite the average of the values published by the
various sources, so as to depend less on the personal views of the analyst
who made that assessment.
HEDGING THE PRICE RISKS
A separate chapter is dedicated to describing the main activity that was
made possible by the introduction of the Brent market, and which turned
out to be the Trojan horse of the financial world to take, by storm, the
oil market and break the power of the historical leaders, the producing
countries and oil companies. This is the so-called hedging, in other
words coverage of price risks.
After the international events that took place towards the end of the
1970s, we have seen how price volatility created conditions of total
uncertainty for oil company operations, both in the short (procurement
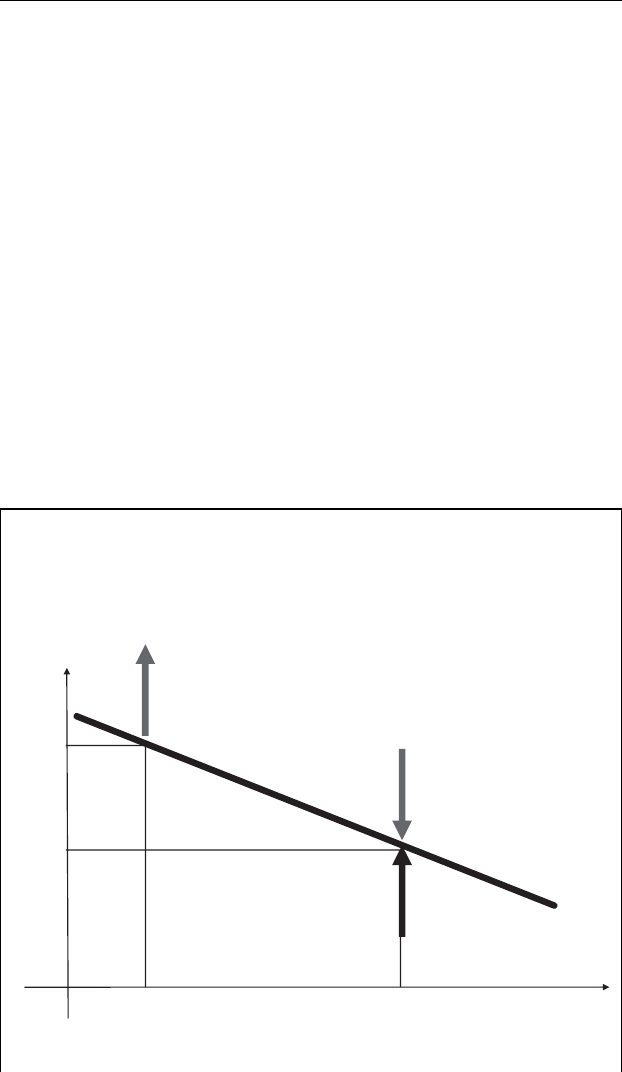
Principal Uses of the Forward and Futures Markets 107
for the refining system, level of stocks) and long term (investments
in the borderline areas whose production costs are higher). The Brent
market, already in its first form, the 15 days Brent, but certainly much
more so with its purely financial form as in Brent ICE, offered and
continues to offer a way to eliminate or significantly limit the risks of
oil professionals. The financial managers of these activities presented
themselves, at quite acceptable costs, to their oil company contacts as
insurers against the risk of price fluctuations. They were very successful
in this role, building up a colossal business, which in the long run has
completely inverted the roles played by everyone. Finance has become
the fundamental business, the core business, with oil becoming a non-
essential marginal incident.
A few examples will be given, quite simple and straightforward, to
allow the reader who is not familiar with these operations to dip his or
her toes into the world of financial hedging and the speculative activities
linked to this sector.
Box 9.1 First Example of Hedging
As a first example let us take the case illustrated in Figure 9.1 below:
20.00
16.00
5 Feb 15 Mar
Brent
($/bbl)
Brent Sale
(Hedging)
Brent Purchase
(Hedging)
Lock of the
Differential
Physical
Sale
Figure 9.1 Example of price-lock hedging

108 Understanding Oil Prices
Let us suppose that on 5 February an oil company, producer of
a certain quality of Nigerian crude (e.g. Nigerian Brass River), is
informed by the export terminal operator, that it must lift a cargo of
1 million barrels of Brass River on the coming 15 March. Obviously,
since the company in question is a partner in the joint venture that
produces the Brass River crude, the delivery of this cargo corresponds
to its production quota, so that it can recover its investments in that
month. The company must therefore lift the crude at the terminal
and try to sell it in the market at the highest possible price so as
to maximize its profit. As soon as he is contacted by the terminal
operator, the commercial manager of the oil company puts his sales
strategy into effect. Referring to our example, in order to make his
decisions, he will make two assumptions:
rThe crude price on 5 February is $20 per barrel.
rMarket sentiment for the following weeks is very negative and
there may be a significant fall in prices. Therefore, there is a real
risk that the price on 15 March (estimated loading date) will be
lower than that of 5 February.
The commercial manager will, therefore, try to sell his cargo of
crude as soon as possible, perhaps trying to freeze today’s price.
Obviously the potential buyer has the same information and will
hence try to do the exact opposite. Moreover, it is common prac-
tice in the oil industry that the price of a cargo is established on
the basis of the market values on the day of loading, therefore, in
our example, on the basis of the value ruling on 15 March. In the
end, the cargo will be sold at the standard market conditions and
accepted by the purchaser, namely at the price of Brent Dated ruling
on 15 March, which no one knows. The negotiation is concluded
(deal done).
But our commercial manager does not resign himself to suffering
the uncertainties of the market for the more than 30 days wait until
the loading date. He decides to enter the paper Brent market.
The same day, 5 February, in which he has sold his cargo of
1 million barrels of Brass River, he also sells 1 million barrels of
Brent futures (short, he does not have them yet). Please note that
in order to simplify the example, we assumed the hedging costs to
be nil.

Principal Uses of the Forward and Futures Markets 109
In practice, in the same day he has effected two commercial
operations:
1. He has taken a contractual commitment to sell one cargo of Brass
River which will load on 15 March, at the price of Brent ruling in
the market on 15 March.
2. He has effectively sold (on the petroleum exchange) 1 million
barrels equivalent of Brent at the price ruling on 5 February.
At this point he can only await the market outcome.
Let us suppose that, for once, the market forecasts are correct and,
therefore, the crude price falls in the following weeks to reach $16
per barrel on 15 March. That same day the purchaser’s ship presents
itself at the terminal and loads 1 million barrels of Brass River.
Obviously, the purchaser has paid the agreed price, that is, that of
Brent at 15 March, namely $16 per barrel, with an overall outlay of
$16 million. At the same time, our man decides to close his position
with the petroleum exchange, buying exactly 1 million barrels of
Brent today (the same quantity as that sold short on 5 February), at
today’s price of $16 per barrel. Having completed all his commercial
transactions built around this cargo of Brass River, the commercial
manager summarizes the situation:
million dollars
1. Sale of 1 million barrels of Brent ($20/b) +20
Hedging costs
2. Purchase of 1 million barrels of Brent ($16/b) −16
3. Sale of 1 million barrels of Brent ($16/b) +16
Overall result obtained +20
Our man, through the integrated deals done in the petroleum
exchange in the Brent market, has cashed in 20 million dollars from
the sale of 1 million barrels of Brass. He has succeeded in block-
ing the price of his cargo of Brass at the level of $20 per barrel
of 15 February. It is important to note that to obtain the result he
had to make two opposing deals on the same financial market of
Brent. That is, he has doubled the volume of paper business vis-`
a-vis
the physical.

110 Understanding Oil Prices
In our absolutely straightforward and simplified example, we have
supposed that our man did nothing between 5 February and 15 March.
In practice, however, he will have followed the fluctuations of the
market day by day, entering it with purchase and sale deals of
paper barrels, to take advantage of every opportunity to maximize
the profits and reduce the losses.
For each physical transaction thousands of paper operations in the
Brent market may be associated, to the point that this market becomes
the most relevant and decisive to determine the mood of the market
and set the price of crude. It must be said here that to cover the price
risk, the strategy adopted by the various oil professionals is incredibly
diversified and has changed over the years. Some companies, right from
the start, have found in the risk hedging operations a fundamental way
to maximize profits, to the point of making it an independent business
with the creation of organizational structures detached from the physical
trading of crude and petroleum products. They have, thus, created within
their organizations a sort of financial group in competition with external
financial institutions. Other companies have on the contrary tried to
reduce the hedging activities to the bare vital ones, introducing very
strict internal criteria for control and corporate governance.
Some companies that started out with the philosophy of the first
group subsequently turned towards the second way of operating, often
after suffering significant losses due to loss of control over the system
and the excessive enthusiasm of certain traders (no-one can forget the
historic banking houses that disappeared after the intemperance of some
over-creative rogue trader).
Box 9.2 Second Example of Hedging
Now we will look at a second example, of how a company can
implement strategies for hedging of its cargoes, cutting possible
recourse to the Brent market down to the minimum. For simplic-
ity, let us go back again to the example just elaborated and refer to
the same characters.
We turn back to 15 March, when our commercial manager has
concluded the operations regarding the cargo of Brass. Just at that
moment he receives fresh advice from the terminal operator that on

Principal Uses of the Forward and Futures Markets 111
29 March he must lift another cargo of 1 million barrels of Brass
River. Since the market scenario is still the same, namely depressed
and negative, he finds himself handling this second cargo, repeating
exactly the process just concluded. So on the same day 15 March:
rHe accepts the contractual commitment to sell a cargo of Brass
River that he will lift on 29 March, at the price of Brent ruling on
29 March.
rHe effectively sells (on the petroleum exchange) 1 million barrels
equivalent of Brent at the price of $16 per barrel on the day of
15 March.
On 29 March the price of Brent will turn out to be $14 per barrel
and he will complete, as in the previous case, the whole process by
effectively selling and cashing in the proceeds from his purchaser
of Brass (at $14 per barrel) and buying on the exchange (at $14 per
barrel) the million barrels to close the new operation opened on
15 March with the purchase of Brent. Overall, this time too the
balance of the situation is as follows:
million dollars
1. Sale of 1 million barrels of Brent ($16/b) +16
Hedging costs
2. Purchase of 1 million barrels of Brent ($14/b) −14
3. Sale of 1 million barrels of Brass River ($14/b) +14
Overall result obtained +16
This time too, the commercial manager has succeeded in blocking
the selling price at the level of the day when he concluded the deal
with the buyer, namely 15 March ($16 per barrel), thus avoiding
the lower price on 29 March ($14 per barrel). In the context of the
two physical sales, the paper market was used four times to carry
out the hedging operations. We said earlier that depending on the
commercial strategy of each company, these paper operations could
multiply ad infinitum with daily actions on the oil exchange, such that
the hedging operations for the two physical cargoes become almost
a pretext.
In the case of a company that steers clear of financial speculation,
is it possible to use the same technique of hedging of the two physical
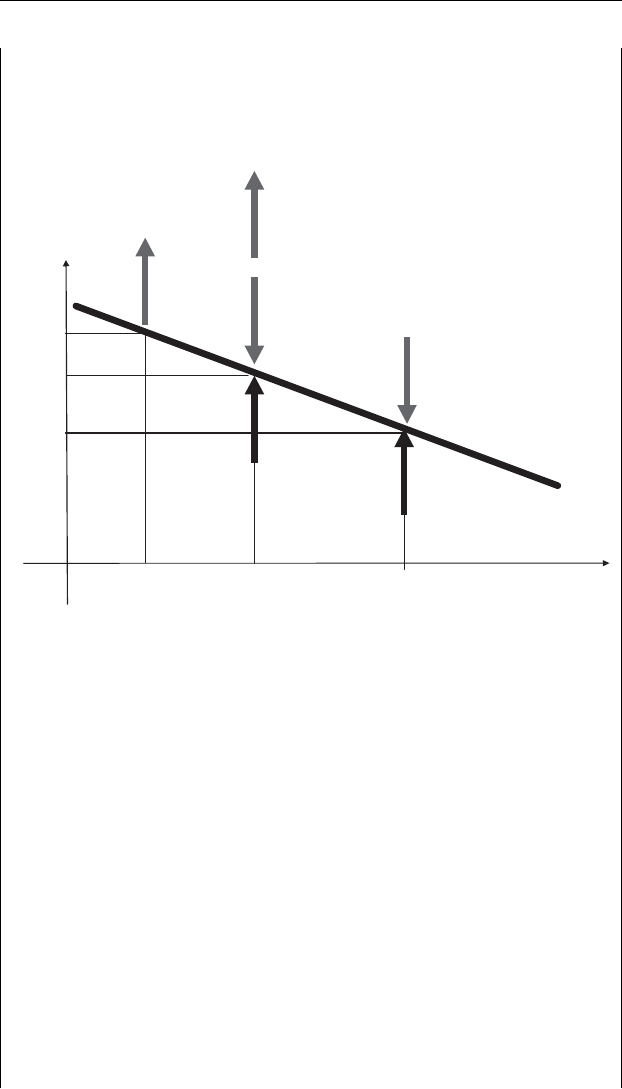
112 Understanding Oil Prices
cargoes, reducing the number of the four operations executed in the
previous example?
20.00
16.00
5 Feb 15 Mar
Brent
($/bbl)
Brent Sale
(Hedging)
Physical Sale
Brent Sale
(Hedging)
Brent Purchase
(hedging)
Lock of the
Differential
10 Apr
14.00
Physical Sale
Lock of the
Differential Brent Purchase
(hedging)
Figure 9.2 Example of integrated price-lock hedging
Let us summarize all the operations carried out by our man in the
two cases:
millions dollars
5 February
1. Sale of 1 million barrels of Brent ($20/b) +20
Hedging costs
15 March
2. Sale of 1 million barrels of Brass River ($16/b) +16
Hedging costs
3. Purchase of 1 million barrels of Brent ($16/b) −16
4. Sale of 1 million barrels of Brent ($16/b) +16
29 March
5. Purchase of 1 million barrels of Brent ($14/b) −14
6. Sale of 1 million barrels of Brass River ($14/b) +14

Principal Uses of the Forward and Futures Markets 113
We have already seen the economic results obtained by the totality
of all these operations. Let us pause to examine only those actions
executed on 15 March and in particular the fact that on the same day,
and at the same price, the commercial manager has sold and bought
the same item (1 million barrels of Brent paper), dealing with the
same entity, the petroleum exchange. The first time he did this was to
close his position regarding the first Brass cargo and the second time
to open a new position for the second Brass cargo. From the economic
viewpoint the process makes no sense. He could simply avoid making
the two operations and still get the same result (saving the costs of
the operations, which we have not discussed, but which exist).
In practice, however, the fact that the overall result does not change,
even eliminating the two intermediate operations on the petroleum
exchange, signifies that the hedging is anyway accomplished: but
with what hedging mechanism?
The lucky coincidence that the date of the second sale is precisely
that of the loading of the first cargo ensures that the second cargo
acts as hedging for the first.
It is preferable not to complicate still further the example by going
into real life where the complexity of the actual cases is obviously
more detailed and requires somewhat more sophisticated techniques
of application of the principles that have been illustrated. Let us limit
ourselves to noting that it is possible to obtain an acceptable level of
price risk reduction, and as such, a reasonable hedging effect, min-
imizing a recourse to the financial market by means of appropriate
programming of:
rThe dates of lifting from the various export terminals.
rThe cargoes which are the property of a company or which have been
purchased.
rThe times in which to agree the sales’ details with the purchaser.
Obviously, the more cargoes a company handles in a month, the
greater are the possibilities of making this policy effective, that is, in
which a cargo bought or sold protects the other cargoes in the month and
is in turn protected by them. This technique is called portfolio hedging
and it is certainly the one that implies the lowest level of recourse to
the financial market, minimizing traders’ temptation to speculate. To

114 Understanding Oil Prices
implement this hedging activity it is essential that a company is able to
programme actively and dynamically the physical operations of loading
at the various terminals, as well as the sales and purchases of outgoing
crudes. A command panel that is effectively under control can generate
enormous added value, often superior to what might be obtained through
sophisticated trading techniques.
SPECULATIONS ON OPERATIONAL
FLEXIBILITIES AT LOADING
At this point it is useful to give an example of how the paper market
can allow and make possible certain forms of speculation by oil profes-
sionals. This explains why the loss of control of the price system by the
producing countries and oil companies has not made many of them feel
like orphans.
Box 9.3 Example of Synergies Between Operational Flexibili-
ties and Hedging
We return again to a concrete example; on the famous starting day of
the previous examples, 5 February, when our commercial manager
is advised by the terminal operator of the date when he must lift his
March cargo. Suppose that this time the loading date is 30 March
(in the previous examples it was 15 March). When the manager goes
into the market to try to sell the cargo he finds two purchase offers
from his best client at these prices:
rthe price of Brent on the loading day (30 March) exactly as it is;
and
rthe arithmetic mean of the Brent quotations in the month of loading,
plus a premium of $1 per barrel.
He will have to decide which option to choose and then, eventually,
reflect on his hedging strategy. In view of the uncertainty regarding
the market in the following weeks (forecasts are always only fore-
casts), but considering a better price of $1 per barrel (which for a
cargo of 1 million barrels means 1 million dollars), the commercial
manager decides to accept the second offer and, thus, to sell the cargo
not at the price of the loading date but at the monthly average of Brent
quotations (see Figure 9.2).
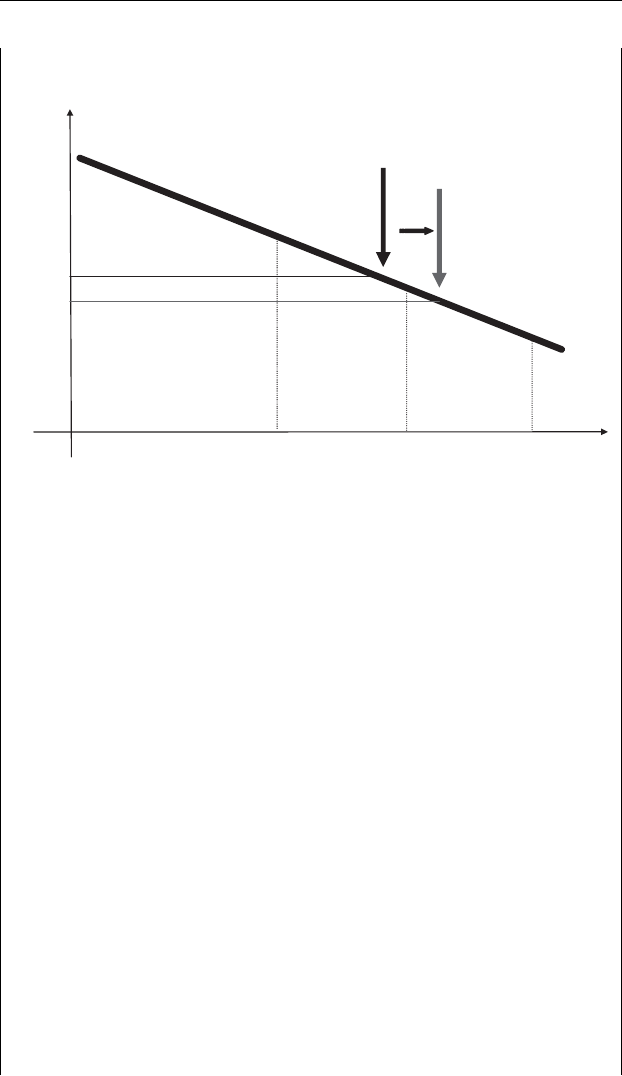
Principal Uses of the Forward and Futures Markets 115
20.00
16.00
5 Feb 31 Mar
Brent
($/bbl)
1 Mar 30 Apr
Programmed
Date
Loading
Date
Sale Options:
a.) Brent = 20.00
b.) Brent + 0.50 = 16.50
Figure 9.3 Example of operational flexibility effects
Let us see whether the decision taken was the best option. Suppose
that once again the expectations for the Brent price are correct. Thus,
on 30 March the crude price will be $18 per barrel and the monthly
average for Brent until that day is $20 per barrel. Further, let us
suppose that projecting the trend for Brent into the following month,
it can be deduced that the April average will be around $16 per barrel.
With these facts in hand, the purchaser decides to play his own cards
to save $4 per barrel (meaning $4 million) on his deal. It is enough
for him to telephone the captain of the ship navigating towards the
terminal, to ask him to ‘take it easy’ and present himself at the berth
only in the afternoon of 31 March. The consequence will be that the
ship’s loading process will inevitably end after midnight of 31 March,
namely at the start of the month of April. Since the contract stated
that the price would be calculated based on the monthly average of
Brent in the ‘month of loading’, the purchaser will not pay $20 but
$16 per barrel.
But this is not all. Suppose that the buyer of the cargo is a refin-
ing company of the same oil company that owns the cargo. On the
physical plane, the only effect will be a shift of income from one
department to another within the same company. If the two entities

116 Understanding Oil Prices
are in different countries with different tax regimes there could be
advantages or disadvantages deriving from a similar operation.
Now let us see what can happen if the physical operation in itself
is associated with a vigilant activity regarding the futures (dynamic
hedging). The seller as from 5 February knows that he has sold a cargo
of Brass at the monthly average for Brent in March (first hypothesis).
In this case his hedging plan will be different. Starting from the first
day of March, he will sell every day on the petroleum exchange a
quantity of Brent equalling 1/31 of 1 million barrels, thus striving
for a selling price for his cargo that is equal to the monthly average
($20 per barrel). When on 30 March he sees the situation, he decides,
together with his refining company, to ‘shift’ the cargo from 30 March
to 1 April. That same day (30 March) he will close on the exchange
the positions opened during the month and buy 1 million barrels of
Brent at $18 per barrel (the day’s price), succeeding in selling at the
average price of the month ($20 per barrel) while having purchased
at $18 per barrel, earning $2 million on the exchange. Moreover, the
producing company will have to pay taxes on the cargo lifted based
on the average price of the month of loading, namely on $16 and not
on $20 per barrel. In addition, the sister refining company will have
a cargo bought at $4 per barrel less, enhancing its refining margins.
Thus an operation is concluded with three net results:
rEarning $2 million on the exchange.
rA net reduction of the taxation basis in the country of production.
rIncreasing the refining margin by $4 million.
Some examples have been given at the academic level so as to allow
a glimpse of the complexities of the business that has developed with
the birth of the paper market of Brent, Forward and Futures, whose
interests have added to a business already exceptionally full of real
risks. It is sufficient to reflect, just for a moment, on the size of the
interests that hang over the management of the loading terminals in the
various producing nations and how vital it is to ensure the transparency
of the information regarding the process of assigning the dates for lifting
the various cargoes.
In countries of unpredictable democracy and where the transparency
of these processes is lacking, we observe a frenetic activity by trading
companies that try to get their hands on crude supply contracts, although

Principal Uses of the Forward and Futures Markets 117
they do not have a refining system behind them or an adequate trading
network. These firms try to acquire cargoes with especially favourable
conditions (particular dates) that they can sell off to other more solid
firms, sometimes earning a (huge) percentage of profit. Obviously the
reality is much more complicated and those without adequate profes-
sional competences risk getting their fingers badly burned. The list
of companies wiped out as a result of speculations that went awry is
very long.
MARKET STRUCTURE: CONTANGO
AND BACKWARDATION
In outlining the previous examples we made a series of simplified
assumptions to illustrate the basic concepts involved. The realities of the
market and industry practice today are obviously more complicated. Just
to hint at some of the complex factors we refer to the so-called market
structure. We have already seen how the 15 days Brent contract (even
in its new forms) allows, every day, the purchase of a cargo planned
for loading in the six months following the current one. The market
transactions concerning these cargoes generate, each day, the forward
quotations for the Brent price. Obviously, the forecast price for the future
months fluctuates in line with market sentiments and the expectations
of the professionals.
Two market situations emerge:
rContango, where the Brent Dated price of today is lower than that
of the subsequent months. This is the classic situation where a price
increase is expected.
rBackwardation, where the Brent Dated price of today is higher than
that of the subsequent months. In this situation pessimism prevails
and the market expects a fall in prices.
Knowledge of the market structure allows and encourages many forms
of speculation.
Box 9.4 Floating Storages
As an example, we may mention what happened in end-2008 and
early-2009 – the speculation on whether crude cargoes were travelling
or held floating ‘on the water’.

118 Understanding Oil Prices
During the month of December, the so-called market structure of
Brent showed more or less this type of movement for the following
months:
Month Price, $ per barrel
December 43
January 48
February 50
March 52
April 54
May 56
This price structure offered the possibility for immense specula-
tions. Anyone who had bought a cargo of crude in December for
resale in December could have obtained a margin from the purchase
and sale of commercial operations limited only to price fluctuations
between the moments of purchase and sale, both values around the
average price of $43 per barrel. If, however, he had succeeded in shift-
ing the moment of sale to a following month, seeing the quotations
of the following months, his margin would have become enormously
greater. In the example, for a shift between December and May it was
possible to arrive at $13 per barrel. For a cargo of 1 million barrels
this would mean $13 million of additional margin. With the typical
techniques of the futures markets it is possible to exchange (swap)
the price of one month with that of another, earning the difference
between the relative prices. Without entering into the technical details
of the operation, we will just say that to consolidate the economic
benefit, the transfer of ownership of the physical cargo – on which
the speculation on the futures market is based – must pass from the
seller (who is speculating) to his buyer in the future month selected
as target for the price. It is easily appreciated that while the financial
part of the operation on the futures market is relatively simple (it is
only a play on financial transactions, stock exchange type), the phys-
ical part – maintaining ownership of the crude for months is not easy
to achieve. In fact the cost of the ship and the associated risks (envi-
ronmental and safety) must be taken into account. Since it is hard to
find a buyer willing to accept these conditions of sale, the only way
to achieve the objective is generally to sell to oneself, or to a related
company. In practice, the tanker carrying the crude arrives normally

Principal Uses of the Forward and Futures Markets 119
at its destination. The crude is offloaded into the refinery storage
tanks (rented by the seller), on behalf of the seller. The transfer of
ownership will take place between the two sister companies at the
most appropriate moment to maximize the margins of the operation.
The net margin will be that guaranteed by the financial speculation
less the logistic costs incurred. With a potential of $13 per barrel
there is ample space to recover the costs.
PROCEDURES AT THE LOADING TERMINALS
From the examples we have just seen it is clear that the real value of
a cargo of crude is not given only by the price of Brent on the day
of loading, but by a series of factors that accompany the commercial
negotiation and the eventual trading operations also involved, namely:
rthe price differential agreed for that crude in that specific market
situation;
rthe hedging deals executed, to block the price at a level desired and
possible;
rthe eventual actions and operational flexibility taken at the moment
of loading, with forward and backwards shifts of the loading date.
These are all actions that the birth of the Brent market has made
possible and that can have a decisive effect on the final value of a
cargo. In particular, the most glaring effects can be derived, as we saw
in the previously elaborated, theoretical examples, from the combined
play of operational flexibilities and oil futures. Many trading firms,
whose main scope is speculative, are present in the business of the
physical market for crude (buying and selling physical cargoes with
all the risks and work entailed) instead of limiting themselves just to
the game of speculation in the exchange, with the precise intention
of taking advantage to make enormous profits inherent in combining
these transactions. Obviously, for these actions to be possible it is
necessary that rules exist at the various loading terminals which al-
low customers who present themselves with tank-ships to load crude
to be able to utilize and exercise some flexibilities. It is furthermore
evident that the oil company that also acts as terminal operator there-
fore has detailed information regarding production, storage and size of
cargoes of the other partners and, with discretional powers over the

120 Understanding Oil Prices
flexibilities permitted, can obtain the maximum advantage in placing
their own cargoes.
It is not unusual to observe within every joint venture bitter conflicts,
often difficult to reconcile, when the so-called lifting procedures or
off-take agreements come up for discussion: these are the rules that
state how and when the various partners in a joint venture have the
right and obligation to lift the cargoes they are entitled to. Normally
the dispute regards certain fundamental matters. The first concerns the
basic mechanism for the procedures, which may be of two types:
rThe mechanistic method, which on a given day in the same month
assigns the priority for lifting a cargo to the partner that on that day
has accumulated the most barrels in the terminal storage facility.
rThe nomination method, where the partners who in a certain month
have the right to lift a cargo of crude inform the terminal operator of
their desires regarding the loading date. The operator makes the final
decision trying to satisfy the partners as far as possible.
Clearly the oil companies that act as operator (generally the majority
partner in a joint venture) will try to impose the second solution, while
the minority partners will try to defend themselves with the mechanical
method. The dollars in play can amount to an enormous sum and can
modify the degree of a partners’ investment recovery.
Then there is another series of factors, apparently technical and
operational, which nevertheless have a fundamental influence on the
final value of a cargo. Just to give one example, depending on the logis-
tics of the terminal, the standard size of the nominal cargo size that can
be lifted at the terminal must be decided, that is, the minimum amount
of crude that will be delivered to a ship arriving for loading. The major
partners will try to impose the highest possible size for the nominal
cargo, so as to increase the frequency of its own liftings and decrease
those of the minority partners. In fact, a partner with a 40% share will
accumulate more crude and quicker than one with only a 10% share.
The greater the size of the nominal cargo, the longer is the waiting time
for the minority partner to accumulate enough crude to allow him to lift
a nominal cargo. For this reason, and wishing to establish the conditions
of maximum operational flexibility for all the partners and potential cus-
tomers at the Sullom Voe terminal, a nominal cargo of 500,000 barrels
was agreed to for Brent, the smallest possible load that nonetheless has
commercial value.

Principal Uses of the Forward and Futures Markets 121
Another bone of contention between partners is the clause regarding
the so-called pooling of rights, that is, the possibility of cooperation
between two or more minority partners, to lift the barrels due to them
and be considered as one sole partner having a participation equal to
the sum of their respective shares. It might, thus, be possible for a
new ‘synthetic’ partner to have a participation superior to that of the
partner with the relative majority and/or function of operator, and thus
be in a position to lift the collective cargoes with greater frequency
(with significant advantages for a company’s cash flow). Obviously,
the game involving the distribution of the privileges and flexibilities
has to be discussed. This is the reason for tenacious opposition and
interminable discussions.
As mentioned previously, all this has a sharp impact on the value of
a cargo of crude. It is one thing to try to sell a crude that is loaded at a
terminal where all these flexibilities can be brought into play together,
it is quite another to sell a crude to be loaded in a terminal where the
operator allows the buyer no flexibilities whatsoever. The price can only
reflect these differences, independently of the benchmark quotations
on the day of loading. And often, for a standard cargo of a million
barrels, it is a question of differences that can fluctuate around a sum of
$10 million. For a partner in a joint venture, for the same investments
made and costs incurred, the utilization of these operational flexibilities
could seriously affect the time needed to recuperate such investments.

10
Problems of the Brent
Forward Market
A separate chapter is dedicated to the distortions that have been created
in the Brent 15 days market and the ways to remedy this. These are
quite technical matters, but it is important to describe them, at least in
general terms, to illustrate the dynamics that have permitted the creation
of today’s situation of almost total separation between the crude market
and the price of crude. The fact that Brent became the worldwide refer-
ence benchmark had the consequence that every case of speculation on
the Brent market translated automatically into a manipulation of the
price of all the other crudes in the world. We can, therefore, under-
stand the interest of Brent’s controllers (and of some trading companies
mainly operating in London circles) in wielding this tool and utilizing
the flexibilities made possible, on the one hand, with the preoccupation
of most of the producing countries that saw the price of their crudes in
the hands of speculations perpetrated by a few operators. It is also for
this reason that Saudi Arabia and Iran decided to uncouple the price of
their crudes from Brent Dated, instead linking them directly to that of
Brent IPE/ICE, where these problems cannot arise.
The most typical of these speculations was the so-called Brent
squeeze. This was an operation for the temporary accumulation of
paper and physical cargoes of Brent, normally carried out by a trading
company, so as to remove them from the market, thus creating a short-
age (undersupply of Brent) and panic, forcing players in the chain of
15 days Brent to purchase cargoes to meet their commitments and forc-
ing many refiners to try to cover their requirements at any price. At the
same time, the creator of the squeeze would buy numerous financial
parcels of Brent on the futures market, artificially increasing demand
expectations and consequently the price of Brent.
In the North Sea, given the short sea voyage (two to three days of
navigation) and continuous availability of supply, many refiners buy
their cargoes at the last moment. In the panic situation during the days
of the squeeze, the price could rise abruptly (and did so) by as much
Understanding Oil Prices: A Guide to What Drives the
Price of Oil in Today’s Markets
by Salvatore Carollo
Copyright © 2012, Salvatore Carollo

124 Understanding Oil Prices
as $2–5 per barrel. Having achieved his objective of raising the price,
the trader who ran the operation came forward as the saviour of the
motherland, selling the cargoes hitherto hidden and for enormous profits,
even on the financial operations. Since all the crudes in the world are
indexed to Brent Dated, but not restricted to only this reason, profits
could be made on crudes from other geographical areas sold to third
parties precisely during the days of the squeeze. We should not forget
that Brent represents the benchmark for over 60% of worldwide crude:
therefore, increasing the Brent price increases the price of all the crudes
linked to it.
Obviously, the success of a squeeze operation depends on the ability
to accumulate all the Brent cargoes in a minimum period (at least a
week). With the reduction of Brent’s production from 700,000 barrels
per day (with about 40–45 cargoes per month, say 10 a week) to 200,000
barrels per day (with 12–13 cargoes per month, say 3–4 a week), the risk
of a squeeze operation arose very frequently, making the value of Brent
Dated completely unreliable. To block three or four loadings within
one week became a feasible and frequently repeated operation for any
trading company.
Box 10.1 Market Squeeze
Given here is a concrete example of a squeeze, now widely known,
that was the proverbial straw that broke the camel’s back. In 2000,
a trading company (which we shall call Squeezer), with the help of
other companies, was able to raise the price of Brent by about $2 per
barrel for several days. Squeezer succeeded in making a market
squeeze by buying early the September forward financial positions.
At the same time, companies allied to Squeezer bought the entire
physical market of Brent for the month of September, consisting of
a few cargoes.
Against this background, at the close of the open financial posi-
tions, Squeezer requested the delivery of the cargoes bought in the
Brent chain, cargoes that did not exist on the market (because they had
been bought by its allies), and, therefore, obtained, as compensation,
a significant monetary premium.
It was clear to everyone that the quotations of Brent Dated, under
a speculative course, were no longer correlated to market conditions,
but distorted upwards by actions orchestrated on the financial and
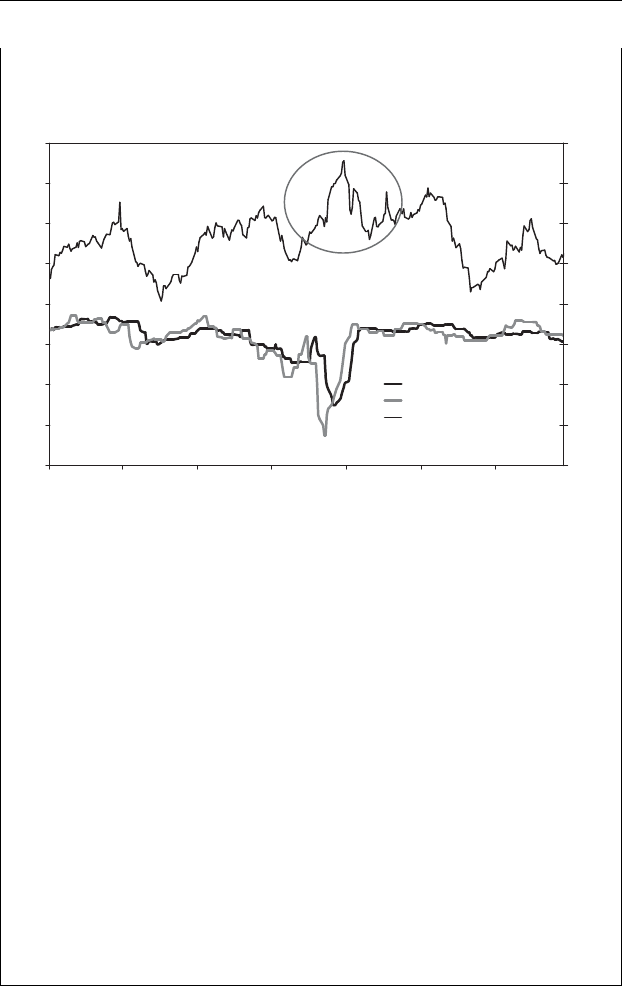
Problems of the Brent Forward Market 125
physical markets. The graph in Figure 10.1 depicts what happened
in the market during this episode.
-3
-2
-1
0
1
2
3
4
5
Jan-00 Mar-00 May-00 Jul-00 Sep-00 Nov-00 Jan-01
$/bbl
0
5
10
15
20
25
30
35
40
$/bbl
Oseberg Differential
Forties Differential
Brent Assessments
Figure 10.1 Distorted Brent Dated quotations
We can see clearly that:
rThe North Sea market in September was obviously weak, as shown
by the movement of the differentials for Forties and Oseberg, two
crudes of higher quality than Brent, which became negative in
that period.
rIn contrast, the price of Brent Dated, parallel to the week of the
squeeze and contrary to all the other similar crudes from the North
Sea, registered a net and unjustified rise.
A US refiner, who right in that period had to buy some cargoes
of Brent, contested the fraudulent behaviour of Squeezer and was
awarded compensation by means of a lawsuit.
It is clear that an action of this type caused not only a rise of the
price of Brent, but rather a distortion of the value of all the activities
(financial and physical) linked to Brent itself. A manoeuvre like that
made by Squeezer upset the entire market.
Something really had to be done to avoid such forms of specula-
tion. An advocate for finding a solution to the problem was Platts, a
McGraw-Hill owned specialized publisher of energy related periodicals

126 Understanding Oil Prices
that receives the support of industry professionals, analysts, traders, oil
companies, university professors and government ministers.
Starting from July 2002, the historic contract for 15 days Brent was
modified with the insertion of a series of new conditions and flexibilities
of which the main ones are:
rthe standard cargo increased from 500 to 600 thousand barrels;
rthe delivery of the physical cargo could be accomplished by using two
alternative crudes of similar quality, Forties and Oseberg; not only of
Brent. The option to declare the type of crude was to be exercised two
days before loading;
rcargo nominations were to be made 21 days before loading and not
15 days. In practice, spurned by the need to comply with the lifting
rules at the terminals of the various crudes, the 15 day Brent became
the 21 day Brent.
In this manner, a new benchmark was artificially created and
expanded to comprise a basket of crudes, whose production permit-
ted around 90–100 cargoes per month (say 20–25 a week). A squeeze
would now require a financial and organizational feat that would be
almost impossible for a trading company to instigate. The new market
should now be named the 21 days BFO (Brent, Forties, Oseberg), but in
industry parlance the old term, Brent contract, continued to be used. The
BFO assessment envisages the daily value of Brent Dated as assuming
the value of the most competitive crude among the crudes forming the
basket; Brent, Oseberg and Forties.
The effects of this modification were clear from the start. The values
of Brent Dated returned to normal, that is, below the assessment levels
for Oseberg and Forties, and the squeeze problems disappeared.
The inclusion of Oseberg and Forties in the assessment also
allowed for:
ra reduction in the degree of concentration of ownership of the various
crudes, favouring greater transparency in the transactions;
ran expansion in the origin of the basket of crudes, which now included
Norwegian crudes – governed by a tax regime separate and different
from the UK tax system; and
rgreater diversification of contract terms, since Brent cargoes respond
to the GTCs (General Terms and Conditions) of Shell, cargoes of
Oseberg respond to the GTCs of Statoil and those of Forties respond
to the BP GTCs.
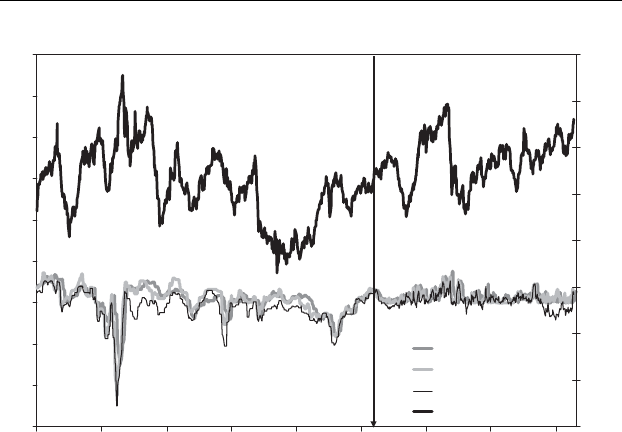
Problems of the Brent Forward Market 127
-3
-2
-1
0
1
2
3
4
5
6
Jan-00 Jul-00 Jan-01 Jul-01 Jan-02 Jul-02 Jan-03 Jul-03 Jan-04
$/bbl
0
5
10
15
20
25
30
35
40
$/bbl
oseberg diff.l
forties diff.l
ekofisk diff.l
brent (right axis)
Figure 10.2 Movement of the benchmark before and after July 2002
As we can see in Figure 10.2, the benchmark, as from July 2002,
began to follow the market trends of the other North Sea crudes, no
longer presenting anomalous situations or unjustified price peaks.
We may, therefore, conclude that the passage to the BFO assessment
was advantageous for the market and its players. The emergence of two
new critical elements compelled a further adjustment to the BFO system
at the beginning of 2007. These factors were:
rA new trend towards reduced North Sea crude production particularly
in the crudes forming the benchmark (BFO).
rThe coming on stream of a new field (Buzzard) inside the Forties
pipeline system. This was a heavy sour crude that worsened the quality
of Forties and hence the reference features of the BFO.
To compensate for the potential reduction in production and quality
of the BFO, the international community, supported yet again by the
forum of Platts, incorporated in the BFO basket the Norwegian crude
Ekofisk. Ekofisk is a light crude with 37.5 degrees API and a sulphur
content of 0.23%, thus transforming the BFO into 21 days BFOE. The
choice of Ekofisk, together with Forties and Oseberg, had the purpose
of providing a safety valve should the value of Brent, normally the

128 Understanding Oil Prices
most competitive of the four, be manipulated for speculative purposes
(upward squeeze).
Expectedly, due to the introduction of crude from the Buzzard field,
Platts had to insert quality standards regarding Forties. Cargoes of For-
ties included in the BFOE assessment must have a minimum API of
37 degrees and a maximum sulphur content of 0.60%. For each per-
centage increase over the 0.6% threshold, a sulphur de-escalation factor
applies in favour of the purchaser. If the sales contracts do not contain
these two clauses, the sales of the cargoes are not taken into considera-
tion for the purposes of estimating the BFOE.
The new assessment system was fine-tuned further to take account of
the presence of the forward markets and the influence that they have in
the final determination of the price of crude. Specifically, it was decided
to refer, in the so-called market structure, to the situation of contango
or backwardation.
Box 10.2 Assessment of Brent Dated (Platts’ Methodology)
One must note that the assessment of Brent Dated has never changed
name, either in its passage to BFO or when in 2007 it became the
BFOE assessment. Purely to complete the information we shall try to
summarize in a practical and concrete manner how the daily valuation
of Brent Dated takes place.
Being the specialized source most adopted internationally, Platts’
method will be utilized. In setting the daily valuation of the 21 day
cash BFOE, Platts uses a system called Market on Close (MOC).
MOC is none other than a system able to take account of all the val-
ues of the transactions effected within the 21 day BFOE contract at
the end of normal trading hours in London at 16:30. Platts only con-
siders arms-length (AL) sales, namely those negotiated openly in the
assessment window. As already mentioned, the BFOE methodology
envisages that the most competitive crude is the one that defines the
value of the benchmark. In normal market conditions, Brent has
always provided the benchmark. However, the introduction of
Buzzard into the Forties stream has resulted in Brent often no
longer being the most marginally competitive crude (see Figure 10.3).
Thanks to this procedure for defining Brent Dated, the assessment
always remains related to the fundamentals of the North Sea market,
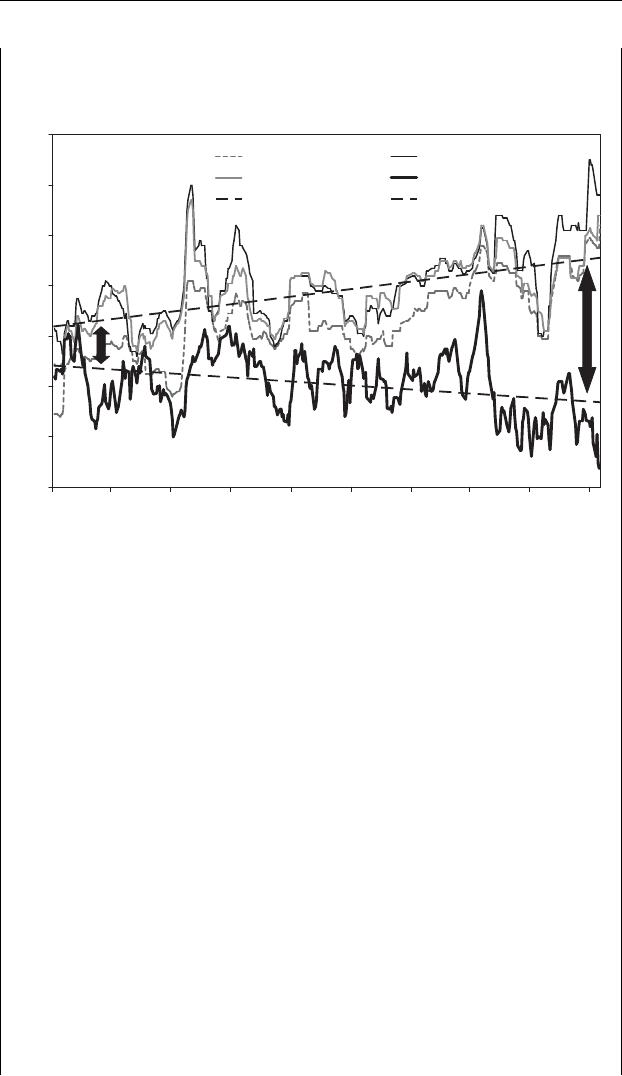
Problems of the Brent Forward Market 129
with the scope of reflecting the true relationship between demand
and supply of these regional crudes.
-2
-1
0
1
2
3
4
5
Jan-07 Mar-07 May-07 Jul-07 Sep-07 Nov-07 Jan-08 Mar-08 May-08 Jul-08
$/bbl
Ekofisk Statfjiord
Oseberg Forties
Linear (Oseberg) Linear (Forties)
Figure 10.3 Relationship between demand and supply of regional crudes
The following example will show how Platts makes, today, the
assessment of Brent Dated. Let us assume that on one particular day
Platts has news of two different market transactions:
ra Brent cargo with window 16–18 July sold at Brent for August +
$0.10 per barrel; and
ra Forties cargo with window 16–18 July sold at Brent Dated +
$0.15 per barrel.
To reflect the market structure Platts must determine:
rThe price of the Brent cargo on the basis of the value of August
Brent Forward (whose assessment will be made based on the infor-
mation available and the transparent movement of Brent ICE). If
we assume that the value of Brent for August is $75.00 per barrel,
then the price of the Brent cargo will be valued at $75.10 per barrel
($75.00 +$0.10).
rThe price of the Forties cargo will emerge from a slightly more
complex valuation. In fact, the value of Brent Dated will have
to be estimated in the period 16–18 July, using a method that

130 Understanding Oil Prices
refers to published data and is not subjective. Platts proceeds in
the following way, weighing:
– the value of Brent for August, which we have assumed to be $75
per barrel; and
– from the CFD market (contracts for difference), Platts deduces
the quotation of the value of the difference between Brent for
August and the value of Brent in the week 15–19 July, namely
the price paid by those operators who wish to modify a price
agreement transferring the calculation of the average for Brent
from one time reference to another (from the days 16–18 July
to the average in August). Let us assume that in this case the
market quotation for this type of exchange is 40.20 per barrel.
rThe premium agreed between the parties is $0.10 per barrel.
Based on these elements, the price of the Forties cargo turns out
to be $74.95 ($75.00 −$0.20 +$0.15).
It will, therefore, appear that on that day there were two transac-
tions regarding crudes in the Brent Dated (BFOE) basket that gave
rise to two values:
r$75.10 per barrel for the Brent cargo; and
r$74.95 per barrel for the Forties cargo.
Since the lower value is that of the Forties cargo, the value of
$74.95 per barrel will be published as the value of Brent Dated
BFOE on that day.
Obviously the same valuation process will have to be used for all
the other days in the time span of 10–21 days used for the assessment.
The method of calculation for the assessment of Brent Dated has
been modified over time, fundamentally to ensure the correct business
procedure and to make life difficult for the cunning types who, to earn
easy profits, could create enormous damage to the other operators by
upsetting the balance of the markets. There is still the fact that it remains
almost completely impossible to base price assessments on effective
market transactions and to have to rely on the estimates, based on the
behaviour of the futures market (ICE), made by the specialized sources.
Consequently, the last word regarding what we call the oil price is now
dictated by the financial markets, since the physical markets align with
these without any possibility of reaction.

11
The European Refinery Crisis
In the previous chapters we saw that there is a financial oil market,
where oil purchase and sale contracts are exchanged every day that
do not involve the physical delivery of goods. There are purely paper
markets, controlled essentially by the biggest banks in the world, which
generate the number that we call the price of oil. Everyone assumes,
even if it is not true, that the exchange of these paper contracts
reflects in some way the dynamics between demand and supply of
the commodity called oil. If you talk to a financial analyst he or she will
confirm, believing it, that the movements in the price of Brent and the
exchanges of the relative futures contracts exclusively and rigorously
respect the fundamentals of the physical oil market. Since this high
level of transactions has contributed, as a collateral effect, to keeping
the price of oil at higher levels than that at which the physical market
would have held it, almost all the players involved (e.g. producing coun-
tries and oil companies, governments etc.) have let the financiers play
their game.
Only the collapse in prices in autumn 2008 reopened the discussion
on the control of the price of oil. The rapid recovery of the prices in
the spring of 2009, however, deferred the discussion to the next crisis.
There is another collateral effect, unfortunately not made sufficiently
clear, that the financial market is having on the oil industry and on the
energy world in general. This is the potential progressive erosion of
the margin of the refiner and hence of the future strategic position of the
refinery industry.
The last refineries built in Europe and the USA appeared in the mid-
seventies. From that time there have only been closures or upgrading
operations of the existing plants. If you enquire about satisfying the
oil consumption in the coming decades you will have to think about
the construction of new technically more developed plants, but with the
current low level of refining margins, these would not be remunerative
investments. No private bodies could get involved in these activities,
faced with negative results.
Understanding Oil Prices: A Guide to What Drives the
Price of Oil in Today’s Markets
by Salvatore Carollo
Copyright © 2012, Salvatore Carollo

132 Understanding Oil Prices
In the past decades refinery experienced crises of different natures
and size. The most dramatic was at the start of the eighties when it had
to deal with:
rthe transformations of the energy market after the two oil shocks of
1973 and 1979; and
rthe entry of the producing countries into the world refinery market.
The oil shocks have encouraged the growth and proliferation of
nuclear power stations and the progressive transformation of the thermal
power stations from fuel oil to gas, causing a collapse in the demand for
fuel oil.
At the same time, the need and desire of many producing countries
to expand their productive share and to recover increasing slices of
oil revenues, led them to invest in the downstream, both by investing
in refining and by acquiring distribution networks in the main con-
sumer countries. Saudi Arabia, Kuwait, Venezuela and Libya are leading
these trends.
The markets in the finished products are inundated with marginal low
price products that will, however, become a new sort of benchmark for
the whole international market.
The refiners find themselves in the situation of having to buy the
raw materials at firmly fixed prices from the producing countries, and
having to sell the finished products at the discounted prices imposed on
the market by the marginal flows coming from the same countries.
The collapse of the refinery margins was inevitable. The sale of the
refined products, at the new price levels, no longer allowed the raw
materials and the refinery costs to be repaid.
Almost 50% of the refineries in the Atlantic Basin (USA and Europe)
were unable to survive this transformation. This was a simple cycle for
most of the refineries (those that were producing about 50% of the fuel
oil) that were swept away by the market.
Only the refineries that either had already made investments to
improve the production cycle or were able to build new conversion
plants (those that transform fuel oil into gasoline and gasoil) survived.
However, still more refineries survived, guaranteeing competition and
productivity, in fact by improving the export facilities were able to ex-
pand the market hinterland and to make the structural export of gasoline
to the US market (see Figures 11.1 and 11.2).
Following these dramatic transformations, the refining situation
seemed to have stabilized in the second half of the nineties.
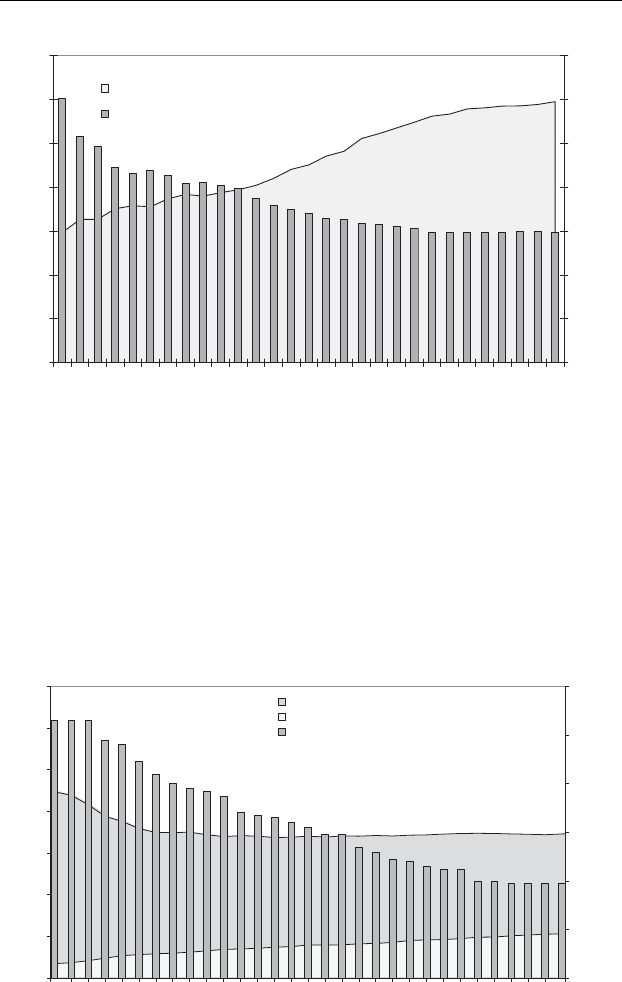
The European Refinery Crisis 133
0
20
40
60
80
100
120
140
1982
1984
1986
1988
1990
1992
1994
1996
1998
2000
2002
2004
2006
2008
2010
1000 bbl/day
0
50
100
150
200
250
300
350
Number of refineries
USA Average Refinery Capacity [left axis]
Number of operable refineries in the USA [right axis]
Figure 11.1 USA: number of refineries versus average refining capacity
Source: U.S. Energy Information Administration
Starting from 2000, the increase in the oil demand on the one hand,
but above all the introduction of the new environmental specifications
for vehicle fuels gave a new impetus to the refinery margins. The lim-
ited industrial capacity (by the majority of the operators) to produce
refined products of high quality, as required by the new standards, led to
0
5
10
15
20
25
30
35
1980
1981
1982
1983
1984
1985
1986
1987
1988
1989
1990
1991
1992
1993
1994
1995
1996
1997
1998
1999
2000
2001
2002
2003
2004
2005
2006
2007
2008
2009
2010
million bbl/day
100
120
140
160
180
200
220
number of refineries
Distillation Capacity in Europe [left axis]
Conversion Capacity in Europe [left axis]
Number of Refineries [right axis]
[Parpinelli]
Figure 11.2 Europe: number of refineries versus distillation and conversion refining
capacity
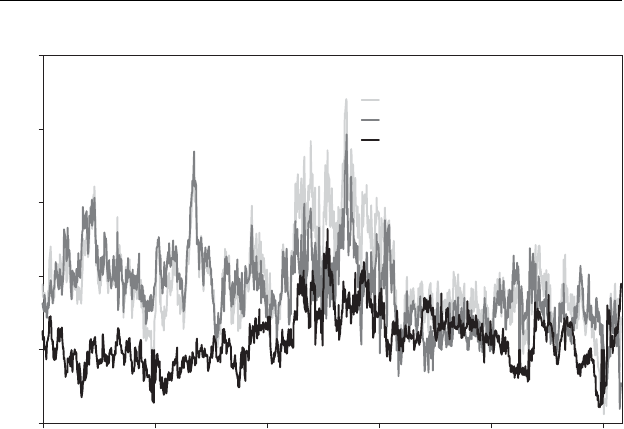
134 Understanding Oil Prices
-5
0
5
10
15
20
2006 2007 2008 2009 2010 2011
$/bbl
NWE Margins (Brent)
MED Margins (Brent)
Margins Difference: NWE-MED
Figure 11.3 NWE and MED refinery margins: cracking plants
higher prices for the finished products also making the refinery margins
leap ahead.
The price of the raw materials, which is something always available
and potentially exceeding the demand, was in fact driven along by the
products level.
For about six years the refiners recorded decidedly positive economic
results. Slowly they began to talk about new investments and building
new plants.
Then unexpectedly in 2009 came the new crisis (see Figure 11.3).
This new collapse of the margins was fairly difficult to understand
and analyse. At first recourse was made to traditional models, citing:
rthe reduction in oil consumption, following the global economic cri-
sis; and
rthe emergence of a consequent excess of refinery capacity, especially
in Europe.
Having accepted this analysis, some companies approached the crisis
by putting in place an exit strategy from the sector: partial or total
closure or sale of the plants to concerns more integrated into the oil
cycle (producing countries) capable of moving (or prepared to move)
margins from one segment of the oil cycle to another, essentially for
strategic, political or fiscal reasons.

The European Refinery Crisis 135
Table 11.1 EUROPE: surplus/deficit in capacity, refining margins and demand
EUROPE
Capacity
Refining Capacity Demand Surplus/Deficit Refining Margins
Year [kbbl/day] [kbbl/day] [kbbl/day] [$/bbl]
2000 17,072 15,222 1,850 2.874
2001 17,150 15,393 1,757 1.459
2002 17,186 15,344 1,842 0.521
2003 17,278 15,468 1,810 3.152
2004 17,352 15,535 1,817 4.515
2005 17,370 15,673 1,697 6.783
2006 17,349 15,688 1,661 4.560
2007 17,305 15,454 1,851 4.797
2008 17,243 15,360 1,884 8.012
2009 17,069 14,498 2,572 3.583
2010 16,744 14,435 2,310 2.466
There is no doubt that the crisis in European refining, in a different
way from the global crisis, is serious, profound and structural.
On the basis of the data available, in Europe against an oil demand
of about 14.5 million barrels per day there is a refinery capacity of
about 16.7 million barrels per day. There is therefore a nominal excess
capacity of about 2 million barrels/day (see Table 11.1).
Obviously the difference between refining capacity and oil demand
is not per se a measure of a potential negative imbalance or necessarily
a cause of economic losses, for at least two reasons:
rDue to the historical trends in European refining, about 1 million
barrels per day of products was exported to the US market.
rThe net excess capacity (spare capacity) in Europe of about 1 million
barrels per day means a lack of use of the existing plants of 6–7%,
or a usage factor of 93–94% that, based on the historic data of this
industrial sector, can be considered absolutely physiological.
In all the situations where it has been attempted to increase the usage
factor above these values a high risk was often encountered. The large
number of serious accidents occurring in American refineries is often
due to the excessive increase in the usage factor.
Obviously, for a more effective analysis it is necessary to exam-
ine the distribution of the spare capacity according to the proprietary
control, territorial distribution and import/export infrastructures with
the network of the production system and the neighbouring markets.
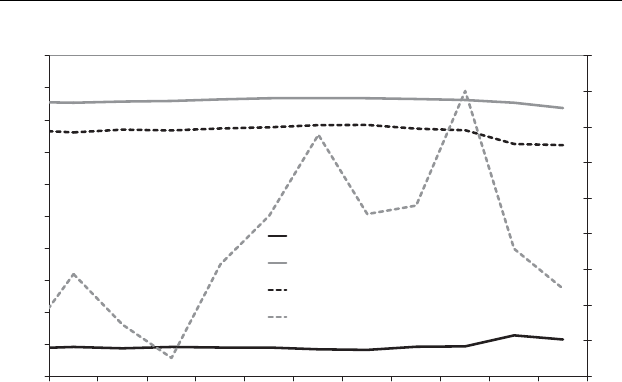
136 Understanding Oil Prices
0
2
4
6
8
10
12
14
16
18
20
2000 2001 2002 2003 2004 2005 2006 2007 2008 2009 2010
[million bbl/day]
0
1
2
3
4
5
6
7
8
9
[$/bbl]
Surplus/deficit in Capacity [left axis]
Refining Capacity [left axis]
Demand EU EIA [left axis]
Refining Margins Brent Cracking [right axis]
Figure 11.4 EUROPE: surplus/deficit in capacity, refining margins and demand
Sources: International Energy Agency and the author
Figure 11.4 clearly shows that the two curves of demand and refining
capacity tend to follow one another.
There is a separation of the two curves in the years 2008–2010, when
against a fall in demand of about 800 thousand barrels per day, there
was a fall in refining capacity of about 500 barrels per day.
This represents a change in the usage factor of about 1.5%, due to a
phase of economic crisis, which cannot on its own explain the collapse
in the margins of the operators.
If the trend of the margins is observed, it can be seen that even at
times of strongly positive values there is no surge in the usage factors
of the capacity, just being limited to fluctuations of around 1%.
In the USA the situation is very different, even if it shows the constant
lack of capacity against the level of internal demand (see Table 11.2).
The interesting element to be observed results from the combined
analysis of the European and US refinery structures in Figure 11.5.
It is easy to see how in 2009 there was an effective fall in the overall
oil demand of the Atlantic Basin of about 1 million barrels per day. This
is a key value in the crucial moment of the crisis, which has already
almost completely disappeared in 2010.
The persistence of heavily negative margins in 2010 cannot, therefore,
be explained just or principally by the excess of spare refining capacity.
There is clearly something new and complex not seen in the past, which
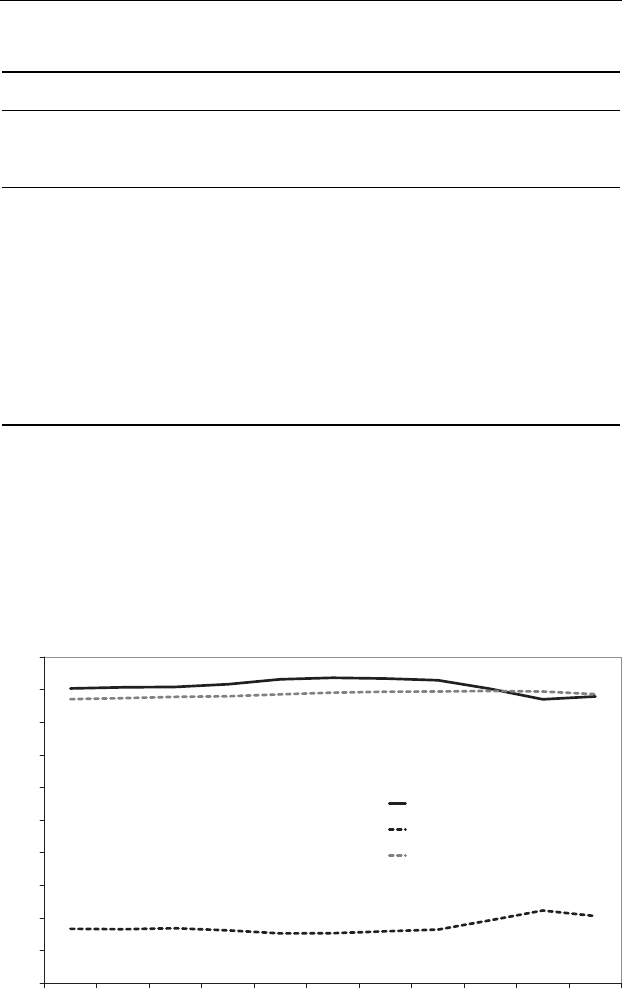
The European Refinery Crisis 137
Table 11.2 USA: surplus/deficit in capacity, refining margins and demand
USA
Capacity
Refining Capacity Demand Surplus/Deficit Refining Margins
Year [kbbl/day] [kbbl/day] [kbbl/day] [$/bbl]
2000 16,525 19,996 −3,471 2.006
2001 16,582 19,995 −3,413 1.315
2002 16,744 20,099 −3,355 0.743
2003 16,748 20,399 −3,651 2.946
2004 16,974 21,104 −4,130 3.648
2005 17,196 21,164 −3,968 9.760
2006 17,385 21,050 −3,665 7.320
2007 17,450 21,031 −3,581 9.300
2008 17,607 19,788 −2,181 5.628
2009 17,678 19,065 −1,387 3.862
2010 17,590 19,548 −1,958 3.890
Source: U.S. Energy Information Administration and International Energy Agency
requires a more sophisticated capacity of operation. In fact if a number
of plants equal to the spare capacity (1 million barrels per day) were
closed, the problem should be considered resolved.
This should produce with immediate effect a return to decidedly
positive refining margins and the start of massive investment to meet
-10
-5
0
5
10
15
20
25
30
35
40
2000 2001 2002 2003 2004 2005 2006 2007 2008 2009 2010
[million bbl/day]
Demand
Capacity Surplus/Deficit
Refining Capacity
Figure 11.5 EUROPE and USA: surplus/deficit in capacity, refining capacity and
demand
Sources: U.S. Energy Information Administration, International Energy Agency and the author
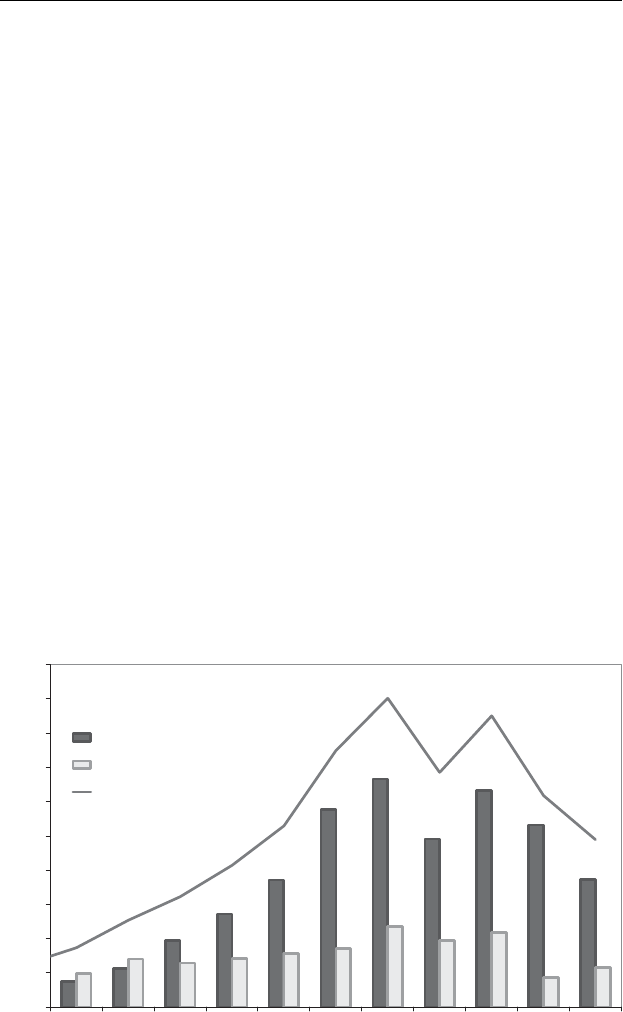
138 Understanding Oil Prices
the technological challenges of the future, imposed by the qualitative
changes in oil demand. Apart from the management of some social
conflicts, if we were sure that this could be done, the problem could be
solved quickly without asking for important economic sacrifices from
the operators in the sector. Perhaps an in-depth analysis is worth while
starting from considerations of good sense.
The market in finished products continued, even during the periods
of collapsing margins, to be supplied without any form of interruption,
meaning that we are not looking at a homogeneous cross-section in
which all the operators find themselves in the same situation. The aver-
age calculated refining margins consider different situations especially
if reference is made to the various geographical areas (e.g. Rotterdam,
Mediterranean) and to the individual plants. Figure 11.6 shows how,
against the changes taking place in the market of US gasoline, the
refiners of Northern Europe have had a higher reaction capacity, pro-
ducing suitable finished products and expanding their market share in
the US market.
It is clear that these industrial and commercial policies have given
these refiners economic advantages that are not visible in the values of
the average standard refining margins published by the various sources.
Just to give an example, which is significant though not exclusive,
a refiner that was able to export alkylate gasoline, especially in certain
0
20
40
60
80
100
120
140
160
180
200
2000 2001 2002 2003 2004 2005 2006 2007 2008 2009 2010
[kbbl/d]
from The Netherlands
from Italy
Italy + The Netherlands
Figure 11.6 US import: gasoline and blending components from Europe
Source: U.S. Energy Information Administration
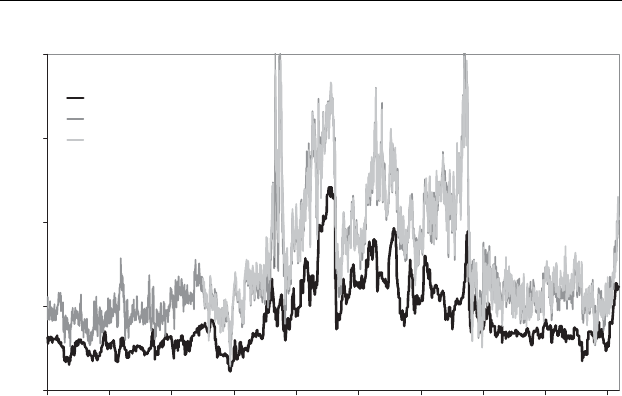
The European Refinery Crisis 139
0
100
200
300
400
2002 2003 2004 2005 2006 2007 2008 2009 2010 2011
$/mt
Premium to USGC Gasoline
Premium to NWE Gasoline
Premium to MED Gasoline
Figure 11.7 Alkylate premium to gasoline
periods of the year, should have been able to collect the extra margins
(of at least $100 per tonne) above the price of gasoline (see Figure 11.7).
Only those refiners that continue to operate in this market segment
have continued to obtain ‘good’ refining margins, despite the crisis
factors. In particular, some differences can be explained in the perfor-
mances of the refining markets in the two different areas of the European
market (negative in the Mediterranean, supportable in Rotterdam). The
different view of the market of the operators in the two areas has led
to different investment policies in the last decade. In the Mediterranean,
investment continued with the view of the eighties, namely sophisti-
cation of the plants to produce ever less fuel oil starting from heavy
low quality crude oils. Above all they were operated to make refining
a regional industry able to cover the local consumption. The potential
hinterland of the market of the refineries was restricted.
There was only marginal investment in the transport infrastructures
and export of finished products towards the more profitable markets.
Some coastal refineries, with a high potential for export infrastructures,
were closed or resized. In this context, Rotterdam has always been
and remains a refinery base aimed at export. To get an idea of what
has happened at Rotterdam, just take a tour of the oil port, where the
refineries are an integral part of the port infrastructures, with thousands
of tanks and loading wharfs for ships (and barges) of every size aimed
for all the European, US and even Asian markets. These infrastructures

140 Understanding Oil Prices
give flexibility and, if managed with business sense, produce profits
even in the difficult times of the market.
Returning to the previous argument, if in this framework the marginal
operators who are no longer able to compete have to close the plants
(1–2 million barrels per day), we will find ourselves in a situation that
is very different from the nineties, when the capacity was decidedly
greater than demand (almost double). In the context of the free market
that exists between the two banks of the Atlantic Basin today, Europe
finds itself in a similar situation to that of the USA, and should share
the consequences of the structural deficit in the provision of finished
products of the USA.
In fact, having balanced the European refining capacity at the level of
the regional demand, to prevent the export of petrol to the USA it would
be necessary either to establish duties (fairly improbable) or to be ready
for an escalation in the prices to compete with the US consumers. In
other words:
rThe USA would no longer have the guarantee of the flows from ‘safe
and friendly’ Europe.
rEurope would no longer be autonomous in the provision of finished
products and could not count on a strategically reliable integrated
area of support (the USA will have Europe, but Europe will not have
another Europe for support).
So we are not able to face a dramatic collapse in the oil demand or
a quantitative transformation such as to require draconian reductions in
capacity. The problem is to adapt to the transformations in the quality
of the demand, of acquisition of flexibility within the network of the
demand of the Atlantic Basin and of a structural change in the manage-
ment of the business in the face of the domain of finance in the control
of the price of the raw materials.
We are, therefore, talking about a complex business in which the long
term market view is important for making the appropriate investments as
is the capacity to gather business opportunities day by day. In this regard
we would like to add a basic consideration to the picture described up
to now. For simplicity of explanation we would like to ask ourselves
the following question: if a European refiner manages its plants in a
perfect way, plans its activities taking account of all the transformations
and evolutions of the international market and taking the opportunities
that present themselves day by day, would it be able to obtain a refining

The European Refinery Crisis 141
margin that was so remunerative as to enable it to make investments for
the total renovation of the plants: or, hopefully, to build a new refinery?
The reply is very simple and it’s ‘no’, which means that, in the current
situation, European refining is destined to remain an industry in slow
structural decline and at risk of progressive obsolescence.
Here we arrive at one of the most virtuous contradictions and anoma-
lies of the international oil market.
As we have already seen, the majority of the financial business is
developed on the market of crude oil, namely the raw material. That of
the finished product is only marginally involved.
For years now there has been a different dynamic in the evolution
of the prices of these two markets. The price of crude is essentially
determined by the trends of the financial exchanges in the stock mar-
ket, on the basis of the market expectations of the bank analysts and
operators, while that of the finished products continues to be fairly
closely connected to the movement in supply and demand of the physical
market.
The two trends are often divergent because of their nature and the
instruments with which the players in the two markets operate.
The crude market alone appears to be sufficiently integrated both in
the commercial dynamics and in the mechanisms that determine the
price, while the market of the products is deeply fragmented according
to product and geographical area.
The players in the physical market, the refiners, are used to operating
according to the laws of the physical markets in which they operate
and on which they place their products, seeking to identify the seasonal
nature of the demand and scaling the supply accordingly.
They also try to acquire the crude with a time-scale that enables them
to reduce their financial costs and the risk of the price changing between
the purchase of the crude and the sale of the finished products. In the
past these dynamics were determined by fixing the price of the crude
and the finished products.
Today the price of the raw material is detached from this reality
and depends on the expectations and dimensions of the business of the
financial stock exchange.
The activity of the players in the virtual market is normally founded
on expectations based on the statistical trends of certain variables con-
sidered to be fundamental by the financial analysts (spare capacity of
OPEC, limitations of the supply, reduction in global reserves etc.) and
on the technical analysis.

142 Understanding Oil Prices
Having had several years experience of the repeated seasonal peaks
of the price of US (and European) gasoline from April to August and
that of diesel oil from November to February, with the consequent
dragging of the price of crude, the financial analysts memorized the
processes and changed their behaviour operating on the stock exchange
so as to anticipate the seasonal phenomena. The massive purchases of
crude (paper) take place at least one or two months before the expected
phenomenon of the physical market.
This results in an increase in the price of crude in advance of the
physical phenomenon and above the level that is only justified by the
dynamics of the physical market of the products.
In putting this strategy in place, the financial operator is not taking
any particular risk, in that he never finds himself in the situation of
having to take possession of a single barrel of crude to be transformed
into products. His job will be to buy one day and resell when the price
has increased sufficiently. The provision in itself is just a pretext to
justify taking the initial position on the market. The financial investor
can ‘escape’ in a few minutes from the market in which he entered.
The impact of his action is, on the other hand, real and has an effect
on the price of crude and the economics of the oil industry.
In our example, the refiner will have to buy the raw material at
the price inflated in advance by the financial speculation but he will,
however, have to sell the finished products at the prices (decidedly
lower) imposed by the actual market. He will, therefore, find himself in
the impossible situation of having to obtain satisfactory margins.
It seems to be a crazy mechanism without a way out that merits more
in-depth analysis.
We have analysed the differences between the market dynamics in
2004 and those of 2010, two years in which the refining margins were
different.
We have already said that the various oil products have a particu-
lar seasonal nature, which obliges the refiner to plan the procurement
activities in a different way. In particular:
rGasoline, for which the peak demand is between May and June (in
preparation for the driving season). The necessary crude must be
bought starting from March.
rGasoil, for which the peak demand is in the winter months (being used
for domestic heating). The necessary crude must be bought starting
from the end of summer.
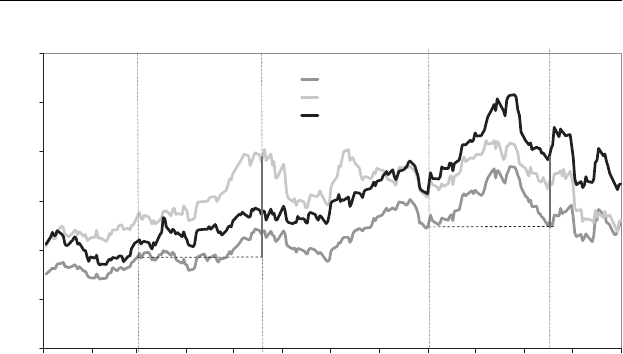
The European Refinery Crisis 143
15
25
35
45
55
65
75
Jan Feb Mar Apr May Jun Jul Aug Sep Oct Nov Dec
$/bbl
Brent
Gasoline
Gasoil
Figure 11.8 Brent and products prices 2004
Let us imagine evaluating the margin of a refiner operating in line
with these criteria. Obviously, in order not to get into complex technical
models, we will assume the extreme simplification that one unit of crude
becomes one unit of finished product (gasoline or gasoil).
As our objective is to understand the dynamics and the mechanisms of
reciprocal influence between raw material and product, the simplifica-
tions should not give us any problems. We have considered the fictitious
margin of the refiner in 2004 (Figure 11.8) and 2010 (Figure 11.9),
particularly significant years because they were less influenced by eco-
nomic crises and political events in the major oil producing countries.
From the two graphs above, it seems quite clear that a theoretical
refiner, who buys crude in March and sells gasoline in May, in 2004
earns $21.10 per barrel (gross of all costs, except that of the crude), that
is about 63% of the cost of the raw material. Just six years later, in 2010,
these earnings are reduced to $7.2 per barrel, that is (in the presence of
crude prices that are more than double) a thin 9%.
As far as the crude bought at the start of September to sell gasoil
in November is concerned, in 2004 our refiner earns $11.9 per barrel
(about 29% of the cost of the raw material), while in 2010 this margin
is $25.1 per barrel, that is about 33%.
Even if this data might seem comforting, we should remember that
2010 was a particularly cold year in Europe, so the demand for gasoil
was significantly higher than expected.
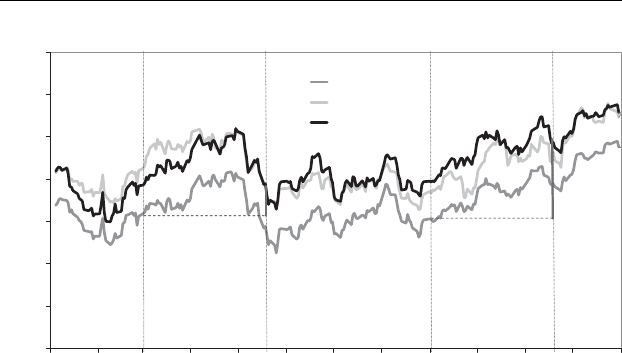
144 Understanding Oil Prices
45
55
65
75
85
95
105
115
Jan Feb Mar Apr May Jun Jul Aug Sep Oct Nov Dec
$/bbl
Brent
Gasoline
Gasoil
Figure 11.9 Brent and products prices 2010
It is also noted that both the products considered for 2004 are of
an inferior quality than those used in 2010, to reflect the change of
specification laid down for both. Gasoil in fact went from 0.2% sulphur
content to 0.1 at the start of October 2007, and gasoline from 50 ppm of
sulphur content to 10 ppm at the start of January 2009.
For this reason we should have expected the margins to increase and
not substantially stay the same.
Now we will analyse the performance of Brent and products in our
two reference years, assuming a price of 100 on 1 January each year.
This operation enables us to analyse the variations for each commodity
better, and to evaluate the reactivity in the peak demand periods.
In 2004 (see Figure 11.10), it is fairly clear that the prices of the
products increase (with respect to their base value) at the moments of
greater demand by the final consumers (mid-May for gasoline, towards
November for gasoil).
At the same time it is noted that the price of crude increases following
the greater demand on the part of the refiners, dragging the demand for
the finished products.
In 2010 (see Figure 11.11), however, the relative increase with respect
to the start of the year seems to be led by a much less marked seasonal
variation, both for the products and for the crude.
We can still see increases in the prices of products at the moments of
greater increase in demand, with the price of crude perfectly in line with
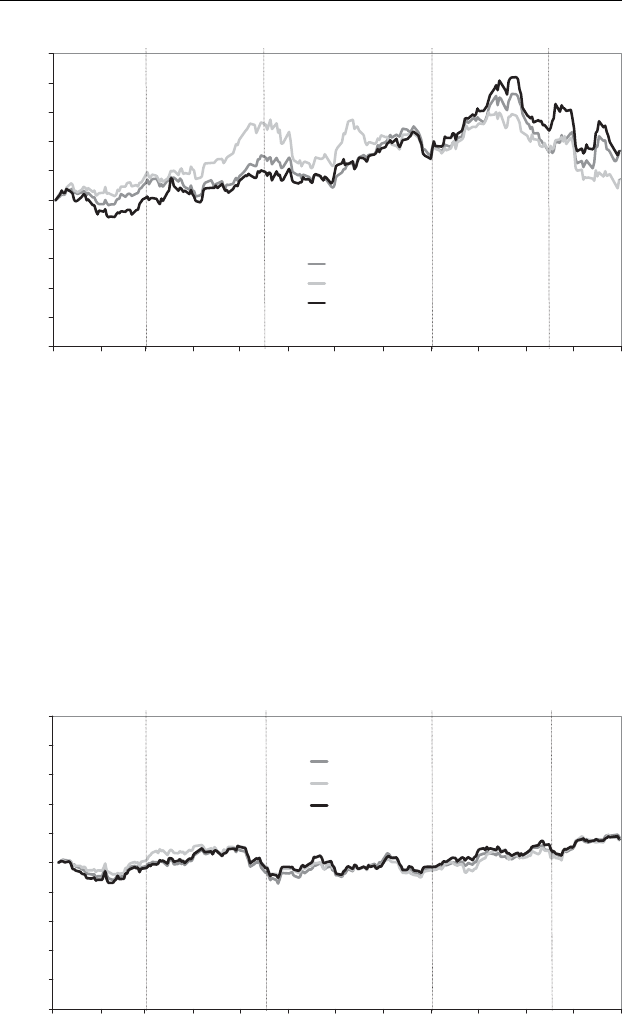
The European Refinery Crisis 145
0
20
40
60
80
100
120
140
160
180
200
Jan Feb Mar Apr May Jun Jul Aug Sep Oct Nov Dec
1
Base: 1 January =100
Brent
Gasoline
Gasoil
Figure 11.10 Brent and products prices 2004 (base: 1 January = 100)
that of the products – a sign of a new ‘driver’ in the crude market that
slavishly follows or anticipates the movements in the product market.
Moreover, it seems that the prices of all three commodities are moving
in a perfectly aligned way during the course of the year: this means that
their percentage growth (with respect to the base value at the start of the
year) is equivalent.
The phenomenon seems to be even more apparent if we look at the
relationship between the prices of product and of crude.
0
20
40
60
80
100
120
140
160
180
200
Jan Feb Mar Apr May Jun Jul Aug Sep Oct Nov Dec
1
Base: 1 January =100
Brent
Gasoline
Gasoil
Figure 11.11 Brent and products prices 2010 (base: 1 January = 100)
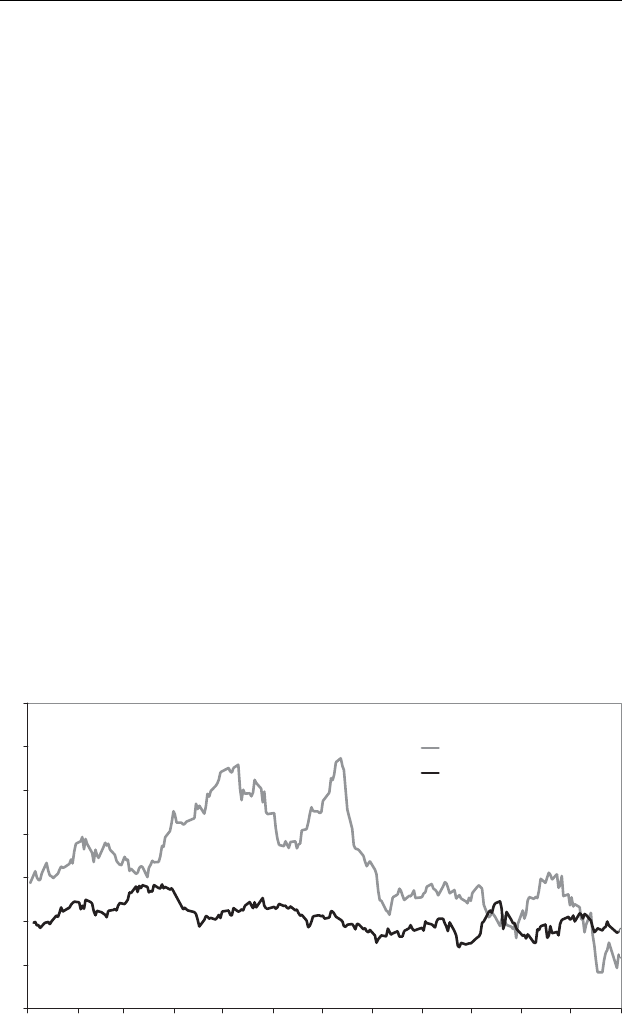
146 Understanding Oil Prices
Even though the refiner is not as interested in the ratio between crude
and product as in the difference between the two (from the moment that
his remuneration is marginal), it is important to study the percentage
profitability of the principal products obtained.
This evaluation can help the refiner to plan the refining in a more
coherent way, turning towards the products with greater profitability.
By analysing the ratio we can understand whether it is better to favour
a particular product at a certain time of the year, according to the logic
of supply and demand.
It seems clear that in 2004 there were increases in profitability in
the periods of the year of greater demand, while this was no longer
happening in 2010. This consideration applies for both the products
analysed. The ratio for gasoline, that was very volatile in 2004, seems
to have levelled off six years later, and does not move substantially
from values of around 1.1; moreover, the seasonal effect is much
less evident.
This means that, while in 2004 the percentage profitability of gasoline
varies considerably, and even reached 45% at the peak of the demand,
in 2010 it stayed below 20% (see Figure 11.12).
Gasoil was subject to a similar fate (see Figure 11.13): while in 2004 a
peak was noted in the ratio between November and December, reaching
about 40% profitability at the peak of the demand, 2010 sees a much
less marked seasonal variation, with profitability always less than 15%;
0.9
1.0
1.1
1.2
1.3
1.4
1.5
1.6
Jan Feb Mar Apr May Jun Jul Aug Sep Oct Nov Dec
2004
2010
Figure 11.12 Gasoline/Brent prices ratio
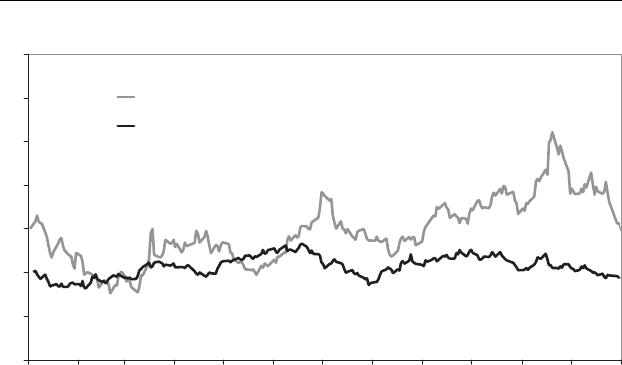
The European Refinery Crisis 147
0.9
1.0
1.1
1.2
1.3
1.4
1.5
1.6
Jan Feb Mar Apr May Jun Jul Aug Sep Oct Nov Dec
2004
2010
Figure 11.13 Gas oil/Brent prices ratio
even in December, at a time of greater tension in the physical market,
the profitability was only 10%.
Having seen the dynamics of the two markets of crude and of finished
products, it is clear that it was the crude market (financial and extremely
flexible) that adapted itself to that of the products, anticipating any
minimal variation and sweeping away the traditional possibility of the
refiner buying in advance in view of the seasonal nature of the demand
for the products. This led to the erosion in the earnings on products even
in the period of greater demand.
In practice, the new sophistication of the financial markets conse-
quently led to the substantial transfer of most of the refining margin
from the refiner to the financial investor. We are facing a situation in
which the market is no longer able to generate reactions to correct the
mechanisms of exaggerated speculation.
It would be logical to expect, under normal conditions, that a reduction
in the margins would correspond to a reduction in the work on crude in
the refineries and hence a reduction in the supply of finished products
with a consequent increase in the price of the products and finally a
rebalancing of the margins.
In our case, the financial speculation has such a capacity to intervene
(due to its size and timing) as to neutralize these mechanisms of the phys-
iological reaction of the market. The increase in the finished products
that should allow the improvement of the margins is separate from the

148 Understanding Oil Prices
immediate rise in the prices of crude (paper), condemning the refiner to
a structural loss. It is the perverse effect of Uranus who ate his children.
What do you do in this absurd situation?
It would be hoped that the problems raised by this situation might
become the subject of the political and energy policy of the various
industrialized countries, but the individual operator cannot avoid looking
for his or her own survival strategy. In a world dominated by the financial
mechanisms, the solution has to be sought in that very context with the
use of certain instruments offered by the world of finance.
It has created, as well as the crude market, a world of virtual refining,
in which it is possible at any time to buy paper barrels, to process them
in a virtual refinery and to sell the finished products obtained, achieving
a refining margin. This margin is called the ‘crack spread’.
A refiner who operates in the real world of the oil industry can
associate his daily activity with certain operations in the virtual world
of financial refining, trying to combine the relative margins of the two
parallel activities. Obviously the technicalities of the market are complex
and varied. What is worthwhile emphasizing is how the virtual refining
process, if suitably managed, enables higher margins to be achieved
than real ones (see Figure 11.14).
Figures 11.15 and 11.16 show how in the last two years the difference
between crack spread and real refining margin registered a value of
$5–15 per barrel.
Therefore, a refiner who knows how to combine his or her activity in
the real market with the parallel and systematic activity on the financial
market is in a position to achieve overall results that enable the margins
for the real activities to be improved in net terms. It is not the solution
to the problem, but a way of managing it.
1 paper barrel
of Brent Virtual Refinery Margin =
8.83 $/bbl
• 1/3 of a barrel of Gasoline
• 2/3 of a barrel of Gasoil
1 physical barrel
of Brent Real Refinery Margin =
-0.13 $/bbl
• 35% of Gasoline
• 45% of Gasoil
• 20% of Fuel Oil
Figure 11.14 Comparison between a financial refinery and a real refinery (MED,
January 2011)
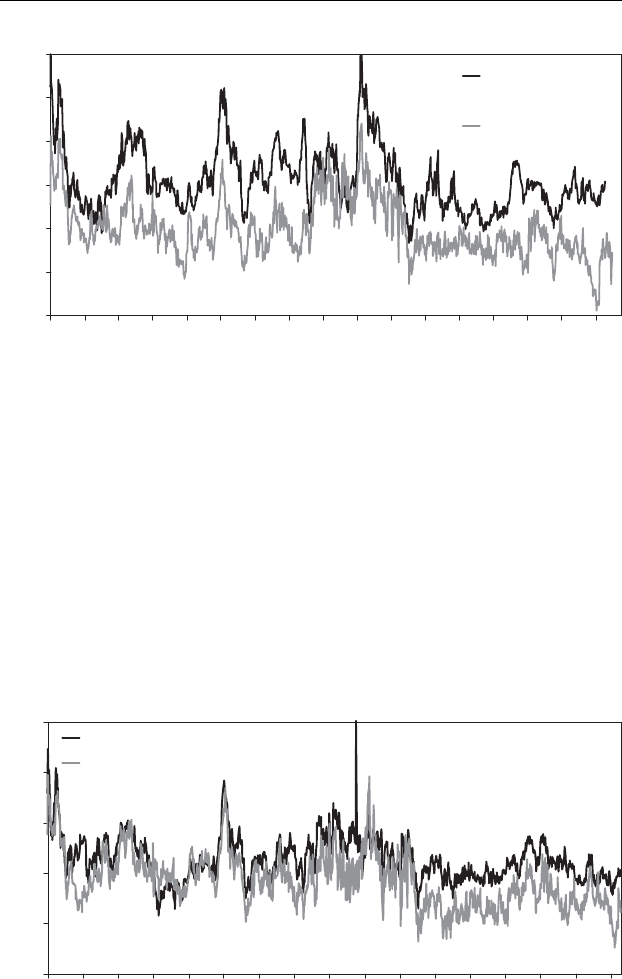
The European Refinery Crisis 149
-5
0
5
10
15
20
25
Sep-05
Jan-06
May-06
Sep-06
Jan-07
May-07
Sep-07
Jan-08
May-08
Sep-08
Jan-09
May-09
Sep-09
Jan-10
May-10
Sep-10
Jan-11
$/bbl
Crack Spread
(seasonal 3-2-1)
Refining Margins
(Cracking - Brent)
Figure 11.15 NWE: refinery margins (cracking plant) versus crack spread (seasonal
3–2–1)
We are, therefore, looking at an industrial problem that has complex
strategic implications, such as, for example:
rHistorical interdependence between American and European refining.
rLevel of technological sophistication of the existing plants.
rCrisis and limitation of the import/export logistics.
rControl of the financial oil markets.
-5
0
5
10
15
20
Sep-05
Jan-06
May-06
Sep-06
Jan-07
May-07
Sep-07
Jan-08
May-08
Sep-08
Jan-09
May-09
Sep-09
Jan-10
May-10
Sep-10
Jan-11
$/bbl
Crack Spread (3-1-1-1)
Refinery Margins (Cracking - Ural)
Figure 11.16 MED: refinery margins (cracking plant) versus crack spread
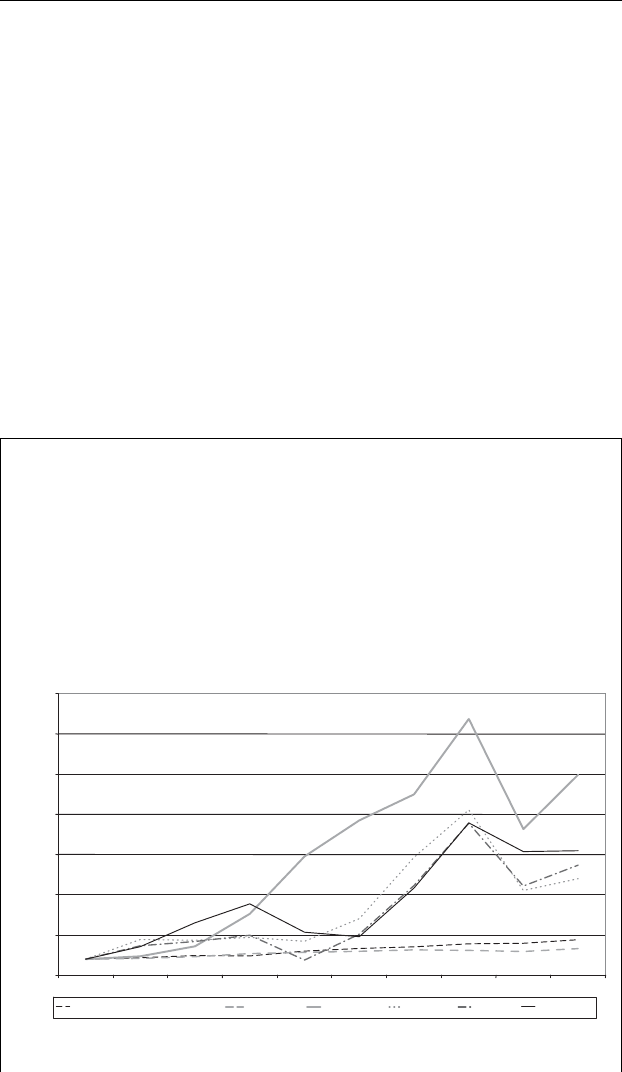
150 Understanding Oil Prices
The problem lies in the future, in at least the next two decades,
in which we will still have a fundamental need of fuels for transport
(gasoline, gasoil, jet fuel).
There will need to be an industrial plan of European and US invest-
ment that enables security of supply to be achieved within this time
horizon. This will mean adopting decisions that are not too dissimilar
from those taken in face of the crisis in the automobile sector, hopefully
before the crisis blows up with very devastating impacts.
The worry is that nothing will be done, in that the size of the problem
still does not seem to be appreciated.
It is the author’s belief that, if similar considerations could be extended
to other sectors of the financial markets (e.g. food), the reasons for the
difficulties and the enormous resistance that exist for any plan to reform
these markets and the international stock exchanges would be clearer.
Box 11.1 Trends in Agricultural Products and Oil Prices
The link between agricultural products and oil prices can be taken
into consideration to understand some of the aspects of the current
North Africa crisis.
Let’s start by looking at some data, in Figure 11.17, on the evolution
of the demand and the prices of oil and food products in the last
10 years.
Base year 2001 =100
80
130
180
230
280
330
380
430
2001 2002 2003 2004 2005 2006 2007 2008 2009 2010
[base year 2001 = 100]
WHEAT, CORN, SOYBEAN DEMAND OIL DEMAND ICE Brent Price Wheat Price Corn Price Soybean Price
Figure 11.17 Agricultural and oil demand and prices
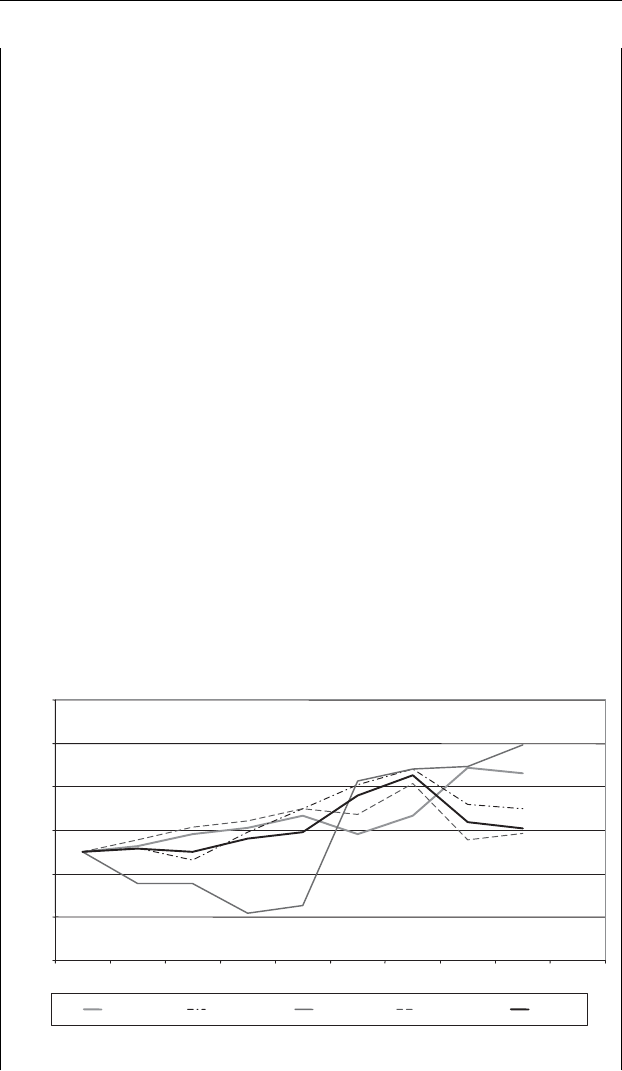
The European Refinery Crisis 151
From 2001 to 2010, the demand for oil, like that for the food
products, increased by 20–25%. In the same period the prices of
oil increased by about 350% and those for food products by up to
280%. We are looking at a price dynamic that is running on average
10 times above the level of demand, despite being in the presence
of a fairly balanced supply. The analysis of the data shows how
the increase in the price of food products has been relatively lower
than that of oil. The increase in the prices of food products becomes
significant, among other things, only starting from 2006, while that
of oil is already evident from 2003. This means that, for the various
producing countries, the oil revenues have been higher than the costs
sustained for importing food products.
It would have been logical to expect that this difference between
oil revenues and costs of food products would transform itself into
an increase in the per capita income of the populations of the coun-
tries concerned. On the contrary, if we look at the published data
in Figure 11.18, we can see that (with the exception of Libya) the
level of the per capita income during the same period only increased
by 10–30%, in line with the increase in the actual demand for the
food products consumed. That is, the increase in income was not
even allowed, given the level of increase in the prices, to continue to
develop as in the past.
Base year 2001 =100
50
70
90
110
130
150
170
2001 2002 2003 2004 2005 2006 2007 2008 2009 2010
[base year 2001 = 100]
Egypt Algeria Libya Morocco Tunisia
Figure 11.18 GDP per capital and open interest

152 Understanding Oil Prices
So, two simple questions arise:
rHow have the rising oil revenues been used in the various countries
in the past 10 years?
rGiven the development of the effective demand for the various
goods, against a substantial stability in the supply (in some cases
even a supply surplus), what causes these enormous increases in
the prices of raw materials (oil and basic food products)?
The answer to the first question is in all the papers and refers to
the scandal of the distribution of wealth in the various oil countries
where minority groups of the population, which gravitate around
the families of the various leaders, are able to accumulate enormous
fortunes, which are invested and spent in the most luxurious areas
of the major metropolises of the world. It would suffice to draw up
the lists of the property assets in London, Paris and New York to get
the picture. Like the flow into these countries of the most expensive
sports and luxury cars. It is astonishing to discover that in some cities
of the Middle East there are more Rolls-Royces than in the whole of
Europe.
The most alarming aspect of the gap between oil revenues and pro
capita income is the impoverishment of the middle classes. In the
past three to four years it turns out that even fairly high level state
officials or state company employees are no longer in a position to
guarantee an acceptable standard of living. A real explosive cocktail
waiting for a detonator.
To answer the second question it is necessary to examine some
more data.
Figure 11.19 shows that starting from the mid 2000s an activity was
triggered on the parallel futures markets for oil and food products.
The exchanges of ‘paper’ contracts of grain are multiplied by more
than seven or eight times with increases of 400%, indicating a new
hunting ground for international finance. The food market became
another refuge for the monetary mass of the international banks. It
can also be seen how, once the moment of crisis of 2008–2009 had
passed, the activity in the futures on these raw materials restarted
with more strength than before.
The result of these activities on the virtual markets is the aggravated
increase in the prices of these goods on the physical markets and,
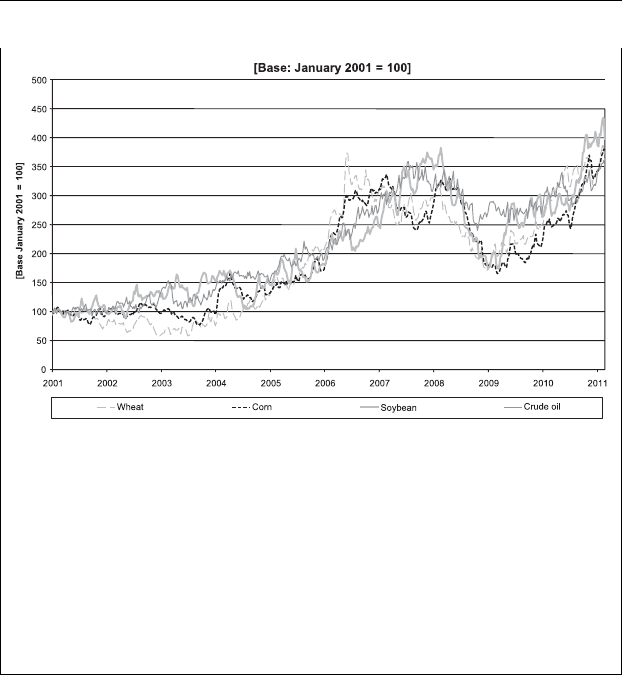
The European Refinery Crisis 153
Figure 11.19 Agricultural and oil futures open interest on NYMEX
hence, an aggravation of the social problems of the poor part of
the population. Once again we are facing a case of the potential
disastrous effects that the financial market can have on the physical
economy and the real word. The financial speculation has penetrated
deep into the mechanisms of the production/physical systems and is
tending to deform its operations beyond the normal physiology of the
markets.
A realignment of the virtual markets with the real ones could have a
dramatic result for the banks in the short term, but perhaps this process
will be unavoidable at some point.
In the meantime, in the oil sector, this climate of expectation brings
concrete and immediate benefits to the producers of the raw material
(producing countries and oil companies), but, as we have seen, is also
having dramatic effects for the refinery industry.
The phenomenon is becoming dramatic in the western areas of con-
sumption, where the economy is strongly dominated by the finan-
cial markets. It is almost paradoxical to see that the only countries
that are investing in the refining sector are China and India, where
the state intervention in the management of the real economy is still
determinant. They are the countries that are looking to the future,
beyond the contingent crises and the uncertainties of today’s market.

154 Understanding Oil Prices
In the west the false conviction often prevails that the liquidity of the
financial markets corresponds to an excess of capacity of the production
systems. At this rate, if nothing is done, together with the tomatoes
coming from China we will begin to depend on the supply of oil products
from China and India. At that point, we will have to be ready to pay
very high prices, given the competition which we will have to face on a
global level.
Perhaps it would be more reasonable and advantageous, economically
and socially, to dig deep into our pocket and invest massively in the
refinery technologies and plants. This is a much more important priority
than the construction of new nuclear power plants.

12
Conclusions: We are
Ourselves OPEC
In the recent past, following a big rise in oil prices, a debate took place
regarding two highly sensitive themes: the clash of civilizations and the
reactivation of a programme for the construction of nuclear power sta-
tions. These are two distinct themes, apparently unrelated to each other.
Yet it is singular that the discussion began and expanded in coincidence
with the materialization of the said initial event, the rise in oil prices.
Having reviewed these themes, no pretences are being made that there
are additional or resolute facts to add to those already circulated by the
world’s press. It is, however, important to relate the themes we have cov-
ered here to the basic model of reasoning which we have developed in
our discourse. It is certainly positive that a discussion regarding nuclear
energy goes ahead in a spirit that is critical, constructive and supported
by hard facts. By moving away from emotional responses to the oil price
alarm, we can move forward and adopt an approach based on economic,
technological, environmental and strategic terms.
In this sense we should clearly envision what we have already elab-
orated on in the preceding analyses. Today, the fundamental question
of the price of oil is linked to a lack of refining capacity and ade-
quate transformation technologies for producing clean transport fuels
(gasoline, gasoil, jet fuel). This problem essentially concerns the
industrialized countries who have created growing and unchallenge-
able environmental legislations, but who have not provided sufficient
investment incentives for the development of technologies and plants
(for production of cleaner products) in the refining sector. Today the pro-
duction of electricity has no direct impact on the price of oil: the fuels
for power stations are residual products available in excess. The choice
of nuclear power for a country should be of an overall strategic nature:
that of being in one of the advanced technology sectors where scientific
research can be a fundamental and decisive factor for advancement in
other sectors. This was actually what many hoped would happen in Italy,
even after the 1987 referendum: to at least keep afloat the existing plants
Understanding Oil Prices: A Guide to What Drives the
Price of Oil in Today’s Markets
by Salvatore Carollo
Copyright © 2012, Salvatore Carollo

156 Understanding Oil Prices
to allow for the conservation of know-how and maintain participation
in worldwide scientific research. This brings to mind what happened in
Europe when the rich and powerful Italian marine republics refused to
finance the challenge proposed by Christopher Columbus. They were
not stimulated to expand their technological capacities to build ships
able to face the waves of the Atlantic. Countries like Holland and Por-
tugal, far behind Italy at the time, accepted the challenges of the ocean
and benefited from remarkable developments. Perhaps they were helped
by the fact that their shores were washed by seas beyond the Columns
of Hercules; there was, thus, no debate on whether to pass through
them. Italy was destined to an inexorable decline and, locked within the
increasingly limited Mediterranean market and restricted by the cultural
climate of the counter-reform and the Council of Trent, was cut off from
all the scientific processes and technological research of those centuries.
One positive outcome of a debate over nuclear power would be if it
once again causes us to face up to the challenges of the technological
frontier. In this case, we will also have to get involved in the challenge
of research on automotive fuels that will enable us to overcome the
crisis of today (unfortunately the solution is not bio-fuels, too easy an
answer). Countries that for over 40 years have been the giants of the
world refining industry cannot sidestep this challenge, of which full
awareness seems not to exist to date.
The environmental challenge has been, till now, a sort of problem
for the elites of the industrialized countries. Fuel laws have become
effective and strict in western countries, leaving emerging countries like
China and India, where the air in the cities has become unbreathable,
out of the picture. If we assume that in the space of a decade these
new consuming countries will move in the same direction as western
countries, the system will reach the point of collapse: there will not be
sufficient clean fuels for everyone. The refining systems which exist
today will be unable to produce clean fuels, starting from the crude oils
available. An economic commitment and a project for technological
research and industrial investments of enormous proportions will be
necessary, for which today’s downstream industry is not at all prepared
nor motivated. Is it conceivable to think of dedicating a part of the huge
amounts of tax paid on petroleum products to these projects?
Too often the debate over oil is concentrated on the size and duration
of the reserves. Certainly this aspect of the problem exists and has to
be considered, even if it is not the key issue that concerns the citizens
and inhabitants of planet Earth. And, above all, when it is invoked to

Conclusions: We are Ourselves OPEC 157
justify an increase in crude price, it is really out of place. The fuels we
need can be obtained using varying technologies starting from the most
disparate raw materials: from crude oil to natural gas, to coal, even up
to bio-components. There is ample availability of these. The problems
in production of clean, environmentally compatible fuels are related to
technology and costs. Let us just think about the development of GTL
(gas to liquid) technology, namely the production of extremely clean,
high-quality liquids, starting from gas. Not only do we know that there
is still enormous availability of natural gas, but that coal can also be
gasified, and from this gas clean liquids can be produced. There is no
need to remember that these are ancient technologies (to be re-studied
and improved) used, for example, in South Africa during the embargo
years. Implementation of these technologies will depend on investments
made in research, on overall production costs, but also on the flexibilities
that the automobile industry will provide in the future. Engines designed
to function with liquids structured in a different way from the traditional
gasoline can make the use of these new products easier.
It is clear that, facing (and on the eve of) far-reaching changes that
can affect the world oil scenario, asking the refiners, who are the
most conservative and traditional members of the oil industry (at times
referred to as ‘petroleum peasants’), to expose themselves today to the
risk of heavy but ultimately excessively risky investments, would be a
pure illusion. The tensions we are facing up to tell us that the break-even
point for the use of different raw materials is now very close. If, when
analysing the future scenarios, the outcome of the environmental prob-
lem in the Far East were taken into serious consideration, the decisions
that would have to be taken would appear more linear and less exempt
from risk. Investments in downstream petroleum technologies should
be much greater and less tentative than they have been in the last three
decades. Within 10 years we could easily discover that someone else
has taken the situation seriously and is guiding the new technological
processes and the production of new fuels. Somewhat similar to what
happened to the Italian marine republics.
The obsession, almost exclusively focused on company share values
as examined by financial analysts and presented to shareholders every
quarter or half-year after, increasingly risks locking companies into
policies that are targeting only short-term results. Without intervention
from national or supra-national institutions, this picture will not change
and there will be no move towards a solution on the basis of free
market forces.

158 Understanding Oil Prices
Discussion of these themes should have progressed in concrete and
scientific terms in the last 10 years, but unfortunately there have been
frequent attempts to sidestep the problem, taking refuge in pointless
exchanges. The most glaring example was the debate on the clash of
civilizations, or on religion, which produced a sort of metaphysical sub-
limation of the attempt to defend the status quo. The author has several
Nigerian friends with important jobs in the State administration, with
whom he has had the occasion to discuss the so-called religious con-
flicts that have characterized Nigeria’s recent history. They explained,
in detail, how the tensions and conflicts were manipulated and amplified
to enable the heads of the various ethnic and social groups to demon-
strate their political weight in the mediations to develop in the centres
of power of the capital. No one had ever raised the problem of con-
testing the religious faith of other persons. And one finds an immediate
example of that when, travelling between villages, Christian churches
and Mosques of all types are seen, well distributed throughout the land.
However, from time to time, one cannot avoid seeing manifestations of
violence. The key problem is in the division of the oil revenues between
the poor regions (with a Christian majority) where the oil is produced,
and the richer regions (with an Islamic majority) where most of the rev-
enue arrives. With the increase or decrease in the flow of petrodollars,
everyone feels entitled to renegotiate previous agreements with all the
tools at their disposal, including using an ideology of religious differ-
ences and the ensuing violent encounters. The author believes there is
not much difference between what happens in this country as charac-
terized by the historic co-existence between peoples of different reli-
gious creeds and what is happening around the globe. At the cusp of a
crucial crisis between availability of energy resources and prospects
of increased demand, the world is rediscovering that hydrocarbon
reserves are distributed across the globe in a very heterogeneous way and
are concentrated in certain specific regions of our planet, where Islam
is prevalent.
During the 1990s, the growth of crude production in the North Sea
and domestic production in the US allowed for the creation of a futures
market. The internal mechanisms of the financial markets have created
a powerfully expansive trading game, where as a founding principle
the sensation of an unlimited supply, readily available everywhere, has
permitted the removal of the physical aspect of the market, namely
the authentic aspect. The basic principles of management of the oil
companies and the refining organizations have been overturned. The

Conclusions: We are Ourselves OPEC 159
operational programming of the production cycle has become a sec-
ondary element vis-`
a-vis the achievement of the overall result. In some
organizations, the risk management department, which handles opera-
tions in the futures market, has become an autonomous business hub,
often the fulcrum of all the trading activities. All this has been strongly
supported by the tax legislation of some European and US states, where
trading activities have enjoyed important fiscal benefits.
Financial instruments have become, as it were, a new religious faith,
whose sole priests are very young traders, fanatics and millionaires,
experts in market techniques. This explains the clamorous events in
which individual traders have triggered the fall or bankruptcy of ven-
erable world financial institutions (see the much publicized case of the
Soci´
et´
eG
´
en´
erale). This is a market that is becoming ever more self-
serving and controlled by the managers of world finance. The move-
ments of crude prices have proved to be linked more to the horizontal
operations of finance (shifts of funds from one asset to another) rather
than to the internal dynamics of the oil market, such as those of demand
and supply. Quiet reflection would be necessary, well away from the
fever of the financial religion which has dominated these last few years.
Only in the last decade, the prevalence of the unflinching trust in finance
has brought us down a path that has resulted in the further deterioration
of the situation and taken us further away from a possible solution.
It is difficult to ask the priests of these new religions, highly tech-
nological but also very fanatical, to formulate a logical, historical and
political approach to the problems of energy and oil. It is easier to
continue speaking about a west surrounded and attacked by another
religious universe that is also in control of the availability of crude.
This allows the world to postpone, still further, any concerted quest for
solutions to the problems at hand, instead permitting the financial arena
to grab further profits.
The author believes that a major part of the debate over the clash
of civilizations takes place at the abstract level, which does not get
to the root of the problems. Right from the start, the confrontation
between Islam and Christianity has been affected by the control of the
Mediterranean economy. Today, it has to take account of the control
of the energy market and distribution of the oil revenues. It may seem
trite to say this, but a true process of stabilization of peace can only
start from a reconsideration of the technology of private transport and
the replacement of the traditional service stations. We may conclude
our narrative by recalling a fable of Aesop, that of the horse, the boar

160 Understanding Oil Prices
and the man. The horse, accustomed to drinking at a fountain of fresh
crystalline water, one day sees a boar dirtying the spring water. To resolve
the problem, the horse decides to ask for the help of a hunter, who riding
the horse follows and captures the boar. With the task completed, the
man discovers the usefulness of the horse and decides to put a rope
round his neck so that he cannot escape. If we change the names of the
actors, putting the oil companies in place of the horse, the turbulence of
the market in place of the boar and the futures markets in place of the
man, we have a snapshot of what happened in the last two decades. All
the actors in the productive cycle of oil have delegated the management
of their company’s risk to the financial fund managers, who at the end
have become the true masters of the business, dictating rules, limits and
perfecting the strategies. The lesson that the financial crisis has given
us should make us understand that the links between finance and oil are
very tight and full of risks for the future.
The events that during the first few months of 2011 upset the political
scenarios of North Africa and the energy markets of the Mediterranean
require an examination that goes beyond the possible future changes in
the control of power in the various countries.
We are therefore facing a crisis scenario in which it seems clear
that the power of finance, which in fact means that of no more than
a dozen banks in the world, is today boundless and devoid of any
political control.
There is nothing new in saying that the power of finance and the
banks is boundless, but it is new to see the new dimension of the
phenomenon on a global level, which can intervene in the political and
social equilibriums of entire regions in the world and of the development
of strategic sectors of the global economy. I remember learning from
the books at high school that the wars of the 16th century were decided
in Antwerp, the financial capital at the time. In an era when armies
were not made up by national troops but by mercenaries, obtaining the
financing from the banks was fundamental to equipping soldiers and
having the chance of winning. Indeed in order to keep Antwerp under
control, Charles V, the emperor of Spain and the Holy Roman Empire,
did not live in Madrid but in Brussels. There was, therefore, a form of
control of political power over international finance.
Today seeing this immense power devoid of control and causing
apparently devastating effects, leads us to ask how all this could be
possible. It is possible to fantasize about scenarios of the type described
by Orwell in 1984, with a Big Brother intent on using its financial

Conclusions: We are Ourselves OPEC 161
power to achieve its objectives, but we know that the complexity of
the world does not permit these simplifications. So we need to look
at two possible alternatives. One is the existence of a neo-liberal and
monetarist economic target at a global level agreed by the majority of the
governments of the economically strongest countries, which, however,
is starting to break up and to cause unexpected and unwanted collateral
effects. The other is that there is no longer political leadership at a global
level able to call upon a capacity for governing these power centres.
The developments after the financial crisis of 2008/2009 incline more
to the second. The banks were saved by the governments without any
attempt to at least change the rules of the financial markets. When Obama
tried to open the Wall Street dossier he had to shut it again immediately.
There are no new Roosevelts, Churchills or De Gaulles around.
If we put together the messages that are coming from Japan with
the Fukushima disaster and from Libya with the shutdown in the pro-
duction of crude almost all of light quality (ideal for the production of
high-quality petrol), we see once again how the control of the market
in hydrocarbons continues to have a strategic bearing for all the indus-
trialized countries. In the next few months we will already be seeing
the effects of these events at the petrol pumps. So, despite the evidence
of this strategic impact of oil (as indeed that of food products) this
raw material will still be allowed to be subject to the most devastating
financial speculation.
Karl Marx describes a world in which the owner of a factory and his
worker represent the two class enemies par excellence. Today they are
both like straws in the wind dragged along by a devastating current.
Perhaps we can continue to talk of the world with models that worked
up to a few years ago, but that no longer allow us to deal with events that
are taking place at a pace unknown before in the history of humanity.
In this framework politics seems too often to be inadequate, bewildered
and incapable of understanding and guiding the economic and social
processes. And we will continue to see the price of fuel increasing at
the service station, at least so long as we continue to produce it in
our refineries.
Every time we stop at a service station to fill up the car we should
be aware of the complex universe that is inside every drop of liquid
that the pump delivers. Above all, we should realize how precarious the
equilibrium is, which allows us, despite complaints about the prices we
have to pay, to receive a fuel that is sufficiently clean, readily available
everywhere, without having to queue or worry about the next fill-up.

162 Understanding Oil Prices
This is not something to be taken for granted and this applies to anyone
who travels around the world. In too many countries this service is not
guaranteed and perhaps it will be even less so in the future, with the
resulting tensions that we can easily imagine. And these tensions foster
powerful financial speculations.
All this can and must change, but it will require a radical cultural
transformation on the part of both consumers and producers. We might
say that it will take generations for this to happen, but we do not have
this time. Solutions are needed more quickly than our habits and lazi-
ness allow. Someone in the past decade has tried to coerce the global
equilibrium so as to guarantee the status quo of our way of life and
thinking, but with disastrous results.
The only way now is to force us to understand and find the right
solutions. We cannot now put our faith in any OPEC, whether Christian
or Muslim. Now, we are OPEC.

Bibliography
Annual report 2009 (2009) Unione Petrolifera.
Augieri, Giuseppe (2002) Cambiare per sopravvivere: la questione energetica in Italia,
Rubbettino Editore Srl.
Banks, Ferdinand E. (2000) Energy Economics: A Modern Introduction, Kluwer Aca-
demic Publishers.
Castagna, Luigi (2008) Il pianeta in riserva. Analisi e prospettive della prossima crisi
energetica, Edizioni Pendragon.
Clˆ
o, Alberto (2002) Economia e politica del petrolio, Hoepli.
Clˆ
o, Alberto (2008) Il rebus energetico. Tra politica, economia e ambiente, Il Mulino.
Clˆ
o, Alberto (1990) Interdipendenza e instabilit`
a nell’oligopolio petrolifero. Lezioni di
economia industriale, CUSL.
Davis, Jerome D. (2006) The Changing World of Oil: An Analysis of Corporate Change
and Adaptation, Ashgate Publishing Limited.
Eden, Richard John (1981) Energy Economics: Growth, Resources, and Policies, Cam-
bridge University Press.
Energy Policies of IEA Countries – the United States of America 2007 Review (2007)
International Energy Agency.
Energy Policies of IEA Countries – Italy 1999 review (1999) International Energy
Agency.
Fattouh, Bassam (2007) The drivers of oil prices, Oxford Institute for Energy Studies.
Gary, James H. and Handwerk, Glenn E. (2001) Petroleum Refining: Technology and
Economics, Marcel Dekker.
Gary, James H., Handwerk, Glenn E. and Kaiser, Mark J. (2007) Petroleum Refining:
Technology and Economics, CRC Press.
Horsnell, P., Brindle, A. and Greaves, W. (1995) The Hedging Efficiency of Crude Oil
Markets, Oxford Institute for Energy Studies.
Jovinelly, Joann (2007) Oil: The Economics of Fuel, Rosen Publishing Group.
Krugman, Paul R. (2002) International Economics: Theory and Policy, Addison Wesley.
Legge, Sarah (1997) A Comparison of the US and European Auto/Oil Programmes,
Oxford Institute for Energy Studies.
Lerche, Ian and Noeth, Sheila (2004) Economics of Petroleum Production: Value and
Worth , Multi-Science Publishing Co.
Mabro, Robert (1992) OPEC and the Price of Oil, Oxford Institute for Energy Studies.
Mabro, Robert (1998) The Oil Price Crisis of 1998, Oxford Institute for Energy Studies.
Understanding Oil Prices: A Guide to What Drives the
Price of Oil in Today’s Markets
by Salvatore Carollo
Copyright © 2012, Salvatore Carollo

164 Bibliography
Mabro, Robert (2005) The International Oil Price Regime: Origins, Rationale and
Assessment, The Journal of Energy Literature, XI(1).
Mabro, Robert (2006) Oil in the 21st Century: Issues, Challenges and Opportunities,
Oxford University Press.
Matteo, Falcione (2004) I contratti del mercato del gas naturale, Eliconie Editrice
(collana AIEE).
Maugeri, L. (2001) Petrolio, Sperling & Kupfer.
Maugeri, L. (2006) L’era del petrolio. Mitologia, storia e futuro della pi `
u controversa
risorsa del mondo, Feltrinelli.
Mitchell, John V., Morita, Koji, Selley, Norman and Stern, Jonathan P. (2001) The
new economy of oil: impacts on business, geopolitics and society, Royal Institute of
international affairs.
Noreng, Oystein (2006) Crude Power: Politics and the Oil Market, I.B. Tauris
Publishers.
OECD environmental outlook to 2030 (2008) OECD.
OECD Factbook 2009: Economic, Environmental and Social Statistics (2009) OECD.
Oil market report, IEA, edizioni 2008 e 2009.
OPEC Bulletin, OPEC, varie edizioni 2008 e 2009.
Simone, Piero De (2009) Il mercato dei carburanti: evoluzione normativa e prospettive,
Conferenza Unione Petrolifera.
Speight, J.G. (1999) The Chemistry and Technology of Petroleum, Marcel Dekker.
Statistiche economiche energetiche e petrolifere (2008) Unione Petrolifera.
Van Der Linde, Coby (2000) The State and the International Oil Market: Competition
and the Changing Ownership of Crude Oil Assets, Springer.
World Oil and Gas Review 2008, Eni, 2008.
Yergin, Daniel (1991) The Prize: The Epic Quest for Oil, Money, & Power, Simon &
Schuster.

Index
Note: Page references in italics refer to Figures; those in bold refer to Tables.
agricultural products, link with oil prices
150–3
Ahmadinejad, Mahmoud 5
Algeria 43
alkylate gasoline 138–9, 139
alkylation 53
Angola 43
Arabian Light crude as benchmark 30–1, 31,
34, 35, 40
Asia-Pacific, per capita oil demand 49
automotive fuels, taxation effect 61
backwardation 117, 128
benchmarking 105–6
BFO (Brent, Forties, Oseberg), 21 day
benchmark 126–7
bio-fuels 156
Bonny Light 105–6
BP 40
BP-Amoco-Arco 44
BP-Chevron 89
Brent 15 day contract 94–9, 117
mechanism 95–6
price risk 98
Brent 15 day market, problems of 123–30
Brent 21 day market 126
Brent Blend 40, 89
Brent Dated 101, 102
1970–2010 2
assessment 128–30
as benchmark 105–6
market 98
Brent IPE 102
Brent Oil
correlation index between international
crudes and 106, 106
discovery 89
features 89
Forward and Futures, paper market 116
Futures contract 40
inter-monthly volatility 27–8, 27
as international benchmark 37–40, 101
market 11–17, 89–103
creation and intention of 15–16
price collapse (1986–88) 8
IPE 100–2
versus NYMEX 14–15, 15,16
product prices
2004 143, 143, 144, 145
2010 143, 144, 144–6, 145
production 89
1976 32
sale and purchase contract 90–4
squeeze 123–5, 126
value, as reference for crude oil price
10–13
Bush, George 50
Carson, Rachel 45
Caspian Sea area, problems in 70
Chavez, Hugo 5
Chernobyl accident 9, 43, 45, 46
Chevron 40
Chevron-Texaco 44
China 48
classical industrial model 81–2, 82
Understanding Oil Prices: A Guide to What Drives the
Price of Oil in Today’s Markets
by Salvatore Carollo
Copyright © 2012, Salvatore Carollo

166 Index
classical model of demand/supply 73, 76, 76
vicious circle in 78, 78
classical model of international oil market
73–80
Clinton, Bill, administration 50
component prices, impact of 53–5
contango 117, 128
Crack Spread 148
cracking 52–3
crude oil
destination of 71
heavy, refining cycle 84, 84
marginal barrel, cost of18–19
market 5
link to physical market 17–18
monopoly and 1970s crises 30–3
prices 1970–2011 30
production
2008 7
2008–10 14
war 1970–2011 30
world demand 47
DDT 45
demand/supply of gasoline and gasoil 21–8
diesel fuel, tax burden 61
distressed cargoes 99
driving season 83
Earth Day 45
economic model 2, 3
Ekofisk 127
electricity production 155
Emirates 42
energy diversification 66
environmental demand, evolution of 45–50
equity quota 72
Europe
automobile taxation 62
construction of refineries 65
gasoline prices 60
per capita oil demand 49
public transport 62
refineries number versus distillation and
conversion refining capacity 132, 133
refinery crisis 131–54
surplus/deficit in capacity, refining margins
and demand 135–6, 135,136,137
taxation
on diesel fuel 59
on gasoline 57–9, 58,59,61
Exxon 30, 40, 89
Exxon-Mobil 44
financial crisis and oil market 2008 10–17
financial market for crude and finished
products 5
financial refinery versus real refinery 148, 148
finished products market 5
fiscal policies 55–62
floating storages 117–19
flows
dependent on price 70, 71
guaranteed 70, 71
Forties pipeline system 126, 127
free market, start of 41–4
Fukushima nuclear accident 9, 10, 28, 161
gasoil 61
demand/supply 21–8
Europe and USA 21–3, 22
in Europe 9
specification, evolution of 47,47
US consumption 61–2
gasoil/Brent prices ratio 146, 147
gasoline
and components 50–3, 51
composition 23
consumption, US 61–2
demand/supply 21–8
Europe and USA 21–3, 22
price
US 61
world 60
shortfall in USA 9
specifications, evolution of 46
gasoline/Brent prices ratio 146, 146
Gore, Al 50
GTL (gas to liquid) technology 157
guaranteed flows 70, 71
Gulf War 9, 43
hedging the price risks 106–14
examples 107–10, 110–13
Hussein, Saddam 32
hydrocarbons, molecular composition
49
hydroskimming 82, 83
India 48
Intercontinental Exchange (ICE) platform,
creation 103

Index 167
International Energy Agency (IEA) 32, 33, 73
variation in estimated stocks 79
International Petroleum Exchange (IPE) 40
Brent market 100–2
Iran 48
revolution in 32–3
Iran-Iraq war 32, 33, 42
Iraq 48
invasion of Kuwait 42
as swing producer 43
US embargo on 43
isomerization 53
Italy
automotive fuel taxation 62
gasoline prices 60
refineries 69, 67
taxation on gasoline 59
Japan 48
jet fuel market 24–5
Kazakhstan 43
kerosene 24
Kuwait 42
invasion by Iraq 42
as swing producers 42–3
laws, fuel 156
US Clean Air Act (1999) 44, 48–50
lead, banning of 49
leaded gasolines, banning of 48
Libya 48, 161
crisis 9
sweet light crude production 10
lifting procedures 130
loading terminals procedures 119–21
market structure 117–19
Marx, Karl 161
Mattei, Enrico 63
mechanistic method 120
modern oil industrial cycle 85, 85
modern supply/demand model 77–8,
77
MTBE (methyl tert-butyl ether) 54
naphtha, light virgin 53
natural gas 157
netback value system 36
Nigeria 43
religious conflicts in 158
crudes, competition with Brent oil
38
crisis in 39
Ninian 89
nominal cargo size 120
nomination method 120
North Africa crisis 8–9, 28
North Sea 43
nuclear power 34, 156
NYMEX 14, 101
versus Brent 14–15, 15,16
Obama, Barack 161
off-take agreements 130
oil crisis 2008 7–8
oil for food programme 43
oil futures market 13
NYMEX 14
NYMEX versus Brent 14–15, 15,16
daily trades (2008–10) 18
oil market, correlation and dynamics in 4
oil price, divorce between oil and 102–3
oil shocks 132
oligopoly model 37
OPEC 162
formation of 31
influence on dynamics of crude prices 17
in 1980s 33–5
production v. Brent 3, 4,
suicide of 40–1
operational flexibilities, hedging and 114–16
Oseberg 126
OSP 40, 41
petroleum peasants 157
Platts 125–6, 127, 128–30
pooling of rights 121
price crash 1986 40
price war 35–7
Reagan, Ronald 35
administration 66
refineries
in Europe 65
in producing countries 66
see also under names
refinery margins versus crack spread 148,
149
refinery scheme, simplified 55, 56
reformed gasoline 52
reforming 51–2

168 Index
reformulated types 48–9
reserves, size and duration 156–7
rogue traders 110
Rotterdam refining market 139–40
Saudi Arabia 39–40, 42
price war 35–6
production 10, 33
quota, 1985 35
renunciation of official price system (OSP)
36
Seven Sisters 63
Shell 30, 40
Shell UK 89, 90, 94
‘15 day Brent contract’ 37
Shell UK-Exxon 89
short-term model of international oil market
81–8
Silent Spring (book) 45
Soci´
et´
eG
´
en´
erale 159
Spar terminal 89
Statoil 126
stocks, fluctuations in, versus Brent price 75,
75
strippers 39
Suez Canal, closure of 65
Sullum Voe terminal 89, 120
sulphur reduction 49
supertankers 66
tax spinning 105
taxation
on gasoline 57
legislation 159
on petroleum products 56, 57
UK 105
US
on fuels 62
on gasoline 57, 58
Thatcher, Margaret 35, 41
thermo-electric power stations 34
Total-Fina-Elf 44
transport costs 66
UK taxation 105
United Nations, Security Council 43
USA
Clean Air Act (1999) 44, 48–50
continual fall in crude domestic production
48
crude demand by sector 46
evolution of oil demand 49
gasoil consumption 61–2
gasoline consumption 61–2
gasoline price 61
imports: gasoline and blending components
54, 138, 138
per capita oil demand 49
petroleum consumption 63
petroleum production 63
refineries and average refining capacity
66–7, 68
refineries number versus average refining
capacity 132, 133
refining capacity versus rate of utilization
67, 68
strippers 39
surplus/deficit in capacity, refining margins
and demand 136, 137,137
taxation
on fuels 62
on gasoline 57, 58
transport cost reduction 63
variable discount 41
Venezuela 42, 43
world energy policy 8–10
world gasoline prices 60
world oil
demand 73–5, 74
2008 7
2005–10 6
versus supply 7, 8
supply 73–5, 74
world oil flow 63–72, 64
downstream transformations 66–70
world supply structure 70–2
world refining system 82–3
WTI (West Texas Intermediate) 101
WTI—Brent differential 24–8, 26
Yamani, Sheikh 35–6, 37, 38, 101
Yom Kippur war 31
Index compiled by Annette Musker
