| ThoughtSpot Thought Spot User Guide 5.1
User Manual:
Open the PDF directly: View PDF ![]() .
.
Page Count: 416 [warning: Documents this large are best viewed by clicking the View PDF Link!]
- Table of Contents
- Introduction to the User Guide
- Finding your way around
- ThoughtSpot browser access
- About your user profile
- Understanding privileges
- Use stickers to organize
- What are Searches and Answers?
- Start a new search
- Choose a data source
- Search bar features
- Search suggestions
- Search results and column types
- Last data refresh time
- Work with Answers
- Results that are tables
- Overview of keyword searches
- Time series analysis
- Search using growth over time
- Proximity searches "near" and "farther than"
- Understand filters
- Add a filter to a table
- Add a filter to a chart
- Create a bulk filter
- Delete a filter
- Filter on null, blank, or empty values
- Other search actions
- Change result display options
- Show underlying data
- See the search behind a result
- Apply conditional formatting
- Download your search
- Replay search
- Understand charts
- Column charts
- Bar charts
- Line charts
- Pie charts
- Area Charts
- Scatter charts
- Bubble charts
- Pareto charts
- Waterfall charts
- Treemap charts
- Line column charts
- Funnel charts
- Geo charts
- Sankey charts
- Pivot table
- Change a chart
- Reorder labels on the axis or legend
- Set the y-axis range
- Hide and show values
- Change chart colors
- Additional chart options
- Zoom into a chart
- Understand formulas in searches
- Add a formula to a search
- View or edit a formula in a search
- Overview of aggregate formulas
- Cumulative functions
- Moving functions
- Flexible aggregation functions (group aggregate and filters)
- Group aggregation functions
- Filtered aggregation functions
- Type conversion functions
- About date formulas
- Percent (simple number) calculations
- Formula operators
- Nested formulas
- Formula support for chasm trap schemas
- Basic pinboard usage
- Edit the layout of a pinboard
- Pinboard filters
- Schedule a pinboard job
- Search actions within a pinboard
- Copy a pinboard
- Copy a pinboard or visualization link
- Reset a pinboard visualization
- Start a slideshow
- About R in ThoughtSpot
- Create and share R scripts
- Run prebuilt R scripts on answers
- Save and share R visualizations
- What is SpotIQ?
- SpotIQ 101: Load and analyze data
- SpotIQ 101: Do more with SpotIQ
- SpotIQ 101: Review insights
- Best SpotIQ Practices
- Custom SpotIQ analysis
- Advanced R Customizations
- Understand data sources
- Create and load a CSV file
- Append data through the UI
- View a data profile
- Set your display language (locale)
- Overview of sharing
- Share a pinboard
- Share answers
- Share uploaded data
- Revoke access (unshare)
- About SearchIQ
- Use SearchIQ
- Teach SearchIQ your language
- Slack and Spot
- How to use Spot
- More help and support
- Keyword reference
- TQL reference
- tsload flag reference
- tscli command reference
- Date and time formats reference
- Row level security rules reference
- Formula function reference
- Alerts code reference
- User action code reference
- Error code reference
- Metadata Errors (100 - 499)|
- Data Service Errors (500 - 699)
- Dependency Errors (700 - 799)
- Admin Service Errors (800 - 899)
- Permissions Errors (900 - 999)
- Import Data Errors (1000 - 1099)
- Scheduled Jobs Errors (1100 - 1199)
- User Admin Service Errors (1200 - 1399)
- Session Service Errors (1400 - 1599)
- Data Management Service Errors (1600 - 1799)
- Cluster Status Service Errors (1800 - 1899)
- Callosum API Errors (9000 - 9199)
- Common Errors (10000 - 10099)
- Falcon Errors (10600 - 10699)
- Data Errors (11000 - 11099)
- Report Generation Errors (12000 - 13000)
- More Metadata Errors (13000 - 13099)
- Loading Errors (30000 - 30099)
- Timely Errors (60000 - 64999)
- Frequently asked questions

Users GuideUsers Guide
Version 5.1 February 07, 2019

Copyright for ThoughtSpot publications. © 2019 ThoughtSpot, Inc. All rights
reserved.
ThoughtSpot, Inc. 1 Palo Alto Square
Building 1, Suite 200
Palo Alto, CA 94306
All rights reserved. This product is protected by U.S. and international copyright
and intellectual property laws. ThoughtSpot is a trademark of ThoughtSpot, Inc. in
the United States and/or other jurisdictions. All other marks and names mentioned
herein may be trademarks of their respective companies.

Table of Contents
IntroductionIntroduction ............................................................................................................................................................................................................................................................ 55
Getting StartedGetting Started
Finding your way aroundFinding your way around.............................................................................................................................................................................................................. 66
ThoughtSpot browser accessThoughtSpot browser access .......................................................................................................................................................................................... 1010
Your user preferencesYour user preferences.................................................................................................................................................................................................................. 1212
Understanding privilegesUnderstanding privileges.......................................................................................................................................................................................................... 1616
Use stickers to organizeUse stickers to organize............................................................................................................................................................................................................ 2121
Use SearchUse Search
What are searches and answers?What are searches and answers? .............................................................................................................................................................................. 2424
Search basicsSearch basics
Start a new searchStart a new search .................................................................................................................................................................................................................... 2626
Choose a data sourceChoose a data source.......................................................................................................................................................................................................... 2828
Search bar featuresSearch bar features.................................................................................................................................................................................................................. 2929
Search suggestionsSearch suggestions.................................................................................................................................................................................................................. 3232
Search results and column typesSearch results and column types........................................................................................................................................................................ 3434
Last data refresh timeLast data refresh time .......................................................................................................................................................................................................... 3636
Work with AnswersWork with Answers .................................................................................................................................................................................................................. 3838
Results that are tablesResults that are tables.................................................................................................................................................................................................................. 4242
Use keywords in searchUse keywords in search
Overview of keyword searchessOverview of keyword searchess .......................................................................................................................................................................... 4545
Time series analysisTime series analysis ................................................................................................................................................................................................................ 4848
Search using growth over timeSearch using growth over time .............................................................................................................................................................................. 5252
Proximity searches "near" and "farther than"Proximity searches "near" and "farther than".................................................................................................................................. 5656
Work with filtersWork with filters
Understand filtersUnderstand filters........................................................................................................................................................................................................................ 5858
Add a filter to a tableAdd a filter to a table.............................................................................................................................................................................................................. 6161
Add a filter to a chartAdd a filter to a chart.............................................................................................................................................................................................................. 6464
Create a bulk filterCreate a bulk filter...................................................................................................................................................................................................................... 6767
Delete a filterDelete a filter ...................................................................................................................................................................................................................................... 7070
Filter on null, blank, or empty valuesFilter on null, blank, or empty values ............................................................................................................................................................ 7171
Other search actionsOther search actions
Other search actionsOther search actions.............................................................................................................................................................................................................. 7373
Change result display optionsChange result display options.................................................................................................................................................................................. 7474
Show underlying dataShow underlying data .......................................................................................................................................................................................................... 7777
ThoughtSpot Users Guide
February 07, 2019
support@thoughtspot.com i

See the search behind a resultSee the search behind a result .............................................................................................................................................................................. 8080
Apply conditional formatting to a tableApply conditional formatting to a table...................................................................................................................................................... 8181
Download your searchDownload your search ........................................................................................................................................................................................................ 8585
Replay searchReplay search .................................................................................................................................................................................................................................. 8787
Work with chartsWork with charts
Understand chartsUnderstand charts.............................................................................................................................................................................................................................. 8888
Chart typesChart types
Column chartsColumn charts.................................................................................................................................................................................................................................. 9191
Bar chartsBar charts................................................................................................................................................................................................................................................ 9393
Line chartsLine charts.............................................................................................................................................................................................................................................. 9595
Pie chartsPie charts ................................................................................................................................................................................................................................................ 9696
Area chartsArea charts............................................................................................................................................................................................................................................ 9898
Scatter chartsScatter charts................................................................................................................................................................................................................................ 100100
Bubble chartsBubble charts................................................................................................................................................................................................................................ 101101
Pareto chartsPareto charts.................................................................................................................................................................................................................................. 103103
Waterfall chartsWaterfall charts .......................................................................................................................................................................................................................... 104104
Treemap chartsTreemap charts .......................................................................................................................................................................................................................... 105105
Line column chartsLine column charts................................................................................................................................................................................................................ 107107
Funnel chartsFunnel charts.................................................................................................................................................................................................................................. 110110
Geo chartsGeo charts.......................................................................................................................................................................................................................................... 111111
Sankey chartsSankey charts .............................................................................................................................................................................................................................. 115115
Pivot tablePivot table .......................................................................................................................................................................................................................................... 116116
Changing a chartChanging a chart
Change the chartChange the chart...................................................................................................................................................................................................................... 121121
Reorder the labelsReorder the labels.................................................................................................................................................................................................................. 122122
Set the y-axis rangeSet the y-axis range ............................................................................................................................................................................................................ 123123
Hide and show valuesHide and show values...................................................................................................................................................................................................... 125125
Change chart colorsChange chart colors............................................................................................................................................................................................................ 127127
Additional chart optionsAdditional chart options................................................................................................................................................................................................ 131131
Zoom into a chartZoom into a chart.................................................................................................................................................................................................................... 139139
Work with formulasWork with formulas
Understand formulasUnderstand formulas.................................................................................................................................................................................................................. 141141
Add a formula to a searchAdd a formula to a search.................................................................................................................................................................................................. 142142
View or edit a formula in a searchView or edit a formula in a search.......................................................................................................................................................................... 145145
Aggregate formulasAggregate formulas
Overview of aggregate formulasOverview of aggregate formulas ...................................................................................................................................................................... 147147
Cumulative functionsCumulative functions ........................................................................................................................................................................................................ 150150
ThoughtSpot Users Guide
February 07, 2019
support@thoughtspot.com ii

Moving functionsMoving functions...................................................................................................................................................................................................................... 153153
Flexible aggregation functions (group aggregate and filters)Flexible aggregation functions (group aggregate and filters)................................................................................ 157157
Grouping functionsGrouping functions................................................................................................................................................................................................................ 160160
Filtered aggregation functionsFiltered aggregation functions ............................................................................................................................................................................ 162162
Conversion functionsConversion functions ................................................................................................................................................................................................................ 166166
Date functionsDate functions ...................................................................................................................................................................................................................................... 167167
Percent (simple number) calculationsPercent (simple number) calculations .............................................................................................................................................................. 174174
Formula operatorsFormula operators.......................................................................................................................................................................................................................... 175175
Nested formulasNested formulas ................................................................................................................................................................................................................................ 177177
Formulas for chasm trapsFormulas for chasm traps .................................................................................................................................................................................................. 178178
Use pinboardsUse pinboards
Basic pinboard usageBasic pinboard usage .............................................................................................................................................................................................................. 179179
Edit a pinboardEdit a pinboard.................................................................................................................................................................................................................................... 184184
Pinboard filtersPinboard filters .................................................................................................................................................................................................................................... 191191
Schedule a pinboard jobSchedule a pinboard job ...................................................................................................................................................................................................... 196196
Search actions within a pinboardSearch actions within a pinboard............................................................................................................................................................................ 199199
Copy a pinboardCopy a pinboard................................................................................................................................................................................................................................ 200200
Copy a pinboard or visualization linkCopy a pinboard or visualization link ................................................................................................................................................................ 202202
Reset a pinboard visualizationReset a pinboard visualization .................................................................................................................................................................................... 205205
Start a slideshowStart a slideshow.............................................................................................................................................................................................................................. 207207
Use custom R scriptsUse custom R scripts
About R in ThoughtSpotAbout R in ThoughtSpot........................................................................................................................................................................................................ 209209
Create and share R scriptsCreate and share R scripts................................................................................................................................................................................................ 212212
Run prebuilt R scripts on answersRun prebuilt R scripts on answers ........................................................................................................................................................................ 221221
Save and share R visualizationsSave and share R visualizations................................................................................................................................................................................ 227227
SpotIQSpotIQ
What is SpotIQWhat is SpotIQ .................................................................................................................................................................................................................................... 232232
101: Load and analyze data101: Load and analyze data ............................................................................................................................................................................................ 234234
101: Review and save insights101: Review and save insights.................................................................................................................................................................................... 238238
101: Do more with SpotIQ101: Do more with SpotIQ.................................................................................................................................................................................................. 243243
Best SpotIQ PracticesBest SpotIQ Practices.............................................................................................................................................................................................................. 250250
Custom SpotIQ analysisCustom SpotIQ analysis........................................................................................................................................................................................................ 253253
Advanced R CustomizationsAdvanced R Customizations.......................................................................................................................................................................................... 258258
Work with dataWork with data
Understand data sourcesUnderstand data sources.................................................................................................................................................................................................... 265265
Create and load CSV FilesCreate and load CSV Files ................................................................................................................................................................................................ 267267
Append data through the UIAppend data through the UI............................................................................................................................................................................................ 270270
ThoughtSpot Users Guide
February 07, 2019
support@thoughtspot.com iii

View a data profileView a data profile.......................................................................................................................................................................................................................... 271271
Date and currency format settingsDate and currency format settings........................................................................................................................................................................ 272272
Share your workShare your work
About sharingAbout sharing................................................................................................................................................................................................................................ 274274
Share a pinboardShare a pinboard...................................................................................................................................................................................................................... 275275
Share answersShare answers.............................................................................................................................................................................................................................. 279279
Share uploaded dataShare uploaded data.......................................................................................................................................................................................................... 282282
Revoke access (unshare)Revoke access (unshare) ............................................................................................................................................................................................ 284284
Use SearchIQUse SearchIQ
About SearchIQAbout SearchIQ.................................................................................................................................................................................................................................. 287287
Use SearchIQ for natural searchesUse SearchIQ for natural searches ...................................................................................................................................................................... 289289
Teach SearchIQ your languageTeach SearchIQ your language.................................................................................................................................................................................. 292292
Slack and ThoughtSpotSlack and ThoughtSpot
Slack and SpotSlack and Spot.................................................................................................................................................................................................................................... 295295
How to use SpotHow to use Spot................................................................................................................................................................................................................................ 296296
More help and supportMore help and support.................................................................................................................................................................................................................. 300300
Keyword referenceKeyword reference .............................................................................................................................................................................................................................. 305305
TQL referenceTQL reference.............................................................................................................................................................................................................................................. 312312
tsload flag referencetsload flag reference.......................................................................................................................................................................................................................... 322322
tscli command referencetscli command reference............................................................................................................................................................................................................ 325325
Date and time formats referenceDate and time formats reference.................................................................................................................................................................................... 347347
Row level security rules referenceRow level security rules reference................................................................................................................................................................................ 350350
Formula function referenceFormula function reference .................................................................................................................................................................................................... 362362
Alert codes referenceAlert codes reference ...................................................................................................................................................................................................................... 377377
User action codes referenceUser action codes reference ................................................................................................................................................................................................ 384384
Error codes referenceError codes reference...................................................................................................................................................................................................................... 386386
Frequently asked questionsFrequently asked questions .................................................................................................................................................................................................. 412412
ThoughtSpot Users Guide
February 07, 2019
support@thoughtspot.com iv

Introduction to the User Guide
This ThoughtSpot User Guide contains information on navigating and searching data with ThoughtSpot.
It will assist you with starting new searches, managing your pinboards, and troubleshooting.
ThoughtSpot enables you to view and analyze your data through a search-based user interface. You can
create your searches on the fly by typing them into a search bar, like you do when using an internet
search engine. ThoughtSpot makes it easy to see your data, get your questions answered, create
interactive graphs, and customize pinboards. You do not need to understand how the data is stored,
attend days of training, or know SQL to do these things. Collaboration and security features make it easy
for to protect sensitive data and share information safely with others.
ThoughtSpot gives administrators the ability to modify data properties to meet business needs, for
example by providing search synonyms for common terms, boosting the importance of a column in
search results, or formatting how the data appears. So if you are not getting the answers you expect
when using ThoughtSpot, check with your ThoughtSpot administrator to see if some settings may need
to be changed.
•Finding your way aroundFinding your way around
ThoughtSpot is organized into several sections to make navigation easy. You can reach them
by using the menu bar.
•About the user profileAbout the user profile
The user icon lets you view your profile or sign out of ThoughtSpot.
•Understanding privilegesUnderstanding privileges
The things you can do in ThoughtSpot are determined by the privileges you have. These are
set at the group level.
•About stickersAbout stickers
You can create stickers to make it easier for people to find data sources and pinboards.
Introduction to the User Guide
February 07, 2019
ThoughtSpot Users Guide Page 5
Finding your way around
Summary:Summary: ThoughtSpot is organized into several sections to make
navigation easy. You can reach them by using the menu bar.
These are the different sections in ThoughtSpot:
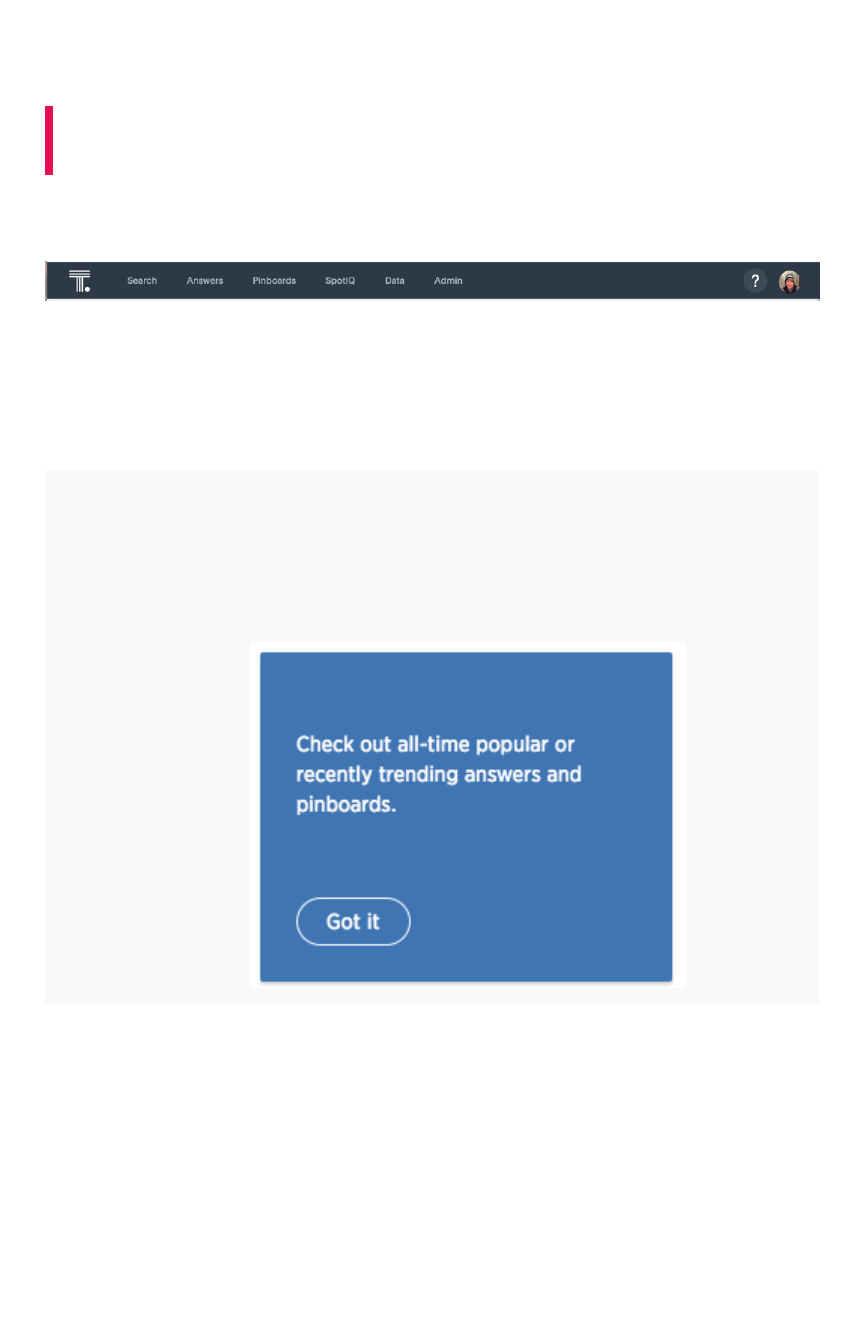
Home
Click the ThoughtSpot logo to go to the application home page. At the top of the home page is a search
bar and below that several areas that show activity in your ThoughtSpot instance.
LabelLabel DescriptionDescription
All time popularAll time popular
Recently trendingRecently trending
Shows all time popular answers and pinboards by number of views. You
can choose between all-time popular or recently in the last 15 days. Small
icons illustrate the type of visualization you'll find when you click on an
item.
Finding your way around
February 07, 2019
ThoughtSpot Users Guide Page 6
LabelLabel DescriptionDescription
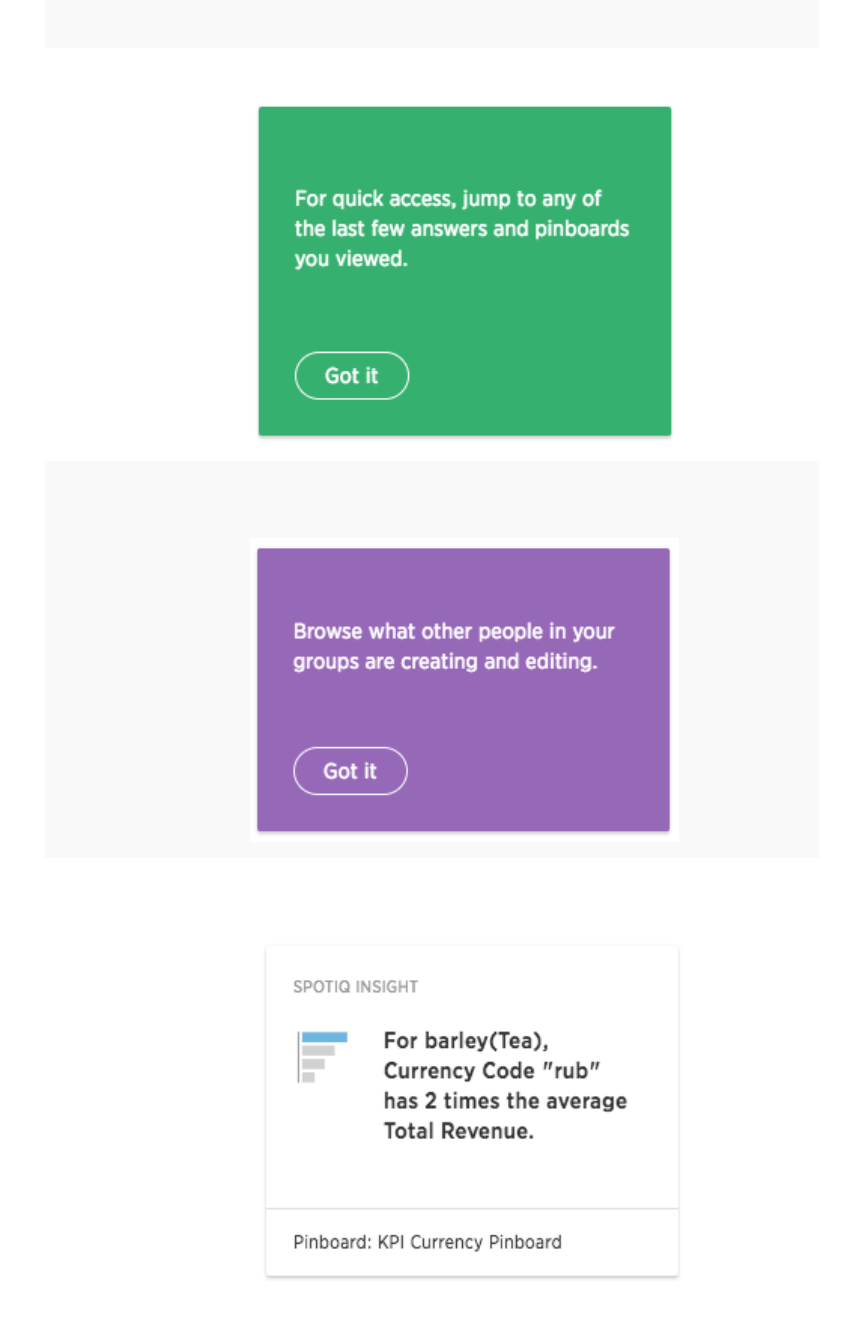
Recently viewedRecently viewed Answers and pinboards you've viewed recently.
Recent team activityRecent team activity Answers, pinboards, worksheets, and tables people in your company have
created or edited recently.
Did you know?Did you know? Contains auto analysis results from SpotIQ. Visible only to users that have
the SpotIQ privilege.
Finding your way around
February 07, 2019
ThoughtSpot Users Guide Page 7

The items shown in these areas are limited to answers, pinboards, worksheets, and other objects you
have access to. For example, if you don’t have the ability to use SpotIQ, that option does not appear.
Search or Search+
SearchSearch is where you will spend most of your time. It allows you to search and explore your data. Choose
your data sources and type in the search bar at the top. As you type your search, results will appear in
the main part of the screen as either a table or a chart.
If SearchIQ has been enabled by your administrator, this label will say Search+Search+ to differentiate it from
SearchIQ. In this case, you’ll go to the search bar on the homepage to use SearchIQ.
To learn more about this section, visit About search.
To learn more about SearchIQ, visit About SearchIQ.
Answers
Answers are the result of a single search. You can save an answer you want to work more on later, or
just keep it for your personal use. Answers are for you alone, until you share them with others.
Pinboards
Pinboards are collections of related search results. You can create your own pinboard or add to an
existing one. Once a pinboard has been saved, it can be shared with others or viewed as a slideshow.
The PinboardsPinboards page shows a list of saved pinboards. Click on one to view, edit, or share it.
To learn more about pinboards, visit About pinboards.
SpotIQ
If SpotIQ has been enabled by your administrator, you can go here to view the status of your request
after you choose Auto AnalyzeAuto Analyze or Custom AnalyzeCustom Analyze, and to see the results.
To learn more about this section, visit About SpotIQ.
Data
DataData contains a list of data sources (tables and worksheets). These are usually loaded and managed by
your administrator. However, you may be able to import a spreadsheet (Excel or CSV) here, if you have
the correct privileges.
To learn more about this section, visit Working with data.
Admin
AdminAdmin only appears if you have administrator privileges.
This section is covered in the ThoughtSpot Administrator Guide.
Finding your way around
February 07, 2019
ThoughtSpot Users Guide Page 8

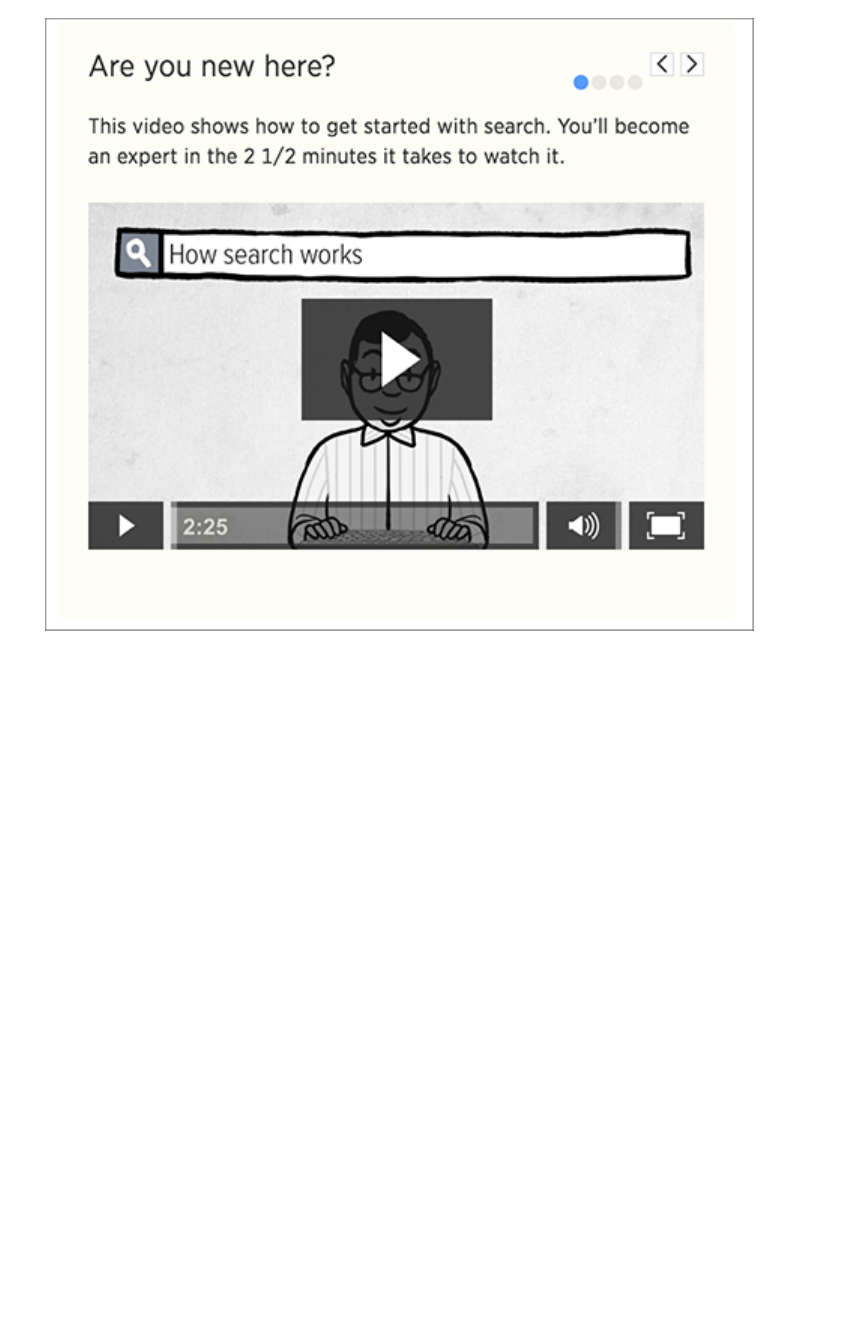
Help Icon
The help icon looks like two people. You can find information and support resources for ThoughtSpot
here. There are short videos, a keyword reference, links to documentation, and other useful materials.
You can also find the support contact information and software version number here.
To learn more about this section, visit More help and support.
User Icon
The user iconuser icon allows you to either view your preferences or log out. You can also change your icon here.
To learn more about this section, visit About the user profile.
Related information
Set your ThoughtSpot locale
Finding your way around
February 07, 2019
ThoughtSpot Users Guide Page 9

ThoughtSpot browser access
To set up and explore your data, access the ThoughtSpot application from a standard Web browser
using a username and password. Before accessing ThoughtSpot, you need:
• The Web address (IP address or server name) for ThoughtSpot.
• A network connection.
• A Web browser.
A username and password for ThoughtSpot.
Supported Web browsers
The following browsers are verified to work well with the ThoughtSpot application:
BrowserBrowser VersionVersion Operating SystemOperating System
Google Chrome 20 and above Windows 7 or greater, Linux, MacOS
Mozilla Firefox 14 and above Windows 7 or greater, Linux, MacOS
Internet Explorer 11 Windows 7 or greater
Safari 10 or greater MacOS
Tip:Tip: While Internet Explorer is supported, using it is not recommended. Depending on your
environment, you can experience performance or UI issues when using IE.
Sign in
To sign in to ThoughtSpot from a browser:
1. Open the browser and type in the Web address for ThoughtSpot: http://HOSTNAME_OR_IP
2. Enter your username and password and click Sign InSign In.
ThoughtSpot browser access
February 07, 2019
ThoughtSpot Users Guide Page 10
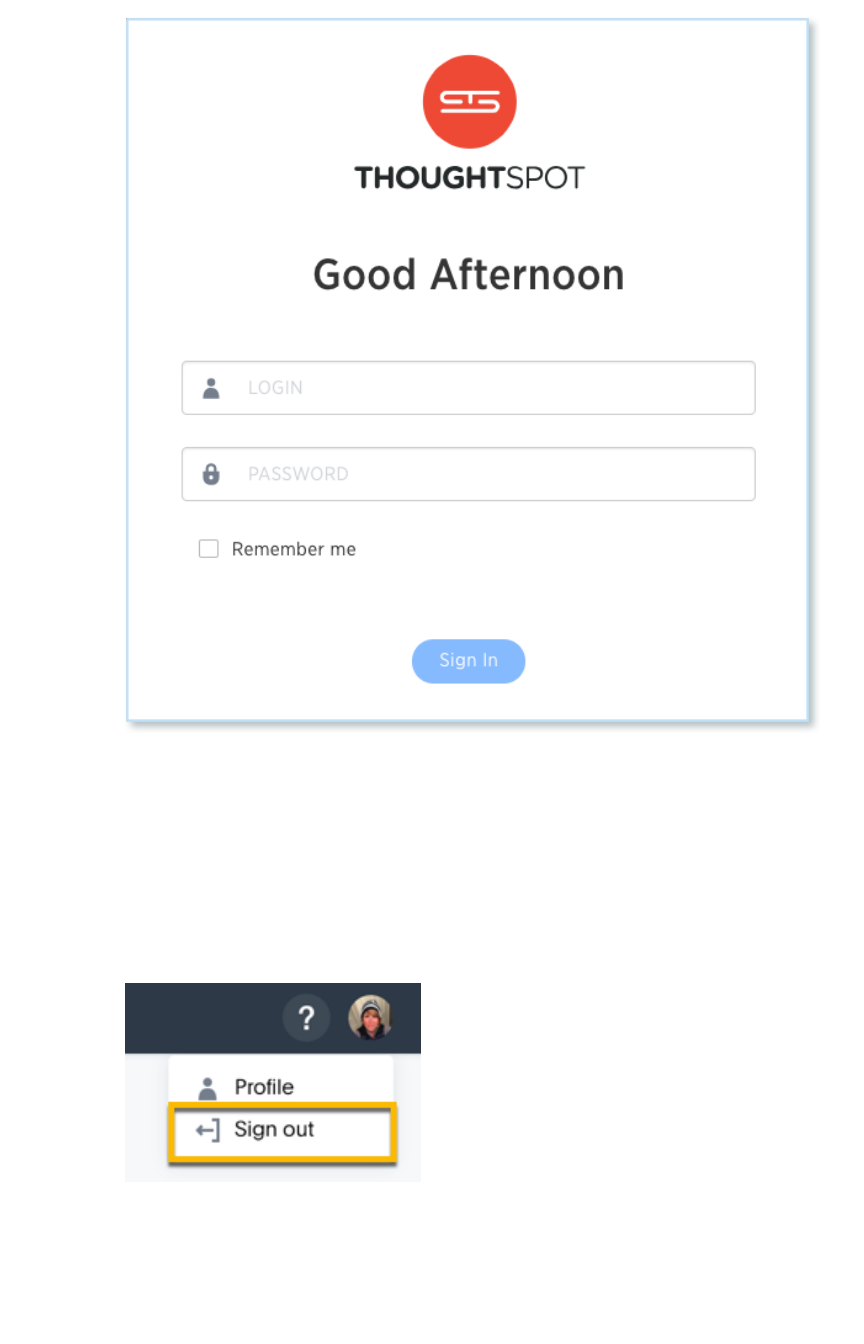
Sign out
Once you’re done with your search session, you can optionally sign out of ThoughtSpot. To sign out of
ThoughtSpot from a browser:
1. Click your user icon at the top right hand corner of the screen.
2. Click Sign outSign out.
ThoughtSpot browser access
February 07, 2019
ThoughtSpot Users Guide Page 11

About your user profile
Summary:Summary: The user icon lets you view your profile or sign out of
ThoughtSpot.
To view the user actions, click on your user icon on the top right corner of the page.
Click ProfileProfile to go to your profile preference page, where you can change your icon, email, and locale
preferences.
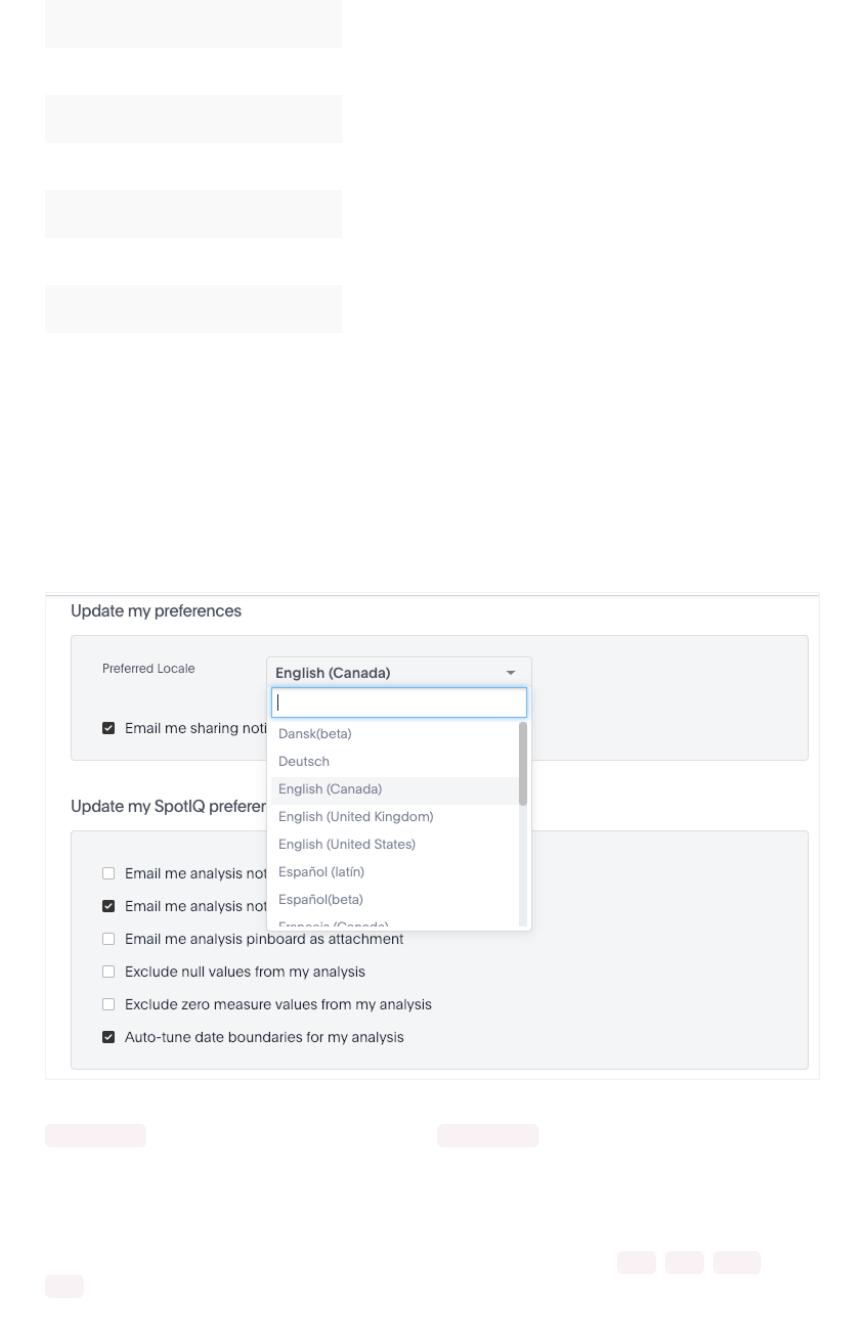
Language and data format settings
The language the ThoughtSpot UI displays is based off of the locale in a user’s profile. The locale
preferences control the language and data formats (date and number formats) by geographic locations.
In addition to American English (
en-US
), ThoughtSpot supports:
LocaleLocale LanguageLanguage
da-DK
Dansk (beta)
de-DE
Deutsche
en-CA
English (Canada)
en-GB
English (United Kingdom)
en-US
English (United States)
es-US
Español (latín)
es-ES
Español (España - beta)
fr-CA
Français (Canada)
fr-FR
Français (France)
it-IT
Italiano (beta)
nl-NL
Nederland (beta)
About your user profile
February 07, 2019
ThoughtSpot Users Guide Page 12
LocaleLocale LanguageLanguage
nb-NO
Norsk (beta)
pt-BR
Português (Brazil)
pt-PT
Português (Portugal - beta)
fi-FI
Suomi (beta)
sv-SE
Svenska (beta)
zh-CN
中文(简体)
ja-JP
日本語
Date and number formats change to reflect your locale. So, if you set Japanese as your default locale in
your profile settings, then the interface will update to reflect that after you refresh your page.
Keywords, operators, and error messages are included in the translated material. (A keyword reference
for all supported languages is included in this documentation under “Keywords in Other Languages”.)
Formulas, however, are
not translated
. Also, all metadata remains as user inputted.
For example, if you are using ThoughtSpot in the US, the number formatting should look like this:
xxx,xxx.xx . And in Europe, it should look like this: xxx.xxx,xx .
How other users see you
You can change your picture by clicking Upload PictureUpload Picture. The system accepts GIF ,BMP ,JPEG , and
PNG files that do not exceed 4MB in size.
About your user profile
February 07, 2019
ThoughtSpot Users Guide Page 13
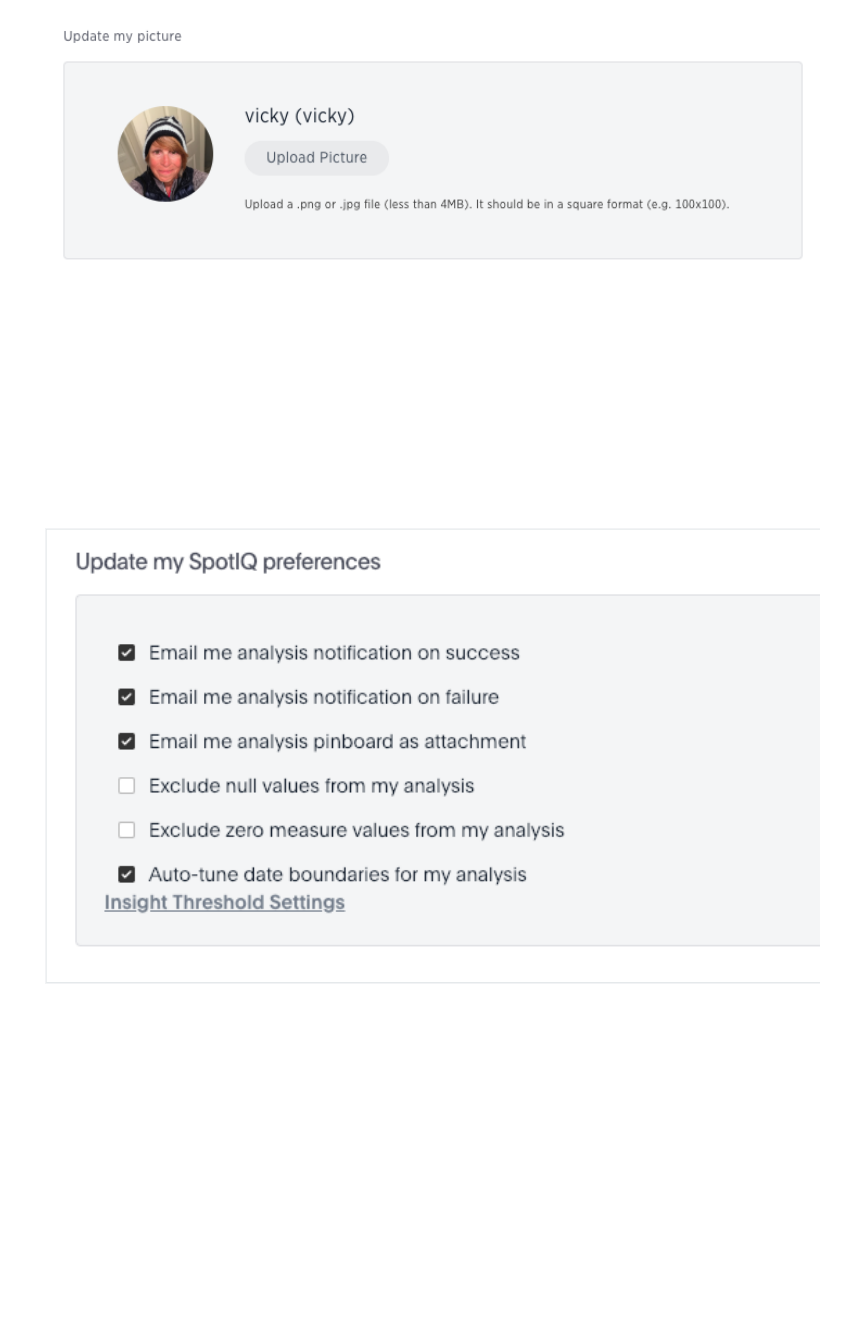
SpotIQ preferences and email notifications
You can specify email notifications behavior along with exclude parameters and threshold settings used
for your SpotIQ analyses.
You can change your SpotIQ basic preferences by checking or unchecking the email and exclude
preferences for analyses.
Click Insight Threshold SettingsInsight Threshold Settings to further refine parameters SpotIQ will use.
About your user profile
February 07, 2019
ThoughtSpot Users Guide Page 14
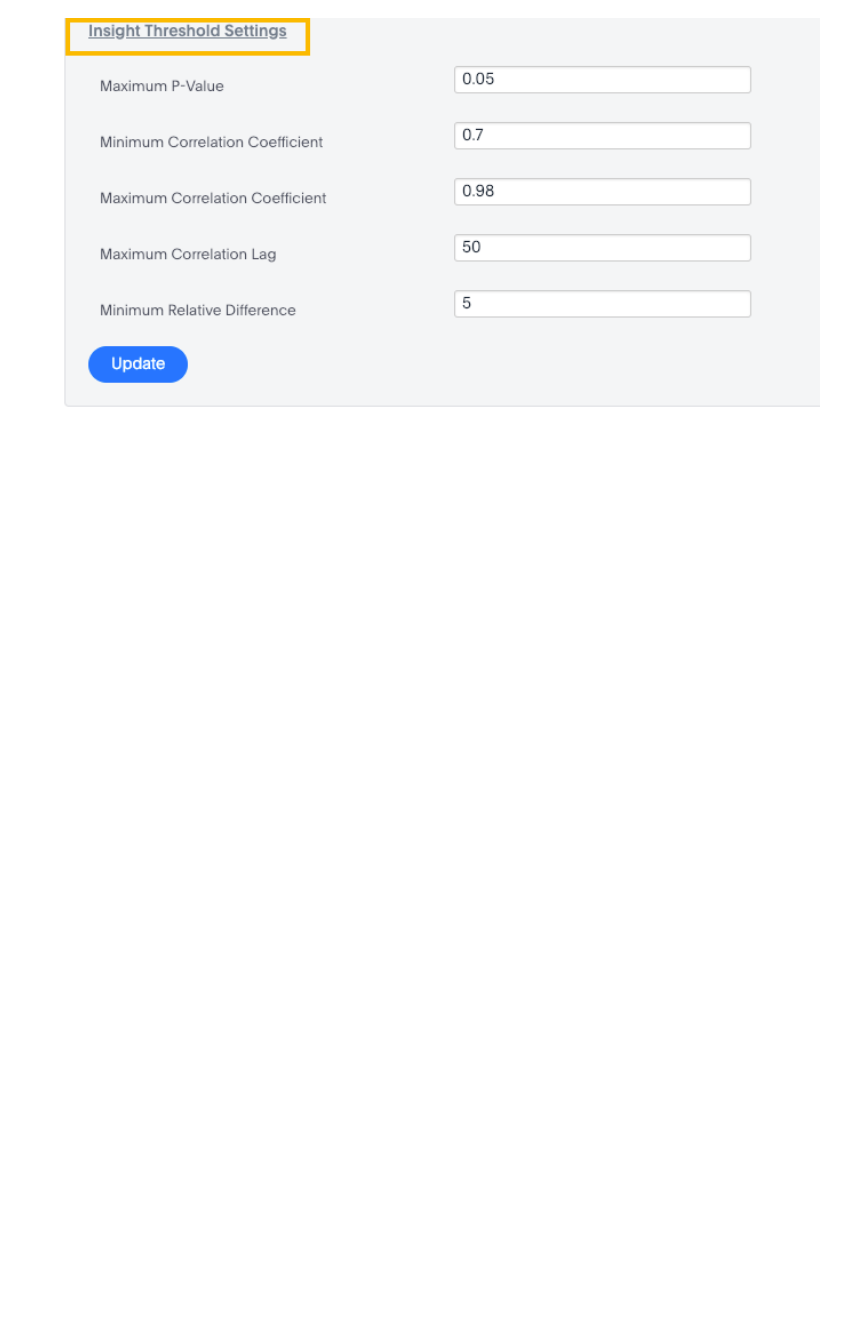
These parameters and threshold settings are a subset of those available on the SpotIQ Customize
analysis dialog. If you set them here, the settings will persist for all your SpotIQ analyses including when
you run custom analyses, unless you explicitly reset options for a custom analysis.
Logging out
Click Profile > Sign outProfile > Sign out to log out of ThoughtSpot, and return to the sign in page.
About your user profile
February 07, 2019
ThoughtSpot Users Guide Page 15

Understanding privileges
Summary:Summary: The things you can do in ThoughtSpot are determined by
the privileges you have. Privileges are granted through group
membership.
If you are trying to do something in ThoughtSpot, and cannot access the screens to accomplish it, you
may not have the correct privileges. In this case, you should contact your administrator and explain what
you want to accomplish. Your administrator may be able to grant you additional privileges.
Note:Note: Permissions to see and edit tables, worksheets, and pinboards are not affected by
privileges. They are given when these items are shared with you.
Here are the privileges that the administrator sets, and the capabilities they enable:
PrivilegePrivilege DescriptionDescription
Can administerCan administer
ThoughtSpotThoughtSpot
Can manage Users and Groups and has view and edit access to all data.
Users with this privilege can also download a saved answer.
Can upload user dataCan upload user data Can upload their own data from the application's DataData page using ActionsActions
> Upload data> Upload data.
Can download dataCan download data Can download data from search results and pinboards.
Can share with allCan share with all
usersusers
Can see the names of and share with users outside of the groups the user
belongs to. Members of groups with this privilege can also share with
groups marked as NOT SHAREABLENOT SHAREABLE.
Can manage dataCan manage data Can create a worksheet. Can also create an aggregated worksheet from
the results of a search by selecting Save as worksheetSave as worksheet. Can also use
ThoughtSpot Data Connect, if it is enabled on your cluster.
Can use experimentalCan use experimental
featuresfeatures
Can access trial and experimental features that ThoughtSpot makes avail-
able to early adopters.
Can invoke Custom RCan invoke Custom R
AnalysisAnalysis
Can access R scripts to further explore search answers. Includes options
to invoke R scripts on visualizations, create and share custom scripts, and
share the results of R analysis as answers and pinboards.
Can schedule pin-Can schedule pin-
boardsboards
Can create pinboard schedules and edit their own scheduled jobs.
Understanding privileges
February 07, 2019
ThoughtSpot Users Guide Page 16

PrivilegePrivilege DescriptionDescription
Can administer andCan administer and
bypass RLSbypass RLS Users in groups with this privilege (directly or via group inheritance):
• Are exempt from row-level security (RLS) rules.
• Can add/edit/delete existing RLS rules.
• Can check or uncheck Bypass RLS on a worksheet.
Your installation configuration may enable or disable the availability of this
privilege. By default, it is enabled. Administrators or groups with the privi-
lege Can administer ThoughtSpotCan administer ThoughtSpot can grant this privilege.
The following table shows the intersection of user privilege and ability:
Understanding privileges
February 07, 2019
ThoughtSpot Users Guide Page 17

The following table shows the intersection of user privilege and ability:
Can administer
ThoughtSpot
YYYYYYYYY2YYYYYYY
Can upload user
data
NNNYNYNNY3Y4NNNNNN
Can download da-
ta
NNNNYYNNNY4NNNNNN
Can manage data Y Y Y Y N Y N N Y4Y4Y5Y N Y N N
Can share with all
users
NNNNNYYNNY4NNNNNN
Can Auto-Analyze
(SpotIQ privilege)
NNNNNNNNNY4NNNNNY
Can Administer
and Bypass RLS
NNNNNNNNYNNNNNNN
None NNNNNYNNNY4NNNNNN
Create/Edit WSCreate/Edit WS
Create ViewCreate View
Modify Col. Props.Modify Col. Props.11
Upload DataUpload Data
Download DataDownload Data
Share within GroupShare within Group
Share with all usersShare with all users
Manage RLS rulesManage RLS rules
CrUD RelationshipsCrUD Relationships
Read RelationshipsRead Relationships
See Hidden ColsSee Hidden Cols
Join with Upload DataJoin with Upload Data
Schema ViewerSchema Viewer
Use Data ConnectUse Data Connect
Use SchedulerUse Scheduler
Use Auto-AnalyzeUse Auto-Analyze
Understanding privileges
February 07, 2019
ThoughtSpot Users Guide Page 18

Table notes:
1. Applies to non-owners only.
2. Any tables.
3. Author of at least one table in relationship.
4. Only when read permission for columns used in the relationship.
5. With edit permission.
Create/Edit WSCreate/Edit WS
Create ViewCreate View
Modify Col. Props.Modify Col. Props.11
Upload DataUpload Data
Download DataDownload Data
Share within GroupShare within Group
Share with all usersShare with all users
Manage RLS rulesManage RLS rules
CrUD RelationshipsCrUD Relationships
Read RelationshipsRead Relationships
See Hidden ColsSee Hidden Cols
Join with Upload DataJoin with Upload Data
Schema ViewerSchema Viewer
Use Data ConnectUse Data Connect
Use SchedulerUse Scheduler
Use Auto-AnalyzeUse Auto-Analyze
Understanding privileges
February 07, 2019
ThoughtSpot Users Guide Page 19

Understanding privileges
February 07, 2019
ThoughtSpot Users Guide Page 20
Use stickers to organize
Summary:Summary: Stickers enable you to create categories for classification
of objects, including pinboards, answers, data sources, and
worksheets.
You can create stickers to make it easier for people to find data sources and pinboards. Stickers are
global in scope. This means that everyone can see the stickers and use them to tag objects. They can
also filter lists of objects by sticker. Stickers are often used to designate subject areas, such as sales,
HR, and finance, but you can use them any way you like.
Keep in mind these permissions when working with stickers:
• Only administrators can create stickers.
• Anyone can apply a sticker.
• Anyone can filter by a sticker.
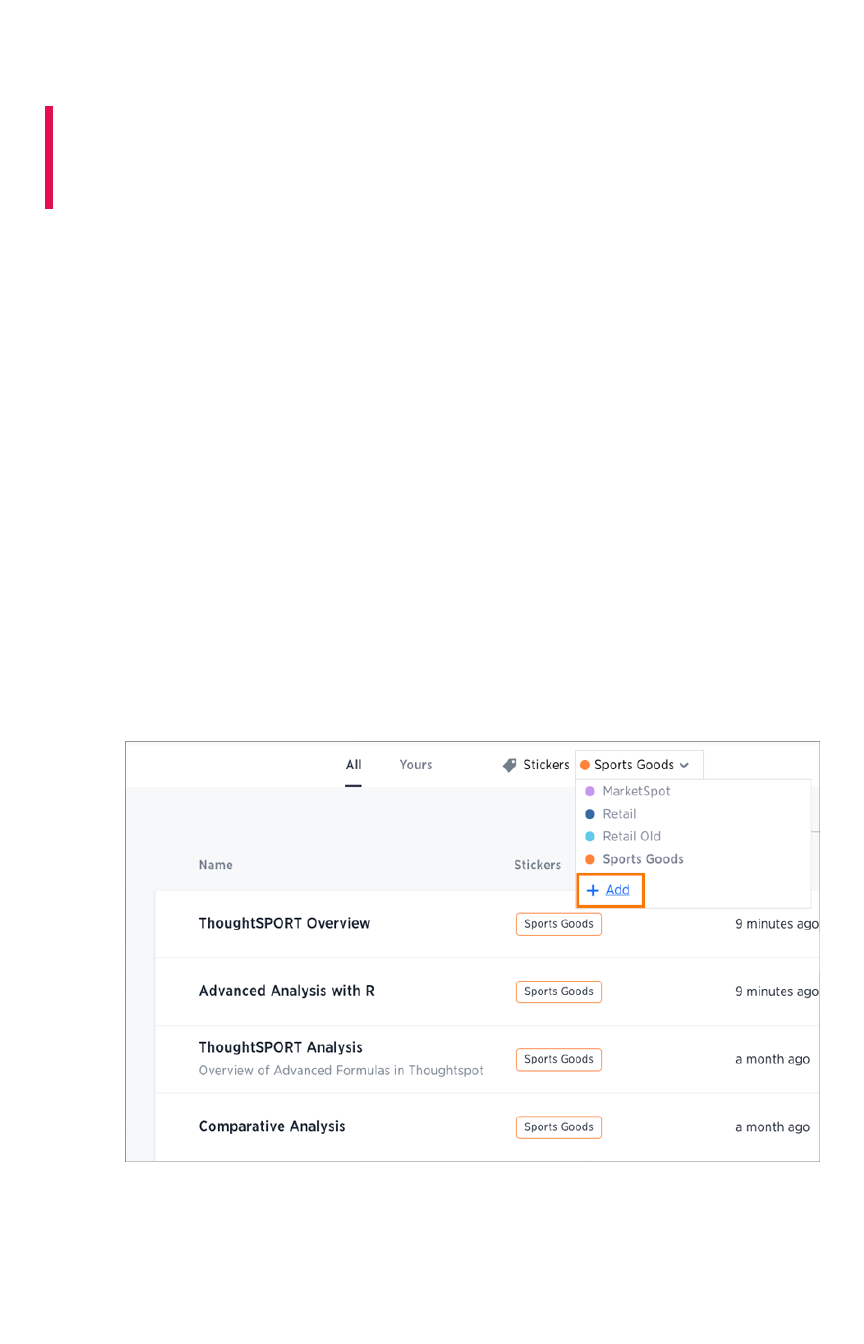
Create a sticker
Only administrator users can create stickers. Anyone can apply the stickers you create, or use them as
filters when selecting from a list of sources or pinboards.
To create a sticker:
1. Navigate to the Manage DataManage Data or PinboardsPinboards screen using the icons in the top navigation bar.
2. Choose the currently selected sticker, scroll to the bottom of the list, and click + Add+ Add.
3. Type the name for the new sticker.
4. You can change the name of a sticker by clicking the edit icon next to its name.
Use stickers to organize
February 07, 2019
ThoughtSpot Users Guide Page 21
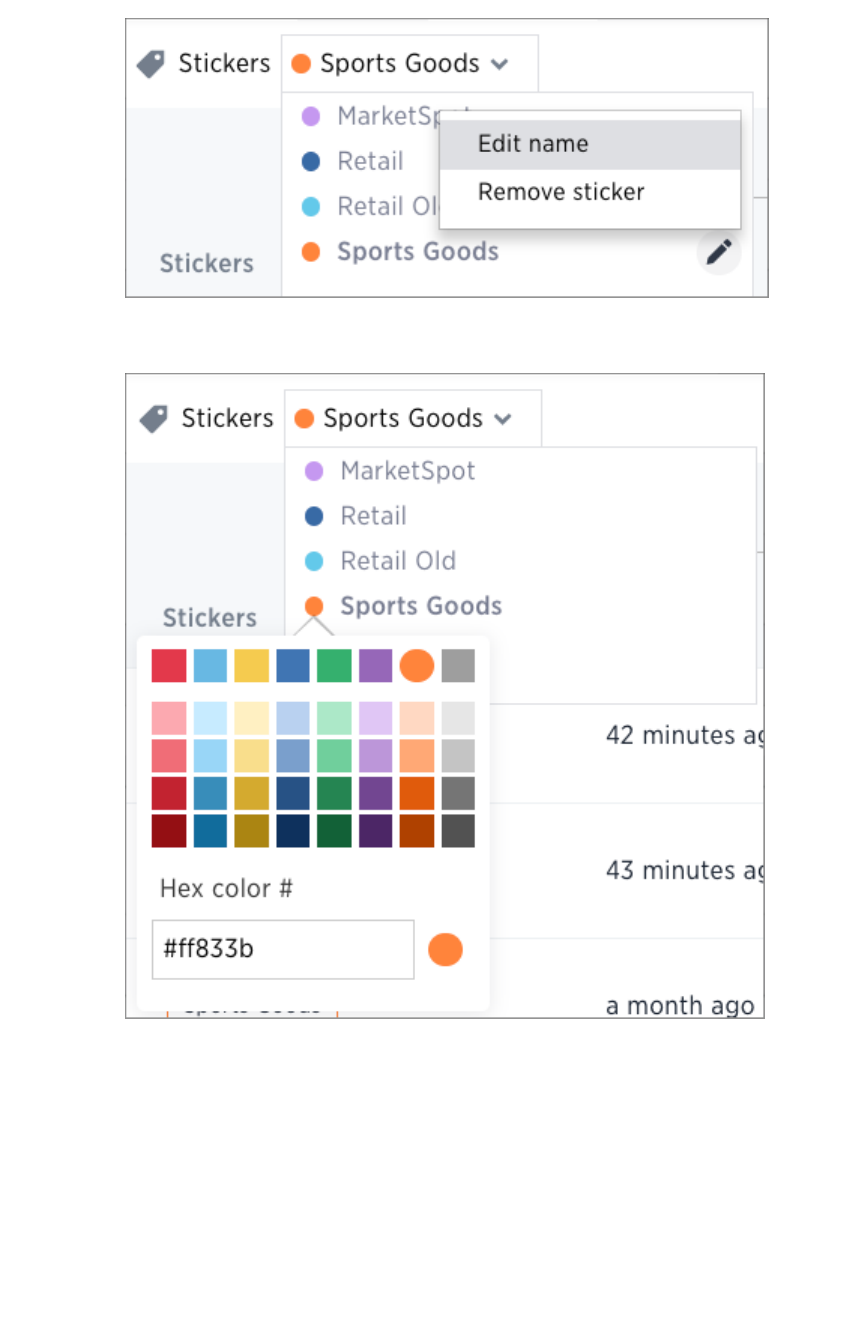
5. You can change the color of a sticker by clicking the color circle next to its name.
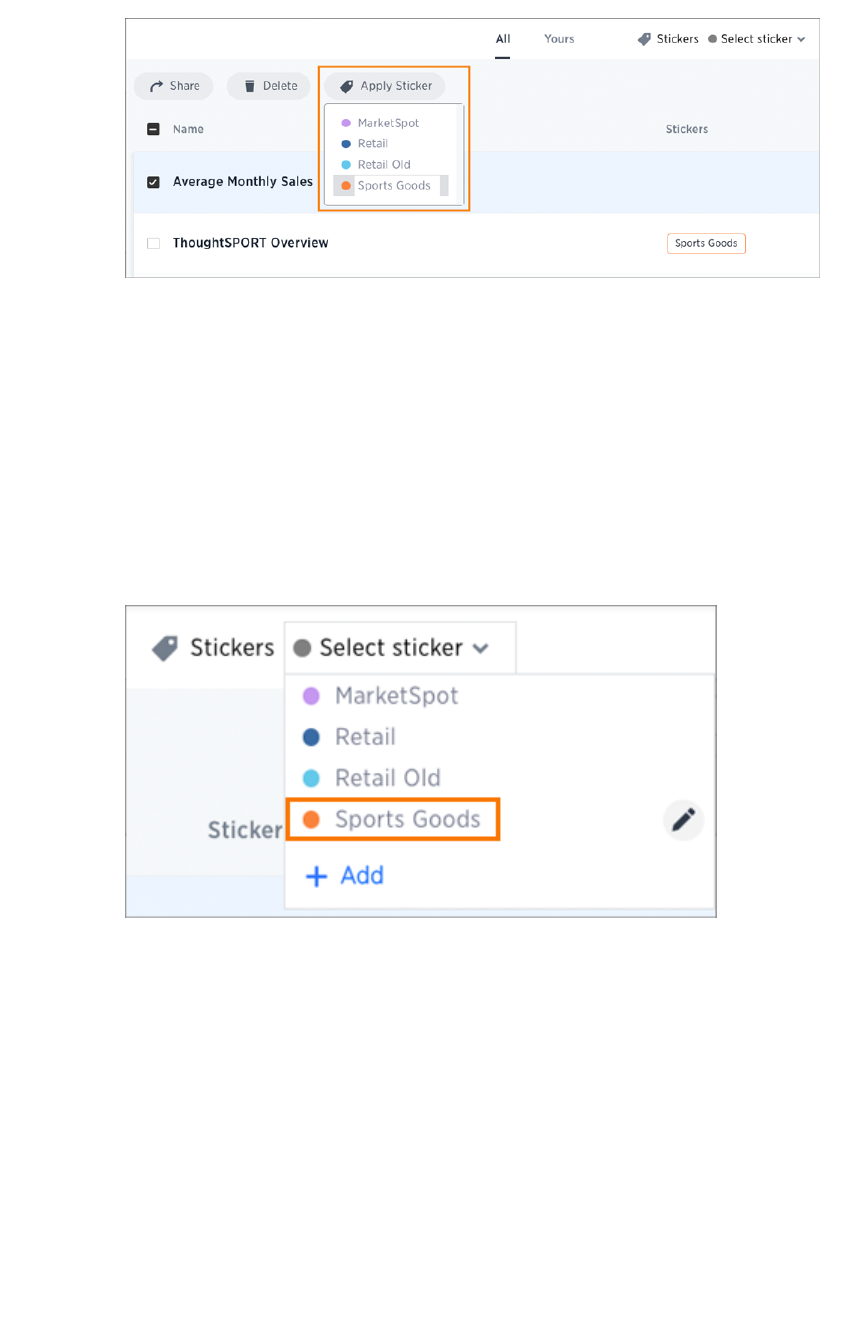
Apply a sticker
Only administrators create stickers, but anyone with edit privileges can tag an object with a sticker.
To tag an object with a sticker:
1. From the top menu, choose Answers, Pinboards, or Data.
2. Find the item(s) you want to tag in the list, and check the box next to its name.
3. Click the apply sticker icon and choose one from the list. You can apply as many stickers as
you like to an object.
Use stickers to organize
February 07, 2019
ThoughtSpot Users Guide Page 22
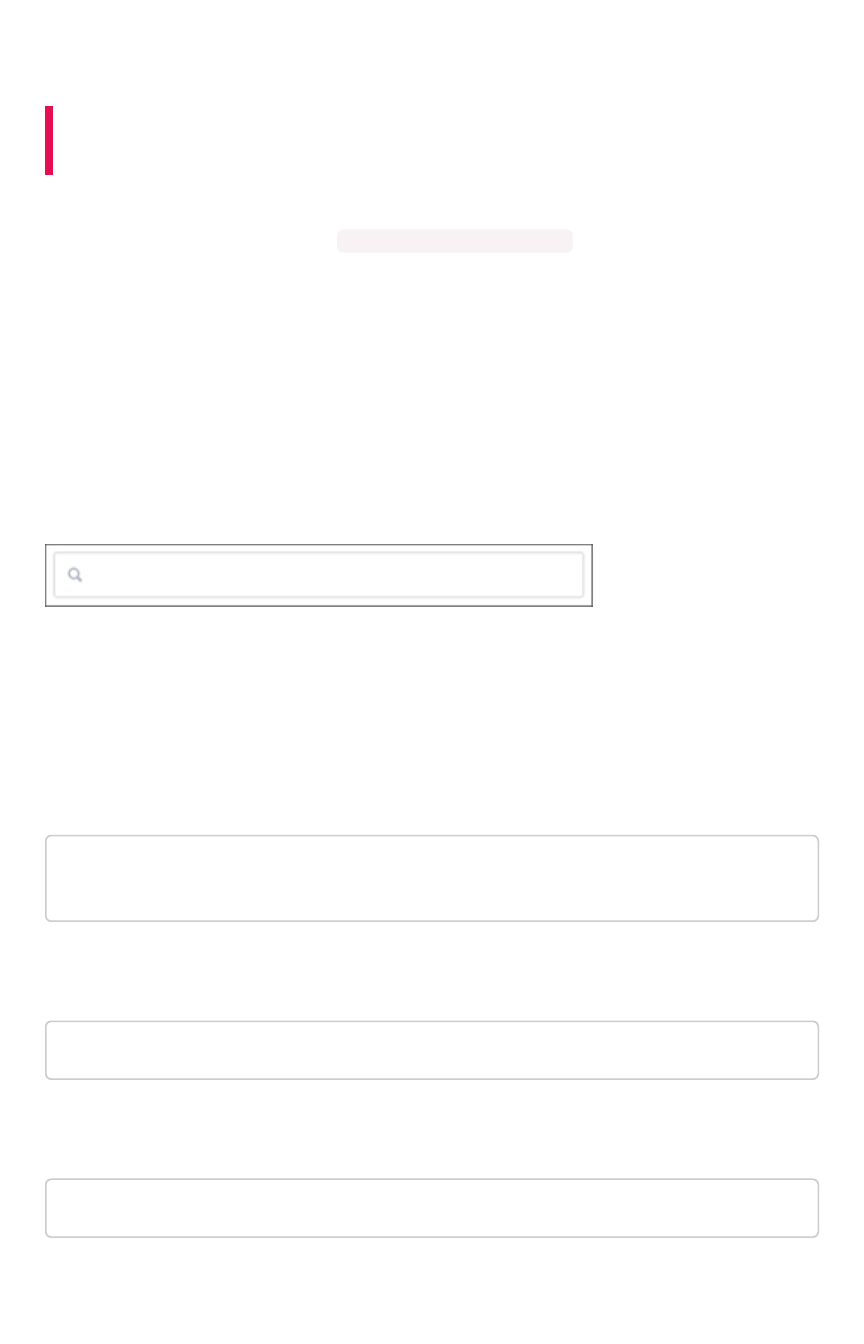
Filter by stickers
Whenever you are selecting objects from a list, you can filter by sticker to find what you’re looking for.
Anyone can use stickers to filter lists of pinboards or data sources. You can also filter by sticker when
selecting data sources.
To filter by sticker:
1. From the top menu, choose AnswersAnswers, PinboardsPinboards, or DataData.
2. Click Select stickerSelect sticker, and select the name of the sticker you want to filter by.
Use stickers to organize
February 07, 2019
ThoughtSpot Users Guide Page 23
What are Searches and Answers?
Summary:Summary: You use search to answer questions about your data
without having to consult a data analyst.
Using ThoughtSpot’s relational search is simple, so anyone can use it. In the search bar, type what you
are interested in exploring, for example revenue midwest sales rep . Searches return a set of results
in the form of a table or a chart. ThoughtSpot likes to call this set of results in response to a search an
answer
.
As you get better with ThoughtSpot’s search, you will be able to get more out of your data by performing
more complex searches. There are a few basic things you should understand before starting a new
ThoughtSpot search.
How do I search data?
You’ve probably seen one of these before:
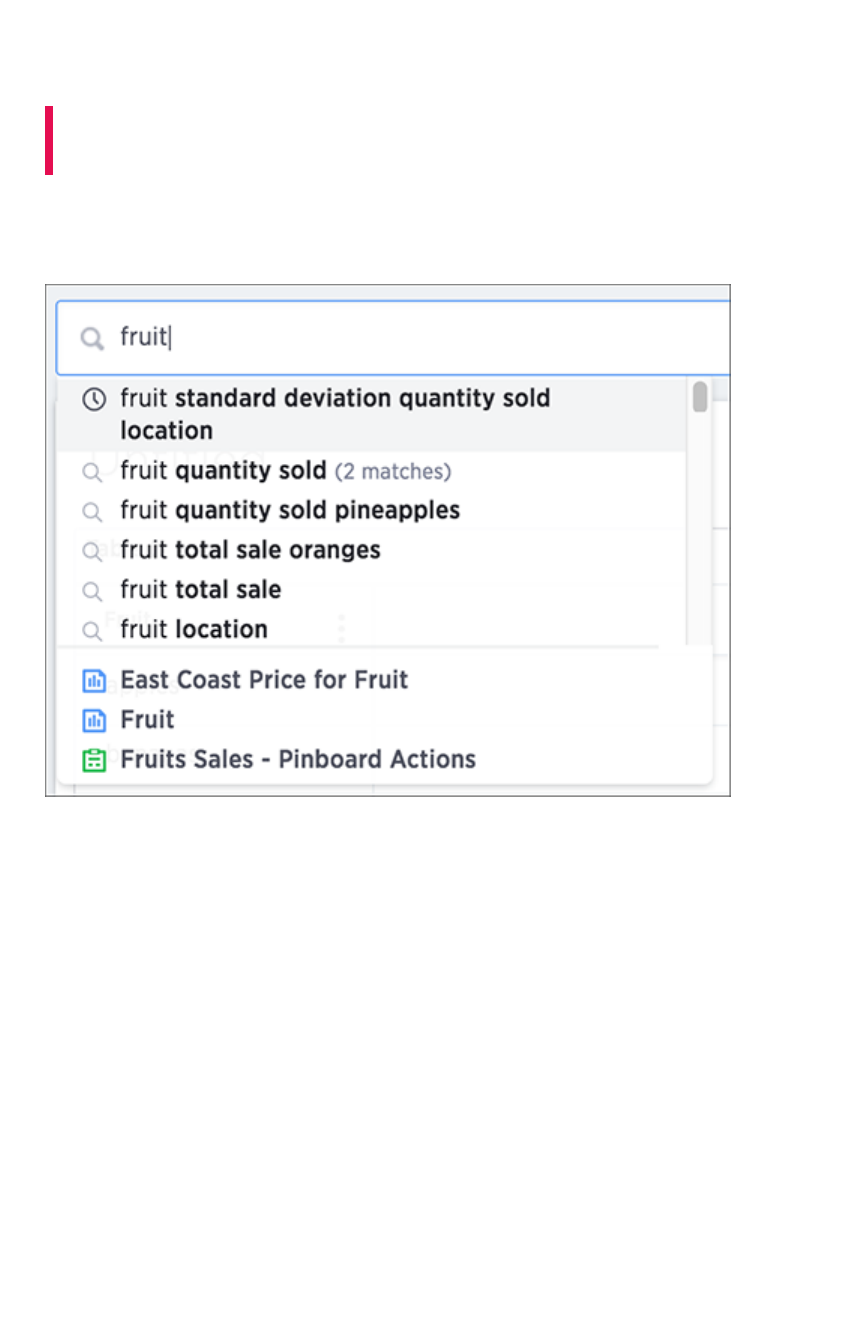
Click in the box and start typing some letters. As soon as you begin typing, ThoughtSpot suggests some
search terms Type slowly and use the suggestions to find what you’re looking for.
You’ll see an answer in the form of a chart or a table. If you do not see an answer, press EnterEnter on your
keyboard.
You should know that search in ThoughtSpot is more like an Amazon search than a conversation. For
example. Instead of:
Find me all books by Lewis Carroll with the title Alice in Wond
erland
You’d type:
carroll alice
Or consider Google. You wouldn’t type in:
Find me the largest city by population
You’d type:
What are Searches and Answers?
February 07, 2019
ThoughtSpot Users Guide Page 24

largest city by population
or simply:
largest city population
That’s how search works in ThoughtSpot. You can use some helping words like “by” and “for” but they
can also be left out, and the search will return the same answer.
What kinds of things can I type?
Search is based on the tables that exist in your data. Tables are made of rows and columns, like
spreadsheets. So you can search by typing in any of these words:
• The column name: like revenue, product name, or store
• Any of the values in the columns: like 20000, kitten chow, or richmond
• One of the special keywords ThoughtSpot understands: like yesterday, >, or contains
Save an answer
An answer is the result of a single search. You can save an answer you want to work more on later, or
just keep it for your personal use. You can also share an answer with other users. The AnswersAnswers tab is
where you can view and then the your saved search results.
Related information
•Choose a data source
•Search bar features
•Search suggestions
•Search results and column types
•Share an answer
•About SearchIQ
What are Searches and Answers?
February 07, 2019
ThoughtSpot Users Guide Page 25
Start a new search
Summary:Summary: Starting a new ThoughtSpot search is simple, like starting
a new Google search.
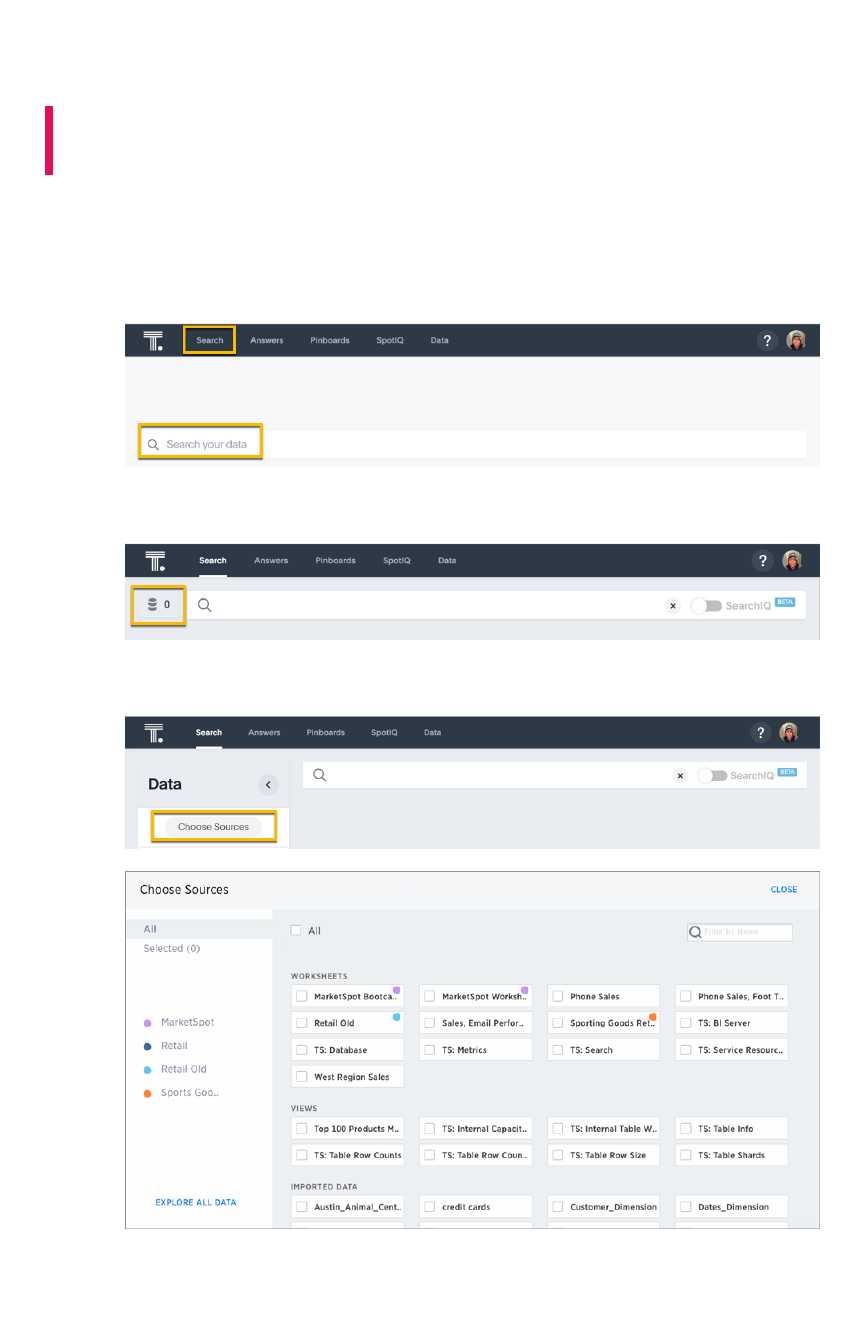
To start a new search:
1. Click Search +Search + on the top navigation bar. You can also click Search your dataSearch your data at the top of the
home page.
2. Click the Data button, to the left of the search field.
3. Choose your sources by clicking Choose SourcesChoose Sources.
To see details of all of the data, click EXPLORE ALL DATAEXPLORE ALL DATA.
a. Filter through all available sources by using the search bar or stickers.
Start a new search
February 07, 2019
ThoughtSpot Users Guide Page 26
b. Select your sources.
c. Click CLOSECLOSE.
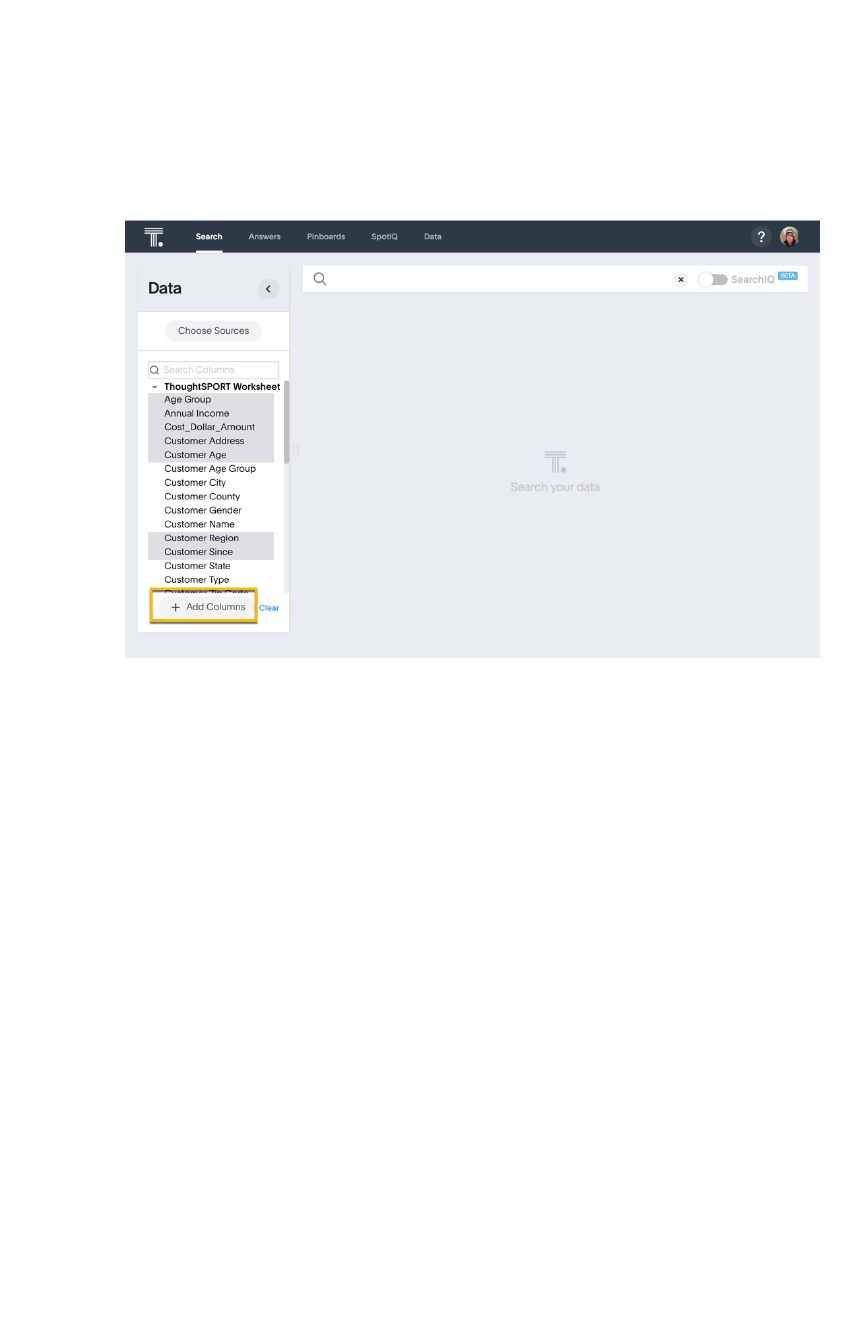
4. Add columns to the search bar, or double click columns in the Data column in the left panel.
The columns listed in the left panel are grouped together by data sources for discoverability
and ease of access. You can also add multiple columns at once by clicking each column to
select it, and then click + Add Columns+ Add Columns.
Your search is given an automatic title based on your search columns, and is displayed as either a table
or chart, depending on how it is best represented. You can change the view to fit your needs.
Start a new search
February 07, 2019
ThoughtSpot Users Guide Page 27

Choose a data source
Summary:Summary: Before you start a new search, make sure you have chosen
the right data sources.
To begin a new search, you must first select your data sources by clicking on the Choose SourcesChoose Sources
button. You will see a list of data sources that have been shared with you. The data sources are usually
created by your administrator, though you can also upload your own data.
Searches happen in the context of the selected data sources. ThoughtSpot will also make suggestions
from other data sources for you, if what you’re typing can’t be found in the selected data source.
Choose a data source
February 07, 2019
ThoughtSpot Users Guide Page 28
Search bar features
Summary:Summary: The search bar is designed to make it easy for you to
identify your search terms.
A lot of work has gone into making ThoughtSpot’s search bar intuitive and easy to use. However, it still
helps to know some details of how the search bar works.
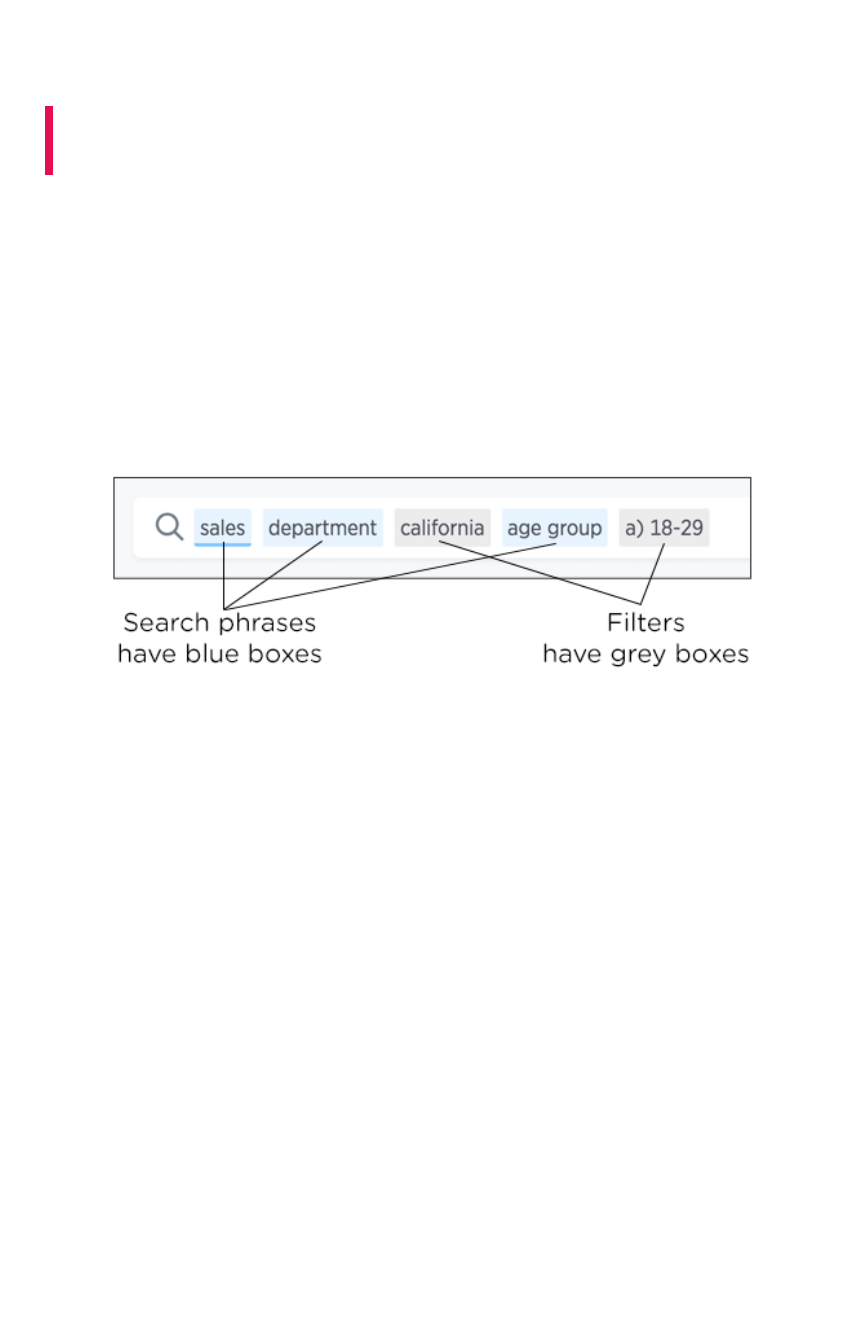
Boxed search phrases
The search bar shows boxes around each search phrase, so you can easily see where it begins and
ends. Your search phrases still appear as text when you are typing, but whenever you click out of the
search bar, they are boxed. Search phrases have blue boxes, and filters have white boxes.
Editing a search
You can edit a search without affecting existing search results. When you click a search phrase, it is
highlighted, and ThoughtSpot displays other suggestions from which you can choose to replace the
highlighted phrase. When you hover over a boxed phrase, you’ll see an xx, which you can click to remove
it from the search. You can insert a new phrase in the middle of a search, by clicking between phrases
and entering the new phrase. You can even merge phrases without breaking the search. As you edit your
search, ThoughtSpot continuously generates new results.
If you find yourself looking at a table or chart, but it doesn’t seem to contain all the data you expect, try
looking in the search bar for white boxes (filters). If you remove all the filters, you will again see all the
available data for that search.
Quick select search results
When you type search phrases in the search bar, the first suggestion is automatically highlighted and
you can use tab to navigate further. In addition, after you type a phrase or a letter and press EnterEnter, the
highlighted suggestion is automatically selected. Suggestions can be an attribute, measures, value,
keyword, historic query, or exactly what you typed as the search phrase. You can also press EnterEnter or
TabTab to select the first suggestion. If there are no suggestions, the suggestion list will not be displayed.
Historic suggestions always display on top with the first suggestion highlighted as default.
Search bar features
February 07, 2019
ThoughtSpot Users Guide Page 29

Spell check
The search bar includes spell check. If you spell or type a term incorrectly, your suggestions will include
the correct spelling of the term or keyword.
The spell check in the search bar also performs a metaphone check for similar sounding words on text
data values.
Dictionary synonyms
A dictionary of common word synonyms is bundled with ThoughtSpot. The dictionary contains
synonyms for common terms that occur in data. For example, if you type in “gross”, and that word is not
found, ThoughtSpot will consider it a synonym for “revenue”. We use the WordNet library of terms,
which takes word proximity into account, and weights words by similarity to the target term.
This frees you from having to know the exact term or column name used in a data source. You can still
find the answer in many cases, if you type a word with the same meaning as a different word that occurs
in the data.
Search help
If you type an unrecognized search term, you will be offered tips on searching. The search help appears
when you type a term that isn’t understood by ThoughtSpot and then press the Enter key.
Search bar features
February 07, 2019
ThoughtSpot Users Guide Page 30
Related searches
At the end of the SearchSearch page is the system provides searches you might find useful. These are quick
searches you can load into the search bar by simply click on the provided link.
Search bar features
February 07, 2019
ThoughtSpot Users Guide Page 31
Search suggestions
Summary:Summary: How ThoughtSpot learns from your searches and helps
you.
Search suggestions include complete recent searches that are similar to the search you are constructing.
You can also search for saved objects, such as pinboards.
Usage-based ranking (UBR)
Search suggestions are relevant to the data and personalized to your search behavior. ThoughtSpot
learns over time what columns are most important to you and to your company as a whole. Then, it uses
this knowledge to rank the search terms it offers. The term for this is usage-based ranking (UBR).
ThoughtSpot keeps usage statistics on frequency of search terms in its local cache. If you frequently use
type terms related to finance or to a particular product, ThoughtSpot provides you with related
suggestions more frequently. Using this information, frequently used terms and phrases are offered in
search suggestions more often than those that are not commonly used.
UBR based on search patterns makes ThoughtSpot more valuable over time. Search suggestions
become more helpful the more searches you complete.
Search suggestions
February 07, 2019
ThoughtSpot Users Guide Page 32
Recent searches
As you type in the search bar, you are given search suggestions that include recent searches. This
makes it easier to learn what you can do with ThoughtSpot. In addition to displaying your own recent
searches, the search bar also learns from searches made by other people. This should provide you with
interesting searches that you may not have been aware of. You’ll see recent searches in a separate
section of search suggestions, as recent searches appear higher in suggestions than other terms.
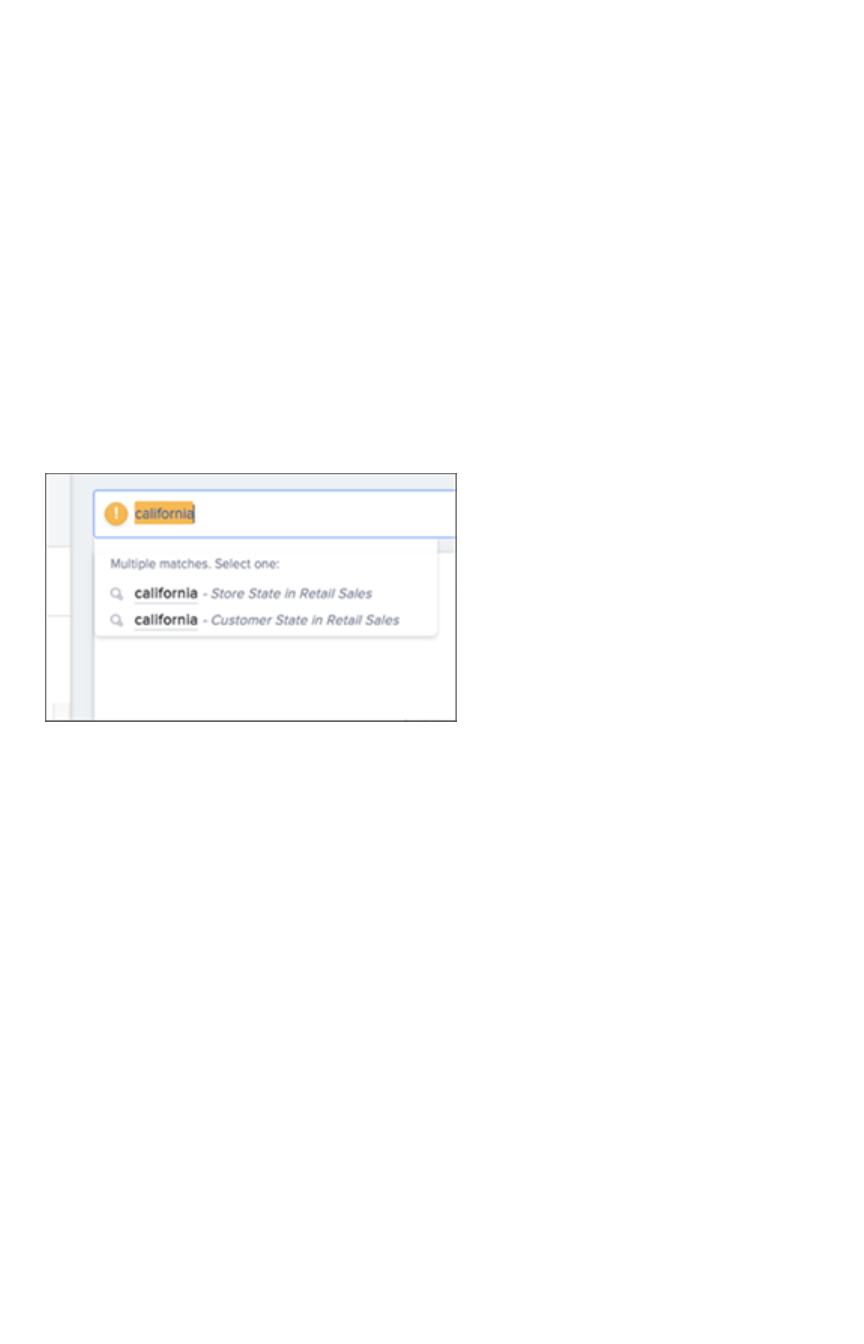
Auto-disambiguation in search
When there are more than one possible meaning for a search term, you can provide disambiguation by
selecting from a list of choices. Now, your choice is sticky. That means you won’t have to select it again,
in the scope of the current search.
Out of scope columns
Search suggestions are not limited in scope to the columns that you select as the data sources.
Suggestions can include columns that are out of scope, too. If you choose one of these suggestions, the
columns will be added to the data sources scope for you.
Object searches
Search suggestions also include relevant pinboards that have already been created. This means that if a
pinboard that is similar to the search you’re trying to do already exists, it will appear in search
suggestions.
Search suggestions
February 07, 2019
ThoughtSpot Users Guide Page 33

Search results and column types
Summary:Summary: Searches in ThoughtSpot use columns that are defined as
either attributes or measures.
ThoughtSpot identifies search columns ( sales ,customer_name ,total_sale ) as either attributes or
measures. The columns you choose impact your search results. That’s because several chart types
expect that your search contains a certain number of attributes and a certain number of measures.
Attributes
Attribute are primarily text or date values. Attributes make up the x-axis of your chart most of time. Some
examples of attributes in terms of a person include name, eye color, occupation, social security number,
address, employee ID, and phone number.
Measures
Measures are numeric values you can do math on, with meaningful results. You will most likely find your
measures on the y-axis of your chart. Some examples of measures in terms of a person are age, height,
and weight.
Query details
After, or while completing a search, you can see how ThoughtSpot displayed the answer. Click the
Query detailsQuery details button on the right-hand side of the screen to open the Query detailsQuery details panel.
Search results and column types
February 07, 2019
ThoughtSpot Users Guide Page 34
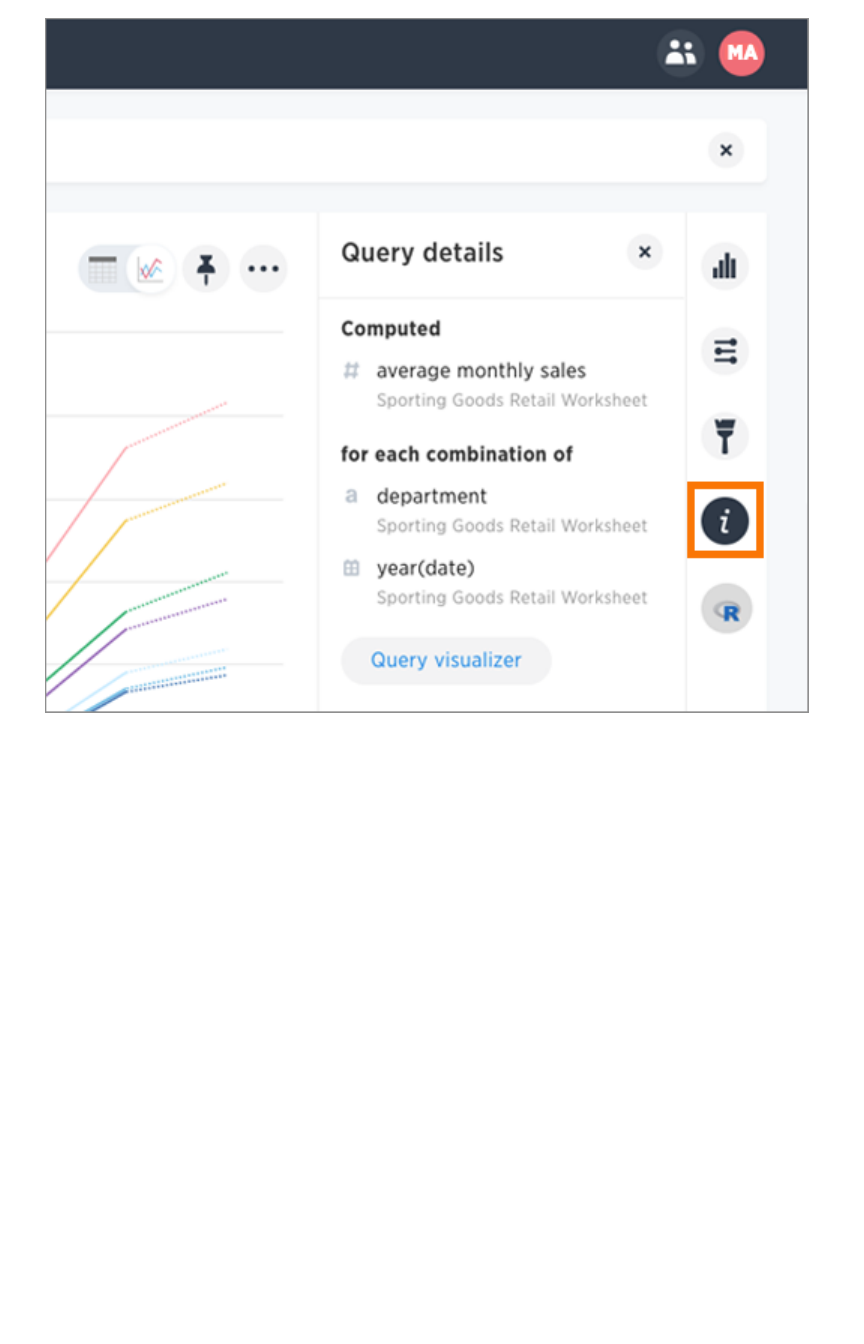
This panel shows the measures that ThoughtSpot computed, for each combination of attributes. Choose
Query visualizerQuery visualizer to see search filters and how the tables were linked and used.
Search results and column types
February 07, 2019
ThoughtSpot Users Guide Page 35
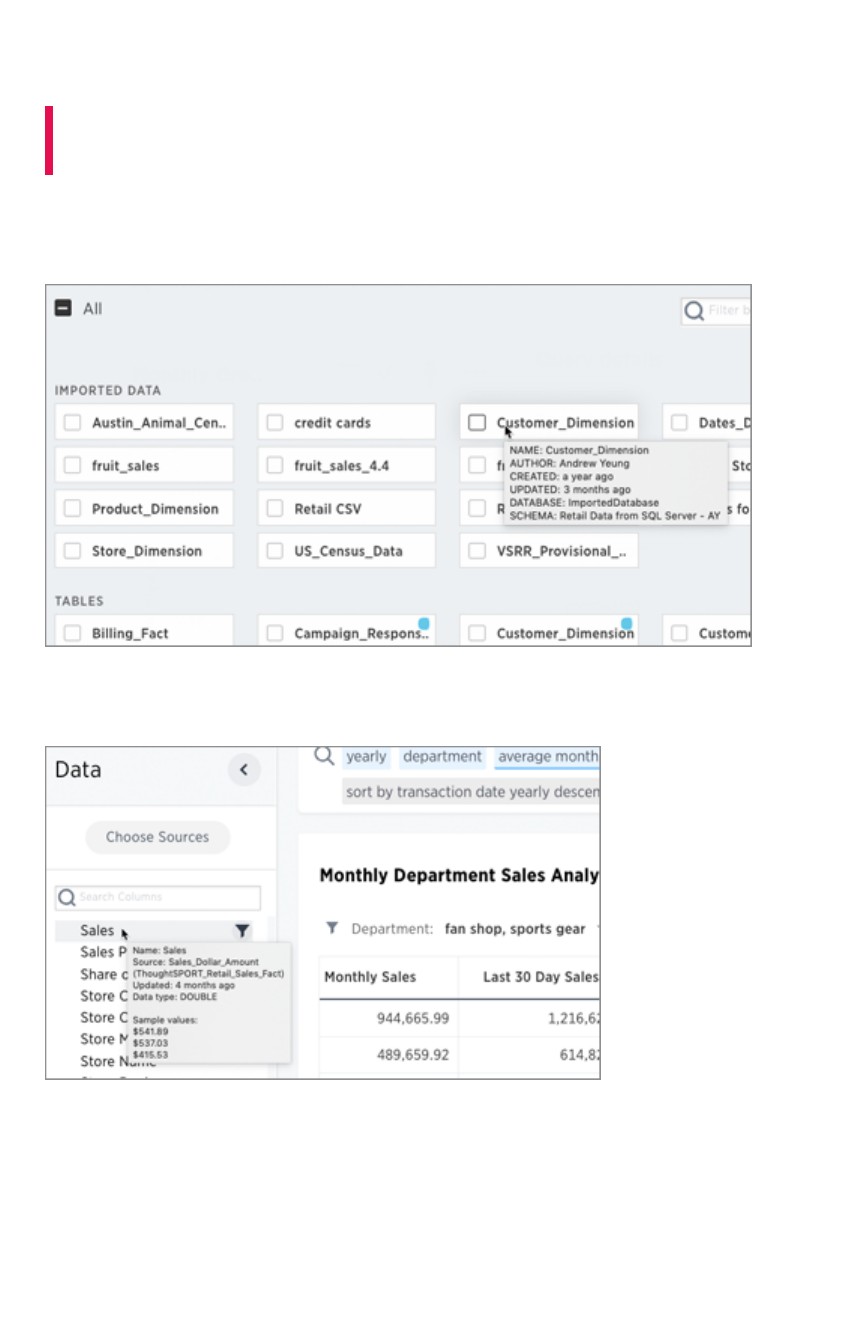
Last data refresh time
Summary:Summary: You can see the last time at which data was refreshed
without having to visit the **Data** page.
Hover over the data when choosing a data source to see the last time it was updated. You will also see
when it was created and by whom.
You can also hover over a column in the DataData column to see when it was last refreshed. This popup will
also show sample values from that column.
And lastly, you can hover over a column or column name in an answer to see last updated information.
Last data refresh time
February 07, 2019
ThoughtSpot Users Guide Page 36

Last data refresh time
February 07, 2019
ThoughtSpot Users Guide Page 37
Work with Answers
Summary:Summary: Answers are the saved results of a search.
You can save the results of any search and share these with other people. Your saved searches appear
on the AnswersAnswers page. From this page, you can see answers you saved and answers other people have
saved, provided these people shared them with you or a group you belong to.
Apply a sticker
Only administrators create stickers, but anyone with edit privileges can tag an object with a sticker. To
add a sticker to an answer:
1. Find the item(s) you want to tag in the list.
2. Check the box next to its name.
3. Click the apply sticker icon and choose one from the list.
You can apply as many stickers as you like to an object.
Copy and edit an answer
You can edit a copy of an answer if you would like to make edits without changing the original answer.
When saving, you can type in a different name for your copy.
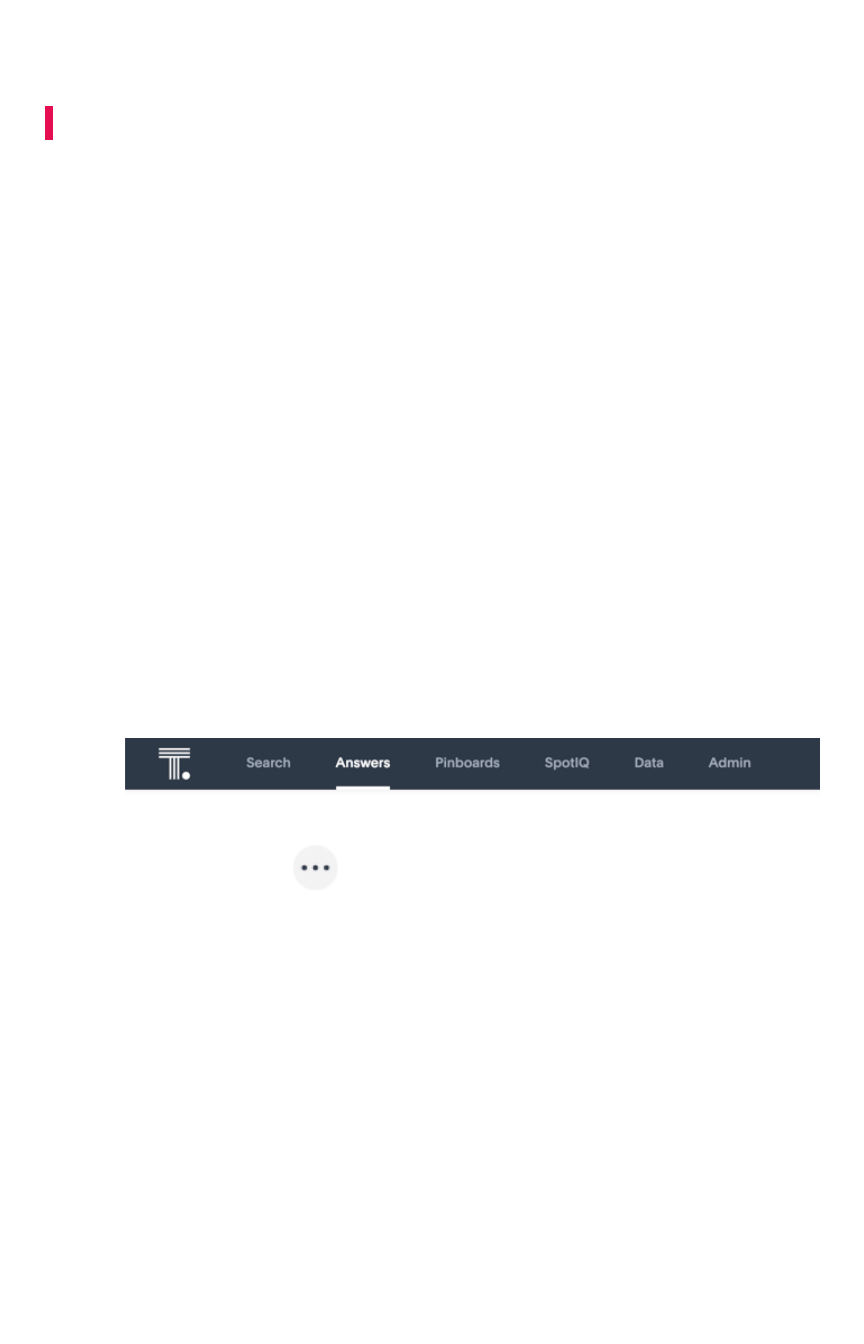
1. Click AnswersAnswers, on the top navigation bar.
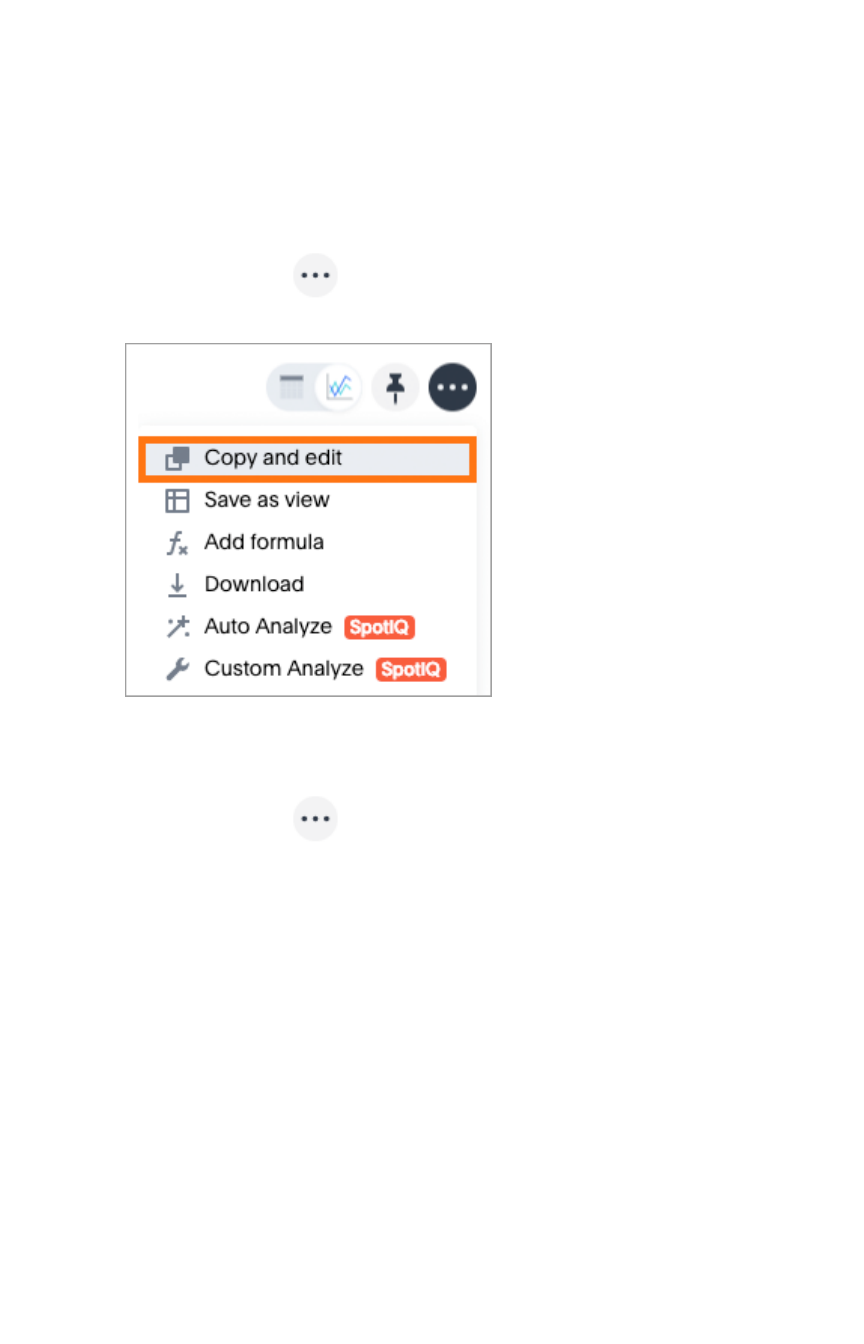
2. On the answer list page, click the answer you would like to edit a copy of.
3. Click the ellipses icon and select Copy and editCopy and edit.
Work with Answers
February 07, 2019
ThoughtSpot Users Guide Page 38
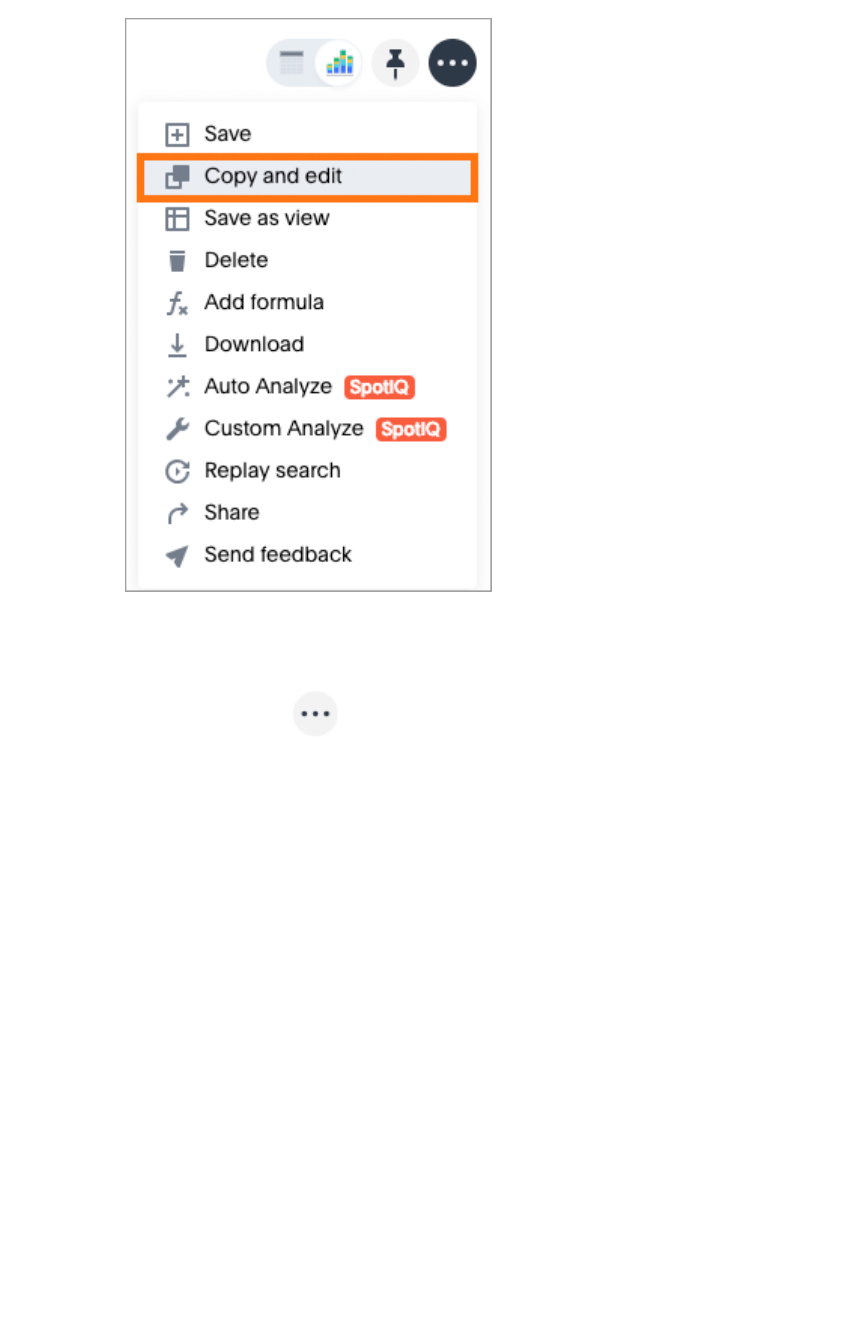
A copy of the answer is displayed with “Copy of” added to the beginning of the title.
4. Make any changes you want to the answer.
5. Click the ellipses icon and select SaveSave.
The Save Answer dialog box appears.
Work with Answers
February 07, 2019
ThoughtSpot Users Guide Page 39

6. Change the name and description, as needed, and click SAVESAVE.
When you navigate back to the Answers page, your edited Answer will appear in the list.
Other features
At the bottom of the AnswersAnswers page, you can an additional area, called SpotIQ InsightsSpotIQ Insights. This area is
derived from your original answer and you can select any of the insights to deepen your search.
The SpotIQ InsightsSpotIQ Insights section is only visible to users with the Has SpotIQHas SpotIQ privilege. Once you expand an
insight on this list, an EditEdit button allows you modify the insight and make it your own. Your installation
configuration determines how many insights can appear in this section. The default is 6.
Work with Answers
February 07, 2019
ThoughtSpot Users Guide Page 40
Copy and edit a SpotIQ Insight
You can edit a copy of a SpotIQ Insight if you would like to make edits without changing the original
insight. When saving, you can type in a different name for your copy.
1. Find the SpotIQ insight you want to edit and click it to open it as an answer.
2. Click the ellipses icon and select Copy and editCopy and edit.
A copy of the answer is displayed with “Copy of” added to the beginning of the title.
3. Make any changes you want to the answer.
4. Click the ellipses icon and select SaveSave.
The Save Answer dialog box appears.
5. Change the name and description, as needed, and click SAVESAVE.
Work with Answers
February 07, 2019
ThoughtSpot Users Guide Page 41

Results that are tables
Summary:Summary: Tables display your answer in a format similar to an Excel
spreadsheet.
Your search results are not limited by the number of attributes or columns in order to be presented as a
table. You can have a table with just one attribute or measure. When you choose to display your answer
as a table, ThoughtSpot will create the columns for you and any relevant headlines.
Sometimes when you view a table, the results will be aggregated (combined). For example, if you only
type “revenue”, you’ll see the total sum of all the revenue the table contains as one combined number. If
you include the keyword monthly , the results will be aggregated by month. You can rearrange the
column order of your table among other search actions.
Every table gives you the option to rearrange the column order and change the column widths.
Rearrange column order
You can rearrange the column order of your table after adding all of your search terms.
To rearrange the column order:
1. While viewing your answer as a table, click the column header you would like to move.
2. Drag it across to its new position.
Resize column widths
You can resize the column widths of your table after adding all of your search terms. Any adjustments
you make to the column widths of your table are saved when you pin the table to a pinboard. To resize
the column widths:
1. While viewing your answer as a table, hover over a column border in the column header row.
2. Click and drag the border to create your preferred column width.
Sort columns
You can sort a table by column values by clicking on the column title. If you hold down the SHIFT key
you can click on multiple heads and sort on them in turn.
Tip:Tip: This same functionality is available on tables you see elsewhere in ThoughtSpot. For
example, a table in the DataData page is also sortable in this manner.
About headlines (summary information)
Headlines display summary information of a table result. Headlines contain summary information for
each column of a table. They appear at the bottom of the table in individual boxes.
Results that are tables
February 07, 2019
ThoughtSpot Users Guide Page 42
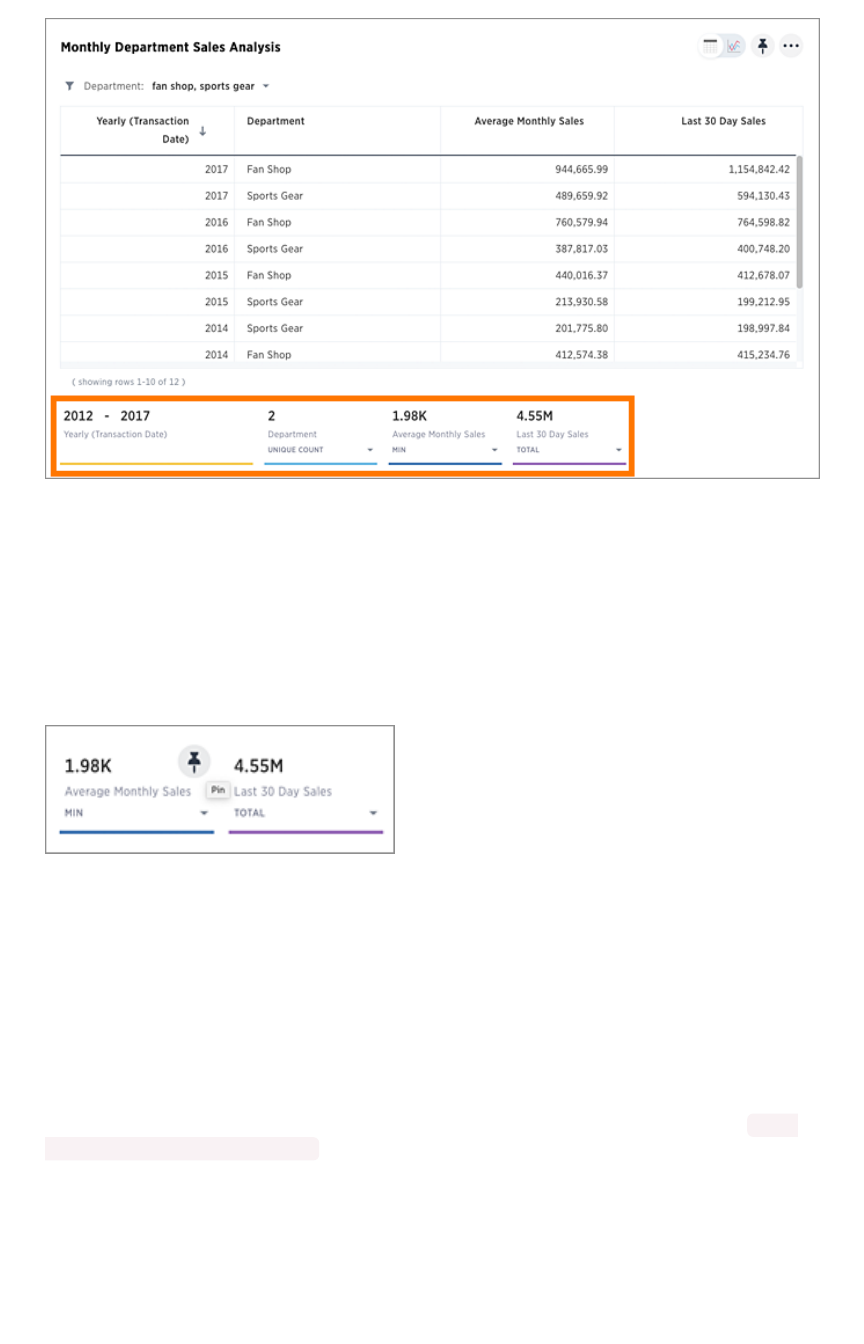
ThoughtSpot automatically creates up to 20 headlines for each table. Your ThoughtSpot configuration
can be changed to accommodate more if needed.
You can modify how you’d like the value to be displayed by clicking the dropdown on a headline and
selecting a different type of aggregation. The usual available aggregations are total, average, standard
deviation, variance, minimum, and maximum. There are also unique count and total count values
available for the appropriate columns.
To add a headline to a pinboard, hover over the headline and click the PinPin icon.
You can decide whether or not to display headlines in your table results. To customize headlines, choose
… > Customize summaries… > Customize summaries.
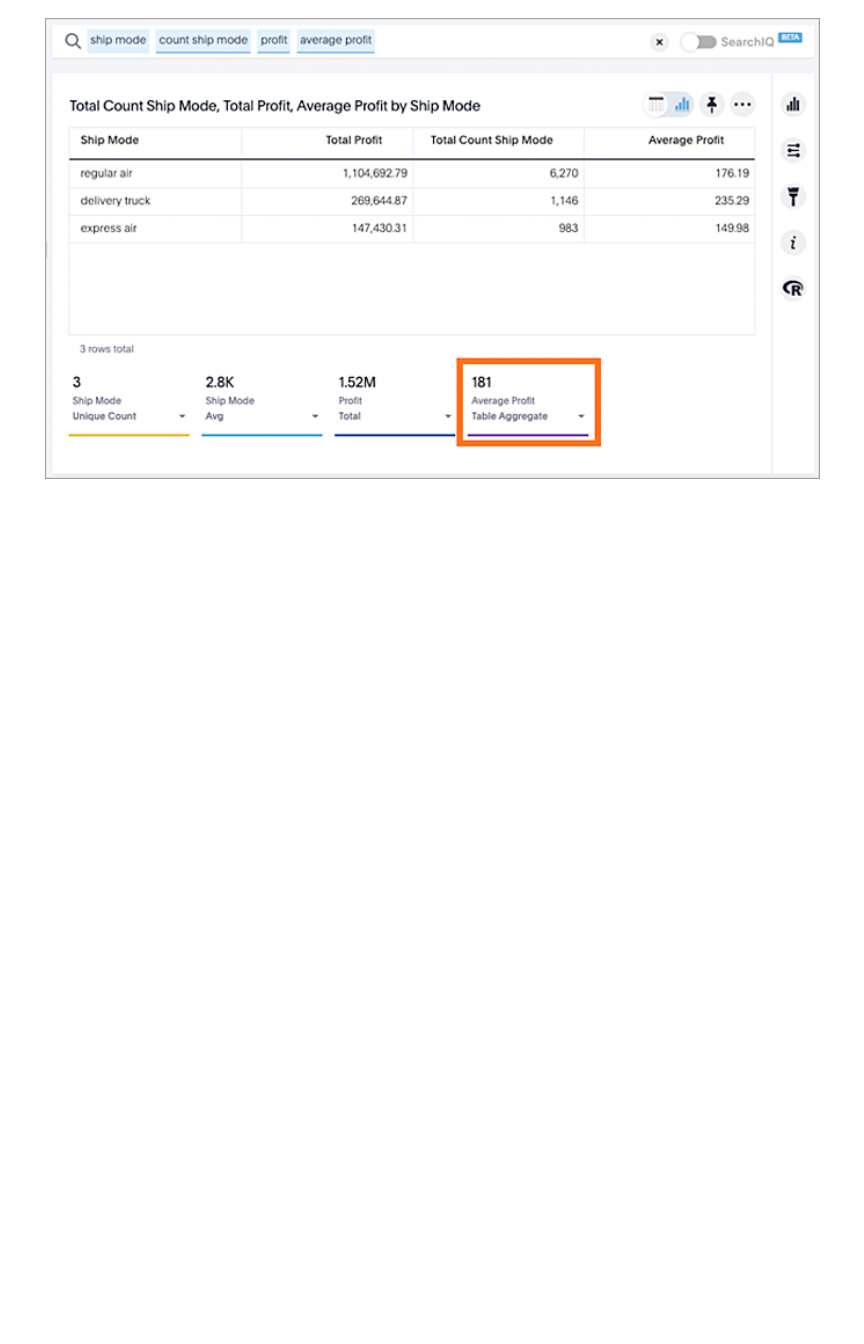
Table aggregate headline
The Table Aggregate headline option is available when an aggregate function is used either through a
formula or a search bar query like average of a measure. It recalculates the function for the entire table.
In such cases, Table Aggregate is shown by default in a headline below the table, instead of the “Avg”
option, which does a second level of aggregation on top of the existing aggregation.
In the following example, the table aggregate is shown as a result of the Average Profit formula sum (
profit ) / count ( ship mode ) which divides the total profit of each ship mode by the sum total
count for that ship mode. Table Aggregate, recalculates that function for the entire table taking the sum
total profits of all ship modes and dividing it by the sum total count of all ship modes, providing a table
aggregate average profit of 181. This a more useful result compared to the Avg headline option which
would simply sum the the average profit for all ship modes and divide it by the number of ship modes (3),
providing an average of 187.
Results that are tables
February 07, 2019
ThoughtSpot Users Guide Page 43
Results that are tables
February 07, 2019
ThoughtSpot Users Guide Page 44
Overview of keyword searches
Summary:Summary: Use keywords when asking a question to narrow and
further define your search.
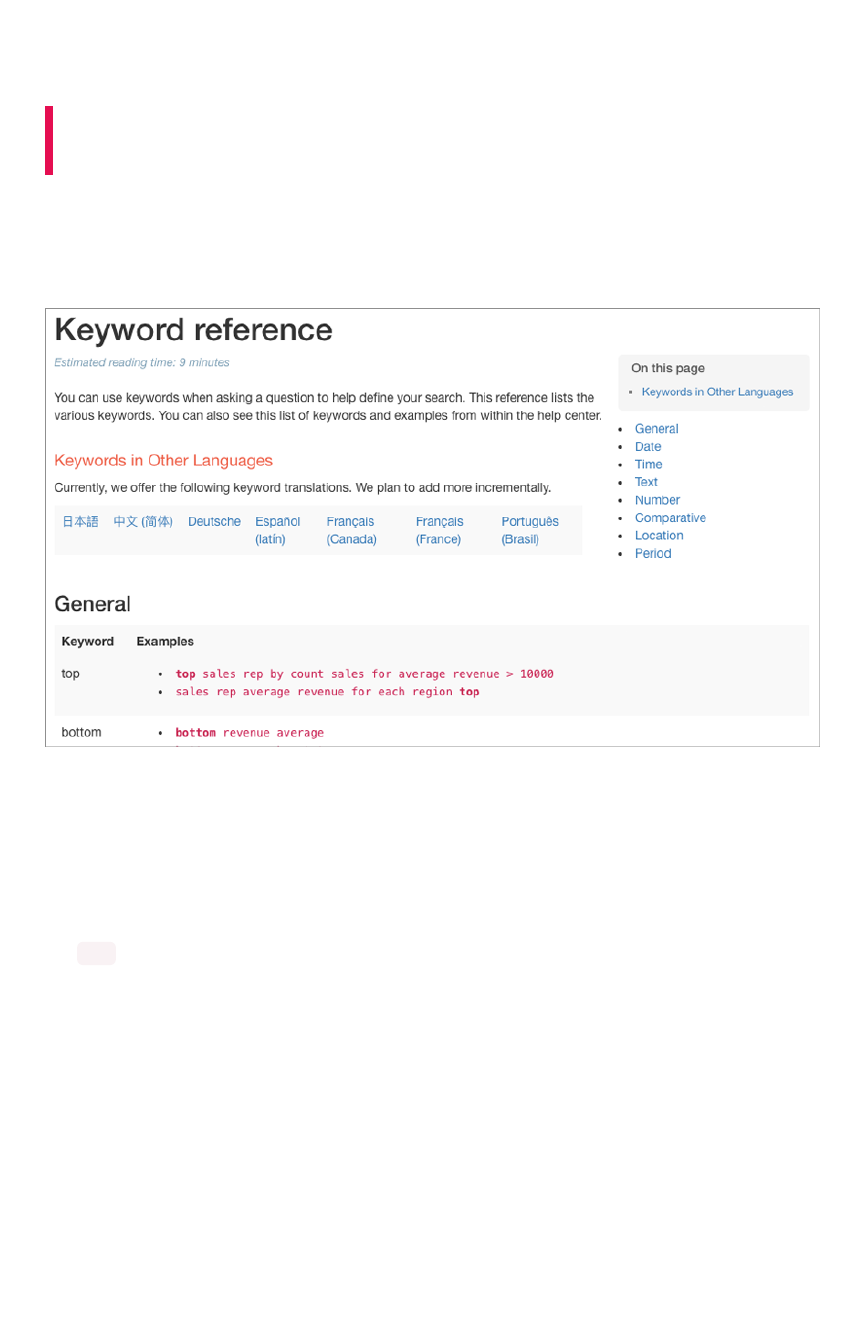
In addition to column names, values, and filters, the search bar also accepts keywords. You can access
a list of keywords and other reference materials in the reference section or in the help. Open the help by
selecting HelpHelp from the top navigation bar.
Within the help center, you’ll find videos and documentation that pertain to the current version of
ThoughtSpot. Here is where you can also find a list of keywords. You can expand each section to see
which keywords are available and examples on how to use them.
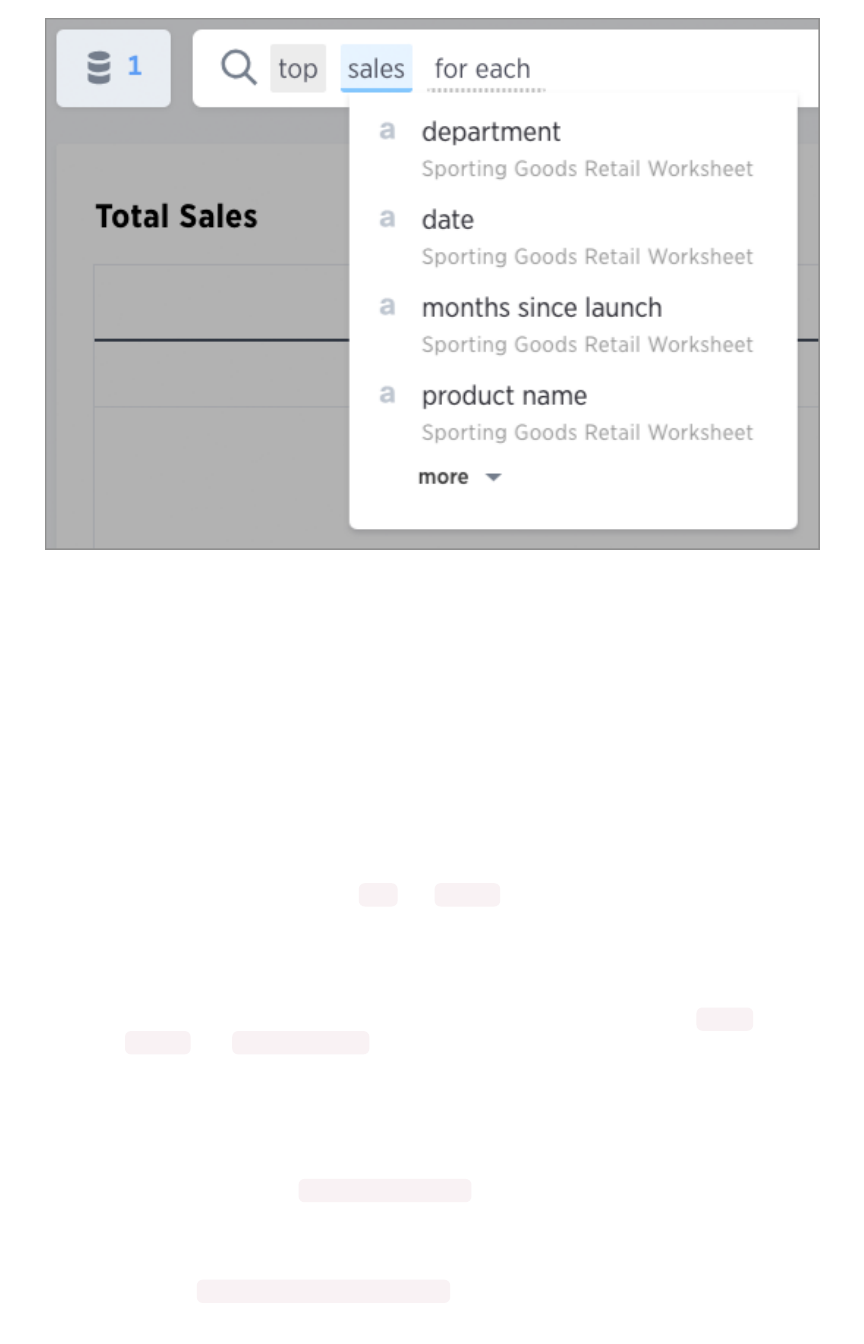
Example: Simplify search with the top keyword
The top keyword can be a powerful addition to your search when you remember to use it. By using
one keyword, you can greatly simplify your searches. The top keyword is one such keyword. Its syntax
looks like top n for each x.
Overview of keyword searches
February 07, 2019
ThoughtSpot Users Guide Page 45
Some common search examples it can simplify are finding the:
• top two performing sales rep
• top revenue average revenue by state
• top two students ranked by source for each class
Types of keywords
Keywords serve a variety of predefined purposes, and are divided into different groups. The groups are
as follows:
• Basic keywordsBasic keywords
You can use keywords such as top and bottom to, for example, only see results for the
best or worst performing sales rep.
• Date keywordsDate keywords
Date keywords give you the freedom to narrow your search by days, weeks, months,
quarters, or years. There are also a number of date related keywords such as after ,
before , and year-over-year . Use the new date keywords to describe dates in the future.
This is useful for exploring things that are scheduled for a future date, such as shipments due
to go out in the next week.
• Time keywordsTime keywords
Time keywords are the most useful when trying to figure out how many visitors you’ve
received within the last n minutes or hours .
• Text keywordsText keywords
You can use text keywords to find similar words or phrases that contains a certain word. For
example, product name contains green .
Overview of keyword searches
February 07, 2019
ThoughtSpot Users Guide Page 46

• Number keywordsNumber keywords
These keywords allows you to define your search by sum, average, count, max, min, and
other accumulations.
• Comparative keywordsComparative keywords
Filter keywords work in the same way as filters on table columns or chart axes.
• Location keywordsLocation keywords
The keywords near and farther than allow you to search with spatial filters on your geo
type columns with latitude/longitude data. This lets you focus your search based on distance
and locations. You can specify a specific radius using miles, kilometers, or meters.
Related information
•Keyword reference
•Search using growth over time
•Geographical proximity keywords “near” and “farther than”
Overview of keyword searches
February 07, 2019
ThoughtSpot Users Guide Page 47
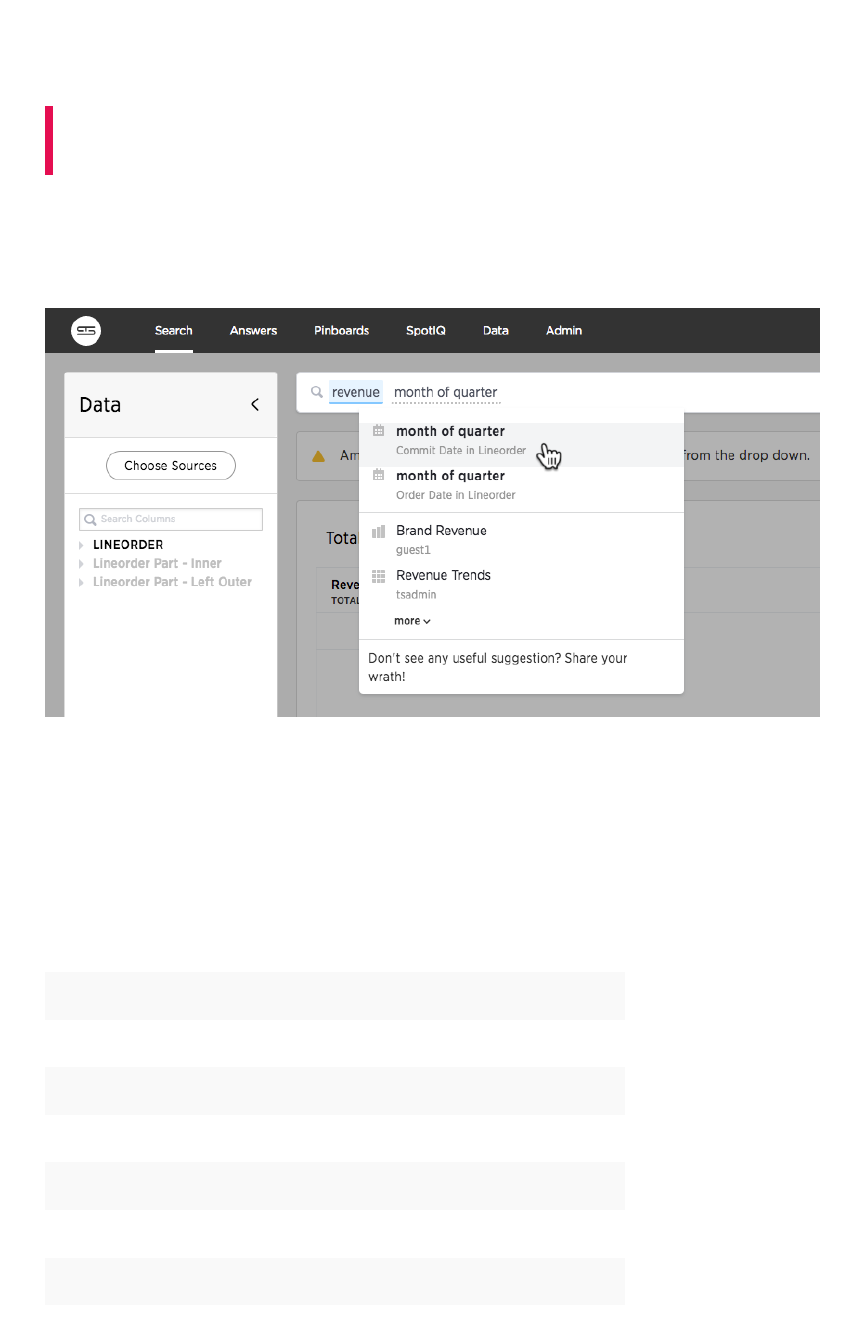
Time series analysis
Summary:Summary: You can compare across time periods without using a
formula.
A
time series
is a set of data points ordered by time. For example, within the same week a sale on
Tuesday comes before a sale on Wednesday in such a data set. You can use ThoughtSpot’s
time series
analysis
feature to search for answers about series data.
You might use this feature to compare a time period across other time periods. For examples sales for
each month across several years. You may also want to calculate an aspect such as growth over the
same time period across other periods. You can also do relative analysis such as sales for the last 3
months of each year across years.
You can use one or more of the following period keywords to create this type of analysis:
Period keywords
KeywordKeyword ExampleExample
quarter (
date
)quarterquarter (purchase date)
quarter of year (
date
)quarter of yearquarter of year (purchase date)
month of quarter (
date
)month of quartermonth of quarter (purchase date)
week of year (
date
)week of yearweek of year (ship date)
week of quarter (
date
)week of quarterweek of quarter (ship date)
week of month (
date
)week of monthweek of month (ship date)
Time series analysis
February 07, 2019
ThoughtSpot Users Guide Page 48
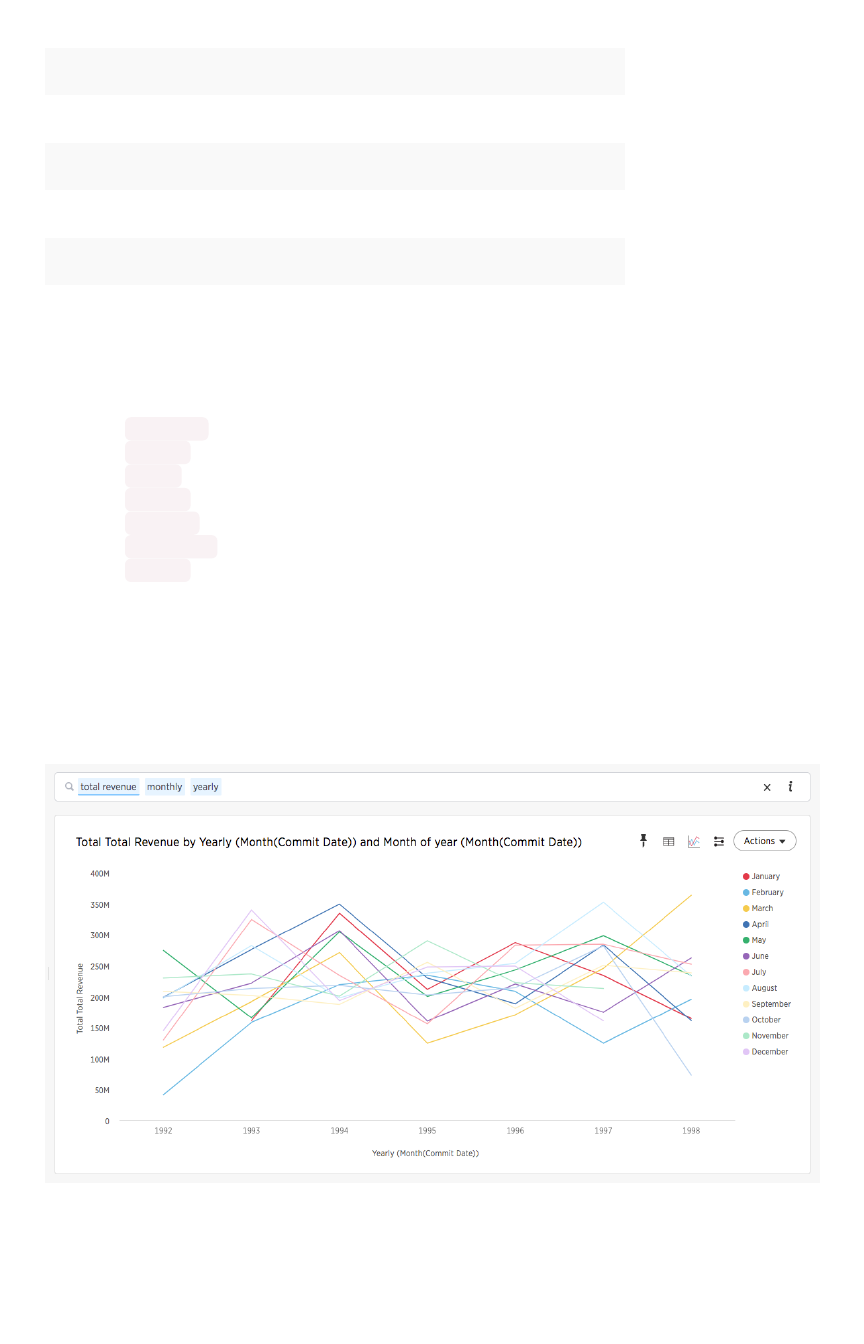
day of year (
date
)day of yearday of year (ship date)
day of quarter (
date
)day of quarterday of quarter (ship date)
day (
date
)dayday (ship date)
day of month (
date
)day of monthday of month (order date)
day of week (
date
)day of weekday of week (order date)
hour (
datetime
)hourhour (timestamp)
All of these keywords sort the data using datetime semantics, that is chronologically in a time sequence.
By default, the SearchSearch bar suggests these keywords less frequently than others.
You can use these new keywords in combination with the existing data keywords which are:
•Detailed
•Hourly
•Daily
•Weekly
•Monthly
•Quarterly
•Yearly
Examples of time series analysis
Typically, when you search for answers about series data, the visualizations that answer your questions
are line charts. These charts frequently but not always include a stack to indicate a period.
When you search for an aspect of data of time series, a typical response is a line chart showing the
aspect as it rises and falls over time.
Time series analysis
February 07, 2019
ThoughtSpot Users Guide Page 49
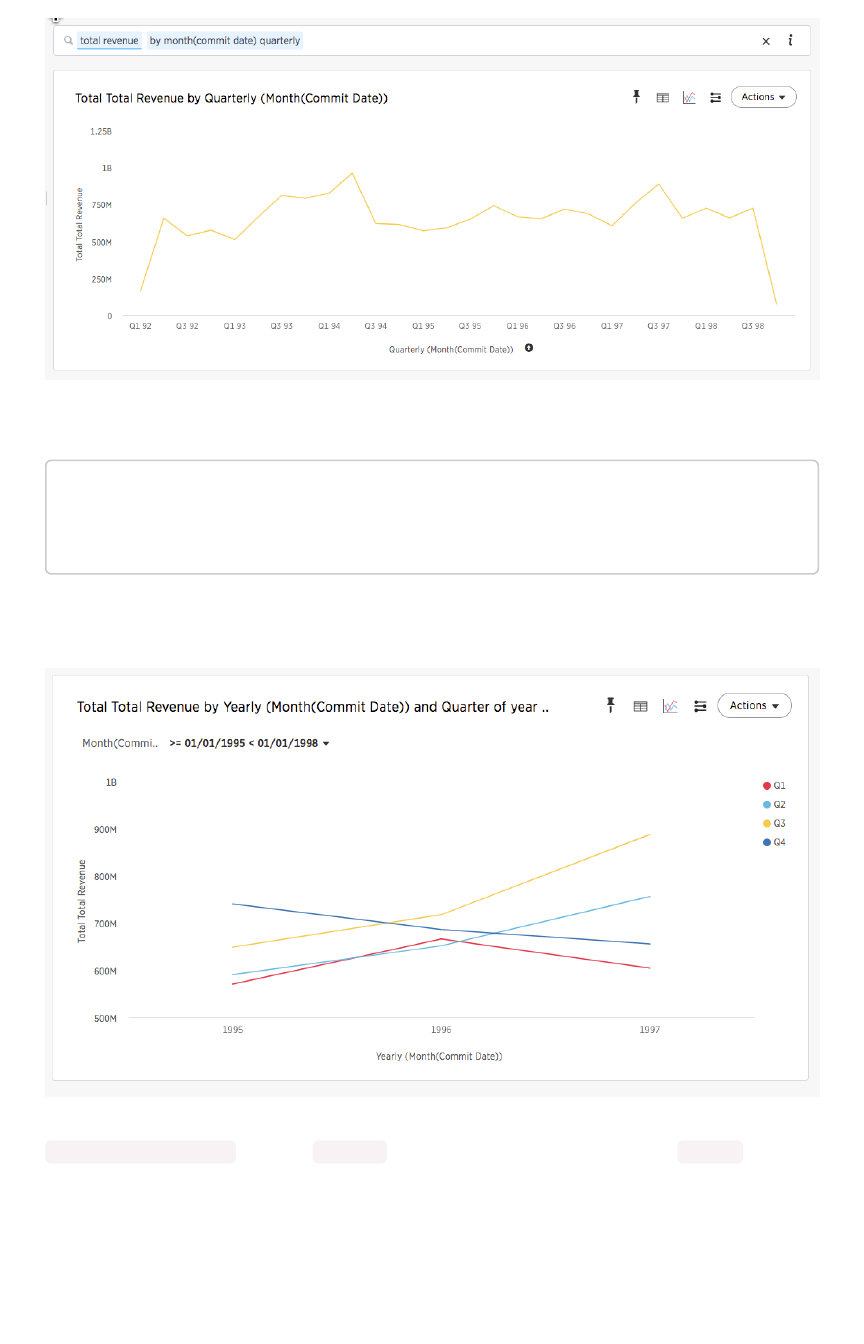
You can also add a relative date filter for example,
total revenue quarterly yearly by year month(commit date) >= 0
1/01/1995
month(commit date) before 01/01/1998
This type of query also yields a stacked line chart:
The child date time attribute is on the X-axis and the parent in the legend. For example, if you search
revenue month yearly the child, monthly , appears on the x-axis and the parent, yearly , in the
legend.
Time series analysis
February 07, 2019
ThoughtSpot Users Guide Page 50

Granularity for date filters
You can refine a simple date filters by adding hierarchical date filter to your query. The ability to specify
two bucket granularities such as “hour of day” or “week of year” are two examples. The syntax of this
type of query is
small_bucket of big_bucket [INTEGER_CONDITION]
The INTEGER_CONDITION is optional but it must be an integer. For example, this query is valid:
revenue by day of week <= 2
This query is invalid:
revenue by day of week = Tuesday
You can specify one or more granular filters.
These tips and gotchas apply to time granularity:
• The system-defined fiscal rules are respected. This means, for example, if the fiscal year
begins in February, month of year = 2 matches dates in March.
• Fiscal shorthands such as Q1 ,Q2 and so on are not supported, so day of week = d1 is
not valid.
•INTEGER_CONDITION with =or != accept a list of filter values, so, day of week = 1 2
3is valid.
•INTEGER_CONDITION with =or != require legal values, so day of week > accepts any
integer on the right hand side while day of week = requires a value in the legal 1-7 range.
• Simple date filters allow you to use edit the filter through the answer to refine your search,
adding a a hierarchical date filter in the search bar disables this ability.
Time series analysis
February 07, 2019
ThoughtSpot Users Guide Page 51
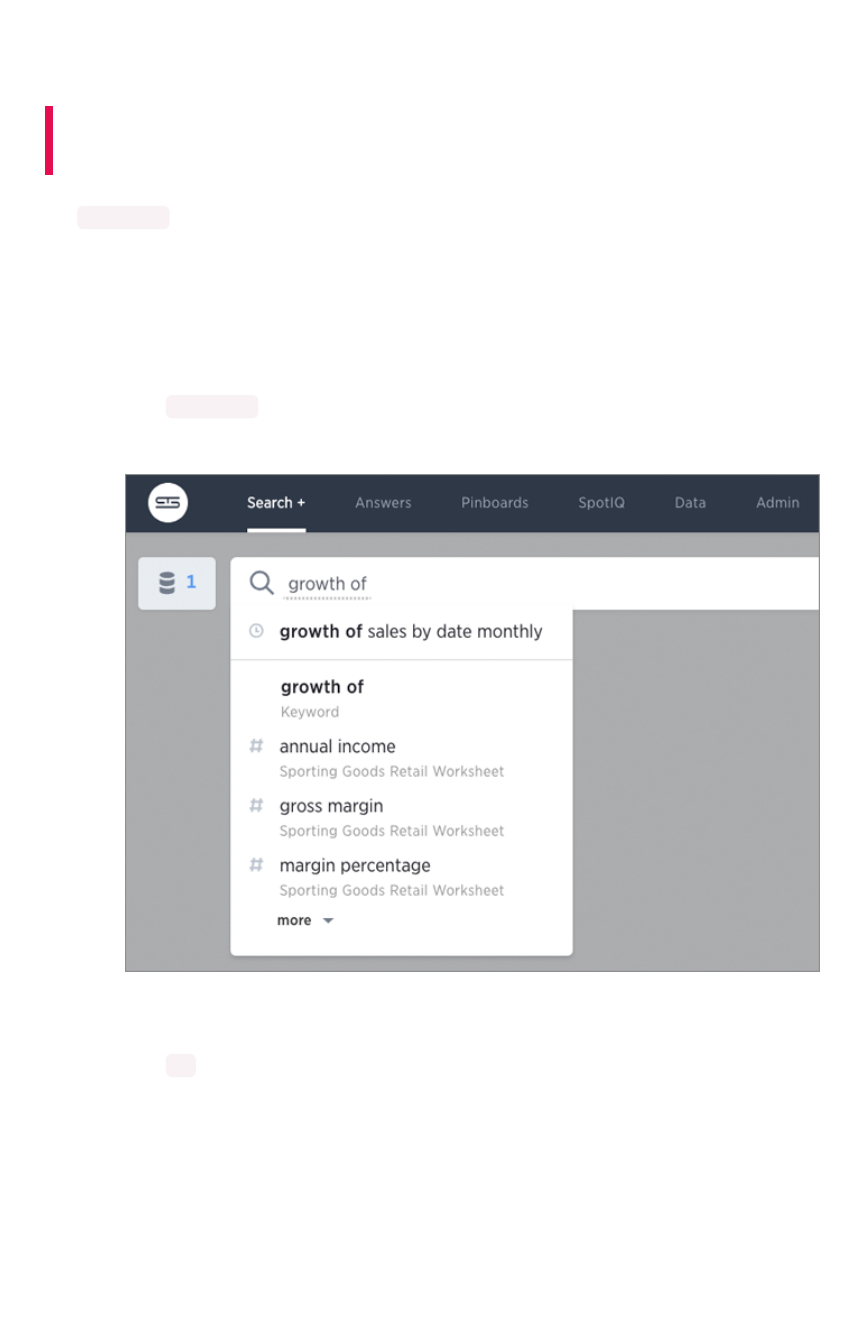
Search using growth over time
Summary:Summary: You can show growth over time by using the growth of
keyword in your search.
The growth of keyword compares the data from different date periods, and returns a percentage of
growth.
Growth of measure by year
To search using growth over time:
1. Type growth of into the search bar, and choose a measure you’re interested in seeing the
growth of.
You will see a list of suggestions to choose from based on your sources. You can also type a
different column name containing numeric data to compare.
2. Type by , followed by a date column name.
The growth is calculated as a positive or negative percentage, for each period relative to the
last period in the series. A line chart is a good way to display your data, but the waterfall chart
is especially effective to show growth.
Search using growth over time
February 07, 2019
ThoughtSpot Users Guide Page 52
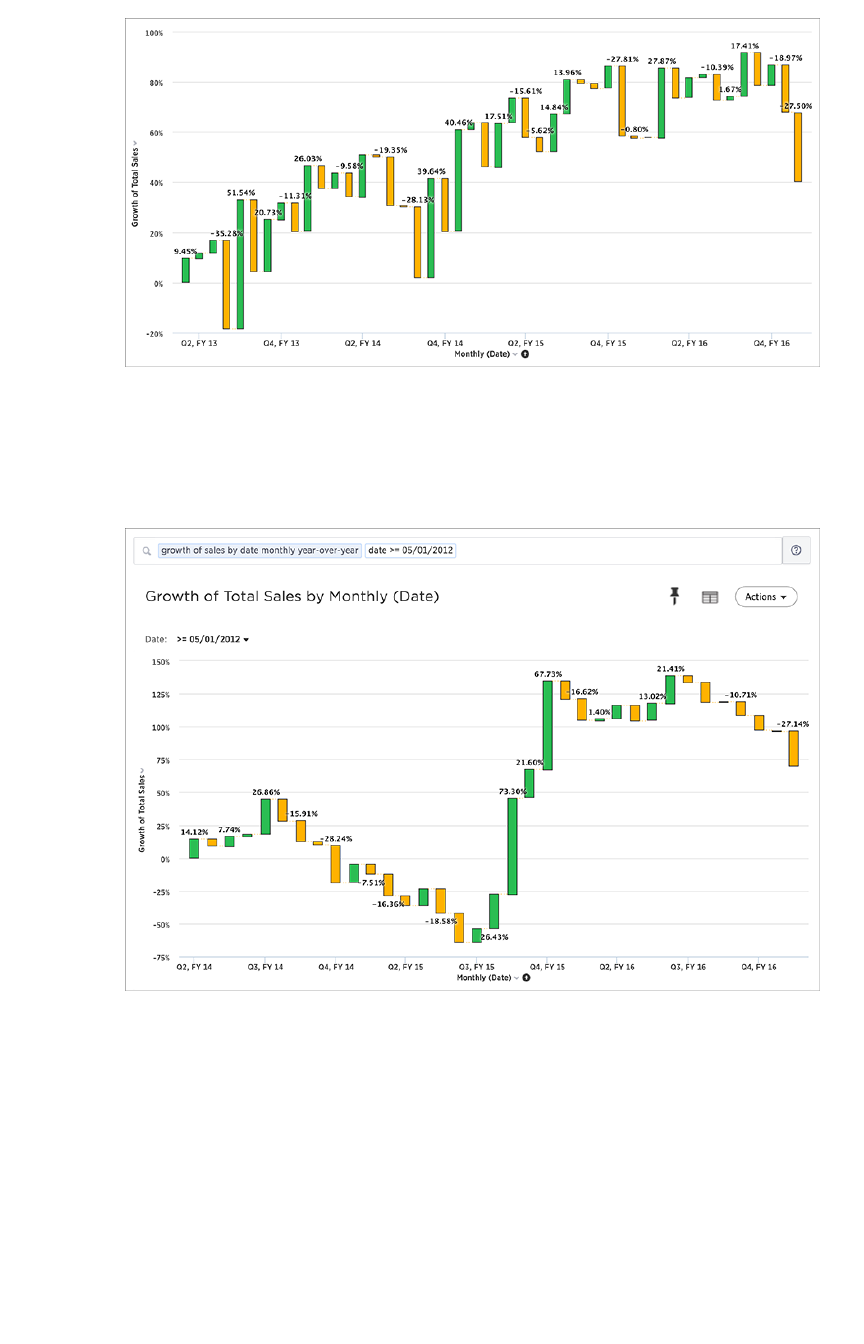
3. You can also do year-over-year analysis, which compares each time period to the
corresponding time period in the prior year.
This type of growth analysis is more common in retail and other seasonal businesses. To do
this, type monthly year-over-year after your growth of phrase in the search bar.
This compares data between the same month from different years. For example, it will allow
you to compare sales from June of this year to the sales from June of last year. Note that for
the first year, values are labeled as “{Blank}” in the Data View since there are no previous data
to compare them to.
Add an attribute to your search see the breakdown of how each grouping of the attribute
contributed to the overall growth of your measure.
4. Click Configure ChartConfigure Chart and add your attribute to the Legend field.
Search using growth over time
February 07, 2019
ThoughtSpot Users Guide Page 53

It looks like Q4, FY 15 was a much more productive period for a number of categories
compared to a year ago.
Display periods (daily) over time (year-over-
year)
Growth query now supports more hierarchical date buckets and period calculations. The growth query
syntax is as follows:
growth of <measure_column> by <date_column> <bucket> <period-over-period>
This table shows the possible buckets and the period-over keywords you can combine:
quarterly monthly weekly daily hourly
year-over-
year
year-over-year year-over-year year-over-year
quarter-over-
quarter
quarter-over-
quarter
quarter-over-
quarter
month-over-
month
month-over-
month
week-over-week
day-over-
day
For example, the following query growth of sales by date daily month-over-month :
Search using growth over time
February 07, 2019
ThoughtSpot Users Guide Page 54
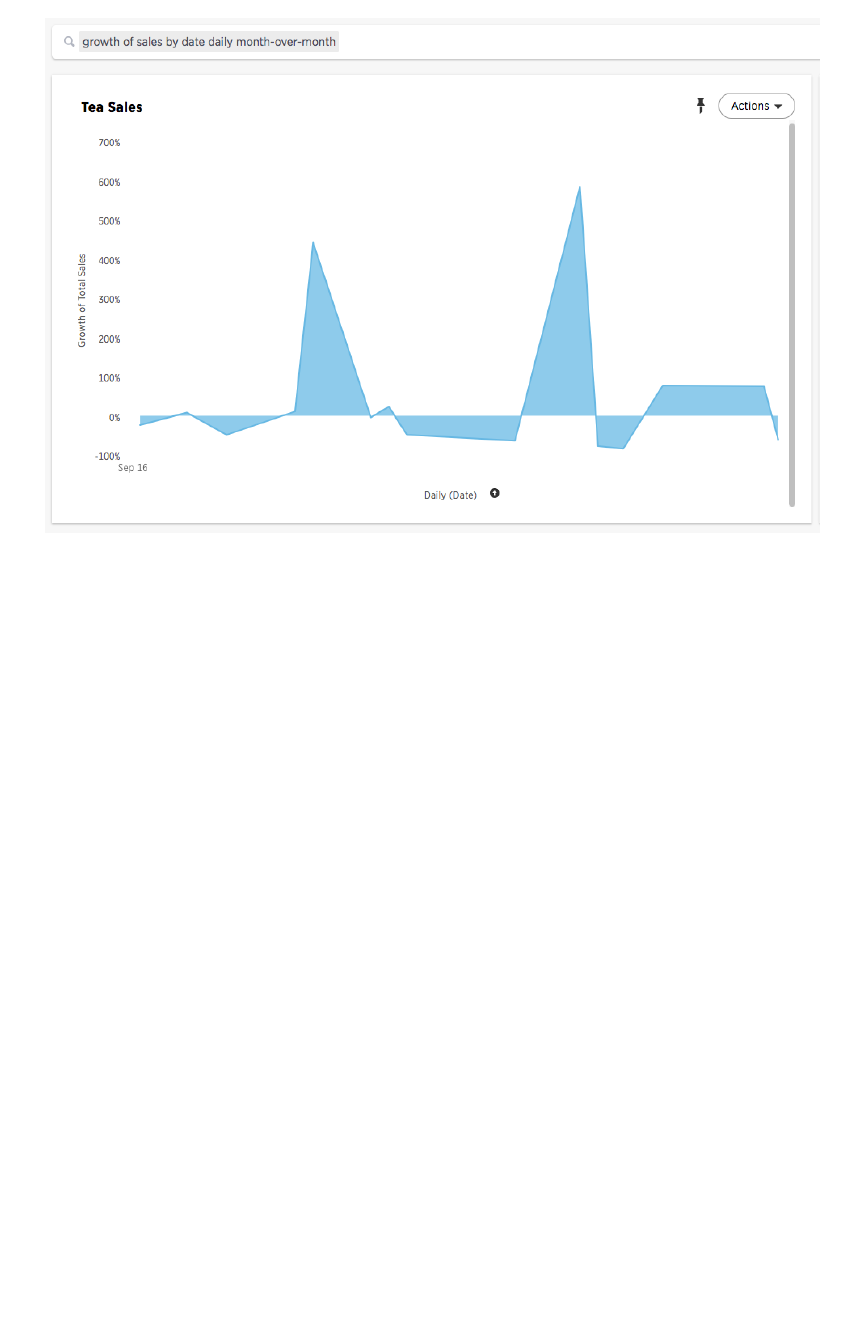
Search using growth over time
February 07, 2019
ThoughtSpot Users Guide Page 55

Proximity searches "near" and "farther
than"
Summary:Summary: If your table contains Latitude and Longitude data, you can
use proximity searches that find entities related to each other by
location.
Proximity keywords allow you to search and show the results on a map. Using proximity keywords
causes ThoughtSpot to display a circle that represents your set distance on the geo charts.
The proximity keywords are:
•near
•
near…within n miles km meters
•
farther than n miles km meters from
The distance is calculated as a straight-line distance (not road distance) radius using miles, kilometers,
or meters from the central point. If you do not specify a distance, the system uses 10 km as the default.
Given a latitude, a longitude, and an optional distance, the search returns all instances of a geotype
column that falls within the parameters. These keywords are limited to 33 latitude/longitude pairs. They
work on duplicate counties. Finally, you can filter on them. Some examples of valid searches are:
Proximity searches "near" and "farther than"
February 07, 2019
ThoughtSpot Users Guide Page 56

landings
latitude longitude city
near tokyo
landings
latitude longitude city
near tokyo within 50 miles
You can bracket your search only with actual values found in the data. So “longitude between
-125.000000 and -115.316670 worked for me, but not longitude between -125 and -115 .
Proximity search configuration requirements
All your data must be in the same set. The worksheet or one of the tables must contain a column of type
longitude and a column of type latitude . The latitude and longitude data have to be on the same
base tables for the feature to work. You can’t, for instance, have a dimension table with all your cities
and their associated geo coordinates and join to it from your fact table and expect proximity search to
work.
Also, your administrators must have configured these columns using the appropriate GeoType.
Proximity searches "near" and "farther than"
February 07, 2019
ThoughtSpot Users Guide Page 57
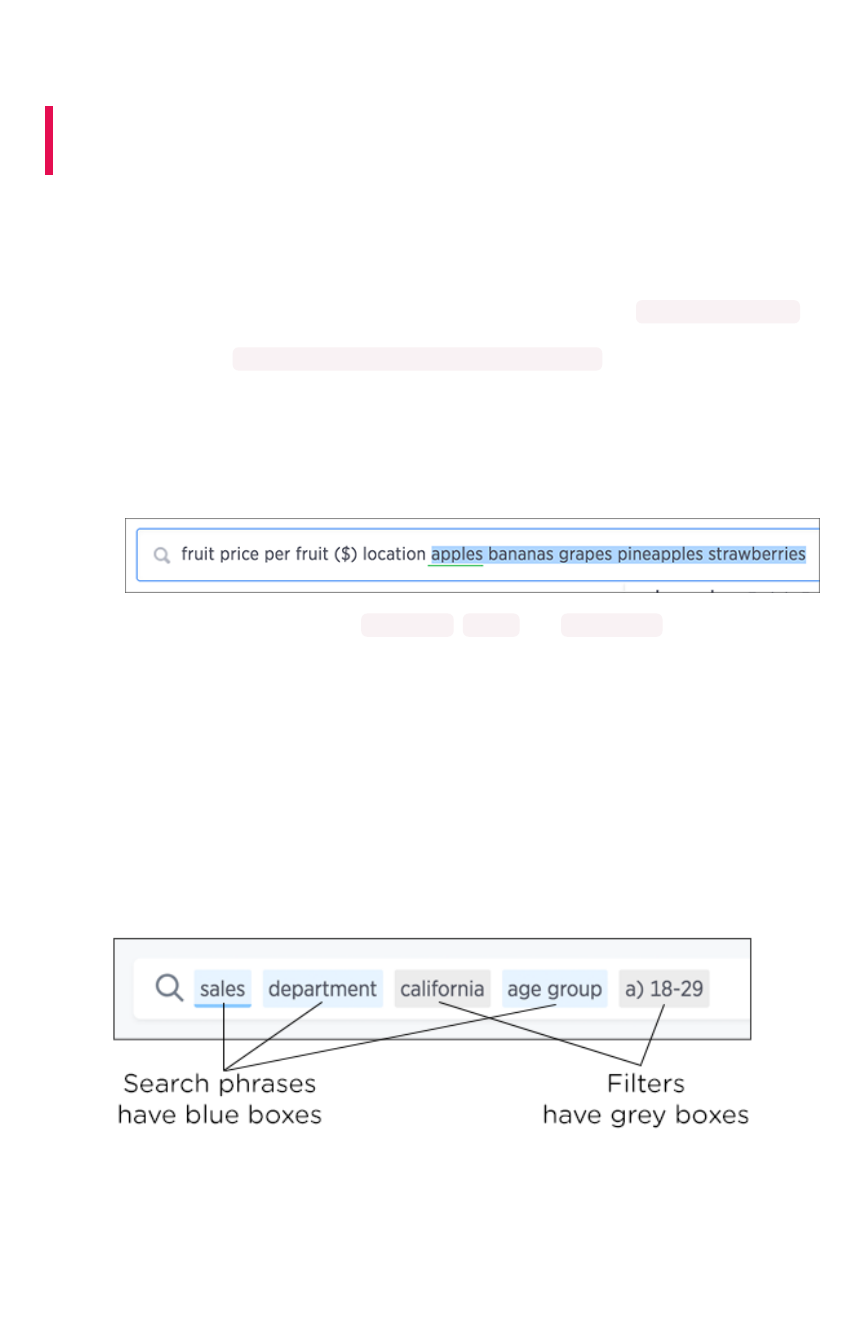
Understand filters
Summary:Summary: Filters narrow down the search result to only include the
data you want to see.
When you add a value to your search, it becomes a filter. You can define filters on tables, views and
worksheets. When you add a filter, it is applied to the table, view, or worksheet, so the result set only
shows rows that satisfy a set of parameters specified in the filter. You can also set filters that are
automatically used in every search you perform using a particular data source. For example, you can
exclude inactive customers records from your search result set. To avoid typing status = inactive
with every search you perform, you can use a filter. The complex the filter is, the more useful it is to set
on the data sources (e.g. status = inactive year = 2017 rating > 0 ).
To add a filter from the search bar:
1. Click in the search bar and type the values you want to include in the search.
Typing a value in the search bar acts as a filter.
You can also use keywords like yesterday ,after , and next month to filter your search.
To see more keywords, refer to the keyword reference.
2. Click outside of the search bar or push enter to apply your filter.
Simple filters can be applied to an answer, while pinboard filters can be applied to all visualizations of a
pinboard. You can find out more about pinboard filters in the pinboards section.
Where filters appear in ThoughtSpot
As you have seen with search, filters appear in grey boxes in the search bar.
In an answer or a pinboard, filters appear just below the title. For pinboards, your filters apply to all
worksheet-based visualizations in the pinboard.
Understand filters
February 07, 2019
ThoughtSpot Users Guide Page 58
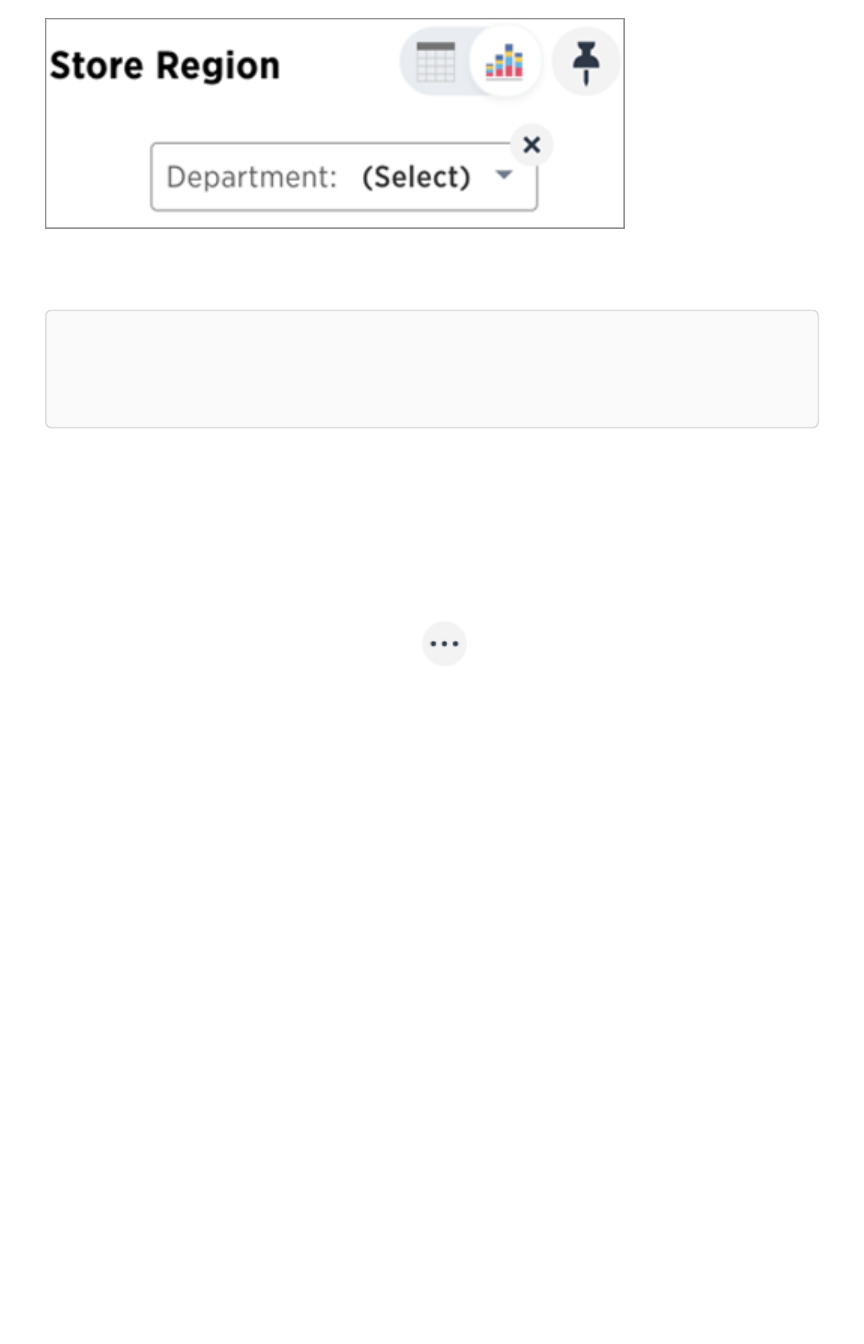
If you ever find that your search or pinboard does not appear to contain all the data you want to see,
check for any existing filters and remove them by clicking the XX to see all the data.
Note:Note: Filtering on NULL and empty values is a special case. You can find out more about how
these values are represented and how to filter for them in About filtering on null, blank, or empty
values.
Simple filters
Simple filters can be applied to searches in a few different ways. You can use the search bar or choose
FilterFilter from the column header or axis label. You can apply simple filters to your search, whether it shows
a table or a chart. Your filters remain part of the search even when you change the visualization type.
When adding a filter from the ellipses icon (3 dots) , in the column header or by clicking on a chart
axis, numeric columns and text columns provide you with the ability to include or exclude values, and a
checkbox selector for the values. If the column contains a date, you’ll see a calendar selector when
applying a filter. This is also where you’ll go to apply bulk filters.
Bulk filters
If you have a large worksheet or table with thousands or millions of rows, you may want to create bulk
filters. You can paste in a list of filter values to include or exclude, without having to click the box next to
each value in the filter selector.
Bulk filters can be very useful when you have a very large worksheet or table. You can use them to filter
a large list of values easily. For example, this is useful if you want to only search on a list of products that
your manager sent to you in an email. You can cut and paste those values into the bulk filter box to
quickly generate a report or chart that includes only those items of interest.
You can create a bulk filter by pasting a list of values, separated by commas, semicolons, new lines, or
tabs, into the bulk filter box. This allows you to easily search a large list of filters repeatedly.
Cascading filters
If you want to apply a table filter whenever the table has been used (Views, Worksheets, Answers, and
Pinboards), use Cascading filters. When columns from that table are applied in a search, the table filter is
implicitly applied to the search. All worksheet filters are accessible from the query visualizer.
Understand filters
February 07, 2019
ThoughtSpot Users Guide Page 59

Consider a table with a filter that is used in a worksheet. When a search uses that worksheet, the filters
are automatically applied as a part of the search.
Worksheet filters
A worksheet filter gets applied every time that worksheet is used. This means that for any search
involving a filtered worksheet, all worksheet filters are applied before the search is submitted. So results
are always filtered, even if the specific terms searched do not include the column(s) that are filtered.
Understand filters
February 07, 2019
ThoughtSpot Users Guide Page 60
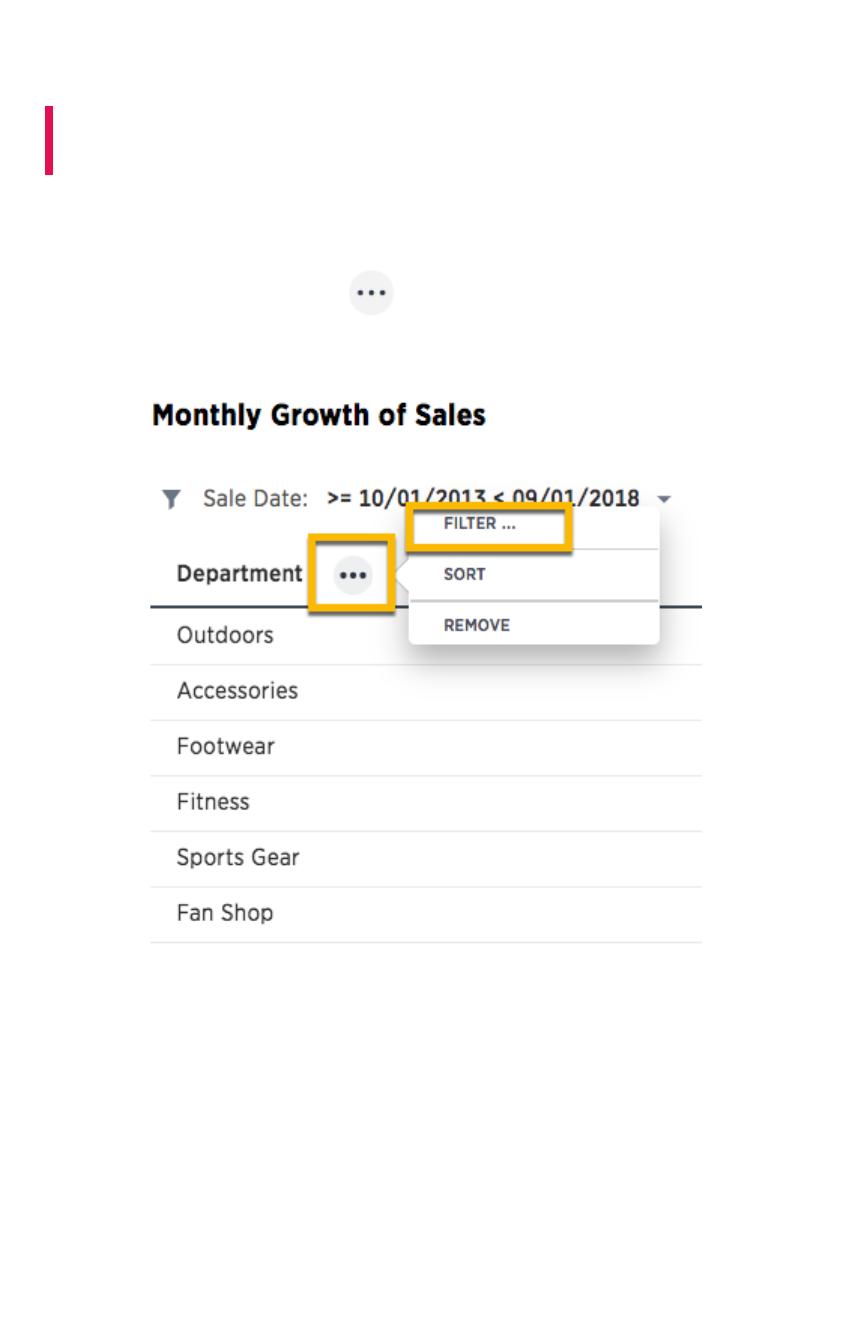
Add a filter to a table
Summary:Summary: You can add a simple filter from a column header while
viewing your answer as a table.
To add a filter from column headers:
1. While viewing your answer as a table, hover over the column header you want to filter, and
click the ellipses icon (3 dots) .
2. Select Filter…Filter….
3. Select the values to include in your answer.
Add a filter to a table
February 07, 2019
ThoughtSpot Users Guide Page 61

4. If you want to exclude values, click ExcludeExclude and choose values to exclude.
Add a filter to a table
February 07, 2019
ThoughtSpot Users Guide Page 62
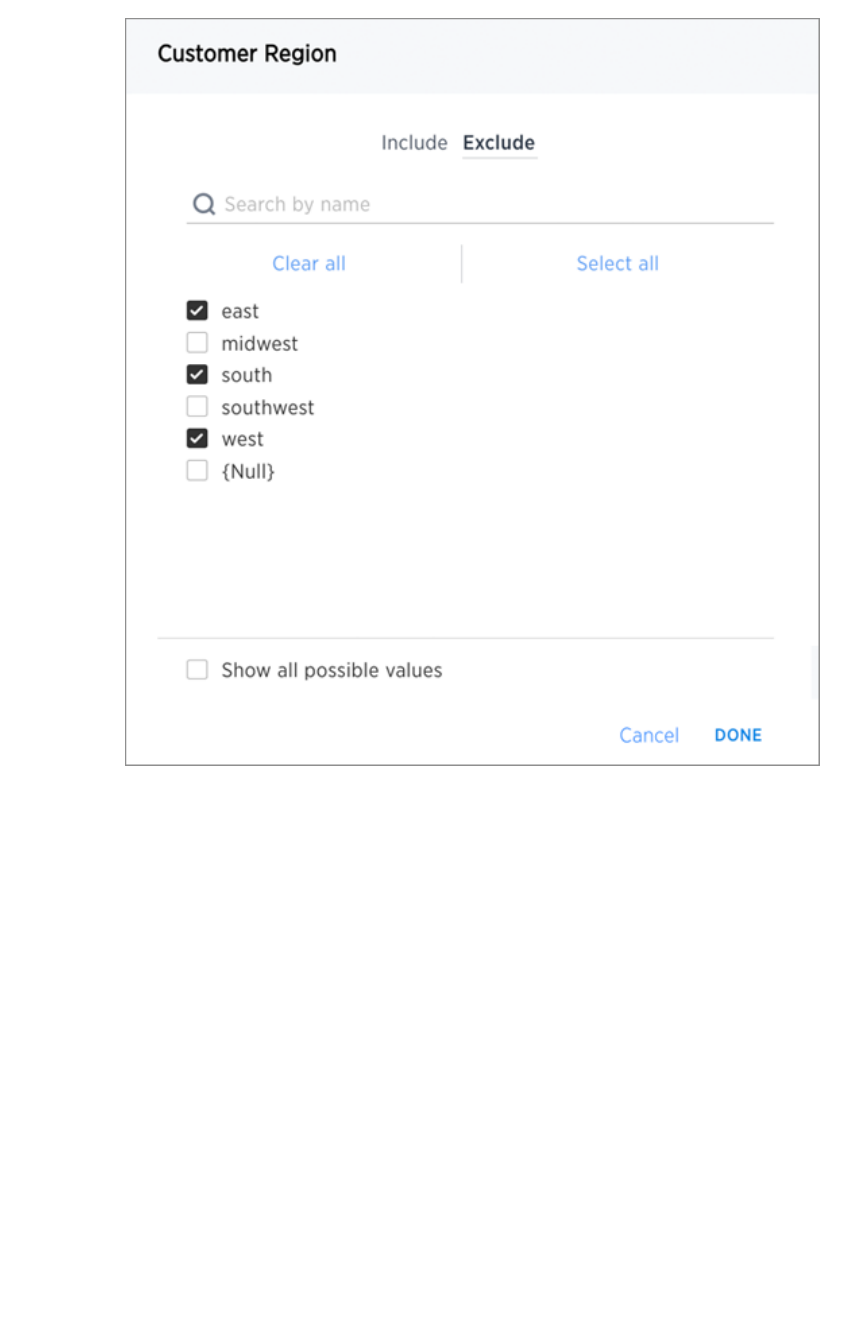
5. Click DONEDONE.
If there are too many values, you can use the filter search bar to find the ones you want.
Add a filter to a table
February 07, 2019
ThoughtSpot Users Guide Page 63
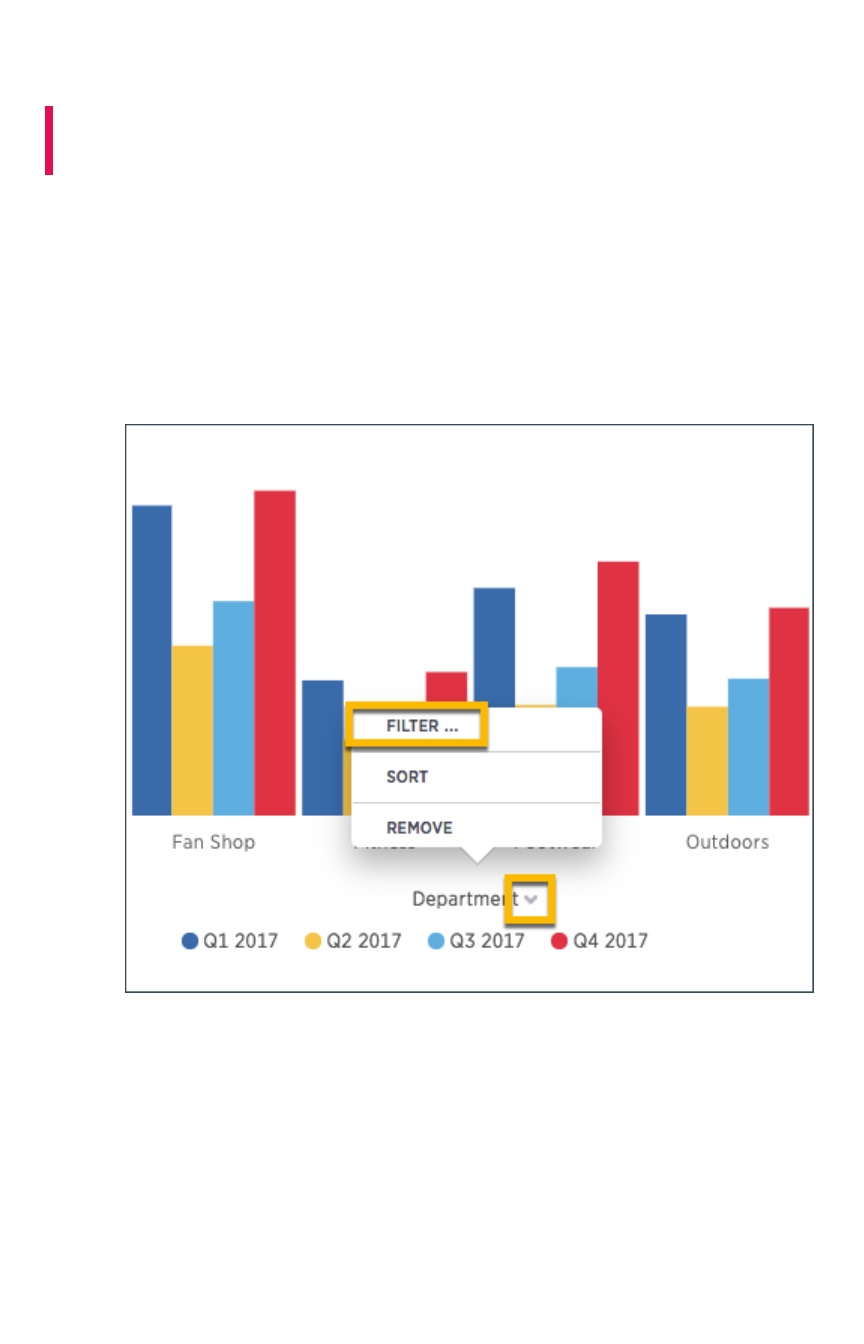
Add a filter to a chart
Summary:Summary: You can add a simple filter from a chart axis while viewing
your answer as a chart.
You can filter a chart in two ways:
1. Click on the legend labels to toggle the values on or off.
2. Follow the steps shown here to filter on the axis values.
To add a filter from the chart axes:
1. While viewing your answer as a chart, click the chart axis you want to filter on, and select
Filter…Filter….
2. Select the values you would like to include in your answer.
Add a filter to a chart
February 07, 2019
ThoughtSpot Users Guide Page 64
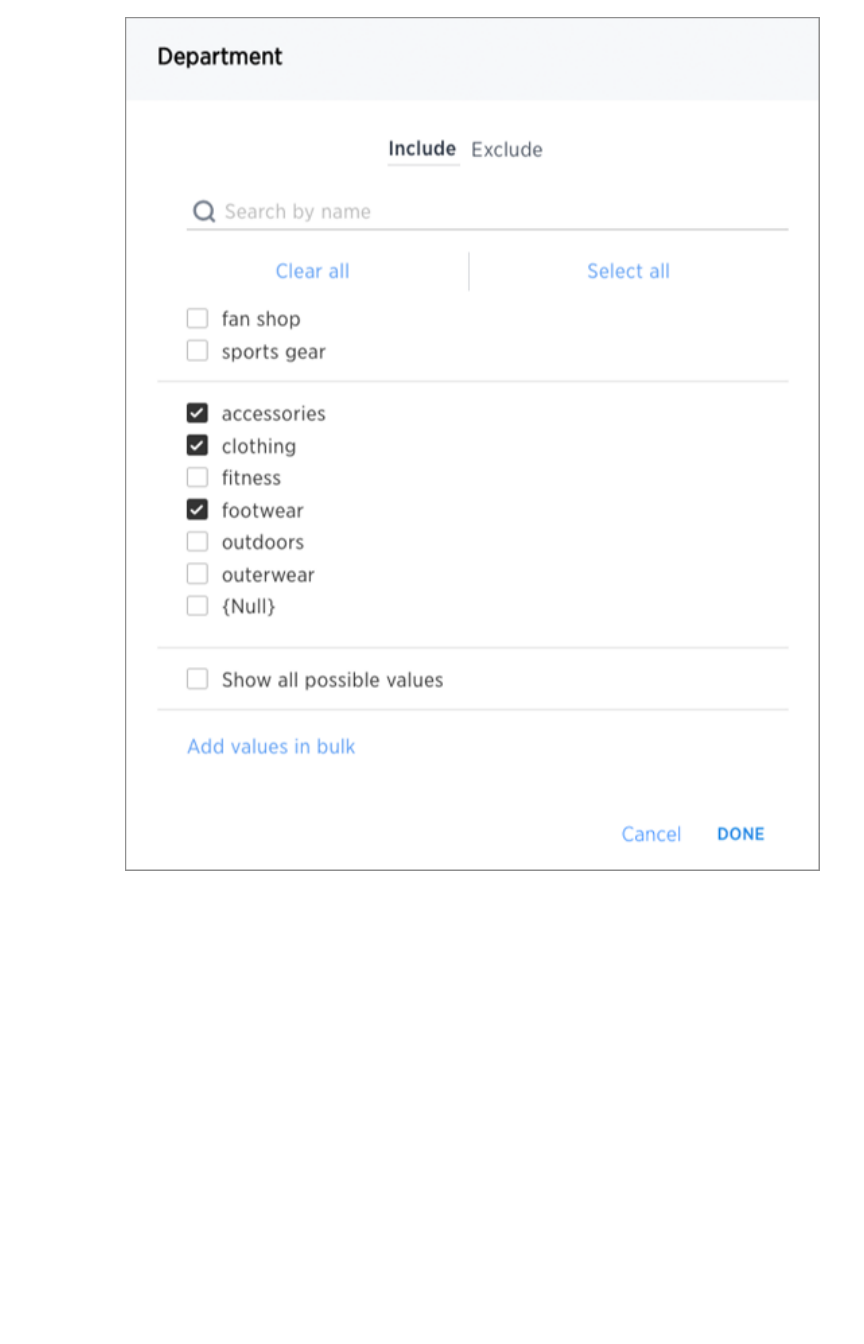
3. If you want to exclude values, click ExcludeExclude and choose values to exclude.
Add a filter to a chart
February 07, 2019
ThoughtSpot Users Guide Page 65
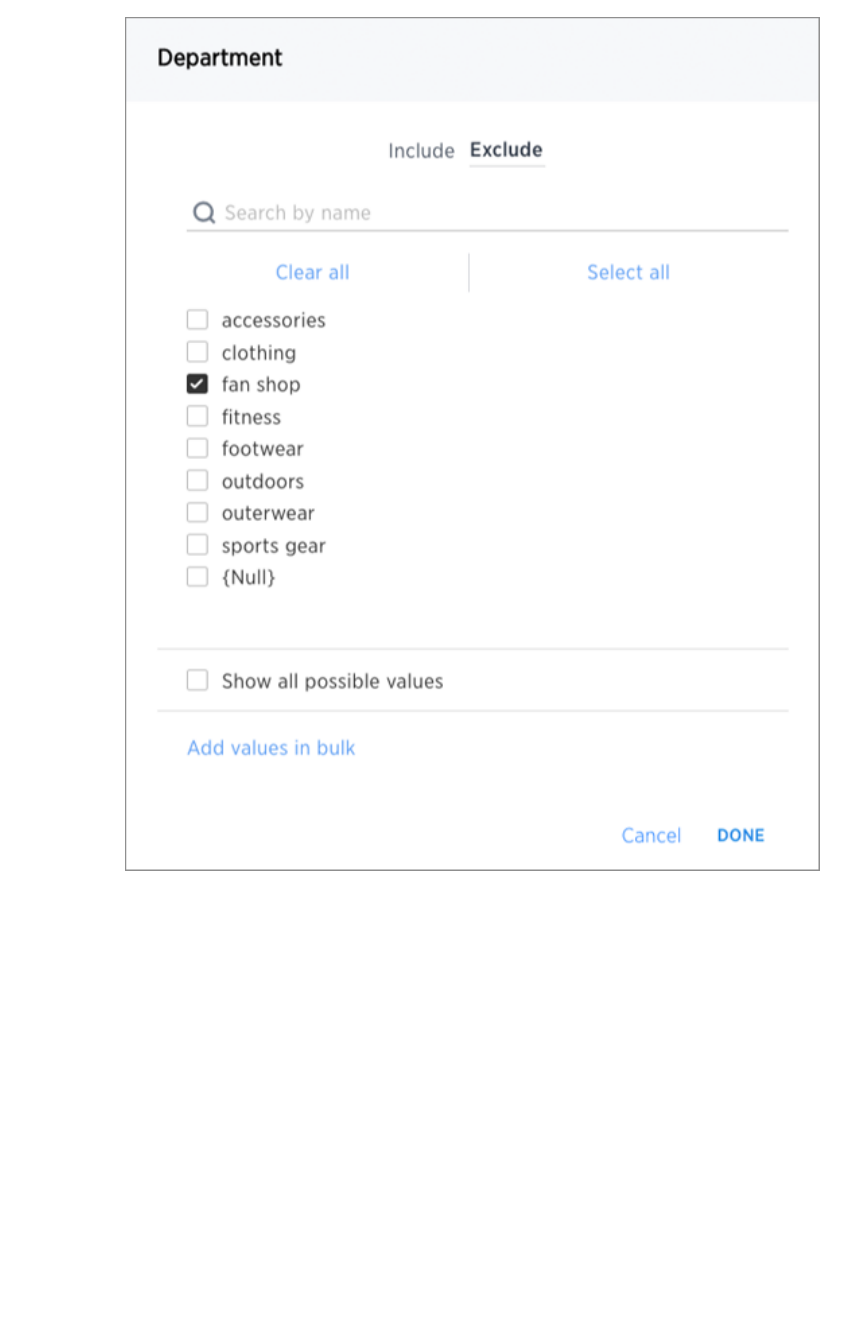
4. Click DONEDONE.
If there are too many values, you can use the filter search bar to find the ones you want.
Add a filter to a chart
February 07, 2019
ThoughtSpot Users Guide Page 66
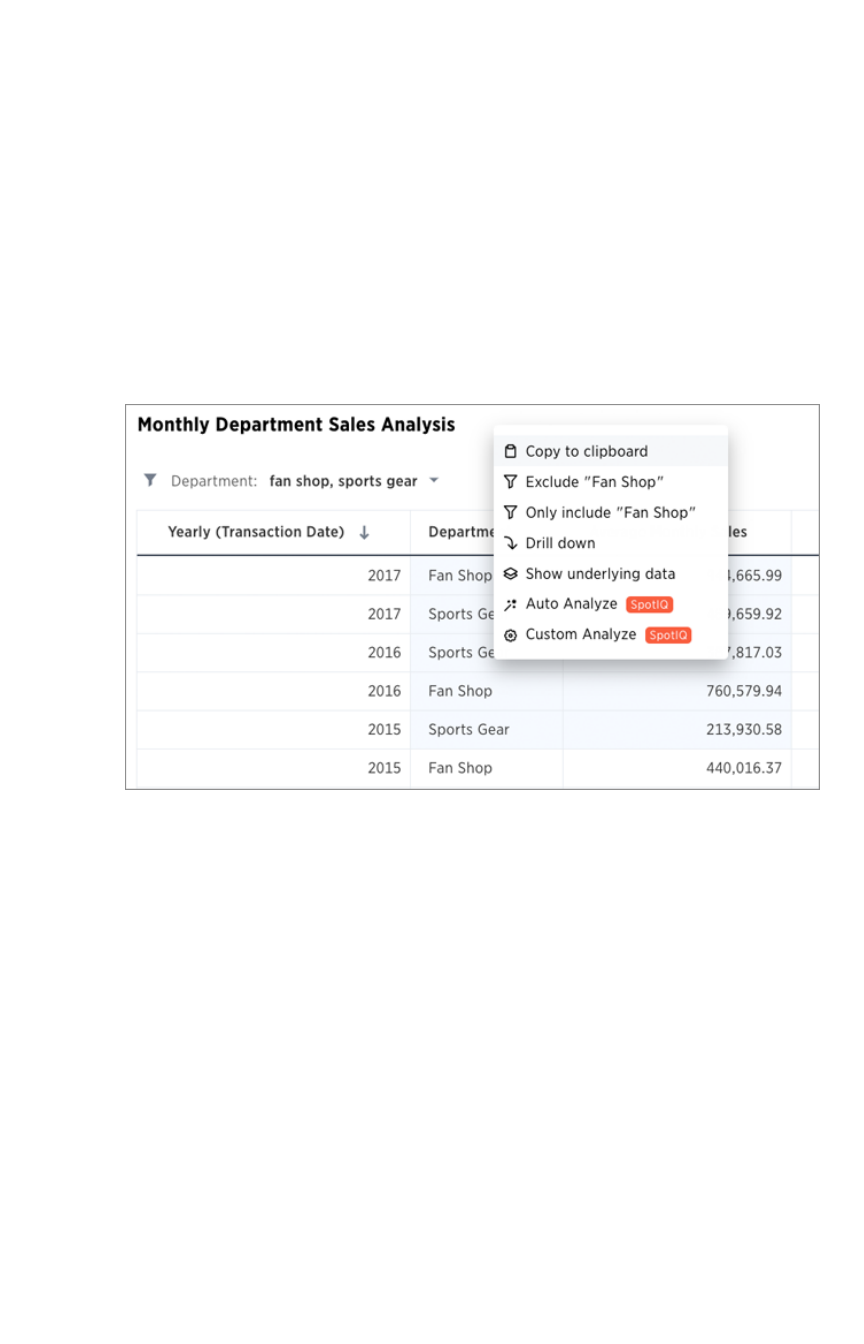
Create a bulk filter
You can create a bulk filter on a saved search. You create the filter by pasting a list of values, separated
by commas, semicolons, new lines, or tabs, into the bulk filter box. A filter allows you to easily search a
large list of values repeatedly.
Your filter can have up to 10k values in it. When you add a filter, the system does not check that the
value exists in the data. This allows you to anticipate values that
may be
added in your filter.
Before you can create a bulk filter, you must have Can editCan edit permission on the table or worksheet. In this
example, you will cut and paste values to create a bulk filter. You could also get a list of text values from
another application such as an email or cells from an Excel or Google Sheets spreadsheet.
1. In table view, select multiple cells by clicking and dragging.
2. Right-click and choose Copy to clipboardCopy to clipboard.
3. Hover over the column header you want to filter, and click the three-dot icon (ellipses)three-dot icon (ellipses) icon.
4. Choose whether you want your bulk filter to IncludeInclude or ExcludeExclude values.
5. Click Add values in bulkAdd values in bulk:
Create a bulk filter
February 07, 2019
ThoughtSpot Users Guide Page 67
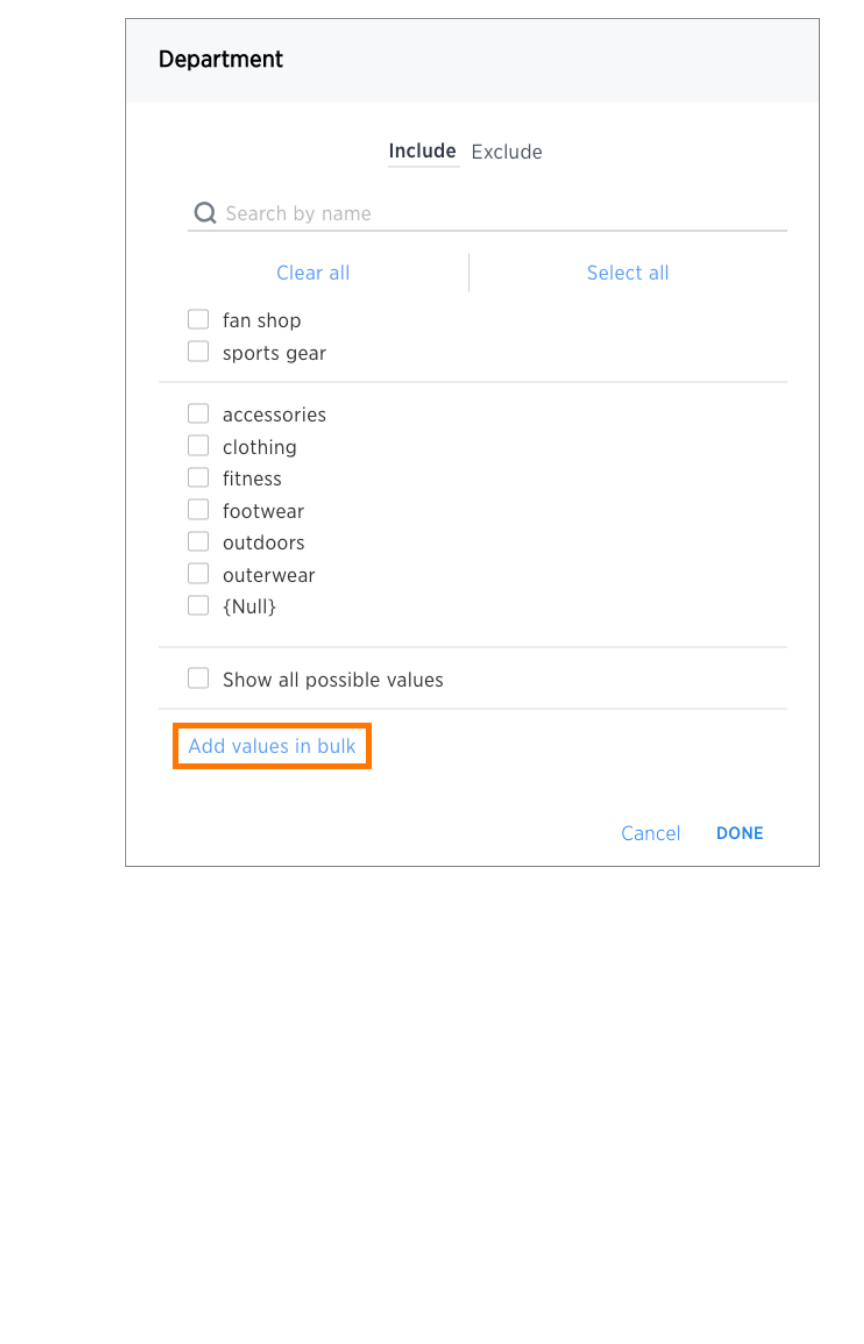
6. Paste the values into the bulk filter box.
Create a bulk filter
February 07, 2019
ThoughtSpot Users Guide Page 68
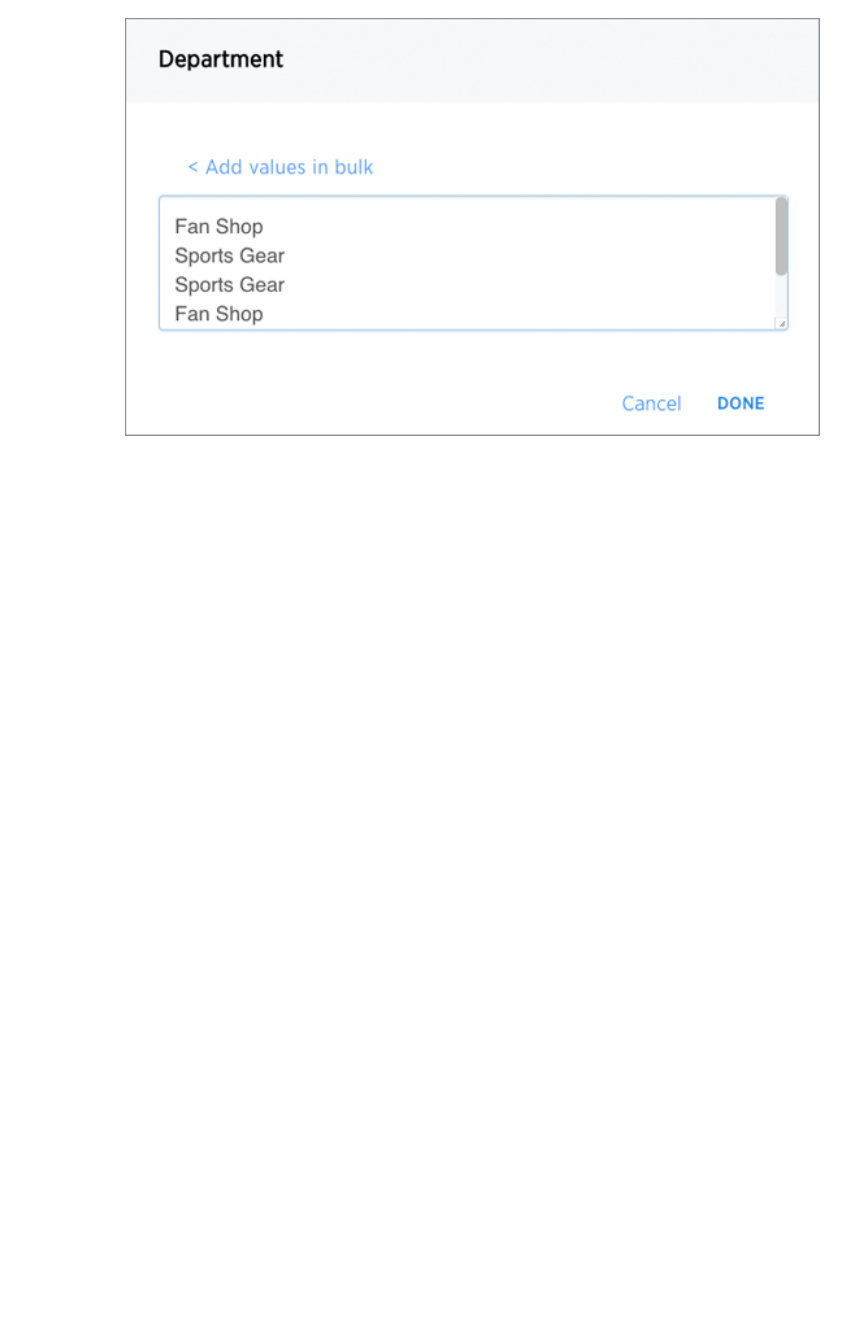
7. Click DoneDone.
Create a bulk filter
February 07, 2019
ThoughtSpot Users Guide Page 69
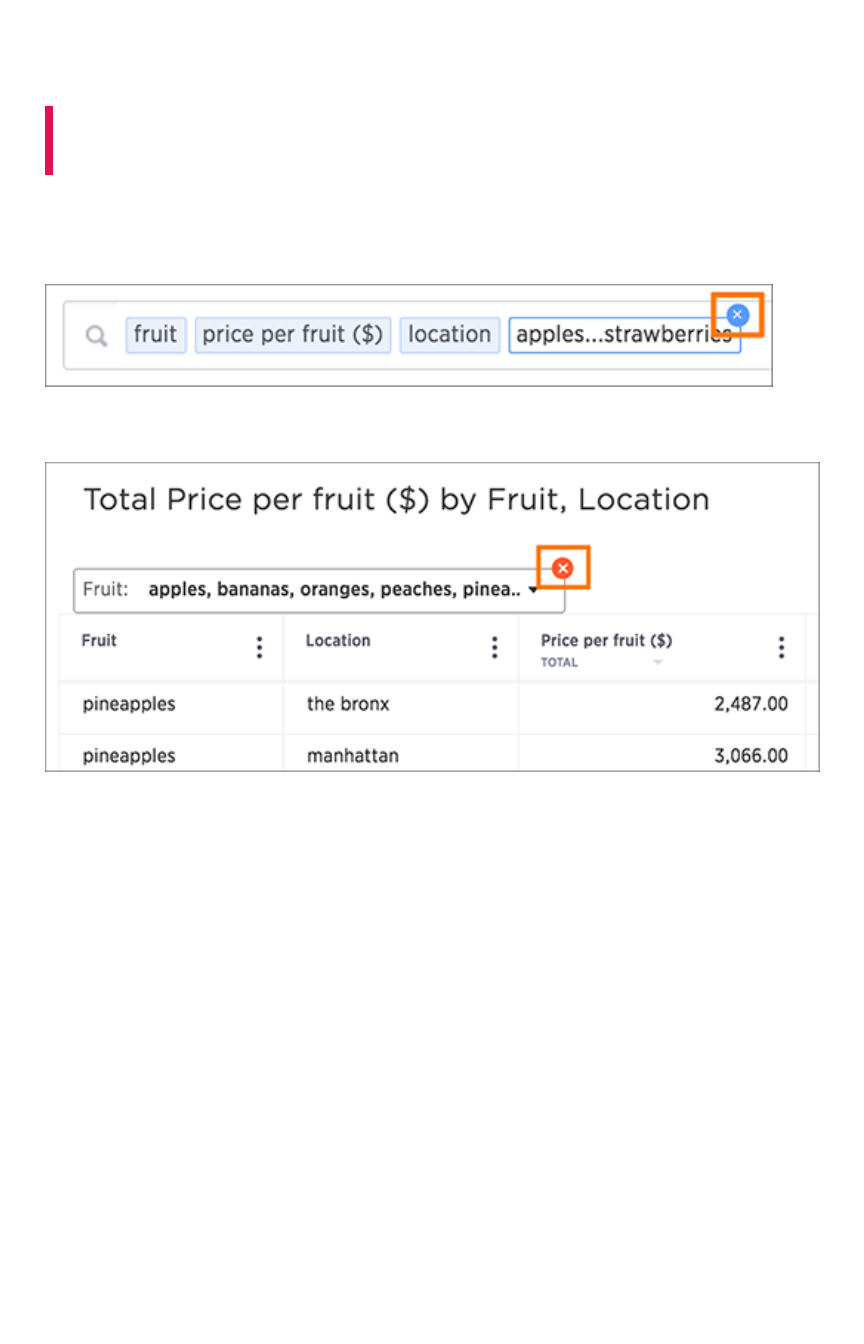
Delete a filter
Summary:Summary: You can delete a filter from an answer to return to the
original unfiltered search result.
There are multiple ways to delete a filter. To delete a filter you can click the xx on the filter term in the
search bar.
You can also click the xx on the filter bar above the answer.
Delete a filter
February 07, 2019
ThoughtSpot Users Guide Page 70
Filter on null, blank, or empty values
Summary:Summary: Filtering on NULL and empty values is a special case.
Filtering on null, blank, or empty values can be tricky if your data contains both of these. You can use
this method to see what’s really going on with these types of values, and to get the filtering behavior you
want.
How NULL and blank values are displayed
When you view a table or chart, you may see values that appear as {blank}{blank}. These can actually be one of
two types of values:
• NULL values, which are essentially missing values.
• blank or empty values, like an empty string of text or a string containing only whitespace
(spaces, tabs).
Both of these types of values are represented as {blank}{blank}, but if you filter on {blank}{blank}, the filter will apply to
only the NULL values. That is, only the NULL values will be included in your result. It can be hard to tell
what’s going on if you have a data source that contains both NULL and blank/empty values.
To show NULL and blank values differently
If you need to differentiate between NULL and blank values, you can Add a formula to make them
appear differently in charts and tables. In this example, we’ll use <text_column> to refer to the text
column which contains both NULL and blank values:
if ( strlen ( <text_column> ) = 0 ) then if ( isnull ( <text_co
lumn> ) ) then 'null' else 'empty' else <text_column>
This formula will show “null” where the value contained in the column is actually NULL. When the value is
blank or empty, it will show up as “empty”.
To allow filtering on both NULL and blank
values
If you want to keep the same display format for NULL and blank values, but be able to filter on both
using “{blank}”, your formula will be slightly different. You can use a formula like:
if ( strlen ( <text_column> ) = 0 ) then null else <text_colum
n>
Use the filter you created instead of the original text column in your search to get the result you desire.
Filter on null, blank, or empty values
February 07, 2019
ThoughtSpot Users Guide Page 71
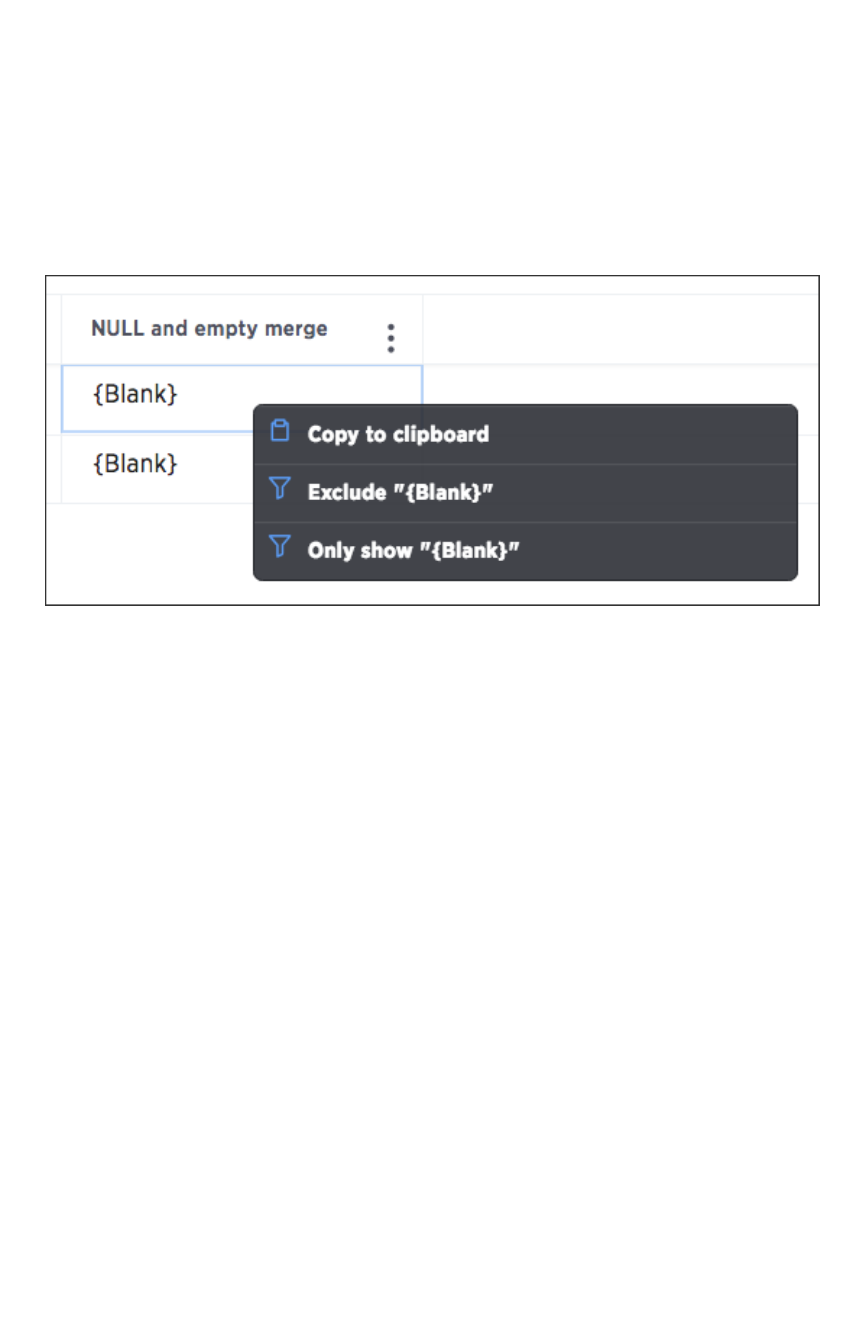
Filtering on your formula
After creating the above formula that fits what you want to do, you can filter on the formula column you
created in the search bar by typing the value {blank}{blank}, which will act as a filter. Or you can filter by left-
clicking on a {blank}{blank} value in your search result table, then right-clicking and selecting Show onlyShow only
“{Blank}““{Blank}“.
Filter on null, blank, or empty values
February 07, 2019
ThoughtSpot Users Guide Page 72

Other search actions
There are other search actions you can perform by interacting directly with your answer. These actions
can be performed in an ad hoc way, or you can pin your answer to a pinboard to save your
configurations.
•Change view optinsChange view optins
You can change the view of your answer so it appears as a table or a chart. Sorting your
search allows you to order your answer, making it easier to read. You can change the date
bucketing on tables and charts for columns with date values.
•Show underlying dataShow underlying data
Viewing the underlying data of your answer gives you an un-aggregated view of the
underlying data.
•Drill downDrill down
Drilling down allows you to see more information about the columns used within your search.
•Exclude and include row valuesExclude and include row values
You can include or exclude row values from your answer.
•Apply conditional formattingApply conditional formatting
You can apply conditional formatting to tables or charts to highlight values in the data. This
makes values above, below, or within a particular threshold stand out.
•Work with saved answersWork with saved answers
You can make a copy of an answer if you would like to make edits without changing the
original answer.
•Download your searchDownload your search
You can download your search as either a table or chart.
•Replay searchReplay search
You can instantly generate a step-by-step replay showing the creation of a table or chart.
Other search actions
February 07, 2019
ThoughtSpot Users Guide Page 73
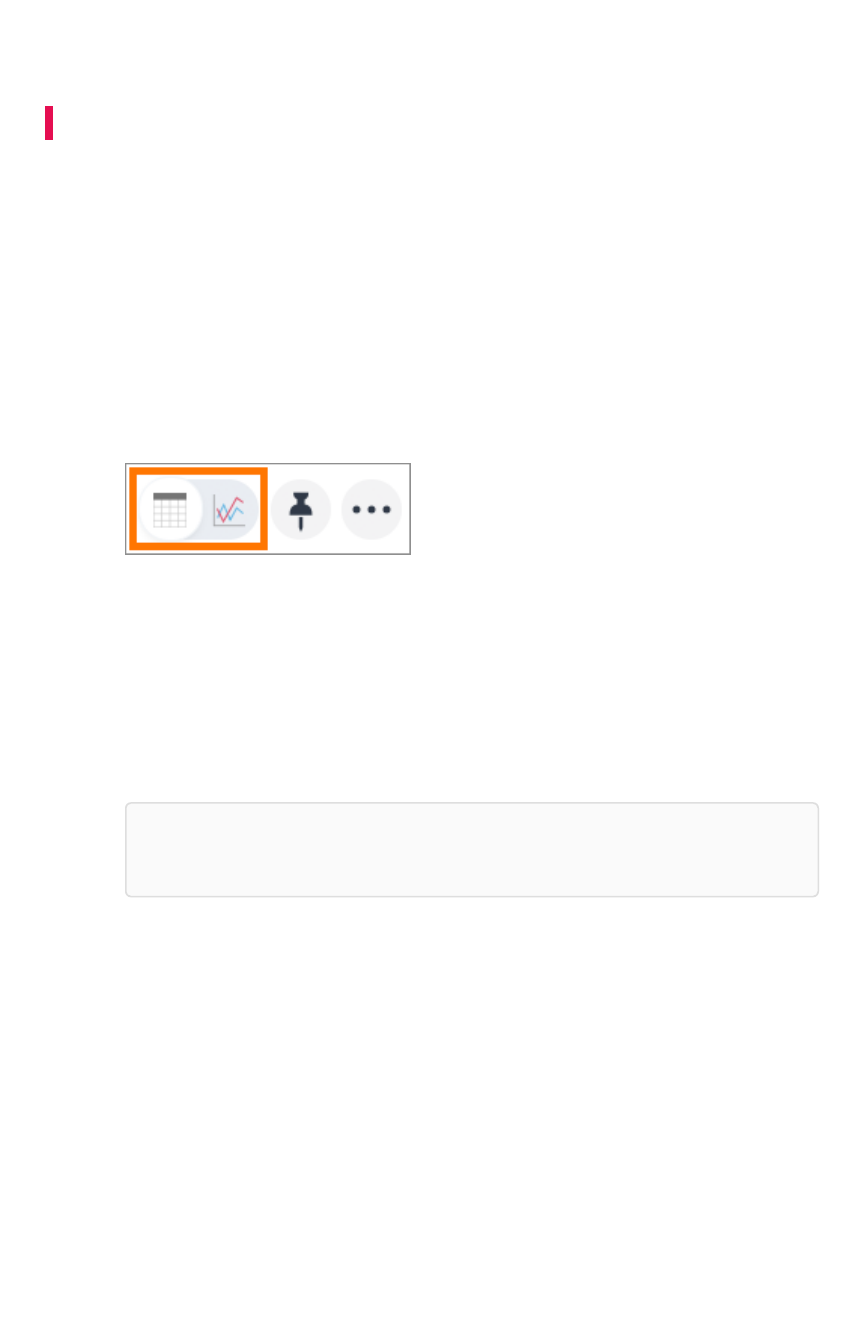
Change result display options
Summary:Summary: You can change how your search results (answers) appear.
Your search answer (results) have various display options. You can change the visualization used to
display your results, their sort oder, and how they are grouped or grouped.
Change the view
You can change the view of your answer so it appears as a table or a chart. To change the view of your
answer:
1. View your answer.
2. Select either table or a chart type.
Sort your search
Sorting your search allows you to order your answer, making it easier to read. To sort your search:
• If you are in the data (table) view, click the column header you would like to sort on.
By default, sorting applies in descending order. You can click a column header to sort again
to sort in ascending order.
Tip:Tip: Hold shift and click another column to add a secondary sort. You can even add
tertiary sorting and so on by continuing to use this trick.
• If you are in the chart view, click the axis label of your chart and select SortSort.
Change the date bucketing (grouping)
You can change the date
bucketing
on tables and charts for columns with date values. Bucketing is a
method for grouping a column in your data. For example, if you have a column of orders, you can use
the date of each order (NO_BUCKETNO_BUCKET).
Change result display options
February 07, 2019
ThoughtSpot Users Guide Page 74
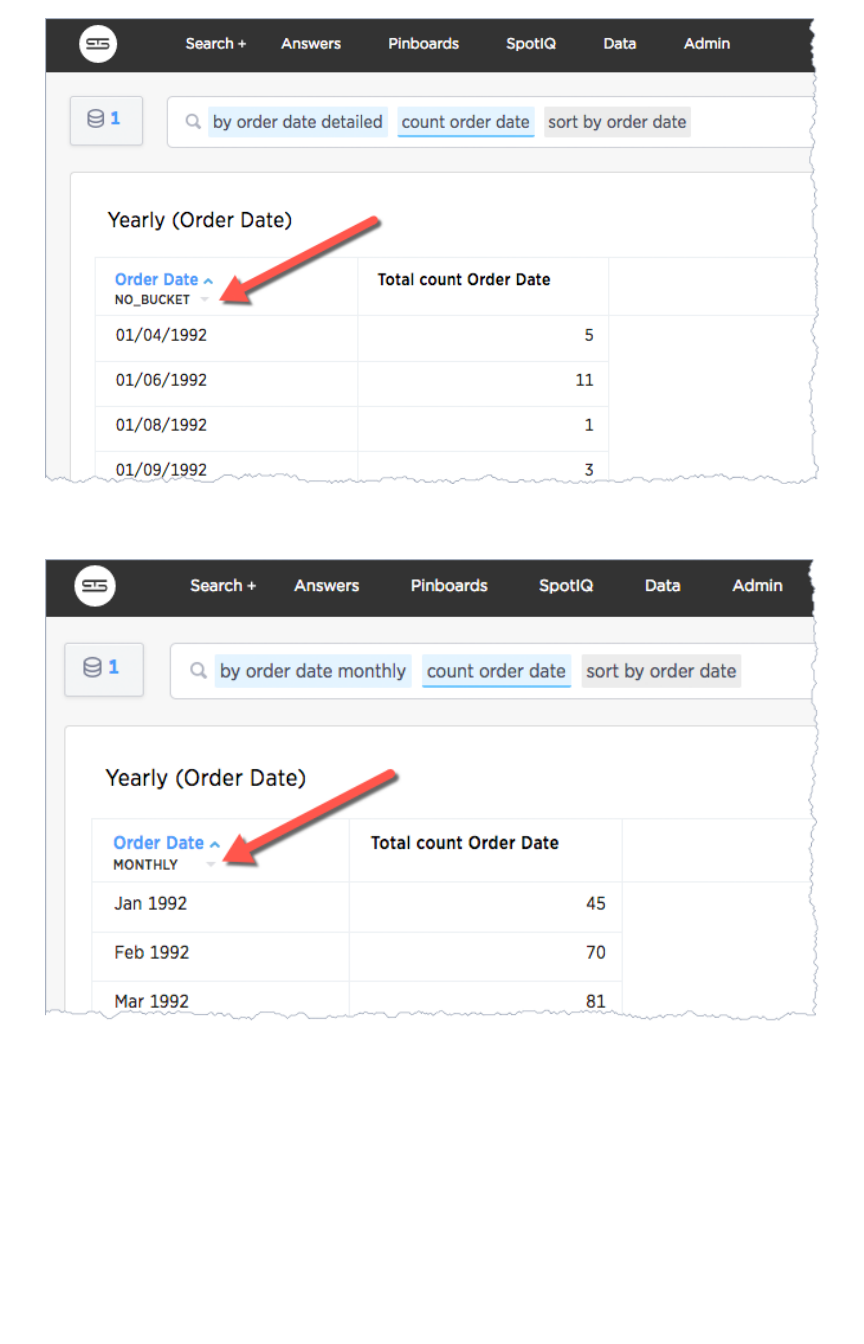
Alternatively, you can group these MONTHLYMONTHLY:
ThoughtSpot chooses a default date bucket for you when you search. This default takes the entire
search result into account. For example, if your search includes last month, dates are bucketed daily
instead of monthly.
On a table view, you use the date bucket drop-down, below the column header. On a chart, you can
change this via the axis label.
Change result display options
February 07, 2019
ThoughtSpot Users Guide Page 75
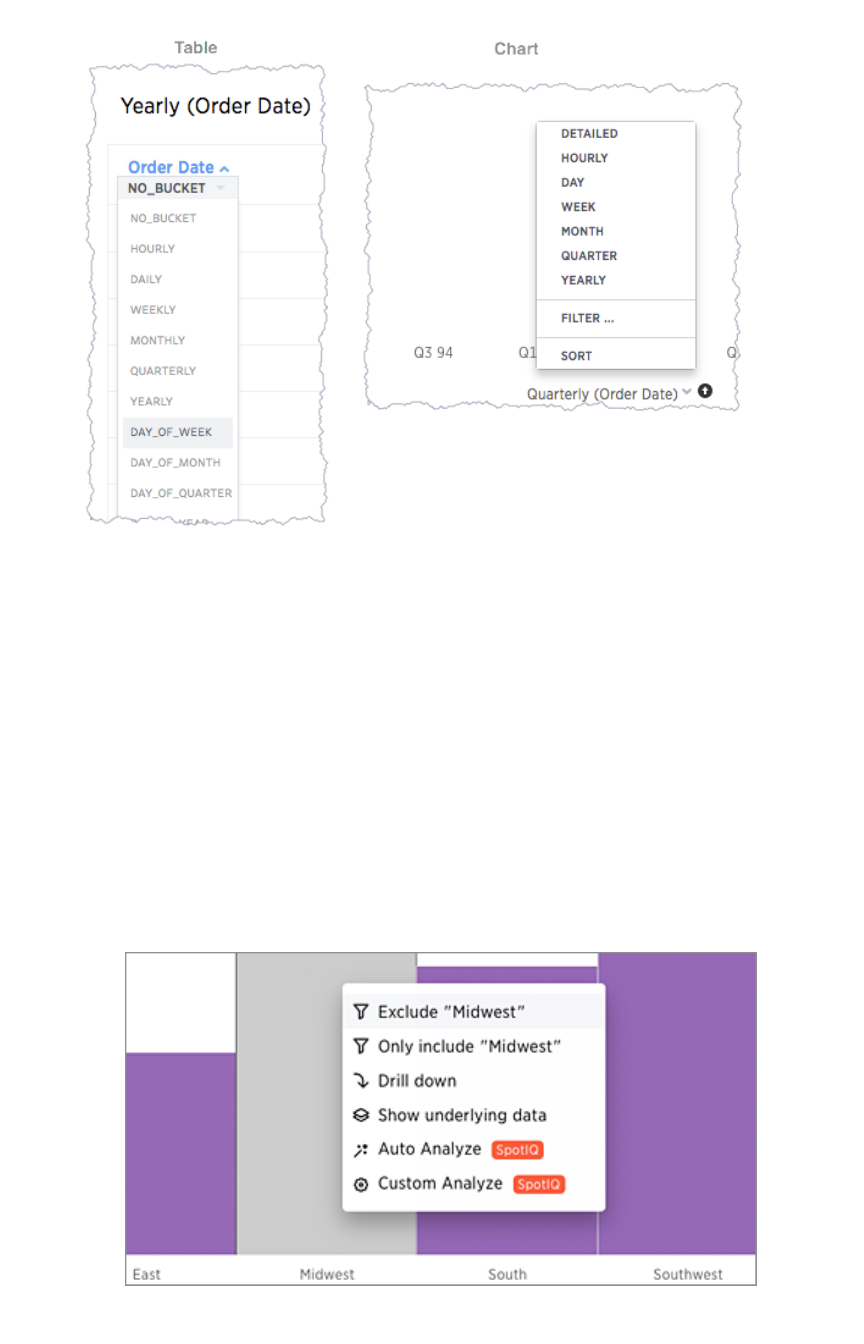
The bucket values are a subset of date and time period keywords. To change the date bucketing:
1. Go to the table or chart you want to change.
2. Locate the column or axis value with the date value you want to change.
3. Click the column’s bucket menu.
4. Select a date bucket.
Exclude and include row values
You can include or exclude row values from your answer.
To exclude or include row values:
1. Right-click the visualization or table cell of interest
2. Select Exclude “value”Exclude “value” or Include “value”Include “value” if available.
Change result display options
February 07, 2019
ThoughtSpot Users Guide Page 76
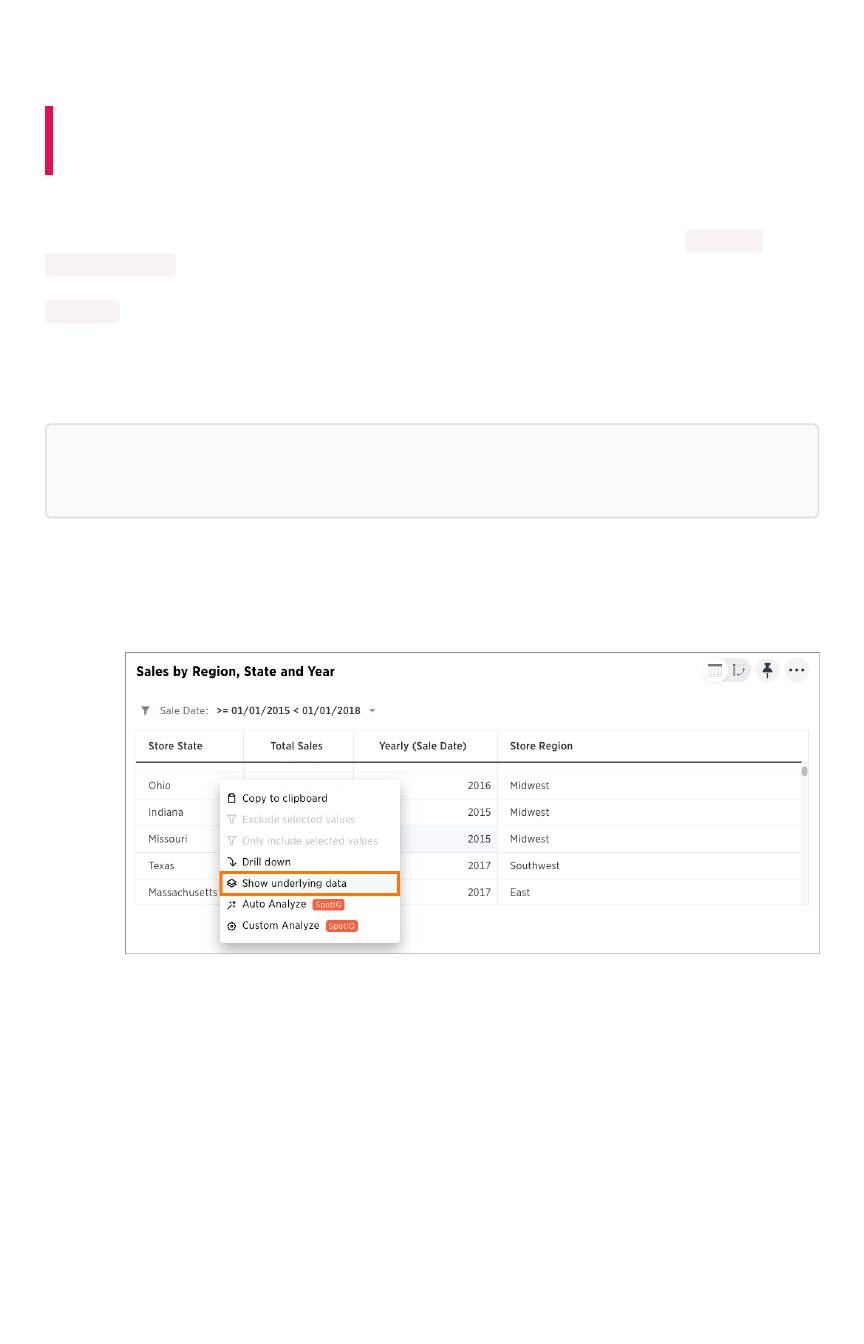
Show underlying data
Summary:Summary: Viewing the underlying data of your answer gives you an
un-aggregated view of the underlying data.
You can see the most granular details of a given result set, i.e. it shows the un-aggregated view. This
feature lets you understand what an answer consists of. For example, if you search for customer
region revenue , the answer shows the aggregate revenue value for each customer region. Then, you
can right-click any row and then click Show underlying dataShow underlying data, to see each value which constitutes
revenue for any given region.
Only the first 1,000 rows are shown when viewing the underlying data. You can even download the
results shown when you choose Show underlying dataShow underlying data from a chart. The download file limit is a million
rows.
Note:Note: Viewing underlying data does not work for answers that are derived from chasm trap
searches. Nor does this feature work for pivot tables.
To show underlying data:
1. Right-click the visualization or table cell of interest
2. Select Show underlying dataShow underlying data.
A new window opens that displays a summary and the underlying data.
3. Optionally, choose to + ADD COLUMNS+ ADD COLUMNS to add additional data.
Show underlying data
February 07, 2019
ThoughtSpot Users Guide Page 77
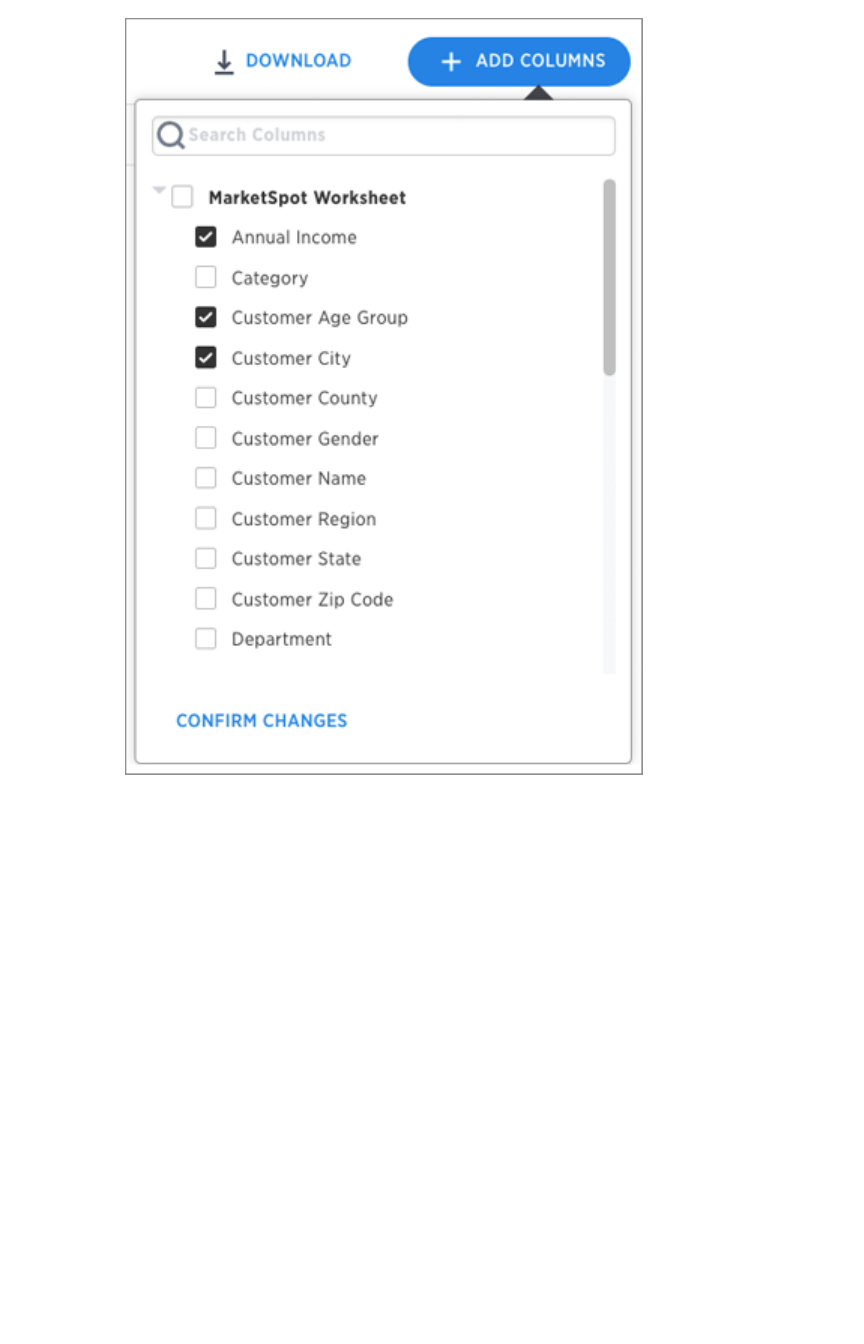
4. Click CONFIRM CHANGESCONFIRM CHANGES.
5. Click DOWNLOADDOWNLOAD to download a CSV file of the data.
Show underlying data
February 07, 2019
ThoughtSpot Users Guide Page 78
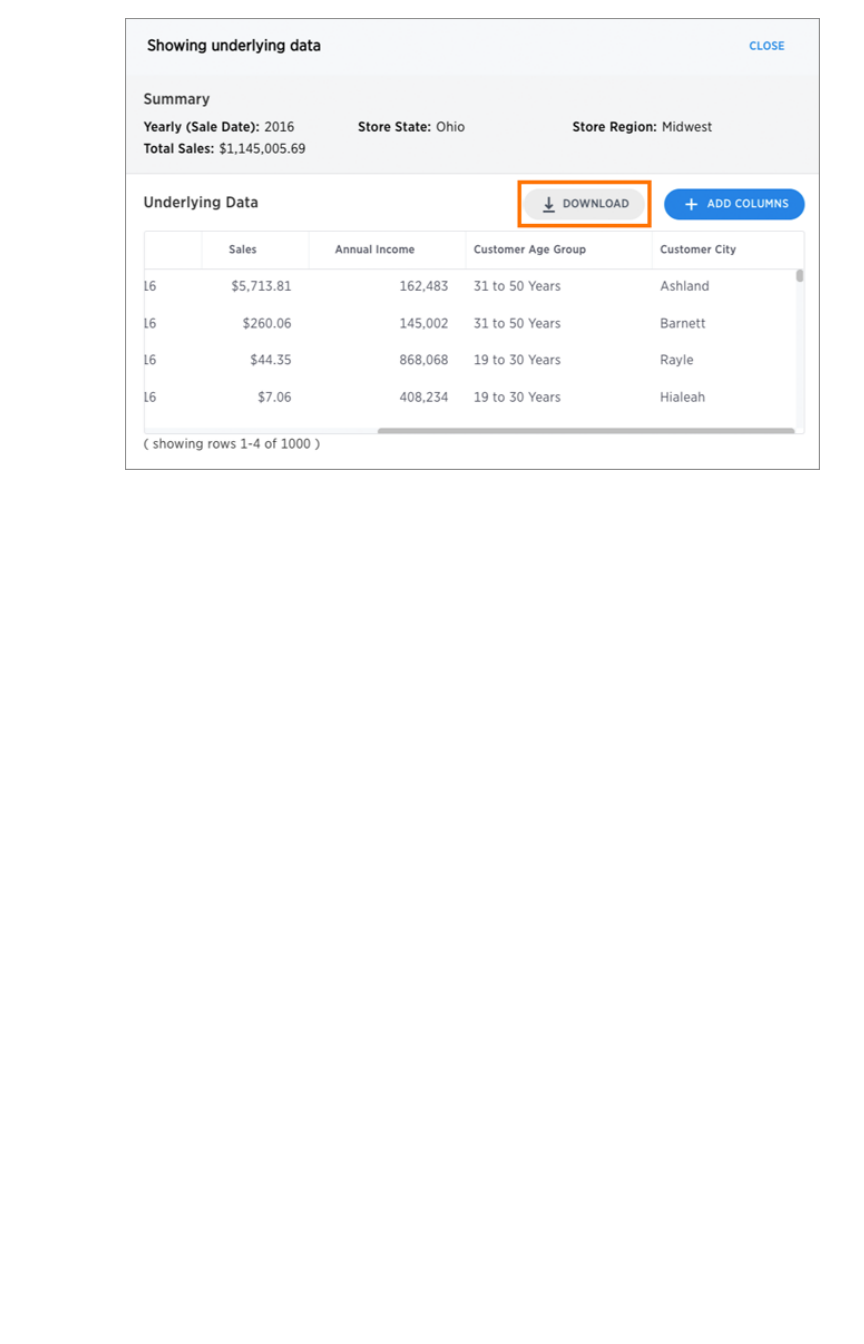
Show underlying data
February 07, 2019
ThoughtSpot Users Guide Page 79
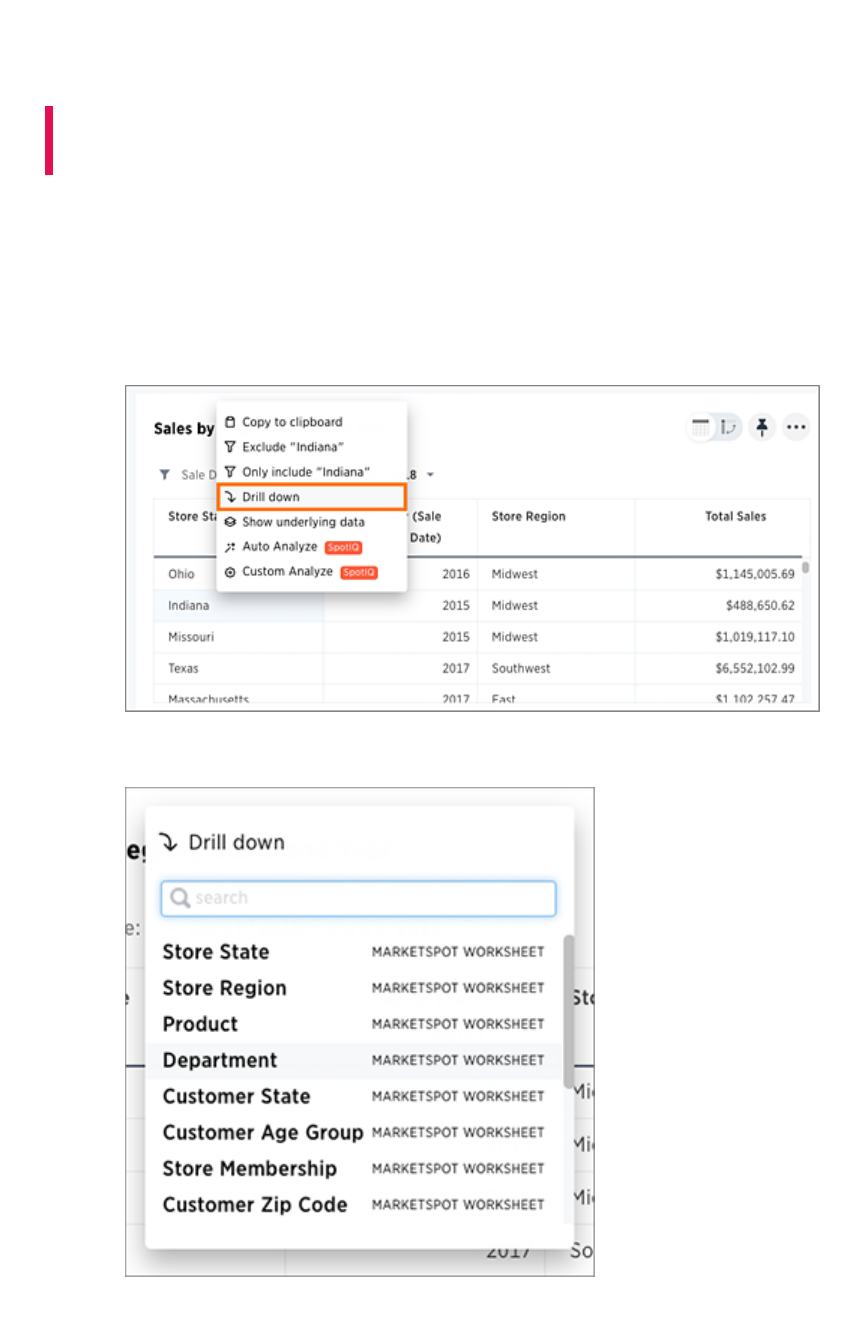
See the search behind a result
Summary:Summary: You can use your answer to learn more about the data
used in your search.
Drilling down allows you to see more information about the columns used within your search. If you own
the pinboard you can drill down to the data beneath. Users you share the pinboard with can also drill
down provide they
also
have access to the data on which the board was based.
To drill down:
1. Right-click the visualization or table cell of interest, and select Drill downDrill down.
2. Click any of the listed data to recreate the search with that data included.
See the search behind a result
February 07, 2019
ThoughtSpot Users Guide Page 80
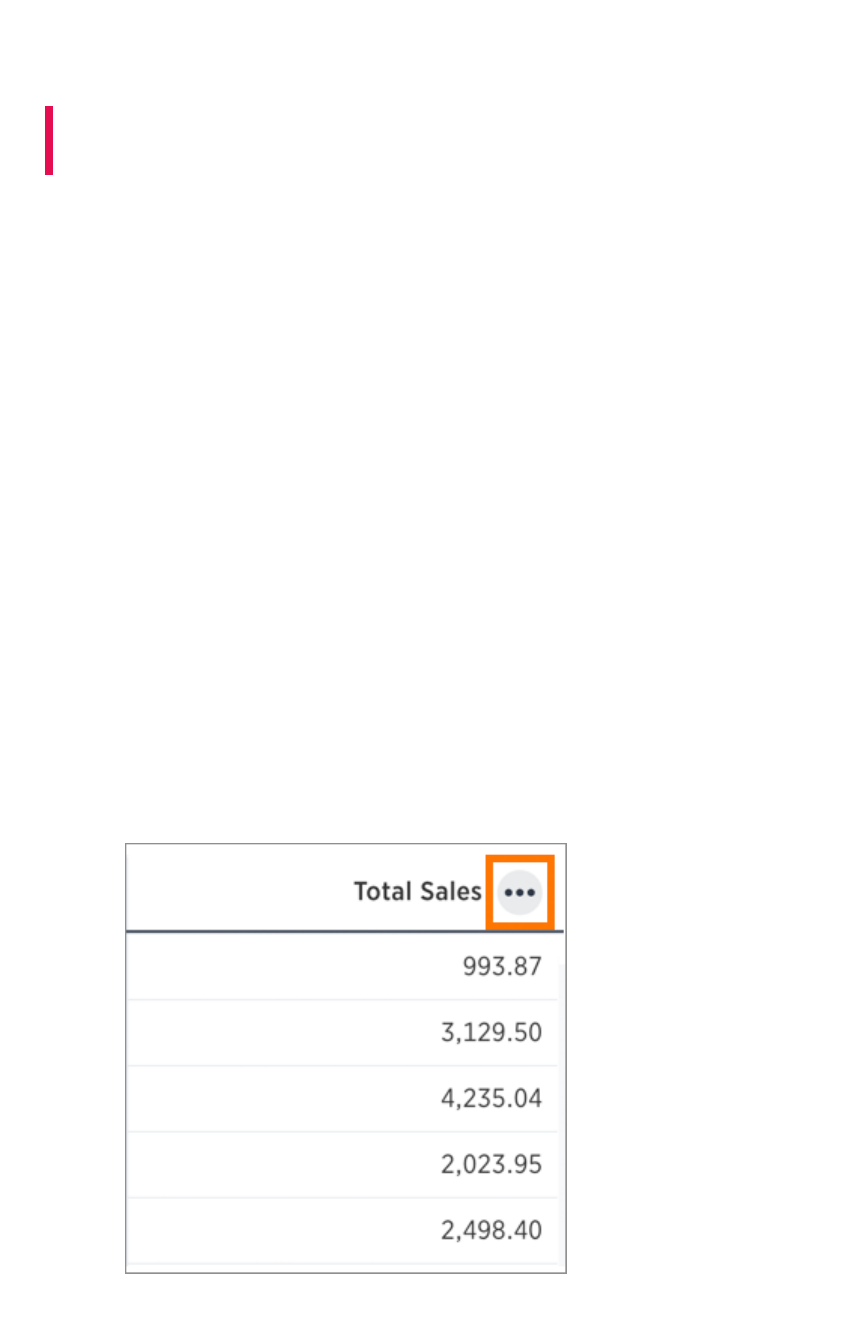
Apply conditional formatting
Summary:Summary: Use conditional formatting to make portiosn of your results
stand out
You can apply conditional formatting to tables or charts to highlight values in the data. This makes
values above, below, or within a particular threshold stand out.
Understand conditional formatting
Many companies create pinboards with key metrics they want to track in daily or weekly staff meetings.
Using conditional formatting, they can see at a glance how they are performing relative to these metrics.
You can add visual cues for KPIs (Key Performance Indicators) or threshold metrics to charts and tables,
to easily show where you are falling short or exceeding targets. These visual cues are called conditional
formatting, which applies color formatting to your search result. For tables, you can add conditional
formatting to set the background color of cells in a table based on the values they contain. For charts,
you can add conditional formatting to show the threshold(s) you defined, and the data that falls within
them will be shown using the same color.
Apply conditional formatting to a table
You can use conditional formatting to show table cells with a background color determined by the value
they contain.
To apply conditional formatting to a table:
1. In the column header of your table for the column you want to apply formatting to, click the
three-dot Change ConfigurationChange Configuration icon.
2. Select Conditional FormattingConditional Formatting.
Apply conditional formatting
February 07, 2019
ThoughtSpot Users Guide Page 81
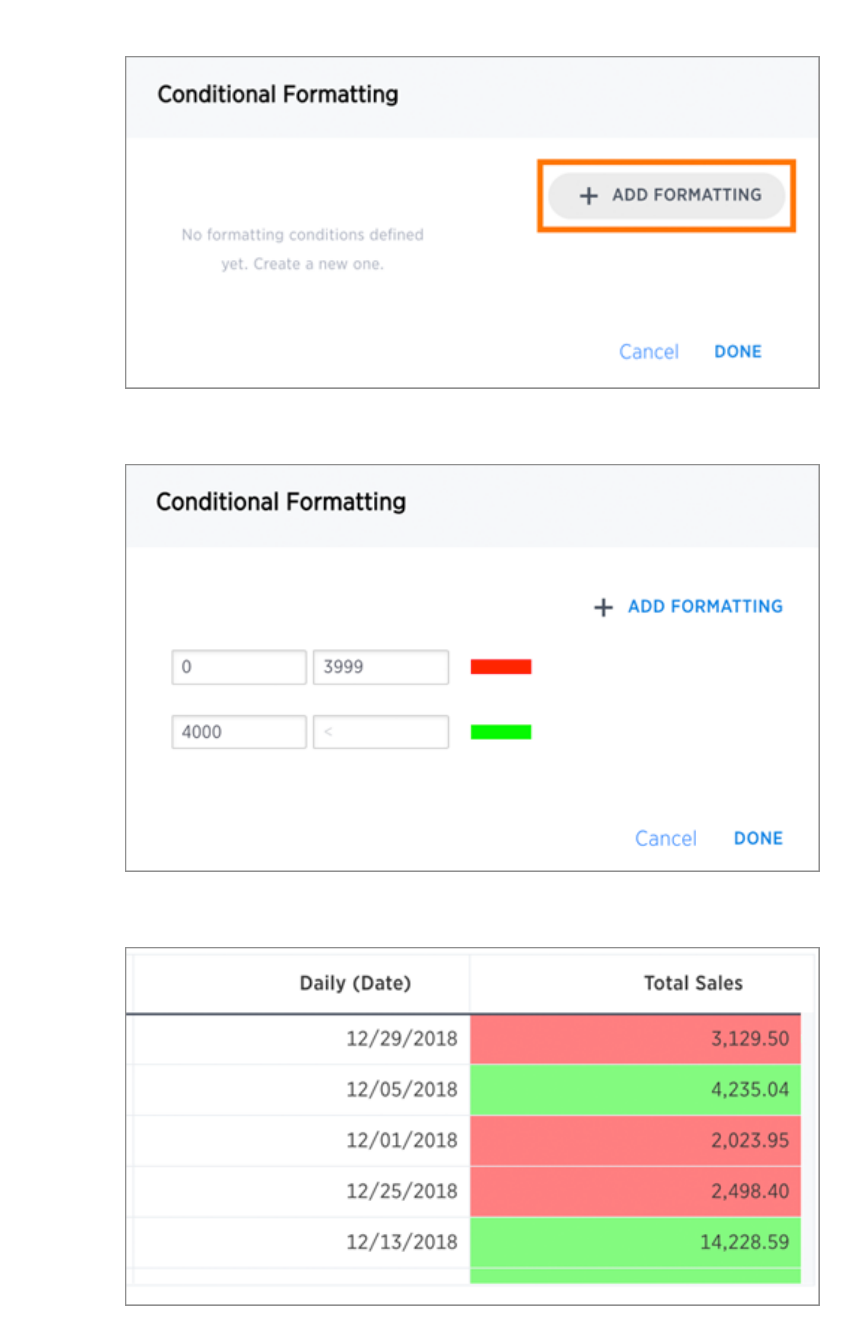
3. Click + ADD FORMATTING+ ADD FORMATTING in the Conditional FormattingConditional Formatting window.
4. Define the sets of values and the color to use for each set.
5. Click DoneDone after defining all of your conditional formatting sets.
Apply conditional formatting
February 07, 2019
ThoughtSpot Users Guide Page 82
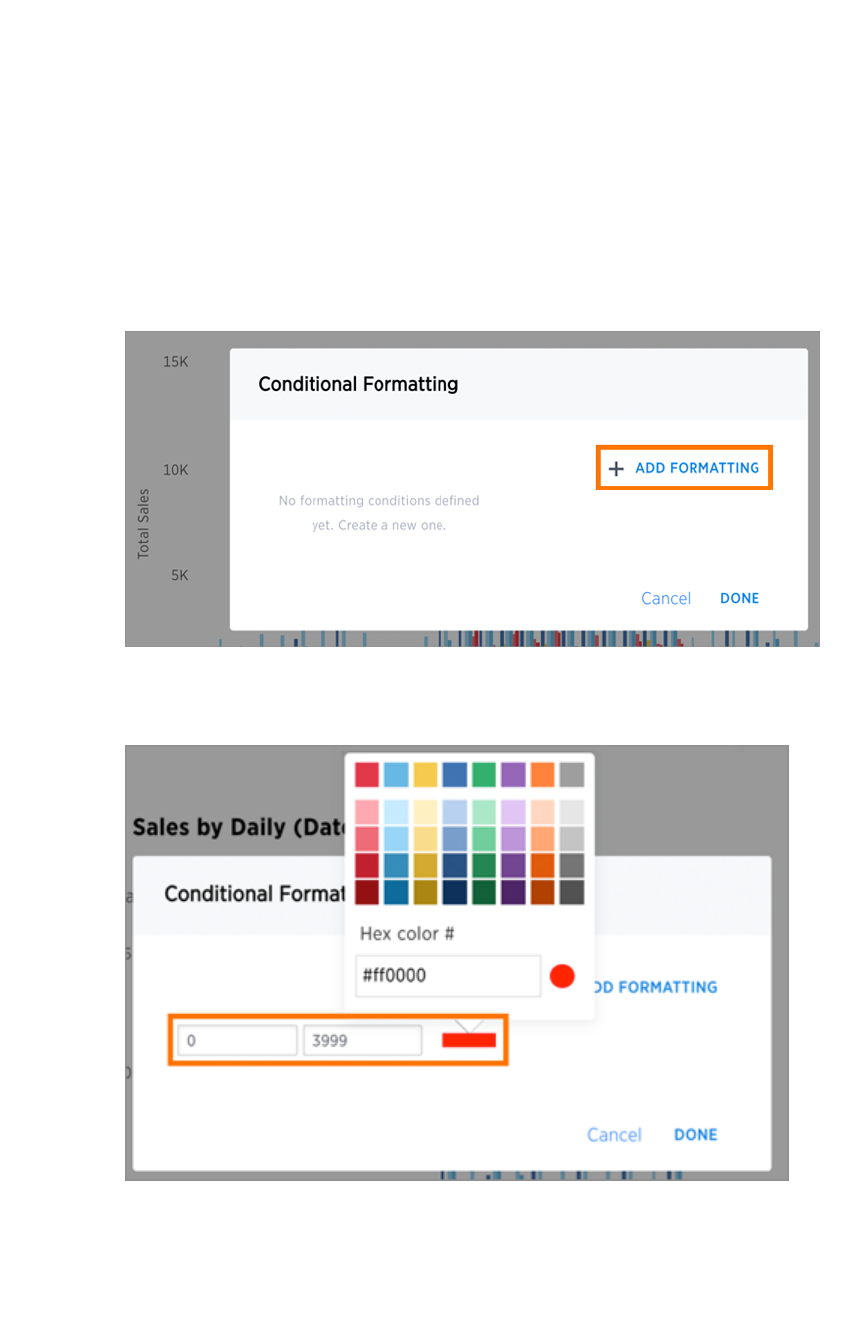
Note: If you change to a chart type, you will need to apply conditional formatting again. Conditional
formatting is tied to the specific visualization.
Apply conditional formatting to a chart
You can use conditional formatting to show charts with a target value or range drawn as a line in the
chart, and the legend colors determined by where values fall relative to the target.
To apply conditional formatting to a chart:
1. Click the axis label of your chart. Select Conditional FormattingConditional Formatting.
2. Click + ADD FORMATTING+ ADD FORMATTING in the Conditional Formatting window.
3. Define the ranges of values and the color to use for each range you want to track. To add
another range, click the ++ icon and repeat.
4. Click DoneDone after defining all of your conditional formatting ranges.
Apply conditional formatting
February 07, 2019
ThoughtSpot Users Guide Page 83
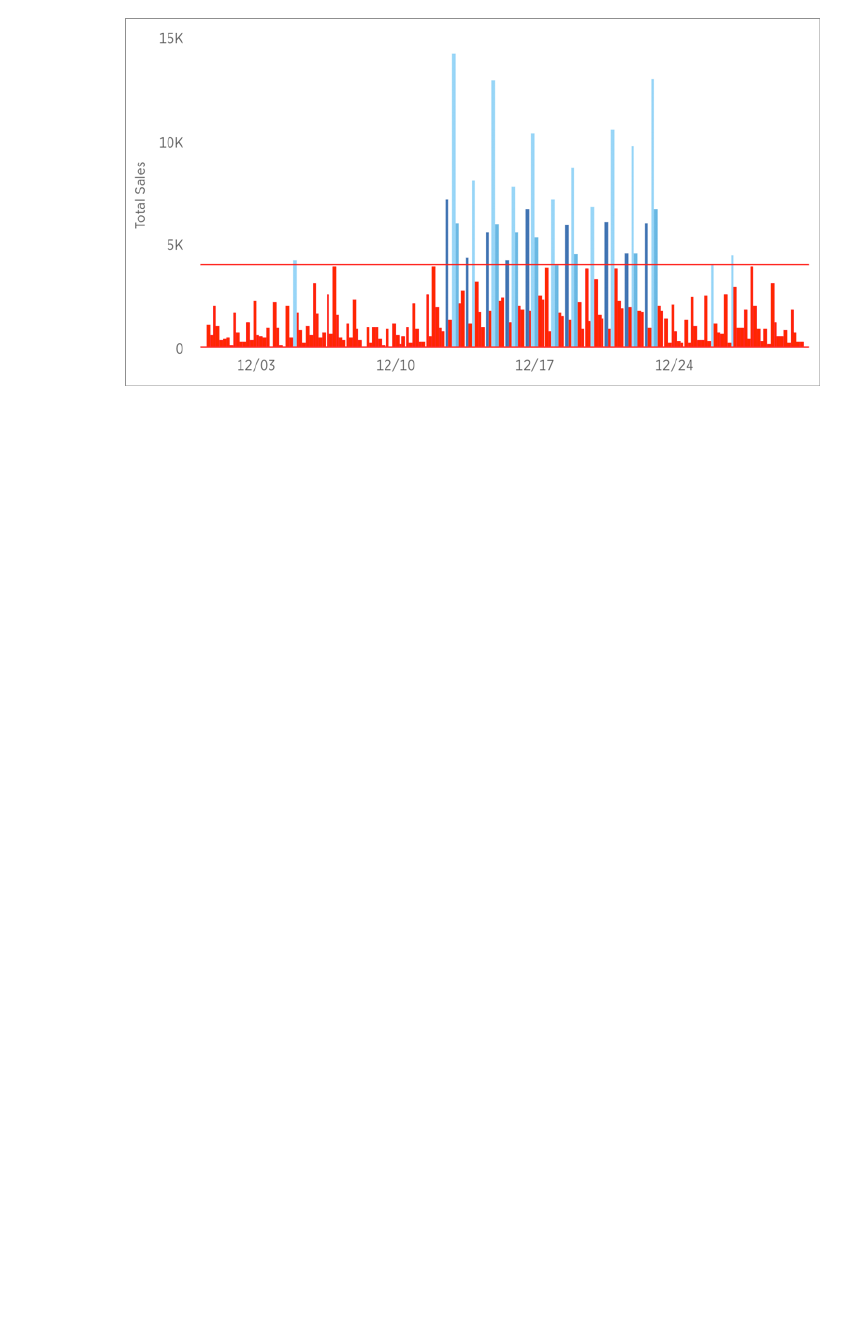
Note: If you change the chart type, you will need to apply conditional formatting again. It is tied to the
specific visualization.
Apply conditional formatting
February 07, 2019
ThoughtSpot Users Guide Page 84
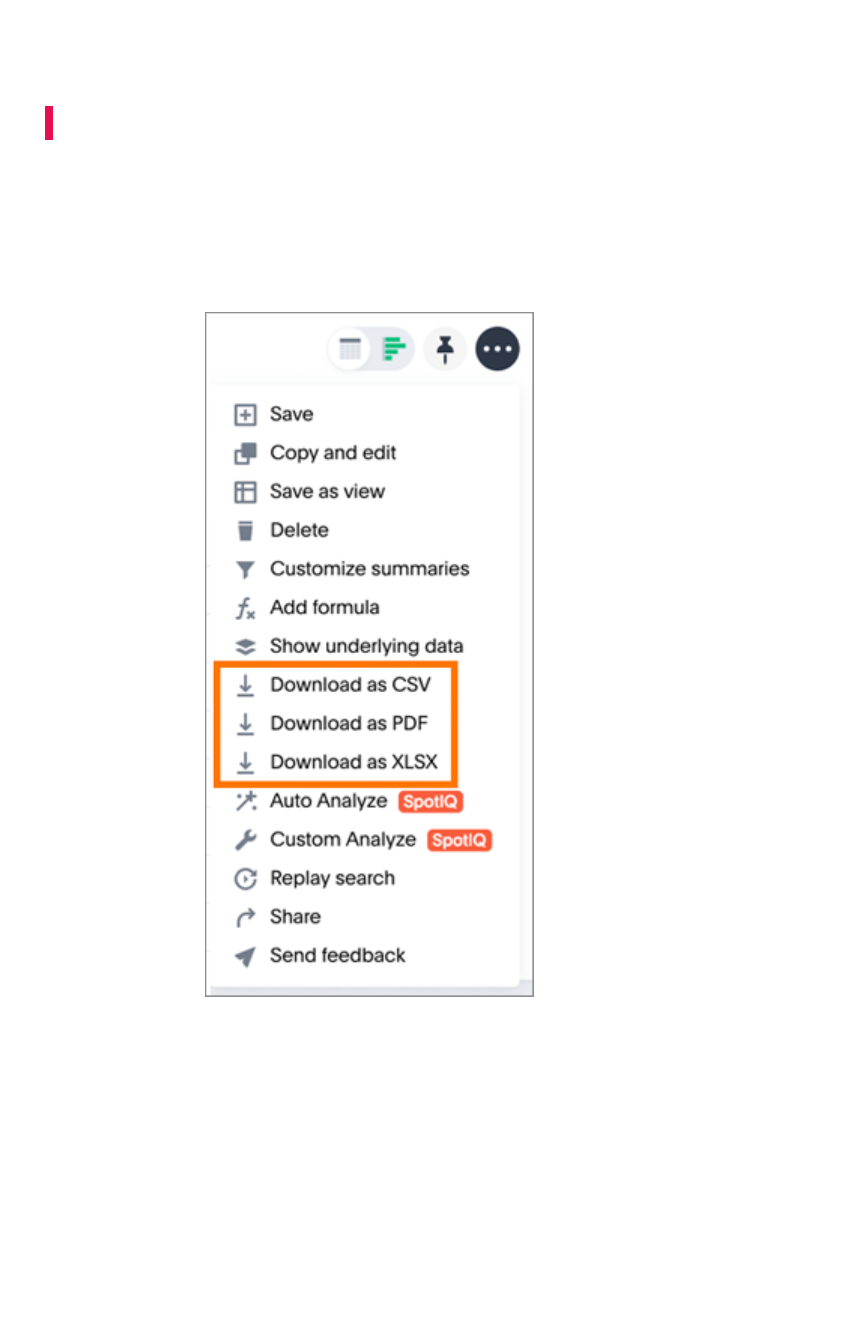
Download your search
Summary:Summary: You can download your search as either a table or chart.
You have the option to download your table as a CSV (comma separated values), PDF, or XLSX (Excel)
file. When you download a chart, it will be a PNG file.
• To download your search, click the three-dot ActionsActions icon, and do any of the following:
• For a table, choose Download as CSVDownload as CSV, Download as PDFDownload as PDF, or Download as XLSXDownload as XLSX.
• For a chart, select DownloadDownload.
Download your search
February 07, 2019
ThoughtSpot Users Guide Page 85
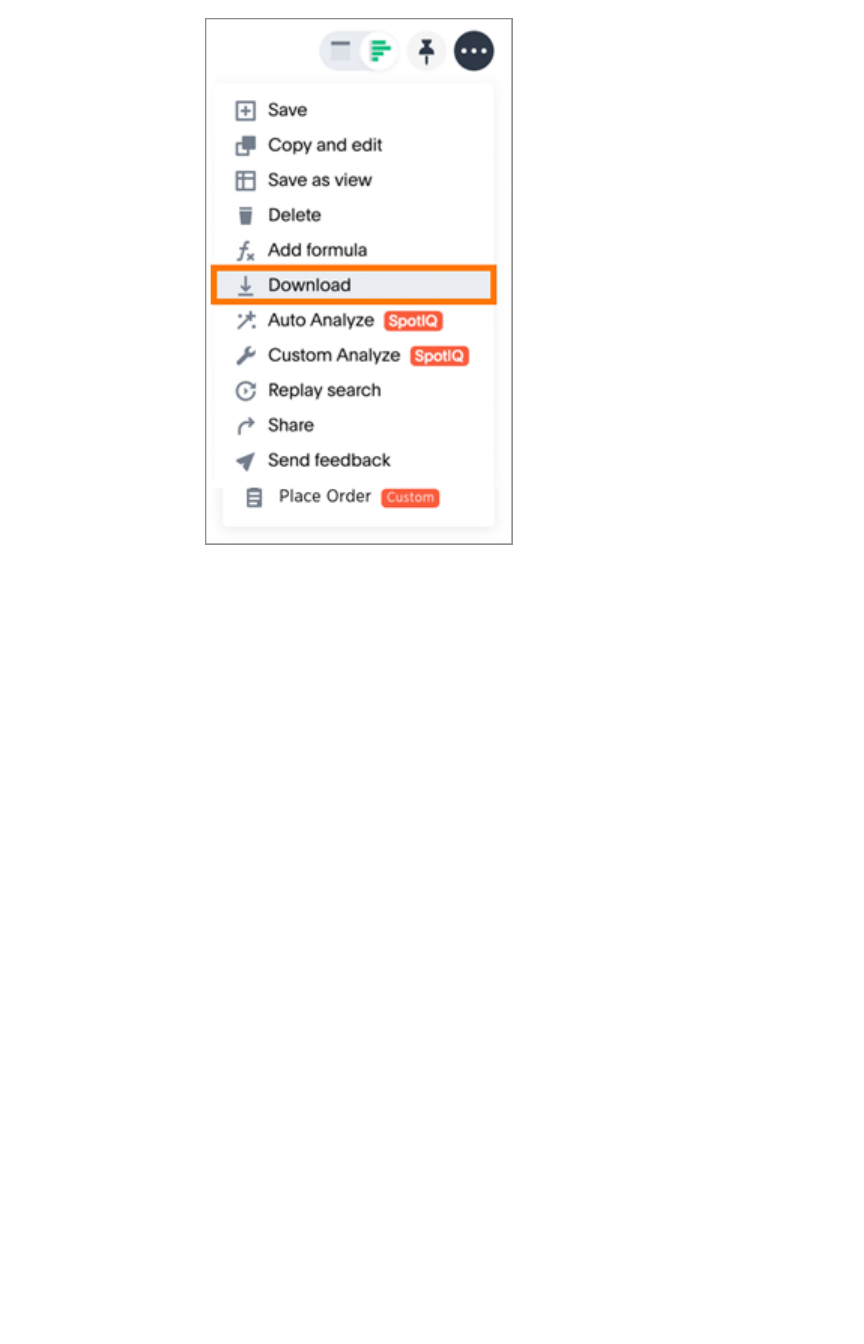
Currently, ThoughtSpot limits the maximum number of rows that can be downloaded to 10M (default is
1M). Your system limit is configured by your ThoughtSpot administrator.
Download your search
February 07, 2019
ThoughtSpot Users Guide Page 86
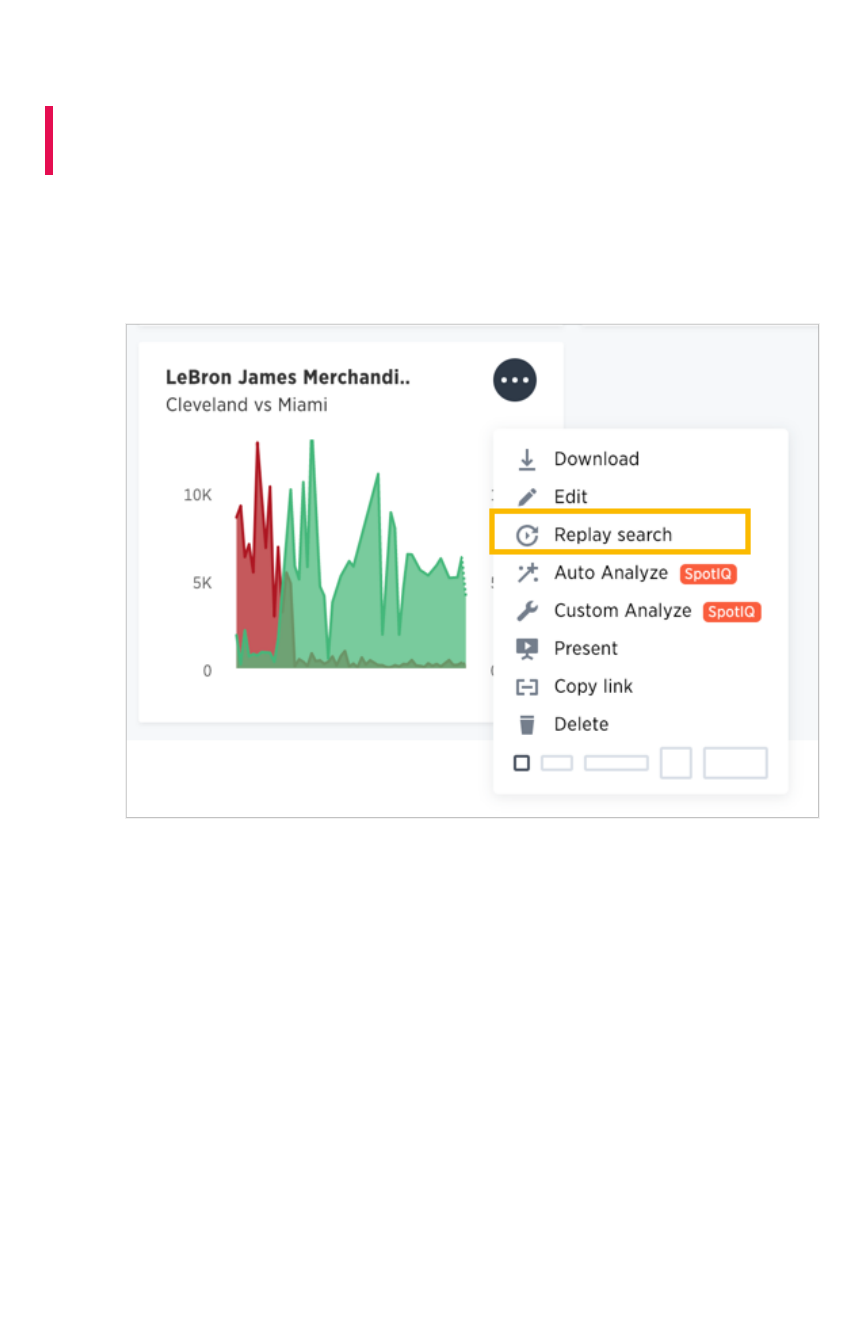
Replay search
Summary:Summary: You can instantly generate a step-by-step replay showing
the creation of a table or chart.
The replay feature shows how to create the chart or table you are viewing. Use it to teach yourself, or
take a screen recording of it and create your own ThoughtSpot training for your team.
• When viewing a chart or table, click the three-dot ActionsActions icon and select Replay searchReplay search.
The replay will start automatically. You can pause and resume it by clicking on it.
Replay search
February 07, 2019
ThoughtSpot Users Guide Page 87
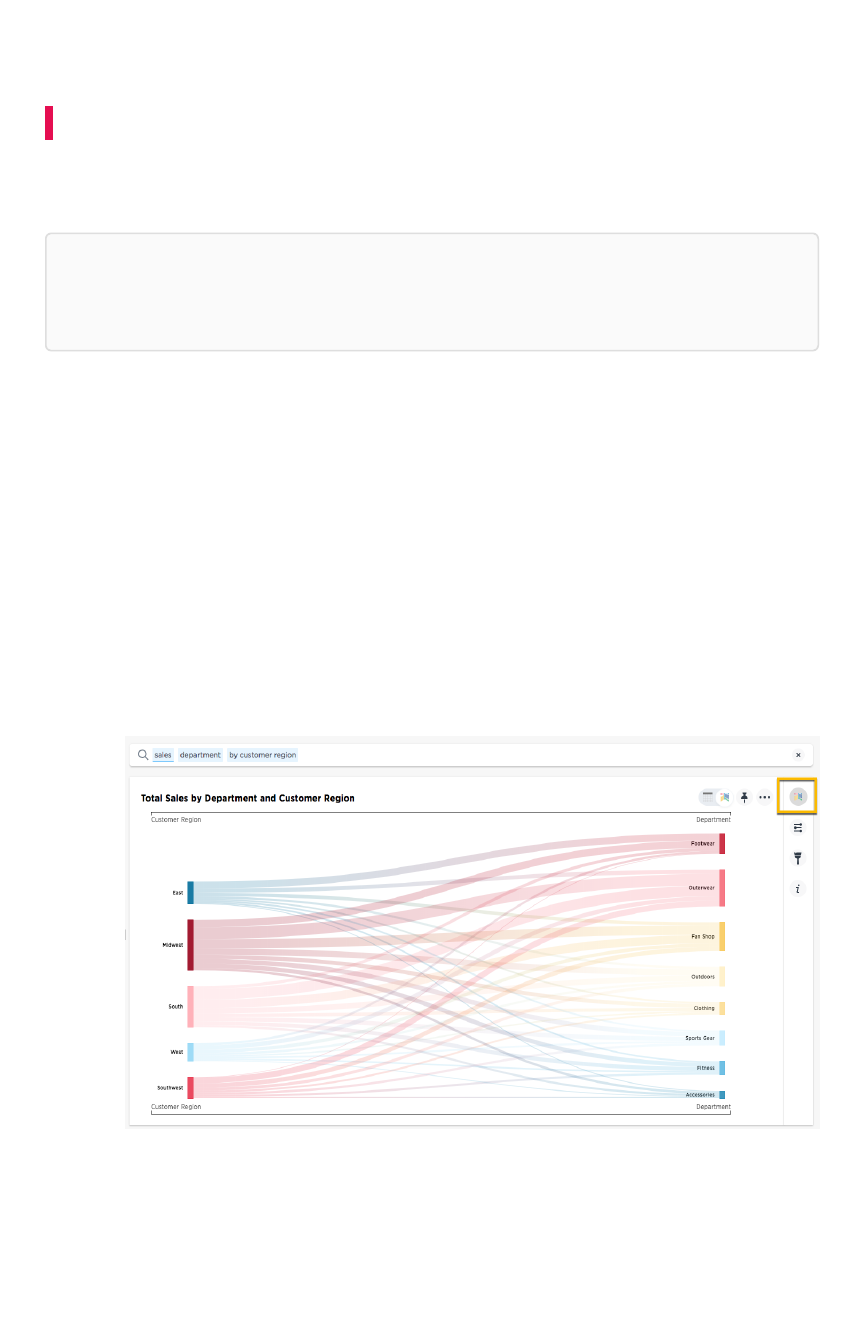
Understand charts
Summary:Summary: Charts display your search answer in a visual way.
Your search needs at least one attribute and one measure to be presented as a chart. When you choose
to display your answer as a chart, ThoughtSpot will assign it the best fit chart type.
Note:Note: Colors are maintained across searches within a session. For example, when doing a
search on revenue by state, each state will keep its color assigned to it even if you change the
search or chart type.
You can choose from a large number of chart types in ThoughtSpot. Each chart type provides you with a
different visualization for your answer.
You can also adjust the axes, labels, and view of the chart.
About chart types
You can choose from a large number of chart types in ThoughtSpot. Each chart type provides you with a
different visualization for your answer.
To change the chart type of your answer:
1. Click Change visualizationChange visualization to get a palette of charts, maps, pivot table, and so on (scroll down
to see more.)
2. Click a different chart or visualization type.
Understand charts
February 07, 2019
ThoughtSpot Users Guide Page 88
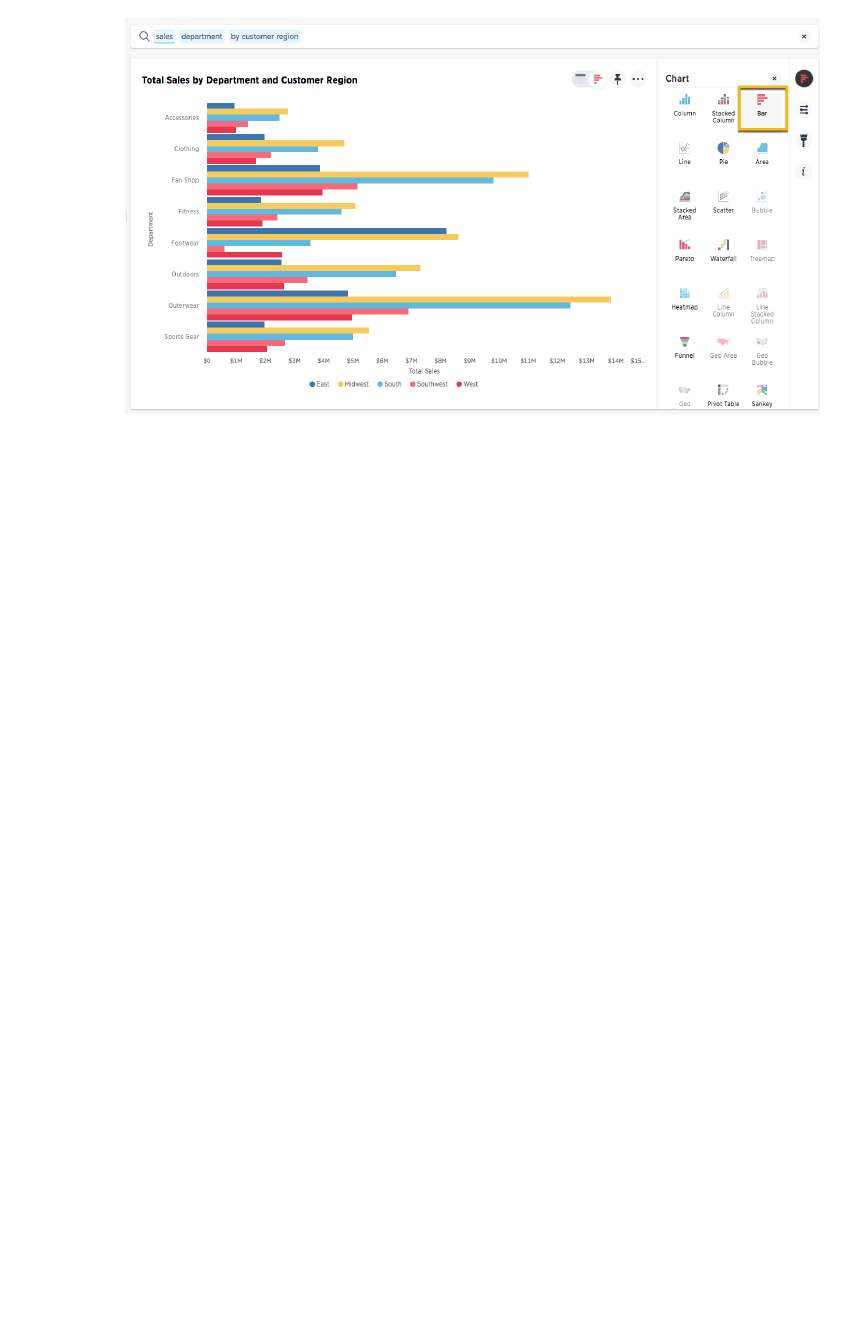
Note:Note: Some chart types may be unavailable for you to select depending on the columns in your search.
For example, if your search does not contain at least one geographical column then you will not be able
to select any of the geo chart types. Unavailable chart types are grayed out. Hovering over one will tell
you what columns are needed before you can choose it.
•Column chartsColumn charts
The column chart is one of ThoughtSpot’s simplest, yet most versatile chart type. More often
than not, the column chart will be chosen as your default chart type.
•Bar chartsBar charts
The bar chart is very similar to the column chart. The only difference is that it is oriented the
other way.
•Line chartsLine charts
Like the column chart, the line chart is one of ThoughtSpot’s simplest, yet most versatile chart
type. More often than not the line chart will be chosen as your default chart type.
•Pie chartsPie charts
The pie chart is a classic chart type that displays your search in a circle. The pie chart
ThoughtSpot shows is in the shape of a doughnut.
•Area chartsArea charts
The area chart is based on the line chart, but has filled in regions.
•Scatter chartsScatter charts
The scatter chart is useful for finding correlations or outliers in your data.
•Bubble chartsBubble charts
The bubble chart displays three dimensions of data with each containing a set of values.
•Pareto chartsPareto charts
The pareto chart is a type of chart that contains both columns and a special type of line chart.
•Waterfall chartsWaterfall charts
The waterfall chart is used to show how an initial value is affected by a series of intermediate
positive or negative values.
•Treemap chartsTreemap charts
The treemap chart displays hierarchical data as a set of nested rectangles.
•Heatmap chartsHeatmap charts
The heatmap chart displays individual data values in a matrix following a color scale.
•Line column chartsLine column charts
The line column chart combines the column and line charts.
•Funnel chartsFunnel charts
The funnel chart shows a process with progressively decreasing proportions amounting to
100 percent in total.
•About geo chartsAbout geo charts
Understand charts
February 07, 2019
ThoughtSpot Users Guide Page 89

There are three geo charts that let you visualize geographical data in ThoughtSpot.
•About sankey chartsAbout sankey charts
Sankey charts show a flow from one set of values to another, usually with visual emphasis
(brighter colors or larger bandwidths) for comparison of the values (e.g., top cities in terms of
sales might be emphasized).
•About pivot tablesAbout pivot tables
Pivot tables in ThoughtSpot use the well known drag-and-drop interface. Creating a pivot
table enables exploring alternate visualization of data in a wide table. The basic idea is that
some data is easier to consume when laid out horizontally, while others, vertically.
Charts with multiple measures on the y-axis
You can have multiple measures on the y-axis of many charts, which is a great additional way of
presenting information in a chart.
Example of multiple measures on the y-axis of a stacked column chart.
Charts which support multiple measures on the y-axis:
• Column
• Stacked Column
• Bar
• Stacked Bar
• Line
• Area
• Stacked Area
• Waterfall
• Line Column
• Line Stacked Column
To learn more, see Stack multiple measures on the y-axis.
Understand charts
February 07, 2019
ThoughtSpot Users Guide Page 90
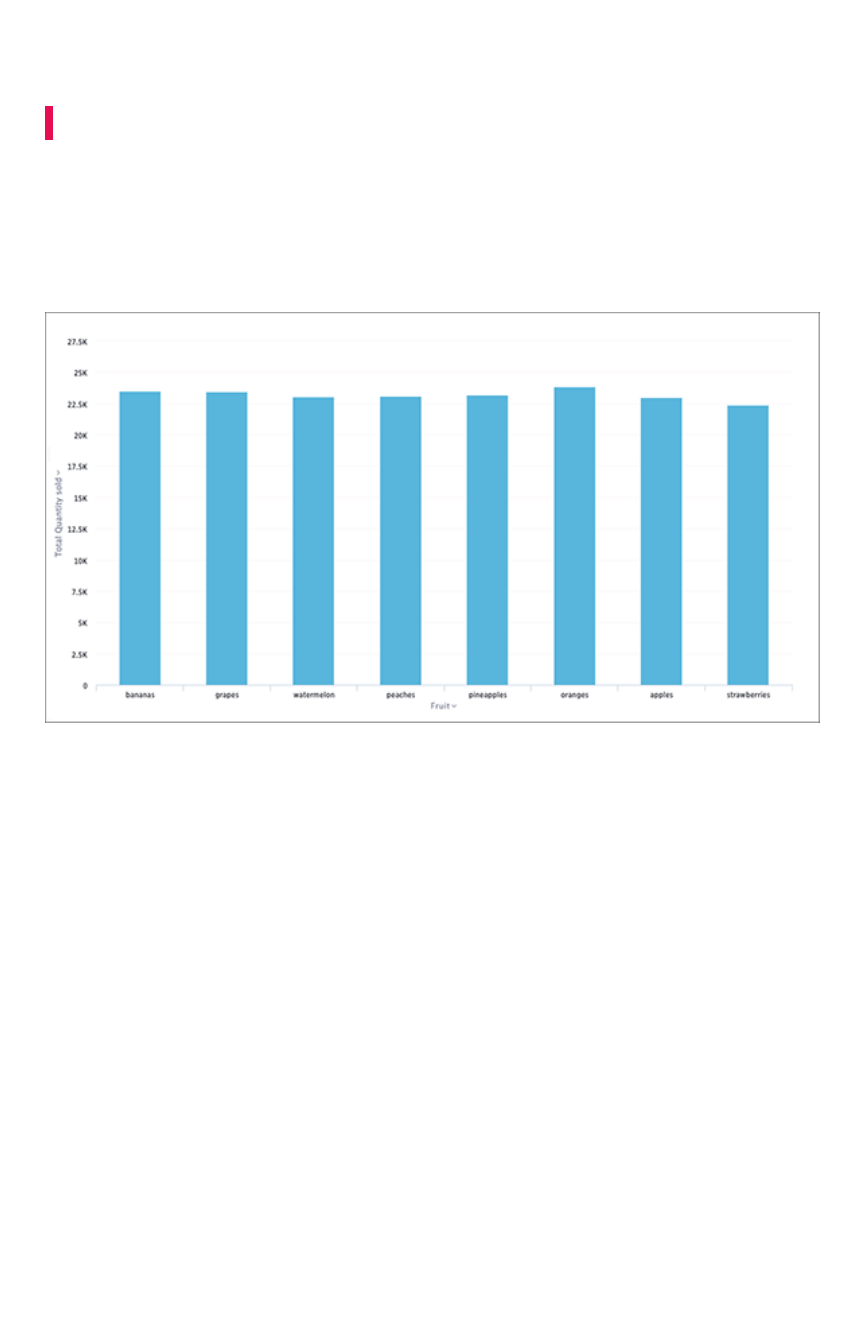
Column charts
Summary:Summary: A column chart is the most versatile chart type
The column chart is one of ThoughtSpot’s simplest, yet most versatile chart type. More often than not,
the column chart will be chosen as your default chart type.
Column charts are vertical bar charts that display your data using rectangular bars. The length of the bar
is proportional to the data value.
Your search needs at least one attribute and one measure to be represented as a column chart.
Stacked column charts
The stacked column chart is similar to the column chart, but with one major difference. It includes a
legend, which divides each column into additional sections by color.
Stacked column charts are typically used when you want to compare aggregated data and the data that
it includes together. You can toggle the options in styles to show Detailed Labels (summaries for each
section of each bar) and Total Labels (show the sum of the stacks at the top of each stack).
It is important to note that stacked column charts plot the y-axis as a percentage by default. You can
choose to toggle Show Y-Axis as %Show Y-Axis as % on or off in the Configuration Options. This feature is also available
for stacked area charts.
Column charts
February 07, 2019
ThoughtSpot Users Guide Page 91
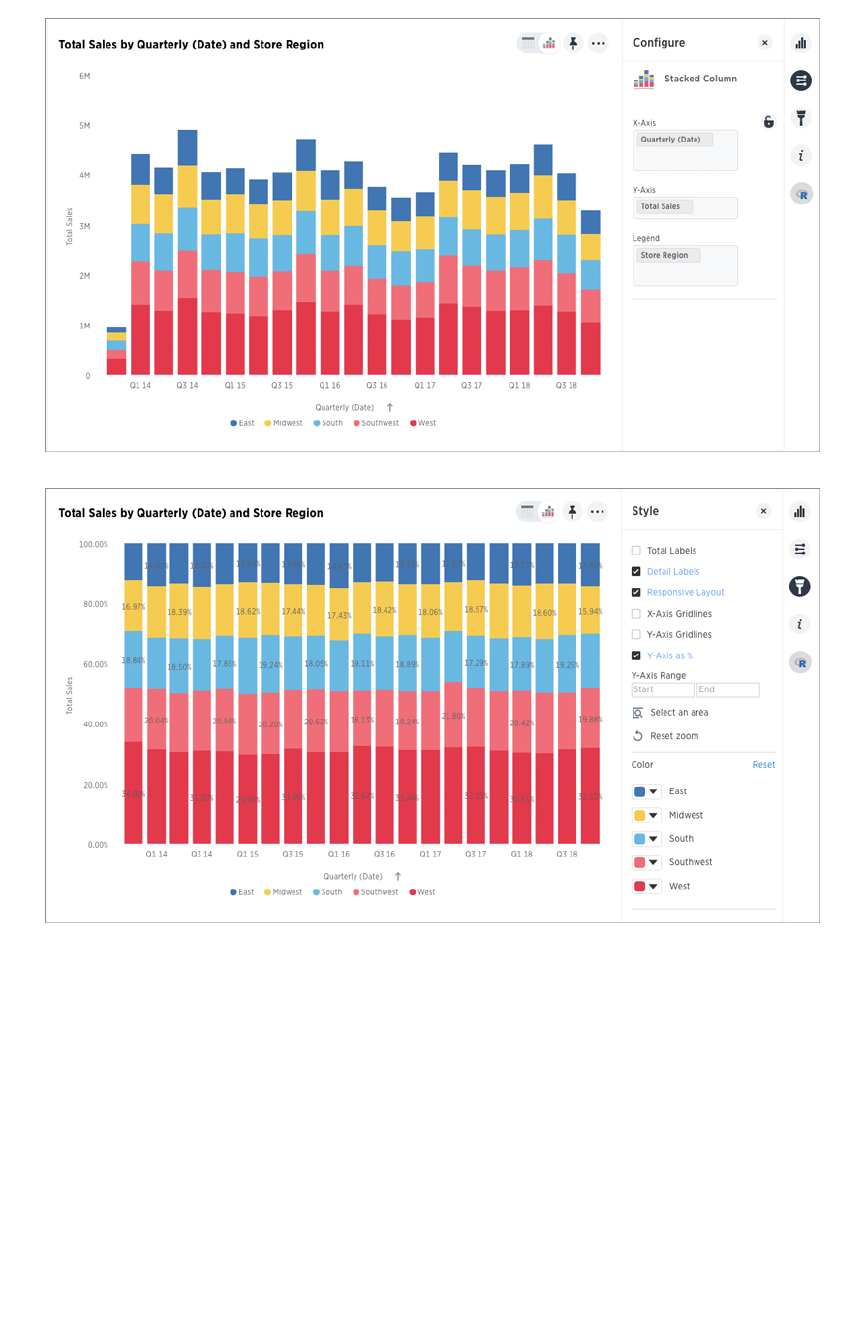
Your search needs at least two attributes and one measure to be represented as a stacked column
chart.
Column charts
February 07, 2019
ThoughtSpot Users Guide Page 92
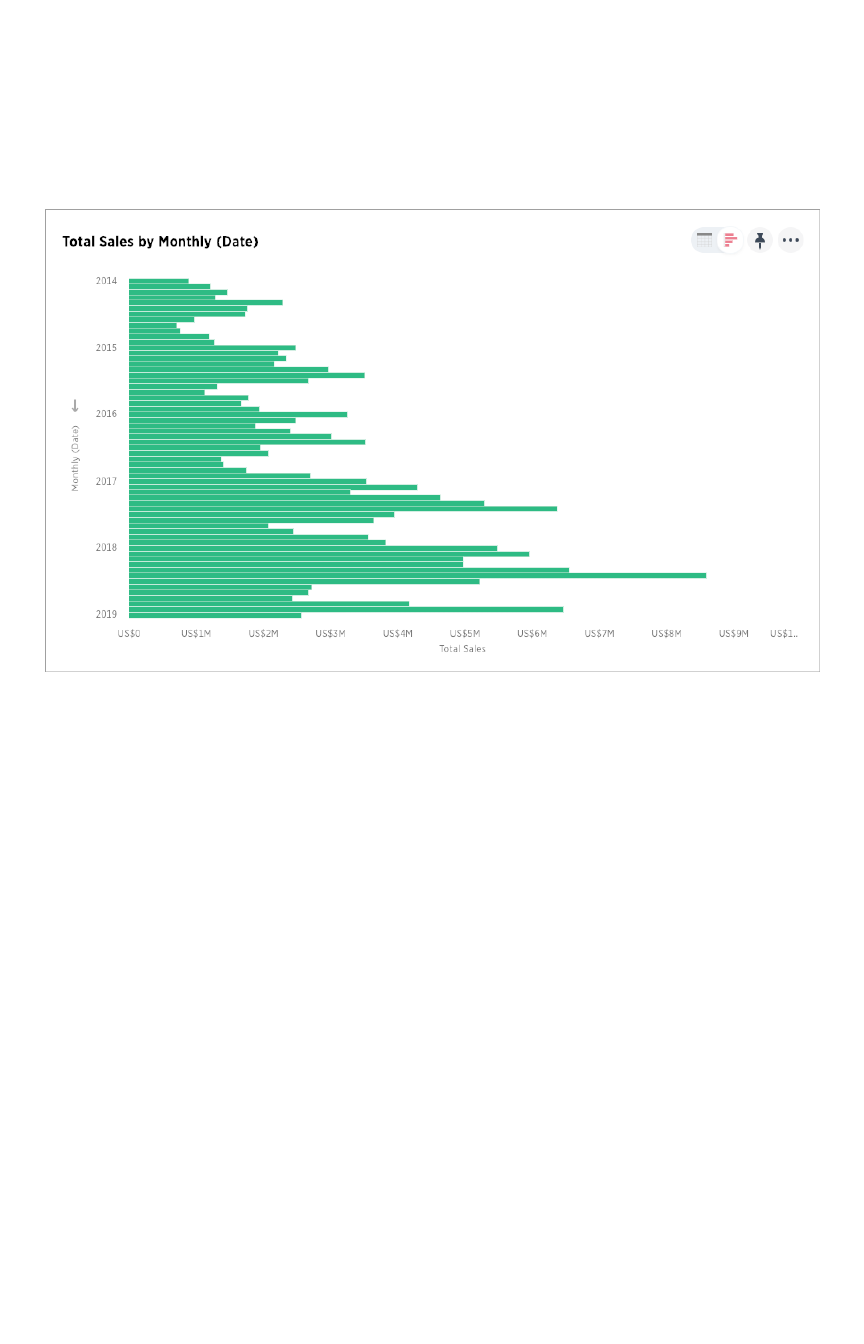
Bar charts
The bar chart is very similar to the column chart. The only difference is that it is oriented the other way.
Bar charts display your data using horizontal rectangular bars. The length of the bar is proportional to the
data value.
Your search needs at least one attribute and one measure to be represented as a bar chart.
Stacked bar charts
The stacked bar chart is similar to the bar chart, but with one major difference. It includes a legend,
which divides each bar into additional sections by color.
Stacked bar charts are typically used when you want to compare aggregated data and the data that it
includes together. You can toggle the options in styles to show Detailed Labels (summaries for each
section of each bar) and Total Labels (show the sum of the stacks for each bar).
Bar charts
February 07, 2019
ThoughtSpot Users Guide Page 93
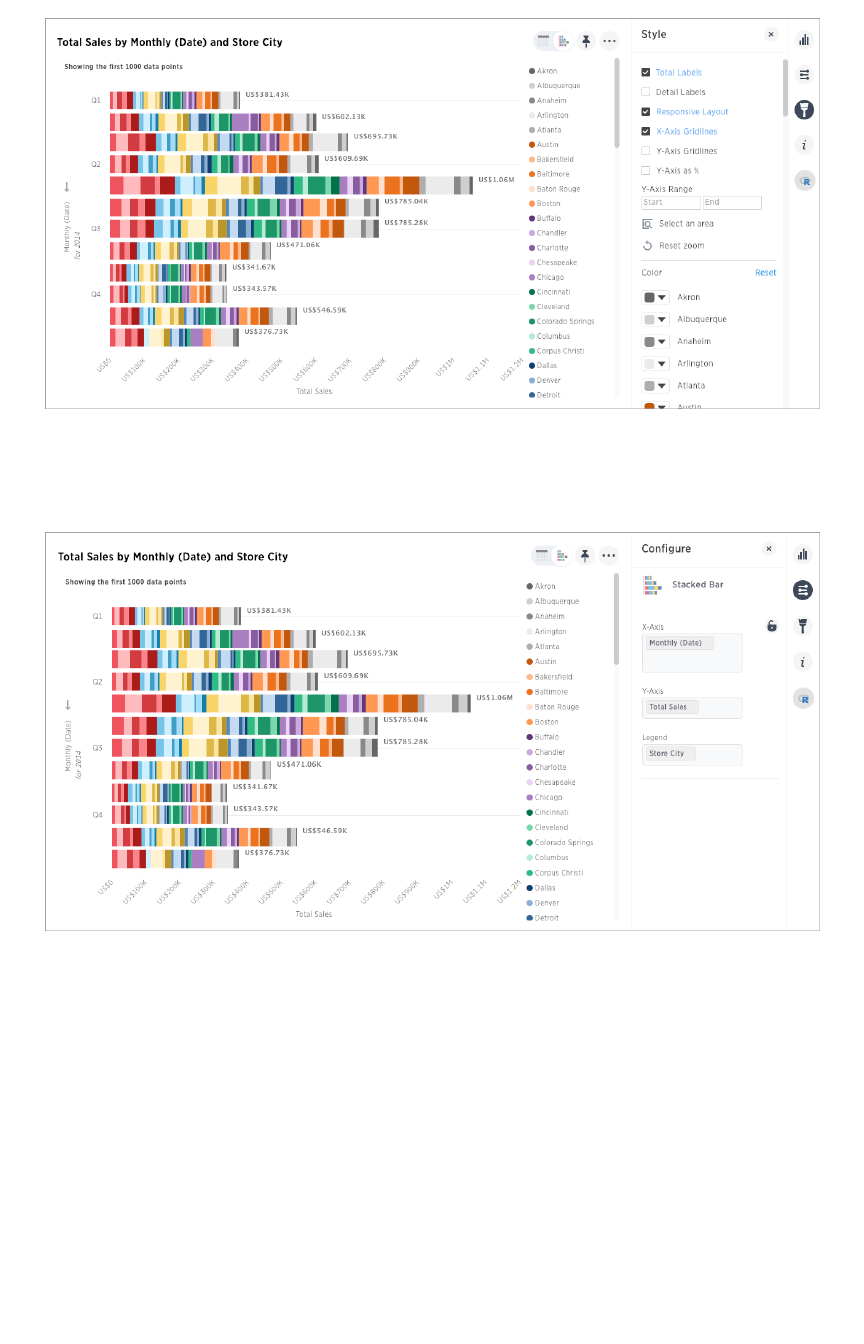
It is important to note that stacked bar charts plot the y-axis as a percentage by default. You can choose
to toggle Show Y-Axis as %Show Y-Axis as % on or off in the Configuration Options. This feature is also available for
stacked area charts.
Your search needs at least two attributes and one measure to be represented as a stacked bar chart.
Bar charts
February 07, 2019
ThoughtSpot Users Guide Page 94
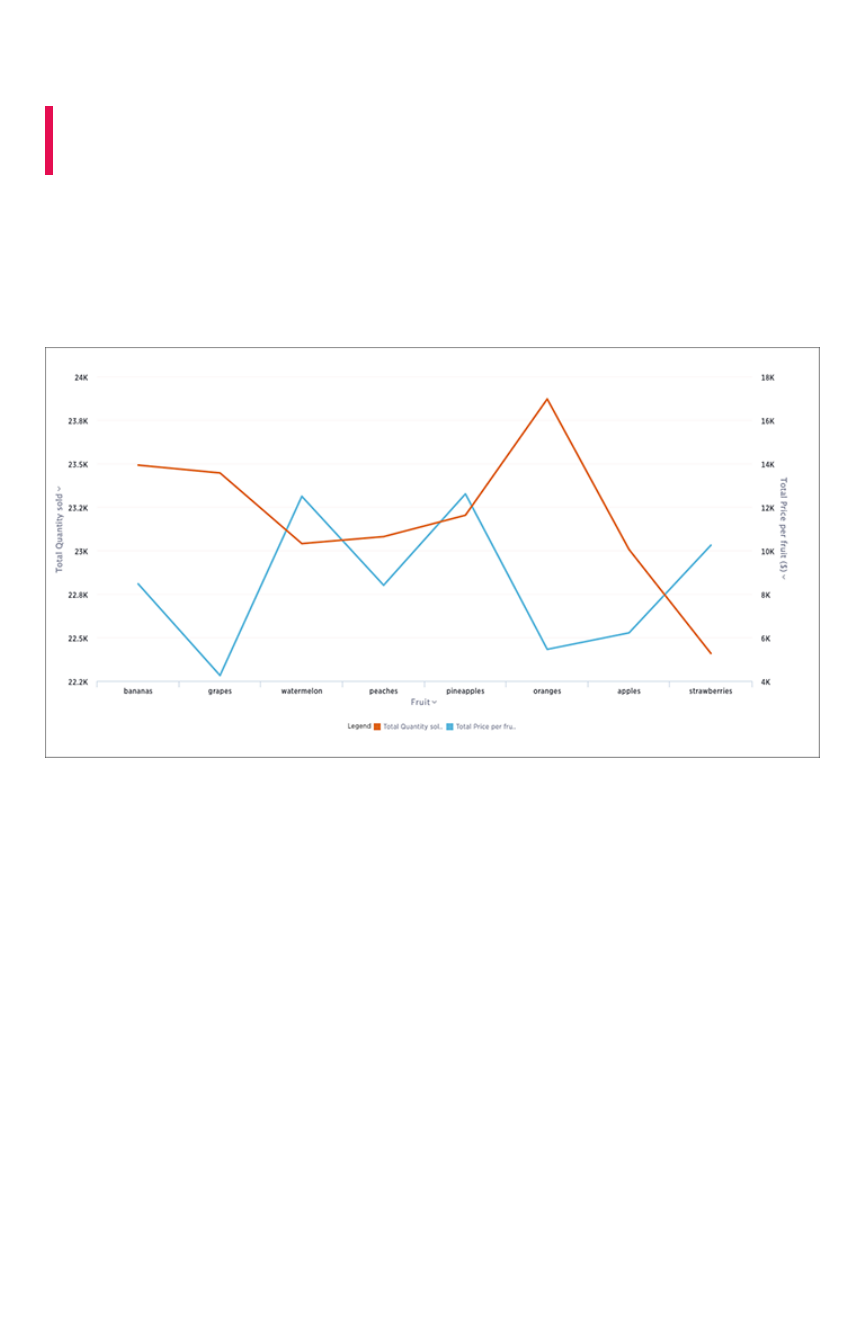
Line charts
Summary:Summary: Line charts are good at showing trends over intervals of
time.
Like the column chart, the line chart is one of ThoughtSpot’s simplest, yet most versatile chart type.
More often than not the line chart will be chosen as your default chart type.
Line charts displays your data as a series of data points connected by straight line segments. The
measurement points are ordered by the x-axis value.
Your search needs at least one attribute and one measure to be represented as a line chart.
Line charts
February 07, 2019
ThoughtSpot Users Guide Page 95
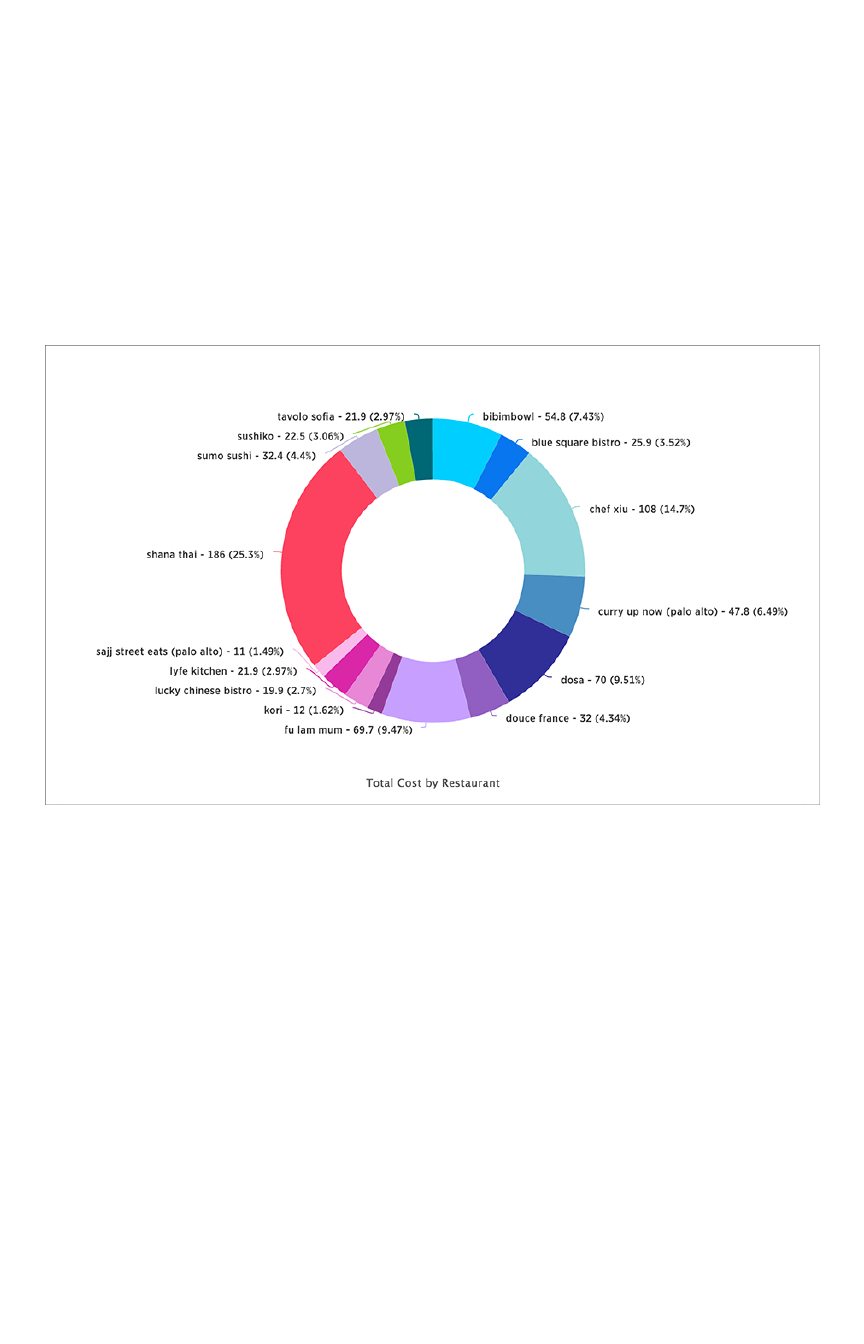
Pie charts
The pie chart is a classic chart type that displays your search in a circle. The pie chart ThoughtSpot
shows is in the shape of a doughnut.
How pie charts divide data
Pie charts divide your data into sectors that each represent a proportion of a whole circle. You can
display the exact values of each slice, in addition to the percentage values by toggling on AdditionalAdditional
chart optionschart options found under Change chart configuration.
Your search needs at least one attribute and one measure to be represented as a pie chart. Also, there
must be fewer than 50 values in the attribute column.
Pie in pie charts
The pie in pie chart can be created from a regular pie chart in order to compare more than one
component of an attribute. Pie in pie charts show two concentric pie charts comparing different
measures.
To see a pie in pie chart, assign two different measures to the y-axis under Configure ChartConfigure Chart.
Pie charts
February 07, 2019
ThoughtSpot Users Guide Page 96
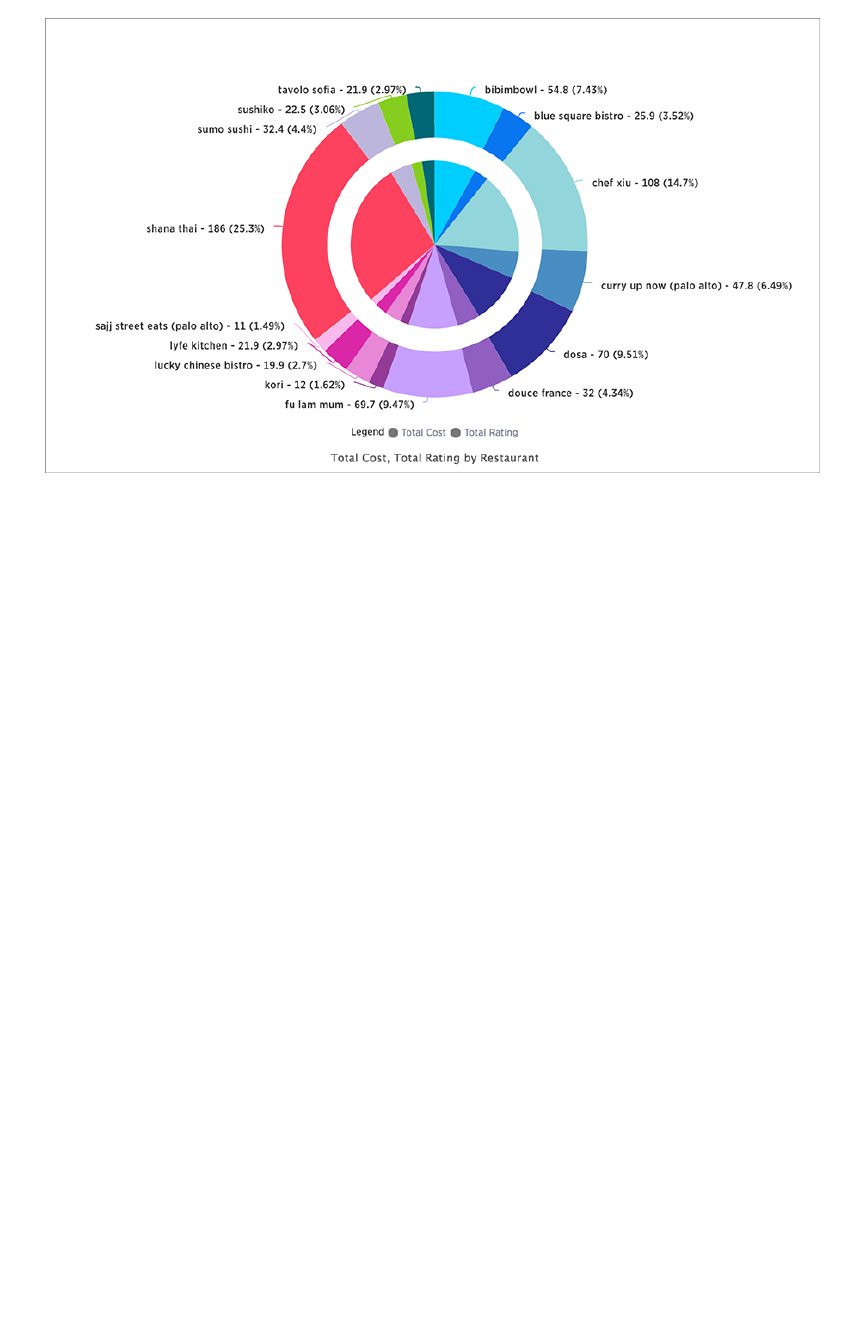
Color customization of pie in pie charts
You can customize the colors of each pie in a pie chart using the Style widget.
1. Choose a pinboard that has a pie chart.
2. Click the Edit chart styleEdit chart style (paintbrush icon) to open the Style widget.
3. From the Style widget, assign a color of your choice to each pie as listed in the widget.
4. Click …… and choose UpdateUpdate to save the changes.
5. Click CloseClose.
6. Optionally, you can click ResetReset to use the default color.
Pie charts
February 07, 2019
ThoughtSpot Users Guide Page 97
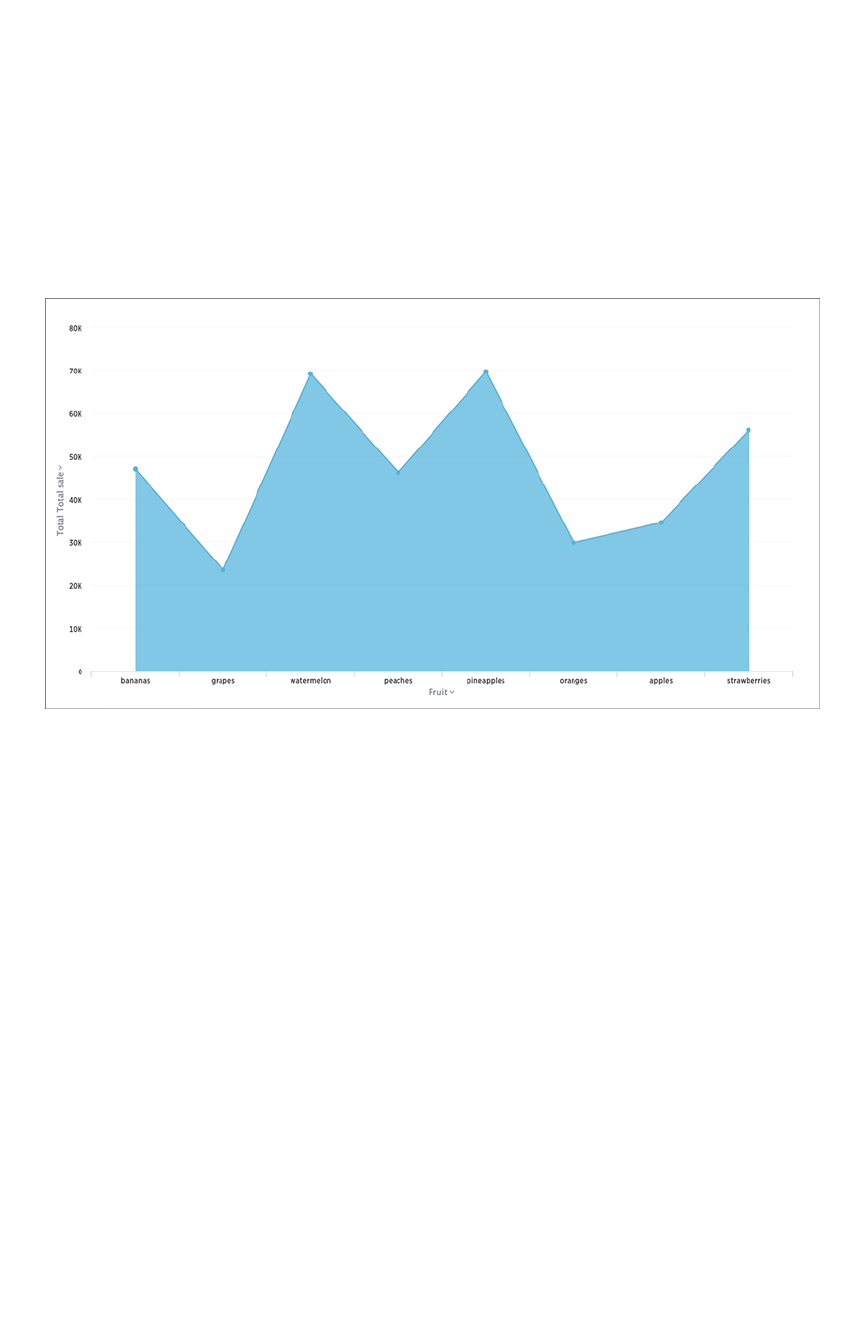
Area Charts
The area chart is based on the line chart, but has filled in regions.
Understand area charts
Area charts display quantitative data graphically. The area between the x-axis and the line are colored in
to help you compare different portions of the chart.
Your search needs at least one attribute and one measure to be represented as an area chart.
Stacked area charts
The stacked area chart is an area chart with an attribute in the legend, which divides the area into layers.
Stacked area charts show the relative contribution to the accumulated total of a measure over time.
Stacked area charts plot the y-axis as a percentage by default. You can choose to toggle Show Y-AxisShow Y-Axis
as %as % on or off in the Configuration OptionsConfiguration Options to create your own mountain-style charts.
Area Charts
February 07, 2019
ThoughtSpot Users Guide Page 98
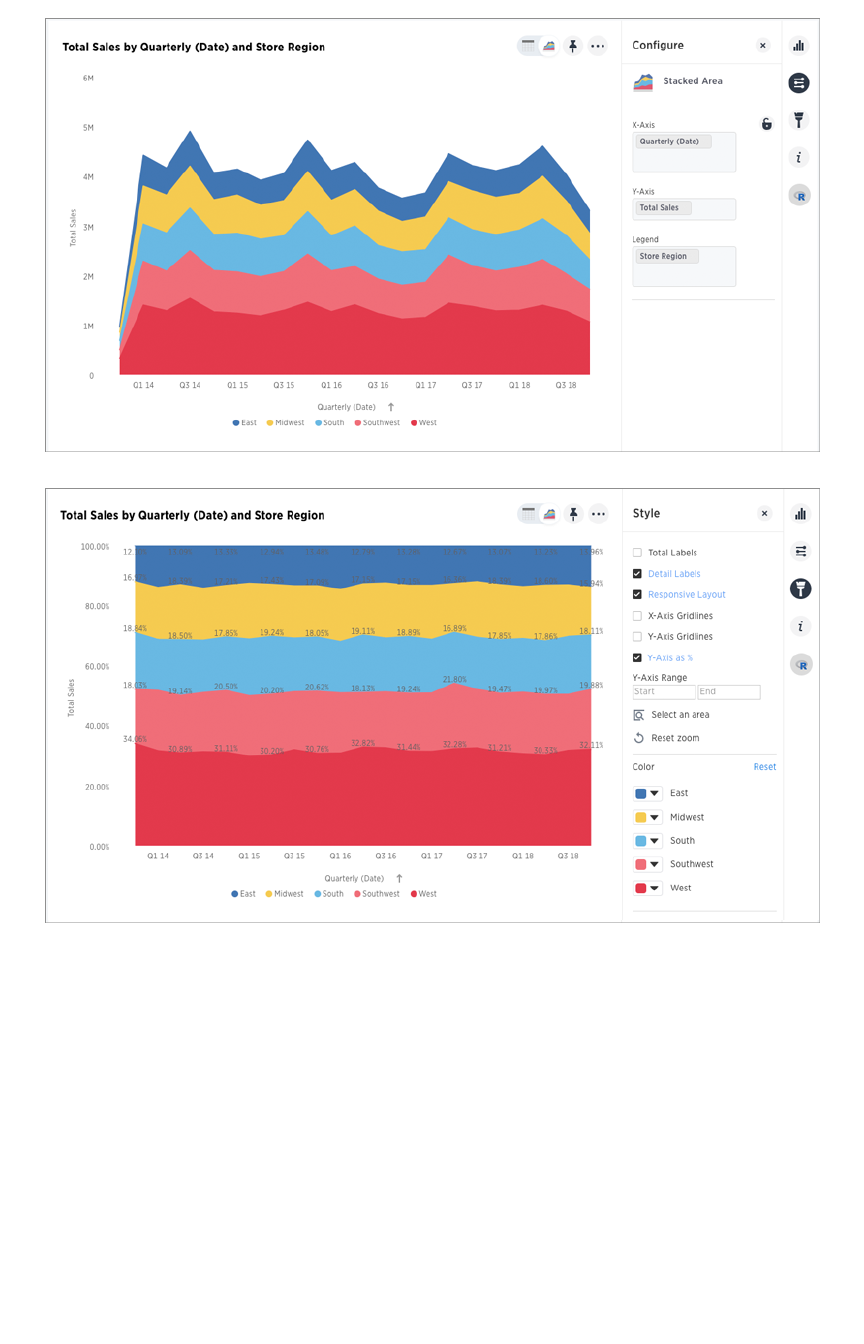
Your search needs at least two attributes and one measure to be represented as a stacked area chart.
Area Charts
February 07, 2019
ThoughtSpot Users Guide Page 99
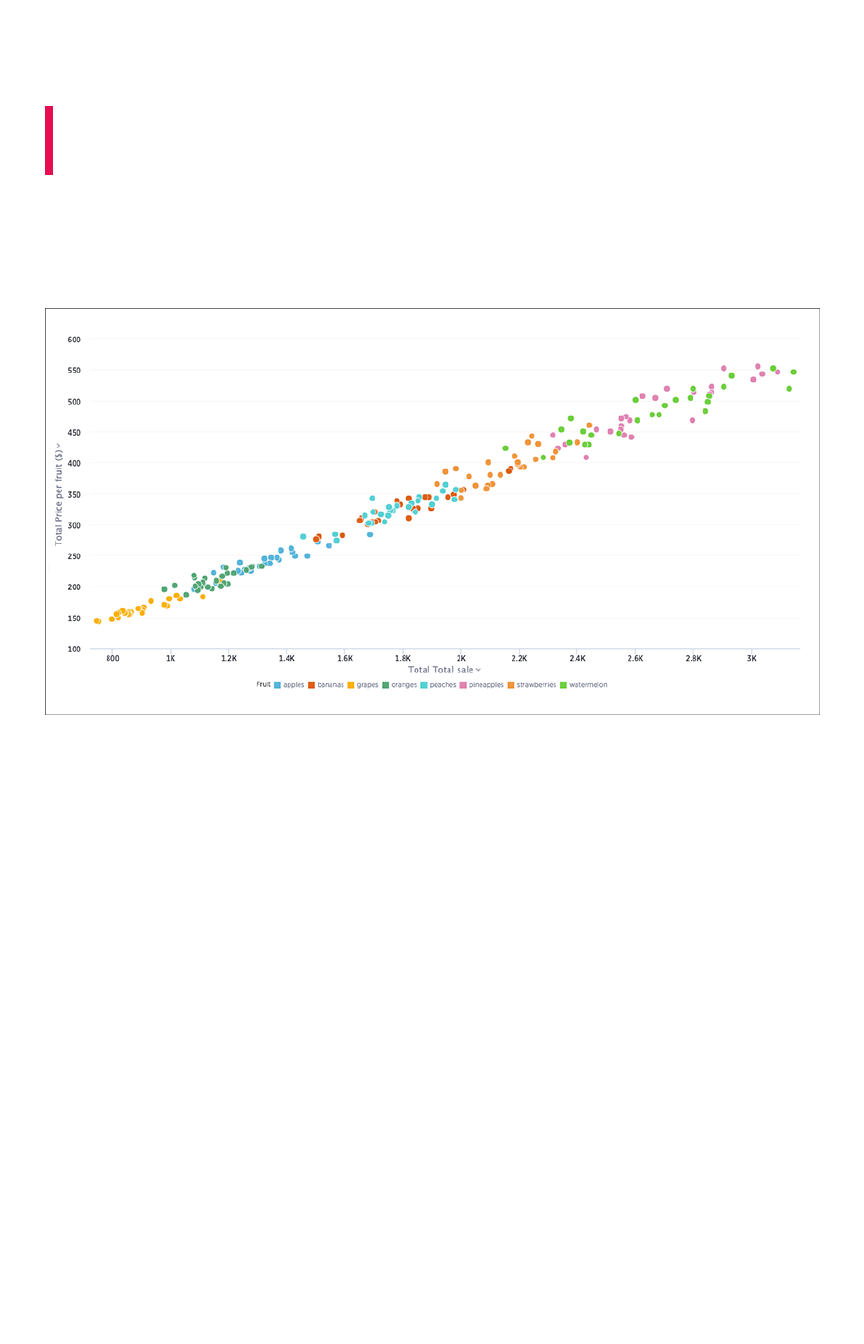
Scatter charts
Summary:Summary: The scatter chart is useful for finding correlations or
outliers in your data.
Scatter charts display your data as a collection of points, which can either be evenly or unevenly
distributed. Each point is plotted based on its own axes values. This helps you determine if there is a
relationship between your searched columns.
Your search needs at least one attribute and one measure to be represented as a scatter chart.
Scatter charts
February 07, 2019
ThoughtSpot Users Guide Page 100
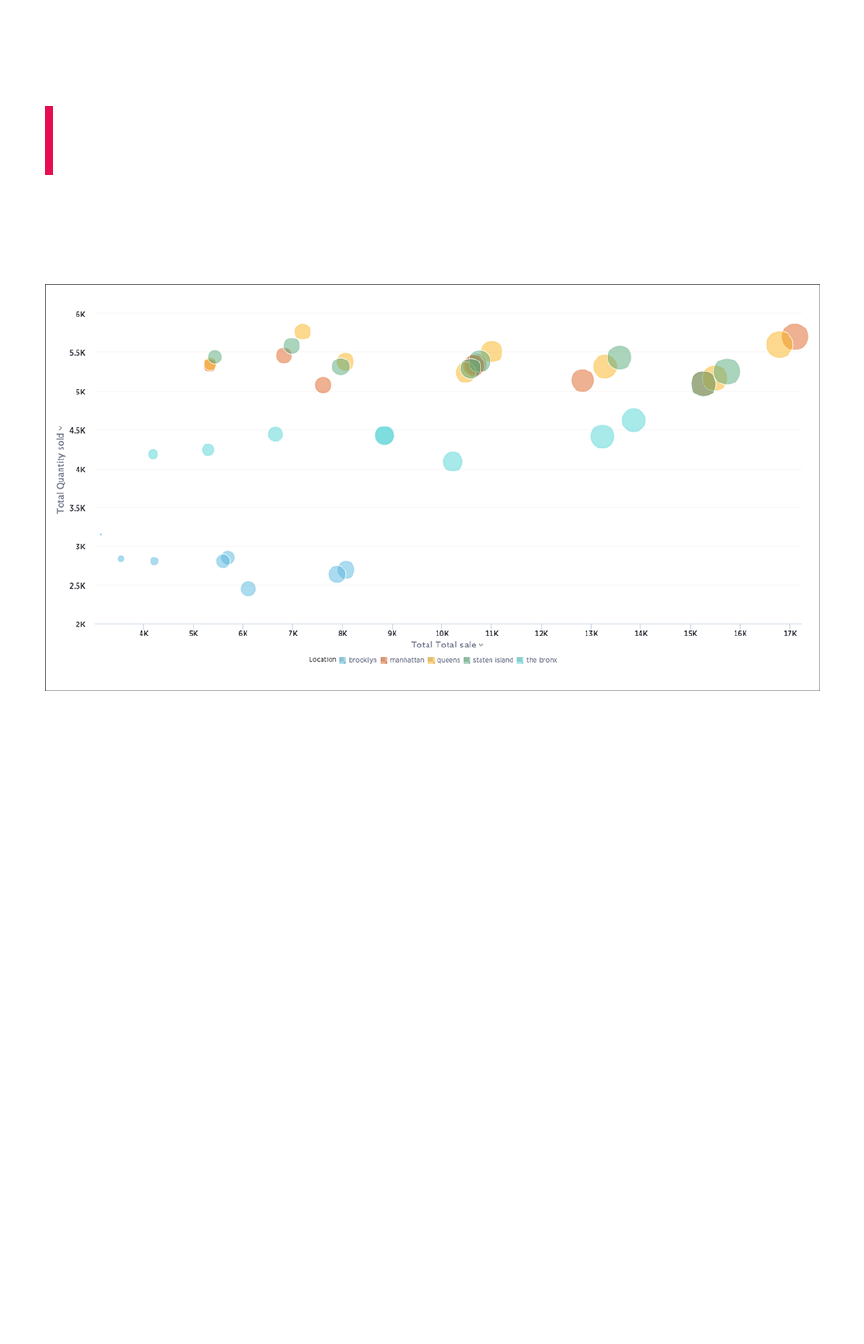
Bubble charts
Summary:Summary: The bubble chart displays three dimensions of data with
each containing a set of values.
The bubble chart is a variation of the scatter chart, with the data points replaced with bubbles. These
bubbles add a third data dimension to your answer.
The size of each bubble depends on the measure you choose under Edit chart configurationEdit chart configuration.
Bubble charts
February 07, 2019
ThoughtSpot Users Guide Page 101
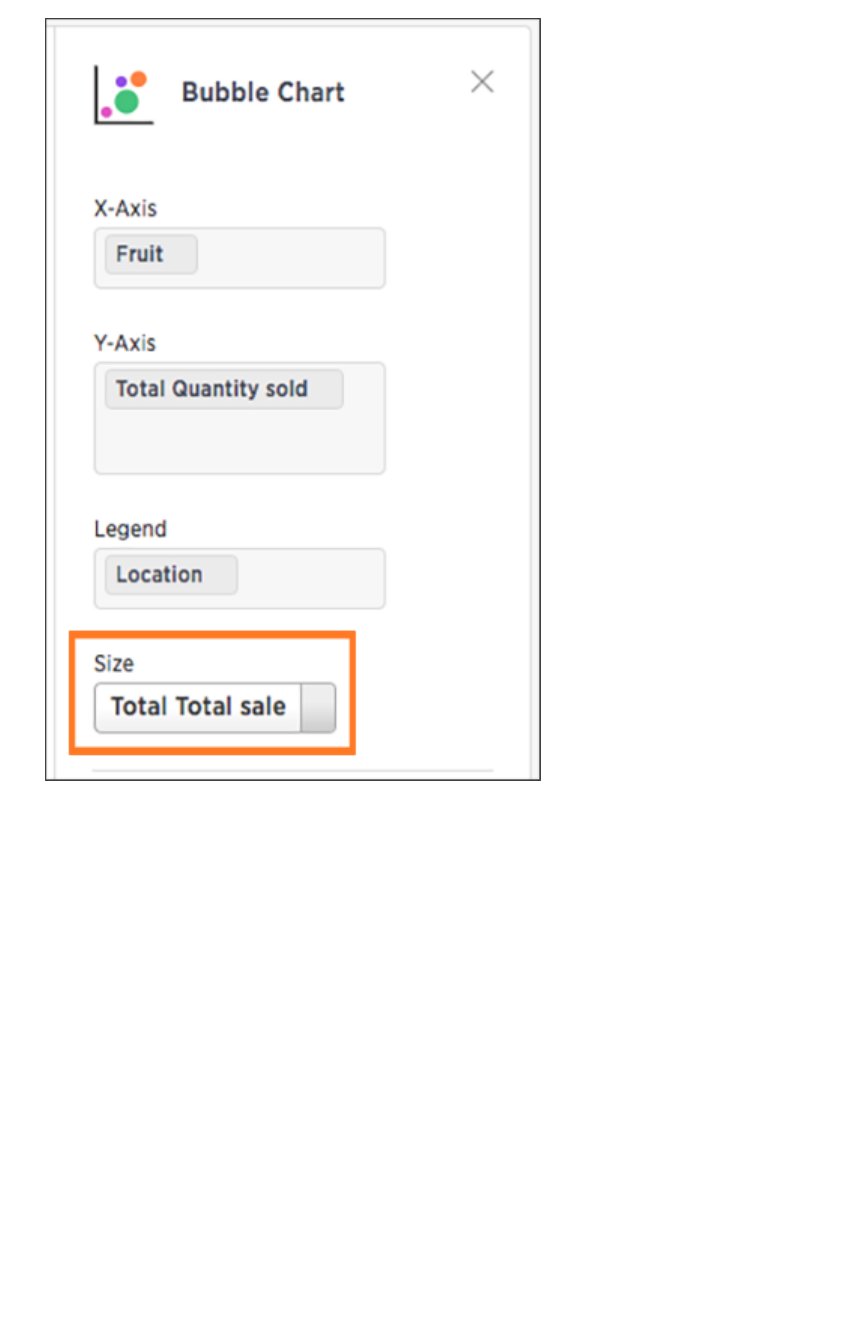
Your search needs at least one attribute and two measures to be represented as a bubble chart.
Bubble charts
February 07, 2019
ThoughtSpot Users Guide Page 102
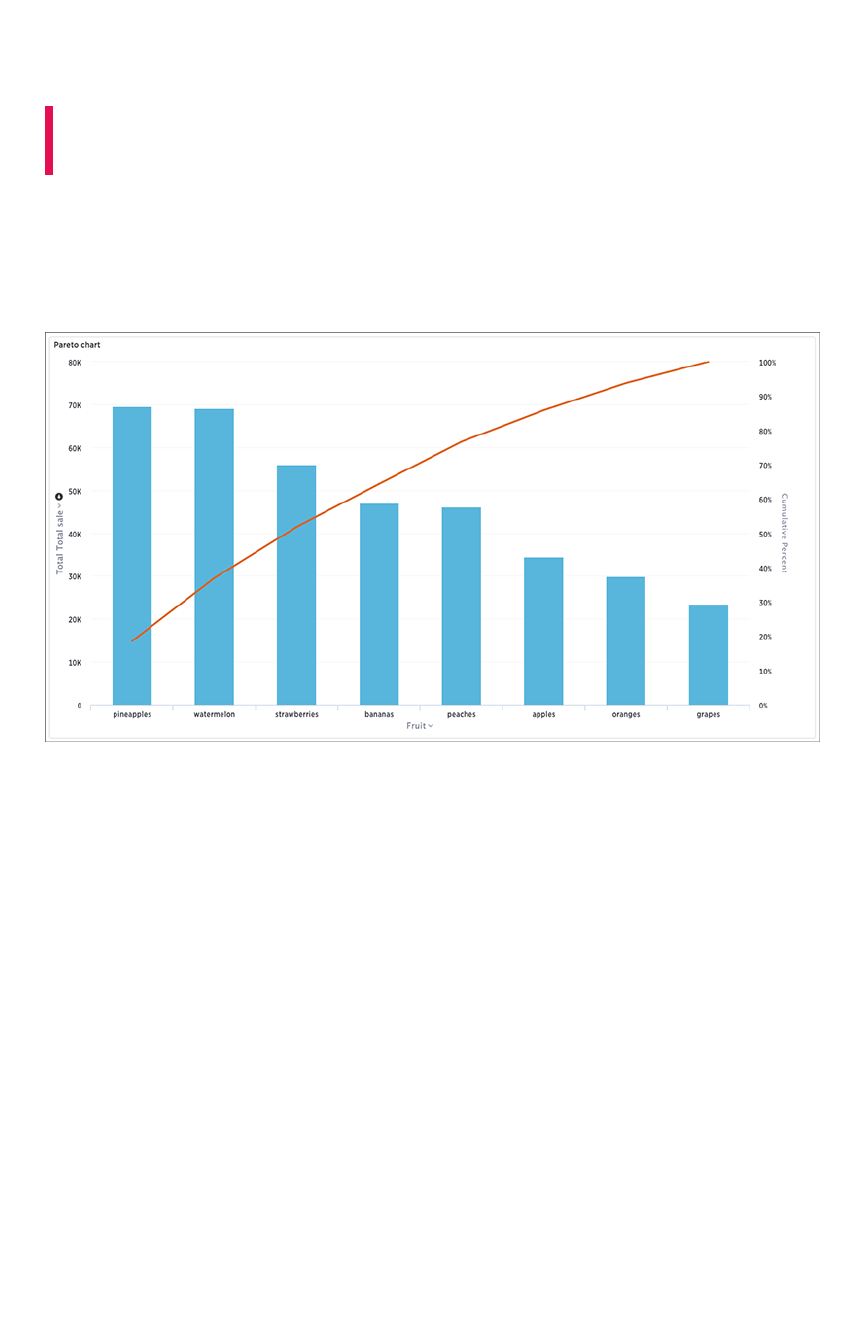
Pareto charts
Summary:Summary: The pareto chart is a type of chart that contains both
columns and a special type of line chart.
The individual values of a pareto chart are represented in descending order by columns, and the
cumulative percent total is represented by the line. The y-axis on the left is paired with the columns,
while the y-axis on the right is paired with the line. By the end of the line, the cumulative percent total
reaches 100 percent.
Your search needs at least one attribute and one measure to be represented as a pareto chart.
Pareto charts
February 07, 2019
ThoughtSpot Users Guide Page 103
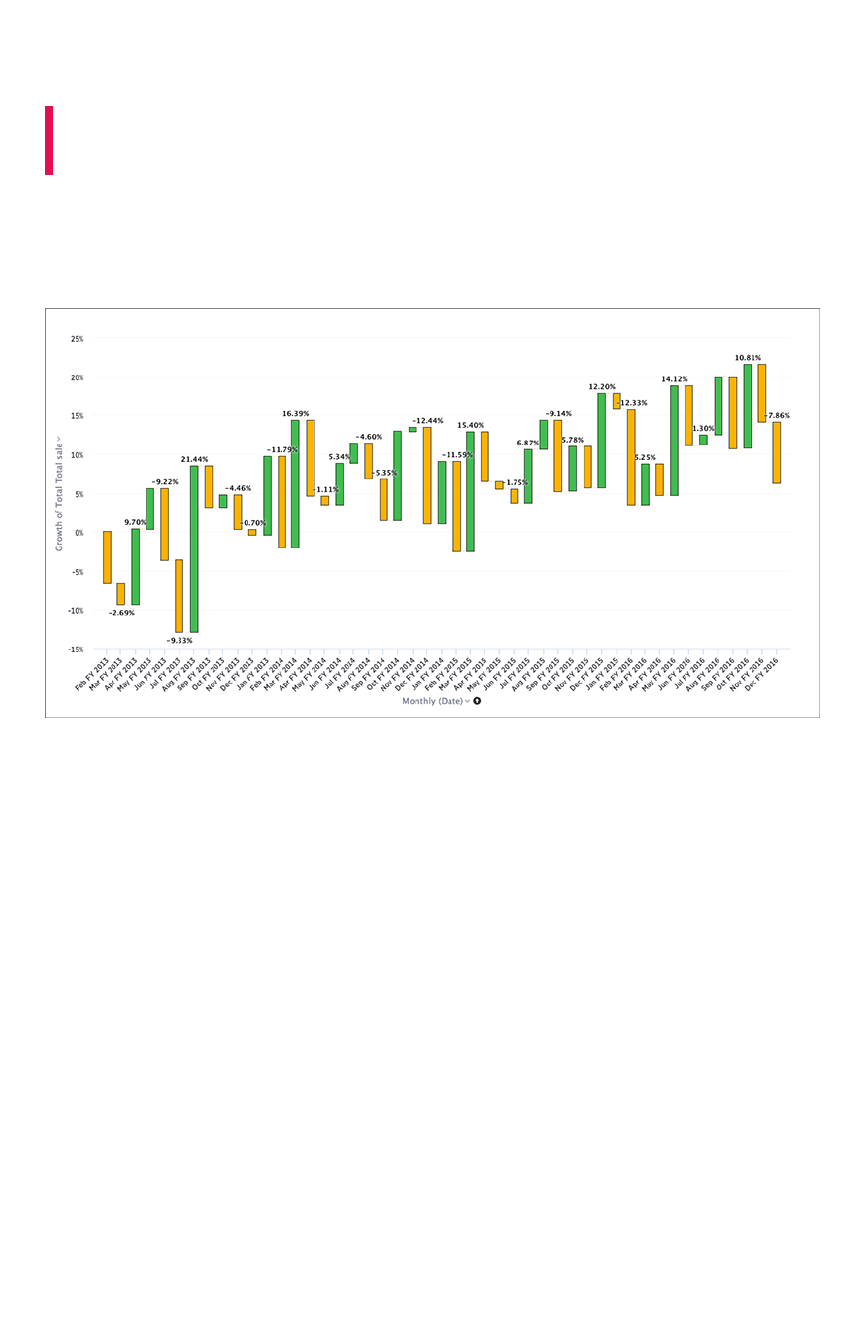
Waterfall charts
Summary:Summary: The waterfall chart is used to show how an initial value is
affected by a series of intermediate positive or negative values.
Waterfall charts are good for visualizing positive and negative growth, and therefore work well with the
growth over time keyword. The columns are color-coded to distinguish between positive and negative
values.
Your search needs at least one attribute and one measure to be represented as a waterfall chart.
Waterfall charts
February 07, 2019
ThoughtSpot Users Guide Page 104
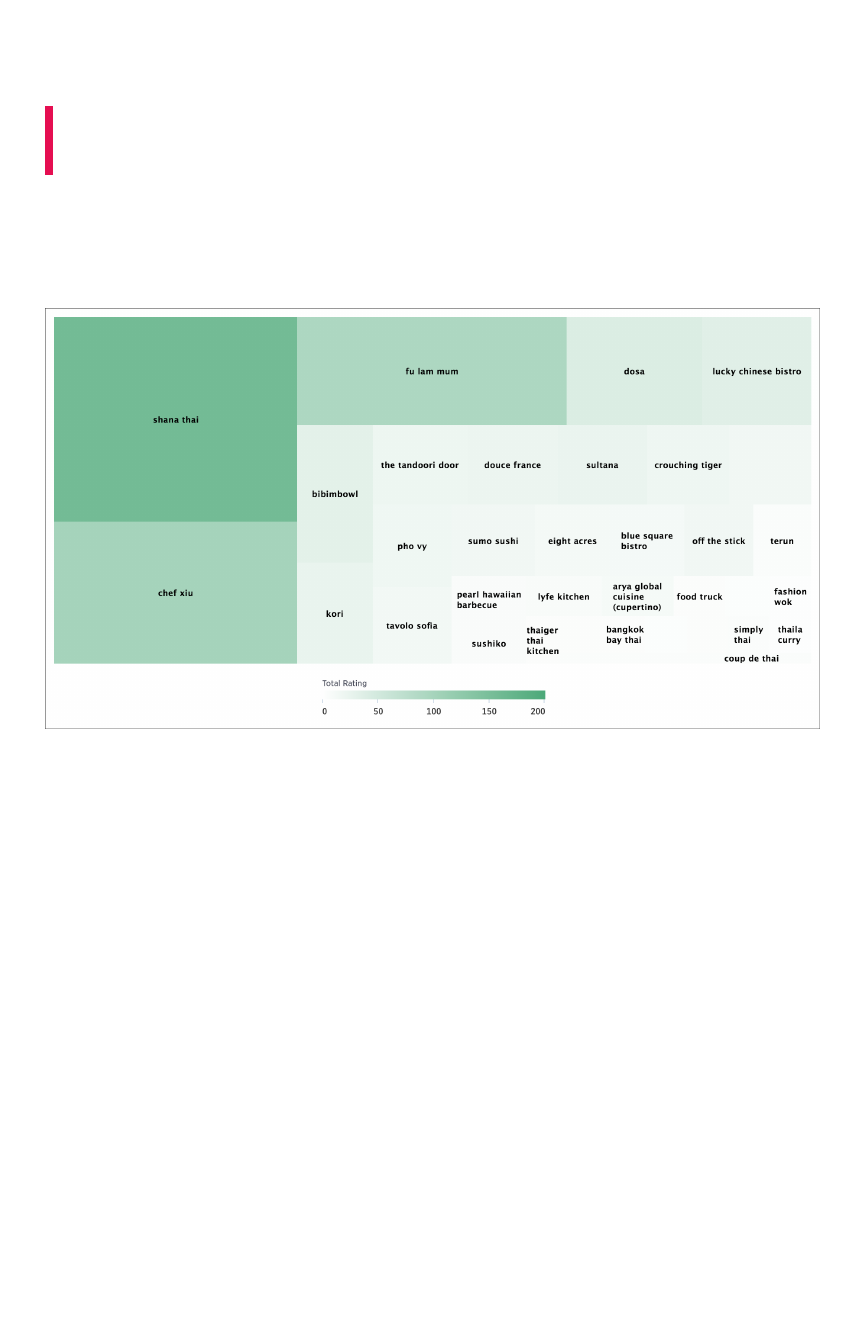
Treemap charts
Summary:Summary: The treemap chart displays hierarchical data as a set of
nested rectangles.
Treemap charts use color and rectangle size to represent two measure values. Each rectangle, or
branch, is a value of the attribute. Some branches can contain smaller rectangles, or sub-branches. This
setup makes it possible to display a large number of items in an efficient way.
You can rearrange the columns of your search into category, color, and size under Edit chartEdit chart
configurationconfiguration.
Treemap charts
February 07, 2019
ThoughtSpot Users Guide Page 105
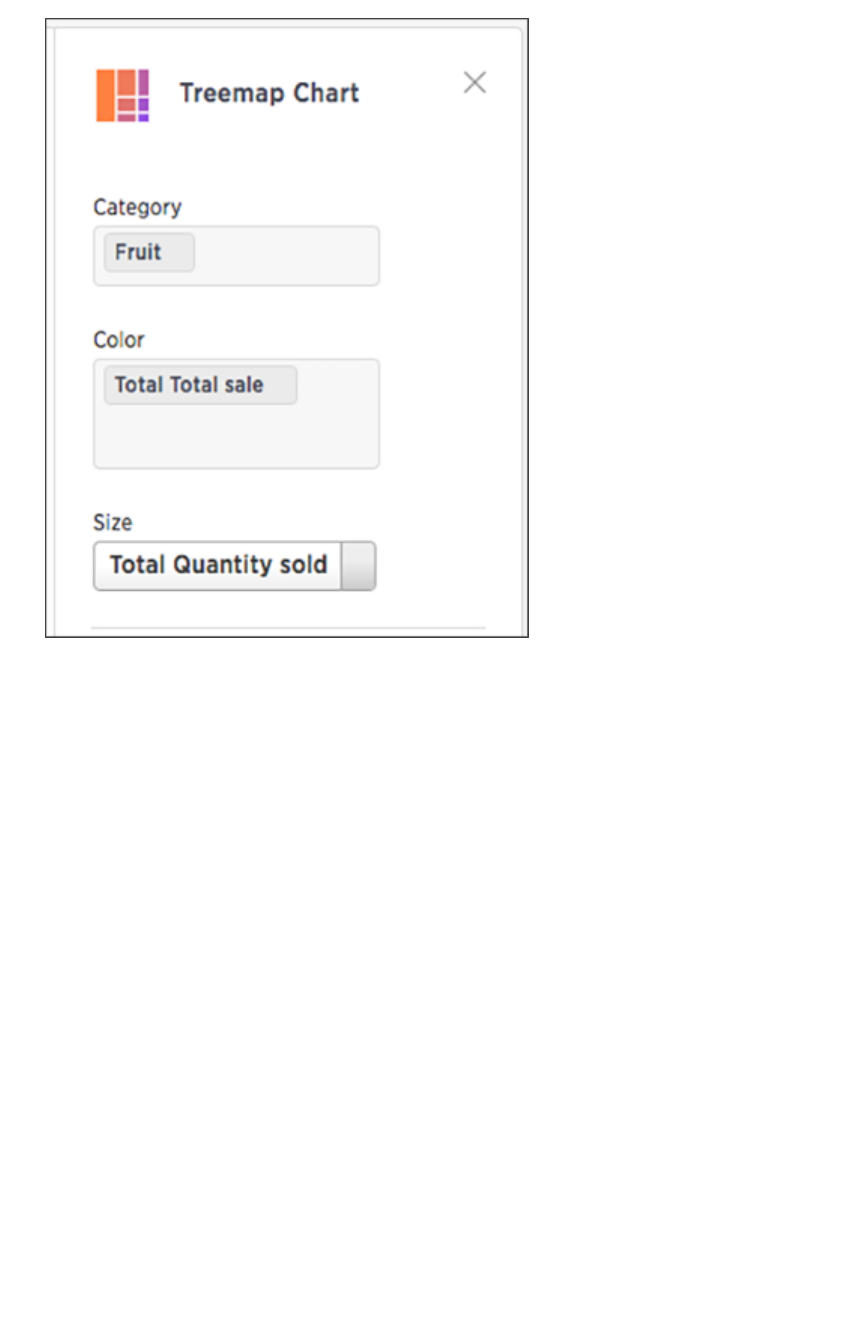
Your search needs at least one attribute and two measures to be represented as a treemap chart.
Treemap charts
February 07, 2019
ThoughtSpot Users Guide Page 106
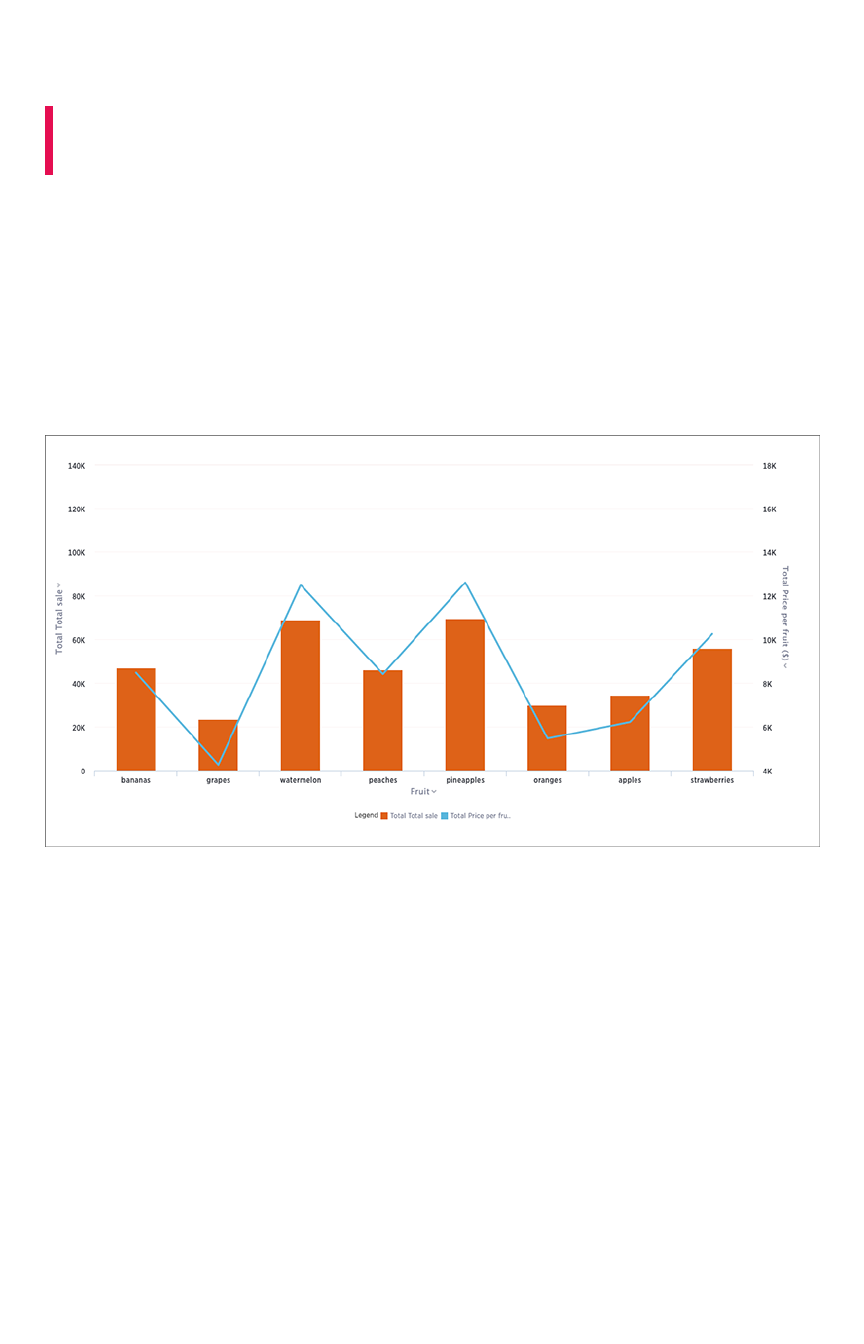
Line column charts
Summary:Summary: The line stacked column chart combines stacked column
and line charts.
The line column chart combines the column and line charts. Your search needs at least one attribute and
two measures to be represented as a line column chart.
Understand line column charts
Line column charts display one measure as a column chart and the other as a line chart. Each of these
measures has its own y-axis.
You can choose to enable shared y-axis by clicking the link icon found under Edit chart configurationEdit chart configuration.
Line column charts
February 07, 2019
ThoughtSpot Users Guide Page 107
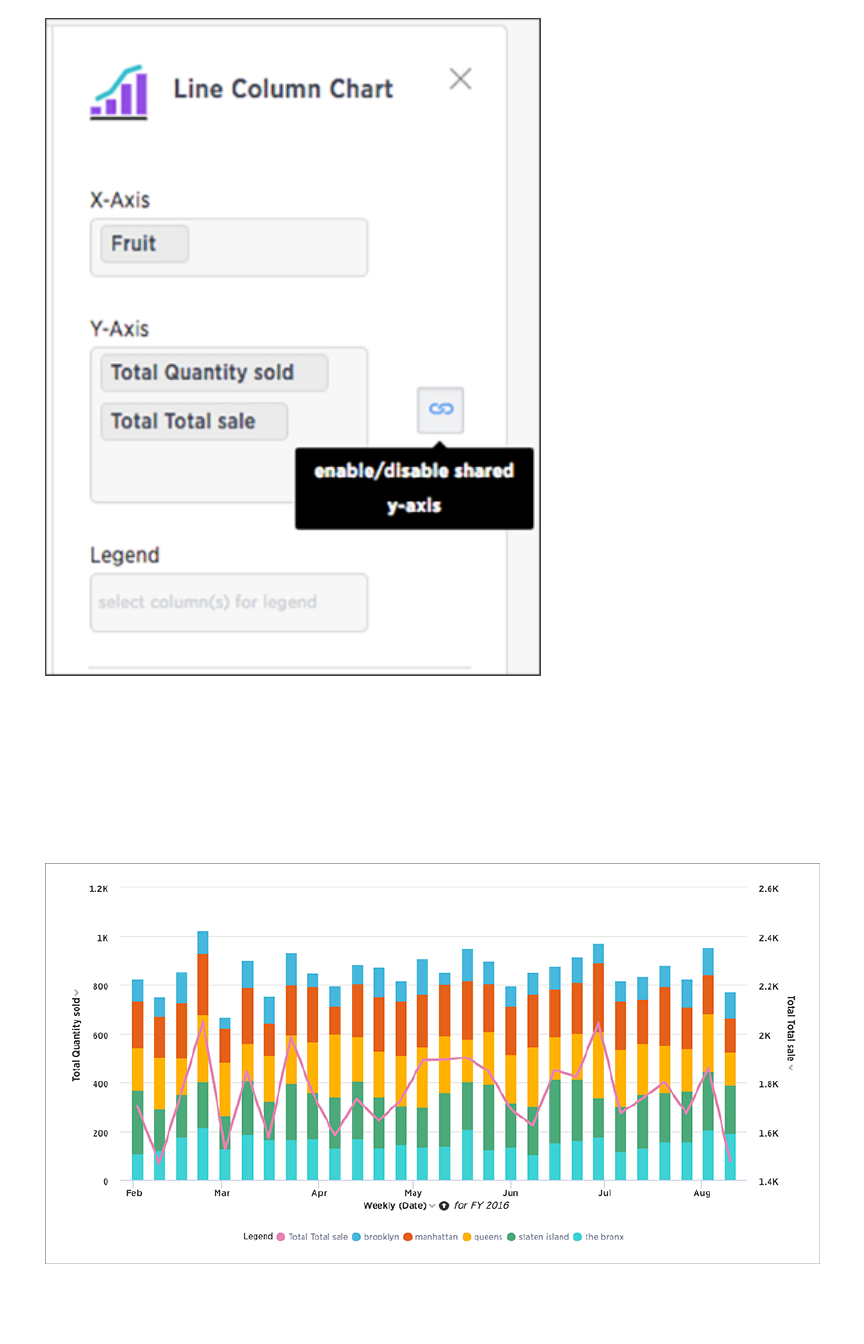
Line stacked column charts
This chart is similar to the line column chart, except that it divides its columns with an attribute in the
legend. There are two y-axes, one for each measure.
You can choose to enable shared y-axis by clicking the link icon found under Edit chart configurationEdit chart configuration.
Line column charts
February 07, 2019
ThoughtSpot Users Guide Page 108
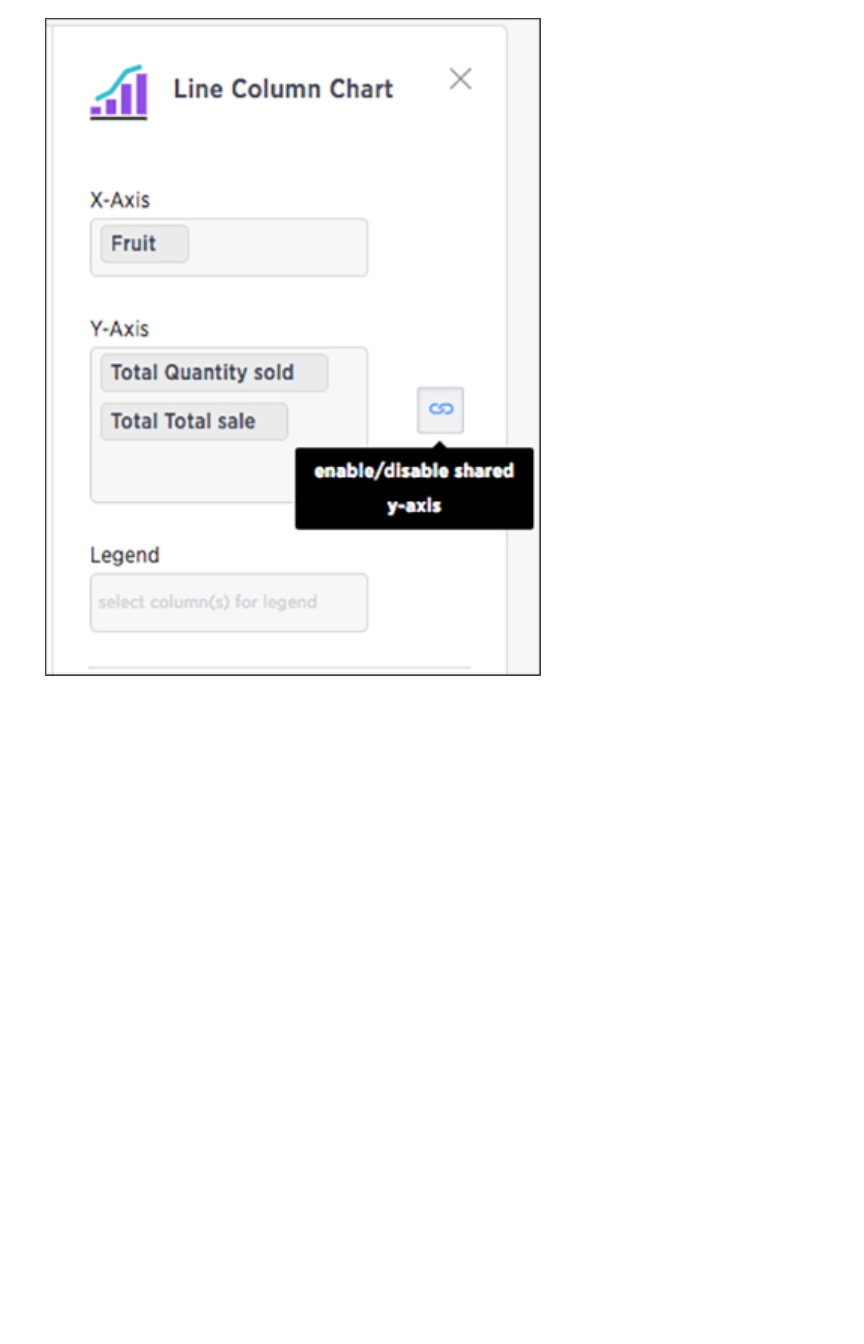
Line column charts
February 07, 2019
ThoughtSpot Users Guide Page 109
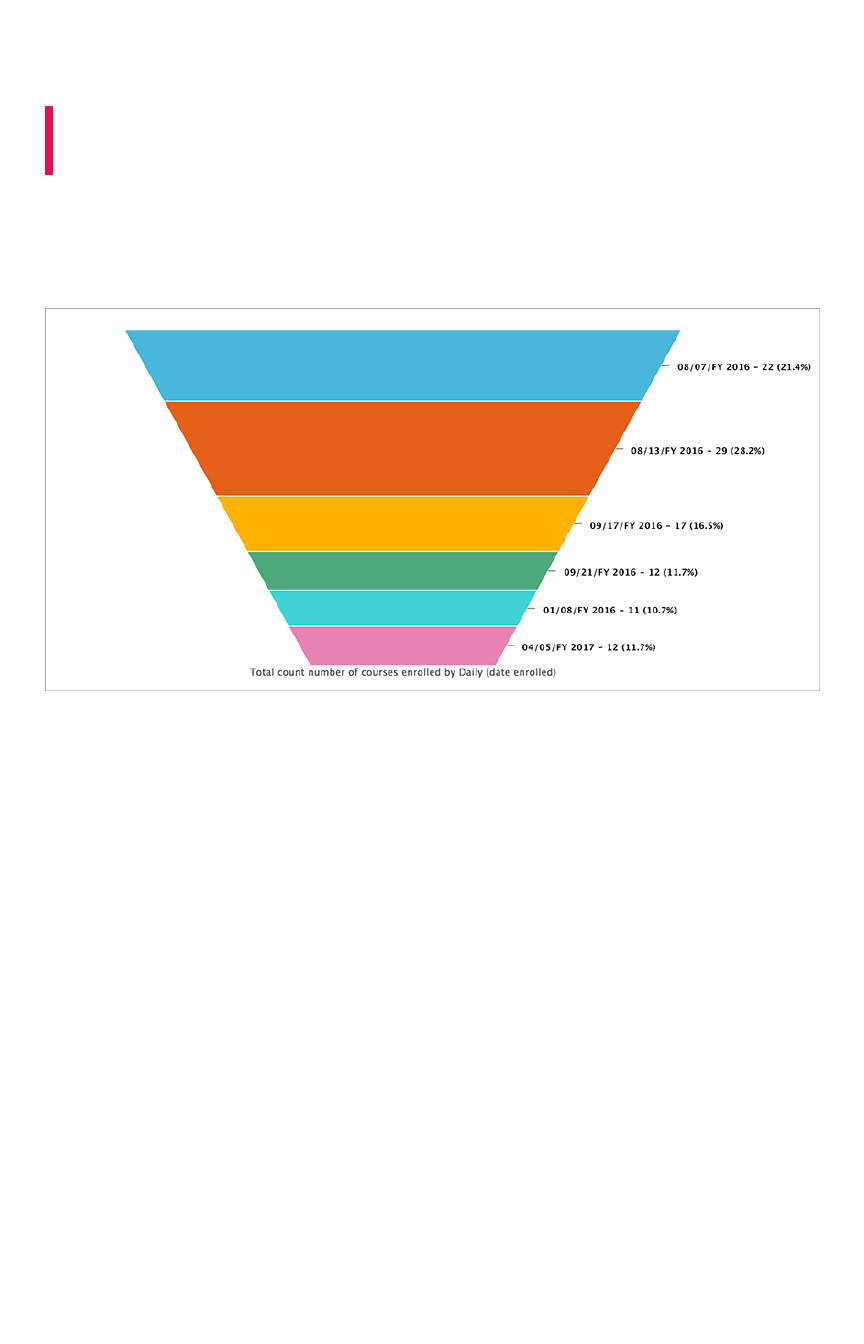
Funnel charts
Summary:Summary: The funnel chart shows a process with progressively
decreasing proportions amounting to 100 percent in total.
A funnel chart is similar to a stacked percent column chart, and is often used to represent stages in a
sales process. You can visualize the progression of data as it passes from one phase to another. Data in
each of these phases is represented as different proportions.
Your search needs at least one attribute and one measure to be represented as a column chart. The
attribute must contain 50 or fewer values.
Funnel charts
February 07, 2019
ThoughtSpot Users Guide Page 110

Geo charts
Summary:Summary: There are three geo charts that let you visualize
geographical data in ThoughtSpot.
Geo charts show data on a map by location. They are geo area, geo bubble, and geo heatmap charts.
And these geo charts can display six types of geographical data, which are:
• Country
• State
• County
• Zipcode
• Point (latitude/longitude)
• Other sub-nation regions (for international countries)
In addition to the United States, ThoughtSpot also supports maps for the Canadian province/count
maps, United Kingdom, Germany, Sweden, South Africa, and France.
Geo data that can be displayed
Here is a table that shows which GeoType data can be displayed using which geo chart type.
GeoTypeGeoType Geo chart typeGeo chart type NotesNotes
Country Geo area (default), geo bub-
ble, geo heatmap
Can also be regions.
County Geo area (default), geo bub-
ble, geo heatmap
Only for counties in the United States.
Point Geo bubble (default), geo
heatmap
Must use both latitude and longitude columns.
State Geo area (default), geo bub-
ble, geo heatmap
Only for states in the United States.
Zipcode Geo bubble (default), geo
heatmap
Zip codes and zip codes +4 in the United
States.
Other sub-na-
tion regions
Geo area (default), geo bub-
ble, geo heatmap
The display will depend on the type of adminis-
trative region chosen.
For data to be displayed using geo charts, your administrator must configure it as geographical data. If
you are expecting to be able to get a map visualization, but it isn’t available, contact your administrator
so they can make the configuration.
Geo charts
February 07, 2019
ThoughtSpot Users Guide Page 111
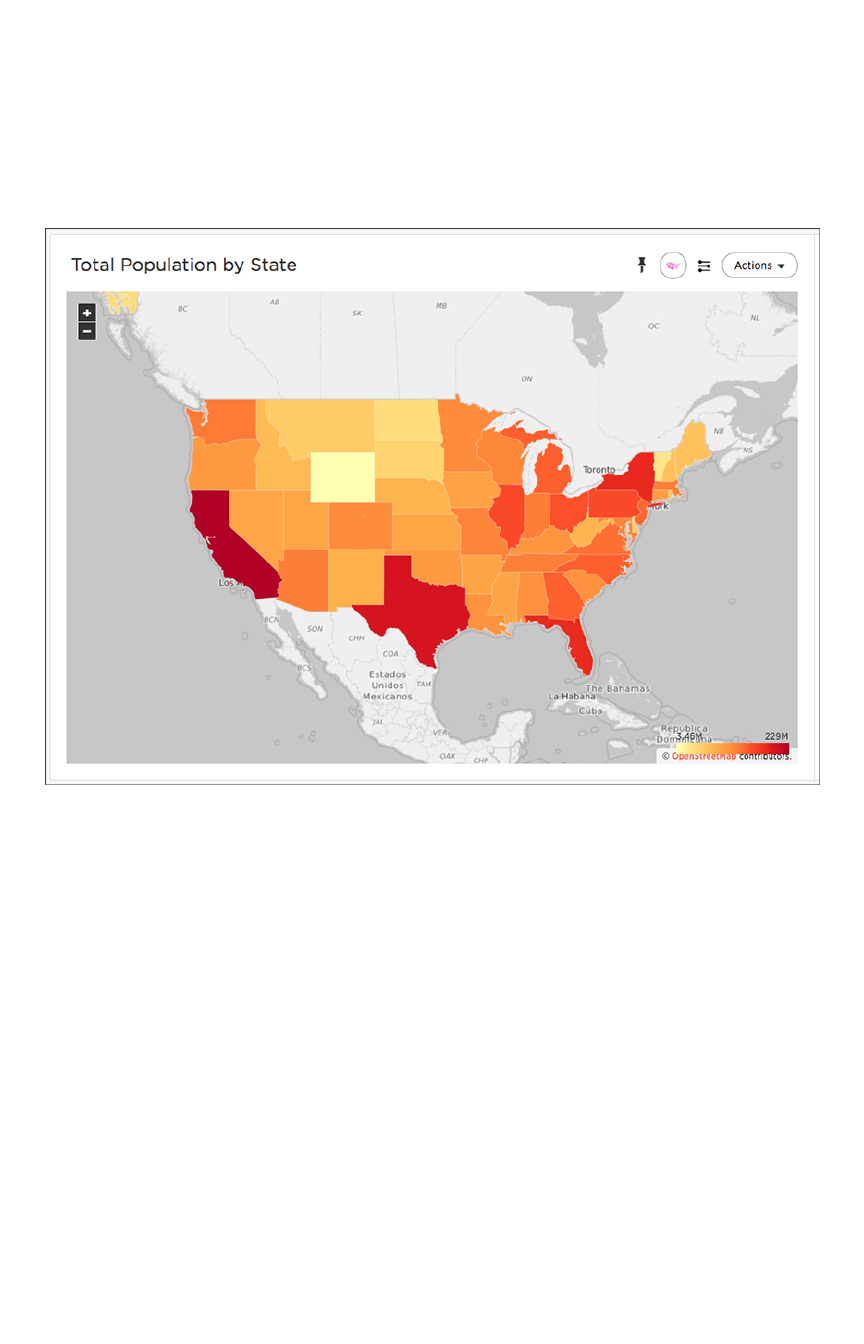
Area charts
Geo area charts highlight the regions of interest. Point data (longitude/latitude) doesn’t work on geo area
charts. Also, only geo area charts display boundaries for counties.
Your search needs one geographical column of granularity to be represented as a geo area chart.
Geo bubble charts
Geo bubble charts, like bubble charts, display the value of the measure by the size of the bubble. Zip
code data makes the most sense for geo bubble charts.
Geo charts
February 07, 2019
ThoughtSpot Users Guide Page 112
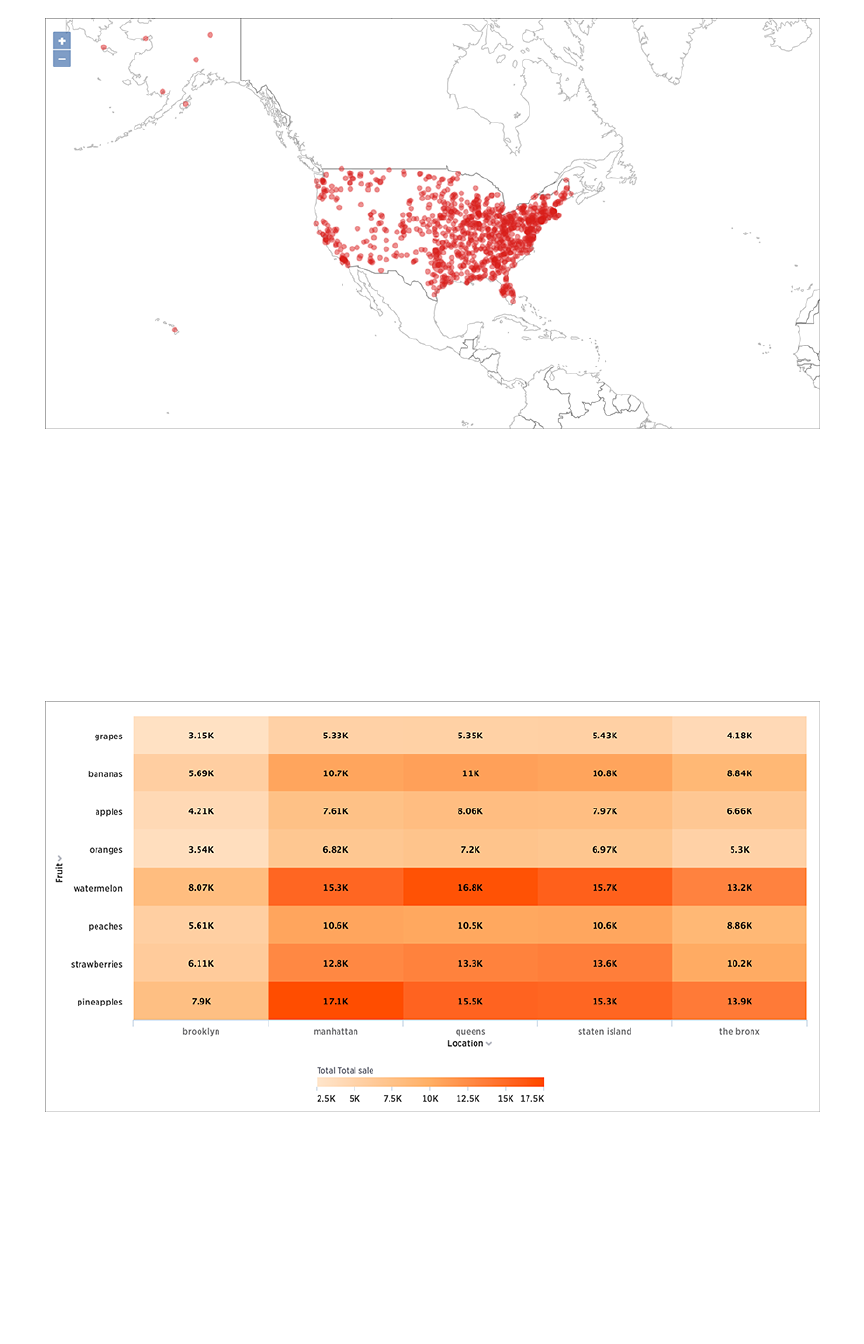
Your search needs one geographical column or a pair of latitude and longitude columns to be
represented as a geo bubble chart.
Heatmap charts
Heatmap charts are similar to treemap charts in that they both use a similar system of color-coding to
represent data values. However, the heatmap does not use size to measure data, and instead requires
an additional attribute.
The value of each cell depends on the measure you choose under Edit char configurationEdit char configuration.
Geo charts
February 07, 2019
ThoughtSpot Users Guide Page 113
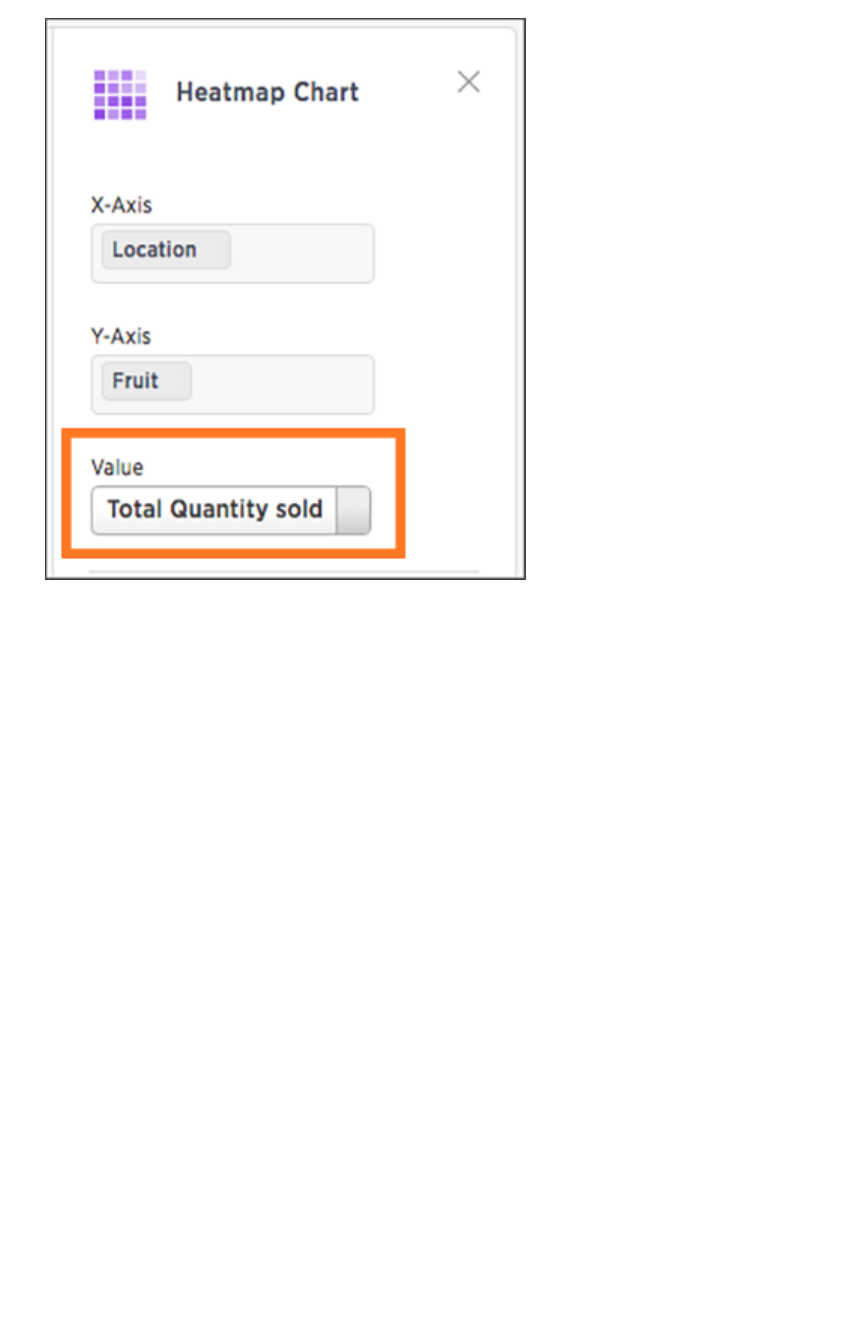
Geo charts
February 07, 2019
ThoughtSpot Users Guide Page 114
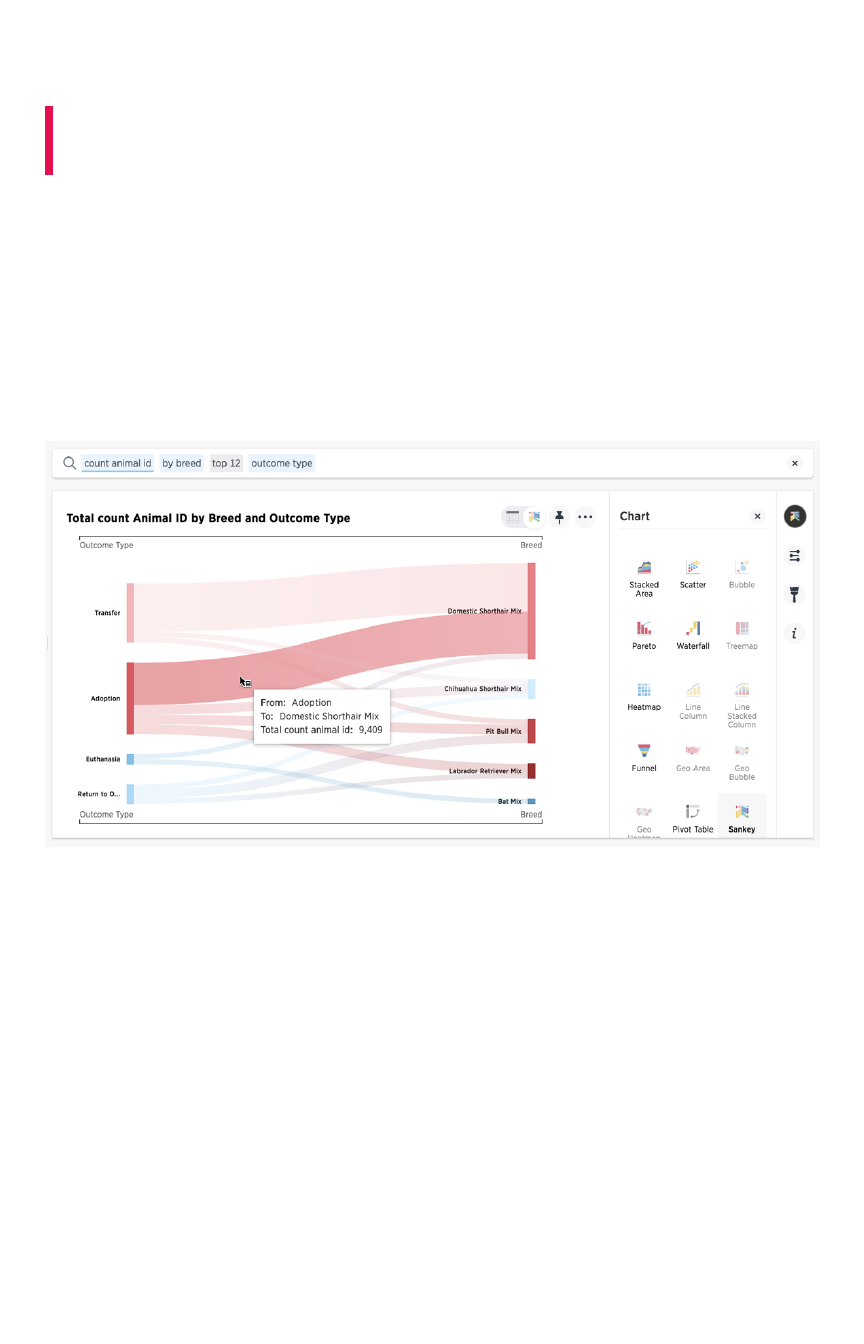
Sankey charts
Summary:Summary: The Sankey chart is a type of chart that contains both
columns and a special type of line chart.
Sankey diagrams illustrate a flow through a process or system. Transactional data is optimal for this type
of diagram. For example, financial transactions that take place as money moves through accounts or as
a product is process. Many marketing users are familiar with Sankey charts from using Google Analytics
to view sales conversions.
When you build a Sankey chart you need to provide at least 2 (two) attributes and one measure. Your x-
axis attributes can contain at most 13 values, any more and you cannot view a SanKey chart.
ThoughtSpot Sankey charts are read from left to right. The width of the flow represents the measure, the
attributes or “steps” appear as solid bars:
The Austin Animal Center Outcomes data shows the outcome of processing for different breeds of
animal. The measure is the count of total animals. Looking at how an animal was classified when they
entered the system, this chart shows the outcome processing that took the animal out of the system.
By clicking on a flow, you can see the total animals in any flow. Many domestic short haired cats (over
10k) were transferred to other agencies. While all bats that came into the system were euthanized. There
were a surprising number of bats processed.
Sankey charts
February 07, 2019
ThoughtSpot Users Guide Page 115
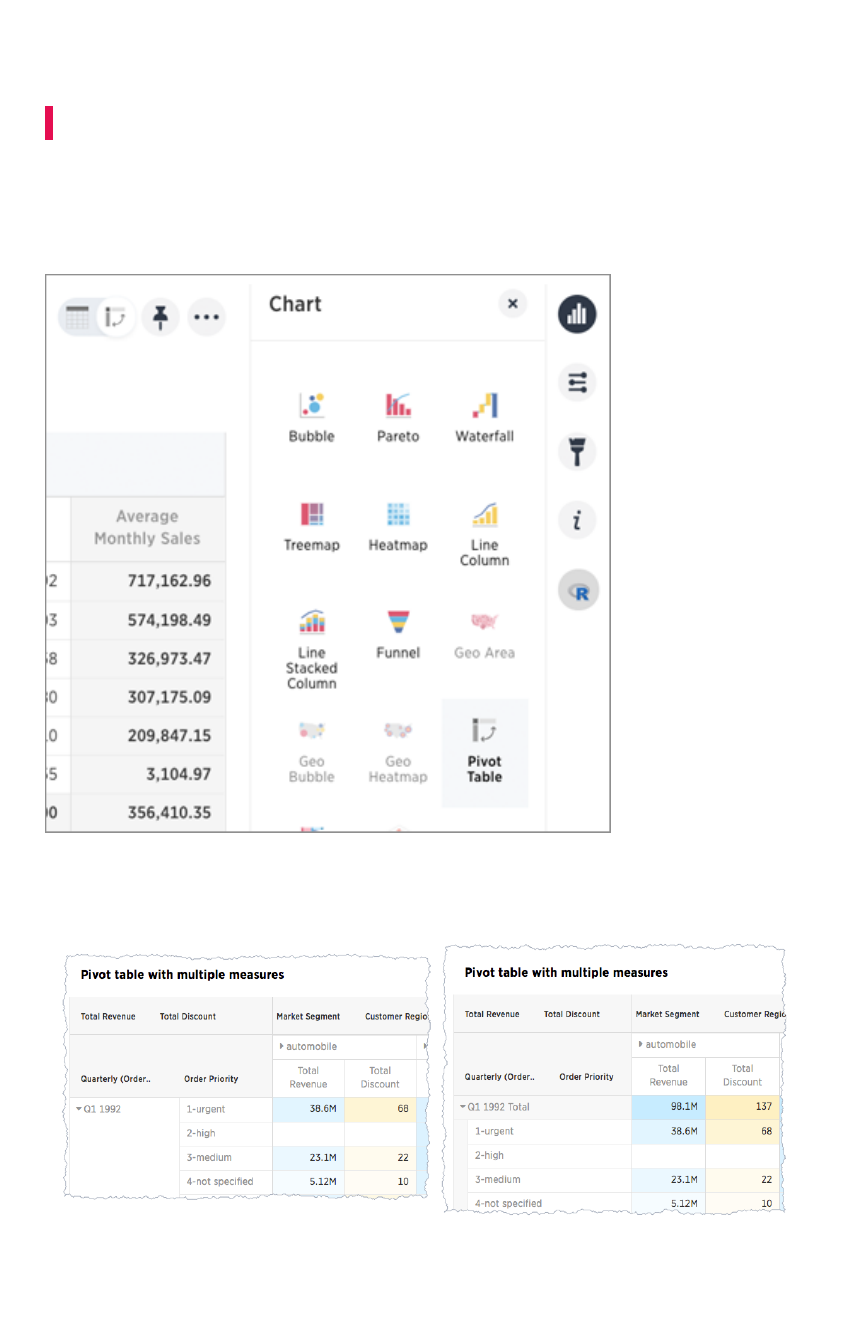
Pivot table
Summary:Summary: A pivot table is a chart type.
Creating a pivot table enables exploring alternate visualization of data in a wide table. It is useful
especially when improve data display when some data is best viewed horizontally, while others,
vertically. Pivot tables are a chart time table that use a drag-and-drop interface.
If a Pivot TablePivot Table is available for your answer, you see this type of visualization as an option under the
visualization. Add rows, measures, and columns to the search bar:
Pivot table
February 07, 2019
ThoughtSpot Users Guide Page 116
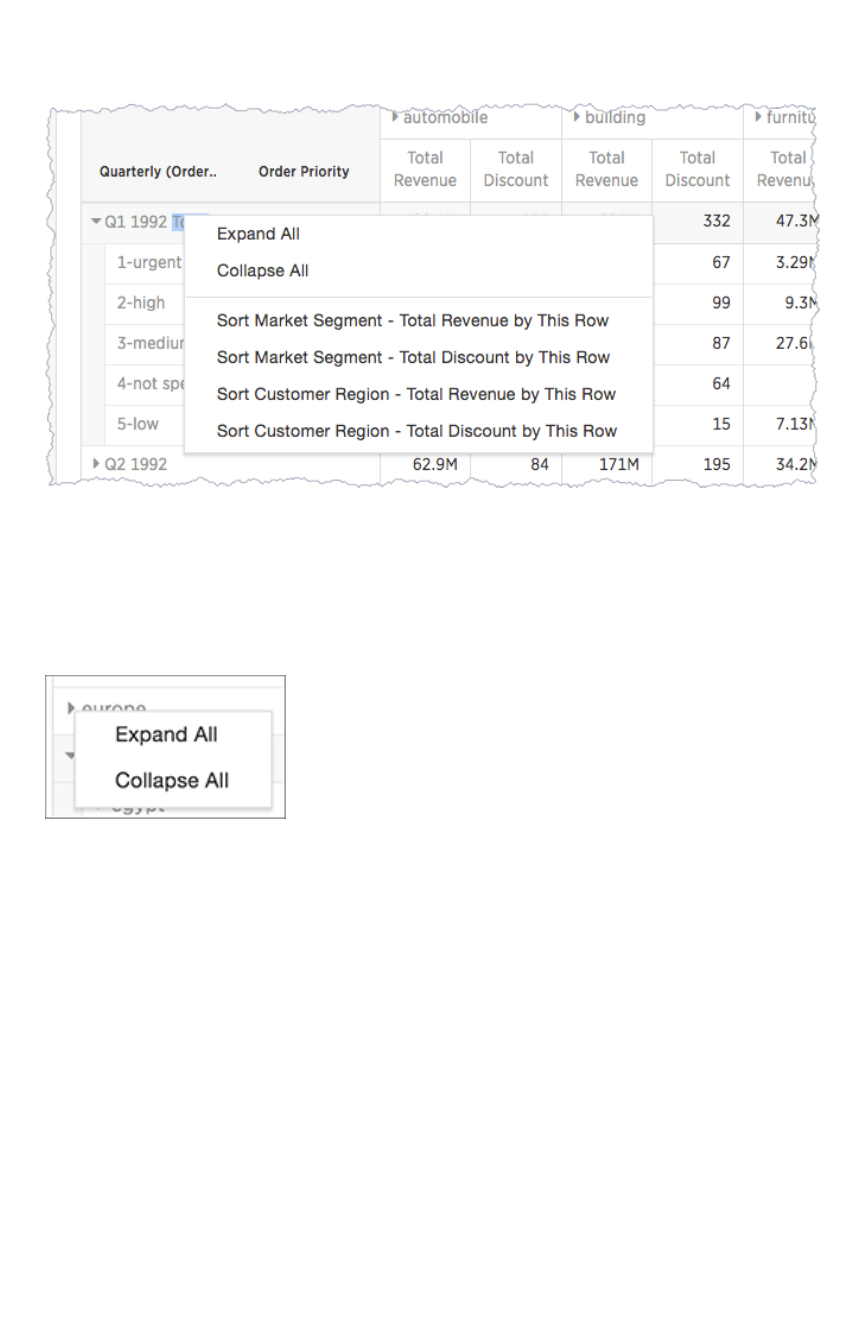
You can restructure your pivot table by moving these values under Configure ChartConfigure Chart or by dragging and
dropping column headings on the table itself. If you right click on a the row headings, the system
displays a contextual sort menu:
Expanding or contract columns and rows
Click a column or row to expand it. Additionally, you can expand or collapse all by right clicking the
arrow on the top left of a cell.
When you pin a pivot table to a pinboard, it will retain your expansion settings.
Display totals
You can show % Row Grand Total% Row Grand Total and, % of Column Grand Total% of Column Grand Total, or % of Grand Total% of Grand Total on pivot tables.
Grand totals aggregate data of the entire pivot grid. They show values summarized across all available
data.
Pivot table
February 07, 2019
ThoughtSpot Users Guide Page 117
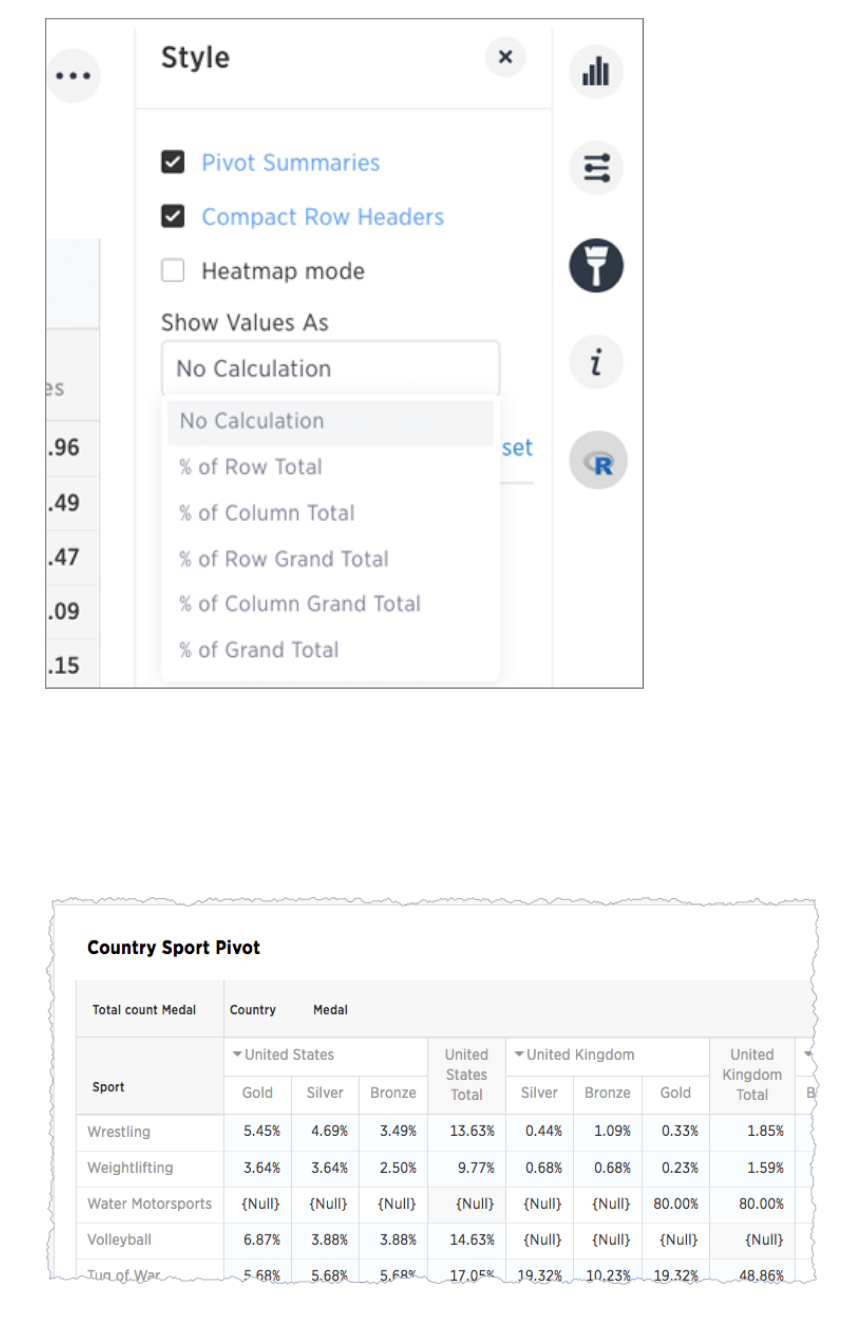
You only see 100% value when grand total rows is enabled. This is because when it is disabled, the rows
and columns they have no parental total column and the percentage cannot be calculated. All
intermediate total (columns or rows) display the percentage values calculated with respect to their
parent. For each inner summary (column or row) the parental total values are assumed to be 100%
internally.
To see the total column make sure you also have Pivot SummariesPivot Summaries checked.
Pivot table
February 07, 2019
ThoughtSpot Users Guide Page 118
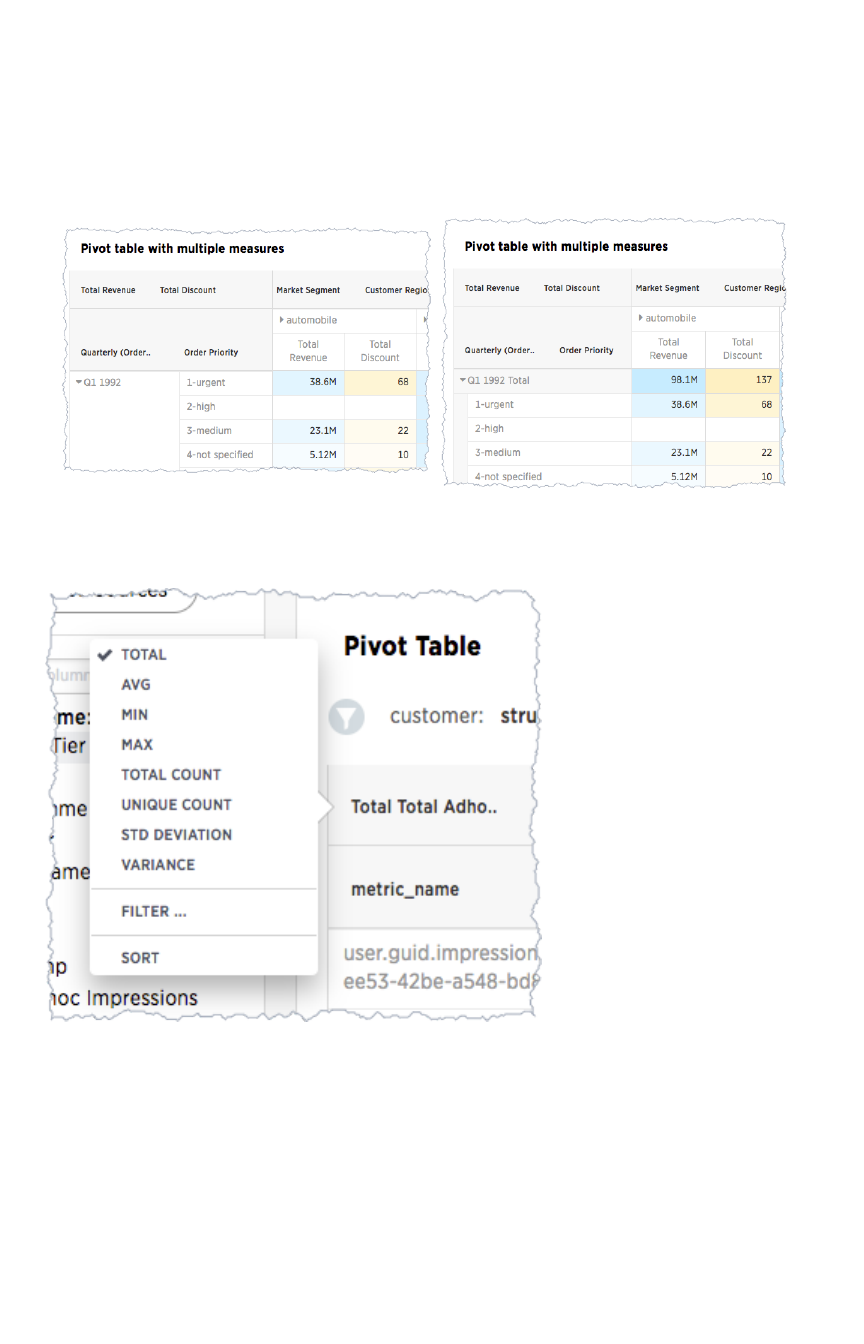
Format row headers
For row headers, you can switch between the default view and a more compact (tree) layout:
From the header menu users, change the type of total shown for an aggregated measure:
You can also RemoveRemove a headline.
Heatmap of large contributors
The heatmap functionality allows you to see which measures contribute more than others (heat) within
the table.
Pivot table
February 07, 2019
ThoughtSpot Users Guide Page 119
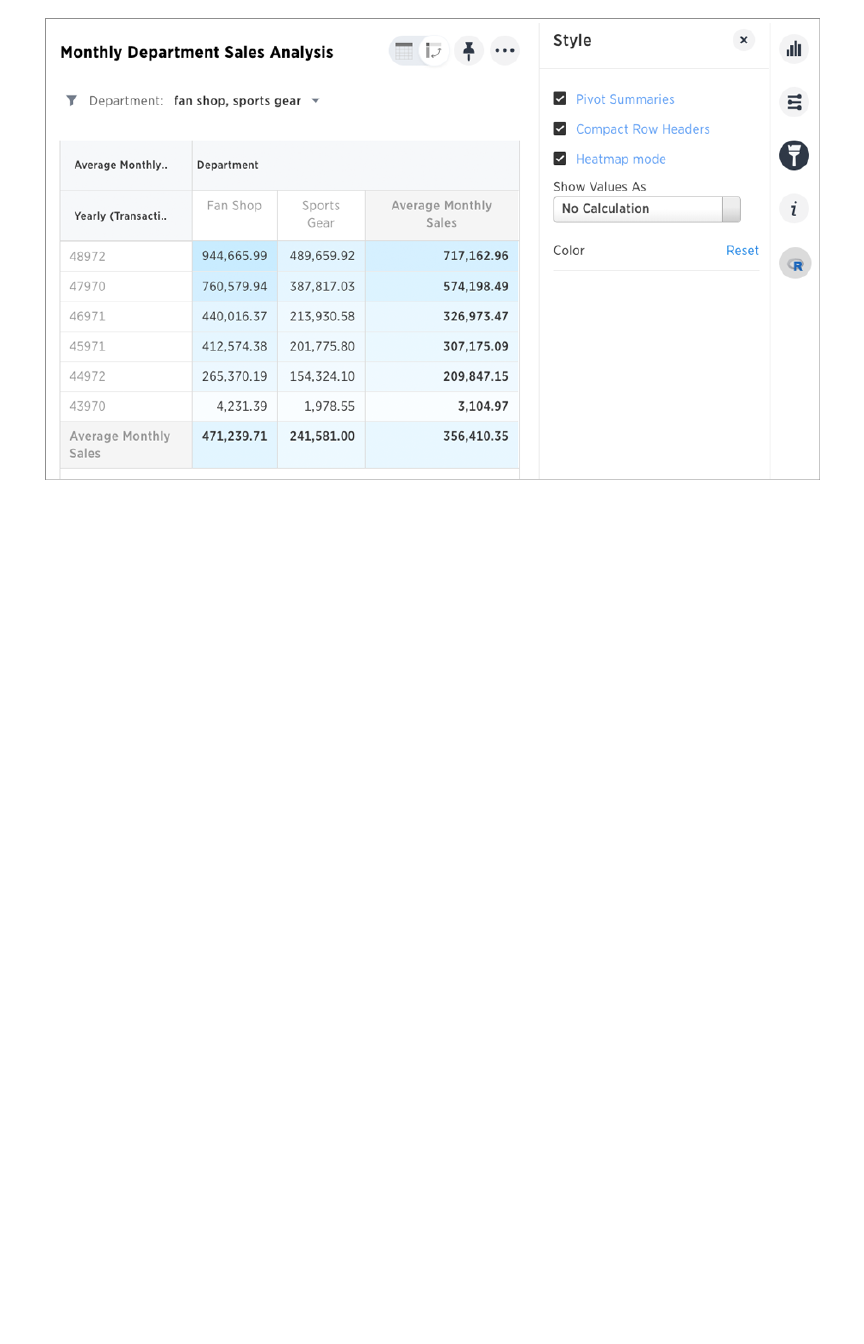
Toggle on the Heatmap modeHeatmap mode found under Configuration OptionsConfiguration Options to add color coordination to your data.
Pivot table limitations
The pivot table chart type has these limitations:
• Only the first 10,000 data values are used. If you would like to increase this limit, please
contact ThoughtSpot Support.
• Pivot table is not available if the dataset contains more than 100,000 rows.
• Cardinality is not configurable.
• Show underlying data menu is unavailable.
• Conditional formatting is not functional.
Pivot table
February 07, 2019
ThoughtSpot Users Guide Page 120
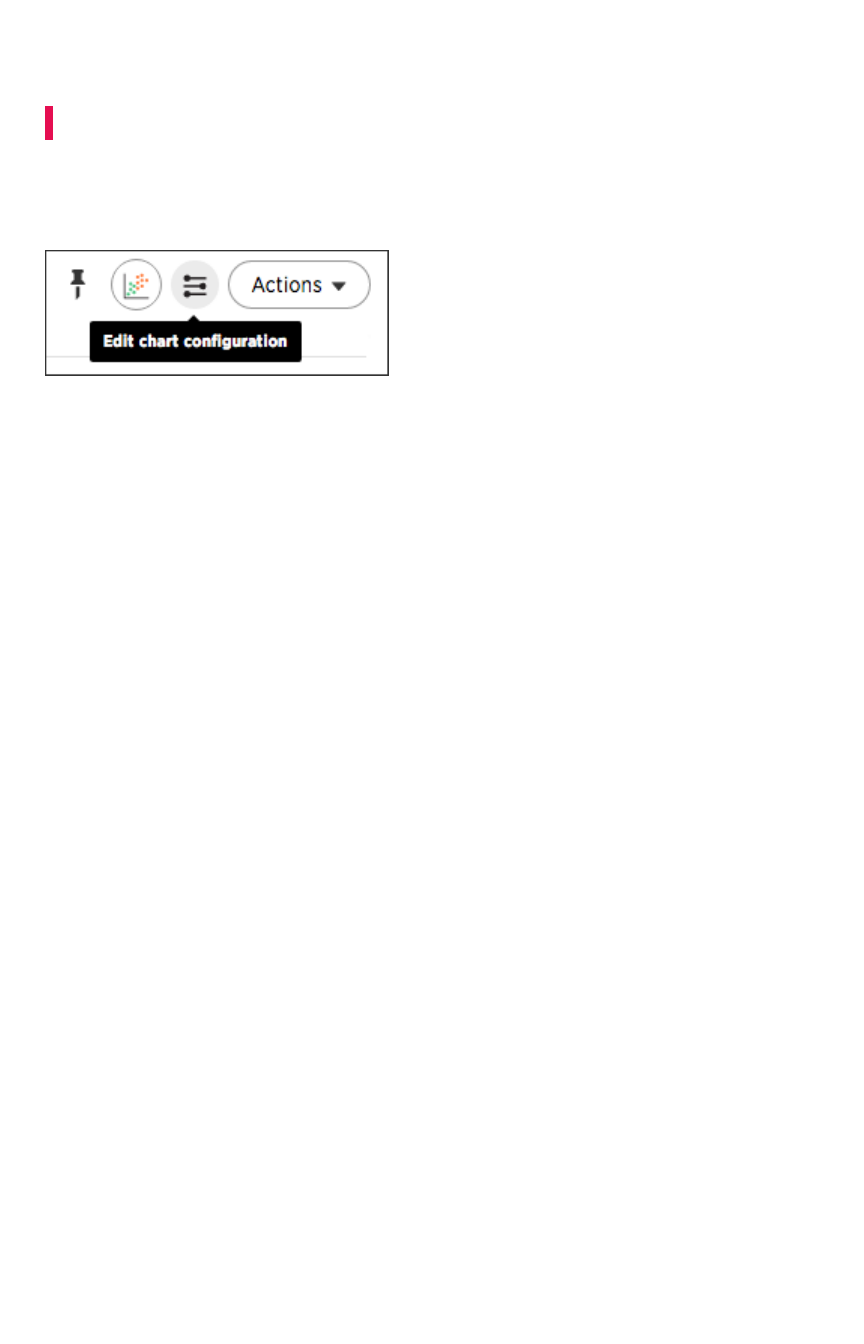
Change a chart
Summary:Summary: You can adjust the axes, labels, and view of the chart.
Every chart gives you the option to move columns between the x- and y-axes, hide or Additional chart
options, and zoom.
The configure chart option (the top icon which looks like a small bar chart) gives you the ability to edit the
chart axes and legends. Click on the icon to view the chart axes, add a legend, lock a visualization, and
more.
•Reorder labels on the axis or legendReorder labels on the axis or legend
When there are multiple columns on the x- or y-axis or legend of a chart, you can reorder
them by using the Configure ChartConfigure Chart icon.
•Set the y-axis rangeSet the y-axis range
You can manually set the y-axis range by using the Edit chart configurationEdit chart configuration icon.
•Hide and show valuesHide and show values
You can hide and show values on the chart using the legend.
•Change chart colorsChange chart colors
You can easily change the legend colors in a chart.
•Additional chart optionsAdditional chart options
You can configure charts to show the y-axis data values.
•Zoom into a chartZoom into a chart
You can zoom into your chart by selecting an area with your mouse.
Change a chart
February 07, 2019
ThoughtSpot Users Guide Page 121
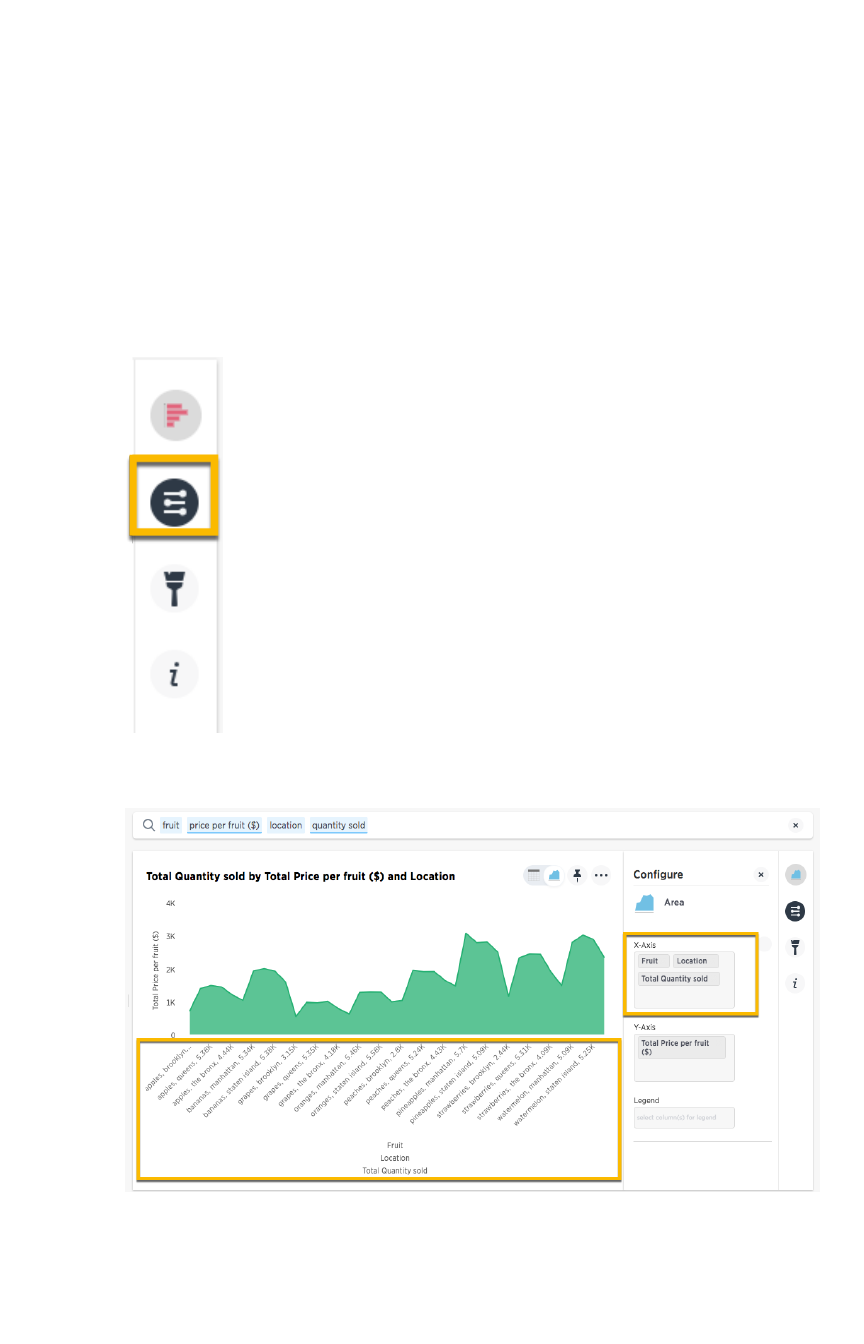
Reorder labels on the axis or legend
When there are multiple columns on the x- or y-axis or legend of a chart, you can reorder them by using
the Configure ChartConfigure Chart icon.
The order in which columns appear on the axis or legend is based on the sequence they are added. The
first field is used as the primary sorting field for the chart. Adding another field adds it after the first one
on the axis label or legend. If you want to change the order, you can remove the fields and re-add them
in the reverse order.
This example shows you how to reorder the x-axis columns.
1. While viewing your answer as a chart, click Edit chart configurationEdit chart configuration near the top right.
2. In the X-Axis box, delete the values. Then re-add them in the new preferred order.
Your chart reorganizes itself to reflect the new label order.
Reorder labels on the axis or legend
February 07, 2019
ThoughtSpot Users Guide Page 122
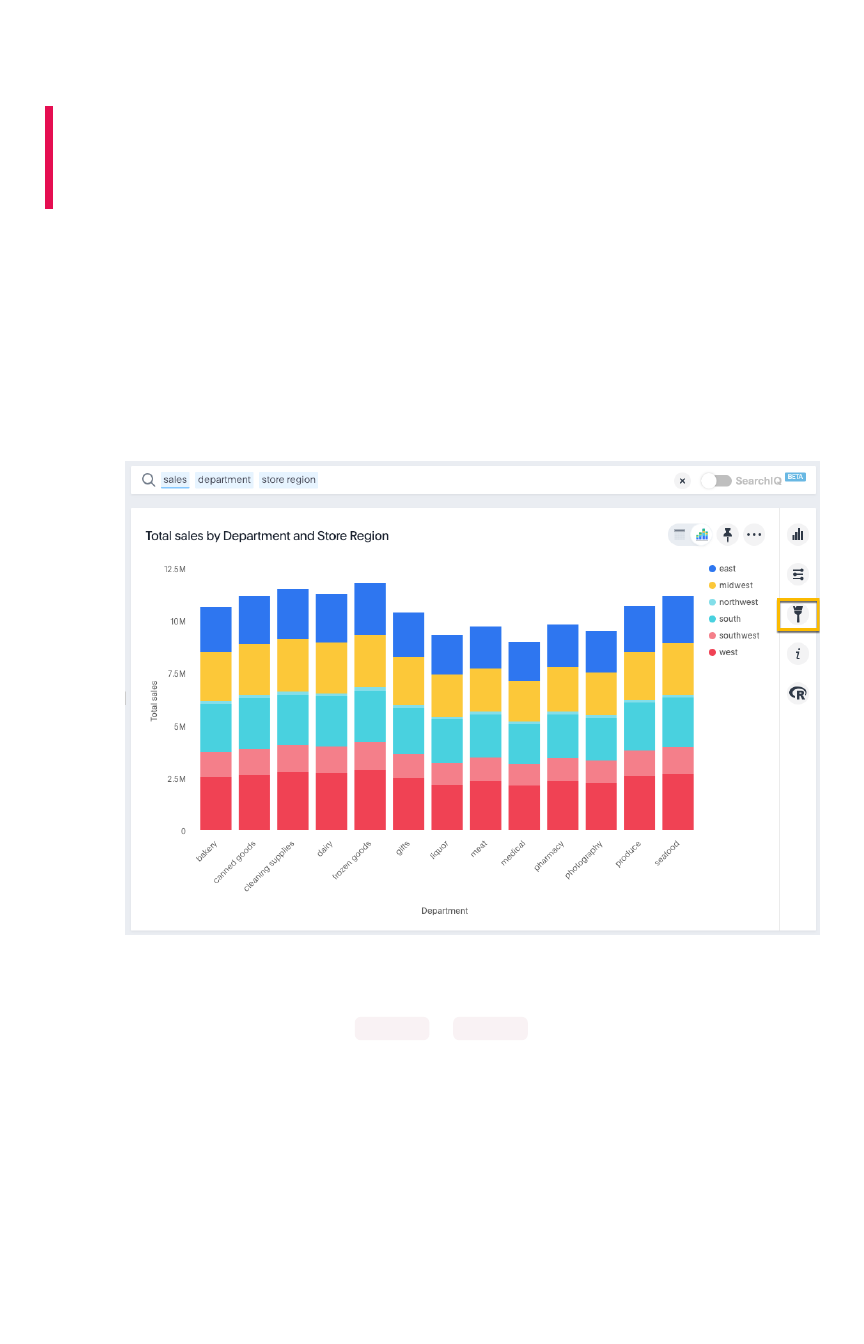
Set the y-axis range
Summary:Summary: On charts, you can manually configure the y-axis range to
be different from the search default. You can have multiple measures
on the y-axis of many charts.
You can manually set the y-axis range by using the Edit chart stylesEdit chart styles icon.
Setting the y-axis range
The style panel includes the option to manually set the y-axis range. To set the y-axis range:
1. While viewing your answer as a chart, click Edit chart stylesEdit chart styles.
2. Under Y-Axis RangeY-Axis Range enter your preferred start and end values.
In this example, our original chart is showing sales values by department from 0 to over $10M.
We can enter a y-axis range of 5000000 to 9000000 to show only sales between $5M and
$10M.
The chart will reorganize itself to reflect the new y-axis range.
Set the y-axis range
February 07, 2019
ThoughtSpot Users Guide Page 123
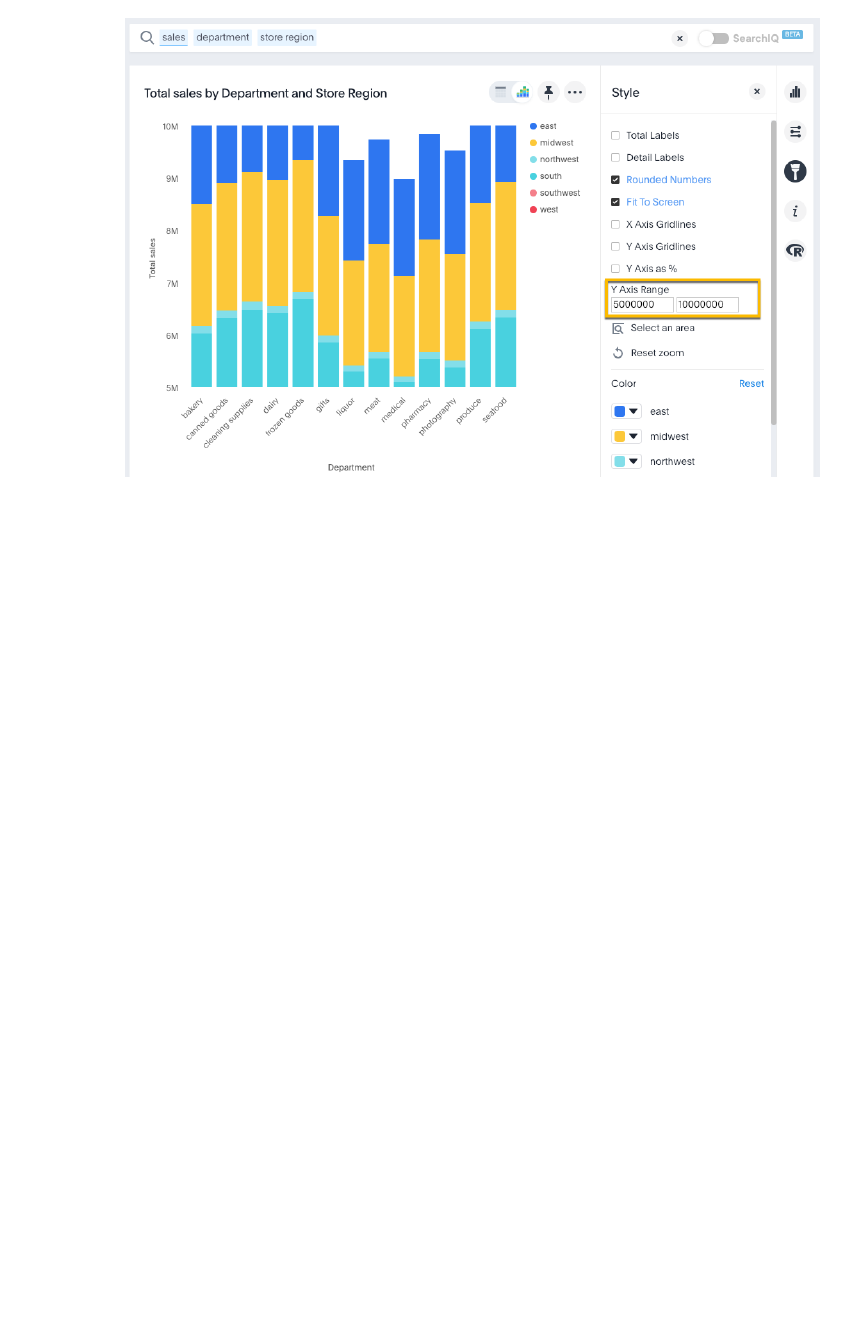
Create charts with multiple measures on the y-
axis
You can have multiple measures on the y-axis of most (but not all) chart types. You can configure this on
the chart styles panel. To learn more, see these topics:
•Configure columns for X and Y axis
•Charts with multiple measures on the y-axis
Set the y-axis range
February 07, 2019
ThoughtSpot Users Guide Page 124

Hide and show values
Summary:Summary: You can hide and show values on the chart using the
legend.
Clicking on a legend item will hide it from the chart. You can click it again to show it. To hide and show
values:
1. While viewing your answer as a chart, click Edit chart configurationEdit chart configuration on the right.
2. Make sure you have a column in the LegendLegend field.
Hide and show values
February 07, 2019
ThoughtSpot Users Guide Page 125
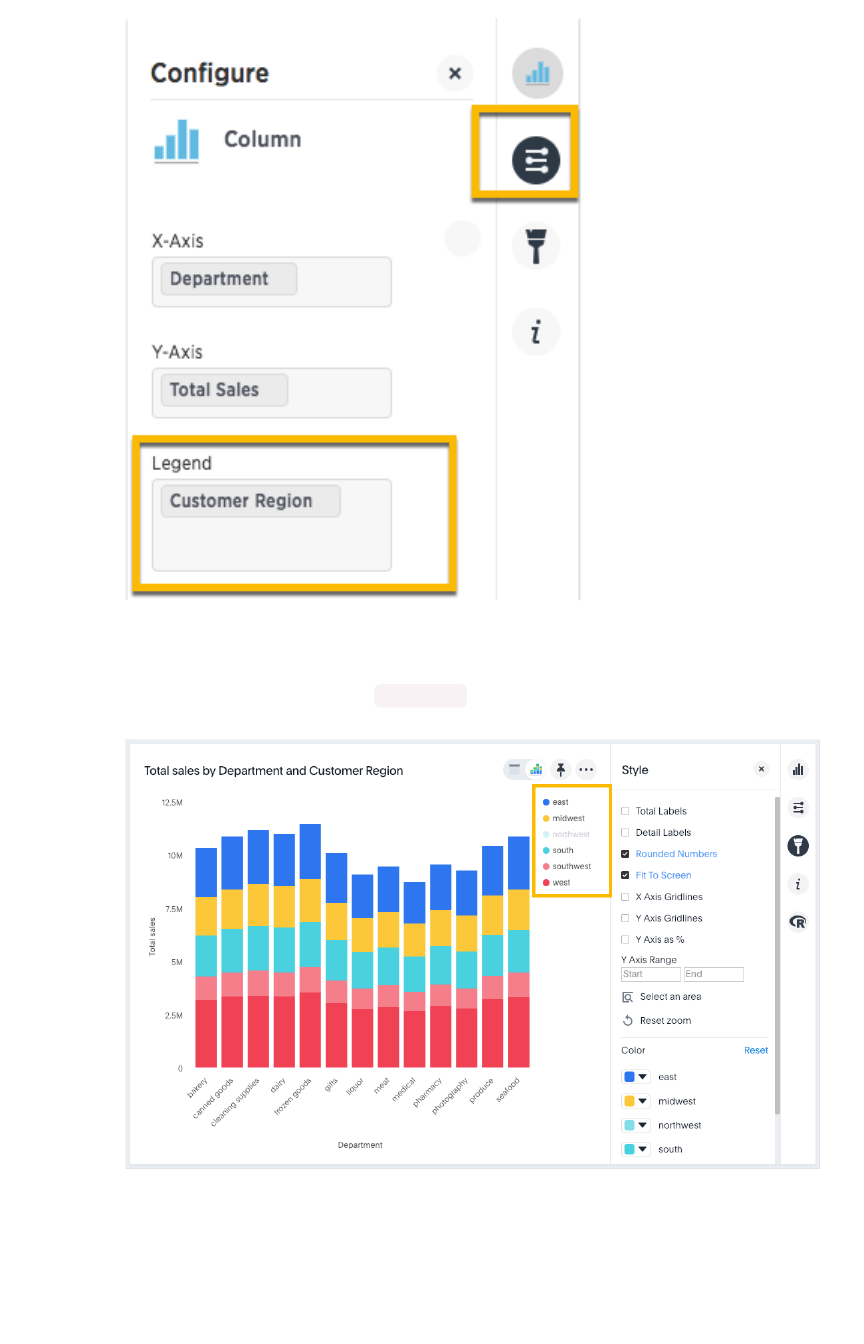
3. On the chart, click the legend value you would like to hide. Click the hidden legend value
again to show it.
In the example below, we clicked northwest to hide it.
Hide and show values
February 07, 2019
ThoughtSpot Users Guide Page 126
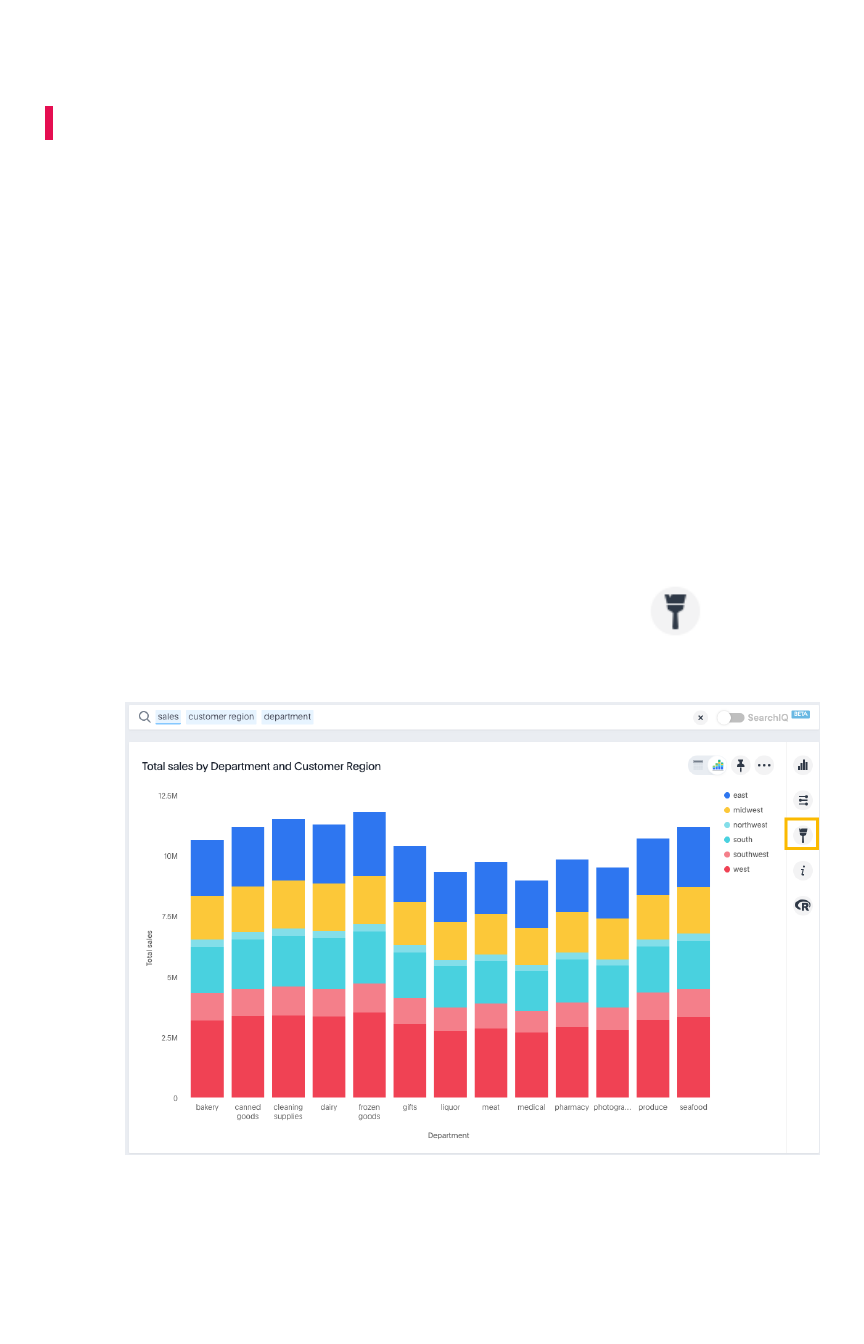
Change chart colors
Summary:Summary: You can change the colors used in a chart.
To change the colors used in a chart, use the color picker on the chart styles panel. You can set colors
for:
• bars, lines, areas, bubbles, maps, and other visuals on charts
• legends on charts
• tables for conditional formatting
• tags and editing the colors
To change the chart colors, you need at least one column in the chart’s legend. If the chart does not
have a legend (not all do) and it is a single-measure chart, you can apply a conditional format to change
the color. This type of conditional formatting does not work with Line charts.
Colors are maintained across searches within a session. For example, when doing a search on revenue
by state, each state will keep its color assigned to it even if you change the search or chart type.
Set colors on a chart
1. While viewing your search or answer as a chart, click Edit chart stylesEdit chart styles ( ) to open the
Styles panel.
2. On the chart, click the color icon of the label or legend value you would like to change the
color of.
Change chart colors
February 07, 2019
ThoughtSpot Users Guide Page 127
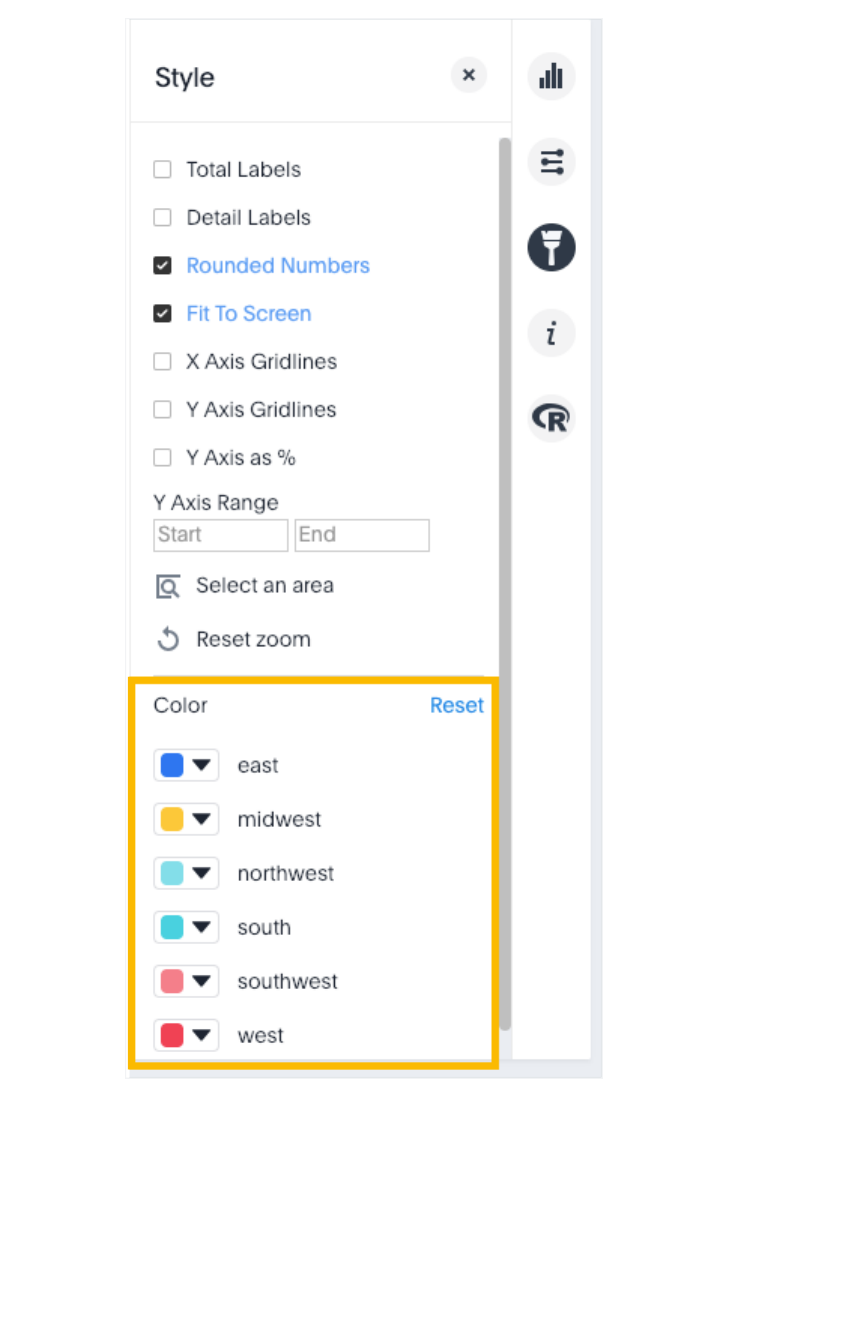
3. Use the color picker to choose a new color to represent that value.
You can also enter a HEX value directly.
Change chart colors
February 07, 2019
ThoughtSpot Users Guide Page 128
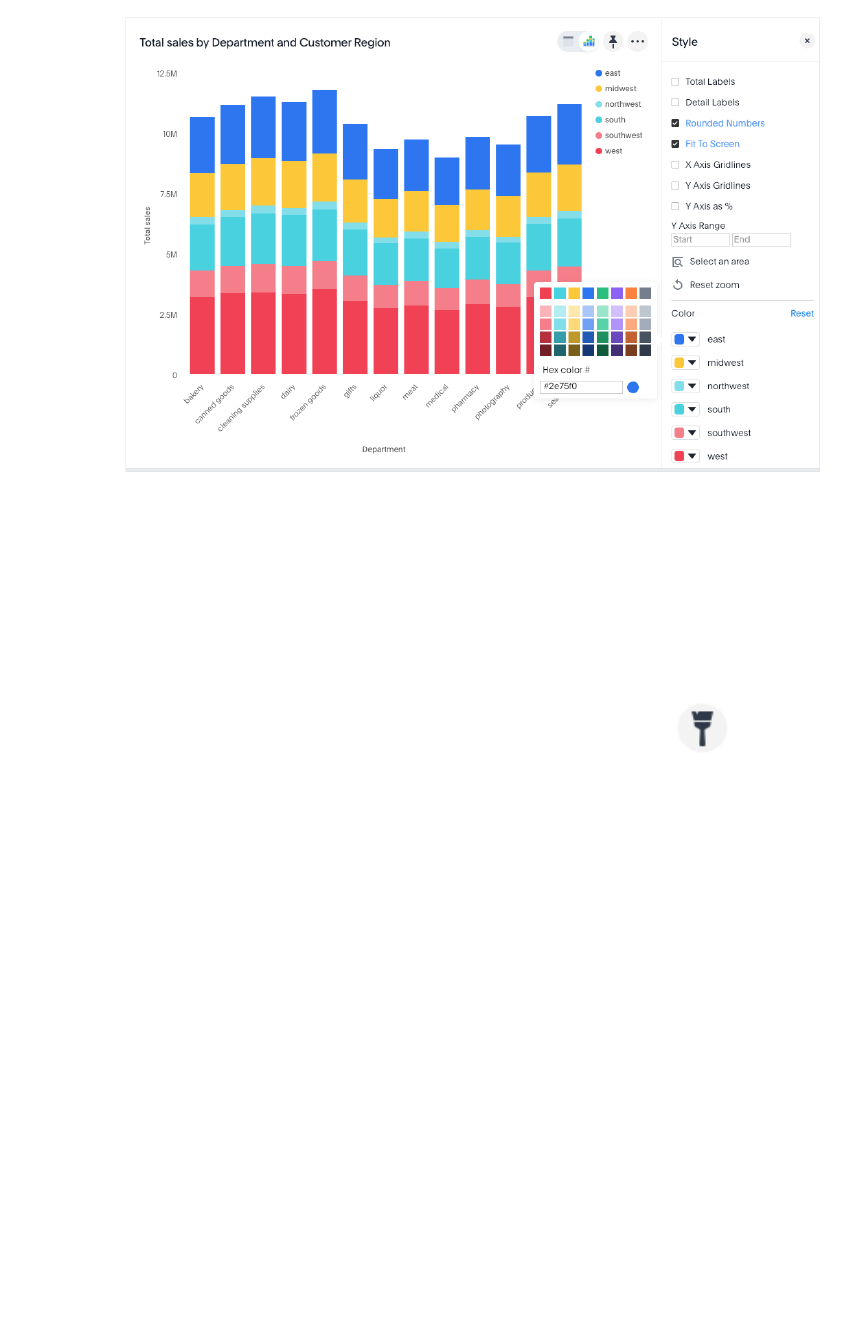
Your changes are saved immediately.
4. Click the XX at top right to dismiss the styles panel.
Set pie chart slice colors
To customize the colors of each slice in a pie chart.
1. While viewing your search or answer as a pie chart, click Edit chart stylesEdit chart styles ( ) to open
the Styles panel.
2. Assign a color of your choice to each pie slice.
Change chart colors
February 07, 2019
ThoughtSpot Users Guide Page 129
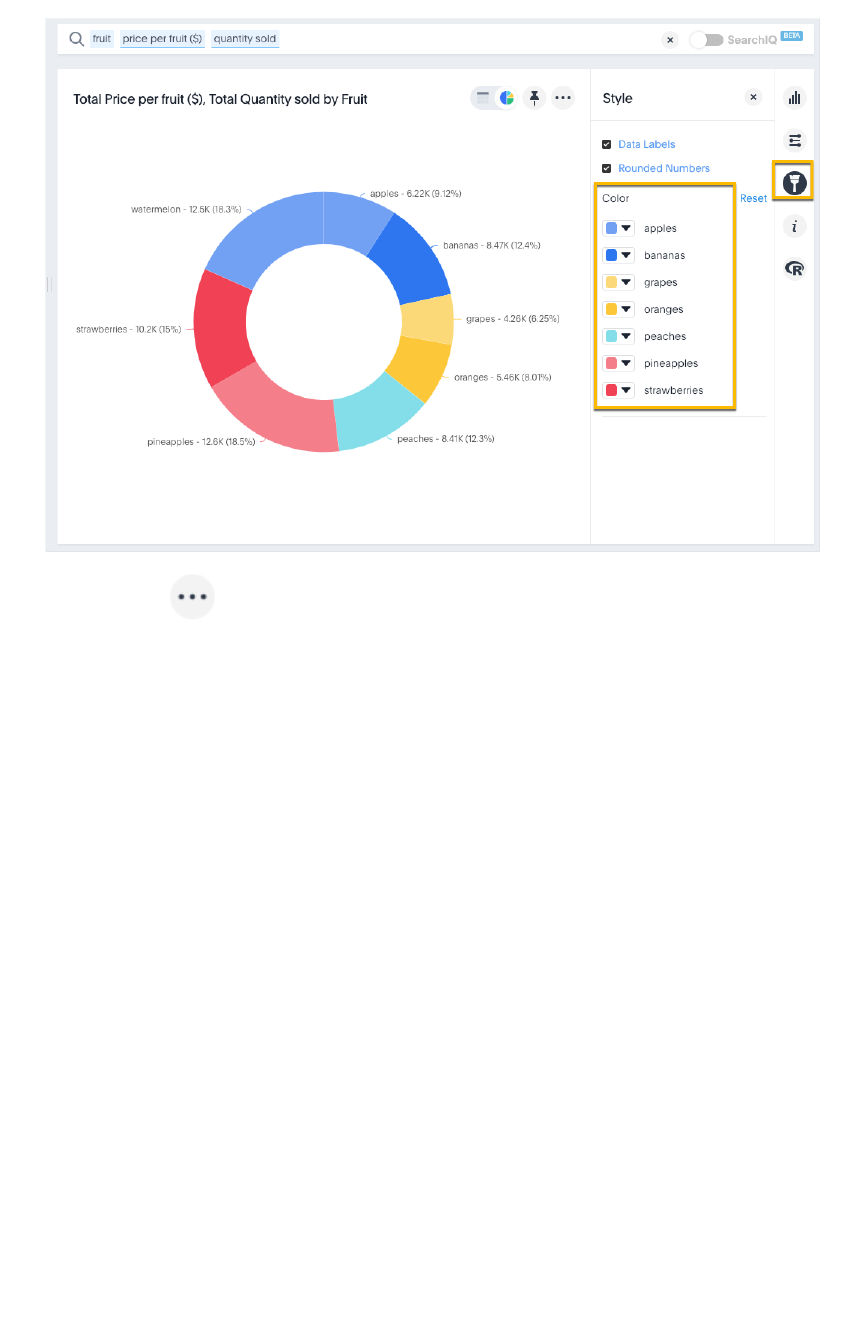
1. Click and choose UpdateUpdate to save the changes.
2. Click Close.
Optionally, you can click ResetReset to use the default colors.
Change chart colors
February 07, 2019
ThoughtSpot Users Guide Page 130
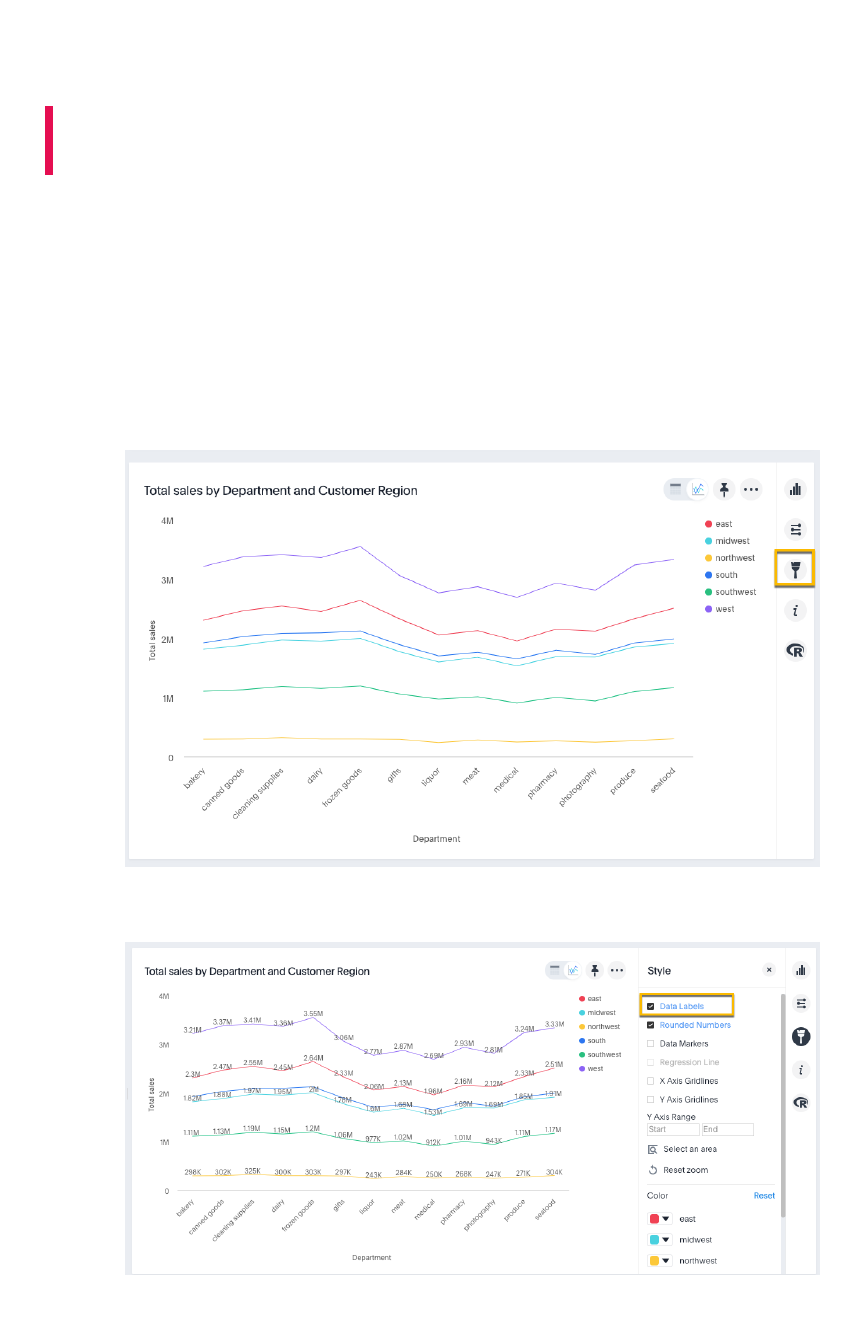
Additional chart options
Summary:Summary: On charts, you can configure data labels, grid lines,
regression lines, legends, values for x or y axis, and lock or unlock.
Some charts have additional options under Chart StylesChart Styles and Configuration OptionsConfiguration Options that are covered in
each chart type topic.
Show detail labels
To show detail labels:
1. While viewing your search or answer as a chart, click Edit chart stylesEdit chart styles on the right.
2. Select Detail LabelsDetail Labels.
Additional chart options
February 07, 2019
ThoughtSpot Users Guide Page 131
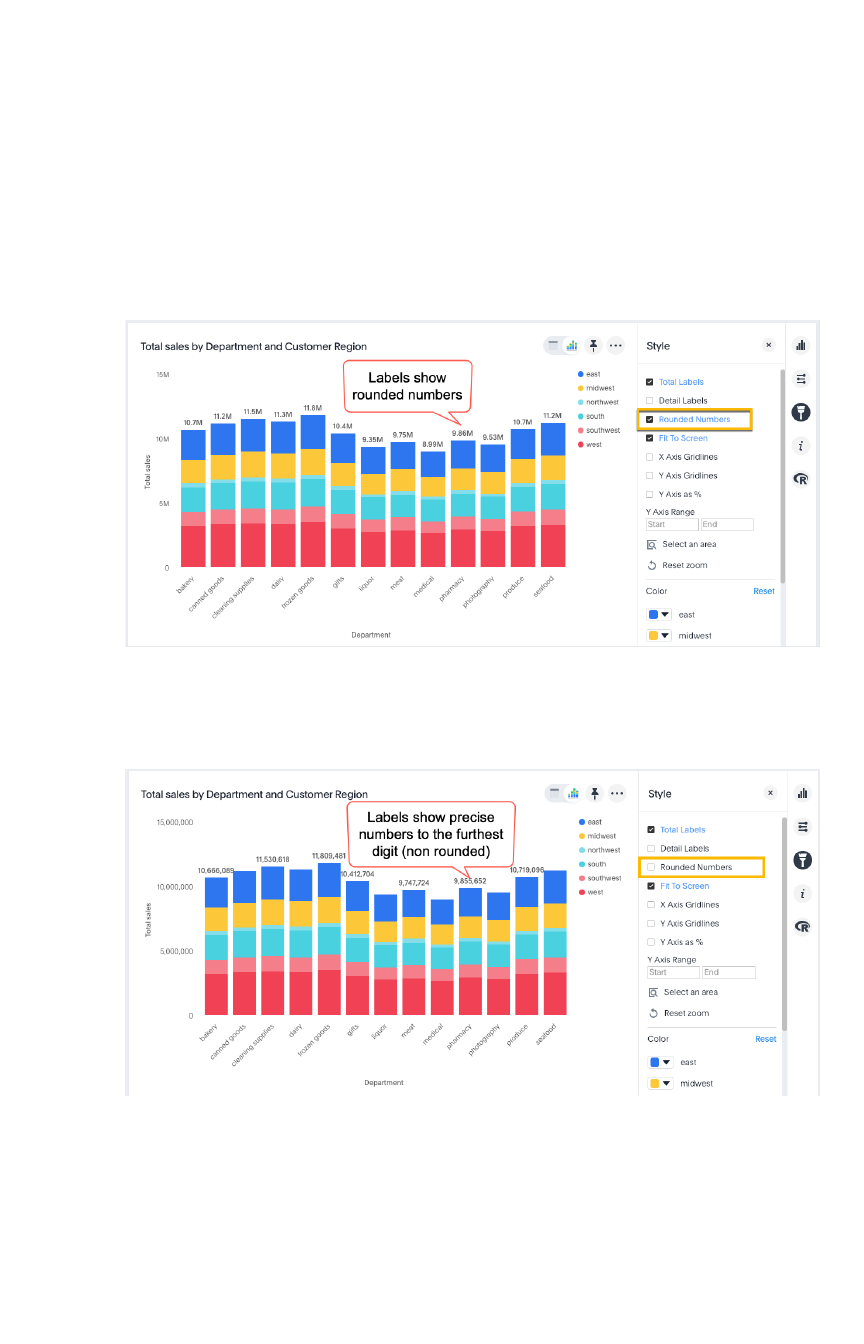
Show rounded or non-rounded numbers
You can toggle this option off to show non-rounded numbers.
1. While viewing your search or answer as a chart, click Edit chart stylesEdit chart styles on the right.
2. Click Rounded NumbersRounded Numbers to toggle on or off.
By default, charts with data labels enabled show rounded numbers on chart labels.
When you uncheck Rounded NumbersRounded Numbers, data labels, X and Y axes, and tooltips show precise,
non-rounded numbers out to the furthest decimal or integer, based on the underlying
worksheet format.
Show data markers
To show data markers:
1. While viewing your search or answer as a chart, click Edit chart stylesEdit chart styles on the right.
2. Select Data MarkersData Markers.
Additional chart options
February 07, 2019
ThoughtSpot Users Guide Page 132
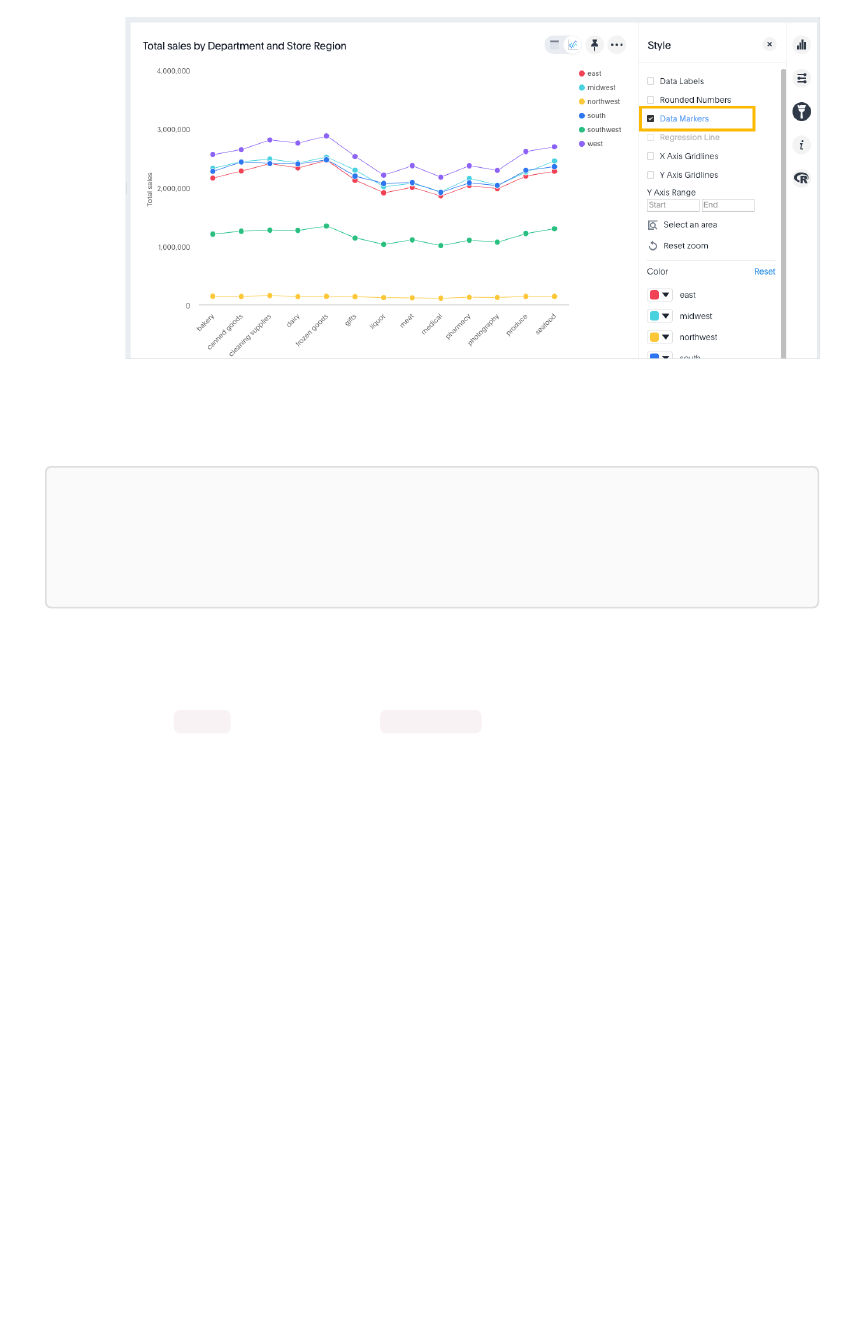
Add regression line
Note:Note: To add a regression line, you need a search with only one attribute and one measure.
Otherwise, this option will show as disabled; i.e., greyed out on the styles panel. As soon as you
modify the search to contain a single measure and attribute, the regression line option will be
clickable.
1. While viewing your answer as a chart, click Edit chart stylesEdit chart styles.
2. Select Regression lineRegression line.
You can show regression lines on most types of charts (bar, stacked bar, line, bubble, and so on). In the
examples below, sales is the measure and department is the attribute.
Additional chart options
February 07, 2019
ThoughtSpot Users Guide Page 133
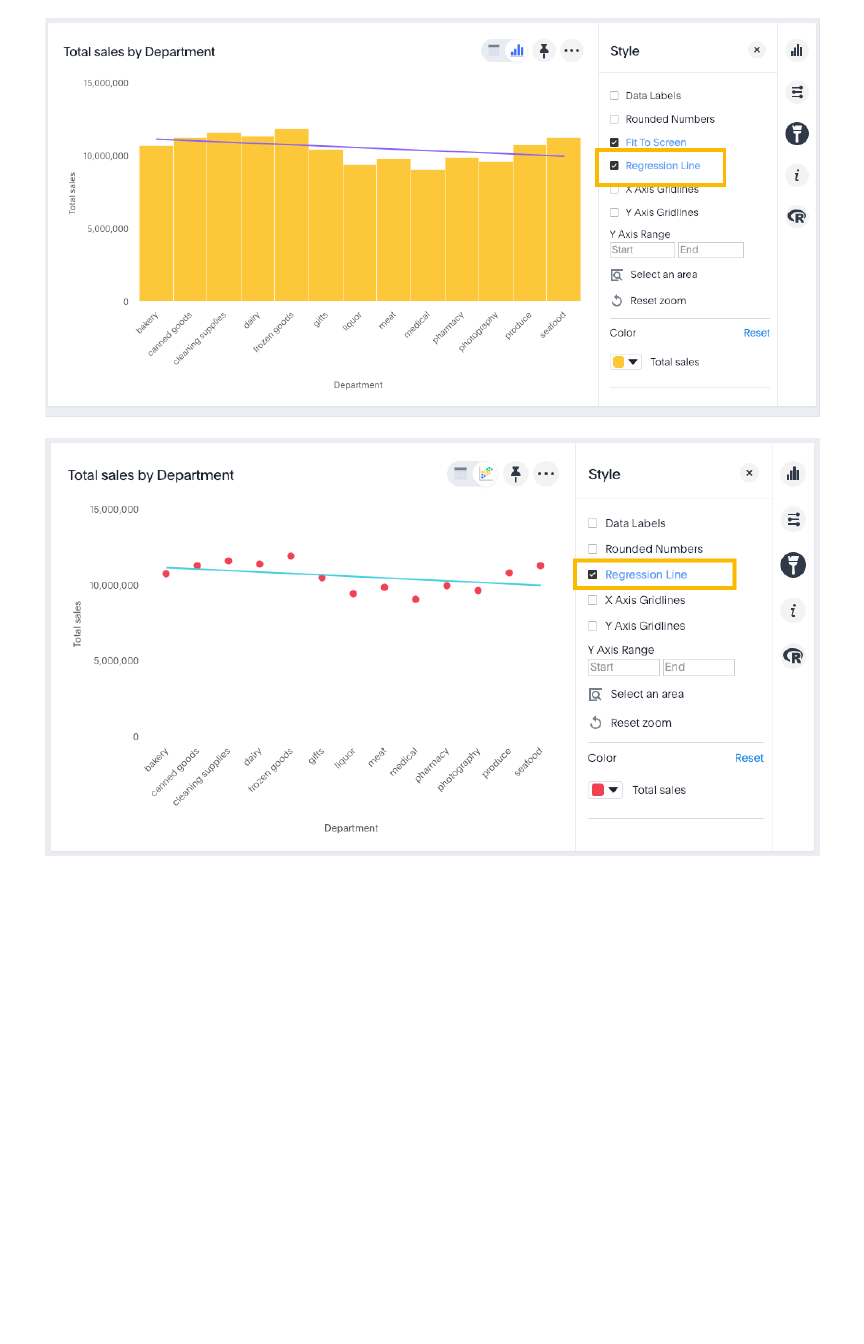
Display gridlines
Charts with X and Y axis can display gridlines. To display them:
1. Choose Edit chart stylesEdit chart styles.
2. Select one or both of the gridline options.
Additional chart options
February 07, 2019
ThoughtSpot Users Guide Page 134
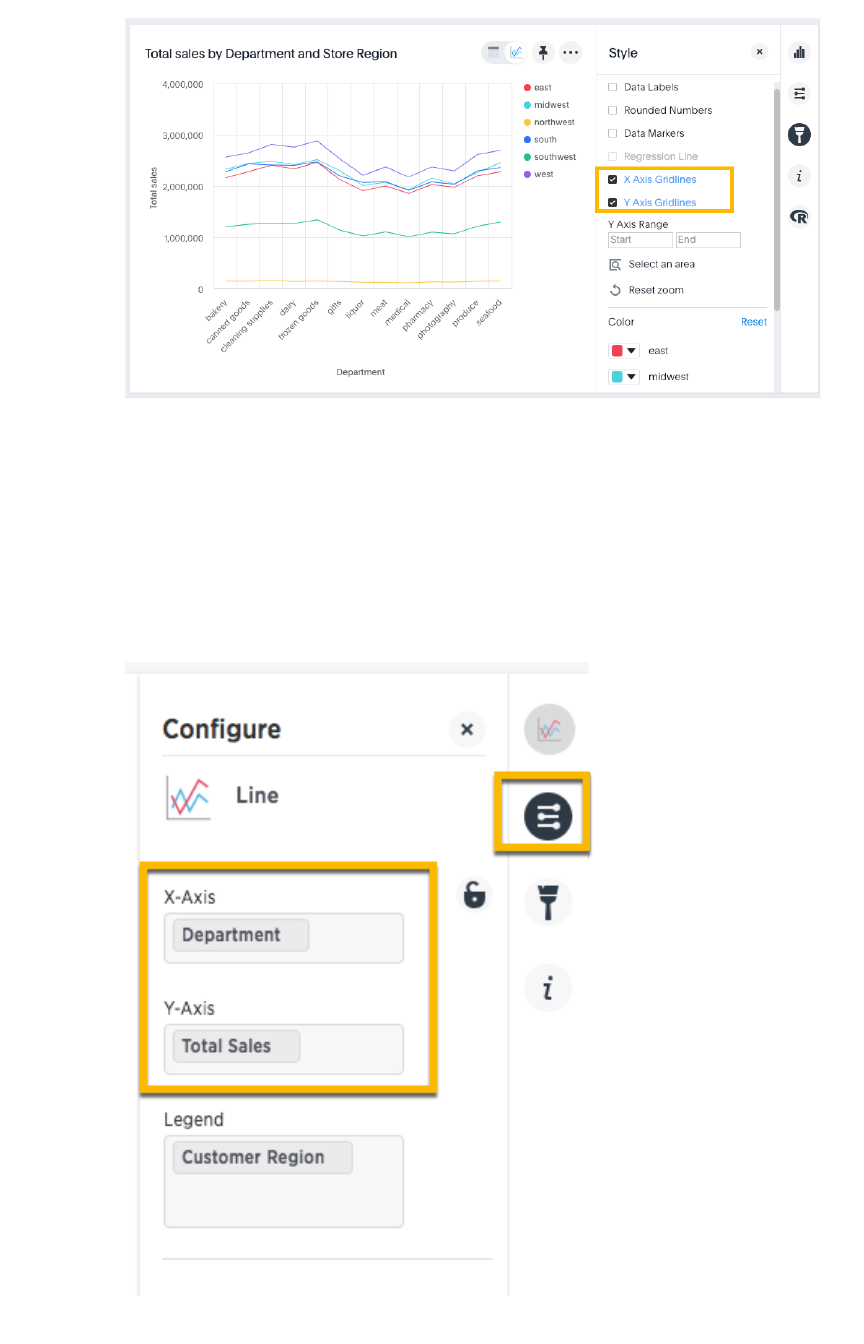
Configure columns for X and Y axis
You can specify which fields to show on the X axis and Y axis of a chart.
1. Click Edit chart configurationEdit chart configuration on the right.
2. Click into the X or Y axis field and select the column used in the search that you want on a
particular axis.
Additional chart options
February 07, 2019
ThoughtSpot Users Guide Page 135

Stack multiple measures on the y-axis
You can have multiple measures on the y-axis of most (but not all) chart types, as follows:
1. Create a chart.
2. Click Edit chart configurationEdit chart configuration on the right.
3. Click into the Y-AxisY-Axis field and start typing the name of a measure used in the search.
4. Select the measure you want.
The chart updates to show multiple measures on the Y-Axis.
• If your original chart had a legend, you will get a message saying
“When there are
multiple columns on the y-axis, you cannot add a legend. <Measure> is already in
use.”
If so, remove the legend and the chart will update to show multiple measures
on the y-axis.
• In some cases, the y-axis measures will show one on either side of the chart (left
and right) instead of stacked on the same side, depending on the parameters of
the analysis.
• For a list of chart types to which this applies, see Charts with multiple measures on
the y-axis.
Add columns to a chart legend
You can add to or edit the legend from the chart configuration panel.
1. Click Edit chart configurationEdit chart configuration on the right.
2. Click into the legend field to add one or more columns used in the search.
Additional chart options
February 07, 2019
ThoughtSpot Users Guide Page 136
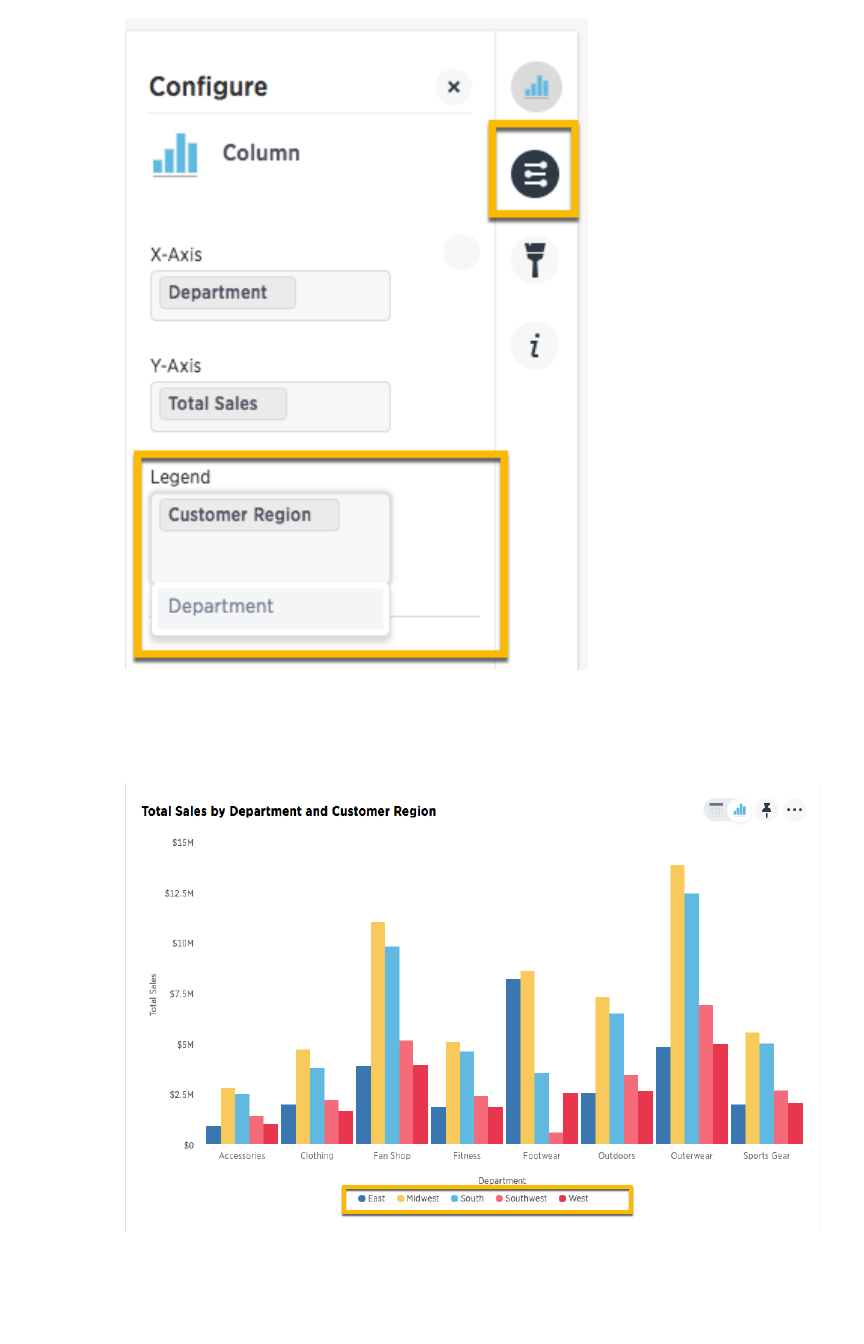
Your changes are saved automatically.
3. View the updated chart.
Additional chart options
February 07, 2019
ThoughtSpot Users Guide Page 137

Lock the chart
You can use the lock icon to prevent ThoughtSpot from recommending other chart options or
configurations. For example, you want a line chart, you can lock that display and stop TS from
recommending an alternative visualization such as a funnel/pie/column and so forth. A lock applies for all
subsequent answers that have the same column set.
Related information
Change chart colors
Additional chart options
February 07, 2019
ThoughtSpot Users Guide Page 138

Zoom into a chart
You can zoom into your chart by selecting an area with your mouse. To zoom into a chart:
1. While viewing your answer as a chart, click Edit chart styleEdit chart style on the right.
2. Click Select an areaSelect an area.
3. Select an area on your chart to zoom into by clicking and dragging your mouse.
Zoom into a chart
February 07, 2019
ThoughtSpot Users Guide Page 139

Your chart will be reconfigured to only show the selected area.
4. If you would like to return to the original chart view, click Reset zoomReset zoom.
Zoom into a chart
February 07, 2019
ThoughtSpot Users Guide Page 140

Understand formulas in searches
Summary:Summary: To provide richer insights, you can add a formula to your
search.
The Formula Builder includes many types of operators, such as logical (if, then, else), math, date, and
text string functions.
You can create a formula from directly within a search. If you have the privilege that allows you to create
or edit worksheets, you can also create a formula within a worksheet. Formulas in worksheets act as
derived columns, so that anyone who uses the worksheet as a data source will see the formula as just
another column.
Adding a formula within a search works much the same way as adding a formula to a worksheet.
However, you will be able to edit the formula directly from within the answer. If you add the answer to a
pinboard and share it with the EditEdit privilege, other people can see the formula results, too. To make edits
to the formula, they also need to have the EditEdit privilege on the underlying data.
•Add a formula to a searchAdd a formula to a search
You can add a formula directly within a search. Some common reasons for using a formula in
a search are to perform mathematical functions, check for and replace null values, or add
if…then…else logic.
•View or edit a formula in a searchView or edit a formula in a search
You can always go back and view or edit a formula that has been added to a search. Do this
by clicking the edit icon next to its name in the ColumnsColumns listing.
•About aggregate formulasAbout aggregate formulas
When working with formulas, it is useful to understand the difference between regular (or row-
wise) formulas and aggregation formulas.
•About conversion formulasAbout conversion formulas
Some formulas require the input to be of a particular data type. If you find that you want to
pass a value to the function, but it is of the wrong data type, you can convert it using a
conversion formula.
•About date formulasAbout date formulas
Date formulas allow you to apply date related functions to your formulas.
•About percent (simple number) calculationsAbout percent (simple number) calculations
You can use simple number functions to perform useful percent calculations.
•About conditional formulas (operators)About conditional formulas (operators)
Conditional formulas, or operators, allow you to apply if /then /else conditions in your
formulas.
•About nested formulasAbout nested formulas
Nested formulas, or formula on formula, allow you to reference a formula within another
formula.
•About formula support for chasm trap schemasAbout formula support for chasm trap schemas
You can create a formula that involves aggregated measures coming from multiple fact tables
of a chasm trap.
Text formulas are also available. These are covered in the comprehensive Formula function referenceFormula function reference,
which provides brief descriptions and examples for all types of formulas. The above topics explain
concepts and give step-by-step instructions of how to work with formulas, whereas the reference is a
quick cheat sheet.
Understand formulas in searches
February 07, 2019
ThoughtSpot Users Guide Page 141
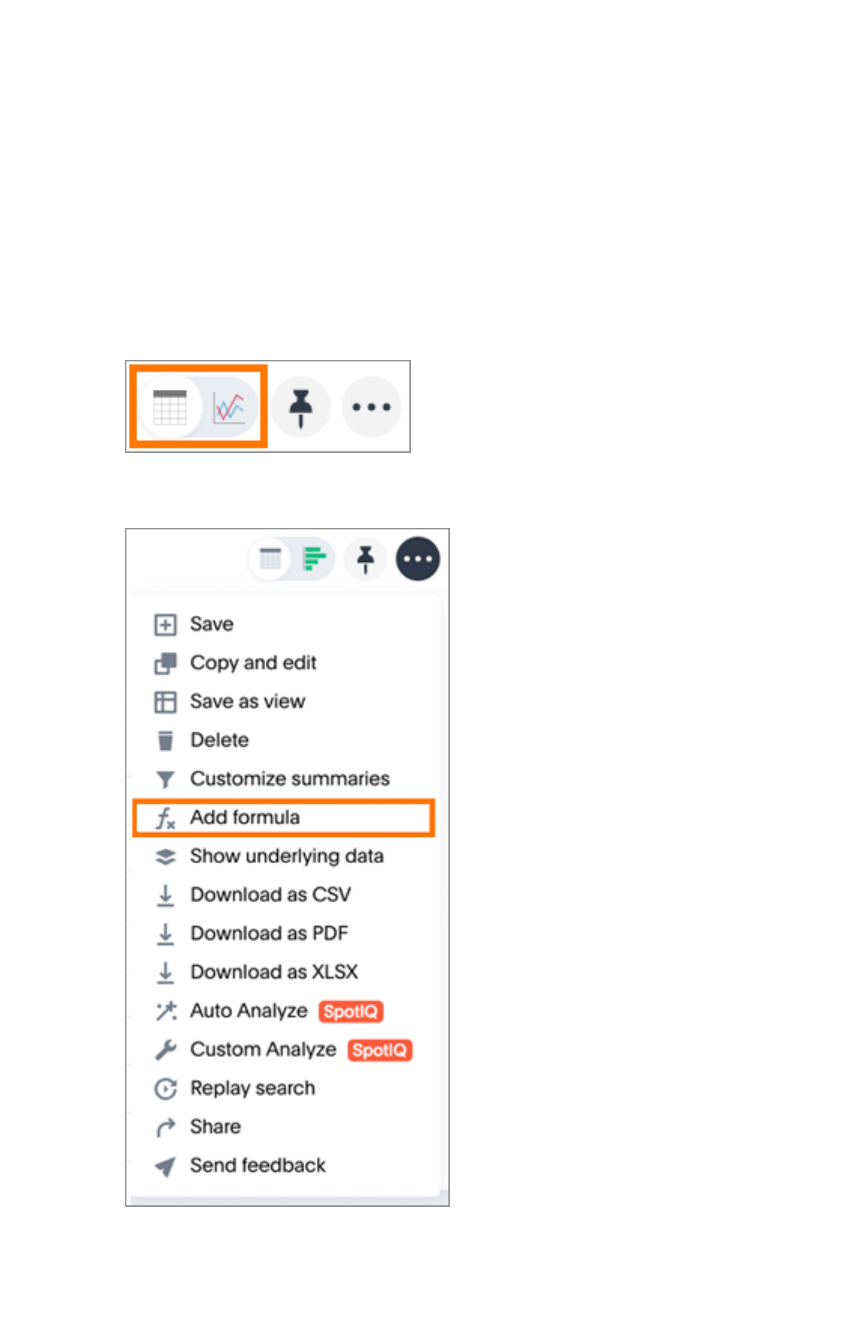
Add a formula to a search
You can add a formula directly within a search. Some common reasons for using a formula in a search
are to perform mathematical functions, check for and replace null values, or add conditional logic.
How to add a formula
To create a formula in a search:
1. Start a new search, or choose an existing answer from a pinboard to edit.
2. If the answer shows a chart, switch to Table ViewTable View.
3. In the upper-right side of the table, click the three-dot ActionsActions icon and select Add formulaAdd formula.
4. Name and enter your formula in the Formula Builder.
Add a formula to a search
February 07, 2019
ThoughtSpot Users Guide Page 142
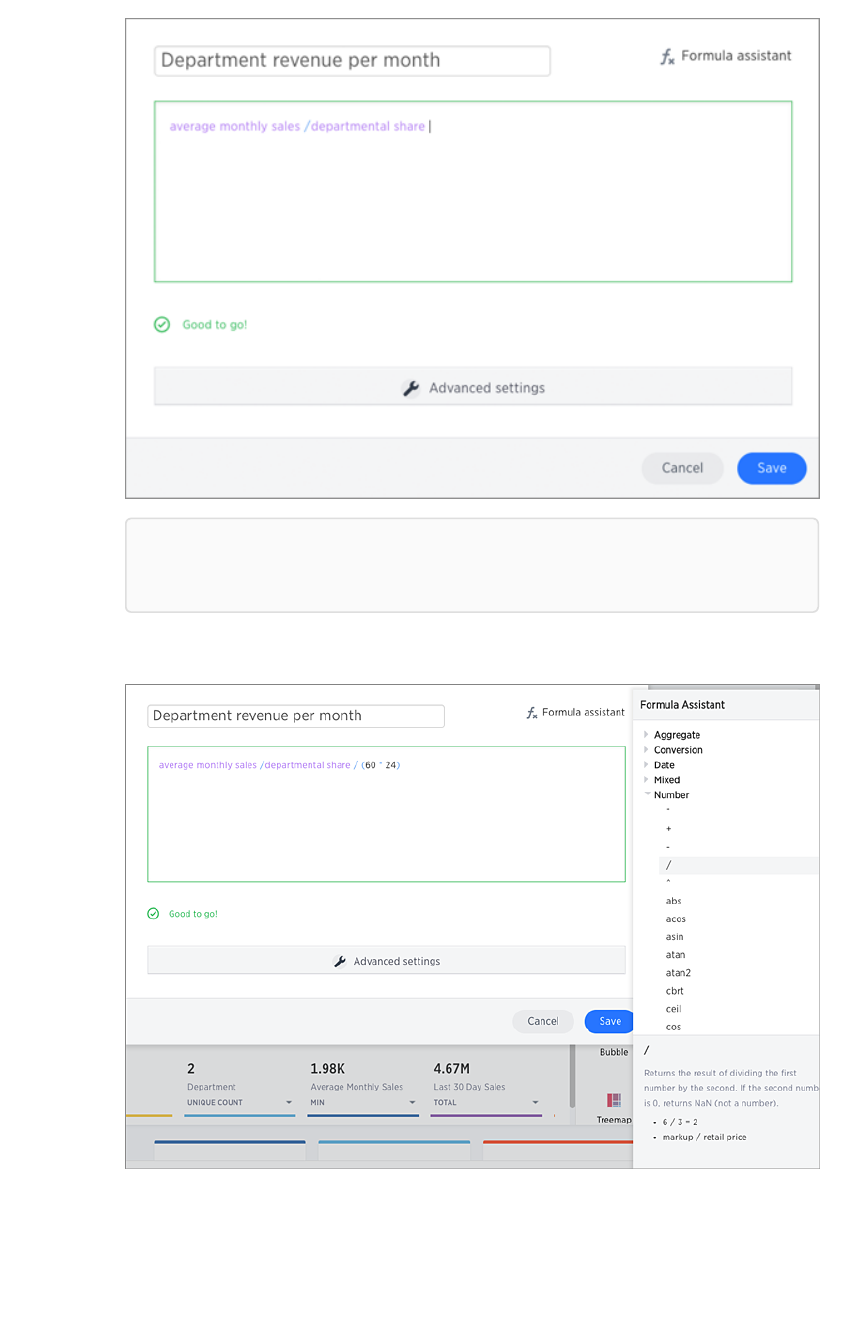
Note:Note: Formulas elements are color coded by type and can include the formula
operators and functions (blue), the names of columns (purple), and/or constants (black).
5. You can see a list of formula operators with examples by clicking Formula Assistant.Formula Assistant.
6. If you want to change what your formula returns, use the Advanced settingsAdvanced settings. Depending on
your formula, you may be able to change:
• Data type
• Measure or attribute
Add a formula to a search
February 07, 2019
ThoughtSpot Users Guide Page 143
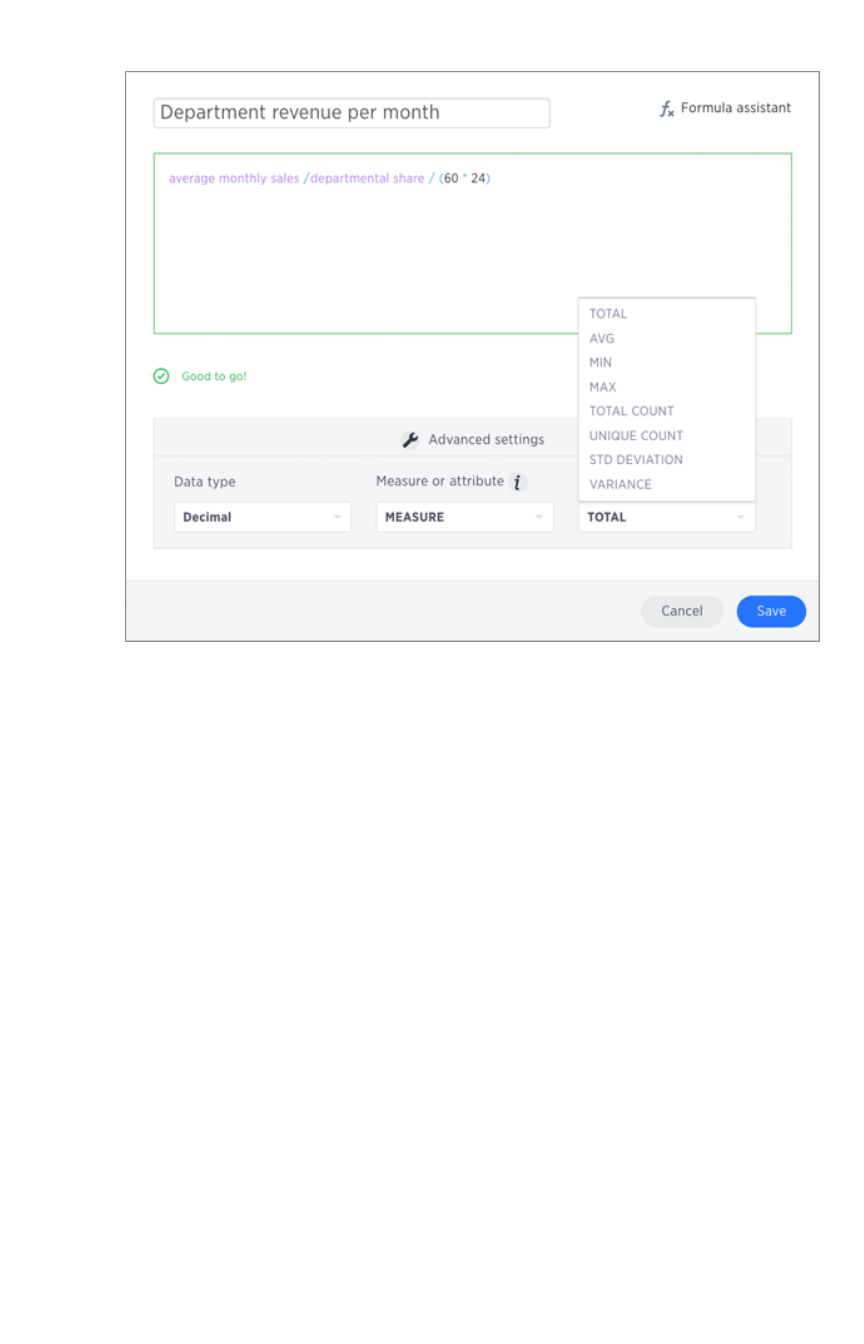
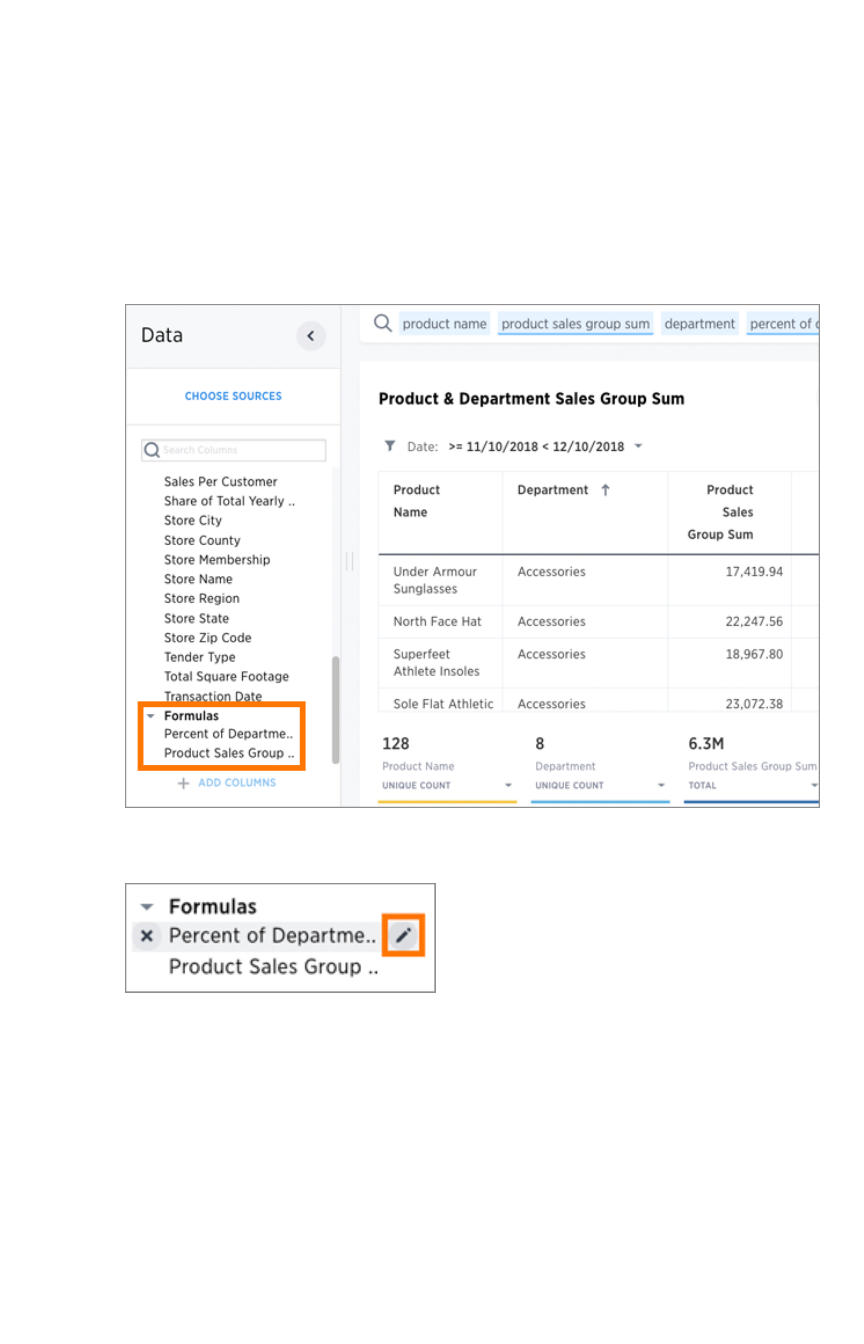
View or edit a formula in a search
You can always go back and view or edit a formula that was added to a search. Do this by clicking the
edit icon next to its name in the ColumnsColumns listing. Anyone who has edit privileges on an answer can also
edit any formulas it contains. To view or edit an existing formula in an answer:
1. Navigate to the pinboard that contains the answer with the formula, click the three-dot
ActionsActions icon and select EditEdit.
2. Scroll down to the bottom of the ColumnsColumns listing. You will see a data source called FormulasFormulas.
3. Expand FormulasFormulas, and you’ll see a list of all the formulas in this answer.
4. Click the edit icon next to the formula name.
5. View or edit your formula in the Formula Builder.
View or edit a formula in a search
February 07, 2019
ThoughtSpot Users Guide Page 145
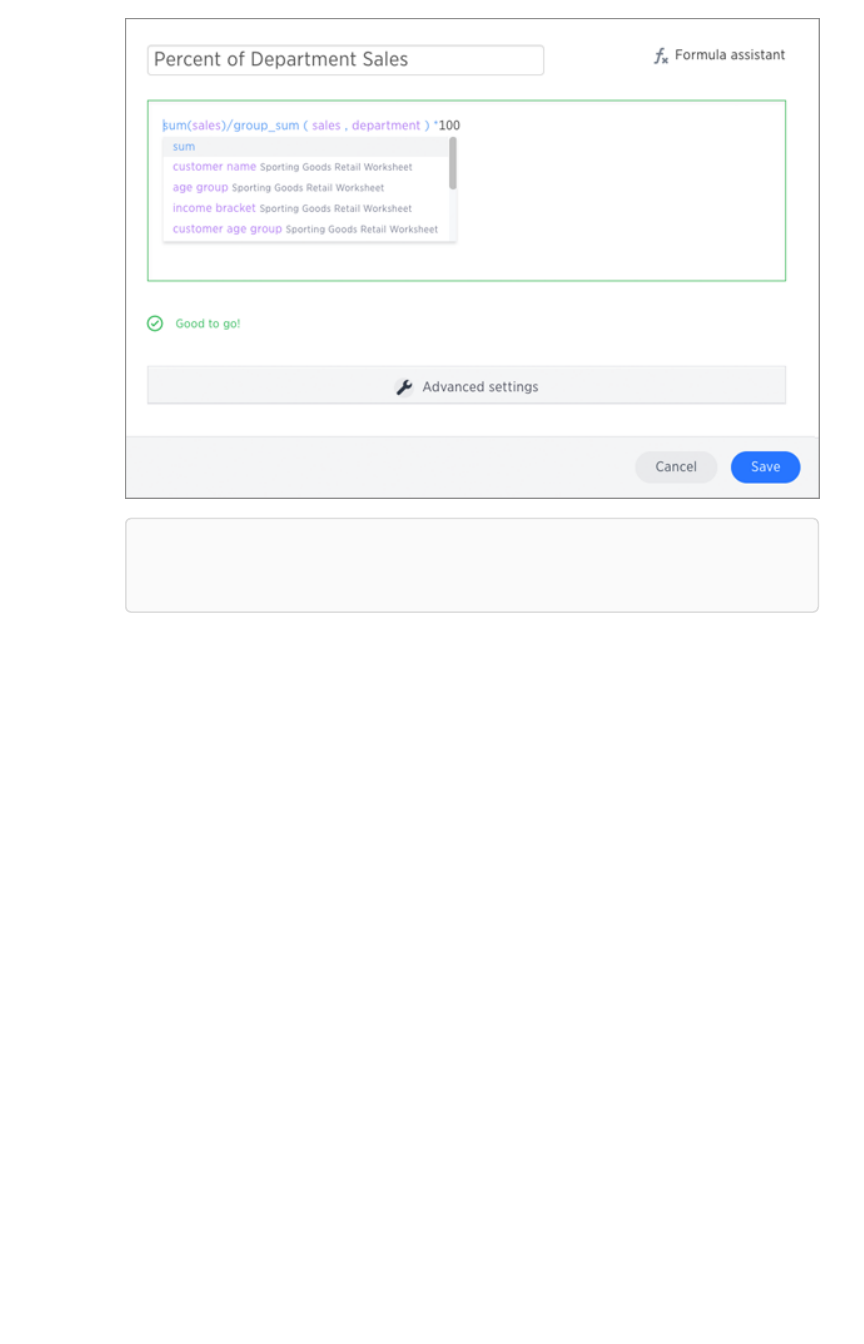
Note:Note: Formulas elements are color coded by type and can include the formula
operators and functions (blue), the names of columns (purple), and/or constants (black).
6. If you edited your formula, click SaveSave to save your changes. Otherwise, click CancelCancel.
View or edit a formula in a search
February 07, 2019
ThoughtSpot Users Guide Page 146
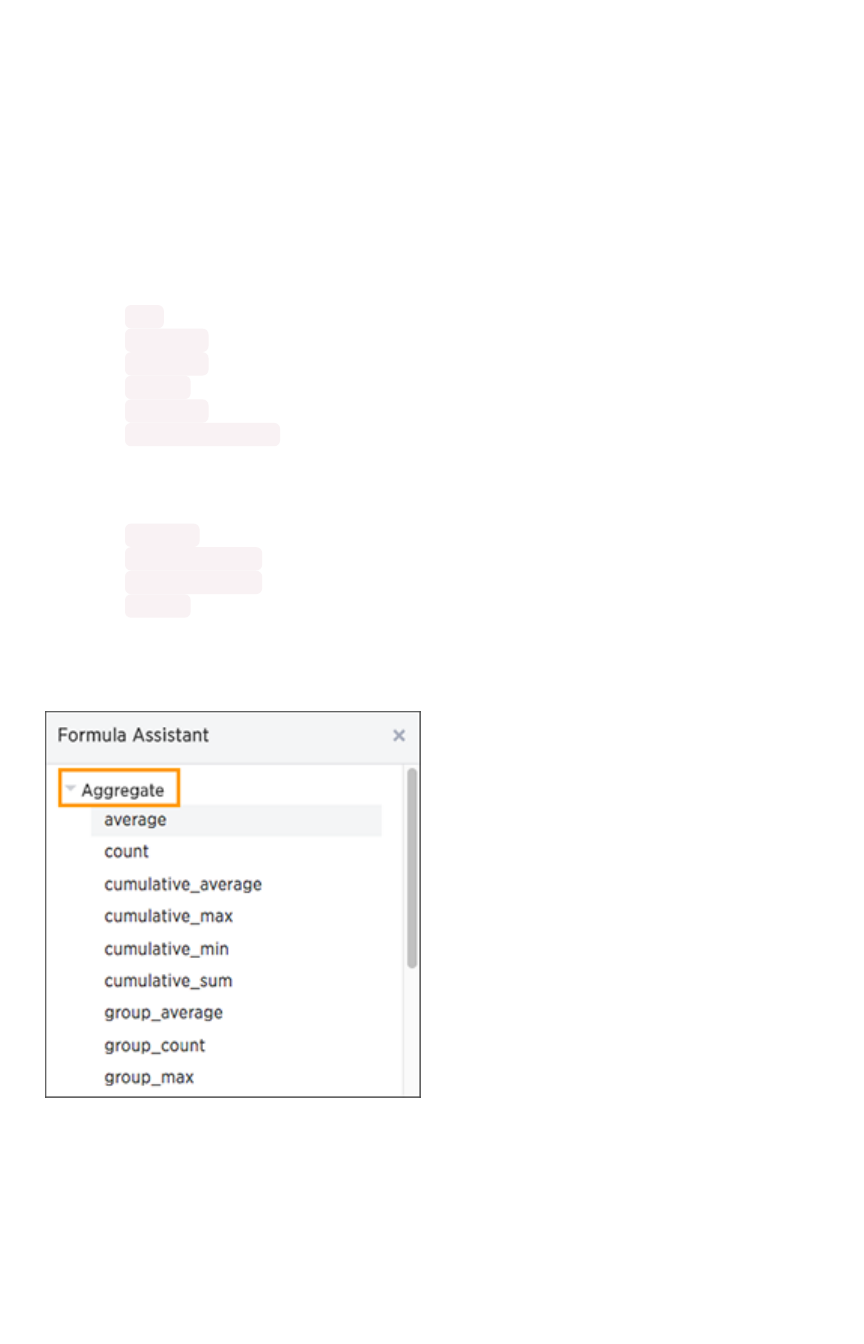
Overview of aggregate formulas
When working with formulas, it is useful to understand the difference between regular (or row-wise)
formulas and aggregation formulas.
Standard and aggregation formulas
Formulas can be broken down into two types standard and aggregation formulas. Standard formulas act
on individual rows and returns one result per row. Standard formulas use functions like:
•add
•subtract
•multiply
•divide
•contains
•if...then...else
Aggregation formulas combine rows together and returns a single result for a group of rows. Aggregation
formulas use functions, some examples of functions you find in aggregation formulas are:
•average
•cumulative_sum
•moving_average
•stddev (standard deviation)
You can tell which formulas are aggregation formulas by looking at the function list in the FormulaFormula
AssistantAssistant. Aggregation functions have their own section.
Advanced aggregation functions
Some more advanced aggregation functions are widely used in business intelligence, since they provide
better insight into data. Some of the more advanced aggregation functions are:
•Group aggregation functions apply a specific aggregate to a value, and group the results by
an attribute in the data.
Overview of aggregate formulas
February 07, 2019
ThoughtSpot Users Guide Page 147
•Cumulative functions measure from the start of your data to the current point. They’re often
applied on time-based data.
•Moving formulas measure within a window (usually time-based) that you define.
Data from any rows that are not included in the search result will not be incorporated, and you cannot
create a filter on aggregated data.
Flexible aggregation
The group_aggregate function makes it possible to aggregate measures at granularities that are
different from the dimensions or column groupings used in the search.
See Flexible aggregation to learn more about working with this formula.
Using division with aggregation in a search
Whenever your search result combines rows, your formula will get aggregated automatically. For
example, if your search contains words like “region”, “monthly”, or “department”, the results will be
grouped (aggregated) by that category. The administrator can change the default aggregation that gets
applied through a configuration, and you can also change it using the dropdown list in the column
header of the search result.
For example, this search would typically return a sum of total sales by department:
sum sales department
This search would return an average of sales by month:
average sales monthly
When you’re using division in your formula, and the search is aggregated like this, you may have to
change the order of operations to get the result you expect. This is best understood by using a real world
example.
Suppose you want to calculate the gross margin by department for a grocery store. The formula for
gross margin is:
profit / sales
But if you use that as your formula, you won’t get the expected calculation. Why? It’s because the
formula will be evaluated in this order: For each row, divide profit by sales and then total up all the
results. As you can see, the results do not look like gross margin values, which should be between 0 and
1.
Overview of aggregate formulas
February 07, 2019
ThoughtSpot Users Guide Page 148
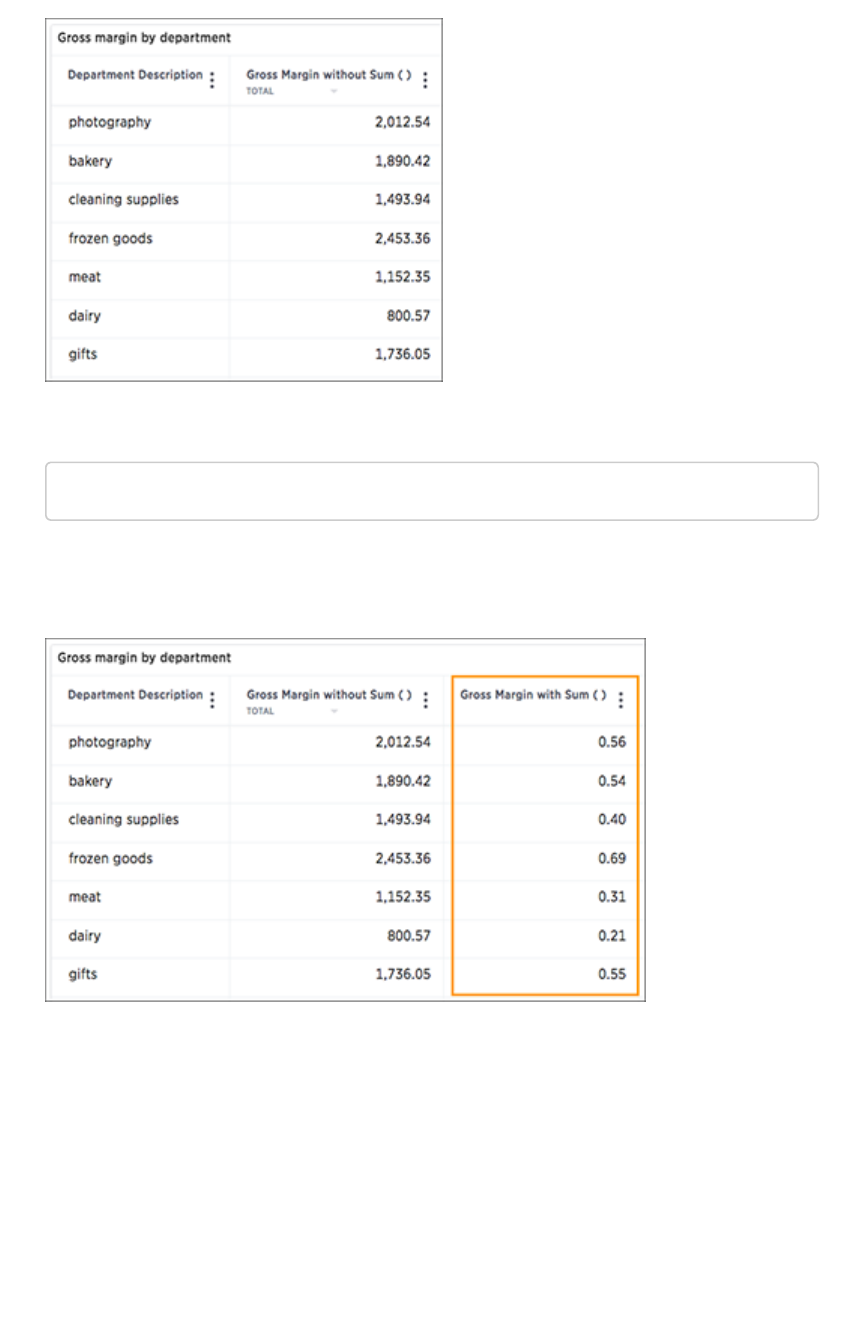
Instead, you’d need to use a formula that uses the order of operations you want:
sum (profit) / sum (sales)
Now the result is as expected, because the formula totals the profits for all rows, and then divides that
by the total of sales for all rows, returning an average gross margin:
Overview of aggregate formulas
February 07, 2019
ThoughtSpot Users Guide Page 149

Cumulative functions
Summary:Summary: Cumulative formulas are aggregate formulas.
Cumulative formulas that allow you to calculate the average, max, min, or sum or your data over time.
Although we usually talk about cumulative formulas over time, you can use them over any other
sequential data. Each of the cumulative formulas accepts a measure and one or more optional grouping
by an attribute (like region or department):
formula (measure, [attribute, attribute, ...])
Only the measure value is required. If you supply both a measure and attributes, the formula returns the
aggregate of the measure accumulated by the attribute(s) in the order specified. You should experiment
with only a measure and then with an attribute to see which output best meets your use case.
The cumulative formulas are:
FunctionFunction DescriptionDescription
cumulative_average Takes a measure and one or more attributes. Returns the average of the
measure, accumulated by the attribute(s) in the order specified. For exam-
ple: cumulative_average (revenue, order date, state)
cumulative_max Takes a measure and one or more attributes. Returns the maximum of the
measure, accumulated by the attribute(s) in the order specified. For exam-
ple: cumulative_max (revenue, state)
cumulative_min Takes a measure and one or more attributes. Returns the minimum of the
measure, accumulated by the attribute(s) in the order specified. or exam-
ple: cumulative_min (revenue, campaign)
cumulative_sum Takes a measure and one or more attributes. Returns the sum of the mea-
sure, accumulated by the attribute(s) in the order specified. For example:
cumulative_sum (revenue, order date)
Calculate a cumulative sum
This example demonstrates using the cumulative_sum formula, also known as a running total. To use the
cumulative function in a search:
1. Start a new search.
Cumulative functions
February 07, 2019
ThoughtSpot Users Guide Page 150
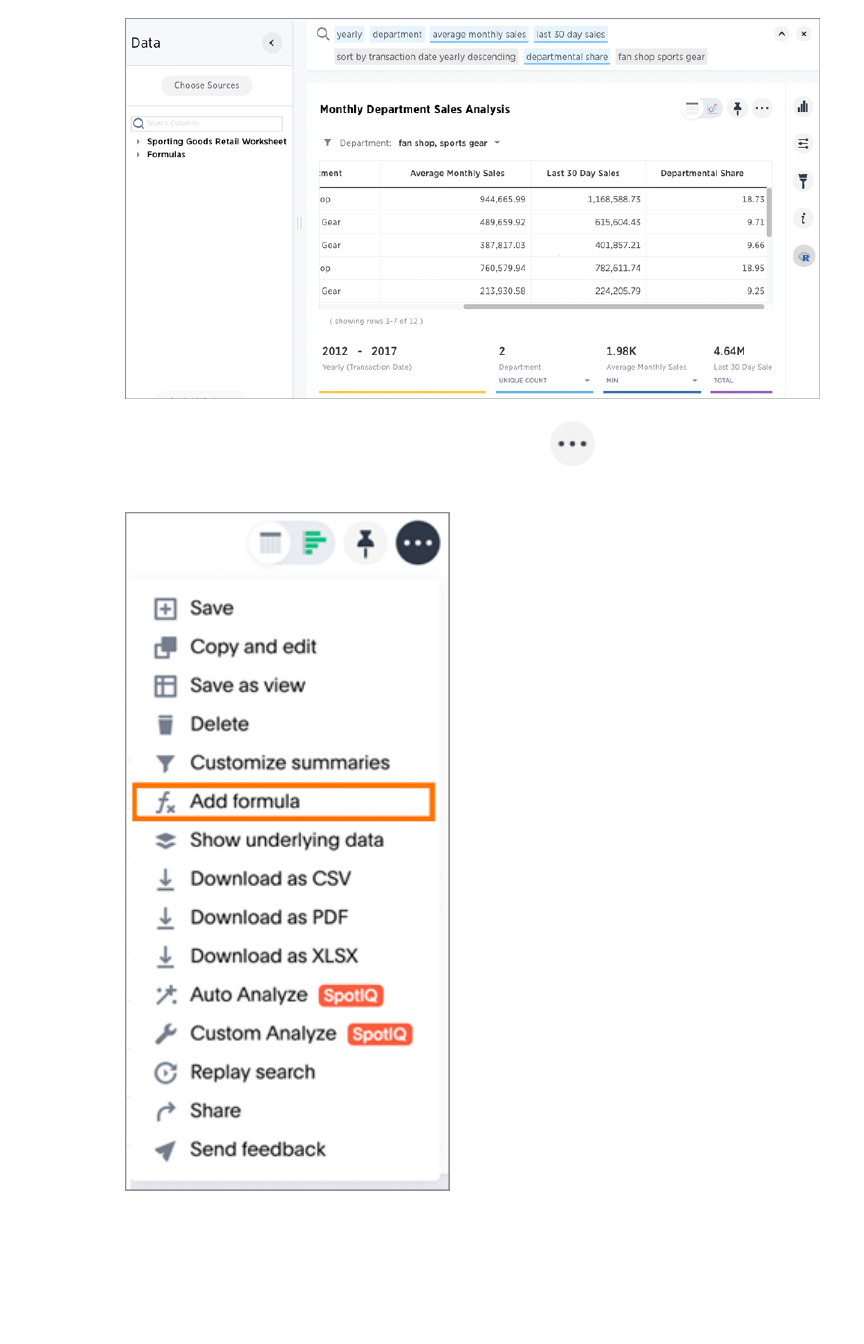
2. In the upper-right side of the table, click the ellipses icon and select Add formulaAdd formula.
3. Enter the cumulative_sum formula, providing a measure and one or more attributes.
The example will return the sum of revenue, accumulated by the commit date.
Cumulative functions
February 07, 2019
ThoughtSpot Users Guide Page 151
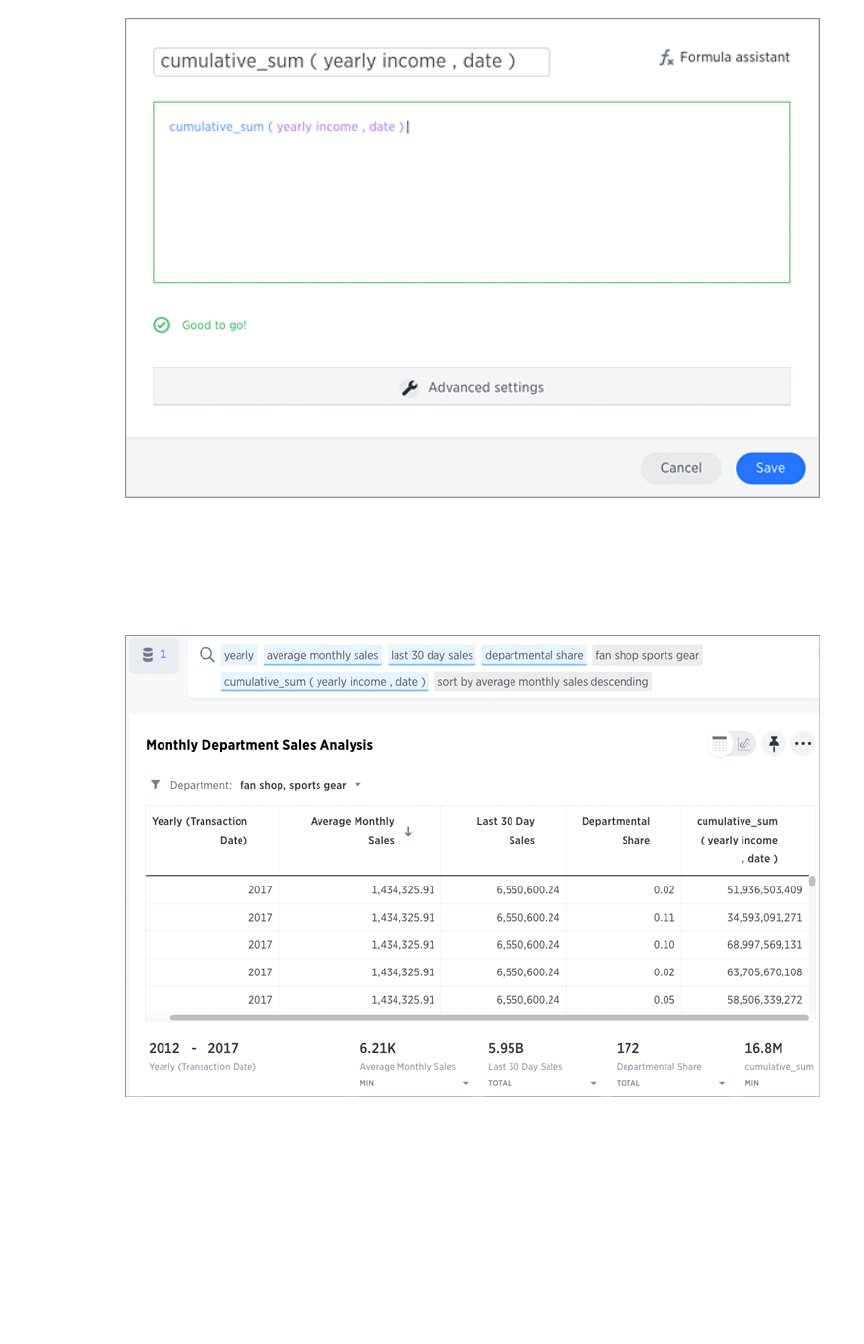
4. Name the formula by clicking its title and typing a new name.
5. Click SaveSave.
The formula will appear in the search bar and in the table as its own column.
A headline box displaying the cumulative sum within the entire table will appear at the bottom.
You can click it to toggle between different aggregations.
Cumulative functions
February 07, 2019
ThoughtSpot Users Guide Page 152

Moving functions
Summary:Summary: Moving formulas are aggregate formulas that allow you to
calculate the average, max, min, or sum of your data over a
predetermined interval, or window, with an adjustable range.
Moving formulas can be used to smooth out any irregularities in your data to easily recognize trends. The
larger the interval you set, the more the peaks and valleys are smoothed out. While the smaller the
interval, the closer the moving averages are to the actual data points.
Each of the moving formula accepts a measure, two integers to define the window, and one or more
optional attributes.
formula (measure,integer,integer,[attribute,attribute,...])
Only the measure and integer values are required. If you supply both required and optional values, the
formula returns the aggregate of the measure over the given window. You should experiment with only a
measure and integers leaving out the attribute and then adding it back in. This will help you decide which
output best meets your use case.
The moving formulas are the following:
•moving_average , for example moving_average (revenue, 2, 1, customer region)
Takes a measure, two integers to define the window to aggregate over, and one or more
attributes. Returns the average of the measure over the given window. The attributes are the
ordering columns used to compute the moving average. The window is ( current -
Num1...Current + Num2 ) with both end points being included in the window. For example,
1,1 will have a window size of 3. To see periods in the past, use a negative number for the
second endpoint, as in the example moving_average(sales, 1, -1, date) .
•moving_max , for example moving_max (complaints, 1, 2, store name)
Takes a measure, two integers to define the window to aggregate over, and one or more
attributes. Returns the maximum of the measure over the given window. The attributes are the
ordering columns used to compute the moving maximum. The window is (current -
Num1…Current + Num2) with both end points being included in the window. For example,
1,1 will have a window size of 3. To see periods in the past, use a negative number for the
second endpoint, as in the example moving_max(sales, 1, -1, date) .
•moving_min , for example moving_min (defects, 3, 1, product)
Takes a measure, two integers to define the window to aggregate over, and one or more
attributes. Returns the minimum of the measure over the given window. The attributes are the
ordering columns used to compute the moving minimum. The window is (current -
Num1…Current + Num2) with both end points being included in the window. For example,
1,1 will have a window size of 3. To see periods in the past, use a negative number for the
second endpoint, as in the example moving_min(sales, 1, -1, date) .
•moving_sum , for example moving_sum (revenue, 1, 1, order date)
Moving functions
February 07, 2019
ThoughtSpot Users Guide Page 153

Takes a measure, two integers to define the window to aggregate over, and one or more
attributes. Returns the sum of the measure over the given window. The attributes are the
ordering columns used to compute the moving sum. The window is (current - Num1…Current
+ Num2) with both end points being included in the window. For example, 1,1 will have a
window size of 3. To see periods in the past, use a negative number for the second endpoint,
as in the example moving_sum(sales, 1, -1, date) .
Calculate a moving average
This example demonstrates using the moving_average formula. To use the moving function in a
search:
1. Start a new search.
2. In the upper-right side of the table, click the ellipses icon and select Add formulaAdd formula.
Moving functions
February 07, 2019
ThoughtSpot Users Guide Page 154
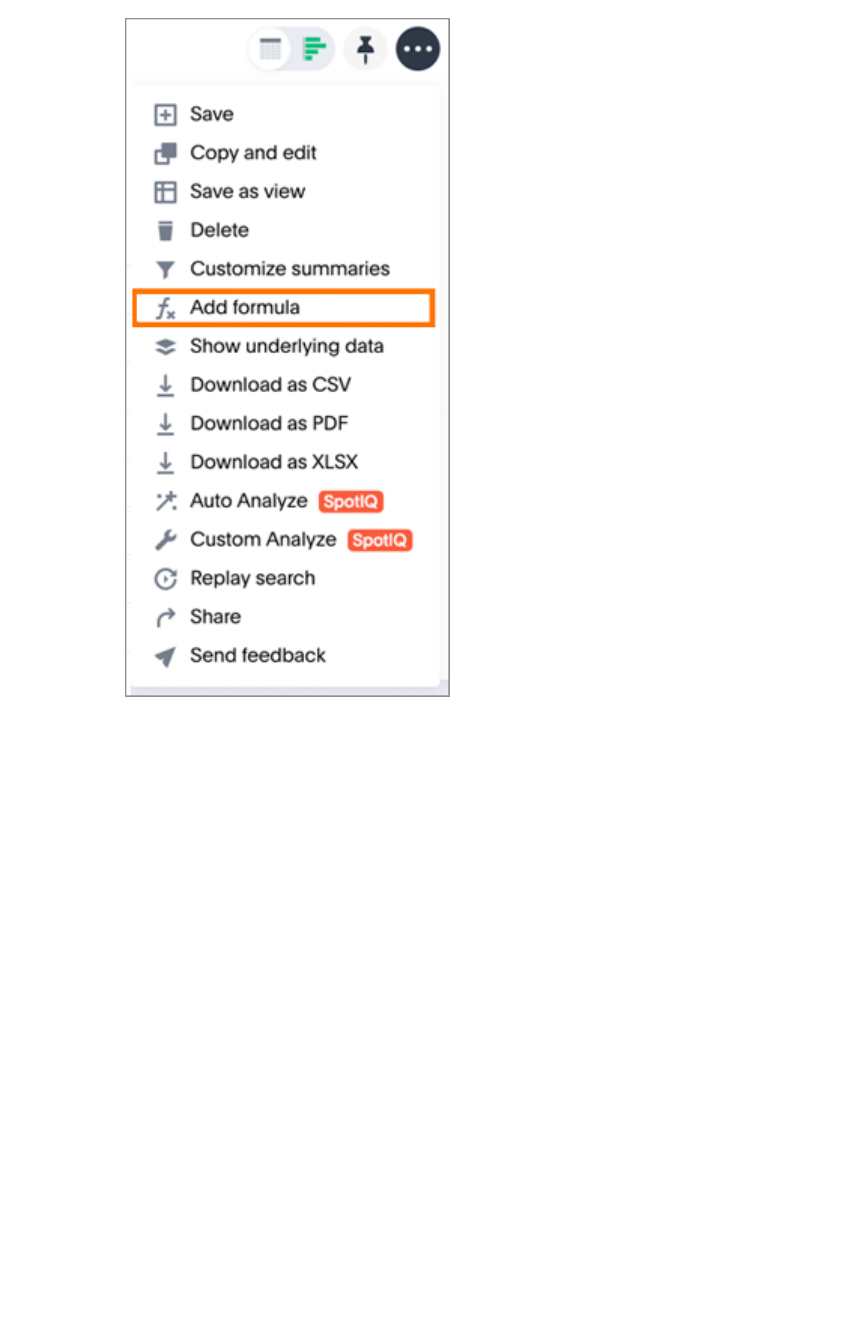
3. Enter the moving_average formula, providing a measure, a window, and one or more
attributes.
The example will return the average of revenue, within the commit date window size of 3. The
window includes the previous, current, and next rows. The attributes are the ordering columns
used to compute the moving average. The window is (current - Num1…Current + Num2) with
both end points being included in the window. For example, “1,1” will have a window size of
3. To see periods in the past, use a negative number for the second endpoint, as in the
example “moving_average(sales, 1, -1, date)”.
Moving functions
February 07, 2019
ThoughtSpot Users Guide Page 155
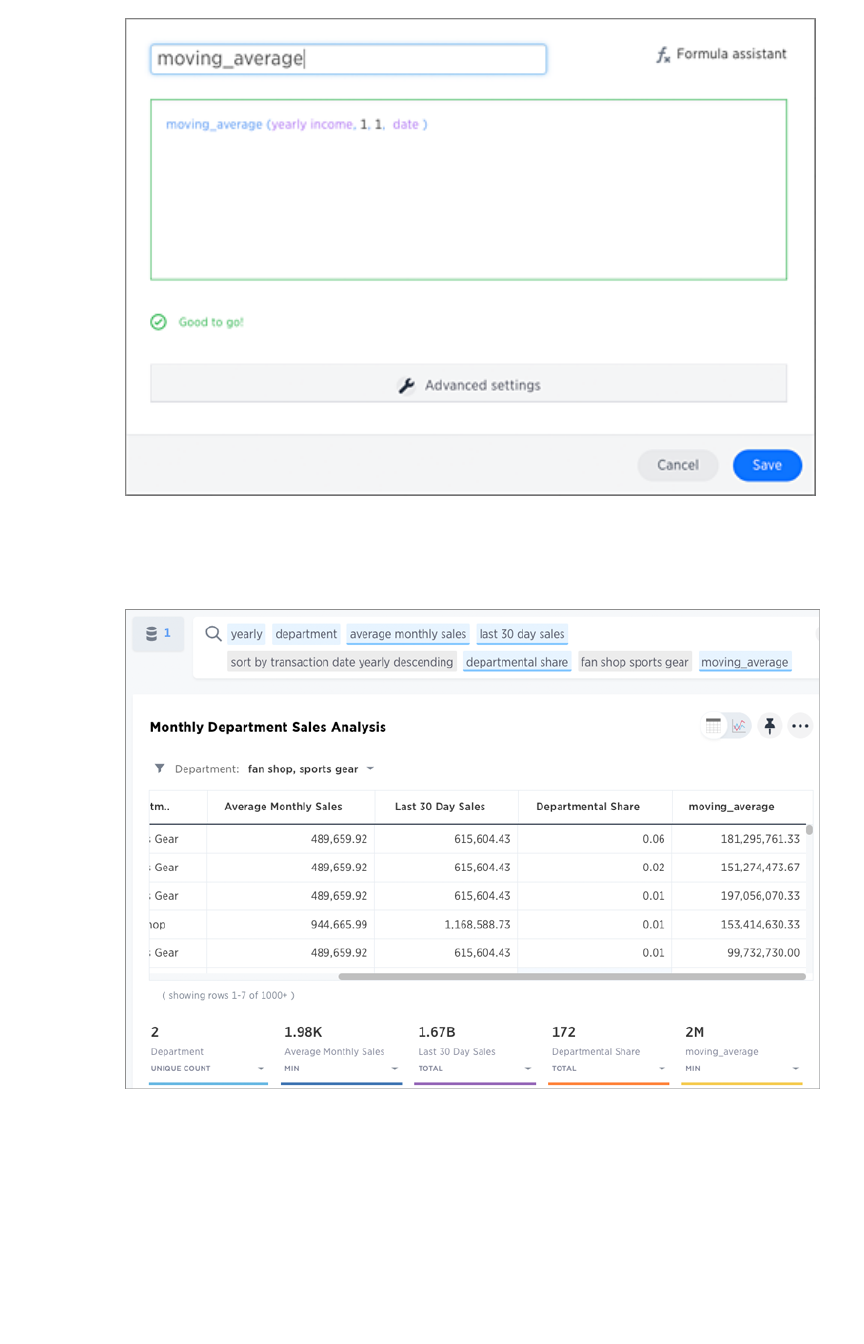
4. Name the formula by entering a title in the top field, and then click SaveSave.
The formula will appear in the search bar and in the table as its own column.
A box displaying the moving average within the entire table will appear at the bottom.
5. To use a different aggregation type, click the current aggregation type in the bottom of the
box and select another type.
Moving functions
February 07, 2019
ThoughtSpot Users Guide Page 156

Flexible aggregation functions (group
aggregate and filters)
You can use the group_aggregate function to aggregate measures at granularities that are different
from the dimensions that you have in columns used in the search.
How aggregation formulas work
Typically, the groupings and filters used in a formula will be the same as those of the columns used in
the search. The concept of a grouping equates to an attribute column.
For example, in the search “revenue ship mode”, revenue is the measure, and ship mode is the attribute
or
grouping
. The result of this search would show total revenue for each ship mode, e.g.,
a
dollars for air,
r
dollars for rail,
t
dollars for truck,
s
dollars for sea transport.
The aggregation formulas are described in Overview of aggregate formulas.
About flexible aggregation
Starting with version 5.0, ThoughtSpot provides for more flexible aggregation capability with a new
function called group_aggregate . You can use this formula to pin columns in a query at a granularity
different from the search bar query, using custom groupings and filters, rather than being bound to those
of the search terms/columns.
The formula uses a sub-query to perform the custom aggregation. If the sub-query is at a courser grain,
result column is simply added to the result of original query. Roll-up or
reaggregation
is used when the
sub-query is at a finer grain than the original query
This is particularly useful for comparison analysis.
You can specify to use the groups and filters from the query with query_groups and query_filters ,
respectively, and for query_groups you can also add or exclude some groups or filters.
You can use roll-up or reaggregation to fill in a column.
Examples
For a search on revenue monthly ship mode , you can add a formula to calculate yearly revenue by
ship mode:
group_aggregate(sum(revenue), {ship mode, year(commit date)},
{})
The same formula can also be written using query_groups() and query_filters() as following:
Flexible aggregation functions (group aggregate and filters)
February 07, 2019
ThoughtSpot Users Guide Page 157
group_aggregate(sum(revenue), query_groups() - {commit date} +
{year(commit date)}, {})
This is helpful to include the main query groups that are not known at formula creation time. You can use
+/- to modify the set of groups included from the query.
Note:Note: +/- is currently supported only for query_groups, not query_filters.
When group formula results are finer-grained
than the search
With the flexibility of groupings for group formulas, the computed column created by a formula can be
finer or courser grained than the search itself.
For example, you can have a search that shows total yearly salestotal yearly sales and a formula that computes total
sales
for each month
(a finer-grained calculation than the search).
In such cases, if an additional aggregation is specified by the formula, the results get
reaggregated
.
Reaggregation can be applied in either of these ways:
• You can add an aggregation keyword just before a formula column in a search. For example,
in this search we’ve added the keyword minmin just before our formula for monthly_sales :
sum revenue yearly min monthly_salessum revenue yearly min monthly_sales
where, the monthly_sales formula is written as:
group_aggregate(sum(revenue), {start_of_month(dat
e)}, {})
• You can create a separate formula, such as in this search for:
sum revenue yearly min_monthly_salessum revenue yearly min_monthly_sales
where, the min_monthly_sales formula is written as:
min(monthly_sales)
Alternatively, if no aggregation is specified, then the search query also inherits the formula groupings, as
in this search:
sum revenue yearly monthly_salessum revenue yearly monthly_sales
where, the original query is computed at a monthly grain instead of yearly.
Flexible aggregation functions (group aggregate and filters)
February 07, 2019
ThoughtSpot Users Guide Page 158

Reaggregation scenarios
Some scenarios require aggregation on an already aggregated result.
For example, computing minimum monthly sales per ship mode, requires two aggregations:
• the first aggregation of sumsum to compute total monthly sales per ship mode.
• the second aggregation of minmin to compute minimum sale that happened for any given month
for that ship mode.
An example of this is this search:
ship mode min monthly_salesship mode min monthly_sales
where the formula monthly_sales is written as:
group_aggregate(sum(revenue), query_groups() + {start_of_mont
h(date)}, {})
Groups and filters
Flexible group aggregate formulas allow for flexibility in both groupings and filters. The formulas give you
the ability to specify only groupings or only filters.
Related information
• For more examples of flexible aggregation, see the group_aggregate function under
“Aggregate functions” in the Formula function reference.
• To learn about aggregation formulas in general, see Overview of aggregate formulas and
Group aggregation functions
Flexible aggregation functions (group aggregate and filters)
February 07, 2019
ThoughtSpot Users Guide Page 159

Group aggregation functions
What if you want to aggregate a value by a specific attribute (for example, show revenue by product)?
This is known as a grouped aggregation, but some people call it a pinned measure or level-based
measure. You can do this for any aggregation using the grouping functions.
Each of the grouping functions accepts a measure and one or more optional attributes:
formula (measure, [attribute, attribute, ...])
Only the measure value is required. If you supply both a measure and an attribute, the function returns
the aggregate of the measure grouped by the attribute(s). You should experiment with only a measure
and then with an attribute to see which output best meets your use case.
List of group functions
Group aggregation functions have names with formats like group_<aggregation> . The group
aggregation functions are the following:
FunctionFunction DescriptionDescription
group_average
Takes a measure and one or more attributes. Returns the average of the
measure grouped by the attribute(s).
group_count (revenue, customer region)
group_count
Takes a measure and one or more attributes. Returns the count of the
measure grouped by the attribute(s).
group_count (revenue, customer region)
group_max
Takes a measure and one or more attributes. Returns the maximum of the
measure grouped by the attribute(s).
group_max (revenue, customer region)
group_min
Takes a measure and one or more attributes. Returns the minimum of the
measure grouped by the attribute(s).
group_min (revenue, customer region)
Group aggregation functions
February 07, 2019
ThoughtSpot Users Guide Page 160

FunctionFunction DescriptionDescription
group_stddev
Takes a measure and one or more attributes. Returns the standard devia-
tion of the measure grouped by the attribute(s).
group_stddev (revenue, customer region)
group_sum
Takes a measure and one or more attributes. Returns the sum of the mea-
sure grouped by the attribute(s).
group_sum (revenue, customer region)
group_unique_count
Takes a column name and one or more attributes. Returns the number of
unique values in a column, grouped by the attribute(s).
group_unique_count ( product, supplier)
group_variance
Takes a measure and one or more attributes. Returns the variance of the
measure grouped by the attribute(s).
group_variance (revenue, customer region)
Flexible aggregation
The group_aggregate function gives you more control over aggregation and filtering.
See Flexible aggregation to learn more about specifying query_groups with this formula.
Group aggregation functions
February 07, 2019
ThoughtSpot Users Guide Page 161

Filtered aggregation functions
Summary:Summary: You can create a filtered aggregation in the search bar.
Filters are useful for queries where the results should reflect a new, filtered value. On this page you learn
about comparative versus derivative filters, and the functions, and the keywords that you can use with
them.
Comparative and derivative filters
Comparative filters compare two segments of some whole against each in the SearchSearch bar. For example,
a company that has locations across the United States, may want to compare total revenue in the West
to the East segment. In a comparative filter, one of the segments you are comparing is filtered.
An example of a comparative filter is comparing west revenue with total revenue. In these cases, one
measure is a
filtered measure
, for example, revenue region = west is a filtered measure.
Derivative filters add a column to your results which is derived from other columns in the same results.
For example, you search for revenue and cost and want to calculate profit in your result.
Some examples of comparative and derivative filters in the real world are:
• revenue of this_soap versus all_soaps (Comparative filter)
• tax as a percentage of revenue (derivative)
• count revenue as a percentage of state revenue (comparative with a derivative)
If you plan to create these types of filters, you need to understand how to create filter functions.
Use filter functions
Filter functions take two arguments, the column ( measure or attribute) to aggregate and the filter
condition:
FUNCTION_NAME(condition, <column name>)
ThoughtSpot functional library will include the following functions:
•sum_if
•average_if
•count_if
•unique_count_if
•max_if
•min_if
•stddev_if
•variance_if
•vs
•all
The table below illustrates some examples of these functions in use:
Filtered aggregation functions
February 07, 2019
ThoughtSpot Users Guide Page 162
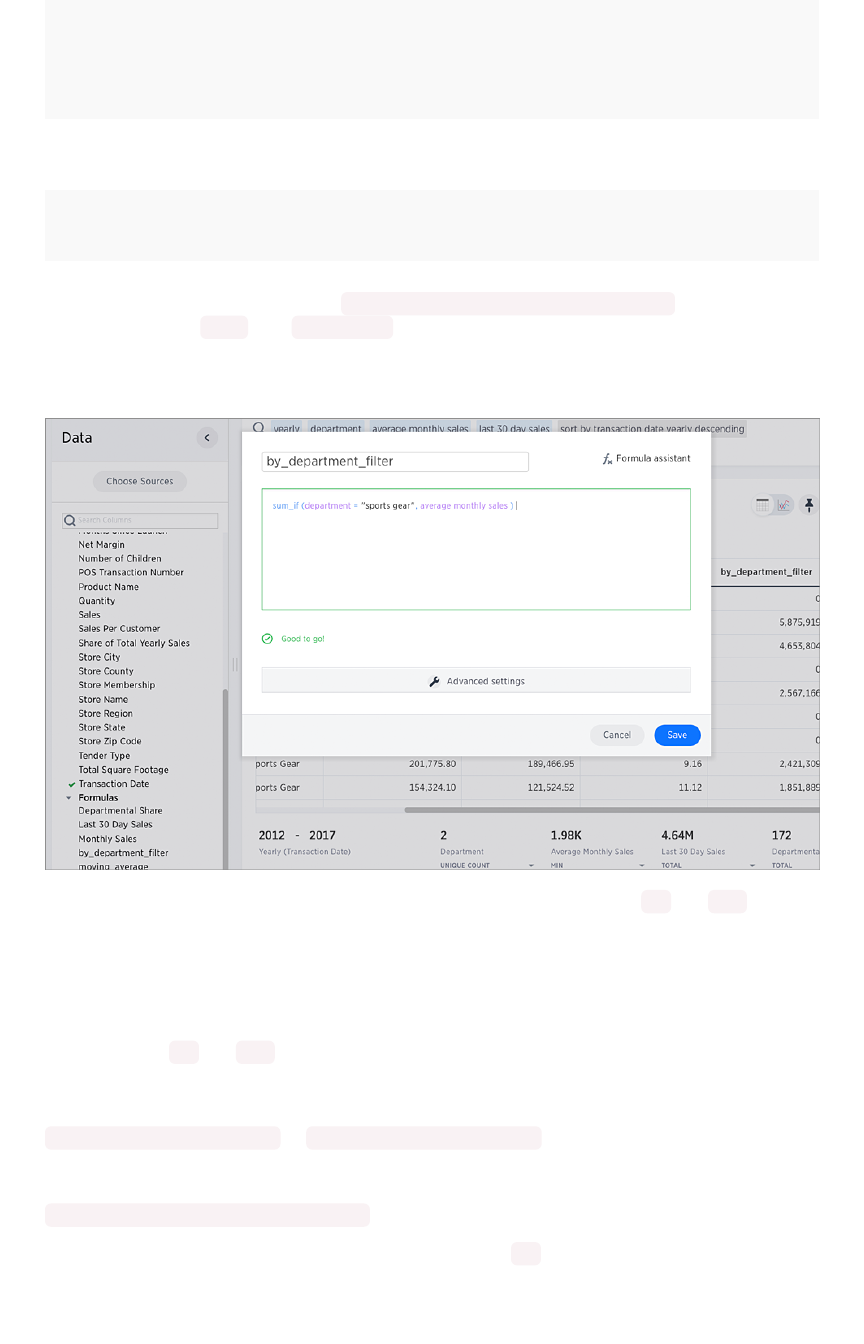
FunctionFunction ExamplesExamples
sum_if(region=’west’,
revenue)
Only aggregate the revenue for the values corresponding to west re-
gion.
count_if(region
=’west’, region)
Only aggregate the region for the values corresponding to west re-
gion.
count_if(revenue >
100, red)
Count the number of times red appears when revenue was greater
than 100 (row level revenue data, not aggregated).
A condition can have multiple filters like sales region = west OR region = east . You can also just
type a value such as east as in sales east as a filter. If there are no rows matching the criteria, the
condition returns a 0 (zero). A 0 can result in situations where there are logic errors in the formula, so be
sure to double-check your work.
Once you have aggregated with a filter, you can do further comparisons with the vs and all
keywords.
Using the vs and all keywords
You can use the vs and all keywords to expand the usefulness of your comparison filters. It
compares a measure across different sets of filters and or groupings. The basic format of a comparison
search is:
<common search tokens> (A vsvs B) <common search tokens>
For example:
revenue region last 10 years vs all
Try this syntax on using the Superstore example data. The first vs example compares two segments
with a single search token:
Filtered aggregation functions
February 07, 2019
ThoughtSpot Users Guide Page 163

The system automatically applies the sales token to both sides and groups each segment. You can
use the all keyword to break out the segments and avoid grouping.
You can also provide multiple vs instances:
Filtered aggregation functions
February 07, 2019
ThoughtSpot Users Guide Page 164
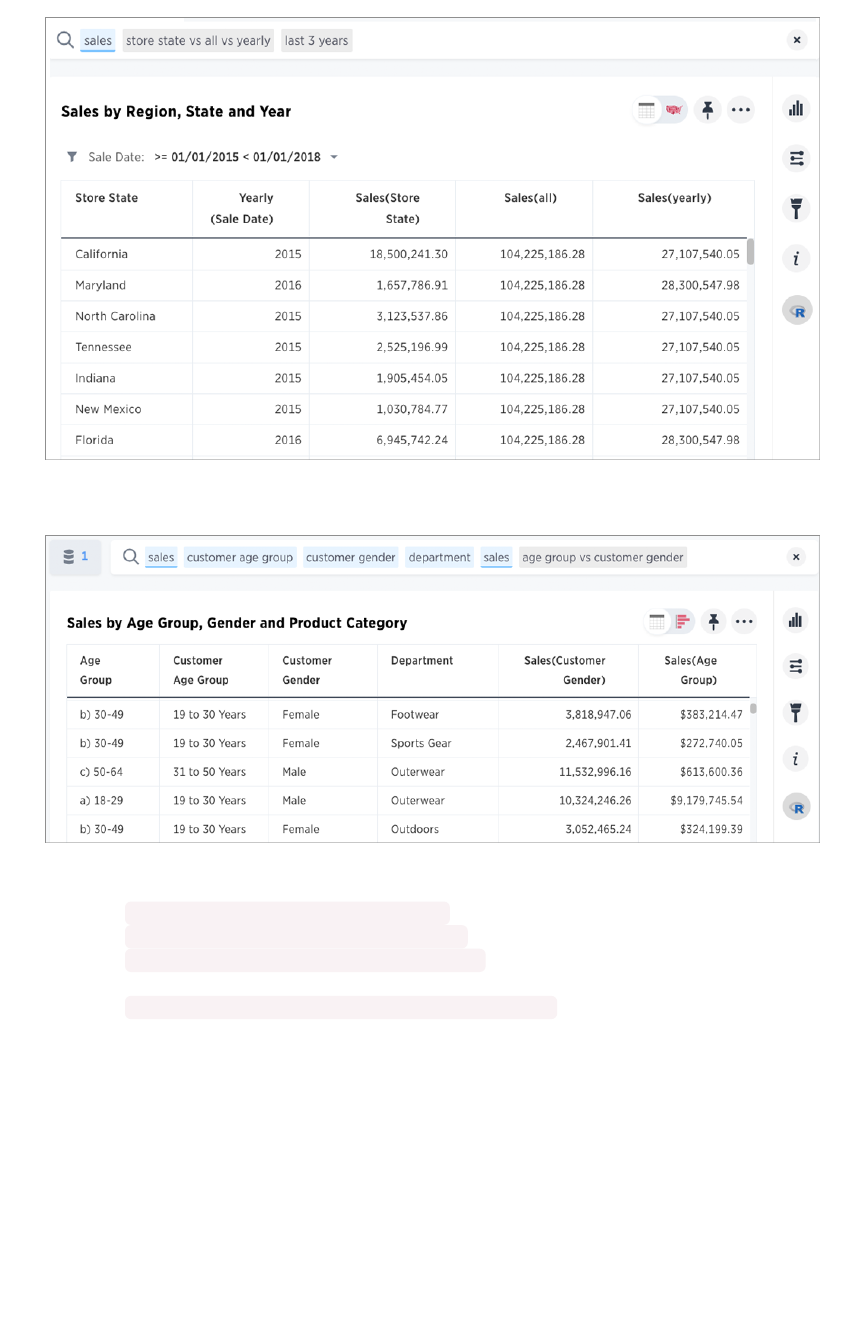
Of course, you can compare across different columns as well:
Other supported formats you can try:
•sales accessory6 accessory12 vs all
•sales monthly accessory6 vs last year
•sales staples file caddy vs all monthly answers what the share of sales belonging
to the file caddy by month
•sales (germany ariel vs laundry) july 2017 time answers what is the category
share of Germany Ariel for July 17?
Filtered aggregation functions
February 07, 2019
ThoughtSpot Users Guide Page 165

Type conversion functions
Some formulas require the input to be of a particular data type. If you find that you want to pass a value
to the function, but it is of the wrong data type, you can convert it using a conversion formula.
The following are the conversion formulas:
FunctionFunction DescriptionDescription ExamplesExamples
to_bool Returns the input as a boolean (true or false). to_bool (0) = false
to_bool (married)
to_date Accepts a date represented as an integer or text
string, and a second string parameter that can
include strptime date formatting elements. Re-
places all the valid strptime date formatting ele-
ments with their string counterparts and returns
the result. Does not accept epoch formatted
dates as input.
to_date (date_sold, '%Y-
%m-%d')
to_double Returns the input as a double. to_double ('3.14') = 3.14
to_double (revenue * .01)
to_integer Returns the input as an integer. to_integer ('45') + 1 =
46
to_integer (price + tax -
cost)
to_string Returns the input as a text string. To convert a
date to a string, specify the date format you
want to use.
to_string (45 + 1) = '46'
to_string (revenue -
cost)
to_string
(date,('%m/%d/%y'))
Type conversion functions
February 07, 2019
ThoughtSpot Users Guide Page 166

About date formulas
Date functions are useful when you want to compare data collected between two date periods. Date
formulas allow you to apply date related functions to your formulas.
Date formulas
The date formulas include:
FunctionFunction DescriptionDescription ExamplesExamples
add_days Returns the result of
adding the specified
number of days to
the given date.
add_days (01/30/2015, 5) = 02/04/
2015
add_days (invoiced, 30)
date Returns the date
portion of a given
date.
date (home visit)
day Returns the number
(1-31) of the day for
the given date.
day (01/15/2014) = 15
day (date ordered)
day_number_of_quarter Returns the number
of the day in a quar-
ter for a given date.
Add an optional
second parameter
to specify whether a
'fiscal' or 'calendar'
year is used to cal-
culate the result.
Default is 'calendar'.
(In examples, start
of fiscal year is set
to May 01.)
day_number_of_quarter (01/30/2015)
= 30
day_number_of_quarter (01/30/2015,
'fiscal') = 91
day_number_of_week Returns the number
(1-7) of the day in a
week for a given
date with 1 being
Monday and 7 being
Sunday.
day_number_of_week(01/15/2014) = 3
day_number_of_week (shipped)
About date formulas
February 07, 2019
ThoughtSpot Users Guide Page 167

FunctionFunction DescriptionDescription ExamplesExamples
day_number_of_year Returns the number
(1-366) of the day in
a year from a given
date. Add an option-
al second parameter
to specify whether a
'fiscal' or 'calendar'
year is used to cal-
culate the result.
Default is 'calendar'.
(In examples, start
of fiscal year is set
to May 01.)
day_number_of_year (01/30/2015) =
30
day_number_of_year ( 01/30/2015,
'fiscal' ) = 275
day_number_of_year (invoiced)
day_of_week Returns the day of
the week for the giv-
en date.
day_of week (01/30/2015) = Friday
day_of_week (serviced)
diff_days Subtracts the sec-
ond date from the
first date and returns
the result in number
of days, rounded
down if not exact.
diff_days (01/15/2014, 01/17/2014)
= -2
diff_days (purchased, shipped)
diff_time Subtracts the sec-
ond date from the
first date and returns
the result in number
of seconds.
diff_time (01/01/2014, 01/01/2014)
= -86,400
diff_time (clicked, submitted)
hour_of_day Returns the hour of
the day for the given
date.
hour_of_day (received)
is_weekend Returns true if the
given date falls on a
Saturday or Sunday.
is_weekend (01/31/2015) = true
is_weekend (emailed)
month Returns the month
from the given date.
month (01/15/2014) = January
month (date ordered)
About date formulas
February 07, 2019
ThoughtSpot Users Guide Page 168

FunctionFunction DescriptionDescription ExamplesExamples
month_number Returns the number
(1-12) of the month
from a given date.
Add an optional
second parameter
to specify whether a
'fiscal' or 'calendar'
year is used to cal-
culate the result.
Default is 'calendar'.
(In examples, start
of fiscal year is set
to May 01.)
month_number (09/20/2014) = 9
month_number ( 09/20/2014, 'fiscal'
) = 5
month_number (purchased)
month_number_of_quarter Returns the month
(1-3) number for the
given date in a quar-
ter. Add an optional
second parameter
to specify whether a
'fiscal' or 'calendar'
year is used to cal-
culate the result.
Default is 'calendar'.
(In examples, start
of fiscal year is set
to May 01.)
month_number_of_quarter (02/20/
2018) = 2
month_number_of_quarter (02/20/
2018,'fiscal' ) = 1
now Returns the current
timestamp.
now ()
quarter_number Returns the number
(1-4) of the quarter
associated with the
given date. Add an
optional second pa-
rameter to specify
'fiscal' or 'calendar'
dates. Default is
'calendar'. (In exam-
ples, start of fiscal
year is set to May
01.)
quarter_number ( 04/14/2014) = 2
quarter_number ( 04/14/2014, 'fis-
cal' ) = 4
quarter_number ( shipped )
About date formulas
February 07, 2019
ThoughtSpot Users Guide Page 169

FunctionFunction DescriptionDescription ExamplesExamples
start_of_month Returns MMM yyyy
for the first day of
the month. Your in-
stallation configura-
tion can override
this setting so that it
returns a different
format such as MM/
dd/yyyy . Speak
with your
ThoughtSpot admin-
istrator for informa-
tion on doing this.
start_of_month ( 01/31/2015 ) = Jan
FY 2015
start_of_month (shipped)
start_of_quarter Returns the date for
the first day of the
quarter for the given
date. Add an option-
al second parameter
to specify whether a
'fiscal' or 'calendar'
year is used to cal-
culate the result.
Default is 'calendar'.
(In examples, start
of fiscal year is set
to May 01.)
start_of_quarter ( 04/01/2014) =
Apr 2014
start_of_quarter ( 04/01/2014, 'fis-
cal') = Feb 2014
start_of_quarter (sold)
start_of_week Returns the date for
the first day of the
week for the given
date.
start_of_week ( 06/01/2015 ) = 05/
30/2015 Week
start_of_week (emailed)
start_of_year Returns the date for
the first day of the
year for the given
date. Add an option-
al second parameter
to specify whether a
'fiscal' or 'calendar'
year is used to cal-
culate the result.
Default is 'calendar'.
(In examples, start
of fiscal year is set
to May 01.)
start_of_year (04/01/2014) returns
Jan 2014
start_of_year (04/01/2014, 'fis-
cal') returns May 2013
start_of_year (joined)
time Returns the time
portion of a given
date.
time (3/1/2002 10:32) = 10:32
time (call began)
About date formulas
February 07, 2019
ThoughtSpot Users Guide Page 170

FunctionFunction DescriptionDescription ExamplesExamples
week_number_of_month Returns the week
number for the given
date in a month.
week_number_of_month(03/23/2017) =
3
week_number_of_quarter Returns the week
number for the given
date in a quarter.
Add an optional
second parameter
to specify whether a
'fiscal' or 'calendar'
year is used to cal-
culate the result.
Default is 'calendar'.
(In examples, start
of fiscal year is set
to May 01.)
week_number_of_quarter (04/03/2017)
= 1
week_number_of_quarter (04/03/2017,
'fiscal') = 10
week_number_of_year Returns the week
number for the given
date in a year. Add
an optional second
parameter to specify
whether a 'fiscal' or
'calendar' year is
used to calculate
the result. Default is
'calendar'. (In exam-
ples, start of fiscal
year is set to May
01.)
week_number_of_year (01/17/2014) =
3
week_number_of_year ( 01/17/2014,
'fiscal') = 38
year Returns the year
from a given date.
Add an optional
second parameter
to specify whether a
'fiscal' or 'calendar'
year is used to cal-
culate the result.
Default is 'calendar'.
(In examples, start
of fiscal year is set
to May 01. Per stan-
dard convention, the
fiscal year is defined
by the year-end
date.)
year (01/15/2014) = 2014
year (12/15/2013, 'fiscal' ) = 2014
year (date ordered)
About date formulas
February 07, 2019
ThoughtSpot Users Guide Page 171

Calculate date formulas
Calculating date formulas is useful when you want to compare data from different date periods. Here are
some examples of using date formulas:
Example 1
The following example shows you how to create formulas that you can use to compare data from this
week to last week.
• The formula for this week is: week ( today () ) - week (date)
• The formula for last week is: diff_days ( week ( today ) ) , week ( date ) )
Example 2
The following example shows you how to calculate the percent increase from the last date period to this
period in terms of revenue.
1. Create the formula: this week revenue = sum ( if ( this week ) then revenue else
0 )
2. Then create the formula: last week revenue = sum ( if (last week ) then revenue
else 0 )
3. Use nested formulas to calculate the percent increase by creating a parent formula: percent
increase = ( ( last week revenue - this week revenue) / last week revenue )
\* 100
Fiscal and Gregorian calendars
For the following date formulas, you can further specify either fiscal or Gregorian calendar on
which to base date calculations. (If you do not specify a calendar type, the formula will default to
standard Gregorian, with the year starting in January.)
•day_number_of_quarter
•day_number_of_year
•month_number
•month_number_of_quarter
•quarter_number
•start_of_quarter
•start_of_year
•week_number_of_quarter
•week_number_of_year
•year
Your ThoughtSpot administrator and ThoughtSpot Support can set up a fiscal calendar year to start on
any month. If the fiscal year is not explicitly configured in the system, fiscal defaults to January,
the same as the Gregorian calendar .
For example, the formula month_number_of_quarter (05/01/2014) would return 2based on the
default Gregorian calendar, whereas the formula month_number_of_quarter (05/01/2014,
'fiscal') would return 1if your administrator has configured the fiscal calendar to start at May.
About date formulas
February 07, 2019
ThoughtSpot Users Guide Page 172


Percent (simple number) calculations
You can use simple number functions to perform useful percent calculations. Simple number functions
include addition, subtraction, multiplication, and division.
FunctionFunction DescriptionDescription ExamplesExamples
* Returns the result of multiplying both num-
bers.
•3 * 2 = 6
•price * taxrate
+ Returns the result of adding both numbers. • 1 + 2 = 3
•price + shipping
- Returns the result of subtracting the sec-
ond number from the first.
•3 - 2 = 1
•revenue - tax
/ Returns the result of dividing the first num-
ber by the second.
•6 / 3 = 2
•markup / retail price
Calculate percentages
Calculating percentages is useful when you want to see, for example, the percentage revenue generated
from each channel (online, stores, partner, etc.). For example, you can figure out the percentage revenue
generated from each channel (online, stores, partners, etc.).
Create a formula called Percent Revenue in the Formula AssistantFormula Assistant:
( sum ( revenue ) / group sum ( revenue ) ) \* 100
Now you can search by each channel, using the percent revenue formula that you just created.
Percent (simple number) calculations
February 07, 2019
ThoughtSpot Users Guide Page 174

Formula operators
Formula operators allow you to apply if /then /else conditions in your formulas. You can leverage
operators in your formulas to have them return true, false, or a predetermined value.
Formula operators
The operators include:
OperatorOperator DescriptionDescription ExamplesExamples
and Returns true when both conditions
are true, otherwise returns false.
(1 = 1) and (3 > 2) = true
lastname = 'smith' and state
='texas'
Note:Note: Not available for row level
security (RLS) formulas.
if…then…else Conditional operator. if (3 > 2) then 'bigger' else
'not bigger'
if (cost > 500) then 'flag' else
'approve'
ifnull Returns the first value if it is not null,
otherwise returns the second.
ifnull (cost, 'unknown')
isnull Returns true if the value is null. isnull (phone)
not Returns true if the condition is false,
otherwise returns false.
not (3 > 2) = false
not (state = 'texas')
or Returns true when either condition is
true, otherwise returns false.
(1 = 5) or (3 > 2) = true
state = 'california' or state
='oregon'
Calculate the conditional sum
Calculating the conditional sum is useful when you want to see, for example, the total revenue for a
product by region.
Conditional sum formulas follow this syntax: if (some condition) then (measure) else 0. You can use this
syntax to limit your search in cases when you don’t want to add a column filter. For example: if (
product = shoes ) then revenue else 0
The following example shows you how to figure out the number of customers who bought both
products, in this case an ipad and galaxy tablet. You can then find out the revenue generated by both
products.
1. Create the following formula in the Formula Builder:
Formula operators
February 07, 2019
ThoughtSpot Users Guide Page 175

ipadcount = sum ( if ( product = 'ipad' ) then 1 else 0 ) > 0
This formula will provide you with the number of ipads that were bought.
2. You can then create another formula that looks like this:
galaxycount = sum ( if ( product = 'galaxy' then 1 else 0 ) > 0
And this formula will provide you with the number of galaxys that were bought.
3. Using nested formulas, you can combine these two formulas.
For example: f1 = ipadcount + galaxycount
4. Now, you can search using the f1 formula to find out the revenue generated by both
products.
Related information
•Operators in the Formula function reference
Formula operators
February 07, 2019
ThoughtSpot Users Guide Page 176
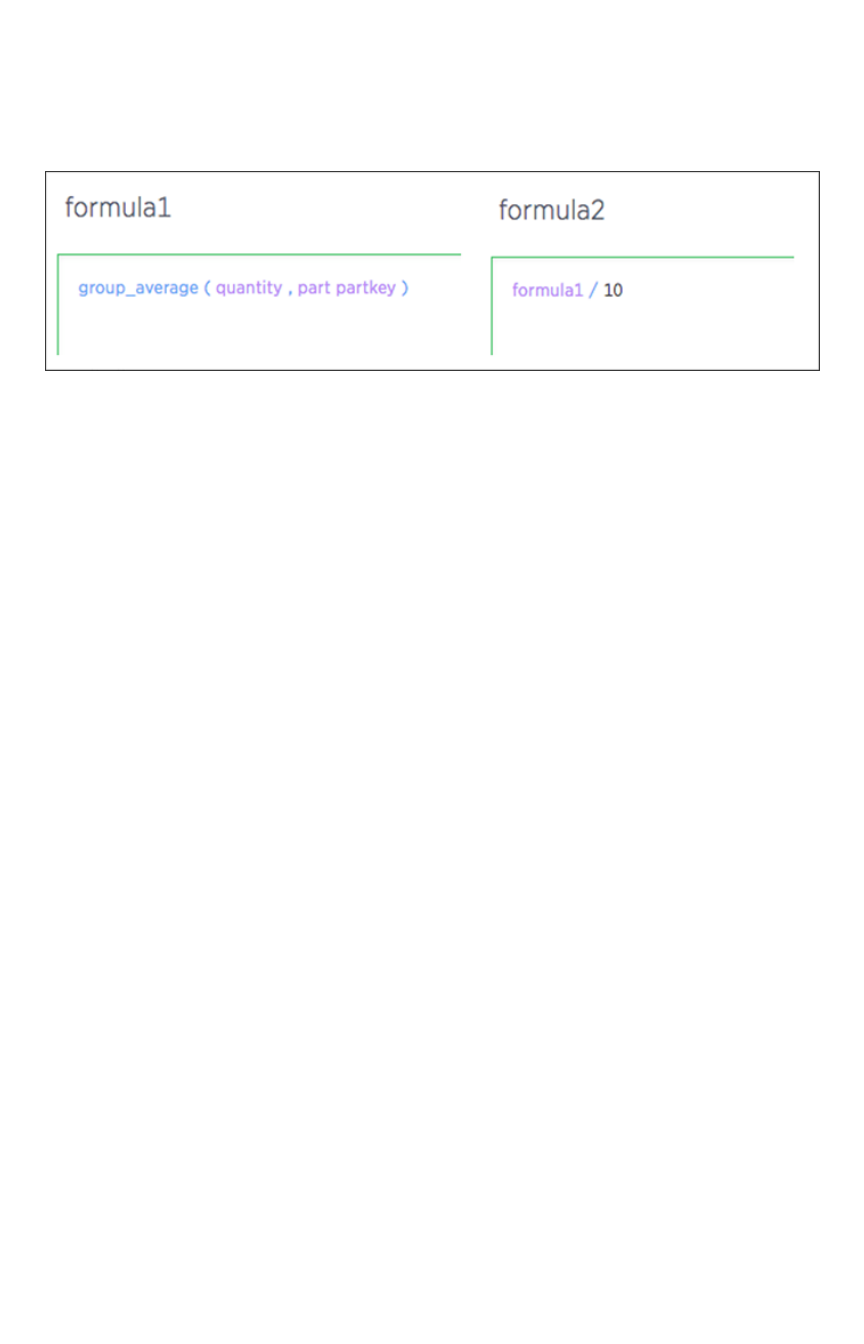
Nested formulas
Nested formulas, or formula on formula, allow you to reference a formula within another formula. This
graphic illustrates how you would define a formula and then reference it from another:
These formulas become columns, and are even suggested within the Formula Builder. There is no limit to
the nesting depth you can create.
ThoughtSpot doesn’t allow users to create invalid formulas, such as cyclic (loops) or inconsistent
aggregation formulas. To support this, formulas have dependency awareness. For example, you cannot
delete a formula that is nested in another. Also, formula dependency awareness ensures that you do not
break any dependent formulas while editing a formula with dependent formulas. For example, common
cases of invalidating occur when users try to change a data type.
Nesting enables encapsulation and decomposition of formula logic. Meaning, you may have a staff
member create some small useful formulas that others can use. This also minimizes duplication of
formulas.
Nested formulas
February 07, 2019
ThoughtSpot Users Guide Page 177

Formula support for chasm trap
schemas
You can create a formula that involves aggregated measures coming from multiple fact tables of a
chasm trap.
Just as you would create any other formula, you can create a formula that spans across a chasm trap.
The Formula Builder will provide column suggestions for formulas that span across chasm traps.
Formula support for chasm trap schemas
February 07, 2019
ThoughtSpot Users Guide Page 178
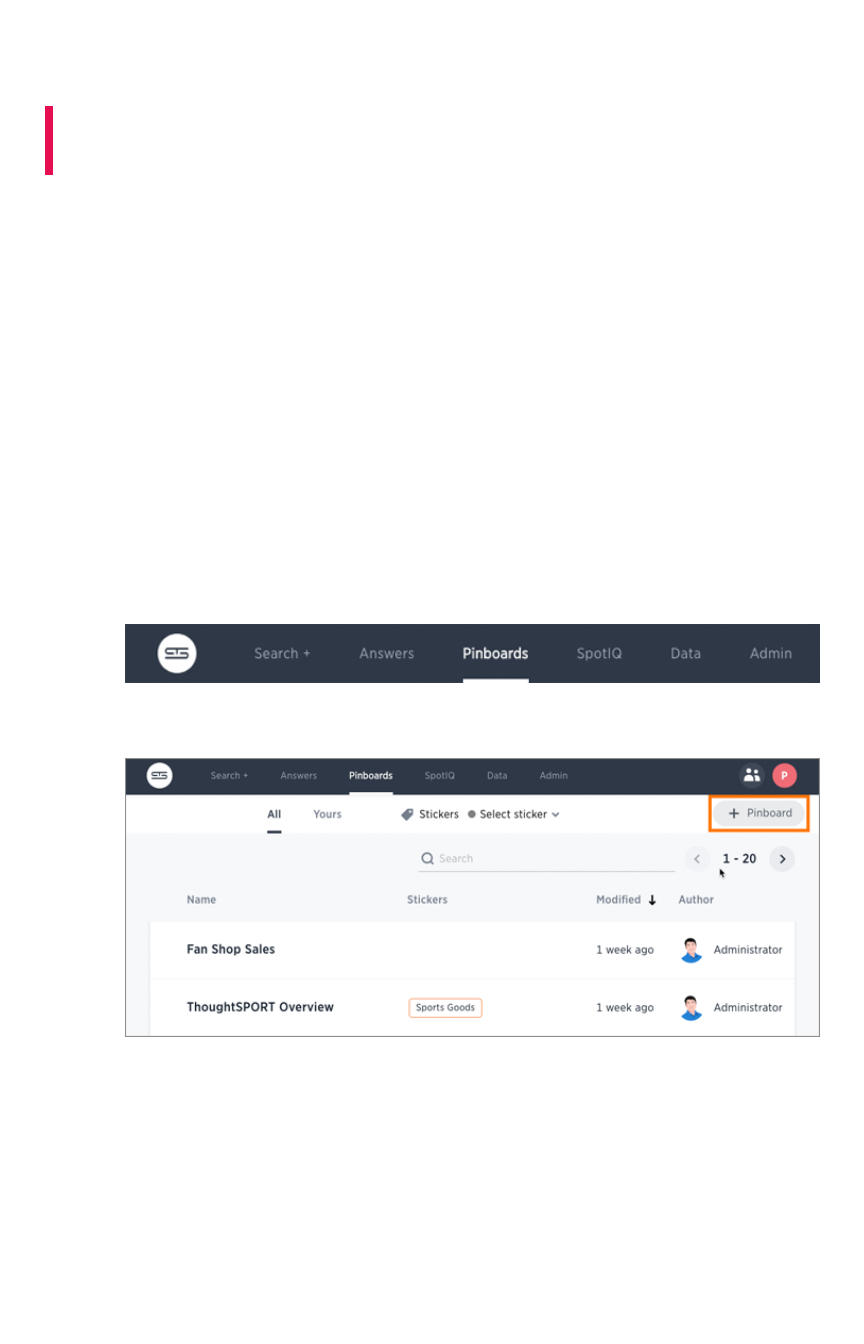
Basic pinboard usage
Summary:Summary: Create a new pinboard to group and manage related
search results. Pinboards are the ThoughtSpot term for a dashboard.
Pinboards act like live dashboards. They are collections of your related charts, tables, and headline.
What are pinboards
You can pin charts and tables to any pinboard which you created, and those that have been shared with
you with the EditEdit privilege. When you create a pinboard, you can share it with other people with either
the ViewView or EditEdit privilege. Pinboards are interactive, allowing you to perform actions like filtering,
excluding values, and drill down on the visualizations.
Create a pinboard
To create a pinboard:
1. Click PinboardsPinboards, on the top navigation bar.
2. Click + New Pinboard+ New Pinboard on the pinboards list page.
3. In the New PinboardNew Pinboard dialog box, give your pinboard a name and description. Then click
CreateCreate.
Basic pinboard usage
February 07, 2019
ThoughtSpot Users Guide Page 179
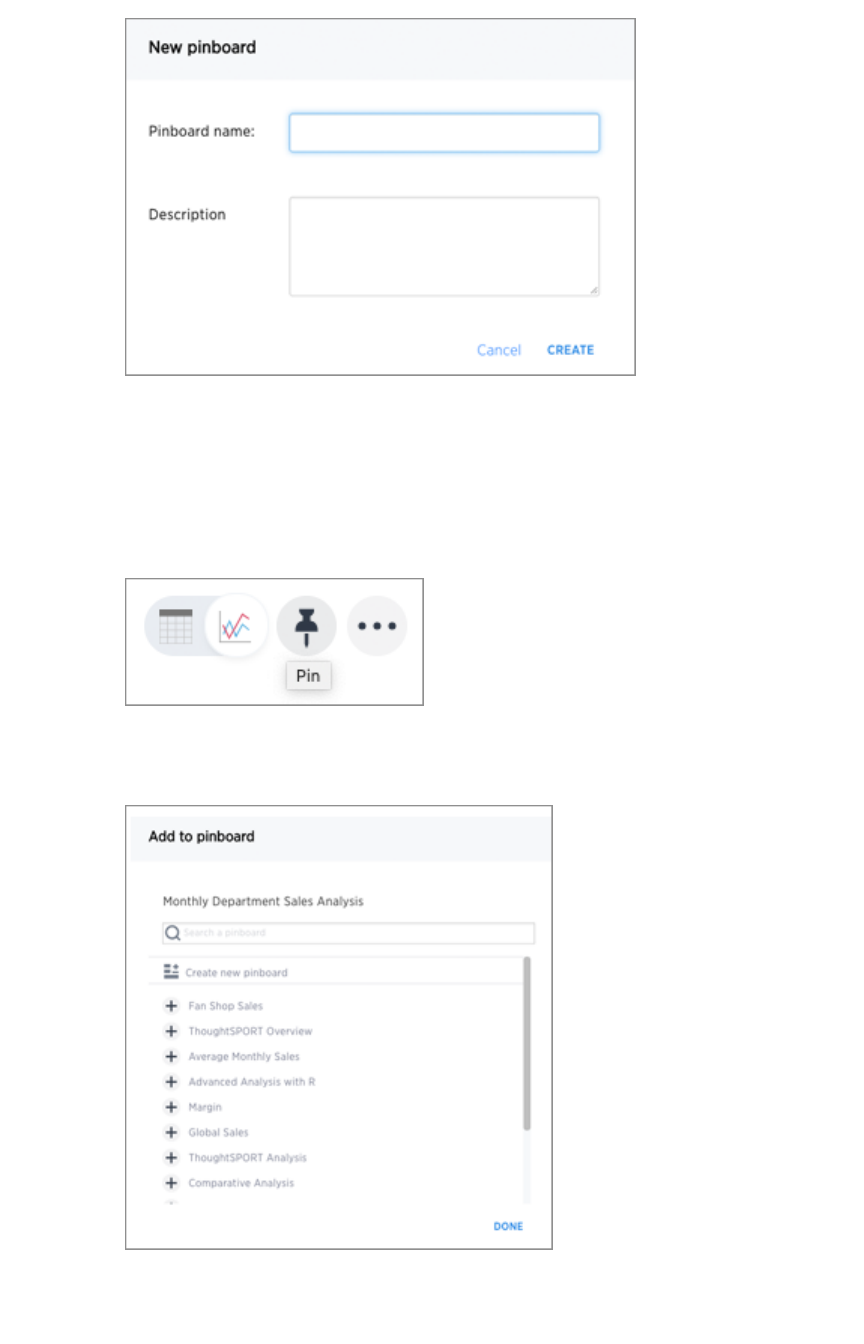
Add an answer to a pinboard
Instead of saving an answer you can add it to a pinboard. To add an answer to a pinboard:
1. While viewing your answer of interest, click the PinPin icon at the top right of the answer.
2. In the Add to pinboardAdd to pinboard dialog box, click the ++ icons next to the pinboards you would like to
add your answer to.
You can also select Create new pinboardCreate new pinboard at the top of the list to create a new pinboard, then
add your answer to it.
Basic pinboard usage
February 07, 2019
ThoughtSpot Users Guide Page 180
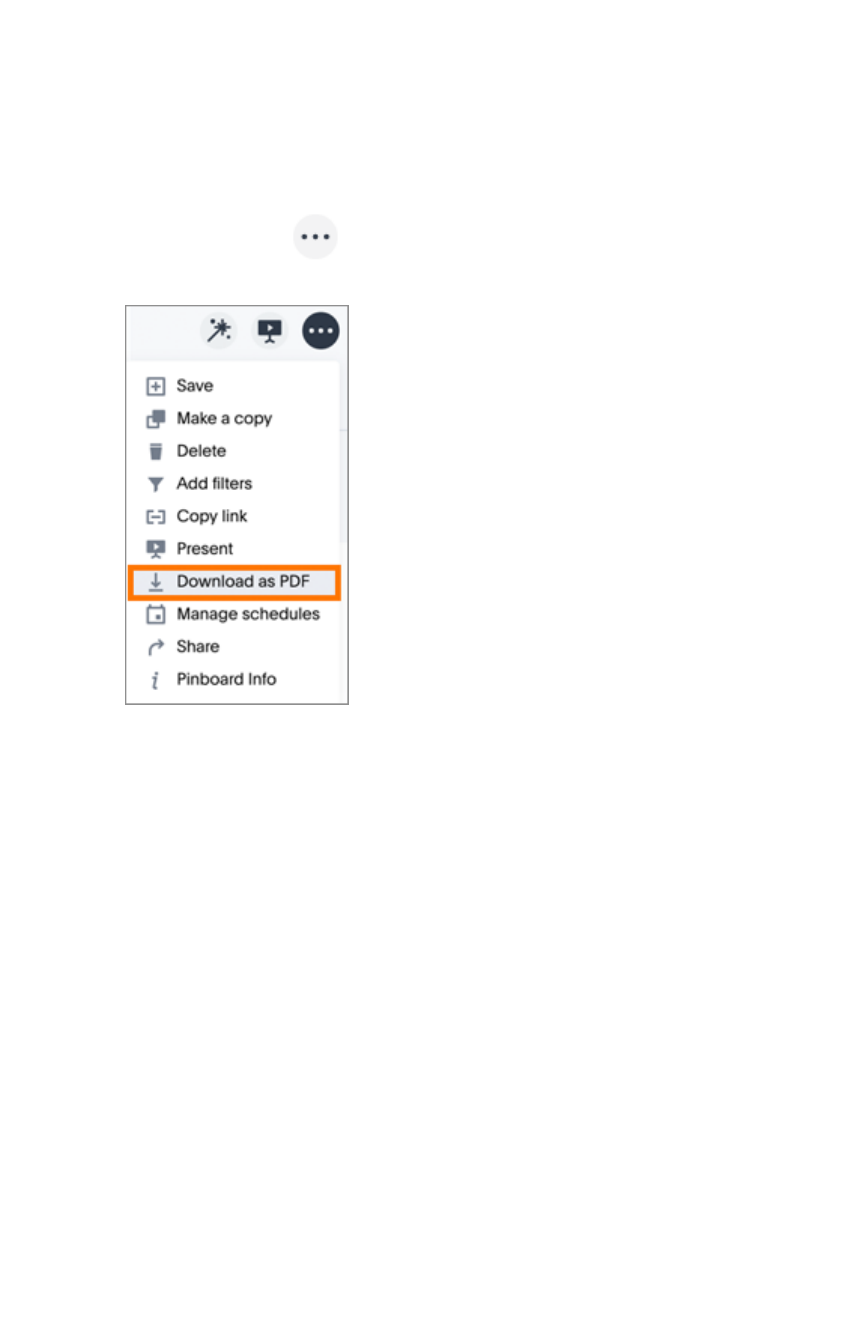
Download a pinboard
You can download a pinboard as a PDF file, without having to download each visualization separately.
Downloading a pinboard works just as it would when downloading an answer. To download a pinboard:
• Click the ellipses icon and select Download as PDFDownload as PDF.
Details about a pinboard
You can see who authored a pinboard, when it was created, and when it was last modified by choosing
Actions > Pinboard InfoActions > Pinboard Info.
Basic pinboard usage
February 07, 2019
ThoughtSpot Users Guide Page 181
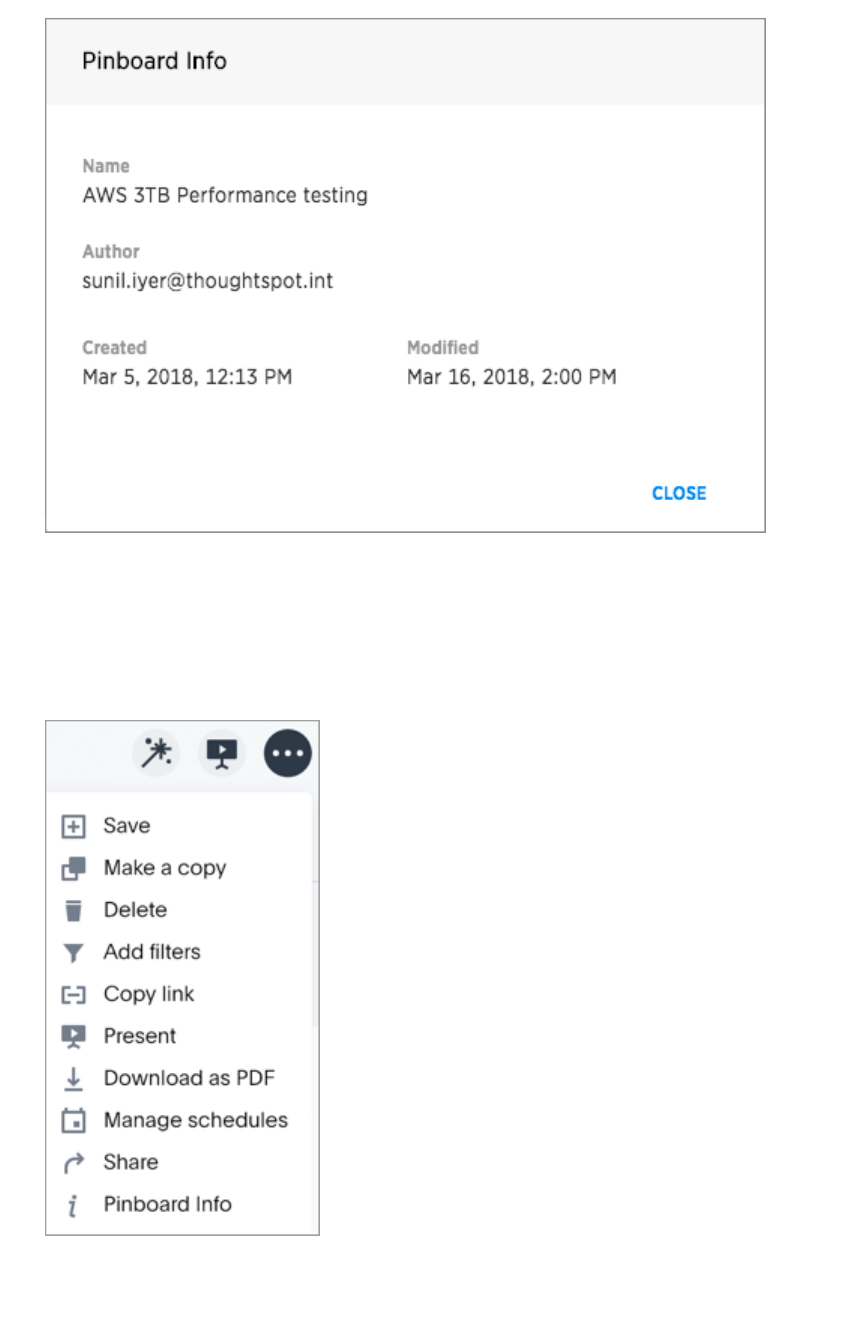
Other pinboard actions
Other pinboard actions include actions you normally perform on your search as well as actions that you
can only perform on a pinboard. Most of these actions are found under the ActionsActions button.
Other actions are available on a pinboard display itself. Some actions always appear, while others
appear only when you hover over specific locations of the pinboard. This diagram displays active action
areas on a pinboard.
Basic pinboard usage
February 07, 2019
ThoughtSpot Users Guide Page 182
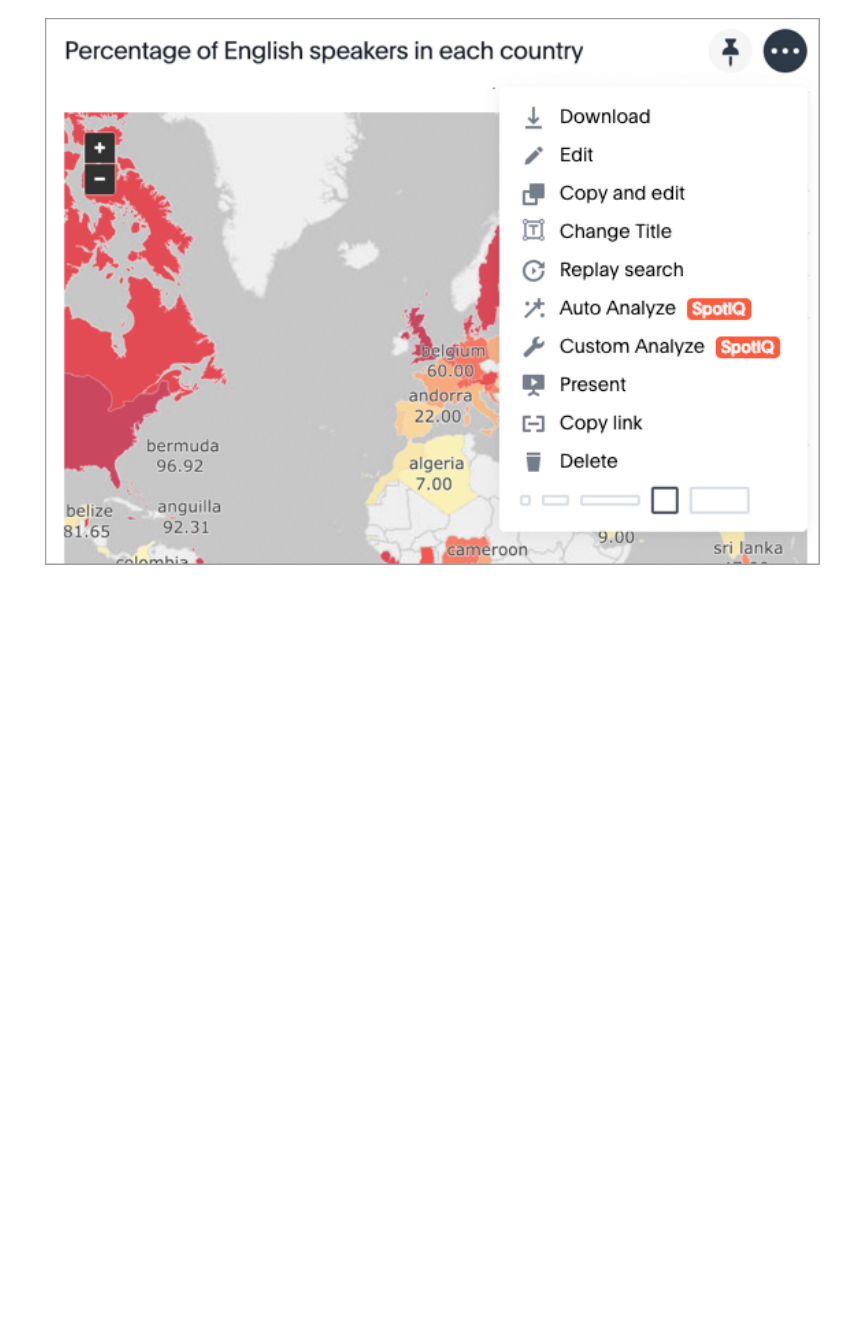
If you make a change to a pinboard, the system recognizes this and displays an alert message with a
Save changesSave changes button at the top of the page. Click this button to make your changes permanent.
Basic pinboard usage
February 07, 2019
ThoughtSpot Users Guide Page 183
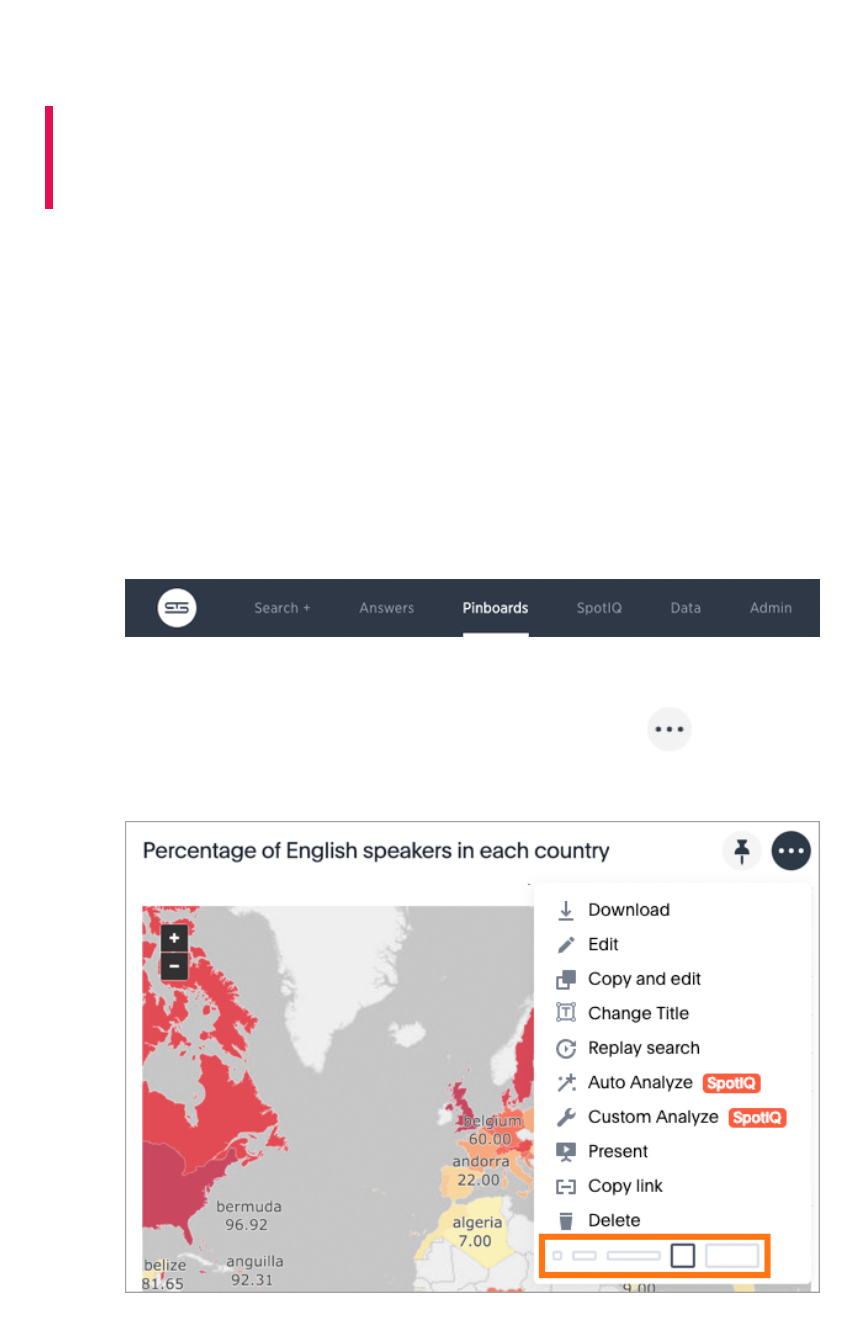
Edit the layout of a pinboard
Summary:Summary: Editing the layout of a pinboard lets you snap visualizations
into place, choose between set visualization sizes, and reset your
layout.
Visualizations within a pinboard are easy to move around and snap into place on a relative flow layout.
Your pinboard layout is also responsive to your browser resolution. This helps keep the layout of your
pinboard neat and organized.
Reorder the visualization
In addition, the size picker at the bottom of a visualization’s three-dot Actions menu lets you toggle
between predetermined sizes for each visualization. Charts and graphs can be toggled between a small,
medium, and full width size, while headlines can be only one size (small). One row of the pinboard can
hold a predetermined number of visualizations of each size.
1. Click PinboardsPinboards, on the top navigation bar.
2. On the pinboards page, click the pinboard you would like to edit.
3. Drag and drop your visualizations on the layout grid to reorder your pinboard. Resize a
visualization by choosing a predetermined size under the ellipses icon for the
visualization.
Edit the layout of a pinboard
February 07, 2019
ThoughtSpot Users Guide Page 184
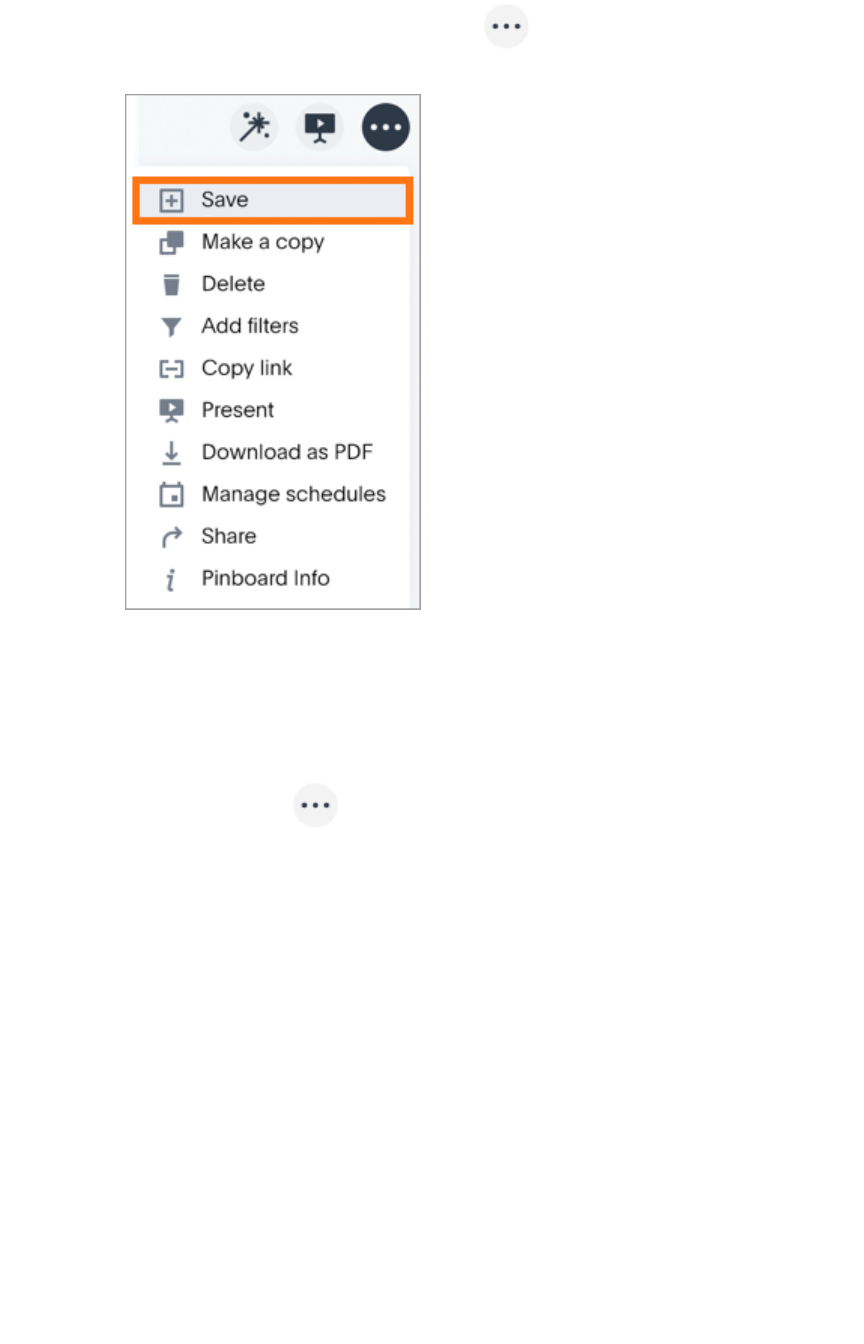
4. Save your pinboard by clicking the ellipses icon and selecting SaveSave.
Change the orientation of a chart or table
You can change the orientation of a chart or table on a pinboard. To do this:
1. Navigate to the chart or table.
2. Click the ellipses icon for the chart or table.
ThoughtSpot displays the drop-down menu.
Edit the layout of a pinboard
February 07, 2019
ThoughtSpot Users Guide Page 185
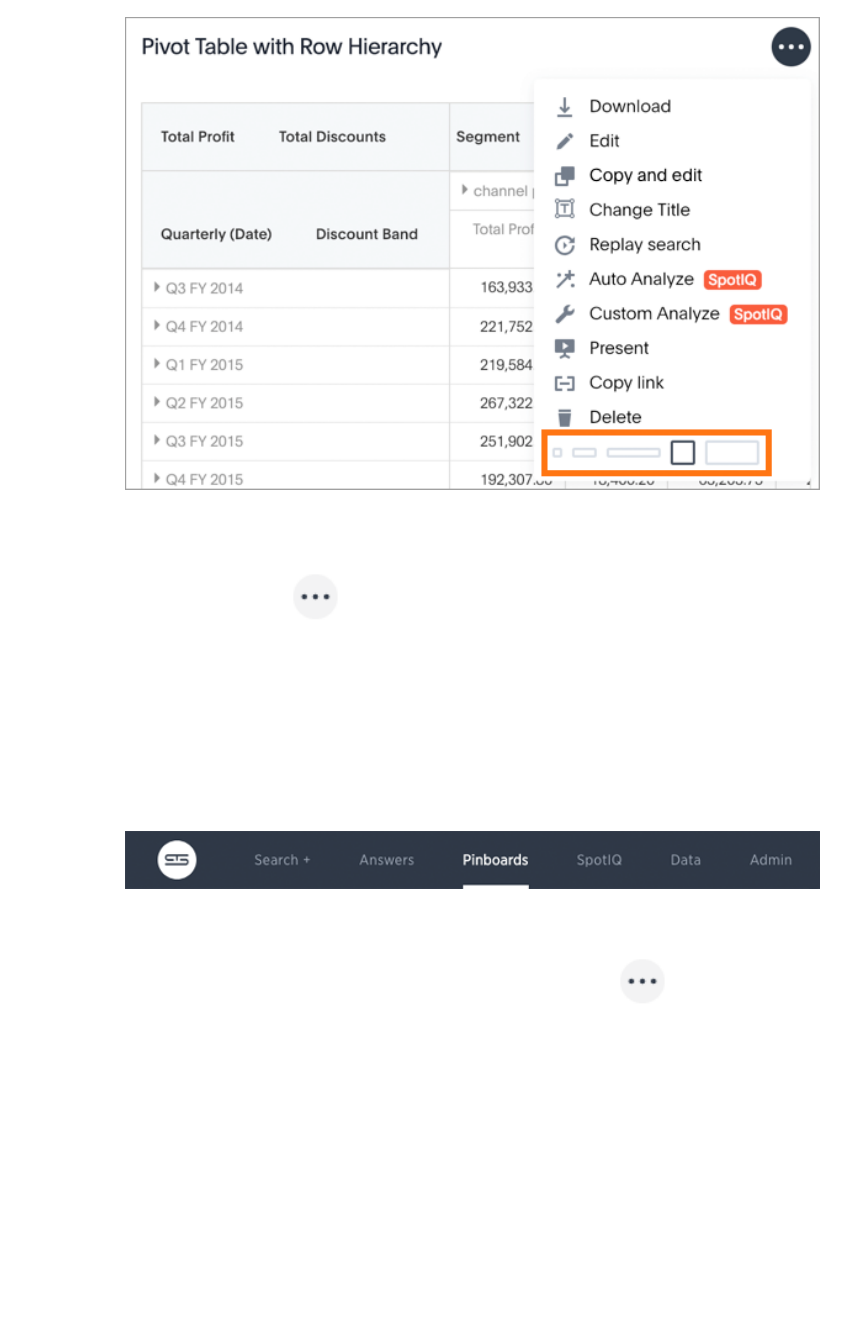
The last item shows different possible orientations, with the current orientation selected.
3. Select a new orientation.
4. Click the ellipses icon and select SaveSave.
Delete a visualization from your pinboard
To delete a visualization:
1. Click PinboardsPinboards, on the top navigation bar.
2. On the pinboard list page, click the pinboard that contains the visualization you would like to
delete.
3. In the upper-right corner of the visualization, click the ellipses icon and select DeleteDelete.
Edit the layout of a pinboard
February 07, 2019
ThoughtSpot Users Guide Page 186
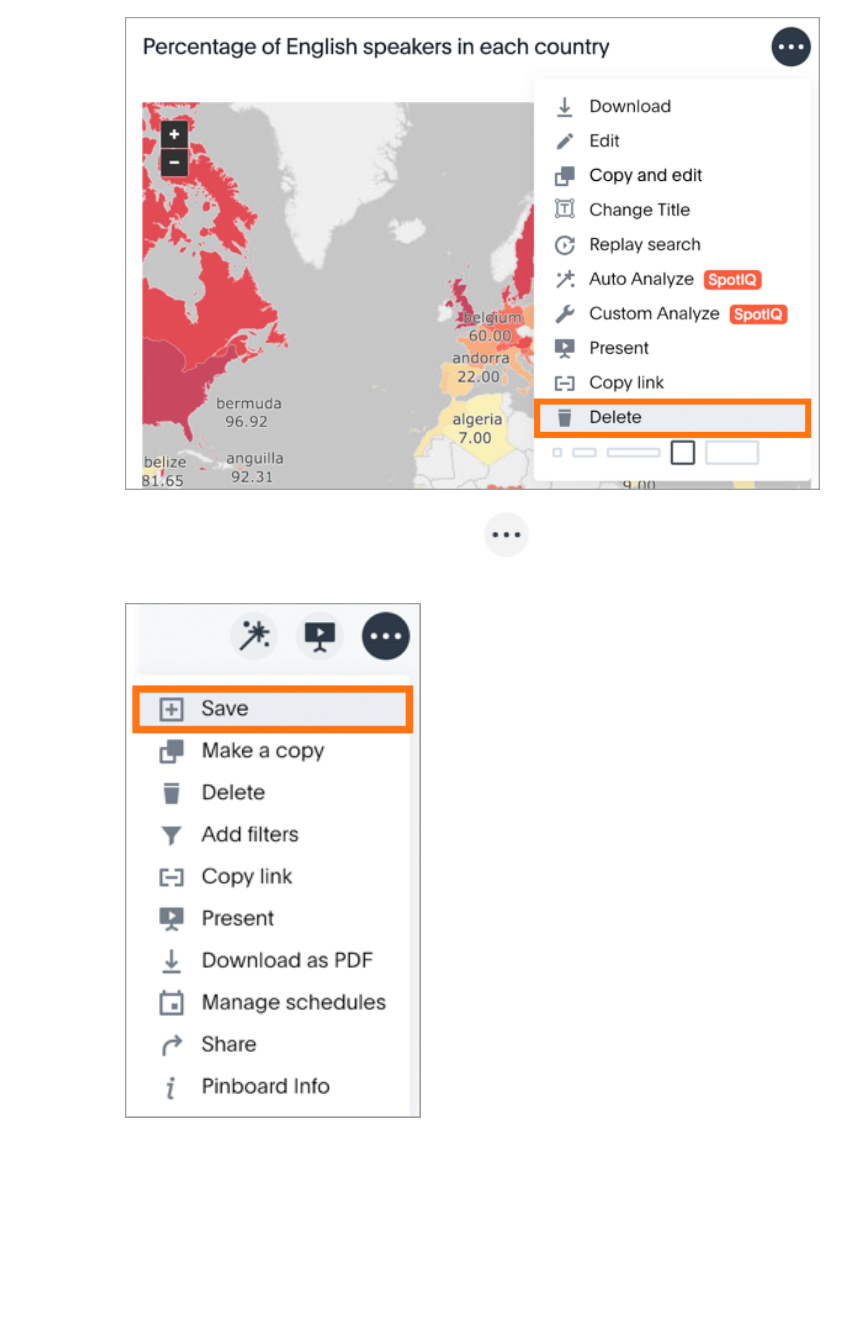
4. Save your pinboard by clicking the ellipses icon and selecting SaveSave.
Copy and edit a visualization from your
pinboard
To edit a copy of a visualization:
Edit the layout of a pinboard
February 07, 2019
ThoughtSpot Users Guide Page 187
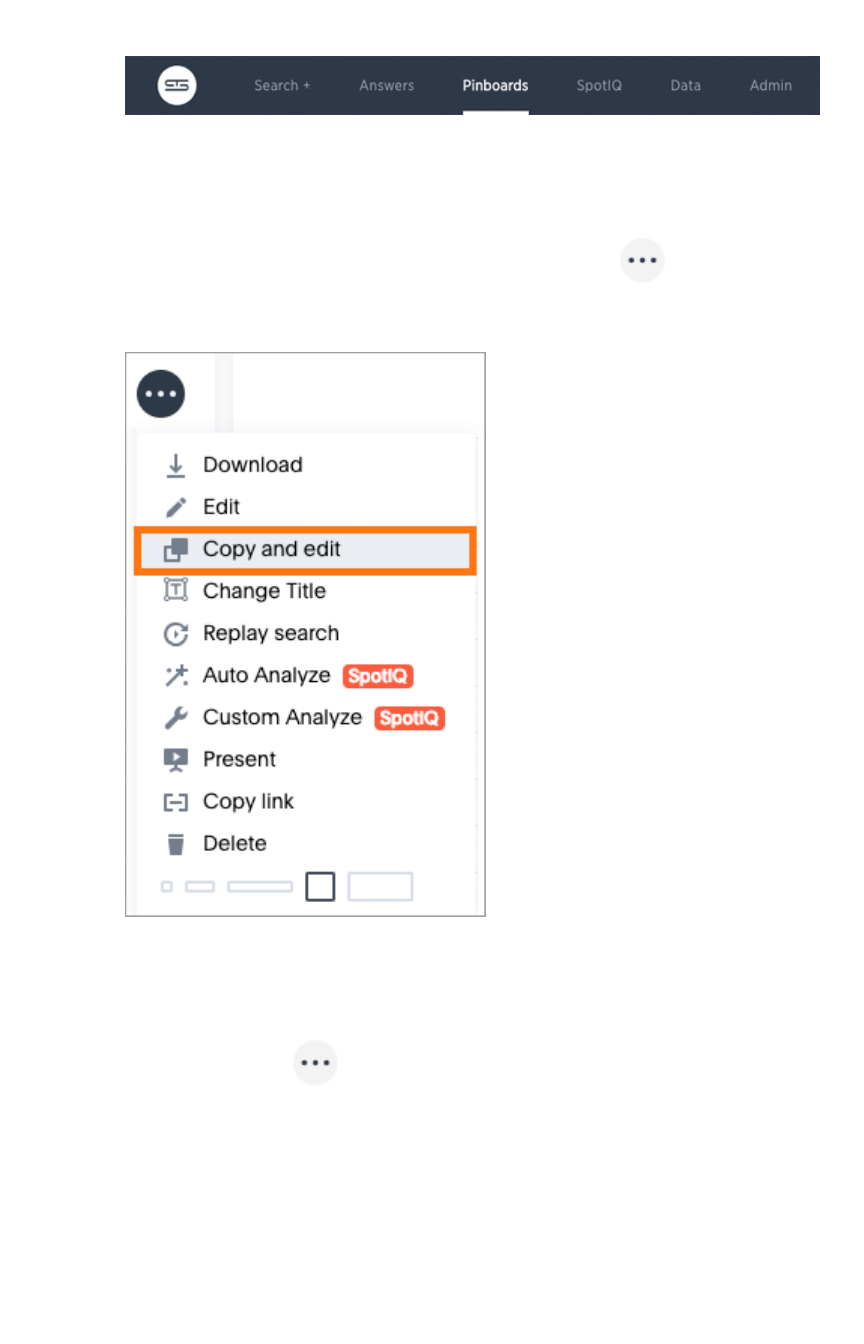
1. Click PinboardsPinboards, on the top navigation bar.
2. On the pinboard list page, click the pinboard that contains the visualization you would like to
edit a copy of.
3. Find a visualization in the pinboard you want to edit.
4. In the upper-right corner of the visualization, click the ellipses icon and select CopyCopy
and editand edit.
A copy of the answer that was used to create the visualization is displayed with “Copy of”
added to the beginning of the title.
5. Make any changes you want to the visualization.
6. Click the ellipses icon and select SaveSave.
The Save Answer dialog box appears.
Edit the layout of a pinboard
February 07, 2019
ThoughtSpot Users Guide Page 188
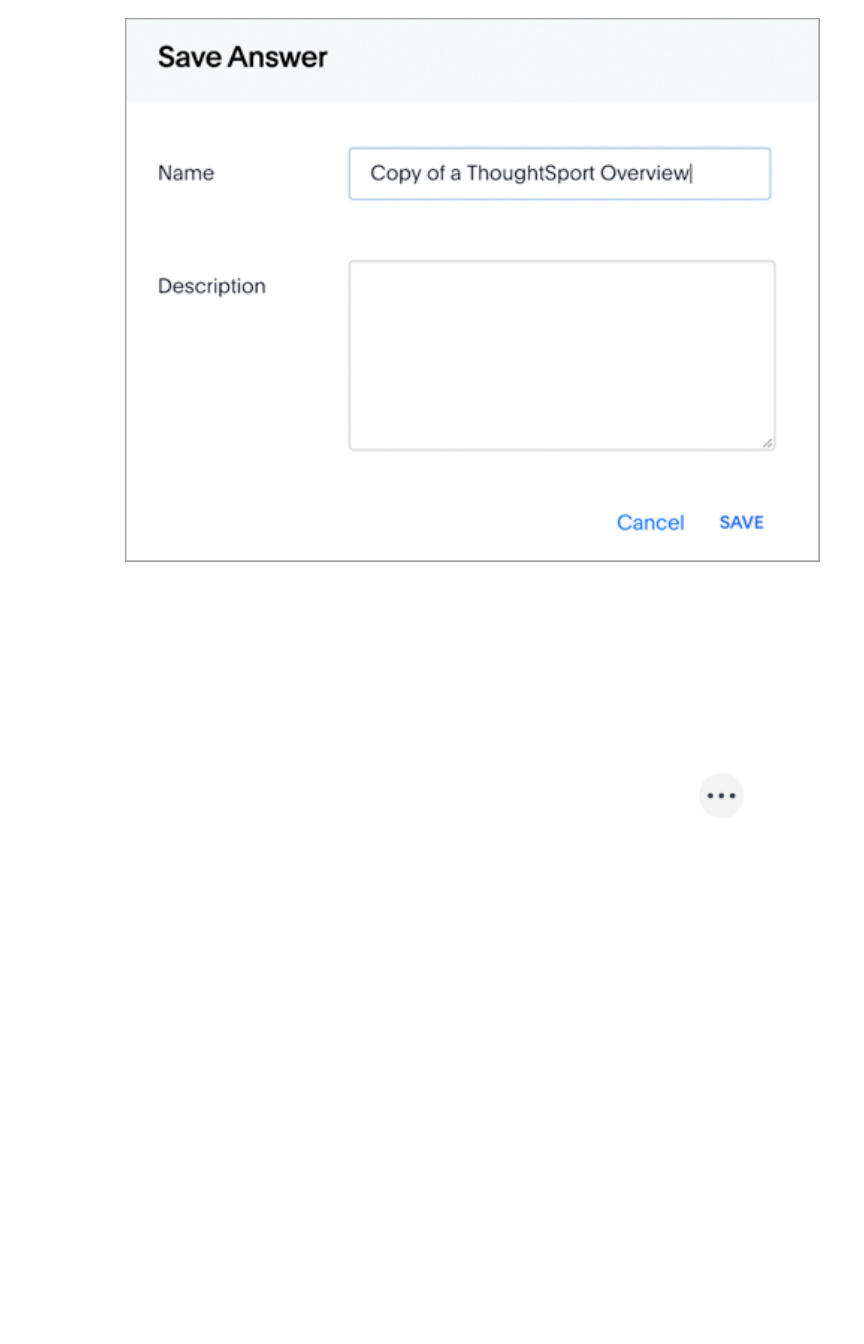
7. Change the name and description, as needed, and click SAVESAVE.
When you navigate back to the Answers page, your edited Answer will appear in the list.
Other pinboard edits
Other pinboard actions include actions you normally perform on your search as well as actions that you
can only perform on a pinboard. Most of these actions are found under the ellipses icon .
Edit the layout of a pinboard
February 07, 2019
ThoughtSpot Users Guide Page 189
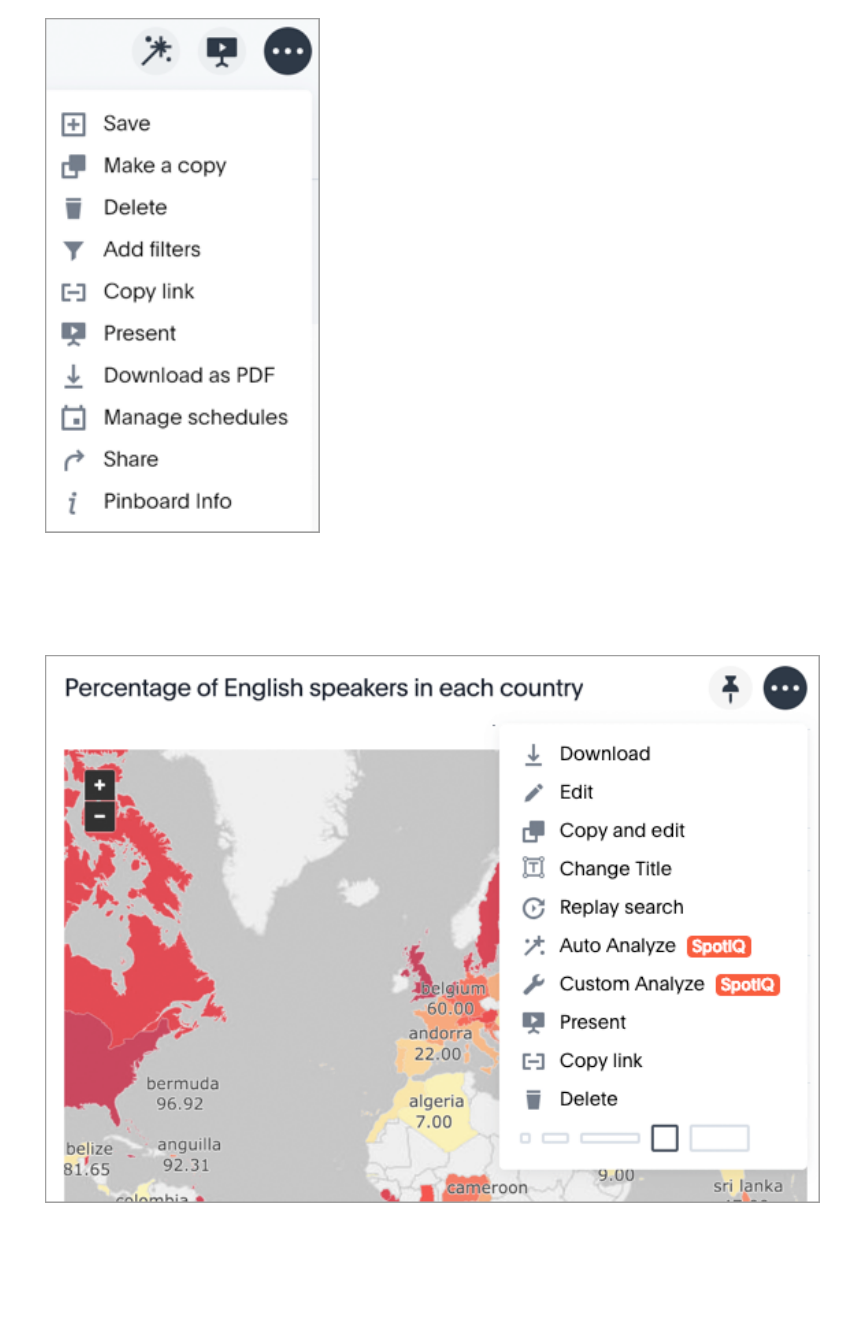
Other actions are available on a pinboard display itself. Some actions are static others appear only when
you over over specific locations of the pinboard. This diagram displays active action areas on a
pinboard.
Edit the layout of a pinboard
February 07, 2019
ThoughtSpot Users Guide Page 190
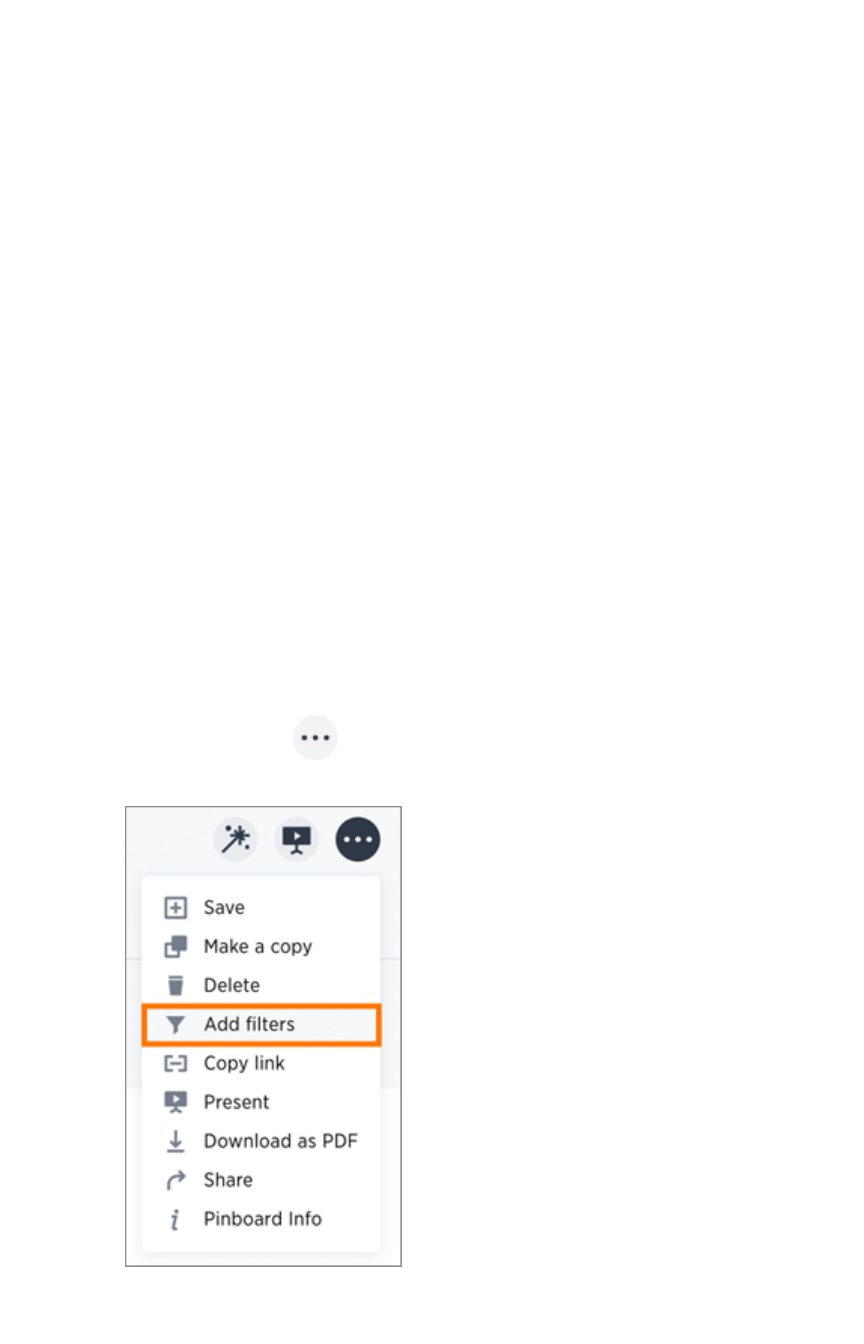
Pinboard filters
Filters, including bulk filters and exclude fiters, can be applied to pinboards just as with tables and
charts. These kinds of filters apply to an entire pinboard, making it easy to see only the data that you are
interested in across the tables and charts within a pinboard.
When to use a pinboard filter
Pinboard filters can be very useful when you want to apply the same filters to more than one related
visualization. You can narrow the focus of your pinboard for specific purposes or audiences.
When you apply a filter, the pinboard is not automatically saved with your filter applied. This is to
encourage ad hoc filtering. Therefore, people with read-only access can create pinboard filters. You
must have edit access to the pinboard, and view access (or higher) to the underlying data source in
order save a pinboard filter.
Note that pinboard filters only apply to the tables and charts that are based on worksheets. If a pinboard
also includes tables and charts that were created from underlying tables or on user uploaded data, the
filters don’t apply to them.
Create a pinboard filter
You can create a filter in the pinboard view for any pinboard. This allows you to easily manipulate the
visualizations and view the modified presentation in one place.
Here is an example that shows you how to add a single filter to a pinboard. To create a pinboard filter:
1. Click the ellipses icon , and select Add filtersAdd filters.
Pinboard filters
February 07, 2019
ThoughtSpot Users Guide Page 191

2. In the populated columns menu, click the Add filterAdd filter icon next to the column you would like to
filter on.
3. Select the values to include in your answer.
Pinboard filters
February 07, 2019
ThoughtSpot Users Guide Page 192
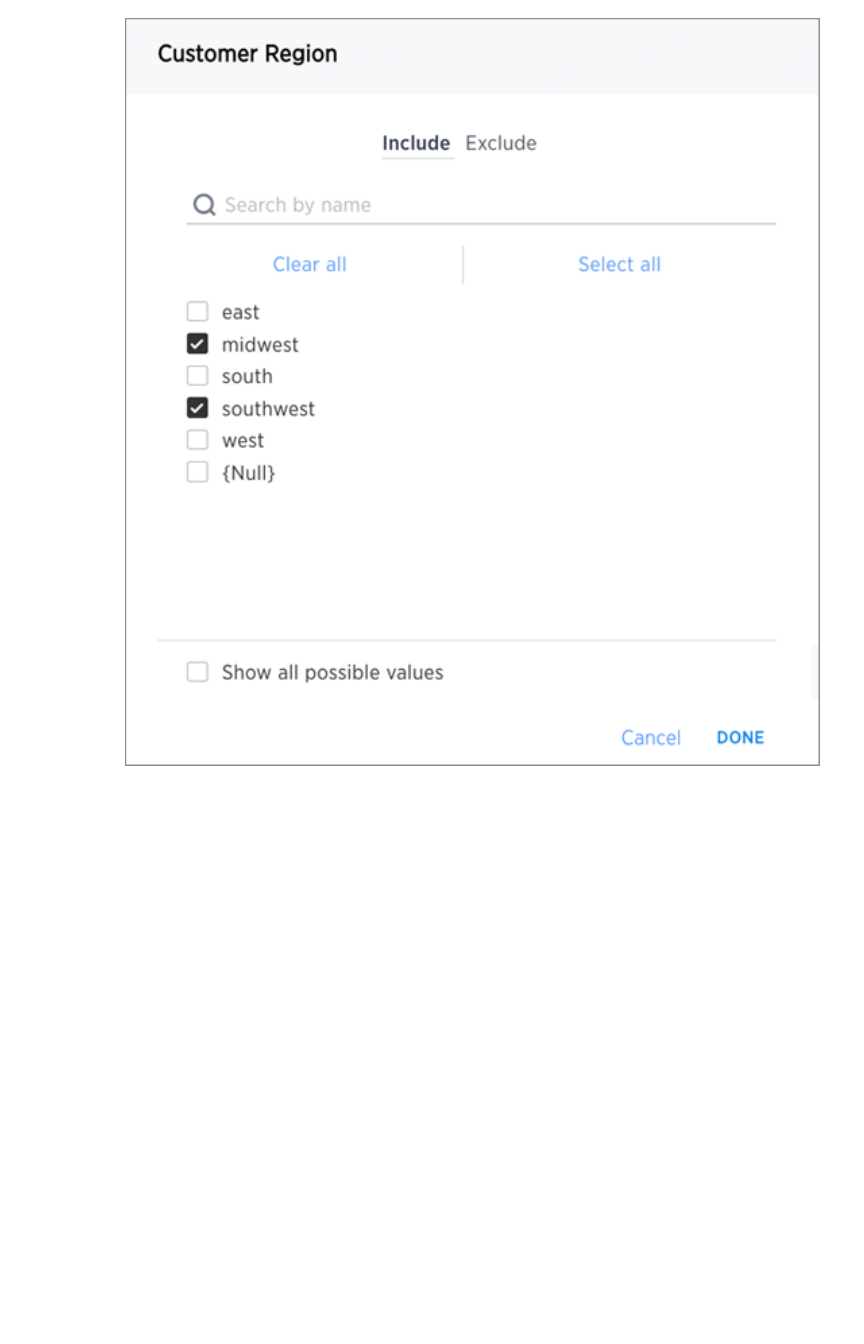
4. If you want to exclude values, click ExcludeExclude and choose values to exclude.
Pinboard filters
February 07, 2019
ThoughtSpot Users Guide Page 193

5. Click DoneDone.
When you apply a filter, the pinboard is not automatically saved with your filter applied to every object in
the pinboard that was created from a worksheet. Pinboard filters do not apply to tables and charts built
directly on top of base tables.
Edit a filter from the answer
Your applied filter will sit at the top of the pinboard, where you can edit it in place:
Pinboard filters
February 07, 2019
ThoughtSpot Users Guide Page 194
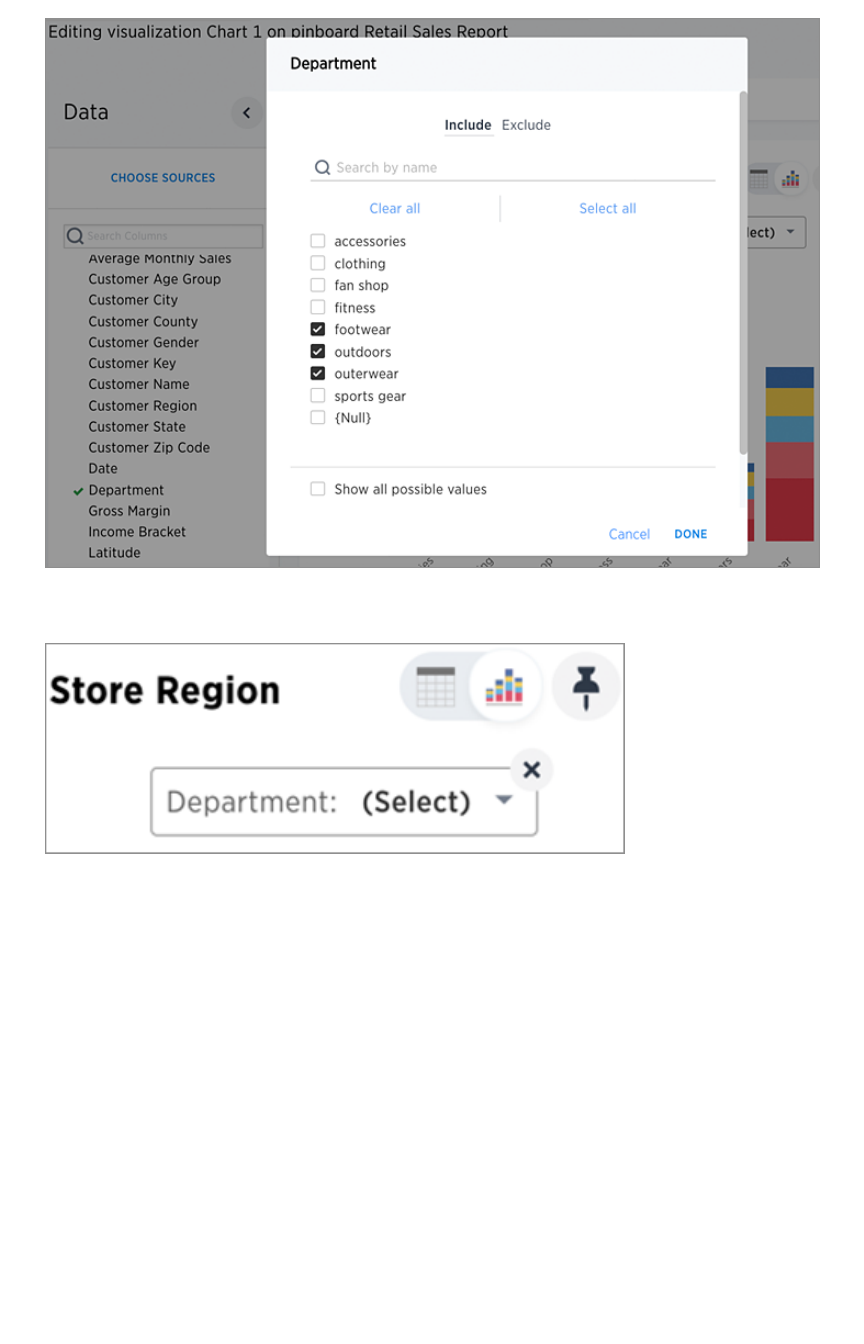
Or delete it:
Pinboard filters
February 07, 2019
ThoughtSpot Users Guide Page 195
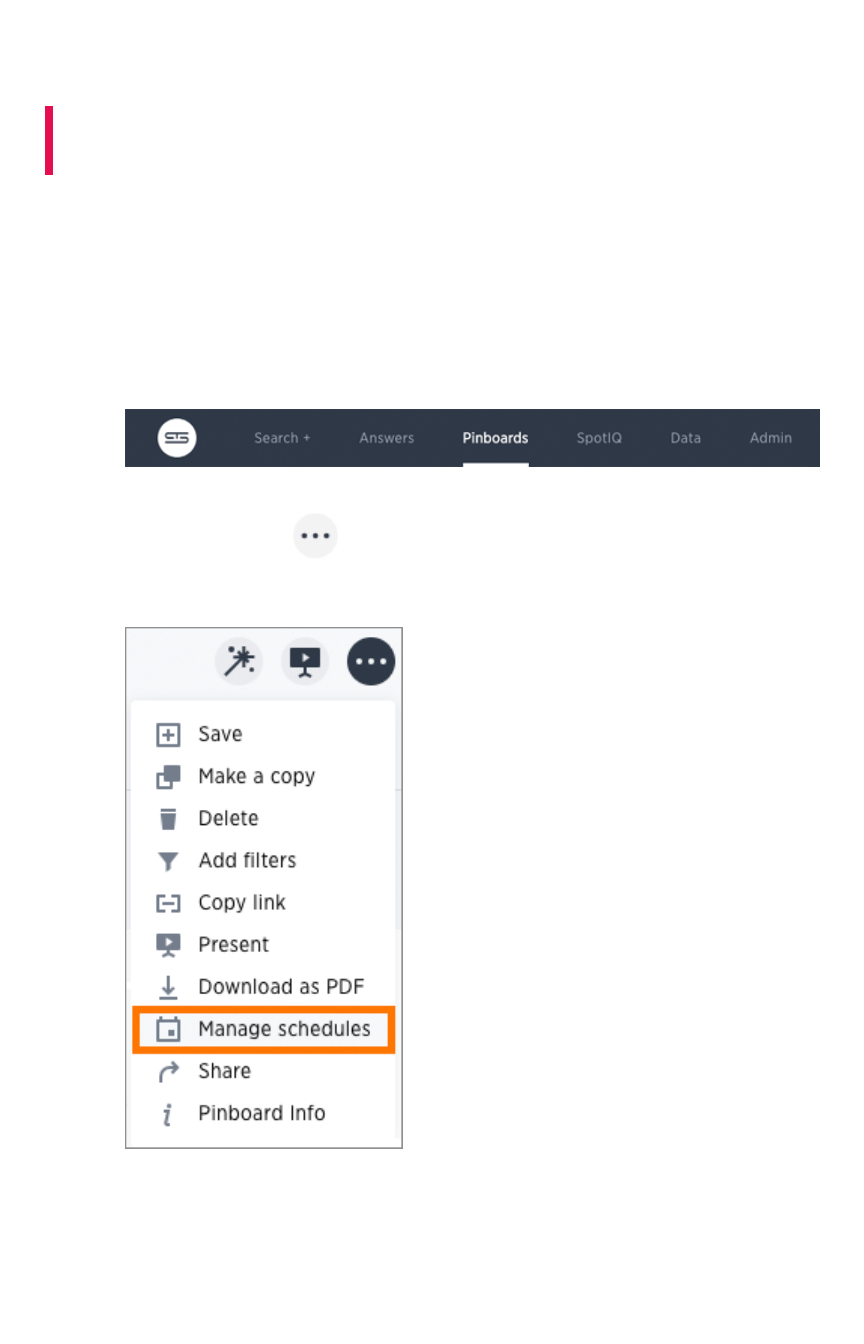
Schedule a pinboard job
Summary:Summary: You can schedule a pinboard job for any pinboard by using
the Add a schedule prompt page.
You can add multiple schedules with different configurations for a single pinboard. However, each job is
limited to one pinboard schedule. To add a schedule, you must either be an administrator or have the
schedule pinboard privilege, and at least edit-only and view-only access to the pinboard.
To schedule a pinboard:
1. Sign in to ThoughtSpot from a browser.
2. Click PinboardsPinboards, on the top navigation bar.
3. Select the pinboard you want to create a schedule for.
4. Click the ellipses icon and select Manage schedulesManage schedules to view all of the schedules set
for the pinboard.
5. Click + Schedule+ Schedule to add a new schedule.
Schedule a pinboard job
February 07, 2019
ThoughtSpot Users Guide Page 196
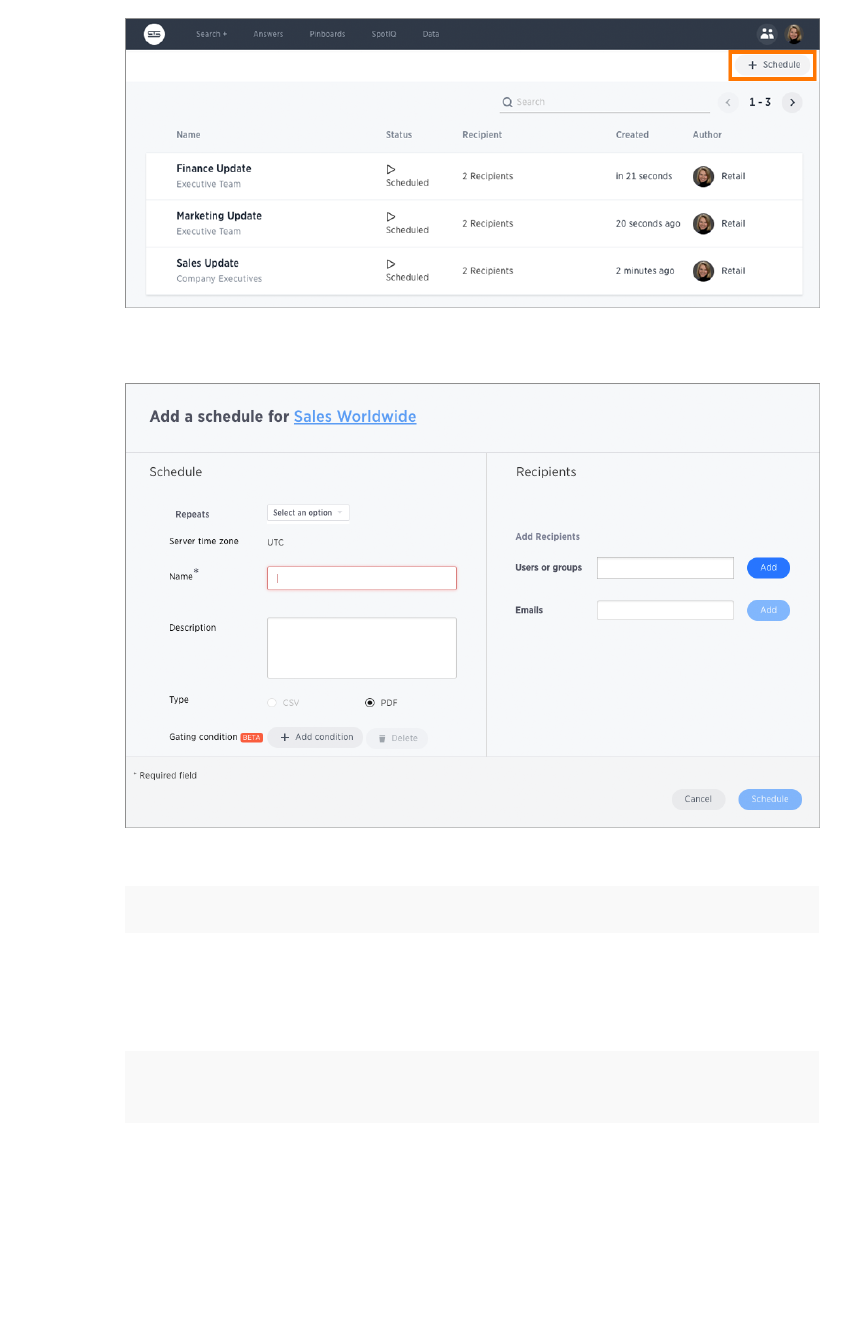
On the Add a ScheduleAdd a Schedule page, you create a new schedule for your pinboard.
6. Set the values for your schedule.
FieldField DescriptionDescription
RepeatsRepeats You can rebuild a pinboard every
n
minutes, hourly, daily, weekly, or month-
ly. For some of these, you can also choose specific times of the day or days
of the week. Make sure to note the Server time zoneServer time zone which is the timezone
which will be used.
NameName Provide a short name for this schedule, Monthly Report Source is an ex-
ample of a good name.
DescriptionDescription Enter a description to remind yourself and to inform others. For example, if
this is an important schedule for a meeting or a report, you should mention
that.
Schedule a pinboard job
February 07, 2019
ThoughtSpot Users Guide Page 197

TypeType CSV files provide all data for tables, with one attachment per table. Use
CSV files to perform further analysis offline. PDF files show all visualizations
in the pinboard. Each chart takes up a whole page in the file, while only the
first 100 rows of a table are included. Use PDF files to skim the data.
GatingGating
conditioncondition Write a statement that returns a single boolean value (true or false). For ex-
ample, sum (revenue) > 100 is a valid condition but is_weekend (com-
mit_date) is not. You can use any valid formula in your statement. Other
than checking your formula syntax, ThoughtSpot does not validate your for-
mula returns a single boolean.
At the scheduled time, ThoughtSpot checks the gating condition, and, if the
condition returns true, processes the pinboard. For a list of valid formulas,
see the Formula function Reference.
RecipientsRecipients
You are limited to 1000 recipients per job. You can add Users or groupsUsers or groups to
enter ThoughtSpot users or groups. Use EmailsEmails to add recipients that are
not ThoughtSpot users. Any users your ThoughtSpot admin must have set
your whitelist domains. Contact ThoughtSpot Support to set your whitelist
domains.
If you experience problems with sending email, your cluster may not have
SMTP enabled. Contact your system administrator to resolve this issue.
7. Click ScheduleSchedule to save your schedule configuration.
Schedule a pinboard job
February 07, 2019
ThoughtSpot Users Guide Page 198
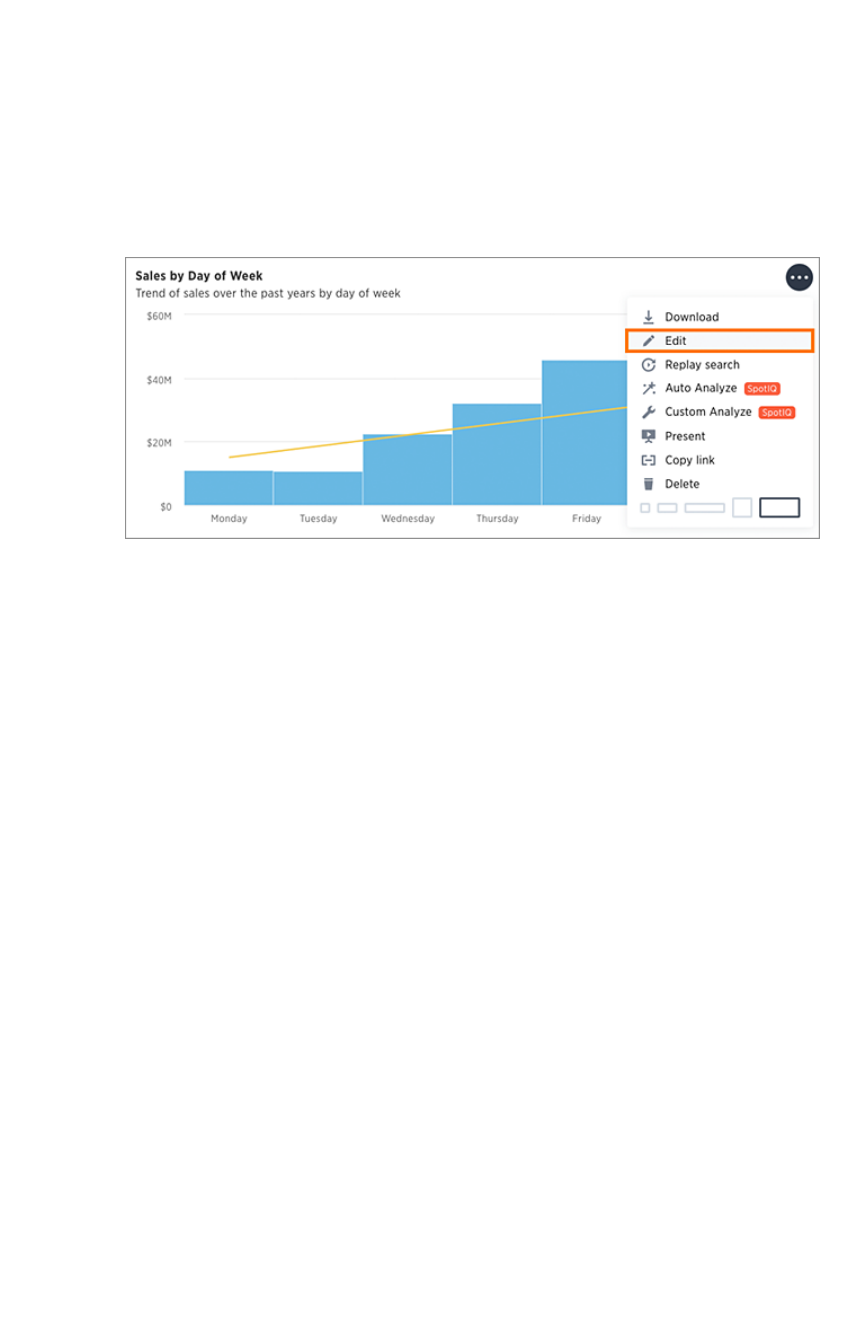
Search actions within a pinboard
You can perform many of the same search actions on individual visualizations within a pinboard as you
can within a search. You can interact directly with a visualization of a pinboard to perform ad hoc
searches or edit it. These search actions include the following:
• Editing a search - You can edit the original search and reconfigure the answer. Click the
three-dot ActionsActions button to the upper-right of your visualization and select EditEdit.
You will now be in edit mode, where you can view and change sources,search different
columns,change the view,save the answer as a worksheet,add a formula, and change the
chart.
Search actions within a pinboard
February 07, 2019
ThoughtSpot Users Guide Page 199
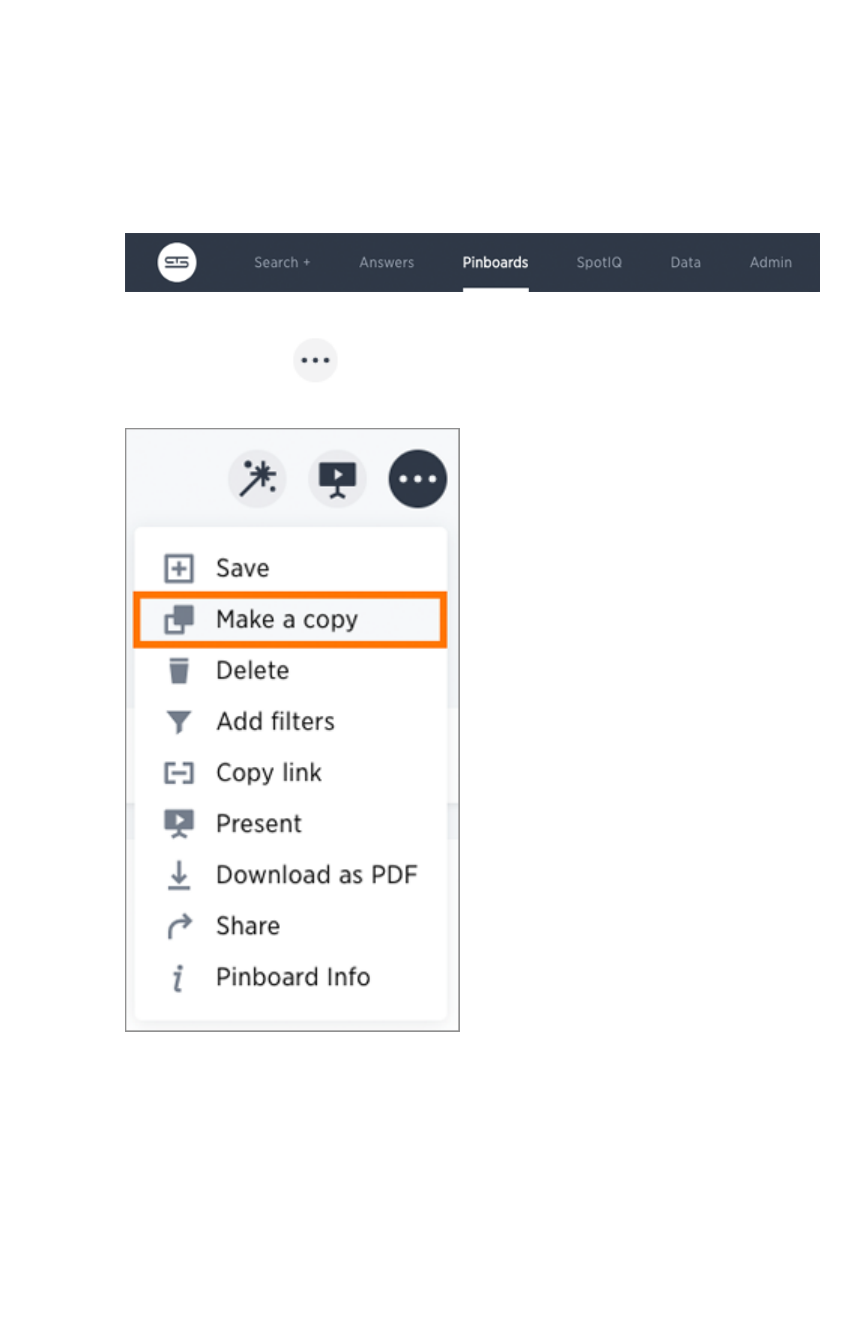
Copy a pinboard
You can make a copy of a pinboard if you would like to make edits without changing the original
pinboard. Making a copy of a pinboard allows you to make your own edits without overwriting the
original. When saving a copy, you can type in a new name.
1. Click PinboardsPinboards, on the top navigation bar.
2. On the pinboard list page, click the pinboard you would like to copy.
3. Click the ellipses icon and select Make a copyMake a copy.
4. Give your pinboard a new name and description, and then click SaveSave.
Copy a pinboard
February 07, 2019
ThoughtSpot Users Guide Page 200

Copy a pinboard
February 07, 2019
ThoughtSpot Users Guide Page 201
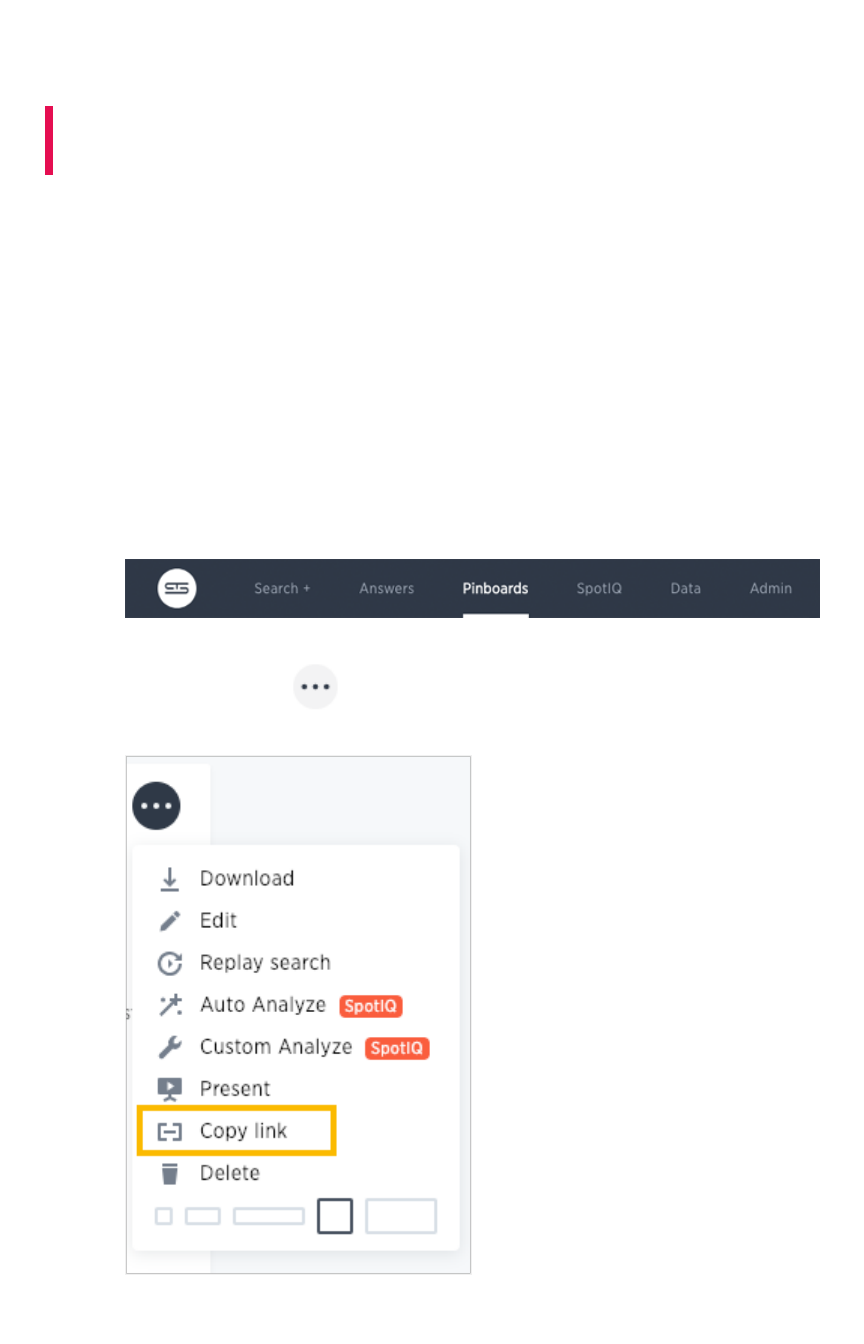
Copy a pinboard or visualization link
Summary:Summary: In pinboards, there is a copy link option that lets you copy
the link to access the pinboard and visualizations directly.
You can copy and paste the copied link to include in a presentation or spreadsheet, or email or Slack it
to other people in your company. Note that when clicking the link, the person must be authenticated to
ThoughtSpot to see the visualization (e.g. by signing in or via LDAP).
You can also use this link for embedding the chart or table in another Web page, Web portal, or
application when using the ThoughtSpot JavaScript API with Embedding or the REST API. For details,
read the ThoughtSpot Application Integration Guide.
Copying a pinboard link
To copy the link for a pinboard:
1. Click PinboardsPinboards, on the top navigation bar.
2. On the pinboard list page, click the pinboard you would like to get a link for.
3. Click the ellipses icon and select Copy linkCopy link.
4. Copy the pinboard link. The highlighted portion is the pinboard ID.
Copy a pinboard or visualization link
February 07, 2019
ThoughtSpot Users Guide Page 202
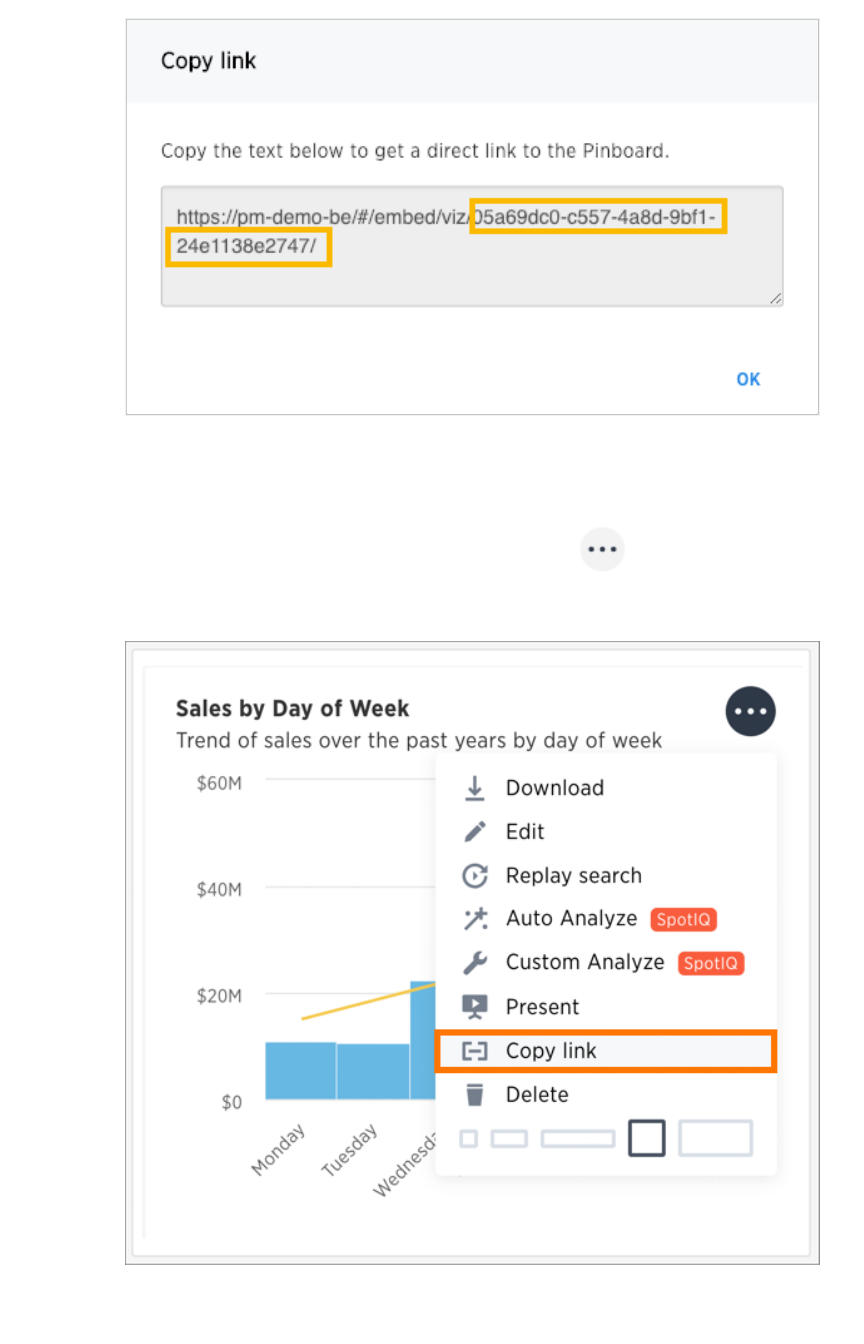
Copying a visualization link
1. To copy an individual visualization link, click the ellipses icon and select Copy linkCopy link of
the visualization you would like to copy a link from.
2. Copy the visualization link. The highlighted portion is the visualization ID.
Copy a pinboard or visualization link
February 07, 2019
ThoughtSpot Users Guide Page 203
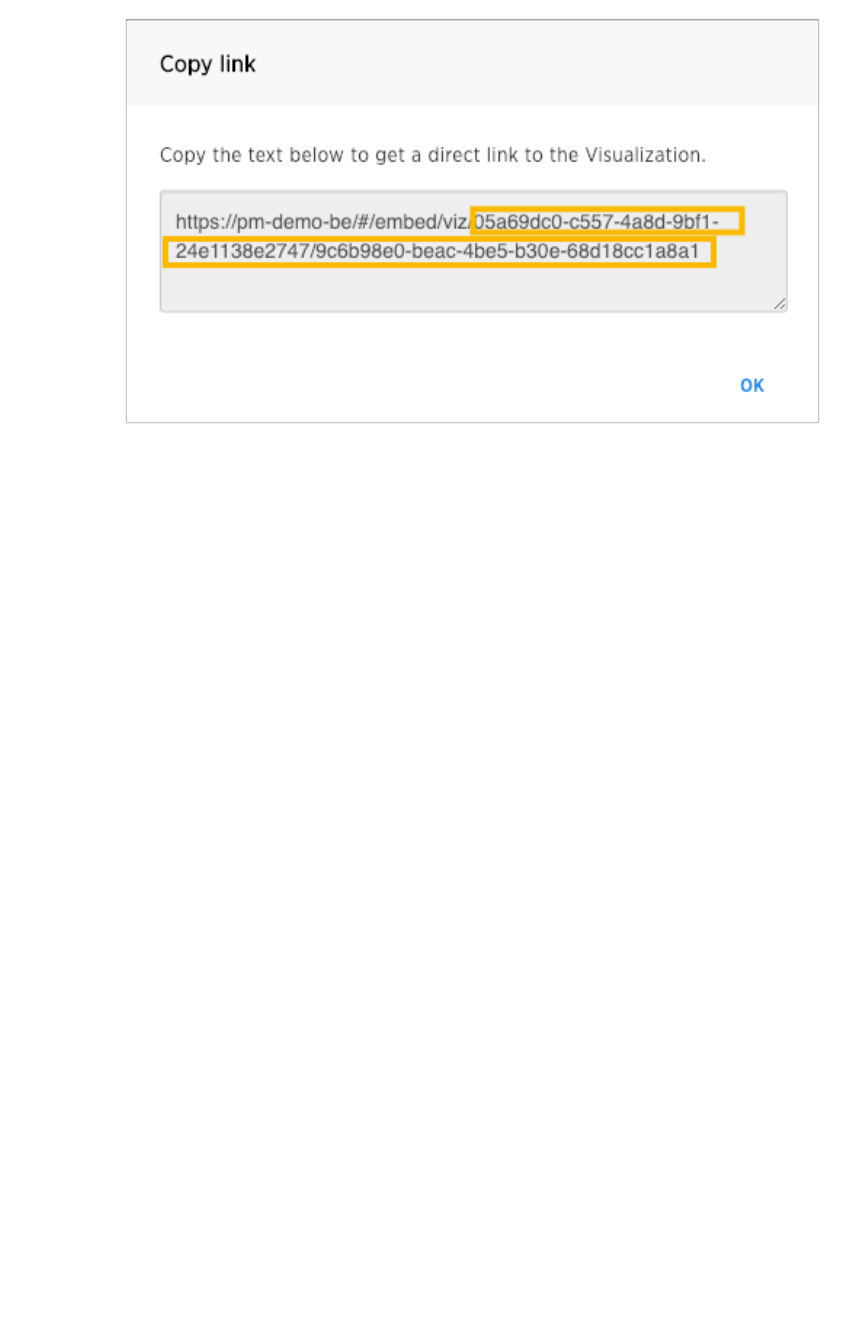
Copy a pinboard or visualization link
February 07, 2019
ThoughtSpot Users Guide Page 204
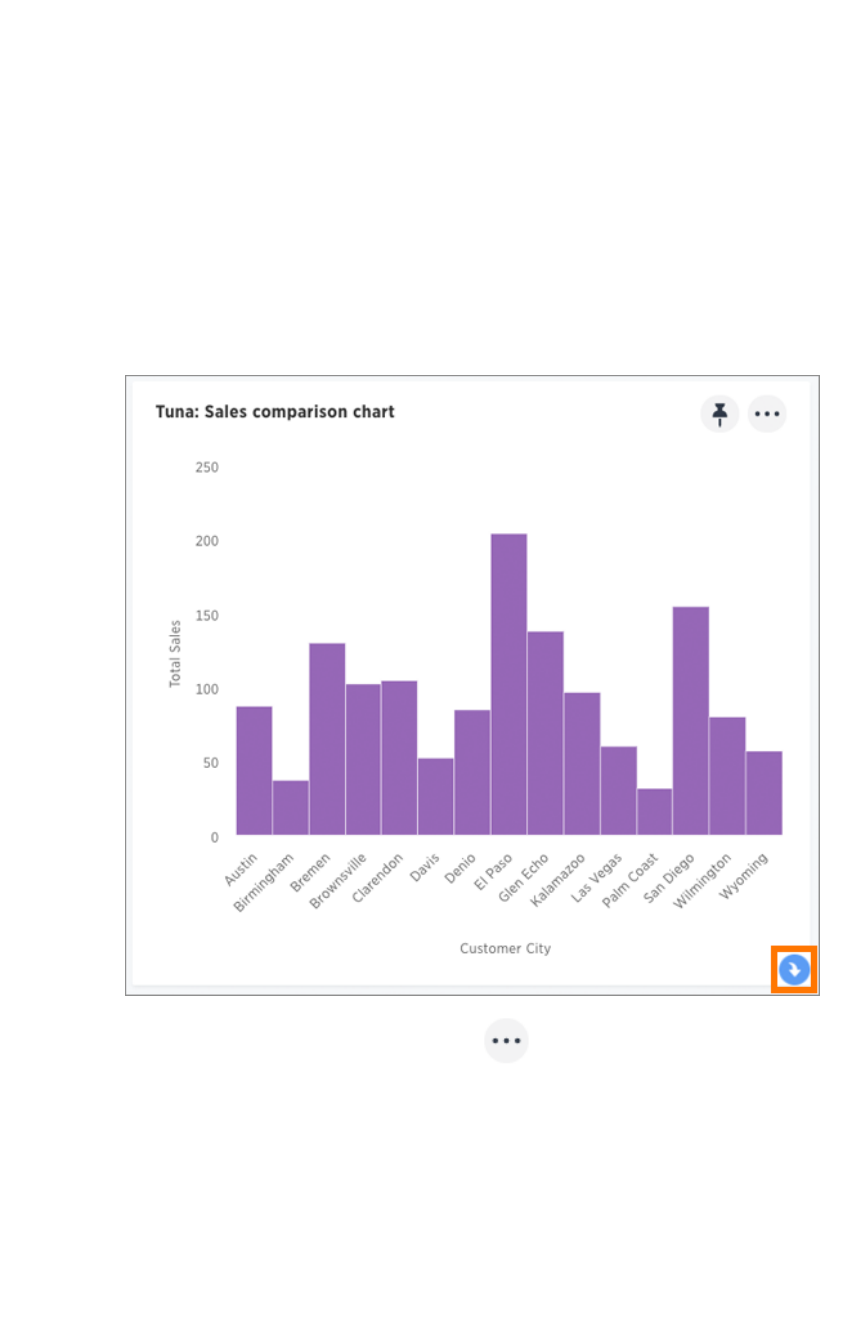
Reset a pinboard visualization
You can undo your edits to a pinboard visualization by resetting it.
Reset a pinboard visualization
After performing ad hoc actions or edits to a visualization of your pinboard, you can reset the
visualization to its original form.
To reset a visualization:
1. On an altered visualization, click the reset icon.
2. Save your pinboard by clicking the ellipses icon and selecting SaveSave.
Reset a pinboard visualization
February 07, 2019
ThoughtSpot Users Guide Page 205
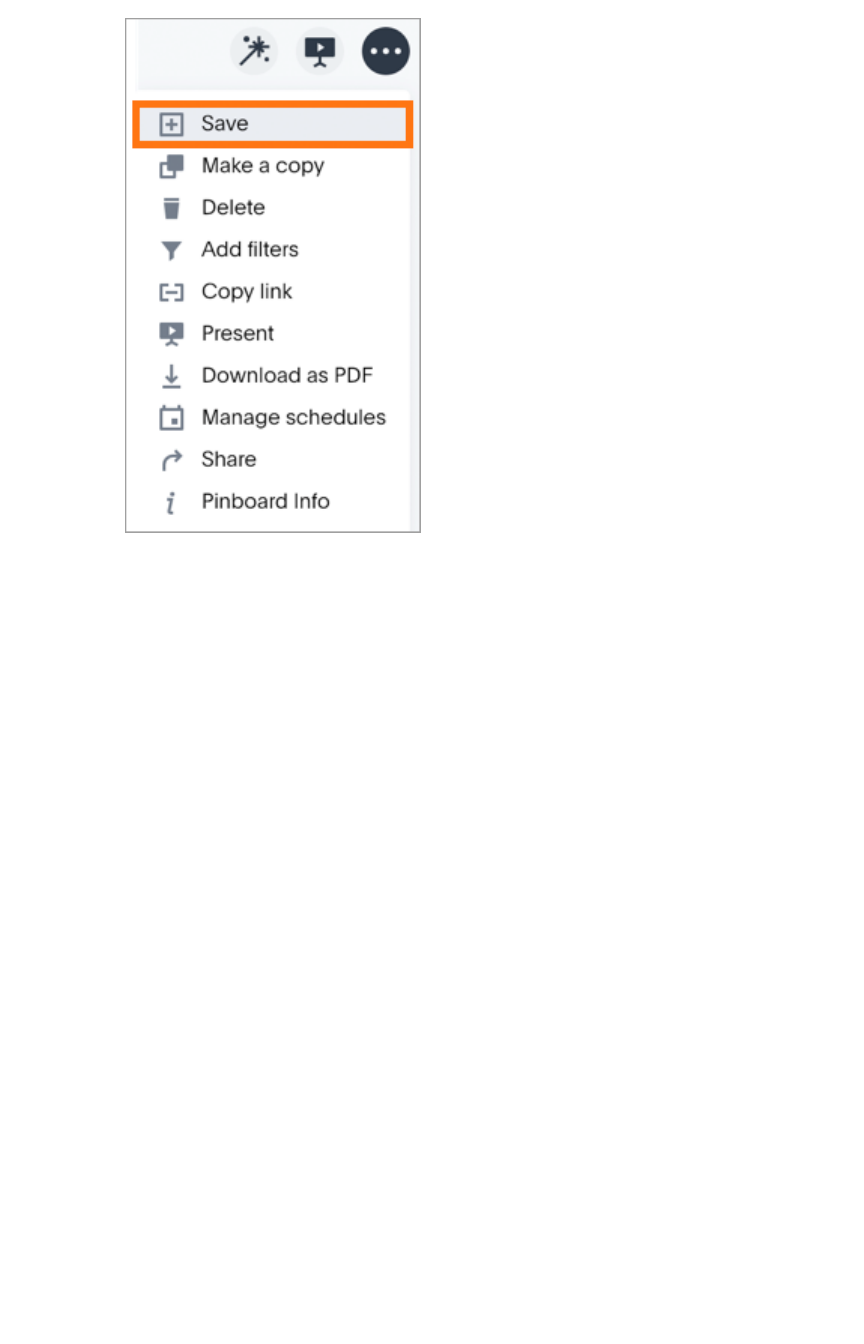
Reset a pinboard visualization
February 07, 2019
ThoughtSpot Users Guide Page 206

Start a slideshow
Summary:Summary: Displaying your pinboard as a slideshow is a good way to
present its contents to others.
Presenting your pinboard displays your visualizations in order from left to right and top to bottom.
To start a slideshow:
1. Click PinboardsPinboards, on the top navigation bar.
2. On the pinboard list page, click the pinboard you would like to present.
3. Click the ellipses icon for the visualization you want to start the slideshow with and
select PresentPresent.
4. Use the left and right arrow keys to navigate between your pinboard’s visualizations.
Start a slideshow
February 07, 2019
ThoughtSpot Users Guide Page 207
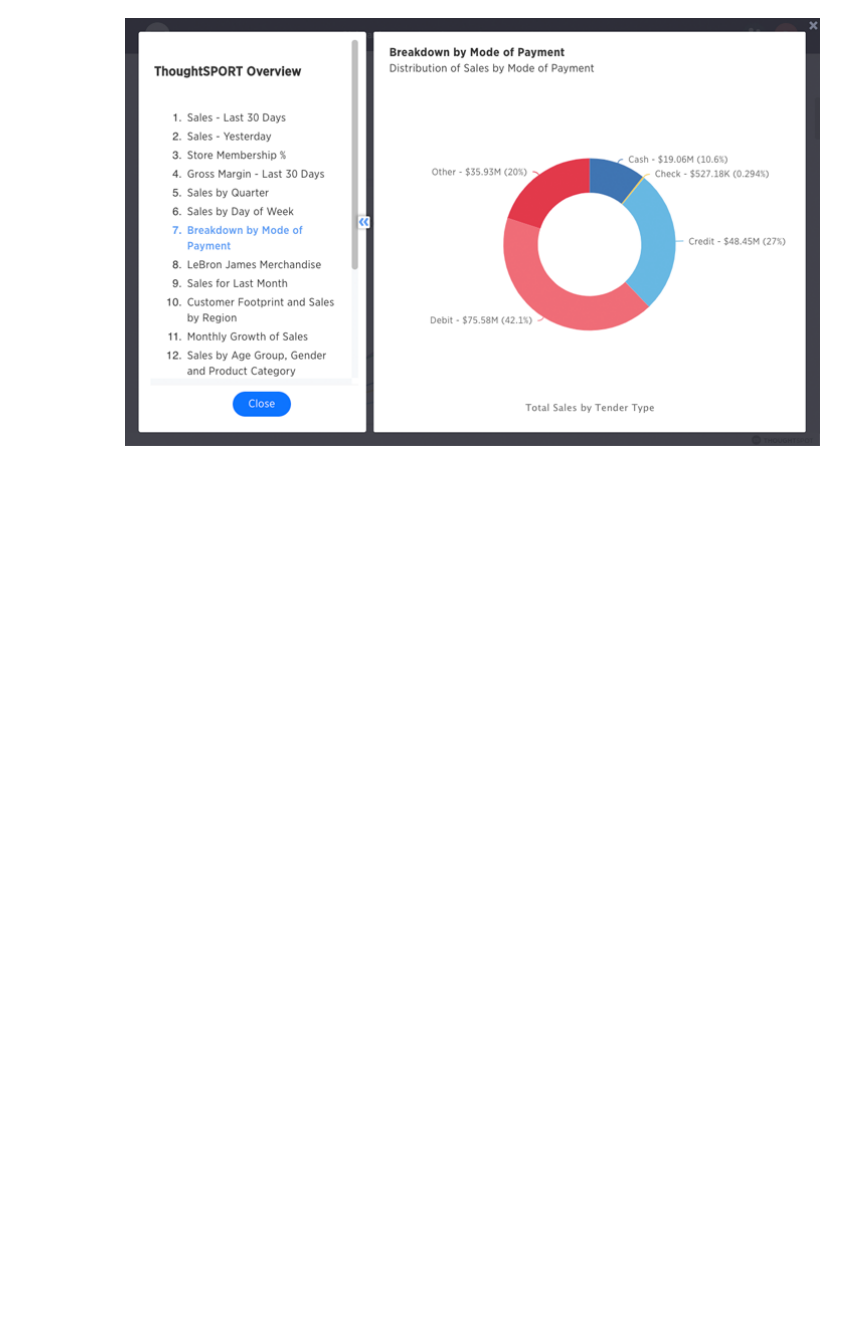
5. Click the xx at the top-right part of the screen or push the Esc key to exit the slideshow view.
Start a slideshow
February 07, 2019
ThoughtSpot Users Guide Page 208
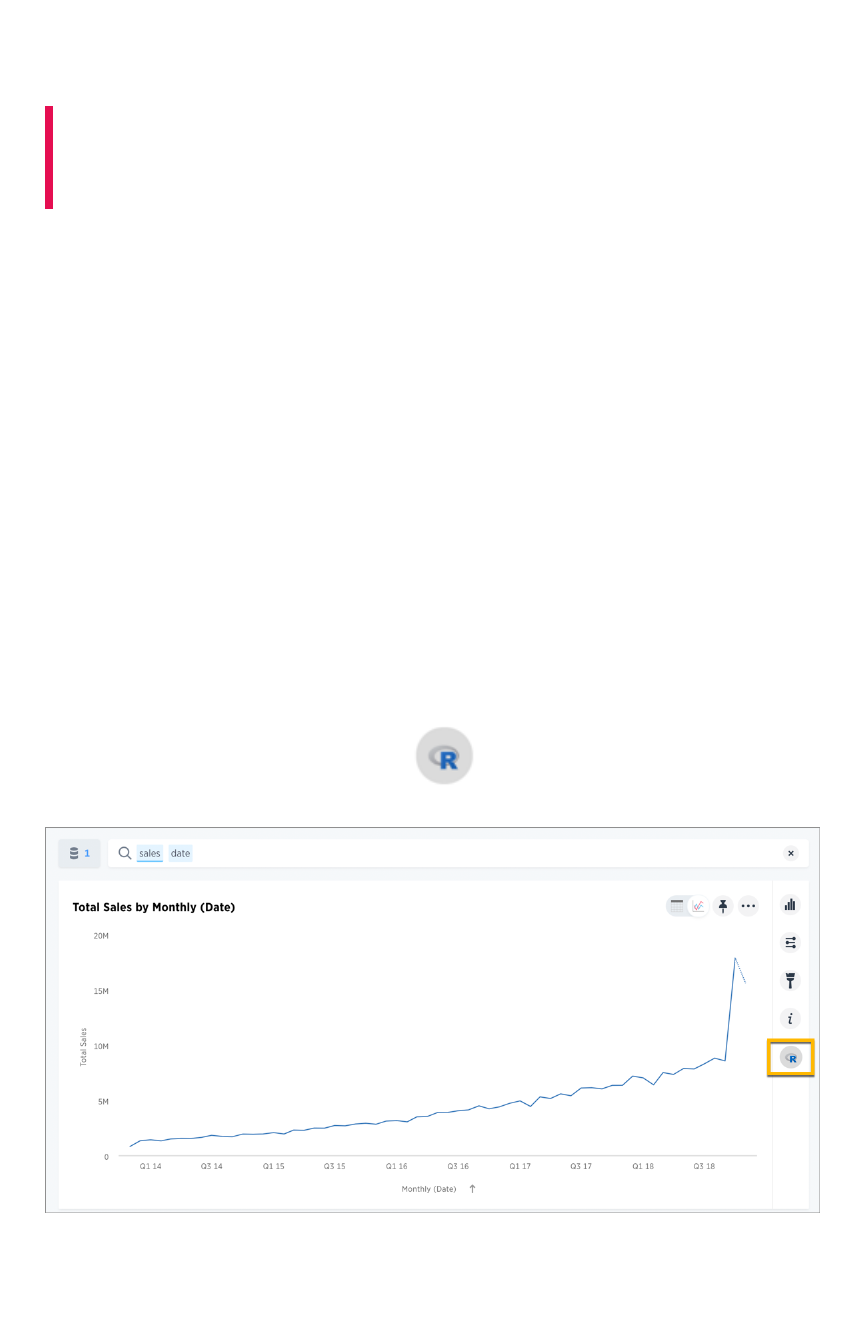
About R in ThoughtSpot
Summary:Summary: You can run an R analysis on your data, using
ThoughtSpot provided scripts, or custom scripts shared with your
team. R visualizations can be shared as answers and pinboards.
R is a popular open source programming language for statistical computing, machine learning, and AI.
ThoughtSpot makes R analysis available as a fully integrated feature in version 5.0
Using R in ThoughtSpot
While the ability to run custom R scripts on ThoughtSpot data was available in previous releases via
SpotIQ custom analysis, as of version 5.0 users with R privileges can now run R scripts directly on
search results.
Analysts and data scientists proficient in R can create and share custom scripts.
Users can leverage custom scripts and ThoughtSpot provided scripts, run pre-built R scripts on top of
their search results, and share R visualizations as answers and pinboards.
This topic explains how to use R in ThoughtSpot both from an end user and scripting perspective, but is
not meant as an R primer.
How to access R scripts
Users with R script privileges can click the RR icon on the toolbar for any search result (answer).
From here, you have options to write a custom script, or load a pre-built or ThoughtSpot provided script.
About R in ThoughtSpot
February 07, 2019
ThoughtSpot Users Guide Page 209
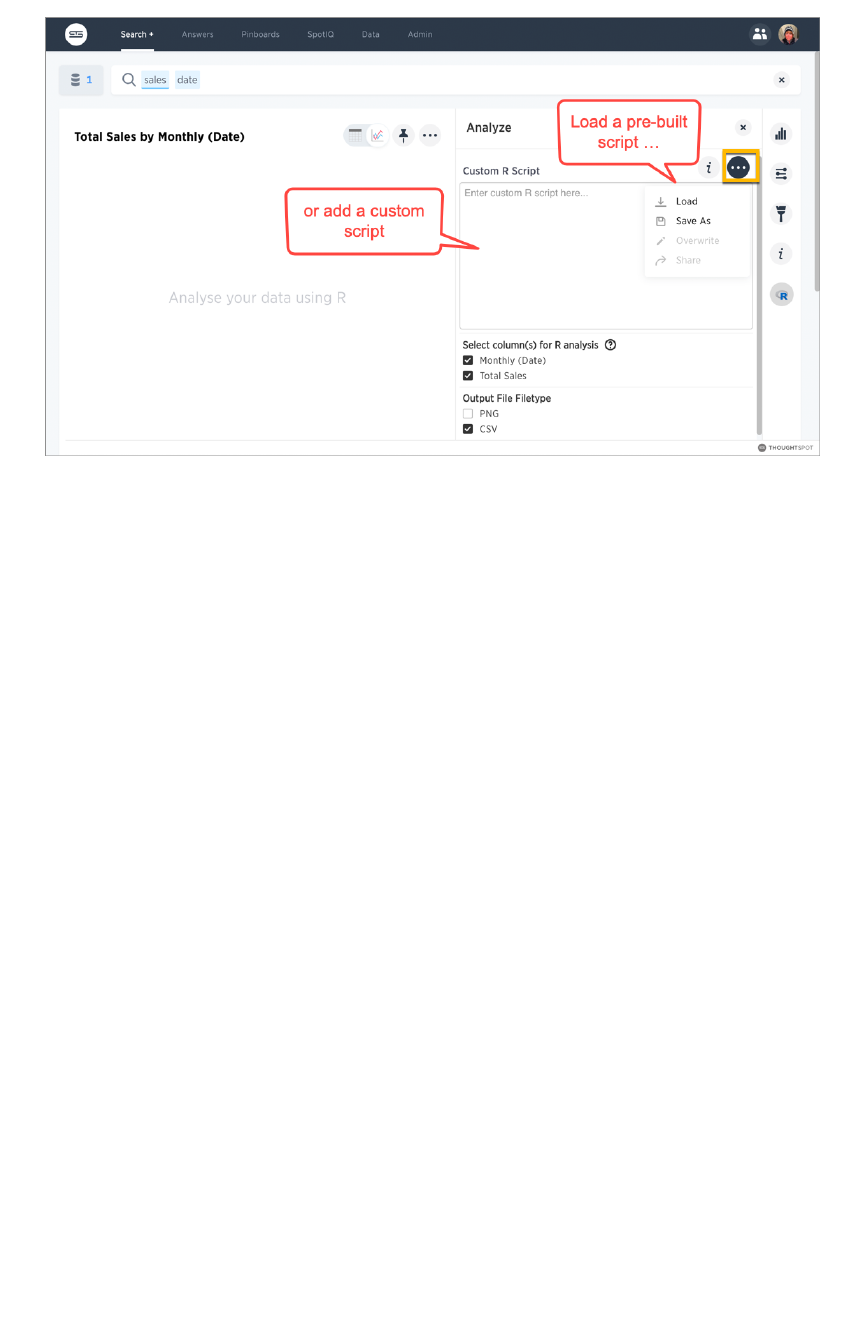
Run pre-built R scripts
You don’t have to have a background in statistics or be an R programmer to run R analyses in
ThoughtSpot. You can use ThoughtSpot-provided scripts and share the R visualizations with others.
For more on how to run provided scripts, skip to Run pre-built R scripts on answers
Write your own R scripts in ThoughtSpot
If you know R, you can write your own custom scripts, share them as templates, test and run them on
your data in ThoughtSpot, and build up a shared library of R analyses, scripts, visualizations, and
pinboards.
Start with the topic on how to Create and share R scripts to learn more about writing R scripts in
ThoughtSpot, including a few particulars on syntax and column bindings.
To learn more about R programming in general, a good place to start is R Project for Statistical
Computing. Also, Anthony Chen’s blog post on Using R Analysis in ThoughtSpot for Time Series
Forecasting is a nice introduction to writing R scripts in ThoughtSpot.
About R in ThoughtSpot
February 07, 2019
ThoughtSpot Users Guide Page 210
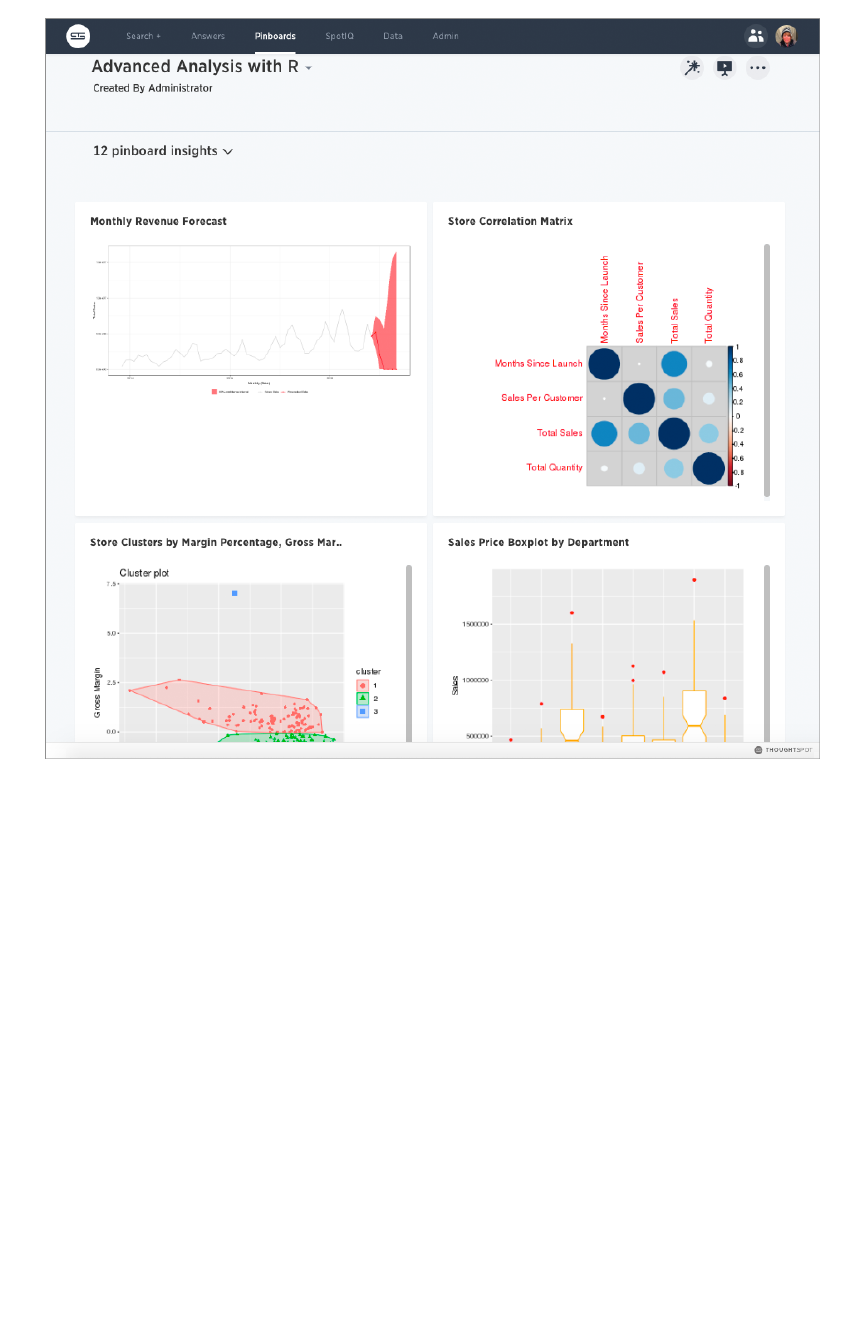
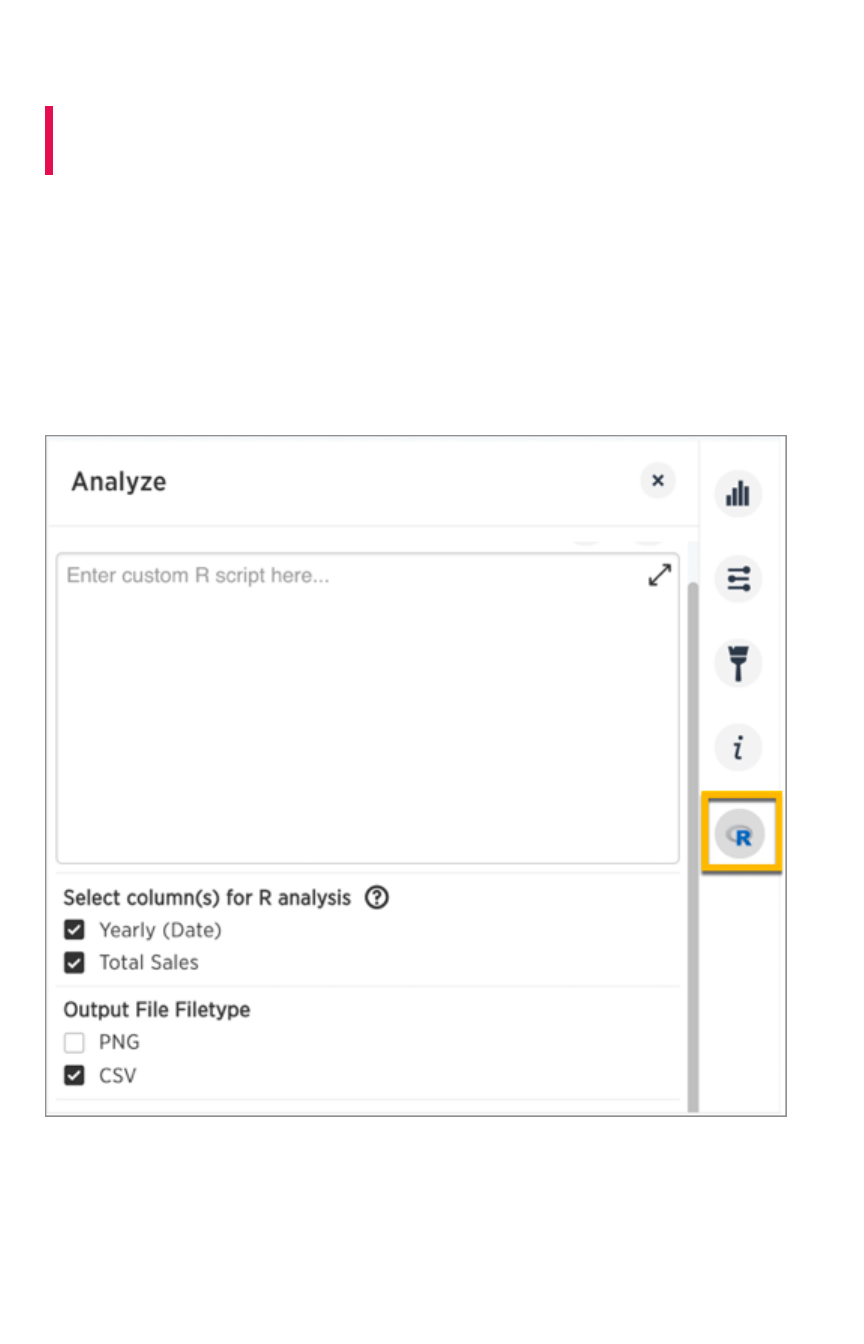
Create and share R scripts
Summary:Summary: You can create and share your custom R scripts in
ThoughtSpot.
Overview
Each ThoughtSpot cluster is capable of running an R analysis on your data. To perform your own R
analysis, start with a simple search and click the R icon on the right.
Use the Custom R ScriptCustom R Script dialog and settings to enter your script, set which columns to include for
analysis, and indicate what output data to expect from your script (PNG or CSV).
ThoughtSpot also supports the sharing of scripts among users to enable you to share your powerful R
analyses across the system, and allow others to run your scripts on different search results.
Create and share R scripts
February 07, 2019
ThoughtSpot Users Guide Page 212
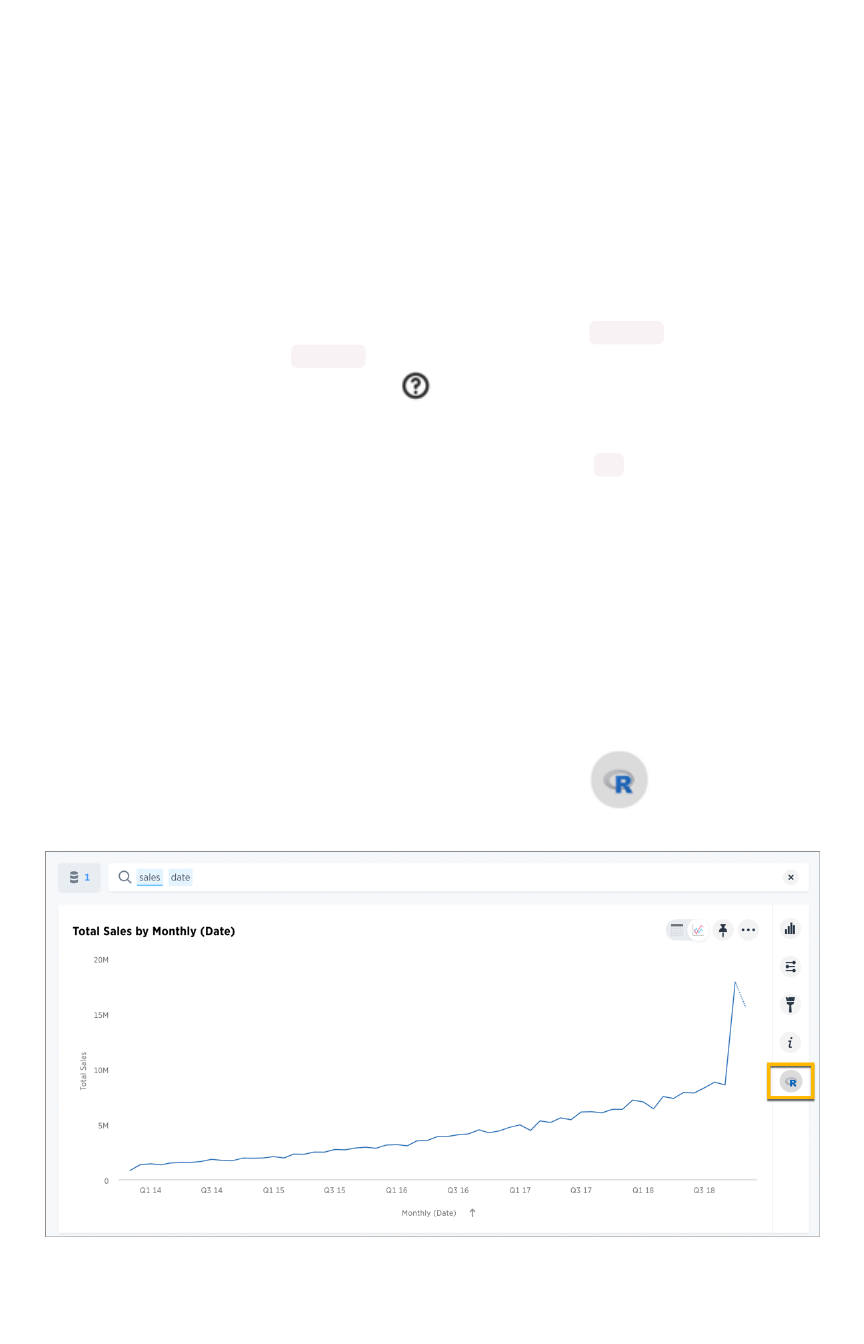
How it works
An R script in ThoughtSpot is based off of your original search (both the data and the schema), using the
columns you select for the analysis. You can select all columns used in the original search or a subset of
those columns, depending on the script.
ThoughtSpot auto generates objects with variable names by which you can refer to data elements in
your script.
You can refer to the data in the selected columns by using vectors that ThoughtSpot generates for these
before the script is run. The first column you select has the variable name .param0 , the second column
you select has the variable name .param1 , and so on. This naming scheme continues if there are more
columns. (You can click the question mark icon next to “Select columns for R analysisSelect columns for R analysis” to get a
visual mapping of how the columns are bound to variables in R.)
ThoughtSpot also provides an automatically-generated
data frame
object, df , that contains all selected
column vectors. The data frame is R’s representation of a table (a 2D data structure containing rows and
columns).
When the script executes, it passes the information to the server to run the analysis, and displays the
answer as a visualization, in either PNG or CSV (table) format.
As shown in the examples below, you can chain R analyses together by running another R script on the
answer to a previous script.
Write a custom script
To add a custom R script, start by running a search, then click the RR icon on the toolbar.
Add your script into the Custom R ScriptCustom R Script dialog, and set the column bindings and output type
appropriately, as shown in the following examples.
Create and share R scripts
February 07, 2019
ThoughtSpot Users Guide Page 213
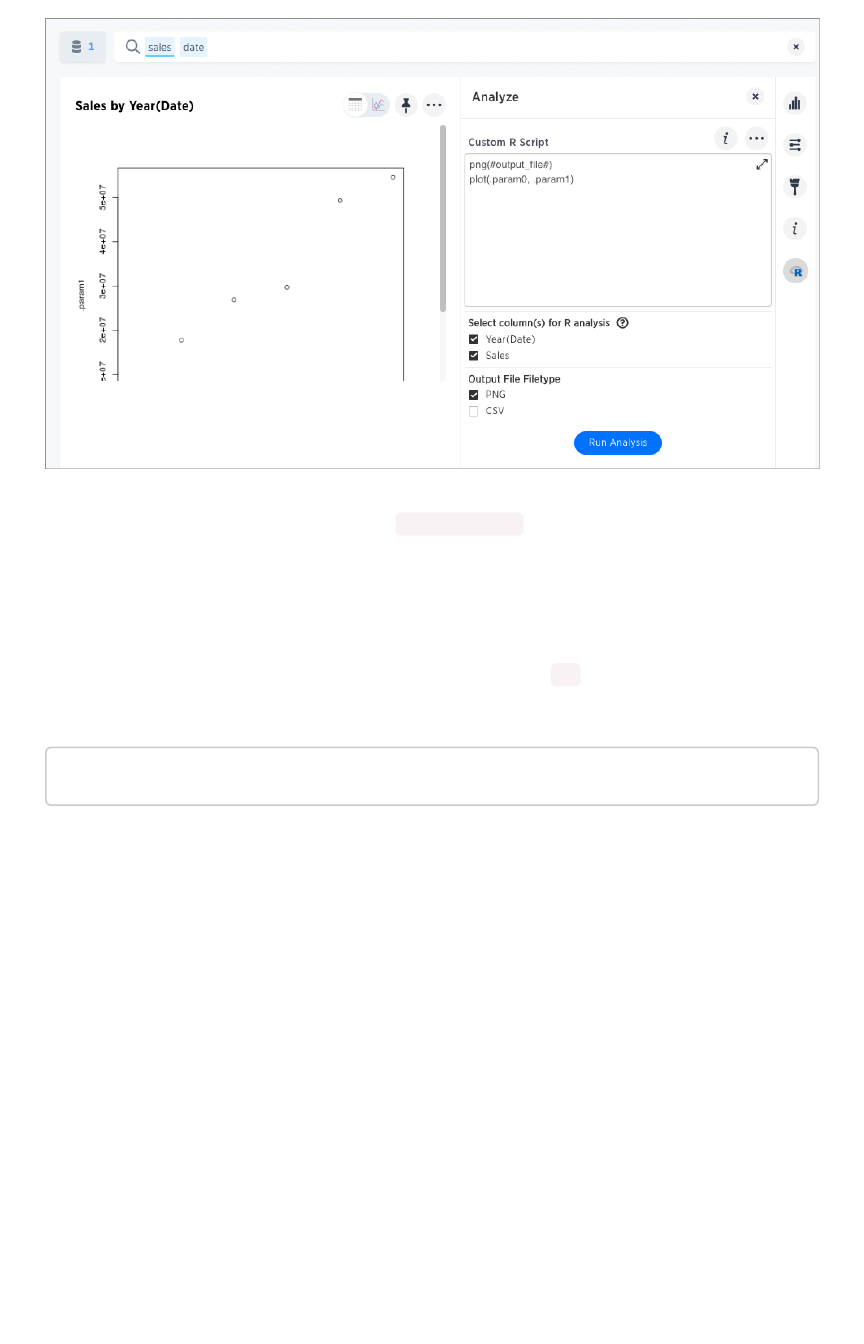
For an R script to produce a meaningful output in ThoughtSpot, the script should generate a CSV or
PNG file. Output should be written to the token #output_file# . CSV output is rendered back as a
simple table in ThoughtSpot, PNG output is rendered back as a static PNG.
Basic R script to generate CSV data
This is an example of a basic R script that generates CSV data. (The df variable name must be lower
case, as shown.)
write.csv(df, #output_file#)
The generated data is displayed back as a table when you run the analysis:
Create and share R scripts
February 07, 2019
ThoughtSpot Users Guide Page 214

This basic script returns the exact same table results as if you did the query directly in ThoughtSpot and
selected the table view, barring some additional formatting you get for free on the search.
Basic R script to generate a PNG graphic
This is an example of a basic R script that generates PNG data as output.
png(#output_file#)
plot(.param0, .param1)
The generated data is displayed back as a static PNG when you run the analysis:
Create and share R scripts
February 07, 2019
ThoughtSpot Users Guide Page 215
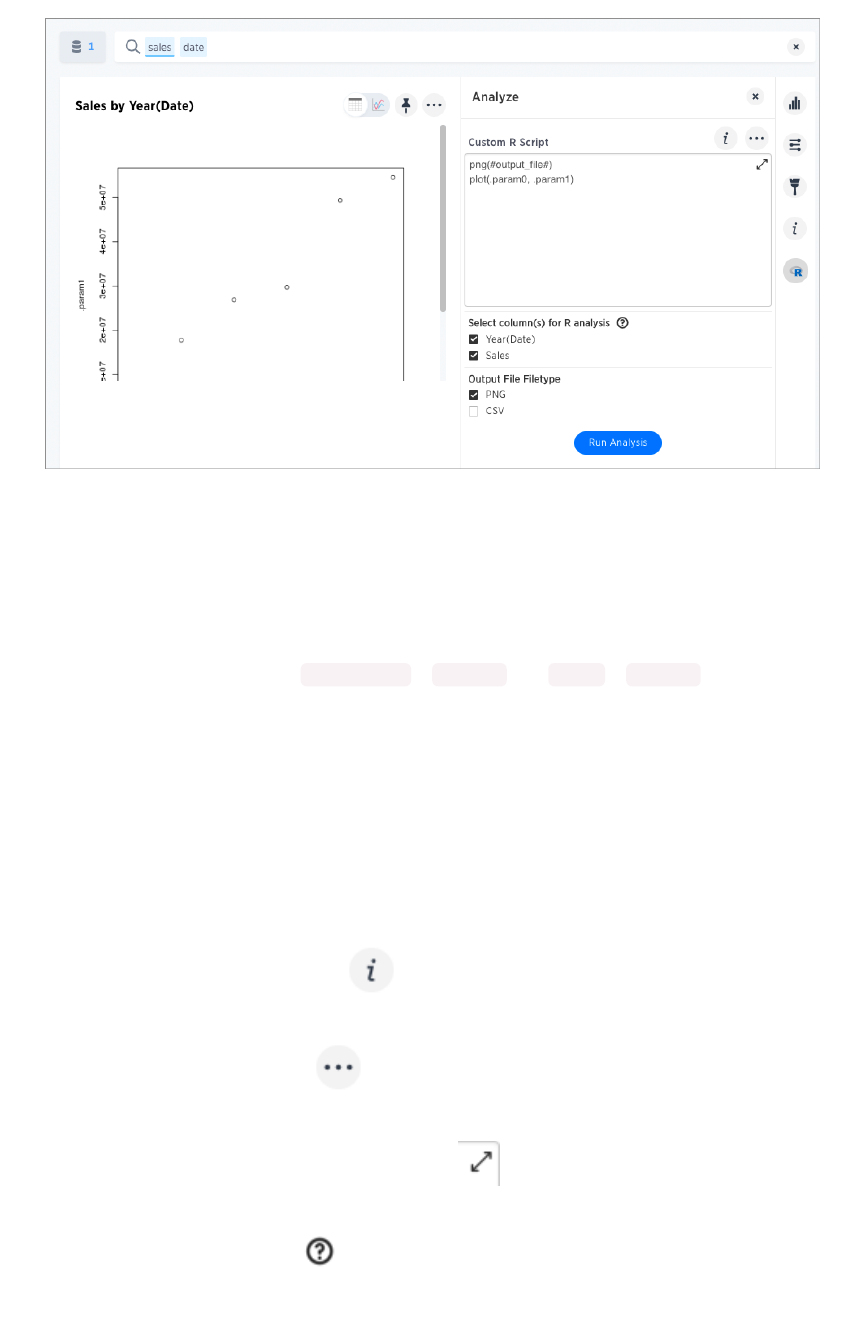
Column bindings and output file type
• Under Select column(s) for R analysisSelect column(s) for R analysis, you specify the data you want to send to R and how to
send it. If you do not make any choices here, all columns in the search are selected in the
order they appear in the search bar.
In the examples above, Year (Date) is .param0 , and Sales is .param1 . To verify this,
click the question mark icon next to Select columns for R analysisSelect columns for R analysis to see the “column
bindings”. Reordering the columns changes the column bindings/params.
• Under Output File TypeOutput File Type Select PNG or CSV, depending on the output details and in your
script.
Options on scripts
You can click these icons in the R script dialog to get more options:
• The R script information icon provides a basic reference guide for creating an R
analysis in ThoughtSpot.
• The ellipses icon (3 dots) provides a menu with options to save or load a previously
saved R script, as well as share your R script with other users in the system.
• The arrow at the top right of the script dialog opens a popout editor that gives you a
larger space in which to view and edit your R script.
• The question mark icon next to “Select column(s) for R analysisSelect column(s) for R analysis” provides a visual
mapping of how the columns are bound to variables in R.
Create and share R scripts
February 07, 2019
ThoughtSpot Users Guide Page 216
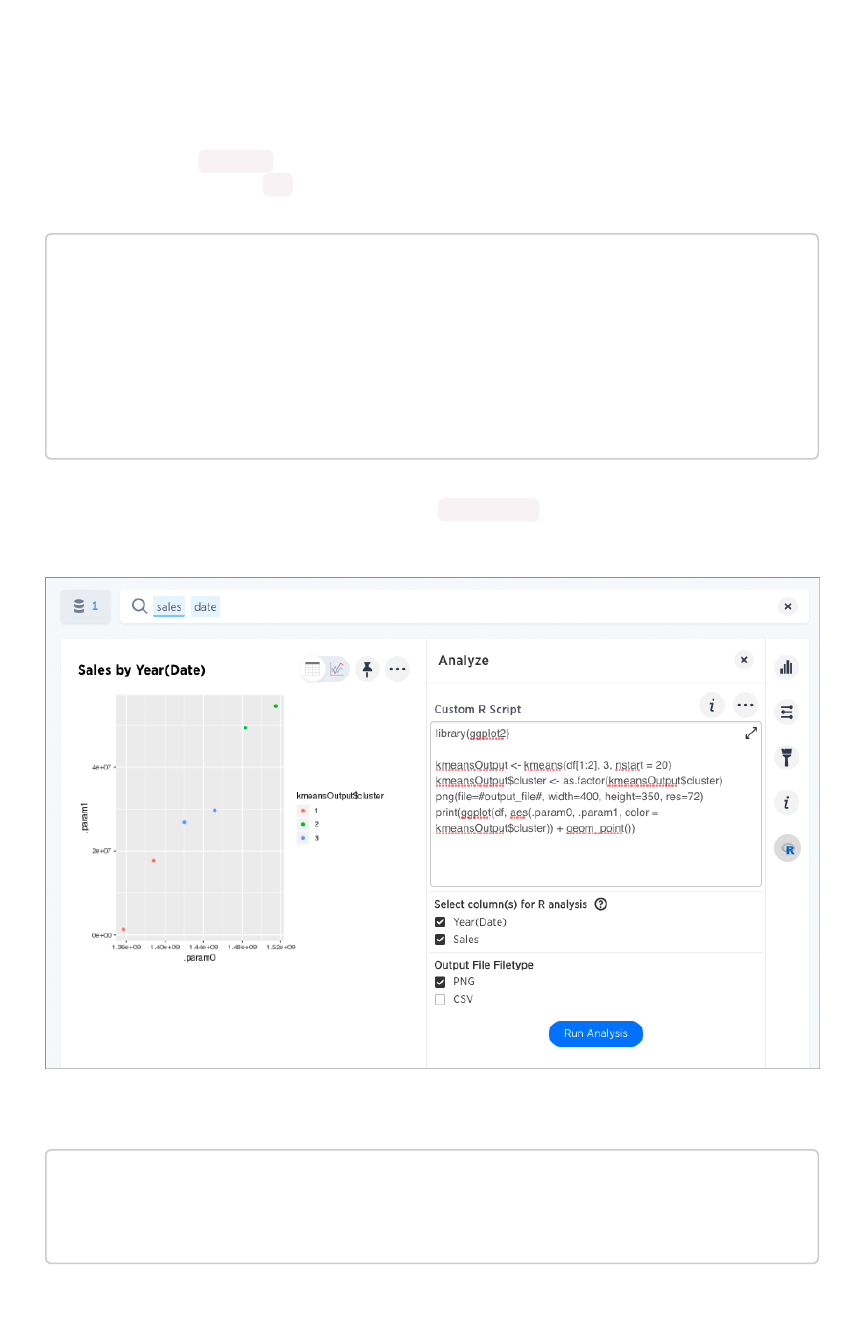
K-Means clustering example scripts
This script loads the ggplot2 visualization package, labels the columns inside of the ThoughtSpot
generated data frame object ( df ), and runs a K-Means clustering algorithm.
library(ggplot2)
kmeansOutput <- kmeans(df[1:2], 3, nstart = 20)
kmeansOutput$cluster <- as.factor(kmeansOutput$cluster)
png(file=#output_file#, width=400, height=350, res=72)
print(ggplot(df, aes(.param0, .param1, color = kmeansOutput$clu
ster)) + geom_point())
When you run this script on the results of the original sales date search, you get the following
visualization as a PNG.
You can run another R script directly on this result to get CSV results:
kmeansOutput <- kmeans(df[1:2], 3, nstart = 20);
df$Cluster <- as.factor(kmeansOutput$cluster);
write.csv(df, file=#output_file#, row.names=FALSE);
The script for CSV output generates a table:
Create and share R scripts
February 07, 2019
ThoughtSpot Users Guide Page 217
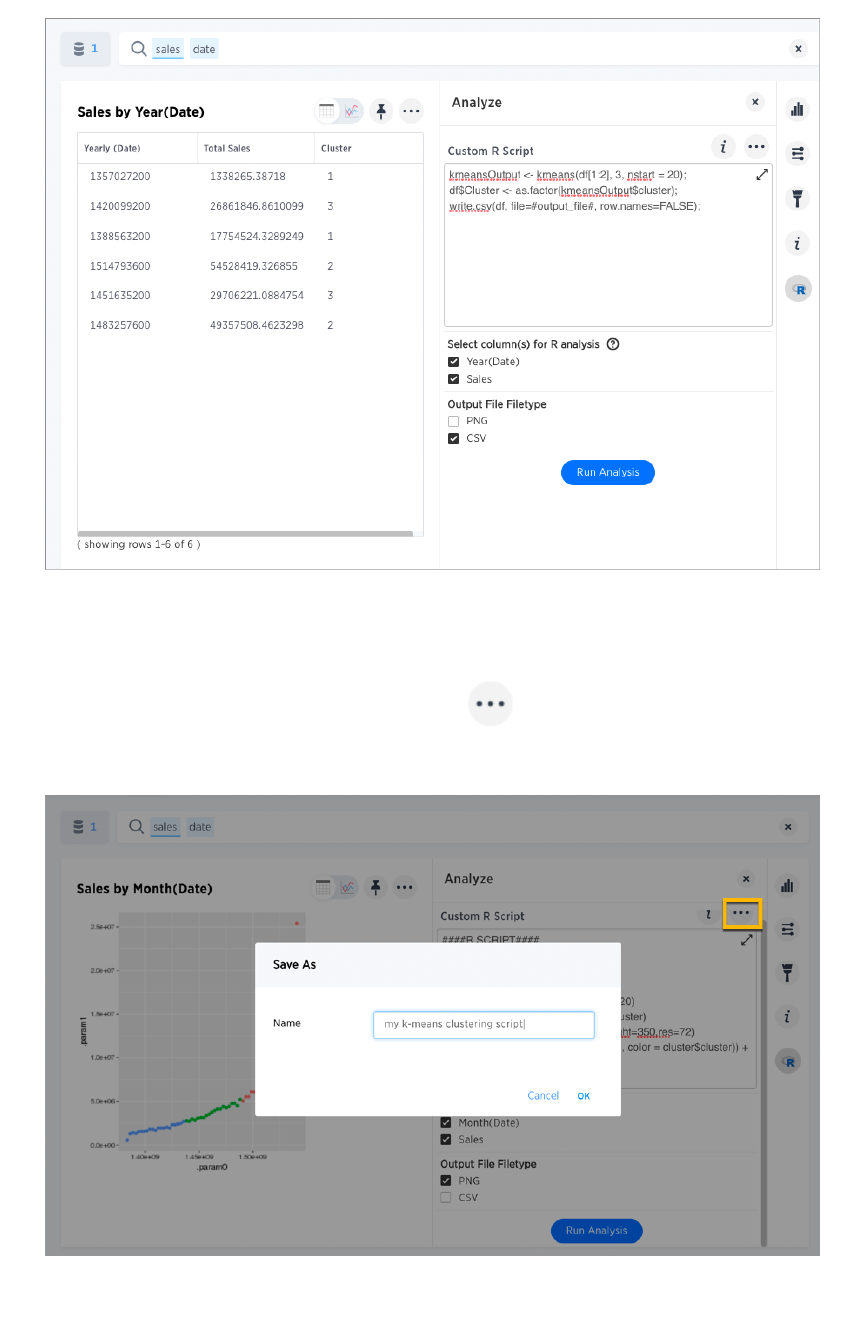
Save and share your script
To save a script, choose Save asSave as from the options menu of the script. After you name and save
it, your script will show in the LoadLoad scripts dialog.
Create and share R scripts
February 07, 2019
ThoughtSpot Users Guide Page 218
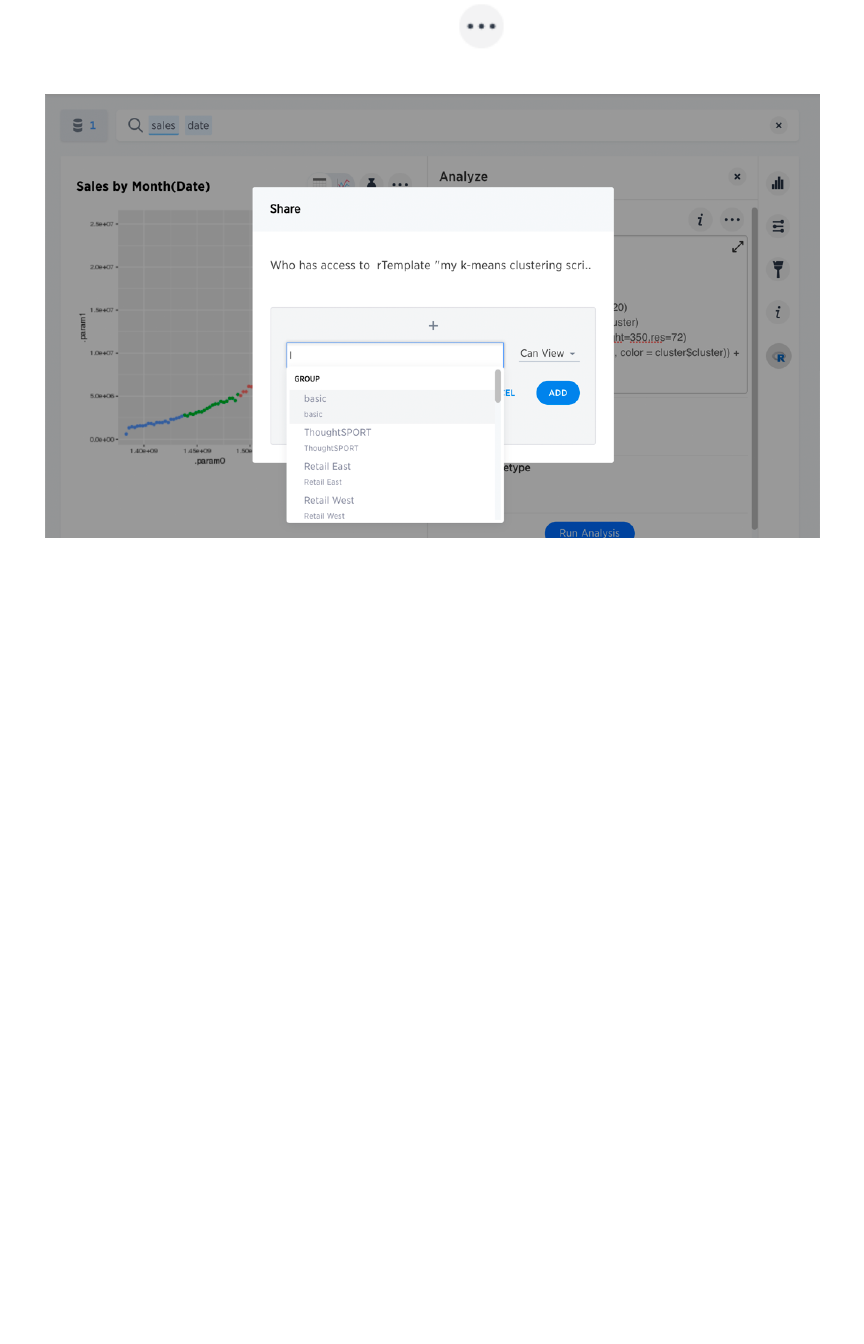
To share a script, choose ShareShare from the options menu .
More script examples
For some more example scripts, check out the blog post on Using R Analysis in ThoughtSpot for Time
Series Forecasting, or load one of the ThoughtSpot provided scripts:
• Binomial Logistic Regression
• K-Means Clustering Plot
• K-Means Clustering Table
• Time Series Outlier Detection
• Time Series Forecast
Create and share R scripts
February 07, 2019
ThoughtSpot Users Guide Page 219
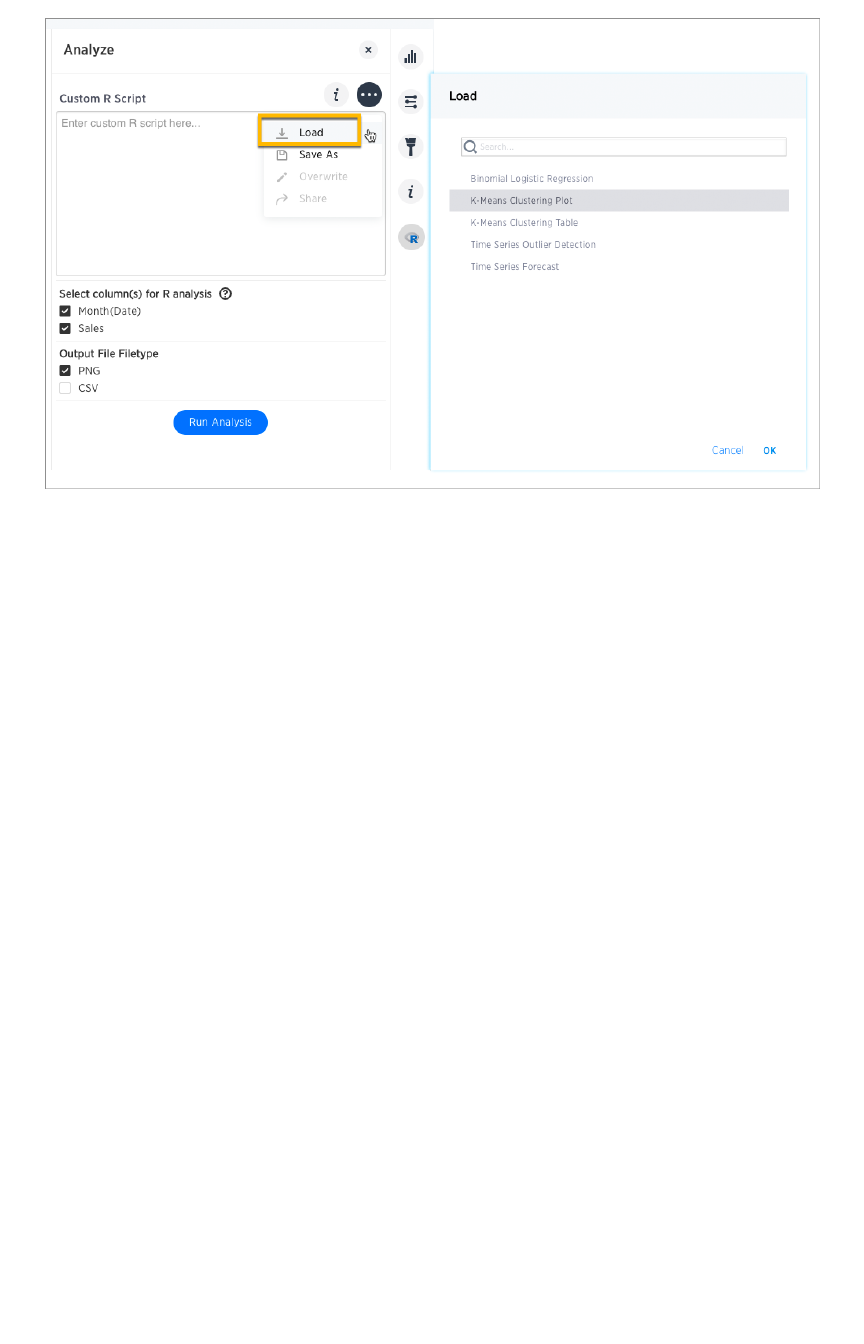
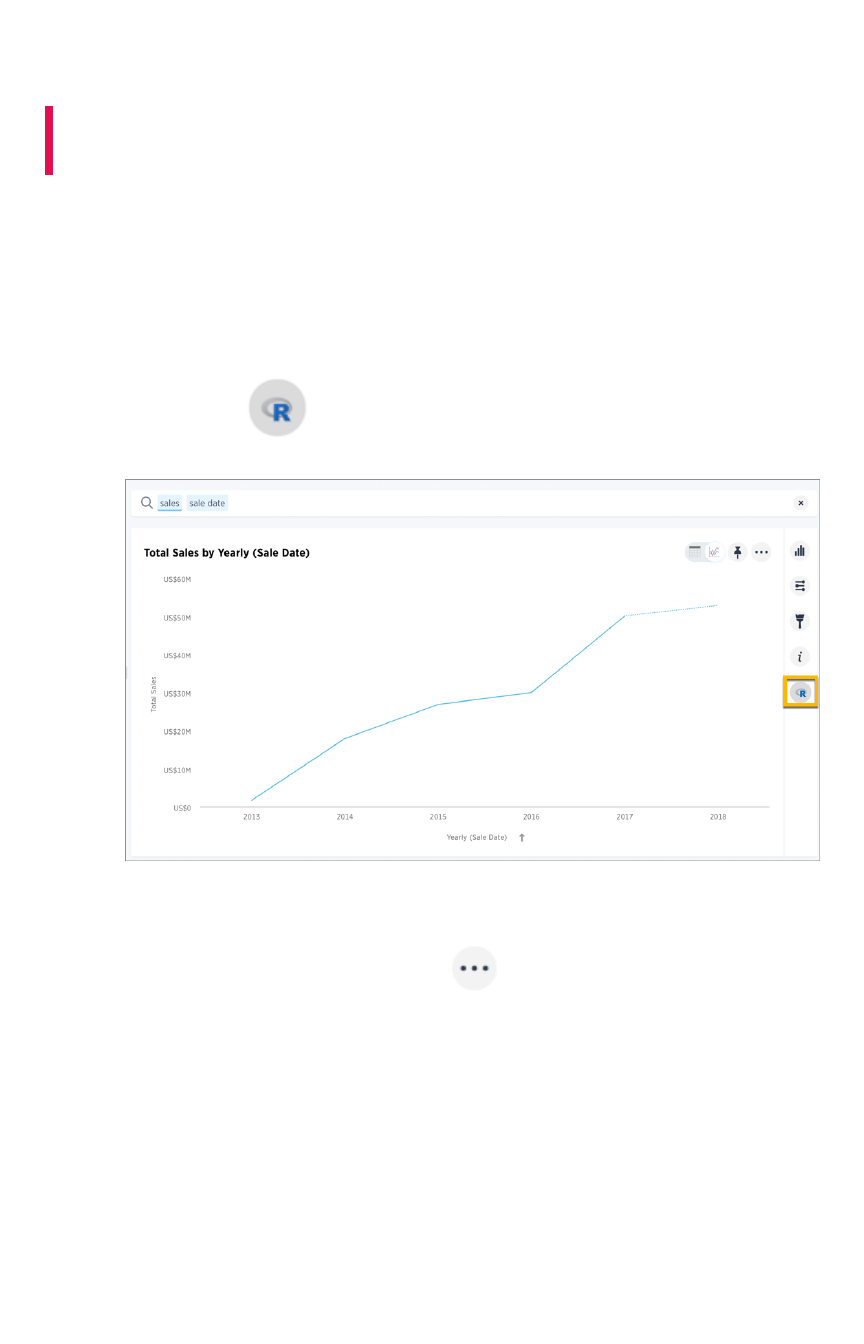
Run prebuilt R scripts on answers
Summary:Summary: Anyone with R privileges can run an R analysis
ThoughtSpot using provided scripts, you don't need to be an expert.
If you have R privileges on your ThoughtSpot instance, you can run R analyses on search results, and
save and share the resulting visualization with others. The users you share visualizations with do not
need R privileges.
Run an R analysis
1. Click the RR icon on the toolbar for any search result (answer).
From here, you have options to write a custom script, or load a pre-built or ThoughtSpot
provided script.
2. In the Analyze dialog, click the ellipses icon next to the Custom R ScriptCustom R Script panel, and
choose LoadLoad.
Run prebuilt R scripts on answers
February 07, 2019
ThoughtSpot Users Guide Page 221
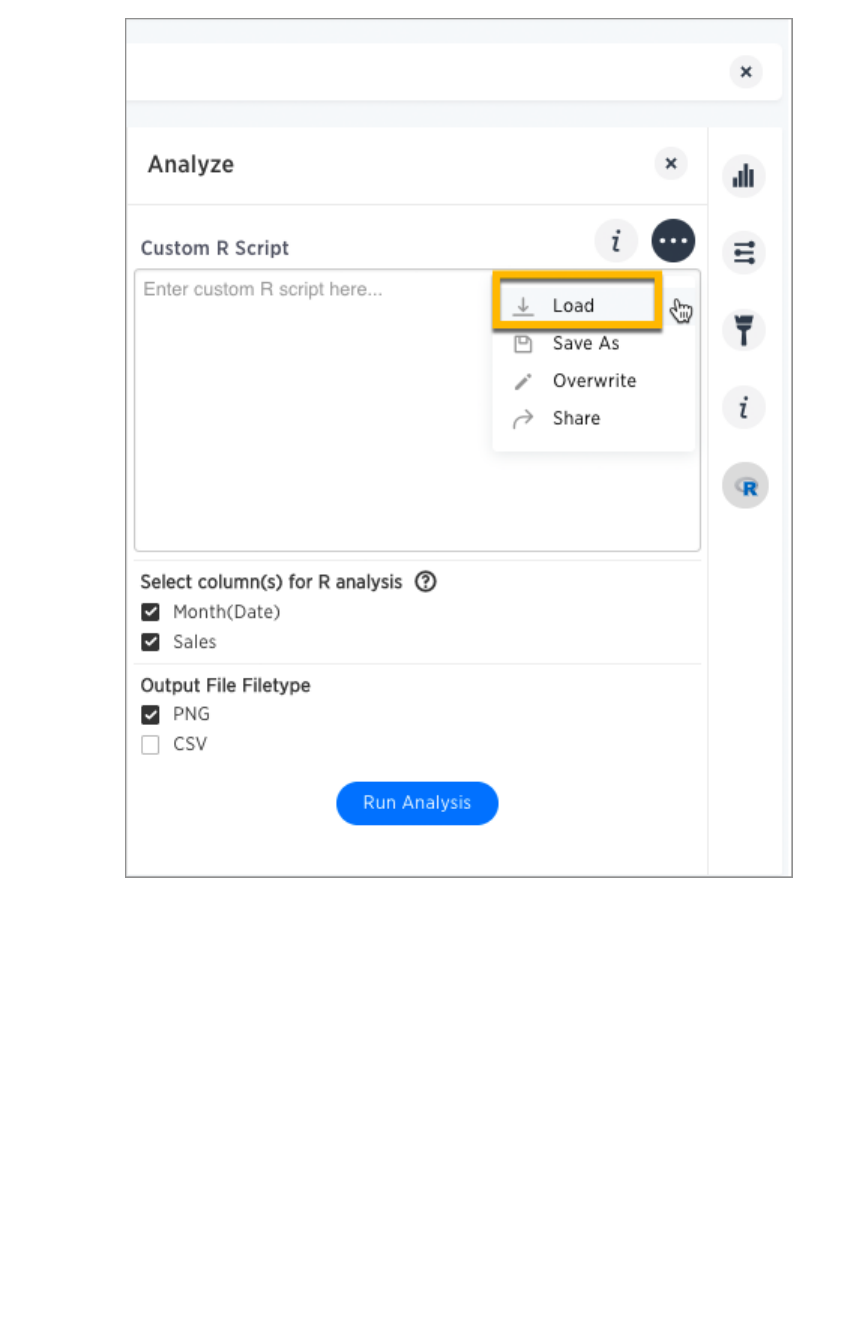
This brings up a list of pre-built scripts, both provided by ThoughtSpot and any created by
programmers on your team.
Run prebuilt R scripts on answers
February 07, 2019
ThoughtSpot Users Guide Page 222
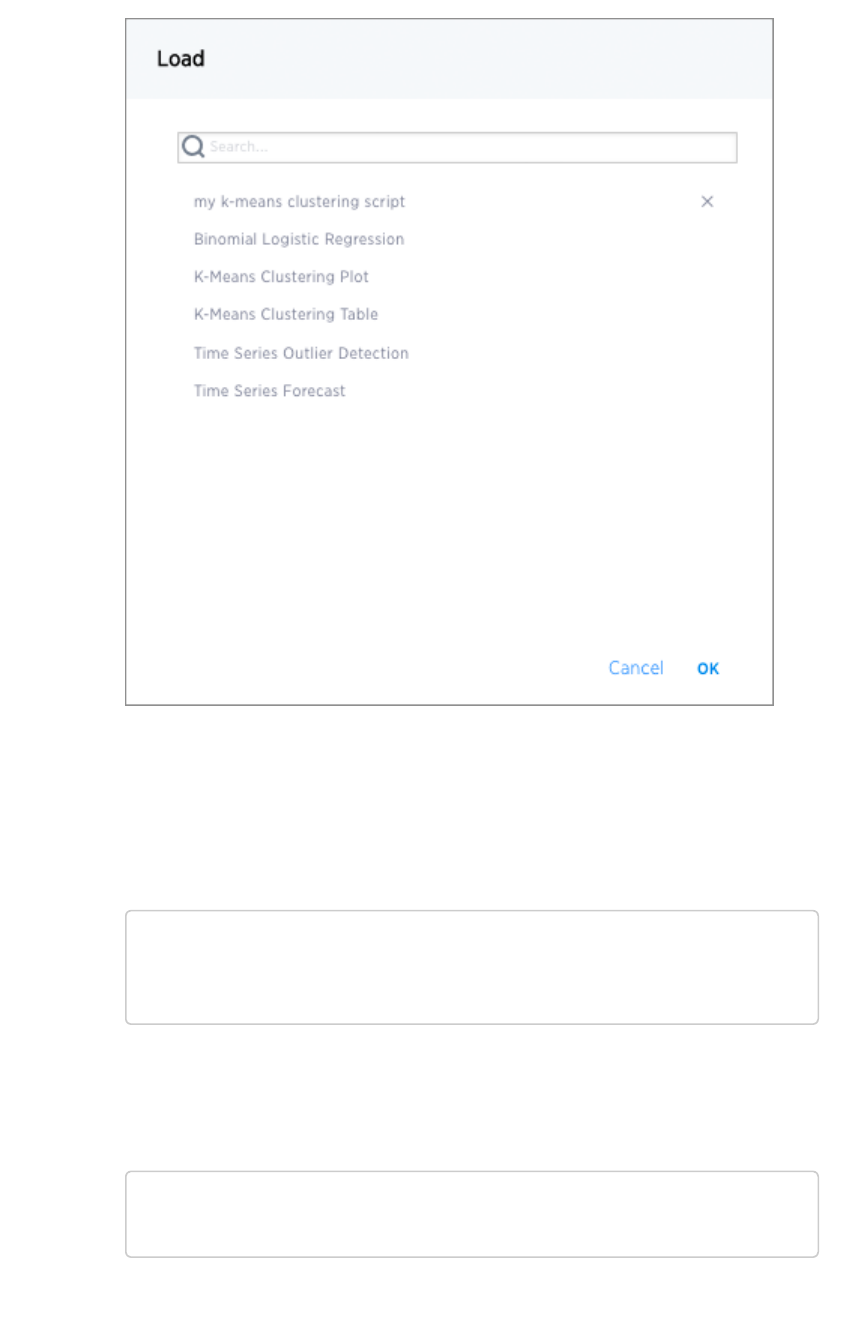
3. Select a script, then choose the columns you want to include in the analysis and the output
file type (PNG or CSV).
Note that the output file type must match the script.
For example, if you select one of the ThoughtSpot provided time series scripts, the comment
at the top of the script provides guidance on what columns to select.
# NOTE: Only two columns are needed for this analysis.
# The first column should represent some date column
# and the second should be some numeric measure column.
Also, scroll through the script to identify whether it’s coded to produce graphical (PNG) or
tabular (CSV) output. The time series scripts are both set up to produce graphical output, as
indicated by a line like this at the end of the scripts.
png(#output_file#, width=1000);
print(img);
4. Select Run AnalysisRun Analysis to execute the script.
Run prebuilt R scripts on answers
February 07, 2019
ThoughtSpot Users Guide Page 223
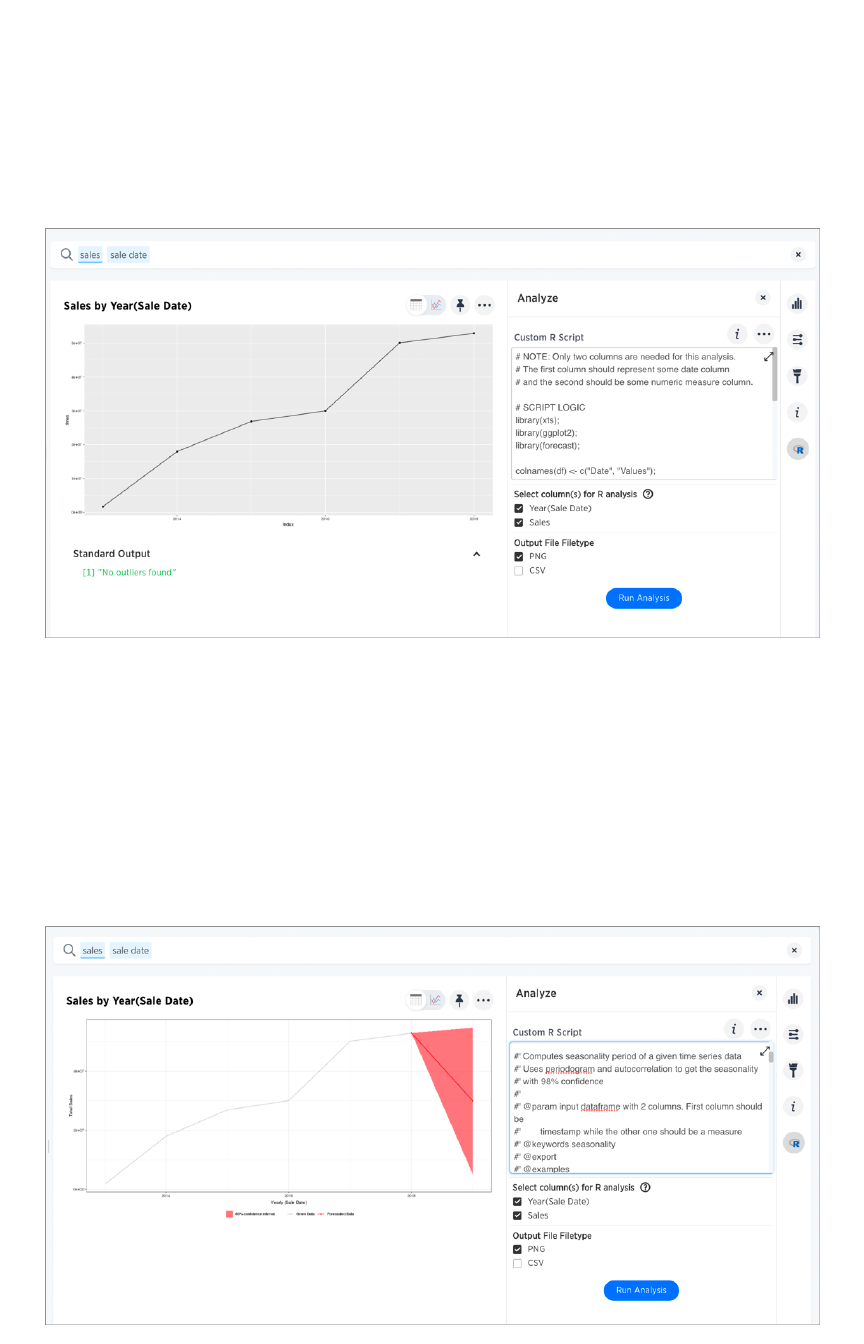
Time Series Outlier Example
In this example, we ran an analysis for Time Series Outlier DetectionTime Series Outlier Detection on search results that show sales
totals by date.
Note that we included a date column and a measure, and selected PNG as the output to match what the
script requires. The original search could have had more columns than this, but you can always structure
the analysis properly by selecting only the date column and measure column you want to focus on.
In this case, no outliers were found, so the R visualization matches the original search result line graph.
Time Series Forecast Example
In this example, we ran a Time Series ForecastTime Series Forecast on the same search result.
Run prebuilt R scripts on answers
February 07, 2019
ThoughtSpot Users Guide Page 224

Diverging Bars Example
Here is an example of taking a script found online and repurposing it for a use case in ThoughtSpot.
Antony Chen demo’ed this in a SpotOn webinar. You can find his full presentation on Custom R Scripts
and demo at SpotOn Learning: ThoughtSpot 5.0 BI and Data Science Features in the Community.
Consider this script, found on this website of Top 50 ggplot2 Visualizations - The Master List (With Full R
Code). A direct link to this script is here.
library(ggplot2)
theme_set(theme_bw())
# Data Prep
data("mtcars") # load data
mtcars$`car name` <- rownames(mtcars) # create new column for
car names
mtcars$mpg_z <- round((mtcars$mpg - mean(mtcars$mpg))/sd(mtcar
s$mpg), 2) # compute normalized mpg
mtcars$mpg_type <- ifelse(mtcars$mpg_z < 0, "below", "above")
# above / below avg flag
mtcars <- mtcars[order(mtcars$mpg_z), ] # sort
mtcars$`car name` <- factor(mtcars$`car name`, levels = mtcar
s$`car name`) # convert to factor to retain sorted order in pl
ot.
# Diverging Barcharts
ggplot(mtcars, aes(x=`car name`, y=mpg_z, label=mpg_z)) +
geom_bar(stat='identity', aes(fill=mpg_type), width=.5) +
scale_fill_manual(name="Mileage",
labels = c("Above Average", "Below Averag
e"),
values = c("above"="#00ba38", "below"="#f87
66d")) +
labs(subtitle="Normalised mileage from 'mtcars'",
title= "Diverging Bars") +
coord_flip()
You can modify the script above to support the phone sales use case discussed in the webinar.
In this script, mtcars is replaced with references to our phone sales ( df$Sales ) and car name is
replaced with Device Name both from the column data in the search example used in the webinar
demo. The script uses the ThoughtSpot
data frame
object ( df ), and adds two lines at the end to specify
output type as a png image.
Run prebuilt R scripts on answers
February 07, 2019
ThoughtSpot Users Guide Page 225

library(ggplot2)
theme_set(theme_bw())
# Data Prep
df$sales_z <- round((df$Sales - mean(df$Sales))/sd(df$Sales),
2) # compute normalized mpg
df$sales_type <- ifelse(df$sales_z < 0, "below", "above") # ab
ove / below avg flag
df <- df[order(df$sales_z), ] # sort
df$`Device Name` <- factor(df$`Device Name`, levels = df$`Devic
e Name`) # convert to factor to retain sorted order in plot.
# Diverging Barcharts
img <- ggplot(df, aes(x=`Device Name`, y=sales_z, label=sale
s_z)) +
geom_bar(stat='identity', aes(fill=sales_type), width=.5) +
scale_fill_manual(name="Sales",
labels = c("Above Average", "Below Averag
e"),
values = c("above"="#00ba38", "below"="#f87
66d")) +
labs(subtitle="Normalised Sales for Phones",
title= "Diverging Bars") +
coord_flip()
png(#output_file#, width=1000, height=1000)
print(img)
Run prebuilt R scripts on answers
February 07, 2019
ThoughtSpot Users Guide Page 226
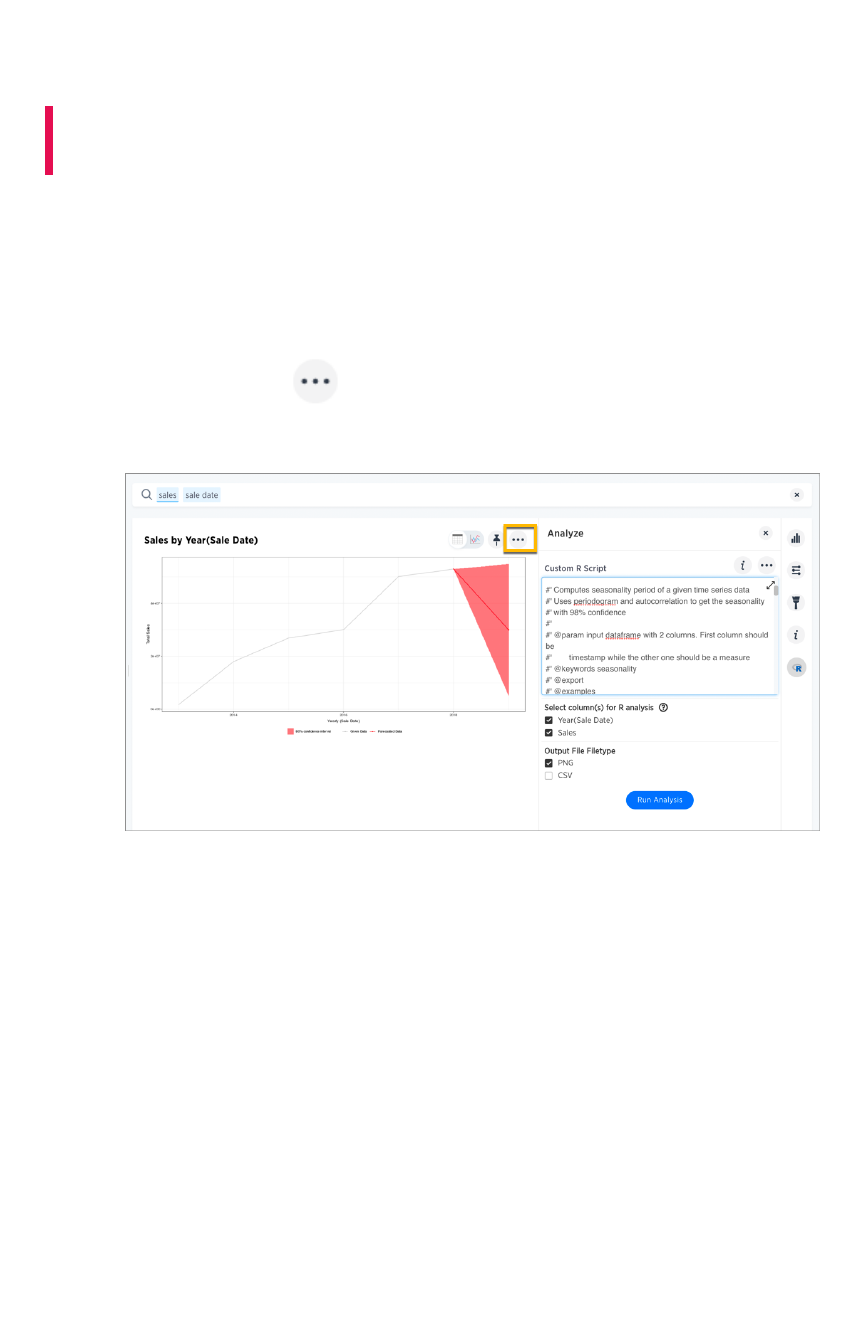
Save and share R visualizations
Summary:Summary: You can save and share R analyses as answers and
pinboards.
In terms of sharing, the R visualization you get as a result of running a script is similar to any other
search result in ThoughtSpot. You can save it, share it, and add it to pinboards.
Save an R visualization
1. Click the ellipses icon above the generated graphic or table containing your analysis,
and select SaveSave from the menu.
2. Add a name and description for the analysis, and click SaveSave.
Save and share R visualizations
February 07, 2019
ThoughtSpot Users Guide Page 227
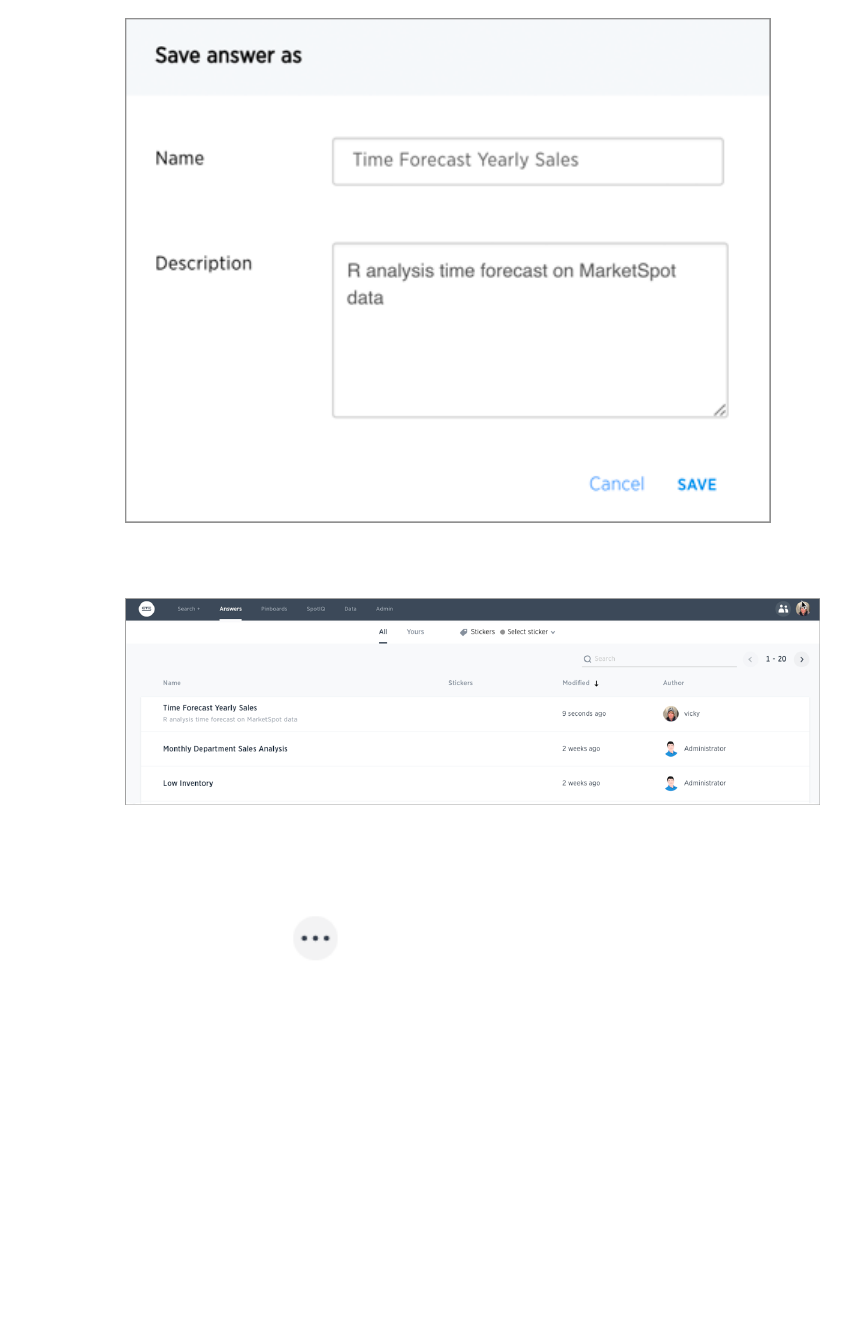
The saved analysis is added to AnswersAnswers.
Share an R visualization
1. Click the ellipses icon above the generated graphic or table containing your analysis,
and select ShareShare from the menu.
Save and share R visualizations
February 07, 2019
ThoughtSpot Users Guide Page 228
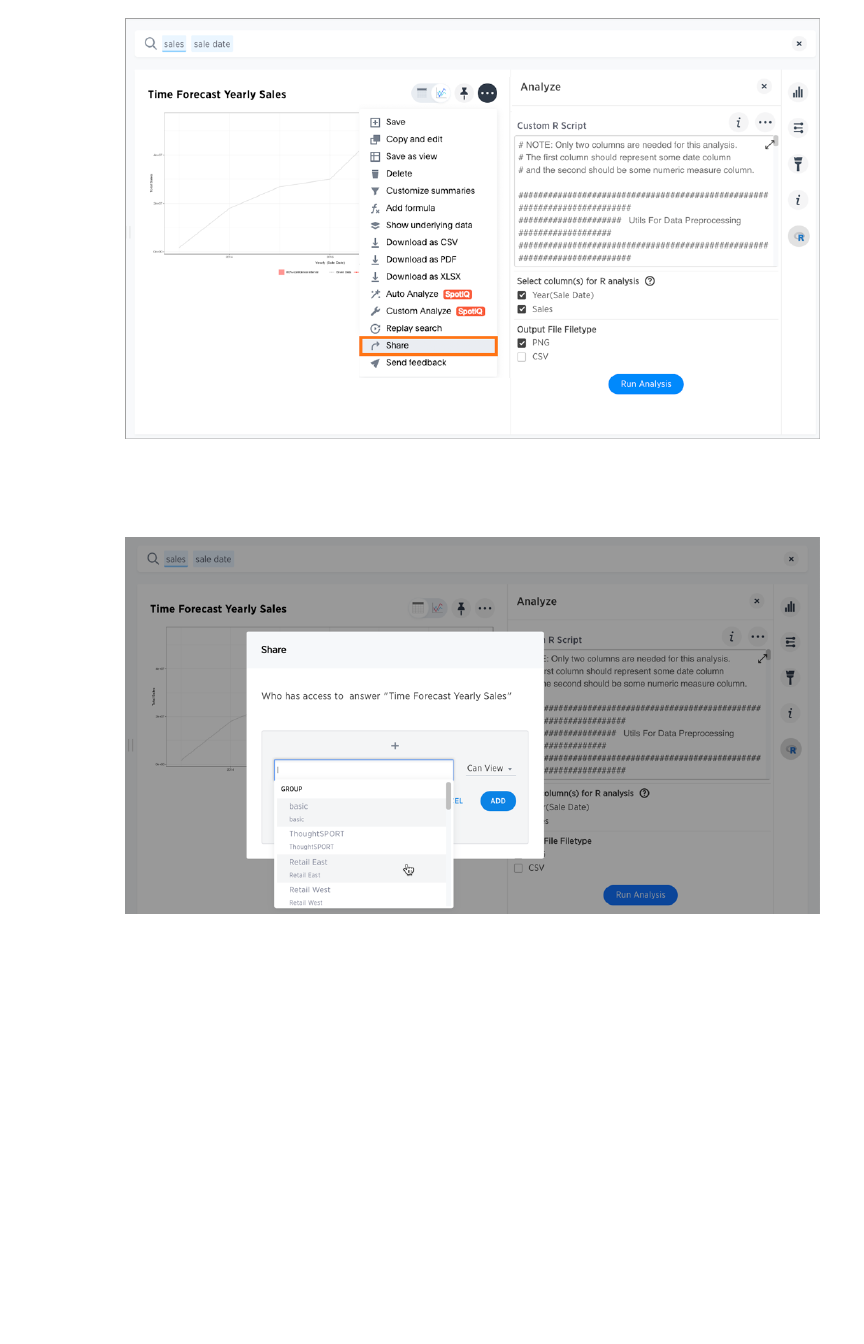
2. Select and add the user or group with which to share, along with level of access (Can ViewCan View,
Can EditCan Edit), and then click DoneDone.
Save and share R visualizations
February 07, 2019
ThoughtSpot Users Guide Page 229
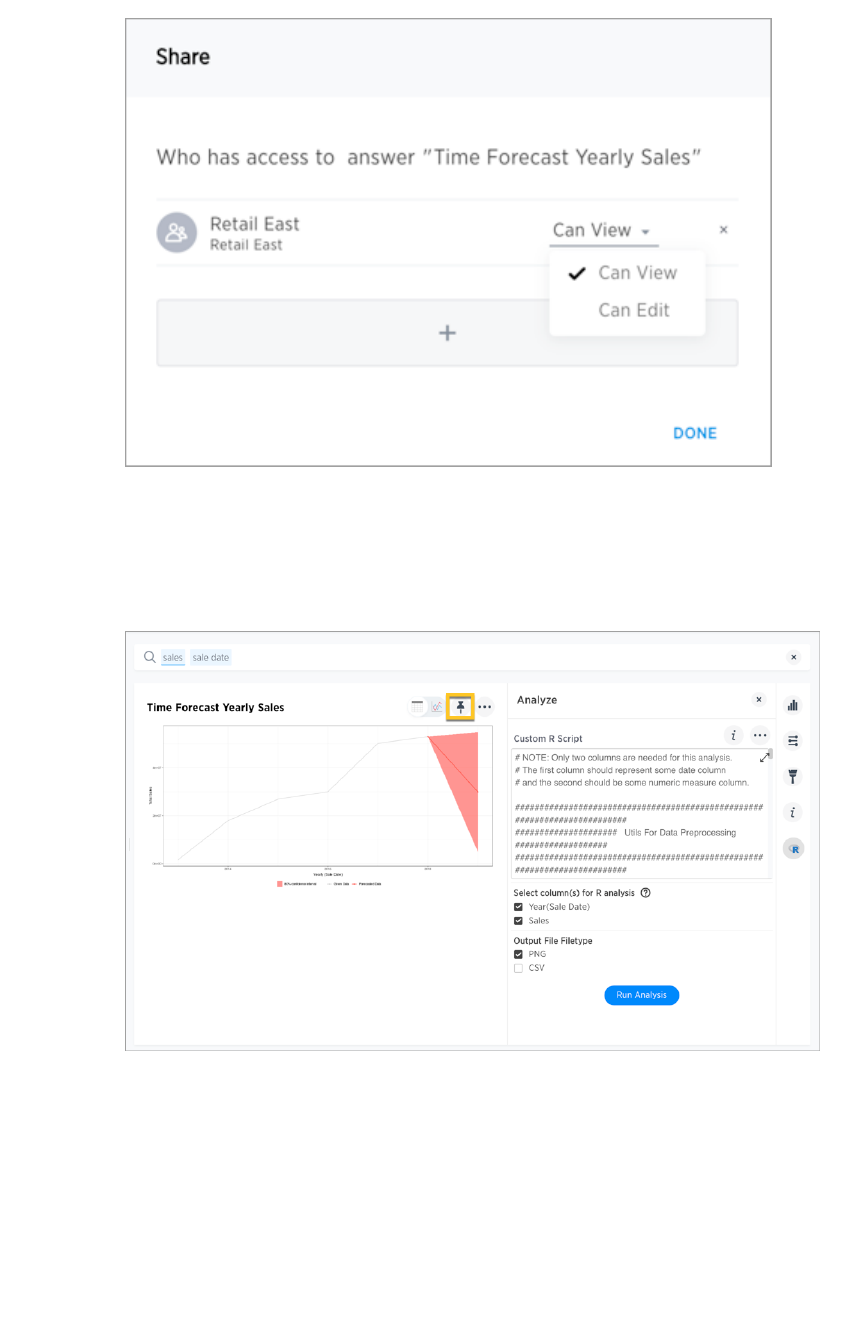
Add an R visualization to a pinboard
1. Click the pin above the the generated graphic or table containing your analysis.
2. Create a new pinboard or select an existing pinboard, then click DoneDone.
Save and share R visualizations
February 07, 2019
ThoughtSpot Users Guide Page 230
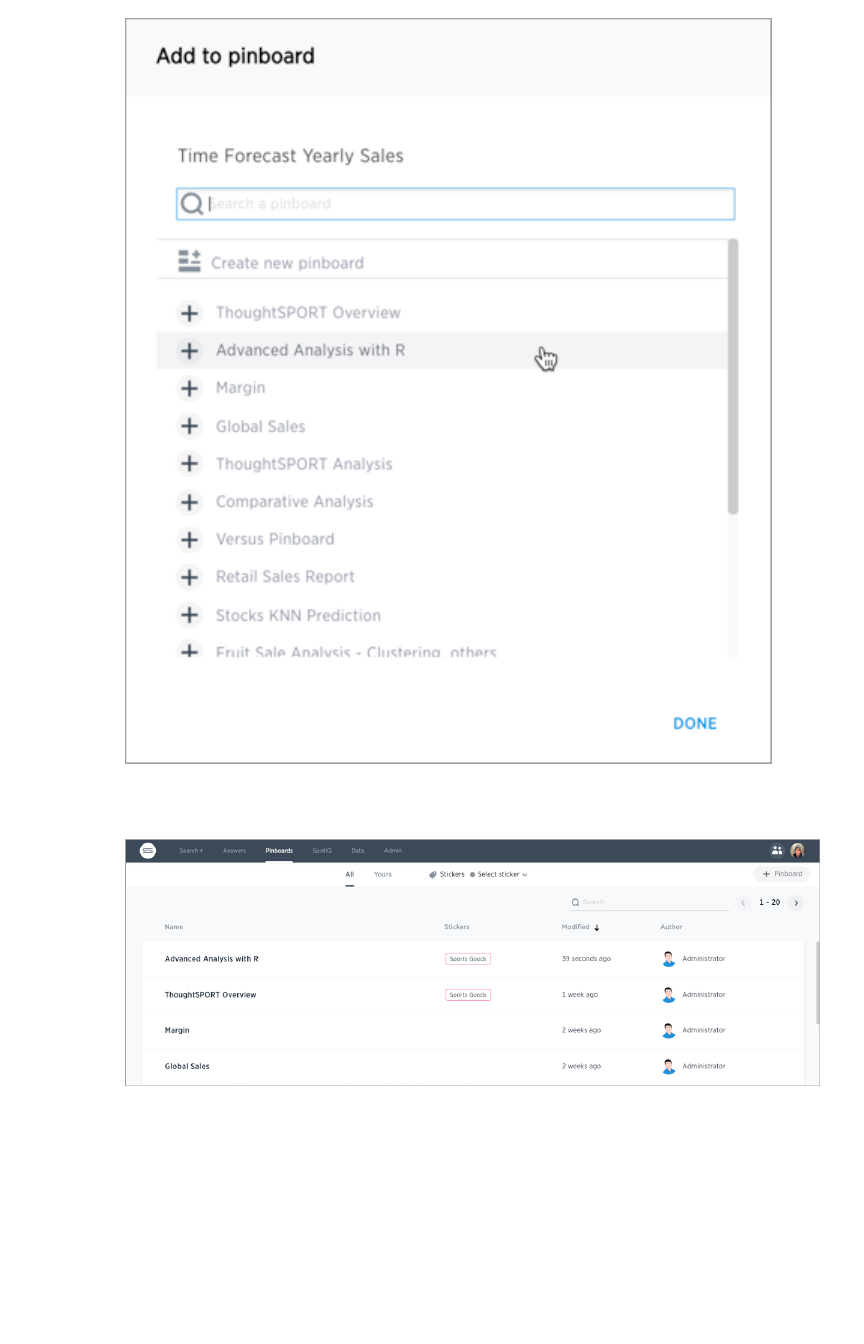
The visualization is available in PinboardsPinboards.
Save and share R visualizations
February 07, 2019
ThoughtSpot Users Guide Page 231
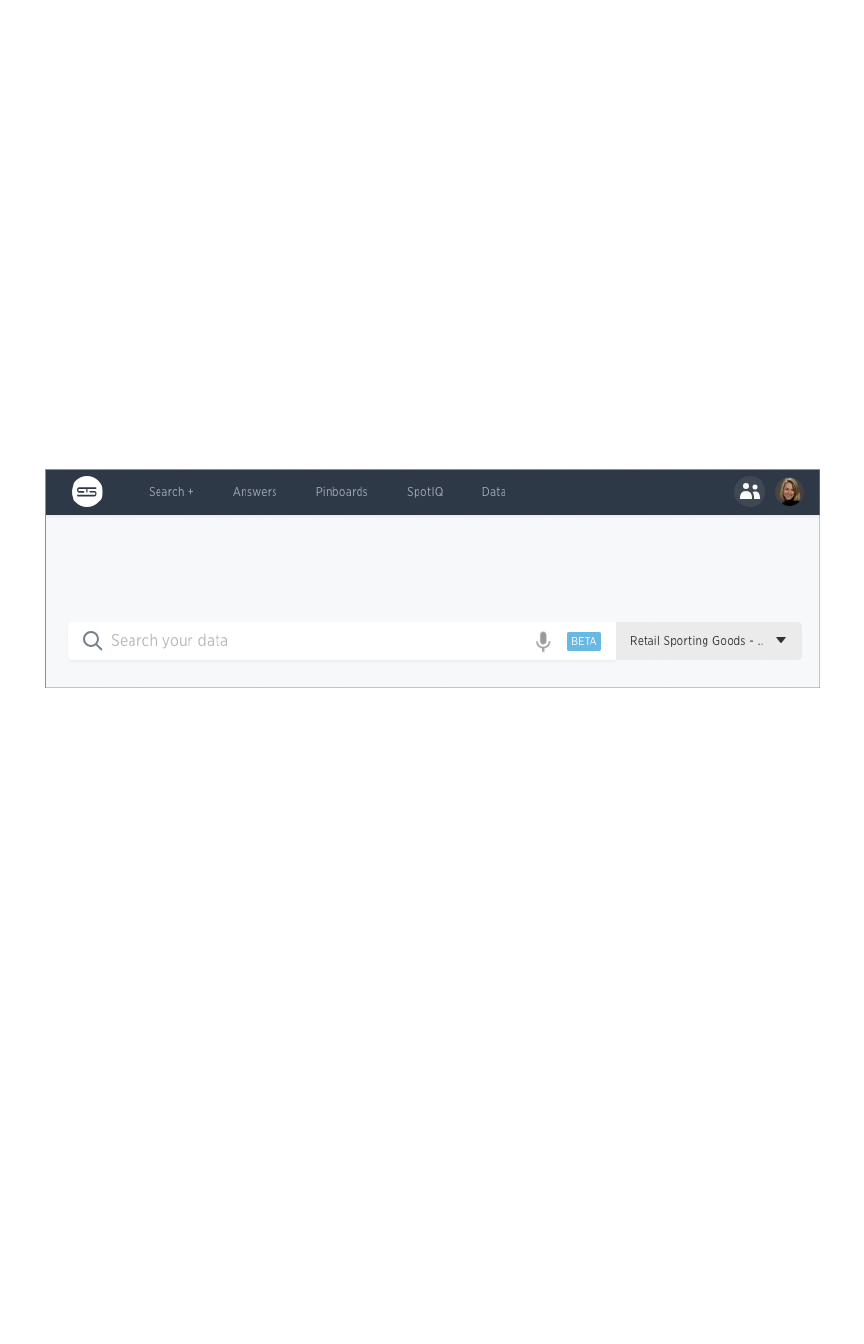
What is SpotIQ?
SpotIQ is a ThoughtSpot feature that helps you find insights into your data. Insights are trends,
correlations, explanations of increases, explanations of decreases, and outliers (values unique from what
is typical in your data).
Using SpotIQ, you can find interesting answers in your data that you might not have found on your own.
SpotIQ also learns from your responses to your insights. Meaning, how you interact with SpotIQ results
helps to build better results.
Who can use SpotIQ?
The SpotIQ feature is made for users who are not data magicians; however, data magicians can use it to
do power data magic. This means SpotIQ is for everyone.
If you can see the SpotIQSpotIQ on your ThoughtSpot dashboard, you have access to SpotIQ:
If you can’t see this option, ask your ThoughtSpot Administrator to give you the Has Spot IQHas Spot IQ privilege.
Where to find SpotIQ actions
The SpotIQSpotIQ page shows you all the analysis results in the system you have access to, these results are
called SpotIQ
insights
. You can create your own results from several different locations in your system:
• search results such as query, saved answer, or visualization.
• tables or worksheets
• data uploads
• SpotIQ insights
The menu items that use SpotIQ have a label that indicates this:
What is SpotIQ?
February 07, 2019
ThoughtSpot Users Guide Page 232
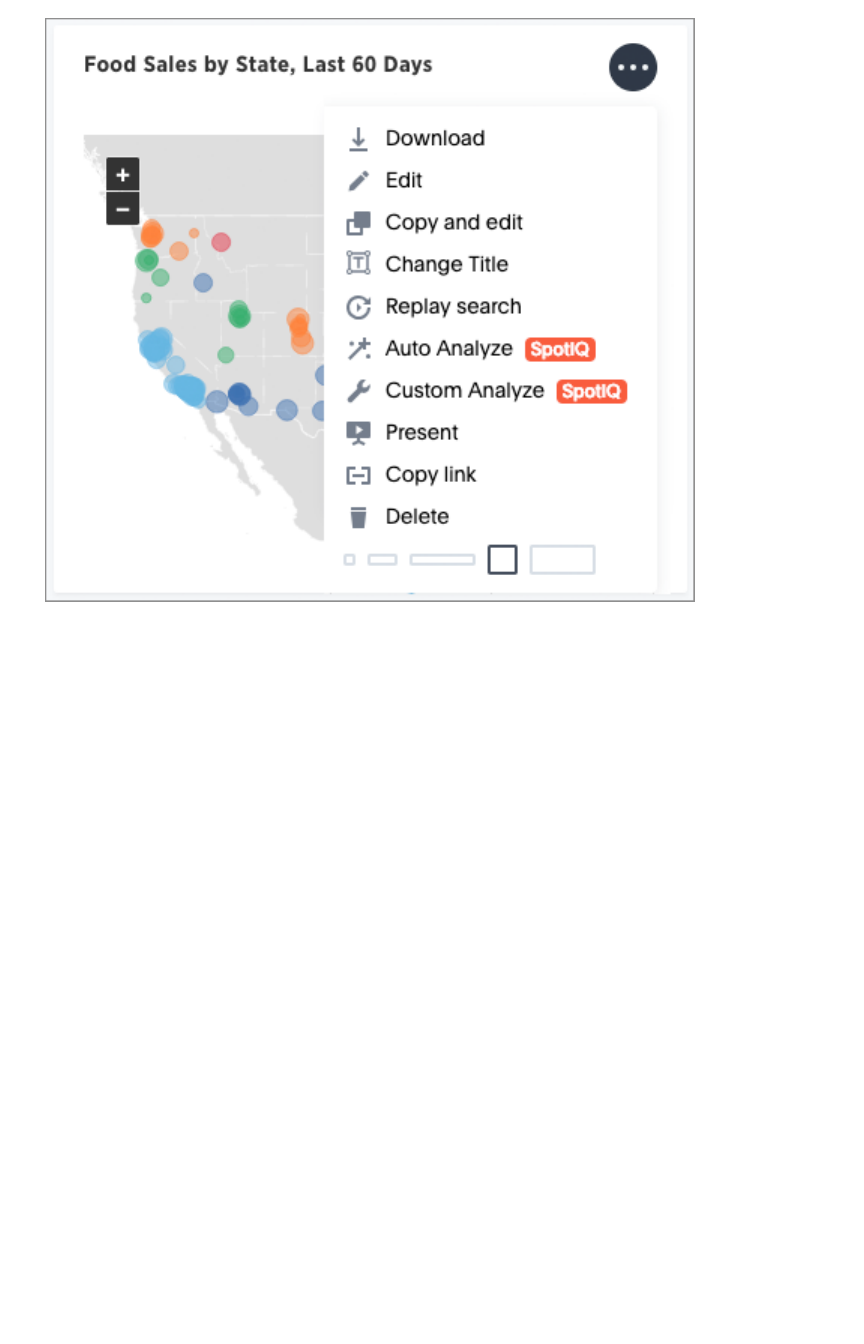
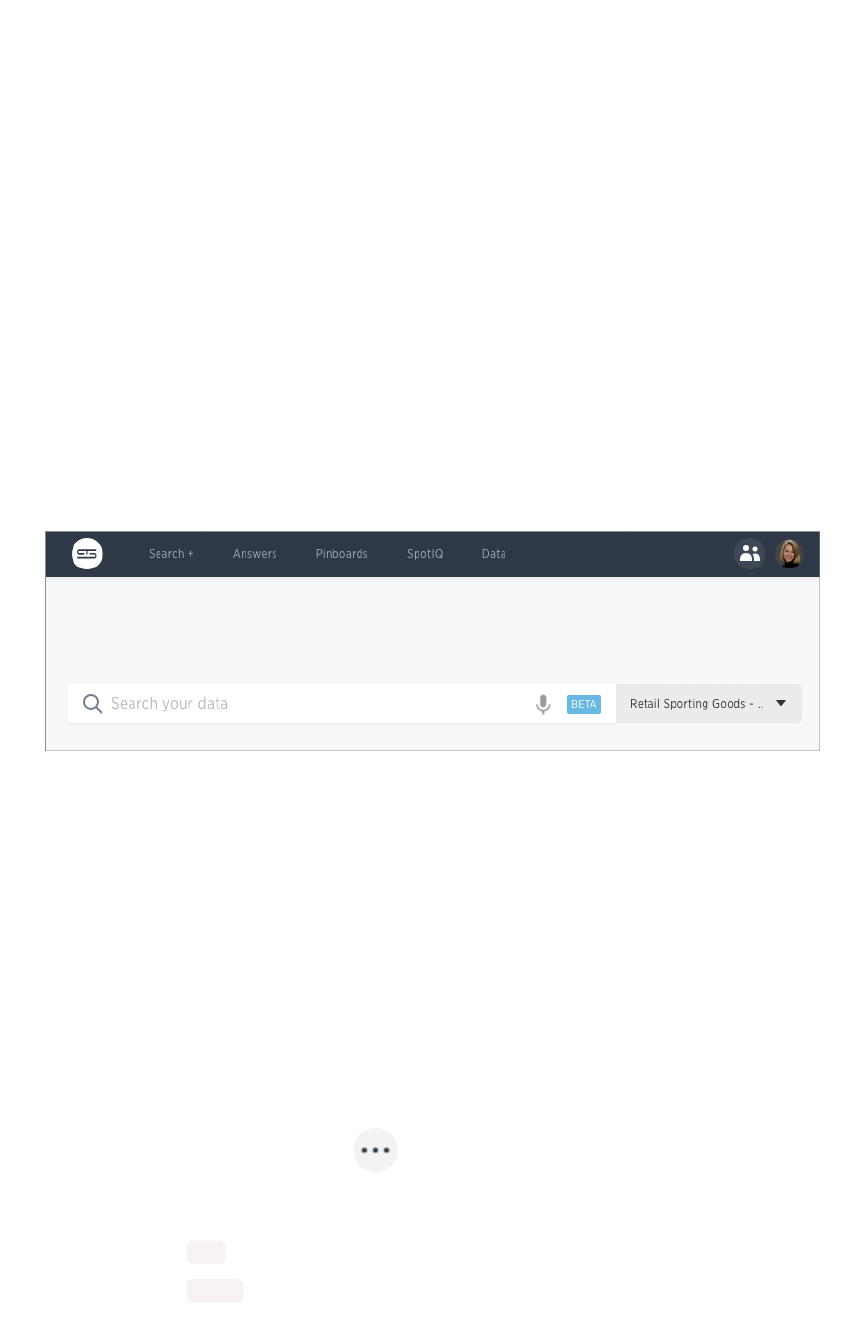
SpotIQ 101: Load and analyze data
This 101 walks you through a few simple, SpotIQ workflows. When you have completed the walkthrough,
you will be able to use the core features of SpotIQ in your ThoughtSpot installation.
If you want a detailed overview of what SpotIQ does before you try it out, first read the introduction to
SpotIQ.
Prerequisites
Before you begin, make sure you can sign in to the ThoughtSpot application. To complete this tutorial,
you need the ability to upload a CSV file and use the SpotIQ application. These features require that your
user account has the following privileges:
• Can upload user dataCan upload user data
• Has Spot IQ privilegeHas Spot IQ privilege
Your ThoughtSpot administrator can give you these privileges. If you can see the SpotIQ option on your
ThoughtSpot dashboard, you have access to SpotIQ:
Get the sample data and some insights
You can use SpotIQ with any of the data in your system.
This tutorial uses a dataset containing a list of sales and movement data by item and department.
1. Download the FoodDollarDataReal CSV file.
2. Save or move the file to a place on your local drive.
Upload the data
1. If you haven’t already, sign in to the ThoughtSpot application and click the DataData tab.
2. Click the ellipses icon (3 dots) , and select Upload dataUpload data.
3. Browse to the sample data file you downloaded or drag the file into the upload area.
4. Choose Yes for the Are the column names already defined in the file header?Are the column names already defined in the file header? setting.
5. Choose Comma for the Are the files separated by?Are the files separated by? setting.
SpotIQ 101: Load and analyze data
February 07, 2019
ThoughtSpot Users Guide Page 234
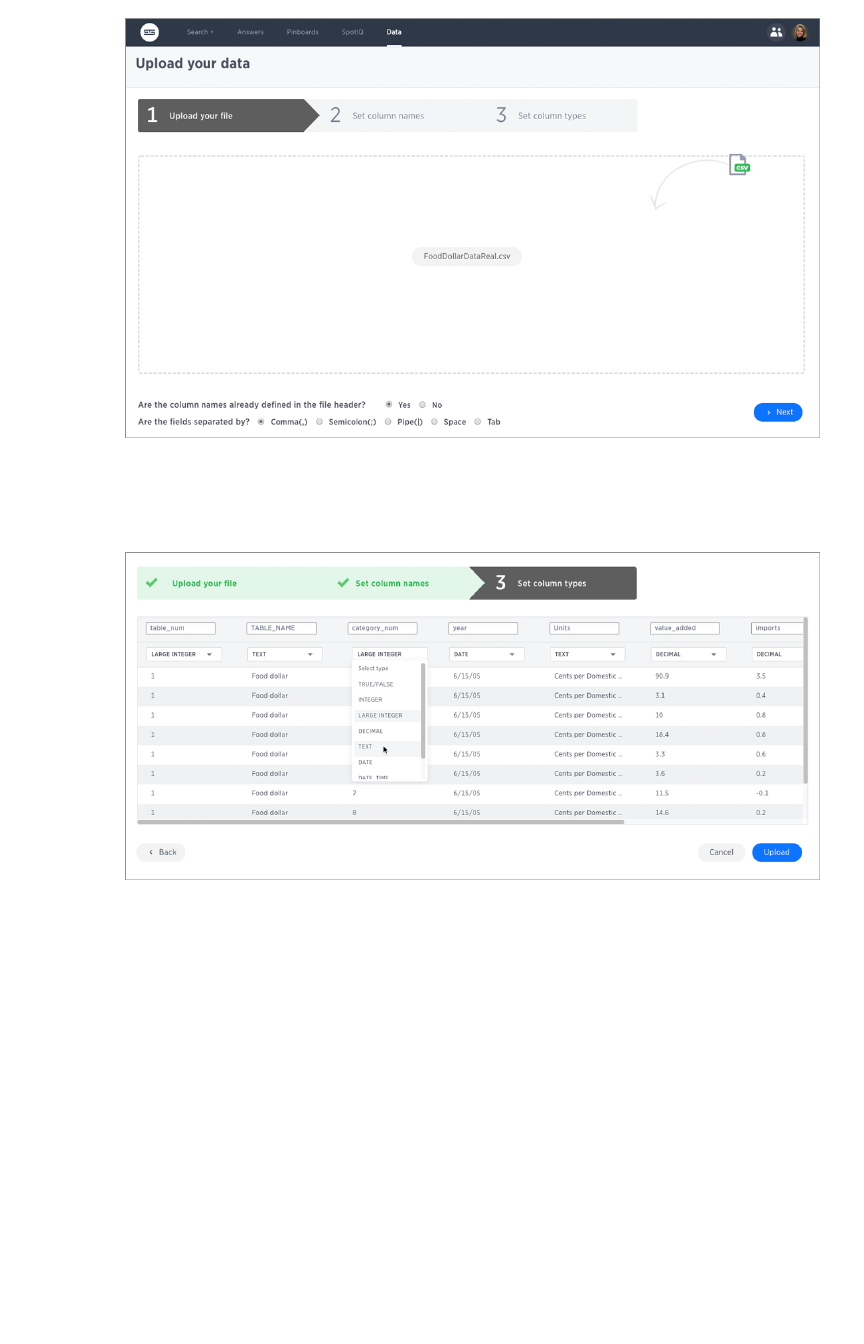
6. Click NextNext to go to the Set column namesSet column names page.
7. Set the category_numcategory_num column to TEXTTEXT on the Set column typesSet column types page.
8. Click UploadUpload.
ThoughtSpot presents you with a few choices.
SpotIQ 101: Load and analyze data
February 07, 2019
ThoughtSpot Users Guide Page 235
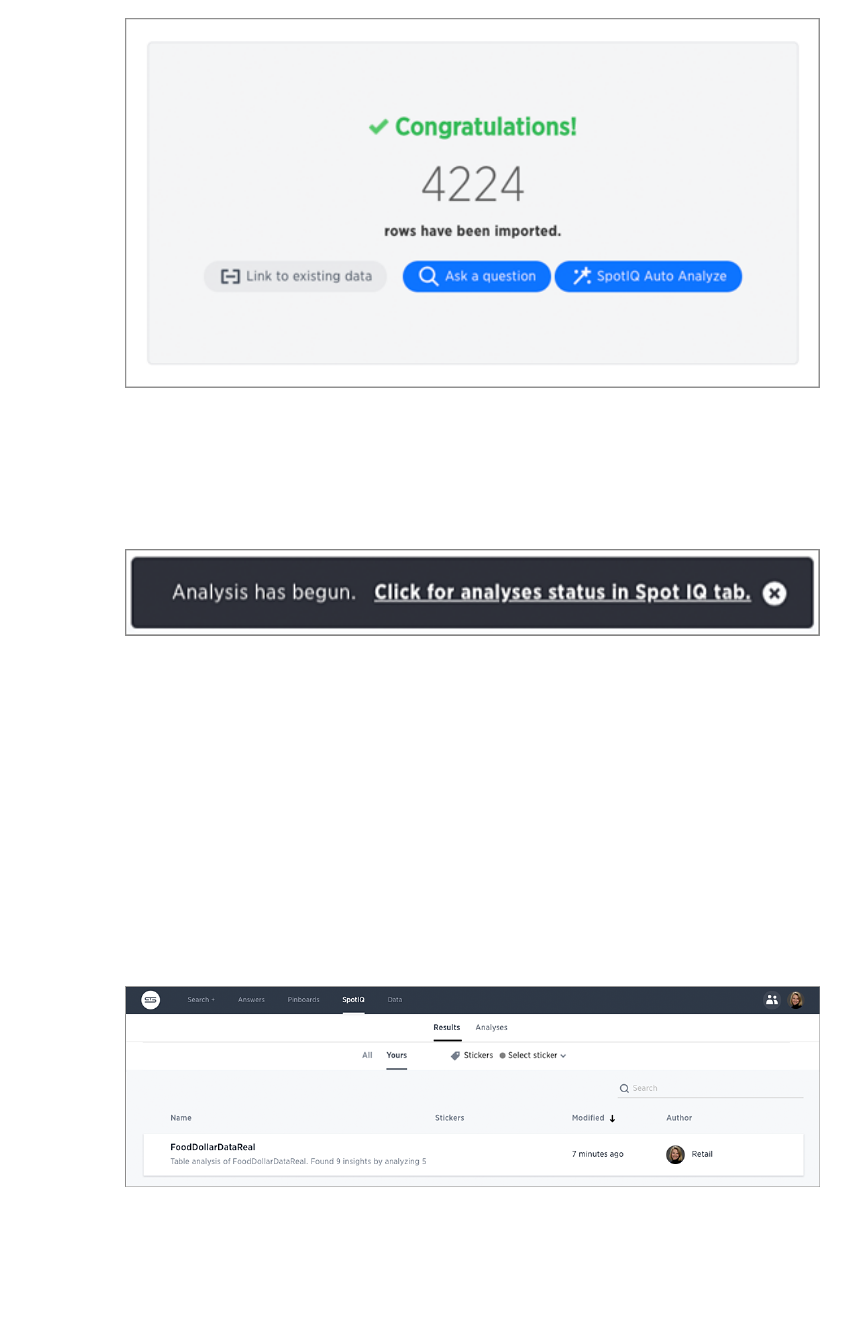
9. Choose SpotIQ Auto AnalyzeSpotIQ Auto Analyze to build SpotIQ insights.
Building insights can take time. How long depends on the data you are analyzing. The
ThoughtSpot application displays an informational message. The message disappears after a
moment.
Work with the INSIGHTS list
Each time SpotIQ does an analysis, it generates a set of results. ThoughtSpots keeps the results until the
user that requested the analysis (or an admin), deletes them. You can run SpotIQ on the same object
multiple times. Each analysis generates new results.
1. To check for the results of your analysis, go to the SpotIQSpotIQ page.
The SpotIQSpotIQ page allows you to see all results with data you have permission for. So the
results lists shows AllAll results or just YoursYours.
2. Select YoursYours.
3. Look for results from your FoodDollarDataRealFoodDollarDataReal data.
SpotIQ labels each result with a NAMENAME, DESCRIPTIONDESCRIPTION, STICKERSSTICKERS, and MODIFIEDMODIFIED. The
NAMENAME comes from the object that was analyzed which is referenced again in the
DESCRIPTIONDESCRIPTION. The combination of NAMENAME, DESCRIPTIONDESCRIPTION, and MODIFIEDMODIFIED is unique.
SpotIQ 101: Load and analyze data
February 07, 2019
ThoughtSpot Users Guide Page 236

4. Take a minute and review the DESCRIPTIONDESCRIPTION and MODIFIEDMODIFIED time.
Not every SpotIQ analysis creates results. You can see information about each analysis as
well as the results.
5. Click the AnalysesAnalyses tab at the top of the page.
Check the STATUSSTATUS and also how long the RESULTRESULT took to generate. Since you got results,
you can see that the analysis succeeded.
6. Select the Analysis for FoodDollarDataRealAnalysis for FoodDollarDataReal and choose DeleteDelete.
The information disappears from the AnalysesAnalyses list.
7. Choose ResultsResults.
You should still see the results for your FoodDollarDataRealFoodDollarDataReal run. Deleting information about
an analysis run does not delete the actual results. You must delete each individually.
Where to go next
At this point, you’ve created a set of insights using SpotIQ, in the next section you Review insights you
created.
SpotIQ 101: Load and analyze data
February 07, 2019
ThoughtSpot Users Guide Page 237
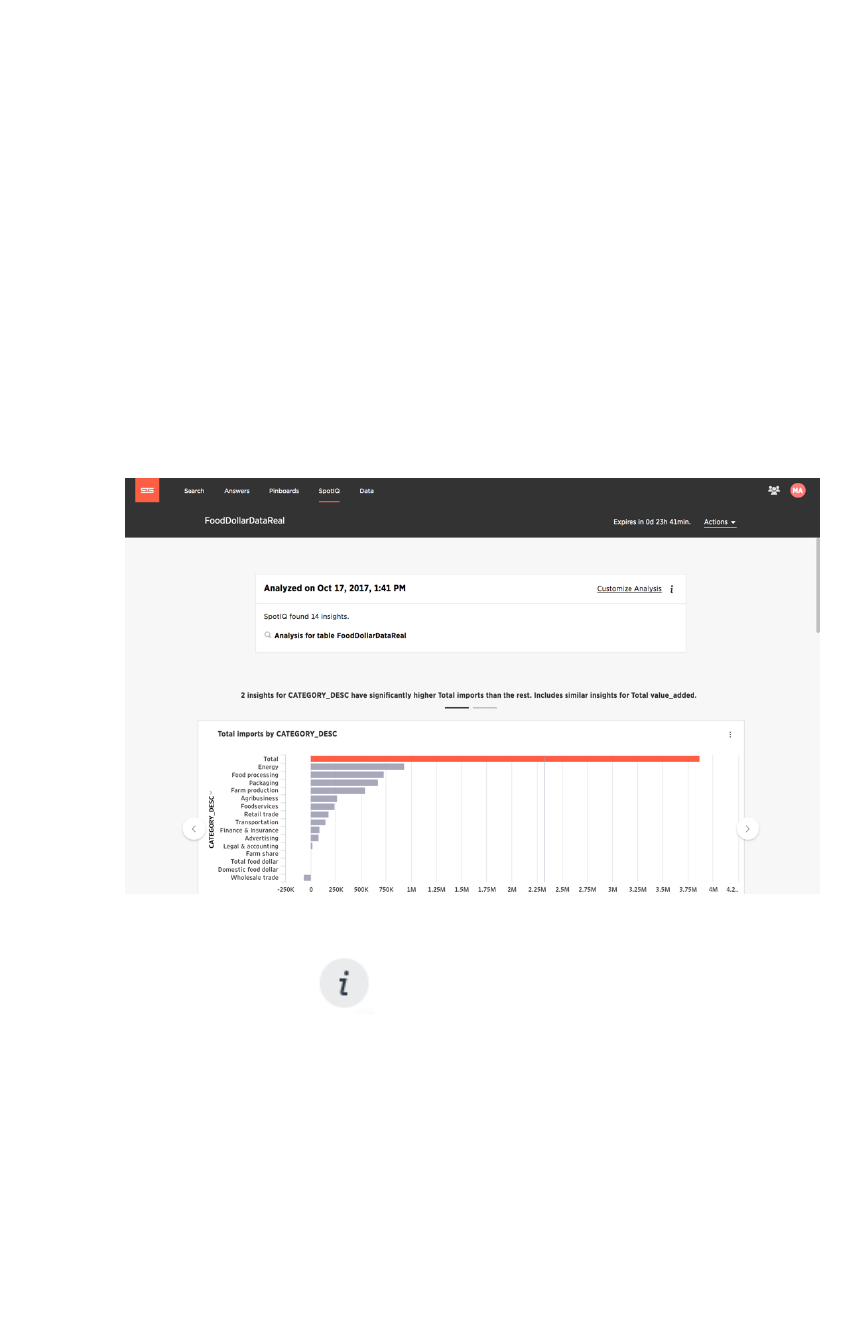
SpotIQ 101: Do more with SpotIQ
At this point, you have done the first set of SpotIQ tutorial tasks, you’ve uploaded some data and run
your first SpotIQ analysis. You should be able to look at the SpotIQSpotIQ list and see when your analysis ran.
This is important knowledge because data changes, you’ll want to run multiple analyzes on the same
data.
In this section, you look at the results and see what insights SpotIQ discovered. You’ll learn about the
basic types of analysis SpotIQ runs on data.
View results of an analysis
1. If you haven’t, log into the ThoughtSpot application.
2. Select the SpotIQ > ResultsSpotIQ > Results page.
3. Look for results from your FoodDollarDataRealFoodDollarDataReal analysis and click on the NAMENAME. The
application opens the SpotIQ insights.
The first panel provides information about the analysis.
4. Click the information icon at the top of the page to see a summary of the SpotIQ
analysis.
SpotIQ 101: Do more with SpotIQ
February 07, 2019
ThoughtSpot Users Guide Page 238
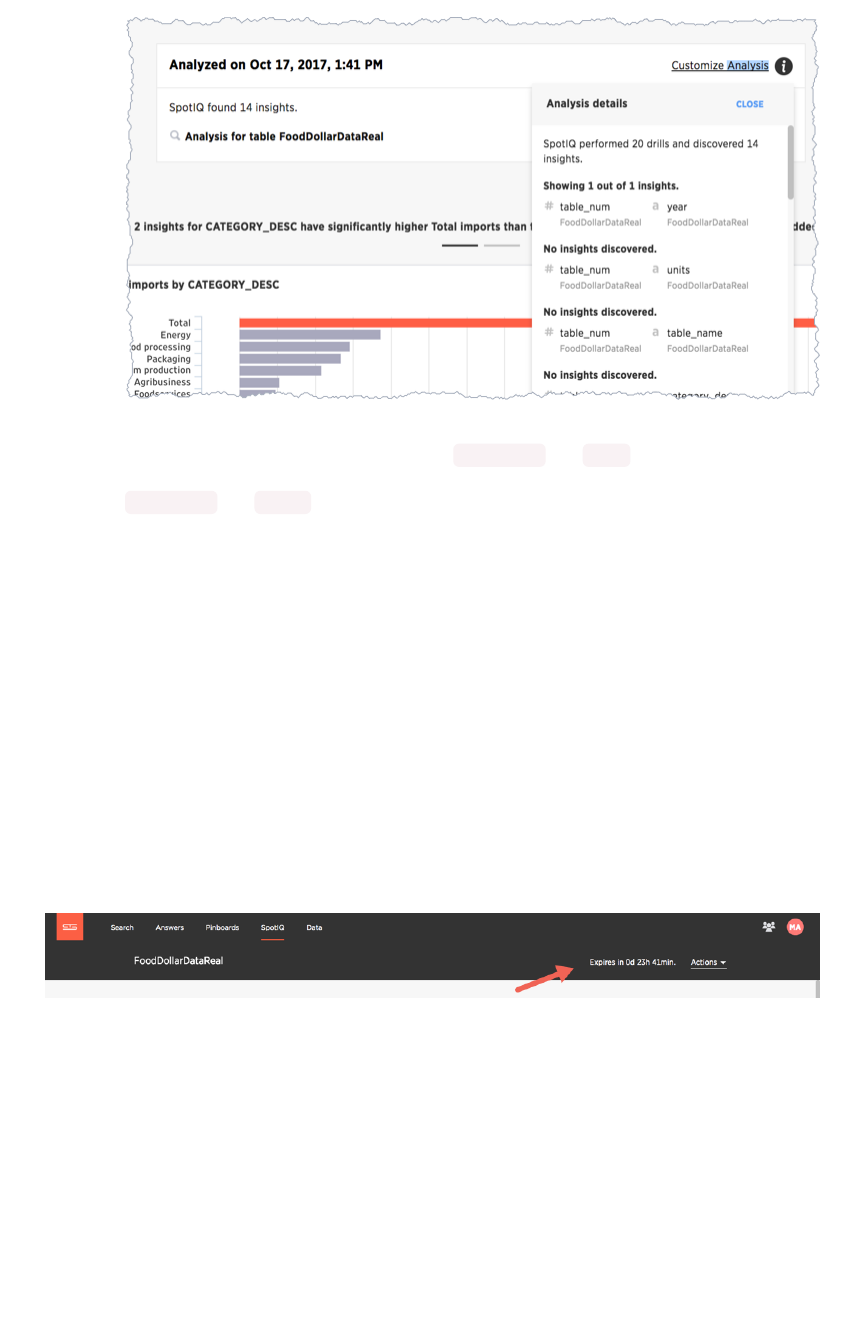
You can tell that SpotIQ ran through 20 combinations and discovered 14 insights. The first
looked for an insight in a combination of the table_num and year columns in the
FoodDollarDataRealFoodDollarDataReal data and discovered one insight. The next to column combination
table_num and units did not reveal any insights.
5. Close the details panel and look at the corresponding insight SpotIQ produced.
You can see that SpotIQ found three sets of insights:
• 2 insights for CATEGORY_DESC have significantly higher Total imports than the
rest. Includes similar insights for Total value_added.
• Insights from Cross Correlation Analysis.
• Insights from Trend Analysis.
There is a reason there are three sets. You’ll learn the answer to that later.
Time and your insight data
You’ll notice that when you first look at an insight there is an expiration date in the upper right corner:
If the expiration time elapses, ThoughtSpot automatically removes the reports.
Insights also take space in the ThoughtSpot installation. A lot of people creating insights can add up to a
lot of data lying around. Just as water rising in a bath tub can overflow or just cause a problem you have
to wade through, too much data can create a lot of old reports to sift through.
Another reason to expire an insight is time. Typically, business data is changing every day if not more
frequently. Any particular set of insights are valid for data during a specific period of time. This doesn’t
mean old insights can’t provide information you can use, just that you are unlikely to get the same insight
twice.
SpotIQ 101: Do more with SpotIQ
February 07, 2019
ThoughtSpot Users Guide Page 239
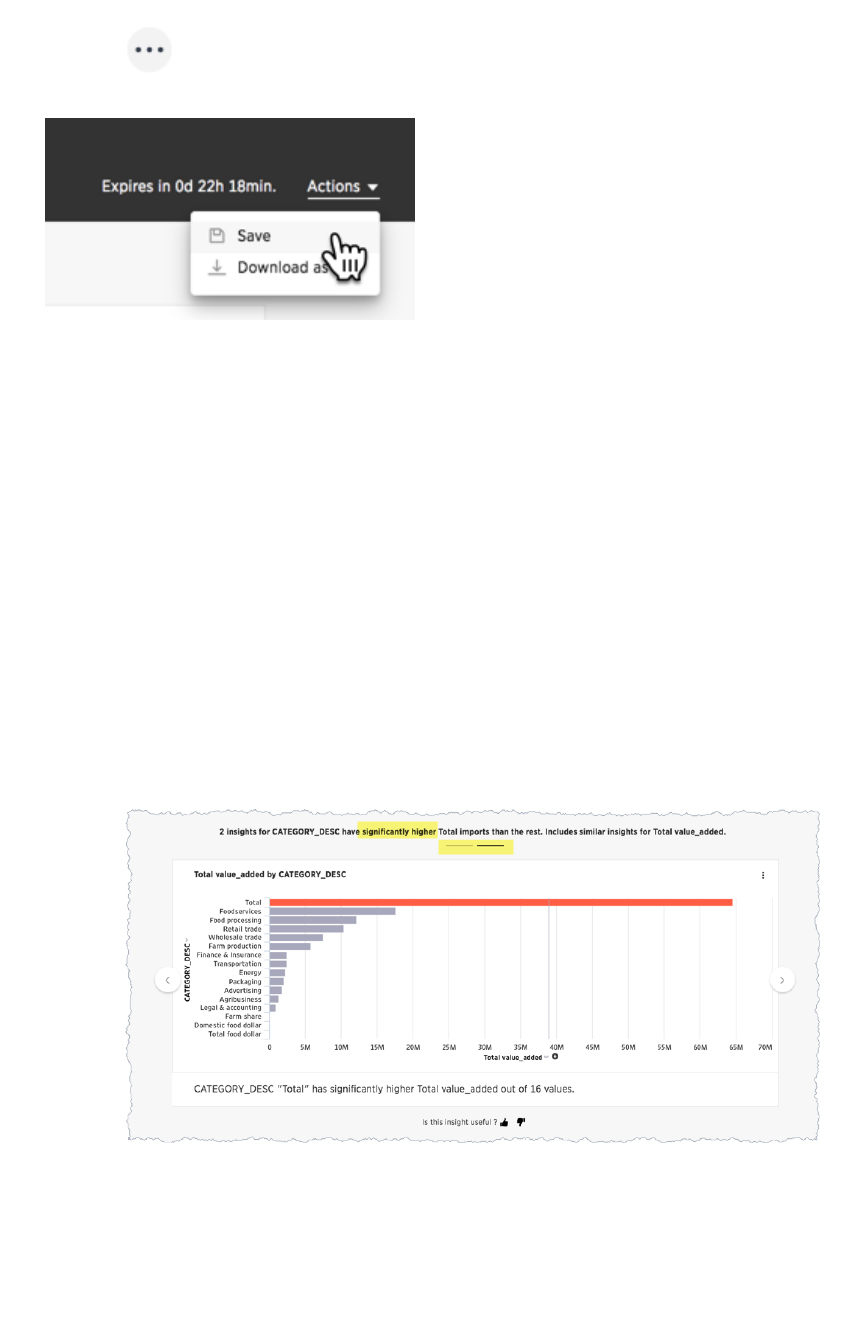
If a set of insights look good, you can SaveSave them and they are not removed when they expire. Do this
now, click > SaveSave:
Now your insights won’t expire as you work with them!
Data outliers
SpotIQ attempts to look for three central insights. The first insight it looks for are data outliers. An outlier
is a value that is “far away” or that differs from the other data.
Outliers can result from measurement or recording errors or they could contain valuable information. For
example, one store might sell significantly more towels in one week out of the year because there was a
flood that week.
1. Scroll to the first carousel of data that SpotIQ created for you.
A carousel groups a set of visualizations on a page. You can use the arrows attached to a
carousel to “page” through its contents.
2. Count the number of items in the carousel.
You should see that SpotIQ found two outliers.
In this case, SpotIQ is indicating that the Total ImportsTotal Imports value is significantly higher than the
other values in your set.
Two facts about this outlier shouldn’t surprise, you. The first fact is that a total exceeds all the
other items in the data. That just makes sense so this isn’t a true outlier.
SpotIQ 101: Do more with SpotIQ
February 07, 2019
ThoughtSpot Users Guide Page 240
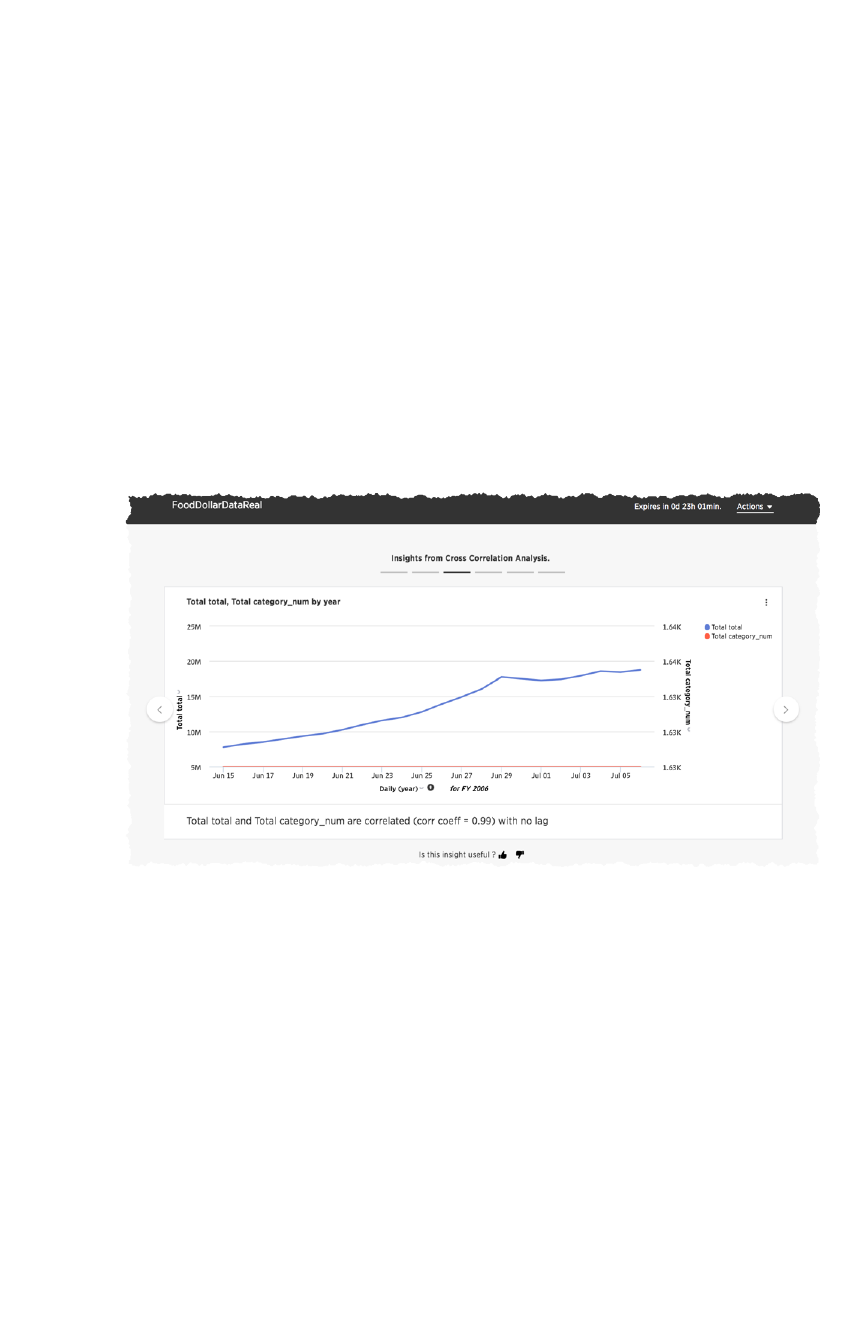
The second fact is that SpotIQ insights are not always interesting. In this case the data
included totals in the row data which caused nonsense outliers. You can use SpotIQ to fix this
issue and go further. More about this later in the tutorial.
Looking for relationships (cross-correlation
analysis)
The second category of insights SpotIQ attempts to find is cross-correlations. Cross-correlation looks for
and measures relationships between two quantitive, continous information sets – in our case two fields
(columns) in our dataset. Usually, you’ll see a cross-correlation in your insights if your data includes time
or date data.
The result of a correlation analysis shows how strong and in what direction a relationship between two
data sets moves. The range is -1 to 1, the closer the cross-correlation value is to 1, the more closely the
information fields (data elements) are correlated.
1. Scroll down your insight page, till you find the correlation results:
2. Page through the correlation category to the third insight:
You can see that the over all total and the total category number values correlate very
strongly. The correlation also looks for a
lag
value.
In the business world the dependence of a variable Y (the dependent variable) on another
variable X (the explanatory variable) is rarely instantaneous. Often, Y responds to X after a
certain lapse of time. Such a lapse of time is called a lag.
Good Data Help.
Trends over time
The third set of insights SpotIQ looks for is a trendline. A trendline is a straight or curved line that
indicates the general pattern or direction of a time series data (information in sequence over time). As
you may have guessed, trendlines rely on your data having a date or time column.
You can use a trendline to determine the general direction of a trend in your data. Are sales are climbing
or are customers are declining over time?
1. Scroll down to the Insights from Trend AnalysisInsights from Trend Analysis section.
2. Look for the Total imports by yearTotal imports by year result.
SpotIQ 101: Do more with SpotIQ
February 07, 2019
ThoughtSpot Users Guide Page 241
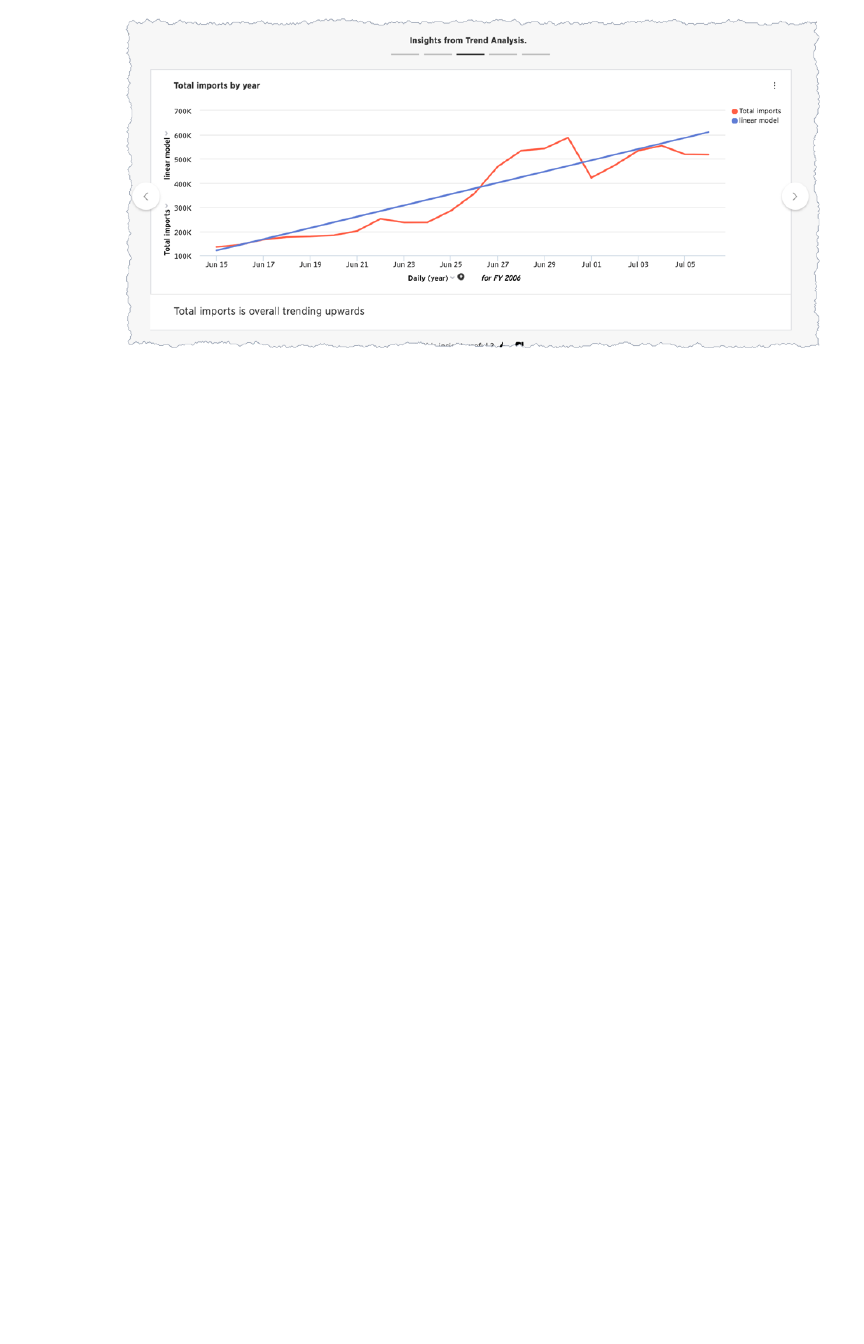
At this point, you may have noticed that SpotIQ grouped each type of insights. Outliers, correlations, and
this last one, trendlines. This grouping makes it easier to locate and review similar types of insights.
Where to go next
In this section, you explored some of the functionality of the SpotIQSpotIQ page. You learned that SpotIQ
combines columns in your data to look for three categories of insights:
• outliers
• cross-correlations
• trendlines
In the next section, you’ll learn how to schedule SpotIQ to deliver insights on a regular basis.
SpotIQ 101: Do more with SpotIQ
February 07, 2019
ThoughtSpot Users Guide Page 242
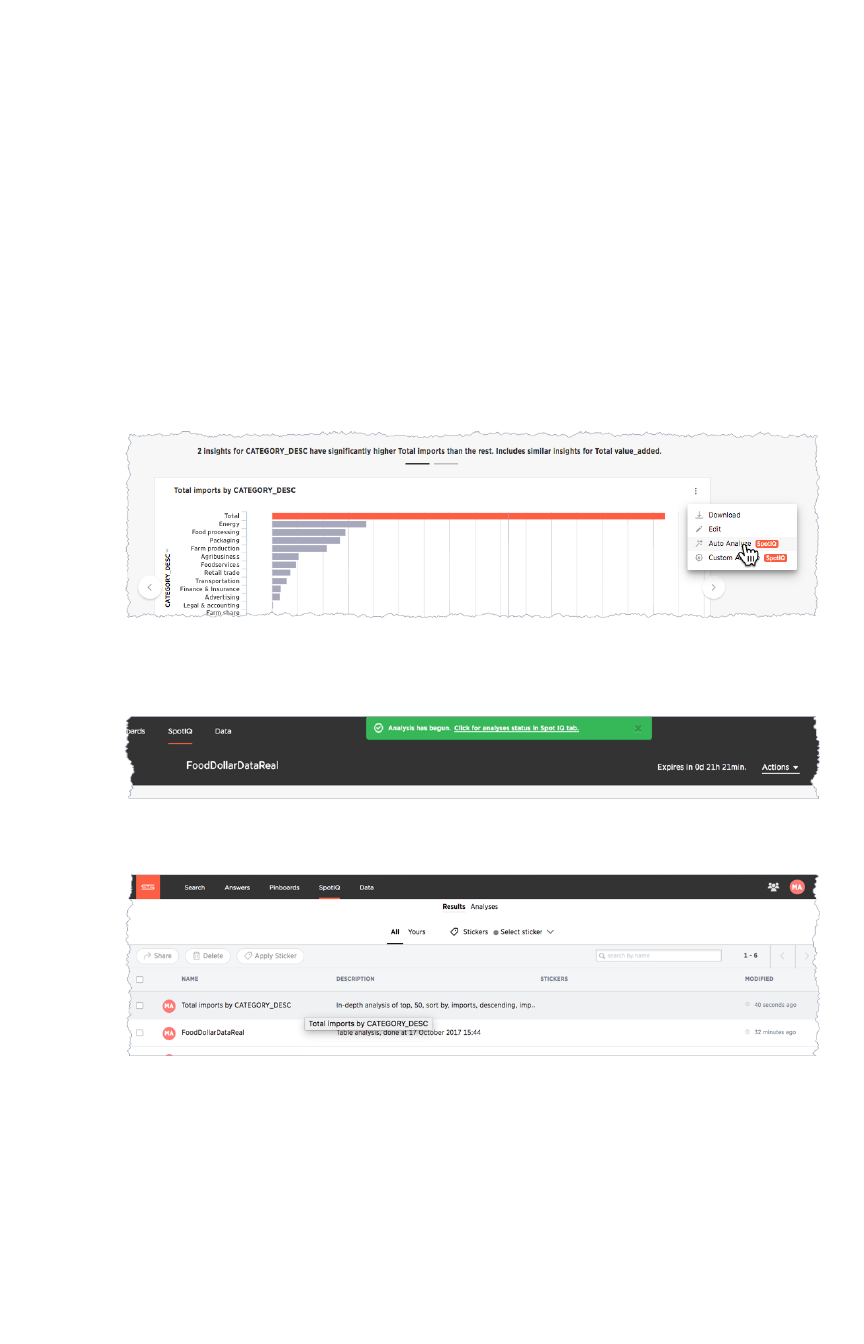
SpotIQ 101: Review insights
You’ve finished the second part of the tutorial. In this, the third and final part, you’ll learn how you can
modify a SpotIQ analysis to extend or customize the analysis. You’ll edit an insight to customize the
chart it uses or modify the SearchSearch syntax behind it.
Customize an analysis
In the second part of the tutorial, you reviewed the first output from SpotIQ. The outlier insights weren’t
really that useful. Let’s try to dig deeper into that.
1. Scroll down to the outlier section.
2. Select the first insight.
3. Choose the menu and select Auto AnalyzeAuto Analyze.
The system responds by starting a new insight run based on the single chart. Each time you
request a change to the analysis settings, it starts another run.
4. Return to the SpotIQ page and select your new analysis.
5. Open the analysis and review the analysis details.
SpotIQ 101: Review insights
February 07, 2019
ThoughtSpot Users Guide Page 243

If you recall, the first run against this data SpotIQ ran through 20 combinations and
discovered 14 insights. In this second run against one table, SpotIQ ran 49 combinations and
developed 17 insights. Only 4 insights were discovered.
Running SpotIQ again does not necessarily result in fewer runs or even, as in this case a
reduced number of insights. It changes the analysis though, by selecting the single insight
from your first run, you gave SpotIQ information it could use to focus the next run.
Continue with the customization.
6. Choose Customize AnalysisCustomize Analysis.
The Customize AnalysisCustomize Analysis dialog appears.
7. Select the Customize algorithmsCustomize algorithms tab.
8. Uncheck the Outlier Detection using Z-ScoreOutlier Detection using Z-Score option.
9. Click ANALYZEANALYZE.
SpotIQ starts a new analysis.
10. Open the new analysis from the SpotIQ page.
You’ll find that the new analysis has the same name as the last one you ran. The new results
include an outlier and a cross-correlation. You’ll discover with these new charts a definite
outlier 6/30/2005 .
SpotIQ 101: Review insights
February 07, 2019
ThoughtSpot Users Guide Page 244
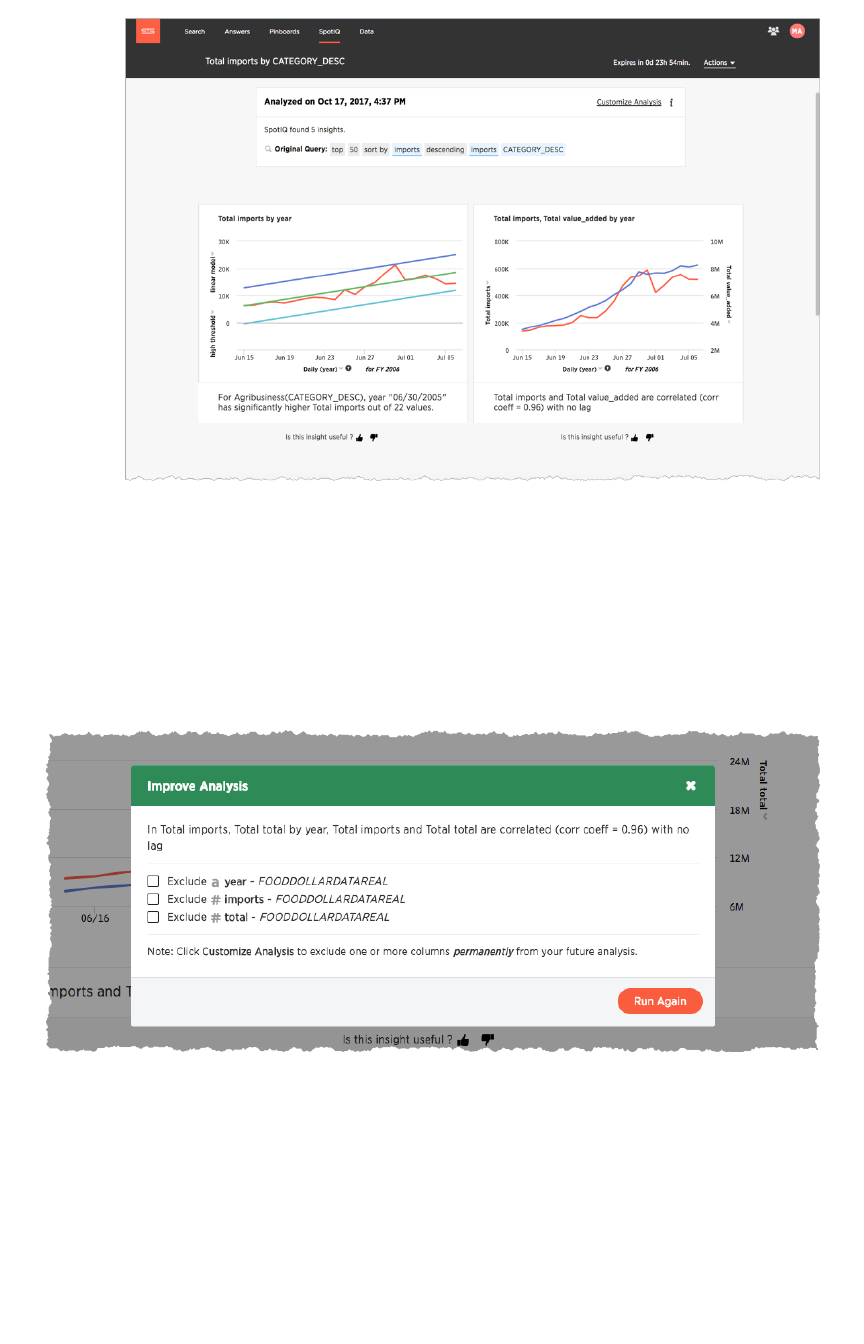
The changes you make in this step persist on the underlying data for all your future analyses. You can
unset these values by going back into the dialog and removing what you set.
A temporary customization for a single insight
Finally, you might have noticed the thumbs at the bottom of each insight. Use the thumbs up to tell
SpotIQ you like the data insight. Clicking thumb’s down display an Improve AnalysisImprove Analysis dialog:
You can exclude a value from this individual analysis and rerun the analysis. Unlike the CustomizeCustomize
AnalysisAnalysis action, this action works only on this analysis and does not persist.
Try this for yourself later at some point.
Modify an insight search and visualization
The lines used in the cross-correlation are somewhat ambiguous. A different visualization may help in
this case. You can also modify the charts you see in your results. Try this now.
SpotIQ 101: Review insights
February 07, 2019
ThoughtSpot Users Guide Page 245
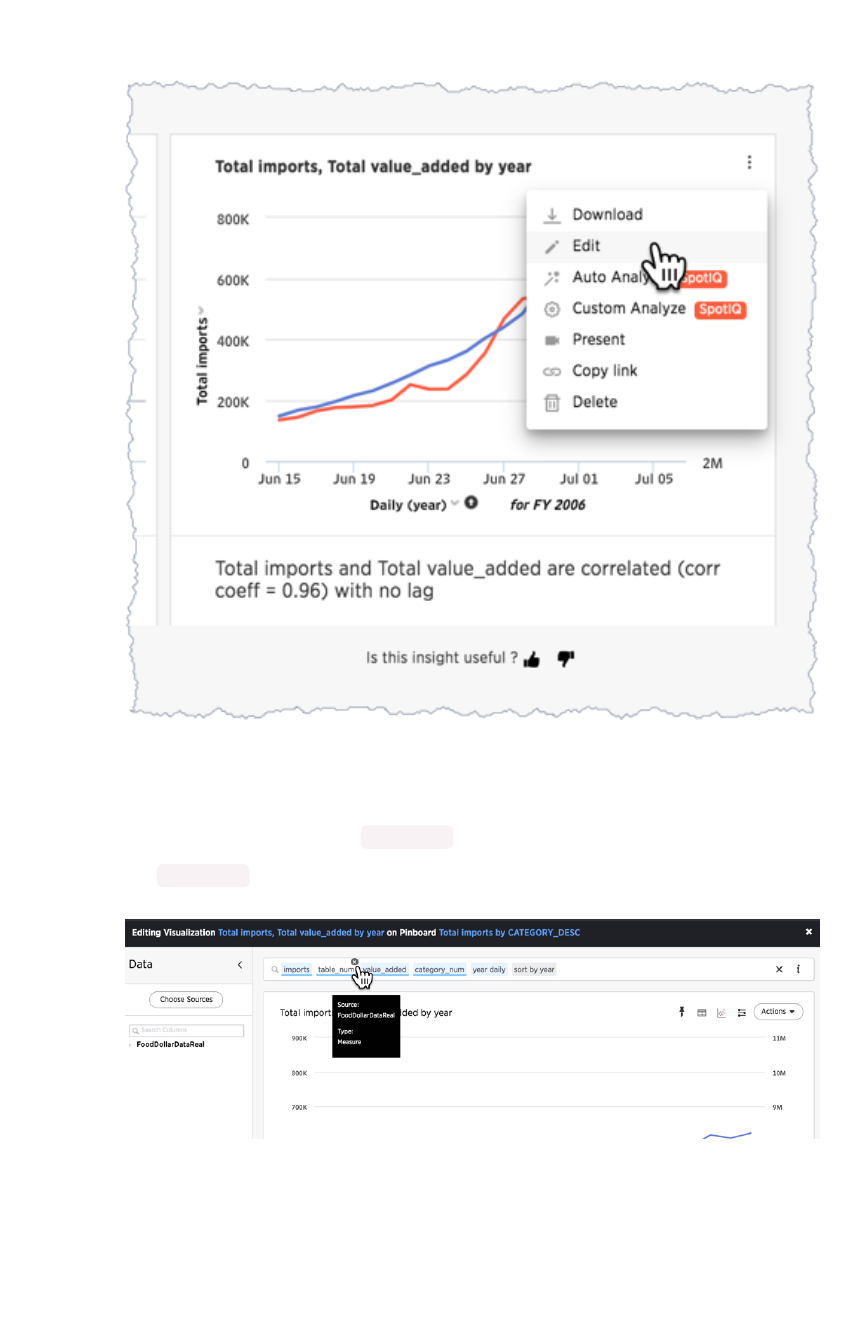
1. Select the menu on the Total imports, Total value_added by yearTotal imports, Total value_added by year chart.
2. Click on the chart menu and choose EditEdit.
The Edit VisualizationEdit Visualization appears. The layout is familiar to any user that has run a ThoughtSpot
search or worked with a result. This is dialog reveals the SearchSearch syntax used to generate the
insight. You can use this dialog to do all the things you would normally do with a search.
3. Edit the search bar and remove table_num from the search.
The table_num isn’t strictly necessary in the data.
4. Select the chart icon and choose Line ColumnLine Column to change the visualization.
SpotIQ 101: Review insights
February 07, 2019
ThoughtSpot Users Guide Page 246
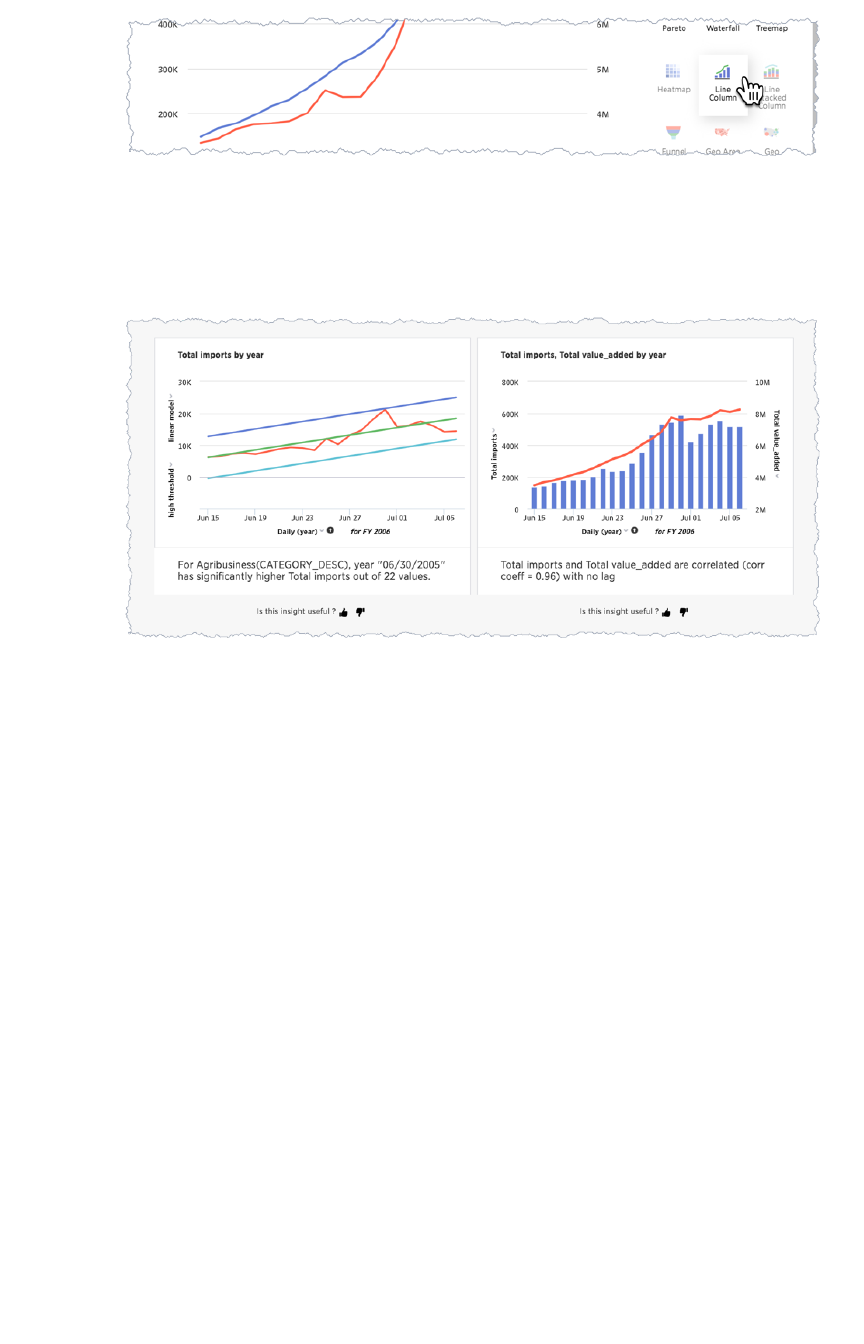
5. Choose Actions > UpdateActions > Update.
6. Close the dialog by pressing the CloseClose.
The chart with your changes now appears in the SpotIQSpotIQ list. The outlier stands out very clearly
now in both charts.
Present your insights
You can present SpotIQ insights in several ways. You can present an individual result or all of them at
once. You can package all the insights in a PDF. This is useful for passing a packet of results. Since any
insight reflects the data at a specific point in time, always consider saving the insight as a PDF.
1. Locate the ActionsActions menu on the corner of the SpotIQSpotIQ page.
2. Choose Actions > Download as PDFActions > Download as PDF from the menu.
The system downloads a file containing all the insights. Keep in mind this file can be very
large if there are a lot of insights found in your data.
You can use the PresentPresent action to view visualizations that appear in a carousel, and present them as a
group.
1. Scroll down to the first carousel with your new charts.
2. Roll over the right corner of the menu to reveal the menu.
SpotIQ 101: Review insights
February 07, 2019
ThoughtSpot Users Guide Page 247
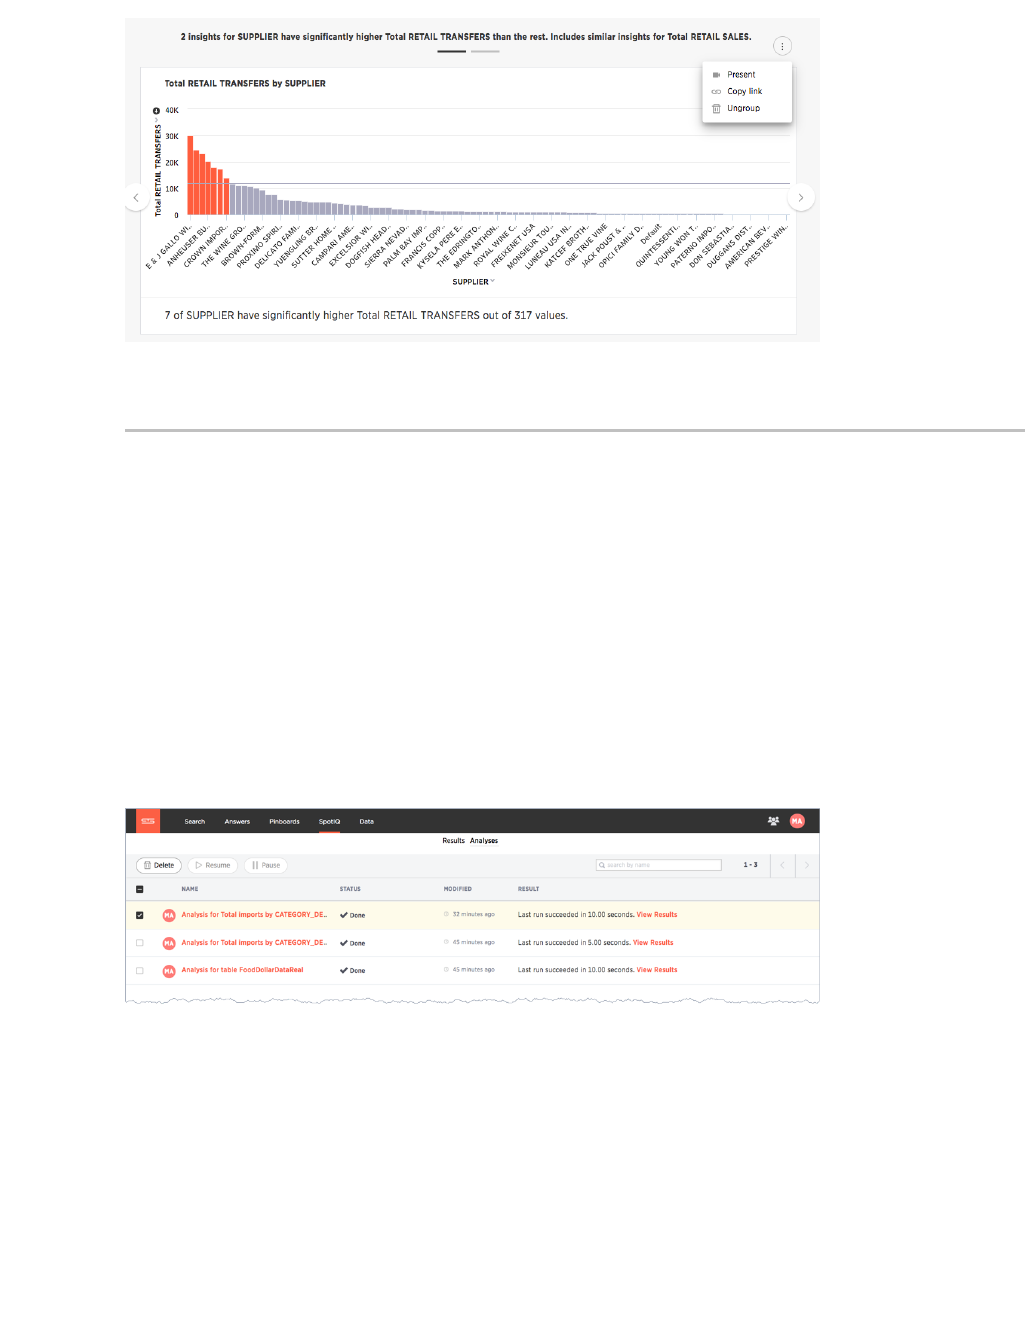
3. Choose PresentPresent from the menu.
Click through the carousel with the next / previous arrow buttons, or use the left side menu of
chart names.
Also, each individual chart has a DownloadDownload, PresentPresent, or Copy linkCopy link action you can take.
Schedule a recurring analysis
If you find an analysis configuration that is useful. You can run that configuration periodically. This is a
good thing to do of course as, in a business, data changes all the time.
1. Go to the SpotIQSpotIQ page.
2. Choose the AnalysisAnalysis tab.
3. Click on the latest Total imports by CATEGORY_DESCTotal imports by CATEGORY_DESC analysis.
The Customize AnalysisCustomize Analysis dialog appears.
SpotIQ 101: Review insights
February 07, 2019
ThoughtSpot Users Guide Page 248
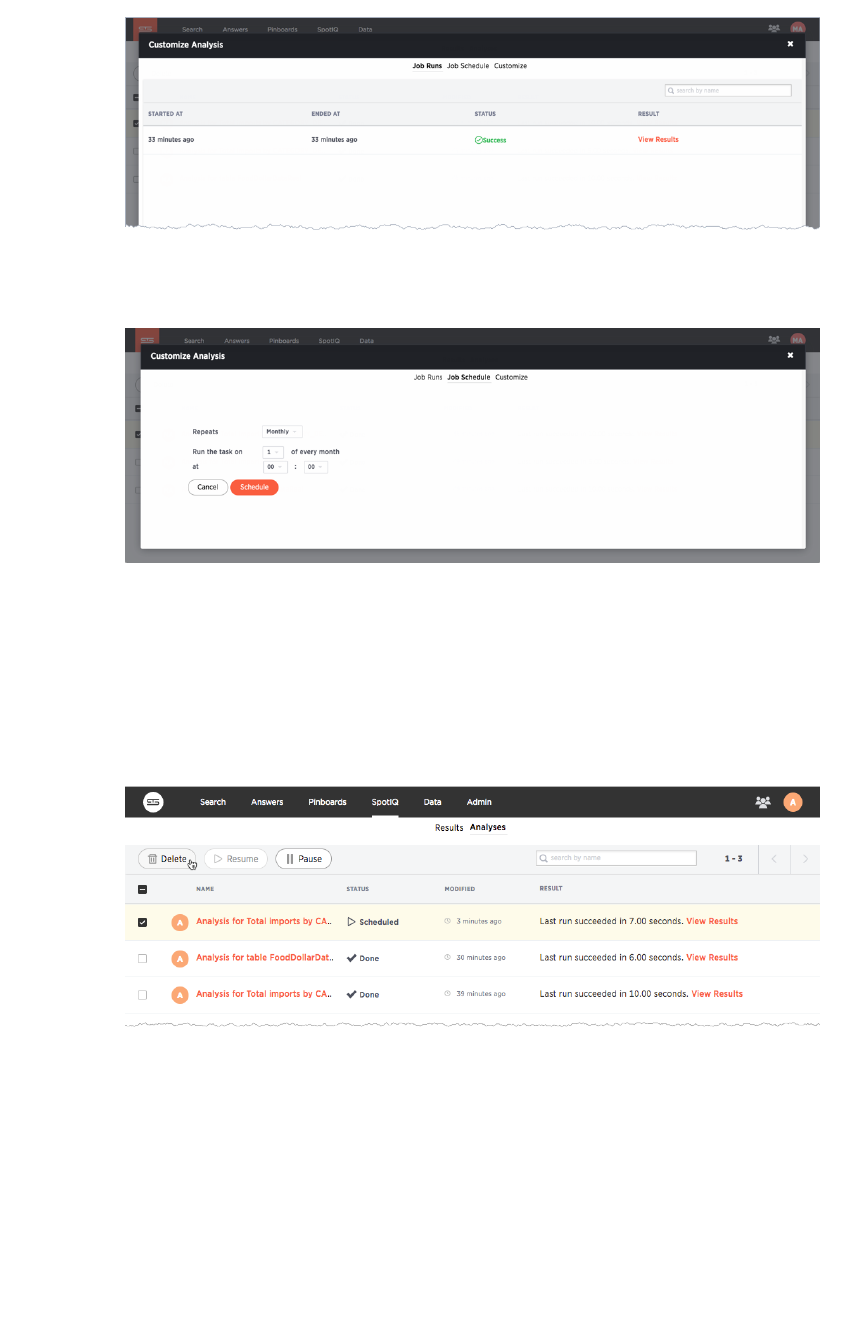
4. Choose the Job ScheduleJob Schedule option.
5. Fill out the schedule to run the job MonthlyMonthly.
Every month SpotIQ will update your analysis with new data.
Keep in mind that SpotIQ jobs take resources in your system. So, you really don’t want to leave casual
jobs running in the system. Go ahead and delete this latest job. Now that you know how to schedule a
job, it isn’t needed anymore.
1. Click the checkbox for the job you just scheduled.
2. Click DeleteDelete to remove it.
Congratulations!
Congratulations, at this point you’ve learned the basics of SpotIQ with ThoughtSpot. Throughout the
application, you’ll find the SpotIQ icon on search answers, pinboards, visualizations, and data. Wherever
you see this option, you can click to run suggested or custom analyses, and get new insights on the
SpotIQ page.
SpotIQ 101: Review insights
February 07, 2019
ThoughtSpot Users Guide Page 249

Best SpotIQ Practices
The SpotIQ feature works without you having to do anything but pushing a button. However, like any
other feature, there things you can do to optimize the feature. This page contains some best practices
you can use to make SpotIQ more effective when you use it.
When to invoke SpotIQ
If you followed the tutorial, you know that right after uploading data is a good time to run Auto AnalyzeAuto Analyze.
SpotIQ can very quickly help you find insights in your data.
Start from a SearchSearch. Enter a single measure in the bar; one you want to explore of course! Then, choose
Actions > Auto AnalyzeActions > Auto Analyze on the results. Choosing the single measure focuses SpotIQ.
Use Custom AnalyzeCustom Analyze to focus or tweak the SpotIQ results. While you are tempted to keep all the
columns, eliminating some can also result in a better analysis.
Do your data modeling
You can increase the SpotIQ’s effectiveness by ensuring you are practicing good data modeling. This is
true if you are user uploading the occasional data file or a data management professional. Modeling data
requires that you can:
1. Click DataData to get to the data management listing.
2. Click on a data source you own or can edit.
This brings up the ColumnsColumns screen, where you’ll make your modeling settings.
3. Modify one or more column settings.
4. Save your changes.
If you worked through the SpotIQ tutorial, you can try experiment on the FoodDollarDataRealFoodDollarDataReal
data you uploaded.
Make sure you set the INDEX PRIORITYINDEX PRIORITY for columns in your data source. Use a value between 8-10 for
important columns to improve their search ranking. Use 1-3 for low priority columns. INDEX PRIORITYINDEX PRIORITY
impacts user-based ranking which helps SpotIQ focus its analysis.
SpotIQ uses measures for correlations. For trendlines and outliers, if SpotIQ has a measure, it then drills
by attributes in turn.
Best SpotIQ Practices
February 07, 2019
ThoughtSpot Users Guide Page 250
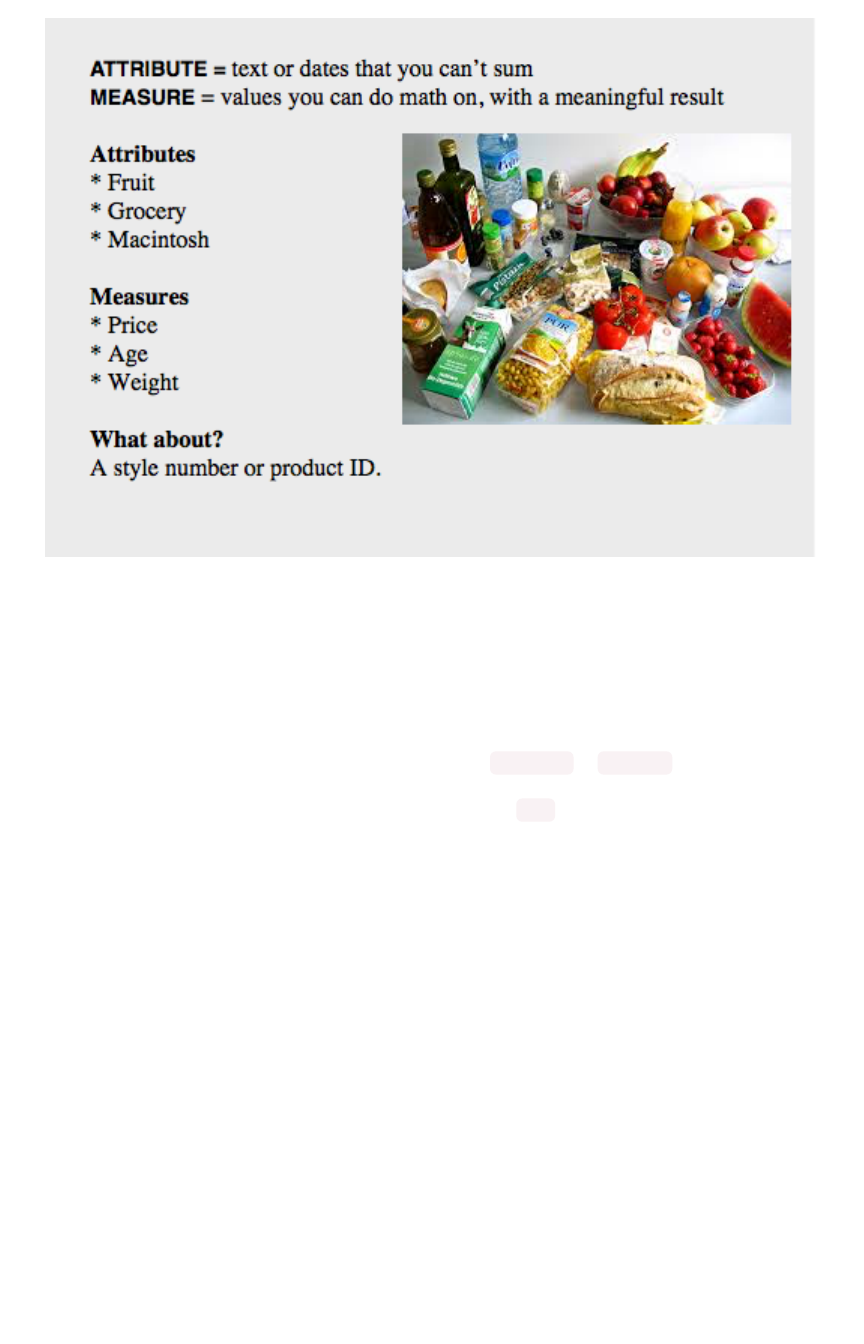
You should also set AGGREGATIONAGGREGATION on your columns. SpotIQ applies the default aggregations from your
data when it pulls measures for analysis.
Situations to avoid
Like any AI, some situations SpotIQ is not yet equip to handle. You should know what these are so you
can avoid them. If your data contains a measure that uses a MOVING_* or GROUP_* formula, SpotIQ
may return results that simply aren’t meaningful. When doing a correlation analysis, SpotIQ may not find
meaningful data if you have a measure with anything other than SUM .
Set SpotIQ preferences
You can set preferences for SpotIQ in your user profile. These preferences allow you to control how you
receive analysis notifications. They also allow you to exclude nulls or zero value measures from analysis.
Best SpotIQ Practices
February 07, 2019
ThoughtSpot Users Guide Page 251
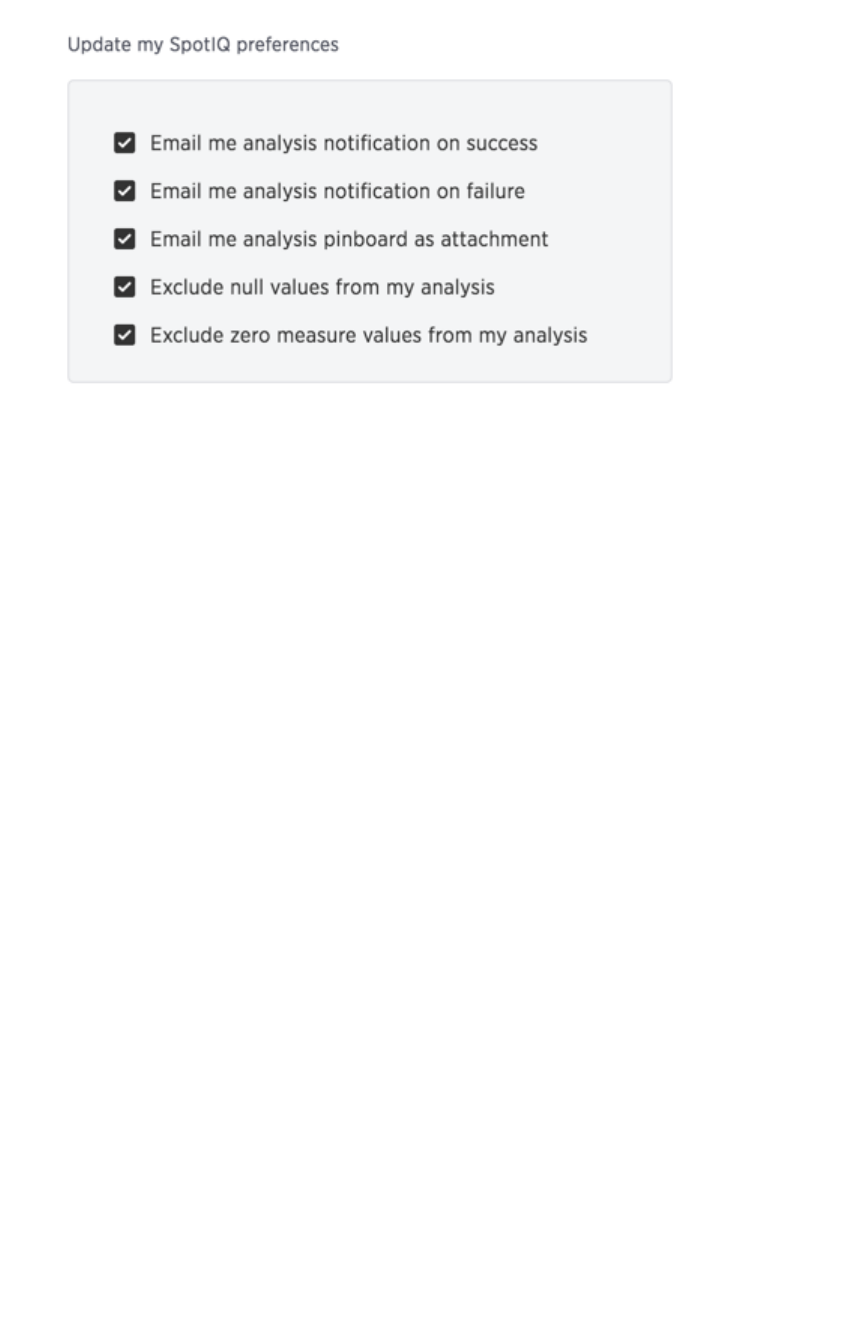
The exclusions impact each SpotIQ analysis. It eliminates points with such values during statistical
calculations for example, for mean, standard deviation SpotIQ excludes values from any equation and
uses only the remaining points.
Best SpotIQ Practices
February 07, 2019
ThoughtSpot Users Guide Page 252
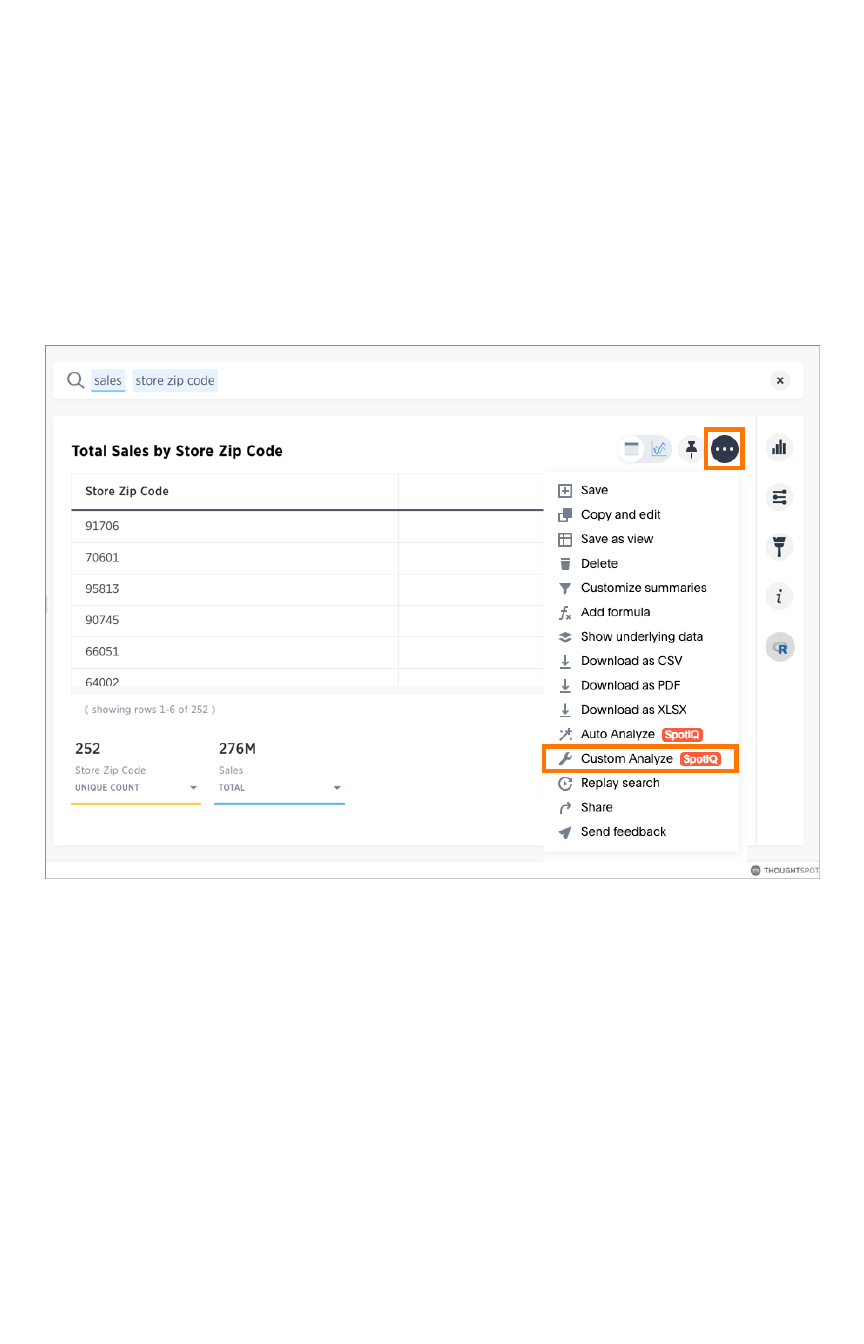
Custom SpotIQ analysis
Everywhere in ThoughtSpot where you can Auto AnalyzeAuto Analyze with ThoughtSpot, you can also configure a
customized SpotIQ analysis. The customized analysis can be a one-time customization or can apply to
all future analysis of that particular data source.
Finding customization controls
Every menu or location where you can Auto AnalyzeAuto Analyze with ThoughtSpot, you can also choose CustomCustom
AnalyzeAnalyze. It looks like this:
Regardless of where you are in the ThoughtSpot UI, the SpotIQ Customize AnalysisCustomize Analysis dialog has the same
layout. The columns, of course, are specific to the data you launched the dialog from.
Custom SpotIQ analysis
February 07, 2019
ThoughtSpot Users Guide Page 253
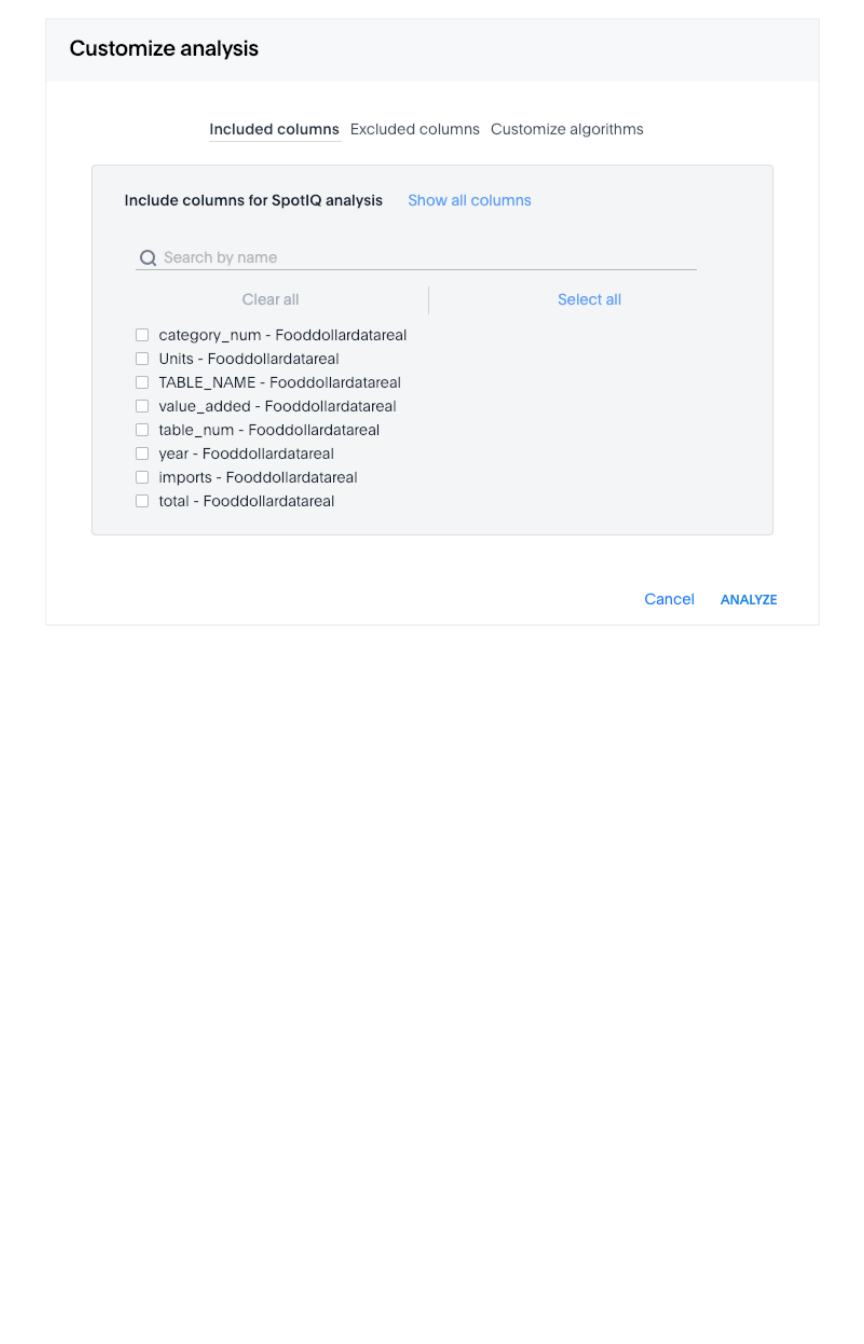
This dialog has three tabs:
• Included columnsIncluded columns, where you can explicitly indicate which columns to include in a SpotIQ
analysis. (You can select all, some, or none.)
• Excluded columnsExcluded columns, where you can explicitly indicate which columns to exclude in an SpotIQ
analysis. (You can select all, some, or none.)
• Customize AlgorithmsCustomize Algorithms, where you can run custom analyses and incorporate R scripts into
SpotIQ.
The Customize AlgorithmsCustomize Algorithms is by far the most advanced panel. (The panel scrolls, so more algorithms are
available than are shown in the picture below.)
Custom SpotIQ analysis
February 07, 2019
ThoughtSpot Users Guide Page 254

The SpotIQSpotIQ insights page has an option for this dialog and also an option to customize a single analysis.
Custom SpotIQ analysis
February 07, 2019
ThoughtSpot Users Guide Page 255
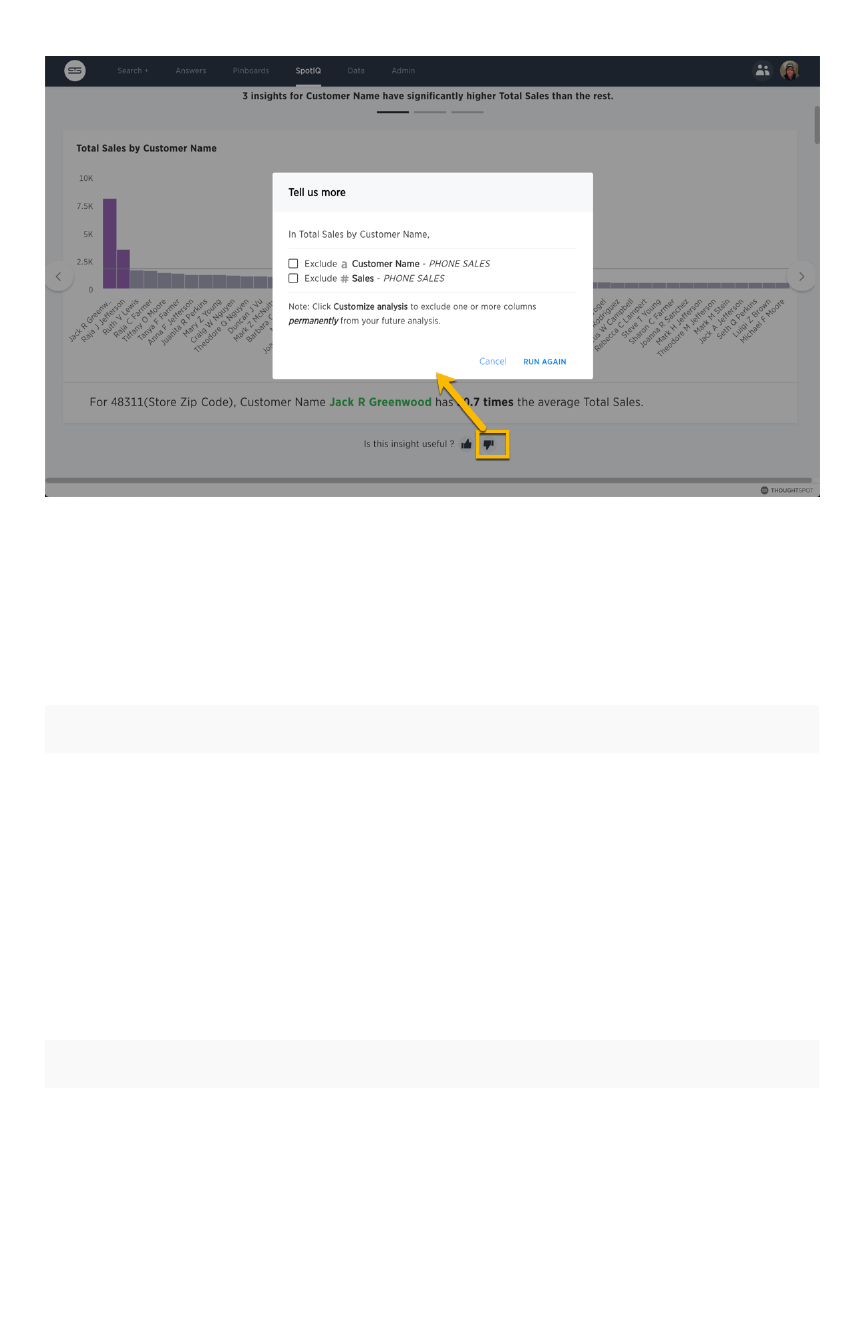
The Improve AnalysisImprove Analysis dialog always excludes a value from all future analysis.
You can set a subset of SpotIQ customization parameters in your profile preferences, along with options
for email notifications when analyses run.
Eliminate null values
Null values should be eliminated from your analysis.
From next analysisFrom next analysis From future analysesFrom future analyses
In the Search bar, add a filter
column
!= Null to the
search bar. Or choose Exclude null values from currentExclude null values from current
analysisanalysis, using the Customize algorithmsCustomize algorithms panel.
Set Exclude null values from my analysisExclude null values from my analysis
on your user ProfileProfile to exclude them from
any future SpotIQ analyses you do.
Exclude uninteresting column(s) in insight
You should always exclude columns you are not interested from your analysis.
From next analysisFrom next analysis From future analysesFrom future analyses
Exclude a column using ImproveImprove
AnalysisAnalysis on a visualization. Or set the
value through the Excluded columnsExcluded columns
tab of the Customize AnalysisCustomize Analysis panel.
Choose Also exclude from all my future analysisAlso exclude from all my future analysis on the Ex-Ex-
cluded columnscluded columns tab of the Customize AnalysisCustomize Analysis panel. Alter-
natively, exclude using the Improve AnalysisImprove Analysis dialog on an in-
sight that uses the column you want to exclude.
Custom SpotIQ analysis
February 07, 2019
ThoughtSpot Users Guide Page 256

Include an interesting column
You can always includes columns that interest you in your analysis.
From next analysisFrom next analysis From future analysesFrom future analyses
Choose Customize AnalysisCustomize Analysis and select to IncludeInclude
columnscolumns that you want to appear.
Ensure **Index Priority** is between 8-10 on the
column through data modeling.
Remove known date outliers
Your data may contain known outliers. For example, you are in the middle of a quarter and only want to
analyize the previous quarter. Anything from the present quarter could contain an outlier.
From next analysisFrom next analysis From future analysesFrom future analyses
In the Search bar, add a filter
date
< last time period to the search bar.
Not applicable.
Too few insights
Your SpotIQ analysis may not provide you as many insights as you think it should.
From next analysisFrom next analysis From futureFrom future
analysesanalyses
Choose Customize AnalysisCustomize Analysis and Customize algorithmsCustomize algorithms Decrease the Multiplier forMultiplier for
Outlier DetectionOutlier Detection to a value closer to zero.
Not applica-
ble.
Custom SpotIQ analysis
February 07, 2019
ThoughtSpot Users Guide Page 257

Advanced R Customizations
Admins and users with the Has SpotIQHas SpotIQ privilege can run an R script using the Custom AnalysisCustom Analysis feature of
SpotIQ. This means you can run an R script from any point in ThoughtSpot where you find the CustomCustom
AnalysisAnalysis menu option.
The R language is an open source programming language used for statistical computing. As such,
knowledgable users can use R to perform sophisticated analysis in a ThoughtSpot environment.
This section explains the feature and how to use it. It is not meant as an R primer. To learn more about R
and how to use it, visit the R Project for Statistical Computing.
Understand R script requirements in
ThoughtSpot
ThoughtSpot provides R running as a service within a ThoughtSpot cluster. Permissions are restricted.
This means the R script does not have permission to issue system commands.
The ThoughtSpot cluster has pre-installed the basic R packages. If your script requires a specific
package, you must request your ThoughtSpot cluster admin to install the package on your behalf.
ThoughtSpot internally transforms and binds an R script prior to sending it to the cluster’s R service. The
system expects each script have a well-defined structure which is the following:
####R SCRIPT####
<Fill script body>
####COLUMN BINDINGS (ONE PER LINE)####
<Fill column bindings here>
The scripts contains the column bindings with the answer results appearing as parameters in the R
script. ThoughtSpot expects for each .param
n
in R your script must provide a corresponding binding.
The following pseudo code illustrates an R script in a form suitable for ThoughtSpot:
####R SCRIPT####
df <- data.frame(.param0,.param1, ...);
...
write.csv(..., file=#output_file#, ...);
Notice that .param0 refers to first column in column binding and .param1 refers to the second.
Should you need a third binding, you would use .param2 and so forth.
The output of the script is either PNG or CSV. This example script uses #output_csv# to emit data in a
CSV (tabular) format. Use #output_png# to emit data in PNG format.
Presently, error reporting is limited for R scripts in SpotIQ. You should validate your R script independent
of your ThoughtSpot environment. Once you are sure they are free of syntax or other errors, then try the
script in ThoughtSpot.
Advanced R Customizations
February 07, 2019
ThoughtSpot Users Guide Page 258
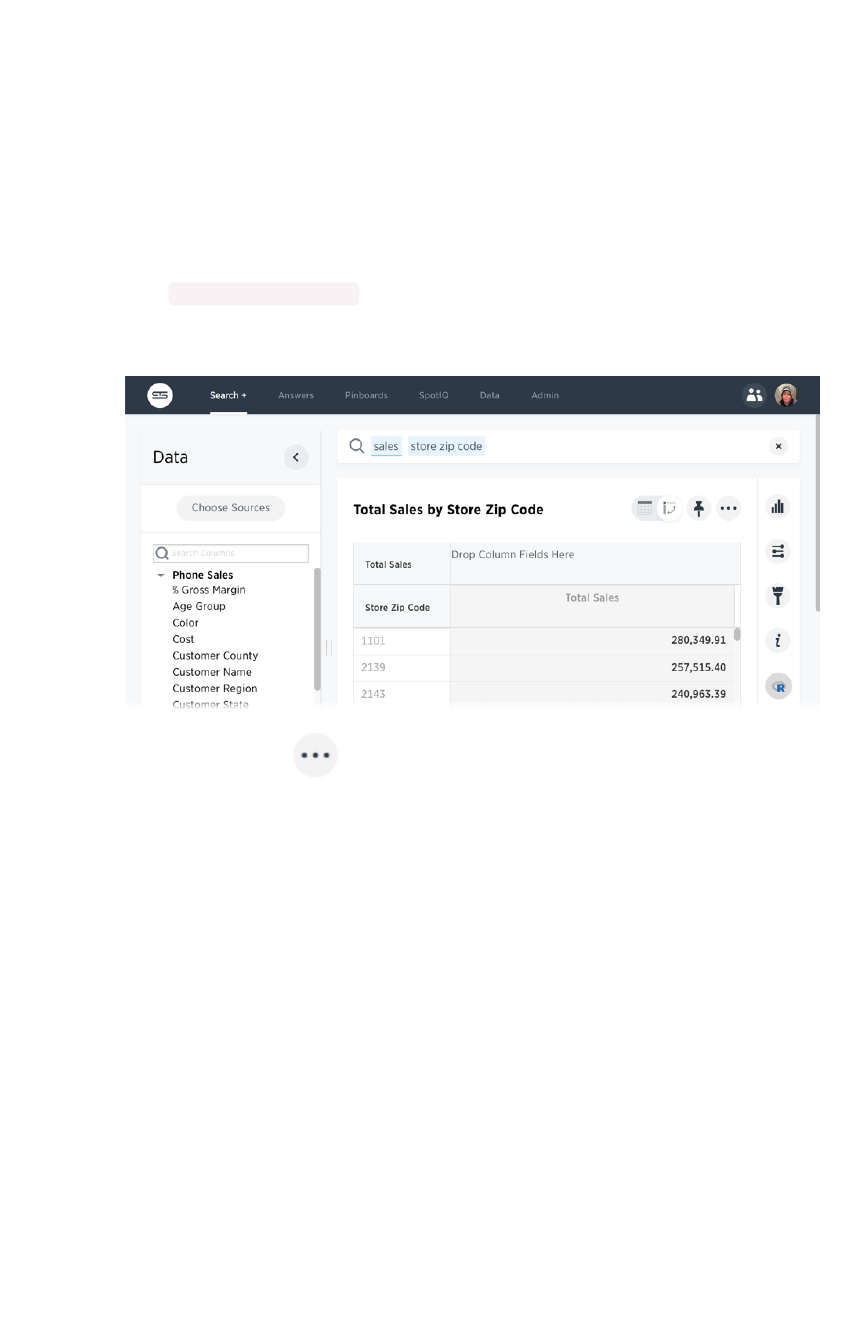
Try a Custom Analysis with R
The following illustrates how to run an R analysis on data that has a sales column and a zip code
column.
1. Log into ThoughtSpot and go to the SearchSearch bar.
2. Use Choose SourcesChoose Sources to locate a source with sales and zip code data. This example uses
Phone SalesPhone Sales data.
3. Enter sales store zip code in the search bar.
If your source contains the proper data, you should see something similar to the following:
4. Click the ellipses icon and select Custom AnalyzeCustom Analyze.
Advanced R Customizations
February 07, 2019
ThoughtSpot Users Guide Page 259
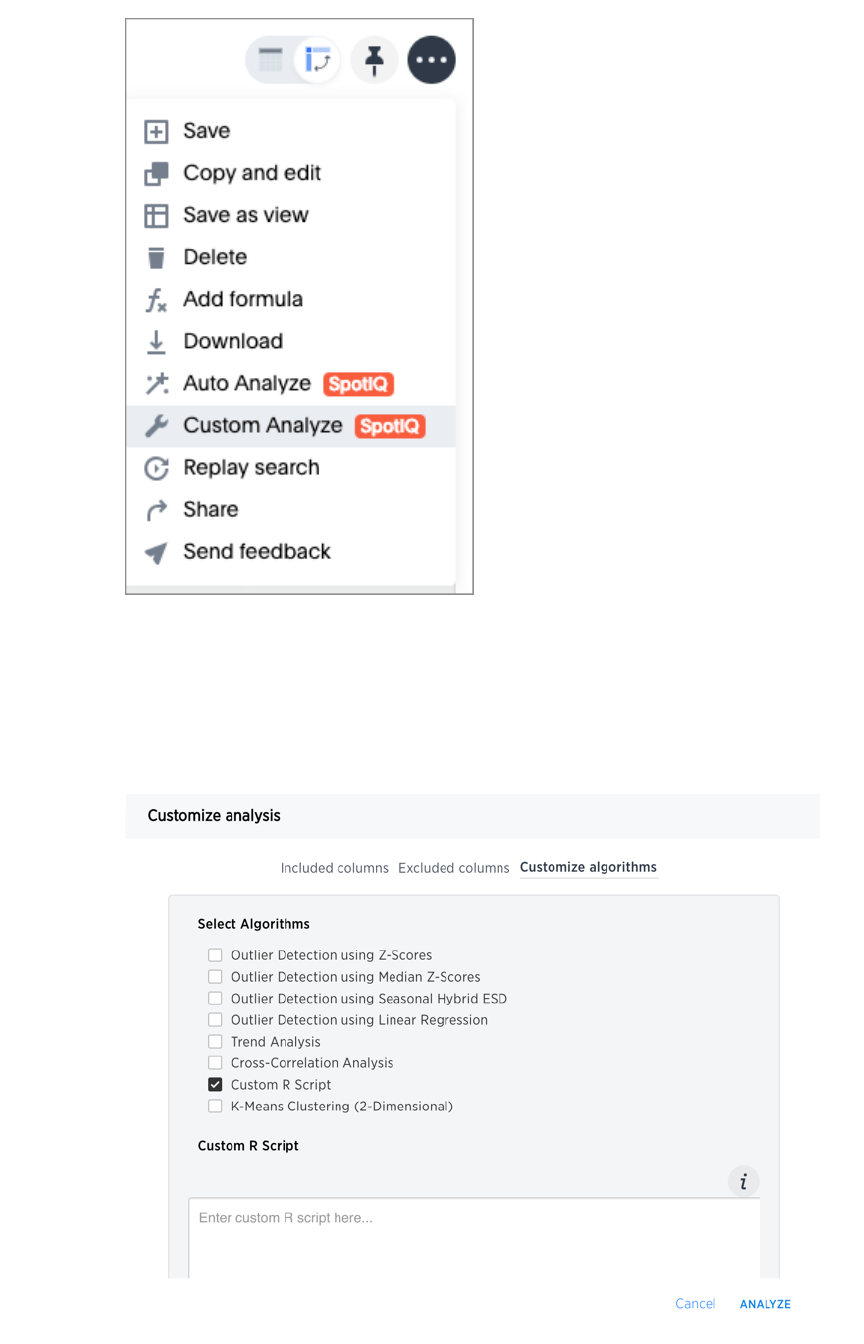
ThoughtSpot opens the Customize AnalysisCustomize Analysis dialog.
5. Choose the Customize algorithmsCustomize algorithms tab.
6. In the Select AlgorithmsSelect Algorithms section, click the Custom R ScriptCustom R Script box.
Selecting this option unsets all the other options on this tab and displays the RefineRefine
ParametersParameters field.
Advanced R Customizations
February 07, 2019
ThoughtSpot Users Guide Page 260

7. Enter this sample script in the field.
####R SCRIPT####
library(ggplot2)
set.seed(20)
df <- data.frame(.param0, .param1)
cluster <- kmeans(df[1:2], 3, nstart = 20)
cluster$cluster <- as.factor(cluster$cluster)
png(file=#output_file#,width=400,height=350,res=72)
print(ggplot(df, aes(.param0, .param1, color = cluste
r$cluster)) + geom_point())
####COLUMN BINDINGS (ONE PER LINE)####
Sales
Zip Code
This script binds .param0 to Sales and .param1 to the Store Zip Code column.
You can see from the script that the output should be PNG ( #output_png# ).
8. Check your work.
Advanced R Customizations
February 07, 2019
ThoughtSpot Users Guide Page 261
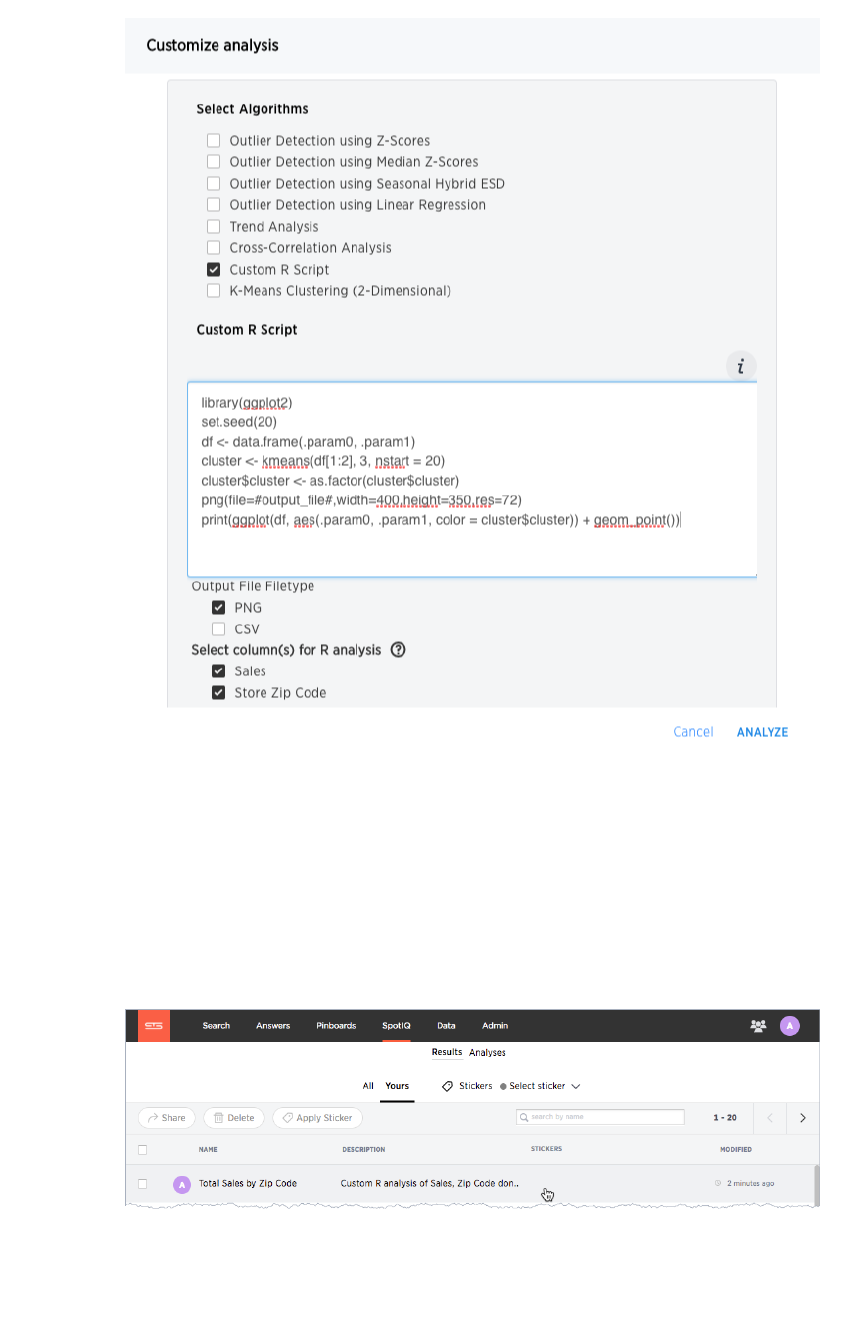
• Make sure that both Sales and Store Zip Code columns are selected for the
column bindings.
• Make sure PNG is selected as the output format.
9. Click AnalyzeAnalyze.
SpotIQ runs your analysis in the background.
10. Go to the SpotIQ page and click on the results of your newly triggered analysis.
You should see the results in PNG format similar to the following:
Advanced R Customizations
February 07, 2019
ThoughtSpot Users Guide Page 262
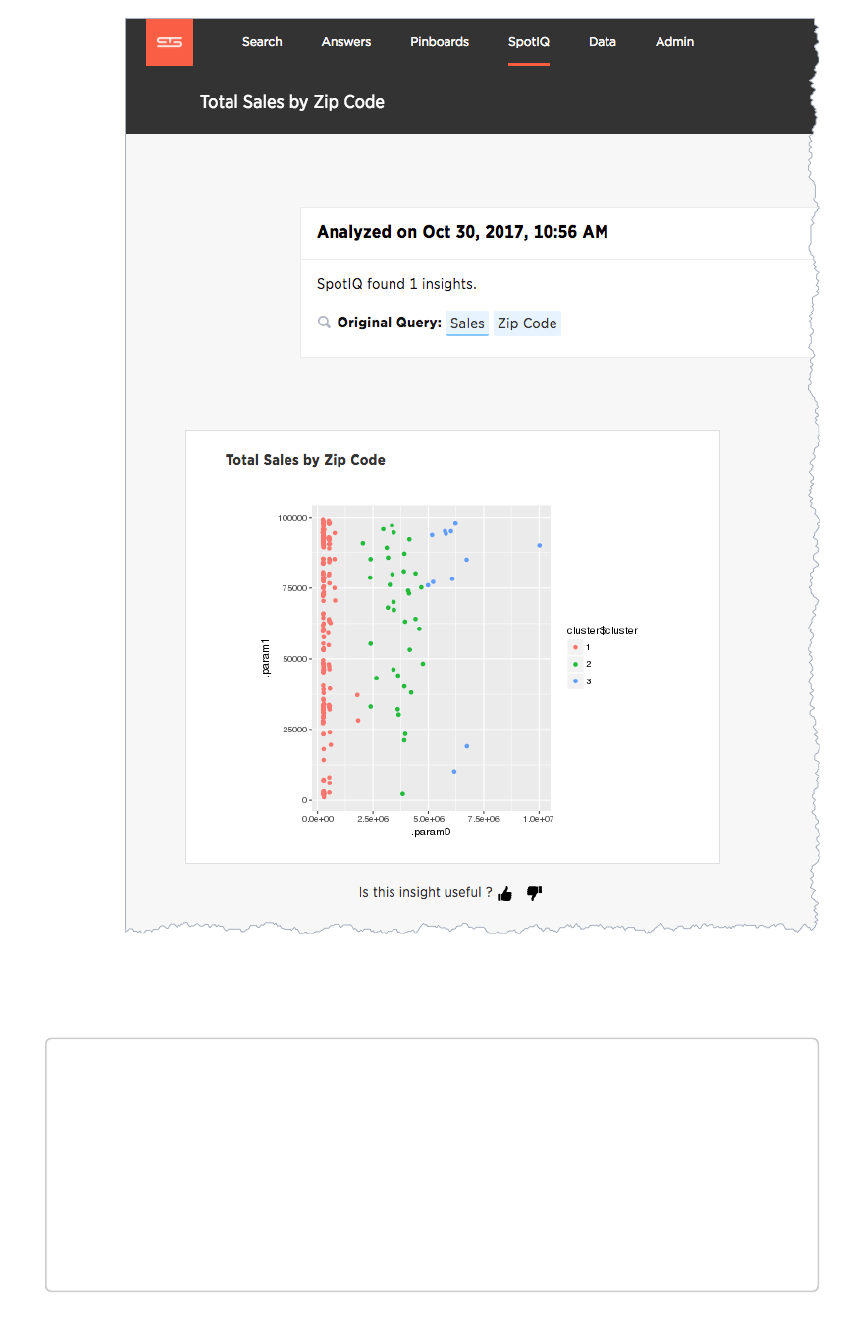
You can run another R script directly on this result to get CSV results. Try this on your own. Here is the
script to give you CSV output:
###R SCRIPT####
set.seed(20);
df <- data.frame(.param0,.param1);
cluster <- kmeans(df[1:2], 3, nstart = 20);
df$Cluster <- as.factor(cluster$cluster);
colnames(df)[1] <- 'Sales';
colnames(df)[2] <- 'Zip Code';
write.csv(df, file=#output_file#, row.names=FALSE);
Advanced R Customizations
February 07, 2019
ThoughtSpot Users Guide Page 263
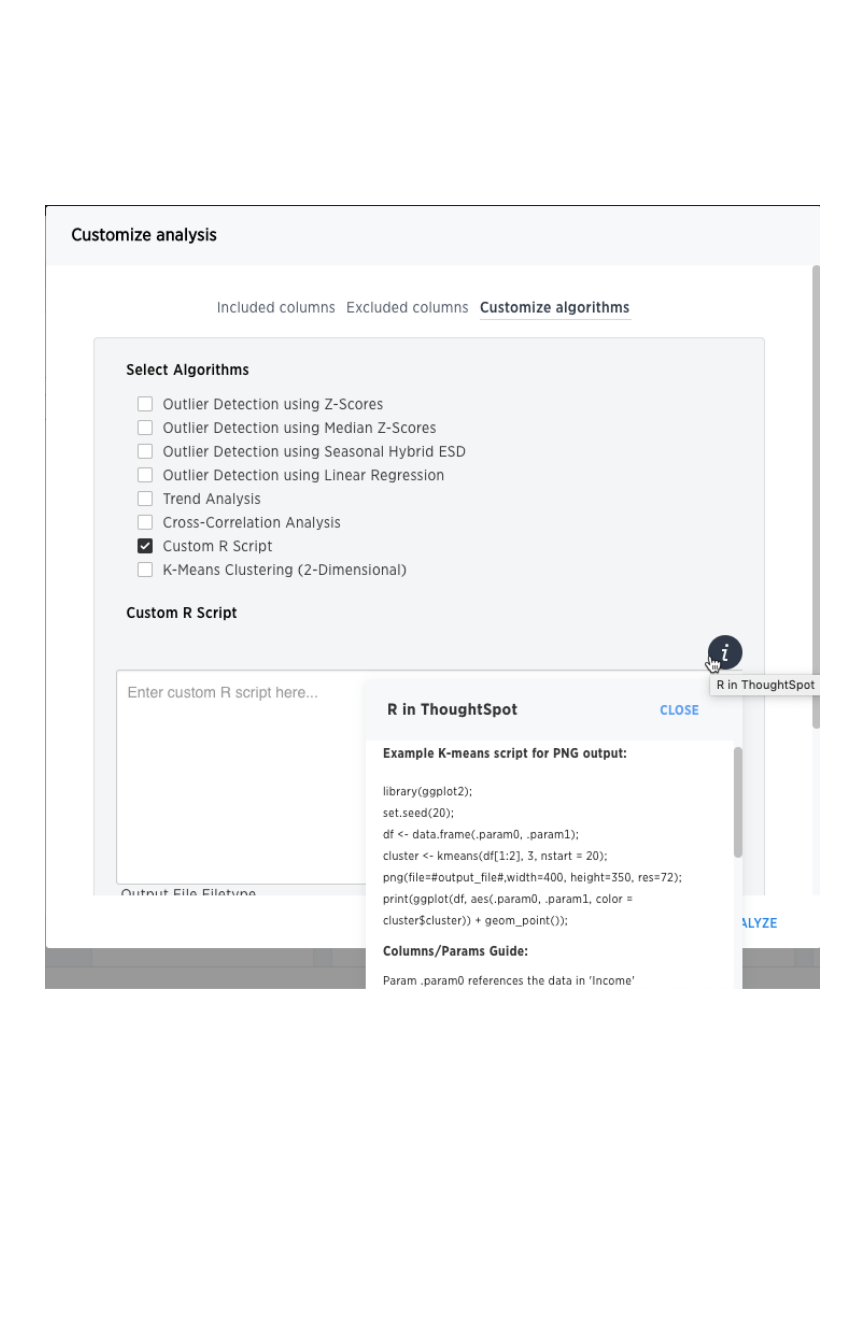
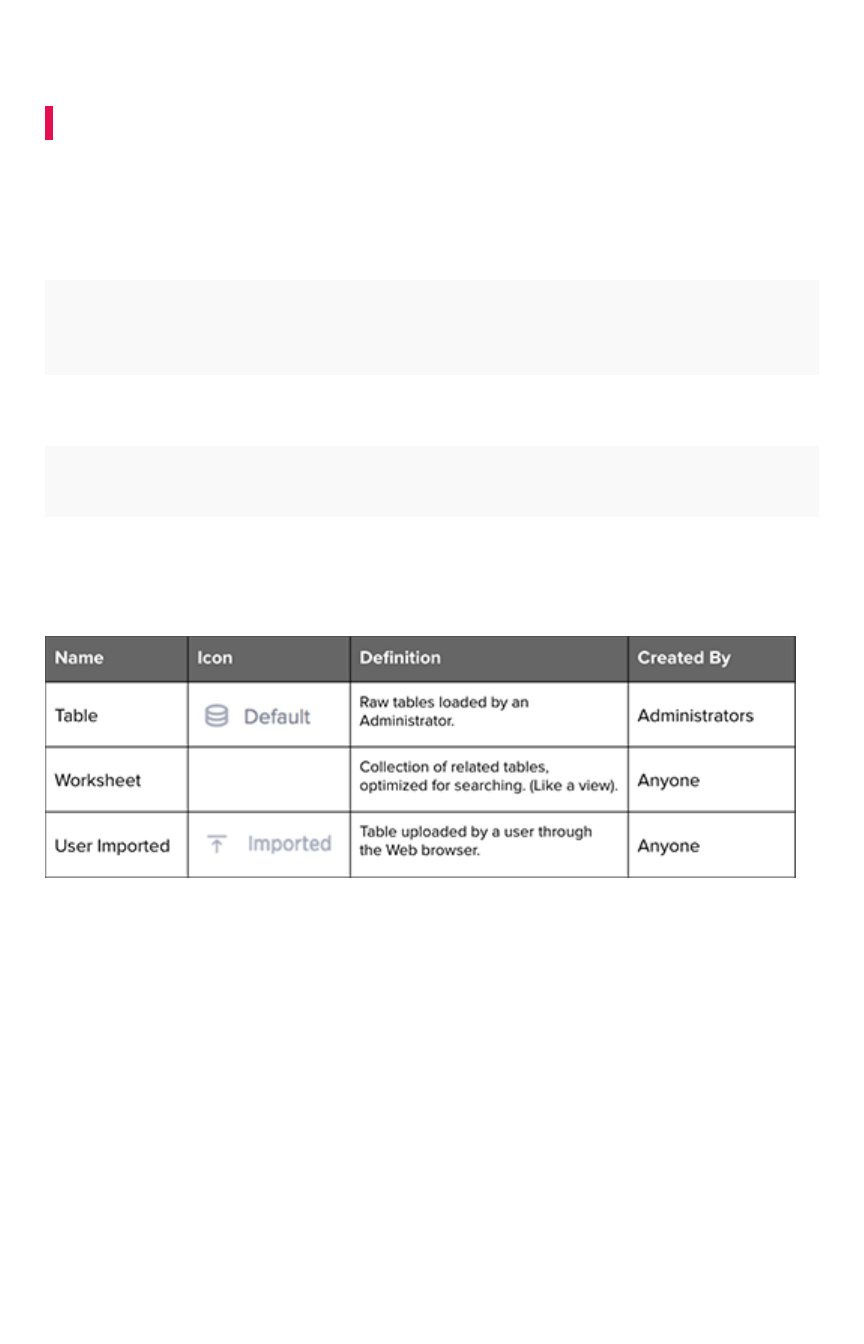
Understand data sources
Summary:Summary: Use the Data tab to manage data sources.
The DataData tab lists all of the tables and data sources available to you. There are three types of data
sources that you may see in the data list. They are tables, worksheets, and user uploaded data. You will
most likely only see worksheets and user uploaded sources. These are the most commonly used data
sources for searching.
NameName IconIcon DefinitionDefinition Created byCreated by
Table Raw table loaded by an Administrator Administrators
Worksheet Collection of related tables optimized for searching (like stan-
dard concept of a
view
)
Anyone
User Im-
ported
Table uploaded by a user through the web browser (e.g. as a
.csv file)
Anyone
View Table saved as a materialized view by a user through the web
browser via Save as viewSave as view option on a search
Anyone
Clicking on the name of a table or data source shows you detailed information about it. You won’t be
able to change these settings or edit the table unless it was shared with you with the EditEdit privilege. To
see how to edit a data source, refer to the
ThoughtSpot Administrator Guide
.
Use the filters at the top of the page to find the data you are interested in. From the DataData tab, you can
also delete or apply stickers to tables and data sources in bulk by selecting them and clicking the
appropriate action button.
Understand data sources
February 07, 2019
ThoughtSpot Users Guide Page 265

Related information
•View your data profile
Basic column data profile information is available under Profile on the Data page.
•About sharing
Whenever you are working in ThoughtSpot, you are in your own private environment until you
share your work with others. This applies to searches, pinboards, and any data you upload.
•Overview of data modeling settings
Understand data sources
February 07, 2019
ThoughtSpot Users Guide Page 266

Create and load a CSV file
Summary:Summary: The simplest way to load data is to upload a CSV or Excel
file from the ThoughtSpot Web interface.
Loading data through the Web browser is recommended for smaller tables (under 50MB) with simple
relationships between them. This method is recommended for small, one time data loads. Using this
method, the data schema is created for you automatically.
Any user who belongs to a group that has the privilege Has administration privilegesHas administration privileges or Can upload userCan upload user
datadata can upload their own data from the browser.
Your data should be in a CSV (comma separated values) before you load it. A CSV file is a text file made
up of data fields separated by a delimiter and optionally enclosed with an enclosing character. If your
data contains multiple tables, you’ll have a separate CSV for each table.
Create a CSV file
The first step in loading data is to obtain or create one or more CSV files that contain the data to be
loaded into ThoughtSpot. CSV is a common format for transferring data between databases.
ThoughtSpot requires this format.
Most applications such as Microsoft Excel or Google Sheets can output CSV formatted files. If your
source is an Excel spreadsheet or Google Sheet:
1. Save, export, or download the file in CSV format. The exact procedure you use will depend on
the source application.
2. Review the file’s format before uploading it to ThoughtSpot.
Your source data may be in another database. If this is the case, your company’s ETL
(extract, transform, load) process will typically generate CSV files. If your source is another
database:
3. Connect to the source database.
4. Extract each table you wish to import into ThoughtSpot as a CSV file.
The column delimiter should be a ,(comma), |(pipe), or tab.
Large organizations typically have a data administrator or department the builds ETL processes. If the
data you want is in another system, speak with your ThoughtSpot administrator about getting CSV files
extracted from this system.
Formatting the CSV
A CSV file contains a delimiter that marks the separation between fields in the data. The delimiter is
usually comma, but it can be any character. The file also contains fields optionally enclosed with double
quotes. Use these guidelines when creating the CSV file:
• If the CSV contains column headers, they must match the column names in the database
exactly.
• Often a |(pipe) or tab is used as the delimiter, because it may be less likely to occur within
the data values.
• When a field contains a double quote, it must be escaped with the character specified in the
Create and load a CSV file
February 07, 2019
ThoughtSpot Users Guide Page 267

escape character argument in tsload .
• When a field contains the delimiter, the field must be enclosed in double quotes.
ThoughtSpot supports a wide range of date and timestamp formats in the CSV file. Blank values in user
uploaded CSV files are interpreted as NULL values. These include the values (case insensitive):
•NULL
•\N
•NA
•N/A
• [space]
If you are appending data to an existing schema or table, columns in the CSV file must be in the same
order as defined in the target table.
Load the CSV File
Any user who belongs to a group that has the privilege Has administration privilegesHas administration privileges or Can upload userCan upload user
datadata can upload their own data from the browser. To load the CSV or Excel file into ThoughtSpot:
1. Log into ThoughtSpot from a browser.
2. Click DataData, on the top navigation bar.
3. Click the the ellipses icon (3 dots) , in the upper right corner, and select Upload DataUpload Data.
4. Upload the CSV or Excel file by doing one of these options:
a. Click on Browse your filesBrowse your files and select the file.
b. Drag and drop the file into the drop area.
5. Answer the question Are the column names already defined in the file header?Are the column names already defined in the file header?
6. Answer the question Are the fields separated by?Are the fields separated by? Click NextNext.
7. Click on the column header names to change them to more useful names, if you’d like. Click
NextNext.
8. Review the automatically generated data types for each column, and make any changes you
want.
There are four data types: Text, Integer, Decimal, and Date.
9. Click ImportImport.
Create and load a CSV file
February 07, 2019
ThoughtSpot Users Guide Page 268
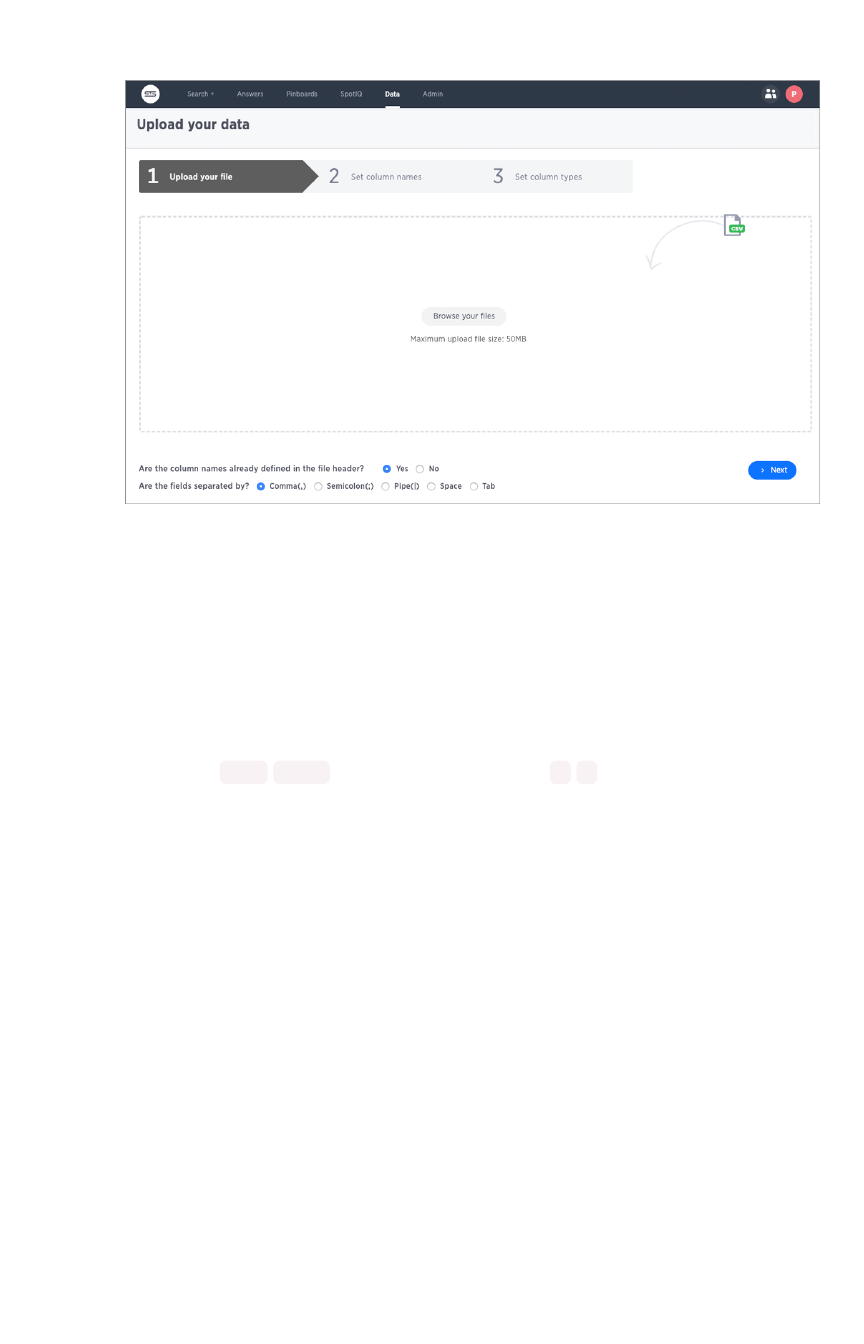
When an upload is complete, the system reports the results and offers you some further
actions.
• Click Link to Existing DataLink to Existing Data if you want to link the data you uploaded to the data in
another table or worksheet.
• Click SearchSearch if you want to begin a new search.
• Click Auto analyzeAuto analyze if you want to use the SpotIQ feature to find insights in your new
data.
Troubleshoot uploads
Boolean data must use TRUE /FALSE values. Other values such as Y/Nare not supported.
Create and load a CSV file
February 07, 2019
ThoughtSpot Users Guide Page 269
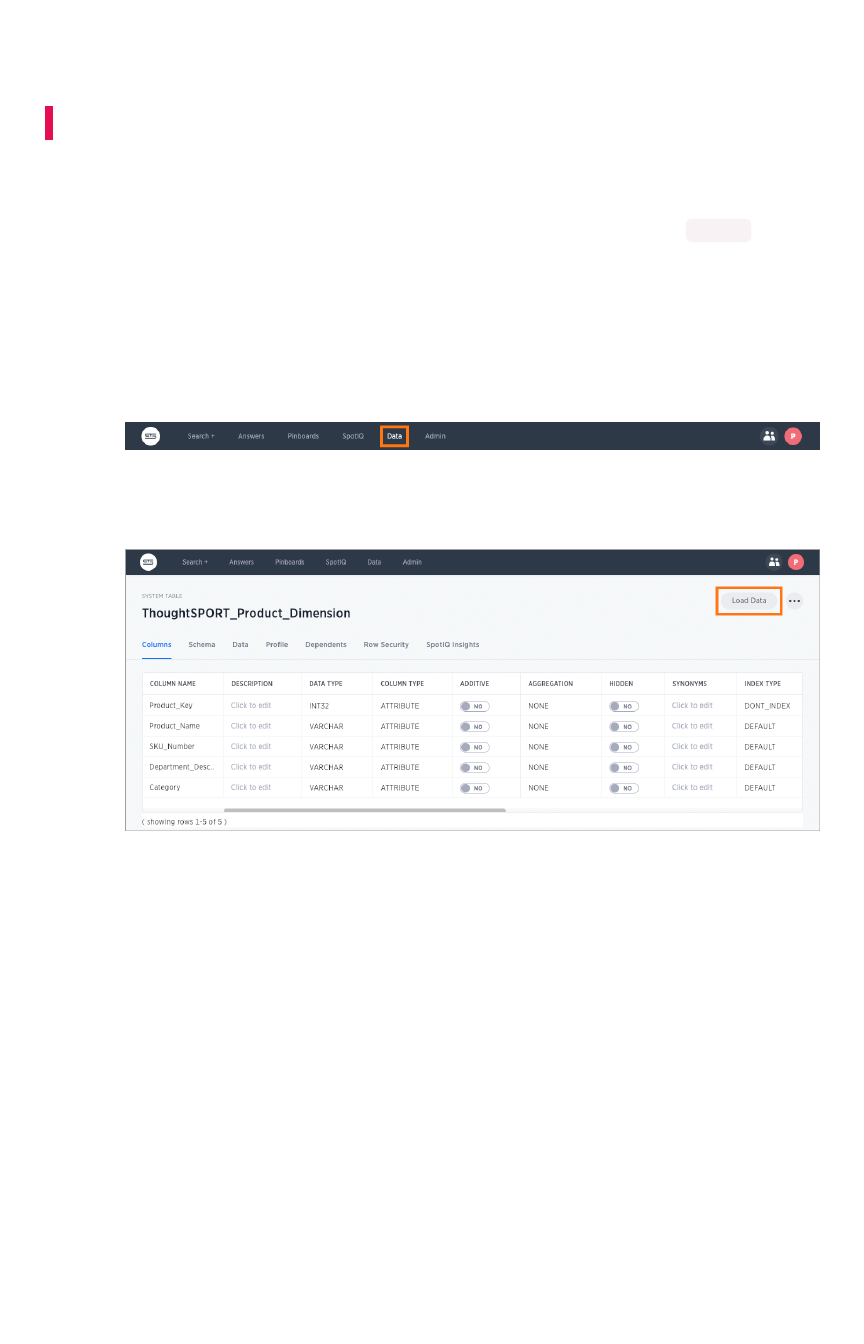
Append data through the UI
Summary:Summary: Use append to add more data to an existing data source.
If you have permissions to upload data and permissions to a data source, you can add to that source by
uploading more data with CSV file. You can append data to your existing system tables through the
ThoughtSpot application, even if the tables were initially loaded using Data Connect or tsload . The
CSV file must have the same structure as the table it is being loaded into, including number and type of
columns, in the same order as the target table.
To append data into ThoughtSpot:
1. Log in to ThoughtSpot from a browser.
2. Click DataData on the top navigation bar.
3. Click the name of the table you would like to append data to.
4. Click the Load DataLoad Data button.
5. Upload the CSV or Excel file by doing one of these options:
• Click Browse your filesBrowse your files and select the file.
• Drag and drop the file into the drop area.
6. Answer the question Are the column names already defined in the file header?Are the column names already defined in the file header?.
7. For the question Do you want to append to the existing data or overwrite it?Do you want to append to the existing data or overwrite it?, select AppendAppend.
8. Answer the question Are the fields separated by?Are the fields separated by?, and click NextNext.
9. Click UploadUpload.
10. Click Link to existing dataLink to existing data if you want to link the data you uploaded to the data in another
table or worksheet. Or click Ask a questionAsk a question if you want to begin a new search.
Append data through the UI
February 07, 2019
ThoughtSpot Users Guide Page 270
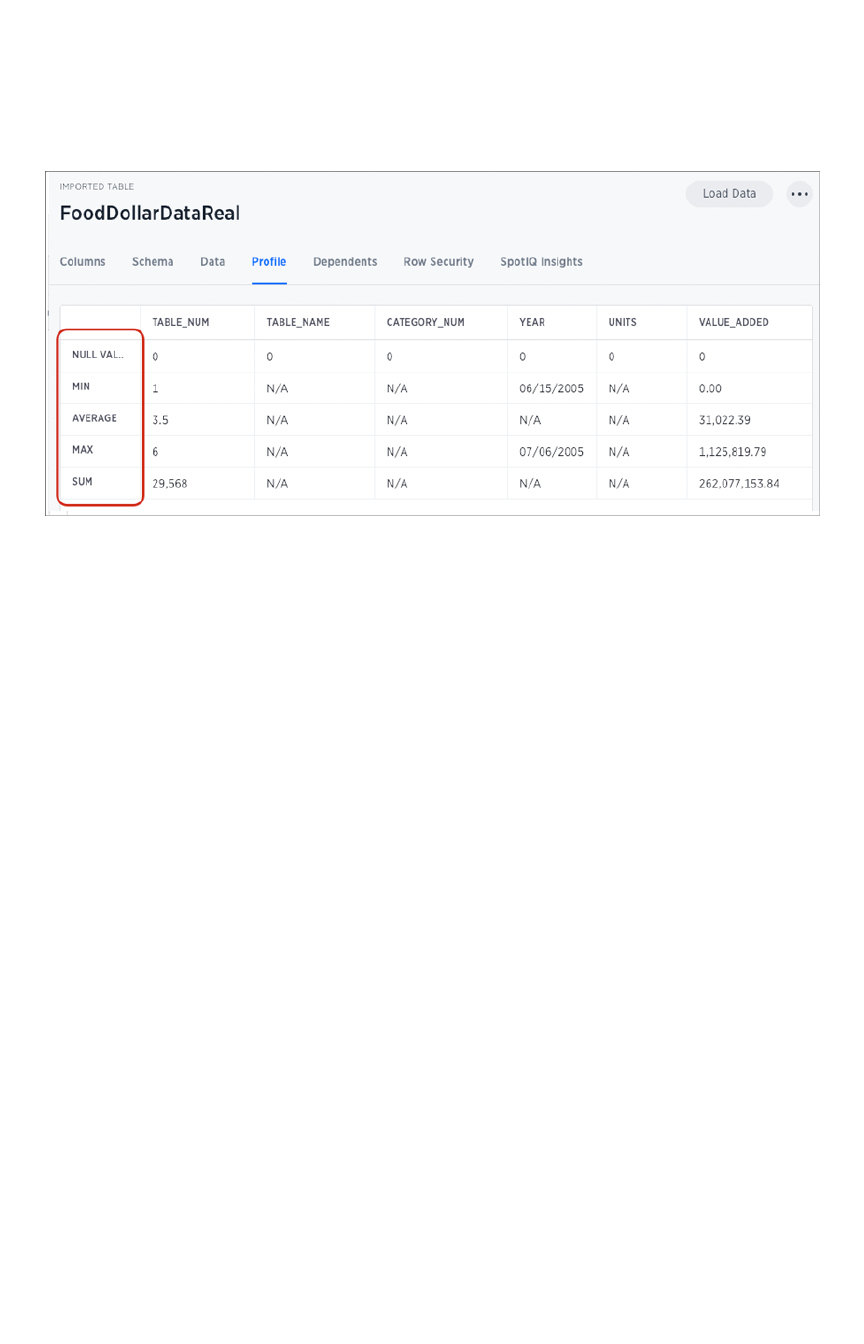
View a data profile
After you upload a CSV file, it is available as a table in ThoughtSpot. Click DataData in the top navigation bar
and select your table. Then click ProfileProfile.
The data profile includes null values, min, max, average, and sum information for each table column. This
ProfileProfile view should help you get a better sense of what’s there before searching on the data.
View a data profile
February 07, 2019
ThoughtSpot Users Guide Page 271

Set your display language (locale)
The language the ThoughtSpot UI displays is based off of the locale in a user’s profile. The locale
preferences control the language and data formats (date and number formats) by geographic locations.
In addition to American English (
en-US
), ThoughtSpot supports:
LocaleLocale LanguageLanguage
da-DK
Dansk (beta)
de-DE
Deutsche
en-CA
English (Canada)
en-GB
English (United Kingdom)
en-US
English (United States)
es-US
Español (latín)
es-ES
Español (España - beta)
fr-CA
Français (Canada)
fr-FR
Français (France)
it-IT
Italiano (beta)
nl-NL
Nederland (beta)
nb-NO
Norsk (beta)
pt-BR
Português (Brazil)
pt-PT
Português (Portugal - beta)
fi-FI
Suomi (beta)
sv-SE
Svenska (beta)
zh-CN
中文(简体)
ja-JP
日本語
Date and number formats change to reflect your locale. So, if you set Japanese as your default locale in
your profile settings, then the interface will update to reflect that after you refresh your page.
Keywords, operators, and error messages are included in the translated material. (A keyword reference
for all supported languages is included in this documentation under “Keywords in Other Languages”.)
Formulas, however, are
not translated
. Also, all metadata remains as user inputted.
Set your display language (locale)
February 07, 2019
ThoughtSpot Users Guide Page 272
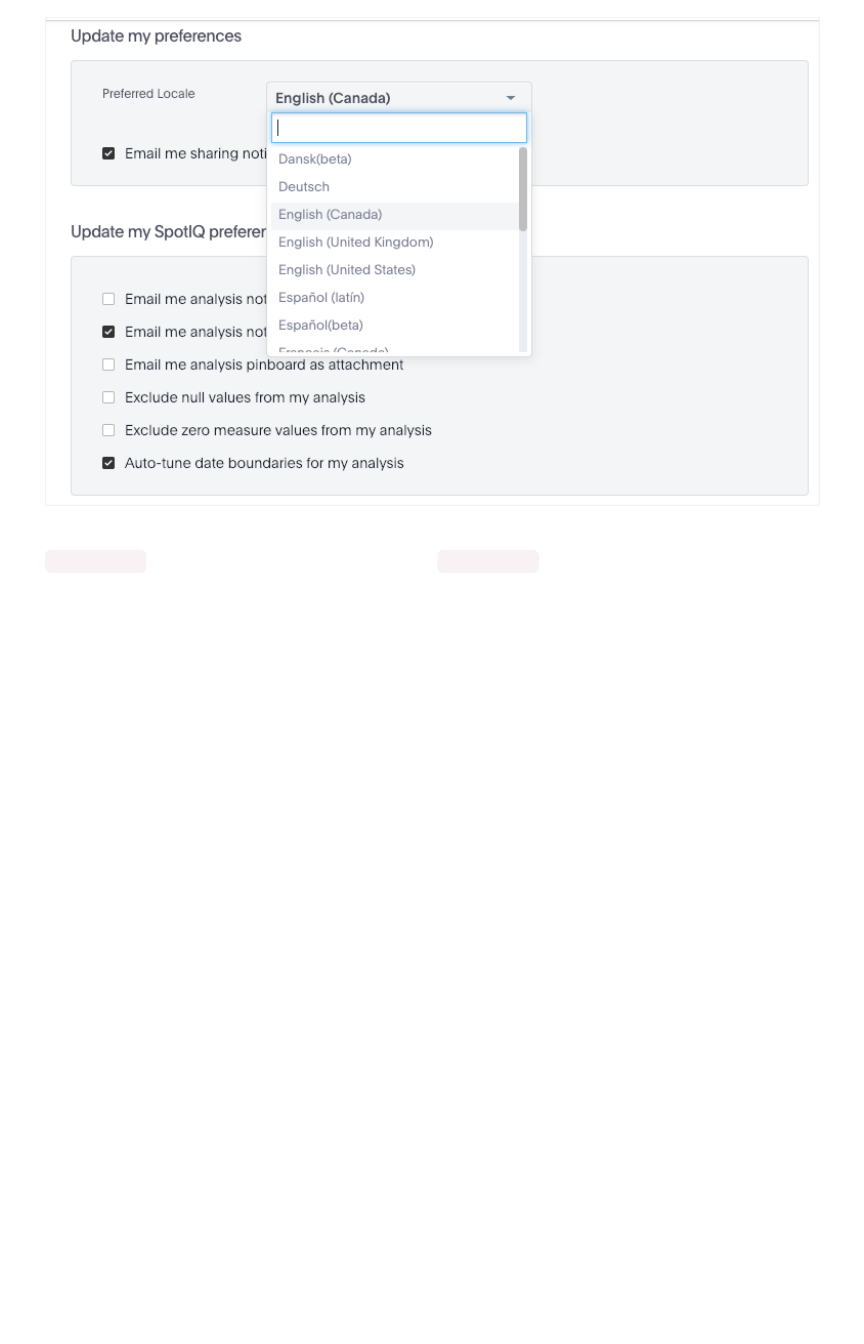
For example, if you are using ThoughtSpot in the US, the number formatting should look like this:
xxx,xxx.xx . And in Europe, it should look like this: xxx.xxx,xx .
Set your display language (locale)
February 07, 2019
ThoughtSpot Users Guide Page 273

Overview of sharing
Whenever you are working in ThoughtSpot, you are in your own private environment until you share your
work with others. Sharing applies to searches, pinboards, and any data you upload.
What you can share
This is a list of objects a regular, non-administrator user can share. Administrators have more granular
control over data security.
You can share with groups and with individual people. You can share several different types of objects:
ObjectObject
typetype
DescriptionDescription Default security modelDefault security model
Uploaded
data
Data that was
uploaded us-
ing a Web
browser.
Only the user who uploaded the data (and any user with administrator
privileges) has access to it by default. They can share a table (or se-
lected columns) with other people or groups. See Share uploaded data
Pinboards A pinboard of
saved search
results.
Anyone who can view a pinboard can share it. See share a pinboard
Answers The result of
a single
search.
Anyone who can view an answer can share it. See share answers
Who can share and to whom
You do not have to be an administrator or the owner, to share saved answers or pinboards. Any user can
share them, based on the access levels the user has.
If you upload a spreadsheet, you can share Can ViewCan View or Can EditCan Edit privileges with other people, who can
further share them with others. This last point is important. Like sharing a secret, sharing an object or
your data can quickly spread in ths way to people you do not intend it to. So, if your data or work is
sensitive to your business be thoughtful in how you share it.
Finally, you can revoke access to an object (table, worksheet, or pinboard) that you have previously
shared. Unsharing an object is very similar to sharing it.
Overview of sharing
February 07, 2019
ThoughtSpot Users Guide Page 274

Share a pinboard
Summary:Summary: Whenever you view a pinboard you have the option of
sharing it with others.
When you share a pinboard what you are really sharing is a live link to the pinboard, when you click
Share with…Share with…. So whenever someone else views it, they will see the most recently saved version with the
most recent data. You do not have to be an administrator or the owner to share saved pinboards. Any
user can share them, based on the access levels the user has.
To share a pinboard:
1. Configure it to look as you’ll want it to appear when shared.
2. From within a pinboard, click the ellipses icon (3 dots) , and select ShareShare.
Alternatively, select the pinboard you want to share from the list of pinboards and click ShareShare.
(The profile picture or avatar for the owner of each pinboard is shown in the list.)
Share a pinboard
February 07, 2019
ThoughtSpot Users Guide Page 275
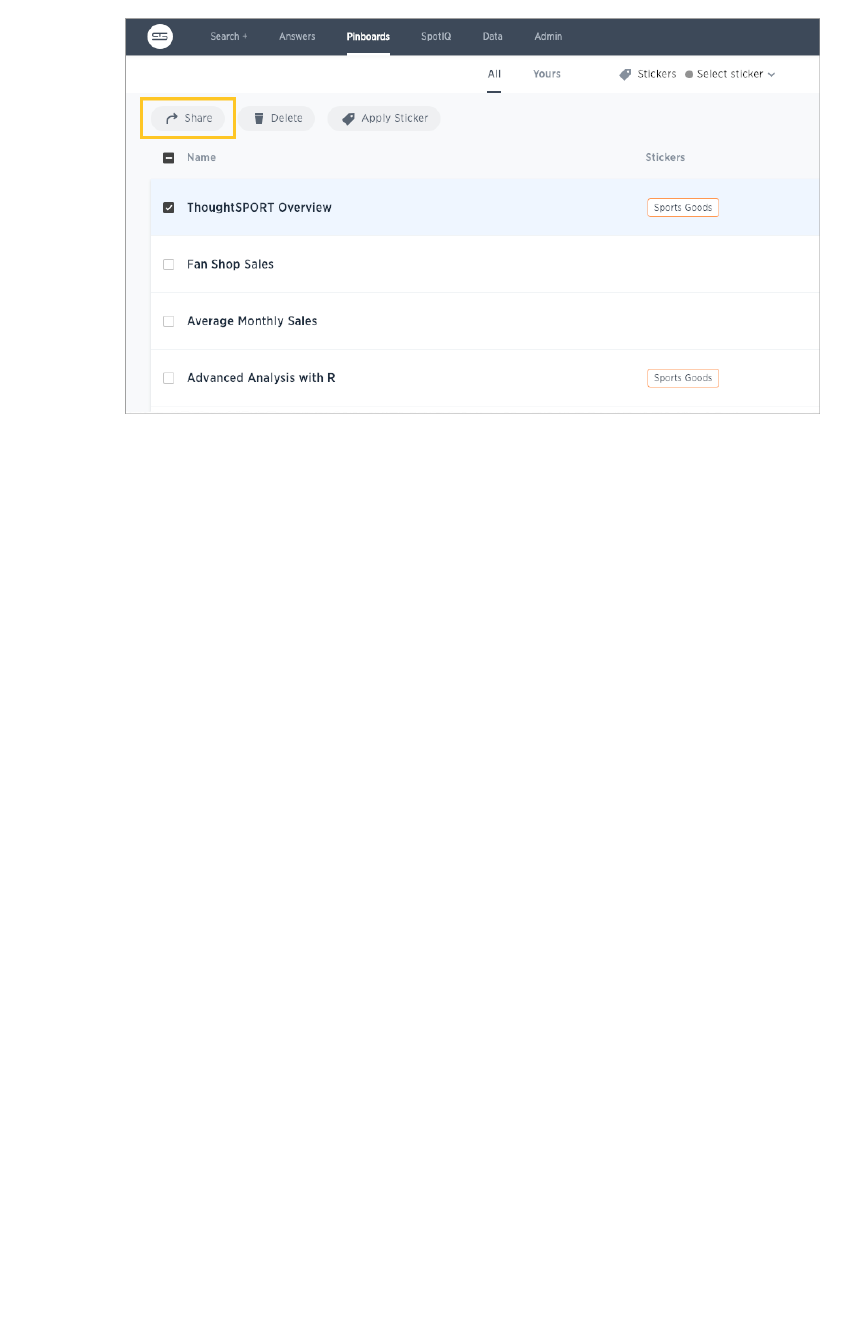
3. Click the plus (++) at the bottom of the Share dialog, and select users or groups with whom you
want to share.
Share a pinboard
February 07, 2019
ThoughtSpot Users Guide Page 276
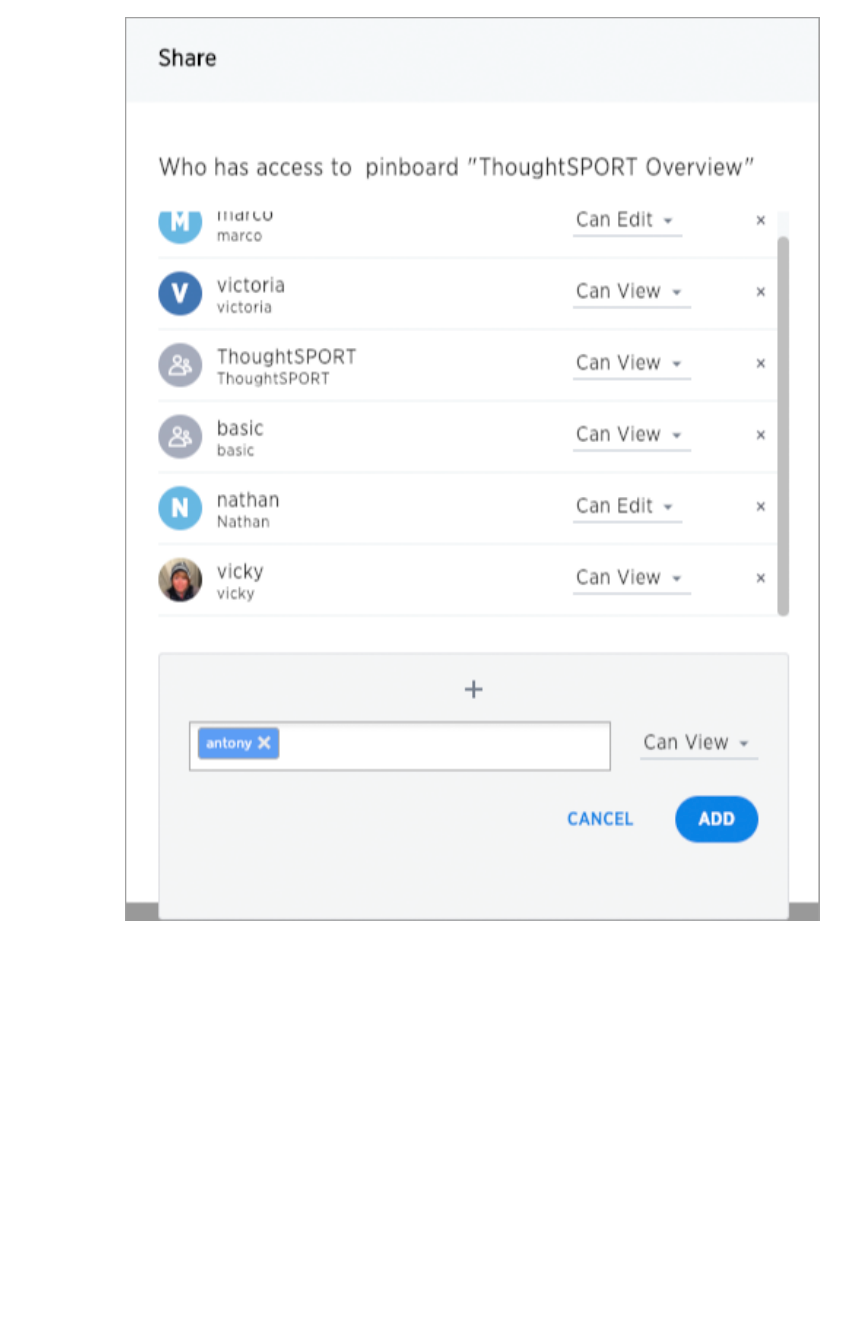
4. Configure the level of access by selecting from the dropdown next to each user or group.
Available options are based on your own access level. For example, if you have only ViewView
access, you will not have an option to share as EditEdit. You can select:
• Can ViewCan View to provide read-only access. If the person doesn’t have access to the
underlying data, they can only view a shared pinboard. If they change anything on
the pinboard, their changes are not saved. In order to persist the changes, the user
would need to make a copy of the modified pinboard.
• Can EditCan Edit to allow modification. Enables renaming or deleting the shared pinboard.
If a person with edit privileges modifies a shared pinboard, their changes will be
saved to it.
5. Click AddAdd to save your changes, then click DoneDone.
Share a pinboard
February 07, 2019
ThoughtSpot Users Guide Page 277
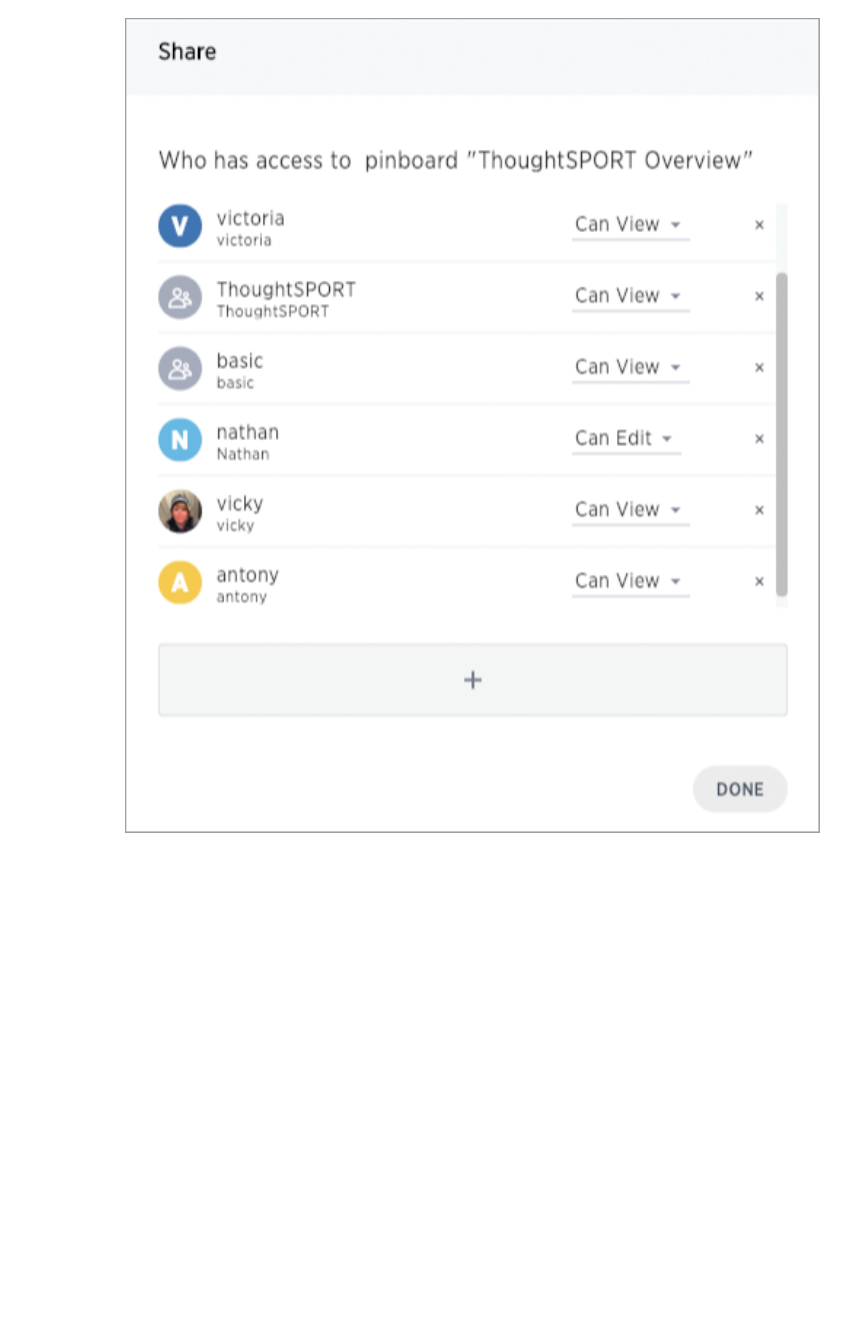
Share a pinboard
February 07, 2019
ThoughtSpot Users Guide Page 278
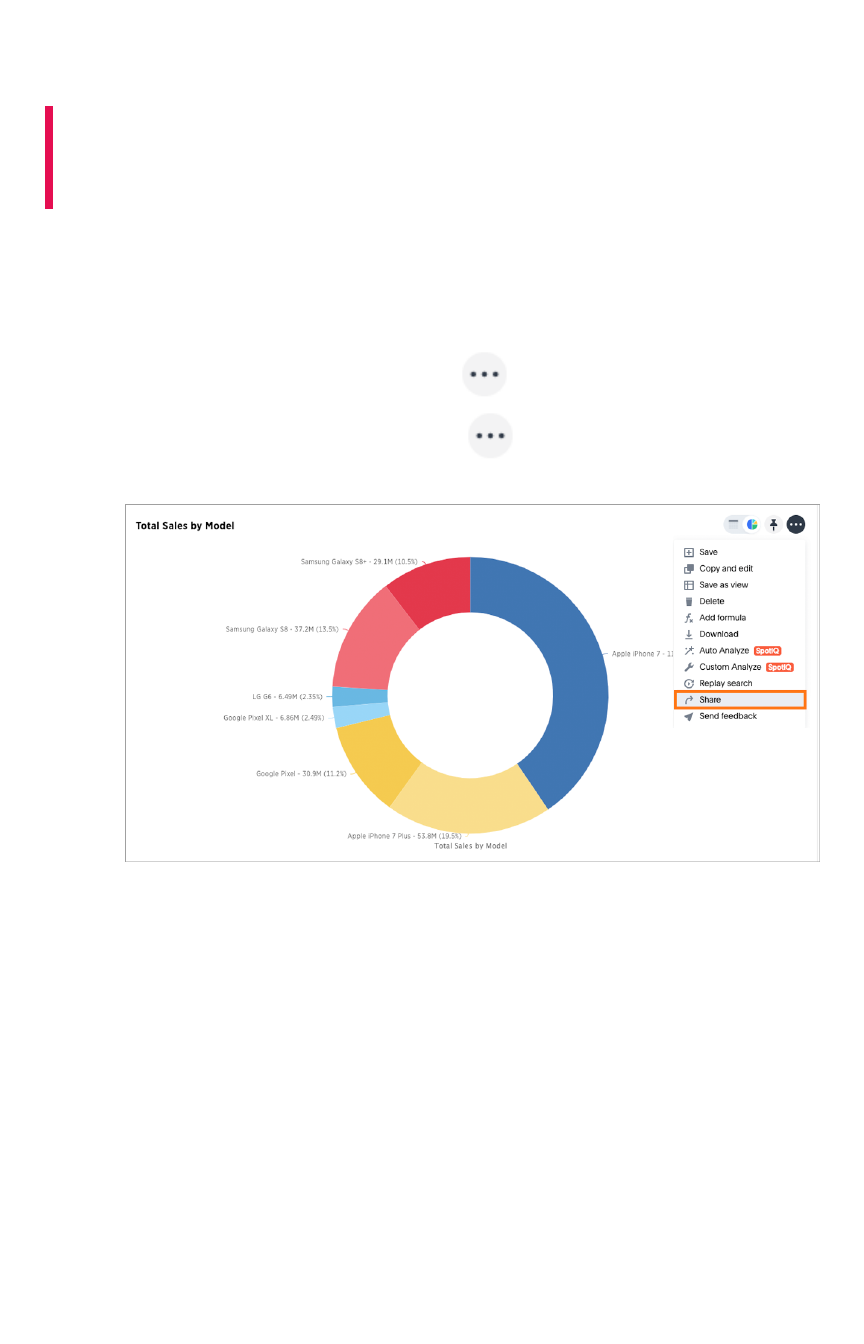
Share answers
Summary:Summary: You do not have to be an administrator or the owner to
share saved answers. Any user can share them, based on the access
levels the user has.
Whenever you view an answer, you have the option of sharing it with others. It will be shared in its
current state, so if you have modified the answer by interacting with the table or chart, the modified
version is what will be shared.
1. Configure the answer to look as you’ll want it to appear when shared.
2. Save the answer by clicking the ellipses icon , and selecting SaveSave.
3. Share the answer by clicking the ellipses icon , and selecting ShareShare.
4. Click the plus (++) at the bottom of the Share dialog and select users or groups with whom you
want to share this answer.
5. Configure the level of access by selecting from the drop-down list. You can select:
• Can ViewCan View to provide read-only access. If the user doesn’t have access to the
underlying worksheet, they can only view the shared answer.
• Can EditCan Edit to allow modification. Enables renaming or deleting the shared answer. If
a user with edit privileges modifies a shared answer, their changes will be saved to
it.
Share answers
February 07, 2019
ThoughtSpot Users Guide Page 279
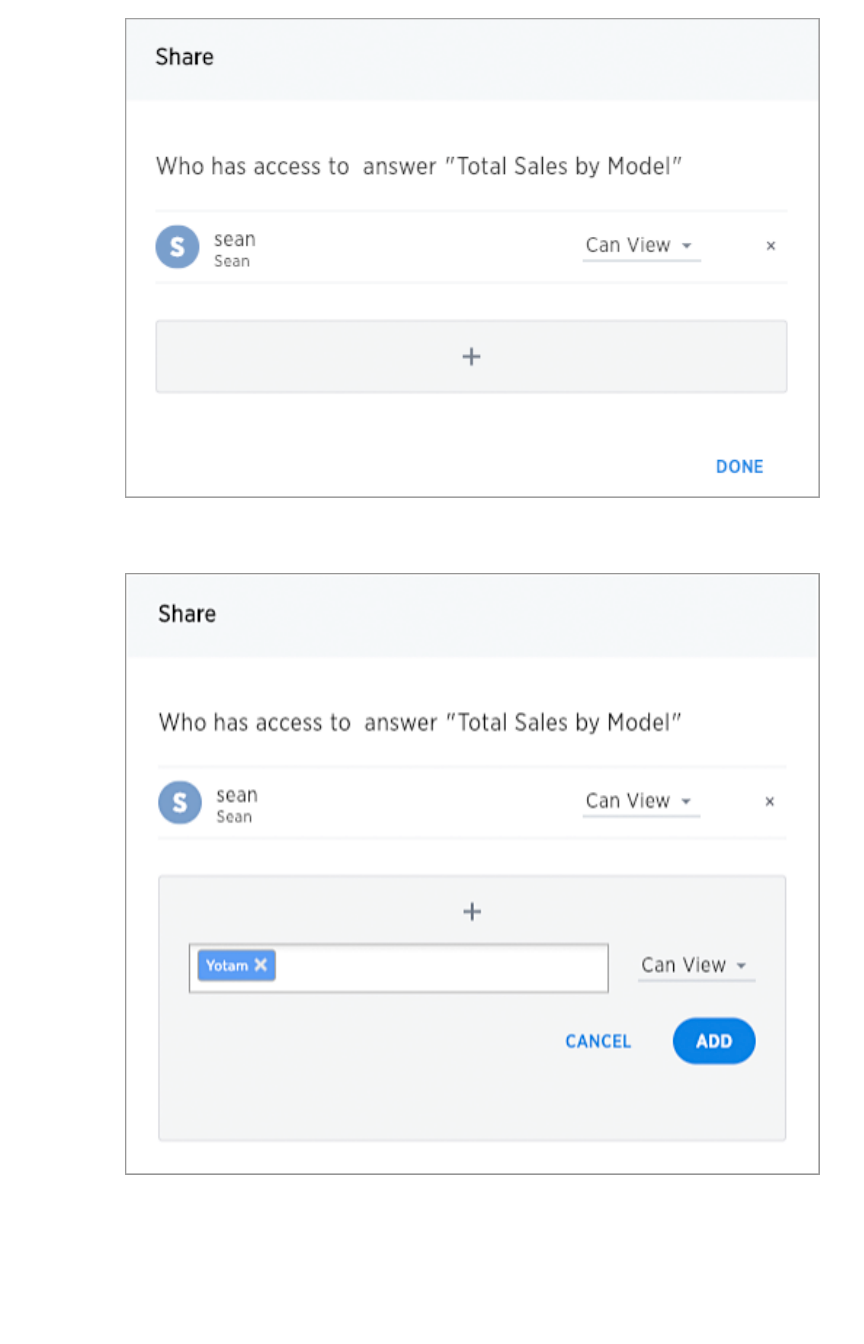
6. Click AddAdd.
7. Click DoneDone.
Share answers
February 07, 2019
ThoughtSpot Users Guide Page 280
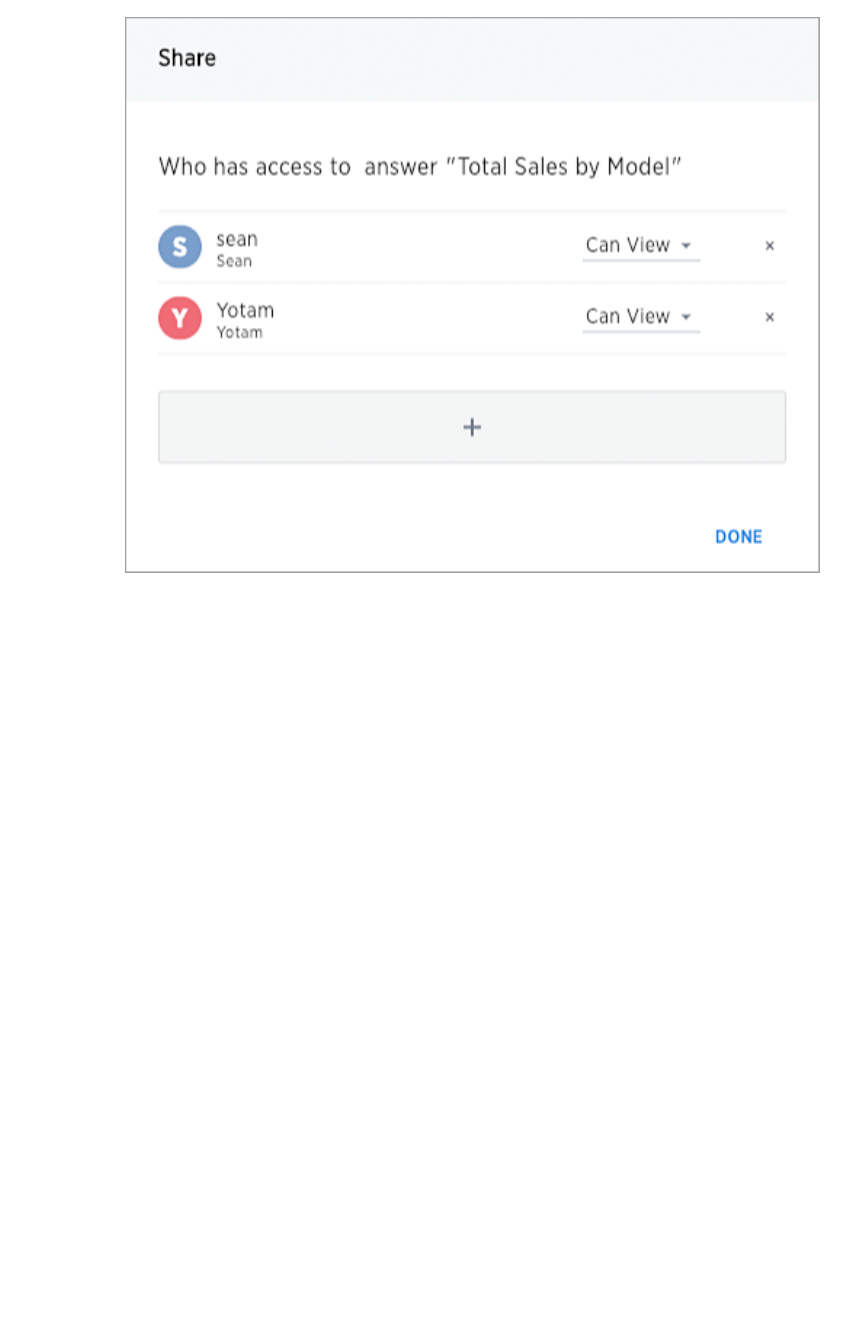
Share answers
February 07, 2019
ThoughtSpot Users Guide Page 281

Share uploaded data
If you upload a spreadsheet, you can share Can ViewCan View or Can EditCan Edit privileges with other people, who can
further share them with others.
Understand data sharing
Data that you uploaded from a Web browser is only visible to you and to the administrator. You can
share the entire uploaded table, or only some of its columns.
By default, if you share only some table columns, users with access to those columns cannot see the
other column’s data in their searches. However, the data can become visible if a worksheet or pinboard
that
also contain
those columns is shared with these users.
If you want to prevent shares of these types from also revealing the columns, you can ask your
administrator to enable a stricter behavior.
How to share data
Share uploaded data by following these steps:
1. Click DataData on the top navigation bar.
2. Click on the name of the uploaded data you want to share.
3. Click the ShareShare icon.
4. Select Entire TableEntire Table or Specific ColumnsSpecific Columns.
Share uploaded data
February 07, 2019
ThoughtSpot Users Guide Page 282

5. If you selected Specific ColumnsSpecific Columns, select the column(s) to share.
6. Click ++ and select the users and groups with whom you want to share.
7. Configure the level of access by selecting from the dropdown list. You can select:
• Can ViewCan View to provide read-only access. This enables viewing the table data and
defining worksheets on the table.
• Can EditCan Edit to allow modification. This enables renaming, modifying, or deleting the
entire table and adding or removing its columns.
8. Click AddAdd.
9. Click DoneDone.
Share uploaded data
February 07, 2019
ThoughtSpot Users Guide Page 283
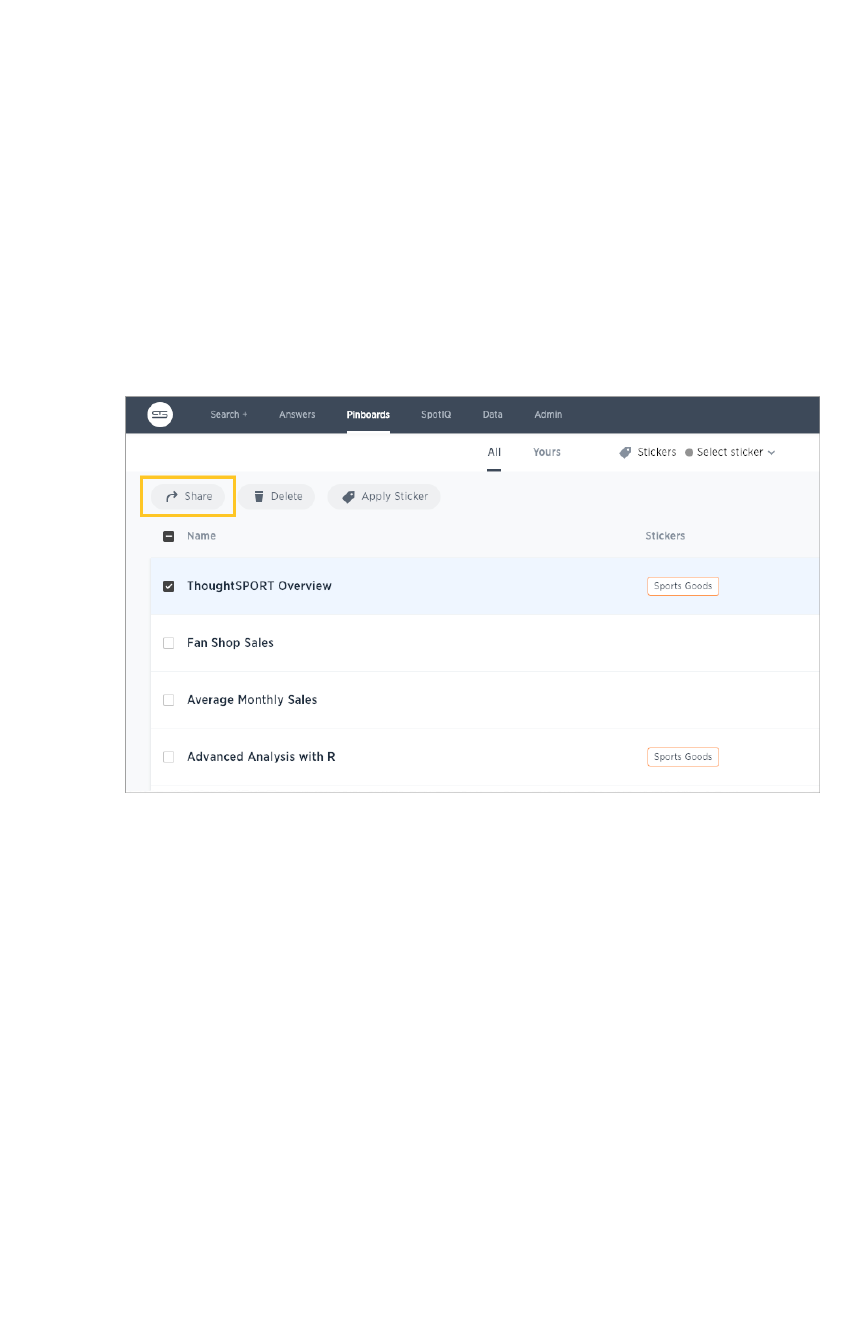
Revoke access (unshare)
You may need to revoke access to an object (table, worksheet, or pinboard) that you have previously
shared. Unsharing an object is very similar to sharing it.
To unshare one or more objects:
1. Go to the area where the object(s) you want to unshare is located. From the top menu bar:
• If the object is a table or worksheet, click DataData.
• If the object is a pinboard, click PinboardsPinboards.
• If the object is an answer, click AnswersAnswers.
2. Find the object(s) in the list, and check the corresponding box(es).
3. Click the ShareShare icon.
4. Click the XX next to the users and groups that you want to remove from sharing.
Revoke access (unshare)
February 07, 2019
ThoughtSpot Users Guide Page 284
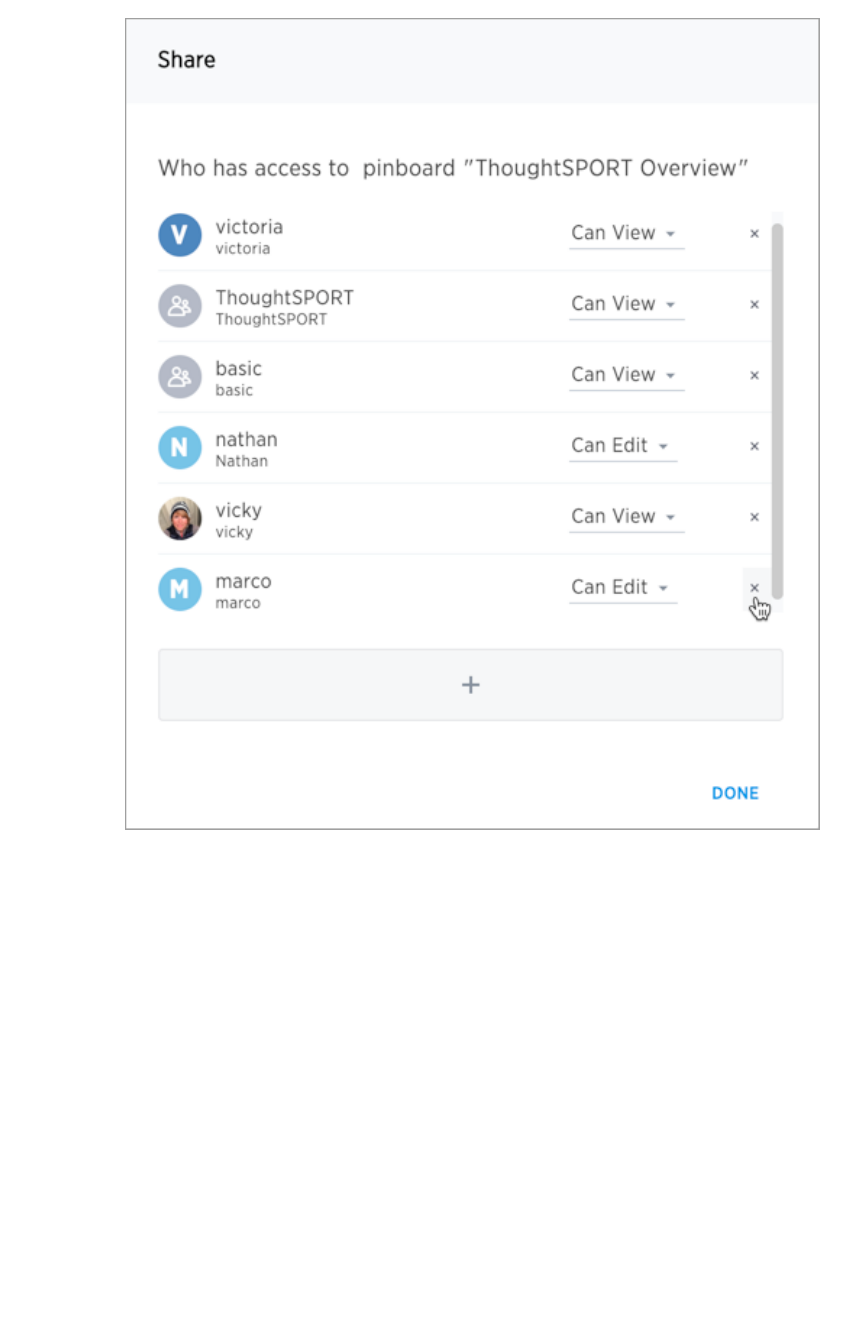
5. Click SaveSave, and then click DoneDone.
Revoke access (unshare)
February 07, 2019
ThoughtSpot Users Guide Page 285
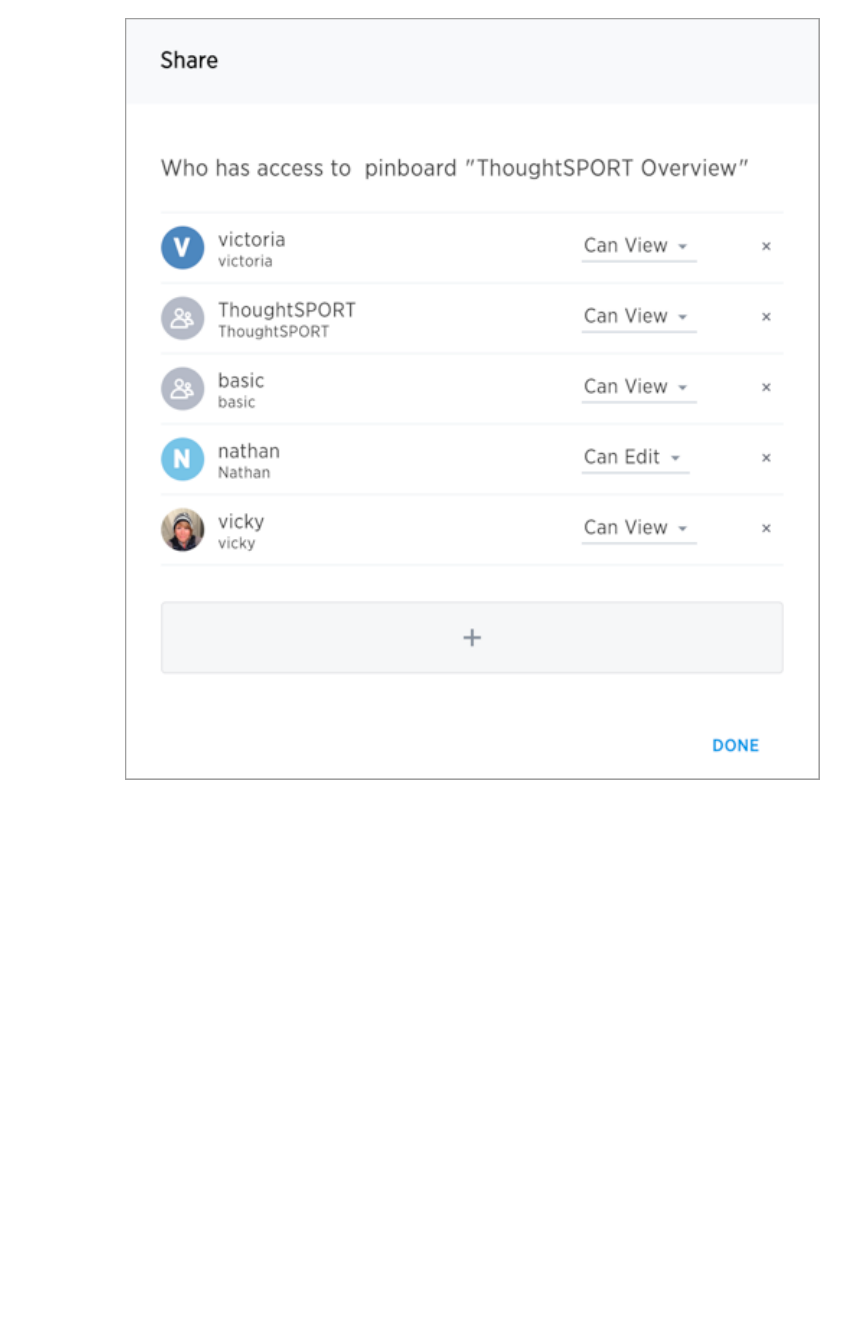
Revoke access (unshare)
February 07, 2019
ThoughtSpot Users Guide Page 286
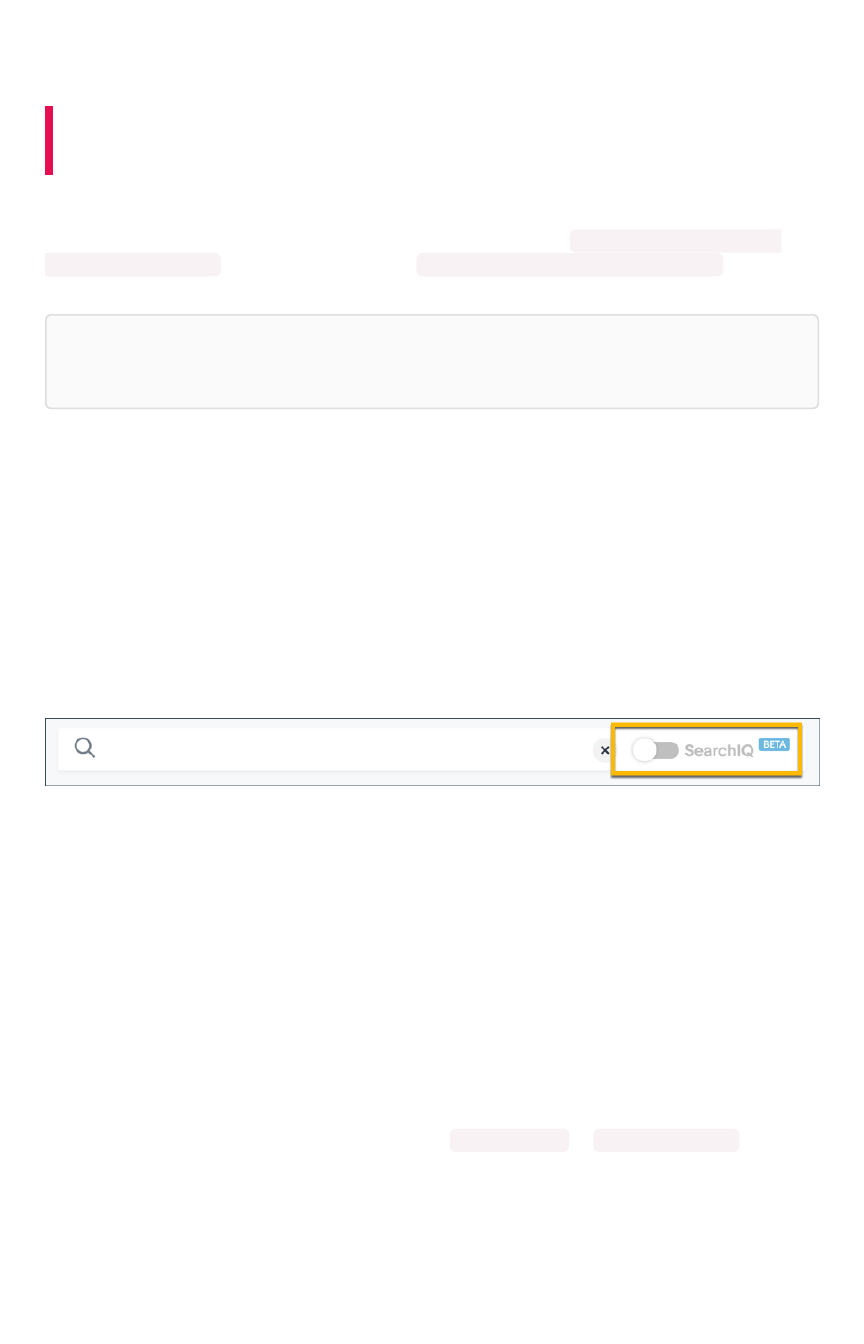
About SearchIQ
Summary:Summary: With SearchIQ you can search using natural language or
by speaking.
SearchIQ is a different search experience that understands more natural, speech-like search language
than the original ThoughtSpot search. For example, you can search for What was my top selling
product last month? , instead of having to type top 1 product by sales last month . You can
also speak your search using the voice-to-text capability of your operating system.
Note:Note: SearchIQ is turned off by default, but your administrator can enable it for you. You’ll also
need to be a member of a group that has the Can use experimental featuresCan use experimental features permission.
How do I use SearchIQ?
Clicking on the search bar on your homepage, or clicking SearchSearch in the top menu bar takes you to the
search screen.
From here, if SearchIQ has been enabled for you by your administrator, you’ll notice a SearchIQSearchIQ toggle
button to the right of the search bar. Switch it to the on position.
This puts the search into SearchIQ mode, and you can now type in a search using plain, speech-like
language.
If you leave the SearchIQSearchIQ setting in the off position, you’ll get the original ThoughtSpot search
experience, which uses keywords, column names, and data values.
What kinds of things can I type?
Like regular search, SearchIQ is based on the tables that exist in your data. Tables are made of rows and
columns, like spreadsheets. So you can search by typing in any of these words:
• The column name: like revenue, product name, or store
• Any of the values in the columns: like 20000, kitten chow, or richmond
• One of the special keywords ThoughtSpot understands: like yesterday, >, or contains
What’s different about SearchIQ is that the form of your question can be more like natural language. This
means that SearchIQ will ignore extraneous words like What was the or Can you show me . If you
find that your natural language search doesn’t return the results you expect, you can teach SearchIQ
your language easily.
About SearchIQ
February 07, 2019
ThoughtSpot Users Guide Page 287

How do I use voice search with SearchIQ?
The ability to do voice search comes with your computer’s operating system and your browser’s
speech-to-text capabilities. As such, it isn’t provided by ThoughtSpot. But you can take advantage of
these when searching with SearchIQ.
Make sure your microphone on your computer is enabled and working correctly. If you’re unsure, check
the documentation for your operating system.
Next, make sure your browser supports the text-to-speech capability by consulting its documentation.
If all is well, you’ll see a microphone icon it the search bar, when it is in SearchIQ mode. Clicking on the
microphone will begin accepting voice input, which is translated to text in the search bar.
Note:Note: If the SearchIQ text-to-speech functionality is not working, ensure that you are accessing
ThoughtSpot in your browser using HTTPS:// and not HTTP://.
Related information
•Use SearchIQ
•Teach SearchIQ your language
About SearchIQ
February 07, 2019
ThoughtSpot Users Guide Page 288
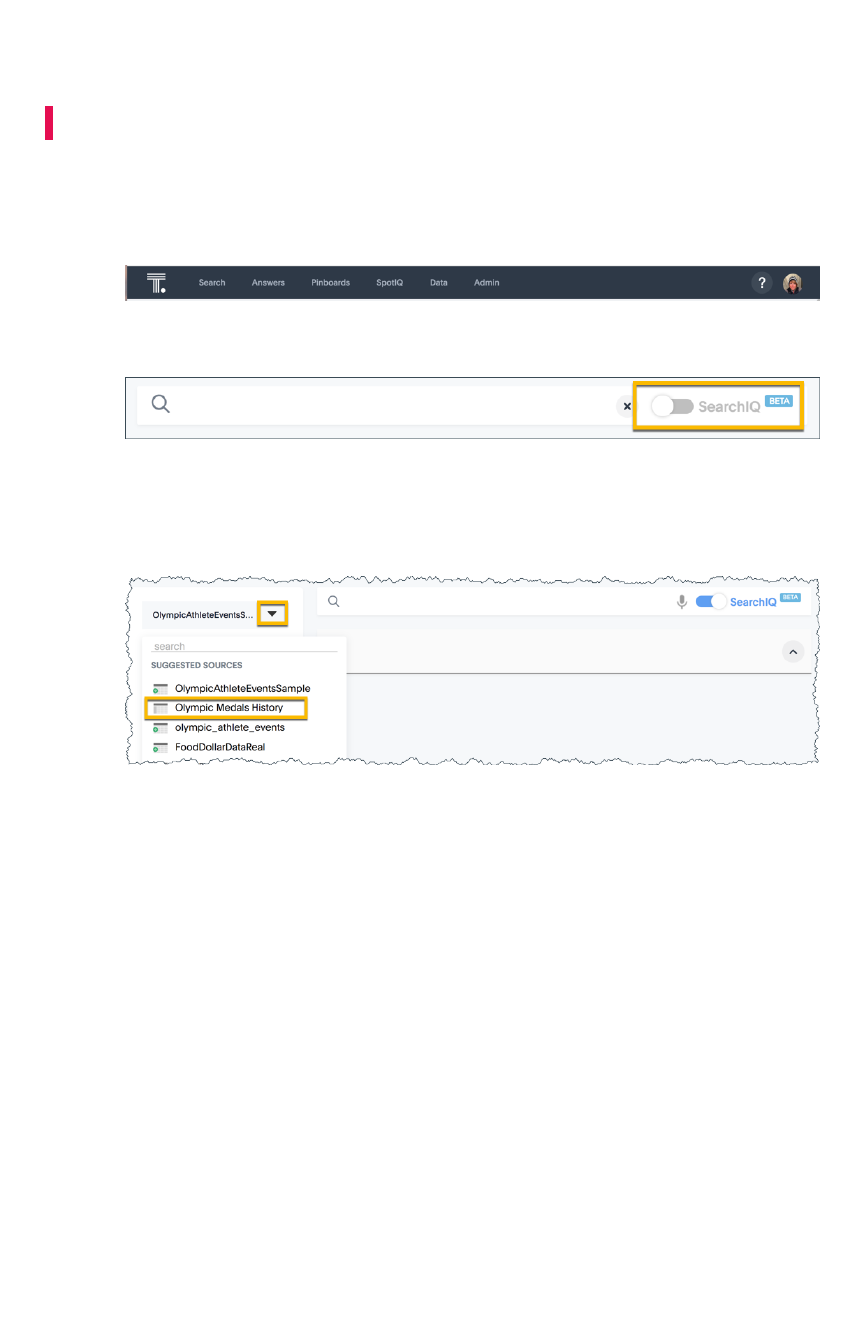
Use SearchIQ
Summary:Summary: Use SearchIQ to do a natural language search.
To do a search using SearchIQ:
1. Click the ThoughtSpot search bar on the homepage or select SearchSearch from the top menu.
2. Click on the SearchIQ toggle button to go into SearchIQ mode.
If you later decide to go back to the classic search mode, you can click on the SearchIQ
toggle button to turn it off again.
3. Choose the data you want to search using the selector in the left panel.
4. Type your search in the search bar using plain language.
If you see a microphone icon in the search bar, that means your operating system and
browser are enabled for speech-to-text. In this case, you can click on the microphone and
speak your search instead of typing.
5. Press the EnterEnter key when your search is complete.
6. When your answer appears, you may also see one of these messages:
• Ignored words: These words were not needed in order to create the answer, so
they are ignored.
Use SearchIQ
February 07, 2019
ThoughtSpot Users Guide Page 289
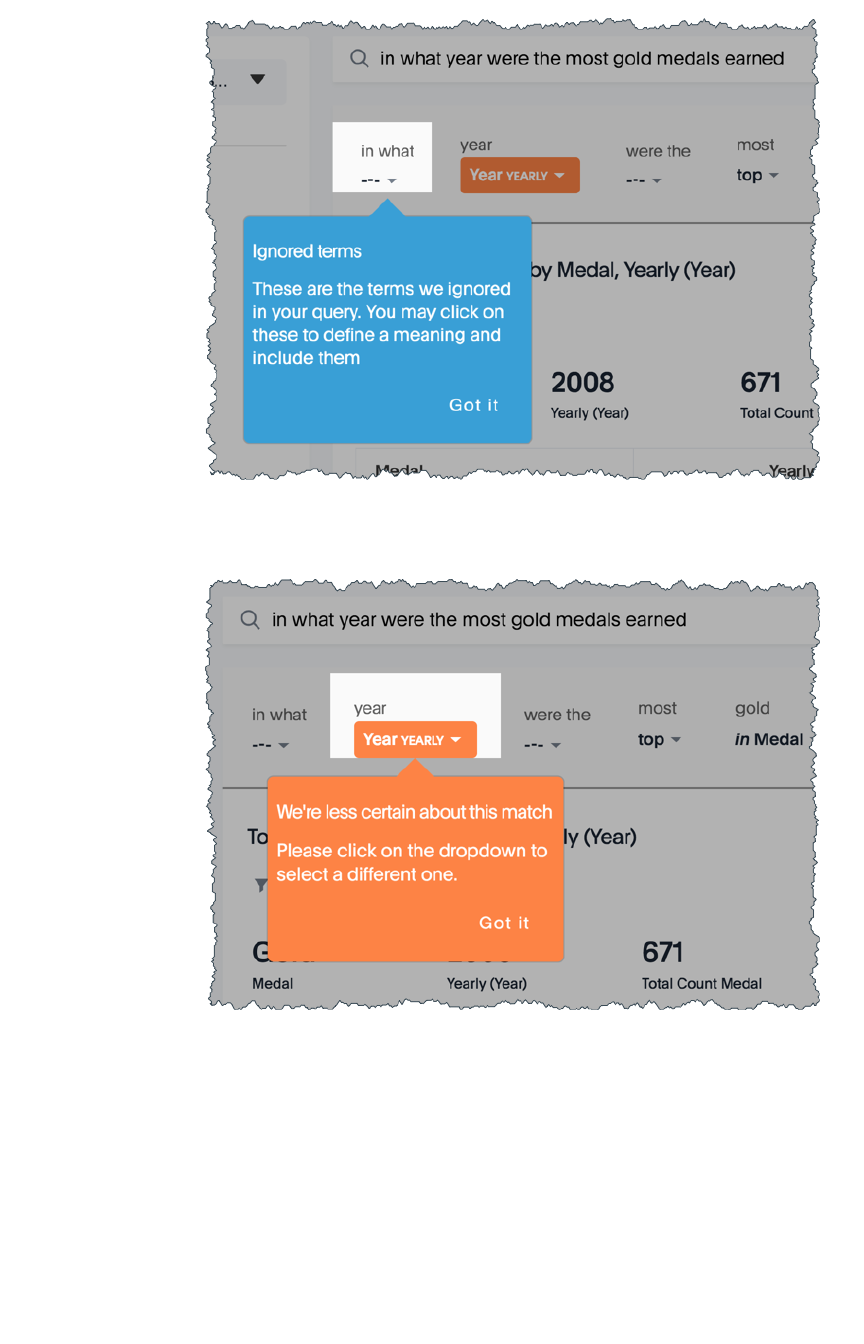
• Ambiguous words: These are words that could have more than one meaning in the
context of the search.
You can clarify by choosing what you meant from the possible meanings shown.
Use SearchIQ
February 07, 2019
ThoughtSpot Users Guide Page 290

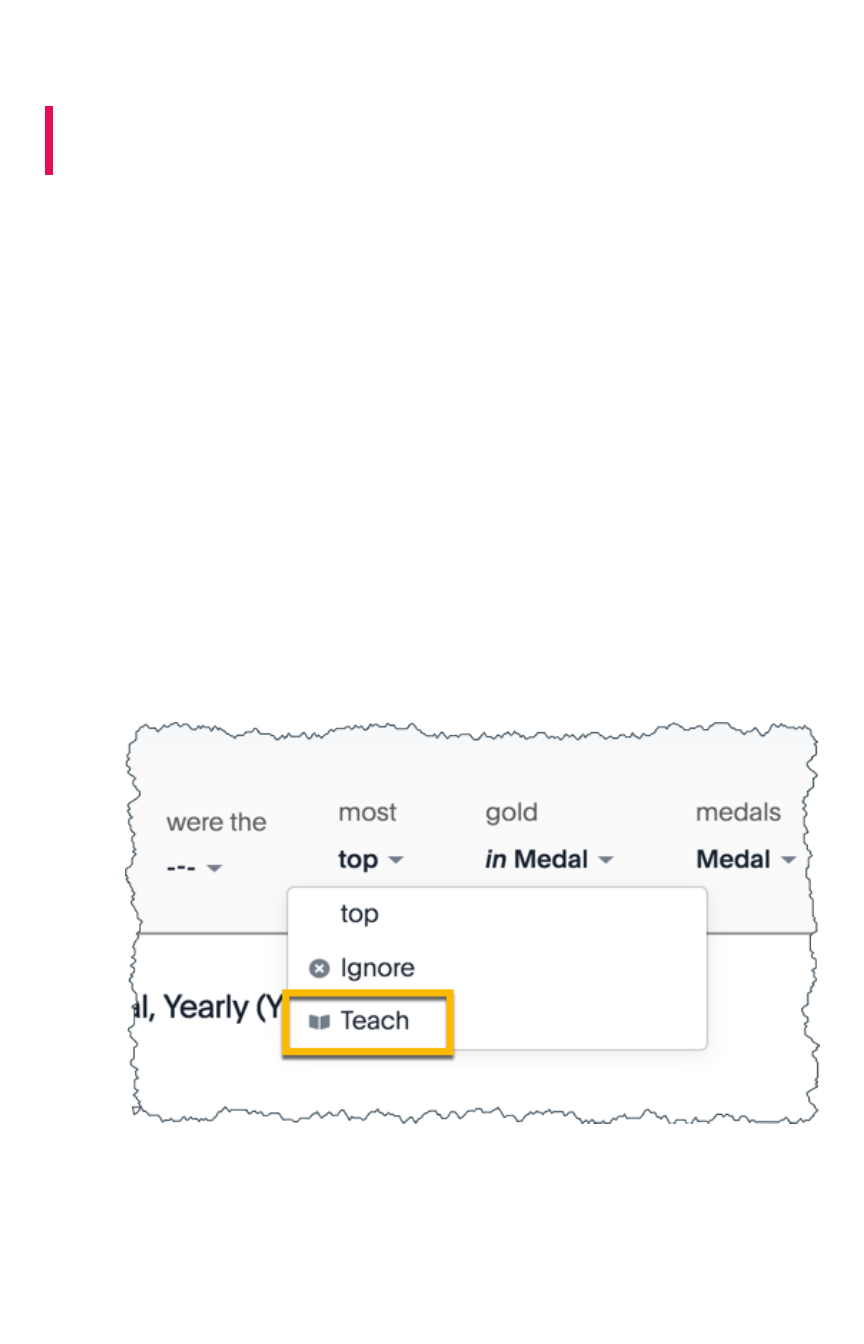
Teach SearchIQ your language
Summary:Summary: You can teach SearchIQ your language, to make its results
more accurate.
Sometimes the results from SearchIQ won’t be quite what you were expecting. You can easily teach
SearchIQ your language as you use it. Over time, it gets smarter about how to interpret terms that don’t
come directly from keywords, column names, or data values.
Teach SearchIQ your Language
To teach SearchIQ your language:
1. After receiving a search result from SearchIQ, you’ll notice a section below the search bar that
shows the SearchIQ interpretation of what you typed or spoke. If you do not see this, click
Refine your queryRefine your query.
Wherever you see - -- -, those terms were ignored. Where you see a word or words, those are
the keywords, column names, or data values as understood by SearchIQ.
Clicking on any term brings up the menu where you can change how ThoughtSpot
understands that term.
2. Click any term you want SearchIQ to ignore in the future, and choose IgnoreIgnore.
3. Click any term you wish SearchIQ had interpreted differently, and choose TeachTeach.
4. When you see the teaching dialog box, 1) use the handles on the search diagram to select a
term for which you want to change the mapping. Then 2) select a column name to map it to,
or type your mapping in the search bar below the diagram. 3) You may need to select what
you mean from the search suggestions.
Teach SearchIQ your language
February 07, 2019
ThoughtSpot Users Guide Page 292
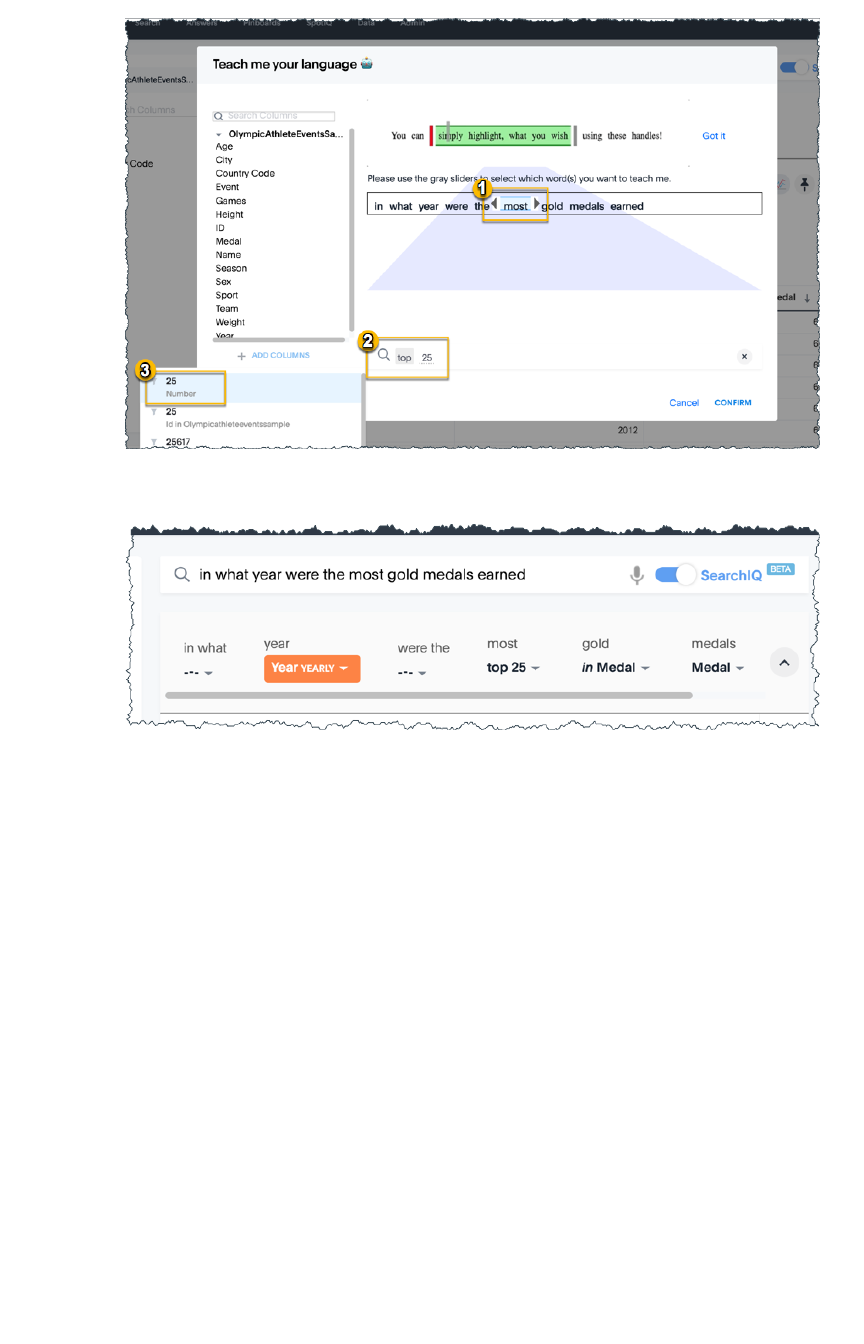
5. Choose CONFIRMCONFIRM to see the new search result.
6. Repeat these steps until SearchIQ understands how to interpret your search.
SearchIQ will remember what you taught it, and use that to understand your searches in the
future.
What if I teach SearchIQ a different language
from somebody else?
SearchIQ learns the language you teach it, and your efforts are useful to everyone else who uses
SearchIQ in the future. If SearchIQ learns different search term mappings from different users, these are
applied to new searches in a hierarchical fashion, with the top learnings carrying more weight than those
further down the list.
The hierarchy of SearchIQ language learning is set up like this:
1. Language mappings the user taught SearchIQ
2. Language mappings the user’s Group members taught SearchIQ
3. Language mappings set by the administrator
In this way, SearchIQ provides the best and most customized search experience possible for all users,
and your efforts to teach it are valuable to as many people as possible.
Teach SearchIQ your language
February 07, 2019
ThoughtSpot Users Guide Page 293

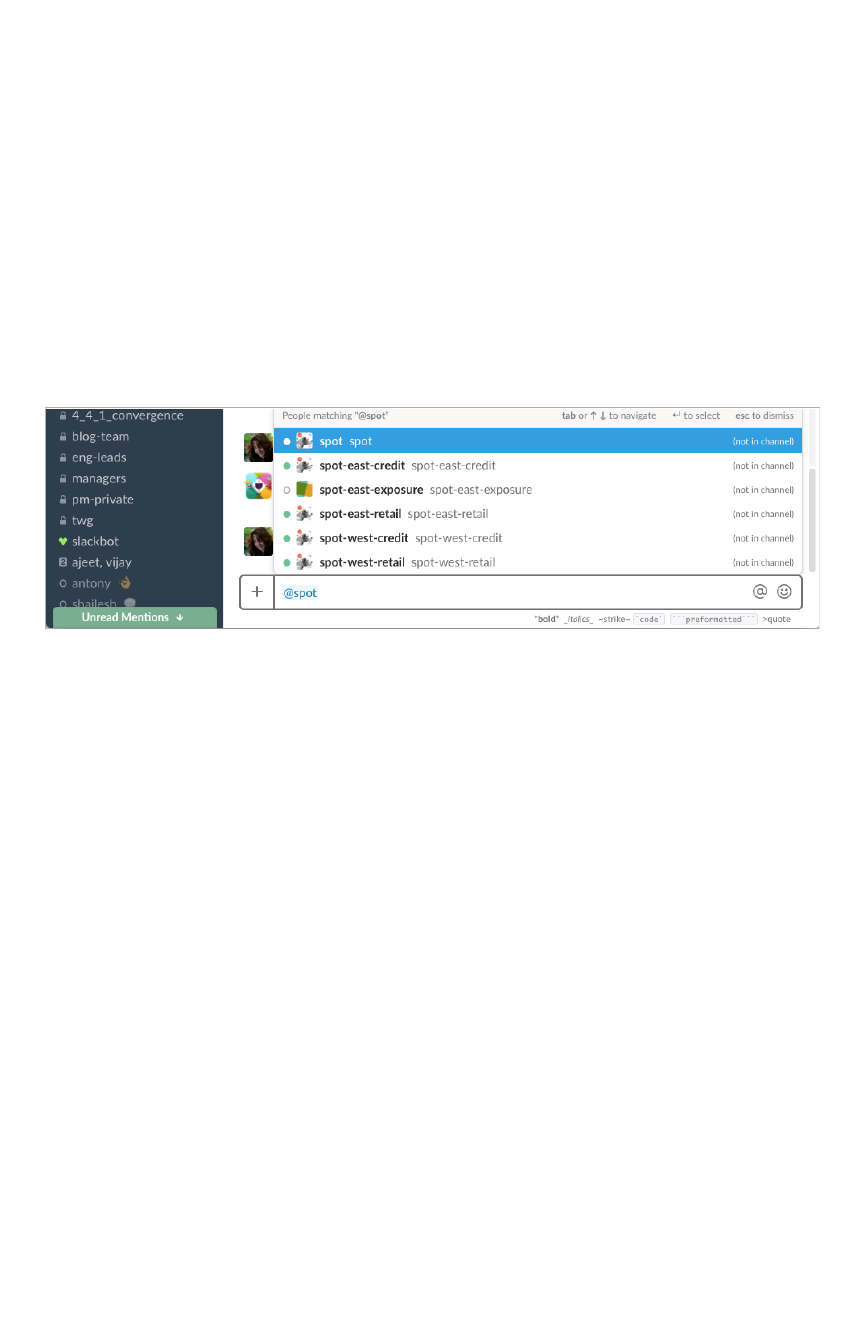
Slack and Spot
Slack is an enterprise software platform that allows teams to communicate effectively through a
messaging application. Slack also allows users to communicate with applications like ThoughtSpot
through chat.
Spot is a ThoughtSpot integration with Slack.
Does your Slack have Spot?
Spot has to be integrated with your Slack team before you can use it. Your team admin or ThoughtSpot
admin can do this. To test if your Slack team has a Spot integration, mention @spot@spot and see if he barks
back:
In this particular channel, @spot@spot is there for you but like his brothers @spot-east-credit@spot-east-credit is not in the
channel.
If @spot@spot doesn’t come when you “call” you are spotless. Ask your administrator to see if you can get
one.
Related Information
• Go to How to use Spot to get started using Spot.
• For information on setting up Spot, see Slack Integration in the Administration Guide.
Slack and Spot
February 07, 2019
ThoughtSpot Users Guide Page 295
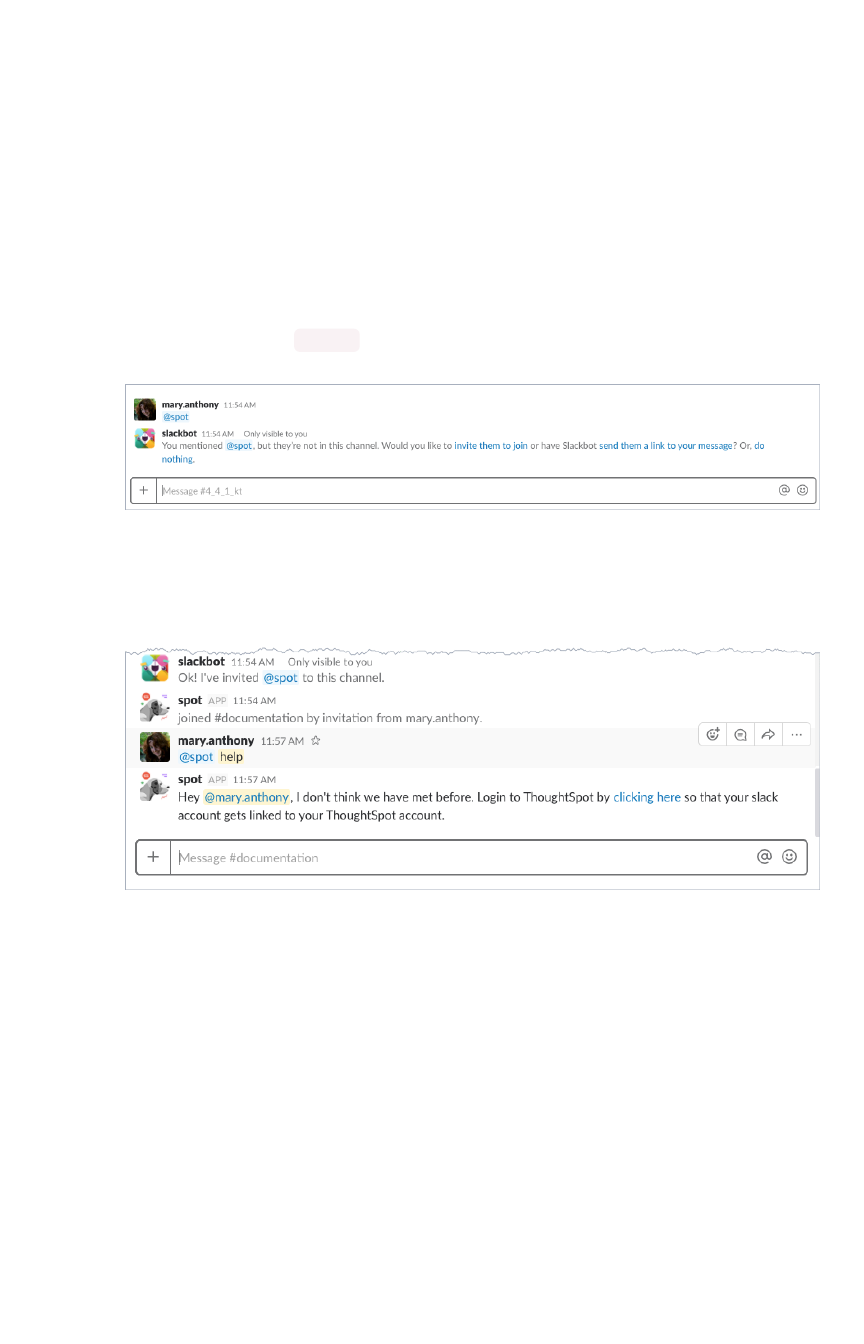
How to use Spot
You can’t ask Spot to do tricks until you after you invite him to a channel and authorize yourself as a
Spot trainer.
Call Spot and make him do tricks
1. Launch Slack if you haven’t already.
2. Go to a channel where you want to invite Spot.
3. Invite @spot@spot like you would invite anyone else.
Type @spot@spot and press RETURN .
4. Click invite them to join.
5. Ask him for help.
If this is the first time you’ve commanded him, Spot tells you:
6. Take the clicking here link.
Spot takes you out of Slack and to the ThoughtSpot application.
7. Enter your username and password.
If you do this successfully, the application tells you:
How to use Spot
February 07, 2019
ThoughtSpot Users Guide Page 296

8. Go back to Slack and ask Spot to list what he does by typing @spot@spot help.
Spot can run a query directly that’s the **1. ** command.
9. Try simply listing your subscriptions.
How to use Spot
February 07, 2019
ThoughtSpot Users Guide Page 297
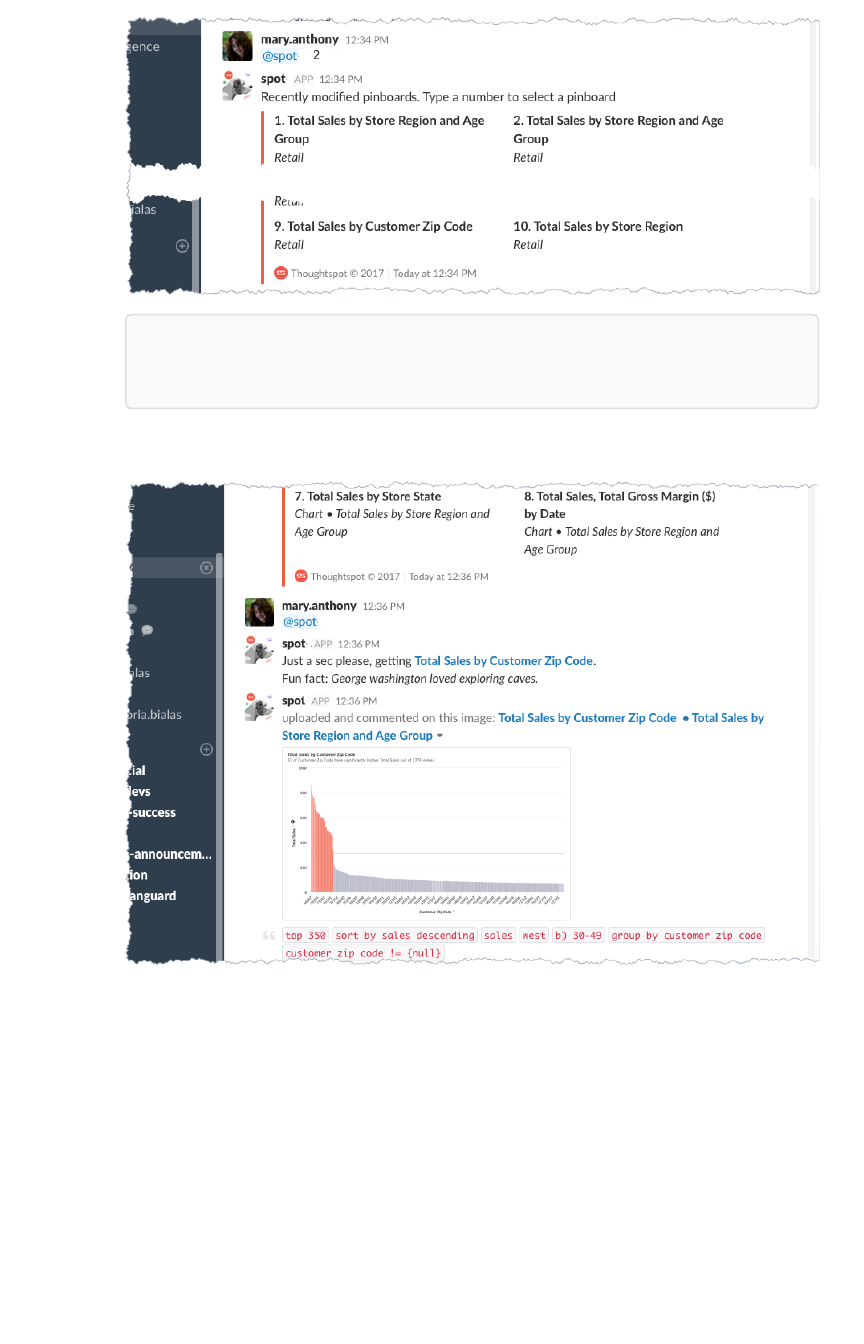
Note:Note: Spot only looks for objects with the spotspot sticker on them. Work your way from
a pinboard to asking for a particular chart.
10. Work your way from a pinboard to asking for a particular chart.
At this point, you should go onto explore your Spot’s talents on your own!
Frequently Asked Questions
Whenever possible, Spot answers questions for you directly in channel. Here, though, are some frequent
questions owners ask.
Can I name my Spot whatever I want?
Sure. This is done by your administrator when the integration is created. Um, I guess the answer is really
“ask your parents?”
How to use Spot
February 07, 2019
ThoughtSpot Users Guide Page 298

Spot isn’t fetching what I want, why?
Spot can only fetch “toys” that are have the spot sticker. Your administrator should do this when he sets
up ThoughtSpot.
My spot looks different, why is that?
The screenshots in this document were taken on desktop integration of Slack. If you are using mobile
device, your interactions with Spot will look different.
How does Spot know you?
The first time you message Spot, it will send back a link which you can click to link your ThoughtSpot
account to Slack account. Once the accounts are linked all charts you query from Spot will be tied to
your permissions/authorization.
How to subscribe to charts posted to a channel?
Any chart retrieved using spot can be subscribed to, and can have any number of channel/user
subscribers.
How do I get the list of Spot commands?
Messaging help to spot gives you a list of commands and how to use them.
How to use Spot
February 07, 2019
ThoughtSpot Users Guide Page 299
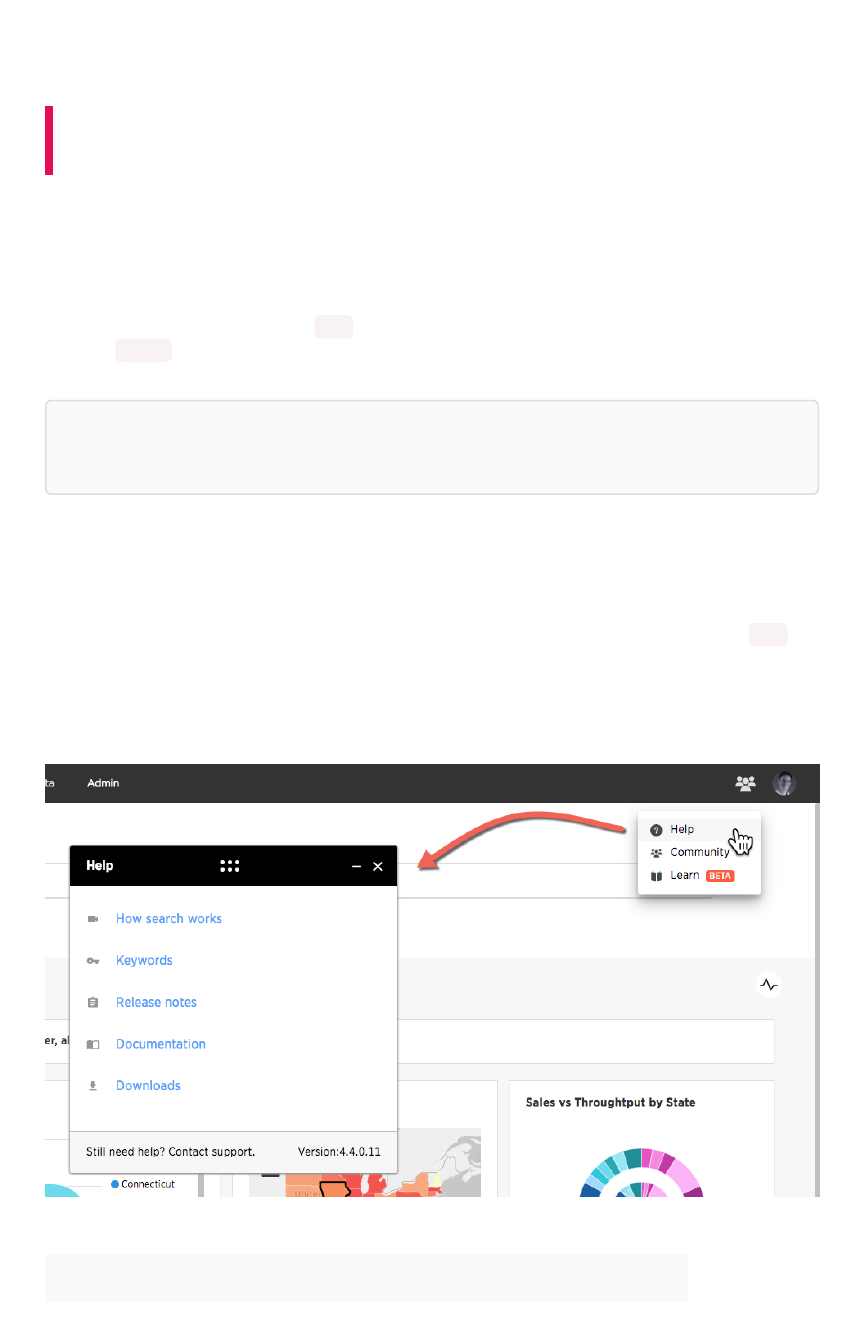
More help and support
Summary:Summary: There are many locations on the web where you can find
help for ThoughtSpot.
There are multiple locations inside and outside the ThoughtSpot application where you can get more
help. This page describes some of the ways to get more help inside or outside of the application
interface.
Each version of ThoughtSpot has its own documentation set. ThoughtSpot releases new documentation
sets for every major release version ( x.y ) of ThoughtSpot. Documentation features added with minor
versions ( x.y.z ) are added to the corresponding major release. This means, for example, that new
documentation for 4.4.1 minor release version appears in the 4.4 major version documentation.
Tip:Tip: ThoughtSpot supplies release notes for every major release and every minor release
version (x.y.z).
Help menu
You can navigate directly to this site on the web by entering docs.thoughtSpot.com in your browser’s
address bar. By default, the latest version (4.4) is presented first. ThoughtSpot versions prior to 4.4
have documentation located at help.thoughtSpot.com.
You can navigate to this documentation from inside the ThoughtSpot application as well. In this case,
the application links directly to the documentation version that matches your product version.
From this dialog you can get to the following:
LinkLink Takes you to ...Takes you to ...
More help and support
February 07, 2019
ThoughtSpot Users Guide Page 300

How search worksHow search works a short video that explains how to use the SearchSearch bar
KeywordsKeywords a product keyword reference
Release notesRelease notes The notes for the ThoughtSpot version.
DocumentationDocumentation this documentation set
DownloadsDownloads a list of software downloads such as connectors
Along the bottom of the HelpHelp dialog you’ll see a link to contact Support as well as the version of
ThoughtSpot you are using.
Learn
Choosing LearnLearn from the HelpHelp menu takes a you to the
Learn
center. The center contains one or more
example queries. You can only play replay on data that you have access to.
Click on a item in Learn to replay it in ThoughtSpot. During a reply, you can click Pause or Resume or
click ESC to exit the replay.
Any administrator can add to the items in the LearnLearn center. To add a replay, do the following:
1. Search in your search bar.
2. Choose the pin from the answer that results. The system lists the pinboards you can pin to.
3. Select Learn how to use ThoughtSpotLearn how to use ThoughtSpot pinboard.
More help and support
February 07, 2019
ThoughtSpot Users Guide Page 301
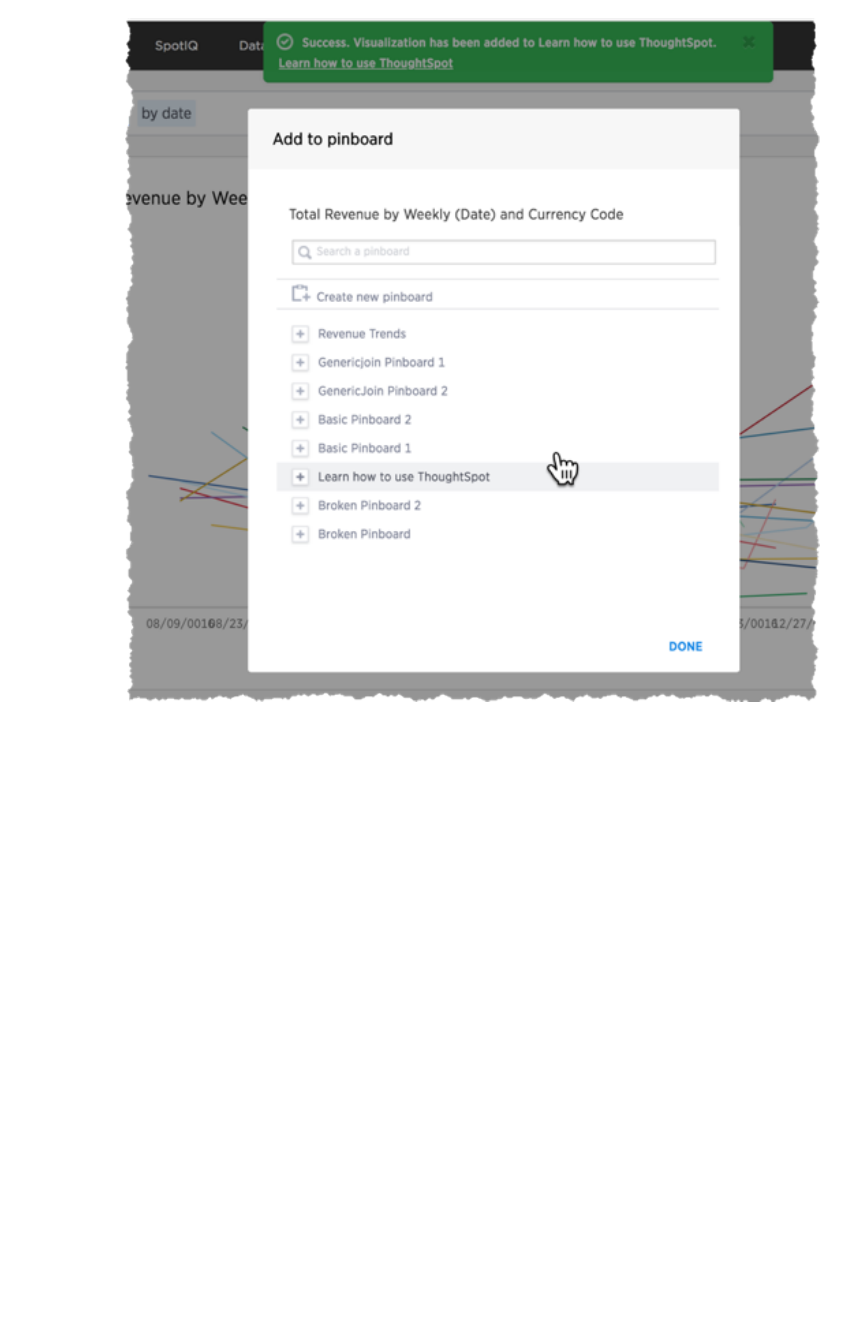
4. Navigate to the
Learn
center to replay your search.
More help and support
February 07, 2019
ThoughtSpot Users Guide Page 302
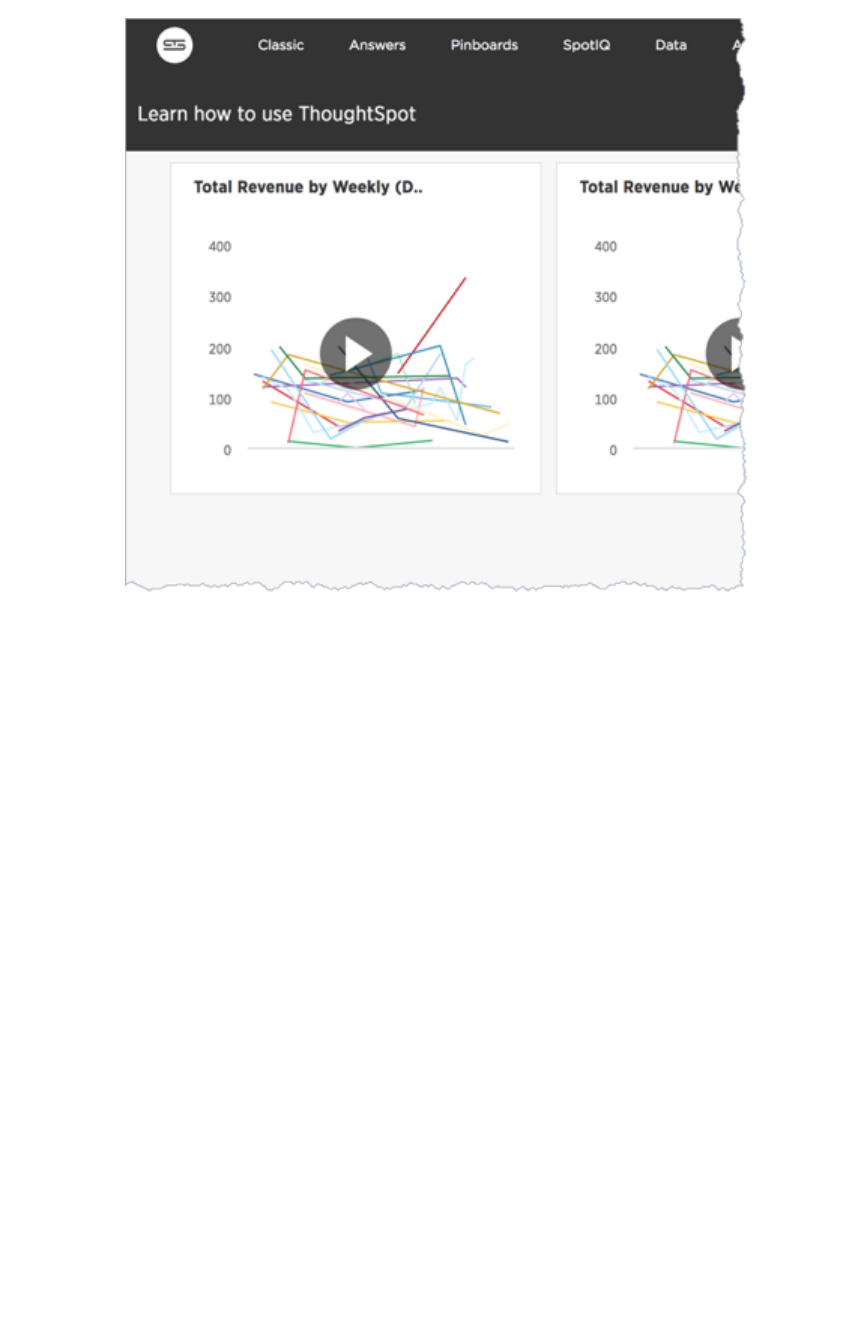
Support contact information
If you still can’t find what you’re looking for, you can contact support.
More help and support
February 07, 2019
ThoughtSpot Users Guide Page 303
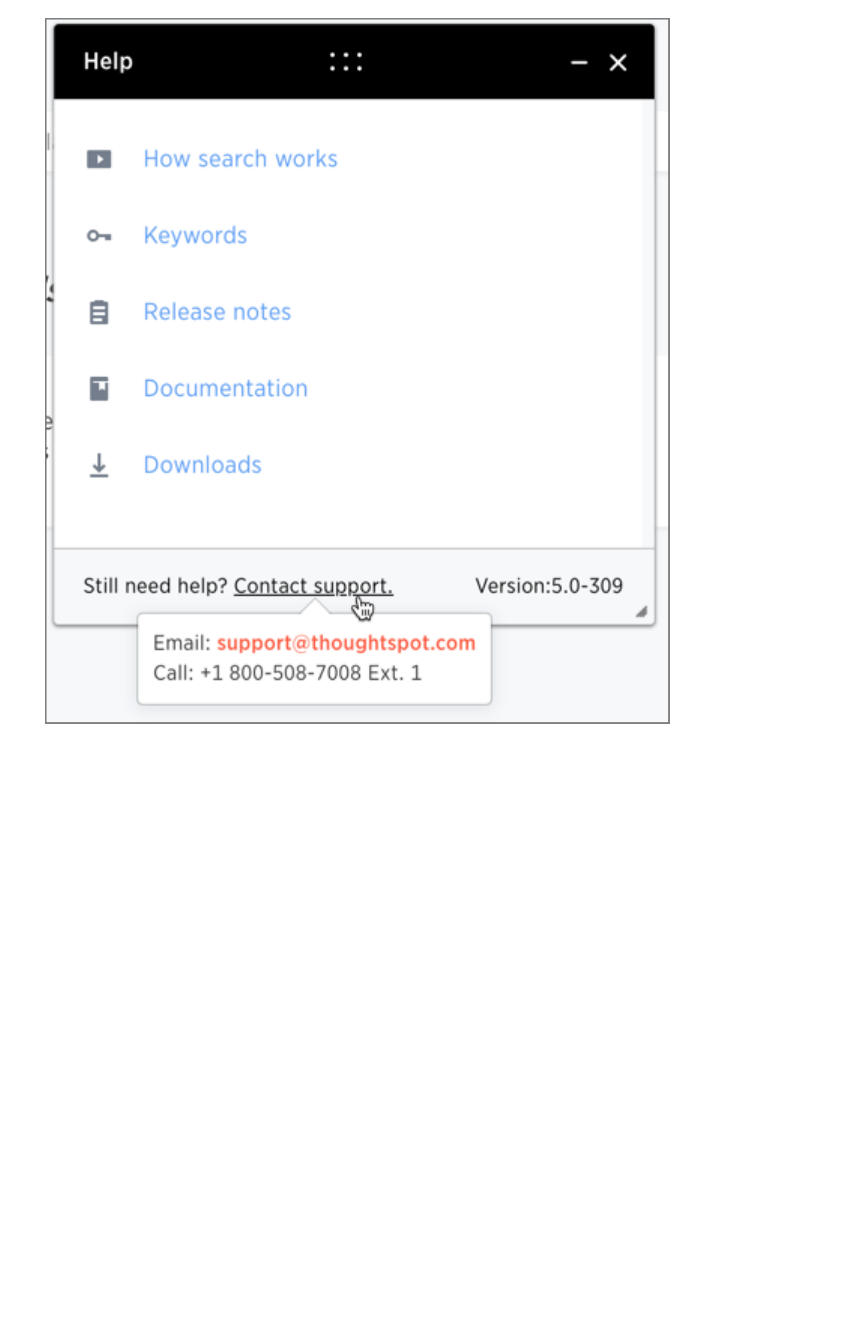
More help and support
February 07, 2019
ThoughtSpot Users Guide Page 304

Keyword reference
You can use keywords when asking a question to help define your search. This reference lists the
various keywords. You can also see this list of keywords and examples from within the help center.
Keywords in Other Languages
Currently, we offer the following keyword translations.
日本語 中文 (简体)Deutsche Español
(latín)
Español
(España)
Français
(Canada)
Français
(France)
Português
(Brasil)
Português
(Portugal)
Italiano
Dansk Suomi Svenska Norsk Nederland
Also, see the topic on how to set locale preferences in your user profile to control language, date, and
number formats on the ThoughtSpot UI.
General
KeywordKeyword ExamplesExamples
top • toptop sales rep by count sales for average revenue > 10000
•sales rep average revenue for each region toptop
bottom • bottombottom revenue average
•bottombottom revenue by state
•customer by revenue for each sales rep bottombottom
n
top 10top 10 sales rep revenue
n
bottom 25bottom 25 customer by revenue for each sales rep
sort by • revenue by state sort bysort by average revenue
•revenue by customer sort bysort by region
Date
KeywordKeyword ExamplesExamples
after order date afterafter 10/31/2014
Keyword reference
February 07, 2019
ThoughtSpot Users Guide Page 305

KeywordKeyword ExamplesExamples
before order date beforebefore 03/01/2014
between … and ... order date betweenbetween 01/30/2012 and 01/30/2014
daily year-over-year growth of revenue by order date daily year-over-yeardaily year-over-year
daily shipments by region dailydaily
day
count mondaymonday restaurant
day of week revenue by day of weekday of week last 6 months
day of week
count shipments MondayMonday
n
days for each month sales last 2 days for each month2 days for each month
n
days for each quar-
ter
revenue last 15 days for each quarter15 days for each quarter
n
days for each week total sold last 2 days for each week2 days for each week
n
days for each year revenue last 300 days for each year300 days for each year
growth of … by … dai-
ly
growth ofgrowth of sales byby order date dailydaily
growth of … by …
monthly
growth ofgrowth of sales byby date shipped monthlymonthly sales > 24000
growth of … by …
quarterly
growth ofgrowth of sales byby date shipped quarterlyquarterly
growth of … by …
weekly
growth ofgrowth of sales byby receipt date weeklyweekly for pro-ski2000
growth of … by …
yearly
growth ofgrowth of sales byby date closed yearlyyearly
growth of … by ... growth ofgrowth of sales byby order date
n
hours for each day sales last 2 hours for each day2 hours for each day
last day by customers last day bylast day by referrer
last month by customers last month bylast month by day
last
n
days visitors last 7 dayslast 7 days
last
n
quarters visitors last 2 quarterslast 2 quarters by month by campaign
last
n
weeks visitors last 10 weekslast 10 weeks by day
Keyword reference
February 07, 2019
ThoughtSpot Users Guide Page 306

KeywordKeyword ExamplesExamples
last quarter customers last quarterlast quarter sale > 300
last week customers last weeklast week by store
last year top 10 customers last yearlast year by sale by store for region west
last
n
years visitors last 5 yearslast 5 years by revenue for sum revenue > 5000
month to date sales by product month to datemonth to date sales > 2400
month year
commission by sales rep February 2014February 2014
month
commission JanuaryJanuary
month revenue by monthmonth last year
monthly year-over-
year
growth of revenue by receipt date monthly year-over-yearmonthly year-over-year
monthly commission > 10000 monthlymonthly
n
months for each
quarter
cost last 2 months for each quarter2 months for each quarter
n
months for each
year
last 8 months for each year8 months for each year
n
days ago sales 2 days ago2 days ago
n
months ago sales 2 months ago2 months ago by region
n
months visitors last 6 months6 months for homepage visits > 30 by month
n
quarters ago sales 4 quarters ago4 quarters ago by product name contains deluxe
n
weeks ago sales 4 weeks ago4 weeks ago by store
n
years ago sales 5 years ago5 years ago by store for region west
n
years opportunities next 5 years5 years by revenue
next day shipments next daynext day by order
next month appointments next monthnext month by day
next
n
days shipments next 7 daysnext 7 days
next
n
months openings next 6 monthsnext 6 months location
next
n
quarters opportunities next 2 quartersnext 2 quarters by campaign
next
n
weeks shipments next 10 weeksnext 10 weeks by day
Keyword reference
February 07, 2019
ThoughtSpot Users Guide Page 307

KeywordKeyword ExamplesExamples
next quarter opportunities next quarternext quarter amount > 30000
next week shipments next weeknext week by store
next year opportunities next yearnext year by sales rep
quarter to date sales by product quarter to datequarter to date for top 10 products by
sales
quarterly year-over-
year
growth of revenue by date shipped quarterly year-over-yearquarterly year-over-year
quarterly sales quarterlyquarterly for each product
n
quarters for each
year
last 2 quarterslast 2 quarters for each year
today sales todaytoday by store
week to date sales by order date week to dateweek to date for pro-ski200
week revenue by weekweek last quarter
weekly year-over-year growth of revenue by date shipped weekly year-over-yearweekly year-over-year
weekly revenue weeklyweekly
n
weeks for each
month
sales last 3 weeks for each month3 weeks for each month
n
weeks for each
quarter
last 2 weeks for each quarter2 weeks for each quarter
n
weeks for each year last 3 weeks for each year3 weeks for each year
year to date sales by product year to dateyear to date
year
revenue by product 20142014 product name contains snowboard
yearly shipments by product yearlyyearly
yesterday sales yesterdayyesterday for pro-ski200 by store
Time
KeywordKeyword ExamplesExamples
detailed ship time detaileddetailed
Keyword reference
February 07, 2019
ThoughtSpot Users Guide Page 308

KeywordKeyword ExamplesExamples
last minute count homepage views last minutelast minute
last hour count unique visits last hourlast hour
n
minutes count visitors last 30 minutes30 minutes
n
hours count visitors last 12 hours12 hours
hourly visitors by page name hourlyhourly
n
minutes
ago
sum inventory by product 10 minutes ago10 minutes ago
n
hours ago sum inventory by product by store 2 hours ago2 hours ago
Text
KeywordKeyword ExamplesExamples
begins with product name begins withbegins with 'pro'
contains product name contains "alpine" description containscontains "snow shoe"
ends with product name ends withends with 'deluxe'
not begins
with
product name not beginsnot begins with "tom's"
not contains product color not contains 'tan' product color not containsnot contains 'red'
not ends
with
product name not ends withnot ends with "trial"
similar to course name similar tosimilar to 'hand'
not similar
to
course name not similar tonot similar to 'hand'
Keyword reference
February 07, 2019
ThoughtSpot Users Guide Page 309

Number
FunctionFunction ExamplesExamples
sum sumsum revenue
average averageaverage revenue by store
count countcount visitors by site
max maxmax sales by visitor by site
min minmin revenue by store by campaign for cost > 5000
standard
deviation
standard deviationstandard deviation revenue by product by month for date after
10/31/2010
unique
count
unique countunique count visitor by product page last week
variance variancevariance sale amount by visitor by product for last year
Comparative
FunctionFunction ExamplesExamples
all allall
between... and revenue betweenbetween 0 andand 1000
vs, versus revenue east vsvs west
>sum sale amount by visitor by product for last year
sale amount >> 2000
<unique count visitor by product by store for sale
amount << 20
>= count calls by employee lastname >=>= m
<= count shipments by city latitude <=<= 0
=unique count visitor by store purchased products == 3
for last 5
days
!= sum sale amount region != canada region !=!= mexico
Keyword reference
February 07, 2019
ThoughtSpot Users Guide Page 310

Location
KeywordKeyword ExamplesExamples
near revenue store name county nearnear san francisco
near... within
n
miles|km|meters revenue store name county nearnear alameda withinwithin 5050
milesmiles
farther than
n
miles|km|meters
from
average hours worked branch farther thanfarther than 80 km80 km from
scarborough
Location keywords only work for searches where the data source includes latitude/longitude data.
Period
KeywordKeyword ExampleExample
quarter (
date
)quarterquarter (purchase date)
quarter of year (
date
)quarter of yearquarter of year (purchase date)
month of quarter (
date
)month of quartermonth of quarter (purchase date)
week of year (
date
)week of yearweek of year (ship date)
week of quarter (
date
)week of quarterweek of quarter (ship date)
week of month (
date
)week of monthweek of month (ship date)
day of year (
date
)day of yearday of year (ship date)
day of quarter (
date
)day of quarterday of quarter (ship date)
day (
date
)dayday (ship date)
day of month (
date
)day of monthday of month (order date)
day of week (
date
)day of weekday of week (order date)
hour (
datetime
)hourhour (timestamp)
Keyword reference
February 07, 2019
ThoughtSpot Users Guide Page 311
TQL reference
TQL is the ThoughtSpot language for entering SQL commands. This reference lists TQL commands you
can use to do things like creating a schema or verifying a data load.
About using TQL
You can use TQL either through the ThoughtSpot application’s web interface or the command line
interface in the Linux shell.
Use --query_results_apply_top_row_count <number> flag to limit the number of result rows
returned by a query. For example:
$ tql --query_results_apply_top_row_count 100
As a best practice, you should enclose object names (database, schema, table, and column) in double
quotes, and column values in single quotes. When referring to objects using fully qualified object names,
the syntax is:
"database"."schema"."table"
To get help on SQL when using TQL, enter help on the command line.
You can use TQL to view and modify schemas and data in tables. Remember to add a semicolon after
each command. Commands are not case sensitive but are capitalized here for readability.
Note:Note: Worksheets and pinboards in ThoughtSpot are dependent upon the data in the
underlying tables. Use caution when modifying tables directly. If you change or remove a schema
on which those objects rely, the objects could become invalid.
View schemas and data
SyntaxSyntax DescriptionDescription
SHOW DATABASES Lists all available databases.
Examples:
SHOW DATABASES;
TQL reference
February 07, 2019
ThoughtSpot Users Guide Page 312

SyntaxSyntax DescriptionDescription
USE <database>
Switches the context to the specified database. This is required if queries
do not use fully qualified names (database.schema.table) for specifying ta-
bles.
Examples:
USE "fruit_database";
SHOW SCHEMAS
Lists all schemas within the current database. For example:
SHOW SCHEMAS;
SHOW TABLES Lists all tables within the current database by schema. For example:
SHOW TABLES;
SHOW TABLE
<table>
Lists all the columns for a table. For example:
SHOW TABLE "locations";
SCRIPT SERVER Generates the TQL schema for all tables in all databases on the server. For
example:
SCRIPT SERVER;
SCRIPT DATABASE
<database>
Generates the TQL schema for all tables in a database. For example:
SCRIPT DATABASE "fruit_database";
SCRIPT TABLE
<table>
Generates the TQL schema for a table. For example:
SCRIPT TABLE "vendor";
TQL reference
February 07, 2019
ThoughtSpot Users Guide Page 313

SyntaxSyntax DescriptionDescription
SELECT
<cols_or_expr>
FROM
<table_list>
[WHERE <predi-
cates>]
[GROUP BY <ex-
pr>]
[ORDER BY <ex-
pr>]
Shows specified set of table data.
If you do not specify the TOP number of rows to select, the top 50 rows will
be returned by default. The number of rows to return can be set using the
TQL command line flag:
--query_results apply_top_row_count
You can use the following aggregation functions:
•sum
•count
•count distinct
•stddev
•avg
•variance
•min
•max
You can use the following date functions:
•absyear
•absmonth
•absday
•absquarter
•date
•time
For example:
SELECT TOP 10 "quantity" FROM "sales_fact";
SELECT COUNT(*) FROM "vendor";
SELECT "vendor", SUM("quantity") FROM "sales_fact" GROUP BY
"vendor";
SELECT "vendor", SUM("amount") FROM "vendor", "sales_fact"
WHERE "sales_fact"."vendorid" = "vendor"."vendorid"
AND "amount" > 100 GROUP BY "vendor" ORDER BY "amount"
DESC;
SELECT "vendor", SUM("quantity") FROM "sales_fact"
GROUP BY "vendor" LIMIT 10;
TQL reference
February 07, 2019
ThoughtSpot Users Guide Page 314

Schema creation
SyntaxSyntax DescriptionDescription
CREATE DATABASE
<data-
base>
Creates a database. For example:
CREATE DATABASE "fruit_database";
CREATE SCHEMA
<schema>
Creates a schema within the current database. For example:
CREATE SCHEMA "fruit_schema";
CREATE TABLE
<table> (<column_def-
initions>
[<con-
straints>]) [PARTI-
TION BY HASH (<num-
ber>) [KEY
("<col-
umn>")]])
Creates a table with the specified column definitions and constraints.
Use PARTITION BY HASH to shard a table across all nodes. If no KEY
is specified, the table will be randomly sharded.
Do not specify relationship constraints ( FOREIGN KEY or RELATION-
SHIP ) in the CREATE TABLE statement. Instead, define these using AL-
TER TABLE statements at the end of your TQL script, after creating your
tables. This method guarantees that tables are created before they are
referenced in the constraint definitions. For example:
CREATE TABLE "vendor" ("vendorid" int, "name" var-
char(255));
CREATE TABLE "sales_fact" ("saleid" int, "locationid" int,
"vendorid" int,
"quantity" int, "sale_amount" double, "fruitid" int,
CONSTRAINT PRIMARY KEY("saleid")) PARTITION BY HASH(96) KEY
("saleid");
Schema modification
SyntaxSyntax DescriptionDescription
DROP DATABASE
<data-
base>
Drops a database and all of its schemas and tables. For example:
DROP DATABASE "fruit_database";
TQL reference
February 07, 2019
ThoughtSpot Users Guide Page 315

SyntaxSyntax DescriptionDescription
DROP SCHEMA
<schema>
Drops a schema within the current database, and drops all of the tables in
the schema. For example:
DROP SCHEMA "fruit_schema";
DROP TABLE
<table>
Drops a table. For example:
DROP TABLE "location";
TRUNCATE TABLE
<table> Removes all data from a table, but preserves its metadata, including all
GUIDs, relationships, etc. This can be used to force a new schema for a
table without losing the metadata.
However, this operation removes all existing data from the table and must
be used with caution. You must reload the data following a TRUNCATE , or
all dependent objects (worksheets and pinboards) in ThoughtSpot will be-
come invalid. For example:
TRUNCATE TABLE "location";
ALTER TABLE
<table>
ADD|DROP|RENAME
COLUMN
<column>
Alters a table to add, drop, or rename a column.
When you add a column to an existing table, you must provide a default
value to use for existing rows. For example:
ALTER TABLE "cart" ADD COLUMN "nickname" varchar(255) DE-
FAULT 'no
nickname';
ALTER TABLE "cart" DROP COLUMN "nickname";
ALTER TABLE "cart" RENAME COLUMN "nickname" TO "shortname";
ALTER TABLE
<table> DROP CON-
STRAINT PRIMARY
KEY;
Drops the primary key from a table.
Note that if you then add a new primary key, the same upsert behavior will
be applied as with adding any primary key. This can result in data deletion,
so make sure you understand how the upsert will affect your data ahead of
time. For example:
ALTER TABLE "sales" DROP CONSTRAINT PRIMARY KEY;
ALTER TABLE "sales" ADD CONSTRAINT PRIMARY KEY ("PO_num-
ber");
TQL reference
February 07, 2019
ThoughtSpot Users Guide Page 316

SyntaxSyntax DescriptionDescription
ALTER TABLE
<table> DROP [FOR-
EIGN KEY| RELA-
TIONSHIP]
<name>;
Drops the named foreign key or relationship between two tables. For ex-
ample:
ALTER TABLE "sales_fact" DROP CONSTRAINT FOREIGN KEY
"FK_PO_number";
ALTER TABLE "fruit_dim" DROP RELATIONSHIP "REL_dates";
ALTER TABLE
<table> DROP [CON-
STRAINT FOREIGN
KEY
[<table_name>] |
RELATIONSHIP
[WITH
<table_name>];
You must use this syntax when dropping relationships between tables cre-
ated before ThoughtSpot version 3.2. This is because relationships could
not be named in older versions.
Drops the foreign key or relationship between two tables where you cannot
reference it by relationship name. If the relationship was created without a
name, use:
• the name of the referenced table, for a foreign key.
• the name of the related table, for a relationship.
If you drop a foreign key without specifying the referenced table, all foreign
keys from the table you are altering will be dropped.
Examples:
ALTER TABLE "shipments" DROP CONSTRAINT FOREIGN KEY "or-
ders";
ALTER TABLE "wholesale_buys" DROP RELATIONSHIP WITH "re-
tail_sales";
Drops all relationships that have wholesale_buys as a source.
ALTER TABLE "wholesale_buys" DROP RELATIONSHIP;
Drops all foreign keys from wholesale_buys.
ALTER TABLE "wholesale_buys" DROP CONSTRAINT FOREIGN KEY;
TQL reference
February 07, 2019
ThoughtSpot Users Guide Page 317

SyntaxSyntax DescriptionDescription
ALTER TABLE
<table> [SET DI-
MENSION | SET
FACT [PARTITION BY
HASH
[(<shards>)]
[KEY(<column>)]]]
Changes the partitioning on a table by doing one of:
• re-sharding a sharded table
• changing a replicated table to a sharded table
• changing a sharded table to a replicated (unsharded) table
By default, ThoughtSpot does not shard dimension tables.
To change the partitioning on a table, or to change a dimension table to a
sharded table, use ALTER TABLE...SET FACT PARTITION BY HASH...;
To make a sharded table into a dimension table (replicated on every node),
use ALTER TABLE...SET DIMENSION; command.
Examples of this statement:
ALTER TABLE "sales_fact" SET FACT PARTITION BY HASH (96) KEY
("PO_number");
ALTER TABLE "fruit_dim" SET DIMENSION;
ALTER TABLE
<table> MODIFY
COLUMN <column>
<new_data_type>;
Changes the data type of a column. This can have implications on sharding
and primary key behavior. See About data type conversion. For example:
ALTER TABLE fact100 MODIFY COLUMN product_id int;
Modify data
SyntaxSyntax DescriptionDescription
INSERT INTO
<table> VALUES ...
Inserts values into a table. Only use this for testing. Do not use INSERT on
a production system. For example:
INSERT INTO "vendor" VALUES ('helen rose', 'jacob norse',
'eileen ruff',
'manny gates');
ALTER TABLE
<table> SET LOAD
PRIORITY <value>
<new_da-
ta_type>;
Sets the load priority for a table. Load priority determines the order in
which a table is loaded on a cluster restart. You can set any value from
1-100 . The system default for all tables is 50 . For example:
ALTER TABLE 'sales_facts' SET LOAD PRIORITY 1;
TQL reference
February 07, 2019
ThoughtSpot Users Guide Page 318

SyntaxSyntax DescriptionDescription
UPDATE <table>
... SET ...
[WHERE ...]
Updates rows in a table that match optionally provided predicates. Predi-
cates have the form column = value connected by the AND keyword.
Sets the column values to the specified values. For example:
UPDATE "location" SET "borough" = 'staten island', "city" =
'new york'
WHERE "borough" = 'staten isl' AND city = 'NY';
DELETE FROM
<table> [WHERE...]
Deletes rows from a table that match optionally provided predicates. Predi-
cates have the form column = value connected by the AND keyword.
For example.
DELETE FROM "vendor" WHERE "name" = 'Joey Smith' AND "ven-
dorid" =
'19463';
Constraints and relationships
Constraints and relationships in ThoughtSpot are used to define the relationships between tables (i.e.
how they can be joined). However, constraints are not enforced, as they would be in a transactional
database. You can define the following constraints when creating a table with CREATE TABLE , or add
them to an existing table using the ADD CONSTRAINT syntax:
SyntaxSyntax DescriptionDescription
PRIMARY KEY Designates a unique, non-null value as the primary key for a table. This can
be one column or a combination of columns. If values are not unique, an
upsert will be performed if a row includes a primary key that is already pre-
sent in the data. Some examples: </p>
CREATE TABLE "schools" ( "schoolID" varchar(15), "schoolName"
varchar(255), "schoolCity" varchar(55), "schoolState" var-
char(55), "schoolNick"
varchar(55), CONSTRAINT PRIMARY KEY ("schoolID") ) ;
ALTER TABLE "cart" ADD CONSTRAINT PRIMARY KEY ("cart_id");
ALTER TABLE "cart" DROP CONSTRAINT PRIMARY KEY "cart_id";
TQL reference
February 07, 2019
ThoughtSpot Users Guide Page 319

SyntaxSyntax DescriptionDescription
FOREIGN KEY
Defines a relationship where the value(s) in the table are used to join to a
second table. Uses an equality operator. The foreign key must match the
primary key of the table that is referenced in number, column type, and or-
der of columns.
When creating a foreign key, give it a name. You can reference the foreign
key name later, if you want to remove it.
Examples of this statement:
ALTER TABLE "batting" ADD CONSTRAINT "FK_player" FOREIGN KEY
("playerID")
REFERENCES "players" ("playerID");
ALTER TABLE "batting" ADD CONSTRAINT "FK_lg_team" FOREIGN
KEY ("lgID" ,"teamID")
REFERENCES "teams" ("lgID" ,"teamID");
ALTER TABLE "shipment" ADD CONSTRAINT "FK_PO_vendor" FOREIGN
KEY ("po_number",
"vendor") REFERENCES "orders" ("po_number", "vendor");
ALTER TABLE "shipment" DROP CONSTRAINT "FK_PO_vendor";
RELATIONSHIP
Defines a relationship where the value(s) in the table can be used to join to
a second table, using an equality condition (required) and one or more
range conditions (optional). These conditions act like a WHERE clause
when the two tables are joined. They are applied using AND logic, such
that all conditions must be met for a row to be included.
You may add multiple relationships between tables. When creating a rela-
tionship, give it a name. You can reference the relationship name later, if
you want to remove it.
Examples of this statement:
ALTER TABLE "wholesale_buys" ADD RELATIONSHIP "REL_fruit"
WITH
"retail_sales" AS "wholesale_buys"."fruit" = "re-
tail_sales"."fruit" AND
("wholesale_buys"."date_order" < "retail_sales"."date_sold"
AND
"retail_sales"."date_sold" < "wholesale_buys"."expire_date");
ALTER TABLE "wholesale_buys" DROP RELATIONSHIP "REL_fruit";
Data types
ThoughtSpot supports a simplified list of data types:
TQL reference
February 07, 2019
ThoughtSpot Users Guide Page 320

SyntaxSyntax DescriptionDescription ExamplesExamples
Character • VARCHAR(
n
) Specify the maximum number of characters, as
in VARCHAR(255). The size limit is 1GB for VAR-
CHAR values.
Floating point • DOUBLE
• FLOAT
DOUBLE is recommended.
Boolean • BOOL Can be true or false .
Integer • INT
• BIGINT
INT holds 32 bits.
BIGINT holds 64 bits.
Date or time • DATE
• DATETIME
• TIMESTAMP
• TIME
DATETIME, TIMESTAMP, and TIME are stored
at the granularity of seconds
.
TIMESTAMP is identical to DATETIME, but is in-
cluded for syntax compatibility.
TQL reference
February 07, 2019
ThoughtSpot Users Guide Page 321

tsload flag reference
For recurring data loads and for scripting loads, use tsload (the ThoughtSpot Loader). This reference
section lists all the flags that can be used to modify the behavior of tsload .
General tsload flags
FlagFlag DescriptionDescription NotesNotes
--target_database <data-
base>
Specifies the pre-existing
target database into which
tsload should load the data.
--target_schema <schema> Specifies the target schema. Default is “falcon_default_schema”.
--target_table <table> Specifies the tables that you
want to load into the data-
base.
The tables must exist in the database speci-
fied by --target_database .
--empty_target Specifies that any data in
the target table is to be re-
moved before the new data
is loaded.
If supplied, any rows that exist in the table
specified by --target_database and --
target table will be deleted before this
data load. To perform an “upsert” on the ex-
isting data, omit this flag or specify --
noempty_target .
--max_ignored_rows <num-
ber>
Specifies the maximum
number of rows that can be
ignored if they fail to load.
If the number of ignored rows exceeds this
limit, the load will be aborted.
--bad_records_file
<path_to_file>/<file_name>
Specifies the file to use for
storing rows that failed to
load.
Input rows that do not conform to the de-
fined schema in ThoughtSpot will be ignored
and inserted into this file.
--date_format <date_for-
matmask>
Specifies the format string
for date values.
The default format is yearmonthday e.g.
“Dec 30th, 2001” and is represented as
20011230 . Use the date format specifica-
tions supported in the strptime library func-
tion.
--date_time_format
<date_formatmask>
<time_formatmask>
Specifies the format string
for datetime values.
The default is yearmonthday
hour:minute:second e.g. Dec 30th, 2001
1:15:12 and is represented as 20011230
01:15:12. Use the datetime format specifica-
tions supported in the strptime library func-
tion.
--time_format <time_for-
matmask>
Specifies the format string
for time values.
The default is hour:minute:second. Use the
time format specifications supported in the
strptime library function.
tsload flag reference
February 07, 2019
ThoughtSpot Users Guide Page 322

FlagFlag DescriptionDescription NotesNotes
--v=[0|1|2|3 Specifies the verbosity of
log messages.
Provide a value for verbosity level. By de-
fault, verbosity is set to the minimum, which
is 0. This value is similar to a volume control.
At higher levels your log receives more mes-
sages and that log more frequently. This is
used for debugging. You should not change
this value unless instructed by ThoughtSpot
Support.
--skip_second_fraction Skips fractional seconds
when loading data.
If supplied, the upserts logic may be affect-
ed, especially if the date time being loaded
is a primary key, and the data has millisec-
ond granularity. Load the data twice, once
as a string with a primary key, and again
with second granularity date time. There is
no support to store fractional seconds in the
ThoughtSpot system.
File loading tsload flags
The following flags are used when loading data from an input file:
FlagFlag DescriptionDescription NotesNotes
--source_file
<path_to_file>/<file_name>
Specifies the location of the
file to be loaded.
--source_data_format
[csv|delimited]
Specifies the data file for-
mat.
Optional. The default is csv.
--field_separator "<delim-
iter>"
Specifies the field delimiter
used in the input file.
-- trailing_field_separa-
tor
Specifies that the field sepa-
rator appears after every
field, including the last field
per row.
Example row with trailing field separator:
a,b,c,The default is false.
--null_value "<null_repre-
sentation>"
Specifies how null values
are represented in the input
file.
These values will be converted to NULL up-
on loading.
--date_converted_to_epoch
[true|false]
Specifies whether the “date”
or “datetime” values in the
input file are represented as
epoch values.
--boolean_representation
[true_false | 1_0 | T_F |
Y_N]
Specifies the format in
which boolean values are
represented in the input file.
The default is T_F. You can also use this flag
to specify other values. For example, if your
data used Y for true and NULL for false, you
could specify: --boolean_representa-
tion Y_NULL
tsload flag reference
February 07, 2019
ThoughtSpot Users Guide Page 323

FlagFlag DescriptionDescription NotesNotes
--has_header_row Indicates that the input file
contains a header row.
If supplied, column names in the header row
are used to match column names in the tar-
get table in ThoughtSpot. If not supplied, the
first row of the file is loaded as data, the
same as all subsequent rows.
--escape_character "<char-
acter>"
Specifies the escape char-
acter used in the input file.
If no value is specified, the default is “(dou-
ble quotes).
--enclosing_character
"<character>"
Specifies the enclosing
character used in the input
file.
If the enclosing character is double quotes,
you need to escape it, as in this example:
--enclosing_character "\""
--use_bit_boolean_values
= [true | false]
Specifies how boolean val-
ues are represented in the
input file.
If supplied, the input CSV file uses a bit for
boolean values, i.e. the false value is repre-
sented as 0x0 and true as 0x1. If omitted or
set to false, boolean values are assumed to
be T_F, unless you specify something else
using the flag --boolean_representa-
tion [true_false | 1_0 | T_F | Y_N] .
tsload flag reference
February 07, 2019
ThoughtSpot Users Guide Page 324

tscli command reference
The tscli command line interface is an administration interface for the ThoughtSpot instance. Use
tscli to take snapshots (backups) of data, apply updates, stop and start the services, and view
information about the system. This reference defines each subcommand and what you can accomplish
with it.
The command returns 0 upon success and a non-zero exit code upon failure. Because the tscli
command is typically running a command on multiple codes, an error may be called at different points.
As much as possible, the command attempts to save errors to the stderr directory as configured on a
node.
How to use the tscli command
The tscli command has the following syntax:
tscli [-h] [--helpfull] [--verbose] [--noautoconfig]
[--autoconfig] [--yes] [--cluster <cluster>]
[--zoo <zookeeper>] [--username username] [--identit
y_file identity_file]
{access,alert,backup,backup-policy,callhome,cassandr
a,cluster,command,dr-mirror,etl,event,feature,fileserver,firewa
ll,hdfs,ipsec,ldap,logs,map-tiles,monitoring,nas,node,patch,rpa
ckage,saml,scheduled-pinboards,smtp,snapshot,snapshot-policy,sp
ot,sssd,ssl,storage,support,tokenauthentication}
The tscli command has several subcommands such as alert ,backup , and so forth. You issue a
subcommand using the following format:
tscli [subcommand ]
Subcommands have their own additional options and actions such as tscli backup create or
tscli backup delete for example. To view help for a subcommand:
tscli [subcommand] -h
A subcommand itself may have several options.
tscli subcommands
This section lists each subcommand and its syntax.
tscli command reference
February 07, 2019
ThoughtSpot Users Guide Page 325

access
tscli access [-h] {list} ...
Use this subcommand to do the following:
•tscli access list Lists objects by last access time.
alert
tscli alert [-h] {count,info,list,off,on,refresh,silence,statu
s,unsilence} ...
Use this subcommand to do the following:
•tscli alert info Lists all alerts.
•tscli alert list Lists the generated alerts.
•tscli alert off Disables all alerts from the cluster in the cluster’s timezone.
•tscli alert on Enables alerts from the cluster.
•tscli alert silence --name <alert_name>
Silences the alert with
alert_name
. For example, DISK_ERROR. Silenced alerts are still
recorded in postgres, however emails are not sent out.
•tscli alert status Shows the status of cluster alerts.
•tscli alert unsilence-name
alert_name
Unsilences the alert with
alert_name
. For example, DISK_ERROR .
backup
tscli backup [-h] {create,delete,ls,restore} ...
Use this subcommand to do the following:
•tscli backup create [-h] [--mode {full,light,dataless}] [--type
{full,incremental}] [--base BASE] [--storage_type {local,nas}] [--remote]
name out
Pulls a snapshot and saves it as a backup where:
•--mode {full,light,dataless}
tscli command reference
February 07, 2019
ThoughtSpot Users Guide Page 326

Mode of backups. To understand these diffrent modes see Understand backup
modes.
•--type {full,incremental} Type of backup.(Incremental incremental is not
implemented yet) (default: full)
•--base BASE
Based snapshot name for incremental backup. (Not Implemented yet) (default:
None)
•--storage_type {local,nas}
Storage type of output directory. (default: local)
•--remote
Take backup through orion master. (default: True)
•tscli backup delete * name *Deletes the named backup.
•tscli backup ls List all backups taken by the system.
•tscli backup restore Restore cluster using backup.
backup-policy
tscli backup-policy [-h] {create,delete,disable,enable,ls,sho
w,status,update} ...
Use this subcommand to do the following:
•tscli backup-policy create Prompts an editor for you to edit the parameters of the
backup policy.
•tscli backup-policy delete
name
Deletes the backup policy with
name
.
•tscli backup-policy disable
name
Disables the policy
name
.
•tscli backup-policy enable
name
Enables the policy
name
.
•tscli backup-policy ls List backup policies.
•tscli backup-policy show
name
Show the policy
name
.
•tscli backup-policy status
name
Enables the policy
name
.
•tscli backup-policy update * name *Prompts an editor for you to edit the policy
name
.
callhome
tscli callhome [-h] {disable,enable,generate-bundle} ...
Use this subcommand to do the following:
•tscli callhome disable Turns off the periodic call home feature.
•tscli callhome enable --customer_name
customer_name
`
Enables the “call home” feature, which sends usage statistics to ThoughtSpot This feature is
enabled by default.
tscli command reference
February 07, 2019
ThoughtSpot Users Guide Page 327

The parameter
customer_name
takes the form Shared/*`customer_name`*/stats .
•tscli callhome generate-bundle –d
directory
--since
DAYS
•--d D Dest folder where tar file will be created. (default: None)
•--since
DAYS
Grab callhome data from this time window in the past. Should be a human
readable duration string, e.g. 4h (4 hours), 30m (30 minutes), 1d (1 day).
(default: None) Generates a tar file of the cluster metrics and writes it to the
specified directory where
DAYS
is how far back you’d like to generate the tar file
from in days. For example, 30 . If this parameter is not specified, the command
will collect the stats from the last 7days by default.
cassandra
tscli cassandra [-h] {backup,restore} ...
Use this subcommand to do the following:
•tscli cassandra backup Take a backup of cassandra
•tscli cassandra restore Restore cassandra from a backup
cluster
tscli cluster [-h] {abort-reinstall-os,check,create,get-confi
g,load,reinstall-os,report,restore,resume-reinstall-os,resume-u
pdate,set-config,set-min-resource-spec,show-resource-spec,star
t,status,stop,update,update-hadoop} ...
Use this subcommand to do the following:
•tscli cluster abort-reinstall-os Abort in-progress reinstall.
•tscli cluster check --includes {all,disk,zookeeper,hdfs,orion-cgroups,orion-
oreo} Check the status nodes in the cluster.
You must specify a component to check.
•tscli cluster create
release
Creates a new cluster from the release file specified by
release
. This command is used by
ThoughtSpot Support when installing a new cluster, for example, tscli cluster create
2.0.4.tar.gz
•tscli cluster get-config Get current cluster network and time configuration. Prints
JSON configuration to stdout. If for some reason the system cannot be connected to all
interfaces, the command returns an error but continues to function.
•tscli cluster load Load state from given backup onto existing cluster
•tscli cluster reinstall-os Reinstall OS on all nodes of the cluster.
•tscli cluster report Generate cluster report.
•tscli cluster restore --release
release_tarball backupdir
`
tscli command reference
February 07, 2019
ThoughtSpot Users Guide Page 328
Restores a cluster using the backup in the specified directory
backupdir
. If you’re restoring
from a dataless backup, you must supply the release tarball for the corresponding software
release.
•tscli cluster resume-reinstall-os Resume in-progress reinstall.
•tscli cluster resume-update Resume in-progress updates.
•tscli cluster set-config Set cluster network and time configuration. Takes JSON
configuration from stdin.
•tscli cluster set-min-resource-spec Sets min resource configuration of the cluster
•tscli cluster show-resource-spec Prints default or min.
•tscli cluster start Start cluster.
•tscli cluster status Gives the status of the cluster, including release number, date last
updated, number of nodes, pending tables time, and services status.
•tscli cluster stop Pauses the cluster (but does not stop storage services).
•tscli cluster update Update existing cluster.
•tscli cluster update-hadoop Updates Hadoop/Zookeeper on the cluster.
command
tscli command [-h] {run} ...
Command to run a command on all nodes.
tscli command run [-h] [--nodes
NODES
] --dest_dir
DEST_DIR
[--copyfirst
COPYFIRST
] [--timeout
TIMEOUT
]
command
•--nodes
NODES
Space separated IPs of nodes where you want to run the command.
(default: all )
•--dest_dir
DEST_DIR
Directory to save the files containing output from each nodes.
(default: None)
•--copyfirst
COPYFIRST
Copy the executable to required nodes first. (default: False )
•--timeout
TIMEOUT
Timeout waiting for the command to finish. (default: 60 )
dr-mirror
tscli dr-mirror [-h] {start,status,stop} ...
•tscli dr-mirror start Starts a mirror cluster which will continuously recover from a
primary cluster.
•tscli dr-mirror status Checks whether the current cluster is running in mirror mode.
•tscli dr-mirror stop Stops mirroring on the local cluster.
etl
tscli etl [-h] {change-password,disable-lw,download-agent,enabl
e-lw,show-lw} ...
tscli command reference
February 07, 2019
ThoughtSpot Users Guide Page 329

•tscli etl change-password --admin_username
admin_user
--username
Informatica_user
`
Changes the Informatica Cloud account password used by ThoughtSpot Data Connect.
Required parameters are:
•--admin_username
admin_user
specifies the Administrator username for
ThoughtSpot.
•--username
Informatica_user
specifies the username for the Informatica
Cloud.
•tscli etl disable-lw Disables ThoughtSpot Data Connect.
•tscli etl download-agent Downloads the ThoughtSpot Data Connect agent to the
cluster.
•tscli etl enable-lw [-h] --username
USERNAME
--thoughtspot_url
THOUGHTSPOT_URL
--admin_username
ADMIN_USERNAME
[--groupname
GROUPNAME
]
--org_id
ORG_ID
[--pin_to
PIN_TO
] [--proxy_host
PROXY_HOST
] [--
proxy_port
PROXY_PORT
] [--proxy_username
PROXY_USERNAME
] [--max_wait
MAX_WAIT
]
You should contact ThoughtSpot Support for assistance in setting this up. Required
parameters are:
•--username
USERNAME
Username for Informatica Cloud (default: None)
•--thoughtspot_url
THOUGHTSPOT_URL
URL to reach thoughtspot. (default:
None)
•--admin_username
ADMIN_USERNAME
Admin username for ThoughtSpot
(default: None)
•--groupname
GROUPNAME
•--org_id
ORG_ID
specifies the Informatica id of the organization (company).
For ThoughtSpot, this is 001ZFA .org_id shouldn’t include the prefix Org . For
example, if on Informatica cloud, the orgid is Org003XYZ , then use only
•--pin_to
PIN_TO
specifies the IP address to pin to. If you specify an IP to pin
to, that node becomes sticky to the Informatica agent, and will always be used.
Defaults to the public IP address of the localhost where this command was run.
•--proxy_host
PROXY_HOST
Proxy server host for network access (default: )
•--proxy_port
PROXY_PORT
Proxy server port (default: )
•--proxy_username
PROXY_USERNAME
Proxy server username (default: )
•--max_wait
MAX_WAIT
Maximum time in seconds to wait for Data Connect
agentto start (default: None)
•tscli etl show-lw Shows the status of ThoughtSpot Data Connect. It also returns the
Informatica username and OrgId.
event
tscli event [-h] {list} ...
This subcommand has the following actions:
tscli event list [-h] [--include
INCLUDE
] [--since
SINCE
] [--from
FROM
] [--to
TO
] [--limit
LIMIT
] [--detail] [--summary_contains
SUMMARY_CONTAINS
] [--
detail_contains
DETAIL_CONTAINS
] [--attributes
ATTRIBUTES
]
tscli command reference
February 07, 2019
ThoughtSpot Users Guide Page 330

•--include
INCLUDE
Options are all, config, notification. Default config. (default: config)
•--since
SINCE
Grab events from this time window in the past. Should be a human
readable duration string, e.g. 4h (4 hours), 30m (30 minutes), 1d (1 day). (default: None)
•--from
FROM
Begin timestamp, must be of the form: yyyymmdd-HH:MM (default: None)
•--to
TO
End timestamp, must be of the form: yyyymmdd-HH:MM (default: None)
•--limit
LIMIT
Max number of events to fetch. (default: 0)
•--detail Print events in detail format. This is not tabular. Default is a tabular summary.
(default: False)
•--summary_contains
SUMMARY_CONTAINS
Summary of the event will be checked for this
string. Multiple strings to check for can be specified by separating them with |(event
returned if it matchesALL). Put single quotes around the param value to prevent undesired
glob expansion (default: None)
•--detail_contains
DETAIL_CONTAINS
Details of the event will be checked for this string.
Multiple strings to check for can be specified by separating them with |(event returned if it
matches ALL). Put single quotes around the param value to prevent undesired glob expansion
(default: None)
•--attributes
ATTRIBUTES
Specify attributes to match as key=value. Multiple attributes to
check for can be specified by separating them with |(event returned if it matches ALL). Put
single quotes around the param value to prevent undesired glob expansion (default: None)
feature
tscli feature [-h] {get-all-config} ...
This subcommand has the following actions:
tscli feature get-all-config Gets the configured features in a cluster. The command will return a
list of features, such as custom branding, Data Connect, and call home, and tell you whether they are
enabled or disabled.
fileserver
tscli fileserver [-h] {configure,download-release,purge-confi
g,show-config,upload} ...
This subcommand has the following actions:
•tscli fileserver configure [-h] --user
USER
[--password
PASSWORD
]
Configures the secure file server username and password for file upload/download and the
call home feature. You only need to issue this command once, to set up the connection to the
secure file server. You only need to reissue this command if the password changes. The
parameter
PASSWORD
is optional. If a password is not specified, you will be prompted to
enter it.
•tscli fileserver download-release [-h] [--user
USER
] [--password
PASSWORD
]
release
Downloads the specified release file and its checksum. Specify the
release by number, to the second decimal point (e.g. 3.1.0, 3.0.5, etc.). You may optionally
specify the --user and --password to bypass the credentials that were specified when
configuring the file server connection with tscli fileserver configure . Before using this
command for the first time, you need to set up the file server connection using tscli
tscli command reference
February 07, 2019
ThoughtSpot Users Guide Page 331

fileserver configure .
•tscli fileserver purge-config Removes the file server configuration.
•tscli fileserver show-config Shows the file server configuration.
•tscli fileserver upload [-h] [--user
USER
] [--password
PASSWORD
] --
file_name
FILE_NAME* –server_dir_path *SERVER_DIR_PATH`
Uploads the file specified to the directory specified on the secure file server. You may
optionally specify the --user and --password to bypass the credentials that were
specified when configuring the file server connection with tscli fileserver configure .
Before using this command for the first time, you need to set up the file server connection
using tscli fileserver configure .
Accepts these flags
•--user
USER
Username of fileserver (default: None)
•--password
PASSWORD
Password of fileserver (default: None). This is required
and the command prompts you for it if you do not supply it.
•--file_name
FILE_NAME
Local file that needs to be uploaded (default: None)
•--server_dir_path
SERVER_DIR_PATH
Directory path on fileserver. (default:
None) The
SERVER_DIR_PATH
parameter specifies the directory to which you want
to upload the file. It is based on your customer name, and takes the form
/Shared/support/* customer_name *.
firewall
tscli firewall [-h] {close-ports,disable,enable,open-ports,stat
us} ...
•tscli firewall close-ports
Closes given ports through firewall on all nodes. Takes a list of ports to close, comma
separated. Only closes ports which were previously opened using “open-ports”. Ignores ports
which were not previously opened with “open-ports” or were already closed.
•tscli firewall disable Disable firewall.
•tscli firewall enable Enable firewall.
•tscli firewall open-ports --ports
ports
Opens given ports through firewall on all nodes. Takes a list of ports to open, comma
separated. Ignores ports which are already open. Some essential ports are always kept open
(e.g. ssh ), they are not affected by this command or by close-ports .
•tscli firewall status Shows whether firewall is currently enabled or disabled.
hdfs
tscli hdfs [-h] {leave-safemode} ...
This subcommand has the following actions:
tscli command reference
February 07, 2019
ThoughtSpot Users Guide Page 332

tscli hdfs leave-safemode Command to get HDFS namenodes out of safemode.
ipsec
tscli ipsec [-h] {disable,enable,status} ...
This subcommand has the following actions:
tscli ipsec disable Disable IPSec tscli ipsec enable Enable IPSec tscli ipsec status
Show IPSec status on all nodes
ldap
tscli ldap [-h] {add-cert,configure,purge-configuration} ...
This subcommand has the following actions:
•tscli ldap add-cert
name certificate
Adds an SSL certificate for LDAP. Use only if LDAP has been configured without SSL and you
wish to add it. Use *name *to supply an alias for the certificate you are installing.
•tscli ldap configure
Configures LDAP using an interactive script. You can see detailed instructions for setting up
LDAP in About LDAP integration.
•tscli ldap purge-configuration Purges (removes) any existing LDAP configuration.
logs
tscli logs [-h] {collect,runcmd} ...
This subcommand has the following actions:
•tscli logs collect [-h] [--include
INCLUDE
] [--exclude
EXCLUDE
] [--
since
SINCE
] [--from
FROM
] [--to
TO
] [--out
OUT
] [--maxsize
MAXSIZE
] [--sizeonly] [--nodes
NODES
]
Extracts logs from the cluster. Does not include any logs that have been deleted due to log
rotation.
These parameters have the following values:
•--include
INCLUDE
tscli command reference
February 07, 2019
ThoughtSpot Users Guide Page 333

Specifies a comma separated list of logs to include. Each entry is either a
“selector” or a glob for matching files.Selectors must be among: all ,orion ,
system ,ts . Anything starting with /is assumed to be a glob pattern and
interpreted via find(1) . Other entries are ignored. Put single quotes around the
param value to prevent undesired glob expansion (default: all )
•--exclude
EXCLUDE
Comma separated list of logs to exclude. Applies to the list selected by –include.
Params are interpreted just like in –include (default: None)
•--since
SINCE
Grab logs from this time window in the past. Should be a human readable duration
string, e.g. 4h (4 hours), 30m (30 minutes), 1d (1 day). (default: None)
•--from
FROM
Timestamp where collection begins, must be of the form:
yyyymmdd-HH:MM (default: None)
•--to
TO
Timestamp where collection ends, must be of the form: yyyymmdd-
HH:MM (default: None)
•--out
OUT
Tarball path for dumping logs from each node (default: /tmp/
logs.tar.gz )
•--maxsize
MAXSIZE
Only fetch logs if size is smaller that this value. Can be
specified in megabytes/gigabytes, e.g. 100MB, 10GB. (default: None)
•--sizeonly Do not collect logs. Just report the size. (default: False)
•--nodes
NODES
Comma separated list of nodes from where to collect logs. Skip
this to use all nodes. (default: None)
•tscli logs runcmd [-h] --cmd CMD [--include
INCLUDE
] [--exclude
EXCLUDE
] [--since SINCE] [--from
FROM
] [--to
TO
] [--outfile
OUTFILE
]
[--outdir
OUTDIR
] [--cmd_infmt
CMD_INFMT
] [--cmd_outfmt
CMD_OUTFMT
] [--
nodes
NODES
]
Runs a Unix command on logs in the cluster matching the given constraints. Results are
reported as text dumped to standard out, the specified output file, or as tarballs dumped into
the specified directory.
•--cmd
CMD
Unix-Command to be run on the selected logs. Use single quotes to escape
spaces etc. Language used to specify CMDSTR has following rules.
• A logfile and its corresponding result file can be referred by keywords
SRCFILE &DSTFILE . eg. cp SRCFILE DSTFILE
• Without any reference to DSTFILE in CMDSTR, > DSTFILE will be
appended to CMDSTR for output redirection. eg du -sch SRCFILE
gets auto- transtalted to du -sch SRCFILE > DSTFILE
• Without any reference to SRCFILE, content of log is streamed to
CMDSTR via pipe. eg. tail -n100 | grep ERROR gets auto-
transtalted to cat SRCFILE | tail -n100 | grep ERROR >
DSTFILE (default: None)
•--include
INCLUDE
tscli command reference
February 07, 2019
ThoughtSpot Users Guide Page 334

Comma separated list of logs to include,each entry is either a “selector” or a glob
for matching files.Selectors must be among: all ,orion ,system ,ts .
Anything starting with / is assumed to be a glob pattern and interpreted via
find(1) . Other entries are ignored. TIP: put single quotes around the param
value to prevent undesired glob expansion (default: all)
•--exclude
EXCLUDE
Comma separated list of logs to exclude. Applies to the list selected by --
include . Params are interpreted just like in --include (default: None)
•--since
SINCE
Grab logs from this time window in the past. Should be a human readable duration
string, e.g. 4h (4 hours), 30m (30 minutes), 1d (1 day). (default: None)
•--from
FROM
Timestamp where collection begins, must be of the form:
yyyymmdd-HH:MM (default: None)
•--to
TO
Timestamp where collection ends, must be of the form: yyyymmdd-
HH:MM (default: None)
•--outfile
OUTFILE
File path for printing all the results. By default printed to
stdout (default: None)
•--outdir
OUTDIR
Directory path for dumping results with original dir structure
from each node. Used as an alternative to printing output to outfile/stdout (default:
None)
•--cmd_infmt
CMD_INFMT
Specify if the inputfile should be compressed/
uncompressed before running CMD .C=compressed, U=uncompressed. Don’t
use this flag if CMD works on both (default: None)
•--cmd_outfmt
CMD_OUTFMT
Specify if
OUTFILE
generated by CMD will be
compressed/uncompressed. C=compressed, U=uncompressed. Don’t use this
flag if output file will be of same format as input file (default: None)
•--nodes
NODES
Comma separated list of nodes where to run command. Skip
this to use all nodes. (default: None)
map-tiles
tscli map-tiles [-h] {disable,enable,status} ...
This subcommand supports the following actions:
•tscli map-tiles enable [-h] [--online] [--offline] [--tar TAR] [--md5 MD5]
Enables ThoughtSpot’s map tiles, which are used when constructing geomap charts. If you
don’t have interest access, you must download the map tiles tar and md5 files. Then you
must append the following to the tscli command.
•--online Download maptiles tar from internet. (default: True)
•--offline Using maptiles tar from local disk. (default: False)
•--tar
TAR
Specified tar file for map-tiles. (default: )
•--md5
MD5
Specified md5 file for map-tiles. (default: )
tscli command reference
February 07, 2019
ThoughtSpot Users Guide Page 335

•tscli map-tiles disable Disable map-tiles functionality.
•tscli map-tiles status Check whether map-tiles is enabled.
monitoring
tscli monitoring [-h] {set-config,show-config} ...
This subcommand has the following actions:
•tscli monitoring set-config [-h] [--email EMAIL] [--clear_email] [--
heartbeat_interval HEARTBEAT_INTERVAL] [--heartbeat_disable] [--
report_interval REPORT_INTERVAL] [--report_disable] Sets the monitoring
configuration.
•--email
EMAIL
Comma separated list (no spaces) of email addresses where the
cluster will send monitoring information.
•--clear_email Disable emails by clearing email configuration. (default: False)
•--heartbeat_interval
HEARTBEAT_INTERVAL
Heartbeat email generation
interval in seconds. Should be greater than 0.
•--heartbeat_disable Disable heartbeat email generation. (default: False)
•--report_interval
REPORT_INTERVAL
Cluster report email generation interval
in seconds. Should be greater than 0.
•--report_disable Disable cluster report email generation. (default: False)
•tscli monitoring show-config Shows the monitoring configuration.
nas
tscli nas [-h] {ls,mount-cifs,mount-nfs,unmount} ...
This subcommand has the following actions:
•tscli nas ls [-h] List mounts managed by NAS mounter service.
•tscli nas mount-cifs [-h] --server
SERVER
[--path_on_server
PATH_ON_SERVER
] --mount_point
MOUNT_POINT
--username
USERNAME
--
password
PASSWORD
[--uid
UID
] [--gid
GID
] [--options
OPTIONS
]
Mounts a CIFS device on all nodes.
•--server
SERVER
IP address or DNS name of CIFS service. For example,
10.20.30.40 (default: None)
•--path_on_server
PATH_ON_SERVER
Filesystem path on the CIFS server to
mount (source). For example: /a (default: /)
•--mount_point
MOUNT_POINT
tscli command reference
February 07, 2019
ThoughtSpot Users Guide Page 336

Directory on all cluster nodes where the NFS filesystem should be mounted
(target). This directory does not need to already exist. If this directory already
exists, a new directory is not created and the existing directory is used for
mounting. For example: /mnt/external (default: None)
•--username
USERNAME
Username to connect to the CIFS filesystem as (default:
None)
•--password
PASSWORD
CIFS password for --username (default: None)
•--uid
UID
UID
that will own all files or directories on the mounted filesystem when the server
does not provide ownership information. See man mount.cifs for more details.
(default: 1001 )
•--gid
GID
Gid that will own all files or directories on the mounted filesystem when the server
does not provide ownership information. See man mount.cifs for more details.
(default: 1001 )
•--options
OPTIONS
Other command-line options to forward to mount.cifs
command (default: noexec )
•tscli nas mount-nfs [-h] --server SERVER [--protocol PROTO --path_on_server
PATH_ON_SERVER] --mount_point MOUNT_POINT [--options OPTIONS]
Mounts a NFS device on all nodes. Parameters are:
•--server SERVER IP address or DNS name of NFS service. For example,
10.20.30.40 (default: None)
•--path_on_server PATH_ON_SERVER Filesystem path on the NFS server to
mount (source). For example: /a/b/c/d (default: /)
•--mount_point MOUNT_POINT
Directory on all cluster nodes where the NFS filesystem should be mounted
(target). This directory does not need to already exist. If this directory already
exists, a new directory is not created and the existing directory is used for
mounting. For example: /mnt/external (default: None)
•--options OPTIONS Command-line options to forward to mount command
(default: noexec ).
•--protocol PROTO One of nfs or nfs4 . The default is nfs .
•tscli nas unmount [-h] --dir
DIR
Unmounts all devices from the specified
DIR
(directory) location. This command returns an
error if nothing is currently mounted on this directory via tscli nas mount (default: None)
node
tscli node [-h] {check,ls,reinstall-os,resume-reinstall-os,stat
us} ...
This subcommand has the following actions:
tscli command reference
February 07, 2019
ThoughtSpot Users Guide Page 337

•tscli node check [-h] [--select {reinstall-preflight}] [--secondary
SECONDARY
]
Run checks per node. Takes the following parameters:
•--select {reinstall-preflight} Select the type of node check (default:
reinstall-preflight )
•--secondary
SECONDARY
Secondary drive for reinstall-preflight (default:
sdd )
•tscli node ls [-h] [--type {all,healthy,not-healthy}] Filter by node state
(default: all )
•tscli node reinstall-os [-h] [--secondary
SECONDARY
] [--cluster] Reinstall
OS on a node. This takes the following parameters:
•--secondary
SECONDARY
Secondary drive to be used to carry to reinstall
(default: sdd )
•--cluster Is the node part of a cluster (default: False )
•tscli node resume-reinstall-os Resume in-progress reinstall
patch
tscli patch [-h] {apply,ls,resume-apply,resume-rollback,rollbac
k} ...
This subcommand has the following actions:
•tscli patch apply [-h] [
release
]
Apply the patch on an existing cluster. Takes the following parameters:
•
release
The relative path to the patch tar ball
•tscli patch ls [-h] [--applied] [--rolled_back] [--service SERVICE] [--md5
MD5] [--history] Lists the patches currently applied. This takes the following parameters:
•--applied Show only the patches applied since last full release (default: ` False` )
•--rolled_back Show only the patches rolled back since last full release (default:
` False` )
•--service SERVICE Show patches filtered by service (default: ` None` )
•--md5 MD5 Shows the details of the patch specified (default: ` None` )
•--history Shows the history of all patch apply/rollback release (default: ` False` )
•tscli patch resume-apply [-h]
Resume patch apply
•tscli patch resume-rollback [-h]
Resume patch roll-backup
•tscli patch rollback [-h]
Rollback the patch from an existing cluster
tscli command reference
February 07, 2019
ThoughtSpot Users Guide Page 338
rpackage
tscli rpackage [-h] {add,delete,list} ...
Manages R packages available to SpotIQ.
•tscli rpackage add [-h] [--repo
REPO
] [--timeout
TIMEOUT
] [--dest_dir
DEST_DIR
] [--nodes
NODES
]
package_name
Command to add an R
package_name
to the cluster. This command has the following options:
•--repo
REPO
Specify the url of a specific repo to download packages
•--timeout
REPO
Timeout waiting for the R Package to be installed (default: 60)
•--dest_dir
REPO
Directory where output of this command will be placed
(default: None)
•--nodes
NODES
Space separated IPs of nodes where you want to run the
command. (default: all).
•tscli rpackage add [-h] [--timeout
TIMEOUT
] [--dest_dir
DEST_DIR
] [--
nodes
NODES
]
package_name
Command to delete an installed R package from the
cluster. This command has the following options:
•--timeout
REPO
Timeout waiting for the R Package to be removed (default: 60)
•--dest_dir
REPO
Directory where output of this command will be placed
(default: None)
•--nodes
NODES
Space separated IPs of nodes where you want to run the
command. (default: all).
•tscli rpackage list [-h] [--detailed] List all R packages installed on the cluster.
saml
tscli saml [-h] {configure,purge-configuration}
This subcommand has the following actions:
•tscli saml configure [-h] Configures SAML. To see a list of prerequisites refer to
Configure SAML.
•tscli saml purge-configuration Purges any existing SAML configuration.
scheduled-pinboards
tscli scheduled-pinboards [-h] {disable,enable}
tscli command reference
February 07, 2019
ThoughtSpot Users Guide Page 339

This subcommand has the following actions:
•tscli scheduled-pinboards disable [-h] Disable scheduled pinboards for this cluster.
•tscli scheduled-pinboards enable [-h] Enables scheduled pinboards, which is
disabled in prod clusters by default.
Note:Note: When you enable scheduled pinboards, you should also configure a whitelist of intended
email domains. Contact ThoughtSpot Support for help configuring a whitelist.
smtp
tscli smtp [-h] {remove-mailfromname,remove-mailname,remove-rel
ayhost,remove-saslcredentials,reset-canonical-mapping,set-canon
ical-mapping,set-mailfromname,set-mailname,set-relayhost,set-sa
slcredentials,show-canonical-mapping,show-mailfromname,show-mai
lname,show-relayhost}
This subcommand takes supports the following actions:
•tscli smtp remove-mailfromname Removes current cluster mailfromname
•tscli smtp remove-mailname Removes current cluster mailname
•tscli smtp remove-relayhost Removes current cluster relayhost
•tscli smtp remove-saslcredentials Clears SASL credentials and disables SMTP AUTH
•tscli smtp reset-canonical-mapping Deletes the current postmap mapping.
•tscli smtp set-canonical-mapping [-h]
new_key new_value
Sets a new Postmap
mapping.
•tscli smtp set-mailfromname
mailfromname
Sets the name, an email address, from
which email alerts are sent, for the cluster.
•tscli smtp set-mailname
mailname
Sets the mailname, a domain, where email alerts
are sent, for the cluster.
•tscli smtp set-relayhost [-h] [--force FORCE] relayhost Sets the Relay Host for
SMTP (email) sent from the cluster.
•--force
FORCE
Set even if relay host is not accessible. (default: False )
•tscli smtp set-saslcredentials Sets SASL credentials and enables SMTP AUTH
•tscli smtp show-canonical-mapping Shows the current postmap mapping.
•tscli smtp show-mailfromname Shows the mailname, from which email alerts are sent, for
the cluster.
•tscli smtp show-mailname Shows the mailname, where email alerts are sent, for the
cluster.
•tscli smtp show-relayhost Shows the for SMTP (email) sent from the cluster. If there is
no Relay Host configured, the command returns NOT FOUND .
tscli command reference
February 07, 2019
ThoughtSpot Users Guide Page 340

snapshot
tscli snapshot [-h] {backup,create,delete,ls,pin,restore,unpi
n,update-ttl}
Learn more about snapshots and backups see the Understand the backup strategies documentation.
This subcommand supports the following actions:
•tscli snapshot backup [-h] [--mode {full,light,dataless}] [--type
{full,incremental}] [--base
BASE
] [--storage_type {local,nas}] [--remote]
name out
Pull snapshot out as a backup. This takes the following parameters:
•--mode {full,light,dataless} Mode of backups. (default: full )
•
name
Name of snapshot to pull out as a backup. To list all snapshots, run tscli
snapshot ls .
•
out
Directory where backup will be written, must not already exist.
•--type {full,incremental} Type of backup.(Incremental backup is not
implemented yet) (default: full )
•--base
BASE
Based snapshot name for incremental backup. (Not Implemented
yet) (default: None)
•--storage_type {local,nas} Storage type of output directory. (default:
local )
•--remote Take backup through Orion master. (default: True )
•tscli snapshot create [-h]
name reason ttl
Creates a new snapshot with the
name
and
reason
provided. This command does not
accept .(periods), but does accept -(dashes). The ttl parameters is the number of
days after which this snapshot will be automatically deleted. A value of -1 disables
automatic deletion.
•tscli snapshot pin [-h]
name
Pins a snapshot so it cannot be deleted or garbage
collected.
•tscli snapshot delete [-h]
name
Deletes the named snapshot.
•tscli snapshot ls [-h] List available snapshots.
•tscli snapshot restore [-h] [--allow_release_change] [--only_service_state]
name
Restore cluster to an existing snapshot. This takes the following parameters:
•--allow_release_change Allow restoration to a snapshot at a different release.
(default: False )
•--only_service_state Restore only service state. (default: False )
•tscli snapshot unpin [-h]
name
Unpin a snapshot so it can be deleted or garbage
collected.
•tscli snapshot update-ttl [-h] [--disable
DISABLE
]
name ttl
Updates manual snapshot garbage collection policy.
tscli command reference
February 07, 2019
ThoughtSpot Users Guide Page 341

•name Specifies which snapshot to update.
•ttl Extends the manual snapshot ttl (time-to-live) value. Use a positive value
to increase ttl . Use negative value to decrease it.
•--disable
DISABLE
Disable manual snapshot garbage collection. Setting this
value to True will override any ttl value. (default: False)
snapshot-policy
tscli snapshot-policy [-h] {disable,enable,show,update}
This subcommand supports the following actions:
•tscli snapshot-policy disable [-h] Disable snapshot policy.
•tscli snapshot-policy enable -h Enable specified snapshot policy.
•tscli snapshot-policy show [-h] Show snapshot policy.
•tscli snapshot-policy update [-h] [--config
CONFIG
]Update periodic snapshot
config. This takes the following parameter:
•--config
CONFIG
Text format of periodic backup policy config (default: None)
spot
tscli spot [-h] {enable} ...
Enables Spot integration. This subcommand supports the following actions:
tscli spot enable [-h] --token
TOKEN
--thoughtspot_url
THOUGHTSPOT_URL
[--
cache_timeout
CACHE_TIMEOUT
]
•--token
TOKEN
Slack authroization token for Spot bot. This is required. You receive this
token when your Slack administrator adds the Spot application.
•--thoughtspot_url
THOUGHTSPOT_URL
URL for the ThoughtSpot application. This is
required.
•--cache_timeout
CACHE_TIMEOUT
Internal cache timeout (default: 60000 )
ssl
tscli ssl [-h] {add-cert,clear-min-tls-version,off,on,rm-cert,s
et-min-tls-version,status,tls-status} ...
This subcommand supports the following actions:
•tscli ssl add-cert [-h]
key certificate
Adds an SSL certificate, key pair.
•tscli ssl clear-min-tls-version [-h] Clears any customizations for the minimum TLS
version to support.
tscli command reference
February 07, 2019
ThoughtSpot Users Guide Page 342

•tscli ssl off
Disables SSL. Disabling SSL will stop users from seeing a security warning when accessing
ThoughtSpot from a browser if there is no SSL certificate installed.
•tscli ssl on [-h] If SSL is enabled and there is no certificate, users will see a security
warning when accessing ThoughtSpot from a browser.
•tscli ssl rm-cert Removes the existing SSL certificate, if any.
•tscli ssl set-min-tls-version [-h] {1.0,1.1,1.2} Sets the minimum supported TLS
version. Sets the minimum SSL version to be supported by the ThoughtSpot application.
Please ensure that client browsers are enabled for this version or newer.
•tscli ssl status Shows whether SSL authentication is enabled or disabled.
•tscli ssl tls-status [-h] Prints the status of TLS support.
sssd
tscli sssd {enable, disable, set-sudo-group, clear-sudo-group}
...
This subcommand uses system security services daemon (SSSD), and has the following actions:
•tscli sssd enable --user
USER
--domain
DOMAIN
Enables system Active Directory (AD) user access on a single node. You will be prompted for
password credentials. The user must have permission to join a computer or VM to the
domain.
•tscli sssd disable
Disables system AD based access on a local node. Running this command will also remove
the AD group from sudoers list.
•tscli sssd set-sudo-group
ACTIVE_DIRECTORY_GROUP_NAME
Allows sudo permissions for AD group.
•tscli sssd clear-sudo-group
ACTIVE_DIRECTORY_GROUP_NAME
Clears any set AD sudo group.
For more about setting up Active Directory access, see Enable Active Directory based access.
storage
tscli storage [-h] {gc,df} ...
This subcommand supports the following actions:
•tscli storage gc [-h] [--log_age
LOG_AGE
] [--force] [--localhost_only]
Garbage collect unused storage. Before issuing this command, you must stop the cluster
using tscli cluster stop . After garbage collection has completed, you can restart the
cluster with tscli cluster start . The command frees space in these directories:
tscli command reference
February 07, 2019
ThoughtSpot Users Guide Page 343

•/tmp
•/usr/local/scaligent/logs/
•/export/logs/orion
•/export/logs/oreo
•/export/logs/hadoop
•/export/logs/zookeeper
•cores
Accepts these optional flags:
•--log_age
LOG_AGE
Delete logs older than these many hours. Use a non-zero value ideally. A zero value
will cause all temporary files to be deleted, including say those which are just
temporarily closed while they are being passed from one component to the next.
(default: 4)
•--force Forces deletion of all logs and temporary files regardless of age. This
must only be run on a stopped cluster. (default: False)
•--localhost_only If used, only the logs on the localhost will be removed. If not
specified, the command acts on the entire cluster.
•tscli storage df [--mode disk|hdfs]
Checks the disk usage on the relevant mounts. Returns output similar to the Linux system
command df -h <directory> .
support
tscli support [-h]
{bundle,restart-remote,rm-admin-email,rm-admin-phone,rm-feedbac
k-email,set-admin-email,set-admin-phone,set-debug-ui-password,s
et-feedback-email,set-remote,show-admin-email,show-admin-phon
e,show-feedback-email,show-remote,start-remote,stop-remote} ...
This subcommand supports the following actions:
•tscli support bundle [-h] [--include INCLUDE] [--exclude EXCLUDE] [--
list_selectors] [--since SINCE] [--from FROM] [--to TO] [--out OUT] [--nodes
NODES]
•--include
INCLUDE
Comma separated list of selectors to include, each entry is
either a “selector” or a glob for matching files. To see the list of valid selectors, run
this command with --list_selectors . You may also specify: “ all to get all
selectors and logs, and “basic” to get only the basic selectors. Selectors may also
be selectors meant for logs collect: all, orion, system, ts, or the name of a service.
Anything starting with / is assumed to be a glob pattern and interpreted via find(1).
Other entries are ignored. TIP: put single quotes around the param value to prevent
undesired glob expansion. Use “all” to collect all selectors and all logs (default:
all_but_logs)
tscli command reference
February 07, 2019
ThoughtSpot Users Guide Page 344

•--exclude
EXCLUDE
Comma separated list of selectors to exclude. Applies to
the list selected by --include . Params are interpreted just like in --include .
Use the special keyword “logs” to exclude logs collection all together. (default:
None)
•--list_selectors List the selectors available for --include and --exclude ,
and then exit. (default: False )
•--since
SINCE
Grab logs from this time window in the past. Should be a
human readable duration string, e.g. 4h (4 hours), 30m (30 minutes), 1d (1 day).
(default: None)
•--from
FROM
Timestamp where collection begins, must be of the form:
yyyymmdd-HH:MM (default: None)
•--to
TO
Timestamp where collection ends, must be of the form: yyyymmdd-
HH:MM (default: None)
•--out
OUT
Tarball path for dumping the support bundle (default: /tmp/
support_bundle.tar.gz )
•--nodes
NODES
Comma separated list of nodes from where to collect logs. Skip
this to use all nodes. (default: None)
•tscli support restart-remote Restarts remote support.
•tscli support rm-admin-email Removes the email address for contacting the customer
administrator. Replaces it with the default ThoughtSpot Support email address.
•tscli support rm-feedback-email Removes the email address for product feedback.
Replaces it with the default ThoughtSpot Support email address.
•tscli support rm-admin-phone Removes the phone number for contacting the customer
administrator. Replaces it with the default ThoughtSpot Support phone number.
•tscli support rm-feedback-email Removes the email for sending feedback out of the
system. If you would like to set a blank email address, issue the command tscli support
set-feedback-email ' ' .
•tscli support set-admin-email
email
Sets the email address for contacting the
customer administrator. If you would like to display a blank email address, issue the
command tscli support set-admin-email ' ' .
•tscli support set-feedback-email
email
Sets the email address for sending
feedback. If you would like to display a blank email address, issue the command tscli
support set-feedback-email ' ' .
•tscli support set-admin-phone
phone_number
Sets the phone number for contacting
the customer administrator. Specify a phone number using any value (e.g. +1 800-508-7008
Ext. 1 ). If you would like to display a blank phone number, issue the command tscli
support set-admin-phone .
•tscli support set-remote [-h] [--addr
ADDR
] [--user
USER
]Configures the
cluster for remote support through SSH tunneling, where
ADDR
is the address of support,
e.g. t unnel.thoughtspot.com , and
USER
is the support username.
•tscli support show-admin-email Shows the email address for customer administrator, if
set.
•tscli support show-feedback-email Shows the email address for product feedback, if
set.
•tscli support show-admin-phone Shows the phone number for customer administrator, if
set.
•tscli support show-remote Shows the status and configuration of remote support.
•tscli support start-remote Starts remote support.
•tscli support stop-remote Stops remote support.
tscli command reference
February 07, 2019
ThoughtSpot Users Guide Page 345

tokenauthentication
tscli cli tokenauthentication [-h] {disable,enable}
•tscli cli tokenauthentication enable Generates a token.
•tscli cli tokenauthentication disable Purges token login configuration.
tscli command reference
February 07, 2019
ThoughtSpot Users Guide Page 346

Date and time formats reference
This is a references for the date and time contexts and formats you can use with ThoughtSpot. You
define data formats in specific contexts and, depending on the context, your choices in data formatting
differ. You must understand date and time when you load data in these contexts:
• using data upload from the browser
• through tsload command
• through data connect or another extract, transform, load (ETL) tool
Data loading formats do not change how data is displayed in tables and charts.
The context where you
can control
date and time formats is data modeling. Data modeling controls how
data is displayed in search and their resulting answers.
Data loading formats via tsload
When loading via the tsload command you must specify date and timestamp formats using the
format specifications defined in thestrptime library function. Data is imported based on the timezone of
the node from which tsload is run.
For date data types, the default format is %Y%m%d which translates to yearmonthday For example,
Dec 30th, 2001 is represented as 20011230 . For time and datetime data types, the default is
%Y%m%d %H:%M:%S which translates to yearmonthday hour:minute:second , for example, Dec
30th, 2001 1:15:12 is represented as 20011230 01:15:12 .
Data modeling formats for browser data upload
These date and time formats are supported in a CSV file when uploading via the browser. You cannot
specify the date format; ThoughtSpot will pick the format that fits your data best:
• 1/30/2014
• 2014-01-30
• 2014-1-30
• 30-Jan-2014
• 2014-Jan-30
• 2014-01-30 10:32 AM
• 2014-01-30 14:52
• 2014-01-30 10:32:22
• 2014-01-30 10:32:22 AM
• 2014-01-30 10:32:22.0
• 2014-01-30 10:32:22.0 AM
• 2014-01-30 10:32:22.000
• 2014-01-30 10:32:22.000 AM
• 1/30/2014
• 30-Jan-14
• 01-Mar-02 (assumes 2002)
• 30/1/2014 10:32 AM
• 30/1/2014 14:52
• 30/1/2014 10:32:22
• 30/1/2014 10:32:22 AM
• 30/1/2014 10:32:22.0
• 30/1/2014 10:32:22.0 AM
Date and time formats reference
February 07, 2019
ThoughtSpot Users Guide Page 347

• 30/1/2014 10:32:22.000
• 30/1/2014 10:32:22.000 AM
• 30-Jan-14 10:32 AM
• 30-Jan-14 14:52
• 30-Jan-14 10:32:22
• 30-Jan-14 10:32:22 AM
• 30-Jan-14 10:32:22.0
• 30-Jan-14 10:32:22.0 AM
• 30-Jan-14 10:32:22.000
• 30-Jan-14 10:32:22.000 AM
• Fri Jan 30 2014 3:26 PM
• Fri Jan 30 2014 13:46
• Fri Jan 30 2014 10:32:22
• Fri Jan 30 2014 10:32:22 AM
• Fri Jan 30 2014 10:32:22.0
• Fri Jan 30 2014 10:32:22.0 AM
• Fri Jan 30 2014 10:32:22.000
• Fri Jan 30 2014 10:32:22.000 AM
• 14:52
• 10:32 AM
• 10:32:22
• 10:32:22 AM
• 10:32:22.0
• 10:32:22.000
• 10:32:22.0 AM
• 10:32:22.000 AM
Data loading formats via data connect or
another ETL tool
Data that is loaded via ETL arrives through ODBC or JDBC connection. After you extract the data from
the source and before you load it into ThoughtSpot, you must transform any date or timestamp into a
valid format for ThoughtSpot. Once transformed, no explicit data masking is required. See the data
integration guide for more details of loading data via ODBC and JDBC.
Data modeling formats
A user with administrative rights can configure data modeling for data on one or all files. You can set
number, date, and currency display formats. These formats define how these value types display in
tables and charts. See the Admin Guide for more information about data modeling settings. The
following format strings are available for use:
Format maskFormat mask DescriptionDescription
YYYY or yyyy four digit year such as 2017
YY or yy last two digits of year such as 17
Mmonth with no leading zero 1-12
MM Two digit month 01 -12
Date and time formats reference
February 07, 2019
ThoughtSpot Users Guide Page 348

Format maskFormat mask DescriptionDescription
MMM Three letter month such as Jan
DDay of year without a leading zero 0-365
DD Day of year with up to one leading zero 01 -365
DDD Day of year with up to two leading zeroes 001 -365
dDay of month with no leading zero 1-31
dd Two digit day of month 01 -31
HH Two digit 24 hour representation of hour 00 -23
hh Two digit 12 hour representation of hour 01 -12
H24 hour representation of hour with no leading zero 0-23
h12 hour representation of hour with no leading zero 1-12
mm Minutes 00 -59
mMinutes with no leading zero 0-59
ss Seconds 00 -59
sSeconds with no leading zero 0-59
aAM/PM indicator
Valid delimiters include most non-alphabet characters. This includes but is not limited to:
•\(forward slash)
•/(backward slash)
•|(pipe symbol)
•:(colon)
•-(dash)
•_(underscore)
•=(equal sign)
Examples of valid format masks you can produce for display are as follows:
•MM/dd/yyyy
•MMM
•DD/MM/yyyy
•MM/dd/yyyy HH:mm
•DD/MM/yyyy HH:mm
Date and time formats reference
February 07, 2019
ThoughtSpot Users Guide Page 349

Row level security rules reference
ThoughtSpot allows you to create row level security rules using expressions. If an expression evaluates
to “true” for a particular row and group combination, that group will be able to see that row. This
reference lists the various operators and functions you can use to create rules.
For information on how to use the row level security functions and operators, see About Rule-Based
Row Level Security. There is a special variable called ts_groups, which you can use when creating row
level security rules. It fetches a list of the groups that the currently logged in user belongs to. For each
row, f the expression in the rule evaluates to ‘true’ for any one of these groups, that row will be shown to
the user.
You can also see this list of operators and examples from within the Rule Builder by selecting RuleRule
AssistantAssistant.
Conversion functions
These functions can be used to convert data from one data type to another. Conversion to or from date
data types is not supported.
FunctionFunction DescriptionDescription ExamplesExamples
to_bool Returns the input as a boolean (true or false). to_bool (0) = false
to_bool (married)
to_date Accepts a date represented as an integer or text
string, and a second string parameter that can
include strptime date formatting elements. Re-
places all the valid strptime date formatting ele-
ments with their string counterparts and returns
the result. Does not accept epoch formatted
dates as input.
to_date (date_sold, '%Y-
%m-%d')
to_double Returns the input as a double. to_double ('3.14') = 3.14
to_double (revenue * .01)
to_integer Returns the input as an integer. to_integer ('45') + 1 =
46
to_integer (price + tax -
cost)
to_string Returns the input as a text string. To convert a
date to a string, specify the date format you
want to use.
to_string (45 + 1) = '46'
to_string (revenue -
cost)
to_string
(date,('%m/%d/%y'))
Row level security rules reference
February 07, 2019
ThoughtSpot Users Guide Page 350

Date functions
FunctionFunction DescriptionDescription ExamplesExamples
add_days Returns the result of
adding the specified
number of days to
the given date.
add_days (01/30/2015, 5) = 02/04/
2015
add_days (invoiced, 30)
date Returns the date
portion of a given
date.
date (home visit)
day Returns the number
(1-31) of the day for
the given date.
day (01/15/2014) = 15
day (date ordered)
day_number_of_quarter Returns the number
of the day in a quar-
ter for a given date.
Add an optional
second parameter
to specify whether a
'fiscal' or 'calendar'
year is used to cal-
culate the result.
Default is 'calendar'.
(In examples, start
of fiscal year is set
to May 01.)
day_number_of_quarter (01/30/2015)
= 30
day_number_of_quarter (01/30/2015,
'fiscal') = 91
day_number_of_week Returns the number
(1-7) of the day in a
week for a given
date with 1 being
Monday and 7 being
Sunday.
day_number_of_week(01/15/2014) = 3
day_number_of_week (shipped)
Row level security rules reference
February 07, 2019
ThoughtSpot Users Guide Page 351

FunctionFunction DescriptionDescription ExamplesExamples
day_number_of_year Returns the number
(1-366) of the day in
a year from a given
date. Add an option-
al second parameter
to specify whether a
'fiscal' or 'calendar'
year is used to cal-
culate the result.
Default is 'calendar'.
(In examples, start
of fiscal year is set
to May 01.)
day_number_of_year (01/30/2015) =
30
day_number_of_year ( 01/30/2015,
'fiscal' ) = 275
day_number_of_year (invoiced)
day_of_week Returns the day of
the week for the giv-
en date.
day_of week (01/30/2015) = Friday
day_of_week (serviced)
diff_days Subtracts the sec-
ond date from the
first date and returns
the result in number
of days, rounded
down if not exact.
diff_days (01/15/2014, 01/17/2014)
= -2
diff_days (purchased, shipped)
diff_time Subtracts the sec-
ond date from the
first date and returns
the result in number
of seconds.
diff_time (01/01/2014, 01/01/2014)
= -86,400
diff_time (clicked, submitted)
hour_of_day Returns the hour of
the day for the given
date.
hour_of_day (received)
is_weekend Returns true if the
given date falls on a
Saturday or Sunday.
is_weekend (01/31/2015) = true
is_weekend (emailed)
month Returns the month
from the given date.
month (01/15/2014) = January
month (date ordered)
Row level security rules reference
February 07, 2019
ThoughtSpot Users Guide Page 352

FunctionFunction DescriptionDescription ExamplesExamples
month_number Returns the number
(1-12) of the month
from a given date.
Add an optional
second parameter
to specify whether a
'fiscal' or 'calendar'
year is used to cal-
culate the result.
Default is 'calendar'.
(In examples, start
of fiscal year is set
to May 01.)
month_number (09/20/2014) = 9
month_number ( 09/20/2014, 'fiscal'
) = 5
month_number (purchased)
month_number_of_quarter Returns the month
(1-3) number for the
given date in a quar-
ter. Add an optional
second parameter
to specify whether a
'fiscal' or 'calendar'
year is used to cal-
culate the result.
Default is 'calendar'.
(In examples, start
of fiscal year is set
to May 01.)
month_number_of_quarter (02/20/
2018) = 2
month_number_of_quarter (02/20/
2018,'fiscal' ) = 1
now Returns the current
timestamp.
now ()
quarter_number Returns the number
(1-4) of the quarter
associated with the
given date. Add an
optional second pa-
rameter to specify
'fiscal' or 'calendar'
dates. Default is
'calendar'. (In exam-
ples, start of fiscal
year is set to May
01.)
quarter_number ( 04/14/2014) = 2
quarter_number ( 04/14/2014, 'fis-
cal' ) = 4
quarter_number ( shipped )
Row level security rules reference
February 07, 2019
ThoughtSpot Users Guide Page 353

FunctionFunction DescriptionDescription ExamplesExamples
start_of_month Returns MMM yyyy
for the first day of
the month. Your in-
stallation configura-
tion can override
this setting so that it
returns a different
format such as MM/
dd/yyyy . Speak
with your
ThoughtSpot admin-
istrator for informa-
tion on doing this.
start_of_month ( 01/31/2015 ) = Jan
FY 2015
start_of_month (shipped)
start_of_quarter Returns the date for
the first day of the
quarter for the given
date. Add an option-
al second parameter
to specify whether a
'fiscal' or 'calendar'
year is used to cal-
culate the result.
Default is 'calendar'.
(In examples, start
of fiscal year is set
to May 01.)
start_of_quarter ( 04/01/2014) =
Apr 2014
start_of_quarter ( 04/01/2014, 'fis-
cal') = Feb 2014
start_of_quarter (sold)
start_of_week Returns the date for
the first day of the
week for the given
date.
start_of_week ( 06/01/2015 ) = 05/
30/2015 Week
start_of_week (emailed)
start_of_year Returns the date for
the first day of the
year for the given
date. Add an option-
al second parameter
to specify whether a
'fiscal' or 'calendar'
year is used to cal-
culate the result.
Default is 'calendar'.
(In examples, start
of fiscal year is set
to May 01.)
start_of_year (04/01/2014) returns
Jan 2014
start_of_year (04/01/2014, 'fis-
cal') returns May 2013
start_of_year (joined)
time Returns the time
portion of a given
date.
time (3/1/2002 10:32) = 10:32
time (call began)
Row level security rules reference
February 07, 2019
ThoughtSpot Users Guide Page 354

FunctionFunction DescriptionDescription ExamplesExamples
week_number_of_month Returns the week
number for the given
date in a month.
week_number_of_month(03/23/2017) =
3
week_number_of_quarter Returns the week
number for the given
date in a quarter.
Add an optional
second parameter
to specify whether a
'fiscal' or 'calendar'
year is used to cal-
culate the result.
Default is 'calendar'.
(In examples, start
of fiscal year is set
to May 01.)
week_number_of_quarter (04/03/2017)
= 1
week_number_of_quarter (04/03/2017,
'fiscal') = 10
week_number_of_year Returns the week
number for the given
date in a year. Add
an optional second
parameter to specify
whether a 'fiscal' or
'calendar' year is
used to calculate
the result. Default is
'calendar'. (In exam-
ples, start of fiscal
year is set to May
01.)
week_number_of_year (01/17/2014) =
3
week_number_of_year ( 01/17/2014,
'fiscal') = 38
year Returns the year
from a given date.
Add an optional
second parameter
to specify whether a
'fiscal' or 'calendar'
year is used to cal-
culate the result.
Default is 'calendar'.
(In examples, start
of fiscal year is set
to May 01. Per stan-
dard convention, the
fiscal year is defined
by the year-end
date.)
year (01/15/2014) = 2014
year (12/15/2013, 'fiscal' ) = 2014
year (date ordered)
Row level security rules reference
February 07, 2019
ThoughtSpot Users Guide Page 355

Mixed functions
These functions can be used with text and numeric data types.
FunctionFunction DescriptionDescription ExamplesExamples
!= Returns true if the first value is not
equal to the second value.
3 != 2 = true
revenue != 1000000
<Returns true if the first value is less
than the second value.
3 < 2 = false
revenue < 1000000
<= Returns true if the first value is less
than or equal to the second value.
1 <= 2 = true
revenue <= 1000000
=Returns true if the first value is equal to
the second value.
2 = 2 = true
revenue = 1000000
>Returns true if the first value is greater
than the second value.
3 > 2 = true
revenue > 1000000
>= Returns true if the first value is greater
than or equal to the second value.
3 >= 2 = true
revenue >= 1000000
greatest Returns the larger of the values. greatest (20, 10) = 20
greatest (q1 revenue, q2 revenue)
least Returns the smaller of the values. least (20, 10) = 10
least (q1 revenue, q2 revenue)
Number functions
FunctionFunction DescriptionDescription ExamplesExamples
*Returns the result of multiplying
both numbers.
3 * 2 = 6
price * taxrate
+Returns the result of adding both
numbers.
1 + 2 = 3
price + shipping
-Returns the result of subtracting
the second number from the first.
3 - 2 = 1
revenue - tax
/Returns the result of dividing the
first number by the second.
6 / 3 = 2
markup / retail price
Row level security rules reference
February 07, 2019
ThoughtSpot Users Guide Page 356

FunctionFunction DescriptionDescription ExamplesExamples
^Returns the first number raised to
the power of the second.
3 ^ 2 = 9
width ^ 2
abs Returns the absolute value. abs (-10) = 10
abs (profit)
acos Returns the inverse cosine in de-
grees.
acos (0.5) = 60
acos (cos-satellite-angle)
asin Returns the inverse sine (speci-
fied in degrees).
asin (0.5) = 30
asin (sin-satellite-angle)
atan Returns the inverse tangent in
degrees.
atan (1) = 45
atan (tan-satellite-angle)
atan2 Returns the inverse tangent in
degrees.
atan2 (10, 10) = 45
atan2 (longitude, latitude)
cbrt Returns the cube root of a num-
ber.
cbrt (27) = 3
cbrt (volume)
ceil Returns the smallest following in-
teger.
ceil (5.9) = 6
ceil (growth rate)
cos Returns the cosine of an angle
(specified in degrees).
cos (63) = 0.45
cos (beam angle)
cube Returns the cube of a number. cube (3) = 27
cube (length)
exp Returns Euler’s number (~2.718)
raised to a power.
exp (2) = 7.38905609893
exp (growth)
exp2 Returns 2 raised to a power. exp2 (3) = 8
exp2 (growth)
floor Returns the largest previous inte-
ger.
floor (5.1) = 5
floor (growth rate)
ln Returns the natural logarithm. ln (7.38905609893) = 2
ln (distance)
log10 Returns the logarithm with base
10.
log10 (100) = 2
log10 (volume)
log2 Returns the logarithm with base 2
(binary logarithm).
log2 (32) = 5
log2 (volume)
mod Returns the remainder of first
number divided by the second
number.
mod (8, 3) = 2
mod ( revenue , quantity )
Row level security rules reference
February 07, 2019
ThoughtSpot Users Guide Page 357

FunctionFunction DescriptionDescription ExamplesExamples
pow Returns the first number raised to
the power of the second number.
pow (5, 2) = 25
pow (width, 2)
random Returns a random number be-
tween 0 and 1.
random ( ) = .457718
random ( )
round Returns the first number rounded
to the second number (the de-
fault is 1).
round (35.65, 10) = 40
round (battingavg, 100)
safe_divide Returns the result of dividing the
first number by the second. If the
second number is 0, returns 0 in-
stead of NaN (not a number).
safe_divide (12, 0) = 0
safe_divide (total_cost,
units)
sign Returns +1 if the number is
greater than zero, -1 if less than
zero, 0 if zero.
sign (-250) = -1
sign (growth rate)
sin Returns the sine of an angle
(specified in degrees).
sin (35) = 0.57
sin (beam angle)
spherical_distance Returns the distance in km be-
tween two points on Earth.
spherical_distance
(37.465191, -122.153617,
37.421962, -122.142174) =
4,961.96
spherical_distance (start_lat-
itude, start_longitude,
start_latitude, start_longi-
tude)
sq Returns the square of a numeric
value.
sq (9) = 81
sq (width)
sqrt Returns the square root. sqrt (9) = 3
sqrt (area)
tan Returns the tangent of an angle
(specified in degrees).
tan (35) = 0.7
tan (beam angle)
Row level security rules reference
February 07, 2019
ThoughtSpot Users Guide Page 358

Operators
OperatorOperator DescriptionDescription ExamplesExamples
and Returns true when both conditions
are true, otherwise returns false.
(1 = 1) and (3 > 2) = true
lastname = 'smith' and state
='texas'
Note:Note: Not available for row level
security (RLS) formulas.
if…then…else Conditional operator. if (3 > 2) then 'bigger' else
'not bigger'
if (cost > 500) then 'flag' else
'approve'
ifnull Returns the first value if it is not null,
otherwise returns the second.
ifnull (cost, 'unknown')
isnull Returns true if the value is null. isnull (phone)
not Returns true if the condition is false,
otherwise returns false.
not (3 > 2) = false
not (state = 'texas')
or Returns true when either condition is
true, otherwise returns false.
(1 = 5) or (3 > 2) = true
state = 'california' or state
='oregon'
Text functions
FunctionFunction DescriptionDescription ExamplesExamples
concat Returns the one or more values
as a concatenated text string.
Be sure to use single quotes
instead of double quotes
around each of the strings.
concat ( 'hay' , 'stack' )
= 'haystack'
concat (last_name ,
first_name )
contains Returns true if the first string
contains the second string,
otherwise returns false.
contains ('broomstick',
'room') = true
contains (product, 'trial
version')
Row level security rules reference
February 07, 2019
ThoughtSpot Users Guide Page 359

FunctionFunction DescriptionDescription ExamplesExamples
edit_distance Accepts two text strings. Re-
turns the edit distance (mini-
mum number of operations re-
quired to transform one string
into the other) as an integer.
Works with strings under 1023
characters.
edit_distance ('attorney',
'atty') = 4
edit_distance (color,
'red')
edit_distance_with_cap Accepts two text strings and
an integer to specify the upper
limit cap for the edit distance
(minimum number of opera-
tions required to transform one
string into the other). If the edit
distance is less than or equal
to the specified cap, returns
the edit distance. If it is higher
than the cap, returns the cap
plus 1. Works with strings un-
der 1023 characters.
edit_distance_with_cap
('pokemon go', 'minecraft
pixelmon', 3) = 4
edit_distance_with_cap
(event, 'burning man', 3)
similar_to Accepts a document text string
and a search text string. Re-
turns true if relevance score
(0-100) of the search string
with respect to the document
is greater than or equal to 20.
Relevance is based on edit dis-
tance, number of words in the
query, and length of words in
the query which are present in
the document.
similar_to ('hello world',
'hello swirl') = true
similar_to (current team,
drafted by)
similarity Accepts a document text string
and a search text string. Re-
turns the relevance score
(0-100) of the search string
with respect to the document.
Relevance is based on edit dis-
tance, number of words in the
query, and length of words in
the query which are present in
the document. If the two
strings are an exact match, re-
turns 100.
similarity ('where is the
burning man concert', 'burn-
ing man') = 46
similarity (tweet1, tweet2)
spells_like Accepts two text strings. Re-
turns true if they are spelled
similarly and false if they are
not. Works with strings under
1023 characters.
spells_like ('thouhgtspot',
'thoughtspot') = true
spells_like (studio, dis-
tributor)
Row level security rules reference
February 07, 2019
ThoughtSpot Users Guide Page 360

FunctionFunction DescriptionDescription ExamplesExamples
strlen Returns the length of the text. strlen ('smith') = 5
strlen (lastname)
strpos Returns the numeric position
(starting from 0) of the first oc-
currence of the second string
in the first string, or -1 if not
found.
strpos ('haystack_with_nee-
dles', 'needle') = 14
strpos (complaint,
'lawyer')
substr Returns the portion of the giv-
en string, beginning at the lo-
cation specified (starting from
0), and of the given length.
substr ('persnickety', 3,
7) = snicket
substr (lastname, 0, 5)
Variables
These variables can be used in your expressions.
Function Description Examples
ts_groups Returns a list of all the groups the current logged
in user belongs to. For any row, if the expression
evaluates to true for any of the groups, the user
can see that row.
ts_groups = 'east'
ts_username Returns the user with the matching neame. ts_username != 'mark'
Row level security rules reference
February 07, 2019
ThoughtSpot Users Guide Page 361

Formula function reference
ThoughtSpot allows you to create derived columns in worksheets using formulas. You create these
columns by building formulas using the Formula AssistantFormula Assistant. An individual formula is constructed from
n
combination of operators and functions.
This reference lists the various operators and functions you can use to create formulas.
Operators
OperatorOperator DescriptionDescription ExamplesExamples
and Returns true when both conditions
are true, otherwise returns false.
(1 = 1) and (3 > 2) = true
lastname = 'smith' and state
='texas'
Note:Note: Not available for row level
security (RLS) formulas.
if…then…else Conditional operator. if (3 > 2) then 'bigger' else
'not bigger'
if (cost > 500) then 'flag' else
'approve'
ifnull Returns the first value if it is not null,
otherwise returns the second.
ifnull (cost, 'unknown')
isnull Returns true if the value is null. isnull (phone)
not Returns true if the condition is false,
otherwise returns false.
not (3 > 2) = false
not (state = 'texas')
or Returns true when either condition is
true, otherwise returns false.
(1 = 5) or (3 > 2) = true
state = 'california' or state
='oregon'
Aggregate functions (group aggregate)
These functions can be used to aggregate data.
FunctionFunction DescriptionDescription ExamplesExamples
average Returns the average of all the values of a
column.
average (revenue)
Formula function reference
February 07, 2019
ThoughtSpot Users Guide Page 362

FunctionFunction DescriptionDescription ExamplesExamples
average_if Returns the average of all the columns that
meet a given criteria.
average_if(city =
"San Francisco", rev-
enue)
count Returns the number of rows in the table
containing the column.
count (product)
count_if Returns the number of rows in the table
containing the column.
count_if(region
=’west’, region)
cumulative_average Takes a measure and one or more attribut-
es. Returns the average of the measure, ac-
cumulated by the attribute(s) in the order
specified.
cumulative_average
(revenue, order date,
state)
cumulative_max Takes a measure and one or more attribut-
es. Returns the maximum of the measure,
accumulated by the attribute(s) in the order
specified.
cumulative_max (rev-
enue, state)
cumulative_min Takes a measure and one or more attribut-
es. Returns the minimum of the measure,
accumulated by the attribute(s) in the order
specified.
cumulative_min (rev-
enue, campaign)
cumulative_sum Takes a measure and one or more attribut-
es. Returns the sum of the measure, accu-
mulated by the attribute(s) in the order
specified.
cumulative_sum (rev-
enue, order date)
group_aggregate Takes a measure and, optionally, attributes
and filters. These can be used to aggregate
measures with granularities and filters dif-
ferent from the terms/columns used in the
search. Especially useful for comparison
analysis.
This formula takes the form: group_aggre-
gate (< aggregation (measure) >, < group-
ings >, < filters >)
Lists can be defined with {} and optional list
functions query_groups or query_fil-
ters , which by default specify the lists or
filters used in the original search. Plus (+) or
(-) can be used to add or exclude specific
columns for query groups.
group_aggregate (sum
(revenue) , {ship
mode, date} , {} )
group_aggregate (sum
(revenue) , {ship
mode , date},
{day_of_week (date) =
'friday'} )
group_aggregate (sum
(revenue) ,
query_groups() ,
query_filters() )
group_aggregate (sum
(revenue) ,
query_groups() +
{date} , query_fil-
ters() )
Formula function reference
February 07, 2019
ThoughtSpot Users Guide Page 363

FunctionFunction DescriptionDescription ExamplesExamples
group_average Takes a measure and one or more attribut-
es. Returns the average of the measure
grouped by the attribute(s).
group_average (rev-
enue, customer re-
gion, state)
group_count Takes a measure and one or more attribut-
es. Returns the count of the measure
grouped by the attribute(s).
group_count (revenue,
customer region)
group_max Takes a measure and one or more attribut-
es. Returns the maximum of the measure
grouped by the attribute(s).
group_max (revenue,
customer region)
group_min Takes a measure and one or more attribut-
es. Returns the minimum of the measure
grouped by the attribute(s).
group_min (revenue,
customer region)
group_stddev Takes a measure and one or more attribut-
es. Returns the standard deviation of the
measure grouped by the attribute(s).
group_stddev (rev-
enue, customer region)
group_sum Takes a measure and one or more attribut-
es. Returns the sum of the measure
grouped by the attribute(s).
group_sum (revenue,
customer region)
group_unique_count Takes a measure and one or more attribut-
es. Returns the unique count of the mea-
sure grouped by the attribute(s).
group_unique_count
(product , supplier)
group_variance Takes a measure and one or more attribut-
es. Returns the variance of the measure
grouped by the attribute(s).
group_variance (rev-
enue, customer region)
max Returns the maximum value of a column. max (sales)
max_if Returns the maximum value among
columns that meet a criteria.
max_if( (revenue >
10) , customer region
)
min Returns the minimum value of a column. min (revenue)
min_if Returns the minimum value among columns
that meet a criteria.
min_if( (revenue <
10) , customer region
)
Formula function reference
February 07, 2019
ThoughtSpot Users Guide Page 364

FunctionFunction DescriptionDescription ExamplesExamples
moving_average Takes a measure, two integers to define the
window to aggregate over, and one or more
attributes. The window is (current -
Num1…Current + Num2) with both end
points being included in the window. For
example, “1,1” will have a window size of 3.
To define a window that begins before Cur-
rent, specify a negative number for Num2.
Returns the average of the measure over
the given window. The attributes are the or-
dering columns used to compute the mov-
ing average.
moving_average (rev-
enue, 2, 1, customer
region)
moving_max Takes a measure, two integers to define the
window to aggregate over, and one or more
attributes. The window is (current -
Num1…Current + Num2) with both end
points being included in the window. For
example, “1,1” will have a window size of 3.
To define a window that begins before Cur-
rent, specify a negative number for Num2.
Returns the maximum of the measure over
the given window. The attributes are the or-
dering columns used to compute the mov-
ing maximum.
moving_max (com-
plaints, 1, 2, store
name)
moving_min Takes a measure, two integers to define the
window to aggregate over, and one or more
attributes. The window is (current -
Num1…Current + Num2) with both end
points being included in the window. For
example, “1,1” will have a window size of 3.
To define a window that begins before Cur-
rent, specify a negative number for Num2.
Returns the minimum of the measure over
the given window. The attributes are the or-
dering columns used to compute the mov-
ing minimum.
moving_min (defects,
3, 1, product)
moving_sum Takes a measure, two integers to define the
window to aggregate over, and one or more
attributes. The window is (current -
Num1…Current + Num2) with both end
points being included in the window. For
example, “1,1” will have a window size of 3.
To define a window that begins before Cur-
rent, specify a negative number for Num2.
Returns the sum of the measure over the
given window. The attributes are the order-
ing columns used to compute the moving
sum.
moving_sum (revenue,
1, 1, order date)
Formula function reference
February 07, 2019
ThoughtSpot Users Guide Page 365

FunctionFunction DescriptionDescription ExamplesExamples
stddev Returns the standard deviation of all values
of a column.
stddev (revenue)
stddev_if Returns a standard deviation values filtered
to meet a specific criteria.
stddev_if( (revenue >
10) , (revenue/10.0) )
sum Returns the sum of all the values of a col-
umn.
sum (revenue)
sum_if Returns sum values filtered by a specific
criteria.
sum_if(region=’west’,
revenue)
unique count Returns the number of unique values of a
column.
unique count (cus-
tomer)
unique_count_if Returns the number of unique values of a
column provided it meets a criteria.
unique_count_if( (rev-
enue > 10) , order
date )
variance Returns the variance of all the values of a
column.
variance (revenue)
variance_if Returns the variance of all the values of a
column provided it meets a criteria..
variance_if( (revenue
> 10) , (revenue/
10.0) )
Conversion functions
These functions can be used to convert data from one data type to another. Conversion to or from date
data types is not supported.
FunctionFunction DescriptionDescription ExamplesExamples
to_bool Returns the input as a boolean (true or false). to_bool (0) = false
to_bool (married)
to_date Accepts a date represented as an integer or text
string, and a second string parameter that can
include strptime date formatting elements. Re-
places all the valid strptime date formatting ele-
ments with their string counterparts and returns
the result. Does not accept epoch formatted
dates as input.
to_date (date_sold, '%Y-
%m-%d')
to_double Returns the input as a double. to_double ('3.14') = 3.14
to_double (revenue * .01)
Formula function reference
February 07, 2019
ThoughtSpot Users Guide Page 366

FunctionFunction DescriptionDescription ExamplesExamples
to_integer Returns the input as an integer. to_integer ('45') + 1 =
46
to_integer (price + tax -
cost)
to_string Returns the input as a text string. To convert a
date to a string, specify the date format you
want to use.
to_string (45 + 1) = '46'
to_string (revenue -
cost)
to_string
(date,('%m/%d/%y'))
Date functions
FunctionFunction DescriptionDescription ExamplesExamples
add_days Returns the result of
adding the specified
number of days to
the given date.
add_days (01/30/2015, 5) = 02/04/
2015
add_days (invoiced, 30)
date Returns the date
portion of a given
date.
date (home visit)
day Returns the number
(1-31) of the day for
the given date.
day (01/15/2014) = 15
day (date ordered)
day_number_of_quarter Returns the number
of the day in a quar-
ter for a given date.
Add an optional
second parameter
to specify whether a
'fiscal' or 'calendar'
year is used to cal-
culate the result.
Default is 'calendar'.
(In examples, start
of fiscal year is set
to May 01.)
day_number_of_quarter (01/30/2015)
= 30
day_number_of_quarter (01/30/2015,
'fiscal') = 91
day_number_of_week Returns the number
(1-7) of the day in a
week for a given
date with 1 being
Monday and 7 being
Sunday.
day_number_of_week(01/15/2014) = 3
day_number_of_week (shipped)
Formula function reference
February 07, 2019
ThoughtSpot Users Guide Page 367

FunctionFunction DescriptionDescription ExamplesExamples
day_number_of_year Returns the number
(1-366) of the day in
a year from a given
date. Add an option-
al second parameter
to specify whether a
'fiscal' or 'calendar'
year is used to cal-
culate the result.
Default is 'calendar'.
(In examples, start
of fiscal year is set
to May 01.)
day_number_of_year (01/30/2015) =
30
day_number_of_year ( 01/30/2015,
'fiscal' ) = 275
day_number_of_year (invoiced)
day_of_week Returns the day of
the week for the giv-
en date.
day_of week (01/30/2015) = Friday
day_of_week (serviced)
diff_days Subtracts the sec-
ond date from the
first date and returns
the result in number
of days, rounded
down if not exact.
diff_days (01/15/2014, 01/17/2014)
= -2
diff_days (purchased, shipped)
diff_time Subtracts the sec-
ond date from the
first date and returns
the result in number
of seconds.
diff_time (01/01/2014, 01/01/2014)
= -86,400
diff_time (clicked, submitted)
hour_of_day Returns the hour of
the day for the given
date.
hour_of_day (received)
is_weekend Returns true if the
given date falls on a
Saturday or Sunday.
is_weekend (01/31/2015) = true
is_weekend (emailed)
month Returns the month
from the given date.
month (01/15/2014) = January
month (date ordered)
Formula function reference
February 07, 2019
ThoughtSpot Users Guide Page 368

FunctionFunction DescriptionDescription ExamplesExamples
month_number Returns the number
(1-12) of the month
from a given date.
Add an optional
second parameter
to specify whether a
'fiscal' or 'calendar'
year is used to cal-
culate the result.
Default is 'calendar'.
(In examples, start
of fiscal year is set
to May 01.)
month_number (09/20/2014) = 9
month_number ( 09/20/2014, 'fiscal'
) = 5
month_number (purchased)
month_number_of_quarter Returns the month
(1-3) number for the
given date in a quar-
ter. Add an optional
second parameter
to specify whether a
'fiscal' or 'calendar'
year is used to cal-
culate the result.
Default is 'calendar'.
(In examples, start
of fiscal year is set
to May 01.)
month_number_of_quarter (02/20/
2018) = 2
month_number_of_quarter (02/20/
2018,'fiscal' ) = 1
now Returns the current
timestamp.
now ()
quarter_number Returns the number
(1-4) of the quarter
associated with the
given date. Add an
optional second pa-
rameter to specify
'fiscal' or 'calendar'
dates. Default is
'calendar'. (In exam-
ples, start of fiscal
year is set to May
01.)
quarter_number ( 04/14/2014) = 2
quarter_number ( 04/14/2014, 'fis-
cal' ) = 4
quarter_number ( shipped )
Formula function reference
February 07, 2019
ThoughtSpot Users Guide Page 369

FunctionFunction DescriptionDescription ExamplesExamples
start_of_month Returns MMM yyyy
for the first day of
the month. Your in-
stallation configura-
tion can override
this setting so that it
returns a different
format such as MM/
dd/yyyy . Speak
with your
ThoughtSpot admin-
istrator for informa-
tion on doing this.
start_of_month ( 01/31/2015 ) = Jan
FY 2015
start_of_month (shipped)
start_of_quarter Returns the date for
the first day of the
quarter for the given
date. Add an option-
al second parameter
to specify whether a
'fiscal' or 'calendar'
year is used to cal-
culate the result.
Default is 'calendar'.
(In examples, start
of fiscal year is set
to May 01.)
start_of_quarter ( 04/01/2014) =
Apr 2014
start_of_quarter ( 04/01/2014, 'fis-
cal') = Feb 2014
start_of_quarter (sold)
start_of_week Returns the date for
the first day of the
week for the given
date.
start_of_week ( 06/01/2015 ) = 05/
30/2015 Week
start_of_week (emailed)
start_of_year Returns the date for
the first day of the
year for the given
date. Add an option-
al second parameter
to specify whether a
'fiscal' or 'calendar'
year is used to cal-
culate the result.
Default is 'calendar'.
(In examples, start
of fiscal year is set
to May 01.)
start_of_year (04/01/2014) returns
Jan 2014
start_of_year (04/01/2014, 'fis-
cal') returns May 2013
start_of_year (joined)
time Returns the time
portion of a given
date.
time (3/1/2002 10:32) = 10:32
time (call began)
Formula function reference
February 07, 2019
ThoughtSpot Users Guide Page 370

FunctionFunction DescriptionDescription ExamplesExamples
week_number_of_month Returns the week
number for the given
date in a month.
week_number_of_month(03/23/2017) =
3
week_number_of_quarter Returns the week
number for the given
date in a quarter.
Add an optional
second parameter
to specify whether a
'fiscal' or 'calendar'
year is used to cal-
culate the result.
Default is 'calendar'.
(In examples, start
of fiscal year is set
to May 01.)
week_number_of_quarter (04/03/2017)
= 1
week_number_of_quarter (04/03/2017,
'fiscal') = 10
week_number_of_year Returns the week
number for the given
date in a year. Add
an optional second
parameter to specify
whether a 'fiscal' or
'calendar' year is
used to calculate
the result. Default is
'calendar'. (In exam-
ples, start of fiscal
year is set to May
01.)
week_number_of_year (01/17/2014) =
3
week_number_of_year ( 01/17/2014,
'fiscal') = 38
year Returns the year
from a given date.
Add an optional
second parameter
to specify whether a
'fiscal' or 'calendar'
year is used to cal-
culate the result.
Default is 'calendar'.
(In examples, start
of fiscal year is set
to May 01. Per stan-
dard convention, the
fiscal year is defined
by the year-end
date.)
year (01/15/2014) = 2014
year (12/15/2013, 'fiscal' ) = 2014
year (date ordered)
Formula function reference
February 07, 2019
ThoughtSpot Users Guide Page 371

Mixed functions
These functions can be used with text and numeric data types.
FunctionFunction DescriptionDescription ExamplesExamples
!= Returns true if the first value is not
equal to the second value.
3 != 2 = true
revenue != 1000000
<Returns true if the first value is less
than the second value.
3 < 2 = false
revenue < 1000000
<= Returns true if the first value is less
than or equal to the second value.
1 <= 2 = true
revenue <= 1000000
=Returns true if the first value is equal to
the second value.
2 = 2 = true
revenue = 1000000
>Returns true if the first value is greater
than the second value.
3 > 2 = true
revenue > 1000000
>= Returns true if the first value is greater
than or equal to the second value.
3 >= 2 = true
revenue >= 1000000
greatest Returns the larger of the values. greatest (20, 10) = 20
greatest (q1 revenue, q2 revenue)
least Returns the smaller of the values. least (20, 10) = 10
least (q1 revenue, q2 revenue)
Number functions
FunctionFunction DescriptionDescription ExamplesExamples
*Returns the result of multiplying
both numbers.
3 * 2 = 6
price * taxrate
+Returns the result of adding both
numbers.
1 + 2 = 3
price + shipping
-Returns the result of subtracting
the second number from the first.
3 - 2 = 1
revenue - tax
/Returns the result of dividing the
first number by the second.
6 / 3 = 2
markup / retail price
Formula function reference
February 07, 2019
ThoughtSpot Users Guide Page 372

FunctionFunction DescriptionDescription ExamplesExamples
^Returns the first number raised to
the power of the second.
3 ^ 2 = 9
width ^ 2
abs Returns the absolute value. abs (-10) = 10
abs (profit)
acos Returns the inverse cosine in de-
grees.
acos (0.5) = 60
acos (cos-satellite-angle)
asin Returns the inverse sine (speci-
fied in degrees).
asin (0.5) = 30
asin (sin-satellite-angle)
atan Returns the inverse tangent in
degrees.
atan (1) = 45
atan (tan-satellite-angle)
atan2 Returns the inverse tangent in
degrees.
atan2 (10, 10) = 45
atan2 (longitude, latitude)
cbrt Returns the cube root of a num-
ber.
cbrt (27) = 3
cbrt (volume)
ceil Returns the smallest following in-
teger.
ceil (5.9) = 6
ceil (growth rate)
cos Returns the cosine of an angle
(specified in degrees).
cos (63) = 0.45
cos (beam angle)
cube Returns the cube of a number. cube (3) = 27
cube (length)
exp Returns Euler’s number (~2.718)
raised to a power.
exp (2) = 7.38905609893
exp (growth)
exp2 Returns 2 raised to a power. exp2 (3) = 8
exp2 (growth)
floor Returns the largest previous inte-
ger.
floor (5.1) = 5
floor (growth rate)
ln Returns the natural logarithm. ln (7.38905609893) = 2
ln (distance)
log10 Returns the logarithm with base
10.
log10 (100) = 2
log10 (volume)
log2 Returns the logarithm with base 2
(binary logarithm).
log2 (32) = 5
log2 (volume)
mod Returns the remainder of first
number divided by the second
number.
mod (8, 3) = 2
mod ( revenue , quantity )
Formula function reference
February 07, 2019
ThoughtSpot Users Guide Page 373

FunctionFunction DescriptionDescription ExamplesExamples
pow Returns the first number raised to
the power of the second number.
pow (5, 2) = 25
pow (width, 2)
random Returns a random number be-
tween 0 and 1.
random ( ) = .457718
random ( )
round Returns the first number rounded
to the second number (the de-
fault is 1).
round (35.65, 10) = 40
round (battingavg, 100)
safe_divide Returns the result of dividing the
first number by the second. If the
second number is 0, returns 0 in-
stead of NaN (not a number).
safe_divide (12, 0) = 0
safe_divide (total_cost,
units)
sign Returns +1 if the number is
greater than zero, -1 if less than
zero, 0 if zero.
sign (-250) = -1
sign (growth rate)
sin Returns the sine of an angle
(specified in degrees).
sin (35) = 0.57
sin (beam angle)
spherical_distance Returns the distance in km be-
tween two points on Earth.
spherical_distance
(37.465191, -122.153617,
37.421962, -122.142174) =
4,961.96
spherical_distance (start_lat-
itude, start_longitude,
start_latitude, start_longi-
tude)
sq Returns the square of a numeric
value.
sq (9) = 81
sq (width)
sqrt Returns the square root. sqrt (9) = 3
sqrt (area)
tan Returns the tangent of an angle
(specified in degrees).
tan (35) = 0.7
tan (beam angle)
Text functions
FunctionFunction DescriptionDescription ExamplesExamples
concat Returns the one or more values
as a concatenated text string.
Be sure to use single quotes
instead of double quotes
around each of the strings.
concat ( 'hay' , 'stack' )
= 'haystack'
concat (last_name ,
first_name )
Formula function reference
February 07, 2019
ThoughtSpot Users Guide Page 374

FunctionFunction DescriptionDescription ExamplesExamples
contains Returns true if the first string
contains the second string,
otherwise returns false.
contains ('broomstick',
'room') = true
contains (product, 'trial
version')
edit_distance Accepts two text strings. Re-
turns the edit distance (mini-
mum number of operations re-
quired to transform one string
into the other) as an integer.
Works with strings under 1023
characters.
edit_distance ('attorney',
'atty') = 4
edit_distance (color,
'red')
edit_distance_with_cap Accepts two text strings and
an integer to specify the upper
limit cap for the edit distance
(minimum number of opera-
tions required to transform one
string into the other). If the edit
distance is less than or equal
to the specified cap, returns
the edit distance. If it is higher
than the cap, returns the cap
plus 1. Works with strings un-
der 1023 characters.
edit_distance_with_cap
('pokemon go', 'minecraft
pixelmon', 3) = 4
edit_distance_with_cap
(event, 'burning man', 3)
similar_to Accepts a document text string
and a search text string. Re-
turns true if relevance score
(0-100) of the search string
with respect to the document
is greater than or equal to 20.
Relevance is based on edit dis-
tance, number of words in the
query, and length of words in
the query which are present in
the document.
similar_to ('hello world',
'hello swirl') = true
similar_to (current team,
drafted by)
similarity Accepts a document text string
and a search text string. Re-
turns the relevance score
(0-100) of the search string
with respect to the document.
Relevance is based on edit dis-
tance, number of words in the
query, and length of words in
the query which are present in
the document. If the two
strings are an exact match, re-
turns 100.
similarity ('where is the
burning man concert', 'burn-
ing man') = 46
similarity (tweet1, tweet2)
Formula function reference
February 07, 2019
ThoughtSpot Users Guide Page 375

FunctionFunction DescriptionDescription ExamplesExamples
spells_like Accepts two text strings. Re-
turns true if they are spelled
similarly and false if they are
not. Works with strings under
1023 characters.
spells_like ('thouhgtspot',
'thoughtspot') = true
spells_like (studio, dis-
tributor)
strlen Returns the length of the text. strlen ('smith') = 5
strlen (lastname)
strpos Returns the numeric position
(starting from 0) of the first oc-
currence of the second string
in the first string, or -1 if not
found.
strpos ('haystack_with_nee-
dles', 'needle') = 14
strpos (complaint,
'lawyer')
substr Returns the portion of the giv-
en string, beginning at the lo-
cation specified (starting from
0), and of the given length.
substr ('persnickety', 3,
7) = snicket
substr (lastname, 0, 5)
Formula function reference
February 07, 2019
ThoughtSpot Users Guide Page 376

Alerts code reference
This reference identifies the messages that can appear in the System Health > Overview > Critical AlertsSystem Health > Overview > Critical Alerts
and in the AlertsAlerts dashboard.
Informational alerts
TASK_TERMINATED
MsgMsg: Task {{.Service}}.{{.Task}} terminated on machine {{.Machine}}
TypeType: INFO
This alert is raised when a task terminates.
DISK_ERROR
MsgMsg: Machine {{.Machine}} has disk errors
TypeType: INFO
Raised when a machine has disk errors.
ZK_AVG_LATENCY
MsgMsg: Average Zookeeper latency is more than {{.Num}} msec
TypeType: INFO
Raised when average Zookeeper latency is above a threshold.
ZK_MAX_LATENCY
MsgMsg: Max Zookeeper latency is more than {{.Num}} msec
TypeType: INFO
Raised when max Zookeeper latency is above a threshold.
ZK_MIN_LATENCY
MsgMsg: Min Zookeeper latency is more than {{.Num}} msec
TypeType: INFO
Raised when min Zookeeper latency is above a threshold.
ZK_OUTSTANDING_REQUESTS
MsgMsg: Number of outstanding Zookeeper requests exceeds {{.Num}}
TypeType: INFO
Alerts code reference
February 07, 2019
ThoughtSpot Users Guide Page 377

Raised when there are too many outstanding Zookeeper requests.
ZK_NUM_WATCHERS
MsgMsg: Number of Zookeeper watchers exceeds {{.Num}}
TypeType: INFO
Raised when there are too many Zookeeper watchers.
MASTER_ELECTION
MsgMsg: {{.Machine}} elected as Orion Master
TypeType: INFO
Raised when a new Orion Master is elected.
PERIODIC_BACKUP
MsgMsg: {{.Process}} periodic backup for policy {{.Name}} failed.
TypeType: INFO
Raised when periodic backup fails.
PERIODIC_SNAPSHOT
MsgMsg: {{.Process}} periodic snapshot {{.Name}} failed.
TypeType: INFO
Raised when a periodic snapshot fails.
HDFS_CORRUPTION
MsgMsg: HDFS root directory is in a corrupted state.
TypeType: INFO
Raised when HDFS root directory is corrupted.
APPLICATION_INVALID_STATE
MsgMsg: {{.Service}}.{{.Task}} on {{.Machine}} at location {{.Location}}
TypeType: INFO
Raised when Application raises invalid state alert.
UPDATE_START
MsgMsg: Starting update of ThoughtSpot cluster {{.Cluster}}
TypeType: INFO
Raised when update starts.
Alerts code reference
February 07, 2019
ThoughtSpot Users Guide Page 378

UPDATE_END
MsgMsg: Finished update of ThoughtSpot cluster {{.Cluster}} to release {{.Release}}
TypeType: INFO
Raised when update completes.
Errors
TIMELY_JOB_RUN_ERROR
MsgMsg: Job run {{.Message}}
TypeType: ERROR
Raised when a job run fails.
TIMELY_ERROR
MsgMsg: Job manager {{.Message}}
TypeType: ERROR
Raised when a job manager runs into an inconsistent state.
Warnings
DISK_SPACE
MsgMsg: Machine {{.Machine}} has less than {{.Perc}}% disk space free
TypeType: WARNING
Raised when a disk is low on available disk space. Valid only in the 3.2 version of ThoughtSpot.
ROOT_DISK_SPACE
MsgMsg: Machine {{.Machine}} has less than {{.Perc}}% disk space free on root partition
TypeType: WARNING
Raised when a machine is low on available disk space on root partition.
BOOT_DISK_SPACE
MsgMsg: Machine {{.Machine}} has less than {{.Perc}}% disk space free on boot partition
TypeType: WARNING
Raised when a machine is low on available disk space on boot partition.
Alerts code reference
February 07, 2019
ThoughtSpot Users Guide Page 379

UPDATE_DISK_SPACE
MsgMsg: Machine {{.Machine}} has less than {{.Perc}}% disk space free on update
partition
TypeType: WARNING
Raised when a machine is low on available disk space on update partition.
EXPORT_DISK_SPACE
MsgMsg: Machine {{.Machine}} has less than {{.Perc}}% disk space free on export
partition
TypeType: WARNING
Raised when a machine is low on available disk space on export partition.
HDFS_NAMENODE_DISK_SPACE
MsgMsg: Machine {{.Machine}} has less than {{.Perc}}% disk space free on HDFS namenode
drive
TypeType: WARNING
Raised when a machine is low on available disk space on HDFS namenode drive.
MEMORY
MsgMsg: Machine {{.Machine}} has less than {{.Perc}}% memory free
TypeType: WARNING
Raised when a machine is low on free memory.
OS_USERS
MsgMsg: Machine {{.Machine}} has more than {{.Num}} logged in users
TypeType: WARNING
Raised when a machine has too many users logged in.
OS_PROCS
MsgMsg: Machine {{.Machine}} has more than {{.Num}} processes
TypeType: WARNING
Raised when a machine has more too many processes.
SSH
MsgMsg: Machine {{.Machine}} doesn't have an active SSH server
Alerts code reference
February 07, 2019
ThoughtSpot Users Guide Page 380

TypeType: WARNING
Raised when a machine has more than 600 processes.
DISK_ERROR_EXTERNAL
MsgMsg: Machine {{.Machine}} has disk errors
TypeType: WARNING
Raised when more than 2 disk errors happen in a day.
ZK_FD_COUNT
MsgMsg: Zookeeper has more than {{.Num}} open file descriptors
TypeType: WARNING
Raised when there are too many open Zookeeper files.
ZK_EPHEMERAL_COUNT
MsgMsg: Zookeeper has more than {{.Num}} ephemeral files
TypeType: WARNING
Raised when there are too many Zookeeper ephemeral files.
HOST_DOWN
MsgMsg: {{.Machine}} is down
TypeType: WARNING
Raised when a host is down.
TASK_UNREACHABLE
MsgMsg: {{.ServiceDesc}} on {{.Machine}} is unreachable over HTTP
TypeType: WARNING
Raised when a task is unreachable over HTTP.
TASK_NOT_RUNNING
MsgMsg: {{.ServiceDesc}} is not running
TypeType: WARNING
Raised when a service task is not running on any machine in the cluster.
Alerts code reference
February 07, 2019
ThoughtSpot Users Guide Page 381

Critical alerts
TASK_FLAPPING
MsgMsg: Task {{.Service}}.{{.Task}} terminated {{._actual_num_occurrences}} times in last
{{._earliest_duration_str}}
TypeType: CRITICAL
This alert is raised when a task is crashing repeatedly. The service is evaluted across the whole cluster.
So, if a service crashes 5 times in a day across all nodes in the cluster, this alert is generated.
OREO_TERMINATED
MsgMsg: Oreo terminated on machine {{.Machine}}
TypeType: CRITICAL
This alert is raised when the Oreo daemon on a machine terminates due to an error. This typically
happens due to an error accessing Zookeeper, HDFS, or a hardware issue.
HDFS_DISK_SPACE
MsgMsg: HDFS has less than {{.Perc}}% space free
TypeType: CRITICAL
Raised when a HDFS cluster is low on total available disk space.
ZK_INACCESSIBLE
MsgMsg: Zookeeper is not accessible
TypeType: CRITICAL
Raised when Zookeeper is inaccessible.
PERIODIC_BACKUP_FLAPPING
MsgMsg: Periodic backup failed {{._actual_num_occurrences}} times in last
{{._earliest_duration_str}}
TypeType: CRITICAL
This alert is raised when a periodic backup failed repeatedly.
PERIODIC_SNAPSHOT_FLAPPING
MsgMsg: Periodic snapshot failed {{._actual_num_occurrences}} times in last
{{._earliest_duration_str}}
TypeType: CRITICAL
Alerts code reference
February 07, 2019
ThoughtSpot Users Guide Page 382

This alert is raised when periodic snapshot failed repeatedly.
APPLICATION_INVALID_STATE_EXTERNAL
MsgMsg: {{.Service}}.{{.Task}} on {{.Machine}} at location {{.Location}}
TypeType: CRITICAL
Raised when Application raises invalid state alert.
Alerts code reference
February 07, 2019
ThoughtSpot Users Guide Page 383

User action code reference
This reference identifies the user action codes that can appear in the System HealthSystem Health pages and in logs or
other reports.
answer_unsaved User makes a change to tokens in the search
bar.
answer_saved User opens an existing saved answer and makes
changes to tokens in the search bar.
answer_pinboard_context User opens an existing saved pinboard, edits a
context viz and makes a change to tokens in the
search bar.
answer_aggregated_worksheet User opens an existing saved aggregated work-
sheet and makes changes to tokens in the
search bar.
answer_upgrade Requests made for the sole purpose of upgrade.
pinboard_view User opens an existing saved pinboard.
pinboard_filter User adds, removes or applies values to a pin-
board filter.
pinboard_ad_hoc User drills down in a pinboard viz.
data_chart_config Request for new data being generated following
a chart config change.
data_show_underlying_row Request to show underlying data for a data
row(s).
data_export Request to export data.
pinboard_tspublic_runtime_filter Request to TSPublic/pinboarddata with runtime
filters.
answer_aggregated_worksheet_save User updates aggregated worksheet.
answer_add_new_filter User adds a filter using the UI.
data_show_underlying_viz Request to show underlying data for a data
row(s).
answer_view User opens an existing, saved answer.
answer_viz_context_view User opens an existing saved pinboard, edits a
context viz.
pinboard_insight_view User opens SpotIQ tab pinboards.
User action code reference
February 07, 2019
ThoughtSpot Users Guide Page 384

pinboard_admin_view User opens admin tab pinboards.
pinboard_embed_view User opens embed pinboard from a URL.
pinboard_homepage_view On loading of homepage pinboard.
pinboard_learn_view On loading learn pinboard.
pinboard_tspublic_no_runtime_filter Request to TSPublic/pinboard data without run-
time filters.
User action code reference
February 07, 2019
ThoughtSpot Users Guide Page 385

Error code reference
Summary:Summary: List of error codes and messages.
This section lists error codes that can appear in ThoughtSpot, with summary information and actions to
take. Error codes and messages are shown in ThoughtSpot when something goes wrong. These
messages can appear in the application and in logs.
When you see an error code, you will also see a message with a brief summary of what has happened. If
there is a remediation action you can take, it will be listed in this references. If there is no action listed,
please contact ThoughtSpot Support.
Tip:Tip: Only the base code number is listed for each error. So keep this in mind when searching
through these codes. For example, error code TS-00125 is simply listed as 125.
Metadata Errors (100 - 499)|
CodeCode SeveritySeverity SummarySummary DetailsDetails ActionAction
TS-00100 INFO Success. {1} has
been added to {2}.
\# {1} – name of vi-
sualization \# {2} –
{name/link to pin-
board}
None None
TS-00101 ERROR Failure adding {1} to
{2}
Visualization could
not be added to {2}
\# {1} – name of vi-
sualization \# {2} –
name/link to pin-
board
None
TS-00102 ERROR Failure adding {1} to
{2} due to corruption
{1} could not be
added to {2} as the
pinboard has one or
more invalid visual-
izations
Please try again after
removing the invalid
visualization(s) from
{2} \# {1} – name of vi-
sualization \# {2} –
name/link to pinboard
TS-00103 INFO Success. Visualiza-
tion has been delet-
ed from {1}. 1 –
name/link to pin-
board
None None
Error code reference
February 07, 2019
ThoughtSpot Users Guide Page 386

TS-00104 ERROR Failure deleting visu-
al from {1}
Visualization could
not be deleted from
the pinboard. 1 –
name/link to pin-
board
None
TS-00105 ERROR Failure deleting visu-
al from {1} due to
corruption
Visualization could
not be deleted from
{1} as the pinboard
has one or more in-
valid visualizations.
1 – name/link to pin-
board
Please try again after
removing the invalid
visualization(s) from
the pinboard
TS-00106 INFO Success. {1} created
successfully. 1 –
name/link to pin-
board
None None
TS-00107 ERROR Failure creating {1}.
1 – name/link to pin-
board
Uh oh. We’re not
sure what hap-
pened. Please email
the trace file to {ad-
minEmail}.
None
TS-00108 INFO Sticker created suc-
cessfully.
None None
TS-00109 ERROR Failure creating the
sticker.
Uh oh. We’re not
sure what hap-
pened. Please email
the trace file to {ad-
minEmail}.
None
TS-00110 INFO Sticker deleted suc-
cessfully.
None None
TS-00111 ERROR Failure deleting
sticker.
Uh oh. We’re not
sure what hap-
pened. Please email
the trace file to {ad-
minEmail}.
None
TS-00112 INFO Pinboards deleted
successfully.
None None
TS-00113 ERROR Failure deleting pin-
boards
Uh oh. We’re not
sure what hap-
pened. Please email
the trace file to {ad-
minEmail}.
None
TS-00114 INFO Answers deleted
successfully.
None None
Error code reference
February 07, 2019
ThoughtSpot Users Guide Page 387

TS-00115 ERROR Failure deleting an-
swers
Uh oh. We’re not
sure what hap-
pened. Please email
the trace file to {ad-
minEmail}.
None
TS-00116 INFO Tables deleted suc-
cessfully.
None None
TS-00117 ERROR Failure deleting ta-
bles
Uh oh. We’re not
sure what hap-
pened. Please email
the trace file to {ad-
minEmail}.
None
TS-00118 INFO Relationship created
successfully.
None None
TS-00119 ERROR Failure creating rela-
tionship
Uh oh. We’re not
sure what hap-
pened. Please email
the trace file to {ad-
minEmail}.
None
TS-00120 INFO Relationship updat-
ed successfully.
None None
TS-00121 ERROR Failure updating the
relationship
Uh oh. We’re not
sure what hap-
pened. Please email
the trace file to {ad-
minEmail}.
None
TS-00122 INFO Relationship deleted
successfully.
None None
TS-00123 ERROR Failure deleting the
relationship
Uh oh. We’re not
sure what hap-
pened. Please email
the trace file to {ad-
minEmail}.
None
TS-00124 ERROR Failure fetching de-
tails for table
Uh oh. We’re not
sure what hap-
pened. Please email
the trace file to {ad-
minEmail}.
None
TS-00125 ERROR Failure fetching de-
tails for the tables
Uh oh. We’re not
sure what hap-
pened. Please email
the trace file to {ad-
minEmail}.
None
Error code reference
February 07, 2019
ThoughtSpot Users Guide Page 388

TS-00126 ERROR Failure fetching de-
tails for datasource
Uh oh. We’re not
sure what hap-
pened. Please email
the trace file to {ad-
minEmail}.
None
TS-00127 ERROR Failure fetching de-
tails for datasources
Uh oh. We’re not
sure what hap-
pened. Please email
the trace file to {ad-
minEmail}.
None
TS-00128 ERROR Failure fetching de-
tails for metadata
items
Uh oh. We’re not
sure what hap-
pened. Please email
the trace file to {ad-
minEmail}.
None
TS-00129 ERROR Failure opening the
answer
Uh oh. We’re not
sure what hap-
pened. Please email
the trace file to {ad-
minEmail}.
None
TS-00130 ERROR Failure opening the
pinboard
Uh oh. We’re not
sure what hap-
pened. Please email
the trace file to {ad-
minEmail}.
None
TS-00131 ERROR Failure opening the
worksheet
Uh oh. We’re not
sure what hap-
pened. Please email
the trace file to {ad-
minEmail}.
None
TS-00132 INFO Table saved suc-
cessfully.
None None
TS-00133 ERROR There was a prob-
lem saving the table
Uh oh. We’re not
sure what hap-
pened. Please email
the trace file to {ad-
minEmail}.
None
TS-00134 INFO Visualization update
successful
None None
TS-00135 ERROR Visualization failed
to update
Uh oh. We’re not
sure what hap-
pened. Please email
the trace file to {ad-
minEmail}.
None
Error code reference
February 07, 2019
ThoughtSpot Users Guide Page 389

TS-00136 INFO {1} saved 1 – name
of answer
None None
TS-00137 ERROR {1} could not be
saved 1 – name of
answer
Uh oh. We’re not
sure what hap-
pened. Please email
the trace file to {ad-
minEmail}.
None
TS-00138 INFO {1} saved 1 - name
of pinboard / link
None None
TS-00139 ERROR {1} could not be
saved 1 - name of
pinboard / link
Uh oh. We’re not
sure what hap-
pened. Please email
the trace file to {ad-
minEmail}.
None
TS-00140 INFO {1} saved 1 – name
of worksheet
None None
TS-00141 ERROR {1} could not be
saved 1 – name of
worksheet
Uh oh. We’re not
sure what hap-
pened. Please email
the trace file to {ad-
minEmail}.
None
TS-00142 INFO {1} saved 1 – name
of answer
None None
TS-00143 ERROR {1} could not be
saved
Uh oh. We’re not
sure what hap-
pened. Please email
the trace file to {ad-
minEmail}. 1 – name
of answer
None
TS-00144 INFO {1} saved 1 – name/
link to pinboard
None None
TS-00145 ERROR {1} could not be
saved
Uh oh. We’re not
sure what hap-
pened. Please email
the trace file to {ad-
minEmail}. 1 – name
of pinboard
None
TS-00146 INFO Worksheet saved None None
TS-00147 ERROR Worksheet could not
be saved
Uh oh. We’re not
sure what hap-
pened. Please email
the trace file to {ad-
minEmail}.
None
Error code reference
February 07, 2019
ThoughtSpot Users Guide Page 390

TS-00148 INFO Sticker updated None None
TS-00149 ERROR The sticker could
not be updated
Uh oh. We’re not
sure what hap-
pened. Please email
the trace file to {ad-
minEmail}.
None
TS-00150 INFO Successfully as-
signed sticker
None None
TS-00151 ERROR The sticker could
not be assigned
Uh oh. We’re not
sure what hap-
pened. Please email
the trace file to {ad-
minEmail}.
None
TS-00152 INFO Successfully unas-
signed sticker
None None
TS-00153 ERROR The sticker could
not be unassigned
Uh oh. We’re not
sure what hap-
pened. Please email
the trace file to {ad-
minEmail}.
None
TS-00154 ERROR Failed to fetch meta-
data list
Uh oh. We’re not
sure what hap-
pened. Please email
the trace file to {ad-
minEmail}.
None
TS-00155 ERROR Failed to fetch table
list
Uh oh. We’re not
sure what hap-
pened. Please email
the trace file to {ad-
minEmail}.
None
TS-00156 ERROR Failed to fetch rela-
tionship list
Uh oh. We’re not
sure what hap-
pened. Please email
the trace file to {ad-
minEmail}.
None
TS-00157 ERROR Failed to fetch an-
swer list
Uh oh. We’re not
sure what hap-
pened. Please email
the trace file to {ad-
minEmail}.
None
Error code reference
February 07, 2019
ThoughtSpot Users Guide Page 391

TS-00158 ERROR Failed to fetch pin-
board list
Uh oh. We’re not
sure what hap-
pened. Please email
the trace file to {ad-
minEmail}.
None
TS-00159 ERROR Failed to fetch work-
sheet list
Uh oh. We’re not
sure what hap-
pened. Please email
the trace file to {ad-
minEmail}.
None
TS-00160 ERROR Failed to fetch ag-
gregated worksheet
list
Uh oh. We’re not
sure what hap-
pened. Please email
the trace file to {ad-
minEmail}.
None
TS-00161 ERROR Failed to fetch im-
ported data list
Uh oh. We’re not
sure what hap-
pened. Please email
the trace file to {ad-
minEmail}.
None
TS-00162 ERROR Failed to fetch sys-
tem table list
Uh oh. We’re not
sure what hap-
pened. Please email
the trace file to {ad-
minEmail}.
None
TS-00163 ERROR Failed to DB view
list
Uh oh. We’re not
sure what hap-
pened. Please email
the trace file to {ad-
minEmail}.
None
TS-00164 ERROR Failed to fetch data
source list
Uh oh. We’re not
sure what hap-
pened. Please email
the trace file to {ad-
minEmail}.
None
TS-00165 ERROR Failed to fetch col-
umn list
Uh oh. We’re not
sure what hap-
pened. Please email
the trace file to {ad-
minEmail}.
None
TS-00166 ERROR Failed to label list Uh oh. We’re not
sure what hap-
pened. Please email
the trace file to {ad-
minEmail}.
None
Error code reference
February 07, 2019
ThoughtSpot Users Guide Page 392

TS-00167 ERROR Failed to fetch an-
swer
Uh oh. We’re not
sure what hap-
pened. Please email
the trace file to {ad-
minEmail}.
None
TS-00168 ERROR Failed to fetch work-
sheet
Uh oh. We’re not
sure what hap-
pened. Please email
the trace file to {ad-
minEmail}.
None
TS-00169 INFO Aggregated work-
sheet {1} created 1 –
name of aggregated
worksheet
None None
TS-00170 ERROR Failure creating Ag-
gregated Work-
sheet.
Uh oh. We’re not
sure what hap-
pened. Please email
the trace file to {ad-
minEmail}.
None
TS-00171 INFO {1} updated 1 –
name of aggregated
worksheet
None None
TS-00172 ERROR {1} failed to update
1 – name of aggre-
gated worksheet
Uh oh. We’re not
sure what hap-
pened. Please email
the trace file to {ad-
minEmail}.
None
TS-00173 ERROR {1} failed to update
1 – name of the for-
mula
Uh oh. We’re not
sure what hap-
pened. Please email
the trace file to {ad-
minEmail}.
None
TS-00174 ERROR Comments cannot
be fetched
Failed to save client
state
None
TS-00175 ERROR Comment cannot be
created
Uh oh. We’re not
sure what hap-
pened. Please email
the trace file to {ad-
minEmail}.
None
TS-00176 ERROR Comment cannot be
updated
Uh oh. We’re not
sure what hap-
pened. Please email
the trace file to {ad-
minEmail}.
None
Error code reference
February 07, 2019
ThoughtSpot Users Guide Page 393

TS-00177 ERROR Comment cannot be
deleted
Uh oh. We’re not
sure what hap-
pened. Please email
the trace file to {ad-
minEmail}.
None
TS-00178 INFO Rule saved success-
fully
None None
TS-00179 ERROR Rule could not be
saved
We're not sure what
happened. Please
email the trace file
to {adminEmail}.
None
TS-00180 INFO Rule deleted suc-
cessfully
None None
TS-00181 ERROR Rule could not be
deleted
We're not sure what
happened. Please
email the trace file
to {adminEmail}.
None
TS-00182 INFO Item deleted suc-
cessfully.
None None
TS-00183 ERROR Item could not be
deleted.
We're not sure what
happened. Please
email the trace file
to {adminEmail}.
None
TS-00184 INFO Related link created
successfully.
None None
TS-00185 ERROR Related link could
not be created.
Uh oh. We're not
sure what hap-
pened. Please click
'Report Problem' to
email a report to
your administrator,
{adminEmail}.
None
TS-00186 INFO Related link updated
successfully.
None None
TS-00187 ERROR Related link could
not be updated.
Uh oh. We're not
sure what hap-
pened. Please click
'Report Problem' to
email a report to
your administrator,
{adminEmail}.
None
TS-00188 INFO Related link deleted
successfully.
None None
Error code reference
February 07, 2019
ThoughtSpot Users Guide Page 394

TS-00189 ERROR Related link could
not be deleted.
Uh oh. We're not
sure what hap-
pened. Please click
'Report Problem' to
email a report to
your administrator,
{adminEmail}.
None
TS-00190 INFO Related link detail
fetched successful-
ly.
None None
TS-00191 ERROR Related link detail
could not be
fetched.
Uh oh. We're not
sure what hap-
pened. Please click
'Report Problem' to
email a report to
your administrator,
{adminEmail}.
None
Data Service Errors (500 - 699)
CodeCode SeveritySeverity SummarySummary DetailsDetails ActionAction
TS-00500 ERROR Failed to fetch
leaf level data
Failed to fetch leaf level data. None
TS-00501 ERROR Failed to fetch
excel data
Failed to fetch excel data. None
TS-00502 ERROR Failed to fetch vi-
sualization data
Failed to fetch visuzliation data. None
TS-00503 ERROR Failed to fetch vi-
sualizations data
Failed to fetch data for visualizations. None
TS-00504 ERROR Failed to fetch
chart data
Failed to fetch table data. None
TS-00505 ERROR Failed to fetch
table data
Failed to fetch table data. None
TS-00506 ERROR Failed to fetch
worksheet data
Failed to fetch worksheet data. None
TS-00507 ERROR Failed to fetch
filter data
Failed to fetch filter data. None
TS-00508 ERROR Failed to fetch
headline data
Failed to fetch filter data. None
Error code reference
February 07, 2019
ThoughtSpot Users Guide Page 395

CodeCode SeveritySeverity SummarySummary DetailsDetails ActionAction
TS-00509 ERROR Failed to fetch
natural query
Failed to fetch natural query. None
TS-00510 INFO File upload suc-
cessful
None None
TS-00511 ERROR Failed to upload
file
Failed to upload None
TS-00512 ERROR The pinboard da-
ta could not be
exported to pdf.
Uh oh. We’re not sure what happened. Please
click ‘Report Problem’ to email a report to your
administrator, {adminEmail}.
None
Dependency Errors (700 - 799)
CodeCode SeveritySeverity SummarySummary DetailsDetails ActionAction
TS-00700 ERROR Failure fetching table depen-
dents
Failed to fetch dependents for the
table.
None
TS-00701 ERROR Failure fetching column de-
pendents
Failed to fetch dependents for the
column.
None
TS-00702 ERROR Failure fetching incomplete
items
Failed to fetch incomplete items. None
Admin Service Errors (800 - 899)
CodeCode SeveritySeverity SummarySummary DetailsDetails ActionAction
TS-00800 ERROR Failure fetching MemCache
stats
Failed to fetch MemCache
stats.
None
TS-00801 ERROR Failure MemCache Clear Failed to clear MemCache. None
TS-00802 ERROR Failure searching from Mem-
Cache
Failed to search from Mem-
Cache.
None
TS-00803 ERROR Failure fetching Loggers Failed to fetch Loggers. None
TS-00804 ERROR Failure setting LogLevel Failed to set Log Level. None
TS-00805 ERROR Failure getting debug info Failed to get debug info. None
TS-00806 INFO Memcache cleared successfully None None
Error code reference
February 07, 2019
ThoughtSpot Users Guide Page 396

CodeCode SeveritySeverity SummarySummary DetailsDetails ActionAction
TS-00807 INFO Log level set successfully None None
TS-00808 ERROR Failed to report problem None None
TS-00809 INFO Problem reported successfully None None
Permissions Errors (900 - 999)
CodeCode SeveritySeverity SummarySummary DetailsDetails ActionAction
TS-00900 ERROR Failure fetching table permis-
sions
Failed to fetch table permis-
sions.
None
TS-00901 ERROR Failure fetching answer permis-
sions
Failed to fetch answer permis-
sions.
None
TS-00902 ERROR Failure fetching pinboard per-
missions
Failed to fetch pinboard per-
missions.
None
TS-00903 ERROR Failure getting metadata per-
missions
Failed to get metadata permis-
sions.
None
Import Data Errors (1000 - 1099)
CodeCode SeveritySeverity SummarySummary DetailsDetails ActionAction
TS-01000 ERROR Data caching failed Data caching failed. None
TS-01001 ERROR Read Columns failed. Failed to read columns. None
TS-01002 ERROR Failed to read keys. Failed to read keys. None
TS-01003 ERROR Failed to read relationships. Failed to read relationships. None
TS-01004 ERROR Failed to load data. Failed to load data. None
TS-01005 ERROR Failed to create table. Failed to create table. None
TS-01006 ERROR Failed to fetch data rows. Failed to fetch data rows. None
TS-01007 ERROR Failed to delete files. Failed to fetch data rows. None
TS-01008 ERROR Failed to abort create table. Failed to abort create table. None
TS-01009 ERROR Failed to create schema. Failed to create schema. None
Error code reference
February 07, 2019
ThoughtSpot Users Guide Page 397

CodeCode SeveritySeverity SummarySummary DetailsDetails ActionAction
TS-01010 ERROR Failed to fetch table models. Failed to fetch table models. None
TS-01011 ERROR Failed to fetch sample values. Failed to fetch sample values. None
Scheduled Jobs Errors (1100 - 1199)
CodeCode SeveritySeverity SummarySummary DetailsDetails ActionAction
TS-01100 INFO The list of jobs. None Please click ‘Report Problem’ to email a re-
port to your administrator.
TS-01110 INFO Successfully creat-
ed job.
None None
TS-01111 ERROR The job could not
be created.
None Please click ‘Report Problem’ to email a re-
port to your administrator.
TS-01112 INFO Successfully up-
dated job.
None None
TS-01113 ERROR The job could not
be updated.
None Please click ‘Report Problem’ to email a re-
port to your administrator.
TS-01114 INFO Successfully delet-
ed jobs.
None None
TS-01115 ERROR The job could not
be deleted.
None Please click ‘Report Problem’ to email a re-
port to your administrator.
TS-01116 INFO The job was
paused.
None None
TS-01117 ERROR The job could not
be paused.
None Please click ‘Report Problem’ to email a re-
port to your administrator.
TS-01118 INFO The job was re-
sumed
None None
TS-01119 ERROR The job could not
be resumed.
None Please click ‘Report Problem’ to email a re-
port to your administrator.
User Admin Service Errors (1200 - 1399)
CodeCode SeveritySeverity SummarySummary DetailsDetails ActionAction
TS-01200 ERROR Failed to fetch users list Failed to fetch users list None
Error code reference
February 07, 2019
ThoughtSpot Users Guide Page 398

CodeCode SeveritySeverity SummarySummary DetailsDetails ActionAction
TS-01201 ERROR Failed to fetch groups list Failed to fetch groups list None
TS-01202 ERROR Failed to fetch users and groups
list
Failed to fetch users and
groups list
None
TS-01203 ERROR Successfully created user Successfully created user None
TS-01204 ERROR Failed to create user Failed to create user None
TS-01205 ERROR Successfully created group Successfully created group None
TS-01206 ERROR Failed to create group Failed to create group None
TS-01207 ERROR Successfully updated user Successfully updated user None
TS-01208 ERROR Failed to update user Failed to update user None
TS-01209 ERROR Successfully updated users Successfully updated users None
TS-01210 ERROR Failed to update users Failed to update users None
TS-01211 ERROR Successfully updated group Successfully updated group None
TS-01212 ERROR Failed to update group Failed to update group None
TS-01213 ERROR Successfully updated password Successfully updated password None
TS-01214 ERROR Failed to update password Failed to update password None
TS-01215 ERROR Successfully deleted users Successfully deleted users None
TS-01216 ERROR Failed to delete users Failed to delete users None
TS-01217 ERROR Successfully deleted groups Successfully deleted groups None
TS-01218 ERROR Failed to delete groups Failed to delete groups None
TS-01219 ERROR Successfully assigned users to
groups
Successfully assigned users to
groups
None
TS-01220 ERROR Failed to assign users to groups Failed to assign users to groups None
TS-01221 ERROR Failed to fetch profile pic Failed to fetch profile pic None
TS-01222 INFO Successfully uploaded profile
pic
None None
TS-01223 ERROR Failed to upload profile pic Failed to upload profile pic None
TS-01224 ERROR Successfully assigned groups to
group
Failed to assign user to group None
Error code reference
February 07, 2019
ThoughtSpot Users Guide Page 399

CodeCode SeveritySeverity SummarySummary DetailsDetails ActionAction
TS-01228 ERROR Successfully created role Successfully created role None
TS-01229 ERROR Failed to create role Failed to create role None
TS-01230 ERROR Successfully deleted role Successfully deleted role None
TS-01231 ERROR Failed to delete role Failed to delete role None
TS-01232 ERROR Successfully updated role Successfully updated role None
TS-01233 ERROR Failed to update role Failed to update role None
Session Service Errors (1400 - 1599)
CodeCode SeveritySeverity SummarySummary DetailsDetails ActionAction
TS-01400 ERROR Failed to fetch session
info
Failed to fetch session info None
TS-01401 ERROR Failed to login Uh oh. We’re not sure what happened.
Please email the trace file to {adminE-
mail}.
None
TS-01402 ERROR Failed to logout Failed to logout None
TS-01403 ERROR Failed to save client
state
Failed to save client state None
TS-01404 ERROR Failed to fetch login con-
fig
Failed to fetch login config None
TS-01405 ERROR Failed to fetch slack
config
Failed to fetch slack config None
TS-01406 ERROR Health check failed Health check failed None
TS-01407 ERROR Failed to fetch health
portal token
Failed to fetch health portal token None
TS-01408 ERROR The health portal release
name could not be re-
trieved
Uh oh. We’re not sure what happened.
Please email the trace file to {adminE-
mail}.
None
Error code reference
February 07, 2019
ThoughtSpot Users Guide Page 400

Data Management Service Errors (1600 - 1799)
CodeCode SeveritySeverity SummarySummary DetailsDetails ActionAction
TS-01600 ERROR Failed to fetch data
source types
Failed to fetch data source types None
TS-01601 ERROR Failed to fetch data
source sample values
Failed to fetch data source sample
values
None
TS-01602 ERROR Failed to delete data
source
Failed to delete data source None
TS-01603 ERROR Failed to execute DDL Failed to execute DDL None
TS-01604 ERROR Failed to update sched-
ule
Failed to update schedule None
TS-01605 ERROR Failed to reload tasks Failed to reload tasks None
TS-01606 ERROR Failed to stop tasks Failed to stop tasks None
TS-01607 ERROR Failed to get creation
DDL
Failed to get creation DDL None
TS-01608 ERROR Failed to load from data
source
Failed to load from data source None
TS-01609 ERROR Failed to create connec-
tion to data source
Failed to create connection to data
source
None
TS-01610 ERROR Failed to create data
source
Failed to create data source None
TS-01611 ERROR Failed to connect to data
source
Failed to connect to data source None
TS-01612 ERROR Failed to get data source
connection field info
Failed to get data source connection
field info
None
TS-01613 ERROR Failed to get connection
list for data source
Failed to get connection list for data
source
None
TS-01614 ERROR Failed to get connection
attributes for data source
Failed to get connection attributes for
data source
None
TS-01615 ERROR Failed to get connections
to data source
Failed to get connections to data
source
None
Error code reference
February 07, 2019
ThoughtSpot Users Guide Page 401

CodeCode SeveritySeverity SummarySummary DetailsDetails ActionAction
TS-01616 ERROR Failed to fetch data
source config
Failed to fetch data source config None
TS-01617 ERROR Failed to parse sql. Failed to parse sql. None
TS-01618 ERROR Failed to execute sql. Failed to execute sql. None
TS-01619 INFO Successfully created
connection to data
source
None None
TS-01620 INFO Successfully updated da-
ta upload schedule
None None
TS-01621 ERROR Failed to execute sql. Please check the failing command,
executed {1} statements successfully.
None
TS-01622 ERROR Lightweight data-cache
disabled
Lightweight data-cache disabled None
TS-01623 INFO Selected tables were
queued for loading.
Selected tables were queued for load-
ing.
None
TS-01624 ERROR DataType conversion er-
ror.
No mapping found for source
datatype to ThoughtSpot datatype.
None
TS-01625 INFO Successfully reload task
started.
None None
TS-01626 INFO Successfully connected
to data source.
None None
TS-01627 INFO Successfully created data
source.
None None
TS-01628 INFO Successfully stopped the
tasks.
None None
TS-01629 INFO Successfully deleted the
connection.
None None
TS-01630 ERROR There was an error delet-
ing this connection.
None None
TS-01631 INFO Successfully executed
the DDL.
None None
Error code reference
February 07, 2019
ThoughtSpot Users Guide Page 402

Cluster Status Service Errors (1800 - 1899)
CodeCode SeveritySeverity SummarySummary DetailsDetails ActionAction
TS-01800 WARNING Failed to fetch cluster information from search
service.
None None
TS-01801 WARNING Failed to fetch table detail information from
search service.
None None
TS-01802 WARNING Failed to fetch cluster information from data-
base service.
None None
TS-01803 WARNING Failed to fetch table detail information from
databse service.
None None
TS-01804 WARNING Failed to fetch cluster information from cluster
management service.
None None
TS-01805 WARNING Failed to fetch detail information from cluster
management service.
None None
TS-01806 WARNING Failed to fetch log from cluster management
service.
None None
TS-01807 WARNING Failed to fetch snapshot list from cluster man-
agement service.
None None
TS-01808 WARNING Failed to fetch cluster information from alert
management service.
None None
TS-01809 WARNING Failed to fetch cluster information from event
service.
None None
TS-01810 WARNING Failed to fetch alerts information from alert
management service.
None None
TS-01811 WARNING Failed to fetch events information from alert
management service.
None None
TS-01812 INFO Thanks for your feedback! None None
TS-01813 WARNING Sorry! Unable to submit the feedback at this
moment!
None None
TS-01814 INFO Successfully exported objects. File can be
found at {1}.
None None
TS-01815 ERROR Sorry! Unable to export objects at this moment! What hap-
pened? {1}.
None
Error code reference
February 07, 2019
ThoughtSpot Users Guide Page 403

CodeCode SeveritySeverity SummarySummary DetailsDetails ActionAction
TS-01816 INFO Successfully imported objects None None
TS-01817 ERROR Sorry! Unable to import objects at this moment! What hap-
pened? {1}.
None
TS-01818 INFO Successfully deleted data source object(s). None None
Callosum API Errors (9000 - 9199)
CodeCode SeveritySeverity SummarySummary DetailsDetails ActionAction
TS-09000 ERROR The data you are
trying to delete
has some depen-
dencies
Some objects depend on the data
you are trying to delete
delete the de-
pendencies
before delet-
ing this data.
TS-09001 ERROR Uh oh. We’re not
sure what hap-
pened.
Please email the trace file to {ad-
minEmail}.
None
TS-09002 ERROR Could not autho-
rize user
Try logging in again None
TS-09003 ERROR Uh oh. We’re not
sure what hap-
pened.
Please email the trace file to {ad-
minEmail}.
None
TS-09004 WARNING Still loading data,
come back soon
None None
TS-09005 ERROR Uh oh. We’re hav-
ing trouble getting
data for this re-
quest.
Please email the trace file to {ad-
minEmail}.
None
TS-09006 ERROR Uh oh. We’re hav-
ing trouble getting
data for this re-
quest.
Please email the trace file to {ad-
minEmail}.
None
TS-09007 ERROR Uh oh. We’re hav-
ing trouble getting
data for this re-
quest.
Please email the trace file to {ad-
minEmail}.
None
TS-09008 ERROR Something went
wrong with your
search
Uh oh. We’re not sure what hap-
pened. Please email the trace file
to {adminEmail}.
None
Error code reference
February 07, 2019
ThoughtSpot Users Guide Page 404

CodeCode SeveritySeverity SummarySummary DetailsDetails ActionAction
TS-09009 ERROR The calculation
engine has timed
out. Please try
again.
Please email the trace file to {ad-
minEmail}.
None
TS-09010 ERROR Cannot open Ob-
ject
Object cannot be opened due to
errors in some of its dependencies
None
TS-0Blink
Generated
Errors
(9500 -
9599)
TS-09500 WARNING Cannot connect
to the calculation
engine. Please try
again soon.
None None
TS-09501 WARNING The calculation
engine has timed
out. Please try
again.
None None
TS-09502 WARNING Cannot connect
to the search en-
gine. Please try
again soon.
None None
TS-09503 WARNING The search en-
gine has timed
out. Please try
again.
None None
TS-09504 ERROR Cannot open {1} {1} cannot be opened due to er-
rors in the following dependencies
1 - Type of the object Table/An-
swer/Pinboard etc.
None
TS-09505 WARNING We’re still index-
ing this data, try
again soon
None None
TS-09506 ERROR Object is not pre-
sent in the system
{1} is not present in the system 1 -
Type of the object Table/Answer/
Pinboard etc.
None
TS-09507 ERROR ThoughtSpot is
unreachable.
Please try again
soon
None None
Error code reference
February 07, 2019
ThoughtSpot Users Guide Page 405

Common Errors (10000 - 10099)
CodeCode SeveritySeverity SummarySummary DetailsDetails ActionAction
TS-10000 ERROR A system er-
ror has oc-
curred
Uh oh. We’re not sure what happened.
Please contact your administrator.
None
TS-10001 ERROR Connection
failed
The metadata store is not reachable. Please contact
your administra-
tor
TS-10002 ERROR The input is
invalid
Input from the client to the server is in-
valid.
Please contact
your administra-
tor
TS-10003 ERROR Unfortunately,
you can’t do
that
You are not authorized to perform {1}. #
{1} – action user is not authorized for
Please request
access from
your administra-
tor
TS-10004 ERROR The user
could not be
authorized
User {0} is not authorized to perform
{1}. # {0} – name of the user # {1} – ac-
tion user is not authorized for
Please request
access from
your administra-
tor
TS-10005 ERROR The base ob-
ject is miss-
ing
An underlying object referenced by this
object is missing in store.
Please contact
your administra-
tor
TS-10006 ERROR The connec-
tion to
Zookeeper
has failed
Zookeeper is not reachable. Please contact
your administra-
tor
TS-10007 ERROR There’s in-
valid parame-
ter(s)
Invalid parameter values: {0}. Please contact
your administra-
tor
TS-10008 ERROR The user can-
not be found
User {0} not found in store. # {0} –
name of the user
Please contact
your administra-
tor
TS-10009 ERROR Cannot add
group
This group already belongs to the
group you are trying to add it to.
None
Error code reference
February 07, 2019
ThoughtSpot Users Guide Page 406

Falcon Errors (10600 - 10699)
CodeCode SeveritySeverity SummarySummary DetailsDetails ActionAction
TS-10603 ERROR Falcon query cancelled None None
Data Errors (11000 - 11099)
CodeCode SeveritySeverity SummarySummary DetailsDetails ActionAction
TS-11001 ERROR Invalid row None None
TS-11002 ERROR Invalid table/query re-
sultset
None None
TS-11003 ERROR Invalid column identifier None None
TS-11004 ERROR Invalid visualization
identifier
None None
TS-11005 ERROR No data Query execution resulted in no data. None
TS-11006 ERROR Query execution failed Error in query execution to Falcon. None
TS-11007 ERROR Answer data generation
failed
Error in Answer data generation for
Sage input.
None
TS-11008 ERROR Data export failed None None
TS-11009 ERROR Data generation failed Error in data generation in Callosum. None
Report Generation Errors (12000 - 13000)
CodeCode SeveritySeverity SummarySummary DetailsDetails ActionAction
TS-12700 ERROR Error while exporting data file. None None
TS-12701 ERROR Invalid input. The definition of the job is in-
valid.
None
TS-12702 ERROR No author provided. None None
TS-12703 ERROR No pinboard provided. None None
Error code reference
February 07, 2019
ThoughtSpot Users Guide Page 407

CodeCode SeveritySeverity SummarySummary DetailsDetails ActionAction
TS-12704 ERROR No recipients provided. None None
TS-12705 ERROR This format is not supported. None None
TS-12706 ERROR No job name provided. None None
TS-12707 ERROR No job description provided. None None
TS-12708 ERROR Pinboard data export error. None None
TS-12709 ERROR Visualization data export error. None None
TS-12710 ERROR User data unavailable. None None
TS-12711 ERROR Configuration information un-
available.
None None
TS-12712 ERROR There are too many recipients. The max number of recipients is
1000.
None
TS-12713 ERROR Attachment size limit exceeded. None None
TS-12714 ERROR Recipient domain is not
whitelisted.
None None
More Metadata Errors (13000 - 13099)
CodeCode SeveritySeverity SummarySummary DetailsDetails ActionAction
TS-13001 ERROR Schema creation
failed
Error creating database
schema.
None
TS-13002 ERROR Views creation
failed
Error creating view. None
TS-13003 ERROR The object can-
not be found in
store
Object with Id: {0} of
type: {1} not found. #
{0} – identity of the ob-
ject # {1} – type of ob-
ject
None
TS-13004 ERROR The object is in
an invalid state
Oject with Id: {0} of
type: {1} in invalid state.
# {0} – identity of the
object # {1} – type of
object
None
Error code reference
February 07, 2019
ThoughtSpot Users Guide Page 408

CodeCode SeveritySeverity SummarySummary DetailsDetails ActionAction
TS-13005 ERROR Object already
exists
Object with Id: {0} of
type: {1} already exists.
# {0} – identity of the
object # {1} – type of
object
None
TS-13006 ERROR Invalid object
type
Invalid type: {0} provid-
ed. # {1} – type of ob-
ject
None
TS-13007 ERROR Invalid Sage
question
Insufficient or invalid in-
put from Sage: {0}. #
{0} – the invalid input
None
TS-13008 ERROR Invalid Sage
question
Input from from Sage –
missing columns of
type: {0}. # {0} – column
type
None
TS-13009 ERROR Invalid Sage
question
Invalid input from Sage
– invalid expression:
{0}. # {0} – the invalid
expression
None
TS-13010 ERROR Sending logical
metadata to
Sage failed
Sending logical meta-
data to Sage failed due
to: {0}. # {0} – reason
for failure
None
TS-13011 ERROR Answer genera-
tion failed
Answer generation
failed due to: {0}. # {0} –
reason for failure
None
TS-13012 ERROR Worksheet gen-
eration failed
Worksheet generation
failed due to: {0}. # {0} –
reason for failure
None
TS-13013 ERROR Service provider
unavailable
Service provider un-
available: {0}. # {0} –
provider details
None
TS-13015 ERROR Physical model
not loaded
None None
TS-13016 ERROR Invalid physical
schema proto
Inconsistency in physi-
cal schema from Fal-
con: {0}. # {0} – error
details
None
TS-13017 ERROR Invalid duplicate
columns
Duplicate columns: {0}.
# {0} – List of duplicate
column identities
None
Error code reference
February 07, 2019
ThoughtSpot Users Guide Page 409

CodeCode SeveritySeverity SummarySummary DetailsDetails ActionAction
TS-13018 ERROR Cyclic relation-
ship
Detected cycles: {0}. #
{0} – cycle details
None
TS-13019 WARNING Older physical
schema version
received
Schema update for old-
er version: {0} received
and ignored. # {0} – re-
ceived version number
None
TS-13020 ERROR Invalid relation-
ship
Attempted to create in-
valid relationship: {0}. #
{0} – relationship details
None
TS-13022 ERROR Invalid filter val-
ues: {values}
None None
TS-13023 ERROR Creating relation-
ship failed.
None None
TS-13024 ERROR Deleting schema
failed.
None None
TS-13025 ERROR Expression vali-
dation failed.
None None
TS-13026 INFO Load schedule
successfully dis-
abled.
None None
TS-13027 ERROR Load schedule
could not be dis-
abled.
None None
TS-13028 ERROR Objects fetched
from the connec-
tion are invalid
for editing data-
source.
None To proceed with editing
the datasource, please
edit the connection below
to fetch valid source ob-
jects.
TS-13029 INFO Successfully
edited data
source connec-
tion.
None None
TS-13030 ERROR Connection test
failed.
None Please verify connection
attributes.
Error code reference
February 07, 2019
ThoughtSpot Users Guide Page 410

Loading Errors (30000 - 30099)
CodeCode SeveritySeverity SummarySummary DetailsDetails ActionAction
TS-30000 ERROR Table is not ready (data loading in progress). None None
Timely Errors (60000 - 64999)
CodeCode SeveritySeverity SummarySummary DetailsDetails ActionAction
TS-60000 ERROR Failed to initialize. None None
Error code reference
February 07, 2019
ThoughtSpot Users Guide Page 411

Frequently asked questions
Where can I find the version of ThoughtSpot I am using?
Users with administrative privileges can see this displayed on the Admin > System Health > OverviewAdmin > System Health > Overview
page.
I’m not seeing certain columns/values in the drop-down, why?
It could be the index has not built with the latest data or something is causing the column to be dropped.
• Verify the the column is available using the DataData page.
• View the table columns and check the INDEX TYPEINDEX TYPE value. If it is set to DONT_INDEX , change
it.
• Check the column’s INDEX PRIORITYINDEX PRIORITY &emdash. make sure it is 1.
To learn more about modeling data see modeling data in this documentation.
How do I track progress of current index build?
If you are an administrator, you can use the Admin > System Health > OverviewAdmin > System Health > Overview page to see the number
of tables currently being indexed. You can also review the
How do I display the features used in my cluster configuration?
1. Log into the ThoughtSpot cluster as the admin user.
2. Use the tscli feature subcommand to display your current configuration.
Frequently asked questions
February 07, 2019
ThoughtSpot Users Guide Page 412

$ tscli feature get-all-config
+---------------------------------+----------
+---------------+
| NAME | STATUS | CONFIGUR
ATION |
+---------------------------------+----------
+---------------+
| Firewall | Disabled
| |
| Saml | Disabled
| |
| Ldap | Disabled
| |
| CustomBranding | Disabled
| |
| CustomBrandingFontCustomization | Disabled
| |
| DataConnect | Disabled
| |
| RLS | Enabled
| |
| Callhome | Enabled
| |
| SSHTunnel | Enabled
| |
| Fileserver | Disabled
| |
+---------------------------------+----------
+---------------+
Is it possible to create a max(date) filed and set it to filter?
If you have a date field in my set of data and want to return the most recent set of data based on specific
date. To do this:
1. Create a formula called Max Date , for example:
date = group_max ( date_to_filter_by )
2. In the search bar, filter your dates by this formula for example:
max date = true
Frequently asked questions
February 07, 2019
ThoughtSpot Users Guide Page 413

This returns only those fields that pass the filter.
Frequently asked questions
February 07, 2019
ThoughtSpot Users Guide Page 414
