MC2Analyzer User Manual UM3182 MC2AUser Rev5
User Manual:
Open the PDF directly: View PDF ![]() .
.
Page Count: 128 [warning: Documents this large are best viewed by clicking the View PDF Link!]

CAEN
Tools for Discovery
n
Electronic Instrumentation
User Manual UM3182
MC2Analyzer User Manual
Software for digital Multi Channel Analyzer
Rev. 5 - December 20th, 2017

Purpose of this Manual
This User Manual contains the full description of the MC2Analyzer software for CAEN 724, 725, and 730 digitizer families, DT5770,
780, 781, and Hexagon MCA families. The description is compliant with DPP-PHA firmware release 4.15_128.36 for 724, 780 and 781
series, firmware release 4.15_139.8 for 725 and 730 series, firmware release 5.03_5.02 for DT5770 series, firmware release 1.0 for
Hexagon and MC2Analyzer software release 1.0.30. For future release compatibility check the firmware and software revision history
files.
NOTE: MC2Analyzer supports also
stream MCA tube-base. All the software functionalities for
stream are described in [RD11].
Change Document Record
Date
Revision
Changes
April 14th, 2014
00
Initial release
January 26th, 2015
01
Added support to 730 and 781 series. Fully revised the Principle of
Operation Chapter. Added Quick Start Guide, and Appendices.
November 4th, 2016
02
Added support to 725 digitizer family and DT5770 MCA. Modified
Channel Aggregate data format for 725 and 730 series.
January 11th, 2017
03
Revised Sect. Histogram and list energy format. Added ADC
calibration for 725 and 730 series.
June 20th, 2017
04
Revised Sect. GUI Description and Appendix B Memory Organization
December 20th, 2017
05
Added support to Hexagon. Added DT5780SC to Tab. 1.1. Removed
Rise Time Discrimination window. Modified Aggregate format for
x725-x730 (Appendix B)
Symbols, abbreviated terms and notation
ADC
Analog to Digital Converter
CSP
Charge Sensitive Preamplifier
DAC
Digital-to-Analog Converter
DAQ
Data Acquisition
DPP
Digital Pulse Processing
DPP-QDC
DPP for Charge to Digital Converter
DPP-PHA
DPP for Pulse Height Analysis
DPP-PSD
DPP for Pulse Shape Discrimination
HPGe
High Purity Germanium
MCA
Multi-Channel Analyser
OS
Operating System
PC
Personal Computer
PHA
Pulse Height Analysis
PMT
Photo Multiplier Tube
TTF
Trigger and Timing Filter
USB
Universal Serial Bus
Reference Documents
[RD1] Jordanov, V.T. et al., Nuclear Instruments and Methods A 353 (1994) 337-345
[RD2] UM2606 – DT5780 Digital MCA
[RD3] GD2783 – First Installation Guide to Desktop Digitizers & MCA
[RD4] M. Morhac et al.: Identification of peaks in multidimensional coincidence gamma-ray spectra. Nuclear
Instruments and Methods in Research Physics A 443(2000), 108-125.
[RD5] GD2827 - How to make coincidences with CAEN digitizers
[RD6] AN2086 - Synchronization of a multi-board acquisition system with CAEN digitizers
[RD7] UM1935 - CAENDigitizer User & Reference Manual
[RD8] UM5407 780 DPP-PHA Registers Description
[RD9] UM5469 724-781 DPP-PHA Registers Description

[RD10] UM5678 725-730 DPP-PHA Registers Description
[RD11] UM3904 - Gamma stream User Manual
[RD12] UM3185 - CAENDPP Library User & Reference Manual
All documents can be downloaded from: http://www.caen.it/csite/LibrarySearch.jsp
CAEN S.p.A.
Via Vetraia, 11 55049 Viareggio (LU) - ITALY
Tel. +39.0584.388.398 Fax +39.0584.388.959
info@caen.it
www.caen.it
© CAEN SpA – 2017
Disclaimer
No part of this manual may be reproduced in any form or by any means, electronic, mechanical, recording, or otherwise,
without the prior written permission of CAEN SpA.
The information contained herein has been carefully checked and is believed to be accurate; however, no responsibility
is assumed for inaccuracies. CAEN SpA reserves the right to modify its products specifications without giving any notice;
for up to date information please visit www.caen.it.
MADE IN ITALY: We remark that all our boards have been designed and assembled in Italy. In a challenging environment
where a competitive edge is often obtained at the cost of lower wages and declining working conditions, we proudly
acknowledge that all those who participated in the production and distribution process of our devices were reasonably
paid and worked in a safe environment (this is true for the boards marked "MADE IN ITALY", while we cannot guarantee
for third-party manufactures).

CAEN
Electronic Instrumentation
UM3182 – MC2Analyzer User Manual Rev. 5
4
Index
Purpose of this Manual ............................................................................................................................................. 2
Change Document Record ........................................................................................................................................ 2
Symbols, abbreviated terms and notation ............................................................................................................... 2
Reference Documents .............................................................................................................................................. 2
Index.......................................................................................................................................... 4
List of Figures ............................................................................................................................. 5
List of Tables .............................................................................................................................. 7
1 Introduction ....................................................................................................................... 8
2 Principle of Operation ...................................................................................................... 11
Traditional Analog Approach................................................................................................................................................11
CAEN Digital Approach .........................................................................................................................................................13
Decimator ..................................................................................................................................................................................15
Trigger and Timing Filter ............................................................................................................................................................16
Trigger and Timing Filter for DT5770 .........................................................................................................................................17
Trapezoidal Filter (Energy Filter) ................................................................................................................................................18
Pole-Zero Adjustment ................................................................................................................................................................19
Baseline Restoration ..................................................................................................................................................................19
Pile-up Rejection ........................................................................................................................................................................20
Dead Time ..................................................................................................................................................................................21
3 Getting Started ................................................................................................................. 22
Hardware setup....................................................................................................................................................................22
Software setup .....................................................................................................................................................................23
Drivers .......................................................................................................................................................................................23
Network configuration...............................................................................................................................................................24
Libraries .....................................................................................................................................................................................27
Software Installation ............................................................................................................................................................28
Software connection ............................................................................................................................................................32
Software connection to the DT5770 MCA .................................................................................................................................33
Channel selection and default GUI layout .................................................................................................................................35
How to power ON the high voltage (780 family only) ...............................................................................................................36
ADC Calibration (725 and 730 series only) ...........................................................................................................................37
Before starting the acquisition .............................................................................................................................................37
How to configure the channel settings ................................................................................................................................38
Open the Signal Inspector window ............................................................................................................................................38
How to configure the Input Signal settings ................................................................................................................................41
How to set the Trigger ...............................................................................................................................................................42
How to set the Trigger filter (DT5770 only) ...............................................................................................................................46
Pole-Zero Adjustment ................................................................................................................................................................51
Start/Stop the acquisition ....................................................................................................................................................52
How to calibrate a spectrum ................................................................................................................................................54
How to select a ROI ...................................................................................................................................................................54
Energy calibration ......................................................................................................................................................................56
How To use Decimation .......................................................................................................................................................58
How to save data .................................................................................................................................................................60
Save the energy spectrum .........................................................................................................................................................60
Save the list file ..........................................................................................................................................................................61
Save the Image ..........................................................................................................................................................................61
Troubleshooting ...................................................................................................................................................................62
4 Software Interface ............................................................................................................ 63
GUI Description ....................................................................................................................................................................63
MC2Analyzer Initial Main Screen Description ...........................................................................................................................63
Menu Bar Items .........................................................................................................................................................................65
Icon Bar ......................................................................................................................................................................................74
Histogram Window ....................................................................................................................................................................75
HV Channels Window ................................................................................................................................................................76
Properties Window ....................................................................................................................................................................78
Signal Inspector Window ...........................................................................................................................................................79
Acquisition Set-up procedure with the Signal Inspector Tool ....................................................................................................81

CAEN
Electronic Instrumentation
UM3182 – MC2Analyzer User Manual Rev. 5
5
Acquisition Setup .......................................................................................................................................................................85
Board Tab ..................................................................................................................................................................................86
General Tab ...............................................................................................................................................................................86
Coincidences Tab .......................................................................................................................................................................86
Generic Writes Tab ....................................................................................................................................................................88
Output Tab .................................................................................................................................................................................89
Header file format .....................................................................................................................................................................90
Histogram and list energy format (x724-x780-x781 DPP-PHA firmware release <128.64 only) ................................................91
GPIO Tab ....................................................................................................................................................................................92
Channels Tab .............................................................................................................................................................................94
Spectra List Window ..................................................................................................................................................................99
Cursor Window ........................................................................................................................................................................101
ROI Editor Window ..................................................................................................................................................................101
MC2Analyzer Energy Calibration .............................................................................................................................................103
Software Exit ............................................................................................................................................................................105
5 Technical support ........................................................................................................... 106
Appendix A ............................................................................................................................ 107
Acquisition Modes .............................................................................................................................................................107
Trigger Modes ..........................................................................................................................................................................107
Normal (Individual) Trigger Mode ...........................................................................................................................................108
Coincidence Trigger Mode .......................................................................................................................................................112
Anti-coincidence Trigger Mode ...............................................................................................................................................112
Neighbour Trigger Mode .........................................................................................................................................................113
Synchronization among different boards ................................................................................................................................116
Appendix B ............................................................................................................................ 117
Memory Organization ........................................................................................................................................................117
724 series .................................................................................................................................................................................117
725/730 series .........................................................................................................................................................................118
Event Data Format .............................................................................................................................................................119
Channel Aggregate Data Format for 724, 780, and 781 series ................................................................................................119
Channel Aggregate Data Format for 725 and 730 series .........................................................................................................122
Board Aggregate Data Format .................................................................................................................................................126
Data Block ................................................................................................................................................................................127
List of Figures
Fig. 1.1: MC2Analyzer main screen ..........................................................................................................................................................8
Fig. 2.1: Nuclear Radiation Detector (with Charge Sensitive Preamplifier) Analog Chain Block Diagram .............................................11
Fig. 2.2: Simplified schematic of a RC-type Charge Sensitive Preamplifier ............................................................................................11
Fig. 2.3: Pile-up of detector signals due to the large decay time of the Preamplifier output ................................................................11
Fig. 2.4: Signals in the traditional analog chain .....................................................................................................................................12
Fig. 2.5: Block Diagram of a Digitizer-based Spectroscopy System ........................................................................................................13
Fig. 2.6: 60Co energy spectrum from HPGe detector .............................................................................................................................13
Fig. 2.7: Pulse Height Analysis with Trapezoid Method .........................................................................................................................14
Fig. 2.8: Block Diagram of the processing chain programmed into the Digitizer’s FPGA .......................................................................14
Fig. 2.9: Block Diagram of the processing chain programmed into the DT5770 FPGA ..........................................................................15
Fig. 2.10: The Trigger and Timing Filter allows to detect pulses on the zero-crossing of the RC-CR2 signal, which corresponds to a 2nd
derivative of the input pulse. The derivative component of the RC-CR2 subtracts the baseline and makes easier to perform a zero-
crossing calculation. ..............................................................................................................................................................................16
Fig. 2.11: Triggering on the fast trapezoid signal (DT5770 only) ...........................................................................................................17
Fig. 2.12: Block diagram showing the DT5770 trigger management .....................................................................................................17
Fig. 2.13: Simplified signals scheme of the Trigger and Timing filter (red) and the Trapezoidal Filter (green). In blue the input pulses
from Preamplifier. In case of DT5770 the TTF corresponds to a fast trapezoid. ...................................................................................18
Fig. 2.14: Pole Zero effects of undershoot (left) and overshoot (right) of the trapezoid (red curve) ....................................................19
Fig. 2.15: The effect of trapezoid overlapping in the four main cases: 1. The two trapezoids are well separated (top left); 2. The
second trapezoid starts on the falling edge of the first one (top right). 3. The second trapezoid starts on the rising edge of the first
one (bottom left). 4. The two input pulses pile-up in the input rise time (bottom right)......................................................................20
Fig. 3.1: Typical setup for resolution measurements using HPGe detectors and the digital MCA DT5780 ...........................................22
Fig. 3.2: Libraries and drivers required for MC2Analyzer .......................................................................................................................27
Fig. 3.3: MC2Analyzer Wizard Dialog Box- Start Installation ..................................................................................................................28
Fig. 3.4: MC2Analyzer Wizard Dialog Box - License Agreement .............................................................................................................28
Fig. 3.5: MC2Analyzer Wizard Dialog Box - Disclaimer ...........................................................................................................................29
Fig. 3.6: MC2Analyzer Wizard Dialog Box – Installation Folder Selection ..............................................................................................29

CAEN
Electronic Instrumentation
UM3182 – MC2Analyzer User Manual Rev. 5
6
Fig. 3.7: MC2Analyzer Wizard Dialog Box – Shortcuts ............................................................................................................................30
Fig. 3.8: MC2Analyzer Wizard Dialog Box – Desktop Icon Selection ......................................................................................................30
Fig. 3.9: MC2Analyzer Wizard Dialog Box – Installation .........................................................................................................................30
Fig. 3.10: MC2Analyzer Wizard Dialog Box – Software Release Version Notes ......................................................................................31
Fig. 3.11: MC2Analyzer Wizard Dialog Box – Finish Installation .............................................................................................................31
Fig. 3.12: the “Add Spectrum” window to add an offline spectrum from file or an online spectrum from board ................................32
Fig. 3.13: “Device Connection” window. Once connected to the board the link becomes green .........................................................32
Fig. 3.14: this window allows to select the desired board channels for the acquisition .......................................................................35
Fig. 3.15: the default GUI at the first connection ..................................................................................................................................35
Fig. 3.16: “HV Channels” window for the setting and monitoring of the HV channels of the DT5780 ..................................................36
Fig. 3.17: “Select Channel” window to select the channel for the signal inspector visualization ..........................................................38
Fig. 3.18: default signal inspector graphical interface ...........................................................................................................................39
Fig. 3.19: signal inspector visualization of Input, Trapezoid, Peaking and Trigger traces ......................................................................39
Fig. 3.20: modification of the “Waveform and Pre-Trigger Length” slider for a better visualization of the waveforms .......................40
Fig. 3.21: The Acquisition Set Up Window – Board Tab - General Tab ..................................................................................................41
Fig. 3.22: “Input Signal” settings and corresponding effect on the signal inspector window................................................................42
Fig. 3.23: “Trigger” tab settings and the visualization of the RC-CR2 settings and corresponding effect on the signal inspector
window ..................................................................................................................................................................................................42
Fig. 3.24: two examples where the “Input Rise Time” is not correctly set. In the left the value is underestimated, on the right it is
overestimated .......................................................................................................................................................................................43
Fig. 3.25: Set the Input Rise time to have the same pulse height of the input signal and the RC-CR2 signal .........................................44
Fig. 3.26: RC-CR2 signal with an overshoot. Set the Trigger Hold-Off to cover the overshoot and avoid re-triggering .........................44
Fig. 3.27: RC-CR2 signal with no overshoot. Set the Trigger Hold-Off to cover the RC-CR2 signal width ...............................................45
Fig. 4.1: MC2Analyzer Initial Main Screen ..............................................................................................................................................63
Fig. 4.2: MC2Analyzer floating windows ................................................................................................................................................64
Fig. 4.3: MC2Analyzer Menu Bar – “File/Add Spectrum” Dialog Box .....................................................................................................65
Fig. 4.4: MC2Analyzer Menu Bar - “File/Add Spectrum/New Board Connection” Dialog Box ...............................................................66
Fig. 4.5: MC2Analyzer Menu Bar - “File/Add Spectrum/New Board Connection/Connect” Dialog Box .................................................66
Fig. 4.6: MC2Analyzer Menu Bar - “File/Add Spectrum/New Board Connection/Connect/Close” Dialog Box ......................................67
Fig. 4.7: MC2Analyzer Wizard Dialog Box – “File/Add Spectrum/EditProperties” Dialog Box - Instrument Type Pull Down Menu ......68
Fig. 4.8: MC2Analyzer Wizard Dialog Box – “File/Add Spectrum/EditProperties” Dialog Box - Radiation Type Pull Down Menu .........68
Fig. 4.9: MC2Analyzer Wizard Dialog Box – “File/Add Spectrum/EditProperties” Dialog Box - Detector Type Pull Down Menu ..........69
Fig. 4.10: MC2Analyzer Wizard Dialog Box – “File/Add Spectrum/EditProperties” Dialog Box - Measure Type Pull Down Menu ........69
Fig. 4.11: MC2Analyzer Menu Bar/Tools/Acquisition Setup/Board Tab.................................................................................................71
Fig. 4.12: MC2Analyzer Menu Bar/Tools/Background/(Advanced)Configure Dialog Box ......................................................................71
Fig. 4.13: MC2Analyzer Menu Bar/Help/About Dialog Box ....................................................................................................................73
Fig. 4.14: MC2Analyzer Icon Bar .............................................................................................................................................................74
Fig. 4.15: The Histogram Window .........................................................................................................................................................75
Fig. 4.16: The High Voltage Window with the “Set VMax” Dialog Box overlapping ..............................................................................76
Fig. 4.17: The MC2Analyzer Main Screen with the Properties Window on the upper right side and the Board Info Dialog Box
overlapping the Histogram Window ......................................................................................................................................................78
Fig. 4.18: The Select Channel window of the Signal Inspector ..............................................................................................................79
Fig. 4.19: The Signal Inspector Window .................................................................................................................................................79
Fig. 4.20: DPP-PHA significant parameters ............................................................................................................................................82
Fig. 4.21: DPP-PHA significant parameters for pile-up ..........................................................................................................................83
Fig. 4.22: Example of Signal Inspector acquisitionSignal Inspector Cursor window ..............................................................................83
Fig. 4.23: The Signal Inspector Cursors ..................................................................................................................................................84
Fig. 4.24: MC2Analyzer Signal Inspector Cursor window .......................................................................................................................84
Fig. 4.25: The Acquisition Set Up Window – Board Tab - General Tab ..................................................................................................85
Fig. 4.26: The Acquisition Set Up Window – Board Tab - General Tab ..................................................................................................86
Fig. 4.27: The Acquisition Set Up Window – Board Section - Coincidences Tab ....................................................................................87
Fig. 4.28: The Acquisition Set Up Window – Board Section - Coincidences Tab. Coincidence on channel 0 and channel 1 enabled ....87
Fig. 4.29: The Acquisition Set Up Window – Board Section - Generic Writes Tab .................................................................................88
Fig. 4.30: The Acquisition Set Up Window – Board Section - Output Tab .............................................................................................89
Fig. 4.31: Header file structure ..............................................................................................................................................................90
Fig. 4.32: Header file structure for DPP firmware..................................................................................................................................91
Fig. 4.33: The Acquisition Set Up window – Channels Tab - Input Signal Tab ........................................................................................94
Fig. 4.34: The Acquisition Set Up Window – Channels Section - Trigger Tab .........................................................................................95
Fig. 4.35: The Acquisition Set Up Window – Channels Section - Trigger Tab in case of DT5770 ...........................................................95
Fig. 4.36: The Acquisition Set Up Window – Channels Section - Energy Filter Tab ................................................................................96
Fig. 4.37: The Spectra List Window ........................................................................................................................................................99
Fig. 4.38: The Cursor Window .............................................................................................................................................................101
Fig. 4.39: MC2Analyzer Main Screen Graph with ROI Editor window ..................................................................................................101
Fig. 4.40: MC2Analyzer Enable Calibration Set up Icon ........................................................................................................................103
Fig. 4.41: MC2Analyzer Energy Calibration Pop Up Confirmation window ..........................................................................................103

CAEN
Electronic Instrumentation
UM3182 – MC2Analyzer User Manual Rev. 5
7
Fig. 4.42: MC2Analyzer Energy Linear Calibration Dialog window .......................................................................................................104
Fig. 4.43: MC2Analyzer Energy Quadratic Calibration Dialog window .................................................................................................104
Fig. A.1: Schematic chain of the trigger architecture of a DPP system ................................................................................................107
Fig. A.2: Memory management of 725 and 730 series ........................................................................................................................108
Fig. A.3: Block diagram of the Trigger Architecture in a DPP-PHA board ............................................................................................109
Fig. A.4: Timing diagram (Normal Trigger Mode) ................................................................................................................................110
Fig. A.5: Pile-up occurred before the peaking time .............................................................................................................................110
Fig. A.6: Pile-up occurred after the peaking time ................................................................................................................................111
Fig. A.7: Overlapped trapezoids that don’t cause pile-up rejection ....................................................................................................111
Fig. A.8: Block diagram of the Trigger Architecture in a board with DPP-PHA firmware .....................................................................112
Fig. A.9: Timing diagram (Neighbour Trigger Mode) ...........................................................................................................................113
Fig. A.10: TRG_VAL outside the acceptance window ..........................................................................................................................114
Fig. A.11: TRG_VAL without TRG_REQ .................................................................................................................................................114
Fig. A.12: Second TRG_VAL occurring within pkrun ............................................................................................................................115
Fig. A.13: Pile-up occurred before the peaking time (Neighbour Trigger Mode) ................................................................................115
Fig. A.14: Pile-up occurred after the peaking time (Neighbour Trigger Mode) ...................................................................................115
Fig. A.15: Overlapped trapezoids that do not cause pile-up rejection (Neighbour Trigger Mode) ......................................................116
Fig. B.1: Data organization into the Internal Memory of x724 digitizer. .............................................................................................117
Fig. B.2: Data organization into the Internal Memory of x725 and x730 digitizers. ............................................................................118
Fig. B.3: Channel Aggregate Data Format scheme ...............................................................................................................................119
Fig. B.4: Dead-time in case of signal saturation. ..................................................................................................................................121
Fig. B.5: Dead-time in case of FULL memory status. Events in the FULL are identified but not saved. ...............................................121
Fig. B.6: Channel Aggregate Data Format scheme for 725 and 730 series ..........................................................................................122
Fig. B.7: EXTRAS bit management in case of FULL memory status. The first event after the FULL has bit[0] = 1, which identifies that
some events are lost due to a FULL memory status. The algorithm counts both the lost events and the total numer of events, and
rise a flag (bit[5] and bit[6] respectively) every N events. ...................................................................................................................124
Fig. B.8: Event flag in case of input signal saturation. The events that saturates has EXTRAS bit[4] = 1 and energy = full scale. .......125
Fig. B.9: Board Aggregate Data Format scheme ..................................................................................................................................126
Fig. B.10: Data Block scheme ...............................................................................................................................................................127
List of Tables
Tab. 1.1: Supported CAEN boards for DPP-PHA firmware .....................................................................................................................10
Tab. 3.1: Troubleshooting table. For any other specific issue not listed in the table please contact CAEN at the support mailing list
(Chapter Technical support) ..................................................................................................................................................................62
CAEN
Electronic Instrumentation
UM3182 – MC2Analyzer User Manual Rev. 5
8
1 Introduction
Nuclear radiation detectors are able to generate electronic pulses containing information on the nuclear radiation that
interacted with them. Depending on the radiation and detector types, the relevant information can be contained in the
shape of the pulse (i.e. a Pulse Shape discrimination is possible between neutrons and gammas in a detector sensitive to
both radiations, by looking at the shape of the corresponding pulses), in some timing information (i.e. arrival of the pulse
compared to a reference starting time “T0”, as in Time Of Flight detectors measurements or in Position Sensitive
Detectors), and in the pulse height, for those detectors where the relationship between incident radiation energy and
detector output pulse height can be re-conducted to direct proportionality (if needed through a calibration curve). For
example, a radio-isotopic source emits gamma radiations of different energies and the corresponding different heights
of the pulses at the output of the detector can be histogrammed during the counting time.
The Multi-Channel Analyzer (MC2Analyzer) software has been designed as a user-friendly interface to manage the
acquisition with pulse height algorithms. Indeed, MC2Analyzer puts the acquisition power of the fast digitizers, such us
CAEN DT5780 at the fingertips of users concerned with the acquisition of energy spectra from one up to multiple channels
of nuclear radiation detectors systems. The selected format recalls the familiar operation of a conventional analog
Nuclear Multi Channel Analyzer, although with some differences which will be described in this manual.
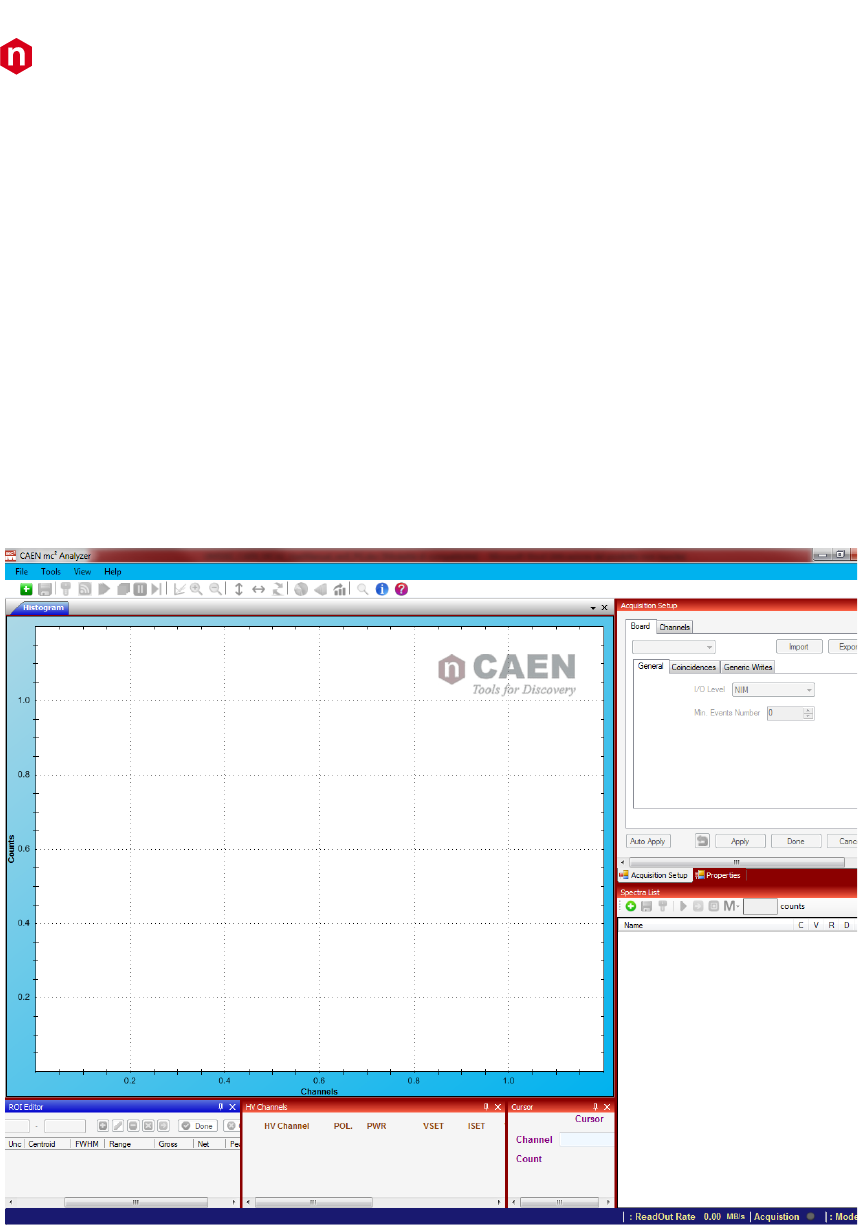
Fig. 1.1: MC2Analyzer main screen

CAEN
Electronic Instrumentation
UM3182 – MC2Analyzer User Manual Rev. 5
9
The MC2Analyzer Software supports CAEN DT5770, 780 and 781 MCA Series, as well as 724, 725, and 730 digitizer families
equipped with the DPP-PHA (Digital Pulse Processing for Pulse Height Analysis) firmware. The complete list of supported
boards is shown in Tab. 1.1.
Note: MC2Analyzer software supports also
stream MCA tube-base. All the software functionalities for
stream are
described in [RD11].
Desktop Digitizers and MCAs(*)
Description
DT5724
4 Ch. 14 bit 100 MS/s Digitizer: 512kS/ch, C4, SE
DT5724A
2 Ch. 14 bit 100 MS/s Digitizer: 512kS/ch, C4, SE
DT5724D
4 Ch. 14 bit 100 MS/s Digitizer: 4MS/ch, C4, SE
DT5724E
2 Ch. 14 bit 100 MS/s Digitizer: 4MS/ch, C4, SE
DT5725
8 Ch. 14 bit 250 MS/s Digitizer: 640kS/ch, CE30, SE
DT5725B
8 Ch. 14 bit 250 MS/s Digitizer: 5.12MS/ch, CE30, SE
DT5730
8 Ch. 14 bit 500 MS/s Digitizer: 640kS/ch, CE30, SE
DT5730B
8 Ch. 14 bit 500 MS/s Digitizer: 5.12MS/ch, CE30, SE
DT5770
Digital MCA - 1 LVPS ±12V/100mA ±24V/50mA
DT5780M
2 Channel Digital MCA - Mixed HV (5kV/300uA)
DT5780N
2 Channel Digital MCA - Negative HV (5kV/300uA)
DT5780P
2 Channel Digital MCA - Positive HV (5kV/300uA)
DT5780SDM
2 Channel Digital MCA - Mixed HV (500V/3mA)
DT5780SDN
2 Channel Digital MCA - Negative HV (500V/3mA)
DT5780SDP
2 Channel Digital MCA - Positive HV (500V/3mA)
DT5780SCM
2 Channel Digital MCA - Mixed HV (4kV/3mA)
DT5780SCN
2 Channel Digital MCA - Negative HV (4kV/3mA)
DT5780SCP
2 Channel Digital MCA - Positive HV (4kV/3mA)
DT5781
Quad Digital MCA
DT5781A
Dual Digital MCA
DT5000M - HEXAGON
Dual Digital MCA - Mixed Dual Range HV (5kV/30uA, 2kV/1mA)
DT5000N - HEXAGON
Dual Digital MCA - Negative Dual Range HV (5kV/30uA, 2kV/1mA)
DT5000P - HEXAGON
Dual Digital MCA - Positive Dual Range HV (5kV/30uA, 2kV/1mA)
NIM Digitizers(*)
Description
N6724
4 Ch. 14 bit 100 MS/s Digitizer: 512kS/ch, C4, SE
N6724A
2 Ch. 14 bit 100 MS/s Digitizer: 512kS/ch, C4, SE
N6725
8 Ch. 14 bit 250 MS/s Digitizer: 640kS/ch, CE30, SE
N6725B
8 Ch. 14 bit 250 MS/s Digitizer: 5.12MS/ch, CE30, SE
N6730
8 Ch. 14 bit 500 MS/s Digitizer: 640kS/ch, CE30, SE
N6730B
8 Ch. 14 bit 500 MS/s Digitizer: 5.12MS/ch, CE30, SE
N6780M
2 Channel Digital MCA - Mixed HV (5kV/300uA)
N6780N
2 Channel Digital MCA - Negative HV (5kV/300uA)
N6780P
2 Channel Digital MCA - Positive HV (5kV/300uA)
N6781
Quad Digital MCA
N6781A
Dual Digital MCA
VME Digitizers(*)
Description
V1724
8 Ch. 14 bit 100 MS/s Digitizer: 512kS/ch, C4, SE
V1724B
8 Ch. 14 bit 100 MS/s Digitizer: 4MS/ch, C4, SE
V1724C
8 Ch. 14 bit 100 MS/s Digitizer: 512kS/ch, C4, DIFF
V1724D
8 Ch. 14 bit 100 MS/s Digitizer: 4MS/ch, C4, DIFF
V1724E
8 Ch. 14 bit 100 MS/s Digitizer: 4MS/ch, C20, SE
V1724F
8 Ch. 14 bit 100 MS/s Digitizer: 4MS/ch, C20, DIFF
V1724G
8 Ch. 14 bit 100 MS/s Digitizer: 512kS/ch, C20, SE
V1725
16 Ch. 14 bit 250 MS/s Digitizer: 640kS/ch, CE30, SE
V1725B
16 Ch. 14 bit 250 MS/s Digitizer: 5.12MS/ch, CE30, SE
V1725C
8 Ch. 14 bit 250 MS/s Digitizer: 640kS/ch, CE30, SE
V1725D
8 Ch. 14 bit 250 MS/s Digitizer: 5.12MS/ch, CE30, SE
V1730
16 Ch. 14 bit 500 MS/s Digitizer: 640kS/ch, CE30, SE
V1730B
16 Ch. 14 bit 500 MS/s Digitizer: 5.12MS/ch, CE30, SE
V1730C
8 Ch. 14 bit 500 MS/s Digitizer: 640kS/ch, CE30, SE
V1730D
8 Ch. 14 bit 500 MS/s Digitizer: 5.12MS/ch, CE30, SE
VX1724
8 Ch. 14 bit 100 MS/s Digitizer: 512kS/ch, C4, SE
VX1724B
8 Ch. 14 bit 100 MS/s Digitizer: 4MS/ch, C4, SE
VX1724C
8 Ch. 14 bit 100 MS/s Digitizer: 512kS/ch, C4, DIFF
VX1724D
8 Ch. 14 bit 100 MS/s Digitizer: 4MS/ch, C4, DIFF

CAEN
Electronic Instrumentation
UM3182 – MC2Analyzer User Manual Rev. 5
10
VX1724E
8 Ch. 14 bit 100 MS/s Digitizer: 4MS/ch, C20, SE
VX1724F
8 Ch. 14 bit 100 MS/s Digitizer: 4MS/ch, C20, DIFF
VX1730
16 Ch. 14 bit 500 MS/s Digitizer: 640kS/ch, CE30, SE
VX1730B
16 Ch. 14 bit 500 MS/s Digitizer: 5.12MS/ch, CE30, SE
VX1730C
8 Ch. 14 bit 500 MS/s Digitizer: 640kS/ch, CE30, SE
VX1730D
8 Ch. 14 bit 500 MS/s Digitizer: 5.12MS/ch, CE30, SE
DPP Firmware(*)
Description
DPP-PHA (4/2ch x724) (**)
DPP-PHA - Digital Pulse Processing for Pulse Height Analysis (4/2ch x724)
DPP-PHA (8ch x724)
DPP-PHA - Digital Pulse Processing for Pulse Height Analysis (8ch x724)
DPP-PHA (8ch x725)
DPP-PHA - Digital Pulse Processing for Pulse Height Analysis for (8ch x725)
DPP-PHA (16ch x725)
DPP-PHA - Digital Pulse Processing for Pulse Height Analysis for (16ch x725)
DPP-PHA (8ch x730)
DPP-PHA - Digital Pulse Processing for Pulse Height Analysis (8ch x730)
DPP-PHA (16ch x730)
DPP-PHA - Digital Pulse Processing for Pulse Height Analysis (16ch x730)
DPP-SUP (8ch x725)
DPP-SUP - Super Licence for 8ch x730 Digital Pulse Processing
DPP-SUP (16ch x730)
DPP-SUP - Super Licence for 16ch x730 Digital Pulse Processing
DPP-SUP (8ch x725)
DPP-SUP - Super Licence for 8ch x725 Digital Pulse Processing
DPP-SUP (16ch x725)
DPP-SUP - Super Licence for 16ch x725 Digital Pulse Processing
Tab. 1.1: Supported CAEN boards for DPP-PHA firmware
(*) For accessories and customizations related to digitizers and for multiple DPP-PHA license packs, refer to the board
User Manual or have a look at the board page on CAEN web site: www.caen.it
(**) DT5770, 780, 781 series and Hexagon are provided with licensed DPP-PHA firmware.
CAEN
Electronic Instrumentation
UM3182 – MC2Analyzer User Manual Rev. 5
11
2 Principle of Operation
Traditional Analog Approach
DETECTOR
Charge Sensitive
Preamplifier
SHAPING
AMPLIFIER
ENERGY
POSITION,
IDENTIF.
TIMING
COUNTING
SHAPING TIME,
GAIN THRESHOLDS
PEAK SENSING
ADC
DISCRIMINATOR
TDC
SCALER
LOGIC
UNIT
Trigger, Coincidence
Fast Out
Fig. 2.1: Nuclear Radiation Detector (with Charge Sensitive Preamplifier) Analog Chain Block Diagram
The traditional analog chain for signal readout from nuclear radiation detector usually makes use of almost all-analog
chains, where the electronics rely upon three fundamental devices: the Charge Sensitive Preamplifier, the Shaping
Amplifier and the Peak Sensing ADC (refer to Fig. 2.1).
The Charge Sensitive Preamplifier (Fig. 2.2) integrates the signal coming from the detector, as the HPGe, thus converting
the collected charge into a voltage step. The integrating capacitor is put in parallel with a discharging resistor, so that the
preamplifier output will have pulses with a fast rise time and a long exponential tail with decay time τ. The charge
information (proportional to the energy released by the particle in the detector) is therefore represented by the pulse
height. The charge-amplitude proportionality is set by the capacitor value
C
Q
Vout
and the decay time of the output
signal is
RC
.
Fig. 2.2: Simplified schematic of a RC-type Charge Sensitive Preamplifier
To have a good charge-amplitude conversion and to minimize the noise, the decay time τ is much larger than the width
of the detector signal, typically 50-100 µs, and for this reason pile-up of different particle detections can arise (Fig. 2.3).
Fig. 2.3: Pile-up of detector signals due to the large decay time of the Preamplifier output
Another drawback when using a Charge Sensitive Preamplifier is when the peak is too sharp for the Peak Sensing ADC to
be detected with the required precision.
To avoid these problems the pre-amplified signal is usually feed into a Shaping Amplifier, that provides out a quasi-
Gaussian output whose height is still proportional to the energy released by the detected particle.
Charge Sensitive
Preamplifier
IN
(PMT)
OUT
Detector
Charge
Sensitive
Preamplifier
CAEN
Electronic Instrumentation
UM3182 – MC2Analyzer User Manual Rev. 5
12
Finally, the signal from the Shaping Amplifier is fed into a Peak Sensing ADC, which is able to evaluate and digitize the
height of the pulses, and filling a histogram with these values, which corresponds to the energy spectrum.
To preserve the timing information, the fast component of the signal (rising edge) is usually treated by a Fast Amplifier
(or Timing Amplifier) that derives the signal; the output of the fast amplifier usually feeds a chain made of a Discriminator
(CFD), a TDC and/or a Scaler for the timing/counting acquisition. Further modules can be present to implement logic
units, to make coincidences (giving the position and the trajectory of the particles), to generate triggers or to give
information about the pulse shape (time over threshold, zero crossing, etc.) for the particles identification. Usually the
Fast Amplifier is included into the Shaping Amplifier module and the relevant signal is provided as a separate fast output
(or timing output).
The typical signal shapes from the analog chain is shown in Fig. 2.4.
DECAY TIME
RISE TIME
TIME Q = ENERGY
PEAK AMPLITUDE = ENERGY
ZERO CROSSING
This delay doesn’t depend
on the pulse amplitude
DETECTOR
PREAMPLIFIER
SHAPING AMPLIFIER
FAST AMPLIFIER
CFD
CFD OUTPUT
Fig. 2.4: Signals in the traditional analog chain
CAEN
Electronic Instrumentation
UM3182 – MC2Analyzer User Manual Rev. 5
13
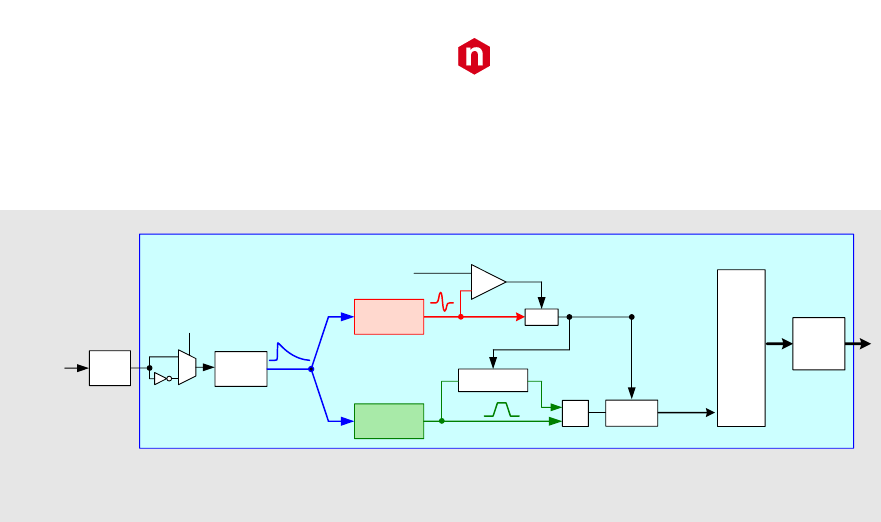
CAEN Digital Approach
In the CAEN digital approach all blocks from the shaping amplifier to the PC are synthetized into a single device, the
digitizer (see Fig. 2.5).
Indeed the new FPGA based techniques allow the user to change the readout parameters according to the detector
characteristics, thus enabling the measurement of different radiations with different detectors using the same hardware.
The digitizer becomes itself a Digital Multi Channel Analyzer (MCA).
In the technique called Multi Channel Analysis the energy spectrum histogram X- axis can be segmented in “bins” or
“Channels”, each one representing a pulse height value, in V (or, if calibrated, the corresponding radiation Energy in Kev).
The maximum number of available “bins” or “channels” is dictated by the resolution of the ADC. A 14-bit (1:16384) ADC
resolution allows a 16 K “Channels” Spectrum to be generated. The spectrum resolution should be matched with the
detector Energy resolution for optimal results (i.e. a 1K Channels Spectrum is good enough of basic gamma spectroscopy
with NaI detectors while at least an 8K Channels Spectrum is needed to appreciate the intrinsic Energy resolution of HPGe
Detectors). The histogram Y-axis values indicate the number of counts accumulated during the measuring time in the
corresponding x-axis “bin” or “Channel”.
Fig. 2.6 shows an example of a typical spectrum of a 60Co source from HPGe detector, acquired with a DT5780 and the
MC2Analyzer software.
Fig. 2.6: 60Co energy spectrum from HPGe detector
DETECTOR
Charge Sensitive
Preamplifier
ENERGY
SHAPE
TIMING
COUNTING
DPP
IN SAMPLES
A/D INTERF
DIGITIZER
VERY HIGH
DATA
THROUGHPUT
Fig. 2.5: Block Diagram of a Digitizer-based Spectroscopy System
CAEN
Electronic Instrumentation
UM3182 – MC2Analyzer User Manual Rev. 5
14
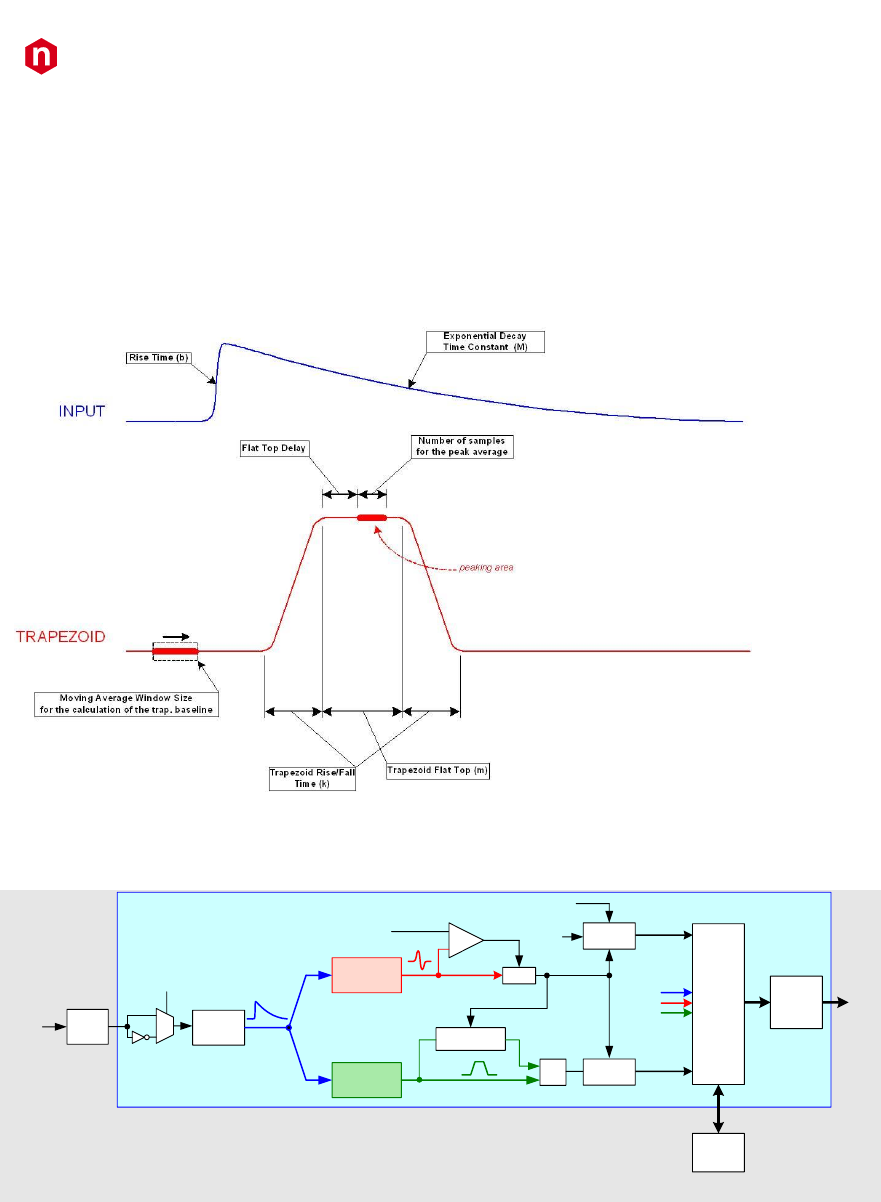
The algorithm implemented in the digitizer FPGA is based on the Jordanov trapezoidal filter [RD1] and it is called DPP-
PHA (Digital Pulse Processing for Pulse Height Analysis). The trapezoidal filter is a filter able to transform the typical
exponential decay signal generated by a charge sensitive preamplifier into a trapezoid whose flat top height is
proportional to the amplitude of the input pulse (that is to the energy released by the particle in the detector) (see Fig.
2.7). This trapezoid plays almost the same role of the shaping amplifier in a traditional analog acquisition system. There
is an analogy between the two systems: both have a “shaping time” constant and must be calibrated for the pole-zero
cancellation. For both, a long shaping time gives a better resolution but has higher probability of pile-up. Both are AC
coupled with respect to the output of the preamplifier whose baseline is hence removed, but both have their own output
DC offset and this constitutes another baseline for the peak detection.
Fig. 2.7: Pulse Height Analysis with Trapezoid Method
The block diagram of the processing chain inside the digitizer FPGA is shown in Fig. 2.8.
DECIMATOR
RC-(CR)2
COMP
TRAPEZOIDAL
FILTER
TRG & TIMING
FILTER
ARMED
TRIGGER
BASELINE
Threshold
SUB
INPUT
TIME STAMP
ENERGY
CLK
PEAK
COUNTER
Polarity
stop
Sync
reset
MEMORY
BUFFERS
ADC
MEMORY
MANAGER
READOUT
INTERF.
ZERO
CROSS
enable
waveforms
Fig. 2.8: Block Diagram of the processing chain programmed into the Digitizer’s FPGA
CAEN
Electronic Instrumentation
UM3182 – MC2Analyzer User Manual Rev. 5
15
In case of DT5770 the block diagram modifies as follows.
DECIMATOR
FAST TRAP
COMP
TRAPEZOIDAL
FILTER
TRG & TIMING
FILTER
ARMED
TRIGGER
BASELINE
Threshold
SUB
INPUT
ENERGY
PEAK
Polarity
stop
ADC
SPECTRUM
READOUT
INTERF.
ZERO
CROSS
enable
Fig. 2.9: Block Diagram of the processing chain programmed into the DT5770 FPGA
Decimator
The first block after the polarity selector is the decimator filter; this can be used in the case the signal is particularly slow,
hence it is necessary to set values for the DPP time parameters that are not within the allowed range. The effect of the
decimator is to scale down the sampling frequency of a factor 2, 4 or 8; it might have also benefits in terms of noise,
since it averages a certain number of samples to make a new sample for the data stream.
The decimation applies to the energy filter only (i.e. to Decay Time (Pole-Zero Compensation), Trap. Rise Time, and Trap.
Flat Top). Timing filter (RC-CR2), Baseline, Trigger Hold-Off, and Record Length are not affected.
Note: The decimation is not available for 770 series.
Note: The decimation is no longer supported for DPP-PHA firmware revision higher than 128.64 (724/780/781 series)
and for Hexagon. It can be used only to rescale the record length but has no effect in the energy and timing filters.
CAEN
Electronic Instrumentation
UM3182 – MC2Analyzer User Manual Rev. 5
16
Trigger and Timing Filter
Note: For the DT5770 MCA check the next section.
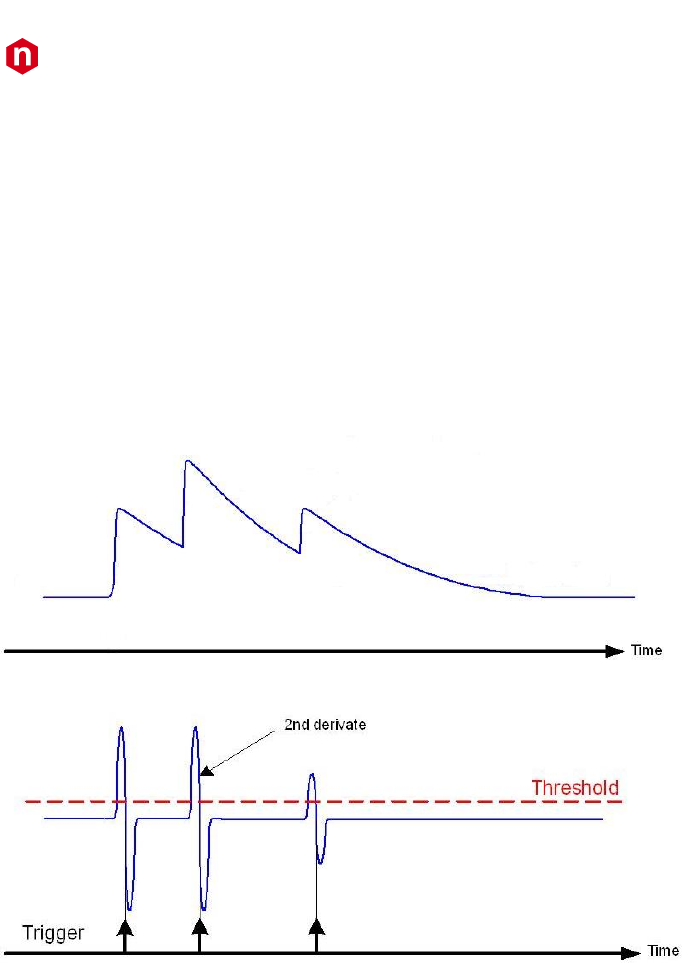
After the decimator, there are two parallel branches: one for timing and triggering, the other one for the energy. The
aim of the Trigger and Timing Filter (TTF) is to identify the input pulses, generate a digital signal called trigger that
identifies the pulse, and calculate the time of occurrence of the event (trigger time stamp).
The TTF performs a digital RC-CR2 filter, whose zero crossing corresponds to the trigger time stamp. In analogy with a
CFD – Constant Fraction Discrimination – the RC-CR2 signal is bipolar and its zero crossing is independent of the pulse
amplitude. The integrative component of the RC-CR2 is a smoothing filter based on a moving average filter that reduces
the high frequency noise and prevents the trigger logic to generate false triggers on spikes or fast fluctuation of the
signals. The derivative component allows to subtract the baseline, so that the trigger threshold is not affected by the low
frequency fluctuation. Moreover the pile up effect is significantly reduced.
Fig. 2.10: The Trigger and Timing Filter allows to detect pulses on the zero-crossing of the RC-CR2 signal, which corresponds to a
2nd derivative of the input pulse. The derivative component of the RC-CR2 subtracts the baseline and makes easier to perform a
zero-crossing calculation.
The trigger logic gets armed at the Threshold crossing, then it generates the trigger signal at the RC-CR2 zero crossing.
Setting the threshold value corresponds to set the LLD (lower level discrimination) of the energy spectrum. The user can
check from the histogram which value corresponds to the set threshold level. Refer to Sect. How to set the Trigger for
further details on how to set the threshold.
Note: In case of 725 and 730 series a linear interpolation of the RC-CR2 signal is performed by default using the samples
before and after the zero crossing.
Another important parameter for the trigger logic is the RC-CR2 smoothing, corresponding to the number of samples
used for the RC-CR2 signal formation. Increasing this parameter may help in reducing high frequency noise, but have the
drawback to make the signal slower and smaller, due to the smoothing.
Finally the Input Rise Time is the time the RC-CR2 reaches its maximum value. This value should correspond to the input
rise time, in such a way the RC-CR2 peak value corresponds to the height of the input signal. Examples on how to proper
set the trigger and timing filter can be found in Sect. How to set the Trigger.
CAEN
Electronic Instrumentation
UM3182 – MC2Analyzer User Manual Rev. 5
17
Trigger and Timing Filter for DT5770
The DT5770 MCA series discriminates events based on a fast trapezoid signal, whose rise time can be defined by the
user. The fast trapezoid rise time ranges from 10 ns up to 300 ns.
The trigger threshold is then referred to the fast trapezoid itself, and the threshold crossing arms the event selection. To
get higher precision in the trigger position, a subsequent derivative of the fast trapezoid is created. The trigger fires at
the zero crossing of the derivative signal itself. The user can only see the fast trapezoid trace on the signal inspector,
while its derivative is implemented onboard and it is not available for the visualization.
A trigger hold-off window is then opened to inhibit other triggers due to noise.
Check Fig. 2.11 and Fig. 2.12 for a diagram of the trigger filter in the DT5770.
Threshold
Fast trapezoid
Derivative
Trigger
Fig. 2.11: Triggering on the fast trapezoid signal (DT5770 only)
Fig. 2.12: Block diagram showing the DT5770 trigger management
Setting the threshold value corresponds to set the LLD (lower level discrimination) of the energy spectrum. The user can
check from the histogram which value corresponds to the set threshold level. Refer to Sect. How to set the Trigger filter
(DT5770 only) for further details on how to set the threshold.
CAEN
Electronic Instrumentation
UM3182 – MC2Analyzer User Manual Rev. 5
18
Trapezoidal Filter (Energy Filter)
As in the traditional analog chain, the Shaping Amplifier is able to convert the exponential shape from the Charge
Sensitive Preamplifier into a Gaussian shape whose height is proportional to the pulse energy, in the same way the
Trapezoidal filter is able to transform it into a trapezoidal signal whose amplitude is proportional to the input pulse height
(energy). In this analogy, the Trapezoid Rise Time corresponds to the Shaping Time times a factor of 2/2.5. Therefore for
an analogic shaping of 3us the user can set a trapezoid rise time of 7-8 us (see also Sect. How to set the Energy Filter
and Acquisition Setup).
In case of high rate signal the trapezoid rise time value should be reduced in order to avoid pile-up effects (see Sect. Pile-
up Rejection), choosing a compromise between high resolution (high value of trapezoid rise time) and pile-up rejection
(and corresponding dead time).
The energy value of the input pulse is evaluated as the height of the trapezoid in its Flat Top region. The user must take
that the flat top is really flat and that the Peaking (i.e. the samples used for the energy calculation) is in the flat region.
Moreover the correct setting of flat top and peaking helps in the correct evaluation of the energy especially when large
volume detectors are involved and the ballistic deficit may cause a significant error in the energy calculation. In this case
it may be convenient to increase the flat top duration and delay the peaking time to wait for the full charge collection.
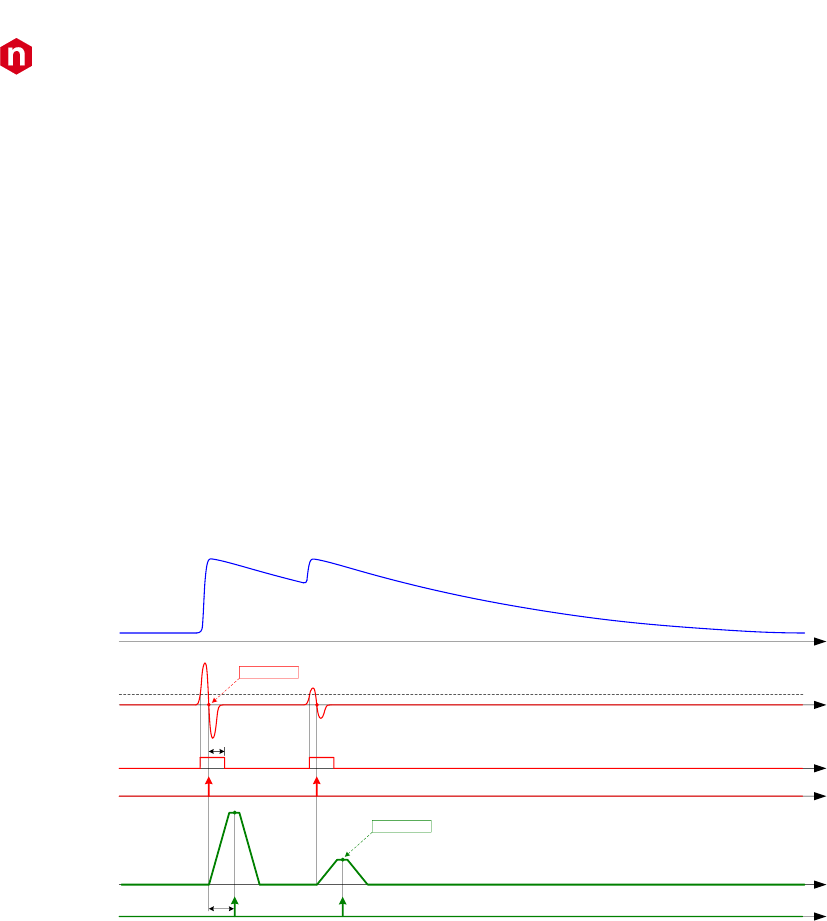
Fig. 2.13 summarizes the settings for both the Trigger and Timing Filter and for the Trapezoid Filter.
INPUT
TT FILTER
ARMED
threshold
TRIGGER
hold-off
baseline
TIME STAMP
ENERGY
peaking time
TRAPEZ. FILTER
PEAKING
Fig. 2.13: Simplified signals scheme of the Trigger and Timing filter (red) and the Trapezoidal Filter (green). In blue the input pulses
from Preamplifier. In case of DT5770 the TTF corresponds to a fast trapezoid.
CAEN
Electronic Instrumentation
UM3182 – MC2Analyzer User Manual Rev. 5
19
Pole-Zero Adjustment
Like the Gaussian pulse of the Shaping Amplifier, also the trapezoid requires an accurate pole-zero adjustment to
guarantee the correct return to the baseline at the end of the falling edge. To correctly set the pole-zero the user must
take care of setting the proper Trapezoid Decay Time value (which corresponds also to the Input Decay Time) to avoid
either undershoot or overshoot effects (as can be seen in Fig. 2.14). Pole Zero Adjustment can reduce signal artifacts due
to pulses pile up occurring when the counting rate is high compared to the pulse decay.
Fig. 2.14: Pole Zero effects of undershoot (left) and overshoot (right) of the trapezoid (red curve)
Baseline Restoration
The energy filter includes also a baseline restorer that operates on the trapezoidal filter output and calculates the
baseline by averaging a programmable number of points before the start of the trapezoid. The baseline is then frozen
for the trapeze duration and used for the height calculation. Once the trapezoid is returned to the baseline, the averaging
restarts to run.
The pulse height (i.e. the trapezoid amplitude) is given as the distance between the flat top and the baseline taken in the
programmed position; to further reduce the fluctuation of this distance due to the noise, it is possible to average a certain
number of points in the flat top before subtracting the baseline.
In case of high resolution measurements, it is strongly suggested to increase the number of Baseline Mean samples at
the maximum allowed value. Furthermore the user can also set the Baseline Hold-Off value to froze the baseline
calculation beyond the trapezoid end, thus reducing the noise on the baseline calculation. In case of high rate those
values must be reduced to avoid pile-up effects.
CAEN
Electronic Instrumentation
UM3182 – MC2Analyzer User Manual Rev. 5
20
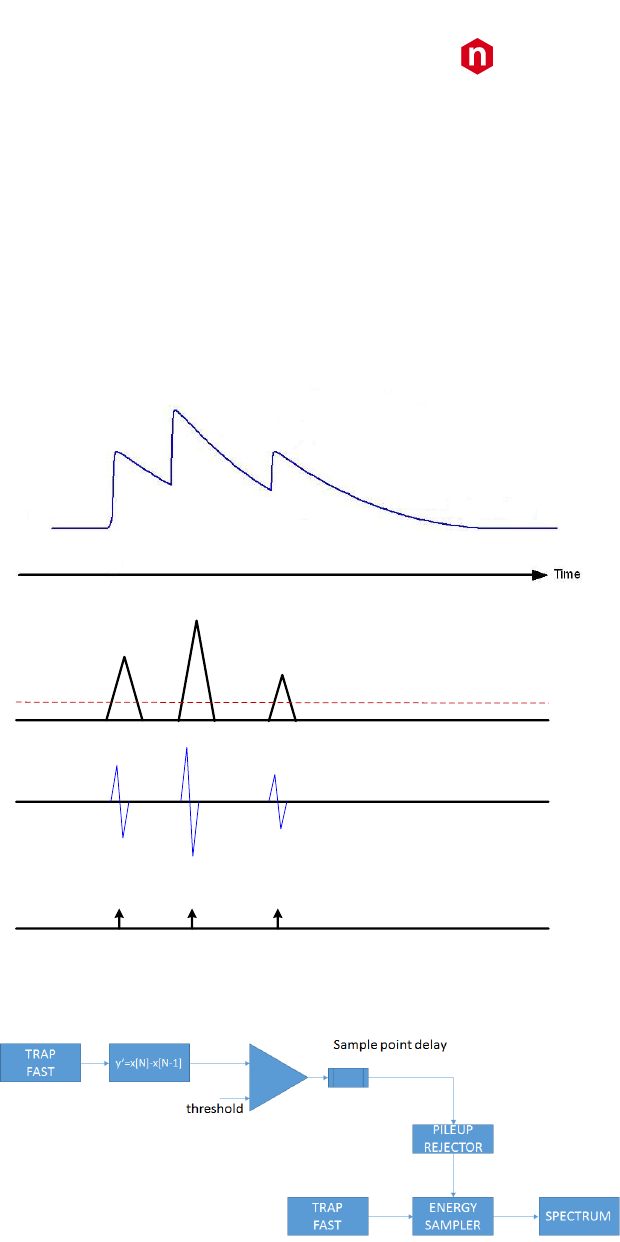
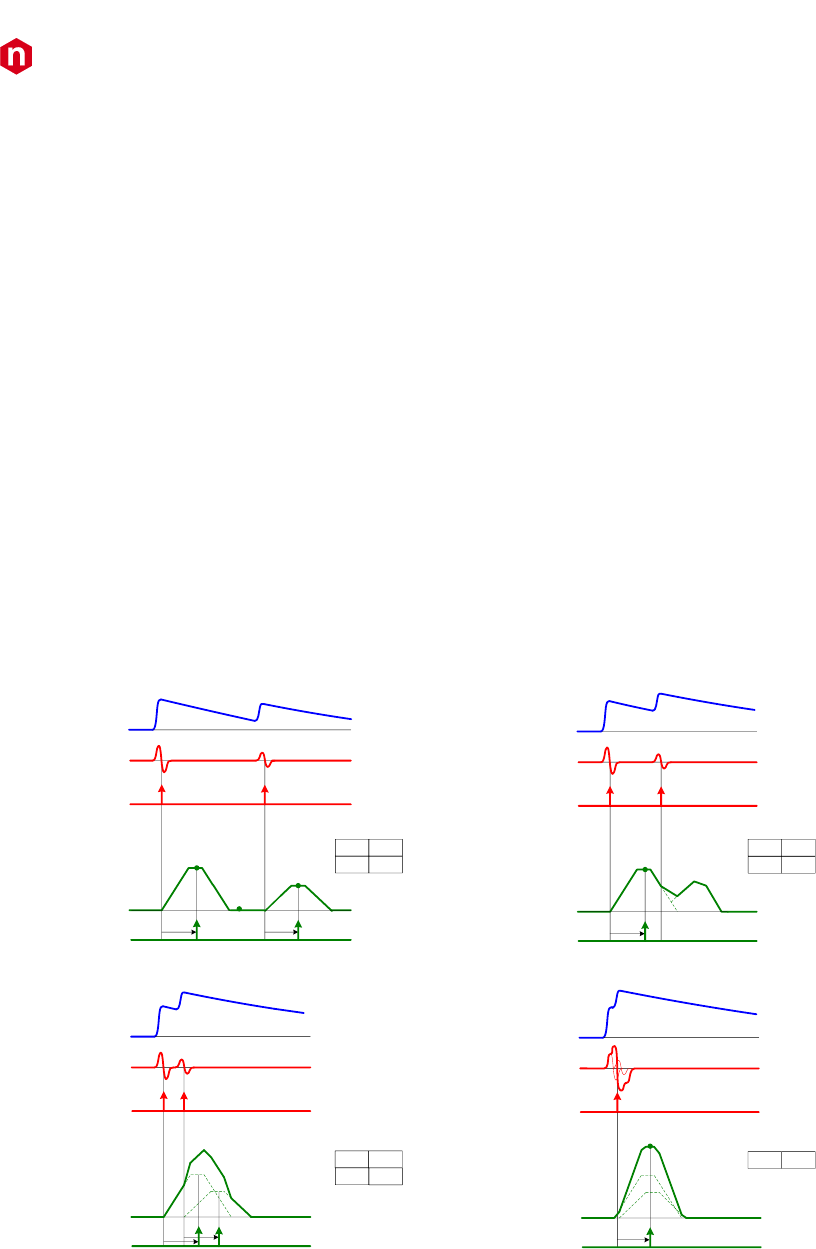
Pile-up Rejection
If two events are separated by less than the trapezoid duration, then the relevant trapezoids overlap. The trapezoid
duration pkrun is defined as pkrun = RT + FT + pkho, where RT is the trapezoid Rise Time, FT is the trapezoid Flat Top,
and pkho is the Peak Hold-Off, which starts at the end of the Flat Top. There are four different cases (Fig. 2.15):
1. ∆T > pkrun, the two events are well separated and none of them is flagged as pile-up;
2. RT + FT < ∆T < pkho, the rising edge of the 2nd trapezoid overlaps on the pkho of the 1st one. In this case only
the first event has a correct value of energy, while the second one is tagged as pile-up (see bit “PU” in Sect.
Channel Aggregate Data Format for 724, 780, and 781 series and Channel Aggregate Data Format for 725 and
730 series).;
3. 1.5 * IRT < ∆T < RT + FT, where IRT is the Input Rise Time, which corresponds to the time the RC-CR2 signal
reaches its maximum value, and 1.5 * IRT is the time the RC-CR2 signal crosses the zero. The two events are
both flagged as pile-up, since the two trapezoids overlaps (see bit “PU” in Sect. Channel Aggregate Data Format
for 724, 780, and 781 series and Channel Aggregate Data Format for 725 and 730 series).
Note: It is also possible to acquire the energy values (not corrected) of the piled-up pulses by setting bit[27] = 1 of register
0x1n80. Refer to [RD8], [RD9], and [RD10] for additional details. Register writes can be performed through tab “Generic
Writes” of MC2Analyzer software (see Sect. Generic Writes Tab).
4. ∆T < 1.5 * IRT, the two pulses are too close and the trigger filter is unable to resolve the double pulse condition.
In this case, the pile-up cannot be recognized and the two pulses are treated as a single pulse. The algorithm
returns only one time stamp and one energy, whose value corresponds to about the sum of the two energies
(‘sum peak’ in the spectrum).
trapezoid
T1T2
trigger
TT filter
input
peaking
E1
T1T2
T1E1
T20
list
T10
T20
list
T1
T1
list
E1
E1
trapezoid
T1T2
trigger
TT filter
input
peaking
E1E2
T1E1
T2E2
list
1. 2.
3. 4.
trapezoid
trigger
TT filter
input
peaking
trapezoid
trigger
TT filter
input
peaking
pkho
Fig. 2.15: The effect of trapezoid overlapping in the four main cases: 1. The two trapezoids are well separated (top left); 2. The
second trapezoid starts on the falling edge of the first one (top right). 3. The second trapezoid starts on the rising edge of the first
one (bottom left). 4. The two input pulses pile-up in the input rise time (bottom right)

CAEN
Electronic Instrumentation
UM3182 – MC2Analyzer User Manual Rev. 5
21
Except for case 3, the DPP-PHA algorithm is able to save into the memory buffer all the incoming events, including the
piled-up pulses; the energy value is anyhow meaningless. During the readout of the event list, these events won’t be
accumulated into the histograms (that are calculated in the software), although they participate to the total count, thus
giving an accurate estimation of the Input Count Rate. Furthermore, the energy spectrum can be corrected run-time by
a statistical redistribution of the missed energies over the spectrum acquired within a specific time slot.
Note: In case of DT5770 the board does not provide the list of time stamp and energy, but it provides only the energy
spectrum. When the energy of the pulse cannot be calculated due to pile-up, the corresponding event is not represented
into the spectrum. The piled-up event is anyway counted into the “Incoming Counting Rate” value.
Dead Time
When a pulse is processed by an analog chain block, the maximum read-out rate is limited by the need to complete the
processing of the current pulse before being able to process a successive valid signal. When the processing time of a
pulse is larger than the time interval before the arrival of the next pulse, the analog chain is “temporarily blind” and
misses one or more successive pulses. The actual live counting time is therefore smaller than the total counting time,
and the difference between total time and live counting time is called “Dead time”.
The Digital MCA read out capability is rather independent from the ADC sampling time and processing speed than from
the signal width, and in general allows for higher counting rates than the analog chain. The digital MCA dead time is also
an information on the relationship between total measurement time and live counting time values.
The MC2Analyzer software is able to automatically evaluate the dead-time including the contributions of pile-up events,
dynamics saturation (see Sect. Channel Aggregate Data Format for 724, 780, and 781 series and Channel Aggregate Data
Format for 725 and 730 series), and Trigger Hold-Off. In the latter two cases the software evaluates the corresponding
probability (Poisson Distribution) to take into account missing events during the board “blindness”.
CAEN
Electronic Instrumentation
UM3182 – MC2Analyzer User Manual Rev. 5
22
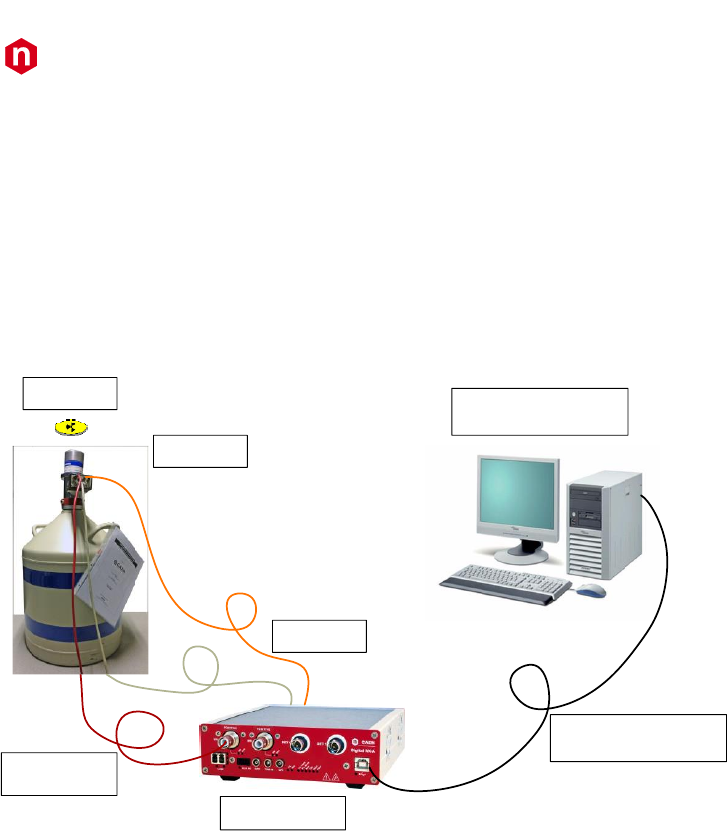
3 Getting Started
Hardware setup
We are going to describe a typical application of DPP-PHA algorithm and MC2Analyzer software for the characterization
of HPGe detectors response in a measurement of resolution of the 60Co source photo-peaks.
The high and low voltages are provided by the DT5780 which integrates in a single unit both the high voltage power
supply, the low voltage, and the readout channels. A scheme of the hardware setup is shown on Fig. 3.1.
PC (Windows OS) +
MC2Analyzer software
Communication link
between digitizer and PC
DT5780
High Voltage
power supply
Low Voltage
Power Inhibit
HPGe detector
Radioactive
source
Fig. 3.1: Typical setup for resolution measurements using HPGe detectors and the digital MCA DT5780
Note: The description of this chapter is compliant also with the 724, 725, and 730 digitizer families, DT5770, 781, and
Hexagon MCA families. Any difference will be explicitly indicated.
Note: In case of 724, 725, 730 digitizer families and 781 MCA, the high and low voltage should be provided externally. In
case of DT5770 MCA family, the low voltage for the preamplifier can be provided by the board itself.
Connect the SHV cable for the high voltage power supply to the HV0/HV1 connector of the DT5780. Connect the low
voltage and the inhibit (if any) to the back-panel connectors of the DT5780. Finally connect the MCA to the PC with the
preferred communication interface between USB and Optical link.
Refer to the DT5780 User Manual for further details about the connectors of the digital MCA [RD2].
CAEN
Electronic Instrumentation
UM3182 – MC2Analyzer User Manual Rev. 5
23
Software setup
Drivers
To deal with the hardware, CAEN provides the drivers for all the different types of physical communication interfaces
featured by the specific digitizer and compliant with Windows OS:
• USB 2.0 Drivers for NIM/Desktop boards are downloadable on CAEN website (www.caen.it) in the
“Software/Firmware” tab of the digitizer/MCA web page (login required).
Note: Windows OS USB driver installation for Desktop/NIM digitizers is detailed in [RD3].
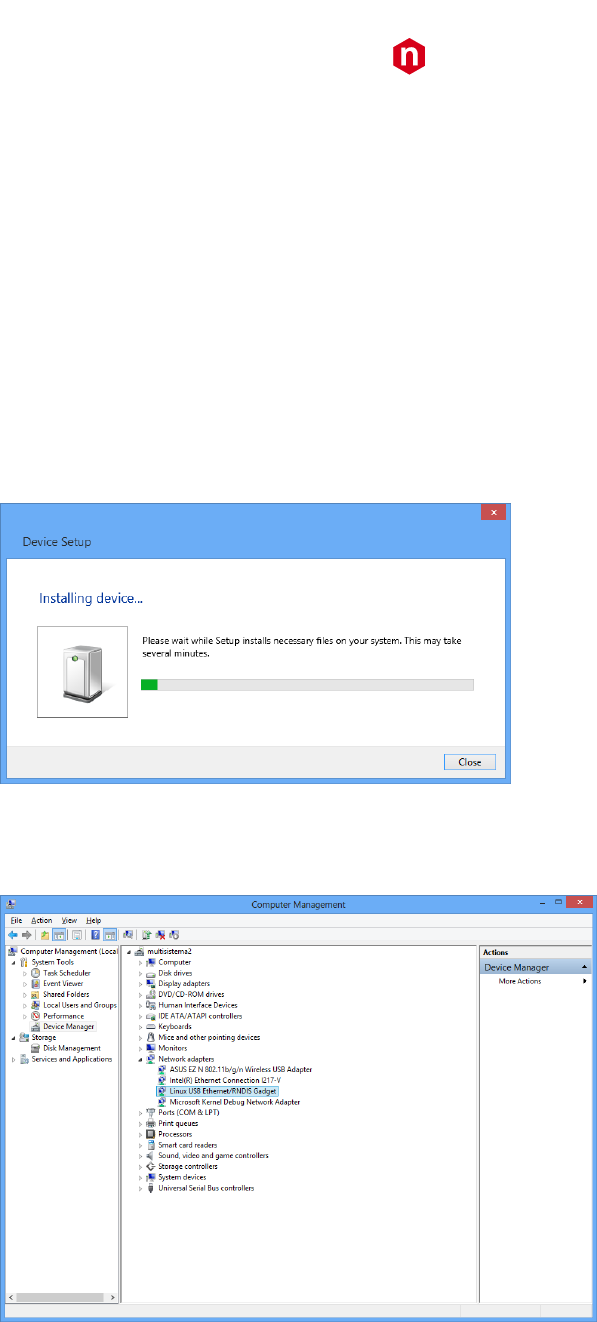
Note: In case of DT5770 the miniUSB driver has to be downloaded from the product web page. At the first
connection of the DT5770 to the PC, Windows will try to automatically install them. The user have to provide
to the drivers installation process the path to the downloaded driver folder. Then a message like this should
appear. Wait for the complete installation of the driver before using the device.
Note: In case of Hexagon the miniUSB driver has to be downloaded from the product web page. Run the installer
and the device will be recognized under the "Device Manager" window among "Universal Serial Bus controllers".
Note: the USB connection to Hexagon is recognized as a virtual Ethernet connection, whose default IP Address
is: 192.168.7.2
• USB 2.0 Drivers for V1718 CAEN Bridge, required for the VME boards interface, is downloadable on CAEN
website (www.caen.it) in the “Software/Firmware” tab of the V1718 web page (login required).
Note: For the installation of the V1718 USB driver, refer to the User Manual of the Bridge.
CAEN
Electronic Instrumentation
UM3182 – MC2Analyzer User Manual Rev. 5
24
• Optical Link Drivers are managed by the A2818 PCI card or the A3818 PCIe card. The driver installation package
is available on CAEN website in the “Software/Firmware” area at the A2818 or A3818 page (login required)
Note: For the installation of the Optical Link driver, refer to the User Manual of the specific Controller.
Network configuration
With the DT5770 and Hexagon MCAs it is also possible to communicate via Ethernet communication interface. The
connection can be done through a server or it can be a point-to-point connection to the PC. In the latter case the
connection can be done using a crossed cable, a switch, or a computer with a Gigabit Ethernet port. Connect the Ethernet
cable from the MCA to the computer and configure the network according to the following instructions.
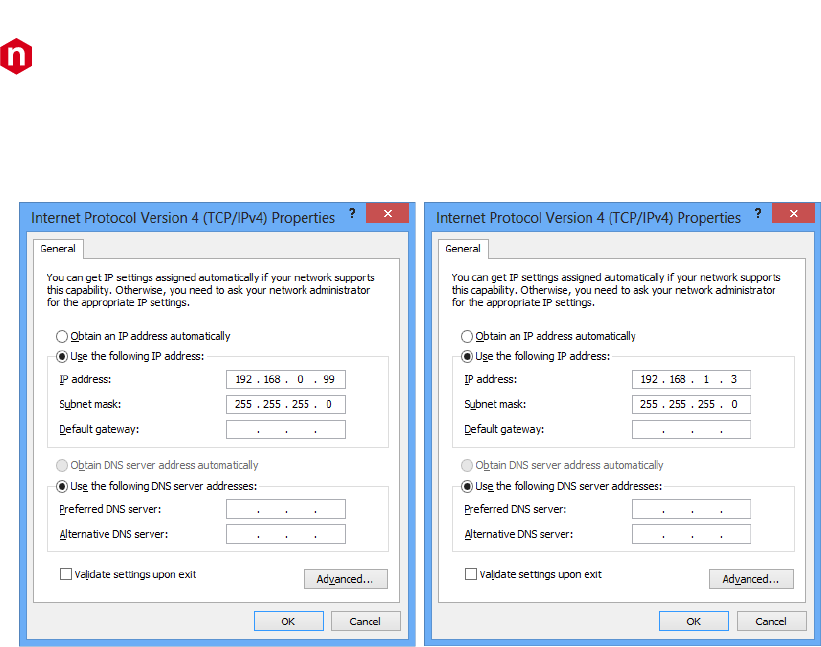
Note: The default IP Address of DT5770 MCA is: 192.168.0.98, while the The default IP Address of Hexagon is: 192.168.1.2
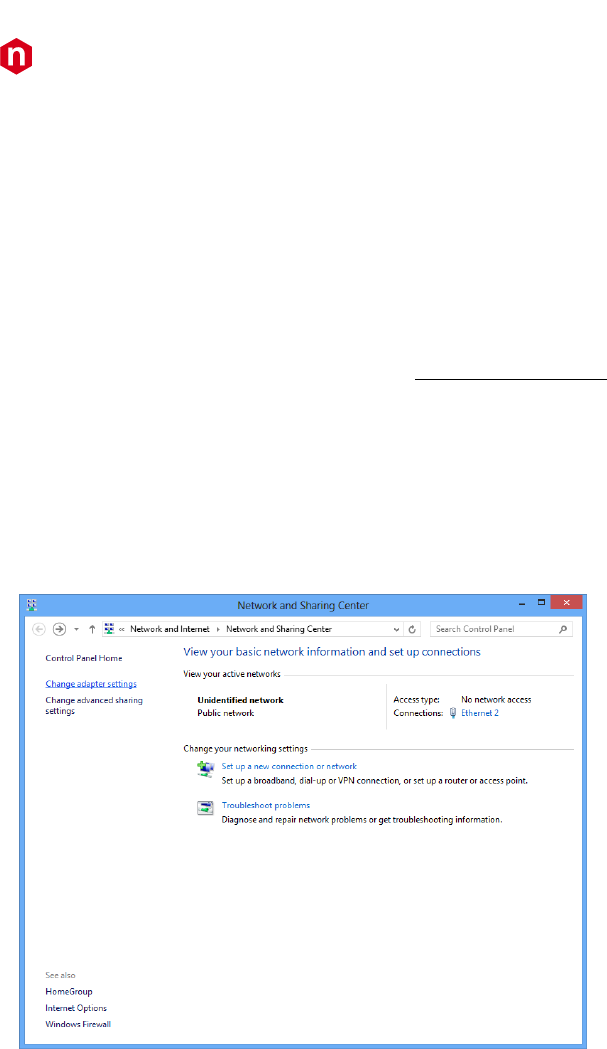
1. Open the path:
Control Panel - Network and Internet - Network and Sharing Center
2. Click on “Change adapter settings”.
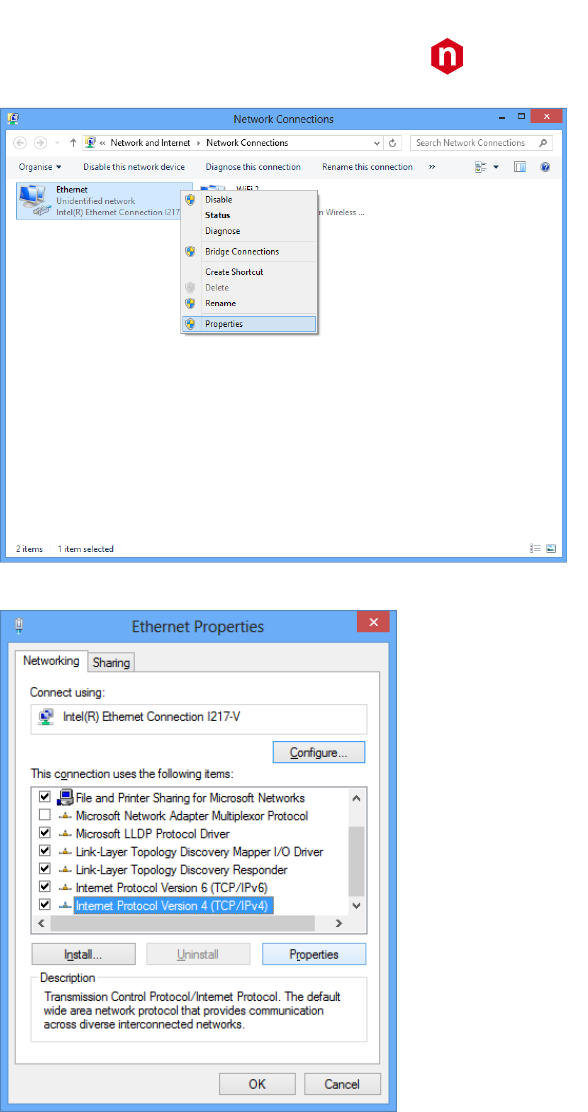
3. Right click on the Ethernet icon and select “Properties”:
CAEN
Electronic Instrumentation
UM3182 – MC2Analyzer User Manual Rev. 5
25
4. Click on “Internet Protocol Version (TPC/IPv4)”, and select “Properties”:
CAEN
Electronic Instrumentation
UM3182 – MC2Analyzer User Manual Rev. 5
26
5. Copy the following configuration on the “Internet Protocol Version (TPC/IPv4) Properties” window (for
DT5770 on the left and for Hexagon on the right):
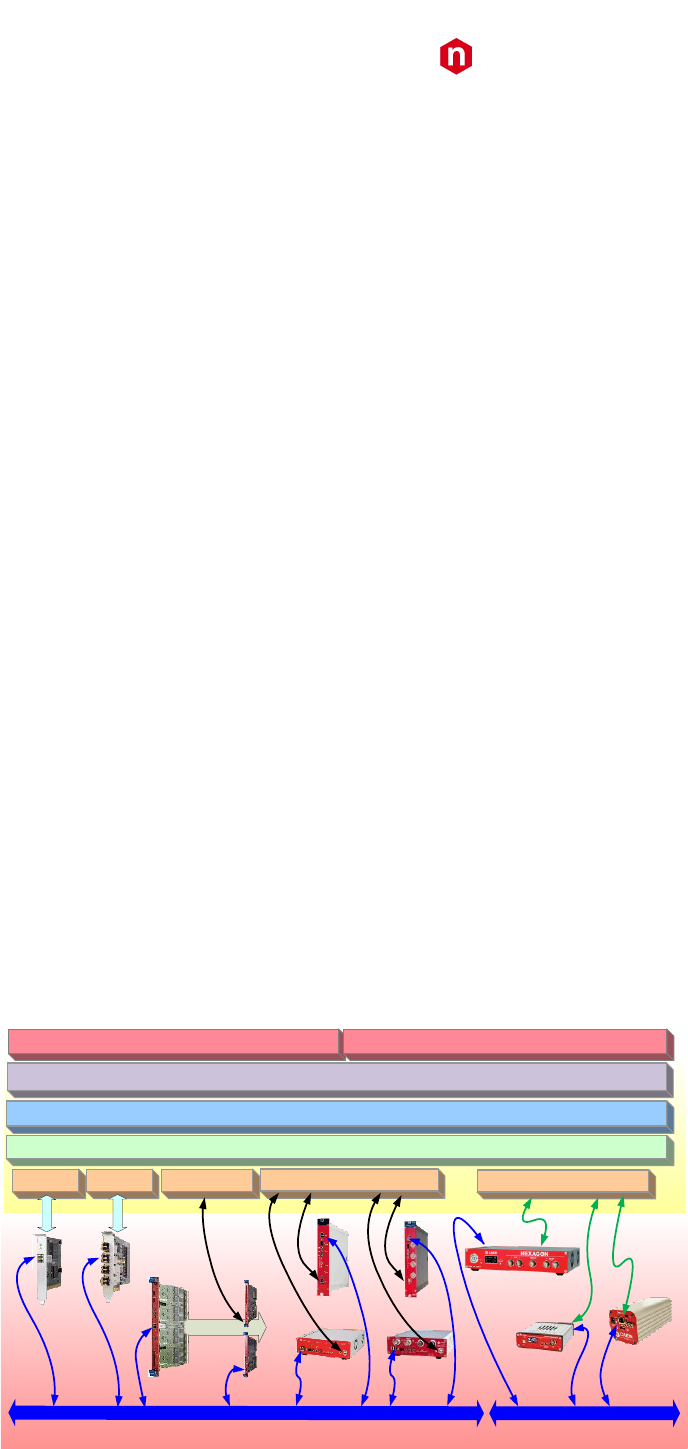
CAEN
Electronic Instrumentation
UM3182 – MC2Analyzer User Manual Rev. 5
27
Libraries
The MC2Analyzer software relies in the following additional set of C libraries which are embedded into the software
setup. The user does not need to install them aside, apart in the case he/she wants to write its own readout software:
• CAENComm library manages the communication at low level (read and write access). The purpose of the
CAENComm is to implement a common interface to the higher software layers, masking the details of the
physical channel and its protocol, thus making the libraries and applications that rely on the CAENComm
independent from the physical layer. Moreover, the CAENComm requires the CAENVMELib library (access to
the VME bus) even in the cases where the VME is not used. This is the reason why CAENVMELib has to be
already installed on your PC before installing the CAENComm.
The CAENComm installation package is available on CAEN website (www.caen.it) in the “Download” tab at:
Home / Products / Firmware/Software / Software Tools / Software Libraries / CAENComm Library
• CAENDigitizer is a library of functions designed specifically for the Digitizer family and it supports also the
boards running the DPP firmware. The CAENDigitizer library is based on the CAENComm library. For this reason,
the CAENComm libraries must be already installed on the host PC before installing the CAENDigitizer.
The CAENDigitizer installation package is available on CAEN website (www.caen.it) in the “Download” tab at:
Home / Products / Firmware/Software / Software Tools / Software Libraries / CAENDigitizer Library
• CAENDPP is a high-level library of C functions designed to completely control exclusively the digitizers running
the DPP-PHA firmware.
The CAENDPP installation package is available on CAEN website (www.caen.it) in the “Download” tab at:
Home / Products / Firmware/Software / Software Tools / Software Libraries / CAENDPP Library
Currently, the CAENComm (and so the CAENDigitizer) supports the following communication interfaces (see also Fig.
3.2):
PC → USB → Digitizer Desktop and NIM form factors
PC → USB → V1718 → VME → Digitizer VME form factor
PC → PCI (A2818) → CONET → Digitizer all form factors
PC → PCI (A2818) → CONET → V2718 → VME → Digitizer VME form factor
PC → PCIe (A3818) → CONET → Digitizer all form factors
PC → PCIe (A3818) → CONET → V2718 → VME → Digitizer VME form factor
CONET (Chainable Optical NETwork) indicates the CAEN proprietary protocol for communication interface using Optical
Link.
Titolo
V1724/VX1724
V1725/VX1725
V1730/VX1730
VME
CONET2 (Optical Link)
DT5724
DT5725
DT5730
A2818 A3818 N6724
N6730
V1718
V2718
DT5780x
DT5781
CAEN MC² Analyzer User’s SW specific for DPP-PHA
N6780x
N6781
CAENDPP Library
A2818 driver A3818 driver V1718 driver USB driver
PCI
PCIe
miniUSB driver
HEXAGON
DT5770 γstream
miniUSB miniUSB
Ethernet
miniUSB
USB 2.0
CAENComm Library
CAENDigitizer Library
Fig. 3.2: Libraries and drivers required for MC2Analyzer
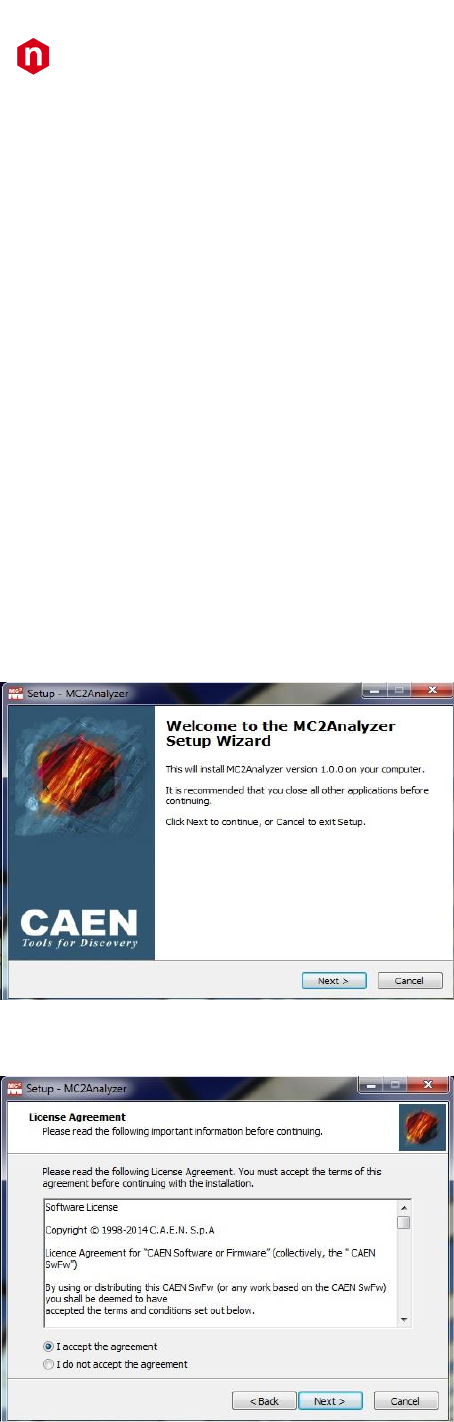
CAEN
Electronic Instrumentation
UM3182 – MC2Analyzer User Manual Rev. 5
28
Software Installation
To manage with the MC2Analyzer software, the host station needs a Windows OS. The Linux version is not supported
yet. The software requires the third-party software .NET Framework 4.0 or later, downloadable from Microsoft©
website.
• Make sure that your hardware (Digitizer and/or Bridge, or Controller) is properly installed (refer to the related
User Manual for hardware installation instructions).
• Make sure you have installed the driver for your OS and the physical communication layer to be used. Driver
installation packages are downloadable from CAEN website (login required) as reported in the section Drivers
(refer to the related User Manual for driver installation instructions).
Note: Hardware and USB drivers installation instructions for desktop digitizers and DT5780 are detailed in [RD3].
CAEN provides the full installation package for the MC2Analyzer Software in a standalone version for Windows OS. This
version installs all the binary files and required libraries.
1. Download the MC2Analyzer Software from CAEN Website under the path:
Home / Products / Firmware/Software / Digitizer Software / Readout Software / MC2 Analyzer
2. Extract the files and run the executable “MC2Analyzer_x.x.x.exe”.
3. The CAEN MC2Analyzer Setup Wizard will guide you throughout the installation procedure.
Note: the following screenshot are taken with Window 7 OS, and they can be generalized for Windows 8 and Windows
10.
Fig. 3.3: MC2Analyzer Wizard Dialog Box- Start Installation
Left click on “Next” (or left click on “Cancel” any time during the installation process to abort the installation).
Fig. 3.4: MC2Analyzer Wizard Dialog Box - License Agreement
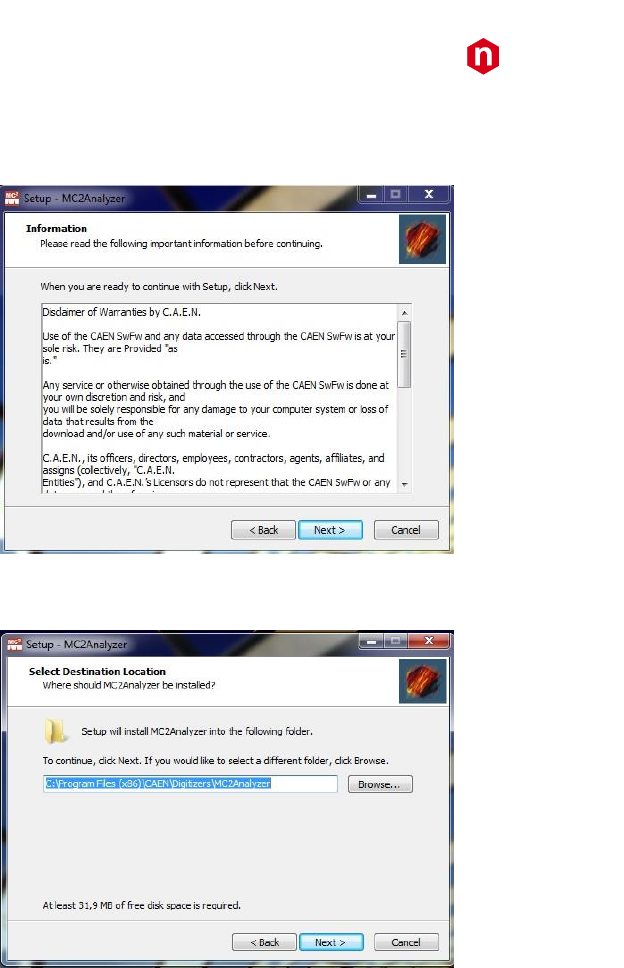
CAEN
Electronic Instrumentation
UM3182 – MC2Analyzer User Manual Rev. 5
29
Please read the MC2Analyzer Software License Agreement and select “I accept the agreement” to continue the
installation. Left click on “Next” (or left click on “Back” at any time during the installation process to modify the previous
settings).
Fig. 3.5: MC2Analyzer Wizard Dialog Box - Disclaimer
Please read the CAEN Disclaimer information then left click on “Next” to continue.
Fig. 3.6: MC2Analyzer Wizard Dialog Box – Installation Folder Selection
To install the MC2Analyzer Software, a minimum free space of about 32 MB of free Hard Disk space is required. Select a
folder for the installation of the CAEN MC2Analyzer Software by using the “Browser” button or by typing the desired
path in the white entry box. The default path is:
C:\Program Files\CAEN\Digitizers\MC2Analyzer (Windows 32 bit)
or
C:\Program Files (x86)\CAEN\Digitizers\MC2Analyzer (Windows 64 bit).
Left click on “Next” to continue.
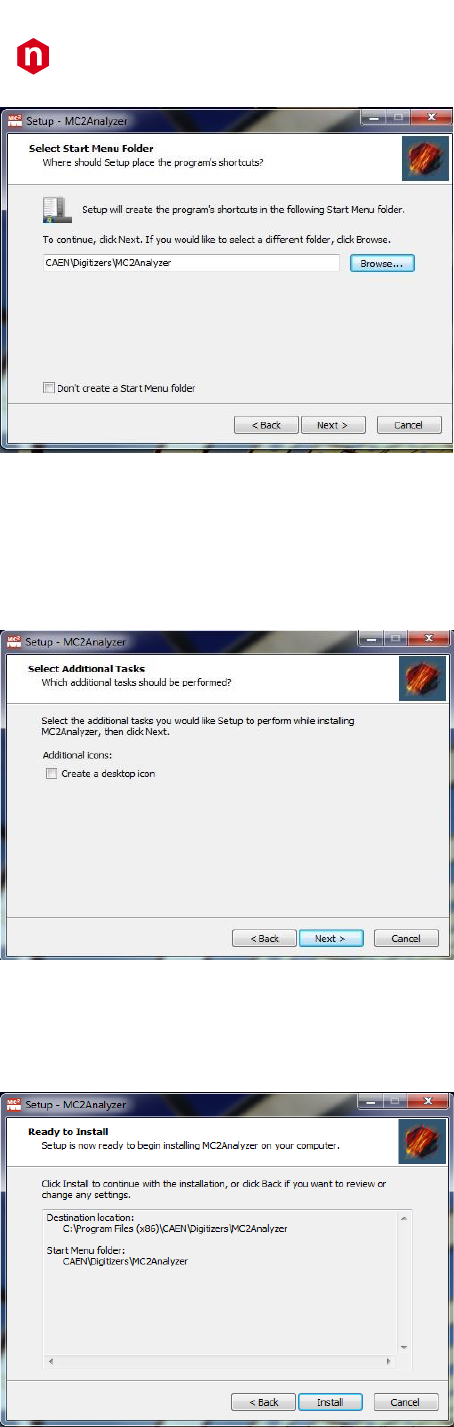
CAEN
Electronic Instrumentation
UM3182 – MC2Analyzer User Manual Rev. 5
30
Fig. 3.7: MC2Analyzer Wizard Dialog Box – Shortcuts
Optionally, select a Start Menu folder for the installation of the CAEN MC2Analyzer Software Shortcuts by using the
“Browser” button or by typing the desired path in the white entry box. The default path is: C:\Program
Files\CAEN\Digitizers\MC2Analyzer (Windows 32 bit) or C:\Program Files (x86)\CAEN\Digitizers\MC2Analyzer (Windows
64 bit). If you do not wish to create a Start Menu folder mark the checkbox labelled “Don’t create a Start Menu folder”.
Left click on “Next” to continue.
Fig. 3.8: MC2Analyzer Wizard Dialog Box – Desktop Icon Selection
Optionally, mark the checkbox labelled “Create a desktop icon” to create an MC2Analyzer icon on your computer
Desktop.
Left click on “Next” to continue.
Fig. 3.9: MC2Analyzer Wizard Dialog Box – Installation
Please revise the MC2Analyzer Program Destination path and the Start Menu folder you have selected, if any.
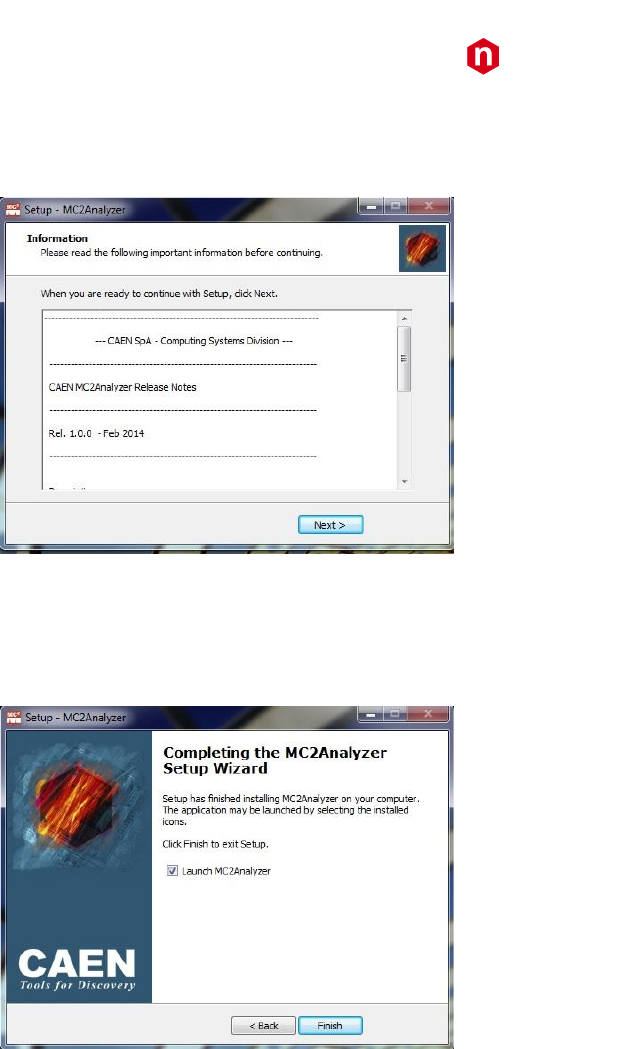
CAEN
Electronic Instrumentation
UM3182 – MC2Analyzer User Manual Rev. 5
31
Left click on “Install” to install the CAEN MC2Analyzer Software.
The CAEN MC2Analyzer Setup Wizard will extract and install the relevant files. At the end of the installation, the following
Dialog Box will appear:
Fig. 3.10: MC2Analyzer Wizard Dialog Box – Software Release Version Notes
Please read the Release Notes of the MC2Analyzer Software before continuing. This document is updated for every official
release of MC2Analyzer and it contains various updated information specific to this software which may not be found in
the User's Manual, available together with the software or on the CAEN web site: www.caen.it.
Fig. 3.11: MC2Analyzer Wizard Dialog Box – Finish Installation
To complete the MC2Analyzer Installation left click on “Finish”. The MC2Analyzer Program can be launched by marking
the check box “Launch MC2Analyzer Analyzer” before finishing the installation, or by left clicking on the installed icons
in the Start Menu Folder.
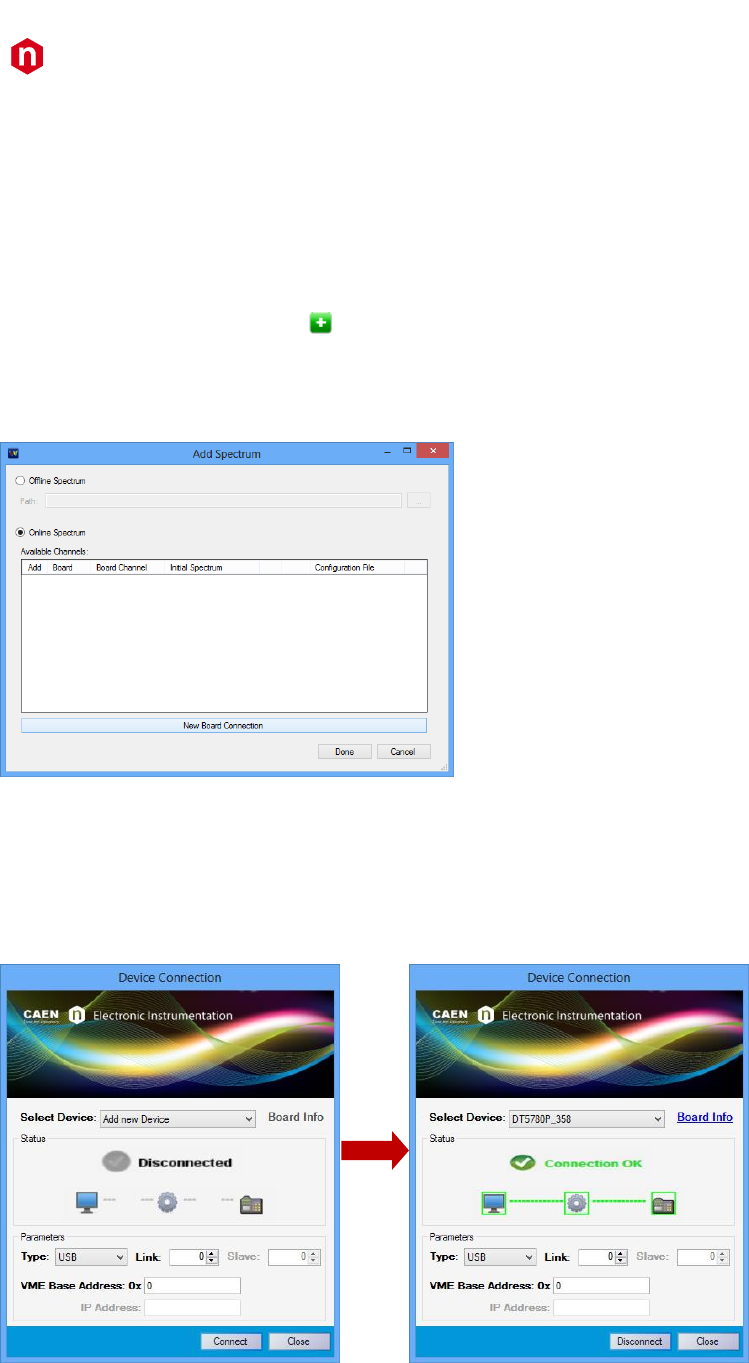
CAEN
Electronic Instrumentation
UM3182 – MC2Analyzer User Manual Rev. 5
32
Software connection
Once you have installed the required driver for the communication interface and the MC2Analyzer software you can
launch the MC2Analyzer software and connect it to the DT5780.
Note: The software requires an active rule in the firewall. Click Allow to permit the MC2Analyzer connection.
From the main panel of the MC2Analyzer software GUI select
FILE -> Add Spectrum, or press the button .
The following window will appear.
Select “Online Spectrum” and “New Board Connection” to connect the software to the digital MCA.
Fig. 3.12: the “Add Spectrum” window to add an offline spectrum from file or an online spectrum from board
Set the device connection parameters. In this example the USB connection interface has been used.
Press “Connect” when ready. The device is then recognized by the software and a green line shows that the connection
has been successfully established.
Then “Close” the “Device Connection” window.
Fig. 3.13: “Device Connection” window. Once connected to the board the link becomes green
Select the board channels you want to enable to acquire the desired spetrum.
Press “Done” when ready.
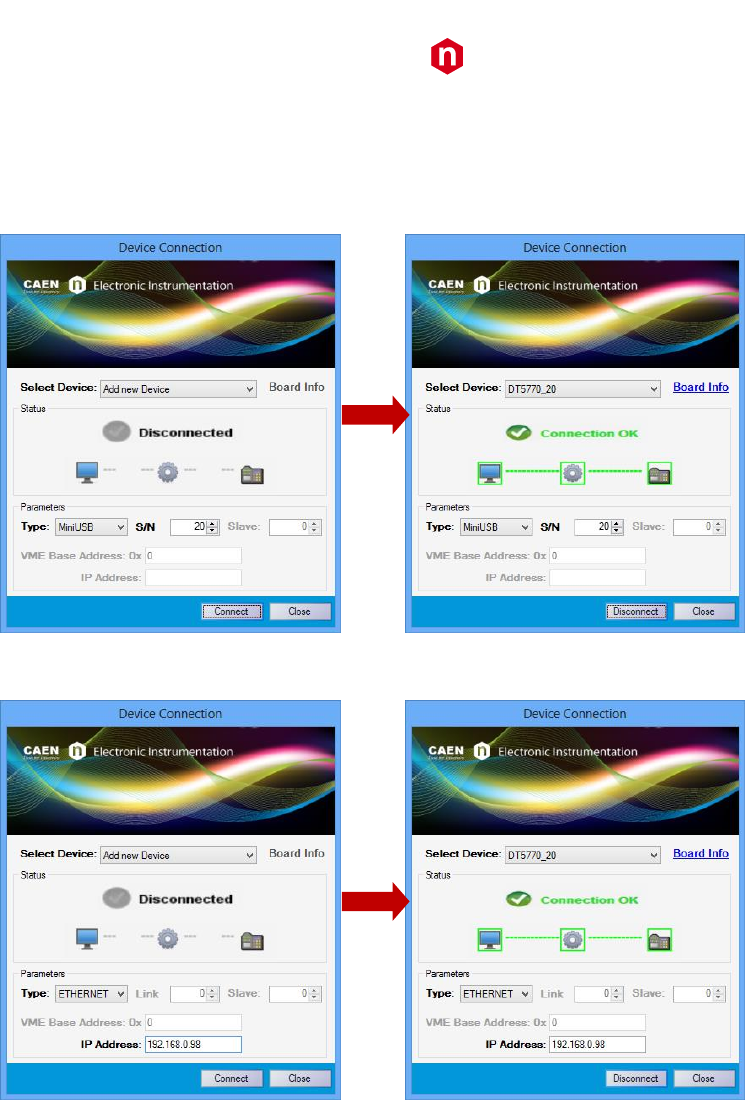
CAEN
Electronic Instrumentation
UM3182 – MC2Analyzer User Manual Rev. 5
33
Software connection to the DT5770 MCA
According to the preferred communication interface it is possible to connect to the MC2Analyzer software via:
1. Mini USB interface. Select Type = MiniUSB, and write the device serial number S/N, which is available on the bottom
panel of the DT5770. Press Connect when ready.
2. Ethernet interface. Select Type = Ethernet, and write the device IP Address = 192.168.0.98. Press Connect when
ready. Refer to Sect. Network configuration to configure the network in the host PC.
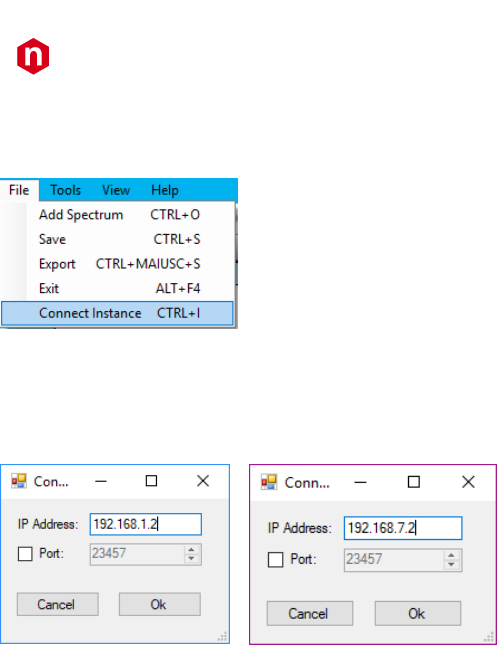
CAEN
Electronic Instrumentation
UM3182 – MC2Analyzer User Manual Rev. 5
34
Software connection to the Hexagon MCA
To connect MC2Analyzer to Hexagon Open the Connect Instance window under File.
In case of Ethernet connection make sure to have configured the Ethernet network as explained in Sec. Network
configuration. In case of USB connection make sure to have installed the USB drivers according to Sec. Drivers.
Write the IP address corresponding to the desired connection interface
(Ethernet = 192.168.1.2 on the left, USB = 192.168.7.2 on the right).
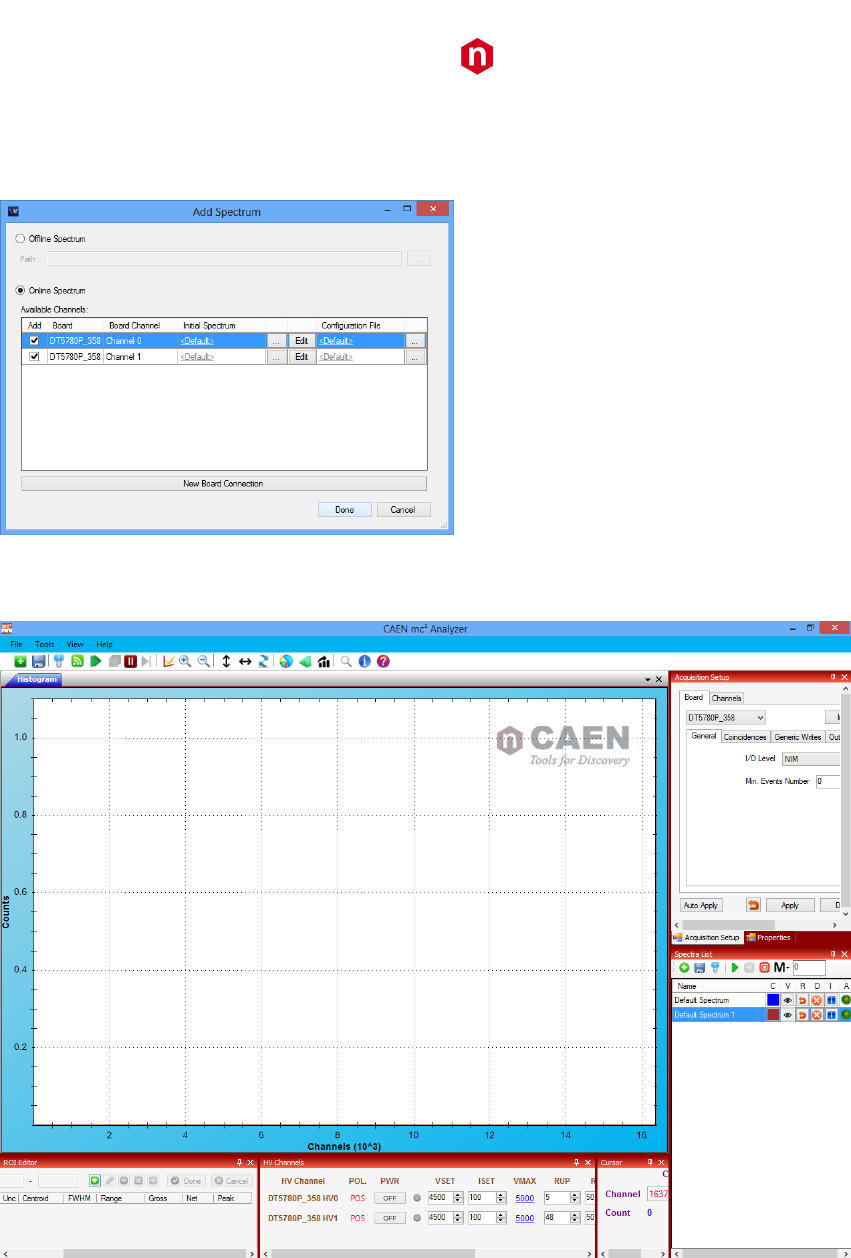
CAEN
Electronic Instrumentation
UM3182 – MC2Analyzer User Manual Rev. 5
35
Channel selection and default GUI layout
From the “Add Spectrum” window select the channels for the acquisition
Fig. 3.14: this window allows to select the desired board channels for the acquisition
The default GUI interface will be then available.
Fig. 3.15: the default GUI at the first connection
Note: In case of Hexagon, the MC2Analyzer software restores the latest configuration and adds the channels previously
added. If the user wants to add the second channel he/she can use the “Add Spectrum” window.
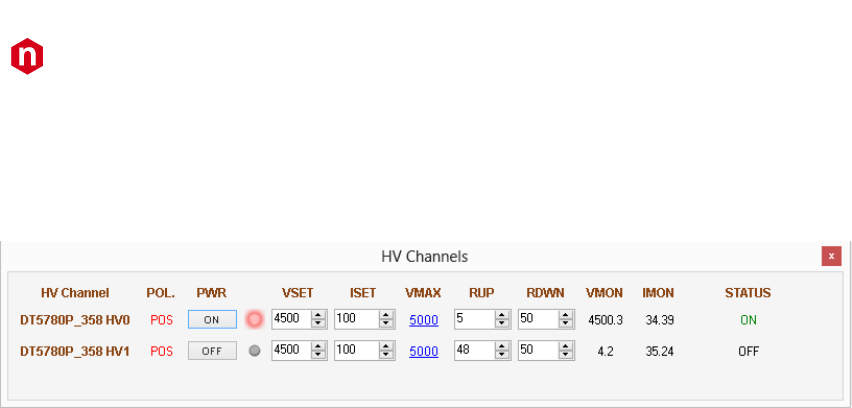
CAEN
Electronic Instrumentation
UM3182 – MC2Analyzer User Manual Rev. 5
36
How to power ON the high voltage (780 family and Hexagon only)
Note: MC2Analyzer software supports also
stream MCA tube-base. All the software functionalities for
stream are
described in [RD11].
Open the “HV Channels” window.
Fig. 3.16: “HV Channels” window for the setting and monitoring of the HV channels of the DT5780
Set the desired High Voltage value VSET, and the maximum current ISET according to your detector specifications.
Set the Maximum allowed Voltage value VMAX, beyond which the HV channel goes into protection.
Select the proper values for Ramp UP and Ramp DOWN (RUP and RDWN respectively), corresponding to the value of
V/sec of voltage ramp.
Press ON when ready and the check the HV status from the VMON, IMON and STATUS flags.
Note: The HV remains ON even if the user disconnects the software from the digitizer. When connected again the
software automatically reloads the last HV settings.
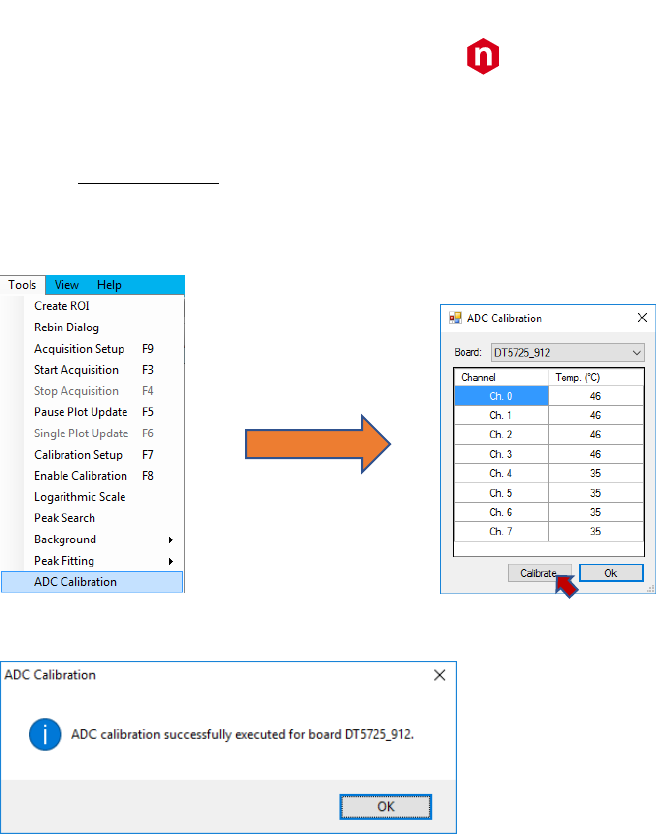
CAEN
Electronic Instrumentation
UM3182 – MC2Analyzer User Manual Rev. 5
37
ADC Calibration (725 and 730 series only)
In case of 725 and 730 series it is required to perform the ADC calibration before starting the acquisition. The board
already performs a calibration at power-on, anyway the ADC is very sensitive to the temperature variations, and the
calibration must be performed again by the user once the temperature gets stabilized.
From the Tools menu select “ADC Calibration”
A window with the ADC temperature for each channel will appear. Monitor the temperature, and once it is stable press
“Calibrate”. A successful pop-up message will appear.
Before starting the acquisition
It is very important to check the preamplifier output in an oscilloscope device before feeding the pre-amplified signal
into the digitizer input. The user must check that:
• there are no grounding loops;
• the preamplifier output dynamics is not saturated.
In the unlikely event one of the above conditions is found the user must take care of the proper work around.
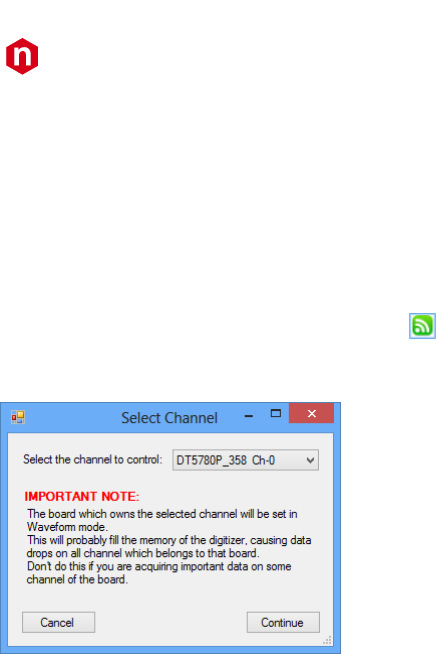
CAEN
Electronic Instrumentation
UM3182 – MC2Analyzer User Manual Rev. 5
38
How to configure the channel settings
The correct configuration of the channel settings allows to reach very precise resolutions in spectroscopy measurement.
For this reason, it is very important to set them properly. This section will guide the user throughout the settings
configuration. The first step is to enable the “Signal Inspector” window to check the effects of the setting modifications
on the digital filters.
Open the Signal Inspector window
To open the “Signal Inspector” window press the button in the icon bar.
Select the board channel for which you want to check the signal inspector. Then press “Continue”.
Fig. 3.17: “Select Channel” window to select the channel for the signal inspector visualization
It is possible to visualize a set of analog and digital traces.
Start with the visualization of:
- “Trapezoid” as “Analog Trace 1”
- “Input” as “Analog Trace 2”
- “Peaking” as “Digital Trace 1”
- “Trigger” as “Digital Trace 2”
Note: Any time you change one setting always press “Apply” to apply the setting. Otherwise press “Auto Apply” once
for automatically applying the changes.
Note: “Gain” and “Offset” of the “Digital Traces” affect only the traces visualization, while have no impact in the internal
board filters.
Note: move the “Waveform and Pre-Trigger Length” slider to increase or decrease the waveform visualization length.
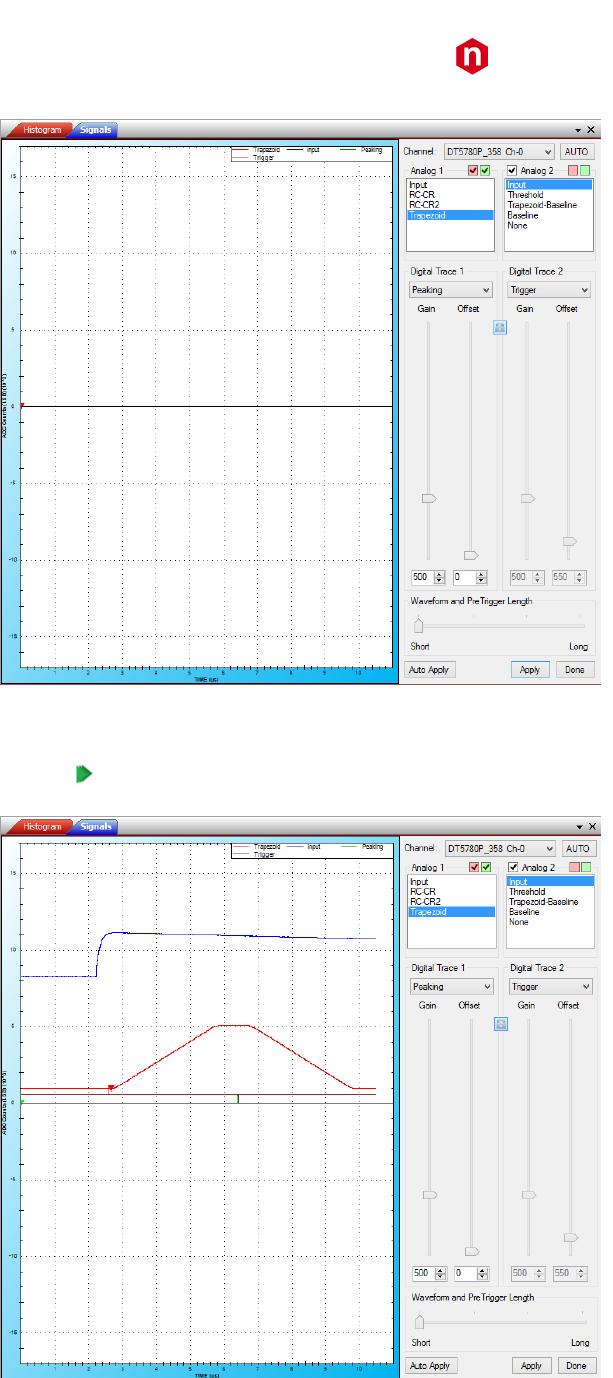
CAEN
Electronic Instrumentation
UM3182 – MC2Analyzer User Manual Rev. 5
39
Fig. 3.18: default signal inspector graphical interface
Press PLAY to start the waveforms visualization.
Fig. 3.19: signal inspector visualization of Input, Trapezoid, Peaking and Trigger traces
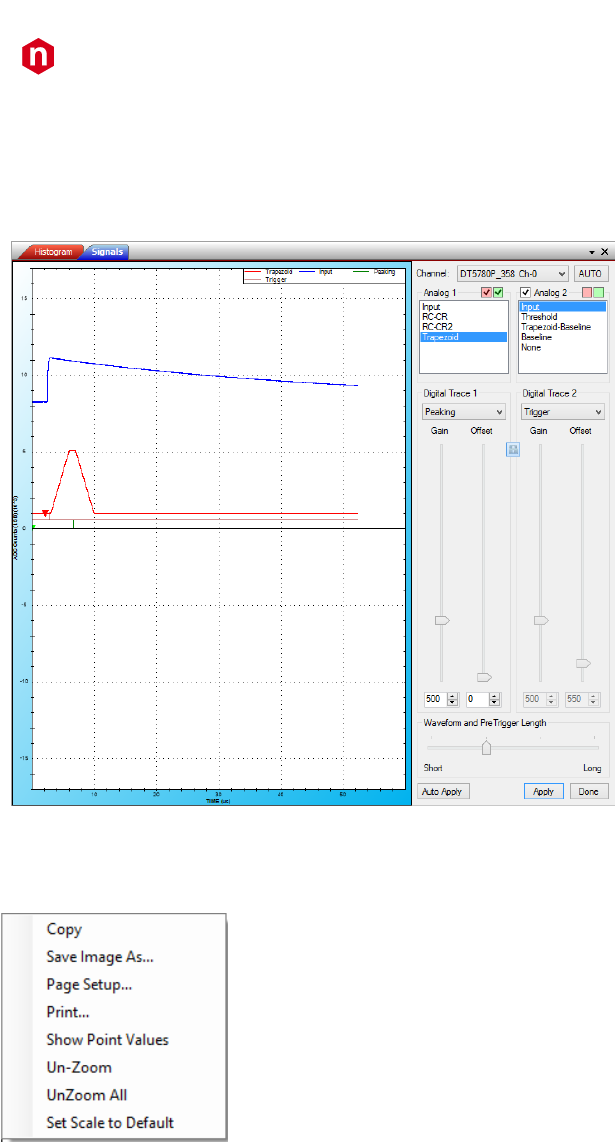
CAEN
Electronic Instrumentation
UM3182 – MC2Analyzer User Manual Rev. 5
40
Note: In case you don’t see any signal press “AUTO” to enable the software-trigger. The software will force the board to
trigger the events. Then adjust the channel settings as described in the following sections. Once the parameters are
correctly set release the AUTO button to disable the software-trigger.
Adjust the record length for a better visualization.
Fig. 3.20: modification of the “Waveform and Pre-Trigger Length” slider for a better visualization of the waveforms
Drag and release to zoom in a region of the plot.
Right click and select “Un-zoom” or “Un-zoom all” to zoom out.
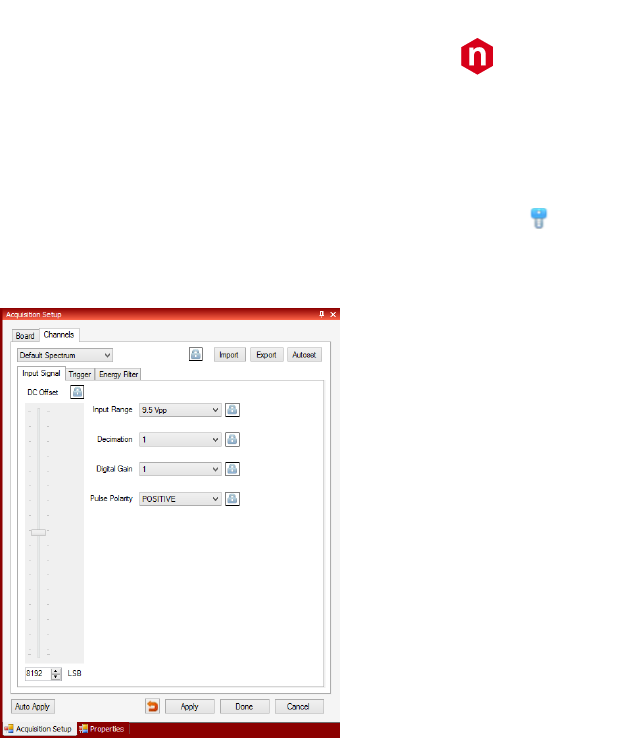
CAEN
Electronic Instrumentation
UM3182 – MC2Analyzer User Manual Rev. 5
41
How to configure the Input Signal settings
The first settings to be configure are those related to the Input Signal.
1. Open the “Acquisition Setup” window, either from the button or from “Tools -> Acquisition Setup”.
Select the tab “Channels” and select the “Default Spectrum”. The input signal settings are in the first tab “Input Signal”.
Fig. 3.21: The Acquisition Set Up Window – Board Tab - General Tab
2. Using the measurement of the pre-amplified pulses from an oscilloscope device (refer to Sect. Before starting
the acquisition) it is possible to check what is the pulse height range.
It is important to select the proper “Input Range”, which corresponds to the input dynamic range of the digitizer in order
to get all the pulses, even in pile-up. Possible choices are 0.6, 1.4, 3.7, 9 Vpp for x780 (0.3, 1, 3, and 10Vpp for x781; 0.5,
2 Vpp for 725 and 730 family; 1.25, 2.5, 5 and 10 Vpp for the DT5770; x0.25, x0.5, x1, …, x256 for Hexagon, not available
for 724 digitizer family). The correct setting of the Input Range is a compromise between the digitizer dynamics saturation
and the use of too few channels of the spectrum. The input range corresponds to the Coarse Gain of the analog chain.
In our example we choose the 3.7 Vpp.
3. Select the input “Pulse Polarity” choosing among “Positive” and “Negative”. Since the algorithm works with
positive pulses only, by setting “Negative” the algorithm will invert the digital samples of the input.
4. Adjust the “DC Offset” to have the input signal baseline around 1000 LSB counts. You can safely go below this
value, only check that the input does not saturate around 0. In that case the algorithm stops any calculation and
increases the dead-time. It is also important to check that the signal does not saturate in the upper limit of the
dynamics (16k LSB). In our example we set DC Offset = 14800.
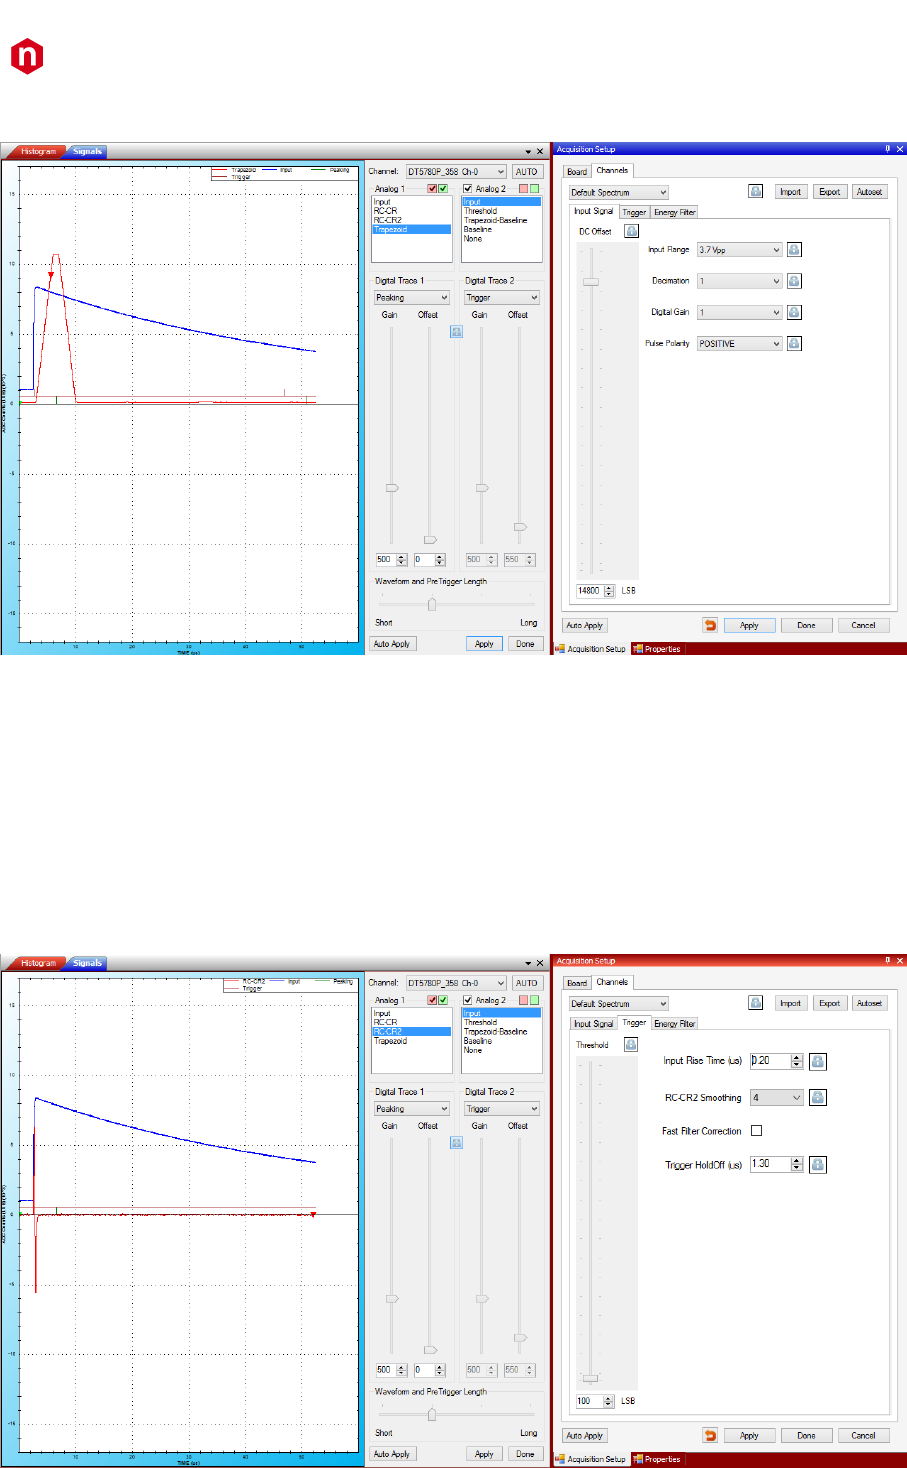
CAEN
Electronic Instrumentation
UM3182 – MC2Analyzer User Manual Rev. 5
42
The result of these settings is shown in the following figure.
Fig. 3.22: “Input Signal” settings and corresponding effect on the signal inspector window
How to set the Trigger
Since the trigger fires at the zero-crossing of the RC-CR2 signal (refer to Sect. Trigger and Timing Filter for further details)
first enable the visualization of the:
- “RC-CR2” as “Analog Trace 1”
- “Input” as “Analog Trace 2”
Select the tab “Trigger” from the “Acquisition Setup” window.
Fig. 3.23: “Trigger” tab settings and the visualization of the RC-CR2 settings and corresponding effect on the signal inspector window
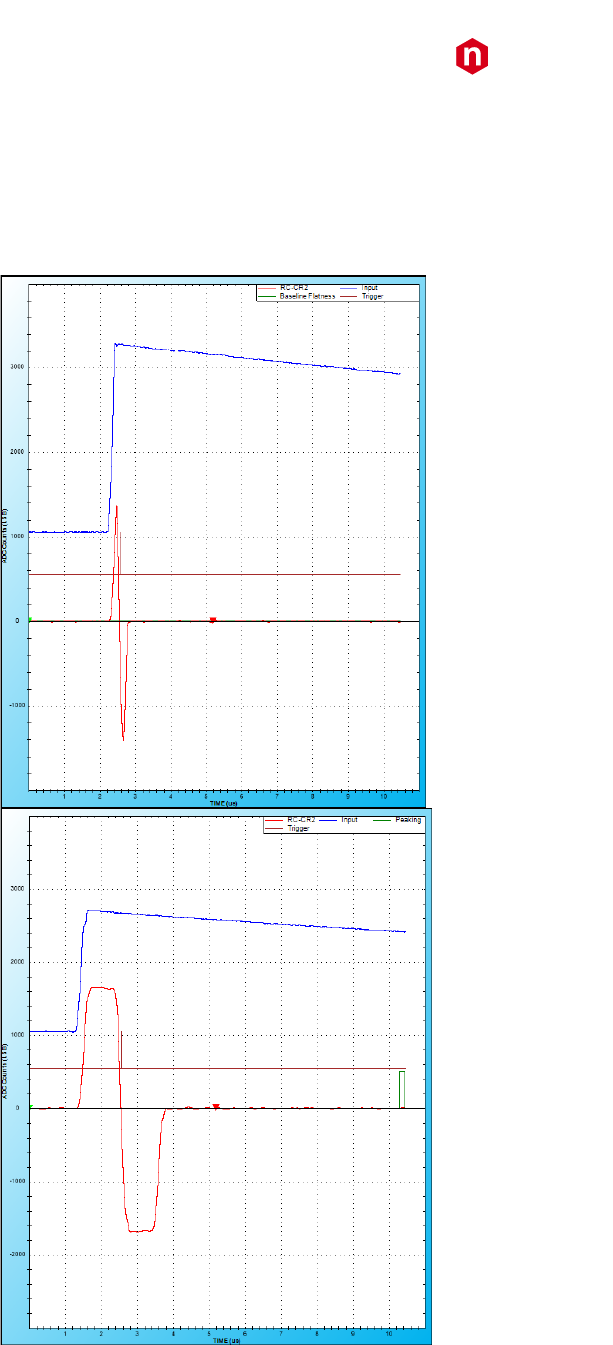
CAEN
Electronic Instrumentation
UM3182 – MC2Analyzer User Manual Rev. 5
43
1. Start by setting the “RC-CR2 Smoothing” factor to 16. All the other settings have to be tuned according to the
smoothing factor (i.e. once you change this value you have to repeat the whole procedure described in this section).
2. Set the “Input Rise Time” value (see Sect. Trigger and Timing Filter and Acquisition Setup for further details) to
have the same height of RC-CR2 signal and the input pulse. Try to avoid cases where the “Input Rise Time” is too
short (the RC-CR2 height will be less than the input) and where the “Input Rise Time” is too long, which are
represented in the following figure. On the left the value is underestimated, on the right it is overestimated.
Fig. 3.24: two examples where the “Input Rise Time” is not correctly set. In the left the value is underestimated, on the right it is
overestimated
The correct value for our example is 0.3 us.

CAEN
Electronic Instrumentation
UM3182 – MC2Analyzer User Manual Rev. 5
44
Fig. 3.25: Set the Input Rise time to have the same pulse height of the input signal and the RC-CR2 signal
3. In case the RC-CR2 shows an overshoot (see Fig. 3.26), set the “Trigger Hold-Off” value as long enough to eventually
include the overshot inside it. The algorithm then inhibits any trigger occurring during the whole “Trigger Hold-Off”
duration.
Check the correct value by enabling the visualization of the “Trigger Hold-Off” as “Digital Trace 1”.
Fig. 3.26: RC-CR2 signal with an overshoot. Set the Trigger Hold-Off to cover the overshoot and avoid re-triggering
In case there is no overshoot set the minimum value of Trigger Hold-Off to cover the RC-CR2 signal.
In our example, we set 0.6 us.
Trigger Hold-Off = 0.8 us
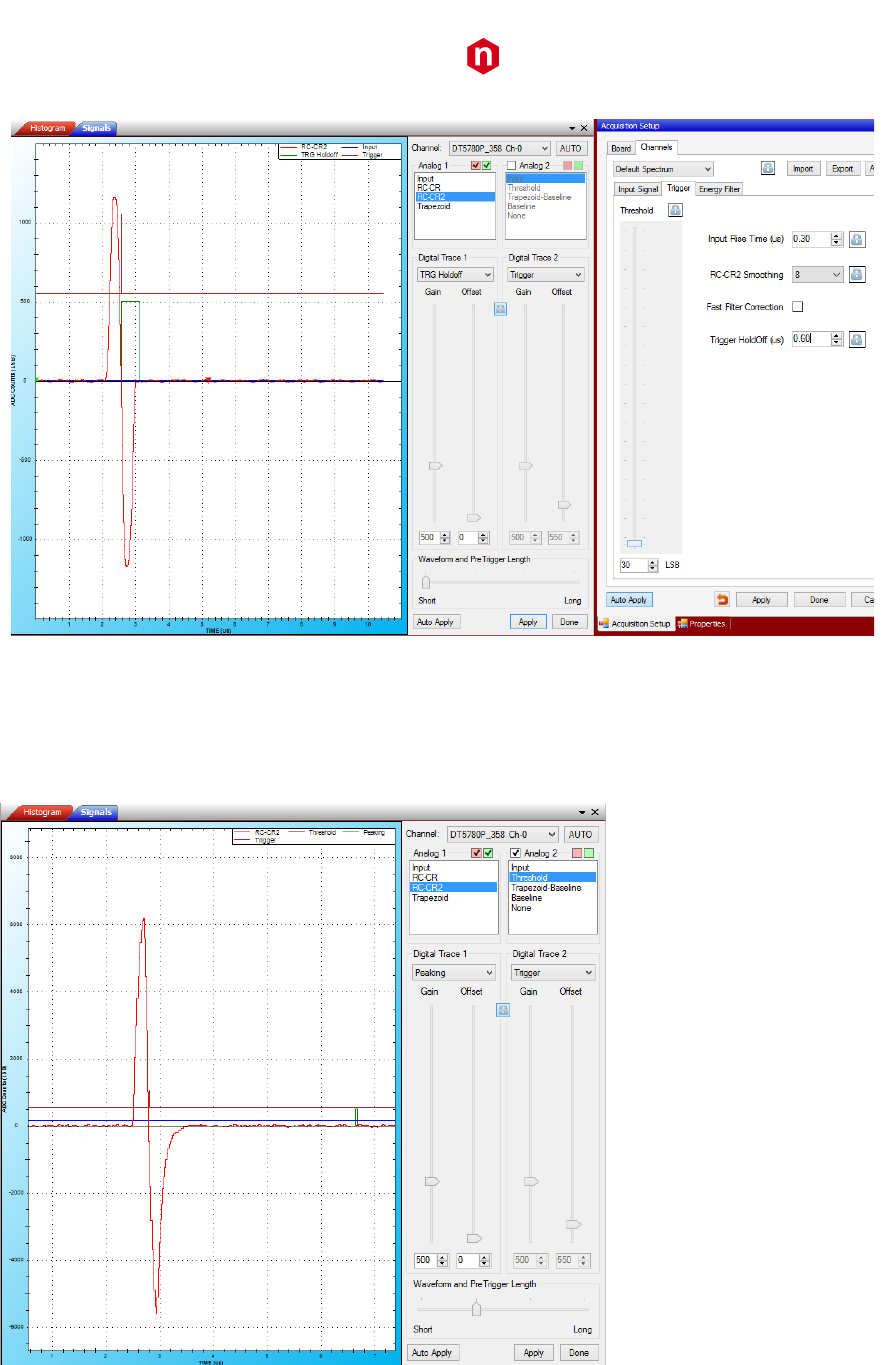
CAEN
Electronic Instrumentation
UM3182 – MC2Analyzer User Manual Rev. 5
45
Fig. 3.27: RC-CR2 signal with no overshoot. Set the Trigger Hold-Off to cover the RC-CR2 signal width
4. Set the “Threshold” value to avoid the noise level of the RC-CR2 signal. You can visualize the “Threshold” Analog
trace on the Signal Inspector Window.
To correctly set the Threshold value, switch to the “Histogram” window. Zoom in in the lowest region of the spectrum
and reduce the threshold level until you get a peak close to zero. You are now triggering below the noise level. Set then
a value slightly higher to trigger on real pulses.
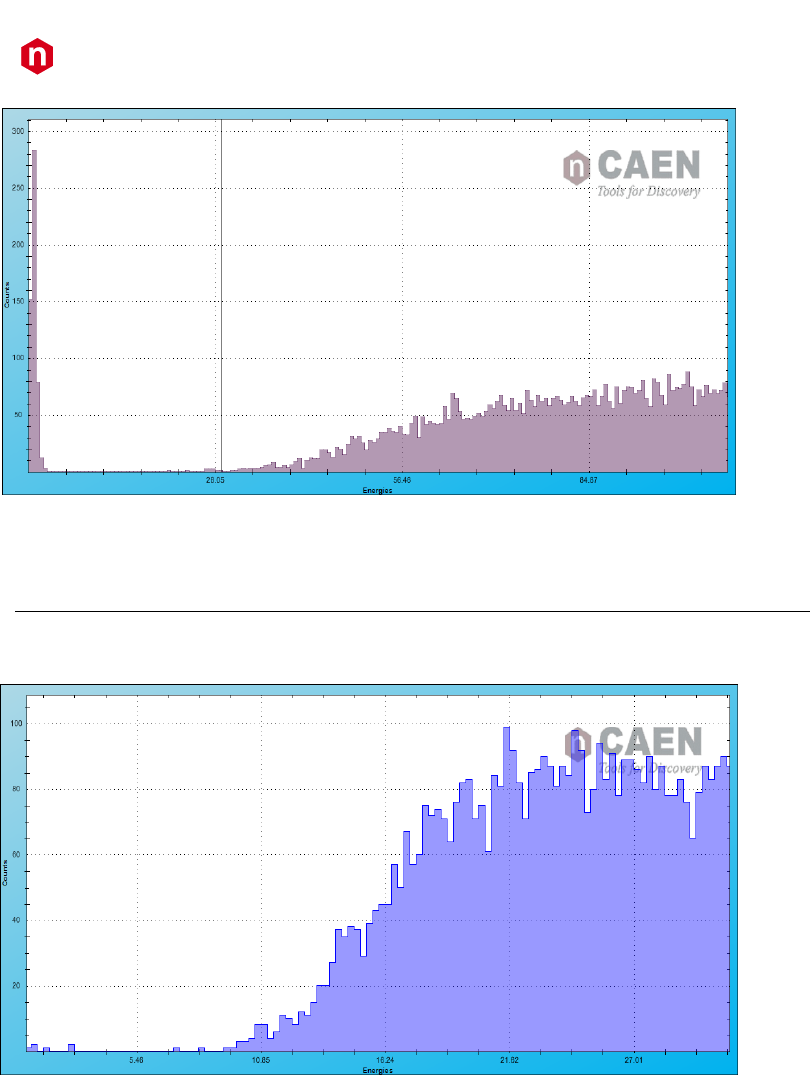
CAEN
Electronic Instrumentation
UM3182 – MC2Analyzer User Manual Rev. 5
46
Note: According to the detector / pre-amplifier conditions it is possible to have particularly noisy input signals. In this
case the lower region of the spectrum is cut off. To overcome this issue set a greater value of RC-CR2 smoothing to use a
greater number of sample for the RC-CR2 signal. In this way high frequency noise will be significantly reduced.
Remember to adjust again the Input Rise Time and Trigger Hold-off in case you change the smoothing factor.
In our example, we can reach up to about 10 keV.
How to set the Trigger filter (DT5770 only)
The trigger on DT5770 fires on the zero crossing of the fast trapezoid derivative (refer to Sect. Trigger and Timing Filter
for DT5770 for further details). Since it is not possible to see the derivative, just enable the visualization of the fast
trapezoid:
- “Input” as “Analog Trace 1”
- “Fast Trapezoid” as “Analog Trace 2”
Select the tab “Trigger” from the “Acquisition Setup” window.
Note: The fast trapezoid uses the same decay time of the trapezoid. Carefully check that the decay time is correctly set,
otherwise the fast trapezoid is not correctly shaped and the board does not acquire events.
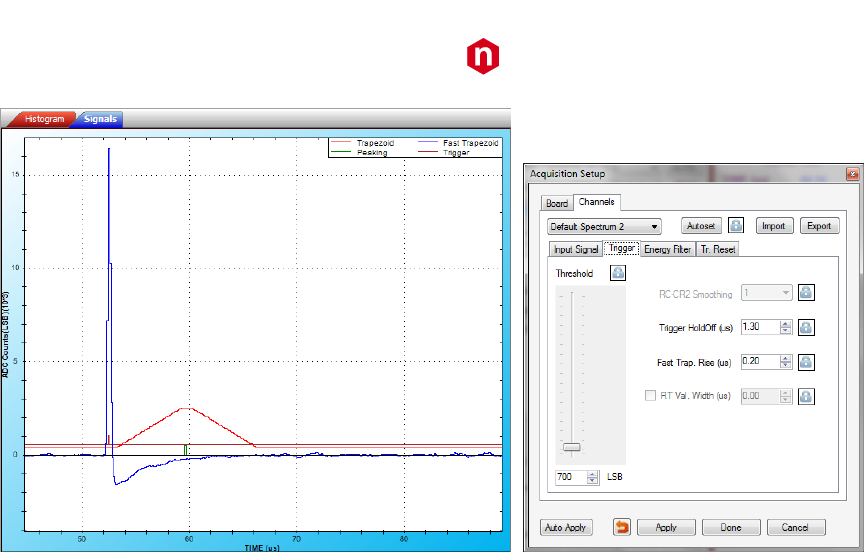
CAEN
Electronic Instrumentation
UM3182 – MC2Analyzer User Manual Rev. 5
47
Choose the desired value of “Fast Trapezoid Rise Time” from a range of 10 ns up to 300 ns.
Set the Threshold value to avoid the noise level of the fast trapezoid itself and arm the trigger filter. The trigger will fire
on the derivative signal of the fast trapezoid.
It is also possible to set a Trigger Hold-Off. Triggers occurring during the Trigger Hold-Off duration are inhibited.
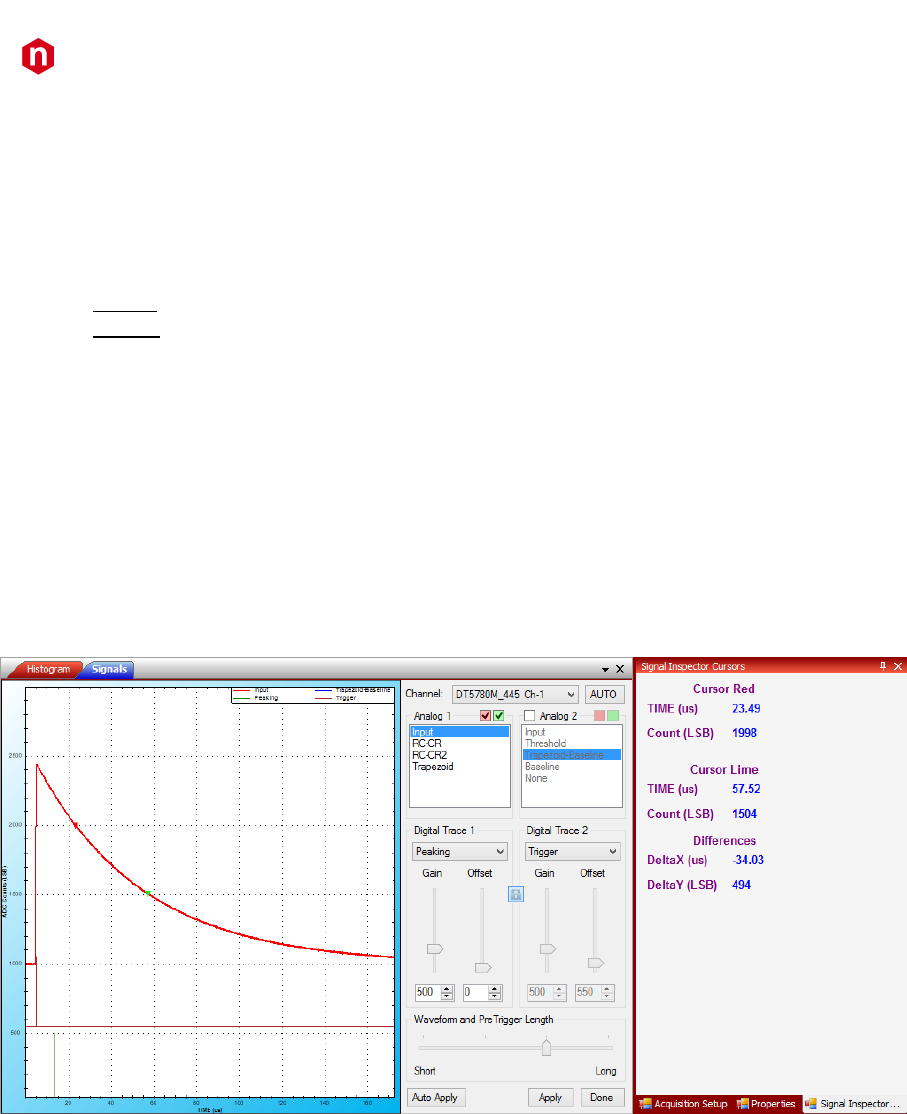
CAEN
Electronic Instrumentation
UM3182 – MC2Analyzer User Manual Rev. 5
48
How to set the Energy Filter
The precise configuration of the Energy Filter strongly affects the final resolution measurement; therefore it is very
important to fine tuning the Energy Filter settings. The user must take care of:
• Checking that the trapezoid is correctly shaped;
• Evaluating the energy value (see the Peaking trace) in the flat top region of the trapezoid.
The two typical measurement setups that we are going to discuss are:
1. Low rate (up to few hundreds of Hz) and very high precision measurement;
2. High rate (up to tens of kHz), where the result is a compromise between high resolution and dead-time.
Before starting, set an approximate value of “Decay Time”. The fine tuning of this parameter is described in section Pole-
Zero Adjustment.
To evaluate the decay time value the user can enable the “Input” visualization from “Analog Trace 1”, and measure the
input half-time using the “Signal Inspector Cursors”. From the half time it is possible to calculate the decay time according
to the formula: T1/2 = ln(2) , where T1/2 is the half time, and is the decay time.
Left click to point the red cursor.
Press the “Shift” key and left click to point the lime cursor.
Then open the “Signal Inspector Cursors” window to check the corresponding cursor values and their difference. From
the “DeltaX” value you can evaluate the Decay Time value. Refer to Sect. Signal Inspector Cursor window for further
details.
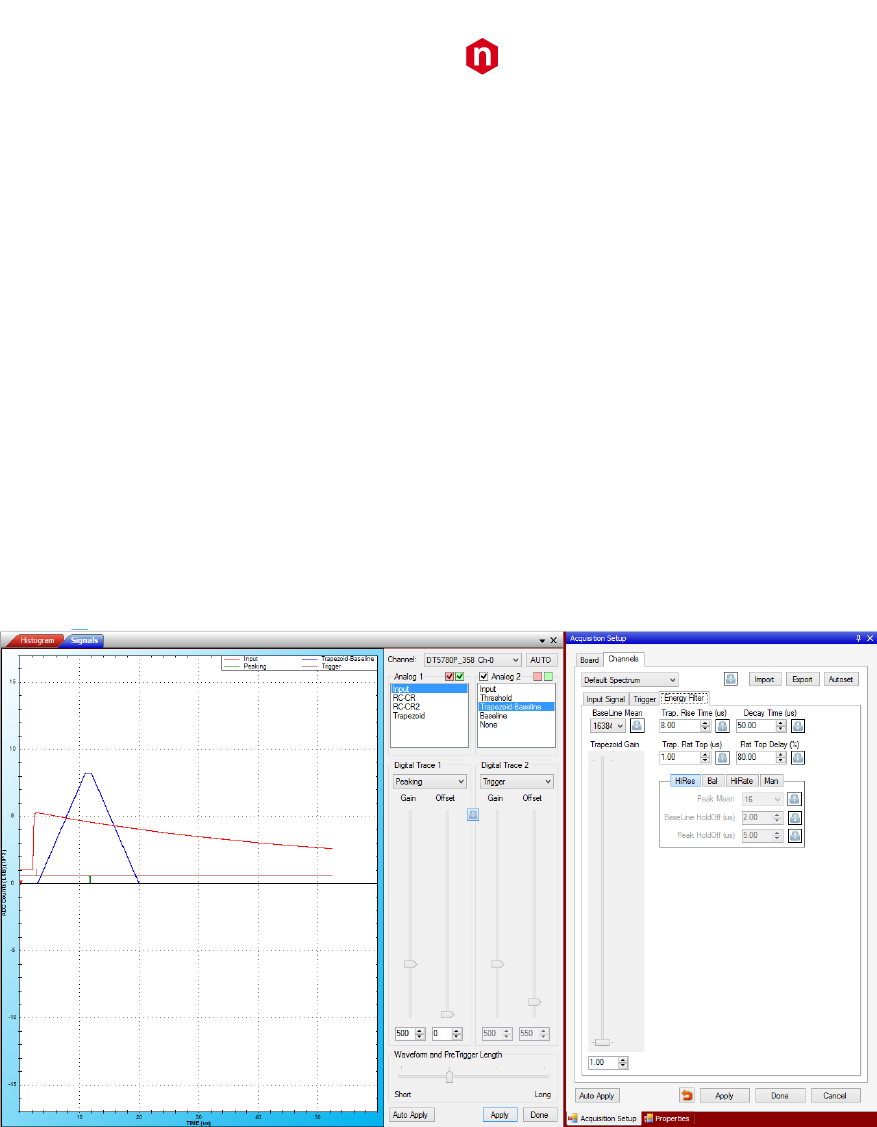
CAEN
Electronic Instrumentation
UM3182 – MC2Analyzer User Manual Rev. 5
49
Select now:
- “Input” as “Analog Trace 1”
- “Trapezoid-Baseline” as “Analog Trace 2”
- “Peaking” as “Digital Trace 1”
- “Trigger” as Digital Trace 2
Note: The baseline of “Trapezoid - Baseline” trace should be at 0.
1. In the low rate case it is recommended to set a high value of “Trapezoid Rise Time”, as for example 8 us. Considering
it in the analogy of the analog chain (refer to Chapter Principle of Operation) it corresponds to about 3 us of shaping
time.
Then set a value of “Trapezoid Flat Top” between 1-2 us, only check that the flat top region is really flat.
Adjust – if necessary – the Peaking position (“Flat Top Delay”) and the number of samples (“Peak. Mean”) for the
energy mean calculation.
Finally for very low rate set the maximum value of “Baseline Mean” (i.e. the number of samples for the baseline
calculation), i.e. 16K.
You can either choose the preset “HiRes” for high resolution settings, or the “Man”. For high resolution
measurement it is strongly recommended to set the maximum value of “Baseline Hold-Off”
Note: The Trapezoid Rise Time and Flat Top Time have a maximum value of about 10 us. In any case their sum should
not exceed 15 us for x724, DT5780 and DT5781.
In case of x730 the sum of Trapezoid Rise Time and Flat Top Time should not exceed 8 us. Suggested settings for x730
are 7 us of Rise Time and 1 us of Flat Top.
In case of Hexagon Trapezoid Rise Time and Flat Top Time have a maximum value of about 40.95 and 20.47 us
1. In the high rate case (tens of kHz) it is recommended to set a lower value of “Trapezoid Rise Time”, as for example
3-4 us. For a rate greater than 20 kHz it might be convenient to set “Trapezoid Rise Time” = 1 us.
Set also “Trapezoid Flat Top” = 1 us, only check that the flat top region is really flat.
Adjust – if necessary – the Peaking position (“Flat Top Delay”) and the number of samples (“Peak. Mean”) for the
energy mean calculation in the flat region.
Finally decrease the value of “Baseline Mean” (i.e. the number of samples for the baseline calculation). A dedicated
study of the impact of the Baseline Mean in the final resolution can be made.
You can either choose the preset “HiRate” for high rate settings, or the “Man” settings for manual adjustments.
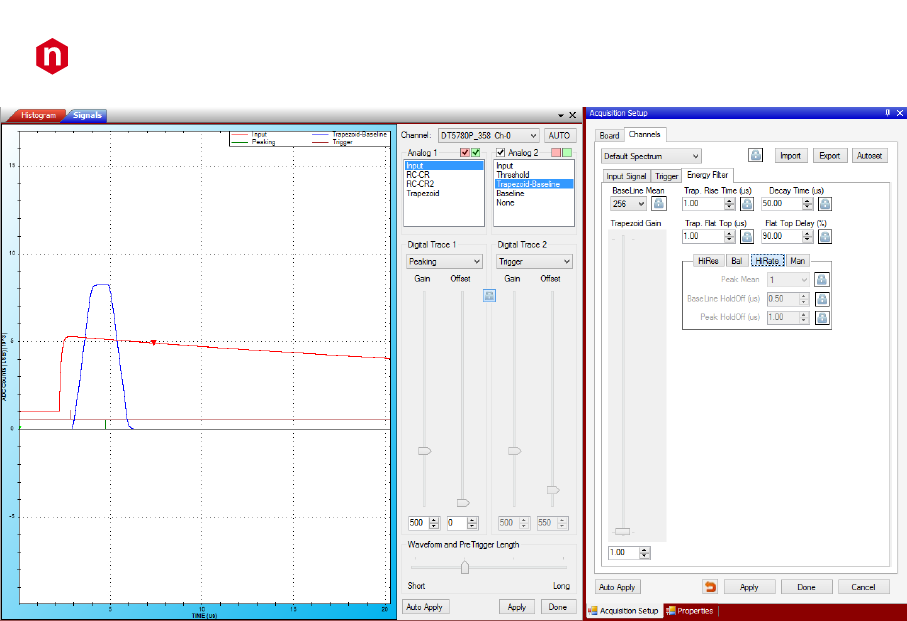
CAEN
Electronic Instrumentation
UM3182 – MC2Analyzer User Manual Rev. 5
50
Both in case of low rate and high rate it is very important to have a flat “Flat Top” region. The “Peaking”, which
corresponds to the samples where the pulse energy is evaluated, should be taken in the flat region. Adjust the “Flat Top
Delay” and the “Peak Mean” values accordingly.
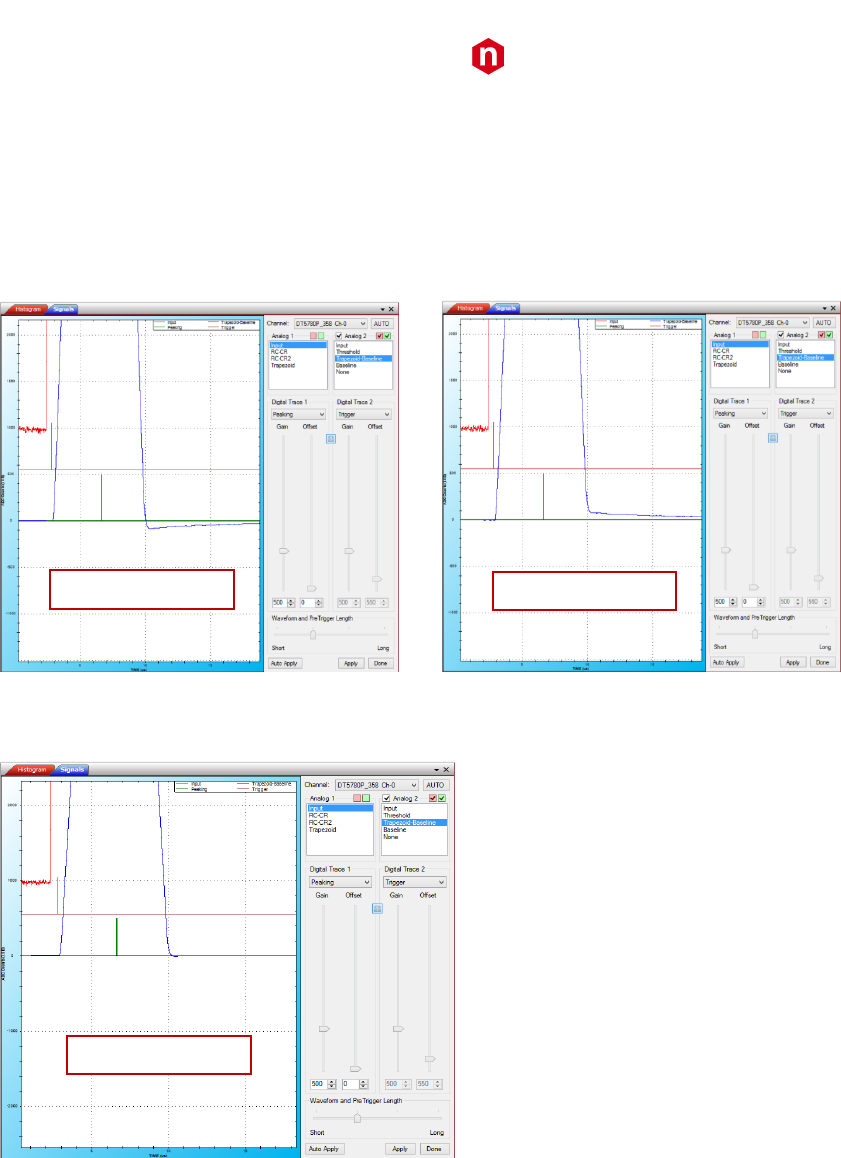
CAEN
Electronic Instrumentation
UM3182 – MC2Analyzer User Manual Rev. 5
51
Pole-Zero Adjustment
The pole-zero adjustment is very important for a correct evaluation of the trapezoid baseline and consequently for a
correct evaluation of the energy value.
The user must adjust the “Decay Time” according to the Pre-Amplifier decay time. Fine adjustments can be done looking
at the zoom of the Trapezoid trace (or Trapezoid-Baseline) in order to have no undershoot nor overshoot. The two cases
are shown in the following figure, where on the left the Decay Time has been set too high giving an undershoot, and on
the right the Decay Time has been set too low thus giving an overshoot.
When the Pole-Zero is correctly compensated, the Trapezoid will not make any overshoot nor undershoot.
Decay Time = 55 us
Decay Time = 45 us
Decay Time = 50 us
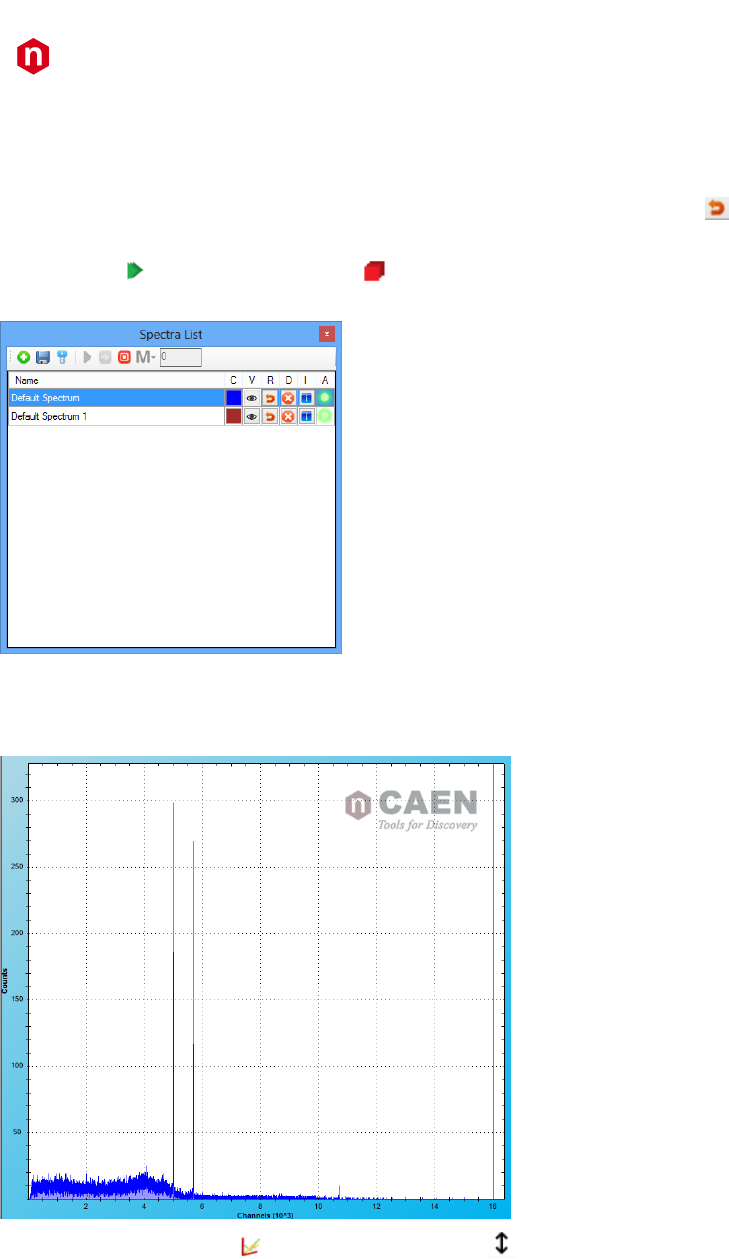
CAEN
Electronic Instrumentation
UM3182 – MC2Analyzer User Manual Rev. 5
52
Start/Stop the acquisition
Once you have configured the acquisition, close the “Signal Inspector” Window.
Select “Default Spectrum” from the “Spectra list” window. Click “R” to reset all spectra, or to reset the single
spectrum.
Then press PLAY to start the acquisition, STOP to stop it. When you select them from the Spectra List window you
start/stop only the selected spectrum. If you select them from the main GUI you start/stop all channels.
Note: The circle under “A” becomes RED in case of dynamics saturation or busy of the data throughput. Refer to Sect.
Troubleshooting to reduce this effect.
Enable the “log scale” if needed , and the “vertical auto-scale”
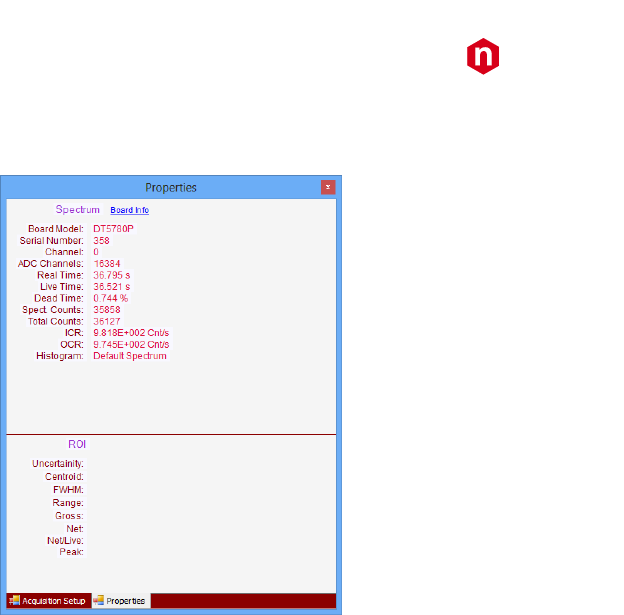
CAEN
Electronic Instrumentation
UM3182 – MC2Analyzer User Manual Rev. 5
53
Check the spectrum properties from the “Properties” window:
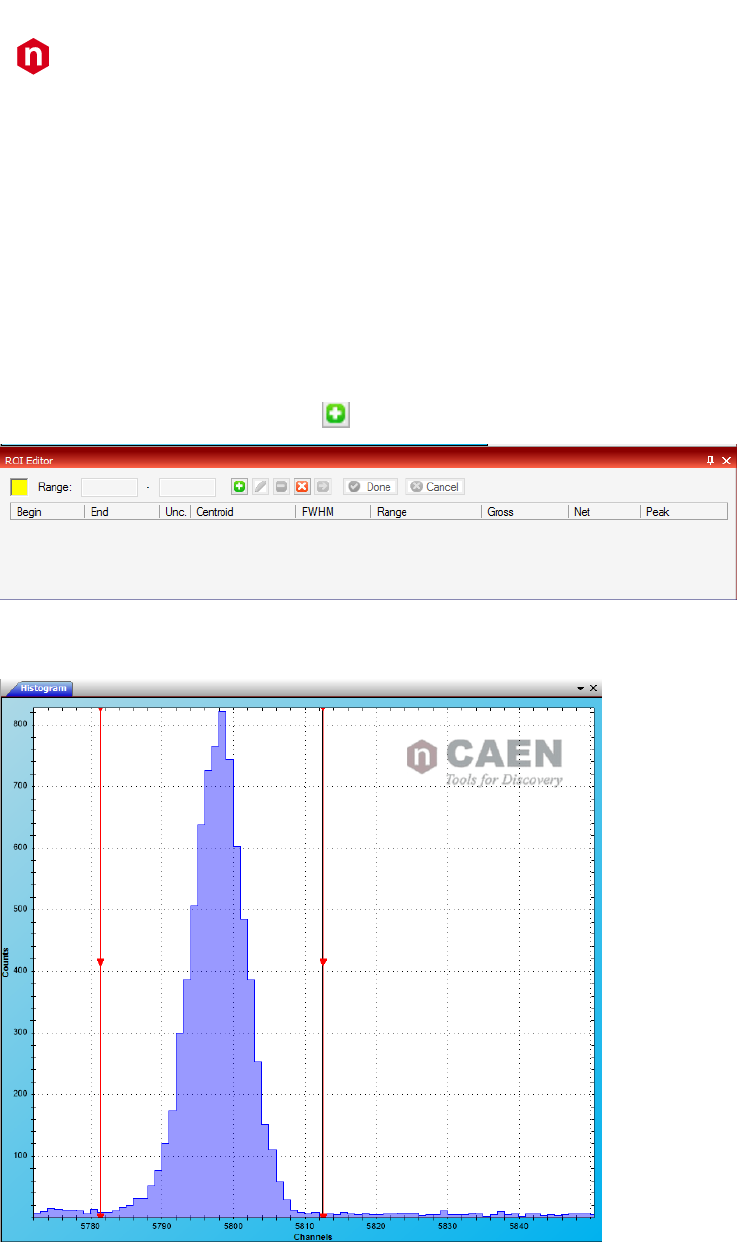
CAEN
Electronic Instrumentation
UM3182 – MC2Analyzer User Manual Rev. 5
54
How to calibrate a spectrum
The software allows the user to calibrate a spectrum from counts to keV using two interpolating functions: Linear and
Quadratic. For the first function the user must define at least a couple of values, while for the second the user must
define at least three values. It is also possible to define more points; the algorithm will then compute the best fit of the
defined points. For more details about the energy calibration refer to Sect. MC2Analyzer Energy Calibration.
The user can select a Region of Interest (ROI) of the spectrum and take the mean value of the distribution for the energy
calibration.
How to select a ROI
Zoom in (drag and release the mouse to zoom in) in the region of the relevant peaks to select the ROI.
From the “ROI Editor” window select “Add” .
Click on the histogram to select the left and right limits of the ROI.
Then press “Done” from the ROI Editor window.
Left click on the ROI to check the fit and to get the parameters. Check Sect. Menu Bar Items for more details about the
ROI fitting.
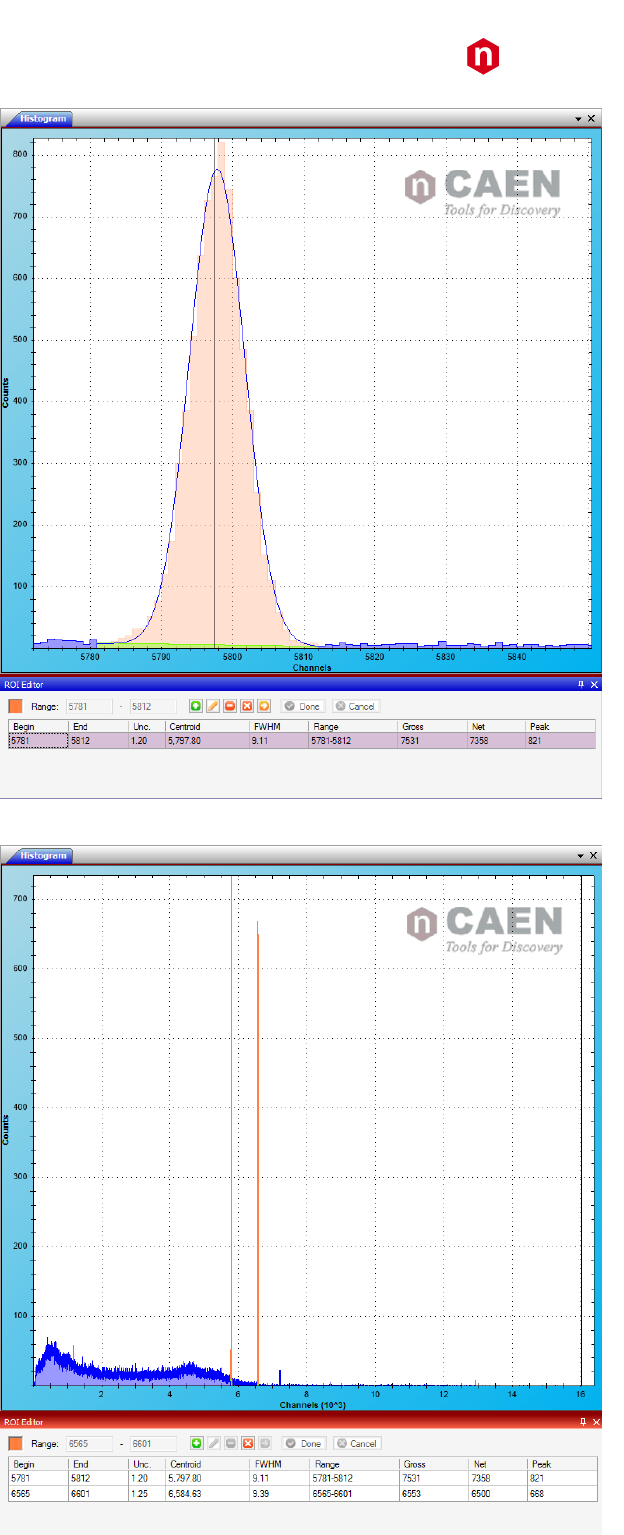
CAEN
Electronic Instrumentation
UM3182 – MC2Analyzer User Manual Rev. 5
55
Repeat the same procedure for the second peak:
CAEN
Electronic Instrumentation
UM3182 – MC2Analyzer User Manual Rev. 5
56
Energy calibration
Pause the spectrum and open the “Energy Calibration” window :
Click on the first ROI and select “Centroid” to use the centroid value of the distribution. Write the desired value of energy,
then click ADD.
Repeat for the second ROI, then click OK
Press “Enable Calibration” to enable the calibration of the spectrum. All the values on the ROI Editor window are
automatically converted.
Note: The user can choose more than two points to perform the calibration. In case two points are used it is usually
recommended to use values in a wide energy range. The more the difference is high the more the linear calibration will
be accurate.
Note: It is also possible the perform a calibration with a single peak, by setting the second point to 0. Set “Channel” = 0
and “Value” = 0.
CAEN
Electronic Instrumentation
UM3182 – MC2Analyzer User Manual Rev. 5
57
CAEN
Electronic Instrumentation
UM3182 – MC2Analyzer User Manual Rev. 5
58
How To use Decimation
The decimation reduces the sampling rate of the board by means of performing an average value of a programmable
number of consecutive samples.
Note: The decimation is not available for 770 series.
Note: The decimation is no longer supported for DPP-PHA firmware revision higher than 128.64 (724/780/781 series)
and for Hexagon. It can be used only to rescale the record length but has no effect in the energy and timing filters.
The decimation is quite convenient for those who want to measure very long signals, or signals with long rise time.
Moreover the decimation allows to increase the range of the trapezoid and timing parameters, as the Trapezoid Rise
Time, Input Rise time, Flat Top, etc. by the same factor of the decimation value.
Usually the user can recognize the need of decimation when he/she set the maximum rise time and he/she cannot get a
correct trapezoid, as shown in the following picture. In the typical situation, the baseline of the “Trapezoid-Baseline”
trace is not zero, the trapezoid is in overshoot, and there is no flat region.
Start with “Decimation” = 2.
Note: When the decimation is enabled (which performs a mean calculation of the digital samples) it might be worth to
also set the same value of “Digital Gain”. Anyway carefully check that the digitizer dynamics is not saturated. It is usually
recommended to change the “Trapezoid Gain” rather than the “Digital Gain”.
CAEN
Electronic Instrumentation
UM3182 – MC2Analyzer User Manual Rev. 5
59
For our example we set the “Input Rise Time” = 5 us (check the overall procedure of How to set the Trigger).
Increase the “Trapezoid Rise Time” and “Flat Top” until you reach a correct trapezoid. In this particular case we have to
increase the Decimation up to 8, and set Trapezoid Rise Time = 50 us, and Decay Time = 40 us.

CAEN
Electronic Instrumentation
UM3182 – MC2Analyzer User Manual Rev. 5
60
How to save data
It is possible to save data in different ways:
1. Save the energy spectrum;
2. Save the list of Trigger Time Stamp and Energy for each event;
3. Save an image of the energy spectrum.
Save the energy spectrum
It is possible to save the energy spectrum through the path: File->Save, or using the command .
Supported file formats are: .n42, .asc, .txt. For the .txt file there are several options, as shown in the following table.
In the .n42 file, the spectrum and the relevant properties are saved.
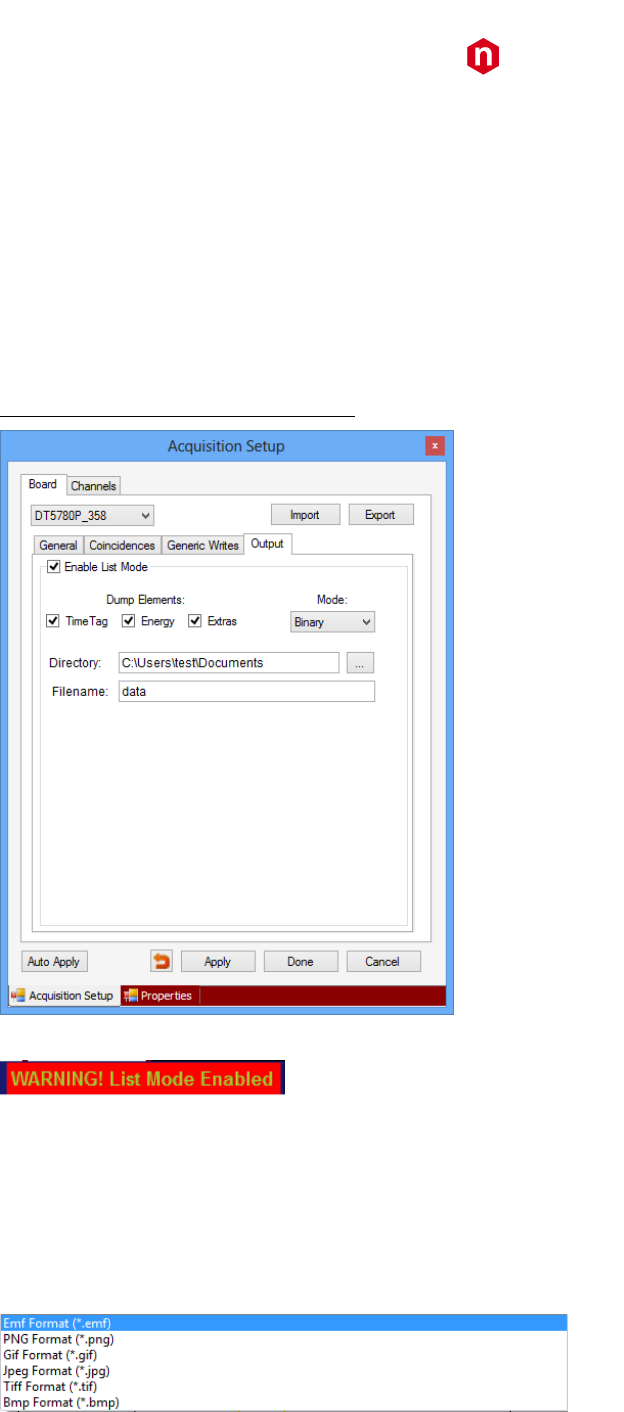
CAEN
Electronic Instrumentation
UM3182 – MC2Analyzer User Manual Rev. 5
61
Save the list file
Note: This option is NOT available for DT5770 MCA.
You can save the list file from the “Acquisition Setup” window, under the “Board” tab, select “Output”.
Click on “Enable List Mode” to enable the window.
The user can select the information to be saved among: Time Tag, Energy, and Extras, where Time Tag corresponds to
the trigger time stamp, i.e. the time of arrival of the pulse, energy is the pulse height, and extras correspond to flags of
the event (refer to Sect. Channel Aggregate Data Format for 724, 780, and 781 series and Channel Aggregate Data
Format for 725 and 730 series for more information).
Binary and ASCII writing are selectable.
Start the acquisition to start dumping the list file. The dump will stop with the stop acquisition.
To avoid useless file generation, a warning message appears at the bottom of the GUI when the list dumping is enabled.
Note: remember to increment the file name index. In case of a new “start acquisition” the new data events will be added
to the previous list file.
Save the Image
The user can export the spectrum in various image format, as listed in the following table.
From “File” click on “Export”. Otherwise right click on the spectrum and select “Save Image As”.

CAEN
Electronic Instrumentation
UM3182 – MC2Analyzer User Manual Rev. 5
62
Troubleshooting
n
Issue
Possible Causes
Fixes
0
It is strongly recommended to first check from an oscilloscope device the signal from the pre-amplifier and check
whether there is no grounding issue, and the pre-amplifier dynamics is not saturated.
Check also Sect. Before starting the acquisition
.
1
Though I decrease the “Threshold”,
I cannot reach lower values in the
energy spectrum
The input signal is noisy and the
trigger fires on the noise
Try to increase the RC-CR2 smoothing
factor to average the noise samples.
Remember to perform all the steps
described in Sect. How to set the
Trigger when you modify the RC-CR2
smoothing.
2
Values in the high region of the
energy spectrum are cut off before
the limit
The input signal is saturating
the dynamics
Check from the “Signal Inspector”
whether the “Input” pulse saturates
the dynamics.
Try to first adjust the DC Offset.
Then you can try to increase the
“Input Range” (not available for x724
series). Check whether the “Digital
Gain” is set too high and set it back to
1. It is preferable to modify the
“Trapezoid Gain” for a fine adjustment
of the dynamics.
3
The peaks in the spectrum show an
asymmetric left (right) tail
The pole-zero cancellation
might be not correct.
The baseline restoration can be
overestimated/underestimated
Check from the “Signal Inspector”
whether the “Trapezoid” trace
correctly returns to zero.
Moreover it is suggested to set the
maximum value for “Baseline Hold-
Off”, and the minimum value of
“Trigger Hold-Off”. This is more
evident in case of high rate signal.
4
The resolution is worse than
expected
Some settings might be better
tuned
In case of low rate it is worth to set
high value of “Trapezoid Rise Time”,
as well high value of “Baseline Mean”
5
The BUSY led is ON, i.e. the “A”
circle under the Spectra List
window is red
There might be a saturation or
a memory full
Check point 2. Also check that the
Signal Inspector window is closed.
6
There is too much dead-time in the
acquisition
The input signal is saturating
the dynamics
Check from the “Signal Inspector”
whether the “Input” pulse saturates
the dynamics.
Try to first adjust the DC Offset.
Then you can try to increase the
“Input Range” (not available for x724
series). Check whether the “Digital
Gain” is set too high and set it back to
1. It is preferable to modify the
“Trapezoid Gain” for a fine adjustment
of the dynamics.
Tab. 3.1: Troubleshooting table. For any other specific issue not listed in the table please contact CAEN at the support mailing list
(Chapter Technical support)
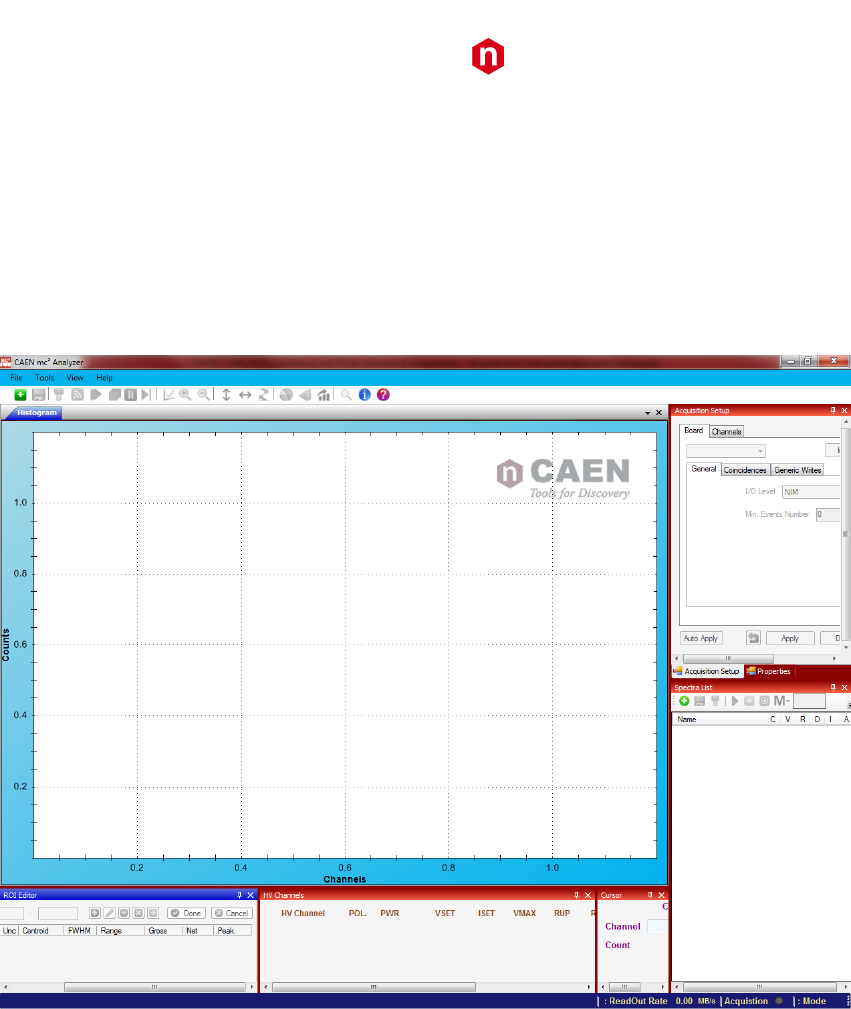
CAEN
Electronic Instrumentation
UM3182 – MC2Analyzer User Manual Rev. 5
63
4 Software Interface
GUI Description
MC2Analyzer Initial Main Screen Description
When the MC2Analyzer program is launched, the following Initial Main Screen is displayed:
Fig. 4.1: MC2Analyzer Initial Main Screen
The CAEN MC2Analyzer Initial Main Screen is composed of one Menu Bar, one Icon Bar and 7 adjacent windows with the
following functions (by default, clockwise):
• Histogram Window
• Spectra List
• Properties Window
• Signal Inspector Cursors Window
• HV Channels Window
• Cursors Window
• ROI Editor Window
Each of the above indicated 7 windows can be left floating, re-positioned and closed independently at the operator
convenience. Each window can be recalled to the main screen by using the Menu Bar pull down menu from the items:
View/Windows. Mark or unmark the items on the “Windows” pull down menu respectively to show or to hide the
corresponding Window on the Main Screen.
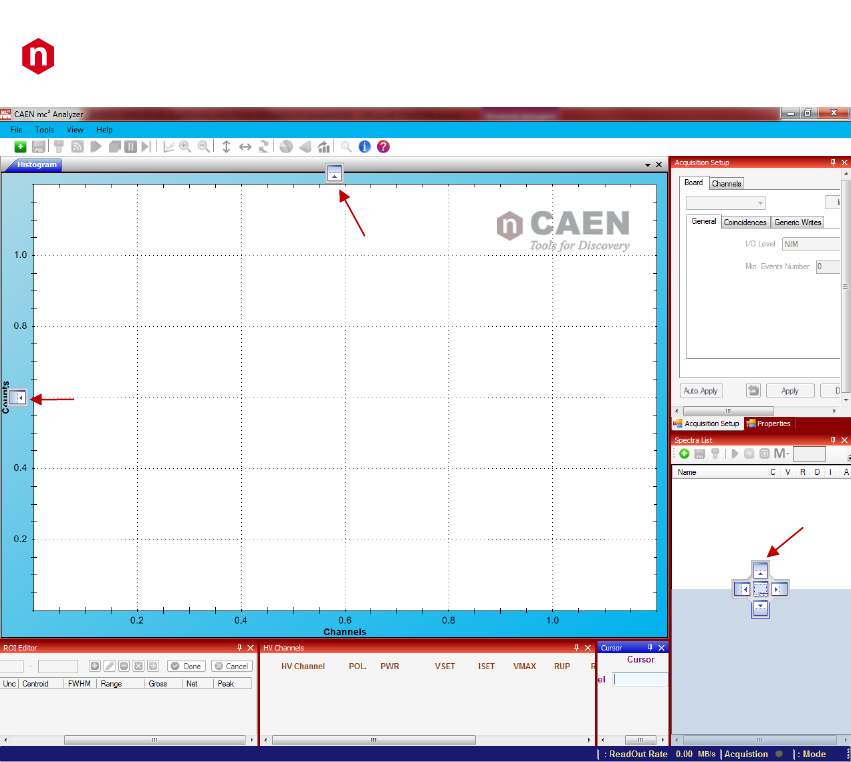
CAEN
Electronic Instrumentation
UM3182 – MC2Analyzer User Manual Rev. 5
64
Fig. 4.2: MC2Analyzer floating windows
To interact with a window, click on it with the mouse pointer. The upper frame of the active window will turn blue. When
another window is activated, the upper frame of the previously selected window turns light brown.
Note: The full Initial Main Screen appears when the MC2Analyzer program is launched for the first time. Successively,
upon launching the MC2Analyzer program, the Main Screen will display only the windows that were active upon the
previous shutdown of the MC2Analyzer program. To return to the full Initial Main Screen display, all windows need to
be checked for display from the View/Windows pull-down menu (see Sect. Menu Bar Items).
Note: AutoHide Function. Each window can be set to AutoHide by clicking on the vertical Tack Pin icon in the upper right
frame of the window itself. When enabled, the window will reduce to a Tab along the bottom frame of the Main window.
It can be recalled by clicking on that tab, becoming then the active window (frame turns blue). It will AutoHide again
when cursor is clicked on another window. When AutoHide is enabled the Tack Pin icon is horizontal. AutoHide is
disabled by clicking on the horizontal Tack Pin icon or, automatically, when the window is closed.
At the bottom of the MC2Analyzer Main Screen a blue System Status Bar displays the following information about the
current activity of the System: Rebin Enabled or Disabled./Read-out Rate in MB/sec. /Acquisition Status (LED) /System
Mode : Spectrum
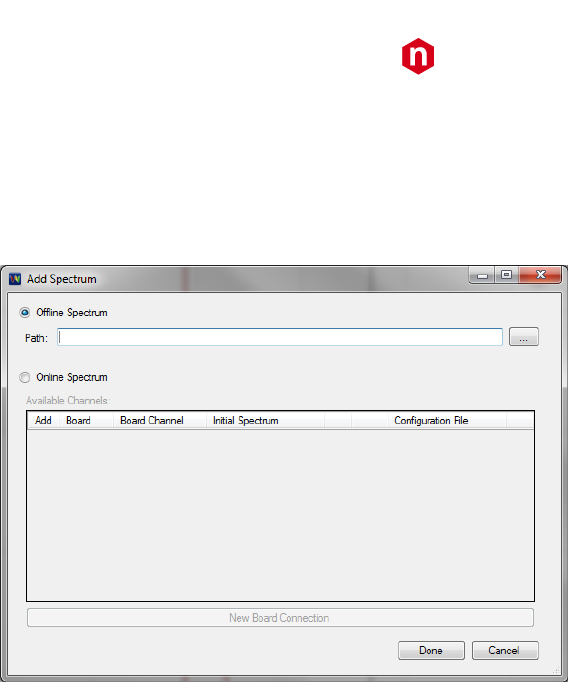
CAEN
Electronic Instrumentation
UM3182 – MC2Analyzer User Manual Rev. 5
65
Menu Bar Items
The menu bar is constituted by the following items: File, Tools, View, and Help.
✓ FILE: the pull-down Menu shows the following items: Add Spectrum/Save/Export/Exit
- Add Spectrum: This function allows the user to recall an acquired spectrum or initiate a new spectrum acquisition.
Fig. 4.3: MC2Analyzer Menu Bar – “File/Add Spectrum” Dialog Box
To recall and display a recorded spectrum, select the “Offline Spectrum” button. The recorded spectra files can
be recalled either by typing the file path in the Path entry box either by left clicking on the “…” button on the
right of the Path entry Box. When clicking on the “…” button, a Windows Directory window will open, allowing
the retrieval of a recorded spectrum file from a previously created storage folder.
Accepted file formats are:
o .n42, CAEN Channel Settings;
o .asc, ASCII.
Left click “Done” when the file path is entered or the file path is selected, to recall the file data to the display
screens. The recalled spectrum will then be displayed in the Histogram window and a line with the corresponding
Spectrum filename will be added to the Spectra List window.
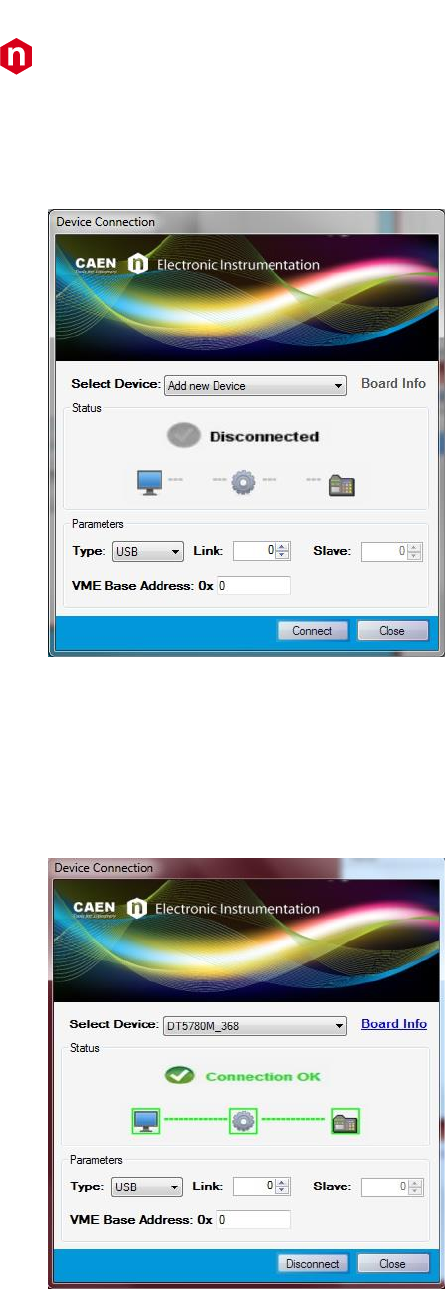
CAEN
Electronic Instrumentation
UM3182 – MC2Analyzer User Manual Rev. 5
66
To set up a new acquisition, select “Online Spectrum”. Left click on “New Board Connection”. The following
dialog box will appear:
Fig. 4.4: MC2Analyzer Menu Bar - “File/Add Spectrum/New Board Connection” Dialog Box
Select “Add New Device” from the “Select Device” Pull down menu. Select the proper connection parameters.
In the following example, we used USB connection to the DT5780, therefore: Type = USB, Link, Slave, VME Base
Address = 0. Left click on “Connect”.
Fig. 4.5: MC2Analyzer Menu Bar - “File/Add Spectrum/New Board Connection/Connect” Dialog Box
Upon successful connection, a green “Connection OK” message will appear. Underneath it, a dotted green link
will appear between the Computer Screen Icon, the Settings Icon and the Hardware icon, indicating that the
system connections for data acquisition and display have been correctly configured.
Repeat this operation separately for all the hardware devices that have to be connected. Additional devices can
be added later at any time by repeating the above procedure after left clicking on the “New Board Connection”
indicated in Fig. 4.3. When done, left click on the “Close” button.
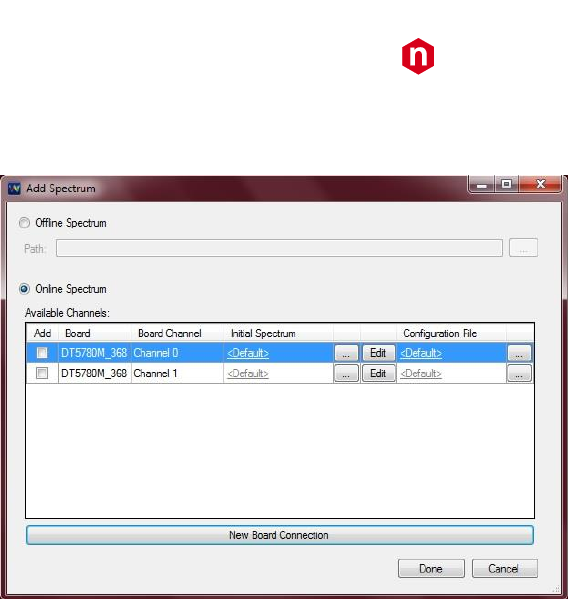
CAEN
Electronic Instrumentation
UM3182 – MC2Analyzer User Manual Rev. 5
67
The following dialog box will then appear (see Fig. 4.6), allowing the user to select and mark the digitizer channels
to be enabled for the acquisition and display of new live spectra:
Fig. 4.6: MC2Analyzer Menu Bar - “File/Add Spectrum/New Board Connection/Connect/Close” Dialog Box
After the connection is made correctly, the Add Spectrum Window will show each acquisition channel recognized
by the system. Five columns are available:
o Add, that allows to add a specific channel. Click on “Add” itself to add all channels;
o Board, where the board model and serial number are specified;
o Board Channel, where the channel number is specified;
o Initial Spectrum, that allows to upload an initial spectrum to be added to the online spectrum. The “…”
button allows to browse a spectrum to be loaded. The button “Edit” allows to modify the spectrum
properties. See Fig. 4.7 and Fig. 4.8;
o Configuration File, allows to upload a configuration file.
Note: The configuration settings can be modified in the GUI itself.
Recorded Initial Spectrum Files and Configuration Files can be loaded by left clicking on the “…” button to the
right of the respective entry boxes, from folders located in the Windows directory. Each channel can then be
activated by marking the correspondent check box to the right of the channel line. Only the activated channels
can be set and read by the acquisition system. To deactivate a channel, the user can unmark the check box on its
line at any time.
Unless a different Spectrum File is loaded, the “defaultSpectrum.n42” file is recalled and the Initial Spectrum
Column will show “<Default>” on the Channel lines. This is the File containing the Data and the Settings of the
Spectrum from the last acquisition made before the MC2Analyzer program was turned off. To upload a different
file, right click on the “…” key to the right of the Initial Spectrum column and access the desired “filename.n42”
file in the Windows directory that opens up.
Unless a different Configuration File is loaded, the “defaultChannel.ccs” file is recalled and the Configuration File
Column will show “<Default>” on the Channel lines. This is the File containing the Data and the Settings of the
hardware Channels from the last acquisition made before the MC2Analyzer program was turned off. To upload a
different file, left click on the “…” key to the right of the Configuration File column and access the desired
“filename.ccs” file in the Windows directory that opens.
The user can tag the spectrum files by left clicking on the “Edit” key of the corresponding channel line. The Add
Spectrum Edit Properties Dialog Box will appear as in Fig. 4.7. The five Pull Down menus allow the user to indicate:
- The Number of Channels in the Spectrum, choosing among: 1024,2048,4096,8192,16384;
- The Type of Instrument used for the data acquisition;
- The Nuclear Radiation detected: Alpha, Beta, Gamma, Neutron, X-Ray;
- The Detector Type;
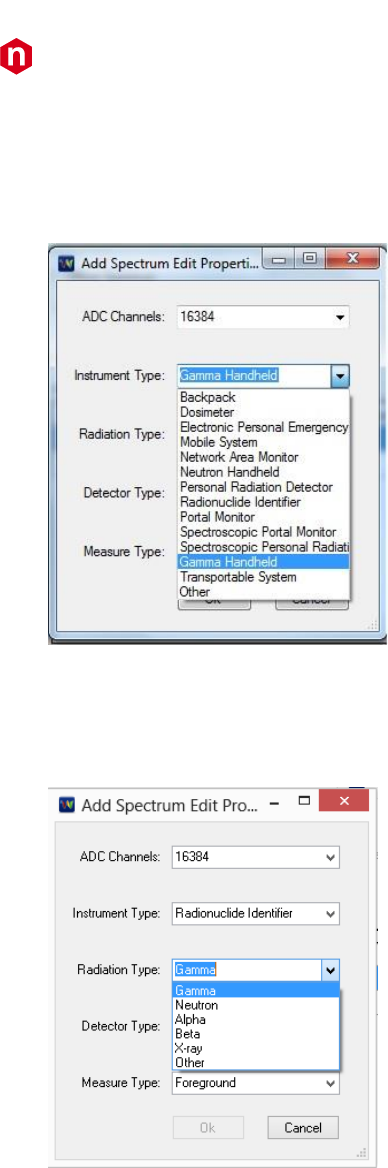
CAEN
Electronic Instrumentation
UM3182 – MC2Analyzer User Manual Rev. 5
68
- The Type of Measurement executed.
The ADC Channels pull down menu allows the user to select the number of channels of the histogram, i.e. the
energy resolution ranging from 1024 channels (10 bits, NaI grade) to 16384 channels (14 bit, HPGe grade).
The Instrument Type pull down menu allows the user to tag the type of equipment being used.
Fig. 4.7: MC2Analyzer Wizard Dialog Box – “File/Add Spectrum/EditProperties” Dialog Box - Instrument Type Pull Down
Menu
The Radiation Type pull down menu allows the user to tag the type of radiation to be measured.
Fig. 4.8: MC2Analyzer Wizard Dialog Box – “File/Add Spectrum/EditProperties” Dialog Box - Radiation Type Pull Down
Menu
From the Detector Pull Down Menu (See Fig. 4.8) the user can associate to the recorded file the type of Detector
that was used to execute the measurement.
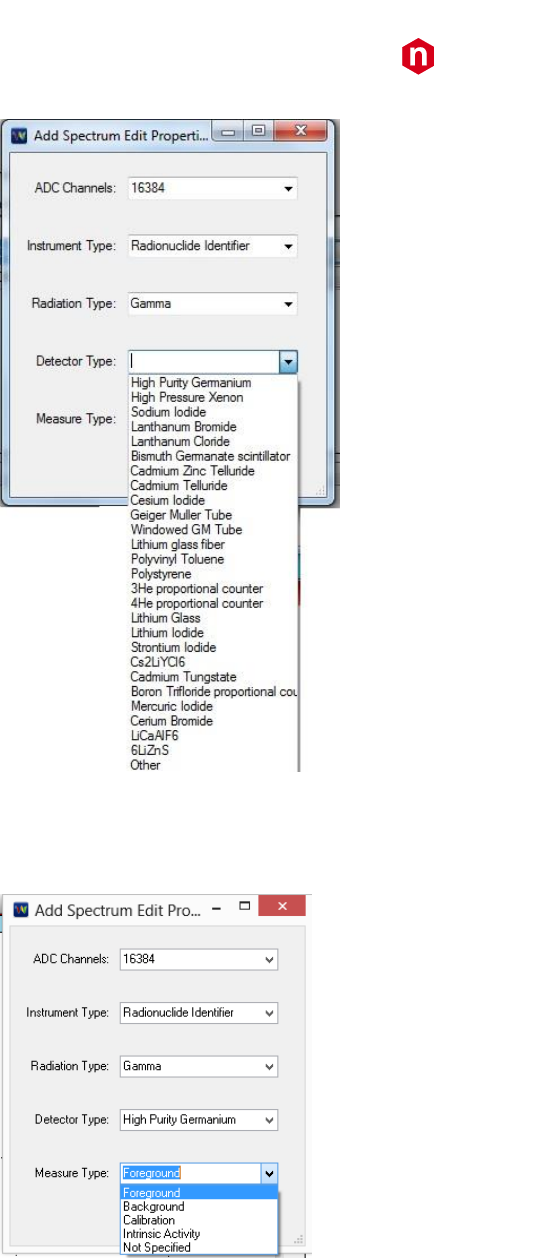
CAEN
Electronic Instrumentation
UM3182 – MC2Analyzer User Manual Rev. 5
69
Fig. 4.9: MC2Analyzer Wizard Dialog Box – “File/Add Spectrum/EditProperties” Dialog Box - Detector Type Pull Down Menu
Finally, the Measure Type pull down Menu allows the user to select the type of measurement.
Fig. 4.10: MC2Analyzer Wizard Dialog Box – “File/Add Spectrum/EditProperties” Dialog Box - Measure Type Pull Down
Menu
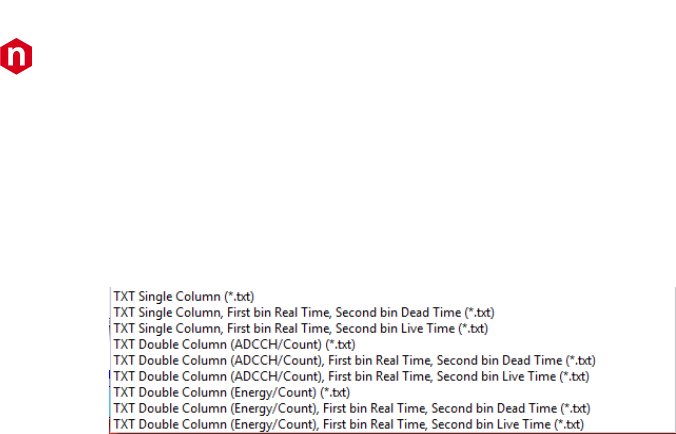
CAEN
Electronic Instrumentation
UM3182 – MC2Analyzer User Manual Rev. 5
70
- Save: This Pull-Down Menu item allows the user to save an acquired spectrum. To save a new acquisition, left
click on “Save”. A Windows Directory window will appear, allowing the user to save the acquired file in the desired
directory. Accepted file formats are:
o .n42, ANSI N42.42;
o .asc, ASCII;
o .txt, various text file format with single or double column, as shown in the following table.
- Export: This Pull-Down Menu item allows the user to export the acquired spectrum as an image. The same menu
is available at the “Save Image As” (right click on the spectrum). Accepted file formats are:
o .emf, EMF;
o .png, PNG;
o .gif, GIF;
o .jpg, JPEG;
o .tif, TIFF;
o .bmp, BMP.
- Exit: This Pull-Down Menu item allows the user to exit the MC2Analyzer Program. When it is used, the
MC2Analyzer program will save automatically the data acquired, the Spectra settings and the channels
configuration to the corresponding Default files.
- Connect Instance: This Pull-Down Menu item allows the user to connect the MC2Analyzer Program to Hexagon.
Refer to Sec. Software connection to the Hexagon MCA for more details.
✓ TOOLS: the pull-down Menu shows the following items: Create ROI/ Rebin Dialog/ Acquisition Setup/ Start
Acquisition/ Stop Acquisition/ Pause Plot Update/ Single Plot Update/ Calibration Setup/ Enable Calibration/
Logarithmic Scale/ Background/ Peak Fitting/ ADC Calibration/Reset Active Spectrum/Reset All Spectra
- Create ROI: This function allows the user to define a Region Of Interest (ROI). Left clicking on the Create ROI item
opens the ROI Editor window (unless it was already open). Default position is leftmost under the Graph Window.
See Section ROI Editor Window for ROI creation procedures.
- Rebin Dialog: Clicking on the “Rebin Dialog” allows the user to transform a High-Resolution Spectrum (i.e. a 16K
channels spectrum) into a lower resolution spectrum (i.e. a 2 K channel spectrum) by clustering the values of the
counts in the adjacent bins according to the rebin factor (i.e. the counts values of 8 adjacent bins of a 16K
spectrum are summed into the corresponding single bin in a 2 K channels spectrum). Accepted vales are: 16K, 8K,
4K, 2K, 1K. The same menu is available from the “Edit” function of Fig. 4.6, at the pull-down menu “ADC
channels”.
- Acquisition Setup: When clicking on the “Acquisition Setup” item, the following window opens:
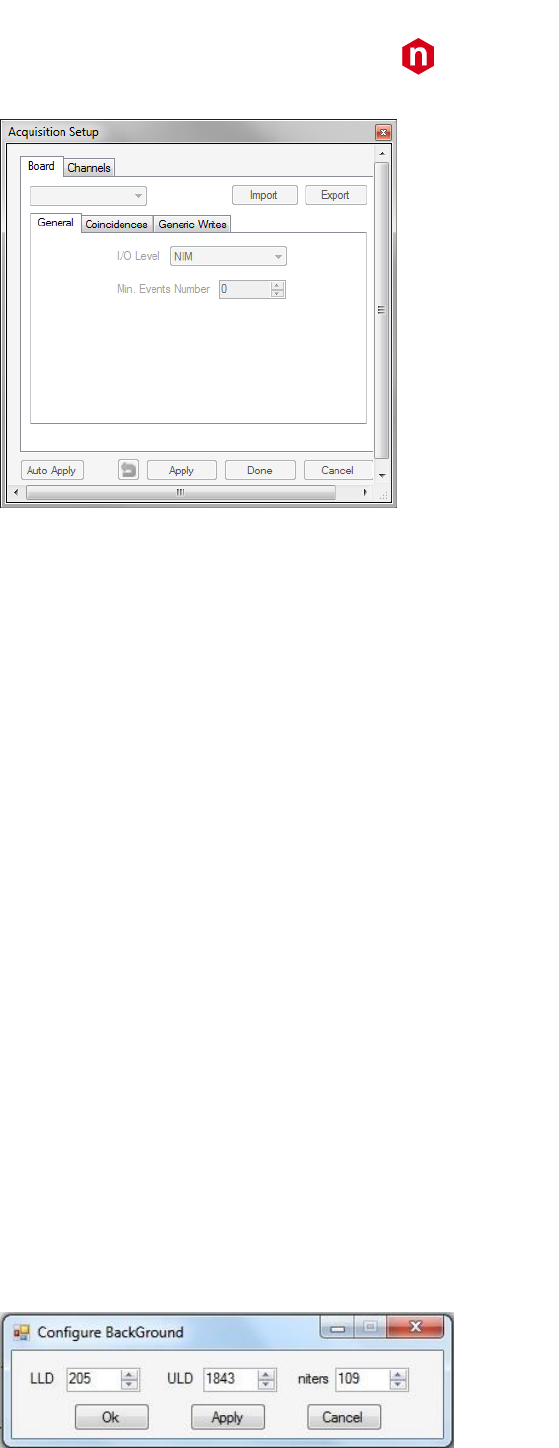
CAEN
Electronic Instrumentation
UM3182 – MC2Analyzer User Manual Rev. 5
71
Fig. 4.11: MC2Analyzer Menu Bar/Tools/Acquisition Setup/Board Tab
The Acquisition Setup features the Board Tab, allowing the user to select the Unit being set from the Pull Down
Menu on the upper left corner of the Tab. Current settings values can be imported from the selected hardware
unit and values set in MC2Analyzer can be exported to the selected hardware unit by using the “Import” and
“Export” keys respectively, located in the upper right corner of the Board Tab. See Section Acquisition Setup for
details about the Acquisition Set Up Dialog Box description.
- Start Acquisition: This function enables the digitizer unit to start the acquisition on all channels. When the unit is
ready to acquire data the icon bar the triangle icon is green. Upon clicking on the Start Acquisition item, data
acquisition begins and on the Icon Bar the Start Acquisition icon turns grey while the Stop Icon turns red.
- Stop Acquisition: This function enables the digitizer unit to stop the acquisition on all channels. When the unit is
acquiring data the icon bar the square Stop Acquisition icon is red. Upon clicking on the Stop Acquisition item,
data acquisition stops on all channels and on the Icon Bar the Stop Acquisition icon turns grey while the Start Icon
turns green.
- Pause Plot Update: This item function freezes the graphic update of the spectra being displayed. The acquisition
on the corresponding hardware channels still continues.
- Single Plot Update: This item function performs a single update of the spectra being displayed
- Calibration Setup: This item function enables the user to enter the relevant energy calibration data. See Sec.
MC2Analyzer Energy Calibration for a complete description of the procedure and system features.
- Enable Calibration: This item function enables the energy calibration. See Sec. MC2Analyzer Energy Calibration
for a complete description of the procedure and system features.
- Logarithmic Scale: This icon function allows the user to toggle between Linear and Logarithmic Scale on the Y-
axis.
- Background: This item has a Pull-down Menu with the following items: Simple/Advanced/ Configure
The user can toggle between “Simple” and “Advanced”.
In the Simple option the background is evaluated as a simple line between the ROI edges.
The “Advanced” option allows the user to access the “Configure Background” item. By clicking on the Configure
Background the following Dialog Box appears:
Fig. 4.12: MC2Analyzer Menu Bar/Tools/Background/(Advanced)Configure Dialog Box
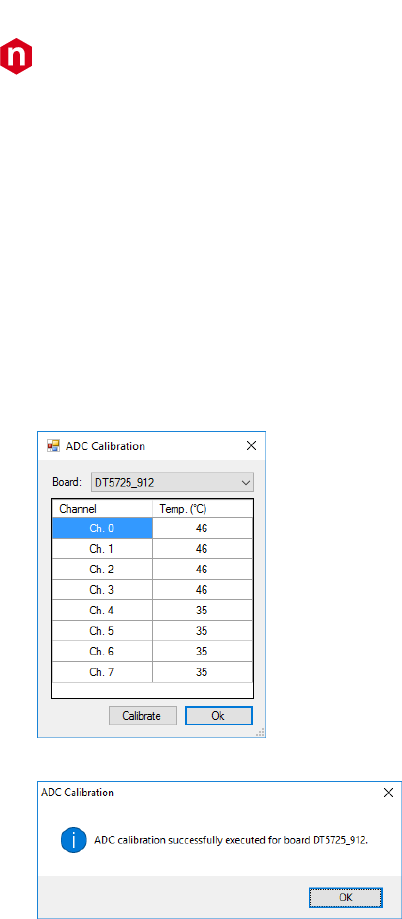
CAEN
Electronic Instrumentation
UM3182 – MC2Analyzer User Manual Rev. 5
72
The user can enter the LLD (Lower Level Discriminator) and ULD (Upper Level Discriminator) background values
in the corresponding entry boxes as well as the desired Number of Iterations niters for the Background
calculation. While in the Simple option the background is evaluated only in the ROI range, the Advanced option
allows the user to include in the background calculation the full spectrum included into the LLD and ULD range.
The more the niters value is increased, the more the background shape is smoothed. Decreasing this value will
probably discard lower peaks. The user should find the proper compromise.
- Peak Fitting: this function determines how the peaks are fitted, choosing between Simple/Advanced.
Simple: the algorithm makes use of a Gaussian shape, whose centroid is evaluated as the weighted average, and
the sigma is evaluated as the distance from the mean value, as the RMS;
Advanced: this function enables the Gaussian fit of the ROI using the minimum chi square method.
- ADC Calibration: this function allows the user to perform the ADC Calibration in case of 725 and 730 series (see
Sect. ADC Calibration (725 and 730 series only)).
Monitor the ADC temperature, and once it is stabilized press “Calibrate”. A successful pop-up message will appear.
- Reset Active Spectrum: this function allows the user to reset the active spectrum
- Reset All Spectra: this function allows the user to reset all the spectra
✓ VIEW: the pull-down Menu shows the following items: Windows/ Zoom In/ Zoom Out/ Autoscale/ Full X Range/
Restore Scale
- Windows: Allows the user to select the Windows to be displayed on the MC2Analyzer Main Screen from the
following Pull Down Menu: Spectrum Properties/ Spectrum List/ Histogram/ HV Channels/ ROI Editor/ Cursor/
Signal Inspector Cursors.
- Zoom In: Allows the user to expand horizontally (and, in proportion, vertically) an area of the Histogram Graph
symmetrical with respect to a central vertical marker line which can be set by positioning the crosshair marker in
the desired central point and left clicking on it. Upon release the “horizontal expansion center” vertical marker
line will remain set until a new position is selected by repeating the above procedure.
- Zoom Out: Allows the user to reduce horizontally (and, proportionally, in vertical) an area of the Histogram Graph
symmetrical with respect to the previously set central vertical marker line.
- Autoscale: When enabled, this command will automatically resize the vertical (counts) Y-axis to fit the highest
counts peak into the visible Graph area.
- Full X Scale: When selected, this command will restore the graph display to the full X- axis original dimension.
- Restore Scale: When selected, this command will restore the graph display to the full original scale.
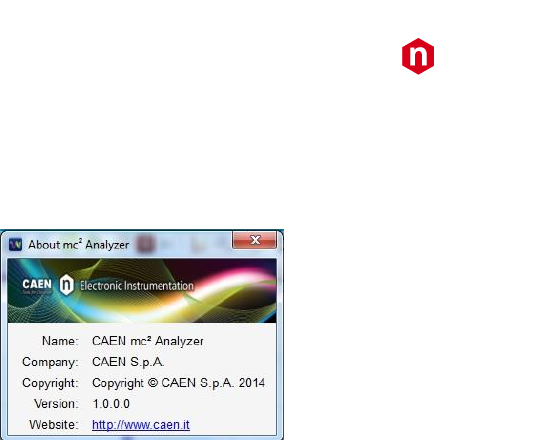
CAEN
Electronic Instrumentation
UM3182 – MC2Analyzer User Manual Rev. 5
73
✓ HELP: shows the About item
- About: dialog box containing information about the manufacturer and the Version of the MC2Analyzer Software.
Fig. 4.13: MC2Analyzer Menu Bar/Help/About Dialog Box
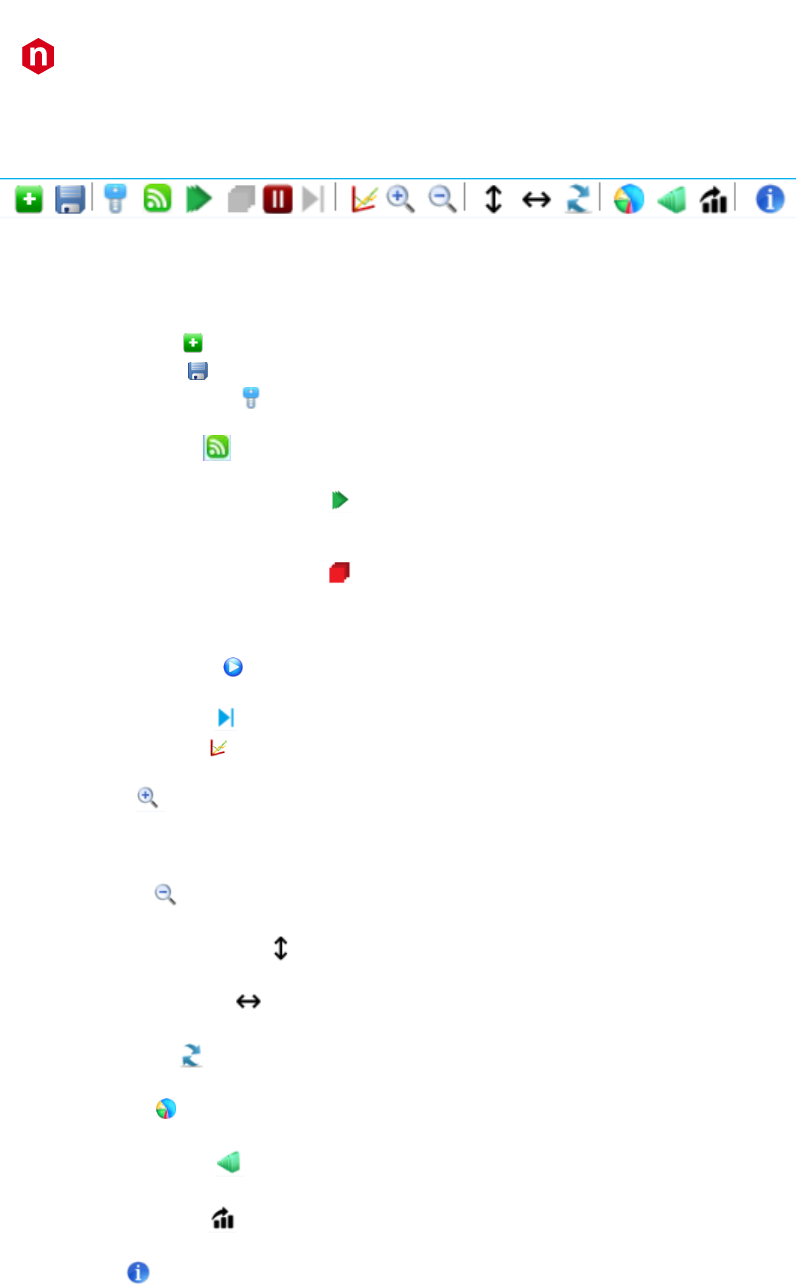
CAEN
Electronic Instrumentation
UM3182 – MC2Analyzer User Manual Rev. 5
74
Icon Bar
The following Icon Bar is present under the MenuBar:
Fig. 4.14: MC2Analyzer Icon Bar
The above icons correspond to the following functions (from left to right):
1) Add Spectrum : This icon has the same function of the Menu Bar/ File/ Add Spectrum command (see above)
2) Save Spectrum : This icon has the same function of the Menu Bar/ File/ Save Spectrum command (see above)
3) Configure Acquisition : This icon function allows the user to Configure the Acquisition Parameters of the
Board. (See Section Acquisition Setup)
4) Signal Inspection : This icon function enables the user to visualize on the graphic screen the actual shape of
the raw electronic signal(s) coming from the nuclear radiation detector(s)
5) Start Acquisition for All Channels : This icon function enables the MCA unit to start the acquisition on all
channels. When the unit is ready to acquire data this triangle icon is green. Upon clicking on the icon, data
acquisition begins and the icon turns grey while the Stop Icon turns red. Keyboard shortcut F3.
6) Stop Acquisition for All Channels : This icon function enables the MCA unit to stop the acquisition on all
channels. Keyboard shortcut F4.
When the unit is acquiring data, this square icon is red. Upon clicking on this icon, the acquisition is stopped
and the icon turns grey while the Start Icon turns green.
7) Pause Plot Update : This icon function freezes the graphic update of the spectra being displayed. The
acquisition on the corresponding hardware channels still continues.
8) Single Plot Update : This icon function performs a single update of the spectra being displayed.
9) Logarithmic Scale : This icon function allows the user to toggle between Linear and Logarithmic Scale on the
Y-axis.
10) Zoom In : Allows the user to expand a selected area of the graph. The graph is expanded symmetrically with
reference to the position of the vertical bar cursor activated by right clicking with the crosshair cursor in the
desired position of the graph area. It is also possible to click on the spectrum and press the keyboard command
“+”.
11) Zoom Out : Allows the user to reduce a previously enlarged area of the graph. It is also possible to click on
the spectrum and press the keyboard command “-”.
12) Enable Vertical Autoscale : When enabled, this command will perform an automatic resizing of the Y-axis
scale, according to the largest spectrum peak height (highest number of counts in a “bin”).
13) Horizontal Autoscale : When enabled, this command will perform an automatic resizing of the X-axis scale,
according to the number of the highest channel containing significant data.
14) Restore Scale : This icon function restores the Graph scale to its originally dimensions, both on the X and
the Y axis.
15) ROI Editor : This icon function is a shortcut to recall to the MC2Analyzer Main Screen the ROI Editor window,
in case it had been removed.
16) Enable Calibration : This icon function enables the energy calibration. See Section MC2Analyzer Energy
Calibration for a complete description of the procedure and system features.
17) Calibration Setup : This icon function enables the user to enter the relevant energy calibration data. See
Section MC2Analyzer Energy Calibration for a complete description of the procedure and system features.
18) About :This Icon opens a dialog box containing information about the manufacturer and the Version of the
MC2Analyzer Software.
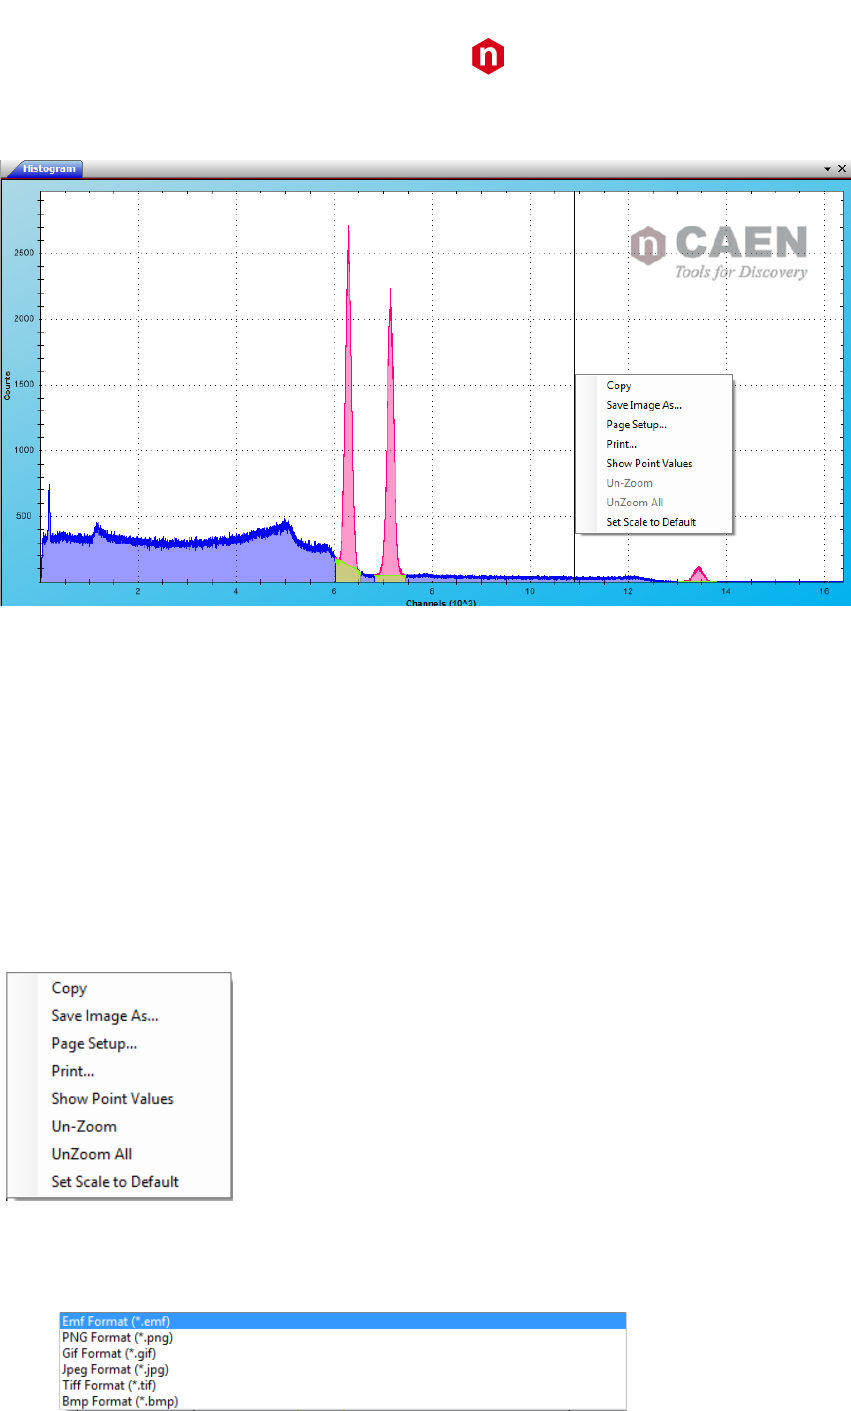
CAEN
Electronic Instrumentation
UM3182 – MC2Analyzer User Manual Rev. 5
75
Histogram Window
Fig. 4.15: The Histogram Window
The Histogram Window allows the user to display the histogram of the Counts vs Energy “bin” or “Channel” when the
spectrum is Uncalibrated, and the Counts vs Energy in keV or MeV when the spectrum is calibrated.
Note: In case of Hexagon the spectrum is displayed over 32k channels.
Crosshair cursor: a crosshair cursor is present on the graph window. By left clicking on it a vertical marker bar is set on
the graph. The marker bar can be moves by left clicking in the desired position of the graph, any time.
Zoom: any section of the graph can be expanded by positioning the crosshair cursor to the leftmost point of the section
of the graph to be expanded, left clicking and holding down while dragging the cursor to the rightmost point of the region
of interest. By releasing then the mouse left key the graph section will be expanded.
By positioning the computer pointer on the Graph and right clicking on it, a pull-down menu is activated, allowing the
user to perform the following functions:
- Copy: The Histogram Window image is copied into the clipboard. A Dialog Message will confirm that the image
has been copied. Click on “OK” to close the Dialog Message.
- Save image as…: This command opens a Windows Directory window allowing the user to store the Graph as a
graphic image file in the desired folder. The default format is “filename.emf”. Other available formats are:
.
- Page setup…: This command allows the user to set up the page for printing the graph, by selecting the size,
margins, page orientation and margins of the print out.
- Print…: This command allows the user to print the graph page.
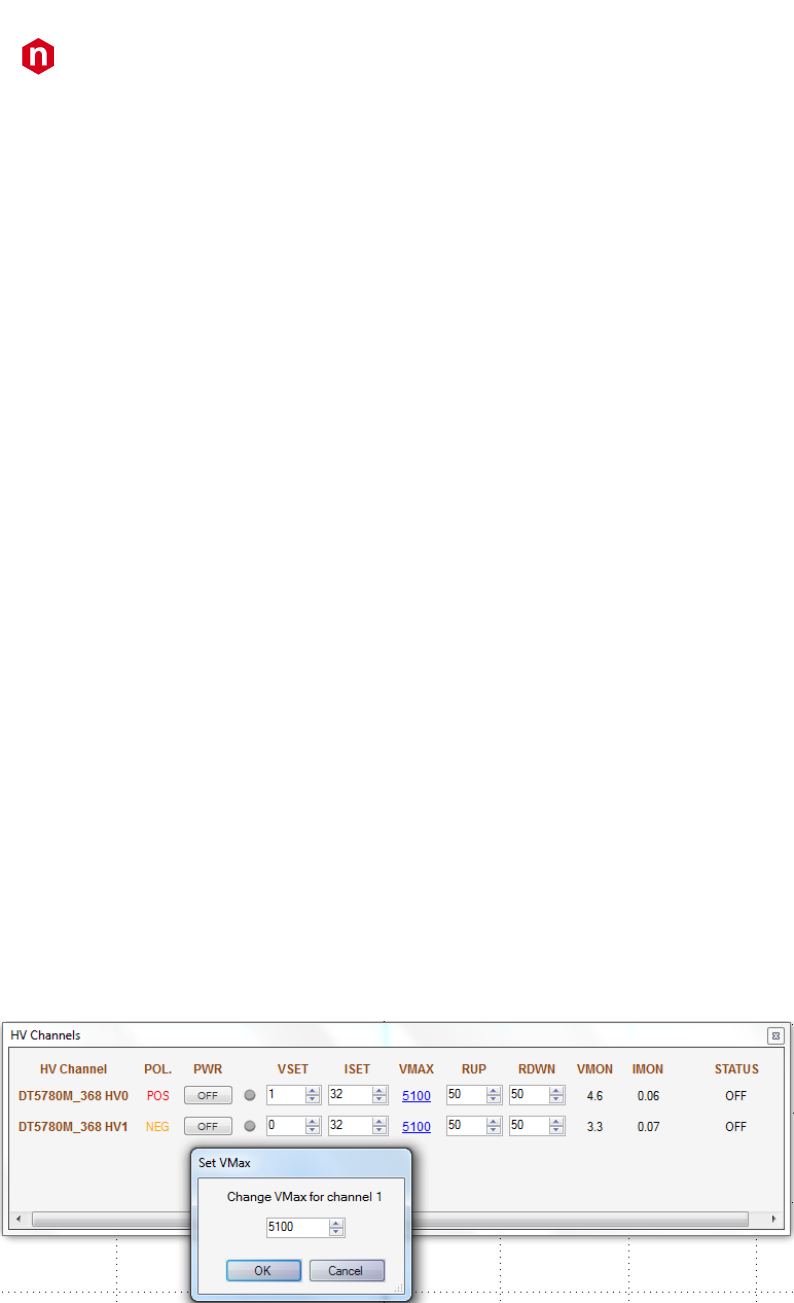
CAEN
Electronic Instrumentation
UM3182 – MC2Analyzer User Manual Rev. 5
76
- Show Point Values: When enabled, this selection enables the visualization on the graph next to the crosshair
cursor of its position (X,Y) values.
- Un-Zoom: This command will un-zoom the last previously expanded section of the graph, in successive steps. If
this command is in grey shaded color it means there is no current zoom applied to the spectrum.
- Un-Zoom All: This command will un-zoom the last previously expanded section of the graph at once to the initial
scale.. If this command is in grey shaded color it means there is no current zoom applied to the spectrum.
- Set Scale to Default: This command restores the Default Scale on the graph.
HV Channels Window
Note: This window can be used only when the acquisition system includes the CAEN DT5780 and Hexagon MCA units.
Upon starting the MC2Analyzer program and when the “HV Channels” window is enabled in the View/Windows Pull-
down Menu, the “HV Channels” window will list all the HV Channels that are available for set-up.
By positioning the pointer on each of the Header Line items VSET, ISET, VMAX, RUP, RDWN, VMON, and IMON, a label
with relevant information concerning the engineering values in which the value is expressed, is displayed (i.e. V, microA,
V/sec). Each HV Channel line contains the following information:
- HV Channel: The HV Channel is identified by the Hardware Model Number, Serial Number and Channel Number
(in the format HVX where X is the Channel Number indicated near the Hardware output of the unit).
- POL: Indicates the HV Output Polarity (Positive or Negative).
- PWR: Allows the user to turn ON and OFF the High Voltage Output on the unit. The LED light the right of the
ON/OFF key of a Positive HV Channel turns red when the HV Output is turned ON. The LED of a Negative HV
Channel turns orange. When the HV are switched OFF the LEDs remain lighted and turn grey only when the HV
Output ramp down is finished and the HV Output is OFF.
- VSET: Allows the user to set the required Voltage in steps of 1 Volt. The value can be either typed into the entry
box or increased and decreased by using the up and down arrows. This is the actual value of the Voltage that will
be applied to bias the Nuclear Radiation Detector HV input. However, if the value entered is larger than the VMax
set value, the VMax value will overrule the VSET request and limit the maximum HV output to the VMax value.
- ISET: Allows the user to set the Maximum allowed current in steps of 1 microampere.
- VMAX: Displays the Maximum High Voltage allowed on the corresponding channel. When the pointer is on the
underlined figure, a small note window will display the value unit (Volts). The Maximum Allowed High Voltage
Output can be modified by the user by left clicking on the value number. The Set VMax Dialog Box will appear
(see Fig. 4.16):
Fig. 4.16: The High Voltage Window with the “Set VMax” Dialog Box overlapping
The Maximum High Voltage value can be set in steps of 1 Volt from 0 up to the maximum output value allowed
by the hardware, by typing it into the entry box or by increasing or decreasing it by using the up and down arrow
keys. If the VSET value is set to a value larger than VMax, then VMax setting will overrule the VSET request and
limit the HV Output to the VMax value. If this happens, the STATUS column will display a red “VMax Protection”
warning message.
- RUP: Upon power up the HV Units outputs are always initialized at V=0 Volts. When the HV output is enabled
thru the PWR ON/OFF key, the voltage at the channel output will ramp up at the speed set in the RUP by the user,

CAEN
Electronic Instrumentation
UM3182 – MC2Analyzer User Manual Rev. 5
77
indicated in Volts/second. The RUP value can be set in steps of 1 V/sec by typing it into the entry box or by
increasing or decreasing it by using the up and down arrow keys.
- RDWN: When the HV output is disabled thru the PWR ON/OFF key, the voltage at the channel output will ramp
down at the speed set in the RDWN by the user, indicated in Volts/second, until the 0 Volt value is obtained. The
RDWN value can be set in steps of 1 V/sec by typing it into the entry box or by increasing or decreasing it by using
the up and down arrow keys.
- VMON: Indicates the actual Voltage at the Output of the corresponding channel, in Volts.
- IMON: Indicates the actual Current at the Output of the corresponding channel, in microA.
- STATUS: When a Channel is turned ON, the STATUS column will display the “Ramp up” message until the VSET
value is reached, then the ON Status of the corresponding HV Channel is displayed.
When a Channel is turned OFF, the STATUS column will display the “Ramp down” message until the 0 value is
reached, then the OFF Status of the corresponding HV Channel is displayed.
If the system Output tries to exceed the VMax value (for example upon a VSET request for a value larger than
VMax) then the “VMax protection” warning message is displayed in red in the STATUS column line of the
protected channel.
Note: The HV remains ON even in case the user disconnects the software from the digitizer before pressing OFF. When
connected again the software automatically reloads the last HV settings.
WARNING: When shutting off the HV, it is recommended to wait until the HV ramp down of the HV Outputs is completed
before exiting the program.
It is mandatory to verify that all the HV Outputs are turned OFF (all LEDs of the HV window must be grey) before
connecting or disconnecting the SHV outputs to or from other equipment, to avoid shock hazard.
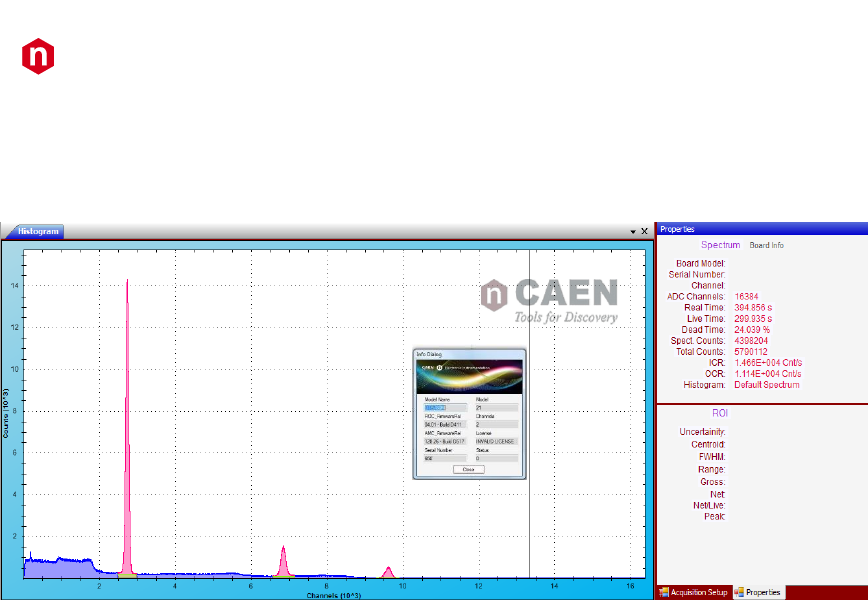
CAEN
Electronic Instrumentation
UM3182 – MC2Analyzer User Manual Rev. 5
78
Properties Window
The Properties window is divided in two sections. The upper one is dedicated to information concerning the Acquisition
Set-Up and time measurement values. The lower one provides information about the selected ROI, if applicable.
Fig. 4.17: The MC2Analyzer Main Screen with the Properties Window on the upper right side and the Board Info Dialog Box overlapping
the Histogram Window
In the first section of the Properties window, the following information is displayed:
- System Mode: Spectrum. The following information is available:
o Board Model
o Serial Number
o Number of Input Channel being displayed
o Number of Channels (“bins” on the X-axis) of the ADC
o Real Time: Full Acquisition Time
o Live Time: Time Available for Data Taking
o Dead Time: Time unavailable for Data Taking as % of Full Acquisition Time
o Spectrum Counts: Number of events converted and histogrammed
o Total Counts: Total number of events detected during the full Acquisition Time
o ICR: Input Counting Rate, number of Valid triggers at the input
o OCR: Output Counting Rate, number of Valid Events read
o Histogram source: Filename or Default Spectrum
- Board Info link: By clicking on it, a Info Dialog Box is displayed with the following Hardware related information:
o Model Name
o Model Number
o ROC Firmware Release Version and Build
o Number of Board Input Channels
o AMC Firmware Release Version and Build
o License Number
o Board Serial Number
o Status
If an active ROI is available, the lower section of the Properties window contains information concerning that ROI:
o Uncertainty: related to the Centroid Calculation. Smaller contents of the bins yield larger uncertainty
on the centroid value calculation.
o Centroid: the value of the peak centroid “bin” is indicated.
o FWHM: the peak Full Width at Half Maximum value is displayed.
o Range: The upper and lower limits of the ROI are displayed.
o Gross: The total number of counts in the ROI is displayed.
o Net: The number of counts in the ROI after the background subtraction is displayed.
o Net/Live: The number of counts in the ROI after the background subtraction and divided by the Live
Time is displayed in counts/sec.
o Peak: The Peak Channel Value is displayed in counts.
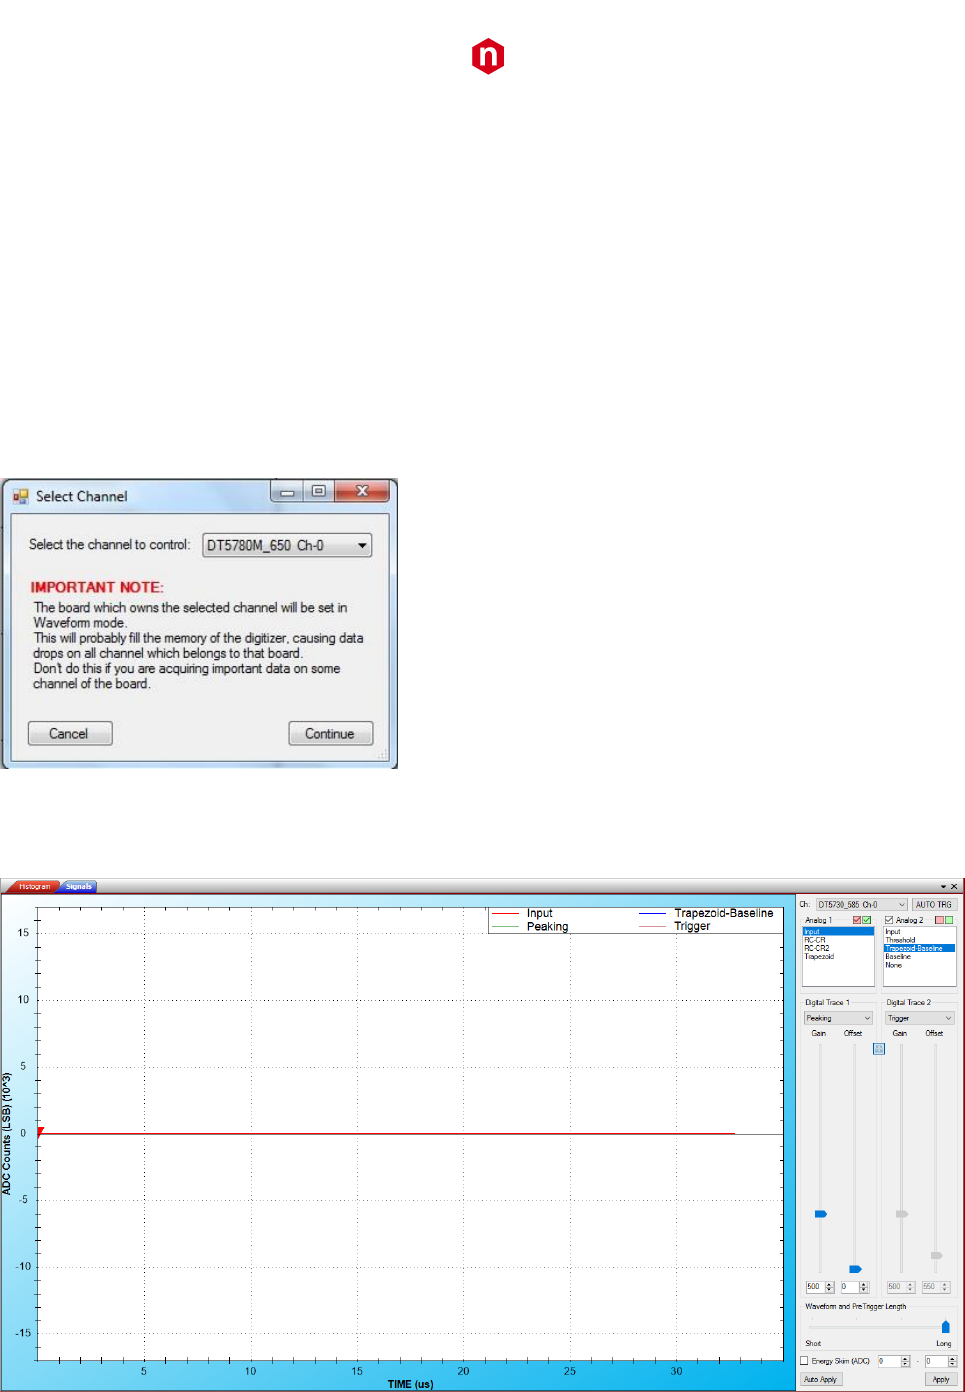
CAEN
Electronic Instrumentation
UM3182 – MC2Analyzer User Manual Rev. 5
79
Signal Inspector Window
The Signal Inspector tool allows the user to visualize the signal coming from the Nuclear Radiation Detector as well as
the trapezoid filter signal applied to it, thus giving the user the capability to optimize if needed the filter parameters to
ensure the best measurement conditions and the best read out resolution for any specific detector. Those settings can
then be recorded to a “settings” file for successive data taking with that specific detector.
The Signal Inspector Tool can be accessed from the Icon Bar by clicking on the 4th Icon from the left
Fig. 4.18: The Select Channel window of the Signal Inspector
To proceed with the Signal Inspector tool, select the channel to be inspected from the Pull Down Menu on the upper
right corner, then click on the “Continue” key. The following Signal Inspector Screen will then appear, overlapping the
area of the Histogram Screen.
Fig. 4.19: The Signal Inspector Window
In the upper left corner of the window a “Signals” Tab is visible together with an “Histogram” Tab, allowing the user to
toggle between the Signal Inspector and the Histogram screens to verify the results of the acquisition parameters set up
on the acquired histogram.
WARNING: when opening the Signal Inspector tool, a pop up window will inform the user that turning on the Signal
Inspector sets the selected channel to Waveform Mode. This means that all raw signal digitized points are sent to the
digitizer memory (instead of the reduced processed data that create the energy histogram in MCA Mode). This memory
clogging may cause data loss in all the channels data acquisitions. Therefore this procedure must not be carried on any
channel of a board currently involved in important data acquisition. If this is the case, click on the “Cancel” key of the
pop up window and return to the main program until the important data acquisition is finished.

CAEN
Electronic Instrumentation
UM3182 – MC2Analyzer User Manual Rev. 5
80
The Signal Inspector Window is divided in two sections. To the left, a graphic display allows the user to visualize the
waveforms as in a digital oscilloscope. To the right, a set up panel allows the user to set up the acquisition parameters
and adapt them to the specific detector signal characteristics for an optimized result of the measurements. For the
meaning of the acquisition parameters and to do this optimization properly refer to Chapter Getting Started.
Note: “Gain” and “Offset” of the “Digital Traces” affect only the traces visualization, while have no impact in the
internal board filters.

CAEN
Electronic Instrumentation
UM3182 – MC2Analyzer User Manual Rev. 5
81
Acquisition Set-up procedure with the Signal Inspector Tool
The user can change at any time the Channel being inspected by selecting it on the Pull-Down Menu at the top of the
Acquisition Set Up panel.
To operate with the Signal Inspector tool, the user must start the acquisition on the selected channel by clicking on the
Start Acquisition Icon ( ). A first Analog trace will be visualized on the Histogram Screen.
- AUTO: This key enables a software Auto Trigger function, helping the user to find the signal when the trigger
conditions are not still set.
The user can select the signal to be visualized on the Analog 1 selection box. Signals that can be chosen are (refer also to
Fig. 4.20, and Fig. 4.21):
- Input: Displays the actual Input signal of the inspected board channel.
- RC-CR: Displays the First Derivative of the Input Signal.
- RC-CR2: Displays the Second Derivative of the Input Signal.
- Trapezoid: Displays the Trapezoid Filter Signal.
A second Analog trace can be activated by ticking the Analog 2 check box. The Analog 2 Trace signals that can be selected
are:
- Input: Displays the actual Input signal of the inspected board channel.
- Threshold: Displays the Trigger Threshold Level.
- Trapezoid: Displays the Trapezoid Filter Signal.
- Trapezoid-Baseline: Displays the Trapezoid Filter Signal at the Baseline Level.
In case of DT5770 the user can select among the following Analog Traces 1 list:
- Input: Displays the actual Input signal of the inspected board channel.
- Trapezoid: Displays the Trapezoid Filter Signal.
- Fast Trapezoid: Display the Fast Trapezoid signal used to select the event.
- Baseline: Corresponds to the baseline of the Trapezoid trace.
- Energy Out: Displays the energy level sampled by the Trapezoidal filter.
- Trapezoid-Baseline: Displays the Trapezoid Filter Signal at the Baseline Level.
A second Analog trace can be activated also for the DT5770, choosing among:
- Input: Displays the actual Input signal of the inspected board channel.
- Trapezoid-Baseline: Displays the Trapezoid Filter Signal at the Baseline Level.
- Baseline: Corresponds to the baseline of the Trapezoid trace.
- Fast Trapezoid: Display the Fast Trapezoid signal used to select the event.
- Trapezoid: Displays the Trapezoid Filter Signal.
- Energy Out: Displays the energy level sampled by the Trapezoidal filter.
Two additional Traces can be activated allowing the user to visualize the Digital Outputs available from the Board. The
Digital signals will have a High or Low Status respectively when the corresponding function is enabled or disabled.
The Digital Trace 1 selections are (refer also to Fig. 4.20, and Fig. 4.21):
- Armed, digital input showing where the RC-CR2 crosses the Threshold;
- Peak Run, starts with the trigger and last for the whole event;
- Pile Up Flag, shows when a pile-up event occurred;
- Peaking, shows where the energy is calculated;
- Trigger Validation Window, shows the trigger validation acceptance window (refer to [RD5]);
- Baseline Hold Off, shows the baseline hold-off parameter;
- Trigger Hold Off, shows the trigger hold-off parameter;
- Trigger Validation, shows the trigger validation signal TRG_VAL (refer to [RD5]);
- Saturation Veto, shows when a saturation occurred that vetoed the acquisition;
- Baseline Flatness, monitor the oscillation of the baseline;
- External Trigger, shows the external trigger signal, if any.
Note: To activate a command from the Acquisition Set up Panel, the Apply Key must be clicked after any selection to
be implemented. If the user doesn’t want to have to confirm each individual selection then the AutoApply key should
be clicked at the beginning of the selections, then all selections made by the user will be immediately activated.
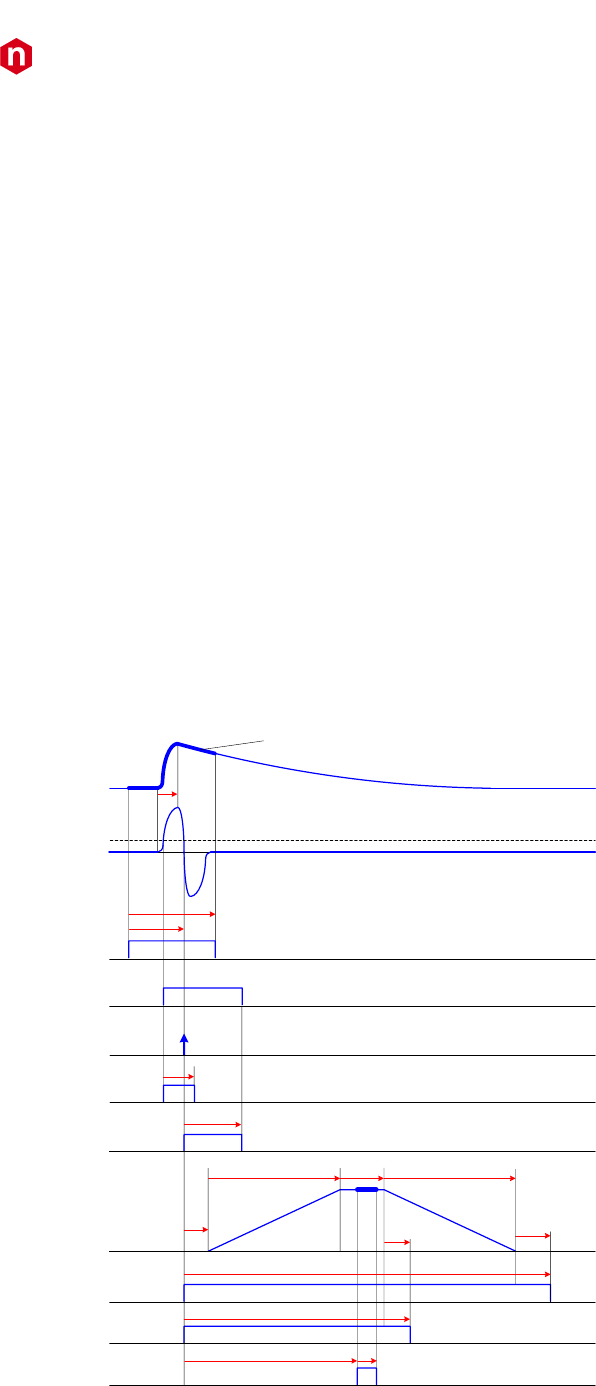
CAEN
Electronic Instrumentation
UM3182 – MC2Analyzer User Manual Rev. 5
82
In case of x725/x730 possible choices for Digital Traces 1 are:
- Peaking, shows where the energy is calculated;
- Armed, digital input showing where the RC-CR2 crosses the Threshold;
- Peak Run, starts with the trigger and last for the whole event;
- Pile Up Flag, shows when a pile-up event occurred;
- Trigger Validation Window, shows the trigger validation acceptance window (refer to [RD5]);
- Trigger Hold Off, shows the trigger hold-off parameter;
- Trigger Validation, shows the trigger validation signal TRG_VAL (refer to [RD5]);
- Saturation Veto, shows when a saturation occurred that vetoed the acquisition;
- Baseline Flatness, monitor the oscillation of the baseline;
- External Trigger, shows the external trigger signal, if any.
- Baseline Freeze, shows the time interval in which the baseline evaluation is freezed
- Busy, shows board busy condition due to a saturation or a memory full condition
- Programmable Veto, shows the duration of the VETO condition, if any.
The Digital Trace 2 allows to visualize only the Trigger output signal.
In case of DT5770 possible choices for Digital Traces 1 and Digital Trace 2 are:
- Peaking, shows where the energy is calculated;
- Energy Accepted, shows whether the pulse is accepted or rejected;
- Baseline Hold Off, shows the baseline hold-off parameter;
- Pile Up Flag, shows when a pile-up event occurred;
- Saturation, shows when an event saturated the dynamics vetoing the acquisition;
- Trigger, shows the position where the input pulse is detected;
- Reset, shows where a reset occurred due to a transient reset.
TRG_REQ
Trapezoid
pkrun
peaking
baseline
hold-off
Ttpdly
Trise Tflattop
Tpk Tpkavg
Tpkhoe
Tblho
Trun
Trise
Tblhoe
TT Filter
input
RTDwin
trg_holdoff
Ttrgho
Threshold
Trtdw
Tirt
armed
acqwin
waveform saved
to memory
Tpretrg
Tacqwin
RC-CR2
= Record Length
Fig. 4.20: DPP-PHA significant parameters
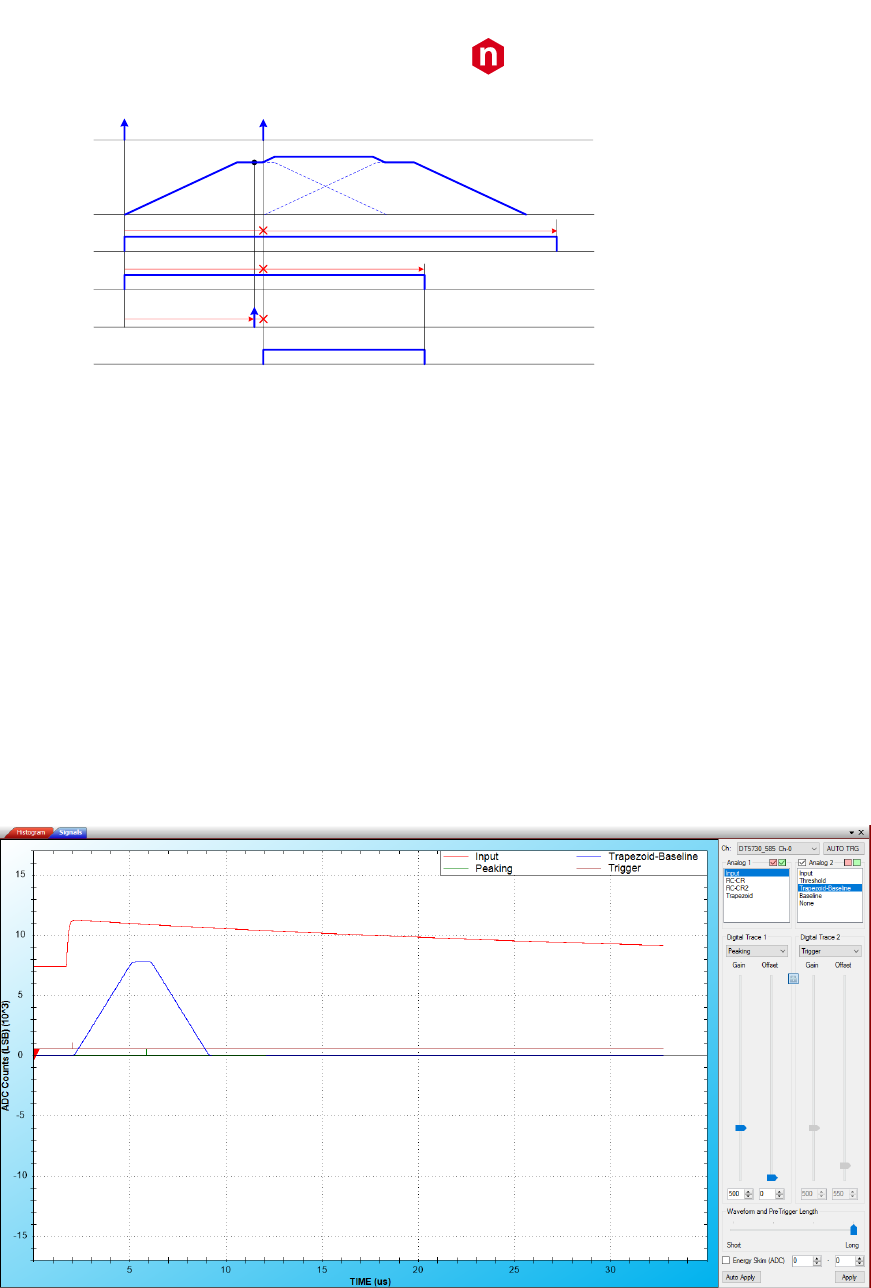
CAEN
Electronic Instrumentation
UM3182 – MC2Analyzer User Manual Rev. 5
83
TRG_REQ
trapezoid
pkrun
peaking
purflag
bloff
Tpk
Tblho
Trun
T1T2
E1
Fig. 4.21: DPP-PHA significant parameters for pile-up
The user can change the Gain and the Offset of the Traces being visualized by entering the desired values in the
corresponding entry boxes “Gain” and “Offset”, for each trace independently. The changes can be operated as well with
the up and down cursors on the side of the entry boxes, and does not affect the final acquisition.
The user can change the waveform record length and the pre-trigger length by operating on the sliding rule “Waveform
and Pre-Trigger Length”
The User can also enable and set the Energy Skim (ADC). The Energy Skim allows the user to select a region in the (not
calibrated) energy spectrum and to inspect the waveforms that provides the energy values falling into the selected
interval.
Fig. 4.22: Example of Signal Inspector acquisition
Note: The Energy Skim does not have any effect for x724-x780-x781 DPP-PHA firmware release less than 128.64.
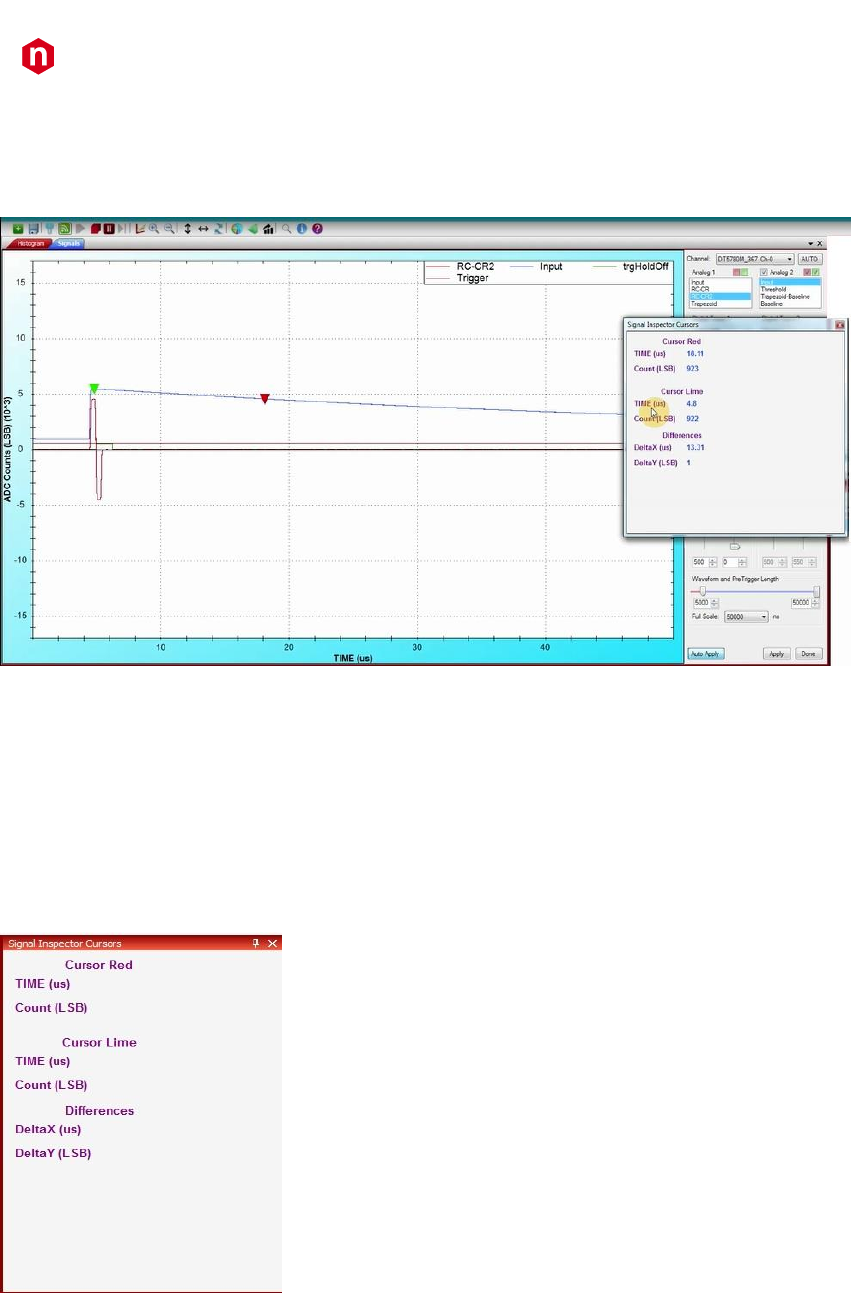
CAEN
Electronic Instrumentation
UM3182 – MC2Analyzer User Manual Rev. 5
84
Signal Inspector Cursor window
The User can place two cursors on the trace of the signals being displayed in the Signal Inspector window. The red arrow
cursor can be placed on the trace with a left click of the mouse. The Lime Green cursor can be placed on the trace by
pressing and holding down the Shift key of the computer keyboard and then with the left click of the mouse.
Fig. 4.23: The Signal Inspector Cursors
The cursor values for the X and the Y axis can be read in the Inspector Cursors window, which can be recalled at any time
from the Menu Bar/View/Windows Pull Down Menu.
In the Inspector Cursors Window both the Cursor Red Section and the Cursor Lime sections contain the respective values
of the time of sampling from the trigger time (in microseconds) and of the signal amplitude (in LSB) at that corresponding
time.
The bottom section allows the user to read directly the difference in time (in microseconds) and in amplitude (in LSB)
between the two cursors.
Fig. 4.24: MC2Analyzer Signal Inspector Cursor window
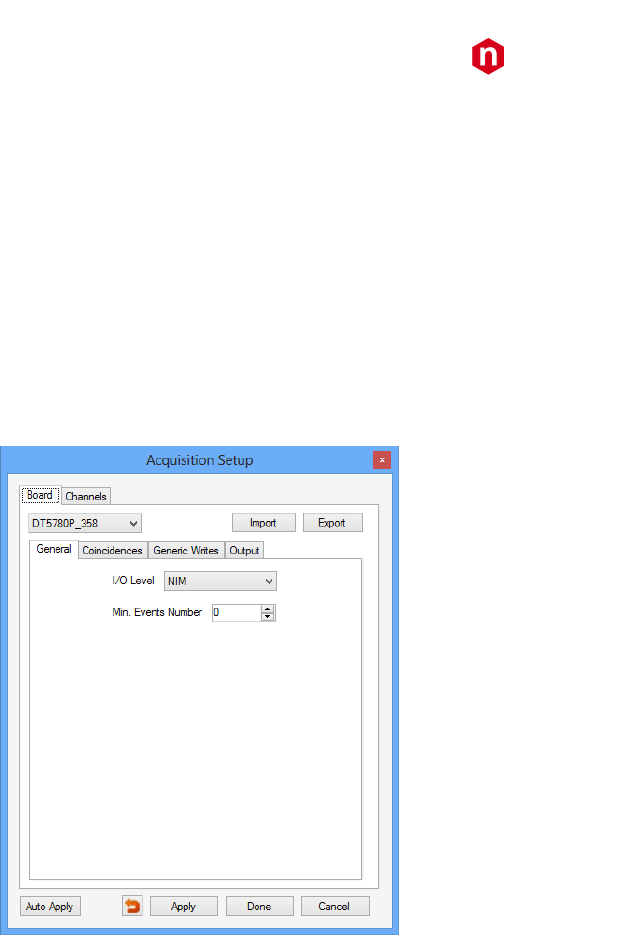
CAEN
Electronic Instrumentation
UM3182 – MC2Analyzer User Manual Rev. 5
85
Acquisition Setup
The Acquisition Set Up Window can be accessed from the Acquisition Set Up Icon in the Icon Bar (3rd icon from the left)
or from the Spectra List window Icon Bar.
To apply the selected parameters to the Hardware the user must Click on the Apply key after every selection. To avoid
this step by step procedure the Auto Apply key can be clicked at the beginning of the selections, for all windows. Clicking
on the “Done” key closes the Acquisition Set Up window and the hardware is set to the parameters that were entered
until then.
At any time the user can cancel the last Entries Selection from the last set confirmed by the “Apply” key with the “Cancel”
key. All other parameter settings entered until the last “Apply” confirmation will anyhow remain as set. At any time the
user can restore the system parameters to the Default ones by using the Brown Return Arrow Key.
Upon clicking on the Acquisition Set Up icon, the Acquisition Set Up Window will appear as in Fig. 4.25:
Fig. 4.25: The Acquisition Set Up Window – Board Tab - General Tab
The Acquisition Set Up window features a Board Tab and a Channels Tab

CAEN
Electronic Instrumentation
UM3182 – MC2Analyzer User Manual Rev. 5
86
Board Tab
This tab allows the user to select the Board being set up, from the Pull-Down Menu.
The current settings can be Exported to a File in the desired Windows Directory by using the Export key. A set of
parameters can be imported to the hardware from a previous Set Up File by using the Import key.
The Board Tab features the Tabs: General, Coincidences, Generic Writes, Output.
In case of DT5770 only the GPIO tab is available.
General Tab
The I/O Logic Level of the Board Digital Inputs/Outputs can be selected between NIM and TTL.
The “Min. Events Number” corresponds to the number of events per aggregate (refer to Appendix A) and corresponds
to the minimum number of events to be acquired in the memory buffer before performing the read-out from the board.
A larger value setting optimizes the data transmission system bandwidth while a smaller value improves the display rate.
In case of very low rate input signals (few Hz) it is recommended to set a small value, like 1 or 2.
The 0 value indicates the automatic set up of the system.
Fig. 4.26: The Acquisition Set Up Window – Board Tab - General Tab
The “Apply” button should be enabled to apply the settings. Press “Auto Apply” for the auto apply feature.
Settings can be saved through the “Export” command, and loaded through the “Import” button.
Coincidences Tab
Coincidence management among channels is described in [RD5]. In the normal acquisition mode, each individual channel
is able to trigger with its individual self-trigger. When the coincidence mode is enabled, each channel continues to self-
trigger, and the event is saved only when a validation signal occurs. The validation is made at the mother board level by
configuring the desired operation among channels (choosing among OR/AND/MAJORITY) and the operation of
COINCIDENCE/ANTICOINCIDENCE.
In case of 725 and 730 series channels are managed at couple level, and the validation might come also from the other
channel of the couple with no mother board processing. The mother board controls the coincidence logic among couples,
thus the two channels of couple cannot have different coincidence logic with the other couples.
Note: Coincidences with 725 and 730 series are not supported by the Coincidence window tab. User must set the
relevant register writes using the Generic Writes Tab. Refer to [RD5] for all the details.
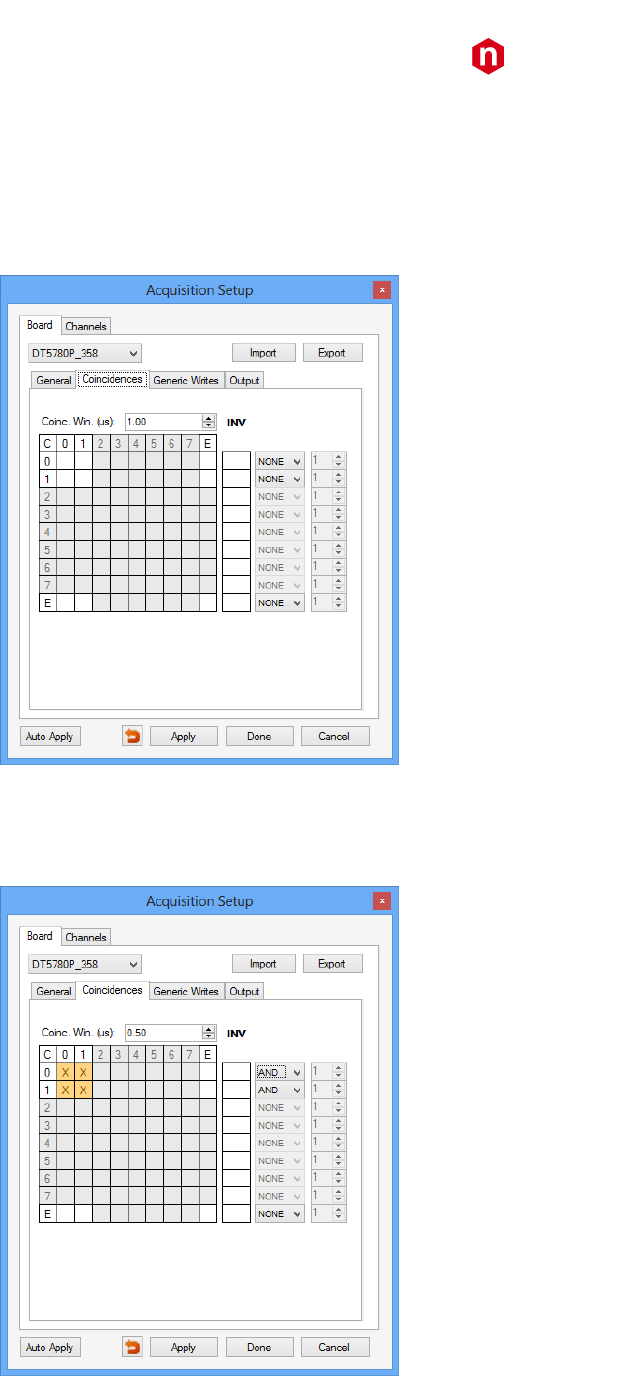
CAEN
Electronic Instrumentation
UM3182 – MC2Analyzer User Manual Rev. 5
87
In the coincidence tab of the MC2Analyzer software (724/780 and 781 series only), the user can set the validation signal
through a matrix (C), where for each row it is possible to write the corresponding validation mask. If an external trigger
is available, it can be selected through the E box. INV allows to set the “anti-coincidence” acquisition mode, while the
following pull down menu allows to select the operation (AND/OR/MAJ)
Coinc. Win. sets the “shaped trigger” width in us ([RD5]), corresponding to the coincidence window.
Fig. 4.27: The Acquisition Set Up Window – Board Section - Coincidences Tab
For example, to enable the coincidence among channel 0 and channel 1, the tab coincidence should appear as from Fig.
4.28. See more examples in [RD5].
Fig. 4.28: The Acquisition Set Up Window – Board Section - Coincidences Tab. Coincidence on channel 0 and channel 1 enabled
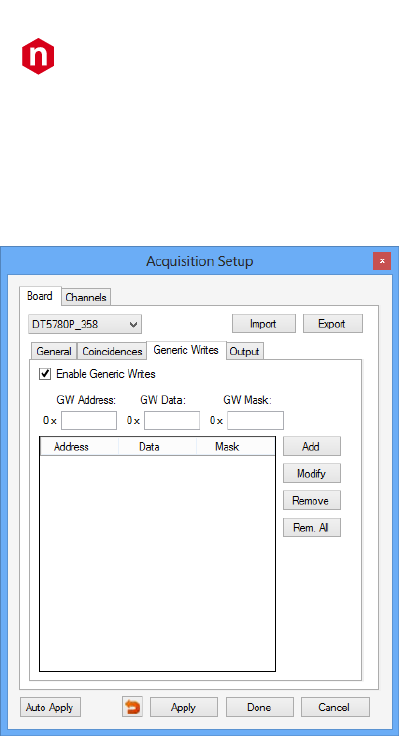
CAEN
Electronic Instrumentation
UM3182 – MC2Analyzer User Manual Rev. 5
88
Generic Writes Tab
The “Generic Writes” tab allows the user to direct access to board registers.
Click on “Enable Generic Writes” to enable this function.
Fig. 4.29: The Acquisition Set Up Window – Board Section - Generic Writes Tab
Write on “GW Address” box the specific register address, on “GW Data” the value you want to write in the register, and
in “GW Mask” the bit mask to be written.
Here some examples:
1. Set only bit [12] of register 1080 to 1, leaving the other bits to their previous value:
GW Address = 0x1080, GW Data = 1000, GW Mask = 1000
2. Set bit [12] = 1 and bit [13] = 0 of register 1080, leaving the other bits to their previous value:
GW Address = 0x1080, GW Data = 1000, GW Mask = 3000
3. Set register 1080 to the value of 0x45:
GW Address = 0x1080, GW Data = 45, GW Mask = FFFFFFFF
By clicking on the “Add” key the GW set line is entered in the GW table. The user can change at any time a GW set by
clicking on the correspondent line and then using the “Modify” key.
The user can also erase any single line by clicking on it and then using the “Remove” key. All GW sets can be removed at
once by using the “Remove All” key.
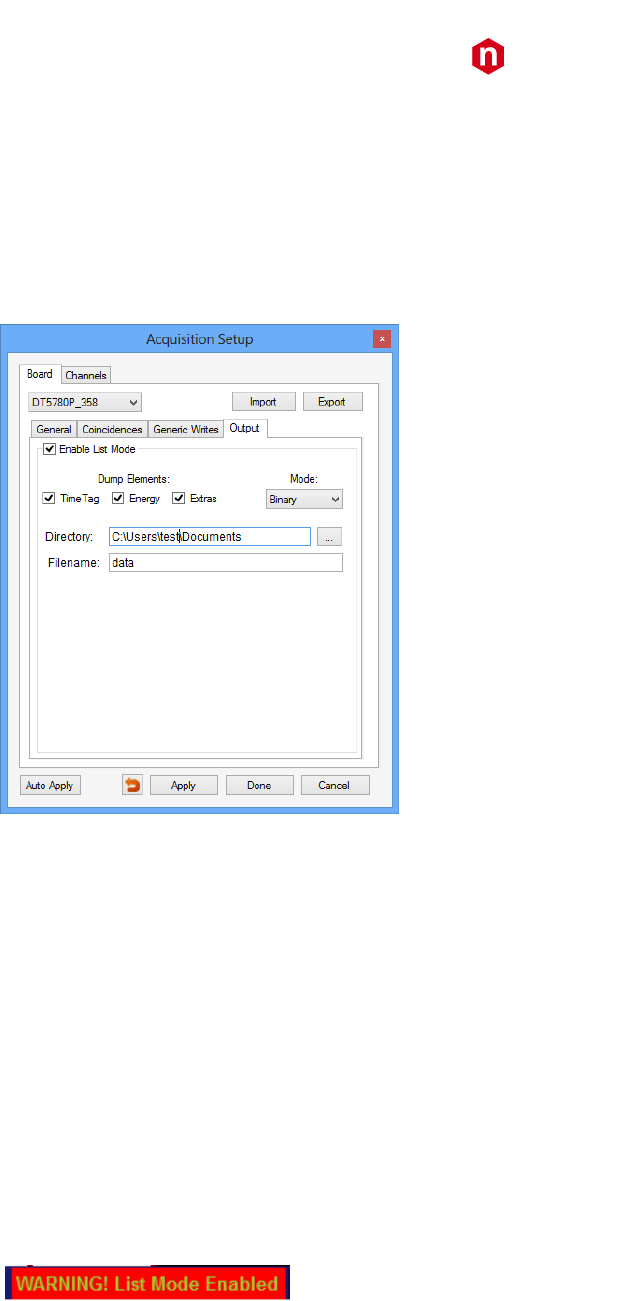
CAEN
Electronic Instrumentation
UM3182 – MC2Analyzer User Manual Rev. 5
89
Output Tab
The Output tab allows the user to save the output file in List mode option (see Fig. 4.30). Each triggered event is then
saved with the information of Time Stamp, Energy, and Extras.
Note: The list mode option is not available on DT5770 MCA.
Click on the “Enable List Mode” to enable the tab options.
Fig. 4.30: The Acquisition Set Up Window – Board Section - Output Tab
Click on the check-box to telect which information is saved into the final output file, choosing among:
• Time Tag: this is the trigger time stamp, i.e. the time of arrival of the pulse. It is expressed in sampling clock
unit, therefore the user has to multiply for the corresponding sampling clock to get the value in ns. Sampling
clock values are: 10 ns for x724, DT5780, DT5781, Hexagon, 4 ns for x725, and 2 ns for x730.
• Energy: this is the energy value, expressed as a 15 bits number. Refer to the following subsection Histogram
and list energy format for more details.
• Extras: this is the value of the word EXTRAS, as read from the event structure. Refer to Sect. Channel Aggregate
Data Format for 724, 780, and 781 series and Channel Aggregate Data Format for 725 and 730 series for more
details.
It is possible to choose among “Binary” and “ASCII” under the “Mode” menu to select the output file format.
Finally the user can select the Directory for the data save and the Filename.
The list file dump starts as soon the user starts the acquisition, and stops with the stop acquisition.
A warning message will appear at the bottom of the GUI when the list dumping is enabled.
Note: remember to increment the file name index. A new start acquisition will increment the previous data file, without
creating a new file.
CAEN
Electronic Instrumentation
UM3182 – MC2Analyzer User Manual Rev. 5
90
Header file format
In case of binary dumping the file header has the following structure:
012345631 789101112131415161718192021222324252627282930 BIT
HEADER 0PROTOCOL VERSIONNWORDS HEADER
HEADER 1DATA TYPETYPE FORMAT
HEADER 2DATA TYPETYPE FORMAT
. . .. . .. . .
HEADER nDATA TYPETYPE FORMAT
Fig. 4.31: Header file structure
The first word of the header describes the header itself, where:
• Bits[7:0] describes the protocol version number;
• Bits[15:8]: corresponds to the number of words of the header itself, including the first word;
• Bits[31:16]: reserved.
Note: the number of bits will be unchanged also for future protocol versions.
From “Header 1” to “Header n” the corresponding word identifies the type of data to be read in the list:
• Bits[7:0]: describes the “Data Type” of the event that has been saved into the list. Each header corresponds to
a different type, i.e. to a different information saved for each event. The complete list is described below:
- 0 = Trigger Time Tag type (which is the trigger time stamp)
- 1 = Energy type
- 2 = Extras type
- 3 = Short Energy type (for DPP-PSD only)
- 4 = DPP Code
- 255 = Fake (in case of error)
• Bits[31:8]: corresponds to the “Type Format” of the corresponding type of the word. Possible choices are:
- 0 = INT8;
- 1 = UINT8;
- 2 = INT16;
- 3 = UINT16
- 4 = INT32;
- 5 = UINT32;
- 6 = INT64;
- 7 = UINT64;
- 8 = STRING;
- 9 = LONG;
- 10 = DOUBLE;
- 11 = CHAR;
- 255 = none.
CAEN
Electronic Instrumentation
UM3182 – MC2Analyzer User Manual Rev. 5
91
For any DPP firmware the protocol version 1 is organized as follows, where words from “Header 1” to “Header 4” identify
the type of information in the list dump. Note: not all the information is available for any DPP firmware:
012345631 789101112131415161718192021222324252627282930 BIT
HEADER 0PROTOCOL VERSIONNWORDS HEADER
HEADER 1Trigger Time TagTrigger Time Tag Format
HEADER 2Energy Energy Format
HEADER 3ExtrasExtras Format
HEADER 4Short EnergyShort Energy Format
HEADER 5DPP CodeDPP Code Format
Fig. 4.32: Header file structure for DPP firmware
The order of Header words defines the order to read the data list.
For example, in case the header has the following structure:
012345631 789101112131415161718192021222324252627282930 BIT
HEADER 00x10x5
HEADER 10x00x7
HEADER 20x10x2
HEADER 30x20x5
HEADER 40x40x80
the user must read 5 words of header, and the data format has to be read as:
- Trigger Time Tag (uint64);
- Energy (int16);
- Extras (uint32)
i.e. 8 Bytes of Time Tag, 2 Bytes of Energy, and 4 Bytes of Extras.
The DPP code 0x80 corresponds to the DPP-PHA for x724 (DT5780, DT5781).
Note: In the ASCII format file the header words has to be read as in the binary format. For each event in the list there is
a corresponding column with the event type as described in the header.
Histogram and list energy format (x724-x780-x781 DPP-PHA firmware release <128.64 only)
The input waveform is sampled by a 14 bit ADC, then the firmware implements the digital trapezoid filter as described
in Sect. CAEN Digital Approach to evaluate its energy. Depending to the programmed parameters, the evaluated energy
inside the FPGA can be expressed as a number of maximum 48 bits.
The energy information in the list file is expressed as a 15 bit value, which is a simple truncation of the original 48 bit
value, taking the most significant bits. The position of most significant bit depends on the trapezoid rise time (k) and on
the input signal decay time (M). The 15 bits value is the most accurate value we can get from the DPP-PHA algorithm.
Anyway some numerical value are not decoded, therefore the energy values do not range from 0 to 215, but from 0 to a
value between 214 and 215, again depending on k and M.
The histogram shown in the MC2Analyzer software is made with a conversion of the (hypothetical) 15 bit histogram
provided by the digitizer into a 14 bit histogram. The final bin content is obtained "splitting" the content of the starting
bins.
The conversion factor (F) can be get as follows. Knowing the signal decay time (M), the trapezoid rise time (k) -- both
expressed in sampling unit (10 ns), and the trapezoid gain (g), it is possible to evaluate a factor G=M*k*g. This number
has to be divided by the closest power of 2 to G, where the exponent is unknown. The exponent (integer) can be found
through the following inequality:
The conversion factor is F = G/(2^n), which is a floating number.
The spectrum linearity is conserved on both spectra.
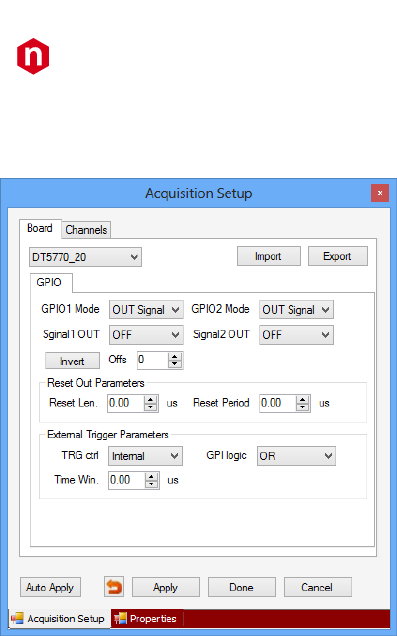
CAEN
Electronic Instrumentation
UM3182 – MC2Analyzer User Manual Rev. 5
92
GPIO Tab
The GPIO Tab is available on DT5770 MCA only.
The GPIO 1/2 can be configured as:
• Signal – OUT mode;
• Trigger – IN mode;
• Reset – IN mode.
In case of Signal 1 OUT the user has a list of digital traces that can be used for many purposes. Options are:
- OFF: disabled;
- Energy Sampled: corresponds to the point where the energy of the trapezoid is evaluated;
- Baseline Sampled: correponds to the samples where the baseline is averaged;
- Reset Detected: digital probe which is high when there is a reset. It stays high for the whole reset duration;
- Running: digital probe which is high for the whole acquisition run;
- Saturation: corresponds to the signal saturation;
- Pile Up Rej.: this probe is high when the last event is rejected due to a pile-up condition;
- Pile Up Inh.: corresponds to the time the board is inhibited due to a pile-up condition;
- Reset Periodic: programmable output to generate a periodic reset. Settings can be configured through the
above panel “Reset Out Parameters”;
- CLKHALF: propagation of the clock out. The clock has half frequency of the internal clock;
- Baseline Inh.: corresponds to the samples where the baseline is not evaluated;
- SCA 1/2: single channel analyzer 1/2.
In addition to those digital probes the user can also choose to provide out an analog signal, through a 10 bit DAC with
62.5 MS/s (Signal 2 OUT only). Options are:
- Input;
- Fast Trapezoid;
- Baseline;
- Trapezoid;

CAEN
Electronic Instrumentation
UM3182 – MC2Analyzer User Manual Rev. 5
93
- Sampled Energy;
- Trapezoid-Baseline.
It is possible to invert and set an offset for the traces, through the button “Invert”, and the field “Offs”.
The “Reset Out Parameters” allows the user to set the length and the period of the reset signal out through “Reset Len.”
and “Reset Period” in us unit. This option is available only when the option Reset Periodic is enabled.
The panel “External Trigger Parameters” allows the user to set the Trigger IN modes, choosing among:
- Internal: this is the default configuration, where the external trigger is not enabled;
- Gate/Veto: the trigger works as a gate/veto. The trigger logic senses to the signal level;
- Gate/Veto Win.: the trigger works as a gate/veto. A programmable time window can be set through the box
“Time Win.”;
- ON/OFF: manages the start/stop acquisition;
- Coincidence: the trigger enable the acquisition which stops at the first input pulse.
The two GPI can be combined through the AND/OR logic selecting the corresponding option in the box “GPI logic”.
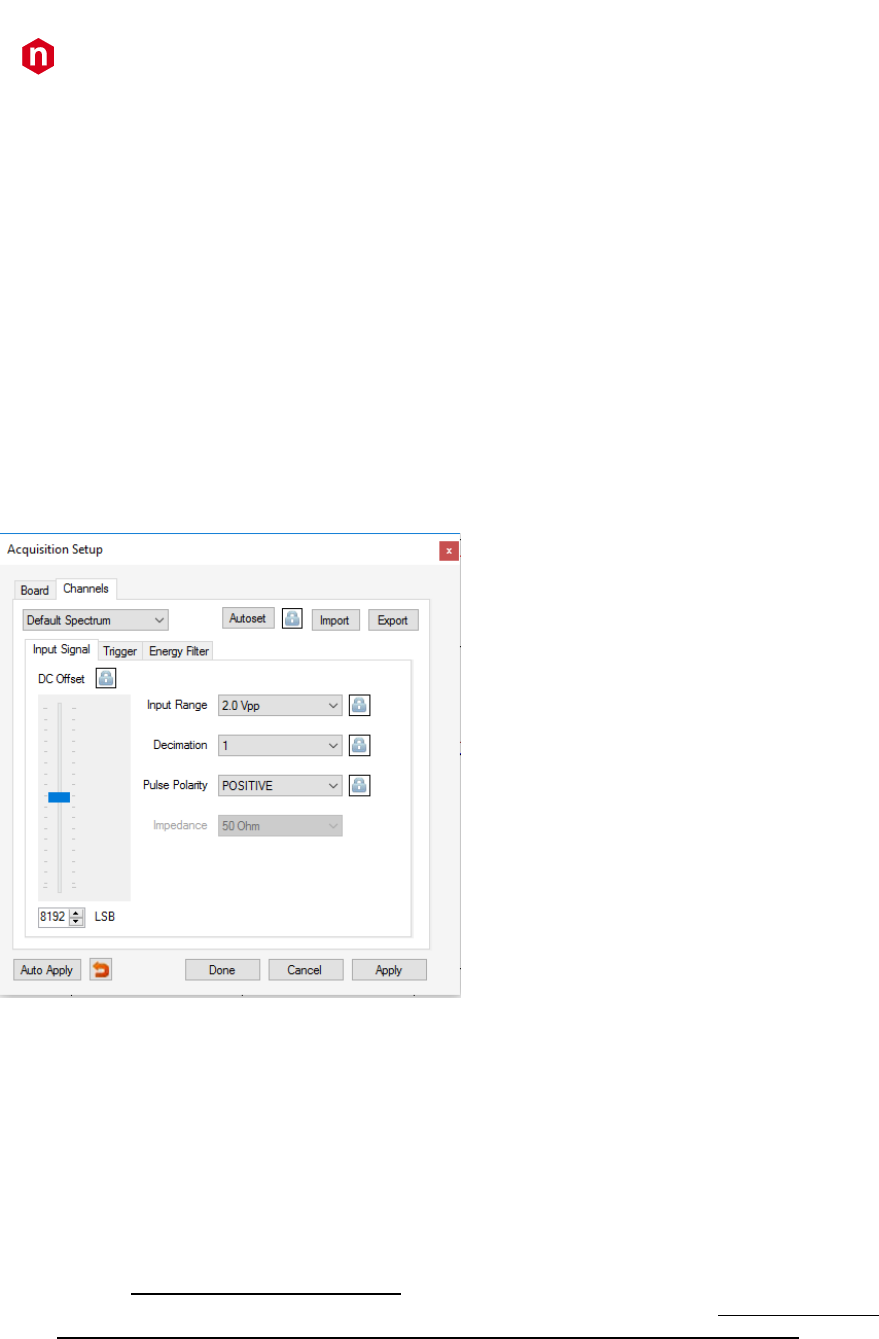
CAEN
Electronic Instrumentation
UM3182 – MC2Analyzer User Manual Rev. 5
94
Channels Tab
The Channels Tab allows the user to set the acquisition parameters for the active channels in the system.
The Live Channels being set are associated with the correspondent Default Spectra which appear in the Pull-Down menu
in the upper left corner of the Channels Tab.
- Autoset: When this key is used, the system analyses the current detector signals and an evaluation algorithm is
run to establish the best fit parameters. This may take some time, usually less than 1 minute for each channel.
There is a timeout of 5 minutes per channel. If the system is unable to find an optimized set of parameters within
the timeout, a pop up window will indicate the system inability to autoset.
To avoid a specific parameter entry to be modified by the Autoset automatic procedure, the user can click on the
Lock icon to the right of that specific entry description before applying the Autoset command. A yellow
background in the Lock Icon will indicate the nearby entry is locked against changes when the Autoset function is
used.
- Import: This key allows the user to import to the hardware a set of parameters from a saved file.
- Export: This key allows the user to save the current set of acquisition parameters to a file.
The Channels Tab features the following Tabs: Input Signal, Trigger and Energy Filter
Fig. 4.33: The Acquisition Set Up window – Channels Tab - Input Signal Tab
The Input Signal Tab allows the user to operate on the following hardware commands:
- DC Offset: The DC offset value can be set using the vertical slider or entering the value in LSB in the entry box
below it.
- Input Range: The user can select the following Input Full Scale Values. Options are:
- 0.5, 2 Vpp for 730 family;
- 1.25, 2.5, 5.0, 10.0 Vpp for the DT5770;
- 0.6, 1.4, 3.7, 9 Vpp for the 780 family;
- 0.3, 1, 3, 10Vpp for the 781 family;
- x0.25, x0.5, x1, x2, x4, x8, x16, x32, x64, x128, x256 for Hexagon;
- not available for x724 digitizer family.
- Decimation: The user can select the following Input Decimation Values: :1 - :2 - :4 - :8. The decimation is not
available for DT5770, for x724-x780-x781 DPP-PHA firmware release higher than 128.64 and Hexagon
- Pulse Polarity: The user can select the following Polarity Values: POSITIVE or NEGATIVE
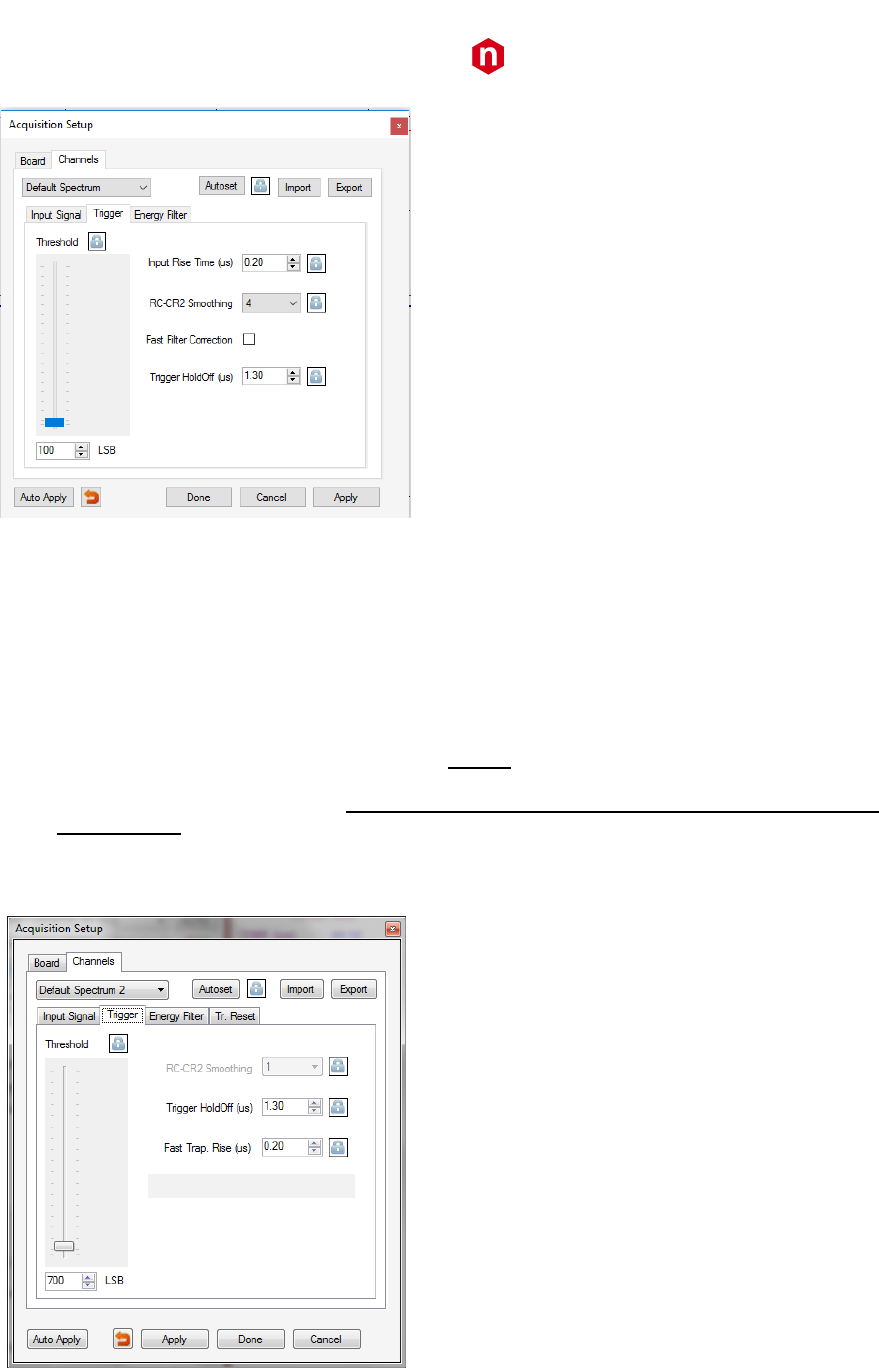
CAEN
Electronic Instrumentation
UM3182 – MC2Analyzer User Manual Rev. 5
95
Fig. 4.34: The Acquisition Set Up Window – Channels Section - Trigger Tab
The Trigger Tab allows the user to operate on the following hardware trigger commands:
- Threshold: The threshold value con be set from 0 to the Max Number of Channels (Bins) in LSB.
- RC-CR2 Smoothing: The RC-CR2 input signal second derivative smoothing value can be selected between 4 -8 –
16 and 32.
- Trigger Hold Off: The Trigger Hold Off Time, during which trigger signals will not be accepted by the digitizer can
be set in microseconds.
- Input Rise Time: This is a value set to optimize the shape the RC-CR2 signal used to trigger the board channels.
Maximum allowed value is 2.55 us (1.27 us in case of Hexagon).
- Fast Filter Correction: It allows the user to correct the slow tail of the the RC-CR2 taking into account the Decay
Time value set on the Energy Filter Tab. It does not have any effect for x724-x780-x781 DPP-PHA firmware release
less than 128.64.
In case of DT5770 the following options are available, where the “Threshold”, and the “Fast Trap. Rise” are referred to
the Fast Trapezoid trace:
Fig. 4.35: The Acquisition Set Up Window – Channels Section - Trigger Tab in case of DT5770
The Energy Filter Tab allows the user to set the following Spectrum Data processing values (see Fig. 2.7):
- Baseline Mean: The baseline mean can be calculated on the following range of Spectrum Channels: 0-16-64-256-
1024-4096-16484.
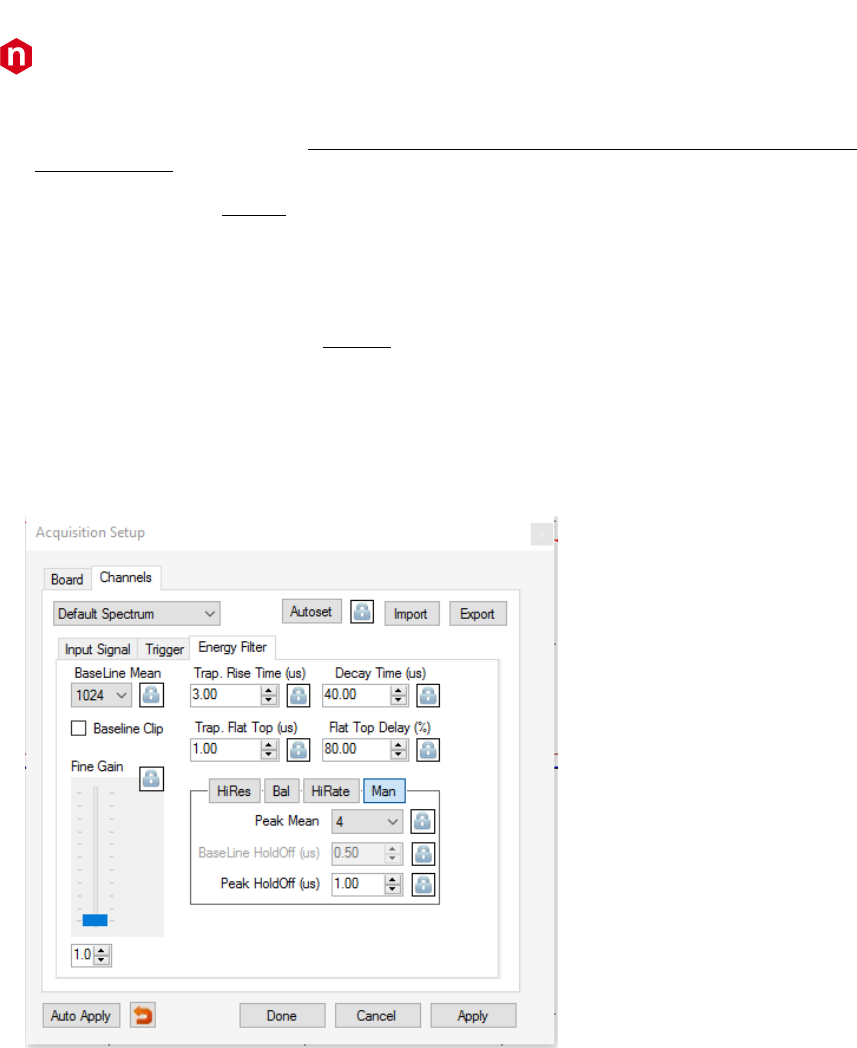
CAEN
Electronic Instrumentation
UM3182 – MC2Analyzer User Manual Rev. 5
96
- Baseline Clip: It disable the baseline calculation in case of events whose profile is not well defined and so not
triggered by the RCCR2 timing filter. It does not have any effect for x724-x780-x781 DPP-PHA firmware release
lower than 128.64.
- Trapezoid Rise Time: The user can set the Trapezoid Rise time from 0 to 10.20 microseconds in 0.01 microseconds
steps (40.95 us in case of Hexagon).
- Decay Time: The user can set the Trapezoid Decay time from 0 up to 655.35 microseconds, in 0.01 microseconds
steps
- Fine Gain: The user can set the Fine Gain from x1 to x10 by using the vertical slider or by entering the value in the
entry box or incrementing and decrementing it with the Up and Down Arrows.
- Trapezoid Flat Top: The user can set the Trapezoid Flat Top Width Value from 0 to 10.20 microseconds in 0.1
microseconds steps (20.47 us in case of Hexagon)
- Trapezoid Delay: The user can set the Trapezoid Flat Top Delay Value from 0% to 95 % in 0.1% steps.
Note: the sum of the Trapezoid Rise Time and Flat Top should not exceed 15 us times the Decimation value for 724, 780,
and 781 series (decimation no longer available for FW revision greater than 128.64), 16 us times the Decimation value
for 725 series, and 8 us times the Decimation value for 730 series.
Note: the maximum values can be increased by using the Decimation. See Sect. How To use Decimation for a specific
example.
HiRes: This key enables a Set of Hold Off Parameters optimized for the best spectrum resolution.
HiRate: This key enables a Set of Hold Off Parameters optimized to minimize the dead-time.
Bal(anced): This key enables a Set of intermediate Hold Off Parameters balanced for best compromise between High
Resolution and High Rate acquisition.
Manual: This key enables the manual setting of the Hold Off Parameters.
Fig. 4.36: The Acquisition Set Up Window – Channels Section - Energy Filter Tab
CAEN
Electronic Instrumentation
UM3182 – MC2Analyzer User Manual Rev. 5
97
In case of DT5770 an additional tab is available to control signals from transistor reset preamplifier. The tab is called “Tr.
Reset”. The shaping time of the Transient Reset is about 1.6 us.
Click on “Enabled” to enable this feature.
It is possible to set:
- Gain, whose options are: 2-5-7-11-16-21-33-40-50-70-88-110;
- Reset Threshold, which corresponds to the input threshold under which the board enable the reset (LSB unit);
- Reset Holdoff, which corresponds to the holdoff due to the reset condition (us unit).
CAEN
Electronic Instrumentation
UM3182 – MC2Analyzer User Manual Rev. 5
98
In case of Hexagon an additional tab is available called “Hexagon”.
The user can select the input DC/AC coupling. DC coupling must be selected in case of Charge Sensitive Preamplifier,
while AC coupling must be selected in case of Resistive Feedback and Transistor Reset Preamplifier. The user can choose
between 5, 10 and 20 us of shaping. In this case he/she must set the Trapezoid Decay Time according to set value.
In case of Resistive Feedback preamplifier it is possible to select the second Pole Zero in percentage, while in case of
Transistor Reset preamplifier it is possible to checkmark the corresponding box and set the Reset Length, i.e. the inhibit
time due to the reset discharge.
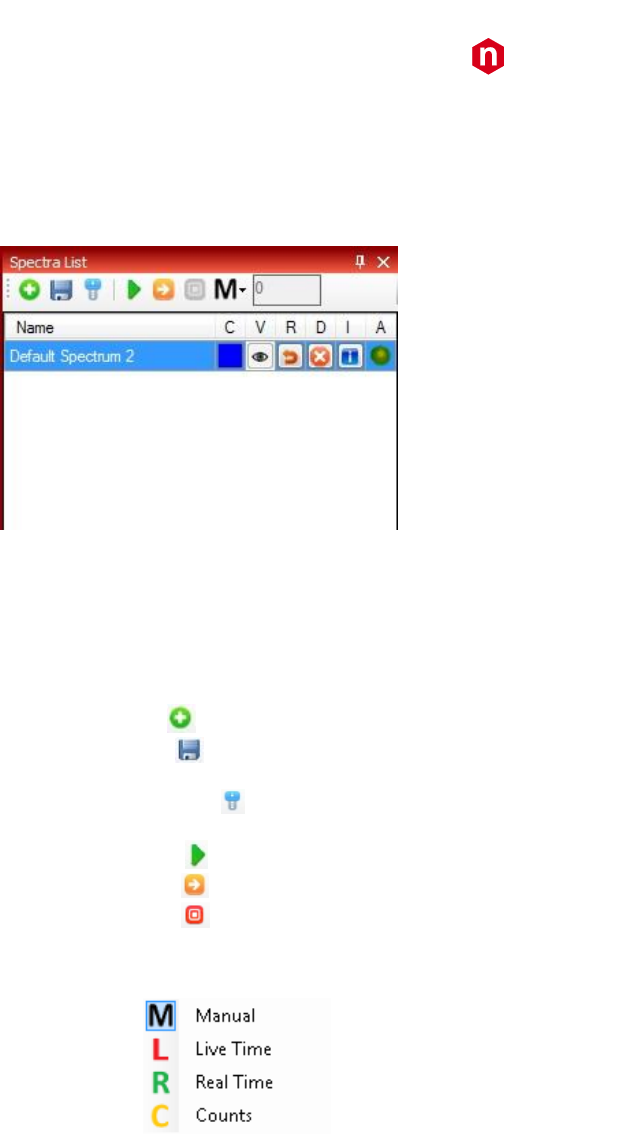
CAEN
Electronic Instrumentation
UM3182 – MC2Analyzer User Manual Rev. 5
99
Spectra List Window
The Spectra List Windows can be accessed from the Tools/View/Windows Pull Down Menu.
Upon clicking on the item the following window appears:
Fig. 4.37: The Spectra List Window
The Spectra List allows the user to Acquire, Save, Resume Acquisition, Recall from a Directory the selected spectrum. The
Spectra List Window features an Icon Bar and a Spectra List Table.
Spectra List Icon Bar:
- Add Spectrum : Same function as the “Add Spectrum” Icon on the Main Screen Icon Bar
- Save Spectrum : Opens a Windows Directory and allows the user to save the Spectra file into the desired
folder.
- Configure Acquisition : Allows the user to configure the acquisition system (see Section Acquisition Setup for
setting procedures).
- Start Acquisition : Acquisition will start upon clicking on the “Start Acquisition” icon.
- Arm Acquisition : Acquisition will start upon reception of valid data (valid trigger).
- Stop Acquisition : Acquisition will stop upon clicking on the “Stop Acquisition” icon for the specific highlighted
channel.
- Stop Acquisition Criteria: Acquisition will stop upon reaching one criteria among:
To manually stop the acquisition
To stop on a specified Live Time;
To stop on a specified Real Time;
To stop on a specified total counts number;
Note: all the spectra list commands act on a single channel. To work with all the channels simultaneously use the main
GUI commands.
CAEN
Electronic Instrumentation
UM3182 – MC2Analyzer User Manual Rev. 5
100
Under the Spectra List Icon Bar there is the Spectra List Table. Every line corresponds either to an activated live acquisition
channel spectrum either to a recalled file spectrum. All Spectra Files listed in the Spectra Table are tagged by their
Filename followed by 5 interactive icons and the Acquisition Status LED referred to that file.
Note: click on the letter to act to all enabled spectra in the “Spectra List” window, while click on the icon to act on the
single selected spectrum.
Spectra List Table Header:
- Name: This is the name either of a recalled spectrum file or of the file where an active live channel acquisition is
being written to. This can be determined at a glance by looking at the Acquisition Status LED color (See the Item
A in the list below)
- C: Color . Allows the user to select a color for the corresponding Spectrum graphic representation
- V: Toggle Visible/Invisible . When two or more spectra are being acquired or recalled to the screen, this icon
allows the user to toggle the correspondent spectrum away from the screen and back on it.
- R: Reset spectra . This icon allows the user to clear the selected spectrum. Keyboard shortcut F10.
- D: Delete File . This icon allows the user to delete the selected (highlighted) spectrum file.
- I: Information : This icon recalls the Board Information Dialog Box (see Fig. 4.17).
- A: Acquisition Status LED . This LED indicates whether the Spectrum is being acquired in real time (light
green/red) or recalled from file (dark green). When it turns red the board is busy due to a dynamics saturation or
to memory busy.
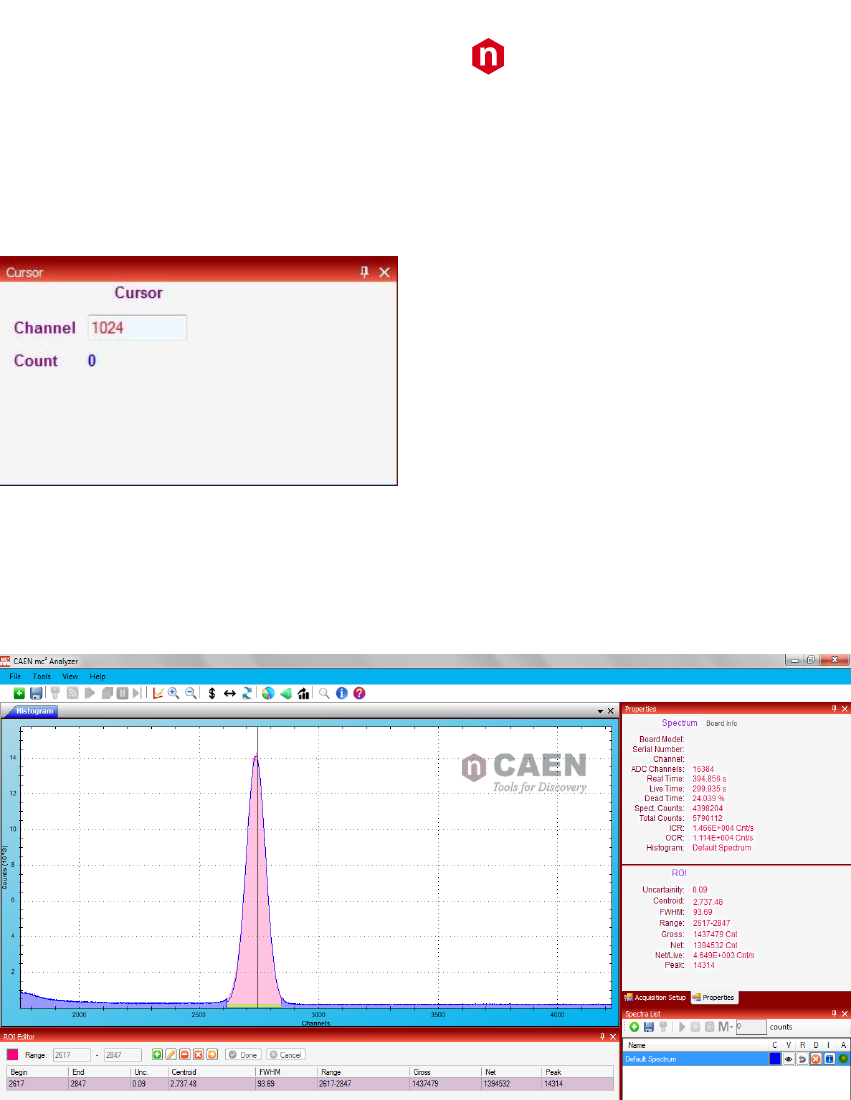
CAEN
Electronic Instrumentation
UM3182 – MC2Analyzer User Manual Rev. 5
101
Cursor Window
The Spectra Cursor window allows the user to read the histogram Y-axis value in correspondence with the X-axis Channel
indicated by the Crosshair Cursor. The X- axis value can be also entered into the Channel entry box. Upon confirmation
with the Enter key of the keyboard, the correspondent Y-axis value is displayed.
Fig. 4.38: The Cursor Window
ROI Editor Window
In the ROI Editor window the user can define one or more Regions Of Interest. Left clicking on the Create ROI item opens
the ROI Editor window (unless it was already open). Default position is leftmost under the Graph Window.
Fig. 4.39: MC2Analyzer Main Screen Graph with ROI Editor window
In the ROI Editor Window, a new ROI can be set by the user by left clicking on the green “+” key to the right of the Range
Entry boxes and then by:
- typing the values corresponding to the leftmost channel of the ROI in the first “Range” entry box and the value
corresponding to the rightmost channel of the ROI in the second “Range” entry box.
- either, placing the crosshair cursor of the graph on the leftmost point of the ROI to be defined and left clicking on
it. A vertical marker line with a red arrow will indicate the left border of the ROI. Then by placing the crosshair
marker on the rightmost point of the ROI being defined and left clicking on it, a second vertical line marker with
a red arrow will mark the rightmost border of the new ROI. At the same time the new ROI line will be added to
the table of ROIS in the ROI Editor Window, and a best fit curve of the ROI will be drawn on the graph.
The user can select a color to characterize the ROI regions of the graph by clicking on the square to the left of the “Range”
entry boxes.
Additional ROIs can be created by repeating the above procedure, starting by clicking on the green “+” key. The selected
color will apply to all the ROIs in the graph.

CAEN
Electronic Instrumentation
UM3182 – MC2Analyzer User Manual Rev. 5
102
The user can modify a ROI by clicking on the second key over the ROI Table then redefining the ROI either with the
crosshair marker graphic procedure or by entering the new numeric Begin and End border values in the corresponding
entry boxes.
The user can delete a single ROI by clicking on the “-“ red key over the ROI Table then left clicking on the correspondent
line in the ROI Table and confirming the ROI cancellation in the dialog box that opens up.
The user can delete all ROIs by clicking on the “X” red key over the ROI Table then confirming the ROIs cancellation in
the dialog box that opens.
Once the ROI is selected, the following data will be automatically displayed in the ROI Editor window last line:
- “Begin”: number of the first ROI channel.
- “End”: number of the last ROI channel.
- “Unc.”: Uncertainty, referred to the Centroid position.
- “Centroid”: Number of the channel corresponding to the Centroid of the Peak, calculated with the above
Uncertainty.
- “FWHM”: This is the value of the Full Width at Half Maximum of the peak, expressed in channels.
- “Range”: Indicates the ROI Range (from initial channel to final channel)
- “Gross”: indicates the Gross count value, as counted in the whole ROI.
- “Net”: indicates the net value of the counts in the whole ROI, corresponding to the Gross counts less the
Background value within the ROI.
- “Peak”: indicates the number of counts in the channel corresponding to the highest peak of the ROI.
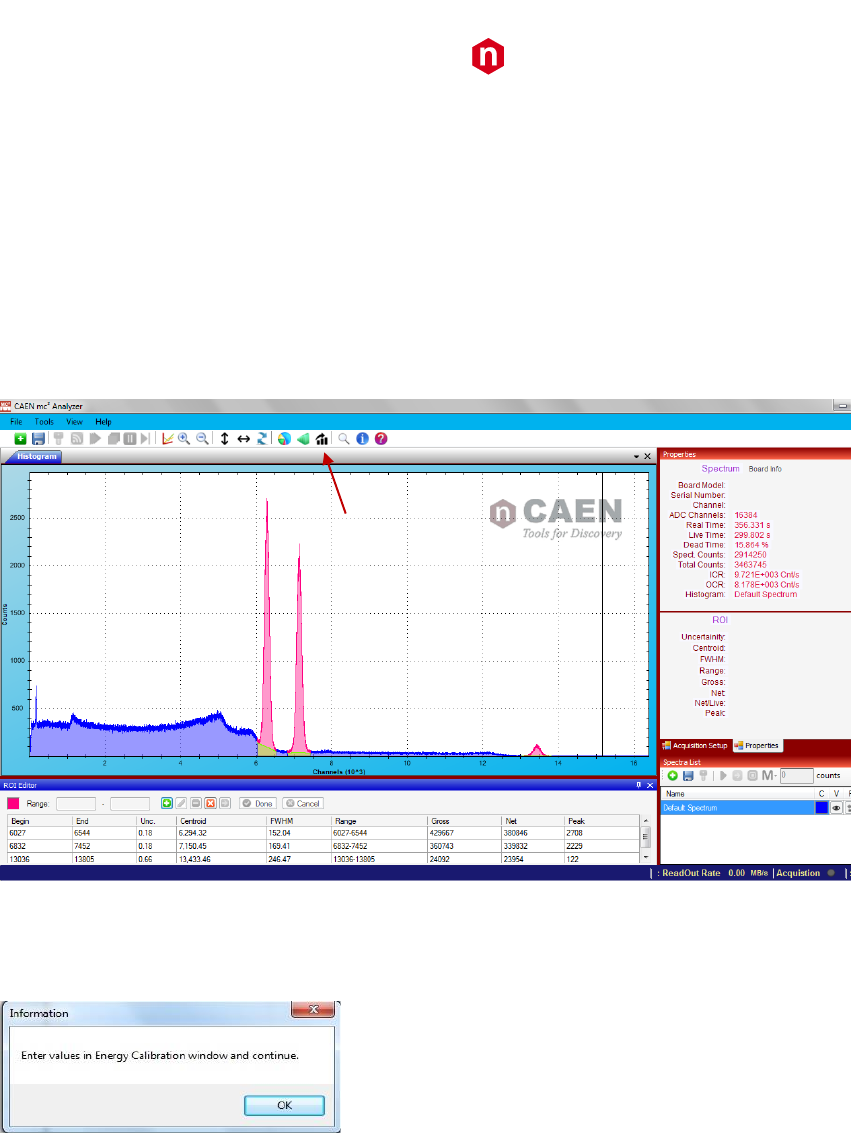
CAEN
Electronic Instrumentation
UM3182 – MC2Analyzer User Manual Rev. 5
103
MC2Analyzer Energy Calibration
The Energy Calibration of a Spectrum is performed by measuring the spectra of known radio isotopic sources and by
assigning Energy values (In keV or in MeV) to the number of the spectrum “bins” or “channels” where the peaks of
corresponding known peak energies of the radiation emitted by the source have been located. By calibrating a spectrum
with at least two peaks values it is possible to interpolate the value of all other channels. For example, a classic calibration
for gamma spectra includes the two photopeaks of the 60Co respectively at 1,17 MeV and at 1,33 MeV, and the
photopeak of the 137Cs at 662 keV.
To perform the calibration on the MC2Analyzer Spectra, a calibration spectrum should be uploaded, either from file or
from a channel in live acquisition from a known calibration source. The user can then left click on the Enable Calibration
Set up Icon in the Icon Bar (see Fig. 4.40).
Fig. 4.40: MC2Analyzer Enable Calibration Set up Icon
This icon function enables the user to enter the relevant energy calibration data. Upon clicking on the icon, if no
calibration values were previously entered in the program, the following dialog box appears:
Fig. 4.41: MC2Analyzer Energy Calibration Pop Up Confirmation window
Upon clicking on “OK”, or if previous values have been entered in the MC2Analyzer program, the following Energy
Calibration Window appears:
CAEN
Electronic Instrumentation
UM3182 – MC2Analyzer User Manual Rev. 5
104
Fig. 4.42: MC2Analyzer Energy Linear Calibration Dialog window
The user can then select the desired Energy units, KeV or MeV, from the pull-down menu to the upper right corner of
the window.
Then the user can locate the desired peaks of known energy on the calibration spectrum (either recalled from records
either acquired live from a calibration source). By clicking on a peak the correspondent channel number will appear in
the “Channel” value entry box. The user can then enter in the “Value” value entry box the Energy corresponding to that
peak and associate this calibrated value by clicking on the “ADD” key. The corresponding values will appear on the
calibration values list below the value entry boxes. This operation can be repeated to add other calibration peaks values.
Any calibration line can be removed by clicking on it (this will highlight the line) and by clicking on the “Remove” key.
The “Remove All” key clears all entered values at once.
If the user defines a ROI around a reference energy peak, then with the “Centroid” key the Peak Centroid Channel is
automatically located and its value written in the channel entry box. The user can then enter the corresponding reference
peak energy in the “Energy value” entry box and include this peak in the calibration by using the “ADD” key. This
operation can be repeated for all available reference energies. If no ROI has been defined an error message pop up
window is issued when the “Centroid” function is invoked.
Energy Calibration Interpolation Type
- Linear Interpolation
If at least 2 channel values are entered, then in the Energy Calibration Pull Down Menu the Linear Calibration
Function appears. The Energy Calibration is performed with a simple linear interpolation where the Y (Energy
value) is calculated as a function of the X (energy “bin” or “channel” number) multiplied by a factor B, added to
a constant A. Both the A and B values calculated from the linear interpolation best fit to the entered reference
energy values are shown in the calibration window.
- Quadratic Interpolation
If at least 3 channel values have been entered, then the Quadratic Interpolation function is also made available.
The Energy Calibration is performed with a quadratic interpolation where the Y (Energy value) is calculated as
a quadratic function of the X (energy “bin” or “channel” number) with the formula:
Y= A+ B*X+ C* X2.
The A, B and C values calculated from the quadratic interpolation best fit to the entered reference energy values are
shown in the calibration window (see Fig. 4.43).
Fig. 4.43: MC2Analyzer Energy Quadratic Calibration Dialog window

CAEN
Electronic Instrumentation
UM3182 – MC2Analyzer User Manual Rev. 5
105
Software Exit
How to exit the program
- Stop the Acquisition.
- Turn off the HV on all channels from the HV Window.
- Exit the MC2Analyzer program by clicking on the standard Windows red “X” key in the upper rightmost corner
of the window, either use the “Exit” item in the Menu Bar “File” Pull Down Menu.
Note: The Acquired spectrum will be saved automatically together with the settings and reloaded as acquisition default
file when the user restarts the MC2Analyzer program.

CAEN
Electronic Instrumentation
UM3182 – MC2Analyzer User Manual Rev. 5
107
Appendix A
Acquisition Modes
Each channel of a board running the DPP-PHA firmware can acquire events independently from the other channels. When
an event is acquired, the DPP-PHA firmware applies a trapezoidal filter to evaluate the pulse energy.
The main acquisition mode is called “List mode”, where the board provides the time of arrival of the input (also called
“Trigger Time Stamp”) and its Energy (“Pulse Height”). As soon as the list reaches a certain size, it is made available for
readout and the acquisition continues in another buffer. Being the size of the event very small (typically few bytes), the
throughput is extremely reduced. The firmware is not designed to make histogram onboard, but it can transfer the list
information to the software that manages the histogram plotting. Conversely, in case of DT5770, the board is designed
to make histograms on-board, and it does not produce any list file.
The DPP-PHA firmware allows also to acquire waveform samples (i.e. a sequence of samples within a programmable
acquisition window) in the “Waveform” acquisition mode. This acquisition mode is mainly intended to debug and to set
the DPP parameters. For each trigger (internal or external), the digitizer saves a portion of the waveform into a local
memory buffer. Running in Waveform Mode, the user can view the input signal, the trapezoid, and other control signals
(such as the trigger, the peaking, etc.) in the same plot, and easily adjust the parameters for the acquisition. Running in
waveform mode implies a very high data throughput, due to the huge number of samples saved into the board memory
and then read out by the DAQ software.
The DPP-PHA firmware can manage the two acquisition modes together in the “Mixed” acquisition mode, where it is
possible to read the energy and the time stamp information together with a portion of the waveform, so that the user
can retrieve further information and use it off-line, keeping a reasonable level of throughput bandwidth.
The MC2Analyzer software can manage both the list and the mixed acquisition mode. In the list mode, the software
retrieves the list information from the board to make the relevant histogram and can save the histogram and list files. In
the mixed mode, the software can show the pulses (Signal Inspector) for online adjustment of the settings, and the
histogram to evaluate the effect of the settings. Once ready the user must close the Signal Inspector window, reset the
spectrum and start again the acquisition, since acquiring the waveforms significantly reduces the bandwidth, thus
increasing the dead-time. Waveform dump is not supported in MC2Analyzer software
Users who wants to customize the acquisition, can write their own software starting from the samples code of the
CAENDigitizer library [RD7] and CAENDPP library [RD12].
Trigger Modes
The general operating principle of a digitizer running with DPP-PHA firmware is summarized in Fig. A.1. Each channel of
the board can trigger on the input pulse independently from the other channels. When the input is over-threshold the
channel FPGA sends a “Trigger Request” (TRG_REQ) signal, that enables the event building (“Normal (Individual) trigger
mode”).
Note: In case of 725, 730 and DT5770 the Waveform mode is not available, while it is available the Mixed mode.
Fig. A.1: Schematic chain of the trigger architecture of a DPP system
ADC DISCR
Threshold
Inputs
FPGA
CHANNELS
Local Bus
ROC FPGA
TRIGGER
LOGIC
(AND, OR, MAJ)
I/Os
EVENT
BUILDER
MEM
TRG REQ
DIGITIZER
FILTERS
TRG VAL
CAEN
Electronic Instrumentation
UM3182 – MC2Analyzer User Manual Rev. 5
108
In case of 725 and 730 series, each channel can acquire independently but it shares the same memory buffer with the
other channel of the couple (0-1, 2-3, etc.) (see Fig. A.2). Moreover the channels of the couple share the same TRG_REQ
for the coincidence logic. This means that it is not possible to set different coincidence logic among channels of two
different couples (refer to [RD5] for further details). Anyway a great advantage comes in case of coincidences between
channels of the same couple, which can be managed inside the channel FPGA, with no propagation to the mother board.
CH0
CH1
FIFO
FIFO
Memory Arbiter
(Record Length > 1792 samples)
1024 Ksamples
per couple
SSRAM
Local Buffer
Local Buffer
Bus Request
Bus Request
Fig. A.2: Memory management of 725 and 730 series
In the “Coincidence/Anticoincidence Trigger Mode” all the trigger requests can be sent to the common “ROC FPGA” for
the coincidence evaluation. The Individual Trigger Logic (ITL) of the ROC FPGA performs the logic operation of AND, OR,
or Majority between TRG_REQ coming from channels (724, 780, and 781) or couples (725 and 730). When the
coincidence condition is met, the ROC sends back one “trigger validation” signal per channel (couple). The coincidence
logic is individual, so that it is possible to program different coincident conditions for each channel. If the trigger
validation arrives within a programmable coincidence window (shaped trigger width), the event is saved in the memory
buffer.
In case of 724 (780 and 781) series, there is an additional coincidence mode, called “Neighbour Trigger Mode”. In this
case the event building can be enabled with a TRG_VAL signal only, even if no TRG_REQ has been occurred for that
channel. This may happen when a “neighbour” channel is over-threshold and generates a TRG_REQ. Then its previous
and consecutive channels receive a TRG_VAL signal too, and they can start the event building with the TRG_VAL signal
as reference. This is particularly useful in case of strip detector where the charge might deposit also in “neighbour”
channels.
Normal (Individual) Trigger Mode
In the normal (individual) trigger mode each channel can trigger on the input pulse independently from the other
channels.
Referring to Fig. A.3 the input signal is discriminated if over-threshold (OVTH). After the discrimination, through a
multiplexer, it is possible to select the output itself, or a logic pulse of adjustable time width TST. This is the shaped trigger
that enables the “trigger request” (TRG_REQ) for data acquisition. Unlike the Coincidence or Neighbour acquisition
modes, the TRG_VAL signal is always set to 1, so the event builder is activated when either a TRG_REQ, or an Individual
Trigger (ITRG), or a Global Trigger (GTRG) signal arrive.
CAEN
Electronic Instrumentation
UM3182 – MC2Analyzer User Manual Rev. 5
109
Fig. A.3: Block diagram of the Trigger Architecture in a DPP-PHA board
In the DPP-PHA the input pulse is fed into a Trigger and Timing Filter for the proper trapezoid calculation. When its output
exceeds the programmed threshold, the trigger logic gets armed (the signal “armed” goes high), then it waits until the
zero crossing to generate a Trigger Request TRG_REQ (Fig. A.4).
After the TRG_REQ, it is possible to program a trigger hold-off time window to prevent a new trigger to be generated on
the tail of the RC-CR2 signal. This might happen especially when the input pulses have an over-shut that causes a small
end pulse at the output of the timing filter. Another reason for using the trigger hold-off is to create a known dead-time
in the acquisition.
When TRG_REQ is generated, the energy filter goes into the run state (pkrun = 1) and the calculation of the trapezoid
baseline is frozen (baseline_off = 1). Note that there is a small delay (16 clock cycles) between the TRG_REQ and the start
of the trapezoid; this prevents the baseline to be frozen when the trapezoid already started.
The peaking time Tpk defines the position on the flat top where the energy is calculated; in this trigger mode, Tpk starts
with the TRG_REQ. Starting from the peaking time Tpk, it is possible to average a certain number of points on the flat
top (Tpkavg).
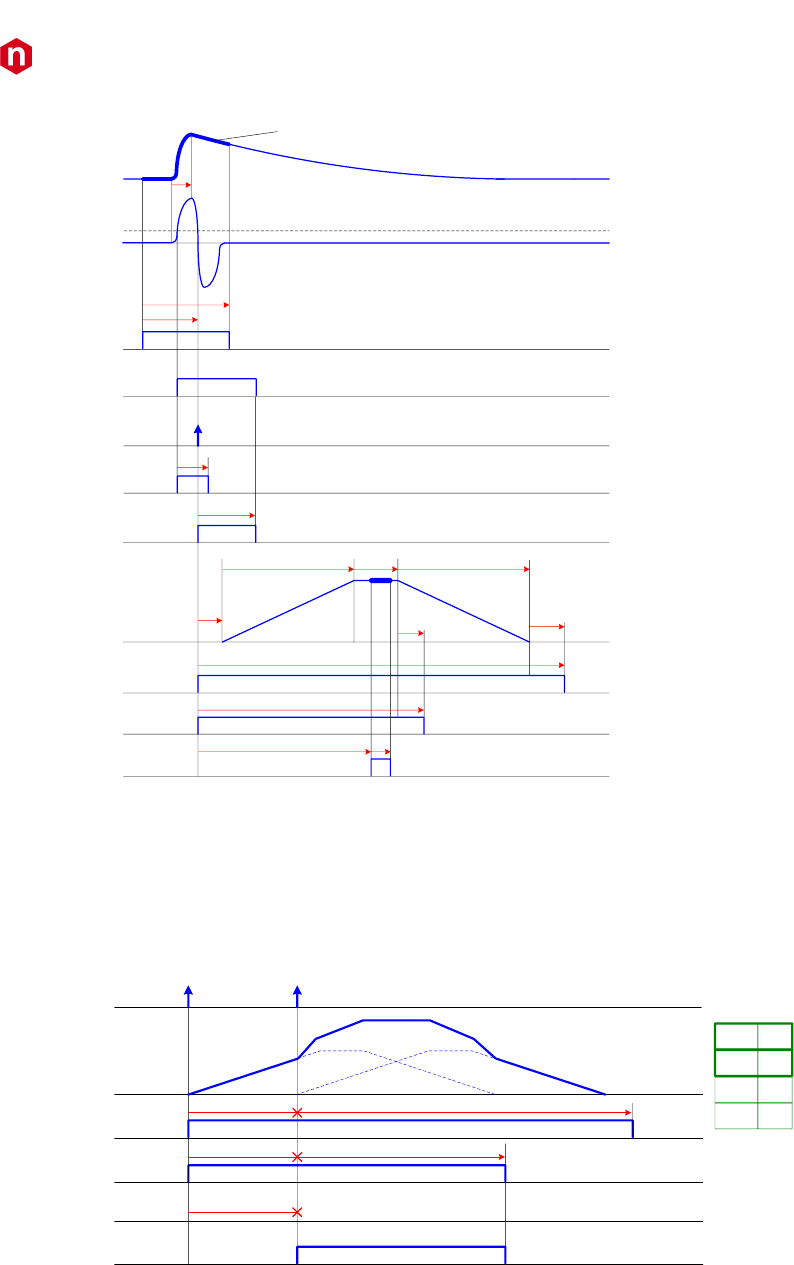
CAEN
Electronic Instrumentation
UM3182 – MC2Analyzer User Manual Rev. 5
110
TRG_REQ
Energy Filter
pkrun
peaking
baseline_off
Ttpdly
Trise Tflattop
Tpk Tpkavg
Tpkhoe
Tblho
Trun
Trise
Tblhoe
TT Filter
input
RTDwin
trg_holdoff
Ttrgho
Threshold
Trtdw
Tirt
armed
acqwin
waveform saved
to memory
Tpretrg
Tacqwin
RC-CR2
trapezoid
= Record Length
Fig. A.4: Timing diagram (Normal Trigger Mode)
According to the theory of the trapezoid filter, it is possible to accept a new trigger as soon as the flat top of the previous
one is finished. However, it is always better to keep some safety margin (Tpkhoe); the effect of this parameter is to
increase the width of the pkrun window. If a new TRG_REQ arrives within that window, then this event is identified as
pile-up. There are three different cases, as shown in the following pictures:
TRG_REQ
trapezoid
pkrun
peaking
purflag
bloff Trun
Tblho
T1T2
T10EV1
T20EV2
list
Fig. A.5: Pile-up occurred before the peaking time
When the second TRG_REQ occurs before the peaking time (Fig. A.5), then the energy filter output becomes meaningless
and the pile-up inspector rejects both TRs. In this case, the event builder saves two time stamps and zero for the relevant
energies (see the memory content represented in green). Notice that the second TRG_REQ restarts the timer for Trun
and Tblho while Tpk is aborted (red crosses).
Note: It is also possible to acquire the energy values (not corrected) of the two pulses by setting bit[27] of register
0x1n80. Refer to [RD8], [RD9], and [RD10] for additional details. Register writes can be performed through tab “Generic
Writes” of MC2Analyzer software (see Sect. Generic Writes Tab).
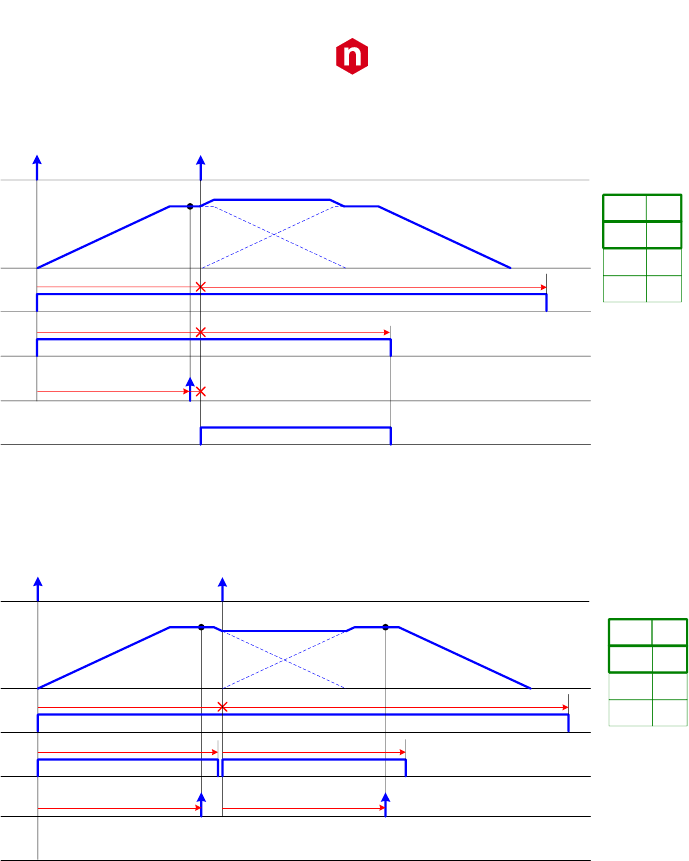
CAEN
Electronic Instrumentation
UM3182 – MC2Analyzer User Manual Rev. 5
111
TRG_REQ
trapezoid
pkrun
peaking
purflag
bloff
Tpk
Tblho
Trun
T1T2
E1T1
EV1
T20EV2
list
E1
Fig. A.6: Pile-up occurred after the peaking time
If the second TRG_REQ occurs after the energy of the previous has been saved (but still before the end of pkrun), then
only the second TRG_REQ will be rejected (see Fig. A.6).
TRG_REQ
trapezoid
pkrun
peaking
purflag
bloff
Tpk
Trun
Tblho
Trun
Tpk
T1T2
E1E2T1
EV1
T2
EV2
list
E1
E2
Fig. A.7: Overlapped trapezoids that don’t cause pile-up rejection
If instead the second TRG_REQ occurs outside the pkrun window, although the two trapezoids are piled-up, both energies
can be calculated and there is no pile-up rejection. However, in this case, the baseline of the second trapezoid cannot be
recalculated, thus the same baseline calculated for the first trapezoid will be used for the second one too (see Fig. A.7).
When the counting rate is high, it might happen that the baseline is kept off for many subsequent pulses and this can
significantly worsen the energy resolution. In this case, it is possible to increase Tpkhoe and make pkrun longer than the
full trapezoid width or even more. Doing that, the pile-up inspector will reject all the pulses but those that are well
separated, thus allowing the baseline to be properly calculated for every pulse. By default, the baseline calculation starts
again at the end of the trapezoid but it is possible to delay it by the Tblhoe value.
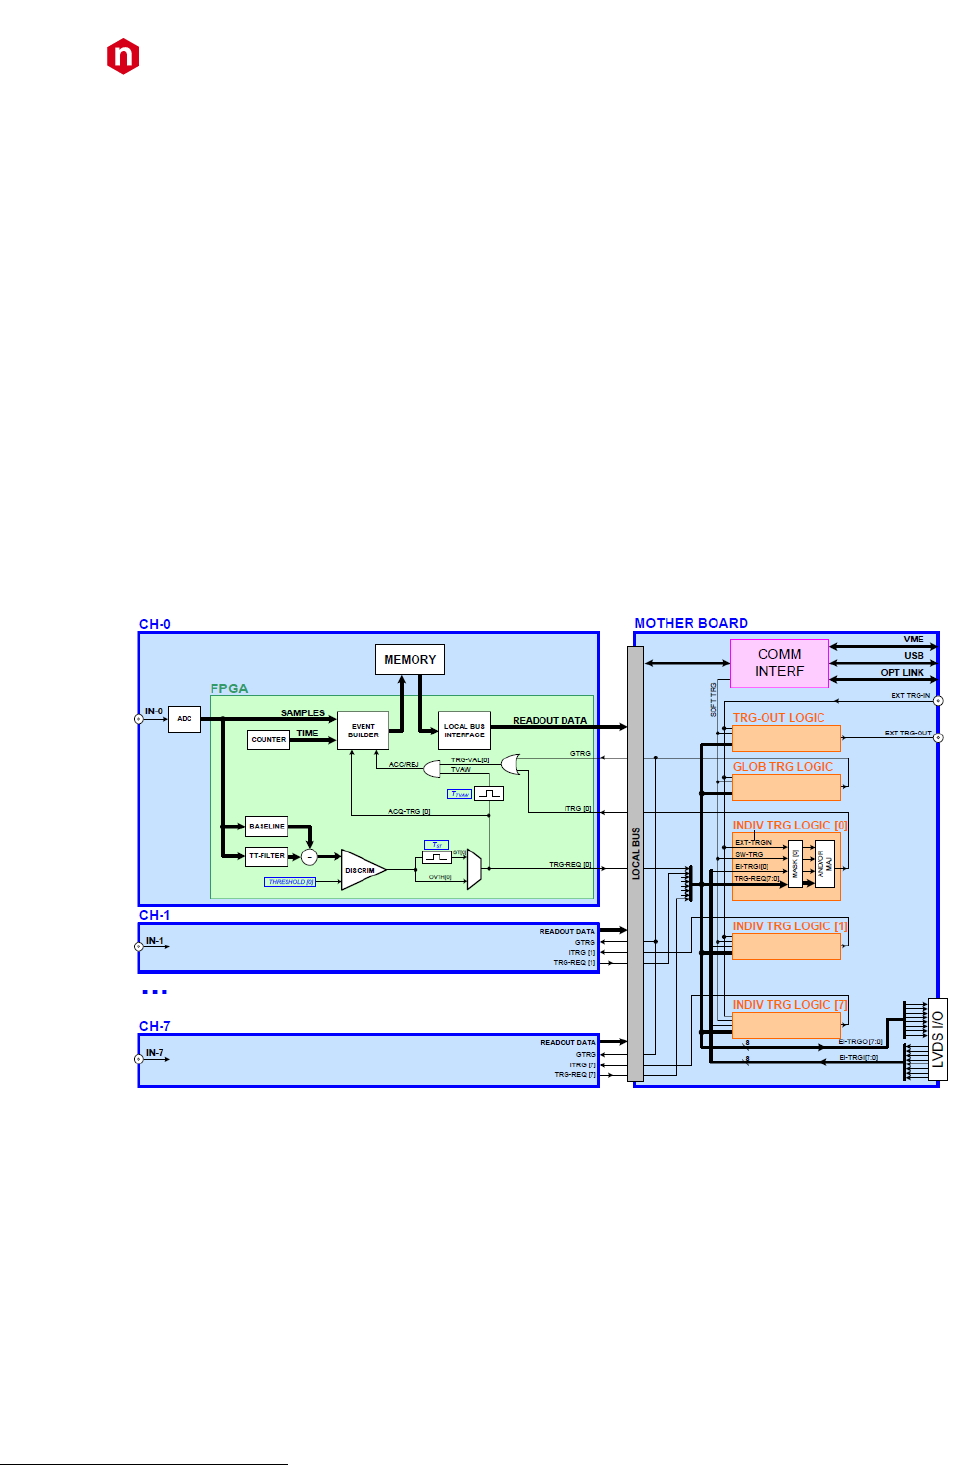
CAEN
Electronic Instrumentation
UM3182 – MC2Analyzer User Manual Rev. 5
112
Coincidence Trigger Mode
Note: The coincidence trigger mode is not available for DT5770.
Acquiring coincident events is a common task in physics, and the DPP-PHA firmware allows you to make online
coincidences among channels. As already introduced, the TRG_REQ signal can be sent to the ROC FPGA (mother board)
that makes a programmable Individual Trigger Logic (ITL) calculation among the logic AND, OR, or Majority
1
(see Fig. A.8).
The ITL has the same multiplicity of the number of channel, and each ITL can be programmed with a different logic
function. Moreover the ITL can receive as input not only the TRG_REQ from all channels, but also the signal from the
front panel output GPIO (line 0 to 7 of the LVDS I/O connector – VME only), the software trigger (SOFT_TRG), and the
external trigger (EXT TRG-IN).
The user has the possibility to rather program a Global Trigger Logic (GTL) or a “TRG_OUT logic”. The GTL and the
TRG_OUT logic can receive as inputs the TRG_REQ from all channels, the EXT TRG-IN and the SOFT TRG. They cannot
receive the inputs from the LVDS I/O. The “TRG-OUT logic” works as the ITL, but it has no the same multiplicity. Only one
TRG-OUT signal is generated for the whole board. At the moment this logic unit can perform only the OR operation, and
there is one GTL for all channels, since its output triggers all channels simultaneously.
Either the ITRG and the GTRG can generate the TRG_VAL signal. To save the event into the memory the TRG_VAL signal
must arrive within a programmable time window TVAW (Trigger Validation Acceptance Window). If the TRG_VAL signal
is outside the TVAW than the event is rejected.
In this trigger mode, all timings are referred to TRG_REQ, and the TRG_VAL never causes pile-up.
Fig. A.8: Block diagram of the Trigger Architecture in a board with DPP-PHA firmware
More information and detailed instructions on how to make coincidences among channels of the same board can be
found in [RD5].
Note: In case of 725 and 730 series coincidences can be performed inside couple of channels, or among different
couples. Channels of the same couple share the same memory SSRAM and the same TRG_REQ; therefore a single
TRG_REQ from the couple is propagated to the mother board FPGA to participate to the ITL, GTL, and TRG-OUT Logic.
Anti-coincidence Trigger Mode
The structure of the anti-coincidence trigger mode is the same of the coincidence one, the only difference being the logic
operation performed between the TRG_VAL signal and the TVAW. Indeed the event is saved into memory when no
TRG_VAL signal arrives within the TVAW window.
1
The Majority is true when at least a programmable “majority level” number of enabled inputs are in coincidence.
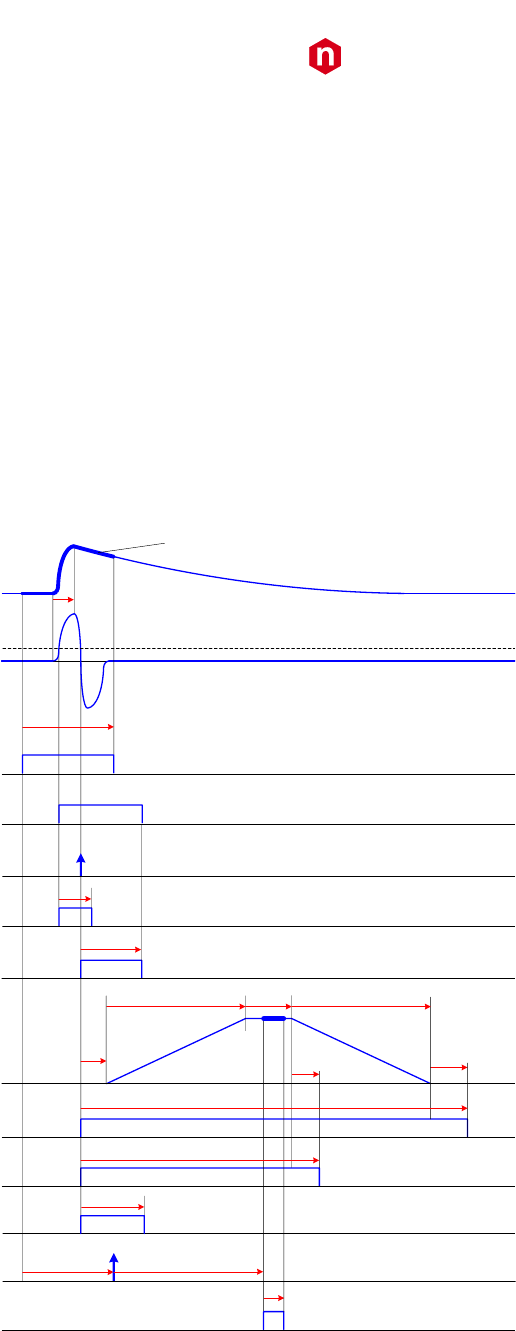
CAEN
Electronic Instrumentation
UM3182 – MC2Analyzer User Manual Rev. 5
113
Refer to [RD5] for more information and detailed instructions on how to make anti-coincidences among channels of the
same board.
Neighbour Trigger Mode
Note: The neighbor trigger mode is not available for 725, 730 and DT5770.
In the neighbour trigger mode, each channel still self-trigger on the input pulse. Moreover its TRG_REQ generates a
TRG_VAL signal that enables the data writing of the channel itself and of the “neighbour” channels, i.e. the previous and
the consecutive.
Note: The neighbor trigger mode is particularly useful with strip detectors.
In order to have the same peaking times and the same waveform acquisition window in both cases (channel triggered
by TRG_REQ or by TRG_VAL), Tpk and Tpretrg are referred to TRG_VAL instead of TRG_REQ. For this reason, the trigger
logic that generates TRG_VAL must keep the jitter between TRG_REQ and TRG_VAL as low as possible. Also the time
stamp saved in the event data is that one of TRG_VAL.
TRG_REQ
Energy Filter
pkrun
peaking
baseline_off
Ttpdly
Trise Tflattop
Tpkavg
Tpkhoe
Tblho
Trun
Trise
Tblhoe
TT Filter
input
RTDwin
trg_holdoff
Ttrgho
Threshold
Trtdw
Tirt
armed
acqwin
waveform saved
to memory
Tacqwin
RC-CR2
trapezoid
= Record Length
Tpk
TRG_VAL
TVAW
Ttvaw
Tpretrg
Fig. A.9: Timing diagram (Neighbour Trigger Mode)
If TRG_VAL signal arrives outside the TVAW window (see Fig. A.10), then the event will have the pile-up flag. Indeed
TRG_VAL is not related to the event that caused the TRG_REQ in that channel and the calculated energy value is not
properly evaluated.
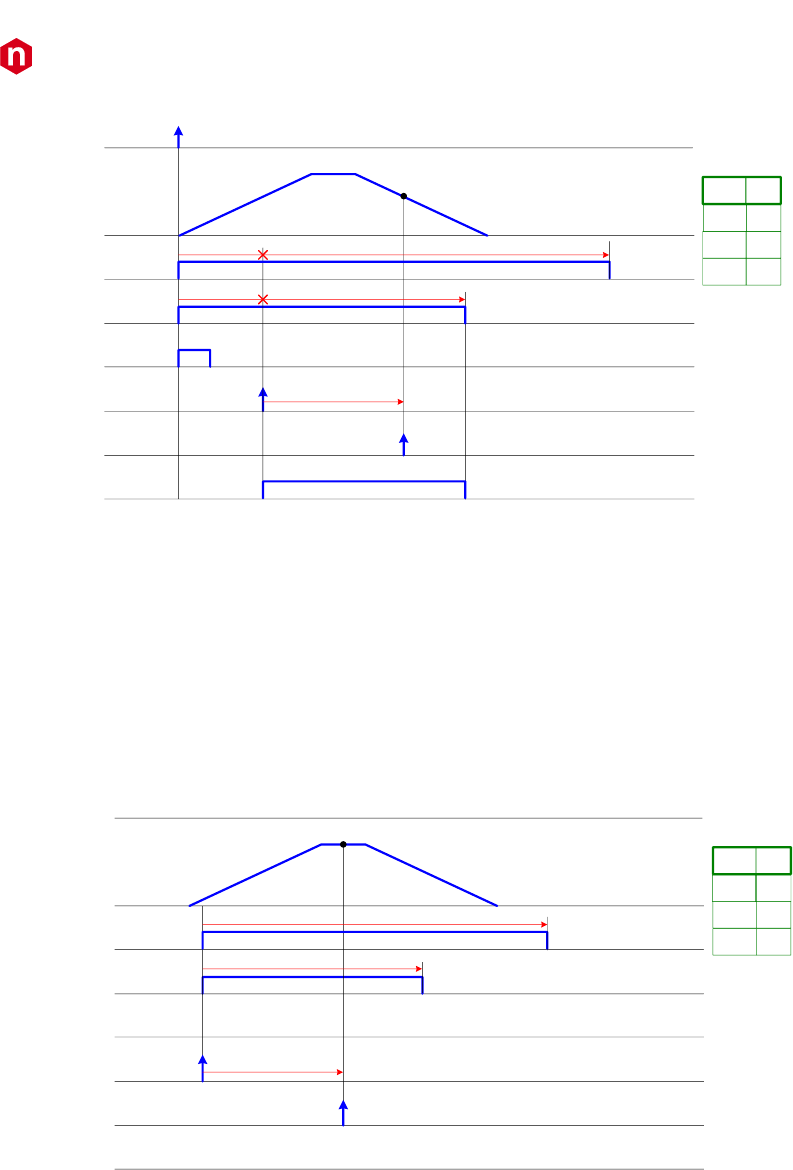
CAEN
Electronic Instrumentation
UM3182 – MC2Analyzer User Manual Rev. 5
114
If a “neighbour” channel triggers and gets a valid TRG_VAL signal, then also the neighbour channels, even if they do not
have enough charge to enable their own TRG_REQ, they receive the same TRG_VAL signal (see Fig. A.11). Please note
that, unlike in the Normal Trigger Mode, the energy value latched at Tpk is saved into the memory with bit[15] = 1 (see
Channel Aggregate Data Format for 724, 780, and 781 series) indicating the pile-up condition. When the neighbour
channel receives the TRG_VAL signal it starts its Tpk and Trun counters even though the value measured will be probably
close 0.
Refer to [RD5] for detailed instructions on how to enable this trigger mode with DPHA.
TRG_REQ
trapezoid
pkrun
TVAW
TRG_VAL
peaking
purflag
bloff
Tpk
Tblho
Trun
T1
E1
T1
EV1
list
E1
Fig. A.11: TRG_VAL without TRG_REQ
TRG_REQ
trapezoid
pkrun
TVAW
TRG_VAL
peaking
purflag
bloff
Tpk
Trun
Tblho
T1
E1P T1
EV1
list
E1P
Fig. A.10: TRG_VAL outside the acceptance window
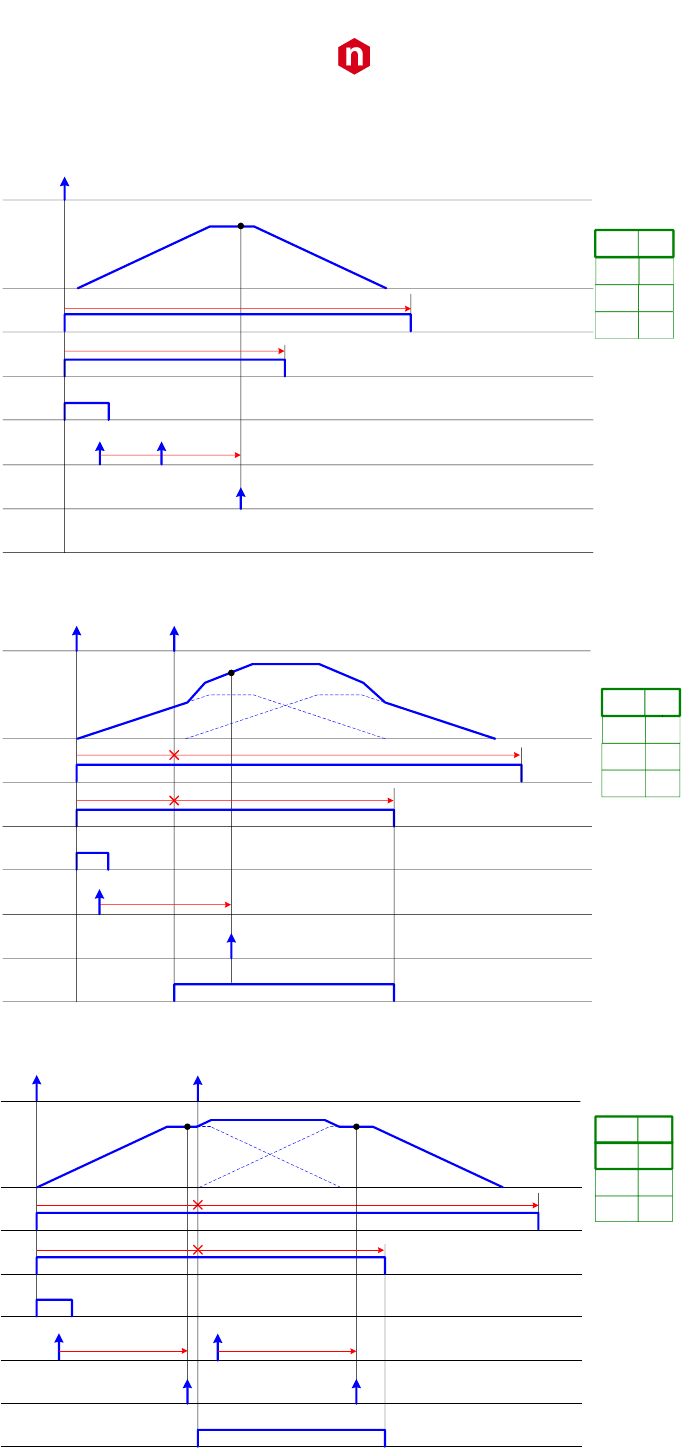
CAEN
Electronic Instrumentation
UM3182 – MC2Analyzer User Manual Rev. 5
115
The TRG_REQ pile-up condition for the Neighbour Trigger Mode is similar to Normal Trigger Mode (see the following
figures).
TRG_REQ
trapezoid
pkrun
TVAW
TRG_VAL
peaking
purflag
bloff
Tpk
Trun
Tblho
E1
T1
T1
EV1
list
E1
Fig. A.12: Second TRG_VAL occurring within pkrun
TRG_REQ
trapezoid
pkrun
TVAW
TRG_VAL
peaking
purflag
bloff
Tpk
Trun
Tblho
T1
E1P
T1
EV1
list
E1P
Fig. A.13: Pile-up occurred before the peaking time (Neighbour Trigger Mode)
TRG_REQ
trapezoid
pkrun
TVAW
TRG_VAL
peaking
purflag
bloff
Tpk
Tblho
Tpk
Trun
T1T2
E1E2P T1
EV1
T2
EV2
list
E1
E2P
Fig. A.14: Pile-up occurred after the peaking time (Neighbour Trigger Mode)
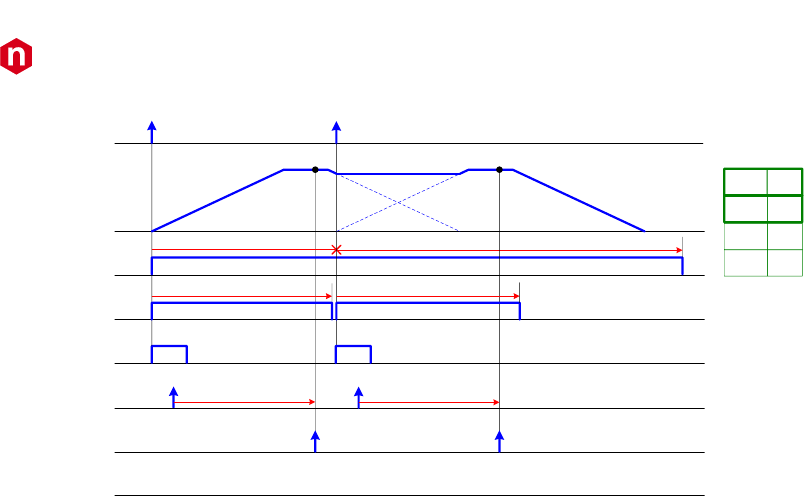
CAEN
Electronic Instrumentation
UM3182 – MC2Analyzer User Manual Rev. 5
116
TRG_REQ
trapezoid
pkrun
TVAW
TRG_VAL
peaking
purflag
bloff
Tpk
Trun
Tblho
Tpk
Trun
T1T2
E1E2
T1
EV1
T2
EV2
list
E1
E2
Fig. A.15: Overlapped trapezoids that do not cause pile-up rejection (Neighbour Trigger Mode)
Synchronization among different boards
In cases when multi-board systems are involved in the experiment, it is necessary to synchronize different boards. In this
way the user can acquire from N boards with Y channel each, like if they were just one board with (N x Y) channels.
The main issue in the synchronization of a multi-board system is to propagate the sampling clock among the boards. This
is made through input/output daisy chain connections among the digitizers. One board has to be chosen to be the
“master” board that propagates its own clock to the others. A programmable phase shift can adjust possible delays in
the clock propagation. This allows to have both the same ADC sampling clock, and the same time reference for all boards.
Having the same time reference means that the acquisition starts/stops at the same time, and that the time stamps of
different boards is aligned to the same absolute time.
There are several ways to implement the trigger logic. The synchronization tool allows to propagate the trigger to all
boards and acquire the events accordingly. Moreover in case of busy state of one or more boards, the acquisition is
inhibited for all boards.
Refer to [RD6] for more details on how to synchronize CAEN digitizers.

CAEN
Electronic Instrumentation
UM3182 – MC2Analyzer User Manual Rev. 5
117
Appendix B
Memory Organization
Each channel has a fixed amount of RAM memory to save the events. The memory is divided into a programmable number
of buffers (also called “aggregates”), where each buffer contains a programmable number of events. For the 725 and 730
families, each buffer is shared between two channels, i.e. channel 0 and channel 1, channel 2 and channel 3, etc. The
event format is programmable as well. The board registers involved are the following (refer to [RD8], [RD9], and [RD10]):
• “Aggregate Organization” (Nb), address 0x800C: defines how many aggregates can be contained in the memory (
Nb
aggrn 2_
).
• “Number of Events per Aggregate” (Ne), address 0x1n34: defines the number of events contained in one
aggregate. The maximum allowed value is 1023.
• “Record Length” (Ns), address 0x8020 (0x1n20 for 725 and 730): defines the number of samples for the waveform
acquisition, when enabled (rec_len = Ns * 2 for 724, 780, and 781 series, rec_len = Ns * 8 for 725 and 730 series).
• “Board Configuration”, address 0x8000: defines the acquisition mode and the event data format.
According to the programmed event format, an event can contain a certain number of samples of the waveform, one
trigger time stamp, the energy and the Extras information.
724 series
The following section describes the structure of the memory organization of 724 series.
The physical memory inside the board is made of memory locations, each of 128-bit (16B).
In terms of location occupancy:
Trigger Time Stamp = 1 location;
Waveform (if enabled) = 1 location every 8 samples;
Energy and EXTRAS = 1 location each.
Fig. B.1 shows the data format as saved into the physical memory of 724 series.
S0
S8
S7
Sn-8
S15
Sn-1
TRIGGER TIME
TAG
S11
S3
Sn-5
One Event
Record_Length/8
Sn-7
Sn-6
S1
S2
S9
S10
S4
S5
S6
S13 S12
S14
Sn-3
Sn-2 Sn-4
.
.
.
.
.
.
.
.
.
.
.
.
.
.
.
.
.
.
.
.
.
.
.
.
ENERGY
EXTRAS
memory
location
Fig. B.1: Data organization into the Internal Memory of x724 digitizer.
CAEN
Electronic Instrumentation
UM3182 – MC2Analyzer User Manual Rev. 5
118
725/730 series
The following section describes the structure of the memory organization of 725/730 series.
The physical memory inside the board is made of memory locations, each of 128-bit (16B).
In terms of location occupancy:
Trigger Time Stamp = 1 location;
Waveform (if enabled) = 1 location every 8 samples;
Energy, EXTRAS and EXTRAS2 = 1 location each.
Fig. B.2 show the data format as saved into the physical memory of 725 and 730 series. The structure is the same as the
724 series apart for the Trigger Time Tag, that has one bit less than the 725 and 730 series. Since two channels share the
same buffer, one bit is reserved to store the channel number, where 0 corresponds to the odd channel of the couple, and
1 to the even channel.
S0
S8
S7
Sn-8
S15
Sn-1
TRIGGER TIME
TAG
S11
S3
Sn-5
One Event
Record_Length/8
Sn-7
Sn-6
S1
S2
S9
S10
S4
S5
S6
S13 S12
S14
Sn-3
Sn-2 Sn-4
.
.
.
.
.
.
.
.
.
.
.
.
.
.
.
.
.
.
.
.
.
.
.
.
EXTRAS 2 Energy
memory
location
EXTRAS
CH
Fig. B.2: Data organization into the Internal Memory of x725 and x730 digitizers.
As previously said, the “Record Length” and the “Board Configuration” settings determine the event size; the user must
calculate the number of event per buffer (Ne) and the number of buffers (
Nb
2
)accordingly. When the board runs in List
Mode, the event memory contains one location for the Trigger Time Tag and one for the Energy and EXTRAS. Therefore
it is very small and it is suggested to use a big value for Ne to make the buffer size as big as at least a few KB. Small buffer
size results in low readout bandwidth. The only drawback of setting high values for Ne is that the events are not available
for the readout until the buffer is complete; hence there is some latency between the arrival of a trigger and the readout
of the relevant event data. Conversely, when the board runs in Oscilloscope Mode, especially when the record length is
large, it is more convenient to keep Ne low (typically 1).
CAEN
Electronic Instrumentation
UM3182 – MC2Analyzer User Manual Rev. 5
119
Event Data Format
When the data readout is performed, the data format will appear as follows.
Channel Aggregate Data Format for 724, 780, and 781 series
The Channel Aggregate is composed by the set of Ne events, where Ne is the programmable number of events contained
in one aggregate. The structure of the Channel Aggregate of two events (EVENT 0 and EVENT 1) is shown in Fig. B.3,
where:
FI: when 1, the second word is the Format Info
DT: Dual trace enabled flag (0 = disabled, 1 = enabled)
ES: Waveform (samples) enabled flag
EE: Energy enabled flag
ET: Trigger Time Stamp enabled flag
AP1: Analog Probe 1 Selection. AP1 can be selected among:
00 = “Input”: the input signal from pre-amplified detectors
01 = “RC-CR”: first step of the trigger and timing filter
10 = “RC-CR2”: second step of the trigger and timing filter
11 = “Trapezoid”: trapezoid resulting from the energy filter
AP2: Analog Probe 2 Selection. AP2 can be selected among:
00 = “Input”: the input signal from pre-amplified detectors
01 = “Threshold”: the RC-CR2 threshold value
10 = “Trapezoid-BL”: the trapezoid shape minus its baseline
11 = “Baseline”: displays the trapezoid baseline
FI
“CHANNEL AGGREGATE” DATA FORMAT
012345631 789101112131415161718192021222324252627282930
AGGREGATE SIZE
EXTRAS PU PEAK (ENERGY)
T0D0S0
T1D1S1
DT NUM SAMPLES/2
TT TRIGGER TIME TAG
ES EE ET AP1 AP2 DP
T2D2S2
T3D3S3
Tn-2 Dn-2 Sn-2
Tn-1 Dn-1 Sn-1
PU PEAK (ENERGY)
T0D0S0
T1D1S1
TT TRIGGER TIME TAG
T2D2S2
T3D3S3
Tn-2 Dn-2 Sn-2
Tn-1 Dn-1 Sn-1
EVENT 0
SIZE
FORMAT
EVENT 1
BIT
EXTRAS
Fig. B.3: Channel Aggregate Data Format scheme for 724, 780, and 781 series

CAEN
Electronic Instrumentation
UM3182 – MC2Analyzer User Manual Rev. 5
120
DP: Digital Virtual Probe Selection. DP can be selected among:
0000 = “TRG Window”: not used
0001 = “Armed”: digital input showing where the RC-CR2 crosses the Threshold
0010 = “Peak Run”: starts with the trigger and last for the whole event (see Fig. A.4)
0011 = “Pile-Up”: shows when there is a pile-up event and corresponds to the time interval when the
energy calculation is disabled due to the pile-up event
0100 = “Peaking”: shows where the energy is calculated
0101 = “Trg Validation Win”: digital input showing the trigger validation acceptance window TVAW
(refer to Acquisition Modes chapter and [RD5])
0110 = “BSL Holdoff: shows the baseline hold-off parameter
0111 = “TRG Holdoff”: shows the trigger hold-off parameter
1000 = “Trg Validation”: shows the trigger validation signal TRG_VAL (refer to Acquisition Modes
chapter and [RD5])
1001 = “Acq Veto”: this is 1 when either the input signal is saturated or the memory board is full
TT: Trigger Type (0=self-trigger, 1=external trigger)
Sm (m = 0, 2, 4… n-2): Even Samples of AP1 at time t = m
Sm’ (m’ = 1, 3, 4… n-1): if DT=0, then Sm’ corresponds to the odd Samples of AP1 at time t = m’. Otherwise, if DT=1, they
correspond to even Samples of AP2 at time t = m’ - 1
Tn: bit identifying in which sample the Trigger occurred
Dn: Digital Virtual Probe for each sample. The Probe type can be read from the “DP” field in the header
PU: Pile Up. This bit is usually set to zero. The user can recognize a pile up event when also the Energy value is zero. The
user can also choose to have this bit equal to 1 in case of pile-up event, by enabling bit[27] of the DPP_CTRL register
(0x1n80 register address). In that case the energy value is what read from the algorithm
EXTRAS: bit[0] = DEAD_TIME. This is set to 1 when a dead time occurred before this event. The dead time can be due to
either a signal saturation or a full memory status. Check Fig. B.4 and Fig. B.5 for more details
bit[1] = ROLL_OVER. Identify a trigger time stamp roll-over that occurred before this event
bit[2] = TT_RESET. Identify a trigger time stamp reset forced from external signals in S-IN (GPI for Desktop)
bit[3] = FAKE_EVENT. This is a fake event (which does not correspond to any physical event) that identifies a
time stamp roll-over. The roll-over can be due to an external or internal reset. The user can set bit[25]
= 1 of register 0x1n80 to enable the fake-event saving in case of reset from S-IN, and bit[26] = 1 of
register 0x1n80 to enable the fake-event saving in case of internal roll-over. In the first case the event
will have both bit[3] and bit[2] set to 1, while in the second case the event will have both bit[3] and
bit[1] set to 1.
Notes:
1. DEAD_TIME in case of signal saturation (see Fig. B.4). If the input signal is over-range (exceeds the input dynamic
range of 16k ADC channels) then the acquisition is inhibited. As soon as the input signal is in saturation an event is
saved with the corresponding time stamp, and bit[15] set to 1. The energy value is set to the maximum. This event
has to be discarded for the energy spectrum, anyway it can be considered for the dead-time calculation. Once the
signal is out of saturation a new trigger is inhibited for a time window of 2*Decay Time. The first event after the
saturation is tagged with bit[16] = 1.
2. DEAD_TIME in case of FULL board memory (see Fig. B.5). When the memory of the board is full (which is usually
due to a write event), the board is not able any more to transfer the event data. When the board is ready again,
the first event after the FULL will have the bit[16] set to 1, and the energy value as read from the algorithm. The
dead-time is equal to the time difference between the last trigger occurred and the trigger after the FULL status.
CAEN
Electronic Instrumentation
UM3182 – MC2Analyzer User Manual Rev. 5
121
0
16K
ADC counts
saturation veto
2
Time Stamp ti
Bit[15] = 1
Energy = 0x7FFF
Time Stamp tj
Bit[15] = 0
Bit[16] = 1
Energy = Ej
Dead-time
Fig. B.4: Dead-time in case of signal saturation.
ADC counts
Board memory FULL
Last event before
the FULL
Time Stamp tj
Bit[16] = 1
Energy = Ej
Dead-time
0
16K
Fig. B.5: Dead-time in case of FULL memory status. Events in the FULL are identified but not saved.
CAEN
Electronic Instrumentation
UM3182 – MC2Analyzer User Manual Rev. 5
122
Channel Aggregate Data Format for 725 and 730 series
The Channel Aggregate is composed by the set of Ne events, where Ne is the programmable number of events contained
in one aggregate (see the previous section). The structure of the Channel Aggregate of two events (EVENT 0 and EVENT
1) for 725 and 730 series is shown in Fig. B.6, where:
T0DP10
T2DP12
CH
T1
T3
Tn-1
PUR
ES AP2
FI
“CHANNEL AGGREGATE” DATA FORMAT
012345631 789101112131415161718192021222324252627282930
CHANNEL AGGREGATE SIZE (in lwords)
EXTRAS 2
DT NUM SAMPLES/8
TRIGGER TIME TAG
EE ET E2 AP1 DP
. . .
EVENT 0
SIZE
FORMAT
EVENT 1
DP00S0
Gl2Gs2S2
Gl1Gs1S1
Gl3Gs3S3
Dn2 Gln2Gsn2
Gln1 Gsn1 Sn-1
. . .
QSHORT
QLONG
Gl0Gs0
D2
S0
Gl2Gs2
D1'D1Gl1Gs1
D3'D3
S1
Gl3Gs3S3
Dn2'Dn2 Gln2Gsn2
Dn1'Dn1 Gln1 Gsn1
EX
D0'
TRIGGER TIME TAG
Sn-2
S2
Sn-1
Sn-2
CH
DP11
DP13
DP1n-1 Tn-2 DP1n-2
Tn-1 DP1n-1 Tn-2 DP1n-2
BIT
PU ENERGY
EXTRAS
T1DP11
T3DP13
T0DP10
T2DP12
EXTRAS 2
PU ENERGYEXTRAS
Fig. B.6: Channel Aggregate Data Format scheme for 725 and 730 series
FI: if 1, the second word is the Format Info
DT: Dual trace enabled flag (1 = enabled, 0 = disabled)
EE: Energy enabled flag
ET: Trigger Time Stamp enabled flag
E2: Extras 2 enabled flag
ES: Waveform (samples) enabled flag
EX: EXTRAS 2 option enabled flag:
000 = the word “EXTRAS 2” will be read as:
[31:16] = extended time stamp: those 16 bits must be read as the most significant bits of the
time stamp, which becomes a 31+16=47 bit number;
[15:0] = the trapezoid baseline value * 4.
100 = the word “EXTRAS 2” will be read as:
[31:16] = Lost Trigger Counter;
[15:0] = Total Trigger Counter.
001 = Reserved;
010 = the word “EXTRAS 2” will be read as:
[31:16] = Extended Time Stamp (MSB);
[15:0] = Fine Time Stamp (linear interpolation of the RC-CR2 signal between the events before
and after the zero crossing);
011 = Reserved;
100 = the word “EXTRAS 2” will be read as:

CAEN
Electronic Instrumentation
UM3182 – MC2Analyzer User Manual Rev. 5
123
[31:16] = Lost Trigger Counter;
[15:0] = Total Trigger Counter;
101 = the word “EXTRAS 2” will be read as:
[31:16] = Event Before the Zero Crossing;
[15:0] = Event After the Zero Crossing;
111 = Reserved.
Note: to enable the “EXTRAS 2” word set bit[17] of register 0x8000.
AP1: Analog Probe 1 Selection. AP1 can be selected among:
00 = “Input”: the input signal from pre-amplified detectors
01 = “RC-CR”: first step of the trigger and timing filter
10 = “RC-CR2”: second step of the trigger and timing filter
11 = “Trapezoid”: trapezoid resulting from the energy filter
AP2: Analog Probe 2 Selection. AP2 can be selected among:
00 = “Input”: the input signal from pre-amplified detectors
01 = “Threshold”: the RC-CR2 threshold value
10 = “Trapezoid-BL”: the trapezoid shape minus its baseline
11 = “Baseline”: displays the trapezoid baseline
DP: Digital Virtual Probe Selection. DP can be selected among:
0000 = “Peaking”: shows where the energy is calculated
0001 = “Armed”: digital input showing where the RC-CR2 crosses the Threshold
0010 = “Peak Run”: starts with the trigger and last for the whole event (see Fig. A.4)
0011 = “Pile-Up”: shows when there is a pile-up event and corresponds to the time interval when the
energy calculation is disabled due to the pile-up event
0100 = “Peaking”: shows where the energy is calculated
0101 = “Trg Validation Win”: digital input showing the trigger validation acceptance window TVAW
(refer to Acquisition Modes chapter and [RD5])
0110 = “BSL Freeze”: shows where the trapezoid baseline is frozen for the energy calculation
0111 = “TRG Holdoff”: shows the trigger hold-off parameter
1000 = “Trg Validation”: shows the trigger validation signal TRG_VAL (refer to Acquisition Modes
chapter and [RD5])
1001 = “Acq Busy”, this is 1 when the board is busy (saturated input signal or full memory board) or
there is a veto
1010 = “TRG Window”: not used
1011 = “Ext TRG”, shows the external trigger, when available
1100 = “Busy”, shows when the memory board is full.
CH: since two consecutive channels share the same buffer, the CH flag identifies whether the even channel or the odd
channel participated to the event (0 for even, 1 for odd).
Sm (m = 0, 2, 4… n-2): Even Samples of AP1 at time t = m
Sm’ (m’ = 1, 3, 4… n-1): if DT=0, then Sm’ corresponds to the odd Samples of AP1 at time t = m’. Otherwise, if DT=1, they
correspond to even Samples of AP2 at time t = m’ – 1
Tn: bit identifying in which sample the Trigger occurred
Dn: Digital Virtual Probe for each sample. The Probe type can be read from the “DP” field in the header
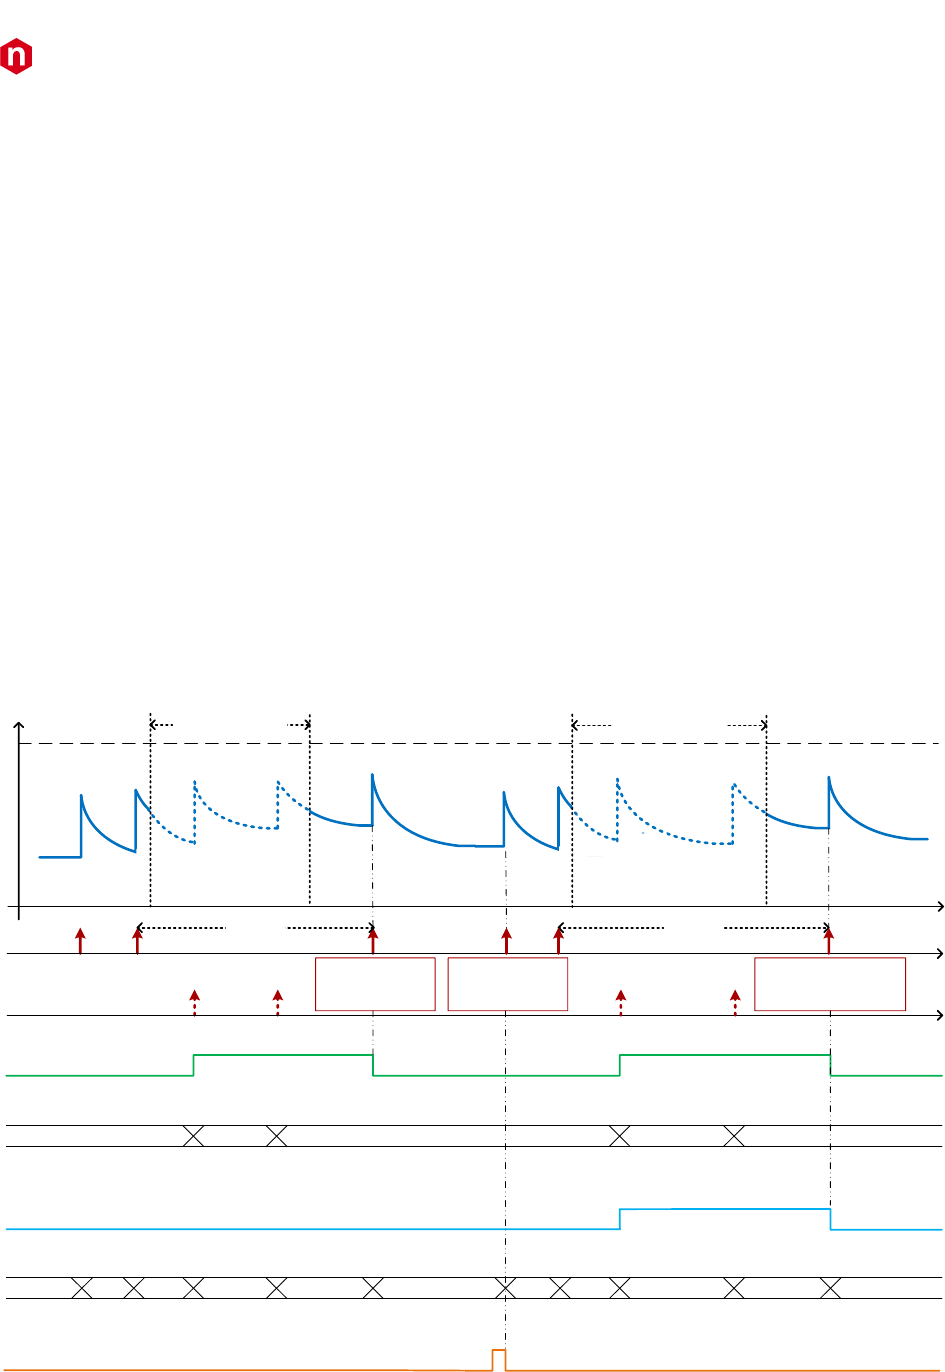
CAEN
Electronic Instrumentation
UM3182 – MC2Analyzer User Manual Rev. 5
124
PU: bit identifying a pile-up event or roll-over.
EXTRAS: bit[0] = LOST EVENT. This is set to 1 when one or more events is lost due to a memory board FULL. The memory
can be FULL due to a write event. The first event after the full has this bit set to 1. Refer to Fig. B.7 for
more details;
bit[1] = ROLL-OVER. This bit identifies a time-stamp roll-over. To enable this option set bit[26] = 1 of register
0x1n80. The DPP-PHA algorithm creates a fake event with Time Stamp = 0, Energy = 0, PU = 1, bit[3]
and bit[1] of EXTRAS = 1.
bit[2] = RESERVED;
bit[3] = FAKE_EVENT. A fake event is generated to identify a time stamp roll-over. See also bit[1] of EXTRAS.
bit[4] = INPUT SATURATION: identifies where an event saturated the input dynamics. The event that saturates
the dynamics has Energy = 0x7FFFF, while the PU flag is set to 1 only if there is also a pile-up. See Fig. B.8.
bit[5] = LOST_TRG: every N lost events this flag is high, where N is set from bits[17:16] of register 0x1nA0 (default
value 1024);
bit[6] = TOT_TRG: every N total events this flag is high, where N is set from bits[17:16] of register 0x1nA0
(default value 1024);
bit[7] = MATCH_COINC: when bit[19]=1 of register 0x1nA0 then all the events are saved and tagged with this
bit when the coincidence criteria is met;
bit[8] = NOTMATCH_COINC: when bit[19]=1 of register 0x1nA0 then all the events are saved and tagged with
this bit when the coincidence criteria is not met;
ADC counts
Board memory FULL
Time Stamp tj
EXTRAS bit[0] = 1
Energy = Ej
Dead-time
0
16K
Board memory FULL
Dead-time
Accepted TRG
Lost TRG
Time Stamp tk
EXTRAS bit[6] = 1
Energy = Ek
Time Stamp tm
EXTRAS bit[0]=1,bit[5]=1
Energy = Em
Lost event flag
(EXTRAS bit[0])
Lost event
counter 1023 1024 10251022… 1021
1K Lost ev. cnt
(EXTRAS bit[5])
TOT event
counter 4096 4097
… 4091 4095
4093 40944092 4100 4101
40994098
1K TOT ev. cnt
(EXTRAS bit[6])
Fig. B.7: EXTRAS bit management in case of FULL memory status. The first event after the FULL has bit[0] = 1, which identifies
that some events are lost due to a FULL memory status. The algorithm counts both the lost events and the total number of
events, and rise a flag (bit[5] and bit[6] respectively) every N events.
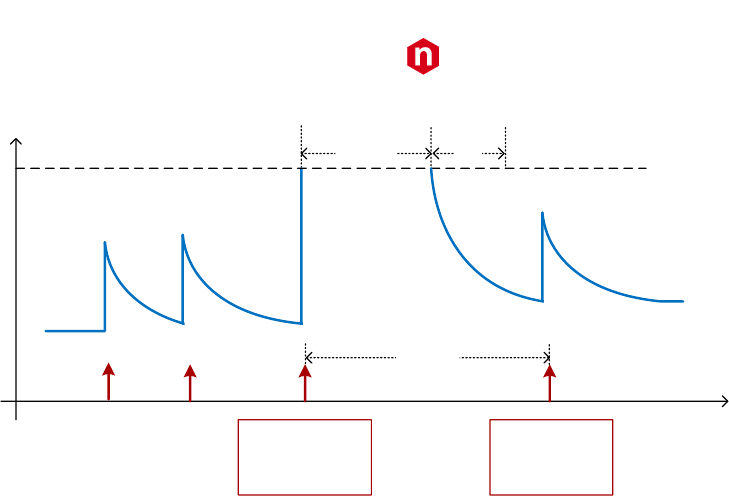
CAEN
Electronic Instrumentation
UM3182 – MC2Analyzer User Manual Rev. 5
125
0
16K
ADC counts
saturation
Time Stamp ti
EXTRAS bit[4] = 1
Energy = 0x7FFF
Time Stamp tj
EXTRAS bit[4] = 0
Energy = Ej
Dead-time
veto
Fig. B.8: Event flag in case of input signal saturation. The events that saturates has EXTRAS bit[4] = 1 and energy = full scale.
CAEN
Electronic Instrumentation
UM3182 – MC2Analyzer User Manual Rev. 5
126
Board Aggregate Data Format
For each readout request (occurring when at least one channel has available data to be read) the “interface FPGA (ROC)”
reads one aggregate from each enabled channel memory. No more than one aggregate per channel is read each time.
The set of Channel Aggregates is the Board Aggregate. If one channel has no data, that channel does not come into the
Board Aggregate.
The data format when all 8 channels of a VME have available data is as shown in Fig. B.9, where:
012345631 789101112131415161718192021222324252627282930
01 BOARD AGGREGATE SIZE (in lwords)01
CHANNEL MASKPATTERNBOARD ID
BOARD AGGREGATE COUNTER
BOARD AGGREGATE TIME TAG
HEADER
CHANNEL AGGREGATE CH0
CH 0CH 1
CHANNEL AGGREGATE CH7
CH 7
CHANNEL AGGREGATE CH1
“BOARD AGGREGATE” DATA FORMAT
... ...
BIT
BF
BOARD AGGREGATE SIZE: total size of the aggregate
BOARD ID: corresponds to the GEO address of the board. In case of VME64X boards this number is automatically set for
each board. In case of VME boards this value is by default = 0 for all boards. It is possible to set the GEO address of the
boards using register 0xEF08, which is quite useful in case of concatenate BLT (CBLT) read.
BF: Board Fail flag. This bit is set to “1” after a hardware problem, as for example the PLL unlocking, or over-temperature
condition. The user can investigate the problem checking the error monitor register 0x8178, or contacting CAEN support
(refer to Chapter Technical support).
Notes: BF bit is meaningful only for ROC FPGA firmware revision greater than 4.5. It is reserved for previous releases.
PATTERN: is the value read from the LVDS I/O (VME only);
CHANNEL MASK: corresponds to those channels participating to the Board Aggregate;
BOARD AGGREGATE COUNTER: counts the board aggregate. It increases with the increase of board aggregates;
BOARD AGGREGATE TIME TAG: is the time of creation of the aggregate (this does not correspond to any physical
quantity);
Fig. B.9: Board Aggregate Data Format scheme
CAEN
Electronic Instrumentation
UM3182 – MC2Analyzer User Manual Rev. 5
127
Data Block
The readout of the digitizer is done using the Block Transfer (BLT, refer to [RD7]); for each transfer, the board gives a
certain number of Board Aggregates, consisting in the Data Block. The maximum number of aggregates that can be
transferred in a BLT is defined by the READOUT_BTL_AGGREGATE_NUMBER. In the final readout each Board Aggregate
comes successively. In case of n Board Aggregates, the Data Block is as in Fig. B.10.
BOARD AGGREGATE n-1
DATA BLOCK
BOARD AGGREGATE 1
BOARD AGGREGATE 0
...
Fig. B.10: Data Block scheme

CAEN
Tools for Discovery
n
Electronic Instrumentation
UM3182 – MC2Analyzer User Manual Rev. 5
128
CAEN SpA is acknowledged as the only company in the world providing a complete range of High/Low Voltage Power Supply
systems and Front-End/Data Acquisition modules which meet IEEE Standards for Nuclear and Particle Physics. Extensive
Research and Development capabilities have allowed CAEN SpA to play an important, long term role in this field. Our
activities have always been at the forefront of technology, thanks to years of intensive collaborations with the most
important Research Centres of the world. Our products appeal to a wide range of customers including engineers, scientists
and technical professionals who all trust them to help achieve their goals faster and more effectively.
CAEN S.p.A.
CAEN GmbH
CAEN Technologies, Inc.
Via Vetraia, 11
Klingenstraße 108
1140 Bay Street - Suite 2 C
55049 Viareggio
D-42651 Solingen
Staten Island, NY 10305
Italy
Germany
USA
Tel. +39.0584.388.398
Phone +49 (0)212 254 4077
Tel. +1.718.981.0401
Fax +39.0584.388.959
Fax +49 (0)212 25 44079
Fax +1.718.556.9185
info@caen.it
Mobile +49 (0)151 16 548 484
info@caentechnologies.com
www.caen.it
info@caen-de.com
www.caentechnologies.com
www.caen-de.com
CAEN
Tools for Discovery
Electronic Instrumentation
UM3182 - MC2Analyzer User Manual rev. 5 - December 20th, 2017
00100-12-DGT08-MUTX
Copyright © CAEN SpA. All rights reserved. Information in this publication supersedes all earlier versions. Specifications subject to change without notice.
