UNICEF Demand For Health Services Field Guide V1 2016 PDF
User Manual:
Open the PDF directly: View PDF ![]() .
.
Page Count: 88

BETA
Demand
for Health
Services
A Human-Centred Field Guide
for Investigating and Responding
to Challenges
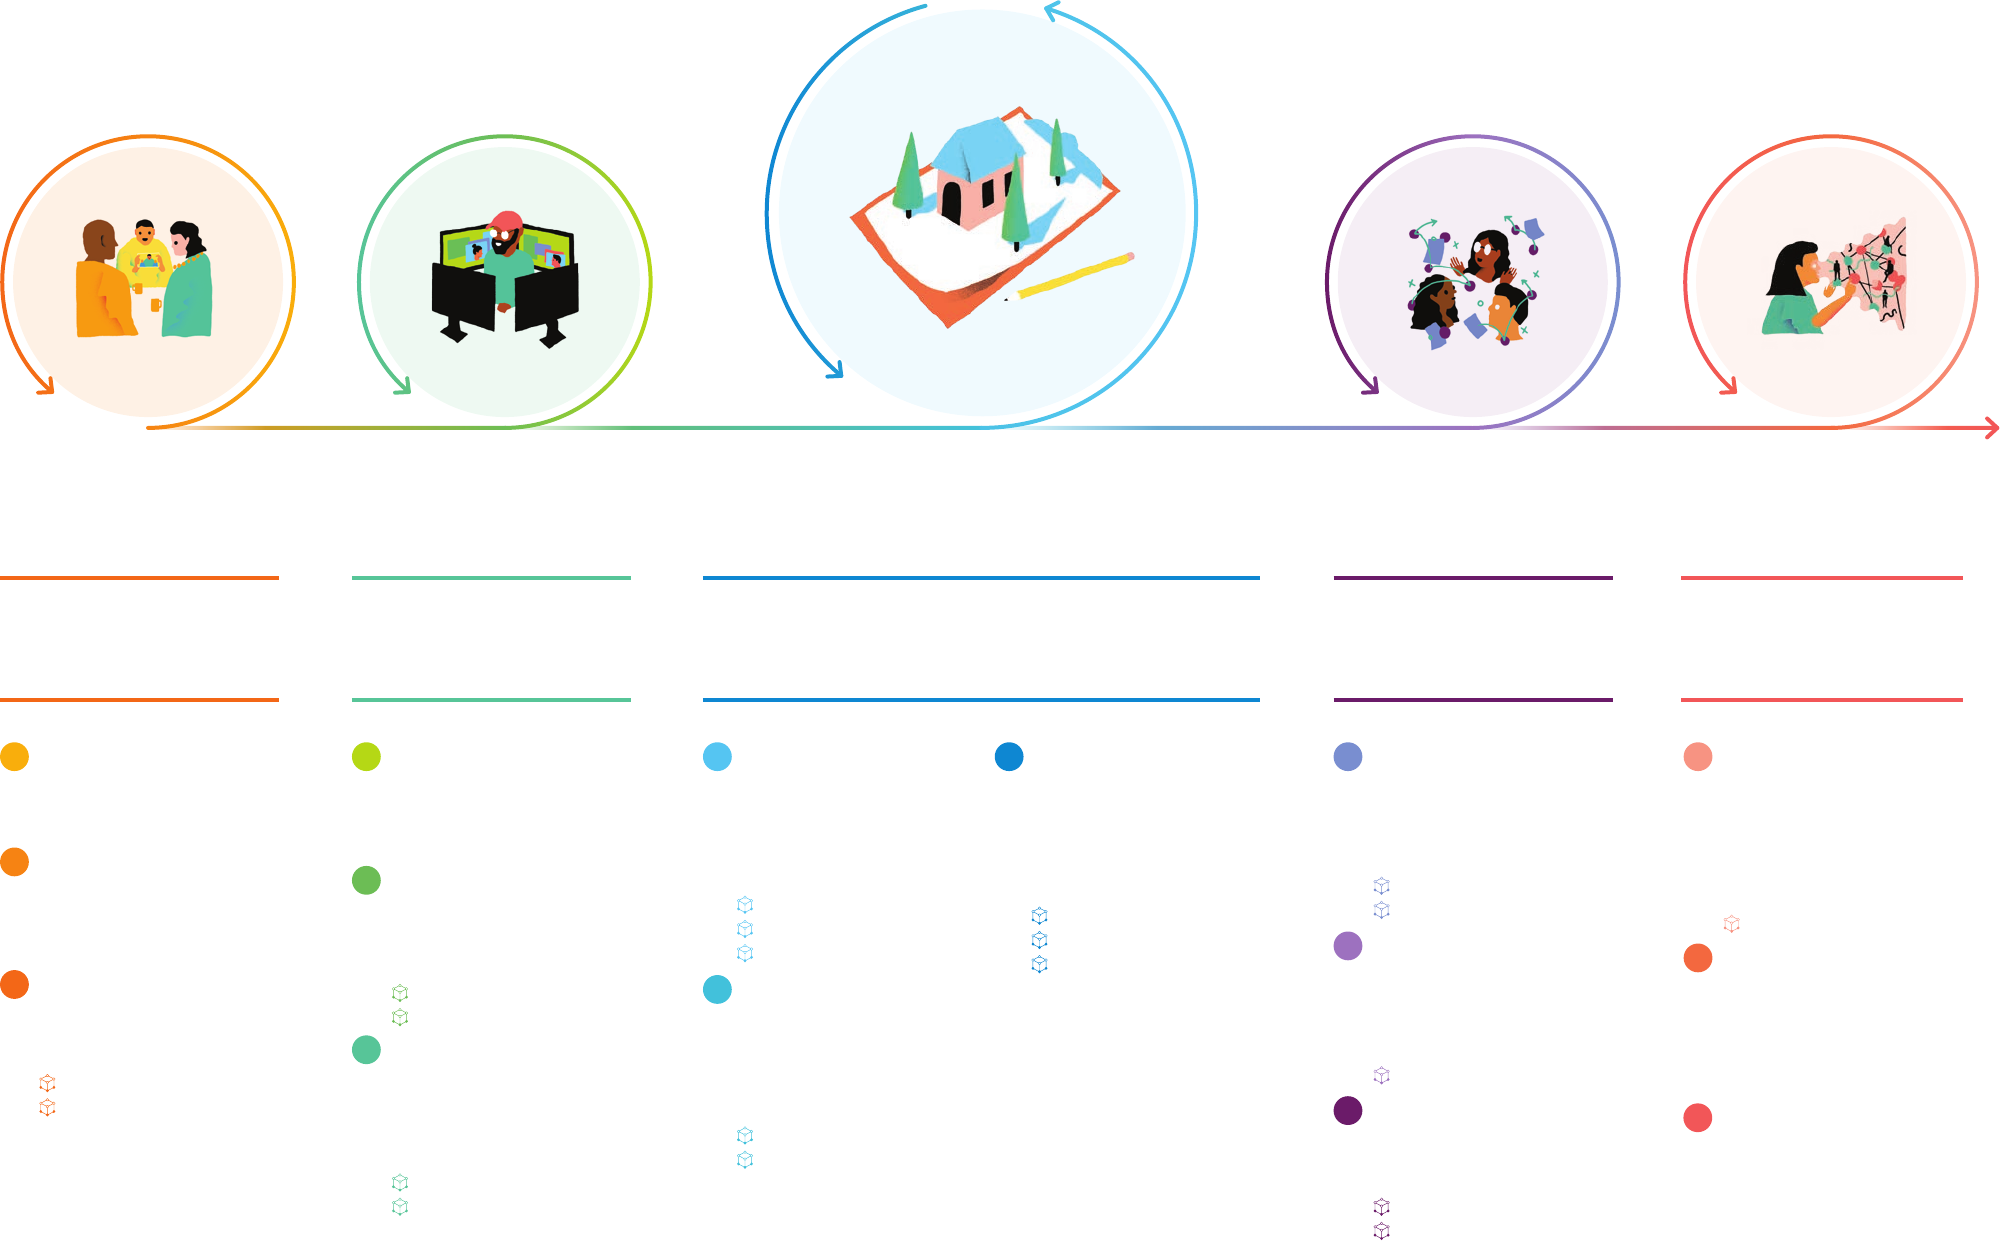
Process Overview
How could
we respond?
What do we
think we know?
What is our
objective? How could
we improve?
What stands
in our way?
FINAL OUTPUT
Adaptation Plan and
Proven Solutions
FINAL OUTPUT
Tested Solutions
FINAL OUTPUT
Field Notes Map
FINAL OUTPUT
Objective Statement
FINAL OUTPUT
Creative Prompts
5a4a3a2a1a
5b
3b
2b
1b
5c
4c
4b
3c
2c
1c
Plan for Iteration
Devise an Adaptation Plan for
each draft initiative. Define the
key evaluative questions, possible
risks, measurable criteria, and
corresponding indicators to track
progress over time. Adjust the
Adaptation Plan after each phase
of implementation.
Adaptation Plan
Evaluate
Eectiveness
Assess each revised idea in the field
using the Adaptation Plan as a guide.
Evaluate the accuracy of diagnoses
and determine what we still know
little about.
Improve Initiatives
Implement adaptive changes that
respond to findings.
Conceptualise
Solutions
With an extended team, quickly
generate many possible solutions.
By the end, we will identify the most
promising solutions.
Assess Concepts
Concept Examples
Design Quick
Examples
Make ideas concrete through initial
outlines, models or rough sketches
of ways to implement promising
concepts.
Design Examples
Prototype Designs
with Users
Take draft ideas into the field to test
with, and get feedback from, users.
Prototype Planning
Prototype Evaluation
Explore The User’s
Environment
Choose which activities, including
observations and interviews,
should be used for research. Collect
information in the field. Record
what is seen, heard, felt, and said.
Research Plan Template
Discussion Guide Template
Record Field Research
Interpret
Collected Stories
Share information from the field.
Identify patterns, surprises and
commonalities. Analyse key
findings to hypothesize why this is
happening.
Diagnostics Worksheet
Theme Examples
Assemble Existing
Knowledge
Gather available information about
the challenge, past efforts, and the
individual or community in question.
Recognise
Assumptions
To help avoid bias, document the
possible assumptions that you and
your team might carry with you.
Assumption Examples
Assumption Catalogue
Compose
Learning Goals
Clarify what you hope to get out of
the research. These learning goals
will help you to decide the research
methods to use during Question 3.
Journey to Immunization
Field Notes Map
Prioritize a
User-group
Clearly delineate exactly which
community we are concerned with.
Define the
Improved State
Specify the change in immunization
outcomes that the team is capable of
influencing.
Describe the
Biggest Obstacle
Explain how the user-group is or is
not engaging with services.
Common Obstacles
Objective Formula
Propose
Opportunities for
Design
Translate diagnoses of the root
causes of the challenge into
creative prompts for design,
or re-design.
Persona Profile
Relationship Map
Prompt Formula
p. 34 p. 46 p. 62 p. 104 p. 116 p. 154
p. 134 p. 160
p. 138 p. 162
p. 34
p. 47
p. 84
p. 35
p. 52
DEMAND FOR HEALTH SERVICES
INTRODUCTION
How to use this:
a road map
Part II. Guiding Principles
Part I. Introduction 02
10
24Part III. Five Big Questions
Welcome! This section provides an
overview of the purpose of this resource,
an introduction to the methodology, and
advice on how to get the most out of it.
Each principle is grounded in evidence and
offers a way of thinking about users —
the people immunization programmes
try to serve — a little bit differently.
Taken together, these principles will be
helpful at each step in part three.
Part III is the heart of this Field Guide.
It presents five general steps — or
five big questions — to move through
when investigating and responding
to challenges involving users.
Small Is Big 14
Intentions Are Not Actions 16
Knowing Is Not Enough 18
Truths Are Buried 20
Context Comes First 22
Attention Is Elsewhere 24
What is this for? 04
Why now? 06
How is this dierent? 08
What is our objective? 30
What do we think we know? 42
What stands in our way? 56
How could we respond? 112
How could we improve? 148
This Field Guide
will help you to:
Save Money
Make low-cost adjustments
to programmes before
scaling the solution.
Find New Solutions
Integrate thinking from
fields beyond public health
that bring systems thinking
and experimentation
to build innovative,
scalable solutions.
Save Time
Conduct swift, low-
cost field research and
test solutions before
investing in larger-scale
implementation.
Reduce Inequities
Identify the most
important challenges facing
the most disadvantaged.
Close the
Empathy Gap
Collaborate directly, or “co-
design,” with the people
we are trying to serve.
1
DEMAND FOR HEALTH SERVICES
INTRODUCTION

A new approach to
demand for services
This field guide introduces human-centred design as an
approach to addressing challenges related to community
demand for basic health services like immunization.
Human-centred design is a problem-solving
process that begins with understanding the
“human factors” and context surrounding
a challenge and works directly with
users — the intended clients or consumers
of services — to develop solutions that are
viable and appropriate in a given context.
Designing for people and their everyday
interactions helps uncover and solve the right
problems using local capacities and resources.
No expert has more knowledge than a
caregiver, nurse, or a community health
worker about how to solve their most
pressing problems. The methodologies in
this toolkit acknowledge this by focusing
on collaboration and designing with — not
for — the people we seek to serve.
Human-centred design works to uncover
latent needs that service providers and
programme recipients may not even
know they have before the process
begins. The approach is “bottom up”
in the sense that both problems and
solutions are defined and developed
locally, not imposed from elsewhere.
While this guide primarily focuses on issues
and examples related to immunization, the
process and tools are relevant to a broad
range of health programmes that depend
on generating community demand for
services. Please adapt and deploy this
approach for your own programme priorities.
2 3
DEMAND FOR HEALTH SERVICES
INTRODUCTION

When vaccinations are available, affordable
and acceptable, populations can remain
persistently under-immunized. “Our results
suggest that… even a fully reliable supply
system has a relatively modest effect on
uptake of immunization... when access
was good and a social worker constantly
reminded parents of the benefits of
immunization, more than 80 per cent did
not get their children fully immunized.”1
How should we respond? The following
three scenarios demonstrate the
types of complex challenges a human-
centred approach responds to:
Availability Fails to Drive Demand2
Immunization camps—a newly implemented
outreach effort—have made significant
advances in making immunization more
physically accessible for a particularly
hard-to-serve population. In recent
surveys, this population has expressed a
near-universal desire for vaccinations.
Despite the heavy investments made in better
provision, a recent evaluation of the outreach
programme found that a sizeable majority of
this population is still un- or under-immunized.
Eorts to Promote Demand Backfire3
In response to a pocket of vaccine resistance
among a subset of a certain population,
a regional immunization programme
launched a large-scale communications
campaign. Messaging emphasized the
life-saving benefits of vaccines.
In follow-up surveys, researchers discovered
that instead of decreasing resistant
attitudes, the campaign increased them.
Proximity to Services Does
Not Predict Coverage4
An assessment of inequities in
immunization outcomes revealed sharp
differences between communities within
a district. A programme team began
planning new ways to expand access.
During its planning, the team encountered
a confounding paradox: in areas where
coverage is high, caregivers tend to walk
long distances to seek out vaccines; and in
areas where coverage is low, caregivers are
more proximate to immunization services.
What is this for?
1 Banerjee, et al. (2010), Improving immunisation Coverage in Rural India: Clustered randomised controlled
evaluation of immunisation campaigns with and without incentives.
2 Generalized example based on empirical evidence from: Banerjee, et al. (2010), ibid.
3 Generalized example based on empirical evidence from: Meszaros, et al. (1992), Cognitive influences on parents’ decisions to
forego pertussis vaccination for their children.
4 Generalized example based on empirical evidence from: Holte, et a.l (2012), The decision to vaccinate a child: An economic
perspective from southern Malawi.
All services are designed, including how
they are promoted, operated, and delivered.
For immunization to be supported by
demand, it is essential to gain a deep
understanding of the people we are serving;
not only what they need and desire, but
what limitations they face, what motivates
them and what is important to them.
The human-centred approach combines a
research methodology that focuses on the
needs of people, a design methodology
that allows for innovative solutions and
an implementation strategy that uses a
wide systems view. As demonstrated
below, the approach demands that we
consider the constraints, opportunities and
interactions of an existing ecosystem.
The process also accounts and corrects for
human error on the side of the researcher,
designer and implementer by starting small
and incrementally testing and improving
ideas. We invite and encourage anyone
who is observant, curious and inquisitive to
follow this process — it uses that expertise
to lead you through proving or disproving
assumptions and conclusions along the way.
T
e
c
h
n
o
l
o
g
y
S
y
s
t
e
m
s
H
e
a
l
t
h
S
y
s
t
e
m
s
I
n
d
i
v
i
d
u
a
l
C
l
i
n
i
c
•
D
i
s
t
r
i
c
t
•
C
o
u
n
t
r
y
C
o
m
m
u
n
i
t
y
F
a
m
i
l
y
I
n
d
i
v
i
d
u
a
l
G
e
o
g
r
a
p
h
y
•
E
c
o
n
o
m
i
c
s
Trying to meet
many demands
in the community
Needs to get to
clinic and road is
washed out
Childcare
mother
father
family
caregivers
Healthcare
health worker
community volunteer
doctor
nurse
Sister needs help
watching children
Cell phone has
not been paid
this month
Balancing new
training with
current patients
Son at home is
sick and requires
immediate care
Intent
A human-centred approach
5
DEMAND FOR HEALTH SERVICES
4
INTRODUCTION

A focus on equity
Immunization today remains one of the
most effective interventions in global
public health. However, inequity divides
those who benefit from their right to
immunization from those who do not.
Sometimes, inequity is driven by the
availability of supply or physical access. But
in most cases, the situation is more complex.
This Field Guide comes at a moment
of recognition and consensus about
equity.5 The global health community has
underscored the importance of prioritizing
the most susceptible populations rather
than exclusively focusing on coverage. This
pro-equity principle requires that health
programmes systematically identify and
reach the least visible and most marginal.
We need to better understand the challenges
facing these groups and identify opportunities
to improve the way services are provided.
This makes human-centred approaches all the
more important — an emphasis on the lives
and lived environments of the communities
immunization programmes intend to serve.
Prioritizing susceptible groups, better
understanding the constraints they face, and
resolving the challenges preventing them
from accessing vital health services has a
fresh urgency. This Field Guide provides
principles and a structured process to achieve
more equitable immunization outcomes.
Why now?
5 World Health Organization (2014), Making fair choices on the path to universal health coverage: Final report of the WHO
Consultative Group on Equity and Universal Health Coverage.
6 Hickler, et al. (2017), Efforts to Monitor Global Progress on Individual and Community Demand for Immunization: Development of
definitions and indicators for the Global Vaccine Action Plan Strategic Objective 2.
7 Reaching Every District and Reaching Every Community Strategy: A literature review and status report on strategies for reducing
immunization inequities in Africa (2015).
This Field Guide exists to help investigate, understand and
respond to challenges of demand. It draws on insights from
behavioural science and employs human-centred methods
to improve immunization outcomes.
A focus on demand
Any programme providing a health service
requires that users accept and seek out those
services. When for any reason that does
not happen, demand fails to meet supply.
In the context of immunization,“demand
is defined as the actions of individuals
and communities to seek, support, and/
or advocate for vaccines and immunization
services. Demand is dynamic and varies
by context, vaccine, immunization services
provided, time, and place. Demand is
fostered by governments, immunization
program managers, public and private sector
providers, local leadership, and civil society
organizations hearing and acting on the
voices of individuals and communities.”6
The global health community has
increasingly highlighted the need to pay
greater attention to demand and the
“human factors” that often determine the
success and failures programmes.7 This
Field Guide is a response to this important
elevation of focus on demand for basic
health services like immunization.
Demand is
about behaviour
Challenges of demand revolve around
decision making and action taking. Constraints,
such as lack of medical records or language
barriers, can influence caregiver decisions to:
• Bring or not bring their children
to a health-care facility
• Receive or not receive a vaccination
• Return or not return for
subsequent vaccinations
In other words, demand is about the
complexity of people and why people
do or do not make decisions and
take actions. To increase demand for
immunization we must understand people’s
decisions and what influences them.
INTRODUCTION
6 7
DEMAND FOR HEALTH SERVICES

How is this dierent?
Experiment and
Experiment Again
Since this process occurs in short
sprints, it encourages experimental
trials that may not always work out.
That is okay — instead of agonizing
over the perfect solution, try many
possibilities and learn just as much
from what does not work as from
what does.
Share a Story
Facts are important, but stories make
facts memorable. Share your stories
from the field. Whom did you meet?
What did you see? How did you see it
in a new way?
Make It
Mock-ups, sketches and role play give
users a physical representation to
experience and react to. Even a rough
approximation of your idea will create
clarity for you as the creator and allow
for realistic feedback from users.
Remember Everyone
is Creative
This process plays off everyone’s
creativity, not just those who hold
“design” positions. Everyone is
familiar with the challenges and
therefore capable of thinking about
causes and designing solutions.
Leave Your
Desk Behind
Regardless of formal training, you
are capable of leaving your desk and
going into the field to observe and
investigate challenges. Go to where
the problem is, interview health-care
workers and observe caregivers.
Think in Weeks,
Not Months
Work fast and be nimble. This entire
process may be completed in a short
amount of time. It should never drag
on for months. Trust your intuition,
you know what you’re doing.
Recruit
Diverse Roles
Ideally, each team member holds
a different role so your team
has diverse and complementary
perspectives. Consider team
members’ breadth of experiences,
not just varied titles and functions.
Work in a
Team of 3-5
While input from many parties is
important, it can lead to a slow
process. There are moments — like
brainstorming — where you will invite
additional participants to join. But
start with a core team of three to five
members that will participate in the
entire process.
INTRODUCTION
8
DEMAND FOR HEALTH SERVICES
9

Part II: Guiding Principles
Thinking About People
Health programmes are people-programmes. At every step
of the way they involve people, from government ocials
to community health workers. Perhaps nowhere is the
involvement of people more important than with users,
or the people for whom programmes exist. Understanding
the constraints under which users make decisions and
take actions accounts for much of the successes and
failures in expanding the reach and impact of health
services — particularly for the most vulnerable.
As many public health experts know, the contrast between
how a programme is designed and how it works can be stark.
Often, that is due to overlooked or less understood factors
regarding how people actually behave in the real world, as
opposed to how we assume they will.
The following six principles are intended as reminders when
investigating and responding to the human challenges facing
immunization programmes. They are grounded in what we
know to be true about human behaviour and can improve
the eectiveness of our eorts.
“Many parents do not seem
to reflect deeply about whether
or not to vaccinate their child,
and their decision often seems
to be based on rules of thumb
and limited information.”
Cappelen, et al. (2012), Demand for Childhood
Vaccination: Insights from Behavioural Economics.
10 11
DEMAND FOR HEALTH SERVICES

In Pakistan, data showed a significant
drop-off between infants’ first dose
of diptheria-tetanus-pertussis (DTP1)
and the third dose (DTP3).
Upon investigating the problem, researchers
noticed a common challenge for many of
the mothers: the physical ‘reminder’ card
that they received after the first dose of
the vaccine was difficult to interpret.
The standard card presented
mothers with two challenges:
• It was too small, 9cm by 8.5cm
when folded. The information
appeared crowded and disorderly.
• The next immunization date — the
most critical piece of information —
was handwritten by the staff at the
clinic, often in cramped and irregular
letters. Less literate mothers in
particular had trouble reading it.
In a randomized controlled trial, the research
team adjusted the card’s design to simplify
the information and make it easier for the
mothers to understand. Some mothers
in the trial received cards that were:
• Bigger: The card was larger, 15.5
cm by 11.5cm when folded.
• Eyecatching: The card was
bright yellow and used pre-printed
stickers with 42-point font.
• Harder to lose: The card was placed in
a plastic jacket with a hanging string.
• More legible: Only essential pieces
of information were included on the
outer sides of the card, which the
mother could see at a glance: the next
immunization dates and day of the week.
These small tweaks had an outsized impact:
67 per cent of the redesigned card group
completed the immunization schedule,
compared with 39 per cent of those who
received the standard card. Furthermore,
the intervention was cost effective: each
new card cost only 5 cents to produce.
Small, cheap and effective — this example
of success was made possible by closely
observing the challenges, however
seemingly minor, facing intended users.
7 Usman (2011), ‘Randomized controlled trial to improve childhood immunization adherence in rural Pakistan: Redesigned
immunization card and maternal education’.
CASE STUDY
Minor Details Have an
Outsized Impact7
Often, seemingly small variables have outsized impacts on immunization
outcomes. We have a tendency to overlook these small things, like the
inconvenient barriers of dealing with immunization programmes that users
face — especially when small costs seem to pale in comparison to the
enormous benefits of immunization. Because people do not always make
reasoned calculations weighing costs and benefits, these small things
can dominate decision-making.
Consider a mother who has lost her child’s health card. She might think: Will
the health worker scold me when I arrive at the clinic empty-handed? Will I
feel ashamed? Am I even allowed a vaccine without the card in hand? What
began as a small event — a lost card — might lead to a big one, like a drop-off
in immunization and a child at risk of disease. Despite the benefits of an
immunized child, minor problems (like the fear of getting scolded) shape
outcomes.
This suggests paying more attention to what might initially appear small.
Efforts to address the smaller things can sometimes be more impactful than
addressing seemingly bigger, more obvious challenges.
Small Is Big
12
GUIDING PRINCIPLES
13
DEMAND FOR IMMUNIZATION

Mozambique’s Ministry of Health instituted
an expanded immunization programme in
1979, but by the early 2000s, full coverage
rates remained low in many parts of the
country. In 2002, researchers set out to
understand the barriers standing in the
way of improved coverage, from the
attitudes of mothers and vaccine access,
to interactions with health-care workers.
A main objective was to determine what
mothers knew about the subject. The
study found that mothers’ knowledge
was generally low. For example, a
majority had no knowledge of key facts
about vaccine-preventable diseases, or
the ages at which a child should have
completed various vaccinations. Further,
many held misconceptions, such as
whether it was safe to vaccinate a sick
child; nearly a third thought it was not.
One might expect that this gap in knowledge
would negatively affect uptake. But despite
misconceptions and significant gaps in
knowledge, mothers in Mozambique
overwhelmingly perceived vaccination as
important to a child’s health and actively
sought out vaccines for their children. In fact,
in an area where misperceptions were more
widely held, coverage rates were actually
higher. As the researchers found, “detailed
knowledge about vaccine-preventable
disease is not necessary to create or
maintain demand — study results show that
knowledge is low while demand is high.”
The case highlights a common assumption:
that there is a causal correlation between
knowledge and behaviour. Across studies,
the relationship is usually more complicated.
A study in the Gambia found that nearly
half of rural mothers could not correctly
name any vaccine-preventable diseases, yet
still actively sought out vaccines (national
coverage was 90 per cent).10 In the case
of Mozambican mothers, the lack of a
robust understanding also mattered little
when it came to seeking out vaccinations.
Whereas practical knowledge about when,
where and how to access vaccinations
can matter greatly, knowledge about
vaccine-preventable diseases and vaccines
themselves are often less directly tied to
immunization outcomes. Investing in the
enhancement of knowledge alone will not
necessarily yield an increase in coverage.
9 Sheldon and Alons (2003), ‘A study to describe barriers to childhood vaccination in Mozambique’.
10 Leach and Fairhead (2008), ‘Understandings of immunization: Some West African perspectives’.
CASE STUDY
Behaviour Is Influenced by
More Than Knowledge9
A common assumption is that knowledge is directly linked to behaviour, but
research suggests otherwise. Knowing about vaccines, having an accurate
understanding of their benefits and understanding how they work, does not
necessarily correlate to high levels of coverage.8
In some cases, mothers with little or even inaccurate knowledge of how
vaccines work are diligent in getting their children fully immunized. For
example, in the following case study a survey among mothers revealed low
levels of knowledge along with significant misperceptions. Yet, full childhood
immunization among many of these same caregivers was high. Perhaps these
mothers feel that getting their child fully immunized makes them good mothers,
and so they carry through, regardless of any misconceptions.
Addressing gaps in knowledge may be tempting. But focusing on knowledge
alone might take time and resources away from more effective strategies. When
we accept that it is possible to alter behaviour without ever changing what
is in someone’s mind, we open ourselves to more innovative solutions.
Knowing
Is Not Enough
8 Favin, et al. (2012), ‘Why Children Are Not Vaccinated: A review of the grey literature’.
14
GUIDING PRINCIPLES
15
DEMAND FOR HEALTH SERVICES

In Thailand, outbreaks of influenza have
had grave consequences. In 2008, the
H1N1 pandemic infected 8.4 million
people and caused 191 deaths. Despite
these headline-grabbing figures, a free
vaccination programme spearheaded
by the government only resulted in 38
per cent coverage in its first year.
To improve coverage, one programme
designed a leaflet using a two-phased
approach. First, it sought to motivate
recipients to vaccinate by providing
information that, for instance, increased
perceptions of the personal risk of getting the
virus. Second, the leaflet helped recipients
with an action plan, including a fill-in-the-
blank form about their planned appointment
at a health facility. The programme’s stated
goals were to strengthen intentions to
seek a influenza vaccination and translate
these intentions into behaviour change.
The programme achieved its first
goal: recipients of the new leaflet had
much stronger intentions to vaccinate
compared to a control group that received
a traditional leaflet. However, there
was no significant difference between
a control and an intervention group
regarding actual vaccination behaviour.13
Increased intentions didn’t lead to
action — something more was needed.
The findings affirm that immunization
programmes should be designed to
facilitate the full journey to vaccination,
not simply to change attitudes, risk
perceptions, or stated intentions. That
effort requires correctly diagnosing and
addressing the particular bottlenecks
preventing individuals from turning positive
intentions into corresponding actions.
12 Payaprom, et al. (2011), ‘Using the Health Action Process Approach and Implementation Intentions to Increase Influenza Vaccine
Uptake in High Risk Thai Individuals: A controlled before-after trial’.
13 While action plans (also referred to in this Field Guide as ‘implementation intentions’) can be a helpful tool to bridge intention and
action, its unsuccessful use suggests that this solution did not adequately address the barriers keeping the intention-action gap.
CASE STUDY
Good Intentions
Are Not Enough12
An intention to get immunized does not always mean actually getting immunized,
and the act of getting immunized is not necessarily preceded by an intention to
do so. Intentions can be poor predictors of corresponding actions.11
Raising awareness of a vaccine’s benefits, for example, may help people to form
positive intentions. Learning that a vaccine could save your child’s life can incite a
powerful form of motivation. But behaviour depends as much (if not more) on
removing the barriers to taking action as it does on forming intentions.
For example, a caregiver might report in a survey that she fully intends to get her
child vaccinated, but taking a day off of work to travel to the clinic simply is not an
option; or she is not clear on where exactly to go; or the clinic’s opening hours are
inconsistent, and she is not sure if making the trek will be worth it. The opposite
may also be true: if a caregiver has no intention of seeking out vaccinations, but
sees others in her community going to the clinic, she may go too.
Intentions may not lead to actions. Instead, we should focus on what it takes to
get caregivers to act.
Intentions Are
Not Actions
11 Webb and Sheeran (2006), ‘Does Changing Behavioural Intentions Engender Behaviour Change? A Meta-Analysis of the
Experimental Evidence’.
16
GUIDING PRINCIPLES
17
DEMAND FOR HEALTH SERVICES

What people believe, say and do can be three different things. During field
research, we cannot assume consistency between what people say about
themselves and their actual behaviour.
Consider a survey that asks the question, “Why isn’t your child immunized
against x?” A caregiver might respond that the transport costs were just too
high. It might be true that transport costs are high, but do we know that’s
actually the reason? Perhaps the caregiver had never really ever thought about
why she had not got around to accessing immunization services. It wasn’t until
now — until faced with the question — that she came up with what seemed like
a plausible explanation.
How we explain our own behaviour is not always accurate. We often edit our
responses to questions to ensure they are consistent with each other
and socially desirable. We struggle to adequately recall past situations
because our memories are far from perfect. We are easily influenced by
the ways that questions are worded and framed.14,15
What people say is prone to error. This makes it critical to disentangle what
people self-report about their behaviours from what is actually happening.
We do this during field research by combining interviews (asking people what
they think and feel) with observations (watching what people say and do).
One medical anthropologist in Malawi
uncovered contradictory evidence.
The self-reported data gathered by a
knowledge, attitude and practice (KAP)
survey was different from the qualitative
data gathered from interviews, focus
groups and participant observation.
The survey, which investigated issues of
malaria during pregnancy, was used to
interview 248 respondents. It asked about
the quality of service at a local antenatal
clinic. Survey responses were largely positive.
However, during in-depth interviews, mothers
voiced criticisms of the clinic’s services.
The researcher investigated what might
explain the discrepancy: mothers assumed
that the survey was being conducted on
behalf of the health centre itself, and that
a negative response might impact the
treatment they would receive in the future.
More generally, the researcher posited,
Malawians are simply “a polite people” and
“dislik[e] the idea of conflict.” Without the
probing discussion that naturally occurs
during in-person interviews, mothers
chose the ‘kinder’ response in the survey
that did not reflect what they actually
believed. Respondents were demonstrating
social desirability bias — a tendency to
say what we think others want to hear.
If the researcher had taken the results of the
survey at face value, a programme might have
focused on other issues while assuming that
mothers were happy with the services. What
people say is not always what they think.
Uncovering the determinants of attitudes
and behaviours requires continuous digging,
approaching questions from multiple angles,
and calling surface-level and initial responses
into question to see what is buried beneath.
16 Launiala (2009), ‘How much can a KAP survey tell us about people’s knowledge, attitudes and practices? Some observations from
medical anthropology research on malaria in pregnancy in Malawi’.
CASE STUDY
What People Say
Is Not Always What
They Think or Do16
Truths Are
Buried
14 Podsakoff, et al. (2003), ‘Common Method Biases in Behavioural Research: A critical review of the literature and recommended
remedies’.
15 Schacter (1999), ‘The Seven Sins of Memory’.
18
GUIDING PRINCIPLES
19
DEMAND FOR HEALTH SERVICES

People do not like waiting in line, whether
in a supermarket or in a clinic waiting room.
Long wait times have been associated with
failure to complete an immunization course;19
busy parents do not have the time to waste.
In Lagos, Nigeria one initiative to address
high drop-out rates took a careful look at
the intake process of a local health clinic.
After mapping the journey of a patient, the
researchers identified an opportunity to
make a simple change to the patient intake
experience. They divided the waiting
room into two groups: mothers coming
to immunize children were separated
from all other patients. The clinic created
a special immunization station where
caregivers were directed after checking in
at reception.20 There was no need for the
usual procedures of taking a patient’s history
and administering a physical examination.
This administrative change led to
a 24 per cent increase in monthly
vaccinations performed — with no cost
increase whatsoever. The percentage of
registered children fully immunized by
age 1 increased by 18 per cent and after
age 1 by 32 per cent. A small, deliberate
change to the clinic environment yielded
outsize changes in outcomes.
18 Ekunwe (1984), ‘Expanding immunization coverage through improved clinic procedures’.
19 Favin, et al. (2012), ‘Why children are not vaccinated: a review of the grey literature’.
20 The intervention also worked with heathcare workers to ensure that all children were receiving immunization, regardless of
whether or not they were ill or healthy.
CASE STUDY
Adjusting the Experience,
Not the Person18
One of the more common terms in public health is ‘behaviour change’. There are
entire fields devoted to the topic, and for good reason. The solutions to many
problems require changes in the way that people behave. However, a singular
focus on behaviour change can be misleading.
Consider a neonatal clinic that has recently redesigned its intake system to
decrease waiting times for immunization. Drop-out rates were a problem, and
waiting times were regularly cited as the cause. With a change in how patients
are directed through the clinical environment, we see changes in behaviour:
fewer drop-outs and more children fully immunized. But here, the focus was not
on asking users to change their behaviour; users were not being asked to do
much of anything. Instead, the programme altered the clinic’s environment to fit
users’ preexisting preferences, like not wanting to wait in long lines. The change
was made to the context, not the person.
The distinction may seem slight, but is important. Changing the context in
which people behave often has more powerful implications for ‘behaviour
change’ than directly asking that people change their behaviour.17 This
means thinking more about the ways that services are being supplied, even
when we are addressing challenges related to demand.
Context
Comes First
17 Ross and Nisbett (1991), ‘The Person and the Situation: Perspectives of social psychology’.
20
GUIDING PRINCIPLES
21
DEMAND FOR HEALTH SERVICES

In poor areas of Pakistan, low parental
literacy presents vaccination programmes
with a challenge. In Karachi, the site of an
intervention in 2008, only 24 per cent of the
population in the study areas was literate.
Acknowledging this barrier, researchers made
a minor redesign to educational materials
provided to caregivers during home-based
outreach efforts. The redesigned materials
consisted of easy-to-understand pictorial
cards with only three messages for mothers
to process. The messages conveyed included:
• That vaccines save children’s lives
• The location of local vaccination centres
• The significance of retaining home-
based health records — including
how they could help at the time of
a child’s admission to school.
The messages took just five minutes to
communicate, and a copy of the materials
designed for low-literacy audiences was
given to mothers after the interaction.
Each set cost Pakistan Rs. 80 (US $1).
The study tapped into an important insight
about the presentation of information. In
addition to addressing low literacy, the
pictorial messages, which took little time
to explain, eased the cognitive burden on
stressed and busy mothers; they did not
require mothers to think too hard about
them. Pictures proved easier to process
and recall than the verbal messages that
mothers in a control group received.
Seventy-two per cent of infants in the
intervention group completed the vaccination
programme, compared to 52 per cent in
the control group. (Additionally, 81 per cent
in the intervention group retained their
home-based records, whereas 69 per cent
did so in the control.) The programme’s
design exhibited empathy with mothers
whose attention is often stretched thin
by other responsibilities. The low-cost
intervention asked less from mothers,
providing comprehensible information
through a simple format in less time.
24 Owais, et al. (2011), ‘Does improving maternal knowledge of vaccines impact infant immunization rates? A community-based
randomized-controlled trial in Karachi, Pakistan’.
CASE STUDY
Simplifying Information
for Busy Caregivers24
If you are reading this, you probably spend a lot of time thinking about
immunization. But that is not the case for everyone.
Most people, most of the time, are not thinking about immunization.
When they are, it is not always (or often) given very deep reflection — or even
much reflection at all. Consider an urban mother with three young children.
Crime in her neighbourhood is high and schools are underperforming, so she is
conducting at-home supplemental education. Her partner’s job does not support
the entire family, so she is also responsible for generating additional income. All
of this, in addition to many other day-to-day responsibilities, mean she is juggling
many things at once
We have the tendency to assume that people consider the universe of
possible costs and benefits before making a decision. But that requires a lot
of thinking. Instead, most people make most decisions quickly, without
much reflection, and with many other priorities vying for focus.21, 22 In the
stressful context of poverty, it is safe to assume that vaccination will not be the
first priority.23
If we remind ourselves that most people spend little time thinking about
vaccination, we will ask less of users and make our programmes simpler,
and easier to use.
21 Wheatley and Wegner (2001), ‘The Psychology of Automaticity of Action’.
22 Kahneman (2003), ‘Maps of Bounded Rationality: Psychology for behavioural economics’.
23 Shah, et al. (2012), ‘Some Consequences of Having Too Little’.
Attention
Is Elsewhere
22
GUIDING PRINCIPLES
23
DEMAND FOR HEALTH SERVICES

Part III: Five Big Questions
Questions Before
Answers
The variance in contexts, communities and challenges
makes the standardization of solutions dicult. Instead
of suggesting solutions, the human-centred approach
emphasizes questions to ask and the activities to pursue
when investigating challenges involving people.
To that end, the human-centred process is shaped by five
phases, or five big questions. Together, the answers will
support your ultimate objective of improving equitable
immunization coverage. Moving through these five questions
will guide your team’s problem-solving approach.
These questions are sequential and build upon one another.
It is likely that your team has already spent a lot of time
considering some of these questions, so use this as a
checklist. Evidence-supported answers to each will help
your team understand and respond to the challenges facing
users and holding immunization programmes back from
improved outcomes.
24 25
DEMAND FOR HEALTH SERVICES
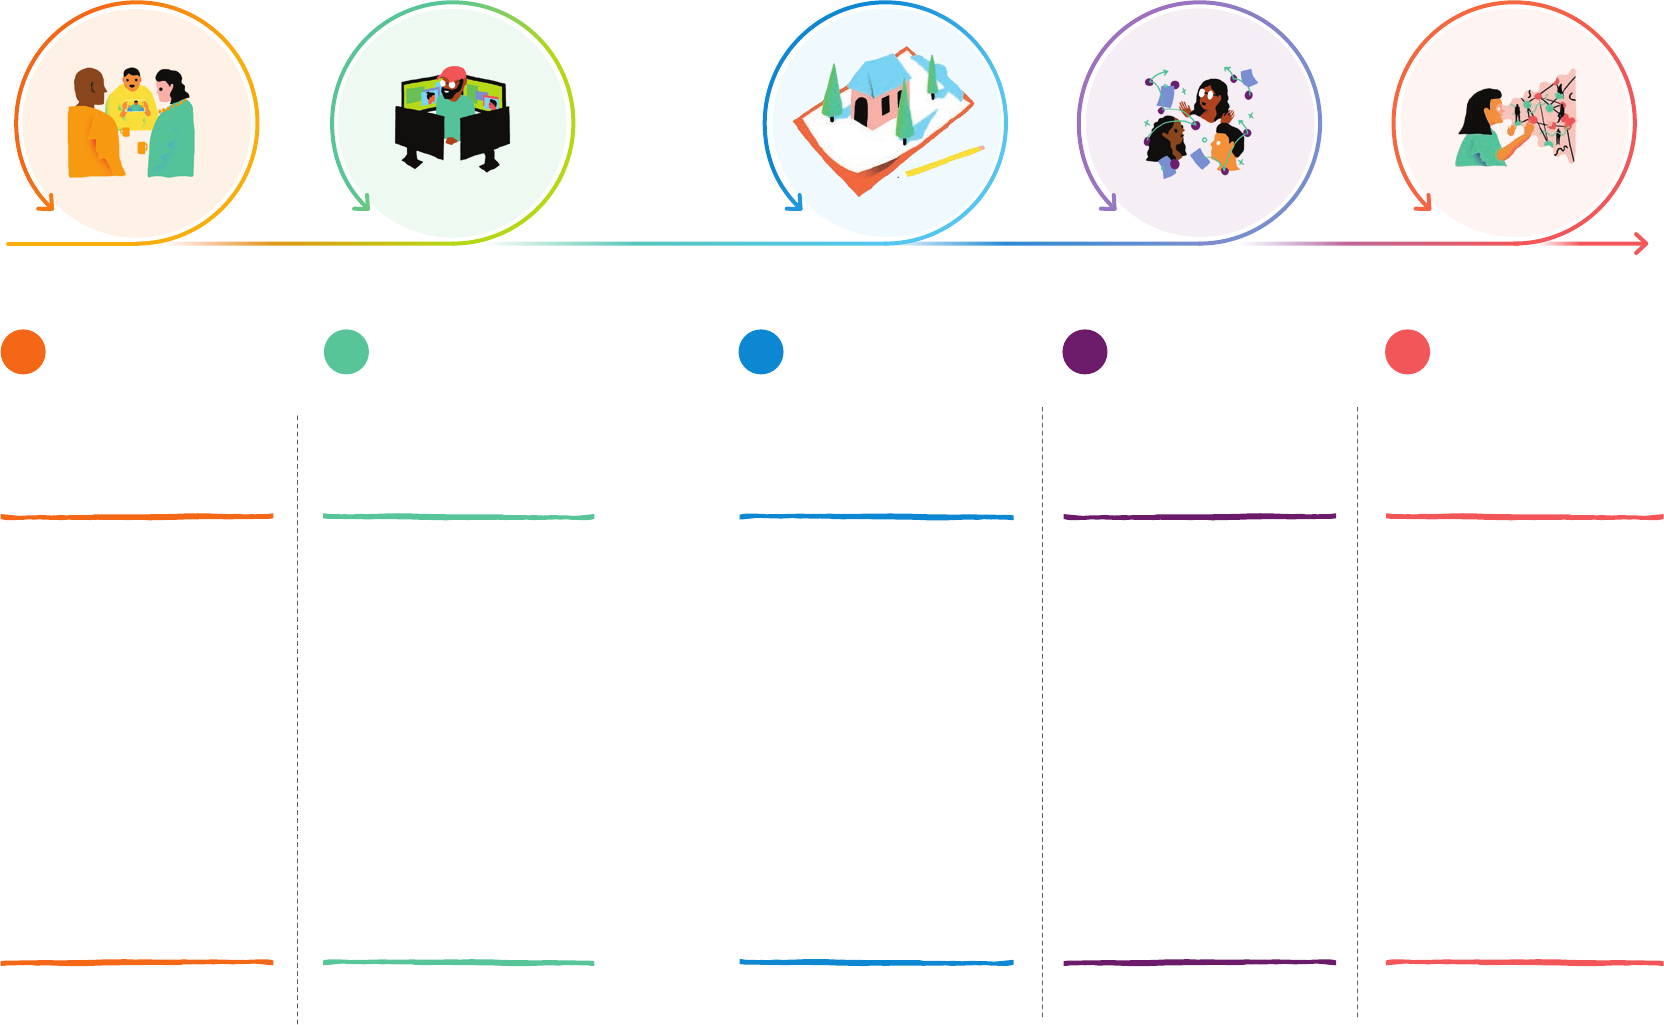
5
How could
we improve?
Good ideas are not only
innovative, but also effective. This
last phase is about continuous
inquiry — measuring how the
ideas respond to the challenges
identified during user research and
making adjustments to improve
their efficacy. Implementation
begins with defining performance
indicators and continues as an
exercise in ongoing user research.
Five
Big ?s
Page 30 Page 42 Page 148Page 56 Page 112
1
What is our
objective?
We start with the user — the
child we are trying to reach,
the caregiver we are trying to
help and health workers. From
there we define the intended
programme outcome as a
measurable goal and focus on
the biggest obstacles we will
set out do address —obstacles
that must be researched a
proven during our user research.
The final objective statement
focuses our work through
all subsequent activities.
2
What do we
think we know?
Before jumping into user research
(Question 3), it is helpful to review
what we already know. While
this involves taking stock of
existing knowledge like lessons
from past efforts (successful
and not) and of past research, it
also requires asking ourselves:
What might we be assuming?
What might we suppose we
know more about than we
really do? What ‘best practices’
could be called into question?
3
What stands
in our way?
What prevents users from using
services? What do they do now
and what do we want them to
do? To find out, we conduct user
research. Without understanding
user behaviour, interventions are
expensive guesses that might not
produce results. User research
should identify and explain the
variables facilitating or preventing
people from engaging with a
programme. The result is a set
of specific challenges to solve.
4
How could
we respond?
Given what we know about
users, how can we shape their
environments and influence
their behaviours to achieve
our objective? We start by
generating a large number of
potential solutions including
communications, clinic
experiences, incentives and
reminders. Once we identify
the best ideas, we test them
with users. This is a creative and
collaborative process: generating
ideas and testing them out.
Iterate or move onIterate or move onIterate or move onIterate or move on
26 27
DEMAND FOR HEALTH SERVICES
FIVE BIG QUESTIONS

expert knowledge low influence
creative mindset
proximate to
strategic piroities
technical mindset
not proximate to
strategic priorities
local knowlege high influence
Before You Begin
1 team
member
keep
informed
1 team
member
keep
informed
1 team
member
recruit as
advisor
1 team
member
keep
satisfied
Build Your Team
While input from many parties is important,
it can lead to a slow process that tries to
appease too many people along the way. To
work collaboratively, but not slowly, take
these two steps when building a team:
First, start with a “core team” of 3-5
members inside UNICEF that will participate
in the entire process. Ideally, each person
holds a different role so your team has
diverse and complementary perspectives.
The matrix below shows how you might
think about this — combining team
members with different knowledge sets and
mindsets. This team is the advocate of the
project, supports consultants when/if they
are needed during execution, and creates
excitement within UNICEF around the project.
Second, identify 1-2 “champions” in
the Ministry of Health to engage the
government, local authorities, and
local health workers. Alone we may go
fast but we cannot go far — so have
the support and active engagement of
officials capable of instituting change.
Choose Your Advisors
Finding the right advisors and aligning
with existing priorities will secure political
support throughout the process. Even
if they are not familiar with digital health
deployments or human-centred design,
influential leaders can help get approvals
during field research, recruit partners, find
funding for the implementation, and provide
bureaucratic navigation along the way. The
matrix below, combined with the questions
that follow, should direct you to choosing 2-3
advisors that have influence and knowledge.
When choosing your advisors, ask yourself:
• Who must be involved in decision making?
• Who will be affected by this work,
and is interested in its success?
• Who should have influence
over how it adapts?
• How can we work with existing
government and community partners?
• What existing priorities and strategic
plans can we align with?
28 29
DEMAND FOR HEALTH SERVICES
FIVE BIG QUESTIONS

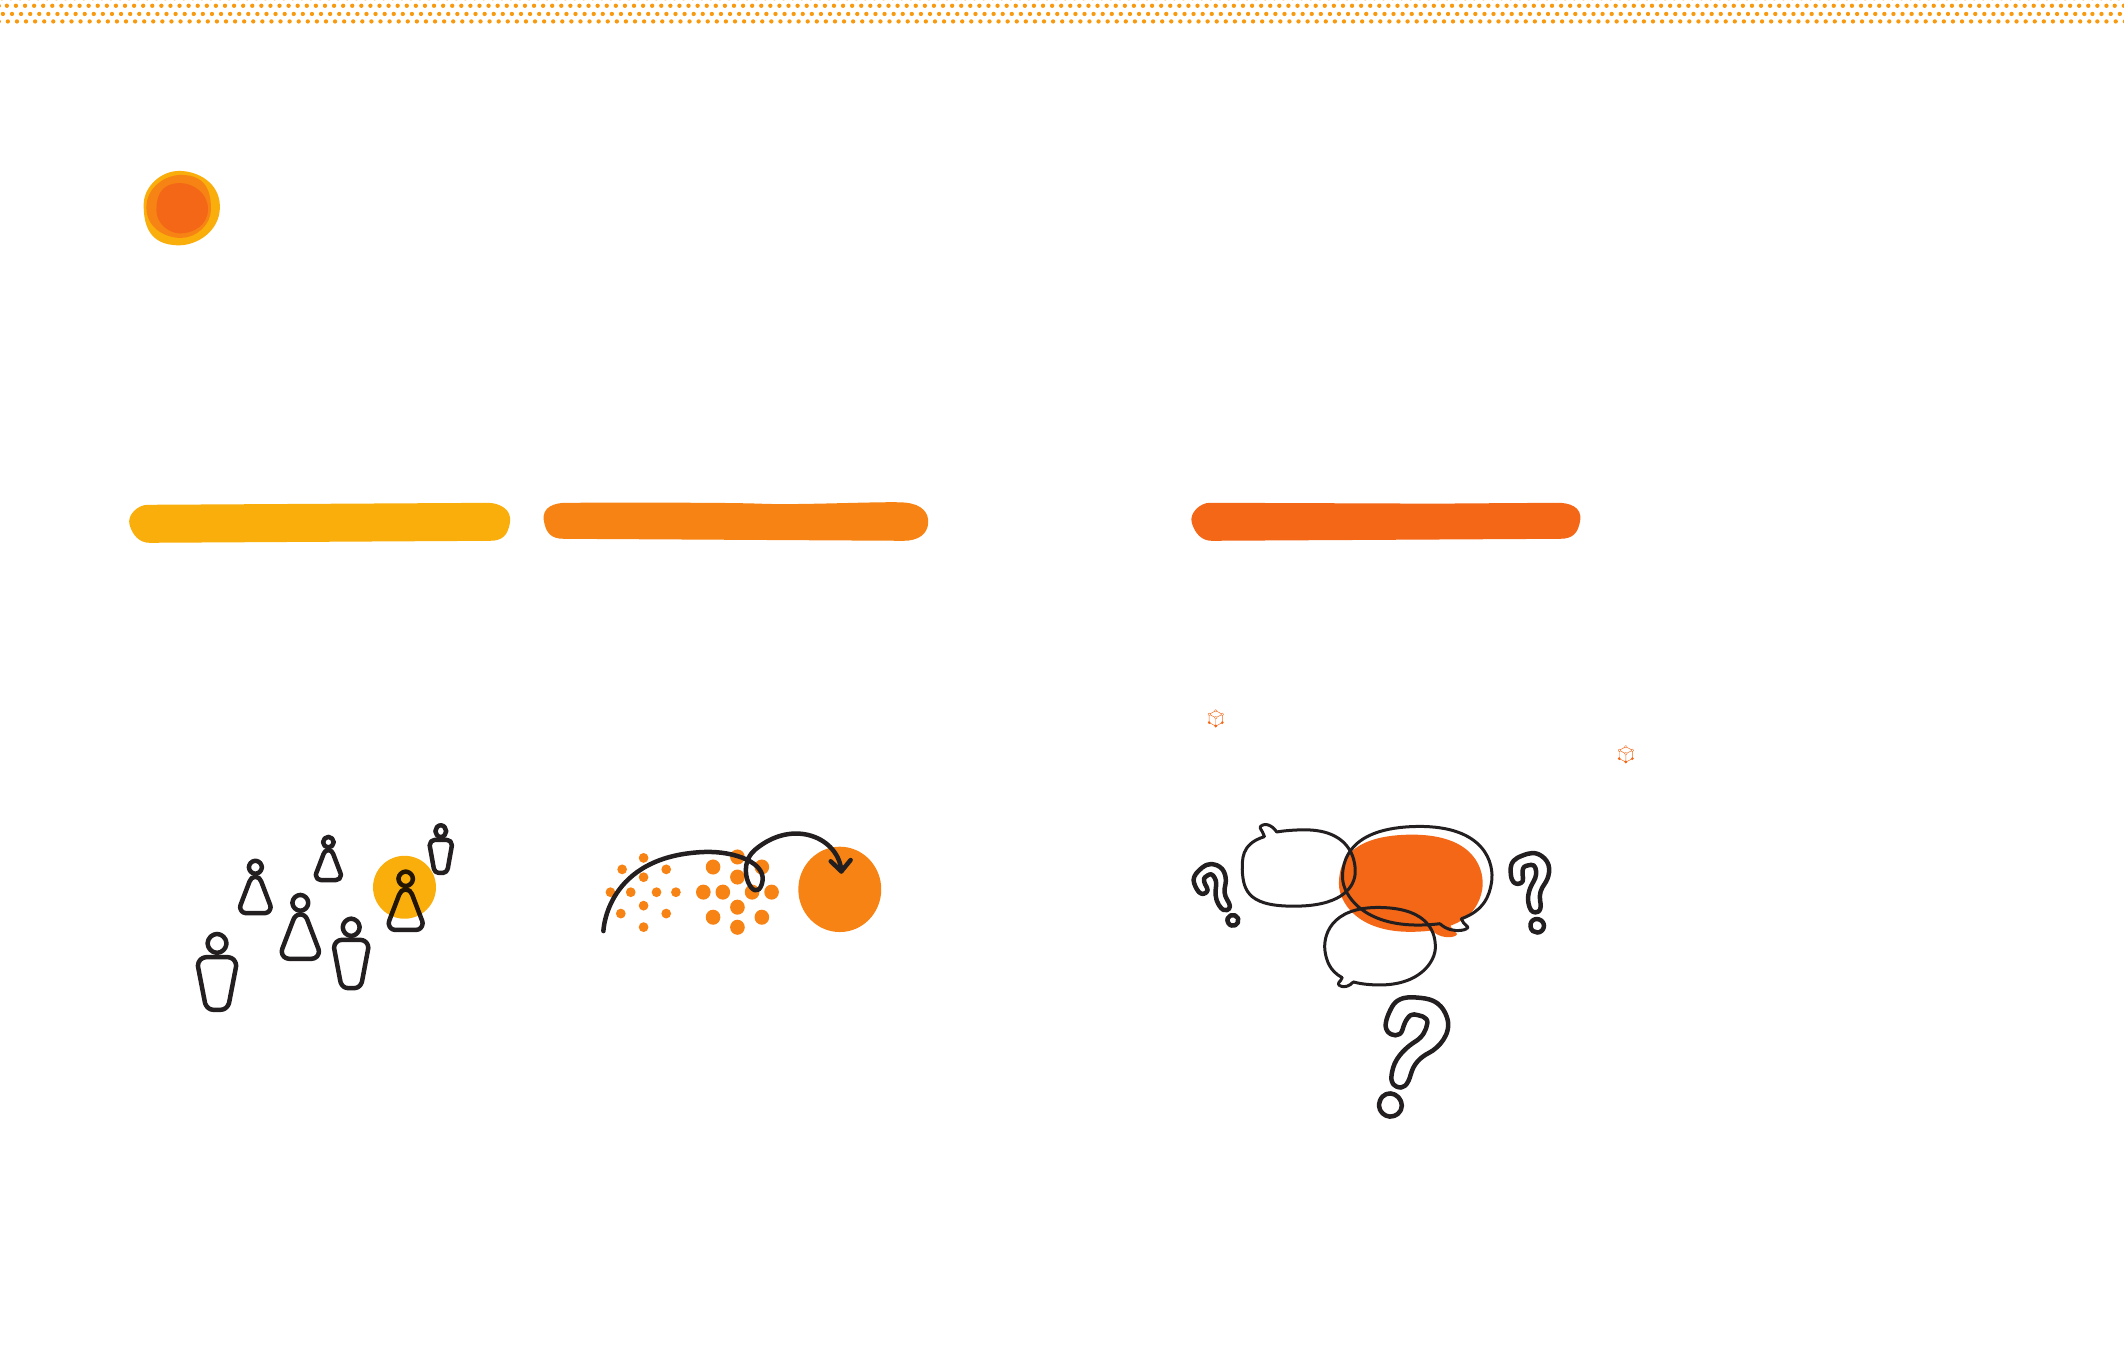
What Is Our
Objective?
Introduction: Problem Definition
As with any health intervention, we start with the
outcome we wish to achieve. Rather than adopt
an abstract goal and quickly move on, this section
advocates for a structured approach and dedicated time
to arrive at a precise objective.
An objective shapes all of the work to come and
significantly influences the ways in which we go about
solving problems: the research we design, the challenges
we focus on, the findings we prioritize and the indicators
we select.
After answering this first question, you and your team
will have a straightforward mandate to focus your work
throughout the process.
30 31
DEMAND FOR HEALTH SERVICES
Specify the change in
immunization outcomes
that the team is capable of
influencing.
Clearly delineate exactly
which community we are
concerned with.
Our objective is an immunization programme goal over a
specific period of time: how we aim to broaden coverage
and shrink inequities among a particular population.
Throughout the process, we will tie all of our interventions
in the field directly back to our starting objective.
Formulate and document
the final objective
statement to reference
throughout the process.
Objective Formula
Explain how the user-
group is or is not
engaging with services.
Common Obstacles
1a: Prioritize a User-Group 1c: Describe the Biggest Obstacle(s)
1b: Define the Improved State
Methodology
Final Output: Objective Statement
1
Current
State
Improved
State
Decisions Incentives &
Roadblocks
Actions
32 33
DEMAND FOR HEALTH SERVICES
Q1: WHAT IS OUR OBJECTIVE?
First describe the current or baseline
state and then set measurable,
achievable improvements.
Depending on your context, goals may
be set at the national level , or you
might have more flexibility in using local
programme data to suggest feasible
improvements in your immediate context.
Your programme objectives should be
within the capacity for you and your team to
influence. Set clear, measurable, attainable
objectives that you can later evaluate.
Begin by identifying the group that requires
your attention. Use available data to prioritize
the people most in need of help. For
example, an equity assessment may have
recently revealed that a specific group is
still persistently under-immunized. Making a
specific population a priority prevents wasting
time and resources on general activities
directed to an unspecified population.
Prioritize a User-Group Describe the Biggest Obstacle
Define the Changed State
1b
1a 1c
Delineate the Programme Challenge
Programme challenges provide a generalized
description of how a group of people are or
are not using the services being provided.
We define the programme challenge in these
generalized terms in order to avoid premature
diagnoses. Making a diagnosis early on
has the potential to mislead our research to
validate a pre-conceived solution instead of
leaving us open to innovative possibilities.
A programme challenge is descriptive of the
basic relationship between a user-group and
an immunization service. Intended users fall
into the following categories:
• Makes full use of services and
attends appointments on time
• Irregularly uses services
• Initially uses services and then stops
• Never uses services
Contemplate the Obstacles
After you clarify which of the programme
challenge categories your user-group
is experiencing, start to think about the
obstacles and underlying causes that
contribute to this current state.
What keeps users from acting or deciding
in a way that is most beneficial for them?
What do users need the system to do?
What environmental factors contribute to
the problem? The biggest obstacles are
usually very human, meaning a bias, habit or
conflicting priority stands between the user
and the desired changed state.
This step is difficult because it requires
describing a problem before we really
know the details of the problem. Existing
experience and knowledge can show us
where to start. At this point, we are not
interested in diagnoses, which we will get
to after a thorough user research process
(Question 3). Identifying a problem too early
has the potential to mislead our research and
block innovative solutions.
If the data is nonexistent or incomplete at
this phase, define the biggest obstacle to
the best of your ability. You will return to
the objective statement after user research
(Question 3) to validate its accuracy or
revise it to reflect the additional insights
that data alone cannot always uncover.
34 35
DEMAND FOR HEALTH SERVICES
Q1: WHAT IS OUR OBJECTIVE? 1A: PRIORITIZE 1B: DEFINE 1C: DESCRIBE
Fears about Vaccines
Action can be scarier than inaction. When given an
option between inaction and action, people tend to
default to the status quo.
1. Identify the programme challenge in your
area, which can be categorized as issues
of Use, Follow-through or Timeliness. For
example, caregivers may be initially using
services (Use), but only irregularly coming
for scheduled visits (Timeliness). Or they
may be coming for their child’s full course
(Follow-through), but coming weeks or
months late (Timeliness). Or, of course,
they may simply not be using services at
all (Use).
2. Ask why this challenge may be happening,
and check all of the obstacles (or add your
own) that may be contributing.
The biggest obstacles have recurring
themes. Competing priorities, demands
for attention, conflicting beliefs, habitual
behaviours and social pressures are
examples of common obstacles that can
hinder the desired programme outcome.
These are some examples of recurring
challenges to prompt new thinking about
the problems you witness in your local
context.
3. Circle the biggest obstacle. This will be a
working assumption that we will question
and return to as we uncover more
information in user research.
Use:
Is the user-group
using immunization
services?
Follow-through:
Do they complete
the schedule or are they
dropping out?
Timeliness:
Do they have diculties
coming on schedule?
Common Obstacles
Social Norms
Vaccination is not a social norm or common practice.
Apprehension About
Health-care Workers
Uncertainty about capacity, knowledge of health
workers, or compassion shown by health workers.
Apprehension About System
Uncertainty about the Health System, Government
or body perceived to be giving the vaccine.
No Feedback
Health workers lack the input or authority to
improve or change services.
Recent News
The easier to recall, the more personal the story,
the more Influential.
Ignoring the Contrary
People tend to seek out and act on information
that conforms to their pre-existing beliefs.
Attention Scarcity
People focus on the most pressing challenge ‘now’,
which may not be vaccination given competing needs.
Complexity
When caregivers are unclear about next steps
and next vaccines, taking action is difficult.
Supply Insecurity
Vaccination is unsafe, unpredictable,
unavailable or available in limited supply
as a result of regional insecurity.
Bias Towards Optimism
People overestimate the likelihood of positive events
occurring and underestimate the likelihood of negative
events occurring (contracting a disease).
Hassle Factors
Seemingly minor inconveniences can deter people
from acting on their intentions, such as getting to the
point of service.
Negative Experiences
Bad experiences from the past outweigh
the neutral or good.
Choice
People value what they choose themselves. For
example, choosing a reward over receiving an award,
even when the rewards are actually equivalent.
36 37
DEMAND FOR HEALTH SERVICES
Q1: WHAT IS OUR OBJECTIVE? 1C: DESCRIBE THE PROGRAMME CHALLENGE

The prioritized user-group, defined change and described
obstacle can be put into a formula to arrive at the objective
statement:
Our Objective is for U (user-group) to change from
E (existing state) to I (improved state) by addressing
O (biggest obstacle).
The tool on page 40 demonstrates each element of the
objective formula.
Example #1:
Our objective is for children of recently
arrived migrant families in the capitol to
change from 50 per cent DTP1 coverage
to 80 per cent DTP1 coverage by
improving access for parents, most of
whom do not have health insurance.
While the example adequately accounts
for the user-group and the changed state,
instead of identifying an obstacle it suggests
a diagnosis: that the cause of under-
immunization is due to a lack of insurance.
While that may be true, we will wait until user
research (Questions 3) to fully investigate and
substantiate that claim. Instead, consider:
Our objective is for children of recently arrived
migrant families in the capitol to change
from 50 per cent DTP1 coverage to 80 per
cent DTP1 coverage by addressing caregiver
perceptions about the accessibility of services.
Perhaps the programme does not have
sufficient administrative data to accurately
describe how this population is or is
not using vaccine services; but they do
have data indicating parents occasionally
seek out care at health centres. Rather
than making a diagnosis in the Objective
Statement, this revised version summarizes
the basic relationship between the Roma
and the service: irregular engagement.
Example #2:
Our objective is for children nomadic
pastoralists in the North to achieve full
immunization coverage by addressing the
obstacles and opportunity costs of accessing
services at fixed sites by families on the move.
This objective statement avoids diagnosing
a problem and clearly articulates the
basic relationship between nomadic
pastoralist families and immunization
services. However, it leaves the changed
state unclear: is the objective to achieve
full coverage among all children, or a
certain percentage? What baseline is the
programme working from? Instead, consider:
Our objective is for children of nomadic
pastoralists in the North to change from
35 per cent completion of the childhood
vaccination schedule to 80 per cent
completion of the schedule by addressing the
obstacles and opportunity costs of accessing
services at fixed sites by families on the move.
Example #3:
Our objective is for children of ethnic
minority background in a poor peri-urban
neighborhood to change from 30 per cent
loss to follow up (“drop out”) to less than
10 per cent loss to follow up by addressing
negative experiences at the point of service
that keep parents from returning to the clinic.
In this scenario, preliminary data suggests
that experiences at the point of service are
keeping some families from returning. The
objective’s variables are clear: a change
from 30 per cent drop out to less than 10
per cent, among minority children in the
peri-urban neighborhood, and a basic
description of the negative experiences
obstacle. This statement is ready to use!
While you should feel at liberty to
construct an objective statement ‘in
your own words’, ensure that the key
variables are accounted for, and that
no premature diagnoses are made.
Compare and ContrastFinal Output: Objective Statement
Defining your objective is essential
for the following reasons:
Objectives help us to avoid
the tendency to jump
immediately to a diagnosis.
We start with the ultimate objective
of our work: equitable coverage. Too
often, programmes start with a diagnosis
instead: for example, unmotivated health
care workers (HCWs) are causing steep
drop-out rates among caregivers. It may
be true that some HCWs are not strongly
motivated. But perhaps this is correlating
to dropouts, not causing them; or perhaps
other variables are influencing dropouts
more than HCW motivation. By starting
with an objective, we avoid prematurely
diagnosing the problem before we have
adequately investigated and pouring
resources into efforts that might not pay off.
Objectives help us to avoid defaulting
to intermediate goals, such as
attitudinal or behavioural objectives.
For example, an existing dataset suggests
that a certain portion of a community doesn’t
value vaccinations; in surveys, residents
self-report skepticism about vaccines’
benefits. It may be tempting to establish
an attitudinal objective such as “increase
the perceived value of vaccination among
mothers.” But do we know that an increase
in perceived value will lead to an increase
in coverage? Perhaps there is more to the
story, and deeper user research later on
(Question 3) will help us better understand it.
Objectives help keep our teams
accountable, linking our field
interventions back to a clearly
defined immunization outcome.
A clear objective acts as the ultimate check
on our work: does an intervention we are
implementing lead to positive changes in
equitable immunization coverage? While
we will aim to track the progress of our
solutions much later on (Question 5) with
mechanisms like intermediate indicators, we
are ultimately concerned with the impact
of our work. After clearly establishing an
objective within a particular context from
the outset, we will return to it often.
38 39
DEMAND FOR HEALTH SERVICES
Q1: WHAT IS OUR OBJECTIVE? 1C: DESCRIBE THE PROGRAMME CHALLENGE
Our Objective is for U (user-group) to
change from E (existing state) to I (improved
state) by addressing O (biggest obstacle).
The tool below helps to separate each
element of the objective formula.
E Existing State (1b)
I Improved State (1b)
O Biggest Obstacle(s)* (1c)
to change from
to
U User-group (1a)
by addressing
Our Objective is for
Examples:
Our objective is for U children of recently arrived migrant
families in the capitol
to change from E 50 percent DTP1 coverage
to I 80 percent DTP1 coverage
by addressing O caregiver perceptions about the accessibility
of services
Our objective is for U children of nomadic pastoralists in
the North
to change from E 35 per cent completion of the childhood
vaccination schedule
to I 80 percent completion of the schedule
by addressing O the obstacles and opportunity costs of
accessing services at fixed sites by families on the move
Our objective is for U children of ethnic minority
background in a poor peri-urban neighborhood
to change from E 30 percent loss to follow up (“drop out”)
to I less than 10 percent loss to follow up
by addressing O negative experiences at the point of service
that keep parents from returning to the clinic
Objective Formula
* This biggest obstacle(s) are working assumptions that we will question during “What do we think we know?”
and return to during user research.
40 41
DEMAND FOR HEALTH SERVICES
Q1: WHAT IS OUR OBJECTIVE? 1C: DESCRIBE THE PROGRAMME CHALLENGE

What Do We
Think We Know?
Introduction: Critical Reflection
It is likely that you have some knowledge about the
programme challenge articulated in Question 1. But some
types of knowledge are more valuable than other types.
While general knowledge is helpful, a full accounting of
the specific challenges facing the intended users of an
health service are dependent upon local context and thus
require local investigation. Local knowledge — gathered
from years of local experience, research and
reflection — is of primary value.
This phase is about composing learning goals starting with
what we know and think we know — the local knowledge
that already exists among you, your team members and
your programme. Because this likely is not the first time
your team has engaged in the process of investigating
and responding to challenges facing users, it is helpful to
begin the process by methodically reflecting upon your
existing knowledge.
Reviewing existing knowledge and recognizing
assumptions before we define our learning goals insures
against duplicating past eorts that didn’t succeed and
avoids overlooking areas of exploration if their past
conclusions are based on insubstantial evidence.
42 43
DEMAND FOR HEALTH SERVICES

2Methodology
To methodically account for the knowledge that already
exists, follow this three-step process.
Place your main learning goals on a wall
or board in a shared space. Document
the possible assumptions that you and
your team might carry with you next to
each learning goal.
Gather available information about
the challenge, past efforts and the
individual or community in question.
Mark key pieces of information that
show what we have learned, what we
should keep in mind, and the relevance
this information has to the present.
To help avoid bias, document the
possible assumptions that you and
your team might carry with you.
Assumption Examples
Assumption Catalogue
Using the “Journey to Immunization”
as a tool, clarify what you hope to get
out of the research. These learning
goals will help you to choose the
research methods to use during
Question 3.
Journey to Immunization
What is been
studied about
this user-group?
What is already
known about
the challenge?
What eorts
have been made
in the past?
yes and...
and also...
maybe but...
2a: Assemble Existing Knowledge 2c: Compose Learning Goals2b: Recognise Assumptions Final Output: Field Research Map
44 45
DEMAND FOR HEALTH SERVICES
Q2: WHAT DO WE THINK WE KNOW? 2A: ASSEMBLE 2B: RECOGNISE 2C: COMPOSE
Assembling and examining existing
knowlege are prerequisites to what
we think is the most important step:
recognizing our assumptions. In any
situation where we are asked to solve a
problem, we bring along implicit and explicit
assumptions — about the population we
are serving and the challenges they are
facing. This is an opportunity to discuss
assumptions prior to problem-solving.
Why, exactly, is recognizing assumptions
so important? Suppose an immunization
programme has long been challenged
by a certain population’s ‘refusal’ to
vaccinate. This non-vaccination behaviour
has led to a critical level of unimmunized
children, representing a stark inequity in
our district. In previous studies, this hard-
to-reach group has cited religious reasons
for refusal. We are now again attempting
to address the problem of low coverage,
and ‘existing knowledge’ points to a clear
reason for the persistence of the problem:
negative beliefs about vaccinations.
By recording this information, we can call it
into question. Maybe negative health beliefs
are, in fact, directly mitigating vaccination
outcomes. But it might also be true that
that is not the whole story. Perhaps we will
later discover in user research (Question
3) that a religious leader has long been
advising followers to avoid vaccination;
but outside the community’s view, many
in fact want to vaccinate their child. A
finding such as that would give us a very
different understanding of that population,
and suggest very different solutions.
The simple act of reflecting on possible
assumptions we might carry can help to
mitigate their influence down the line.
Assembling the available information on the
current challenge can be an overwhelming
task. Instead of casting too wide a net, we
encourage you to collate only those pieces
of information that fall into one of the
three categories of ‘existing knowledge’:
• Knowledge about the programme
challenge
For example, if the challenge is about
irregular use of immunization services, or
caregivers regularly accessing services late
and out of step with their immunization
course, it is possible that your team
already is aware of the situation.
• Knowledge about past efforts
Maybe this is the first time your team is
attempting to address this problem. If not,
then it is possible to gather lessons from
past efforts, such as what has worked and
what has not — and, most importantly, why.
• Knowledge about the user-group
The population in question — the users you
are most concerned about — may have
been previously studied. It is possible that
some outside group your own programme
has already conducted formative research.
A review of the material you have assembled
does not have to be exhaustive. Because
examining existing knowledge can become
a time-intensive task, mark key pieces
of information (for example, a past effort
that went very well, or terribly wrong) and
spend more time with those outliers.
While the volume of material can be large, the
output of an examination does not need to
be. A thorough examination should result in
succinct answers to the following questions:
• In summary, what do we think we
already know about the situation?
• What have we learned from any
past efforts, and what should we
keep in mind during this one?
• What has been studied about these
users, and how relevant is that
information to the present?
2a 2b
Assemble Existing Knowledge Recognise Assumptions We May Have
46 47
DEMAND FOR HEALTH SERVICES
Q2: WHAT DO WE THINK WE KNOW? 2A: ASSEMBLE 2B: RECOGNISE 2C: COMPOSE

A thorough accounting of the possible
assumptions we are at risk of making will
help to avoid missteps down the road. To
help in the process, here is a short list of
general assumptions made in the past. It is
likely that you will recognise many as they
span contexts and communities. While this
is by no means exhaustive, we hope it is a
helpful starting place when thinking about the
assumptions that we and our team members
might inadvertently bring to the table.
Information
Correcting misinformation with
accurate information will not
necessarily change minds; in fact,
corrective messaging carries the
risk of unintended consequences.
In a randomized trial, interventions designed
to correct misinformation about autism-MMR
ties only served to reinforce existing beliefs.
None of the interventions studied — ranging
from information explaining the lack of
evidence of an autism-MMR tie and
information about the disease prevented by
MMR, to dramatic images and narratives
about the disease — increased parental intent
to vaccinate. In fact, some did the opposite.25
Misconceptions
Incorrect knowledge, such as
misconceptions about vaccines and
diseases, does not always (or often)
impair vaccine uptake. Misconceptions
may exist, but those misconceptions
may not necessarily regulate
vaccination decision-making very much.
In Mozambique, mothers shared various
misconceptions about vaccines with
researchers. However, the researchers also
found that “taboos and misconceptions
[did not] play an important role in the
decision not to vaccinate.” Instead, the
“overwhelming barrier” was simply distance
to services.26 Another group of researchers
in India, after successfully using micro-
incentives to increase coverage, commented
that “while [study participants] might
appear to believe in all kinds of things,
there is not much conviction behind many
of those beliefs: otherwise they would
not change their minds so easily.”27
Consideration
Given the importance of immunization,
it is sometimes taken as a given
that caregivers engage in an active
decision-making process: thoughtfully
weighing costs and benefits, and
either deliberately taking or not
taking actions. However, very
often, the decision is not given
such due consideration.
Reflecting on “current theories” surrounding
the decision to vaccinate, one group of
researchers commented that they “rest
upon an assumption of caregivers who
reflect upon the decision to vaccinate or
not vaccinate; who calculate the benefits
and costs.” However, “[i]t is not clear
that caregivers actually make reflected
choices concerning vaccination.”28 Said
another way by a researcher reflecting on
his field experience: “It is my impression
that in most contexts vaccinations are
not thought about very much.”29
Intentions
Strong intentions are not always
sucient (or even necessary) for
action-taking. Even the smallest
of barriers can work to keep the
gap between a positive intention
and a corresponding action open.
Among subjects in a Hong Kong study that
reported being likely, very likely, or certain to
get vaccinated against swine influenza, less
than 12 per cent actually did. Strengthening
intentions futher would have been unlikely
to nudge vaccination coverage up. Instead,
as the study found, vaccination planning
proved a more significant determinant of
uptake than intention, such as by “suggesting
where, when and how to get vaccination,
improving and publicizing accessibility of
vaccination centres and opening times.”30
Access
Making it easier to access
vaccinations, while often important,
does not necessarily translate
into increased coverage. Similarly,
increases in access do not always
adequately explain high coverage.
In India, a programme provided free
immunization camps in 60 villages. In each,
a social worker educated communities
about the programme, about the vaccines,
and identified eligible children. However,
researchers found that “adequate supply
of vaccines and education only increased
the share of fully immunized children to
17 per cent” (up from 6 per cent).31, 32 In
Malawi, researchers found that coverage
was actually higher in some areas where
caregivers walked long distances, and vice
versa, suggesting that “easy access to
vaccinations (short travelling and waiting time)
cannot explain why the demand for childhood
vacciantions in the study area is so high.”33
Resistance
Resistance risks being understood as
an irrational rather than a rational
reaction. Although people may
express resistance in religious or
other belief-related terms, entirely
rational reasons such as previously
experienced or communicated
negative events are often at play.
A review of polio eradication programming
noted that in Nigeria, “memories of a
disastrous meningitis vaccine test which
killed several thousands is still current; in
India, the association between a government
with a history of sterilization campaigning,
and Auxiliary Nurse-Widwives who are used
both to deliver polio vaccine and to ‘advise’
parents in favour of family planning (under
a minimum monthly quota), can be traced
to the ‘myth’ of OPV and infertility.”34
25 Nyhan, et a.l (2014), ‘Effective Messages in Vaccine
Promotion: A randomized trial’.
26 Sheldon and Alons (2003), ‘A study to describe barriers to
childhood vaccination in Mozambique’.
27 Banerjee, et al. (2010), Improving Immunisation Coverage in
Rural India: Clustered randomised controlled evaluation of
immunisation campaigns with and without incentives.
28 Holte, et a.l (2012), The decision to vaccinate a child: An
economic perspective from southern Malawi.
29 Nichter (1995), ‘Vaccinations in the Third World: A
consideration of community demand’.
30 Liao (2011), ‘Factors Affecting Intention to Receive and Self-
Reported Receipt of 2009 Pandemic (H1N1) Vaccine in Hong
Kong: A longitudinal study’.
31 As quoted in Cappelen, et al. (2010), ‘Demand for Childhood
Vaccination: Insights from behavioural economics’,
referencing Banerjee, et al. (2010), Improving Immunisation
Coverage in Rural India: Clustered randomised controlled
evaluation of immunisation campaigns with and without
incentives.
32 A concurrent incentive programme doubled that coverage
figure, by comparison.
33 Holte, et al. (2012), The decision to vaccinate a child: An
economic perspective from southern Malawi.
34 UNICEF, ‘Social Mobilisation and Communication for Polio
Eradication: Documentation in Nigeria, India and Pakistan
(2002-2003)’.
Assumption Examples
48 49
DEMAND FOR HEALTH SERVICES
Q2: WHAT DO WE THINK WE KNOW? 2B: RECOGNISE ASSUMPTIONS WE MAY HAVE

Questioning Assumptions Assumption Catalogue
Public versus private beliefs
Immunization programmes are sometimes
challenged by the ‘negative health beliefs’
of the populations they are trying to reach.
Further, it is often assumed that programmes
must campaign to shift those beliefs as a
prerequisite to the programme’s success.
However, beliefs are often intractable in
the individual and reinforced by community
norms; they are not easy to change.
A programme in Zambia in 1999 was faced
with “hard to reach and hard to convince”
populations.35 Among these groups were
members of the Apostolic Church in
Zambia. The church’s doctrine explicitly
rejected all ‘Western’ medicine. This was
a belief that the community affirmed;
publicly, all members adhered to it.
However, researchers discovered that,
privately, many people did want to participate
in the vaccination programme — but they
were worried about the reactions of their
fellow members.36 Researchers devised
an elegant solution: health workers
stayed late in the area so members could
come for immunization when fewer
people would be there to see them.
This group, which publicly denied the value
of vaccination, ended up vaccinating almost
all of their children. Without this additional
observation, the programme may have
assumed the need to change this publicly
articulated ‘negative health belief’. By putting
all assumptions on the table, however
seemingly bullet-proof, programmes open
themselves up to interventions that are more
responsive to the challenges facing users.
Tool
Using the Assumption examples on
page 55 as a guide, document existing
assumptions about the challenge, past
efforts, and the user-group in question.
Do we sometimes assume that providing
more information to this user-group is
usually better? That ensuring they ‘value’
vaccinations is necessary? Take a moment
to consider the possible assumptions that
you and your team might carry with you.
This should be no more than a
quick reflection exercise.
35 Communication for Immunization and Polio Eradication in Zambia: A joint case study by CBOH, MOH, UNICEF, WHO/AFRO and
USAID (1999).
36 This phenomenon is known as ‘pluralistic ignorance’, where a majority of group members privately reject a social norm while
incorrectly assuming that most others accept it. See: Miller and McFarland (1991), ‘When Social Comparison Goes Awry: The case
of pluralistic ignorance’.
Start with the “Common Obstacles”
identified on page 37 and used in the
objective statement. Do we really know for
certain that this is what stands in our way?
Consider assumptions of misinformation,
access, consideration, resistance, intentions
and misconceptions from the examples.
What else do you assume about the culture,
barriers, beliefs and health workers?
50 51
DEMAND FOR HEALTH SERVICES
Q2: WHAT DO WE THINK WE KNOW? 2C: RECOGNISE ASSUMPTIONS WE MAY HAVE

The gap between the change we are
supporting in the community (the objective
statement) and what we know and think
we know from past research (assumptions)
leaves us with what we still need to figure
out. These questions that need additional
research become our learning goals.
Do we know how decisions are made? Do
we know everything about the prioritized
user-group’s motivations, perceptions,
and trade-offs? Do we know about how
they are influenced by and interact with
their family, community, health system,
and political system? Do we know who and
what they trust? Do we know about gender
dynamics, community outreach mechanisms
and channels with the community?
Using the Journey to Immunization
model on this page, think about what
areas need the most attention, and what
we can learn at each stage. Reference
the Assumption Catalogue from
page 51 to further investigate the
questions that need to be answered.
While the model follows a caregiver
journey to immunization, consider the
journey of the health-care provider as
well, since both work in equal parts
toward the goal of immunization. What
must they know and prepare? What
cost and efforts must they make to be
present both physically and mentally?
2c Compose Learning Goals Journey to Immunization
1st vaccination
Fully vaccinated
2nd vaccination
H
e
a
l
t
h
S
y
s
t
e
m
s
F
a
m
i
l
y
I
n
d
i
v
i
d
u
a
l
C
o
m
m
u
n
i
t
y
I
n
d
i
v
i
d
u
a
l
P
o
l
i
t
i
c
a
l
S
y
s
t
e
m
s
Awareness
Knowledge &
6
Cost & Eort
After Service
3
1
Preparation
4
Point of Service
5
Intent 2
Knowledge and Awareness
Awareness of vaccination, of disease, of
service (when/where) and how to get it.
Intent
Overcoming the gap between intention
and behaviour. Caregivers readiness
to vaccinate is determined by three
things: their attitude towards the specific
behaviour, their subjective norms and
their perceived behavioural control.
Preparation
Preparing for vaccination including
consideration of the disease/vaccination/
service, planning the logistics of accessing
services, finding transportation, arranging
child care and mitigating opportunity costs.
Cost and Eort
Cost is not only financial – there is effort
to find the time and make the required
trade-offs to travel to the point of service.
Opportunity, transport, lost income,
uncertainty of service, and social and
security costs are all part of this step.
Point of Service
All aspects of the vaccination experience,
including client satisfaction, interpersonal
communication with health workers, missed
opportunities and health center experience.
It is also important to remember the health
workers’s experience, and how that effects
their ongoing perceptions and performance.
After Service
Short-term factors include immediate
feedback, understanding the next steps
and getting home from the clinic.
Long-term factors include side effects,
cues to action, reminders, reinforcement
and vaccination as a social norm.
Surrounding Mental
and Social Models
Surrounding every stage are socio-
ecological levers that help us understand
what rationalization and logic cannot.
Consider interwoven levels of influence on
each step: subjective/social norms, trust,
confidence, social values, community-
level political structures, influences and
interactions such as gender dynamic
within families, inclusive and adaptive
immunization policy with health systems,
community outreach mechanisms
and channels with the community.
52 53
DEMAND FOR HEALTH SERVICES
Q2: WHAT DO WE THINK WE KNOW? 2C: COMPOSE LEARNING GOALS
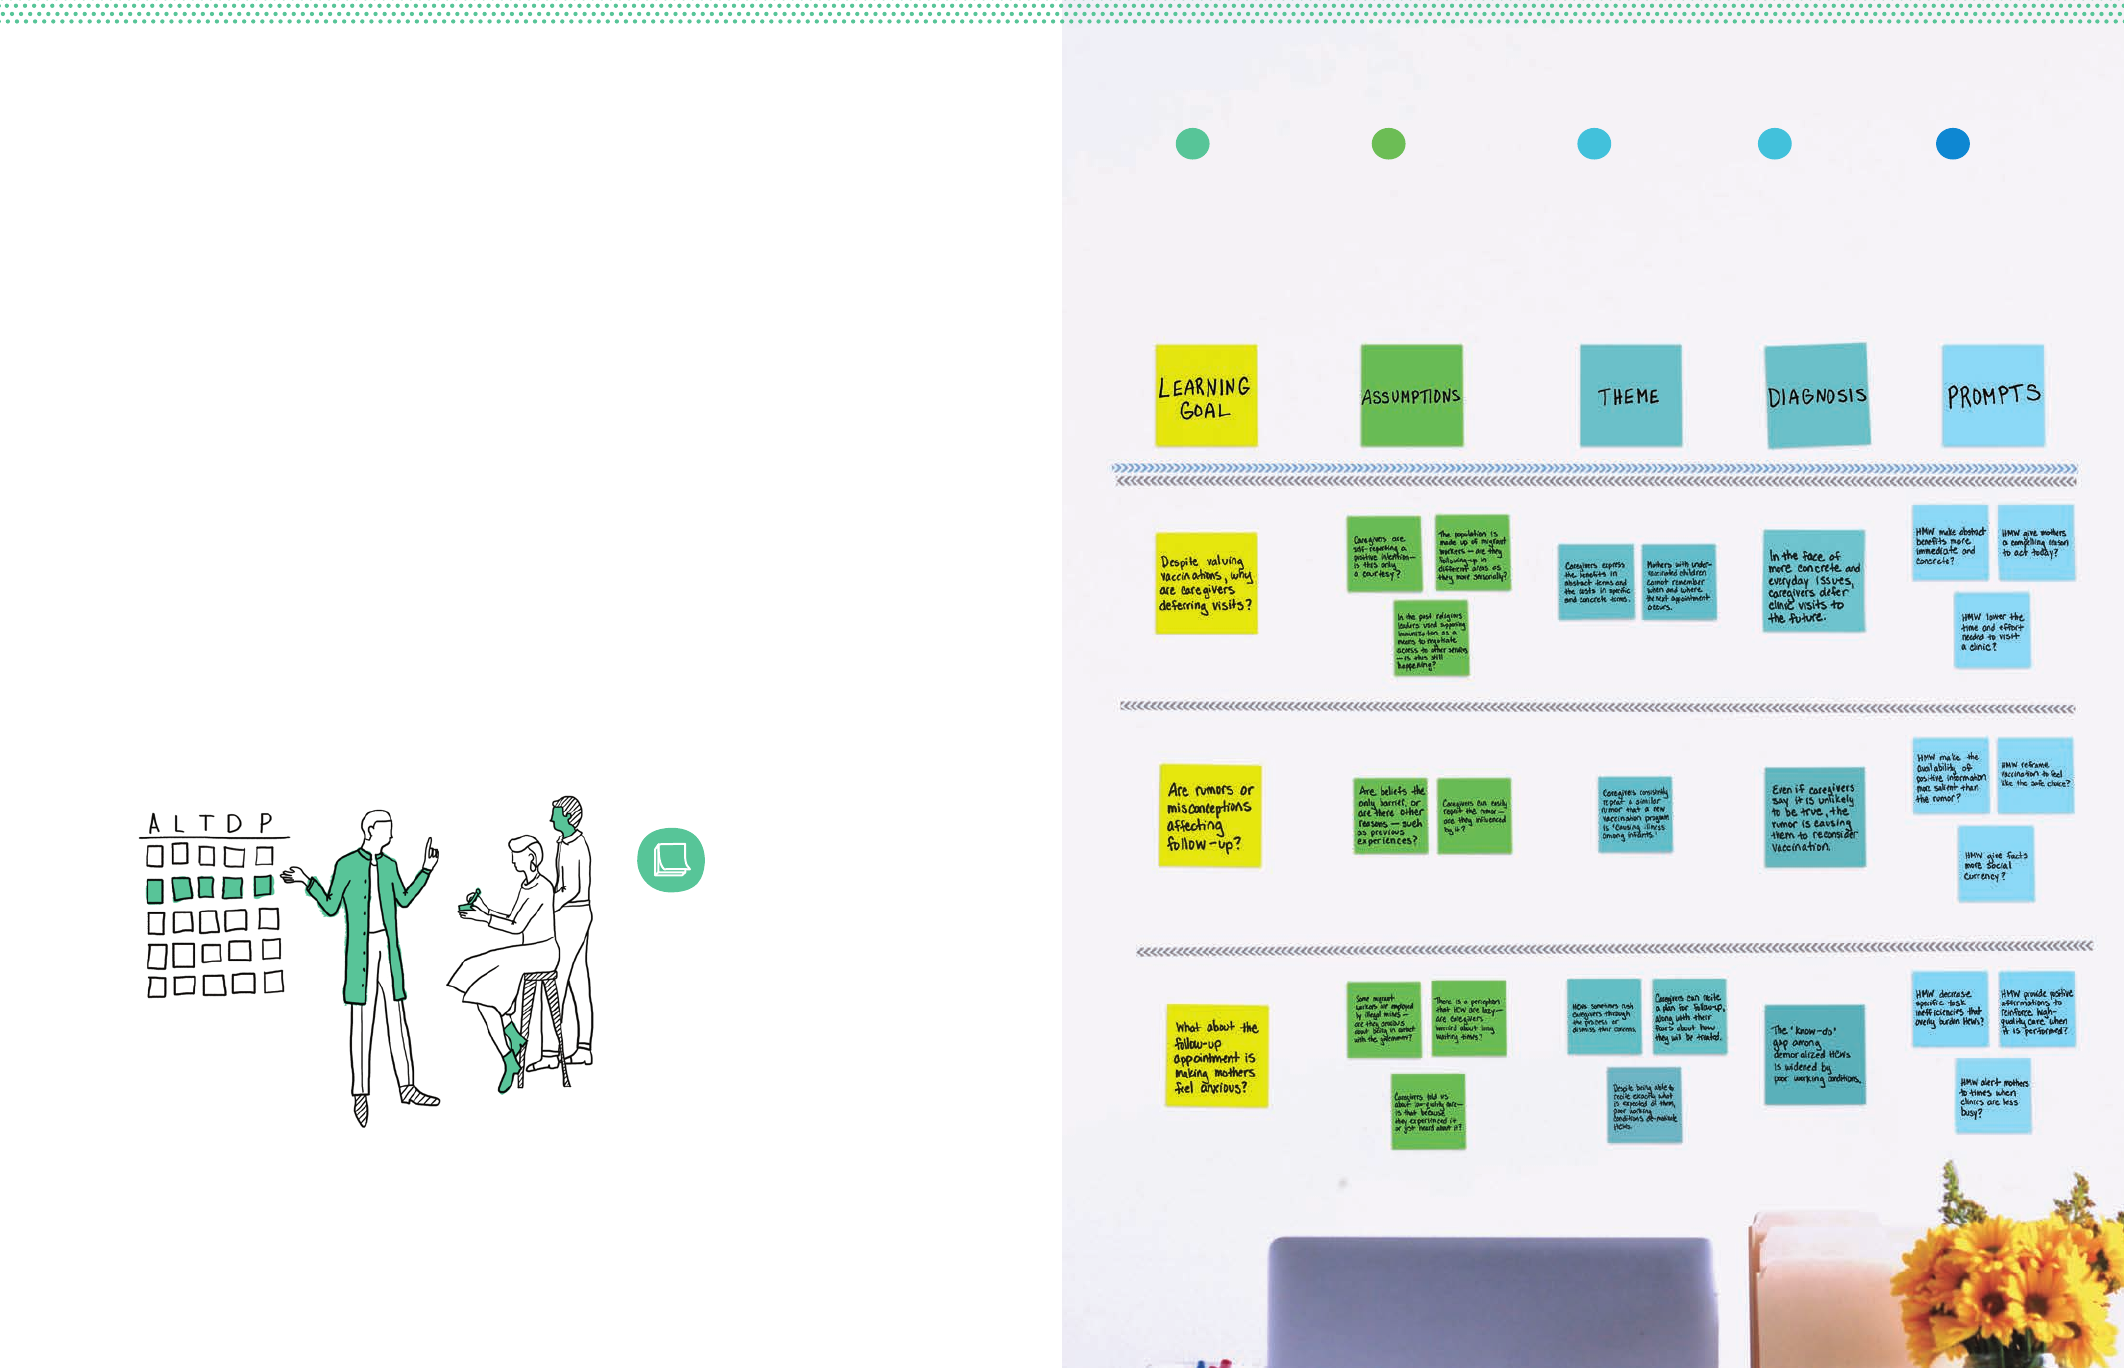
Learning Goal:
What do we
not know?
Research questions
that will be
investigated during
user research.
Assumptions:
What do we
think we know?
Acknowledgment of
any assumptions we
might be making or
biases we might have.
Theme:
What is really
happening?
Recurring information
from observations and
interviews that relates
to user behaviour.
Prompts:
What does this
imply for us?
Redefine challenges
as opportunities to
prepare for generating
solutions.
Diagnosis:
Why is it
happening?
Hypothesis of why we
are seeing what we
are seeing or hearing
what we are hearing.
2c 2b 3b 3c
Field Notes Icon
This icon indicates where you
should pause and add your final
sticky notes to the designated
Field Notes area.
During research, each step will yield distinct outputs — your “Field Notes.”
The Field Notes Map is designed to give you a place to capture them.
Set aside a part of your workspace — space behind your computer screen, an
open wall, or the back of a used poster — to track your team’s progress and
findings in a shared space. The matrix to the right demonstrates how this might
look using tape and sticky notes.
Each row represents a distinct Learning Goal from page 52 paired with any
Assumptions we must prove or disprove. At the end of the user research
process, you will have a final ‘wall’ of completed Field Notes that synthesize your
findings. During Question 4, we will use these Field Notes to generate solutions
to the challenges that they describe.
FN
Field Notes Map
3b
54 55
DEMAND FOR HEALTH SERVICES
Q2: WHAT DO WE THINK WE KNOW? 2C: COMPOSE LEARNING GOALS

What Stands
In Our Way?
Introduction: User Research
This is the question that will require the most of your time
and energy.
This phase introduces human-centred approaches to
investigate the challenges facing intended users of your
programmes. What prevents the prioritized user-group from
fully engaging with an immunization programme? This phase
uncovers the variables that stand in the way of success and
prepares teams to generate smart solutions.
While this may be the most intensive part of this Field
Guide, we are guessing that it still stands in contrast to
many other resource-intensive approaches to research.
Rather than suggest multi-year longitudinal studies, or
time (and resource) heavy cross-sectional analyses, we will
introduce here the processes and techniques of rapid inquiry.
While it may require your steadfast focus, it need not require
unwieldy budgets. Basic resources, deliberate attention and
an energetic team are all you need to begin.
56
DEMAND FOR HEALTH SERVICES
57

People are complex and riddled with paradoxes. We
respond to well-planned programmes in unpredictable ways
and give answers to surveys that contradict our real-world
behaviour.
The principal challenge of this phase is that people designing
immunization programmes are usually not the same
people that use them. We are asked to design solutions to
problems we have not confronted personally. There is a gap
between our experience and the experience of the people
using the programmes, called an empathy gap.
Each user research method works to close that gap. The more
we can empathize with the lives and lived environments
of the people we intend to serve, the more eective our
programmes will be. Activities grounded in dialogue and
listening give us divergent perspectives on problems and new
inspirations for solutions. This is a methodical approach to
investigating, understanding and diagnosing problems built
on that premise.
This phase will yield a set of insights that help to clarify
what might be preventing users from fully utilizing
immunization services. What are the factors that shape how
people do and don not engage with our programmes? These
insights will allow us to create and test solutions.
Our goal is to design solutions that improve
immunization outcomes. To do so, we will
focus on the intended users of immunization
programmes. The human-centred research
methodology identifies the constraints facing
users through immersive research exercises.
These exercises will prepare us to diagnose
root causes and propose new ideas.
Augmentation, Not Replacement
Many readers of this Field Guide are
well versed in research. The process
of understanding and diagnosing what
is going on in communities and why
is not new. Most teams already have
practiced and established methodologies
for researching these challenges.
So we don not intend to wholly replace
those. Instead, consider what follows
as opportunities for augmentation: a
way of considering human-centred
approaches to better understanding
intended users, and integrating those
approaches into your investigative work. It
is our hope that pieces of this approach
and the principles that guide it will help
to support existing research methods.
Working with People
58 59
DEMAND FOR HEALTH SERVICES
Q3: WHAT STANDS IN OUR WAY? 3A: EXPLORE 3B: INTERPRET 3C: PROPOSE
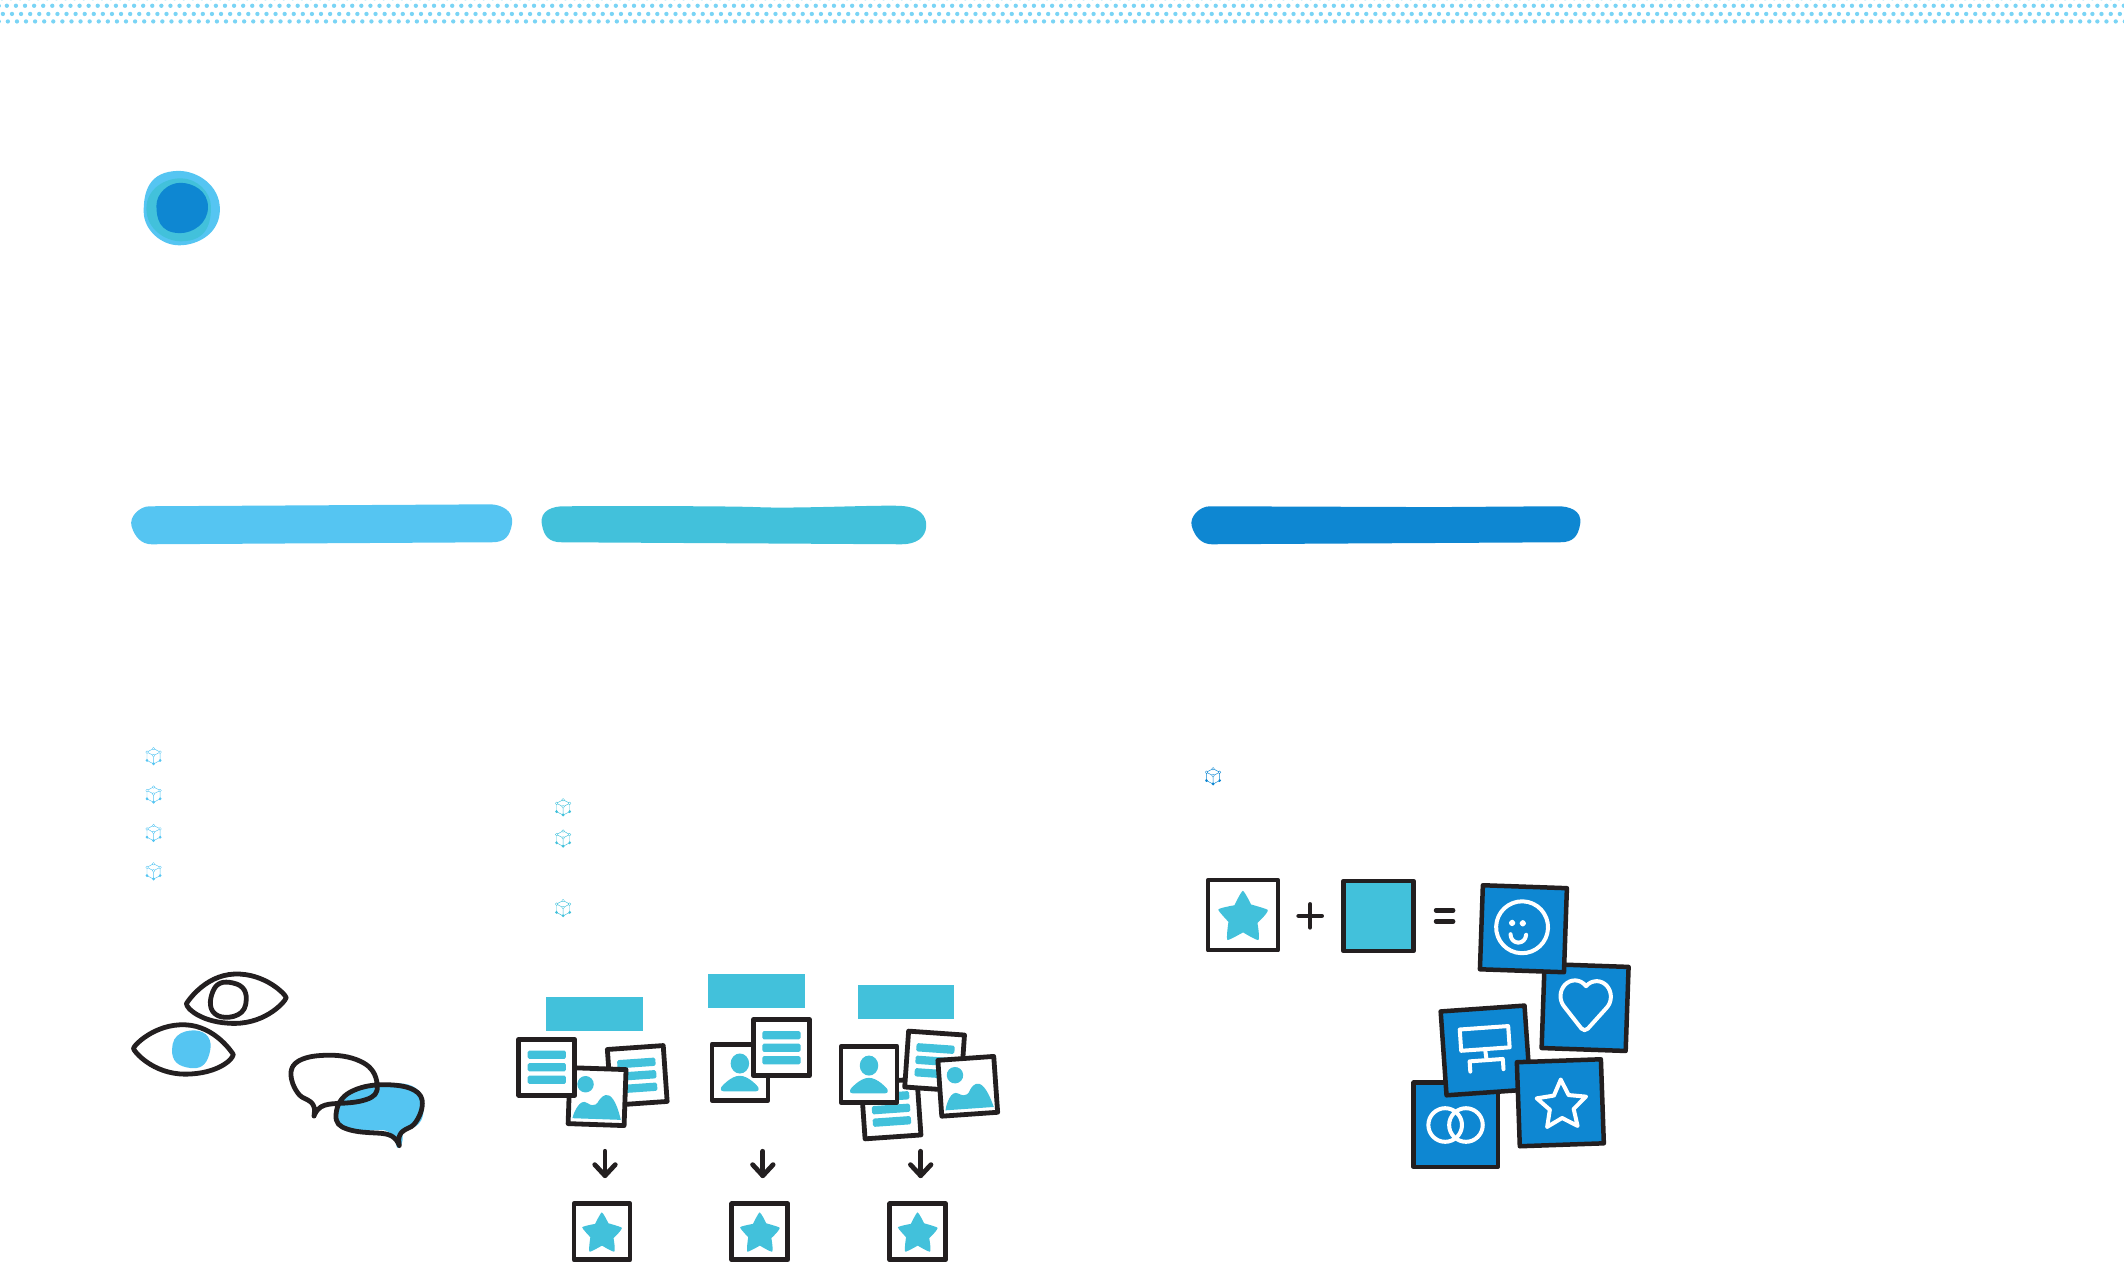
Each part of this process is tightly linked; skipping is not
advisable. However, it should be iterative. Rather than
only moving from one part to the next, it is likely (and
encouraged) that you will return to earlier steps.
3Methodology
Prompt Formula
Research Methods
Develop a Research Plan
Conduct Field Research
Record Field Research
Share User Stories
Identify Important
Information in Stories
Diagnose the Underlying Causes
Final Output: Creative Prompts
3c: Propose Opportunities for Design3a: Explore the User’s Environment 3b: Interpret Collected Stories
Gain a detailed understanding of
the challenges preventing better
immunization outcomes. Better
understand user’s conditions and
experience to ensure you address the
right problems.
Share information from the field
through user stories. Analyse themes
within user stories to hypothesize
why this is happening. Develop
diagnoses to explain what the team
saw and heard, returning to the
field to gather more information as
needed.
Transform our diagnoses into
actionable tools. Personas help teams
understand the prioritized user-group’s
thoughts, feelings, actions. Prompts
translate the technical diagnosis
into a simple question that points to
solutions.
Make sure each prompt is articulated
succinctly and helps us make sense
of what we have gathered in the field.
Corresponding
Diagnoses
Creative
Prompts
Prioritized
Information
Theme 1
Theme 2 Theme 3
60 61
DEMAND FOR HEALTH SERVICES
Q3: WHAT STANDS IN OUR WAY? 3A: EXPLORE 3B: INTERPRET 3C: PROPOSE

Exploring starts broad, gathering as much information from
the field as possible. This is about engaging in open-ended
inquiry — familiarizing ourselves with an environment, the
people in it and the challenges that it presents.
This methodology uses human-centred activities that help
us to develop an intimate familiarity with users and the
contexts that influence them. These activities are loosely
split between recording what we see happening in the field
and what people say. Respectively, these are observations
we make and interviews we conduct. The observational
and narrative data we gather will serve as the raw material
used to analyse the challenges facing intended users of
our programmes.
Explore the User’s Environment
3a
After each day of field research, quickly
synthesize and record the information you
have gathered. Document what is seen,
heard, felt and said. Record as much as
possible — even the seemingly mundane.
i. Research Methods
ii: Develop a Research Plan
iv: Record Field Research
iii: Conduct Field Research
We will use two types of qualitative
research: interview techniques and
observational techniques, observing users
within the environments that shape their
day-to-day lives and behaviours. There
is a list of observational activities and
techniques for collecting and analysing
data at the end of this section.
Plan how you will go in the field and
talk to people. Choose which activities,
including both observations (what we see)
and interviews (what others say), to use
while allowing for flexibility later. Build a
discussion guide to help guide interviews.
Observe intended users within the
environments that shape their day-to-day
lives and behaviours. Interview intended
users and allow them to speak about
specific events and experiences.
63
DEMAND FOR HEALTH SERVICES
62
Q3: WHAT STANDS IN OUR WAY? 3A: EXPLORE THE USER’S ENVIRONMENT

Learn from Outliers
Finally, observational activities can help
to elucidate phenomena that quantitative
data cannot — such as learning from
the ‘extremes’ rather than only from the
statistically average. Whereas quantitative
research tends to focus on patterns and
aggregates, observational research can draw
out equally important insights from outliers.
For example, a survey might reveal that
only a small group within a large community
initiates immunization courses. Observational
research can help us to go beyond the
‘averages.’ Spending quality time observing
and speaking with this outlier group could
point us in the direction of what works
based on what they are doing differently.
—
The following examples show how
observational techniques aid in better
understanding users and their contexts:
Timing Activities
How long does it take someone
to complete a particular task?
Suppose we are researching the the day-to-
day work of health-care workers at district
clinics, investigating ways their work is being
made unnecessarily difficult. What might
we learn from timing how long it takes them
to perform certain tasks? By gathering a
small sample of figures and comparing them
across clinics, we could pinpoint tasks that
use a disproportionate amount of their day.
We might learn that data-entry is absorbing
most of their time, encroaching on the time
they could devote to patients. This might
give us specific information to support
health-care workers, rather than general
information to ‘increase performance.’
Diagramming Movements
How are people interacting with
each other in a particular situation?
Suppose we are interested in learning more
about how new mothers experience health
services in a neonatal setting. Vaccinations
are only one aspect of care, and we are
concerned with how immunization fits into
her broader clinical experience. Throughout
their visit, how does she move throughout
the space, from entering to exiting? With
whom does she interact at different
moments? Observation here takes the
form of diagramming people’s movements
and interactions. Perhaps we find that
mothers spend most of their time waiting;
and the time spent engaged with care
providers is quick and intense. Vaccination-
related conversations get buried easily,
despite there being ample down-time
during which immunization education and
instruction could be delivered to mothers.
Identifying Patterns
How many caregivers perform an
activity one way versus another?
Suppose we are looking into home-based
records, investigating what happens outside
the clinic. While interviewing caregivers
during at-home visits, we notice that some
keep their records concealed in a box, some
keep them out in the open and some do
not immediately know where they are.
Throughout interviews, simply tallying each
record-keeping observation into one of
these categories could quickly reveal either
a dominant or varied behaviour. Perhaps a
majority know exactly where their child’s
health card is; but because they keep it out of
sight (the dedicated box), it is also out of mind.
Go Beyond Self-reporting
The things that people say and what people
actually do are often not the same. Having a
body of observational research can ensure
that we are checking against the say-do gap.
For example, perhaps we noted in our
assumptions from Question 2 that previous
KAP surveys have consistently found
respondent claims of seeking out clinics but
finding them closed during usual business
hours. Observational research could affirm or
question this self-reported claim. Spending
time at clinics and with community members
provides the opportunity to see rather than
only rely on what we have been told.
Observational research might confirm
what the KAP surveys suggested: clinics
appeared to open and close at inconvenient
times, perhaps inconsistent with their stated
hours. However, observational research
might also tell a different story: perhaps
at one point a certain clinic’s hours were
unpredictable; we might find though that
this is no longer the case, and that over a
few weeks of observing clinic operations,
most appear to be open consistently
and in accordance with accessible hours.
Follow-up interviews with caregivers might
find the belief of inconvenient hours was
spread throughout the community, de-
incentivising clinic visits among caregivers
who had never actually gone to the clinic.
Unearth the Details
Observational research can provide a
more complete assessment of challenges.
Intended users rarely identify exact problems
and solutions. However, observing people’s
behaviours and how those behaviours are
shaped by their environments can provide
additional clues. For example, we might
know that users report “poor interactions
with health-care workers” as a reason for
dropouts. But what exactly about these
interactions is negative? Interviews might
be helpful; but again, interviews are still
subject to self-reporting challenges. They
might reveal that health-care workers are
seen as rude. But rude how, and why?
Spending time observing these interactions
will uncover more details. We might learn
the typical clinic environment in a district
is chaotic and overburdened; the problem
lies with the clinic environment rather than
with the care providers. Observational
details about unorganised intake systems,
long waiting times and inefficiently tiered
tasking between health-care workers
and physicians could give us a richer
understanding as to why users cite “poor
interactions” as a reason for not returning.
Observations allow us to be open-ended. Whereas a survey
requires that we generate specific lists of static questions,
observing people, asking questions in context, and revisiting
our assumptions enables deeper understanding.
Research Methods: Observations
i
64 65
DEMAND FOR HEALTH SERVICES
Q3: WHAT STANDS IN OUR WAY? 3A: EXPLORE THE USER’S ENVIRONMENT
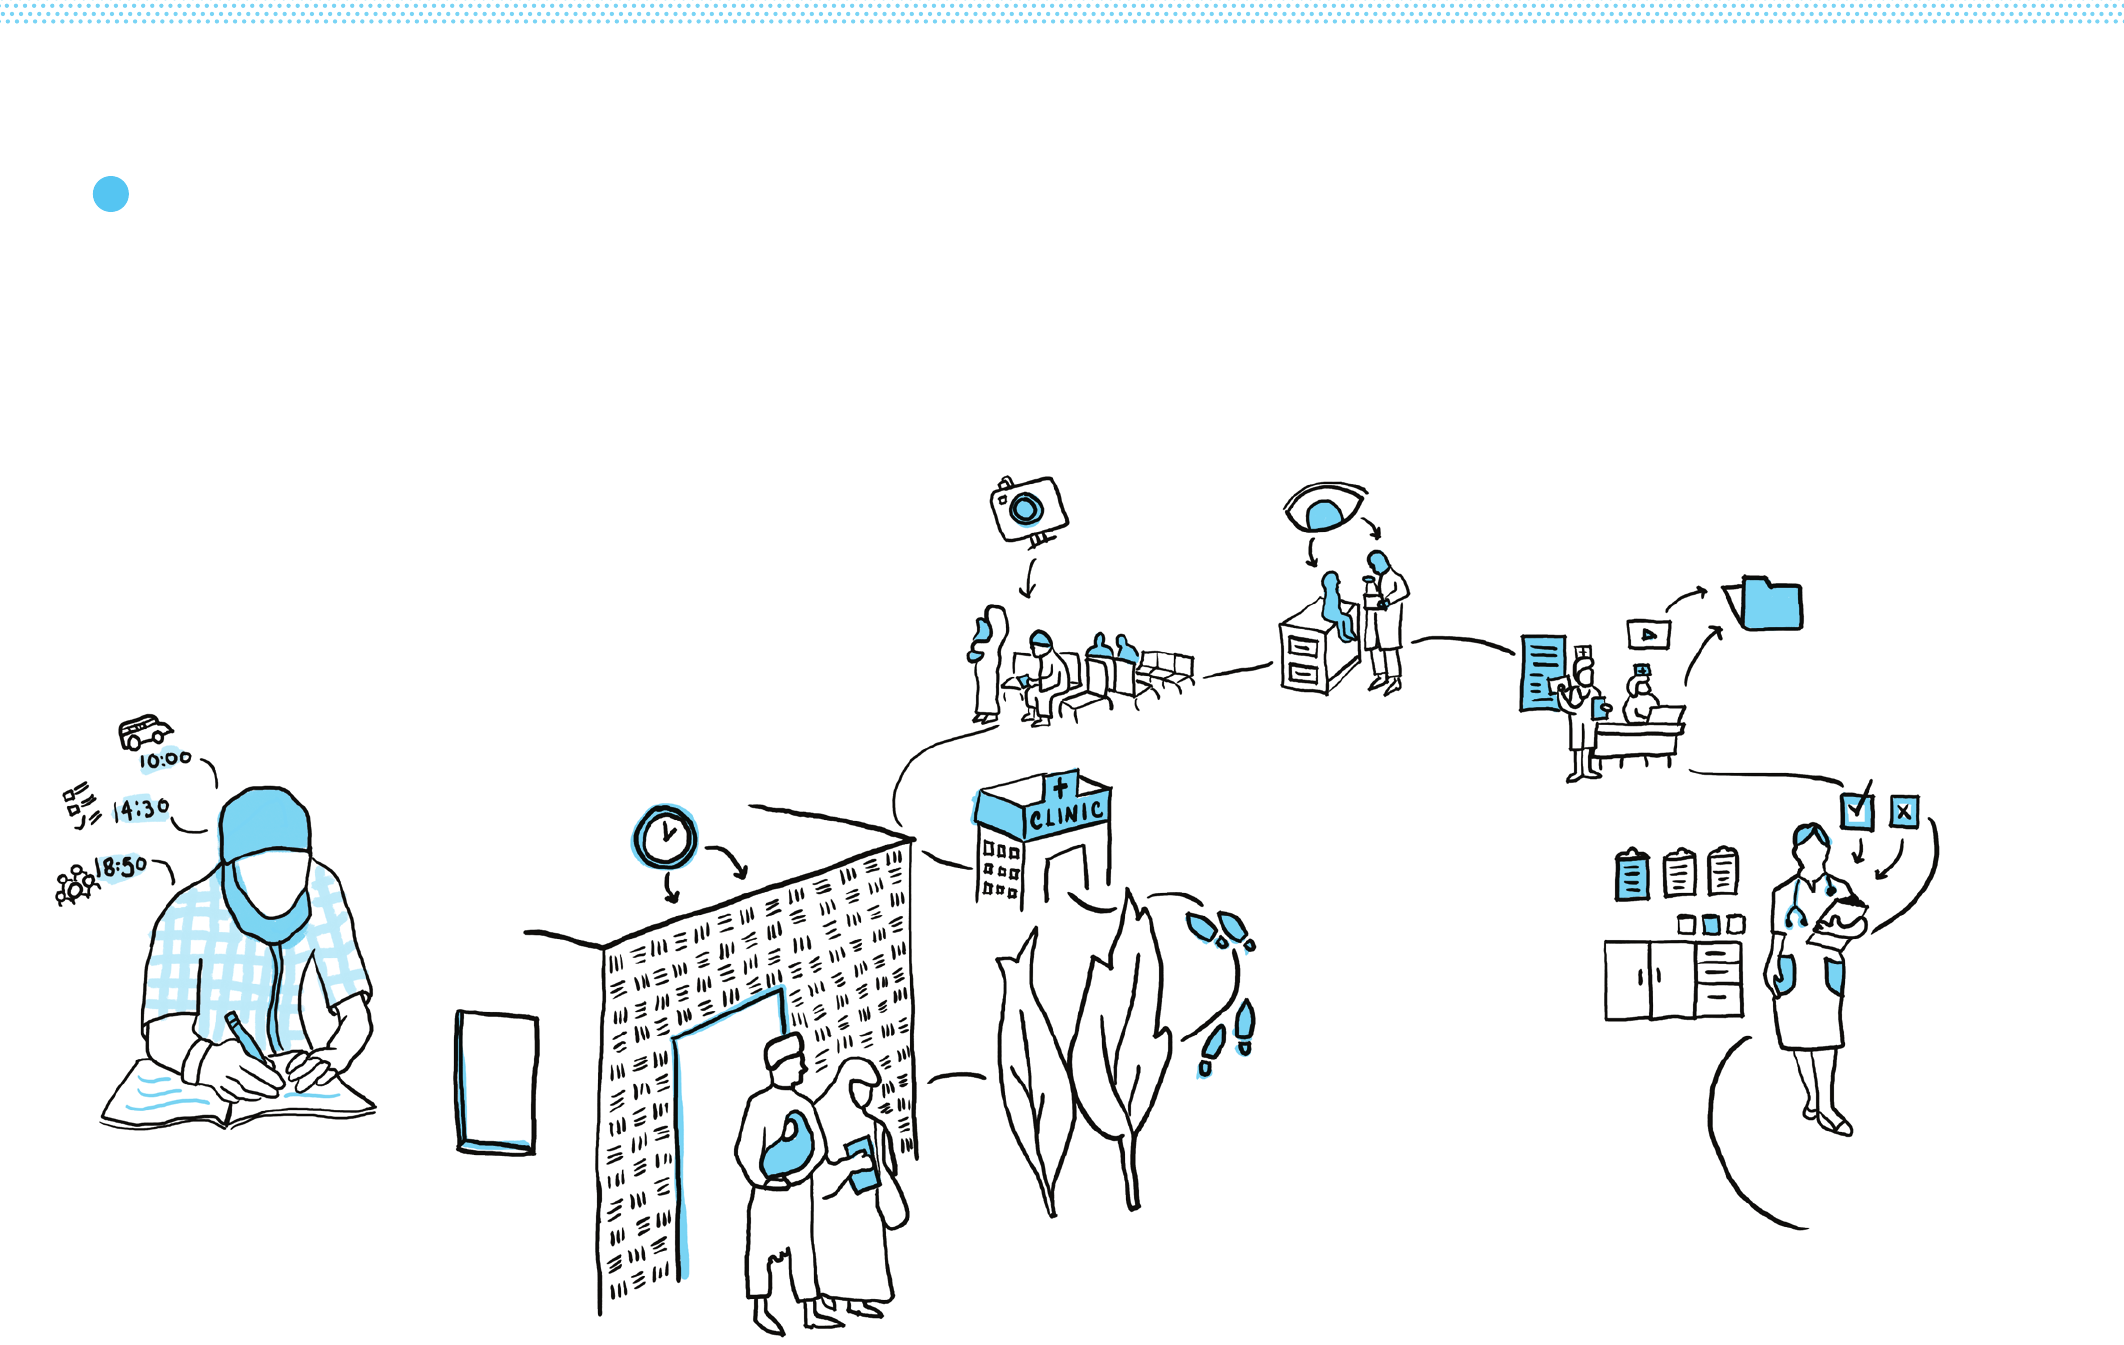
Home Visits
Developing deeper relationships
with a select user or group of users
through an immersive experience,
such as a full day at their home.
Artifact
Collection
Examining information
from materials, such
as investigating home-
based records or clinic
education materials.
Peer-to-peer
Observation
Involving users directly in observation,
such as by equipping health-care
workers with daily journal forms to
document what they observe and
find important throughout the day.
Non-
participant
Observation
Removing oneself from direct
observation and instead using
less intrusive mechanisms
to gather material, such as
by setting up a camera (like a
GoPro) in a clinic waiting room.
Research Methods: Observations
Collect information from the field about what may be impeding or facilitating immunization
outcomes among your user-group(s). Plan observations for multiple environments and balance
passive observation with experiencing users’ lives directly. Try to refrain from judgement based
on your own experience. The point of this research is to understand the experience of the user.
First-hand
Experience
Experience an event as the
user yourself. Move through a
clinic experience as though you
are a patient. Work alongside
a mother or health-care
worker for a day. Accompany
a caregiver on a clinic visit.
i
66 67
DEMAND FOR HEALTH SERVICES
Q3: WHAT STANDS IN OUR WAY? 3A: EXPLORE THE USER’S ENVIRONMENT

Interviews provide us with specific
events, not generalized statements.
For example, rather than just learning that
users are ‘too busy’ to get a vaccination, we
might learn that a user is indeed busy; and
that as a new mother, she feels overwhelmed
with new responsibilities. While she intends
to get her baby vaccinated, she is struggling
right now to focus on properly feeding and
clothing him. She sees these essentials as
taking priority. Once they are taken care of,
and she feels like she has more time, she will
get to the clinic.
This richer story goes beyond a generalized
statement, and gives us more to analyse:
there is a gap between intention and action;
the emotional stress of being a new mother is
causing her to defer taking action; and there
may be perceived or real opportunity costs
to seeking out vaccinations such as less time
to focus on survival essentials like clothing
and food. Later, it will be much easier to
brainstorm solutions for these detailed facets
of her story than to a generalized and abstract
problem like ‘busyness’.
Interviews establish empathy with
users and mitigate judgement.
Despite our best intentions, it is hard to
reserve judgement — even subconsciously.
When learning about ‘suboptimal decisions’
made by others we may imagine that we
would have made a better decision. Stories
help to mitigate that tendency by inviting
empathy. When we learn, for example, what
it feels like to be a new mother in a particular
context — the pressing details of her day, the
mercurial emotions of motherhood — it is
easier for us to engage in the imaginative
exercise of putting ourselves into her shoes.
Empathy helps us to design solutions
for others, not for ourselves. Solutions
influenced by what we would have done
in that situation will be different (and less
effective) than solutions influenced by a
visceral understanding of the capacities
and constraints facing the intended users
of immunization programmes. Whereas
judgement separates us from others’ lived
experiences, empathy helps us to appreciate
them. Gathering first-person narratives — in
users’ own words — helps get us there.
Lastly, there is an important caveat to
interviewing. While gathering stories is
important, this does not mean that we
should take all stories at face value. What
people believe and say is not always what
they do. Repeated observation of people in
context can help us to juxtapose stories to
what we see with our own eyes — which
is why comparing what we observe to the
stories we hear can be critical. Our next
step (3b: Interpret Collected Stories) will
help us determine what is really happening.
Interviews improve knowledge
transmission to our teams.
It is easier for our brains to remember
stories than numbers. Narratives are more
easily recalled, and so can be more easily
transmitted to others — and, in turn, more
easily acted upon. Imagine a bar graph
with ‘reasons for non-vaccination’ listed
across the x-axis: too busy, rude health
workers, and fear of side effects. Compare
that image to a storyboard of events as
recalled by a mother: how she planned to
go to the clinic that day; how she was asked
to watch over her neighbour’s children
instead; how she might have dragged
them along, but felt overwhelmed when
she imagined the chaotic waiting room of
the clinic. This is not to say the bar graph
is unnecessary; but it is not enough.
When it comes time to think about solutions
to the challenges faced by this mother in
an effort to get her child vaccinated, the
storyboard will help transmit empathic
knowledge to your team more than
numbers alone. Because narratives put
what we learn in context — because they
give meaning to otherwise abstracted
information — they help our teams to
make sense of what we see in the field.
Incorporating listening tools into our field research invites
users to tell us their stories. Open-ended questions in
particular unearth important information. Here are some
ways that open-ended questions produce new insights.
Research Methods: Interviews
i
68 69
DEMAND FOR HEALTH SERVICES
Q3: WHAT STANDS IN OUR WAY? 3A: EXPLORE THE USER’S ENVIRONMENT
Inviting users to share stories about their lives, their local
contexts, and their engagement with immunization systems,
we can complement our observations with a more ‘active’
form of inquiry. I know that without
vaccines my child may get
sick. But what if she also gets
sick from the the side eects? I
think that it would be worse if the
child became ill from the vaccine,
because that is my fault, then if
she became ill from the disease.
That would be nature’s
fault, not my own.
They tell us the
vaccines are free, but
that isn’t right. I had to
pay a fee before receiving
my child’s health card. I
didn’t know that was
going to happen.
They tell me that
vaccines will help my
entire community. But
why then isn’t my entire
community contributing
by getting their vaccines?
Once others do their
part, then I will, too.
I planned to take
my child for her next
vaccination, but this week
was very busy, and you
can never be sure that
the clinic is open.
The rumour about
that vaccine probably
is not true. But I have
heard it so many times
from so many people.
Vaccines are for
poorer children.
Our children do
not require them
as much.
It seems just as
likely that my child
will get sick with or
without the vaccine, so
why should I spend so
much time and money
at the clinic?
Some children have
gotten sick from that
disease, but I don’t think
my child will. Even if she
does, I will be able to
care for her.
I took my children
to the clinic for their
immunization because I
am a good mother. Other
good mothers in our
community get their
children vaccinated.
I was told that
vaccines will not
help to make my child
healthier now, only
later, so there is no
reason to go now.
I don’t think
that many of my
friends are taking their
children to the clinic as
much as they tell us we
should. It’s just too much.
I don’t think others
are doing it more
than me.
Story
Quotes
Research Methods: Interviews
i
70 71
DEMAND FOR HEALTH SERVICES
Q3: WHAT STANDS IN OUR WAY? 3A: EXPLORE THE USER’S ENVIRONMENT
Research Methods: Interviews
Interviewing should almost always be part of the research plan. Interviews collect what
people — caregivers, health-care workers, community leaders, families, communities — think
and feel, in their own words. Whenever possible, conduct interviews in the home of the
family, or a location where health services are offered.
i
Structured
interviews
These are scheduled and
deliberate conversations.
Use the Discussion Guide
(Tool #9) to ensure you are
probing the most important
topics consistently in each
interview so you have
points of comparison.
Photo
Documentation
This method allows users to self-
select what they find important.
Give them a basic camera and loose
instructions (example: take pictures
of what makes her think of ‘health’)
to gain an intimate perspective—
and draw out more stories.
Show and Tell
User-guided tours allow users
to show their environment and
share their experiences within
them. For example, a health-care
worker might walk you through
a clinic. Combining a guided tour
with informal interviews can
prompt users to share stories
when cued by their context.
Card Sorting
This method can be used as an
activity within an interview. It
provides a hands-on way to engage
users and allow them to share their
perspective through non-verbal
means. By using simple pictures
or illustrations on index cards,
users can sort processes they
experience or desire (a sequence
of events) or rank preferences
(their priorities for the week).*
For more on card sorting methods, see The Field
Guide to Human-Centred Design by Ideo.org.
Informal
interviews
This style of interview is
helpful to familiarize oneself
with the environment and build
rapport with users. These
conversations can be conducted
as an exploratory prerequisite
to structured interviews.
72 73
DEMAND FOR HEALTH SERVICES
Q3: WHAT STANDS IN OUR WAY? 3A: EXPLORE THE USER’S ENVIRONMENT

KAP (knowledge, attitudes, and practices)
surveys are an attractive approach to
investigate health-related behaviours for a
number of understandable reasons: the
data are quantifiable and thus perceptively
rigorous; findings can be generalized to a
larger population beyond those surveyed;
and the methods for execution are well
known and so more easily implemented.
However, despite the comfort of obtaining
hard numbers, KAP surveys face considerable
limitations, especially when it comes
to obtaining nuanced understandings of
behaviours and the environments that
shape them. This page presents common
challenges to interpreting quantitative data.
Knowledge and Behaviour
An emphasis on assessing knowledge can
falsely presuppose a direct relationship
between knowledge and behaviour.37
For example, a KAP survey finding that
respondents generally have a low level
of knowledge regarding the link between
certain symptoms and a disease might
presuppose that this has a direct influence on
health-seeking behaviour — that insufficient
knowledge will impair desirable outcomes.
However, this may not be the case; the
relationship between knowledge and
behaviour is often counterintuitive and indirect.
Measuring Attitudes
Here are some ways that survey responses
may fail to accurately measure attitudes:38
1) People tend to provide answers
they think are correct or which they
think the researcher wants to hear,
regardless of their true attitudes.
2) When people have no opinion they
may feel compelled to invent one.
3) Social norms may lead
respondents to modify responses
in order to appear acceptable.
4) Respondents tend to change their
responses to make contradictions
appear consistent.
We need to consider these constraints
before assuming that quantitative data
can accurately measure attitudes.
Past Practices
Asking respondents to report past events,
such as decisions they made or thoughts
they had in previous situations, can
assume an outsized ability among people
to accurately recall information.39 For
example, when asking a respondent about
the symptoms experienced during an
illness and the subsequent health-seeking
Research Methods:
Knowledge, Attitudes and Practices
Challenges to Interpreting Quantitative Data
37 Yoder (1997), ‘Negotiating Relevance: Belief, knowledge, and practice in international health projects’.
38 Podsakoff, et al. (2003), ‘Common Method Biases in Behavioural Research: A critical review of the literature and recommended remedies.’
39 Hassan (2005), ‘Recall Bias can be a Threat to Retrospective and Prospective Research Designs’.
40 Bernard et al (1984), ‘The Problem of Informant Accuracy: The validity of retrospective data’.
41 Pelto and Pelto (1997), ‘Studying knowledge, culture, and behaviour in applied medical anthropology’.
42 Launiala (2009), ‘How much can a KAP survey tell us about people’s knowledge, attitudes and practices? Some observations from
medical anthropology research on malaria in pregnancy in Malawi’.
43 Podsakoff, et al. (2003), ‘Common Method Biases in Behavioural Research: A critical review of the literature and recommended remedies.’
behaviour demonstrated, the responses
provided will likely be impaired by imperfect
informant accuracy.40 An over-reliance
on memory of past practices can lead
to compromised retrospective data.
Descriptive Data
Perhaps most critically, KAP surveys — as with
most survey instruments — can be helpful in
assessing people’s general understanding
of local practices, but are much less capable
of teasing out the logic behind respondents’
behaviours.41 In other words, KAP surveys
can give us lots of descriptive data, but
are less capable of providing explanatory
data. The implicit risk here is the use of KAP
surveys to determine the reasons behind
behaviours, rather than acknowledge the
limitations of such survey instruments.
Stated versus Actual
Surveys may reveal misalignment between
statements and facts. In one example, a
researcher recorded positive attitudes
towards an antenatal clinic’s services through
a KAP survey, and then vocal criticism of
that same clinic during in-depth interviews.42
The illustration is an example of courtesy
bias, where respondents produce answers
that they think the researchers want to
hear. Other issues, such as the difficulty of
obtaining veracious opinions on sensitive
topics, can also skew findings.43 Awareness
of potential misalignments will help to
interpret survey findings more accurately.
“The most important aspects of a situation are not necessarily those
which can be readily quantified… However, quite often the appeal
of quantification derives from the unfounded belief that the process
of quantification itself can promise or ensure precision, intelligibility,
reliability and concreteness. Of course, it does nothing of the sort;
quantification often involves a large measure of abstraction.”
Bauer, P. T. (1972), Dissent on Development: Studies and debates in development economics
i
74 75
DEMAND FOR HEALTH SERVICES
Q3: WHAT STANDS IN OUR WAY? 3A: EXPLORE THE USER’S ENVIRONMENT

ii Develop a Research Plan Research Plan Template
Observations
Where to Use
Choose a place where you can have an
experience that is relevant to your challenge.
Clinics, homes, transportation to and from
health centres, community centres, trusted
religious or spiritual centres are all potential
places for observation. Think about the daily
journey of your user — what places do they
touch along the way?
How to Use
Choose which activities will help you learn:
• Observing mothers and
families, experts, or clinics
• Shadowing mothers, caregivers, health-care
workers, or community health workers
• Co-create with the community, learning
from peer-to-peer observation
Interviews
Where to Use
Whenever possible, conduct interviews
in the home of the family, or a location
where health services are offered.
How to Use
• Describe the people you want to meet:
How are these people distinct? Who else
is part of their life that you can learn from?
• Select research participants: Talk with your
team, colleagues and partners to help locate
the contact the types of people you want to
speak with. Send an email describing what
you are looking for, post in a common area,
or reach out to a community leader for help.
• Develop a discussion guide but allow
for spontaneity (see page 78).
• Include interactive activities for
interviewees who may be reluctant to
share openly with open-ended questions.
How Many?
The difficult question for research is: how
much is enough? We are not trying (at
least immediately) to find a representative
group whose behaviours reliably can be
generalized to the entire population. We
are trying to solve for a distinct group
within a population — the prioritized user-
group — so the number we start with will
be small. We cannot give you an exact
number of interviews or observances,
but we can give some guidelines:
• Talk to more than one subgroup and
visit more than one location.
• Visit enough locations or speak to
enough people that you start to
recognise patterns — if you only see
or hear it once, it is anecdotal.
• There is no magical number, but talking
to seven people is a good rule to have
diversity of perspectives, but also
be able to draw commonalities.
Plan Your Interviews Plan Your Observations
Prioritized Users In the Home / Community
shadowing, peer-to-peer, first-hand experience
Adjacent Users Type A
Adjacent Users Type B
At a Care Facility
shadowing, peer-to-peer, first-hand experience
At a Religious/Influential Location
shadowing, peer-to-peer, first-hand experience
1 1
4 4
66
2 2
5 5
77
3 3
76 77
DEMAND FOR HEALTH SERVICES
Q3: WHAT STANDS IN OUR WAY? 3A: EXPLORE THE USER’S ENVIRONMENT

Express Gratitude!
Introduce Yourself
Start Specific
Go Broad
1
1
2
2
3
3
4
Concentrate on the Interest Areas:Try an Activity
Tell me a bit about yourself. Where do you
live? Where are you from? What do you do?
Can you show me how you...? Send me three
pictures of when you feel (x)... Sort these
cards in order of importance to (x)... Think
aloud as you perform (x) process or task
Tell me about a time when... What are
the best/worst parts about…? Can you
help me understand more about…?
Take me through a typical day... Where
do you get your information on...? What
work-arounds have you found for...?
Develop a Research Plan:
Discussion Guide
Having a good conversation with a stranger
is not always easy. You have to help the
person feel comfortable and build trust
while collecting relevant information. To
manage this delicate balance, prepare a
discussion guide to serve as an outline
for your conversation — a checklist to
ensure you have covered everything.
The exact order of the questions may change
to accommodate the natural flow of each
conversation. All questions in the guide
should be followed up with probing questions
such as “Why?” or “How?” or “In what way?”
Identify topics
As a team, brainstorm themes you want
to learn about in your conversations
with research participants.
• What do you need to learn
about your challenge?
• What are you hoping to understand about
people’s motivations and frustrations?
• What do you want to learn about their
activities? Network? Habits? Beliefs?
Write questions
Write questions that are broad enough
to encompass the experience of many
perspectives. Frame them as open-
ended questions (avoid questions with
a “yes” or “no” answer) that invite
discussion of their experiences, such as:
• Tell me about a time when...
• What are the best/worst parts about…?
• Can you help me understand more about…?
• Take me through a typical day...
• Where do you get your information on...?
• What work-arounds have you found for...?
Include interactive activities
Activities are fun, interactive and can help
uncover the behavioural information you
are looking for when interviewees are
reluctant to share openly. Consider asking:
• Can you show me how you...?
• Send me three pictures of
when you feel (x)...
• Sort these cards in order of
importance to (x)...
• Think aloud as you perform
(x) process or task
Organise the order
• Introduce yourself: Explain what
you are doing, and reassure that you
are not here to judge the person.
• Start specific: Begin with questions your
participants are comfortable answering.
• Try an activity: Activities are a great
warm-up, so if they are part of your
plan, put them towards the beginning.
• Go broad: Ask more profound questions
about hopes, fears and objectives.
• Concentrate on the interest areas:
Explore your challenge or any interesting
theme you picked up on during the
conversation in more depth.
• Close the conversation: Always thank
the interviewee for his or her contribution.
ii
78 79
DEMAND FOR HEALTH SERVICES
Q3: WHAT STANDS IN OUR WAY? 3A: EXPLORE THE USER’S ENVIRONMENT
Conduct Field Research
Conducting
Interviews
• Interview in pairs (alone can be hard,
the entire team can be intimidating).
• Assign roles: one person leads the
conversation and reads the participants’
body language/facial expressions, the
other takes careful notes (get word-
for-word quotes where possible).
• If possible, take photographs. Remember
to ask permission before taking any photos.
• Hold the interview in a place with
minimal distractions or interruptions.
• Allow interviewees to share incorrect
answers, it does not matter who is
right, it matters what they believe.
• Do not make the interview about
you — even if you identify with stories
the interviewee is sharing. Build rapport
without dominating the conversation. Any
judgement, including positive or negative
reinforcement, can influence responses.
Exploring and
Observing
• Explore and take notes — try to blend in
with everyone else during your observation.
• Find a spot that is out of the way.
• Take notes and photos (ask
permission where appropriate).
• Capture interesting quotes (and the
context in which you hear them).
• Draw sketches, plans and layouts
(patient or health-care worker/
community health worker journeys).
• Look for interactions between people,
and between objects, instructions
and people (key experiences
and how they are created).
• Collect objects that facilitate activities,
experiences and interactions.
iii
Conducting research requires that we leave
our world behind, and become sponge-like
inside the environment, home, community
or health centre of our user. This acclimation
requires a few general preparations:
• Make sure you are not interested in a
particular outcome before you start. If we
know what we want to see or hear, we can
convince ourselves that we saw or heard
it. Be curious and inquisitive without an
agenda. If you feel you have an agenda or
expected outcome, share this with your
team when drawing-out your assumptions.
• Have your team meet somewhere
that is not where you will interview or
observe users. This ensures you are
prepared, gives you time to review
the most important questions you
have left to answer, and transitions
you into a research-ready mindset.
• We want to know about their lives.
Make sure you are aware of the social
expectations and customs in the region
where you are conducting research.
80 81
DEMAND FOR HEALTH SERVICES
Q3: WHAT STANDS IN OUR WAY? 3A: EXPLORE THE USER’S ENVIRONMENT

After each day interview, quickly synthesize and record the information you have
gathered as an empathy map — what the interviewee is thinking, feeling, seeing,
doing and saying. This serves two key purposes: it ensures that important details
are not forgotten and helps guide what you are looking for during interviews.
Record Field Research: Interviews
iv
Name
Date
Saying
5 memorable
quotes
Feeling
3 frustrations/
motivations they
were feeling:
Doing
4 recent actions
they took:
Thinking
2 things they might
have been thinking:
Describe setting Seeing: Describe setting
After each day of field research, quickly synthesize and record the information
you have gathered — what you observed people seeing, doing and saying. This
serves two key purposes: it ensures that important details are not forgotten
and helps guide what you are looking for during additional research.
Record Field Research: Observations
iv
4 Moments that stood out:
5 Observations
What are people doing in this situation? How are people
doing this? Why might they be doing it this way?
3 Things that were
new or surprising:
2 Things that felt familiar:
1 Way we could help our prioritized user-group:
82 83
DEMAND FOR HEALTH SERVICES
Q3: WHAT STANDS IN OUR WAY? 3A: EXPLORE THE USER’S ENVIRONMENT

Our next task is to make sense of what we saw during
our observations and what we heard in the stories we
collected—in other words, to interpret our field research.
If seeing and listening are about using a judgement-free
lens to take stock of environments and the ways in which
users behave within them, interpretation is about critically
analysing what we gathered.
The purpose of interpreting is to move from seeing “what
exists” to establishing “what this means.” This process will
lead us to articulate insights that capture the underlying
challenges facing users and what is standing in the way of
our programme objective.
Interpret Collected
Stories
3b
Analyse key findings to hypothesize
why this is happening. Call-out patterns,
surprises and commonalities.
Choose the most important to consolidate
into prioritized pieces of information.
Hypothesize: Ask yourself why
this is happening, drawing from
research and educated guesses.
Debate: Can we prove ourselves
wrong? What might we have
overlooked? Misinterpreted?
Revisit and Finalize: Articulate final
diagnosis succinctly to help teams make
sense of what was gathered in the field.
Share information from the field to help
everyone internalize what you observed.
Use creative presentation methods
that help close the empathy gap.
i: Share User Stories
ii: Identify Important Information
iii: Diagnose the Underlying Causes
Theme 1
Theme 2 Theme 3
There are three steps to interpreting the information we gathered from the field:
84 85
DEMAND FOR HEALTH SERVICES
Q3: WHAT STANDS IN OUR WAY? 3A: INTERPRET COLLECTED STORIES

There are many methods for sharing what
you learned with your team members. The
presentation method allows colleagues
to passively receive information. The
interactive method walks colleagues
through a storyboard of events as recounted
by a user; asking them to view a wall of
pictures you snapped of a user’s lived
environment; inviting them to listen to an
audio recording of the crying babies and
shouting physicians in a clinic waiting room.
We prefer the latter method. While the
techniques for inviting team members into
the worlds of our intended users is vast,
what the effective ones share is a examples
of the concrete over the abstract.
For example, video clips of a chaotic
afternoon at a clinic can help team
members empathize with a mother who
was reluctant to bring her children there.
Rather than only share with colleagues
that “moms complain about the clinic
because it’s stressful,” this helps team
members to viscerally understand why.
Sharing should be a fun — and even
playful — team activity. Tell from the
user’s experience and viewpoint, not
judging from how you think they should
behave or what you want them to do.
Tool
Using notes from Record Field Research
along with material gathered from the
field, transcribe what you have seen and
heard in the field to your team members.
Sharing stories allows you to bring the
context of the user with you throughout
the rest of the process, ensuring you are
designing a solution that is addressed to
them. Rely as much on ‘sensory’ sharing
as possible—use visuals of the location or
person. Sample share back activities include:
Presentation: Set up a slideshow to
share photographs and quotes from
the field. Remember to keep it based
on observations and stories, without
including your opinions (yet).
Gallery Walk: Place large printed
photographs taken in the field around a
room. Each picture should communicate
something notable you / your team observed.
Storyboards: Draw simple storyboards to
walk your team through a story, a setting,
or a process you observed. Look at the
event through a user’s perspective.
Video or Audio Share: Did you capture
any audio or video in the field? Maybe
you set up a camera (example: GoPro)
to capture daily movement through an
environment. Sharing these assets can help
to transport team members to the field.
Share User Stories
Sharing our material from the field is an exercise in
transmission. As with any piece of communication,
information has the potential to be transmitted
eectively or ineectively.
Environment
What you noticed about their home,
community, or work place.
Connections and Relations
People and organizations
they are connected to.
Objects
Physical and digital objects they use.
Portrait / Images
Attach Photographs Here
Their Story
Who are they? What type of
user do they represent?
Quote
What was the most memorable
thing they said?
i
86 87
DEMAND FOR HEALTH SERVICES
Q3: WHAT STANDS IN OUR WAY? 3A: INTERPRET COLLECTED STORIES

It is possible that we’ll overlook important
pieces of information. Unfortunately,
sometimes those realizations come as
we implement and observe our ideas in
the field (more on that in Question 5). But
we try our best to identify what matters
most. With the information you laid out
during ‘Share User Stories,’ you are in a
position to mark the information that is
surprising, familiar from other contexts, or
suggests a pattern. These themes are likely
to be the most important information.
First, what surprises you should not be
relegated as ‘just’ an anomaly; it may be
tempting to disregard surprising information,
principally because it might not fit with what
we think we know about the challenge.
Second, if you saw something in other
contexts, it is possible that you are seeing
a well-observed, common challenge of
immunization programmes. And lastly,
spotting a recurring theme — a pattern across
multiple observations and stories — suggests
a behaviour that is not an aberration, but
instead one that is being shaped by an
environment affecting many users.
As with ‘Share User Stories,’ the ‘Identify
Important Information’ process can take
many forms. We recommend following
a general principle: allow for both group
and individual analysis. Group analysis
can look something like this: after sharing
your field observations and stories, ask
colleagues to write down on sticky notes
what surprised them, what reminded
them of past observations (in this or
other contexts), and what jumped out
as patterned. (These are the same three
criteria listed above.) Grouping the sticky
notes by common themes on a wall can
provide a quick visualization of what
collectively appeared to the group.
Group exercises like this can be preceded
by more individual reflection on the
information presented. Allowing colleagues
time to independently analyse what you
shared widens the scope of what the
team might find important. It curtails our
tendency to focus too quickly and achieve
a group consensus on what is important.
After independent analysis, invite team
members to share their interpretations
of what seemed important and why.
The ‘Identify Important Information’ process
should conclude with a synthesized list of
surprises that stuck out, commonalities
from this or other contexts, and patterns
in the research. You will end this step
with the perspectives of an entire group
regarding what might be most important
from your user research. Rather than simply
reflecting on your own research, putting
the information you gathered in front of
others broadens the scope of inquiry.
It is now up to you to reflect on what
information has been prioritized and isolate
what you believe to be the most important
themes. For example, maybe a common
pattern identified by your team during an
‘Identify Important Information’ exercise
was the persistence of an intention-action
gap: that mothers consistently self-reported
their belief in the value of vaccines and
want to access them, but seem to defer
the action to an undefined later date.
Place the most important
themes emerging from field
research in your Field Notes
Map next to the learning goal
and assumptions they address.
During ‘Identify
Important Information’,
we face a key risk:
the tendency to assign too much
importance to the wrong information.
Consider, for example, research conducted
in Mozambique. In both surveys and focus
group discussions, researchers discovered
that a portion of the population held
misconceptions about vaccinations, or
a “general lack of accurate knowledge.”
Mothers stated that vaccines cure disease,
that it is dangerous to vaccinate a sick
child, and that receiving more than one
vaccine in a day can be dangerous.
If evaluating this information on its own,
it may be tempting to make an erroneous
conclusion: these misconceptions
negatively influence immunization
outcomes. However, the researchers
also found that in some areas, where
misconceptions were more prevalent,
immunization coverage was actually higher.
By contrasting these findings to other pieces
of information — for example, first-hand
accounts that “virtually every mother”
wants to have her child “completely
vaccinated”— researchers were careful
to not give disproportionate value to an
observation’s importance. Instead, they
found that the “overwhelming barrier for
mothers who have never had their child
vaccinated was... distance to services.”44
44 Sheldon and Alons (2003), ‘A Study to Describe Barriers to
Childhood Vaccination in Mozambique’.
Identify Important Information in Stories
Mistaking
the Value
of Data
Identifying what matters asks that we prioritize what we just
shared. It requires that we make informed but nonetheless
subjective judgements about what information we think is
important and what we’ll choose to focus on.
FN
ii
88 89
DEMAND FOR HEALTH SERVICES
Q3: WHAT STANDS IN OUR WAY? 3A: INTERPRET COLLECTED STORIES
Source
Caregivers speak consistently
about both the source of the
vaccines and the sources of
information behind vaccines;
they are assigning importance
to where vaccines are
made and questioning the
veracity of what health-care
workers are telling them.
Familiarity
Most caregivers can recite
a similar rumour about a
new vaccination causing
illness, suggesting broad
familiarity with a repeated
story; at the same time,
caregivers deny the rumour’s
plausibility in interviews.
Deferral
Non-vaccinating caregivers
affirm the importance
of immunization but are
continually pushing the task
into the future; they express
immunization’s benefits in
abstract and general terms,
and the costs in specific
and concrete terms.
Independent Analysis
After (or during) ‘Share User Stories,’
individual team members should note
important information — one thought per
sticky note — according to the Criteria
for Important Information below.
Group Analysis
and Generation
Share Sticky notes from the Independent
Analysis in small groups. Use each other’s
sticky notes to generate additional notes
about what seemed important (refrain
from criticizing what others share).
Cluster Themes
Group the sticky notes by common
theme on a wall— what collectively
stood out to the group?
Example ThemesCriteria for Important Information
Add final themes to your
Field Notes Map next to the
learning goal and assumption(s)
they respond to.
FN
Identify Important Information in Stories
Isolate the most important pieces of
information from ‘Share User Stories’ and
cluster into themes. These themes will be
further investigated during ‘Diagnose the
Underlying Causes.’ Consider sharing user
stories and identifying important information
during the same team work session.
Surprise:
Does the information cause
you to raise an eyebrow?
Familiar:
Have you seen this before
in other contexts?
Patterns:
Are there recurrences you spot
across stories and observations?
ii
90 91
DEMAND FOR HEALTH SERVICES
Q3: WHAT STANDS IN OUR WAY? 3A: INTERPRET COLLECTED STORIES

We shared what saw and heard in the field — and forced
ourselves to identify the information that seems most
important. Diagnoses ask us to hypothesize why the
obstacles we identified exist.
Generating hypotheses is the most challenging step, prone
to assumptions and error. Moving through a rigorous process
will ensure we are fully and accurately investigating the
underlying causes.
Diagnosing requires that we develop viable hypotheses
about what is going on in the field; referencing evidence
from user research that works to either help validate or
reconsider those hypotheses before we articulate them as
final diagnoses.
Your Field Notes Map now includes
themes from field research. You will
begin to speculate about the causes that
shape the obstacles you identified.
Example:
Suppose you learned in the field that most
mothers really want to get their children
vaccinated. Nearly every mother you speak
with tells you exactly that and appears to
mean it. There is a strong stated intention.
When asked during a group discussion,
mothers could recite the general benefits
of vaccines and definitively affirm that
they want their children fully immunized.
During one-on-one interviews in mothers’
homes, you collected information about
their practical knowledge, such as where
the clinic is located and when their next
appointment is. A pattern soon emerged:
among mothers with under-vaccinated
children; most eagerly agreed that vaccines
were important, but could not accurately
recite when and where they were due
for their next appointment. By contrast,
mothers whose children were fully up to
date could recite that information, or they
were able to easily look it up in their personal
records. It would seem that this practical
piece of information separated those who
got immunized from those who did not.
Theme 1: Most mothers are aware
of immunization benefits and intend
to vaccinate their children.
Theme 2: Mothers with under-vaccinated
children cannot remember when and
where the next appointment occurs.
Hypothesis #1: The intention-to-action gap
is widest with mothers who lack the mind
space to keep track of appointments.
Hypothesis #2: Lack of practical knowledge
around appointment times might be what
is keeping mothers from fully vaccinating.
Diagnose the Underlying Causes Hypothesize
Developing a hypothesis is a combination of using
evidence gathered from the field along with educated
guesses about causal factors. There may be multiple causes
behind a single obstacle, and therefore multiple hypotheses.
Strong diagnoses are argu-
ably the most important —
and most challenging — phase
of interpretation. Determining the most
probable cause of challenges facing users
is the strongest link between research and
interventions. Without sufficient diagno-
ses, interventions may rely on mistaken
speculation. Unfortunately, taking the time
to form thoughtful diagnoses is rare.
This is understandable. In much of the
day-to-day work of those involved with
immunization programmes, situations
arise and we are called upon to act quickly.
From an unexpected outbreak to the roll-
out of a new vaccine, we are sometimes
compelled to bypass considered diagnoses
in favour of speedy implementation.
We may also face administrative con-
straints. Programme planning may not
permit empathic user research. Too often,
conducting thorough analysis feels like
a luxury. However, finding the time and
permission to engage in the diagnostics
process will undoubtedly lead to more
effective (and less wasteful) interventions.
Finding
the Time
iii
92 93
DEMAND FOR HEALTH SERVICES
Q3: WHAT STANDS IN OUR WAY? 3A: INTERPRET COLLECTED STORIES
Debating is the process of stress-testing
our initial hypotheses by finding competing
and affirming pieces of information
from our research. By the end of this
exercise, you should be able to (1) dismiss
initial hypotheses that do not hold up
to more scrutiny, and/or (2) refine what
you have with additional evidence.
Continued Example:
Let us bring the previous hypothetical
diagnosis into question. What other
information might have been gathered
that could contradict — or at least
modify — the conclusion we came to?
Consider the fact that mothers were
asked about their beliefs and intentions
in a group setting: in front of their peers,
they collectively agreed that vaccinations
were good, and that they wanted to get
their children immunized. But perhaps they
would have given different answers out of
sight of their peers? Maybe some could
not remember when and where to go for
their child’s next vaccine because they had
already decided not to go, and so did not
bother with those unnecessary details?
Going back out into the field, we set up
one-on-one, private conversations with
mothers. During our at-home visits, we ask
about any concerns they have regarding
vaccinations. A few mothers say that they
are a bit nervous about their child getting
too many vaccines, especially in the same
day. This is mentioned inconsistently among
them. We also follow up on the practical
information: we ask to look at their health
cards and find that the information is right
there, but neither we nor the mothers can
read it. The date, time, and place scribbled
by the health-care worker is illegible.
We ask the mothers why this information
was not clarified at the clinic. It becomes
clear that if they asked the health-care
workers for clearer information, they
might have been scolded. Or worse,
these proud mothers may have risked
seeming illiterate. During our interviews,
none seemed particularly willing to
follow up when information given to
them at the clinic was not clear.
Additional Factor 1: Answers about beliefs
and intentions were given in a group setting.
New Evidence (individual conversations):
Conversations only uncover additional
concerns about too many vaccinations; other
answers consistent with group responses.
Additional Factor 2: Inability to remember
appointment times may be the result of
not wanting to vaccinate, not the cause.
New Evidence (individual conversations):
Appointment information is present
but illegible and mothers are averse
to confirming the information.
This last exercise should yield an improved
diagnosis for each of the themes we
placed in our Field Notes Map.
A stress-tested hypothesis has
allowed us to create a more
refined and insightful diagnosis.
Capture each of your diagnoses
in the Field Notes Map.
Continued Example:
Our initial hypothesis seems to have been
on the right track; the additional evidence we
gathered now serves to make it stronger.
We acknowledge that other variables may
be at play, such as concerns regarding
multiple vaccinations. However, it seems
possible that such a strong social norm
contributing to immunization might mitigate
that concern; it appears unlikely that it
plays a significant role in preventing full
immunization. What appears more likely
is that the key pattern separating the
fully from not fully immunized — a lack of
practical knowledge around appointment
times — is creating a significant barrier
separating intention from action. We can
articulate a newly improved diagnosis.
Improved Diagnosis: Missing pieces of
practical knowledge about the when and
the where of a next appointment, created
by variables as minor as illegible health-
care worker handwriting and caregivers too
nervous to clarify, is preventing mothers
from following through on their intentions.
RevisitDebate
With this new information, we have a dierent perspective.
We revisit our initial hypotheses to rethink and rewrite as
final diagnoses.
Debating our diagnosis is not about arguing among team
members. Instead, debating is about trying to prove
ourselves wrong. What might we have overlooked?
Misinterpreted? Neglected to ask about entirely?
FN
94 95
DEMAND FOR HEALTH SERVICES
Q3: WHAT STANDS IN OUR WAY? 3A: INTERPRET COLLECTED STORIES

Hypothesis are iterative,
and may require additional
research to validate.
Suppose we observed ‘refusal’ by a group of
users — caregivers who were not engaging
with immunization services. Through
interviews, we gathered stories about how
mothers were not getting their children
vaccinated because the vaccines, they
heard, were coming from a non-Western
country. A possible hypothesis might be
that a lack of trust in producers of vaccines
(‘performance trust’) was leading to refusal.
To stress-test that hypothesis we went
back out into the field. Instead of just
interviewing users this time, we also spoke
to nurses and doctors, all of whom shared
that mothers were indeed coming to the
clinic. In fact, many were asking lots of
questions about the source of vaccines.
When the clinicians strongly affirmed that
the vaccines were effective, some mothers
acquiesced and some mothers did not.
In this case, it would be appropriate to refine
our hypothesis. Mothers trekking to the
clinic, asking lots of questions, and some
making a new decision — such observations
suggest that these potential users are not
really hard-line ‘refusers’ at all. In fact, it
would seem there is quite a lot of room
for persuasion. By all accounts, they are
demonstrating normal information-seeking
behaviours. As opposed to pinpointing ‘lack
of trust’ as the singular hypothesis, it is
more likely that conflicting information is
causing a form of decision-making paralysis.
Ambiguity and conflicting information
have the tendency to incline people
toward inaction: it is much easier to avoid
a decision when the information you have
gathered seems unclear or inconclusive.
Had we kept the initial hypothesis, we
may have been careful not to flood the
community with vaccine efficacy messages.
With hardline refusers, we would risk
a ‘backfire effect’. But now that our
hypothesis suggests a slightly different
scenario, we could very well test out a
communications campaign that makes the
efficacy of vaccines the dominant piece
of information mothers’ receive. Iterative
hypotheses will yield improved solutions.
Sometimes, additional research will
refine a hypothesis, as with the situation
above. In other instances, new research
might reverse our hypothesis. Either
way, hypotheses should be considered
iterative. Making observations is one
thing — they are empirical. But inferring
the underlying causes of what we are
observing leaves open ample room for
reconsidering and improving our hypotheses.
Diagnoses should be mindful of over-
reliance on past research and events.
In the Democratic Republic of the Congo,
past research has highlighted the prevalence
of “rumours and false religious beliefs”
as a reason for “mothers’ resistance”
to vaccinations, particularly among
hard-to-reach populations. For example,
one piece of research found that:
• “[A] a pastor wrongly told his community
that the cases of polio… were caused by
the poor quality of the anti-polio vaccine.”
• “For some religious followers… the
‘vaccine is a spirit of the devil and only God
can immunize with the blood of Christ.’”
• “For others, AFP [acute flaccid
paralysis] are caused by witchcraft
and not by disease.”45
These findings may still hold true; they
also may be outdated, or perhaps not
as relevant to decision-making as they
once were among community members.
When engaging in a fresh diagnostics
exercise, including past research can be
helpful. However, it is critically important
that such knowledge (1) is not outdated:
perhaps these beliefs are no longer
widespread; and (2) if still relevant, is not
over-emphasized: perhaps these beliefs
still persist, but have little bearing on user
behaviour (see ‘Challenges to Interpreting
Qualitative Data’ on pages 74-75).
In many cases, teams working in a certain
context have been working there for a
long time. There is deep knowledge, a
history of past projects, and many lessons
learned. Separating what is helpful from
existing knowledge from what might
put the current diagnoses at risk is a key
challenge. It may be helpful to return to
your Assumption Catalogue (page 51).
A diagnosis focuses on a why a
user is or is not acting, not on the
presence or absence of an action.
Effective diagnoses suggest a reason for
the persistence of a problem, not simply the
absence of a solution. This may sound like
splitting hairs, but the distinction matters.
For example, we might know that clinics in a
given district have less well-trained health-
care workers than in others. A tempting
diagnosis could be “a lack of well-trained
health-care workers impedes vaccination
rates.” But this ‘absence’ says nothing
about a persistent problem as it relates to
users; moreover, it also presupposes an
appropriate solution (health-care training).
Consider this alternative based on
hypothetical information: “When caregivers
become frustrated because their questions
are not answered by health-care workers,
they do not return to complete their
immunization course.” This diagnosis does
not jump to an absent solution (trained
health-care workers). Instead, its emphasis
is exclusively on the challenge facing the
user and the possible reason behind it.
Tips for Diagnoses
45 Communication for Immunization and Polio Eradication in the Democratic Republic of the Congo: A joint case study by BASICS,
WHO and UNICEF (1999).
iii
96 97
DEMAND FOR HEALTH SERVICES
Q3: WHAT STANDS IN OUR WAY? 3A: INTERPRET COLLECTED STORIES
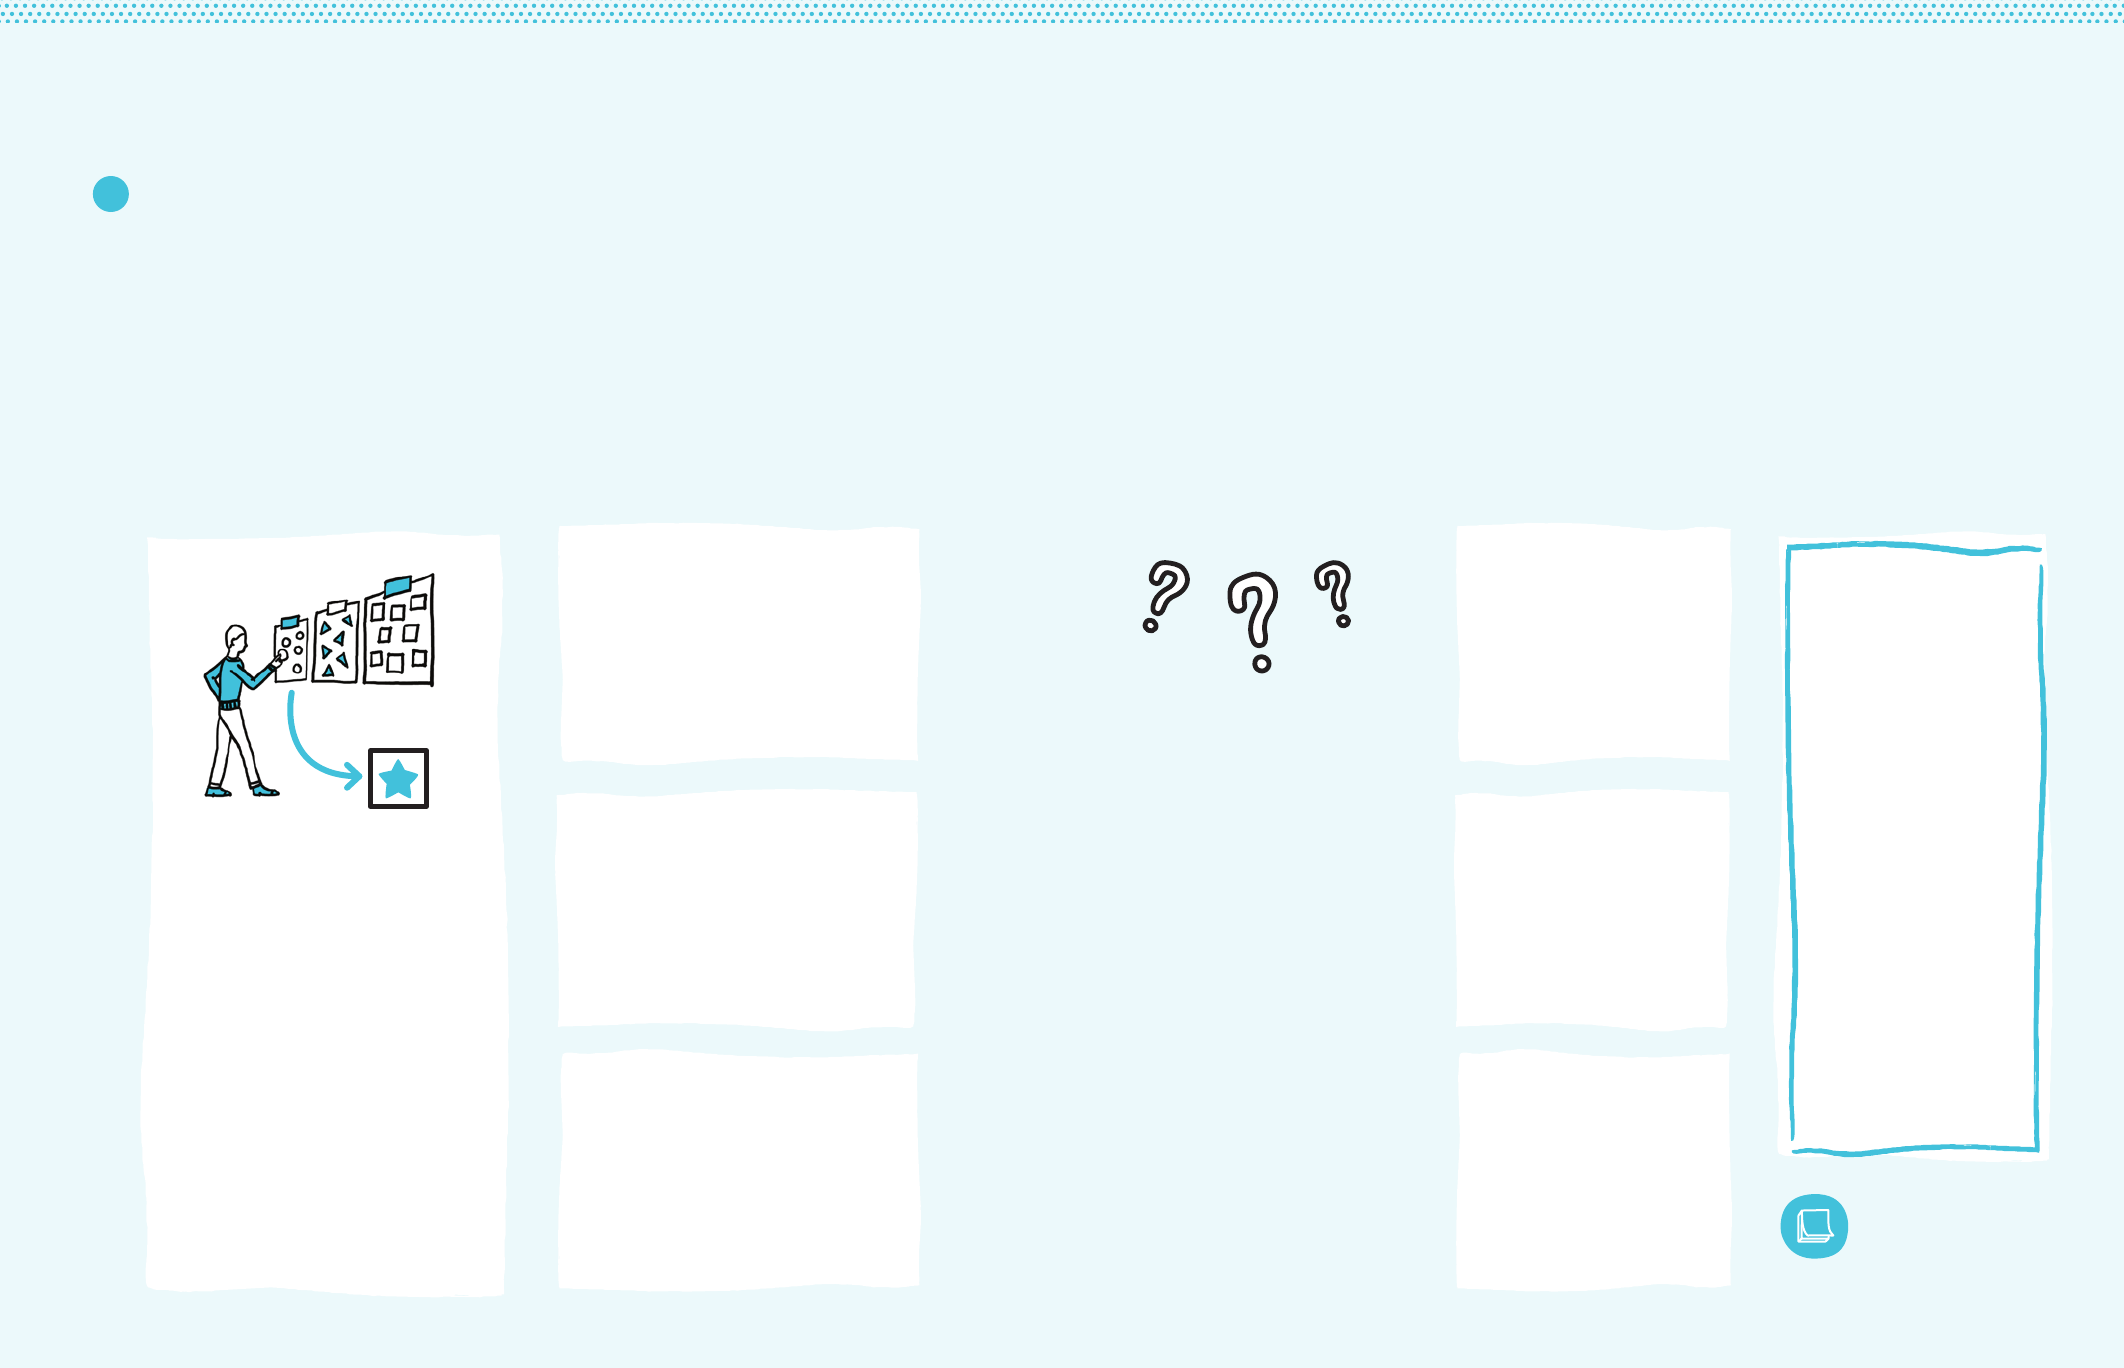
iii Diagnostics Worksheet
For each theme isolated by you/your team, create
hypotheses by responding to each of the following:
Hypothesize
Ask yourself why this is happening. On
sticky notes, write three or more causes
that help to explain or make sense of
the prioritized piece of information.
Debate
Can we prove ourselves wrong?
What might we have overlooked?
What might we have neglected
to inquire more about? What
might we have misinterpreted?
Themes from ‘Identify Important
Information in Stories’
What theme are we about to examine?
Revisit
Refine hypotheses to delete,
modify, or rewrite to reflect
any new information that has
emerged during the debate.
Rewrite as Final Diagnoses
Articulate a ‘final’ diagnosis
for each theme.
Add final diagnoses to your
Field Notes Map in line with
the theme(s) it refers to.
FN
98 99
DEMAND FOR HEALTH SERVICES
Q3: WHAT STANDS IN OUR WAY? 3A: INTERPRET COLLECTED STORIES
Theme Examples
Indecision
Ambiguity and uncertainty
foster inaction.
The perception of missing
information, conflicting
information, or unknown
probabilities can incline people
toward inaction. When the risks
and benefits of vaccination are
unclear, caregivers are more likely
to opt for inaction — or non-
vaccination — as the safer choice.
It is easier to avoid taking an
action like getting vaccinated
than to search for accurate (or
convincing enough) information.
As studies suggest, non-
vaccinators in many cases are
not ‘refusing’ as much as they
are ‘fence-sitting’—what one
group of researchers referred
to as ‘a state of indecision’. This
can be caused, for example,
“when doctors present different
information than friends…”51
51 Betsch, et al. (2015), ‘Using Behavioural
Insights to Increase Vaccination Policy
Effectiveness’.
“I’m being told
dierent things
by dierent people,
so it’s better that I
just avoid this.”
Deferral
Bias towards the present.
People tend to devote most
attention to present tasks
while neglecting tasks with
consequences farther into the
future, as with immunization.
This bias towards the present is
further aggravated by poverty,
which requires the poor to
address pressing concerns at
the cost of dedicating mental
resources towards the long
term. This can lead people to
‘defer’ health-seeking behaviour,
passing off actions and their
associated costs (such as mental
energy) to their future selves.
One study involving low-income
parents in Baltimore found that
for those “with limited time or
resources... the importance of
decision-making about vaccines
may be far less pressing than
other issues in the family’s life...
Among parents’ concerns, which
included drugs, street violence,
and negative peer pressure,
immunization did not emerge
as a high-priority issue.”50
50 Sturm, et al. (2005), ‘Parental Beliefs
and Decision Making About Child and
Adolescent Immunization: From polio to
sexually transmitted infections’.
“I needed to focus
on this week’s
harvest; I can think
about vaccines later.”
Fundamental
Attribution Error
Blaming the person,
not the situation.
People tend to place an undue
emphasis on an individual’s
characteristics, or elements of
personality, to explain his or her
behaviour in a given situation
rather than considering the
situation’s external factors.
In the context of health-care,
especially among health-care
workers, this misattribution man-
ifests itself as a “tendency to be
judgemental and blame patients
for their illnesses (dispositional
causes) rather than examine
the circumstances (situational
factors) that might have been
responsible. In particular, psy-
chiatric patients, minorities and
other marginalized groups tend
to suffer from this CDR [cogni-
tive disposition to respond].”52
This might result, for example,
in pegging a caregiver’s deci-
sion-making to inherent ‘laziness’
rather than to contexts of poverty,
potentially affecting the equitable
rendering of services by HCWs.
52 Croskerry (2003), ‘The Importance
of Cognitive Errors in Diagnosis and
Strategies to Minimize Them’.
“She must be a
neglectful mother;
she should be
ashamed of herself for
not getting her child
immunized.”
These examples offer some recurring themes of challenges that impede the ability of users to successfully use
immunization services. They are not exhaustive. In fact, we hope that many of the themes you may be familiar
with are not here, and that at least some of the themes listed here are less frequently discussed. Reviewing
these challenges might help to prompt new thinking about why the problems we witness in the field persist.
Omission
Action can be scarier
than inaction.
People tend to favour harmful
omissions over equally or
more harmful commissions.
In the context of vaccinations,
caregivers can prefer to allow
harm rather than do harm — such
as allowing a child to get sick,
rather than risk getting the child
sick through side effects — even
if allowing harm is much riskier
and more likely to occur.
In a hypothetical scenario
provided by researchers, subjects
preferred not to vaccinate a child
when risk of death from disease
was 10 in 10,000, but risk of
death from the vaccine was 5 in
10,000 or less. The discrepancy
is explained by the fact that even
in the riskier scenario, parents
are concerned that they might
be directly responsible for harm
(commission) more so than letting
harm happen (omission).46
46 Ritov and Baron (1992), ‘Status-quo and
Omission Biases’.
Social Norms
Perceived group rules
regulate behaviour.
People tend to behave in
ways that conform to how
they perceive others would be
behaving. Vaccination-related
behaviour can be affected
by whether such behaviour
is seen as normal or deviant
in a given community.
As one study illustrated, “[p]eople
have their children vaccinated
because everybody does so
and it seems the normal thing
to do. There are not necessarily
deep reflections behind
mothers taking their infants
to the child health clinic. They
do so because everyone else
does, and because it is what
good mothers seem to do.”49
49 Streefland, et al. (1999), ‘Patterns of
Vaccination Acceptance’.
Hidden Costs
Free is not always free.
In addition to non-financial costs
(such as travel time), small
financial costs can also become
large impediments, especially
among the poor. Even when
vaccinations are ‘free’, users
can face fees for ancillary
elements of immunization
services — such as health
cards — or encounter illicit fees.
In Malawi, researchers observed
that although “there are no direct
user fees, caregivers usually pay
a small amount for a health card
that is needed for the recording
of vaccinations and other health
status information.”47 In Nigeria,
caregivers were required to show
that they paid into an annual
development levy fund prior to
receiving vaccines. Despite the
‘low’ cost (three US dollars),
“[m]ost of the poor cannot afford
to do this and so desert public
facilities, especially children’s
education and health services.”48
47 Holte, et al. (2012), The decision to vaccinate
a child: An economic perspective from
southern Malawi.
48 Oluwadare (2009), ‘The Social
Determinants of Immunisation in Ekiti
State of Nigeria’.
“It would be worse
if the child died from
the vaccine—because
that is my fault—than
if she died from
the disease.”
“I had to
pay a fee before
receiving my child’s
health card after
she received the
vaccinations.”
“I doubt that other
mothers I know
get their children
vaccinated this much.”
100 101
DEMAND FOR HEALTH SERVICES
Q3: WHAT STANDS IN OUR WAY? 3A: INTERPRET COLLECTED STORIES
Confirmation
Comfortable information
takes priority.
People tend to seek out and agree
with information that conforms to
their pre-existing beliefs. Contrary
information can be uncomfortable
and so is more likely to be avoided.
A bias towards information that
confirms rather than conflicts
with pre-existing beliefs can
translate into not just ignoring
contrary information, but doubling-
down on pre-existing beliefs in
the face of new information.
In one study comparing vaccinators
to non-vaccinators, when the
latter “were presented with the
sort of risk-benefit information
that leads many medical and
public-health experts to conclude
that the risks of the disease
are worse than the risk of the
vaccine, they became more
committed to non-vaccination, not
less.”54 Another study witnessed
a similar effect, finding that
corrective information designed
to reduce misperceptions around
vaccines actually “decreased
intent to vaccinate among
parents with the least favourable
attitudes towards vaccines.”55
54 Meszaros, et al. (1992), Cognitive processes
and the decisions of some parents to forego
pertussis vaccination for their children.
55 Nyhan, et al. (2014), ‘Effective Messages in
Vaccine Promotion: A randomized trial’.
Status Quo
Past behaviour predicts
future behaviour.
When given the choice between
continuing in the current state
or making a change, the current
state often wins. People tend
not to change an established
behaviour unless the incentive
to do so is compelling. Therefore,
past experience with vaccinations
is a very strong predictor of
future behaviour; for those not
vaccinated previously, it is likely
they will continue not to seek out
vaccinations. Importantly, this is
less a matter of strong beliefs
or thoughtful decision-making
and more a matter of comfort.
As one study found, “those
who had been vaccinated in
the past were much more
willing to be vaccinated than the
average person, while those
who had never been vaccinated
were much less willing than
the average person.”56 In fact,
among those who had been
vaccinated in the past, this
bias towards the status quo
was more Influential than what
might otherwise be problematic
beliefs, such as their subjective
probability of getting sick.
56 Tsutsui, et al. (2010), ‘A Policy to Promote
Influenza Vaccination: A behavioural
economic approach’.
Availability
The easier to recall, the
more Influential.
People tend to rely on immediate
examples that come to mind
when making a decision. A
bias towards ‘easily available’
information — such as a
recent story — can skew the
probabilities people make
when evaluating the likelihood
of possible adverse events.
Consider a story spreading
through a community about an
unlikely event, such as adverse
effects from a vaccination.
As one group of researchers
concluded in regard to such
a scenario, “negative side
effects of vaccination, because
they are rare, may get more
attention than positive effects
of vaccination, both in the news
and in the community more
generally, and this may contribute
to overestimation of the likelihood
of such events.” The result
is that “[t]he choice between
vaccinating and not vaccinating
can therefore be seen as a choice
between two gambles,”53 rather
than as a choice between a
low-risk and high-risk decision.
53 Cappelen, et al. (2010), ‘Demand for
Childhood Vaccination: Insights from
behavioural economics’.
“A new vaccination?
I’ll just do whatever
I did last year.”
“I recently heard
about a child that
got very sick from the
vaccine, so I think I’ll
avoid that one.”
“Seeing that
information from the
health-care workers just
makes me even more
sceptical of it.”
Service Experiences
The bad outweighs the good.
Negative experiences tend to
outweigh neutral or negative
ones, proving ‘stickier’ in people’s
memory of an event. This bias
towards negativity suggests
that ‘minor’ negative incidences
during an immunization-
related experience can
overshadow the positives.
In Ethiopia, small negativities as
perceived by caregivers risked
dominating their memories of
vaccination-related experiences.
Researchers observed that
“outreach vaccination teams
tend to arrive late, but leave on
time, speeding up vaccination
practices to the extent that
needles are used immediately
after sterilization, when they are
still hot.”57 While it may not be
surprising that “[a]ttitudes and
behaviour of health staff… are
frequently cited as discouraging
children’s vaccination”58 in many
contexts, the disproportionate
power of negative incidences
adds a challenging element
to service experiences.
57 Streefland, et al. (1999), ‘Patterns of
Vaccination Acceptance’.
58 Favin, et al. (2012), ‘Why Children Are Not
Vaccinated: A review of the grey literature’.
Practical Knowledge
Missing information
leads to inaction.
Despite having a positive intention
to access immunization, the
effort to figure out how can de-
incentivize action-taking. Needing
to seek out practical information,
such when and where to access
immunization services, presents
a cost (in time, in mental energy)
and can therefore impede
health-seeking behaviour.
In studying barriers to childhood
immunization in Mozambique,
researchers found that two thirds
of mothers at various ‘mobile
brigades’ did not know when to
return for the next vaccination.
As the study concluded, this
piece of missing information was
in part to blame for suboptimal
coverage — as opposed to
knowledge about diseases or
the perceived importance of
vaccinations.59 Another study on
influenza vaccination in the US
found that even though logistical
information such as the location
of a clinic was technically available
to participants, vaccination rates
decreased when it was not made
immediately and easily available.60
59 Sheldon, et al. (2003), A study to describe
barriers to childhood vaccination in
Mozambique.
60 Ross, et al. (2013), Using Behavioural
Economics for Postsecondary Success.
Optimism
It will not happen to me.
People tend to overestimate
the likelihood of positive events
occurring and to underestimate
the likelihood of negative events
occurring. This bias towards
optimism can manifest itself
in discounting the likelihood
of contracting a disease or in
overestimating the likelihood
of surviving it, decreasing
people’s motivation to seek
out immunization services.
In studying parents who forewent
a pertussis vaccine for their
children, researchers found that
many “believe that statistical
analyses of pertussis and vaccine
risks are accurate.” At the same
time, they “believe that they do
not pertain to their children.” This
is in part due to a belief that “they
have control over whether their
child gets the disease or how
it progresses”— an optimistic
perspective on events that are
largely out of their control.61
61 Meszaros, et al. (1992), Cognitive influences
on parents’ decisions to forego pertussis
vaccination for their children.
“I planned to
take my child for
her vaccinations, but
I didn’t know if the
clinic was open.”
“Other people
might get sick from
that disease, but it
won’t happen to my
kid. And if it does, I
can take care of it.”
“I was rushed,
my child cried a lot,
and I didn’t have any
time to ask questions.
That’s what I
remember most.”
Theme Examples
102 103
DEMAND FOR HEALTH SERVICES
Q3: WHAT STANDS IN OUR WAY? 3A: INTERPRET COLLECTED STORIES
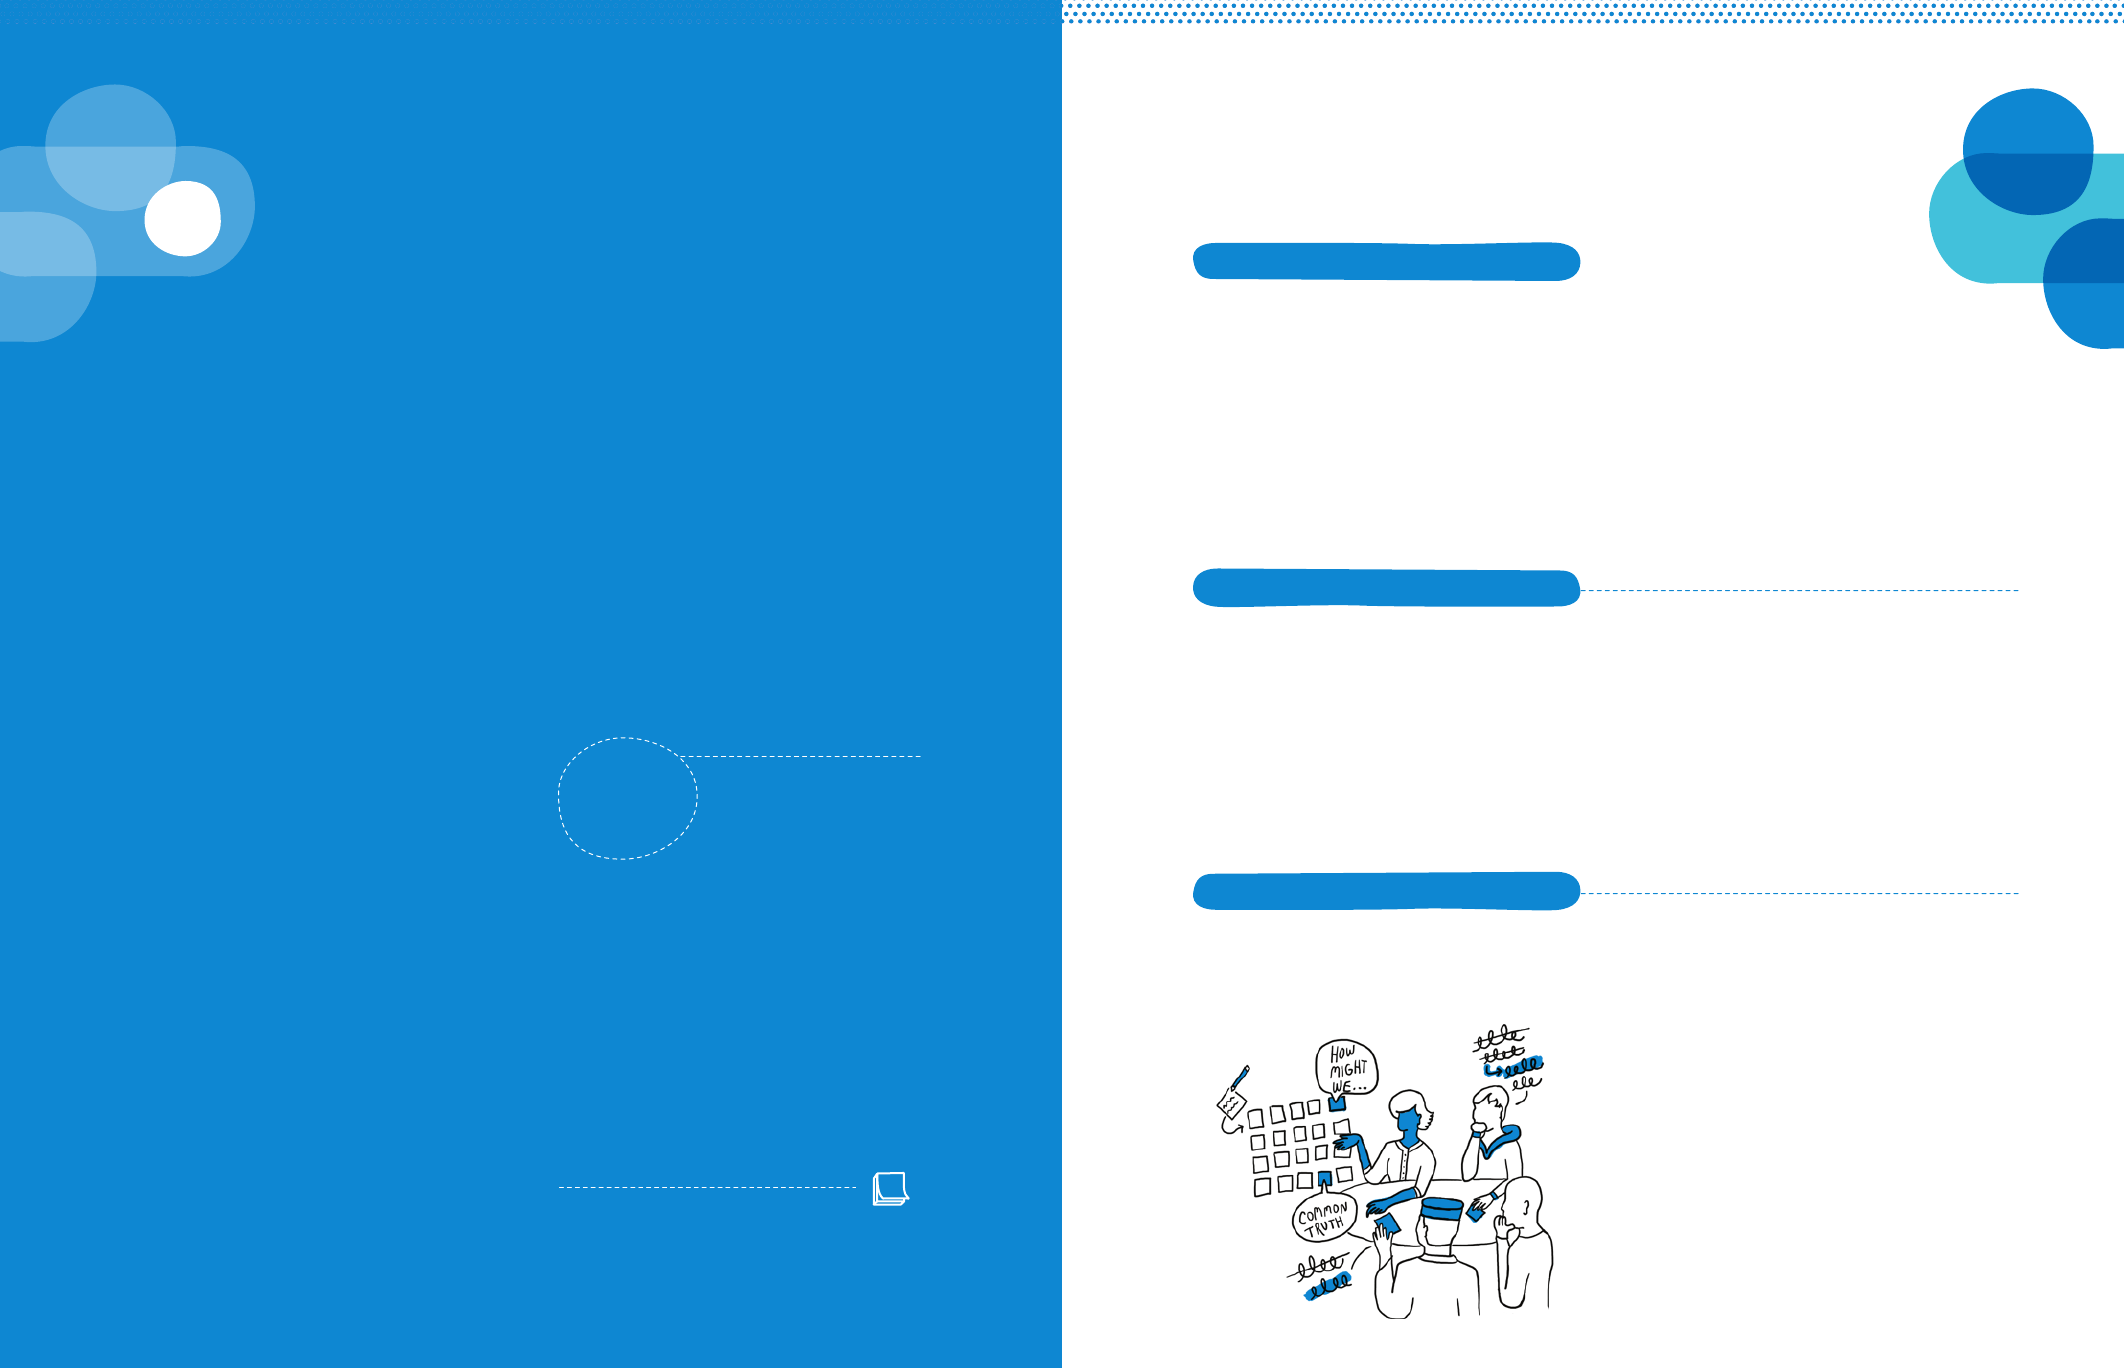
This step creates a bridge between research and solutions.
During this step we translate the final diagnoses into
prompts: actionable questions that prepare your team to
generate solutions. Prompts are a way of presenting the
problems from user research as opportunities for inventive
solutions. They help our teams begin to answer the
overarching question: what is to be done?
Propose Opportunities for Design
3c
To help us write prompts that respond to
the people we’re trying to reach we create
Persona Profiles, and to help us write
prompts that respond to the challenges
we identified during field research we
create a Relationship Map, or system
map. Together, these activities allow us to
look at the problem from multiple angles
and pivot from problem to possibility.
Each prompt prepares your team to
brainstorm different categories of solutions,
all of which could respond to the challenges
identified in the insight. By generating
multiple prompts against the same insight,
we enlarge the scope of possibilities.
After forming diagnoses
and articulating prompts,
your Field Notes
should be complete.
Take time to reflect on each row. Are
there additional assumptions worth jotting
down? Are the challenges diagnosed
in some instances likely to be more
important or weighty than others?
A completed wall of Field Notes will help
us to link user research (Question 3)
to the creative process of generating
solutions (Question 4). Next you will
conceptualise, design, and prototype
solutions that respond to each row.
Final
Field Notes
FN
Example Personas for this Diagnosis:
1. Higher-income caregivers
(the prioritized user)
2. Health worker (service provider)
3. Community leader (role who most
influences the caregivers)
Relationship Map Example:
The example diagnosis showcases a
tension between public and private
beliefs and behaviours, highlighting social
norms and influential identities affecting
these caregivers. The relationship map
shows these barriers and influences.
Prompt Examples (multiple
prompts for each diagnosis):
• How might we deliver immunization
out of sight from the perceived
judgement of peers?
• How might we flip the association
between vaccines and poverty, to
vaccines and success/well-being?
• How might we make these caregivers’
identities as good mothers more important
than their identities as ‘not poor’?
To help analyse and make sense of
the diagnoses, map the relationships
between your personas, their needs,
and the people responsible.
For each diagnosis, articulate multiple “How
might we?” questions that will prompt
teams to think about creative solutions.
Identify all users and describe them
in more detail, including the service
recipient and service provider.
Diagnosis Example: While they may
privately value vaccinations, higher-income
caregivers publicly decline immunization
for their children because of an association
between vaccines and being poor.
i: Create Persona Profiles
ii: Draw the Relationship Map
iii: Articulate Creative Prompts
There are three steps to move from diagnoses (why something is
happening) to prompts (redefining challenges as opportunities):
105
DEMAND FOR HEALTH SERVICES
104
Q3: WHAT STANDS IN OUR WAY? 3A: PROPOSE OPPORTUNITIES FOR DESIGN
Personas are fictional characters that are
used to understand the needs, values,
aspirations, abilities, limitations and character
traits of different users, along with the
challenges they face and their desires for
potential solutions. They will help your
team consider designs and plans from
a point of view that is not their own.
Determine realistic combinations of
characteristics that together could form
a single person. A persona is developed
from a range of different sources, pulling
together common characteristics of
similar people into an “archetype” through
which a group can be understood.
If possible, validate the persona.
Get feedback from stakeholders
who understand the real people that
these personas represent, or go back
and review with interviewees.
Finally, create multiple personas. In addition
to your prioritized user-group, represent your
caregiver’s interactions with community
leaders, other mothers, health-care workers,
community health workers and other key
players. You will present these personas
along with prompts during Question 4.
User Type (priority population, health-care worker, community health worker, caregiver, technician, community advocate, volunteer)
What they do now
(current behaviour)
What they should do
(ideal state)
Place photo / drawing
Influences
Think about single behaviours that result from external
pressures (rather than regular habits). Who or what are
the influential stakeholders in their life?
Environment
What is the geography and conditions where they live?
Role/Responsibilities
Describe what his/her job is, or what role her or she plays
in the community.
Time
What does a typical day look like? How do they divide
their time? What do they spend time worrying about or
celebrating?
morning
mid-day
afternoon
evening
Background
What important life experiences or events have
contributed to this person’s current situation? What social
determinants of health influence his/her current situation?
Needs
What frustrations do they have? What limitations do they
encounter? Write as a quote — how would they say this?
1
2
Persona Profiles Name:
i
106 107
DEMAND FOR HEALTH SERVICES
Q3: WHAT STANDS IN OUR WAY?

Often, we blame the moral character of
caregivers or human error of health workers
for what are really system failures. We draw
the false conclusion that the people who
made mistakes need to be reprimanded,
retrained, or more closely monitored.
Looking at the systems allows us to see
beyond the symptoms (mistakes) to uncover
the complex network of root causes.
Two main insights emerge from mapping
the relationships — or system. First,
we can identify what emerges from
the interconnected relationships. For
example, looking at the responsibilities
of a volunteer in isolation may seem
overwhelming. Considering the social
influence they receive from the local leader
may change this view. We can never
understand these traits without seeing
the societal, technological, and economic
ecosystem in which they operate.
The second thing we look for is opportunities
for incremental change. Remembering
our “Small is Big” principle, we can
look for small changes that can lead to
significant improvement instead of, or in
partnership with, designing a new solution.
Now, armed with a better understanding of
the people we are trying to serve and the
diagnosis of the challenges we face, we can
map the relationships. During this exercise,
we will organise the different pieces of
the system and show how they connect
to and communicate with one another.
Relationship Map
Local
International NGOs / Global governing bodies
National ministries / NGO headquarters
Regional governments / Health facilities / NGO offices
Child or Individual / Religous leader / Health centre Front-
line health worker / Community leader / Marginalized
group / School / Community volunteer / Service provider
Regional
National
International
• Chains of command
• Decision-making
inputs
• Funding
• Social links
• Familial links
• Patient-provider
relationships
Draw Connections
Draw lines between all the users and
institutions that are formally or informally
connected in some way. Use two different
colors: one for social relationships and
one for service relationships. Examples:
• Infrastructure
solutions/gaps
• Communication
solutions/gaps
• Funding/Lack
of funding
• People who can/
cannot fulfill their
responsibilities
• User knowledge
about services
• Societal norms
Mark Barriers + Positive Influences
Note where barriers that impede our goals
and influences that support our goals exist.
What technologies or tools exist at these
intersections? What makes it harder for
users to get what they need? What points
of leverage make it easier? Examples:
List Everything
Identify all the users and institutions
that are in some way connected to the
issue you identified. Start with your final
personas, and include additional roles
that relate to your challenge. Examples:
• Front-line worker
• Health worker
• Family
• Health centre
• Child or Individual
• Service provider
• School
• Community
volunteer
• Religious leader
• Community leader
ii
108 109
DEMAND FOR HEALTH SERVICES
Q3: WHAT STANDS IN OUR WAY?

Diagnosis #1:
Poorer mothers feel anxious about
going to clinics because they receive
derisive judgement from health-care
workers, many of whom attribute under-
immunization to mothers’ laziness.
Not-so-Good Prompt:
How might we improve
interactions between
health-care workers and
patients?
This prompt is too vague. A too-general
prompt that does not respond to the
important details in the insight fails to
give your team clear enough direction
on how to address the challenge.
Better Prompt:
How might we sensitize
health-care workers to the
tough challenges facing
poorer patients so that they
demonstrate empathy?
Use the prompt formula to build
on each of your diagnoses. Follow
these tips and examples.
Be Open-Ended vs. Prescriptive
Prompts inspire and guide your team to
generate a lot of solutions (more on that
in Question 4). Open-ended prompts do
not assume solutions but allow teams to
consider as many solutions as possible.
To ‘check’ if your prompt is sufficiently
open-ended, ask yourself: can I immediately
think of more than a single solution to the
problem? If not, you may have been too
prescriptive. The opposite can also be a
problem: prompts that are too general feel
overwhelming and difficult to comprehend.
Prompt-writing is a balancing act.
Respond to the Diagnosis
If a prompt is crafted just right — not too
general, and not too prescriptive — it must
also directly address the problem we
identified as our final diagnosis. A prompt
that is not risks leading your team down a
wrong path that yields ineffective solutions.
Incite Inspiration
Feeling inspired matters. The best solutions
come from prompts that excite you and your
team members. Does the prompt feel like
a call to action? Is it a mandate to explore
interesting ideas? Does it immediately
make you start thinking of solutions?
Diagnosis #2:
Confronted by immediate challenges, parents
are deferring their visits to the clinic while
thinking that they will go soon enough.
Not-so-Good Prompt:
How might we use non-
financial, micro-incentives
to motivate mothers to get
their children vaccinated?
This prompt is too specific. Rather than
guide your team’s problem-solving, this
prompt prescribes a solution. Non-financial,
micro-incentives might very well be a strong
idea, but it is certainly not the only one.
Better Prompt:
How might we give mothers
reasons to act today rather
than wait to return to the
clinic?
Diagnosis #3:
Despite a recent campaign promoting
immunization as a public good that
helps everyone, most parents think
that their neighbours do not get
their children vaccinated and so they
do not feel compelled to act.
Not-so-Good Prompt:
How might we convince
parents that getting
vaccinated will protect the
entire community?
This prompt fails to correctly respond
to the diagnosis. It ignores the
information that as long as parents don’t
perceive their neighbours accessing
vaccinations, they will not bother getting
their own children immunized.
Better Prompt:
How might we reveal to
parents the actual volume
of community members
accessing vaccinations,
demonstrating a widespread
social behaviour?
Prompt Formula Add final prompts to your
Field Notes Map next to the
diagnosis they respond to.
FN How Might We + Verb + Response to Diagnosis = Prompt
iii
110 111
DEMAND FOR HEALTH SERVICES
Q3: WHAT STANDS IN OUR WAY? 3A: PROPOSE OPPORTUNITIES FOR DESIGN

How Could
We Respond?
Introduction: Experimental Solutions
This phase outlines a three-step creative process to respond
to user challenges, facilitating your team’s ability to generate
solutions and test their ecacy. It will encourage divergent
thinking: generating many ideas before converging on the
most desirable, viable and feasible. Top ideas will be rapidly
prototyped so that early, promising solutions can be modified
and improved, and less promising solutions can be cut prior
to investing too many resources.
The creative process of generating and evaluating solutions
is experimental. The exercises of conceptualising ideas and
getting feedback from the field will be iterative. Some ideas
might prove problematic, and we will drop them; others might
prove promising, and we will work to improve them. Only
through experimentation can we design optimal solutions.
These phases should not involve undue time and resources.
Months of planning are not necessary. These phases and their
associated exercises are intended to enable rapid ideation
and the gathering of imperfect but critical experimental
evidence in little time. By the end of this question, we will
have a set of solutions ready for initial implementation in
the field.
112 113
DEMAND FOR HEALTH SERVICES
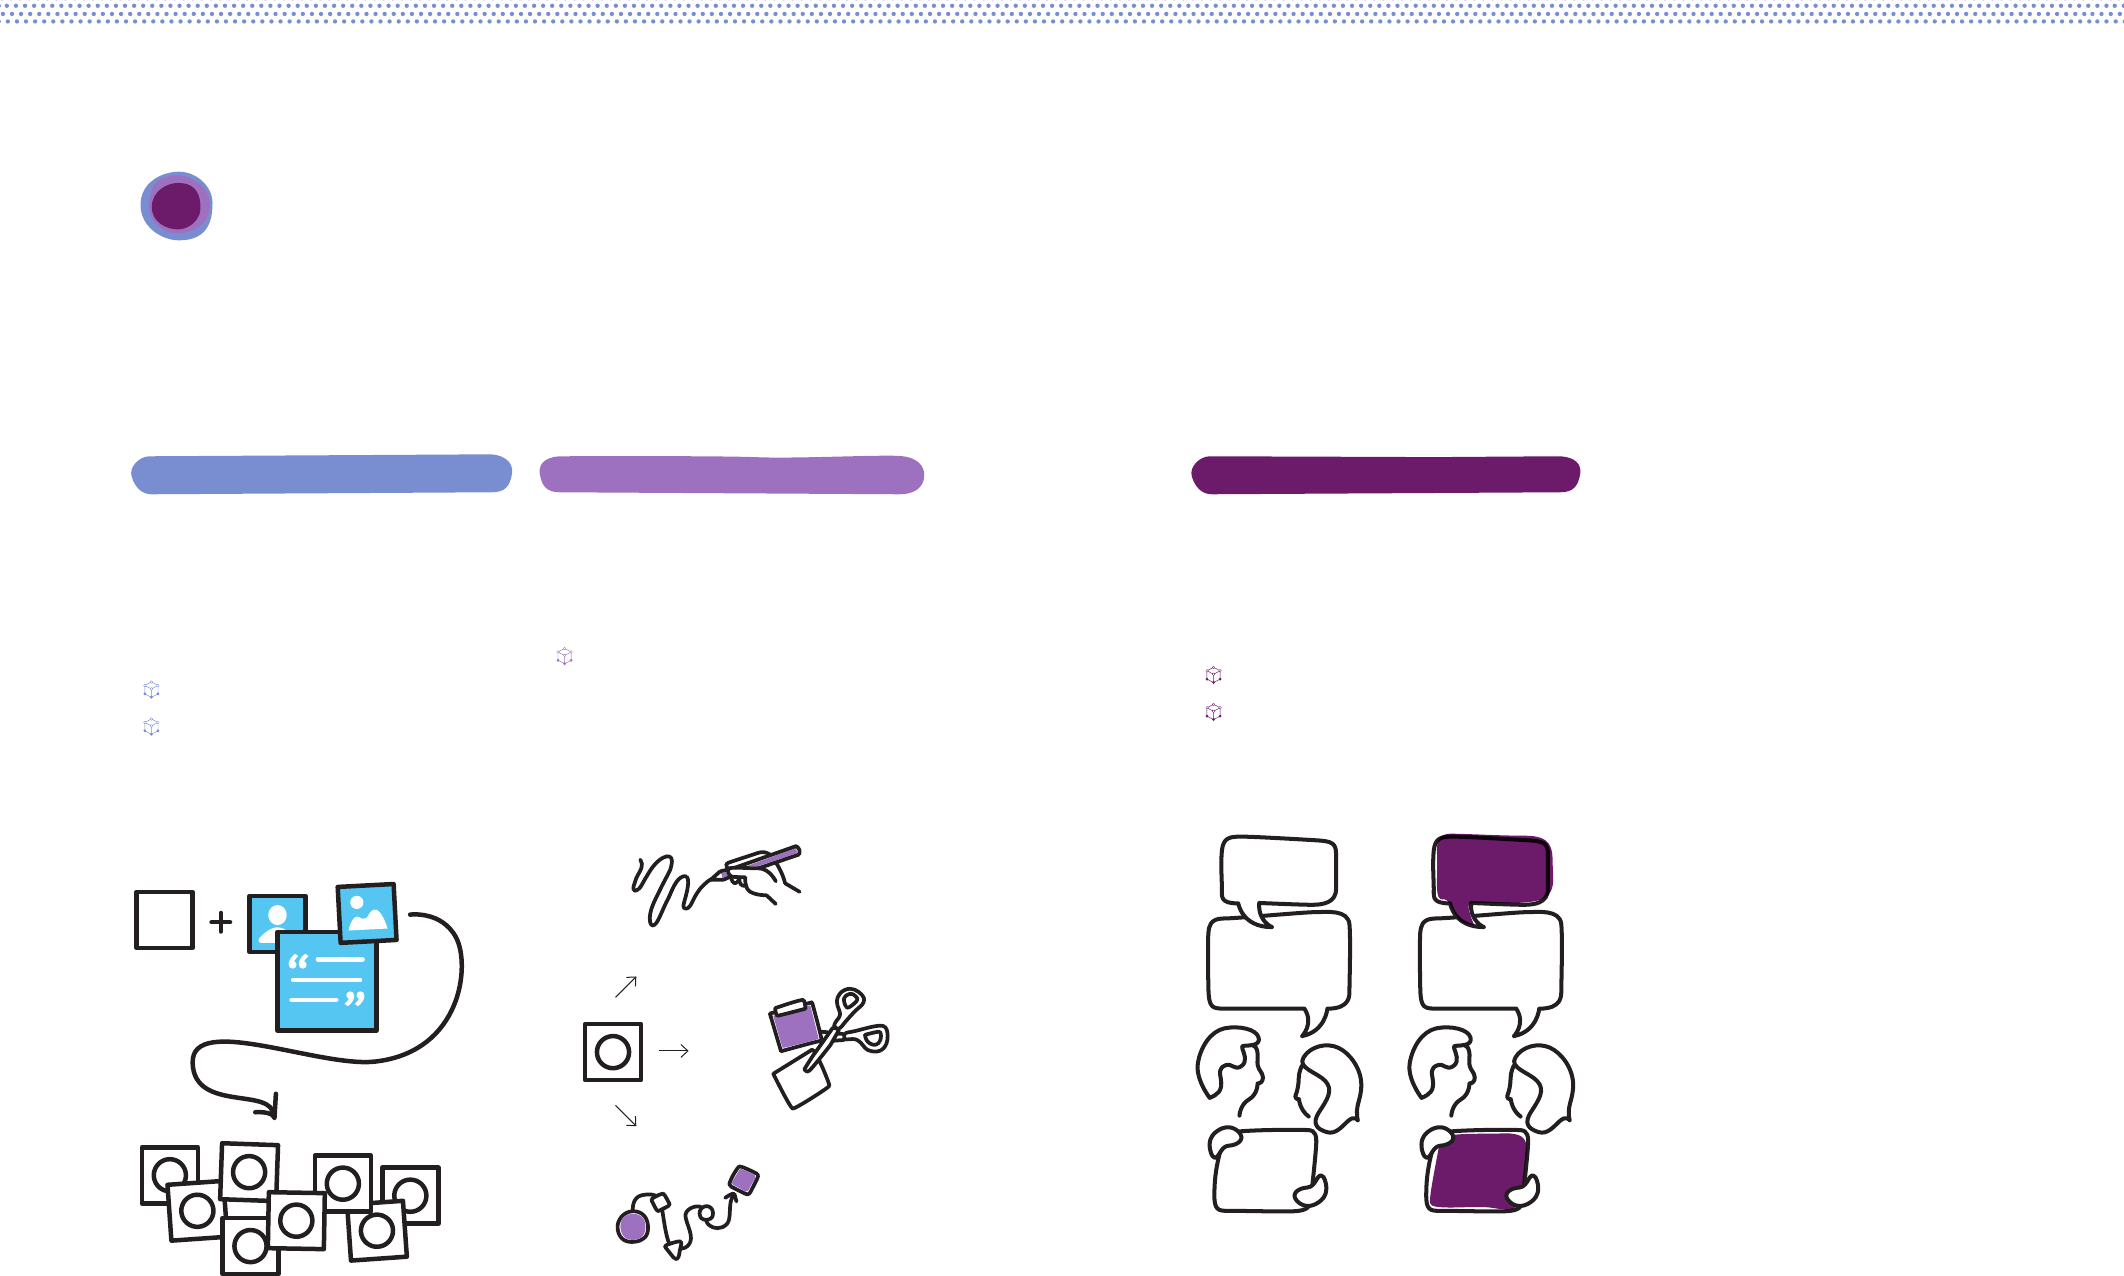
While these phases are linear, they are also iterative. It is likely
that prototyping will generate feedback that forces changes to
the design of an idea, or in some cases, will require that teams
go back to conceptualising new ideas entirely.
4Methodology
Make ideas concrete through initial
outlines, models or rough sketches
of ways to implement promising
concepts.
Design Examples
With an extended team, quickly
generate many possible solutions for
each prompt. Assess the solutions
to identify 2-3 promising ideas per
prompt.
Assess Concepts
Concept Examples
Define learning goals for each design,
then select activities that will test
(prototype) the design in the field.
Take draft ideas into the field to test
with, and get feedback from, users.
Prototype Planning
Prototype Evaluation
Photos / materials to
visualize the challenge
Concepts
Prototype Revised
Prototype
HMW
Question Revised
Question
Prompt
Visualizations
Models
Sequences
User Feedback User Feedback
4a: Conceptualise Solutions 4c: Prototype Design with Users4b: Design Quick Examples Final Output: Tested Designs
At the end of this phase, you have
designs that respond to initial user
research and have been tested
with the user in their environment.
Initial prototypes have been evaluated
and necessary adjustments have
been made.
114 115
DEMAND FOR HEALTH SERVICES
Q4: HOW COULD WE RESPOND? 4A: CONCEPTUALISE 4B: DESIGN 4C: PROTOTYPE

This first step is built on the premise that good ideas are
born from a lot of ideas. Conceptualising is the exercise of
generating as many solutions as possible that might help to
solve the challenges presented in your prompts.
Conceptualising is centred around team brainstorms, which
require thoughtful preparation and disciplined facilitation.
Conceptualising ends with a short evaluative exercise
to categorize the solutions coming out of a brainstorm,
highlighting top contenders.
Conceptualise
Solutions
4a
Many, Many Solutions
Some programmes have a familiar and well-
practised set of solutions. Behaviour change
communications might be an example. It
is possible that this creative process will
suggest a communications solution to a
given challenge — but it is not a given. We
will aim to push ourselves to think differently
about what constitutes a potential solution.
We may discover that a creative
solution does not require printing a
single poster, or spending a single dime.
From changing the timing of outreach
services, to communicating a message
differently; from simplifying the steps a
user is required to go through to access
services, to offering SMS reminders;
from activating a latent social norm, to
increasing the importance of a positive
identity — both familiar and less familiar
ideas should emerge during this process.
What is a creative process?
To illustrate the idea of a creative process,
consider the example of a public health
organization in Zambia that recruits and
trains hairstylists (‘agents’) to educate
their clients on HIV prevention and to
distribute condoms. The organization, in
collaboration with researchers, sought to
address issues of agent motivation in an
effort to increase condom sales. One idea
aimed to do so by incentivising agents
with financial rewards. Another idea
imagined a type of non-financial reward:
“[A]gents are provided with a thermometer
display, akin to those used in charitable
fund-raisers. Each sale is rewarded with a
star stamped on the thermometer, which is
labelled as measuring the stylist’s contribution
to the health of their community.... In addition,
stylists were told that all those who sell
more than 216 packs over a year would be
awarded a certificate at a ceremony.”62
These ideas were then piloted and evaluated.
Agents were either given a 90 per cent
margin on condom sales or a 10 per cent
margin on condom sales (two very different
levels of financial rewards), were given
the “stars”, or were given nothing at all.
Agents receiving the public recognition
scheme sold, on average, over twice as
many condoms as those in any other group.
A creative process is one that liberally
experiments with different ideas until the
best ones materialize. It generates multiple
(and often competing) ideas and tests
them out — even if on a small scale for the
purposes of improving some ideas while
discarding others. And it does not take a
specialist. What it does take is a commitment
to open-mindedness and experimentation.
62 Ashraf, et al. (2014), ‘No Margin, No Mission? A field
experiment on incentives for public service delivery’.
117
DEMAND FOR HEALTH SERVICES
116
Q4: HOW COULD WE RESPOND? 4A: CONCEPTUALISE SOLUTIONS
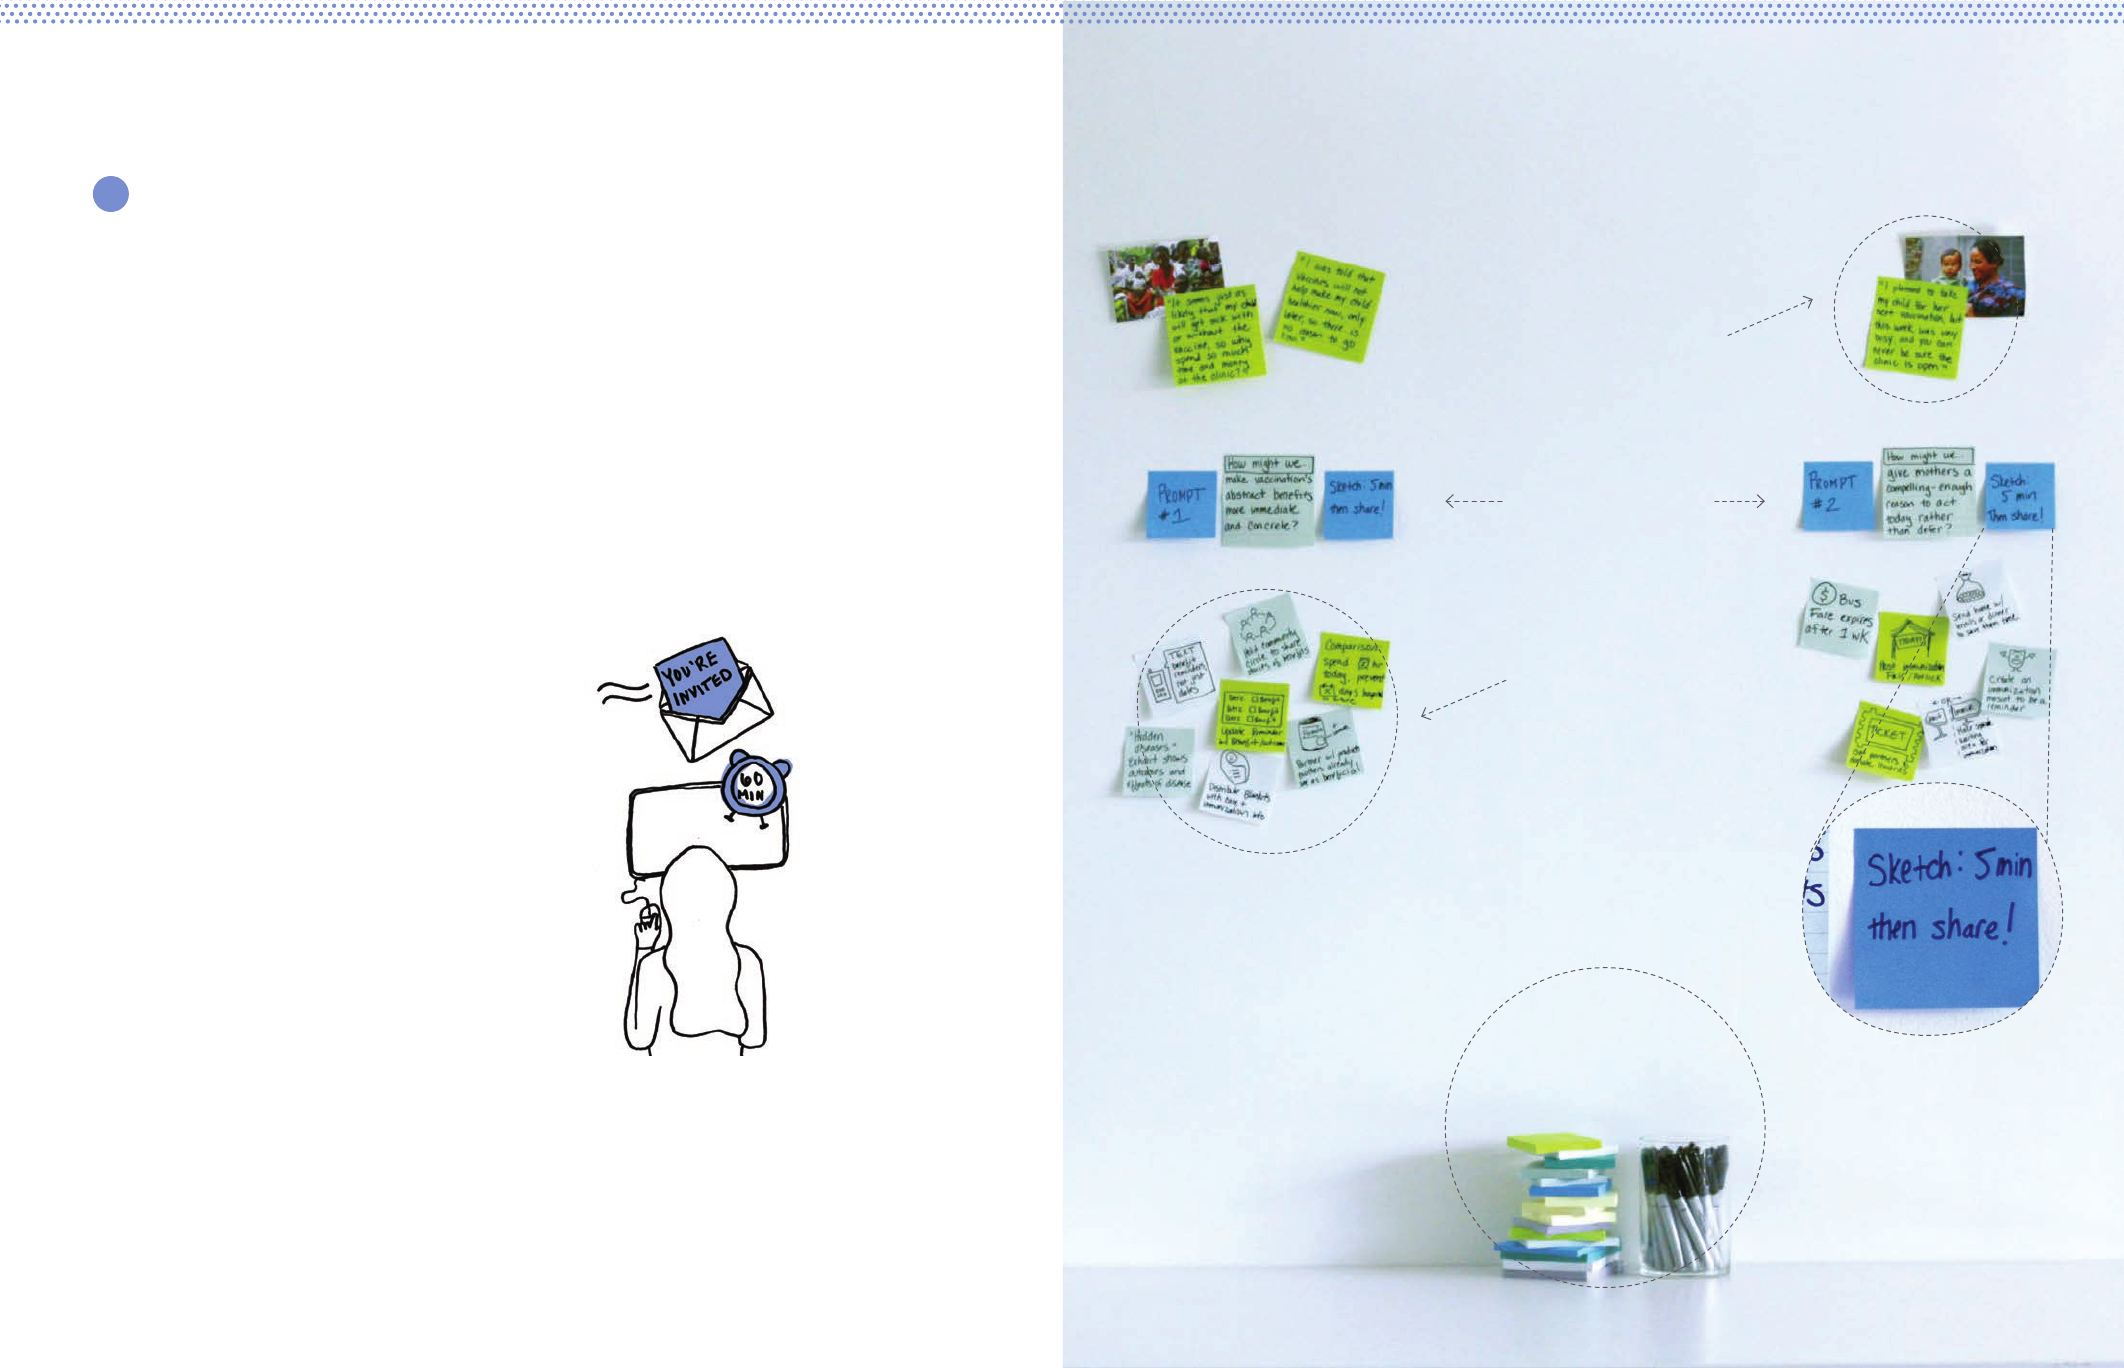
Facilitating a productive brainstorm can be challenging —
too often, brainstorms become undisciplined conversations.
To get the most out of a brainstorm, clearly communicate
the purpose and enforce the rules (e.g. time).
Materials matter:
have plenty of
sticky notes,
notepads and pens
Include evidence from the
field — photographs and
quotes — to make the
problem more tangible
Place a few “wild”
example ideas to
encourage creative
thinking
Alternate activities
between individual
sketching, partner
collaboration,
and group sharing
Separate prompts
and brainstorm
solutions around
each separately
To start, schedule an uninterrupted period
of time and invite additional participants.
Divide the available time between each
prompt, usually five minutes of generating
ideas followed by five minutes of sharing
ideas. Sometimes this is repeated for
the same prompt so participants can
improve upon each other’s ideas.
Each Field Notes row ends with a
diagnosis, which describes a challenge,
and a prompt, which suggests a way
to approach the challenge. Creative
brainstorming gives us dedicated space to
think big and broadly about each prompt. In
preparation for brainstorming solutions:
• Freshly transcribe each prompt; print
it out to fill an entire piece of paper.
• Gather supporting material relevant
to each prompt; for example, a few
pictures to help team members
during brainstorming visualize the
challenge embodied in the prompt.
Both of these — prompts and visuals —will
serve as the reference points during
your team’s brainstorming. The last
thing to do is to collect materials for
participants to write and draw on.
Prepare for a Brainstorm Session
i
118 119
DEMAND FOR HEALTH SERVICES
Q4: HOW COULD WE RESPOND? 4A: CONCEPTUALISE SOLUTIONS
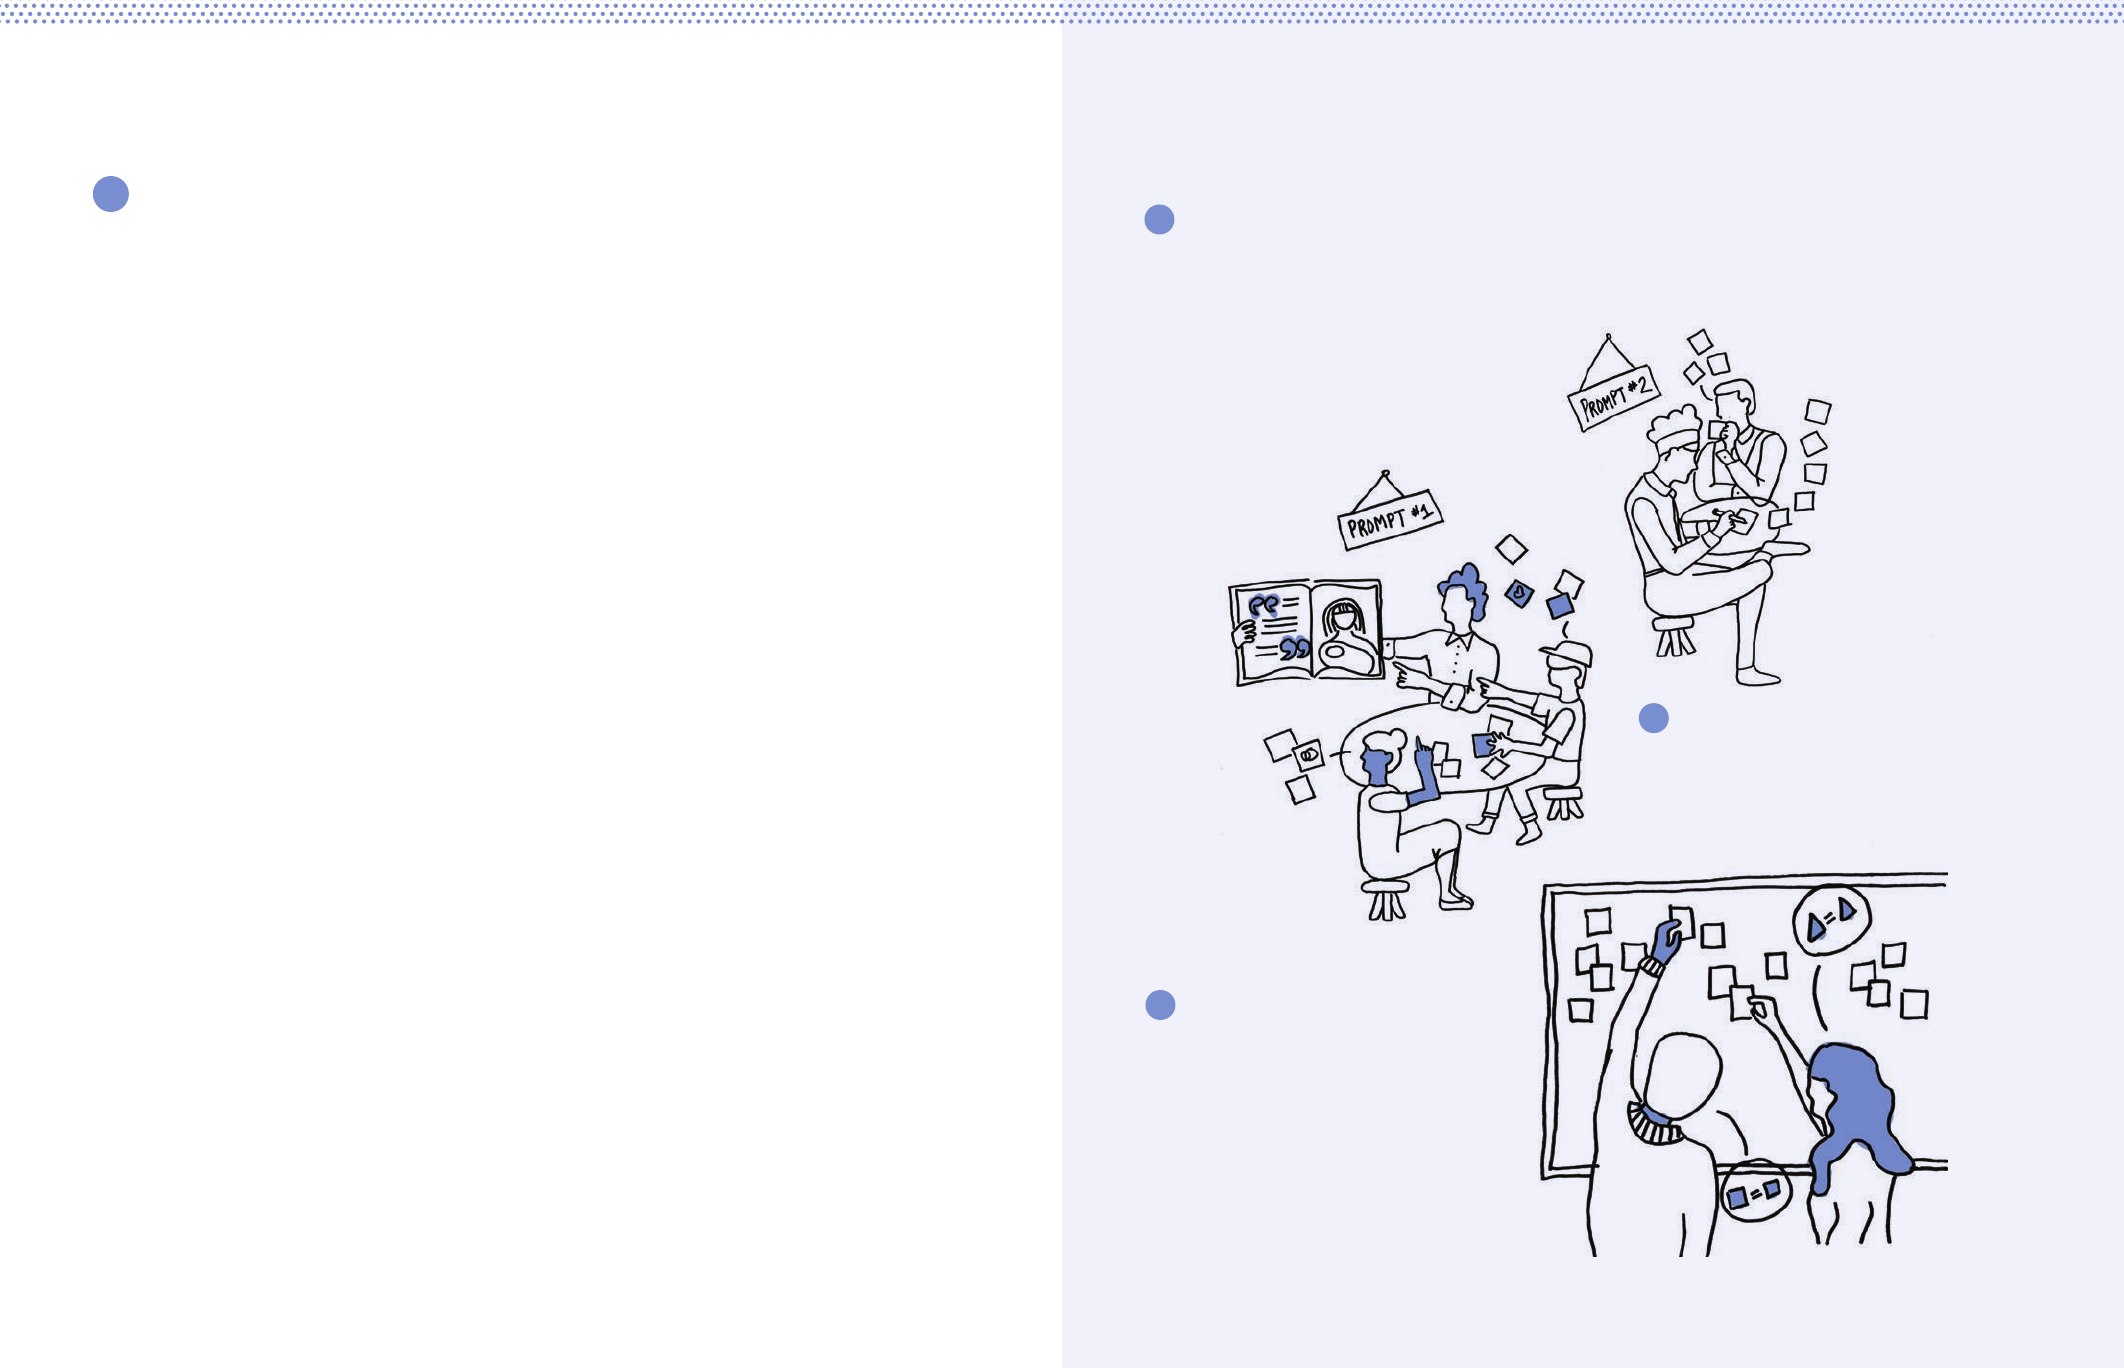
iii Converge
With a large volume of ideas on the table,
coalesce around recurring themes — what
“categories” of ideas are surfacing among
us? You can also use voting dots (3
stickers each) to let participants select the
concepts they find most compelling.
i Share User Stories
and Scenarios
A great idea is driven by the collective expertise
and knowledge available in the room. Immerse
the room in the field research by sharing
back user stories, photographs and quotes.
ii Diverge
When brainstorming solutions, always begin
by going for quantity — large volumes of
ideas that generate as much brainstormed
material as possible, no matter the quality.
Brainstorm Concepts
The initial objective of conceptualising
is to generate a substantial volume of
ideas, not only good ideas. Disciplined
brainstorming can work to quickly and
efficiently generate that volume. We will
work to design good ideas later; but a
necessary prerequisite to good ideas is a
large enough amount of them to work with.
Brainstorming creative solutions can be done
over the course of many days; but it can
also successfully be done in an afternoon
of dedicated and uninterrupted time. Either
way, brainstorming should be an intentional
and well-defined period of time. At the
end of a team brainstorm, you will have
a collection of ideas and solutions that
respond to each of the prompts from the
Field Notes in the previous phase of work.
Tool
Generate a large quantity of possible
solutions to each of the prompts
drawn from your Field Notes.
Rules of Brainstorming:
• Build off each others’ ideas — do not be
afraid to suggest alternatives or additions
• Aim for quantity over quality
• Turn off phones! Concentrate on the
ideas for short, intense spurts
• Draw what you can — a picture
is worth 1,000 words
• Go for ideal, wild ideas!
• Do not eliminate or critique ideas (save
for the next step: Assess Concepts)
The process of generating a large volume of ideas
(brainstorming) happens best in groups, with team members
building o of one another.
ii
120 121
DEMAND FOR HEALTH SERVICES
Q4: HOW COULD WE RESPOND? 4A: CONCEPTUALISE SOLUTIONS
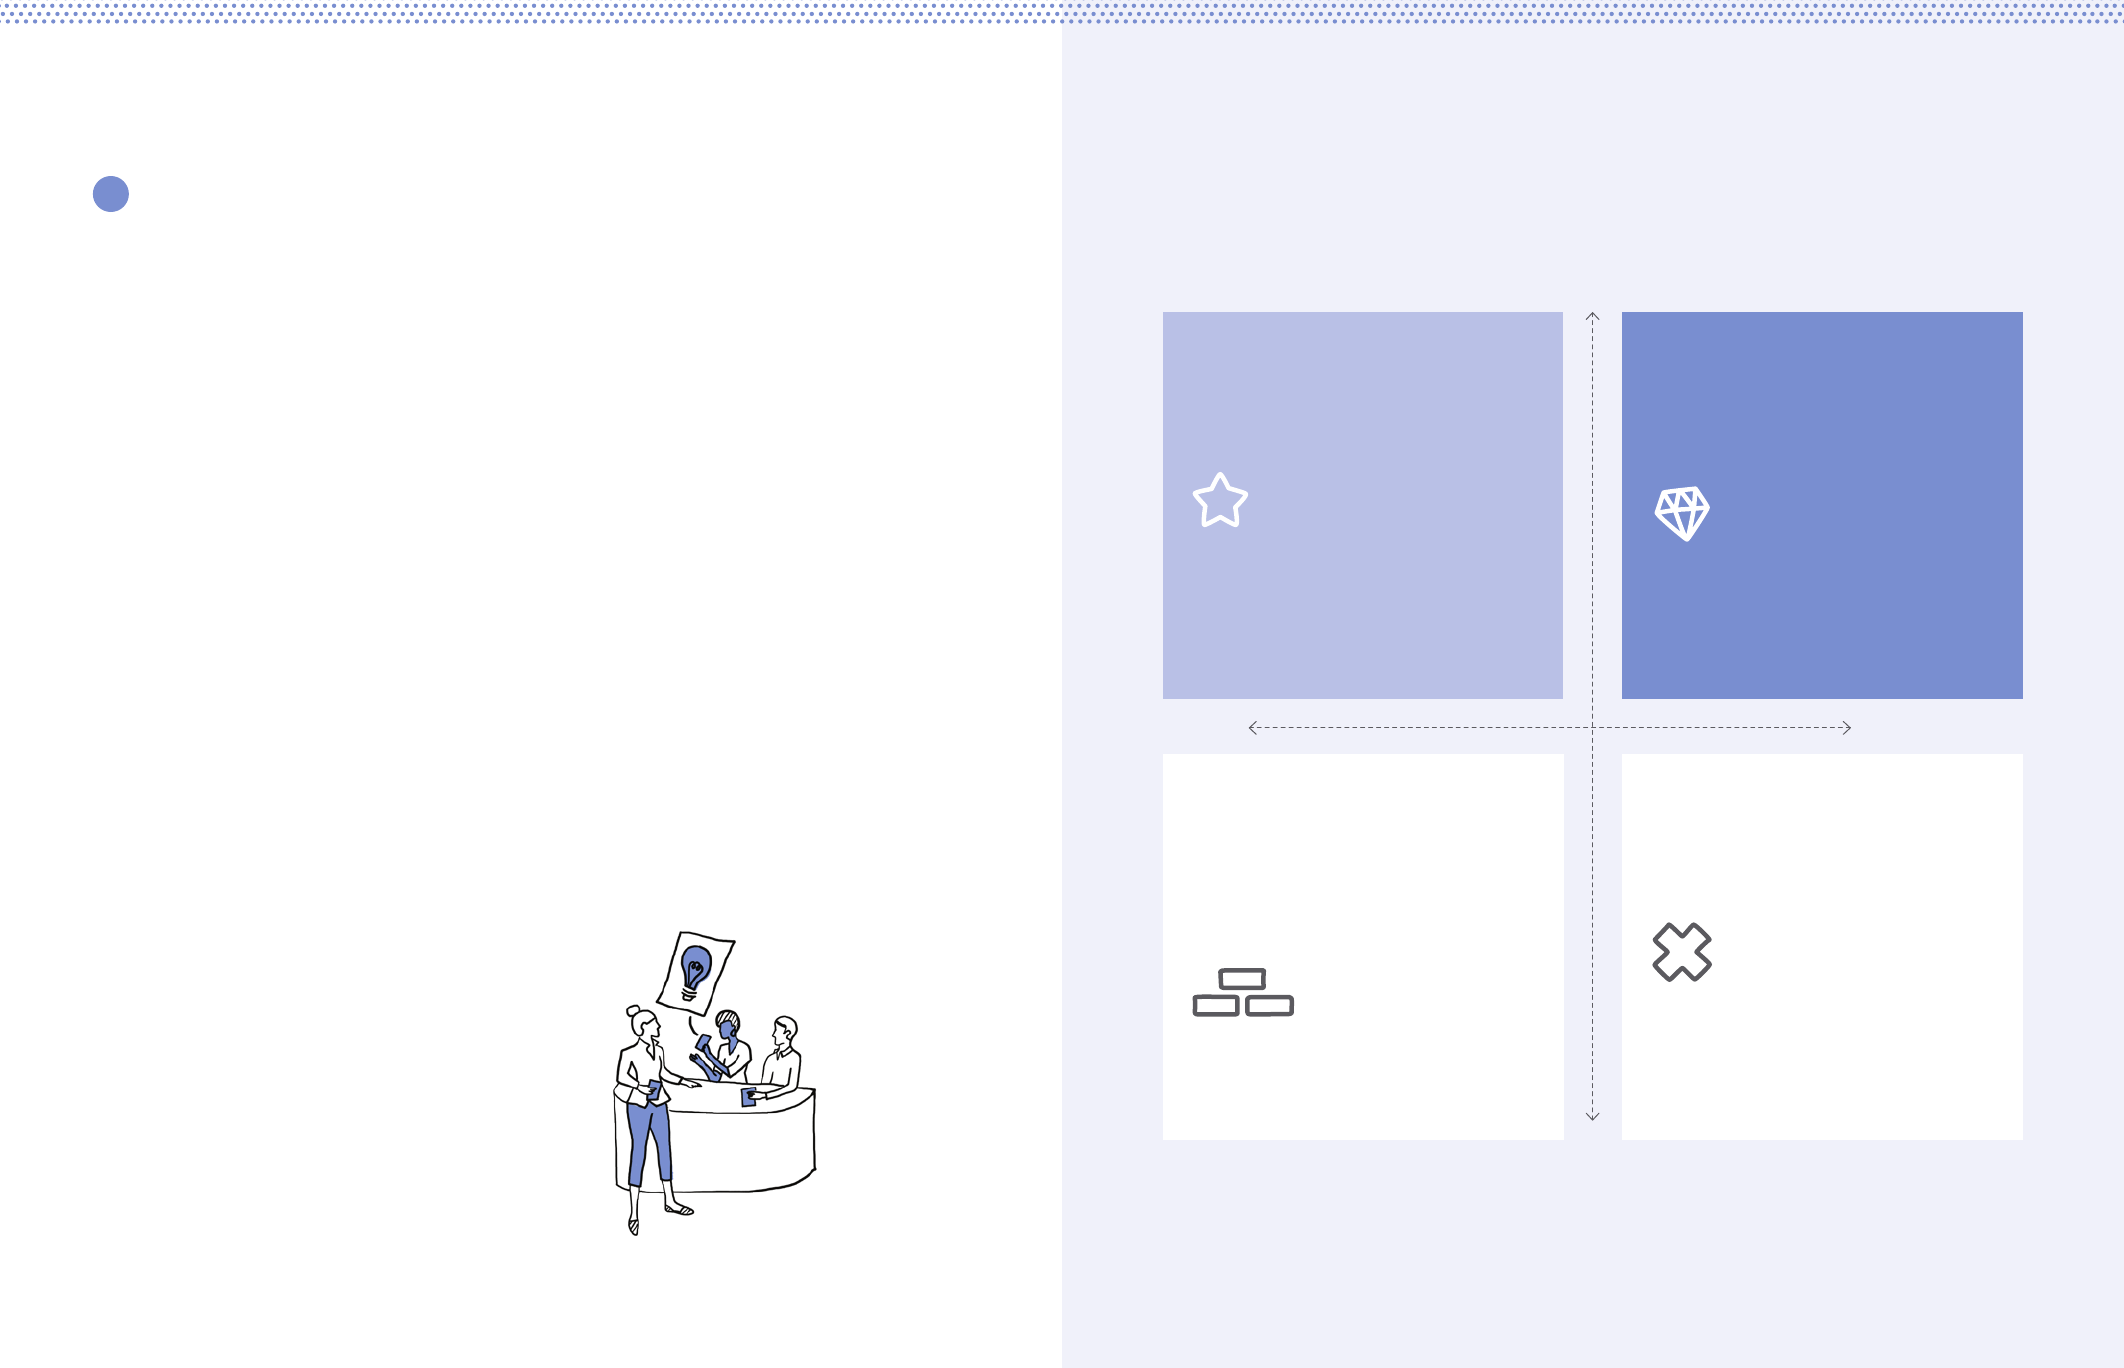
Unsuccessful Tries
These ideas are neither responsive
to the prompt nor easy to
make happen. Discard them!
Building Blocks
While it is possible that your programme
could feasibly implement these ideas,
they need work. Adapt these to
make them more responsive to the
challenge captured in the prompt.
Innovative possibilities
Ideas that are clearly responsive to the
prompt, but may be difficult to implement.
Obvious Wins
Ideas that are relatively
easy to make happen, and directly
respond to the prompt.
Very Responsive to Prompt
Unresponsive to Prompt
Safe Unrealistic
Assess Concepts
Effective brainstorming should generate a
broad spectrum of ideas, from the obvious
and low risk to the unconventional. Ideas
that veer towards the latter can be the
most important because they can often
be made more feasible. An idea that is
not quite plausible may still have elements
that are worth exploring. The process
of selecting candidate ideas to move
forward is not just about selecting the top
ones from your brainstorming; it is about
editing imperfect ideas with promise.
To that end, the following tool Assess
Concepts is meant to aid in the process
of both selecting ‘top’ ideas along with
identifying imperfect but interesting ideas that
may require further thinking. The objective of
this step is to finalize a group of ideas from
your brainstorming to be designed for the
purpose of learning more. Ideas here are far
from final. Instead, they are ones that seem
to respond well to your prompts, and that
deserve to be explored through prototyping.
At the minimum, you should aim to
select at least 2-3 ideas per prompt. If
you only land on a single idea at this
step for a particular prompt, you may
risk coming up empty-handed if that sole
idea later becomes ineligible. Multiple
ideas for each prompt increase the
likelihood of finding one that works.
Tool
After brainstorming, use this chart to
organise ideas for each prompt you
used. You will need to create multiple
charts — one for each prompt.
Place a sticky note (containing one idea each)
into the quadrant that seems appropriate.
Select 2-3 ideas from the ‘Obvious
Wins’ and ‘Innovative Possibilities’
that are interesting and show promise.
After you have a large volume of ideas responsive to each of
your prompts, you are in a position to make decisions about
which ideas deserve to move forward.
iii
122 123
DEMAND FOR HEALTH SERVICES
Q4: HOW COULD WE RESPOND? 4A: CONCEPTUALISE SOLUTIONS

The following stories are meant to instigate your team’s creativity, drawing inspiration from various
ways that other immunization programmes have creatively responded to the challenges facing
their users. These examples are not meant to be an exhaustive list of solutions. Instead, examples
from solutions elsewhere can help to stimulate your team’s own brainstorming efforts.
Sometimes, however, a norm is
not obvious. There is little visible
‘proof’ that a group is collectively
practising some behaviour, which
reduces the power of positive
group norms.64 In some cases,
vaccinations fit this phenomenon:
caregivers who do not access
vaccinations may simply not
know that their peers are doing
so, and therefore are not being
motivated by a perception that
getting vaccinated is the norm
in their community. The idea of
providing ‘social proof’ aims to
harness the power of norms by
making them publicly visible.
Experiments in India and Timor
Leste demonstrate the power of
social proof. In the project, known
as “My Village is My Home”
(MVMH), a large poster was
displayed in a public space.65 On
the poster, clinic staff recorded
the birth dates of all infants and
made note of every immunization
along a timeline. The poster turned
normally private information
(dates of birth and vaccination
status) into a visible record.
This simple public tracking
scheme not only made it easier for
outreach workers to notify families
of a child’s next vaccination date,
but also broadcast a positive
behaviour exhibited by a majority
of the community. It visualized
previously ‘unseen’ behaviours
(one’s peers getting their children
vaccinated). By making others’
behaviours visible in a safe
context, the posters tapped into
subtle social pressures to mobilize
those with under-vaccinated
children; caregivers were dually
accountable to the infants and
to the community as a whole.
The intervention proved motivating.
In India, pilot MVMH communities
achieved immunization rates of 80
per cent, considerably higher than
comparable districts’ rates, which
ranged from 49 per cent to 69 per
cent. As a World Bank report noted,
social proof ideas are especially
potent in contexts where “the
difficulty of observing a behaviour
makes it difficult to correctly
estimate how common it is.”66
Previously, community members
may have assumed accessing
vaccines was uncommon; a
public visualization changed that.
Social Proof
As social beings, we modify our behaviour by conforming to perceptions of group
norms and expectations. For example, people are generally more likely to follow
health advice when it is presented in groups of peers, rather than individually.63
63 Bertrand, Mullainathan and Shafir (2006), ‘Behavioural Economics and Marketing in Aid of Decision Making Among the Poor’.
64 For example, the general public in the US significantly underestimates childhood immunization coverage. When asked to estimate the proportion of
children who receive no vaccinations, only 9 per cent currently estimate “1 per cent or less,” whereas over onethird estimate the figure to be somewhere
between 21 per cent and 30 per cent. (Kahan (2004), ‘Vaccine Risk Perceptions and Ad Hoc Risk Communication: An empirical assessment’.
65 Jain, et al. (2015), ‘Engaging communities with a simple tool to help increase immunization coverage’.
66 World Bank (2015), Mind, Society and Behaviour.
One key to isolating practical
information is understanding
precisely the gaps in information
that currently prevent a user
from completing an action. For
instance, a landmark 1965 study
on tetanus shots on US college
campuses compared the efficacy
of merely “warning” students
of the dangers of tetanus with
an intervention that provided
critical pieces of information to
practically assist students with
accessing the vaccination.
When only verbally warned
about tetanus and encouraged
to get the shot, coverage was
3 per cent. Meanwhile, another
group of students received key
pieces of practical information: a
campus map with the location
of the infirmary circled, a list of
times when immunization were
available, and a prompt to schedule
an appointment immediately.
Twenty-eight per cent of these
students ended up getting
vaccinated — a ninefold increase.
The experiment demonstrated how
practical information can help to
overcome small inconveniences
that might otherwise stand in the
way of a user taking action. Noting
the value of the map, for instance,
a review of the study suggested
that “these [students] may have
already known how to get to the
infirmary or had access to the
same campus map. However,
having the map at the right time
made the information salient,
reduced the hassle of looking for
its exact location, or reduced the
thinking required to get there.”67
Practical information seeks to
remove any ‘friction’ in a decision-
making and action-taking process.
From simple visualizations (like
maps) to tactile actions (like
writing down an appointment
time), making the most important
pieces of information salient
helps to remove obstacles to
accessing a health service.
Practical Information
Practical information enables users to locate and process only the most critical
details about a programme. It tackles issues of vagueness on the one hand and
over-communication on the other, providing only the necessary information
for people to follow through on their intentions to access services.
67 Ross, et al. (2013), Using Behavioural Economics for Postsecondary Success.
Solution Examples
124 125
DEMAND FOR HEALTH SERVICES
Q4: HOW COULD WE RESPOND? 4A: CONCEPTUALISE SOLUTIONS

Visible:
To account for challenges like
forgetfulness, in contexts where
people’s attention is spread thin,
action cues bring only the most
important information to the user’s
attention, making it easier to see.
For instance, in Peru, mothers
are typically given a handwritten
paper reminder at clinics that is
easily lost or misinterpreted. One
organization is piloting a solution:
the Alma Sana bracelet — a durable,
customizable and colourful
bracelet that records a child’s
immunization schedule. Infants
wear the bracelets on their wrists
as a physical and always visible
reminder to the caregiver (and
community). In a pilot study, 91
per cent of mothers reported that
the bracelets helped to remind
them of their next appointment,
and 90 per cent said they
plan to keep using them. The
bracelets cost US$0.10 each.73
Timely:
Action cues work best when
they can prompt users with
information on a timely, repeated
basis through channels that
they consistently access.
SMS reminders have proven
effective in several settings. In
Kadoma City, Zimbabwe, one study
found that 95 per cent of children
in a group that received SMS
reminders were fully immunized
at 14 weeks, compared to 75
per cent of children in a similar
group that did not receive the
reminders. Those who received
reminders —sent 7 days, 3 days,
and 1 day before a scheduled
visit — were also 75 per cent less
likely to delay.74 A majority of the
intervention group preferred to
receive a reminder the day before
their appointment: a time-sensitive
feature made possible by SMS.
Actionable:
Action cues should result in
just that — action. Rather than
assume that people will figure
out the requisite steps to take
on their own, action cues can
help people to follow through on
their intentions by guiding them.
Research shows that encouraging
people to take an action with a
generic reminder letter often is
not enough. In one experiment
regarding influenza vaccination,
letters that included specific
information about where and when
to get the vaccination resulted in
a 28.2 per cent vaccination rate,
compared to 19.2 per cent among
users who only received general
encouragement to get the shot.75
As the researchers hypothesized,
lack of action cues — missing
information about when and where
to access the vaccination — was
a more important obstacle to
overcoming the gap between
intentions and actions than
people’s attitudes about
receiving the vaccination.
Action Cues
Action cues are reminders built into a programme’s design that prompt users to do
something. They help to address issues like forgetfulness and procrastination, which
prevent people from following through on positive intentions. Successful action cues
present critical information to the user in visible, timely and actionable ways.
73 <www.indiegogo.com/projects/alma-sana-vaccine-reminder-bracelets-for-moms>
74 Bangure, et al. (2015), ‘Effectiveness of Short Message Services reminder on Childhood Immunization Programme in Kadoma, Zimbabwe: A randomized
controlled trial’.
75 McCaul and Johnson (2002), ‘The Effects of Framing and Action Instructions on Whether Older Adults Obtain Influenza Shots’.
For this type of intervention to
succeed, programme designers
must have a clear understanding of
which incentive(s) would work to
sufficiently push a group of users
towards the desired behaviour.
Research has shown that both
small financial and non-financial
incentives can be effective — but
the appropriate incentive is
different in different contexts and
with different groups of users.
Financial:
In one experiment, college
students in the US were twice as
likely to get an influenza shot when
offered a $20 reward (19 per cent
vs. 9 per cent). Researchers found
that many students had a strong
intention to get vaccinated, but
perpetually postponed taking the
necessary actions. (As the authors
explained, “individuals postpone
getting vaccinated, because the
cost is immediate and the benefits
accrue only in the future.”)68
Why cash?: Researchers
observed that extra money was
highly motivating for college
students. Even this (relatively)
small incentive was enough to
motivate twice as many students
to take the time to vaccinate.
Non-financial:
In India, an organization provided
families whose children completed
a full vaccination course with
a small bag of raw lentils. The
actual monetary value of the
bag was less than US$1. A
concurrent programme to increase
reliable access to vaccinations
pushed immunization rates from
6 per cent to 18 per cent in
participating villages — but when
the additional incentive of lentils
was added, the figure jumped
to 39 per cent, representing a
more than sixfold increase. The
researchers hypothesized that
a minor incentive helped to
overcome small but powerful
barriers, like procrastination
among people juggling many
competing priorities.69, 70
Why lentils? In this resource-
poor environment, the bag of
lentils offered an immediate and
tangible benefit to users. The
long-term benefit of vaccinating
was harder to visualize — but the
lentils provided a compelling-
enough reason to act today.
Various other forms of micro-
incentives have been studied
across contexts. In Pakistan,
DTP coverage at 18 weeks
of age increased twofold
compared to a control group
when food and medicine
vouchers were introduced.71 In
rural Nicaragua, a food incentive
increased turnout at mobile
clinics by over 60 per cent.72
As the authors of that study
suggested, food in Nicaragua
(rather than vaccines alone)
proved an effective motivator
because it “directly influence[d]
a family’s economic welfare.” It
turned caregivers’ focus from
something abstract in the future to
something tangible in the present.
Micro-incentives
Micro-incentives are small, motivating bonuses given to users that increase adoption of a desired
behaviour. They often help to cancel out small costs that discourage users from accessing services,
giving people a small reward for doing something that is often perceived as an inconvenience.
68 Bronchetti, Huffman and Magenheim (2015), ‘Attention, Intentions and Follow-through in Preventive Health Behaviour: Field experimental evidence on
influenza vaccination’.
69 Banerjee, et al. (2010), Improving Immunisation Coverage in Rural India: Clustered randomised controlled evaluation of immunisation campaigns with and
without incentives.
70 UNICEF (2011), ‘Child Poverty Insights, A new look at an old problem: Why do so many poor children miss out on essential immunization?’.
71 Chandir, et al. (2009), ‘Effect of Food Coupon Incentives on Timely Completion of DPT Immunization in Children from a Low-income area in Karachi,
Pakistan: A longitudinal intervention study’.
72 Loevinsohn and Loevinsohn (1986), ‘Improvement in coverage of primary health care in a developing country through use of food incentives’.
Solution Examples
126 127
DEMAND FOR HEALTH SERVICES
Q4: HOW COULD WE RESPOND? 4A: CONCEPTUALISE SOLUTIONS

Implementation Intentions
Follow-through can be increased
by implementation intentions —
for instance, by asking patients
or caregivers to describe or
write down in detail their plan
to vaccinate.81 These plans ask
users to specify when, where
and how to carry out an action,
forcing the ‘present self’ to prepare
the ‘future self’ for following
through. Rather than relying on
open-ended intentions (“I want
to get my child immunized”),
implementation intentions
prompt users to link that positive
intention to a plan for action.
In one study of workplace
vaccination, employees that
received a postcard about available
workplace influenza shots were
more likely to vaccinate if they
were prompted to write down
when they planned to come for
the vaccination. Moreover, when
they were prompted to write down
both a date and a time, vaccination
rates were even higher.82
Commitment Devices
Follow-through can also be
deployed through commitment
devices, which help bind users
to a future action — say, by
adding a penalty if they do not
follow through.83 This approach
helps to ‘lock in’ an action that
the future self takes based on a
decision made in the present.
In one (non-vaccine-related)
study, grocery store shoppers
were asked to commit in advance
to buying healthier foods. They
received a discount if they
increased their healthy purchases
by a specified percentage, and
agreed to relinquish the savings
if they didn’t meet the threshold.
The shoppers who made a
binding agreement increased
their healthy food spending
relative to a control group.84
As some researchers observed,
if applied to immunization, a
parent “could be asked to
pre-commit to approving the
scheduled vaccines for the child
and to put down a deposit that
would only be returned (perhaps
with a bonus) once the vaccine
had been administered.”85
—
Making a decision and following
through takes effort, which we
can always put off until tomorrow,
again and again. Follow-through
helps us to overcome our
inclination to delay, forget
or ignore our positive
intentions — whether by making
plans concrete, or by incurring a
cost or relinquishing a reward.
Consider the following three
methods of structuring choices
relevant to immunization:
defaults, presumptive language
and enhanced active choices.
Defaults
Defaults capitalize on our tendency
to stick with the status quo, or
‘go with the flow’. We are usually
content to continue with the
option that we are automatically
given, and are much less likely
to opt out of a decision that is
suggested for us, especially if
suggested by a perceived authority
figure or someone whom we trust.
One study on influenza
vaccinations found that people
‘pre-scheduled’ for a influenza
shot were far more likely to get
vaccinated than those who had
to make an appointment on their
own. (In the former group, people
could ‘opt out’ of the appointment;
in the latter, people were forced to
‘opt-in’ by making an appointment
independently.) The study found
a 36 per cent relative increase
for the pre-scheduled group.26
Presumptive Language
Presumptive Language refers to
the way in which a conversation
is started during a provider-patient
interaction, suggesting that how
providers initiate a vaccination
recommendation matters.
In one study, paediatric providers
either used presumptive or
participatory language with
parents. The presumptive language
(e.g. “Well, we have to do some
shots”) significantly outperformed
participatory language (e.g. “What
do you want to do about shots?”)
among all parents, even vaccine-
hesitant ones. When the provider
used participatory language, 89
per cent of the vaccine-hesitant
parents resisted compared to
30 per cent when the provider
used presumptive language.77
Enhanced Active Choices
Enhanced Active Choices ask
people to make a deliberate
choice between multiple
options presented to them. The
preferred choice is framed
in positive, encouraging
language, and the undesirable
choice in dissuasive language.
In another series of influenza
vaccination experiments,
researchers structured choices so
one group “had to actively select
whether they would get a influenza
shot to reduce their risk of getting
the influenza, or would choose
not get a influenza shot, even if
it meant increasing their risk.”78
Seventy-five per cent of this group
said that they would get the shot,
compared to 42 per cent of a
control group that saw a standard
message79 about the shot.80
—
In each of these three instances,
caregivers maintain the ability to
make a non-vaccination decision.
However, most people (even
many vaccine-hesitant ones) tend
to stick with options that are
presented favourably or as the
default. The deliberate structuring
of choices can encourage desired
behaviours among users in ways
that affirm their inclination to do
what is easier and beneficial.
Follow-through
Follow-through ideas help to bridge positive intentions with corresponding actions.
Sometimes, decisions are easier to translate into actions when the actions feel concrete and
achievable. Other times, creating a ‘deal’ with your future self can increase the likelihood of
action. Either way, follow-through ensures that decisions translate into actual behaviour.
Structuring Choices
Ways of structuring choices can have a powerful influence on an individual’s decision-
making. The same information presented in dierent ways can result in dierent outcomes.
Thoughtfully designing how choices are presented can shape the choices that are made.
81 Gollwitzer and Sheeran (2006), ‘Implementation Intentions and Goal Achievement: A meta-analysis of effects and processes’.
82 Milkman, et al. (2011), ‘Using Implementation Intentions Prompts to Enhance Influenza Vaccination Rates’.
83 Rogers, et al. (2014), ‘Commitment Devices: Using initiatives to change behaviour’.
84 Schwartz, et al. (2014), ‘Healthier by Precommitment’.
85 Betsch, et al. (2015), ‘Using Behavioural Insights to Increase Vaccination Policy Effectiveness’.
76 Chapman, et al’ (2010), ‘Opting In vs. Opting Out of Influenza Vaccination’.
77 Opel, et al. (2013), ‘The Architecture of Provider-Patient Vaccine Discussions at Health Supervision Visits’.
78 Participants facing an enhancd active choice were asked to check one of two boxes: “I will get a Influenza Shot this Fall to reduce my risk of getting the
influenza and I want to save $50 or, I will not get a Influenza Shot this Fall even if it means I may increase my risk of getting the influenza and I don’t want to
save $50.”
79 The standard message read: “Place a check in the box if you will get a Influenza shot this Fall.”
80 Keller, et al. (2011), ‘Enhanced Active Choice: A new method to promote behaviour change’.
Solution Examples
128 129
DEMAND FOR HEALTH SERVICES
Q4: HOW COULD WE RESPOND? 4A: CONCEPTUALISE SOLUTIONS

In a field experiment in Zambia,
four groups of hairstylists were
recruited to sell female condoms.
One group received no additional
reward beyond the proceeds
of sales, two additional groups
received financial rewards (90 per
cent and 10 per cent margins on
sales, respectively), and a final
group received symbolic social
rewards in the form of stars
stamped on a publicly displayed
chart to represent each sale.
After one year, members of the
‘star treatment’ group had sold
twice as many condoms, on
average, as any other group.90
Public recognition proved far
more powerful than financial
incentives in driving performance.
Recognizing HCWs with small,
non-monetary gifts can likewise
improve outcomes. An experiment
in the United Republic of Tanzania
promised a biographical book
about a doctor to HCWs at a future
date; it was also inscribed with
a thank you message from the
research team. The gift “triggered
an immediate response at the
time of the promise.” After 10
weeks, adherence to protocol
remained consistently high.91
Small material rewards can work
to trigger reciprocity: a social
behaviour by which we respond to
another’s action with an equal, and
sometimes more significant, action.
Non-financial rewards can be
particularly appealing given that
they cost so little to implement.
As the World Bank noted, “[social]
rewards are free to give and carry
no immediate material benefits
but have a substantial effect
on productivity and may play a
key role in sustaining... effort
over time.”92 While non-financial
rewards will not substitute as
solutions to more fundamental
problems, like inconsistent or
inadequate salary disbursements,
examples show that ideas like
reciprocity and recognition can
be implemented in ways that
move HCW motivation and
performance in a positive direction.
Community Feedback
Community Feedback creates
mechanisms for dialogue
between service providers
and the people they serve—
and can go well beyond the
‘transaction’ of immunization
at the point of service.
In one study in Uganda,
researchers established a
“community monitoring scheme.”
Service providers and community
members met regularly to discuss
how to improve services and
created a shared action plan. A
year later, health facilities in these
villages were 36 per cent more
likely to have suggestion boxes
and 20 per cent more likely to have
numbered waiting cards; waiting
times decreased on average
by 12 minutes, absenteeism
decreased by 13 per cent, and
the facilities were cleaner. Overall
immunization rates increased
for all age groups, though
especially among newborns.86, 87
Peer Feedback
Peer Feedback has proved to be
an effective means of improving
the quality of care administered
by HCWs. Studies have shown
that simply reminding HCWs
of the social expectations of
their performance can make
a positive difference.88
A study in urban United Republic
of Tanzania showed that clinicians
increased their performance
when a visiting peer recited a
short ‘encouragement script’
and mentioned five specific and
important protocol items (which
most clinicians knew but did not
regularly perform). There were no
additional changes to the incentive
structure for clinicians (i.e. no
pay-for-performance schemes
or rewards were introduced),
and yet the researchers found
a “large increase in quality
with a simple and seemingly
inconsequential intervention.”89
—
Community Feedback strengthens
local relationships by giving
users a voice and a stake in the
success of a programme, fostering
mutual accountability between
users and HCWs. Peer Feedback
leverages social pressure by
reminding those delivering care of
their professional responsibilities
and building their self-esteem.
These strategies place a
premium on dialogue—moving
immunization from a technical
transaction to part of a mutual
effort towards a common goal.
HCW Incentives
Rewards are an age-old mechanism to modify behaviour. Importantly, rewards
may take many forms. While salary increases and opportunities for career
advancement can be instrumental to improve HCW performance, so too can public
recognition, symbolic armations of social status, and feelings of reciprocity.
Feedback
Systems of regular feedback can help to encourage positive behaviours and discourage
negative ones. Establishing feedback systems between the community and health-care workers
(HCWs), or among HCWs themselves, can serve as powerful performance motivators.
90 Ashraf, et al. (2014), ‘No Margin, No Mission? A field experiment on incentives for public service delivery’.
91 World Bank (2015), Mind, Society and Behaviour.
92 Ibid.
86 Bjorkman, et al. (2009), ‘Power to the People: Evidence from a randomized field experiment on community-based monitoring in Uganda’.
87 Specifically, 46 per cent and 42 per cent more newborns received the first doses of BCG and polio vaccines, respectively, compared to the control group.
88 Jamtvedt, et al. (2007), ‘Audit and Feedback: Effects on professional practice and health care outcomes (Review)’.
89 Brock, et al. (2012), ‘Generosity Norms and Intrinsic Motivation in Health Care Provision: Evidence from the laboratory and the field’.
Solution Examples
130 131
DEMAND FOR HEALTH SERVICES
Q4: HOW COULD WE RESPOND? 4A: CONCEPTUALISE SOLUTIONS

Health communications have
sometimes sought to appeal
to caregivers’ identities as key
members of a community with
messages emphasizing shared
responsibility. Activating certain
identities — making them more
salient in a given situation — can
influence behavioural outcomes.
Appealing to certain identities
not only requires isolating the
identity most likely to yield a
corresponding desired behaviour,
but also requires using an effective
cue. In other words, how would
we make salient, for example, a
woman’s identity as a responsible
member of a community?
In a series of randomized
experiments, researchers used
different linguistic phrases to
evaluate which yielded stronger
voter turnout. Researchers
embedded linguistic cues within
a survey delivered to participants,
and found that cues phrased
as a noun (“be a voter”) led to
higher voter turnout than those
phrased as a verb (“go vote”). By
framing voting as an issue of
identity rather than simply as
a behaviour, the distinction in
phrasing resulted in an 11 per cent
difference in actual turnout.88
It so happens that nouns tend to
do a much better job of priming
identities and prompting desired
behaviours than verbs — whether
with turning out to vote, or turning
out to access vaccines. That is
principally because “[v]erbs are
harder to remember, more broadly
defined, more prone to be altered
in meaning when conflict of
meaning occurs, [and] less stable
in translation between languages...
than nouns.”89 For example, a
message could encourage a parent
to “be a protector” by getting
her child immunized, rather than
instruct her to “protect your child.”
Nouns help to activate particular
identities, subtly tapping into
a person’s sense of self.
Consider, for example, the
proposals made by a design
firm to change the standard
home-based record in an
effort to increase immunization
coverage.93 The firm observed
that a home-based record — as
the name might suggest — should
be designed for the home, not
just a clinical environment.
In that case, what function
should it serve in the home?
“In the home the most critical
role of the record is to indicate
when the child needs to return
for a follow-up visit. The record
may, however, be put away for
safe-keeping, reducing it to a
static record rather than a present
reminder for action. Conversely,
the record may be kept out and
be subject to general wear and
tear or unintentional misuse.”
In response, the improved design
featured four essential elements:
Prompt:
The principal design form features
a yellow sleeve inside which
records are kept. Each time a HCW
writes the date of the next visit and
inserts the record into the sleeve,
the date ‘sticks out’ visibly from
the sleeve for the family to see.
Materials:
The record used by HCWs
and put into the yellow sleeve
is printed on a low-cost type
of paper that is resistant to
wear and moisture. The sleeve
itself is made from Tyvek, a
durable and low-cost material.
Photo:
A HCW takes a photo of the
immunized child, displayed
on the yellow sleeve’s cover,
“transform[ing] the record into a
keepsake that may be proudly
displayed in the home.” This
functions to not only ensure the
record’s continued visibility, but
also motivates the family to keep
the records out of harm’s way.
Visuals:
The visual design “emulates a
government document, like a
passport, to ensure it is kept
safe and not discarded.”
—
When modifying objects such as a
home-based record, small changes
can yield large consequences.
However, especially with objects,
we should be mindful of only
modifying materials — for example,
only making home-based records
more durable with elements
like water-resistant paper. While
helpful, “[t]he durability of a record
is as much about its materials
as it is about ensuring that the
record is prized and visible in
the home and not damaged or
discarded unintentionally.” In
addition to making physical
changes, considering how an
object will emotionally impact a
user — such as motivating a sense
of pride — is equally important.
Identity Saliency
Identity is fundamental to behaviour. Individuals have more than a single identity: a woman
can be a mother, daughter, wife, head of a business, community activist and member of a
particular clan within a particular ethnic group — all at the same time. While identities co-
exist, some become more Influential than others — or more salient — in dierent contexts.
Modified Objects
Small details in the design of objects, such as a user’s home immunization records, can have
an outsized impact on an object’s intended function. Attributes like physical design, content,
and the way information is presented can all aect whether an object serves its purpose.
88 Bryan, et al. (2011), ‘Motivating Voter Turnout by Invoking the Self’.
89 Gentner, Dedre (1981), ‘Some Interesting Differences Between Verbs and Nouns.’93 <www.gravitytank.com/pdfs/RFL/gravitytank_RFL_Final_v5.pdf>
Solution Examples
132 133
DEMAND FOR HEALTH SERVICES
Q4: HOW COULD WE RESPOND? 4A: CONCEPTUALISE SOLUTIONS

For a piece of communication, like a radio
spot, maybe a draft script would be helpful;
if the idea involves an SMS reminder, a
storyboard could lay out how sequential
SMS messages lead to a clinic visit; an idea
related to a new clinic intake experience
could be visualized as a diagram.
Where possible, consider creating
multiple designs of the same idea.
Sometimes, users may be reluctant to
give feedback when only a single design is
presented. However, having multiple options
may help to open up conversation, as well as
allow you to compare key variables of an idea.
While you should aim to design each idea,
it is equally important not to over-design.
A design is just a physical approximation
of your idea. It may be tempting to give a
certain idea more love and attention than
others — to dedicate more effort to a certain
design. Hard as it may be, refrain from
investing too much in any one idea at this
stage. Keeping designs ‘low-fidelity’ (or
simple) will allow your team to explore
many different ideas without feeling
committed to any single one too early.
Remember: design is not about
perfection. Design is about making ideas
concrete enough to gather feedback
from the field during prototyping.
Design Quick
Examples
4b
The process of design forces us to think in concrete terms
about how an idea would work. For each of the candidate
ideas that made it through your Assess Concepts step,
consider how the idea might be made more real.
Know that designing does not require designers. Ideas can
be designed quickly, easily and cheaply by anyone with basic
materials.
Common Categories of
Idea Designs:
Visualizations
Visualizing an idea involves putting pen
to paper. What does an idea look like?
How does it work? Visualizing is the most
direct way to move from an abstract to
a concrete idea. Ideas that would likely
be two-dimensional in reality — from a
sticker to a poster — are best visualized.
Models
Physical models of an idea go beyond
two-dimensional visualizations, offering
a way to understand certain ideas more
concretely. Ideas that would likely be
three-dimensional once produced — from
a micro-incentive to a reminder bracelet —
are best to design with models.
Sequences
Some ideas will not require ‘making’
anything, but instead require changing an
experience. These ideas still deserve to
be designed. Tools like storyboarding can
help to elucidate how a new experience
might unfold, sequence by sequence.
135
DEMAND FOR HEALTH SERVICES
134
Q4: HOW COULD WE RESPOND? 4B: DESIGN QUICK EXAMPLES

Visualization
Example:
Personal
Pledge
Model Example:
Health Card Sequence
Example: Clinic
Experience
Model Example:
Health Card
An idea to reorganise the information on users’ health
cards might be sufficiently communicated through
a visualization. But perhaps the idea goes beyond
health card information to include new aspects like a
plastic cover, a string to hang it inside the home, and
so on. Rather than leave these to the imagination,
use rough materials to further bring the idea to life.
Sequence Example:
Clinic Experience
An idea to redesign elements of a clinic experience
for users is hard to capture with just words. Instead,
a storyboard of events — from the beginning
of a user’s experience to the end — helps to
communicate the idea more fully. It also makes
clear to others what exactly needs to change,
at what point, involving whom, and so on.
Visualization Example:
Personal Pledge
An idea like a ‘personal pledge’ is intended
to help users follow through on their
intentions — a specific plan a user makes
to carry out an action. Visualizing this idea
could require sketching out the different
elements of a pledge card: perhaps a
piece of paper with sections about what a
user is pledging to do, when and how.
Design Examples
136 137
DEMAND FOR HEALTH SERVICES
Q4: HOW COULD WE RESPOND? 4B: DESIGN QUICK EXAMPLES

Prototype Designs
with Users
Prototyping is the exercise of testing low-fidelity designs
with real users. This method allows users to experience and
react to simulated solutions within their environment (the
home, the clinic, the community).
The purpose is not to rigorously measure performance (that
comes later). Instead, we are interested in determining
elements of an idea that are working well and elements
that require rethinking. This step precedes full-scale
implementation to optimize ideas prior to investing
resources in their roll-out.
By the end of this phase, your team will have a final set of
ideas that have been tested, reassessed, and redesigned.
Investigating the Challenge, Again
In creating prototypes that users can interact
with, we have the opportunity to not only
examine the strengths and weaknesses of
our ideas, but also to further examine our
conclusions about the challenges. Putting
solutions in context further confirms
or questions our initial diagnoses.
For example, perhaps we concluded
that users were not completing a full
immunization course because of the length
and cost of travel. Existing quantitative data
showed that clinic transport costs require a
significant portion of monthly income, and
narrative data from users confirmed that
caregivers’ perceptions of costs matched
this reality; many told us that transport
costs were just too high. In response, we
designed a voucher programme to mitigate
costs and incentivize follow-through.
To prototype our idea, we set up a mini-
version of the voucher programme. We
distributed our low-fidelity vouchers to
groups of new mothers. We then tracked
voucher collection at a local clinic and
found that few mothers used them. In
our follow-up interviews, we asked why
they were not used and found that costs
are indeed perceived as high; but that is
not the only problem. Additionally, many
mothers shared a common negative
experience: the last time they went to
the clinic, it had run out of the vaccine.
Taking another day off work and paying
transport costs again when the availability
of vaccine is uncertain was an additional
challenge, and a different diagnosis.
Prototype Tools
Successful prototyping is predicated
on successful planning and evaluation:
defining when, where, and with whom
to prototype each idea; selecting the
prototyping activities to assign for each
idea; recording key lessons as they emerge
during and after prototyping exercises; and
articulating and refining your evaluations
of each idea’s performance in the field.
The tools in this section — Prototype
Planning and Prototype Evaluation
Worksheets — are intended to assist
you and your team when planning
and evaluating the prototyping of your
various designs. Each idea requires its
own set of Prototype Worksheets.
The Prototype Worksheets help you
and your team to make decisions
about which ideas to implement and
what to improve prior to doing so.
4c
139
DEMAND FOR HEALTH SERVICES
138
Q4: HOW COULD WE RESPOND? 4B: PROTOTYPE DESIGNS WITH USERS

01
Establish Learning Goals
Each design should have a clear goal or set
of goals associated with its prototyping.
While prototyping will likely uncover
unexpected findings about the strengths and
weaknesses of an idea, an overall learning
goal should help to guide in-field exercises.
For example, if you are prototyping a
voucher programme, your primary concern
could be whether or not the vouchers
are actually used. Prototyping exercises,
such as a mini-pilot combined with post-
pilot interviews, should be in service of
learning whether vouchers are leading
to clinic visits, and why or why not.
For each design ask yourself: what
do we want to learn from putting
this idea out into the field?
02
Enable Real Use-Cases
If prototyping is limited to asking users
their opinions on a solution, what we
learn will be limited. As far as possible,
prototyping exercises should be designed
to simulate real use-cases. This allows
for observing people’s responses and
behaviours — a more reliable predictor of
an idea’s efficacy than self-reported data.
For example, if you are prototyping a
redesigned health card, your primary
concern might be to ascertain whether
it facilitates timely return visits to the
clinic. Simply handing a redesigned card
to a person on the street and asking
for feedback will not usually yield data
in service of that learning goal.
While a mini-pilot might not always be
feasible if you are rapidly prototyping, you
could instead distribute cards to users
and evaluate through exercises whether
the new cards overcome some of the
challenges associated with the old cards,
like poor comprehension. Such data
would be an imperfect but still helpful
indicator of the new card’s ability to
facilitate return visits by addressing key
challenges discovered in user research.
For each prototyping exercise ask
yourself: how can we quickly create
the idea in context with real users?
03
Iterate as You Go
As your prototyping exercises unfold
in the field, making small, iterative
changes as you go is one of the surest
ways to gain deeper insights.
For example, if during an exercise you learn
about a shortcoming, improving the design
prior to the next exercise will help you to
learn more. Did the design change yield
new feedback from users? Iterating as
you go is especially valuable when certain
elements are distracting from the core idea.
Maybe a particular color is throwing users
off, preventing you from getting deeper
feedback? Best to correct this early on.
After each prototyping exercise
ask yourself: what could we
adjust prior to the next one?
04
Filter Feedback
Not all feedback has equal value.
Key to processing feedback after prototyping
exercises is filtering the helpful from the
unhelpful. Often, ‘unhelpful’ feedback
is generated in response to low-fidelity
designs — feedback from users that touches
on the low quality of a particular solution.
In other instances, users may express
stated preferences that do not align with
observed behaviour. For example, maybe
some users say they prefer cash over
food as a reward for getting their child
immunized; however, your prototyping
shows little difference in the impact of
the financial versus non-financial reward.
After prototyping ask yourself:
how much weight should be given
to each piece of feedback?
05
Invite User Co-Creation
The best form of feedback can come in the
form of direct contributions from users.
Often, users will have questions about
the solution you are introducing. Suppose
you are prototyping a public recognition
scheme to motivate HCW performance. A
HCW asks you if this recognition is only
among her HCW peers, or among the wider
community. Rather than provide an answer,
invite her to share an opinion: should it
only be among peers, or among the wider
community? What would that look like?
Throughout prototyping ask
yourself: where are there
opportunities to directly involve
users in developing an idea?
Prototype Principles
140 141
DEMAND FOR HEALTH SERVICES
Q4: HOW COULD WE RESPOND? 4B: PROTOTYPE DESIGNS WITH USERS
Activity:
Suppose we designed this idea in response
to an intention-action gap observed during
user research; we found that forgetfulness96
causes users with an intention to
vaccinate not to do so (or not to do so on
time). The personal pledge is designed
to narrow that gap by helping users to
concretely establish a plan of action.
According to our learning goals, we
are concerned about whether the
pledge supports increased action-
taking, and whether it does so simply.
To those ends, we could design a
mini-pilot like the example below.
The gathered data will be far from perfect.
Nothing about prototyping is or should be
rigorous by usual standards. We will not
be able to confidently assess the idea’s
impact one way or the other. However, what
it should enable us to do is identify some
initial strengths and weaknesses for the
purpose of developing the idea further.
For example, if most mothers return for
their next appointment late, we know that
we have more work to do, prompting us
to investigate why (say, through more
follow-up interviews). If some mothers
return on time, we will not be able to
veritably attribute it to our idea; however,
we might get valuable feedback when
interviewing mothers who return on time
versus those who return late or not at
all. We might also learn that HCWs do
not administer the pledge as we had
anticipated, causing complications that
we can address in our next iteration.
96 Issues with memory are now widely studied phenomena; for a helpful survey on “how and why memory can get us into trouble,”
see: Schacter (1999), The Seven Sins of Memory: Insights from Psychology and Cognitive Neuroscience.
Prototype Activities, as suggested in the
Prototype Principles, should get as close
to a real scenario as possible. The more
similar to a real use-case we can get, the
more valuable our learnings will be.
However, prototyping should also be
rapid, allowing us to learn and improve our
ideas quickly. Finding a balance between
polishing enough for real-world users to
understand the idea, and working rapidly,
is important. Activities that require too
much investment are less desirable than
ones that can be pulled off quickly.
To illustrate prototyping activities that
are both in context and rapid, here is
an example using the personal pledge
from ‘Design Quick Examples’.
Example: Personal Pledge
Prototype:
We designed a ‘personal pledge’ using
a piece of laminated paper that asks a
user to articulate what she is pledging to
do (get her child fully vaccinated), when
she is planning to undertake certain
actions (the dates, times and location
of future clinic visits), and how she
plans to make those actions happen (for
example, her exact transport plans).
Learning Goals:
• Does the prototype help users to follow
through on an existing intention to get
their children fully vaccinated on time?
• Is the pledge easily administered by HCWs
and easily comprehended by users?
Location
Choose a location and
communicate the process to
administration for support.
Team
Station a team member on
site throughout the day in
case questions emerge or
unexpected challenges arise.
Partners
Find HCWs or partners
that will help administer
the prototype. Conduct a
short training on what you
would like them to do.
Measurement
Create a simple
tracking system to
measure outcomes.
Users
Ensure that the desired
user-group participates.
Follow-up
To evaluate ease of use,
directly observe the activity
and conduct follow-up
interviews with users.
Prototype Activities
142 143
DEMAND FOR HEALTH SERVICES
Q4: HOW COULD WE RESPOND? 4B: PROTOTYPE DESIGNS WITH USERS
For each idea, use this worksheet to develop a prototype
plan in preparation for gathering in-field feedback.
When
Decide upon precise times, such as when a prototyping activity begins and when
interviews will be conducted. Include the duration — hours or days — for the activity.
With Whom
Confirm that you are engaging the intended user-group as defined in
your Objective. Remember that selecting a variety of people — both non-
vaccinators and vaccinators — can generate more helpful feedback.
Where
Select the precise location(s) where you will introduce the prototype, such as a group
of clinics. Remember that the more an idea is prototyped in context, the better.
Learning Goals
What do we want to learn
from field-testing this idea?
Prototype Planning
Demonstrate the Idea
How will you demonstrate the idea? Examples include: paper
sketch, cardboard sign, SMS text(s), radio spot script, etc.
144 145
DEMAND FOR HEALTH SERVICES
Q4: HOW COULD WE RESPOND? 4B: PROTOTYPE DESIGNS WITH USERS
Desirability
Desirability is the evaluation of an idea from
the perspective of intended users. It helps
fit our ideas to actual people. Consider
whether an idea is asking a little or a lot
of users’ time and energy, whether or
not it is easy to process or engage with,
and whether or not it is being correctly
used. Focusing on elements such as these
(burden, comprehension and use) ensures
that ideas are being designed for the user.
Feasibility
Feasibility is the evaluation of an idea
in the context of your programme’s
organizational and technical capacities. It
requires identifying the range of capabilities
necessary for effectively executing an idea
and sustaining it over time. Imagine what
might be needed to implement, distribute
and sustain an idea. If moving from a
prototype to full-scale implementation seems
difficult because of programmatic limitations,
this means you have challenges of feasibility.
Viability
Viability is about evaluating the financial
resources required to sustain an idea.
Consider whether or not an idea has a
sufficient initial programmatic budget
for implementation and whether
possible savings will help to make
the case for sustaining and scaling the
idea over time. Low-cost ideas, or ideas
that save programmes money in the
long run, are often the most viable.
Biggest strengths
Do the user responsibilities
seem realistic?
Observed weaknesses
Is this idea desirable?
• Is this idea currently designed to
ask as little of users as possible?
• Does the idea easily fit into people’s lives?
• Is the idea actually appealing to users?
• Is the idea understood
and correctly used?
• Is it inviting or complicated?
Is this idea feasible?
• Is the technology required of
the idea easily available?
• Is the technology easily
sustained over time?
• Can your programme actually
make it happen?
• How long will the idea take to
move beyond a prototype?
Is this idea viable?
• What can be projected
about possible costs?
• Is the idea honouring the
programme’s budget?
• Might the idea actually save
the programme money?
• How near-term versus long-
term are potential savings?
What do we still need to know?
Not yet?
Return to
the design
phase and
refine.
Not yet?
Return to
the design
phase and
refine.
All yes?
Move on!
All yes?
Move on!
Not yet?
Return to
the design
phase and
refine.
All yes?
Move on!
Prototype Evaluation
Use these three dimensions that focus on an idea’s potential
to evaluate the simulated solution’s future success.
For each idea, use this page to evaluate the idea post-prototyping.
146 147
DEMAND FOR HEALTH SERVICES
Q4: HOW COULD WE RESPOND? 4B: PROTOTYPE DESIGNS WITH USERS

How Could
We Improve?
Introduction: Continuous Learning
We established what we want to achieve, investigated
what might be preventing our desired outcomes and
generated potential solutions to those challenges. Now it
is time to scale and implement our ideas.
But this is not the end. As we bring these ideas to the
field, how can we continually improve them throughout
their implementation?
Improving immunization programmes requires a continual
process of discovery, experimentation and learning. Many
variables shape the success of a programme; some may be
identified before implementing new ideas, but some will be
identified during implementation. This calls for iteration.
Implementation is an opportunity for further learning and
improvement. While disappointing, it is possible (and even
likely) that our initial diagnoses were incorrect, or partially
correct, and that our evaluations of prototyping were
insucient. Only by scaling and implementing our ideas can
we see what works and what does not in the real world.
148 149
DEMAND FOR HEALTH SERVICES

One way to think about methods of iterative
implementation is ongoing user research.
This implies that we always have more to
learn and more to improve upon. These
methods promote the concept of ‘phasing’:
rather than approach implementation
as a one-time task, it advocates phased
steps to implementing an idea. This
cyclical approach to planning, assessing
strengths and weaknesses, and making
adjustments before scaling a programme
initiative (and repeating that process) gives
us the opportunity to properly iterate.
For many programmes, this principle — that
implementation is iterative — will be easier
in theory than in practice. Those who fund
programmes are not often interested in
imperfect results, and those who execute
programmes are sometimes wary of
acknowledging them. But by candidly
recognizing that implementation will reveal
both shortcomings and opportunities
for our ideas, programmes can work to
improve initiatives over time, increasing
impact and decreasing waste.
Iterative implementation requires that
programmes think ahead about behaviours
that will either facilitate or handicap the
ability to adapt ideas over time. Consider the
following three ways in which programmes
can set themselves up to embrace adaptation.
Eective Programme Management
A lot goes into successfully bringing an idea
to the field during its iterative implementation:
building capacity to implement programme
initiatives, logistical planning, staff training
and ensuring financial resources. Distinct
from those concerns, this section is
exclusively focused on methods to ensure
we learn about and improve ideas over
time. This does not negate the importance
of effective programme management.
Resources for Adaptation
Plan to budget resources — time, money
and effort — for the explicit purpose
of learning and making changes
throughout implementation.
Resources tend to be tied to particular,
pre-decided activities, and also tend to
stay static. This can prove challenging. If
an idea calls for introducing new clinic
procedures, implementation might require
creating and deploying new materials,
conducting HCW trainings on how to use
them, and so on. But perhaps in the course
of implementing we find that a change to our
planned activities is appropriate. Maybe an
adjustment to an activity becomes necessary,
or an additional activity is required?
Ensuring up front that budgets
enable adaptation of planned efforts
in the field allows for responding to
the realities of implementation.
Permission for Adaptation
Do not avoid change simply because an
initial investment in the idea has been made.
Too often, programmes feel compelled to
continue a project as is despite evidence
of ineffectiveness, or identification of
new opportunities for improvement.
This may come from a fear that if a project is
put on hold, or a part must be redesigned, it
will appear that the programme has wasted
resources.97 But by letting ineffectiveness
continue, we will waste even more
resources. This tendency is prevalent
when we have already invested a lot of
time, energy and money, and therefore do
not feel we have permission to adapt.
Iterative implementation calls for
giving programmes permission to
honestly evaluate, adjust and improve
ideas throughout their execution.
97 Arkes and Blumer (1985), ‘The Psychology of Sunk Cost’.
Standards for Adaptation
Iterative implementation is dependent
upon knowing exactly what should be
improved. This requires knowing what to
measure — which standards to apply.
Indicators are tools; some are helpful for
certain tasks and some are not. Selecting
the appropriate indicators for the purpose
of adapting ideas over time is often a
tension between indicators that will help
us to make effective adaptations, and
ones that will please a programme’s
stakeholders. They are not always the same.
The methodology that follows is
dedicated to selecting the most useful
techniques to evaluate ideas and
support their continual improvement.
Iterative Implementation
Phasing Model:
Learn to scale, and scale to learn
Time
Scale
5A: PLAN 5B: EVALUATE 5C: IMPROVE
150 151
DEMAND FOR HEALTH SERVICES
Q5: HOW COULD WE IMPROVE?
5
The approach is divided into three parts. At the end of the
process, we will return to our initial implementation planning
and make adjustments prior to repeating the process and
further scaling an idea.
Methodology
Revisit the initial Adaptation Plan
to reflect what we are learning,
adjust what we are measuring, and
continue to improve the execution
of our ideas. Implement adaptive
changes that respond to findings as
you scale the improved idea.
If the idea is working, the final output
is a revised Adaptation Plan and
proven ideas that can be scaled. If the
idea is not working, step back into the
creative conceptualising and design
exercises laid out in Question 4,
then redeploy.
Devise an Adaptation Plan for
each draft initiative. Define the
key evaluative questions, possible
risks, measurable criteria and
corresponding indicators to track
progress over time. We will return
to the Adaptation Plan after each
phase of implementation and make
adjustments.
Assess each revised idea in the field
using the Adaptation Plan as a guide.
Evaluate the accuracy of diagnoses
and determine what we still do not
know much about.
Revised
Adaptation Plan
Revised
Idea
5a: Plan for Iteration 5c: Improve Initiatives5b: Evaluate Eectiveness Final Output: Revised Adaptation
Plan and Proven Ideas
5A: PLAN 5B: EVALUATE 5C: IMPROVE
152 153
DEMAND FOR HEALTH SERVICES
Q5: HOW COULD WE IMPROVE?

Plan for Iteration
Separate Plans for Separate Ideas
Each initiative requires its own iterative
implementation process. For every
prototyped idea your team should devise
an Adaptation Plan, evaluate the idea’s
performance in the field and make
adjustments prior to scaling it further.
While some ideas may be implemented
together (for example, perhaps you plan
to introduce both new health cards and
a new intake process at neonatal clinics),
devising separate planning, evaluation
and improvement processes ensures that
each idea gets the attention it deserves.
Adaptation Plan: Making Ideas Better
What do we hope to learn during programme
implementation? What are we going to measure? How will
we measure it?
An Adaptation Plan contains questions that we will return
to during the iterative implementation of our ideas. These
questions determine what we learn and what we change.
Adaptation Plans are ‘living’ documents. They should
change from phase to phase. For example, we might identify
unforeseen obstacles to success and we might change what
we choose to measure.
i
Questions
What are we hoping to
learn more about?
Choosing what to measure is predicated
on what we want to learn.
Suppose we are implementing an SMS
reminder programme responding to user
research indicating forgetfulness as a
chief reason for under-immunization. We
want to know whether or not reminders
actually increase coverage—articulated
in our Objective Statement (Question 1).
However, that will require long-term tracking.
For the Adaptation Plan, we are only
concerned with what we can learn about
and improve during iterative implementation.
To learn whether reminders help decrease
forgetfulness we could ask: Does the
SMS reminder programme make it
easier for caregivers to follow through
on their intentions to vaccinate?
We might also evaluate details of the
programme such as the frequency and
the timing of reminder messages.
To generate valuable questions, first return
to the diagnosis behind the idea. In the
short-term, it is more realistic to evaluate
whether an idea is effectively responding
to its insight than to evaluate overall impact.
Second, consider elements of the idea that
would improve its performance (in this case,
perhaps the volume or timing of messages).
ii
Indicators
What are we going to measure?
Now that we know what we want to learn,
we can determine how we want to measure
progress towards our learning goals. We
choose indicators that can be reliably
followed over time, and that reveal how an
idea is working through change or stagnation.
To continue our example, if we want to know
whether SMS reminders make it easier for
caregivers to follow through on their positive
intentions, an increase in clinic visits is a
strong indication that the idea is working.
Therefore, we could select “percent change
in clinic visits” as a corresponding indicator.
We could also select more than one
indicator to help answer a question. Having
multiple indicators gives us multiple
perspectives on the same question.
Components of an Adaptation Plan
5a
5A: PLAN FOR ITERATION
155
DEMAND FOR HEALTH SERVICES
154
Q5: HOW COULD WE IMPROVE?

iii
Verification
How are we measuring?
Now that we established what we are
measuring, we need to devise how to
measure. What methods will we employ
to track the indicators we laid out?
There are many ways to measure the
effectiveness of SMS reminders to increase
clinic visits. One approach could rely on
clinics’ administrative data: evaluating
the aggregate change in visit volumes over
some period of time. However, total visits
could increase for various reasons, and it
could prove difficult to confidently attribute
our SMS reminders to this outcome.
Another approach could rely on an
individual tracking system: enrolling
a sample of caregivers into the SMS
reminder programme whom we track
throughout the duration of the programme.
While this method may be more verifiable,
it is also potentially more effortful to
administer. Each means of verification
will have distinct pros and cons.
Finally, quantitative approaches are not
the only (or necessarily the best) way
to gather information that improves the
effectiveness of an idea. The data we gather
for iterative implementation do not need
to be definitive; they need to be enough
to inform incremental improvements.
Because an Adaptation Plan is intended
to help improve an initiative, re-engaging
with qualitative user research is a useful
verification tool. Consider the value of
follow-up interviews with caregivers after
experiencing the SMS reminder programme.
In addition to the data of change in clinic
visits, we can learn about why the SMS
reminders helped some caregivers
and not others. As with user research
(Question 3), qualitative approaches can
help to uncover motivations that would
not likely emerge in quantitative data.
iv
Justifications
Why are we measuring this way?
Why have we selected a particular
indicator, and why have we chosen
to track it in a particular way?
In the previous parts of the Adaptation Plan,
we chose indicators, methods to measure
and means to verify. The Justification
component exists to track why we made
these decisions and communicate the
reasoning to a broader team. Articulating
justifications will also instigate critical
reflection on those decisions to help us
avoid selecting inappropriate measurements.
Justifications should be given specifically
for each means of verification (you may
have multiple methods for verifying a single
indicator). For example, perhaps we chose
to measure the percentage increase in
clinic visits to see if forgetfulness is the
biggest obstacle. In addition, we chose
to measure changes in timeliness to see
if follow-up is the biggest obstacle.
To track those indicators, our chosen
means of verification is administrative
data provided by participating clinics.
Our justification acknowledges the
attribution issues with the approach, but
explains that given a short timeframe and
limited budget, it is an optimal option.
Like recognizing assumptions we
may have (Question 2), identifying
external variables helps us design
for the existing system and
users, rather than for an ideal
system and generalized users.
There may be a lot that does not go according
to plan throughout implementation — some
within a programme’s control, and much
outside of it. While effective programme
management should help to account for
those variables within a programme’s
control, identifying external ones that
might jeopardize an idea is another way to
adapt our ideas to be more risk-resilient.
For example, the effectiveness of an SMS
reminder programme might rely on the
assumption that throughout the duration
of the programme, a caregiver is reliably
accessing the same mobile phone. In
reality, the phone may be shared within
the family and therefore reminders may
not reliably reach the caregiver at the right
time. The idea might also require that
caregivers can consistently pay for mobile
service, which may not be realistic. From
internet connectivity, to the performance of
programme agents like HCWs, to vaccine
supply itself, many external variables
pose as risks to an idea’s success.
Taking these risks into account is critical
for three reasons. First, we must recognise
possible external variables in order to
address them by adapting our ideas.
Second, knowing external variables that
stand in our way helps identify which
measurements are reliable within the
Adaptation Plan. It is unlikely that all risks
will be taken into account up front during
the development of an Adaptation Plan. It
is more likely that key risks are discovered
during implementation. This is why the
Adaptation Plan must be ‘live’— we
should be able to return to it and adjust
as an idea is tested in the real world.
Third, external variables help explain why the
idea did not perform the way we thought it
would. Shortcomings in the SMS reminder
programme that show up in the data may not
indicate shortcomings of the idea’s concept.
Instead, they might suggest that the idea’s
design and distribution should be better
adapted to mitigate these external variables.
External Variables
156 157
DEMAND FOR HEALTH SERVICES
Q5: HOW COULD WE IMPROVE? 5A: PLAN FOR ITERATION

Define Implementation Questions
Define what you want to learn about and improve
from phase to phase during iterative implementation.
Remember the Objective
Locate the Objective from Question 1 for reference—
this is what our continuous learning should support.
External Variables
Recognise external variables that may
jeopardize an idea or interfere with indicators.
Sample External Variables:
! Caregivers may not have reliable access to the
same mobile phone—it could be shared.
! Caregivers may not consistently pay for mobile
phone service.
! Caregivers may not have regular access to Internet.
! Clinics may not regularly stock all vaccines.
iii iii iv
For each idea, use this worksheet to develop an Adaptation Plan. Adjust the plan throughout
implementation. Add additional rows as needed for additional implementation questions.
Select Indicators
Based on your questions, determine
what you need to measure.
Articulate Justification
Document why each indicator and its associated
means of verification were selected.
Determine Means of Verification
Determine which methods to use for tracking
the indicators and improving the idea (not
for definitively evaluating its impact).
Question Examples:
? Does the SMS reminder programme make it easier for
caregivers to follow through on their intentions to vaccinate?
? Are more messages better than fewer?
? How important is timing?
Indicator Examples:
+ percentage change in clinic visits
+ percentage increase in on-time visits
Method Examples:
» Use clinics’ administrative data (aggregate change in visits)
» Enrol a sample of caregivers into the SMS reminder
programme and track this controlled set
» Conduct individual interviews with caregivers after
experiencing the SMS reminder programme
Justification Examples:
» The two indicators address two related issues (forgetfulness
leading to non-access or late-access)
» Administration data from clinics is a more suitable means of
verification given short time frame and limited budget
Tool #1 Adaptation Plan
5a
5A: PLAN FOR ITERATION
158 159
DEMAND FOR HEALTH SERVICES
Q5: HOW COULD WE IMPROVE?

Whereas Planning happens on paper, Evaluation happens
in the field. This step is comprised of two sequential
parts: executing the means of verification chosen in the
Adaptation Plan and analysing information as it is collated.
The methods used to execute the means of verification and
analyse findings will vary significantly depending upon the
chosen initiatives chosen for implementation.
Evaluate Eectiveness
5b Incomplete Diagnoses
Our user research (Question 3)
did its best to identify and explain issues
impacting the intended users of immu-
nization programmes. Our diagnoses
captured why these issues exist.
However, no amount of research will
produce definitive diagnoses. One of
the benefits of iterative implementation
is the opportunity to use the real world
to test our findings: are the solutions
we developed actually responsive to
the challenges articulated in our diag-
noses? If not, what did we miss?
Consider two different scenarios; one
of them reveals an incomplete diag-
nosis, and one of them does not.
In the first example, a box of tea is used
as a non-financial reward for completing
an immunization course. Our evaluations
reveal that clinic visits did not meaningfully
change with this new reward system in
place. Through individual interviews, we
learn that the reward itself is of little interest:
tea is not especially desired, and the idea
miscalculated its relevance. This example
does not point to an incomplete diagnosis,
but to the shortcoming of the idea itself.
In a second scenario, tea was very much of
interest to this user-group: non-users of the
rewards programme discussed how much
they would have liked to have received the
reward. But these non-users also communi-
cated that because of high transport costs,
they still could not dependably visit the
clinic, despite wanting to. In this instance,
the diagnosis was incomplete: forgetfulness
is a problem, but so too are travel costs.
Our idea only addressed the former.
When we recognise evidence of incomplete
diagnoses, we must refine them, adjust
their corresponding prompts and revisit idea
generation and design. This iterative loop
ties our implementation (Question 5)
back to our research outputs (Question 3)
and creative efforts (Question 4).
Unknowns
Finally, one of the most important aspects
of an honest evaluation is acknowl-
edging what we still do not know.
One example of a predictable unknown
is the degree to which an idea effectively
supports a programme’s objective. Is the
idea actually increasing coverage among
the user-group? Is it decreasing inequities?
This measurement of impact will come from
rigorous evaluation over a longer time.
Our evaluations will be incomplete in many
other ways. Data will be imperfect, or
inconclusive — and explicitly identifying
those ‘unknowns’ at the end of an imple-
mentation phase will help us to adjust an
Adaptation Plan for a subsequent phase. For
example, continuing with our hypothetical
rewards programme, perhaps data from
an initial phase suggest that a particular
sub-segment of users (young caregivers) are
using the programme less than others. At
this point, we have an outstanding unknown:
why are these particular caregivers tending
to use the rewards programme less?
Identifying unknowns will help to complete
our measurement activities— and, subse-
quently, improve the ideas themselves.
In addition to the tracking and analysis
activities your team chooses, the following
three categories will help improve an
idea from one phase to the next.
External Variables
The Adaptation Plan lays out the potential
external variables (risks) beyond the
immediate control of your team that can
jeopardize the effectiveness of an idea
once implemented. For example, a reward
given to a user for seeing an immunization
course through will not be useful if upon
the last visit, the vaccine was not available.
If you cannot resolve them (e.g. vaccine
supply) you must adapt ideas to be more
risk-resilient. Consider the same example
of a reward for a user that is not very useful
if a vaccine is not in supply. After visiting
a clinic twice, motivated by the promise
of a reward upon the third and last visit, a
user is likely to be upset by the absence
of a vaccine — and moreover, by the
absence of a promised reward. Following
the adaptation option, the reward system
is modified: users who encounter this
situation are offered an increased reward
for returning for a fourth clinic visit, when
the vaccine stock is scheduled to be
replenished. This may not work perfectly
(especially in the unpredictable context of
a failing vaccine supply system); but it may
improve an idea’s chances of success.
It may not be possible to fully address
the external variables facing an initiative.
Evaluating those risks is still critical to
any measurement exercise, as it helps to
explain how an initiative’s effectiveness
will continue to be mitigated.
5B: EVALUATE EFFECTIVENESS
161
DEMAND FOR HEALTH SERVICES
160
Q5: HOW COULD WE IMPROVE?

There are two ways that findings from ‘Evaluate
Eectiveness’ help teams to improve an initiative.
The first involves eorts to improve the idea itself. Discovering
that a particular risk is impeding an idea’s potential, or
that the idea is not being received by users in the way we
anticipated, requires returning to concept creation and
design (Question 4). Once we have a new idea, we redeploy
in a new phase of implementation and re-evaluate its
performance. We can call this Idea Improvements.
The second involves making adjustments to how we measure
and learn. Before we continue scaling up, we should revisit
the initial Adaptation Plan: have we been asking the right
questions? Are the indicators we chose proving helpful, or
too challenging to meaningfully track? Are there others we
should consider? What additional risks emerged that we did
not anticipate? What risks did we anticipate that had no
impact? We can call this Planning Improvements.
Improve Initiatives
5c
Checking Ourselves
Throughout this problem-solving process we risk viewing
ourselves as the experts and users as the people who
require help. This is not the case. A human-centred
methodology treats users as the ultimate experts and
ourselves as learners intent on better understanding what
is preventing better immunization outcomes. While you
may be the one holding this Field Guide, it is unlikely
that you also know the problems facing immunization
programmes as well as those aected by them.
Intended users are not alone in facing the
challenges presented here. Our cognitive
abilities are a relatively poor predictor of how
susceptible we are to cognitive biases.98
Educated, high-income people are just as
susceptible to forgetting important tasks
or exaggerating probabilities as the less
well-educated and poor. As Jim Yong Kim,
President of the World Bank, commented,
“development professionals and policy
makers are, like all human beings, subject
to psychological biases.”99 On the next
page are three reminders to help us be
self-critical of biases and assumptions we
might inadvertently bring into this work.
5C: IMPROVE INITIATIVES
98 Stanovich and West (2008), ‘On the Relative Independence of Thinking Biases and Cognitive Ability.’
99 World Bank (2015), Mind, Society and Behaviour.
163
DEMAND FOR HEALTH SERVICES
162
Q5: HOW COULD WE IMPROVE?

Hearing What We Want
Consider two uncontroversial observations.
First, it is unlikely that health professionals
approach a problem without any pre-
existing experience or knowledge. To
the contrary, most engage with a
challenge having the distinct advantage
of a career’s worth of expertise.
Second, it is usually easier for us
to get behind familiar ideas than
unfamiliar ones. Familiar information is
comfortable, and unfamiliar information
is less so. And we usually do our
best — even if unconsciously — to
avoid feeling uncomfortable.
Taken together, these two phenomena
can handicap our work: the more we
know, and the more uncomfortable it is to
process unfamiliar information, the more
likely it is that we will be selective in what
we hear. From conducting field research
to analysing research findings, we exhibit
the tendency to fit what we see and hear
to pre-existing models of how we think
things work. We bypass information that
goes against those mental models.100
For example, consider the researcher who
developed the following hypothesis: a
particular user-group is rejecting vaccinations
because of a dearth of proper education. For
years, across many contexts, this researcher
observed the correlation between low levels
of education around vaccines and low uptake.
In the present context, the researcher
takes special note of these observations:
there is no discussion of vaccines in
schools and little education at clinics.
The researcher may have also heard during
interviews that vaccines are not safe. This
seems to further support the researcher’s
hypothesis: people are not properly educated
given that they think vaccines are dangerous.
But that is not the whole story. Suppose
the researcher is in a country with a
history of forced sterilization. Users
may have reason to believe vaccines are
dangerous. ‘Rumours’ of sterilization may
not be accurate in the present, but they
are meaningful historical events.101 The
problem is a distrust of public services
rather than misconceptions about vaccines.
Had the researcher stuck with the initial
hypothesis regarding under-education,
the solutions developed would not be
effective. By selectively emphasizing certain
observations and bypassing others based
on previous knowledge and experience, we
risk misdiagnosis and ineffective solutions.
Having an Answer
Health systems and the various ways
that populations engage with them
are complex. Despite that evident
complexity, health professionals are
sometimes more comfortable with
definitive answers than with ambiguity.
At their best, human-centred methods
avoid overstated precision by surfacing
our assumptions, by questioning the
perfection of any diagnosis or idea, and
by mandating continual investigation
and improvement. Being unsure is far
better than falsely confident. In any arena
where practitioners are tasked with
better understanding and responding
to the subtle and complex elements of
human behaviour, overconfidence can
be debilitating. Having no answer is
better than having the wrong answer.
For example, take a programme that has
invested significant amounts of time, money
and effort into communication assets
that used positive framing to motivate
caregivers: it used messages like “getting
fully vaccinated can save your child’s
life.” Assessments during the prototyping
of the communication assets were not
conclusive; the initial evaluations did not
strongly suggest success or failure.
Before implementation, the programme
decided to additionally prototype negative
messages to better compare and contrast
the idea (for example: “your children
will be more likely to contract a serious
disease if you don’t get them fully
vaccinated”). The findings did not reveal
anything conclusive. So the programme
brought both negative and positive
messages through to implementation,
piloting them over time and evaluating
their potential affect on clinic visits.
Rather than defaulting to an answer for
the sake of conclusivity, the programme
maintained humility in its assessments
and, as a consequence, opened itself up
to further experimentation by bringing the
negative messages into its prototyping
and iterative implementation.102
We do not have all the answers. Humility
helps us remain open to new insights.
Letting Go
Lastly, human-centred methodologies
require that practitioners let go of certainty.
In the course of the work presented in
this Field Guide, teams will likely articulate
an insight, discover a finding or devise a
solution that needs to be changed — or
discarded altogether. However, when
we invest significant energy in an
effort, or are especially satisfied with
our work, making changes or discarding
that work can prove challenging. We
have a tendency to resist change.
For example, during the prototyping of
creative ideas, it is unlikely that any later
ideas will bear a strong resemblance to
the concepts initially developed during
creative brainstorming. However, the
more we hold onto our ideas as they are,
the less we are able to objectively listen
to users and adapt our ideas based on
the valuable feedback they provide.
Resisting overcommitment opens our work
to more possibilities for experimentation
and effectiveness in the long run.
100 Nickerson (1998), ‘Confirmation Bias: A ubiquitous phenomenon in many guises’.
101 Generalized example based on empirical evidence: ‘Social Mobilisation and Communication for
Polio Eradication: Documentation in Nigeria, India and Pakistan (2002-2003)’.
102 Gallagher and Updegraff (2012), ‘Health Message Framing Effects on Attitudes, Intentions, and
Behaviour: A Meta-Analytic Review’.
“As it happens, research has largely been inconclusive on framing effects as they relate to
vaccination-related behaviours; loss-framed messages generally tend to perform better with
health-related behaviours overall, but their strength is less certain in regards to immunization.”
A human-centred approach to problem-solving is
accepting that our pre-existing knowledge is incomplete,
that definitive answers can be dangerous, and that better
findings and new solutions await our discovery.
5C: IMPROVE INITIATIVES
164 165
DEMAND FOR HEALTH SERVICES
Q5: HOW COULD WE IMPROVE?

For additional details, or to download a
digital version of the full Field Guide, visit
HCD4I.org. Additional components to
accompany the full field guide include:
For examples of how UNICEF’s
Innovation Team is using a human-centred
approach: unicef.org/innovation
Take Acumen Courses in Human-Centred
Design: plusacumen.org/courses
For more information on interviewing
users and creating a discussion guide, read
Rosenfeld’s Interviewing Users:
rosenfeldmedia.com/books/
interviewing-users
For an overview of human-centred
design and a complete kit of methods to
apply throughout the process, visit the
IDEO.org Design Kit: designkit.org
View tools for collaboration and
brainstorming in the HyperIsland
Toolkit: toolbox.hyperisland.com
frog’s Collective Action Toolkit puts
design-thinking tools into the hands of
local change agents: frogdesign.com/
work/frog-collective-action-toolkit.html
Find practical tools to trigger and
support social innovation in the
DIY Toolkit: diytoolkit.org
For tools focused on improving the
conditions and experiences of vulnerable
populations visit the Social Innovation
Lab Guide: socialinnovationtoolkit.com
Additional
Resources About This
Guide
1 2 3
Principles & Process Poster
This 6-page, fold-out poster provides a short
introduction to the project, an overview
of the process, and the six behavioural
principles to keep in mind during the process
(which can be posted your workspace).
Workbook
This fold-out workbook provides an summary
of each step of the process and its associated
tools. The form encourages immediate trial
for new users and provides helpful reminders
for users familiar with the process.
If you are interested in thinking about
innovation at an organizational (not project or
service) level, visit Capacity
to Innovate: capacitytoinnovate.org
For ready-to-use workshop agendas and
guidance bringing together groups, download
the Social Innovation Lab Guide:
rockefellerfoundation.org/report/
social-innovation-lab-guide/
About This Guide
In 2015, the SAGE Decade of Vaccines
(DoV) Working Group tasked UNICEF
and WHO to establish a working group
related to GVAP Strategic Objective
2 (GVAP SO2). This Field Kit builds on
the findings and recommendations of
the “GVAP SO2 Working Group.”
The SO2 findings disrupt a simple distinction
between “supply” and “demand.” They push
for increased EPI capacity to understand
and respond to challenges, whether
they are related to care-giver KAPs, HW
skills, or issues of service quality.
This resource was created by the
Communication for Development (C4D)
team in the Immunization Unit of the Health
Section, UNICEF PD, to help colleagues
apply “human-centred design” approaches
informed by emerging insights from the
behavioural sciences to do just that.
Share Feedback and Ask Questions
To share your successes and stories
from the field, or to ask any questions
you have regarding this guide email
HCDimmunization@gmail.com.
166
CONCLUSION

Some terms used in this guide may be foreign in health
programming fields, but their meaning is probably not as
foreign. Terms common to human-centred design are listed
below. The language is also meant to be human-centred:
simple terms that can be understood outside technical
jargon and specialized acronyms.
Diagnosis – the identification of the root cause of a
behaviour, perception, or other challenge by examination
of the symptoms
Hypothesis – initial or proposed explanations, made
on the basis of available evidence, as a starting point
for further investigation
Lexicon
168 169
DEMAND FOR HEALTH SERVICES
CONCLUSION
User – the person who will be using or interacting with
our solution: the child we are trying to reach, the caregiver
we are trying to help and health-care workers
Brainstorming – a group activity for generating ideas collectively
Prototype – a mini-pilot that acts as the a first
preliminary model of an idea
Low fidelity – a draft plan, sketch, or rough drawing
that serves to quickly to make an idea real
High fidelity – a refined plan, sketch, or rough drawing
that serves to more closely approximate the final version
of the idea
Adaptation Plan – an implementation plan that
will continually change during the implementation
process to become better suited for the initiative
and its changing environment