User Manual
User Manual:
Open the PDF directly: View PDF ![]() .
.
Page Count: 6
Introduction
Motion Capture Analysis & Plotting Assistant (MCAPA) is developed for analyzing upper limbs’ joint angles
captured by the Xsens1 motion capture systems. The app has four different tabs, ‘Load’, ‘Comparison’,
‘Control Group’, and ‘Table’. This is a run through of all the tabs and functionalities of the app.
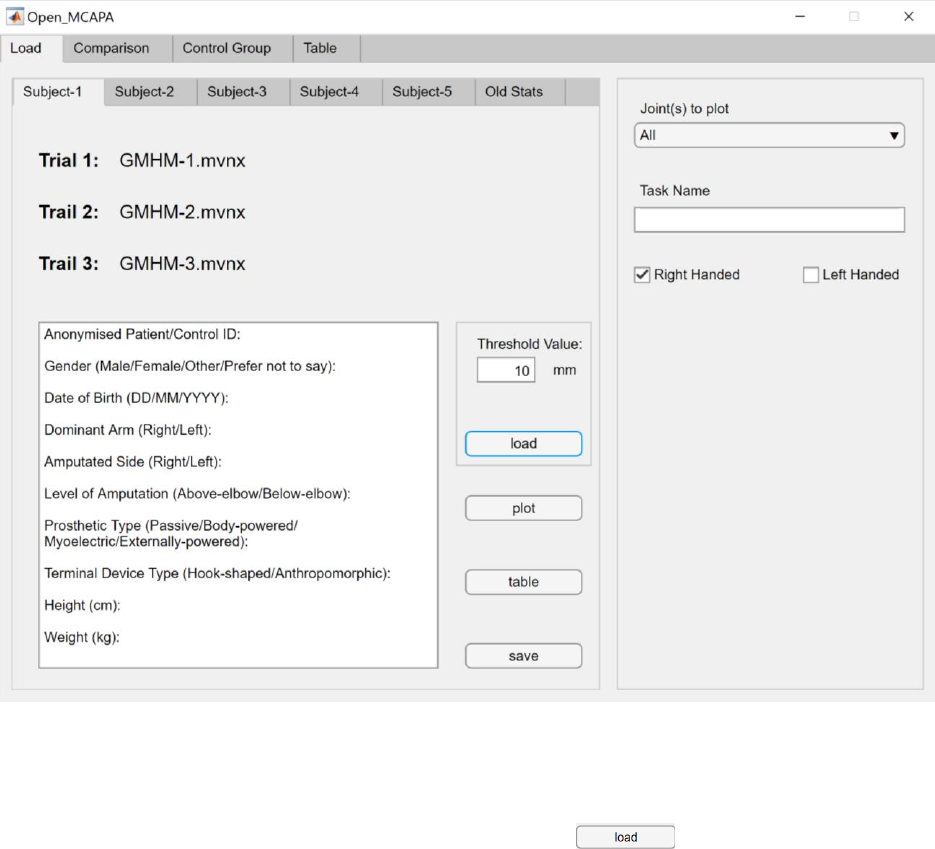
Load
The app starts up on the ‘Load’ tab. This is where you import the data sets to be processed throughout
the session.
There are two sections on this tab. To the left it’s the loading window, and to the right it’s a property input
window for individual plots.
Loading New Data
To load a new set of data, first, input a threshold value (in millimeters), which determines the initial and
final valid frames (only frames in between the first and last frames to pass the threshold will be valid).
And then choose one of the five subject tabs, and press the button, and a file selection
window will pop up. Select up to three *.mvnx2 files to be imported (once loaded, you’ll NOT be able to
add more files to the same subject without overwriting the previous import, so please select all desired
files at once). Once imported, a notification will pop up displaying ‘loading success’, please do NOT try to
carry out any other tasks in the app until then.
The note pad below is for entering basic information regarding the subject, the pre-existing texts are
recommendations for what to record, and can be edited.
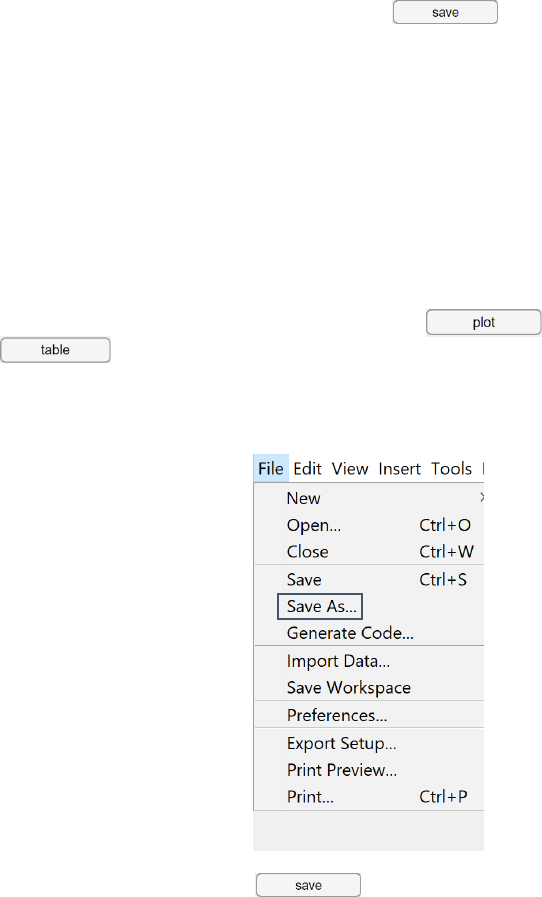
Once imported, the data set could be saved for later uses, either as old stats or a new control group profile.
To save the data and the attached note pad, press the button, and a file saving window will
pop up, select a folder and enter an appropriate name. The data will be saved as a *.mat3 file, and the
notes will be saved in a text file.
Plot and Data Table
To generate a plot, first select the angle(s) to plot in the drop down to the right, this will not affect the
data table. Then, enter the name of the task captured, this will show up in the title of the plot as well as
the data table. Check the ‘left handed’ check box if the task was carried out with the left arm, if both ‘left
handed’ and ‘right handed’ check boxes are unchecked, the task is processed for the right arm by default.
Once the above properties have been entered, press the button to generate a plot, or
press the button which will take you to the table tab of the app, listing the maximum,
minimum angles and movement range for every degree of freedom.
To save a plot, go to ‘File’ in the manu bar, and select ‘Save As…’, saving as a *.jpg is recommanded.
To save a data table, simply press the button below the table, and a saving window will
pop up. The table will be saved in a Microsoft® Excel file.
Loading Saved Data
Previously saved *.mat files can be loaded as old stats for further comparison. To import the *.mat files,
go to the ‘Old Stats’ tab where up to 5 old data sets can be loaded separately by pressing the
buttons.
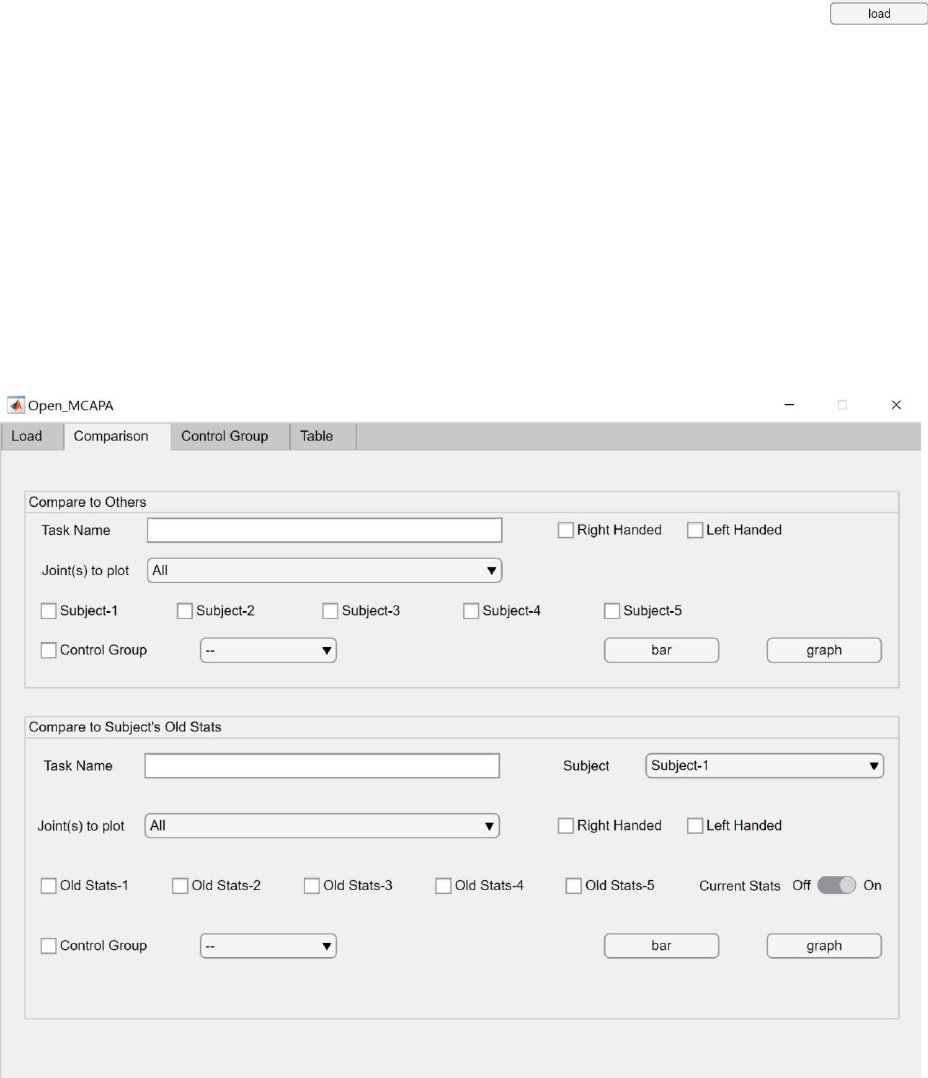
Comparison
Before you start making comparisons, select the joint angle(s) to be plotted, enter the task name, and
indicate whether it was a left-handed task.
Quantitative and qualitative comparisons could be done for:
1. Between subjects
2. Between a subject’s recent and past captures
3. To a control group with non-amputees
Tick all the data sets to be compared. For the control group (CG), select the task in the drop down next to
the tick box. For comparisons between a subject’s recent and past captures, select a subject from the
‘Subject’ drop down if the recent data is imported as one of the five subjects in the ‘Load’ tab.
Quantitative comparisons are done by pressing the button, and it’s presented as bar plots
of maximum and minimum angles and ranges side by side. All joint angles cannot be plotted together for
this type of comparison due to visibility issues.
Qualitative comparisons are done by pressing the button, and it’s presented as overlapping
line plots of the joint movements.
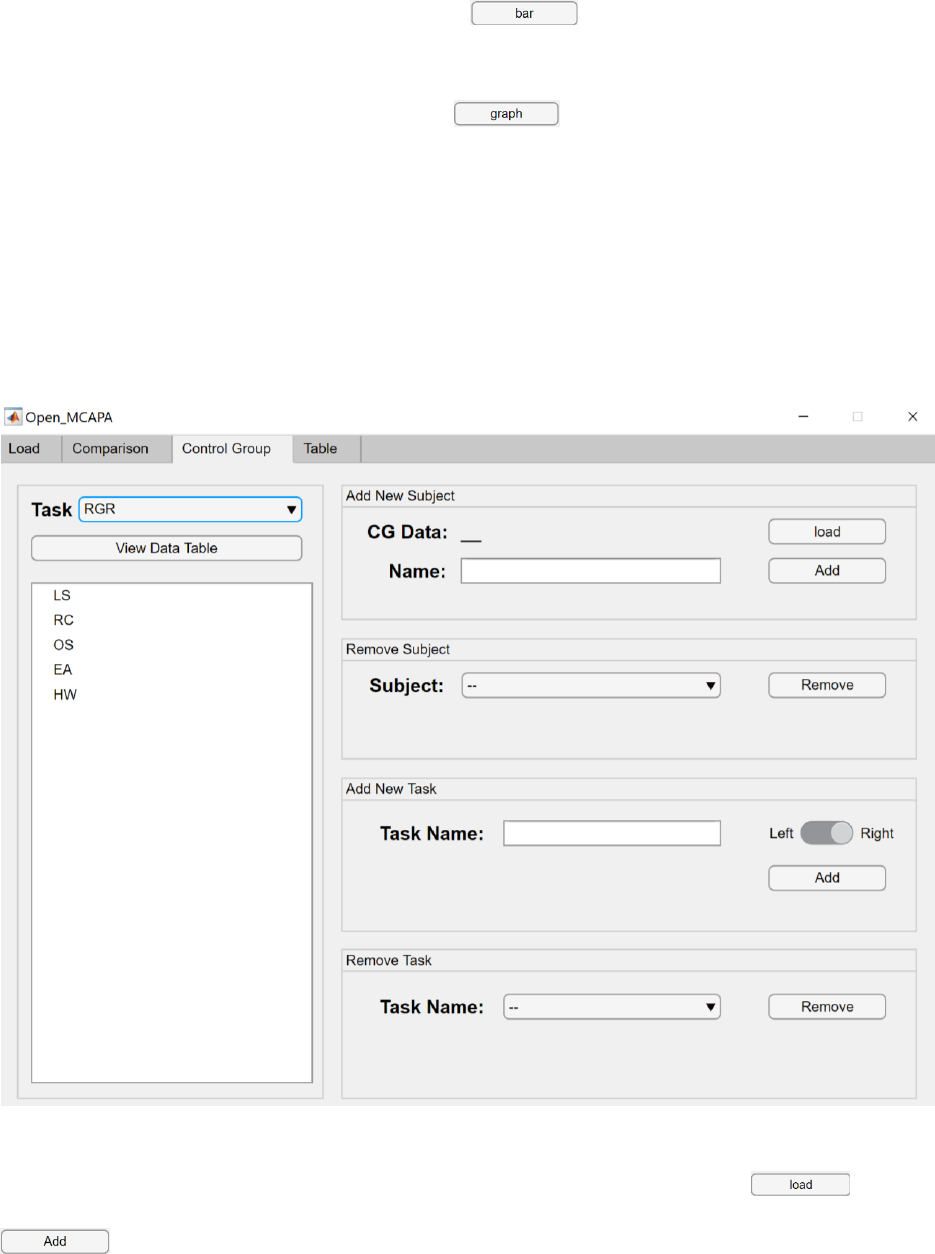
Control Group
The ‘Control Group’ tab allows you to manage the control group profiles. You can add or remove subjects
from the control group (CG) profiles and view CG angle tables for different tasks. To manage a CG profile,
select a task from the ‘Task’ drop down, and indicate whether to edit the left-handed or the right-handed
profile of the task. The list on the left shows all the subjects in the selected profile.
Adding New CG Subject
To add a subject, first save the data as a *.mat file in the ‘Load’ tab. Then, press the button,
and a file selection window will pop up. Import the *.mat file, give it an appropriate name and press the
button.
Removing a CG Suject
To remove a subject, select the subject to remove from the drop down, and press the
button.
Adding New CG Task
To add a new task, enter the task name in the edit field, select the arm used to carry out the task
(left/right), and then press the button. Once the task is added, add the subjects to it using
the add new CG subject feature.
Removing a CG Task
To remove a task, select the task to remove from the drop down, and press the button.
Additional Info
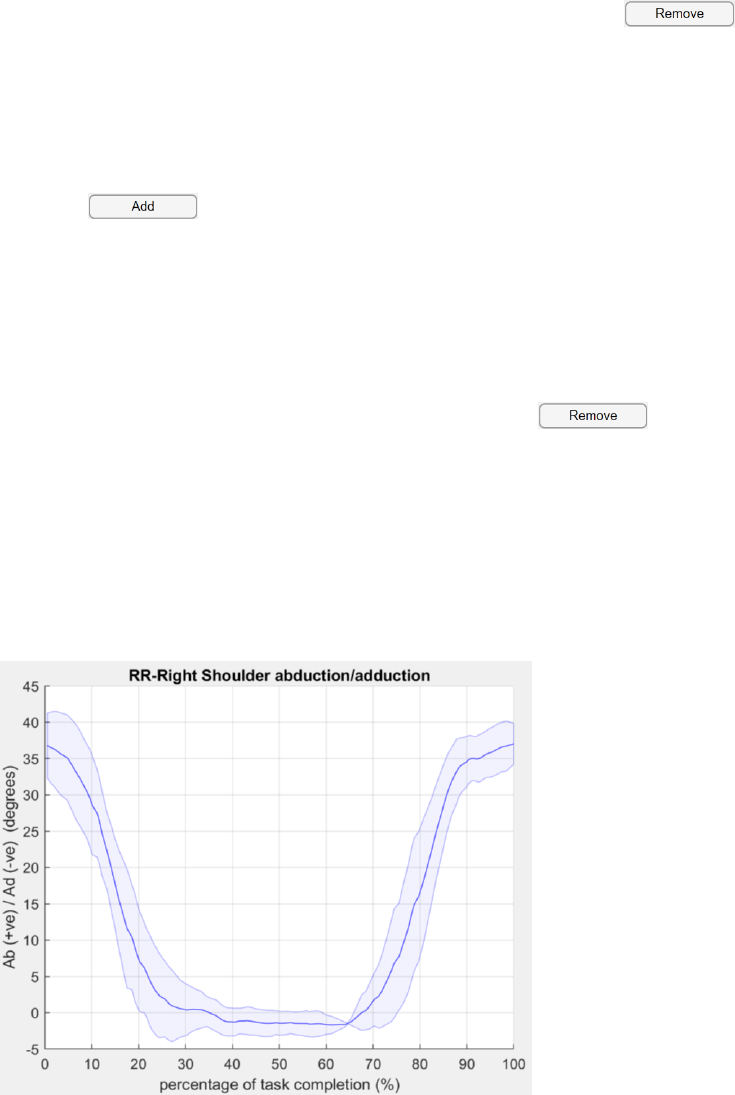
Interpreting the Plots
For plots with more then one trials included, the solid line in the middle is the median, and the shaded
area is the IQR.
Saving Files
When saving a file, make sure the file’s name does not begin with a number or contain any symbols other
than the underscore (_).

