CA NetQoS Multi Port Collector User Guide User_Guide
User Manual: User_Guide user guide pdf - FTP File Search (7/20)
Open the PDF directly: View PDF ![]() .
.
Page Count: 129 [warning: Documents this large are best viewed by clicking the View PDF Link!]
- CA NetQoS Multi-Port Collector User Guide
- Contents
- 1: What is Multi-Port Collector?
- 2: Post-installation Configuration Tasks
- Log In to the Web Interface
- Configure a Trusted Internet Site
- Change the Password of the Administrator Account
- Verify Packet Flow Through Ports
- Configure Logical Ports
- Use Hardware Filters to Manage Data
- Configure Multi-Port Collector as a Collection Device for SuperAgent
- Install the TIM Software
- Set Global Application Preferences
- Create SNMP Traps
- What are Users and Roles?
- 3: Analyzing Data
- 4: Multi-Port Collector Health and Maintenance
- 5: Troubleshooting
- A: Best Practices for Deployment
- B: Integration with SuperAgent
- C: Command Line Syntax
- D: Regular Expression Syntax
- Index

User Guide
Version 2.2
CA NetQoS Multi-Port Collector
This documentation, which includes embedded help systems and electronically distributed materials, (hereinafter referred to as
the “Documentation”) is for your informational purposes only and is subject to change or withdrawal by CA at any time.
This Documentation may not be copied, transferred, reproduced, disclosed, modified or duplicated, in whole or in part, without
the prior written consent of CA. This Documentation is confidential and proprietary information of CA and may not be disclosed
by you or used for any purpose other than as may be permitted in (i) a separate agreement between you and CA governing
your use of the CA software to which the Documentation relates; or (ii) a separate confidentiality agreement between you and
CA.
Notwithstanding the foregoing, if you are a licensed user of the software product(s) addressed in the Documentation, you may
print or otherwise make available a reasonable number of copies of the Documentation for internal use by you and your
employees in connection with that software, provided that all CA copyright notices and legends are affixed to each reproduced
copy.
The right to print or otherwise make available copies of the Documentation is limited to the period during which the applicable
license for such software remains in full force and effect. Should the license terminate for any reason, it is your responsibility to
certify in writing to CA that all copies and partial copies of the Documentation have been returned to CA or destroyed.
TO THE EXTENT PERMITTED BY APPLICABLE LAW, CA PROVIDES THIS DOCUMENTATION “AS IS” WITHOUT WARRANTY OF ANY
KIND, INCLUDING WITHOUT LIMITATION, ANY IMPLIED WARRANTIES OF MERCHANTABILITY, FITNESS FOR A PARTICULAR
PURPOSE, OR NONINFRINGEMENT. IN NO EVENT WILL CA BE LIABLE TO YOU OR ANY THIRD PARTY FOR ANY LOSS OR DAMAGE,
DIRECT OR INDIRECT, FROM THE USE OF THIS DOCUMENTATION, INCLUDING WITHOUT LIMITATION, LOST PROFITS, LOST
INVESTMENT, BUSINESS INTERRUPTION, GOODWILL, OR LOST DATA, EVEN IF CA IS EXPRESSLY ADVISED IN ADVANCE OF THE
POSSIBILITY OF SUCH LOSS OR DAMAGE.
The use of any software product referenced in the Documentation is governed by the applicable license agreement and such
license agreement is not modified in any way by the terms of this notice.
The manufacturer of this Documentation is CA.
Provided with “Restricted Rights.” Use, duplication or disclosure by the United States Government is subject to the restrictions
set forth in FAR Sections 12.212, 52.227-14, and 52.227-19(c)(1) - (2) and DFARS Section 252.227-7014(b)(3), as applicable, or
their successors.
Copyright © 2011 CA. All rights reserved. All trademarks, trade names, service marks, and logos referenced herein belong to
their respective companies.

CA Technologies Product References
This document references the following CA Technologies products:
■ CA NetQoS SuperAgent
■ CA Application Performance Management (APM)
■ CA Customer Experience Manager (CEM)
■ CA NetQoS NetVoyant
■ CA NetQoS Performance Center
■ CA Transaction Impact Manager (TIM)
Contact CA Technologies
Contact CA Support
For your convenience, CA Technologies provides one site where you can access the
information you need for your Home Office, Small Business, and Enterprise CA
Technologies products. At http://ca.com/support, you can access the following:
■ Online and telephone contact information for technical assistance and customer
services
■ Information about user communities and forums
■ Product and documentation downloads
■ CA Support policies and guidelines
■ Other helpful resources appropriate for your product
Providing Feedback About Product Documentation
If you have comments or questions about CA Technologies product documentation, you
can send a message to techpubs@ca.com.
If you would like to provide feedback about CA Technologies product documentation,
complete our short customer survey, which is available on the CA Support website at
http://ca.com/docs.

Contents 5
Contents
Chapter 1: What is Multi-Port Collector? 9
Support for SuperAgent ............................................................................................................................................. 10
Packet-Capture Investigations ............................................................................................................................ 11
Architecture for SuperAgent Support ................................................................................................................. 12
Comparison with the SuperAgent Standard Collector ........................................................................................ 13
Overview of SuperAgent Data ............................................................................................................................. 14
Support for Transaction Impact Manager .................................................................................................................. 15
Chapter 2: Post-installation Configuration Tasks 17
Log In to the Web Interface ....................................................................................................................................... 17
Configure a Trusted Internet Site ............................................................................................................................... 18
Change the Password of the Administrator Account ................................................................................................. 18
Verify Packet Flow Through Ports .............................................................................................................................. 19
Configure Logical Ports ............................................................................................................................................... 19
Use Hardware Filters to Manage Data ....................................................................................................................... 21
What is Packet Slicing? ........................................................................................................................................ 22
What are the Default Hardware Filters? ............................................................................................................. 22
Configure a Hardware Filter ................................................................................................................................ 23
Use Regular Expressions for Precise Filtering ..................................................................................................... 25
Configure Multi-Port Collector as a Collection Device for SuperAgent ...................................................................... 28
Verify Logical Port Status in SuperAgent ............................................................................................................. 30
Review TCP Session Information ......................................................................................................................... 31
Install the TIM Software ............................................................................................................................................. 32
Set Global Application Preferences ............................................................................................................................ 33
Create SNMP Traps .................................................................................................................................................... 35
SNMP Trap Severity Levels .................................................................................................................................. 36
Change Trap Behavior ......................................................................................................................................... 38
What are Users and Roles? ........................................................................................................................................ 39
User Account Information ................................................................................................................................... 40
Change the Properties of a User Account ........................................................................................................... 40
Role Information ................................................................................................................................................. 42
Product Permissions ............................................................................................................................................ 43
Chapter 3: Analyzing Data 47
What is an Analysis? ................................................................................................................................................... 48
Analysis Menu ..................................................................................................................................................... 48

6 User Guide
Predefined Analyses ............................................................................................................................................ 49
Create a Custom Analysis .................................................................................................................................... 51
Duplicate an Analysis .......................................................................................................................................... 52
Delete a Custom Analysis .................................................................................................................................... 52
Data Views .......................................................................................................................................................... 53
Use Filters to Customize Data in the Display Area ..................................................................................................... 55
View the Current Filter Conditions...................................................................................................................... 56
Analysis Filters ..................................................................................................................................................... 57
Global Filters ....................................................................................................................................................... 65
Understand the Data in the Display Area ................................................................................................................... 67
Types of Charts .................................................................................................................................................... 68
Types of Data ...................................................................................................................................................... 71
Export Data to a PDF File ..................................................................................................................................... 80
Export Data to a CSV File ..................................................................................................................................... 81
Export Data to a PCAP File .................................................................................................................................. 82
Share Data by Email ............................................................................................................................................ 84
Chapter 4: Multi-Port Collector Health and Maintenance 85
System Status ............................................................................................................................................................. 85
System Information ............................................................................................................................................. 86
Process Information ............................................................................................................................................ 86
Database Status .................................................................................................................................................. 87
Capture Card Physical Port Status ....................................................................................................................... 88
Capture Card Logical Port Status ......................................................................................................................... 88
Capture Card Physical Port Statistics .................................................................................................................. 89
RAID Status Information ..................................................................................................................................... 90
File Systems ......................................................................................................................................................... 91
Memory ............................................................................................................................................................... 92
CPU ...................................................................................................................................................................... 92
Maintenance Tasks ..................................................................................................................................................... 93
Upgrade Software ............................................................................................................................................... 93
Stop or Restart a Process .................................................................................................................................... 94
Review System Logs ............................................................................................................................................ 94
Generate a Support File ...................................................................................................................................... 95
Database Status and Usage ................................................................................................................................. 96
Purge Data from the Database ............................................................................................................................ 97
Log In to the Appliance ....................................................................................................................................... 99
System Setup ............................................................................................................................................................ 100
Machine Settings ...................................................................................................................................................... 101
Network Setup .................................................................................................................................................. 101
Choose the Time Zone ...................................................................................................................................... 102

Contents 7
Shut Down or Restart the Appliance ................................................................................................................. 102
Chapter 5: Troubleshooting 103
Capture Card Clock Differs from System Clock ........................................................................................................ 103
Time Range Exceeds Raw Packet Retention Time .................................................................................................... 103
Appendix A: Best Practices for Deployment 105
Appliance Placement ................................................................................................................................................ 105
Port Mirroring .......................................................................................................................................................... 105
Port Requirements ................................................................................................................................................... 108
Packet Deduplication ............................................................................................................................................... 109
Appendix B: Integration with SuperAgent 111
Collection Device Incidents ...................................................................................................................................... 111
Enable Collection Device Incidents ................................................................................................................... 112
Respond to an Inactive Collection Device Incident ........................................................................................... 113
Support for Special Initialization (.ini) Files .............................................................................................................. 114
Eliminate Duplicate Packets .............................................................................................................................. 115
Filter Out Keep-Alive Messages ........................................................................................................................ 116
How to Monitor in a WAN-Optimized Environment ................................................................................................ 118
SuperAgent Support for Cisco WAAS ................................................................................................................ 118
How Multi-Port Collector Integrates with a WAN Optimization Device ........................................................... 119
The SuperAgent Optimization Report ............................................................................................................... 120
Sharing Data from WAN Optimization Devices ................................................................................................. 120
Appendix C: Command Line Syntax 123
Appendix D: Regular Expression Syntax 125
Index 127

Chapter 1: What is Multi-Port Collector? 9
Chapter 1: What is Multi-Port Collector?
CA NetQoS Multi-Port Collector is a powerful appliance that captures session-level
packet data from a monitored data center. The appliance captures the data for
reporting in CA NetQoS SuperAgent and CA Application Performance Management
(APM).
■ Data from TCP packet headers help SuperAgent monitor end-to-end performance
to measure application response time.
■ Data from full HTTP packets help APM map transactions in your environment to
monitor the end-user experience and measure service-level agreements.
By passively monitoring large volumes of data center traffic from multiple ports,
Multi-Port Collector helps keep a continuous record of end-to-end system performance.
Packet headers from all traffic passing through the monitored mirrored ports are
recorded and stored on Multi-Port Collector for a short time. Data taken from 1-minute
reporting intervals is kept for a few days and provided for analysis. Metrics are
forwarded to SuperAgent for reporting or to CA Transaction Impact Manager, for
reporting in APM.
Charts and tables in a Multi-Port Collector analysis show per-host activity and
performance data, with multiple views of sessions, volume statistics, and response
times. An analysis also offers work flows for troubleshooting, several options for
exporting data, and filtering options to help IT staff diagnose and respond to issues.
Multi-Port Collector offers features to monitor its functionality.
■ Hardware-based filtering and packet-capturing options per logical port.
■ Hardware filters to calibrate performance and capture only the data of interest.
■ Multiple data feeds administered from a single web page.
■ SNMP traps send an automatic notification when errors occur that can affect data
collection or capture.
Multi-Port Collector includes the following components:
Appliance
Hardware and software that monitor traffic that flows into and out of a switch.
Performs the following functions:
■ Captures packets and writes them to storage.
■ Collects traffic statistics and analyzes packets for performance information.

Support for SuperAgent
10 User Guide
■ Stores statistical data about network, server, and application performance in a
high-performance database.
■ Sends statistical data to TIM or the SuperAgent management console for
reporting and analysis.
Web interface
An administrative interface, accessible from a web browser, that lets you:
■ View appliance statistics, including drive, CPU, and capture card status.
■ Configure system settings, such as port definitions, filtering options, and secure
user accounts.
■ View, filter, and sort performance data based on captured packets and
presented in formatted charts and tables.
■ Review locally stored session-level data on the Analysis tab.
This section contains the following topics:
Support for SuperAgent (see page 10)
Support for Transaction Impact Manager (see page 15)
Support for SuperAgent
The Multi-Port Collector appliance aggregates and exports metrics to one SuperAgent
management console in a format compatible with a SuperAgent standard collector. The
appliance collects more data, faster, than multiple standard collectors. The appliance is
an alternative for enterprises that require high-volume monitoring with more flexibility
and less overhead.
The appliance stores packets to let you perform enhanced packet-capture investigations
in SuperAgent. With a standard collector, these investigations capture only the packets
that are sent after the investigation is initiated. By contrast, the capture files stored on
the appliance let you perform a forensic analysis of a performance issue.
With Multi-Port Collector and the management console, you can:
■ Process a network throughput rate equivalent to multiple standard collectors.
■ View data at 1-minute granularity, and select from multiple chart types.
■ Generate packet-capture investigation files taken at the time the incident occurred,
and store those files for up to 90 days.
■ Perform rapid, accurate detection of networks, servers, and applications.
■ Configure the items specified by inclusion rules in the management console and
send data about the appropriate items to SuperAgent.
■ Track TCP sessions on multiple switches, and drill down into detailed metrics from a
high-level SuperAgent summary report.

Support for SuperAgent
Chapter 1: What is Multi-Port Collector? 11
■ Leverage multiple filtering and sorting capabilities to analyze the available data and
rapidly isolate problem hosts.
■ Create and save analyses, which are troubleshooting work flows that combine
frequently used filtering and reporting options.
■ Export packet-capture files in PCAP format and send them to IT Engineering staff for
further analysis.
■ Monitor a Cisco Wide-Area Application Services (WAAS) environment without
installing a separate Aggregator appliance.
■ Calculate response time metrics from the packet digest files provided by GigaStor.
More information:
Configure Multi-Port Collector as a Collection Device for SuperAgent (see page 28)
Integration with SuperAgent (see page 111)
Packet-Capture Investigations
SuperAgent automatically runs packet-capture investigations in response to a network
or server performance incident. These investigations increase the granularity of
performance metric analysis by automatically recording packet-level data that can then
be further analyzed.
When such investigations are performed with the SuperAgent standard collector, the
captured data may not include the traffic of interest. A packet-capture investigation
performed by the Multi-Port Collector appliance is far more comprehensive. The
short-term packet storage capabilities of the appliance let packet-capture investigations
provide details of the traffic that was flowing at the time the incident occurred.
Options for capture and collection let you inspect the packet headers or the entire
packet, according to your preferences. By default, the appliance stores packet-capture
investigation files for 90 days. To access them, log in to the SuperAgent management
console and navigate to the Packet Capture Investigations report. Click the Incidents tab
to see a link to the Investigations Report page.
When a GigaStor is assigned to an appliance as a collector feed, it sends periodic packet
digests to the appliance for aggregation. In the presence of a GigaStor, SuperAgent
packet-capture investigations are based only on packets stored on GigaStor.
Support for SuperAgent
12 User Guide
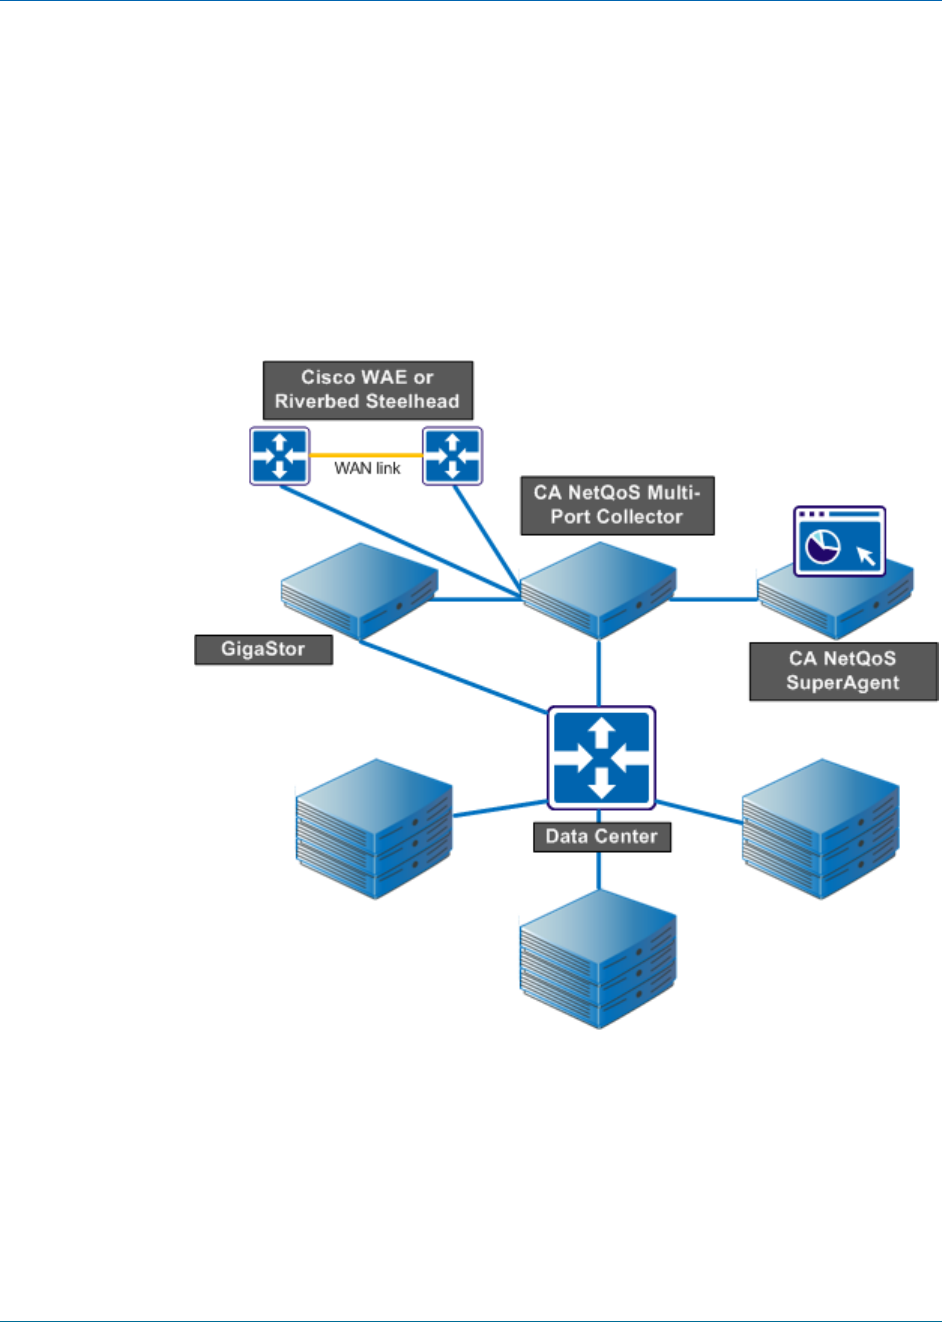
Architecture for SuperAgent Support
The following illustration depicts Multi-Port Collector architecture and configuration to
support SuperAgent. The Multi-Port Collector appliance works within a typical
SuperAgent distributed configuration, with network connectivity to the SuperAgent
management console server.
Depending on the configuration you purchased, one appliance can be connected to
mirror ports on as many as eight separate switches. The appliance sends data from the
monitored switches to the management console, where it is included in all SuperAgent
reports.

Support for SuperAgent
Chapter 1: What is Multi-Port Collector? 13
Comparison with the SuperAgent Standard Collector
The following table summarizes the most significant differences between the
SuperAgent standard collector and Multi-Port Collector:
Feature
Standard Collector
Multi-Port Collector
Monitors multiple mirrored
switch ports
No
Yes
Offers availability
monitoring of servers,
applications, and networks
Yes
Yes
Offers self-monitoring and
alerting
Yes
Yes. The SuperAgent Inactive
Collection Device incident is
supported. Additional
alerting provided by SNMP
traps.
Monitors URLs
Yes
No
Supports investigations from
the SuperAgent
management console
Yes
Yes. Enhanced
packet-capture
investigations are
supported.
Collects all SuperAgent
metrics
Yes
Yes
Supports automatic
configuration of servers,
applications, and networks
Yes
Yes
Duplicate packets (from a
mirrored VLAN, for example)
are ignored
Yes, after extra
configuration.
Yes, automatically.
Provides performance data
at 1-minute granularity
No
Yes
Filters and displays captured
data for the host, server, or
application you specify
No
Yes
Receives packet digest data
from Cisco Wide-Area
Application Engine device
Yes
Yes
Receives packet digest data
from GigaStor device
Yes
Yes

Support for SuperAgent
14 User Guide
Feature
Standard Collector
Multi-Port Collector
Supports SuperAgent
management console on
64-bit operating system
Yes
Yes. SuperAgent must be
running on 64-bit operating
system to be compatible
with Multi-Port Collector.
Overview of SuperAgent Data
The SuperAgent product documentation provides information for interpreting report
data and diagnosing issues that stem from a monitored network, server, or application.
The metric that serves as a starting point for any troubleshooting activity is transaction
time, another term for response time. A transaction consists of the following:
■ a single request and a single server response
■ one period of data transfer
■ one or more acknowledgments
■ observed latency caused by retransmitted packets
SuperAgent data identifies performance from the network perspective. Corresponding
data in an analysis highlights activity and performance data with multiple views of TCP
sessions, volume statistics, and response times. As you investigate a performance issue,
consider the transaction time and related metrics, such as throughput.
Note: Session-level performance data is available only for the port mirror data received
on the Multi-Port Collector logical ports. Session level data is not available for the
packet digest data received from GigaStor or WAE devices.
The basic process is as follows:
■ Click Session Analysis in a SuperAgent report.
■ The management console passes information to Multi-Port Collector to identify the
context and time frame of the data for the selected network, server, or application.
■ In a separate browser window, the web interface opens to the Analysis page. Data
is filtered to display relevant performance data for the selected context. The graphs
in an analysis look different from the graphs displayed in SuperAgent because
Multi-Port Collector data is available in 1-minute increments. The smallest
SuperAgent reporting interval is 5 minutes.

Support for Transaction Impact Manager
Chapter 1: What is Multi-Port Collector? 15
Averaging of metrics is also different because of the different reporting interval
lengths. Your configuration determines whether data displayed in the analysis
appears in the management console. For example, data from networks that are not
defined in SuperAgent is available only in the analysis.
■ You can apply additional filters, select different chart formats, change the time
frame, and save custom analyses.
Support for Transaction Impact Manager
Multi-Port Collector captures HTTP packets for Transaction Impact Manager (TIM).
■ TIM passively monitors traffic from mirrored ports
■ TIM records HTTP and HTTPS packets to identify user logins and related
transactions for Customer Experience Manager (CEM) and Application Performance
Management (APM)
■ TIM performs Secure Sockets Layer (SSL) decoding
When TIM is installed on Multi-Port Collector, the resulting converged appliance
provides visibility into the application and network-level data of application usage per
user. As a standalone appliance, TIM monitors HTTP transactions in real-time and
immediately generates defects for any anomalies it detects. Multi-Port Collector
provides session-level data at 1-minute intervals. With the converged appliance, this
finer granularity of data can be used to investigate the defects detected by TIM. You
can drill down from defects in the APM console to data in the Multi-Port Collector web
interface.
The web interface lets you perform TIM-related administrative and maintenance tasks.
Support for Transaction Impact Manager
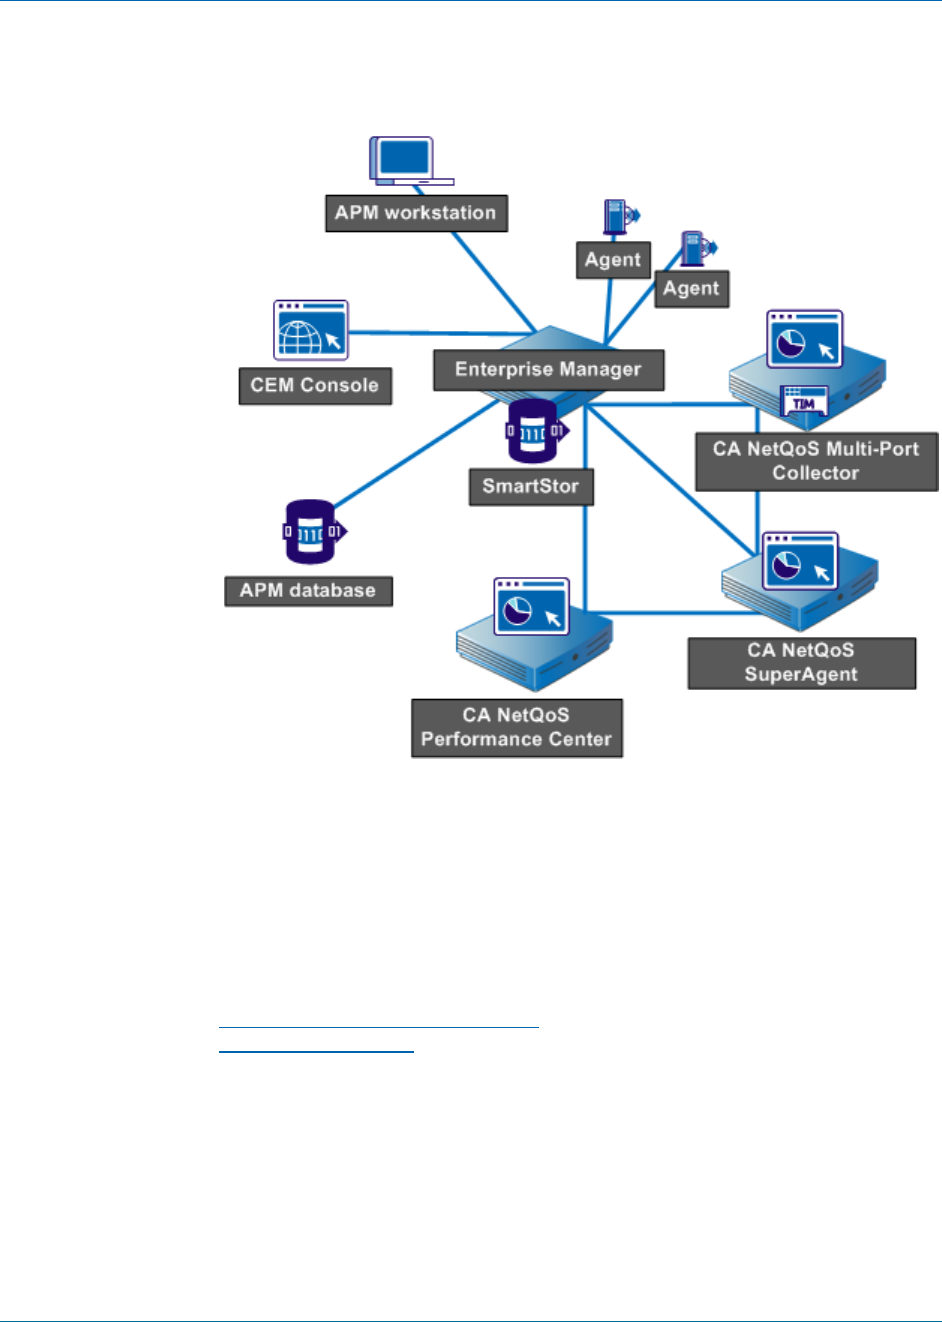
16 User Guide
The following diagram shows the components in a network in which Multi-Port
Collector, APM, and SuperAgent are installed.
As shown in the diagram, Multi-Port Collector can support TIM and SuperAgent
simultaneously. In this scenario, packets for TIM and SuperAgent are processed in
parallel. Separate RAM disks help buffer packets for both applications.
■ For SuperAgent, Multi-Port Collector provides all packets with headers only.
■ For TIM, Multi-Port Collector provides filtered HTTP packets with a full payload.
More information:
What are the Default Hardware Filters? (see page 22)
Install the TIM Software (see page 32)

Chapter 2: Post-installation Configuration Tasks 17
Chapter 2: Post-installation Configuration
Tasks
The Multi-Port Collector appliance is designed to run with minimal configuration.
However, the Administrator can organize, secure, and customize the system. After you
install the hardware and the Multi-Port Collector software, perform the tasks discussed
in this section.
Note: Installation tasks are discussed in the CA NetQoS Multi-Port Collector Installation
Guide.
This section contains the following topics:
Log In to the Web Interface (see page 17)
Configure a Trusted Internet Site (see page 18)
Change the Password of the Administrator Account (see page 18)
Verify Packet Flow Through Ports (see page 19)
Configure Logical Ports (see page 19)
Use Hardware Filters to Manage Data (see page 21)
Configure Multi-Port Collector as a Collection Device for SuperAgent (see page 28)
Install the TIM Software (see page 32)
Set Global Application Preferences (see page 33)
Create SNMP Traps (see page 35)
What are Users and Roles? (see page 39)
Log In to the Web Interface
Log in to the web interface to perform configuration tasks, analyze data, and monitor
Multi-Port Collector system health.
Follow these steps:
1. Access the web interface in a web browser. Use the following syntax in the browser
Address field:
http://<hostname or IP address>/
The Multi-Port Collector Login page opens.
2. Log in using the following case-sensitive user name and password:
■ User name: nqadmin
■ Password: nq
The web interface opens.

Configure a Trusted Internet Site
18 User Guide
Configure a Trusted Internet Site
To improve user interface performance, add the host name of the appliance to the list
of trusted internet sites. Microsoft Internet Explorer uses high security settings that
restrict navigation to trusted sites.
In Internet Explorer, you can add the host name to the list of Trusted Sites by clicking
Tools, Internet Options, Security.
We recommend Internet Explorer version 7 or 8, or Mozilla Firefox version 3.6.
Change the Password of the Administrator Account
The Multi-Port Collector appliance ships with predefined user accounts that provide
different product privileges. The default Administrator account provides access to all
configuration options. Administrators should change the password for this account in
the following situations:
■ Multi-Port Collector will be a collection device for SuperAgent, but SuperAgent is
not yet deployed. When Multi-Port Collector is configured as a collection device, it
retrieves all user and role information, including passwords, from SuperAgent.
■ Multi-Port Collector is deployed only with TIM in an APM environment.
Follow these steps:
1. Click Administration, Users in the web interface.
The User Accounts page opens.
2. Click the Edit link for the nqadmin account.
The Edit User page opens.
3. (Optional) Edit the default text in the Description field to mention that the default
password has been changed. Although optional, this step is a best practice.
4. Delete the encrypted text and type the new password in the Password and Confirm
Password fields.
5. Select the Enabled check box. This setting prevents you from accidentally disabling
the account under which you are logged in to the web interface.
6. Click Save.
The new password is saved.
More information:
What are Users and Roles? (see page 39)

Verify Packet Flow Through Ports
Chapter 2: Post-installation Configuration Tasks 19
Verify Packet Flow Through Ports
Verify that packets flow through the ports to ensure that installation of the hardware
and software was successful.
Follow these steps:
1. Click System Status in the web interface.
2. Scroll to the Capture Card Physical Port Status section, which identifies the
following:
■ Which ports are connected on the adapter
■ The number of packets received through each port
Configuration is successful if the ports are active.
Configure Logical Ports
The Multi-Port Collector appliance has two, four, or eight physical ports through which it
receives data from switches in your network. When connected to a mirrored port, a
physical port is assigned a logical port definition that corresponds to its ID number on
the high-performance adapter.
You can associate a name with a logical port to make it easier to identify associated
activity. You can change the default logical port definitions.
Logical port settings also let you limit the amount of data captured and monitored from
each mirror session. Port filters determine the segments of the network or hosts that
are monitored and the types of data to include or exclude from capture files.
TIM monitors mirrored ports from one logical port, despite the availability of multiple
logical ports on the Multi-Port Collector appliance. To map multiple physical ports to
one logical port, mirror the web traffic from the WAN to the logical port. This traffic is
processed for TIM and SuperAgent. Use the other logical ports for other port mirroring,
ideally from the access-layer switches closest to the servers. The non-TIM logical ports
are processed for SuperAgent only.
Follow these steps:
1. Click Administration, Logical Ports in the web interface.
The Logical Ports page opens.
2. Take the following steps for each port that you want to configure:
a. Type a new name for the port in the Name field. The name helps to identify the
source of the traffic you want to monitor, such as the name or location of a
core switch.

Configure Logical Ports
20 User Guide
b. Select Enabled to enable the port for monitoring.
c. (Optional) Select Save Packets To Disk to save captured data packets on the
hard disk drive of the appliance.
Note: If this option is disabled, packet capture files are not saved, and are not
available for packet capture investigations that are launched from SuperAgent.
Nor are they available for the Export to PCAP feature.
d. Select TIM Monitor to identify the port you are configuring as a TIM port. This
check box is available only when TIM is installed on the Multi-Port Collector
appliance.
e. Click Filters to enable a hardware filter for the port you are configuring. For
more information, see Use Hardware Filters to Manage Data (see page 21).
Web traffic monitored by TIM must have full packets.
f. Select a check box to assign a Physical Port to the logical port. The number of
available ports depends on the capture card configuration you purchased. You
can map two or more physical ports to one logical port. This configuration
provides more accurate monitoring in environments with asymmetrical
routing, and lets you monitor primary and failover circuits.
Logical port numbering begins at 0. The capture layer performs the mapping of
physical ports to logical ports. The mapping process is transparent to TIM.
3. Click Save.
4. Restart the nqcapd process if you changed any parameter other than the port
Name.
5. (Optional) Review the status of the logical ports in the Capture Card Logical Port
Status table on the System Status page.
More information:
Use Hardware Filters to Manage Data (see page 21)
What is Packet Slicing? (see page 22)
Export Data to a PCAP File (see page 82)
Capture Card Logical Port Status (see page 88)
Stop or Restart a Process (see page 94)
Regular Expression Syntax (see page 125)

Use Hardware Filters to Manage Data
Chapter 2: Post-installation Configuration Tasks 21
Use Hardware Filters to Manage Data
Hardware filters can further refine the data that is processed from your switches and
thus optimize Multi-Port Collector performance. For example:
■ If data volume is heavy on your network, you can apply filtering or packet slicing to
selected logical port definitions.
■ You can refine data capture and select specific IP addresses or subnets.
Filtering options include prioritization and packet inclusion or exclusion per-protocol,
per-VLAN, per-subnet or IP address, and per-port. Advanced filtering lets you create
complex, regular-expression filters to determine the protocols, VLANs, or subnets to
include or exclude from monitoring. The packet-slicing feature lets you limit the portion
or size of the packets that are written to disk.
Multi-Port Collector filtering and packet-slicing options are applied on a per-port basis,
as part of logical port definition. You can set filter priority to determine the order in
which filters are applied.
Hardware filters are distinct from the analysis filters you can apply to captured data.
■ Hardware filters affect the capture of data.
■ Analysis filters affect the display of data.
Traffic is captured when a packet matches the criteria of an enabled filter. Filters with
overlapping instructions are applied in order, based on their Priority setting. The capture
card provides a limited number of hardware filtering resources. Use these filters to
refine the limitations on mirrored traffic.
Tip: You can use hardware filters to refine the captured data. However, do not use
hardware filters in place of properly configured mirror ports, which filter the data
before it is captured.
More information:
Configure Logical Ports (see page 19)
Use Filters to Customize Data in the Display Area (see page 55)
Port Mirroring (see page 105)

Use Hardware Filters to Manage Data
22 User Guide
What is Packet Slicing?
Multi-Port Collector filters include a packet-slicing option that lets you selectively
discard parts of a frame as it is captured.
Packet slicing is typically deployed when data volumes are high and the data of interest
is in the packet headers. The packet payload is not typically needed for SuperAgent
monitoring. Packet slicing reduces Multi-Port Collector load and uses fewer resources
for capture file storage.
The "All Traffic — headers only" filter specifies that all types of packets are captured and
sliced to retain only their headers. The filter slices a packet to the size of the frame
through the header, plus one byte of payload. Unless you add a filter or edit this filter,
packet slicing is applied to all new logical port definitions on new installations. This filter
was designed to maximize Multi-Port Collector performance while still capturing all data
needed for monitoring with SuperAgent.
The network adapter installed on the Multi-Port Collector appliance offers options for
packet slicing, including fixed-length truncation and dynamic, per-protocol truncation.
The capture card performs two types of slicing:
Fixed slicing
The frame size is truncated to a maximum specified length that you can set in bytes.
Dynamic slicing
The frame size is truncated to a maximum length after the header is included, for
example, the full TCP header plus 8 bytes of payload. When dynamic slicing is
selected, the card included encapsulations or TCP options when calculating the
place where payload data is discarded.
What are the Default Hardware Filters?
Because higher data volumes can impede Multi-Port Collector performance, you can
associate filters with logical port definitions. A filter determines the protocols, VLANs, or
subnets to include or exclude from monitoring. For more granular captures, you can
exclude or include individual IP addresses or TCP ports.
Multi-Port Collector offers the following predefined filters.
All Traffic — headers only
Captures traffic of all types (protocols). Slices the packets to retain packet headers,
plus one payload byte from each packet that passes through the SPAN or mirror
source port. This filter is optimized for troubleshooting tasks you can perform using
the Multi-Port Collector web interface. The filter is not strictly for use in TCP
response-time monitoring in SuperAgent. This filter is enabled by default.

Use Hardware Filters to Manage Data
Chapter 2: Post-installation Configuration Tasks 23
HTTP — full packets
Captures HTTP packets with full payloads from TCP traffic. The packets are needed
for monitoring with TIM, which records and observes packets to identify user logins
and related transactions. This filter is disabled by default.
TCP — headers only
Captures only TCP packet headers. This filter is disabled by default. This filter
optimizes Multi-Port Collector performance for SuperAgent support. When applied
to a logical port, the filter instructs the capture card to discard data for all non-TCP
protocols.
More information:
Support for Transaction Impact Manager (see page 15)
Configure a Hardware Filter
You can create, enable, disable, and modify predefined filters or the filters you create.
Follow these steps:
1. Click Administration, Logical Ports in the web interface.
The Logical Ports page opens.
2. Click the Filters link in the Edit Filters column for the logical port you want to filter.
The Logical Ports: Hardware Filters page opens.
3. Perform one of the following:
■ Click New to create a filter. The Logical Ports: New Hardware Filter page opens.
■ Click Edit to modify or enable a filter. The Logical Ports: Edit Hardware Filter
page opens.
4. Complete the following fields:
■ Filter Enabled: Applies the filter on the logical port whose name is indicated. If
selected, the filter is applied after you restart the nqcapd process.
■ Filter Name: The name of the filter you are creating or editing. The filter name
is shown on the Hardware Filters page for the logical port to which it is applied.

Use Hardware Filters to Manage Data
24 User Guide
■ Filter Priority: Priority determines which filters take precedence when filter
criteria overlap. If two or more overlapping filters have the same priority, it is
undefined which filter overrules the other. Values range from 0 (highest
priority) to 62 (lowest priority). The default priority is 10.
Filter priority settings can be used with packet slicing. For example, you want to
keep more bytes of each HTTP packet. You specify a filter for TCP and Port 80
with slicing set to TCP headers + 50 bytes and Priority set to 1. You then apply a
separate filter for TCP with slicing set to TCP headers + 1 byte and Priority set
to 10. In this scenario, more payload bytes are kept for HTTP traffic than for
other TCP traffic.
Packet Slicing Mode: Options for capturing only selected parts of each packet.
The hardware filters allow you to capture packets for protocols other than
TCP/IP. However, Multi-Port Collector collects performance metrics only for
TCP traffic. Volume metrics are collected for all traffic types.
■ Capture full packet: All information is captured from each packet that
passes the filter.
■ Capture fixed size: Some bytes are captured from every packet. In the
Packet Slicing Size field, supply the number of bytes to capture.
■ Capture headers plus size: All Layer 2, Layer 3, and Layer 4 headers are
captured, plus the fixed number of payload bytes from the Packet Slicing
Size field.
-- Layer 2 headers include Ether II, LLC, SNAP, and Raw headers, and VLAN,
ISL, and MPLS tags.
-- Layer 3 headers include IPv4 (including IPv4 options), IPv6, and IPX
headers.
-- Layer 4 headers include TCP, UDP, and ICMP headers.
Include only Protocols: Limits the protocols to capture and process. Only the
selected protocols are included in monitoring. If no check boxes are selected,
all protocols are included.
■ TCP: Transport Control Protocol, which is the main protocol monitored by
SuperAgent
■ UDP: User Datagram Protocol, which is used for transport of data send by
real-time or streaming applications, such as voice over IP
■ ICMP: Internet Control Message Protocol, which is used for error
messaging among servers and for SuperAgent traceroute investigations
■ VLANs: The identifiers of the virtual local area networks (VLANs) to include in
or exclude from monitoring. List the identifiers of VLANs whose traffic passes
through the indicated logical port. Separate multiple VLANs with commas and
no spaces. Select Exclude to discard traffic from the VLANs you listed.

Use Hardware Filters to Manage Data
Chapter 2: Post-installation Configuration Tasks 25
■ Subnets: The subnets to include in or exclude from monitoring. Supply a valid
IP address and subnet mask. Specify the number of bits to use for the mask.
Use the following format: 10.9.8.0/24. Select Exclude to discard traffic from the
subnets you listed.
■ IP Addresses: The IP addresses of individual hosts to include in or exclude from
monitoring. Separate multiple IP addresses with commas and no spaces. Use
dotted notation for the format, such as 10.9.8.7 or 10.9.8.7,10.9.8.5,10.9.7.7.
Select Exclude to discard traffic from the IP addresses you listed.
Ports: The TCP ports or port ranges to include in or exclude from monitoring.
Separate multiple port numbers with commas and no spaces. For a range of
ports, use the following format: 2483-2484. Select Exclude to discard traffic
from the ports you listed.
5. (Optional) Click Show Details to view your selections as a regular expression.
6. (Optional) Click Advanced to use regular expressions to create more precise filters.
For more information, see Use Regular Expressions for Precise Filtering (see
page 25).
7. Click Save.
The new filter appears on the Logical Ports: Hardware Filters page.
8. Restart the nqcapd process if you enabled a filter.
More information:
Configure Logical Ports (see page 19)
Stop or Restart a Process (see page 94)
Use Regular Expressions for Precise Filtering
Hardware filters can include regular expressions that precisely control the data that is
captured or discarded. You can apply regular expressions when you create a filter.
Follow these steps:
1. Create a hardware filter (see page 23).
2. Click Advanced on the Logical Ports: New Hardware Filter page.
The Logical Ports: New Advanced Hardware Filter page opens.
3. Complete the following fields:
■ Filter Enabled: Applies the filter on the logical port whose name is indicated. If
selected, the filter is applied after you restart the nqcapd process.
■ Filter Name: The name of the filter you are creating or editing. The filter name
is shown on the Hardware Filters page for the logical port to which it is applied.

Use Hardware Filters to Manage Data
26 User Guide
■ Filter Priority: Priority determines which filters take precedence when filter
criteria overlap. If two or more overlapping filters have the same priority, it is
undefined which filter overrules the other. Values range from 0 (highest
priority) to 62 (lowest priority). The default priority is 10.
Filter priority settings can be used with packet slicing. For example, you want to
keep more bytes of each HTTP packet. You specify a filter for TCP and Port 80
with slicing set to TCP headers + 50 bytes and Priority set to 1. You then apply a
separate filter for TCP with slicing set to TCP headers + 1 byte and Priority set
to 10. In this scenario, more payload bytes are kept for HTTP traffic than for
other TCP traffic.
Packet Slicing Mode: Options for capturing only selected parts of each packet.
The hardware filters allow you to capture packets for protocols other than
TCP/IP. However, Multi-Port Collector collects performance metrics only for
TCP traffic. Volume metrics are collected for all traffic types.
■ Capture full packet: All information is captured from each packet that
passes the filter.
■ Capture fixed size: Some bytes are captured from every packet. In the
Packet Slicing Size field, supply the number of bytes to capture.
■ Capture headers plus size: All Layer 2, Layer 3, and Layer 4 headers are
captured, plus the fixed number of payload bytes from the Packet Slicing
Size field.
-- Layer 2 headers include Ether II, LLC, SNAP, and Raw headers, and VLAN,
ISL, and MPLS tags.
-- Layer 3 headers include IPv4 (including IPv4 options), IPv6, and IPX
headers.
-- Layer 4 headers include TCP, UDP, and ICMP headers.
4. In the Field lists and the blank field, build your expression. All packets that match
the filter syntax are captured. Wildcards are not accepted.
a. From the first list, select the field from the packet header on which you want to
filter. The filters you create include traffic. The items you select correspond to
data that is captured from the traffic seen by the logical port where the filter is
applied. To create a filter that excludes traffic, specify all traffic except for the
traffic you want to exclude.
■ VLAN ID: The identifier of the virtual LAN (VLAN) whose data you want to
include. Specify the VLAN IDs to include as a comma-separated list in the
empty field provided. For example, to include traffic from VLANs 165 and
140, enter 165,140. If you did not add filtering to this logical port, the
packets with either of these VLAN identifiers is captured. You can also
specify a range of VLANs, such as 140-165. Such a filter is inclusive.

Use Hardware Filters to Manage Data
Chapter 2: Post-installation Configuration Tasks 27
■ Encapsulation: The encapsulation applied to a packet. If you select this
option, then supply a value for the type of encapsulation to include from
capture files. The following values are valid:
-- VLAN: A category that includes all packets with a VLAN header in the
filter operation.
-- MPLS: The Multiprotocol Label Switching network architecture. MPLS
affixes a header to each packet containing labels to control packet routing,
including quality of service and TTL information.
-- ISL: A proprietary Cisco VLAN encapsulation method for
high-performance links.
■ Layer 3 Protocol: The Layer 3 protocol to include in the filter operation. If
you select this option, then specify one protocol, or a comma-separated
list of protocols. Valid values are IP, IPv4, and IPv6.
■ Layer 4 Protocol: The Layer 4 protocol to include in the filter operation. If
you select this option, then specify one protocol, or a comma-separated
list of protocols. Valid values are TCP, UDP, and ICMP.
■ Source Subnet, Destination Subnet: The IP address of the subnet to
include in the filter operation. Select Source Subnet or Destination Subnet,
or click the AND or OR button to add them both to the regular expression.
The filter is applied to the Source or Destination field in the packet header.
Provide an IP address and mask, the number of bits in the subnet mask.
Use the following syntax: 123.45.67.0/24.
■ IPv4 Source IP Address, IPv4 Destination IP Address: The full IPv4 address
of the host to include in the filter operation. The filter is applied to the
Source or Destination field in the packet header. You can enter one IPv4
address, a comma-separated list, or a range. Use standard syntax, such as
123.45.67.89, or 123.45.67.8,123.45.67.15, or 123.45.67.8 - 123.45.67.15.
■ IPv6 Source IP Address, IPv6 Destination IP Address: The full IPv6 address
of the host to include in the filter operation. You can enter one IPv6
address, a comma-separated list, or a range. Each IPv6 address has the
format xxxx:xxxx:xxxx:xxxx:xxxx:xxxx:xxxx:xxxx where xxxx is hexadecimal
separated by colons. Do not remove leading zeros.
■ TCP Source Port, TCP Destination Port: A single port number, a
comma-separated list of port numbers, or a hyphenated range of port
numbers to include in the filter operation. The filter is applied to the
Source or Destination port fields in the packet header.
b. Select a condition from the second list: Equals (==) or Not Equals (!=).

Configure Multi-Port Collector as a Collection Device for SuperAgent
28 User Guide
c. In the blank field, type the value associated with your selection in step a.
d. (Optional) To add additional conditions to the filter, click one of the Boolean
operator buttons, AND or OR, and then repeat steps a through d.
The filter syntax appears in the Conditions field.
5. Click Save.
The filter appears on the Logical Ports: Hardware Filters page.
6. Restart the nqcapd process if you enabled a filter.
More information:
Stop or Restart a Process (see page 94)
Regular Expression Syntax (see page 125)
Configure Multi-Port Collector as a Collection Device for
SuperAgent
When configured as a collection device, Multi-Port Collector sends data to SuperAgent.
Note: If you use Multi-Port Collector only with TIM and APM, you do not need to add a
collection device to SuperAgent.
Tip: Take the following optional steps before configuring the collection device.
■ Configure hardware filters to control the data that is sent to SuperAgent. For more
information, see Configure a Hardware Filter (see page 23).
■ Assign meaningful labels to each logical port to make it easier to identify each data
source. For more information, see Configure the Logical Ports (see page 19).
Follow these steps:
1. Disable the popup blocking feature in your web browser. SuperAgent uses popups
when it adds the collection device.
2. Log in to the SuperAgent management console as a user with Administrative
privileges.
3. Click Administration, Data Collection, Collection Devices.
The SuperAgent Collectors page opens.
4. Click Add SuperAgent Collector.
The Standard Collector Properties page opens.

Configure Multi-Port Collector as a Collection Device for SuperAgent
Chapter 2: Post-installation Configuration Tasks 29
5. Complete the following fields:
Server Name
Type the server name for the Multi-Port Collector appliance. If you do not know
the server name, type an IP address in the "Management Address" field and
click DNS. SuperAgent attempts to resolve the IP address.
Management Address
Type the IP address of the Multi-Port Collector Management NIC. If you do not
know the IP address, type the DNS name in the "Server Name" field and click IP.
SuperAgent attempts to resolve the DNS name.
Incident Response
(Optional) Select Collector to receive a SuperAgent incident report when
Multi-Port Collector is not running.
Availability Monitoring
(Optional) If you selected Collector in the "Incident Response" field, select
Enabled in this field. The Enabled option lets SuperAgent monitor the
availability of Multi-Port Collector every 5 minutes.
Is Multi-Port Collector
This field is displayed only when SuperAgent cannot contact Multi-Port
Collector. Select this check box to identify the type of collection device.
The management console verifies the collection device as Multi-Port Collector.
Note: The following fields do not apply to Multi-Port Collector:
■ Enable Multiple Monitor NICs
■ Disable Packet Collection
■ Monitor Address
6. Click OK.
The page refreshes to show that Multi-Port Collector is available.
7. Click the Synchronize Collection Devices link to send monitoring instructions to
Multi-Port Collector.

Configure Multi-Port Collector as a Collection Device for SuperAgent
30 User Guide
8. Configure the networks, servers, and applications that you want to monitor. The CA
NetQoS SuperAgent Administrator Guide contains complete instructions.
9. Perform synchronization again:
a. Click Administration, Data Collection, Collection Devices.
The SuperAgent Collectors page opens.
b. Click the blue arrow above the Options column and select Synchronize
Collection Devices.
The Synchronize Collection Devices confirmation dialog opens.
c. Click Continue.
The Current Status dialog opens.
d. Click Close Status Window when synchronization is complete.
10. Confirm that Multi-Port Collector sends data to SuperAgent:
a. Click Administration, Data Collection, Collection Devices.
b. Review the Collectors list, which provides status information for all collection
devices.
Note: The Last Collection and Status fields are not updated until you configure
at least one valid server subnet and one network. See Step 8. Several minutes
can elapse after the completion of Step 9 before Multi-Port Collector sends
data to SuperAgent.
More information:
Support for SuperAgent (see page 10)
Verify Logical Port Status in SuperAgent
For SuperAgent, Multi-Port Collector monitors network data from multiple switches. A
discrete logical port definition identifies each monitored switch. A logical port is a
source of TCP response-time data. You can view the status of each logical port,
identified as a collector feed, in the SuperAgent management console.
This procedure is valid only if Multi-Port Collector is configured as a collection device for
SuperAgent.
Follow these steps:
1. Click Administration, Data Collection in the SuperAgent management console.
The Multi-Port Collector device name appears in the Collectors list.
2. Click the Edit icon in the Options column.

Configure Multi-Port Collector as a Collection Device for SuperAgent
Chapter 2: Post-installation Configuration Tasks 31
The Multi-Port Collector Properties page opens. The Collector Feeds table provides
status information for each logical port.
3. Click Help for a description of the information in the table.
Review TCP Session Information
The Multi-Port Collector appliance tracks the health and performance of your enterprise
network based on TCP data. A mirror port on a switch sends data to the
high-performance capture card on the appliance. The appliance has the processing
power and sufficient monitoring ports to handle data from multiple switches.
A discrete logical port definition identifies each monitored switch. Each logical port
reports the number of active TCP sessions, with a server name, address, and port
number to identify the traffic. A logical port is identified as a collector feed in the
SuperAgent management console.
Follow these steps:
1. Click Administration, Data Collection, Collection Devices in the SuperAgent
management console.
The device name of the Multi-Port Collector appears in the Collectors list.
2. Click the Edit icon in the Options column.
The Multi-Port Collector Properties page opens.
3. Click Active Sessions in the third Show Me list.
The Active Sessions page opens.
The Active Sessions page provides information about monitored servers and their
corresponding feeds. The Active Sessions data is helpful for verifying collector and
mirror port setup and for troubleshooting network or server issues.
4. Select the feed whose TCP sessions you want to review in the "View Active Sessions
for Feed" field.
The page refreshes to display active sessions for the selected feed.
5. Click Help for information about the fields on the Active Sessions page.

Install the TIM Software
32 User Guide
Install the TIM Software
The software for Transaction Impact Manager (TIM) is available for download from CA
Technical Support.
Note: If you use Multi-Port Collector only with SuperAgent, you do not need to install
the TIM software.
You use the Multi-Port Collector web interface to install the following:
■ TIM third-party-CentOS5.5 file
■ TIM tim-complete-CentOS5.5 file
Follow these steps:
1. Download the installation files from CA Technical Support to a workstation that has
web browser access to the Multi-Port Collector appliance.
2. Log in to the Multi-Port Collector web interface as a user with Administrative
privileges.
The web interface opens.
3. Click System Setup, Install Software in the web interface.
The Install Software page opens.
4. Click Browse and navigate to the location where you downloaded the installation
files.
5. Select the TIM third-party-CentOS5.5 file.
6. Click Open.
The name of the file appears on the Install Software page.
7. Click Upload and Install.
8. Read and accept the License Agreement.
The software installation log opens. If the log contains errors in red text, contact CA
Technical Support.
9. Click Browse on the Install Software page and navigate to the location where you
downloaded the installation files.
10. Select the TIM tim-complete-CentOS5.5 file.
11. Repeat Steps 6 through 8.
12. Click System Setup in the web interface.
When installation is successful, the names of the files you installed appear on the
System Setup page.

Set Global Application Preferences
Chapter 2: Post-installation Configuration Tasks 33
13. Identify the logical port to use for TIM monitoring. For more information, see
Configure the Logical Ports (see page 19).
14. Enable the "HTTP - full packets" hardware filter to capture full packets
a. Click Administration, Logical Ports in the web interface.
b. Click the Filters link for the logical port that is associated with TIM monitoring.
The Logical Ports: Hardware Filters page opens.
c. Click the Edit link for the "HTTP - full packets" filter.
The Logical Ports: Edit Hardware Filter page opens.
d. Select the Filter Enabled check box.
e. Restart the nqcapd process.
More information:
Support for Transaction Impact Manager (see page 15)
Stop or Restart a Process (see page 94)
System Setup (see page 100)
Set Global Application Preferences
You can configure global settings that affect the way data is automatically collected,
stored, and forwarded, such as the following:
■ The number of hours to retain packet capture files
■ The frequency of automatic database maintenance
■ Whether packet deduplication is enabled
In most cases, the default settings are appropriate. However, you can change the
settings to help ensure optimal functioning of your system.
Follow these steps:
1. Click Administration, Application Settings in the web interface.
The Application Settings page opens.
2. Complete the following fields:
■ Perform automatic file maintenance every. The number of minutes between
automatic file maintenance operations. If necessary, the oldest raw packet
capture files are deleted during maintenance. This setting determines the
frequency of capture file deletion. The default is 5. If you change this setting,
restart the nqmaintd process. The Raw Packet Capture Removal threshold also
affects the frequency of file deletion.

Set Global Application Preferences
34 User Guide
■ When disk space usage is normal, keep raw packet capture files for. The
length of time raw packet capture files are stored before being automatically
deleted. These files are continually generated during ordinary monitoring. The
default is 6. If you change this setting, restart the nqmaintd process.
■ Automatically remove raw packet capture files older than one hour when disk
utilization reaches. The maximum percentage of disk space that can be in use
before raw packet capture files older than one hour are automatically purged.
The File Maintenance Interval also affects the frequency of file deletion. The
default is 80 percent. This threshold does not apply to packet capture
investigation files. If you change this setting, restart the nqmaintd process.
■ Keep SuperAgent packet capture investigation files for. The number of days
that packet capture investigation files are stored before being automatically
deleted. These files are generated in response to a packet capture investigation
request from SuperAgent. Packet capture investigation files are stored
separately from raw capture files. This threshold does not apply to raw packet
capture files. The default is 90. If you change this setting, restart the nqmaintd
process.
■ Keep one-minute session metrics for. The number of days that metric data
taken from captured packets are kept in the Multi-Port Collector database. The
default is 7. An internal maximum threshold is applied to this database. Data
from fewer than the selected number of days is kept when the number of rows
in the database exceeds 12 billion rows. If the threshold is exceeded, the oldest
data is discarded first.
■ Perform packet deduplication. When enabled, Multi-Port Collector attempts to
filter out duplicate packets that can be received from mirrored ports. By
default, deduplication is enabled. The System Status page tracks the number of
packets that the capture card discarded. If you change this setting, restart the
nqcapd process.
■ Encrypt raw packet capture files on disk. When enabled, raw packet capture
files are saved in encrypted format on the Multi-Port Collector hard disk. By
default, these files contain only the header information of all traffic captured.
But they can contain payload data when packet slicing options are changed to
retain more of the packet. Packet capture investigation files, which are filtered
to contain information from a single server, are not encrypted. Encryption is
processor-intensive. Enabling this option can degrade the ability of the
collection device to save packet capture files. A unique key for the encryption is
created when you first start Multi-Port Collector. The key is not changed
thereafter. If you change this setting, restart the nqcapd process.
3. Click Save.
The Application Settings page is refreshed with your changes.
4. Restart the nqmaintd process or the nqcapd process if necessary.

Create SNMP Traps
Chapter 2: Post-installation Configuration Tasks 35
More information:
What is Packet Slicing? (see page 22)
Capture Card Physical Port Statistics (see page 89)
Stop or Restart a Process (see page 94)
Purge Data from the Database (see page 97)
Packet Deduplication (see page 109)
Create SNMP Traps
The Multi-Port Collector SNMP alerting feature adds a layer of error reporting to the
SuperAgent incidents feature. Alerting by SNMP traps is distinct from the SuperAgent
incidents feature. Multi-Port Collector performs some self-monitoring and sends trap
notifications to alert you to conditions that potentially affect its performance.
The nqsnmptrap_[Date].log files identify the conditions that triggered SNMP traps. For
more information, see Review System Logs (see page 94).
SNMP traps are sent automatically to a third-party monitoring application when an error
condition is detected. You can modify SNMP trap settings to change reason that traps
are sent. Traps are defined in the Management Information Base (MIB) and are sent as
SNMP v2 notifications.
Multi-Port Collector includes a MIB file that contains unique OIDs:
NETQOS-MULTI-PORT-COLLECTOR-MIB. You can review the contents of the MIB file at
Administration, SNMP Traps in the web interface.
Prerequisites:
■ Configure a trap receiver, such as CA NetVoyant, to communicate with the
Multi-Port Collector appliance.
■ Import NETQOS-MULTI-PORT-COLLECTOR-MIB into the trap receiver. The process of
importing a MIB file is specific to the trap receiver.
Follow these steps:
1. Click Administration, SNMP Traps in the web interface.
The SNMP Traps page opens.

Create SNMP Traps
36 User Guide
2. Type the IP address or host name of the computer where the SNMP trap receiver is
installed.
3. Click Save.
By default, all traps shown in the table are enabled, with a severity level of
Warning. This setting means that Info traps are not sent by default. However, traps
are sent in response to conditions that meet either the Warning criteria or the Error
criteria.
More information:
Review System Logs (see page 94)
SNMP Trap Severity Levels
Multi-Port Collector SNMP traps are associated with key processes that detect error
conditions that affect performance. Error conditions that correspond to the following
severities trigger each trap:
■ Info (least severe condition)
■ Warning (medium-severity condition)
■ Error (highest-severity condition)
You can select the minimum severity of traps that you want Multi-Port Collector to
send. Traps are then sent for any condition that meets or exceeds the criteria for the
minimum severity. By default, all traps are enabled with a Warning severity, which
means that the Error trap is also enabled, but not the Info trap.
The following SNMP traps are available:
mpcProcessTrap
This trap is sent when a Multi-Port Collector process fails or is restarted. The trap
text supplies the name of the process that was restarted.
■ Warning is sent when the watchdog process restarts another process.
■ Error is sent when the watchdog process restarts the same process the
maximum number of times.
By default, traps are sent for a Warning or Error condition.

Create SNMP Traps
Chapter 2: Post-installation Configuration Tasks 37
mpcCaptureTrap
This trap is sent in response to an error or warning message from the network
adapter (the capture card). Where applicable, the trap text supplies information to
identify the affected adapter.
■ Warning is sent when a physical port is no longer connected.
■ Error is sent when the nqcapd process encounters a problem while capturing
packets.
By default, traps are sent for a Warning or Error condition.
mpcDiskUsageTrap
This trap is sent when a disk usage threshold is exceeded for a file system.
■ Warning is sent when disk usage reaches 80 percent.
■ Error is sent when disk usage reaches 95 percent.
By default, traps are sent for a Warning or Error condition.
Tips:
■ The mpcDiskUsageTrap monitors the /nqtmp/headers file system, a RAM disk
file system. When the /nqtmp/headers file system exceeds a threshold, it often
means that the nqmetricd process is not sufficiently processing header files.
Possible reasons include the following:
– The nqmetricd process cannot query the SuperAgent management console
for configuration information. Review the nqMetricReader.log file for
indications of a SQL error.
– The Multi-Port Collector appliance can have resource issues that affect the
nqmetricd process. Restart the appliance. If the problem persists or occurs
again, contact CA Technical Support.
■ The mpcDiskUsageTrap also monitors the /nqtmp/tim file system, a RAM disk
file system. When the /nqtmp/tim file system exceeds a threshold, it often
means that the TIM process is not sufficiently processing packet files.
mpcRAIDTrap
This trap is sent in response to a RAID array or disk drive failure.
■ Info is sent when a RAID array that was rebuilding returns to an Optimal state.
■ Warning is sent when a disk RAID array is degraded because a disk drive is
rebuilding.
■ Error is sent when either a disk RAID array failure or a degraded disk RAID array
due to a disk drive failure is detected.
By default, traps are sent for a Warning or Error condition.
Note: This trap is available only if the Adaptec Storage Manager (arcconf) utility is
installed. For more information, see the CA NetQoS Multi-Port Collector Installation
Guide.

Create SNMP Traps
38 User Guide
More information:
Process Information (see page 86)
Review System Logs (see page 94)
Log In to the Appliance (see page 99)
Change Trap Behavior
Multi-Port Collector SNMP trap notifications are sent in response to selected error
conditions. By default, these traps are sent in response to conditions that meet Warning
or Error severity. By default, traps that meet the Info severity level are not sent.
You can change the severity for each type of trap. For mpcDiskUsageTrap, you can also
change the usage thresholds. Each type of trap includes several severity parameters.
You can select a minimum severity level that can trigger the trap notification. Severity
levels range from Info, the least severe, to Error, the most severe.
Follow these steps:
1. Click Administration, SNMP Traps in the web interface.
The SNMP Traps page displays the IP address or host name of the configured trap
receiver and table describing the SNMP traps.
2. Click Edit for the trap you want to disable or change.
The Edit SNMP Trap Settings page opens.
3. Select the severity level of the trap in the Setting field.
4. Change the value in the "Send Warning trap when disk utilization reaches" field.
The default is 80.
Note: This field applies to mpcDiskUsageTrap.
5. Change the value in the "Send Error trap when disk utilization reaches" field. The
default is 95.
Note: This field applies to mpcDiskUsageTrap.
6. Click Save.
The SNMP Traps page opens. The changes you made to the trap settings are shown
in the table.

What are Users and Roles?
Chapter 2: Post-installation Configuration Tasks 39
What are Users and Roles?
Before you configure the Multi-Port Collector appliance as a collection device for
SuperAgent, two default user accounts can be used: nqadmin and nquser.
After the appliance is configured as a collection device, the appliance obtains user and
role information from SuperAgent. The SuperAgent Administrator creates and manages
secure user accounts that are valid for SuperAgent and Multi-Port Collector. These
accounts allow operators to access the System Status page, Analysis page, System Setup
page, or Administration page. In addition, these accounts are synchronized and
displayed on the User Accounts page in the web interface.
Important: Multi-Port Collector does not obtain user and role information from TIM or
APM. Only the default user accounts are applicable when TIM is installed on the
appliance and the appliance is not a collection device for SuperAgent.
Multi-Port Collector security is fully compatible with SuperAgent and is based on login
access privileges.
■ Users with the SuperAgent User right can view the data on the System Status tab.
■ Users with the SuperAgent Administrator right can access the Multi-Port Collector
Administration tab.
The rights associated with user account roles further determine access.
■ Users with the SuperAgent Engineering role can view the Analysis page.
■ Users with the SuperAgent Investigations role can view the Analysis page and use
the Export to PCAP feature.
The SuperAgent Administrator can create additional user accounts to track Multi-Port
Collector status and configure data collection. For better security, change the default
password of the Administrator and user accounts.
More information:
Change the Password of the Administrator Account (see page 18)

What are Users and Roles?
40 User Guide
User Account Information
Multi-Port Collector provides default user accounts with different product permissions
and different roles. The product permissions of the default accounts allow for two
different levels of access to the web interface.
■ User permission level: Provides view-only privileges that are restricted to the
System Status and Analysis pages.
■ Administrator permission level: Provides access to all product features.
The role assigned to each user account determines, at a more granular level, the
product web pages and features that the associated user can access.
When Multi-Port Collector is a collection device for SuperAgent, the Administrator can
create and modify accounts in the management console or in NetQoS Performance
Center. These accounts are synchronized and displayed on the Multi-Port Collector web
interface. You can view details about user accounts at Administration, Users.
Name
The user name and login ID for this account. Identifies the user account. Identifies
the product permission level for the default accounts.
Role
Determines the level of access to product features for the user.
Privilege
The level of access to product configuration, either Administrator or User. Only a
user with the Administrator permissions can change product configuration, such as
setting capture filters or changing database retention settings.
Status
The status of the user account, either Enabled or Disabled.
Time Zone
The local time zone of the operator most likely to be using the user account. Allows
reports to be viewed in the local time zone.
Change the Properties of a User Account
User accounts establish the credentials of people who are authorized to operate
Multi-Port Collector and perform certain tasks. Information about the default user
accounts, nqadmin and nquser, can be viewed on the User Accounts page of the web
interface.
You use the SuperAgent management console to create new user accounts. Therefore,
configure Multi-Port Collector as a collection device for SuperAgent before creating a
user account.

What are Users and Roles?
Chapter 2: Post-installation Configuration Tasks 41
However, before you add Multi-Port Collector as a collection device, you can use the
web interface to modify the default user accounts. For example, you can change an
account password, update the associated time zone, or assign the user another role.
Note: The settings associated with these accounts are updated with the settings from
SuperAgent after you add Multi-Port Collector as a collection device and synchronize.
SuperAgent user accounts can be viewed in the web interface after you add Multi-Port
Collector as a collection device. However, they can be edited only in the SuperAgent
management console or in NetQoS Performance Center.
Follow these steps:
1. Click Administration, Users in the web interface.
The User Accounts page displays the predefined user accounts and the custom
accounts you created.
2. Click the Edit link for the account that you want to edit.
The Edit User page opens.
3. Complete the following fields:
Description
Type a description of the account or of a recent change. For example, you can
state that the password has been changed. This optional step is a best practice.
Password, Confirm Password
Delete the encrypted text in each field and type a new password in each field.
Product Privilege
Select a permission level that determines whether the user can perform
administrative tasks.
Role
Select a role to determine the permissions that the user has to view report data
and access product features.
Time Zone
Select the local time zone of the operator most likely to use this user account.
Enabled
Select this check box to prevent accidental disabling of the account under
which you are logged in to the web interface. To disable the nqadmin account,
create another user with the Administrator product permission and log in as
that user.
4. Click Save.

What are Users and Roles?
42 User Guide
Role Information
Multi-Port Collector user roles are managed in the SuperAgent management console
until you configure SuperAgent as a data source for NetQoS Performance Center.
In SuperAgent and NetQoS Performance Center, user roles control operator access to
menus and data sources. Assigning roles lets you restrict functionality to selected users.
For instance, the Administrator can limit Multi-Port Collector operators to have access
only to the System Status page. If you limit users by role, they cannot view restricted
parts of the product.
The role associated with a user account determines the following:
■ The menus and report pages a user can access.
■ The ability of the user to customize data and to drill down for additional
information.
In SuperAgent, each role has an Area Access parameter that determines page-level
access to SuperAgent reports and other features, such as on demand investigations. The
same roles also operate within NetQoS Performance Center after the SuperAgent data
source is registered.
The privileges controlled by the role do not extend to administration. Administration
permissions are assigned to the user during user account creation.
The Multi-Port Collector Roles page is a view-only list of predefined role names and
descriptions.
Network Manager
This Administrator role for Multi-Port Collector and SuperAgent provides access to
the following SuperAgent reports:
■ Investigations
■ Engineering
■ Operations
■ Incidents
■ Management

What are Users and Roles?
Chapter 2: Post-installation Configuration Tasks 43
Network Engineer
This role consists of user permissions geared toward the troubleshooting of
reported issues. This role is also known as the Investigator role and provides access
to the following SuperAgent reports:
■ Investigations
■ Engineering
■ Operations
■ Incidents
■ Management
Network Operator
This role consists of user permissions with access to basic SuperAgent reports:
■ Engineering
■ Operations
■ Incidents
■ Management
Product Permissions
Product permission is an aspect of a user account that grants or restricts access to
administrative features.
Each level of product permission corresponds to a predefined role. The SuperAgent
Administrator can assign different roles and privileges to user accounts and can
customize roles to grant access to different product areas.
The predefined Power User permission does not exist in Multi-Port Collector. However,
Power Users with access to the SuperAgent Engineering product area can access all
Multi-Port Collector features except features on the Administration page.
NetQoS Performance Center supports the product permissions in use in SuperAgent and
Multi-Port Collector, but they operate on a different level. Product privileges can be
used to allow a single user account different levels of access to different CA data source
products. For example, a person can be a user of SuperAgent, with the ability to view
selected items in NetQoS Performance Center. This same person can also be an
Administrator for a specific instance of SuperAgent when navigated to from a NetQoS
Performance Center view.

What are Users and Roles?
44 User Guide
All Multi-Port Collector operators have access to the System Status page by default. The
Administrator product permission is required for an operator to access the
Administration page. However, the role for the user account determines access to the
Analysis area. And the ability to export an analysis to PCAP format is further restricted
to a second area access parameter.
Access to the Analysis page in Multi-Port Collector is associated with access to the
SuperAgent Engineering tab. The Area Access parameter of the user account role
determines this access. But even this access is not sufficient to allow the user to export
PCAP files, which requires access to the Investigations area.
The following list summarizes the types of product permission available in SuperAgent
and Multi-Port Collector and explains their default areas of access:
Administrator level
This level of permission is typically associated with the role of Network Manager
and provides access to the following features:
■ Analysis page
■ System Status page
■ Administration page
■ Export Analysis to PCAP feature
Power User, or Investigator, level
No predefined Power User account is available in Multi-Port Collector. This level of
permission is the default for the role of Network Engineer and provides access to
the following features:
■ Analysis page
■ System Status page
■ Export Analysis to PCAP feature
User level
This level of permission is the default for the role of Network Operator and provides
access to the following features:
■ Analysis page
■ System Status page
The default Network Operator role does not allow the associated user to export data to
the PCAP format, which can contain sensitive data. To grant the necessary area access
to a user with this role, the SuperAgent Administrator can add the Investigations area to
the Network Operator role.
SuperAgent user accounts also have assigned permission sets, which control access to
data by user, based on aggregations of managed items. Multi-Port Collector does not
support permission sets.

What are Users and Roles?
Chapter 2: Post-installation Configuration Tasks 45
In NetQoS Performance Center, the product permission setting overlaps with the role
settings at the data source level. A user must have access rights and at least User
product permissions for a data source to perform the following:
■ View reports
■ Drill into views
■ Navigate to that data source from NetQoS Performance Center.
Permissions and role-determined access rights that apply in NetQoS Performance
Center are preserved within the Multi-Port Collector web interface.

Chapter 3: Analyzing Data 47
Chapter 3: Analyzing Data
Granular views of session-level network data appear on the Analysis page in the web
interface. The Analysis page contains two panes.
Display area
The right pane, which contains a chart and a data table. Tabbed views provide easy
access to formatted performance metrics. The chart and table provide multiple
options for viewing data, selecting chart formats, and sorting metrics to find
outliers.
Note: Although Multi-Port Collector reports data at a 1-minute granularity, it loads
collected metrics to the database every 2 minutes, for performance reasons. This
difference causes a delay before you can view the most recent collected data in the
Display area.
Analysis pane
The left pane, which contains options for selecting data views and filtering the data
shown in the Display area. You can create analytical filters for data views and save
them as reusable troubleshooting work flows. A list of active filters appears at the
top of the Analysis pane. The primary filtering types are:
■ Analysis filters (see page 57) are explicitly applied to data when you use the
Add Analysis Filter option, or are implicitly created when you double-click an
item in the Display area.
■ Global filters (see page 65) apply to all analyses and are based on a drill-down
context from SuperAgent.
This section contains the following topics:
What is an Analysis? (see page 48)
Use Filters to Customize Data in the Display Area (see page 55)
Understand the Data in the Display Area (see page 67)

What is an Analysis?
48 User Guide
What is an Analysis?
An analysis is a description of a troubleshooting path into packet-level session data
stored on Multi-Port Collector. The description proceeds as a series of hierarchically
organized views of the data.
Multi-Port Collector offers two types of analysis.
Predefined Analysis
Provides access to TCP session-level information that is used when drilling in from a
SuperAgent report or APM Defect Details page.
For example, you examine the SuperAgent Components report and narrow the data
for the 192.94.5.6 network. When you click the Session Analysis button, an analysis
for the selected report appears on the Multi-Port Collector Analysis page. The
selected network and time frame filter the session-level data in the analysis.
Custom Analysis
Provides multiple options for filtering and viewing session-level metrics to speed up
the troubleshooting process. The Multi-Port Collector user can create, save, and
reuse custom analyses.
For example, the drilldown, or Session Analysis, path from SuperAgent places you in
a preselected context that is not applicable to your situation. You create an analysis
or open a saved analysis to save some steps in selecting the desired views and their
hierarchical arrangement. The associated charts and tables provide a sufficiently
narrowed perspective on the data you want to analyze.
All analyses are displayed in the Analysis pane, to the left of the Display area on the
Analysis page.
Filters are added to analyses at the view level and are applied to all subordinate views
within the same analysis.
New analyses do not contain default data views. Add a view to data before applying a
new analysis.
Analysis Menu
The Analysis menu lets you see all available analyses, and create and modify analyses.
The menu is visible by default in the left pane of the Analysis page. You can hide it to
expand the available viewing area for charts and tables.
Click the << or >> symbol labeled Analysis Menu to hide or display the Analysis pane.
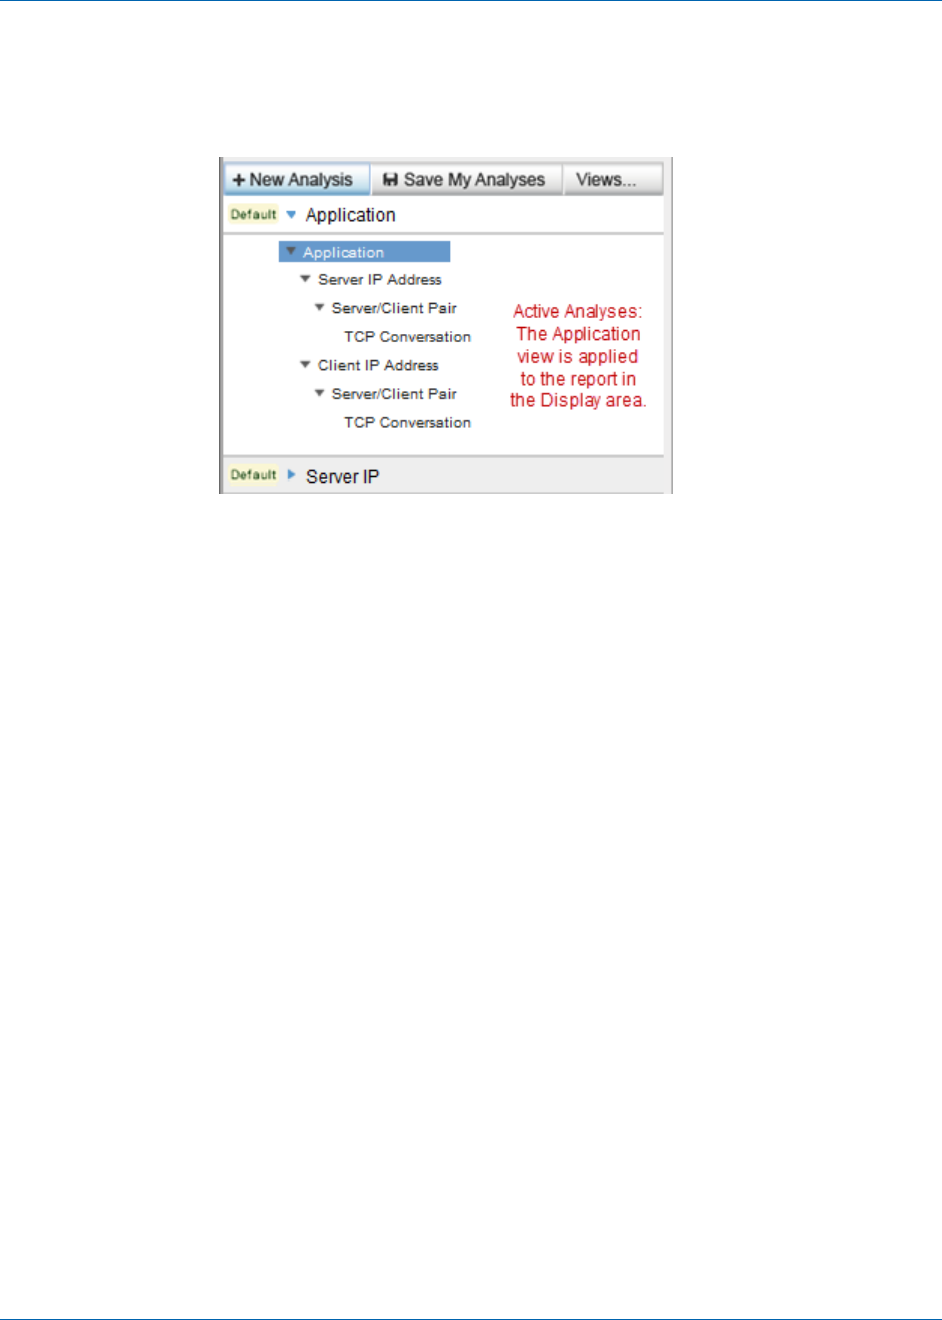
What is an Analysis?
Chapter 3: Analyzing Data 49
Within the Analysis pane, the active analysis is highlighted in blue with white text. All
other analyses are shown in gray. The active analysis and its filters are applied to the
report that is visible in the Display area.
Child views of the active analysis are available to report increasing levels of detail, down
to the TCP conversation level in some analyses. Their associated filters are designed to
include or exclude specific sessions in the metrics shown in the Display area.
Expand an analysis to see the views associated with it. Click the blue arrow next to the
analysis name to expand or collapse it. Collapsing or expanding an active analysis does
not remove or add filters.
You can apply another view to the current time frame to look at the data in a different
context. To apply another analysis, expand it in the Analysis pane, and then click an
associated view.
Predefined Analyses
Predefined analyses are sorting and display options selected to assist you in analyzing
data. They have a designation of "Default" in the Analysis menu.
You can temporarily customize predefined analyses by adding analysis filters. You
cannot save these modifications, which persist only for the current login session.
All analyses mine the data to an increasing level of granularity. Each view into the data is
associated with a predefined analysis. When you select an analysis, it expands to show a
list of views in a hierarchical structure. This structure represents the increasing level of
detail that you can access from the monitored data. Each view thus provides access to
more detailed metrics stored in the database for the selected time frame.

What is an Analysis?
50 User Guide
Analyses aid troubleshooting efforts by helping you investigate a particular item. With
any analysis, it is helpful to think of the initial data view as corresponding to the item
being investigated. For example, the Client IP Address analysis helps you find the source
of an issue with a client computer whose IP address is known. First, the Client view is
applied. Double-click a client to drill down to the next view in the analysis, which shows
all servers that conversed with that client.
Multi-Port Collector offers the following predefined analyses.
Application
Use this analysis to identify an application that has a problem. This analysis
identifies the IP address of the server where the application is running and the port
numbers that the application uses. Contains the following data views:
■ Server IP Address Server/Client Pair TCP Conversation
■ Client IP Address Server/Client Pair TCP Conversation
Server IP or Client IP
Use this analysis to identify a single host that has a problem. Contains the following
data views:
■ Server IP Address Server/Client Pair TCP Conversation
■ Client IP Address Server/Client Pair TCP Conversation
Network
Use this analysis to identify the problem for multiple hosts on a subnet. Contains
the following data views:
■ Server IP Address Server/Client Pair TCP Conversation
■ Client IP Address Server/Client Pair TCP Conversation
IP Address
Use this analysis to identify a single host that has a problem. Contains the following
data views, organized into several possible filtering paths through the captured
data:
■ Server IP Address Server/Client Pair TCP Conversation
■ Client IP Address Server/Client Pair TCP Conversation
■ IP Address Pair IP Session
Protocol
Use this analysis to identify the problem for traffic that uses a single protocol.
Contains the following data views:
■ IP Address IP Address Pair IP Session
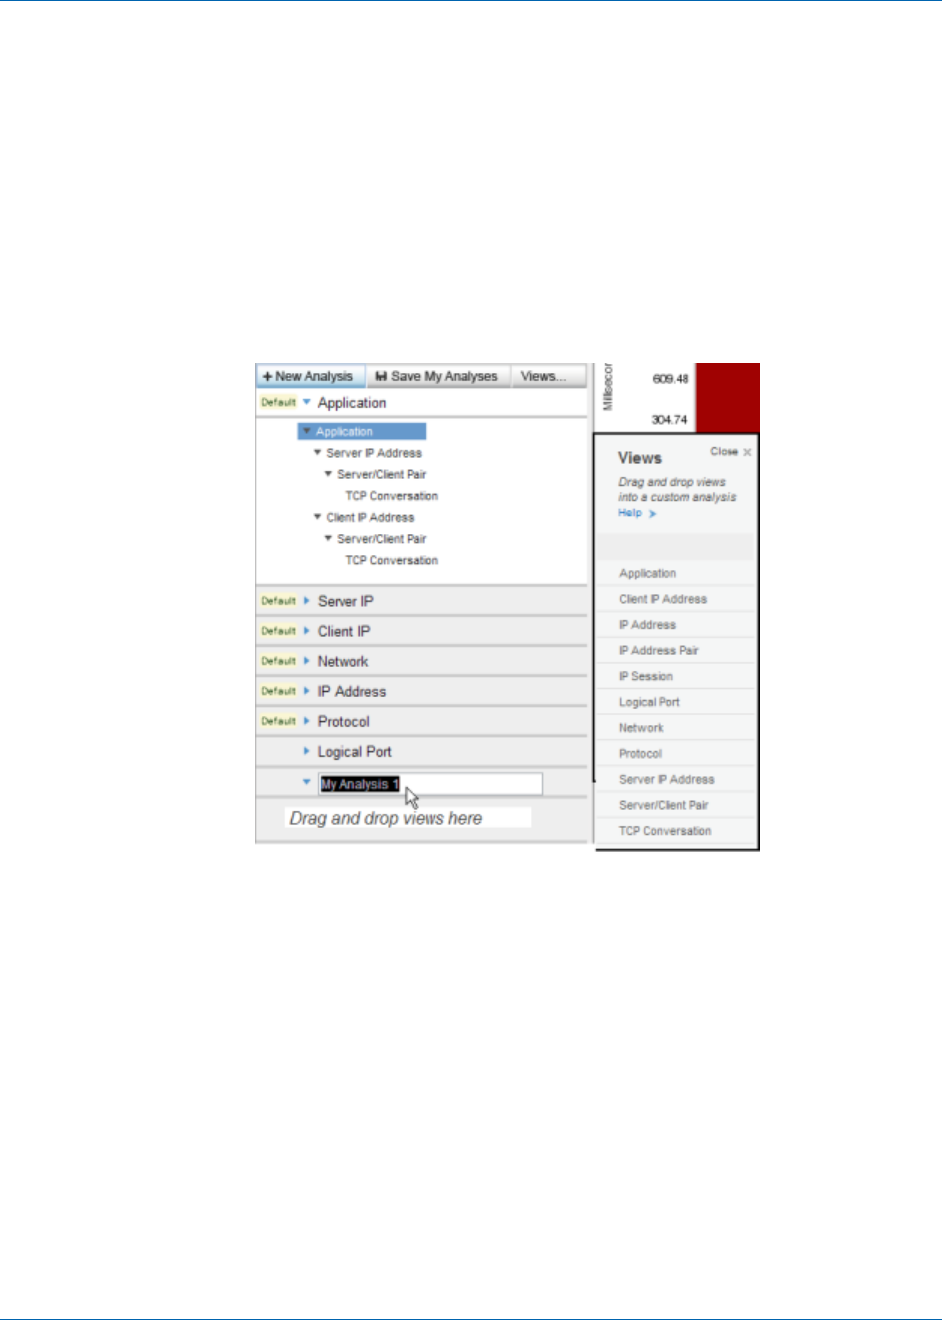
What is an Analysis?
Chapter 3: Analyzing Data 51
Create a Custom Analysis
Predefined analyses cannot be permanently modified. To preserve filters or analytical
work flows, create a custom analysis.
Follow these steps:
1. Click New Analysis in the Analysis pane.
A new item appears in the Analysis pane. The default name, My Analysis 1, is
highlighted.
The Views pane opens to the right of the Analysis pane.
2. Type a name for the new analysis in the highlighted field.
3. Select a view to add to your custom analysis in the Views pane.
4. Drag the view to the "Drag and drop views here" section of the Analysis pane.
5. Repeat Steps 3 and 4 to add data views to your analysis. We recommend adding
views in a hierarchical flow of increasing granularity, with additional items filtered
out as the views proceed downward.

What is an Analysis?
52 User Guide
6. (Optional) Add advanced filters. Right-click a view and select Add Analysis Filter.
The Add Analysis Filter dialog opens. For descriptions of the fields, see Filters for
Data Views (see page 57).
7. Click Save My Analyses.
The action of saving an analysis preserves the changes you make to a custom
analysis. Multiple changes can be saved simultaneously.
Important: If you are viewing an emailed analysis that you received from another
user, clicking Save My Analyses overwrites all previously saved analyses.
Duplicate an Analysis
You can duplicate custom and predefined analyses. The duplication feature lets you save
the modifications you make to an analysis.
Follow these steps:
1. In the Analysis pane, right-click the analysis that you want to duplicate.
2. Select Duplicate.
A new analysis appears in the Analysis pane, with the naming convention of "My
Analysis #."
3. Type a new name for the duplicated analysis.
Delete a Custom Analysis
You can delete a custom analysis. You cannot delete a predefined analysis.
Follow these steps:
1. In the Analysis pane, right-click the name of the analysis you want to delete.
2. Select Delete Analysis.
3. Click OK in the confirmation message.
The analysis is removed from the Analysis pane.

What is an Analysis?
Chapter 3: Analyzing Data 53
Data Views
Data views help you investigate an area of network performance. Predefined analyses
contain data views. You can create and modify custom analyses with their own sets of
views.
The Views menu opens automatically when you create an analysis. You can also click the
Views button to see the list of available data views.
You can customize Multi-Port Collector data views based on the following:
■ Filters, which focus on the traffic of interest
■ Chart formats, which graphically display performance metrics of interest
■ Data table settings, which selectively display metrics of interest. For each view, a
default sorting method is applied. For example, in the Protocol analysis, protocols
are sorted from highest byte rate to lowest.
You can customize data views. Some changes are automatically saved to views, such as
a change in the chart format.
Application
Highlights response time (Transaction Time in milliseconds) per application.
Application names are derived from SuperAgent configuration or from well-known
port usage. Where available, the application name is supplied. Otherwise, the port
number is shown.
The default chart shows the trend in response times and their composition. The
Transaction Time is broken down into Network Round-Trip Time, Retransmissions,
Data Transfer Time, and Server Response Time.
Client IP Address
Highlights response time (Transaction Time in milliseconds) per client. Multi-Port
Collector identifies client computers based on the three-way handshake that
initiates a TCP conversation. The chart shows the trend in response times and their
composition.
IP Address
(Traffic tab) Highlights throughput (Byte Rate in bits per second) per host IP
address, sorted by highest to lowest byte rate. The chart shows the directional Byte
Rate, to and from the host with the highest rate.
IP Address Pair
(Traffic tab) Highlights throughput (Byte Rate in bits per second) per conversing pair
of host IP addresses, sorted by highest to lowest byte rate. The chart shows the
directional Byte Rate, to and from the pair of hosts with the highest rate.

What is an Analysis?
54 User Guide
IP Session
(Traffic tab) Highlights throughput (Byte Rate in bits per send) per session. Each
session represents a conversing pair of host IP addresses. Sessions are sorted by
highest to lowest Byte Rate. The chart shows the composition of the Byte Rate to
and from the top ten sessions with the highest throughput.
Logical Port
Highlights response time per logical port, that is, per switch mirror port session,
coming in to Multi-Port Collector. The chart shows the trend in response times (as
Byte Rate).
Network
Highlights response time (Transaction Time in milliseconds) per network. Networks
are identified based on SuperAgent configuration. The chart shows the trend in
response times and their composition.
Protocol
(Traffic tab) Highlights throughput (Byte Rate in bits per second) for each protocol
that passes hardware filtering. The total number of bytes sent and received is
shown, and the number of TCP bytes. The Layer 3 protocol is also indicated. The
chart shows the throughput trend (as Byte Rate) over time.
Server IP Address
Highlights response time (Server Response Time in milliseconds) per server. The
chart shows the trend in response times and their composition.
Server/Client Pair
Highlights response time (Transaction Time in milliseconds) per pair of hosts (client
and server). The chart shows the trend in response times and their composition.
TCP Conversation
Highlights response time (Transaction Time in milliseconds) per session. Each
session consists of a server host plus a client host and port. The chart shows the
trend in response times and their composition.
More information:
Use Hardware Filters to Manage Data (see page 21)
Configure Logical Ports (see page 19)
Create an Analysis Filter (see page 57)
View the Current Filter Conditions (see page 56)

Use Filters to Customize Data in the Display Area
Chapter 3: Analyzing Data 55
Use Filters to Customize Data in the Display Area
Multi-Port Collector offers several methods for narrowing the scope of session-level
metrics shown in the Display area of the Analysis page. The following options can be
applied to the data displayed from a selected analysis.
Data views
You can select different data views to focus on the network aspect that makes the
most sense for the current troubleshooting task. For example, if an application has
slow response time, select the Server IP view or the Application view to see the
associated metrics.
Use analysis filters (see page 57) to filter the data in a view.
Note: Analysis filters are distinct from the Hardware filters you apply to captured
data. Hardware filters affect the capture of data. Analysis filters affect the display of
data.
Context-specific filtering
■ Select a row or a series of rows in the data table. Right-click and select Apply As
Filter to narrow the scope of data in the current analysis. To highlight multiple
rows, use Ctrl+Click or Shift+Click.
■ Use the mouse pointer to select a specific section of the chart. Release the
mouse pointer and click Set. The chart refreshes to focus on a narrower
segment, such as a spike in the line graph indicating exceptions to baseline
metrics.
Drill-down filtering
■ Double-click a row in the data table to drill one level down to the next view in
the analysis.
■ Drill down from an APM defect to view associated data on the Analysis page.
An analysis filter is automatically created based on the context of the defect,
such as server, application, or client.
■ Click Session Analysis in a SuperAgent report to view associated data on the
Analysis page. Global filters (see page 65) on the Analysis page are based on
the context of the SuperAgent report.
Zoom filtering
Line graphs provide additional filtering options. The Zoom In and Zoom Out links let
you focus more closely on the performance metrics from a smaller segment of
captured data.
■ Zoom In reduces the current time frame so that a smaller segment of data is
charted.
■ Zoom Out restores the time frame to a broader segment of data.

Use Filters to Customize Data in the Display Area
56 User Guide
Time frame filtering
The Summary Trend chart, Line Trend chart, and Stacked Trend chart formats
include a time-navigation component above the Display area. The default time
frame is 15 minutes. The Time Period Selector enables precise selection of another
time frame.
■ The Backward and Forward buttons let you move forward or backward in time
through the captured data. This type of time navigation lets you view trend
data and follow each trend as it proceeds.
■ The date, hour, and minutes are menus from which you can select other date
and time parameters.
■ The date is a graphical calendar menu with forward and backward navigation.
■ The Timeframe link provides quick access to larger time segments, from "Last
15 Minutes" to "Last 180 Minutes."
More information:
Use Hardware Filters to Manage Data (see page 21)
Data Views (see page 53)
View the Current Filter Conditions
You have several options for viewing the information about the filters that are applied
to an analysis.
■ Click the Show Filters link in the Analysis pane or in the Display area to see the
following information:
■ A list of all global filters inherited from the SuperAgent report
■ A list of analysis filters applied to the current data view
■ In an analysis, use the mouse pointer to hover over a filtered data view. The flyover
text describes the conditions and syntax of the filter.
■ In an analysis, right-click a data view and select Edit Analysis Filter. The Conditions
field in the Edit Analysis Filter dialog identifies the conditions and syntax of the
filter.
■ In an analysis, click the filter icon. The Conditions field identifies the conditions and
syntax of the filter.

Use Filters to Customize Data in the Display Area
Chapter 3: Analyzing Data 57
Analysis Filters
You can apply regular expressions to data views to limit the data in the Display area.
This type of filtering is an analysis filter.
Regular expression filters are applied directly to a data view that is a component of an
active analysis. You can only save the filters as part of analysis customization.
Create an Analysis Filter
You can apply regular expressions to data views to limit the data in the Display area.
This type of filtering is an analysis filter.
Regular expression filters are applied directly to a data view that is a component of an
active analysis. You can only save the filters as part of analysis customization.
When you add an analysis filter to a data view, the new filter and any inherited filters
are applied to the view. You can see the inherited filters in the Add Analysis Filter dialog.
Note: New filters do not modify inherited global filters. Instead, they provide an
additional filter to the data that passed the global filters.
Follow these steps:
1. Right-click a view within an analysis and select Add Analysis Filter.
The Add Analysis Filter dialog opens. Filters inherited from another view in the
same analysis are indicated in the Inherited Analysis Filters field.
2. Select filters from the Parameter field. As you click each item, help with the
appropriate syntax for the Value appears.
3. Select an operator.
■ Equals (=)
■ Does Not Equal (!=)
4. Type a value to complete the expression. Use the syntax online help for guidance.
Note: The use of certain expressions in the Value field effectively disables the filter.
Do not use the expressions from the list of Reserved Filter Expressions.
5. Click Add to Conditions.
The filter statement appears in the Conditions field.
Note: To remove the filter statement, click the [Clear] link above the Conditions
field. You can also edit the statement by typing in the Conditions field.

Use Filters to Customize Data in the Display Area
58 User Guide
6. (Optional) Select a Boolean operator and repeat steps 3 through 5 to add conditions
in relationship to the existing filter statement.
■ AND (concatenation)
■ OR (alternation)
7. Click OK.
The filter is validated. If valid, it is applied to the data table and chart in the Display
area. A filter icon appears next to the view name in the Analysis pane to indicate
that analysis filtering is applied.
More information:
Create a Custom Analysis (see page 51)
Reserved Filter Expressions
The following is a list of reserved filter expressions. Do not use the following
case-sensitive strings in the Value field in the Add Analysis Filter dialog.
ApplicationName, ApplicationTypeID, ApplicationNameTypeID
ClientNetworkName, ClientNetwork
HostName, Host
L4Port
LogicalPortName, LogicalPort
L3ProtocolName, L3ProtocolNumber, L4ProtocolName, L4ProtocolNumber,
L34ProtocolName, L34ProtocolNumber
MAC
NetworkName, Network
PairName, Pair
ServerName, Server
SessionID, ToS, or VLAN
The analysis filtering function cannot create the query syntax when the parameters
include one of the reserved filter types followed by "=" or "!=." If you use a reserved
term, use a different case than the one specified in the list.

Use Filters to Customize Data in the Display Area
Chapter 3: Analyzing Data 59
Values Associated with the Parameter Field
The following table describes the syntax for the Values field, based on the item selected
in the Parameter field.
Application Name
Filter for an application name. Application names in the Display area are derived
from SuperAgent configuration or from well-known port usage. Type a name or a
comma-separated list of names. Wildcards are accepted. Examples:
Secure HTTP*
Secure HTTP (443)
Application Name/Type/ID
Filter for three values that represent an application name, type, and ID number.
These values can be seen when the Application Name, Application Type, and
Application ID columns are enabled in the Edit Columns dialog. Specify the trio as
“name/type/ID.” Example:
MySQL (3306)/Monitored/3
Note: The Application Type/ID and Application Name/Type/ID parameters require
internally assigned values. Apply them directly from the data table with the
right-click menu.
Application Type/ID
Filter for a pair of values that represent an application type and its ID number.
These values are available when the Application Type and Application ID columns
are enabled in the Edit Columns dialog. Specify the pair as “type/ID." Example:
Monitored/10
Client Network
Filter for the IP address of a client network subnet, or a comma-separated list of
subnets. Use a slash (/) to separate the mask from the address. Examples:
192.3.45.0/24
192.3.45.0/24,192.3.46.0/24,192.3.50.0/24
Client Network Name
Filter for the name of a client network, or a comma-separated list of networks that
are defined for monitoring in SuperAgent.
Host
Filter for an IP address. The default filter parameter. Type a single IP address, a
range of IP addresses, a comma-separated list of IP addresses, or a
comma-separated list of address ranges. Use hyphens and no spaces in address
ranges. Examples:
198.168.0.1, 198.165.0.1-198.165.1.255

Use Filters to Customize Data in the Display Area
60 User Guide
Host Name
Filter for a client or server DNS host name. Type a DNS host name or a
comma-separated list of host names. Wildcards (*) are supported. This parameter is
the default. Examples:
exchangeserver1, *noc*, database*
Layer 3 Protocol Name
Filter for a Network Layer protocol. Type the name of a Layer 3 protocol, or a
comma-separated list of names. Example:
IP
Layer 3 Protocol Number
Filter for a Network Layer protocol. Type the decimal registry number of a Layer 3
protocol, or a comma-separated list of registries.
Layer 3-Layer 4 Protocol Name
Filter for a pair of protocols from Layers 3 and 4. Type a pair of protocol names, or a
list of pairs of names. Use a slash (/) as a separator to indicate a pairing. Example:
IP/TCP
Layer 3-Layer 4 Protocol Pair
Filter for a pair of protocols from Layers 3 and 4. Type a pair of protocol registry
numbers, or a list of pairs of numbers. Use a slash (/) as a separator to indicate a
pairing. Example, for IP/TCP:
2048/6
Layer 4 Port
Filter for Transport Layer port numbers. Type a port number or a comma-separated
list of port numbers. Example, for HTTPS:
443
Layer 4 Protocol Name
Filter for a Transport Layer protocol. Type the name of a Layer 4 protocol, or a
comma-separated list of names.
Layer 4 Protocol Number
Filter for a Transport Layer protocol. Type the decimal registry number of a Layer 4
protocol, or a comma-separated list of registries.
Logical Port
Filter for a logical port number. Type a logical port number or a comma-separated
list of numbers. This parameter lets you see only the data that is mirrored from
specific sources.

Use Filters to Customize Data in the Display Area
Chapter 3: Analyzing Data 61
Logical Port Name
Filter for a logical port name that you defined on the Multi-Port Collector appliance.
Type a logical port name or a comma-separated list of names.
MAC Address
Filter for a Media Access Control address, or a comma-separated list of MAC
addresses. Example:
00:19:2f:aa:bb:cc
Network Name
Filter for a SuperAgent network name. When you configure networks in SuperAgent
Administration, you can provide a name for each. In this field, type a network name
or a comma-separated list of names.
Network
Filter for a network subnet. Type the IP address of a network subnet, or a
comma-separated list of subnets. Use a slash (/) to separate the mask from the
address. Examples:
192.3.45.0/24
192.3.45.0/24,192.3.46.0/24,192.3.50.0/24
Pair
Filter for a pair of conversing hosts by IP address. Type a pair of IP addresses or a
comma-separated list of pairs of IP addresses. Use a slash (/) between the
addresses to indicate a pair. Example:
198.168.0.1/198.168.0.18
Pair Name
Filter for a pair of conversing hosts by DNS host name. Type a pair of host names or
a comma-separated list of pairs for the value. Use a slash (/) between the host
names to indicate a pair. Example:
MyServer1/MyClient1
Server
Filter for a server IP address. Type the IP address of a server, or a comma-separated
list of addresses. Use dotted notation. Example:
192.3.45.0
Server Name
Filter for a server host name. Type a host name or a comma-separated list of host
names.
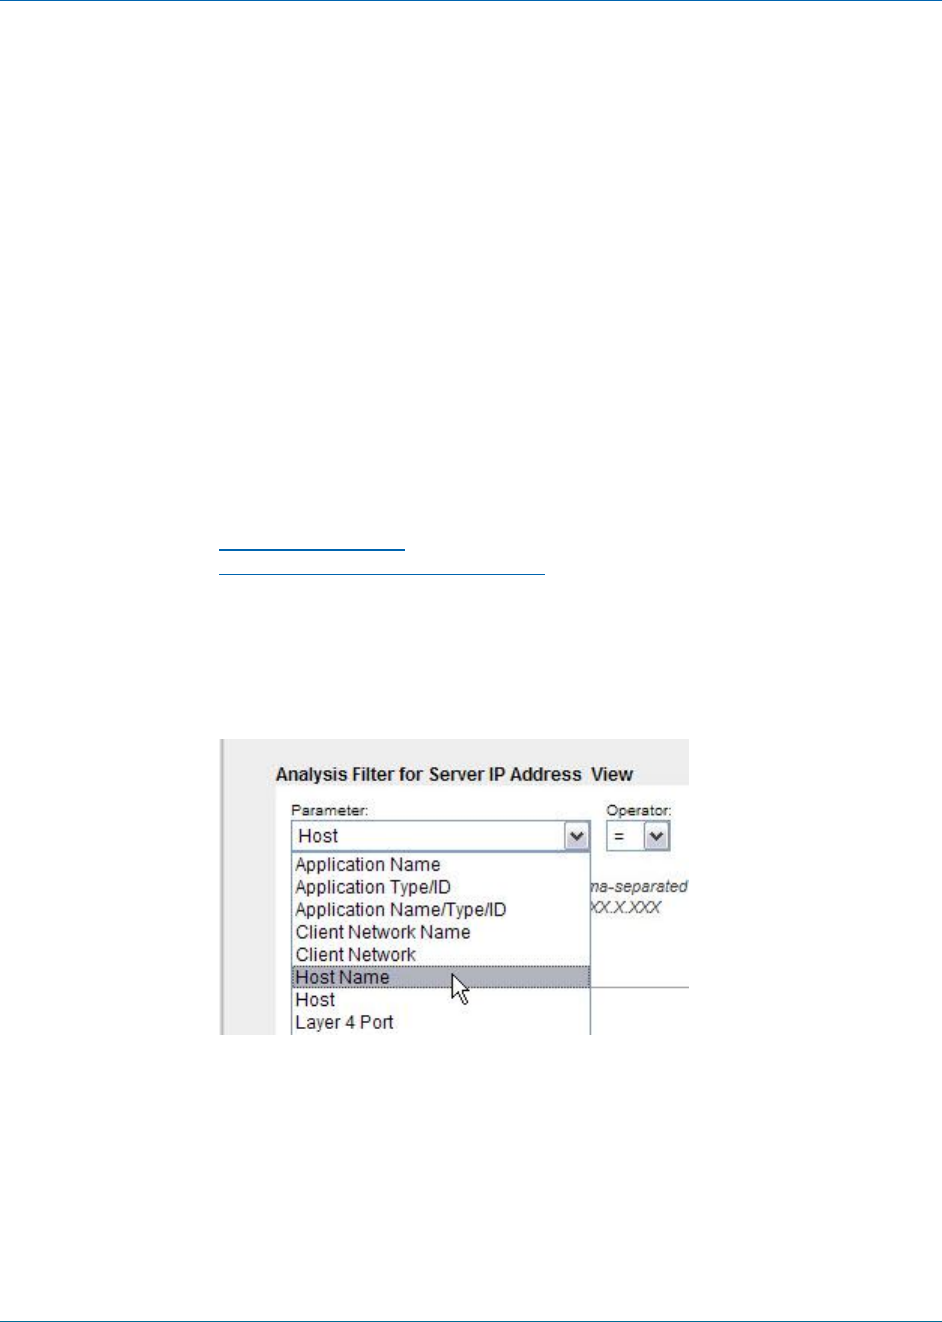
Use Filters to Customize Data in the Display Area
62 User Guide
Session ID
Filter for a TCP session ID number. Type a session ID number or a comma-separated
list of ID numbers.
The session ID is an internal identifier that is available when the Session ID column
is enabled in the Edit Columns dialog.
ToS
Filter for a Type of Service bit setting. Type a ToS setting, in decimal format, or a
comma-separated list of settings. Example for 0100, maximize throughput:
4
VLAN Number
Filter for a Virtual LAN ID number. Type a VLAN ID number or a comma-separated
list of numbers.
More information:
Configure Logical Ports (see page 19)
Add or Remove Columns in a Data Table (see page 80)
How Filters Query the Database
Some analysis filters are paired sets in the Add Analysis Filter dialog. For example, you
can filter by Host (the IP address) or by Host Name:
These filter parameters are applied intelligently to create a useful chart. For example,
select the Host parameter to filter data on the TCP tab of the Client IP Address view. The
data shows only client addresses that match the filter value. If you then apply the same
Host filter to the Server IP Address view, the data shows only server addresses that
match the value.
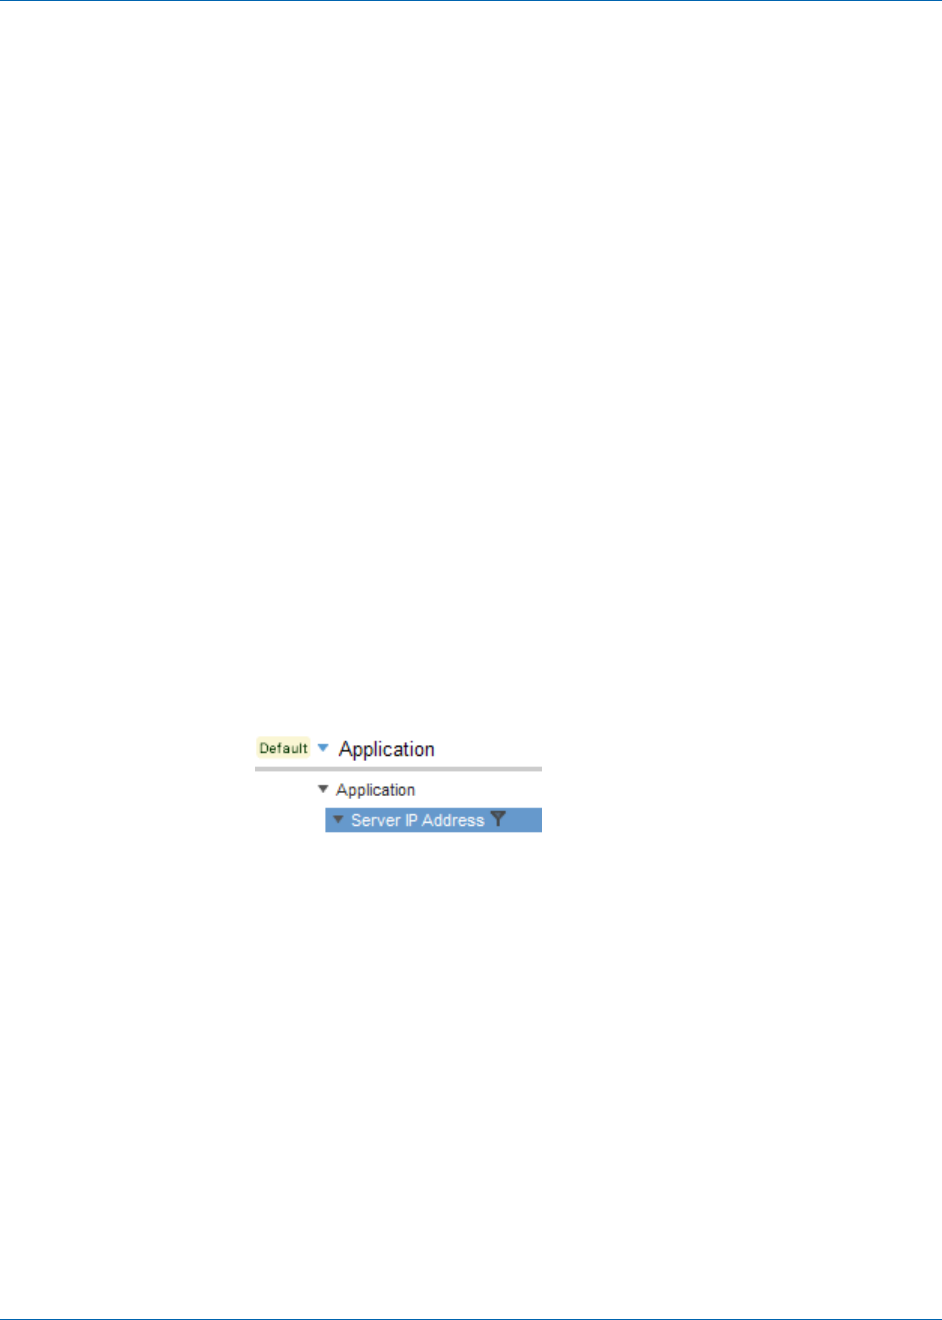
Use Filters to Customize Data in the Display Area
Chapter 3: Analyzing Data 63
Some data views do not limit the display in this way. For example, the Protocol or
Application views filter by clients or servers. The Traffic tab applies less filtering in
general. For the Host or Host Name parameters, the Traffic tab displays hosts in the
Address1 or Address2 column.
The Network data view and the Network analysis filters do not always search all
networks defined in SuperAgent. SuperAgent classifies networks as either client or
server networks, based on the role these hosts play in captured transactions. The
Network and Network Name filters, which match network address or name values,
default to matching on client networks. However, they also issue different database
queries based on the selected data view and tab.
■ When the Network view and TCP tab are selected, only client networks are queried
for matching values.
■ When the Server IP view is selected, only the Network and Network Name analysis
filters send queries for matching server networks.
Change the Properties of an Analysis Filter
You can modify an analysis filter that is applied to a data view. You can modify filters
from the Analysis menu, using the following procedure detailed. Or you can modify a
parent filter using the right-click options on the data table. Those changes overwrite any
analysis filters previously applied to child views.
Follow these steps:
1. Locate the filter you want to delete. A filter icon identifies an active filter.
2. Right-click the filter and select Edit Analysis Filter.
The Edit Filter dialog identifies the active filters in the Conditions field. Filters
inherited from another view in the same analysis are shown in the Inherited
Analysis Filters" field.
Note: Within an analysis, filter inheritance proceeds downward from a preceding
view to all subsequent views in the same analysis.
3. Select a Boolean operator to add conditions in relationship to the existing filter
statement.
■ AND (concatenation)
■ OR (alternation)
4. Select filters from the Parameter field. As you click each item, help with the
appropriate syntax for the Value field appears.

Use Filters to Customize Data in the Display Area
64 User Guide
5. Select an operator.
■ Equals (=)
■ Does Not Equal (!=)
6. Type a value to complete the expression. Use the syntax online help for guidance.
Note: Certain expressions disable the filter when supplied for the Value field. Do
not use the expressions from the list of Reserved Filter Expressions.
7. Click Add to Conditions.
The filter statement appears in the Conditions field.
Note: To remove the statement, click the [Clear] link above the Conditions field.
You can also edit the statement by typing in the Conditions field.
8. Click OK.
The modified filter is validated. If valid, the filter is applied to the data table and
chart in the Display area.
More information:
Reserved Filter Expressions (see page 58)
Values Associated with the Parameter Field (see page 59)
Delete an Analysis Filter
You can delete an analysis filter that is applied to a data view. Use the mouse pointer to
hover over a filter to see the current filter conditions. You can delete one filter or all
filters for an analysis.
Follow these steps:
1. Locate the filter that you want to delete. A filter icon identifies a filter.
2. Right-click the filtered view and select Remove Analysis Filter to delete one filter.
The table and chart in the Display area are refreshed to include data that had been
filtered out.
3. Right-click the name of the analysis and select Remove All Filters to delete all filters.
The table and chart in the Display area are refreshed to include data that had been
filtered out.

Use Filters to Customize Data in the Display Area
Chapter 3: Analyzing Data 65
Global Filters
Global filters are inherited from the SuperAgent report context that was in effect when
you initiated a Session Analysis. Each global filter setting indicates the context, such as a
specific server, or ‘All’ if no specific context is indicated by SuperAgent.
A list of active global filters is displayed at the top of the Analysis pane. Application,
Server, and Network global filters are listed first, followed by the Logical Port that was
selected during the Session Analysis procedure.
Queries to the Multi-Port Collector database filter the data. The queries depend on the
type of filter and on the selected data view, and are selected to optimize the data that is
returned. The Server global filter focuses attention on the specified server. The Network
global filter focuses attention on clients within that network. You can modify a global
filter to limit the data that is presented in the Display area. You can also clear a global
filter to return it to the default setting.
Global Filters Dialog
The Global Filters dialog provides the following information.
Application tab
■ Name. The name of the application, if available. The port number is shown in
parentheses.
■ Application Type/ID. The application identifier. Usually a pair of values that
represent an application type and its ID number. Each pair identifies an
application in the Multi-Port Collector database.
Server tab
The Server tab contains a list of hosts. A host is determined to be a server based on
its role in monitored transactions. Multi-Port Collector can distinguish servers and
clients within the captured conversation data.
■ Name. The name of the server as configured in SuperAgent, usually the DNS
host name.
■ IP Address. The IP address of the server.
Network tab
The Network tab identifies client networks. The SuperAgent concept of networks is
based on monitoring client regions and observing client-server transactions from
those regions.
■ Name. The name of a network as defined in SuperAgent. A network is treated
as a client region for purposes of SuperAgent performance monitoring.
■ Subnet. The client region, as determined by the combination of subnet IP
address and mask.

Use Filters to Customize Data in the Display Area
66 User Guide
Logical Port tab
■ Name. The name of the logical port, as defined by the Multi-Port Collector
Administrator. The default name is the same as the port number.
■ Logical Port. The number of the logical port. Identifies the port on the Logical
Ports page. The default logical port definition corresponds to the port ID
number on the adapter.
Modify a Global Filter
You can change a global filter to restrict the data included in an analysis.
Note: If you change the Logical Ports global filter, you effectively change the entire data
set for the selected analysis.
Follow these steps:
1. Click [change] next to the global filter you want to change in the Analysis pane.
The Global Filters dialog opens.
2. Click the tab that corresponds to the global filter you want to change. For example,
to filter the analysis by an application running on the monitored network, click the
Application tab.
The tab displays a list of all known applications whose traffic is reflected in the
captured packets from the time frame you are viewing.
3. Select an application in the list. For example, select "Simple Mail Transfer Protocol."
The application you selected is displayed as Currently Selected, and the application
port number is displayed in parentheses. The selected application also filters the
lists of items on the other tabs in the Global Filters dialog.
4. Click another tab to apply more restrictions to the data included in the analysis.
For example, click the Server tab. Only servers that are running the selected
application (SMTP, in this example) are shown in the list. Select a server.
5. Click OK.
The chart and table for the current analysis are filtered to show only data from the
SMTP application and its application servers.

Understand the Data in the Display Area
Chapter 3: Analyzing Data 67
Clear a Modification to a Global Filter
You can remove, or clear, a change you made to a global filter. By clearing a change, you
return the global filter to the default setting, "All."
Follow these steps:
1. Click [change] next to the global filter you want to clear in the Analysis pane.
The Global Filters dialog opens and displays active global filters as Currently
Selected.
2. Click [Clear] next to the selected filter.
3. Click another tab to see which filters are selected and then repeat step 2.
4. Click OK.
The data table and chart are refreshed to include the information that had been
filtered out.
Understand the Data in the Display Area
The Display area contains a chart and a data table. The following items affect the data in
the chart and table:
■ Time frame
■ Global filters
■ Analysis filters
■ The active tab in the data table: either the TCP or Traffic tab
The chart provides a series of format buttons down the right side to let you apply other
chart formats for the same data. You can expand the size of the Display area by hiding
the Analysis pane. Click the Hide icon (<<) on the Analysis pane to hide it.
The chart and table are linked so that they always display data in complementary
formats. The table displays more data than the chart. However, the chart reflects the
filters you apply to the table, such as changing the sort order and selecting a new page.
The data table presents performance data for troubleshooting and analysis. You can sort
each column to view outliers and minimum results. Two filters always affect the data
table:
■ The current time frame
■ The filtering parameters of the current analysis

Understand the Data in the Display Area
68 User Guide
A predefined analysis includes minimal filters and applies some logic to limit the data to
a manageable quantity. This technique speeds up database queries and also makes the
Display area more coherent for the typical user.
Data from the first ten table rows is represented in the chart, with the exception of the
Summary Trend chart. The Summary Trend chart reflects data from all table rows. You
can display more table rows by increasing the Max Per Page setting.
More information:
Data on the Traffic Tab (see page 72)
Data on the TCP Tab (see page 75)
Add or Remove Columns in a Data Table (see page 80)
Types of Charts
The chart in the Display area is refreshed in the following circumstances:
■ You initiate a Session Analysis from a SuperAgent report
■ You click a data view in the Analysis pane
■ You select a column in the data table in the Display area
■ You drill down from an APM defect
The chart and table offer mutually supported filtering options. When you click a column
heading in the data table, the table is refreshed to sort all the available rows by the
selected item. The chart is refreshed to display the selected item.
When you click the TCP or Traffic tab, the data in the chart automatically changes
accordingly. Most charts are restricted to the top ten entries. One exception is the
Summary Trend chart, which conforms to SuperAgent conventions and includes data
from the entire data table.
Each trend chart lets you select the time frame and zoom options.

Understand the Data in the Display Area
Chapter 3: Analyzing Data 69
Bar Chart
The Bar chart format represents data averages from across the selected time period.
Each bar represents the data in a single table row. The Y-axis identifies each table row. A
maximum of ten rows can be included in a single Bar chart. The Y-axis label indicates the
columns that identify the row. For example, the Y-axis shows each corresponding server
name for the Server IP Address view. The X-axis usually displays the metric values and
their units.
This type of chart format is most useful for comparing performance metrics from
different entities. For example:
■ Compare the server response time of one server to another
■ Compare the TCP Byte Rate of the top ten applications
Each part of the bar provides flyover text to identify a metric and its value. This feature
is useful for understanding which component metric contributed the most to the total
represented by the bar. Click a bar in the chart to highlight the corresponding row in the
data table. You can then right-click the table row and select Apply as Filter to view data
associated solely with the entity on which you are focused.
Important: Certain metrics are shown as a single value, such as Server Response Time.
Other metrics are shown in a composite format, such as Transaction Time. A composite
chart displays as selected metric as a portion of the whole metric. The composite Bar
chart shows a breakdown of a single value to its units.
Line Trend Chart
In the Line Trend chart format, a line represents data from each row in the data table.
The line plots the selected metric across the time period. Up to ten data rows are
plotted per chart. The Y-axis identifies buckets of metric values, such as Server Response
Time (SRT) in milliseconds. The X-axis displays time units to indicate trends.
This type of chart format provides a quick overview of system status and trends. For
example:
■ when you access the Server IP Address view to compare server response time
trends and drill down into a spike in SRT
■ when you filter on a single IP address to find the source of gradually increasing
transaction times

Understand the Data in the Display Area
70 User Guide
Pie Chart
The Pie chart format represents the top ten entries for a selected metric as pieces of a
pie. Each piece is a percentage of a whole. All pieces add up to 100 percent of the
selected metric total for the top 10 table entries. One pie piece, with an assigned color,
represents a row in the data table.
Note: Certain metrics, such as TCP Byte Loss Percentage, are not appropriate for display
in the Pie chart format.
The top 10 entries do not always account for 100 percent of all activity observed during
the selected time period. You can enable an 11th pie piece to represent an aggregate of
the rest of all the table rows (Other). Flyover text is available for each pie piece to help
identify the hosts. Click a pie piece to highlight the associated hosts in the data table.
You can then filter by that data. Drill-in to the “Other” piece is not supported.
This type of chart format is most useful for comparing the relative contributions of hosts
to a selected metric. For example, filter on a particular server and select the
Server/Client Pair view. Then select the TCP Bytes metric and see which clients
contribute most to the data volume of a server.
Stacked Trend Chart
The concept behind the Stacked Trend chart is similar to that of the Pie chart, except
that the values are plotted over time. One line of a different color is displayed per table
row. Up to ten rows are plotted per chart. The lines are filled and stacked, with the
highest table row plotted on the bottom of the chart. A downward fill below each line
helps you see how each region of data is related to the others and to the larger metric.
A thick, black line labeled "Total" identifies where 100 percent of the plotted metric falls
along the Y-axis. To remove this line from the chart, click the Hide link next to the
legend.
This type of chart is most useful for comparing the relative contributions of selected
entities to a performance metric over time. For example, filter on a particular server and
select the Server/Client Pair view. A Stacked Trend chart for the TCP Bytes metric
indicates whether data volumes from different clients are changing over time.
The Stacked Trend chart is not applicable for certain types of metrics, such as TCP Byte
Loss Percentage.

Understand the Data in the Display Area
Chapter 3: Analyzing Data 71
Summary Trend Chart
The Summary Trend chart uses a stacked format to display the data points from all table
rows and all pages in the data table. The chart displays a layered view of the values for a
selected metric. Each value equals the vertical distance between the upper and lower
metric boundary lines, not the distance from 0 to the upper boundary line.
This chart format resembles the Stacked Trend chart, with the following differences:
■ The Stacked Trend chart displays a single metric, representing a single column in
the data table, for only the current page of the data table.
■ The Summary Trend chart displays multiple metrics from all rows and table
columns, with values averaged across all columns.
The stacked format is useful for showing composite data. The value for each metric is
treated as a portion of the whole metric. Each data point shows a breakdown of a single
metric into its component parts.
Lines of different colors show the data points that compose an overarching value, such
as the components of TCP transaction response time: network round-trip time, server
response time, and data transfer time.
To represent the trends in the plotted metrics, the chart is plotted over the selected
time period, with time values shown on the X-axis.
Types of Data
The data table consists of two tabbed views that provide different perspectives on
captured data from the same time frame. Each view provides different metrics and
applies filters in different ways.
TCP tab
The TCP tab contains data specific to TCP-based applications and metrics that are
used in SuperAgent reports, and performance metrics calculated from the captured
packets. The label on the Name column changes to indicate whether clients or
servers are displayed.
Note: The TCP tab is selected by default when you drill down from SuperAgent. In
general, the format of the data on the TCP tab closely resembles the format of data
in SuperAgent reports.

Understand the Data in the Display Area
72 User Guide
Traffic tab
The Traffic tab contains all other available data, not restricted to TCP applications.
The Traffic tab does not apply a concept of client or server. Therefore, the Name
column can show the names of both clients and servers, depending on the selected
view. The Traffic tab also includes non-TCP traffic, which can result in the inclusion
of additional hosts.
The names of some performance metrics are abbreviated in the data table to reduce
table width. To see the full name of a metric, position the mouse pointer over the
abbreviated column name or its check box. The flyover text provides the full name of
the selected metric.
Data on the Traffic Tab
The Traffic tab of the data table provides a comprehensive view of the packets passing
through the monitored mirror ports. Only the columns applicable to the selected view
are shown in the table. The following list describes all possible columns for the Traffic
tab.
Application
Application names are derived from SuperAgent configuration or from well-known
port usage. Where available, the application name is supplied. Otherwise, the port
number is shown in parentheses.
Application ID
The second value in a pair of values that identifies an application. An internal
identifier.
Application Type
Identifies an application in the Multi-Port Collector database. In most cases,
conveys the state of this application with respect to SuperAgent. One of the
following types:
■ n/a: Unknown protocol.
■ Monitored: Application uses TCP. SuperAgent monitors this application.
If multiple collection devices report to one SuperAgent management console, it
is possible that a different collection device monitors this application for
SuperAgent. The Application Type designation refers to items actively
monitored only by this Multi-Port Collector.
■ UDP-Not monitored: Application is defined in SuperAgent, but uses UDP.
SuperAgent does not monitor UDP.
■ TCP-Not monitored: Application is defined in SuperAgent and uses TCP.
However, SuperAgent is not monitoring the application.

Understand the Data in the Display Area
Chapter 3: Analyzing Data 73
■ TCP-Unknown: Application uses TCP, but is not defined in SuperAgent.
Application column shows “Port X.”
■ UDP-Unknown: Application uses UDP, which SuperAgent does not monitor.
Application is not defined in SuperAgent or in the Multi-Port Collector list of
well-known UDP ports. Application column shows “Port X.”
Byte Rate
Server processing efficiency, measured in bits per second (bytes per second x 8).
This throughput value is significant for capacity planning, because it provides a
sense of server load or usage.
Byte Rate From, Byte Rate To
Throughput in bits per second (bytes per second x 8) for data sent by or received by
the selected host.
Bytes
Data volume in bytes. The total number of Application-Layer bytes sent and
received during the selected time period and selected client-server sessions.
Bytes From, Bytes To
Data volume in bytes. The total number of Application-Layer bytes sent by or
received by the selected host during the selected time period.
IP Address, IP Address 1, IP Address 2
The IP address of the host. The “1” or “2” designation appears for the paired data
views and indicates the direction of data flow between hosts.
Layer 3 Protocol
The name of the Network Layer protocol (IP, IPv6, or ARP), or an ID number from
the Ethertype field in the packet header. Indicates “Ethertype=X” when an IEEE 802
Ethertype value is found.
Layer 3 Protocol Number
The decimal registry number of a Network Layer protocol, such as 2048 for IPv4.
Layer 4 Protocol
The name of the Transport Layer protocol, such as TCP.
Layer 4 Protocol Number
The decimal registry number of the Transport Layer protocol, such as 6 for TCP.
Logical Port, Logical Port Number
The logical port and port number on the Multi-Port Collector appliance that is the
source of the data in the table.

Understand the Data in the Display Area
74 User Guide
MAC Address, MAC Address 1, MAC Address 2, IP Address MAC
The Media Access Control address of the server that had the assigned IP address
indicated during the selected session. The “1” or “2” designation appears for the
paired data views and indicates the direction of data flow between hosts.
Name, Name 1 or 2, Server Name, Client Name
The name of the host, either a client or a server. For some views, a Client or Server
designation is indicated. Where not indicated, hosts are shown without regard to
their client or server role. The “1” or “2” designation appears for the paired data
views and indicates the direction of data flow between hosts.
Network Name, Network Name 1, Network Name 2
The name of a network as it is defined for monitoring in ADA. The “1” or “2”
designation appears for the paired data views and indicates the direction of data
flow between networks.
Network Subnet, Network Subnet 1, Network Subnet 2
The IP address of a network subnet. The “1” or “2” designation appears for the
paired data views and indicates the direction of data flow between subnets.
Packet Rate
Server processing efficiency, measured in packets per second. This throughput
value is significant for capacity planning, because it provides a sense of server load
or usage.
Packet Rate From, Packet Rate To
Throughput in packets per second data sent or received by the selected host.
Packets
Data volume in packets. The total number of packets sent and received during the
selected time period and selected client-server session.
Packets From, Packets To
Data volume. Total number of packets sent or received by the selected host.
Port 1, Port 2
The port on the host that sent or received conversation- or session-related data.
Session ID
The ID number of the TCP session. An internal identifier.
ToS
The bit setting for the Type of Service field in the IPv4 header.
ToS Description
A standard description of the TOS setting, such as “Default Traffic” or “Max
throughput.”

Understand the Data in the Display Area
Chapter 3: Analyzing Data 75
TCP Bytes
TCP data volume in bytes. The total number of TCP bytes sent and received during
the selected time period by the selected host or pair of hosts.
TCP Packets
TCP data volume in packets. The total number of TCP packets sent and received
during the selected time period by the selected host or pair of hosts.
VLAN
The ID number of the Virtual Local Area Network.
Data on the TCP Tab
The TCP tab of the data table excludes non-TCP packets and displays the data that
SuperAgent and APM monitor from all Multi-Port Collector logical ports. Only the
columns applicable to the selected view are shown in the table. The following list
describes all possible columns for the TCP tab.
Application
Application names are derived from SuperAgent configuration or from well-known
port usage. Where available, the application name is supplied. Otherwise, the port
number is shown in parentheses.
Application ID
The second value in a pair of values that identifies an application. An internal
identifier.
Application Type
Identifies an application in the Multi-Port Collector database. In most cases,
conveys the state of this application with respect to SuperAgent. One of the
following types:
■ n/a: Unknown protocol.
■ Monitored: Application uses TCP. SuperAgent monitors this application.
If multiple collection devices report to one SuperAgent management console, it
is possible that a different collection device monitors this application for
SuperAgent. The Application Type designation refers to items actively
monitored only by this Multi-Port Collector.
■ UDP-Not monitored: Application is defined in SuperAgent, but uses UDP.
SuperAgent does not monitor UDP.
■ TCP-Not monitored: Application is defined in SuperAgent and uses TCP.
However, SuperAgent is not monitoring the application.

Understand the Data in the Display Area
76 User Guide
■ TCP-Unknown: Application uses TCP, but is not defined in SuperAgent.
Application column shows “Port X.”
■ UDP-Unknown: Application uses UDP, which SuperAgent does not monitor.
Application is not defined in SuperAgent or in the Multi-Port Collector list of
well-known UDP ports. Application column shows “Port X.”
Client IP Address
The IP address of the client computer in the client-server session.
Client Name
The host name of the client computer in the client-server session (a conversation
pair).
Client Port
The port on the client that sent or received the data.
CT Obs
Connection Time Observations. The number of monitored TCP connections
occurring during the selected time interval. A good indication of usage levels and a
gauge of metric significance. For example, many observations can indicate an event
that can affect users.
DTT
Data Transfer Time. Elapsed time between when the server starts responding and
when it finishes sending data. Factors such as the response sizes, the bandwidth
available on the network, and interaction between the application and the network
affect this value. Excludes the initial server response time and includes only NRTT if
there is more data to send than fits in the TCP window. This metric is related to the
number of network round trips required to deliver all data and the delay per round
trip.
ENRTT
Effective Network Round-Trip Time. NRTT plus delays caused by retransmissions for
a single transaction. Reflects the latency that users actually experience and serves
as an indicator of performance degradation caused by retransmissions. Includes
NRTT and Retransmission Delay.
Layer 3 Protocol
The name of the Network Layer protocol (IP, IPv6, or ARP), or an ID number from
the Ethertype field in the packet header. Indicates “Ethertype=X” when an IEEE 802
Ethertype value is found.
Layer 3 Protocol Number
The decimal registry number of a Network Layer protocol, such as 2048 for IPv4.
Layer 4 Protocol
The name of the Transport Layer protocol, such as TCP.

Understand the Data in the Display Area
Chapter 3: Analyzing Data 77
Layer 4 Protocol Number
The decimal registry number of the Transport Layer protocol, such as 6 for TCP.
Logical Port, Logical Port Number
The logical port and port number on the Multi-Port Collector appliance that is the
source of the data in the table.
NCT
Network Connection Time. The time it takes the client to confirm the server
connection acknowledgment. In general, network latency causes delay in
connection times. NCT serves as a baseline for carrier latency and comparison to
NRTT values.
NRTT
Network Round-Trip Time. The amount of time it takes for a packet to travel to and
from the server and clients on a network, excluding latency from retransmissions.
Application and server processing times are excluded from this value. This value is
often useful when compared to the NCT value.
Retrans
Retransmission Delay. The additional delay in the NRTT caused by retransmissions,
which are packets that are retransmitted after data loss. The data is expressed as an
average across all observations, not the actual retransmission time for each
transaction. A delay in client acknowledgment caused by Retransmission Delay
increases the NRTT value. This metric does not reveal the impact of losses on the
DTT because of TCP congestion. This metric reflects only data loss from the server
to the clients, not from clients to the server.
SCT
Server Connection Time. The amount of time that elapses from when the server
receives the initial SYN packet from the client until the server sends the first
SYN/ACK.
Opening a TCP connection involves exchanging three packets: SYN, SYN/ACK, and
ACK. The TCP header has SYN (for synchronize) and ACK (for acknowledge) bits. The
first packet has the SYN bit set. The second packet has both bits set. The third
packet has only the ACK bit set. This exchange establishes the initial sequence
numbers of the connection.
SCT and NCT comprise the Connection Setup Time metric. For more information,
see the ADA Sessions reports.
Server IP Address
The IP address of the server computer in the client-server session.
Server MAC, Client MAC
The unique Media Access Control address that identifies a host.

Understand the Data in the Display Area
78 User Guide
Server Name
The host name of the server computer in the client-server session (a conversation
pair).
Server Network Name, Client Network Name
The name of a network as it is defined for monitoring in ADA. The “Client” or
“Server” designation appears for the paired data views and indicates the direction
of data flow between networks.
Server Network Subnet, Client Network Subnet
The IP address of a network subnet. The “Client” or “Server” designation appears
for the paired data views and indicates the direction of data flow between subnets.
Server Port
The port on the server that sent or received the data.
SRT
Server Response Time. The amount of time a server takes to respond to a request
made by a client. Server speed, application design, and volume of requests affect
SRT.
TCP Byte Loss
Data loss, expressed as a percentage of TCP bytes sent and received.
TCP Byte Rate From, TCP Byte Rate To
TCP throughput in bits. The data rate in bits per second (bytes per second x 8)
between the selected server and clients during the selected time period.
TCP Byte Rate Retransmtd
Ratio of retransmitted data to total data, percentage of data lost on the monitored
network, and loss rate in bits per second.
TCP Bytes
TCP data volume in bytes. The total number of Application-Layer bytes seen on the
network during the selected time period.
TCP Bytes From, TCP Bytes To
TCP data volume in bytes. Total number of Application-Layer bytes sent from or
received by the selected server to clients during the selected time period.
TCP Packet Loss
Data loss, expressed as a percentage of TCP packets sent and received.
TCP Packet Rate
TCP throughput in packets. The data rate in packets per second during the selected
time period. ADA reports use the term Data Rate.

Understand the Data in the Display Area
Chapter 3: Analyzing Data 79
TCP Packet Rate From, TCP Packet Rate To
TCP throughput in packets. The data rate in packets per second from the selected
server to clients, or from clients to the server, during the selected time period.
TCP Packet Rate Retransmtd
Ratio of retransmitted data to total data, percentage of data lost on the monitored
network, and loss rate in packets per second.
TCP Packets
TCP data volume in packets. The total number of packets seen on the network
during the selected time period. Includes zero-byte packets, such as TCP
acknowledgments.
TCP Packets From, TCP Packets To
TCP throughput in bits. The data rate, calculated as bytes per second x 8, during the
selected time period. ADA reports use the term Data Rate.
TCP Retransmtd Bytes
The number of TCP bytes that were retransmitted due to data loss.
TCP Retransmtd Packets
The number of TCP packets that were retransmitted due to data loss.
ToS
The bit setting for the Type of Service field in the IPv4 header.
ToS Description
A standard description of the TOS setting, such as “Default Traffic” or “Max
throughput.”
Transaction Time
Time elapsed from the moment a client sends the request (packet-level or
transaction-level) to the moment the client receives the last packet in the response.
Transaction Time Obs
Transaction Time Observations. The number of monitored TCP transactions that
occurred during the selected time interval. A good indication of usage levels and a
gauge of metric significance. For example, many observations can indicate an event
that can affect many users.
VLAN
The ID number of the Virtual Local Area Network.

Understand the Data in the Display Area
80 User Guide
Byte Counts for Networks and Hosts
The TCP tab shows activity from the client network perspective. The Traffic tab shows
generic network activity, without regard to which conversing host is the client and
which the server. If a pair of hosts in the same subnet exchanges data, the byte counts
for the same conversation can be different on each tab.
On the Traffic tab, byte totals for conversations within the same subnet can appear to
be double the totals shown on the TCP tab. The total bytes exchanged between the two
hosts are tallied as they exit the network and as they reenter it. Both directions are
included in the total, rather than broken out per host.
On the TCP tab, which reflects the client perspective, the bytes sent and received by a
single host are tallied for the same time period. The result is a total bytes value that is
smaller than the total bytes value on the Traffic tab.
Add or Remove Columns in a Data Table
By default, some data is excluded from the data table on the Traffic and TCP tabs. You
can include additional columns of data.
Follow these steps:
1. Click Edit Columns.
The Edit Columns dialog opens.
2. Select the check boxes for the metrics you want to add to the data table.
3. Clear the check boxes for the metrics you want to remove from the data table.
4. Click Default to restore default column settings.
5. Click Save.
Your changes are reflected in the data table after it refreshes.
Export Data to a PDF File
The charts in analyses can be shared in PDF format, with the following limitations:
■ The data table is not exported.
■ Legends that explain the colors in a chart are not exported. For charts with these
legends (specifically, the Line Trend and Stacked Trend chart formats), send the
view as a link by email.
All filters applied to the current chart are preserved in the exported analysis.

Understand the Data in the Display Area
Chapter 3: Analyzing Data 81
Follow these steps:
1. Display the data you want to export:
a. Click a data view in the Analysis pane.
b. Apply additional filters or sort the data table by a selected column.
2. Click Export, To PDF.
The File Download dialog opens.
3. Select whether to open or save the file.
■ If you click Open, the PDF is saved in a temporary folder and displayed in the
Acrobat Reader application.
■ If you click Save, use the Save As dialog to browse to the file save location and
click Save.
The current chart is exported to a file with a .pdf file extension. A label identifies the
data view, the active filters, the time frame of the data, and the time when the PDF
was generated.
Export Data to a CSV File
You can export the data table in an analysis to a spreadsheet in comma-separated
values (.csv) format. All filters applied to the data table are preserved in the exported
analysis.
As a best practice, select a precise segment of data to limit the size of the spreadsheet:
■ Apply hardware filters to the logical ports you defined
■ Apply filters to the data views you selected
■ Select a relatively small time period using the Time Period selector
Follow these steps:
1. Display the data you want to export:
a. Click a data view in the Analysis pane.
b. Apply additional filters or sort the data table by a selected column.
2. Click Export, To CSV.
The Export To CSV dialog opens.
3. (Optional) Type the maximum number of data table rows to export in the Export
Row Limit field. Or, select No Limit to export all rows in the data table from the
selected time period.
4. Click OK.
The File Download dialog opens.

Understand the Data in the Display Area
82 User Guide
5. For fastest download times, click Save.
Note: We do not recommend the option to open the file. If you select this option
when attempting to export a large amount of data, the download can take longer.
6. Enter or browse to the file save location, and click OK.
The details you selected are exported to a file with a .csv file extension. The process
can take a few minutes to complete, depending on the amount of data available in
the database and the row limit you supplied.
More information:
Use Hardware Filters to Manage Data (see page 21)
Use Filters to Customize Data in the Display Area (see page 55)
Export Data to a PCAP File
You can export the packet-capture data for the current view to a packet-capture file, in
PCAP format. The packet-capture file is built from raw capture files and displays packets
for all sessions included in the current analysis.
The PCAP format is widely used for network trace files and other methods of examining
and exchanging packet-level data. PCAP is compatible with WinPcap (Windows) and
libpcap (UNIX). Applications that use these application programming interfaces easily
read and display PCAP.
The nqadmin user and user with rights for the SuperAgent Investigations role can use
the Export to PCAP feature. By default, only the Network Engineer and Network
Manager roles allow access to this feature.
Tips:
■ PCAP file exports can take a while to complete. The amount of time necessary
to open the File Download dialog depends on the amount of data being
exported.
■ Narrow the time frame of the analysis to improve the performance of the
Export to PCAP feature. A narrower time frame reduces the number of raw
capture files that are searched for relevant packets. Use the Time Period
selector or the chart time control to zoom in on the time frame of interest.
■ The ability to export to PCAP is not available when the raw capture files
containing the data of interest are deleted. Capture files are not retained as
long as the metric data in the metrics database.

Understand the Data in the Display Area
Chapter 3: Analyzing Data 83
■ When exporting to PCAP, the "Header Only" option for the "Maximum Bytes
per Packet" parameter applies to IP (TCP and UDP) headers. If you are
exporting non-IP traffic, selecting the "Header Only" option yields only the
Layer 2 MAC headers. Instead, select a byte value, such as 128, to see more of
each frame.
■ The PCAP files you export from can be viewed in a protocol analyzer, or packet
sniffer, such as the freeware tool Wireshark. Protocol analyzers observe data
flows passing across the network and inspect copies of each packet. They
display the contents of each field in the packet header in a graphical user
interface, where data can be filtered, sorted, and analyzed.
■ A protocol analyzer is a valuable tool for performing troubleshooting tasks or
forensic analysis on the data that Multi-Port Collector captures. Use of a
protocol analyzer requires an understanding of Ethernet, IP, and Layer 4
protocol packet structures.
Follow these steps:
1. Display the data you want to export:
a. Click a data view in the Analysis pane.
b. Apply additional filters or sort the data table by a selected column.
2. Click Export, To PCAP.
The Export To PCAP dialog displays the time range of the packet trace to export.
3. Select the port that received the data that you want to export in the Logical Port
field. A list of available logical ports is provided. The number of sessions and the
traffic volume in bytes are shown for each available port. These statistics are based
on the current filters, such as time frame and view. They are not an indication of
the size of the file you want to export.
Select only one port for each exported PCAP file.
4. Select the maximum number of bytes to include from each packet in the Maximum
Bytes per Packet field. The default option is to include only headers in the PCAP file.
5. Click OK.
The Save As dialog opens.
6. Select a location in which to save the exported PCAP file.
7. Click Save.
More information:
Set Global Application Preferences (see page 33)
Time Range Exceeds Raw Packet Retention Time (see page 103)

Understand the Data in the Display Area
84 User Guide
Share Data by Email
Sending a link to an analysis is often the quickest way to share data. The Email option
constructs a URL from an analysis and uses the default mail client to create an email
message.
Restrictions
■ An email client is required. To use the email feature, install an email client and
configure an SMTP server on the computers where users access the web interface.
■ The recipient must have a user account with permission to view the Analysis page.
■ The recipient must click the URL and view the analysis within a few days, before the
underlying data is purged from the database.
Follow these steps:
1. Display the data you want to export:
a. Click a data view in the Analysis pane.
b. Apply additional filters or sort the data table by a selected column.
2. Click Email.
A blank message opens in your messaging application. The URL appears in the body
of the message. The date and time appear in the Subject line. The date and time
represent the moment when the email message is generated, not the time frame of
the analysis. The time frame of the analysis is shown in the Display area of the
Analysis page.
3. Type a recipient address and click Send.
The email that is sent to the recipient contains a link to the URL for the analysis.
More information:
What are Users and Roles? (see page 39)

Chapter 4: Multi-Port Collector Health and Maintenance 85
Chapter 4: Multi-Port Collector Health and
Maintenance
Multi-Port Collector performs self-monitoring and self-maintenance to keep the system
performing at peak levels. In addition, it lets the Administrator perform the following
tasks:
■ View system status
■ Customize system maintenance options
■ Stop or restart processes
■ Apply software upgrades to the appliance
■ View system logs for troubleshooting purposes
This section contains the following topics:
System Status (see page 85)
Maintenance Tasks (see page 93)
System Setup (see page 100)
Machine Settings (see page 101)
System Status
The System Status page displays the status of all active Multi-Port Collector processes.
On this page, you can track capture card and disk performance, file system status, and
memory and CPU usage. Both users and Administrators have access to the System
Status page.
Click System Status in the web interface to see the System Status page.

System Status
86 User Guide
System Information
The System Information section provides details about the Multi-Port Collector
appliance.
Hostname (IP Address)
The DNS host name and IP address of the appliance.
SuperAgent Management Console
The IP address of the SuperAgent management console and a hyperlink to the
SuperAgent login page.
This information is available only if the appliance is configured as a collection device
for SuperAgent.
Multi-Port Collector Version
The version and build number of the software.
Process Information
Multi-Port Collector consists of multiple processes, or daemons, that perform tasks
related to packet capture, metric calculation, packet inspection, and automatic system
maintenance. The Process Information section provides frequently updated status
information for the following processes:
nqcapd
The packet-capture daemon. Its log file name is nqnapacapd.log.
Tip: To reset port statistics, restart the nqcapd process.
nqmetricd
The metric-computation engine, roughly equivalent to the Metric Compute Module
on the SuperAgent standard collector. Its log file name is nqMetricReader.log.
nqinspectoragentd
The inspector daemon, roughly equivalent to the SA Collector service on a standard
collector. Its log file name is nqInspectorAgentd.log.
nqwatchdog
The process that monitors the status of other processes and restarts them if
necessary. Its log file name is nqwatchdog.log.
nqmaintd
The system-maintenance daemon. Its log file name is nqmaintd.log.

System Status
Chapter 4: Multi-Port Collector Health and Maintenance 87
sadatatransfermanager
The Data Transfer Manager, a process that receives and transfers data from a Cisco
Wide-Area Application Services deployment. This process has a status of Stopped
when Multi-Port Collector is not configured as a SuperAgent collection device. After
you configure the collection device, this process is always running, even if it is not
used. The log file name is saDataTransferManager.log.
Note: You can also see the status of these processes on the Process Status page at
Administration, Processes.
More information:
Stop or Restart a Process (see page 94)
Database Status
The Database Status section provides information about the high-performance database
on the Multi-Port Collector appliance. The information reported on this page is limited
to current database status. The Database Status section shows the name of the local
database and its status, which is one of the following:
■ UP
■ DOWN
■ SHUTTING DOWN
■ INITIALIZING
A time stamp indicates the recency of the status.
More information:
Database Status and Usage (see page 96)

System Status
88 User Guide
Capture Card Physical Port Status
The Capture Card Physical Port Status section provides information about the traffic
flowing through each port and describes each link. Most values are dynamically updated
and the browser refreshed every 5 seconds.
Physical Port
The physical port on the Multi-Port Collector appliance.
Type
The type of cable used for the connection.
Link State
The status of the link to this port: connected or not connected.
Link Quality
The quality of this connection, based on information from the network adapter.
Indicates whether the link is down.
Link Speed
The normal speed of this link.
More information:
Capture Card Clock Differs from System Clock (see page 103)
Capture Card Logical Port Status
The Capture Card Logical Port Status section provides information about the status of
each logical port and the number of processed and dropped packets. Assign multiple
physical ports, or data feeds, to a single logical port definition, for reasons such as:
■ To organize your reporting around primary and failover circuits
■ To monitor more accurately in asymmetrical routing environments
Logical Port
The logical port, as defined on the Logical Ports page. Each physical port on the
capture card is associated with a logical port definition. This association helps you
identify data feeds and lets you aggregate sources of data so that they are
monitored together. Logical port definitions include a port number, a name, and
hardware filter settings that let you determine the traffic that is captured.
Logical Name
The logical port name. If you do not assign a name to the port, default values are
used: Port 0, Port 1, and so on.

System Status
Chapter 4: Multi-Port Collector Health and Maintenance 89
State
The status of the link to this port: Enabled or Disabled.
Status
The current port status: Running, Stopped, or Error. If the status is Error, position
the mouse pointer over the error icon to display the reason for the error.
Packets Processed
The number of packets incoming from this logical port that the capture card
processed after statistics were reset.
Drops
The number of packets incoming from this logical port that the capture card
dropped and did not process. The number of drops provides an indication of
capture card load. Under normal performance conditions, the number of drops
should be zero.
More information:
Configure Logical Ports (see page 19)
Capture Card Physical Port Statistics
The Capture Card Physical Port Statistics section provides information about the amount
of data flowing through each physical port on the Multi-Port Collector appliance. The
section also identifies the number of current errors. This information lets you verify
mirror port configuration to help ensure that the mirrored session is not overloaded.
These statistics are reset to zero when the nqcapd process is started or restarted.
Physical Port
The physical port through which data flows to Multi-Port Collector. Either All (a
total from all channels) or the identifier of a physical port. The number of physical
ports depends on the type of capture card in use.
Logical Name
The name of the logical port associated with this physical port.
Packets Received
The total number of discrete packets received through this port after statistics were
reset.
Bytes Received
The total number of bytes received through this channel after statistics were reset.

System Status
90 User Guide
CRC/Align Errors
The total number of frames with cyclical redundancy check (CRC) errors or
alignment errors.
Discarded Duplicates
The number of packets that the capture card discarded, according to its
deduplication logic, because they were duplicates of packets already received. You
can enable or disable automatic deduplication on the Application Settings page.
Provides an indication of whether the mirror port is appropriately configured. If a
large percentage of captured traffic consists of duplicate packets, verify the port
mirroring configuration.
Receive Rate
The number of packets received per second through this channel.
More information:
Set Global Application Preferences (see page 33)
Stop or Restart a Process (see page 94)
RAID Status Information
The RAID section provides information about disk performance from the RAID arrays on
the Multi-Port Collector appliance.
Note: RAID information is available only if the Adaptec Storage Manager (arcconf) utility
is installed. For more information, see the CA NetQoS Multi-Port Collector Installation
Guide.
Array
The identifier of the RAID array. Indicates whether the information applies to the
System array or the Data array.
Status
The status reported by this array, one of the following:
■ Optimal: Performing at the highest level
■ Degraded: Not performing at the highest level

System Status
Chapter 4: Multi-Port Collector Health and Maintenance 91
■ Failed: Not running; showing an error condition. The error type and the ID and
serial number of the affected drive are indicated.
■ Rebuilding: Coming back online. After the RAID controller detects a drive that is
rebuilding, the status changes to Optimal. Meanwhile, the array is still running
in Degraded state. All metrics are still collected.
Note: Even if the data array shows a Failed status for a drive, metric processing is
not interrupted, but packet capture investigations cannot be performed. You can
change out a failed drive without interrupting metric processing.
Type
The type of RAID array. Multi-Port Collector RAID arrays are configured as RAID 5.
Number of Drives
The number of disk drives controlled by this array.
Failed Drives
An indication of drives that have failed, that indicate an error, or that are
rebuilding. Includes drive numbers, ID numbers, and serial numbers. The System
Array drives have ID numbers of 1 through 4. Data Array drives have ID numbers of
5 through 16.
File Systems
The File Systems section provides usage statistics for the file systems on the Multi-Port
Collector appliance.
File System
The name of the file system whose statistics are shown.
Size
The total capacity, as a number of bytes, of this file system.
Used
The number of bytes in this file system that are in use.
Avail
The number of bytes in this file system that are free and available for use.
Use%
The percentage of file system capacity that is in use.
Mounted
The mount point of the file system in the operating system directory.

System Status
92 User Guide
Memory
The Memory section provides information about memory size, used and free bytes, and
buffering statistics.
Total
Total capacity of either the memory or the swap file, in bytes.
Used
The percentage of memory capacity that is in use.
Free
The percentage of memory capacity that is free and available for use.
Buffers
The number of bytes stored in memory buffers.
Cached
The number of bytes in the disk cache.
CPU
The CPU section provides information about CPU usage and performance statistics. Use
these statistics to understand Multi-Port Collector performance and load.
CPU
Indicates to which CPU on the appliance the statistics correspond. One of the
following:
■ All: Shows statistics averaged for all processors
■ 0 through 15: The CPU identifier, 0 through 15. The Multi-Port Collector
platform has a dual quad core CPU with hyper-threading that appears as 16
CPUs.
User
The percentage of CPU time used by processes executing at the user level.
Nice
The percentage of CPU time used by processes executing at the user level with nice
priority. The kernel determines priority.
System
The percentage of CPU usage attributable to the kernel itself.
IO Wait
The percentage of time that the CPU was idle, but the system had an outstanding
disk I/O request.

Maintenance Tasks
Chapter 4: Multi-Port Collector Health and Maintenance 93
IRQ
The percentage of CPU time spent processing interrupt requests.
Soft
The percentage of CPU time spent in soft interrupt state.
Steal
The percentage of CPU time that a virtual CPU is waiting for a real CPU while the
hypervisor services another virtual processor.
Idle
The percentage of time that the CPU was idle, and the system did not have an
outstanding disk I/O request.
Interrupts/Sec
The total number of interrupts received per second by the CPU.
Maintenance Tasks
Some system maintenance is performed automatically. Other tasks are performed
manually, such as restarting a daemon or process.
The need to log in to the Multi-Port Collector appliance is minimal, even for database or
system maintenance. You can use the web interface to perform the following tasks:
■ Stop and start processes
■ Open system logs and safe them to a file
■ Upgrade software
Upgrade Software
Administrators can upgrade the Multi-Port Collector software, the operating system,
and the TIM software when new releases or patches are available. Product upgrade files
are delivered from CA Technical Support.
You can upgrade software from the Administration, Upgrade page in the web interface.
Upgrading the Multi-Port Collector software and the operating system
The CA NetQoS Multi-Port Collector Upgrade Guide contains complete instructions
for upgrading Multi-Port Collector and the operating system, CentOS.
Upgrading the TIM software
The procedure for upgrading TIM is the same as the procedure for installing TIM.
For more information, see Install the TIM Software (see page 32).

Maintenance Tasks
94 User Guide
In general, the upgrade process is as follows:
1. Browse to the location where you saved the upgrade file.
2. Select it and click Open.
3. Click Upgrade to start the process.
Messages indicate the progress of the patch or upgrade. Do not navigate away from
the page until the message indicating completion appears.
Stop or Restart a Process
Stop or restart the Multi-Port Collector processes when certain error conditions occur,
or when you change a systemwide setting.
Note: The nqmaintd process can be restarted through the web interface. However, it
cannot be stopped or started through the web interface. If the nqmaintd process is
stopped, log in to the appliance directly to start it.
Follow these steps:
1. Click Administration, Processes in the web interface.
The Process Status page opens. The Process column lists the names of the
processes.
2. Click a link to start, stop, or restart a process in the Start/Stop column.
Tip: To reset port statistics, restart the nqcapd process.
More information:
Process Information (see page 86)
Review System Logs
You can view the last 200 lines of logged activity in a log file associated with a Multi-Port
Collector process. In addition to logs for the Multi-Port Collector processes, you can
view the recent entries in the following logs:
SAService.log
Contains entries for communications from SuperAgent to Multi-Port Collector,
including heartbeats and feed status updates.
Also contains entries for requests from APM to Multi-Port Collector for network
health information that appears on the Defect Details page in the APM console.

Maintenance Tasks
Chapter 4: Multi-Port Collector Health and Maintenance 95
SAInvestigations.log
Contains entries that record packet capture investigation requests from
SuperAgent.
nqsnmptrap.log
Contains entries for every condition that triggered an SNMP trap.
Follow these steps:
1. Click Administration, System Logs in the web interface.
The System Logs page opens.
2. Select a log file from the Log File field.
The System Logs page refreshes to show the size of the log you selected. For
example:
The file nqInspectorAgentd_20110228.log is 300160 bytes in size.
3. Click View.
The System Logs page refreshes to show up to the last 200 lines of the log you
selected.
More information:
Process Information (see page 86)
Generate a Support File
You can generate a Support file that contains troubleshooting information that is useful
for CA Technical Support personnel. The Support file compiles all recent logs from all
processes and saves the data in compressed tar format (.tgz).
Follow these steps:
1. Click Administration, System Logs in the web interface.
The System Logs page opens.
2. (Optional) Select "Include metrics database diagnostics" to include additional
information generated by a diagnostics utility running on the Multi-Port Collector
metrics database.
Note: Generating the Support file can take longer when the "Include metrics
database diagnostics" option is selected. Select this option only for problems
related to the operation of the metrics database, or when instructed to do so by CA
Technical Support.

Maintenance Tasks
96 User Guide
3. Click Generate.
The System Logs page refreshes to display the name of the new Support log file.
4. Select the log file from the "Select the support file for download" field.
5. Click Download.
The File Download dialog opens.
6. Click Save and navigate to the location in which you want to save the file.
Database Status and Usage
The statistics on the Database Status page describe database status and usage. Use this
information to gauge system usage and to guide you when selecting purge (File
Retention) settings on the Application Settings page. The information listed in the
Database Usage section is especially useful for determining when to purge older
database entries containing metrics from 1-minute monitoring intervals.
The Database Status page provides the following information:
Database
The name of the local databases on the Multi-Port Collector appliance.
Status
Status of a database: UP, DOWN, SHUTTING DOWN, or INITIALIZING.
Start/Stop
Links that let you start or stop a database. Stop a database if you shut down or
restart the appliance.
Date of oldest data
The oldest time stamp of the data that is in a database.
Date of newest data
The most recent time stamp of the data that is in a database.
Rows in database
The total number of rows in the database that are in use. The maximum number of
rows is 12 billion. If the maximum threshold is exceeded, the nightly maintenance
routine prunes it to less than 12 billion.
Rows for past day
The number of database rows that were used during the past 24 hours.
Rows for past 7 days
The number of database rows that were used during the past week.

Maintenance Tasks
Chapter 4: Multi-Port Collector Health and Maintenance 97
Tips:
■ The Database Usage section provides a range of dates to show when the oldest and
most recent data was inserted, and several database row counts. This information
helps you gauge how quickly data is accumulating. Based on this information, you
can adjust the number of days that information is kept in the database.
■ To reduce the number of rows added to the database, adjust the filters that are
applied to each logical port. For example, instead of using the default filter that
captures all protocol traffic, you can capture only TCP packets.
■ The status of the database is automatically updated every 60 seconds. The row
counts are updated only when the page loads when you navigate to the Database
Status page or when you refresh the browser.
■ Users who do not have the Administrator product permission can review database
status on the System Status page. All Multi-Port Collector users can access the
System Status page.
More information:
Use Hardware Filters to Manage Data (see page 21)
Set Global Application Preferences (see page 33)
System Status (see page 85)
Command Line Syntax (see page 123)
Purge Data from the Database
During normal operation, Multi-Port Collector performs routine maintenance on the
database and file systems. Routine maintenance includes purging data and files of
various types. Typically, raw packet capture files are retained for six hours before being
purged. Files containing performance metrics from 1-minute reporting intervals are
retained for one week before being purged.
You can perform a manual purge of the Multi-Port Collector database for reasons such
as the following:
■ The Database Status page reveals a problem.
■ Statistics on the System Status page indicate that file systems are nearly full.
■ You receive an mpcDiskUsage SNMP trap indicating that disk usage exceeds a
threshold.
Important: Purged data is permanently removed from the database. You cannot recover
purged data.

Maintenance Tasks
98 User Guide
Follow these steps:
1. Click Administration, Purge Data in the web interface.
The Purge Data page opens.
2. Select "Purge all data and metric database tables" to remove all data and database
tables.
This option stops the processes that collect data. No new data is collected until you
restart the processes.
When you select this option, all other options on the page are unavailable.
3. Select at least one of the following options to remove only selected data. Processes
continue to run and new data is still collected.
Purge one-minute session metrics
Removes the 1-minute session metrics from the metrics database.
Purge raw capture files
Removes packet capture files. These files are continually generated during
ordinary monitoring and are used to derive performance statistics. The default
is 6.
Purge packet capture investigations
Removes files created for packet capture investigations. Investigation files are
stored separately from raw capture files. The default is 90.
Purge log files
Removes log files created by Multi-Port Collector.
4. Select the time frame for removing the data you selected in step 3.
Purge across all dates
Removes data of the selected type, regardless of the time frame.
Purge prior to this date (UTC)
Removes data collected before the date you specify.
Note: Data is stored in Coordinated Universal Time (UTC). This option removes
data that was collected before midnight UTC. When you view data using the
local time, it may seem as though some data still exists for the previous day.
5. Click OK.
6. Restart the processes that were stopped if you purged all data as described in step
2.

Maintenance Tasks
Chapter 4: Multi-Port Collector Health and Maintenance 99
More information:
Set Global Application Preferences (see page 33)
Create SNMP Traps (see page 35)
System Status (see page 85)
Database Status (see page 87)
Log In to the Appliance
Typically, it is not necessary to log in to the Multi-Port Collector appliance after you
install the hardware and software. Most administrative tasks can be performed from the
web interface. However, you access the server directly for the following tasks:
Start the maintenance daemon (nqmaintd) if it is stopped
The daemon is required to start or restart other processes. The daemon cannot be
started or stopped from the web interface.
Shut down or restart the appliance
A shutdown or reboot is not required, even for an upgrade. However, to take the
computer offline, use the login procedure and commands to shut it down correctly.
The local database on the appliance can become corrupted when the appliance is
shut down in the middle of a load or merge operation. Stop the database before
you shut down the appliance.
Log in to the appliance directly using the attached keyboard and monitor. You can also
log in from a remote system using a secure shell (SSH) client such as PuTTY, which runs
on Windows.
Follow these steps:
1. Press Alt+F2 on the initial screen.
The Linux login screen opens.
2. Log in with the following credentials:
■ User name: netqos
■ Password: The password you created when you installed the Multi-Port
Collector software.
The Linux command line interface opens.
3. Run the necessary command.

System Setup
100 User Guide
More information:
Database Status (see page 87)
Command Line Syntax (see page 123)
System Setup
The System Setup page identifies components that are installed on the Multi-Port
Collector appliance, such as prerequisite packages and software. Often, the name of the
component is a hyperlink to more information.
Machine Settings
The build number and a link to the Machine Settings page. Here you can review
your network setup, set the time zone, and shut down or restart the appliance.
Multi-Port Collector
The build number and a link to the Administration page. Here you can configure
data collection, system settings, and authentication, and perform maintenance.
Multi-Port Collector Prerequisites
The build number of the most recently downloaded prerequisites package.
System Health
The build number and a link to the Appliance Health page on the Customer
Experience Manager (CEM) console. Here you can review information about disk
and memory usage, logged-in users, and running processes. This item is available
only if TIM is installed on the appliance.
Third-party
The version and build number of TIM third-party applications installed on the
appliance. This item is available only if TIM is installed on the appliance.
TIM
The build number and a link to the TIM Setup page on the CEM console. Here you
can stop and start TIM, view status and statistics, and configure Watchdog settings.
This item is available only if TIM is installed on the appliance.
More information:
Support for Transaction Impact Manager (see page 15)
Install the TIM Software (see page 32)
Machine Settings (see page 101)

Machine Settings
Chapter 4: Multi-Port Collector Health and Maintenance 101
Machine Settings
The Machine Settings page provides links to the following pages:
■ Network Setup (see page 101)
■ Set Time Zone (see page 102)
■ System Shutdown/Restart (see page 102)
Network Setup
The Network Setup page identifies the network configuration that was created when
you installed the Multi-Port Collector software and enabled network access. For more
information, see the CA NetQoS Multi-Port Collector Installation Guide that was shipped
with your appliance.
You can use the fields on this page to change the network configuration.
Select which interface to configure
The selection in this field determines the contents of the other fields on this page.
Select an interface and click Set before changing the information in the remaining
fields. The page refreshes and indicates whether the interface has IPv4 addresses.
Automatically obtain IP address settings with DHCP
Select this option to use DHCP (Dynamic Host Configuration Protocol) to obtain the
IP address of the management NIC. You can provide the DHCP host name of the
management NIC.
Manual IP Address Settings
Select this option to type the IP Address, Subnet Mask, and Default Gateway
Address of the management NIC.
Note: The IP address of the management NIC must match the IP address assigned
to Multi-Port Collector in the SuperAgent management console.
Manual DNS Settings
Type the IP address of the local DNS server in the "DNS server 1" field.
(Optional) Type the IP addresses of secondary DNS servers in the "DNS server 2"
and "DNS server 3" fields.
Submit
Click to preserve your changes to network settings.

Machine Settings
102 User Guide
Choose the Time Zone
You can change the time zone of the Multi-Port Collector appliance.
Follow these steps:
1. Click System Setup, Machine Settings in the web interface.
The Machine Settings page opens.
2. Click Set Time Zone.
The Set Time Zone page opens.
3. Select the time zone of the appliance.
4. Click Set Time Zone at the confirmation prompt.
A confirmation message appears.
Shut Down or Restart the Appliance
You can use the web interface to shut down or restart the Multi-Port Collector
appliance.
Follow these steps:
1. Click System Setup, Machine Settings in the web interface.
The Machine Settings page opens.
2. Click System Shutdown/Restart.
3. Click one of the following:
Shut down the computer
Select this option to turn off the appliance. You must have physical access to
the appliance to turn it back on.
Restart the computer
Select this option to turn off the appliance and then restart it.
More information:
Log In to the Appliance (see page 99)

Chapter 5: Troubleshooting 103
Chapter 5: Troubleshooting
Capture Card Clock Differs from System Clock
Symptom:
I see the following message on the System Status page, in the Capture Card Physical Port
Status section:
"Capture card clock differs from system clock by N seconds."
Solution:
The capture card has an independent clock that stamps the time of incoming packets. In
normal operation, this clock is synchronized with the Multi-Port Collector system clock.
The error message appears when there is a discrepancy between the Multi-Port
Collector system clock and the clock on the capture card. The discrepancy can occur
when, for example, someone manually changes the time of the system clock.
Synchronize the clocks using the following methods:
■ Immediately synchronize the clocks. Run the following command from the Linux
command line interface on the appliance. This command stops the nqcapd and
nqmetricd processes, which disrupts monitoring. The processes are restarted after
the clocks are synchronized.
sudo /opt/NetQoS/scripts/syncNapatechClock --force
■ Maintain synchronization. Run the Network Time Protocol (NTP) to maintain
synchronization between the clocks. You can configure NTP with the Network
Settings Utility on the appliance. To open the utility, run the following command
from the Linux command line interface:
sudo /opt/NetQoS/tui/tui-setup.php
In the utility, type the host name or IP address of your NTP server in the NTP Server
field. The default is pool.ntp.org.
Time Range Exceeds Raw Packet Retention Time
Symptom:
I received the following warning message when attempting to export data to PCAP
format:
Time range exceeds raw packet capture retention time.

Time Range Exceeds Raw Packet Retention Time
104 User Guide
Solution:
The Applications Settings (see page 33) page in the web interface includes a File
Retention setting that affects the Export to PCAP (see page 82) feature. The error occurs
when the data you want to export is from a time frame that is less than the "Keep raw
packet capture files for" setting.
Use the System Status page to assess the disk usage for /data in the File Systems
section. If you have sufficient free space, increase the value of the "Keep raw packet
capture files for" setting. Future PCAP exports will include data from farther in the past.

Appendix A: Best Practices for Deployment 105
Appendix A: Best Practices for Deployment
This section contains the following topics:
Appliance Placement (see page 105)
Port Mirroring (see page 105)
Port Requirements (see page 108)
Packet Deduplication (see page 109)
Appliance Placement
The Multi-Port Collector appliance requires connectivity to a SPAN or mirror port on
each network switch that handles the traffic you want to monitor. Connectivity typically
occurs at the access layer.
The appliance must be able to see as much of the relevant network traffic as possible.
Consider the following:
■ Which applications do you want to monitor?
■ Which servers host these applications?
■ To which switches are these servers connected?
■ From which subnets do users access the monitored applications?
If your network or traffic volume is exceptionally large, you can purchase an additional
appliance to balance the processing load.
Port Mirroring
On a network switch, the port mirroring function sends copies of network packets from
one port to another switch or port for analysis.
Note: The port mirroring function on Cisco switches is named Switched Port Analyzer
(SPAN).
Mirror the switch ports, where traffic travels to and from the monitored servers, to the
ports where Multi-Port Collector is connected. When mirror ports are configured
correctly, SuperAgent monitors the flow of application among clients and servers
without the use of desktop or server agents.

Port Mirroring
106 User Guide
Limit the amount of data that Multi-Port Collector sends to SuperAgent and APM. A CA
Technical Support representative can help you implement a strategy for data
acquisition. But it is helpful to understand the ramifications of the various mirroring
options.
The following tips outline port-mirroring techniques and filtering options.
Identify mission-critical servers and applications
Identify the mission-critical applications and servers that you want to monitor.
Then, target the switches where you want to set up port mirroring.
Review the current VLAN configuration for each switch. If servers of interest are all
on the same VLAN, include the VLAN in mirror configuration (or VSPAN in a Cisco
environment). Consider mirroring multiple VLANs to capture all the traffic you want
to monitor. For each VLAN, consider how many hosts are included and the resulting
collection and capture load. Also be aware of the possibility of packet duplication.
Connect Multi-Port Collector to the key switches that carry application traffic
Select a rack with cable-ready access to all switches that carry data to and from the
larger enterprise network. Access-layer switches are the best candidates because
they carry the application (TCP) data that SuperAgent monitors. Access switches
typically send fewer duplicate packets to Multi-Port Collector.
Configure a port on each access switch as a mirror output (destination) port. Verify
that the traffic of interest is forwarded to the capture card on the Multi-Port
Collector appliance.
Consider the application architecture
When you mirror data from servers that support a multitier application
architecture, Multi-Port Collector sends duplicate packets to SuperAgent. The
servers in a multitier architecture send data back and forth among themselves.
When a server with mirror port sees a packet in both transmit and receive
directions, the packet is sent to the mirror port. Generally, include only front-end
servers in the port mirroring configuration. Mirroring the middle-tier servers sends
duplicate packets because both transmit and receive packets are spanned.
Mirror ports work better with Multi-Port Collector than network taps
However, you can connect a Multi-Port Collector port to a standard copper or fiber
tap. You can also connect Multi-Port Collector to an aggregating tap in place of a
mirror port. For example, use a network tap if mirror ports are already used for
another purpose, such as an intrusion detection system (IDS). Purchase a tap that
sends the request and the response traffic over the same connection on the tap.
Purchase taps that support pass through on failure. If a tap fails without a pass
through or fail-closed mechanism, data ceases to flow through the switch. The pass
through mechanism helps ensure that data stops flowing toward the monitoring
tool but passes through the switch ports.

Port Mirroring
Appendix A: Best Practices for Deployment 107
Do not oversubscribe the output capacity of the mirrored port
In high-traffic situations, you can limit the amount of traffic on the SPAN or mirror
port. For example, set an Access Control List (ACL) on the mirror port to forward
only the traffic from key servers to Multi-Port Collector. With an ACL, traffic that
SuperAgent does not monitor can be discarded before it is sent out the mirror port.
Cisco 4500 Series switches support the use of an ACL.
If you use an ACL, verify that all TCP traffic is forwarded to Multi-Port Collector.
Then add other protocols used by the critical applications you want to monitor.
Specify the appropriate ports in the port mirroring statement.
Exclude irrelevant traffic
SuperAgent measures and analyzes only TCP network traffic. Therefore, sending
additional traffic through the mirror port can add unnecessary load to the capture
card on Multi-Port Collector. In extreme cases, the unneeded data can cause packet
loss. However, Multi-Port Collector analyzes traffic composition and performance
metrics from all active protocols on the network. Consider these valuable metrics,
which are complementary to the TCP metrics of SuperAgent, when deciding which
traffic is irrelevant.
Increase buffer depth at the destination port
To enable passive monitoring of a mirror port, data is sent out of a single Gigabit
interface. Exported data is sourced from many Gigabit interfaces. This many-to-one
relationship means that it is possible to overrun the buffer on the destination
interface of the switch. The resulting congestion can cause the switch to discard
packets. Multi-Port Collector therefore assumes the presence of packet loss,
reporting an inaccurate volume and rate count.
We recommend exporting mirrored data to a port on the Ethernet module with the
largest buffer size per port. You can obtain a list of Cisco 6500 modules and the
buffer depth per port on each module from the Cisco website. Use this list, with the
show module command, to determine the best locations from which to export
traffic. The increased buffer depth decreases the likelihood of packet loss at each
switch port, which helps ensure that each packet is counted.
Avoid packet duplication
Packet duplication occurs when a packet crosses multiple source interfaces. When a
VLAN is included in the mirror configuration, all intra-VLAN traffic is duplicated. In
cases where packet duplication is likely, consider mirroring individual ports rather
than whole VLANS. With this technique, only individual ports or interfaces are used
as mirror sources. Only packets destined for selected servers are sent to the mirror
port. Use the show command to see a list of all ports included in a VLAN.
Another option for avoiding duplication is to mirror only packets traveling in the
receive direction. This setup excludes traffic coming from clients into the VLAN. For
more information, see Packet Deduplication (see page 109).

Port Requirements
108 User Guide
Technologies available on Cisco routers can limit the amount of data sent to
Multi-Port Collector
■ VSPAN. A SPAN port that uses a VLAN or multiple VLANs as the source. All the
ports in the source VLANs are the source ports. If both ingress and egress are
configured, packet duplication occurs each time packets are switched on the
same VLAN. Use VSPANs to forward relevant traffic to the appropriate SPAN
port and remove unnecessary packets. Otherwise, the captured VLAN traffic
traverses multiple physical interfaces, which creates duplicate traffic.
Do not set up VSPAN sessions on your core switches. Instead, set up VSPAN
sessions on your access-layer switches where packets are duplicated as they
pass between switches at each layer.
■ VACL. An Access Control List applied to a VLAN. All packets that enter the VLAN
are verified against the rules in the list, such as packet type or destination. A
VACL limits the amount of data sent over the SPAN port by denying certain
types of data. VACLs are supported on Cisco 6500 Series switches.
A VACL filters unneeded traffic so that it is not sent to the SPAN port where
Multi-Port Collector captures packets. A VACL allows you to filter by protocol.
Port Requirements
Multi-Port Collector requires several ports to be open to support the following
communication paths:
■ Between SuperAgent and Multi-Port Collector
■ Between Enterprise Manager and Multi-Port Collector, when TIM is installed
■ To allow web interface access for Multi-Port Collector administration
Port
Direction
Description
80
Inbound from
SuperAgent and
Enterprise Manager
■ HTTP for web interface access
■ Enterprise Manager communications with TIM
80
Outbound to
SuperAgent
Multi-Port Collector web service requests for
configuration data
161
Inbound
SNMP MIB queries
162
Outbound
SNMP traps
3308
Outbound to
SuperAgent
Write access to the SuperAgent MySQL database

Packet Deduplication
Appendix A: Best Practices for Deployment 109
Port
Direction
Description
7878
Inbound
TCP flows containing packet digests from WAE
devices
Note: Needed only if a WAE device is a collector
feed.
8080
Inbound from
SuperAgent and
Enterprise Manager
■ SuperAgent web service requests for data
■ Enterprise Manager requests for network health
data that appears on the Defect Details page in
the APM console
9995
Inbound
UDP flows containing packet digests from the
GigaStor Connector
Note: Needed only if GigaStor is a collector feed.
More information:
Architecture for SuperAgent Support (see page 12)
Support for Transaction Impact Manager (see page 15)
Packet Deduplication
The term packet duplication refers to reporting on the same traffic multiple times as it
passes through interfaces on a switch. Several port mirroring configurations can result in
duplication. When a VLAN sends all traffic to the mirror port, duplication occurs because
traffic from all ports is forwarded to Multi-Port Collector.
The presence of duplicate packets can skew the metrics that are collected. Packet loss
statistics are affected because duplicate packets are viewed as retransmissions.
As a best practice, configure mirror ports to minimize or eliminate duplicate packets.
Multi-Port Collector provides a packet deduplication setting that applies to the capture
card and is enabled by default. This setting discards packets deemed to be duplicates of
packets already received and processed if they arrive within a few packets of each
other.
During initial port mirroring configuration, you can temporarily disable the global setting
for packet deduplication. Disabling the setting lets you see duplicate packets, which can
help you eliminate duplication from mirrored sessions.

Packet Deduplication
110 User Guide
Deduplication logic applies to all packets received on a given logical port. Therefore, if a
duplicate packet from the same VLAN is received on a different logical port, it is not
discarded. If you combine two physical ports into a single logical port definition, a
duplicate is discarded in the following situations:
■ If it arrives on a physical port within a few packets of the original packet on the
other physical port
■ If it arrives on a second switch.
Both packets are retained if the two physical ports are not combined into a logical port.
More information:
Eliminate Duplicate Packets (see page 115)

Appendix B: Integration with SuperAgent 111
Appendix B: Integration with SuperAgent
Multi-Port Collector supports most of the features that the SuperAgent standard
collector supports. Multi-Port Collector also offers unique features such as packet
capture, short-term storage, and metric analysis. The following SuperAgent features
require Multi-Port Collector support:
■ Collection device-specific incident reporting
■ Support for additional configuration options, contained in initialization files
■ The ability to receive and correlate metrics from other collection devices, such as a
WAN Optimization device.
This section contains the following topics:
Collection Device Incidents (see page 111)
Support for Special Initialization (.ini) Files (see page 114)
How to Monitor in a WAN-Optimized Environment (see page 118)
Collection Device Incidents
In the SuperAgent management console, the Administrator can specify whether to
create a collection device incident when Multi-Port Collector or a collector feed
becomes inactive.
An Inactive Collector incident is raised when the management console stops receiving
data from a standard collector, a Multi-Port Collector, or a collector feed. All collection
device incidents have an Excessive severity. SuperAgent does not create Degraded
collection device incidents.
Multi-Port Collector also offers its own SNMP trap reporting of collector issues. SNMP
traps are sent in response to issues associated with the following:
■ Critical process status
■ Packet capture functionality
■ Disk usage levels
■ RAID array and disk drive failures that can affect Multi-Port Collector
The management console considers a collection device to be inactive when SuperAgent
stops receiving performance data from that device. For example:
■ The network is down. No data is generated.
■ The collection device is down. Data is present on the mirror port, but the collection
device is not active.

Collection Device Incidents
112 User Guide
■ A feed assigned to this collection device is inactive. For example, a WAN
Optimization device is unavailable.
■ The mirror port connection is lost. Data is generated, but the port is not active.
The incident can be created even when some logical ports still send data to SuperAgent.
For example, collector feeds assigned to Multi-Port Collector stop sending packet
digests, but other ports remain active. Therefore, the incident does not necessarily
indicate complete inactivity for Multi-Port Collector.
Enable Collection Device Incidents
A default Collection Device incident response is assigned to each collection device. The
default response has no actions associated with it. You associate an incident response
with an action on the Collector Properties page in SuperAgent. The typical SuperAgent
work flow is as follows:
■ Create a Collection Device incident response
■ Edit it to add an action, such as an email notification
■ Edit collector properties to select the new incident response
The “Availability Monitoring” setting on the Collector Properties page determines
whether SuperAgent raises Inactive Collection Device incidents for Multi-Port Collector.
The setting is enabled by default on all new collection devices. To prevent SuperAgent
from creating Inactive Collection Device incidents, disable availability monitoring on the
device.
The SuperAgent online help contains guidance for creating incident responses.
However, the following overview of the procedure can help you get started.
Follow these steps:
1. Click Administration, Policies, Incident Responses in the SuperAgent management
console.
2. Click Add Collection Device Response.
The Collection Device Incident Response Properties page opens.
3. Type a name for the new incident response, and click OK.
The new incident response appears in the Collection Device Incident Responses list.
4. Click the Edit icon for the new response.
The Collection Device Incident Response Actions page opens.
5. Click Add Action.
The Collection Device Action Types page opens.
6. Select Send Email or Send SNMP Trap, and then click Next.

Collection Device Incidents
Appendix B: Integration with SuperAgent 113
7. Complete the required fields, which vary depending on the action you selected.
8. Click OK.
A description of the action appears in the Collection Device Incident Response
Actions page
9. Enable the incident response:
a. Click Administration, Data Collection, Collection Devices in the management
console.
The Collectors page opens.
b. Click the Edit icon for the Multi-Port Collector.
The Multi-Port Collector Properties page opens.
c. Select the new incident response from the Incident Response field.
d. Click OK.
The action you specified is performed when an Inactive Collection Device incident is
created.
Respond to an Inactive Collection Device Incident
If you receive an Inactive Collection Device incident, perform one or more of the
following:
■ Click the date link on the SuperAgent Incident page to see more information.
■ Review your trap receiver for alerts. Multi-Port Collector sends SNMP traps for
multiple issues that can affect collection and capture.
■ Review the System Status page in the Multi-Port Collector web interface. The page
lets you assess whether the incident stemmed from:
– a hardware or software issue. Review the Process Information table for
stopped processes.
– a network issue. Review the Capture Card Physical Port Status table for links
that are not connected or have gone down.
– a collector feed issue. Review the Capture Card Logical Port Status table for
feeds that are inactive. An inactive WAN Optimization device or GigaStor is not
reported here.
– a configuration issue. Review the Capture Card Logical Port Status table for
logical ports that have a state of Disabled. Verify whether these ports show
packet counts in the "Packets Processed" column.

Support for Special Initialization (.ini) Files
114 User Guide
– a packet-capture issue. Review the Capture Card Physical Port Statistics table
for abnormal error counts and values of "0" in the "Packets" or "Bytes
Received" columns.
– a RAID drive issue. Review the RAID table for RAID status and failed drives.
More information:
Create SNMP Traps (see page 35)
System Status (see page 85)
Stop or Restart a Process (see page 94)
Support for Special Initialization (.ini) Files
Multi-Port Collector supports scenarios in which additional parameters are required to
instruct collection devices to ignore irrelevant data. These parameters are distributed to
collection devices by the following supported initialization (.ini) files.
DataTransferManager.ini
Sets the TCP port number on which the sadatransfermanager process listens for
client connections. Do not change this port number.
DTMDistributedConsoles.ini.sav
Controls which IP addresses receive shared packet digest data. For more
information, see the DTMDistributedConsoles.ini.readme file located in the
/opt/NetQoS/bin directory on the Multi-Port Collector appliance.
LimitDTTParams.ini.sav
Controls the Data Transfer Time threshold.
LimitServerResponseParams.ini.sav
Controls the Server Response Time threshold.
RetransPacketDefs.ini.sav
Controls software deduplication.
saCollectorOptions.ini
Contains the default debug trace logging flags used by the nqmetricd service. A CA
Technical Support technician can tell you which flags to enable when more logging
is required.
saLinuxCollectorDirectives.ini
Defines the naming formats for log files and the parameters for accessing the local
MySQL database. Do not change this information.

Support for Special Initialization (.ini) Files
Appendix B: Integration with SuperAgent 115
saMetricEngine.ini.sav
Controls the size of the Active Sessions report. For more information, see the
saMetricEngine.ini.readme file located in the /opt/NetQoS/bin directory on the
Multi-Port Collector appliance.
Other initialization files are documented in the CA NetQoS SuperAgent Administrator
Guide.
More information:
How to Monitor in a WAN-Optimized Environment (see page 118)
Eliminate Duplicate Packets
Multiple mirror port configurations can result in packet duplication on a Multi-Port
Collector feed. This section discusses the best practices for mirroring TCP traffic to
Multi-Port Collector in environments where the typical hardware filtering options do not
suffice.
Discarded packets in the SuperAgentErrors.log file are not a factor here. The SuperAgent
collector discards a packet that does not match the SuperAgent configuration. By
contrast, dropped packets can cause problems because SuperAgent does not analyze
dropped packets.
Note: For information about deduplicating packets for GigaStor, see the CA NetQoS
SuperAgent Administrator Guide.
When you mirror VLANs to a SuperAgent collection device, SuperAgent receives two
copies of each VLAN packet. To correct this duplicate packet situation, you can pass
additional configuration parameters to Multi-Port Collector. Use the "sudo" command
prefix because superuser permissions are required to modify the files in this directory.
Follow these steps:
1. Navigate to the /opt/NetQoS/bin/ directory on the Multi-Port Collector appliance.
cd /opt/NetQoS/bin
2. Copy the RetransPacketDefs.ini.save file to remove the .sav extension.
sudo cp RetransPacketDefs.ini.sav RetransPacketDefs.ini
When the .sav extension is removed, the .ini file is activated during the next
collector synchronization or when the nqmetricd process is restarted.

Support for Special Initialization (.ini) Files
116 User Guide
3. Add the following lines of code to the RetransPacketDefs.ini file:
<nologging>
50 1000
10 20 30 40 50 60
The first line instructs SuperAgent not to log information about duplicate packets.
The standard collector supports this type of logging. Multi-Port Collector does not.
The second line indicates how the retransmitted data filtering is applied. The
numbers 50 and 1000 instruct SuperAgent to maintain a buffer of 50 packets to
look for duplicates. If you reduce this parameter, Multi-Port Collector consumes
fewer CPU cycles when looking for duplicates. As a result, Multi-Port Collector
performance is improved, but fewer duplicates are found. These default values are
recommended.
The third line describes the bins of the histogram of duplicates. The standard
collector supports the histogram as part of the logging option. Multi-Port Collector
does not.
4. Restart the nqmetricd process from the Multi-Port Collector web interface.
More information:
Stop or Restart a Process (see page 94)
Port Mirroring (see page 105)
Packet Deduplication (see page 109)
Command Line Syntax (see page 123)
Filter Out Keep-Alive Messages
You can limit the impact of application keep-alive messages on monitoring statistics in
reports. Limit Server Response Time (SRT) or Data Transfer Time (DTT) to a maximum
value so that unnecessary SRT or DTT observations are ignored. You can set the value to
a number of seconds that falls below the keep-alive frequency.
If you suspect that an application sends keep-alive messages, look for the inverse
relationship between observations and SRT. Also look for SRT averages in the second
range instead of the millisecond range. If you verify that the application sends
keep-alive messages, you can apply a threshold to the SRT.
If your application uses keep-alive messages that result in high DTT, you can apply a
similar limit to filter DTT.

Support for Special Initialization (.ini) Files
Appendix B: Integration with SuperAgent 117
If you are unsure of the keep-alive frequency of a selected application, use 10 seconds
as a starting point. In general, a server is unlikely to take more than 10 seconds to start
responding to a user request. In most cases, the keep-alive frequency is greater than 10
seconds.
Note: You can also apply SRT and DTT filters on the SuperAgent standard collector. For
more information, see the CA NetQoS SuperAgent Administrator Guide.
Follow these steps:
1. Navigate to the /opt/NetQoS/bin directory on the Multi-Port Collector appliance.
cd /opt/NetQoS/bin
Note: Root permission is required to modify files in the /opt/NetQoS/bin directory.
Therefore, use the "sudo" prefix with all commands described in this procedure.
2. Specify an SRT threshold.
a. Copy the LimitServerResponseParams.ini.sav file to remove the .sav extension:
sudo cp LimitServerResponseParams.ini.sav LimitServerResponseParams.ini
When the .sav extension is removed, the .ini file is activated during the next
collector synchronization or when the nqmetricd process is restarted.
b. Verify that the new file is writeable:
sudo chmod u+w LimitServerResponseParams.ini
c. Edit the .ini file to change the SRT threshold for each port you want to filter.
For each application, type the port number and the maximum amount of
acceptable SRT. Set the maximum SRT to a value that is slightly less than the
keep-alive frequency. For example, to ignore Citrix keep-alive messages that
occur at a frequency of 60 seconds, enter the following:
-port=1494 -max seconds=59
Note: In this example, max seconds is a single parameter name that contains a
space.
d. Save the file.
3. Specify a DTT threshold for each port you want to filter.
a. Copy the LimitDTTParams.ini.sav file to remove the .sav extension:
sudo cp LimitSDTTParams.ini.sav LimitDTTParams.ini
b. Ensure the new file is writeable:
sudo chmod u+w LimitDTTParams.ini
c. Edit the .ini file to change the DTT threshold as described in step 2.
d. Save the file.
4. Restart the nqmetricd process in the Multi-Port Collector web interface.

How to Monitor in a WAN-Optimized Environment
118 User Guide
More information:
Stop or Restart a Process (see page 94)
How to Monitor in a WAN-Optimized Environment
SuperAgent integrates with WAN Optimization solutions, such as Cisco® Wide Area
Application Services (WAAS), to monitor application performance. In a WAN-optimized
environment, application data is not visible to a monitoring system. The data appears to
be from the WAAS device and not from the actual hosts. SuperAgent integrates with
WAN Optimization devices to gain visibility into how WAN optimization affects
individual application response times.
Cisco WAAS requires multiple Cisco Wide Area Application Engine (WAE) devices at key
points in the network, such as data centers and branch offices. Cisco WAE devices and
WAN Optimization devices send performance data to SuperAgent collection devices.
This data provides visibility into how WAN optimization affects application response
times at segments of the network.
Multi-Port Collector receives performance data from a WAN Optimization device as it
sends that data over a monitored mirror port. You manually activate WAN Optimization
support during Multi-Port Collector configuration. The process is described in the CA
NetQoS SuperAgent Administrator Guide. Review the chapter titled “Integrating Data
Collection with Cisco WAAS.”
SuperAgent Support for Cisco WAAS
When SuperAgent is configured for monitoring a Cisco WAAS environment, the WAE
devices export FlowAgent data to a CA data source. Cisco WAAS effectively creates
three distinct TCP segments for the network. Transaction performance data is collected
from each segment and correlated. SuperAgent monitors from multiple collection points
for a single optimized application-server-network combination. Therefore, SuperAgent
generates a separate set of metrics for each TCP segment and treats each set as a
separate application.
To provide full visibility into Cisco WAAS effectiveness, SuperAgent reports application
performance per segment, as follows:
■ [Client] segment: The network segment between the clients in a branch location
and the WAE device for that branch location
■ [WAN] segment: The network segment between the branch WAE device and the
WAE device running in the data center
■ [Server] segment: The network segment between the WAE device and the servers
in the data center

How to Monitor in a WAN-Optimized Environment
Appendix B: Integration with SuperAgent 119
Application behavior on all three segments is analogous to that of a three-tier
application. The source and destination ports and addresses remain the same
throughout the tiers. A new SuperAgent application property monitors the
WAN-optimized applications and identifies each segment.
SuperAgent reports append a segment identifier to the application name. For example,
HTTP application traffic can be identified as three separate items: HTTP [Client], HTTP
[WAN], and HTTP [Server]. An additional report, the SuperAgent Optimization page,
shows data for optimized transactions. The default view, Client Experience for
Optimized Transactions, provides a single performance map of client segments for
applications with segmented data.
How Multi-Port Collector Integrates with a WAN Optimization Device
The sadatatransfermanager process aggregates data on the TCP headers that it receives
from WAN Optimization devices. The process is always running, even when not actively
transferring or aggregating data. You can stop or restart it.
The WAN Optimization device polls the Multi-Port Collector appliance every 5 minutes
for a list of servers to monitor. The device sends packet digest files to the appliance.
These files contain the TCP headers of all optimized traffic that matches the server list
on the WAN Optimization device. The device does not send TCP headers for
unoptimized traffic.
The appliance performs the following from the packet headers it receives from the WAN
Optimization device:
■ Calculates performance metrics for the optimized traffic on the Client and WAN
segments.
■ Replaces the Server segment performance data received from the WAN
Optimization device with more accurate data that the appliance receives from the
mirrored port.
■ Automatically detects application traffic in the port mirror and provides an updated
list of servers. SuperAgent propagates this list to all WAN Optimization devices to
verify that all servers are monitored.
The sadatatransfermanager process listens on port 7878 for incoming packet headers
sent by the WAN Optimization device.
More information:
System Status (see page 85)
Stop or Restart a Process (see page 94)
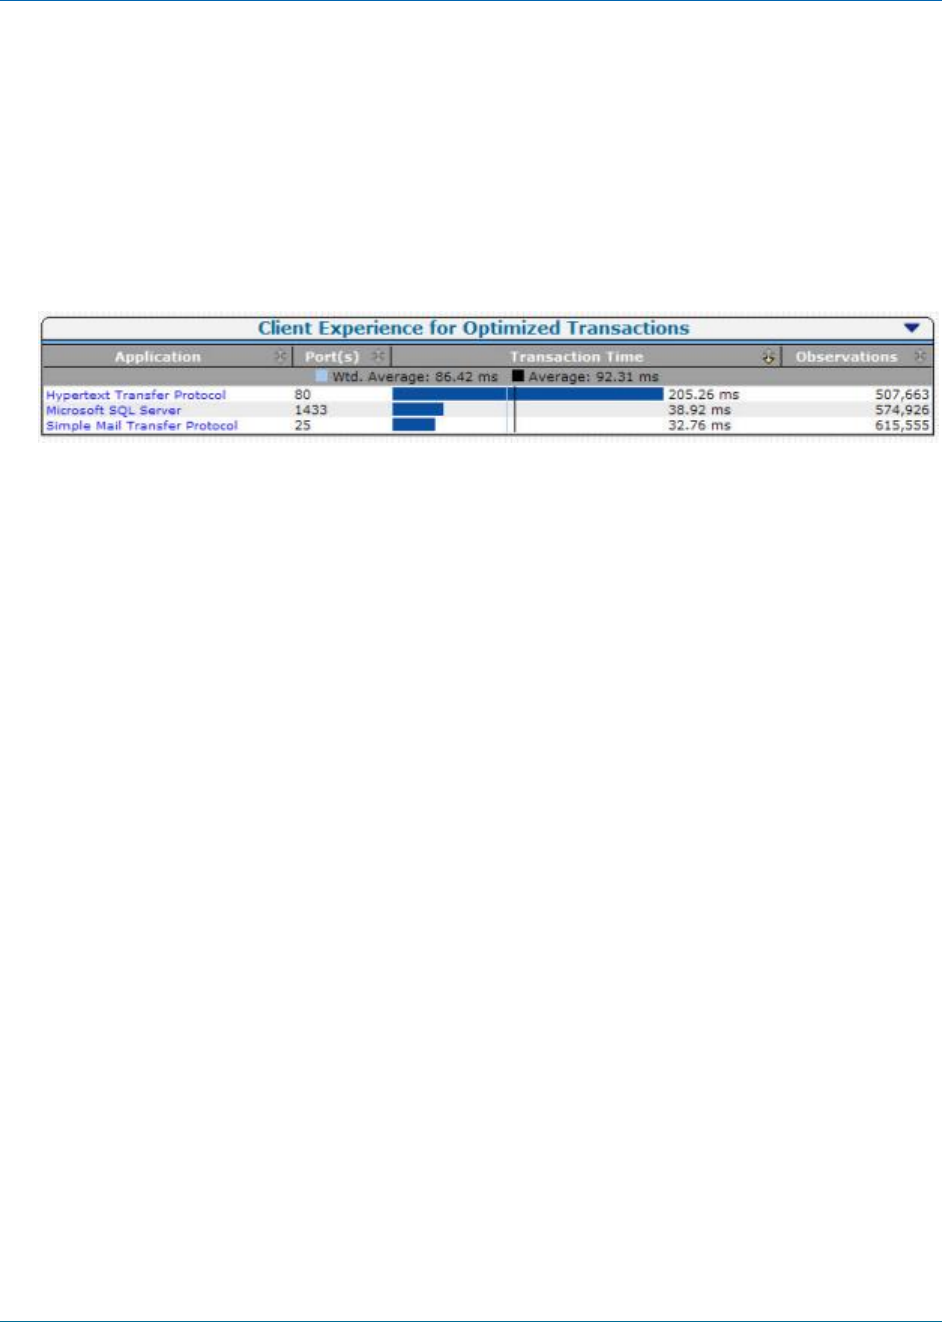
How to Monitor in a WAN-Optimized Environment
120 User Guide
The SuperAgent Optimization Report
Multi-Port Collector processes the contents of packet digests and sends performance
metrics to the SuperAgent management console. These metrics are displayed on the
Optimization page.
The default view on the Optimization page is the Client Experience for Optimized
Transactions, a performance map of transaction times and observations. The
applications with the longest transaction times (response times) are listed first.
The Optimization page does not let you navigate to a Session Analysis in Multi-Port
Collector. However, the name of each application is a link to a Components report for
that application. This report breaks the transaction time into server response time,
network round-trip time, retransmission delay, and data rates and volumes. The
Components report page provides links to information about related incidents and
availability.
Sharing Data from WAN Optimization Devices
One SuperAgent management console can typically support all WAN Optimization
devices in your environment. However, you can distribute the load when your WAN
Optimization deployment requires more collection devices than a management console
can support. The following procedure describes how to share the [Client], [WAN], and
[Server] segment performance data among several Multi-Port Collectors.
Follow these steps:
1. Create a configuration file named DTMDistributedConsoles.ini.
2. Open the .ini file.
3. Type the IP address of the management console that is assigned to Multi-Port
Collector. The management console instructs Multi-Port Collector how to find other
collection devices to receive the shared data.
Note: A sample file is provided, with a .sav extension appended. The sample
contains invalid IP addresses to illustrate the proper file format. Locate the sample
in the /opt/NetQoS/bin folder.
4. Separate each IP address on a new line using dotted decimal notation.
5. Copy the DTMDistributedConsoles.ini file to all collection devices. For Multi-Port
Collector, copy the file to the /opt/NetQoS/bin folder.

How to Monitor in a WAN-Optimized Environment
Appendix B: Integration with SuperAgent 121
6. Restart the sadatatransfermanager process.
Up to 25 minutes can elapse before WAN-optimized Client segment data is shared
between the collection devices.
7. To share data with additional collection devices, repeat steps 2 through 5.
Note: More information about sharing data from WAN Optimization devices is available
in the CA NetQoS SuperAgent Administrator Guide. See the topic titled "Integrating Data
Collection with Cisco WAAS."

Appendix C: Command Line Syntax 123
Appendix C: Command Line Syntax
The default user name and password for the Multi-Port Collector appliance provide
superuser access. You can perform the following operations at the Linux command line
interface using the “sudo” prefix that identifies a superuser command.
sudo /sbin/service nqmaintd status
Verifies the status of the maintenance daemon (nqmaintd).
sudo /sbin/service nqmaintd restart
Restarts the maintenance daemon. Use only if the status message indicates the
process is running.
sudo /sbin/service nqmaintd start
Starts the maintenance daemon. Use only if the status message indicates the
process is stopped.
sudo /opt/NetQoS/scripts/stopprocs.sh
Stops all daemons (processes).
sudo /opt/NetQoS/scripts/startprocs.sh
Starts all daemons (processes).
sudo /sbin/shutdown -h now
Stops the appliance immediately. Stop the Multi-Port Collector database before you
stop the appliance.
sudo reboot
Stops and restarts the appliance immediately. Stop the Multi-Port Collector
database before you stop the appliance.
sudo /opt/NetQoS/scripts/doVerticaCmd.sh -shutdown
Stops the Multi-Port Collector database. You can also stop the database from the
web interface.
sudo /opt/NetQoS/scripts/doVerticaCmd.sh -start
Starts the Multi-Port Collector database.
sudo /opt/NetQoS/scripts/doVerticaCmd.sh -status
Verifies the status of the Multi-Port Collector database. You can also verify the
status from the web interface.

How to Monitor in a WAN-Optimized Environment
124 User Guide
sudo /opt/NetQoS/tui/tui-setup.php
Invokes the Network Settings Utility on the appliance.
sudo /opt/NetQoS/scripts/syncNapatechClock --force
Immediately synchronizes the clock on the Multi-Port Collector capture card with
the system clock. This command temporarily stops the nqcapd and nqmetricd
processes, which disrupts monitoring. Both processes are restarted after the clocks
are synchronized.
More information:
Database Status (see page 87)
Database Status and Usage (see page 96)
Log In to the Appliance (see page 99)
Capture Card Clock Differs from System Clock (see page 103)

Appendix D: Regular Expression Syntax 125
Appendix D: Regular Expression Syntax
For advanced filters, the syntax that is written to the Conditions field automatically
conforms to vendor specifications for capture card compatibility. Review the generated
expressions, especially the placement of parentheses used to group the expressions, to
verify that they are evaluated in the correct order. For example, the following grouping:
(A OR B) AND C
has a different result than this grouping:
A OR (B AND C)
You can edit the syntax in the Conditions field.
Multi-Port Collector filtering includes packets that match the criteria. Take special care
when creating filters that exclude packets from specific hosts or subnets. Discuss any
questions you have about expression syntax with CA Technical Support.
Example
You want to ignore a conversation between Host A (192.168.32.15) and Host B
(10.10.21.10). The conversation represents an automatic backup process that runs once
per week and skews the baseline each time. You want to report on “all other traffic.”
You also want to retain all packets from traffic that travels to hosts other than the
excluded pair. So you create a filter that retains the following:
■ all packets where Host A is the source but where the destination does NOT EQUAL
Host B, AND
■ all packets where Host B is the source but where the destination does NOT EQUAL
Host A, OR
■ all packets with source addresses that do NOT EQUAL the IP address of Host A and
Host B (all other traffic)
If translated into English, the expression you create reads something like the following:
(IP Source Address EQUALS 192.168.32.15 AND IP Destination Address does NOT EQUAL
10.10.21.10) OR (IP Source Address EQUALS 10.10.21.10 AND IP Destination Address
does NOT EQUAL 192.168.32.15) OR (IP Source Address does NOT EQUAL 192.168.32.15,
10.10.21.10)
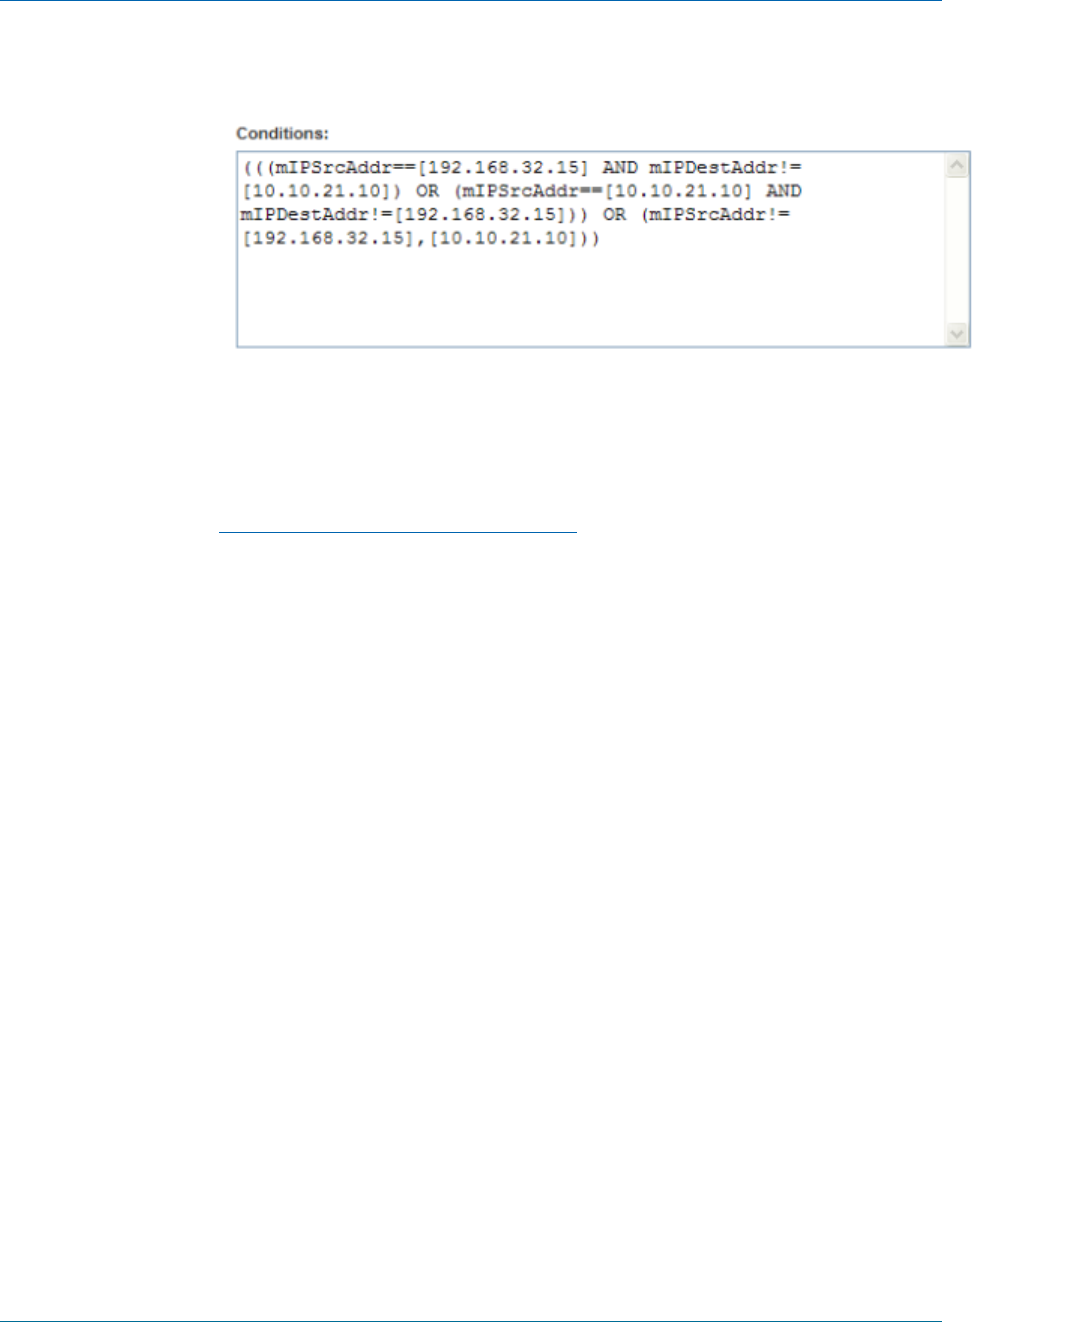
How to Monitor in a WAN-Optimized Environment
126 User Guide
In the Conditions field, the proper syntax looks like the following:
When creating an advanced filter with regular expressions, select "Equals" to insert
"==." Select "Not Equals" to insert "!=."
More information:
Use Regular Expressions for Precise Filtering (see page 25)

Index 127
Index
A
access control list (ACL) • 105
administrative password, changing • 18
analysis
analysis filters • 55
create • 51
data views • 53
delete • 52
description • 48
duplicate • 52
global filters • 65
predefined • 49
analysis filters
apply to data view • 57
change • 63
delete • 64
types • 55
analysis pane • 47
appliance
Linux commands • 123
log in • 99
placement • 105
port requirements • 108
shut down or restart • 102
application metrics, defined • 72, 75
architecture
Multi-Port Collector and SuperAgent • 12
Multi-Port Collector and TIM • 15
B
Boolean operator • 25, 57, 63
byte rate metrics, defined • 72, 80
C
capture card
logical port status • 88
physical port statistics • 89
physical port status • 88
capture files
export to PCAP • 82
investigations • 11, 94
monitor for ADA • 10
purge • 97
chart types
bar • 69
line • 69
pie • 70
stacked • 70
summary • 71
Cisco Wide-Area Application Service, monitoring •
10, 118
client metrics, defined • 75
collection device
.ini files • 114
configure • 28
incidents • 111
collector feed
incidents • 111
port requirements • 108
components, description • 9
configuration, post-installation • 17
connection time observations, defined • 75
CPU usage • 92
CRC errors • 89
CSV, exporting data to • 81
CT Obs, defined • 75
D
data table
add or remove columns • 80
description • 71
TCP tab • 75
Traffic tab • 72
data transfer time, defined • 75
data views
description • 53
filter • 57
database
purge data • 97
shut down • 123
status • 96
troubleshooting • 95
default password, changing • 18
deployment, best practices • 105
discarded duplicates • 89
display area
charts • 68
data tables • 71
dropped packets • 88

128 User Guide
DTT • 75
E
email, sharing data by • 84
ENRTT • 75
export data
in email • 84
to CSV • 81
to PCAP • 82
to PDF • 80
F
failed drives • 90
file system usage • 91
filters
analysis • 55, 57
global • 65
hardware • 21
keep-alive messages • 116
regular expression syntax • 125
time frame • 55
G
GigaStor, port requirements • 108
global filters
change • 66
description • 65
remove • 67
global preferences • 33
H
hardware filters
and packet slicing • 22
and regular expressions • 25
create or change • 23
default filters • 22
description • 21
I
incidents
enable • 112
inactive • 113
interrupts • 92
K
keep-alive messages, filtering • 116
L
layer 3 and 4 protocol metrics, defined • 72, 75
Linux commands • 123
log files
processes • 86
services • 94
log in to appliance • 99
logical ports
and TCP sessions • 31
configure • 19
metrics • 72, 75
status for capture card • 88
view status in SuperAgent • 30
M
MAC address metrics, definied • 72
memory usage • 92
MIB file • 35
N
NCT • 75
NetQoS Performance Center, and user accounts and
roles • 39
network configuration • 101
network metrics, defined • 72, 75, 80
network taps • 105
nqcapd process • 19, 23, 25, 33, 36, 86, 94
nqmaintd process • 33, 86, 94, 99, 123
NRTT • 75
P
packet rate metrics, defined • 72
packets
deduplication • 109, 115
dropped • 88
packet slicing • 22
processed • 88
password, changing • 18
PCAP, exporting data to • 82
PDF, exporting data to • 80
port mirroring, best practices • 105, 115
port requirements • 108
port statistics, resetting • 94
post-installation tasks • 17
change administrative password • 18
configure collection device • 28
configure global settings • 33

Index 129
configure logical ports • 19
configure SNMP traps • 35
configure users and roles • 39
create hardware filters • 21
install TIM software • 32
power user • 43
processed packets • 88
processes
status • 86
stop or start • 94, 99, 123
purge data • 97
R
RAID status • 90
regular expression syntax • 125
restart appliance • 102
retransmission delay, defined • 75
S
sadatatransfermanager process • 86, 119
SCT • 75
server metrics, defined • 75
service log files • 94
session analysis, examples of • 14, 48, 55, 65, 68
shut down appliance • 102, 123
SNMP traps
change trap behavior • 38
create • 35
nqsnmptrap.log • 94
port requirements • 108
severity levels • 35
software
install TIM • 32
SPAN, best practices • 105
SRT • 75
SuperAgent
and Multi-Port Collector • 10, 111
architecture • 12
collection device incidents • 111
configure collection device • 28
data in Multi-Port Collector • 14
monitoring WAN-optimized environments • 118
packet-capture investigations • 11, 94
review TCP sessions • 31
verify port status • 30
system logs • 94, 95
system maintenance • 93
System Setup page • 100
System Status page • 85
T
TCP metrics, defined • 72, 75
TCP sessions, how monitored • 10
TCP tab
add or remove columns • 80
data • 75
filters • 55, 65
time zone, setting • 102
ToS metrics, defined • 72, 75
Traffic tab
add or remove columns • 80
data • 72
filters • 55, 65
Transaction Impact Monitor (TIM)
and Multi-Port Collector • 15
install software • 32
transaction time metrics, defined • 75
U
UDP, port requirements • 108
user accounts
and Performance Center • 40
change default information • 40
description • 40
permissions • 43
user permissions • 43
user roles
and Performance Center • 42
description • 42
permissions • 43
V
VACL • 105
VLAN
filters • 21, 22, 23, 58
metrics defined • 72, 75
VSPAN, best practices • 105
W
WAN-optimized environments, monitoring • 118
watchdog process • 86
Z
zoom in or out • 55
