User Manual
User Manual:
Open the PDF directly: View PDF ![]() .
.
Page Count: 7
Tabulate v1.0 User’s Manual 1
User’s Manual Rev. 1
Tabulate v1.0
User’s Manual, October 15, 201
Summary
Tabulate v1.0 is a Windows program that ports the capabilities of the original Genie-VMS/FORTRAN
software into a Genie-PC/C++ paradigm. The program first reads a nuclide library file to determine energy
lines of interest. Next, an analysis sequence file selected by the user is executed on a user-selectable set
of data files. Finally, the software analyzes the peak search results for the energy lines found in the nuclide
library file and generates a formatted output file containing peak and energy data. The output is
configurable among for options; additional options could be made available in future releases of the
software.
The new Tabulate v1.0 features greater flexibility by virtue of its reliance on user-supplied analysis
sequence files. The analysis sequence file permits the inclusion or exclusion of a variety of analysis steps,
for instance the use of interactive peak fitting, or no peak searching/fitting altogether.
How to Use
Tabulate is a Windows GUI-based software, therefore the “how to use” section will employ numerous
screen captures to help illustrate the process of analyzing data.
Starting Tabulate
Any journey, no matter how long or short, starts with a single step. That first single step is to double click
the icon. This is such an obvious first step that I will decline to capture a screen shot of it. I think you can
figure this one out on your own.
Tabulate does rely on the existence of certain files and hardware. For instance, you must have an
installation of the Genie-PC installed on the computer that will be used for the analysis. The installation
includes essential libraries that Tabulate cannot execute without. Conveniently, Windows will detect if
you have the required library files installed at run-time; inconveniently, the instance of Tabulate that is
attempting to start will crash and Windows will issue a dire warning. You must also have a valid Genie-PC
hardware key; the hardware key is a USB device that appears to be a thumb drive. The Genie-PC libraries
are designed to detect the hardware key and they will not function if the key is missing.
User Selections: Analysis Library
Prior to initiating an analysis, the Peak Library data must be selected. At startup the program populates
the left window in the Peak Library grouping with the names of all files in the indicated directory that have
“.nlb” as an extension. Within these files are collections of nuclides and their energy lines that will be
searched for when Tabulate executes the analysis sequence file. The user has the option to create his or
her own nuclide library using the “Nuclide Library Editor” utility provided with the base installation of
Genie-PC. When one of the libraries is selected and the “Select” button is pressed, the short nuclide name
and energy line(s) associated with that nuclide library entry are printed so that the user may confirm this
is in fact the desired library. Figure 2 illustrates how Tabulate represents the library data.
Tabulate v1.0 User’s Manual 2
User’s Manual Rev. 1
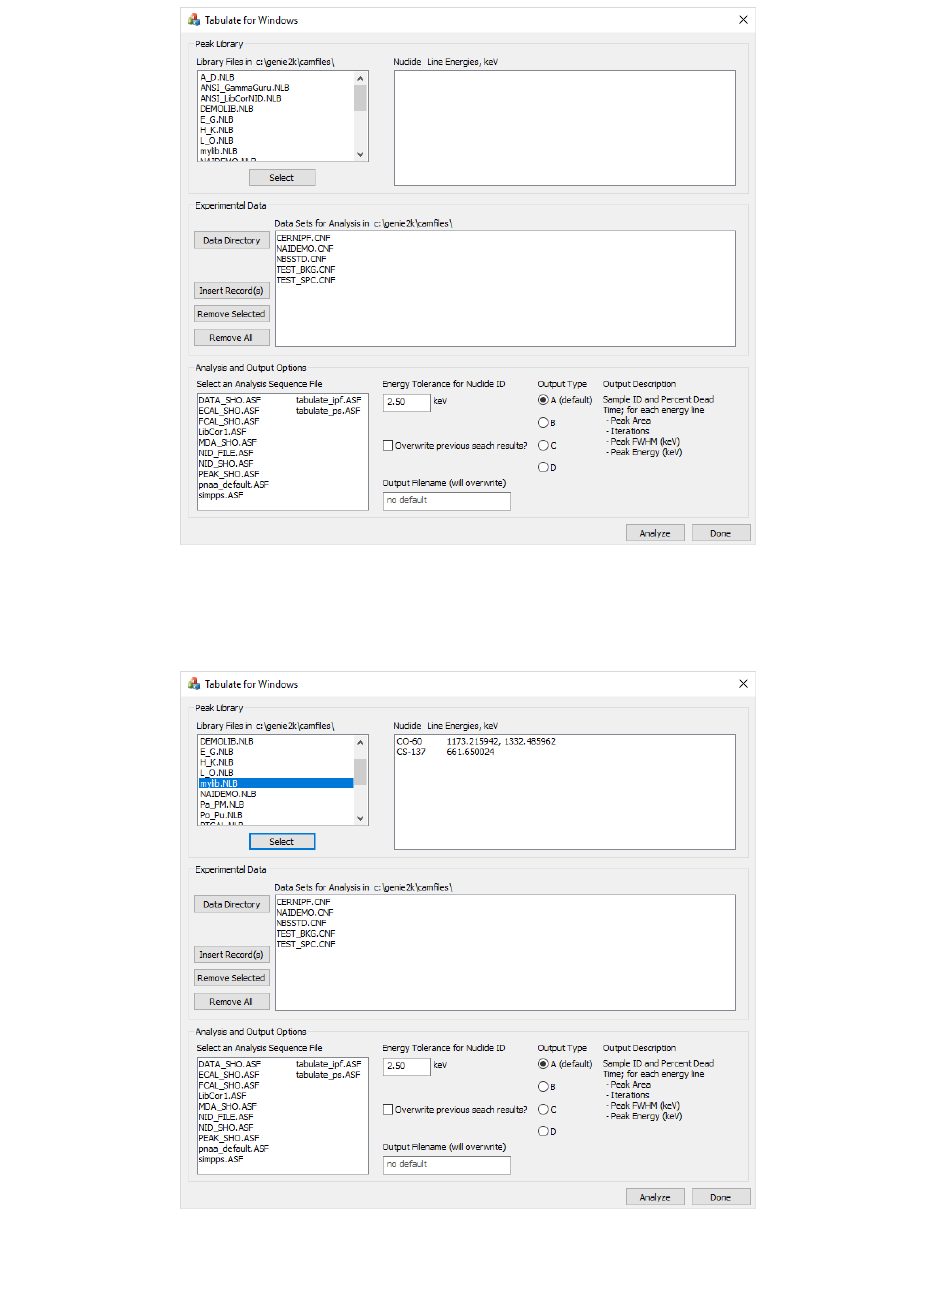
Figure 1. Tabulate v1.0 when first started. Notice that certain data fields have been automatically filled in, and that in
certain cases a default option or value has been suggested.
Figure 2. When a library file is selected and the ‘Select' button is pressed, the nuclides and lines associated with the nuclide
that are stored in the library are printed in the adjacent window.
Tabulate v1.0 User’s Manual 3
User’s Manual Rev. 1
User Selections: Data Files
Prior to initiating an analysis, the Experimental Data must be selected. At startup the program populates
the window with a list of available configuration files in the default data directory (c:\genie2k\camfiles);
the program searches for files that use “.cnf” as an extension. The user may remove items from the list by
selecting one or more filenames to exclude, and then clicking on the “Remove Selected” button.
Alternately, all files may be removed by clicking the “Remove All” button. In the event that a file was
inadvertently removed, or that all files were removed, at least one file must show in the window,
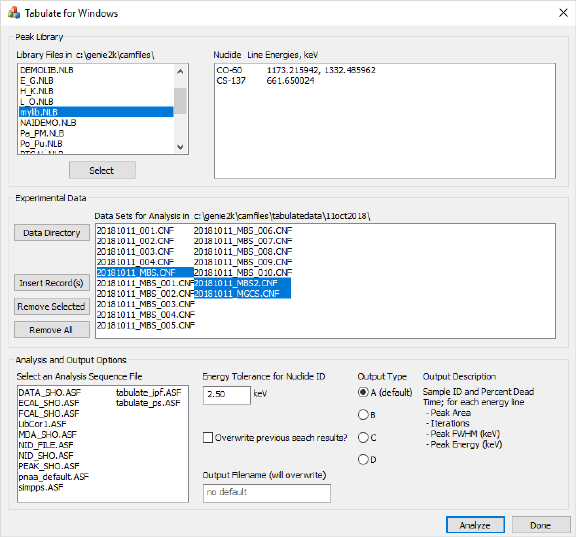
otherwise no analysis will take place. Figure 3 illustrates a set of data where multiple selections have been
made; it is important to note that ALL filenames that appear in this window will be part of the analyzed
data set, and not just those the user has selected.
Figure 3. All files in the window will be analyzed. Use a combination of the buttons to select the appropriate directory and files for
analysis. The window supports multiple selection.
User Selections: Analysis and Output Options
Prior to initiating an analysis, certain portions of the Analysis and Output Options group must be supplied,
including the analysis sequence file to use and the name for the output file. Optional selections are
available for the energy tolerance used when Tabulate searches for energy peaks, whether to overwrite
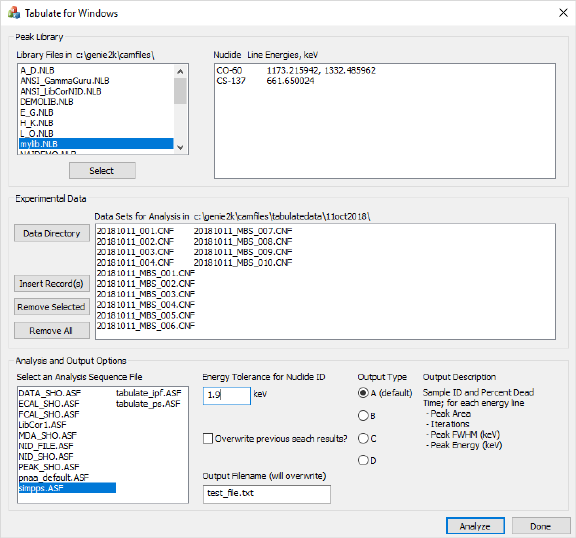
peak search data with that produced during the analysis, and the form of the output file. Figure 4 shows
a non-default energy tolerance of 1.9 keV, an output filename “test_file.txt”, and an analysis sequence
file “simpps.ASF” selected.
The analysis sequence selection window is automatically populated with analysis sequence files stored in
the default control file directory (c:\genie2k\ctlfiles) and that have “.asf” as a filename extension. No
default exists, therefore Tabulate will not produce output if no analysis sequence file is selected.
Tabulate v1.0 User’s Manual 4
User’s Manual Rev. 1
The energy tolerance for nuclide identification is an optional parameter that sets the window width
within which a peak energy line must fall relative to the library peak energy line. Thus, for 137Cs and a
2.5 keV peak energy tolerance, any peak whose centroid Ec falls in the range 660.4 < Ec < 662.9 keV will
be identified by the searching algorithm as 137Cs. The software internally constrains the peak energy
tolerance to the following range: 0 < Etol ≤ 5 keV; supplied values outside of this range will result in the
tolerance reverting to the default value of 2.5 keV.
Figure 4. The user must select an analysis sequence file to execute and the name of an output file to store the results of the
analysis in. Other options are automatically set to default values.
A checkbox is available to store the results of the analysis sequence in the configuration file. Thus, if the
configuration file originally contains only the spectrum and various configuration data, and the overwrite-
file checkbox is selected, once the analysis sequence file commands are executed the results will be save
in the configuration file. For instance, if a peak search, peak area analysis, background subtraction,
efficiency correction, and nuclide ID were performed, the results would be saved in the configuration file.
An output filename must be specified before the analysis will proceed. If the filename already exists,
Tabulate v1.0 will warn the user; if the user proceeds after the warning, the output file will be overwritten.
The output file, in this case, is a human-readable text file that contains summary data from the
configuration file. This data may be fed into a spreadsheet, for instance, to perform additional
computations.
Finally, the output type may be selected from a menu of four options. These options were ported directly
from the Genie-VMS version of Tabulate. A description of each output type is provided in the window to
the right of the radio buttons. A default selection is already made when the program initializes; it is up to
the user to modify this selection, if desired.
Tabulate v1.0 User’s Manual 5
User’s Manual Rev. 1
Run Analysis
Once all of the previous data is provided, and the user presses the “Analyze” button, Tabulate v1.0 begins
to execute its routine. The program first imports the peak library data into memory. The program then
sequentially goes through the list of data files, importing them, executing the analysis sequence file
commands on them, performing a peak search on the results, and then outputting a formatted line of text
into the output file. While the program is iterating through the analyses, the text of the “Analyze” button
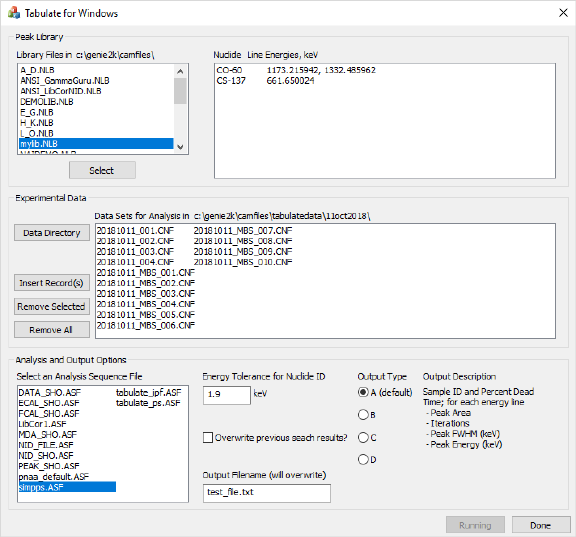
changes to “Running” and the button is disabled, as seen in Figure 5. After all of the data files have been
analyzed and the final line of text has been appended, the “Analyze” button reverts to its original state to
inform the user that the analysis is complete. Following the analysis, the output file is available for user
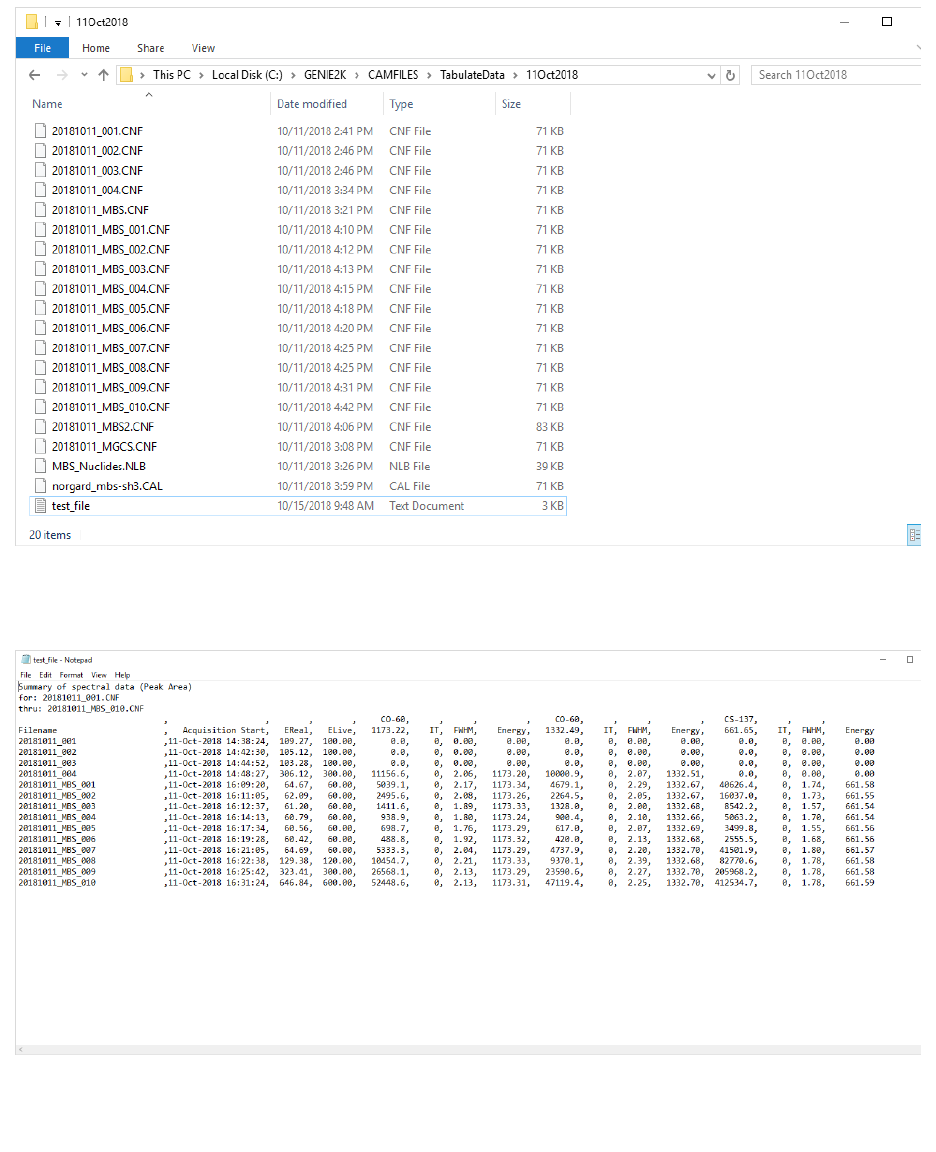
manipulation. The output file is stored in the same directory as the originating data, as shown in Figure 6
Figure 5. When the 'Analyze' button is pressed, the program begins iterating through the list of data files, executing the analysis
sequence file and extracting data into the output file, one file at a time. The button text changes to ‘Running’ and the button is
disabled. Once the sequence of analyses are complete, the button reverts to its original text and state.
Output Data File
The output data file structure, to the greatest extent possible, was retained from the Genie-VMS version
of Tabulate. Figure 7 shows the structure of a file conforming to the default output type. The output file
is organized to contain a header that is similar to the original header, including a nuclide listing and an
ideal energy for each nuclide in the library. The order in which nuclides appear depends on the order in
which they are stored in the nuclide library file; numerically from smallest neutron number to largest.
Similarly, the energy lines for each nuclide are organized as they appear in the nuclide library file;
numerically from least to greatest energy.
Tabulate v1.0 User’s Manual 6
User’s Manual Rev. 1
Comments on the Nuclide ID Algorithm
A custom identification algorithm is employed in Tabulate v1.0, as described in analysis output options
section of the manual. For each peak in the nuclide library, the peak search results are scanned for a peak
centroid that falls within the energy band established by the nuclide energy line and the user supplied
Figure 6. The directory now contains the data file "test_file.txt".
Figure 7. Inspection of the file "test_file.txt" demonstrates the program has generated the requested output.
Tabulate v1.0 User’s Manual 7
User’s Manual Rev. 1
energy tolerance. Therefore, the Analysis Sequence File need not contain a step to perform NID or
tentative NID.
Not every peak search will result in found peak values. In cases where a library peak search has revealed
no corresponding peak in the data set, the algorithm assigns zero to all values in the output stream. In the
case of the first four data set in Figure 7, the peak search routine failed to locate any peaks. In this case,
the peak search failed because the energy calibration for this data set exhibited a systematic error that
caused the reported peak energy lines to fall outside of the tolerance band used by the peak search
algorithm. If peak centroids cannot be located in a data set known to be populated with said peak
centroids, this points to a problem with the detection hardware or the software settings.
Problems, Comments or Questions
If the user encounters any problems, has comments or questions about the software, or would like to see
additional features, please correspond with the author, Peter Norgard.
