Wave Analytics Bindings Developer Guide
User Manual:
Open the PDF directly: View PDF ![]() .
.
Page Count: 73
- Bindings in Wave Dashboards
- Selection Binding
- Result Binding
- Bindings in Wave Designer Dashboards
- Bindings in Classic Designer Dashboards
© Copyright 2000–2017 salesforce.com, inc. All rights reserved. Salesforce is a registered trademark of salesforce.com, inc.,
as are other names and marks. Other marks appearing herein may be trademarks of their respective owners.

CONTENTS
Bindings in Wave Dashboards ...........................................1
Selection Binding ......................................................1
Result Binding ........................................................2
Bindings in Wave Designer Dashboards ......................................3
Bindings in Classic Designer Dashboards ....................................53
BINDINGS IN WAVE DASHBOARDS
Bindings enable interactions among different components in a dashboard. You control the interactions by binding steps to each other.
There are two types of bindings: selection binding and results binding. The selection or results of one step triggers updates in other
steps in the dashboard.
You can set up bindings in dashboards built in the Wave dashboard designer or classic designer. The bindings syntax is different for each
designer. Salesforce.com recommends that you use the Wave dashboard designer, which offers more ways to use bindings.
Tip: Before you create bindings to make widgets interactive, consider faceting. Facets are the simplest and most common way
to specify interactions between widgets. When faceted, selections made in one widget automatically filter all other widgets using
steps from the same dataset. Faceting is easy to set up, but it is limited. It can only filter other steps and works only on steps from
the same dataset. To create interactions outside this scope, use bindings.
For more information about steps, see Widget Steps in a Wave Dashboard. For more information about faceting, see Making Widgets
Interactive Using Facets and Bindings.
Selection Binding
Selection binding is a method used to update a step based on the selection in another step. Selection bindings are interaction-driven,
where it’s evaluated each time the user selects something in a widget.
Result Binding
Results binding is a method used to update a step based on the results of another step.
Bindings in Wave Designer Dashboards
The Wave dashboard designer treats selection and results bindings the same. Both types of bindings operate on tabular data and
return complete rows, even for columns not used in widgets. The Wave dashboard designer treats multiple selections as tabular
data and single selections as a single row of tabular data. The designer expresses each row of tabular data in the form of an array of
objects, where each object is keyed by the column name.
Bindings in Classic Designer Dashboards
Unlike the Wave dashboard designer, the classic designer treats selection and results bindings differently. The classic designer
assumes results binding returns tabular data and selection binding returns a single string. Because the classic designer doesn’t emit
full rows, you can only create bindings based on a grouping column.
Selection Binding
Selection binding is a method used to update a step based on the selection in another step. Selection bindings are interaction-driven,
where it’s evaluated each time the user selects something in a widget.
For example, you have the following dashboard.
1
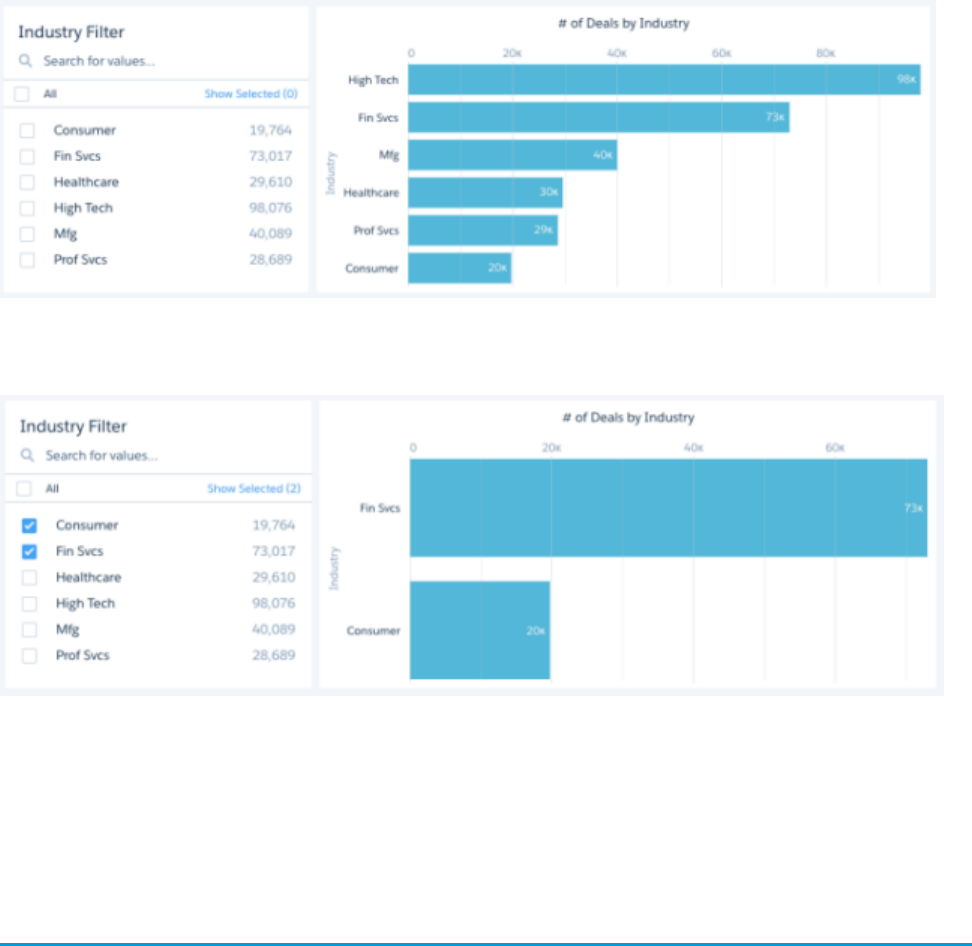
A selection in the Industry Filter widget filters the results in the # of Deals by Industry chart.
A selection binding can be used to:
•Specify interactions between widgets which use steps from different datasets.
•In addition to filters, specify the measures, groupings, and other aspects of a step query.
•Set widget display properties for some widget types (number and chart only).
Result Binding
Results binding is a method used to update a step based on the results of another step.
A results binding is typically used to:
•Define intermediate results for a complex calculation. For example, to calculate the total opportunity amount for the top-five products,
use one step to calculate the top-five products. Then use those results to filter another step that calculates the total opportunity
amount for each product.
•Dynamically change the display of a widget based on the results of a step. For example, you can configure a number widget to show
different colors based on the value of the measure. (In Wave dashboard designer only.)
2
Result BindingBindings in Wave Dashboards

Bindings in Wave Designer Dashboards
The Wave dashboard designer treats selection and results bindings the same. Both types of bindings operate on tabular data and return
complete rows, even for columns not used in widgets. The Wave dashboard designer treats multiple selections as tabular data and single
selections as a single row of tabular data. The designer expresses each row of tabular data in the form of an array of objects, where each
object is keyed by the column name.
Syntax
You must specify the right syntax when creating a binding in a Wave designer dashboard. The syntax is different for each dashboard
designer.
Binding Functions
The Wave dashboard designer provides different types of bindings functions that get data from a source step, manipulate it, and
serialize it to make it consumable by the target step.
Binding Errors
If you create an invalid binding in a Wave designer dashboard, the widget that uses the binding displays an error in the dashboard.
Use Cases
To help you better understand how to build bindings using functions, take a look at these different binding use cases.
Syntax
You must specify the right syntax when creating a binding in a Wave designer dashboard. The syntax is different for each dashboard
designer.
To specify a selection or results binding in the Wave dashboard designer, use the following syntax.
<stepID>.<result|selection>
For example,
mySourceStep.selection
Note: When specifying the step, you specify the ID, not the label.
Binding Functions
The Wave dashboard designer provides different types of bindings functions that get data from a source step, manipulate it, and serialize
it to make it consumable by the target step.
If the input data has empty results, the function returns a null value. If the specified location of the data doesn’t exist, an error occurs.
For example, the binding is defined to get data from row 3, but row 3 doesn’t exist. An error also occurs if the shape of the input data
doesn’t meet the requirement for the function.
Binding functions operate on input data with one the following shapes.
•Scalar value, like 0, "this is scalar", or null.
•One-dimensional array, like ([1, 2, 3]) or (["one","two","three"])
•Two-dimensional array (an array of arrays), like ([ [1, 2], [3, 4] ])
3
Bindings in Wave Designer DashboardsBindings in Wave Dashboards
The required shape of the input data varies with each function. After processing the data, the functions can change the shape of the
data.
Each binding consists of nested functions. Each binding must have one data selection function and one data serialization function.
Optionally, bindings can have multiple data manipulation functions. (The following sections describe these types of functions.) The
following example illustrates how nested functions in a binding work together to produce the expected result for a target step in which
they are defined. The example is based on the following binding.
coalesce(cell(mySourceStep.selection, 0, \"grouping\"), \"state\").asString()
The mySourceStep step has the following input data.
groupingdisplay
regionRegional Area
countryCountry
stateState
Technically, the data for this step is stored as a two-dimensional array, where each row is stored as a map of key-value pairs.
[
["display":"Regional Area", "grouping":"region"],
["display":"Country", "grouping":"country"],
["display":"State", "grouping":"state"]
]
At runtime, Wave evaluates the binding functions, starting with the innermost function. Using that logic, Wave evaluates the example’s
binding functions in the following order.
DescriptionFunction
Wave returns each row of selected data as a map of key-value pairs.
If a single selection is made, only one row returns. If multiple
selections are made, multiple rows return.
[
["display":"Regional Area",
mySourceStep.selection
"grouping":"region"],
["display":"Country",
"grouping":"country"],
["display":"State", "grouping":"state"]
]
The cell function returns a scalar value from the "grouping"
column of the first row (indicated by the 0 index) returned by
cell(mySourceStep.selection, 0,
\"grouping\")
mySourceStep.selection. Based on the selection, the
return value can be "region", "country", or "state". If
no selection is made, the function returns null.
4
Binding FunctionsBindings in Wave Dashboards

DescriptionFunction
The coalesce function returns the value of the cell function
if a selection was made. If no selection was made, the coalesce
function returns the specified default value "state".
coalesce(cell(mySourceStep.selection, 0,
\"grouping\"), \"state\")
Tip: Use the coalesce function to provide a default
value so that an error doesn’t occur when a null value is
encountered.
The .asString function returns the result of the coalesce
function as a SAQL string.
coalesce(cell(mySourceStep.selection, 0,
\"grouping\"), \"state\").asString()
To see how these functions are used in bindings, see Use Cases.
Data Selection Functions
A data selection function selects data from a source. The source can be either a selection or results of a step. The function returns a
table of data, where each column has a name, and each row has an index, starting with 0. From the table, you can select one or
more rows, one or more columns, or a cell to include in your binding.
Data Manipulation Functions
A data manipulation function changes the data into the format required by the data serialization function (see the next section).
You can apply a manipulation function on the results from a data selection or other data manipulation function. If the input data is
null, the manipulation function returns null, unless otherwise specified.
Data Serialization Functions
Serialization functions convert the data into the form expected by the step in which the binding is inserted. For example, if the
binding is used in a compact-form step, use the asObject() function to format the data into a one-dimensional object.
Data Selection Functions
A data selection function selects data from a source. The source can be either a selection or results of a step. The function returns a table
of data, where each column has a name, and each row has an index, starting with 0. From the table, you can select one or more rows,
one or more columns, or a cell to include in your binding.
In cases where multiple rows or columns of data are selected, the function returns a two-dimensional array. When a single row or single
column is selected, the function returns a one-dimensional array. When a cell is selected, the function returns a scalar value. The function
returns null if the source is empty. If the function tries to select data that doesn’t exist, a binding error occurs. For example, the table only
has two rows, but you try to select data from the third row.
cell Function
Returns a single cell of data as a scalar, like "This salesperson rocks", 2, or null. An error occurs if the rowIndex is not an integer,
the columnName is not a string, or the cell doesn’t exist in the table.
column Function
Returns one column of data (as a one-dimensional array) or multiple columns of data (as a two-dimensional array).
5
Binding FunctionsBindings in Wave Dashboards
row Function
Returns one row of data (as a one-dimensional array) or multiple rows (as a two-dimensional array). For selection binding, you
typically use this function to return the first row or all rows. For results binding, you might want specific rows. To determine the row
index, display the step results in a values table.
cell Function
Returns a single cell of data as a scalar, like "This salesperson rocks", 2, or null. An error occurs if the rowIndex is not an integer,
the columnName is not a string, or the cell doesn’t exist in the table.
Syntax
cell(source), rowIndex, columnName)
Arguments
DescriptionArgument
(Required) Specify the name of the step and selection or
result.
source
(Required) Specify the row using its index. Row index starts at 0.rowIndex
(Required) Specify the column name.columnName
The following example is based on the myStep source step. Assume that myStep.selection retrieves the following rows from
the step.
[
{stateName: ‘CA’, Amount:100},
{stateName: ‘TX’, Amount:200},
{stateName: ‘OR’’, Amount:300},
{stateName: ‘AL’, Amount:400},
]
Although Wave doesn’t store this data as a table, let’s show the data in this format to make it easier to understand the example.
AmountstateName(row index)
100CA0
200TX1
300OR2
400AL3
Example:
cell(myStep.selection, 1, "stateName")
6
Binding FunctionsBindings in Wave Dashboards
Output:
"TX"
column Function
Returns one column of data (as a one-dimensional array) or multiple columns of data (as a two-dimensional array).
Syntax
column(source), [columnNames...])
Arguments
DescriptionArgument
(Required) Specify the name of the step and selection or
result.
source
(Required) Specify an array of column names. The order of the
listed columns affects the order that the columns appear in the
columnNames
output. The order is important for serialization functions. For
example, the asOrder function requires the first element to be
a field name and the second to be the direction.
The following examples are based on the myStep source step. Assume that myStep.selection retrieves the following rows
from the step.
[
{stateName: ‘CA’, Amount:100},
{stateName: ‘TX’, Amount:200},
{stateName: ‘OR’’, Amount:300},
{stateName: ‘AL’, Amount:400},
]
Although Wave doesn’t store this data as a table, let’s show the data in this format to make it easier to understand the examples that
follow.
AmountstateName(row index)
100CA0
200TX1
300OR2
400AL3
7
Binding FunctionsBindings in Wave Dashboards

Example:
column(myStep.selection, ["stateName"])
Output:
["CA", "TX", "OR", "AL"]
Example:
column(myStep.selection, [])
Output:
[ ["CA", "TX", "OR", "AL"], ["100", "200”," "300", "400"] ]
row Function
Returns one row of data (as a one-dimensional array) or multiple rows (as a two-dimensional array). For selection binding, you typically
use this function to return the first row or all rows. For results binding, you might want specific rows. To determine the row index, display
the step results in a values table.
Syntax
row(source), [rowIndices...], [columnNames...])
Arguments
DescriptionArgument
(Required) Specify the name of the step and selection or
result.
source
(Required) Specify an array of row indices, where each element of
the array identifies a row. Row index 0 identifies the first row. To
include all rows, specify an empty array.
rowIndices
(Optional) Specify an array of column names to select and order
them. If not specified, all columns are selected and every row has
columnNames
the same order of columns. However, that order isn't guaranteed
to be the same across different queries.
The following examples are based on the myStep source step. Assume that myStep.selection retrieves the following rows
from the step.
[
{stateName: ‘CA’, Amount:100},
{stateName: ‘TX’, Amount:200},
{stateName: ‘OR’’, Amount:300},
{stateName: ‘AL’, Amount:400},
]
8
Binding FunctionsBindings in Wave Dashboards
Although Wave doesn’t store this data as a table, let’s show the data in this format to make it easier to understand the examples that
follow.
AmountstateName(row index)
100CA0
200TX1
300OR2
400AL3
Example:
row(myStep.selection, [0], ["Amount"])
Output:
["100"]
Example:
row(myStep.selection, [0,2], [])
Output:
[ ["CA", "100"], ["OR", "300"] ]
Example:
row(myStep.selection, [], ["stateName"])
Output:
[ ["CA"], ["TX"], ["OR"], ["AL"] ]
Example:
row(myStep.selection, [0,2], ["stateName", "Amount"])
Output:
[ ["CA", "100"], ["OR", "300"] ]
Data Manipulation Functions
A data manipulation function changes the data into the format required by the data serialization function (see the next section). You
can apply a manipulation function on the results from a data selection or other data manipulation function. If the input data is null, the
manipulation function returns null, unless otherwise specified.
Note: If data manipulation isn’t required, add a data serialization function to the results of the data selection functions.
9
Binding FunctionsBindings in Wave Dashboards
coalesce Function
Returns the first non-null source from a list of sources. Useful for providing a default value in case a function returns a null value.
concat Function
Joins streams from multiple sources into a one- or two-dimensional array. Null sources are skipped.
flatten Function
Flattens a two-dimensional array into a one-dimensional array.
join Function
Converts a one- or two-dimensional array into a string by joining the elements using the specified token. An error occurs if the data
has any other shape.
slice Function
Selects one or more values from a one-dimensional array given a start and, optionally, an end position, and returns a one-dimensional
array. An error occurs if the start value is greater than the end value. Negative indices are supported.
valueAt Function
Returns the single scalar value at the given index.
coalesce Function
Returns the first non-null source from a list of sources. Useful for providing a default value in case a function returns a null value.
Syntax
coalesce(source1, source2,...)
Arguments
DescriptionArgument
(Required) Source can be the results of a data selection or other
data manipulation function. The source can have any shape.
source
Example:
coalesce(cell(step1.selection, 0, "column1"), "green")
Output: The output is the result returned by cell(step1.selection, 0, "column1"). However, if
cell(step1.selection, 0, "column1") returns null, then the output is
"green"
For an application of this function in a bindings use case, see Change the Map Type Based on a Toggle Widget.
concat Function
Joins streams from multiple sources into a one- or two-dimensional array. Null sources are skipped.
10
Binding FunctionsBindings in Wave Dashboards

Syntax
concat(source1, source2,...)
Arguments
DescriptionArgument
(Required) Each source can be the results of a data selection or
other data manipulation function. Each source must be either a
source
one- or two-dimensional array. An error occurs if you try to
concatenate data from sources of different shapes. For example,
the following function produces an error: concat(["a",
"b"], ["c", "d", "e"]).
Example:
concat(["a", "b"], ["c", "d"])
Output:
["a", "b", "c", "d"]
Example:
concat([["a", "b"]], [["c", "d"]])
Output:
[["a", "b"], ["c", "d"]]
flatten Function
Flattens a two-dimensional array into a one-dimensional array.
Syntax
flatten(source)
Arguments
DescriptionArgument
(Required) Source can be the results of a data selection or other
data manipulation function. The source must be a two-dimensional
source
array; otherwise, an error occurs because there’s no reason to flatten
a one-dimensional array or scalar.
11
Binding FunctionsBindings in Wave Dashboards
Example:
flatten([["CDG", "SAN"], ["BLR", "HND"], ["SMF", "JFK"])
Output:
["CDG", "SAN", "BLR", "HND", "SMF", "JFK"]
join Function
Converts a one- or two-dimensional array into a string by joining the elements using the specified token. An error occurs if the data has
any other shape.
Syntax
join(source, token)
Arguments
DescriptionArgument
(Required) Source can be the results of a data selection or other
data manipulation function. The source must be a two-dimensional
array; otherwise, an error occurs.
source
(Required) Any string value, like + or ,.token
Example:
join(["a", "b", "c"], "+")
Output:
["a+b+c"]
Example:
join([["a", "b", "c"], [1, 2]], "~")
Output:
["a~b~c~1~2"]
slice Function
Selects one or more values from a one-dimensional array given a start and, optionally, an end position, and returns a one-dimensional
array. An error occurs if the start value is greater than the end value. Negative indices are supported.
12
Binding FunctionsBindings in Wave Dashboards

Syntax
slice(source, start, end)
Arguments
DescriptionArgument
(Required) Source can be the results of a data selection or other
data manipulation function. The source can have any shape.
source
(Required) Index that identifies the start value in the array. For
example, 0 represents the first element in the array.
start
(Optional) Index that identifies the end value in the array.end
Example:
slice(step.selection, -1, 0)
Returns the last selected row.
valueAt Function
Returns the single scalar value at the given index.
Syntax
valueAt(source, index)
Arguments
DescriptionArgument
(Required) Source can be the results of a data selection or other
data manipulation function. The source can have any shape.
source
(Required) Negative indexes are supported. If you specify an index
that doesn’t exist, the function returns null.
index
Example:
valueAt(cell(step.selection, 0, "column"), -1)
Returns the last selected value.
13
Binding FunctionsBindings in Wave Dashboards
Data Serialization Functions
Serialization functions convert the data into the form expected by the step in which the binding is inserted. For example, if the binding
is used in a compact-form step, use the asObject() function to format the data into a one-dimensional object.
asDateRange() Function
Returns the date range filter condition as a string for a SAQL query. The date range is inclusive. Use the string as part of a filter based
on dates.
asEquality() Function
Returns an equality or "in" filter condition as a string for a SAQL query. The input data must be a scalar, one-dimensional array, or
two-dimensional array.
asGrouping() Function
Returns a grouping as a string for a SAQL query.
asObject() Function
Passes data through with no serialization. Returns data as an object (an array of strings).
asOrder() Function
Returns the sort order as a string for a SAQL query.
asProjection() Function
Returns the query expression and alias as a string that you can use to project a field in a step. The query expression determines the
value of the field. The alias is the field label.
asRange() Function
Returns a range filter condition as a string for a SAQL query. The range is inclusive.
asString() Function
Serializes a scalar, one-dimensional array, or two-dimensional array as a string. Escapes double quotes in strings.
asDateRange() Function
Returns the date range filter condition as a string for a SAQL query. The date range is inclusive. Use the string as part of a filter based on
dates.
The input data must be a one- or two-dimensional array. If the input data is a one-dimensional array with two elements, the function
uses the first element as the minimum and the second element as the maximum. Null results in fieldName in all, which applies
no filter.
Syntax
<input data>.asDateRange(fieldName)
Arguments
DescriptionArgument
(Required) The name of the date field.fieldName
14
Binding FunctionsBindings in Wave Dashboards
The following example is based on the stepFoo source step. Assume that stepFoo.selection retrieves the following rows
from the step.
[
{min: 1016504910000, max: 1281655993000}
]
Example:
row(stepFoo.selection, [0], ["min", "max"]).asDateRange("date(year, month, day)")
Output:
date(year, month, day) in [dateRange([2002,3,19], [2010,8,12])]
See also Date Range Filters.
asEquality() Function
Returns an equality or "in" filter condition as a string for a SAQL query. The input data must be a scalar, one-dimensional array, or
two-dimensional array.
If a single field name is provided, the returned string contains the in operator for a one-dimensional array (fieldName in ["foo",
"bar"]) or the equality operator for a scalar (fieldName == "foo").
If multiple field names are provided, the returned string contains a composite filter. For this case, a two-dimensional array is expected.
The number of values in each array must match the number of specified fields.
If the input to this function is null, the function returns <fieldName> by all, where <fieldName> is the first field. For example,
if cell(step1.selection, 0, "column1") evaluates to null, cell(step1.selection, 0,
"column1").asEquality("field1") evaluates to 'field1' by all, which applies no filter.
Syntax
<input data>.asEquality(fieldName)
Arguments
DescriptionArgument
(Required) The name of the field.fieldName
The following examples are based on the myStep source step. Assume that myStep.selection retrieves the following rows
from the step.
[
{grouping: "first", measure: 19}
{grouping: "second", measure: 32}
]
Example:
cell(myStep.selection, 1, "measure").asEquality("bar")
15
Binding FunctionsBindings in Wave Dashboards

Output:
bar == 32
Example:
column(myStep.selection, ["grouping"]).asEquality("bar")
Output:
bar in ["first","second"]
See also Equality Filters.
asGrouping() Function
Returns a grouping as a string for a SAQL query.
The input data must be a scalar or one-dimensional array of groupings. Null results in a group by all.
Syntax
<input data>.asGrouping()
The following example is based on the stepFoo source step. Assume that stepFoo.selection retrieves the following rows
from the step.
[
{grouping: "first", alias: "foo"}
{grouping: "second", alias: "bar"}
]
Example:
cell(stepFoo.selection, 1, "grouping").asGrouping()
Output:
'second'
Example:
column(stepFoo.selection, ["grouping"]).asGrouping()
Output:
('first', 'second')
See also Group Bindings.
asObject() Function
Passes data through with no serialization. Returns data as an object (an array of strings).
16
Binding FunctionsBindings in Wave Dashboards
Syntax
<input data>.asObject()
Example:
column(StaticMeasureNamesStep.selection, [\"value\"]).asObject()
For an application of this function in a bindings use case, see Binding Parts of a Step Query.
Example:
cell(static_1.selection, 0, \"value\").asObject()
asOrder() Function
Returns the sort order as a string for a SAQL query.
The input data must be a scalar, one-dimensional array, or two-dimensional array. A two-dimensional array is treated as a tuple of
bindings.
Syntax
<input data>.asOrder()
The following example is based on the stepFoo source step. Assume that stepFoo.selection retrieves the following rows
from the step.
[
{order: "first", direction: "desc"}
{order: "second", direction: "asc"}
]
Example:
cell(stepFoo.selection, 1, "order").asOrder()
Output:
'second'
Example:
column(stepFoo.selection, ["order"]).asOrder()
Output:
('first', 'second')
Example:
row(stepFoo.selection, [], ["order", "direction"]).asOrder()
17
Binding FunctionsBindings in Wave Dashboards
Output:
('first' desc, 'second' asc)
See also Order Bindings.
asProjection() Function
Returns the query expression and alias as a string that you can use to project a field in a step. The query expression determines the value
of the field. The alias is the field label.
Returns the query expression and alias as a string that you can use to project a field in a step. The query expression determines the value
of the field. The alias is the field label.
Syntax
<input data>.asProjection()
The following example is based on the stepFoo source step. Assume that stepFoo.selection retrieves the following rows
from the step.
[
{expression: "first", alias: "foo"}
{expression: "second", alias: "bar"}
]
Example:
stepFoo.selection, [0], ["expression", "alias"]).asProjection()
Output:
first as 'foo'
Example:
stepFoo.selection, [], ["expression", "alias"]).asProjection()
Output:
first as 'foo', second as 'bar'
See also Projection Bindings.
asRange() Function
Returns a range filter condition as a string for a SAQL query. The range is inclusive.
The input data must be a one-dimensional array with at least two elements. The function uses the first as the minimum and the second
as the maximum. null results in fieldName by all, which applies no filter.
Syntax
<input data>.asRange(fieldName)
18
Binding FunctionsBindings in Wave Dashboards
Arguments
DescriptionArgument
(Required) The name of the field.fieldName
The following example is based on the myStep source step. Assume that myStep.selection retrieves the following rows from
the step.
[
{grouping: "first", measure: 19}
{grouping: "second", measure: 32}
]
Example:
row(myStep.selection, [0], ["min", "max"]).asRange("bar")
Output:
bar >= 19 && bar <= 32
See also Range Filters.
asString() Function
Serializes a scalar, one-dimensional array, or two-dimensional array as a string. Escapes double quotes in strings.
Syntax
<input data>.asString()
Example:
cell(stepOpportunity.selection, 1, "measure").asString()
Example:
cell(color_1.result, 0, "color").asString()
For an application of this function in a bindings use case, see Highlight Values with Color Coding.
Binding Errors
If you create an invalid binding in a Wave designer dashboard, the widget that uses the binding displays an error in the dashboard.
Generally, there are two types of errors.
19
Binding ErrorsBindings in Wave Dashboards
Validation errors
These errors occur when Wave is unable to parse the binding due to the wrong syntax or illegal arguments used in your bindings.
Another typical issue is that you didn’t escape double quotes when they are inside other double quotes. For example, notice how
the inner set of double quotes is escaped.
"numberColor": "{{cell(color_1.result, 0, \"color\").asString()}}"
A validation error also occurs if you use the wrong syntax for a values table step, where the step type is grain. You must use the
old binding syntax. For more information about the old syntax, see Bindings in Classic Designer Dashboards.
Execution errors
These errors occur when Wave executes the binding and either the expected columns or rows are missing or the data is in the wrong
shape. For example, the binding received a row, when it expected a cell.
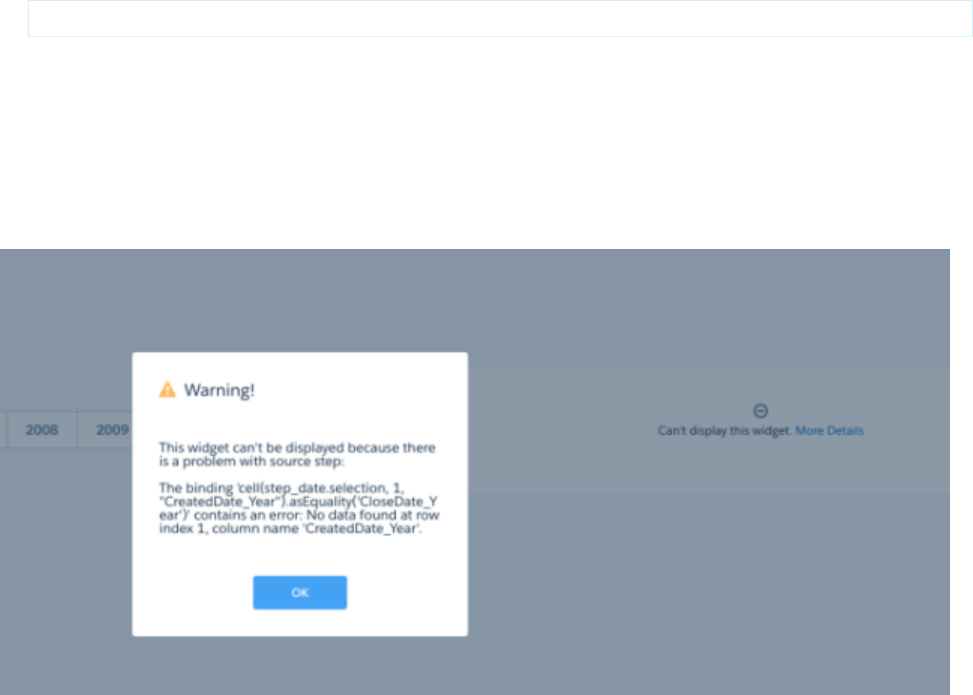
Review error messages to understand how to resolve binding issues. For example, here’s an example of a bindings error in a dashboard.
Use Cases
To help you better understand how to build bindings using functions, take a look at these different binding use cases.
Binding Parts of a Step Query
You can dynamically set parts of a step query based on the selection or results of another step. For example, you can set the grouping
in a step based on the grouping selected in a chart.
Bindings Steps from Different Datasets
You can bind steps from different datasets. For example, the following dashboard contains two charts, each based on its own dataset.
Binding a Static Step with Other Steps
You can create static steps to specify your own values for a step, instead of getting values from a query. For example, you might
create a static step to show “Top 5 Customers” and “Bottom 5 Customers” in a toggle widget. After you create the static step, to
make it interact with the other widgets in the dashboard, manually bind the static step to the steps of the other widgets.
20
Use CasesBindings in Wave Dashboards
Binding Widget Properties
In a Wave designer dashboard only, you can implement bindings to dynamically change properties for number or chart widgets.
Binding Parts of a Step Query
You can dynamically set parts of a step query based on the selection or results of another step. For example, you can set the grouping
in a step based on the grouping selected in a chart.
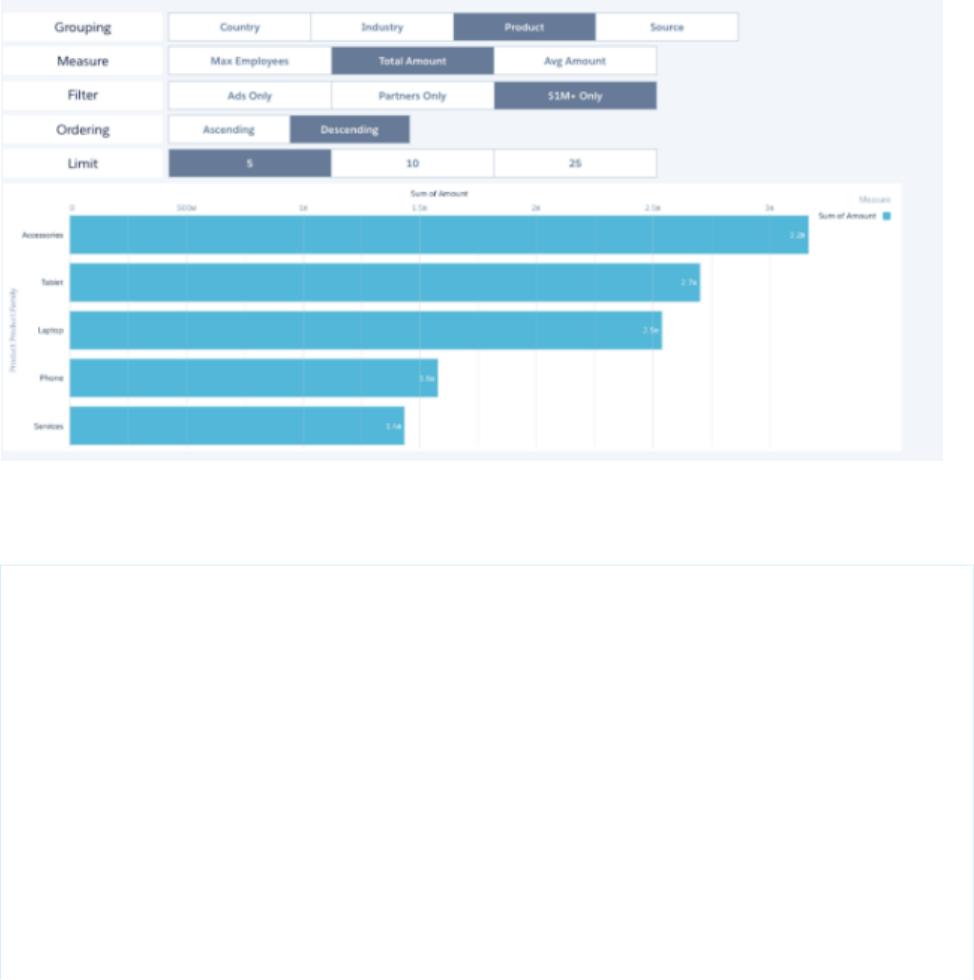
Before we discuss how to bind the different parts of the query, let’s look at a comprehensive example to illustrate what the bindings
look like for different parts of a query. In the following example, the chart is bound based on selections for grouping, measure, filter,
order, and limit. When you make a selection in one of the toggle widgets, the chart morphs to visualize the results of the modified query.
Here’s the JSON for the steps that power this dashboard. The Account_BillingCount_1 step is the underlying step for the chart widget.
This step contains multiple bindings based on other steps.
"steps": {
"Account_BillingCount_1": {
"datasets": [
{
"id": "0FbB00000000oEkKAI",
"label": "Opportunities",
"name": "opportunity",
"url": "/services/data/v38.0/wave/datasets/0FbB00000000oEkKAI"
}
],
"isFacet": true,
"isGlobal": false,
"query": {
"measures": "{{column(StaticMeasureNames.selection,
[\"value\"]).asObject()}}",
"limit": "{{column(StaticLimits.selection, [\"value\"]).asObject()}}",
21
Use CasesBindings in Wave Dashboards

"groups": "{{column(StaticGroupingNames.selection,
[\"value\"]).asObject()}}",
"filters": "{{column(StaticFilters.selection, [\"value\"]).asObject()}}",
"order": "{{column(StaticOrdering.selection, [\"value\"]).asObject()}}"
},
"selectMode": "single",
"type": "aggregateflex",
"useGlobal": true,
"visualizationParameters": {
"visualizationType": "hbar",
"options": {}
}
},
"StaticGroupingNames": {
"datasets": [],
"dimensions": [],
"isFacet": true,
"isGlobal": false,
"selectMode": "single",
"start": {
"display": [
"Country"
]
},
"type": "staticflex",
"useGlobal": true,
"values": [
{
"display": "Country",
"value": "Account.BillingCountry"
},
{
"display": "Industry",
"value": "Account.Industry"
},
{
"display": "Product",
"value": "Product.Product.Family"
},
{
"display": "Source",
"value": "Account.AccountSource"
}
],
"visualizationParameters": {
"options": {}
}
},
"StaticFilters": {
"datasets": [],
"dimensions": [],
"isFacet": true,
22
Use CasesBindings in Wave Dashboards

"isGlobal": false,
"selectMode": "single",
"start": {
"display": "Ads Only"
},
"type": "staticflex",
"useGlobal": true,
"values": [
{
"display": "Ads Only",
"value": [
"LeadSource",
[
"Advertisement"
],
"in"
]
},
{
"display": "Partners Only",
"value": [
"Account.Type",
[
"Partner"
],
"in"
]
},
{
"display": "$1M+ Only",
"value": [
"Amount",
[
[
1000000,
11921896
]
],
">=<="
]
}
],
"visualizationParameters": {
"options": {}
}
},
"StaticOrdering": {
"datasets": [],
"dimensions": [],
"isFacet": true,
"isGlobal": false,
"selectMode": "single",
"start": {
"display": "Ads Only"
23
Use CasesBindings in Wave Dashboards

},
"type": "staticflex",
"useGlobal": true,
"values": [
{
"display": "Ascending",
"value": [
-1,
{
"ascending": true
}
]
},
{
"display": "Descending",
"value": [
-1,
{
"ascending": false
}
]
}
],
"visualizationParameters": {
"options": {}
}
},
"StaticLimits": {
"datasets": [],
"dimensions": [],
"isFacet": true,
"isGlobal": false,
"selectMode": "single",
"start": {
"display": [
"5"
]
},
"type": "staticflex",
"useGlobal": true,
"values": [
{
"display": "5",
"value": 5
},
{
"display": "10",
"value": 10
},
{
"display": "25",
"value": 25
}
],
24
Use CasesBindings in Wave Dashboards

"visualizationParameters": {
"options": {}
}
},
"StaticMeasureNames": {
"datasets": [],
"dimensions": [],
"isFacet": true,
"isGlobal": false,
"selectMode": "singlerequired",
"start": {
"display": [
"Total Amount"
]
},
"type": "staticflex",
"useGlobal": true,
"values": [
{
"display": "Max Employees",
"value": [
"max",
"Account.NumberOfEmployees"
]
},
{
"display": "Total Amount",
"value": [
"sum",
"Amount"
]
},
{
"display": "Avg Amount",
"value": [
"avg",
"Amount"
]
}
],
"visualizationParameters": {
"options": {}
}
},
"Account_AccountSourc_1": {
"datasets": [
{
"id": "0FbB00000000oEkKAI",
"label": "Opportunities",
"name": "opportunity",
"url": "/services/data/v38.0/wave/datasets/0FbB00000000oEkKAI"
}
],
"isFacet": true,
25
Use CasesBindings in Wave Dashboards

"isGlobal": false,
"query": {
"measures": [
[
"count",
"*"
]
],
"groups": [
"Account.AccountSource"
],
"order": [
[
-1,
{
"ascending": false
}
]
]
},
"type": "aggregateflex",
"useGlobal": true,
"visualizationParameters": {
"visualizationType": "hbar",
"options": {}
}
}
},
"widgetStyle": {
"backgroundColor": "#FFFFFF",
"borderColor": "#E6ECF2",
"borderEdges": [],
"borderRadius": 0,
"borderWidth": 1
}
Measure Bindings
You can select which measures to show in a widget. For example, you can show different measures in a dashboard based on selection
in a toggle widget. Determine measures in a step query based on the selection in a static step.
Filter Bindings
You can create different types of filters in a SAQL query. The following sections walk you through some example filters that use
different types of bindings.
Projection Bindings
Use the asProjection() serialization function to specify the projection of a field in a SAQL query.
Group Bindings
Use the asGrouping() serialization function to bind groupings in a SAQL query or compact-form query.
Order Bindings
Use the asOrder() serialization function to specify the sort order in a SAQL query.
Limit and Offset Bindings
You can also bind the limit and offset of a SAQL query. These bindings don’t require data serialization functions.
26
Use CasesBindings in Wave Dashboards
Bindings in Compact-Form Queries Versus SAQL Queries
Bindings can be used both in compact-form queries and SAQL queries. If you bind a measure or group in a SAQL query step, you
must define the binding in two places: in the measures and groups fields as well as in the pigql field.
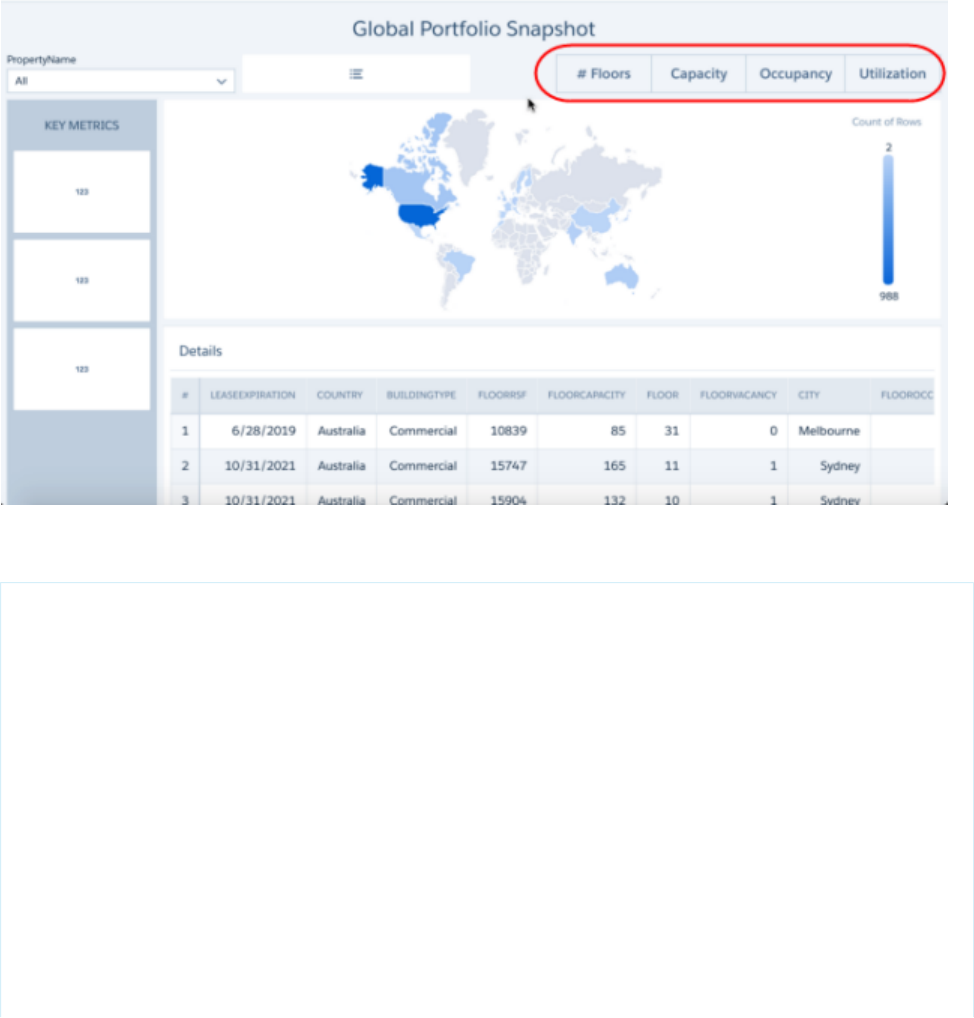
Measure Bindings
You can select which measures to show in a widget. For example, you can show different measures in a dashboard based on selection
in a toggle widget. Determine measures in a step query based on the selection in a static step.
Let’s look at an example.
The toggle widget uses the following step.
"static_1": {
"datasets": [],
"dimensions": [],
"isFacet": false,
"isGlobal": false,
"selectMode": "single",
"type": "staticflex",
"useGlobal": false,
"values": [{
"display": "# Floors",
"value": [
"count",
"*"
]
}, {
"display": "Capacity",
"value": [
"sum",
27
Use CasesBindings in Wave Dashboards

"FloorCapacity"
]
}, {
"display": "Occupancy",
"value": [
"sum",
"Occupied"
]
}, {
"display": "Utilization",
"value": [
"sum",
"FloorVacancy"
]
}],
"visualizationParameters": {
"options": {}
}
}
The measures attribute of the COUNTRY_1 step is bound to the static_1 step. Any selection in the static step passes the
aggregation method (like sum or count) and the measure field (like Occupied or FloorCapacity).
"COUNTRY_1": {
"datasets": [{
"id": "0FbB00000000qwyKAA",
"label": "Serraview Floor Metrics",
"name": "Serraview_Floor_Metrics",
"url": "/services/data/v38.0/wave/datasets/0FbB00000000qwyKAA"
}],
"isFacet": true,
"isGlobal": false,
"query": {
"measures": ["{{cell(static_1.selection, 0, \"value\").asObject()}}"],
"groups": [
"COUNTRY"
]
},
"selectMode": "single",
"type": "aggregateflex",
"useGlobal": true,
"visualizationParameters": {
"visualizationType": "hbar",
"options": {}
}
}
The map widget is based on the COUNTRY_1 step.
"chart_1": {
"parameters": {
"legend": {
"showHeader": true,
"show": true,
"position": "right-top",
28
Use CasesBindings in Wave Dashboards

"inside": false
},
"highColor": "#1674D9",
"lowColor": "#C5DBF7",
"visualizationType": "choropleth",
"step": "COUNTRY_1",
"theme": "wave",
"exploreLink": true,
"trellis": {
"enable": false,
"type": "x",
"chartsPerLine": 4
},
"title": {
"label": "",
"align": "center",
"subtitleLabel": ""
},
"map": "World Countries"
},
"type": "chart"
}
Filter Bindings
You can create different types of filters in a SAQL query. The following sections walk you through some example filters that use different
types of bindings.
Equality Filters
Use the asEquality() serialization function to bind filters based on equality.
Non-Equality Filters
Use a combination of non-equality filters and SAQL comparison operators to create filters based on more complex bindings.
Range Filters
Use the asRange() serialization function to bind filters based on numeric ranges.
Date Range Filters
Use the asDateRange() serialization function to bind filters based on date ranges. You can create filters using absolute or
relative date ranges.
Equality Filters
Use the asEquality() serialization function to bind filters based on equality.
Let's say you have the following results from the source step.
[
{grouping: "first", measure: 19}
{grouping: "second", measure: 32}
]
29
Use CasesBindings in Wave Dashboards
You can bind a filter using the asEquality() binding function. The following filter condition determines whether the returned
value equals “bar.”
q = filter q by {{cell(stepFoo.selection, 1, "measure").asEquality("bar")}};
After evaluating the binding based on the data returned from the source step, Wave produces the following filter.
q = filter q by bar == 32;
The following filter condition determines if any value in the “grouping” column equals “bar.”
q = filter q by {{column(stepFoo.selection, ["grouping"]).asEquality("bar")}};
After evaluating the binding, the filter becomes:
q = filter q by bar in ["first","second"];
Non-Equality Filters
Use a combination of non-equality filters and SAQL comparison operators to create filters based on more complex bindings.
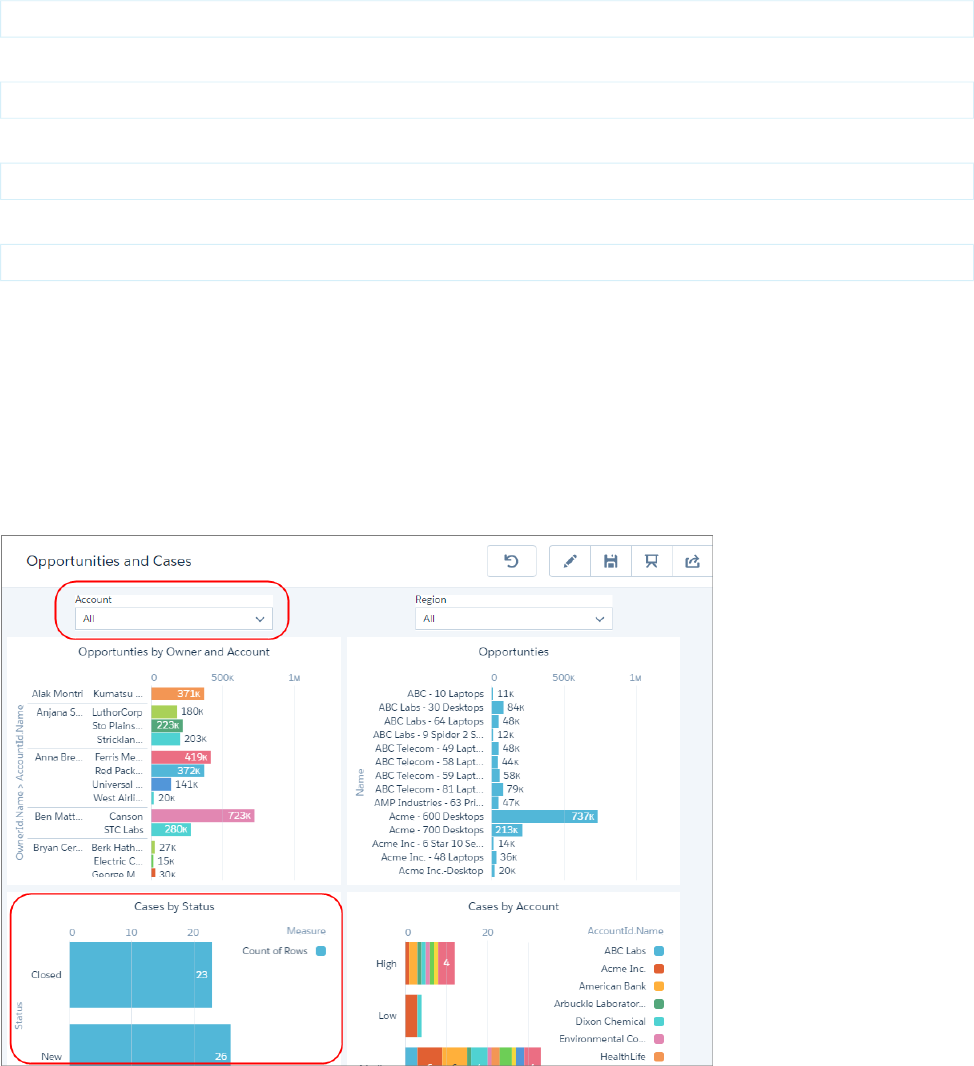
Compact-Form Step Example
Let’s say you want to filter the Case by Status widget in the following dashboard based on the account selected in the Account list
widget.
Faceting doesn’t work in this case because the steps of these widgets are based on different datasets. To enable filtering, create a binding
in the Cases by Status widget’s step (Status_1) based on the selection in the Account widget’s step (AccountId_Name_1). This
30
Use CasesBindings in Wave Dashboards

binding compares the value of the AccountId.Name field in the Status_1 step to the selected value in the AccountId.Name
field of the AccountId_Name_1 step.
"steps": {
"Status_1": {
"datasets": [{
"id": "0FbB00000000rlDKAQ",
"label": "CasesAccounts",
"name": "CasesAccounts",
"url": "/services/data/v38.0/wave/datasets/0FbB00000000rlDKAQ"
}],
"isFacet": true,
"isGlobal": false,
"query": {
"measures": [
[
"count",
"*"
]
],
"groups": [
"Status"
],
"filters": [
[
"AccountId.Name",
"{{column(AccountId_Name_1.selection, [\"AccountId.Name\"]).asObject()}}",
"in"
]
]
},
"type": "aggregateflex",
"useGlobal": true,
"visualizationParameters": {
"visualizationType": "hbar",
"options": {}
}
},
"AccountId_Name_1": {
"datasets": [{
"id": "0FbB00000000rlIKAQ",
"label": "OpptiesAccountsSICsUsers",
"name": "OpptiesAccountsSICsUsers",
"url": "/services/data/v38.0/wave/datasets/0FbB00000000rlIKAQ"
}],
"isFacet": true,
"isGlobal": false,
"query": {
"measures": [
[
"count",
"*"
]
],
31
Use CasesBindings in Wave Dashboards

"groups": [
"AccountId.Name"
]
},
"selectMode": "single",
"type": "aggregateflex",
"useGlobal": false,
"visualizationParameters": {
"options": {}
}
}
...
SAQL-Form Step Example
For example, let's say you have the following results from a source step.
[ {grouping: "first", measure: 19} {grouping: "second", measure: 32} ]
You can create a filter binding using on a non-equality operator.
q = filter q by bar > {{cell(stepFoo.selection, 1, "measure").asString()}};
After evaluating the binding, the filter becomes:
q = filter q by bar > 32;
You can also use other SAQL comparison operators, like matches.
q = filter q by bar matches "{{cell(stepFoo.selection, 1, "grouping").asString()}}";
After evaluating the binding, the filter results to this.
q = filter q by bar matches "second";
Range Filters
Use the asRange() serialization function to bind filters based on numeric ranges.
Let’s look at some examples with inclusive ranges.
The source step for a binding produces the following results.
[ {grouping: "first", measure: 19} {grouping: "second", measure: 32} ]
You can bind the filter using the following syntax.
q = filter q by {{row(stepFoo.selection, [0], ["min", "max"]).asRange("bar")}};
After evaluating the binding, Wave produces the following range filter.
q = filter q by bar >= 19 && bar <= 32;
Date Range Filters
Use the asDateRange() serialization function to bind filters based on date ranges. You can create filters using absolute or relative
date ranges.
32
Use CasesBindings in Wave Dashboards

If the input data is a one-dimensional array with two elements:
•If both elements are numbers, Wave assumes the numbers are a epoch times. [1016504910000, 1016504910000] results
in fieldName in [dateRange([2002,3,19], [2010,8,12])].
•Otherwise, the first element is used as the minimum and the second element is used as the maximum. ["current day", "1
month ahead"] results in fieldName in ["current day".."1 month ahead"]. If one of the elements is null,
the date range is open-ended. ["1 month ago", null] results in fieldName in ["1 month ago"..].
If the input data is a two-dimensional array where the outer array has two elements:
•If both nested arrays have two elements, Wave assumes the data is in the relative date array format. [["year", -2], ["year",
1]] results in fieldName in ["2 years ago".."1 year ahead"]. If both nested arrays have 3 elements, the
nested arrays are passed to the SAQL dateRange() function. [[2015, 2, 1], [2016, 2, 1]] results in fieldName
in [dateRange([2015,2,1], [2016,2,1])].
If the input data is null will result in fieldName in all, which doesn’t filter anything.
Binding to a Date Filter Widget
For instance, let’s say you make a selection in a date widget that returns the following absolute date range (in epoch format).
[ {min: 1016504910000, max: 1281655993000} ]
You can create a filter using the returned selection data.
q = filter q by {{row(stepFoo.selection, [0], ["min", "max"]).asDateRange("date(year,
month, day)")}};
After evaluating the binding, Wave produces the following date range filter.
q = filter q by date(year, month, day) in [dateRange([2002,3,19], [2010,8,12])];
What about relative dates? Assume the date widget returns the following relative dates based on your selection.
[ {min: ["quarter", -2], max: ["quarter", 3]} ]
After evaluation, the following date range filter results.
q = filter q by date(year, month, day) in ["2 quarters ago".."3 quarters ahead"];
Binding to a Custom List of Date Ranges
It’s common to filter based on a custom set of date ranges. To accomplish this, create a static step with rows for each custom date range.
You can specify ranges using absolute or relative dates.
To do this with absolute ranges, the results of the static step must return absolute dates.
[
{label: "8/30/15 - 8/30/16", range: [[2015, 8, 30], [2016, 8, 30]]}
{label: "7/30/16 - 8/30/16", range: [[2016, 7, 30], [2016, 8, 30]]}
]
You can create the filter based on the selected value of the source step.
q = filter q by {{cell(stepFoo.selection, 0, "range").asDateRange("date(year, month,
day)")}};
33
Use CasesBindings in Wave Dashboards

After Wave evaluates the binding, the filter becomes this.
q = filter q by date(year, month, day) in [dateRange([2015, 8, 30], [2016, 8, 30])];
To do this with relative ranges, the source step’s results must look like this.
[
{"label": "YTD", "range": ["1 year ago", "current day"]}
{"label": "MTD", "range": ["1 month ago", "current day"]}
{"label": "Everything up to today", "range": [null, "current day"]}
]
You can use the following binding to create a filter based on the selected value of the source step.
q = filter q by {{cell(stepFoo.selection, 0, "range").asDateRange("date(year, month,
day)")}};
After Wave evaluates the binding, the filter becomes:
q = filter q by date(year, month, day) in ["1 year ago".."current day"];
You can also create an open-ended range filter by specifying null as one of the relative date keywords in the source step. The bound
filter looks like this.
q = filter q by {{cell(stepFoo.selection, 2, "range").asDateRange("date(year, month,
day)")}};
After Wave evaluates the binding, the filter becomes:
q = filter q by date(year, month, day) in [.."current day"];
Projection Bindings
Use the asProjection() serialization function to specify the projection of a field in a SAQL query.
Given the following data from a source step:
[
{expression: "first", alias: "foo"}
{expression: "second", alias: "bar"}
]
You can bind the projection of a field in a target step.
q = foreach q generate {{row(stepFoo.selection, [0], ["expression",
"alias"]).asProjection()}};
After Wave evaluates the binding, the projection becomes:
q = foreach q generate first as 'foo';
To return all rows in the binding, create the following filter.
q = foreach q generate {{row(stepFoo.selection, [], ["expression",
"alias"]).asProjection()}};
After Wave evaluates the binding, the filter becomes:
q = foreach q generate first as 'foo', second as 'bar';
34
Use CasesBindings in Wave Dashboards

Group Bindings
Use the asGrouping() serialization function to bind groupings in a SAQL query or compact-form query.
Let’s look at examples where the selection in a toggle widget determines the groupings in a step query.
Given the following data from a source step:
[ {grouping: "first", alias: "foo"} {grouping: "second", alias: "bar"} ]
Apply the following grouping to the target step.
q = group q by {{cell(stepFoo.selection, 1, "grouping").asGrouping()}};
After Wave evaluates the binding, the grouping becomes:
q = group q by 'second';
To make the binding return multiple fields for the grouping, apply the following grouping logic.
q = group q by {{column(stepFoo.selection, ["grouping"]).asGrouping()}};
After Wave evaluates the binding, the grouping becomes:
q = group q by ('first', 'second');
Order Bindings
Use the asOrder() serialization function to specify the sort order in a SAQL query.
Let’s look at an example where the selection in a toggle widget determines the sort order in a step’s SAQL query.
Given the following data from a source step:
[
{order: "first", direction: "desc"}
{order: "second", direction: "asc"}
]
To order by a single field, apply the following order logic. When you don’t specify the direction in the query, the default is ascending.
q = order q by {{cell(stepFoo.selection, 1, "order").asOrder()}};
After Wave evaluates the binding, the grouping becomes:
q = order q by 'second';
To order by multiple fields, use the following grouping logic.
q = order q by {{column(stepFoo.selection, ["order"]).asOrder()}};
After Wave evaluates the binding, the grouping becomes:
q = order q by ('first', 'second');
To specify the order and the direction, use the following grouping logic.
q = order q by {{row(stepFoo.selection, [], ["order", "direction"]).asOrder()}};
After Wave evaluates the binding, the grouping becomes:
q = order q by ('first' desc, 'second' asc);
35
Use CasesBindings in Wave Dashboards

Limit and Offset Bindings
You can also bind the limit and offset of a SAQL query. These bindings don’t require data serialization functions.
Consider a source step that provides the following data.
[ {limit: 100, offset: 10} ]
To bind the limit and offset, create the following logic.
q = limit q {{cell(stepFoo.selection, 0, "limit").asString()}};
q = offset q {{cell(stepFoo.selection, 0, "offset").asString()}};
After Wave evaluates the binding, the limit and offset become:
q = limit q 100; q = offset q 10;
For information about limits and offsets, see the Wave Analytics SAQL Reference.
Bindings in Compact-Form Queries Versus SAQL Queries
Bindings can be used both in compact-form queries and SAQL queries. If you bind a measure or group in a SAQL query step, you must
define the binding in two places: in the measures and groups fields as well as in the pigql field.
Here’s an example where parts of a SAQL query are bound to other steps. Notice that the bindings are defined in two places for measures
and groups.
"steps": {
"StaticSAQLGroupingNames": {
"datasets": [],
"dimensions": [],
"isFacet": true,
"isGlobal": false,
"selectMode": "multirequired",
"start": {
"display": [ "Country" ]
},
"type": "staticflex",
"useGlobal": true,
"values": [
{
"display": "Country",
"value": "Account.BillingCountry",
"expression": "'Account.BillingCountry'",
"alias": "Account.BillingCountry"
},
{
"display": "Industry",
"value": "Account.Industry",
"expression": "'Account.Industry'",
"alias": "Account.Industry"
},
{
"display": "Product",
"value": "Product.Product.Family",
"expression": "'Product.Product.Family'",
"alias": "Product.Product.Family"
36
Use CasesBindings in Wave Dashboards

},
{
"display": "Source",
"value": "Account.AccountSource",
"expression": "'Account.AccountSource'",
"alias": "Account.AccountSource"
}
],
"visualizationParameters": {
"options": {}
}
},
"StaticSAQLMeasureNames": {
"datasets": [],
"dimensions": [],
"isFacet": true,
"isGlobal": false,
"selectMode": "singlerequired",
"start": {
"display": [ "Total Amount" ]
},
"type": "staticflex",
"useGlobal": true,
"values": [
{
"display": "Max Employees",
"cf": [
"max",
"Account.NumberOfEmployees"
],
"expression": "max('Account.NumberOfEmployees')",
"alias": "max_Account.NumberOfEmployees"
},
{
"display": "Total Amount",
"cf": [
"sum",
"Amount"
],
"expression": "sum('Amount')",
"alias": "sum_Amount"
},
{
"display": "Avg Amount",
"cf": [
"avg",
"Amount"
],
"expression": "avg('Amount')",
"alias": "avg_Amount"
}
],
"visualizationParameters": {
"options": {}
37
Use CasesBindings in Wave Dashboards

}
},
"Account_BillingCount_2": {
"datasets": [
{
"id": "0FbB00000000oEkKAI",
"label": "Opportunities",
"name": "opportunity",
"url": "/services/data/v38.0/wave/datasets/0FbB00000000oEkKAI"
}
],
"isFacet": true,
"isGlobal": false,
"query": {
"pigql": "
q = load \"opportunity\";\nq = filter
q by 'Account.AccountSource' == \"Advertisement\";\n
q = group q by {{column(StaticSAQLGroupingNames.selection,
[\"value\"]).asGrouping()}};\n
q = foreach q generate
{{row(StaticSAQLGroupingNames.selection, [], [\"expression\",
\"alias\"]).asProjection()}},
{{row(StaticSAQLMeasureNames.selection, [], [\"expression\",
\"alias\"]).asProjection()}};\n
q = filter q by {{column(StaticSAQLFilters.selection,
[\"value\"]).asEquality(\"Account.BillingCountry\")}};\n
q = filter q by {{row(StaticSAQLMinRanges.selection, [0], [\"min\",
\"max\"]).asRange(\"sum_Amount\")}}; \n
q = order q by {{row(StaticSAQLOrdering.selection, [], [\"order\",
\"direction\"]).asOrder()}};",
"measures": "{{column(StaticSAQLMeasureNames.selection, [\"cf\"]).asObject()}}",
"measuresMap": {},
"groups": "{{column(StaticSAQLGroupingNames.selection, [\"value\"]).asObject()}}"
},
"type": "aggregateflex",
"useGlobal": true,
"visualizationParameters": {
"options": {}
}
}
Bindings Steps from Different Datasets
You can bind steps from different datasets. For example, the following dashboard contains two charts, each based on its own dataset.
38
Use CasesBindings in Wave Dashboards
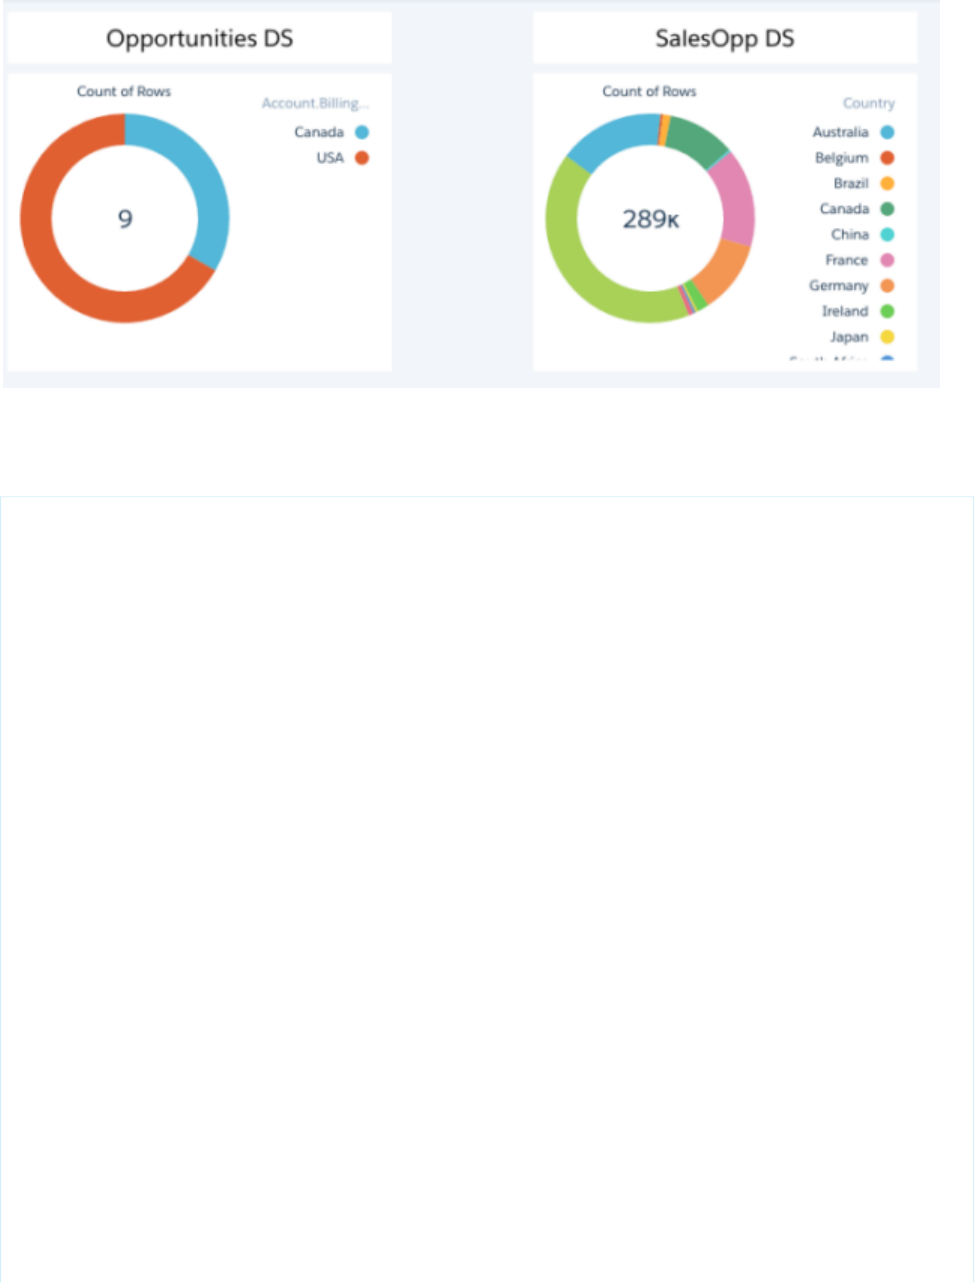
When a selection is made in the Opportunities DS chart, that selection also filters the SalesOpp DS chart because of a selection binding.
The filters attribute of the Country_1 step contains a selection binding based on the Account_BillingCount_1 step.
Here’s the dashboard JSON for the steps and chart widgets.
{
"label": "Cross-Dataset Bindings",
"state": {
"gridLayouts": [...],
"layouts": [],
"steps": {
"Account_BillingCount_1": {
"datasets": [
{
"id": "0Fbx000000000LzCAI",
"label": "Opportunities",
"name": "opportunity1",
"url": "/services/data/v38.0/wave/datasets/0Fbx000000000LzCAI"
}
],
"isFacet": true,
"isGlobal": false,
"query": {
"measures": [
[
"count",
"*"
]
],
"groups": [
"Account.BillingCountry"
]
},
"type": "aggregateflex",
"useGlobal": true,
"visualizationParameters": {
"visualizationType": "hbar",
"options": {}
39
Use CasesBindings in Wave Dashboards

}
},
"Country_1": {
"datasets": [
{
"id": "0Fbx000000000NACAY",
"label": "SalesOpps",
"name": "SalesOpps",
"url": "/services/data/v38.0/wave/datasets/0Fbx000000000NACAY"
}
],
"isFacet": true,
"isGlobal": false,
"query": {
"measures": [
[
"count",
"*"
]
],
"groups": [
"Country"
],
"filters": [
[
"Country",
"{{column(Account_BillingCount_1.selection,
[\"Account.BillingCountry\"]).asObject()}}"
]
]
},
"type": "aggregateflex",
"useGlobal": true,
"visualizationParameters": {
"visualizationType": "hbar",
"options": {}
}
}
},
"widgetStyle": {...},
"widgets": {
"text_1": {
"parameters": {
"fontSize": 20,
"text": "Opportunities DS",
"textAlignment": "center",
"textColor": "#000000"
},
"type": "text"
},
"text_2": {
"parameters": {
"fontSize": 20,
"text": "SalesOpp DS",
40
Use CasesBindings in Wave Dashboards

"textAlignment": "center",
"textColor": "#000000"
},
"type": "text"
},
"chart_2": {
"parameters": {
"legend": {
"showHeader": true,
"show": true,
"position": "right-top",
"inside": false
},
"showMeasureTitle": true,
"showTotal": true,
"visualizationType": "pie",
"step": "Country_1",
"exploreLink": true,
"inner": 70,
"title": {
"label": "",
"subtitleLabel": "",
"align": "center"
},
"theme": "wave",
"trellis": {
"enable": false,
"type": "x",
"chartsPerLine": 4
}
},
"type": "chart"
},
"chart_1": {
"parameters": {
"legend": {
"showHeader": true,
"show": true,
"position": "right-top",
"inside": false
},
"showMeasureTitle": true,
"showTotal": true,
"visualizationType": "pie",
"step": "Account_BillingCount_1",
"exploreLink": true,
"inner": 70,
"title": {
"label": "",
"subtitleLabel": "",
"align": "center"
},
"theme": "wave",
"trellis": {
41
Use CasesBindings in Wave Dashboards
"enable": false,
"type": "x",
"chartsPerLine": 4
}
},
"type": "chart"
}
}
},
"datasets": [
{
"id": "0Fbx000000000LzCAI",
"label": "Opportunities",
"name": "opportunity1",
"url": "/services/data/v38.0/wave/datasets/0Fbx000000000LzCAI"
},
{
"id": "0Fbx000000000NACAY",
"label": "SalesOpps",
"name": "SalesOpps",
"url": "/services/data/v38.0/wave/datasets/0Fbx000000000NACAY"
}
]
}
Binding a Static Step with Other Steps
You can create static steps to specify your own values for a step, instead of getting values from a query. For example, you might create
a static step to show “Top 5 Customers” and “Bottom 5 Customers” in a toggle widget. After you create the static step, to make it interact
with the other widgets in the dashboard, manually bind the static step to the steps of the other widgets.
For an example, see Measure Bindings.
Binding Widget Properties
In a Wave designer dashboard only, you can implement bindings to dynamically change properties for number or chart widgets.
Note: Chart and number widgets support binding all widget properties, except the following ones.
Unsupported Widget PropertiesWidget Type
Number •borderEdges
•borderWidth
•compact
•exploreLink
•measureField
•textAlignment
Chart •borderEdges
•borderRadius
42
Use CasesBindings in Wave Dashboards
Unsupported Widget PropertiesWidget Type
•borderWidth
•exploreLink
•measureField
Highlight Values with Color Coding
You can highlight content in a widget based on selections or results in other steps. For example, color code the values of number
widgets based on thresholds to draw attention to low and high numbers.
Change the Map Type Based on a Toggle Widget
You can dynamically change the map type based on selections in a toggle widget. For example, you can create a toggle that switches
between two different types of maps.
Dynamically Set the Reference Line and Label
You can dynamically set a reference line and its label based on a measure from a step. For example, you might want to set the
reference line to represent the sales target and then compare it against your won opportunities.
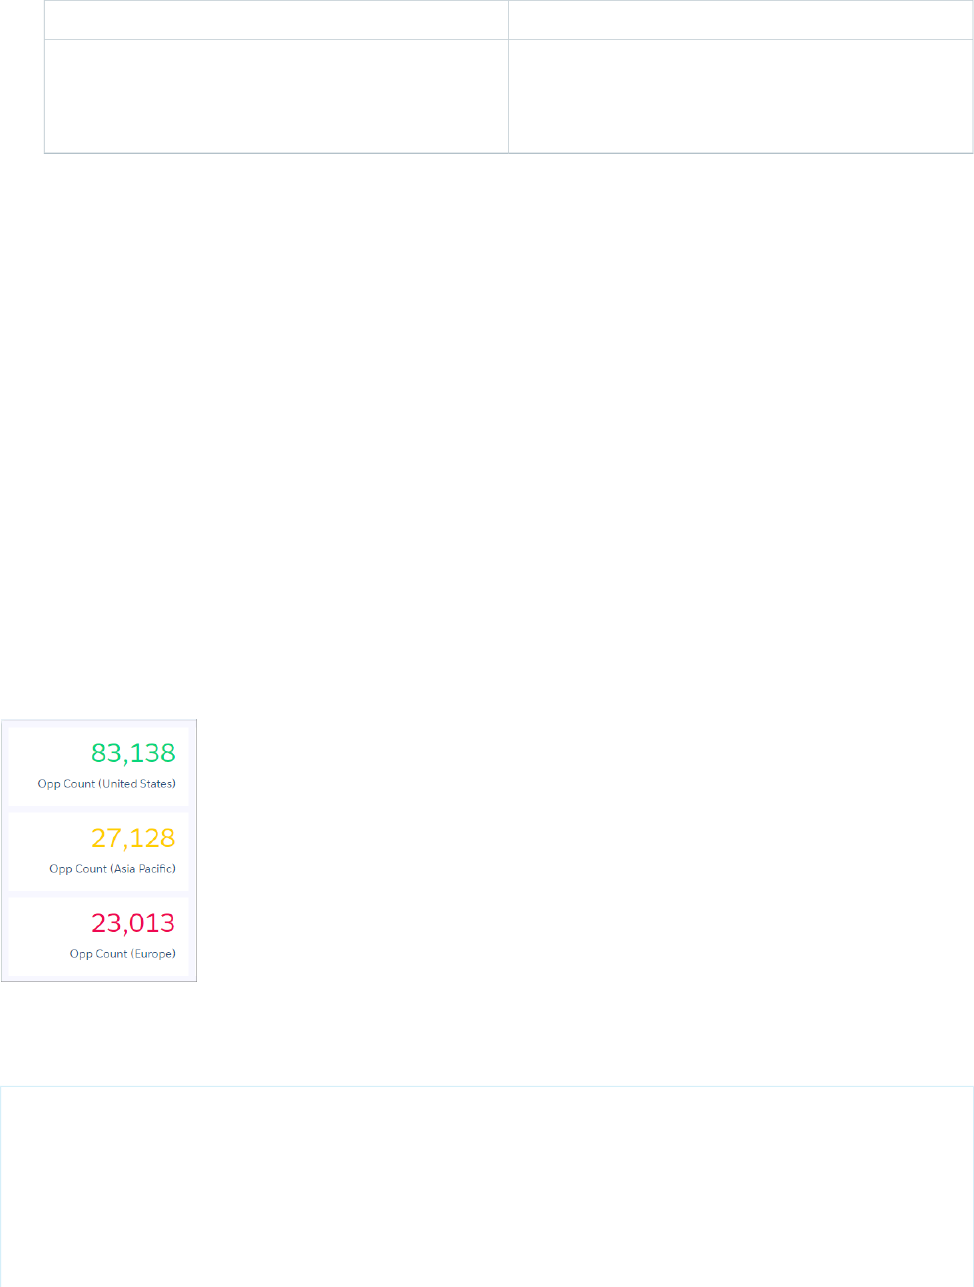
Highlight Values with Color Coding
You can highlight content in a widget based on selections or results in other steps. For example, color code the values of number widgets
based on thresholds to draw attention to low and high numbers.
Let’s say you want to change the colors of measures in three number widgets based on whether the numbers are high (green), medium
(yellow), or low (red).
In the dashboard JSON, compute the color based on the measure of each step. Then apply the computed color to the numberColor
field of each number widget.
{
"label": "Sales Overview",
"state": {
"gridLayouts": [...],
"layouts": [],
"steps": {
"color_1": {
"type": "aggregateflex",
43
Use CasesBindings in Wave Dashboards

"visualizationParameters": {
"options": {}
},
"query": {
"pigql": "q = load \"Opportunity_Dataset\";\n
q = filter q by 'Region' == \"US\";\n
q = group q by all;\n
q = foreach q generate count() as 'count',
(case when count() < 25000 then \"#EE0A50\"
when count() < 50000 then \"#F8CE00\"
else \"#0FD178\" end) as 'color';\n
q = limit q 2000;",
"measures": [ [
"count",
"*",
"count" ] ],
"groups": [ "color" ],
"measuresMap": {}
},
"isFacet": true,
"useGlobal": true,
"isGlobal": false,
"datasets": [{
"name": "Opportunity_Dataset",
"url": "/services/data/v38.0/wave/datasets/0Fbx000000000KLCAY",
"id": "0Fbx000000000KLCAY"
}]
},
"color_2": {
"type": "aggregateflex",
"visualizationParameters": {
"options": {}
},
"query": {
"pigql": "q = load \"Opportunity_Dataset\";\n
q = filter q by 'Region' == \"AP\";\n
q = group q by all;\n
q = foreach q generate count() as 'count',
(case when count() < 25000 then \"#EE0A50\"
when count() < 50000 then \"#F8CE00\"
else \"#0FD178\" end) as 'color';\n
q = limit q 2000;",
"measures": [ [
"count",
"*",
"count"
] ],
"groups": [ "color" ],
"measuresMap": {}
},
"isFacet": true,
"useGlobal": true,
"isGlobal": false,
"datasets": [{
44
Use CasesBindings in Wave Dashboards

"name": "Opportunity_Dataset",
"url": "/services/data/v38.0/wave/datasets/0Fbx000000000KLCAY",
"id": "0Fbx000000000KLCAY"
}]
},
"color_3": {
"type": "aggregateflex",
"visualizationParameters": {
"options": {}
},
"query": {
"pigql": "q = load \"Opportunity_Dataset\";\n
q = filter q by 'Region' == \"EU\";\n
q = group q by all;\n
q = foreach q generate count() as 'count',
(case when count() < 25000 then \"#EE0A50\"
when count() < 50000 then \"#F8CE00\"
else \"#0FD178\" end) as 'color';\n
q = limit q 2000;",
"measures": [ [
"count",
"*",
"count"
] ],
"groups": [ "color" ],
"measuresMap": {}
},
"isFacet": true,
"useGlobal": true,
"isGlobal": false,
"datasets": [{
"name": "Opportunity_Dataset",
"url": "/services/data/v38.0/wave/datasets/0Fbx000000000KLCAY",
"id": "0Fbx000000000KLCAY"
}]
}
},
"widgetStyle": {...},
"widgets": {
"number_5": {
"type": "number",
"parameters": {
"step": "color_1",
"measureField": "count",
"textAlignment": "right",
"compact": false,
"exploreLink": true,
"titleColor": "#335779",
"titleSize": 14,
"numberColor": "{{cell(color_1.result, 0, \"color\").asString()}}",
"numberSize": 32,
"title": "Opp Count (United States)"
}
},
45
Use CasesBindings in Wave Dashboards

"number_6": {
"type": "number",
"parameters": {
"step": "color_2",
"measureField": "count",
"textAlignment": "right",
"compact": false,
"exploreLink": true,
"titleColor": "#335779",
"titleSize": 14,
"numberColor": "{{cell(color_2.result, 0, \"color\").asString()}}",
"numberSize": 32,
"title": "Opp Count (Asia Pacific)"
}
},
"number_7": {
"type": "number",
"parameters": {
"step": "color_3",
"measureField": "count",
"textAlignment": "right",
"compact": false,
"exploreLink": true,
"titleColor": "#335779",
"titleSize": 14,
"numberColor": "{{cell(color_3.result, 0, \"color\").asString()}}",
"numberSize": 32,
"title": "Opp Count (Europe)"
}
}
}
},
"datasets": [...]
}
Change the Map Type Based on a Toggle Widget
You can dynamically change the map type based on selections in a toggle widget. For example, you can create a toggle that switches
between two different types of maps.
Let’s say you want to analyze how your company is doing both globally and specifically in the U.S. To enable this, add a toggle that
allows you to switch between showing a country map of the world and a state map of the U.S. If no selection is made in the toggle,
show the world map by default.
46
Use CasesBindings in Wave Dashboards
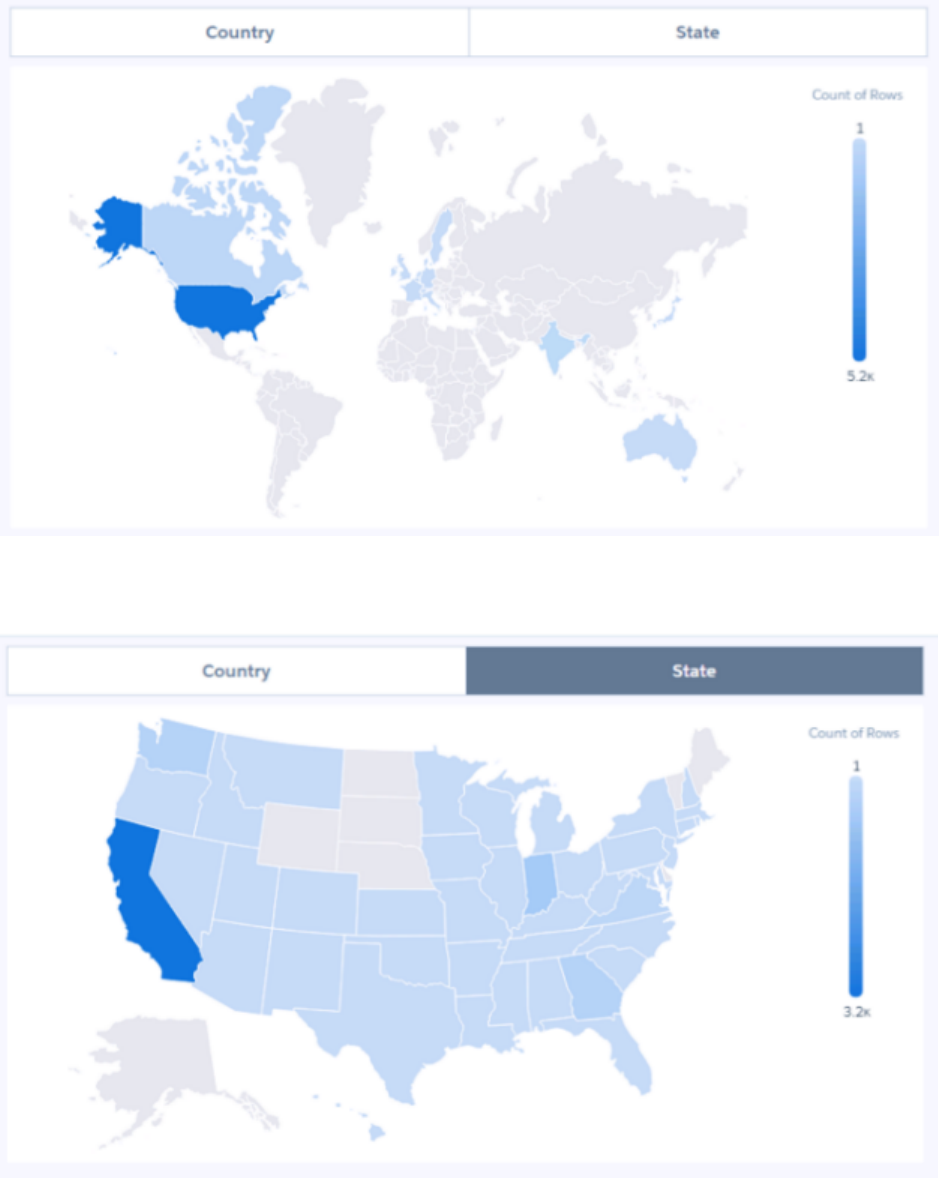
When you click the State toggle option, the dashboard shows your results for each state.
The static step (static_1) provides the "Country" and "State" values that appear in the toggle widget. The chart widget has a Map
Type property that allows you to select the type of map to display. To dynamically set the map type based on a selection in the static
47
Use CasesBindings in Wave Dashboards

step (static_1), bind the Map Type property in the step (State__c_1) of the chart widget to the static step (static_1). For
more information about maps, see Maps.
Here’s the dashboard JSON.
{
"label": "Choropleth Binding",
"state": {
"gridLayouts": [...],
"layouts": [],
"steps": {
"static_1": {
"datasets": [],
"dimensions": [],
"isFacet": false,
"isGlobal": false,
"selectMode": "single",
"type": "staticflex",
"useGlobal": false,
"values": [
{
"display": "Country",
"grouping": "Country__c",
"mapType": "World Countries"
},
{
"display": "State",
"grouping": "State__c",
"mapType": "US States"
}
],
"visualizationParameters": {
"options": {}
}
},
"State__c_1": {
"datasets": [
{
"id": "0FbB000000001uGKAQ",
"label": "GUS Roster",
"name": "Roster",
"url": "/services/data/v38.0/wave/datasets/0FbB000000001uGKAQ"
}
],
"isFacet": true,
"isGlobal": false,
"query": {
"measures": [
[
"count",
"*"
]
],
"groups": [
"{{coalesce(cell(static_1.selection, 0, \"grouping\"),
48
Use CasesBindings in Wave Dashboards

cell(static_1.result, 0, \"grouping\")).asString()}}"
]
},
"type": "aggregateflex",
"useGlobal": true,
"visualizationParameters": {
"visualizationType": "hbar",
"options": {}
}
}
},
"widgetStyle": {...},
"widgets": {
"pillbox_1": {
"parameters": {
"compact": false,
"exploreLink": false,
"step": "static_1"
},
"type": "pillbox"
},
"chart_1": {
"parameters": {
"legend": {
"showHeader": true,
"show": true,
"position": "right-top",
"inside": false
},
"highColor": "#1674D9",
"lowColor": "#C5DBF7",
"visualizationType": "choropleth",
"step": "State__c_1",
"theme": "wave",
"exploreLink": true,
"title": {
"label": "",
"align": "center",
"subtitleLabel": ""
},
"trellis": {
"enable": false,
"type": "x",
"chartsPerLine": 4
},
"map": "{{coalesce(cell(static_1.selection, 0, \"mapType\"),
cell(static_1.result, 0, \"mapType\")).asString()}}"
},
"type": "chart"
}
}
},
"datasets": [...]
}
49
Use CasesBindings in Wave Dashboards
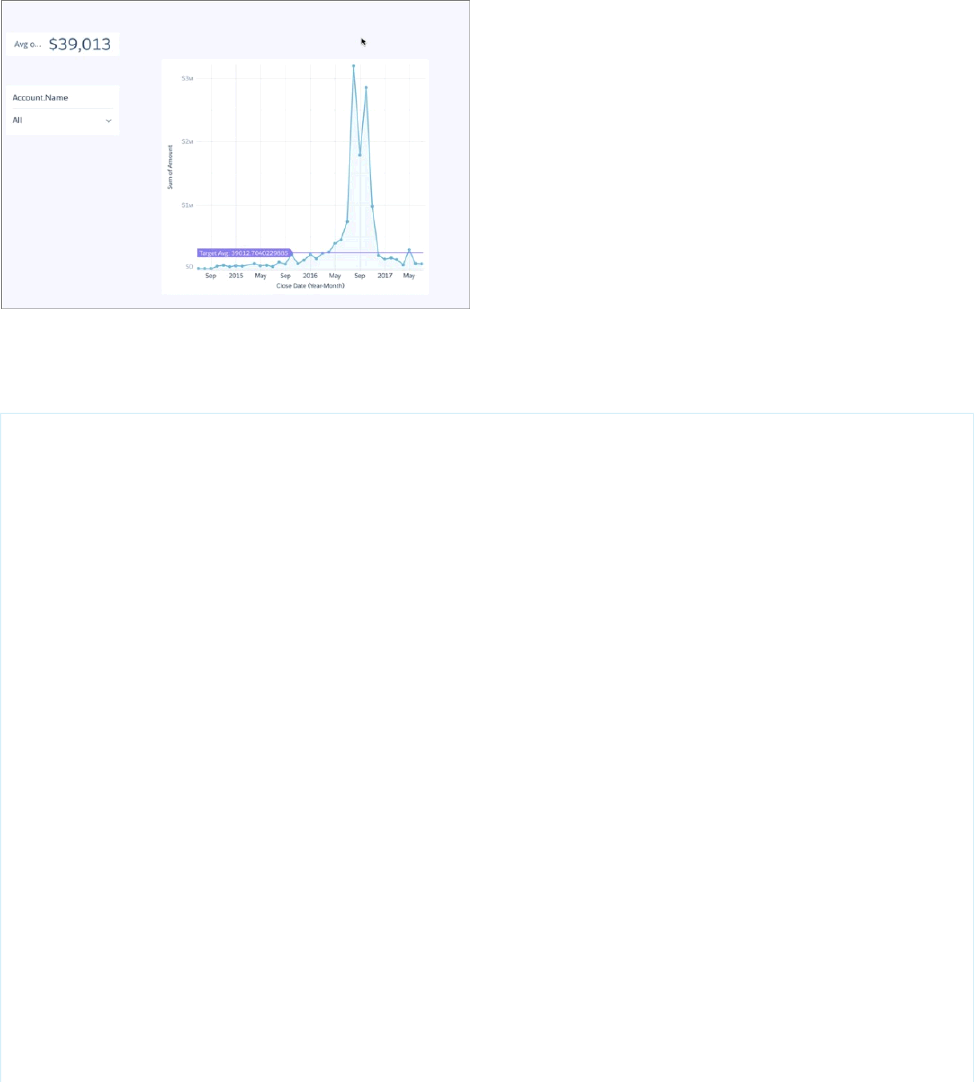
Dynamically Set the Reference Line and Label
You can dynamically set a reference line and its label based on a measure from a step. For example, you might want to set the reference
line to represent the sales target and then compare it against your won opportunities.
In the example below, let’s say you have a timeline chart that shows the total opportunity amount over time. The dashboard also contains
a list selector that allows you to show the total amount for a particular account. To compare the total for each account against the
average for all accounts, you’d like to set a reference line based on the average opportunity amount for all accounts.
To create the reference line label and its value based on the average for all accounts, add bindings in widget properties for the timeline
chart as follows.
{
"label": "Total Opportunity Amount Per Rep Vs. Average",
"state": {
"gridLayouts": [...],
"layouts": [],
"steps": {
"Account_Name_1": {
"datasets": [{
"id": "0FbB00000000pNNKAY",
"label": "Opportunities",
"name": "opportunity",
"url": "/services/data/v38.0/wave/datasets/0FbB00000000pNNKAY"
}],
"isFacet": true,
"isGlobal": false,
"query": {
"measures": [
[
"sum",
"Amount"
]
],
"groups": [
"Account.Name"
]
},
"type": "aggregateflex",
"useGlobal": true,
50
Use CasesBindings in Wave Dashboards

"visualizationParameters": {
"visualizationType": "hbar",
"options": {}
}
},
"CloseDate_Year_Close_1": {
"datasets": [{
"id": "0FbB00000000pNNKAY",
"label": "Opportunities",
"name": "opportunity",
"url": "/services/data/v38.0/wave/datasets/0FbB00000000pNNKAY"
}],
"isFacet": true,
"isGlobal": false,
"query": {
"measures": [
[
"sum",
"Amount"
]
],
"groups": [
[
"CloseDate_Year",
"CloseDate_Month"
]
]
},
"type": "aggregateflex",
"useGlobal": true,
"visualizationParameters": {
"visualizationType": "time",
"options": {}
}
},
"Amount_1": {
"datasets": [{
"id": "0FbB00000000pNNKAY",
"label": "Opportunities",
"name": "opportunity",
"url": "/services/data/v38.0/wave/datasets/0FbB00000000pNNKAY"
}],
"isFacet": true,
"isGlobal": false,
"query": {
"measures": [
[
"avg",
"Amount"
]
]
},
"type": "aggregateflex",
"useGlobal": true,
51
Use CasesBindings in Wave Dashboards

"visualizationParameters": {
"visualizationType": "hbar",
"options": {}
}
}
},
"widgetStyle": {
"backgroundColor": "#FFFFFF",
"borderColor": "#E6ECF2",
"borderEdges": [],
"borderRadius": 0,
"borderWidth": 1
},
"widgets": {
"number_1": {
"parameters": {
"compact": false,
"exploreLink": true,
"measureField": "avg_Amount",
"numberColor": "#335779",
"numberSize": 32,
"step": "Amount_1",
"textAlignment": "right",
"titleColor": "#335779",
"titleSize": 16
},
"type": "number"
},
"listselector_1": {
"parameters": {
"compact": false,
"expanded": true,
"exploreLink": false,
"instant": true,
"measureField": "sum_Amount",
"step": "Account_Name_1",
"title": "Account.Name"
},
"type": "listselector"
},
"chart_3": {
"parameters": {
"fillArea": true,
"showPoints": true,
"legend": {
"showHeader": true,
"show": true,
"position": "right-top",
"inside": false
},
"measureAxis1": {
"showZero": true,
"showTitle": true,
"referenceLine": {
52
Use CasesBindings in Wave Dashboards

"color": "#9271E8",
"label": "Target Avg: {{cell(Amount_1.result, 0, \"avg_Amount\").asString()}}",
"value": "{{cell(Amount_1.result, 0, \"avg_Amount\").asString()}}"
},
"showAxis": true,
"title": ""
},
"visualizationType": "time",
"missingValue": "connect",
"theme": "wave",
"step": "CloseDate_Year_Close_1",
"timeAxis": {
"showTitle": true,
"showAxis": true,
"title": ""
},
"exploreLink": true,
"title": {
"label": "",
"align": "center",
"subtitleLabel": ""
},
"trellis": {
"enable": false,
"type": "x",
"chartsPerLine": 4
}
},
"type": "chart"
}
}
},
"datasets": [{
"id": "0FbB00000000pNNKAY",
"label": "Opportunities",
"name": "opportunity",
"url": "/services/data/v38.0/wave/datasets/0FbB00000000pNNKAY"
}]
}
Bindings in Classic Designer Dashboards
Unlike the Wave dashboard designer, the classic designer treats selection and results bindings differently. The classic designer assumes
results binding returns tabular data and selection binding returns a single string. Because the classic designer doesn’t emit full rows, you
can only create bindings based on a grouping column.
Note: For classic designer dashboards, you can't bind a static step to a range widget to show a particular measure, such as the
range of an amount.
Selection Binding in a Static Step
Almost all parts of a step can include a selection binding to the results of a prior query.
53
Bindings in Classic Designer DashboardsBindings in Wave Dashboards
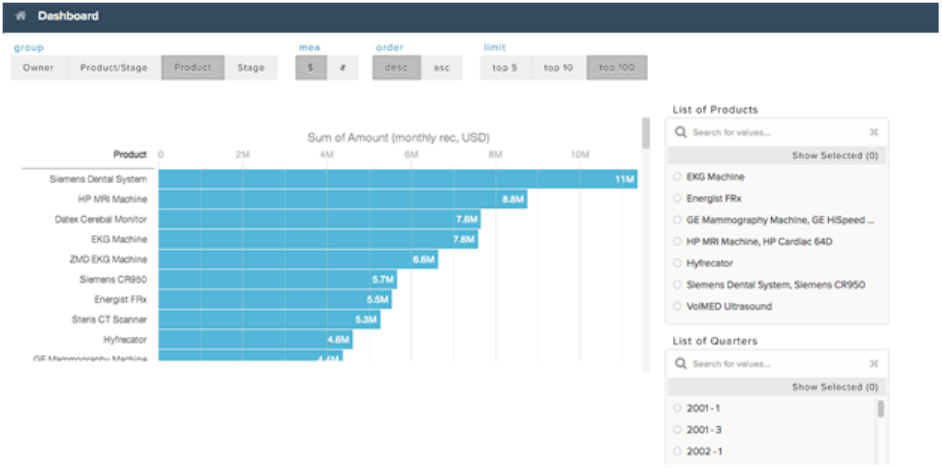
Bind a Static Filter and Group Selector to a Query
Static filters or group selectors can be bound to a query that’s written in SAQL.
Binding a Date Picker and Static Dates
You can use selection bindings to filter lenses for dates from a date picker lens or a static absolute or relative date step.
Binding Operations
You can use several more operations with results and selection bindings to extract the correct results.
Selection Binding in a Static Step
Almost all parts of a step can include a selection binding to the results of a prior query.
In an aggregate query, the fields that can be included in a selection binding are:
•Group
•Measure
•Filters
•Sort
•Limit
Use Static Steps for Binding Any Part of a Query
This example shows a dashboard with static steps and selection bindings in multiple parts of a query.
In the following example:
•The static step step_filter_dim populates the "List of Products" list selector. It includes options that have multiple
values.
54
Selection Binding in a Static StepBindings in Wave Dashboards

•The static step step_group populates the group toggle selector. "Product" is the default value when the dashboard is
initialized, because the start value is "Product". The display values change the display name in the user interface.
•The static step step_measure populates the measure toggle selector.
•The static step step_order populates the order toggle selector.
•The static step step_limit populates the limit toggle selector.
•The aggregate step query step_quarterly_bookings is grouped by close-date year and quarter.
•The aggregate step query step_top_10 has groupings that depend on the selection option from the static step_group.
The start value is the "Product" grouping (based on step_group).
{
"steps": {
"step_filter_dim": {
"type": "static",
"dimensions": [ "Product" ],
"datasets":[{"name":"opp"}],
"selectMode": "single",
"values": [
{
"value": ["EKG Machine"]
}, {
"value": ["Energist FRx"]
}, {
"value": ["GE Mammography Machine", "GE HiSpeed DXi", "GE Stress System"]
}, {
"value": ["HP MRI Machine", "HP Cardiac 64D"]
}, {
"value": ["Hyfrecator"]
}, {
"value": ["Siemens Dental System", "Siemens CR950"]
}, {
"value": ["VolMED Ultrasound"]
}
],
"isFacet": true
},
"step_group": {
"type": "static",
"values": [
{
"display": "Owner",
"value": ["Owner-Name"]
}, {
"display": "Product/Stage",
"value": ["Product", "StageName"]
}, {
"display": "Product",
"value": ["Product"]
}, {
"display": "Stage",
"value": ["StageName"]
}
],
"start": [["Product"]],
55
Selection Binding in a Static StepBindings in Wave Dashboards

"selectMode": "single"
},
"step_measure": {
"type": "static",
"values": [
{
"display": "$",
"value": [["sum", "Amount"]]
}, {
"display": "#",
"value": [["count", "*"]]
}
],
"start": [[["sum", "Amount"]]],
"selectMode": "singlerequired"
},
"step_order": {
"type": "static",
"values": [
{
"display": "desc",
"value": false
}, {
"display": "asc",
"value": true
}
],
"selectMode": "singlerequired"
},
"step_limit": {
"type": "static",
"values": [
{
"display": "top 5",
"value": 5
}, {
"display": "top 10",
"value": 10
}, {
"display": "top 100",
"value": 100
}
],
"start": [100],
"selectMode": "singlerequired"
},
"step_quarterly_bookings": {
"type": "aggregate",
"datasets":[{"name":"opp"}],
"query": {
"groups": [["CloseDate_Year", "CloseDate_Quarter"]],
"measures": [["sum", "Amount"]]
},
"isFacet": true,
56
Selection Binding in a Static StepBindings in Wave Dashboards

"useGlobal": true
},
"step_top_10": {
"type": "aggregate",
"datasets":[{"name":"opp"}],
"query": {
"groups": "{{ selection(step_group) }}",
"measures": "{{ selection(step_measure) }}",
"order": [
[
-1, {
"ascending": "{{ value(selection(step_order)) }}"
}
]
],
"limit": "{{ value(selection(step_limit)) }}"
},
"isFacet": true
}
},
"widgets": {
"sel_list_filter_dim": {
"type": "listselector",
"position": {
"x": 860,
"y": 90,
"w": "290",
"h": "288"
},
"parameters": {
"step": "step_filter_dim",
"title": "List of Products",
"expanded": true,
"instant": true
}
},
"sel_list_filter_compound_dim": {
"type": "listselector",
"position": {
"x": 860,
"y": 390,
"w": "290",
"h": "288"
},
"parameters": {
"step": "step_quarterly_bookings",
"title": "List of Quarters",
"expanded": true,
"instant": true
}
},
"sel_group": {
"type": "pillbox",
"position": {
57
Selection Binding in a Static StepBindings in Wave Dashboards

"x": 10,
"y": 10
},
"parameters": {
"title": "group",
"step": "step_group"
}
},
"sel_measure": {
"type": "pillbox",
"position": {
"x": 380,
"y": 10
},
"parameters": {
"title": "mea",
"step": "step_measure"
}
},
"sel_order": {
"type": "pillbox",
"position": {
"x": 480,
"y": 10
},
"parameters": {
"title": "order",
"step": "step_order",
"start": true
}
},
"sel_limit": {
"type": "pillbox",
"position": {
"x": 620,
"y": 10
},
"parameters": {
"title": "limit",
"step": "step_limit"
}
},
"widget1": {
"type": "chart",
"position": {
"x": 10,
"y": 110,
"w": "830",
"h": "330"
},
"parameters": {
"visualizationType": "hbar",
"step": "step_top_10"
}
58
Selection Binding in a Static StepBindings in Wave Dashboards
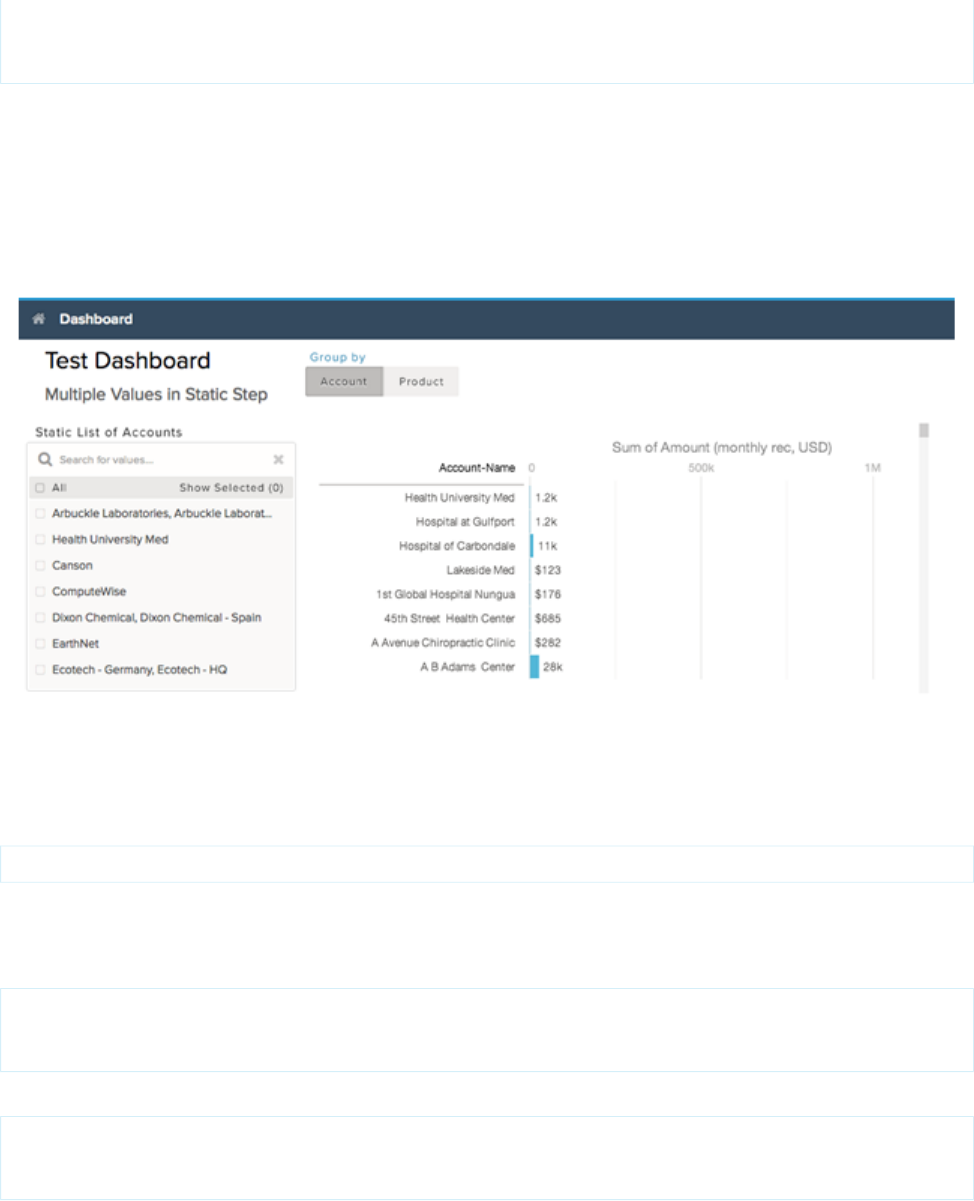
}
}
}
Bind a Static Filter and Group Selector to a Query
Static filters or group selectors can be bound to a query that’s written in SAQL.
Templates are expressions, embedded in double braces ({{ }}), that get replaced with the current state of the step that they’re attached
to.
For example, this dashboard contains a static filter widget that contains a list of accounts. The dashboard also contains a group selector
widget that lets users indicate whether to group by account or product. When a user makes a selection, the chart is updated accordingly.
The part of the query that controls the filtering is:
q = filter q by 'Account-Name' in {{ selection(step_Account_Owner_Name_2) }};
The step that’s named step_Account_Owner_Name_2 is configured as a selection binding so that it picks up the current selection
state. Because it’s within the double braces, the value of that selection is substituted and used in the query.
The part of the query that controls the grouping is:
q = group q by {{ single_quote(value(selection(step_StageName_3))) }};
q = foreach q generate {{ single_quote(value(selection(step_StageName_3))) }} as {{
value(selection(step_StageName_3)) }}, sum('Amount') as 'sum_Amount', count() as 'count'";
If a user selects Product in the group selector widget, the actual query that’s passed to the query engine contains:
q = group q by 'Product';
q = foreach q generate 'Product' as "Product", sum('Amount') as 'sum_Amount', count() as
'count';
59
Bind a Static Filter and Group Selector to a QueryBindings in Wave Dashboards

Note: To view the query that’s used to update the chart, open your browser’s JavaScript console and type
edge.log.query=true. On the dashboard, select a different group. The new query appears in the console unless the query
is cached.
"steps": {
"step_Account_Name_1": {
"isFacet": false,
"query": {
"pigql": "q = load \"opp\";\nq = filter q by 'Account-Name' in {{
selection(step_Account_Owner_Name_2) }};\nq = group q by {{
single_quote(value(selection(step_StageName_3))) }};\nq = foreach q generate {{
single_quote(value(selection(step_StageName_3))) }} as {{ value(selection(step_StageName_3))
}}, sum('Amount') as 'sum_Amount', count() as 'count'",
"groups": "{{ selection(step_StageName_3) }}",
"measures": [["sum", "Amount"]]
},
"visualizationParameters": {
"visualizationType": "hbar"
},
"selectMode": "none",
"useGlobal": true,
"datasets":[{"name":"opp"}],
"type": "aggregate",
"isGlobal": false
},
"step_Account_Owner_Name_2": {
"dimensions": [ "Account-Name" ],
"isFacet": false,
"values": [
{
"value": ["Lakeside Med", "Hospital at Gulfport", "Hospital at Carbondale"],
"display": "Arbuckle Laboratories, Arbuckle Laboratories - Austria, Arbuckle
Laboratories - France"
}, {
"value": ["Health University Med"],
"display": "Health University Med"
}, {
"value": ["Canson"],
"display": "Canson"
}, {
"value": ["ComputeWise"],
"display": "ComputeWise"
}, {
"value": ["Dixon Chemical", "Dixon Chemical - Spain"],
"display": "Dixon Chemical, Dixon Chemical - Spain"
}, {
"value": ["EarthNet"],
"display": "EarthNet"
}, {
"value": ["Ecotech - Germany", "Ecotech - HQ"],
"display": "Ecotech - Germany, Ecotech - HQ"
}
],
"selectMode": "multi",
60
Bind a Static Filter and Group Selector to a QueryBindings in Wave Dashboards

"useGlobal": true,
"datasets":[{"name":"opp"}],
"type": "static",
"isGlobal": false
},
"step_StageName_3": {
"isFacet": false,
"values": [
{
"value": ["Account-Name"],
"display": "Account"
}, {
"value": ["Product"],
"display": "Product"
}
],
"useGlobal": true,
"datasets":[{"name":"opp"}],
"type": "static",
"selectMode": "singlerequired",
"isGlobal": false
}
}
Binding a Date Picker and Static Dates
You can use selection bindings to filter lenses for dates from a date picker lens or a static absolute or relative date step.
These examples demonstrate how to bind a date picker lens to filter another query and a static relative date step to another query.
Binding a Date Picker to a Compact and SAQL Query
In this example, a date picker lens filters a time chart lens using a selection() binding. The lens for the date picker is:
"step_for_datePicker": {
"type": "aggregate",
"datasets":[{"name":"opp"}],
"query": {
"groups": [
[
"CloseDate_Year",
"CloseDate_Month"
]
],
"measures": [
[
"count",
"*"
]
],
"limit": 50
},
"start": [
61
Binding a Date Picker and Static DatesBindings in Wave Dashboards

[
[
"year",
-3
],
[
"year",
1
]
]
]
},
To filter another lens by the selection in the date picker, add the following code into a compact or SAQL step.
{{selection(step_for_datePicker)}}
The compact form looks like the following.
"step_compact_filtered_by_date_saql": {
"type": "aggregate",
"datasets":[{"name":"OpportunityWithAccount"}],
"query": {
"groups": [
[
"CloseDate_Year",
"CloseDate_Month"
]
],
"measures": [
[
"count",
"*"
]
],
"filters": [
[
"CloseDate",
"{{ selection(step_for_datePicker) }}"
]
],
"limit": 50
}
}
The SAQL looks like the following.
"step_date_saql_binding": {
"type": "aggregate",
"query": {
"pigql": "q = load \"OpportunityWithAccount\";\nq = filter q by date('CloseDate_Year',
'CloseDate_Month', 'CloseDate_Day') in {{selection(step_for_datePicker)}};\nq = group q
by ('CloseDate_Year', 'CloseDate_Month');\nq = foreach q generate 'CloseDate_Year' + \"~~~\"
+ 'CloseDate_Month' as 'CloseDate_Year~~~CloseDate_Month', count() as 'count';\nq = limit
q 2000;",
"groups": [
62
Binding a Date Picker and Static DatesBindings in Wave Dashboards

[
"CloseDate_Year",
"CloseDate_Month"
]
],
"measures": [
[
"count",
"*"
]
]
},
"isFacet": false,
"useGlobal": true
}
}
Note: The date dimension that the selection is filtering (in this example, "CloseDate") must be the same dimension name
that’s used in "groups" in the date picker lens.
Binding a Static Date List Selector to Filter Other Compact or SAQL Lenses
In this example, a selection from a list or toggle lens of predefined date ranges filters another lens in a dashboard. The following sample
shows a selection() binding from a static toggle button lens ("step_date_static_with_start") to a bar chart lens in compact
form ("compact_step_faceted_by_static") or SAQL ("saql_step_faceted_by_static"). Each value is a relative
date range, for example, five years ago ("year", -5) until this year ("year", 0).
"step_date_static_with_start": {
"type": "static",
"values": [
{
"display": "-6 years",
"value": [
[
[
"year",
-6
],
[
"year",
0
]
]
]
},
{
"display": "-5 years",
"value": [
[
[
"year",
-5
],
63
Binding a Date Picker and Static DatesBindings in Wave Dashboards

[
"year",
0
]
]
]
},
{
"display": "-4 years",
"value": [
[
[
"year",
-4
],
[
"year",
0
]
]
]
}
],
"selectMode": "singlerequired",
"start": [
[
[
[
"year",
-5
],
[
"year",
0
]
]
]
]
}
You can then use the previous sample to filter another compact or SAQL step on selection by using the selection() binding.
{{selection(step_date_static_with_start)}}
The compact form looks like the following.
"compact_step_faceted_by_static": {
"type": "aggregate",
"datasets":[{"name":"opp"}],
"query": {
"groups": [
"Product"
],
"filters": [
[
64
Binding a Date Picker and Static DatesBindings in Wave Dashboards

"CreatedDate",
"{{selection(step_date_static_with_start)}}"
]
],
"measures": [
[
"sum",
"Amount"
]
],
"limit": 2000
},
"isFacet": false
}
The SAQL selection binding is:
"saql_step_faceted_by_static": {
"type": "aggregate",
"query": {
"pigql": "q = load \"opp\";\nq = filter q by date('CreatedDate_Year',
'CreatedDate_Month', 'CreatedDate_Day') in {{selection(step_date_static_with_start)}};\nq
= group q by 'Product';\nq = foreach q generate 'Product' as 'Product', sum('Amount') as
'sum_Amount', count() as 'count';\nq = limit q 2000;",
"groups": [
"Product"
],
"measures": [
[
"sum",
"Amount"
]
]
},
"isFacet": false,
"useGlobal": true
},
Binding Operations
You can use several more operations with results and selection bindings to extract the correct results.
value()
The value() operation is used to get a selector array value and convert it to a single value. If the selector array value is empty, the
operation returns all values. Because the value() operation can return multiple values when the selector array value is empty, use in,
not ==, like in this example:
q = filter q by 'Owner Name' in {{ value(selection(step_StageName_3))}}
65
Binding OperationsBindings in Wave Dashboards

single_quote()
The single_quote() operation is typically used in selection bindings in a SAQL step to correctly format the "group" and "foreach
generate" lines in the query. The single_quote() operation takes an array of values and converts double quotes into single
quotes and square brackets into parentheses. For example: "Owner-Name" converts to 'Owner-Name', and ["Owner-Name",
"Owner-Region"] converts to ('Owner-Name', 'Owner-Region').
Consider the following static selector, with the array values ["Account-Name"] and ["Product"]:
{
"step_StageName_3": {
"isFacet": false,
"values": [
{
"value": [
"Account-Name"
],
"display": "Account"
},
{
"value": [
"Product"
],
"display": "Product"
}
],
"useGlobal": true,
"datasets":[{"name":"opp"}],
"type": "static",
"selectMode": "singlerequired",
"isGlobal": false
}
}
The following example binds the array values to a SAQL query that requires the "group by" and "foreach generate" values
to use single quotes. Therefore single_quote() converts ["Account-Name"] to 'Account-Name'.
{
"step_Account_Name_1": {
"isFacet": false,
"query": {
"pigql": "q = load \"opp\";\nq = group q by
{{ single_quote(value(selection(step_StageName_3))) }};\nq =
foreach q generate {{ single_quote(value(selection(step_StageName_3)))
}} as {{ single_quote(value(selection(step_StageName_3)) }},
sum('Amount') as 'sum_Amount', count() as 'count'",
"groups": "{{ selection(step_StageName_3) }}",
"measures": [
[
"sum",
"Amount"
]
]
},
"visualizationParameters": {
66
Binding OperationsBindings in Wave Dashboards

"visualizationType": "hbar"
},
"selectMode": "none",
"useGlobal": true,
"datasets":[{"name":"opp"}],
"type": "aggregate",
"isGlobal": false
}
}
The resulting query is:
q = load "opp";\nq = group q by 'Account-Name';\nq =
foreach q generate 'Account-Name' as 'Account-Name', sum('Amount') as
'sum_Amount', count() as 'count'
no_quote()
The no_quote()operation is typically used in selection bindings in a SAQL step to correctly format the "order" line in a query.
The no_quote() operation takes an array of values and converts double quotes and square brackets into no quotes. For example,
["desc"] converts to desc.
Consider the ["desc"] and ["asc"] array values that are specified in the following static step:
{
"step_order": {
"type": "static",
"values": [
{
"display": "desc",
"value": [
"desc"
]
},
{
"display": "asc",
"value": [
"asc"
]
}
],
"selectMode": "singlerequired"
}
}
The following example binds the array values into a SAQL step:
q = order q by 'Amount' {{ no_quote(value(selection(step_order))) }}
The desc or asc value is inserted without any quotes:
q = order q by 'Amount' desc
67
Binding OperationsBindings in Wave Dashboards

field()
The field() operation creates a field for each object in an array.
Three field values are assigned to the "$" and "#" options in this static step (step_measure): "compact", "alias", and
"proj":
{
"step_measure": {
"type": "static",
"values": [
{
"display": "$",
"value": [
{
"compact": [["sum", "Amount"]],
"alias": "sum_Amount",
"proj": "sum('Amount')"
}
],
"display": "#",
"value": [
{
"compact": [["count", "*"]],
"alias": "count",
"proj": "count()"
}
]
}
],
"selectMode": "singlerequired"
}
}
After being assigned, each field value can be referenced in other step selection bindings by using the field() operation.
For example, when a dashboard user clicks # in the toggle selector that uses step_measure, the SAQL query in this aggregate step
(step_top_10) references the "proj" field to insert a count() function, the "alias" field to insert "count" as a string,
and the "compact" field to insert [["count", "*"]].
{
"step_top_10": {
"type": "aggregate",
"datasets":[{"name":"opp"}],
"query": {
"pigql":
"q = load 'edgemarts/Opportunity/OpportunityEM';
q = group q by 'Account_Name';
q = foreach q generate
'Account_Name' as 'Account_Name',
{{ no_quote(value(field(selection(step_measure),'proj'))) }}
as {{ single_quote(value(field(selection(step_measure), 'alias'))) }};
q = order q by {{ single_quote(value(field(selection(step_measure), 'alias'))) }}
{{ no_quote(value(field(selection(step_order), 'pigql'))) }};
q = limit q {{ value(selection(step_limit)) }};",
"groups": ["Account_Name"],
68
Binding OperationsBindings in Wave Dashboards

"measures": "{{ value(field(selection(step_measure), 'compact')) }}",
"order":
[[ -1, { "ascending": "{{ value(field(selection(step_order), 'compact')) }}" } ]]
},
"isFacet": true
}
}
69
Binding OperationsBindings in Wave Dashboards
