FL200 A2313petitionpart2
User Manual: FL200
Open the PDF directly: View PDF ![]() .
.
Page Count: 140 [warning: Documents this large are best viewed by clicking the View PDF Link!]
Pört LA Distribution Ce
FI URES
Technical Report - Site Closure March 2014
S£ S£*N i'r 1 NIE E E S.
VISI: 7
&I WAR
B r '
A1,04ß
iR
v
e s- Yt a
-5G.).-aG
1 nWYnFe+ [JIt
v
P
.le9.11.0,20c`.im30(s..e,e,.s.e6..s41,Calre
MW
18AMpV Ml c"
nrmr+emalî,msaiunla
9ì4i EaDoa sle2
Sar,CieQCCaRlem.a
4ver
, 9_122
X
EXPLANATION
4
V%-.5.R S Snaiw. aast ar.ons wee C++ezi msrcs.xu
art -ó tniermedate].0?nurttanna sea smlakea-+ar2810
v. a+ Deep 4aZrMmNmgeel nata@C'1Cb.+ra%ia are Joy are
A:s Y YoNia1MVr0421'a4uatet1
uuu--PtmysN2muM
N v.W mole .}es;
yi\TqdTjla Tee hnY
aeaaealiea ;Man a,.m maa basin mwaacs s.o° w
Mae aY.®e.,orvemannls ay m tes as rxgsuea f erv rom
ctsmu raisrvs,aYrms:em tmas., .ealax V
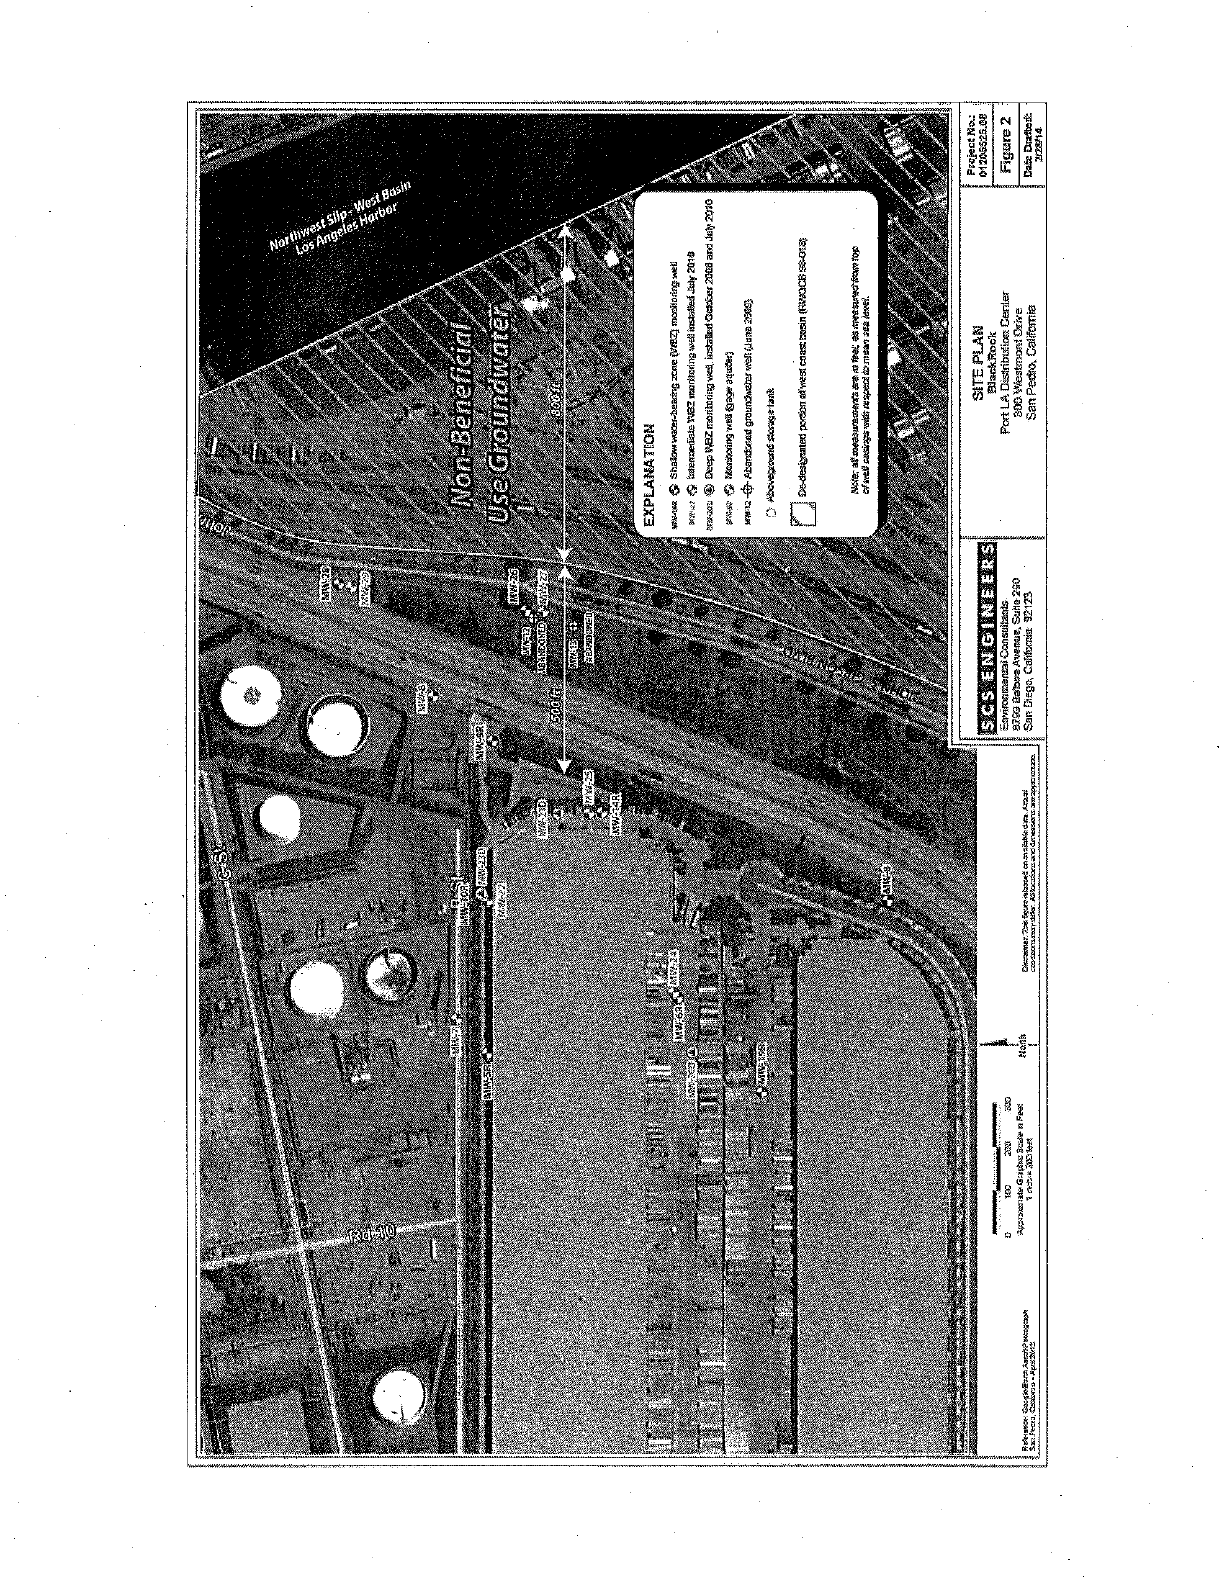
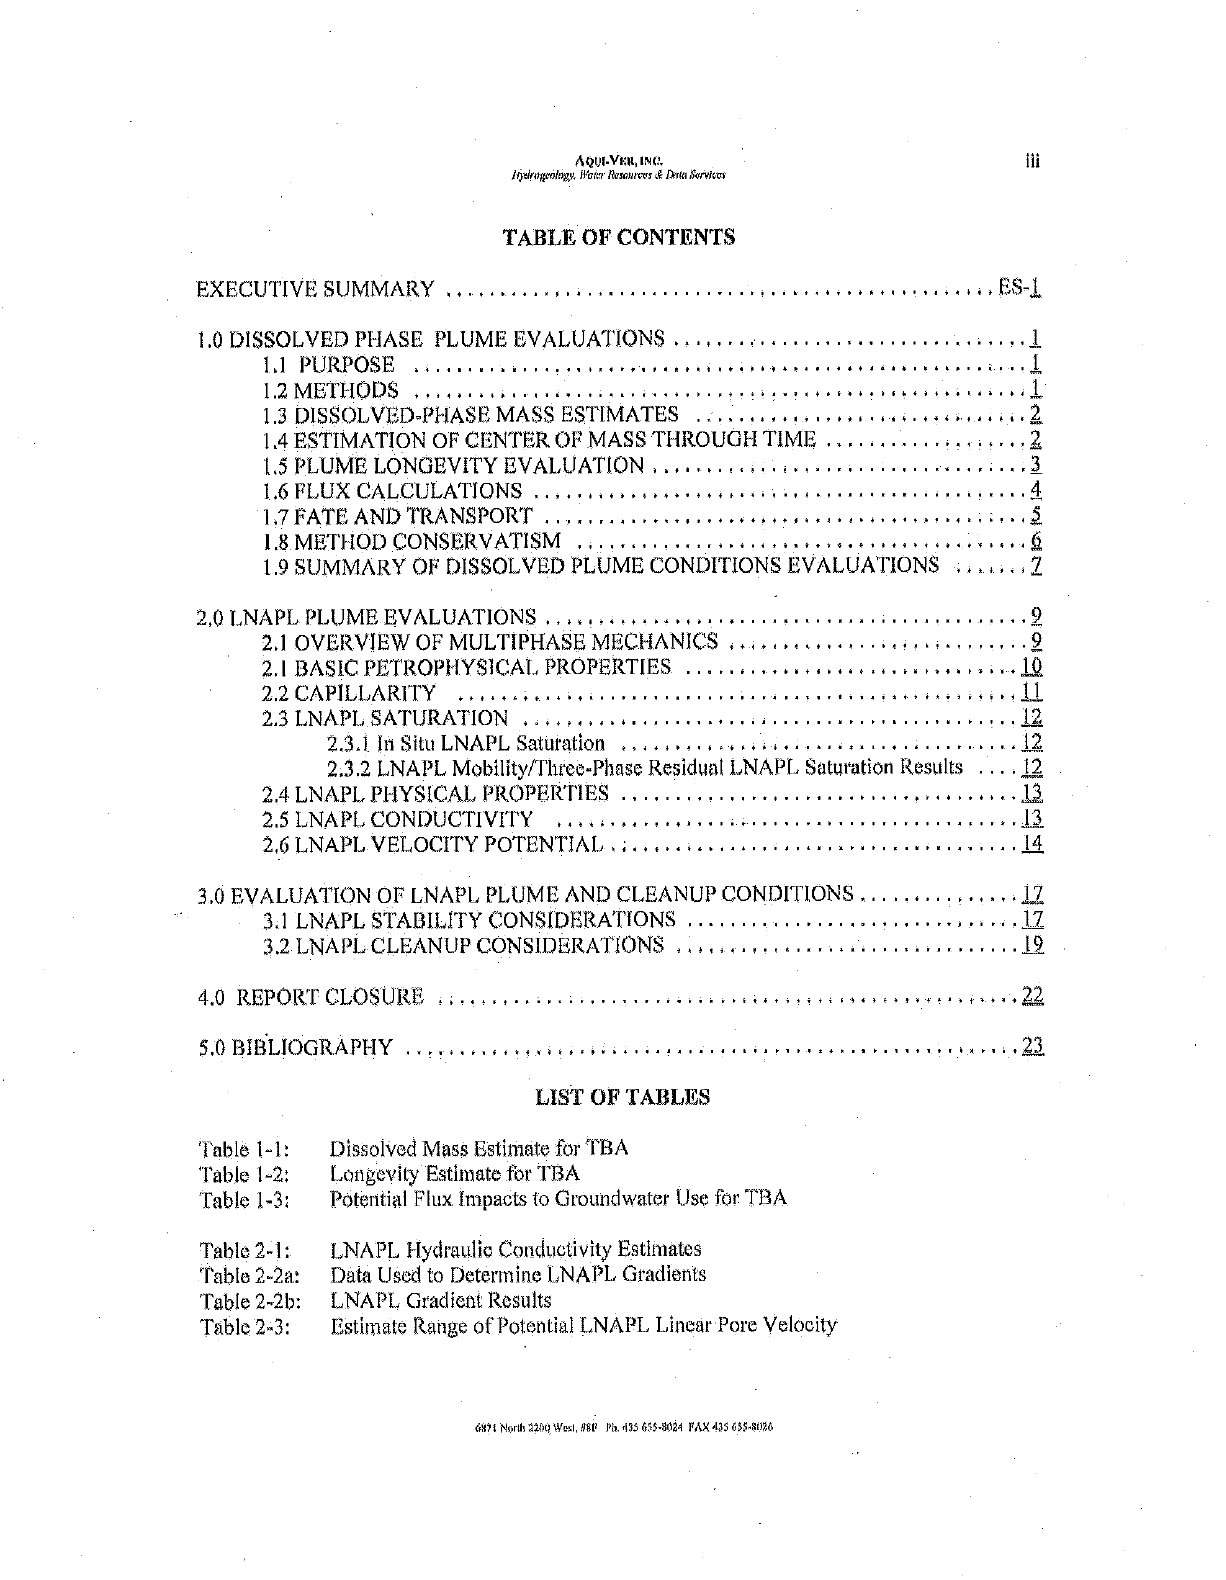
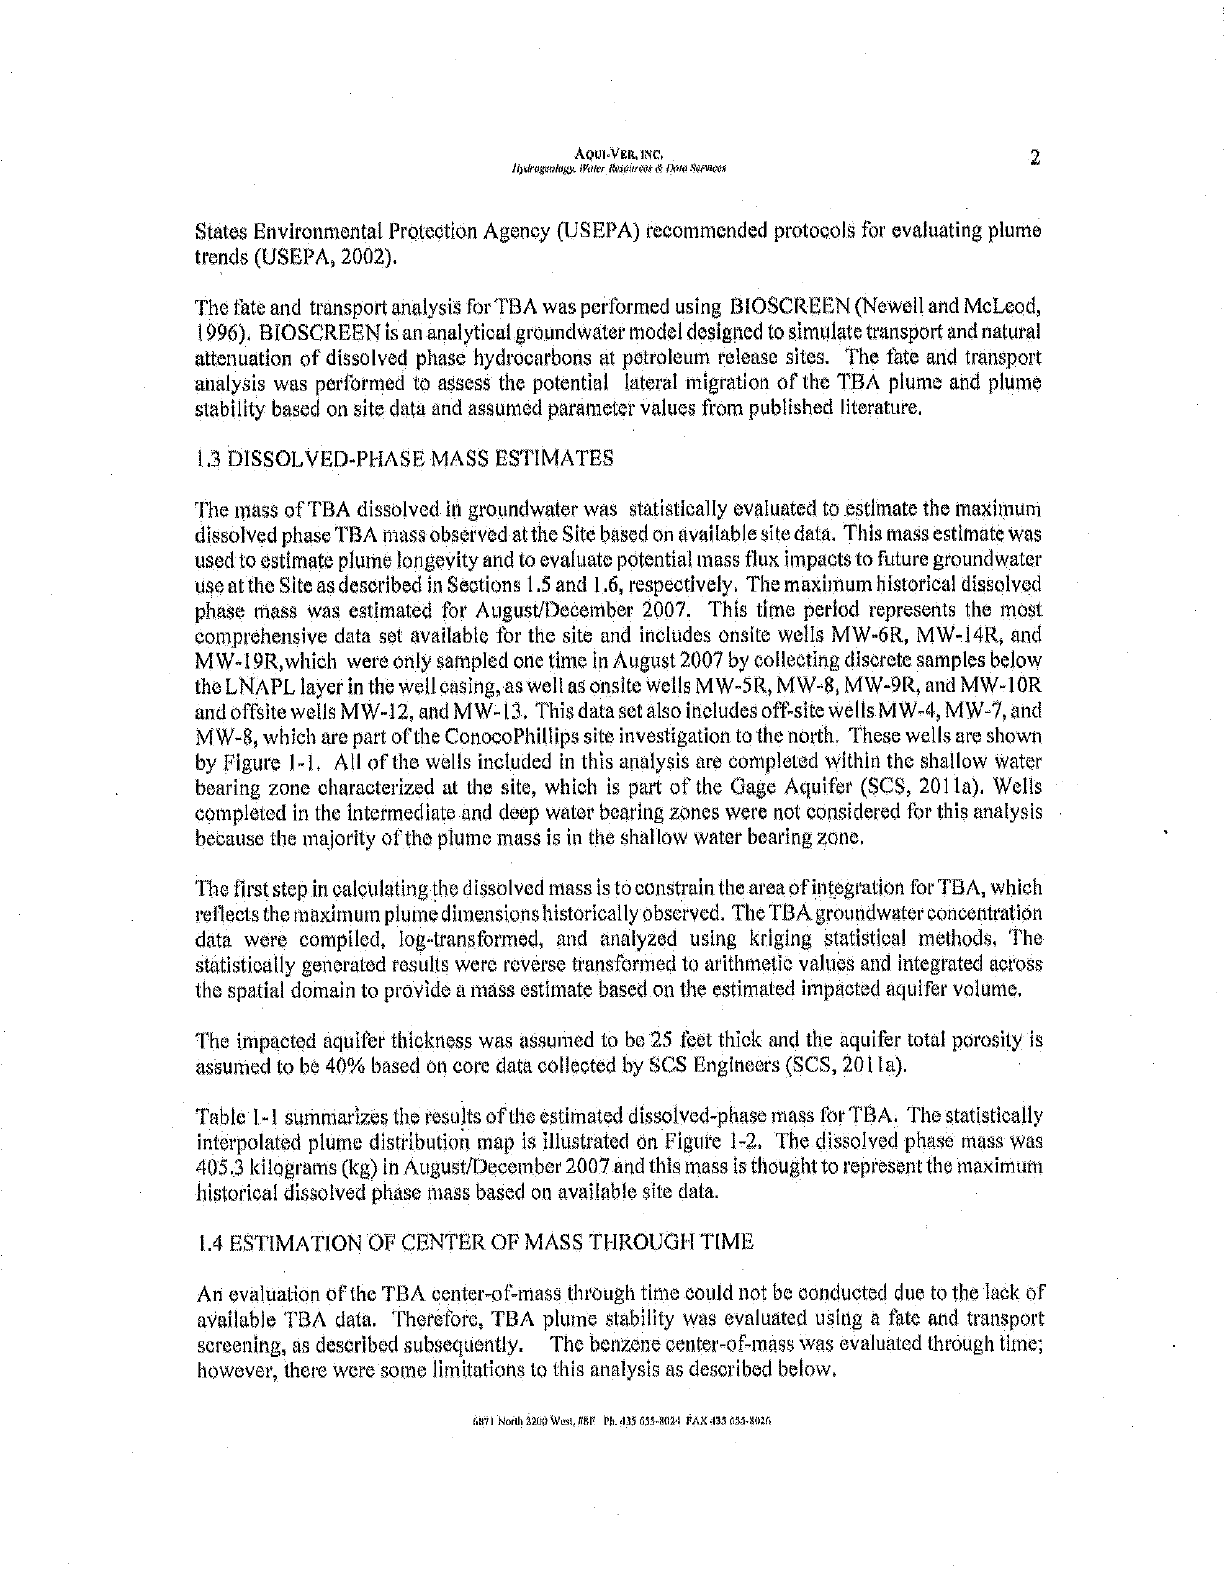
SETE PLAN
S1acfPock
Port LA Osenbif Dr Center
áD'3 ' +w.e
San Poto eto C airfomra
DaulmgU»,,
af
LCriCr+rpórarinn
4r11C,Idl wall{
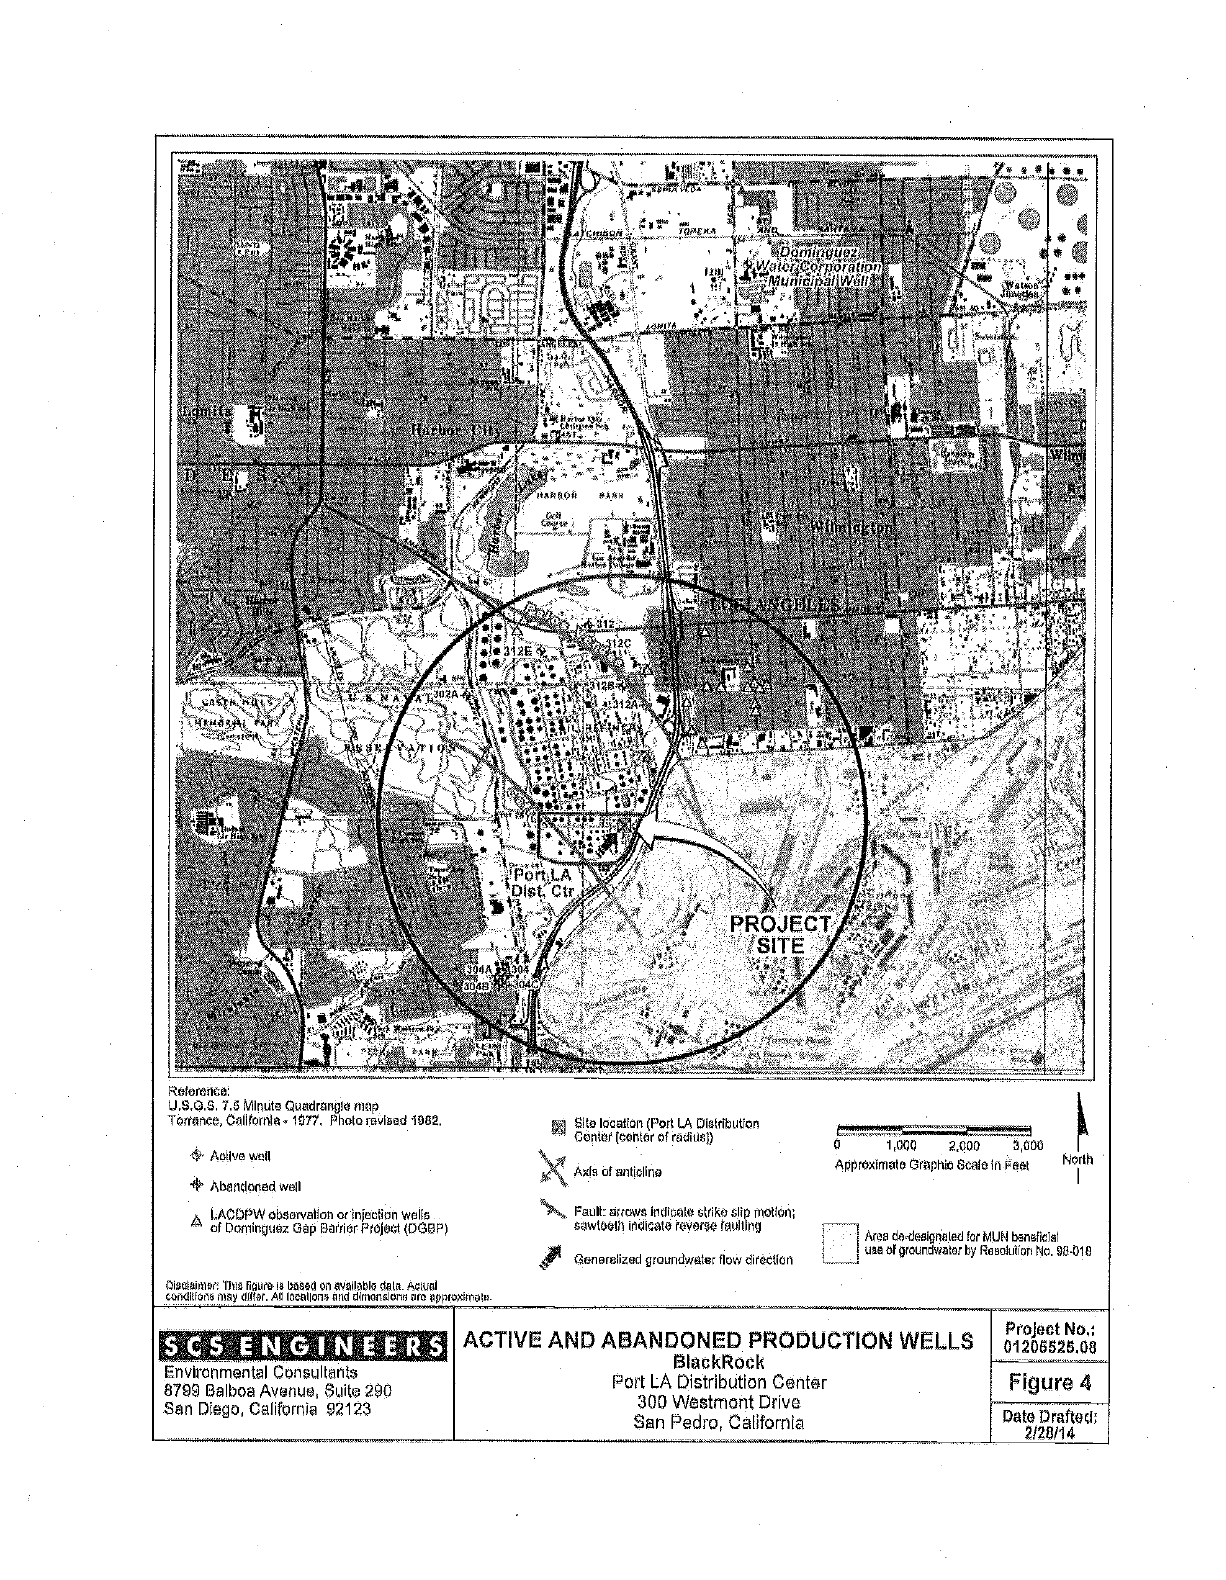
Rclsmnce.
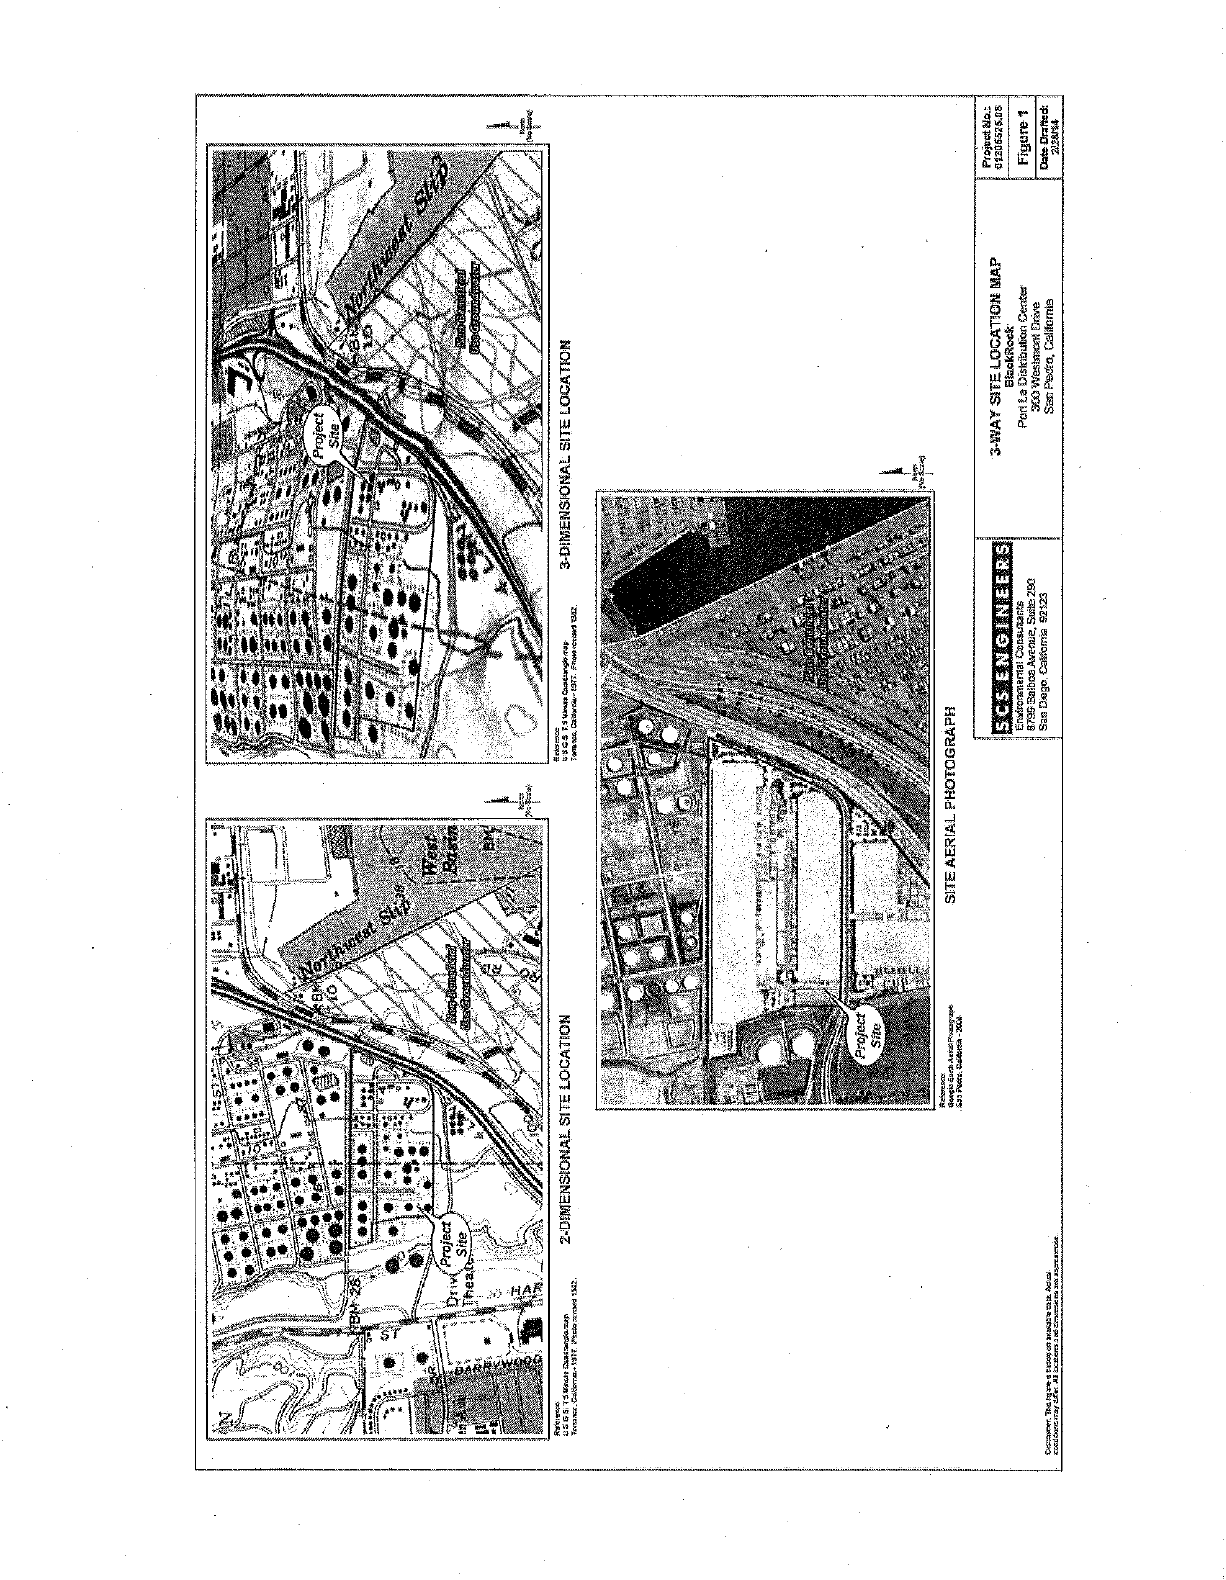
U,S,G.e. 7.5 Minute quadrangle map.
Torrence, California 1077. Photo revised 1082.
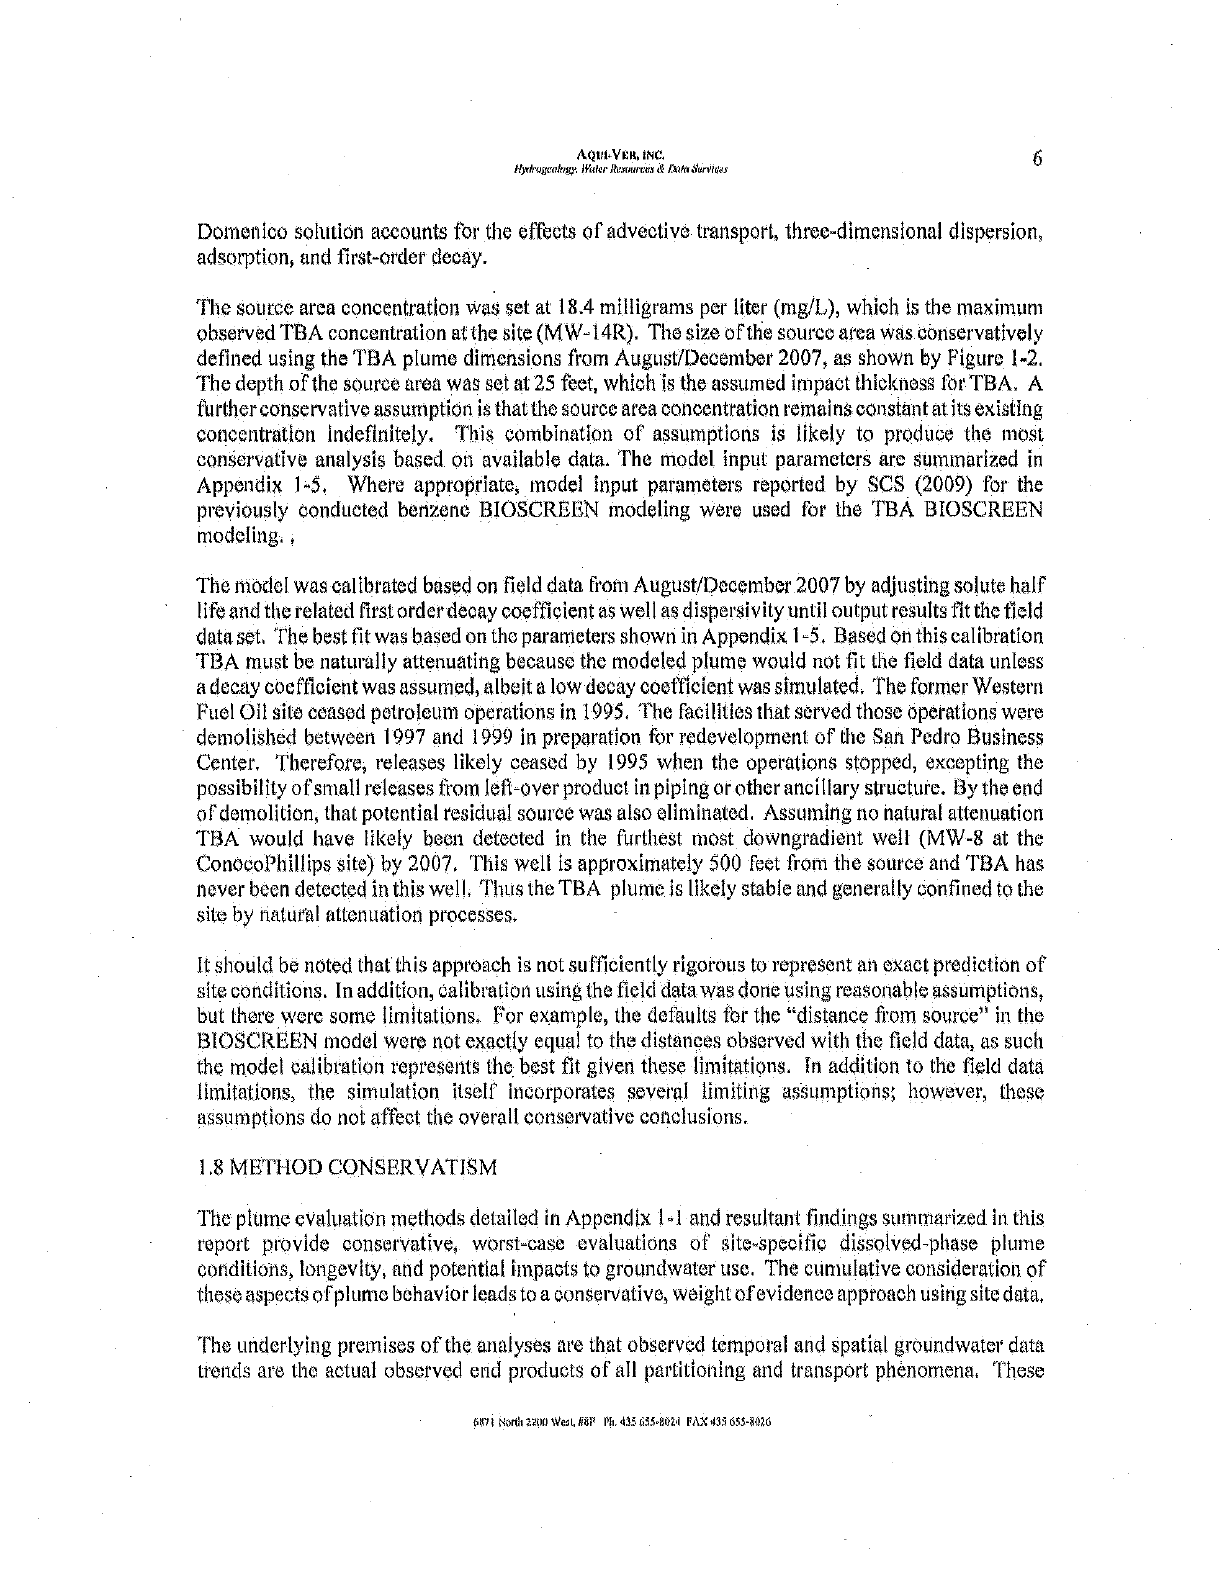
Active well
+ Abandoned well
A LACDPW obsorvatlon or injection wells
of Dominguez Gap Barrier Project (OGBP)
Riaelainlor This Spure Is based On F
condlllane may dlpef. All locdllono a
able dala - Actual
l!mansions Pro opproormoln
Fnvlionmental Consultants
879g Balboa Avenuo, Suite 290
Sen Diego, California 92123
Ei Silo location (Port LA Distribution
Cantor (center of radit*p
d AJa of anticline
, Fault: arrows indicate strike slï mol
sawtoeth inddlcate reverse touille
Generalized groundwater flow dirdetion
0 1,000 2,000 3,0o
Approximate Graphic Scale In. Feet
Ares de,designeied for MUN beneficial
use of groundwater by Resolution No. 58 -018
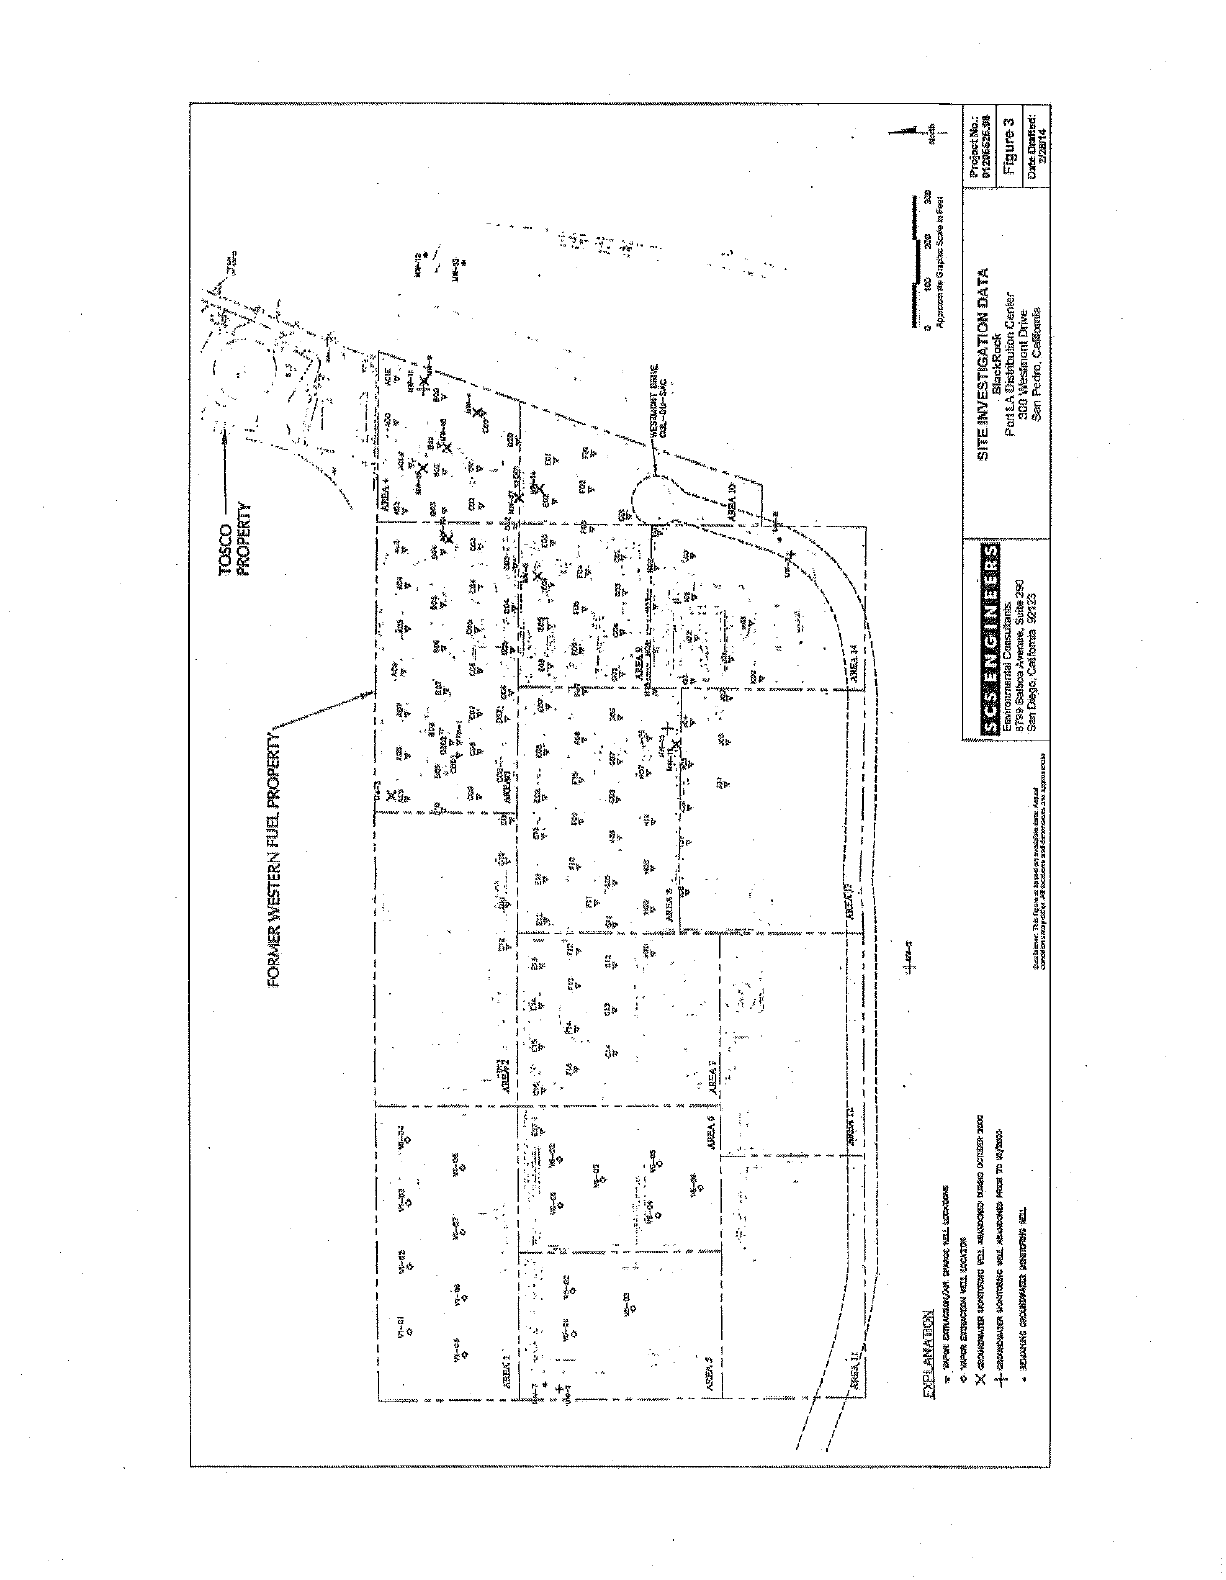
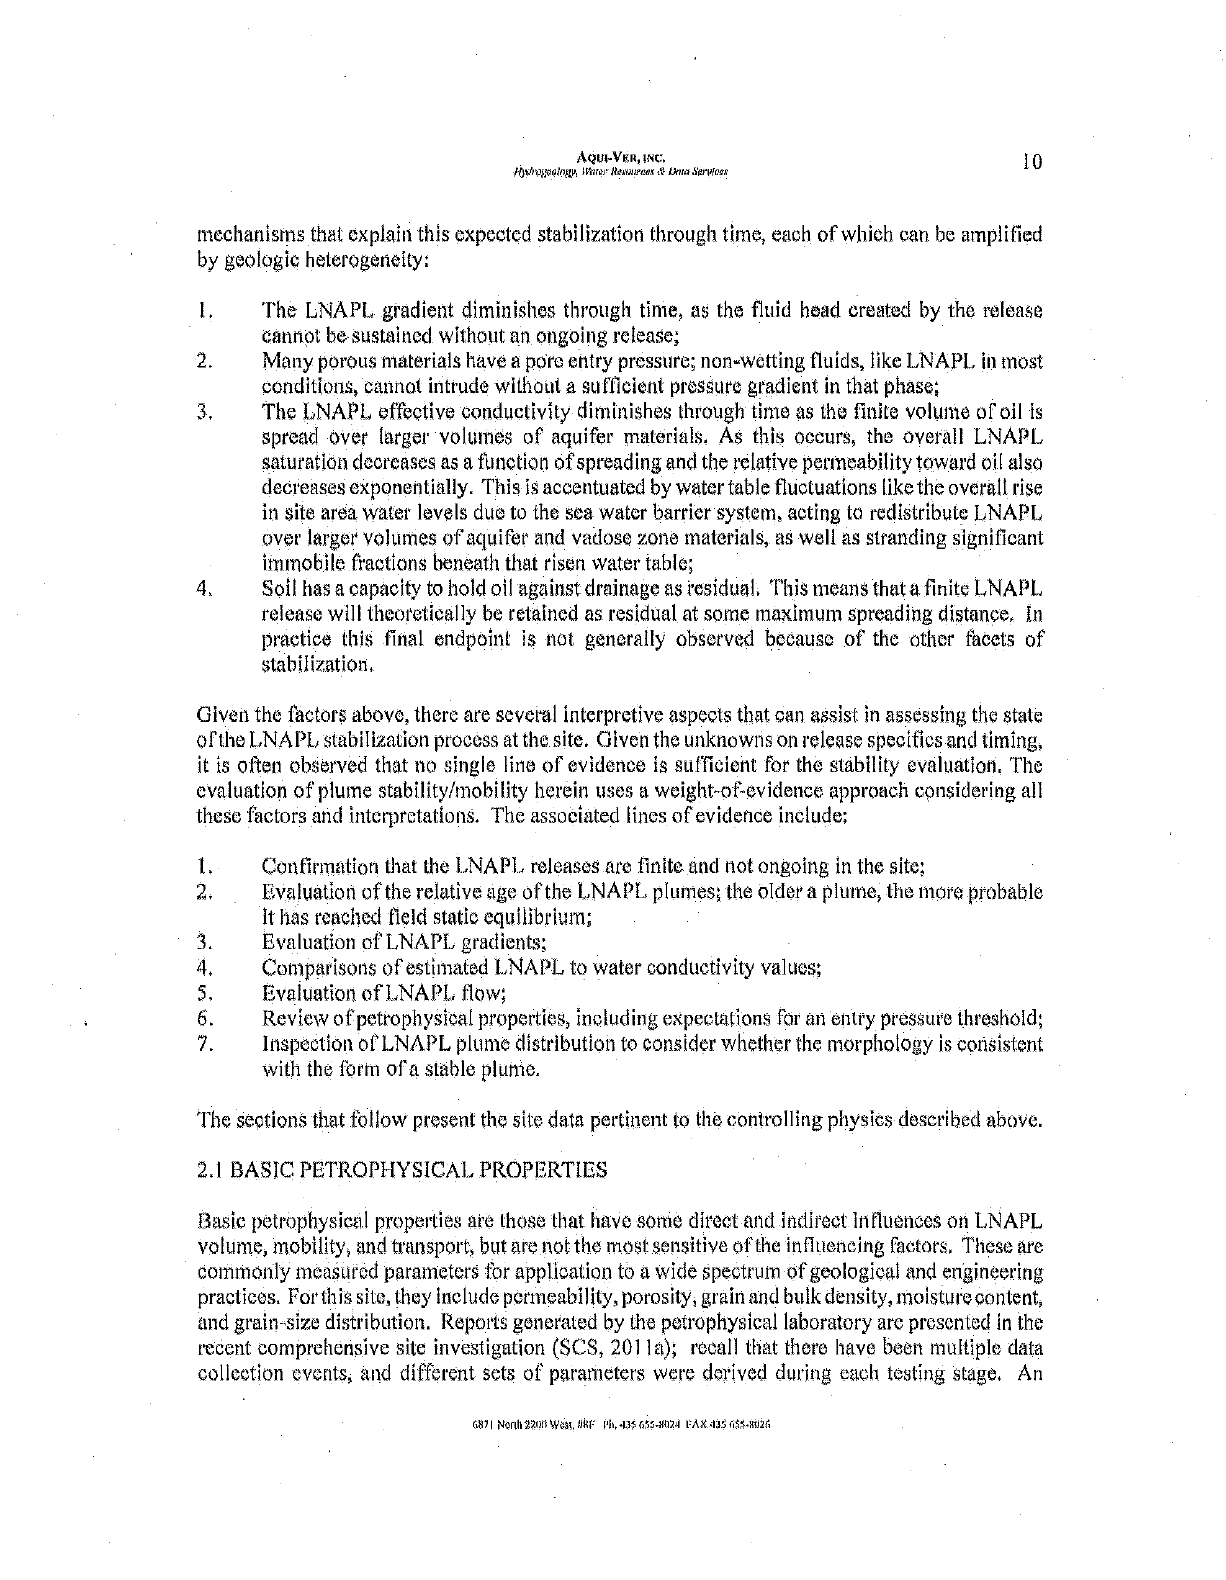
ACTIVE AND ABANDONED PRODUCTION WELLS
BlackRock
Port LA Distribution Center
300 Westmont Drive
San Pedro, California
Project No.:
01205526.00
Figure 4
Date Drafted:
2120(14
fa '
15891
MM/-25
350
PBMACtlRC ea"s-R
äCS Ri
E dnmwdaCdrrkante
B'45 Baitaa Axone Sa..`e:9B
San (Sego, Sal-darn a 9212_
Y.
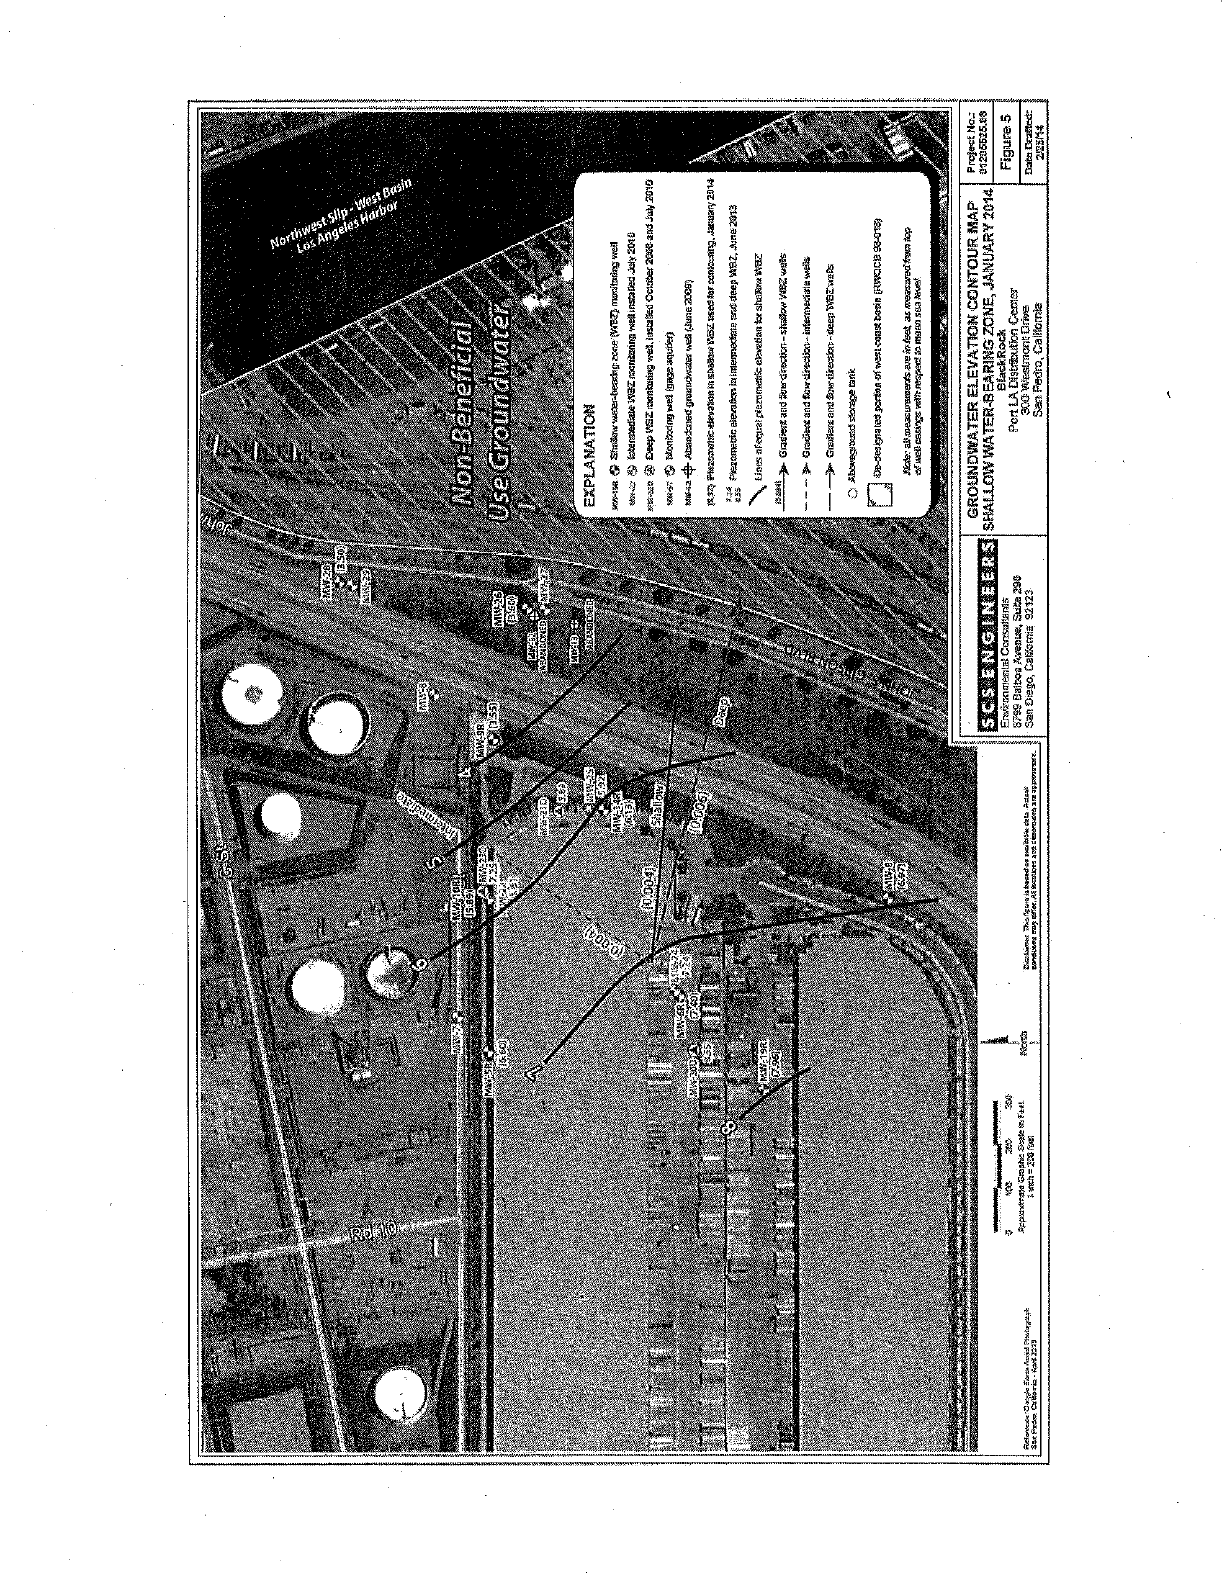
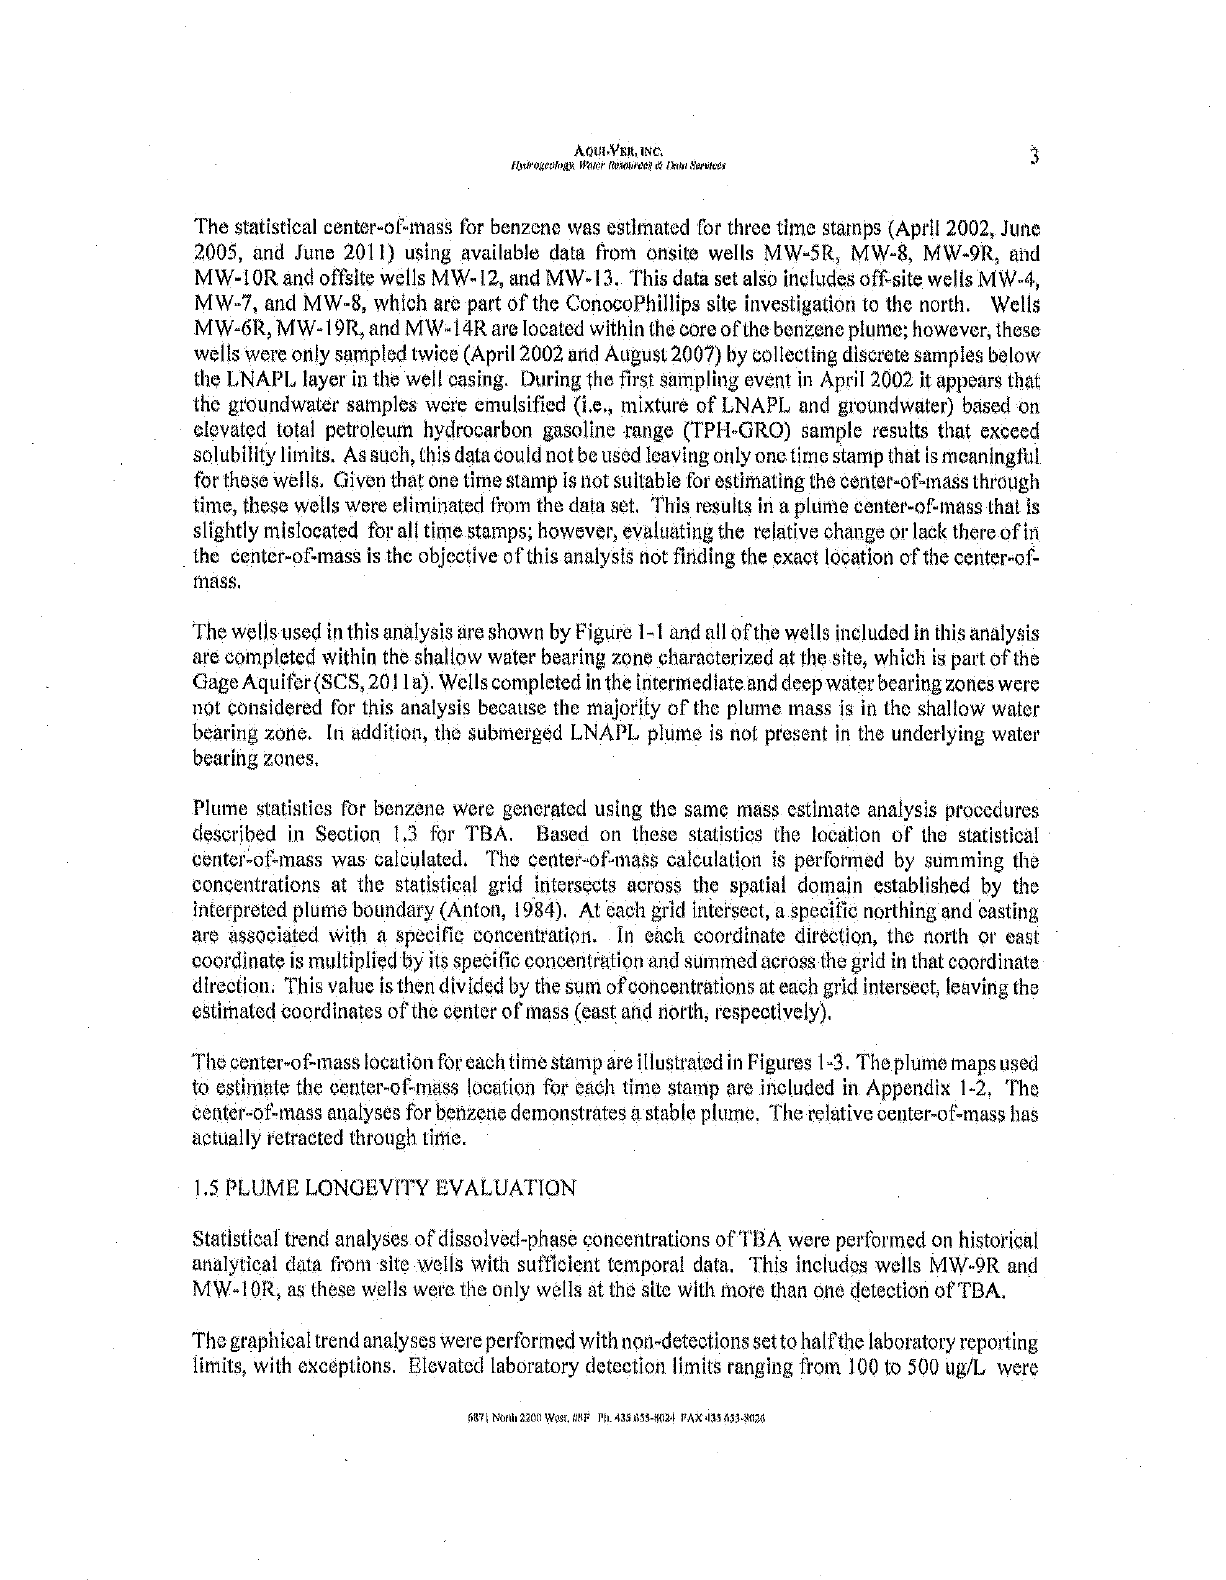
EXPLANATfON
we sa 4" s.am...+re--uewoos awns çwtvZk monitions ,.m
._ j. NIIÆBaatP'93Zraldenn9voSIostaVtl xis 20íU
me s 8 Deep USC 150559 ne'. to-stated CctaYriCNR and July 2]r0
.s= i tlmYrwa9 wed 19 Fa9wh1
>re u.4- Affin!e^oR9muM,.Aee .asóNUne2005t
Per FUxriaFC+MY
olasltalltutGZtse9Nrmnt.e.nlg trümy2014
owomxtlceiershomlmematea'AdeedaSHZ..il.neëili
\ 3
YY U06 o( POW/ PeIDM1MLs:eYUetlnniv511aYxa sear
Grad-tad and Sew Owsbdr -shYw'naweds
- - - ;- Göthecd end few desiste aeewa
-
-}- Grader: awl 4llxa4,sMa CMP SPEC soft
AKi. pooped n^cgebnt
Cn-de.ypl GpseonMar^stroa5town ßaWGB9S9dái
foie as snoodae is e n robed as weaswm Ism,*
oitsß cauta amrcsaec.o mean sea lam'
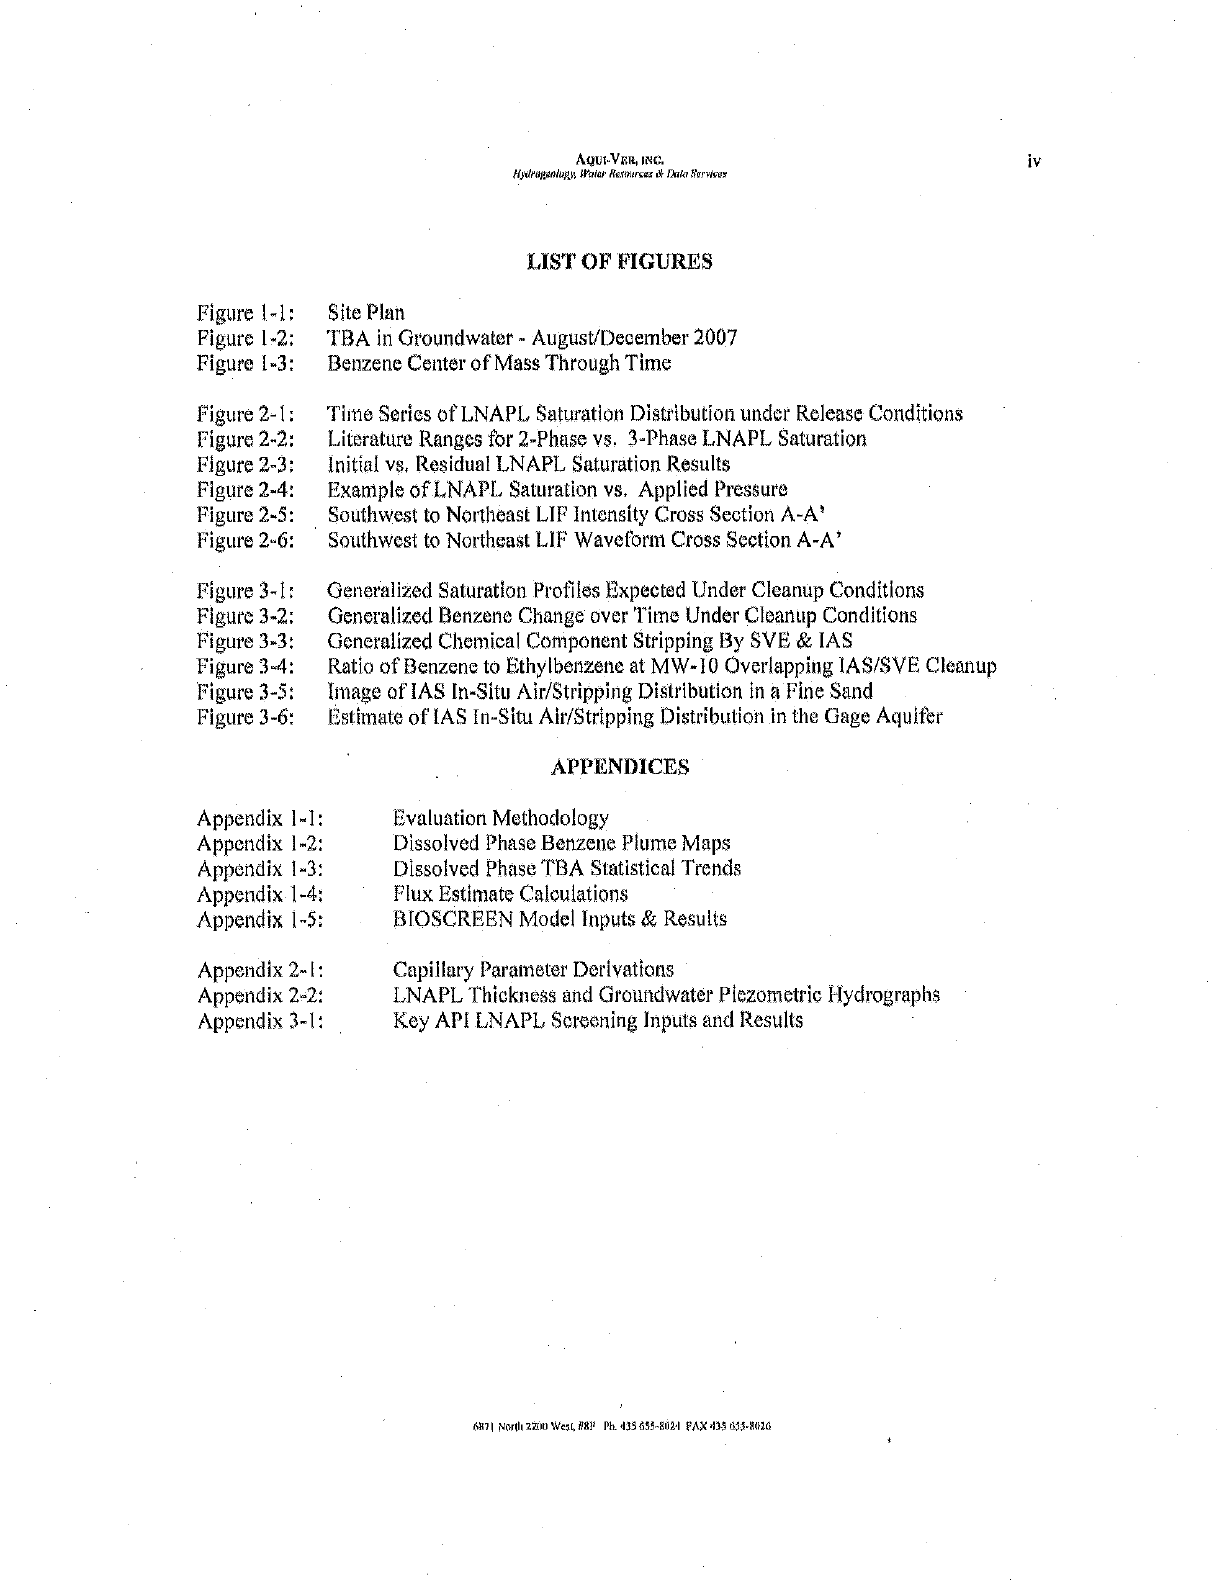
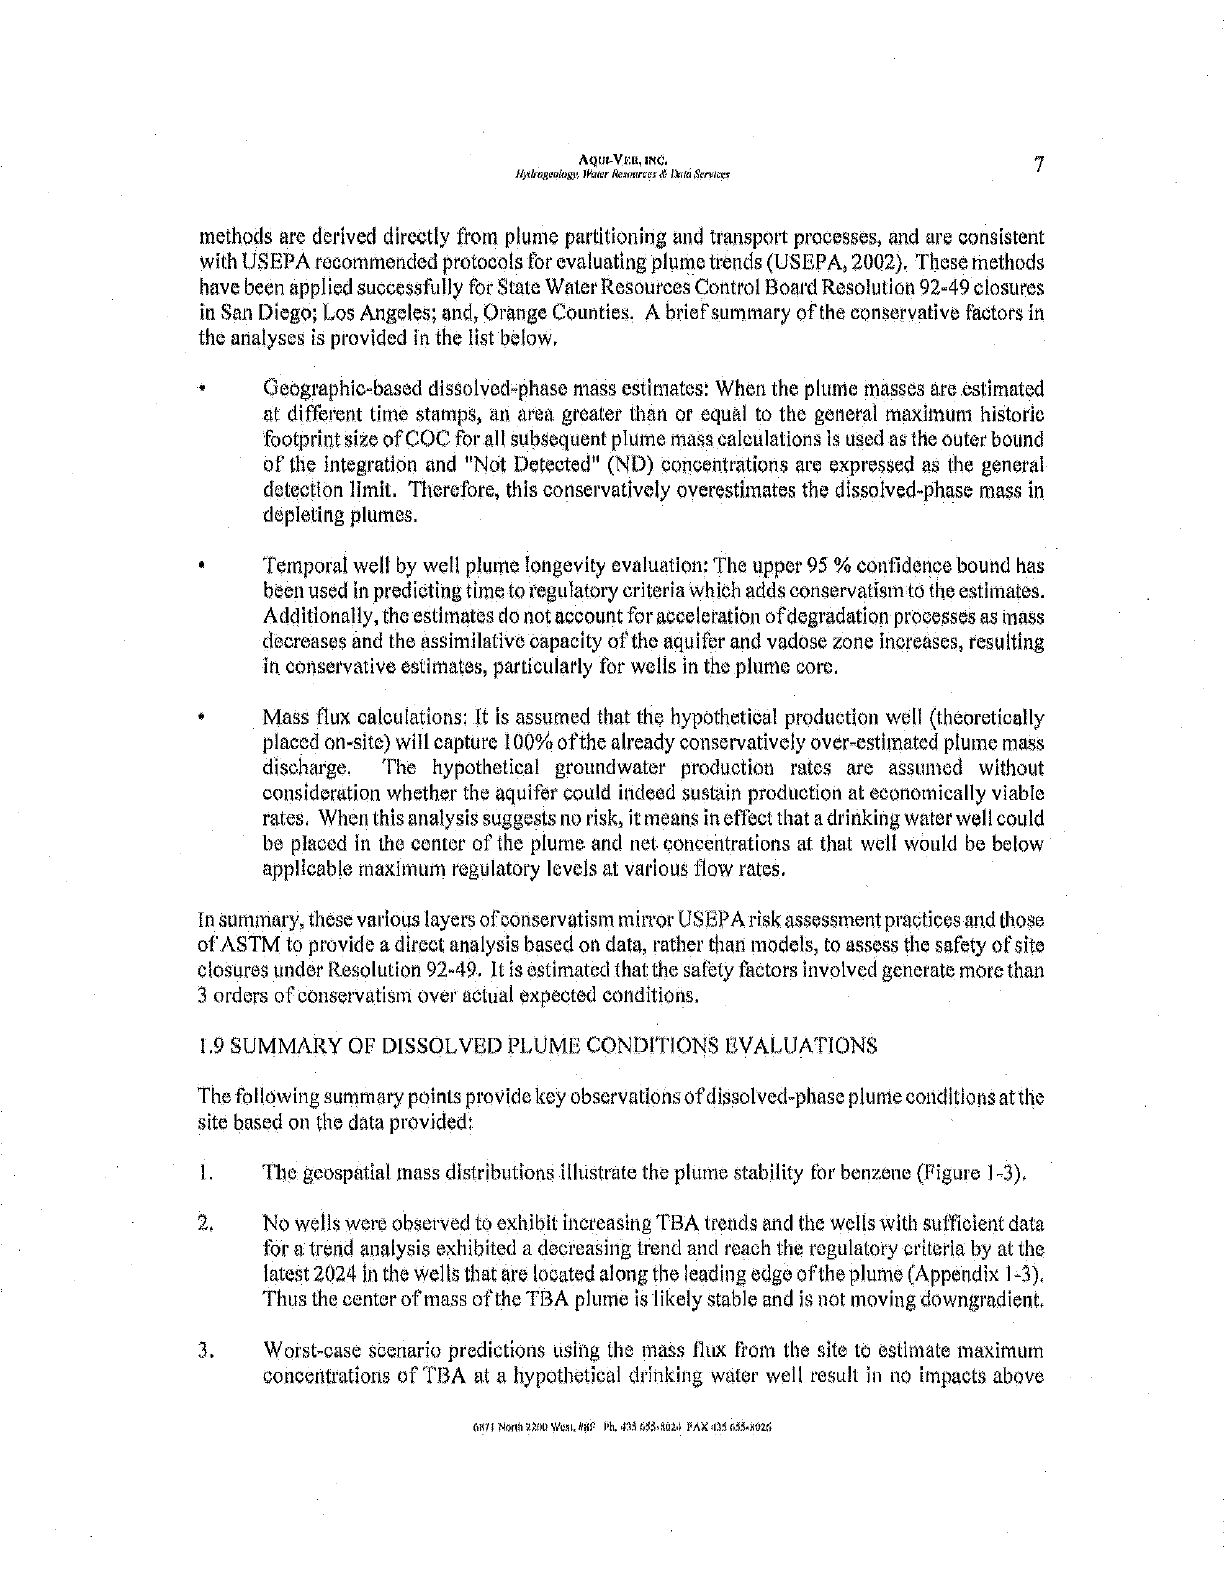
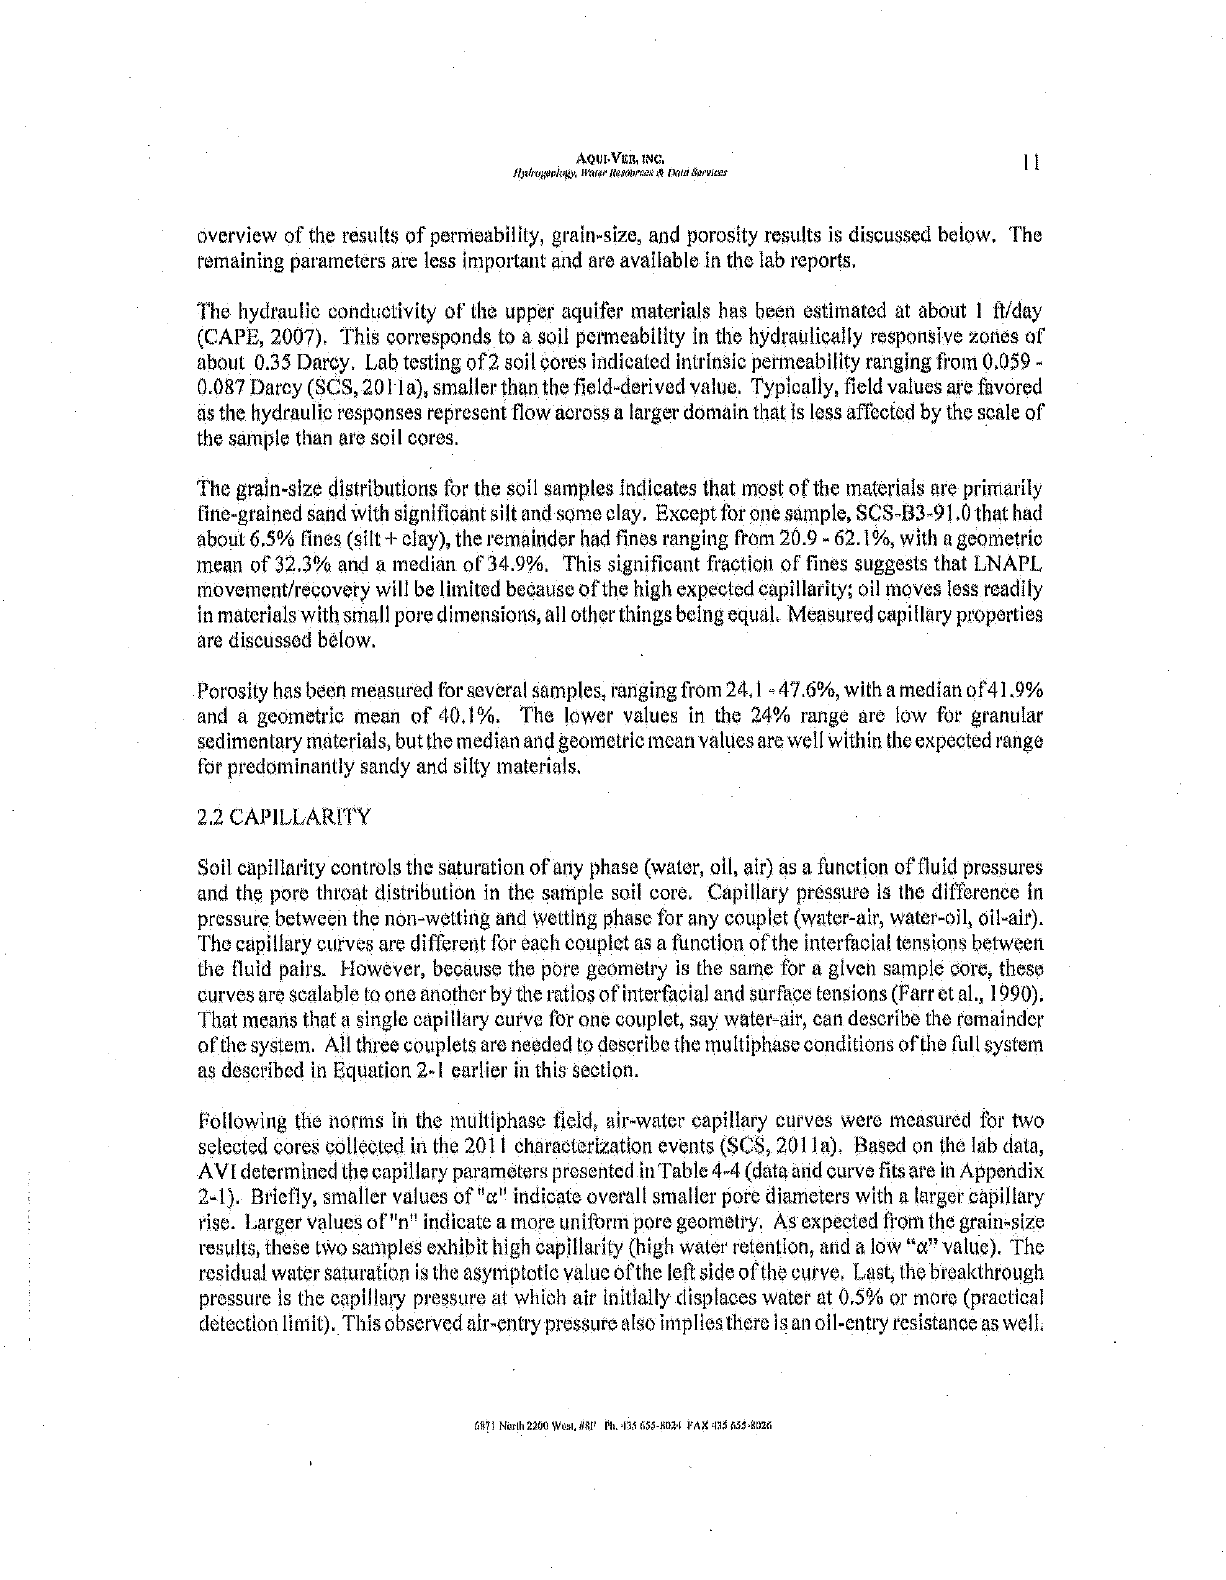
GROUNDWATER ELEVATION CONTOUR MAP Project No.
SHALLOW WATER -BEA RING ZONE, JANUARY2014 01255525 PS
81acfROA3 Fe uce 5
tort Li, OS : etatotrn Cer,r 9
3., Nesln one Owe gam Sneed ,
at
S Pedro, Cakrame 2/38114

AAA
o
WAtigR
!Y 0
MW-]6
egr
I
I i
""'
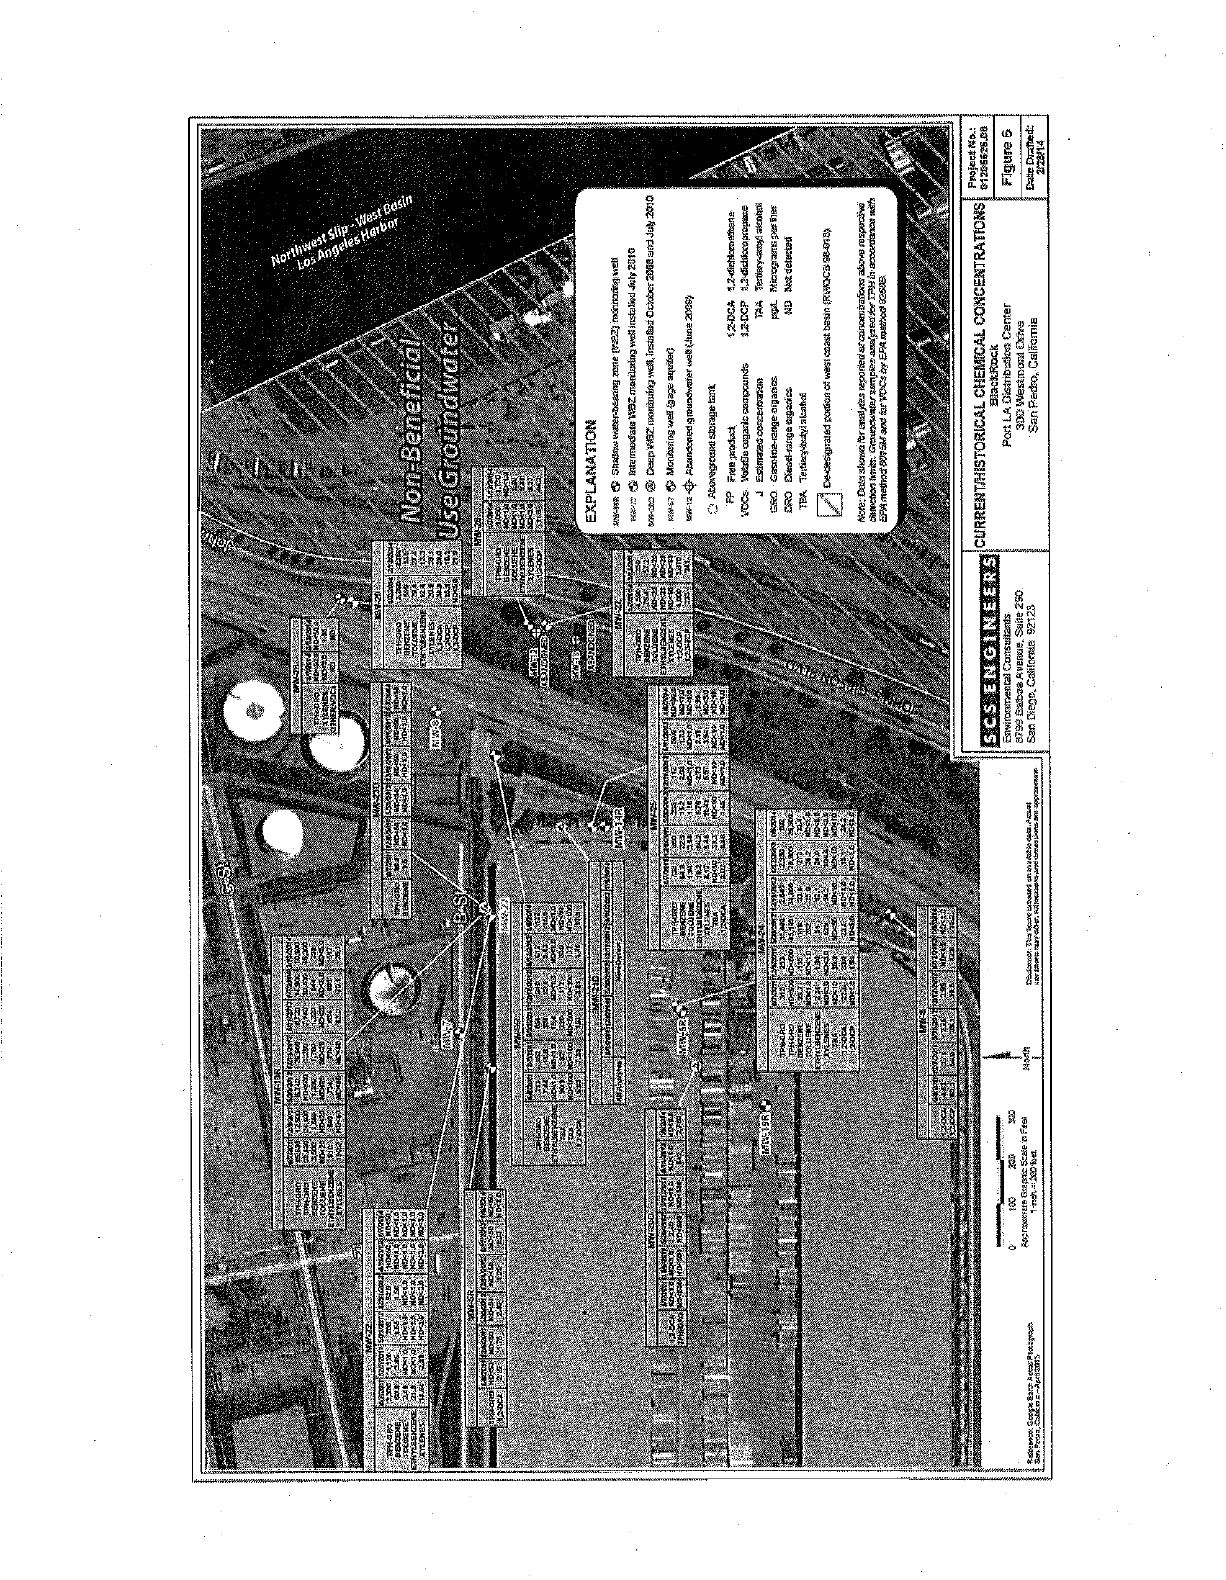
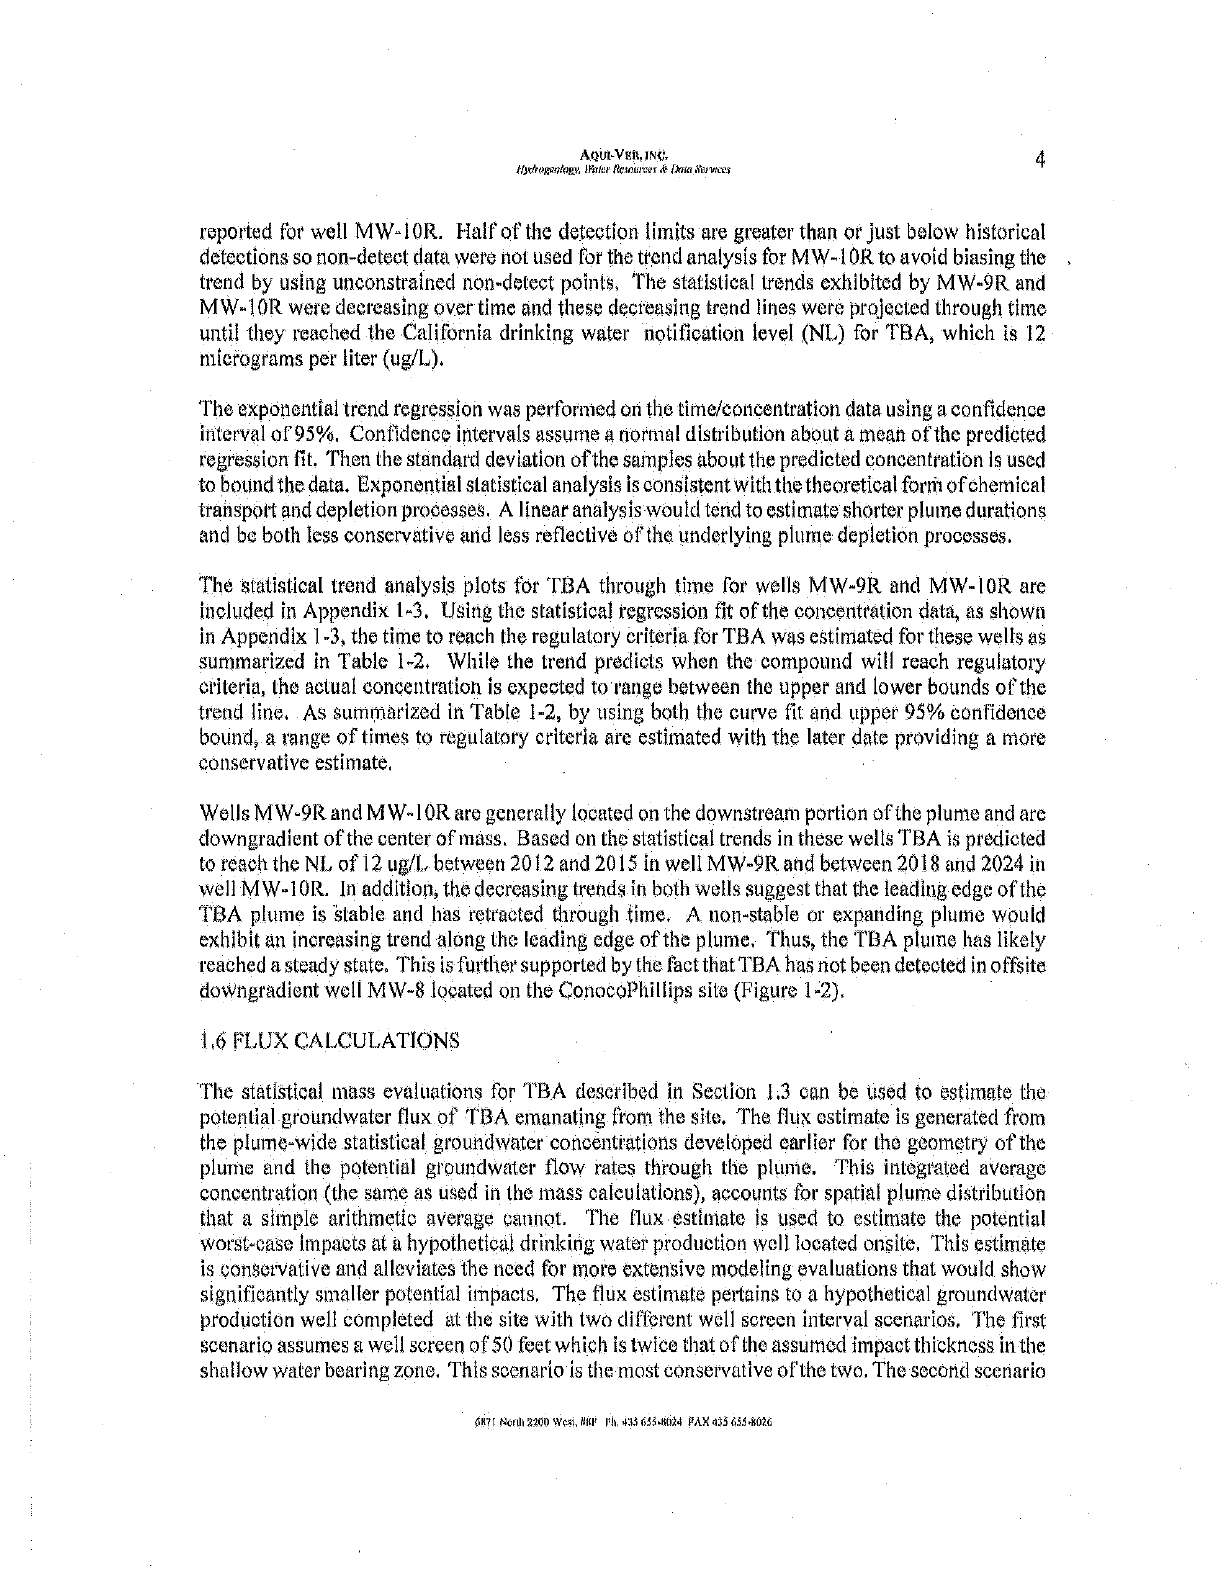
EXPLANATION
RN +p 5 Sav14.7n seater town Aug C`leZ rraro^ag wat
S IMsmSaleYt32mrnvn}xefStaled auaS11n
v 3 Caa4R133ZmrHa.rgueErav[rlOöoter2WH3ad.tte,etEC
.>µ' PI* aNmgv+liSegesurfer
gv.a+0-,.(pidona.,4n-*+a+aiernee{+owiN'di
óeagmeGaoagalenk
7 Dadesgtdri psi, of west mast ta p31/4003 SAMS)
A. C+..Cancesrair Cfeemena:lxy.j.ramrmNia
111333 Aa(sasse
raer ,mt®a,..e¢
fu.t via anMRöJ
FPa Saesa3rq
Ia(eomepuYaearb.=SeodMassie({gia
law GwYd.wívYsMyaaa soh: edAfUe'sse+W mbDWF4Y
mHEPT tiri!'M2,aJ5
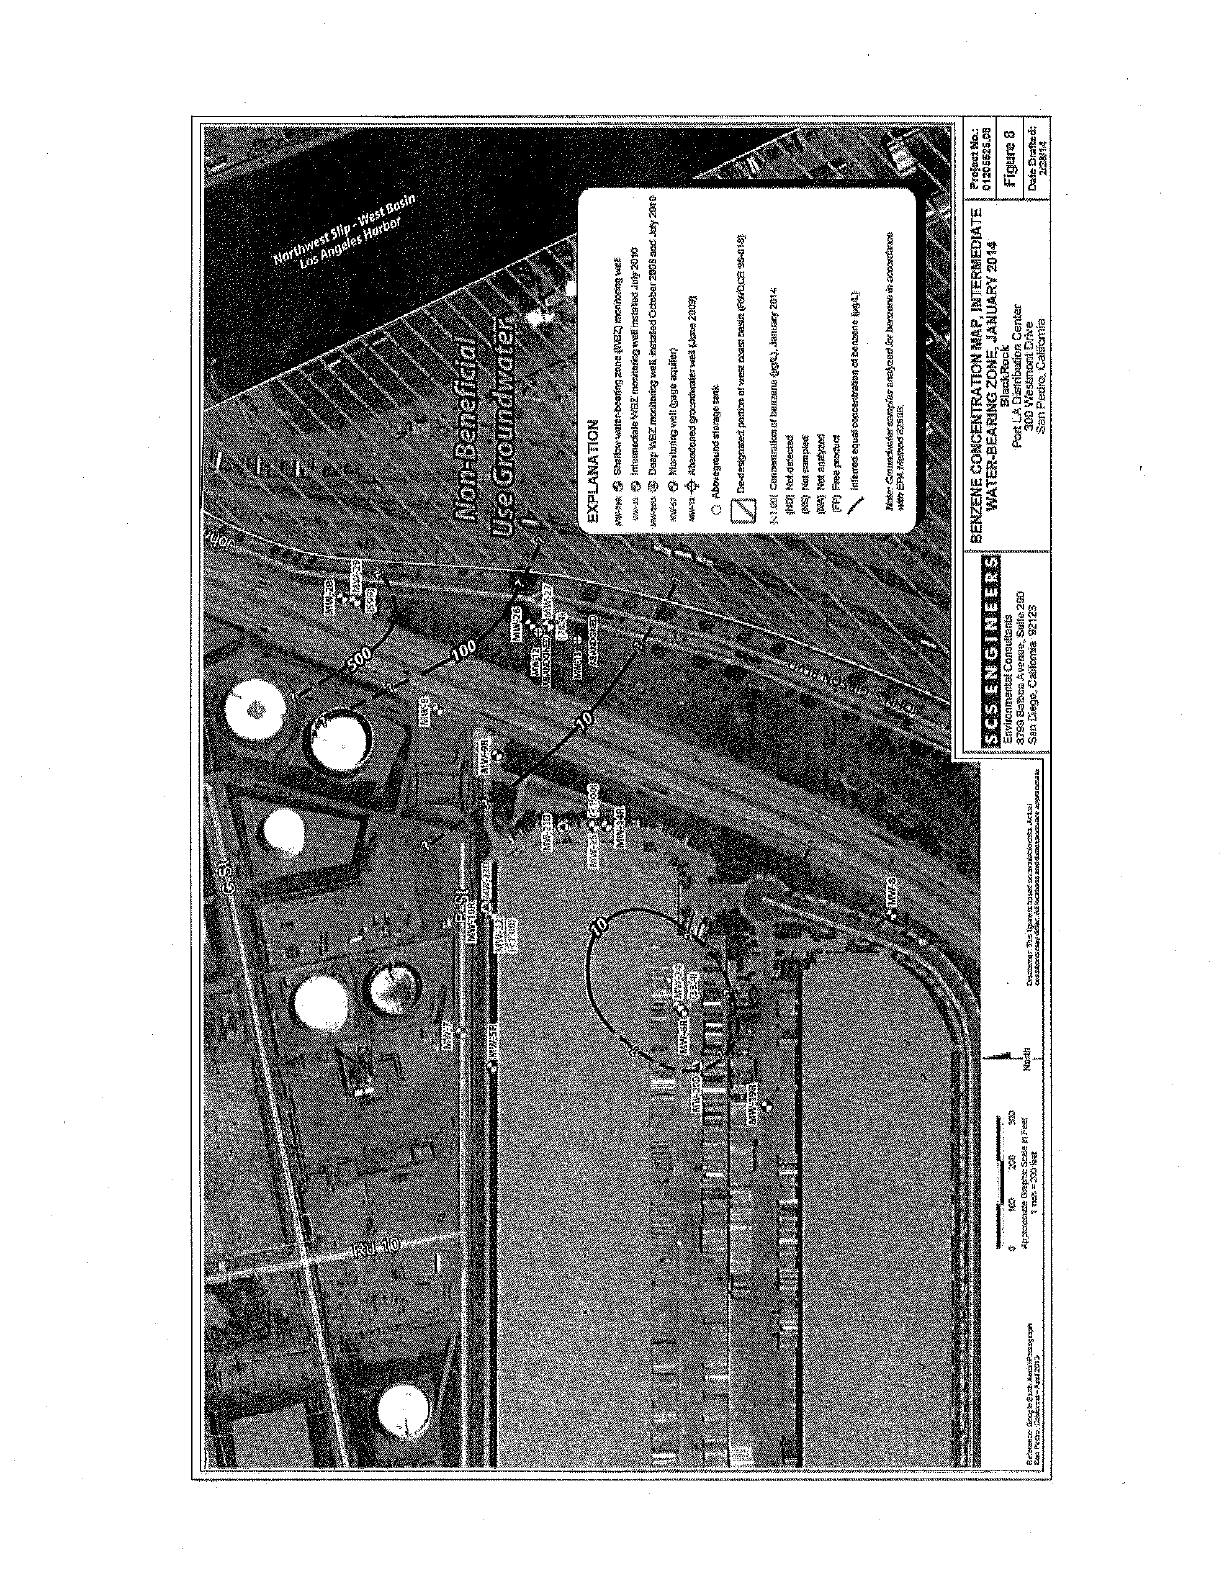
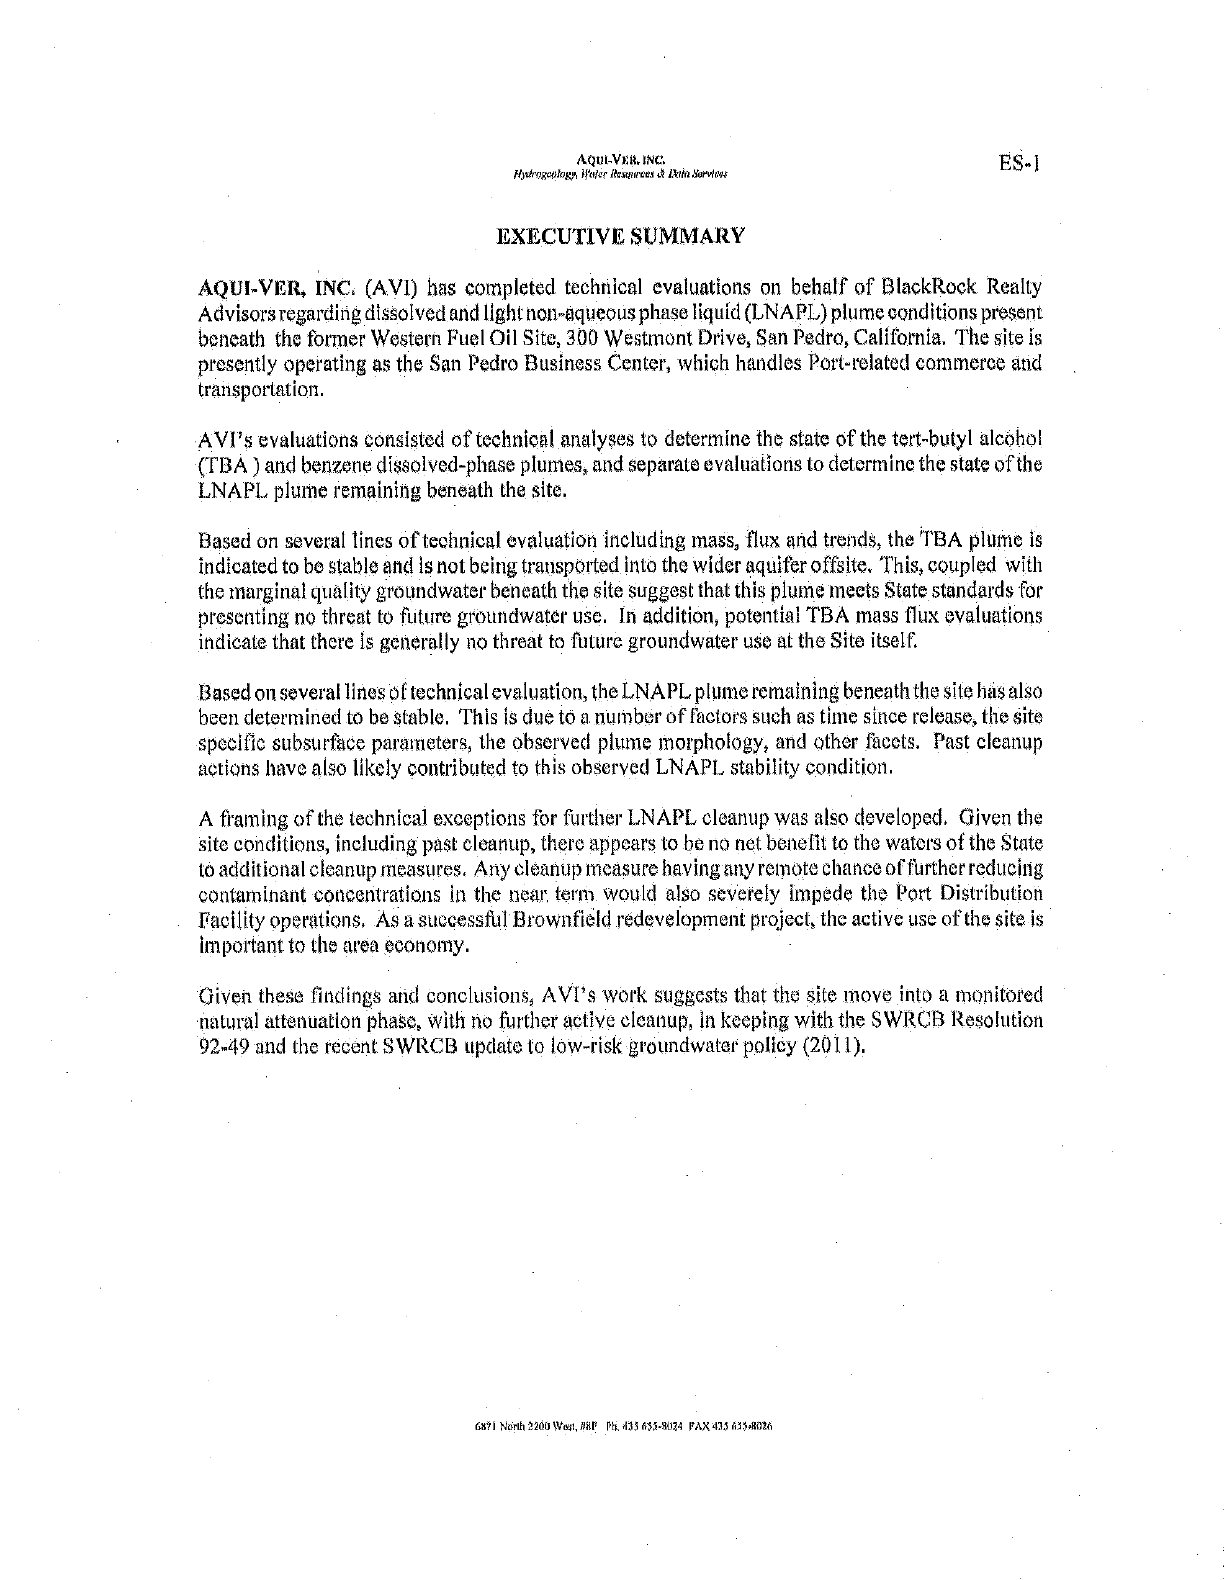
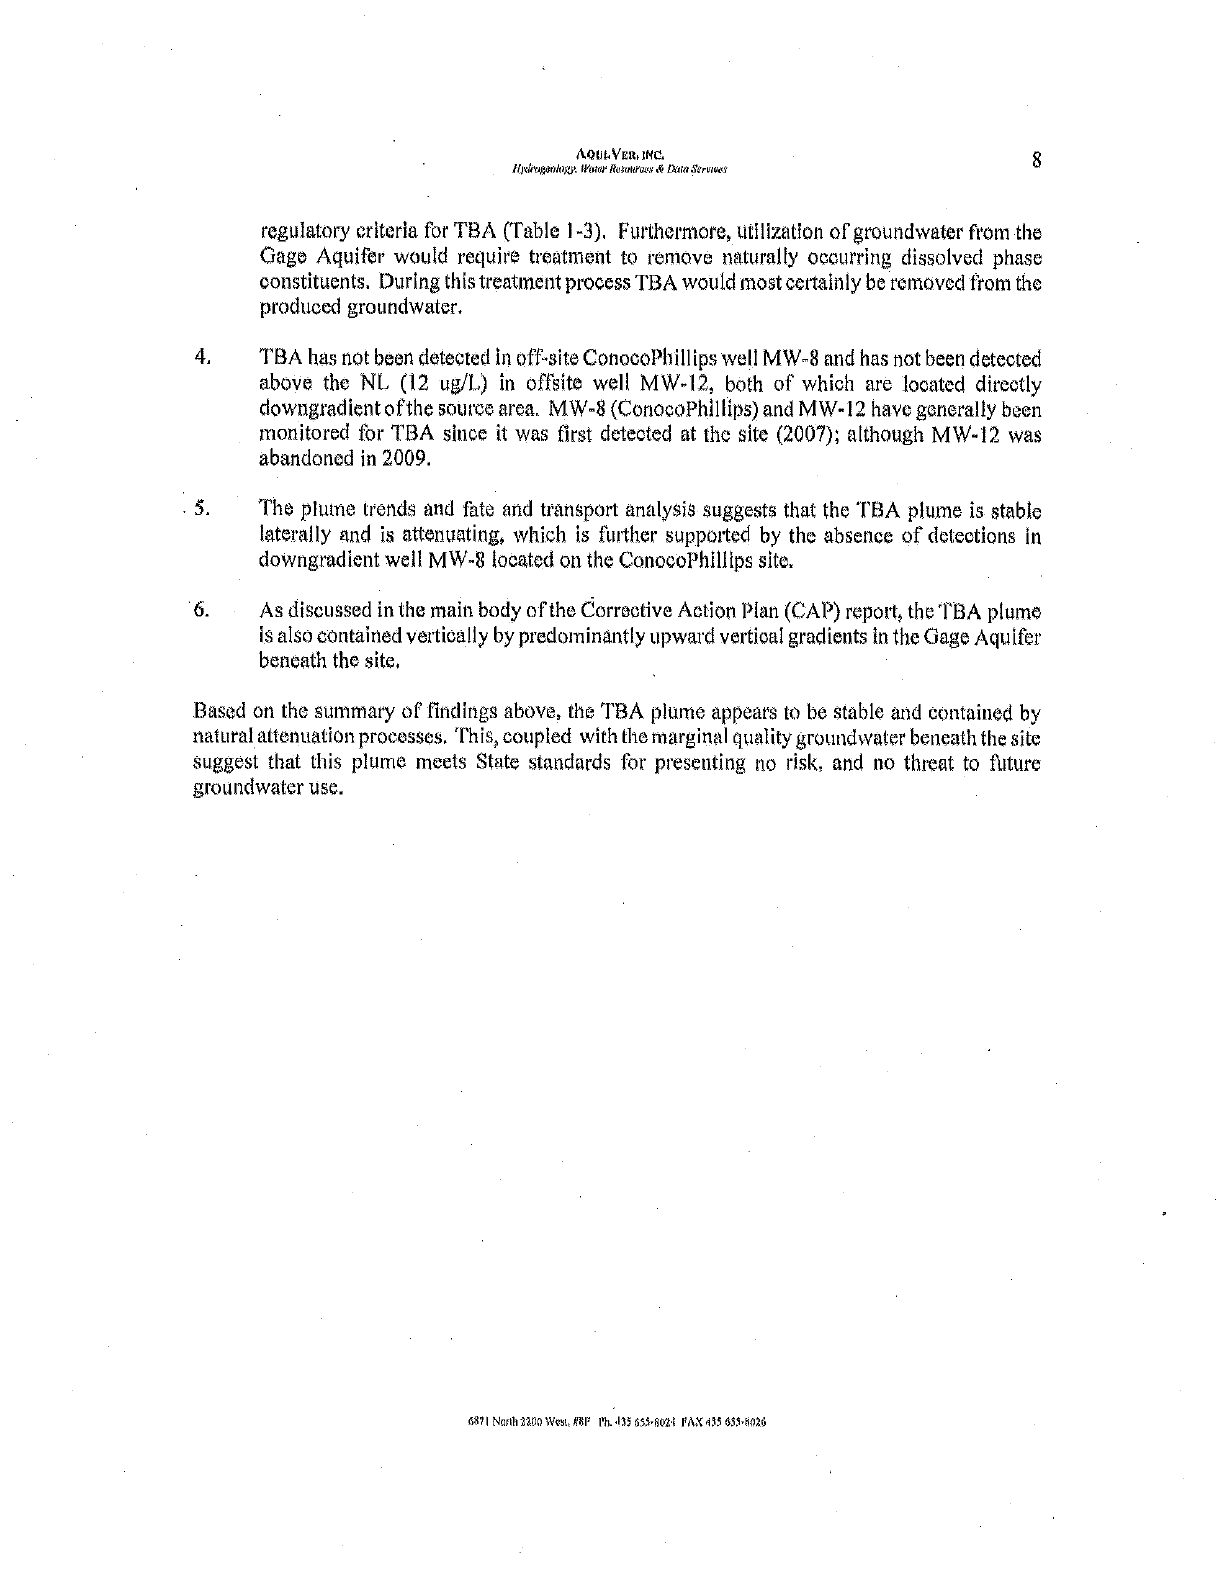
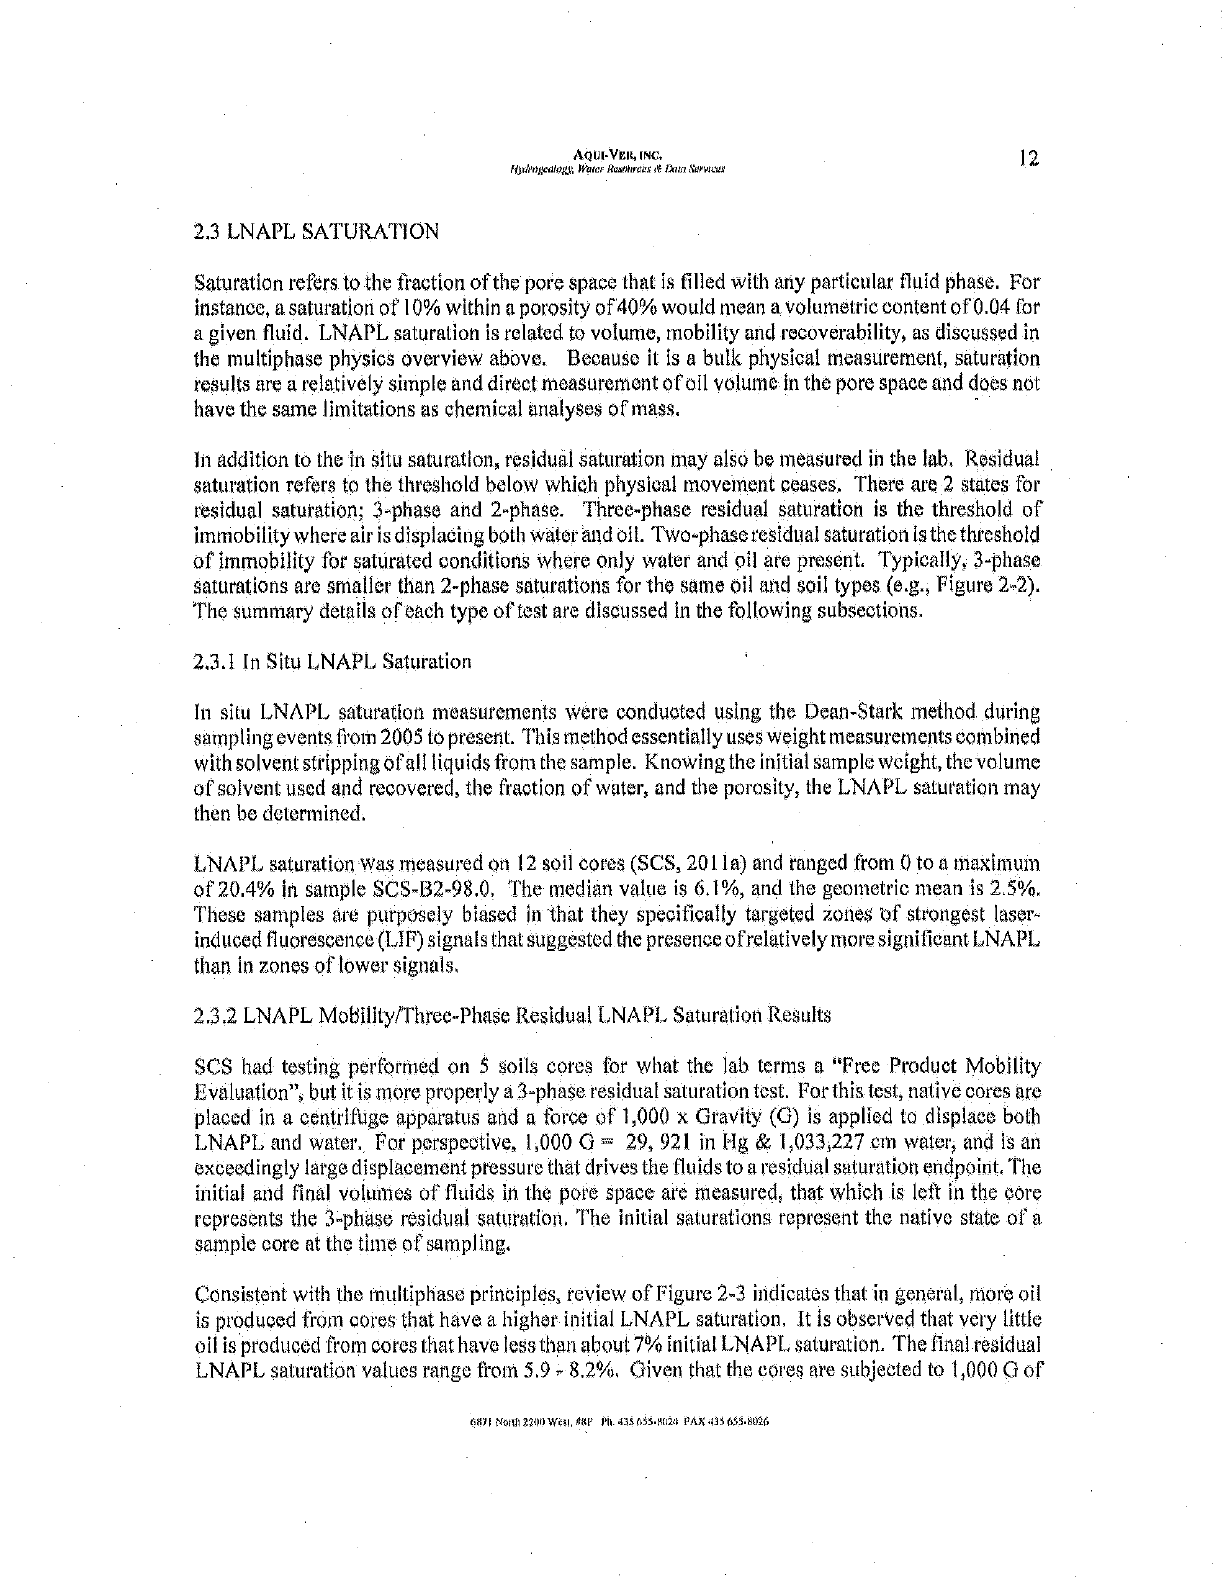
BENZENE CONCENTRATION MAP, INTERMEDIATE
1 Pif"'" 010
ATER-BEARING ZONE, .IANUAPY 2614 I
olxosscs ve
Prat La ©sGnbntror.Cerfr.
303 WessmoniOwe
San Pad :C Cal-tame
1 Figure 8
, Dan Drafted
I N1í14
14971L
:WOUTICI Mrce
14. WU
2092"99)0Z
isajeld
e!uJokle0 ',wad yes
aAparsourasem oat
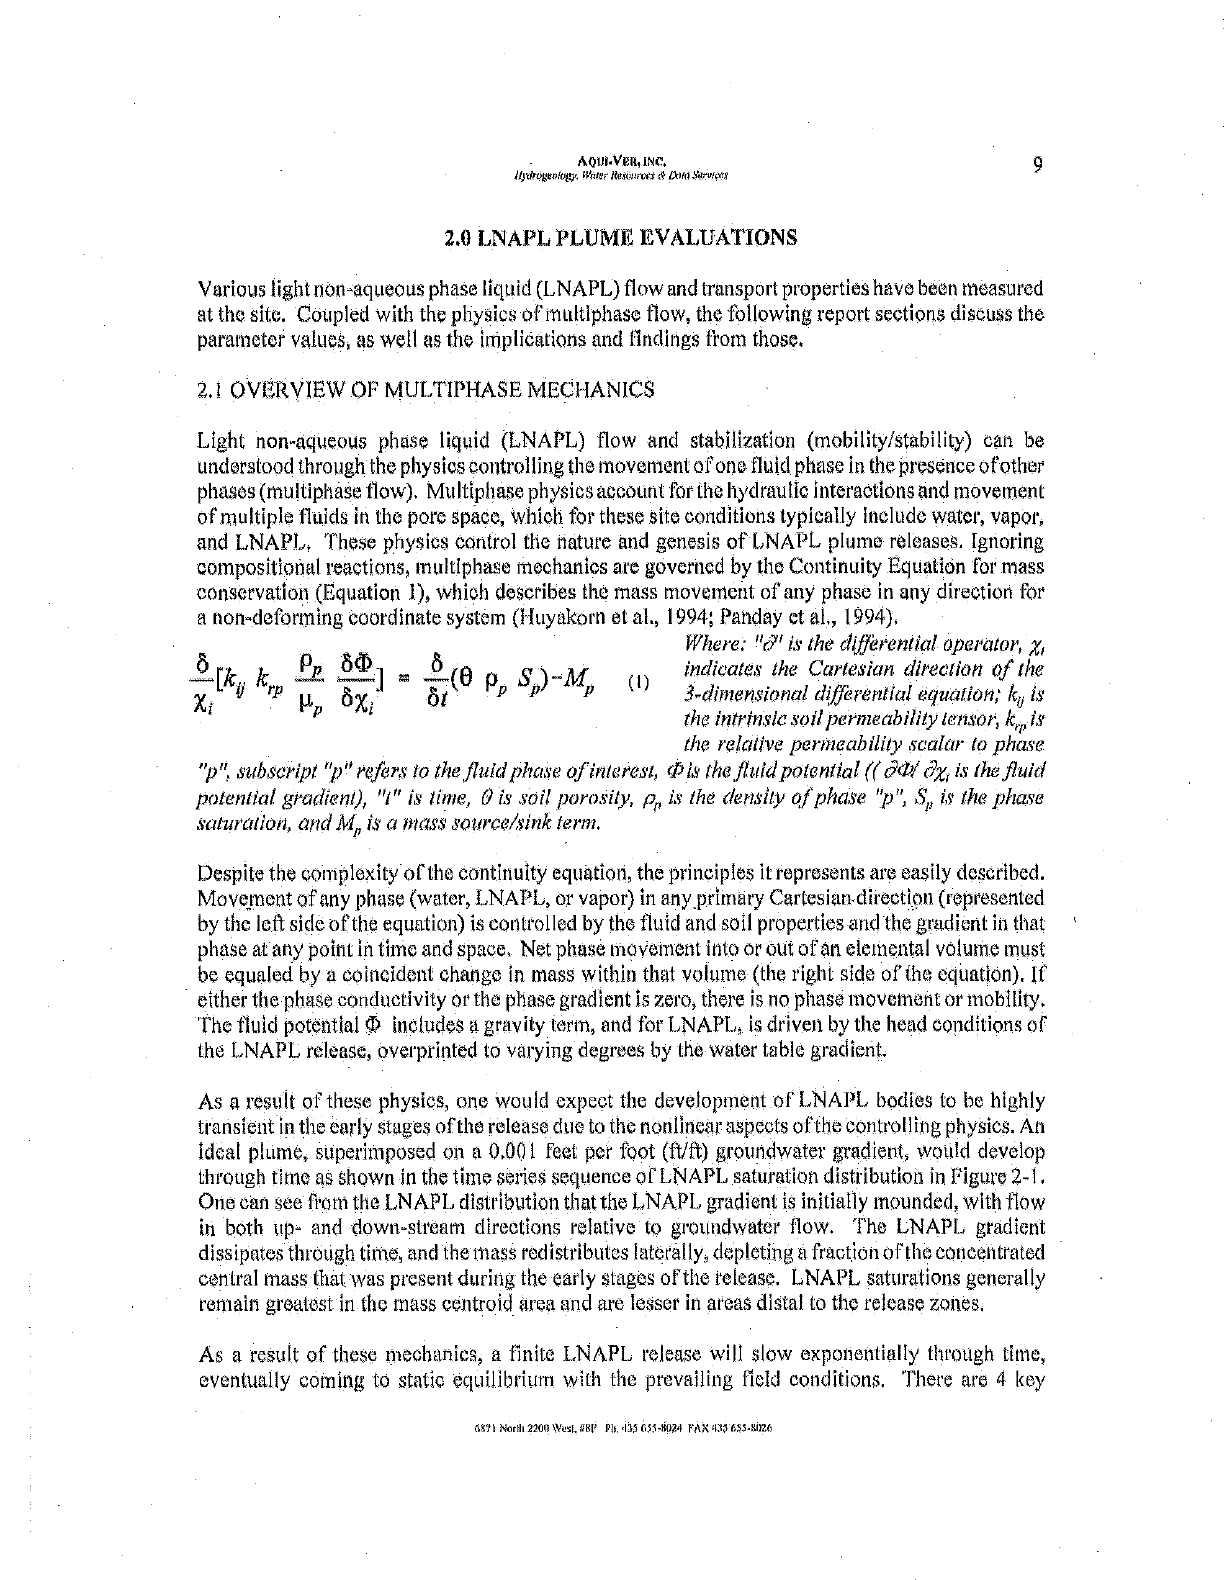
Jalua3 mMat) Yi Pod
IrracliVtlE
'or salmons A0 inn as VRI4Y N04
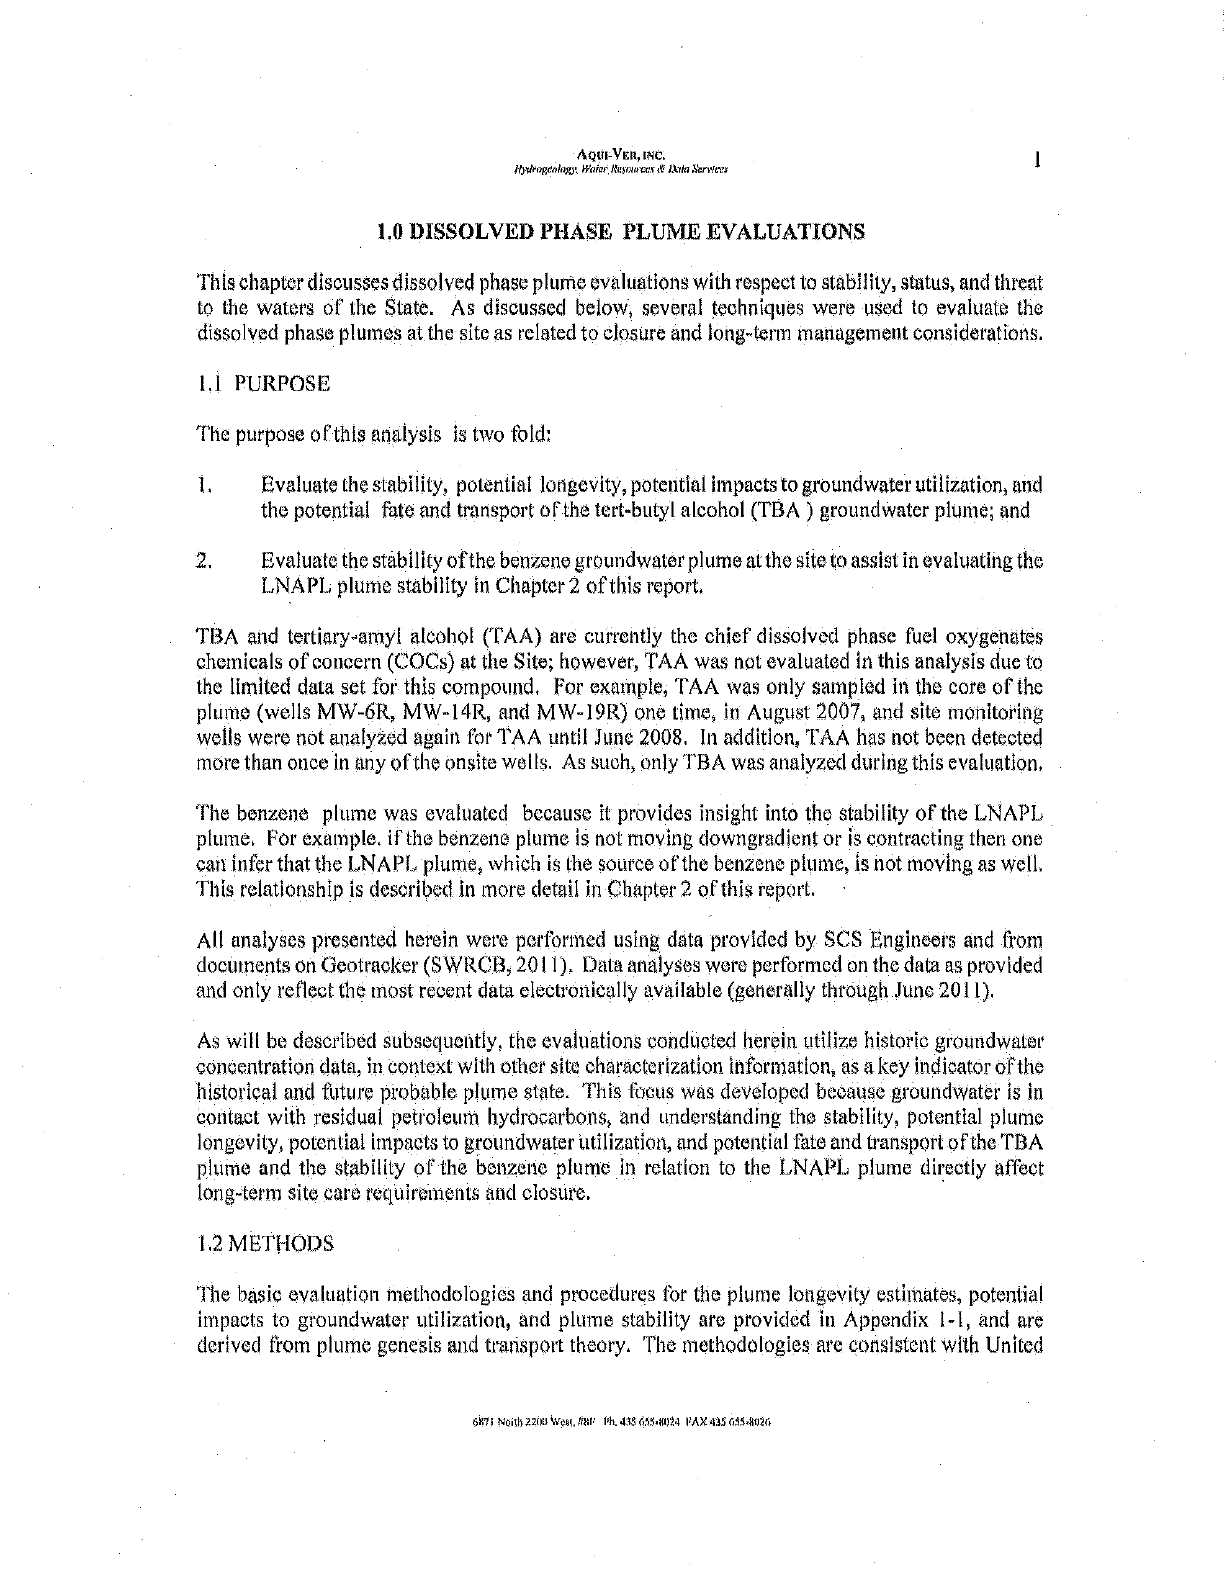
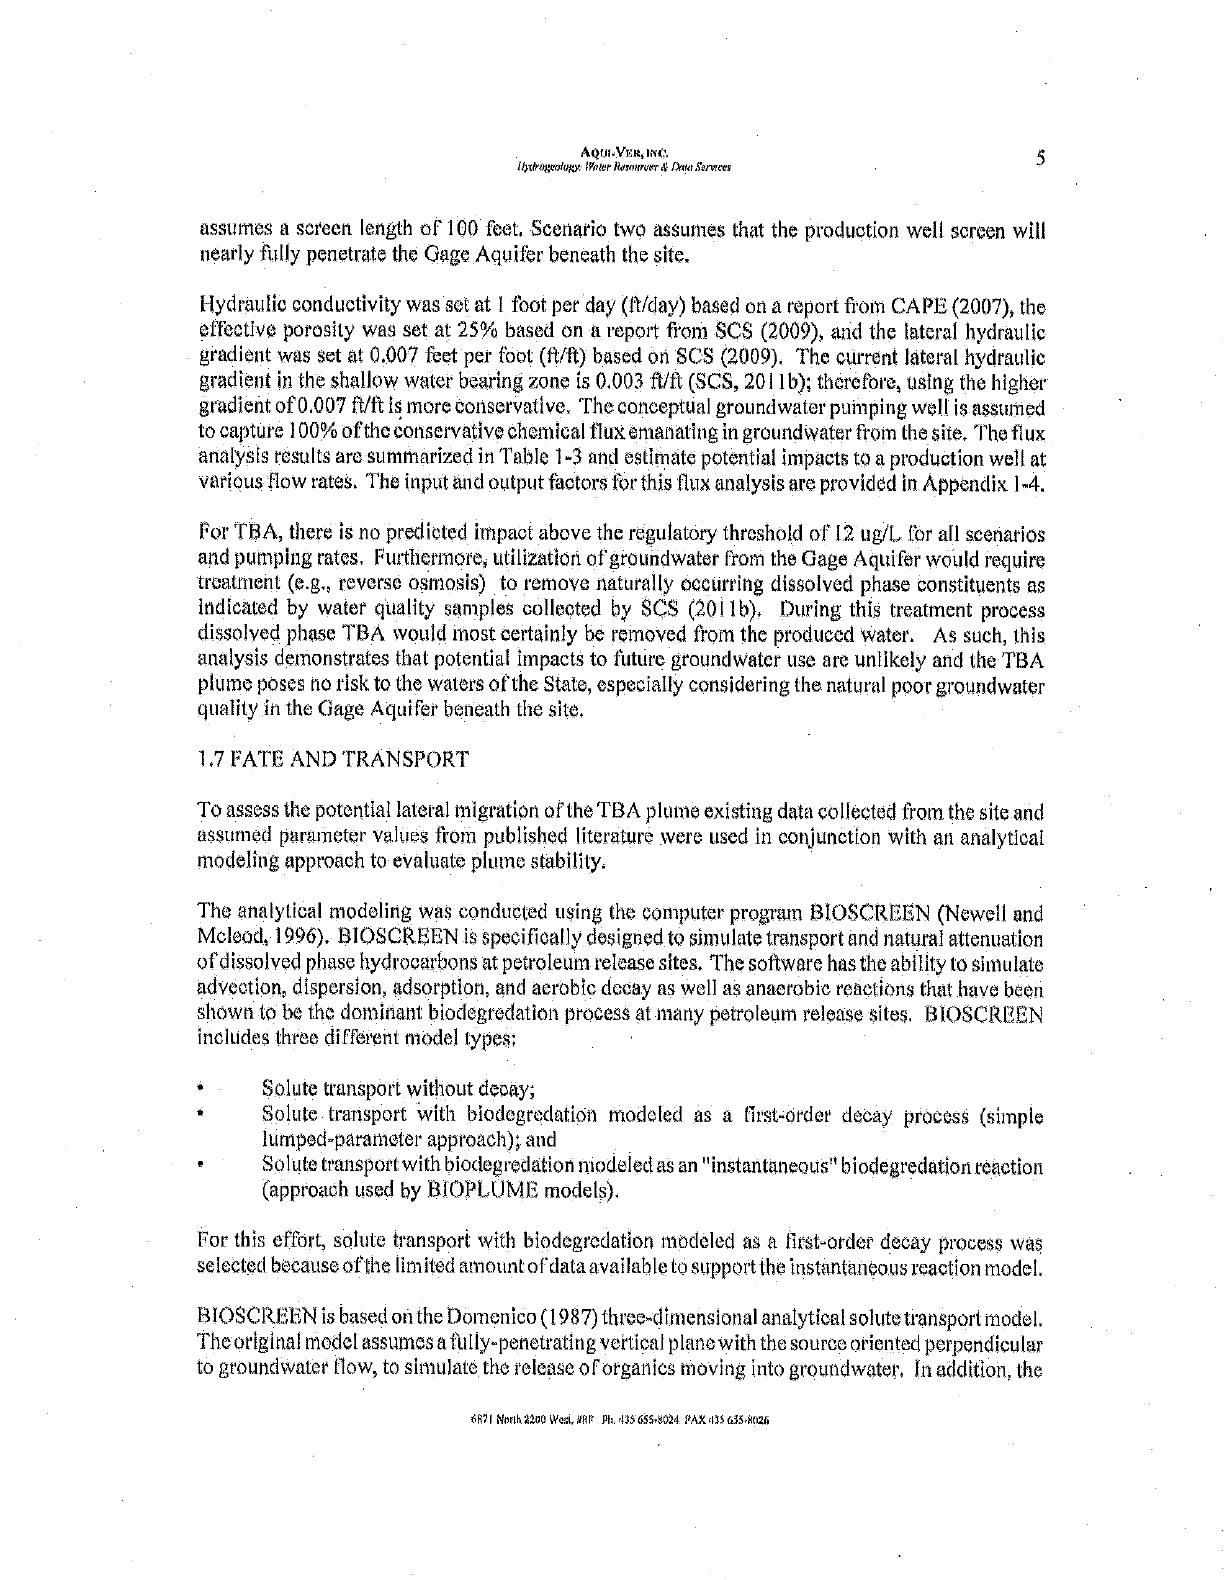
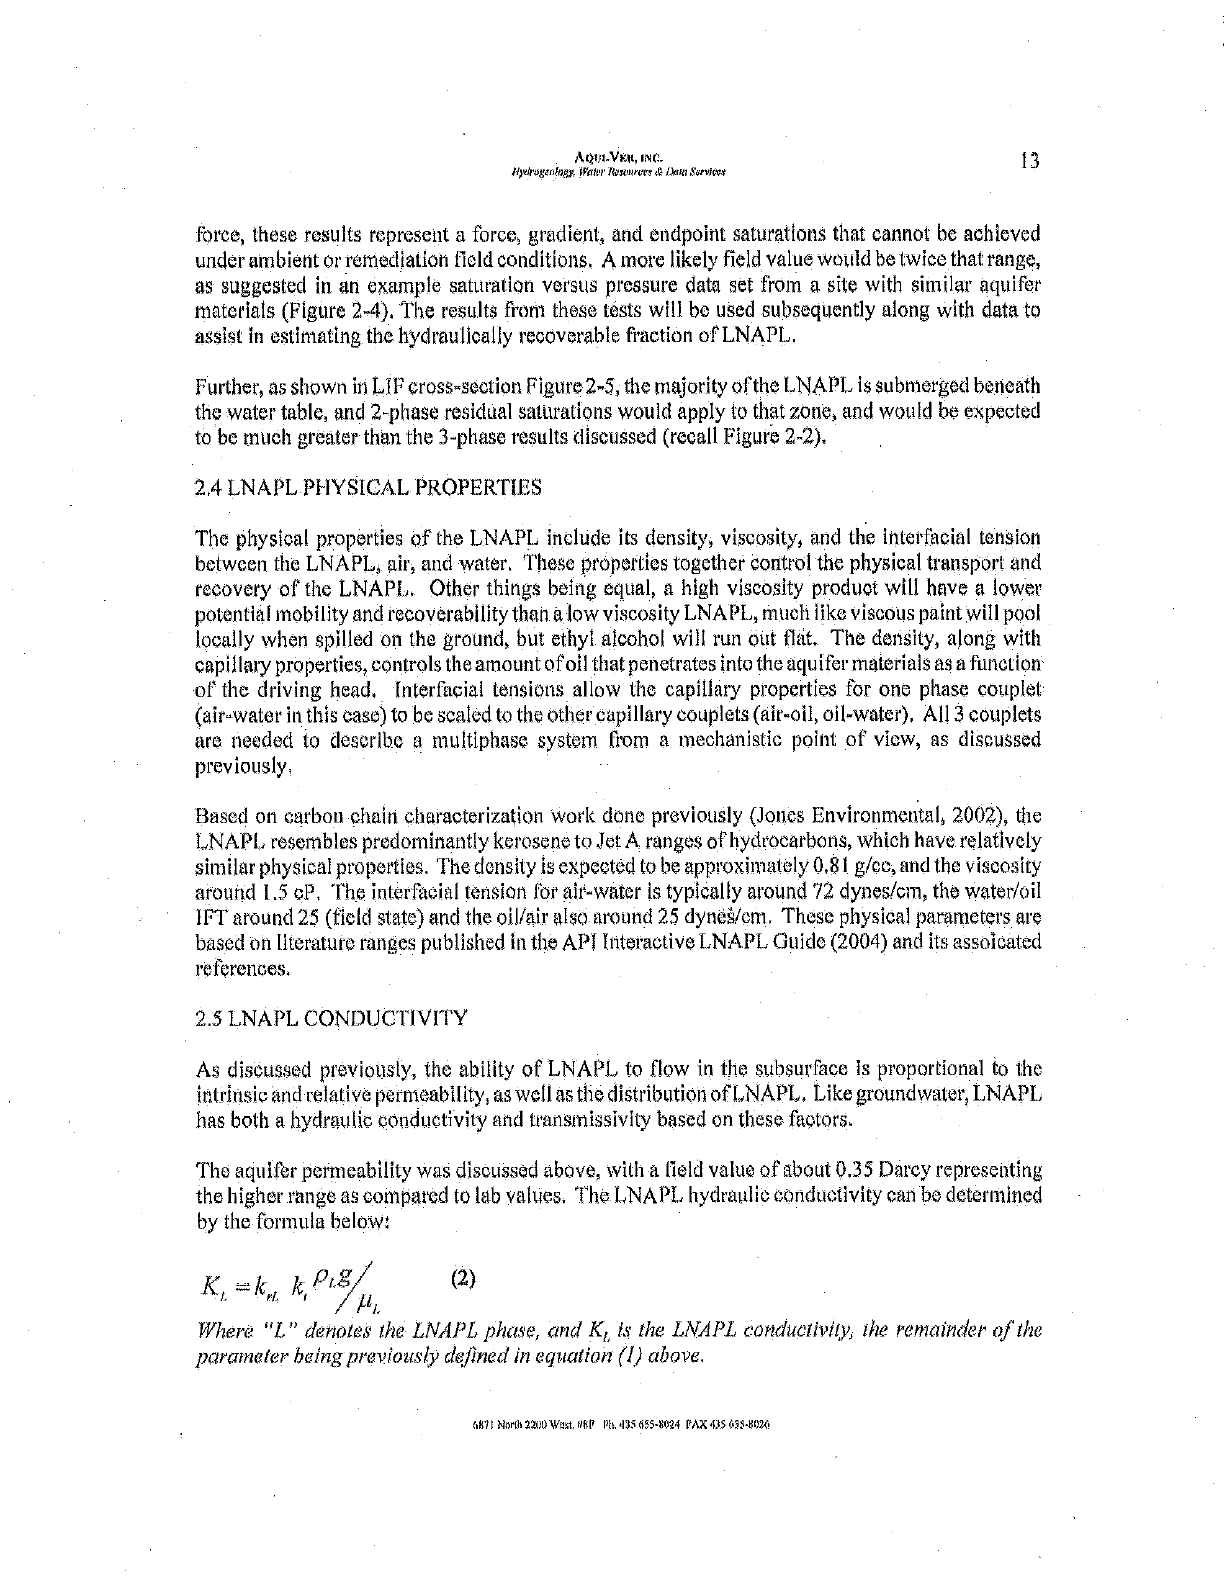
- 3 HOLL33S-SSOkE3 LSO N C3Z11)fti3N3e.
suzs egummo tosam zsgs
ostaRRS'armarev ectl13 66t8
sitnelinsocrmemaunttairala
saa3NION3 S3S
04.1r4oe p»zw4 ie a(r-SMCcx-c,*
71-ne Se Ist
5.44,..e9ee.C.,... ?Wart wdre
CI CC. 05 0
aser...
;Mt 5e9Pc4,14ICS Art,reecaehetra ..ssyrspagn.fri.t.essenefin qecoceNsR3d
NOLLYN'eldX3
io
tO e
(AT
aScia Elrid3 SVId3
.3
Bazipoiv
8l2t.. 00 t
st
E
VO
O
t.
9E-140 n.1.43
05-
OE'
0E-
I a
Ott
3
1-santygnos
A 4 41444 i
4 A e
4
A
o
00
503
9- mm UVAl
W Oltx,ThEc!
X a.° 01-.6tEd.
h-n
EIX
Ng(
p.
Al
p. o A
g 03 03"
fi il
r-rtimrl'i-l-T-T-77-711II 'V°
ti; mummglimemwommualm,0
Port LA 01 Ibution Center
APPENDICES
Technical Report - Site Closure March 2014
Port LA Distribution Conte'.
Appendix A
Dissolved- and LNAPL Plume Stability Evaluations and
Discussion of Cleanup Implications
Aqui -Ver, Inc'.
August 30, 2011
To cí7 nlcol fte port - Site Clatu re March 2014
DISSOLVED- AND LNAPL PLUME STABILITY EVALUATIONS AND
DISCUSSION OF CLEANUP IMPLICATIONS
FORMER WESTERN FUEL OIL FACILITY
300 WESTMONT DRIVE
SAN PEDRO, CALIFORNIA
August 30, 2011
For:
Mr. Leland Nakaoka
BlackRock Realty Advisors
4400 MacArthur Boulevard, Suite 700
Newport Bench, CA 92660
In Cooperation With:
SCS Engineers
8799 Balboa Avenue, Suite 290
Sau Diego, CA 92123
AQUI -VER, INC.
Hydrogeology Water Resources & Dala Services
DISSOLVED- AND LNAPL PLUME STABILITY EVALUATIONS AND
DISCUSSION OF CLEANUP IMPLICATIONS
FORMER WESTERN FUEL OIL FACILITY
300 WESTMONT DRIVE
SAN PEDRO, CALIFORNIA
For:
Mr. Leland Nakaoka
BlackRock Realty Advisors
4400 MacArthur Boulevard, Suite 700
Newport Beach, CA 92660
In Cooperation With:
SCS Engineers
8799 Balboa Avenue, Suite 290
San Diego, CA 92123
By:
AQUI-VER, INC.
Hydrogrodqgy, Water Resources ' cF Data Scrvices
Principal Authors:
C.D. Beckett, R.G., CilG,, Principal Hydrogeologist
Nathaniel Beal, P.G. Senior Hydrogeologist
cmviloepi nimispoor, (lid Id
AQUI-VER, INC
101rngeólógy. Wahr Rennin-es .@ Mk. Su
TABLE OF CONTENTS
EXECUTIVE SUMMARY ES-1
1.0 DISSOLVED PHASE PLUME EVALUATIONS 1
1,1 PURPOSE . , 1
1.2 METHODS 1
1,3 DISSOLVED -PHASE MASS ESTIMATES , 2
1,4 ESTIMATION OF CENTER OF MASS THROUGH TIME 2
1.5 PLUME LONGEVITY EVALUATION ......... n . . . . ... :..: ..... . . ..:. . .1
1.6 FLUX CALCULATIONS .... .............:. 4, ............ ..;....4
i J FATE AND TRANSPORT ................... ............,,,.,,,.,5
1,8 METHOD CONSERVATISM , , , . .... , ,. Ç
1.9 SUMMARY OF DISSOLVED PLUME CONDITIONS EVALUATIONS ... , , , . 2
APL PLUME EVALUATIONS 9_
2,1 OVERVIEW OF MULTIPHASE MECHANICS ,.:.,,,,,,,,,,;,;,,,,,,,,,;,9
2.1 BASIC PETROPHYSICAL PROPERTIES ,,,,,,,,,,,,,,,,,,,,,,,,,,,,;,, IQ
2.2 CAPILLARITY , ......... . ... . .... . , , . , , , l.1
2.3 LNAPL SATURATION 12
2.3.1 In Situ LNAPL Saturation . . . . . . . ... . . . . . . ......... .
2,3.2 LNAPL Mobility/Three-Phase Residual LNAPL Saturation Results
2.4 LNAPL PHYSICAL PROPERTIES
2,5 LNAPL CONDUCTIVITY ....:......... ..:: 13
2,6 LNAPL VELOCITY POTENTIAL- 14
3.0 EVALUATION OF LNAPL PLUME AND CLEANUP CONDITIONS ,....... ,,,.., j7
3.1 LNAPL STABILITY CONSIDERATIONS 17
3,2 LNAPL CLEANUP CONSIDERATIONS . , . .. .... . ... . .......... . 19
,..,.12
...12
4.0 REPORT CLOSURE ,22
5,0 BIBLIOGRAPHY ..,......,.,. :...::::.. ......... ......... ........ ........ 23
'Fable 1 -1:
Table 1 -2:
Table 1 -3:
LIST OF TABLES
Dissolved Mass Estimate for TBA
Longevity Estimate for TBA
Potential Flux Impacts to Groundwat l'BA
Table 2 -1: LNAPL Hydraulic Conductivity Estimates
Table 2 -2a: Data Used to Determine LNAPL Gradients
Table 2 -2b: LNAPL Gradient Results
Table 2.3: Estimate Range of Potential LNAPL Linear Pore Velocity
r,h230qWesi,08F Ph. 495655- 0
to MOANER, Me.
Ipglt Watt" Re.rsnrce & Data 5'arvövs
LIST OF FIGURES
Figure I -l: Site Plan
Figure l -2: TBA in Groundwater - August/December 20
Figure 1-3: Benzene Center of Mass Through Time
Figure 2 -1: Time Series of LNAPL Saturation Distribution under Release Conditions
Figure 2-2: Literature Ranges for 2 -Phase vs. 3 -Phase LNAPL Saturation
Figure 2 -3: Initial vs. Residual LNAPL Saturation Results
Figure 2-4: Example of LNAPL Saturation vs. Applied Pressure
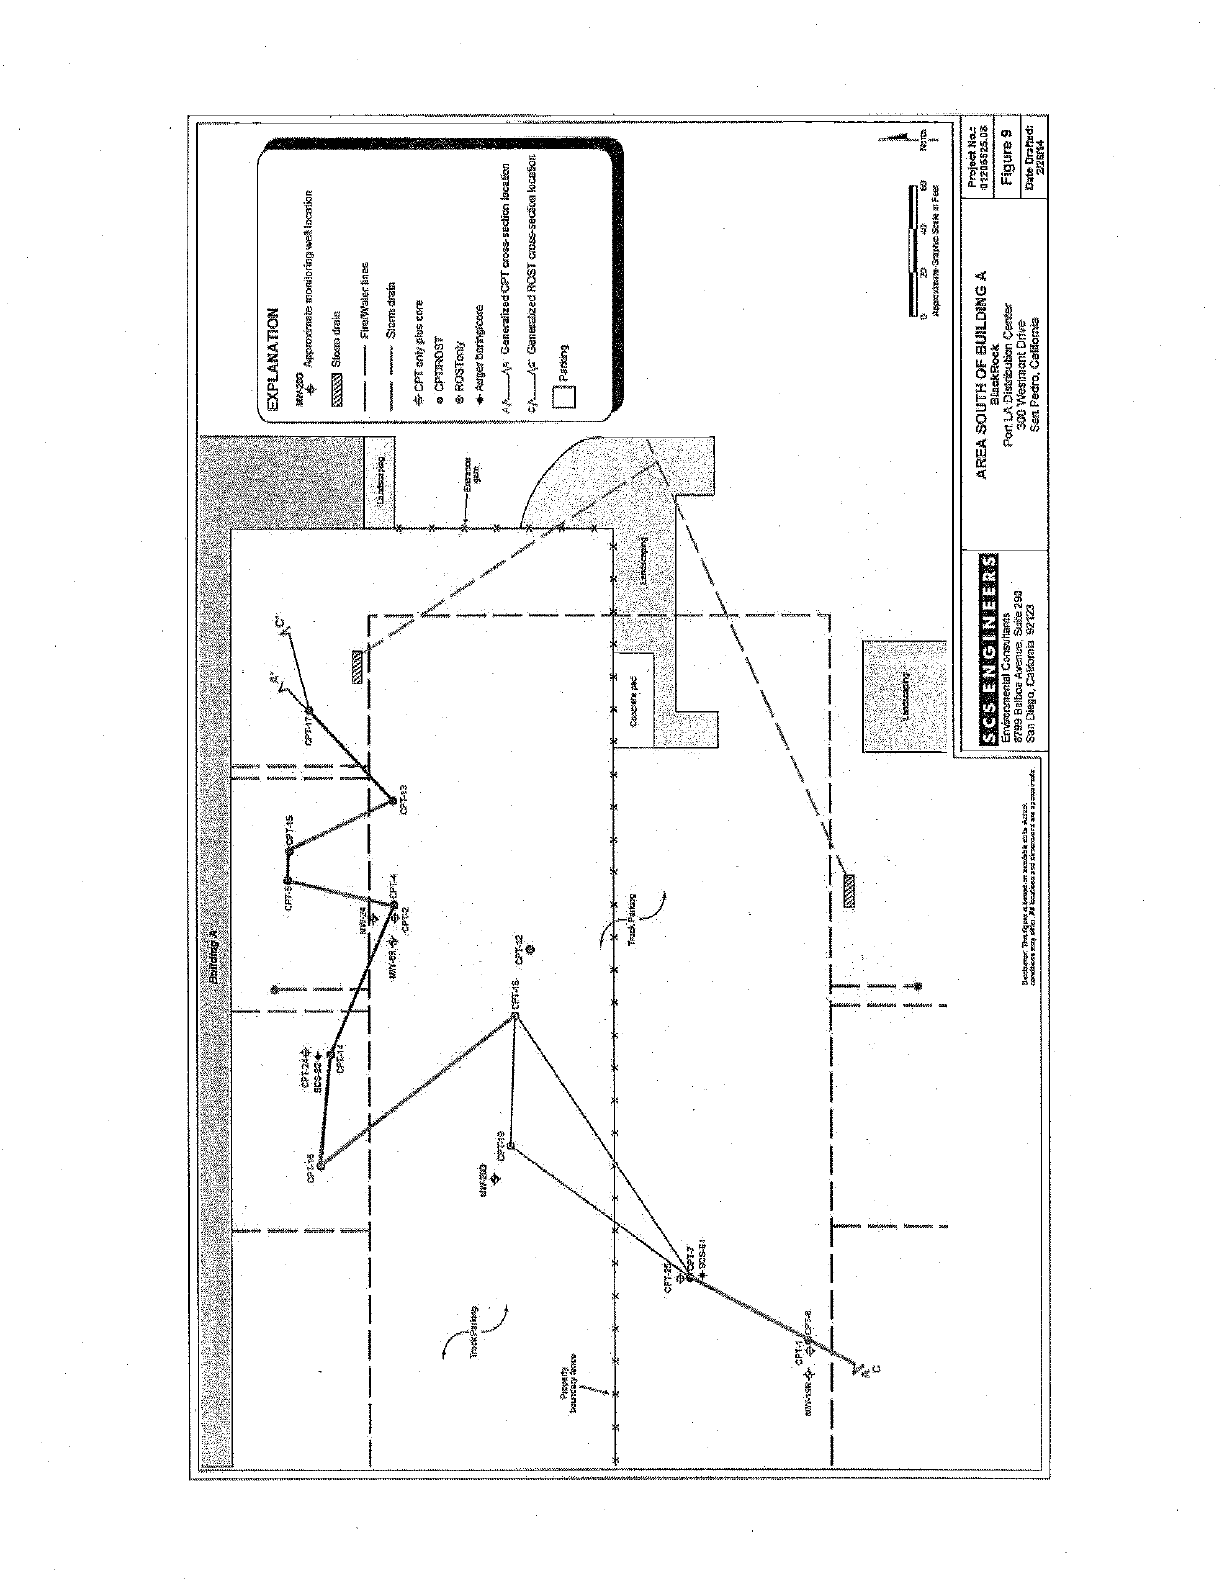
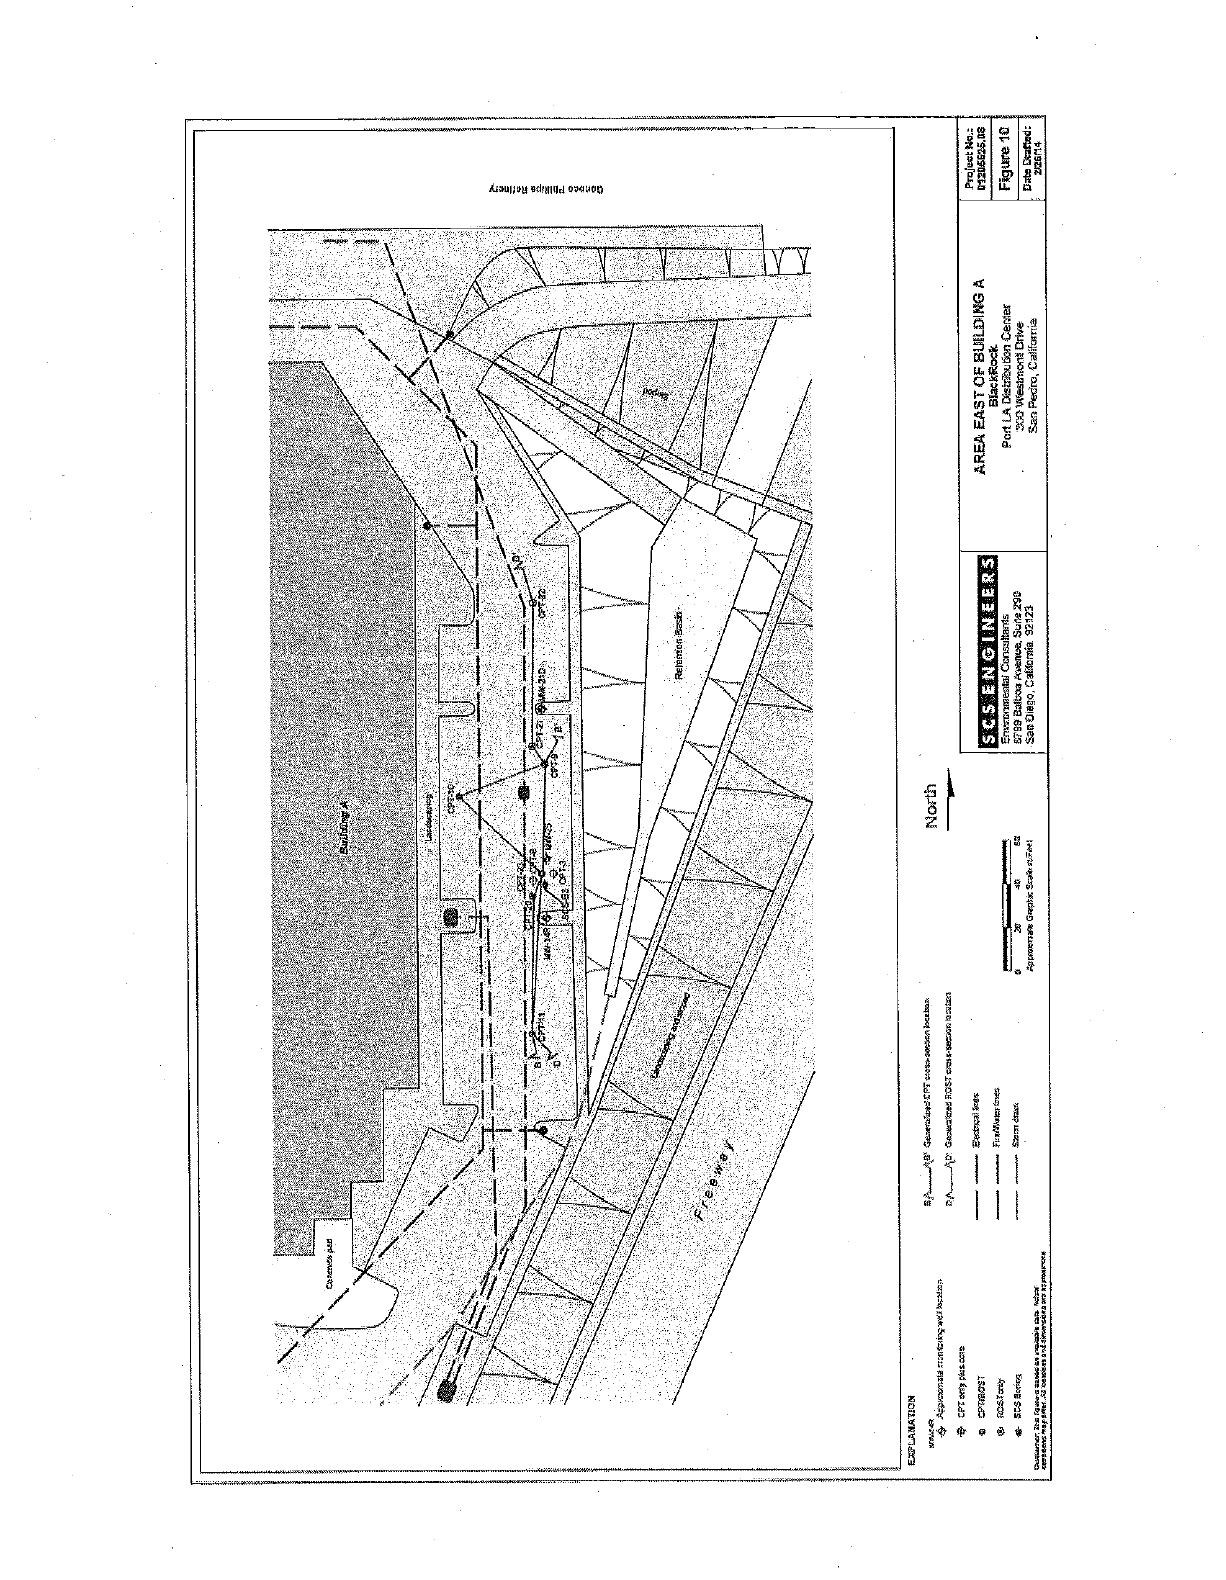
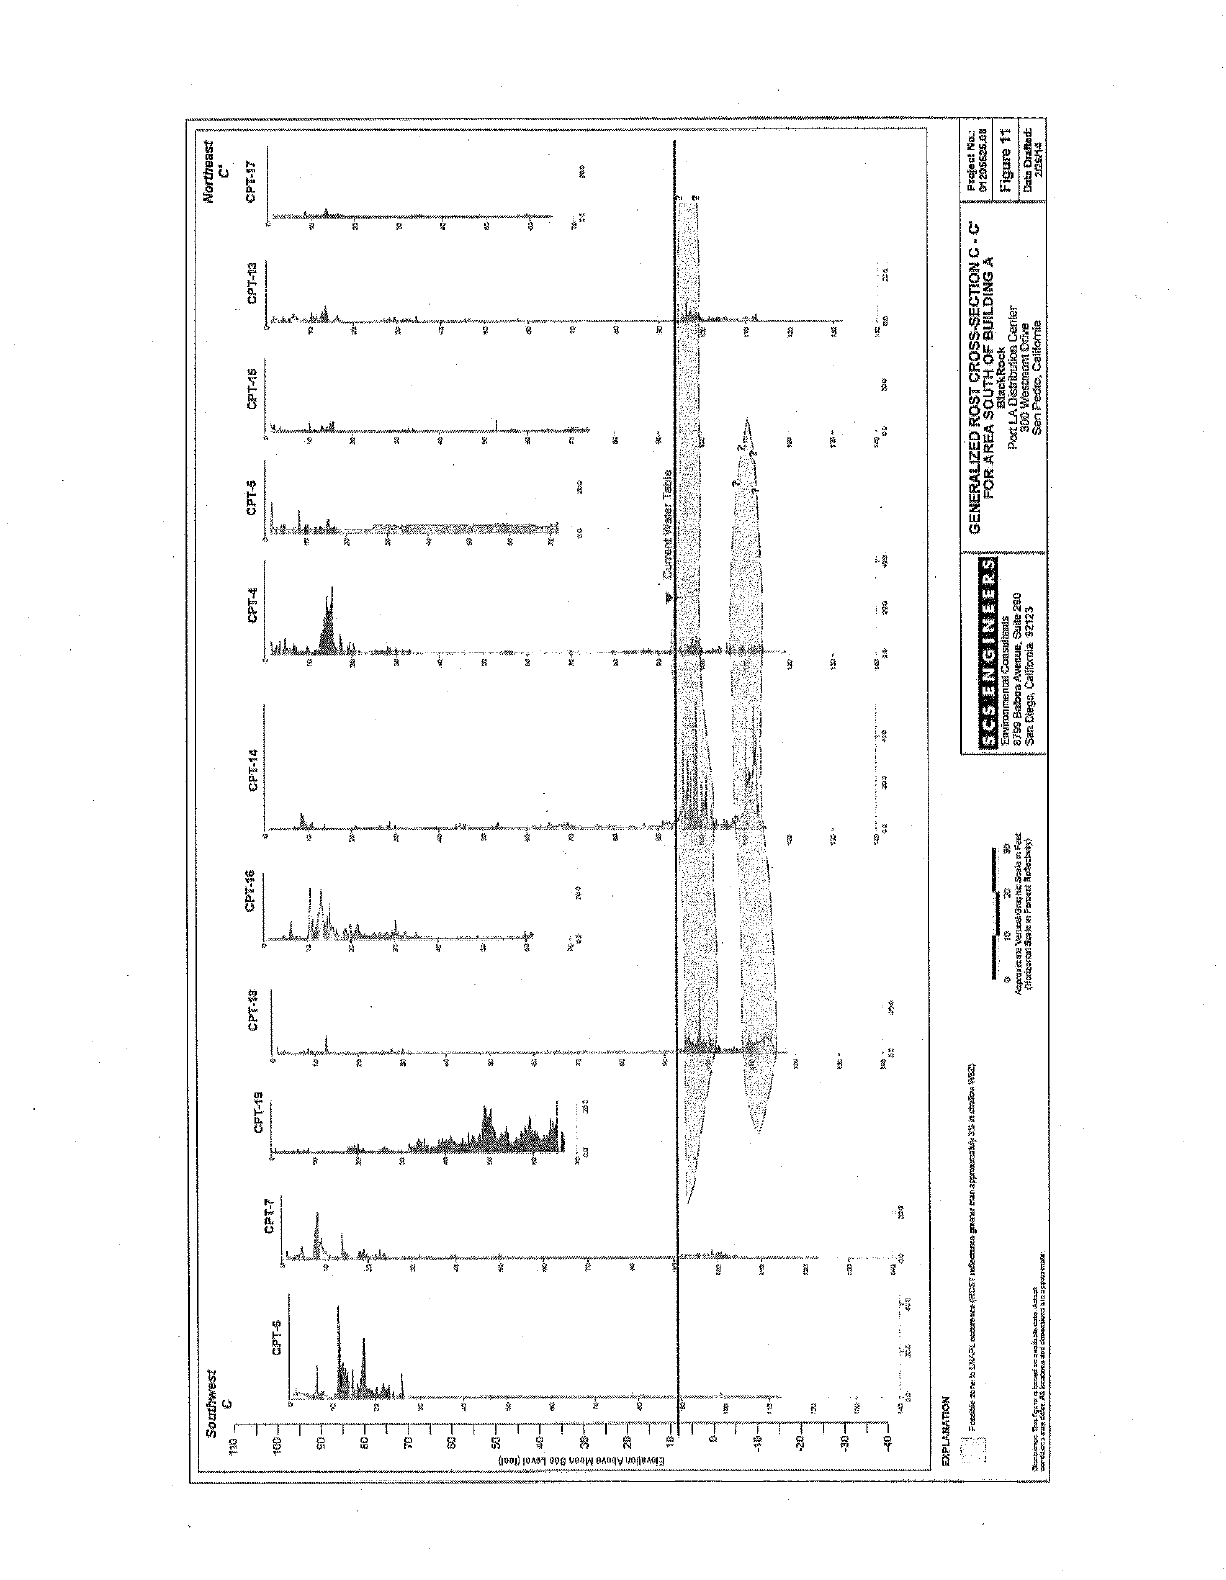
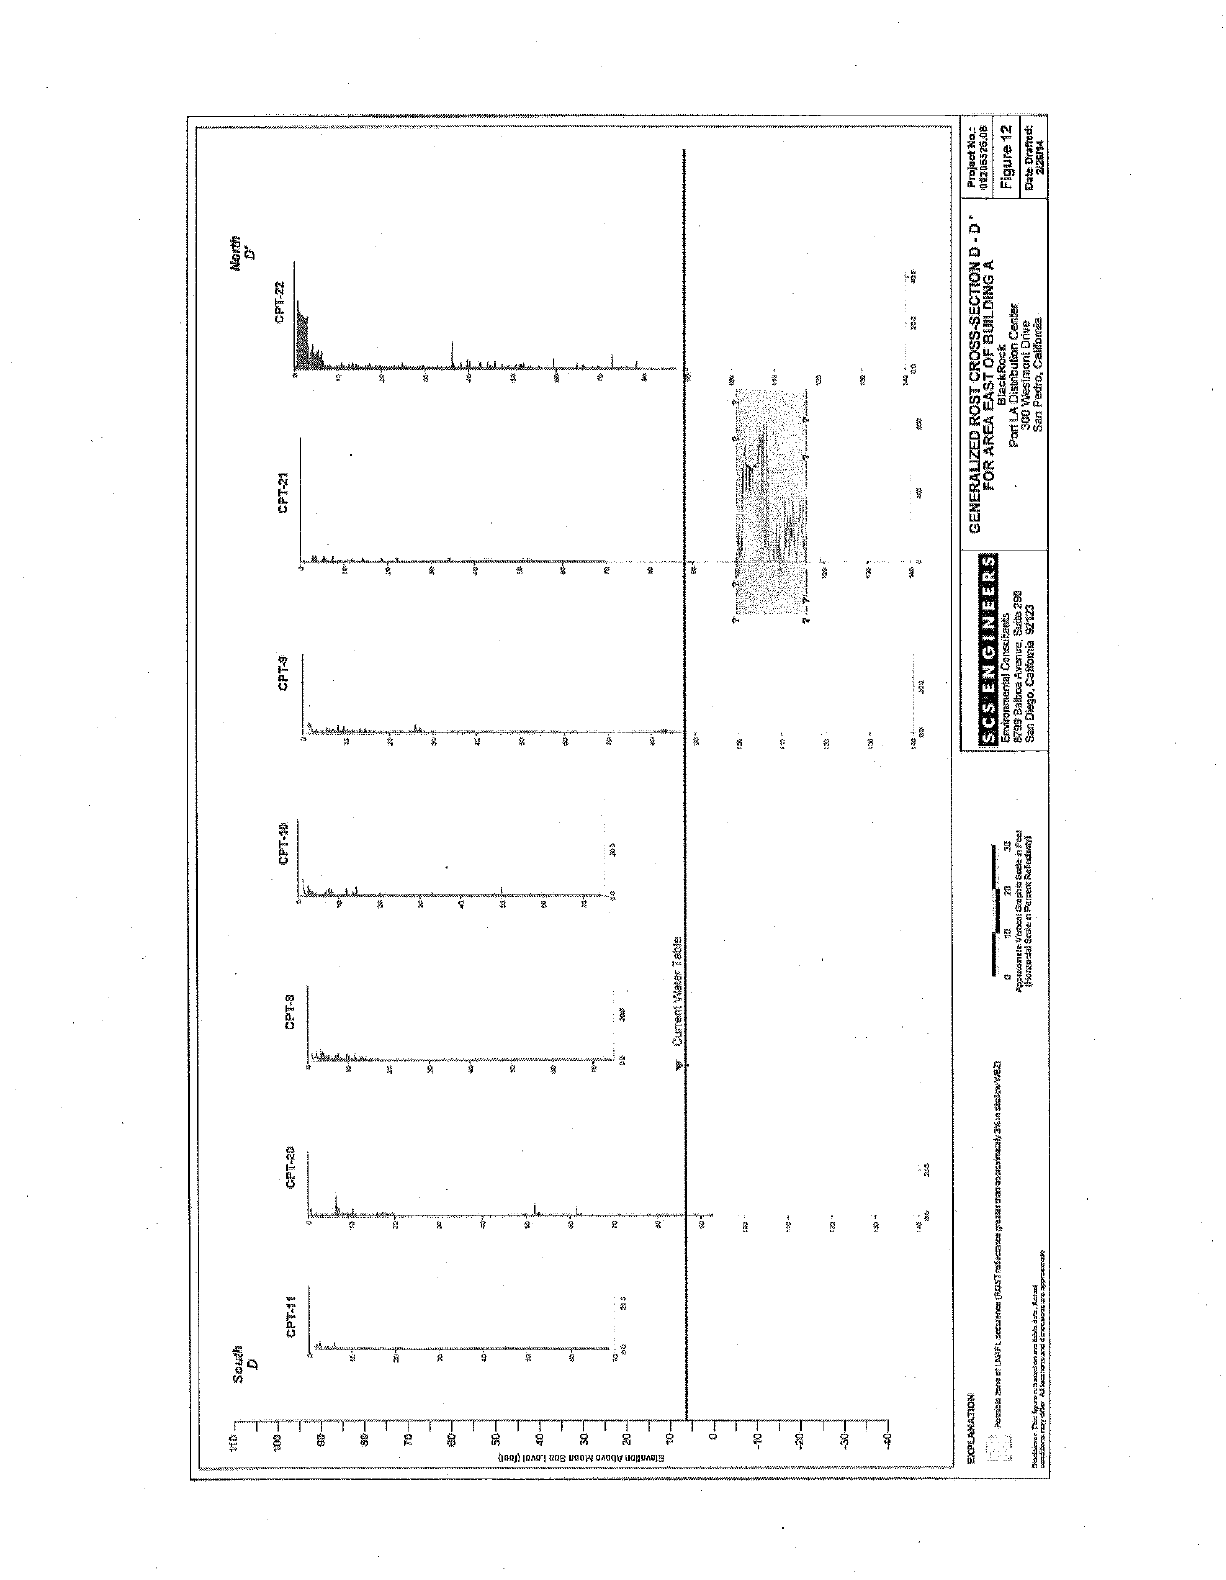
Figure 2 -5: Southwest to Northeast LIF Intensity Cross Section A -A'
Figure 2 -6: Southwest to Northeast LIF Waveform Cross Section A -A'
Figure 3 -I: Generalized Saturation Profiles Expected Under Cleanup Conditions
Figure 3-2: Generalized Benzene Change over Time Under Cleanup Conditions
Figure 3-3: Generalized Chemical Component Stripping By SVE & IAS
Figure 3-4: Ratio of Benzene to Ethylbenzene at MW -10 Overlapping IAS /SVE Cleanup
Figure 3 -5: Image of IAS In -Situ Air/Stripping Distribution in a Fine Sand
Figure 3 -6: Estimate of 1AS In -Situ Air /Stripping Distribution in the Gage Aquifer
Appendix I -l:
Appendix I -2:
Appendix I -3:
Appendix 1-4:
Appendix l -5:
Appendix 2 -I:
Appendix 2 -2:
Appendix 3 -1:
APPENDICES
Evaluation Methodology
Dissolved Phase Benzene Plume Maps
Dissolved Phase TBA Statistical Trends
Flux Estimate Calculations
BIOSCREEN Model Inputs & Results
Capillary Parameter Derivations
LNAPL Thickness and Groundwater Piezomenìc Ì-Sydrographs
Key API LNAPL Screening Inputs and Results
UXe l Naftll 2200 West, OBP PL. '35 b5&10 1I FAX X13565511036
iv
AQUI-Vµ,Irve
N}dnUPaQ2oyn Weller Ihianronr.4 ES -I
EXECUTIVE SUMMARY
AQUI-VER, INC. (AVI) has completed technical evaluations on behalf of BlackRock Realty
Advisors regarding dissolved and light non-aqueous phase liquid (LNAPL) plume conditions present
beneath the former Western Fuel Oil Site, 300 Westmont Drive, San Pedro, California. The site is
presently operating as the San Pedro Business Center, which handles Port- related commerce and
transportation.
AVI's evaluations consisted of technical analyses to determine the state of the tert -butyl alcohol
(TBA ) and benzene dissolved -phase plumes, and separate evaluations to determine the state of the
LNAPL plume remaining beneath the site.
Based on several lines of technical evaluation including mass, flux and trends, the TBA plume is
indicated to he stable and Is not being transported into the wider aquifer offsite. This, coupled ,,vith
the marginal quality groundwater beneath the site suggest that this plume meets State standards for
presenting no threat to future groundwater use In addition, potential T'BA mass flux evaluations
indicate that there is generally no threat to future groundwater use at the Site itself.
Based on several lines of technical evaluation, the LNAPL plume remaining beneath the site has also
been determined to be stable. This is due to a number of factors such as time since release, the site
specific subsurface parameters, the observed plume morphology, and other facets. Past cleanup
actions have also likely contributed to this observed LNAPL stability condition.
A framing of the technical exceptions for further LNAPL cleanup was also developed. Given the
site conditions, including past cleanup, there appears to be no net benefit to the waters of the State
to additional cleanup measures. Any cleanup measure having any remote chance of further reducing
contaminant concentrations in the near. term would also severely impede the Port Distribution
Facility operations. As a successful Brownfield redevelopment project, the active use of the site is
important to the area economy.
Given these findings and conclusions, AVI's work suggests that the site move into a monitored
natural attenuation phase, with no further active cleanup, in keeping with the SWI CFS Resolution
92 -49 and the recent SWRCB update to low -risk groundwater policy (2011).
6101 Nor W fl200 WuxtPkR Ph. 035 655.13024 NA%4Ap 63$rx02
AQth-Y Eli , INC:
IYwar Mammy Arta 5'emex 1
LO DISSOLVED PHASE PLUME EVALUATIONS
This chapter discusses dissolved phase plume evaluations with respect to stability, status, and threat
to the waters of the Slate. As discussed below, several techniques were used to evaluate the
dissolved phase plumes at the site as related to closure and long -term management considerations.
1.1 PURPOSE
The purpose of this ttnälyss is two fold:
I. Evaluate the stability, potential longevity, potential impacts to groundwater utilization, and
the potential fate and transport of the tert -butyl alcohol (TBA) groundwater plume; and
2. Evaluate the stability of the ben7ene gi oundwatet plument the bite to assist in evaluattng the
LNAPL plume stability in Chapter 2 of this report.
TBA and tertiary -arnyl alcohol (TAA) are currently the chief dissolved phase fuel oxygenates
chemicals of concern (COCs) at the Site; however, T'AA was not evaluated in this analysis due to
the limited data set for this compound, For example, TAA was only sampled in the core of the
plume (wells MW -6R, MW -I4R, and MW -19R) one time, in August 2007, and site monitoring
wells were not analyzed again for TAA until June 2008. In addition, TAA has not been detected
more than once in any of the onsite wells. As 'such, only 'FBA was analyzed during this evaluation,
The benzene plume was evaluated because it provides insight into the stability of the LNAPL
plume. For example. if the benzene plume is not moving dowitgradient or is contracting then one
can infer that the LNAPL plume, which is the source of the benzene plume, is not moving as well
This relationship is described in more detail in Chapter 2 of this report.
All analyses presented herein were performed using data provided by SCS Engineers and from
documents on Geotracker (SWRCB, 2011). Data analyses were performed on the data as provided
and only reflect the most recent data electronically available (generally through June 2011).
As will be described subsequently, the evaluations conducted herein utilize historic groundwater
concentration data, in context with other site characterization information, as a key indicator of the
historical and future probable plume state. This focus was developed because groundwater is in
contact with residual petroleum hydrocarbons, and understanding the stability, potential plume
longevity, potential impacts to groundwater utilization, and potential fate and transport of the TBA
plume and the stability of the benzene plume in relation to the LNAPL plume directly affect
long -term site care requirements and closure.
1.2 METHODS
valuutìon methodologies and procedures for the plume longevity estimates, potential
impacts to groundwater utilization, and plume stability are provided in Appendix 1 -I, and are
derived from plume genesis and transport theory. The methodologies are consistent with United
0471 NoN, 22011 Wal. 084 II. 4706M15.0024 FAR 42
Aqul.veR
hydro grr9n¿,ry. N<oerlWraie 2
States Environmental Próteçtiôn Agency (USEPA) récommended protocols for evaluating plume
trends (USEPA, 2002).
The fate and transport analysis for TBA was performed using BIOSCREEN (Newell and McLeod,
1996): BIOSCREEN is an analytical groundwater model designed to simulate transport and natural
attenuation of dissolved phase hydrocarbons at petroleum release sites. The tate and transport
analysis was performed to assess the potential lateral migration of the TBA plume and plume
stability based on site data and assumed parameter values from published literature.
1.3 DISSOLVED -PHASE MASS ESTIMATES
The mass of TBA dissolved in groundwater was statistically evaluated to estimate the maximum
dissolved phase TBA mass observed at the She based on available site data This mass estimate was
used to estimate plume longevity and to evaluate potential mass flux impacts to future groundwater
use at the Site as described in Sections 1.5 and 1.6, respectively. The maximum historical dissolved
phase mass was estimated for August /December 2007, This time period represents the most
comprehensive data set available for the site and includes onsite wells MW -6R, MW -14R, and
M W- 19R,which were only sampled one time in August 2007 by collecting discrete samples below
the LNAPL layer in the well casing, as well as onsite wells MW -5R, MW-8, MW -9R, and MW -10R
and offsite wells MW -12, and MW -I3, 'Phis data set also includes off -site wells MW -4, MW -7, and
M W -8, which are part of the ConocoPhillips site investigation to the north. These wells are shown
by figure I -1. All of the wells included in this analysis are completed within the shallow water
bearing zone characterized at the site, which is part of the Gage Aquifer (SCS, 201 la). Wells
completed in the intermediate and deep water bearing zones were not considered for this analysis
because the majority of the plume mass is in the shallow water bearing zone.
The first step in calculating the dissolved mass is to coustram the area of integration for TBA, which
reflects the maximum plume dimensions historically observed. The TBA groundwater concentration
data were compiled, log -transformed, and analyzed using kriging statistical methods, The
statistically generated results were reverse transformed to arithmetic values and integrated across
the spatial domain to provide a mass estimate based on the estimated impacted aquifer volume.
The impacted aquifer thickness was assumed to be 25 feet thick and the aquifer total porosity is
assumed to be 40% based on core data collected by SCS Engineers (SCS, 201 la).
Table I -I summarizes the results of the estimated dissolved -phase mass for TBA: The statistically
interpolated plume distribution map is illustrated on Figure l -2. The dissolved phase mass was
405.3 kilograms (kg) in August /December 2007 and this mass is thought to represent the maximum
historical dissolved phase mass based on available site data.
1.4 ESTIMATION OF CENTER OF MASS THROUGH TIME
An evaluation of the TBA center-of-mass through time could not be conducted due to the lack of
available TBA data Therefore, TBA plume stability was evaluated using a fate and transport
screening, as described subsequently. The benzene center- of-mass was evaluated through time;
however, there were some limitations to this analysis as described below,
éá5 I Noi@ 6 53.80 FAX 43 5 tl15.5o2
AQUIN6R,1NC,
Fpùrnqunlagn Nmár 6MiHIflYl.y Al3
The statistical center -of -mass for benzene was estimated for three time stamps (April 2002, June
2005, and June 2011) using available data from onsite wells MW -5R, MW -8, MW -911, and
MW -1 OR and offsite wells MW -12, and MW -13, This data set also includes off -site wells MW-4,
MW -7, and MW -8, which are part of the ConocoPhillips site investigation to the north. Wells
MW -6R, MW -19R, and MW -14R are located within the core of the benzene plume; however, these
wells were only sampled twice (April 2002 and August 2007) by collecting discrete samples below
the LNAPL layer in the well casing. During the first sampling event in April 2002 it appears that
the groundwater samples were emulsified (i,e,, mixture of LNAPL and groundwater) based on
elevated total petroleum hydrocarbon gasoline range (TPH -GRO) sample results that exceed
solubility limits. As such, this data could not be used leaving only one time stamp that is meaningful
for these wells. Given that one time stamp is not suitable for estimating the center -of -mass through
time, these wells were eliminated from the data set. This results in a plume center-of-mass that is
slightly mislocated for all time stamps; however, evaluating the relative change or lack thereof in
the center -of -mass is the objective of this analysis not finding the exact location ofthe center -of-
mass.
The wells used in this analysis sure shown by Figure I -t and all of the wells included in this analysis
are completed within the shallow water bearing zone characterized at the site, which is part of the
Gage Aquifer (SCS, 2011a). Wells completed in the intermediate and deep water bearing zones were
not considered for this analysis because the majority of the plume mass is in the shallow water
bearing zone. In addition, thé submerged LNAPL plume is not present in the underlying water
bearing zones,
Plume statistics for benzone were generated using the same mass estimate analysis procedures
described in Section 1,3 for TBA. Based on these statistics the location of the statistical
center -of-mass was calculated, The center -of -mass calculation is performed by summing the
concentrations at the statistical grid intersects across the spatial domain established by the
interpreted plume boundary (Anton, 1984). At each grid intersect, a specific northing and casting
are associated with a specific concentration. In each coordinate direction, the north or east
coordinate is multiplied by its specific concentration and summed across the grid in that coordinate
direction: This value is then divided by the sum of concentrations at each grid intersect, leaving the
estimated coordinates of the center of mass (east and north, respectively).
of -mass location for each time stamp are illustrated in Figures 1 -3. The plume maps used
tat e the center -of mass location for each time stamp are included in Appendix I -2, The
center -of -mass analyses for benzene demonstrates a stable plume, The relative center -of -mass has
actually retracted through time.
1,5 PLUME LONGEVITY EVALUATION
Statistical trend analyses of dissolved -phase concentrations of Tl3A were performed on historical
analytical data from site wells with sufficient temporal data This includes wells MW -9R and
MW -10R, as these wells were the only wells at the site with more than one detection of TEA.
The graphs analyses were performed with non- detections settc>halfthe laboratory reporting
limits, with exceptions. Elevated laboratory detection limits ranging from 100 to 500 ug /L were
F Pb.43S t53 H9S.1 FAX I»{¢3.áa2.6
AQút Van,mï.
/)UYW¿aufa0}f Wager Raen7niyrkllnnAIi 4
reported For well MW -10R. Half of the detection limits are greater than or just below historical
detections so non- detect data were not used for the trend analysis for MW-10R to avoid biasing the
trend by using unconstrained non- detect points. The statistical trends exhibited by MW -9R and
MW -1 OR were decreasing over time and these decreasing trend lines were projected through time
until they reached the California drinking water notification level (NL) for TBA, which is 12
micrograms per liter (ug/L),
The exponential trend regression was performed on the time /concentration data using a confidence
interval of 95 %. Confidence intervals assume a normal distribution about a mean of the predicted
scion fit. Then the standard deviation ofthe samples about the predicted concentration Is used
to bound the data Exponential statistical analysis is consistent with the theoretical form of chemical
transport and depletion processes. A linear analysis would tend to estimate shorter plume durations
and be both less conservative and less reflective of the underlying plume depletion processes.
The statistical trend analysis plots for TBA through time for wells MW -9R and MW -IOR are
included in Appendix l -3. Using the statistical regression fit of the concentration data, as shown
in Appendix 1-3, the time to reach the regulatory criteria for TBA was estimated for these wells as
summarized in Table l -2, While the trend predicts when the compound will reach regulatory
criteria, the actual concentration is expected to range between the upper and lower bounds of the
trend line. As summarized in Table I.2, by using both the curve lit and upper 95% confidence
bound, a range of times to regulatory criteria arc estimated with the later date providing a more
conservative estimated
Wells M W -9R and MW- I OR are generally located on the downstream portion ofthe plume and are
downgradient of the center of mass. Based on the statistical trends in these wells TBA is predicted
to reach the NL of 12 ug /L, between 2012 and 2015 in well MW-9R and between 2018 and 2 024 in
well M W -I OR. In addition, the decreasing trends in both wells suggest that the leading edge of the
TBA plume is stable and has retracted through time A non -stable or expanding plume would
exhibit an increasing trend Jilong the leading edge of the plume, 'Chus, the 'FBA plume has likely
reached a steady state. This is further supported by the fact that TBA has not been detected in offsite
downgradient well MW -8 located on the ConocoPltillips site (Figure 1.2).
1,6 FLUX CALCULATIONS
The statistical mass evaluations for TBA described in Section 1.3 can be used to estimate the
potential groundwater flux of TBA emanating from the site The flux estimate is generated from
the plume -wide statistical groundwater concentrations developed earlier for the geometry of the
plume and the potential groundwater flow rates through the plume. This integrated average
concentration (the some as used in the mass calculations), accounts for spatial plume distribution
that a simple arithmetic average cannot. The flux estimate is used to estimate the potential
worst -case impacts at a hypothetical drinking water production well located onsite. This estimate
is conservative and alleviates the need for more extensive modeling evaluations that would show
significantly smaller potential impacts. The flux estimate pertains to a hypothetical groundwater
production well completed at the site with two different well screen interval scenarios. The first
scenario assumes a well screen of 50 feet which is twice that of the assumed impact thickness in the
shallow water bearing zone. This scenario is the most conservative of the two. The second scenario
h 2]00 Wc L 11&F Ph, 433 653.8044 PAX 43 5 L4540
ApooVexd
WS Itemrzm
assumes a screen length of 100 feet. Scenario two assumes that the production well screen will
nearly fully penetrate the Gage Aquifer beneath the site.
Hydraulic conductivity was set at i foot per day (ft /clay) based on a report from CAPE (2007), the
effective porosity was set at 25% based on a report from SCS (2009), and the lateral hydraulic
gradient was set at 0.007 feet per foot (ft/ft) based on SCS (2009). The current lateral hydraulic
gradient in the shallow water bearing zone is 0.003 ft /ft (SCS, 201 lb); therefore, using the higher
gradient of0.007 ft/ft is more conservative. The conceptual groundwater pumping well is assumed
to capture 100% oftheconservative chemical flux emanating in groundwater from the Site The flux
analysis results arc summarized in Table 1 -3 and estimate potential impacts to a production well at
various flow rates, The input and output factors for this flux analysis are provided in Appendix 1.4.
For TBA, there is no predicted impact above the regulatory threshold or 12 ug /L for all scenarios
and pumping rates. Furthermore, utilization of groundwater from the Gage Aquifer would require
treatment (e.g., reverse osmosis) to remove naturally occurring dissolved phase constituents as
indicated by water quality samples collected by SCS (2011b), Curing this treatment process
dissolved phase TBA would most certainly be removed from the produced water. As such, this
analysis demonstrates that potential impacts to future groundwater use are unlikely and the TBA
plume poses no risk to the waters Mite State, especially considering the natural poor groundwater
quality in the Gage Aquifer beneath the site.
1.7 FATE AND TRANSPORT
To assess the potential lateral migration of the TBA plume existing data collected from the site and
assumed parameter values from published literature were used in conjunction with an analytical
modeling approach to evaluate plume stability.
The analytical modeling was conducted using the computer program k ItiSCREEN (Newell and
Mcleod, 1996). BIQSCREEN is specifically designed to simulate transport and natural attenuation
of dissolved phase hydrocarbons at petroleum release sites. The software has the ability to simulate
advection, dispersion, adsorption, and aerobic decay as well as anaerobic reactions that have been
shown to be the dominant biodegredation process at many petroleum release sites, BIOSCRPCN
includes three different model types;
Solute transport without decay;
Solute transport with biodegredation modeled as a first =order decay process (simple
lumped -parameter approach); and
Solute transport with bindegredation modeled as an " instantaneous" biodegredation reaction
(approach used by BIOPLUME models),
For this effort, solute transport with biodegredation modeled as a first -order decay process was
selected because of the limited amount of data available to support the instantaneous reaction model.
CREEN is based on the Domenico (1987) three- dimensional analytical solute transport model.
The original model assumes a fully- penetrating vertical plane with the source oriented perpendicular
to groundwater flow, to simulate the release of organics moving into groundwater, In addition, the
6ß7I North 2200Wc:i,nnr 19i.d9565bXD34 Pd%1
AQ411.V ER, iNC.
Hldroyemogy. /Yale Rorrxn iP 1: 6
Domenico solution accounts for the effects of advective transport, three -dimensional dispersion,
adsorption, and first -order decay.
The source area concentration was set at 18.4 milligrams per liter (mg /L), which is the maximum
observed TBA concentration at the site (MW -14R). The size of the source area was conservatively
defined using the TBA plume dimensions from August /December 2007, as shown by Figure I -2.
The depth of the source area was set at 25 feet, which is the assumed impact thickness for TBA. A
further conservative assumption is that the source area concentration remains constant at its existing
titration Indefinitely. This combination of assumptions is likely to produce the most
votive analysis based on available data The model input parameters arc summarized in
Appendix 1.5, Where appropriate, model input parameters reported by SCS (2009) for the
previously conducted benzene BIOSCREEN modeling were used for the TBA BIOSCREEN
modeling,
The model was calibrated based on field data from August /December 2007 by adjusting solute half
life and the related first order decay coefficient as well as dispersivity until output results fit the field
data set. The best fit was based on the parameters shown in Appendix 1 -5, Based on this calibration
TI3A must be naturally attenuating because the modeled plume would not fit the field data unless
a decay coefficient was assumed, albeit a low decay coeff cientwassimulated, The former Western
Fuel Oil site ceased petroleum operations in 1995. The facilities that served those operations were
demolished between 1997 and 1999 in preparation for redevelopment of the San Pedro Business
Center. Therefore, releases likely ceased by 1995 when the operations stopped, excepting the
possibility of small releases from leli -over product in piping or other ancillary structure, By the end
of demolition, that potential residual source was also eliminated. Assuming no natural attenuation
"WA would have likely been detected in the furthest most downgradient well (MW -8 at the
ConocoPhillips site) by 2007, This well is approximately 500 feet from the source and TBA has
never been detected in this well Thus the TBA plume is likely stable and generally confined to the
site by natural attenuation processes,
It should be noted that this approach is not sufficiently rigorous to represent an exact prediction of
site conditions. In addition, calibration using the field data was done using reasonable assumptions,
but there wore some limitations. For example, the defaults for the "distance from source" in the
BIOSCREEN model were not exactly equal to the distances observed with the field data, as such
the model calibration represents the best fit given these limitations. In addition to the field data
imitations, the simulation itself incorporates several limiting assumptions; however, these
ptions do not affect the overall conservative conclusions,
METHOD CONSERVATISM
The plume evaluation methods detailed in Appendix 1.1 and resultant findings summarized in this
report provide conservative, worst -ease evaluations of site -specific dissolved -phase plume
conditions, longevity, and potential impacts to groundwater use The cumulative consideration of
these aspects of plume behavior leads to a conservative, weight of evidence approach using site data,
The underlying premises of the analyses are that observed temporal and spatial groundwater data
trends are the actual observed end products of all partitioning and transport phenomena. These
4511 Honk «WO Wen, F'LF Ph, AA3p554Ü2d FAX 65 26
AQUI -VEIL, INC.
frtI wEngy% 1rmer &mawe,I áná Seri x 7
methods are derived directly from plume partitioning and transport processes, and are consistent
with USEPA recommended protocols for evaluating plume trends (USEPA, 2002), These methods
have been applied successfully for State Water Resources Control Board Resolution 92 -49 closures
in San Diego; Los Angeles; and, Orange Counties. A brief summary of the conservative factors in
the analyses is provided in the list below,
Geographic -based dissolved -phase mass estimates: When the plume masses are estimated
at different time stamps, an area greater than or equal to the general maximum historic
Footprint size of COC for all subsequent plume mass calculations is used as the outer bound
of the Integration and "Not Detected" (ND) concentrations are expressed as the general
detection limit. Therefore, this conservatively overestimates the dissolved -phase mass in
depleting plumes.
Temporal well by well plume longevity evaluation: The upper 95 % confidence bound has
been used in predicting time to regulatory criteria which adds conservatism to the estimates.
Additionally, the estimates do not account for acceleration of degradation processes as mass
decreases and the assimilative capacity of the aquifer and vadose zone increases, resulting
in conservative estimates, particularly for wells in the plume core.
Mass flux calculations: It is assumed that the hypothetical production well (theoretically
placed on -site) will capture 100% of the already conservatively over- estimated plume mass
discharge. The hypothetical groundwater production rates are assumed without
consideration whether the aquifer could indeed sustain production at economically viable
rates. When this analysis suggests no risk, it means in effect that a drinking water well could
be placed in the center of the plume and net concentrations at that well would be below
applicable maximum regulatory levels at various flow rates.
In summary, these various layers of conservatism mirror USEPA risk assessment practice s and those
of ASTM to provide a direct analysis based on data rather than models, to assess the safet
closures under Resolution 92.49. It is estimated that the safety factors involved generate morethan
3 orders of conservatism over actual expected conditions.
1.9 SUMMARY OF DISSOLVED PLUME CONDITIONS LNALUATIONS
The following summary points provide key observations of dissolved -phase plume eonditio
site based on the data provided:
at the
The geospatial mass distributions illustrate the plume stability for benzene (Figure l-
No wells were observed to exhibit increasing TBA trends and the Wells with sufficient data
for a trend analysis exhibited a decreasing trend and reach the regulatory criteria by at the
latest 2024 in the wells that are located along the leading edge of the plume (Appendix I -3).
Thus the center of mass of the TBA plume is likely stable and r not moving downgradient.
Worst -case scenario predictions using the mass flux from the site to estimate maximum
concentrations of TBA at a hypothetical drinking water well result in no impacts above
6 n1 Hagb 22110 wCS,NNO 93 mmu21 PAX C93633.AOItl
ApmN2a,tNC.
//IYPrOgeglYpyt Mal N,um,raarh AIM Servna 8
regulatory criteria for TBA (Table 1.3). Furthermore, utilization of groundwater from the
Gage Aquifer would require treatment to remove naturally occurring dissolved phase
constituents. During this treatment process TBA would most certainly be removed from the
produced groundwater.
4. TBA has not been detected in off -site ConocoPhillips well MW -8 and has not been detected
above the NL (12 ug /L) in offsite well MW -I2, both of which are located directly
downgradient ofthe source area. MW -8 (ConocoPhlllips) and MW -I2 have generally been
monitored for TBA since it was first detected at the site (2007); although MW -12 was
abandoned in 2009.
5. The plume trends and fate and transport analysis suggests that the TIM plume is stable
laterally and is attenuating, which is further supported by the absence of detections in
downgradient well MW -8 located on the ConocoPhillips site.
6. As discussed in the main body of the Corrective Action Plan (CAP) report, the IBA plume
is also contained vertically by predominantly upward vertical gradients in the Gage Aquifer
beneath the site.
Based on the summary of findings above, the TBA plume appears to be stable and contained by
natural attenuation processes. This, coupled with the marginal quality groundwater beneath the site
suggest that this plume meets State standards for presenting no risk, and no threat to future
groundwater use.
687 I North 330$ West, IBF Ph. 435 655.0021 FAX 135 655 -$026
AQu1.Ven,INC.
tlrelrpgenlegy. 1asur 8eèv/1,14 N UvnY
2.0 LNAPL PLUME EVALUATiONS
9
Various light non -aqueous phase liquid (LNAPL) flow and transport properties have been measured
at the site. Coupled with the physics of multiphase flow, the following report sections discuss the
parameter values, as well as the implications and findings from those.
2,1 OVERVIEW OF MULTIPHASE MECHANICS
Light non -aqueous phase liquid (LNAPL) flow and stabilization (mobility /stability) can be
understood through the physicscontrolling the movement of one fluid phase in the presence of other
phases (multiphase flow). Multiphase physics account for the hydraulic interactions and movement
of multiple fluids in the pore space, which for these site conditions typically Include water, vapor,
and LNAPL. 'Those physics control the nature and genesis of' LNAPL plume releases. Ignoring
compositional reactions, multiphase mechanics are governed by the Continuity Equation for mass
conservation (Equation 1), which describes the mass movement of any phase in any direction for
a non-deforming coordinate system (l tuyukorn et al., 1994; Panday et al., 1994),
Where: now is the differential operator, z,
Ó rk k Pt ] (6 p S) -11f I) indicates the Cartesian direction of the
2' q rp &x: of p p p 3- dimensional differential equation, ku is
the intrinsic soil permeability tensor, k,.,, is
the relative permeability scalar to phase
"p ", strbscr'ipt "p" refers to the fluid phase of interest, (Pis the fluid potential (( ckle c), , is the fluid
potential gradient), "t" is tine, p is soil porosity, p is the density of phase "p", 5 is the phase
saturation, and M is a rrtas's sourcc/sink term.
Despite the complexity of the continuity equation, the principles it represents are easily described.
Movement of any phase (water, LNAPL, or vapor) in any_primary Cartesian direction (represented
by the left side of the equation) is controlled by the fluid and soil properties and the gradient in that
phase at any point in time and space. Net phase movement into or out of an elemental volume must
be equaled by a coincident change in mass within that volume (the right side of the equation). If
either the phase conductivity or the phase gradient is zero, there is no phase movement or mobility.
The fluid potential 9? includes u gravity term, and for LNAPL, is driven by the head conditions of
the LNAPL release, overprinted to varying degrees by the water table gradient.
As a result of these physics, one would expect the development of LNAPL bodies to be highly
transient in the early stages of the release due to the nonlinear aspects of controlling physics. An
Ideal plume, superimposed on a 0,001 Feel per foot (it /ft) groundwater gradient, would develop
through time as shown in the time series sequence of LNAPL saturation distribution in Figure 2 -1.
One can see from the LNAPL distribution that the LNAPL gradient is initially mounded, with flow
in both tip- and down -stream directions relative to groundwater flow. The LNAPL gradient
dissipates through time, and the mass redistributes laterally, depleting ti fraction olthe concentrated
central mass that was present during the early stages of the release. LNAPL saturations generally
remain greatest in the mass ccntroid area and are lesser in areas distal to the release zones.
As a result of these mechanics, a finite LNAPL release will slow exponentially through time,
eventually coming to static equilibrium with the prevailing field conditions. There are 4 key
4119í NOtl11 2200 \V Br ró.435 Ò$5 -8024 FAX » 655.11026
ripN-VFn,
roW,erx 10
mechanisms that explain this expected stabilization through time, each ofwhich can be amplified
by geologic heterogeneity:
1. The LNAPL gradient diminishes through time, as the fluid head created by the release
cannot be sustained without an ongoing release;
2. Many porous materials have a pore entry pressure; non -wetting fluids, like LNAPL in most
conditions, cannot intrude without a sufficient pressure gradient in that phase;
3. The LNAPL effective conductivity diminishes through time as the finite volume of oil is
spread over larger volumes of aquifer materials. As this occurs, the overall LNAPL
saturation decreases as a function of spreading and the relative permeability toward oil also
decreases exponentially. This is accentuated by water table fluctuations like the overall rise
in site area water levels due to the sea water barrier system, acting to redistribute LNAPL
over larger volumes of aquifer and vadose zone materials, as well as stranding significant
immobile fractions beneath that risen water table;
4. Soil has a capacity to hold oil against drainage as residual, This means that a finite LNAPL
release will theoretically be retained as residual at some maximum spreading distance. In
practice this final endpoint is not generally observed because of the other tacets of
stabilization,
Given the factors above, there are several interpretive aspects that can assist in assessing the state
oftha LNAPL stabilization process at the site. Given the unknowns on release specifics and timing,
it is often observed that no single line of evidence is sufficient for the stability evaluation. The
evaluation of plume stability /mobility herein uses a weight- oFevidence approach considering all
these factors and interpretations. The associated lines of evidence include,
I. Confirmation that the LNAPL releases are finite and not ongoing in the site;
2. Evaluation of the relative ange of the LNAPL plumes; the older a plume, the more probable
It has reached field static equilibrium;
3. Evaluation of LNAPL gradients;
4. Comparisons of estimated LNAPL to water conductivity values;
5, Evaluation of LNAPL flow;
6. Review of petrophysical properties, including expectations For an entry pressure threshold;
7. Inspection of LNAPL plume distribution to consider whether the morphology is consistent
with the form of a stable plume.
The sections that follow present the site data pertinent to the controlling physics described above.
2.1 BASIC PETROPHYSICAL PROPERTIES
Basic petrophysica.l properties are those that have some direct and indirect Influences on LNAPL
volume, mobility, and transport, but are not the most sensitive of the influencing factors. These are
commonly measured parameters for application to a wide spectrum of geological and engineering
practices. For this site, they include permeability, porosity, grain and bulk density, moisture content,
and grain -size distribution. Reports generated by the petrophysical laboratory are presented In the
recent comprehensive site investigation (SCS, 201 la); recall that there have been multiple data
collection events, and different sets of parameters were derived during each testing stage, An
6871 PorlhARnbWúLIINp 111.434 024 PAX AS$GiS=Bi1
AQUI.VRR, INC.
Alx/r o,rod<.gv, warp RwabrcesR Men 11
overview of the results of permeability, grain -size, and porosity results is discussed below. The
remaining parameters are less important and are available in the lab reports,
The hydraulic conductivity of the upper aquifer materials has been estimated at about I ft /day
(CAPE, 2007), This corresponds to a soil permeability in the hydraulically responsive zones of
about 0.35 Darcy. Lab testing oft soil cores indicated intrinsic permeability ranging from 0.059 -
0.087 Darcy (SCS, 201 Ia), smaller than the field -derived value. Typically, field values are favored
as the hydraulic responses represent flow across a larger domain that is less affected by the scale of
the sample than are soil cores.
The grain -size distributions for the soil samples indicates that most of the materials are primarily
fine -grained sand with significant silt and some clay. Except for one sample, SCS -B3 -91 0 that had
about 6.5% tines (silt + clay), the remainder had fines ranging from 20.9 - 62.1 %, with a geometric
mean of 32.3% and a median of 34:9 %. This significant fraction of fines suggests that LNAPL
movement/recovery will be limited because of the high expected capillarity; oil moves less readily
in materials with small pore dimensions, all other things being equal. Measured capillary properties
are discussed below.
Porosity has been measured for several samples, ranging from 24.1 - 47.6 %, with a median of41.9%
and a geometric mean of 40.1 %, The lower values in the 24% range are low for granular
sedimentary materials, but the median and geometric mean values are well within the expected range
for predominantly sandy and silty materials,
2.2 CAPILLARITY
Soil capillarity controls the saturation of any phase (water, oil, air) as a function of fluid pressures
and the pore throat distribution In the sample soil core. Capillary pressure is the difference In
pressure between the non- welting and wetting phase for any couplet ( water -air, water -oil, oil -air).
The capillary curves are different for each couplet as a function of the interfacial tensions between
the fluid pairs. However, because the pore geometry is the same for a given sample core, these
curves are scalable to one another by the ratios of interfacial and surface tensions (parr et al., I990),
That means that a single capillary curve for one couplet, say water -air, can describe the remainder
01 the system All three couplets are needed to describe the multiphase conditions of the full system
as described in Equation 2 -I earlier in this section.
swing the norms in the multiphase field, air -water capillary curves were measured for two
ed cores collected in the 201 I characterization events (SCS, 201 I a). Based on the lab data,
AV I determined the capillary parameters presented in Table 4.4 (data and curve fits are in Appendix
2 4). Briefly, smaller values of "cc" indicate overall smaller pore diameters with a larger capillary
rise. Larger values of indicate a more uniform yore geometry. As expected from the grain-size
results, these two samples exhibit high cap llai ty (high water retention, and a low "a" value). The
residual water saturation is the asymptotic value of the left side of the curve. Last, the breakthrough
pressure is the capillary pressure at which air initially displaces water at 0.5% or more (practical
detection limit). This observed air-entry pressure also implies there is an oil -entry resistance aswell:
an North 22G4 Wu n6 OftP PI PAX 9l5 GS$ =X2
AQUpVaiti,na.
Hp/mamma Ivurer ikaxrveex tit /bm,ibnvnO
2.3 LNAPL SATURATION
12
Saturation refers to the fraction of the pore space that is filled with any particular fluid phase. For
instance, a saturation of 10% within a porosity of would mean a volumetric content of 0.04 for
a given fluid. LNAPL saturation is related to volume, mobility and recoverability, as discussed in
the multiphase physics overview above. Because it Is a bulk physical measurement, saturation
results are a relatively simple and direct measurement of oil volume in the pore space and does not
have the same limitations as chemical analyses of mass.
In addition to the in situ saturation, residual saturation may also be measured in the lab. Residual
saturation refers to the threshold below which physical movement ceases. There are 2 states for
residual saturation; 3 -phase and 2- phase. Three -phase residual saturation is the threshold of
immobility where air is displacing both water and oil. Two -phase residual saturation Is the threshold
of immobility for saturated conditions where only water and oil are present. Typically, 3- phase
saturations are smaller than 2 -phase saturations for the same oil and soil types (e.g., Figure 2 -2).
The summary details of each type of test are discussed in the following subsections.
2.3.1 In Situ LNAPL Saturation
In situ LNAPL saturation measurements were conducted using the Dean -Stark method during
sampling events from 2005 to present. This method essentially uses weight measurements combined
with solvent stripping of all liquids from the sample. Knowing the initial sample weight, the volume
of solvent used and recovered, the fraction of water, and the porosity, the LNAPL saturation may
then be determined.
LNAPL saturation was measured on 12 soil cores (SCS, 2011a) and ranged from 0 to a tnaximtun
of 20.4% in sample SCS -132 -98.0. The median value is 6.1 %, and the geometric mean is 2.5 %.
These samples are purposely biased in that they specifically targeted zones of strongest laser-
induced fluorescence (LW) signals that suggested the presence of relatively more significant LNAPL
than in zones of lower signals,
2.3.2 LNAPL Mobility /Three -Phase Residual LNAPL Saturation 1
SCS had testing performed on 5 soils cores for what the lab terms a "Free Product Mobility
Evaluation ", but it is more properly a 3 -phase residual saturation test. For this test, native cores are
placed in a centrifuge apparatus and a force of 1,000 x Gravity (0) is applied to displace both
LNAPL and water. For perspective, 1,000 0 29, 921 in big 84 1,033,227 col water, and is an
exceedingly large displacement pressure that drives the fluids to a residual saturation endpoint The
initial and final volumes of fluids in the pore space are measured, that which is left in the core
represents the 3 -phase residual saturation. The initial saturations represent the native state of a
sample core at the time of sampling.
Consistent with the multiphase principles, review of Figure 2 -3 indicates that in general, n
is produced from ewes that have a higher initial LNAPL saturation. It is observed that very little
oil is produced from cores that have less than about 7% initial LNAPL saturation. The final residual
LNAPL saturation values range from 5.9 8.2%. Given that the cores are subjected to 1,000 G of
(¢ PAX OS
,AQ114YF.N,IMC.
afpg,t Warte Amway k Aml .S'avives
force, these results represent a force, gradient, and endpoint saturations that cannot be achieved
under ambient or remediation field conditions. A more likely field value would be twice that ranIIe,
as suggested in an example saturation versus pressure data set from a site with similar aquifer
materials (Figure 2.4). The results from these tests will be used subsequently along with data to
assist in estimating the hydraulically recoverable fraction of LNAPL.
Further, as shown in LIP cross -section Figure 2 -5, the majority of the LNAPL is submerged beneath
the water table, and 2 -phase residual saturations would apply to that zone, and would be expected
to be much greater than the 3 -phase results discussed (recall Figuré 2 -2).
2,4 LNAPL PHYSICAL PROPERTIES
The physical properties of the LNAPL include its density, viscosity, and the interfacial t
between the LNAPL, air, and water. These properties together control the physical transport and
recovery of the LNAPL, Other things being equal, a high viscosity product will have a lower
potential mobility and recoverability than a low viscosity LNAPL, much like viscous paint will pool
locally when spilled on the ground, but ethyl alcohol will run out flat, The density, along with
capillary properties, controls the amount of oil that penetrates into the aquifer materials as a function
of the driving head. Interfacial tensions allow the capillary properties for one phase couplet
(air -water in this case) to be scaled to the other capillary couplets (air -oil, oil -water), All 3 couplets
are needed to describe a multiphase system from a mechanistic point of view, as discussed
previously,
Based on carbon chain characterization work done previously (Jones Environmental, 2002), the
LNAPL resembles predominantly kerosene to Jet A ranges of hydrocarbons, which have relatively
similar physical properties. The density is expected to be approximately 0,81 g /cc, and the viscosity
around 1..5 cP, The interfacial tension for air -water is typically around 72 dynes /cm, the water /oil
IFT around 25 (field state) and the oil /air also around 25 dynes /cm. These physical parameters are
based on literature ranges published in the API Interactive LNAPL Cuide (2004) and its assoicated
references.
2.5 LNAPL CONDUCTIVITY
As discussed previously, the ability of LNAPL to flow in the subsurface is proportional to the
intrin.sie and relative permeability, as well as the distribution of LNAPL, Like groundwater, LNAPL
has both a hydraulic conductivity and transmissivity based on these factors.
The aquifer permeability was discussed above, with a field value of about 0.35 Darcy representing
the higher range as compared to lab values. The LNAPL. hydraulic conductivity can be determined
by the formula below:
K =k k PIS / (2)
/ 4f
Where "L" denotes. the LNAPL ¡ihn , and Kf, is the LNAPL condiaçzivfly, zlre re»XCZinrler of the
parameter being previously defined in egf.ratioit (iJ above.
r FII. Agi Fis -XD24 PAX4
Na.tr4it4'°I"}J
Ill-Wit, IN
IOriItlSVllttfpY Ifd t4
krc «(I- S,,,,)0."(I Se")xpri M =1 -t /N (3)
9r, _ K,1r. OS (4) Where N is the van Genuchten capillary fitting
parameter discussed previously, and 5' °,,, is the
effective water phase saturation, where residual saturation values are settled out äs thora represent
a volume ofdte pore -space not available to active flow.
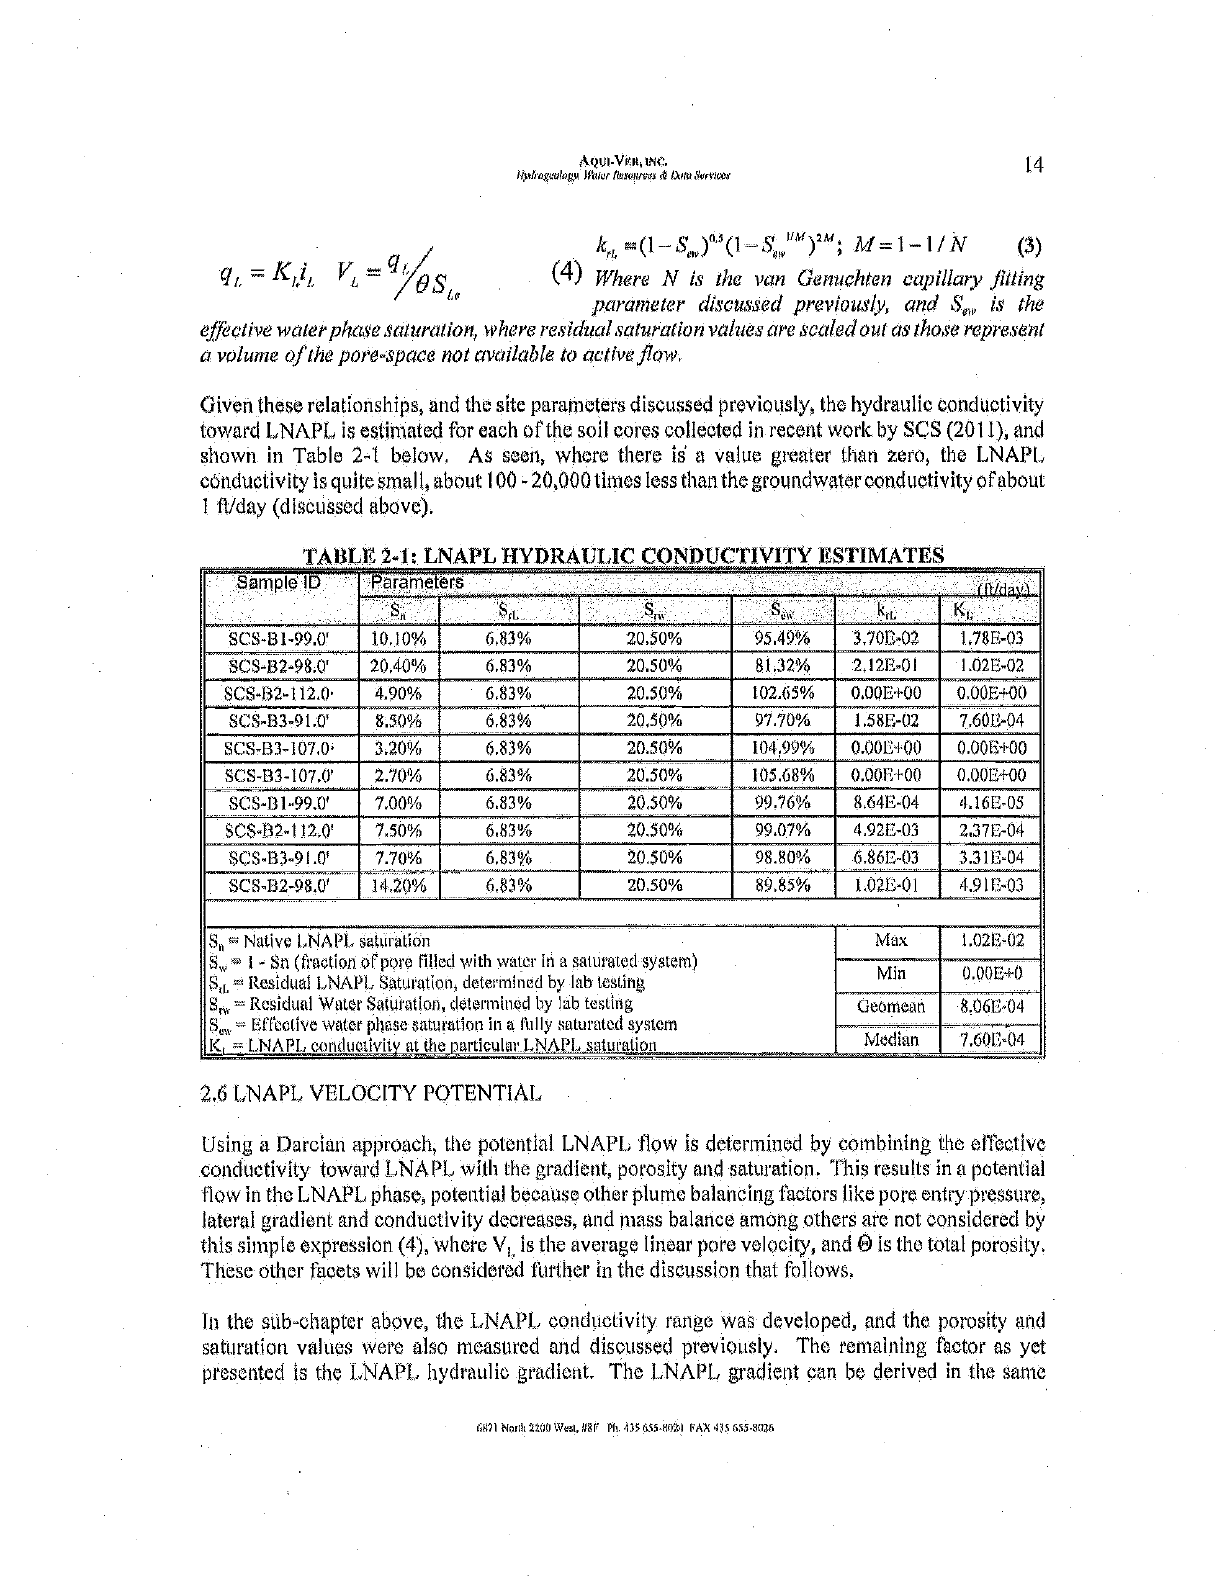
Given these relationships, and the site parameters discussed previously, the hydraulic conductivity
toward LNAPL is estimated for each of the soil cores collected in recent work by SCS (201 t), and
shown in Table 24 below. As seen, where there is a value greater than zero, the LNAPL
conductivity is quite small, about 100 - 20,000 times less than the groundwater conductivity ofabout
1 fl/day (discussed above).
TABLE 2-1 ! LNAPL HYDRAULIC CONDUCTIVITY ESTIMATES
ple ID arameters Nd ,
S 5,. h,l KI"
SCS431-99.0' 10.10% 6,83% 20.50% 95.49% 3.704i-02 1.78E-03
5[;8432.98.0' 20.40°l0 6.83% 20.50% 81,32'Y0 2,12E=01 1.02E-02
SCS-ß2-112.0 4.90% 6.83% 20.50"/° 102.69% 0"00E-F00 O00F"-t00
SCS-133.91:0' 8:50°Í 6.$3°f°
_.. ....
20,50"!° 9770"/e 1581:02 7601',-04
5C5-133-107.0 3 20% 6.83°(0 20.50°/" 104 99% 0 001.100 0.001d+00
SCS-B3-107.0'
.... 2.70"/a 6.83% 20.50°l° ..._.__. 105.68°f° 0.00E F00 0.00E+00
SCS-1)1-99 0' 7,00°/n 6.83°/u
-
20,50"/° 99.76"/" 8.64C-04 4.16E-05
St'5-112.1120' 7,50% 6.83% 20.50% 99.07% 4.92E-03 2.37E-04
SC'8-133-910' 730% ___.. 6.83%.
._...... 20.50"f0 98.80% ....... 6.861;-03
.._ 3311;-04
...
.
SCS-B2-98 6' ._-.....
14.20°U/0 6.83"/0 20.50% ..
89.85°/u 1.021x01 4 911'-03
...... --------.--
Native LNA1'I., satui n
'i dien tiPporo filled
Residual NAPE, Sahn'atiáli,
= Residual wtüer Satúèatioti,
S , -° Effective water phase Saturation
K L.NAPG eonduotieitv at tha
with water in a saturated system)
determined by lab testing
ïlétermined by lab testing
in a fully saturated system
narticular LNA['L s. m
Max 1.02E«02
Min O.00 E+0
Goomeein 8,06E-04
Median 7.60E"04
2.6 LNAPL VELOCITY POTENTIAL
Using a ©arciali approach, the potential LNAPL flow is determined by combining the effective
conductivity toward LNAPL with the gradient, porosity and saturation. This results in a potential
flow in the LNAPL phase, potential because other plume balancing factors like pore entry pressure,
lateral gradient and conductivity decreases, and mass balance among others arc not considered by
this simple expression (4), where VI, Is the average linear pore velocity, and 0 is the total porosity,
These other tacets will be considered further in the discussion that follows.
In the sub- chapter above, the LNAPL, conductivity range was developed, and the porosity and
saturation values were also measured and discussed previously. The remaining factor as yet
presented is the LNAPL hydraulic gradient. The LNAPL gradient can be derived in the sanie
Nasl.iii Ph 80;
Aüut_V ER. INo;
iQNrapelipgy.IYUUP$h..mnraerX ,N'heWolves 15
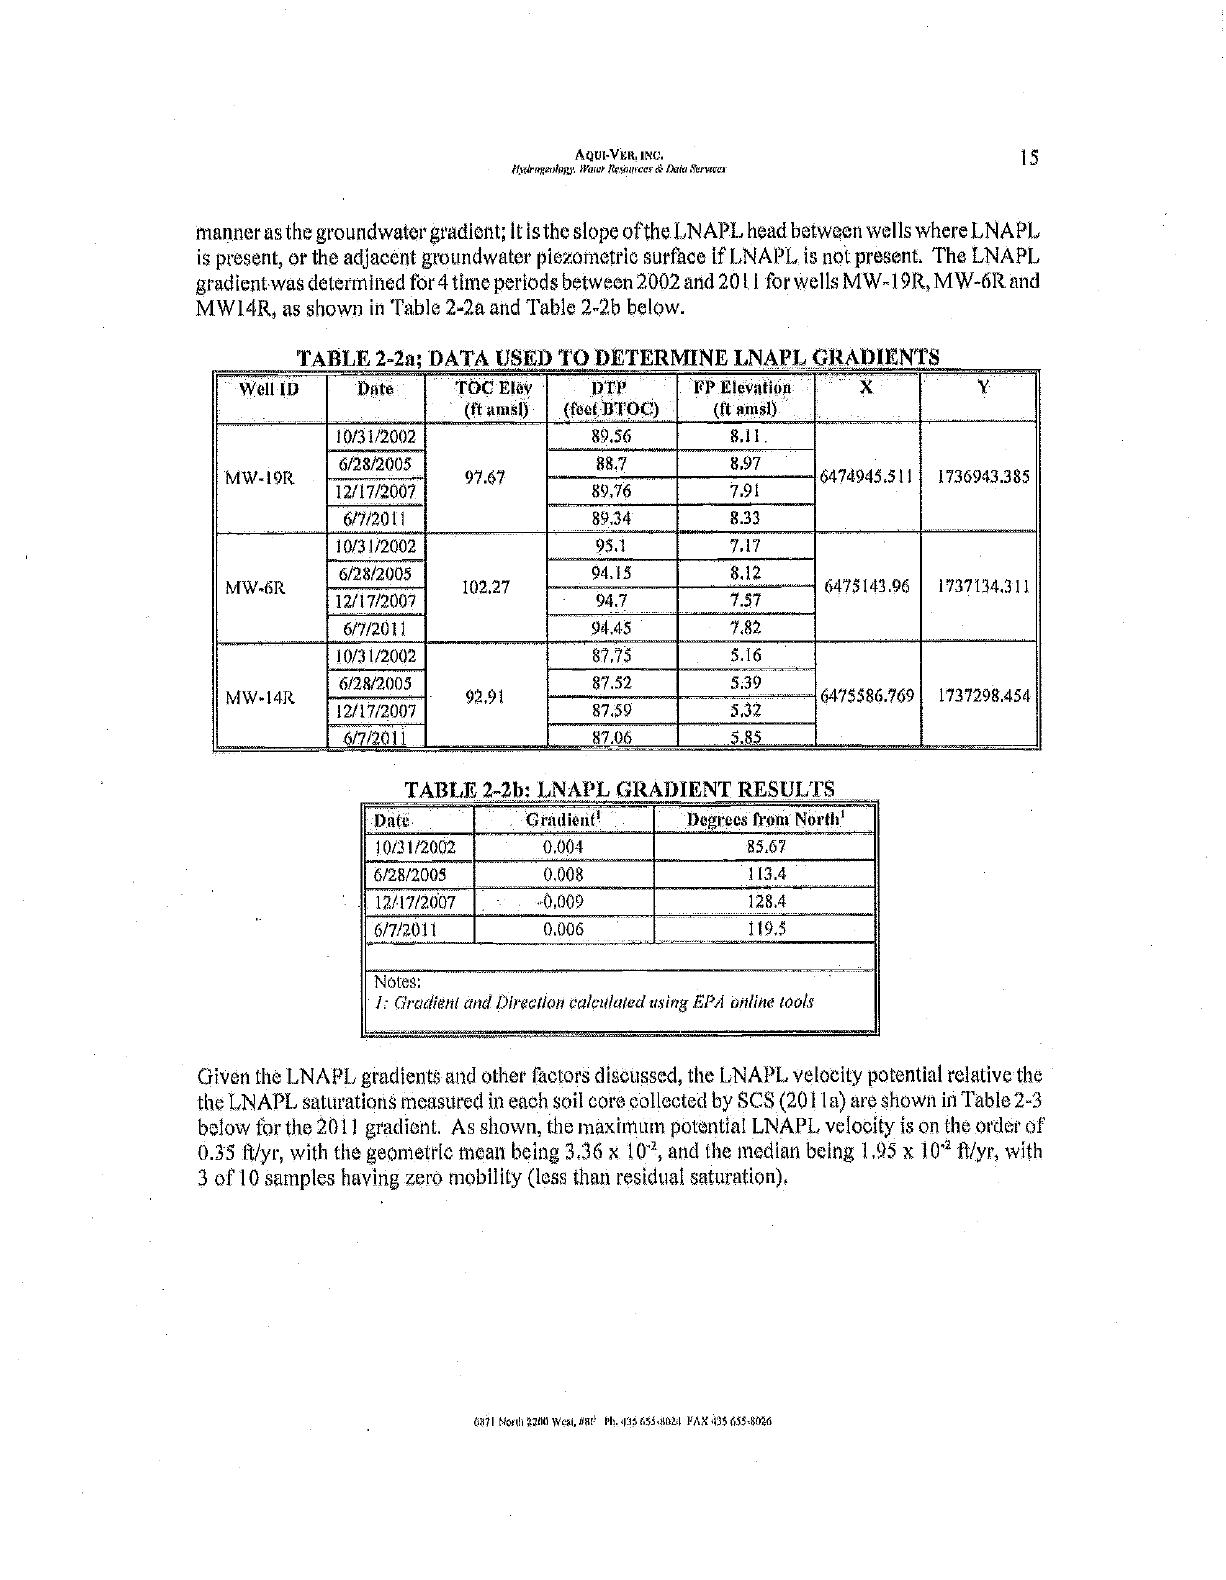
manner as the groundwater gradient; R t is the slope ofthe LNAPL head between wells where LNAPL
is present, or the adjacent groundwater piezo metric surface if LNAPL is not present. The LNAPL
gradient was determined for 4 time periods between 2002 and 2011 for wells MW-19R, MW-6R and
MWl4R, as shown in Table 2 -2a and Table 2 -2b below.
TABLE 2 -2 DATA USED TO DETERMINE LNAP RADIENTS
Well ID Unte fOC Elev
(ft nmsl)
I7T)'
(feet ßfOC) PP Elevation
(fimnsl)
X Y
F
W- 19R
10/31/2002
97.67
89.56 8,11
6474945.511 1736943.385
6/282005 88.7 8.97
7.91
12/17/2007 89,76
6/7/2011 8934 8.33
MW-6R
10/31/2002
102.27
95.1 7.17
6475143.96 1737134.311
6/28/2005 94.15 .12
° ° ° ''
12/17/2007 - 94.7 -°° - 7.57
6/7/2011 94.45 7.82
MW14R
_
10/31/2002
92,91
__
87.75 5.16
6475586.769 1737298,454
6/28/2005 87.52 5,3
12/17/2607 87.59 5.32
6/7/2011 87.06 5.85
TA
0/31/2 02
E 2-2b NA GRADIENT RESULT
lieut?
0.004
1)egrees from North
85.67
8/2005 0,008 113.4
12/17/2007
6/712011
,0.009
0.006
Notes:
7: Gradient and Dim lo alclll
128.4
d using EPA ón /1n tools
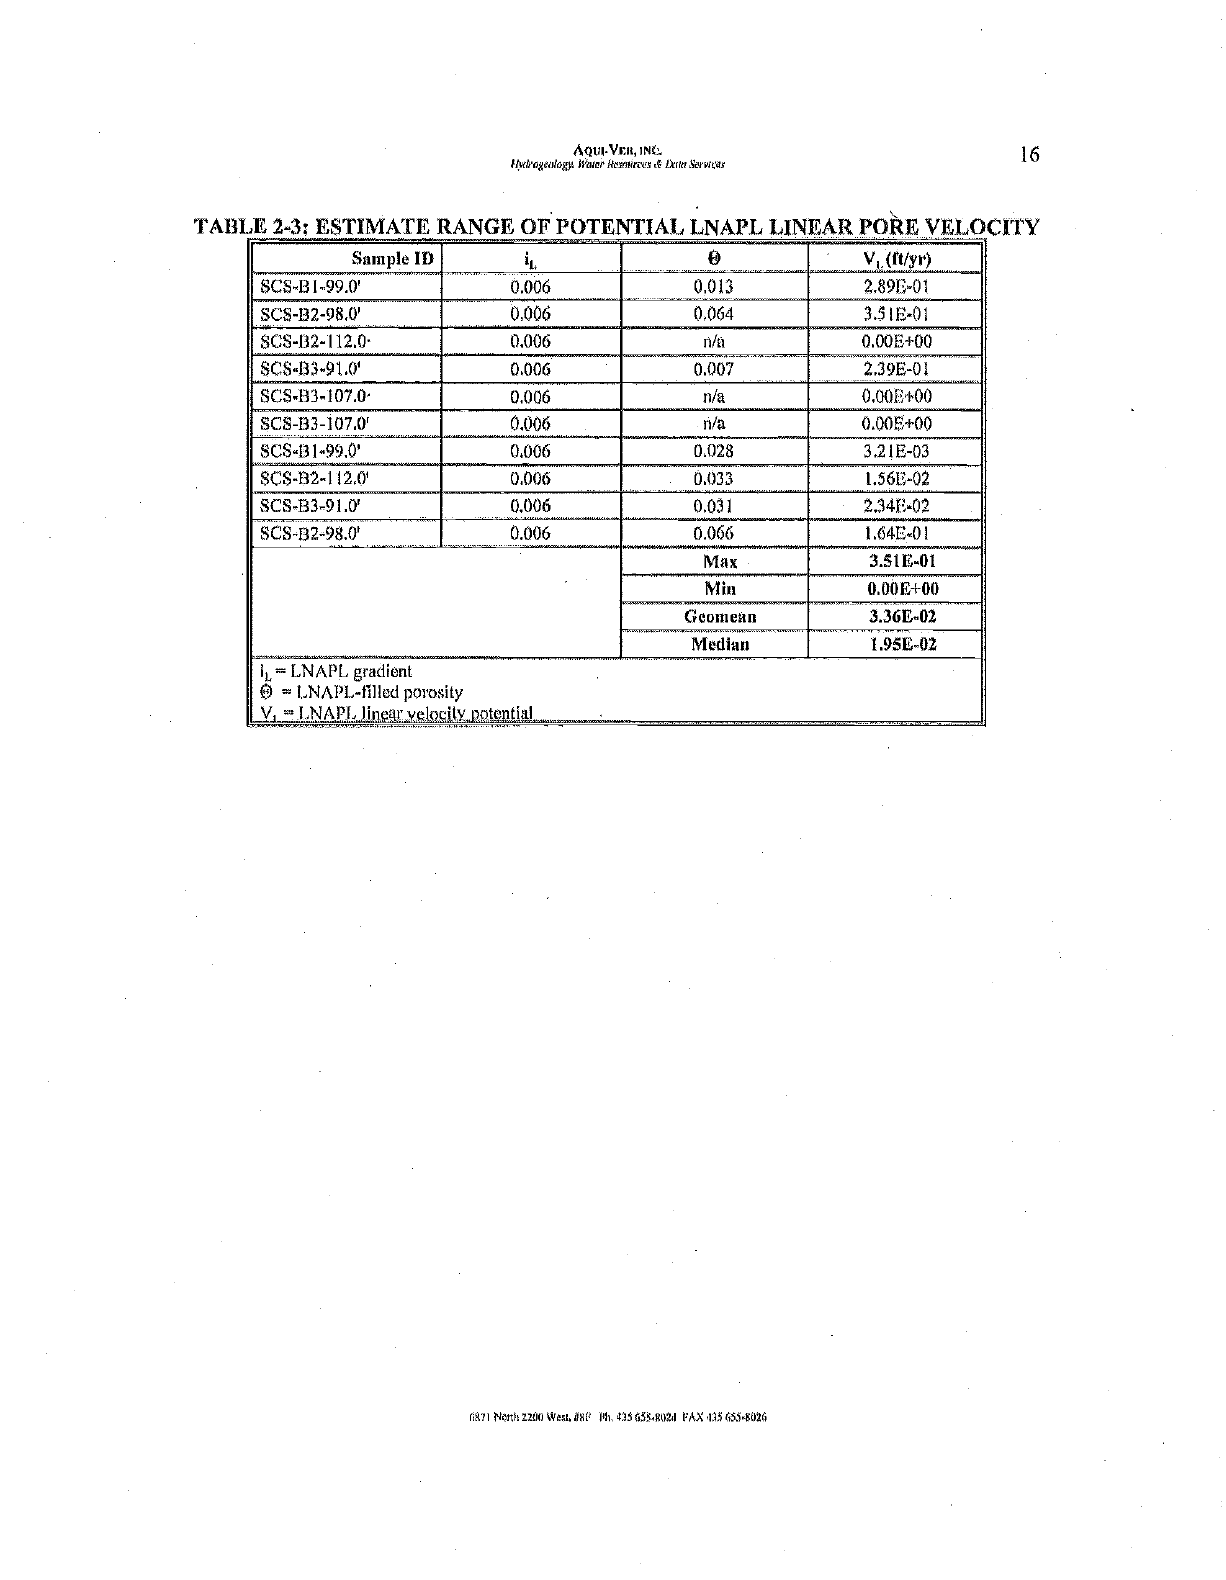
he LNAPL gradients and other factors discussed, the LNAPL velocity potential relative the
LNAPL saturations measured in each soil core collected by SCS (201 la) are shown in Table 2-3
below for the 2011 gradient. As shown, the maximum potential LNAPL velocity is on the order of
0.35 11/yr, with the geometric mean being 3.36 x 10"x, and the median being 1.95 x 10⁴ R /yr, with
3 of l0 samples having zero mobility (less than residual saturation).
6371 No th 2210 µkgl, II3F Plt, 73 p LS1,NOM FA X d4S 65530
AQm.VF:a, INC.
««fogeology. Major INim,r,t's Aart Ste
TABLE 2 -3: ESTIMATE RANGE OF POTENTIAL LNAPL NEAR PORE V
16
OCITY
.. ....... Sample ID i @ Vi,(Cf/yr) __..
. . ..m._..,
SCS-ß1-99.0'
..
0,006 0.013 2,89E-01
SCS-62-98.0' 0.006 0.064 3.51E-01
SCS-132-112.0 0.006 n/a 0.00E+00
SCS-133.91.0' 0,006 ... 0.007 2.39E-01
SCS,H3.107.0' ..... .... ..
0.006 n/a 0.011E+00 ......_
... .. .. ,...
SCS-63-107.0'
_._ ... 0.1106 n/a 0.00E+00
Ane ..,......
SCS13]99.0' ._. .
0,006
.._.. 0.028 3.21E-03
SCS-62 I 12,0' 0.006 0.033
.... ......_._.. 1.5613-02
. .... __.
SCS-S391.0' 0.006
..... ..... . ........ 0.031 2.34E-02
SCS-62-98.0' .. .. 0,006
__ _. 0.066 ..
I.64E-01
Max 3.51E-01
Min 0.00E+00
G cornea n 3.36E-02
Median 1.95E-02
il, = LNAPL gradient
0 = LNAPL-tilled porosity
V, -LNAPI.língar velocity pPtentïyl-
Gsn North 220ntVCS bxF Ph49i 8024 PAX 63S.8026
AQUI-VER, INC.
tlivlropeo loyy. Water Rekaúrçesi4 Pala S'rvos
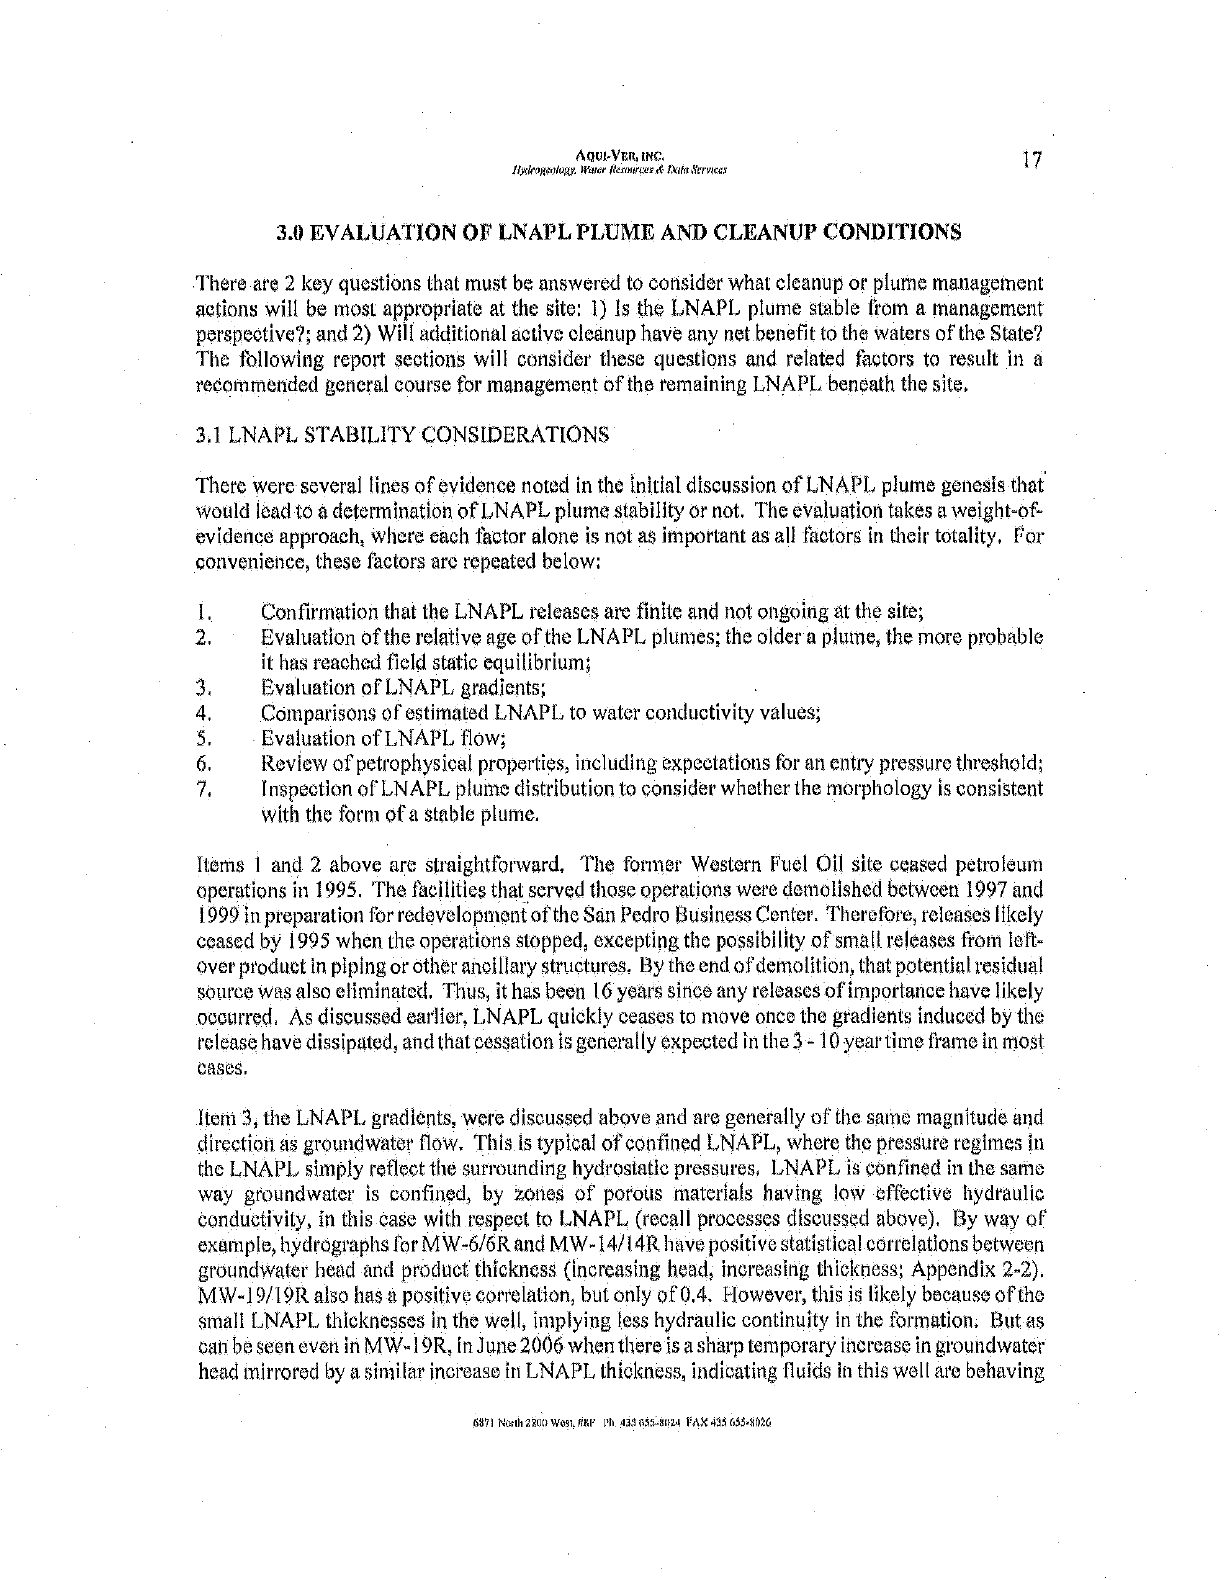
3.0 EVALUATION OP LNAPL PLUME AND CLEANUP CONDITIONS
17
There are 2 key questions that must be answered to consider what cleanup or plume management
actions will be most appropriate at the site I) Is the LNAPL plume stable from a management
perspective?; and 2) Will additional active cleanup have any net benefit to the waters of the State?
The following report sections will consider these questions and related factors to result in a
recommended general course for management of the remaining LNAPL beneath the site.
3,1 LNAPL STABILITY CONSIDERATIONS
There were several lines of evidence noted in the initial discussion of LNAPL plume genesis that
would lead to a determination of LNAPL plume stability or not The evaluation takes a weight -of-
evidence approach, where each factor alone is not as important as all factors in their totality, For
convenience, these factors arc repeated below;
1. Confirmation that the LNAPL releases are finite and not ongoing at the site;
2. Evaluation of the relative age of the LNAPL plumes; the older a plume, the more probable
it has reached field static equilibrium;
3, Evaluation of LNAPL gradients;
4. Comparisons of estimated LNAPL to water conductivity values;
5. Evaluation of LNAPL flow;
6. Review of petrophysical properties, including expectations for an entry pressure threshold;
7, Inspection of LNAPL plume distribution to consider whether the morphology is consistent
with the form of a stable plume.
Items I and 2 above are straightforward. The former Western Fuel Oil site ceased petroleum
operations in 1995. The facilities that served those operations were demolished between 1997 and
1999 in preparation for redevelopment of the San Pedro Business Center. Therefore, releases likely
ceased by 1995 when the operations stopped, excepting the possibility of small releases from left-
aver product in piping or other ancillary structures. By the end of demolition, that potential residual
source was also eliminated. Thus, it has been 16 years since any releases of importance have likely
occurred. As discussed earlier, LNAPL quickly ceases to move once the gradients induced by the
release have dissipated, and that cessation is generally expected in the 3. 10 year time frame in most
cases.
Item' 3, the LNAPL gradients, were discussed above and are generally of the saine magnitude and
direction as groundwater flow. This Is typical of confined LNAPL, where the pressure regimes in
the LNAPL simply reflect the surrounding hydrostatic pressures, LNAPL is confined in the same
way groundwater is confined, by zones of porous materials having low effective hydraulic
conductivity, in this case with respect to LNAPL (local' processes discussed above). By way of
example, hydrographs for MW- 6 /6Ránd MW -14/ 14 have positive statistical correlations between
groundwater head and product thickness (increasing head, increasing thickness; Appendix 2 -2).
MW-19/19R also has a positive correlation, but only of 0.4. However, this is likely because of the
small LNAPL thicknesses in the well, implying less hydraulic continuity in the formation. But as
can be seen even in M W -I 9R, in.) une 2006 when there is a sharp temporary increase in groundwater
head mirrored by a similar increase In LNAPL thickness, indicating fluids in this well are behaving
2 60U ill .4j]0354n34 rn%á9lbls.nilw
A2m-v77 n, mC.
iprbogenlop¢JVarerRes 18
in a confined manner. Increased pressure means higher head or thickness, and vice versa. In
summary, it appears the LNAPL has no independent driving head of significance beyond the forces
in the groundwater regime. That makes perfect sense given the extensive excavation and cleanup
actions taken to date In the shallow portion of the system, effectively cutting off any residual
gradients that might have remained from the original releases.
Item 4 has also been discussed above. The analyses determined that, where there is a value greater
than zero, the LNAPL: conductivity is quite small, about 100 - 20,000 times less than the
groundwater conductivity of about I ftlday (discussed above). This of course means the potential
for LNAPL now is also approximately 100 - 20,000 times less than groundwater, And in 30% of
these cores, the LNAPL conductivity was zero. Given that the coring program by SOS targeted
LNAPL -rich zones, if there is a bias in this analysis, it would be expected to be toward the worst-
se conditions (i.e., conservative).
The potential velocity of LNAPL (Item 5), was also found to be quite low, well less than I -f1 /yr at
a maximum, and less than a few hundreths of a 11 /yr in the median and geometric mean case. As
mentioned, the velocity potential does not account for a wide variety of real -world factors that cause
LNAPL plumes to halt movement in the environment. Therefore these de minimis values of
potential mobility are a worst -case screening and indicating the plume is stable.
Petrophysicnl properties, Item 6, have also been developed above. The combination of high
capillarity, a distinct non- wetting entry pressure exhibited in the capillary data, and the relatively
high percentage of fines in the majority of soil cores all indicate the LNAPL will not now easily in
this setting absent high pressure gradients. As discussed, gradients are in fact small, and unlikely
to mobilize LNAPL beyond its present position in the subsurface now or in the future.
Finally. Item 7, plume morphology, remains to be inspected, There are 2 facets that will be
reviewed here. First, the distribution of LNAPL inferred from the LIP investigation, augmented
with other data will be reviewed in map and cross -section views. Second, as discussed in the first
part of this report, dissolved benzene concentrations over time will serve as an indirect reflection
of LNAPL conditions; the benzene plume was found to be stable and contracting; The concept here
is simple; if the LNAPL that is the source of benzene is stable, then the benzene plume should also
be stable. Conversely, if the dissolved benzene plume is moving downstream over time, then
potential movement of the LNAPL "source" could be one explanation for that observed behavior,
Cross Section A -A' discussed previously (Figure 2 -5) shows the inferred LNAPL distribution from
the southwest to the northeast. As seen, the submerged LNAPL plume is dominant in the area of
CPT -17 and CPT -21, but other constraining data points indicate that the plume pinches out, as
expected, toward the northeast. The LIF waveform along the sanie section (Figure 2 -6) shows
distinctly different product types in different zones ol'the plume as reflected in LIF spectral color
differences, again consistent with discrete product releases that remained pr cdominantly local to the
areas of the original release. The plume has the expected morphology of a stable plume,
In stimnlary, for this particular site, all the factors above point to LNAPL plume stability. While
there may be small -scale movement in response to localized gradients, the plume is old enough and
displays all the other features of a stable plumé relative to site management objectives,
iINotlN34üWm, 4310.55.guzdl'nX415435.x97ó
MUI-Y611, INC.
ftl,tr4.v4lnyy. Water gnaw un,ODula ótmrices
3.2 LNAPL CLEANUP CONSIDERATIONS
19
Given that the LNAPL plume is stable, as discussed above, the plume management options range
from managing it in -place to more active engineered cleanup approaches. In this section, the net
benefit of various potential actions relative to the waters of the State will be considered. The
discussion will also consider the impact of any potential actions on the site operations of the Port
Distribution Center that represents an economic positive for the property and surrounding area.
As summarized by SCS, this site has had numerous active cleanup actions taken to date, including
pump and treat, extensive soil excavation, air sparge /soil vapor extraction (IAS & SVE), free
product recovery and other ancillary actions. As of 2001, it was estimated that approximately 12
million pounds of hydrocarbons were treated by the IAS /SV1 system, and another 20,000 yd3 of
impacted soil was excavated (Cape, 2001). About 13,000 gallons of water /product mixture have
been hydraulically recovered from wells MW -GR and MW -14R, with water typically being the
major component of that volume (SCS, 2011a). Certainly all of these past cleanup actions have
improved site environmental conditions in that the vapor pathway is now negligible, and the mass
recovered helps to further stabilize and reduce the long -term presence of the LNAPL plume.
However, as observed in the investigations and discussed previously, LNAPL mass remains
submerged below the water table.
As noted in our 2005 Draft Report to the LARWQCB "Bast Practices Study of Groundwater
Remediation al Refineries in the Los Angeles Basin (Beckett, Sale, Huntley. & Johnson, 2005)" the
single -most applied remediation technique in the area to address LNAPL is hydraulic recovery, We
discuss the limitations of that method, but also why it is used so often in practice. In a nutshell,
LNAPL recovery can mitigate the potential for LNAPL transport and it does recover some mass.
Whether it recovers enough mass to make a difference in plume management or the longevity of
chemicals of concern is the key question often left unaddressed at the majority of release sites.
Hydraulics also can typically be installed at site boundaries and not dramatically affect the
operations of various petroleum refining and storage facilities. Whereas more aggressive cleanup
techniques commonly require a much higher density of cleanup and/or control points to be safe and
effective.
The API has developed screening tools to consider the general expect effect o l'LNAPL recovery and
cleanup (API ' /44715, 2002; API Interactive LNAPL Guide, 2004). These tools arc intended to give
some frauMg to the physical and chemical processes at work, and how cleanup may affect the
longevity of chemicals of concern in the environment. The petrophysical and fluid parameters
discussed above provide the necessary inputs to the screening evaluations. To provide an analogous
initial condition to that observed at the site, the initial LNAPL peak saturations are on the order of
20 %, as measured by SCS in sample SCS -B2 -98.0' (2011). 1'1w surrogate chemistry of key
compounds in the LNAPL were matched to MW -10R, a well with a history of high'IPU -Ig and
benzene impacts. The estimate is run in a "type nle«' context, whew we are interested in relative
change, not in a precise rendering of site -wide plume conditions; the geometry of the type area
includes a depth of 90 -ft, and lateral dimensions of 330 x330 ft ( -100 ni), A Rill report of the inputs
W the estimates that follow is attached (Appendix 3 -1).
4871 Nudh 2200 W84 ,111111 Pit 4 7 ú55@112i PAX 13
Avw.Wit,wc.
vhxv. JIt,wr to s +kAlla$ r 20
Using this screening approach, the baseline condition (natural mass loss scenario) is then compared
to hydraulic recovery by skimming and by pump and treat with active groundwater pumping. As
seen in Figure 3 -1, the expected change in saturation due to hydraulic recovery is quite negligible,
as is the associated change in benzene concentration over time for each scenario (Figure 3.2, IAS
context will be discussed below). In effect, and consistent with an old, stable, and submerged plume
with all the given properties, hydraulics will no longer have any effect on plume management over
the long- term. As observed in MW 10 and other locations, the IAS /SVE cleanup initially reduced
concentrations significantly, followed by rebound to nearly the same levels as prior to that cleanup
action. That observation is completely consistent as well with the fact that submerged LNAPL
exists well below the intervals of cleanup targeted by that IAS /SVE action. Again, this site scenario
is intended only to point toward reasonable technical expectations; like all screening approaches,
the model and method is not designed to be highly site specific (API, 2004).
Taking this a step further, IAS can, in principle, remove the volatile components from the LNAPL
as long as the subsurface coverage is sufficient in lateral and vertical dimensions. SVG will capture
that vapor stream. Because more volatile compounds partition preferentially into the vapor stream,
the remaining LNAPL will in principle become more enriched in less volatile and heavier
compounds (e.g., Figure 3 -3). As shown then, if coverage and stripping is effectively designed, the
ratio of benzene to heavier compounds should decrease through time as benzene is lost more rapidly
to the IAS. Figure 3.4 is a chart showing the change over time of benzene to ethylbenzene at M W-
10 overlapping the time of IAS /SVE actions, As observed, this ratio is changing puor to the start
of cleanup, which is also consistent with natural partitioning processes In groundwater and vapor.
It is also seen that the cleanup did not change the overall slope of this ratio, and after IASISVE was
shut down, there was rebound in this ratio (not shown on the particular plot, but observed in the
subsequent well data). These observations are again entirely consistent with not only LNAPL
submerged below the zone of cleanup, but also with the limited lateral coverage of the IAS system
installed on (»t; -ft centers.
It is well documented through tank and field seal: measurements that the zone of active vapor
stripping around an IAS location is quite limited, I-m instance, Lundegard et al. show an active IAS
stripping zone of about 8 -ft (2,4 ni) in a fiat -grained sand (e.g., Figure 3 -5). Beckett et al. (1995)
demonstrated IAS in the Gage aquifer would have a coverage of about 2 - 3m (- 6 ,5 1040 radially
depending on operating conditions (Figure 3 -6). So, despite recovering significant mass from the
subsurface (12 million pounds), the IAS /SVE system clearly missed existing mass, and thus the
observed rebound and persistence of LNAPL and its associated chemical compounds. Given the
shallow aquifer materials are similar to the Gage, LAS wells would require a spacing of 10- to 15 -ft
on center and to a depth of at least 20 -ft below the present water table, as indicated by LNAPL
saturation impacts at all depth levels investigated to 107 fbg (SCS- B3.107', SCS, 2011).
So, following further hypothetically on what IAS may achieve in principle. If we take the same
LNAPL scenario discussed above for hydraulics and assume that stripping at an adequate lateral and
vertical distribution of IAS operation could reduce benzene by an order ofmagnitude (as seen onsite
before rebound of the old system); what would be the expected result? Recall in Figure 3 -3 above,
IAS under these ideal conditions would be expected to reduce the overall concentrations of benzene
and other compounds in the near -term, but would not have a significant effect on the long -term
presence of the compound or the management of the site.
(At' N 0 Went, NAP Ph.455 655892i PAX 435 655.8N4
AQUINEIS,SN
/Wow lugy.lVa<aNtamuroat
IAS is in any ways a surrogate for any form of intensive or aggressive cleanup. Cleanup well
densities vertically and laterally are intense, particularly at this site, both for control and for the
effectiveness of the action. But more to the point, executing such an action at this site has obvious
limitations from a feasibility point of view, and again, even it implemented, would have negligible
benefit to the environment or the waters of the State. SCS has extensively discussed the poor water
quality and the limited value of the resource at this particular location.
Any use of the groundwater in the future at or near the site would require treatment prior to use to
remove salt and other man -made impacts besides the petroleum beneath the site. Water treatment
would also remove any petroleum hydrocarbons that might reach that hypothetical point of use. As
shown in the groundwater analyses earlier in the report, the dissolved -phase plumes are stable, and
in the case of benzene, where there are sufficient data to so demonstrate, that plume is contracting.
Therefore there are no reasonable or plausible impacts to water use by the remaining LNAPL, at this
facility.
Given that the site has all risk pathways contained and managed (low- rIsk), and given that additional
cleanup would have no net benefit to the waters of the State, and a high impact to site operations that
would need to cease to complete that effort, it is our opinion that no further action is warranted,
beyond monitoring plume stability and ongoing natural attenuation. There simply is no additional
action that might be taken in the thee of these beneficial site commercial operations that would have
any benefit, and in a variety of scenarios would have negative net benefits.
In summary, this site meets the concepts of the SWRCB 92 -49 Resolution allowing impacts greater
than MCL.s to remain in -place if they pose no threat to the waters of the State, and if additional
cleanup is infeasible or expected to have no net benefit, and if those impacts are stable and naturally
diminishing. The site meets all these criteria..
057 1 Nmip 12110 Wavh IBF Ph. Á35655-H02Á VAX 435 6554026
AQR4vhit, ma.
N,IdfaRenlayy, Wow. Rasourvus M LeanSUrvleea
4.0 REPORT CLOSURE
22
The work herein has been conducted based on current scientific principles and the data provided by
SCS Engineers and other sources. These site evaluation results depend directly on this information.
Changes or corrections to site data may alter interpretations herein, and ifsuch changes are manifest,
it is recommended that these evaluations be updated accordingly. Flydrogeologic and multiphase
(LNAPL) evaluations have some level of inherent uncertainty in that pore and molecular scale
processes are represented by a macroscopic continuum, and results should be viewed accordingly.
Similarly, the discrete distributions and effects ofgeologic heterogeneity at most sites are unknown.
The analyses and evaluations herein are intended to set technical scenarios, not to represent highly
detailed spatial or temporal variability. This work has been conducted in accordance with scienti fie
principles and the professional standards of the State of California and other states with reciprocal
professional standards. No other warranty, express or implied, is provided.
687I Norm ;elR cacai, 11W Vh. 43 FAX 435 655,8026
AQN.VEit,INC.
1lmguringy. Wahr 2¢.wnroo3 R üYMS081883
5.0 BIBLIOGRAPHY
Abriola, L.M. and Pinder, G.F., 1985h. A Multiphase Approach to the
Contamination by Organic Compounds, 2; Numerical Simulation, Water
No. I, pp, 19 -26.
ling of Porous Media
Res., Vol. 21,
Abriola, L.M. and Pinder, G.F., 1985a. A Multiphase Approach to the Modeling of Porous Media
Contamination by Organic Compounds, L Equation Development. Water Resources Res., Vol, 21,
No. I, pp, I1 -18.
Anton, Howard, 1984, Calculus, Second Edition, ,lohn Wiley & Sons, New York,
API, 2002 (Huntley, David, and Beckett, G.D.), Publication #4715, "Evaluating Hydrocarbon
Recovery from Source Zones and its Effect on Dissolved Phase Plume Longevity and Mobility ".
API, 2004. The API Interactive LNAPL Guide Software & Resources
Baehr, A.L., 1987. Selective Transport of Hydrocarbons in the Unsaturated Zone Due to Aqueous
and Vapor Phase Partitioning. Water Resources Res., Vol. 23, No.10, pp, 1926 -1938.
Beater, A.L. and Corapcioglu, M.Y,, 1987. A Compositional Multiphase Model for Groundwater
Contamination by Petroleum Products, 2. Numerical Solution, Water Resources Res., Vol 23, No,
1, pp, 201 -214.
Beckett, G.D., Lundegard, P,, 1997. PraCticaliy Impractical -The Limits Of LNAPL Recovery And
Relationship Tu Risk, Proceedings of Petroleum Hydrocarbons and Organic Chemicals in Ground
Water: Prevention, Detection and Restoration, Houston
Beckett, G. D., Huntley, D, 1998. Soil Properties and Design Factors Influencing Free -Phase
Iydrocarbon Cleanup, Environmental Science & Technology, 32(2); 287.293.
Beckett, 0.0, Huntley, D., 1994, The Effect of Soil Characteristics
Recovery Rates, Proceedings or Petroleum Hydrocarbons and Oi game Ch
Prevention, Detection and Restoration, Houston
-Phase Hydrocarbon Hydrocarbon
als in Ground Water:
Beckett, O. D., Huntley, D., 1998, Soil Properties and Design Factors Influencing Free -Phase
Hydrocarbon Cleanup, Environmental Science & Technology; 32(2); 287 -293.
Brooks, R.H. and Corey, A.T., 1964. Hydraulic Properties of Media. Colo. State Univ., Fort
Collins, Colo., Hydrol. Pap. No, 3, pp. 27.
Burdine 1953. Relative Permeability Calcu ions from Pore -Size Date .E.198, p 71-
77.
CAPE Environmental, 2007, Fuel Oxygenates and Benzene Evaluation, San Pedro Business Center
(Formerly We ?uel Oil Site), San Pedro, California.
6871 Nonó d290 Waái, I/9R PL. 435 65 }2i FAX =05
11.QubVf:N
to In IW,rrltrmuzrs A A''A 24
Charbeneau et al., 1999, Free Product Recovery of Liquid Hydrocarbons, API Publication #4682,
Health and Environmental Sciences Department of the American Petroleum Institute.
Corapcioglu, M.Y. and Beahr, A.L., 1987, A Compositional Multiphase Model for Groundwater
Contamination by Petroleum Products, 1 Theoretical Considerations. Water Resources Res., Vol.
23, No. 1, pp. 191 -200.
Corey, A.T., 1986. Mechanics of Immiscible Fluids in Porous Media. Water Resources
Publications, Littleton, Colo., pp. 259.
Dclshad, M. and Pope, GA., 1989. Comparison of the Three -phase Oil Relative Permeability
Models. Transp, Porous Media, Vol. 4, No.1, pp. 59 -83.
Domenico, P.A,, 1987. An Analytical Model for Multidimensional Transport of a Dec
Contaminant Species. Journal of Hydrology, 91 (1987) 49 -58.
Driscoll, F.G., 1986. Ground water and wells, Second Edition, Johnson Filtration Systems Inc., St.
Paul, Minnesota
Farr, A.M., Floughtalen, R.J. and McWhorter, D.B., 1990, Volume Estimates of Light Nonaqueous
Phase Liquids in Porous Media. Ground Water, Vol, 28, No.1, pp. 48 -56.
Faust, C,R., 1985. Transport of Immiscible Fluids Within and below the Unsaturated Zone: a
Numerical Model. Water Resources Res., Vol, 21, No. 4, pp. 587 -596.
Ferrand, L.A., Mïlly, P.C:D, and Pinder, G.F., 1989. Experimental Determination of Three -fluid
Saturation Profiles in Porous Media. J, Contant. Hydrol., Vol. 4, No. 4, pp. 373 -395,
Fetter, C.W., 1994, Applied Hydrogeology. Prentice-1-411, inc., Englewood Cliffs, New Jersey:
Forsyth, P.A., 1990, A Finite Volume Approach to LNAPL Groundwater Contamination, Research
Report, CS- 89 -46. University of Waterloo, Waterloo, Ontario, Canada.
e, R.A., and J.A. Cherry 1979, Groundwater. Prentice- 1tall, Inc,, Englewood Cliffs, New
Y.
lute, A. and Heermann, D.F 1.979. Measurement and Numerical Simulation of
Hysteretic Flow in a Heterogeneous Porous Media, Soil Sci, Soc. J., Vol. 43, pp. 1061 -1067.
ïliel, D,, 1980 introduction to soil physics. Academic Press, Inc, San Diego, California, 92101
Hoag, G,[, and Marley, M.C., 1986, Gasoline Residual Saturation in Unsaturated Uniform Aquifer
Materials. n, Eng., Proc, Am. Soc. Civ, Eng Vol, 112, No. 13, pp. 586 -604.
Honapour, M. and Mahmood, S.M., 1988. Relative- permeability Measurements, an Oven
Pet. Teéhnol, Vol, 40, No. 8, pp. 963 -966,
017INUn0EannWC 41xfiYbAO¢4 PAX "Q3655H0
IQOIXFIIt, INC.
H)vhogePl,a , lY,hr Rarouroer.@ 1krmSVrvurs
Hunt, J.R,, Sitar, N. And Udell, K.S., 198h, Nonaqueous Phase Liquid Transport and Clea
Analysis of Mechanisms. Water Resources Res., Vol, 24, No, 8, pp. 1247 -1258.
Hunt, J.R., Sitar, N. And Udell, K,S., 1988h. Nonaqueous Phase Liquid Transport and Cleanup, 2,
Experimental Studies. Water Resources Res Vol. 24, No 8, pp. 1259.1269.
25
p, I ,
lltualloy, D., Beckett, G,D., ?002. Persistence of LNAPL Sotrc:4::
Relationship 13eLweeti. Risk Reduction and [,\APL, Recovery,
Journal of Contaminant Hydrology, //59 pp 3 26. Revised
1997 NCiPl1 Conference manuscript,
T1LtnLléy, D,. Hawk, R.N., äïi.d Corley, H.P.,
ase I-lydrocarbon in a F'In.c-
Grai.necl S`r_lnclsLonE, (1) Comparison Bet
Predicted in Saturations and Mobil. y:
Water
U e O LI S
red
of Cr
t4Lnttley, D., Hawk, R., and Wallace, J., 1991, un Analysis of the History, Distribution, and
Movement of the 131oh, a Hydrocarbon Pool Underlying Downtown Sau Diego; in, Abbott, P. (ed),
Environmental Perils: San Diego Association of Geologists.
Huntley, D., 1997, Analytic Determination of Hydrocarbon Transmissibility from Baildown Tests.
Conference Proceedings of the 1997 Petroleum Hydrocarbons & Organic Chemicals in Ground
Water. Houston, Texas, sponsored by the National Ground Water Association & American
Petroleum Institute.
Huntley, D Hawk, R,N., and Corfey, H.P., 1994, Non -aqueous Phase Hydrocarbon in a
Fine -grained Sandstone, (I) Comparison Between Measured and Predicted Saturations and Mobility;
Journal of Ground Water, v. 32, n. 4,
1- luyakorn, P,S Panday, S., and Wu, Y.S., 1994. A Three -dimensional Multiphase Flow Model for
Assessing LNAPL. Contamination in Porous and Fractured Medial I, Formulation. Journal of
Contaminant Hydrology, Vol, 16, pp 109 -130,
I iuynkorn, P.S., Wu, Y.S. and Park N.S., 1994, An Improved Sharp- intefiacc Model for Assessing
LNA Pl. Contamination and Remediation of Groundwater Systems. Journal of Contaminant
Hydrology, Vol. 16, pp. 203 -234.
Kruseman, G.P., and N.A. DeRidder, 1979. Analysis and Evaluation of Pumping Test Data, Bulletin
11, International Institute for Land Reclamation and Improvements, Wageningen, Netherlands, pr
200.
L.M, Gibbs, "How Gasoline Has Changed ", SAE Technical Paper Series - 932828, L ternat
Fuels and Lubricants Meeting & Exposition, Philadelphia, Pennsylvania, October 18 -21, 1993
Y%11Np,1il22lAiAVpç6OM, Oh..lai613,9921 FAX J93655992ij
A4ubVss, ItÍG,
'òpy, Wp7eP !knows tW Alto Sanwa 26
Lenhard, R,J. and Parker, J.C., 1988. Experimental Validation of the Theory of Extending
Two -phase Saturation - Pressure Relations to Three -fluid Phase Systems for Monotonic Drainage
Paths. Water Resources Red Vol, 24, No. 3, pp. 373 -380.
Lenhard, R,J., and Parker, J.C., 1990. Estimation of Free Hydrocarbon Volume from FluidLeveh
in Monitoring Wells. Ground Water, v. 28, no. I, p. 57 -67.
Lundegard, P.D., Mudford, B., 1995. A Modified Approach to Free Product Volume Estimati ©n,
Conference Proceedings of the 1997 Petroleum Hydrocarbons & Organic Chemicals in Ground
Water; Houston, Texas, sponsored by the National Ground Water Association & American
Petroleum Institute,
MAGNAS3, [992, 1994. Multiphase Analysis of Groundwater, Non -aqueous Phase Liquid and
Soluble Component in 3 Dimensions, Documentation and User's Guide, Hydrogeologic, Inc,,
Herndon, Virginia.
Mercer, J. W Faust, C,R Cohen, R.M., Andersen, P.F. and Huyakorn, P.$ 1985, Remedial Action
Assessment for Hazardous Waste Sites via Numerical Simulation. Water Man, Res 3, pp. 377 -387.
Mercer, J, W and Cohen, R.M., 1990. A Review oflmmiscible Fluids in the Subsurface: Properties,
Models, Characterization and Remediation. Journal of Contaminant Hydrology, Vol. 6, Pp.
107 -163.
Morrow, N;R., Chatzis, I. and Taber, J.J., 1988. Entrapment and Mobilization of Residual Oil in
Bead Packs. Soc, Pet. Eng. Reserv. Eng., Aug. 1988, Pp. 927 -934.
Mualem, Y., 1976b. A New Model for Predicting the Hydraulic Conduetivity of Unsaturated Porous
Media. Water Resources Research. Volume 12, pp: 513 -522,
M.ualem, Y., I976a, A Catalogue of the Hydraulic Properties of Unsaturated Soils, Development
of Methods, Tools and Solutions for Unsaturated Flow with Application to Watershed Hydrology
and Other Fields. Israel Institute of Technology.
Newell, C,J and McLeod, R.K., 1996. B1OSCREEN Natural Attenuation Decision Support
System, User's Manual Version 1 -3, Groundwater Services, Inc, Houston, TX, EPA /600/12- 96/087,
August 1996
Nilkuha, K, and Hüyakorn, P., 1989. Numerical Solution of Two -phase Flow Through Porous
Media, Dept. OfGeoscience, New Mexico Inst. Of Mining and Technology.
Ostendorf, D.W., 1990. Long Term late and Transport of Immiscible Aviation Gasoline in the
Subsurface Environment. Water Science and Technology, Vol. 22, pp, 37 -44.
Panday, S., Forsyth, P,A,, Falta, R.W., Wu, Y.S. and Huyakorn, P.S., 1995. Considerations or
Robust Compositional Simulations of Subsurface Nonaqueous Phase Liquid Contamination and
Remediution. WRR, Vol. 3I, No. 5, pp. 1273 -1289.
51371 Nmlh 33D0 Wc,l, If NP i'b, d14 (dSS AX J9.9 63d
A4UI.V@II,INC.
±pdNgm/ugk. IYtilJr 2w017662s ä {blm5'bwvlHm 27
Panday, S., Wu, Y.S., Huyakorn, P.S., and Springer, E.P., 1994. A Three -dimensional Multiphase
Flow Model for Assessing LNAPL Contamination in Porous and Fractured Media: li. Porous
Medium Simulation Examples. Journal of Contaminant Hydrology, Vol 15, pp 131 -156.
Pankow, J.F., Cherry, J.A., 1996, Dense Chlorinated Solvents and Other DNAPLs in Groundwater.
Waterloo Press, Portland, Oregon..
Penman, D.W., 1977. Fundamentalso
176.
tealreservoir simulation. Elsevier, Amsterdam, pp.
t inder,G.F.andAbriola,L.M., 1986. On the Simulation ofNonaqueous Ph
in the Subsurface. Water Rescrv. Res., Vol. 22, No 9, pp. 109S -I 195.
Rathmell, J.i., Braun, P.H. and Perkins, T.K., 1973. Reservoir Waterilood
from Laboratory Tests, J. Pet. Technol pp. 175 -185.
Schiegg, I1,O., 1985. Considerations on Water, Oil, and Air in Porous
Technol., Vol, 23, No. 4 & 5, pp. 467 -476,
SCS Engineers, 2009. Conceptual Site Model, Port LA Distribution Center (CAO 85 -17, SI IC No.
352 Site ID 2040069), 300 Westmont Drive, San Pedro California 90733. May.
se Organic Compounds
Residual Oil Saturation
Media. Water Science
SCS Engineers, 2011a, Report of' Cone Penetration Testing Investigation, San Pedro Business
Center, 300 Westmont Drive, San Pedro California 90733. June.
SUS Engineers, 2011b. Groundwater Monitoring Report, Second Semiannual 2010, San Pedro
Business Center, 300 Westmont Drive, San Pedro California 90733. May,
Water Resources Control Board, 1996. Resolution No 92 -49, "Policies and Procedures for
Investigation and Cleanup and Abatement of Discharges Under Water Code Section I3304 ",
Stone, Ht., 1973. Estimation of Three-phase Relative Per
Pet. Technol., Vol. 12, No. 4, pp. 53 -61.
Theis, C,V 1935, The Relation Between the Lowering of
Duration of Discharge of a Well Using Ground Water
Transactions, vol. 16, pp. 519 -524,
USEPA, 2002 (Newell, C.J.; et al.).
Monitored Natural Attenuation Studies ".
ulatión zuid IJ
eability and Residual Oil Data. Can.
Piezometrie Surface and the Rate and
rage, American Geophysical union
of First -Order Rate Constants fi
van Genachten, M.Th., 1980. A Closed Forni Equation for Predicting the Hydraulic Conductivity
of Unsaturated Soils. Soil Sel. Soc. Ant J. 44, pp,892 -898.
682 l Nnrih 2200 Nis1, eer Ph. 435 655.8024 CA%J35155.ygáb
AQ(it-Vitte, INC.
pldrogeuloyy. Water Remnrw ,31 28
Wise, WA., Chang, C.C., Klopp, R.A. and Bedient, P.B., 1991. Impact of Recharge Through
Residual Oil upon Sampling of Underlying Ground Water, GWMR, pp, 93 -99.
Wu, Y.S., Huyakorn, P.S. and Park, N,S., 1994, A Vertical Equilibrium Model for Assessing
Nonaqueous Phase Liquid Contamination and Remediation of Groundwater Systems. WRR, Vol,
30, No. 4, pp, 903 -912,
CAÇVIle,upe630066Nn@\NInnllleporl\texóL.Yi100562.0ld,apY
71 NnnO MO West, ANF Fh, 493 ri3itt FAX 435 á34.8O&
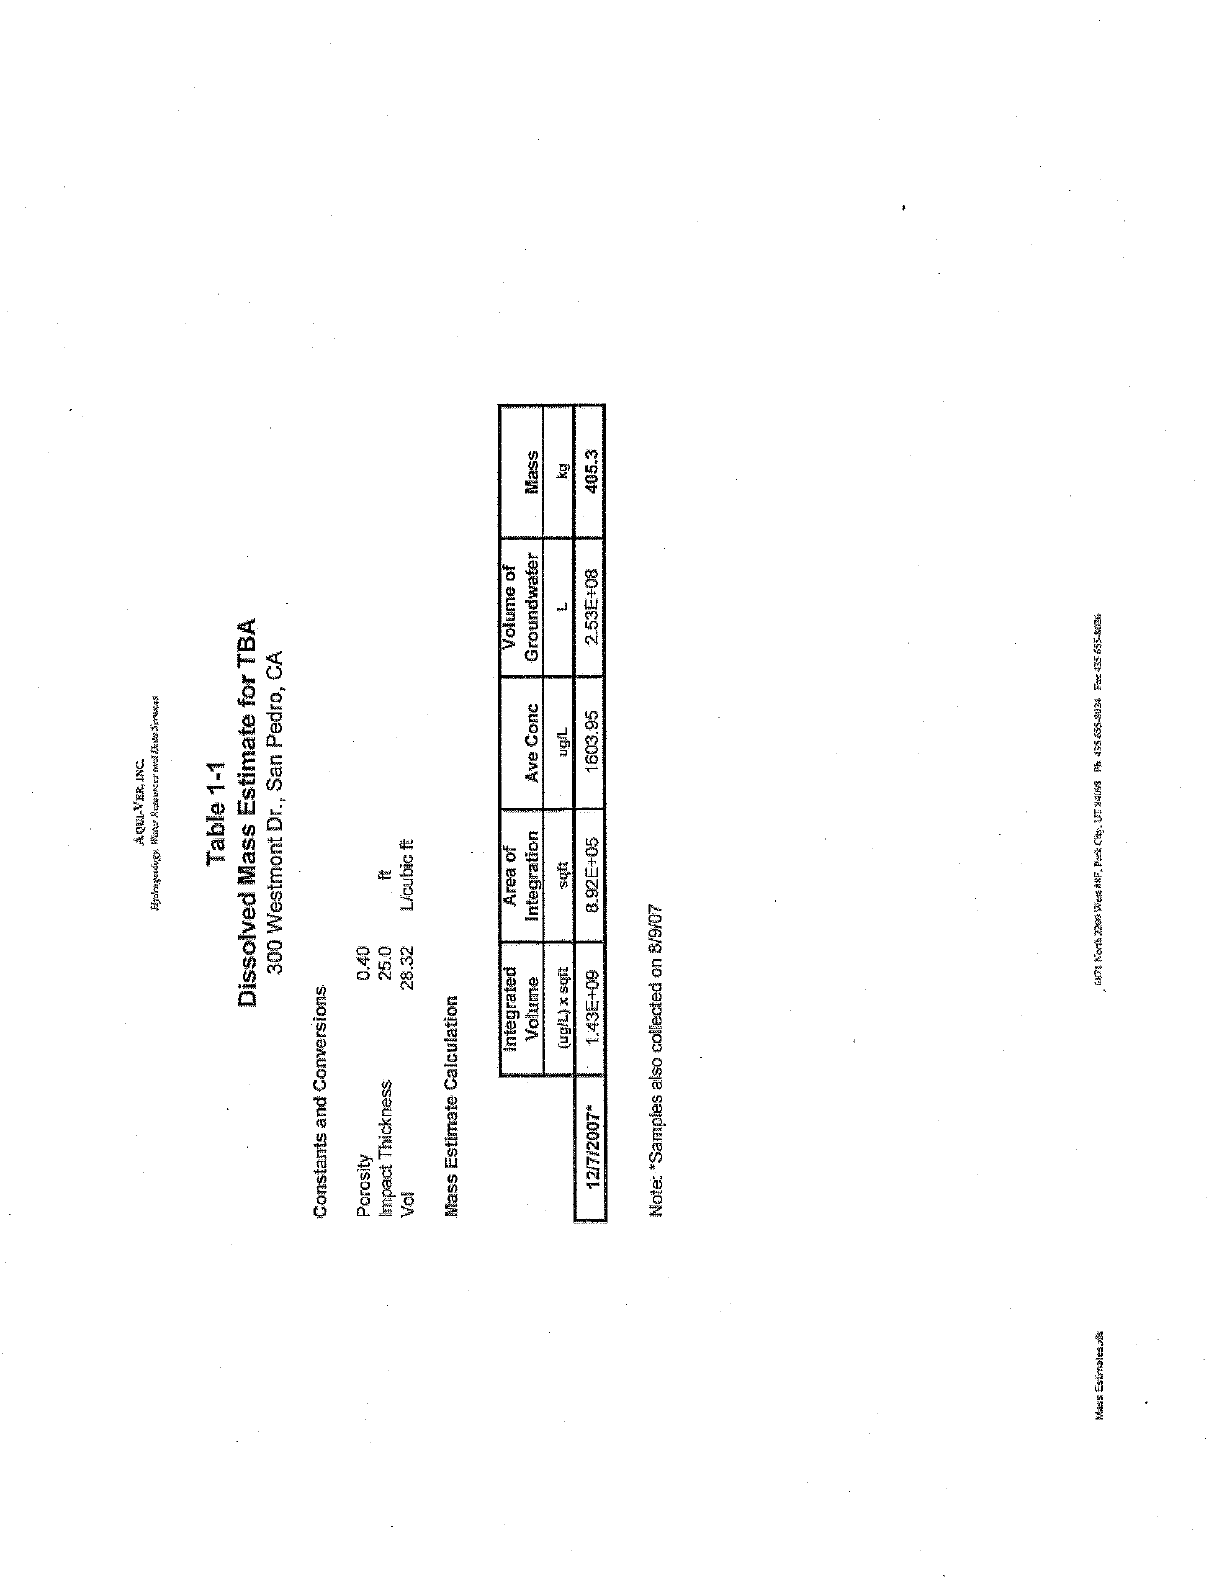
AQUI-VERine
Hy'myeWVgy MAT Rwaaxcn sad tkwe5rrvrc:r,a
Table 1 -1
Dissolved Mass Estimate for TBA
300 Westmont Dr.,. Pedro, CA
Constants and Conversions.
Porosity 0,40
Impact Thickness 25.0 ft
Vol 28.32 Licubic ft
Mass Estimate Calculation
Integrated
Volume Area of
Integration Ave Conc
Volume of
Groundwater - Mass
(u& L) x sqn sgft ugfL L kg
1217/2007* - 1.43E+09 1603.95 _ 2.53E +08 405.3 8.92E +05
Note: "Samples also aoliected on 819107
Mass Es males. as æs
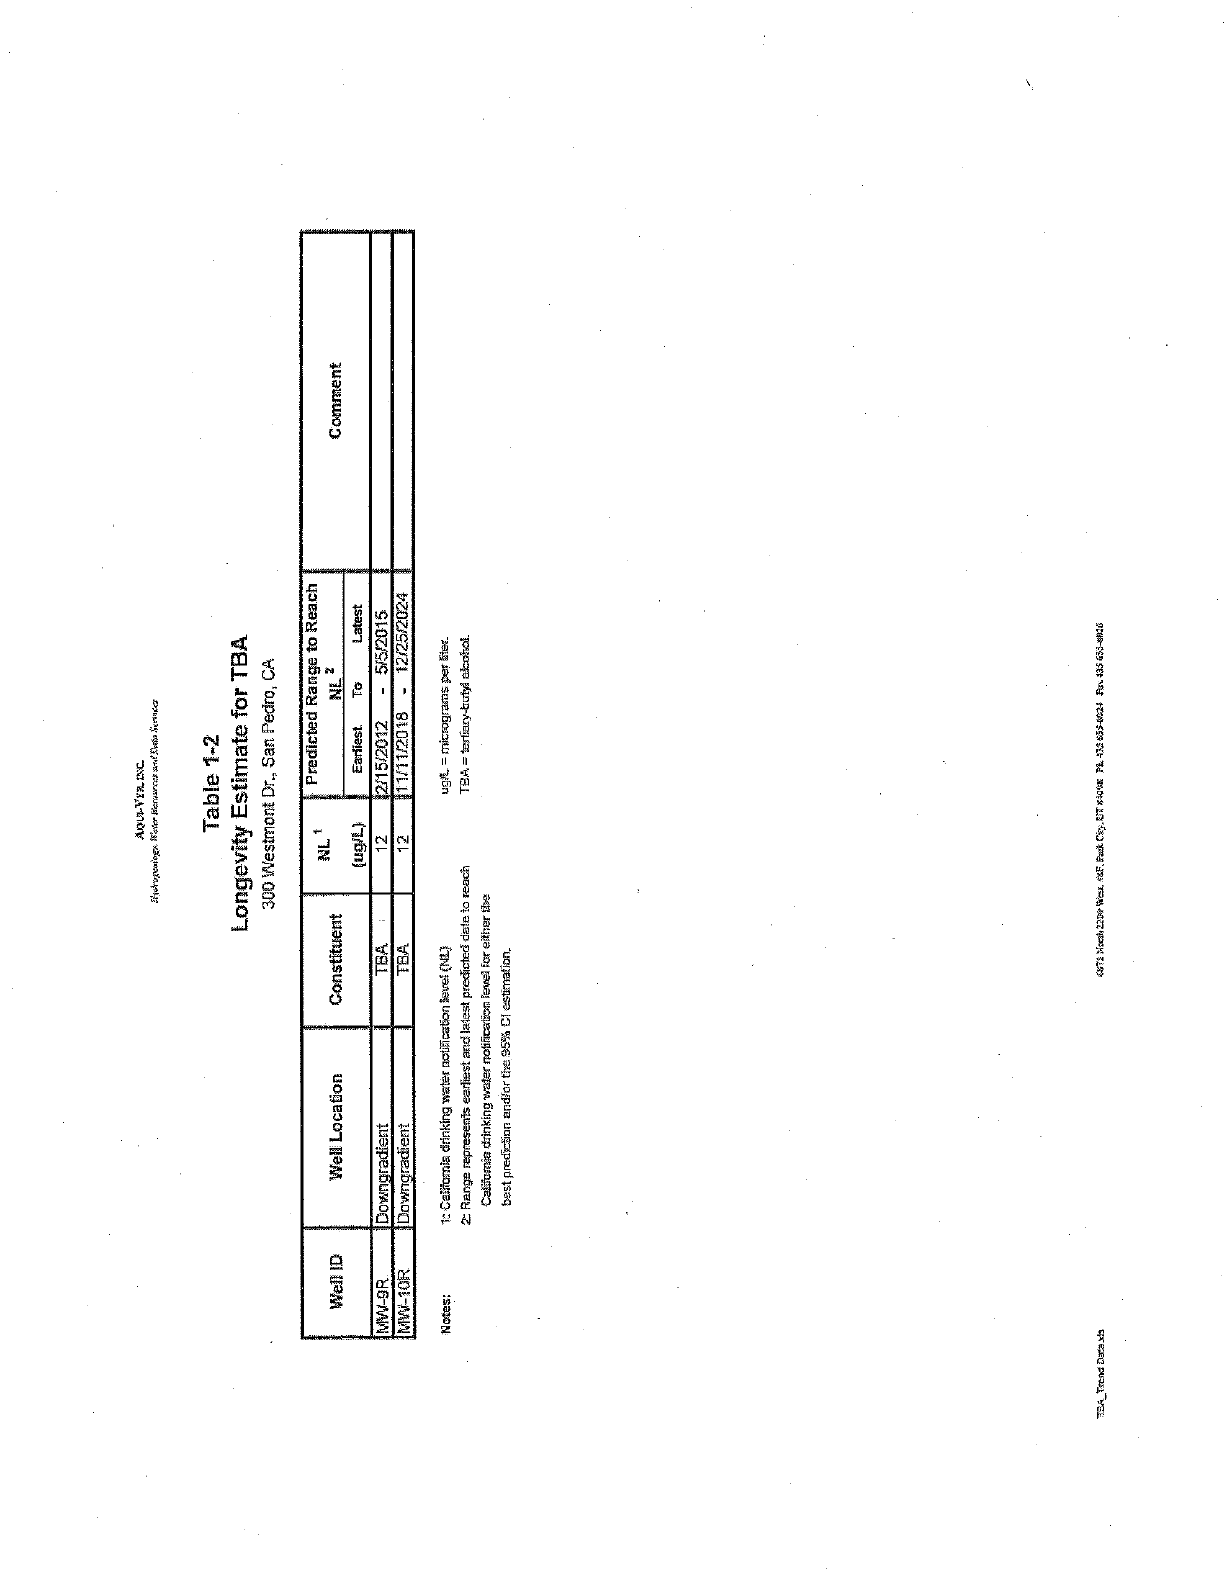
Asedara.cc
'h>tioxeaìere. Wart vrrerwnxsw,t Dan St. ,un
Table 1 -2
Longevity Estimate for TBA
300 Westmont Dr., San Pedro, CA.
Welt ID Well Location Constituent NL'
(ngIL)
Predicted Range to Reach
NLa
Earliest To Latest
MW-9R Downgradient TBA 12 2115/2012 - 5752015
MW-30R Downgradient TBA 12 _1.1l11/2018 - 12/252024 ,
1:_ £aitomie drinking water notification rawer (NL)
22 Range represents earliest and latest predicted dale to reach
Cardenas drinking water notification revel for either the
best erediclon endder the 35t CI estimation.
u9t£. = micrograms per tier.
Tßn - tertiary-boy alcohol.
MBA trend na'.ask Yxh:3ln Wet sllF,hùCCt.LZVON pkiï&i>Ni2t rat:43565>aIR6
Comment
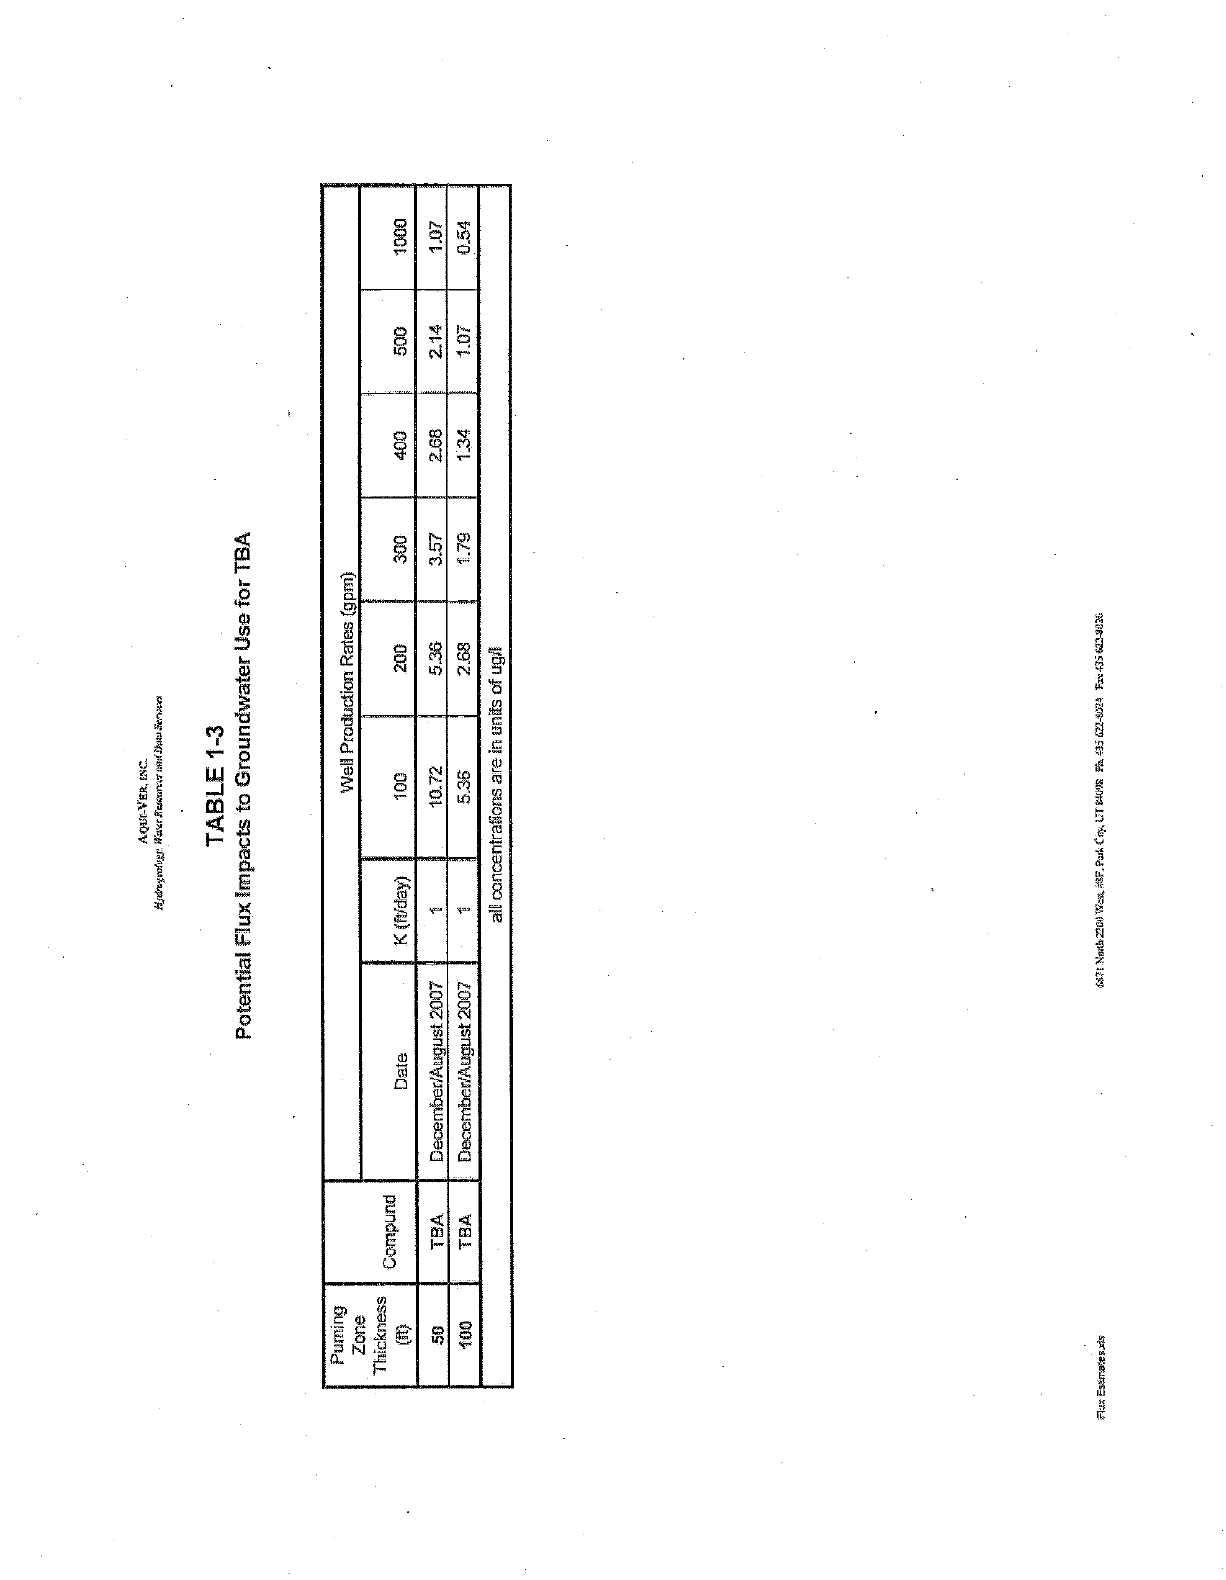
Ague -VER, me
TABLE 1 -3
Potential Flux Impacts to Groundwater Use for TBA
Purring Well Production Rates (9p
(-Lit rc
Thickness Compund
CO Date K (ft/day) 100 200 400 500 1000
50 TBA ', December/August2007 1 10.72 5:36 3.57 2.68 . 2.14 1.07
100 TBA December/August 2007 5.36 2.68 139 1.34 1.07 0.54 '
alt concentrations are in units of ugli
Flax Et.lra:estls 6M Northnoo Wcn ü. PvLtp ewes ?% -s5 GL* -PAi4 alt sai 62-25
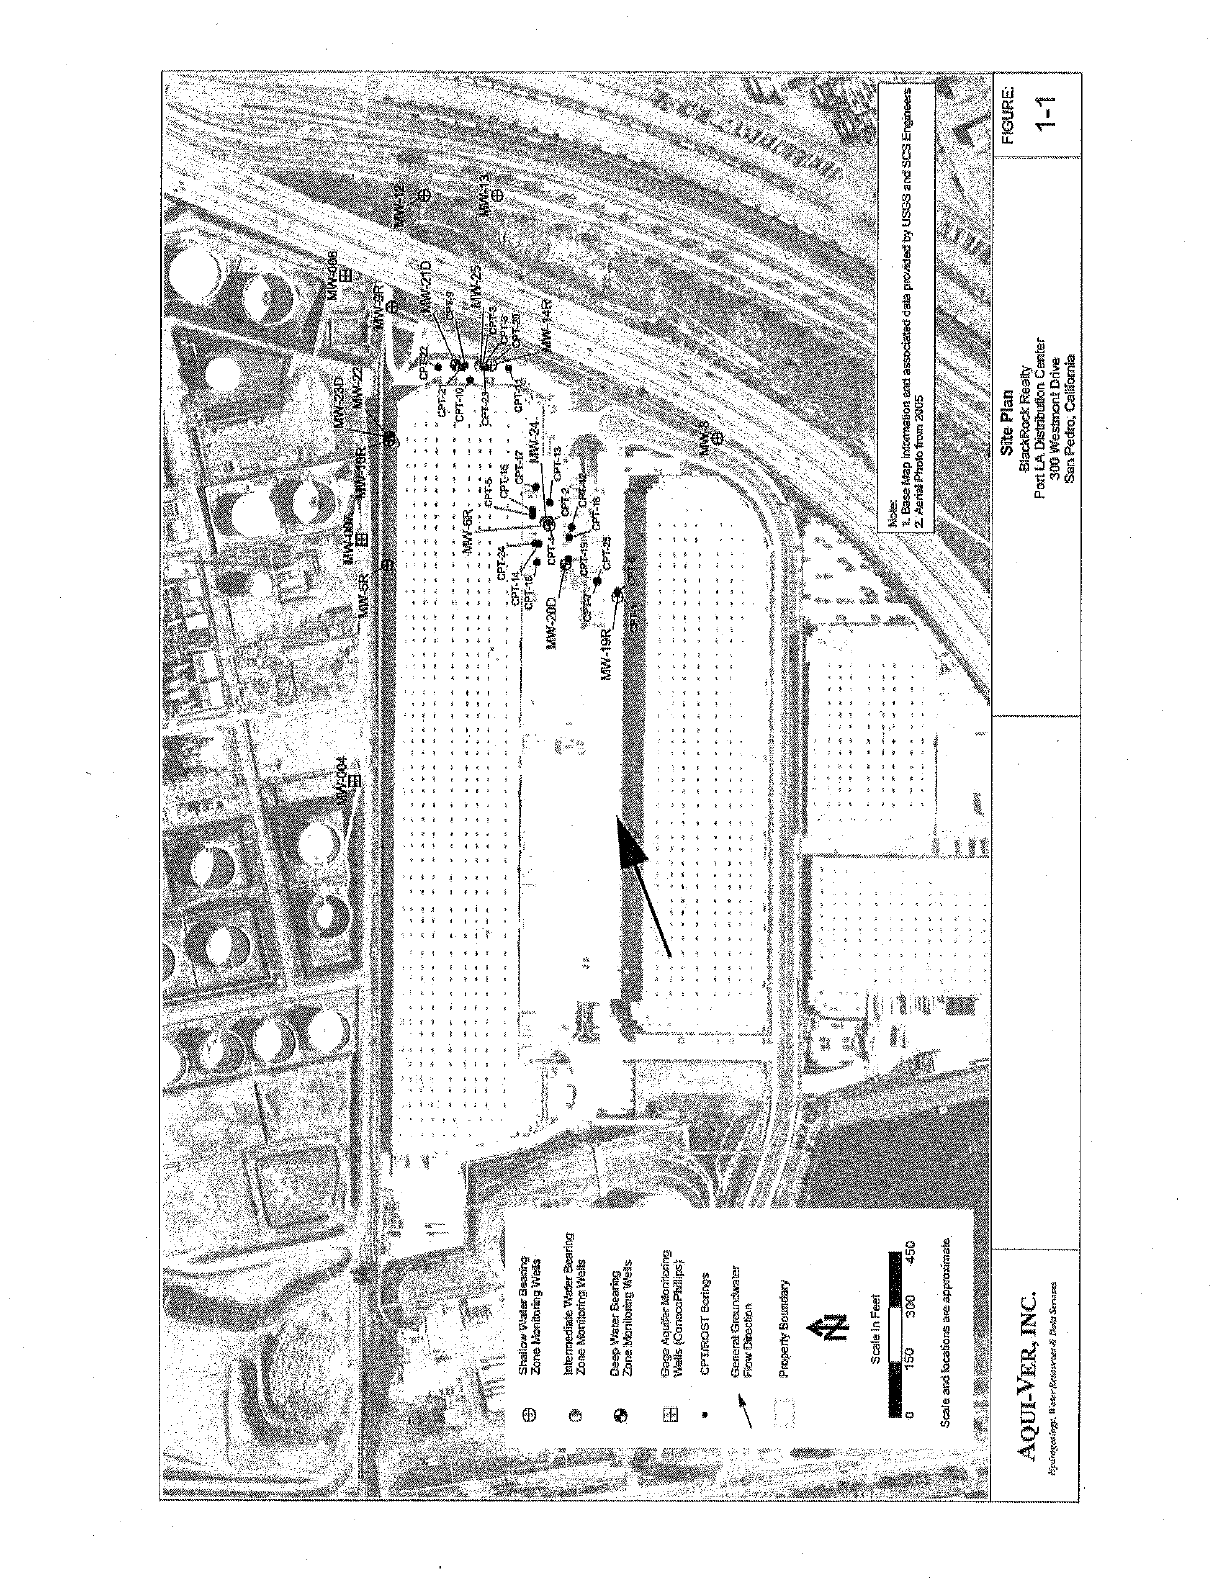
GPT ..l j CPL,E
CPT 14 j lt_ GPT-I>
CPT,a* 1 is $.9Ya-24 _
MW-200 cvr 10`-¿P'r-13
00_5_72
Crn L'Ai,9 t CRfA2.
3R r-25 CPT ta
Y
ó Scale n Feet
0 150 300 450
Smile a^d acaóors a e app mamma
r,n
NMr6+/Y./ N> 7,4,ti
Base Map mt+IT26oa sod assaaateà Sara promet W USOS andâtS En_ae=s t
matPholo tram 2005
AQUI VER INC.
! v. oCUiog finer 4 vv sI 1
Site Plan
ElathRmd Peaty
Part LA Dist -Luton Center
300 Westmont On de
San Pedro, Calrzorma
FIGURE
1 -1
1
I
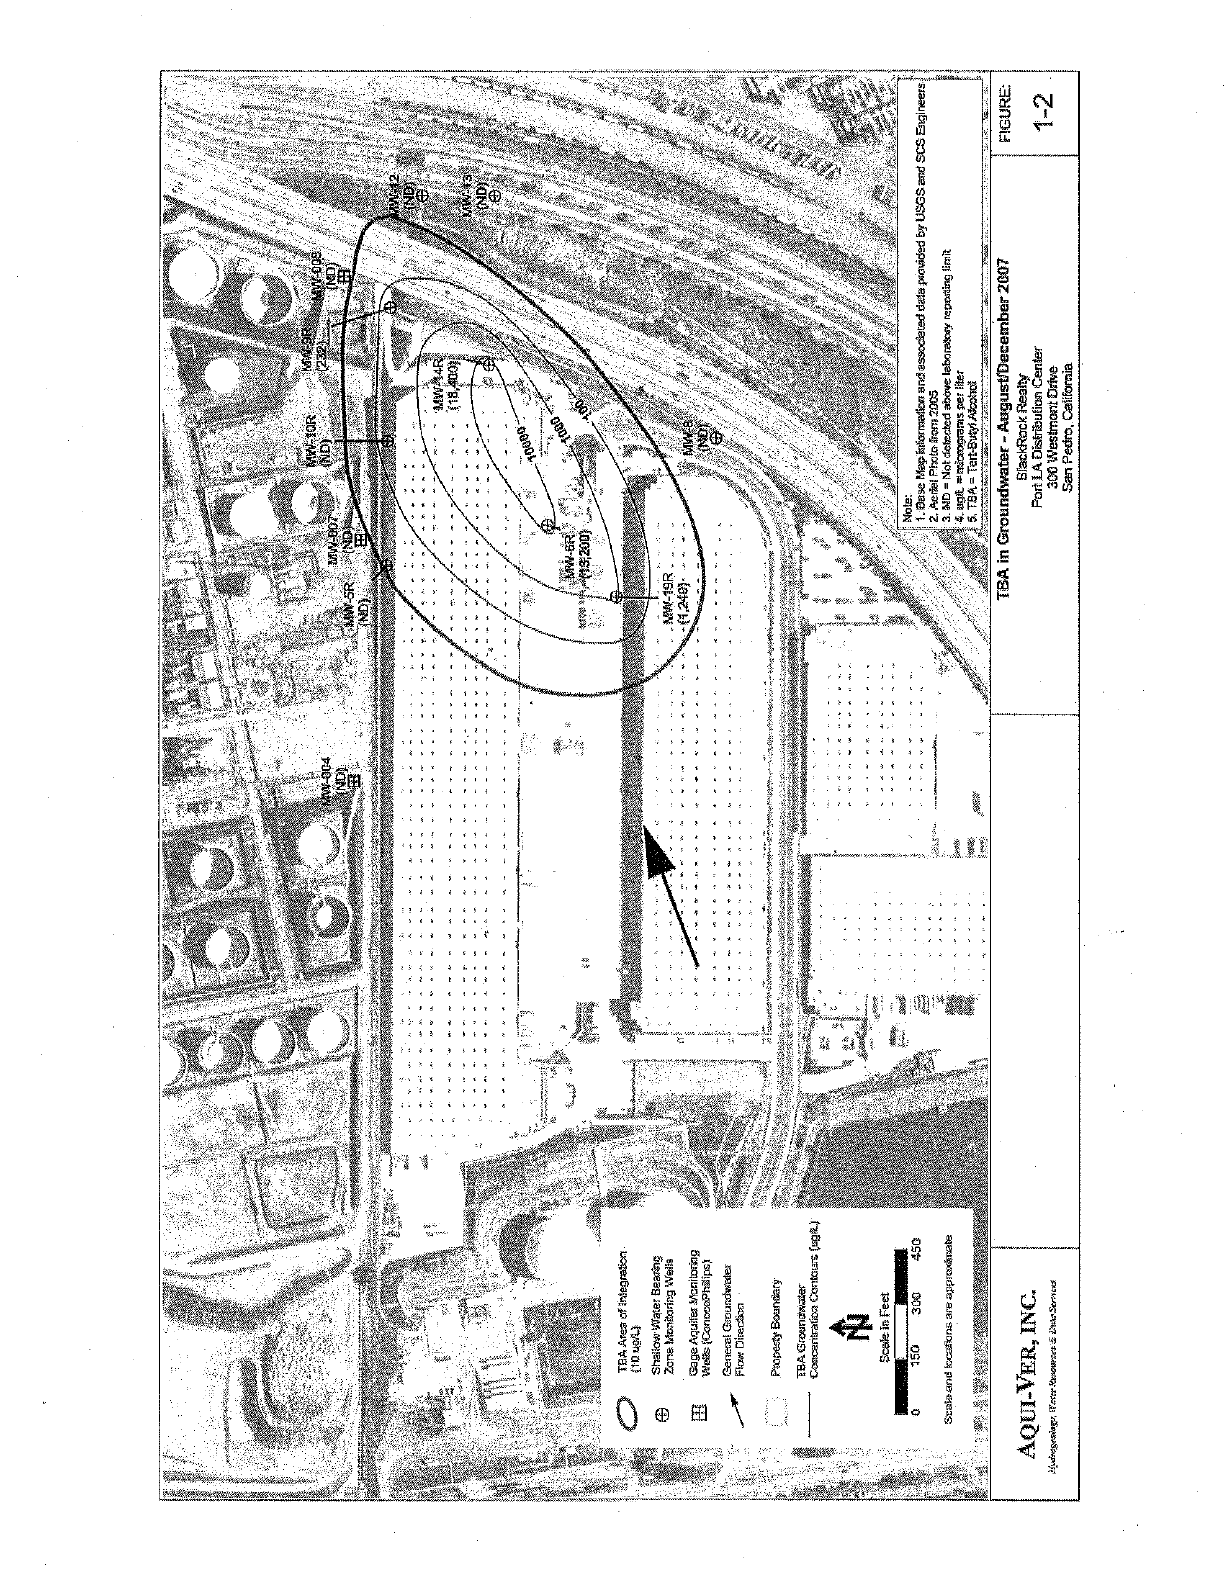
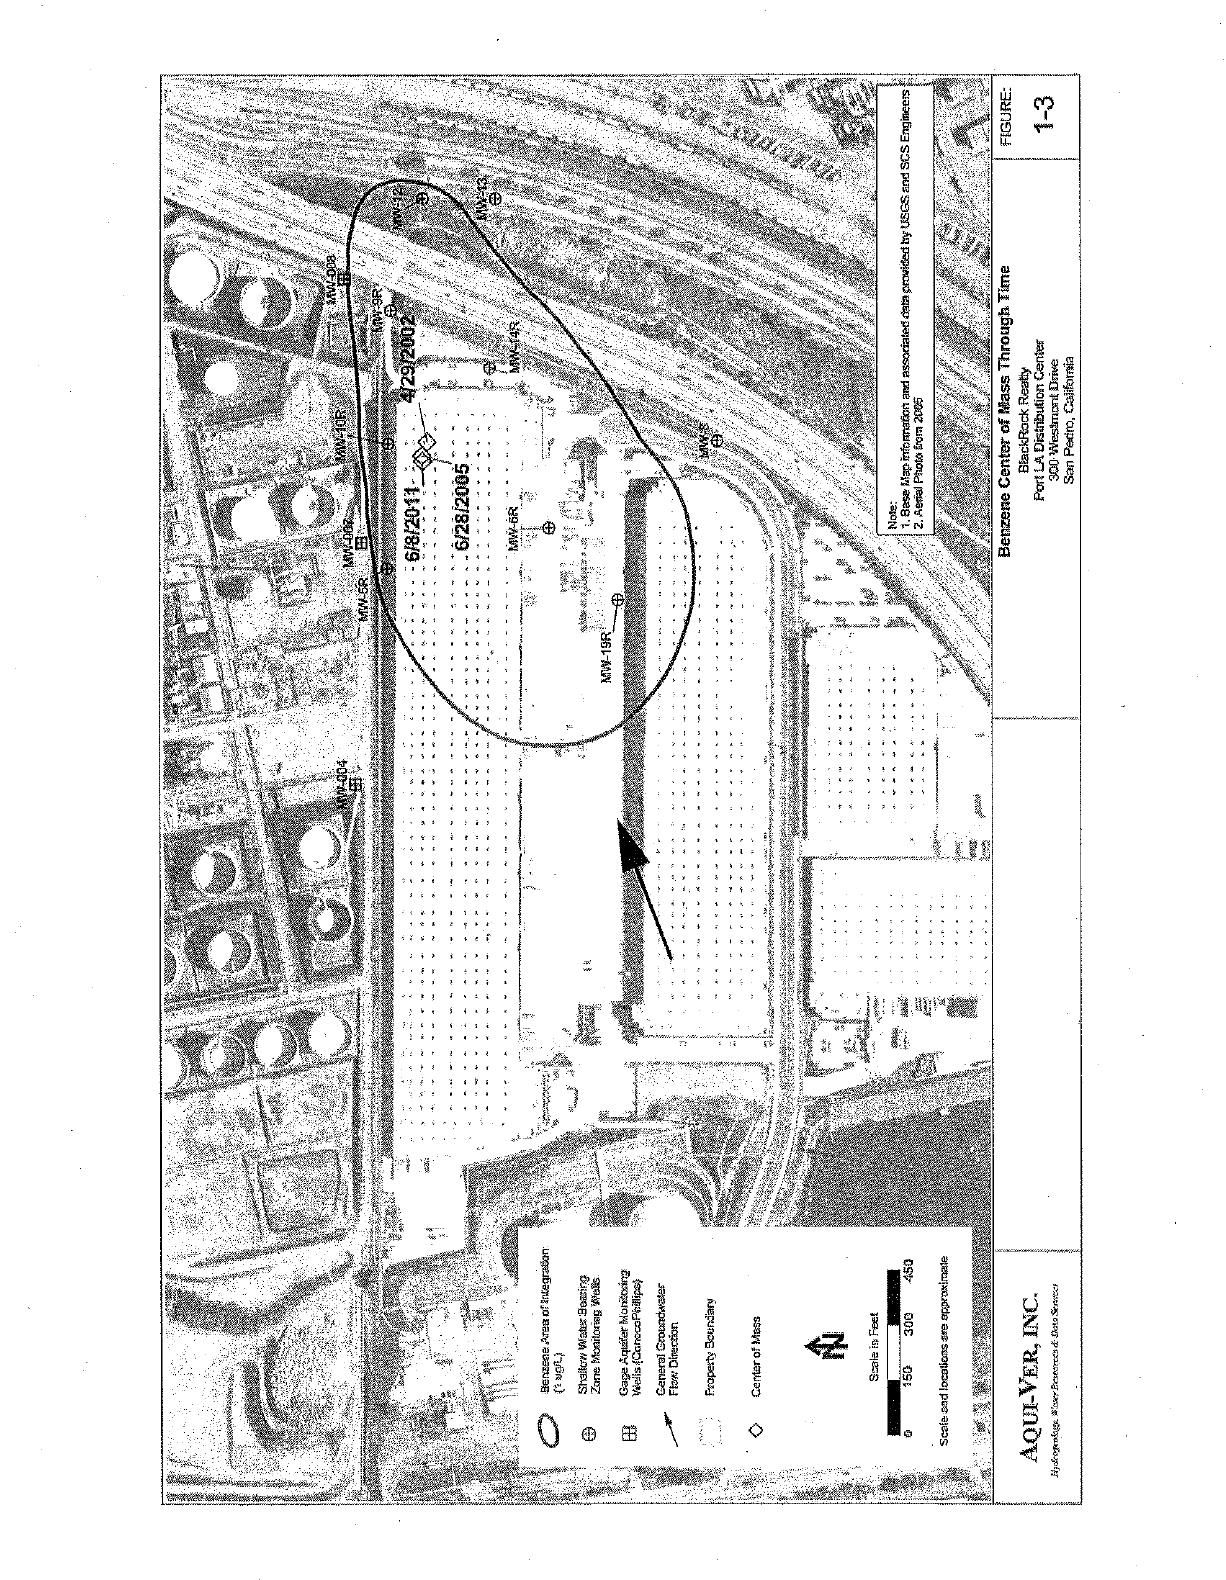
eituo7pJ'alPad ties
a ua Jua1+4seM 00E
a*OarJ La4n91490 V1 Jad
kleal.l 4301110e18
asua y*Bnosyl, sse`y go 1a?.Ua3 auazua8
. ,...lan,.a .,a.,. ,o...-,
'3ia `2IHA-L'1t7V
9DoLuor0104dleuay Z
aaw6u3sasPUeses+APauoosFeeFTevm:e¡aeuuwuaydeliasee L
SION
.61/2121 is am sect Pus eleoS
Os S' 00E OS,
aaad 41 qezS
ssa413oJaiUaa ^
VIeCUOY'c y.adod
e
i.-, /6",
4'
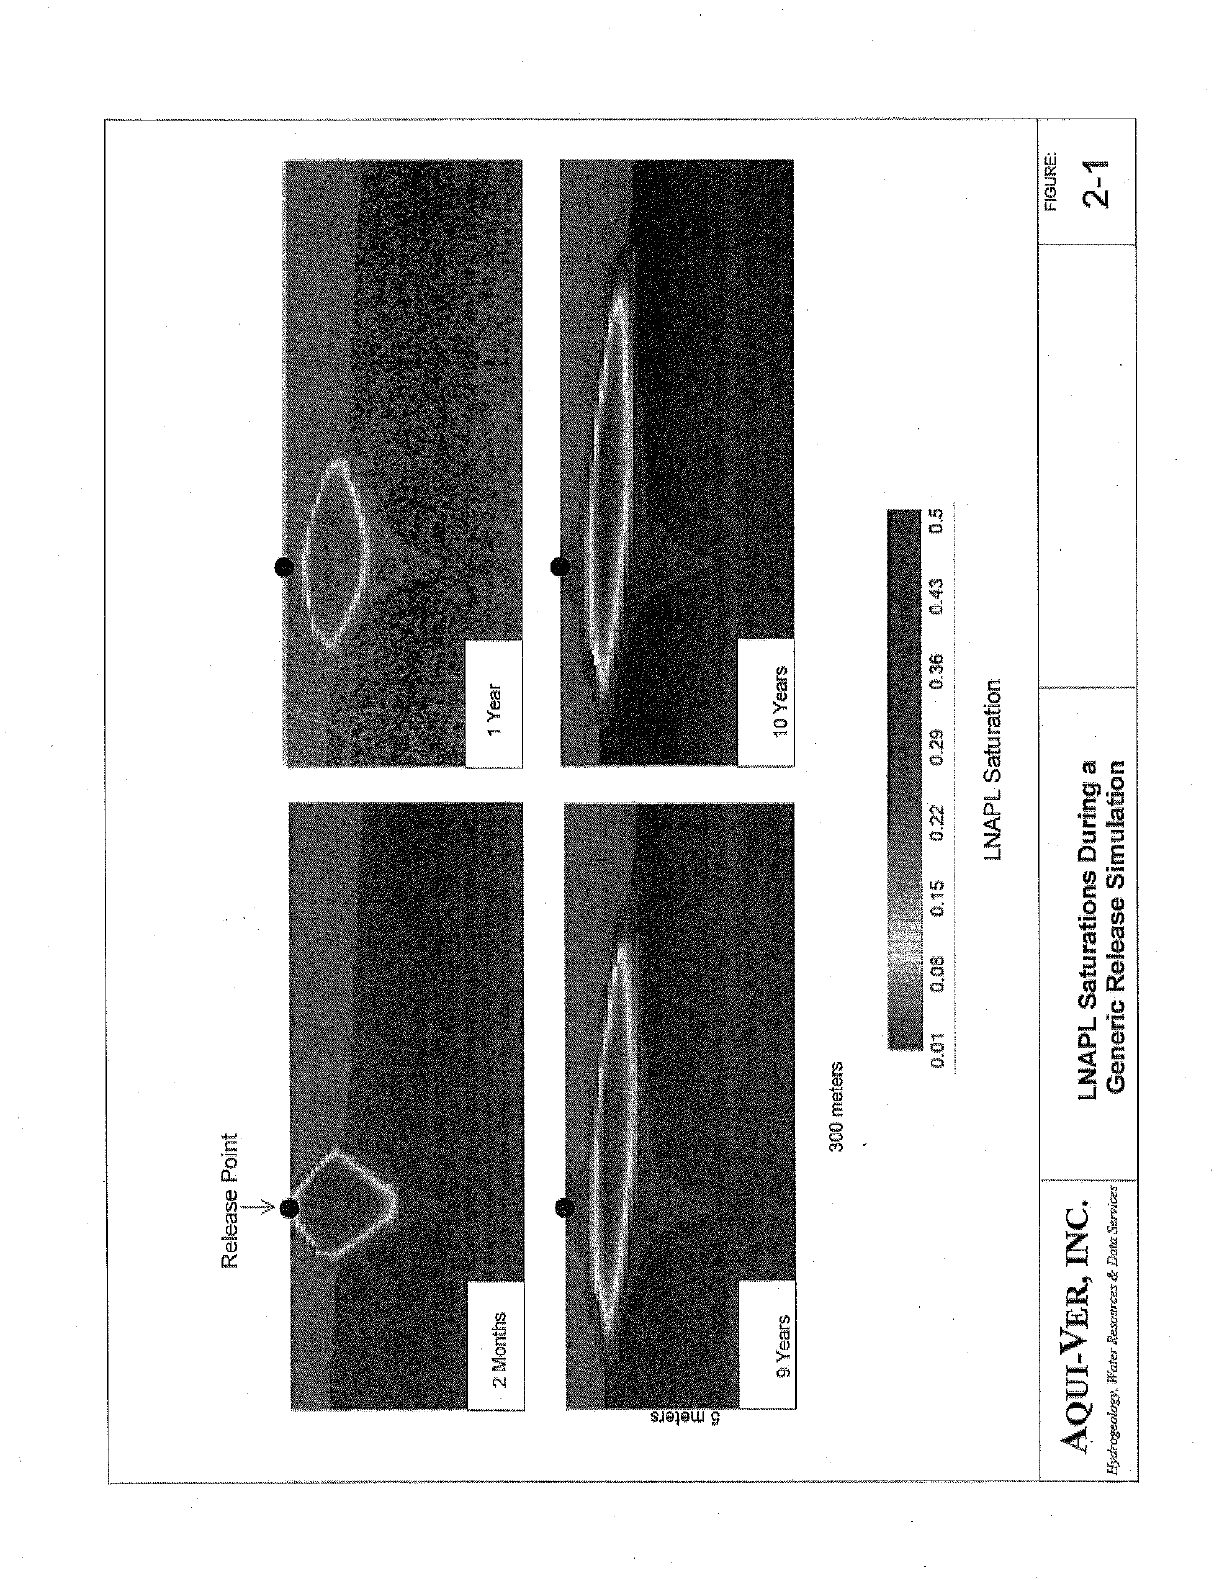
r r
saeleui g
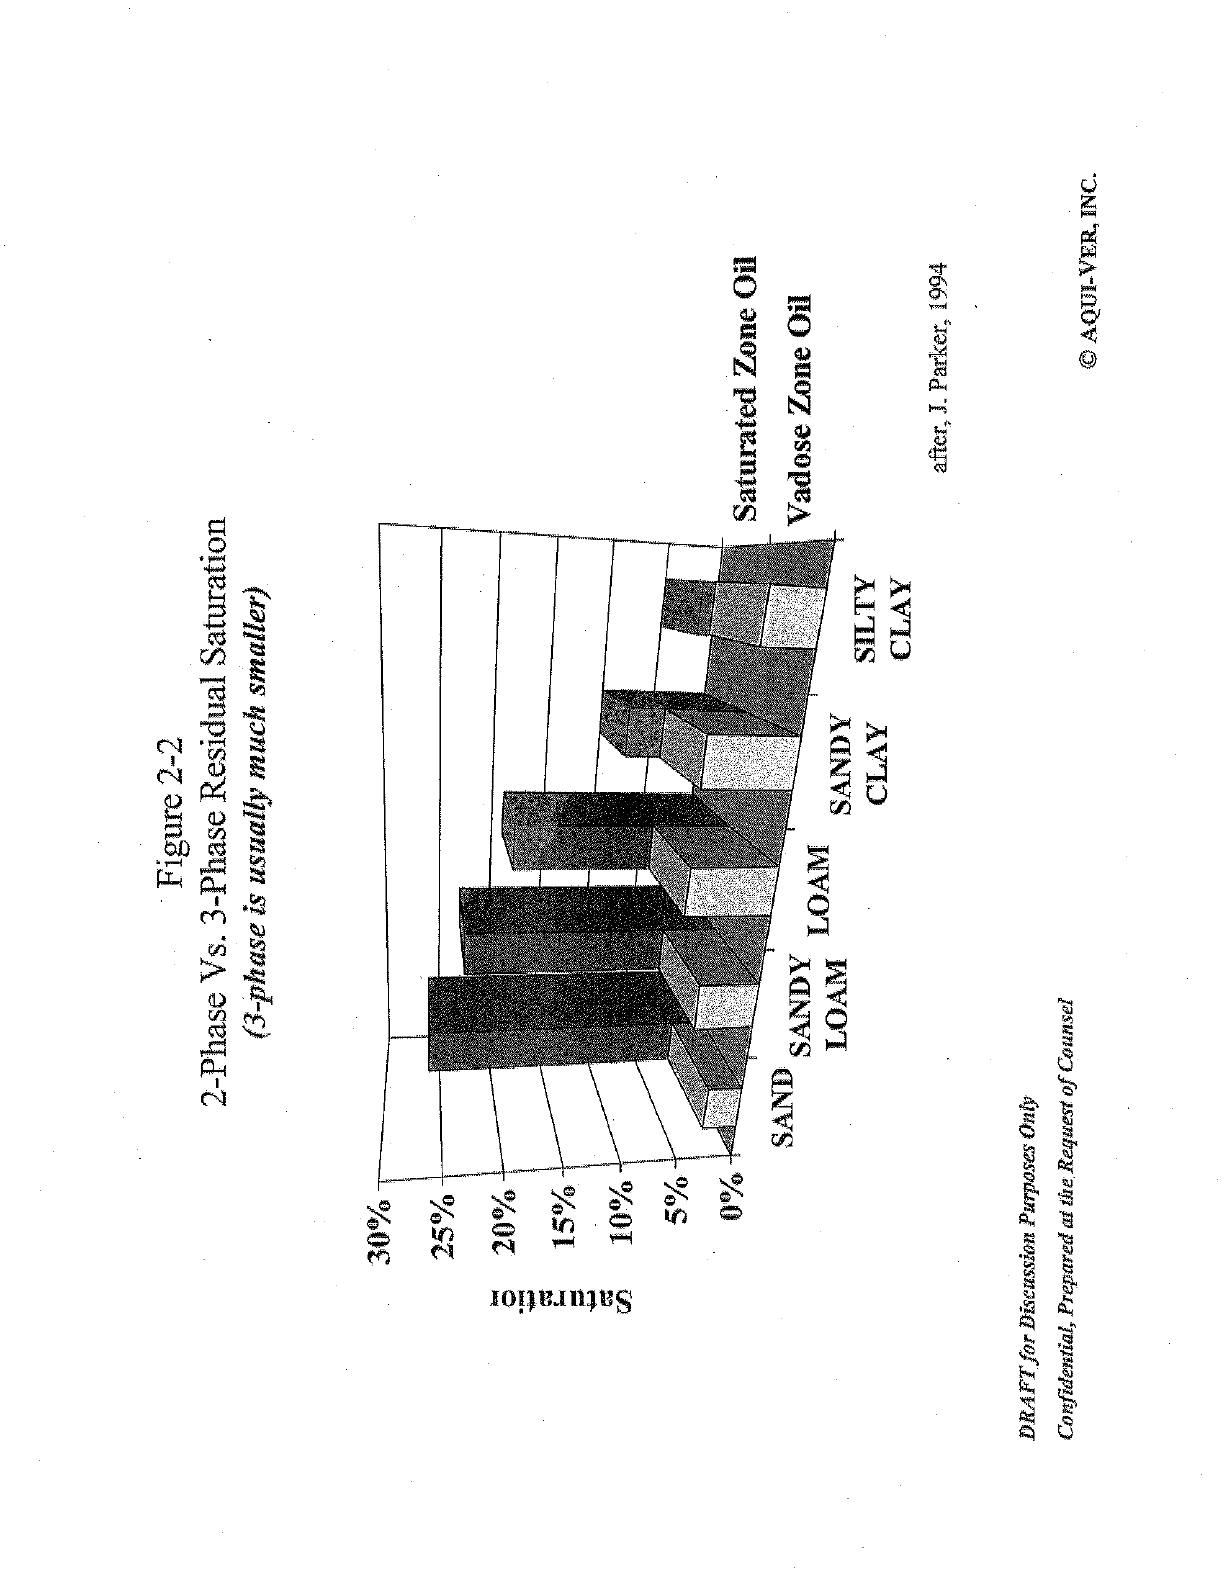
30%
25%
20%
15%
10%
5%
0%
Figure 2 -2
2 -Phase Vs. 3 -Phase Residual Saturation
(3 phase is usually much smaller)
SAND SANDY
LOAM
DRAFT
for Discussion Purposes Only
Confidential, Prepared ai the Request of
Counsel
LOAM SANDY
CLAY SILTY
CLAY
Saturated Zone Oil
Vadose Zone Oil
J. Parker, 1994
ß AQUI -YER, INC.
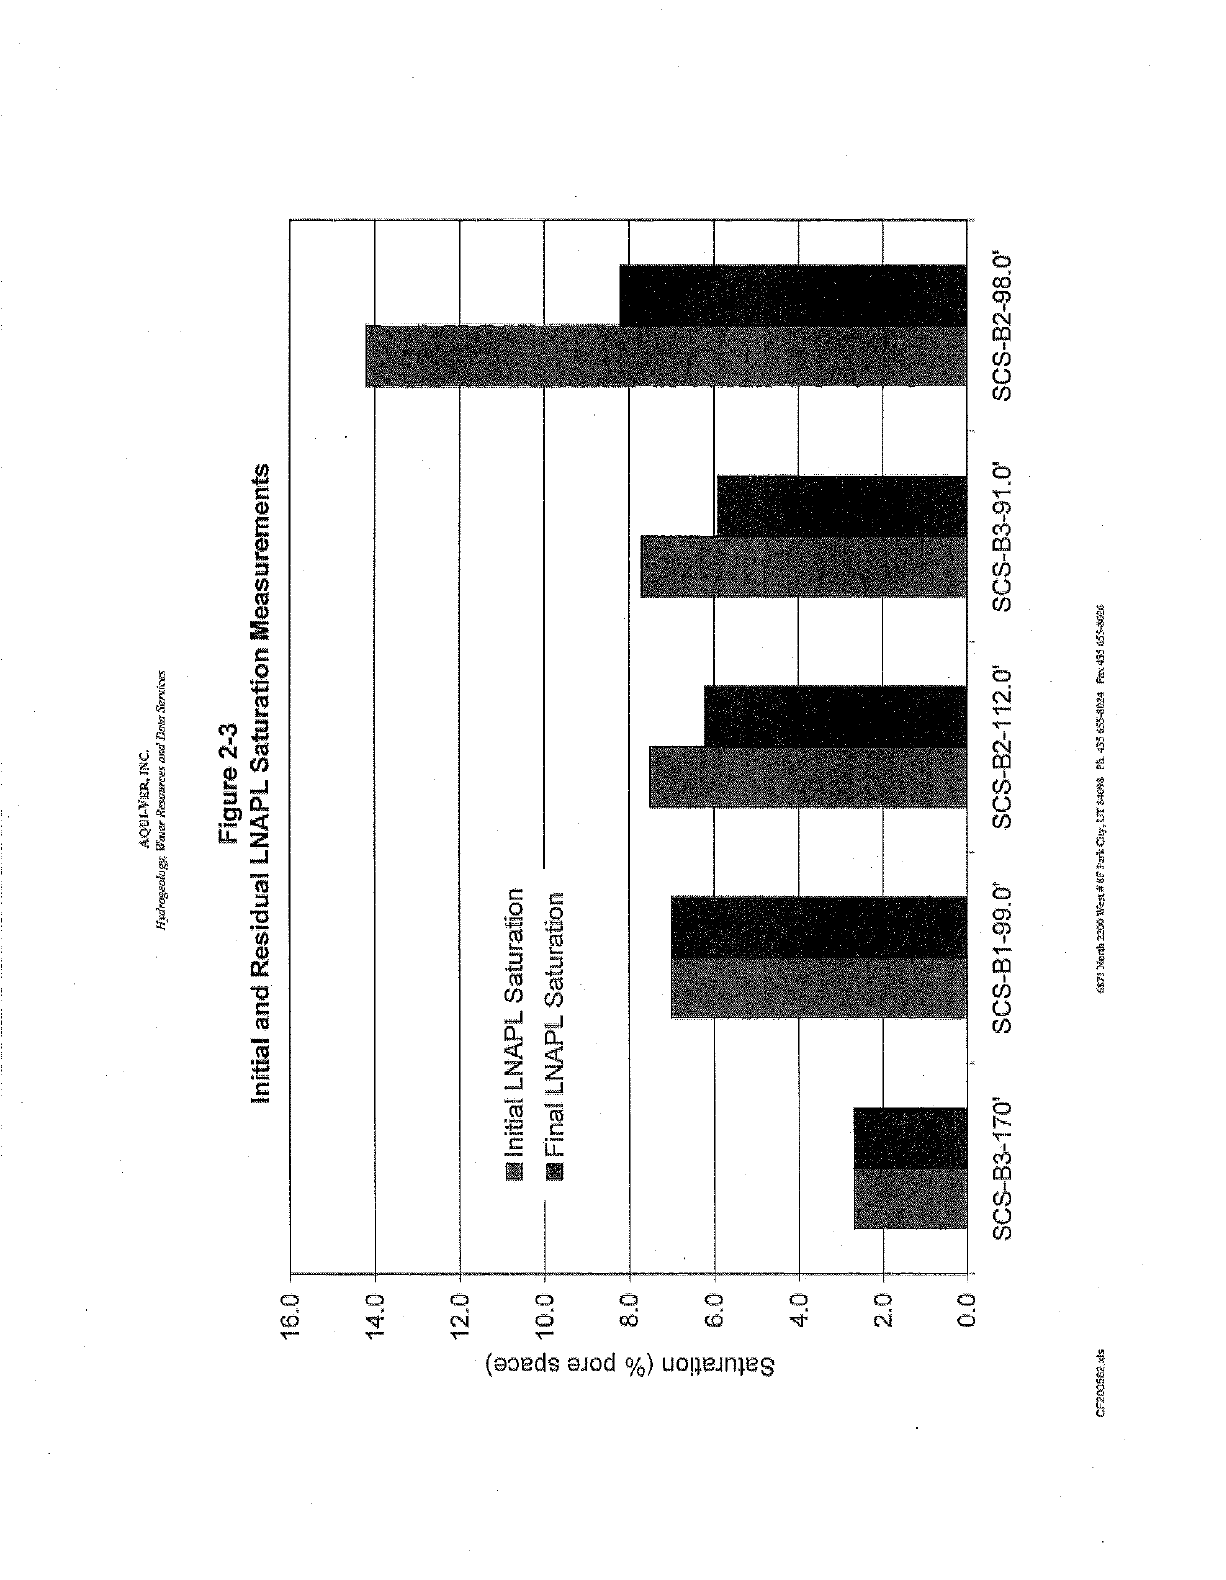
16.0
14.0
12
m
Ñ- 10.0
m
L
o
Q
C
o
:_-
8
4.
AQUI-VER, lNC.
Htdrogeatogy; iWaaerReararcar ared Daa Szrvi.t
Figure 2 -3
Initial and Residual LNAPL Saturation Measurements
i Initial LNAPL Saturation
Final LNAPL Saturation
2.+
0.0
SCS-B3-170' SCS-B1-99.0' SCS-B2-112.0' SCS-B3-91.0' SCS-B2-98.0'
CF203562 G8llNOrfi =CO W.t %EYvk Ow, LTRAM PS.4î56i54624 Fa..435455
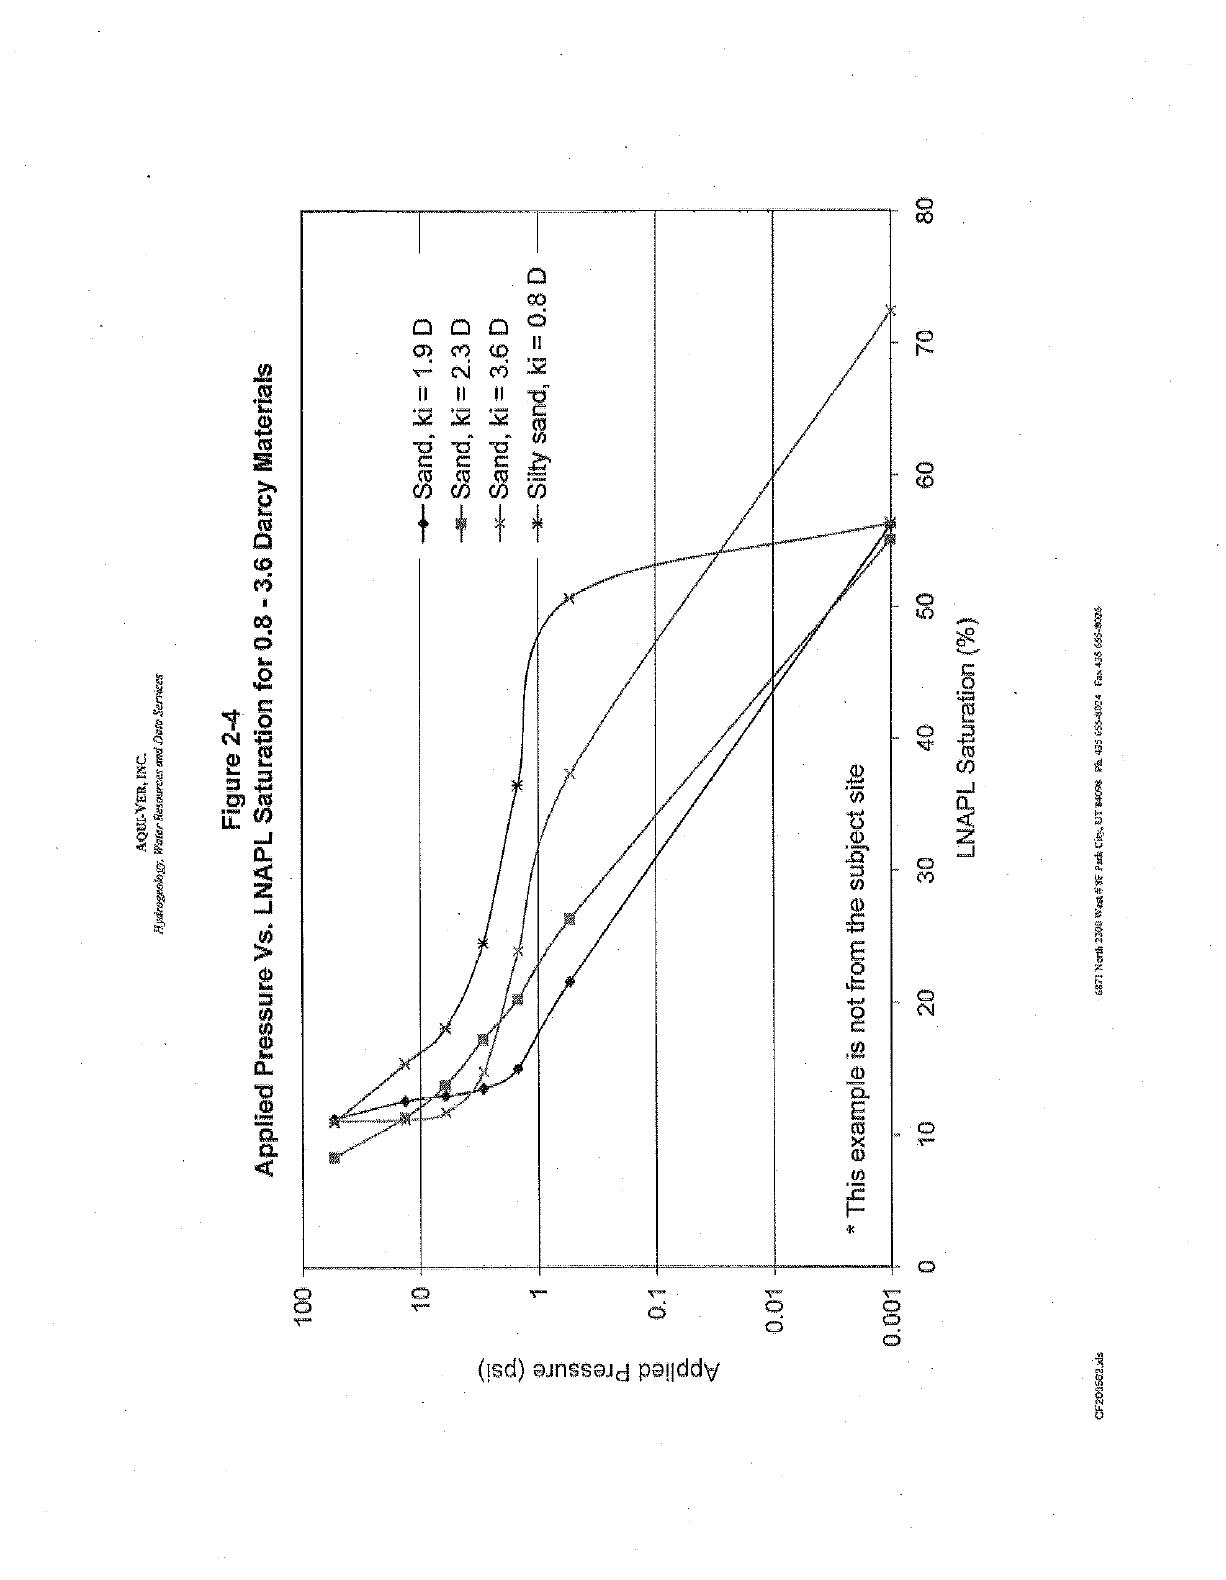
100
Applied P
Aßll &VE1b.PNG
HydmgeabS3; Water
Rexmrees ama Data Senkes
Figure 2-4
sure Vs. LNAPL Saturation for OS - 3.6 Darcy Materials
-*-Sand, ki = 1.9 D
Sand, ki = 2.3 D
x Sand, ki = 3.6 D
Silty sand, ki = 0.8 D
0.01
0.00
This example is not fro
o 10 20
he subject site
30 40
LMAPL Saturation (%
50
CF269562,:ds tR3lNCnA2JJ14't`.'SEPVl.Ciu'.k35&f4TtP¢h35655AG'_iEm13S655-@:?5
60 70 80
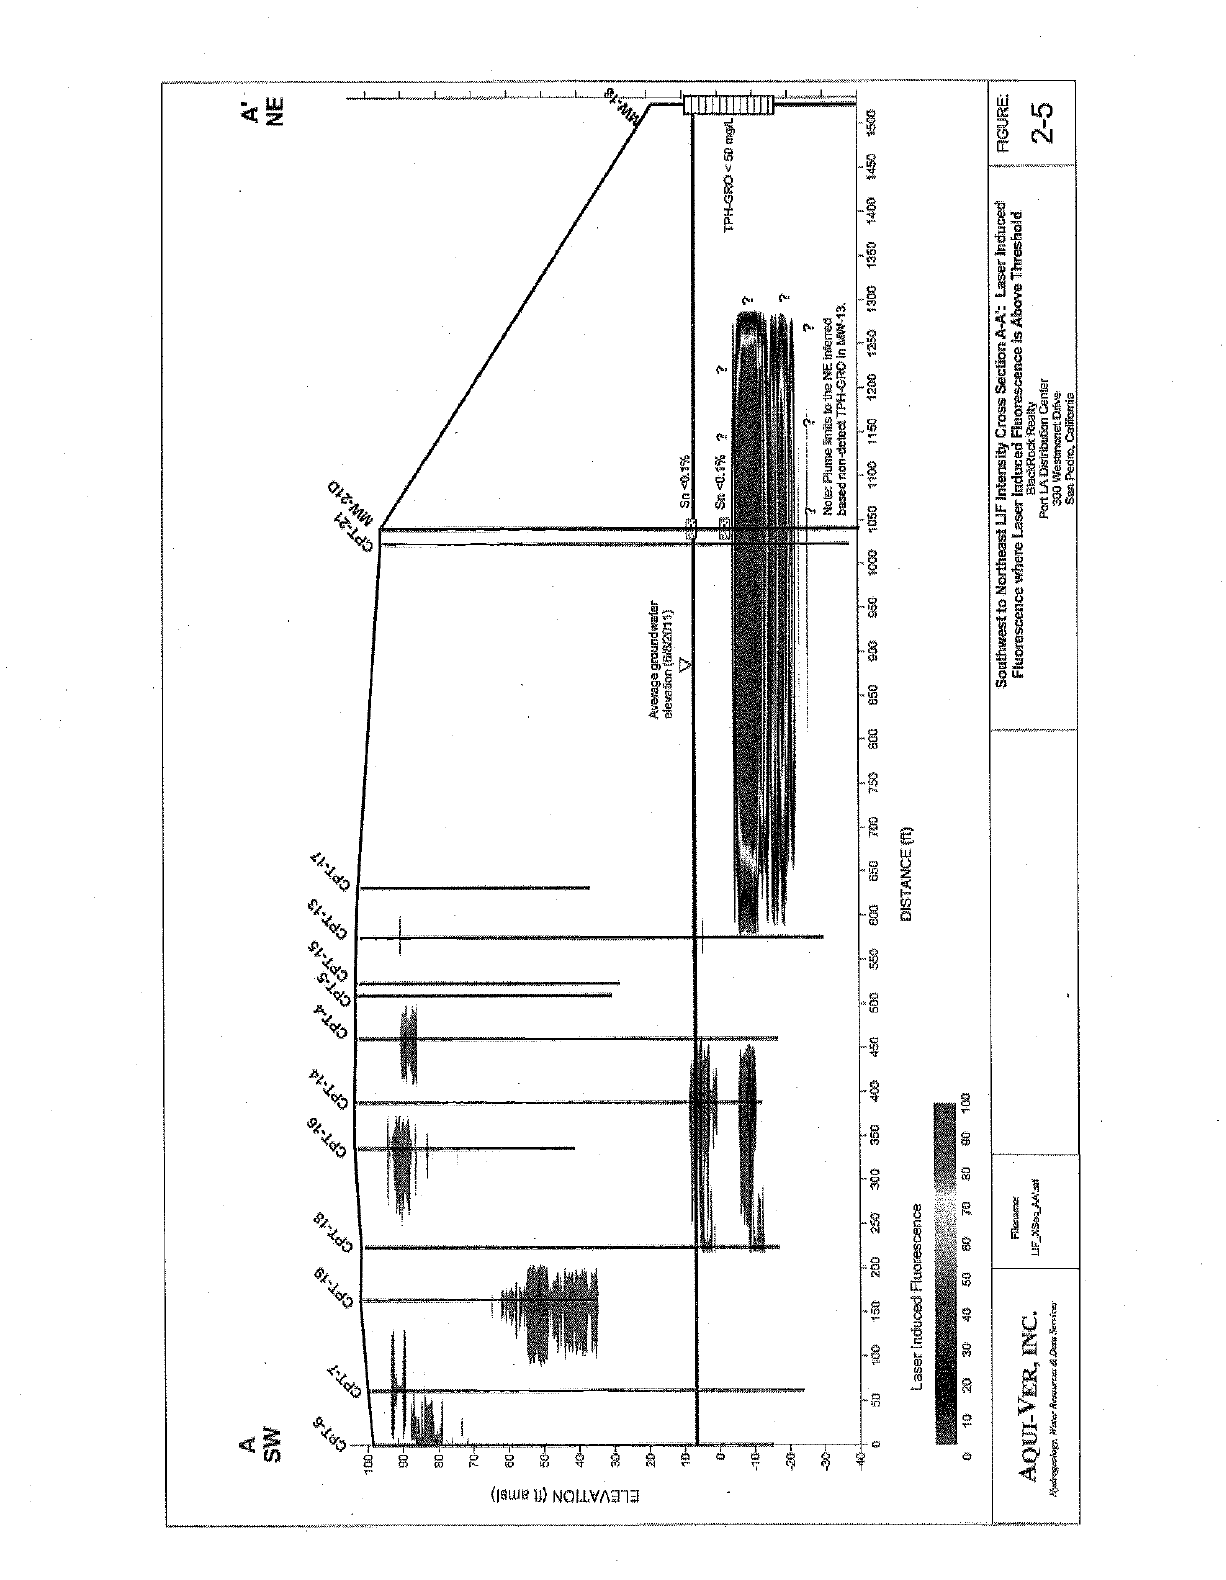
11111111
8
o
á m m r+ e cJri d PI N
(Iswe 11) NJLLVA31d
o
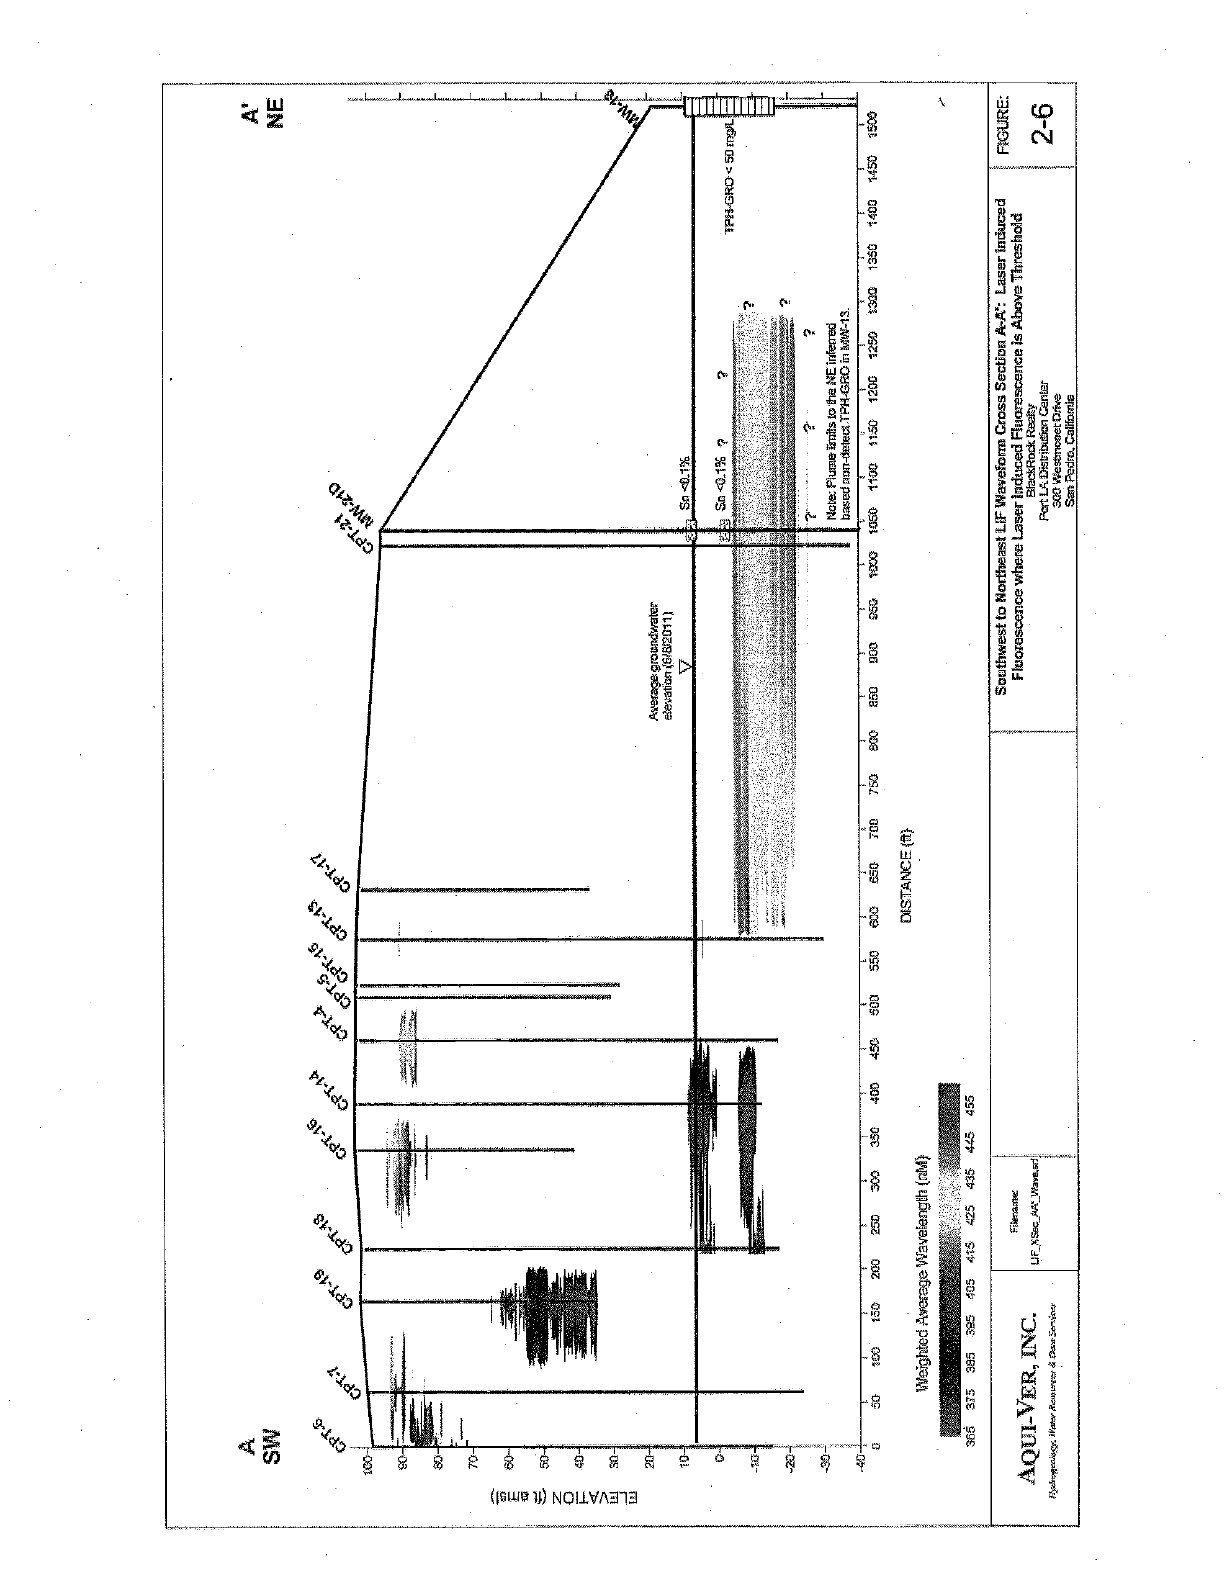
50
40-
30-
20 4.rera3egrovrdrster
e-,eoanan{W82011j
Sn<O1% T ;Pt RO <50
200 250 390 350
Weighted Average Wavelength (nM)
05 415 425 4
500 ,-00 750
DISTANCE (ft)
250
Note Piur e Tmrfs to the NE inferred
eased non -detect TFH
-GPC e, ARAM 3
1050 X100 .150 1200 1250 1300 1350 1400 1450 1505
AQUI -VER, INC.
Southwest to Northeast LtF Waveform Cross Section A -N: Laser Induced
Fluorescence where Laser Induced Fluorescence is Above Threshold
BleelsRodc Realty
Pert LkOiseibc5ce Center.
300 Wesencnetttee
San Pedro. Cantor/lie
CURE:
2 -6
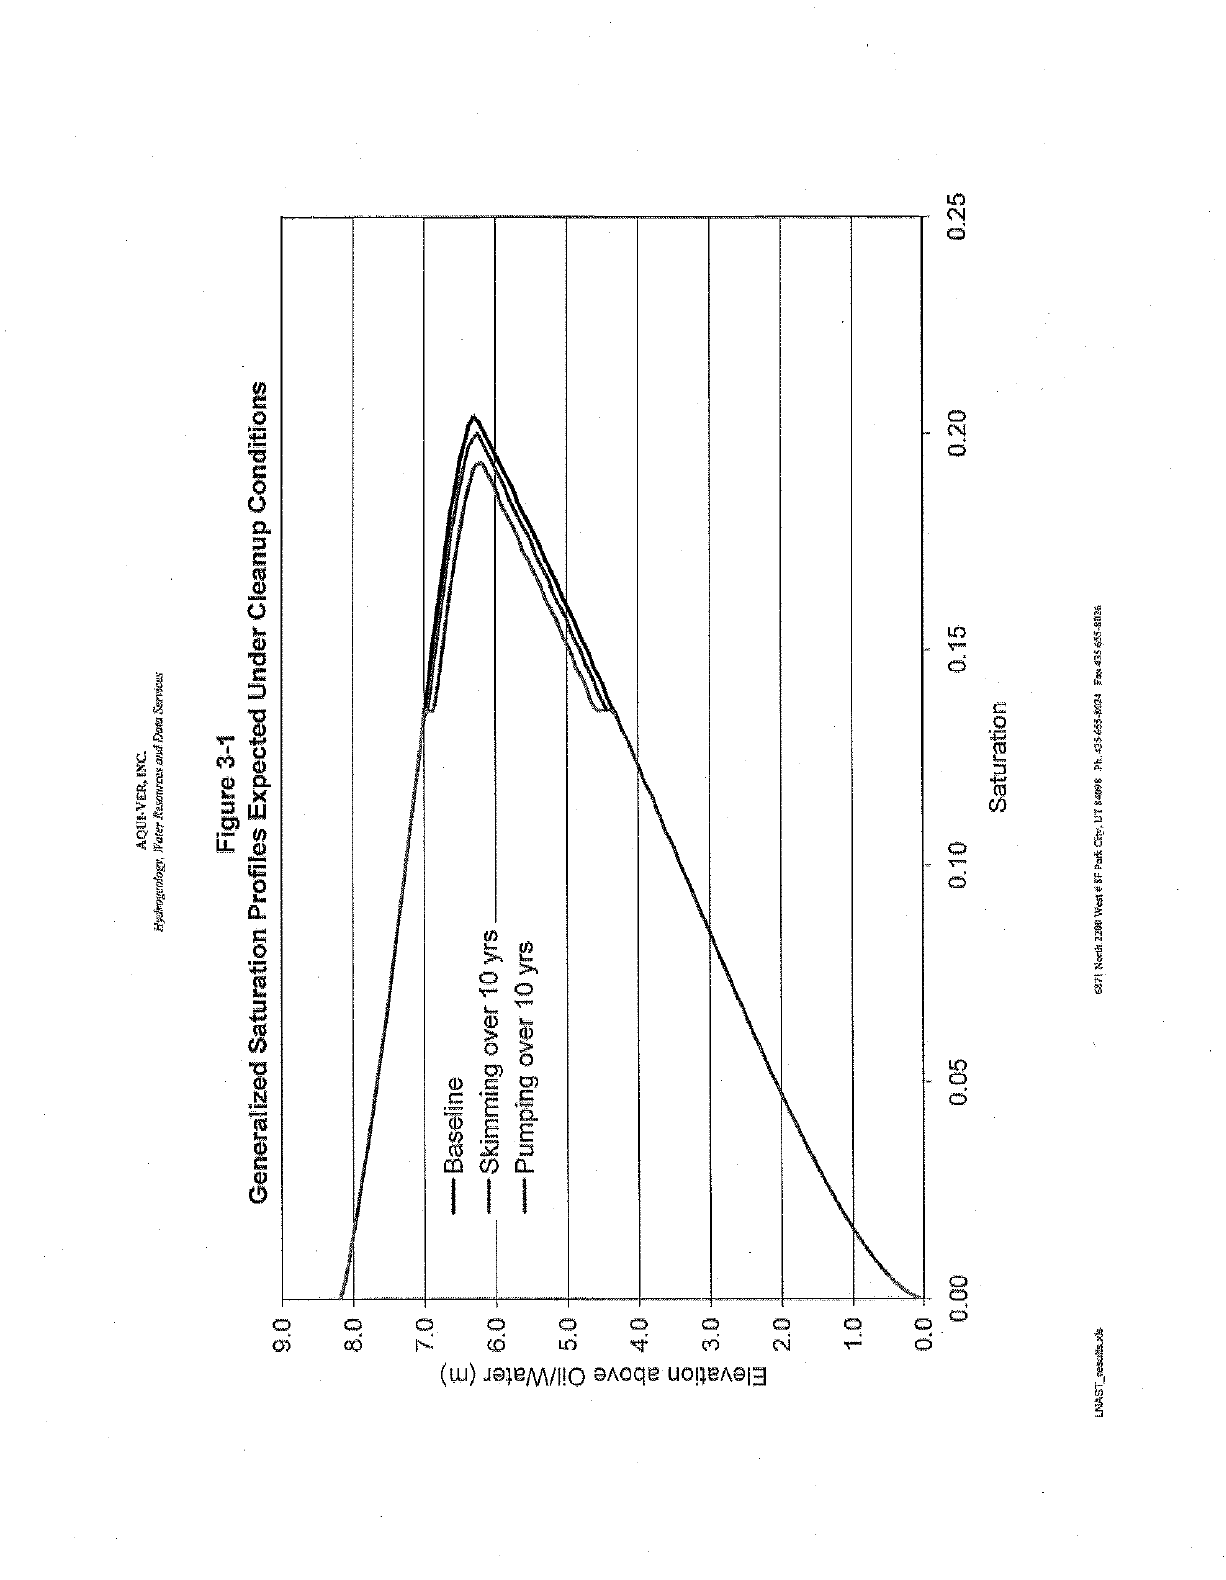
Elevation
above
Oil/Water
(rn)
ca a
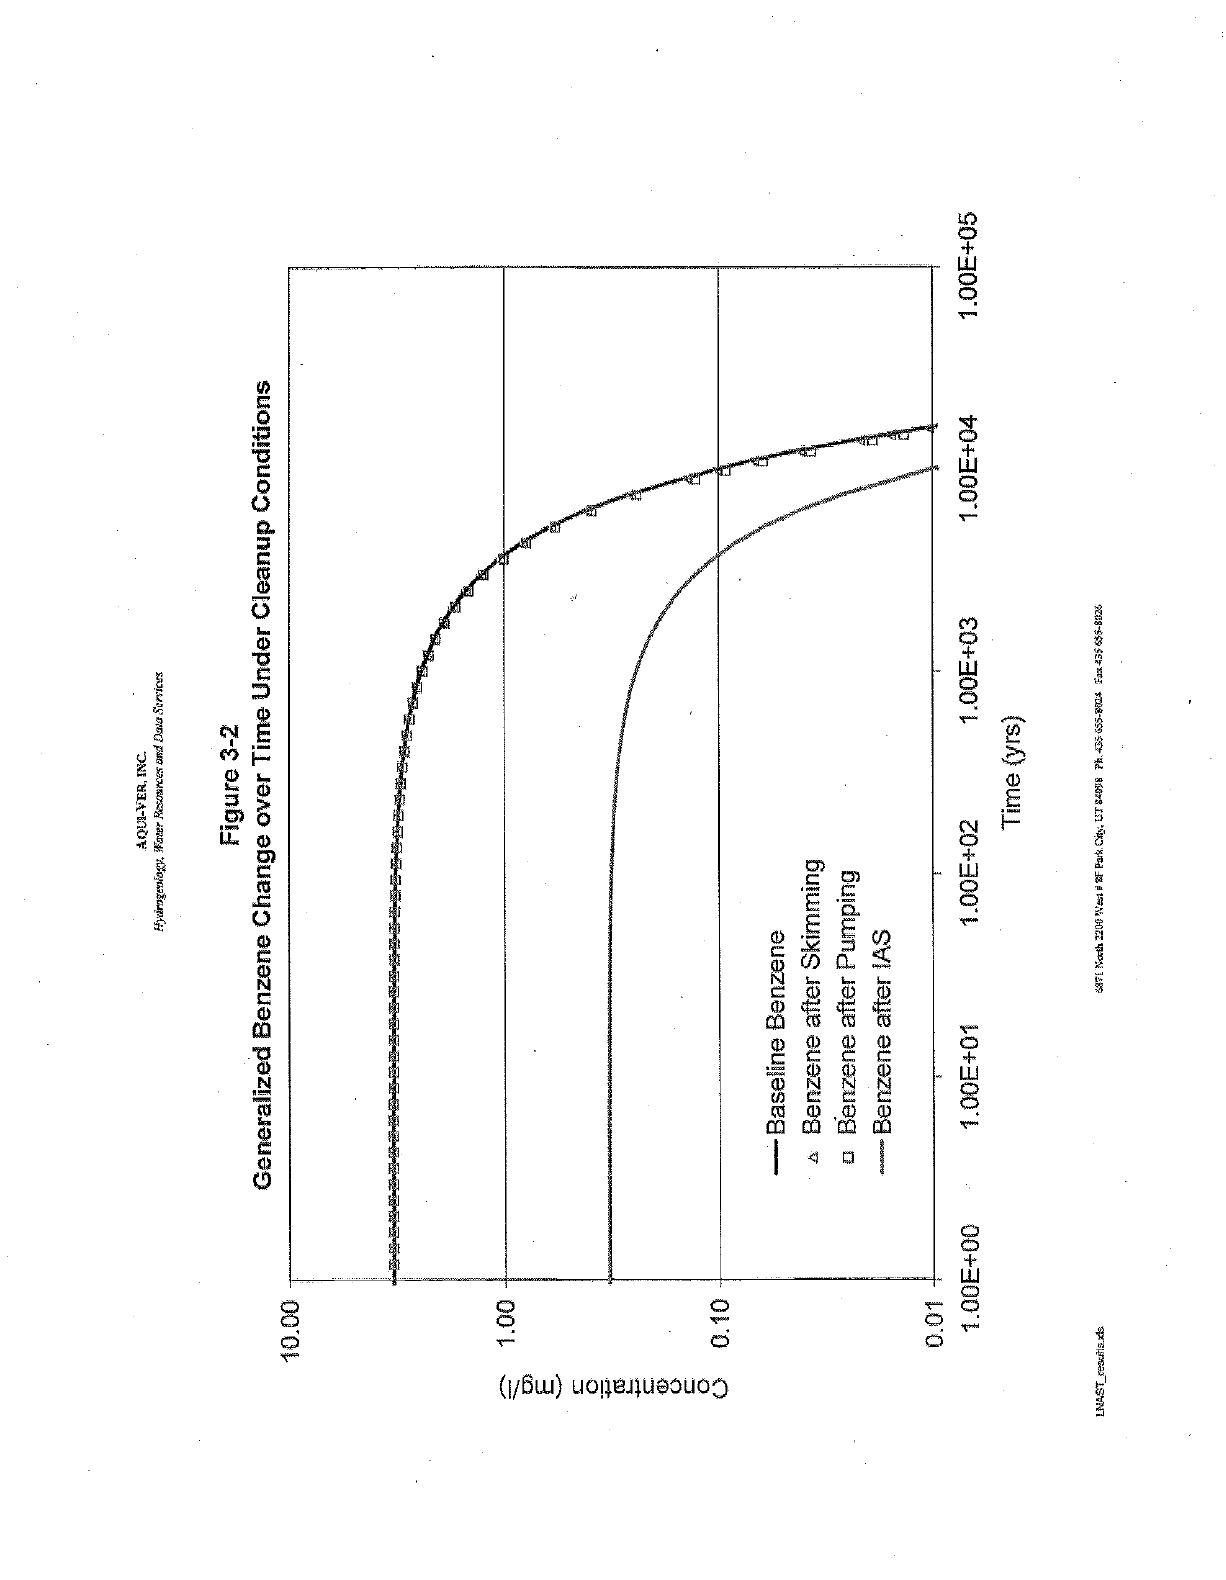
AQUI-VER, INC.
XjrìrogroFag, Water RrSearce.v and Than Senicra
Figure 3 -2
Generalized Benzene Change over Time Under Cleanup Conditions
0.01
1.00E
+00
lld5S5ressAis.d':
-
Baseline Benzene
a Benzene after Skimming
Benzene after Pumping
-Benzene after ¡AS
1.00E +01 1.00E +02 1.00E +03
Time {y+rs)
687t P'acfi22GU West tBFPak.Cmr.L]'Stp98 Ph.355fS5-SC^A Eaz435.5t5-8926
1.00E +04 1.00E +05
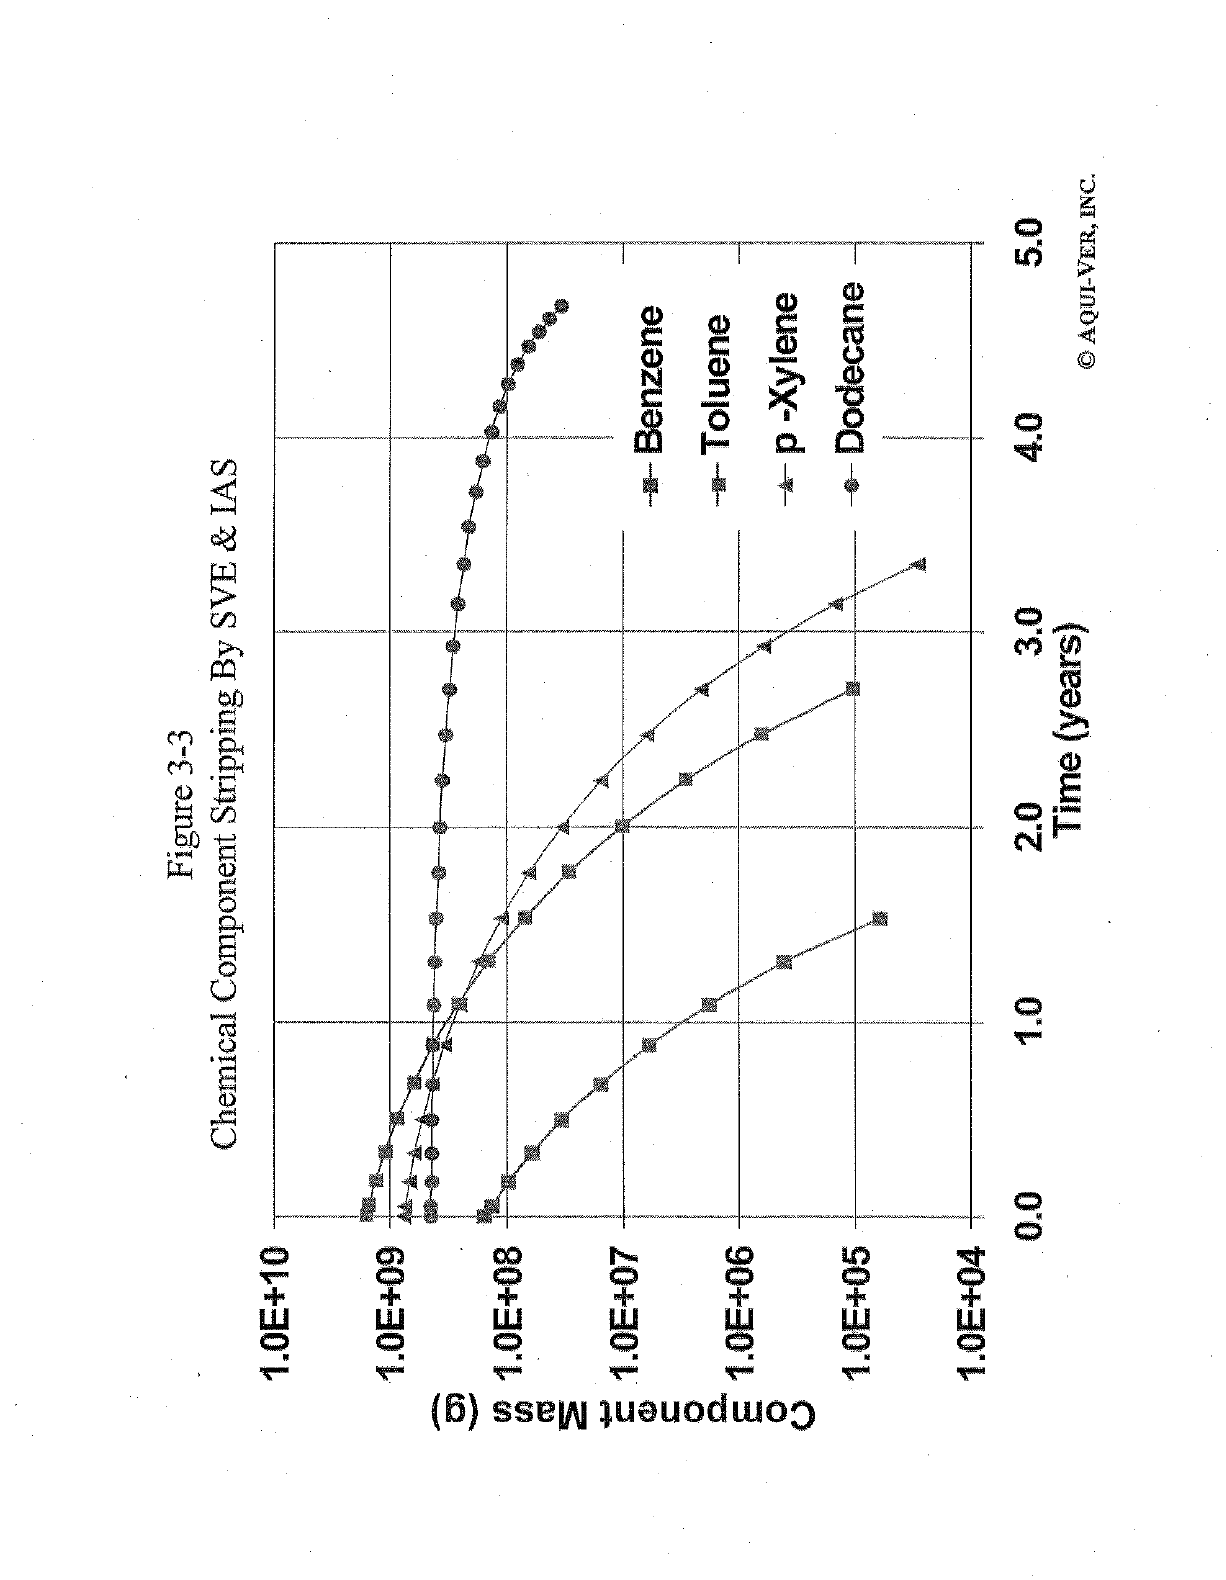
1.0E+10
1.0E+09
.flE+fl8
:E; 1.0E+07
t 1.0E+06
a
v
E+05
1.0E +04
Figure 3 -3
Chemical Component Stripping By S JAS
Benzene
Toluene
p -Xylene
i- Dodecane
0.0 1.0 2.0 3.0
Time (years)
4.0 5.0
Ci AQUI-VER, INC.
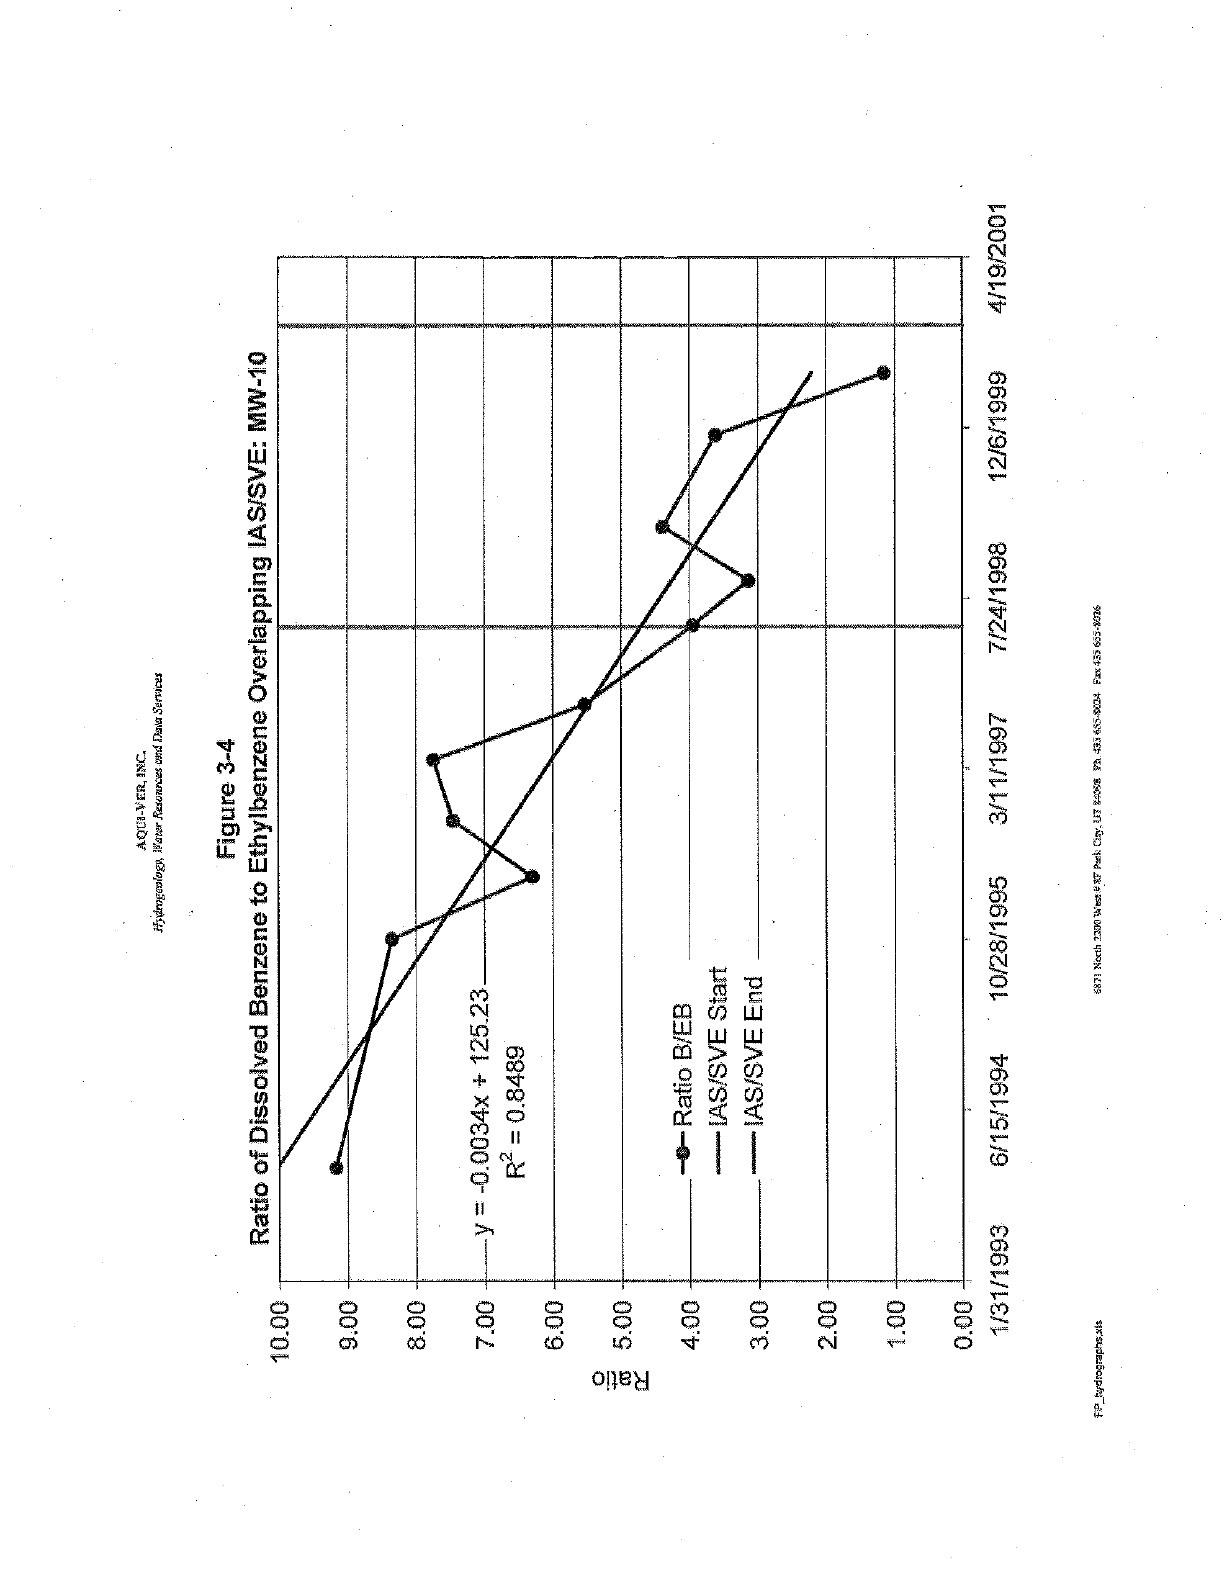
10.00
9.00
8.00
Ratio of Dissolved
A@te-VER, 1kC
$zpUugeoWgµ IGm:urRVO wsundCMVerSerúrV
Figure 3-4
Benzene to Ethylbenzene Overlapping IAS /SVE: M
7.00 y = -0.0034x + 125 23
R2 = 0.8489
6.00
ta 5.00
cc
4.00
3.00
2.00
t Ratio B/EB
IAS/SVE Start
-IAS/SVE End
1.00 -i
0.00
1/31/1993
FP hytlropgraphs.xh
6/15/1994 10/28/1995 3/11/1997 7/24/1998 12/6/1999 4/19/2001
äß7t N ç t 1200 Wm. 4 &T Psk C 435 655-5026
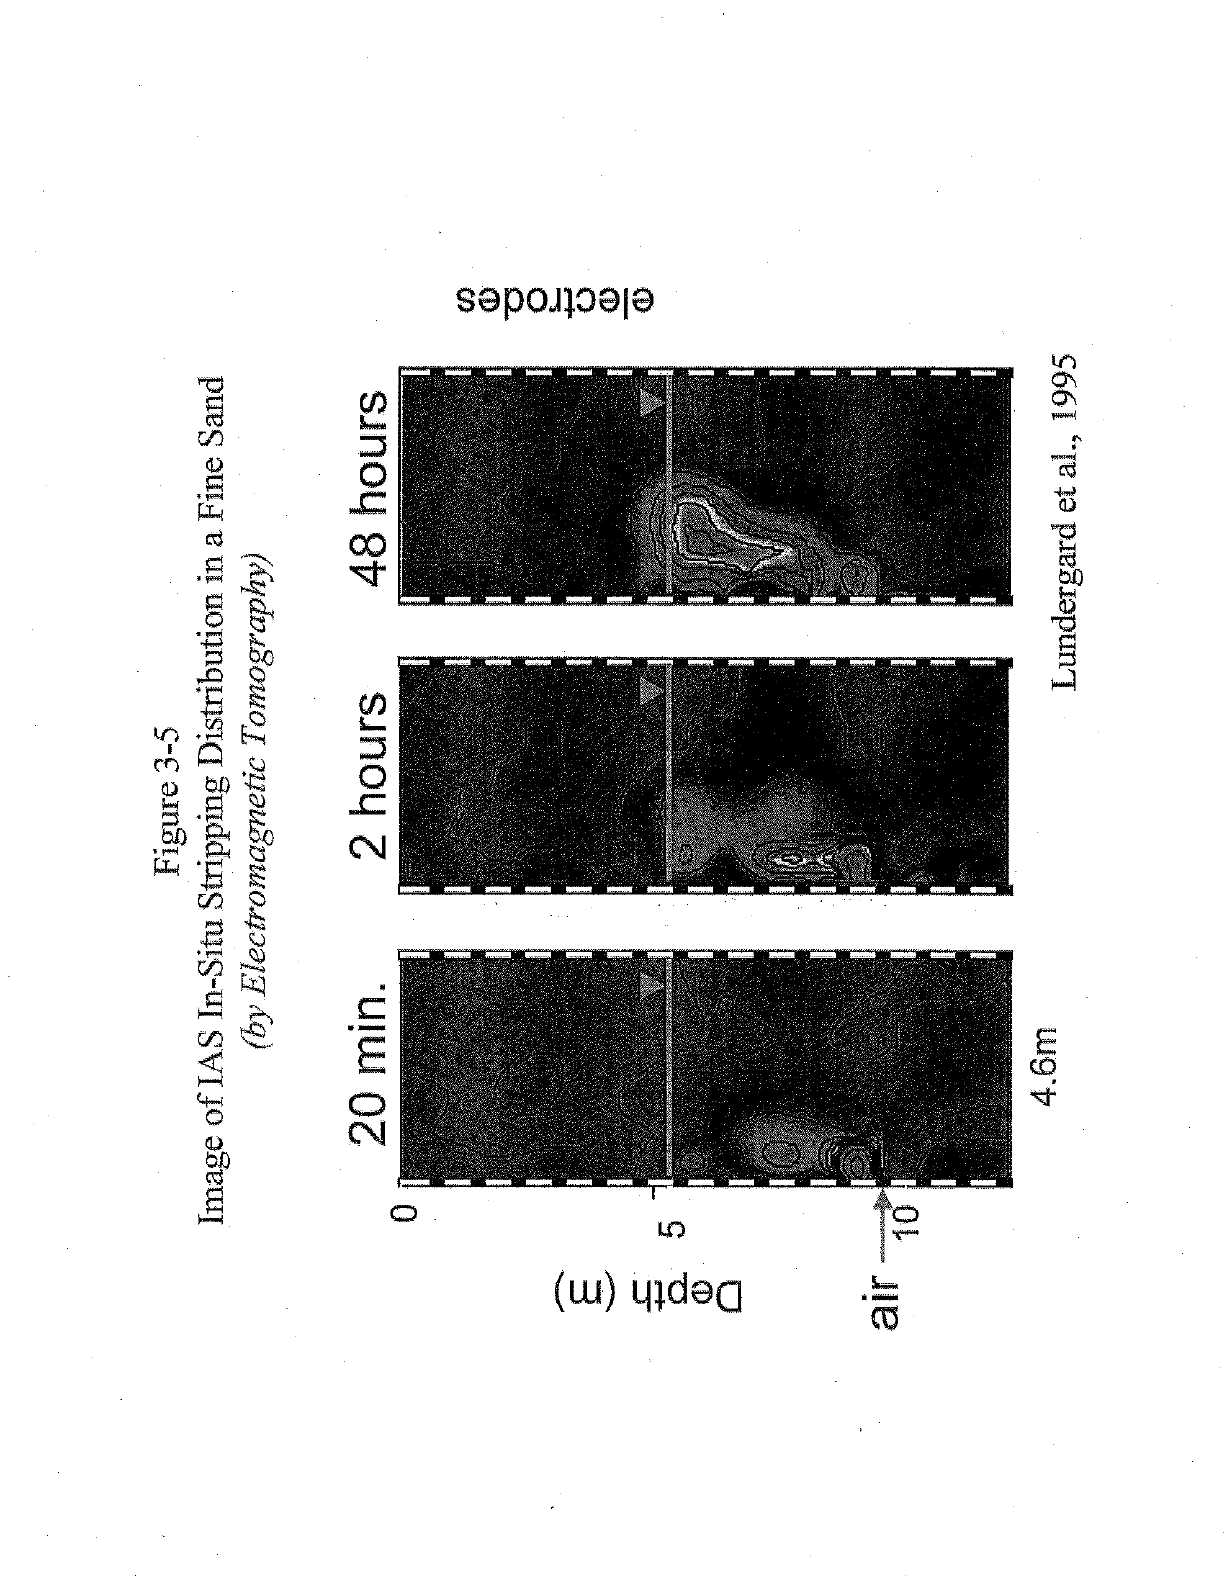
Figure 3 -5
Image of TAS In -Situ Stripping Distribution in a Fine Sand
(by Electromagnetic Tomography)
o 20 min. 2 hours 48 hours
Q 5
o
o
air o
4.6m Lundergard et al., 1995
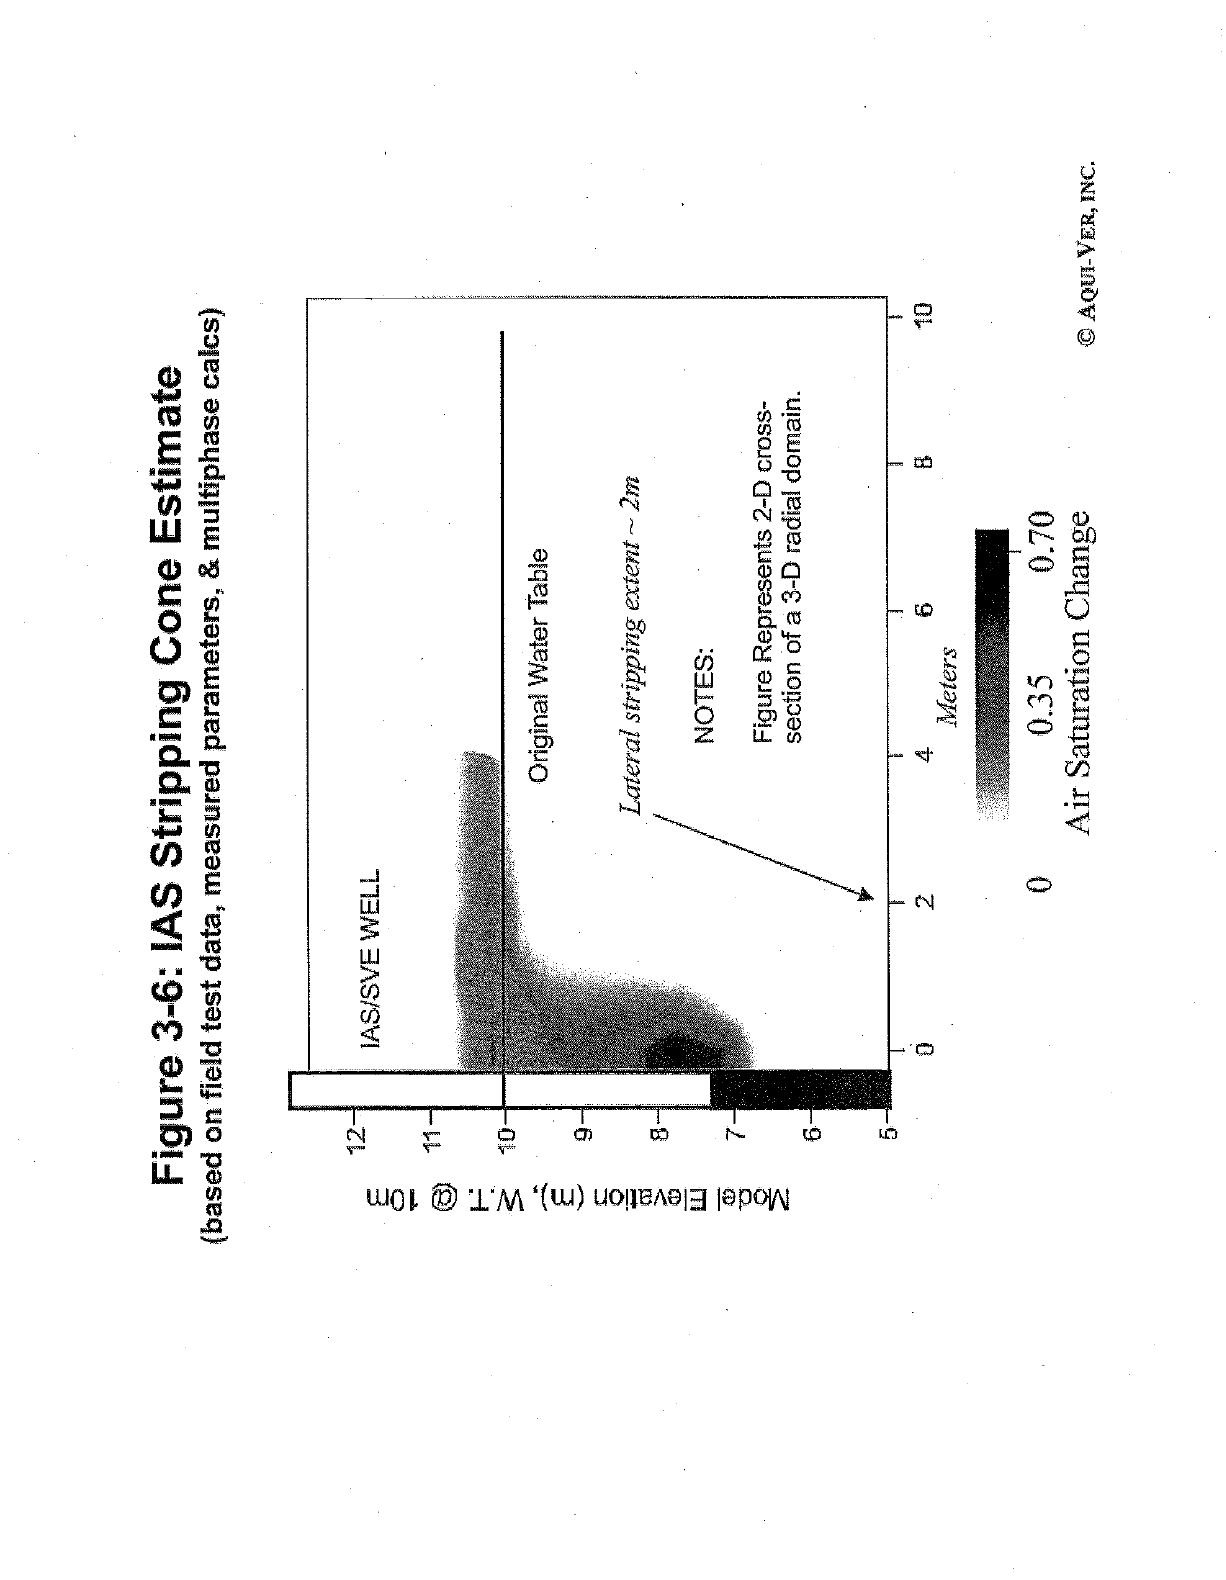
Figure 3-6: IAS Stripping Cone Estimate
(based on field test data, measured parameters, & multiphase cales)
Original Water Table
Lateral stripping estent --- 2m
NOTES:
Figure Represents 2 -D cross -
section of a 3 -D radial domain.
2 4 ô i3 10
Meters
ß 0.35 0.70
Air Saturation Change O AQUI-VER, INC.
4Q01-Vea,INC.
iqmn6M,Ir,Xr, w I<r Remnrvun,e i
APPENDIX 1 -1
EVALUATION METHODOLOGY
41I North 2rÙ Wort, nfl Ph, 495fi56BON PdX495bP
30
AQUIVER, INC.
lpdrnyanlugy. ¿VolerltesmmWs & lkiM$Rrvl
GROUNDWATER PLUME ASSESSMENT METHODS
A set of evaluation methods have been developed that use site groundwater data to estimate
plume conditions, stability, and longevity. The following sections discuss the approach that
Is applied to sites affected by petroleum releases under relatively simple and conservative
conditions. In summary, the approach includes evaluations of plume stability and
attenuation (mass loss). This evaluation process builds extensively on contaminant fate and
transport concepts outlined in the 2002 American Petroleum Institute Publication 114715.
EVALUATION OF PLUME STABILITY & MASS THROUGH TIME
Plume stability refers to a lack of observable geographic spreading through time after some
known or unknown period ofinitial spreading. "Plume" as used here refers to the dissolved-
phase footprint of any compound of concern, with different compounds often exhibiting
different footprints at a site When a stable plume condition is present, it provides a static
environmental management footprint. Expanding plumes generally require different and
more dynamic evaluation and management approach. For the purposes here, geographic
stability can also include plume contraction whereby the boundary pertaining to a given
dissolved -phase chemical is shrinking through time. A stable or contracting plume allows
for simple and conservative estimates of potential impacts to the waters of the State and
other receptors, as applicable.
Plume stability or contraction is caused by a variety of attributes in the subsurface
hydrogeologic and chemical system, Biodegradation of amenable compounds is often a key
facet to stability. Nonlinear sorption of chemicals to certain mineral and organic materials
in saturated soil can remove mass from the dissolved-phase plume system. Dispersion and
transport of chemicals in aquifer materials will dilute a compound plume to lower
concentrations on the plume periphery. Abiotic reactions are also possible (hydrolysis,
oxidation, photolysis, etc.) but generally are not important in near- surface aquifer conditions.
Plume stability as a function of all these dynamic transport and attenuation processes can be
simply evaluated by spatial statistics: These analyses consider the total relative dissolved -
phase mass of a particular compound as observed from monitoring data through time First,
the If the maximum plume
boundary is not expanding after some maximum distribution time stamp, the relative plume
mass through time can be inspected for mass losses.
If the integrated dissolved -phase mass of the plume is decreasing in the footprint, th
clearly losing mass with an accoittingly diminishing threat to the waters of the
Related to this analysis is a center -of -mass evaluation. If the center-of-mass is not moving
downgradient significantly, then this too is an indicator that the plume center is stable,
Often, this stable mass represents a small residual chemical source in diffusion- limited
zones, imparting small but persistent mass to clean groundwater that moves into the area
froth an upgradient direction.
The calculation methodology produces a dissolved -phase mass that ìs generally
82411 Ocean Avon üu.SPia uFfa4.CA l'h.5M12MAIM
AQULV6141NC
FI}.Gogunfog@J4alar FYYOIif4tYN 0114 5cN!M 2
conservative, and more importantly, is used to compare mass at different times. The
dissolved -phase mass is used as an indicator of plume conditions, while recognizing that
there may be additional sorbed or residual mass in soil that feeds this dissolved- plume. The
total mass in the system is typically greater than the dissolved -phase mass alone. The
maximum volume of impacted groundwater is estimated. The volume is derived froni the
areal extent of impacts determined through site characterization and dissolved -phase plume
tracking through time The dissolved -phase plume thickness is estimated from site data
where available, or conservatively assumed if data are not available. The porosity of the
saturated zone is based on site data if available, or estimated from literature values based on
the described soil types at a site. The relative dissolved -phase mass is then estimated by
integrating the spatial concentrations over the volume of contaminated groundwater. That
total dissolved mass, divided by the total water volume in the area of integration, equals the
integrated average concentration that can be used in flux estimates. The changes in mass are
relative comparisons. The total mass is a function of the volume of groundwater that is
impacted. The changes in mass are independent of the total mass,
ESTIMATION OF TEMPORAL CONCENTRATION DECREASES
In addition to the spatial plume evaluations above, the temporal concentration trends at key
wells along the plume axis are determined; the nature and distribution of the site specific
plume(s) determine the wells selected for analysis. These temporal trends allow a forward
estimate of the time to reach State MCL for any particular compound of concern at a
particular location when statistically decreasing trends are present. It is often observed that
central "core" wells will exhibit a longer expected chemical lifespan than peripheral wells
where transport processes and degradation act to reduce plume concentrations.
The temporal evaluations for key chemicals of concern are conducted using statistical trend
analysis consistent with the form of chemical transport and decay equations (exponential
form). The trends are plotted with the associated 95% confidence interval to ensure that a
downward, upward, or stable trend at a specific monitoring well is identified in context with
the data confidence. Obviously, an increasing or flat trend will not result in estimates of
plume longevity, and other analysis methods are then required to derive those estimates and
eire not part of the work presented herein. Downward trends, when present, are used to
estimate the time required to reach MCLs at that location under the implicit assumption that
past plume decay processes will continue in the future. In general, this last assumption is
conservative as plume decay processes, particularly biodegradation, often improve as
chemical loading to the system decreases along with the increasing assimilative capacity of
the aquifer and /or vadose zones.
POTENTIAL IMPACTS TO GROUNDWATER USE
The potential impacts to groundwater use can be assessed using a conservative flux -based
analysis for stable or contracting plumes. Using the integrated plume concentrations
discussed above for each compound of concern, a potential worst -case chemical flux can be
estimated by combining those data with sitegroundwaterflow estimates. In this evaluation,
it is conservatively assumed that integrated plume concentration is allowed to propagate into
Armaa, San( b
AQUI-Vp.Ii,INC.
17)Mbgeuloµ. Hitter ltnminmv k Dam
the aquifer system with no attenuation or other mass losses. This results In a conservatively -
high mass loading of compounds of concern to the aquifer, That mass loading is then
evaluated in context with potential groundwater pumping rates to estimate the maximum
potential groundwater concentrations at hypothetical pumping locations. Lossesofeltemical
mass as a result of all forms of natural attenuation are not considered. if a plume is stable
or contracting, it is clear that there are actually no relevant mass fluxes into the aquifer
system past the non- detection boundary. As a result, the calculation is a highly conservative
determination of mass flux from the defined area of impacts and is intended as a
conservative screening method, and not as a realistic set of transport or flux conditions. The
value used for hydraulic conductivity was I 1 feet per day.
The groundwater flow through the aquifer is estimated from Darcy's Law using the
measured or assumed aqul for hydraulic conductivity and the average groundwatergrádi
That groundwater flow /unit area (Damian Velocity) is then combined with the integrated
concentration data at the most recent plume time stamp to determine the mass flux, Then,
using the width and depth of the plume used in the statistical spatial analysis as the cross -
sectional area, the total mass loading to the system is estimated. This mass flux is then
allowed to be fully captured by a hypothetical groundwater production well pumping at
pumping rates ranging from 100 to 1,000 gallons per minute. The calculation results in a
value for the concentration of a compound of concern in the pumped groundwater as a
function of the applied pumping rate, This maximum potential concentration of the
compounds of concern in produced groundwater are compared to State maximum
contaminant levels (MCLs) in drinking water, or notification levels where MCLs have not
been determined.
ß290 Cecnn Memm, Buoi Gmell. CA 11,N2296499ú rat 562 733 á6O5

Aqui -Ven, ¡Nt,
Hydrogenloz WUkr&Warce ST, fa Services
APPENDIX 1 -2
DISSOLVED PRASE BENZENE PLUME MAPS
68716464h Yaeyuól' Vh.n2S63Sa10fln I3A 6
31
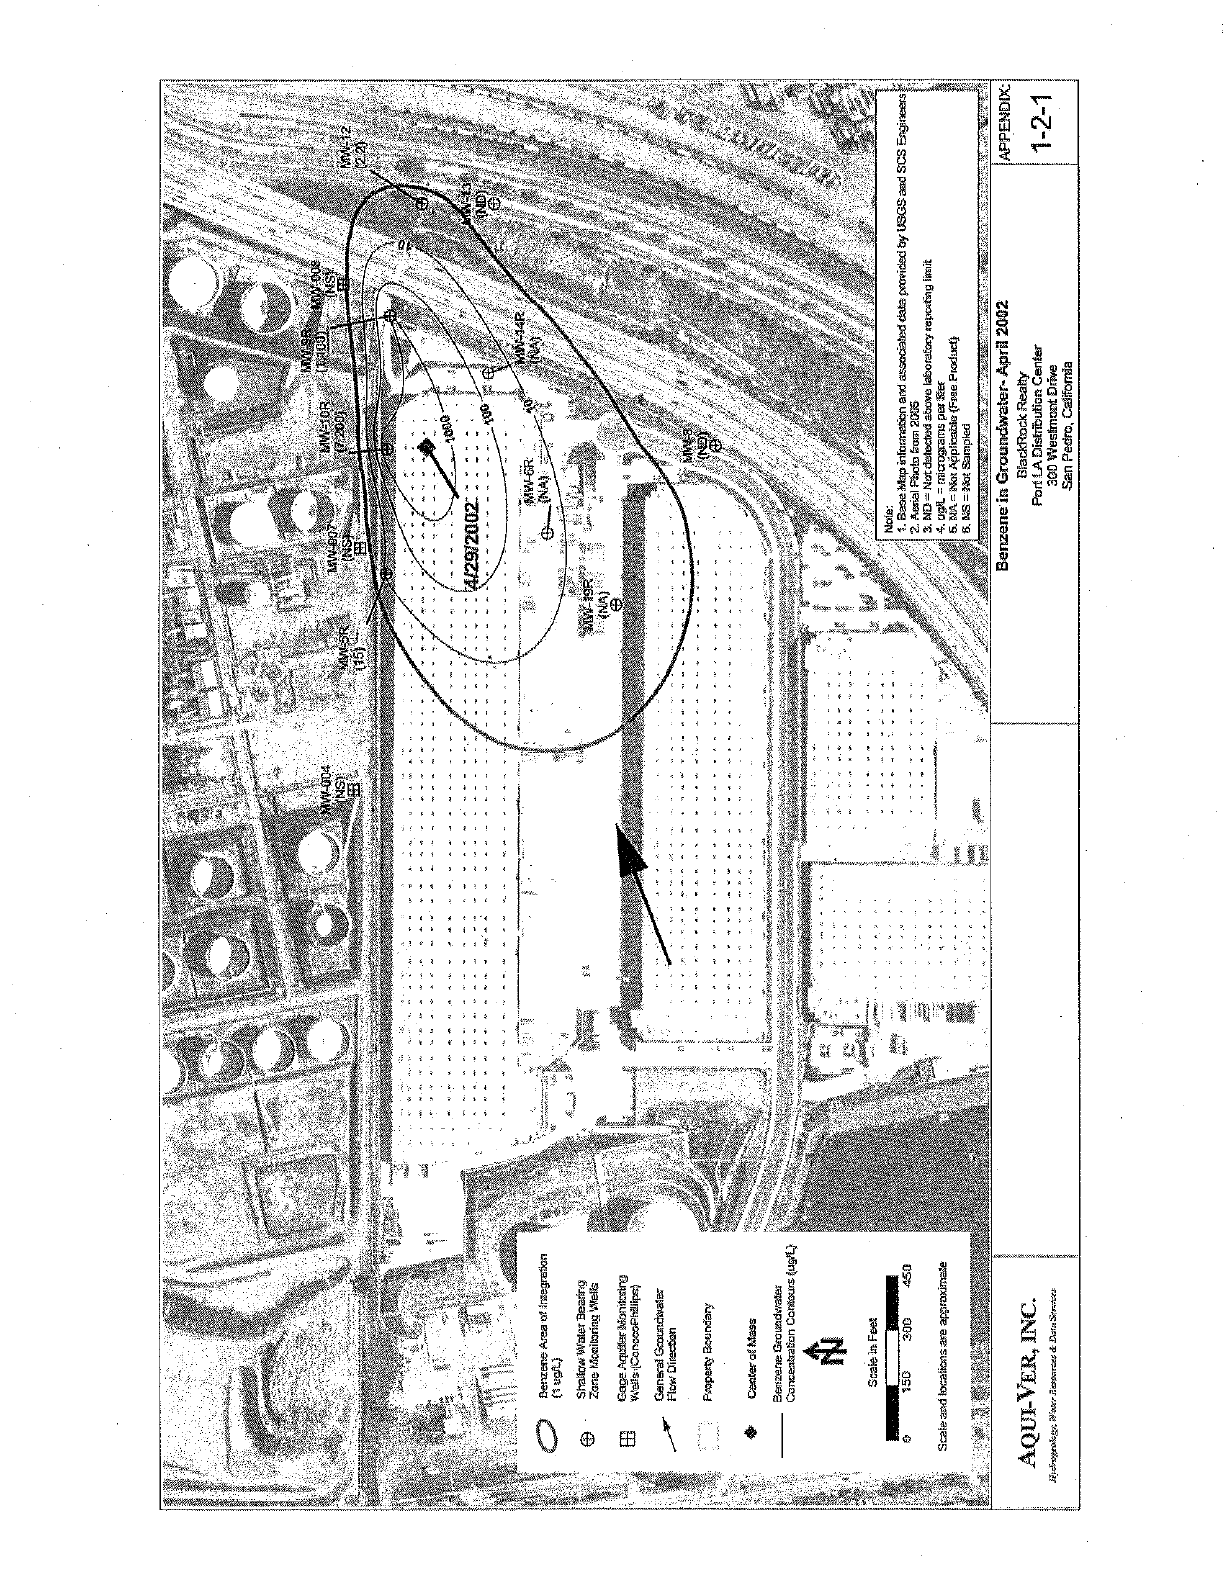
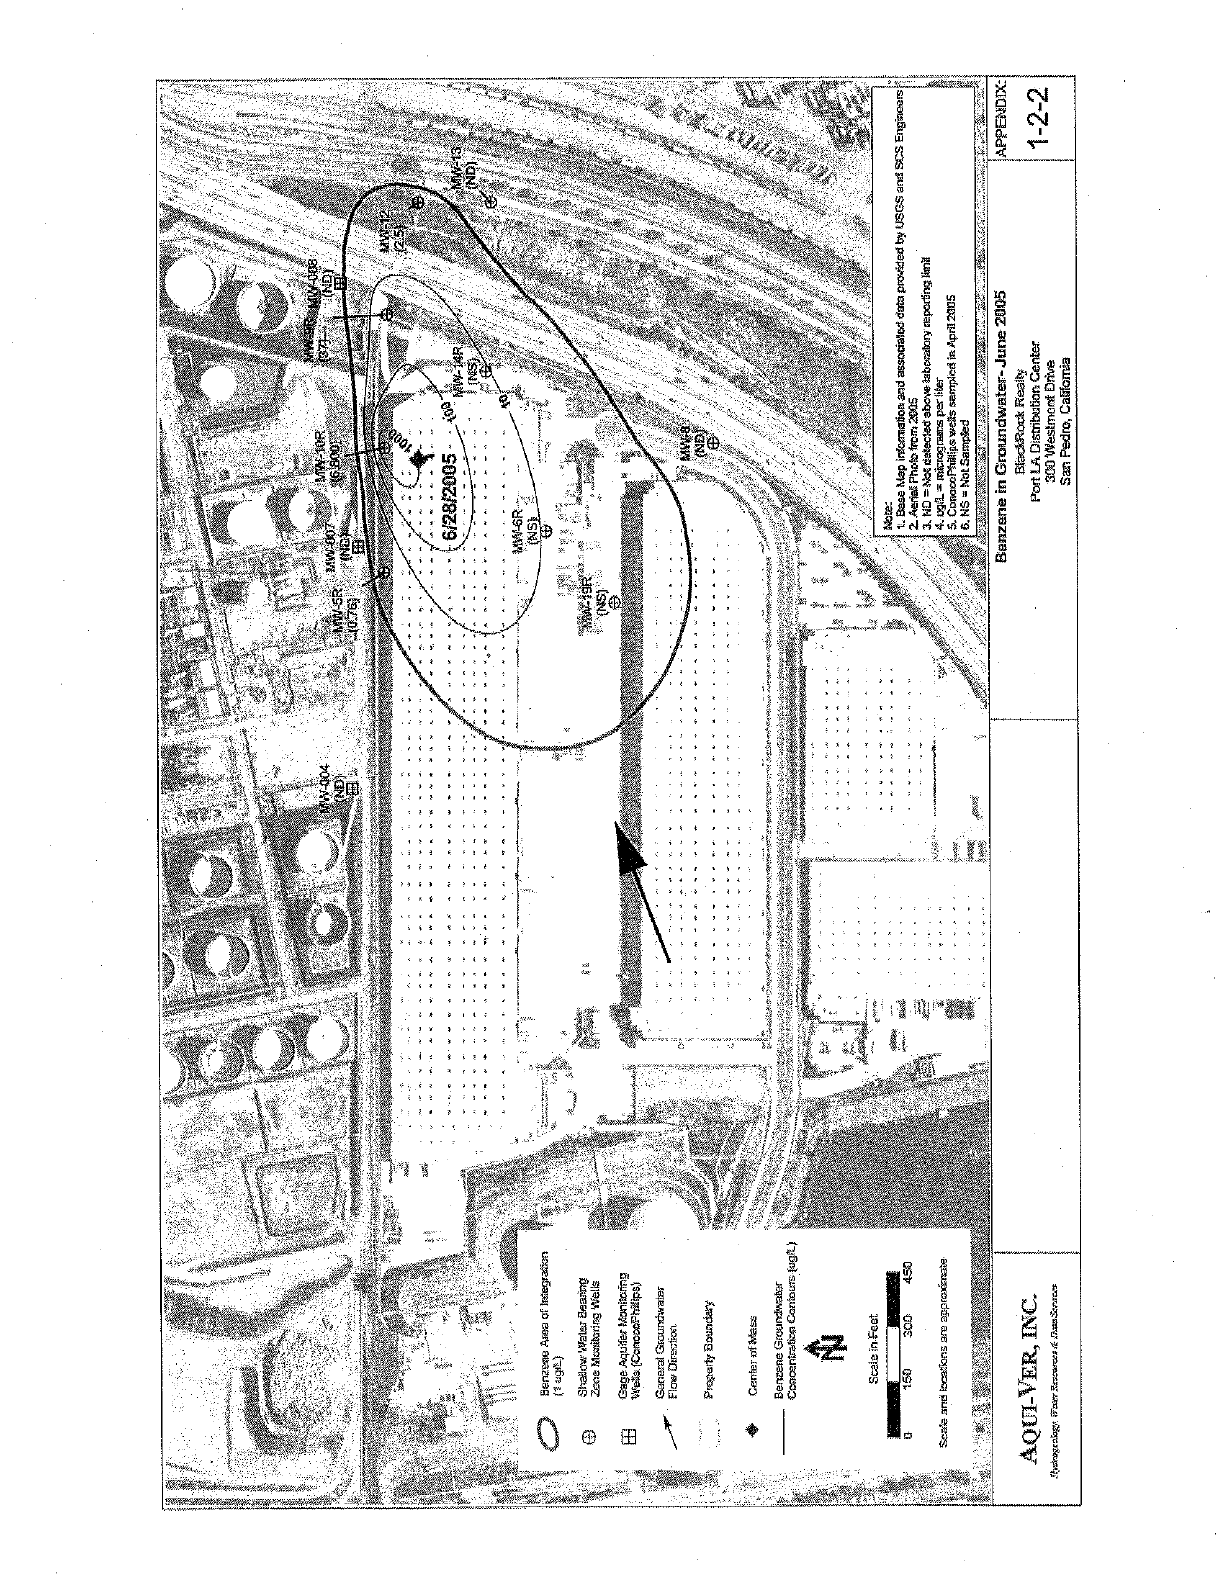
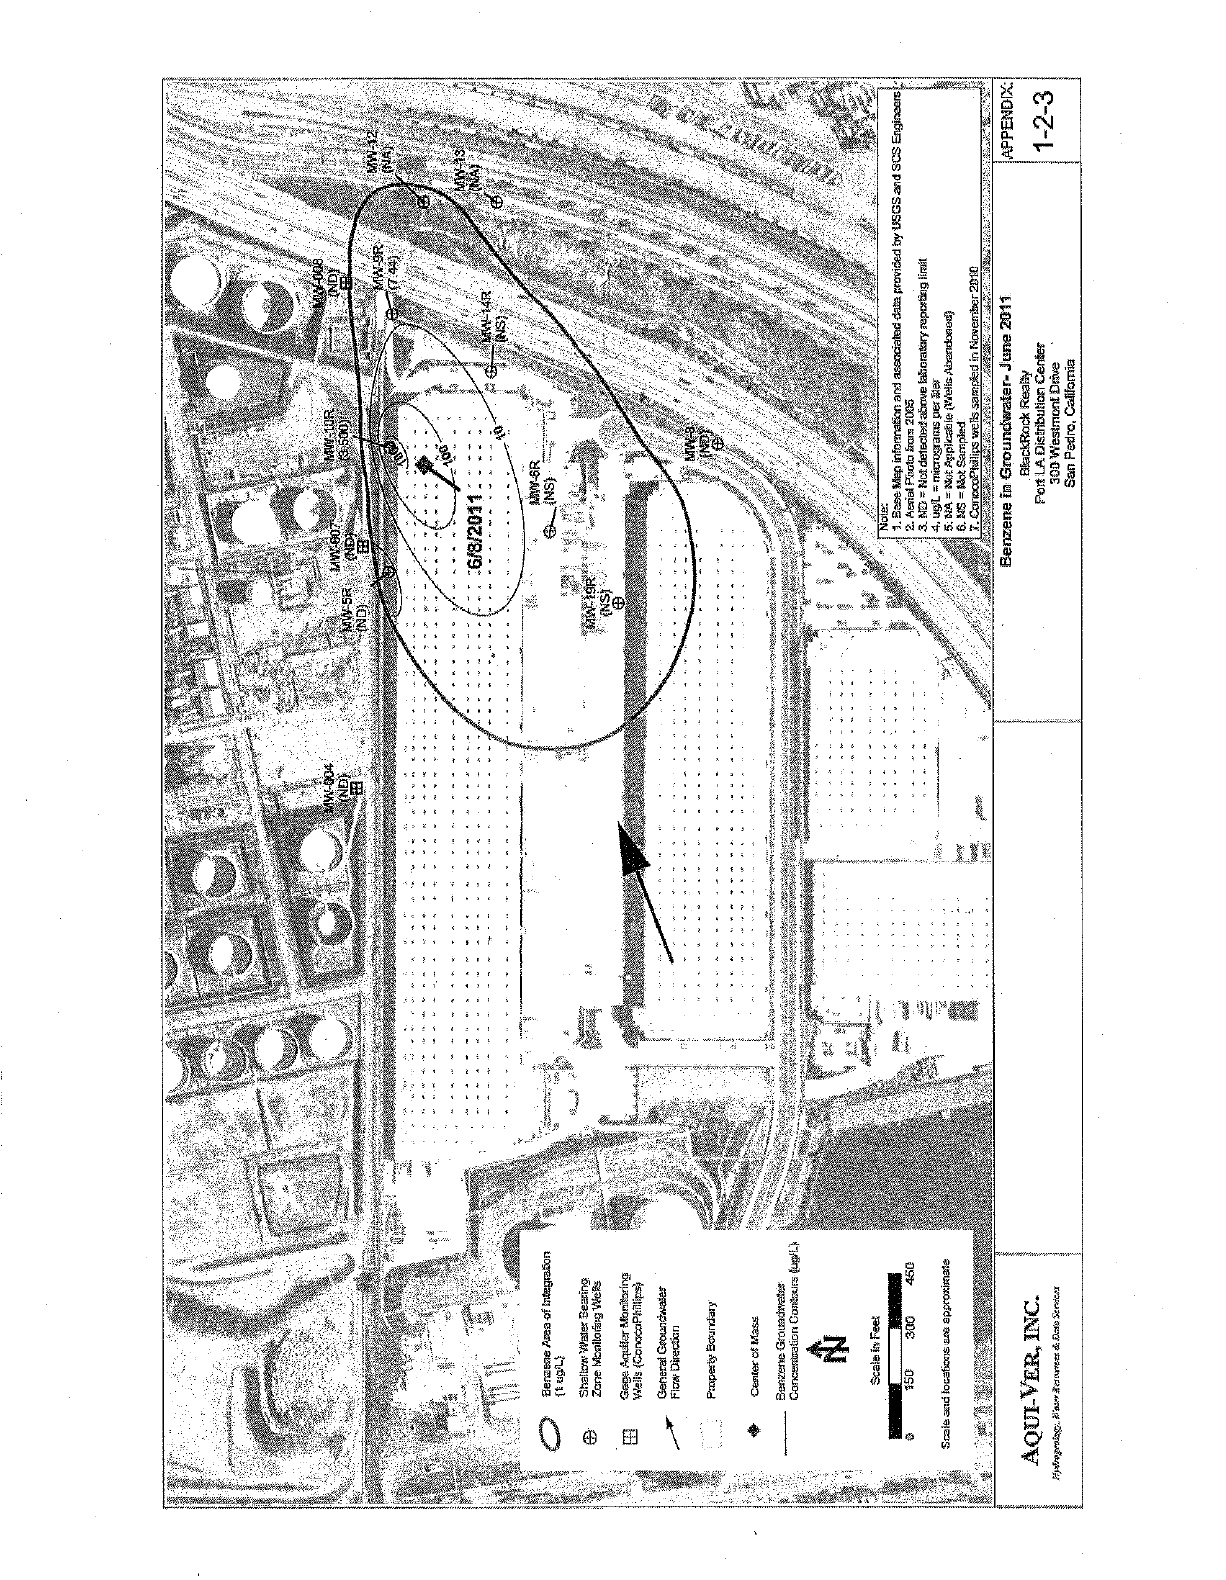
AQIIINER,INC.
H/druEUOlu¿IV. IF ilur Moaner a Duty Stir vim
APPENDIX I -3
DISSOLVED PHASE TBA STATISTICAL TRENDS
6871 Nmib 2280 81.180, 1181' 611. á7565.540/I FAX 875
32
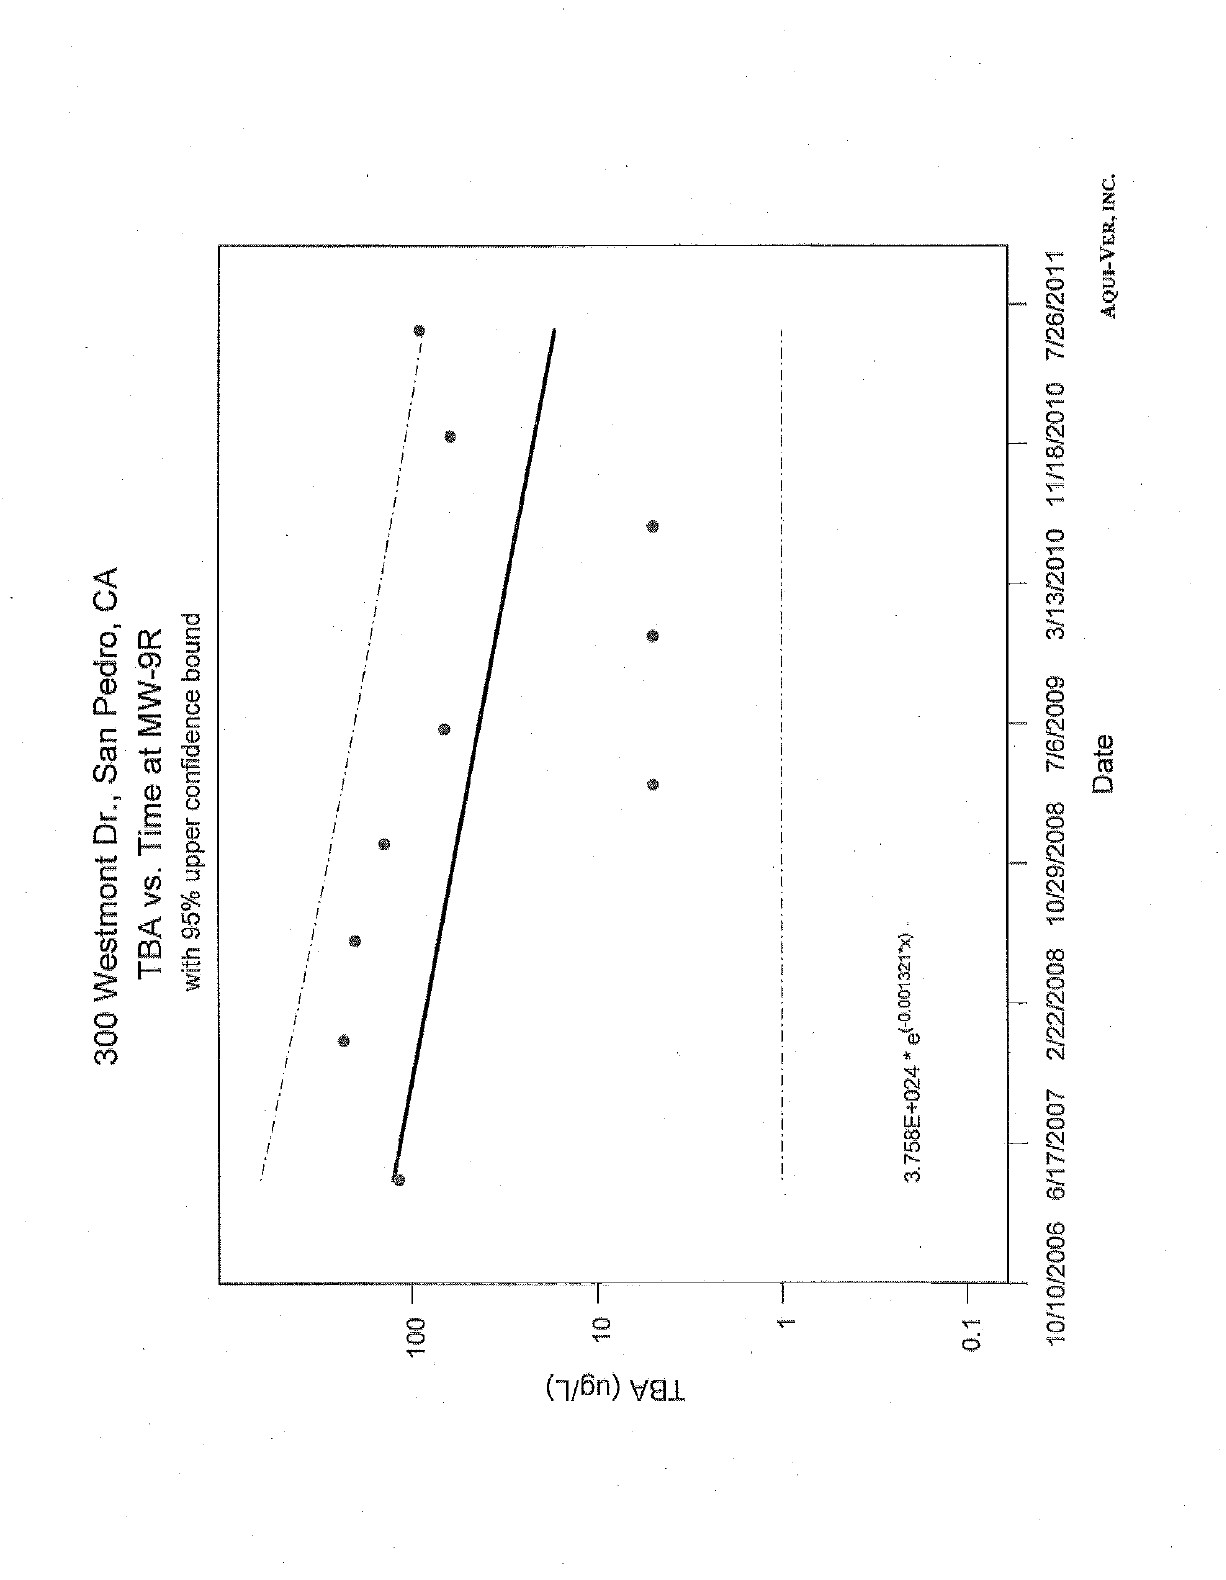
3C}ß Westmont Dr., San Pedro, CA
TBA vs. Time at MW -9R
with 95% upper confidence bound
1
0.1
3.758E+024 * e(-o.00n2rx)
i/2006 6/17/2007 2/22/2008 10/29/20{}8 7/6/24019 3/13/2010 11/18/2010 7/26/2011
Date AQUI -VER, INC.
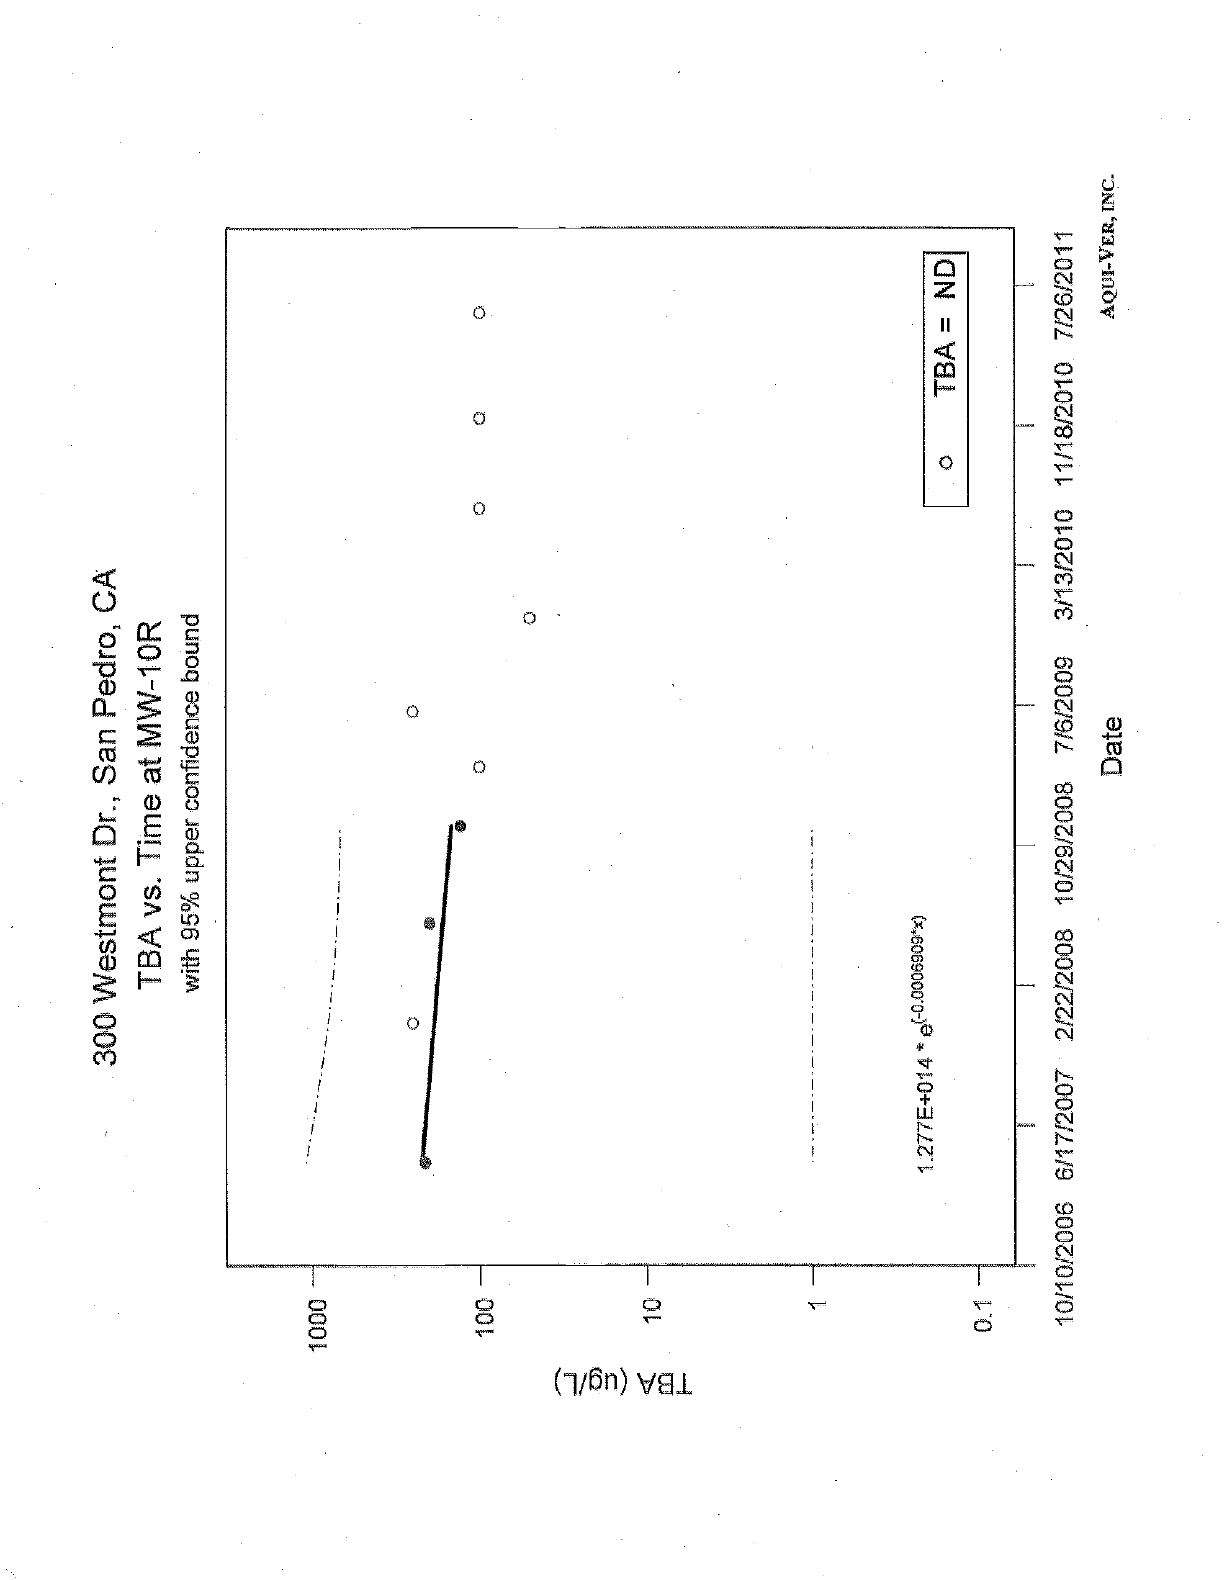
1000
100
0.1
300 Westmont Dr., San Pedro, CA
TBA vs. Time at MW -101R
with 95% upper confidence bound
1.277E+ 4. e(-0.0006909*x) TBA = ND
1011 006 17/2007 2/2212008 10129/2008 7/6/2009 3/13/2010 11118/2010 7126/2011
Date AQUI-VER, INC.
AQUI-VER, irvC.
/pv/+oge!+rngµ WOW IMrui,rcer S hrtrt Sum
APPENDIX I -4
FLUX ESTIMATE CALCULATIONS
61171 Penh 321 19 Wß6 u20 04 a 659.004 PAX 43$ 6554026
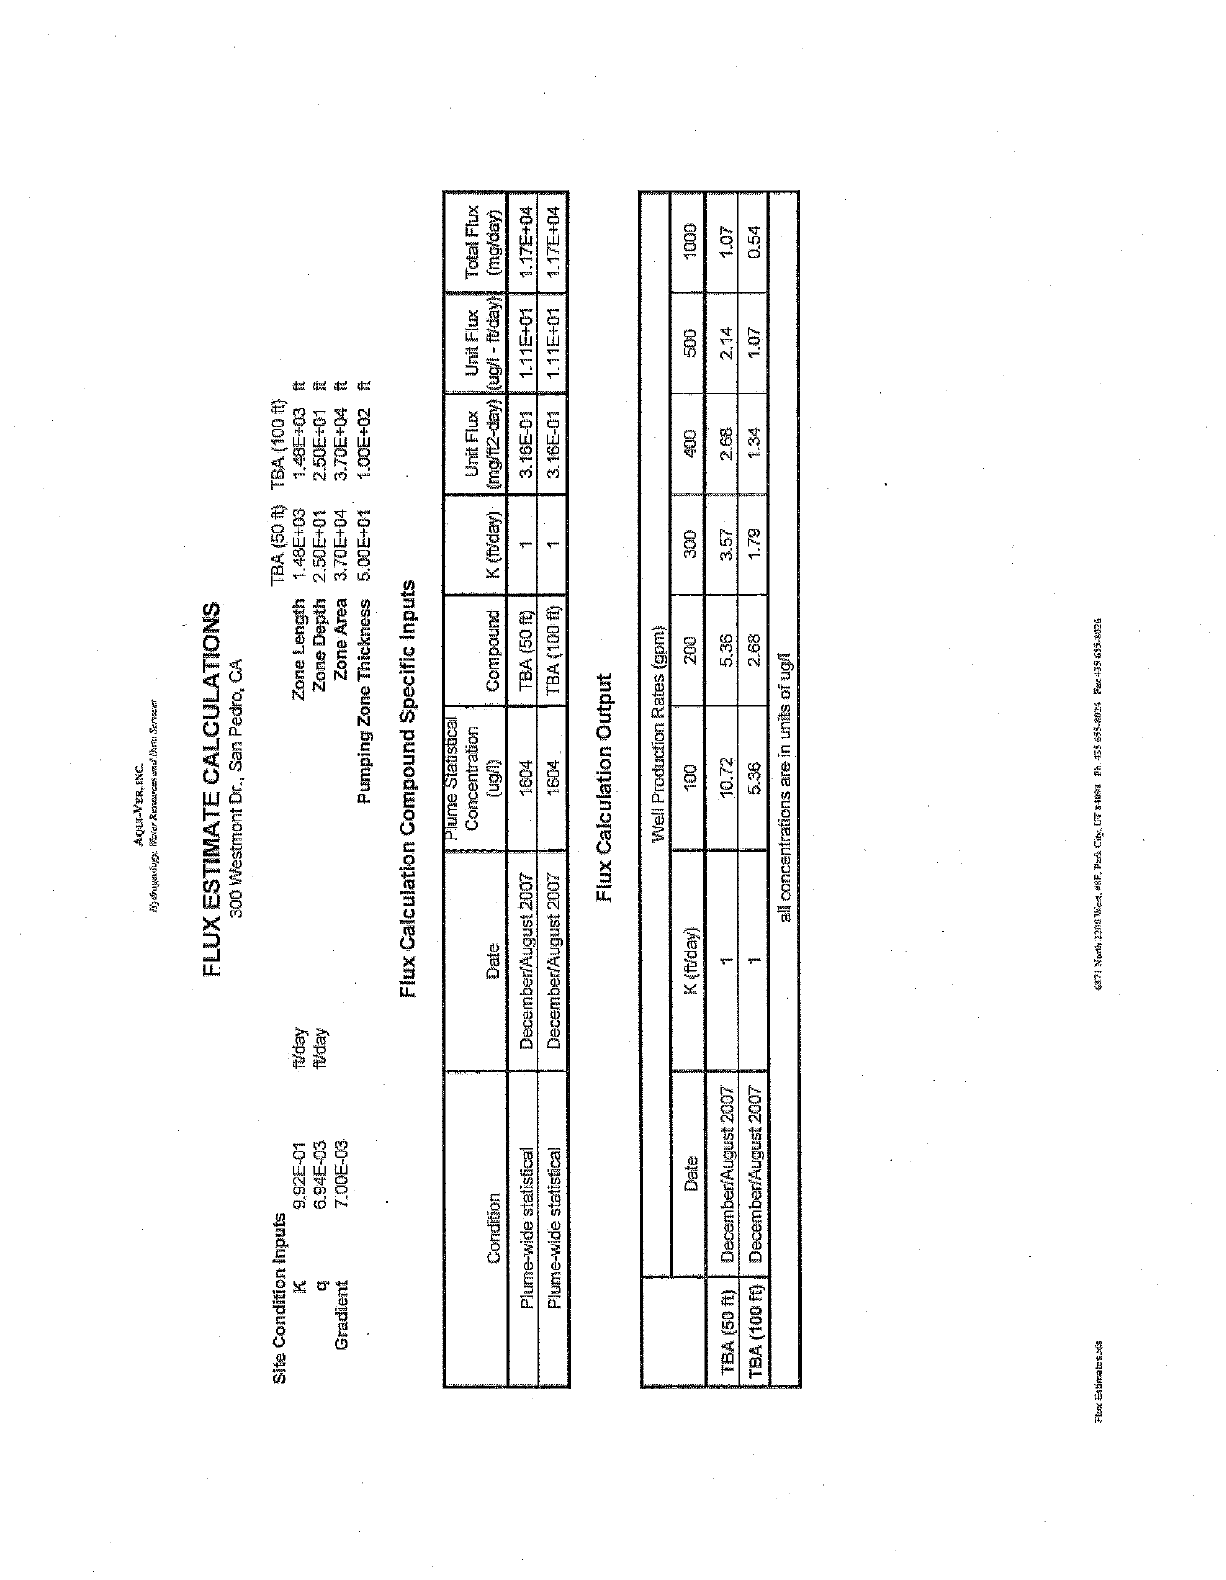
2{YY;59'3Etxj tIA%<.<F3_k-4tl IW t'A ..9'w']And'3NF'A7ñtUtli2'.Y4°Rli£3 sR'salry59 A^L+
g¡6n lo ]@un tit 91E Suai;El;uaouoo IIE
hS"0 4£3 6L "1 892 95.5 LOOZIsn6nypaqwaaaa
LO l bGZ 139Z LS'£ 95,9 ZL"OL LOOZ4sn6nypagwa3a (a os)
OoOI 005 00V 00£ OOZ Ool (hep/4) H a;E(1
(wd6) sale>j vogonpwd IHM
Indhno uo(;e(no)ea xnld
40+3LG3 CO+3GG.I- 60-391-£ 1 (1;001)y81". í91 LOOZISn6nypagwáoaa IEO4sl;E;sapm-awnId
4O+3LC1 Gû+31. 13 10-391'£ 1 (4 OS) Val_ ; 4091 - L0g;sn6nypagwaosa IEOysI;E;^,.aplx,awnfd
(6EP16w)
xn131an01 Il6n)
)31Id Pu ft :
(AuP-Z4l6w)
'mid yuß ( P171)71 punodwoo -; (1¡6n)
uogElluaouo0.
lao4sREl5 awnld
ape uolypuo0 ..
.
8 Z0+300î
t5 40+301£
11 40+309Z
d3 £0+38Y6
slndu( o(}ioads punadmoo uone¡noEe X
40+30L£
10+30SZ
£13+39V-
0.) a0l) ys1 h104) ysl
ssauoIalgl auoZ 6uldwnd
eaazy auoz
g4daa auoz
g15uai auoZ
y "o1Pad ue5 "la IuowIsaM 00s
SI+ifQlltJlfloitt3 31tYU111iS3 Xfllj
- uzuÇ'WYJpun Kfe
UM3Y3Al-IRÌik`
£0-3001 ;ualpElg
ED-346-9 b
1.0-3Z6`5 )Í
s;ndui uol;Ipuoo aus
AQiIIN@x, INC.
fl?etrnganfo yy. IYnfnr Itunuumwd R Dora Sor Igo*
APPENDIX 1 -5
R MODEL INPUT AND RESULTS
cHïl North Y20DWUSI,IIéP PhJ35655.8024 MX 4356354026
34
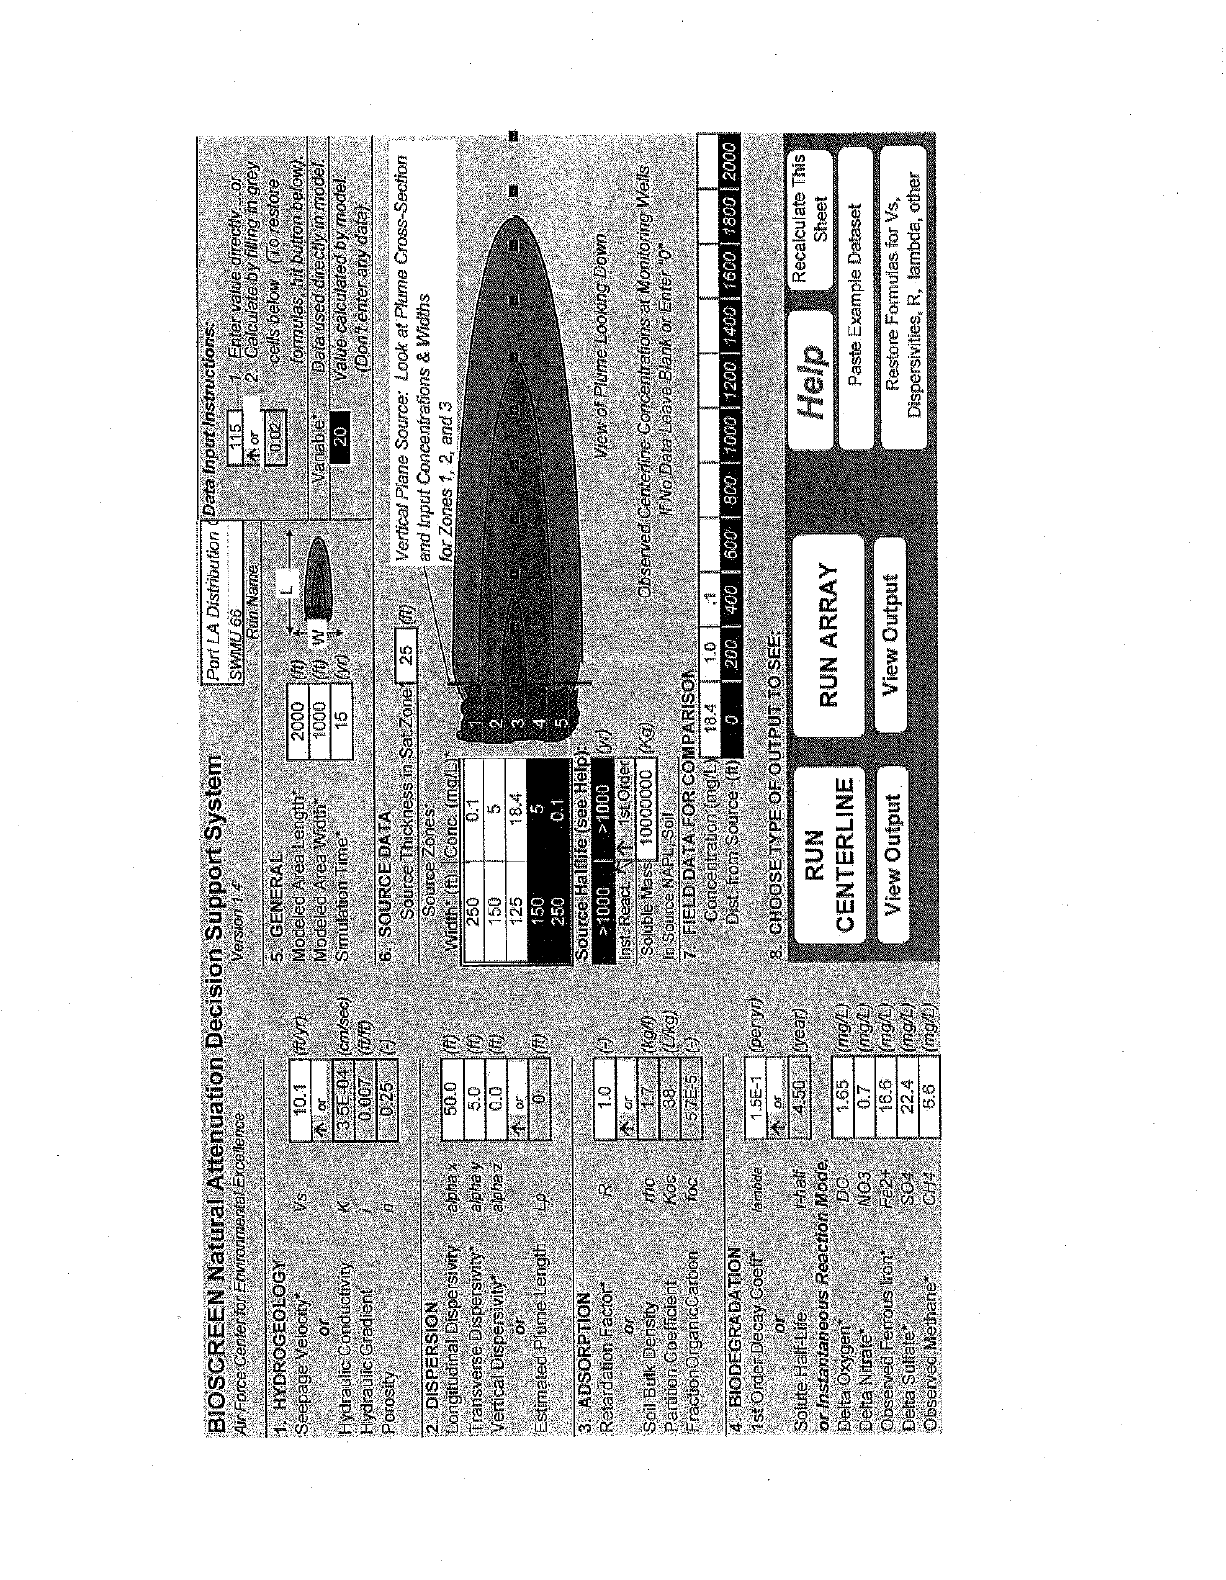
Port LA Drstnbubon
SWMU 66
BIOSCREEN Natural Attenuation Decision Support System
Air Force Center
for Environmental Excellence Version 14
1 HYDROGEOLOGY
Seepage Velocity'
or
Hydraulic Conductivity
Hydraulic Gradient
Porosdy
Vs k 101 IrtUyr)
,T or
3 5E-04 (em/sec)
O.007 (fllftj
025 ()
Kn
n
2- DISPERSION
Longitudinal Dfspersrvity
Transverse Dispersivey'
Vertical Dispersivity'
or
Estrnated Plume Length
alpha
alpha y
atpha z
Lp
50-0
5G
a6
T or
o
3 ADSORPTION
Retardation Factor R
or
Soil Bulk Density
Partition Coefficient
Fraction O rga n icC arbon
mo
Koc
foc
10
'1` or
17
38
5 7E-5
4 131ODEGRADATION
1st Order Decay Coeff` lambda
or
Solute Half -Life f -hatf
orInstantaneous Reaction Mode
Delta Oxygen' DO
Delta Nitrate` NO3
Observed Ferrous Irons Fe2+
Delta Sulfate' SO4
Observed Methane CH4
1 5E-1
T or
4.50
1 65
07
166
22 4
66
(R)
(N)
(fr)
(ft)
(-1
(kg/1)
Pig)
()
(per yr)
(year)
(mg2)
(mgfi-)
(mgt)
(mg/L)
(mg2)
Run Name
5. GENERAL
Modeled Area Length'
Modeled Area Width'
Simulation Time
2000
1000
15
(ff) t
(ft)
(Yr)
Data Input Instructions.
115 I 1. Enter value directly. or
T or 2 Calculate by Ring to grey
1 0 02 I cells below (To restore
fonndlas, hit button below)
Variable Data used directly in model
Value calculated by model
(Don't enter any data)
6 SOURCE DATA
Source Thickness in Sat Zone
Source Zoner
Width ' ft Con
25 (¡t) Vertical Plane Source Look at Plume Cross -Section
and Input Concennatrons & Widths
I _ for Zones 1, 2, and
SourceHalftrfe see Hel )
or r l (yr)
InstReact T 1st Order
Soluble Ma 10000000 (Kg)
In Source NPPL, Soil
7 FIELD DATA FOR COMPARISON
Concentration (mgIL 1a 4 1 0
Dist from Source (ft)
8. CHOOSE TYPE OF OUTPUT TO SEE
RUN
CENTERLINE
View Output
View of Plume Looking Down
Observed Centerline Concentrations at Monitoring Wells
if No Data Leave Blank or Enfer "0"
RUN ARRAY
View Output
Help Recalculate This
Sheet
Paste Example Dataset
Restore Formulas for Vs,
D.spersivities R, lambda, other
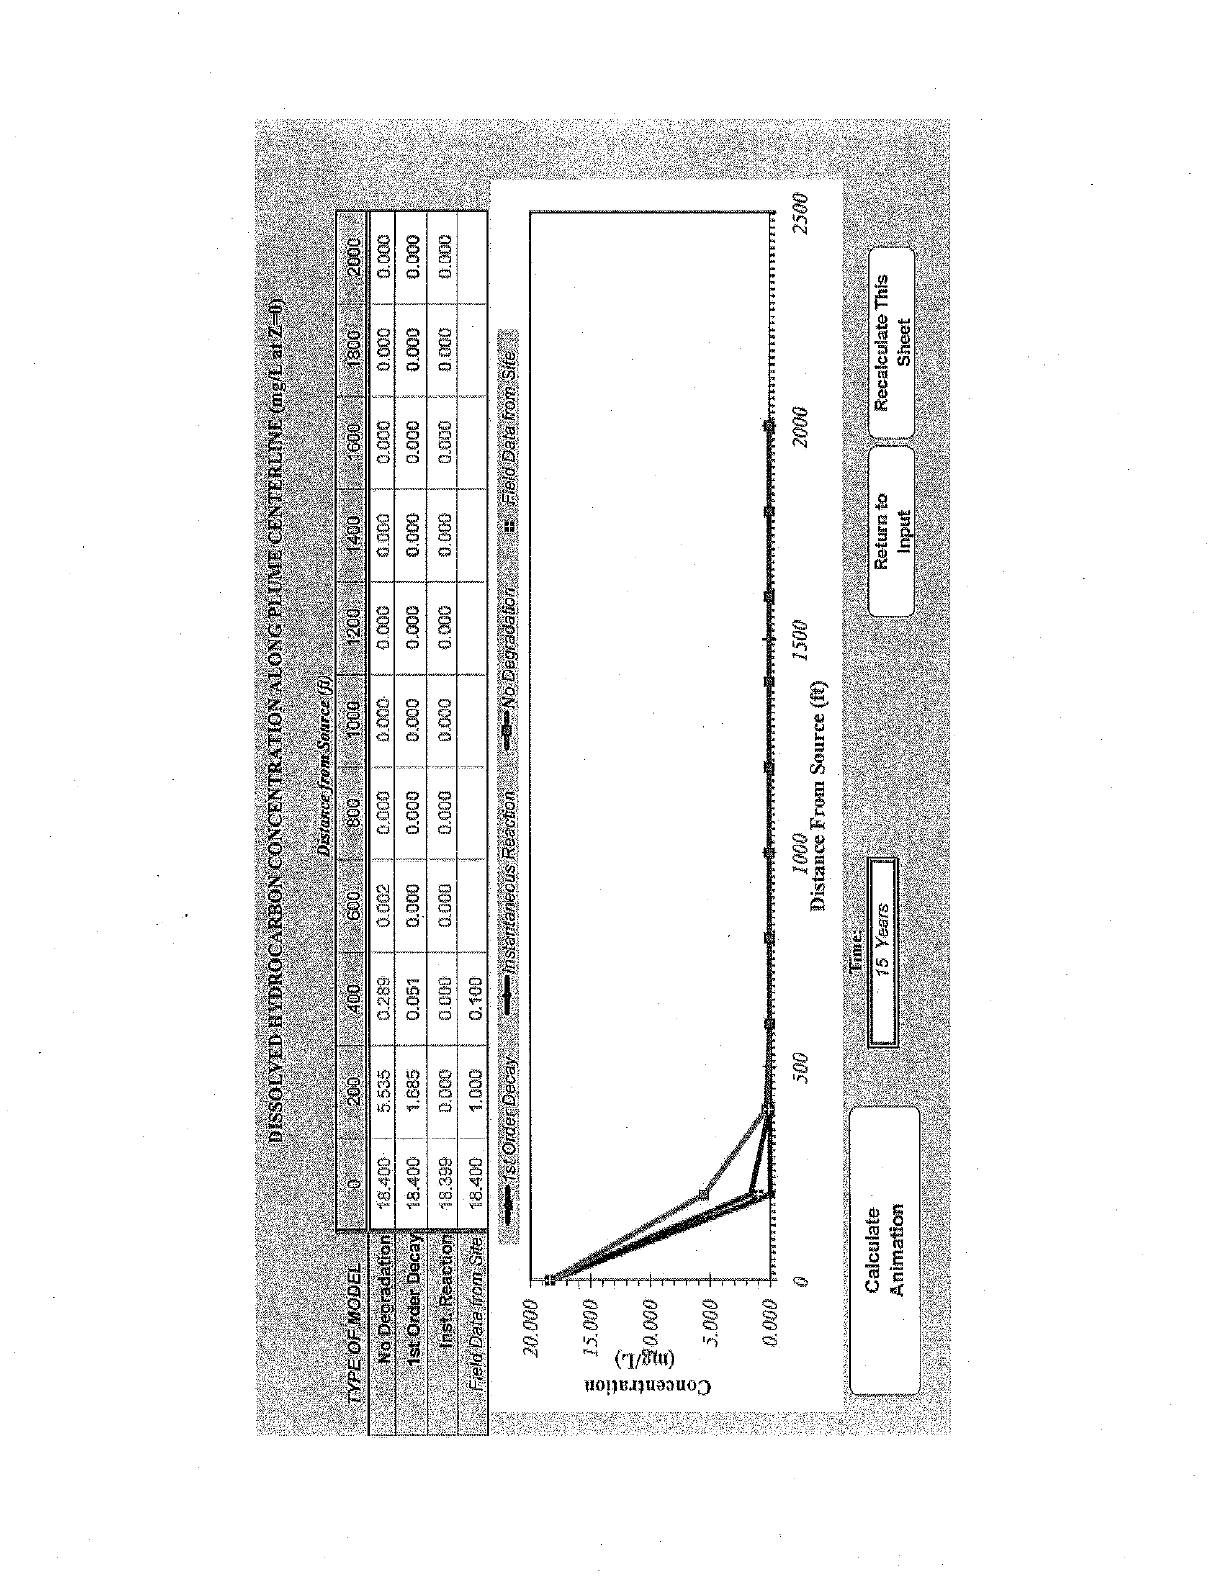
DISSOLVED Ei1DROCARBON CONCENTRATION ALONG PLLME CENTERLINE (mg/L at 7,11)
TYPE OF MODEL 0 200
No De radatíon "a 2,C0 5 525
1st Order Dec .8 LOG 1 885
inst. Reactio S S %9 0 OC G
Oútaace
front Source {fiJ
400 600 800 1000 1200 I 1400 1600 ¢ 1800 2000
; 2% C 01,2 C J:7 G COCO ; C vCfl ; 0 000 5 COO I 9 OCC
0 051 0 000 0 000 C 000 : 0 000 0 000 ; 0 000 0 000 , 0 000
C 000 C 000 C 000 ; O 000 ; O J00 0 06O 1 0 9CC
Field Data from Site 18 400 1 CCG 0.100
20 000
_ 15 000
A 0000
Ç
111IstOrderDecay instantaneous Reaction eNo Degradation :: Fred Data from Site
5 000 }
U 000
Calculate
Animation
500 1000 1500 2000 2500
Distance From Source lft)
Tune.
15 Years Return to
Input I,
It
Recalculate This
Sheet
ARm.Vren, INC.
/Qx?aRPOhp)t IWUm lner,mrcnR A(aria Services
APPENDIX 2-
CAPILLARY PARAMETER RIVATIONS
rlh32U0t4ns,,ildR PI,. I Vnte
35
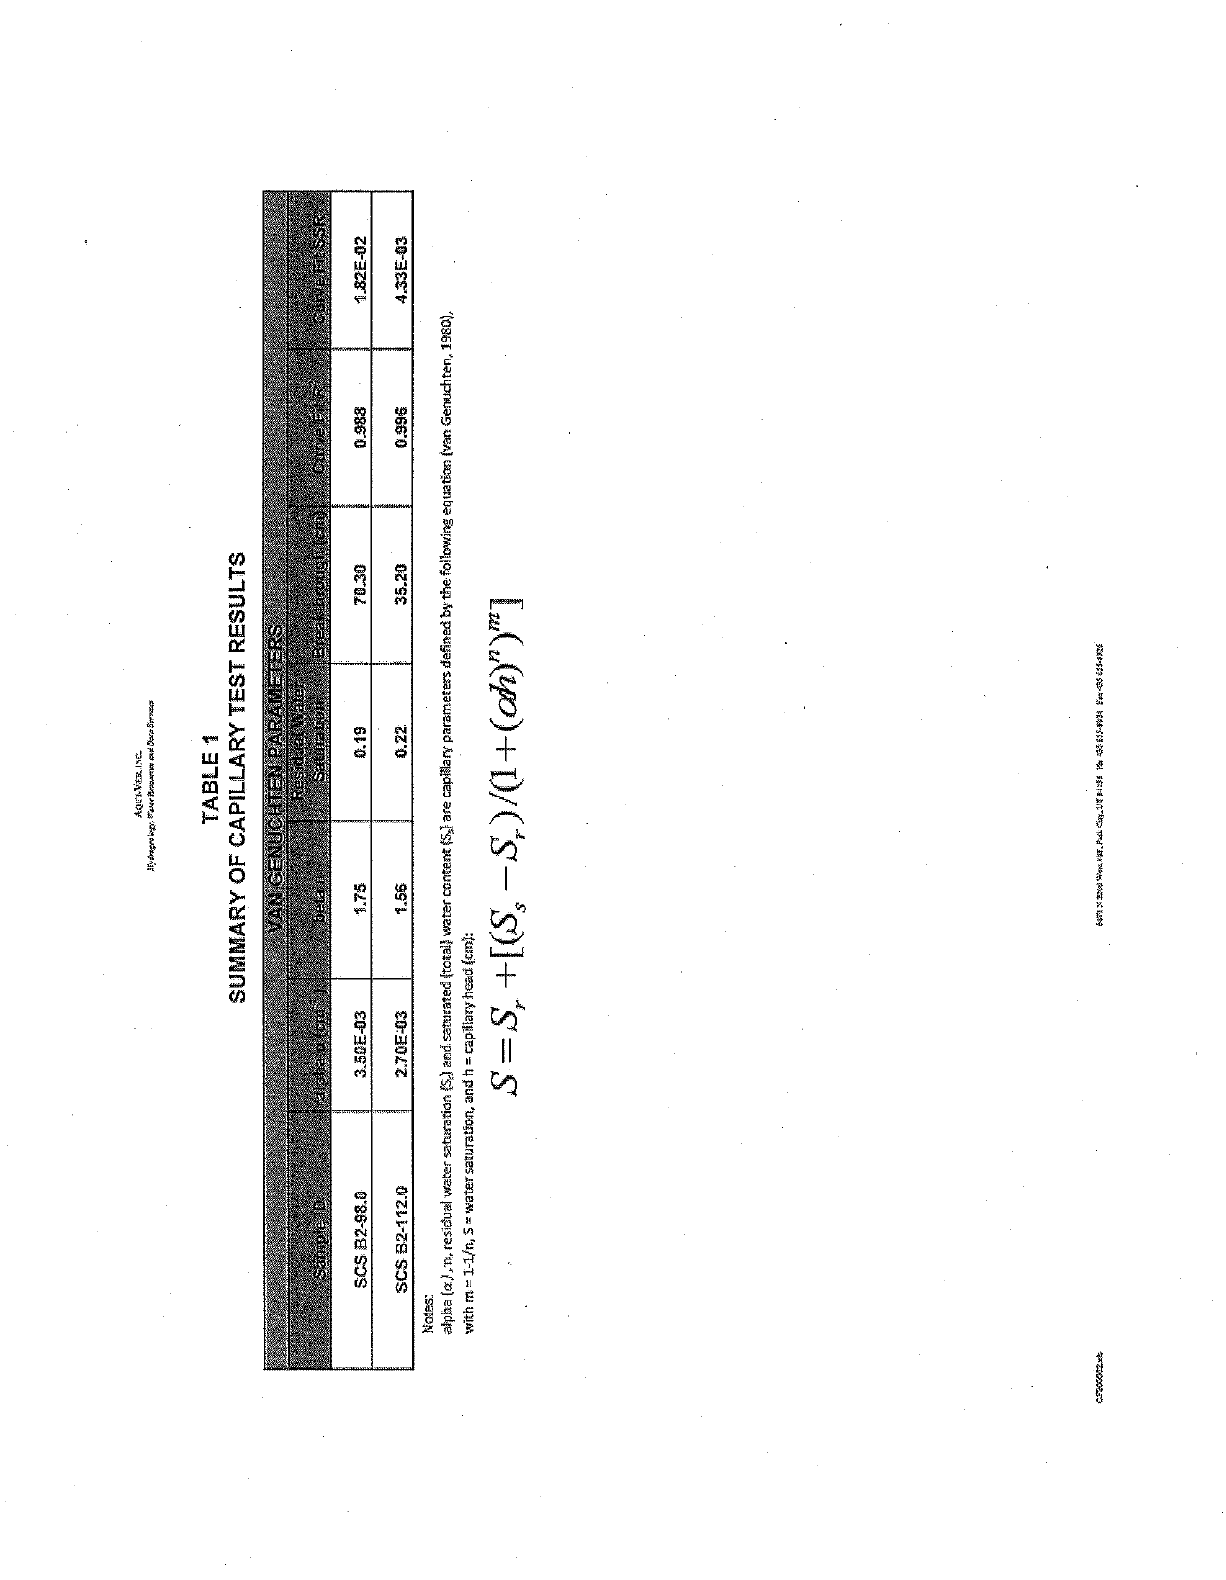
><eo.vsx i.+e.
Nytrvealow
,s.urA ,,s, aeasa$n.ua
TABLE 7
SUMMARY OF CAPILLARY TEST RESULTS
SCS S2-98 0 3.50E -03 1.75 0 19 7030 0 988 122E -02
SCS B2 -
112.0 2..70E -03 1.56 0.22. 35.20 0.996 4.33E -03
Noies:
alpha (áL p, residual water saturation (SC) and. saturated {total} water content (Sr( are capiilary parameters defined by the following equation (van Gesuchten, 1980),
with m = 1 -1,tn, S = water
saturation, and h = capillary head (cmy:
:iJ = S [(r Sr
S - ) ! (t + (. °)
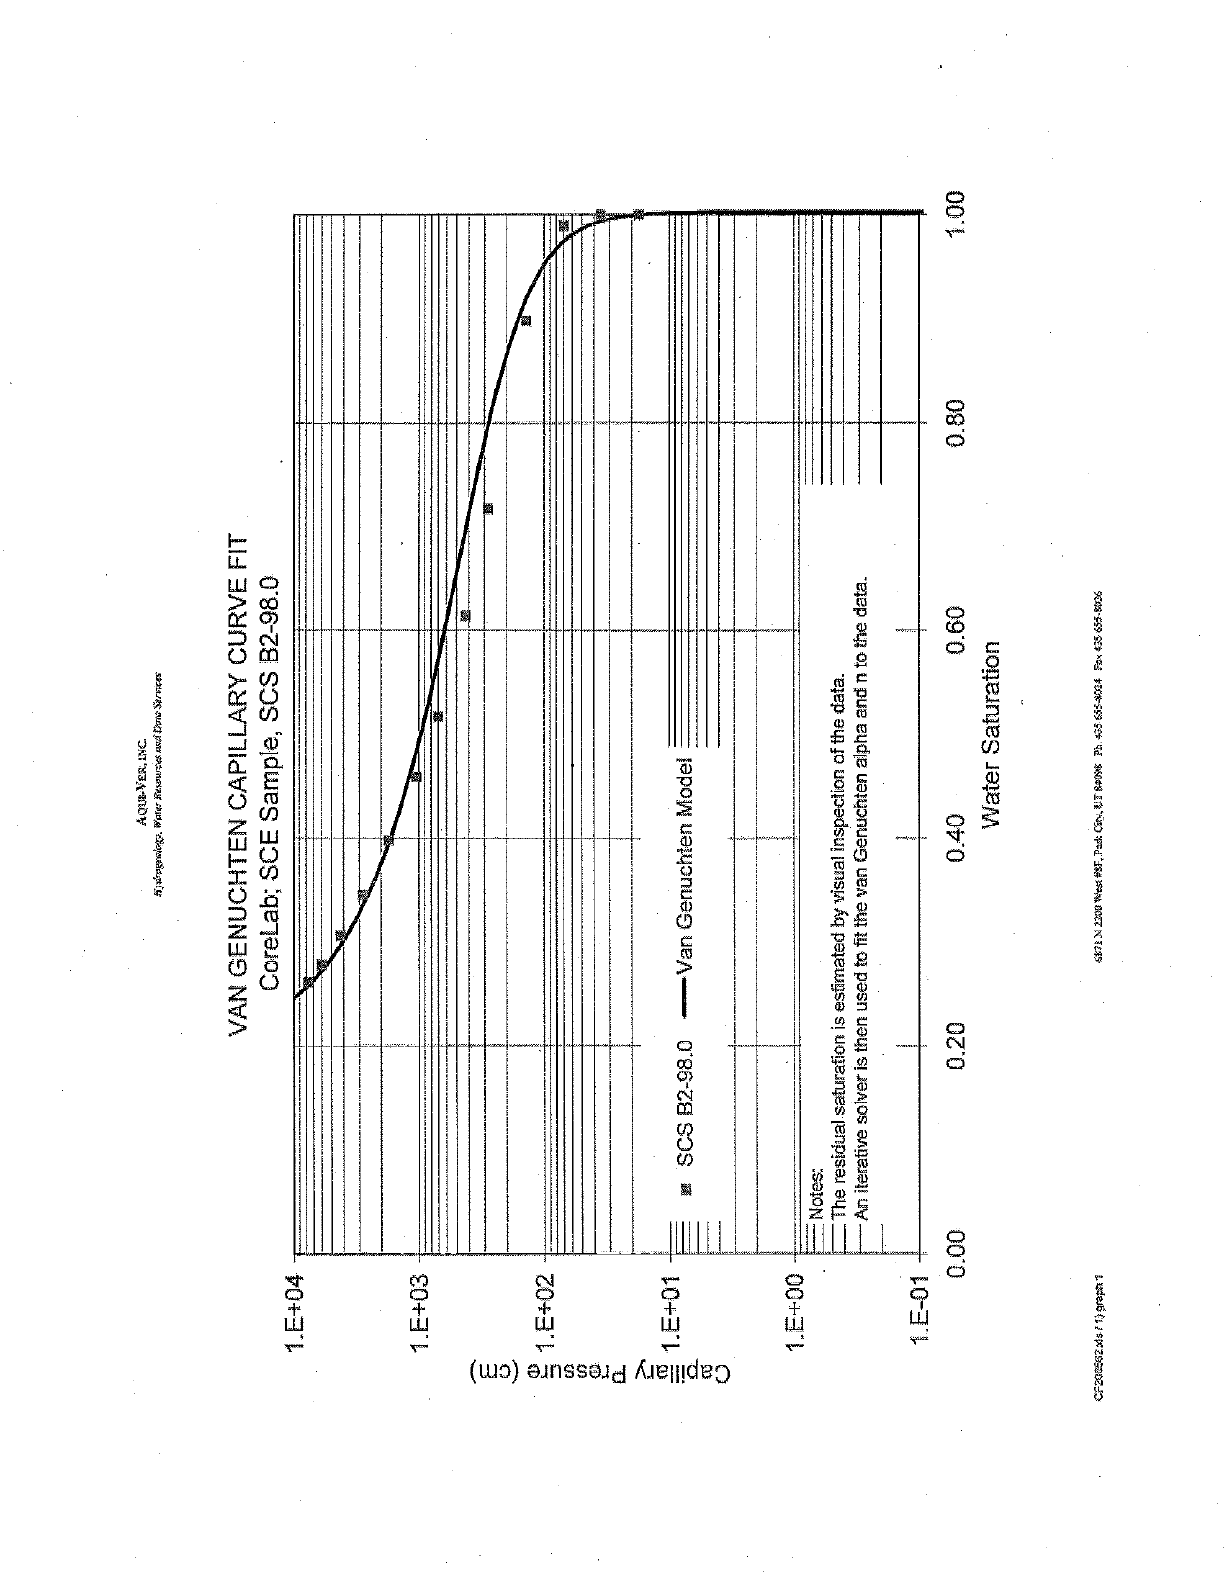
1.E+04
1.E+03
.,..e AQUC:ke,
AiJmR^`pA. WurvRe.nu
VAN GENUCHTEN CAPILLARY CURVE FIT
CoreLab; SCE Sample, SCS B2 -98.0
1.E +00
1.E-01
0.00
Notes:
The residual saturation is estimated by visual inspection of the data.
An iterative solver is then used to lit the van Genuchten alpha and n to the data.
Cc200562 .bst 1) graph I
0.20 0.40 0.60
Water Saturation
óknl N 2240AkRktF,P26; Ciey.Uñ 655
0.80 1.00
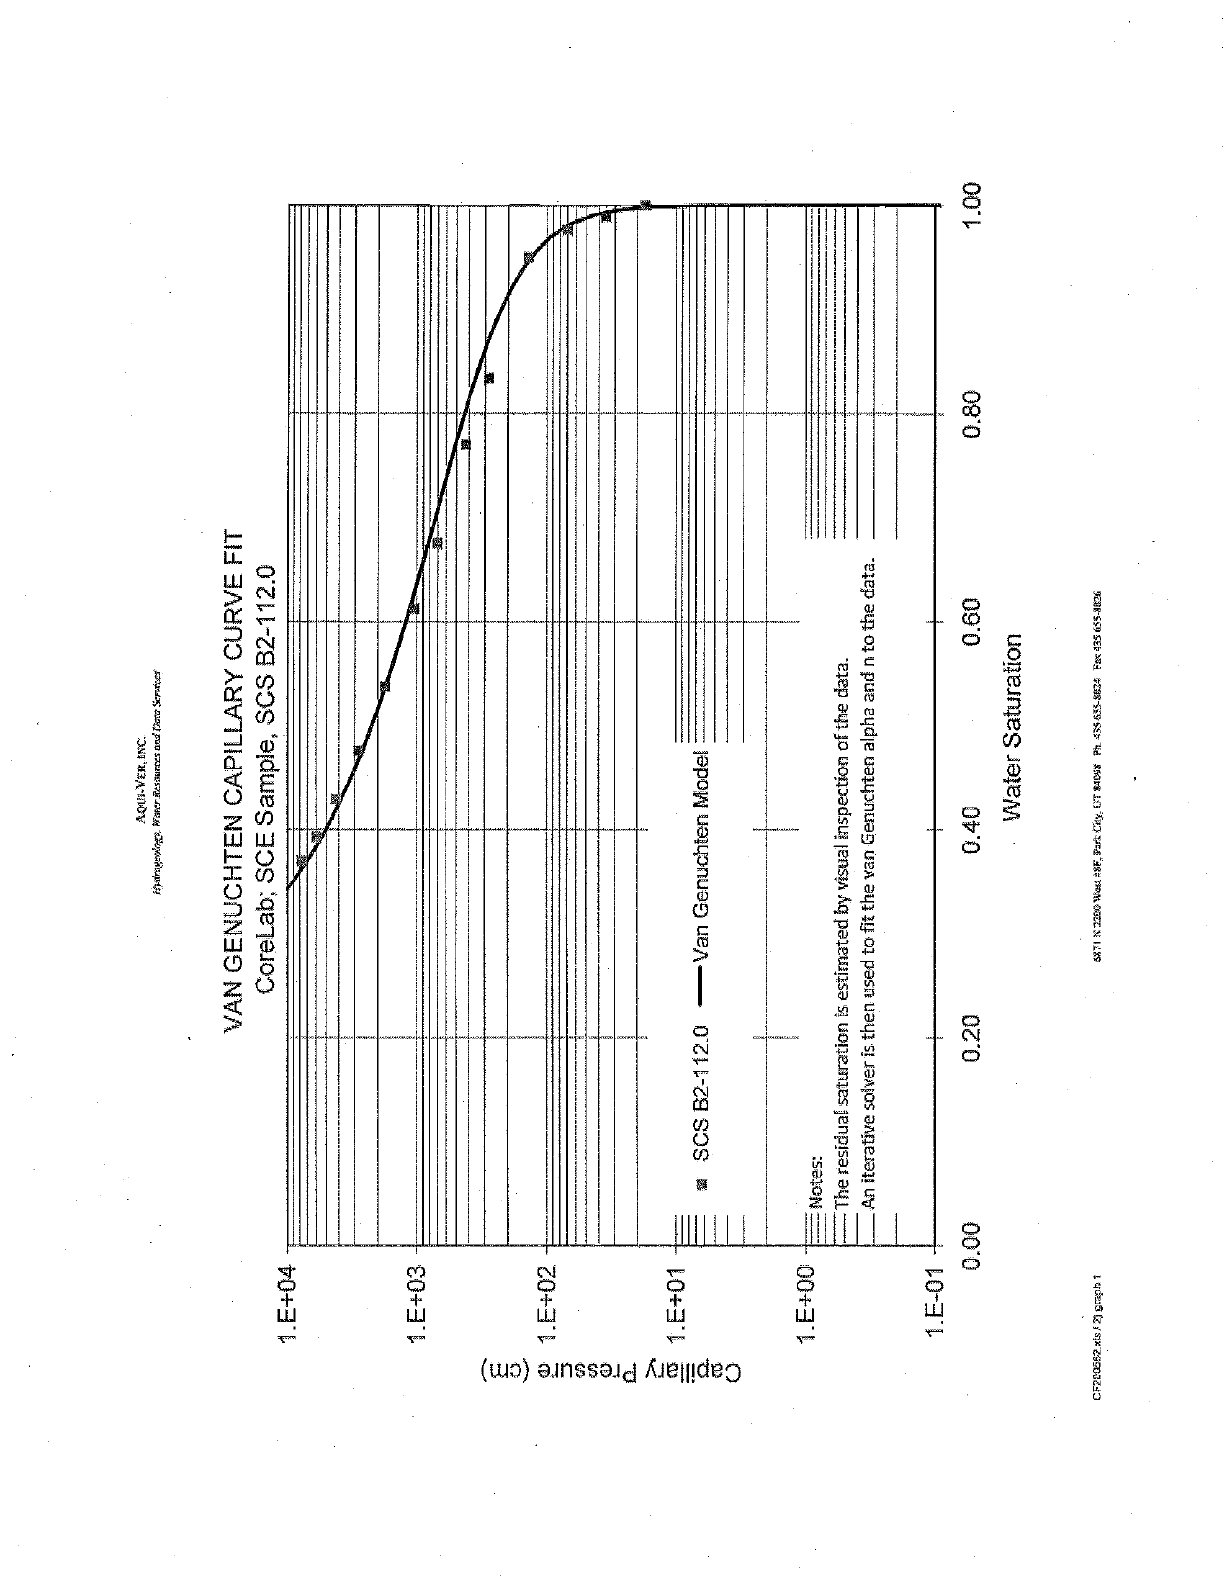
1.E-1- 4
.E+0
9._,) 1 .E+02
co
a_
2_5 1 E +01
a
C-)
.E+00
1.E-0
CF2C0552xLs12) grksh 1
AQUa-VER, 87C.
yai.DRerXecr_ WateriTt.surtes °SD= Semen
VAN GENUCHTEN CAPILLARY CURVE FIT
CoreLab; SCE Sample,
SCS 82-112.0
= u SCS 82-112M -Van Genuchten Model
--- Notes:
The residual saturation n is estimated by visual inspection of the data.
An iterative solver is then used to fit the van Genuchten alpha and n to the data
0.00 0.20 0.40 0.60
Water Saturation
UPI P22OOWeS PPF,Par3 City. W !1 Pb. 435555-5034 Fop 133 555-3026
0.80 1.00
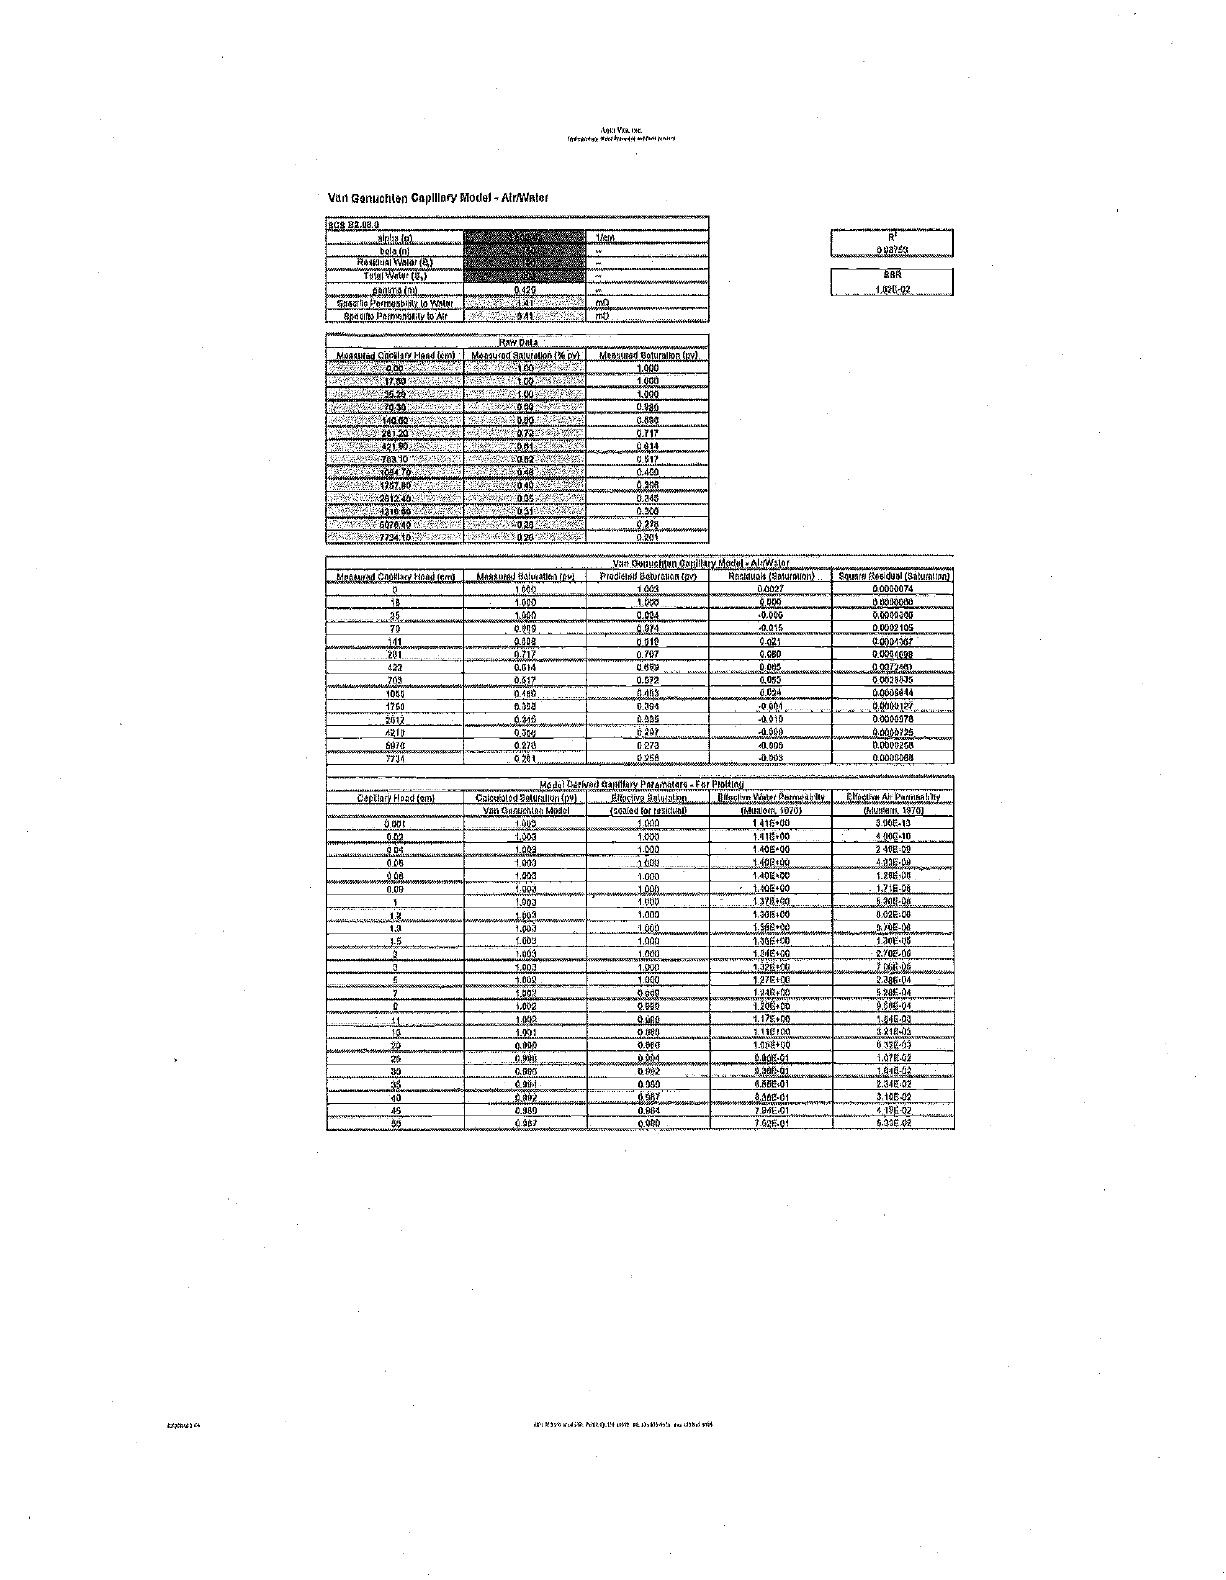
V8013auuolilen Capillary Modal - AIrOWatef
40402000
..... ell
Lalo n
NaubuglW01aliß4
101flalVliar)
2264
w
0420
SpacO[ Nmma9bll0 N 001101
41; 8 0260 01012601011 IoNr
MonaVdC0ylary Hand rml 1 Moo woo Saturation l%p»
100
0400040.40elmblbn VRrwOna
1000
3530 100
0
14040 000 042
30t30 0l3 0 717
100 0914
t0510 042 0000
4t 048 0400
176100 040 0349
241340 030 02711
4 in 0 i 0300
40Y040 020 -2>tn 4 2555
7734f0 024 9301
008750
8811
1.078.00
22,21104 Nnablrvn0 MAN9111M1N41urbibg1p41 (IOCVYbtl60Nlu4ub[p1) AbM6VQN19gIUlgüQM1j.. 9gVOMl$gEItlUQ119úI1Lgllen) 1,,,,,41,44412.,40
0
10
_.... 5
1000 I
t009
1.000
two 00022 OOOOOBid
.1020.__.
2004
)UO _.
_
00000000
0000 0,0022100..
0.014 2015 00063105
101 0808 2010 0010 OAOwadY
..._ ?PI ..._ 0717 0.007 0000 1 21
422 0.614 060e ,,,601L5 ^a0]100i,y
9@n20up- 69 0,517 0.673 9915
1065 9400 2400
0004
00at444
1760 0000 010001 +
0 0205 00000070
A310 0000 0 u+ 00u0
3202
00000 205 e
® 0 0000200 á2Y0 0170 0J0á
0604 0WOW00
.........6tRn ...
Way 11 AOQa0111AtPeronlQlm9 in Plolllny
,vinN+SlerOgrnv0611
MOalem 1 0l0
122244121 nrmulAgy
OOplllary Road (mr1 100 01104411011 IIaaV+e p11VnOnjS
Ile fe Itluel VanOanmM1leMxaol 14xn22 I479
0401 1003 1020 141f 00 5 00 U
60] 1003 1200 1416.00 4 (2-00
000
000
000
1003 1000 1 40E0 2 40441
100 3
..
1020 ..... 1400100 4- 00
1003 1.020 . 040E100 121000
00@ .. ,. 1.0Q .. _. 1000
I0M10
- 0401000 . Lt0E03
i 0100 17012 q 0021 OH
14
_
1 a
fa09
1001
1 000 1 207000 00 lE00
1000 19QI.00
1301+00
] )00 00
il0[Oa
le 1Wq 1000
' ` r lnV1 1000 Y8IF04 210E06
00
00 1 17041
t27(r00
I 110.04
1201 On
117P02
1 11uX1
10tt100
tlua I
d 18 04
284 04
nt 04
141003
13001
1 ".of
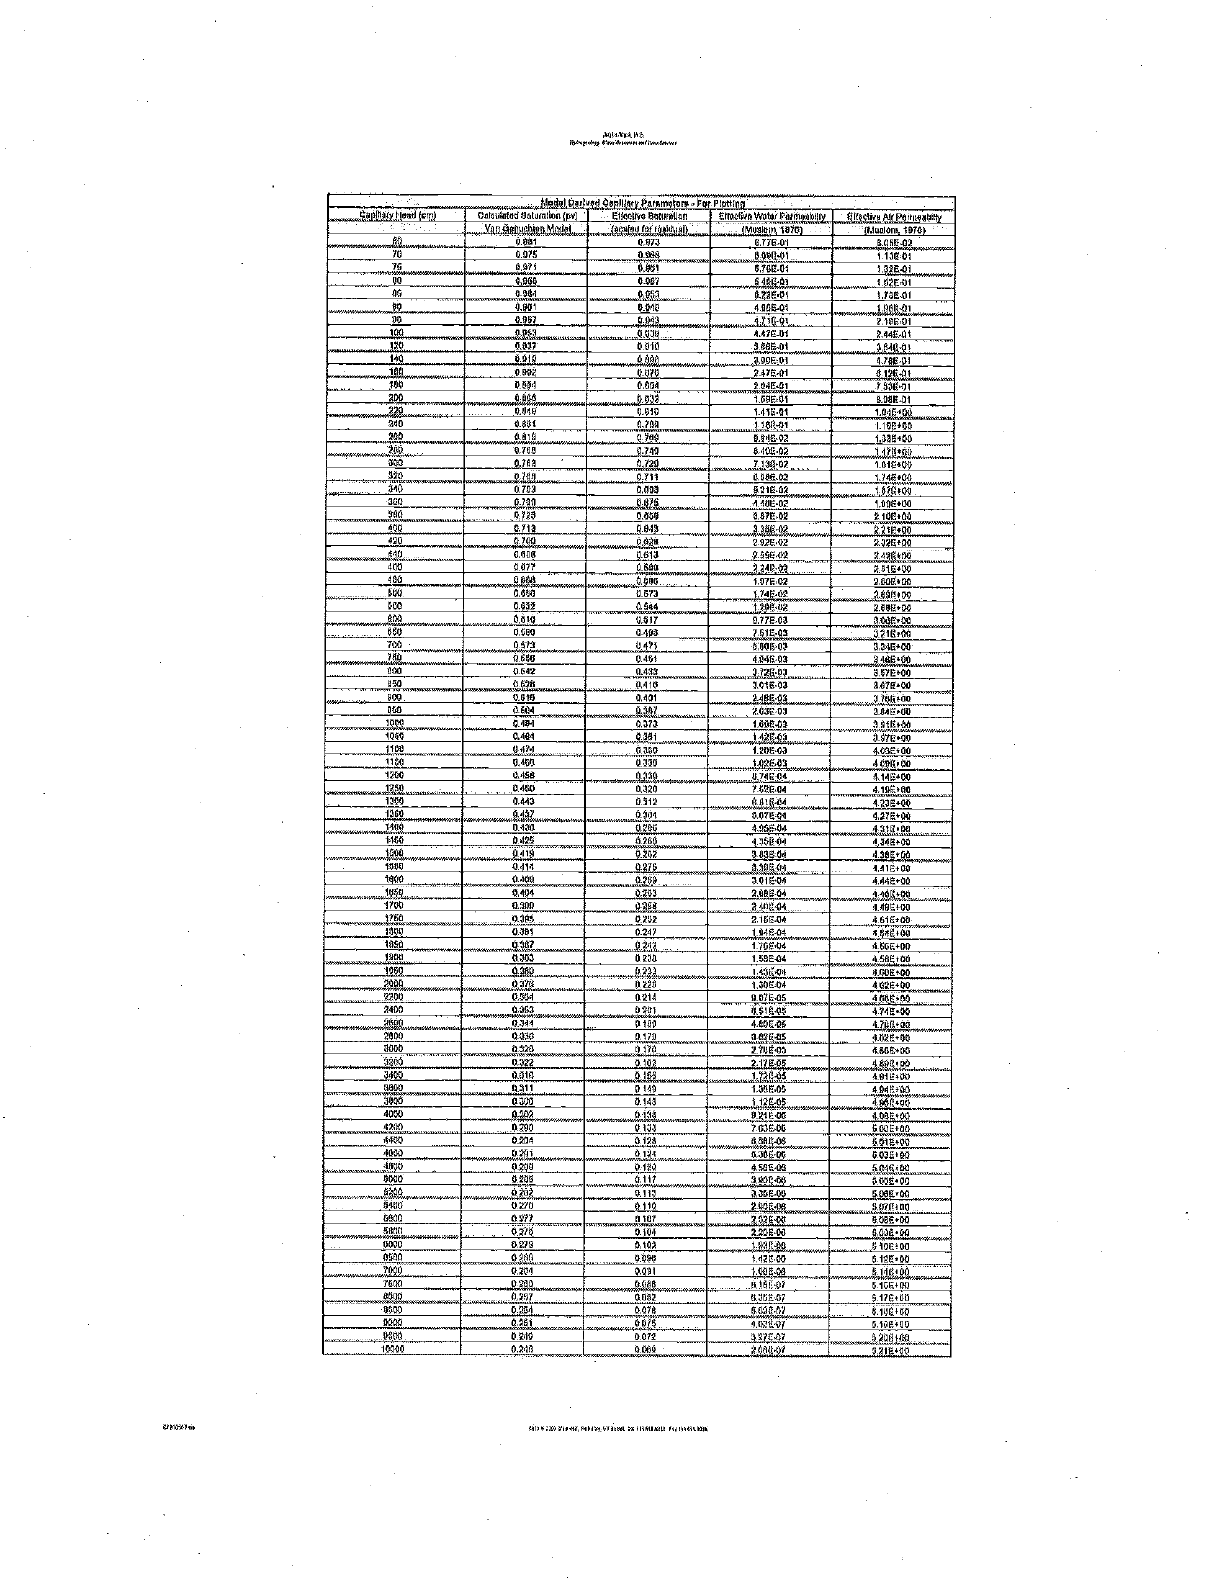
b14è91uPd 4dQ9PIHP/YáátnmPlOryrFV PlpHlpp
P102P1Y11Mh0 ISnQ ON011k1gL20N rod 1M1ÿN) :.. 11IN1N08E1VIÀYM £(PoCiWAW4k(Ph1ÌAg2b1' £Ilpylwn,jadPglMá4Mlft
.. WOOD N`1140.M1HIP1
O.
{áSdfiJ^Ij,1 9nI01R1P61 alo 01
g0 QP]i 617E0i 8A6E-02
70 O.0]9 0 OB6 Opoä-01 LiJE01
I6 0.6]1 bPbl 6)0[01 t33E-01
co O. 006] 6W1y0i 1.02EA1
OC 0.084 Og9 092FPI LTdE01
[U 0 .g01 con P 4 O E01 1G6n-0I
r
.... ..
OP 096} O 0 j? 1P111'41 T IBEOI
aAPE01 R44E.Ui
.... IN1 0P3T 0010 ABhEAi .L94R41
140 á01O O .949E01 AI8E 01
;09d;
100 0-P$9 09cá s04E 01 - t8JH411.
200 d.000 geH2 109EU1 009E.01
320 .. . 0048 0.010 1A1E.01 104E+pd
0.8U1 0109 ?1b$ll1 0162+90
200 0d10 g.i60 084E02 L33E+00
0.700 0.940 6100.02
9.703 ' G.]20 L109-92 101EaW
930 .. 03fi 0.0@à.M 1}40400
__.RiQfl
07 08 0.909 621E02
40ER
5WEO2
1000+00
9959 t10E+00
- ddP O 210+00
420 0 3á'j6 ^P)0+02 li?Ca00
0.090 001J s25E01 ^UPIM
rP1E+pp
400 P0]] 0.M0 224! CO
060 0 ....... d.bdG... t0]E.O2 ROPérOp
0.044 t14EJ2 M1060199
000 0022 0044 t 2086+00
0.010 .. U917 70 01 g00[+M
_.... .. BB0 0. 00 O10! ijylCO} 1tb.A1=
10p 9s9a 0471 0901 04 250:+00
0G 0669 ` 0 104 404003 dIBk+W
000 0.642 0 143 iR,(yno 507E+00
k60 jl]r 0 501003
0 0. 010 0401 148004 1 MM+00
960 0304 0901 Rb3Ë0J 2.040.00
MO 9n&1 03Rd 190E-0} 391000
.,_ ,...
_._ .
@50 0.4 0d 0601 1220¿0¢_..... . 99)2.00
0 .A00
0 JG0.... 120E.9á 4. 00
0áO0 1¢E03 AQÇ+M
O}tlE04
t$9á,,. OALN 0.2 20 }5CE09 4.19E+0O,,,a
..
1390 0.440 G912 $tllfi-on 12JEW
1060
....IAbp ,.. 0.4U
0AJ9 _
{09 OOiE-01 42}E+00
0.200 _
A.O6E.OA 4 3lorM
0160 0425 0100 12%n4 A,04E+gt
9414 p1n2 4B3t04 430Er(p
--.--- 1609 0414 02/6
OAQO . .....,Oy4
0901
i01404
2uPL01
21110fi4
4.44E+00
414 E?nn
á,A94 ¡
1}00 0.200 02G
02nd rt3Ps
0Y01
OJ++ 216104 461E 00
0211 1810Q4
i/4004 n 400+00
1964 0167
Oi9i
0210
0220
140E+00
lnui 158EL4 1 eFyOW
dl'AEe00
tgd9
1100
030U 023)
nz?n IUI-01
1á0E04
ú+}n 4u2EM
0411 00 td3 10nÇ no
...+. .. 4900 0áS3
np1 bit
0 100
0.41E44 4}40.00
m9n 4000.05 4700100
"009
1060
03i0
0vd
0122
0116
0 ]0
ü11E*
0165
i8y,^E-03 4.00E+OP
4. 10
1 PO
3100
41}005 4 BE106
mr
1.t3CA! 4010+00
Mu 0 11 0110 i00E.00
.3000 0 000 0143 i 12E0S 4 tl0.}0+0P.
4000 0.302 9:j36
4210 . 0299 rt 0.106 >9JE06 600E+d0
4400 0.214 0.126 60A1;b0
4000 0.301 0.109_. &00e W 0
,.. 0?09 0.120 4,567.03
,+ ...._. ..ilg5w
0000 0409 0,117 9907Z40
000 P113
P^!P 0-010 2.90E no
cedo nitli, _...,......â,32EW.
Ói04
: rr
51140
0000
___0}> b3/M1
82]9 0.102 1.08R-0ó
0000
iIAL4tl0-
0001 1Wfi00
80M Ab0?.. .. .;< 0R 0.26E07 017E+G0
0^J1A 007 6 60hP0'I
0 0.}h 10'.600 SNE+dO
1ÆW4
0399 0071 !1]7,00
21q,U]
q 9f11j(d.._
'EIE+d0.
0 dAd 000u
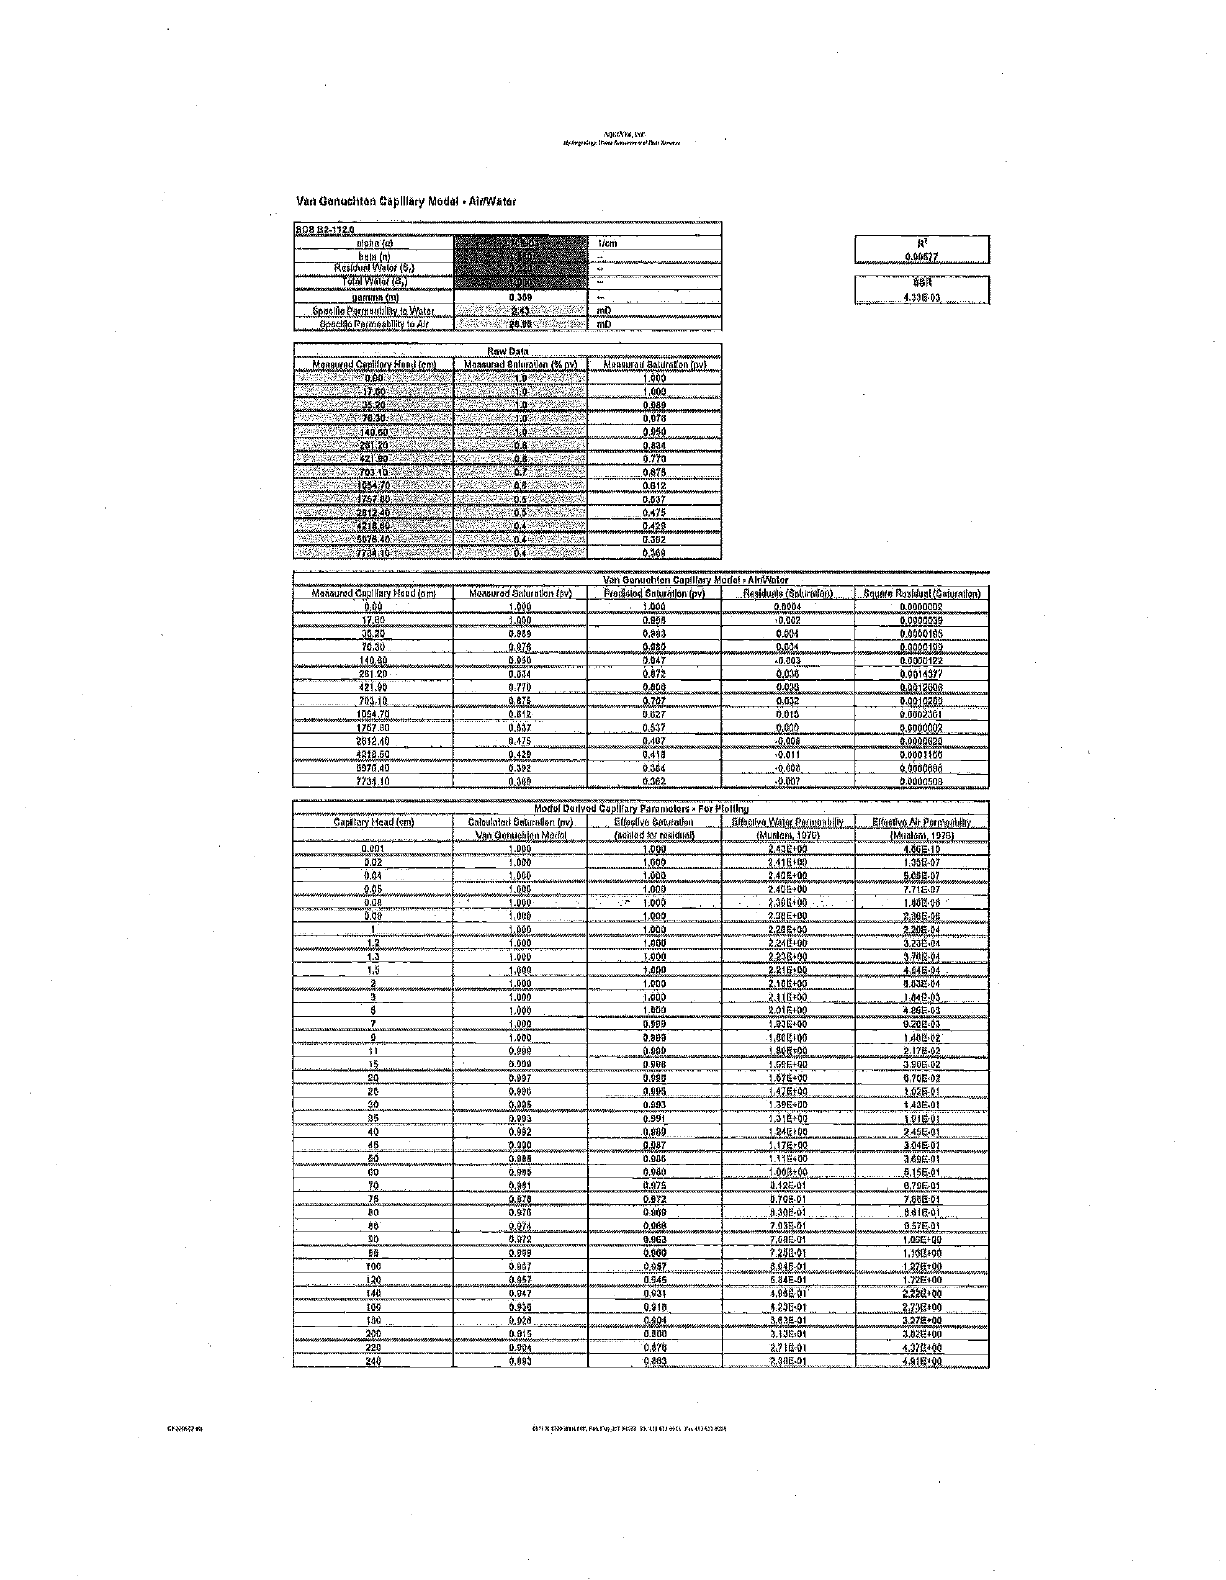
Van GelnUaltith Capillary 4Air/Water
ro.0082-112 0
alpha 014
6010 n
" 'et"
an 0170
amain 00) 0 +68
Orillo r indel 1 Is
0 ate 7 levalaityln Alt 043
0000
aio
OID
Bay/bolo
7,0704 Hoke 0 M400097.18010railon ellperl I Manurial tigelOrdon v
010 i
1/10 00i)
-11716
7020 0 o 070
pro 30 10 0 poo
00130 o 831
401 80 00 0 790
701 ro 07
70 00 0012
173710 0 0037
2842 au 06 0474
4 0427
007840 04 0302
MA Ur 04 0146
Woolard Coniliory e o
I40
4.44,073
4011 --
4.27007
Yin Donualiton 00011077 Modot eAleAmintor
Monoorod O roo,o6or, 97e1nd 001n,nIlo,o floo,doOlo 0600rorboIoiO I .343404 Ro,OIonOLOoOo,oLiO
O ou
1Z 00
30,20
1 000 _
1 000
0.0004 0.0000002
.0,002 0.0000039
0,900 0.004 0.0009105
,.,1170P.,. .
20120
1
0 OH
OMO G.004
..0.003
0 00.(1100
0.0000122
0 034 0.0014937
77 10
Pill
el 0',9
.. ; t op 00 1 0
0.0010200
100470 0 812 II 0000211)
1707 00 0 037 P00 3030 0 011009 1
2814.40
4210.00
0.475 0.407
0.410
4000 00900010
0.0001100 '0.011
0.332 'P00 0.000 0.00004
0,300 k. 0 0000100
Abdo( Ilealv 4001112 Porimeotore e F060lolihi
' Catuulad to Seturallon lnarlarMill 010071100 relr'Pot ,
3/97 000310nMedol 0000100 Mr r0710000 01001001 1070 Deltudom 10701
41,00477.
0,001 1.000
1.000
1.000
1 000
2.461+00
1 40000
0400000
240000
4.000,1t1
1 17047
5 09E 07
7 710. 07
,,,,,,,,a______
1,000
0,04 1.000
000 1 000 - 1 000 ?Mono
I
1 IV 96
000 400 1 000 230)i00 010000
6 200 04
1 290 1_693
0 400
1 200400
9 7401-00
1 /7000
1 2 1 000 1 23E ni
3 mr. 151
4 74E 04
4 03e On
1.3 l-000 l Onn
1.0 4.000 1000 2 21640
2 170000
2 0.000 1 000
3 1,000 1.037 7117+00 1148.00
1,000 1,000 2.0104(14
1,000 0,009 1.03E700 0,200=01
1,000 an 080810
1,407e07,
0.40000
11 0.000 0 OD
0,000 O 700 ,
0.00E+00 1.0
20 pooi 0370 1,6/0700 0,700.02
0.000 9,000 , F41004 .1,1333:71
70 9940 , 0_003 1 390.70 1.420.00
30 0.000 n 1.31e-tell I 01701
40 0137 0_000 1,24700
1,17Et 00
1,100400
7457.01
3.040.00
45 0 900 0,007
0,000 30 Gano 3_000,00
00 0,000 0,000 1,003007
142E01
0.1000141
, 0,707,01
PO 0141 0.735
0.070 0 972 0.700,01 totile
PO 0.970 9 707 0.307'01 0.41001
00 0.014 0,960 7 057 01
00 0,072 0.073 7.00E01 1.00E+00
00 0,000 » ado 7.000.00 Joano
Too 0 401 0.097
04E-01
8781.98
130 0403 0,045 1.72E700
140 0.947 0,031 4,040-0) 2.20E400 -
100 0,030 0.010 4 29E-71 2.7,;55100
3.27E000
180
270
0.028 0,03E-01
0.000 0,000 3.130.01 3.00000
220 0,004 0.078 7712.01 433E300
240 0.005
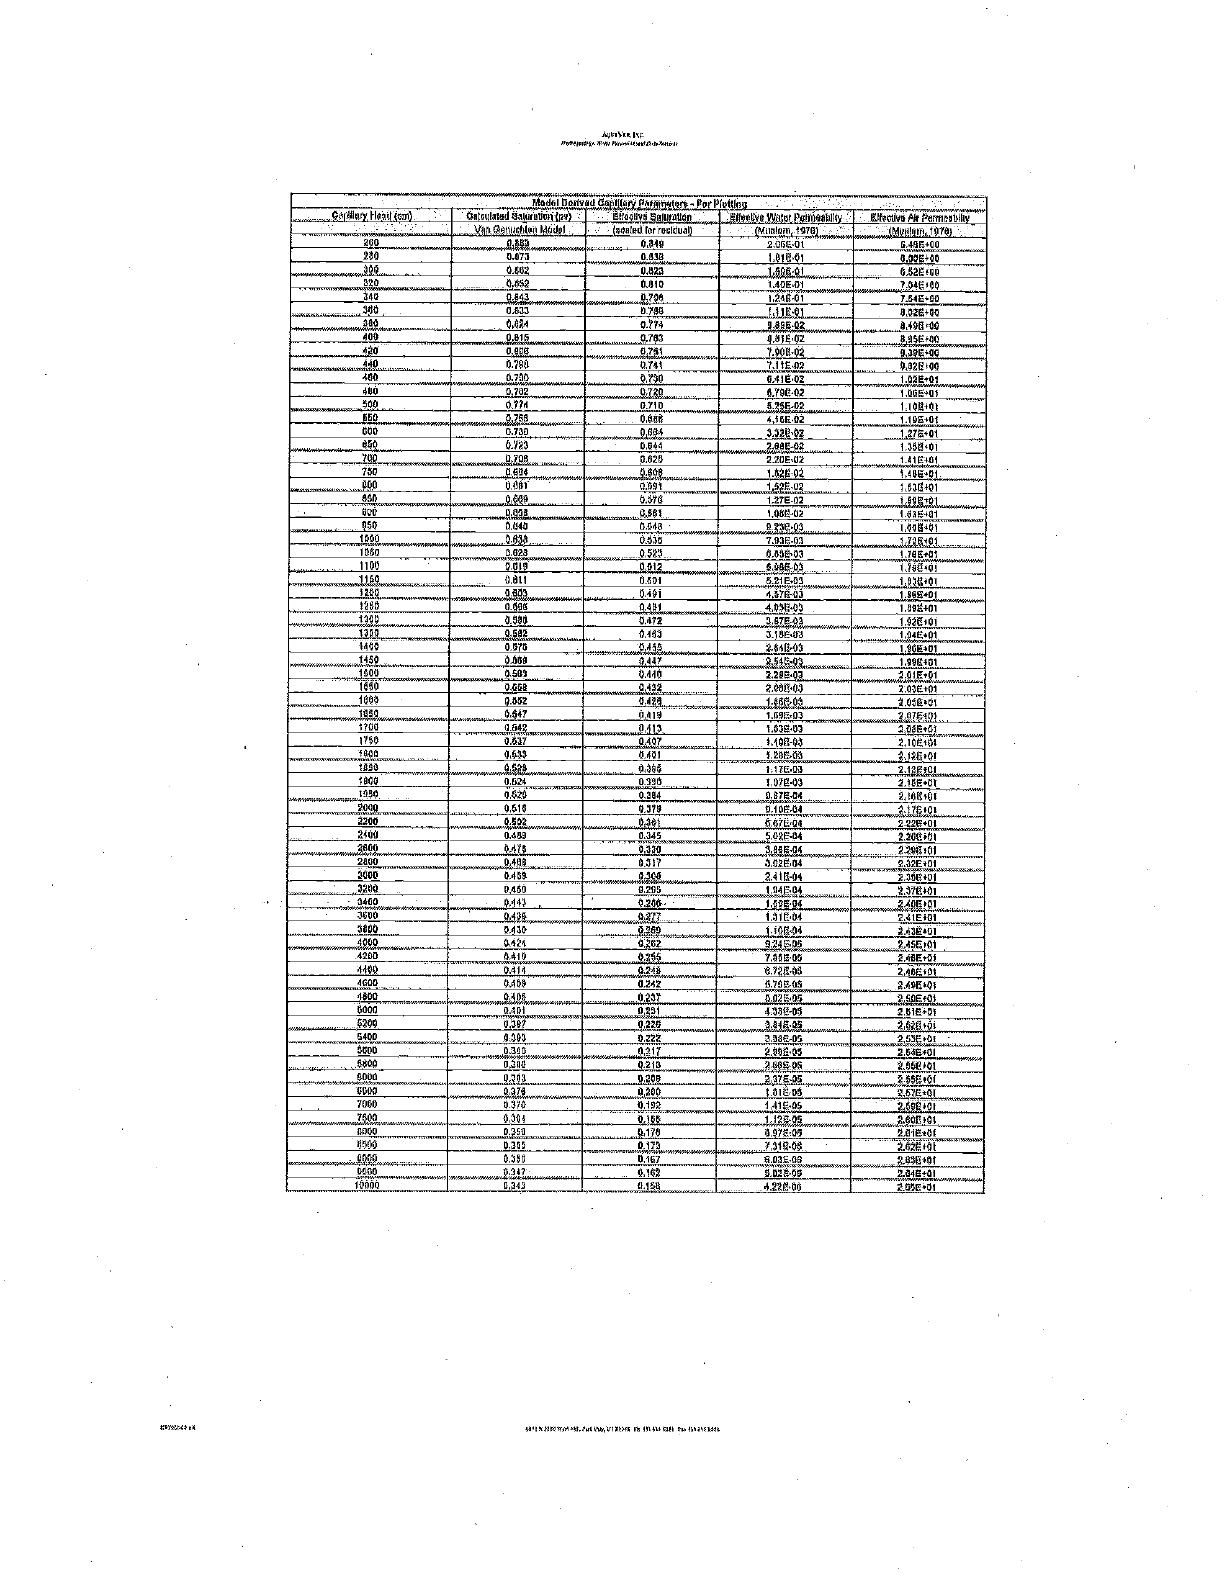
Mod0lOnd Ito dC4 I a !nay
61135115B Mean .PotPIo11G '-'
gal oldtodBdwrOtlnn(PY} ((@@Ily@YV016ID@110Aa4lllY O1790GV6PkpE[IIIOWO
200
n < I I -4 el 6 .I Wnlddlor mcldual Mnnlnm 1926 (MUNIOIp 102ai
0rv
0023 ...._. ... 0,046
.. 0098 ._. 2.00EÄ1 540F+00
e.,. e e» . .
00E+40
_
200 i@IE01
. . 0.002 0,022 1.344: 4,02ti+00
e .o 0843 0,010 140E01 704E+00
19B 0540 02Q0 IFd@01
..
2.04E+0B
010 0.533 0,700 1i]70,},._ 0.02E+00
200 ...... 0.92A 024 0 OBE 02 0A4E+00
400 0.510 0,201 0 015 02 0,95E+00
440 0.500 0.731 7.00[b03 10 +00
940, 0A00 0,741 2.ItE02
400 0250 . 0,700 8.4fEm 1.02E+01
400 0,782 0.730 42055. 03 .... ,_ L065+0
. ._. , ,A09
060
0,774 0710
0956
5 .2 1.100401
0x200 1.10E+01
...__..,
000 .. .. .
0700 0y04
0 014
. ....
1.22E+01
800 0521 2650-02 1991501
700 0205 9309 224E.02 -01
250
,
0694 5100Q 1.03E-D2 1.90E+01.
009 0.091 0 001 1,OR5-0$ 1.89tl+41
MO :.:ry
PS''E
0500 127E-02
.. 0640 IA5E02 I00 b+01
..... 0,040
0.050 . .. ..
0045
0.520
013
7.02 09
OOEbi
28E+04 se
I /45.501 a
1000
1000 0,028 0920. G.00
1100
1100
OGIO
_ 0.011
0.012
0L01
S.p605
4210.09 r189E401
SG 401
4200 0.803 15A41 4,516'01
.. 1280 005G 0,40
19p9 ....... MOO 0.472 OBIb.m 10}Hr01
1200 0,483 310E6 1,94E+Qt
tÄ00 P.M ..._ ..
0.5 0 04Op 3.84E00
1440 ONO
OffiI 0,441 S9Ep L66E+Ot
1000 0,440 2,20002 20fE01
1d40 0060. 0.402 2AeQAJ Y.OJE+Ot
i@00 003 04gQ 19aF01 295Ero1
0542
0 0g n416
0 gp
0420
iG9E03
f 620' Ul
140 791
,9241
200E+0i
A1850,
1700
0.037
' 9013 0401
n00
ni:0
wI_26E62
112E40
2.1$@+01
2.10Ea0f
9024 10/E0r 3,10E+01
3350
2000
2200
2400
0.020 0
007a
0 W
0 145
052E04
0418
0.500
010E04
007E04
562E04 222E+01___
Y 2GE401
0.400
._.:40 ... .....
2000
042 8
OAOB
o2Q0^ 9eeESt
0,03E.04
2zaE,01
E+01
3000 0405 0d08 2,41E.04 20500401
55.00 0.455
..0.443 ..
0430
8.20
9.200
02 )
1947A4
169E04 ..
111L04
370@!01
. 340801
201E+01
.... 9800 0430 0'85 150704 240E+01e--
4000 OM1 4
0410
OZr2 924E01
200E0n
245F+0)
0¡5}
0210
2457r01
0411 r75E0 240E40
btO@ 0242 0 20E05
00E05
4 VW 05 3 40E50
0297
0^d 150E+01
...r OIDI 241E+2I
" 5400
U362 0228 254705
3 00E 05
2000+01
A 701 _ 0122
0117
0214
I 207+05
-0000
251E+01
4904+401
,.
0302 4400-01
TmEOS
5800 0300
BON _.__.
000
y run 0209 222005 'SSEtp(.
0370 0200 1 OIL 04 267E+01
4Á9Eï0ï-
7000 0070 0101
0100
111705
11^f05
2400
0000
Or44 ,000r01
0359 01/8 00/7 00 201E+01
282E+00
9500 0 15 0124 /1100$
_Ág00 OJ40 0162 3 09E0B
002800 r0%G+01
ors 0 2142 0 102 204E+01
10000 0719 01.0_ 480' 00 205E+01
AQUI-VEX,INC.
NltlengPnlpV.P, Water t7manrtlp8.ö /A :item
APPENDIX 2 -2
LNAPL THICKNESS AND GROUNDWATER PIEZOMETRIC HYDROGRAPHS
APX'ENDT
6tl7i Noi lAPr2Q9WCai,DYf PII.d7SAss-RII2,1 VAX tlaä
36
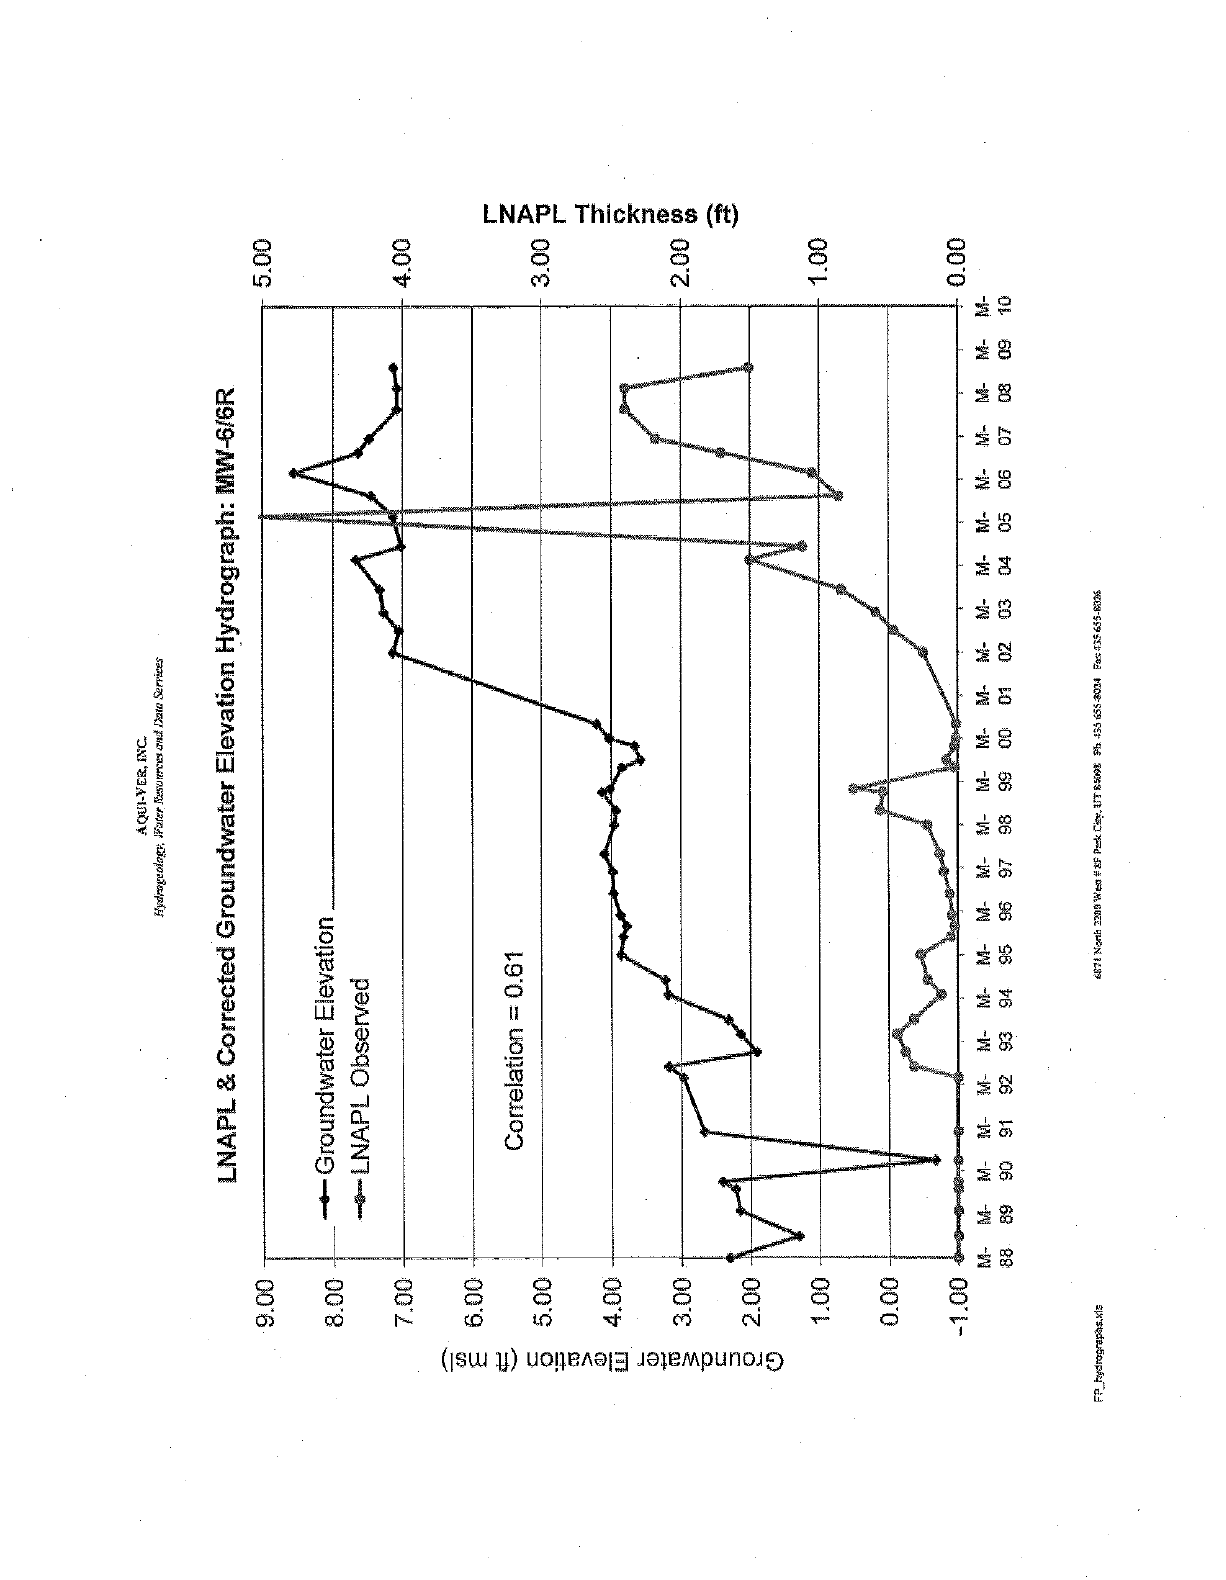
D
W
U
LNAPL Thickness (ft)
c c
c c
(Isua }}) uoReAOl3 nnpunoas
a
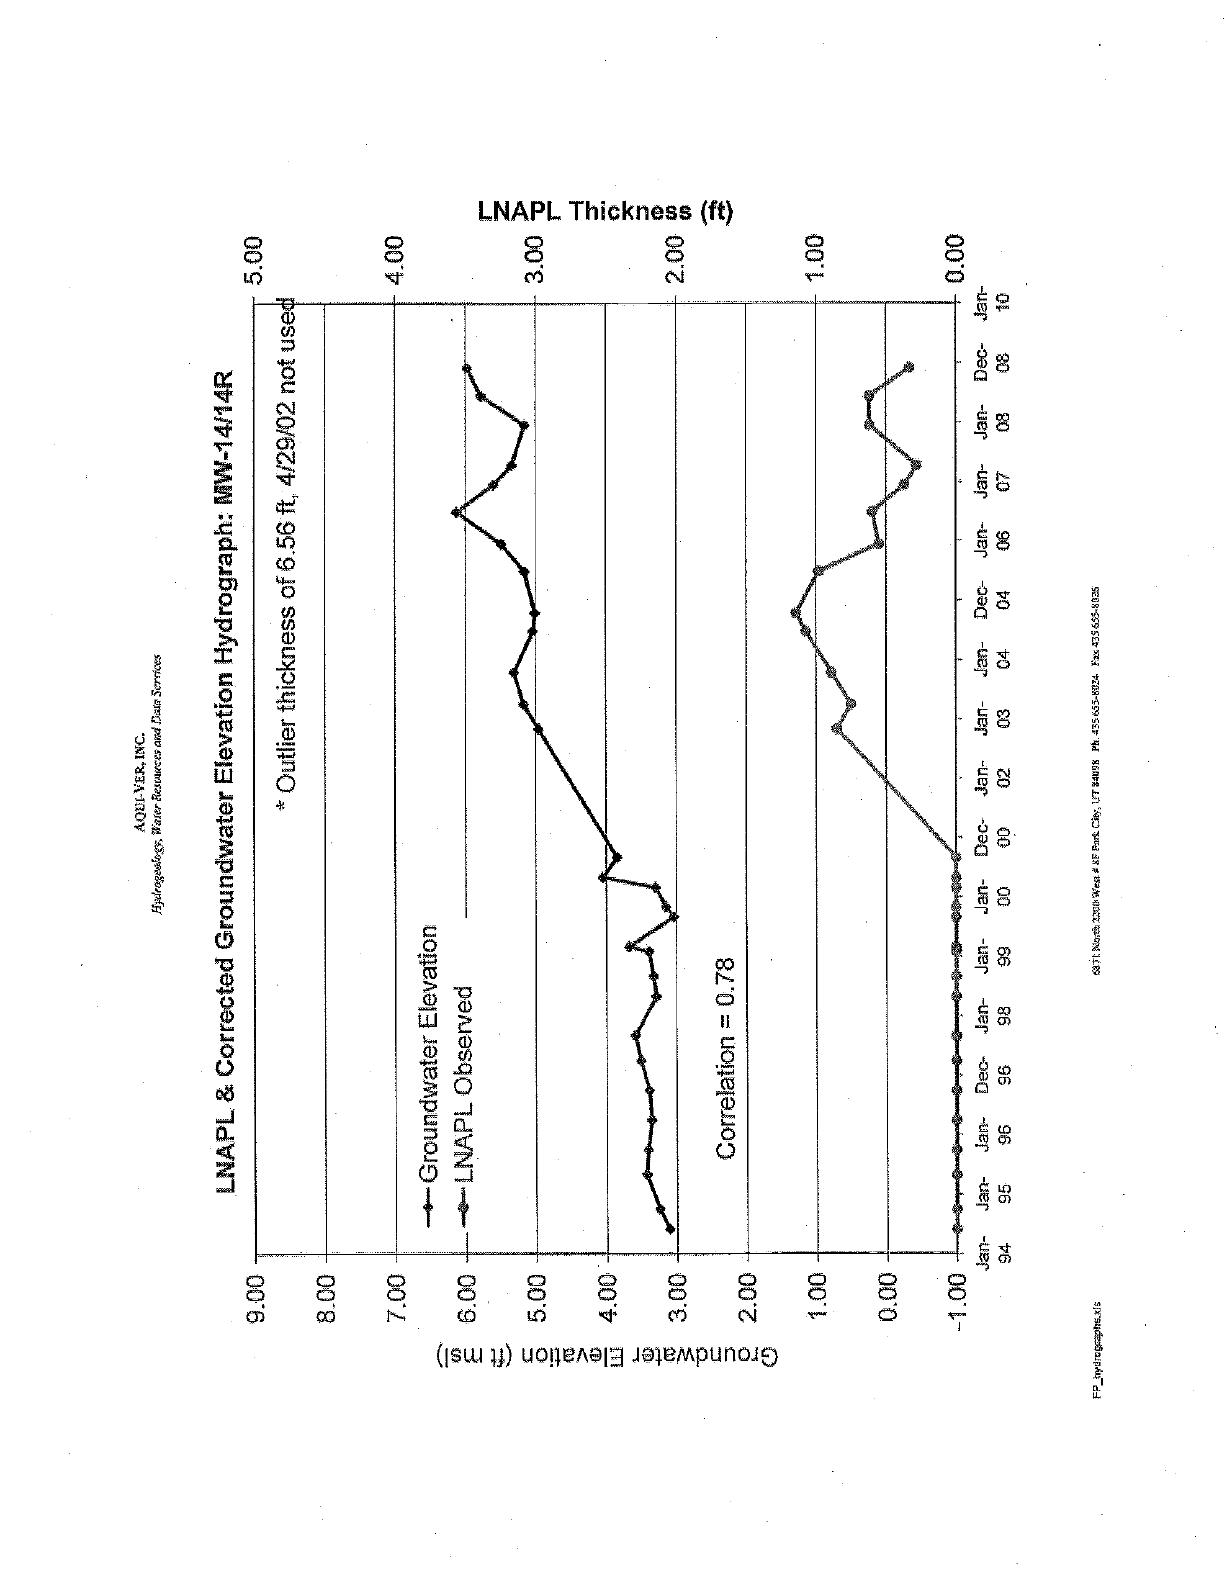
9:00
8_00
7.00
6.00
5.00
4.00
3.00
2.00
1.00
0.00
AQiì1-VER, INC.
H)viregemhg>; Wflfer *feswirce.v amd lMdc Serzices
LNAPL & Corrected Groundwater Elevation Hydrograph: MW-14/14R
* Outlier thickness of 6.56 ft, 4/29/02 not use
5.00
4 -00
Groundwater Elevation
LNAPL Observed r
z
3.00 -o
r
ó
2.00
elation = 0.78
1.00
-1.00. 0.00
Jan- Jan- Jan- Dec- Jan- Jan- Jan- Dec- Jan- Jan- Jan- Dec- Jan- Jan- Jan- Dec- Jan
-
94 95 96 96 98 99 00 00 02 03 04 04 06 07 08 08 10
FP_írytlmrephsxJs 6471 944444 2365 Weye ö SF Faci Ci L 84098 Ph. 435E954OZ4 Fas 435653-85:5
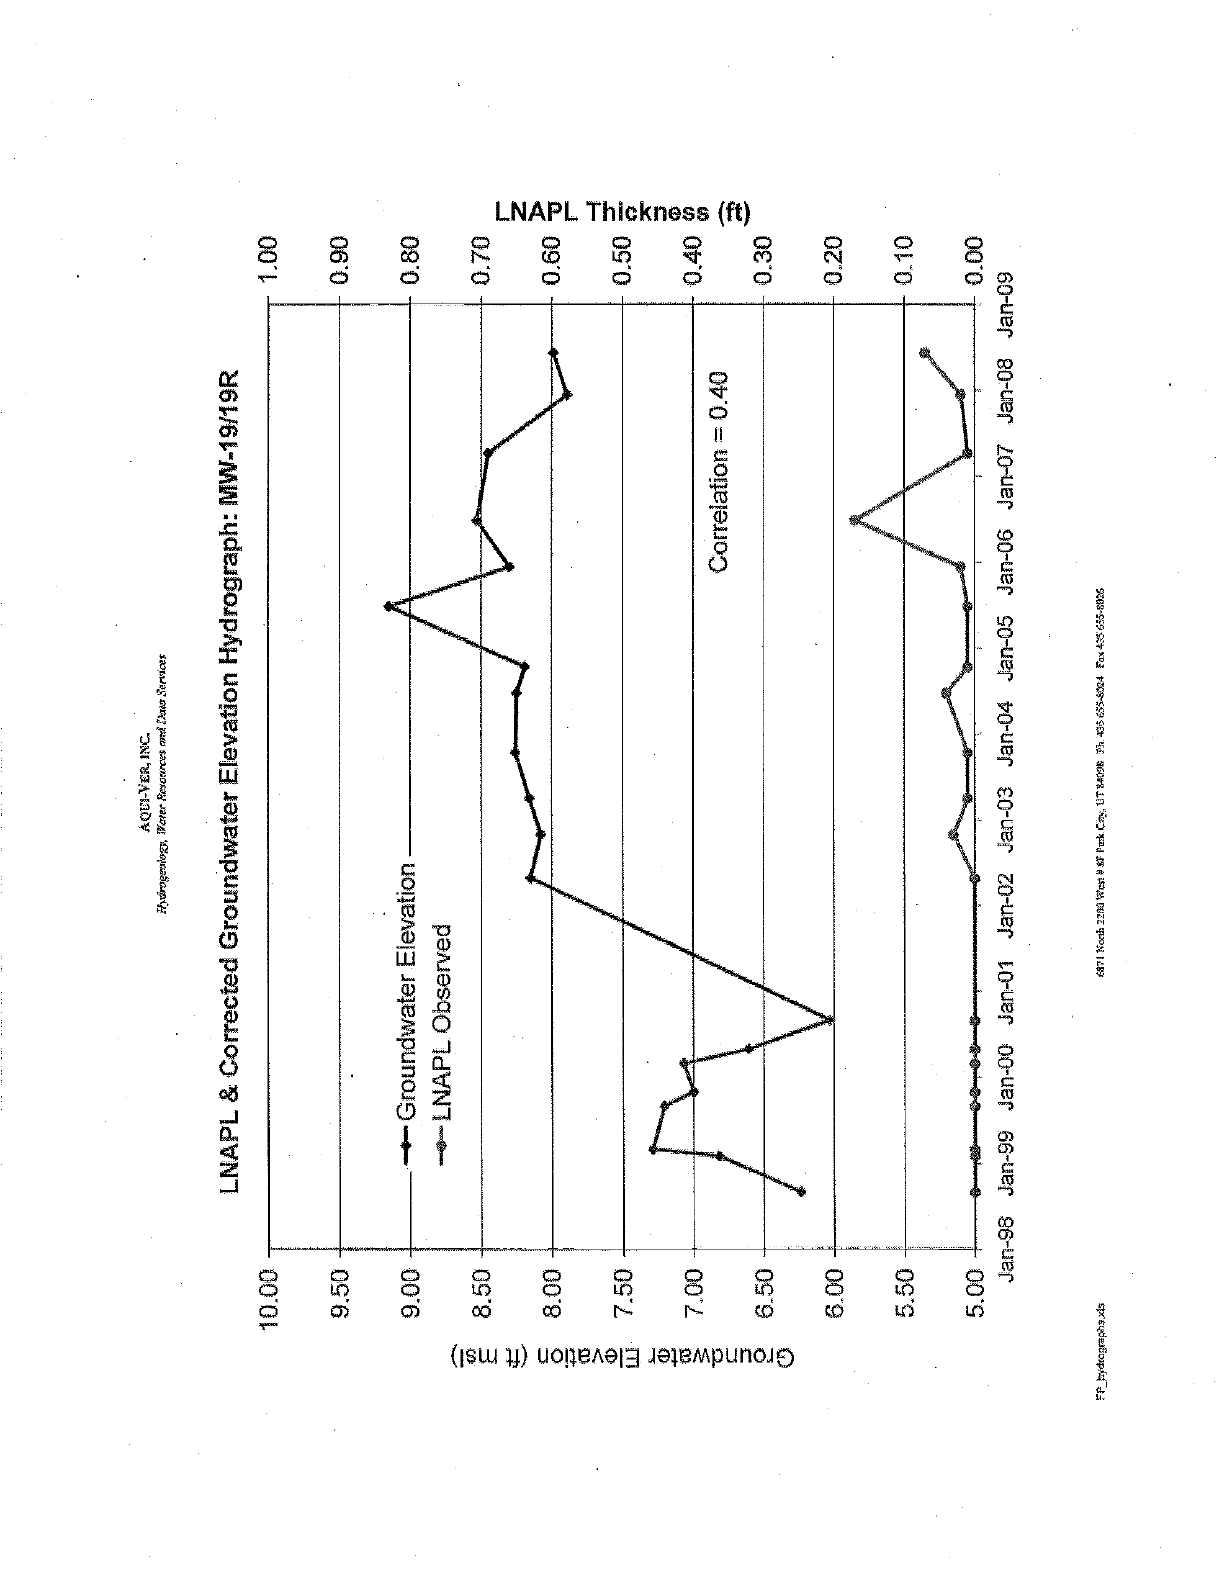
LNAPL Thickness (ft)
CD
Ì`'`+ o °n 0
C3 ri G Ó G7 Ó CQ
9
Ñ
©
(Is
o o 06
u©gG'nal al nnpu noa o
AQULVER,INC,
tpurogaofnpp wow HertománstN Dom d'npolMS
APPENDIX 3 -1
KEY API LNAPL SCREENING INPUT'S AND RESULTS
i1i220UWaSi.9NP MASS D1 F4YA35ag5.NUz
37
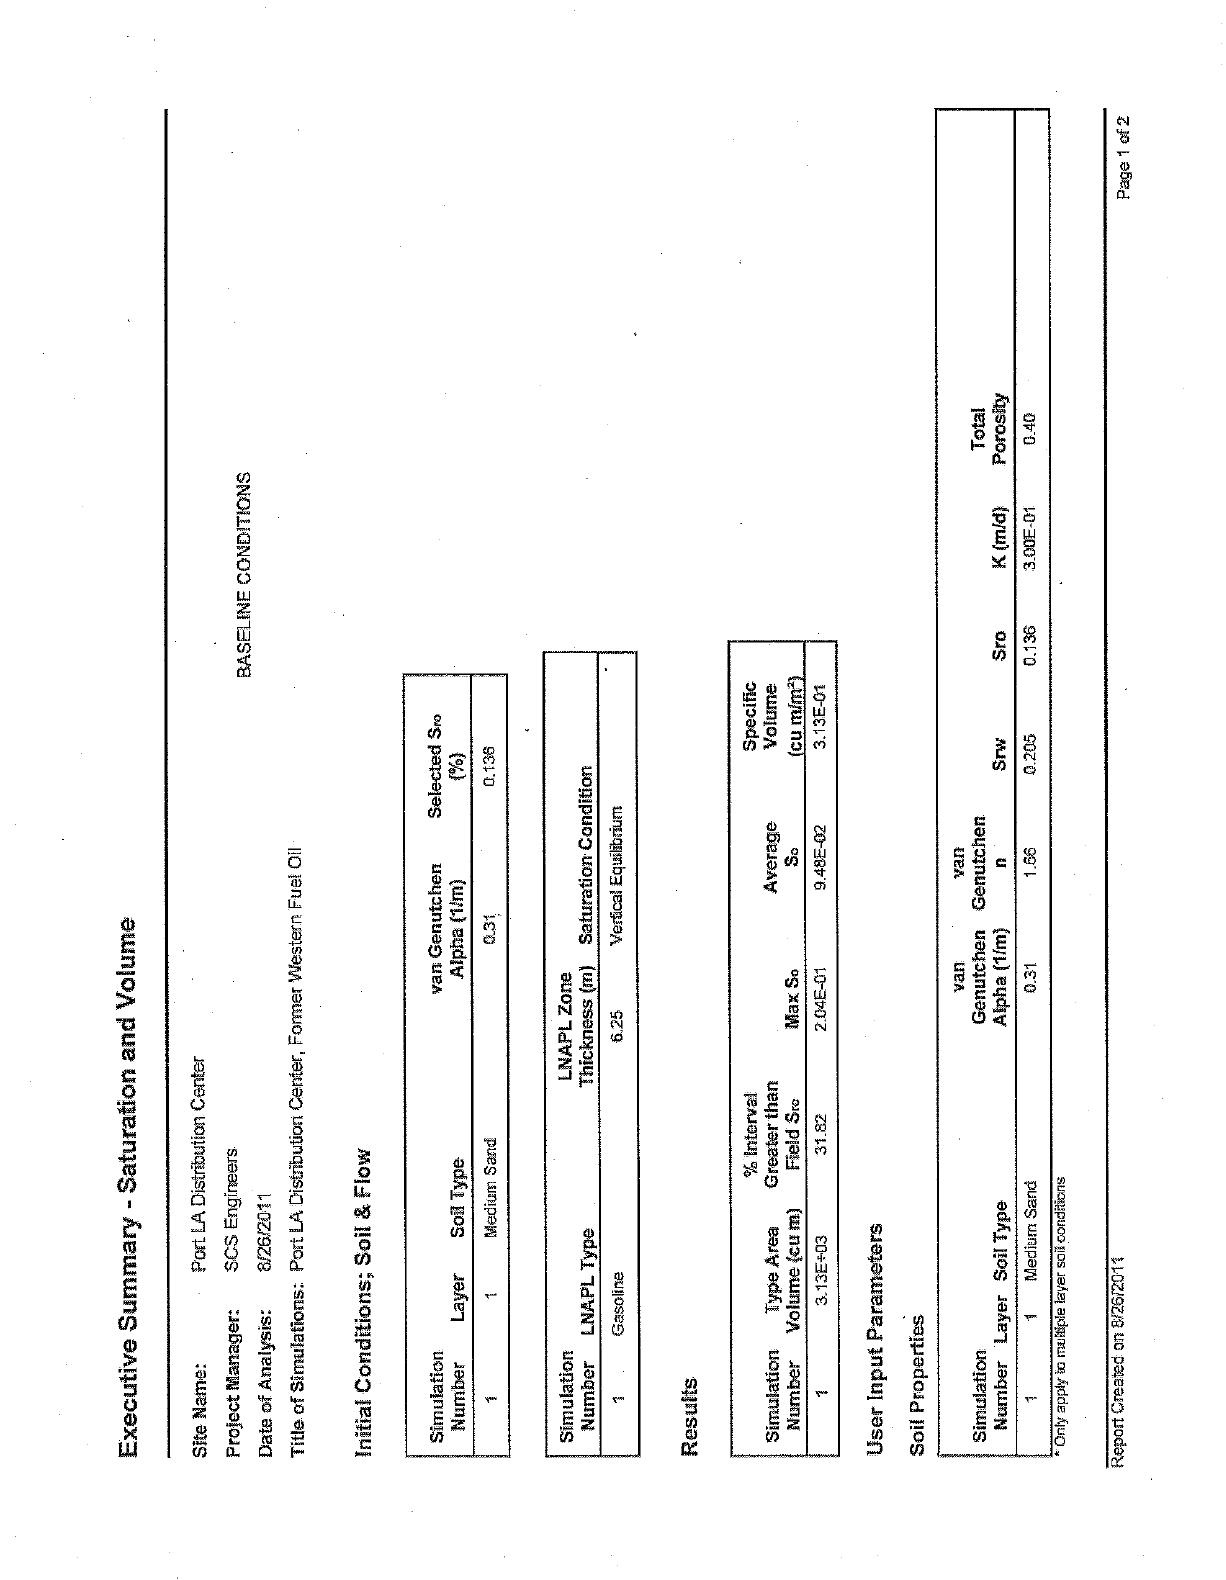
Executive Summary - Saturation and Volume
Site Name: Port LA Distribution Center
Project Manager: SCS Engineers.
Date of Analysis: 8/26/2011
Title of Simulations: Port LA Distribution Center, Former Western Fuel Oil
Initial Conditions; Soil &. Flow
Simulation.
BASELINE CONDITIONS
Number Layer Soil Type
van Genutchen
Alpha (11m)
Selected Sro
(%0)
Medium Sand 0.136
Simulation
Number LNAPL Type
LNAPL Zone
Thickness (m) Saturation Condition
Gasoline 6.25 Vertical Equilibrium
Results
% Interval
Simulation Type Area Greater than
Number Volume (cu m) Field Sro Max So Average
So
Specific
Volume
(cu mime)
3.13E03 31.82 2.04E -01 9.48E -02 3.13E -01
User Input Parameters
Soil Properties
Simulation.
Number Layer Soil Type
van van
Genutchen Genutchen
Alpha (11m) n Srw Total
Sro K (mid) Porosity
1 1 Medium Sand 0.31 1.66 0.205 0.136 3_00E-01: 0.40
* Only apply to multiple layer sail nditbn
Repon Greeted. on 8/26120 Page 1 of 2
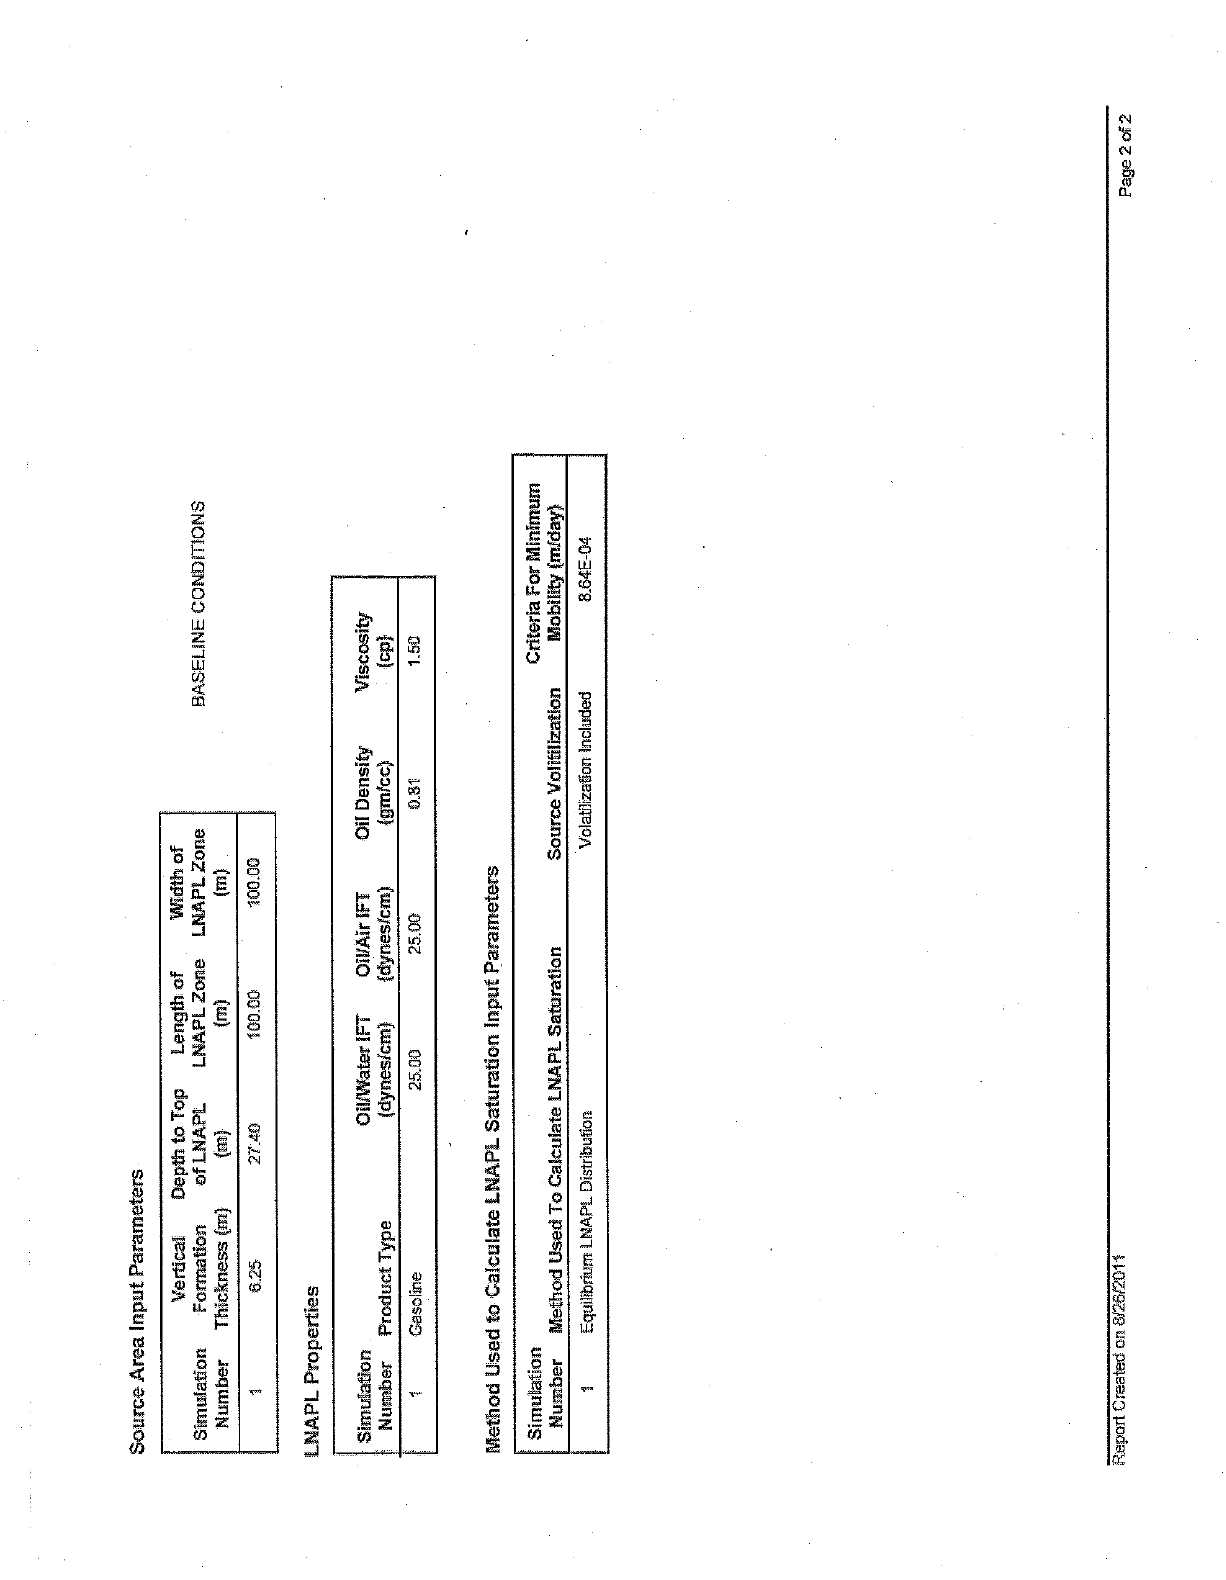
Source Area Input Parameters
Vertical Depth to Top Length of Width of
Simulation Formation of LNAPL LNAPLZone LNAPL Zone BASELINE CONDITION
Number Thickness (m) (an) (m) (m)
6 25 27.40 100.00 100.00
LNAPL Properties
Simulation
Number Product Type
O°il(Water IFT OïUAir WT
(dyneslcm) (dynesTCm)
Oil Density
(gmfcc) Viscosity
(cp)
Gasoline 25.00 25.00 0.81 1.50
Method Used to Calculate LNAPL Saturation Input Pa e
Simulation
Number Method Used To Calculate LNAPL Saturation Criteria For Minimum
Source Volitilization Mobility (mlday)
Equilibrium LNAPL Dístributio Volatilization Included 8.64E -04
Report Created on 8052011 Page 2 of 2
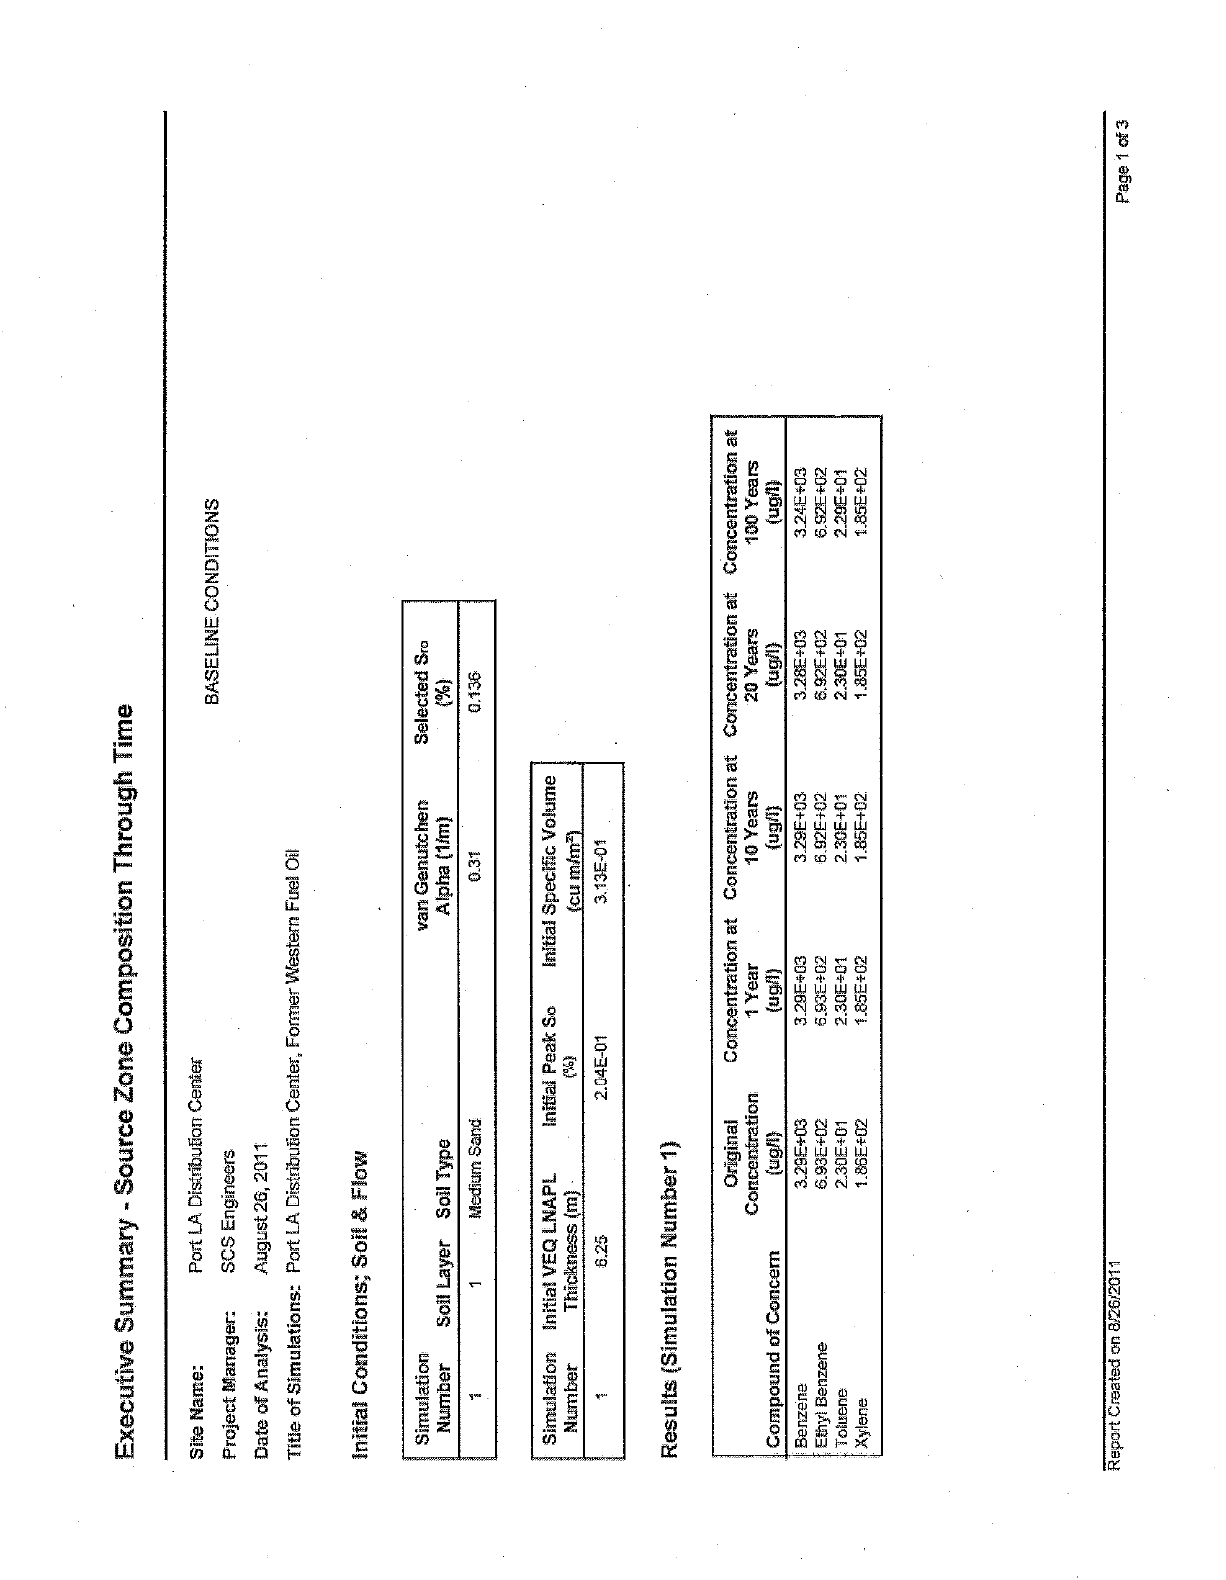
Executive Summary - Source Zone Co position Through Time
Site Name: Port LA Distribution Center
Project Manager:
Date of Analysis:
SCS Engineers
August26., 2011.
Title of Simulations: Port LA Distribution Center, FonnerWestern Fuel Oii
initial Conditions; Soil & Flow
Simulation
BASELINE CONDITIONS
Number Soil Layer Soil Type van Genutchen
Alpha (1fm)
Sel d Sra
1 Medium Sand 0.31 0.136
Simulation Initial VEQ LNAPL
Number Thickness (m) Initial Pe
C51
615 2.04E -01
a Initial Specific Volume
(eu Wm')
3.73E -01
Results (Simulation Number 1)
Original
Compound of Concern Concentration.
(agil)
Concentration at
1 Year
(ugll)
Concentration.
10 Years
(ugh)
ncentration a
20 Years
(agil)
Concentration at
100 Years
(ug11)
Benzene 3.29E+03 3 29E +03 3.29E
+03 328E
+03 324E +03
Et iyl Benzene 6.93E
+02 6.93E+02 6.92E +02 6.92E +02 6.97E +02
Toluene 2.30E +01 2.30E +01 2.30E +01 2.30E
+01 2 29E
+01
Xylene 1 86E+02 1.85E +02 1.85E +02. 1.85E +02 1.85E +02
Report Created on 826/2011 Page 1 of 3
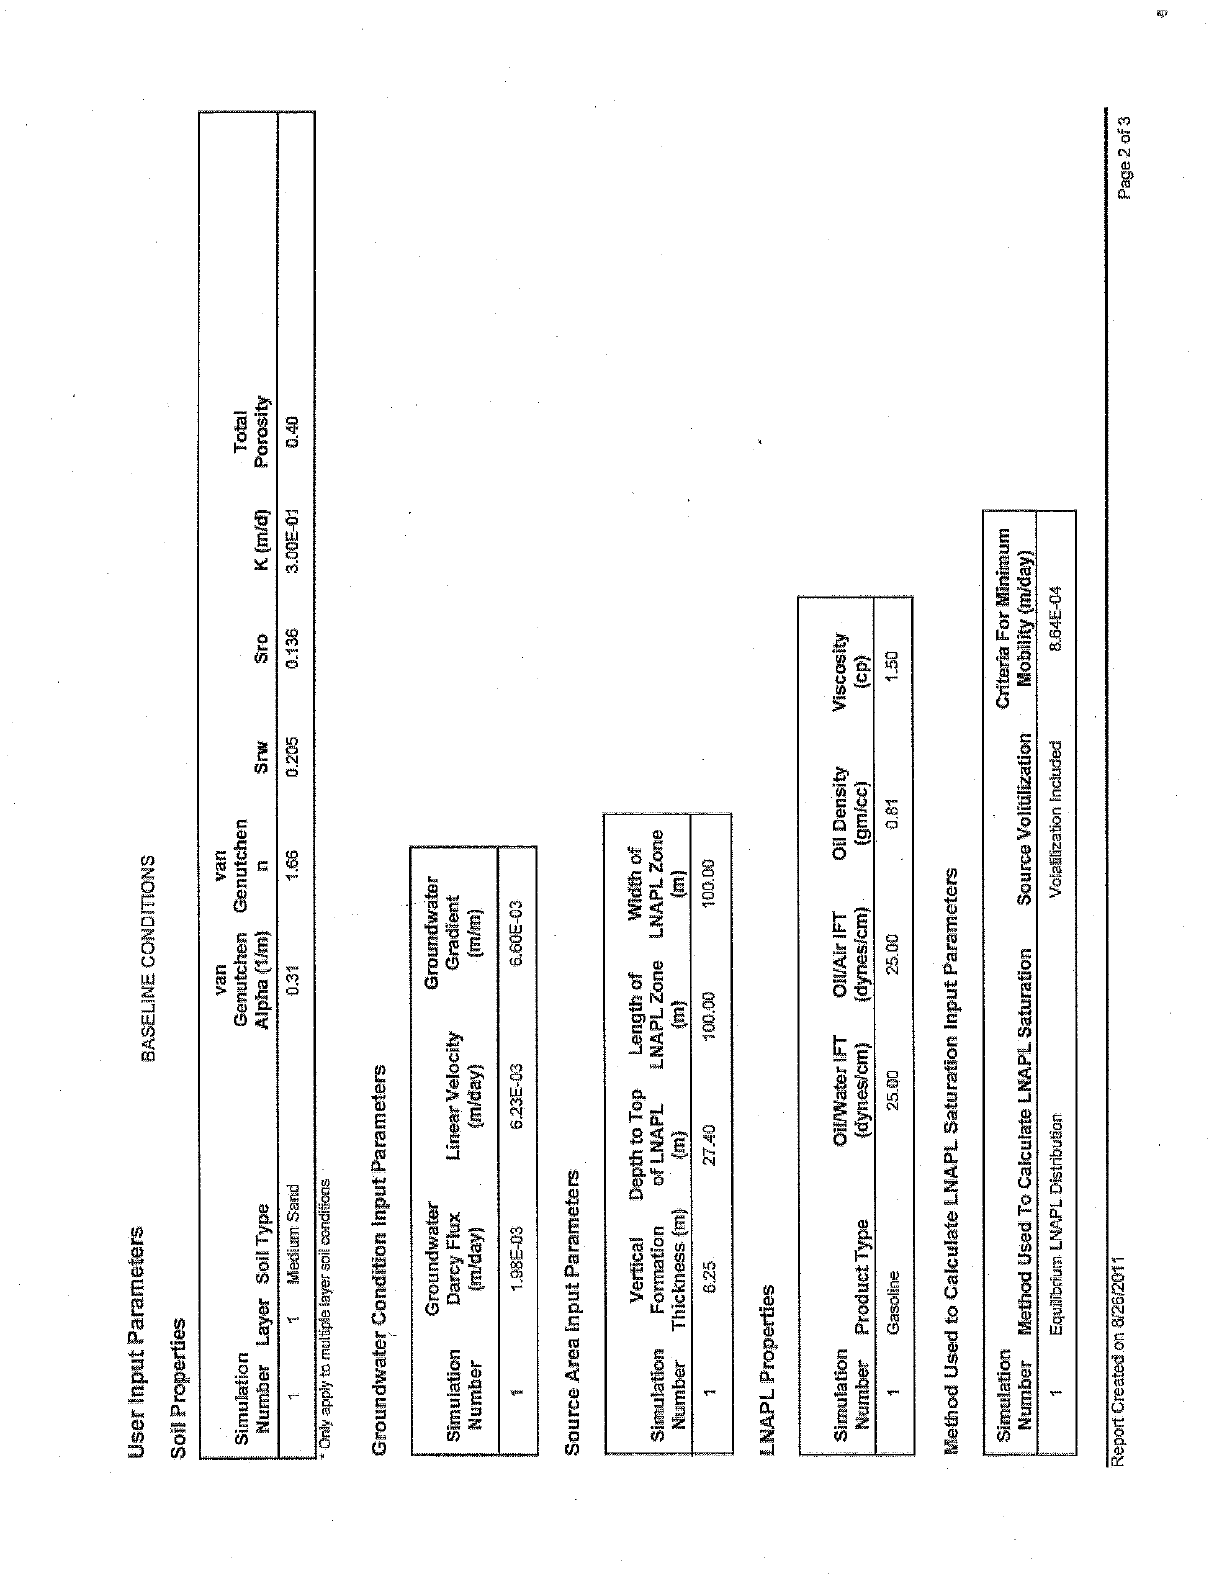
User input Parameters
Soil Properties
BASELINE CONDITIONS
Simulation
Number Layer Soil Type
van van
Genutchen Genutchen
Alpha (11m) n Srw Total
Sr* If (mid) Porosity
1 Medium and 0.31 1.66 0.205 0.136 3.00E-01 0.40
Only apply to multiple layer s s
Groundwater Condition Input
"Pa .eters
Simulation
Number
Groundwater
Darcy Flux Lin
(mid ay) Velocity
day)
Groundwater
Gradient
(min))
1.98E -03 6.23E
-03 fr.60E-03
Source Area input Pa rame
Vertical Depth to Top
Simulation Formation of LNAPL
Number Thickness (m) (m)
Length of
LNAPL Zone
(m)
Width of
LNAPL Zone
(m)
6.25. 27.40 1 ©0.00 100.09
LNAPL Properties
Simulation
Number Product Type OillWater IFT OIIfAIr IFT Oil Density
(dynes /cm) (dyneslcm) (gm /cc) Viscosity
(cp)
Gasoline 25_ùO 25.00 130
Method Used to Calculate LNAPL Satu n Input Parameters
Simulation
Number d Used To Calculate LNAPL Saturation Criteria For Minimum
Source VoliUliization Mobility (mlday)
Equilibrium. LNAPL. Distribution Vofa .ization Included 8:64E-04
Repon Created çrn Page 2 of 3
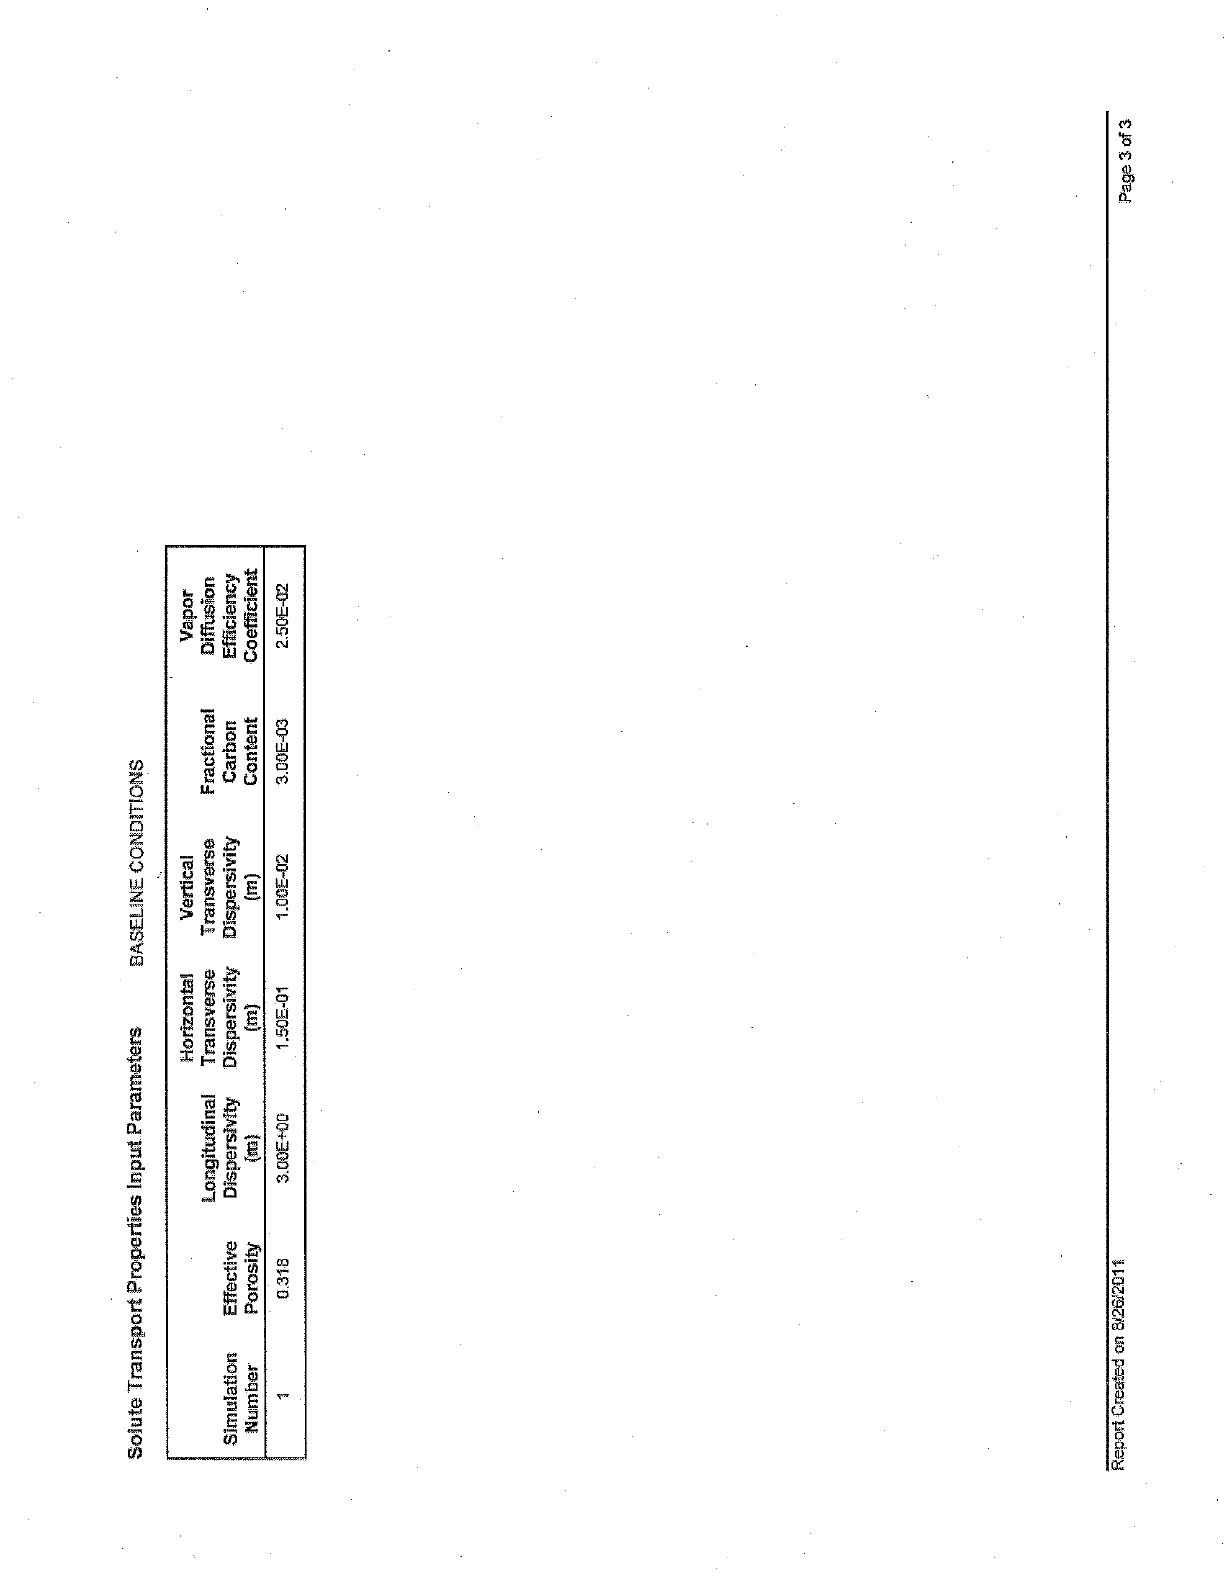
Solute Transport Properties Input Parameters BASELINE CoNlTIDNS
Horizontal Vertical Vapor
Longitudinal Transverse Transverse Fractional Diffusion
Simulation Effective Dispersivity Dispersivity Dispersivity Carbon Efficiency
Number Porosity (in) (m) (m) Content Coefficient
0.318 3.00E+00 101E -01 1.00E
-02 3.00E -03 2.50E
-62
Report Created on 8/26/2011 Page 3 of 3
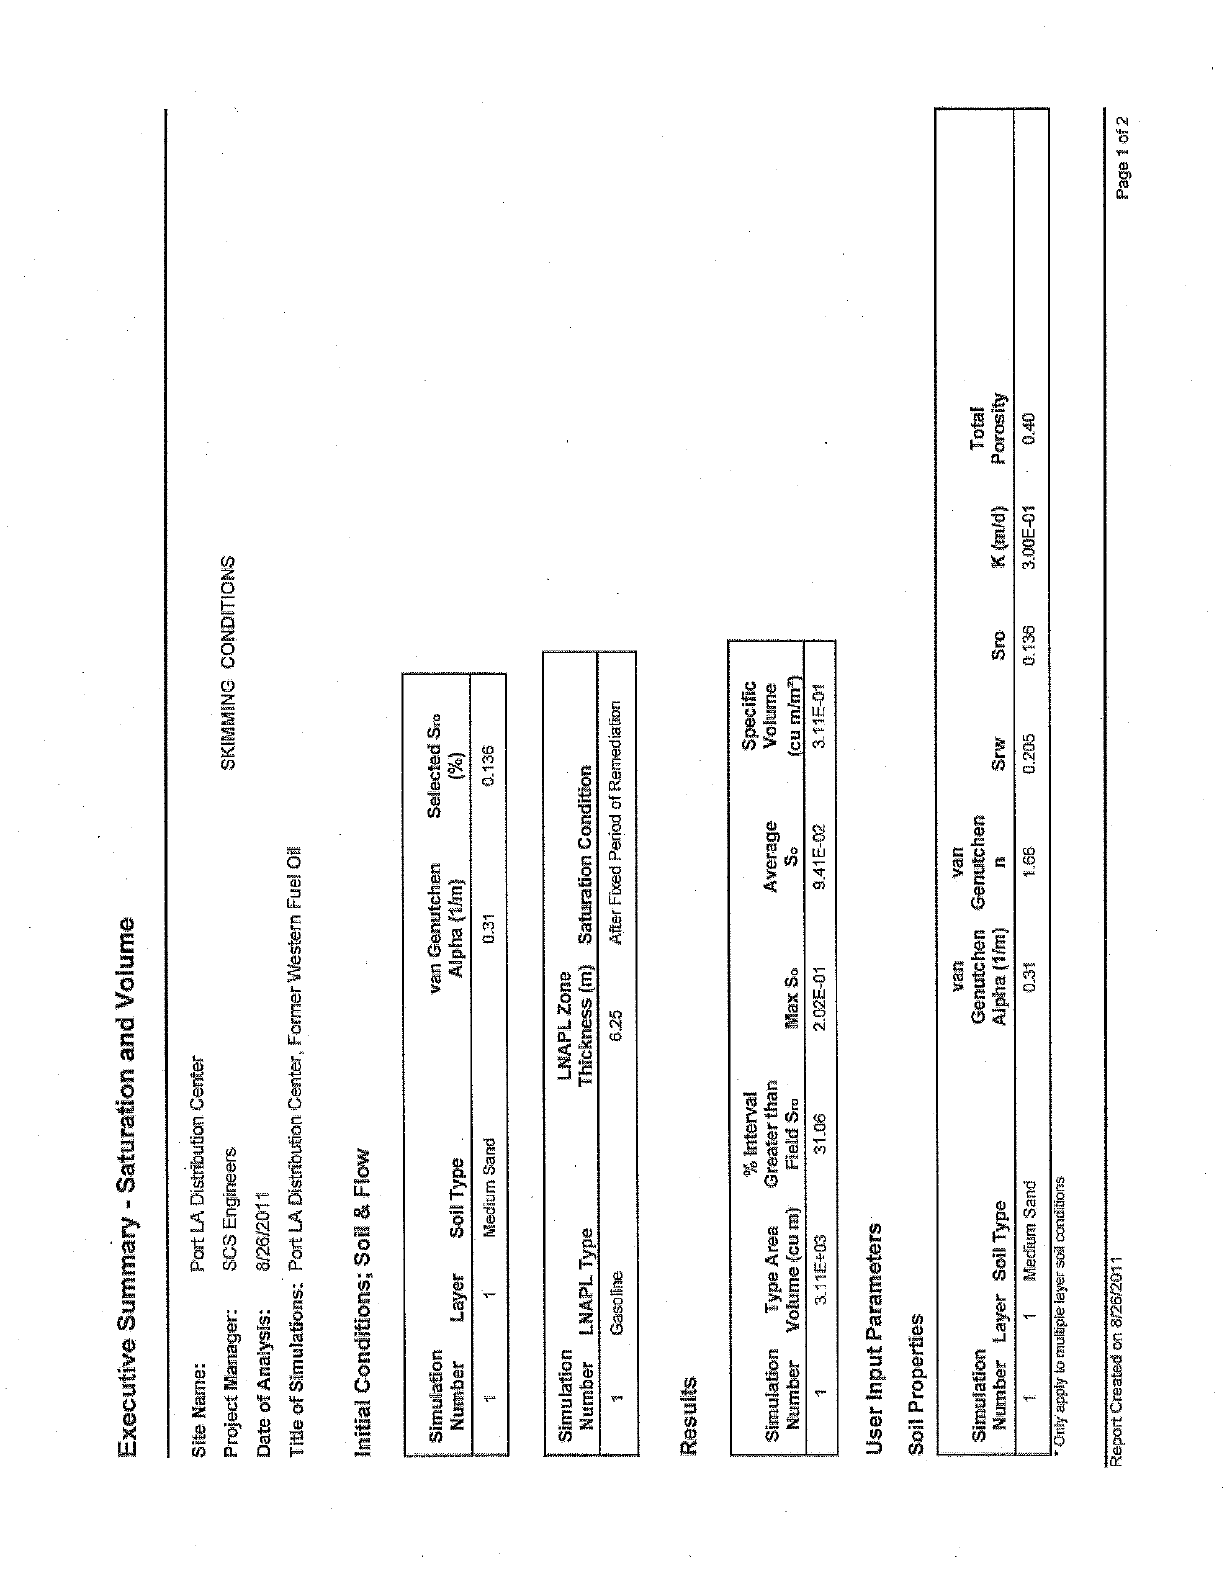
Executive Summary - Satu ion and Volume
Site Name:
Project Manager:
Date of Analysis:
Port LA Distribution Center
SCS Engineers
8/26/2011
Title of Simulations: Port LA Distribution Center, Former Western Fuel Oil
Initial Conditions; Soii & Flow
SKIMMING CONDITIONS
Simulation
Number Layer Soil Type
van Genutchen Selected Sro
Alpha (11m) ( °Je)
Medium Sand 0.31 fl_136
Simulation
Number LNAPL Type
LNAPL Zone
Thickness (m) Saturation Condition
Gasoline 625 After Fixed Period of Remediation
Results
% Interval
Simulation Type Area Greater than
Number Volume {cu mi Field'. Sro Max So Average
So
Specific.
Volume
(cu mime)
3.11E+03 31.06 2.02E-01 9.41 E-02 111E-01
User Input Parameters
Soil Properties
Simulation
Number Layer Soil Type
van van
Genutchen Genutchen
Alpha (11m) n Srw Total
Sro K (mid) Porosity
1 Medium Sand 0.31 t66 0.205 0.136 3.00E-01 GAO
' Only apply to multiple la soil conditions
Report Created on 8726/2011 Page 1 of 2
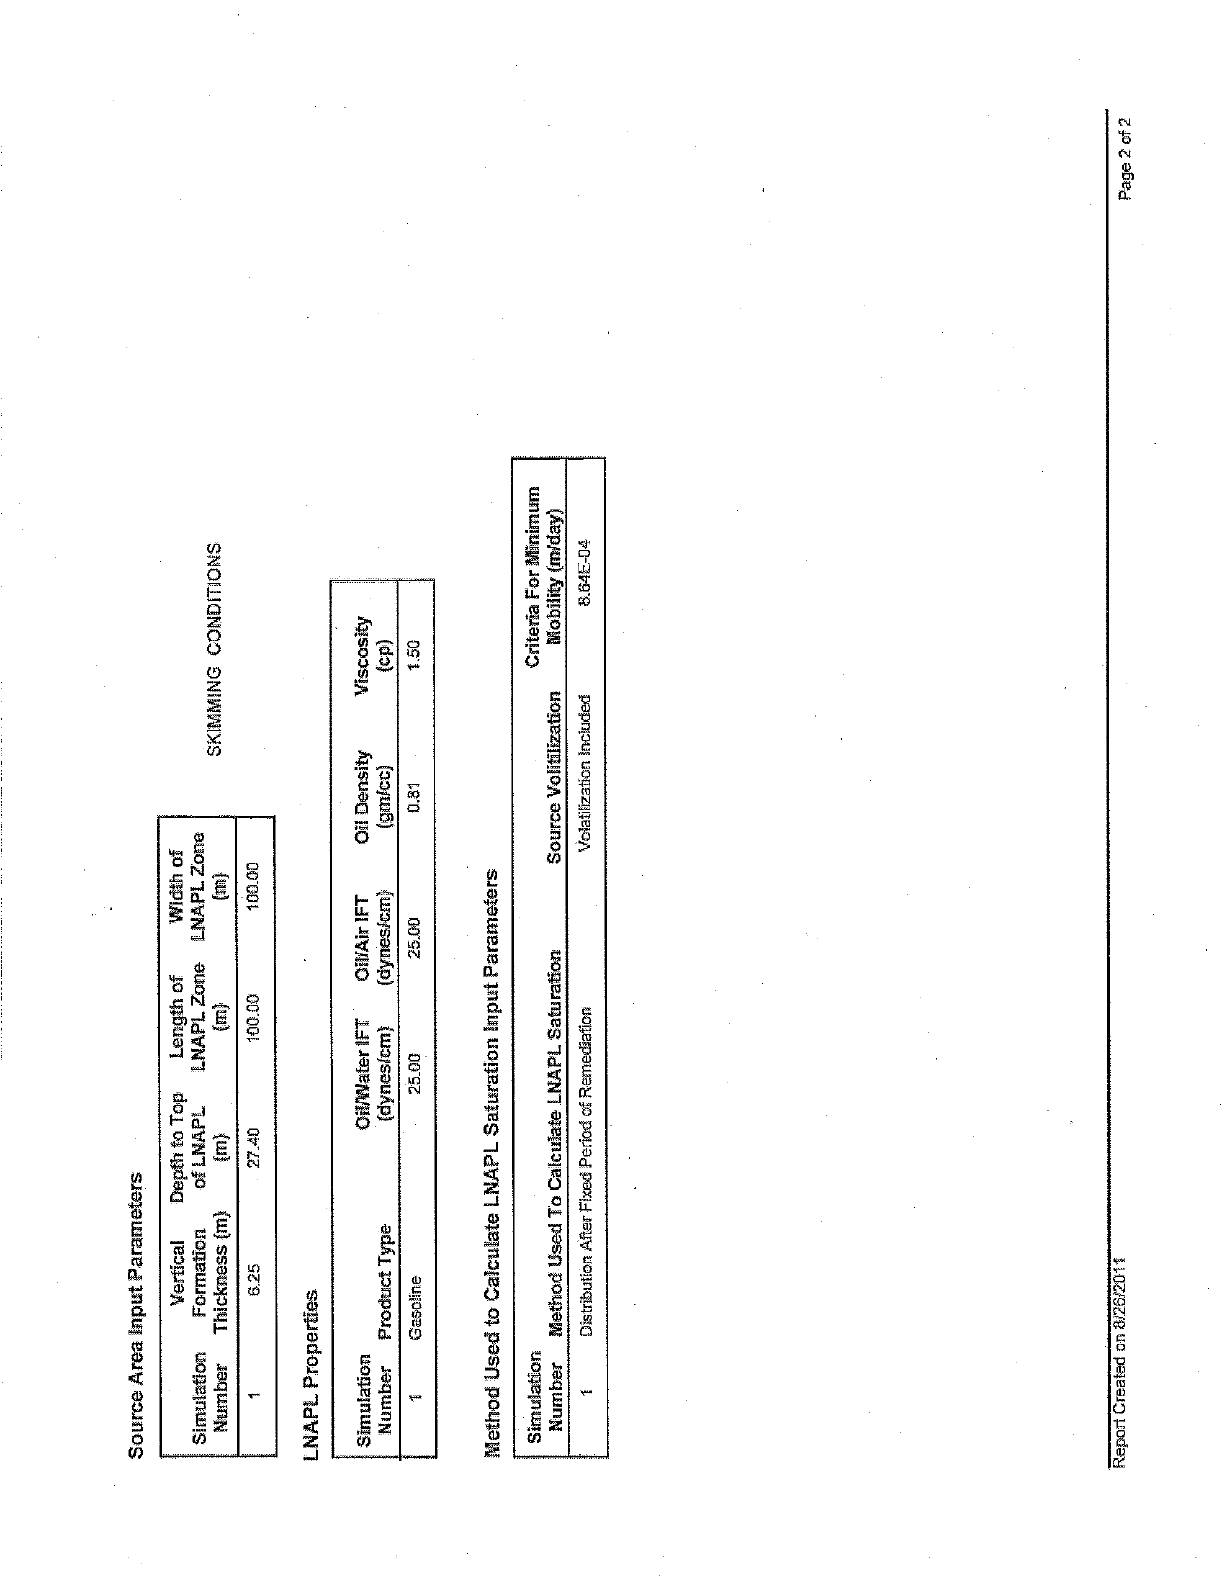
Source Area input Parameters
Simulation
Number
Vertical Depth to Top
Formation of LNAPL
Thickness (m) (m)
Length of
LNAPL Zone
(m)
Width of
LNAPL Zone
(m)
6.25 27.40 100.00 i boo0
LNAPL Properties
SK.Í513MIN CONDITIONS
Simulation ©il/Water IFT ©iÍlAir IFT Oil Density Viscosi
Number Product Type (dynes /cm) (dynes/cm) (gm /cc)
Gasoline 25_00 25.00 0.81 1.50
Method Used to Calculate LNAPL Saturation Input Parameters
Simulation Criteria For Minimum
Number Method Used To Calculate LNAPL Saturation Source Volitilization Mobility (rnlday)
Distribution After Fixed Period of Remedietion Volatilization Included 8.64E -04
Report Created on 8/26M20 Page 2 of 2
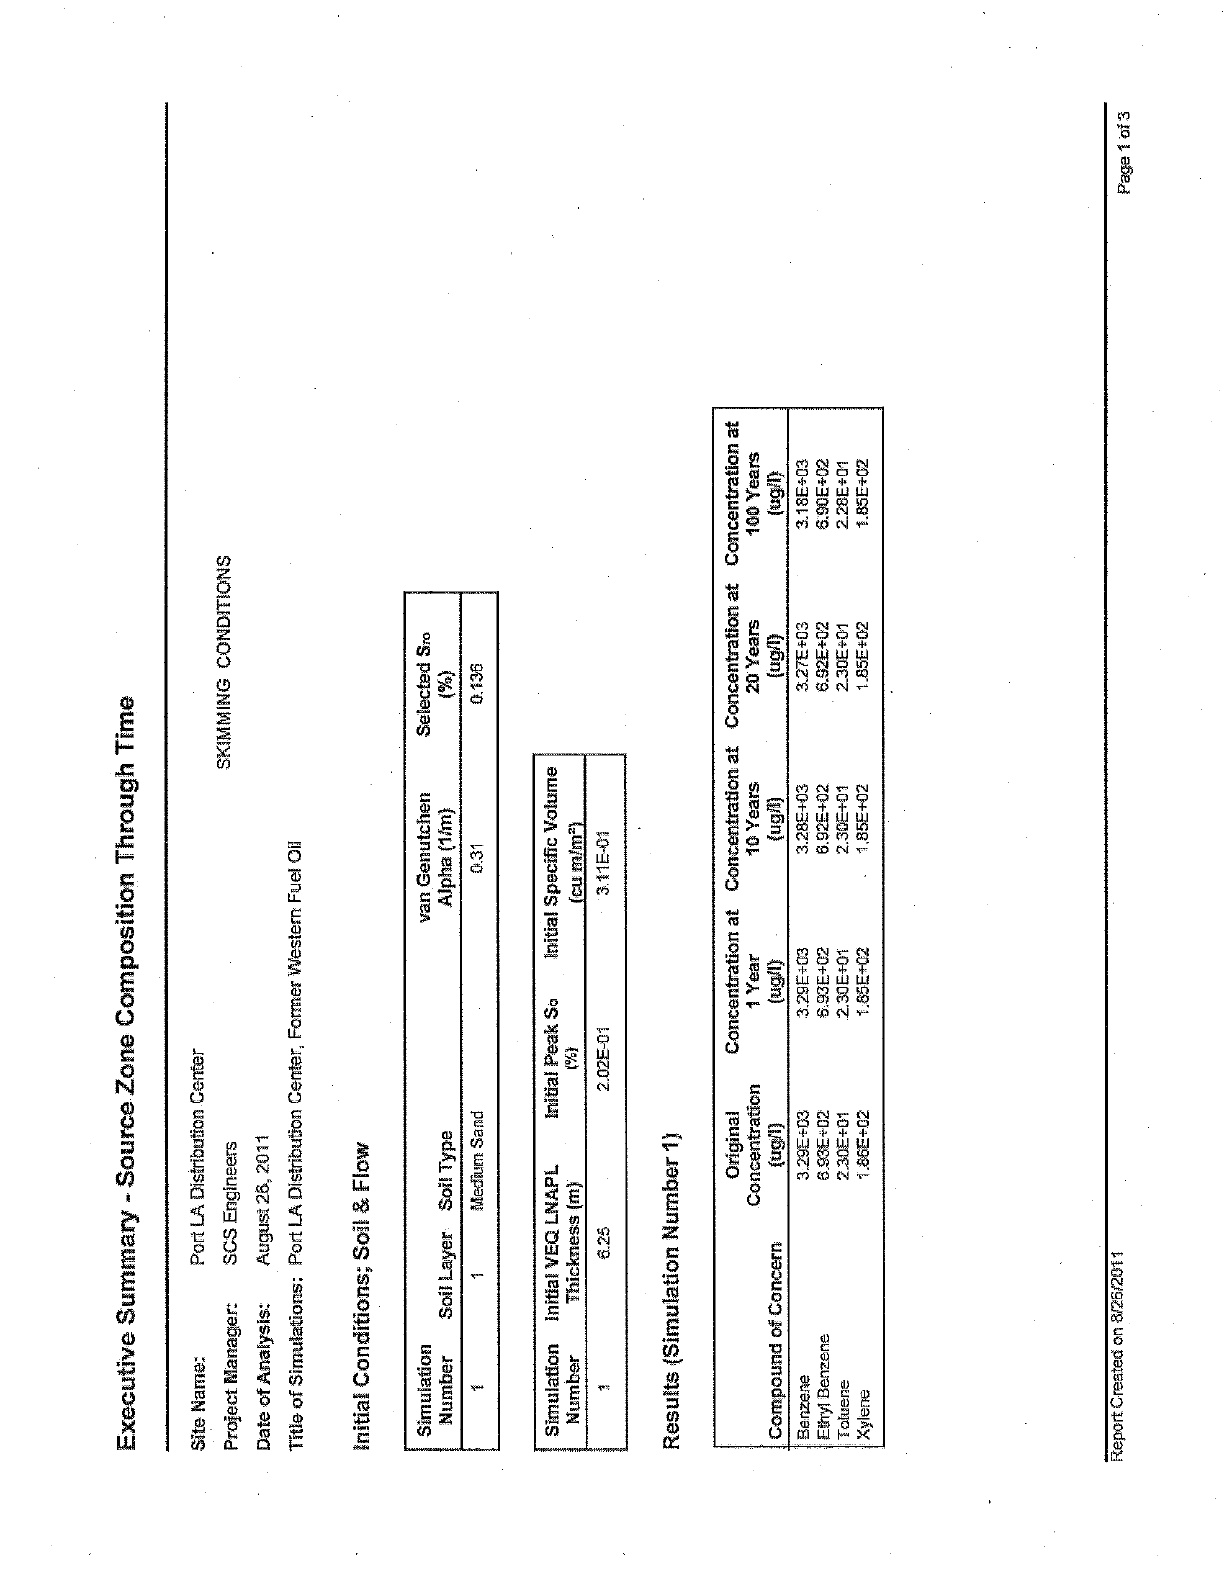
Executive Summary - Source Zone Composition Through Time
Site Name:
Project Manager:
Date of Analysis:
Title of Simulations:
Port LA Distribution Center
SGS Engineers
August 26, 2011
Port LA Distribution Center, Fo
Initial Conditions; Soil & Flow
er Western Fuel Oil
SKIMMING CONDITIONS
Simulation
Number Soil Layer on Type van. Genutchen Selected Sm
Alpha (1 /m) ( %)
and 0.31 0.136
Simulation Initial VEQ LNAPL
Number Thickness (m)
1 6.25
Initial Peak So
1 %i
2 02E-01
Initial pecific Volume
(eu mim)
3.51E -01
Results {Simul tion Number 1)
Compound of Concern
Original
Concentration.
(ug/I)
Concentration at Concentration at Concentration at
1 Year 10 Years 20Years
(ugh) (ugR) (ug/1)
Concentration at
100 Years
(vg
/1)
'IBenzene 3.29E +03 3.29£+03 3.28E+03 3.27E+03 3.18E +03
Ethyl Benzene 6.93E +02 6.93E +02 6.92E+02 6.92E+02 6.9ÓE +02
Toluene 2.30E +01 2.30E +01 2;30E+01 230E+01 2 28E +01
Xylene 1.86E
+02 1.85E +02 1.85E+02 1.85E+02 1.85E +02
Report Created on 8126/2011 Page 1 of 3

User Input Paramete
Soil. Properties
Simulation
Number Layer Soil Type
van van
Genutchen Genutchen
Alpha (11m) n Sro Total
K (mid) Porosity
1 1 Medium Sand 0.31 1.66 0205 3.00E -01 0.40
a lay ñl ndiEío
Groundwater Condition input Parameters
Simulation
Number
Groundwater
Darcy Flux
(mlday)
Groundwater
Linear Velocity Gradient
(mlday) (mim)
1.98E -03 6.23E -03 6.60E -03
Source Area Input Parameters.
Vertical
Simulation Formation
Number Thickness (n)
Depth to Top Length of
of LNAPL LNAPL Zone
(m) (m)
Width of
LNAPL Zone
(m)
625 27.40 t 00.00 100:00
LNAPL Properties
SKIMMING CONDITIONS
Simulation
Number Product Type Oil/Water IFT Oil/Air IFT Oil Density
(dynes/cm) (dynes/cm) (gmicc) Viscosity
(cp)
Gasoline 25.00 25:00 0.81 1.50
Method Used to Calculate LNAPL S oration Input Parameters
Ligation
rober Method Used To Calculate LNAPL Saturation Criteria For Minimum
Source Voliti lization Mobility(nlday)
Distribution After Fixed Period of Re Volatilization Included 6.64E -04
Report Created on 8/26/2011 Page 2 of 3
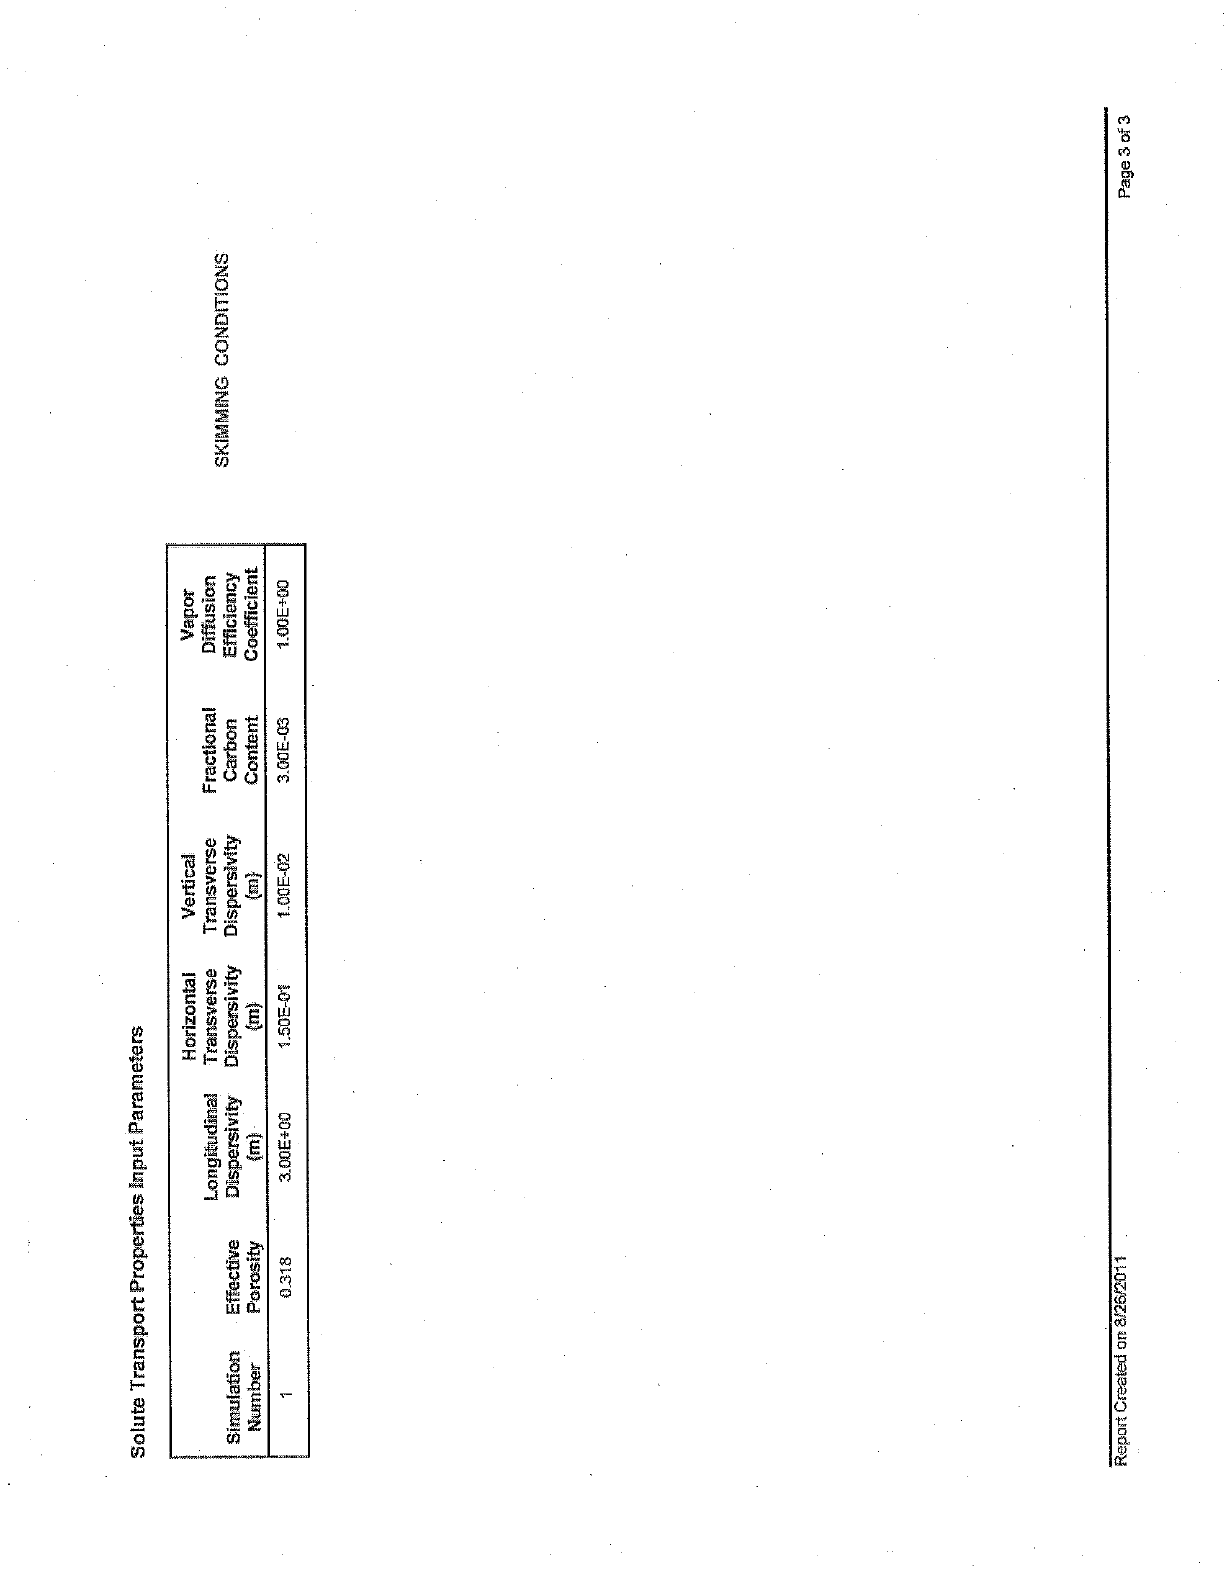
Solute Transport Properties input Parameters
Simulation
Number Effective
Porosity
Longitudinal
Dispersivity
(m) -
Horizontal
Transverse
Dispersivity
(m)
Vertical
Transverse
Dispersivity
(m}
Fractional
Carbon
Content
Vapor
Diffusion
Efficiency
Coefficient
SKIMMING CONDITIONS
1 0318 3.00E+00 1.50E-01 1.00E-02 100E-03 1.00E+00
Report Created on 812 Page 3of3
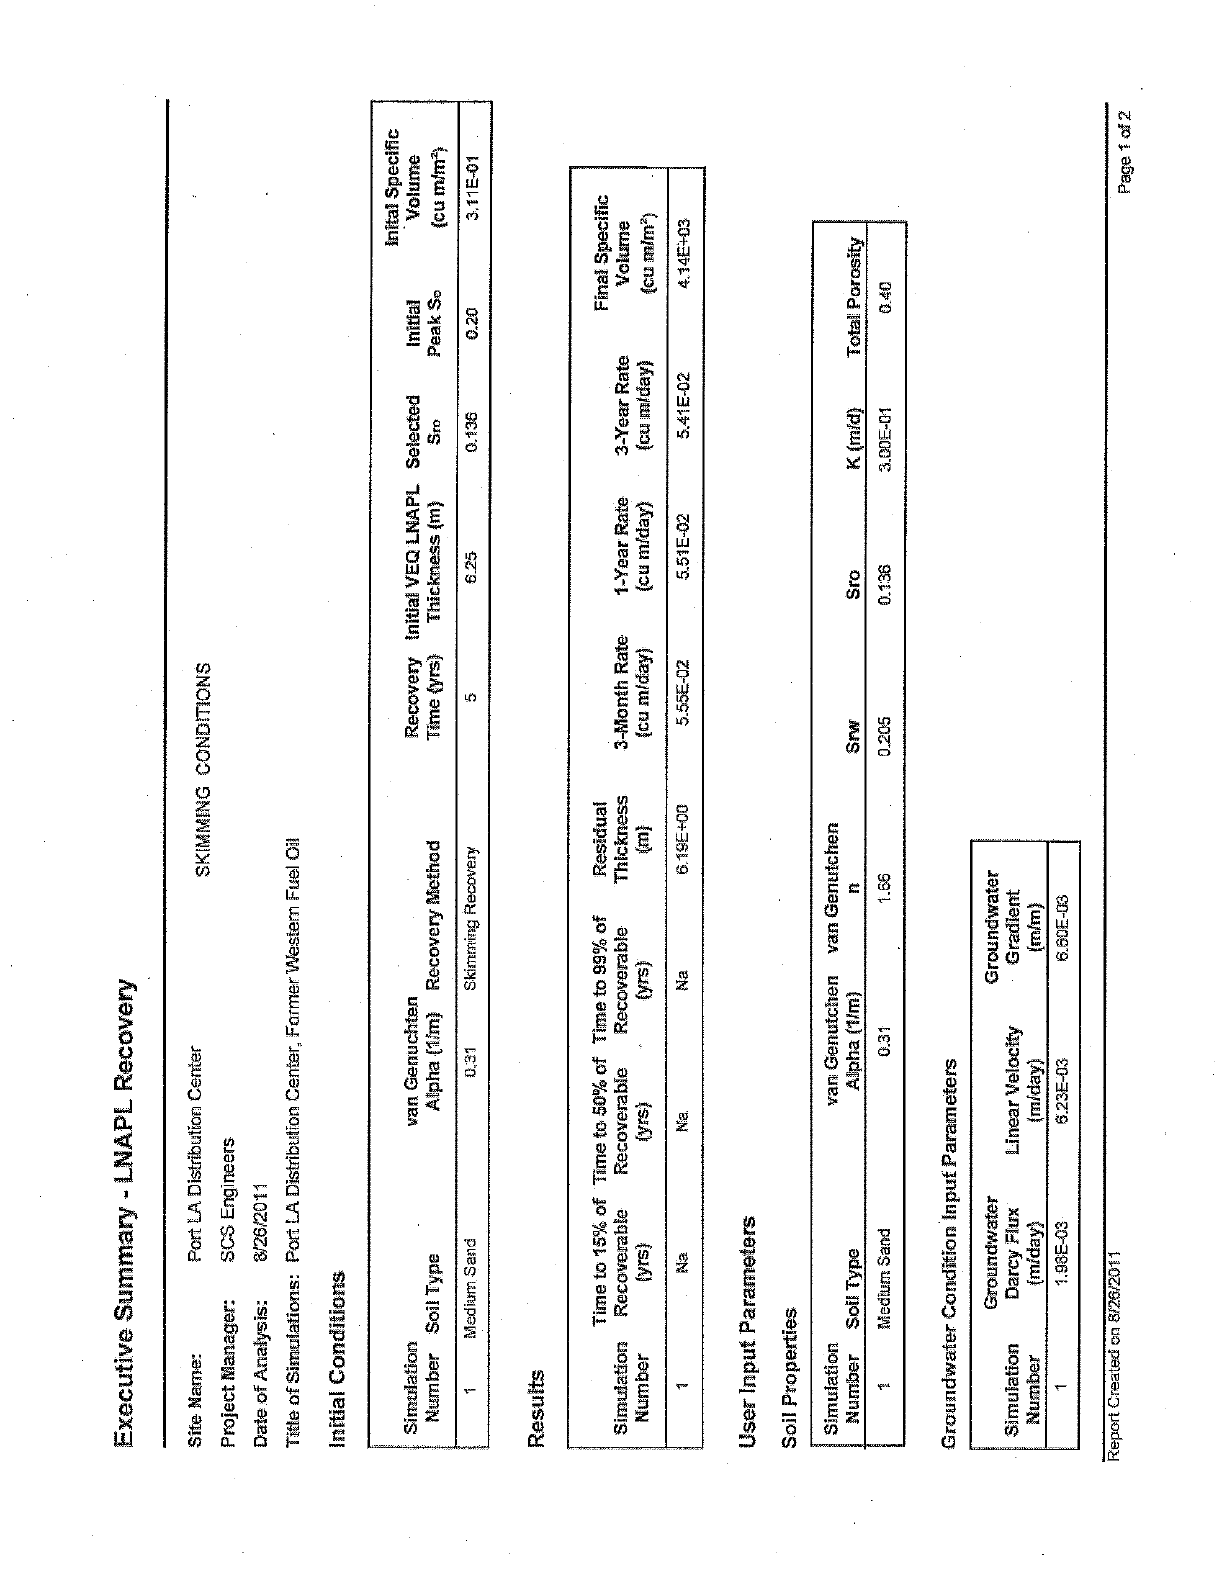
Executive Summary - LNAPL Recovery
Site Name:
Project Manager:
Date of Analysis:
Port LA Distribution Center
SOS Engineers
8/26/2011
SKIMMING CONDITIONS
Title of Simulations: Port LA Distribution Center, Former Western Fuel ©il
Initial Conditions
Simulation
Number Soil Type van Genuchten
Alpha (11m overy Method Recovery Initial VEQ LI
Time (yrs) Thickness (m) Sele Initial
Peak So
Inital Specific
Volume
(cu mine)
Medium Sand Skimming Recovery 625 0.136 020 3.11E -01
Results
Time to 15% of Time to 50% of Time to 99% of Residual
Simulation Recoverable Recoverable Recoverable Thickness
Number (Sirs} (Yrs) (Sirs) (m} 3 -Month Rate 1 -Year Rate
(cu mfday) (cu mfday) 3-Year Rate
(cu mfday)
Final Specific
Volume
(eu mire
Na Na 6.19E +00 5.55E -02 5.51E-02 5.41E-02 4.14E+03
User Input. Parameters
Soil Properties
Simulation
Number Soil Type van Genutchen van Genutchen
Alpha (1/m) n Srw Sro K (mld) Total Poro
fuiedium Sand 6.31 1.66 0205 0.136 3.00E -01 0.40
Groundwater Condition Input Parameters
Simulation
Number
Groundwater
Darcy Flux
{mfday}
Groundwater
Linear Velocity Gradient
(mfday) (Eft)
1.98E-03 ú23E -03 6.60E -03
Report Created on 8/26/2011 Page 1 of 2
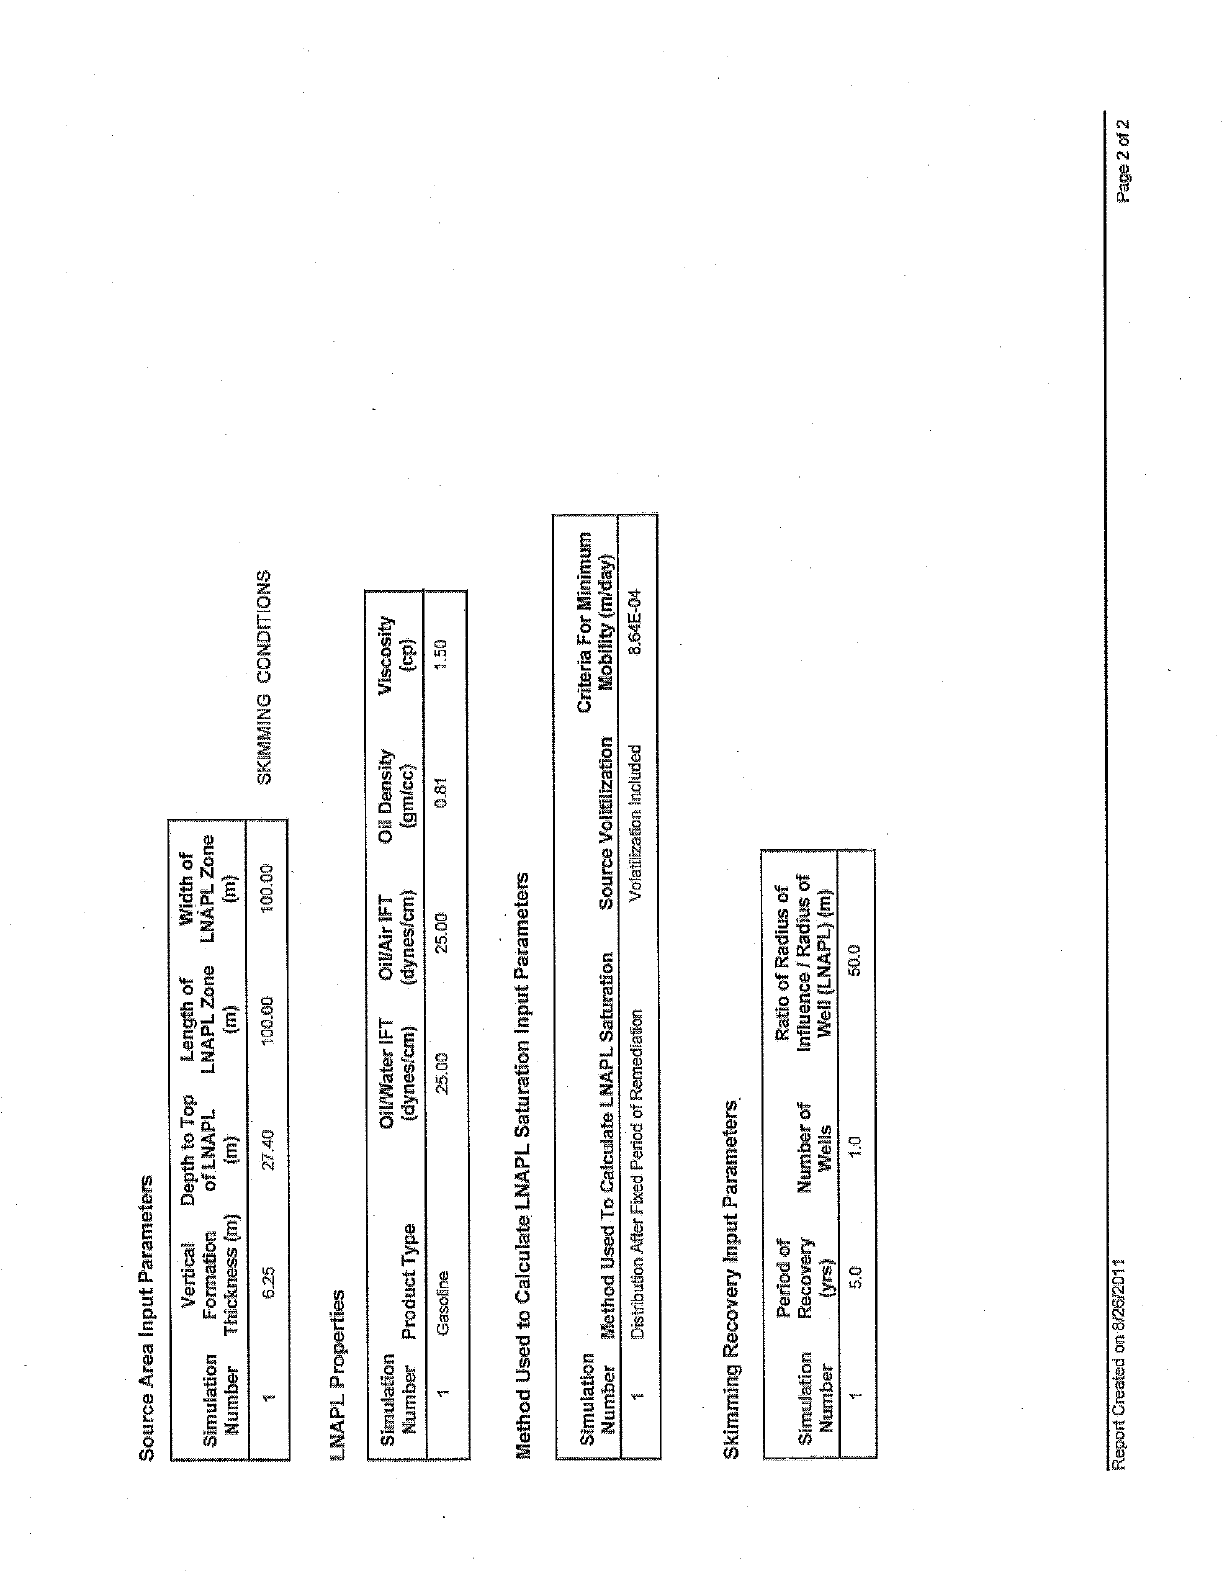
Source Area Input Parameters
Simulation
Number
Vertical Depth to Top
Formation of. LNAPL
Thickness (m) (m)
Length of
LNAPL Zone
(m)
Width of
LNAPL Zone
(m)
t 6.25 2740 100.00 100.00
LNAPL Properties
SKIMMING CONDITIONS
Simulation Oi'IANater IFT Oil/Air IFT
Number Product Type (dynes!cm) (dynes/cm)
Oil Density
(gmlcc)
Viscosi
(cp)
Gasoline 25.00 25.00 0_Sf 1.50
Method Used to Calculate L. Sa n Input P ameters
Simulation
Number Method. Used. To Calcula NAPL Saturation. Criteria For Minimum
Source Volitilization Mobility (mlday)
Distribution After. Fixed. Pero. mediati -on. Volatilization Included 8.64E-04
Skimming Recovery input Parameters.
Period of
Simulation Recovery Number of
Number (Yrs) Wells
Ratio of Radius of
Influence 1 Radius of
Well (LNAPL) (m)
5.0 50.0
Rep orf Created on 8126/2011 Page 2 oft
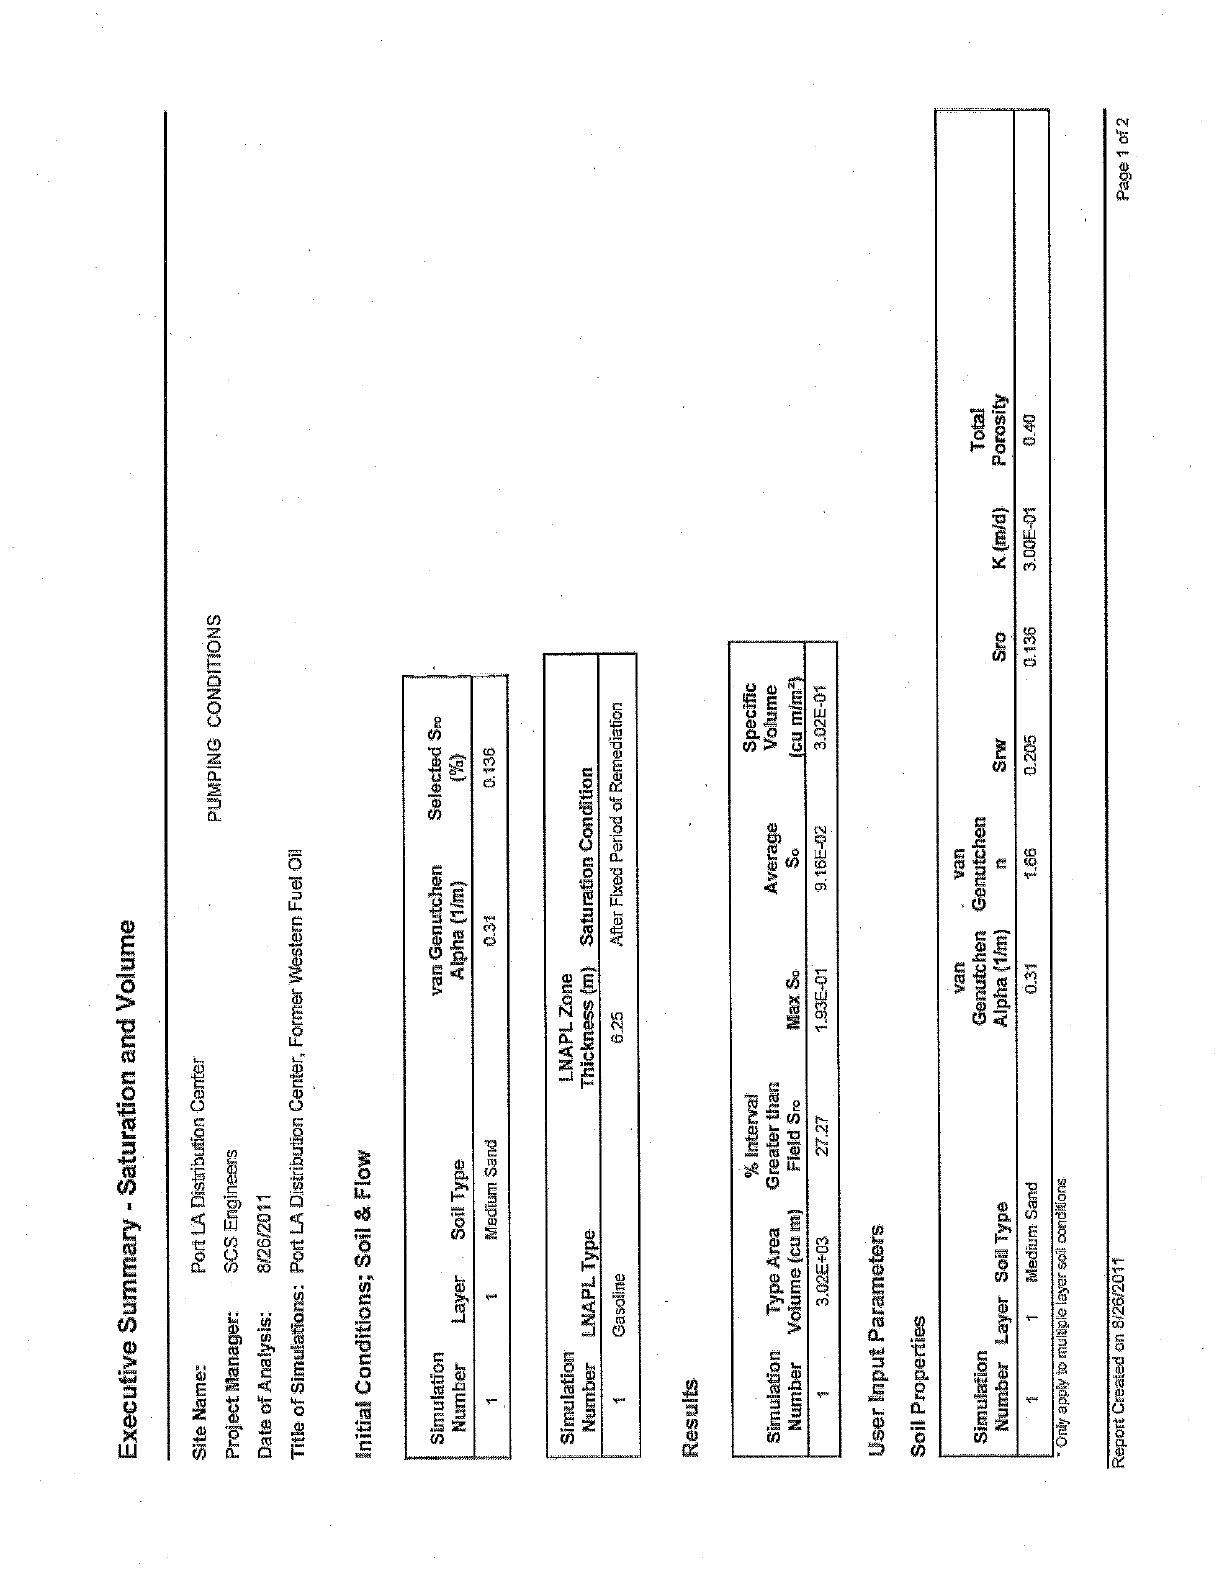
Executive Summary - Saturation and Volume
Site Name: Port LA Dist bution Center
Project Manager: SCS Engineers
Date of Analysis: 8126(2011
Title of Simulations: Port LA Distribution Center, Former Western Fuel Oil
Initial Conditions; Soil. & Flow
Simulation
PUMPING CONDITIONS
Number Layer Soil Type
van Genutchen
Alpha (11m)
Selected Sro
(%)
Medium Sand 031 0.136
Simulation
Number LNAPL Type
LNAPL Zone
Thickness (m) Saturation Condition
Gasoline 625 After Fixed Period in Remediation
Results
% interval
Simulation Type Area Greater than
Number Volume (cu m) Field Sro Max So Average
50
Specific
Volume
(cu mime
3.02Eí-03 27.27 1 93E -01 9.16E -02 3.02E -01
User Input Parameters
Soil Properties
Simulation
Number Layer Soil Type
van van
Centric hen Genutchen
Alpha (11m) n Srw Sra Total
K.(mld) Porosity
1 Medium Sand 1.66 0205 3:00E-01
' Gnñ} apply to mullipié di ans.
Report Created an 8126/2011 Page 1 of 2
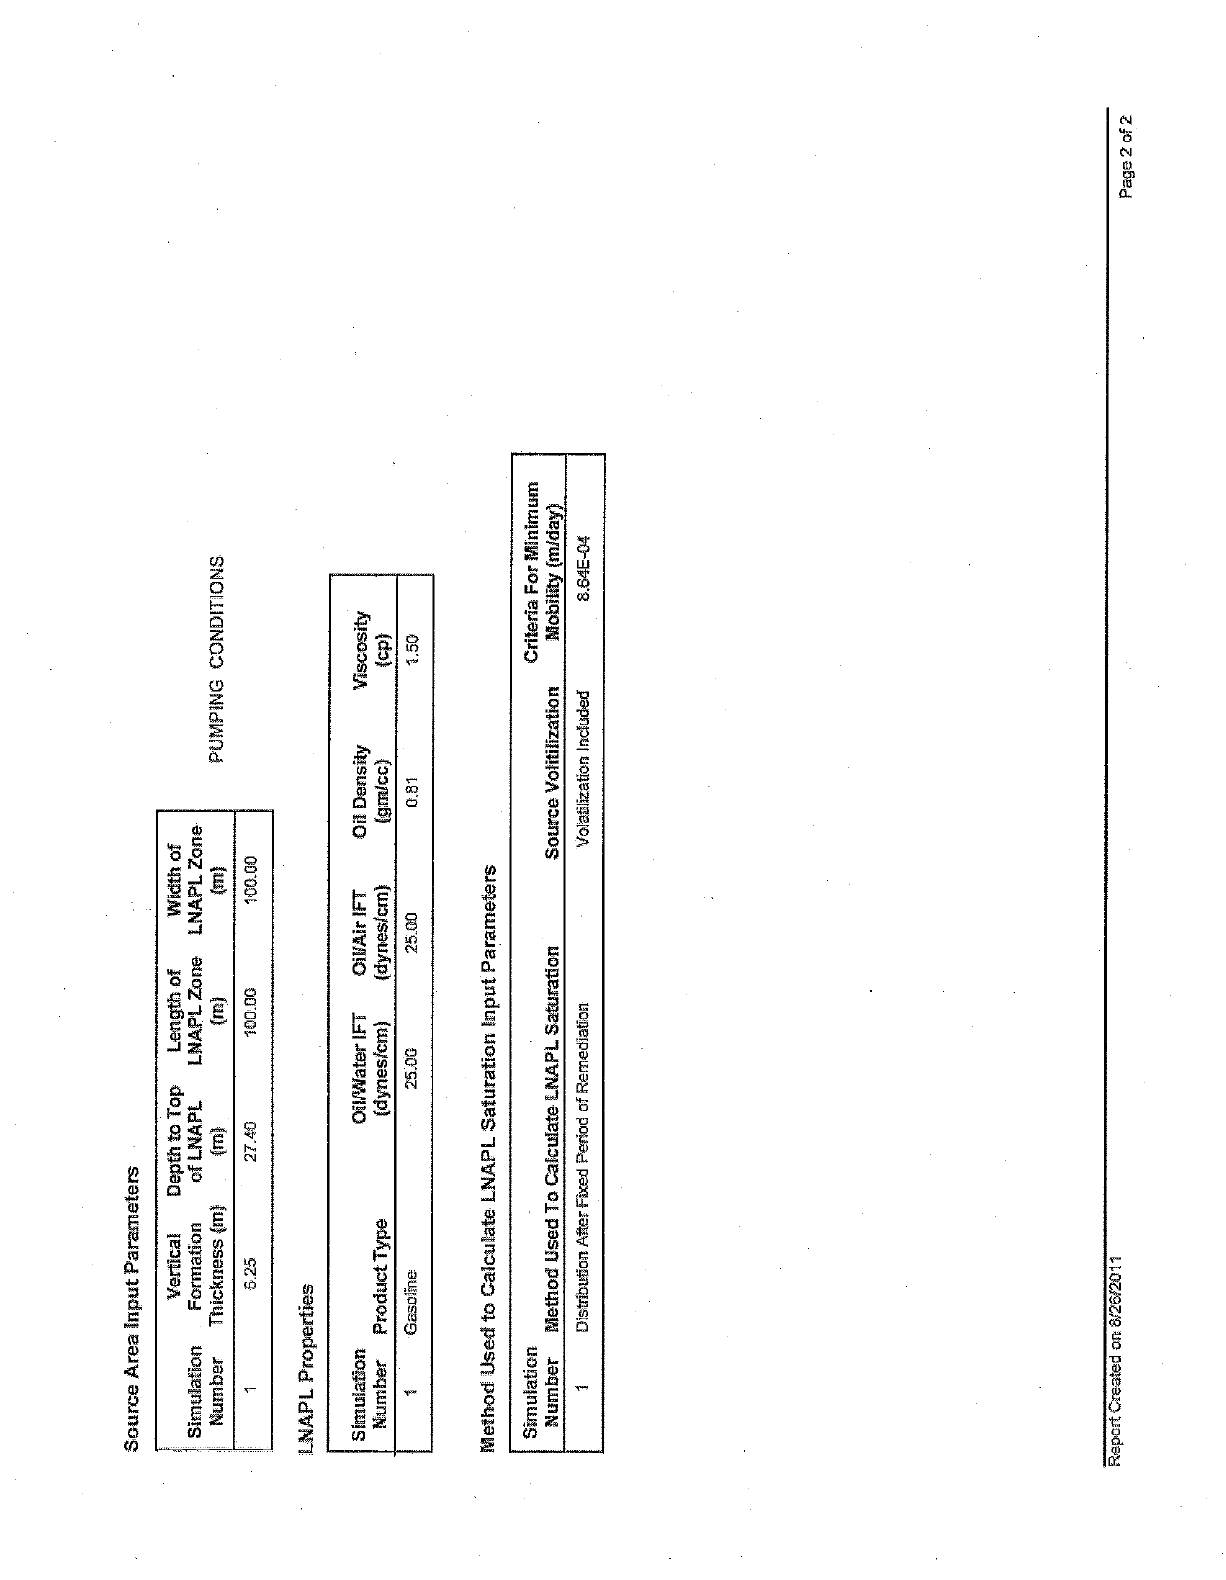
Z /o Z aSed l LdZl9Z/8 UG paleaia.lrodal
6(-369'8 papn!oul uo!lezg9e10A. teol}e!pawa o poPacl P
(JteplW) Jrn!iigoiq uo!lezq!lyvA awnog
wnw!um Jod eualuO uogesn;es ldtlN1 aleinaJe'J of paskl Poglaihi minim
uapeinw!s
sualawwed indui uo!letn;eg ldtlNl alelnaleO pasfl Po4laW
(do)
Apsoasrn (33¡w6) (wa¡sauRp) (waisaullp)
A!suaa i!o -Iltl/l!o id! Jalem!!o adAlmposd JaqwnN
uone!nw!g
satlaadoid 1dVN1
60'©0 L ©0`0 ©L D> LZ SZ
SNOliIaNOO JNldWfid (w) (to) (w) (w)ssaun!a!yl JaqwnN
auóZ ldtlNl auoZ ld*JNi ldtlNl la u©geuuoj uolleinw!g
10 gip!M }o qi6ual dalolgldaa !ea!haq
saa pump d;ndul eaJ+ aaun
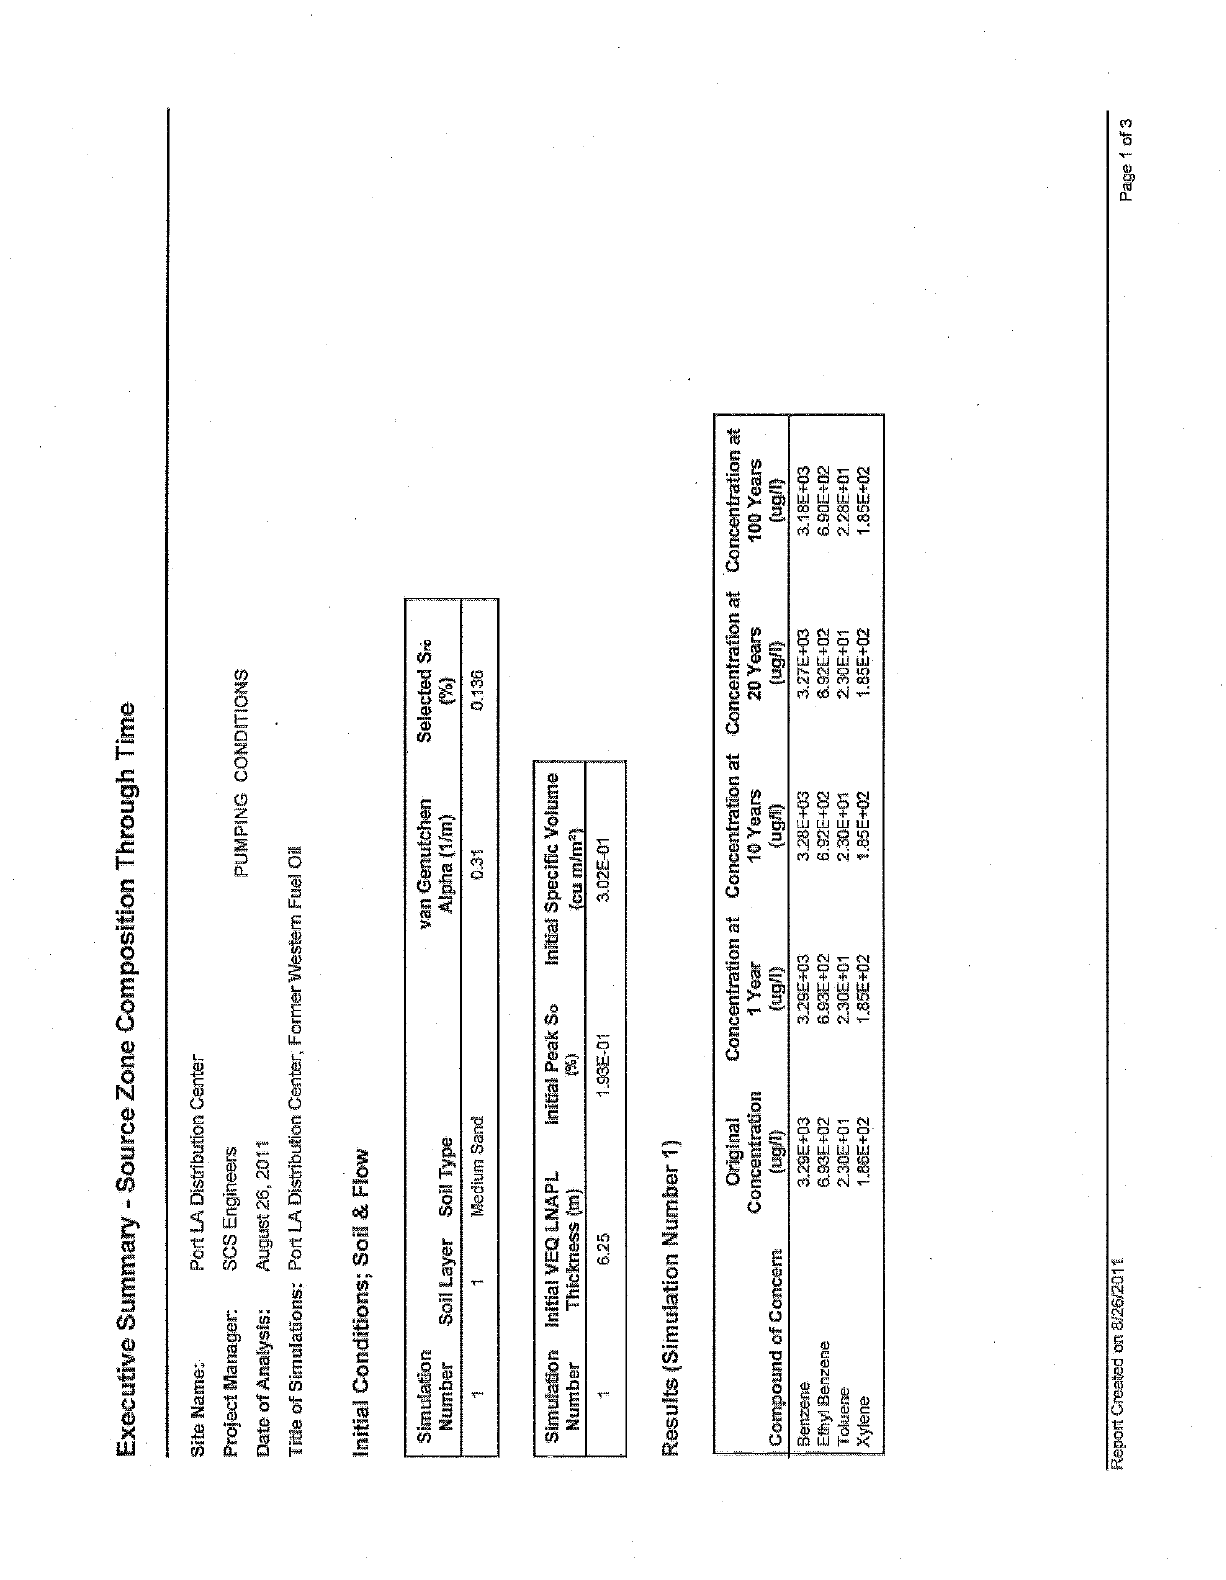
Executive Summary - Source Zone Composition Through Time
Site Name:
Project Manager:
Date of Analysis:
The of Simulations;
Port LA Distribution Center
SCS Engineers
August 26, 2011
Port LA Distribution Center, Former Western Fuel Oil
PUMPING CONDITIONS
Initiai Conditions; Soil & Flow
Simulation
Number Soil Layer Soil Type
van Genutchen
Alpaa (llml Selected Sri,
(%)
Medium Sand o:31
Simulation Initial VEQ LNAPL Initial Peak So
Number Thickness (in) t's)
Initial Specific Volume
{eu mlm2)
6.25 1 93E-01 3.02E -01
Results (Simulation Number 1)
Original Concentration at Concentration at Concentration a Concentration at
Concentration 1 Year 10 Years 20 Years 100 Years
Compound of Concern ( tigli) fug/I) Owl) (ugll) (ugll)
Benzene 3.29E +03 3.29E +03 3.28E+03 3.27E +03 318E+03
Ethyl Benzene 6.93E+02 6.93E +02 6.92E +02 6.92E +02 6.90E +02
Toluene 2.30E +01 2.30E +01 2.30E +01 2.30E +01 2 28E +01
Xylene 1.86E +02 1.85E +02 1.85E +02 1.85E +02 1.85E +02
Report Created on 812 Page 1 of 3
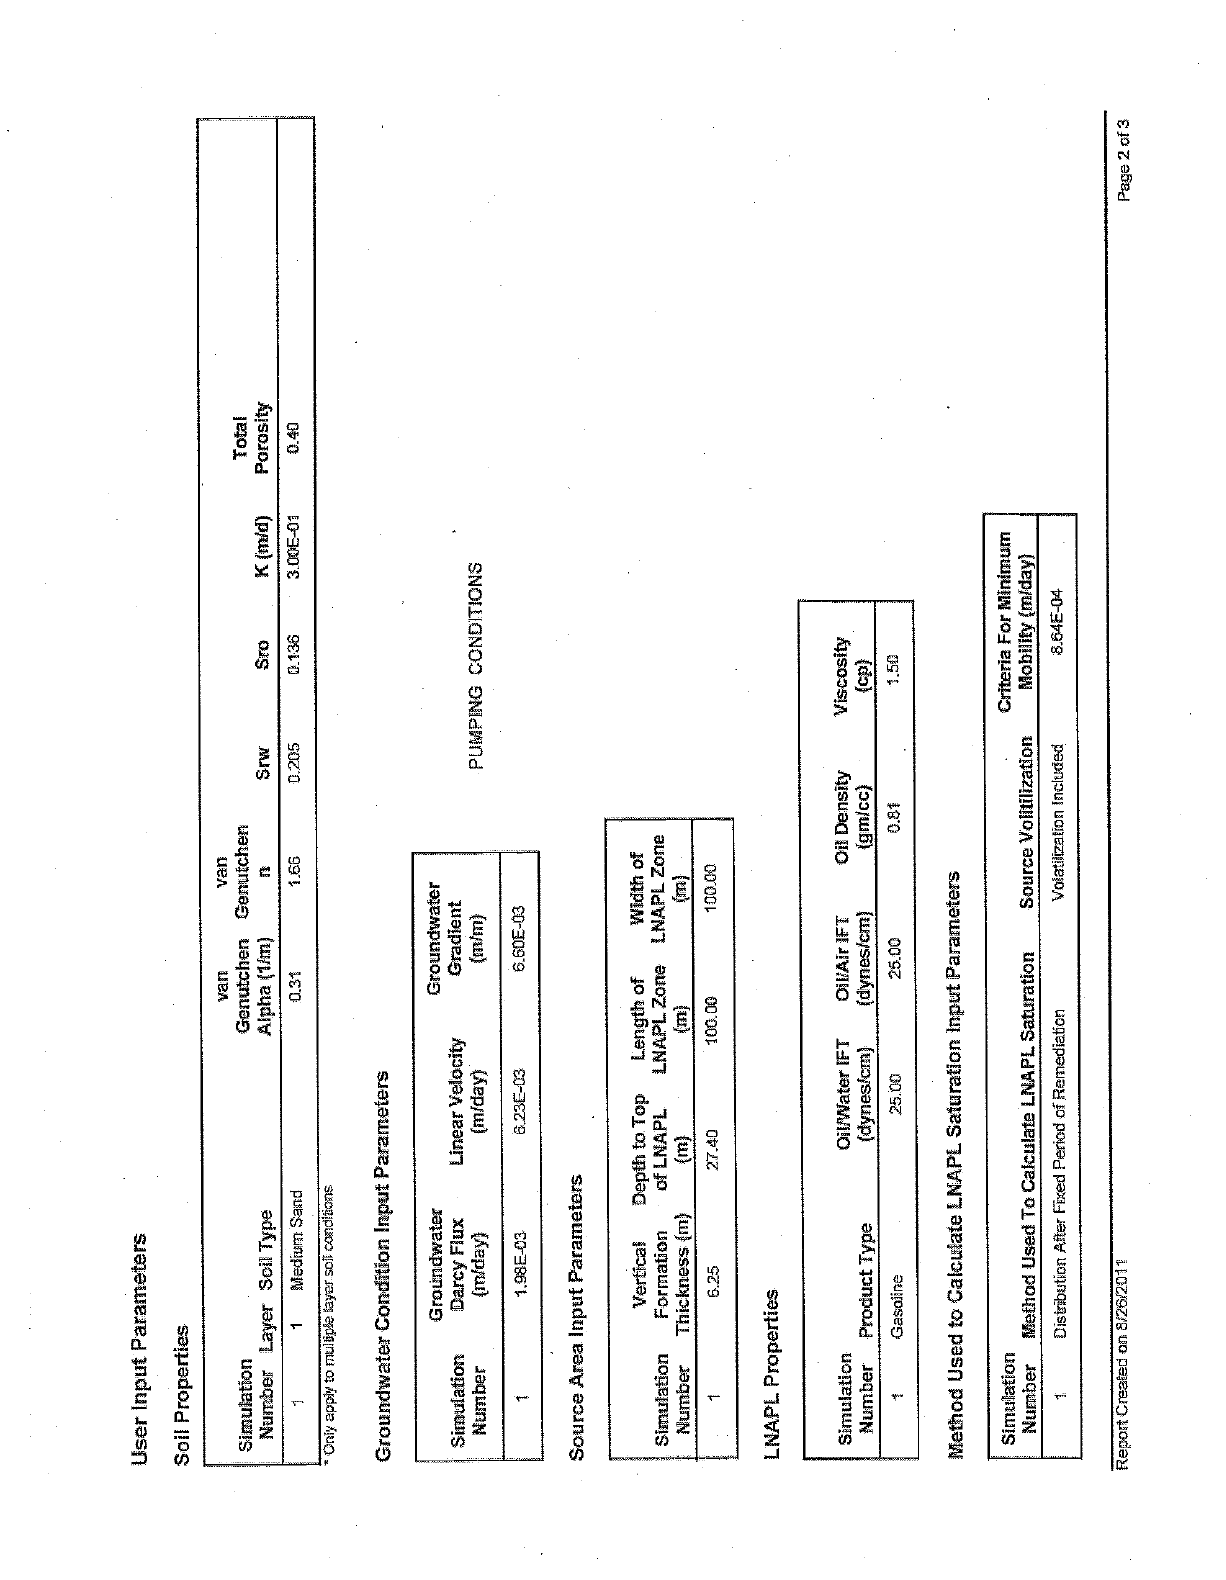
User Input Parame
Soil Properties
Simulation
Number Layer Soil Type
van
Genutchen
Alpha (11m)
van
Genutchen
n Srw Total
Sra K (mid) Porosity
1 Medium. Sand 0.31 1.66 0:205 0.136 3.00E-01 0.40
Only apply to multiple layer
Soil conditions
Groundwater Condition Input Parameters
Simulation
Number
Groundwater
Darcy Flux
(miday)
Linear Velocity
(m
Ida y)
Groundwater
Gradient
(Wm)
1.98E
-03 6.23E -03 6.60E -03
Source Area Input Parameters
Vertical Depth to Top
Simulation Formation of LNAPL.
Number Thickness (ni) (m)
Length of Width of
LNAPL Zone LNAPL Zone
(in) (m)
6.25 27.40 00.00 100.00
LNAPL Prop
PUMPING CONDITIONS
Simulation Oi.UWater IFT OiUAir lFT
Number Product. Type (dyneslcrn) (dynes/cm)
Oil Density
(gm /cc)
Viscosity
(cp)
Gasoline 25.00 25.00 0.81 1.50
od Used to Calculate LNAPL Satu ion Input Parameters
Simulation
Number Method Used To CalculateL Criteria For Minimum
PL Saturation Source Vtrlitilization Mobility (mlday)
Disàrzbutlon After Fixed Period of R dìation Volatilization Included &64E
-04
Report Created on 8/26/2 Page 2 of 3
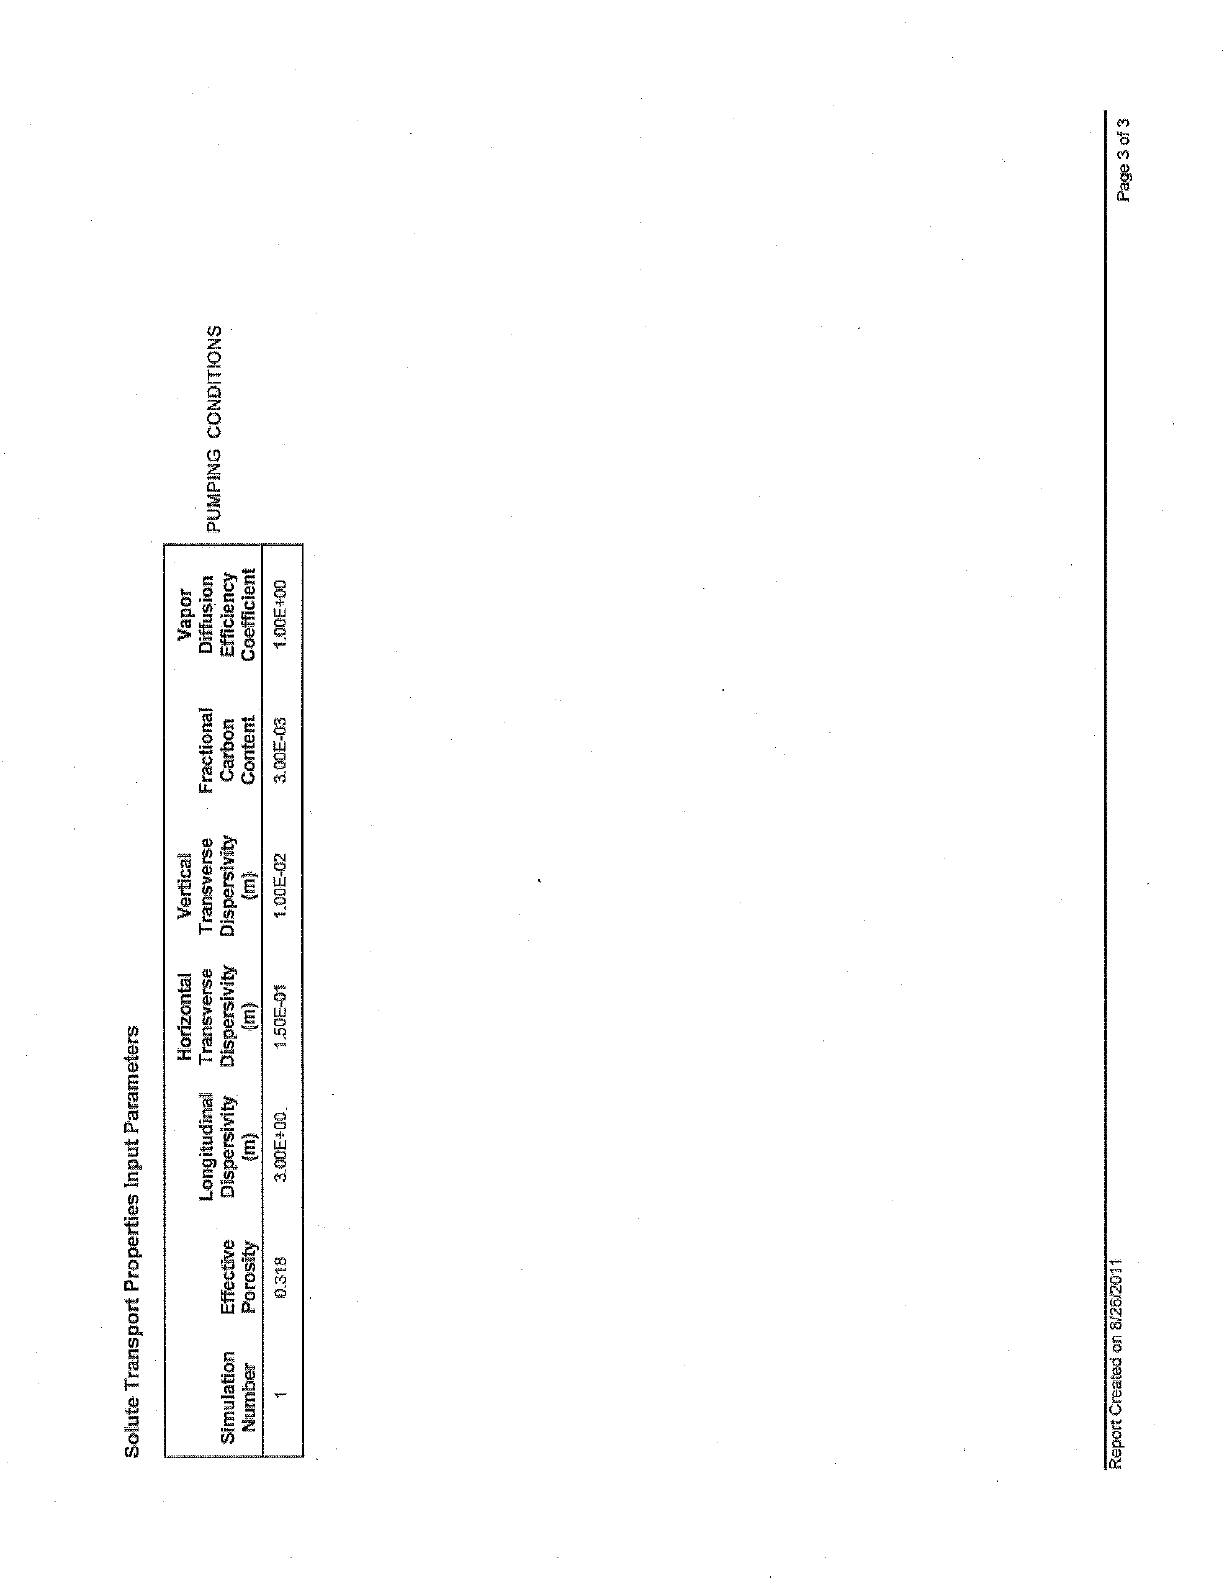
Solute Transport Properties Input Parameters
Horizontal Vertical Vapor
Longitudinal Transverse Transverse Fractional Diffusion PUMPING CONDITIONS
Simulation Effective Dispersivity Dispersivity Dispersivity Carbon Efficiency
Number Porosity (m) (m) (m) Content Coefficient
1 0.318 3.00E+00 1.50E-01 1.00E-02 3.00E-03 1.00E+00
Report Created on 8725/2011. Page 3 of 3
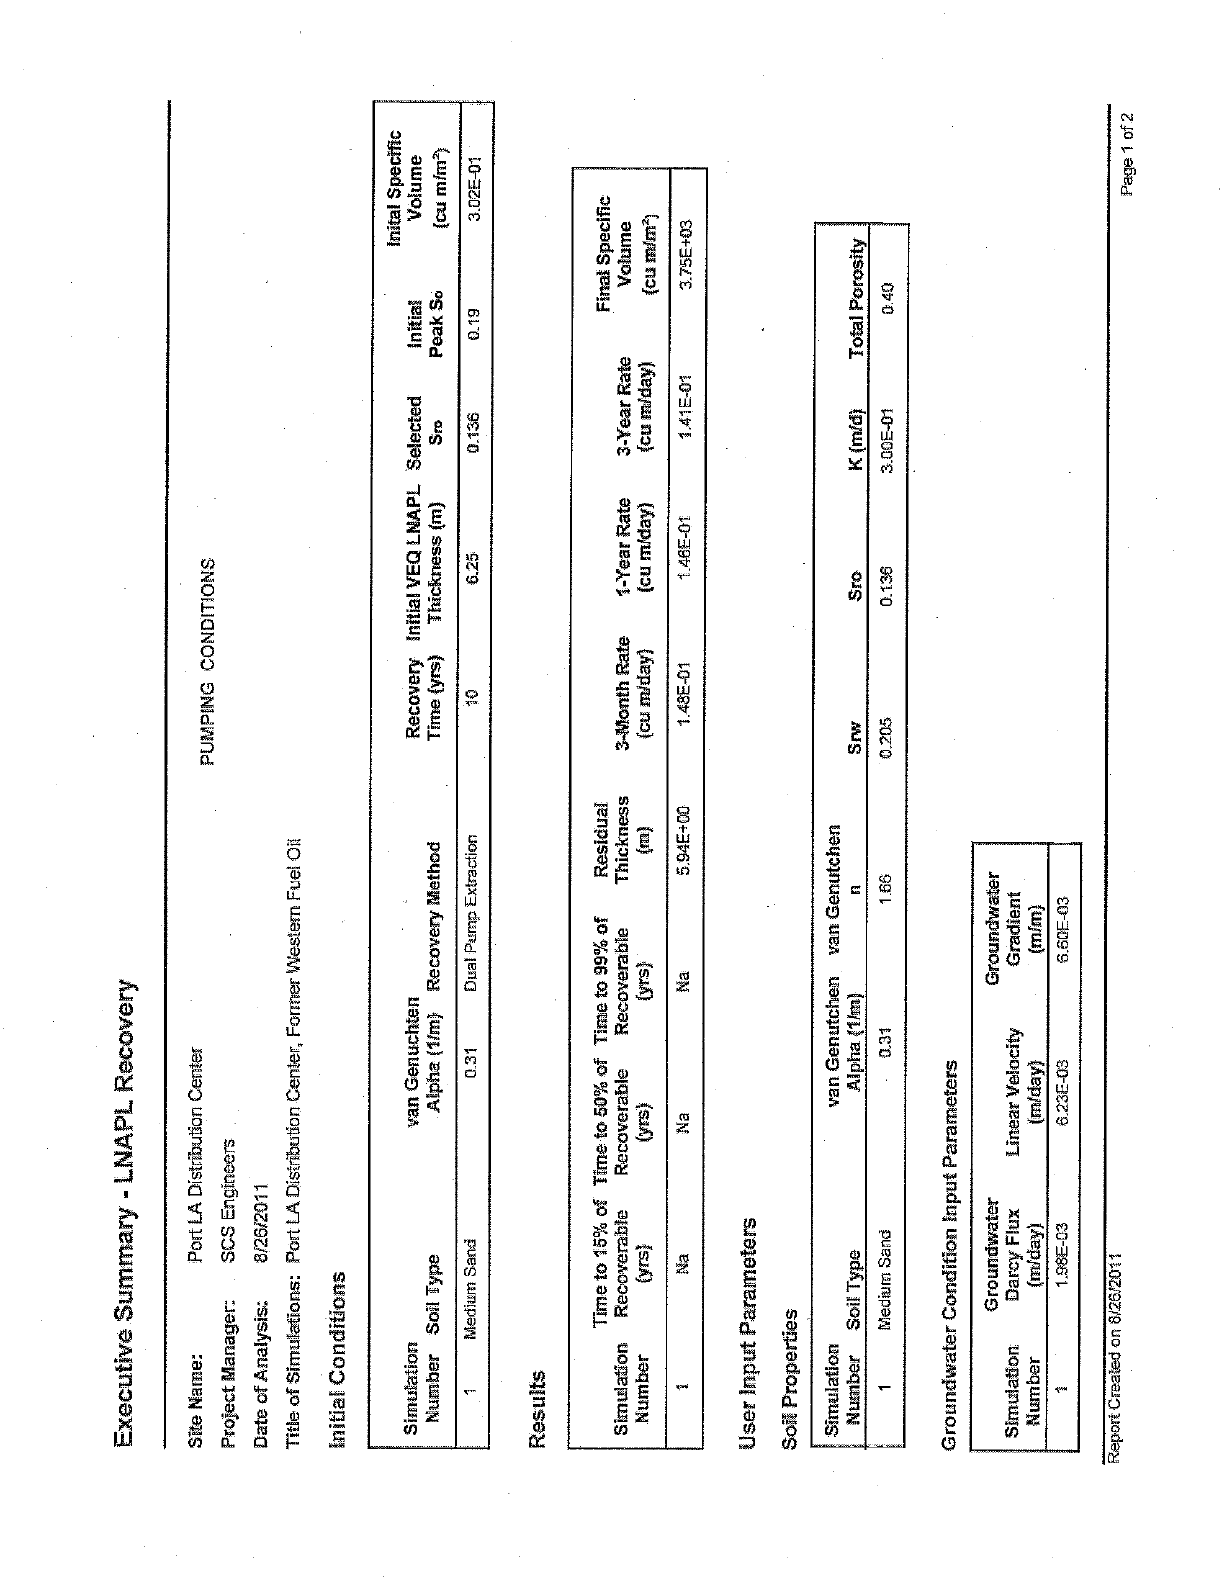
Executive Summary - LNAPL Recovery
Site Name:
Project Manager:
Date of Analysis:
Port LA Distribution Center
SOS Engineers
8
/2612 01 1
Title of Simulations: Port LA Distribution Center, Forme estern Fuel Oil
initiai Conditions
PUMPING CONDITIONS
Simulation
Number Soil Type van Genuchten
Alpha (1 /m) Recovery Method Recovery Initial VEQ LNAPL Selected Initial
Time (yrs) Thickness (m) Sm Peak So
Inital Specific
Volume
(cu m /mf)
Medium Sand 031 Dual Pump Extraction 10 6.25 0.19 3.02E-01
Results
Simulation
Number
Time to 15% of Time to 50% of Time to 99% of
Recoverable Recoverable Recoverable
(yrs} (yrs) (yrs)
Residual
Thickness
(m)
3 -Month Rate 1 -Year Rate 3 -Year Rate
(cu in/day) (cu m
/day) (cu m/day)
Final Specific
Volume
(cu Wm)
Na Na Na 5.94E+00 1.48E
-01 t.46E-01 1.41E
-01 3.75E +03
User Input Parameters
Soil Properties
Simulation
Number Seil'. Type
van Genutchen an Genutchen
Alpha (1 /m) n Srw Sro K (m
/d) Total Porosity
Medium Sand 0.31 1.66 1205 0.136 300E -01 0.40
Groundwater Condition Input Parameters
Simulation
Number
Groun. dwater
Darcy Flux
(m/day)
Groundwater
Linear Velocity Gradient
(m /day) (Wm)
.98E -03 6.23E -03 6.60E -03
Report Created on 8/2612011 Page 1 of 2
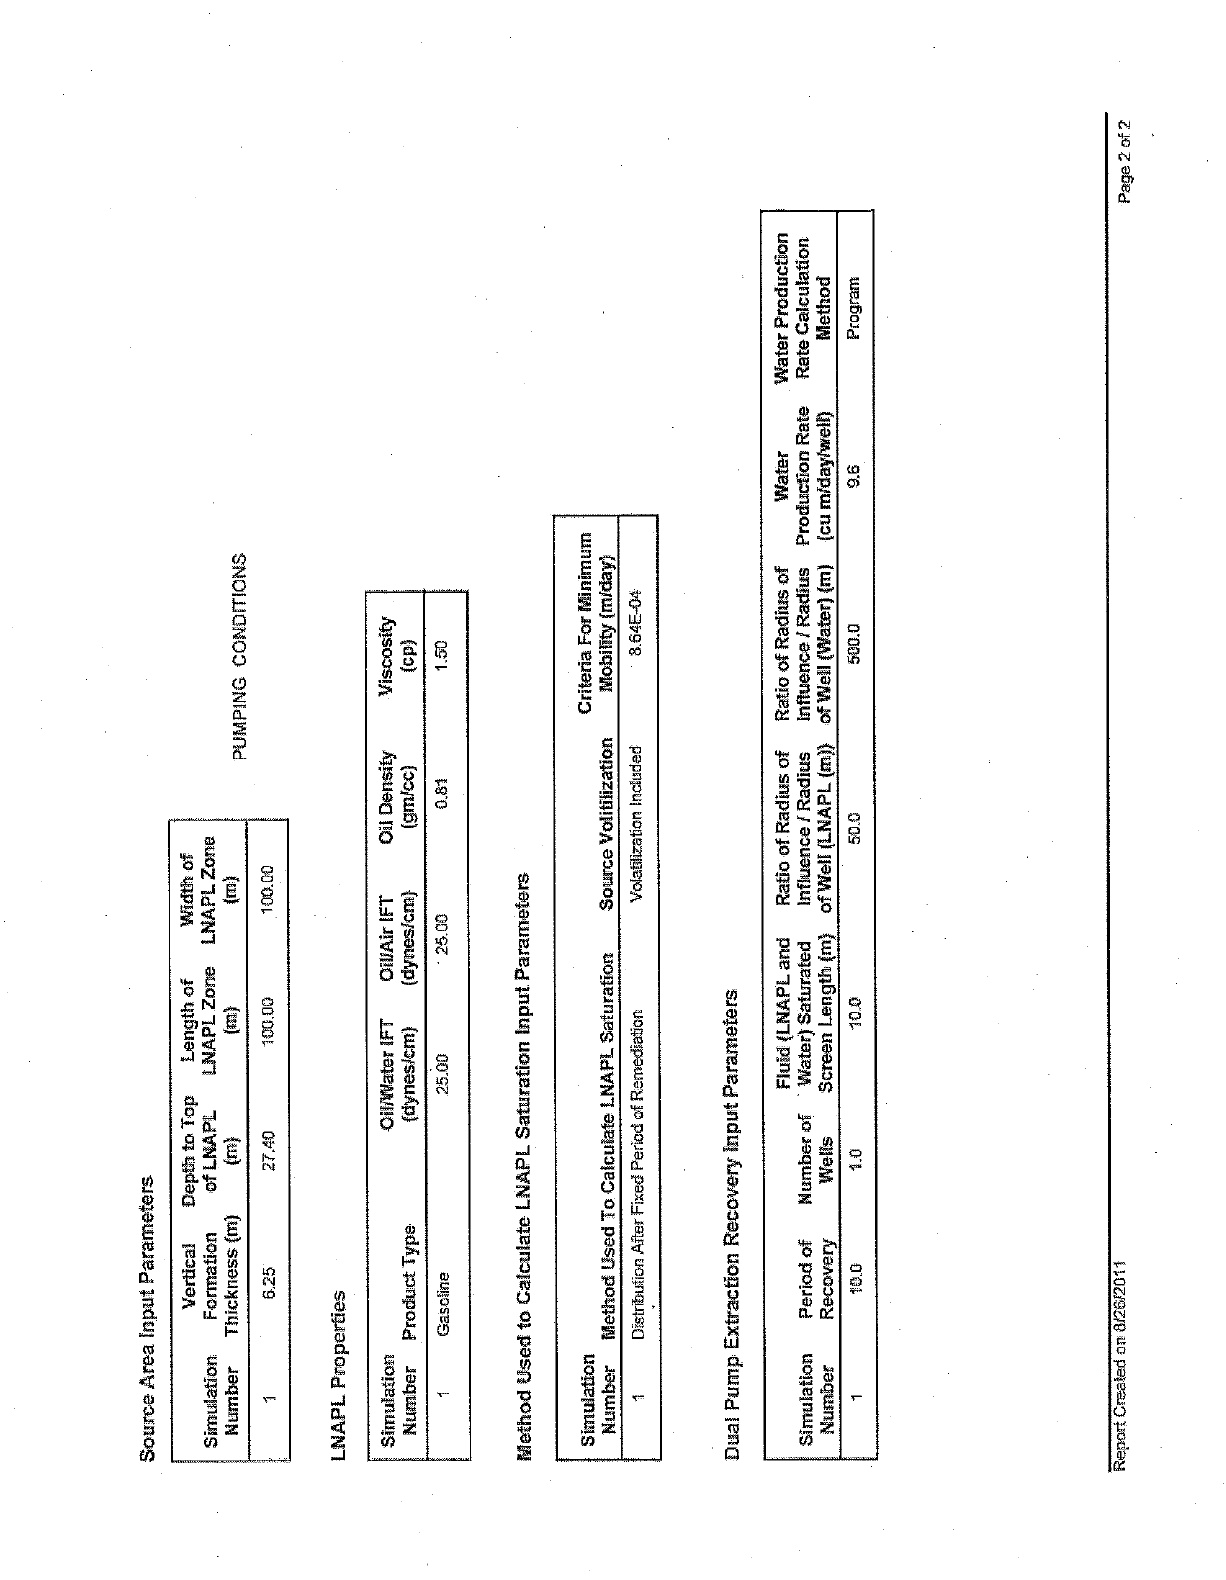
Source Area Input Parameters
Simulation
Number
Vertical Depth to Top
Formation of LNAPL
Thickness (m) (m)
Length of
LNAPL Zone
(m)
5.25 27.40 100.00
Width of
LNAPLZon
(m)
100.00
LNAPL Properties
PUMPING CONDITIONS
Simulation Oil/Water iFT OillAir IFT
Number Product Type (dyneslcm) (dyneslcm) Oil Density
(gm /cc) Viscosity
(cp)
Gasoline 25. ©0 25.00 0.81 1.50
Method. Used to Calculate LNAPL Saturation Input. Parameters
Simulation
Number Method Used To Calculate LNAPL Saturation Criteria For Minimum
Source Volitilization Mobility (mlday)
Distribution After Fixed Period of Remediation Volatilization Included 8.64E-04
Dual Pump Extraction Recovery Input Parameters
Simulation Period of Number
Number Recovery Wells
Fluid {LNAPL and Ratio of Radius of Ratio of Radius of Water
Water) Saturated Influence / Radius Influence / Radius Production Rate
Screen Length (m) of Well (LNAPL (m)) of Well (Water) (m) (cu mldaylwell)
Water Production
Rate Calculation
Method
10.0 1.0 70.0 50.0 500.0 9.6 Program
Repart Created on 8i2612011 Page 2 of 2
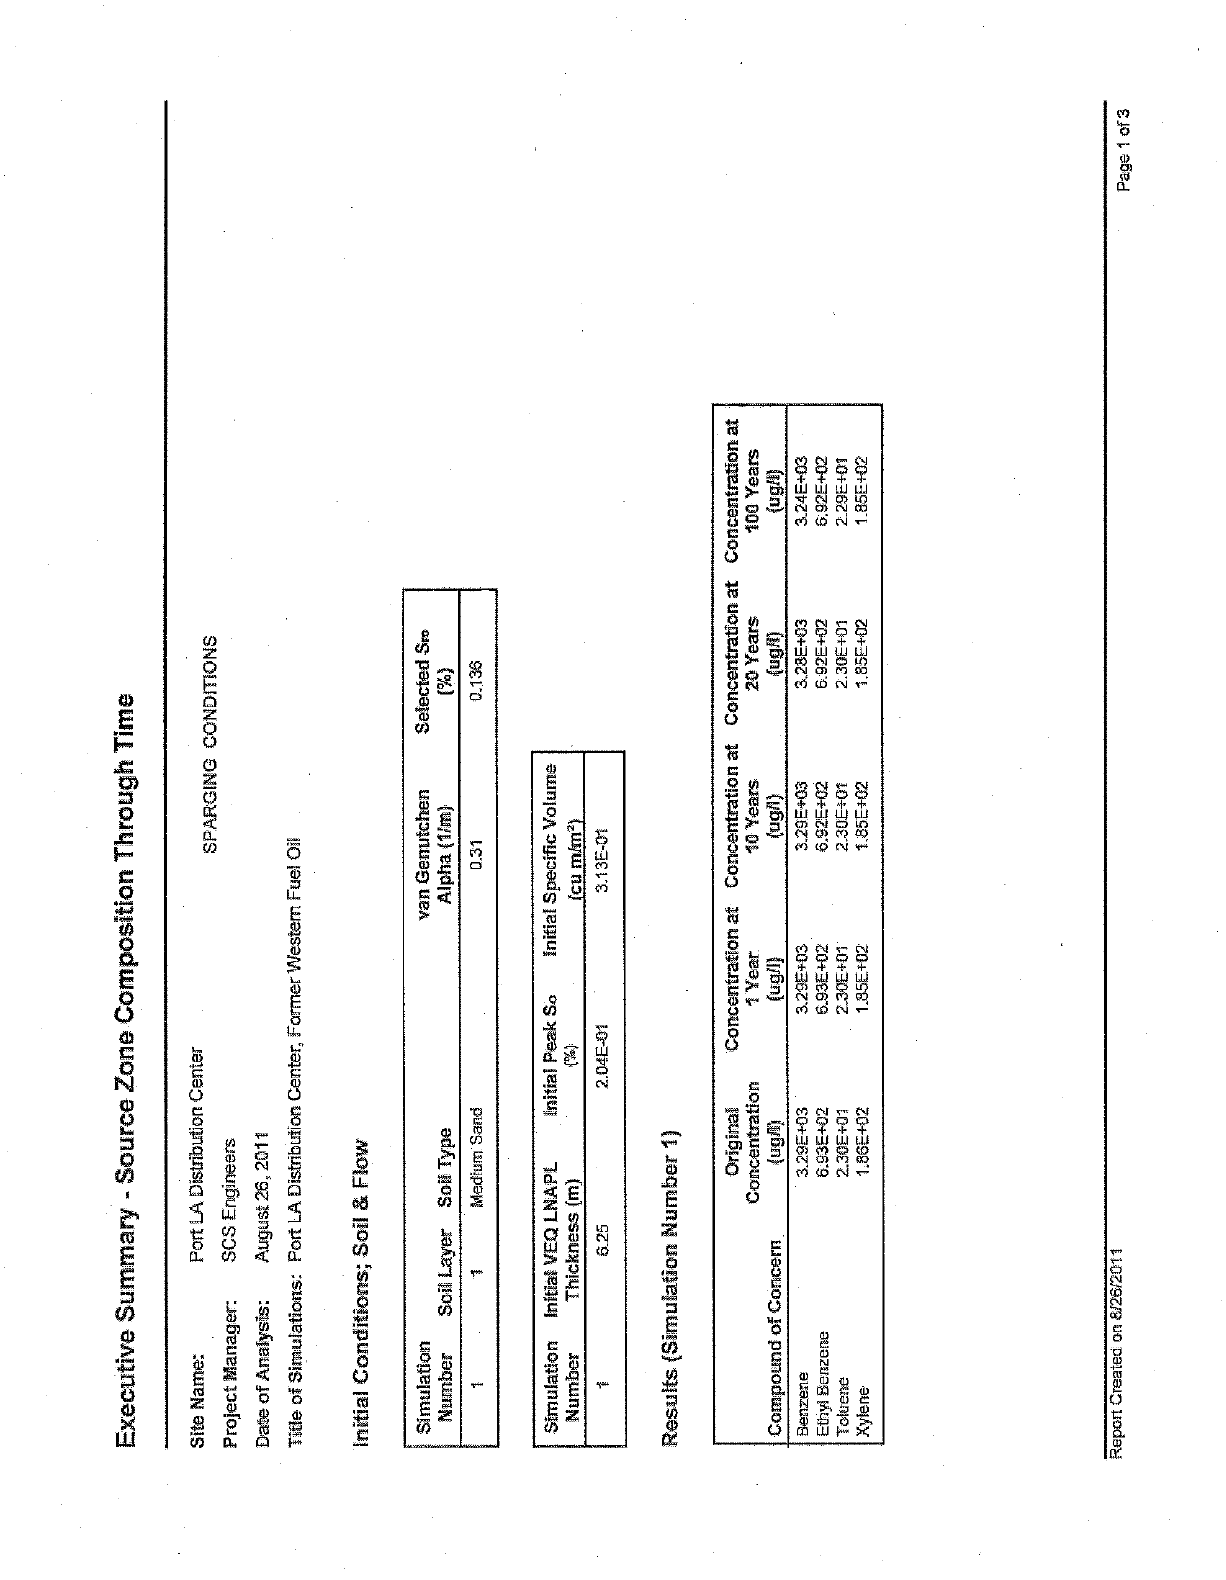
Executive Summary - Source Zone Composition Through Time
Site Name:
Project Manager:
Date of Analysis:
Port LA Distribution Center
SCS Engineers
August 26, 2011
Title of Simulations: Port LA Distribution Gen
Initial Conditions; Soil & Flow
Simulation
SPARGING CONDITIONS
este m Fuel Oil
Number Soil Layer Soit Type
van Genutchen
Alpha (11m)
Selected Sro
(° %a)
i Medium Sand 031 0.136
Simulation Initial VEQ LNAPL
Number Thickness (m)
nitial Peak So Initial Specific Volume
lcu m /m2)
625 2 E 3.13E -01
ResuE Simulation Number 1)
Originai
Concentration Concentration at
1 Year Concentration at
10 Years Concentration at
20 Years Concentration at
100 Years
Compound of Concern (ugü) fug /l) (ugll) Ogg) (ugh])
Benzene 3.29E+03 3.29E+03 3.29E +03 3.28E +03 324E+03
Ethyl Benzene 6.93E+92 6.93E+02 6.92E +02 6.92E +02 6.92E+02
Toluene 2.30E+01 2.30E+01 2 30Ey01 2.30E +01 229E+01
Xyiene 1.86E+p2 1.85E+02 1.85E +02 1.85E +02 1 85E+02
Report Created on 8(26/2011 Page 1 of 3
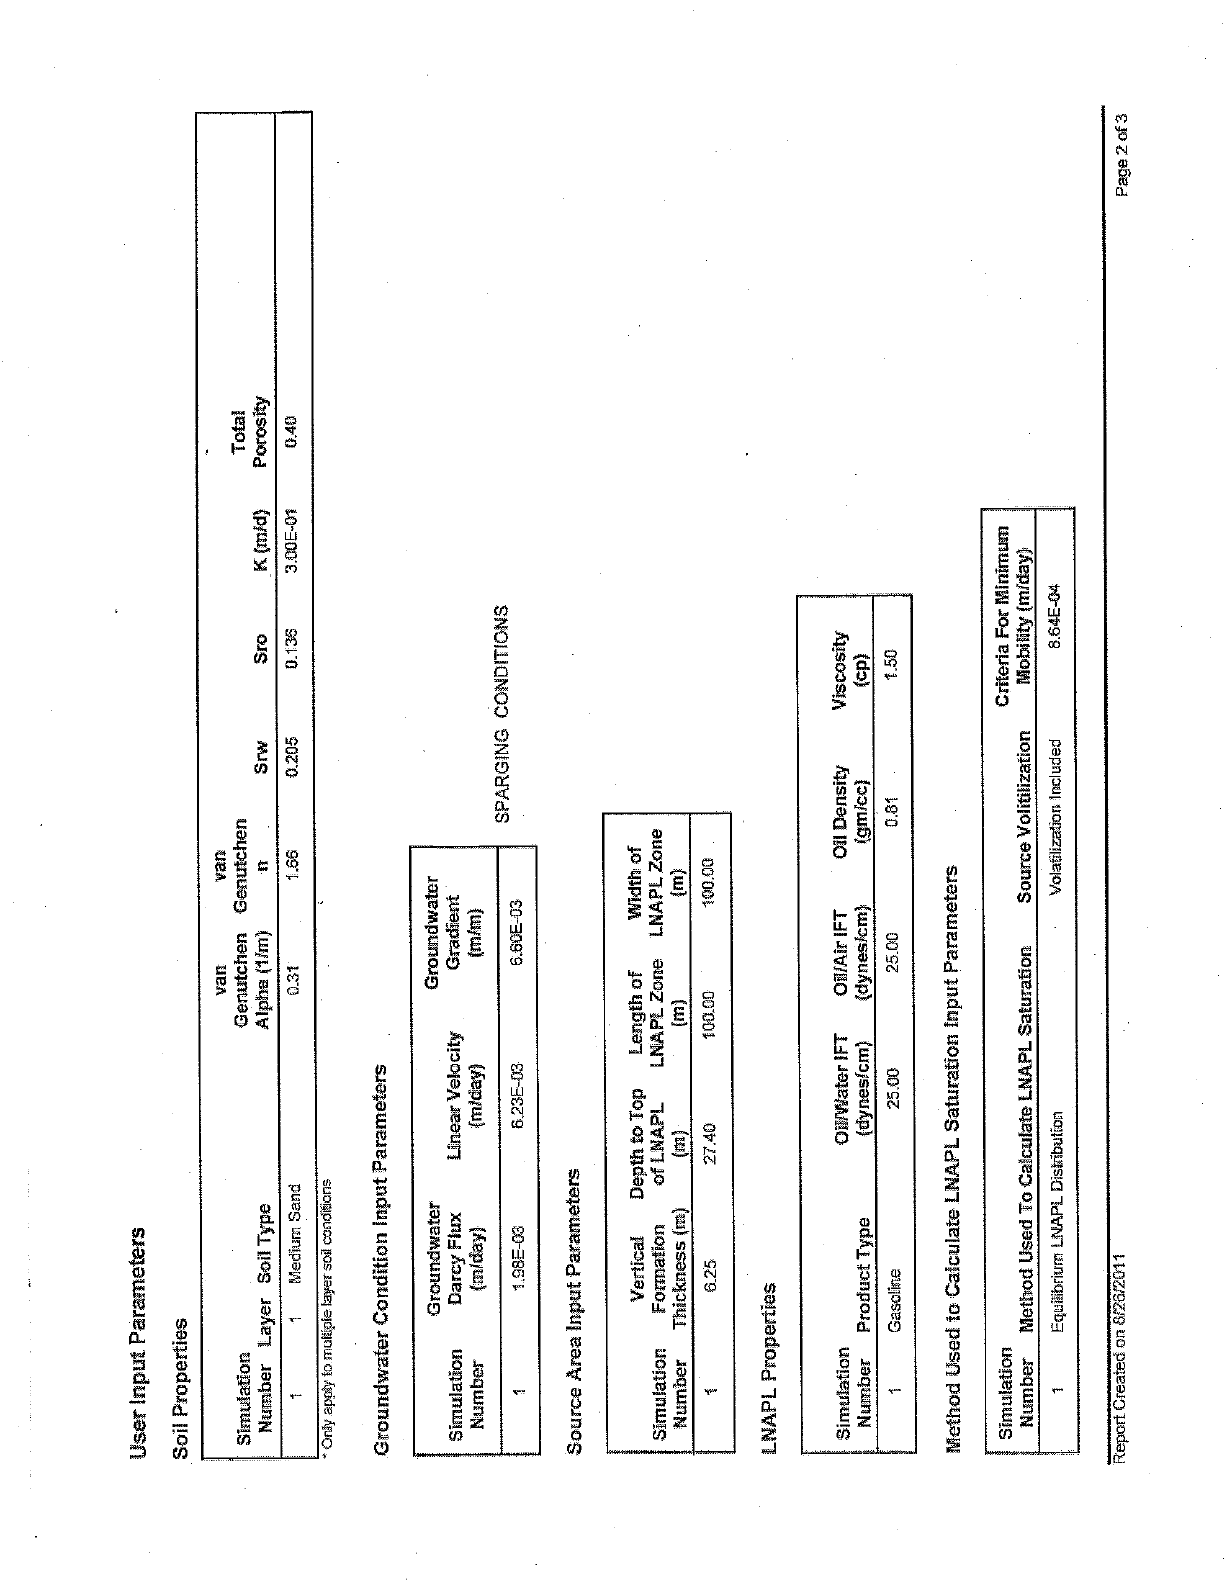
User Input Parameters
Soil Properties
Simulation
Number Layer Sail Type
van van
Genutchen Genutchen
Alpha (11m) n Srw Total
Sro K (mid) Porosity
1 1 Medium Sand Oil 1..66 0.205 Q136 3.00E -01 0.40
OnBy apply to multi e toyer soil conditions
Groundwater Condition Input Parameters
Groundwater Groundwater
Simulation Darcy Flux Linear Velocity Gradient
Number (miday) (rn day) (tnlm)
7.98E
-03 623E -03 6.60E
-03
Source Area Input Parameters
SPARGING CONDITIONS
Vertical Depth to Top Length of Width.. of
Simulation Formation of LNAPL LNAPL Zone LNAPL Zone
Number Thickness (m) (rn) (m) (m)
625 27.40 100.00 100.03
LNAPL Prapertïe
Simulation Oil/Water IFT Oíl /Air IFT Oil Density Viscosity
Number Product Type (dyneslcm) (dynes/cm) (gm /cc) (cp)
1 Gasoline 25.00 25.00 0.81 1.50
Method. Used to Calculate LNAPL Saturation Input Parameters
Simulation. Criteria For Minimum
Number Method Used To Calculate LNAPL Saturation Source Volitilization Mobility (mlday)
Equilibrium LNAPL Distribution Volatilization Included 8.64E-04
Report Created on 82612011 Page 2 of 3
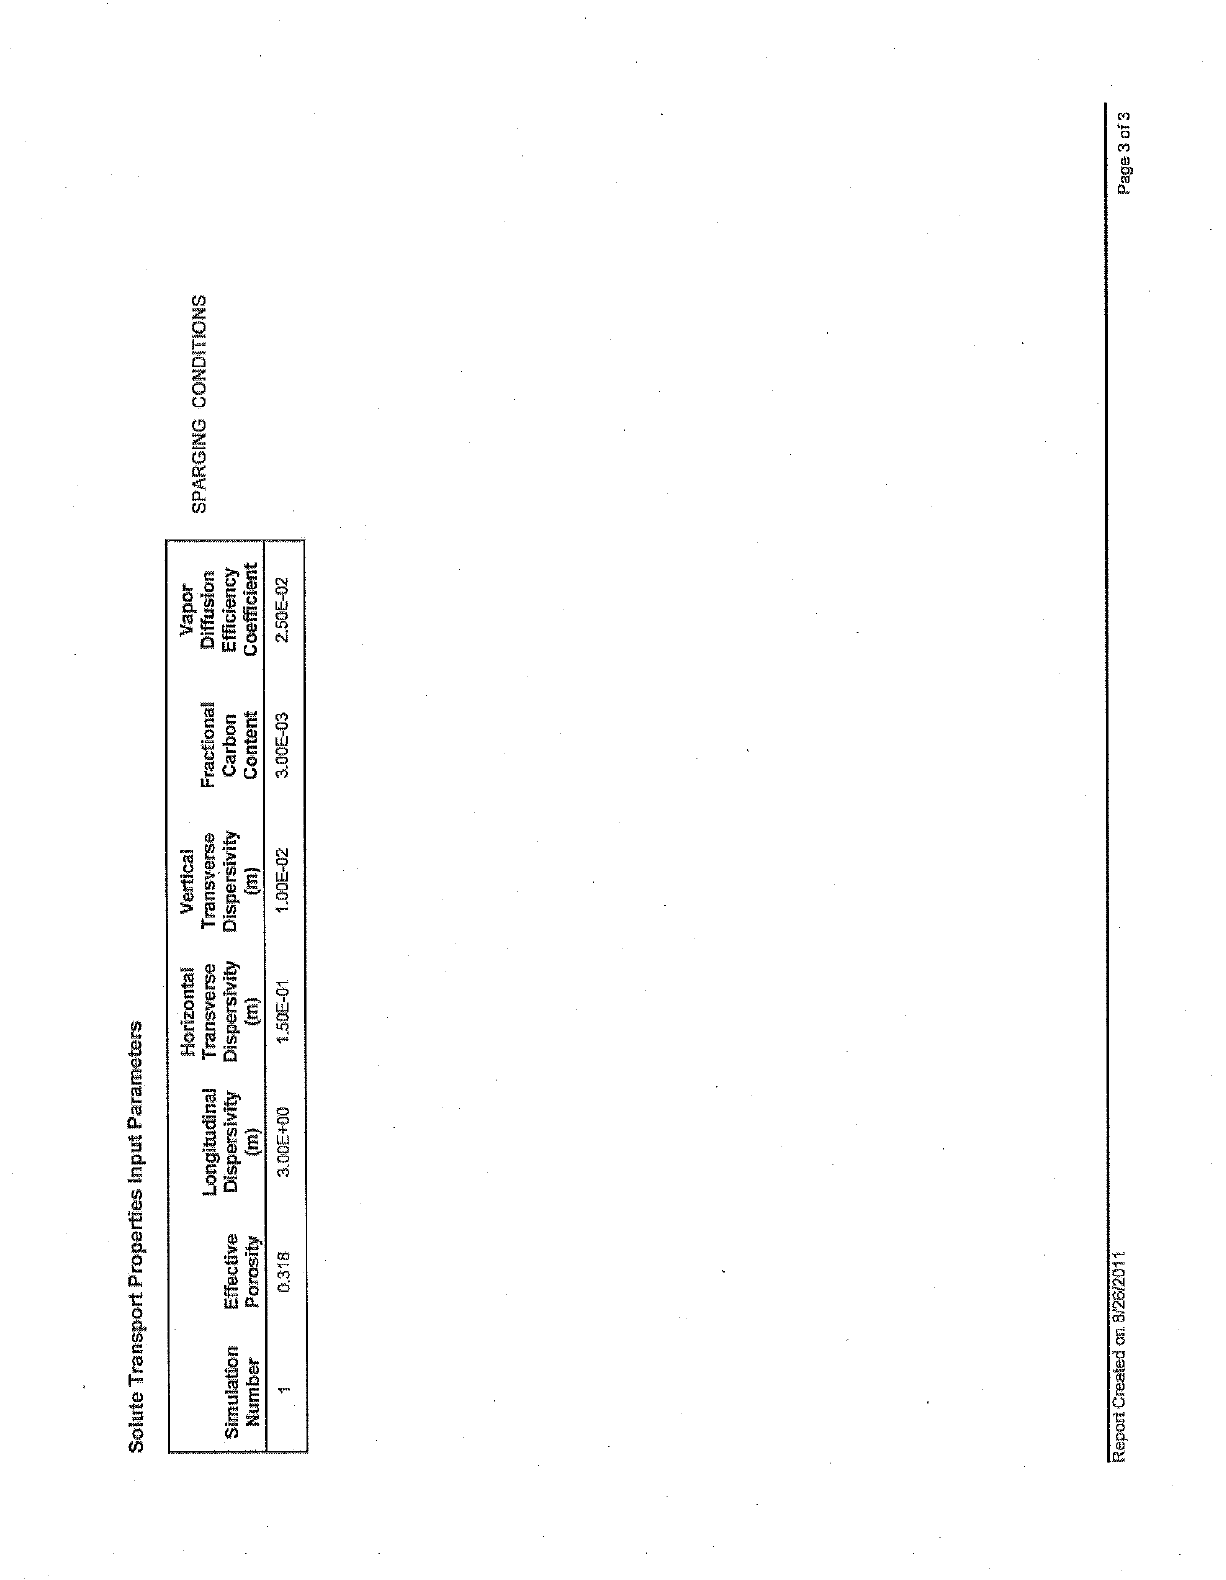
Solute Transport Properties Input Parameters
Longitudinal
Horizontal
Transverse Vertical
Transverse Fractional Vapor
Diffusion SPARGING CONDITIONS
Simulation Effective Dispersivity Dispersivity Dispersivity Carbon Efficiency
Number Porosity (m) (in) (m) Content Coefficient
0.318 3.00E +00 1.50E -01 1A0E -02 300E -03 2.50E
Report Created on 812 011 Page 3 of 3
Port LA Distribution Center
Appendix B
March 14, 2014 Addendum to Dissolved- and LNAPL Plume
Stability Evaluations and Discussion of Cleanup Implications
Aqul -Ver. Inc.
I Report - Site Closure Marsh 2014
AQObVXß INC.
unwo5eomyX Iv<,rer R¿eowe.oa & Dam Survive
MARCH 14, 2014 ADDENDUM TO:
DISSOLVED AND LNAPL PLUME STABILITY EVALUATIONS AND
DISCUSSION OF CLEANUP IMPLICATIONS
PORT OF LOS ANGELES DISTRIBUTION CENTER
(FORMER WESTERN FUEL OIL FACILITY)
300 WESTMONT DRIVE
SAN PEDRO, CALIFORNIA
Original issue: August 30, 2011
to the:
LA. Regional Water Quality Control Board
Attention: Paul Cho
For:
Mr. Leland Nakaoka
BlackRoek Realty Advisors
4400 MacArthur Boulevard, Suite 700
Newport Beach, CA 92660
In Cooperation With:
SCS Engineers
8799 Balboa Avenue, Suite 290
San Diego, CA 92123
G.D. Beckett, CEHO
AQUI -VER, INC.
HydrogeoloD,, Water Resources & Doto Services
5871 North 2200 Woo, 01W rh. .13202í.01R9 FAX 9J2625-N026
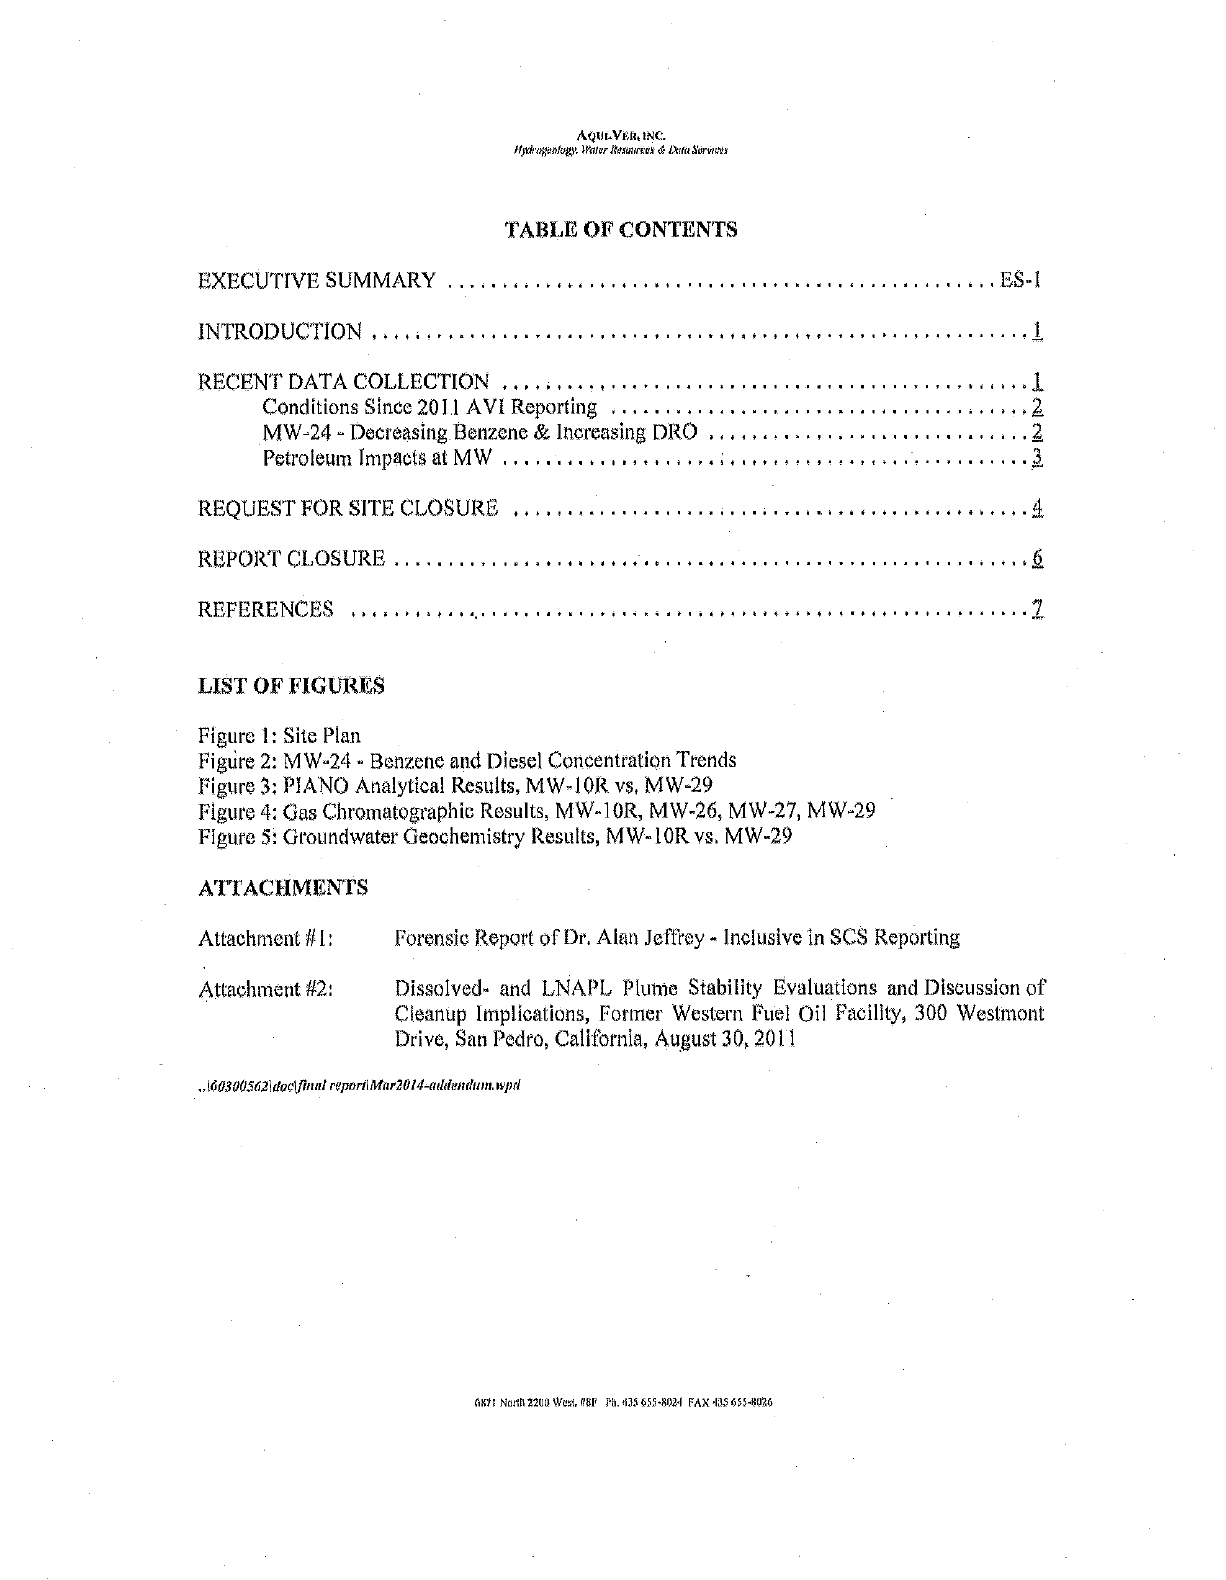
AQt14Ye@,INC.
Htelruganloyv. Water Reitman' & Ana 5'arv,
TABLE OF CONTENTS
EXECUTIVE SUMMARY ES -I
INTRODUCTION ........ .................. ........ ........ ........ . ......... .I
RECENT DATA COLLECTION 1
Conditions Since 2011 AVI Reporting
MW -24 - Decreasing Benzene & Increasing DRO 2
PetroleumImpacts at MW 3
REQUEST FOR SITE CLOSURE .................. ..............................4
REPORT CLOSURE
REFERENCES ,,,.,,, .................... ..............................7
LIST OF FIGURE,
Figure I: Site Plan
Figtire 2: MW-24 - Benzene and Diesel Concentration Trends
Figure 3: PIANO Analytical Results, MW -10R vs, MW -29
Figure 4: Gas Chromatographic Results, MW-10R, MW -26, MW -27, MW -29
Figure 5: Groundwater Geochemistry Results, MW- IOR vs. MW -29
ATTACHMENTS
Attachment #1:
Attachment #2:
-I60300 do Waal rppurtlMö
nsic Report or Dr, Alan Jeffrey - Inclusive in SCS Reporting
Dissolved- and LNAPL Plume Stability Evaluations and Discussion of
Cleanup Implications, Former Western Fuel Oil Facility, 300 Westmont
Drive, San Pedro, California, August 30, 2011
IRdIWA1Vpd
ail, Non!, 220/ Wart, IMP Ph. 135á554402q FAX 435 655.0024
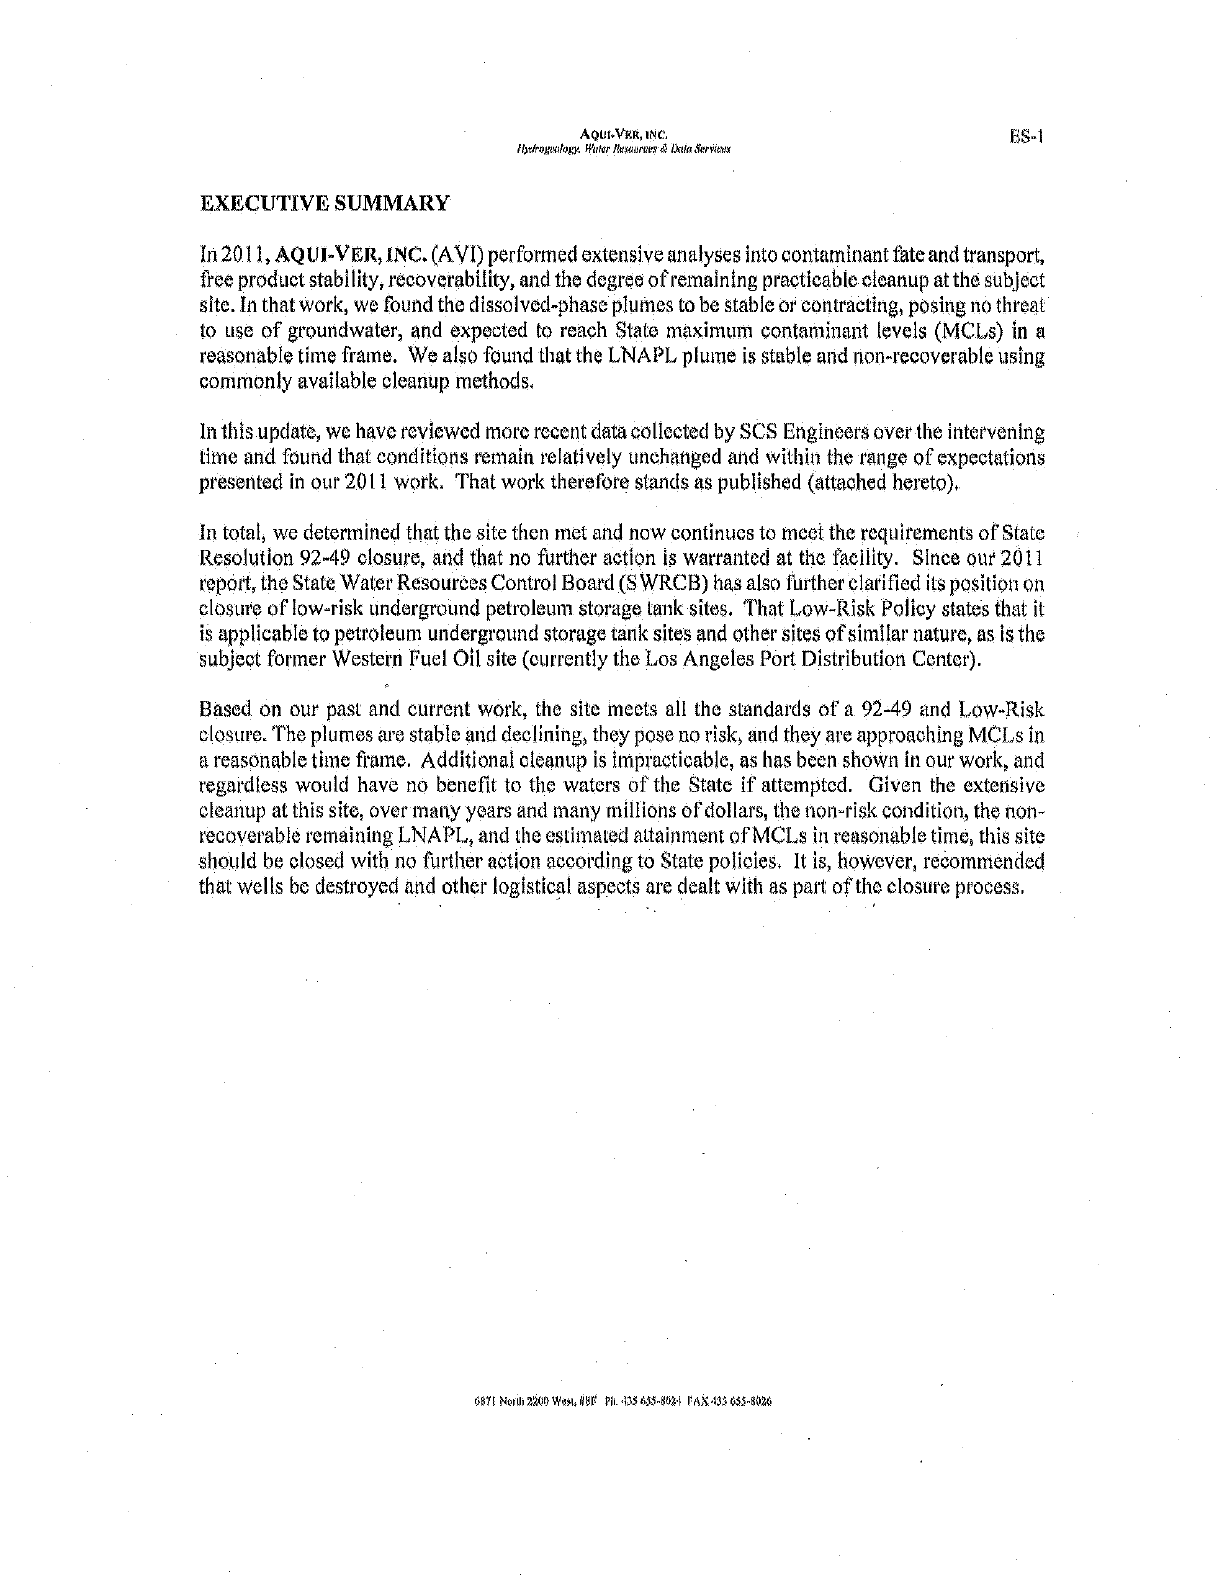
AQU1NI4R, INC
(b*oMvofalry. Wutar Rexuorot,S, 1
EXECUTIVE SUMMARY
L15-1
In 2011, AQUI -VEIL, INC. (AVI) performed extensive analyses into contaminant fate and transport,
free product stability, recoverability, and the degree of remaining practicable cleanup at the subject
site In that work, we found the dissolved -phase plumes to be stable or contracting, posing no threat
to use of groundwater, and expected to reach State maximum contaminant levels (MCLs) in a
reasonMe time frame. We also found that the LNAPL plume is stable and non -recoverable using
commonly available cleanup methods.
In thisupdate, we have reviewed more recent data collected by SCS Engineers over the intervening
and found that conditions remain relatively unchanged and within the n'ange of expectations
seated in our 2011 work. That work therefore stands as published (attached hereto),.
In total, we determined that the site then met and now continues to meet the requirements of State
Resolution 92 -49 closure, and that no further action is warranted at the facility. Since our 2011
report, the State Water Resources Control Board (SWRCB) has also further clarified its position on
closure of low -risk underground petroleum storage tank sites. That Low -Risk Policy states that it
is applicable to petroleum underground storage tank sites and other sites of similar nature, as is the
subject former Western Fuel Oil site (currently the Los Angeles Port Distribution Center).
Based on our past and current work, the site meets all the standards of a 92 -49 and Low -Risk
closure. The plumes are stable and declining, they pose no risk, and they are approaching MCLs in
a reasonable time frame. Additional cleanup is impracticable, as has been shown in our work, and
regardless would have no benefit to the waters of the State if attempted. Given the extensive
cleanup at this site, over many years and many millions of dollars, the non -risk condition, the non-
recoverable remaining LNAPL, and the estimated attainment of MCLs in reasonable time, this site
should he closed with no further action according to State policies, It is, however, recommended
that wells be destroyed and other logistical aspects are dealt with as part of the closure process.
I) .iasGseaai i r..nesosfea
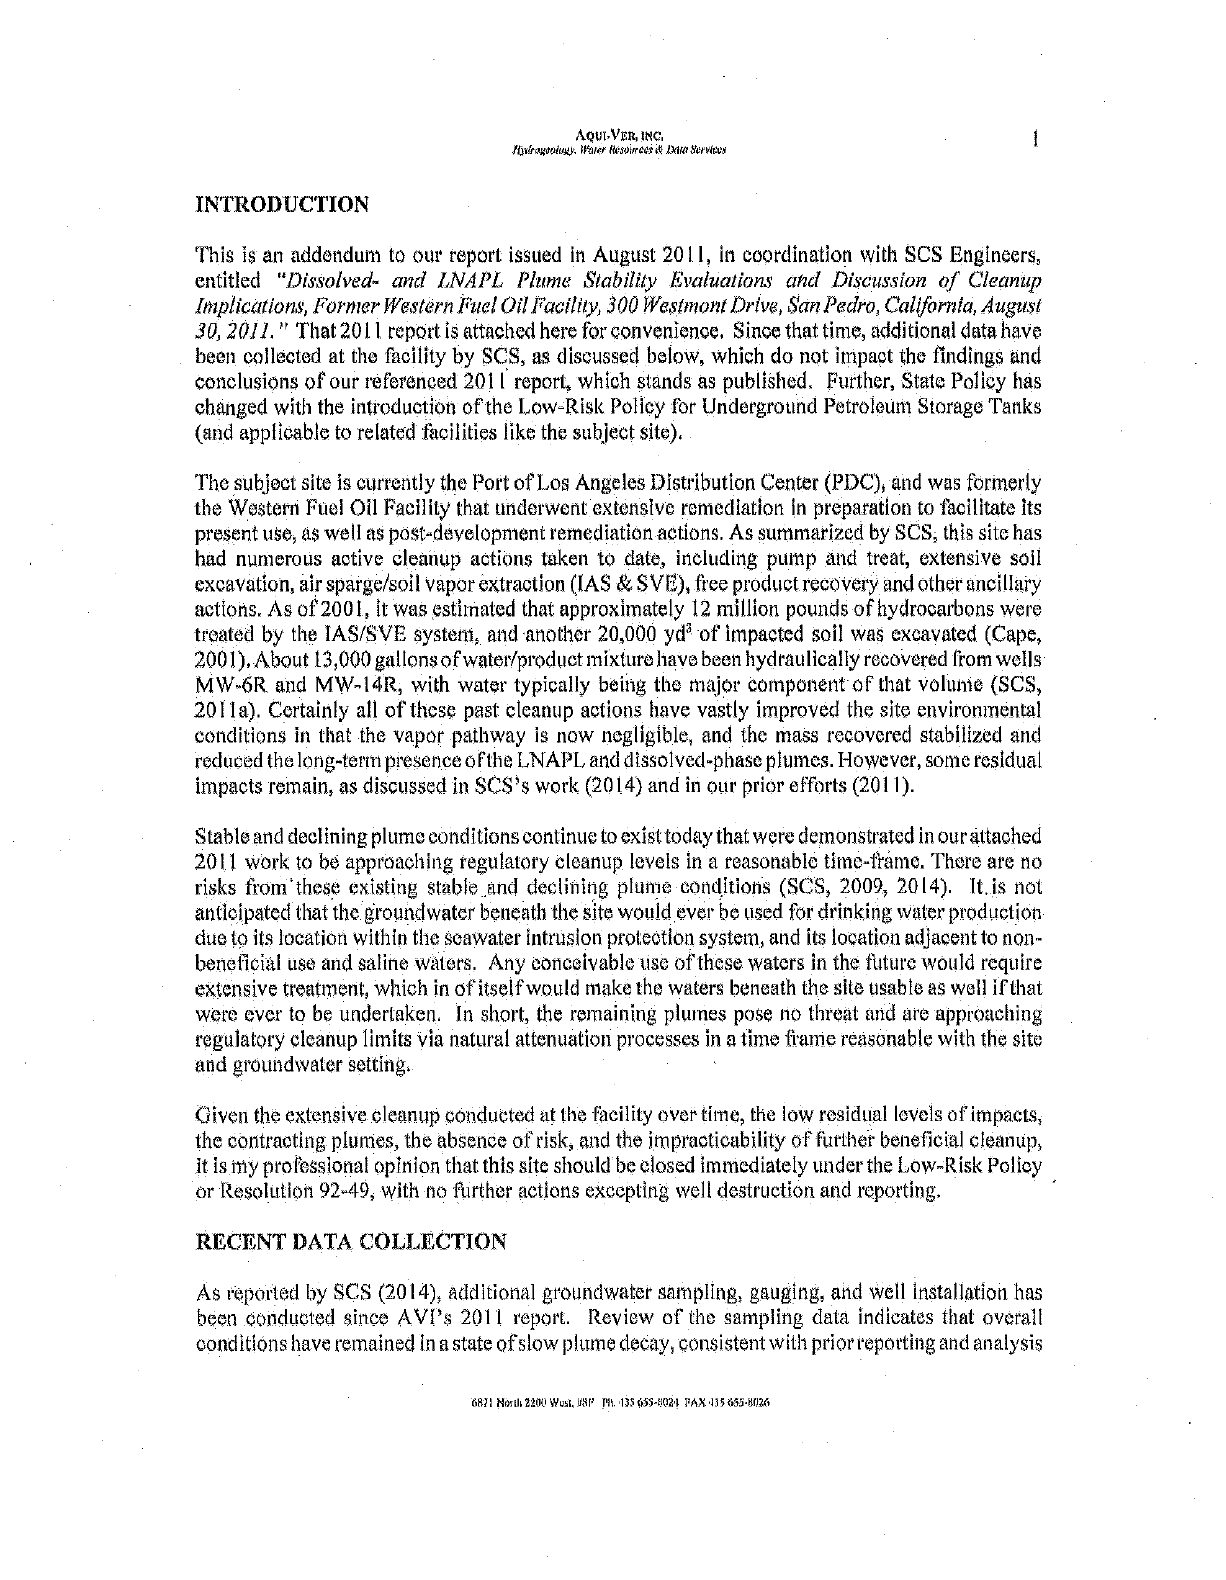
AQUbGR, INC.
/QJraReOla/pl IYnur &sOlme>P ip nun Saito
INTRODUCTION
This is an addendum to our report issued in August 201 I, in coordination with SCS Engineers,
entitled "Dissolved- and I NAP, Plume Stability Evaluations and Discussion of Cleanup
lmplwatr'ons, Farmer Western Fuel Oil Facility, 300 Westmont Drive, San Pedro California, August
30, 2011. " That 2011 report is attached here for convenience. Since that tine, additional data have
been collected at the facility by SCS, as discussed below, which do not impact the findings and
conclusions of our referenced 201 I report, which stands as published. Further, State Policy has
changed with the introduction of the Low -Risk Policy for Underground Petroleum Storage Tanks
(acid applicable to related facilities like the subject site).
The subject site is currently the Port of Los Angeles Distribution Center (PDC), and was formerly
the Western Fuel Oil Facility that underwent extensive rcmediation In preparation to facilitate its
present use, as well as post -development rcmediation actions. As summarized by SCS, this site has
had numerous active cleanup actions taken to date, including pump and treat, extensive soil
excavation, air sparge/soi I vapor extraction (IAS & SVE), free product recovery and other ancillary
actions. As of 2001, it was estimated that approximately 12 million pounds of hydrocarbons were
treated by the IAS /SVE system, and another 20,000 yd' of impacted soil was excavated (Cape,
2001). About [3,000 gallons of water /product mixture have been hydraulically recovered from wells
MW-6R and MW -14R, with water typically being the major component of that volume (SCS,
201 la). Certainly all of these past cleanup actions have vastly improved the site environmental
conditions in that the vapor pathway is now negligible, and the mass recovered stabilized and
reduced the long -term presence ofthe LNAPL and dissolved -phase plumes. However, some resIdual
impacts remain, as discussed in SCS's work (2014) and in our prior efforts (201 I).
Stable and declining plume conditions continue to exist today that were demonstrated in ourattached
2011 work to be approaching regulatory cleanup levels In a reasonable time -frame. There are no
risks from these existing stable and declining plume conditions (SCS, 2009, 2014). It. is not
anticipated that the groundwater beneath the site would ever he used for drinking water production
due to its location within the seawater intrusion protection system, and its location adjacent to non -
beneficial use and saline waters. Any conceivable use of these waters in the future would require
extensive treatment, which in of itself would make the waters beneath the site usable as well if that
were ever to be undertaken. In short, the remaining plumes pose no threat and are approaching
regulatory cleanup limits via natural attenuation processes in a time frame reasonable with the site
and groundwater setting.
Given the extensive cleanup conducted at the facility over time, the low residual levels of impacts,
the contracting plumes, the absence of risk, and the impracticability of further beneficial cleanup,
it is my professional opinion that this site should be closed immediately under the Low -Risk Policy
or Resolution 92 -49, with no further actions excepting well destruction and reporting.
RECENT DATA COLLECTION
As reported by SCS (2014), additional groundwater sampling, gauging, and well installation has
been conducted since AVl's 2011 report. Review of the sampling data indicates that overall
conditions have remained in a state of slow plume decay, consistent with prior reporting and analysis
WI Nomi 2200 Wmt, INN PII. ill 0a -arai SAX 025655400
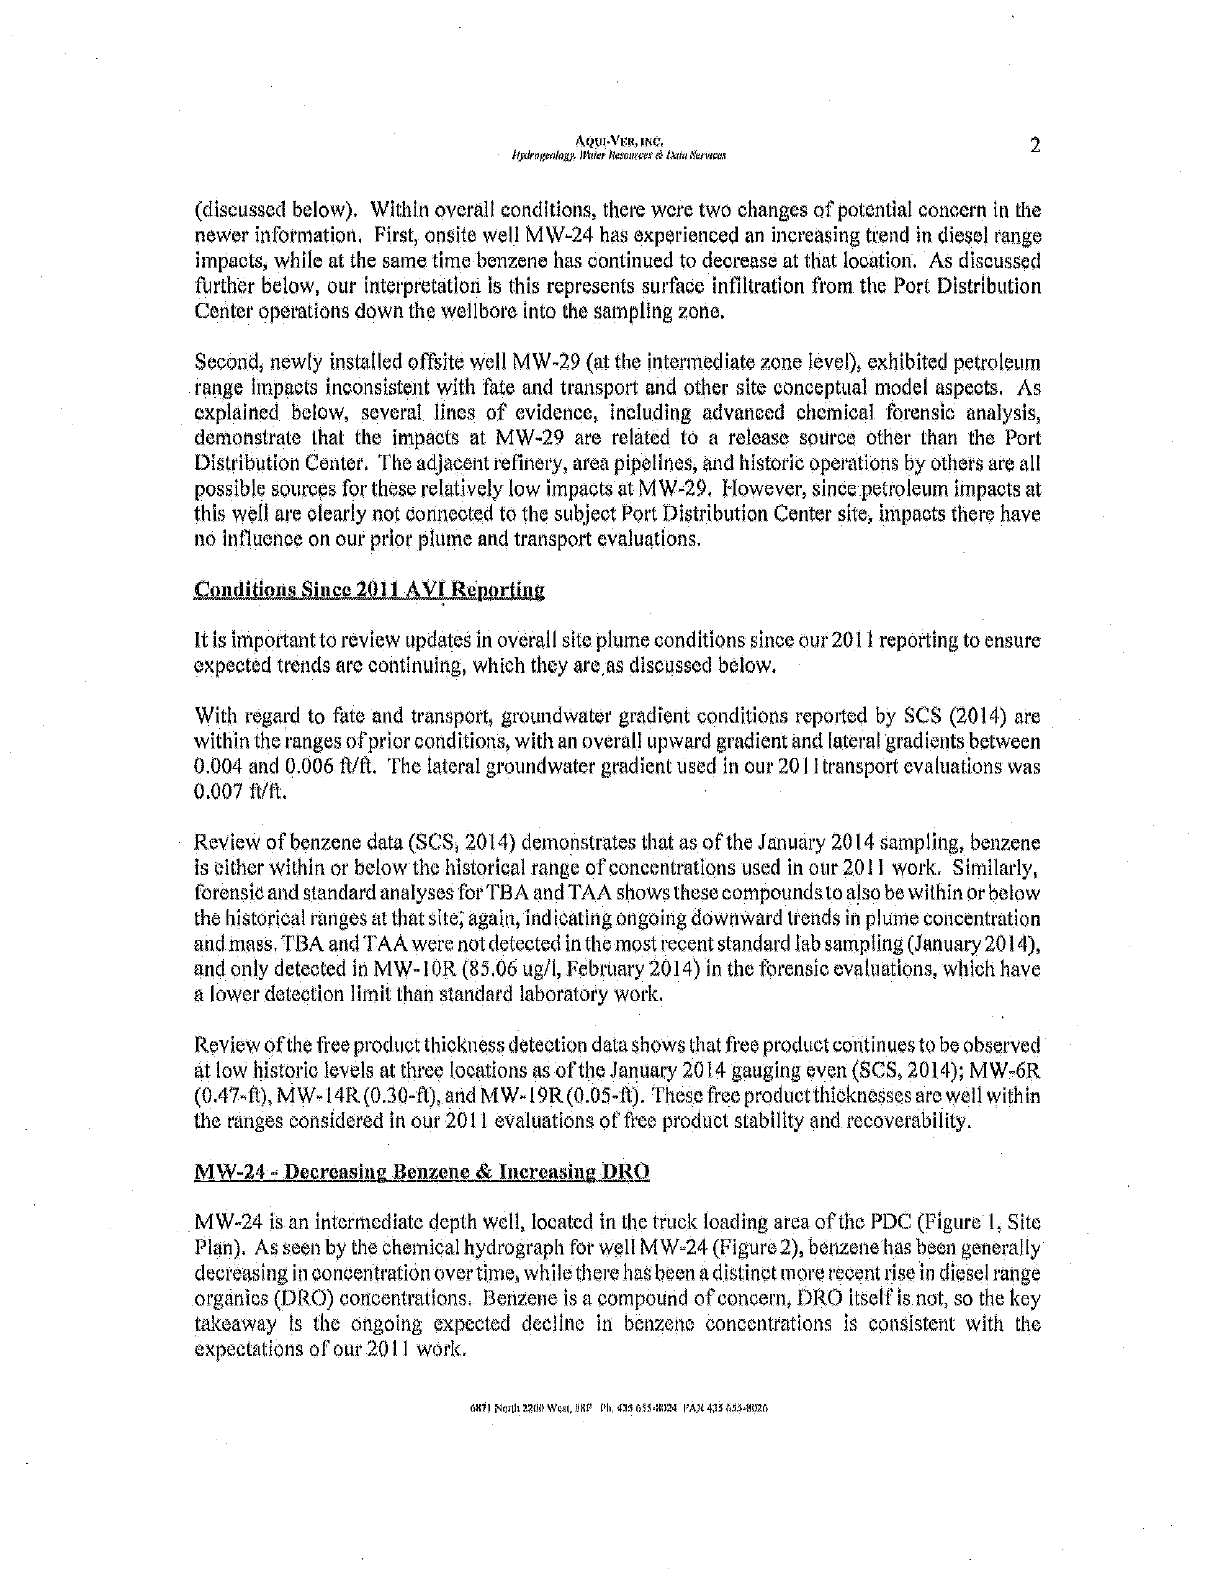
A@n(YFat,INC.
{fjelrnV,a+lnçy.IVnierRrm urce rd 2
(discussed below). Within overall conditions, there were two changes of potential concern in the
newer information, First, ensile well MW -24 has experienced an increasing trend in diesel range
impacts, while at the same time benzene has continued to decrease at that location. As discussed
further below, our interpretation is this represents surface infiltration from the Port Distribution
Center operations down the weilbore into the sampling zone,
lid, newly installed offsite well MW -29 (at the intermediate zone level), exhibited petroleum
range Impacts inconsistent with fate and transport and other site conceptual model aspects. As
explained below, several lines of evidence, including advanced chemical forensic analysis,
demonstrate that the impacts at MW -29 are related to a release source other than the Port
Distribution Center. The adjacent refinery, area pipelines, and historic operations by others are all
possible sources for these relatively low impacts at MW -29. However, since petroleutn impacts at
this well are clearly not connected to the subject Port Distribution Center site, impacts there have
no influence on our prior plume and transport evaluations.
Conditions Since 2011 AVI Reporting
It is important to review updates in overall site plume conditions since our 201 l reporting to ensure
expected trends are continuing, which they areas discussed below.
With regard to fate and transport, groundwater gradient conditions reported by SCS (2014) are
within the ranges of prior conditions, with an overall upward gradient and lateral gradients between
0.004 and 0.006 ft /11. The lateral groundwater gradient used in our 2011 transport evaluations was
0.007 fi /fì.
Review of benzene data (SCS, 2014) demonstrates that as of the January 2014 sampling, benzene
is either within or below the historical range of concentrations used in our 201 I work. Similarly,
forensic and standard analyses fol'TBA and TAA shows these compounds to also be within or below
the historical ranges at that site, again, indicating ongoing downward trends in plume concentration
and mass. TBA and TAA were not detected in the most recent standard lab sampling (January 2014),
and only detected in MW -I OR (85.06 ugh!, February 2014) in the forensic evaluations, which have
a lower detection limit than standard laboratory work.
Review of the free product thickness detection data shows that free product co tinuesto be observed
at low historic levels at three locations as of the January 2014 gauging even (SCS, 2014); MW-6R
(0.47,f1), MW-14R (0.30 -f1), and MW-19R (0.05.It). These free product thicknesses are well within
the ranges considered in our 2011 evaluations of free product stability and recoverability.
MW-24 - Decreasing Benzene & Increasing DRO
MW-24 is an intermediate depth well, located in the truck loading area of the PDC (Figure 1, Site
Plan). As seen by the chemical hydrograph for well MW -24 (Figure 2), benzene has been generally
decreasing in concentration over tine, while there has been a distinct more recent rise in diesel range
organics (DRO) concentrations. Benzene is a compound of concern, DRO itself is not, so the key
takeaway is the ongoing expected decline in benzene concentrations is consistent with the
expectations of our 2011 work.
I Nani, xa,
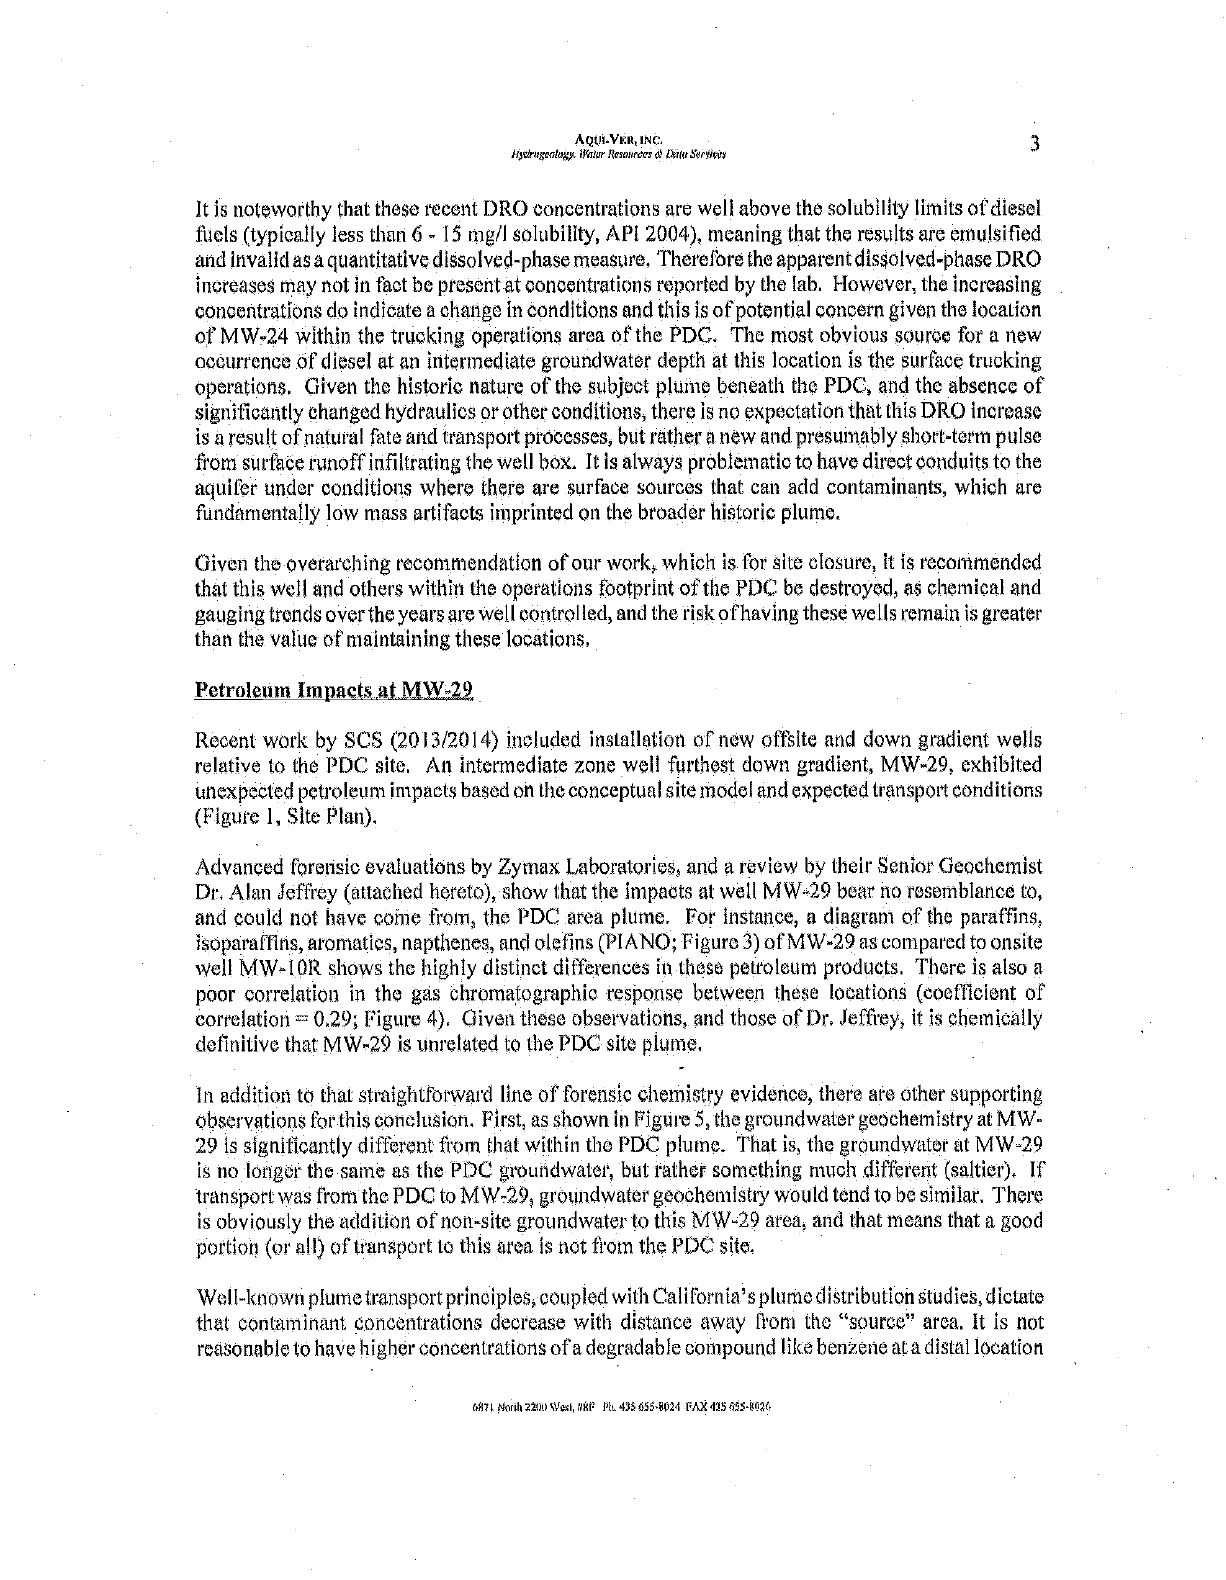
QtIGYeA, INC
ko(nrgen logy. lWtur Resent ner0.'(kiRrS
It is noteworthy that these recent DRO concentrations are well above the solubility limits of diesel
fuels (typically less than 6 - I5 mgll solubility, API 2004), meaning that the results are emulsified
and invalid as a quantitative dissolved -phase measure, Therefore the apparent dissolved -phase DRO
increases may not in fact be present at concentrations reported by the lab. However, the increasing
concentrations do indicate a change in conditions and this is of potential concern given the location
of MW -24 within the trucking operations area of the PDC. The most obvious source for a new
occurrence of diesel at an intermediate groundwater depth at this location is the surface trucking
operations. Given the historic nature of the subject plume beneath the PDC, and the absence of
significantly changed hydraulics or other conditions, there is no expectation that Oils DRO increase
is a result of natural fate and transport processes, but rather á new and presumably short -term pulse
from surface runoff infiltrating the well box. It is always problematic to have direct conduits to the
aquifer under conditions where there are surface sources that can add contaminants, which are
fundamentally low mass artifacts imprinted on the broader historic plume.
Given the overarching recommendation of our work, which is for site closure, it is recommended
that this well and others within the operations footprint of the PDC be destroyed, as chemical and
gauging trends over the years are well controlled, and the risk of having these wells remain is greater
than the value or maintaining these locations.
Petroleum Impacts at MW -29
Recent work by SCS (20 I 3/20 I 4) included installation or new offslte and down gradient wells
relative to the PDC she. An intermediate zone well furthest down gradient, MW -29, exhibited
unexpected petroleum impacts based on the conceptual site model and expected transport conditions
(Figure 1, Site Plan).
Advanced Forensic evaluations by Zyrnax Laboratories, and a review by their Senior Geochemist
Dr, Alan Jeffrey (attached hereto), show that the impacts at well MW -29 bear no resemblance to,
and could not have collie from, the PDC area plume. For instance, a diagram of the paraffins,
isoparaffins, aromatics, napthenes, and olefins (PIANO; Figure 3) of MW -29 as compared to ensile
well MW-10R shows the highly distinct differences in these petroleum products. There is also a
poor correlation in the gas chromatographic response between these locations (coefficient of
correlation = 0.29; Figure 4), Given these observations, and those of Dr. Jeffrey, it is chemically
definitive that MW -29 Is unrelated to the PDC site plume.
In addition to that straightforward line of forensic chemistry evidence, there are other supporting
observations for this conclusion. First, as shown in Figure 5, the groundwater geochemistry at MW-
29 is significantly different from that within the PDC plume. That is, the groundwater at MW -29
is no longer the saine as the PDC groundwater, but rather something much different (saltier). If
transport was from the PDC to MW -29, groundwater geochemistry would tend to be similar. There
is obviously the addition of non -site groundwater to this MW -29 area, and that means that a good
portion (or all) of transport to this area is not from the PDC site.
Well -known plume transport principles, coupled with California's plume distribution studies, dictate
that contaminant concentrations decrease with distance away from the "source" area, It Is not
reasonable to have higher concentrations ofa degradable compound like benzene at a distal location
111231111 Wed, IIpP
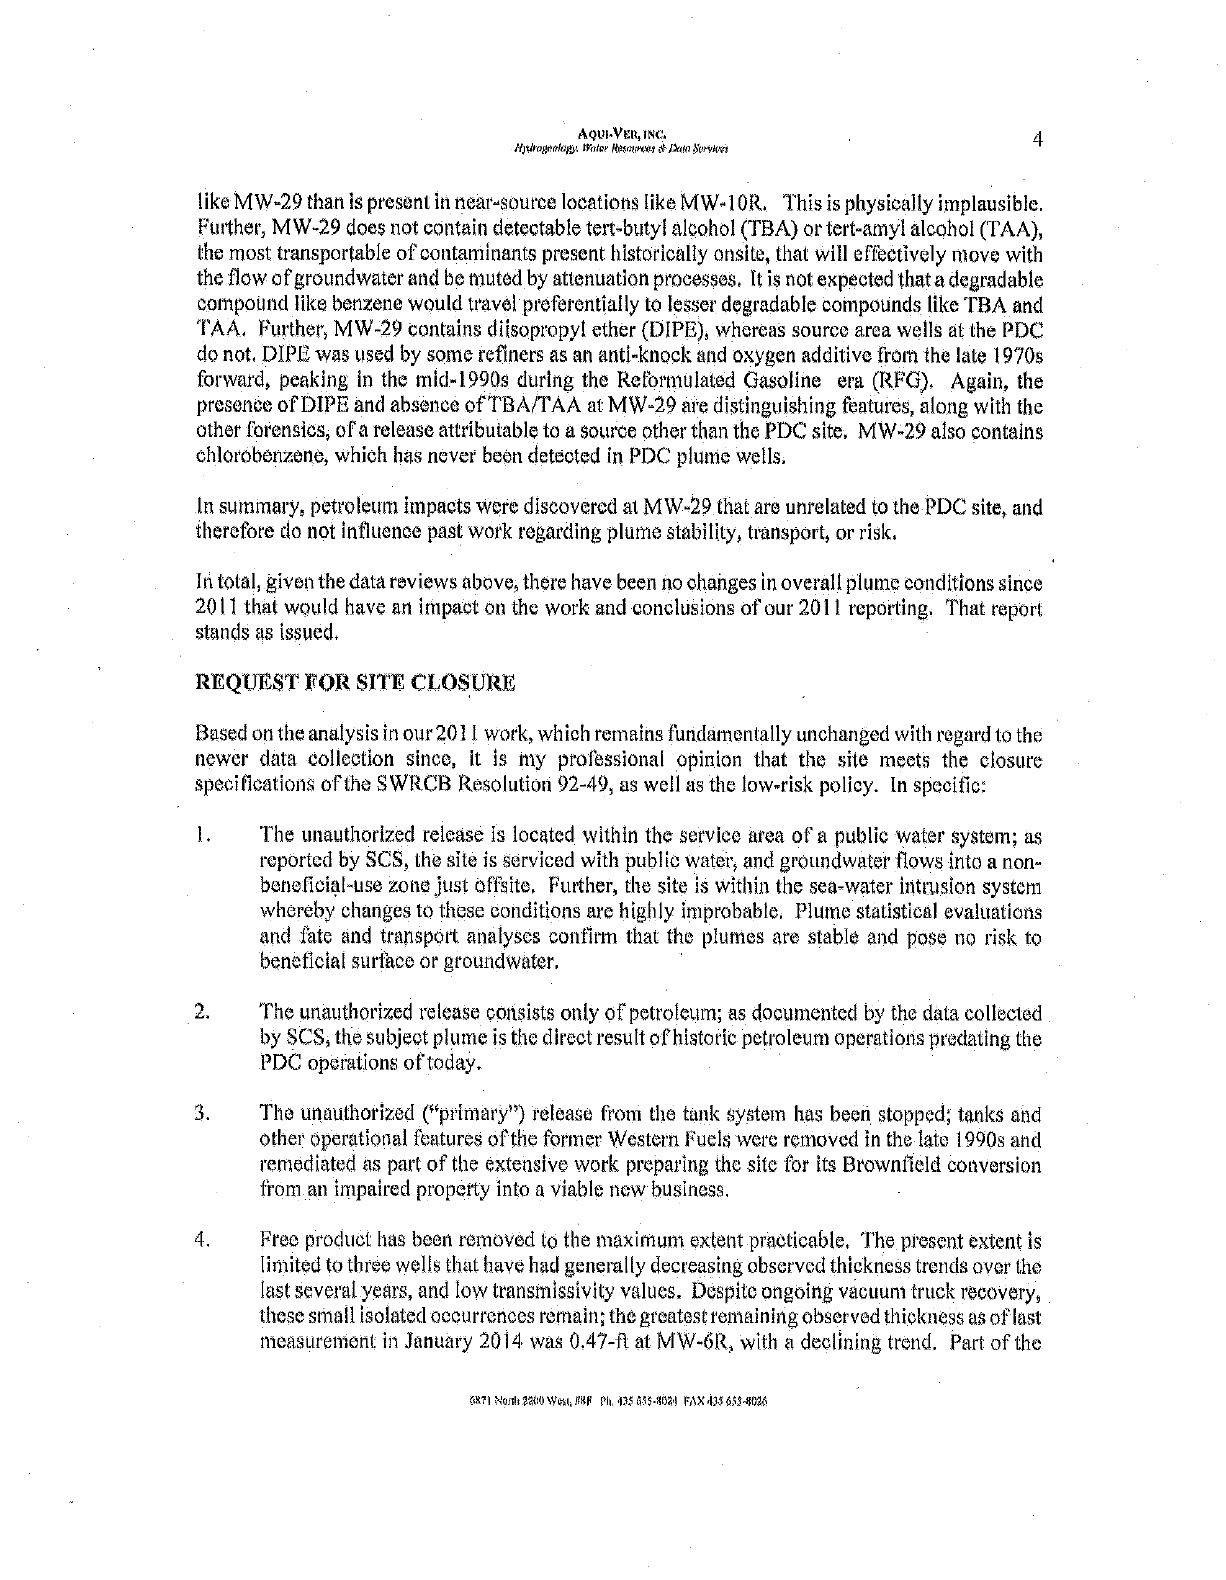
A4m.Ycn,7nc.
H,Hrnymning,, w,vcr M&ntcvt4Hhan 4
like MW -29 than k present in near -source locations like MW -10R. This is physically implausible.
Further, M W -29 does not contain detectable tert-butyl alcohol (TBA) or tert -amyl alcohol (TAA),
the most transportable of contaminants present historically onsite, that will effectively move with
the flow of groundwater and be muted by attenuation processes. It is not expected that a degradable
compound like benzene would travel preferentially to lesser degradable compounds like TBA and
TAA, Further, MW -29 contains diisopropyl ether (DIPE), whereas source area wells at the PDC
do not DIPL was used by some refiners as an anti -knock and oxygen additive from the late 1970s
forward, peaking In the mid -1990s during the Reformulated Gasoline era (RFG). Again, the
presence of DIPE and absence ofTBA/TAA at MW -29 are distinguishing features, along with the
other forensics, of a release attributable to a source other than the PDC site. MW -29 also contains
chlorobenzene, which has never been detected in PDC plume wells.
In summary, petroleum impacts were discovered at MW -29 that are unrelated to the PDC site, and
therefore do not influence past work regarding plume stability, transport, or risk,
In total, given the data reviews above, there have been no changes in overall plume conditions since
2011 that would have an impact on the work and conclusions of our 2011 reporting. That report
stands as issued.
REQUEST FOR SITE CLOSURE
Based on the analysis in our 2011 work, which remains fundamentally unchanged with regard to the
newer data collection since, it is my professional opinion that the site meets the closure
specifications of the SWRCB Resolution 92 -49, as well as the low -risk policy. In specific:
1. The unauthorized release is located within the service area of a public water system; as
reported by SCS, the site is serviced with public water, and groundwater flows into a non -
beneficial -use zone, just offsite, Further, the site is within the sea -water intrusion system
whereby changes to these conditions are highly improbable: Plume statistical evaluations
and fate and transport analyses confirm that the plumes are stable and pose no risk to
beneficial surface or groundwater.
2. The unauthorized release consists only of petroleum; as documented by the data collected
by SCS, the subject plume is the direct result of historic petroleum operations predating the
PDC operations of today.
3. The unauthorized ( "primary ") release from the tank system has been stopped; tanks and
other operational features of the former Western Fuels svere removed in the late 1990s and
remediated as part of the extensive work preparing the site for its Brownfield conversion
from an impaired property into a viable new business.
4. Free product has been removed to the maximum extent practicable, The present extent is
limited to three wells that have had generally decreasing observed thickness trends over the
last several years, and low transmissivity values. Despite ongoing vacuum truck recovery,
these small isolated occurrences remain; the greatest remaining observed thickness as of last
measurement in January 2014 was 0.47-ft at MW -6R, with a declining trend. Part of the
{xFl NUM zaoo wat. 09F Pit -03S 1)&7 rAxd
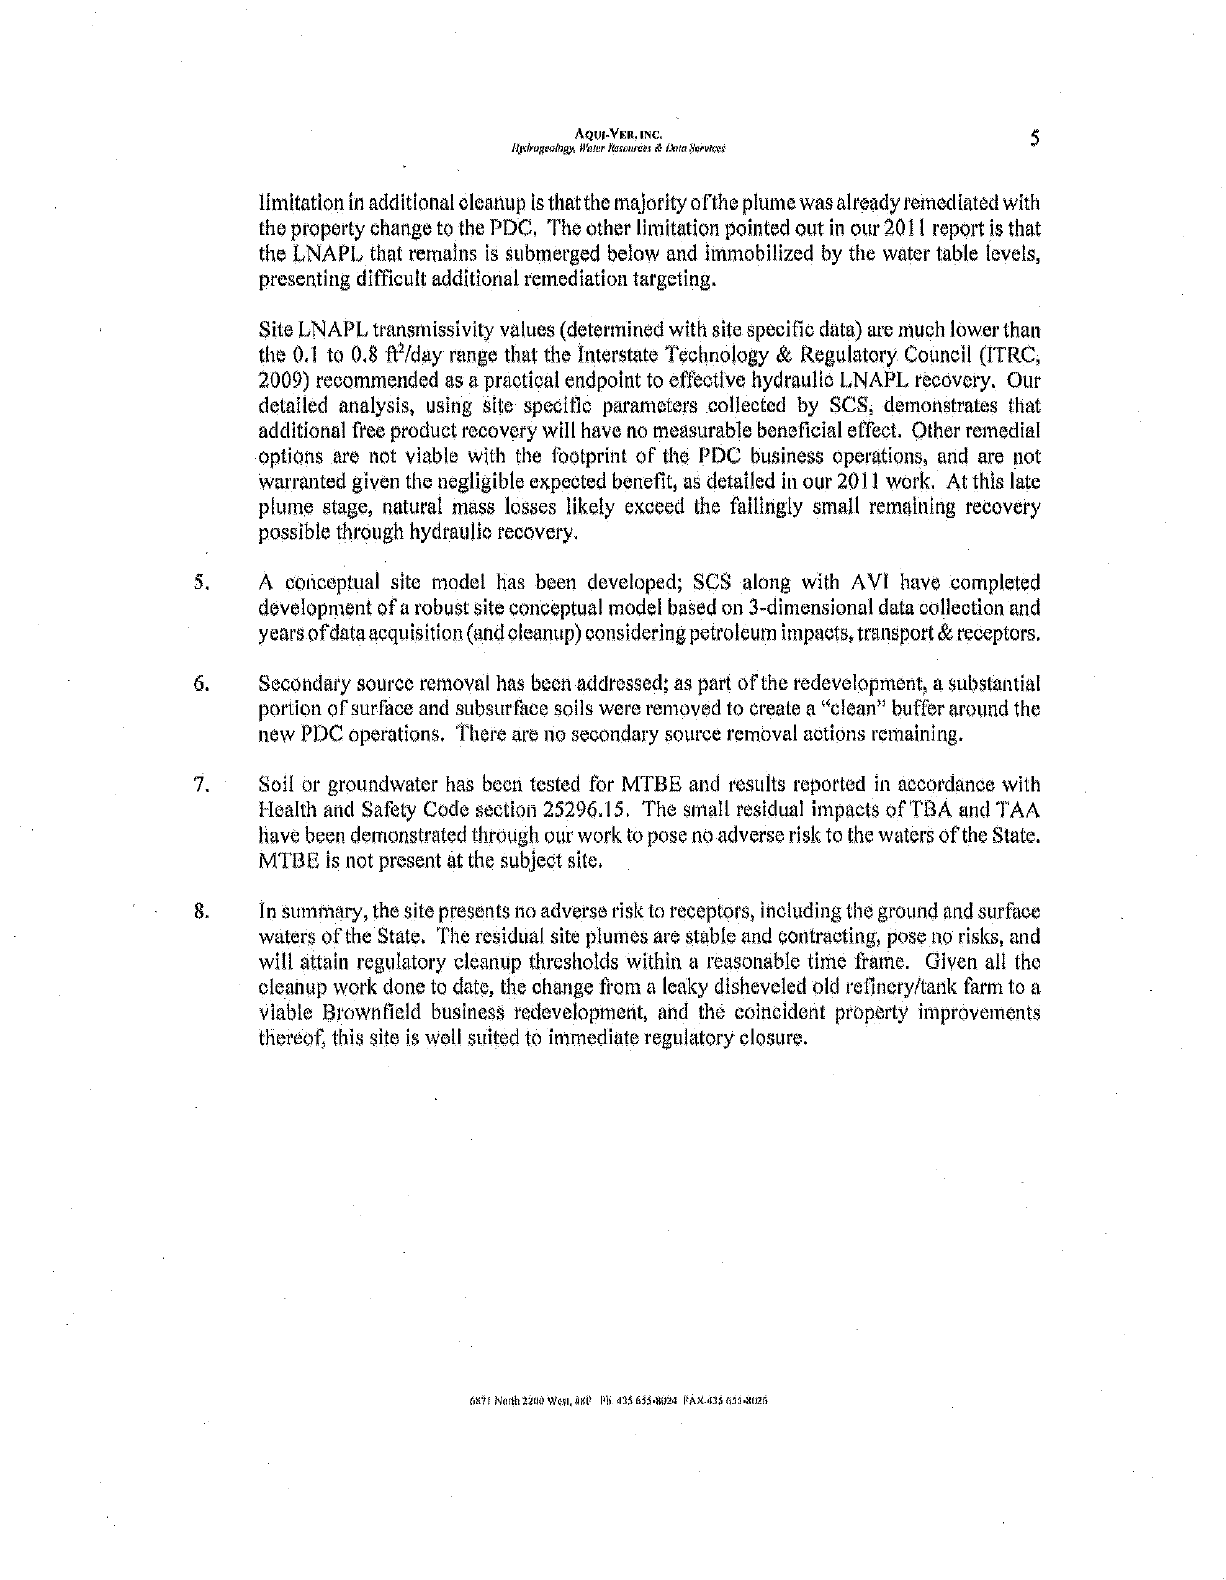
Aßt4-vFlt, INC.
11lrMagi.»h+FY. Water lYcrnurée.r lbm 9 5
limitation in additional cleanup is that the majority ofthe plume was already remediated with
the property change to the PDC, The other limitation pointed out in our 2011 report is that
the LNAPL that remains is submerged below and immobilized by the water table levels,
presenting difficult additional remediation targeting.
Site LNAPL transmissivity values (determined with site specific data) are much lower than
the 0.1 to 0,8 ft' /day range that the Interstate Technology & Regulatory. Council (ITRC;
2009) recommended as a practical endpoint to effective hydraulic LNAPL recovery. Our
detailed analysis, using site specific parameters collected by SCS, demonstrates that
additional free product recovery will have no measurable beneficial effect. Other remedial
options are not viable with the footprint of the PDC business operations, and are not
warranted given the negligible expected benefit, as detailed in our 2011 work, At this late
plume stage, natural mass losses likely exceed the faitingly small remaining recovery
possible through hydraulic recovery.
5. A conceptual site model has been developed; SCS along with AVI have completed
development of a robust site conceptual model based on 3- dimensional data collection and
years of data acquisition (and cleanup) considering petroleum impacts, transport & receptors,
6. Secondary source removal has been addressed; as part of the redevelopment, a substantial
portion of surface and subsurface soils were removed to create a "clean" buffer around the
new PDC operations. There are no secondary source removal actions remaining.
7, Soil or groundwater has been tested for MTBE and results reported in accordance with
Health and Safety Code section 25296.15. The small residual impacts ofTBA and TAA
have been demonstrated through our work to pose no adverse risk to the waters of the State.
MTBE is not present at the subject site.
8. In summary, the site presents no adverse risk to receptors, including the ground and s
's of the State. The residual site plumes are stable and contracting, pose no risks, and
will attain regulatory cleanup thresholds within a reasonable time frame. Given all the
cleanup work done to date, the change from a leaky disheveled old refinery /tank farm to a
viable Brownfield business redevelopment, and the coincident property improvements
thereof, this site is well suited to immediate regulatory closure.
North "Cino Well, NIP Pli.ngsu5i-NR3n PAN -0l5ndl.gnzz
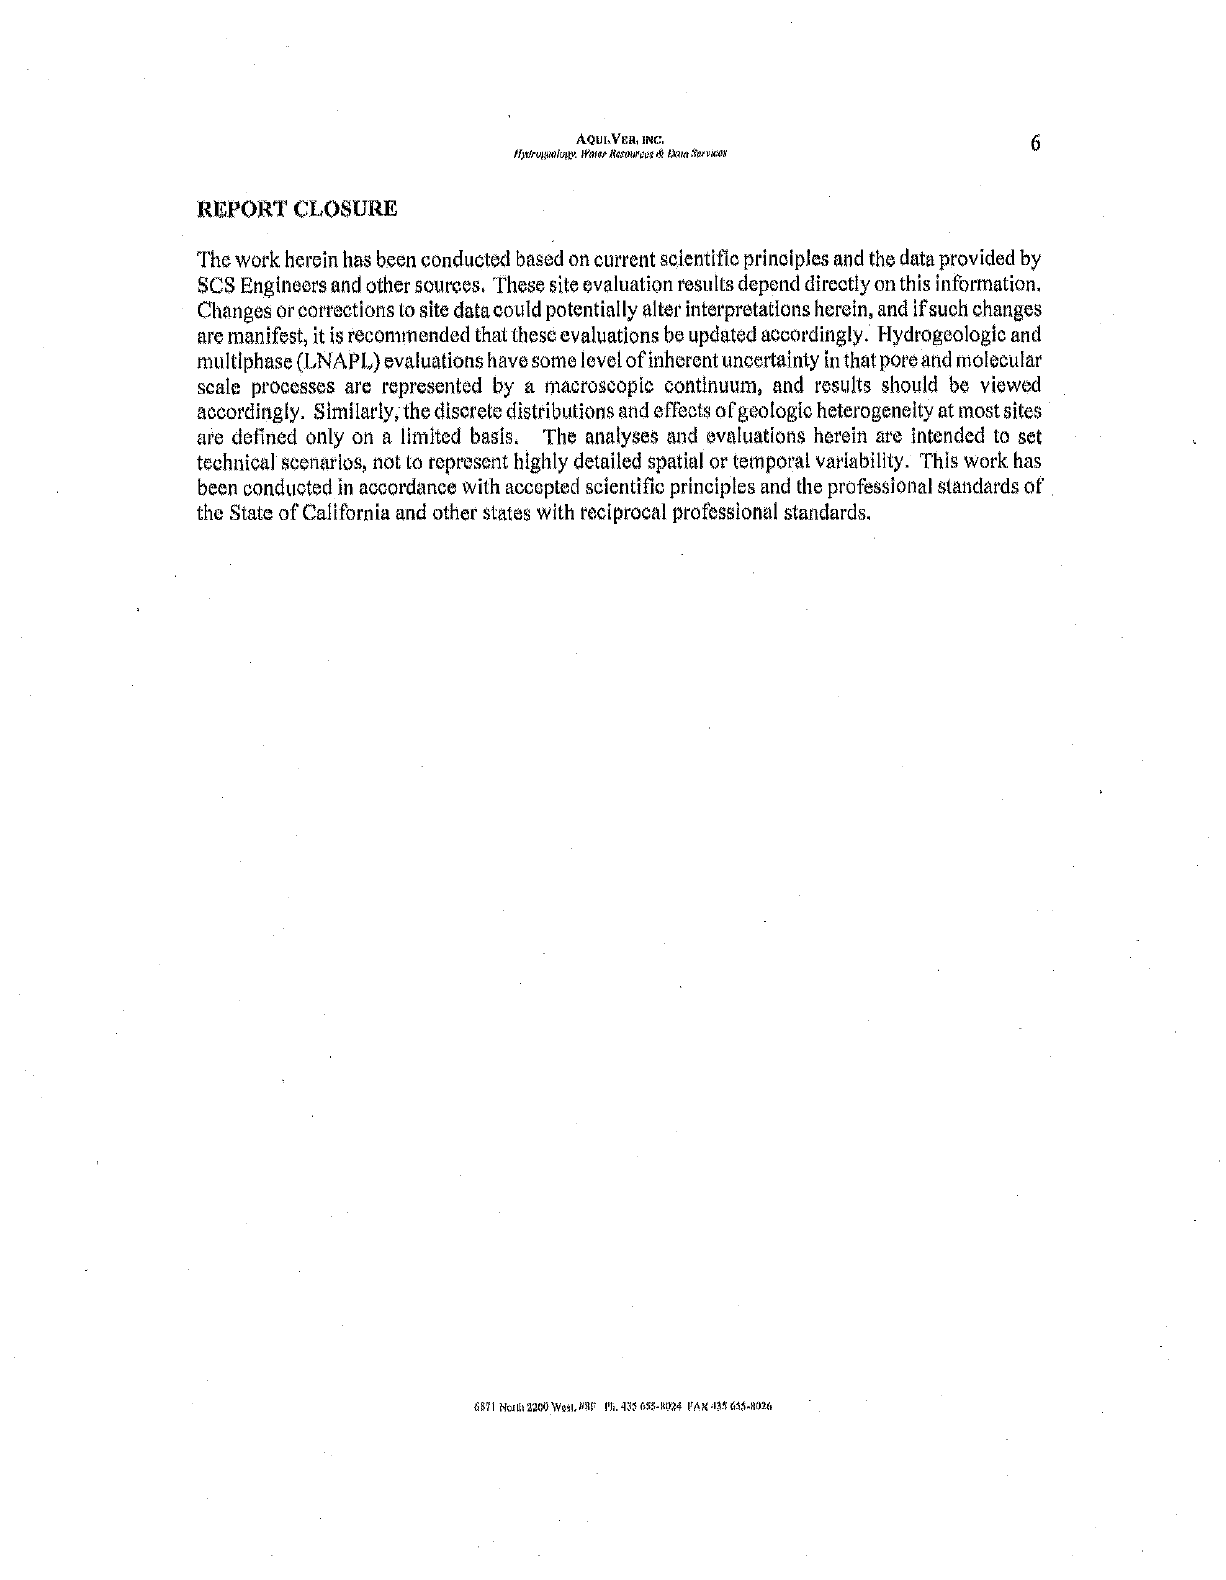
AQUI+VEn, INC.
HkNruy4úlupy. 170$0141 :11$ M kam fikrvko
REPORT CLOSURE
6
The work herein has been conducted based on current scientific principles and the data provided by
SCS Engineers and other sources, These site evaluation results depend directly on this information,
Changes or corrections to site data could potentially alter interpretations herein, and if such changes
are manifest, it is recommended that these evaluations be updated accordingly. Hydrogeologie and
multiphase (LNAPL) evaluations have some level of inherent uncertainty in that pore and molecular
scale processes are represented by a macroscopic continuum, and results should be viewed
accordingly. Similarly, the discrete distributions and effects olgeologle heterogeneity at most sites
are defined only on a limited basis, The analyses and evaluations herein are intended to set
technical scenarios, not to represent highly detailed spatial or temporal variability. This work has
been conducted in accordance with accepted scientific principles and the professional standards of
the State of California and other states with reciprocal professional standards.
áÁ9i N 220owa 429 FAX.I3S 11024
AI{IIVRN,INC.
O»#rugealogy. IVIOPr MUMMY A DOM SFYVI6N, 7
RRS+RRINCES
Air Force Center for Environmental Excellence, 2012 (various authors). Low Risk Site Closure,
API, 2004. Interactive LNAPL Guide
1TRC, 2009. Evaluating LNAPL Remedial Technologies for Achieving Project Goals,
SWRCB, undated. Technical Justification for Groundwater Plume Lengths, Indicator Constituents,
Concentrations, and Buffer Distances (Separation Distances) to Receptors.
SWRCB, October 1996. Resolution 92.49. Policies and Procedures for Investigation and Cleanup
and Abatement of Discharges under Water Code Section 13304
SOS Engineers, 2009, Conceptual Site Model, Port I.A Distribution Center (CAO 85 -17, SLIC No.
352 Site ID 2040069), 300 Westmont Drive, San Pedro California 90733. May.
SCS Engineers, 201la. Report of Cone Penetration Testing Investigation, San Ped
Center, 300 Westmont Drive, San Pedro California 90733. June.
SCS Engineers, 201Ib, Groundwater Monitoring Report, Second Semiannual 2010, San Pedro
Business Center, 300 Westmont Drive, San Pedro California 90733. y.
SWRCB, 2012. Low -threat Underground Storage Tank Case Closure Policy, www.swreb.ca.gov,
http://www.waterboards.ca.gov/ust/It_els_pley.shtm I.
SCS Engineers, 2014; Groundwater Monitoring Report, Second Semi -annual 2013. San Pedro
Business Center, 300 Westmont Drive, San Pedro, California
Zymax Forensices, February 2014. Forensic Report of Dr. Alan Jeffrey
Zymax Forensices, February 2014. Forensic Testing Results, MW-10R, MW-26, MW -27, MW -29
"* other relevant references are in AVI's 2011 report
ì.\AVlmnp\60100 548\IiadPinul Rnpb,iÍhIU201dMddanJUnuvpJ
6811 Nonh 2200 Wont lBP Pk 435 655 40E4 FAX 433 600S.W,26
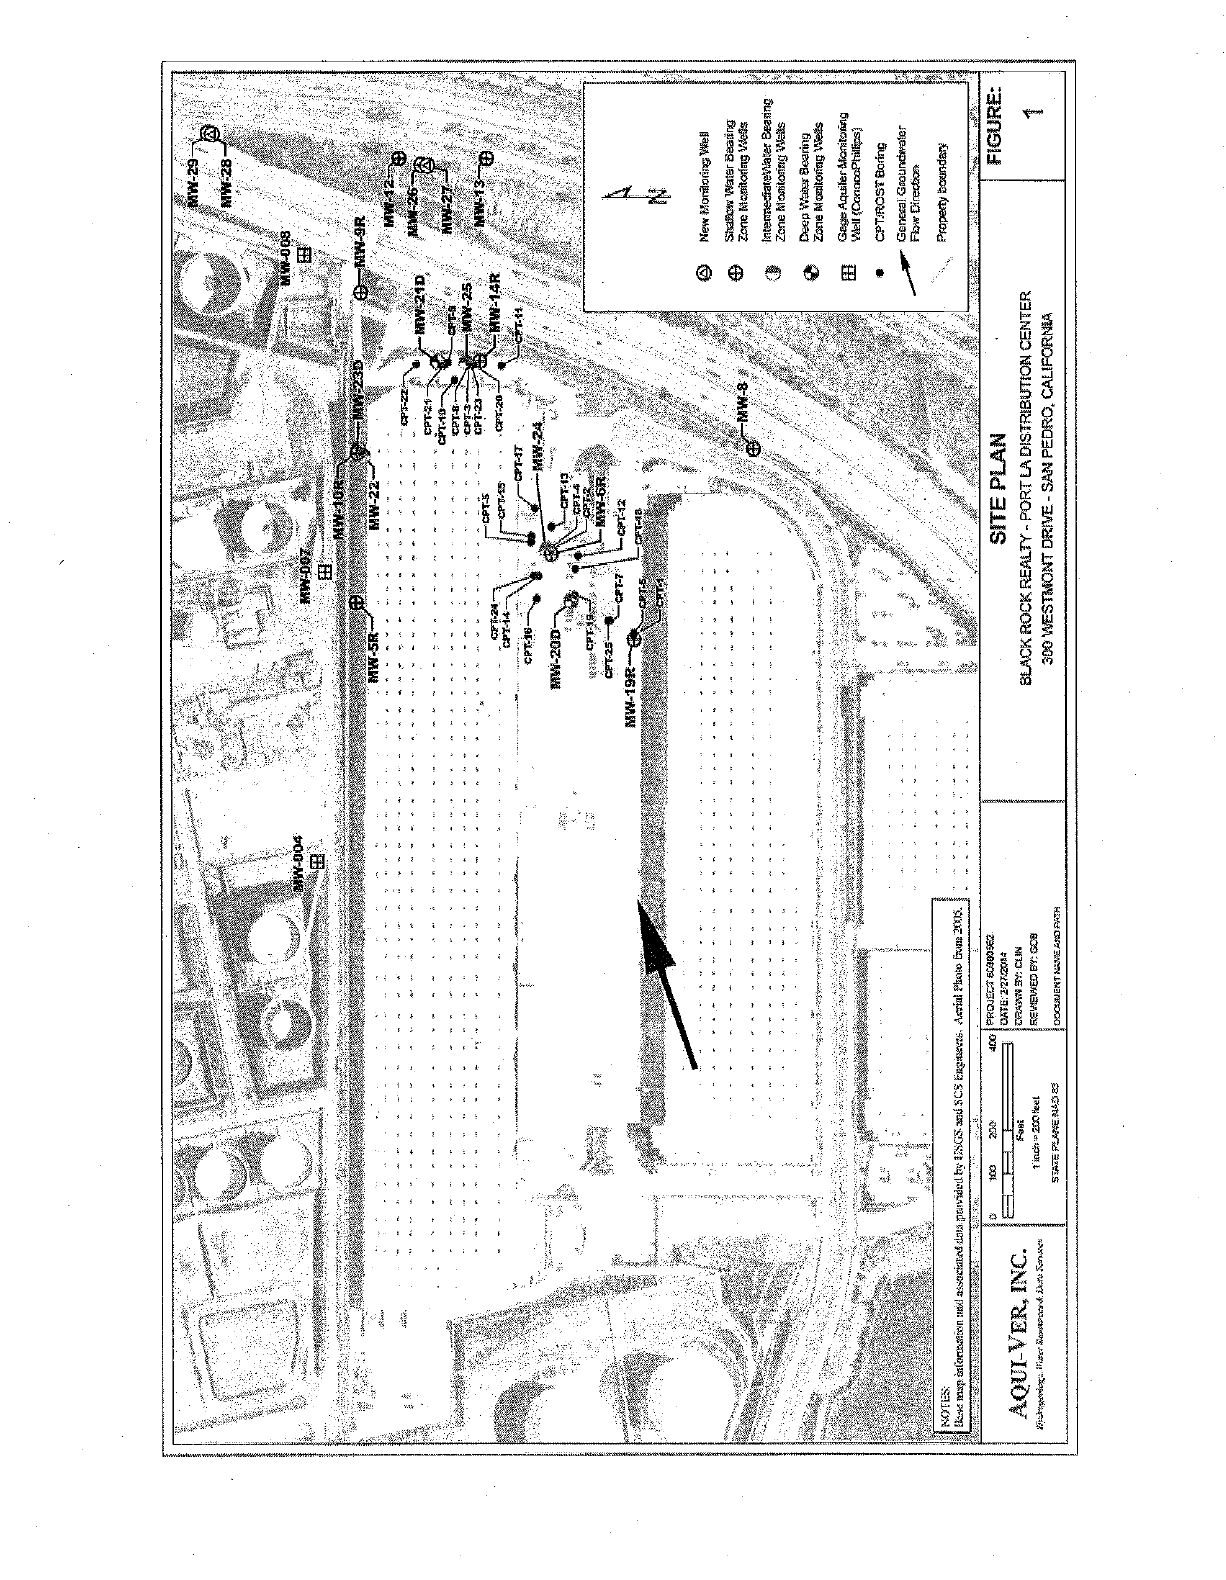
MW-0@î
MlNsle9i
MW-22 A
MW-12-b)
MW-213
MW-27
CPT23
RT:
OPT 15 Mt MW-13-4,
OPT-0Y
Mfi/-24
® New tAomlanrywell
Slew Water Beaerg
Zane Mcertoeng t"eCs
letemratet ater Dewing
Zone etomtonie *,sees
e Deep Starer eeanng
Zone eam[onng Wei l
Gape AGwferteoneonog
Nell recnncPhnt;sl
e CPTaROST Bong
Mweter
\0[I J
EL, m-yminnarrR ry.us4 -u.Atn+v.a wad ^ gq.ic.,a ImEgE'h.n. Mtn, 'ISn
AQUI-FER, INC.
,W 2.12
coe,
tme -= led
570-EP-Ane14-0
4COI°P0.1£GI5ba3S&
3 ORTE 2'27263.
-...n-4, C I
f "-,4e, a
.a-...lentn... £,.r.aP-ti
SITE PLAN
BLACK ROCK REALTY - PORT LA DISTR!BJTION CENTER
300 WESTMONT O4i'IE - SAN PEDRO CALIFORNIA
FIGUR
i
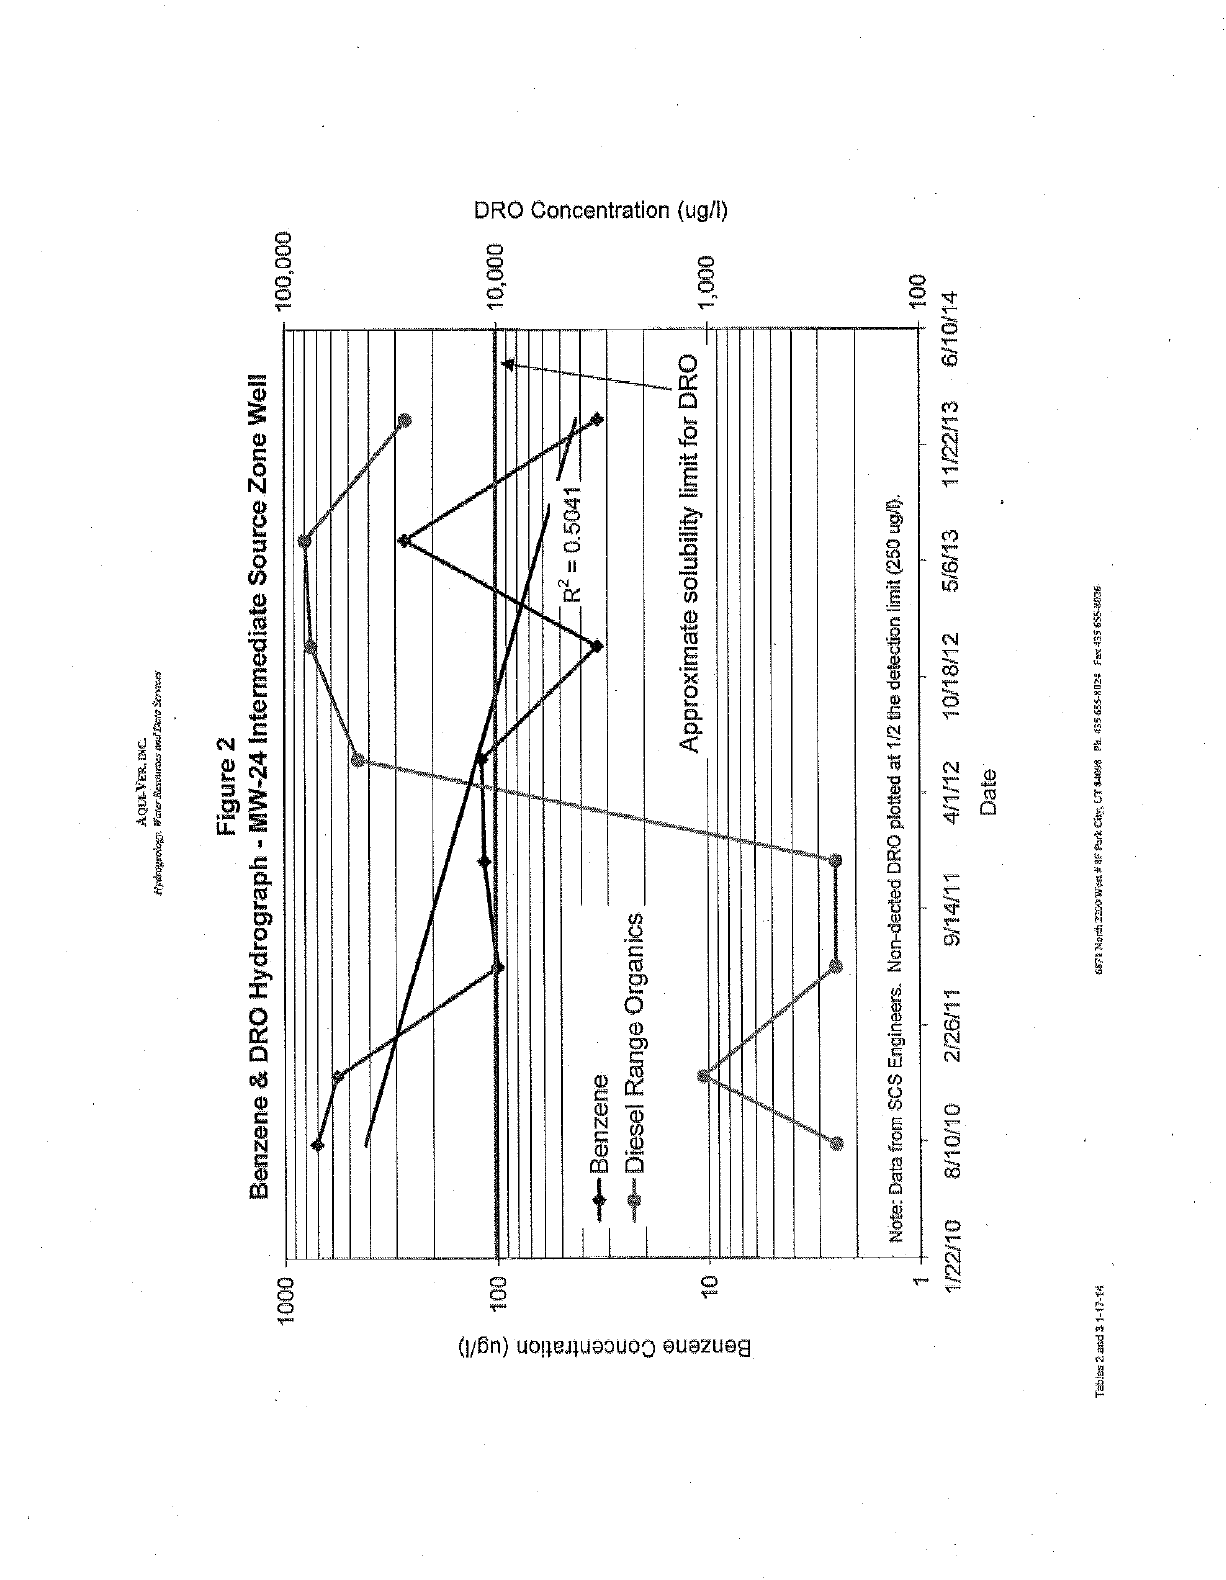
00
10
1
Figure 2
Benzene & DRO Hydrograph - MW -24 Intermediate Source Zone Well
2 = 0.5041
--o Benzene
-e-- Diesel Rancie ©rganics
100,000
- 10,000 t
n
o
Approximate solubility limit for DRO - 1,000
Note: Data from SCS Engineers. Non- dected DRO plotted at 1/2 the detection limit (250 ugl0. 100
1l22I10 8110/10 2126111 9/14/11 4/1/12 10/18/12 5/6/13 11122/13 6i10114
Date
Ta151¢s2a4d31-17-74 G47FVVkhY]'AWev28E
Park City, GTti149A Ph_-0':1455-10?: fa7 435 6544II26
"E"
rc,
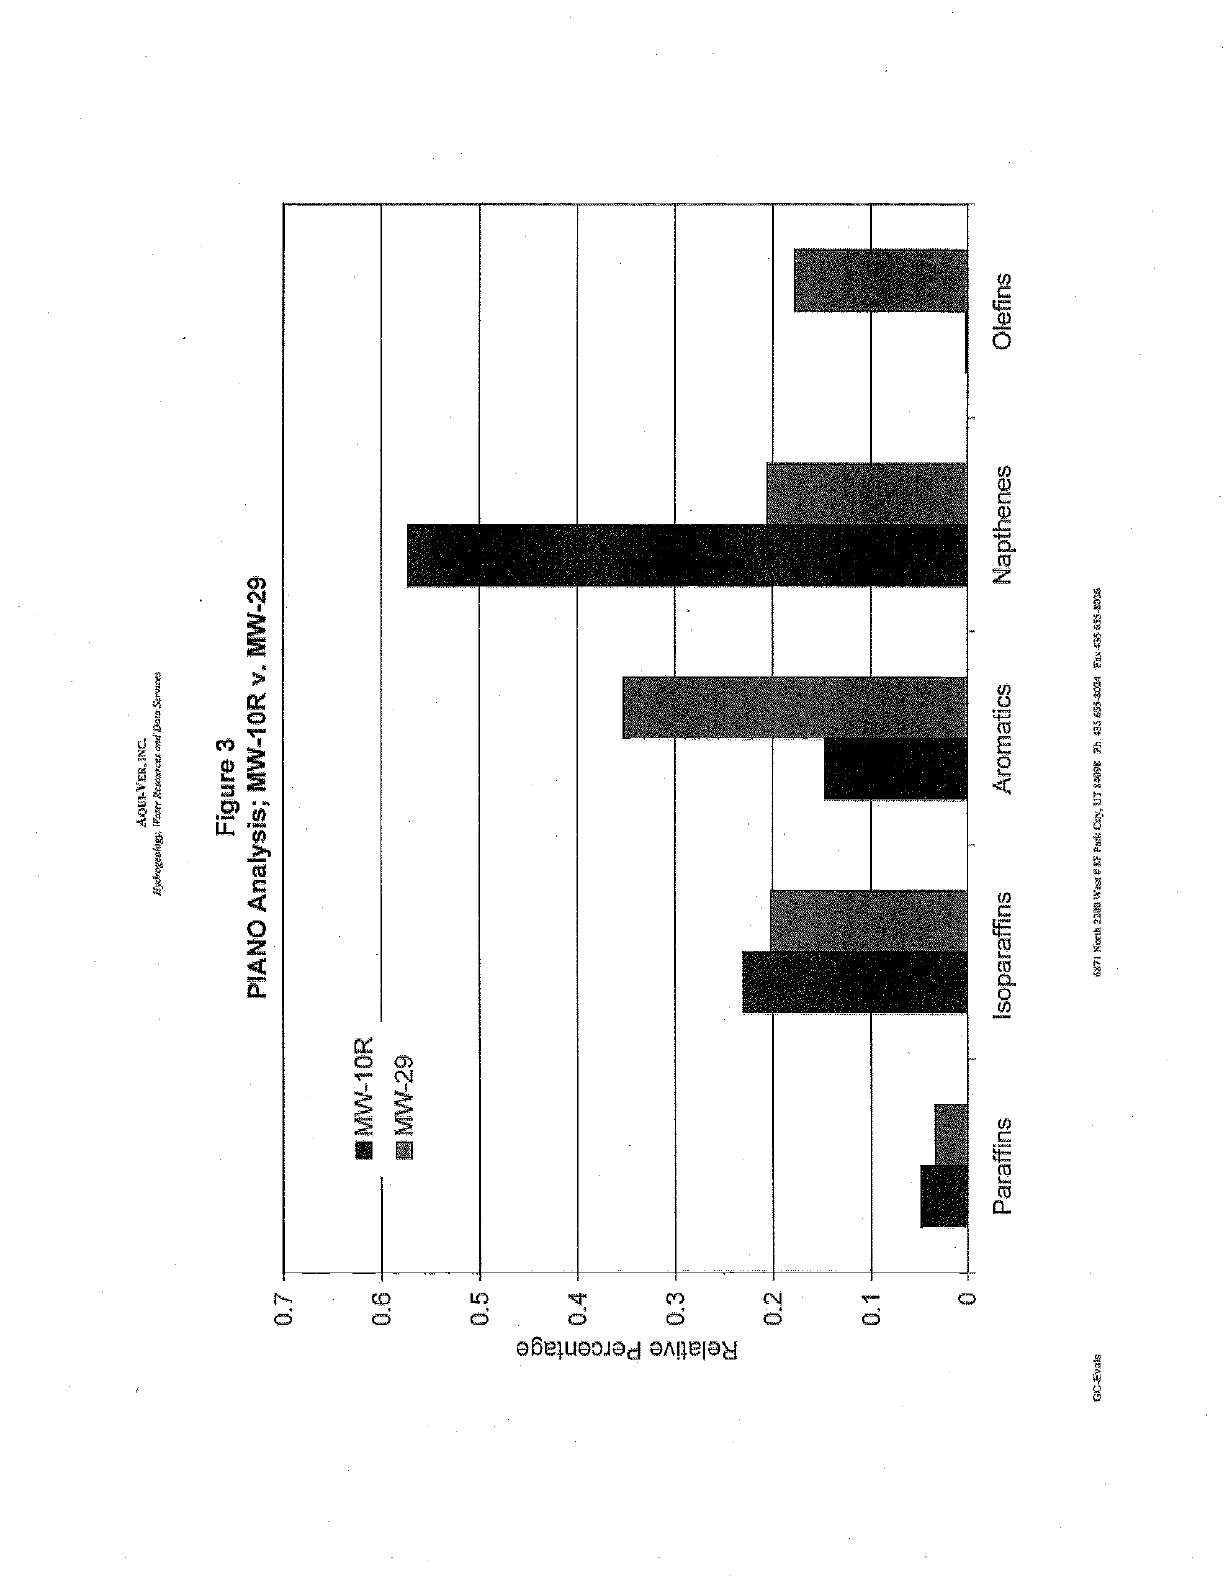
0.7
0.6
0.5
AQUI-ï'`EB,3itiG
ragwPngy, IFmnR.wmce< and 6aufi s
Figure 3
PIANO Analysis; MW -1OR v.
-10R
E MW-29
0.2
0.1
Paraffins Isoparaffins Aromatics.
GCEvals E %71 Marty ?'Ugl'':.a Y&F Put: Cëiv, UT 2#41n Th 05655-8024 Fa%05G55 -&!SS
Napthenes Olefins
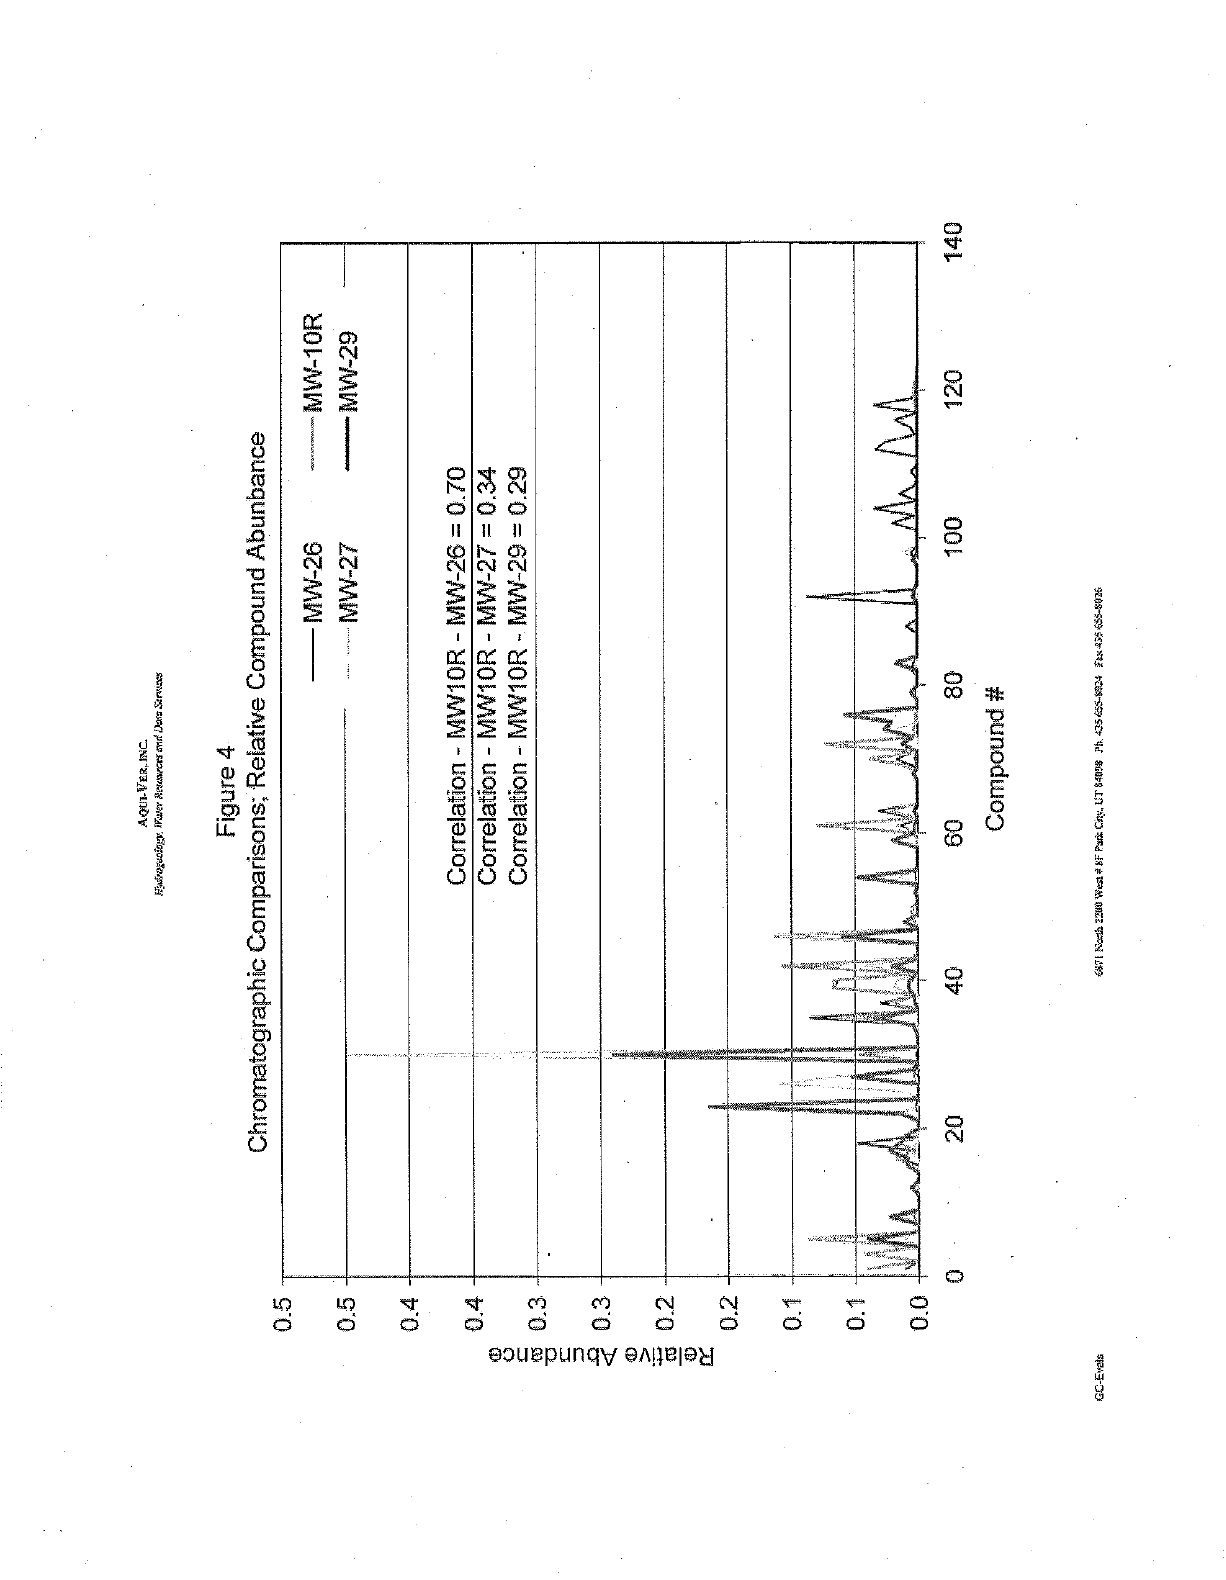
0.5
0.5
0.4
0.4
lE
0.2
0.
0.
Agua- VER,.3NC.
R "utw¡eotag'. Wser Resistors asid t)an Se rwats
Figure 4
Chromatographic Comparisons; Relative Compound Abunbance
-
MW-26
MW-27
Correlation - 10R - -26 = 0.70
Correlation - MW1OR -
Correlation - MW1OR -
0.0
0 20
GC-Evais
60 80
Compound #
an N 4v 220 Wet. si T 84098 Pn, 056554M:4 sae1556i3-8836
100 120 140
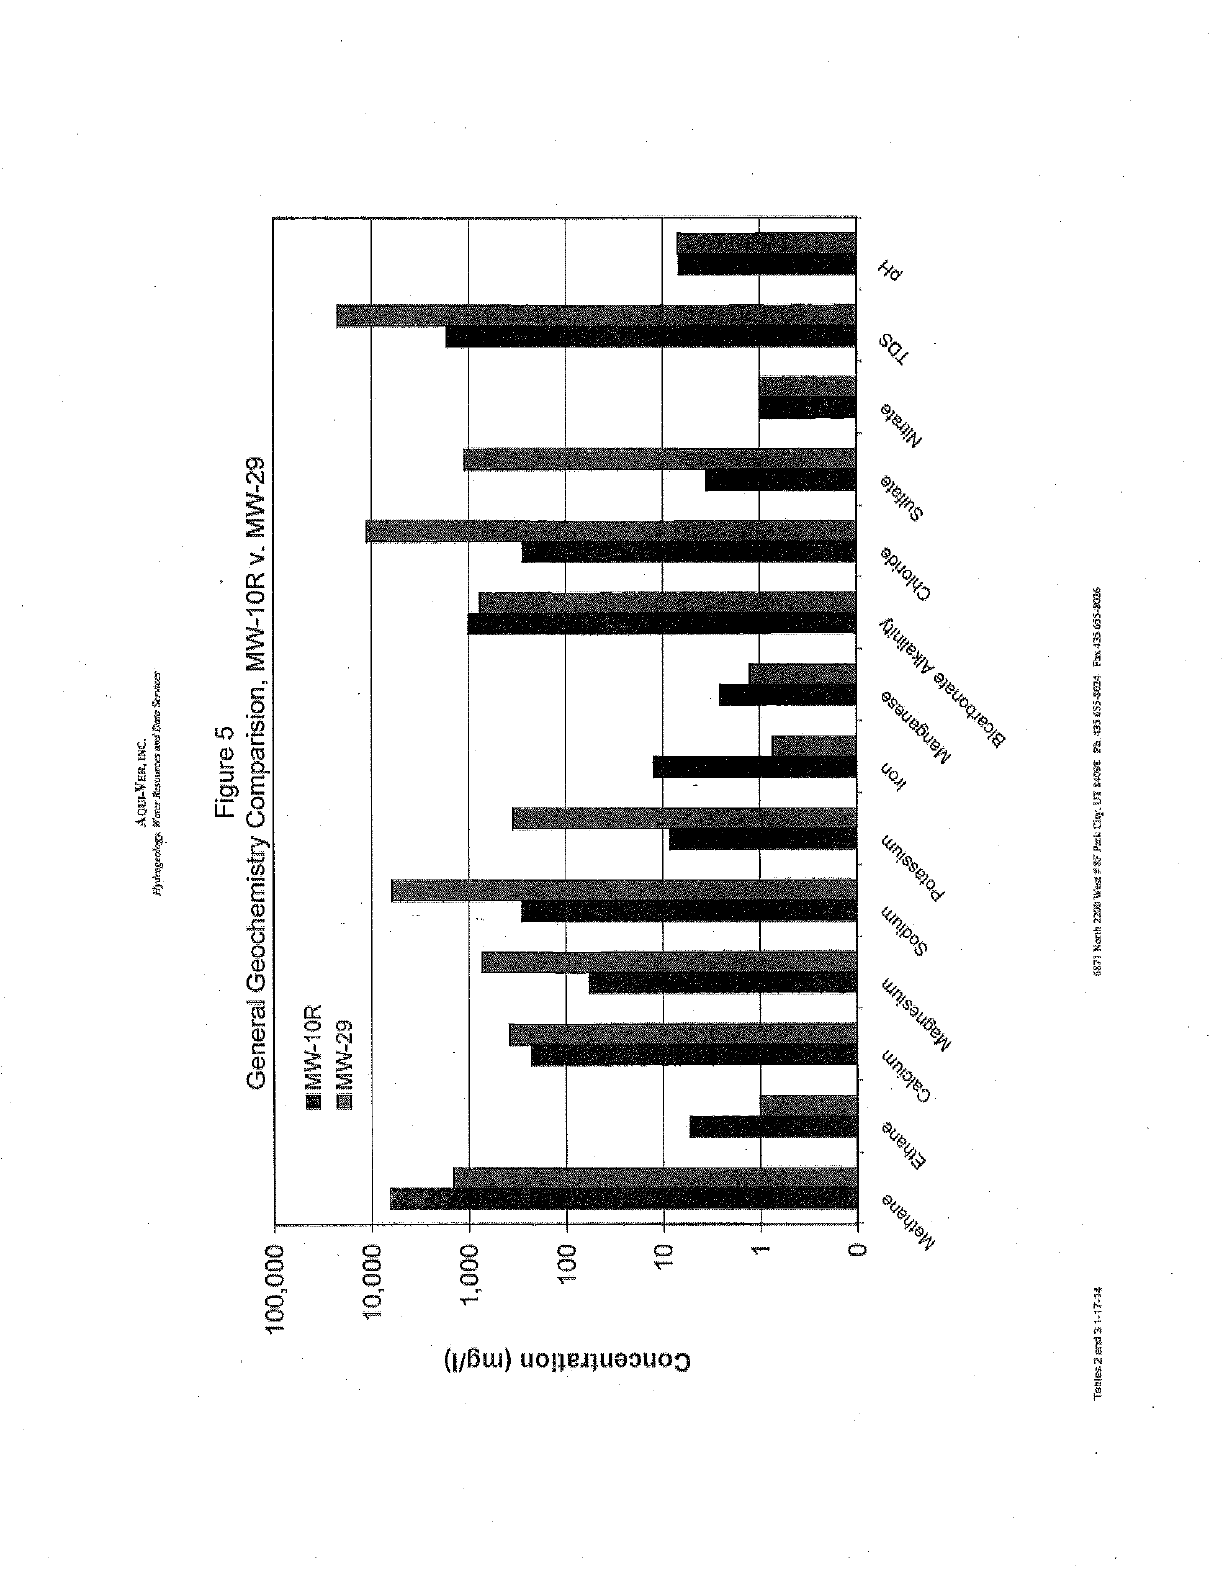
100,000
10,000
1,000
100
10
AQUFVEB.iT`C.
Figure 5
Gene al Geochemistry Comparision, MW -10R v. t-29
3í9 vx
1
F
:
%H,'.ti ti
t
yx
Ax;
y
x
F
r
,
9
o-diyy
YYfx'.}
3
x
111111111: n
.
.
F
, , <
v
íx
9 ?;3
z
Tahles2 anL 31-17-]{ 6171 Ranh?MU Wait e0 Pai Cit4.313 BYX>£ Yb.433ú554&E4. Fa:J74534CCb
íe 05
Port LA Distribution Center
Appendix C
Zymox Port D. C. Report
February 28, 2014
T n 1 cul Report m Site Glasure March 2014
forensics
Port D.C.
Report Prepared
SCS Engineers
3900 Kilroy Airport Way
Long Beach, CA 90806
Report Prepared By:
Alan Jeffrey, PhD
ZymaX Forensics, 600 S. Andreasen Drive, Suite B, Escondido, CA 92029
28 February 2014
TABLE OF CONTENTS
INTRODUCTION
METHODOLOGY
HYDROCARBON CHARACTERIZATION AND
COMPARISON
CONCLUSIONS 6
Port 17,C', Page 2
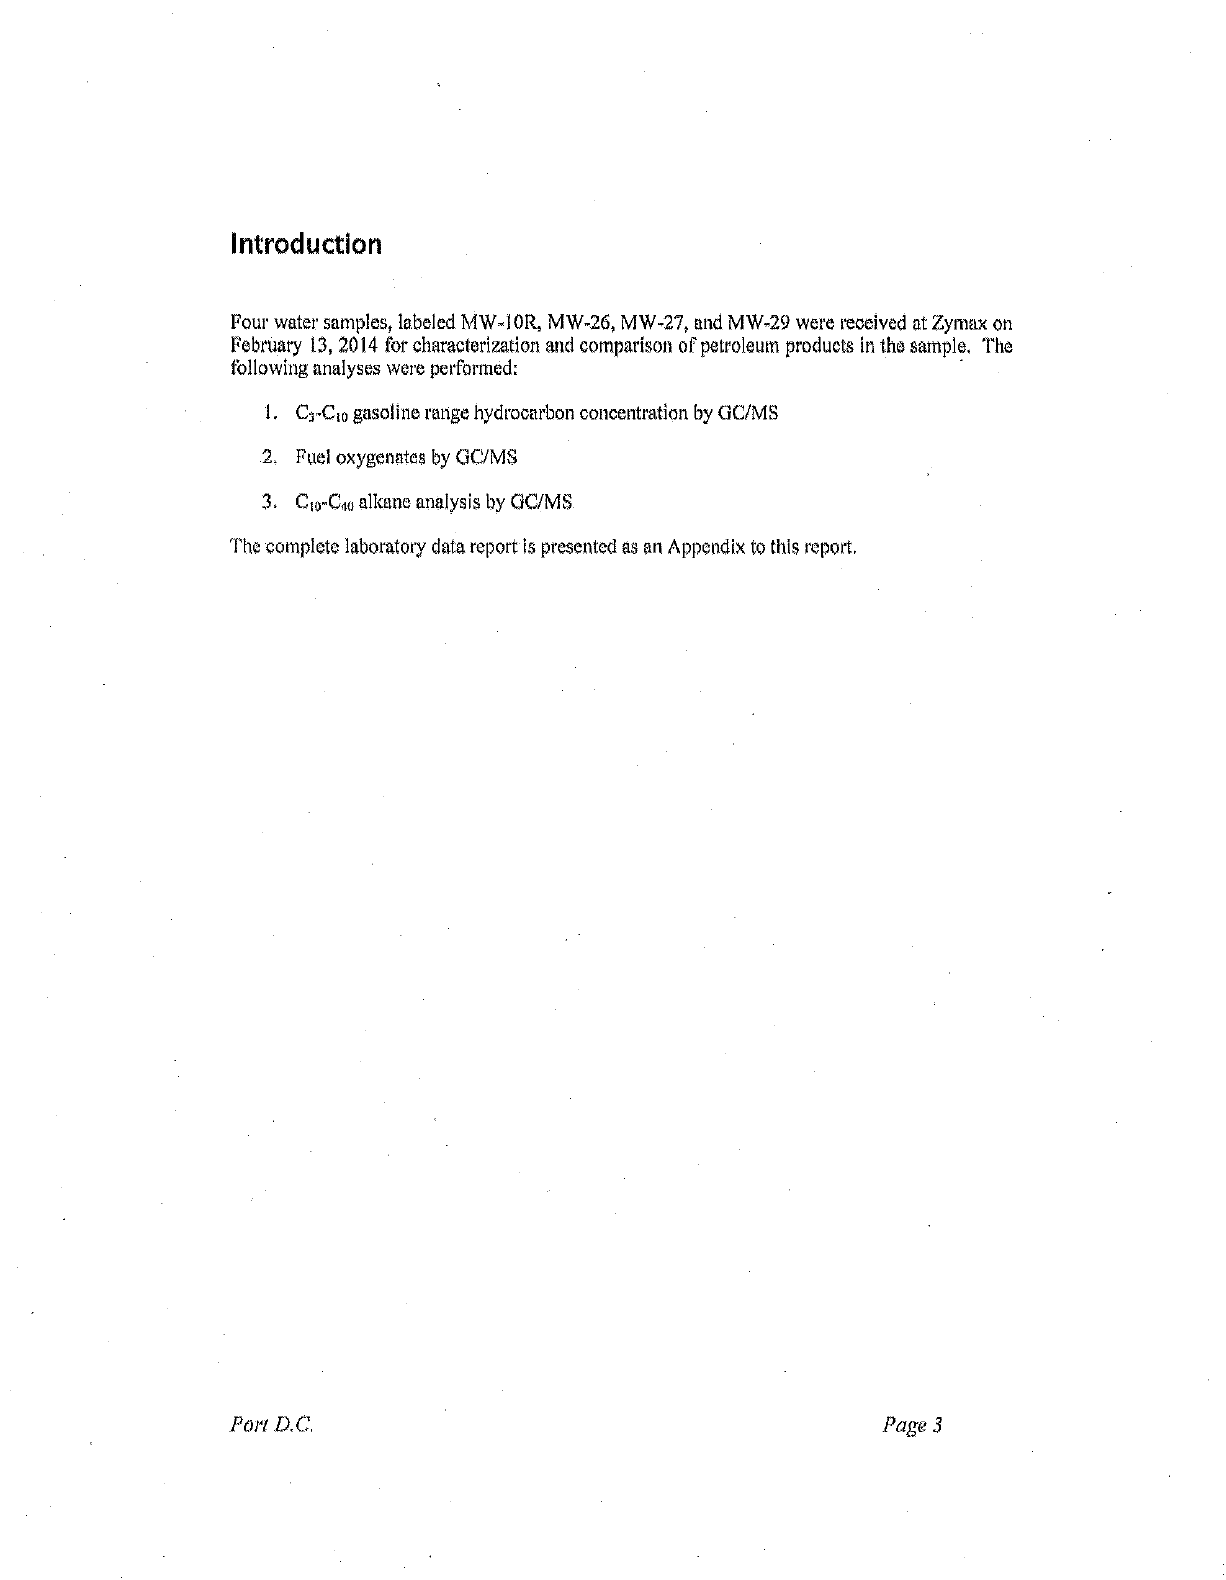
Introduction
Four water samples, labeled M W -10R, M W -26, MW -27, and M W -29 were received at Zymax on
February 13, 2014 for characterization and comparison of petroleum products In the sample, The
following analyses were performed:
1. Co -Cio gasoline range hydrocarbon concentration by GC /MS
2. Fuel oxygenates by GC /MS
3. C,o -C40 alkane analysis by GC /MS
The complete laboratory data report is presented as an Appendix to this report.
Ft t ^X RC:, Page 3
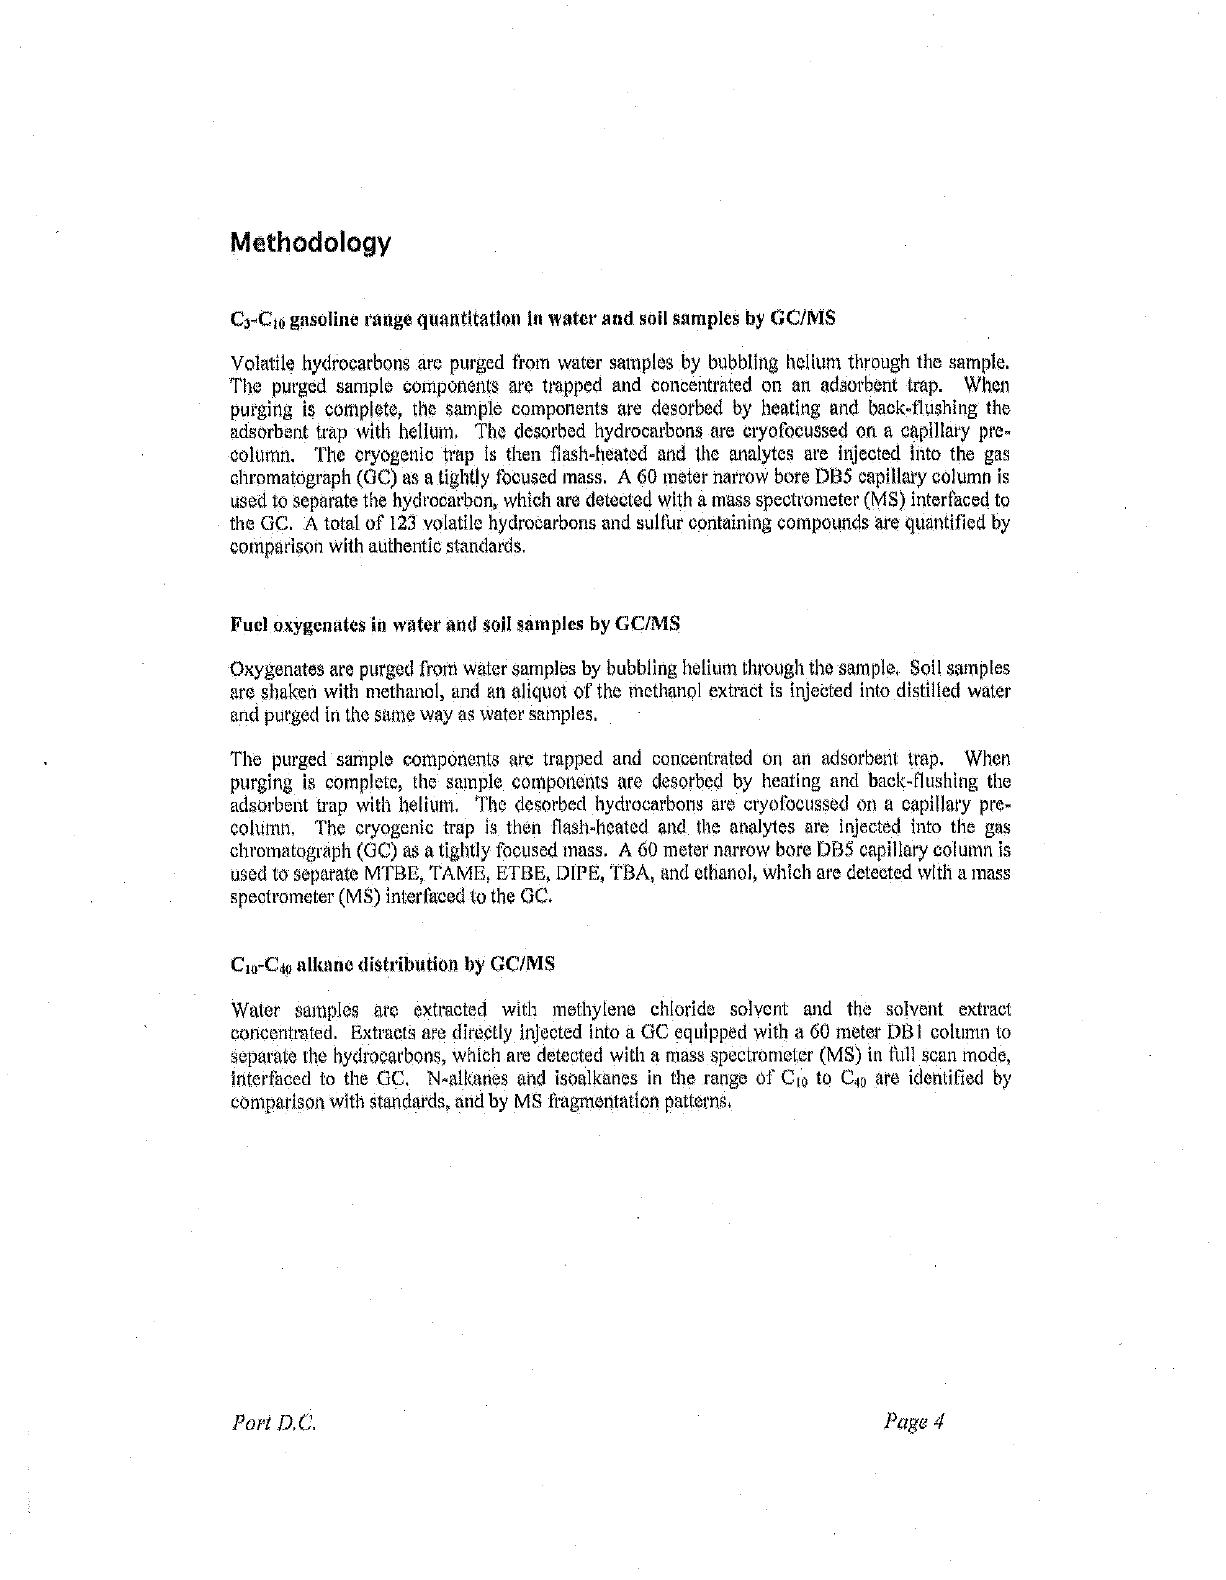
Methodology
C3 -Cto gasoline range gaaatitatlott iu water and soil samples by GC /MS
Volatile hydrocarbons are purged from water samples by bubbling helium through the sample.
The purged sample components are trapped and concentrated on an adsorbent trap. When
purging is complete, the sample components are desorbed by heating and back -flushing the
adsorbent trap with helium. The desorbed hydrocarbons are cryofocussed on a capillary pre -
column. The cryogenic hnp Is then flash -heated and the analytes are injected into the gas
chromatograph (GC) as a tightly focused mass. A 60 meter narrow bore DB5 capillary column is
used to separate the hydrocarbon, which are detected with a mass spectrometer (MS) interfaced to
the GC. A total of 123 volatile hydrocarbons and sulfur containing compounds are quantified by
comparison with authentic standards.
Fuel oxygenates in water and soli samples by CC /MS
Oxygenates are purged from water samples by bubbling helium through the sample, Soil samples
are shaken with methanol, and an aliquot of the methanol extract is injected into distilled water
and purged in the same way as water samples.
The purged sample components are trapped and concentrated on an adsorbent trap. When
purging is complete, the sample components are desorbed by heating and back -flushing the
adsorbent trap with helium. The desorhed hydrocarbons are cryofocussed on a capillary pre -
column. The cryogenic trap is then flash-heated and the analytes are injected into the gas
chroutatograph (GC) as a tightly focused mass. A 60 meter narrow bore DB5 capillary column is
used to separate MTBE, TAME, ETBE, DIPE, TUA, and ethanol, which are detected with a mass
spectrometer (MS) interfaced to the GC.
Cup -C40 alkane distributl on by CC /MS
Water samples are extracted with methylene chloride solvent and the solvent extract
orated. Extracts are directly infected into a GC equipped with a 60 meter DB I column to
separate the hydrocarbons, which are detected with a mass spectrometer (MS) in Bill scan mode,
interfaced to the GC. N- alkalies and isoalkanes in the range of 0w to C40 are identified by
comparison with standards, and by MS fragmentation patterns.
Pon D.C. Page 4
Hydrocarbon Characterization and Comparison
The C3-Ci0 gasoline range concentrations in the samples are shown in the Appendix, and are
displayed as bar diagrams in the following pages. MW -10R, shown on p.7, contains a suite of
hydrocarbons that is dominated by cycloalkanes, but contains small concentrations of
trimethylpentanes, which are alkylate hydrocarbons that are blended into gasoline to increase
octane levels. The BTEX components are dominated by benzene and ethylbenzene, which is
characteristic of degradation In ail anaerobic environment (Chapelle, 2001). The bar diagram of
MW -26 on p.7 shows a similar distribution to MW- IOR tip to C8, Benzene and ethylbenzene,
however, are In hutch lower concentrations in MW -26, which would be consistent with the
dissolved hydrocarbon plume migrating Into a more aerobic environment, which would promote
the degradation of the benzene and ethylbenzene. The concentrations of the C3- benzenes and
Cd- benzenes are relatively higher hi MW -26, and may reflect input from another source.
The bar diagram of MW -29 on p,8 shows a very different hydrocarbon distribution, which is
dominated by benzene and a methylpentene. In addition, in comparison with MW -26, the
distribution of ütethylpentaites (identified as horizontal line l) is different, and the concentrations
of the dirnethylcyclopentanes (horizontal line 2) are considerably lower. The relative
concentrations of the BTEX compounds in MW -29 reflect their solubility in water and represent a
relatively undegraded dissolved gasoline plume. MW -29 also contains DIPC, (7 ug/L), a fuel
oxygenate that was not detected in any other samples. These differences in the hydrocarbon and
additive compositions indicate that the gasoline in MW -29 is not sourced from MW-10R.
In the bar diagram of MW -27 on p.9, benzene is dominant, with very small concentrations of
other hydrocarbons. Ethylene dichloride (EDC) was also detected, which is probably associated
with the other chlorinated solvents, dichloropropane and trichloropropane, that were detected in
the sample, as shown in the appendix. Dichloropropane is an intermediate m the production of
tetrachloroethene and other chlorinated chemicals ( Rossberg et al, 2006). Ilistorically,
trichloropropane has been used as a paint or varnish remover, a cleaning and degreasing agent,
and in the production of pesticides. Currently, it is also being used as a chemical intermediate in
the process of making chemicals such as hexafluoropropyiene and polysulfides and as an
industrial solvent (Cook, 2009). Tetrahydrofuran, an industrial solvent, was also detected in
MW -27: The minor hydrocarbon constituents in MW -27 are in such small concentrations that it
is difficult to make any reliable correlation to the other samples. However, the BTCX distribution
more closely resembles the distribution in MW -29 than MW -26, suggesting that In MW -27 the
BTEX compounds in particular are probably derived from the same source as MW -29.
Chapelle, RL!. (2001) Groundwater Microbiology and Geochemistry ; 2 "" Edition. John Wiley and Sons Inc
New York, pp:398.3l9.
Cooke, Mary (2009). Emerging Contaniiña n =- 1,2,3- Trlchloro ni i s (TCP (Report). United Slates EPA,
Manfled Rossberg, Wilhelm Lendle, Gerhard I'fleidercr, Adolf 'Mph Eberhard- Ludwig Dreher, Ernst
Longer, i-ieit z Kassaorts, Peter Klelnschmidt, I leint Struck, Richard Cuok; Uwe Beck, Karl- August Lipper,
Theodore R. l orkelson, Eckhard Loser, Klaus K. newel, Trevor Mann "Chlorinated Hydreeerbúns" in
Ullmann's Encyclopedia Industrial Chemistry 2006, Wiley- VCl-I, Weinheim.
&Kit19,100P143.1.0 o a ur, 233,102
Pori D,C. Pcrf,>c: 5
The C,o -Co GC /MS all me chromatograms are shown on pp.7 -9. MW -10R contains a suite of
hydrocarbons from 20 min to 55 min retention time in the carbon range CIO -C24, which is the
range of diesel and 42 fuel oil. Isoalkanes arc dominant, with no evidence of n- alkancs, which
are dominant in fresh diesel and ii2 fuel oil, but are the most readily biodegraded hydrocarbons.
The peaks up to 20 min retention time represent volatile hydrocarbons. There is no evidence of
this diesel( /12 fuel oil in MW -26, MW -27, or MW -29. In MW -26, there is, in addition to the
volatile hydrocarbons up to 30 min retention time, unidentified material from 45 -50 min and a
suite of n- alkanes from nC25 to nC35; this represents a small amount of petroleum wax from an
unknown source, In MW-27, the only alkanes identified were from petroleum wax. MW -29 also
contained a small amount of petroleum wax. A large peak, identified as C IOH 15N ©2S, probably
represents n- butylbenzenesulfonamide, which is widely used as a plasticizer in polyacetals,
polyamides, and polycarbonates, and has been found in ground water and effluent from
wastewater treatment sites.
Conclusions
Water sample MW -IOR contains dissolved hydro carbons that most likely represent
degraded gasoline.
MW -26 contains a similar gasoline, and some heavier aromatic hydrocarbons, probably
from another source.
MW -29 contains a different gasoline with the fuel oxygenate DIM, This gasoline Is
from a different source than MW-10R.
The dissolved gasoline in MW-27 appears to be more similar to MW -29, and is probably
from the same source as MW29.
MW -I OR also contains degraded diesel or #2 fuel oil that was not detected In MW -26,
MW-27, or MW -29.
Port D.C. Page 6
