Activity For Lab 3 Activity3 Lab3 Instructions
User Manual:
Open the PDF directly: View PDF ![]() .
.
Page Count: 2
Activity for Lab 3
Problem 1
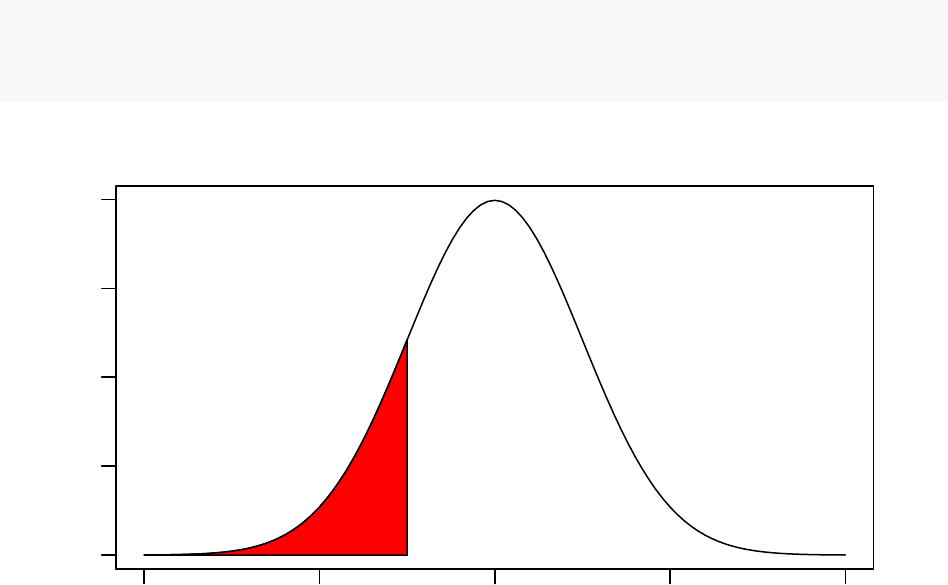
In lecture 3 notes a density plot of a normally distributed random variable with area under the curve was
created using base R graphics:
curve(dnorm, from=-4,to=4,ylab="PDF",main="Pr(X <= -1)")
coord.x = c(-4,seq(-4,-1,by=0.1),-1)
coord.y = c(0,dnorm(seq(-4,-1,by=0.1)), 0)
polygon(coord.x, coord.y, col=2)
−4 −2 0 2 4
0.0 0.1 0.2 0.3 0.4
Pr(X <= −1)
x
PDF
Write R code using ggplot2 to recreate the density plot with area under the curve.
1
0.0
0.1
0.2
0.3
0.4
−4 −2 0 2 4
x
Density
Pr(X <= −1)
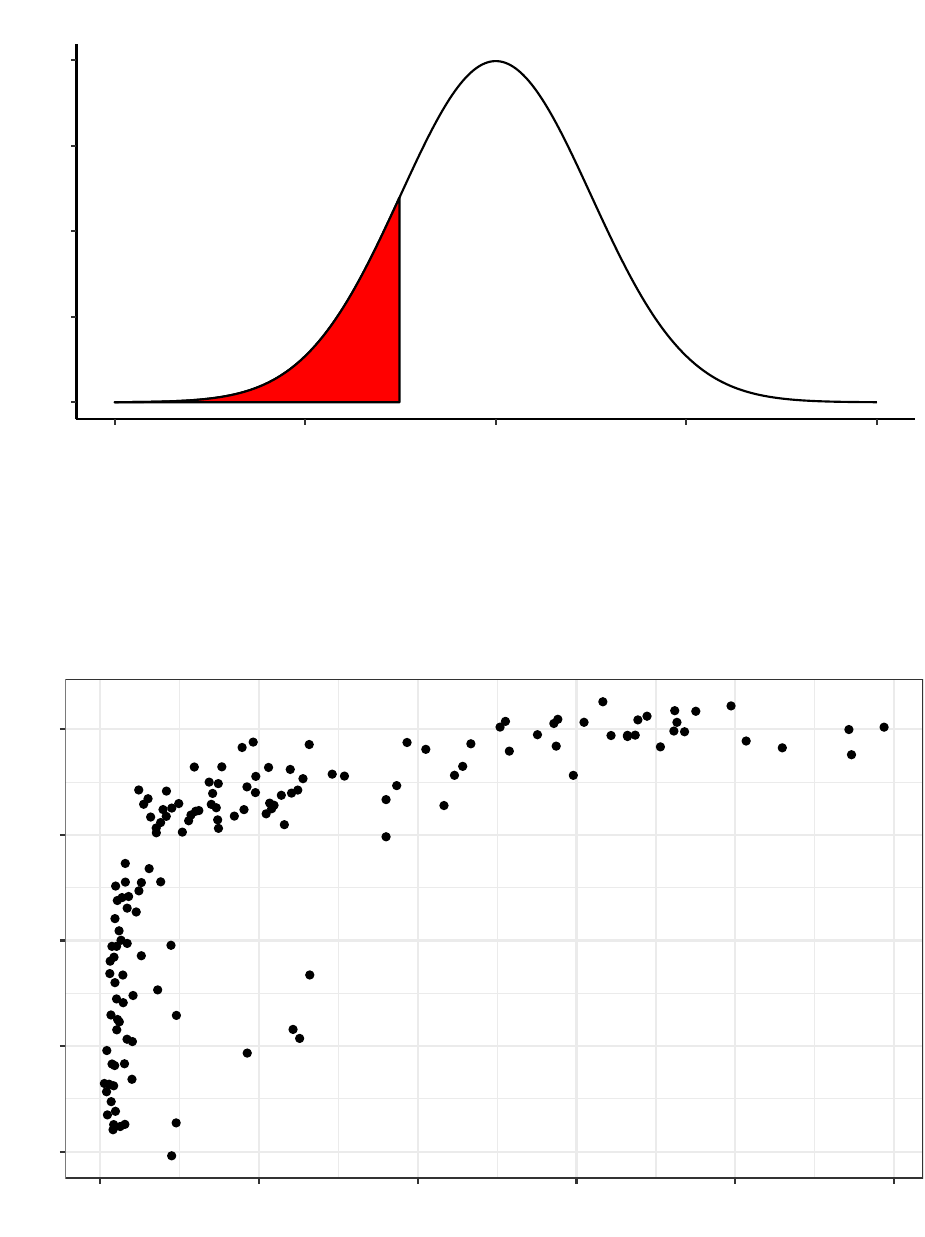
Problem 2
•Load gapminder data.
•Create a plot for 2007 year data only: “GDP per capita” Vs “life expectancy”
•Annotate european countries with “GDP per capita”" > 40000
Ireland Norway
40
50
60
70
80
0 10000 20000 30000 40000 50000
GDP per capita
life expectancy
2
