Activities ://www.wvgs.wvnet.edu/www/geoeduc/adaptiveactivities Adaptiveactivities
User Manual: ://www.wvgs.wvnet.edu/www/geoeduc/adaptiveactivities Security Systems & Surveillance Equipment | JMAC Supply
Open the PDF directly: View PDF ![]() .
.
Page Count: 80
- Adaptive Earth Science Activities
- Foreword
- Contents
- And the Winner Is...
- Latitude and Longitude
- Core Sampling
- Analogy of Relative Humidity
- How Much Lime is in Limestone?
- Parking Lot Gravel
- Groundwater Flowmeister
- Epicenters
- Star Gazing Inside
- Let's Talk Trash
- Contour Line Activity
- Our Earth's Address
- Mudcracks: A Clue to the Earth's Past
- Are All Limestones Created Equal?
- Whether it Weathers?
- Spelunking: Exploring Caves and Caverns
- Make Your Own Hertzsprung-Russell Diagram
- Fossil Origins
- Weathering and Fossil Preservation
- Compass Treasure Hunt
- Pasta Paleontology
- Rock Riddles
- Deep Ocean Current Forces
- Fossils in Time
- Name That Rock
- Mighty Metamorphic Power Rocks
- Musical Rocks
- Modeling Geologic Columns with Sand Art
- Doughy Topos
- Black-Box Ocean Floor Landforms
- Constellation Box Activity
- Oooh, What A Relief It Is...
- Behind Jurassic Park
- Contour Mappiing Earthquake Intensities
- Strike and Dip
- Solar System Travel Company
Adaptive Earth
Science Activities
EPICENTER
West Virginia Geological
and Economic Survey
Publication ED-13
1998
Mark Lemasters
John Lewis
Carol Mathis
Nancy Moore
Sally Morgan
Linda Newcome
Ruth Oaks
Karen Parlett
Devon Raddish
Debra Rockey
Jennifer Smith
Elizabeth Strong
Fran Sturgill
Megan Widdecombe
Karen Williams
Mary Williamson
Freda Akers
Suzanne Anderson
Krystal Berry
Linda Bush
Keith Childers
Barbara Cline
Deborah Conner
Cathy Connor
Deb Hemler
Production design, production editing, graphic design, and illustrations by Betty L. Schleger, Three
Sisters Production (304-379-2310) in cooperation with West Virginia Geological and Economic
Survey (1-800-WVGEOLOgy).
Foreword
In 1992 the National Science Foundation funded “Earth Science in West Virginia for the Twenty-First
Century.” This program evolved into RockCamp, now funded by the West Virginia Geological and
Economic Survey. RockCamp continually provides West Virginia K-12 teachers with experiential up-
to-date earth science education. After graduating from an introductory session, participants are eli-
gible to apply for advanced leadership sessions (RockCamp II) and field trip-based learning opportu-
nities (RockCamp III, IV, etc.).
The word "adaptive" is not used lightly in the title. Some educators argue that the classroom imple-
mentation of new teaching ideas is not so much adoption as it is adaptation. RockCamp participants
have volunteered to share some of their ideas with you. Your task is to imaginatively adapt their ideas
for use in your unique classroom environment.
Tom Repine
RockCamp Director
A small committee of RockCamp graduates selected the activities in this book. Each reviewer was
asked to select five activities from the 200 submissions. They then tested the five in their classrooms.
Adaptive Earth Science Activities thanks them for their work, commitment, and energy.

Adaptive Earth Science Activities 1
Contents
And the Winner Is.............................................. 2
Elise Adkins
Latitude and Longitude ...................................... 4
Brenda Anderson
Core Sampling ..................................................... 6
Suzanne M. Anderson
Analogy of Relative Humidity .......................... 8
Pamela Blackford
How Much Lime is in Limestone?................. 10
Mary Sue Burns
Parking Lot Gravel............................................ 13
Mary Sue Burns
Groundwater Flowmeister............................. 16
Timothy A. Butcher
Epicenters ........................................................... 21
Jo Ann Byron
Star Gazing Inside ............................................. 23
Barbara A. Cline
Let's Talk Trash................................................. 25
Melanie Files
Contour Line Activity...................................... 26
Billie Diane Frame
Our Earth's Address ........................................ 29
James Giles
Mudcracks: A Clue to the Earth's Past ........ 31
Donis Hannah
Are All Limestones Created Equal?.............. 33
Deb Hemler
Whether it Weathers? .................................... 35
Deb Hemler
Spelunking: Exploring Caves and Caverns... 38
Michele Lomano
Make Your Own Hertzsprung-Russel
Diagram............................................................... 40
Mark Lynch
Fossil Origins ..................................................... 43
Angela McKean
Weathering and Fossil Preservation............. 44
Margaret Miller
Compass Treasure Hunt................................. 45
Nancy Moore
Pasta Paleontology............................................ 47
Nancy Moore
Rock Riddles ...................................................... 48
Nancy Moore
Deep Ocean Current Forces......................... 49
Sally Morgan
Fossils in Time ................................................... 51
Karen Parlett
Name that Rock................................................ 54
Karen Parlett
Mighty Metamorphic Power Rocks .............. 56
Karen Parlett
Musical Rocks .................................................... 57
Kathleen Prusa
Modeling Geologic Columns with
Sand Art .............................................................. 58
Debra Rockey
Doughy Topos................................................... 61
Christine Sacco
Black-Box Ocean Floor Landforms .............. 62
Ron Sacco
Constellation Box Activity ............................. 64
Jennifer L. Smith
Oooh, What A Relief It Is... ........................... 66
Tanya Smith
Behind Jurassic Park ......................................... 69
Paula Waggy
Contour Mapping Earthquake Intensities.... 72
Paula Waggy and Deb Hemler
Strike and Dip.................................................... 75
Donald J. Wagner
Solar System Travel Company ...................... 77
Karen Williams
2 RockCamp
And the Winner Is...
by Elise Adkins
Logan Jr. High School
TIME: 5 weeks at 5 minutes per class after the original set-
up of 1 class period.
PROCEDURES:
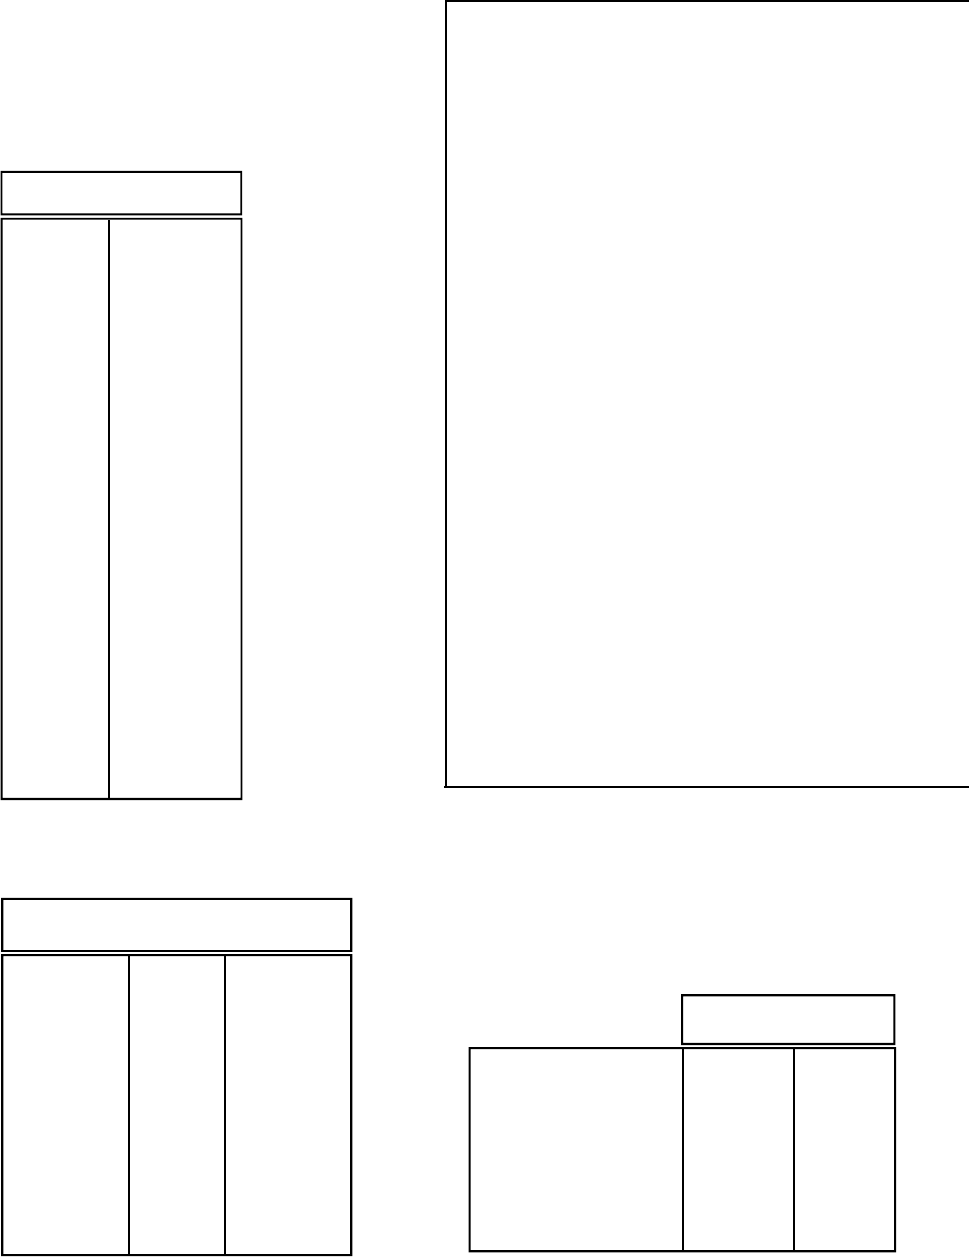
1. Remove the bottom of the can. Cover the bottom of the
can with hardware cloth and secure it to the outside of
the can with a large rubber band. Repeat for the second
can.
2. Trace the outline of each rock in the notebook. Measure
the length, width, and thickness of the rock at various
locations and record the data on the drawing. Mark the
measured locations on the rock with a permanent marker
or whiteout so future measurements can be repeated.
3. Place the piece of limestone in the can and label with the
rock type. You can leave the rock in the can throughout
the entire experiment.
4. Measure 30 ml of distilled water in a graduated cylinder.
This water will drain into a collecting tray placed under
the can.
5. Hold the can over the collecting tray and pour distilled
water over the rock sample. Place collecting tray in a warm
location to accelerate evaporation. Label the collecting
tray limestone.
6. Repeat steps 2-5 for the sandstone sample.
7. As a control, pour 30 ml of distilled water in a collecting
tray and place it with the others.
8. Repeat steps 4 and 5 a minimum of 15 times for each
sample. Use only the first runoff for evaporation. Discard
all runoff thereafter.
9. Remove each rock from the can.
10. Measure the marked locations; record data. Compare to
the original.
11. Trace the outline of each rock; record measurements at
marked locations. Compare data to the original.
12. Have students discuss the results and explore reasons for
change.
ASSESSMENT:
•Students are to keep a record of procedures and measure-
ments in a notebook. After all measurements are complete,
water
rock
rubber band
hardware cloth
metal can
OBJECTIVE:
•To observe and compare the effects of
running water on limestone and sand-
stone.
Materials and Equipment:
(For a group of two students)
•2 small empty metal cans
•2 pieces of hardware cloth
•2 large rubber bands
•1 vernier caliper
•Permanent marker or whiteout
•3 collecting trays (dissecting trays,
disposable aluminum pans, etc.)
•1 piece each of sandstone and
limestone (approximately same
size)
•1 half-gallon distilled water
•1 graduated cylinder
•Notebook
Adaptive Earth Science Activities 3
a chart should be compiled to ease interpretation of the
information. Students are to write a brief summary of their
conclusions. Possible questions to consider to help with the
write-up are:
1. Have the dimensions of the rock samples changed?
2. If so, what could be responsible for these changes?
3. Did the dimensions of one rock change more than the
other?
4. Is there a residue in the collecting tray(s)?
5. What do you think the residue is?
6. Where did it come from?
7. What would happen if water passed through the soil
and layers of limestone underground for thousands of
years?
Further Challenges:
•Compare the beginning and the ending mass of each rock
sample. Calculate the percentage of mass loss in each sample.
(Allow rocks to dry before taking the mass.)
•Use an equal mass of small limestone and sandstone pieces
in each can. Pour 200 ml of distilled water through each
sample and collect the runoff in a collecting tray. Allow water
to evaporate. Compare the residue to that left when the
same amount of distilled water is evaporated.
4 RockCamp
Latitude and Longitude
by Brenda Anderson
Oceana Middle School
TIME: 2 to 3 class periods of 40 minutes each.
PROCEDURES:
1. Divide the class into groups of two. Pass out a balloon
and two permanent markers of two different colors to
each group. (Use permanent markers so lines will not wipe
off immediately.)
2. Have students blow up the balloon and tie it off. Use the
tied part as the North Pole and the other as the South
Pole. Working with these two points, draw a ring around
the center of the balloon for the Equator and mark with
"0" and "Equator."
3. Draw a line halfway between the Equator and each pole.
Have students identify this as the 45° north and south
latitude lines. Draw another line between the pole and
each 45° latitude line. Have students calculate this to be
the 45°/2 or 22½° north and south latitude lines. What is
the value of the latitude line between 45° and each pole?
[(90° - 45°)/2 = 22.5° + 45° = 67.5°]. Continue this until a
sufficient number of lines are on the balloon. Make sure
each latitude is labeled with "North" or "South" and value
in degrees.
4. Draw a line from the North Pole to the South Pole. Mark
this with "0" and the "Prime Meridian." Then mark a half
circle on the other side of the balloon directly behind the
Prime Meridian. Label this "180°" and the "International
Date Line." Repeat the halfing process and then create
additional longitude lines. Mark off these longitude lines
on the balloon using care to keep the lines as straight as
possible. Do this on both sides of the Prime Meridian.
5. Students have now gridded their balloon just as a globe of
the earth is gridded. They are now ready to work with
these lines to place specific towns on the globe. Using an
atlas, look up the longitude and latitude of well-known
cities of the world and mark them on the balloon globe.
OBJECTIVES:
•Create latitude and longitude lines on
a balloon, determine measurements
in degrees, and use the lines to locate
places as well as learn to use time
zones.
•Understand imaginary lines of longi-
tude and latitude and understand how
these lines help in locating places on a
round surface.
Materials and Equipment:
•Large round balloons or balls
(plain, no writing)
•Permanent markers
•Atlases
•Worksheet of places to identify
Adaptive Earth Science Activities 5
ASSESSMENT:
•Using a short verbal exchange, determine if the students
have distinguished the difference between latitude and
longitude lines.
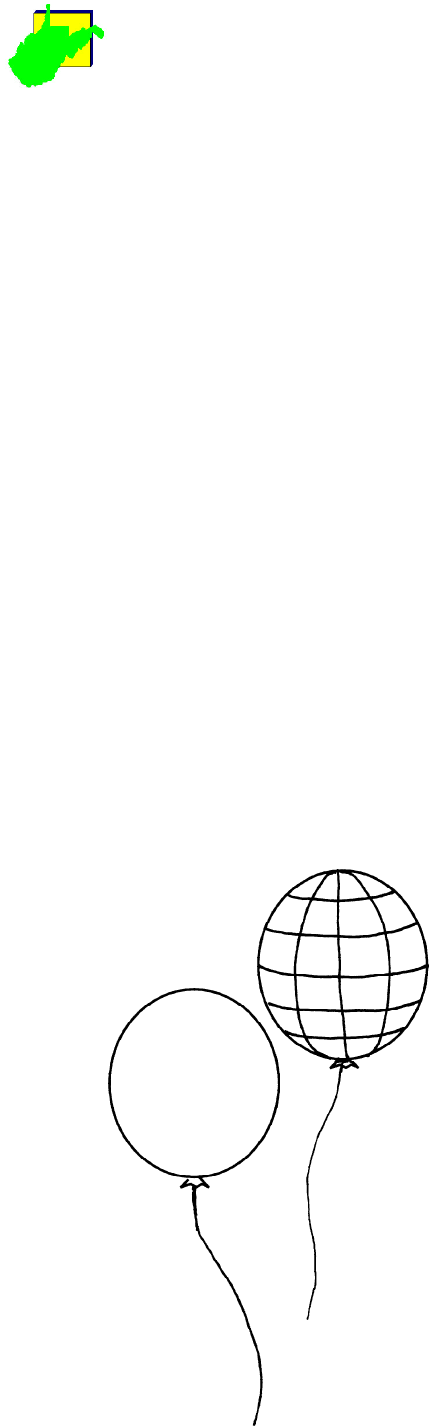
•Deflate one of the balloons. Lay it out as flat as possible.
Compare and contrast the appearance of the flat balloon
grid with the spherical balloon grid.
•Have students describe the geometric shape made by
longitude lines at the Equator and poles. Why does this
occur? Can they explain why a map of a polar region might
show a different-sized area than a map of the equatorial
region?
6 RockCamp
Core Sampling
by Suzanne M. Anderson
Worthington Elementary School
OBJECTIVES:
•Infer from formulating a model that
studying cores is one way to interpret
Earth’s history
•Model core sampling using a pasta
noodle
•Model a sedimentary rock formation
Materials and Equipment:
•Different breads (white, wheat,
banana nut, etc.)
•Various spreads (peanut butter,
jams, jellies, fresh fruit, etc.)
•Cereal (Rice Krispies, Cheerios,
etc.)
•Plastic bags
•Plastic knives
•Paper towels
•Permanent markers (to mark bags)
•Manicotti or other large tube-
shaped noodles
•Paper
•Colored pencils
•Straws (optional)
•Refrigerator
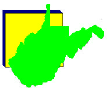
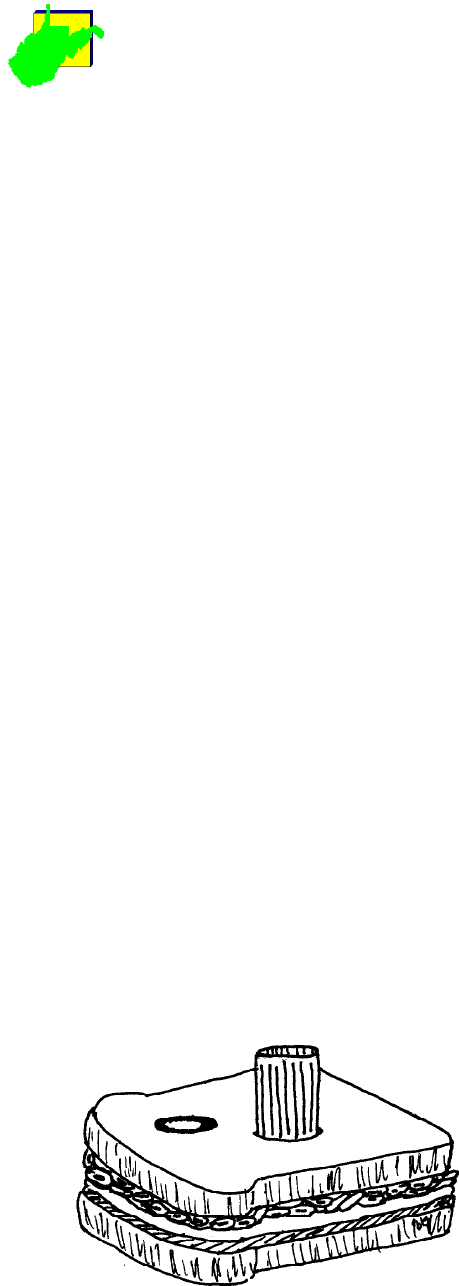
Sedimentary rocks are formed from loose particles that
have been carried from one place to another and redepos-
ited. These rocks generally are deposited in layers similar to
the layers in a sandwich. Each layer can be identified by differ-
ences in color, texture, and composition. The oldest layer is
the lowest (bottom) layer while the youngest layer is on the
top. Over time the loose particles become compacted and
cemented together to form layers of solid rock.
Evidence of change through time comes from the core
samples that show layers of rock that make up Earth’s crust.
TIME: Two class periods, 30-45 minutes long (including dis-
cussion).
PROCEDURES:
1. Have students bring in as many of the food items on the
materials list as possible. You will need enough materials
for pairs of students.
2. Construct the “sedimentary rock” sandwiches. Cereal
within the layers can represent large particles or fossils.
3. Have students write their names on the plastic bags. Place
the sandwiches inside the bags and store the sandwiches
in a refrigerator until the next day. (The bread will harden
a little and the layers will not slide around as much if the
sandwiches are refrigerated.)
4. Next day, have students make core samples using the
noodle as coring devices. Use the noodle to cut through
the sandwich. The sandwich pushed up inside the hollow
noodle is called a “core sample”. To get the sandwich out
of the noodle, break the noodle gently. (You could use
straws to gently “plunge” the sandwich out of the noodle.)
5. On a sheet of paper have the students draw a picture of
the "core sample." Color the different layers according to
a predetermined legend (brown for peanut butter, red
for jelly, etc.), and label them. Inform students that they
have created a "strip log"--a useful tool made by geolo-
gists to model rock units.
6. Have students compare strip logs. Can they interprete
the sequences of their classmates' sandwichs?
Adaptive Earth Science Activities 7
ASSESSMENT:
•Evaluation can be based on teacher observation of students’
performance and cooperation, evaluating the drawings, and
both written and oral questions. Student journals including
all work, legends, and the interpretation of classmates "cores"
are helpful.
8 RockCamp
Analogy of Relative Humidity
by Pamela Blackford
Martinsburg High School
TIME: 25-45 minutes.
PROCEDURE:
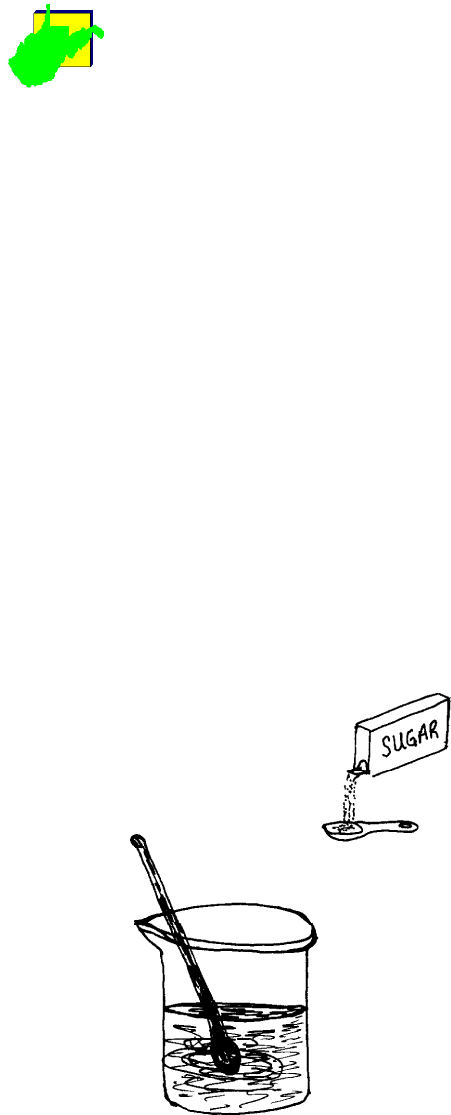
1. Place students in small groups. Each group will need 3
beakers, a supply of sugar, and 2 spoons. (You can have
the students bring water to a boil or you can have a large
common container of boiling water available.)
2. Record observations in a journal.
a. 1st beaker:
•Heat water to boiling or get some boiling water from
the common container. Measure and record tempera-
ture.
•Add 1 teaspoon of sugar at a time to the water and stir.
Does it all dissolve?
•Continue to add sugar one teaspoon at a time until all
the sugar no longer dissolves.
•Record your observations.
b. 2nd beaker:
•Using water which is at room temperature, stir in one
teaspoon of sugar at a time until all the sugar no longer
dissolves. How many teaspoons of sugar did it hold?
c. 3rd beaker:
•Repeat steps above using ice-cold water. How much
sugar did it hold? Measure and record temperature.
3. Students will use their data to make a graph showing the
relationship between the amount of sugar dissolved and
the temperature of the water.
4. After the graph is completed, provide students with a water
temperature. Ask them to use their graph to estimate the
amount of sugar that can be dissolved in it.
5. Verify the estimate through experimentation.
6. Plot the results on the graph. Ask student to suggest pos-
sibilities for any differences found between estimate and
experimental result.
7. Repeat steps 4, 5, and 6 with another water temperature.
8. Ask the students to explain the relationship on their graph.
9. Have students look up the definition of relative humidity.
10. Ask students to relate their results to develop a simple
definition of relative humidity.
OBJECTIVES:
•Develop a graph with experimental
data that will help students construct
their own definition of the relationship
between air temperature and the
amount of water the atmosphere can
hold.
Materials and Equipment:
•30 beakers
•Sugar
•Measuring spoons (10-15)
•Hotplates
•Graph paper
Adaptive Earth Science Activities 9
ASSESSMENT:
Journals are reviewed according to the following scale.
A. Journal very complete, neat, well written. Student's ideas are
supported by observations.
B. Journal complete, neat, needs some grammatical work. Most
ideas are supported by observations.
C. Journal lacking some information, not very orderly, needs ma-
jor grammatical work. Very few ideas support by observation.
D. Journal incomplete. Observations lacking. Very few ideas pre-
sented. None supported by observations.

10 RockCamp
How Much Lime is in Limestone?
by Mary Sue Burns
Pocahontas County High School
OBJECTIVES:
•Determine the percent composition of
lime (calcium oxide) in a limestone
sample.
•Determine the best economic use for
a particular type of limestone.
•Recognize the integrated nature of
chemistry and geology.
Materials and Equipment:
(Class of 30 working in pairs)
•30 safety goggles
•30 lab aprons
•30 beakers (250 ml or others)
•30 pieces of filter paper (15 of
these for Step #9 must be high
quality for very small particles)
•15 funnels
•15 graduated cylinders
•15 stirring rods
•Centrigram balances
•Limestone samples (use local
samples that students bring in or
teacher supplied. Samples should
be crushed or chipped.)
Reagents:
(Amounts are approximate)
•300 ml 6M hydrochloric acid
•400 ml 0.5M ammonium oxalate
•150 ml ammonium hydroxide
•5 ml methyl orange indicator (pH
meter or pH paper may be substi-
tuted)
Limestone (CaCO3) is primarily made of calcium carbon-
ate. Lime (CaO) is this carbonate minus carbon dioxide. Lime-
stone is an important economic resource. Appropriate uses
depend on the chemical composition of the sample, primarily
the CaO content. For example a cement company in
Martinsburg, WV uses the New Market limestone, which has
a very high CaO content, mixed with the Chambersburg lime-
stone which has a CaO content that varies from 38% to 52%.
The final product will have a CaO content of 58% to 65%.
Dolomitic limestone, which contains less CaO and more MgO,
is not suitable for cement-making and is primarily used as
aggregate (road bases, concrete, railroad ballast, etc.).
The procedure that follows is not intended to give a pre-
cise quantitative measurement of the CaO content. How-
ever, with care, student results should be adequate for com-
parison and for determination of appropriate economic uses.
All metallic compounds will be dissolved in the hydrochloric
acid. Any insoluble material, at this step, will consist primarily
of silicas. Addition of the ammonium oxalate precipitates
calcium as calcium oxalate. Most everything else stays
dissolved. The mass of the calcium oxalate can be used to
calculate the CaO content of the original sample.
This lab is not difficult for students who have prior expe-
rience working in the chemistry lab. It does require that
students are familiar with basic techniques including measur-
ing mass and volume, filtering, and use of reagents.
Many textbook chemistry labs are very abstract to
students. The practical application, stressed in this lab, should
add relevancy to previously learned skills and concepts. This
activity would benefit both chemistry students and earth
science students.
TIME:40-60 minutes plus additional time to allow filter
paper to dry.
PROCEDURES:
1. Put on safety goggles and lab aprons.
2. Find the mass of a sample of limestone. Use about 0.5
grams. Record the mass to the nearest 0.01 gram (or 0.001
gram, if possible).
Adaptive Earth Science Activities 11
3. Place the sample in a beaker. Add 20 ml of 6M hydrochlo-
ric acid. Wait until all bubbling stops.
4. Add a very small amount of additional hydrochloric acid.
If bubbling occurs, wait until it stops and continue to add
a small amount at a time until no more bubbling occurs.
5. Filter the solution into a clean beaker to remove any in-
soluble residue.
6. Slowly add 20 ml of 0.5M ammonium oxalate to the fil-
trate in the beaker.
7. Add about 2 drops of methyl orange indicator to the bea-
ker.
8. While stirring, gradually add ammonium hydroxide to the
beaker until the contents just turn yellow. Add an addi-
tional 5 ml of 0.5M ammonium oxalate.
9. Measure and record the mass of a clean piece of filter
paper. (Use type that will filter out very small particles.)
10. Filter the contents of the beaker using the massed filter
paper.
11. Allow the filter paper to dry thoroughly.
12. Measure and record the mass of the filter paper and pre-
cipitate.
13. Calculate the mass of the precipitate by subtracting the
mass of the filter paper. (This is calcium oxalate monohy-
drate.)
14. Calculate the CaO content of your sample by multiplying
the mass of the calcium oxalate by 38.39%.
15. Calculate the percent CaO in your original sample.
16. Write a statement describing an appropriate economic
use for the type of limestone you tested. Compare the
composition of your sample with those tested by class-
mates. Back up your statement with evidence gained in
the chemical analysis.
ASSESSMENT:
•Students results can be compared for consistency of re-
sults and to known ranges of CaO content. Student tests of
New Market and Chambersburg limestones fell within
known ranges.
•Students should be able to describe an economic use for
limestone consistent with their results.
SAFETY NOTE: Skin contact with
these reagents should be avoided.
Should it occur, rinse the affected
area with large amounts of water.
Also, this lab should be performed in
a well-ventilated area. All safety
procedures for a high school chem-
istry laboratory should be followed.
12 RockCamp
•Lab results can be checked for completeness.
•Follow-up activities can ask students to describe an example
of the importance of chemistry in evaluating geologic re-
sources.
Teaching Suggestions:
•Do this as a microscale lab using a wellplate and smaller
quantities. Use the same mass for each sample and compare
relative amounts of calcium by estimating the height of the
precipitate in the wells.
•Maximum precipitation of calcium and minimum precipita-
tion of everything else occurs at a pH between 3 and 4.5. A
pH meter, pH paper, or other indicator could be used in
place of the methyl orange.
•The heating of the solution, to 80-90 degrees celsius before
proceeding to Step #6 will increase the size of the calcium
oxalate crystals. They form very quickly from cold solu-
tions and are small enough to go through ordinary filter
paper. This requires more time and more safety precau-
tions, but should increase the accuracy of results. A fume
hood is recommended during the heating and during the
addition of ammonium hydroxide to the warmed solution.
Further Challenges:
•Estimate the silica content of the sample by saving, drying,
and weighing the insoluble residue from Step #5.
•Save the filtrate from Step #10 and analyze for magnesium
content.
•Have students write chemical equations for the reactions
that take place.
•Have students use solubility tables to explain the rationale
behind the method of retrieving the calcium.
Adaptive Earth Science Activities 13
Parking Lot Gravel
by Mary Sue Burns
Pocahontas County High School
Gravel parking lots are an easily accessible but often over-
looked geologic resource for teachers and students at most
rural schools. The type of gravel found is usually indicative of
an abundant nearby source. So, even though it is not in situ, it
does give some clues about local rock types. In this way, com-
parisons can be made about different regions. This is also a
good way to begin considerations of human impact on the
land and the use of natural resources. In this activity, models
are used to determine why gravel is used on parking lots.
TIME: 30 minutes for Pre-lab and Procedures; 30-60 min-
utes for Further Challenge.
PROCEDURES:
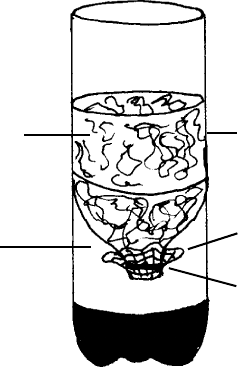
Pre-lab preparation: Cut the top off of two of the soda
bottles close to the curve. Use a graduated cylinder or mea-
suring cup to measure out a known quantity of water. Pour
this into the soda bottle and mark this level with a marker.
Do the same to the other soda bottle. Cut the bottom off of
the other two bottles. Using the rubber bands, put netting
over the mouths of the two bottles that still have tops. Invert
these into the first two bottles. A small hole must be cut in
each of the lower bottles in order to allow air to escape
during the investigation.
The following may be done in groups or as a whole class
experiment:
1. Place some gravel in the top section of one of the soda
bottle columns.
2. Put soil in the other column to the same level.
3. Pour water into the top of the gravel column, timing how
long it takes to reach the marked level; or time how long
it takes for a certain quantity of water to drain through.
Repeat for the soil column and any other materials. Record
data and observations.
4. Students should provide a well-worded hypothesis to
explain the observations and data.
5. The economic and environmental impact of simple crushed
stone versus soil versus pavement should be explored.
OBJECTIVES:
•Increase awareness of human impact
and use of a natural resource.
•Use models to observe differences in
properties of materials.
•Determine why gravel is in parking
lots.
Materials and Equipment:
•4 plastic soda bottles (1 or 2 liter)
•Plastic or cloth netting (gauze or
cheesecloth)
•2 rubber bands
•Gravel
•Soil
•Sand, asphalt, clay, or other mate-
rial (optional)
•Container for water
•Timer or watch
•Sample data table (sample in-
cluded)
14 RockCamp
ASSESSMENT:
Tell students they are preparing a report for an environ-
mental company evaluating parking lot construction. Students
can prepare a short written description of their findings. In
the course of their paper, they seamlessly incorporate an-
swers to the following questions:
•What would happen to rain that landed on packed soil?
Describe what a dirt parking lot would look like after a
heavy rain.
•What would happen to rain that landed on a parking lot
that was covered with a thick layer of gravel? What would
this parking lot look like after a heavy rain?
•Many parking lots are paved. What would be the advan-
tages of this? What would happen to rain that landed on a
paved parking lot?
•Why do people put gravel on parking lots?
Teaching Suggestions:
•Use a key or field guide to identify the rock types in the
samples.
•Use a geologic map showing exposed rock types and locate
the collection sites for the samples. Is there any correlation
between the exposed rock types and the gravel sample?
•Test the pH of water before and after it runs through the
gravel sample.
•Observe gravel samples from other states. Compare these
and hypothesize why they are different or similar.
netting
(cheesecloth or gauze)
test material
(gravel, soil, asphalt)
rubber band
first soda bottle
second soda bottle
Adaptive Earth Science Activities 15
Materials:
•Various samples of gravel (these
could include student- or teacher-
collected samples. Samples could be
collected as a class activity).
•Each group of students conducts an
open-ended investigation to deter-
mine as much as possible about the
properties of the gravel pieces in a
given sample. Students should also
look for weathering effects and fos-
sils. Each group presents their find-
ings and explanations of the rocks'
geologic and economic history.
Further Challenge:
•Is all parking lot gravel the same?
Further Challenge Questions:
a. Describe the properties of the rocks in your gravel sample.
Include any similarities and differences that you noticed.
b. Did any of your observations give any clues about the type
of place where this rock was formed or where this rock
has been?
c. Compare your sample to those of the other groups. Is
there anything that is unique about your sample? Explain.
Describe the similarities and differences among the vari-
ous samples.

16 RockCamp
Groundwater Flowmeister
by Timothy A. Butcher
Williamstown High School
OBJECTIVES:
•Learn how water flows through the
ground and its effects on stream
levels.
•Learn how contaminates seep into
groundwater and affect water sup-
plies.
Materials and Equipment:
•Clear plastic or glass container
(4" x 12")
•Fine sand
•Small gravel
•Fresh modeling clay
•Plastic cup
•20 oz. plastic bottle
•Food coloring
•Spray pump (cleaned)
•Smoother (cardboard or plastic)
•Straw
•Gauze bandage
•3' rubber hose
•Nail
•Knife/scissors
•Water
•8" x 12" sheet white paper
Contrary to the belief of many, groundwater is not usu-
ally found in underground streams as we see in caverns, but is
stored in layers of porous rock, flowing at about 4 cm/day.
Groundwater is often viewed as a limitless resource which
will remain constant regardless of rainfall. Knowing water is
stored in rock, the water must somehow move into this aquifer
and replenish itself. Through rainstorms, the supply of ground-
water is replenished or recharged at the high point in the
watershed. Groundwater usually flows to lower elevations
and fills streams, ponds, etc.
However, in time of drought the aquifer is not recharged,
dropping the water table and causing the level of the stream/
lake to fall. This drop in water level may result in residential
wells going “dry” (the water level is too low for a pump to
function).
The amount of rainfall is not the only item which affects
the water table. People are currently using groundwater and
over-drilling aquifers at such an alarming rate that we can
cause water tables to dry. Some refer to this as "water min-
ing." Home owners and industry, especially agriculture, are
combining to place an enormous stress on the water table.
We live in a society of buried waste and storage tanks.
These waste products and tanks often leak, very quietly, tons
of toxic chemicals into our water table, contaminating a great
area. The Environmental Protection Agency estimated that
between 1950 and 1975, 5.5 billion metric tons of hazardous
waste were spilled onto or buried in dumpsites throughout
the United States. These have a great probability of eventu-
ally winding up in our groundwater supply.
TIME: Construction 1 hour; activities one to five 50-minute
classes.
Adaptive Earth Science Activities 17
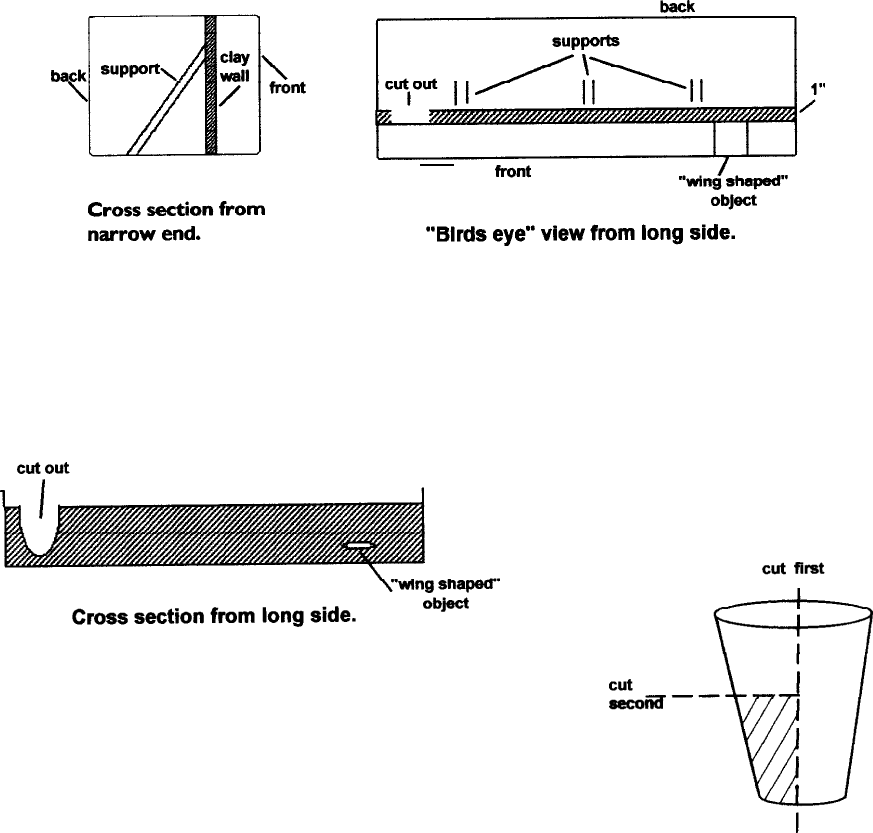
PROCEDURES:
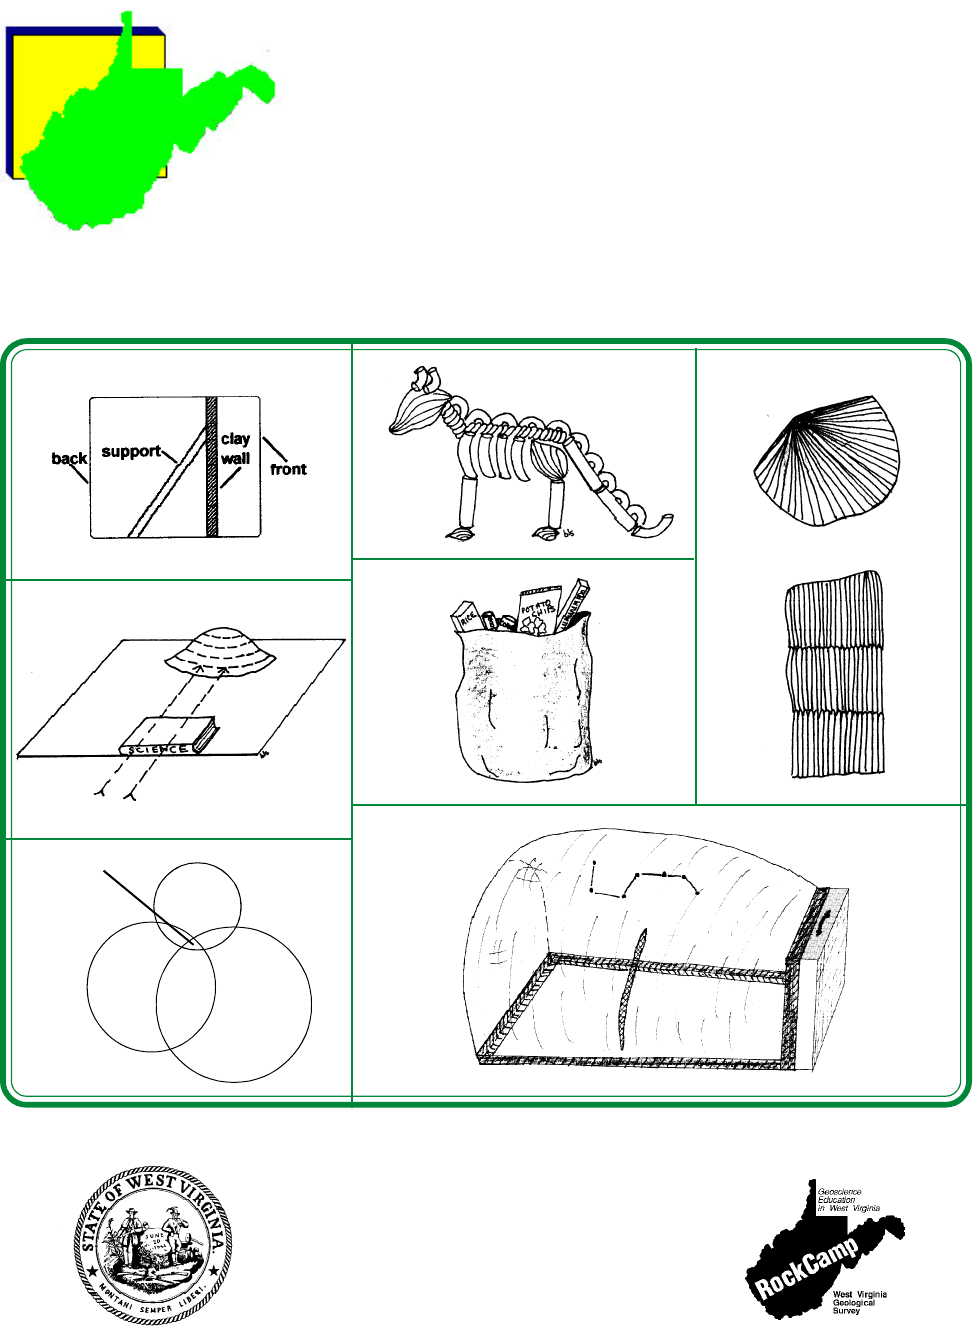
Flowmeister Construction
1. Divide the clear container with a modeling clay wall, so
you have approximately a 1" channel on the front side.
The clay wall should be about 1/4" thick. To reinforce the
wall, roll clay to make supports.
2. Taper the edges of the clay against the container by run-
ning your finger down the border between the clay and
container, making a firm bond between the two.
3. Cut out a small portion of the wall on the left side, so that
only 3/4" of clay is left to the bottom.
4. Construct a clay object in the shape of a wing. Attach the
clay object to the clay wall approximately 3/4" from the
bottom. This represents an impermeable object.
5. Cut the cup in half so each side has a top and bottom
portion. Then cut the top half off of one side.
6. Cut the bottom of this piece, leaving a 1/4" ledge.
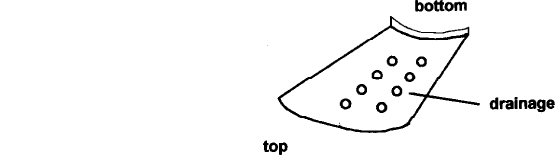
18 RockCamp
7. Using the nail or scissors, punch 5 holes in the side to
allow for drainage.
8. Place sand on the bottom, producing a small incline. Use a
smoother to smooth this layer. A smoother can be a piece
of cardboard or plastic.
9. Place the plastic drainage piece against the clay wall lying
flat on the sand. Turn a small portion of clay over the
cup’s lip. This will create a stream bed.
10. Fill remaining channel with gravel.
11. Poke a hole in the bottom of a 20 oz. bottle. Place a finger
over the hole, fill with water, replace lid and sit upright on
a paper towel.
12. To remove water from the back, place one end of the
rubber hose in reservoir and the other in a bucket. Start
siphoning by using your mouth or a hand pump.
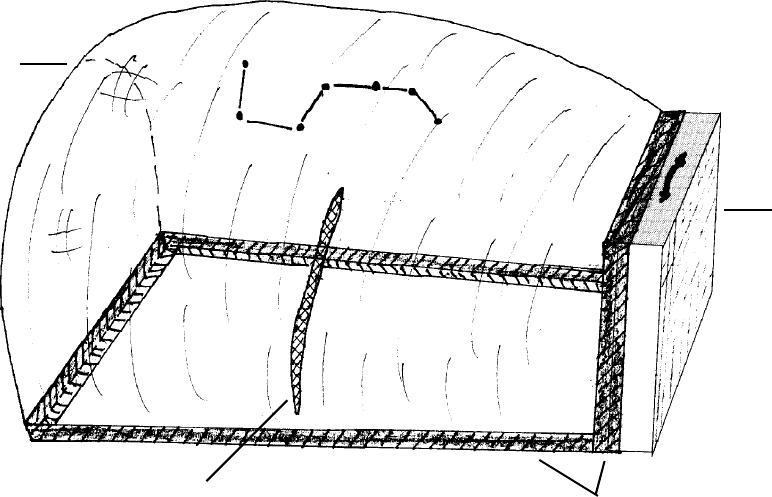
Using the Flowmeister
To Produce Stream Flow:
1. Place the bottle on the right end of the container so the
hole is exposed over the soil layers.
2. As water flows, observe the spread of water across the
aquifer into the stream bed.
To Demonstrate Drilling and Using a Well:
1. Cut straw into 3" sections.
2. Drill a well by pushing the straw into the soil layers.
3. Place gauze in spray pump tube (keeps out sand).
4. Insert spray pump into well and start pumping.
Adaptive Earth Science Activities 19
To Demonstrate Contamination:
1. Take eye dropper and place drops deep in the soil for
deep contamination or take eye dropper and place drops
on surface for surface contamination.
2. Watch it spread and notice the events which happen
around the clay.
3. Use spray pump to pump water supply from soil. Ob-
serve how groundwater becomes contaminated.
4. Spray contaminate onto white paper.
Calculations:
1. Speed at which water contaminations flow.
•Measure time and distance of water flow and use
formula: speed = distance/time.
2. Area which contaminate covers.
•Measure the length, width, and height. This may have to
be estimated.
•What are some problems a well may encounter?
Further Challenges:
•Turn bottle off to simulate no rain. Watch what happens to
the water level.
•Open bottle lid so stream flows out bottom of bottle. This
simulates a major thunderstorm (flood).
•Build barriers to stop contamination.
ASSESSMENT:
•Can students accurately describe the movement of ground-
water through rock?
•Presented with definitions of the terms "porosity" and "per-
meability," students are able to complete a written assign-
ment comparing and contrasting the porosity and perme-
ability of various rock types relative to stream recharge and
toxic waste disposal and clean-up.
20 RockCamp
Assessment Questions to be Answered from
Recorded Student Observations:
•How does water flow through the ground?
•What types of contaminates will seep into groundwater?
•Describe how a contaminate might affect a water supply for
a city, in a housing development, or in a single-family home
with well water.
•How does groundwater affect stream (pond) levels?
•As the dye flows, describe the path it follows.

Adaptive Earth Science Activities 21
Epicenters
by Jo Ann Byron
Shady Springs Junior High
TIME: Preparation and one 45-minute period.
PROCEDURES:
1. The mathematical solution for each situation is calculated
as follows:
Arrival time of S-wave minus arrival time of P-wave times
60 seconds per minute times 2 miles per second (speed of S-
wave) times 3 miles per second (speed of P-wave) equals the
distance of epicenter from seismograph.
By doing some of the fixed calculations first, a short ver-
sion of the previous equation would be:
Arrival time of S-wave minus arrival time of P-wave times
360 equals distance to epicenter from seismograph.
2. Here are some representative data for students to use
for practice.
Distance from
epicenter
Hawaii 12:00 12:09 ___________ miles
Alaska 11:08 11:14 ___________ miles
California 10:43 10:48 ___________ miles
Cuba 10:00 10:10.41 ___________ miles
Iceland 10:01 10:07.94 ___________ miles
Italy 10:02 10:10.33 ___________ miles
3. Use a world map with a scale. Have students draw circles,
to scale, around each of the locations given in the chart.
The radius of their circles should be equal to the calcu-
lated distance from the earthquake epicenter. The com-
mon point defined by an overlapping of circles reveals the
geographic location of the epicenter.
P-waves S-waves
3240
2160
OBJECTIVES:
•To calculate distance to epicenter
from seismograph using arrival times
of P-waves and S-waves.
•To find on a map the location of the
epicenter of an earthquake.
Materials and Equipment:
•Compass
•World map
•Ruler, edge of paper, or string
•Calculator (optional)
EPICENTER
22 RockCamp
ASSESSMENT:
•Students can accurately calculate the distances from the
epicenter.
•Students correctly identify the location of the epicenter.
Further Challenge:
•A tsunami is a seismic sea wave that can be caused by an
earthquake. They travel an average of 400 miles per hour.
To determine how long it will take a tsunami to hit a given
area, divide 400 into the distance from the epicenter to the
“hit” area.

Adaptive Earth Science Activities 23
Star Gazing Inside
by Barbara A. Cline
Jefferson Elementary Center
Commercially available inflatable planetariums are expen-
sive to buy or require reservations for borrowing far in ad-
vance. This homemade version is inexpensive, flexible, and
fun to make. Older students can make the planetarium. Teach-
ers will have to construct it for younger students.
TIME: Pre-class setup and 5 minutes per student groups of
3 for viewing.
PROCEDURES:
1. Take two plastic sheets and put one on top of the other.
2. Tape all four edges of the sheets together using duct tape.
3. Cut a hole half the size of a floor fan in one end of the
plastic.
4. Tape the sheet to the floor fan.
5. Inflate planetarium by turning on the fan.
6. Cut a slit in the side of the inflated planetarium. This al-
lows students to enter the planetarium to view the sky.
7. Make a sun and attach to the top of the fan.
8. Cut out the planets and arrange them in scale distance
from the sun on top and outside of the planetarium.
9. Use star stickers to "draw" a model of a constellation
onto the transparency or plastic wrap (Saran Wrap works
best). Then tape the transparency constellation or plastic
wrap constellation to the outside and top of the plan-
etarium. Have the constellations match the night sky at
the time you use the planetarium.
10. Darken the room, enter the planetarium, and use a flash-
light to find the night space objects.
ASSESSMENT:
•Sketches of constellations should help student recognize
them during a review process.
OBJECTIVES:
•To construct an inexpensive
classroom planetarium.
Materials and Equipment:
•2 plastic sheets 10' x 10'
•Duct tape
•Floor fan
•Extension cord
•Scissors
•Scale models of the planets
•Constellation patterns
•Star stickers
•Transparent tape
•Flashlight
24 RockCamp
TAPE
FAN
PLASTIC
ENTRANCE
Adaptive Earth Science Activities 25
Let’s Talk Trash
by Melanie Files
Berkeley Springs High School
In areas where recycling is stressed, about 50% of the
population recycles the allowed materials. What isn't recycled
or reused is pitched in the trash.
TIME: One 60-minute class period.
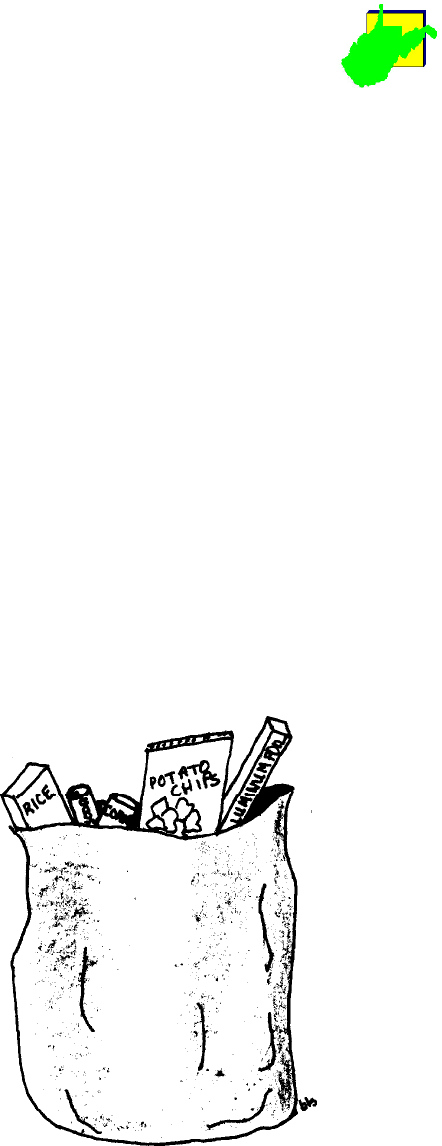
PROCEDURE:
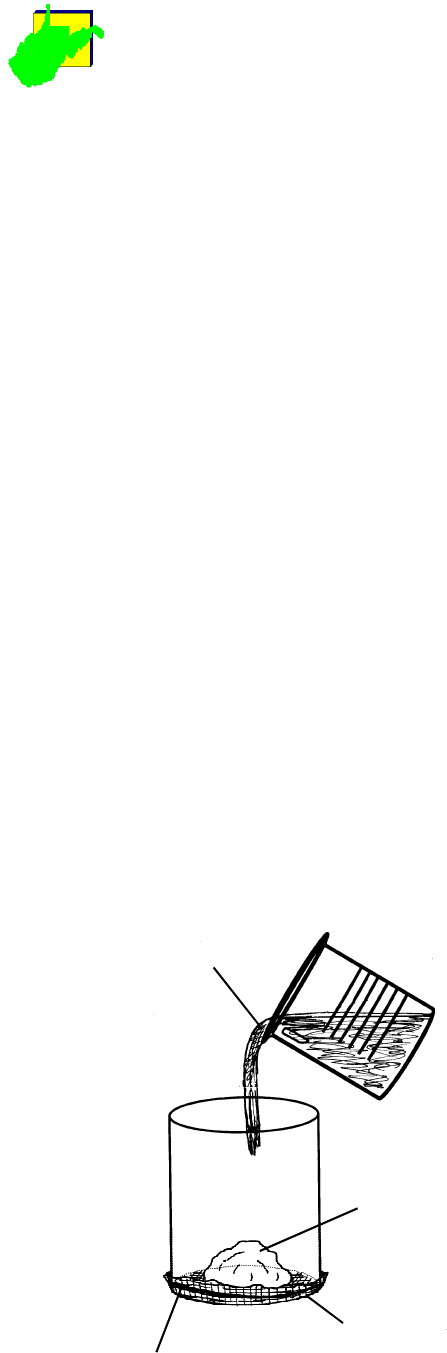
1. Empty the contents of the bag onto the table.
2. For each item indicate in your journal at least one way
that you could:
a. reduce the use of the item.
b. reuse the item (recycle the item).
dpre-cycle (choose not to use/buy the item) and tell why.
3. After you have completed the journal entries, compare
and discuss the ways the items could be used and reused.
4. Construct something using all of the materials, including
the bag they came in!
ASSESSMENT:
•Completeness of journal description and tables.
•Demonstrate student understanding of key terms by writ-
ing a short essay on recycling.
OBJECTIVE:
•Inspecting a bag of trash.
•Deciding how to recycle or dispose of
the contents.
Materials and Equipment:
•One bag of trash (supplied by
instructor)
•Scissors
•Glue
•String
•Staples/tape
26 RockCamp
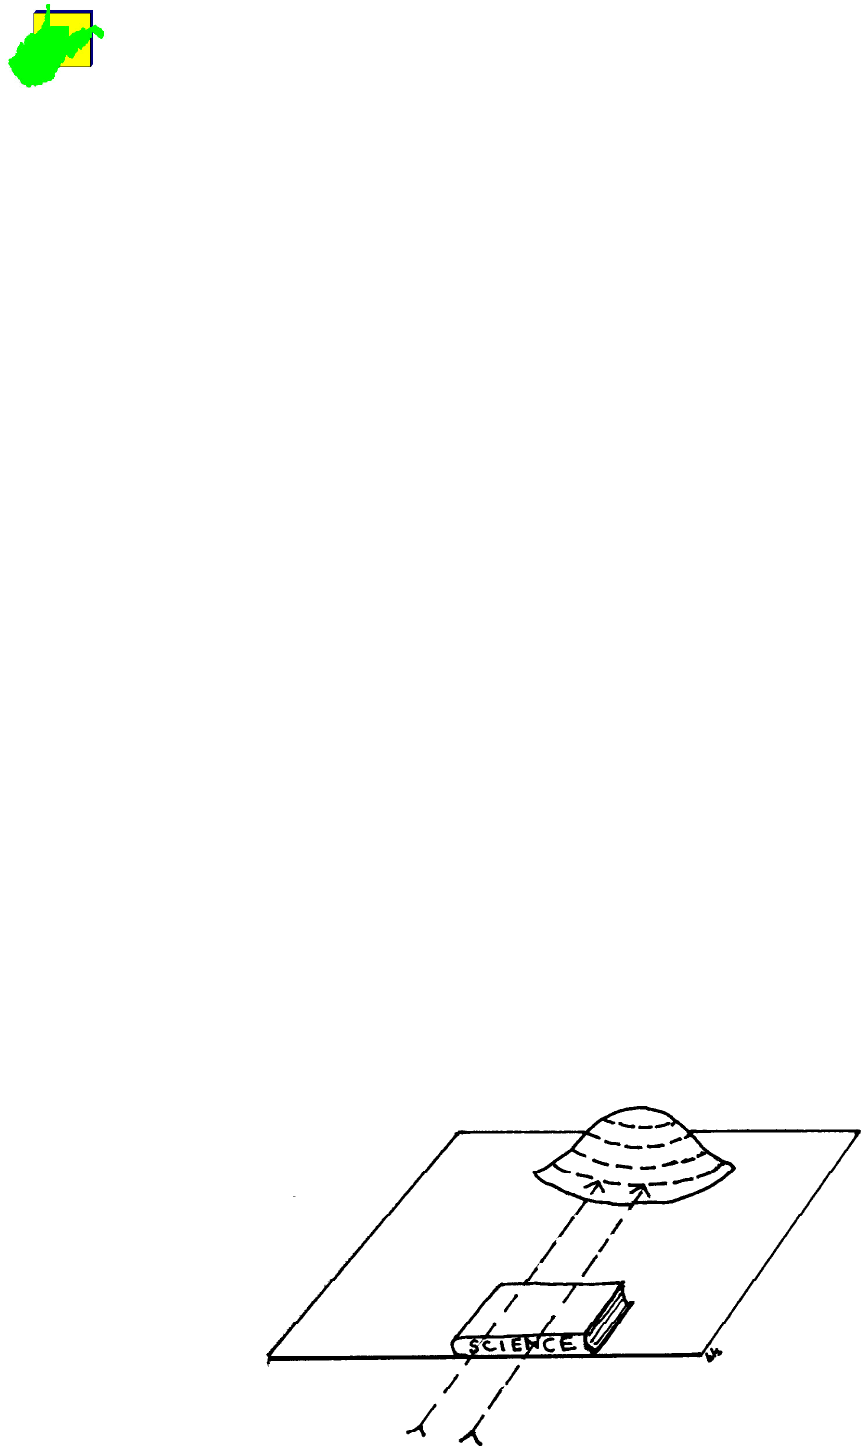
Contour Line Activity
by Billie Diane Frame
Martinsburg North Middle School
OBJECTIVES:
•Develop the concept of
representing the earth, or small
portions of the earth, on paper.
•Explain scale as representations in
miniature form.
Materials and Equipment:
•Clay (various colors)
•Pencil
•Paper
•Thick book
•Thin book
•Piece of cardboard
•Colored pencils
•Toothpick
TIME: One 50-minute class period.
PROCEDURE:
1. On the piece of cardboard, form the clay into the shape
of a mountain. Include hills and valleys, steep slopes and
gradual slopes.
2. Lay a thick book on the table beside the “mountain.”
3. Have the student sight across the book to the mountain
and put marks all the way around the mountain at the
same level as the top of the book.
4. Draw a line around the mountain with a toothpick, con-
necting the marks made in step #3.
5. Have the student stand above their mountain and look
directly down at the line just drawn. Ask these questions:
Does the line form a circle? What shape does it form?
What might the line represent?
6. Use a thinner book and draw a line further down the
mountainside.
7. Stack two books and draw a line further up the
mountainside.
8. Have the student stand over their mountain and look down
at the contour lines. Ask the question: Are the lines the
same distance apart all the way around the mountain?
Where are they closer together? Where are they further
apart?
9. Have the student draw two views of their mountain on
paper. . One will be a sketch of a profile of the mountain.
Ask them to devise a way to show what the mountain
looks like from an airplane. When finished tell the stu-
dents they have drawn a Contour Map.
Adaptive Earth Science Activities 27
ASSESSMENT:
•Journal entries describe the activity and results. Entries must
be concise, legible, accurate, and useful. A table of contents
must be included and the pages numbered. A student defini-
tion of a contour line, what it represents, and some prop-
erties of contour line spacing should be included.
•Student must demonstrate an understanding of contour lines
and contour maps by describing the landforms observed on
an assigned map. These observations will be entered in the
journal.
•Evaluation is also based on teacher observation, discussions
with the student(s), and peer-group contract grading.
Teaching Suggestions:
•Modifications can easily be made depending on the grade
level or the individual ability/interest of the students. Topo-
graphic maps and symbols can be introduced. Schedule a
spokesperson from the state geological survey to present a
program to the class. Contact a local surveyor and plan a
local field trip to an on-sight surveying business.
•The teacher’s objective is not to present a thorough treat-
ment on map reading, but to develop the concept of repre-
senting the earth on paper that can lead into further discus-
sion and maps activities.
•Review all directions orally. Display them in the room at
the same time. This will alleviate questions that may occur
during the activity. Designating stations within the room
and letting the students work cooperatively in groups will
provide optimum learning situations for all.
Further Challenges:
•As an extension activity, have the student exchange con-
tour maps with a classmate. The student will look at the
classmate’s map only (not the clay model). They should each
try to visualize and sketch what the other’s mountain looks
like just by looking at the map drawing. (Then they can look
at the actual mountains and see if they were right.)
•At this point, each classmate can try to construct a new
clay model using the contour map and the original materials
28 RockCamp
only. When models are complete, comparisons can be made
for accuracy.
•More contour lines can be added by stacking various width
books. Just remember to keep all lines from intersecting
each other.
•Information obtained through constructing a model or ex-
changing maps with classmates can be charted or graphed.
The entire class can assemble their hills and valleys to cre-
ate a landscape. Locating some of the highs and lows on the
earth will help the student visualize their planet.

Adaptive Earth Science Activities 29
Our Earth's Address
By James Giles
Craigsville Elementary School
OBJECTIVES:
•Increase the level of students' reten-
tion concerning latitude and longitude.
•Differentiate between lines of latitude
and longitude.
•Describe how latitude and longitude
are used to identify locations.
Materials and Equipment:
•Yarn (2 skeins of different colors)
•Masking tape (1 roll)
•World map (flat)
•Scissors
•Globes
TIME: 45 minutes.
PROCEDURES:
1. Arrange the class into groups of four.
2. Select one group to cut a piece of yarn that will reach
across the room. Have them tape it across the center of
the room from east to west. Tape the yarn about six feet
from the floor. Label the yarn the "equator." Discuss as-
pects of the equator with the class.
3. Select another group to cut a piece of yarn (use a differ-
ent color). Ask them to tape it across the center of the
room perpendicular to the equator (north to south). La-
bel this line the "prime meridian." Discuss the aspects of
the prime meridian with the class.
4. Instruct the students to make longitude lines that will di-
vide each row of students. Use the same color yarn used
to make the prime meridian.
5. Instruct the students to make latitude lines that will di-
vide the class into a grid system. Use the same color yarn
used for the equator. When completed, each student will
be inside their square.
6. After the class has built the latitude/longitude system, there
are several concepts that can be taught using the grid pat-
tern:
•Latitude/Longitude;
•Room location of each student;
•World wind patterns;
•Climate zones by latitude;
•Your city/town address by latitude and longitude;
•Continent hemisphere locations;
•Different hemisphere locations;
•Compass direction from the classroom;
•Plate tetonics;
•Topographic maps.
30 RockCamp
Yarn Prime Meridian
Yarn Longitude Line
Seats
Yarn Latitude Line
30° W 15° W 15° E30° E
30° S
15° S
15° N
30° N
bls
Yarn Equator
ASSESSMENT:
•When asked to move to a new square, the student will be
able to identify their new location based on the constructed
longitude and latitude lines.
•When asked to construct a paper map of the room, stu-
dents will cite the lines as references to locate various ob-
jects.

Adaptive Earth Science Activities 31
Mudcracks: A Clue to the
Earth’s Past
by Donis Hannah
Robert L. Bland Middle School
OBJECTIVE:
•Achieve an understanding of how
sedimentary deposits, such as
mudcracks, can form clues to the
Earth’s past.
•Determine how infilled mudcracks
can be used to determine "which way
is up?"
Materials and Equipment:
•Shallow aluminum pans (suitable
for oven or stovetop heating) or
styrofoam plates or trays
•Mud with a consistency of thick
pudding
Up
First Layer With Mudcracks
Second Layer
TIME: Two to three 45 minute class periods.
PROCEDURES:
1. Predict what environments are needed to form mud-
cracks.
2. Students predict what will occur before activity is initi-
ated (what will the dried mud look like?).
3. Collect or make mud and place 1/2 inch to 1 inch of mud
on shallow aluminum pan.
4. Dry in oven at 250-300 degrees until dry or on electric
stovetop at low setting until dry, or air and sun dry it.
(Drying outside in the sun allows for potential evidence
of animal trails, tracks, or burrowing.)
5. Add loose sediment (such as fine sand) to show how cracks
fill in as layers form.
6. Add another layer of mud to dried layer. Allow this layer
to dry.
7. When dry, slowly separate the two layers of mud.
8. Have students record observations made about the two
layers when separated.
9. How can these observations be used to identify which
way is up?
10. How would a geologist use fossil mudcracks to tell if a
layer of rock was folded?
32 RockCamp
ASSESSMENT:
•Results of mudcrack study in a journal should include:
a. descriptions of the activity;
b. the predicted results;
c. the observations made;
d. conclusion based on what was learned about mudcracks
and how they can be used to interprete the Earth’s past.
Teaching Suggestion:
•If the opportunity allows, take the students outside where
existing mudcracks have formed so they can make com-
parisons. The most exciting opportunity, if conditions al-
low, would be to air dry your mud, so the students can
observe the trails of life forms in it.

Adaptive Earth Science Activities 33
Are All Limestones Created
Equal?
by Deb Hemler
Preston High School
OBJECTIVE:
•Recognize the difference in composi-
tion of carbonate rocks.
•Relate this to depositional
environment and economic
importance.
Materials and Equipment:
( for class of 30)
•15 samples from 3 different lime-
stone formations
•15 pairs of safety glasses
•15 rock hammers
•Diluted hydrochloric acid (5-10%)
•15 triple beam balances
•15 graduated cylinders
•15 funnels
•15 pieces of filter paper
•15 Bunsen burners
•45 cotton swabs (Q-tips with
paper stems)
SAFETY NOTE: When using hydro-
chloric acid, follow all lab safety
measures.
Sedimentary rocks include those which form as layers of
sediment, become compacted and cemented, or fall out of
solution. One example of sedimentary rocks is a group known
as the carbonates. Carbonates, such as limestones, are con-
sidered nonclastic sedimentary rocks because they are not
formed from the cementation of fragments of pre-existing
rocks. Rather, they are primarily composed of the mineral
calcite. Calcite is comprised of the compound calcium car-
bonate (CaCO3) which is commonly found in solution in ocean
water and is readily incorporated into the shells of sea organ-
isms. A classic mineral characteristic of calcite is that it readily
reacts with hydrochloric acid (HCI). This investigation uses
this property to see whether all limestones have the same
calcium carbonate composition.
TIME: Two 45-minute class periods.
PROCEDURES:
1. Wearing safety goggles, use a masonry hammer to pow-
der medium-sized limestone specimens from each of the
three locations. Using a mortar and pestle, work the power
to uniform size.
2. Mass l-gram sample of crushed limestone from site A.
Transfer to a clean 150-mL flask.
3. Pour 50 mL of dilute HCl over each sample. Let the solu-
tion react. Swirl the flask often to ensure all of the lime-
stone has reacted to the acid. Continue this process until
no visible or audible fizz is detected.
4. Mass a clean, dry piece of filter paper. Record.
5. Filter the solution in 150-mL beakers to obtain the undis-
solved residue. (Note: Suction filtration works best; how-
ever, if gravity filtration is only available then allow 15-20
minutes of the period for filtration.)
6. Repeat steps 2-5 for limestone samples from site B and C.
7. Using forceps, place filter paper on a watch glass and place
in an oven or leave out to dry overnight.
8. Mass the insoluble residue and subtract the weight of the
filter paper.
34 RockCamp
Questions:
1. Calculate percentage of calcium
carbonate in each sample. How
does the amount of carbonate
compare in each type of lime-
stone? What could have caused
this difference?
2. What metals, if any, were
present in the carbonate
samples?
3. Investigate the importance that
purity (percentage of calcium
carbonate) plays in the economic
value of limestones.
4. What are your recommenda-
tions for the use of these lime-
stones?
9. Compare the results obtained for the samples.
10. Using the data from other groups, calculate the average
insoluable residue mass for each limestone sample.
11. Place the wet tip of a cotton swab into the insoluble resi-
due of site A. Flame the swab and record any color change.
12. Repeat for site B and C.
Teaching Suggestions:
•West Virginia limestone samples from the Ordovician,
Mississippian, and Devonian work well for this lab. If ac-
cessible, limestone from Florida could be substituted for
one sample or used to add an addtional treatment. Dolo-
mite and siderite are other carbonates which may be used,
however the word "limestone" in the lab title should then
be changed to "carbonate" to reflect this modification.
•For younger students, the teacher should powder the lime-
stone for students. The rock can be placed in a plastic bag
to minimize airborne fragments. A masonry hammer or
heavy rock hammer works best for this.
•This activity utilizes many laboratory techniques in one
activity: using a mortar and pestle, massing powders, fil-
tering and drying filtrates, and using flame tests. This lab is
best staged near the middle to end of a semester when
students have had prior experience with these varied tech-
niques.
•The flame tests may be left out as these results are often
inconclusive. Due to its magnesium content a dolomite
may be used to produce a different flame color. Only cot-
ton swabs with paper stems should be used.
•Older students can calculate the relative deviations of their
data from class averages.

Adaptive Earth Science Activities 35
Whether it Weathers?
by Deb Hemler
Preston High School
OBJECTIVE:
•Examine physical weathering of rocks.
•Investigate the efficiency of various
erosional agents.
Materials and Equipment:
(for class of 30)
•12 shale samples
•12 sandstone samples
•12 limestone samples
•12 pieces of wire mesh
(30 cm x 20 cm)
•12 strips survey flags
•12 wire cutters
•12 metal stakes
•1 roll wire
•Pliers
•6 portable balances
•6 metric tapes
•6 stopwatches
•6 oranges (or floating balls)
•Thermometer
•Mallet
•Wind gauge
Students generally comprehend that mechanical weather-
ing of rocks leads to the formation of sediments. What is not
realized is the amount of energy in an environment or the
length of time required for processes to happen. The follow-
ing activity is a lesson in mechanical weathering, a process
involving the physical breakdown or disintegration of rock by
erosional agents such as wind, water, and ice. These agents
carry materials which wear down rocks through actions such
as abrasion. The speed at which rocks weather depends on
several variables. This semester-long activity investigates the
process.
TIME:Two 50-minute periods to organize, and then one 50-
minute period a month for a semester for data
collection.
PROCEDURES:
1. Assign students into 12 groups, for each group mass one
each of the limestone, shale, and sandstone samples and
record. Soak samples for one week in water and record
the new masses.
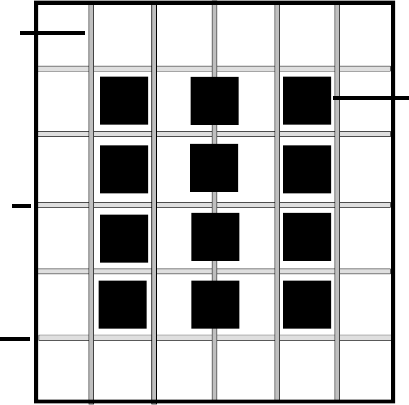
2. Cut the wire mesh with wire cutters into six 10 cm x 10
cm squares (see drawing on next page).
3. Wire four of the squares together to form a cube with-
out wiring the top. Place the samples of limestone and
sandstone into the wire cube and secure the last wire
square to the top of the cube (see drawing on next page).
4. If a stream environment is available near the school, the
project should be done there. If one is not within walking
distance, have the groups place the samples in those envi-
ronments near home.
5. Groups 1 and 2 will place their cages in the fast-moving
water of the stream. Groups 3 and 4 will place their cage
in slow-moving water. Groups 5 and 6 will place their
cage in a pool (still water).
6. Groups 1 through 6 should stake their cages and secure
them to the stakes using heavier wire. Flagging may be
attached to the stakes for easy relocation and data collec-
tion.
a. Students will record the velocity of the stream at the
various sites. Using a meter tape, measure 10 meters,
36 RockCamp
drop an orange, and record the time it takes for the
orange to travel the 10 meters. The velocity can be
determined by dividing distance by time.
b. Once a month students should return to their sites
and record the masses of their samples and stream
velocities on their data sheets. Students should ex-
press lost mass in terms of percent mass lost.
7. Groups 7 and 8 will place their samples on the floor of a
picnic shelter (preferably in a windy area). Groups 9 and
10 will place their samples out in the elements. Groups
11 and 12 will place their samples in a sheltered room
with no temperature controls. Groups 7 through 12 will
alternate recording daily temperatures, wind speed, and
precipitation at the beginning of class. Temperatures should
be averaged monthly and precipitation totalled.
8. At the end of the study, groups will assimilate their data
and present their findings to the class in a “poster ses-
sion.” All groups prepare graphs illustrating the relation-
ship between loss of mass over time and variable(s) such
as water velocity, amount of rainfall, or temperature. Their
posters are displayed on the walls of the classroom.
9. Given a copy of the cumulative data, their final project is
to write an individual paper on the class results. Their
discussion should include the weathering rates of the three
types of rocks and the overall effectiveness of each envi-
ronment as an erosional agent (still, slow, and fast water,
and precipitation and wind).
Questions To Be Addressed Might Be:
•Which rock sample initially absorbed the most water? Of
what importance is this?
•Which sample weathered the most? Is this consistent with
what you have learned about the local geology?
•Which erosional agent is the most effective? Explain the
mechanism behind this type of erosion.
10 cm
10 cm
Wire mesh design for cutting out
cubes for construction
Wire mesh cube with
rock samples
Adaptive Earth Science Activities 37
ASSESSMENT:
•Did students successfully use the available data to compare
and contrast the samples?
•Does the data support their contention that the experi-
ment was conducted over the course of the academic year/
semester?
•Is the graphical representation of the data appropriate?
Teaching Suggestions:
•This project can be done as a year-long study to simulate
actual data collection and research. It could be simplified
for younger students. If the cages are constructed for the
students in advance, little time is required for setup and
these may be used the following year.
•While chicken wire is easier to cut, it is too pliable and only
with some difficulty will form rigid cubes. Being a thin wire,
it will degrade more rapidly than a stronger gauge.
38 RockCamp
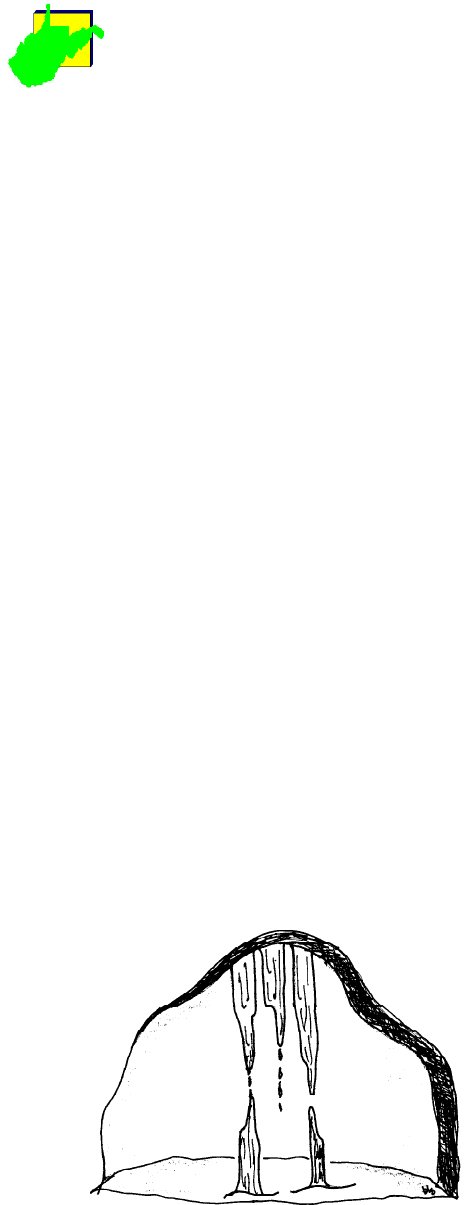
Spelunking: Exploring Caves and
Caverns
by Michele Lomano
Hedgesville Elementary School
OBJECTIVE:
• Determine which rock type best forms
caves.
Materials and Equipment:
(for each group of students)
•6 Small beakers or baby food jars
•Diluted hydrochloric acid (5-10%)
•Triple-beam balance
•Grease pencil or masking tape
•2 similar-sized pieces (hand speci-
men size) each of sandstone, shale,
and limestone
•Paper towels
SAFETY NOTE: When using
hydrochloric acid, follow all lab
safety measures.
A cave or cavern is a natural opening in the ground that
extends beyond the zone of light. Caves can occur in various
rock types, but one rock type forms the most numerous
caves—limestone. Limestone is composed of the mineral cal-
cite (CaCO3).
Most caves are formed by moving acidic water. Carbonic
acid (H2CO3), produced when carbon dioxide (CO2) com-
bines with water, dissolves limestones. This acid begins to
move slowly in small fractures in the limestone. This process
may continue for thousands of years as the cracks become
holes, and the holes become rooms, forming caves.
While this dissolving process continues, another process
may occur—deposition.
Stalagmites, stalactites, columns, and flowstone are formed
in the reverse way of that by which the cave itself forms. The
formations occur when the mineral calcite, which dissolves
from the rock as the cave is forming, is deposited. The drip-
ping or seeping of the calcite-rich water determines the shape
of the formation. When the water evaporates, the CO2 leaves
and only the calcite is deposited. Most formations are esti-
mated to grow only one cubic inch per 120 years.
TIME: One 40-minute class period or one prior day setup
and next day activity.
PROCEDURES:
1. Hypothesize which rock type best forms caves. Record
hypothesis.
2. Label each beaker with the following:
A. Sandstone w/water
B. Shale w/water
C. Limestone w/water
D. Sandstone w/acid
E. Shale w/acid
F. Limestone w/acid
Adaptive Earth Science Activities 39
3. Using the triple-beam balance, measure the mass of each
rock piece and record the data. Place each piece in the
beaker labeled with its rock type.
4. Pour 50 ml (or enough to cover rock sample) of water in
beakers A, B, and C. Pour 50 ml of diluted hydrochloric
acid (or enough to cover rock sample) in beakers D, E,
and F.
5. Let the beakers stand undisturbed for 20 minutes. Start-
ing with the rock in beaker A, CAREFULLY and THOR-
OUGHLY rinse the rock, being careful to avoid contact
with the skin. Remove the rock, dry, then measure the
mass of the rock. Record the results. Repeat this process
for rocks B-F.
ASSESSMENT:
•Student data is clear and reasonable.
•Students properly relate the formation of a cave in lime-
stone to chemical weathering.
•Students identify the solution weathering of limestone as
chemical weathering.
•Students use observed results to successfully determine the
effects of acid on various rock types and devise a way of
positively identifying limestones in the field.
Questions:
1. In which beakers did change
occur in the rock mass? In which
beakers did no change occur?
2. Which rock type lost the most
mass?
3. Why do you feel change
occurred in some rock but not
in others?
4. At the rate at which the rock in
question 3 was dissolving, how
long would it take to completely
dissolve?
5. Compare and contrast the cave-
forming abilities of the rock
types you have tested.

40 RockCamp
Make Your Own Hertzsprung-
Russell Diagram
by Mark Lynch
Lewis County High School
OBJECTIVE:
•Create and use a Hertzsprung-Russell
diagram.
Materials and Equipment:
•Graph paper (1 per student)
•Colored pencils (1 set per group)
•Data tables (samples included)
References:
Astronomy: From the Earth to
the Universe. Jay M. Pasachoff.
Saunders College Publishing. 1991
Earth Science. Edward Tarbuck
and Frederick K. Lutgens. Charles
E. Merril Publishing. 1985
By plotting the absolute magnitude against spectral class
or surface temperature of stars, a useful pattern results. Most
of the stars fall along a broad line running diagonally from hot
and bright to cool and dim. Such graphs are very valuable to
astronomy especially when studying life cycles of stars.
TIME: 50 minutes.
PROCEDURE:
1. Draw a spectrum across the bottom of the graph using
colored pencils. This should look like a continuous spec-
trum (rainbow).
2. Plot the stars on the graph using the absolute magnitude
versus the temperature. Use different colors that corre-
spond to the colors you drew across the bottom of the
graph.
3. Observe the heavy concentration of stars along the main
sequence.
4. Label areas of the chart that correspond to the location
of dwarfs, giants, supergiants, and white dwarfs.
5. Add some of the names of the stars you have heard of
from the second list of stars.
6. Add the progression of stars from dust and gas at M 0 to
a Black Dwarf at K +14. Draw a line to show how a star
might move around in the H-R diagram during its life.
Adaptive Earth Science Activities 41
ASSESSMENT:
Assessment rubric
A. Plots accurately represent data. Student is able to inter-
pret plot by identifying location of main sequence stars
on plot. Student can describe the relationship between
magnitude and temperature.
B. Most data is accurately plotted. Student can identify main
sequence stars on plot. Student has some understanding
of relationship between magnitude and temperature.
C. Majority of data is plotted well. Student has trouble iden-
tifying main sequence stars on plot. Student cannot de-
scribe the relationship between magnitude and tempera-
ture.
D. Plot is very inaccurate. Student has no understanding of
the main sequence portion of the plot. Student will not
try to explain relationship between magnitude and tem-
perature.
Teaching Suggestions:
•Students should have been introduced to magnitudes of stars
and the idea that stars evolve from one type or another.
They also need to have a working idea of how color and
temperature are related.
•You may want to use a larger piece of paper for the graphs,
as they can get crowded if you add all the names.
42 RockCamp
-5
-4
-3
-2
-1
0
+1
+2
+3
+4
+5
+6
+7
+8
+9
+10
+11
+12
+13
+14
+15
+16
Hotter Stars Cooler Stars
Absolute
Magnatude
Hertzsprung-Russell Diagram
Absolute
Magnitude
Temperature
(K)
Data for
Hertzsprung-Russell
Diagram
-5 27,000
-4.5 25,000
-4 5,000
-3 4,000
-2 20,000
-1 15,000
012,000
0 3,500
110,000
2 9,000
3 8,000
4 7,000
5 6,500
6 6,000
7 5,500
8 5,000
9 4,500
10 3,500
10 9,000
11 3,400
11 8,500
12 3,200
12 8,000
13 3,100
13 7,000
14 3,050
14 6,500
15 6,000
15 3,000
Sun 4.79 G2
Betelgeuse -5.6 M2
Sirius 1.4 A1
Arcturus -0.2 K2
Vega 0.5 A0
Rigel -7.1 B8
Altair 0.2 A7
Aldebaran -0.3 K5
Antares -4.7 M1
Spica -3.5 B1
Pollux 0.2 K0
Deneb -7.5 A2
Regulus -0.6 B7
Castor 1.2 A0
Polaris -4.6 F8
Name Absolute
Magnitude
Spectral
Class
Common Stars in the
Northern Latitudes violet . . . . . . . . . . . . . . . . . . . . . . . . . . . . . . . . . . . . . red
Temperature (K) OBAFGKM
30,000 25,000 7,000 5,000 3,000
1-Dust and Gas M 0
2-Protostar K 0
3-Sun G+5
4-Giant K-5
5-Variable G-5
F-3
B+2
6-Planetary Nebula B+2
7-White Dwarf F+10
8-Black Dwarf K+15
Absolute
Magnitude
Spectral
Class
Progression of a Typical Dwarf Star
Like the Sun
Adaptive Earth Science Activities 43
Fossil Origins
by Angela McKeen
Valley High School
OBJECTIVES:
•Categorize and hypothesize the origin
of fossils.
•Explain the reasoning behind their
ideas.
Materials and Equipment:
•Marine fossils of West Virginia
•Plant fossils of West Virginia
•Sheet of poster board per group
•Lots of imagination
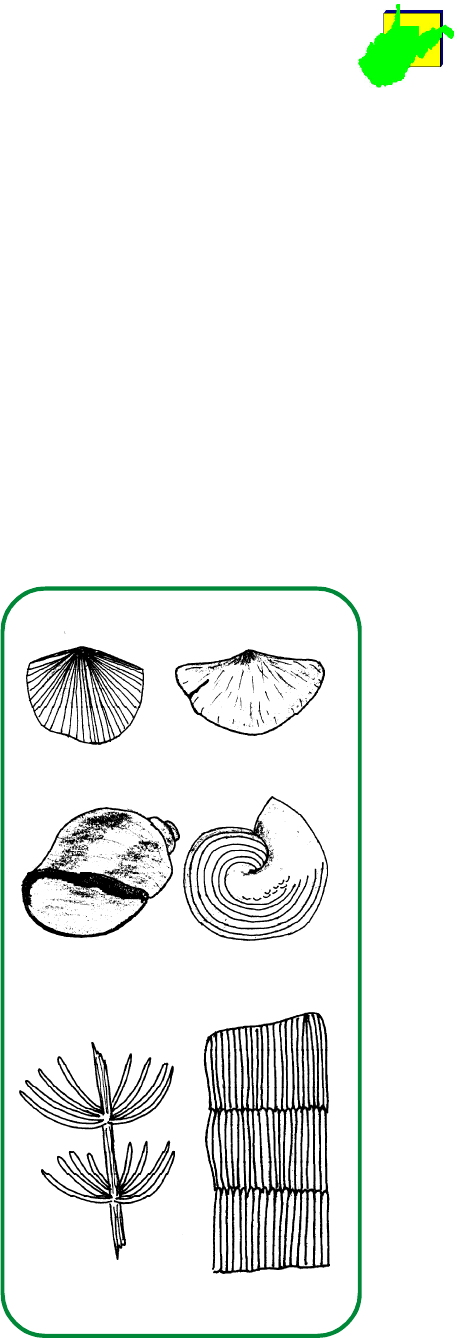
BRACHIOPODS
GASTROPODS
Asterophyllites
equisetiformis
bls
Calamites sp.
PLANTS
The students are placed in groups of three, and each group
receives a shoebox filled with various fossils. The students
are to sort the fossils, give each fossil a geographic origin, and
explain how they believe each fossil could have been formed.
TIME: Approximately 50 minutes.
PROCEDURES:
1. Separate fossils into groups that are similar in appearance.
2. Write a brief description of each group of fossils. What
type of rock is the fossil in? What does the fossil look
like? etc.
3. Try to come up with a present-day animal or “thing” that
looks like your fossil. Does it look like a flower? Does it
look like a shell? etc.
4. Where do you think this fossil came from? A swamp? A
lake? An ocean?
5. Select one group of fossils and write a brief (at least one
complete paragraph) “history” for these fossils. Where
were they when they were alive? How long ago did they
exist? What happened to them? Why did they fossilize?
6. Be prepared to share your ideas out loud with the class.
ASSESSMENT:
•Student achievement is assessed through cooperative par-
ticipation in a small group (no more than 3 per group).
•Students’ ability to express their thoughts in an organized
written description and ideas.
•Students’ sharing their ideas with the rest of the class.
Further Challenge:
Use this activity as an introduction to the fact that West
Virginia was periodically covered by a shallow sea. Relate this
idea to plate tectonics and reasons for changes in sea level.
44 RockCamp
Weathering and Fossil
Preservation
by Margaret Miller
Pratt Elementary
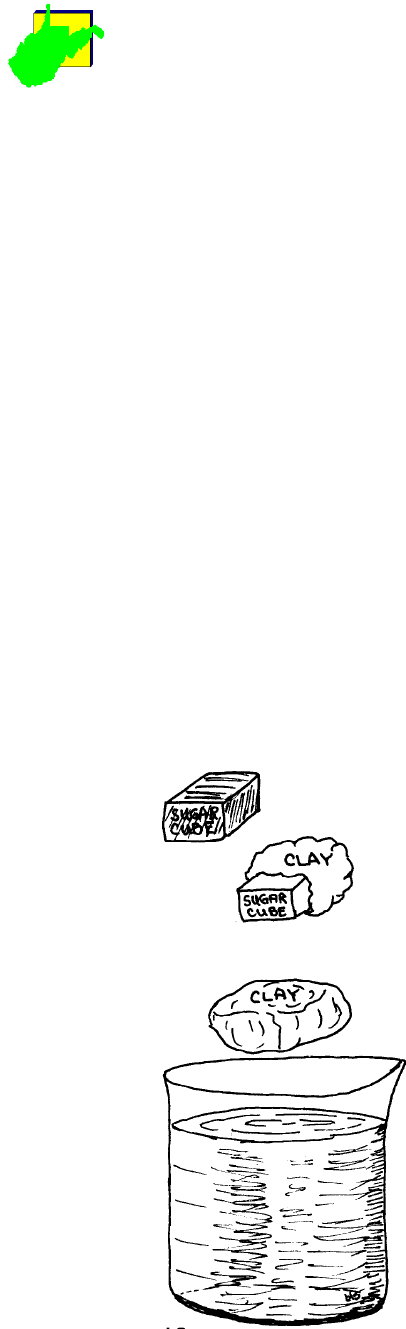
OBJECTIVE:
• Demonstrate how plants or animals
become preserved as a fossil by
blocking off exposure to water and
air.
Materials and Equipment:
•Disposable cups
•2 one-inch diameter balls of clay
•3 sugar cubes
•1 plastic spoon for each student
•Water for each cup
TIME: 20 minutes.
PROCEDURES:
1. Wrap a piece of clay around one of the sugar cubes so
that one half of it is covered with the clay. Wrap clay
entirely around the second sugar cube and seal it tightly.
2. Drop the sugar cube without any clay on it, the cube half
wrapped, and the cube which is entirely wrapped in clay
into the water.
3. Stir until the plain sugar cube is dissolved.
4. Remove the other cubes from the water and examine the
remains.
ASSESSMENT:
•Student observations are recorded in a portfolio. Observa-
tions are legible, clear, and sensible.
•Inferences and comparisons should be supported directly
by observations recorded in the portfolio.
Teaching Suggestions:
•Have students first predict what they think will happen.
•Have the students write the procedures. Once the cubes
have been removed, have students write their observations
about the conditions of the two remaining cubes.
•Have students make inferences and comparisons as to how
fossils are preserved.
•Have students write their conclusions.
•If possible, take students on a fossil hunt field trip.

Adaptive Earth Science Activities 45
Compass Treasure Hunt
by Nancy Moore
Walton Middle School
Task Card
Starting at your desk
take four paces east,
two paces northwest,
six paces west, and
three paces south-
east.
Describe your new
location.
OBJECTIVES:
•Use a compass for orientation and to
follow a course.
Materials and Equipment:
(for class of 30)
•Compasses (30 or 1 per group)
•Index cards with four directions
on them (1 per group)
•Treasure bags (baggies with 1 treat
per student)
Make a set of task cards (one card per group of students),
each card with a starting point (a desk, a tree, etc.), followed
by four directions which include the number of paces to be
taken in a particular direction. The course should have the
students ending up at some object (tree, desk, etc.).
TIME: Prior setup and one 40-minute period.
PROCEDURES:
1. Allow class to experiment with the compass. See if they
can discover and share the techniques for basic compass
orienteering. Make sure students know how to orient
themselves in a particular direction using a compass. If the
student wants to go east, he should hold the compass
parallel to the ground. Without moving the compass, he
must pivot until the red arrow (the north-seeking arrow)
points to “N.” Direct the student to locate a point that is
due east. He now must walk toward that point the num-
ber of steps indicated.
2. Have class practice orienting themselves in a variety of
directions. Have them stand with compass in hand. Say,
“Find south.” Check to see that all students are facing the
correct way. Do the same with east, west, and north.
Depending upon the age and experience of students, you
can also try to have them locate NE, NW, SE, SW, NNE,
ENE, etc.
3. Once students can orient themselves well, divide the class
into groups of three or four. Give each group a task card.
The students will follow directions and find their trea-
sure.
ASSESSMENT:
•The students can be asked to stand and orient themselves
in a particular direction. If you do this with individual stu-
dents, the rest of the class can help you to evaluate by plac-
ing their compasses on the table with the north-seeking
arrow pointing to “N” and checking to see that the indi-
vidual student is facing the right way.
46 RockCamp
Teaching Suggestion:
•This activity can be done inside or outside.
Extension:
Have students determine the length of their pace. Measure
a hallway or use a field. Have each student count the number
of steps needed to cover a predetermined distance. Divide
the distance by the number of paces to determine the length
of one pace. How could this be used for calculating distance
walked, or the length of a building, or the height of a tree
(geometry lesson)?
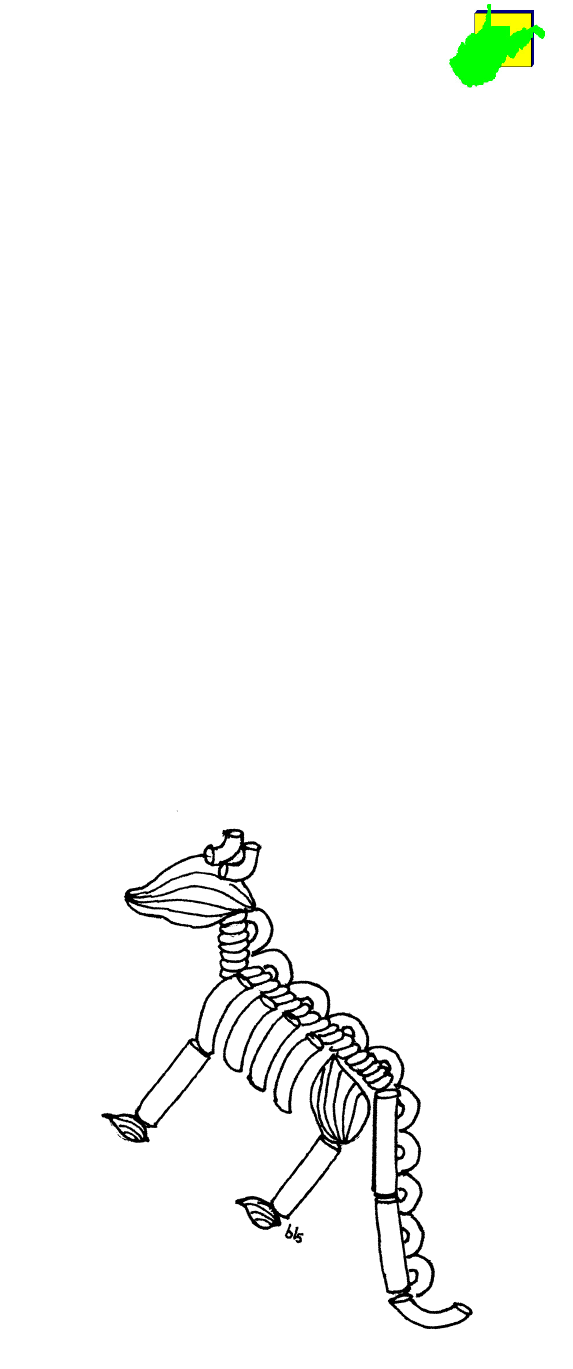
Adaptive Earth Science Activities 47
Pasta Paleontology
by Nancy Moore
Walton Middle School
OBJECTIVES:
•Use different types of pasta to
represent bones as they reconstruct a
“dinosaur.”
•See one of the problems of a paleon-
tologist as they view the variety of
“dinosaurs” that are constructed from
the “bones.”
Materials and Equipment:
•1 baggie per student or group
containing an equal assortment of
pasta (elbows, spaghetti broken
into smaller equal size pieces,
small and large rigatoni, rotini, 1
shell pasta to represent head).
TIME: 40-minute period.
PROCEDURES:
1. Give each student or group of students a bag of pasta.
Tell them to pretend that they are paleontologists. Their
assignment is to take these bones and put them together
to make a dinosaur skeleton.
2. Give students enough time to construct their dinosaur,
then encourage them to travel around the classroom to
examine the dinosaurs made by the other students.
3. Discuss differences and similarities in the dinosaurs. Plant-
eating dinosaurs usually walked on all four legs. Meat-eat-
ers usually walked on their two hind legs. Plant-eaters
often had some sort of protective device (horns, plates,
etc.). Have students identify the plant-eaters and the meat-
eaters made by classmates.
4. Record characteristics used to identify each pasta dino-
saur.
5. Discuss the importance of a paleontologist having knowl-
edge of biology, anatomy, etc. Have students think about
identifying unknown animals from strange bones.
ASSESSMENT:
•Students are actively involved in the construction of a "pasta
dinosaur."
•Record why they picked certain pasta to be certain bones.
•Have students observe all constructions. Verbal discussion
of similarities and differences should be supported by their
written observations.
Teaching Suggestions:
•Tell students that their dinosaur will be lying on the table,
not standing up. Relate this to problems encountered by
paleontologists working with real dinosaur fossils.
Further Challenge:
•Give students pictures of dinosaurs and have them identify
them as plant-eaters or meat-eaters.
48 RockCamp
Rock Riddles
by Nancy Moore
Walton Middle School
OBJECTIVE:
•Use synonyms of words used in earth
science lessons to write “Rock
Riddles.”
Materials and Equipment:
•Paper and pencil for each student.
•Copies of dictionaries and thesau-
ruses which can be shared by
students.
What do youWhat do you
call a conversationcall a conversation
among stones?among stones?
Rock Talk!
“Hink Pinks” are riddles with one-syllable rhyming answers
(fat cat, sweet treat). “Hinky pinkies” are riddles with two-
syllable rhyming answers (paper scraper, handy candy). Rock
Riddles are patterned after this.
TIME: 45 minutes.
PROCEDURES:
1. Have students come up with a list of earth science words.
List these on a chalkboard. (Examples: rock, stone, plate,
coal, slate, shale, etc.)
2. Have students come up with words that rhyme with the
earth science words. The pair of words will usually be an
adjective/noun combination. Watch out--they may be quite
silly. (Examples: rock talk, stone loan, plate fate, coal bowl,
late slate, pale shale, etc.)
3. The students must now write a question for which the
rhyming pair would be the answer. They may NOT use
either of the rhyming words in the question. This is where
the thesaurus comes in handy. For example:
a. What do rocks get when they need money? (stone
loan)
b. What happened to the earth’s crust? (plate fate)
c. Where did the black sedimentary rock play football?
(coal bowl)
d. What metamorphic rock was running? (late slate)
e. What do you call a crumbly sedimentary rock that is
light in color? (pale shale)
4. Once students have the knack of writing “Rock Riddles,”
they can write them independently and share them with
their classmates. This may be a fun way to start each class
by sharing a new riddle.
ASSESSMENT:
•Students will be evaluated according to their ability to write
“Rock Riddles.”

Adaptive Earth Science Activities 49
Deep Ocean Current Forces
by Sally Morgan
East Fairmont High School
OBJECTIVES:
•Find out how different densities affect
a solution.
•Find out how differences in salinity
affect a solution.
•Find out how temperature affects a
solution.
Materials and Equipment:
•8-10 test tubes (straws can be
substituted with clay or potato
slices)
•4 droppers
•4 different density solutions of
different colors (alcohol, water,
salt water, and glycerine)
•4 different saline solutions of
different colors (freshwater, 25%
salt solution, 50% salt solution, and
saturated salt solution)
•Ice
•Candle or bunsen burner
•Beaker
•Food coloring
TIME: One 50-minute class period.
PROCEDURES:
PART A: Density
Obtain the 4 different colored, different density solutions.
It is up to you to determine the layering order of the solu-
tions. Place one or two fingers' width of each solution, drop
by drop, into the test tube (straw) without mixing them, so
that the most dense solution will go to the bottom.
1. Choose a colored solution and place it into the test tube
(straw). Make sure to record the order in which you place
the solutions.
2. Choose another colored solution and slowly place it in
the test tube (straw).
3. If mixing occurs, start a new trial. Make sure to begin with
a different color. Reminder: Record all data.
4. Continue in this manner until you have determined the
order of density.
Questions:
•In which order did you find the solutions layered (from
bottom to top)?
•Why do you think this occurred?
•If these materials were added to the ocean, which order
would they arrange themselves?
PART B: Salinity and Density
Salinity affects ocean currents. You will now need to ob-
tain the 4 different colored, different saline solutions.
Repeat the procedures in Part A with the new solutions.
This time you will be determining the order of salinity.
Questions:
•In which order did you find the solutions layered (from bot-
tom to top)?
•Why do you think this occurred?
•If these materials were added to the ocean, which order
would they arrange themselves?
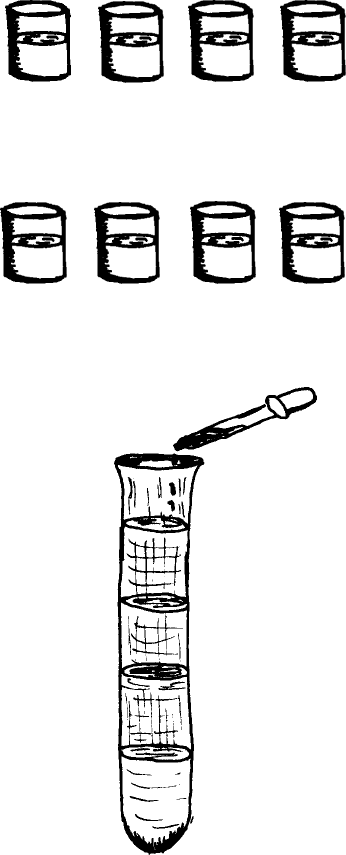
50 RockCamp
25%
salt
solution
blue
green
green
blueyellow
red
yellow red
freshwater
salt
water
alcohol water glycerine
saturated
salt
solution
50%
salt
solution
•Where in the ocean would the saltiest water be located?
PART C: Temperature and Density
Temperature affects ocean currents.
1. Heat your test tube from Part B. Observe any internal
movement. Record your observations.
2. Obtain a beaker. Fill it half full of warm water.
3. Gently add a drop of yellow or red food coloring at the
center. Observe the movement. Record your observa-
tion.
4. Add an ice cube to the beaker of colored water.
5. Add one or two drops of dark food coloring (blue or
green) directly on the ice cube. Observe the movement.
Record your observations.
Questions:
•What happened when you heated the salt water solution?
•Where in the ocean might this occur?
•What happened when the ice and food coloring were added
to the water?
•Where in the ocean might this occur?
ASSESSMENT:
•From this investigation, discuss how the density affects ocean
water.
•Students have recorded data.
•Recorded data supports statements and hypothesis.
•Students relate density, salinity, and temperature to each
other.
•Students develop an understanding of what drives some
ocean currents.

Adaptive Earth Science Activities 51
Fossils in Time
by Karen Parlett
Pleasants County Middle School
This unit consists of a set of activities that introduce stu-
dents to fossils. It can easily be adapted to other grades with
a few changes. The focus can also be changed. Students can
be introduced to fossil formation, fossil types, index fossils,
or mapping.
TIME: Each station lasts one 45-minute class period. Last 10
minutes are devoted to cleanup and completing record sheet.
PROCEDURES:
Students use a set of learning stations at which they work
in cooperative groups. Students rotate through jobs as the
groups rotate through the stations. The stations are labeled
for descriptive purposes only. They are designed to be
completed in any order.
DAY 1—STATION A: Message in a Fossil
This program simulates a fossil dig and shows the students
tools and techniques used in uncovering fossils.
1. As the students uncover fossils, they match them to fos-
sils in a “museum” and build an appropriate diorama for
their own museum.
2. Record the information in logbook and on time scale chart.
Questions:
•Name two tools a paleontologist uses when looking for
fossils.
•Name two fossils your group found.
•From what era and/or period did those fossils come?
DAY 2—STATION B: Fossil Casting
Each student makes a plaster cast of a fossil of their choice.
1. Soften the piece of clay. Make it large enough to fit the
bottom of the cardboard tube. Do not attach it to the
tube yet.
2. Rub dishwashing liquid on the fossil. This keeps the clay
from sticking to the fossil. Press the fossil firmly into the
clay and then lift it out of the clay. You now have a mold.
3. Put your name on the cardboard tube. Place the tube on
the clay, centering your mold. Seal the tube with the clay
so it won’t leak.
4. Mix two scoopfuls of plaster with about 15 ml of water.
OBJECTIVE:
•Use a variety of skills to explore and
develop an understanding of fossil
formation, types, age, environments,
and identification.
Materials and Equipment:
STATION A: Message in a
Fossil
•Computer
•"Message in a Fossil" software by
Edunetics. Students work through
1 lesson.
Materials and Equipment:
STATION B: Fossil Casting
•Plaster of paris
•Plastic cups
•Stirring sticks
•Water
•Dishwashing liquid
•Graduated cylinders
•Clay
•Cardboard rings
•Labeled collection of fossils
•Fossil handbook
52 RockCamp
Stir the mixture so it looks like pancake batter (thick, but
easy to pour). Add water or plaster as necessary.
5. Pour the plaster mixture into the cardboard tube. Place it
on a tray to dry overnight. This will be your cast.
6. Read about the fossil you are reproducing and choose
one of the following activities to complete:
a. Draw a picture of the animal in the environment it
may have inhabited.
b. Write a short story telling about how this animal may
have lived.
c. Write two or three paragraphs describing a present-
day animal that is similar to the fossil you cast.
Questions:
•What fossil did you choose?
•From what era and/or period did the fossil come?
•What does “index fossil” mean?
•Would your fossil be a good index fossil? Why or why not?
DAY 3—STATION C: Mystery Fossils
1. Students use the resource materials to identify at least
five fossils found at the station.
2. Students draw a picture of the fossil and name it.
3. Tell the time range (era, period) and environment or habi-
tat in which it lived.
Questions:
•How many fossils did you identify?
•Which resource helped you find the most information?
•Which fossil was the earliest one you identified? In which
era and/or period did it exist?
Materials and Equipment:
STATION C: Mystery Fossils
•Collection of unlabeled fossils
•Variety of resource materials
(fossil handbooks, encyclopedias,
posters)
Adaptive Earth Science Activities 53
Materials and Equipment:
STATION E: Puzzle Time
•Envelope containing pieces for 1
geologic time scale puzzle
•Glue
•Newsprint or construction paper
for mounting puzzle
•Colored pencils for coloring com-
pleted puzzles
Materials and Equipment:
STATION D: Fossil Dig
•Container large enough for group
of four students to work in
•Fossiliferous soil (obtained locally
or from a reliable source)
•Sand
•Soil
•Rocks for filler
•Identification sheet
•Handbooks
•Hand lenses
DAY 4—STATION D: Fossil Dig
1. Students work together as a group to sift and search a
box of sand to find fossils.
2. Students draw what they find, identify it and keep one
sample. Extra fossils are returned to the box for the next
group.
Questions:
•Name three kinds of fossils your group found.
•In what type of environment did these plants or animals
live?
•How did you decide what the environment was like?
DAY 5—STATION E: Puzzle Time
1. Students glue puzzle pieces to newsprint to make a time
scale poster.
2. Check completed puzzles to make sure they are correct.
2. Students color puzzle or complete a word puzzle based
on geologic terms.
Questions:
•During which era did fossil signs of bacteria and algae first
appear?
•During which period did fish fossils first appear?
•Name the era and the periods when dinosaurs flourished.
ASSESSMENT:
•Assessment is based on the student’s work at each station,
the completion of the logbook questions, and the geologic
time chart. Most stations also have written work that the
student must complete either individually or as part of a
group.
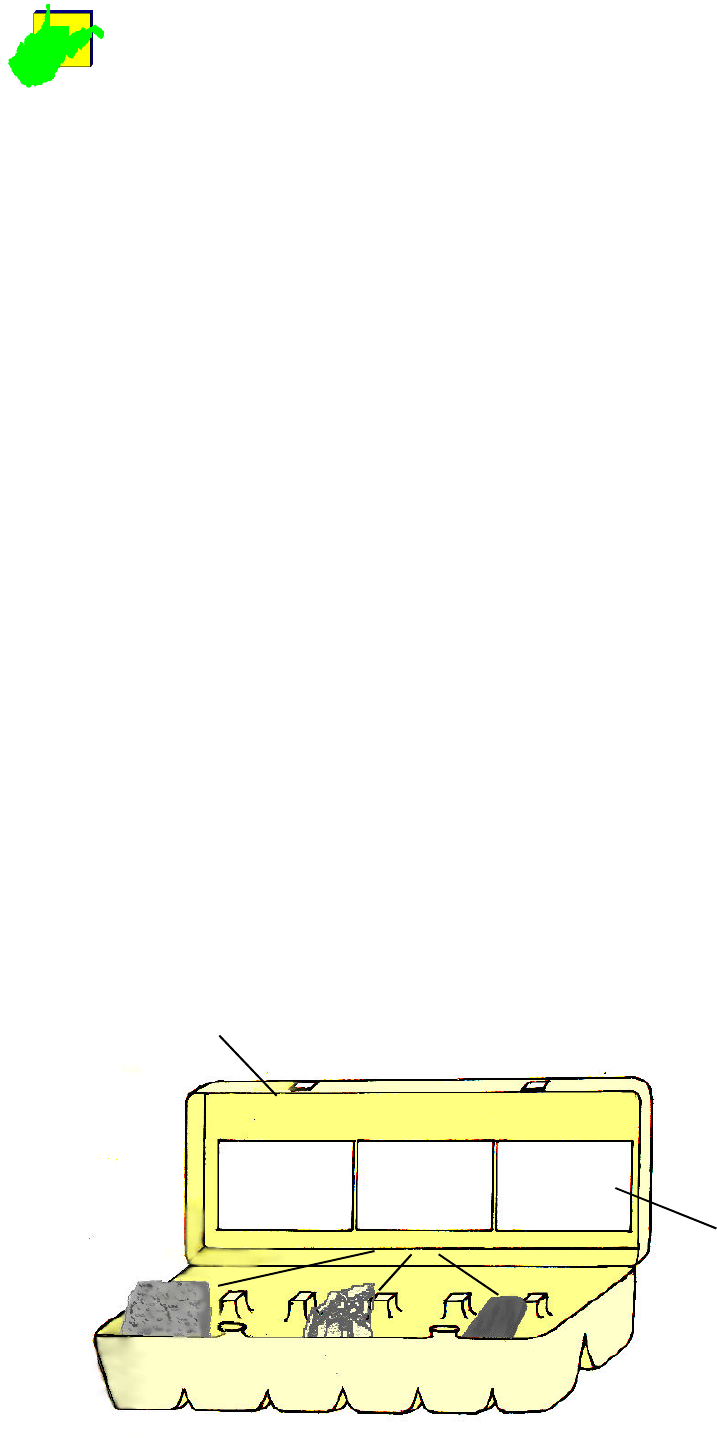
54 RockCamp
Name that Rock
by Karen Parlett
Pleasants County Middle School
TIME: One or two 45-minute class periods.
PROCEDURES:
1. Students work in groups of 4 or 5. Each group will need a
small container of mixed gravel, a cup of water, and paper
towels. Instruct the students to rinse off their rocks and
group them. Give as many or as few limitations as needed.
Give a time limit (such as 5 to 8 minutes) and tell the
students that each group will need to explain how they
grouped the samples. After each group has explained the
classification system used, spend a few minutes discussing
the use of classification in science in general. Introduce or
review the three major classes of rocks and give them
some general characteristics to look for.
2. Ask the student to develop a classification chart based on
the system developed in Step 1. Check each group’s work
and make suggestions where necessary. When students
find rocks that may be limestone, they should test the
rocks with acid. (Teacher may need to do this step for
students depending on grade level.)
3. Each student should prepare a half egg carton for the col-
lection. On an index card, each student should write lime-
stone, sandstone, granite, gneiss, and whatever other rocks
you have available. The index card should be attached to
the inside cover of the egg carton.
4. Each student should then number their rock samples to
correspond to the labels on the index card.
5. Once each student’s collection has been checked, stu-
dents should use rock identification books
to determine which of their rocks are
sedimentary, igneous, and metamorphic.
Students then list their rocks on a chart
under the appropriate heading.
Objectives:
•Reinforce observation, classification
skills, and organizational skills.
•Remember characteristics of the
three main classes of rocks.
•Learn to recognize and identify some
locally common rocks and begin their
own rock collection.
Materials and Equipment:
•Container of mixed gravel includ-
ing limestone aggregate
•Cups with water for rinsing rocks
•Acid for testing limestone
•Egg cartons for collection
•Pens for marking rocks
•Hand lenses
•Rock identification books
(optional)
•Index cards
Safety Note: When using hydrochloric
acid, follow all lab safety measures.
igneous
1. 2.
3. 4.
sedimentary
1. 2.
3. 4.
metamorphic
1. 2.
3. 4.
GRADE AAGRADE AA
bls
egg carton
rock samples index cards
Adaptive Earth Science Activities 55
ASSESSMENT:
Assessment rubric
A. Classification system complete. Numerous aspects of rock
description mentioned such as size, shape, color, surface
appearance (luster), hardness (resistance to scratching),
reaction to acid, grain size, composition, rock type (sedi-
mentary, igneous, or metamorphic), etc. All samples de-
scribed.
B. Classification system consistently lacks one or two major
descriptors. All but one sample fully described.
C. Classification system lacks many major descriptors. More
than one sample not described.
D. Classification system inadequate. Many samples not de-
scribed.
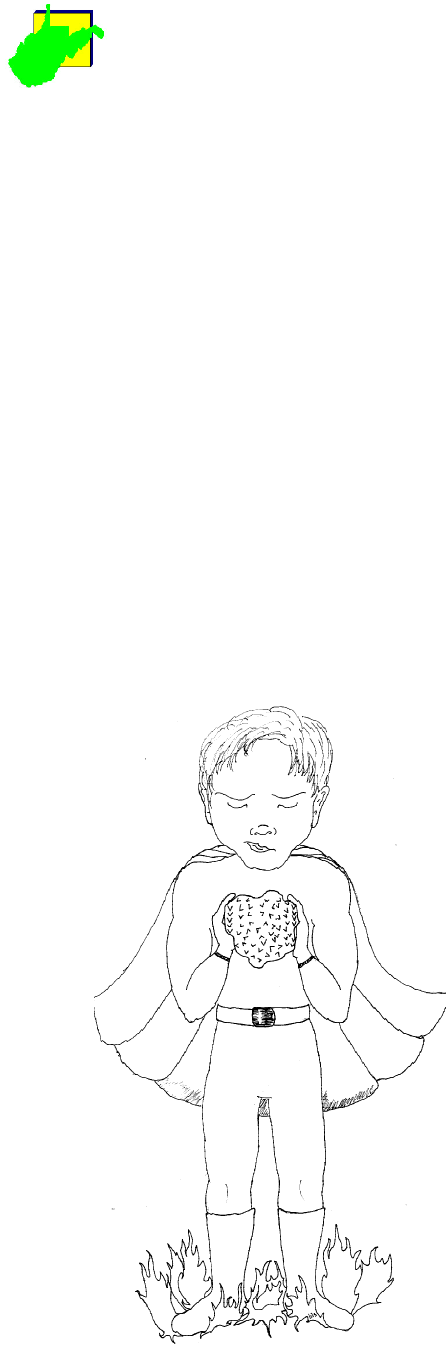
56 RockCamp
Mighty Metamorphic Power Rocks
by Karen Parlett
Pleasants County Middle School
Metamorphic
Power
OBJECTIVE:
•Students will describe various ways
rocks can form, and recognize that
rocks change over time.
•Students will write a short story, skit,
or comic strip about how the rocks
became the Mighty Metamorphic
Power Rocks.
Materials and Equipment:
•Various resource books
•Brief description of rocks
•Biographical information of rock
“personalities”
TIME: Two to three 40-minute classes.
PROCEDURES:
Mighty Metamorphic Power Rocks
Biographical Sketch:
We are normal igneous and sedimentary rocks.
Gary Granite: Used to be a hothead magma
man, but is cool now.
Larry Limestone: Smooth, gray, strong, but kind of
fizzy (or is that dizzy).
Beverly Bituminous Dark, energetic, "lights up the
room" type girl.
Sammy Sandstone: Gritty, often tough, but tends to
crack under pressure.
Sharon Shale: Smooth, but kind of crumbly.
1. Heat and pressure changed us into the Mighty Metamor-
phic Power Rocks. What are our Mighty Metamorphic
Power names?
2. Use these descriptions, or some of your own, to make up
a story, skit, or comic strip about these rocks who be-
come the “Mighty Metamorphic Power Rocks.” You may
want to add more characters. Just remember to use real
rocks and some real possibilities in your story. Use rock
books and encyclopedias to help you. Add illustrations if
you wish.
3. Students will present this to the class when finished.
Teaching Suggestion:
•Limestone can become marble, bituminous can become
anthracite, sandstone can become quartzite, shale can be-
come slate or schist, and granite might become gneiss.
ASSESSMENT:
•The finished product, story, skit, or comic strip is assessed
as to accuracy and creativity. Students can explain how
change relates the three kinds of rocks.

Adaptive Earth Science Activities 57
Musical Rocks
by Kathleen Prusa
Philippi Elementary School
OBJECTIVE:
•Provide young students with an
innovative way of seeing the differ-
ences in physical properties of rocks.
Materials and Equipment:
(for each group)
•Textbook
•Rock samples
•Toilet paper rolls
•Tissues
•Tape
•Paper
•Rubber mallets
TIME: Approximately 40 minutes.
PROCEDURES:
1. Lecture/Discussion: Using the book, observe and discuss
the differences between rocks and minerals, and then rock
types (igneous, sedimentary, and metamorphic).
2. Activity: Bring out rock samples from each type (for ex-
ample: igneous--granite, diorite, basalt; sedimentary--sand-
stone, shale, limestone, conglomerate; metamorphic--
gneiss, marble, or slate).
3. Have students describe the rocks. Color, texture, size,
mass (heft), roundness, angularity, etc. may be important
contributors to their instruments.
4. Have the students decide which work better at being
shaken, struck, or scraped.
5. Create instruments from the rocks. Use other materials
(toilet paper rolls, rubber mallets, paper, tape, etc.) to
enhance sounds or to strike the rocks. For example, sand-
stone pieces can be scraped together, marble can be hit
with rubber mallet, small pieces can be made into shakers
with toilet paper rolls and tape.
6. Have a rock concert!
7. Observe reasons for the different sounds.
8. Make suggestions about the composition and nature of
each specimen.
ASSESSMENT:
•Observe how the instruments work.
•Have students make suggestions for the noise each instru-
ment makes.
•Grades are based on participation, creativity, and complete-
ness of ideas about the nature of each specimen(s).
•Students reveal some understanding of the differences in
rocks.
bls

58 RockCamp
Modeling Geologic Columns with
Sand Art
by Debra Rockey
Wellsburg Middle School
Geologists use rock descriptions to construct a vertical
model (geologic column) of a site. By comparing the columns
for different sites, it may be possible to trace (correlate) key
beds from site to site. The accuracy of geologic maps and
estimates of mineral reserves is dependent upon the accu-
racy of correlations.
Correlations may be made by modeling outcrops and sur-
face exposures. Correlation of sub-surface strata may be made
by modeling drilling data.
Geologists use certain colors to distinguish sedimentary
rock types in stratigraphic models. Sandstones are indicated
by yellow, black is used for coal, blue is for limestone, and
green is used for shale. Red is a modifier used to denote spe-
cial features of the rock such as reddish shales. Important
features of the rock layer such as fossils or concretions should
also be noted.
TIME: Three 45-minute class periods.
PROCEDURES:
1. Prepare the plastic tube. One end should be permanently
sealed. If necessary, prepare the end of the tube by using
a permanent glue to seal the end.
2. Mix the non-toxic powdered Tempera paint with the sand
and water as needed. You may use buckets or large plas-
tic containers to mix the sand.
3. Divide the students into small groups of 2 or 3.
4. Each group is given a handout of geologic formations. The
students will use colored pencils to shade the geologic
columns and local cross sections to correspond with the
various rock strata. The students will color the rock lay-
ers in the following manner: limestone (Ls)--blue; shale
(Sh)--green; coal (C)--black; sandstone (Ss)--yellow; clay--
green; and concealed areas--white or undyed sand.
5. Determine any appropriate scale for the model. Divide
the total height of the rock layers in the cross section by
the length of the tube. (Caution: Leave space at the top to
seal the tube.)
OBJECTIVES:
•Construct geologic column models of
regional sedimentary rocks.
•Construct a scale model of rock
layers.
•Compare the models with geologic
time.
•Determine the relative age of each
rock.
•Explain the relationship between
rocks and the environments in which
they formed.
•Relate minable coals to the local
economy.
Materials and Equipment:
(for each group)
•1 clear plastic tube or plastic
container
•1 stopper (to seal tubes)
•Clear glue
•Masking tape
•White sand (200 grams)
•Non-toxic powdered Tempera
paint (black, blue, yellow, orange,
red, and green)
•Mixing bucket
•4-6 containers for colored sand
•Small paper cup (for filling tubes)
•Dowel rod (for compressing sand)
•Set of colored pencils
•Symbol key for sedimentary rocks
•Cross section of local rock out-
crop
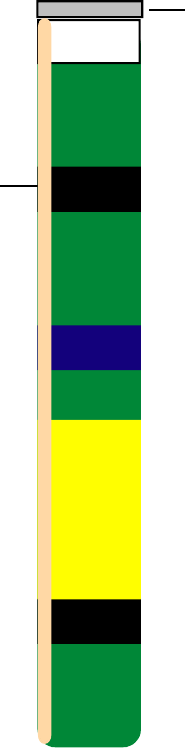
6. The students must place a strip of masking tape on the
side of the plastic tube, placed from the sealed end of the
tube to the opening at the top. The tape will be used to
note measurements, presence of fossils, or special fea-
tures of the rock strata.
7. Each group will construct a geologic column to represent
their assigned outcrop. Using the handouts as a guide, the
students fill their tubes with the colored sand to com-
plete their model. As each layer is poured, it must be
compacted with a dowel rod. (If the layers of colored
sand do not completely fill the tube, the remaining area
should be filled with undyed sand.
8. Each completed tube is capped with a stopper. Attach
labels to indicate the outcrop represented in the model.
ASSESSMENT:
•The students must correctly label each rock layer in the
model.
•The students must propose at least one environment of
deposition indicated by their model.
•The students must indicate the scale used to create their
model.
Teaching Suggestions:
•There are some factors which make correlation difficult.
The deposition of a sedimentary rock layer may not be con-
tinuous over an extended area. In some areas, erosion may
have removed all or part of the rock layer.
•Plastic tubes should be 30 cm long and have an internal
diameter of 2.2 cm. Each tube holds 180 grams of sand
(slightly more than 1/2 cup of sand)
•The dyed sand can be reused. Rinse the sand with water
and strain it through cheesecloth. Allow the sand to dry
and then re-dye the sand.
•Conduct a field trip to compare the models with the out-
crop sites.
•In some cases, siltstone may be distinguished from sand-
stone by using orange colored sand. The fire clays which lie
under some coals may be indicated by using purple sand.
Scale taped
to side
Stopper
or cap
100 meters
0
Colored sand
representing
sedimentary
rock
sequence
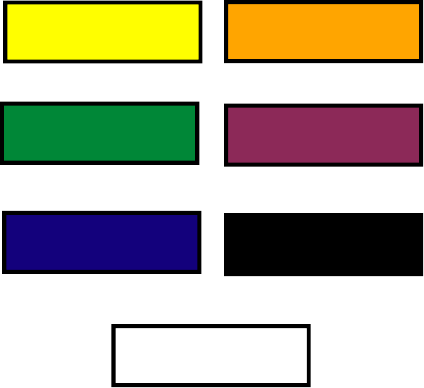
60 RockCamp
Coal - C (black)
Clay (green or purple)
Siltstone (orange)Sandstone - Ss (yellow)
Shale - Sh (green)
Limestone - Ls (blue)
Concealed areas - (white)
Abbreviations, Color Codes,
and Symbols
for Sedimentary Rocks
•Have samples of the rock types available for students to
observe.
•Have the students compare the model geologic columns
with slides or photographs of the actual outcrops.
•Red sand may be used as a modifier to distinguish certain
rock types such as “red bed” shales.
•Place emphasis on recording the proper sequence of rock
layers in the models.

Adaptive Earth Science Activities 61
Doughy Topos
by Christine Sacco
Warwood Middle School
TIME: 60 minutes.
PROCEDURES:
1. Have each group make 4 different sizes of pancakes out
of different colored dough.
2. Trace the 4 pancakes on a sheet of white paper.
3. Have the students stack the four different size pancakes
on top of each other, largest on the bottom. Have one
edge of the dough line up.
4. Discuss elevation. Discuss the way water will flow. Dis-
cuss slope (steepness, gentle erosion from water over a
period of years).
5. Pour water over the dough so students can see the path
of water.
6. Have students use a plastic knife and cut out a pie wedge.
7. Discuss stream flow (V’s).
8. Take the traced shapes and cut them out.
9. Glue shapes on top of each other, largest on the bottom.
Have one edge of the shapes line up (same as the dough).
10. Label contour lines starting with 0 m.
11. Place a folded piece of paper on the contour map and
mark the contours.
12. Take the marked paper and construct a profile on grid
paper provided.
13. After profile is made, make a cross section of the dough
model and compare files.
ASSESSMENT:
•Student profile is realistic.
•Student can find stream carved "V's" on a topographic map
and use them to explain the direction of water flow.
•Given a clay model showing dipping layers of rock, the stu-
dents can extrapolate their findings to explain why some
"V's" point downstream.
Objectives:
•Understand the basic concept of
elevation.
•Understand that streams may form
upstream V’s.
•Construct a contour map.
•Construct a topographic profile.
•Compare and constuct a flat contour
map to a 3-D model.
Materials and Equipment:
(for each group)
•4 different colors of dough
•Paper and pencil
•Plastic knife
•Glue
•Scissors
Topo Dough
1 cup flour
1/2 cup salt
1 cup water
3 tablespoons oil
2 teaspoons cream of tartar
Food coloring
Mix together and cook over
medium to low heat. Knead
1-2 minutes.

62 RockCamp
Black-Box Ocean Floor Landforms
by Ron Sacco
Moundsville Junior High
TIME: Allow 3 class periods.
PROCEDURE:
1. Draw a grid on the top of the box lid. (I have the students
follow these instructions since the boxes vary in size.)
a. Place box so its length is running left to right in front
of them.
b. Measure and mark the middle on both ends and con-
nect the marks creating a middle line.
c. Draw two more lines parallel to the middle line and
equally dividing the distance above the middle line.
d. Draw two more lines parallel to the middle line and
equally dividing the distance below the middle line.
e. Starting at the left end measure across the top and
bottom marking every inch (or 2 or 3 cm).
f. Connect the top and bottom marks to complete the
grid.
g. Label the five rows of holes A, B, C, D, and E. Label
the column of holes 1, 2, 3, etc.
2. Calibrate the probing device (example: cm)
3. Create various landforms by taping cardboard inside the
box.
Examples of landforms:
continental shelf mid-ocean ridge
continental slope seamount
abyssal plain island
ocean trench guyot
4. Tape the lid on the box.
5. Students exchange boxes with another group (a box with
contents they have not seen).
6. Students use the probing device to determine the depth
below sea level for each grid intersection and record data
on the data table (activity sheet).
7. Graph data from each line to make several profiles.
8. Label predictions of landform names on profiles.
9. Don't open box. Discuss uncertainity of explanation and
inference.
10. Open box and compare profiles with content.
OBJECTIVES:
•Measure the depth of various points
simulating sonar mapping of the
ocean floor.
•Construct profiles from recorded data.
•Identify examples of ocean landforms.
Materials and Equipment:
(per student)
•1 shoebox with lid
(or similar box)
•1 calibrated chopstick or dowel
rod for a probing device
•Ruler
•Nail to punch holes in box lid
•Scissors
•Masking tape
•School glue
•Supply of cardboard
•Writing utensil
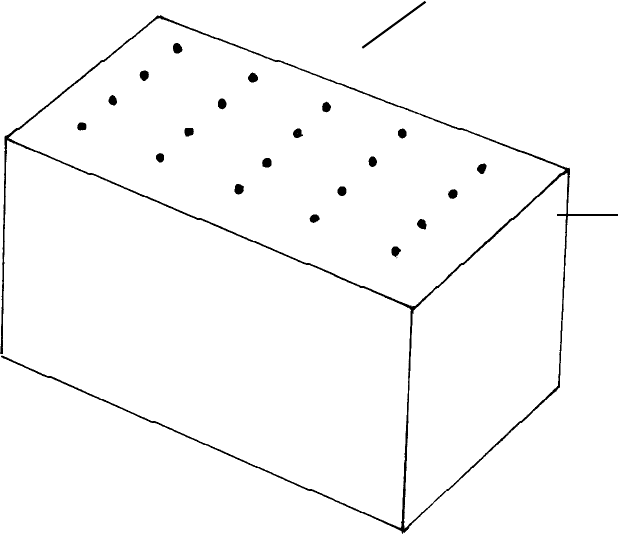
Adaptive Earth Science Activities 63
A
B
C
D
E
1
2
3
4COLUMNS
ROWS
ASSESSMENT:
•Participation and performance.
•Ability to record data.
•Ability to use data to make and support predictions.
64 RockCamp
Constellation Box Activity
by Jennifer L. Smith
Mountainview Elementary
TIME: Prior preparation and one 45-minute class period.
PROCEDURES:
Construction Directions for Constellation Box:
You will need two boxes for this activity. One box should
represent a winter sky and one should represent a summer
sky. (If you prefer, boxes could represent fall and spring skies.)
1. Turn one box so that the open end faces up.
2. Use packing tape to tape down any flaps that are on the
inside of the box.
3. Paint the inside of the box black. Allow to dry.
4. Turn the box over so that the bottom is facing up.
5. Draw dots in the form of constellations on the bottom of
the box. Using an enlarged star chart from a book will
help. (If you are using a star chart from a book, don’t
forget to reverse the pattern so it will be correct from
the inside.)
6. Use the hammer and nails to punch out the dots through
the bottom of the box. The holes should vary in size to
match the relative brightness of the stars.
7. Turn the box over and cut a "doghouse door" opening in
one side of the box that is large enough for a child's mid-
section to fit through.
8. Attach black cloth over the opening so that no light can
enter the box. It should be long enough so that it will
drape over a child’s midsection and out onto the floor.
9. When both boxes are completed, place them in a sunny
or well-lit area of the classroom.
Activity Directions:
1. The student will lie down with his/her head and upper
part of the torso inside one of the constellation boxes to
observe the sky and record observations. Be sure to set a
time limit for observing before the student enters the box.
Optional: While lying in the box, student can listen to the
cassette tape of “space” music through the headphones.
OBJECTIVES:
•Compare and contrast the winter and
summer constellations.
•Use observations and additional
resources to answer questions about
constellations.
Materials and Equipment:
•2 constellation boxes, one winter
sky and one summer sky (see
separate directions)
•Data sheet to record observations
•Question sheet to be completed
at end of activity
Optional:
•Audio tape of “space” music
•Cassette tape player with head-
phones
Materials and Equipment for
Constructing Constellation
Box:
•2 large cardboard boxes (equal in
size)
•Paintbrush
•Hammer
•Pencil, pen, or marker
•Nails of various diameters
•Heavy, black cloth
•Black tempera paint
•Clear, wide packing tape
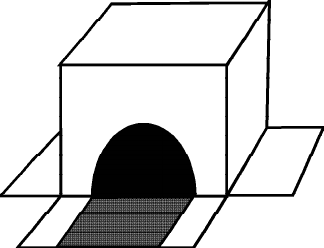
Adaptive Earth Science Activities 65
2. The student will lie down in the second constellation box
to observe the sky. He/she will make and record observa-
tions.
3. After the student has had an opportunity to observe both
constellation boxes, he/she will use their observations plus
other additional resources to compare and contrast the
visible stars and complete the question sheet.
4. Assign each student a constellation to research. Have them
tell the names of the stars in that constellation, how the
constellation was named, etc.
ASSESSMENT:
The evaluation of this activity can include, but is not limited
to, the following techniques:
•Teacher observations of the activity.
•Student self-evaluation.
•Completeness of student observations and statements.
•Checking answers to the questions.
Further Challenge:
•Invite your students and their parents to bring a blanket
and join you at the school on a Friday evening. Play the
“space” music cassette to get everyone in the mood to star-
gaze. You may also want to bring along snacks to share with
your fellow stargazers.
•Invite a guest speaker to your classroom to talk about the
stars, planets, the space program, or any other appropriate
topic.
•Have students write and illustrate a book about stargazing
or other appropriate topics.
•Have each student make their own constellation box, fol-
lowing the instructions provided with this lesson.
•Have students graph brightness, size, color, etc. of the stars
in various constellations.

66 RockCamp
Oooh, What A Relief It Is...
by Tanya Smith
Sacred Heart of Mary School
TIME: Adapted over 3 or 4 days. Limit group size to 5 stu-
dents.
PROCEDURES:
1. Introduce the topic of elevation with a relief map. Discuss
and review the four basic landforms. Involve the group in
making a cross-sectional profile of the United States.
2. From the relief map, introduce the use of contour lines.
Go over rules for using contour lines. Develop through
discussion and examples.
Rules for Using Contour Lines:
a. Contour lines never cross.
b. In areas of high relief (steep areas), contour lines
are closer together.
c. In areas of low relief (flat areas), contour lines
are farther apart.
d. Contour lines "V" upstream.
e. Hachure marks show a depression in elevation.
3. Break class into small groups for "Constructing the Land-
form Models." Each group will use the following materi-
als:
a. Approximately 2 pounds of clay
b. Popsicle sticks, toothpicks (used as "tools")
c. Clear container with clear lid
Each group is responsible for constructing a landform
model with the materials provided.
4. Let models dry overnight.
5. Assign each student to draw a cross-sectional profile of
their model and write a short paragraph describing the
features of their environment.
6. Review concepts covered so far. Use a collapsible drink-
ing cup to reinforce the use of contour lines. Distribute
materials to groups and lead class through the procedures
for "Constructing Contours." Each group will use the fol-
lowing materials:
a. Previously constructed landform models.
b. Metric ruler
c. Overhead transparency
OBJECTIVES:
•Understand use of cross-sectional
profiles and contour lines to represent
elevation.
•Create a landform model demonstrat-
ing an understanding of major land-
forms.
•Apply concepts through constructing a
"contour map" of landform models.
Materials and Equipment:
•Flashlight
•Relief map/physical map of the U.S.
•Potters clay (non-firing/2 pounds
per group)
•Tools (popsicle sticks, toothpicks,
etc.
•Metric ruler
•Graduated cylinder
•Clear containers with clear lids
•Overhead transparency
•Transparency markers
•Tape
•Water
•Blue food coloring
•Beaker
•White unlined paper
•Newspapers, paper towels (for
spills)
•Collapsible drinking cup
•7.5-minute topographic map of
surrounding area
Adaptive Earth Science Activities 67
d. Transparency marker
e. Tape
f. Water
g. Food coloring
h. Beaker
i. Graduated cylinder
7. Students will work to create contour maps by following
these procedures:
a. Use tape to secure an overhead transparency to the
container's lid.
b. Measure a predetermined amount (e.g. 100 ml) of
colored water into a graduated cylinder and pour the
liquid over the landform model.
c. Place lid over the model and use marker to carefully
trace the water line.
d. Repeat steps 2 and 3, adding a consistent amount of
colored water and tracing the water line until the land-
form has been mapped by means of contour lines.
e. Drain water off of landform models and dispose.
f. Have a class discussion and demonstration of concepts
and evaluation.
ASSESSMENT:
•Have students present their completed projects to the class
illustrating their understanding of:
a. How elevation is shown on topographic maps.
b. How contour maps relate to cross-sectional profiles
and contour intervals.
c. How the distance between contour intervals indicates
the steepness of the slope of the landform, and basic
landform features.
•Have students exchange contour maps and draw cross-
sectional profiles from this information, identify features,
and then match with appropriate models.
Further Challenges:
•Provide groups of students with 7.5-minute topographic
maps of the local area and have them identify various land-
form features.
68 RockCamp
•Practice cross-sectional drawings from maps.
•Have a “Topographic Treasure Hunt” and have students
locate specific information on topographic maps.
•Have students construct original topographic maps with
scale and legend.

Adaptive Earth Science Activities 69
Behind Jurassic Park
by Paula Waggy
Franklin High School
The possibility of recreating dinosaurs from DNA in in-
sect saliva stirs the imagination. This improbable scenario can
be used to start students considering what other organisms
shared the Jurassic scene with ancient behemoths. They may
be startled to realize that most of the insects alive during
T- rex's reign would be familiar to them, as all but six com-
mon modern orders of insects had already evolved.
TIME: 50 minutes.
PROCEDURE:
1. With students working in pairs, pass out the cardboard
or styrofoam strips with insects pinned to them but in
the wrong time periods. As an alternative, students can
use their own insect collections and receive empty strips.
2. Line each strip up with the marked sections matching the
geologic time periods on the Geologic History of Insects
sheet. Use the sketches on the sheet to help determine
where to put each insect. Insect field guides can be used
to check questionable specimens.
ASSESSMENT:
•Ask students to keep the strips lined up beside the Geo-
logic History of Insects charts. Check for accuracy after
they have rearranged the insects into the correct time
periods during which they evolved. For most insects, a
typical member of an insect order has been represented
on the chart. Consider that all the other insects in that
order evolved during the same time period. For instance,
a yellow jacket would be placed beside the Triassic period
where bees, wasps, and ants are listed. The exception is
order Orthoptera. Most evolved during the Triassic period
(i.e. crickets, mantids, katydids, etc.). However, the cock-
roach was 115 million years ahead of the rest of the or-
der and evolved during the Carboniferous period.
OBJECTIVE:
•Match modern insects to the time
period in which they evolved as an
attention-getting introduction to
geologic time.
Materials and Equipment:
•8-10 pinned insect specimens
•Cardboard or styrofoam strips
divided into sections which match
the time periods on the Geologic
History of Insects sheet
•Geologic History of Insects sheet
70 RockCamp
Further Challenge:
•Pick a geologic time period and research it to find out what
type of plants lived then, what large and small land crea-
tures inhabited the earth, and if any other flying creatures
besides insects had appeared. Draw the environment on a
poster or mural including as much detail and as many
species as possible. This activity can take as long as five 50-
minute class periods. Working in pairs on a posterboard is
an effective way of accomplishing this. By the end of the
activity after students have shared their research and art
work, they have a good working knowledge of the geologic
time periods.
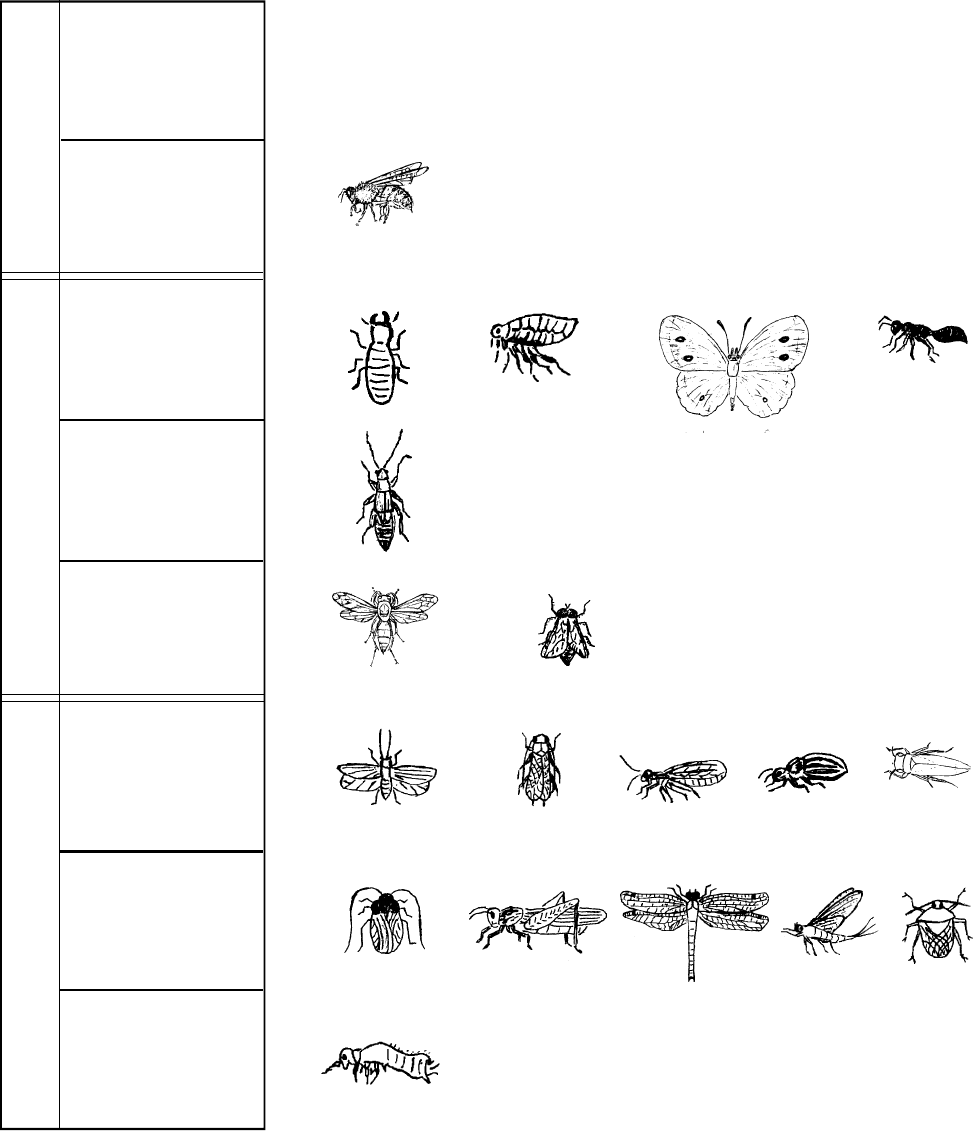
Adaptive Earth Science Activities 71
CENOZOIC
MESOZOICPALEOZOIC
Geologic History of Insects
(Ins(Insects are listed beside the period during which they first developed.)
Quaternary
2 million
years ago
Tertiary
65 million
years ago
Cretaceous
144 million
years ago
Jurassic
208 million
years ago
Triassic
245 million
years ago
Permian
286 million
years ago
Carbonifer-
ous
360 million
years ago
Devonian
408 million
years ago
small no wings
Butterflies &
Moths
Ter-
mites
Fleas
wings do not
cover abdomen
Earwigs
hard forewings
soft hindwings
thick waist
Caddisflies Beetles
Stoneflies
flattened body
long antennae
True
Bugs
triangle
between wings
overlapping
wings
Cock-
roaches
Mayflies
no wings
small
antennae often
knobbed or feathery
and scales on wings
lacy wings
Net-veined
Insects
Hoppers
Bees
Ants
bent antennae
narrow waist
small traingle
between wings
wngs do not
overlap
bent antennae
body quite hairy
narrow waist and
stinger
Dragon-
flies
aquatic
insects
3 tails
Grasshop-
pers
clear wings
slender abdomen
long, tough forewings
large hind legs
Spring-
tails
Wasps Flies
bent anntennae
narrow waist and stinger
only
two
wings
looks like brown moth
but no scales on wings
aquatic insects
two tails
72 RockCamp
Contour Mapping Earthquake
Intensities
by Paula Waggy and Deb Hemler
West Virginia
•Giles County, Virginia
OBJECTIVE:
•Investigate a historical earthquake
using the Mercalli Intensity Scale.
• Plot the intensities of the quake to
create a contour map.
Materials and Equipment:
•West Virginia road map
•West Virginia county outline map
•West Virginia newspaper accounts
of the Giles County, Virginia,
earthquake of 1897
•Colored pencils or magic markers
•Mercalli Scale of earthquake
intensities
Students often associate earthquakes with California and
the San Andreas fault. They do not realize that sizable earth-
quakes, although not frequent, can occur in other parts of the
United States, particularly their own state of West Virginia.
The following activity makes the topic of earthquakes more
relevant to students living on the east coast.
TIME: 90 to 135 minutes.
PROCEDURE:
1. Introduce students to the Mercalli Scale of earthquake
intensities. Students use one of the Giles County, Vir-
ginia, earthquake newspaper articles to determine the
Mercalli intensity number to assign to that area of the
state. Students should then assign Mercalli intensities for
all the cities listed on the map. They can use a West Vir-
ginia road map to find the locations of the additional cities
not listed on the county map.
2. Instruct the students to write these intensities at the ap-
propriate locations on the West Virginia state map. When
all intensities are recorded, students should draw con-
tour lines delineating areas of similar intensities. They can
color the map using reds, oranges, and yellows for the
highest intensities and greens, blues, and violets for the
lowest intensities.
3. Students then try to explain any patterns that they see in
the contour map.
Questions:
•Ask students why the contour lines are not in neat concen-
tric circles around the epicenter. Relate this to the general
geology and geography of West Virginia. (Reference mate-
rials may be required for this.)
•Consider the higher and more rugged mountains in the east-
ern part of West Virginia as compared to the mountains of
lower elevation in the western part of the state.
•Discuss the fact that every student’s map has slightly differ-
ent contours. The Mercalli Scale does not match precisely
the newspaper accounts, therefore different values may be
assigned to the same location by different students. How
does the Richter Scale avoid these discrepancies?
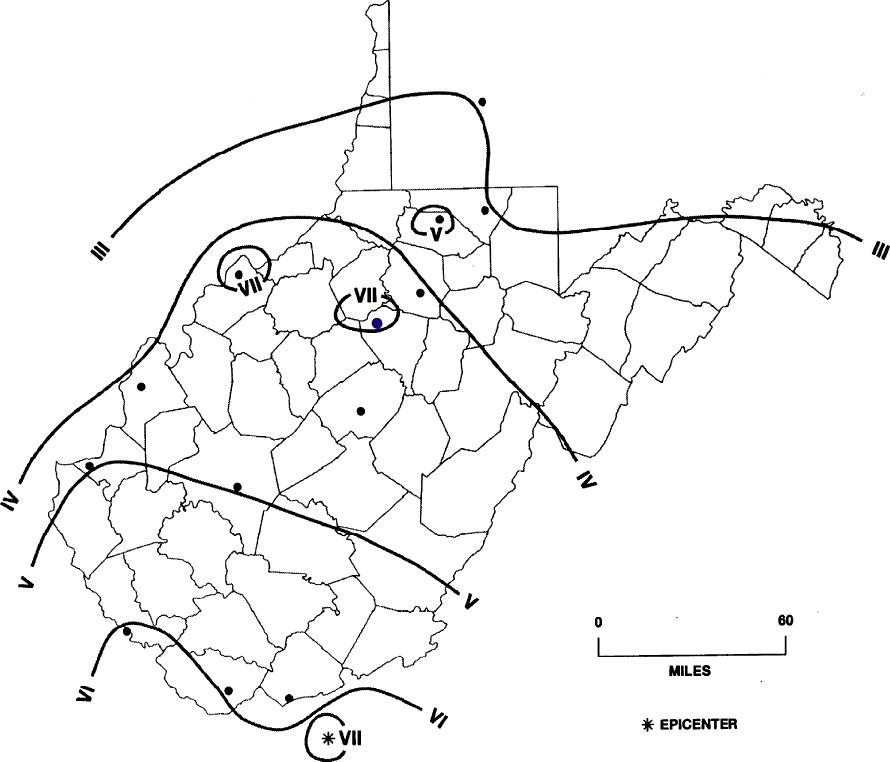
Adaptive Earth Science Activities 73
Weston
ASSESSMENT:
•Identification of Mercalli intensities is appropriate.
•Contour map appropriately reflects available data and
obeys rules of contouring.
•Interpretation of contour patterns is appropriate.
•Hypothesis for contour variations is appropriate.

74 RockCamp
Modified Mercalli Intensity
Scale of 1931 (Abridged)
I. Not felt except by a very few under espe-
cially favorable circumstances.
II. Felt only by a few persons at rest, especially
on upper floors of buildings.
III. Felt quite noticeable indoors, especially on
upper floors, but many people do not recog-
nize it as an earthquake. Vibration like pass-
ing truck.
IV. During the day felt indoors by many, outdoors
by few. At night some awakened. Dishes,
windows, doors disturbed; walls make crack-
ing sound. Sensation like heavy truck strik-
ing building.
V. Felt by nearly everyone; many awakened.
Some dishes, windows, etc., broken; a few
instances of cracked plaster; unstable ob-
jects overturned. Disturbance of trees, poles,
and other tall objects sometimes noticed.
Pendulum clocks may stop.
VI. Felt by all; many frightened and run outdoors.
Some furniture moved; a few instances of
damaged chimneys. Damage slight.
VII. Everybody runs outdoors. Damage negligible
in buildings of good construction; slight to
moderate in well-built ordinary structures;
considerable in poorly built or badly designed
structures.
VIII. Damage slight in specially designed struc-
tures; considerable in ordinary substantial
buildings; great in poorly built structures. Fall
of chimneys, factory stacks, columns, monu-
ments, walls.
IX. Damage considerable in specially structures;
well-designed frame structures thrown out
of plumb; great in substantial buildings, with
partial collapse. Ground cracked conspicu-
ously. Underground pipes broken.
X. Some well-built wooden structures de-
stroyed; most masonary and frame struc-
tures destroyed; ground badly cracked. Con-
siderable landslides from river banks and
steep slopes.
XI. Few, if any, (masonry) structures remain
standing. Bridges destroyed. Broad fissures
in ground. Underground pipelines completely
out of service. Earth slumps and land slips
in soft ground.
XII. Damage total. Waves seen on ground sur-
face. Lines of sight and level distorted. Ob-
jects thrown upward into the air.
Giles County Earthquake of 1897
In May of 1897, the second strongest earthquake ever to strike the
southeastern quarter of the United States occured near the town of
Pearisburg, Virginia. It was a powerful quake and demonstrated its strength
by damaging buildings in Virginia, West Virginia, Tennessee, and North
Carolina.
It was felt over an area of 280,000 square miles from Georgia in the
south, to Pennsylvania in the north, and from the Atlantic coast west as
far as Indiana.
Today, an earthquake of this size would be detected by numerous
seismographs throughout the world and digital information would pour
into earthquake research centers via satellite networks. However, in 1897
there were no satellite networks or even seismographs to record this
event.
This earthquake was largely forgotten, and within a few decades, most
people living in the area were not even aware that such a strong earth-
quake had ever occurred in their region. However, in the 1960s, the
construction of nuclear power plants created a demand for information
about the strongest earthquake that could reasonably be expected in all
parts of the country. These maximum expected events were to become
"design earthquakes," i.e. earthquakes that nuclear power plants are built
to withstand.
When the Giles County earthquake of 1897 was named as the design
earthquake for the Blue Ridge physiographic province, scientists wanted
to learn as much as they could about it. With no seismograph records,
the easiest way was to obtain newspaper accounts of its effects. The
following is an example of the 37 newspaper accounts students are pro-
vided with:
1897 NEWSPAPER REPORT FROM WESTON, WV
Weston, WV: An earthquake shock was felt here about two o'clock
this afternoon. Several ladies were badly scared, and one fainted. A wall in
the store room of the American Tea Company, which building is owned
by A.A. Lewis, was split from top to bottom, leaving a crack fully one
eighth of an inch wide. Several people were shaken from their chairs, and
numerous articles upon walls and stands were tumbled to the floor.
(Wheeling Register, Wheeling, WV)

Adaptive Earth Science Activities 75
Strike and Dip
by Donald J. Wagner
Franklin High School
OBJECTIVES:
•Clarify the concepts of strike and dip.
•Measure strike and dip of a simulated
rock outcrop.
Materials and Equipment:
(class of 30 working in teams of 3)
•10-20 wooden boards
•20-40 wooden wedges (optional)
•10 magnetic compasses
•10 plastic protractors
•10 wires
•10+ masking tape
•10 index cards
TIME: 30 minutes.
PROCEDURES:
1. Stick a 1-foot piece of masking tape to a flat table top.
Align the tape as directed by the teacher.
2. Line up the edge of the short wooden board with the
masking tape, and prop the board on a textbook. Align
the mark on the board with the edge of the book. This
board represents a tilted rock layer.
3. Obtain a piece of wire and insert it in the center hole of a
plastic protractor.
4. To measure dip angle, place the wire and protractor on
the tilted board, with the wire parallel to the masking
tape and the 90° mark on the protractor straight down. An
index card, one edge on the table, the upright edge aligned
with the 90° mark and the wire, will assure this. The angle
of the dip is read where the upper edge of the board
intersects the protractor. Record this dip value.
5. The direction of the strike is perpendicular to the dip, in
line with the masking tape. Measure the direction with a
compass. Record the strike direction.
6. Repeat steps 2-5 with other boards, props or masking
tape directions as instructed by the teacher.
ASSESSMENT:
•This exercise is designed to clarify the concepts of strike
and dip, and possibly practice before a field trip. Informal
observational evaluation may be sufficient. If a grade is de-
sired, simply check the student records of dip angle and
strike direction against your predetermined correct answers.
More advanced students should be more accurate.
Teaching suggestions:
•“Grade level” depends on ability. Students should be able
to read a compass and a protractor.
•Assemble the “rock units” beforehand if you want two or
more angles to measure. Wooden wedges are available at
hardware or building supply stores.
•To allow the teacher to check the accuracy of the mea-
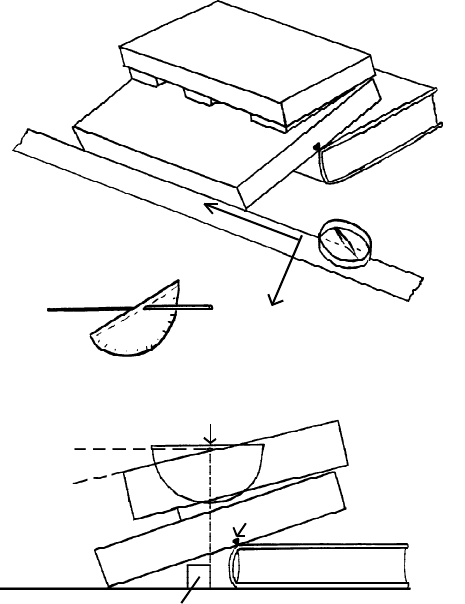
76 RockCamp
surements, have the students orient the masking tape in a
specific direction (same for all, different?), use a specific book
as a prop (their science text!) and align the book with marks
you have put on the boards (see figure).
•The protractor must be held so that the 0-180° line is
parallel to the table and the 90° line is perpendicular (see
figure).
wooden
rock layers
alignment mark
book
masking tape
STRIKE
direction
compass
book
mark
wire
plastic protractor
wire
right
angle
angle
of dip
direction
DIP

Adaptive Earth Science Activities 77
Solar System Travel Company
by Karen Williams
Elkins Middle School
OBJECTIVE:
•Learn about the bodies that make up
our solar system.
•Gain skills in using the tools of the
library.
•Understand how to make a concise,
informative, and interesting presenta-
tion.
Materials and Equipment:
•Video camera/VCR/videotape
•Construction paper
•Glue
•Markers
•Crayons
•Colored pencils
•Scissors
•Pictures, brochures, etc., from
NASA
•Local travel brochures
•Optional: computer for Internet
searches
In this activity I explain to my students that they are now
employees of the SST Co. As such they will have to travel to
their assigned solar body to study it so they can create an
informative yet interesting travel brochure and TV commer-
cial that will entice earthlings into vacationing there.
TIME: Seven to eight 50-minute classes.
PROCEDURES:
1. Assign students to groups of 3 or 4. Have each group
draw the name of their planet/moon from a hat. To cover
8 planets, our moon, the sun, and some of the larger moons
of other planets, they will share the presentations with
each class through the videotaped commercials and bro-
chures.
2. Their exploratory trip will actually involve 2 days of li-
brary research. During this time they may NOT use ency-
clopedias. They should discover basic information and in-
teresting facts about their planet/moon that would be im-
portant to the tourists. Some of these include but are not
limited to:
a. Size
b. Distance from Earth
c. Day/night length
d. Length of year
e. Average temperature (day/night)
f. Atmospheric composition and characteristics
g. Surface composition, characteristics, and geology
h. Number of moons and if they make good side trips
(briefly describe)
i. Any information that makes the body unique or spe-
cial
3. The next 2 days are spent planning their commercial and
creating their brochure. The teacher can provide mate-
rial to help create these. NASA will provide information
if it is requested. Web sites contain many pictures and
much information.
4. For the brochure, fold a large piece of construction paper
into thirds to make a booklet. Samples of travel brochures
78 RockCamp
from the local tourism bureau are helpful to have on hand.
5. Criteria for the commercial are as follows:
a. All students must participate;
b. It must be creative--have them think about what com-
mercials hold their interest;
c. Must last between one and two minutes;
d. Must have visual aids;
e. Must communicate relevant information.
6. On day 5, return to library to videotape the commercials.
While one group is taping, the others are “checking out”
the brochures as a study method and taking notes. The
commercial is 1-2 minutes in length and all group mem-
bers must participate in some way.
7. Show to all classes as a lesson on the solar system. They
should take notes. Show each commercial twice and have
the group answer questions if they are in that class; if not,
the teacher may answer their questions.
8. The students rate each commercial on a scale of 1-5 for
entertainment value. This will be used as part of the grade
for this project.
ASSESSMENT:
Brochure:
Creativity Is it “eye-catching”?
Is it attractive?
Is the material presented in an
interesting way?
Content Is it accurate?
Does it contain an adequate amount?
Is it well organized?
Commercial:
Creativity Student evaluation.
Does it hold your interest?
Is it a unique idea?
Is it well presented?
Content Same as brochure.
