AP 2006 Statistics FRQ 5 Ap06 51653
User Manual: 2006 5
Open the PDF directly: View PDF ![]() .
.
Page Count: 15

AP® Statistics
2006 Free-Response Questions
The College Board: Connecting Students to College Success
The College Board is a not-for-profit membership association whose mission is to connect students to college success and
opportunity. Founded in 1900, the association is composed of more than 5,000 schools, colleges, universities, and other
educational organizations. Each year, the College Board serves seven million students and their parents, 23,000 high schools, and
3,500 colleges through major programs and services in college admissions, guidance, assessment, financial aid, enrollment, and
teaching and learning. Among its best-known programs are the SAT®, the PSAT/NMSQT®, and the Advanced Placement
Program® (AP®). The College Board is committed to the principles of excellence and equity, and that commitment is embodied
in all of its programs, services, activities, and concerns.
© 2006 The College Board. All rights reserved. College Board, AP Central, APCD, Advanced Placement Program, AP, AP
Vertical Teams, Pre-AP, SAT, and the acorn logo are registered trademarks of the College Board. Admitted Class Evaluation
Service, CollegeEd, connect to college success, MyRoad, SAT Professional Development, SAT Readiness Program, and Setting the
Cornerstones are trademarks owned by the College Board. PSAT/NMSQT is a registered trademark of the College Board and
National Merit Scholarship Corporation. All other products and services may be trademarks of their respective owners.
Permission to use copyrighted College Board materials may be requested online at:
www.collegeboard.com/inquiry/cbpermit.html.
Visit the College Board on the Web: www.collegeboard.com.
AP Central is the official online home for the AP Program: apcentral.collegeboard.com.
2006 AP® STATISTICS FREE-RESPONSE QUESTIONS
2
Formulas begin on page 3.
Questions begin on page 6.
Tables begin on page 12.
2006 AP® STATISTICS FREE-RESPONSE QUESTIONS
3
Formulas
(I) Descriptive Statistics
x
x
i
n
=∑
snxix
x=−−
∑
1
1
2
di
s
nsn s
nn
p
=
−+−
−+ −
1
2
12
2
2
12
11
11
didi
didi
yb b
x
=+
01
bxxyy
xx
ii
i
12
=−−
−
∑
∑
didi
di
byb
x
01
=−
rn
xx
s
yy
s
i
x
i
y
=−
−−
F
H
G
I
K
J
∑F
H
G
I
K
J
1
1
br
s
s
y
x
1
=
s
yy
n
xx
b
ii
i
1
2
2
2
=
−
−
−
∑
∑
di
di
2006 AP® STATISTICS FREE-RESPONSE QUESTIONS
4
(II) Probability
P
A
BP
A
PB P
A
B()()()()∪= + − ∩
PAB P
A
B
PB
() ()
()
=∩
E
Xx
x
ipi
()==
∑
µ
Var( )Xxp
i
xix
== −
∑
s
22
µ
di
If X has a binomial distribution with parameters n and p, then:
PX k n
kpkpnk
() ()== − −
F
H
G
I
K
J1
µ
x
np=
s
x
np p=−()1
µ
pp=
s
()
p
pp
n
=−1
If
x
is the mean of a random sample of size n from an infinite
population with mean
µ
and standard deviation
s,
then:
µ
µ
x
=
s
s
xn
=
2006 AP® STATISTICS FREE-RESPONSE QUESTIONS
5
(III) Inferential Statistics
Standardized test statistic: statistic parameter
standard deviation of statistic
-
Confidence interval: statistic critical value standard deviation of statistic±()( )
∑
Single-Sample
Statistic Standard Deviation
of Statistic
Sample Mean
σ
n
Sample Proportion
pp
n
()1−
Two-Sample
Statistic Standard Deviation
of Statistic
Difference of
sample means
σσ
1
2
1
2
2
2
nn
+
Special case when
σ
σ
12
=
σ
11
12
nn
+
Difference of
sample proportions
pp
n
pp
n
11
1
22
2
11()( )
−+−
Special case when
pp
12
=
pp1−
bg
11
12
nn
+
Chi-square test statistic observed expected
expected
=−
∑af
2

2006 AP® STATISTICS FREE-RESPONSE QUESTIONS
© 2006 The College Board. All rights reserved.
Visit apcentral.collegeboard.com (for AP professionals) and www.collegeboard.com/apstudents (for students and parents).
GO ON TO THE NEXT PAGE.
6
STATISTICS
SECTION II
Part A
Questions 1-5
Spend about 65 minutes on this part of the exam.
Percent of Section II grade—75
Directions: Show all your work. Indicate clearly the methods you use, because you will be graded on the
correctness of your methods as well as on the accuracy and completeness of your results and explanations.
1. Two parents have each built a toy catapult for use in a game at an elementary school fair. To play the game,
students will attempt to launch Ping-Pong balls from the catapults so that the balls land within a 5-centimeter
band. A target line will be drawn through the middle of the band, as shown in the figure below. All points on the
target line are equidistant from the launching location.
If a ball lands within the shaded band, the student will win a prize.
The parents have constructed the two catapults according to slightly different plans. They want to test these
catapults before building additional ones. Under identical conditions, the parents launch 40 Ping-Pong balls from
each catapult and measure the distance that the ball travels before landing. Distances to the nearest centimeter
are graphed in the dotplots below.
(a) Comment on any similarities and any differences in the two distributions of distances traveled by balls
launched from catapult A and catapult B.
(b) If the parents want to maximize the probability of having the Ping-Pong balls land within the band, which
one of the two catapults, A or B, would be better to use than the other? Justify your choice.
(c) Using the catapult that you chose in part (b), how many centimeters from the target line should this catapult
be placed? Explain why you chose this distance.
2006 AP® STATISTICS FREE-RESPONSE QUESTIONS
© 2006 The College Board. All rights reserved.
Visit apcentral.collegeboard.com (for AP professionals) and www.collegeboard.com/apstudents (for students and parents).
GO ON TO THE NEXT PAGE.
7
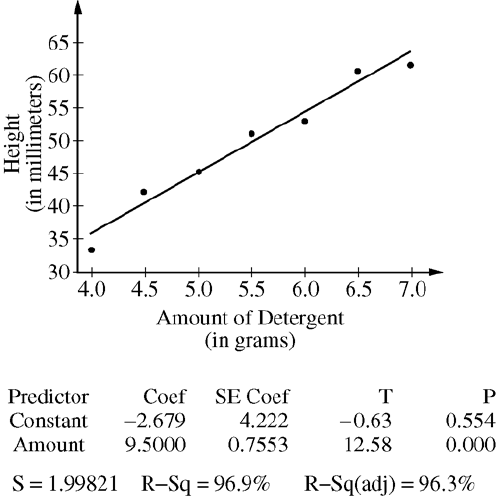
2. A manufacturer of dish detergent believes the height of soapsuds in the dishpan depends on the amount of
detergent used. A study of the suds’ heights for a new dish detergent was conducted. Seven pans of water were
prepared. All pans were of the same size and type and contained the same amount of water. The temperature of
the water was the same for each pan. An amount of dish detergent was assigned at random to each pan, and that
amount of detergent was added to the pan. Then the water in the dishpan was agitated for a set amount of time,
and the height of the resulting suds was measured.
A plot of the data and the computer output from fitting a least squares regression line to the data are shown
below.
(a) Write the equation of the fitted regression line. Define any variables used in this equation.
(b) Note that
1.99821s=
in the computer output. Interpret this value in the context of this study.
(c) Identify and interpret the standard error of the slope.

2006 AP® STATISTICS FREE-RESPONSE QUESTIONS
© 2006 The College Board. All rights reserved.
Visit apcentral.collegeboard.com (for AP professionals) and www.collegeboard.com/apstudents (for students and parents).
GO ON TO THE NEXT PAGE.
8
3. The depth from the surface of Earth to a refracting layer beneath the surface can be estimated using methods
developed by seismologists. One method is based on the time required for vibrations to travel from a distant
explosion to a receiving point. The depth measurement (M) is the sum of the true depth (D) and the random
measurement error (E). That is,
.
M
DE=+
The measurement error (E) is assumed to be normally distributed
with mean 0 feet and standard deviation 1.5 feet.
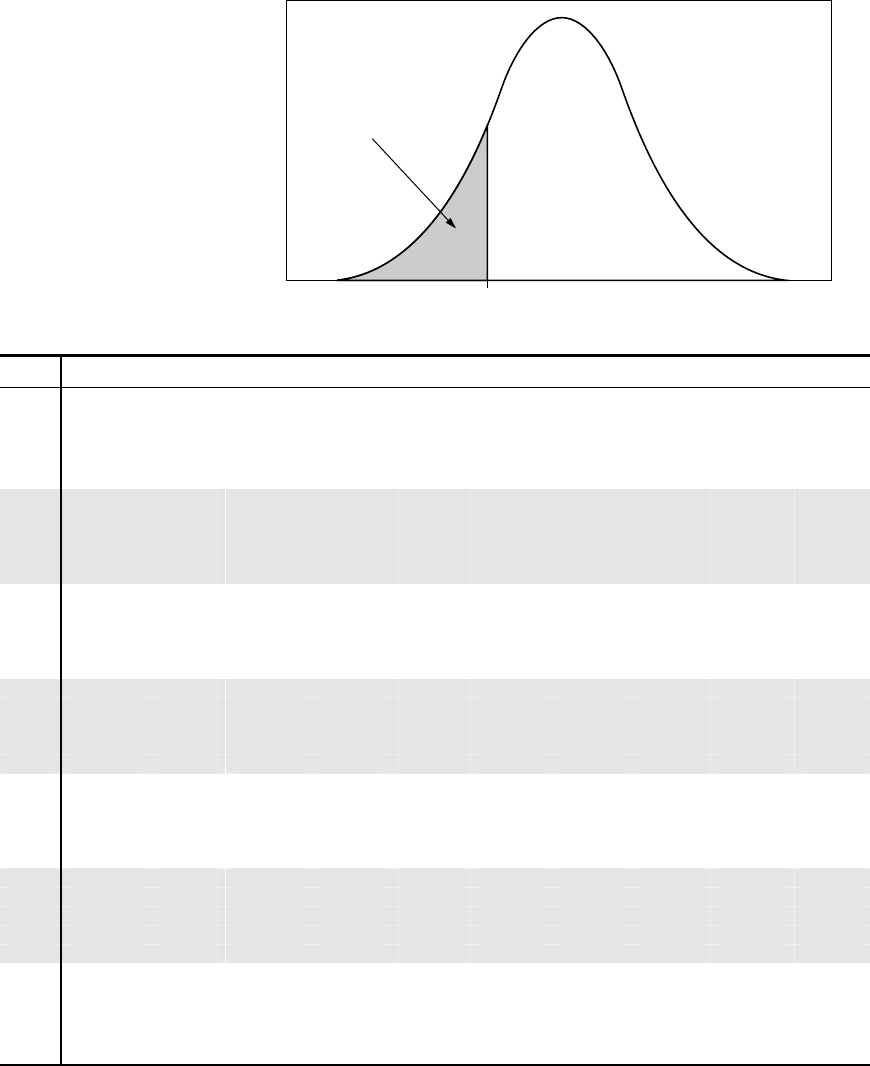
(a) If the true depth at a certain point is 2 feet, what is the probability that the depth measurement will be
negative?
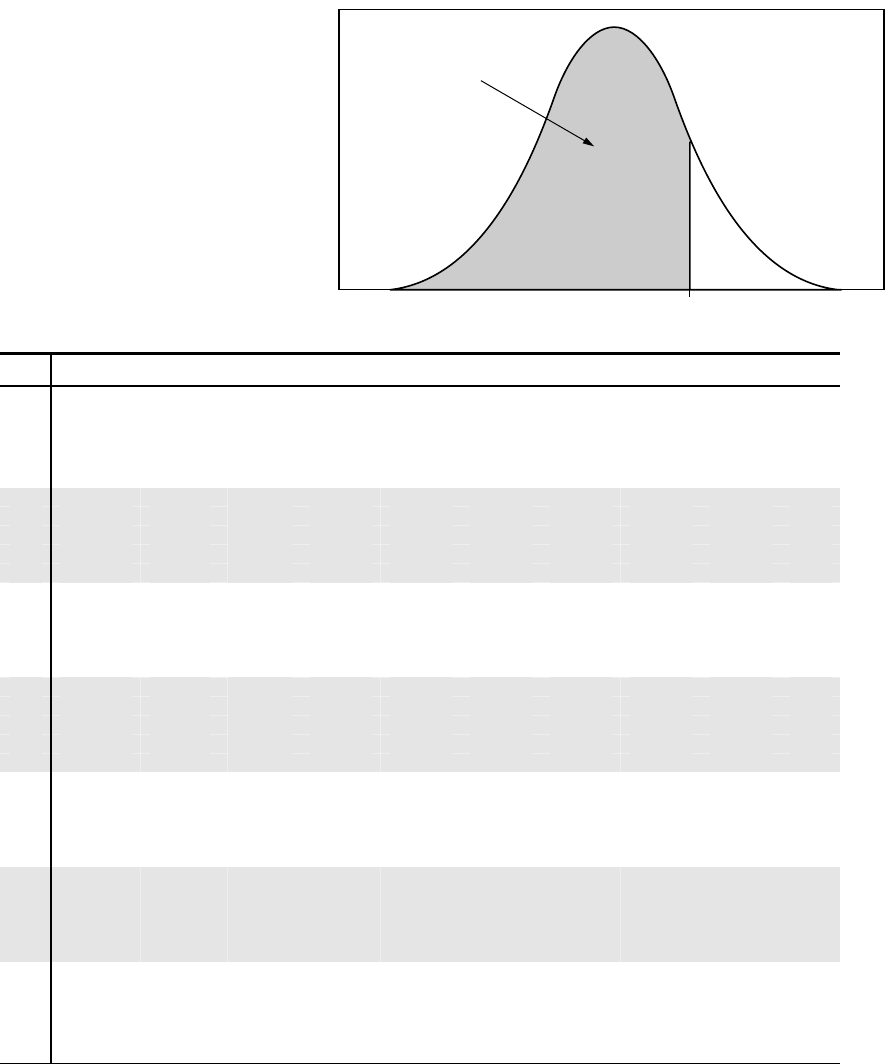
(b) Suppose three independent depth measurements are taken at the point where the true depth is 2 feet. What is
the probability that at least one of these measurements will be negative?
(c) What is the probability that the mean of the three independent depth measurements taken at the point where
the true depth is 2 feet will be negative?
4. Patients with heart-attack symptoms arrive at an emergency room either by ambulance or self-transportation
provided by themselves, family, or friends. When a patient arrives at the emergency room, the time of arrival is
recorded. The time when the patient’s diagnostic treatment begins is also recorded.
An administrator of a large hospital wanted to determine whether the mean wait time (time between arrival and
diagnostic treatment) for patients with heart-attack symptoms differs according to the mode of transportation.
A random sample of 150 patients with heart-attack symptoms who had reported to the emergency room was
selected. For each patient, the mode of transportation and wait time were recorded. Summary statistics for each
mode of transportation are shown in the table below.
Mode of
Transportation Sample Size Mean Wait Time
(in minutes)
Standard Deviation
of Wait Times
(in minutes)
Ambulance 77 6.04 4.30
Self 73 8.30 5.16
(a) Use a 99 percent confidence interval to estimate the difference between the mean wait times for ambulance-
transported patients and self-transported patients at this emergency room.
(b) Based only on this confidence interval, do you think the difference in the mean wait times is statistically
significant? Justify your answer.

2006 AP® STATISTICS FREE-RESPONSE QUESTIONS
© 2006 The College Board. All rights reserved.
Visit apcentral.collegeboard.com (for AP professionals) and www.collegeboard.com/apstudents (for students and parents).
GO ON TO THE NEXT PAGE.
9
5. A biologist is interested in studying the effect of growth-enhancing nutrients and different salinity (salt) levels in
water on the growth of shrimps. The biologist has ordered a large shipment of young tiger shrimps from a supply
house for use in the study. The experiment is to be conducted in a laboratory where 10 tiger shrimps are placed
randomly into each of 12 similar tanks in a controlled environment. The biologist is planning to use 3 different
growth-enhancing nutrients (A, B, and C) and two different salinity levels (low and high).
(a) List the treatments that the biologist plans to use in this experiment.
(b) Using the treatments listed in part (a), describe a completely randomized design that will allow the biologist
to compare the shrimps’ growth after 3 weeks.
(c) Give one statistical advantage to having only tiger shrimps in the experiment. Explain why this is an
advantage.
(d) Give one statistical disadvantage to having only tiger shrimps in the experiment. Explain why this is a
disadvantage.
2006 AP® STATISTICS FREE-RESPONSE QUESTIONS
© 2006 The College Board. All rights reserved.
Visit apcentral.collegeboard.com (for AP professionals) and www.collegeboard.com/apstudents (for students and parents).
GO ON TO THE NEXT PAGE.
10
STATISTICS
SECTION II
Part B
Question 6
Spend about 25 minutes on this part of the exam.
Percent of Section II grade—25
Directions: Show all your work. Indicate clearly the methods you use, because you will be graded on the
correctness of your methods as well as on the accuracy and completeness of your results and explanations.
6. A manufacturer of thermostats is concerned that the readings of its thermostats have become less reliable (more
variable). In the past, the variance has been 1.52 degrees Fahrenheit (F) squared. A random sample of 10
recently manufactured thermostats was selected and placed in a room that was maintained at 68°F. The readings
for those 10 thermostats are given in the table below.
Thermostat 1 2 3 4 5 6 7 8 9 10
Temperature (°F) 66.8 67.8 70.6 69.3 65.9 66.2 68.1 68.6 67.9 67.2
(a) State the null and alternative hypotheses that the manufacturer is interested in testing.
It can be shown that if the population of thermostat temperatures is normally distributed, the sampling
distribution of
()
2
2
1
ns
s
-
follows a chi-square distribution with
1n-
degrees of freedom.
(b) Calculate the value of
()
2
1
1.52
ns-
for these data.
(c) Assume that the population of thermostat temperatures follows a normal distribution. Use the test statistic
()
2
1
1.52
ns-
from part (b) and the chi-square distribution to test the hypotheses in part (a).
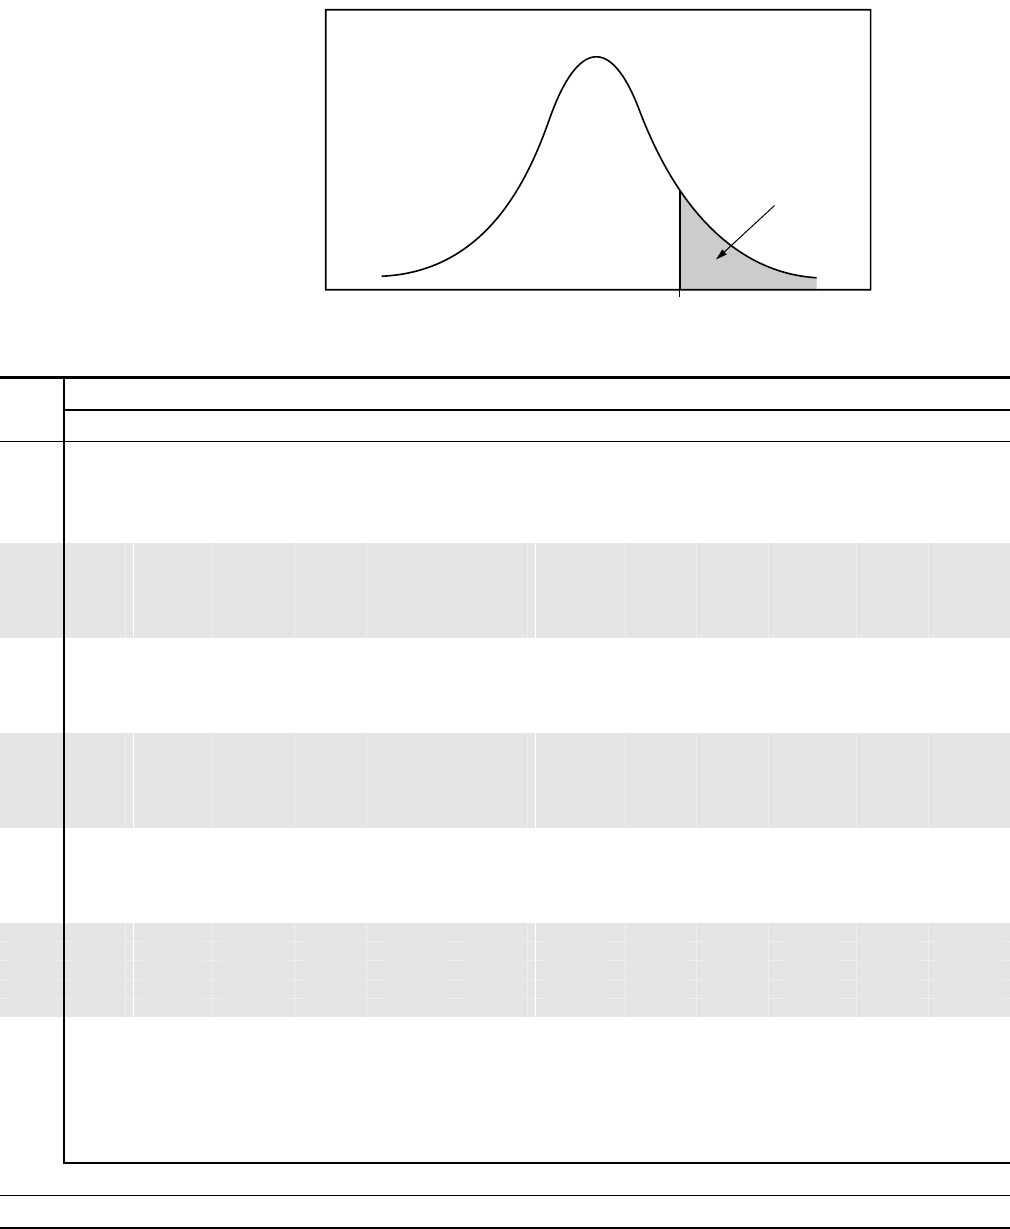
(d) For the test conducted in part (c), what is the smallest value of the test statistic that would have led to the
rejection of the null hypothesis at the 5 percent significance level?
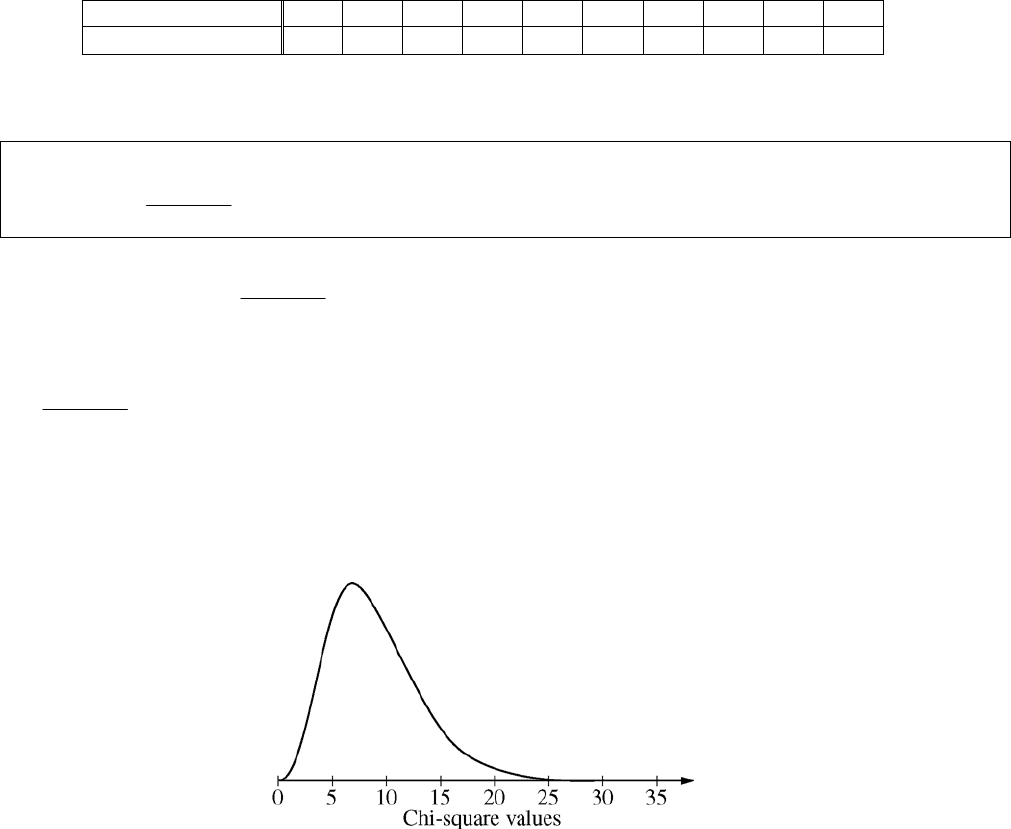
Mark this value of the test statistic on the graph of the chi-square distribution below. Indicate the region that
contains all of the values that would have led to the rejection of the null hypothesis.
2006 AP® STATISTICS FREE-RESPONSE QUESTIONS
© 2006 The College Board. All rights reserved.
Visit apcentral.collegeboard.com (for AP professionals) and www.collegeboard.com/apstudents (for students and parents).
11
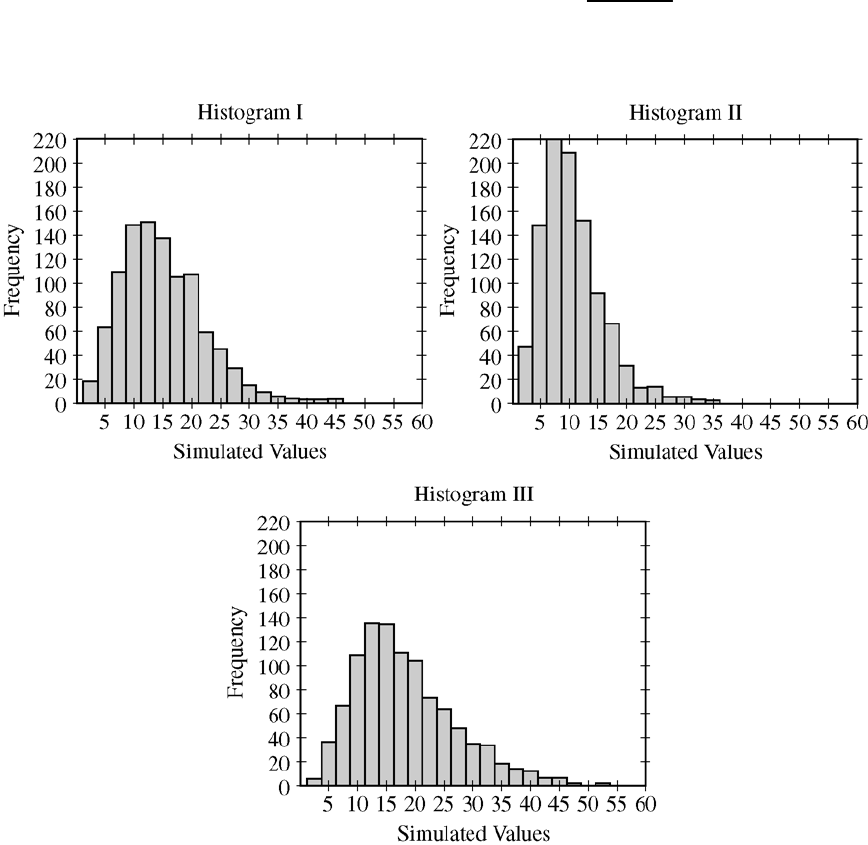
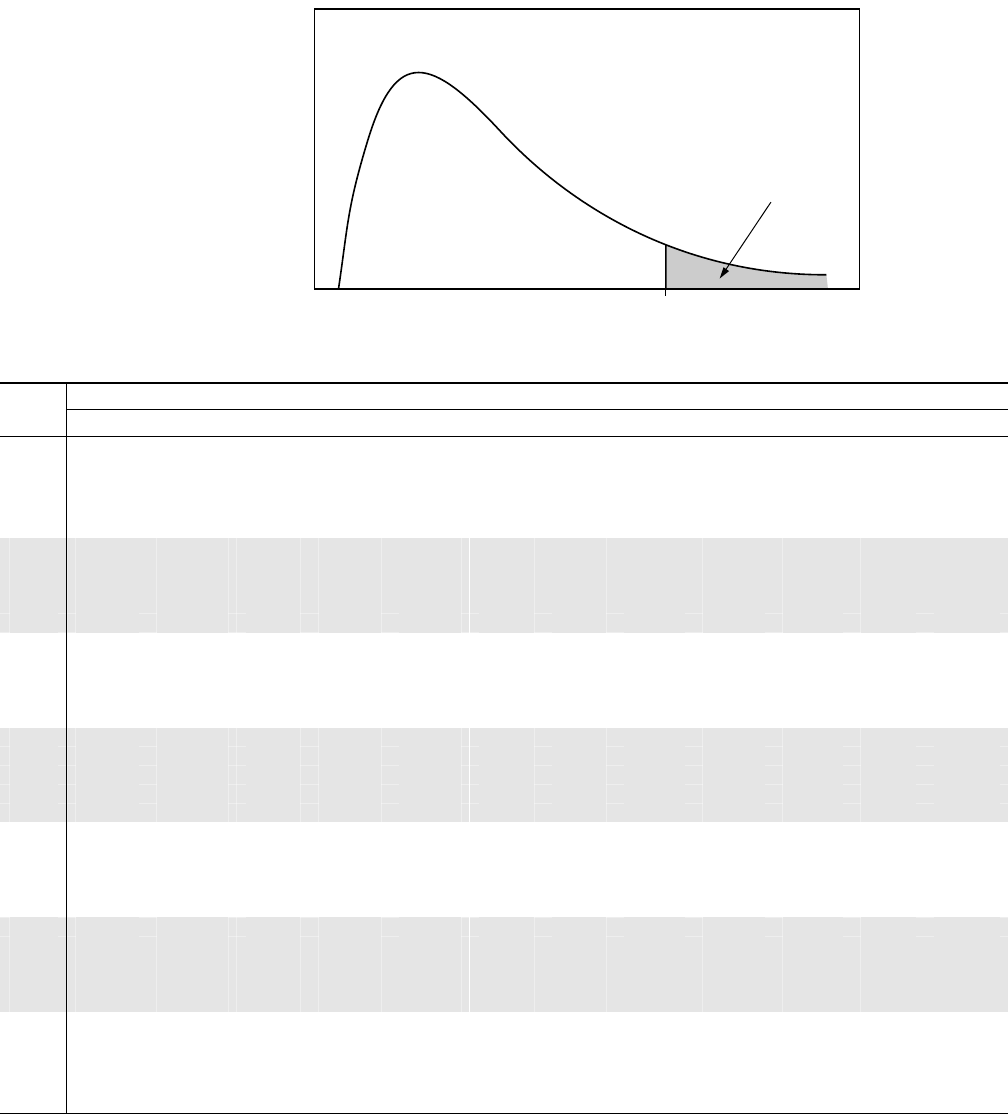
(e) Using simulation, 1,000 samples, each of size 10, were randomly generated from 3 populations with
different variances. Each population was normally distributed with mean 68 and variance greater than 1.52.
The histograms below show the simulated sampling distribution of
()
2
1
1.52
ns-
for each population.
Mark the region identified in part (d) on each of the histograms below.
(f) Based on the regions that you marked in part (e), identify the simulated sampling distribution that
corresponds to the population with the largest variance. Then identify the simulated sampling distribution
that corresponds to the population with the smallest variance. Justify your choices.
STOP
END OF EXAM
2006 AP® STATISTICS FREE-RESPONSE QUESTIONS
12
Probability
z
Table A Standard normal probabilities
z .00 .01 .02 .03 .04 .05 .06 .07 .08 .09
– 3.4 .0003 .0003 .0003 .0003 .0003 .0003 .0003 .0003 .0003 .0002
– 3.3 .0005 .0005 .0005 .0004 .0004 .0004 .0004 .0004 .0004 .0003
– 3.2 .0007 .0007 .0006 .0006 .0006 .0006 .0006 .0005 .0005 .0005
– 3.1 .0010 .0009 .0009 .0009 .0008 .0008 .0008 .0008 .0007 .0007
– 3.0 .0013 .0013 .0013 .0012 .0012 .0011 .0011 .0011 .0010 .0010
–2.9 .0019 .0018 .0018 .0017 .0016 .0016 .0015 .0015 .0014 .0014
–2.8 .0026 .0025 .0024 .0023 .0023 .0022 .0021 .0021 .0020 .0019
–2.7 .0035 .0034 .0033 .0032 .0031 .0030 .0029 .0028 .0027 .0026
–2.6 .0047 .0045 .0044 .0043 .0041 .0040 .0039 .0038 .0037 .0036
–2.5 .0062 .0060 .0059 .0057 .0055 .0054 .0052 .0051 .0049 .0048
– 2.4 .0082 .0080 .0078 .0075 .0073 .0071 .0069 .0068 .0066 .0064
– 2.3 .0107 .0104 .0102 .0099 .0096 .0094 .0091 .0089 .0087 .0084
– 2.2 .0139 .0136 .0132 .0129 .0125 .0122 .0119 .0116 .0113 .0110
– 2.1 .0179 .0174 .0170 .0166 .0162 .0158 .0154 .0150 .0146 .0143
– 2.0 .0228 .0222 .0217 .0212 .0207 .0202 .0197 .0192 .0188 .0183
–1.9 .0287 .0281 .0274 .0268 .0262 .0256 .0250 .0244 .0239 .0233
–1.8 .0359 .0351 .0344 .0336 .0329 .0322 .0314 .0307 .0301 .0294
–1.7 .0446 .0436 .0427 .0418 .0409 .0401 .0392 .0384 .0375 .0367
–1.6 .0548 .0537 .0526 .0516 .0505 .0495 .0485 .0475 .0465 .0455
–1.5 .0668 .0655 .0643 .0630 .0618 .0606 .0594 .0582 .0571 .0559
– 1.4 .0808 .0793 .0778 .0764 .0749 .0735 .0721 .0708 .0694 .0681
– 1.3 .0968 .0951 .0934 .0918 .0901 .0885 .0869 .0853 .0838 .0823
– 1.2 .1151 .1131 .1112 .1093 .1075 .1056 .1038 .1020 .1003 .0985
– 1.1 .1357 .1335 .1314 .1292 .1271 .1251 .1230 .1210 .1190 .1170
– 1.0 .1587 .1562 .1539 .1515 .1492 .1469 .1446 .1423 .1401 .1379
–0.9 .1841 .1814 .1788 .1762 .1736 .1711 .1685 .1660 .1635 .1611
–0.8 .2119 .2090 .2061 .2033 .2005 .1977 .1949 .1922 .1894 .1867
–0.7 .2420 .2389 .2358 .2327 .2296 .2266 .2236 .2206 .2177 .2148
–0.6 .2743 .2709 .2676 .2643 .2611 .2578 .2546 .2514 .2483 .2451
–0.5 .3085 .3050 .3015 .2981 .2946 .2912 .2877 .2843 .2810 .2776
– 0.4 .3446 .3409 .3372 .3336 .3300 .3264 .3228 .3192 .3156 .3121
– 0.3 .3821 .3783 .3745 .3707 .3669 .3632 .3594 .3557 .3520 .3483
– 0.2 .4207 .4168 .4129 .4090 .4052 .4013 .3974 .3936 .3897 .3859
– 0.1 .4602 .4562 .4522 .4483 .4443 .4404 .4364 .4325 .4286 .4247
– 0.0 .5000 .4960 .4920 .4880 .4840 .4801 .4761 .4721 .4681 .4641
Table entry for z is the
probability lying below z.
2006 AP® STATISTICS FREE-RESPONSE QUESTIONS
13
Probability
z
Table A (Continued)
z .00 .01 .02 .03 .04 .05 .06 .07 .08 .09
0.0 .5000 .5040 .5080 .5120 .5160 .5199 .5239 .5279 .5319 .5359
0.1 .5398 .5438 .5478 .5517 .5557 .5596 .5636 .5675 .5714 .5753
0.2 .5793 .5832 .5871 .5910 .5948 .5987 .6026 .6064 .6103 .6141
0.3 .6179 .6217 .6255 .6293 .6331 .6368 .6406 .6443 .6480 .6517
0.4 .6554 .6591 .6628 .6664 .6700 .6736 .6772 .6808 .6844 .6879
0.5 .6915 .6950 .6985 .7019 .7054 .7088 .7123 .7157 .7190 .7224
0.6 .7257 .7291 .7324 .7357 .7389 .7422 .7454 .7486 .7517 .7549
0.7 .7580 .7611 .7642 .7673 .7704 .7734 .7764 .7794 .7823 .7852
0.8 .7881 .7910 .7939 .7967 .7995 .8023 .8051 .8078 .8106 .8133
0.9 .8159 .8186 .8212 .8238 .8264 .8289 .8315 .8340 .8365 .8389
1.0 .8413 .8438 .8461 .8485 .8508 .8531 .8554 .8577 .8599 .8621
1.1 .8643 .8665 .8686 .8708 .8729 .8749 .8770 .8790 .8810 .8830
1.2 .8849 .8869 .8888 .8907 .8925 .8944 .8962 .8980 .8997 .9015
1.3 .9032 .9049 .9066 .9082 .9099 .9115 .9131 .9147 .9162 .9177
1.4 .9192 .9207 .9222 .9236 .9251 .9265 .9279 .9292 .9306 .9319
1.5 .9332 .9345 .9357 .9370 .9382 .9394 .9406 .9418 .9429 .9441
1.6 .9452 .9463 .9474 .9484 .9495 .9505 .9515 .9525 .9535 .9545
1.7 .9554 .9564 .9573 .9582 .9591 .9599 .9608 .9616 .9625 .9633
1.8 .9641 .9649 .9656 .9664 .9671 .9678 .9686 .9693 .9699 .9706
1.9 .9713 .9719 .9726 .9732 .9738 .9744 .9750 .9756 .9761 .9767
2.0 .9772 .9778 .9783 .9788 .9793 .9798 .9803 .9808 .9812 .9817
2.1 .9821 .9826 .9830 .9834 .9838 .9842 .9846 .9850 .9854 .9857
2.2 .9861 .9864 .9868 .9871 .9875 .9878 .9881 .9884 .9887 .9890
2.3 .9893 .9896 .9898 .9901 .9904 .9906 .9909 .9911 .9913 .9916
2.4 .9918 .9920 .9922 .9925 .9927 .9929 .9931 .9932 .9934 .9936
2.5 .9938 .9940 .9941 .9943 .9945 .9946 .9948 .9949 .9951 .9952
2.6 .9953 .9955 .9956 .9957 .9959 .9960 .9961 .9962 .9963 .9964
2.7 .9965 .9966 .9967 .9968 .9969 .9970 .9971 .9972 .9973 .9974
2.8 .9974 .9975 .9976 .9977 .9977 .9978 .9979 .9979 .9980 .9981
2.9 .9981 .9982 .9982 .9983 .9984 .9984 .9985 .9985 .9986 .9986
3.0 .9987 .9987 .9987 .9988 .9988 .9989 .9989 .9989 .9990 .9990
3.1 .9990 .9991 .9991 .9991 .9992 .9992 .9992 .9992 .9993 .9993
3.2 .9993 .9993 .9994 .9994 .9994 .9994 .9994 .9995 .9995 .9995
3.3 .9995 .9995 .9995 .9996 .9996 .9996 .9996 .9996 .9996 .9997
3.4 .9997 .9997 .9997 .9997 .9997 .9997 .9997 .9997 .9997 .9998
Table entry for z is the
probability lying below z.
2006 AP® STATISTICS FREE-RESPONSE QUESTIONS
14
Probability p
t*
Table B t distribution critical values
Tail probability p
df
.25 .20 .15 .10 .05 .025 .02 .01 .005 .0025 .001 .0005
1 1.000 1.376 1.963 3.078 6.314 12.71 15.89 31.82 63.66 127.3 318.3 636.6
2 .816 1.061 1.386 1.886 2.920 4.303 4.849 6.965 9.925 14.09 22.33 31.60
3 .765 .978 1.250 1.638 2.353 3.182 3.482 4.541 5.841 7.453 10.21 12.92
4 .741 .941 1.190 1.533 2.132 2.776 2.999 3.747 4.604 5.598 7.173 8.610
5 .727 .920 1.156 1.476 2.015 2.571 2.757 3.365 4.032 4.773 5.893 6.869
6 .718 .906 1.134 1.440 1.943 2.447 2.612 3.143 3.707 4.317 5.208 5.959
7 .711 .896 1.119 1.415 1.895 2.365 2.517 2.998 3.499 4.029 4.785 5.408
8 .706 .889 1.108 1.397 1.860 2.306 2.449 2.896 3.355 3.833 4.501 5.041
9 .703 .883 1.100 1.383 1.833 2.262 2.398 2.821 3.250 3.690 4.297 4.781
10 .700 .879 1.093 1.372 1.812 2.228 2.359 2.764 3.169 3.581 4.144 4.587
11 .697 .876 1.088 1.363 1.796 2.201 2.328 2.718 3.106 3.497 4.025 4.437
12 .695 .873 1.083 1.356 1.782 2.179 2.303 2.681 3.055 3.428 3.930 4.318
13 .694 .870 1.079 1.350 1.771 2.160 2.282 2.650 3.012 3.372 3.852 4.221
14 .692 .868 1.076 1.345 1.761 2.145 2.264 2.624 2.977 3.326 3.787 4.140
15 .691 .866 1.074 1.341 1.753 2.131 2.249 2.602 2.947 3.286 3.733 4.073
16 .690 .865 1.071 1.337 1.746 2.120 2.235 2.583 2.921 3.252 3.686 4.015
17 .689 .863 1.069 1.333 1.740 2.110 2.224 2.567 2.898 3.222 3.646 3.965
18 .688 .862 1.067 1.330 1.734 2.101 2.214 2.552 2.878 3.197 3.611 3.922
19 .688 .861 1.066 1.328 1.729 2.093 2.205 2.539 2.861 3.174 3.579 3.883
20 .687 .860 1.064 1.325 1.725 2.086 2.197 2.528 2.845 3.153 3.552 3.850
21 .686 .859 1.063 1.323 1.721 2.080 2.189 2.518 2.831 3.135 3.527 3.819
22 .686 .858 1.061 1.321 1.717 2.074 2.183 2.508 2.819 3.119 3.505 3.792
23 .685 .858 1.060 1.319 1.714 2.069 2.177 2.500 2.807 3.104 3.485 3.768
24 .685 .857 1.059 1.318 1.711 2.064 2.172 2.492 2.797 3.091 3.467 3.745
25 .684 .856 1.058 1.316 1.708 2.060 2.167 2.485 2.787 3.078 3.450 3.725
26 .684 .856 1.058 1.315 1.706 2.056 2.162 2.479 2.779 3.067 3.435 3.707
27 .684 .855 1.057 1.314 1.703 2.052 2.158 2.473 2.771 3.057 3.421 3.690
28 .683 .855 1.056 1.313 1.701 2.048 2.154 2.467 2.763 3.047 3.408 3.674
29 .683 .854 1.055 1.311 1.699 2.045 2.150 2.462 2.756 3.038 3.396 3.659
30 .683 .854 1.055 1.310 1.697 2.042 2.147 2.457 2.750 3.030 3.385 3.646
40 .681 .851 1.050 1.303 1.684 2.021 2.123 2.423 2.704 2.971 3.307 3.551
50 .679 .849 1.047 1.299 1.676 2.009 2.109 2.403 2.678 2.937 3.261 3.496
60 .679 .848 1.045 1.296 1.671 2.000 2.099 2.390 2.660 2.915 3.232 3.460
80 .678 .846 1.043 1.292 1.664 1.990 2.088 2.374 2.639 2.887 3.195 3.416
100 .677 .845 1.042 1.290 1.660 1.984 2.081 2.364 2.626 2.871 3.174 3.390
1000 .675 .842 1.037 1.282 1.646 1.962 2.056 2.330 2.581 2.813 3.098 3.300
⬁ .674 .841 1.036 1.282 1.645 1.960 2.054 2.326 2.576 2.807 3.091 3.291
50% 60% 70% 80% 90% 95% 96% 98% 99% 99.5% 99.8% 99.9%
Confidence level C
Table entry for p and
C is the point t* with
probability p lying
above it and
probability C lying
between
−
t
* and t*.
2006 AP® STATISTICS FREE-RESPONSE QUESTIONS
15
Probability p
(χ
2
)
Table C
χ
2
critical values
Tail probability p
df .25 .20 .15 .10 .05 .025 .02 .01 .005 .0025 .001 .0005
1 1.32 1.64 2.07 2.71 3.84 5.02 5.41 6.63 7.88 9.14 10.83 12.12
2 2.77 3.22 3.79 4.61 5.99 7.38 7.82 9.21 10.60 11.98 13.82 15.20
3 4.11 4.64 5.32 6.25 7.81 9.35 9.84 11.34 12.84 14.32 16.27 17.73
4 5.39 5.99 6.74 7.78 9.49 11.14 11.67 13.28 14.86 16.42 18.47 20.00
5 6.63 7.29 8.12 9.24 11.07 12.83 13.39 15.09 16.75 18.39 20.51 22.11
6 7.84 8.56 9.45 10.64 12.59 14.45 15.03 16.81 18.55 20.25 22.46 24.10
7 9.04 9.80 10.75 12.02 14.07 16.01 16.62 18.48 20.28 22.04 24.32 26.02
8 10.22 11.03 12.03 13.36 15.51 17.53 18.17 20.09 21.95 23.77 26.12 27.87
9 11.39 12.24 13.29 14.68 16.92 19.02 19.68 21.67 23.59 25.46 27.88 29.67
10 12.55 13.44 14.53 15.99 18.31 20.48 21.16 23.21 25.19 27.11 29.59 31.42
11 13.70 14.63 15.77 17.28 19.68 21.92 22.62 24.72 26.76 28.73 31.26 33.14
12 14.85 15.81 16.99 18.55 21.03 23.34 24.05 26.22 28.30 30.32 32.91 34.82
13 15.98 16.98 18.20 19.81 22.36 24.74 25.47 27.69 29.82 31.88 34.53 36.48
14 17.12 18.15 19.41 21.06 23.68 26.12 26.87 29.14 31.32 33.43 36.12 38.11
15 18.25 19.31 20.60 22.31 25.00 27.49 28.26 30.58 32.80 34.95 37.70 39.72
16 19.37 20.47 21.79 23.54 26.30 28.85 29.63 32.00 34.27 36.46 39.25 41.31
17 20.49 21.61 22.98 24.77 27.59 30.19 31.00 33.41 35.72 37.95 40.79 42.88
18 21.60 22.76 24.16 25.99 28.87 31.53 32.35 34.81 37.16 39.42 42.31 44.43
19 22.72 23.90 25.33 27.20 30.14 32.85 33.69 36.19 38.58 40.88 43.82 45.97
20 23.83 25.04 26.50 28.41 31.41 34.17 35.02 37.57 40.00 42.34 45.31 47.50
21 24.93 26.17 27.66 29.62 32.67 35.48 36.34 38.93 41.40 43.78 46.80 49.01
22 26.04 27.30 28.82 30.81 33.92 36.78 37.66 40.29 42.80 45.20 48.27 50.51
23 27.14 28.43 29.98 32.01 35.17 38.08 38.97 41.64 44.18 46.62 49.73 52.00
24 28.24 29.55 31.13 33.20 36.42 39.36 40.27 42.98 45.56 48.03 51.18 53.48
25 29.34 30.68 32.28 34.38 37.65 40.65 41.57 44.31 46.93 49.44 52.62 54.95
26 30.43 31.79 33.43 35.56 38.89 41.92 42.86 45.64 48.29 50.83 54.05 56.41
27 31.53 32.91 34.57 36.74 40.11 43.19 44.14 46.96 49.64 52.22 55.48 57.86
28 32.62 34.03 35.71 37.92 41.34 44.46 45.42 48.28 50.99 53.59 56.89 59.30
29 33.71 35.14 36.85 39.09 42.56 45.72 46.69 49.59 52.34 54.97 58.30 60.73
30 34.80 36.25 37.99 40.26 43.77 46.98 47.96 50.89 53.67 56.33 59.70 62.16
40 45.62 47.27 49.24 51.81 55.76 59.34 60.44 63.69 66.77 69.70 73.40 76.09
50 56.33 58.16 60.35 63.17 67.50 71.42 72.61 76.15 79.49 82.66 86.66 89.56
60 66.98 68.97 71.34 74.40 79.08 83.30 84.58 88.38 91.95 95.34 99.61 102.7
80 88.13 90.41 93.11 96.58 101.9 106.6 108.1 112.3 116.3 120.1 124.8 128.3
100 109.1 111.7 114.7 118.5 124.3 129.6 131.1 135.8 140.2 144.3 149.4 153.2
Table entry for p is the point
()
χ
2
with probability p lying
above it.
