41044_BZ_AR_2012 PRO30 4 GAS AR 2012
User Manual: PRO30 4 GAS AR
Open the PDF directly: View PDF ![]() .
.
Page Count: 104 [warning: Documents this large are best viewed by clicking the View PDF Link!]

SOLUTIONSBUSINESS
ANNUAL REPORT 2012

WE ARE BUNZL

WE ARE A FOCUSED AND SUCCESSFUL
INTERNATIONAL DISTRIBUTION AND
OUTSOURCING GROUP WITH
OPERATIONS ACROSS THE AMERICAS,
EUROPE AND AUSTRALASIA.
WE SUPPORT OUR CUSTOMERS ALL OVER THE
WORLD WITH A VARIETY OF PRODUCTS THAT ARE
ESSENTIAL FOR THE SUCCESSFUL OPERATION OF
THEIR BUSINESSES.
BY OUTSOURCING THE PURCHASING, CONSOLIDATION
AND DELIVERY OF A BROAD RANGE OF EVERYDAY
ITEMS, OUR CUSTOMERS ARE ABLE TO FOCUS ON
THEIR CORE BUSINESSES, ACHIEVE PURCHASING
EFFICIENCIES AND SAVINGS, FREE UP WORKING
CAPITAL, IMPROVE DISTRIBUTION CAPABILITIES AND
SIMPLIFY THEIR INTERNAL ADMINISTRATION.
Growth
2012 2011
Actual
exchange
rates
Constant
exchange
rates
Revenue £m 5,359.2 5,109.5 5% 6%
Operating profit £m 293.8 279.3 5% 7%
Operating profit* £m 352.4 335.7 5% 7%
Profit before tax £m 269.3 193.7 39% 42%
Profit before tax† £m 323.9 306.1 6% 8%
Basic earnings per share p 59.9 38.2 57% 61%
Adjusted earnings per share† p 71.8 68.5 5% 7%
Dividend per share p 28.2 26.35 7%
*Before intangible amortisation and acquisition related costs
† Before intangible amortisation, acquisition related costs and disposal of business
CONTENTS
Business review
01 Financial highlights
02 Business model
03 Strategy
04 Group at a glance
06 Key performance indicators
08 Chairman’s statement
10 Chief Executive’s review
22 Financial review
25 Principal risks and
uncertainties
27 Corporate responsibility
Governance
32 Board of directors
33 Corporate governance report
38 Directors’ remuneration report
51 Other statutory information
Financial statements
54 Consolidated income
statement
55 Consolidated statement of
comprehensive income
56 Consolidated balance sheet
57 Consolidated statement of
changes in equity
58 Consolidated cash flow
statement
59 Notes
89 Company balance sheet
90 Notes to the Company
financial statements
97 Statement of directors’
responsibilities
98 Independent auditor’s report
99 Five year review
100 Shareholder information
WHO WE ARE
The Annual Report can be
downloaded online. To find out
more visit www.bunzl.com.
FINANCIAL HIGHLIGHTS
+6%
Revenue at constant
exchange rates
+7%
Operating profit* at constant
exchange rates
+7%
Adjusted earnings per share†
at constant exchange rates
+7%
Dividend per share
BUNZL PLC ANNUAL REPORT 2012 01

WE SOURCE
WE DELIVER
WE SOURCE AND PROCURE BRANDED, OWN BRAND AND UNBRANDED
PRODUCTS GLOBALLY, WORKING WITH BOTH MULTINATIONAL AND LOCAL
SUPPLIERS, TO ENSURE THAT OUR CUSTOMERS HAVE ACCESS TO THE BEST
AND MOST SUITABLE PRODUCTS TO MEET THEIR NEEDS.
BY APPLYING OUR RESOURCES AND CONSOLIDATING A BROAD RANGE OF
PRODUCTS INTO OUR EXTENSIVE WAREHOUSING INFRASTRUCTURE, WE
ARE ABLE TO OFFER OUR CUSTOMERS A ONE-STOP-SHOP SOLUTION WHICH
REDUCES OR ELIMINATES MANY OF THE HIDDEN COSTS OF SELF-DISTRIBUTION.
WE OFFER SEVERAL DELIVERY OPTIONS, INCLUDING DIRECT STORE DELIVERY,
CROSS DOCK AND WAREHOUSE REPLENISHMENT PROGRAMMES, ON A LOCAL,
REGIONAL AND NATIONAL BASIS, TO ENSURE THAT OUR CUSTOMERS GET
THEIR PRODUCTS WHEN AND WHERE THEY ARE NEEDED.
BUSINESS MODEL
WE CONSOLIDATE
02 BUNZL PLC ANNUAL REPORT 2012

FOR MANY YEARS BUNZL
HAS CONTINUED TO PURSUE
A CONSISTENT STRATEGY OF
FOCUSING ON ITS STRENGTHS
AND CONSOLIDATING THE
MARKETS IN WHICH
IT COMPETES.
CONTINUALLY REDEFINING AND
DEEPENING OUR COMMITMENT TO
CUSTOMERS AND MARKETS, AS WELL
AS EXTENDING OUR BUSINESS INTO
NEW GEOGRAPHIES, REMAIN IMPORTANT
ELEMENTS OF OUR STRATEGY.
HOW OUR GROWTH IS ACHIEVED
Organic growth
We achieve organic growth by applying our resources and expertise to
enable customers to outsource to Bunzl the purchasing, consolidation
and delivery of a broad range of products, thereby enabling them to
achieve efficiencies and savings.
Acquisition growth
Since 2004 we have announced more than 70 acquisitions with an
average annual spend of £167 million, adding average annualised
revenue of £263 million.
Operating model efficiencies
We continually strive to make our businesses more efficient by investing
in new IT systems and warehouse facilities and implementing best
practice operational procedures.
OUR STRATEGY BUILDING BLOCKS
Unique business model
Our supply chain management and one-stop-shop offering allows our
customers to focus on their core businesses more effectively and at the
same time reduce their working capital.
Attractive markets
We operate across six fragmented markets sectors, many of which are
growing and resilient to challenging economic conditions.
Balanced business portfolio
We have a geographically balanced but diversified business portfolio
operating across 27 countries.
Operational focus
With a decentralised operational structure, our management areable
to focus on our customers’ needs while retaining full responsibility for
the financial performance of their businesses.
Strong financial discipline
Over the last 10 years we have delivered consistently good results
with very high returns on capital and operating cash flow conversion.
Experienced management
Our executive directors and business area heads have extensive
experience in managing the Group’s businesses with an average
of15 years’ service with Bunzl.
Acquisition strategy and track record
Our acquisition strategy is to seek out those businesses which satisfy key
criteria, including having good financial returns in resilient and growing
markets, while at the same time providing opportunities to extract further
value as part of the Bunzl Group.
STRATEGY
BUNZL PLC ANNUAL REPORT 2012 03
GROUP AT A GLANCE
WE PROVIDE A ONE-STOP-SHOP DISTRIBUTION AND
OUTSOURCING SERVICE SUPPLYING A BROAD RANGE
OF INTERNATIONALLY SOURCED NON-FOOD PRODUCTS
TO A VARIETY OF MARKET SECTORS.
* Before intangible amortisation and acquisition related costs
04 BUNZL PLC ANNUAL REPORT 2012
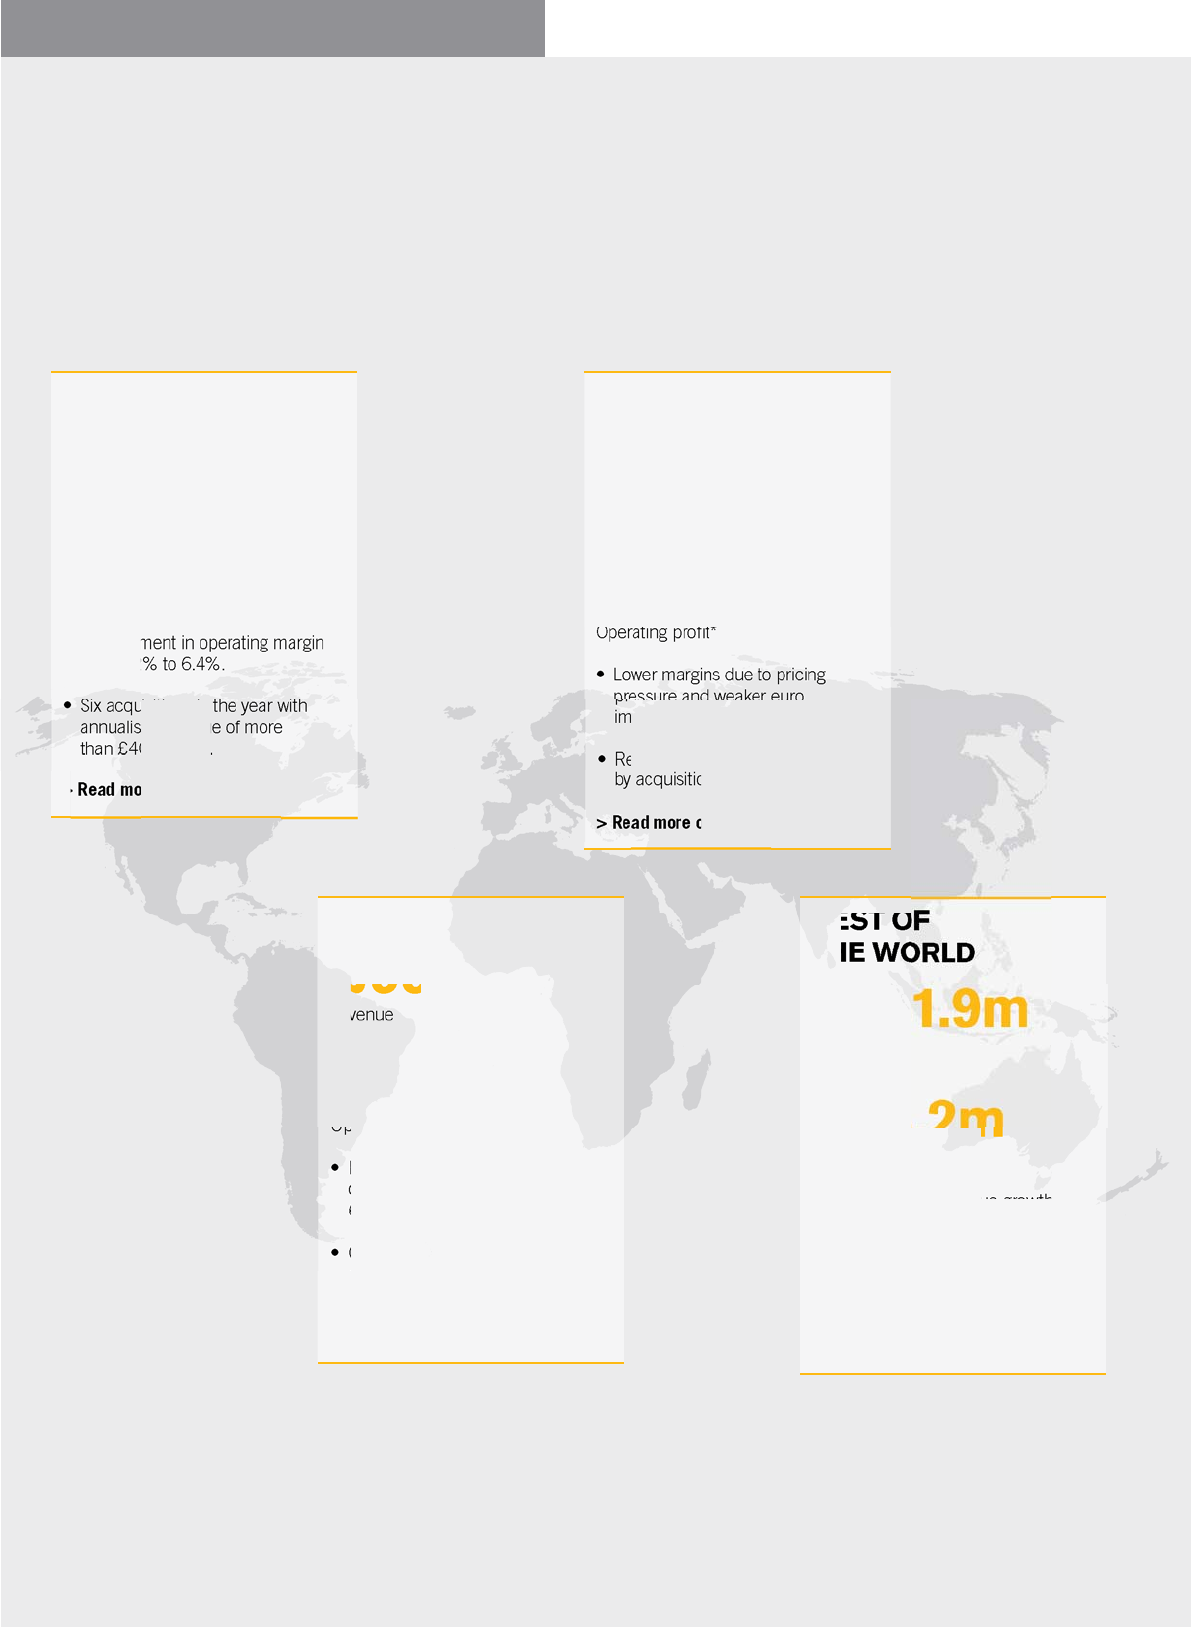
NORTH AMERICA
£2,905.8m
Revenue
£184.6m
Operating profit*
t Improvement in operating margin
from 6.2% to 6.4%.
t Six acquisitions in the year with
annualised revenue of more
than£400 million.
> Read more on page 14
CONTINENTAL
EUROPE
£1,079.4m
Revenue
£87.5m
Operating profit*
t Lower margins due to pricing
pressure and weaker euro
impacting imports.
t Revenue growth bolstered
byacquisitions.
> Read more on page 15
UK & IRELAND
£992.1m
Revenue
£65.2m
Operating profit*
t Higher organic growth and
operating margin up from
6.0% to 6.6%.
t Continued focus on operating
efficiency and own brand
development.
> Read more on page 18
REST OF
THE WORLD
£381.9m
Revenue
£33.2m
Operating profit*
t Strong organic revenue growth
in both Australasia and Brazil.
t Expansion in South America
outside Brazil with acquisition
of Vicsa.
> Read more on page 19

Growth drivers
t Increasing trend to outsourcing.
t Expansion of ‘away from home’ activity.
t Global legislative trends for health & safety.
t Favourable demographics in healthcare.
Fragmented markets
t No one does what we do, on our scale,
across our international markets.
t Bunzl’s national distribution networks provide
competitive advantage.
Customers
t Strong national, regional and local customer base.
t Working with national and international leading
companies.
MARKET CONTEXT
NON-FOOD RETAIL
Goods not for resale, including packaging
and a full range of cleaning and hygiene
products, to department stores, boutiques,
office supply companies, retail chains and
home improvement chains.
FOODSERVICE
Non-food consumables, including food packaging,
disposable tableware, guest amenities, catering
equipment, cleaning products and safety items,
to hotels, restaurants, contract caterers, food
processors and theleisure sector.
GROCERY
Goods not for resale (items grocers use but do
not actually sell), including food packaging, films,
labels and cleaning and hygiene supplies, to
grocery stores, supermarkets and retail chains.
HEALTHCARE
Disposable healthcare consumables, including
gloves, swabs, gowns and bandages, tothe
healthcare sector.
CLEANING & HYGIENE
Cleaning and hygiene materials, including
chemicals and hygiene paper, to cleaning
and facilities management companies and
industrial and healthcare customers.
OTHER
A variety of product ranges supplied to other
markets such asgovernment and education
establishments.
SAFETY
A complete range of personal protection
equipment, including hard hats, gloves,
boots and workwear, to industrial and
construction markets.
FOODSERVICE
GROCERY
CLEANING & HYGIENE
SAFETY
% 2012 REVENUE
HEALTHCARE
NON-FOOD RETAIL
OTHER
4
7
8
9
14
29
29
BUNZL PLC ANNUAL REPORT 2012 05

ORGANIC REVENUE
GROWTH %
Increase in revenue for the year
excluding the impact of currency,
current year acquisitions and
disposal of business, but including
a pro rata part year in respect
ofprior year acquisitions.
ADJUSTED EARNINGS
PER SHARE p
Earnings per share excluding the
impact of currency, intangible
amortisation, acquisition related
costsand disposal of business.
PROFIT MARGIN %
Ratio of operating profit before
intangible amortisation and
acquisition related costs to revenue.
ACQUISITION SPEND £m
Consideration paid and payable,
together with net debt assumed,
inrespect of businesses acquired
oragreed to be acquired during
theyear.
UNDERLYING PROFIT
MARGIN %
Profit margin excluding the impact of
currency, current year acquisitions
and disposal of business but
including a pro rata part year in
respect of prior year acquisitions.
ANNUALISED REVENUE
FROM ACQUISITIONS £m
Estimated revenue which would have
been contributed by acquisitions
made or agreed to be made during
the year if such acquisitions had been
completed at the beginning of the
relevant year.
MEASURING
KEY PERFORMANCE INDICATORS
11 12
2.6
4.0
11 12
71.8
68.5
11 12
6.66.6
11 12
272
185
11 12
6.4
6.6
11 12
518
204
06 BUNZL PLC ANNUAL REPORT 2012

All data for carbon emissions and fuel usage for each year is based on the 12 months ended 30 September.
FREE CASH FLOW £m
Cash generated from operations
before acquisition related costs
lessnet capital expenditure,
interestand tax.
SCOPE 1 CARBON
EMISSIONS
Tonnes of CO2 per
£m revenue
Measured in accordance with the
Greenhouse Gas Protocol applying
2012 Defra conversion factors.
RETURN ON AVERAGE
OPERATING CAPITAL %
Ratio of operating profit before
intangible amortisation and acquisition
related costs tothe average of the
month end operating capital employed,
being tangible fixed assets, inventories
and trade and other receivables less
trade and other payables.
SCOPE 2 CARBON
EMISSIONS
Tonnes of CO2 per
£m revenue
Measured in accordance with the
Greenhouse Gas Protocol applying
2012 Defra conversion factors.
RETURN ON INVESTED
CAPITAL %
Ratio of operating profit before
intangible amortisation and
acquisition related costs to the
average of the month end invested
capital, being equity after adding
back net debt, retirement benefit
obligations, cumulative intangible
amortisation, acquisition related costs
and amounts written off intangible
assets, net of the related tax.
FUEL USAGE
Ltrs per £000 revenue
Diesel, petrol and LPG used
in the Group’s own vehicles.
OUR PERFORMANCE
11 12
235
275
11 12
16.0
17.9
11 12
56.4
57.4
11 12
5.2
5.7
11 12
17.9
17.3
11 12
5.6
6.1
BUNZL PLC ANNUAL REPORT 2012 07

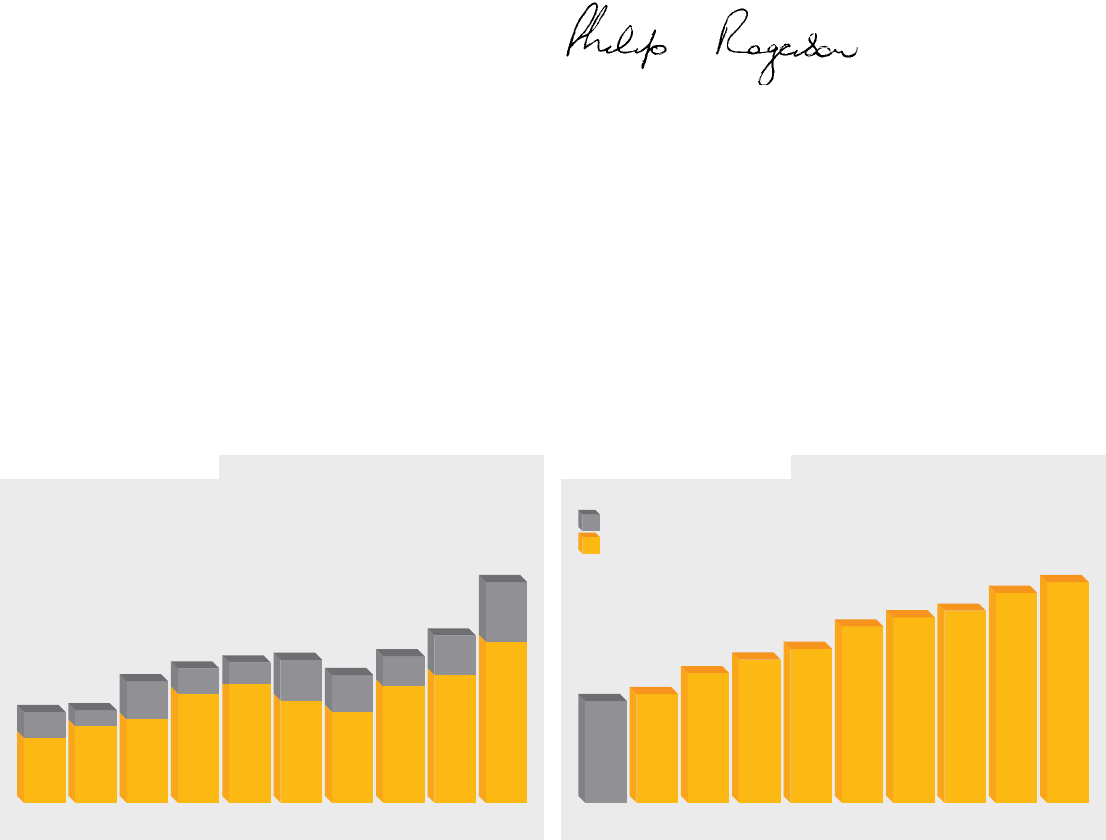
03
UK GAAP
IFRS
31.3 32.1
38.7 41.7 45.1
52.7 55.9 60.6
68.5 71.8
04 05 06 07 08 09 10 11 12 03
2.3 2.4
2.9 3.3 3.6
4.2 4.6 4.8 5.1 5.4
04 05 06 07 08 09 10 11 12
03–05 continuing operations
RESULTS
I am very pleased to be able to report another good set of results for Bunzl
despite the continuing difficult macroeconomic conditions which have
persisted for the last few years across many of the international markets
inwhich we compete.
Group revenue increased to £5,359.2 million (2011: £5,109.5 million), an
increase of 6% at constant exchange rates, due to organic growth of 2.6%
combined with the impact of recent acquisitions, net ofthe disposal of the
UK vending business in August 2011.
Operating profit before intangible amortisation and acquisition related
costs was £352.4 million (2011: £335.7 million), up 7% at constant
exchange rates, with the improvement in the Group operating margin on
the same basis being driven by the impact of acquisitions and the sale of
the UK vending business. Adjusted earnings per share before intangible
amortisation, acquisition related costs and the vending disposal were
71.8p (2011: 68.5p), an increase of 7% at constant exchange rates.
Adverse currency translation movements, principally the euro, reduced
the growth rates marginally by between 1% and 2%.
DIVIDEND
The Board is recommending a final dividend of 19.4p. This brings the total
dividend for the year to 28.2p, up 7% compared to 2011. Shareholders
will again have the opportunity to participate in our dividend reinvestment
plan.
STRATEGY
We continue to pursue our proven strategy of developing the business
through organic growth, consolidating the markets in which we compete
through focused acquisitions in both existing and new geographies and
continuously improving the efficiency of our operations.
We achieve our organic growth by applying our resources and expertise
toenable customers to outsource to Bunzl the purchasing, consolidation
and distribution of a broad range of goods not for resale. By doing so our
customers are able to focus on their core business more cost effectively
by achieving purchasing efficiencies and savings, freeing up working
capital, improving their distribution capabilities and simplifying their
internal administration.
Acquisition activity increased significantly in 2012, particularly towards
the end of the year, with 13 acquisitions announced and a total investment
of approximately £270 million adding annualised revenue of over £500
million. A key highlight this year was our first acquisition in South America
outside Brazil which has provided Bunzl with a first entry into four new
countries in the region. Having pursued our strategy consistently over
many years, we have built leading positions in a variety ofmarket sectors
across the Americas, Europe and Australasia.
ADJUSTED EARNINGS PER SHARE p REVENUE £bn
CHAIRMAN’S STATEMENT
‘ EXECUTING OUR CONSISTENT AND
PROVEN STRATEGY HAS RESULTED IN
ANOTHER SUCCESSFUL YEAR, WITH
CONTINUED GROWTH IN EARNINGS AND
DIVIDENDS, THROUGH A COMBINATION
OF ORGANIC AND ACQUISITION GROWTH
AND OPERATING EFFICIENCIES.’
Philip Rogerson
Chairman
08 BUNZL PLC ANNUAL REPORT 2012
03
UK GAAP
IFRS
171 183
218 241 259
297 312 323
353 371
04 05 06 07 08 09 10 11 12
03–05 continuing operations
*Before amortisation and acquisition related and corporate costs
INVESTMENT
While Bunzl does not have high levels of capital expenditure for a
company of its size, both organic growth and acquisitions require
investment in the business to expand and enhance its asset base.
OurITsystems and warehouse facilities are critical to our ability to serve
our customers in the most efficient and appropriate manner. We have
therefore continued to invest in order to support our growth strategy and
ensure that we retain our competitive advantage. By doing so we maintain
our leadership in the marketplace, as we integrate new businesses into
the Group and look to improve our existing infrastructure.
CORPORATE RESPONSIBILITY
Efficient and ethical management of our business and long term
relationships with all our stakeholders, whether customers, employees
orsuppliers, remain key to our sustained business success. During 2012
our managers and sales and procurement staff completed tailored training
covering our Corporate Responsibility (‘CR’) policies which included our
Business Standards/Code ofEthics and our stance on gifts and
entertainment, facilitation payments and information on our whistle
blowing process. Our employee survey again provided useful feedback
and resulted in a variety of actions. We have also continued to assist our
customers in meeting their CR objectives by providing them with product
choices, including some innovative environmentally friendly products
made from materials such as bamboo and sugar cane as well as, in some
cases, offering them a closed loop recycling facility. Our Quality Assurance
and Quality Control department based inShanghai continues to work with
our Asian suppliers to ensure that high quality and ethical standards of
operation are maintained.
EMPLOYEES
Our employees’ experience, dedication, commitment and approach to
their work remain key strengths of Bunzl. Across the world we depend
onthem to continue to provide high quality care to our customers, adding
value to our service provision. The relationships formed by our employees
with all our stakeholders shape the reputation of Bunzl and build our
culture of a positive ‘can-do’ company. As ever, we are genuinely grateful
for the loyalty and hard work of all our employees and we are delighted
that 2012 has been a year in which many new employees have joined
the Group through acquisition, providing new ideas and challenges to
continue the development of Bunzl internationally.
CREDIT FACILITIES
The Group remains highly cash generative and we continue to have
access to diverse sources of funding to achieve our strategic objectives.
InOctober 2012 we refinanced some of our debt facilities by raising
US$350.0 million of fixed interest rate borrowings in the US private
placement market with maturities ranging from seven to 11 years at an
average interest rate of 3.4%. US$110.0 million was drawn in December
with the balance due to be drawn in April 2013. During the year we also
refinanced or agreed new banking facilities totalling £150.7 million. Our
undrawn committed facilities at the end of the year were £589.3 million.
BOARD
Ulrich Wolters, who has served as a non-executive director since 2004,
will be retiring after the Company’s Annual General Meeting in April 2013.
We thank Ulrich for his significant contribution over many years and he
will leave the Board with our gratitude and best wishes for the future.
Jean-Charles Pauze was appointed as a non-executive director in January
2013 and Meinie Oldersma will join the Board in the same capacity in
April. Based in Paris, Jean-Charles is presently Chairman of Europcar and
Chairman of the Supervisory Board of CFAO Group and was Chairman
and Chief Executive of Rexel for 10 years until 2012. Prior to that he held
a number of senior positions with PPR Group, Strafor Facom Group and
Alfa Laval Group in France and Germany. A Dutch national, Meinie is
currently based in the UK and has been Chief Executive of 20:20 Mobile
Group since 2008 and previously held a variety of senior positions with
Ingram Micro, most recently as Chief Executive and President of their
China Group and Managing Director of their business in Northern Europe.
Both Jean-Charles and Meinie have extensive international experience
across a range of distribution and service sectors, particularly in Europe
and Asia, which willbe of great value to Bunzl as we continue to expand
and develop. Iamdelighted to welcome them to the Board.
Philip Rogerson
Chairman
25 February 2013
03
345 405 443
578 627 542 482
616 676
852
04 05 06 07 08 09 10 11 12
1,167
884
777
675
757
742
710
643
486
482
SHARE PRICE RANGE p OPERATING PROFIT* £m
BUNZL PLC ANNUAL REPORT 2012 09

10 BUNZL PLC ANNUAL REPORT 2012
OPERATING PERFORMANCE
The Group once again had a successful year in 2012 due to a
combination of organic growth, good performance from the acquisitions
made in 2011 and increased acquisition spend during the year.
Although some currencies, notably the US dollar, were marginally stronger
than in 2011, the translation effects of the weaker euro and overall
currency movements have reduced the reported growth rates of revenue
and operating profit. The operations, including the relevant growth rates,
are reviewed below at constant exchange rates to remove the distorting
impact of these currency movements. Changes in the level of revenue and
profits at constant exchange rates have been calculated by retranslating
the results for 2011 at the average rates used for 2012. Unless otherwise
stated, all references in this review to operating profit are to operating
profit before intangible amortisation and acquisition related costs.
Revenue increased 6% (5% at actual exchange rates) to £5,359.2 million
and operating profit was £352.4 million, an increase of 7% (5% at actual
exchange rates). The percentage growth in operating profit at constant
exchange rates was greater than that of revenue due to the improvement in
Group operating margin by 10 basis points to 6.6% as a result of the impact
of acquisitions and the sale of the UK vending business in August 2011.
In North America revenue rose 6% (7% at actual exchange rates) due to
good organic revenue growth and the impact of acquisitions completed
in2011 and 2012, while operating profit increased 8% (9% at actual
exchange rates). Revenue in Continental Europe rose 8% (1% at actual
exchange rates) as a result of some organic revenue growth and the
impact of acquisitions but operating profit was down 2% (8% at actual
exchange rates) as margins came under pressure. In UK & Ireland
revenue was flat at both constant and actual exchange rates primarily
dueto good organic revenue growth and the impact of relatively small
acquisitions being more than offset by the impact of the sale of vending
during the second half of 2011. However operating profit rose 8% at both
constant and actual exchange rates due to the positive impact of cost
reduction initiatives, product mix improvements in some businesses and
the disposal of vending. In Rest of the World revenue increased 23%
(20% at actual exchange rates) and operating profit was up 22% (17%
at actual exchange rates) due to both excellent organic revenue growth
and the impact of acquisitions.
Basic earnings per share were 61% higher (57% at actual exchange rates)
at 59.9p due to the significant impact in 2011 of the loss on disposal of
the vending business. Adjusted earnings per share, after eliminating the
effect of intangible amortisation, acquisition related costs and the disposal
of vending, were 71.8p, an increase of 7% (5% at actual exchange rates).
Although the underlying return on average operating capital increased,
the overall return decreased slightly from 57.4% to 56.4% due to the
recent acquisitions currently having a lower return on operating capital
than the rest of the Group.
Our operating cash flow continued to be strong. Despite an acquisition
cash outflow of £254.7 million and net capital expenditure of £20.2
million, our year end net debt of £738.1 million was only £85.2 million
higher than at the end of 2011. The net debt to EBITDA ratio increased
marginally to 1.8 times compared to 1.7 times at the previous year end.
Our continued focus on the sustainability of our business has once again
led to a further reduction, relative to revenue, of our Scope 1 and 2 carbon
emissions. This has been achieved partly as a result of further investment
in energy efficient lighting systems in our facilities and the introduction
MANAGEMENT TEAM
Managers from across the
Groupmeet regularly to review
performance, discuss trends
affecting our businesses and
seek further opportunities for
growth and competitive
advantage.
Patrick Larmon
President and CEO North America
Celia Baxter
Director of Group Human Resources
Brian May
Finance Director
Frank van Zanten
Managing Director Continental Europe
Andrew Mooney
Director of Corporate Development
Rodrigo Mascarenhas
Managing Director South America
Kim Hetherington
Managing Director Australasia
Paul Hussey
General Counsel and Company
Secretary
Paul Budge
Managing Director UK & Ireland
CHIEF EXECUTIVE’S REVIEW
‘ BUNZL HAS AGAIN DEMONSTRATED THE
STRENGTH OF ITS VALUE PROPOSITION
AND SHOWN ITS ABILITY TO DEVELOP
BOTH IN EXISTING AND NEW MARKETS.’
Michael Roney
Chief Executive
Having been Director of Corporate Development since 1999,
NancyLester left Bunzl at the beginning of 2013. We thank her for
hervaluable contribution and wish her all the very best for the future.

BUNZL PLC ANNUAL REPORT 2012 11
within our transport fleet of a number of vehicles which have lower
emissions. The health, safety and well-being of our staff remains a key
feature of the way in which we operate.
ACQUISITIONS
Our committed acquisition spend in 2012 of £272 million was the highest
level since 2004 with 13 transactions announced.
In February we acquired the business of CDW Merchants. Based in Chicago,
the business is principally engaged in the sale of retail gift packaging and
visual merchandising solutions and products to the specialty retail and
online retailing sectors throughout the US. Revenue inthe year ended
31 December 2011 was US$12 million. The business, which works
closely with its customers to increase brand appeal and consumer loyalty
through innovative gift packaging concepts and merchandising displays,
complements our existing non-food retail supplies business in North
America and extends our customer base, particularly inthe specialty
and online retail sector.
We acquired three businesses at the end of April. FoodHandler, also
based in Chicago, is a leading supplier of a broad range of disposable
gloves and other foodhandling products to the foodservice sector
throughout the US. Revenue in the year ended 31 December 2011
was US$99 million. The business enhances our existing foodservice
operations in North America and expands our product offering and
importprogramme in this sector. Based near Tel Aviv, Zahav is a leading
distributor of packaging supplies to the foodservice sector throughout
Israel. Revenue in the year ended 31 December 2011 was ILS66 million.
This is our second acquisition in Israel which is a market we entered in
2010 with the purchase of Silco. It has a strong and broad customer base,
especially in the bakery sector, and significantly increases the size of
our business in that country. The Group also purchased in Aprilthe
Queensland based redistribution operations of Star Services International
in Australia. Based in Brisbane and Cairns, the business is engaged in
the supply of foodservice disposable products to wholesalers and
redistributors throughout Queensland. Revenue for the year ended
30June 2012 was A$12 million. The acquisition complements our
existing foodservice supplies operations in Queensland and will allow
us to penetrate further into the redistribution sector of this market.
Based near Seattle, Service Paper was purchased in June. The business
is principally engaged in the distribution of disposable supplies to the
grocery, foodservice, food processor and industrial packaging sectors
throughout the Pacific Northwest. Revenue of the business acquired for
the year ended 31 December 2011 was US$61 million. The business,
which has a reputation for providing high levels of customer service, will
expand our existing business in the region.
At the end of June we acquired Distrimondo which is based near Zurich
and is principally engaged in the distribution of foodservice disposables
and cleaning and hygiene products throughout Switzerland. Revenue in
the year ended 31 December 2011 was CHF17 million. The acquisition
extends our operations in Switzerland which is a key market that we
entered in 2010 with the purchase of Weita.
The acquisition of Indigo Concept Packaging was completed in October.
Indigo is based in the UK and is principally engaged in the sale of quality
retail packaging products to a variety of customers. Revenue in the year
ended 31 December 2011 was £6 million.
At the end of October we acquired Atlas Health Care in Australia. Based
inAdelaide, the business is principally engaged in the supply of medical
consumables to the healthcare sector and gives us an enhanced market
position in this growing sector. Revenue in the year ended 30 June 2012
was A$22 million.
In December we entered into agreements to acquire five businesses.
Based near Toronto, McCordick Glove & Safety is a distributor of gloves
and other personal protection equipment to a variety of industrial and
retail customers as well as to redistributors. It has enabled us to enter
the personal protection equipment sector in Canada and enhances the
Company’s existing safety product offering. Revenue in the year ended
31December 2011 was C$53 million. Vicsa Safety in Chile and its
subsidiaries based in Peru, Argentina, Colombia and Mexico specialise
inthe sourcing and sale of a variety of personal protection equipment
throughout the region. The aggregate revenue of the Vicsa businesses in
2012 was US$65 million of which more than half was accounted for by
the business in Chile. At the same time we entered into an agreement to
purchase Vicsa Brasil which was completed earlier this month following
clearance from the Brazilian Competition Authority. Revenue in 2012
wasUS$9 million. The acquisition of the Vicsa businesses is an exciting
development for us as they expand our operations in South America
outside Brazil into four new countries as well as extending our business
inMexico into the safety sector. In December we also acquired Destiny
Packaging in the US which had revenue in 2012 of US$52 million.
Basedin Monterey, California, Destiny Packaging is a leading distributor
offlexible packaging supplies, principally produce bags, to fruit and
vegetable growers throughout California and Arizona and complements
both Cool-Pak and Netpak which we acquired in 2010 and 2011
respectively. Together these three businesses give us an increasing
presence in the market of innovative packaging solutions for both growers
and food retailers in North America. Finally the Company purchased
Schwarz Paper Company in the US at the end of December. Based in
Chicago and operating from 14 locations, Schwarz Paper Company is
principally engaged in the provision of consumables and supply chain
solutions for the non-food retail and grocery sectors. It significantly
increases the size of our non-food retail business and will further enhance
the Company’s market leading position in the grocery sector. Revenue
ofthe acquired business in the year ended 30 September 2012 was
US$363 million.
The acquisition of McNeil Surgical in Australia was completed at the
beginning of February 2013. With revenue of A$16 million in the year
ended 30 June 2012, the business is engaged in the sale of healthcare
consumables and equipment to aged care facilities, hospitals and medical
centres as well as to redistributors and increases our market presence in
this growing sector.
PROSPECTS
The macroeconomic outlook continues to be challenging but we believe
that our resilient customer base and the opportunities for additional
market consolidation will provide the Group with a good platform for
further growth.
In North America we expect to see stronger growth as a result of the six
acquisitions completed last year and an improvement in organic revenue
growth from the levels seen in the second half of 2012. In spite of the
difficult market conditions in Continental Europe, we currently anticipate
some growth with a stable operating margin. The performance of UK
& Ireland should continue to improve, in spite of the sluggish economies,
led by organic growth and ongoing cost reduction initiatives. Rest of the
World should see a strong performance through a combination of good
organic growth and the impact of the recent significant acquisition activity.
Acquisition growth is an important part of our strategy. The pipeline is
promising as we continue discussions with a number of potential targets.
The Board believes that the prospects for the Group are positive due
to our strong market position, growing customer sectors and good
opportunities to consolidate further the markets in which we compete.
Michael Roney
Chief Executive
25 February 2013

12 BUNZL PLC ANNUAL REPORT 2012
SOURCING
CHIEF EXECUTIVE’S REVIEW CONTINUED
WE SOURCE HUNDREDS OF THOUSANDS OF DIFFERENT PRODUCTS
FROM ALL OVER THE WORLD, LIAISING CLOSELY WITH OUR SUPPLIERS
SO THAT WE ARE ABLE TO OFFER A FULL RANGE OF ITEMS WHICH
SATISFY OUR CUSTOMERS’ DEMANDS. FROM SAFETY HARNESSES
AND HARD HATS TO BAKERY PACKAGING AND COFFEE CUPS,
WE ENSURE THAT THE PRODUCTS WE SOURCE ARE THE MOST
APPROPRIATE FOR THEIR EVERYDAY REQUIREMENTS.

BUNZL PLC ANNUAL REPORT 2012 13
EVERYDAY
ESSENTIAL
PRODUCTS

14 BUNZL PLC ANNUAL REPORT 2012
NORTH AMERICA
In North America revenue increased by 6% to £2,905.8 million due to
sales growth with existing customers, new business wins and acquisitions.
This, together with the impact of higher margin acquisitions and good cost
control, contributed to an 8% increase in operating profit to £184.6 million,
with the operating profit margin improving 20 basis points to 6.4%. Our
extensive distribution network and delivery fleet across North America and
our experienced sales force continued to produce value for our customers
in the diversified business sectors we service.
Our largest business, which serves the grocery sector, produced good
growth in 2012 principally as a result of the full year impact of a significant
customer win in the third quarter of 2011 but also as we expanded our
business with other customers by offering integrated supply chain product
and information supply chain solutions. Execution of our cornerstone
programmes of direct store delivery, cross dock and warehouse
replenishment programmes on a local, regional or national basis provides
us with a unique competitive advantage in the marketplace and generates
opportunities for us to reduce the operating costs and working capital
investment of our customers. Our overall business in the Pacific
Northwest was boosted by the acquisition of Service Paper in June.
The redistribution business also grew as we continued to enable our
distributor customers, predominantly in the foodservice, jan/san (janitorial/
sanitation) and office products sectors, to achieve increased profitability
through our proximity and scale. Our business model allows not only these
customers but all ofour customers to consolidate their sources of supply
and reduce their administrative and operating costs through our one-stop-
shop offering. Asa result of our excellent fill rates and dependable delivery
capabilities, our customers can improve their profitability and asset
utilisation by rededicating storage space, once occupied by the stock
items we now provide, to support higher revenue generating items.
Our food processor business continued to perform well, with customers
across the full breadth of the food processor supply chain from the fields
to the stores. These include growers, packers, large food companies and
meat, fresh cut produce, home meal and specialty food processors. The
recent addition of Destiny Packaging and its flexible packaging offering
complements Cool-Pak’s and Netpak’s rigid packaging product lines and
increases our ability to provide innovative packaging solutions for growers,
packers and retailers.
+8%
INCREASE IN OPERATING PROFIT AT
CONSTANT EXCHANGE RATES WITH
IMPROVEMENT IN OPERATING MARGIN.
Our business serving the non-food retail sector also developed well
despite slow US retail sales growth. Our coast to coast distribution network
gives us the scale needed to support national retail chains cost effectively
through our uniform operating platform. Our recent acquisition of Schwarz
Paper Company complements our existing non-food retail and grocery
distribution businesses. Schwarz will significantly expand our customer
base and market presence in these sectors across the US in the coming
year. We also continued to improve our expertise and breadth of product
line through our acquisition of CDW Merchants in February. Their design
and marketing offerings will further enhance our ability to introduce new
and unique point of sale designs and, together with Keenpac, allow us
to offer innovative packaging and store supply programmes that will lead
to increased business with our existing customer base as well as attract
newcustomers, particularly in the specialty and online retail sectors.
Although the convenience store sector is still impacted by higher fuel
costs, it continued to expand in 2012. We continuously work with retail
convenience store chains to provide additional programmes and products
to help them meet the demands of the new services being offered at the
store level. Our investment in a well trained sales force gives us a better
opportunity to develop more expansive programmes with these local,
regional and national chains. Wholesalers in this sector also continue to
extend their services which provides us with additional sales opportunities.
We continue to strengthen our relationships with our preferred suppliers
and further integrate our supply chains as we position their products
closer to the customer reducing their operating costs and improving their
profitability. Working as supply chain partners allows us to leverage our
combined strengths to create unique programmes and products that best
satisfy our customers’ needs at competitive prices.
Our private label import and import logistics programmes saw further
expansion by utilising our state-of-the-art Shanghai distribution centre
andquality control services and leveraging our international logistics
expertise. We also penetrated more deeply into the foodservice sector
andstrengthened our competitive position through our acquisition of
FoodHandler, a leading supplier of own brand disposable gloves and
otherfood handling products. Not only does FoodHandler expand our
foodservice product offering, it also complements our existing foodservice
operations, augments our sales force with extensive product sales and
marketing expertise and extends our customer base. In addition, our
recent acquisition of McCordick Glove & Safety enables us to enter the
personal protection equipment sector in Canada which is a product area
where wehave already been very successful in a number of other
geographies. Italso has a wide range of successful own brands that will
enhance our existing safety product offering.
We continued to manage successfully our operating costs despite ongoing
pressures on fuel, freight and healthcare costs. As part of this process
wediligently evaluate new warehouse technologies that could improve
warehouse efficiencies and continually analyse the number of facilities
werequire in order to optimise our operating costs and service levels.
CHIEF EXECUTIVE’S REVIEW CONTINUED
‘ OUR IT PLATFORM, EXTENSIVE
WAREHOUSE NETWORK AND DELIVERY
FLEET CONTINUE TO POSITION US WELL
TO MEET OUR CUSTOMERS’ DEMANDS
IN THE FUTURE.’
Patrick Larmon
President and CEO North America

BUNZL PLC ANNUAL REPORT 2012 15
CONTINENTAL EUROPE
Revenue rose by 8% to £1,079.4 million due to a combination of some
organic growth and acquisition activity in 2011 and 2012, although
operating profit fell 2% to £87.5 million. In the difficult economic
environment in most of the countries in which we are present, pricing
pressure in our markets together with a weaker euro impacting import
prices has led to a decline in gross margin. Although operating costs remain
tightly controlled, underlying revenue growth has slowed compared to
recent years such that the revenue growth, together with the impact from
acquisitions, was not sufficient to compensate for the gross margin decline.
Our largest business, the cleaning and hygiene operations in France, saw
a slight reduction in sales. Gross margin continues to be under pressure,
in particular from thehealthcare and public sectors with cost control
measures at our customers continuing to impact our business, leading
to a decline in operating profit. Measures to increase gross margin and
reduce costs have been implemented with a view to improving future
profitability. By contrast, our personal protection equipment business
in France enjoyed good sales growth with an improved operating profit.
In the Netherlands, sales continued to grow significantly in our businesses
supplying the food and non-food retail sectors. Our healthcare business
saw reasonable growth although the horeca (hotel, restaurant and
catering) sector recorded a small decline. Margins remain under pressure
although improved in the healthcare sector, partly due to synergies from
recent acquisitions. Overall underlying operating profit improved and was
further enhanced by the full year impact of the acquisition of D-Care
which was acquired in 2011.
2012 was the first full year of ownership of Majestic Products, a personal
protection equipment and safety products business in the Netherlands,
Belgium, Germany and the US. While trading in the European businesses
was soft, the US business recorded strong growth both in sales and
operating profit, in particular due to the successful introduction of new
products. It also relocated to a larger, purpose-built facility to allow for
further growth in the coming years.
£1,079.4m
RECORD LEVEL OF SALES AS
BUSINESS AREA REVENUE
INCREASES 8% AT CONSTANT
EXCHANGE RATES.
In Belgium, we recorded strong sales growth in the cleaning and hygiene
sector due to further gains with a number of existing customers although
sales in the retail sector declined following the loss of one larger account
leaving overall sales flat. Good margin management led to an overall
increase in operating profit and margins.
In Germany, sales growth was modest with gains in sales to fast food
chains, coffee shops and wholesalers being partly offset by lower sales to
contract caterers. Margins remain under pressure in particular from larger
accounts. Costs were reduced during the year to compensate for lower
margins leaving operating profit flat.
In Switzerland, our Weita business saw a slight decline in sales as the
Swiss economy, and in particular its tourism industry, has been adversely
impacted by the continuing strength of the Swiss franc, although margins
were in line with last year. At the end of June we acquired Distrimondo, a
distributor of foodservice disposables and cleaning and hygiene products
throughout Switzerland, which is integrating well into the Group and
generating synergies with Weita.
In Denmark, sales have declined in the retail and horeca sectors and
grown in the personal protection equipment sector. Gross margins are
alsounder pressure in the retail and public sectors and this, combined
with some one-off costs associated with implementing a new IT system,
resulted in a reduced operating profit.
In Spain, extremely difficult economic circumstances led to a fall in
underlying sales in both the cleaning and hygiene and personal protection
equipment businesses, although overall sales in the cleaning and hygiene
business were ahead due to the purchase of King Espana in 2011.
Margins have also fallen as a result of the weaker euro increasing import
prices and competitive pressures although this has partially been
mitigated by synergies achieved following the acquisition of King Espana.
In central Europe, sales grew after the decline of 2011 with the strongest
growth in the retail sector although the cleaning and hygiene and safety
sectors also improved. Margins, however, remain under pressure across
the region leading to a lower level of operating profit.
In Israel, our foodservice disposables business, Silco, continued to deliver
strong sales growth but margins have declined, partly due to the strength
of the US dollar. In April we acquired Zahav, a leading distributor of
packaging supplies to the foodservice sector which is integrating well
into the Group.
‘ OUR BROAD PORTFOLIO OF BUSINESSES
ACROSS A NUMBER OF MARKET SECTORS
AND GEOGRAPHIES ENABLES US TO MEET
THE CHALLENGING MARKET CONDITIONS
WE ARE FACING.’
Frank van Zanten
Managing Director Continental Europe

16 BUNZL PLC ANNUAL REPORT 2012
CONSOLIDATION
CHIEF EXECUTIVE’S REVIEW CONTINUED
WE HAVE AN EXTENSIVE FOOTPRINT OF WAREHOUSE FACILITIES
ACROSS FOUR CONTINENTS WHICH MEANS THAT OUR PRODUCTS
ARE NEVER FAR FROM WHERE THEY NEED TO BE. WHETHER
CUSTOMERS REQUIRE ORDERS FOR A NETWORK OF LOCATIONS
OR INDIVIDUAL OUTLETS, WE CAN QUICKLY AND EASILY FACILITATE
THEIR NEEDS FROM OUR BROAD RANGE OF STOCK KEEPING UNITS.

BUNZL PLC ANNUAL REPORT 2012 17
THAT OFFERS OUR
CUSTOMERS
ONE-STOP-SHOP
SOLUTIONS

18 BUNZL PLC ANNUAL REPORT 2012
UK & IRELAND
Our businesses in the UK & Ireland have shown a continued improvement
in performance in 2012. Although total revenue was flat at £992.1 million,
due to the impact of the sale of vending in August 2011, operating profit
increased 8% to £65.2 million. In a market where demand is still
suppressed and there is constant pressure from customers to make
savings, we have achieved underlying growth and margin improvement by
further developing our market position and by successfully integrating the
recent acquisitions. We have also improved results by constantly appraising
our resource levels and operating efficiency, investing in product sourcing
and procurement and the continued development of our own brands.
The London 2012 Olympics was an important event for Bunzl as we
provided a number of products specifically for the Games through our
catering and hospitality customers. These included catering disposables,
healthcare consumables and cleaning and hygiene supplies. In addition
to the business opportunity it presented, we were able to enhance our
reputation for delivering an outstanding level of service.
The safety market has continued to be subdued as a result of reduced
demand, particularly in the construction and industrial sectors, although
the results for the year of our safety supplies business were boosted by
the integration of SIG Safety and Workwear which was purchased during
2011. Our cleaning and hygiene supplies business performed well
as a result of good organic growth in the facilities management sector
and the full year impact of the Cannon Consumables business also
acquired in 2011. We remained focused on operating costs in this difficult
environment and further consolidated the branch network of our cleaning
and safety businesses, reducing the number of facilities by two.
86.5%
RETURN ON OPERATING CAPITAL,
THE HIGHEST OF ALL OF THE
BUSINESS AREAS.
In hospitality we saw good growth, particularly with high street coffee
shops and contract caterers. Our ability to offer an extensive range of own
brand products, which complement branded products, helped to make
savings for our customers and maintain our operating margins. This
remains a very competitive market, so we are conscious of the need to
provide high levels of service at low levels of operating cost. As part of our
programme to deliver these, we have further rationalised our network and
closed twolocations.
In our food retail business we have continued to increase sales by gaining
an additional major grocery retailer during the year, together with the
impact of a new grocery account won towards the end of 2011. Our
non-food retail packaging business had a successful year, despite the
significant challenges being faced by many of our high street customers,
due to continuing strong demand from luxury branded retailers and the
acquisition of Indigo Concept Packaging in October. Gross margins are
under constant pressure in the retail supplies market and it is through
offering innovative supply solutions and reducing customers’ existing costs
that we have managed to continue to be successful.
Although the healthcare market has been challenged by ongoing
government spending constraints, we have made good progress during
2012. This has been achieved by focusing on more profitable business,
expanding and developing our range of own brand products and by taking
measures to reduce operating costs. During the year we also increased
the efficiency of our operations by introducing a new electronic ordering
platform for our customers.
In spite of a continuing difficult economy in Ireland and the negative
impact of the weaker euro, our business there has seen further recovery
in 2012. This reflects the work that had already been done to reduce our
cost base and improve the sales performance. The overall market that we
serve has stabilised, reflecting an increase in demand from hotels and the
hospitality sector. We have also been successful in winning tenders for
supply to government agencies and facilities management companies.
This has enabled us to offset the ongoing weak demand from high street
retailers and the takeaway food market.
CHIEF EXECUTIVE’S REVIEW CONTINUED
‘OUR ORGANIC REVENUE GROWTH
INCREASED THIS YEAR TO ITS
HIGHEST LEVEL FOR FIVE YEARS
AS WE CONTINUED TO IMPROVE
OUR PERFORMANCE.’
Paul Budge
Managing Director UK & Ireland

BUNZL PLC ANNUAL REPORT 2012 19
REST OF THE WORLD
In Rest of the World revenue increased 23% to £381.9 million while
profits rose 22% to £33.2 million. Both Australasia and Brazil experienced
strong organic revenue growth with the results also benefitting from the
impact of recent acquisitions.
In Australasia, our largest business, Outsourcing Services, which supplies
the healthcare, cleaning and catering sectors, continued to perform
strongly and again delivered strong results. This was achieved through a
consistent strategy of focusing on the resilient market sectors and growing
market share in aged care facilities and hospitals where we supply a wide
range of disposable and medical consumables. We also saw some solid
growth with our catering and cleaning customers who supply into the
mining and resource sectors. In addition in April we made our first entry
into the redistribution sector through the acquisition of the redistribution
business of Star Services International in Queensland.
To help consolidate our market position in healthcare, in October
we acquired Atlas Health Care which is a major supplier of specialist
healthcare consumables in South Australia. This acquisition brings
additional market specialisation and expertise in woundcare and nutrition
and complements our current product offering. The purchase of McNeil
Surgical in February 2013 will further strengthen our position in this
growing sector.
Although sales in our food processor business increased in 2012, it
performed below expectations. The business is continuing to develop
expertise with major national non-meat food processors which diversifies
and balances our stronger position with retail supermarkets. We are also
growing in our traditional markets by introducing a number of new product
development initiatives. The business has created capacity for continued
growth and made a number of operational improvements, recently
implementing scanning technology into the warehouse operations,
to improve accuracy and increase productivity in the future.
Our catering equipment businesses had a disappointing year as
we continued to be challenged by further softening in the traditional
hospitality markets. To offset this, the business has been refocusing its
+22%
RISE IN OPERATING PROFIT AT
CONSTANT EXCHANGE RATES DUE
TO STRONG ORGANIC GROWTH AND
IMPACT FROM ACQUISITIONS.
efforts to grow market share in the more resilient healthcare and resources
sectors. During the year we successfully integrated our largest business
onto the main IT platform which has improved operational performance
and increased efficiency and service levels.
Our business in Australasia continues to invest in infrastructure and
technology to enable the business to grow efficiently. During 2012 two
ofour business units successfully relocated their New South Wales
operations into our new 20,000m2 distribution centre in the Sydney
suburb of Enfield. This facility will improve operational efficiency and
represents a major investment to facilitate future growth in Australia’s
most populated region. In 2013 we will consolidate two further facilities
into this location as their current property leases expire.
In Brazil our personal protection equipment businesses performed well
despite the continuing slowdown in the rate of economic growth as the
year progressed and weakness in the Brazilian real which particularly
impacted import prices. Danny, the redistribution business with a focus
on own brands acquired in November 2011, was successfully integrated
into the Group and launched a series of new products. Prot Cap also grew
and increased its profitability, partly as a result of new customer wins
particularly in the oil and gas sectors which are continuing to expand, and
developed some important relationships with additional suppliers which
has enhanced our product offering. The recent acquisition of Vicsa Brasil,
which was completed on 19 February 2013, complements and further
extends our range of safety products.
Ideal, the cleaning and hygiene business which was also acquired in
2011, gained a number of new accounts in the retail sector and was
able to realise operational efficiencies and increase the operating
margin through the implementation of a new IT system and a logistics
restructuring programme.
The purchase in December of Vicsa Safety with its operations in Chile,
Peru, Argentina, Colombia and Mexico, expands our personal protection
equipment business in the region outside Brazil and provides Bunzl with
an exciting first entry into five high growth safety markets.
‘ OUR BUSINESS IN AUSTRALASIA HAS
CONTINUED TO IMPROVE ITS OPERATIONAL
EFFICIENCY THROUGH INVESTMENT IN
NEW FACILITIES AND TECHNOLOGY WHICH
SHOULD FACILITATE FURTHER GROWTH.’
Kim Hetherington
Managing Director Australasia
‘ OUR EXPANSION INTO NEW COUNTRIES IN
SOUTH AMERICA NOT ONLY EXTENDS OUR
SAFETY BUSINESS IN THE REGION BUT
ALSO PROVIDES A PLATFORM FOR FUTURE
GROWTH INTO OTHER MARKET SECTORS. ’
Rodrigo Mascarenhas
Managing Director South America

20 BUNZL PLC ANNUAL REPORT 2012
DELIVERING
CHIEF EXECUTIVE’S REVIEW CONTINUED
WITH OUR FLEETS OF DELIVERY VEHICLES AND THIRD PARTY
CARRIERS, WE ARE ABLE TO GET PRODUCTS TO OUR CUSTOMERS
IN A TIMELY MANNER. WHETHER DELIVERIES ARE DAILY, WEEKLY
OR MONTHLY, WE WORK WITH OUR CUSTOMERS TO MEET THEIR
REQUIREMENTS AND ENABLE THEM TO FOCUS ON THEIR CORE
BUSINESSES, HELPING TO INCREASE THE EFFICIENCY AND
COMPETITIVENESS OF THEIR OPERATIONS.

BUNZL PLC ANNUAL REPORT 2012 21
ON TIME TO
KEEP YOUR
BUSINESS MOVING

22 BUNZL PLC ANNUAL REPORT 2012
GROUP PERFORMANCE
Revenue increased by 6% at constant exchange rates to £5,359.2 million
(2011: £5,109.5 million) reflecting organic growth and the benefit
of acquisitions net of the disposal of the UK vending business in August
2011. Operating profit before intangible amortisation and acquisition
related costs increased by 7% at constant exchange rates to £352.4
million (2011: £335.7 million) as a result of the revenue growth and the
operating profit margin at constant exchange rates increasing from 6.5%
to 6.6%. Currency translation had a 1% to 2% negative impact on the
results for the year principally due to some weakening of the euro and
the Brazilian real, partially offset by the strengthening of the US dollar.
At actual exchange rates, both revenue and operating profit before
intangible amortisation and acquisition related costs increased by 5%.
Intangible amortisation and acquisition related costs of £58.6 million
were up £2.2 million due to a £2.3 million increase in transaction costs
and expenses and a £1.2 million increase in intangible amortisation,
partially offset by a £1.3 million decrease in net deferred consideration
payments relating to the continued employment of former owners of
businesses acquired and earn outs.
The net interest charge of £28.5 million was down £1.1 million on 2011,
principally due to lower average net debt levels. Interest cover improved
to 12.4 times compared to 11.3 times in 2011.
The profit on disposal of business of £4.0 million reflects the reassessment
of provisions relating to the disposal of the UK vending business in 2011
(2011: loss of £56.0 million).
Profit before income tax, intangible amortisation, acquisition related
costs and disposal of business was £323.9 million (2011: £306.1 million),
up 8% on 2011 at constant exchange rates and up 6% at actual exchange
rates, due to the growth in operating profit before intangible amortisation
and acquisition related costs and the benefit from the lower
interestcharge.
TAX
A tax charge at a rate of 27.7% (2011: 27.5%) has been provided on
the profit before tax, intangible amortisation, acquisition related costs
and disposal of business. Including the impact of intangible amortisation
of £47.7 million, acquisition related costs of £10.9 million, the profit on
disposal of business of £4.0 million and the associated deferred and
current tax of £15.7 million, the overall tax rate is 27.5% (2011: 36.1%).
The underlying tax rate of 27.7% is higher than the nominal UK rate of
24.5% for 2012 principally because many of the Group’s operations are
in countries with higher tax rates.
PROFIT FOR THE YEAR
Profit after tax of £195.3 million was up £71.5 million, primarily due
to the non-recurrence of the £56.0 million loss on disposal of vending
in 2011 and the 6% increase in profit before income tax, intangible
amortisation, acquisition related costs and disposal of business.
EARNINGS
The weighted average number of shares increased to 326.1 million from
324.0 million due to employee option exercises, partially offset by shares
being purchased from the market into the Company’s employee benefit
trust. Earnings per share were 59.9p, up 57% on 2011, principally due
to the non-recurrence of the loss on disposal of business in 2011. After
adjusting for intangible amortisation, acquisition related costs and the
respective associated tax and the profit/loss on disposal of business,
earnings per share were 71.8p, an increase on 2011 of 7% at constant
exchange rates and 5% at actual exchange rates.
The intangible amortisation and associated tax and the profit/loss on
disposal of business are non-cash charges which are not taken into
account by management when assessing the underlying performance
of the business. Similarly, the acquisition related costs and associated tax
do not relate to the underlying performance of the business. Accordingly,
such charges are removed in calculating the adjusted earnings per
share on which management assesses the performance of the Group.
DIVIDENDS
An analysis of dividends per share for the years to which they relate is
shown below:
2012 2011 Growth
Interim dividend (p) 8.80 8.05 9%
Final dividend (p) 19.40 18.30 6%
Total dividend (p) 28.20 26.35 7%
Dividend cover (times)* 2.5 2.6
*Based on adjusted earnings per share
ACQUISITIONS
The principal acquisitions made or agreed to be made in 2012 were
CDW Merchants, the redistribution business of Star Services International,
FoodHandler, Zahav, Service Paper, Distrimondo, Indigo Concept
Packaging, Atlas Health Care, McCordick Glove & Safety, Vicsa Safety,
Vicsa Brasil, Destiny Packaging and Schwarz Paper Company. Annualised
revenue and operating profit before intangible amortisation and acquisition
related costs of the businesses acquired or agreed to be acquired were
£518.4 million and £36.1 million respectively. A summary of the effect
of acquisitions is as follows:
£m
Fair value of assets acquired 156.5
Goodwill 63.6
Consideration 220.1
Satisfied by:
cash consideration 206.0
deferred consideration 13.1
other consideration 1.0
220.1
Contingent payments to former owners 16.3
Net bank overdrafts acquired 21.8
Transaction costs and expenses 6.9
Total expected spend in respect of current year
completed acquisitions 265.1
Committed spend in respect of current year
acquisitions not completed 7.2
Total committed spend in respect of current year acquisitions 272.3
The net cash outflow in the year in respect of acquisitions comprised:
£m
Cash consideration 206.0
Net bank overdrafts acquired 21.8
Deferred consideration in respect of prior year acquisitions 6.7
Net cash outflow in respect of acquisitions 234.5
Acquisition related costs 20.2
Total cash outflow in respect of acquisitions 254.7
FINANCIAL REVIEW
‘ COMMITTED ACQUISITION SPEND OF
£272 MILLION WILL ADD MORE THAN
£500 MILLION OF ANNUALISED REVENUE.’
Brian May
Finance Director

BUNZL PLC ANNUAL REPORT 2012 23
CASH FLOW
Cash generated from operations before acquisition related costs was
£349.1 million, a £41.0 million decrease from 2011, primarily due to
a working capital outflow in 2012 of £22.4 million compared to a
£31.4 million inflow in 2011, attributable to a particularly low working
capital level at the end of 2011, partially offset by a £17.8 million increase
in profit before tax, intangible amortisation, acquisition related costs and
disposal of business. The Group’s free cash flow of £234.7 million was
down £40.5 million from 2011. After payment of dividends of £85.7
million in respect of 2011, a £3.7 million outflow on employee share
schemes and an acquisition cash outflow of £254.7 million, the net cash
outflow was £109.4 million. The summary cash flow for the year was
asfollows:
£m
Cash generated from operations* 349.1
Net capital expenditure (20.2)
Operating cash flow* 328.9
Operating cash flow* to operating profit†93%
Net interest (30.6)
Tax (63.6)
Free cash flow 234.7
Dividends (85.7)
Acquisitions (254.7)
Employee share schemes (3.7)
Net cash outflow (109.4)
*Before acquisition related costs
†Before intangible amortisation and acquisition related costs
BALANCE SHEET
Return on average operating capital employed before intangible
amortisation and acquisition related costs decreased to 56.4% from
57.4% in 2011 due to the impact of acquisitions having a lower return
on operating capital than the rest of the Group. Return on invested capital
increased from 17.3% in 2011 to 17.9% due to a combination of improved
returns in the underlying business and the disposal of the UK vending
business, partly offset by the impact of recent acquisitions. Intangible
assets increased by £66.1 million to £1,322.9 million reflecting goodwill
and customer relationships arising on acquisitions in the year of £158.3
million, partially offset by an amortisation charge of £47.7 million and a
reduction of £44.5 million due to exchange. The Group’s pension deficit
of £75.5 million at 31December 2012 was £1.2 million higher than at
31December 2011, with an actuarial loss of £13.5 million and a service
cost of £5.4 million being largely offset by contributions of £13.2 million,
a net financial return of £2.2 million and an exchange gain of £2.3 million.
The actuarial loss arose primarily as a result of the £28.8 million impact of
changes in assumptions relating to the present value of scheme liabilities,
principally due to lower discount rates, partially offset by the actual return
on scheme assets being £15.3 million higher than expected.
The movements in shareholders’ equity and net debt during the year were
as follows:
Shareholders’ equity £m
At 1 January 2012 806.7
Profit for the year 195.3
Dividends (85.7)
Currency (30.4)
Actuarial loss on pension schemes (13.5)
Share based payments 11.1
Other 2.0
At 31 December 2012 885.5
Net debt £m
At 1 January 2012 (652.9)
Net cash outflow (109.4)
Currency 24.2
At 31 December 2012 (738.1)
Net debt to EBITDA (times) 1.8
EXCHANGE RATES
Average 2012 2011
US$: £ 1.59 1.60
€: £ 1.23 1.15
A$: £ 1.53 1.55
C$: £ 1.58 1.59
Brazilian real: £ 3.10 2.68
Closing 2012 2011
US$: £ 1.63 1.55
€: £ 1.23 1.20
A$: £ 1.57 1.52
C$: £ 1.62 1.58
Brazilian real: £ 3.33 2.90
CAPITAL MANAGEMENT
The Group’s policy is to maintain a strong capital base so as to maintain
investor, creditor and market confidence and to sustain future
development of the business.
The Group monitors the return on average operating capital employed and
the return on invested capital as well as the level of total shareholders’
equity and the amount of dividends paid to ordinary shareholders.
The Group funds its operations through a mixture of shareholders’ equity
and bank and capital market borrowings. All of the borrowings are
managed by a central treasury function and funds raised are lent onward
to operating subsidiaries as required. The overall objective is to manage
the funding to ensure the Group has a portfolio of competitively priced
borrowing facilities to meet the demands of the business over time and,
in order to do so, the Group arranges a mixture of borrowings from
different sources with a variety of maturity dates.
The Group’s businesses provide a high and consistent level of cash
generation which helps fund future development and growth. The Group
seeks to maintain an appropriate balance between the higher returns that
might be possible with higher levels of borrowings and the advantages and
security afforded by a sound capital position.
There were no changes to the Group’s approach to capital management
during the year and the Group is not subject to any externally imposed
capital requirements.
TREASURY POLICIES AND CONTROLS
The Group has a centralised treasury department to control external
borrowings and manage liquidity, interest rate and foreign currency risks.
Treasury policies have been approved by the Board and cover the nature
of the exposure to be hedged, the types of financial instruments that may
be employed and the criteria for investing and borrowing cash. The Group
uses derivatives to manage its foreign currency and interest rate risks
arising from underlying business activities. No transactions of a speculative
nature are undertaken. The treasury department is subject to periodic
independent review by the internal audit department. Underlying policy
assumptions and activities are periodically reviewed by the executive
directors and the Board. Controls over exposure changes and transaction
authenticity are in place.
HEDGE ACCOUNTING
The Group designates derivatives which qualify as hedges for accounting
purposes as either (a) a hedge of the fair value of a recognised asset or
liability; (b) a hedge of the cash flow risk resulting from changes in interest
rates or foreign exchange rates; or (c) a hedge of a net investment in a
foreign operation. The Group tests the effectiveness of hedges on a
prospective and retrospective basis to ensure compliance with IAS 39
‘Financial Instruments: Recognition and Measurement’. Methods for
testing effectiveness include dollar offset, critical terms and
regressionanalysis.

24 BUNZL PLC ANNUAL REPORT 2012
161
BANK FACILITIES – UNDRAWN
BANK FACILITIES – DRAWN
US DOLLAR AND STERLING BONDS
13 14 16 17 18
147
31 32
112
67
31
49
86
80
50
50
123
33
287
19 20 21 22 23
59 41 32
67
15
LIQUIDITY RISK
Liquidity risk is the risk that the Group will not be able to meet its financial
obligations as they fall due. The Group continually monitors net debt and
forecast cash flows to ensure that sufficient facilities are in place to meet
the Group’s requirements in the short, medium and long term and, in
order to do so, arranges borrowings from a variety of sources. Additionally,
compliance with the Group’s biannual debt covenants is monitored on a
monthly basis. The principal covenant limits are net debt to EBITDA of no
more than 3.5 times and interest cover of no less than 3.0 times. Sensitivity
analyses using various scenarios are applied to forecasts to assess their
impact on covenants and net debt. During 2012 all covenants have been
complied with and based on current forecasts it is expected that such
covenants will continue to be complied with for the foreseeablefuture.
The Group has substantial borrowing facilities available to it comprising
multi-currency credit facilities from the Group’s banks and US dollar and
sterling bonds. During the year an issue of fixed interest rate US dollar bonds
was agreed for a total value of US$350.0 million of which US$110.0
million was drawn down in December 2012 and US$240.0 million is
due to be drawn by the Group in April 2013 to refinance bonds which
are maturing. At 31 December 2012 the total bonds outstanding were
£618.9 million (2011: £585.1 million) with maturities ranging from 2013
to 2023. During the year the Group also refinanced or agreed new banking
facilities totalling £150.7 million. The Group’s committed bank facilities
mature between 2013 and 2017. At 31December 2012 the available
committed bank facilities totalled £758.5 million (2011: £730.8 million)
of which £169.2 million (2011: £109.3 million) was drawn down. The
undrawn committed facilities available to the Group at 31 December 2012
were £589.3 million (2011: £621.5 million). The committed facilities
maturity profile at 31 December 2012 is set out in the chart below.
INTEREST RATE RISK
The Group is funded by a mixture of fixed and floating rate debt. In
addition, interest rate swaps and interest rate caps are used to manage
the interest rate risk profile. At 31 December 2012 fixed rate debt of
£472.2 million (2011: £425.2 million) related to fixed rate US dollar and
sterling bonds stated at amortised cost with maturities ranging from
2014 to 2023.
At 31 December 2012 floating rate debt comprised £174.3 million of
floating rate bank loans (2011: £109.3 million) and £146.7 million of fixed
rate US dollar bonds which have been swapped to floating rates using
interest rate swaps (2011: £159.9 million). Bank loans are drawn for
various periods of up to three months at interest rates linked to LIBOR.
The interest rate swaps reprice every three or six months.
The interest rate risk on the floating rate debt is managed using interest
rate options. Borrowings with a notional principal of £162.6 million were
capped at 31 December 2012 (2011: £266.7 million).
FOREIGN CURRENCY RISK
The principal underlying currencies of the Group’s earnings are sterling,
US dollars and euros. The Group does not hedge the impact of exchange
rate movements arising on translation of earnings into sterling at average
exchange rates. For the year ended 31 December 2012, a movement of
one cent in the US dollar and euro average exchange rates would have
changed profit before tax by £0.8 million and £0.3 million respectively
and profit before tax, intangible amortisation, acquisition related costs
and disposal of business by £0.9 million and £0.5 million respectively.
The majority of the Group’s transactions are carried out in the respective
functional currencies of the Group’s operations and so transaction
exposures are usually relatively limited. Where they do occur, the Group’s
policy is to hedge significant exposures of firm commitments for a period
of up to one year as soon as they are committed using forward foreign
exchange contracts and these are designated as cash flow hedges.
However, the economic impact of foreign exchange on the value of
uncommitted future purchases and sales is not hedged. As a result,
sudden and significant movements in foreign exchange rates can impact
profit margins where there is a delay in passing on to customers the
resulting price increases.
The majority of the Group’s borrowings are effectively denominated in
sterling, US dollars and euros, aligning them to the respective functional
currencies of its operating profit before depreciation, intangible amortisation
and acquisition related costs (‘EBITDA’). This currency profile is achieved
using short term foreign exchange contracts, long term cross currency
interest rate swaps and foreign currency debt. This currency composition
minimises the impact of foreign exchange rates on the ratio of net debt
toEBITDA.
CREDIT RISK
Credit risk is the risk of loss in relation to a financial asset due to
non-payment by the counterparty. The Group’s objective is to reduce
its exposure to counterparty default by restricting the type of counterparty
it deals with and by employing an appropriate policy in relation to the
collection of financial assets.
The Group’s principal financial assets are cash and deposits, derivative
financial instruments and trade and other receivables which represent the
Group’s maximum exposure to credit risk in relation to financial assets.
The maximum exposure to credit risk for these financial assets is their
carrying amount.
Dealings are restricted to those banks with the relevant combination of
geographic presence and suitable credit rating. The Group continually
monitors the credit ratings of its counterparties and the credit exposure
to each counterparty.
For trade and other receivables, the amounts represented in the balance
sheet are net of allowances for doubtful receivables, estimated by the
Group’s management based on prior experience and their assessment
of the current economic environment.
At the balance sheet date there were no significant concentrations of
credit risk.
GOING CONCERN
Details of the Group’s activities, developments and performance are set
out on pages 8 to 31. This Financial review summarises the Group’s
financial performance, balance sheet and cash flows and provides
information on its treasury policies, exposure to financial risks, debt profile
and funding headroom. Note 13 to the consolidated financial statements
provides further details of the Group’s debt profile, capital management
policy, treasury policies and controls, hedging activities and financial
instruments and its policies and exposures to liquidity, interest rate,
foreign currency and credit risks.
The Group has significant financial resources, a well established,
fragmented customer base, strong supplier relationships and a diverse
geographic presence. As a consequence, the directors believe that the
Group is well placed to manage its business risks successfully. Based
on the expected future profit generation, cash conversion and current
facilities’ headroom over the 12 months to March 2014, the directors
have a reasonable expectation that the Group has adequate resources
to continue in operational existence for the foreseeable future. For this
reason the directors believe it is appropriate to continue to adopt the
going concern basis in preparing the financial statements.
COMMITTED FACILITIES MATURITY
PROFILE 2013–2023 £m
FINANCIAL REVIEW CONTINUED

BUNZL PLC ANNUAL REPORT 2012 25
Bunzl has an extensive risk management framework designed to identify and assess the likelihood and consequences of risk and to manage the
actions necessary to mitigate their impact.
RISK OVERVIEW
The effective identification, management and mitigation of risks and uncertainties across the Group are an integral part of delivering the Group’s
strategic objectives. The ‘Risk management and internal control’ section of the Corporate governance report on pages 36 and 37 includes further
information on the specific procedures designed to identify, manage and mitigate business risk which could have a material impact on the Group’s
business, financial condition or results of operations.
The Company’s approach involves risks being regularly reviewed by each business area and measured against a defined set of probability and
impact criteria. This is then captured in a consistent reporting format, enabling management to consolidate the business area risk information
and summarise the material risks in the form of a Group risk assessment. The Executive Committee then reviews the Group risk assessment,
the relevant controls and other steps taken to mitigate the risks identified and the assurance procedures in place over such controls with a view
to determining any further actions required in order to reduce the levels of risk to acceptable levels. The risk assessment is then submitted for
review and approval by the Board.
CHANGES TO THE RISK PROFILE
The Group operates in many business environments and across a number of geographies in which risks and uncertainties exist, not all of which
arenecessarily within the Company’s control. The risks identified in the 2011 Annual Report remain those of most concern to the business at the
end of 2012. However in particular the risks relating to the impact of price deflation and competitive pressures are considered to have increased
and the risk relating to financial liquidity has decreased since the previous year. The principal risks and uncertainties faced by the Group and the
steps taken to mitigate such risks and uncertainties are detailed below. This summary is not intended to be exhaustive and is not presented in
order of potential probability or impact.
Market risks Mitigating factors
Competitive pressures
The Group operates in highly competitive markets and faces competition
from international companies as well as national, regional and local
companies in the countries in which it operates. Increased competition
and unanticipated actions by competitors or customers could lead to an
adverse effect on results and hinder the Group’s growth potential, either
through pressure on margins or loss of customers.
The Group seeks to remain competitive by maintaining high service
levels and close contacts with its customers to ensure that their needs
and demands are being met satisfactorily, developing a national
presence in the markets in which the Group operates and maintaining
strong relationships with a variety of different suppliers thereby enabling
the Group to offer a broad range of products to its customers.
Product price changes
The purchase price and availability of products distributed by the Group
can fluctuate from time to time, thereby potentially affecting the results
of operations. Adverse economic conditions resulting in a period of
commodity price deflation and increased levels of imported products
may lead to reductions in the price and value of the Group’s products.
Ifthis were to occur, the Group’s revenue and, as a result, its profits,
could be reduced and the value of inventory held in stock may not
be fully recoverable.
The Group endeavours, whenever possible, to pass on price increases
from its suppliers to its customers and to source its products from a
number of different suppliers so that it is not dependent on any one
source of supply for any particular product. Increased focus on the
Group’s own import programmes and brands, together with the
reinforcement of the Group’s service and product offering to
customers, helps to minimise the impact of price deflation.
The Group mitigates against the risk of holding overvalued inventory
ina deflationary environment by managing stock levels efficiently and
ensuring they are kept to a minimum.
Economic environment
The Group’s business is partially dependent on general economic
conditions in the US, the UK, France and other important markets.
Asignificant deterioration in these conditions could have an adverse
effect on the Group’s business and results of operations.
The Group’s operations and its customer base are diverse, with a
variable and flexible cost base, and many of the sectors in which
itcompetes are traditionally, by their nature, relatively resilient to
economic downturns.
Financial risks Mitigating factors
Foreign exchange
The majority of the Group’s sales are made and income is earned in
US dollars, euros and other foreign currencies. As a result, movements
in exchange rates may have a material translation impact on the
Group’s reported results.
The Group may also be subject to transaction exposures where
products are purchased in one currency and sold in another and
movements in exchange rates may also adversely affect the value
of the Group’s net assets.
The Group’s businesses, reported results and net assets could similarly
be affected by the exit from the eurozone of countries where the Group
has operations.
The Group believes that the benefits of its geographical spread
outweigh the associated risks.
The majority of the Group’s transactions are carried out in the
functional currency of the Group’s operations. As a result, transaction
exposures are usually limited and exchange rate fluctuations have
minimal effect on the quality of earnings unless there is a sudden and
significant adverse movement of a foreign currency in which products
are purchased which may lead to a delay in passing on to customers
the resulting price increases.
Although the consequences of a country leaving the eurozone, and the
resulting impact this will have on other countries both within and outside
the eurozone, are difficult to predict, the Group’s operations in those
countries most likely to do so at the current time are relatively small.
PRINCIPAL RISKS AND UNCERTAINTIES

26 BUNZL PLC ANNUAL REPORT 2012
Financial risks continued Mitigating factors
Financial liquidity and debt covenants
The Group needs continuous access to funding in order to meet its
trading obligations, to support investment in organic growth and to
makeacquisitions when appropriate opportunities arise. There is a risk
that the Group may be unable to obtain the necessary funds when
required or that such funds will only be available on unfavourable terms.
The Group’s borrowing facilities include a requirement to comply with
certain specified covenants in relation to the level of net debt and interest
cover. A breach of these covenants could result in a significant proportion
of the Group’s borrowings becoming repayable immediately.
The Group arranges a mixture of borrowings from different sources
andcontinually monitors net debt and forecast cash flows to ensure
thatit will be able to meet its financial obligations as they fall due and
that sufficient facilities are in place to meet the Group’s requirements
inthe short, medium and long term.
Compliance with the Group’s biannual debt covenants is monitored
onamonthly basis based on the management accounts. Sensitivity
analyses using various scenarios are applied to forecasts to assess
their impact on covenants.
Operational risks Mitigating factors
Acquisitions
A significant portion of the Group’s historical growth has been achieved
through the acquisition of businesses and the Group’s growth strategy
includes additional acquisitions. Although the Group operates in a
number of fragmented markets which provide future acquisition
opportunities, there can be no assurance that the Group will be able
to make acquisitions in the future or that any acquisitions made will
be successful.
In the longer term, if an acquisition consistently underperforms
compared to its original investment case, there is a risk that this will
lead to a permanent impairment in the carrying value of the intangible
assets attributed to that acquisition.
The Group’s acquisition strategy is to focus on those businesses
which operate in sectors where it has or can develop competitive
advantage and which have good growth opportunities. The Group
continually reviews acquisition targets and has established processes
and procedures with regard to detailed pre-acquisition due diligence
and post-acquisition integration.
The Group endeavours to maximise the performance of an acquisition
through the recruitment and retention of high quality management
combined with effective strategic planning, investment in resources
and infrastructure and regular reviews of performance by both
business area and Group management.
Business continuity
The Group would be affected if there was a significant failure of its
major distribution facilities or information systems.
The Group seeks to reduce the impact of facilities’ failure through
the use of multi-site facilities with products stocked in more than one
location and the impact of information systems’ failure through the
adoption of detailed back up plans which are periodically tested
and which would be implemented in the event of any such failure.
Laws and regulations
The international nature of the Group’s operations exposes it to potential
claims as the Group is subject to a broad range of laws and regulations
in each of the jurisdictions in which it operates.
In addition the Group faces potential claims from customers in relation
tothe supply of defective products or breaches of their contractual
arrangements. The sourcing of products from lower cost countries
increases the risk of the Group being unable to recover any potential
losses relating thereto from the relevant supplier.
Although the Group does not operate in particularly litigious market
sectors, it has in place processes to report, manage and mitigate
against third party litigation using external advisers where necessary.
The use of reputable suppliers and internal quality assurance and
quality control procedures reduce the risks associated with
defectiveproducts.
The Financial review on pages 22 to 24 and Note 13 to the consolidated financial statements include information relating to the Group’s risk
management policies so far as they relate to financial instruments.
PRINCIPAL RISKS AND UNCERTAINTIES CONTINUED

BUNZL PLC ANNUAL REPORT 2012 27
Further details of the Group’s CR policies, processes and controls
and how they are monitored are available in the Responsibility
section of the Company’s website, www.bunzl.com.
OUR BUSINESS RELIES ON
DEVELOPING STRONG AND
STABLE RELATIONSHIPS WITH
ALL OUR STAKEHOLDERS
WHICH REQUIRES US TO
MANAGE OUR BUSINESS
WITH INTEGRITY, MAKING
SUSTAINABLE, LONG TERM
DECISIONS.
OUR APPROACH
To transform our strategy into tangible
activities we undertake the following steps:
CORPORATE RESPONSIBILITY
MEASURE AND
MONITOR
PERFORMANCE
(CR METRICS)
COMMUNICATE
AND REPORT TO
STAKEHOLDERS
SEEK AND ACT ON
STAKEHOLDER
FEEDBACK
DEVISE AND
MAINTAIN
SYSTEMS
SET POLICY
2013 objectives
t Review the CR training modules to identify any gaps and, if appropriate,
add to the existing e-learning modules.
t Taking into account the results of our monitoring and reviewing of the
existing policies, processes and controls, makeany necessary
amendments thereto as well as considering further training and/or
communication requirements that may be necessary.
EMPLOYEES
Bunzl currently operates in 27 countries worldwide. We are a service
provider, not a manufacturer and, as such, our business relies heavily on
the skills and experience of our employees. We pride ourselves on the fact
that we run our businesses locally with local managers. We do not unfairly
discriminate and we respect human rights. We seek to recruit the right
people who are passionate about our business and provide opportunities
for people to progress within the organisation on the basis of their skills,
experience and aptitude. We believe that to get the best from people
we need to respect each other and encourage honest, straightforward
communication. Our acquisition pipeline continues to be a valuable
source of management talent for the Group and the completion of a
number of acquisitions during the year has brought further highly skilled
people into Bunzl.
Performance against 2012 objectives
t The 2012 Employee Survey was run which covered all employees in
UK & Ireland, Continental Europe and Rest of the World which together
represent two thirds of the Group’s workforce. A variety of actions have
subsequently been implemented in different businesses across the
Group as a result of feedback from the survey, for example the
introduction of more flexible working, improved communication
and teambriefings.
t We have also continued to monitor key HR measures:
–voluntary turnover remains at low levels in all business areas other
than Rest of the World, reflecting the current economic conditions
within the countries in which we operate rather than any intrinsic
reasons related to the Group; and
–sickness absence has fallen slightly in Continental Europe, remained
flat in North America and Rest of the World and slightly increased in
UK & Ireland. No underlying issues of concern have been identified.
2013 objectives
t Continue to monitor key HR measures such as voluntary turnover,
sickness absence, training days, workforce gender and age mix and,
as appropriate, take action to address any issues that may arise.
STRATEGY
We believe that Corporate Responsibility (‘CR’) is not only about the good
management of our business but also excellent and responsive long term
relationships with all our stakeholders, whether customers, employees or
suppliers. We have identified seven CR elements relevant to our business
model: business conduct/code of ethics; employees; health & safety;
environment; community; customers; and suppliers. These are governed
by a policy framework, which is approved and monitored by the Board,
with implementation at a business area level.
BUSINESS CONDUCT/CODE OF ETHICS
The Group’s business conduct/code of ethics policy is disseminated to
every employee as a guide to how employees are expected to conduct
themselves both from a corporate and individual perspective. The policy
clearly states that employees should avoid conflicts of interest, provides
guidance on the giving and receiving of gifts and entertainment, prohibits
illegal payments as well as political donations and reinforces the need to
comply with laws, rules and regulations, protect confidential information
and company assets and maintain high standards in relationships with
our customers and suppliers.
No material breaches of our business conduct/code of ethics policy were
recorded in 2012. However, some minor incidents relating to employee
conduct, such as theft or misuse of the Group’s property, did occur and
were dealt with during the normal course of business using Group human
resource (‘HR’) policies and procedures. Seven (2011: seven) calls/letters
were received through the ‘Speak Up’ process, none of which raised any
issues of material concern.
Performance against 2012 objectives
t By April 2012 all management and sales and purchasing staff across the
Group had undertaken a suite of nine tailored e-learning modules which
highlight the key responsibilities of employees in relation to CR. One of
the modules provides an overview of the business conduct/code of
ethics policy and this is supplemented by modules relating to anti-
bribery issues such as facilitation payments and gifts and entertainment.
A further module details our whistle blowing process ‘Speak Up’. These
modules now form part of the induction process for managers and sales
and purchasing staff who join the Group. From inception to date there
have been at total of approximately 19,000 viewings of the modules.
t During the year our internal audit department monitored and reviewed
many of the new processes and procedures introduced in 2011 as a
consequence of the Bribery Act, such as the enhanced Gifts Register
to ensure that both gifts received and given are recorded by employees
in all companies in the Group. Any areas of non-compliance have been
highlighted and the relevant processes and controls have subsequently
been implemented. In addition we have strengthened our Quality
Assurance and Quality Control (‘QA/QC’) function based in Shanghai
to ensure that we are able to ensure that our suppliers in the Far East
are maintaining appropriate ethical standards.

28 BUNZL PLC ANNUAL REPORT 2012
WE WORK CONTINUOUSLY WITH
OUR EMPLOYEES, SUPPLIERS
AND CUSTOMERS TO IMPROVE
OUR HEALTH AND SAFETY
PRACTICES, AS WELL AS
DECREASING ALL OF OUR
STAKEHOLDERS’ IMPACTS ON
THE ENVIRONMENT BY EFFICIENT
ROUTE PLANNING, SAFE DRIVING
AND REDUCING WASTE.
12%
IMPROVEMENT
IN ACCIDENT
INCIDENCE RATE.
11%
DECREASE IN
SCOPE 1 CARBON
EMISSION RATES.
CORPORATE RESPONSIBILITY CONTINUED

BUNZL PLC ANNUAL REPORT 2012 29
Our direct water usage and emissions are minimal. Water usage is
principally confined to workplace cleaning and hygiene purposes. In 2012
we monitored water usage across a sample of our sites worldwide. This
confirmed the conclusions drawn from the 2011 water audit. We will
continue to monitor both usage and emissions going forward.
ISO 14001 accreditation was renewed in a number of locations. To date
all sites in UK & Ireland, Australasia and many sites in Continental Europe
are accredited. By revenue this represents more than 30% of the Group.
Performance against 2012 objectives
The reported environmental data has been restated as a result of the
disposal of our vending business in August 2011 and double reporting
of fuel from some locations in previous years and updated in accordance
with the Defra carbon conversion factors published in 2012. These
updated factors have been applied retrospectively to 2010 and 2011
to develop the Group Carbon Footprint given in the table below:
Greenhouse gas emissions data for period 1 October to 30 September
Tonnes of CO2e
Base year 2010 2011 2012
Scope 1 93,125 89,286 84,727
Scope 2 30,117 28,637 27,497
Total gross emissions 123,242 117,923 112,224
Total carbon emissions
per £m revenue 26.1 23.6 21.2
t Our target for 2012 was to reduce our Scope 1 and Scope 2 carbon
emissions relative to revenue by 13% and 14% respectively from the
2010 base year. These figures cover more than 95% of the Group by
revenue as businesses recently acquired are not yet included.
t Scope 1: emission rates per £m of revenue have decreased between
2011 and 2012 by 11% (see the KPI bar chart on page 7) and from
2010, our base year, by 19%. Fuel for transportation contributes about
90% of Bunzl’s Scope 1 emissions. The level of fuel consumed per
£000 of revenue decreased between 2011 and 2012 by 8% (see
the KPI bar chart on page 7). Fuel efficiency has increased through
improved driver behaviour as a result of training and the use of
telematics providing in-cab feedback on performance. In addition we
regularly renew our fleet and new vehicles introduced in the UK are
showing significant reductions in fuel consumption. Many of the
businesses acquired since 2010 do not operate their own transport
fleets and there has been some transfer from own fleet to carriers
where this has been shown to be more cost effective. Natural gas
consumption has been positively affected by a number of site
consolidations, a focus on usage and boiler maintenance and
a relatively warm winter.
t Scope 2: emission rates per £m of revenue have decreased between
2011 and 2012 by 9% (see the KPI bar chart on page 7) and from
2010, our base year, by 19%. We have continued to implement a
number of measures to reduce electricity consumption including the
installation of energy efficient lighting systems and voltage optimisation
equipment, replacement of battery chargers with high frequency energy
efficient chargers and ‘Switch off’ campaigns. During 2012 the Group
invested more than £500,000 in a further 10 projects with payback
periods of up to three years giving estimated annual savings of almost
3million kwh.
t North America appointed waste disposal contractors who are able to
provide us with data on the weight of waste collected from our sites.
As data was not available for the whole of 2012 we have extrapolated
the full year’s data from a sample of three months. Through the year
there has been an improvement in the segregation of waste, with some
of our facilities achieving zero waste to landfill. Where segregation of
waste for recycling is not possible we continue to seek an increase
of waste to incineration in preference to landfill.
t Review and assess the benefits of the introduction into UK & Ireland
in 2012 of an IT based networking tool and to consider the potential
application of the tool across the Group to improve communication
and share best practice.
HEALTH & SAFETY
The health and safety of our employees and other stakeholders is a
priority. Although we try to minimise the risks which occur, particularly
relating to the operation of our warehouses and vehicles, incidents relating
to manual handling, slipping and tripping remain the highest cause of
accidents. Regretfully in 2012 there was a fatality (2011: no fatalities)
when a member of the public died in a road traffic accident in North
America having collided with a Bunzl vehicle that was parked on the hard
shoulder. This accident was fully investigated and Bunzl was found not to
be at fault. A number of actions have been taken to raise awareness and
continue to improve our health and safety performance.
Performance against 2012 objectives
t The 2012 target was to reduce the Group accident incidence rate by 3%
and the Group accident severity rate by 5% from the 2011 accident rates:
–for the year ended 30 September 2012 our accident incidence rate
improved by 12%. This was principally due to better performance in
North America, UK & Ireland and Continental Europe; and
–for the same period our accident severity rate increased by 3%.
This was principally due to a slight increase in Rest of the World
and a relatively flat performance in the rest of the Group. In the
previous year the accident severity rate improved by 29%.
Details of our performance from 2010 to 2012 are provided in the bar
charts below. The accident data provided is for the whole Group with the
exception of some of the most recent acquisitions which represent less
than 1% of the total workforce.
2013 objectives
t Reduce the Group accident incidence rate by 3% from 2012.
t Reduce the Group accident severity rate by 6% from 2012.
ENVIRONMENT
We seek to prevent, mitigate and remediate the harmful effects of Bunzl’s
operations on the environment. To ameliorate our impact on and exposure
to climate change, our facilities operate worldwide to Group standards, we
promote environmental awareness throughout the business and our
branch network mitigates against the effects of extreme local climate
conditions. Our reported environmental data includes all businesses that
are subsidiaries of the Group for financial reporting purposes, with the
exception of recent acquisitions which are excluded from environmental
data reporting to allow the acquired businesses sufficient time to adopt
our reporting guidelines. Bunzl had no environmental incidents in 2012.
10
AVERAGE NUMBER OF
DAYS LOST PER MONTH
PER 100,000 EMPLOYEES.
4,863
3,446 3,552
11 12
10
AVERAGE NUMBER OF
INCIDENTS PER MONTH
PER 100,000 EMPLOYEES.
157 159
140
11 12
INCIDENCE RATE SEVERITY RATE

30 BUNZL PLC ANNUAL REPORT 2012
The bar chart shows waste indexed against revenue of those businesses
reporting data. The 2011 data includes UK & Ireland, parts of Continental
Europe and Australasia only. The 2012 data includes these areas as well
as, for the first time, North America. As a result, the waste data reported
for 2012 covers 91% of the Group by revenue. Although there has been
improvement in waste management in the Group, the primary driver of the
reduction in the index shown in the chart is the inclusion of North America
in the 2012 statistics. Obtaining accurate waste data continues to be
challenging. Now we have the majority of the Group providing such data,
going forward we will be better able to measure our waste streams and
identify trends and opportunities to improve waste management.
2013 objectives
t Using the 2010 data as the baseline, reduce the Scope 1 and 2 carbon
emissions by 22%.
t Continue to improve the accuracy of waste data and include this as
Scope 3 data.
t Review current reporting practices and prepare for mandatory
environmental reporting.
COMMUNITY
Although Bunzl’s operations are international, our strength is in the local
nature of our businesses. In keeping with this ethos, we particularly
support the fund raising activities championed by our employees locally.
This is supplemented by donations made at Group level to charities
predominantly in the fields of healthcare, disability and the environment as
well as benevolent societies to support projects in communities where our
operations are based. Where possible and appropriate, Bunzl also looks to
donate stock free of charge (‘in-kind’). Group wide, Bunzl donated a total
of £480,000 (2011: £444,000) to charities in 2012. This does not include
in-kind donations or employee fund raising.
Performance against 2012 objectives
t We continued to support projects with a high environmental impact
on the communities in which we operate. In the UK this has included
donating towards the provision of outdoor play equipment for Alexander
Park in Belfast; supporting a community project ‘Seeds, Soups and
Sarnies’ being run by the Eden Project to bring communities together
around the themes of ‘plant’, ‘grow’, ‘share’ and ‘eat’ and also by
assisting Groundwork in Leicester to convert the EcoHouse into an
Ecoactivity Centre for young people. Other larger donations were made
to support healthcare initiatives, which assist both our employees and
the communities in which they live, through Macmillan Cancer Support,
Diabetes UK and the Alzheimer’s Society.
t Group companies and employees worldwide have continued to support
local charitable initiatives. In North America employees raised money
for the National Multiple Sclerosis Society, while employees in Buffalo
undertook a number of activities to support St Luke’s mission, which
helps the Buffalo area’s needy, and six Bunzl Phoenix employees
participated in a five kilometre ‘Race for the Cure’ in support of breast
cancer research. In Shanghai a number of employees undertook a
sponsored run to support UNICEF. In the UK employees have raised
funds through cycling from London to Paris for the Alzheimer’s Society
and taking part in Olympic themed activities to raise monies for PALS,
a charity that provides leisure activities for children and young people
with physical and or sensory disabilities.
t For the seventh consecutive year North America was honoured with a
Greater St Louis Top 50 Business Shaping our Future Award from the
StLouis Regional Commerce and Growth Association. Bunzl was
honoured for being among the best companies in its field and for
making significant contributions to the St Louis region and the future of
its business community. In the UK, one of Greenham’s managers was
awarded the British Safety Industry Federation’s first ever ‘Outstanding
Contribution Award’ for being an outstanding contributor to
improvements in Occupational Health & Safety.
t We continued to make a number of in-kind donations of goods. In the
UK, the majority of such donations have been made through In-Kind
Direct and Crisis at Christmas. In North America donations of sanitation
and foodservice products were made to assist the families struck by the
tragedy in Connecticut when 27 people were killed at Sandy Hook
Elementary School in Newton.
2013 objectives
t Continue to strengthen the links of the business with the communities
in which we operate, supporting employee fundraising and charitable
projects in the fields of environment and healthcare.
t Improve our corporate website to communicate better Bunzl’s approach
to Corporate Responsibility and improve community awareness.
CUSTOMERS
As a service business, our ability both to anticipate and meet our
customers’ needs is key to our success. We strive to ensure that we
provide high levels of service. We achieve this by building solid
relationships at a local level by regularly meeting with and seeking
feedback from our customers. In line with our 2012 objective we have
continued to provide innovative service and product solutions to meet our
customers’ needs including requirements to meet sustainability goals.
Performance against 2012 objective
t In the Netherlands we introduced a new environmentally friendly
laundry bag and a green carrier bag for fruit and vegetables. Our
guest amenities business in Europe launched a sustainable and
environmentally friendly handwash and shampoo dispenser. A number
of UK businesses have been working with customers to provide a
closed loop waste recycling service which supplements the work we
continue to do with suppliers to reduce the amount of packaging used
by them.
t The Group has received a number of awards from our customers
including North America’s Processor Division being the proud recipient
of the Spirit of Excellence Award from Hormel Foods for the 15th year
for achieving or exceeding a 92% supplier rating during a 12 month
period and the R3 Safety team was named as the 2011 Distributor
Partners of America (DPA) Safety Supplier of the Year. In the UK
Bunzl Retail won Supplier of the Year from Boots and Bunzl Cleaning
& Hygiene Supplies won Supplier of the Year from ISS.
2013 objective
t Continue to provide innovative products and improve customer service.
WASTE TONNES PER £m REVENUE
CORPORATE RESPONSIBILITY CONTINUED
INCINERATED WASTE
GENERAL WASTE
RECOVERED/RECYCLED WASTE
11
1.96
1.14
12
0.55
0.21
0.93
0.08

BUNZL PLC ANNUAL REPORT 2012 31
SUPPLIERS
Bunzl has relationships with many suppliers. We want our suppliers to
meet the same CR standards we set ourselves and to that end we have
set up our own QA/QC department as part of our purchasing office in
Shanghai. Our QA/QC staff perform regular audits of many of our Asian
suppliers and work with them to implement appropriate CR standards.
During the year we have increased the staffing of this department.
Although the team is based in Shanghai, they make regular trips
to other parts of Asia to undertake audits as required.
RISKS AND OPPORTUNITIES
The Principal risks and uncertainties section on pages 25 and 26 details the principal risks and uncertainties which could have a material impact on
the Group’s business, financial condition or results of operations. Although many CR risks are not seen as principal risks to the Group, as part of the
Group risk analysis the following CR risks which could impact the Group’s business have been identified together with the steps taken by management
to mitigate such risks:
Risk Mitigating factors
CR compliance failures
Lack of adherence to the Group’s CR policies could result in a variety
of issues including those relating to inappropriate business practices,
accidents at work and increased levies due to levels of waste or carbon
emissions.
The Group has comprehensive CR policies and procedures (including
those relating to anti-bribery and corruption) in place throughout the
business as well as an established reporting framework.
Loss of key employees
The Group is not capital intensive but the business is based on strong
customer and supplier relationships which are built up locally. Stability
of key relationship roles amongst the Group’s employees is therefore
important.
The Group seeks to secure key staff with appropriate incentive
packages, development opportunities and career progression.
Voluntary staff turnover is measured on a monthly basis, which
enables any issues to be identified and resolved.
Loss of operating facilities/unavailability of staff
Climate change may result in higher frequency of extreme weather
conditions. This could result in some of the Group’s facilities being
affected or employees being unable to attend for work.
The Group has multi-site facilities with products stocked in more than
one location as a result of which the Group usually has the ability to
distribute products from nearby facilities. Business continuity plans
are in place to minimise the impact of any such issues.
Suppliers’ non-compliance with good CR practices
The Group is not a manufacturer and has many international suppliers
across the world. The failure of one of the Group’s key suppliers to adhere
to recognised CR standards could affect the Group’s reputation.
The Group’s key suppliers are principally publicly owned multinational
organisations with high standards of operations. Suppliers are monitored
by the Group’s purchasing departments and the QA/QC department
based in China audits many suppliers throughout Asia. Key suppliers
are made aware of the Group’s CR aspirations.
These risks are seen to be outweighed by a variety of opportunities that arise as a consequence of CR and its impact on the business environment.
The principal opportunities include:
Opportunity Response
Environment
Throughout the world there is an increased awareness of the need
to conserve resources and reduce carbon emissions.
Bunzl is not a manufacturer and therefore there is complete flexibility
to offer products that meet customers’ requirements. A full range of
environmentally friendly products are available.
The Group provides customers with the ability to benefit from a
consolidated delivery of their consumable products. This reduces
carbon emissions by eliminating the need for multiple deliveries from
many different suppliers and streamlining the related administration for
our customers.
Climate change
Climate change may result in higher frequency of extreme weather
conditions such as floods, cyclones and heavy snowfall.
There is likely to be an increase in demand for protective clothing to
cope with climate change as well as the need for other products
supplied by the Group, such as cleaning and hygiene products.
Employees
Competition for good quality people continues to be strong. A key element of Bunzl’s strategy is the acquisition of high quality
businesses. This results in a number of motivated, high performing
people joining the Group each year. It also brings new ideas and
fresh approaches to the business which can be utilised elsewhere
in the Group.
Health & safety
Throughout the world there has been an increase in health & safety
legislation and an emphasis on safe working environments.
This leads to an increased demand from both existing and new
customers for the Group’s personal protection equipment as well as
providing the potential to introduce new innovative products in this area.
Performance against 2012 objective
t During the year we have reviewed our key suppliers, i.e. those suppliers
that provide us with approximately 50% of our products by value.
2013 objectives
t Contact any new key suppliers as identified to update them on our
CR aspirations and to encourage them to adopt a similar approach.
t Continue to build long term sustainable relationships with our
key suppliers.

32 BUNZL PLC ANNUAL REPORT 2012
1 PHILIP ROGERSON # (AGE 68)
Appointed to the Board in January 2010 and became Chairman in March
2010. Chairman of the Nomination Committee. He was anexecutive
director of BG plc (formerly British Gas plc) from 1992 to 1998, latterly
as Deputy Chairman. He is Chairman of Carillion plc and De La Rueplc.
2 MICHAEL RONEY # (AGE 58)
Chief Executive since 2005 having been a non-executive director since
2003. After holding a number of senior general management positions
within Goodyear throughout Latin America and then Asia, he became
President of their Eastern European, African and Middle Eastern
businesses and subsequently Chief Executive Officer of Goodyear Dunlop
Tires Europe BV. He is the senior independent non-executive director of
Johnson MattheyPlc.
3 ULRICH WOLTERSos!'%
Non-executive director since 2004. Formerly Managing Director of Aldi
Süd in Germany, he built the business into one of the world’s leading
retailers operating principally in Germany and Austria, the US, the UK
and Australia. He is a non-executive director of Douglas Holding AG
and Deichmann SE. He will retire from the Board following the Annual
General Meeting on 17 April2013.
4 PETER JOHNSON os!'%
Non-executive director since 2006, senior independent director and
Chairman of the Remuneration Committee. Having spent most of his
earlier career in the motor industry, he joined Inchcape plc in 1995,
became Chief Executive in 1999 and was Chairman from 2006 until
2009. He is the senior independent non-executive director of Wates
Group Limited and was Chairman of The Rank Group Plc from 2007
until2011.
5 PATRICK LARMON (AGE 60)
Executive director since 2004 and President and Chief Executive Officer,
North America. Having joined Bunzl in 1990 when Packaging Products
Corporation, of which he was an owner, was acquired, he held various
senior management positions over 13 years before becoming President
ofNorth America in 2003 and additionally assuming the role of Chief
Executive Officer in2004.
6 BRIAN MAY (AGE 48)
Finance Director since 2006. A chartered accountant, he qualified with
KPMG and joined Bunzl in 1993 as Internal Audit Manager. Subsequently
he became Group Treasurer before taking up the role of Finance Director,
Europe & Australasia in 1996 and Finance Director designate in 2005.
Heis a non-executive director of United Utilities Group PLC and United
Utilities WaterPLC.
7 DAVID SLEATH os!'%
Non-executive director since 2007 and Chairman of the Audit Committee.
Formerly a Partner and Head of Audit and Assurance for the Midlands
region of Arthur Andersen, he subsequently became Finance Director
ofWagon plc before joining SEGRO plc, the European industrial property
group, where he was Group Finance Director from 2006 until 2011 and
isnow Chief Executive.
8 EUGENIA ULASEWICZ os!'%
Non-executive director since 2011. After holding a number of senior retail
positions with Bloomingdale’s, Galeries Lafayette and Saks Fifth Avenue,
she joined Burberry Group plc in 1998 as President of Burberry, Americas,
one of four global regions of Burberry Group plc which includes North and
Latin Americas.
9 JEAN-CHARLES PAUZE os!'%
Non-executive director since January 2013. Having previously held a
number of senior positions with PPR Group, Strafor Facom Group and
AlfaLaval Group in France and Germany, he was Chairman and Chief
Executive of Rexel SA from 2002 until 2012. He is presently Chairman of
Europcar Groupe SA and Chairman of the Supervisory Board of CFAO SA.
MEINIE OLDERSMA os!'%(not pictured)
Appointed as a non-executive director and member of the Audit,
Remuneration and Nomination Committees of the Board with effect from
1 April 2013. With over 20 years’ experience in the technology distribution
sector, he held a variety of senior positions with Ingram Micro and served
as Chief Executive and President of their China Group and Managing
Director of their business in Northern Europe before joining 20:20 Mobile
Group Limited in 2008 as Chief Executive.
* Member of the Audit Committee
† Member of the Remuneration Committee
# Member of the Nomination Committee
t *OEFQFOEFOUEJSFDUPS
BOARD OF DIRECTORS
12345
6789

BUNZL PLC ANNUAL REPORT 2012 33
CORPORATE GOVERNANCE REPORT
INTRODUCTION
Bunzl’s corporate governance framework is designed to facilitate effective,
entrepreneurial and prudent management that can safeguard shareholders’
interests and sustain the success of the Company over the longer term.
Inorder to achieve this the Company is committed to high standards of
corporate governance. The UK Corporate Governance Code issued by the
Financial Reporting Council in 2010 (‘the Code’) contains broad principles
together with more specific provisions which set out standards of good
practice in relation to Board leadership and effectiveness, accountability,
remuneration and relations with shareholders. This report describes
howthese principles have been applied by the Company during the year
ended 31 December 2012. The Company confirms that it has complied
throughout 2012 with the provisions of the Code, a copy of which is
available at www.frc.org.uk.
BOARD COMPOSITION
As at 31 December 2012 the Board was made up of eight members
comprising a Chairman, a Chief Executive, two other executive directors
and four non-executive directors. As at the date of this report, the Board
was made up of nine members following the appointment of Jean-Charles
Pauze as a non-executive director with effect from 1 January 2013.
Asannounced in December 2012, an additional non-executive director,
Meinie Oldersma, will join the Board on 1 April 2013 and Ulrich Wolters
will retire from the Board following the Company’s Annual General Meeting
on 17 April 2013. Brief biographical details of the directors are given on
page 32. None of the Company’s non-executive directors had any
previous connection with the Company or its executive directors on
appointment tothe Board and all of them are considered by both the
Board and the criteria set out in the Code to be independent. The
Chairman and each ofthe non-executive directors have a breadth of
strategic, management and financial experience gained in each of their
own fields in a range of multinational businesses. In accordance with the
terms of the Code, with the exception of Ulrich Wolters who retires at the
conclusion of the Annual General Meeting, each of the directors will be
subject to re-election at the forthcoming Annual General Meeting.
THE ROLE OF THE BOARD
To ensure directors maintain overall control over strategic, financial
andoperational and compliance issues, the Board meets regularly
throughout the year and has formally adopted a schedule of matters
which are required to be brought to it for decision. Key aspects of the
Board’s role include:
t setting the Group’s strategic aims and ensuring that the Company
has the necessary capabilities to deliver the Group’s strategy;
t reviewing the Group’s operating performance and approving the
Group’sfinancial results;
t reviewing and approving larger capital expenditure and acquisition/
divestment proposals and material increases to borrowing and
loanfacilities; and
t overseeing the Group’s risk management and internal controls
processes and procedures.
There is a clear division of responsibilities between the Chairman and
the Chief Executive which is set out in writing and has been agreed by
the Board and encompasses the following parameters:
t the primary job of the Chairman is to be responsible for the leadership
of the Board and ensuring its effectiveness on all aspects of its role
while the Chief Executive is responsible for the leadership and the
operational and performance management of the Company within
the strategy agreed by the Board.
t the Chairman is viewed by investors as the ultimate steward of the
business and the guardian of the interests of all the shareholders.
t the Chairman:
–takes overall responsibility for the composition and capability
of the Board and its Committees;
–consults regularly with the Chief Executive and is available on a
flexible basis to provide advice, counsel and support to the Chief
Executive; and
–ensures corporate governance is conducted in accordance with
current best practice, as appropriate to the Group.
t the Chief Executive:
–manages the executive directors and the Group’s management
andday-to-day activities;
–prepares and presents to the Board the strategy for growth in
shareholder value;
–sets the operating plans and budgets required to deliver the
agreedstrategy;
–ensures that the Group has in place appropriate risk management
and control mechanisms; and
–communicates with the Company’s shareholders and analysts on
aday-to-day basis as necessary (subject to an overview of such
matters by the Chairman).
The Chief Executive is also the designated member of the Board
responsible for environmental, social and governance matters and
reports to the Board in relation to such matters.
Peter Johnson is the senior independent director and is available to
shareholders if they have concerns which contact through the normal
channels of Chairman, Chief Executive or Finance Director has failed
toresolve or for which such contact is inappropriate.
The Board has appointed Audit, Remuneration and Nomination
Committees all of which comply with the provisions of the Code and play
an important governance role through the detailed work they carry out to
fulfil the responsibilities delegated to them. Briefing papers are prepared
and circulated to Committee members in advance of each meeting and,
inrespect of the Audit Committee, made available to the other directors.
Further information relating to the Board Committees is set out below.
INFORMATION AND SUPPORT
Board agendas are set by the Chairman in consultation with the Chief
Executive and with the assistance of the Company Secretary, who
maintains a rolling programme of items for discussion by the Board to
ensure that all matters reserved for the Board and other key issues are
considered at the appropriate time. To enable informed decision making,
briefing papers are prepared and circulated to directors approximately
oneweek before the scheduled Board meeting. All Directors have access
to the advice and services of the Company Secretary who is tasked with
ensuring that Board procedures are complied with and the Board is fully
briefed on relevant legislative, regulatory and corporate governance
developments. Directors may also take independent professional advice
atthe Company’s expense where they judge this to be necessary in the
furtherance of their duties to discharge their responsibilities as directors.
The Board meets formally at least eight times a year and the Board
calendar is planned to ensure that the directors discuss a wide range of
topics throughout the year. Normally at least two Board meetings a year

34 BUNZL PLC ANNUAL REPORT 2012
are held at or near Group locations in the UK and overseas where the
directors have the opportunity to meet and interact with senior executives
from different businesses within the Group’s portfolio as well as observe
the operations in situ. During 2012 a number of the Group’s senior
executives made presentations to the Board about the businesses
forwhich they are responsible. These included presentations from the
management of the cleaning and safety, non-food retail and hospitality
businesses in the UK and the Group’s operations in the Netherlands and
Denmark as well as operational reviews by the business area management
in North America and Continental Europe.
In addition to routine Board meetings, the directors meet annually to
review and discuss the Group’s overall strategy. As part of this process,
presentations are made by the Chief Executive and the heads of each of
the business areas together with the Director of Corporate Development.
The Board also oversees the process for reviewing any potential conflicts
of interest which may arise in relation to each member of the Board and
this process was carried out satisfactorily during the year.
All new directors receive a tailored induction on joining the Board,
including meetings with senior management and visits to some of the
Group’s locations. They also receive a detailed information pack which
includes details of directors’ duties and responsibilities, procedures for
dealing in Bunzl’s shares and a number of other governance related
issues. Directors are continually updated on the Group’s businesses
andtheir markets and the changes to the competitive and regulatory
environments in which they operate.
Training and development needs of the Board are kept under review and
directors attend external courses where it is considered appropriate for
them to do so.
AUDIT COMMITTEE
Composition
The Audit Committee comprises all of the independent non-executive
directors and is chaired by David Sleath who is considered by the Board
tohave recent and relevant financial experience as required by the Code.
While the other directors are not members of the Committee, they
normally attend meetings of the Committee by invitation together with
theHead of Internal Audit and representatives from the external auditor.
The Secretary to the Committee is Paul Hussey, Company Secretary.
Role
The Committee’s principal role is to ensure the integrity of the financial
reporting and auditing processes and the maintenance of sound internal
control and risk management systems. In particular the Committee is
responsible for:
t monitoring and reviewing the integrity of the financial statements of the
Group and the significant reporting judgements contained in them;
t reviewing the effectiveness of the Company’s internal financial controls;
t reviewing the process for the management of risk and the assurance
procedures over controls designed to manage key risks;
t reviewing the appropriateness of the Company’s relationship with the
external auditors, including auditor independence, fees and provisions
of non-audit services;
t making recommendations to the Board in relation to the appointment
ofthe external auditor; and
t developing and implementing a policy on the engagement of the
external auditor to supply non-audit services.
The Committee’s terms of reference, which were reviewed and revised
bythe Board during the year to take account of the recent changes to the
Code which will apply to the 2013 financial year, are available on the
Company’s website, www.bunzl.com.
In the performance of its duties, the Committee has independent access
to the services of the Company’s internal audit function and to the external
auditor and may obtain outside professional advice as necessary. Both the
Head of Internal Audit and the external auditor have direct access to the
Chairman of the Committee outside formal Committee meetings.
Activities
The Committee Chairman holds preparatory meetings with the Company’s
senior management and, when appropriate, the Head of Internal Audit
and the external auditor prior to Committee meetings to discuss the
itemsto be considered at the Committee meetings. In addition, separate
discussions are held between the Committee and the Head of Internal
Audit and the external auditor without management present. The
Committee Chairman also attends the Annual General Meeting to respond
to any shareholder questions that might be raised on the Committee’s
activities. The Committee met on four occasions during the year and
members’ attendance at those meetings is set out in the table on page 36.
During the year its activities included:
t receiving and considering reports from the external auditor in relation
tothe half year and annual financial statements;
t reviewing the half year and annual financial reports and the formal
announcements relating thereto;
t receiving and considering reports from the Head of Internal Audit
inrelation to the work undertaken by the internal audit function and
reviewing and approving the internal audit work programme for the year;
t reviewing the effectiveness of the Company’s internal financial controls
and the assurance procedures relating to the Company’s risk
management systems;
t reviewing the arrangements by which staff may, in confidence, raise
concerns about possible improprieties in matters of financial reporting
or other matters and receiving periodic reports relating to the matters
raised through such arrangements;
t reviewing the Committee’s terms of reference and the Committee’s
effectiveness and the internal audit function’s charter;
t reviewing the effectiveness of both the external auditor and the internal
audit function following completion of detailed questionnaires by both
the Board and senior management within the Company;
t making recommendations to the Board concerning the appointment
ofthe external auditor and approving the remuneration and terms of
engagement of the auditor including the audit strategy and planning
process for the current financial year;
t reviewing and approving the level and type of non-audit work which the
external auditor performs, including the fees paid for such work; and
t reviewing the principal tax risks applicable to the Company and the
steps taken to minimise such risks.
Following each Committee meeting, the Committee Chairman reports
anysignificant findings to the Board and copies of the minutes of the
Committee meetings are circulated to all of the directors and to the
external auditor.
CORPORATE GOVERNANCE REPORT CONTINUED
BUNZL PLC ANNUAL REPORT 2012 35
External auditor’s independence
The Committee ensures that the external auditor remains independent of
the Company and receives written confirmation from the external auditor
as to whether it considers itself independent within the meaning of its own
internal and the relevant regulatory and professional requirements. Key
members of the audit team rotate off the Company’s audit after a specific
period of time.
In order to ensure that the objectivity and independence of the external
auditor is not compromised, the Committee has also pre-approved the
non-audit service categories that can be provided by the external auditor
and agreed monetary amounts for each service category that can be
provided by them, subject to a maximum individual engagement value.
Certain categories of services are prohibited under the ethical standards
of the Accounting Practices Board. A permitted service requires specific
authorisation from the Committee or the Committee Chairman where it
does not fall within the pre-approved categories or where its value exceeds
the maximum pre-approved individual engagement value. Such non-audit
service categories which are pre-approved principally comprise tax
services and further assurance services relating to pre-acquisition due
diligence and other duties carried out in respect of acquisitions and
disposals of businesses. The Committee believes that given the external
auditor’s detailed knowledge of the Group’s operations, its structure
andaccounting policies and the importance of carrying out tax services
and detailed due diligence as part of the acquisition process, it is often
appropriate for this additional work to be carried out by the Company’s
auditor. However other firms are also used by the Company to provide
non-audit services and it is the Company’s policy to assess the services
required on a case by case basis to ensure that the best placed adviser
isretained. Details of the fees paid to the external auditor in 2012 in
respect of the audit and for non-audit services are set out in Note 4 to
thefinancial statements.
As part of the decision to recommend to the Board the re-appointment
ofthe external auditor, the Committee takes into account the tenure of
theauditor in addition to the results of its review of the effectiveness of
theexternal auditor and considers whether there should be a full tender
process. There are no contractual obligations restricting the Committee’s
choice of external auditor.
As a consequence of its satisfaction with the results of its review of
theexternal auditor’s activities during the year, the Committee has
recommended to the Board that a resolution proposing the re-appointment
of KPMG Audit Plc as external auditor be put to shareholders at the
forthcoming Annual General Meeting.
REMUNERATION COMMITTEE
The Remuneration Committee comprises all of the independent
non-executive directors and is chaired by the senior independent director,
Peter Johnson. While neither the Chairman of the Company nor the
ChiefExecutive are members of the Committee, they normally attend
meetings by invitation except when the Committee is considering matters
concerning themselves. The Secretary to the Committee is Celia Baxter,
Director of Group Human Resources. Further details of the Remuneration
Committee, the Company’s remuneration policy and how it is applied are
set out in the Directors’ remuneration report on pages 38 to 50. Members’
attendance at the Committee meetings held during the year is set out in
the table on page 36. The terms of reference of the Committee, which
were reviewed and revised by the Board during the year are available on
the Company’s website.
NOMINATION COMMITTEE
Composition
The Nomination Committee comprises the Chairman of the Company,
who chairs the Committee, the Chief Executive and all of the non-executive
directors. In accordance with the provisions of the Code, the majority of
the members are independent non-executive directors. The Secretary
tothe Committee is Paul Hussey, Company Secretary.
Role
The Committee’s principal role is to consider, and make recommendations
to the Board concerning, the composition of the Board including
proposedappointees to the Board, whether to fill any vacancies that
mayarise or to change the number of Board Members. The Committee’s
responsibilities include:
t reviewing the structure, size and composition (including the skills,
knowledge, experience and diversity) of the Board and making
recommendations to the Board with regard to any proposed changes;
t nominating, for the approval of the Board, appropriate individuals to fill
Board vacancies as and when they arise having considered candidates
with relevant experience from a wide range of backgrounds; and
t succession planning, taking into account the challenges and
opportunities facing the Company and the background, skills and
expertise that will be required on the Board in the future, and reviewing
annually management succession planning processes in relation to the
Company’s senior executives.
The Committee meets as necessary throughout the year to discharge
itsresponsibilities. An external search consultancy is retained by the
Company to assess potential candidates to be considered as prospective
non-executive directors and, when appropriate, executive directors.
Activities
The Committee met on four occasions during 2012. Members’ attendance
at those meetings is set out in the table on page 36.
The Committee’s main focus during the year was the process of
identifying and selecting two new non-executive directors. Having taken
account of the existing skills, knowledge, experience and diversity of the
Board, the Committee prepared and agreed a detailed specification for
the role and appointed an external search consultancy, Lygon Group, to
assist the Committee in the recruitment process. Lygon Group does not
provide any other services to, or have any other connection with, the
Company. In particular the Committee were keen to find successful senior
business executives from Continental Europe with extensive international
management experience, preferably in the distribution or service sectors.
As potential non-executive directors, it was important that the candidates
were able to play a supportive role to the executive management team
while at the same time provide strategic input into the Company’s direction
and development. It was also a requirement that the prospective directors
could provide wise counsel and independence of mind and to challenge
management constructively by offering impartial, independent and
objective advice. All members of the Committee had the opportunity to
meet the preferred candidates before a final recommendation was made
to the Board. Following a thorough process Jean-Charles Pauze and
Meinie Oldersma were recommended to the Board in December 2012
tobe appointed as independent non-executive directors. Both these
recommendations were unanimously approved by the Board with
Jean-Charles Pauze being appointed with effect from 1 January 2013
andMeinie Oldersma joining the Board on 1 April 2013.
The Committee also reviewed and took account of the balance of skills,
knowledge, experience and diversity of the Board, the time commitment
expected of the non-executive directors and the conclusions of the
formalevaluation process which was carried out during the year when
considering and recommending the nomination of directors for re-election
at the 2013 Annual General Meeting. In particular the Committee
reviewed the performance of Peter Johnson, who was appointed to the
Board in January 2006. The Committee believes that he continues to
beeffective and to demonstrate strong independence in character and
judgement in the manner in which he discharges his responsibilities as a
director. Consequently the Committee is satisfied that, despite his length
of tenure, he remains independent. Ulrich Wolters, who was appointed
asa non-executive director in 2004, is retiring from the Board after the
forthcoming Annual General Meeting.

36 BUNZL PLC ANNUAL REPORT 2012
The Chief Executive presented his annual management succession plan
to the Committee. The Company recognises that having the right directors
and senior management is crucial for the Group’s success and it is a
keytask of the Committee to ensure that the Company has a robust and
continuous succession planning process. As part of the review this year
the Committee retained an external consultant to provide objective insight
into the development of the Company’s senior executives.
As part of the review of the composition of the Board and the succession
planning process, the Committee notes the publication of the Davies
Review on Women on Boards in February 2011 and the subsequent
amendments which have been made to the Code which will apply to the
2013 financial year. Both the Board and the Committee recognise the
importance of gender diversity throughout the Group. Currently one of the
nine Board members and one of the five Executive Committee members
are female. The Committee aims to have a Board with a broad range of
skills, backgrounds, experience and diversity and while the Committee will
continue to follow a policy of ensuring that the best people are appointed
for the relevant roles, the Committee recognises the benefits of greater
diversity and will continue to take account of this when considering
anyparticular appointment. However, the primary responsibility of the
Committee in selecting and recommending candidates to the Board
whenmaking new appointments is to ensure the strength of the Board’s
composition and the overriding aim is to always select and recommend
the best candidate for the position.
The terms of reference of the Committee, which were reviewed and
revised by the Board during the year to take account of the recent
changes to the Code, are set out on the Company’s website.
BOARD AND COMMITTEE ATTENDANCE
The following table shows the attendance in 2012 of directors at
Boardmeetings and at meetings of the Board Committees of which
theyare members:
Board
Audit
Committee
Remuneration
Committee
Nomination
Committee
Number of meetings 8 4 4 4
Philip Rogerson 8 4
Michael Roney 8 4
Ulrich Wolters 8 4 4 4
Patrick Larmon 8
Peter Johnson 8444
Brian May 8
David Sleath 8444
Eugenia Ulasewicz 8443
PERFORMANCE EVALUATION
The Company has a formal performance evaluation process for the Board,
its Committees and individual directors overseen by the Chairman. This
includes individual discussions between the Chairman and each director
when their individual training and development needs are reviewed. Led
by the senior independent director, the non-executive directors also meet
without the Chairman present at least annually to appraise the Chairman’s
performance including a review of his other commitments to ensure that
he is able to allocate sufficient time to the Company to discharge his
responsibilities effectively. The Chairman also periodically holds meetings
with the non-executive directors without the executive directors present.
All of these processes were carried out satisfactorily during the year.
In accordance with the requirements of the Code an external performance
evaluation was carried out in 2012 and the results were subsequently
presented to the Board. The facilitator of the external evaluation, Lintstock,
does not provide any other services to, or have any other connection with,
the Company. Following the evaluation, the Board agreed to implement
anumber of recommendations including:
t increasing the size of the Board by recruiting two additional
non-executive directors to replace Ulrich Wolters who is due
to retire following the 2013 Annual General Meeting;
t increasing the level of strategic oversight as part of the Board’s annual
strategy review; and
t continuing the focus of the Nomination Committee on the Group’s
senior executive development programmes as part of the Committee’s
annual review of the management succession plan.
As a result of the overall performance evaluation process carried out, the
Board concluded that both it and its Committees are operating effectively.
FINANCIAL AND BUSINESS REPORTING
When reporting externally the Board aims to present a balanced and
understandable assessment of the Group’s position and prospects. Such
assessment is set out in the business review sections of this Annual
Report. The responsibilities of the directors in respect of the preparation of
the Group and parent company financial statements are set out on page
97 and the auditor’s report on page 98 includes a statement by the
external auditor about their reporting responsibilities. As set out on page
24, the directors are of the opinion that it is appropriate to continue to
adopt the going concern basis in preparing the financial statements.
RISK MANAGEMENT AND INTERNAL CONTROL
The directors acknowledge that they have overall responsibility for
identifying and managing the risks faced by the Group and for the Group’s
system of internal control relating to those risks. However, such a system
is designed to manage rather than eliminate the risk of failure to achieve
business objectives and can only provide reasonable and not absolute
assurance against material misstatement or loss. In accordance with
Principle C.2 of the Code and the related guidance, the Company has
established the procedures necessary to ensure that there is an ongoing
process for identifying, evaluating, managing and mitigating significant
risks to the Group and for determining the nature and extent of the
significant risks it is willing to take to achieve its strategic objectives.
Thedirectors confirm that such procedures have been in place for the
year ended 31 December 2012 and up to the date of approval of these
financial statements and have been reviewed during the year.
Further information relating to how the directors maintain overall control
over all significant strategic, financial, operational and compliance issues
is set out in the ‘Role of the Board’ section on page 33.
In addition, the Board has delegated to an Executive Committee,
consisting of the Chief Executive, Finance Director and other functional
managers, the responsibility for identifying, evaluating and monitoring
therisks facing the Group and for deciding how these are managed and
toestablish a system of internal control appropriate to the business
environments in which the Group operates. The principal features of this
system include:
t a procedure for monitoring the effectiveness of the internal control
system through a tiered management structure with clearly defined
lines of responsibility and delegation of authority;
t clearly defined authorisation procedures for capital investment
andacquisitions;
t strategic plans and comprehensive budgets which are prepared
annually by the business areas and approved by the Board;
t formal standards of business conduct (including a code of ethics and
whistle blowing procedure) based on honesty, integrity and fair dealing;
t a well established consolidation and reporting system for the statutory
accounts and monthly management accounts;
t continual investment in IT systems to ensure the production of timely
and accurate management information relating to the operation of the
Group’s businesses; and
t detailed manuals covering Group accounting policies and policies and
procedures for the Group’s treasury operations.
CORPORATE GOVERNANCE REPORT CONTINUED
BUNZL PLC ANNUAL REPORT 2012 37
Some of the procedures carried out in order to monitor the effectiveness
of the internal control system and to identify, manage and mitigate
business risk are listed below:
t central management holds regular meetings with business area
management to discuss strategic, operational and financial issues
including a review of the significant risks affecting each of the
businessareas and the policies and procedures by which these
risks are managed;
t the Executive Committee meets twice per month and also reviews the
outcome of the discussions held at business area meetings on internal
control and risk management issues;
t the Board in turn reviews the outcome of the Executive Committee
discussions on internal control and risk management issues which
ensures a documented and auditable trail of accountability;
t both the Executive Committee and the Board carry out an annual
fraud risk assessment;
t actual results are reviewed monthly against budget, forecasts and the
previous year and explanations obtained for all significant variances;
t the Group’s bank balances around the world are monitored on a weekly
basis and significant movements are reviewed centrally;
t the internal audit department periodically reviews individual businesses
and procedures, makes recommendations to improve controls and
follows up to ensure that management implement the recommendations
made. The internal audit department’s work is determined on a risk
assessment basis and their findings are reported to Group and business
area management as well as to the Audit Committee;
t the Audit Committee, which comprises all of the independent
non-executive directors of the Company, meets regularly throughout
theyear. Further details of the work of the Committee are set out in the
Audit Committee report on pages 34 and 35;
t regular meetings are held with insurance and risk advisers to assess the
risks throughout the Group;
t the management committee, which oversees issues relating principally
to environment, health & safety, insurance and business continuity
planning matters, sets relevant policies and practices and monitors their
implementation;
t risk assessments, safety audits and a regular review of progress against
objectives established by each business area are periodically carried
out; and
t developments in tax, treasury and accounting are continually monitored
by Group management in association with external advisers.
The directors confirm that they have reviewed the effectiveness of the
system of internal control and risk management in operation during 2012.
The external auditor is engaged to express an opinion on the financial
statements. The audit includes the review and test of the system of
internal financial control and the data contained in the financial statements
to the extent necessary for expressing an audit opinion on the truth and
fairness of the financial statements.
RELATIONS WITH SHAREHOLDERS
The Company reports formally to shareholders twice a year with the half
year results announced normally at the end of August and the annual
results announced normally at the end of February. In addition the
Company publishes two interim management statements a year as
required by the Disclosure and Transparency Rules.
The Chief Executive and Finance Director have regular meetings with
representatives of institutional shareholders and report to the Board the
views of major shareholders. Additional forms of communication include
presentations of the half year and annual results. The Chairman and
thesenior independent director and the other non-executive directors
areavailable to meet with major shareholders on request. The Board
alsoperiodically reviews and discusses analysts’ and brokers’ reports
andsurveys of shareholder opinions conducted by the Company’s
ownbrokers.
The Company hosted an Investor Day for institutional investors in March
2012, which included business area presentations by senior management
from North America, Continental Europe, UK & Ireland and Brazil.
Awebcast and copies of the presentations made are available on the
Company’s website.
Notice of the Annual General Meeting is sent to shareholders at least
20working days before the meeting. All shareholders are encouraged
toparticipate in the Annual General Meeting, are invited to ask questions
atthe meeting and are given the opportunity to meet all of the directors
informally. Shareholders unable to attend are encouraged to vote using
theproxy card mailed to them or electronically as detailed in the Notice
ofMeeting. Shareholders are given the option to withhold their vote on
theproxy form. As in previous years, at the forthcoming Annual General
Meeting each of the resolutions put to the meeting will be taken on a poll
rather than on a show of hands as directors believe that a poll is more
representative of shareholders’ voting intentions because shareholder
votes are counted according to the number of shares held and all votes
tendered are taken into account. The results of the poll will be publicly
announced and made available on the Company’s website as soon as
practicable following the Annual General Meeting.
On behalf of the Board
Paul Hussey
Secretary
25 February 2013

38 BUNZL PLC ANNUAL REPORT 2012
DIRECTORS’ REMUNERATION REPORT
INTRODUCTION FROM PETER JOHNSON, CHAIRMAN OF THE REMUNERATION COMMITTEE
The Committee is very much aware of the increased level of public debate surrounding executive pay over the last 12 months. We have closely
followed the proposals by the Department for Business, Innovation and Skills on executive remuneration and consider that the changes we made to
last year’s Directors’ remuneration report to increase transparency were in keeping with the intentions behind these proposals. We have decided this
year principally to retain our report structure following its total revision in 2011, but in response to discussions with shareholders and a shareholder
proxy voting body have added some additional information relating to our annual bonus targets.
During 2012 there were very few changes to the compensation packages of our senior executives. The senior executive team’s salary increases were
consistent with pay levels throughout the Group during the year. The Company achieved the challenging financial objectives set in the budget agreed
by the Board for the year and this performance has resulted in bonus payments for the executives being slightly above target.
In spite of the fact that many countries in which Bunzl operates continued to face difficult economic conditions, the Company has continued to perform
well during 2012. The Committee believes that this consistency has over the years been appropriately rewarded through the Bunzl Long Term Incentive
Plan (the ‘LTIP’). As I reported last year the current LTIP expires in April 2014. The Committee believes that the LTIP has worked well in both incentivising
our senior management and aligning their interests with those of our shareholders. Following a rigorous tender process, the Committee appointed
Deloitte LLP (‘Deloitte’) in October 2012 to assist us in reviewing the current long term incentive arrangements in the context of the remuneration package
as a whole. Deloitte reported their findings back to the Committee in February 2013. Following on from the review, proposals for the introduction of
a new plan upon expiry of the current LTIP will be developed and we will consult with the Company’s principal shareholders on the draft proposals.
If the Committee proposes to retain a share option plan as part of the new LTIP, the relevant performance condition will be on a sliding scale. Subject
to it being approved by shareholders, it is our intention to implement the new LTIP following the Annual General Meeting (‘AGM’) in2014.
This report has been prepared in accordance with the requirements of the Companies Act 2006 (the ‘Act’) and Schedule 8 of the Large and Medium
Sized Companies and Groups (Accounts and Reports) Regulations 2008, the Listing Rules of the UK Listing Authority and the UK Corporate
Governance Code. KPMG Audit Plc has audited the relevant content as required by the Act (the tabular information on pages 47 to 50). A resolution
to approve this report will be proposed at the AGM on 17 April 2013.
COMMITTEE REMIT AND MEMBERSHIP
The terms of reference of the Committee have been formally adopted by the Board and are available for inspection in the Investor Centre section
of the Company’s website, www.bunzl.com. The key responsibilities of the Committee include:
t ensuring that executive directors and senior executives are properly incentivised to attract, retain and fairly reward them for their individual
contribution to the Company and having due regard to the policies and practices applied to the rest of the employees within the Group;
t determining the framework or broad policy for the remuneration of the Chairman and the executive directors of the Board including setting their
individual remuneration packages as well as their level of remuneration and overseeing all the Company’s long term incentive plans;
t ensuring that remuneration is aligned with and supports the Company’s strategy and performance, having due regard to the shareholders and
to the financial and commercial health of the Company, while at the same time not encouraging undue risk taking; and
t communicating and discussing any remuneration issues with the Company’s stakeholders as and when appropriate.
In carrying out these responsibilities, the Committee seeks external remuneration advice as necessary. During the year the Committee received advice
from PricewaterhouseCoopers LLP (‘PwC’), New Bridge Street and Deloitte. In 2012 PwC provided external survey data on directors’ remuneration and
benefit levels and New Bridge Street made a presentation to update the Committee on recent market changes relating to executive remuneration and
provided information to determine whether, and if so to what extent, the performance conditions attached to share options and performance share
awards under the LTIP had been satisfied. In October 2012 Deloitte were appointed by the Committee to undertake a review of the long term incentive
arrangements as described above. In addition to the work undertaken on behalf of the Committee, PwC also provides the Company with some tax and
pre-acquisition due diligence services, New Bridge Street may from time to time also provide services to the Company on remuneration and benefit
related matters that are not subject to review by the Committee and Deloitte also provides the Company with some tax related services.
The following independent non-executive directors were members of the Committee during 2012. Ulrich Wolters will retire from the Board at the
conclusion of the 2013 AGM:
Date of appointment
to the Committee
Meetings eligible
to attend
Meetings
attendance
Ulrich Wolters 21 July 2004 4 4
Peter Johnson 18 January 2006 4 4
David Sleath 5 December 2007 4 4
Eugenia Ulasewicz 20 April 2011 4 4
Jean-Charles Pauze, who was appointed as a non-executive director with effect from 1 January 2013, is also a member of the Committee and
MeinieOldersma, who will join the Board as a non-executive director on 1April 2013, will also be a member of the Committee going forward.
The Secretary to the Committee is Celia Baxter, Director of Group HR. No executive director or Board member plays any part in determining his or her
remuneration. During the year ended 31 December 2012, both the Chief Executive and the Chairman were consulted and invited to attend meetings of
the Committee, but were not present during any part of the meeting when their own remuneration was under consideration.
In line with its remit, the following key issues were addressed by the Committee during the year:
t approval of the 2011 Directors’ remuneration report;
t review of all share plan earnings per share performance measures for the three year period ended 31 December 2011 and the total shareholder
return (‘TSR’) performance measures for the three year periods ended 31 March and 30 September 2012;
t review of the achievement against targets of the awards under the annual bonus plan and the Deferred Annual Share Bonus Scheme (the ‘DASBS’)
and the setting of the targets for 2012;

BUNZL PLC ANNUAL REPORT 2012 39
t review and approval of the performance measures to be applied to the 2012 grants and awards under the LTIP;
t review and approval of all grants and awards made under the LTIP and exercise of Committee discretion regarding the vesting of any outstanding
grants and awards where appropriate;
t annual review of all executive directors’ base salaries and benefits in line with the Company’s policies and practices;
t consideration of current and prospective guidelines and regulations on executive remuneration;
t development of a specification for the review of the LTIP, identification of potential remuneration consultants to assist the Committee in the review
of the LTIP and appointment of a consultant following a tender process; and
t analysis of the shareholder voting results at the 2012 AGM relating to the Directors’ remuneration report and engagement and discussion with
relevant shareholders and a shareholder proxy voting body in connection therewith.
REMUNERATION POLICY ALIGNMENT WITH GROUP STRATEGY
Bunzl continues to pursue its well defined strategy of developing the business through organic growth and targeted acquisitions in both existing and
new geographies, while continuously improving the efficiency of our operations. Bunzl’s business model relies on excellent customer and supplier
relationships and the skills, knowledge and experience of its directors and employees. The Company’s remuneration policy supports this strategy
by ensuring that the overall remuneration package is set at a competitive level whilst ensuring that additional reward is paid for high performance over
a sustained period. This policy is designed to ensure the recruitment, retention and motivation of the executive directors and other senior executives
over the long term.
The performance related elements of the remuneration package are designed to incentivise executives to meet key performance metrics which align
their interests and remuneration with those of shareholders, for example targets relating to earnings per share and TSR. In setting such targets the
Committee takes due account of the potential effect such targets could have on the attitude and behaviour of executives to risk within the business.
In addition the Committee has the discretion to take into account performance on environmental, social and governance matters. The remuneration
package comprises both core fixed elements (base salary, pension and other benefits) and performance based variable elements (cash bonus, the
DASBS and the LTIP). The Committee has set a guideline that for on target performance approximately half of the remuneration package should be
performance related. The structure of the remuneration packages for on target and stretch performance for each of the executive directors is illustrated
in the bar charts below:
77%
34%
23%
10% 24%
23% 7% 27%
Target performance
Below target
performance
Stretch performance
Target performance
Below target
performance
Stretch performance
Target performance
Below target
performance
Stretch performance
Michael Roney
78%
36%
22%
10% 24%
30%
25% 7% 27%
Brian May
70%
35% 15% 24%
25% 11 % 2 6 %
Patrick Larmon
PensionSalary and benefits Bonus (cash/DASBS) LTIP
32%
43%
30%
41%
26%
38%
Notes
a) Salary represents annual salary for 2012 and benefits such as a car or car allowance and private medical insurance as shown on page 47.
b) Pension represents the cost of pension accrued in 2012 in the Defined Benefit Section of the Bunzl Pension Plan for Brian May, the value of the
annual pension allowance for Michael Roney and Brian May, the contributions to the Defined Contribution Section of the Bunzl Pension Plan for
Michael Roney and the total of company contributions to Patrick Larmon’s 401K Plan, Retirement Savings Benefit (the ‘RSB’) and through the
Defined Contribution Senior Executive Retirement Agreement (‘SERA’), further details of which are shown on page 45.
c) Below threshold performance comprises salary, benefits and pension only with no bonus awarded and no LTIP awards vested.
d) Target performance comprises annual bonus awarded at target level (i.e. 70% of base salary comprised of 50% cash and 50% deferred shares
under the DASBS) and, for the LTIP, an assumption that 50% of performance shares will vest and the share options will deliver 25% of their face
value in gain to the executives.
e) Stretch performance comprises annual bonus awarded at maximum level (i.e. 115% of base salary for Michael Roney and Brian May and 110%
of base salary for Patrick Larmon comprised of 50% cash and 50% deferred shares under the DASBS) and, for the LTIP, an assumption that 100%
of performance shares will vest and the share options will deliver 50% of their face value in gain to the executives.

40 BUNZL PLC ANNUAL REPORT 2012
EXECUTIVE DIRECTORS’ REMUNERATION
In setting executive directors’ remuneration, the Committee is mindful of a range of factors, including remuneration policy, incentive arrangements and
the remuneration packages across the Group. In addition, the Committee reviews information on remuneration and benefit levels based on external
survey data produced by PwC. The Committee seeks to maintain, wherever possible, a consistent and appropriate basis for comparison year on year in
terms of the survey methodology and, in particular, the use of comparator groups from which the survey data is produced. There are three comparator
groups that the Committee uses. These are related to revenue, profit before tax and market capitalisation. In each case the comparator group consists
of at least 20 non-financial and non-oil/oil services UK based companies that have substantial operations overseas. Half of the companies in each
comparator group are the next highest and half are the next lowest compared with Bunzl. The total number of companies included in this survey will
depend on the overlap of the companies within each of the three comparator groups but the aim is for the total number of companies to be at least 40.
The results from each of the comparator groups are blended by PwC to provide an overall assessed market position as at 1 January of the year of the
review. Neither PwC nor New Bridge Street provide specific recommendations to the Committee on remuneration or benefit levels for the executive
directors. The Committee does, however, review survey information provided by them in the light of its established remuneration policy before making
its decisions. All decisions of the Committee were implemented in full.
SALARY
Purpose t recognise knowledge, skills and experience
t reward individual performance
t reflect scope and size of the role
t consider achievement related to environmental, social and governance issues
Delivery t monthly
t cash
Policy t annual review in December (with any changes effective from January)
t taking into consideration individual and Group performance, salary increases across the Group are benchmarked for appropriate
salary levels using a comparator group of similarly sized companies with large international presence
t pensionable
The summary table above sets out the key policy principles for the salaries for the executive directors. Similar principles are applied to the salaries of
senior managers and other levels of employees in the organisation, taking into account local market practices across the Group.
Details of the executive directors’ annual salaries are as follows:
Salary from
1 January 2013
Salary from
1 January 2012
Increase in salary
2012 to 2013
%
Michael Roney £870,000 £845,000 3.0%
Brian May £480,000 £468,000 2.6%
Patrick Larmon US$989,000 US$960,000 3.0%
Employees across the Group have received, on average, increases in the range of 2%–4% dependent on geographical location with the exception
being those employees based in Brazil and China where current market salary increases are much higher. The actual increases received by employees
have been based on each individual’s contribution and performance as well as the market competitiveness of the salary.
ANNUAL BONUS
Purpose t incentivise the attainment of annual corporate targets
t retain high performing employees
Delivery t annual award
t 50% cash and 50% shares (shares deferred normally for three years – DASBS)
t Patrick Larmon’s maximum cash bonus payment is 65% of the total bonus although the total of cash and deferred shares is
capped at 110% of base salary
Policy t the measure for performance is the growth at constant exchange rates in the Company’s earnings per share adjusted to exclude
items which do not reflect the Company’s underlying financial performance (‘constant exchange rate eps’). Bonus awards are at
the Company’s discretion and may take into account performance on environmental, social and governance matters as
appropriate. Patrick Larmon has additional measures based on the operating profit before intangible amortisation and acquisition-
related costs (‘pbit’) and working capital employed in the business area for which he has direct responsibility (North America)
t the annual on target bonus opportunity for Michael Roney and Brian May is 70% of base salary with a maximum award of 115%
of base salary and for Patrick Larmon is 70% of base salary with a maximum award of 110% of base salary
t non-pensionable
The annual bonus rewards short term business performance. Appropriately stretching financial performance targets are set by the Committee at the
beginning of the year. The use of the constant exchange rate eps measure is seen as appropriate as it is one of Bunzl’s KPIs and aligns the executive
directors’ interests with those of our shareholders. The additional measures relating to pbit and working capital are relevant for Patrick Larmon as these
are the key performance indicators of the business he is responsible for running and these measures, together with other business measures, are used
to incentivise the management group in North America. The relevant performance points are: threshold (which must be exceeded to attract any
payment of bonus); target; and maximum amount (the level at which the bonus for that measure is capped). These performance points are determined
DIRECTORS’ REMUNERATION REPORT CONTINUED

BUNZL PLC ANNUAL REPORT 2012 41
at the start of the year by reference to the Group’s annual budget. No elements of the bonus are guaranteed. As in previous years, the specific
performance points are commercially sensitive and are therefore not made public.
At the end of the performance period, which is the Group’s financial year from 1 January until 31 December, the Committee assesses the extent to
which the performance measures have been achieved. The level of bonus for each measure is determined by reference to the performance relative
to that measure’s performance points, on a pro rata basis.
2012 bonus targets and outturn
As outlined above 100% of Michael Roney’s and Brian May’s and 25% of Patrick Larmon’s bonus potential relate to the growth in the constant
exchange rate eps. This resulted in a total bonus payment 7% above target for Michael Roney and Brian May. For Patrick Larmon, a further 50% of his
bonus potential relates to the pbit performance of North America and the final 25% of his bonus potential relates to the percentage of working capital
employed by North America. Pbit performance for North America resulted in a bonus payment 3% above target and the percentage of working capital
employed resulted in a bonus payment 11% above target. Accordingly the total payments under the annual bonus plan were:
Total bonus payment (cash and deferred shares) as a % of salary
2012
%
2011
%
2010
%
2009
%
Michael Roney 77.0 114.0 81.6 52.2
Brian May 77.0 114.0 81.6 52.2
Patrick Larmon 85.9 110.0 76.7 54.2
Note
a) The actual performance related payments for 2012 and 2011 are included in the table on page 47.
Under the DASBS, eligible executives, including the executive directors, receive the deferred element of their annual bonus as conditional awards of
ordinary shares or nil cost options. The awards are satisfied by ordinary shares that are purchased in the market and provided via the Bunzl Group
General Employee Benefit Trust (the ‘Trust’). The awards are normally made between 1 March and 30 April and normally vest in the third year after the
year in which the award is made. In Brian May’s case the awards are satisfied as nil cost options with a three year exercise window commencing onthe
date of vesting. The rules of the DASBS provide that executives who leave the Group prior to the vesting of their awards lose their rights to any deferred
shares although the Committee has discretion to allow such shares to vest if deemed appropriate to do so. No dividends accrue on the awards prior
tothe shares being transferred to the eligible executives following the vesting of the awards. For awards made in 2011 and in subsequent years, the
clawback terms provide scope for the Committee to reduce or cancel such DASBS awards to the extent that the value of the bonus originally awarded
is subsequently deemed to have been overstated as a result of a material misstatement of the relevant financial statements by which the bonus was
originally determined.
2013 bonus targets
The structure for Michael Roney’s, Brian May’s and 25% of Patrick Larmon’s bonus are unchanged from that described above for 2012. The threshold
for bonus payments on growth in constant exchange rate eps has been set above the outturn for 2012 on a constant exchange rate basis. For Patrick
Larmon the other 75% of his bonus will relate to the attainment of pbit performance of North America relative to budget which will be modified,
positively or negatively, by the attainment of North America’s return on average operating capital targets.
LONG TERM INCENTIVES
Purpose t incentivise growth in longer term earnings per share adjusted to exclude items that do not reflect the Company’s underlying
financial performance (‘eps’) and TSR
t recruit and retain senior employees
Delivery t discretionary biannual awards
t executive share options and performance shares
t variable as related to the achievement of performance measures over a three year period
Policy Executive share options
t maximum annual award of 300% of salary (although this level of award has never been granted, see the ‘Grant/award levels’
section below)
t three year performance period
t performance measure relates to the growth in the Company’s eps relative to UK inflation (RPI)
Performance shares
t maximum annual award of 200% of salary (although this level of award has never been granted, see the ‘Grant/award levels’
section below)
t three year performance period
t TSR performance measure (50% of the total award) compares a combination of both the Company’s share price and dividend
performance during the three year performance period against a comparator group of similarly sized companies with large
international presence (the same group that is used for benchmarking salary)
t eps performance measure (50% of the total award) relates to the growth in the Company’s eps relative to UK inflation (RPI)
The long term element of remuneration continues to be delivered through the LTIP. The LTIP Part A relates to the grant of executive share options and
Part B to the award of performance shares. All of the executive directors, Executive Committee members and other key employees participate in both
parts of the LTIP which was adopted in 2004. The majority of senior management only participate in the LTIP Part A. Share options are granted and
performance shares awarded under the LTIP in respect of both new issue shares and market purchased shares.

42 BUNZL PLC ANNUAL REPORT 2012
Grant/award levels
The total actual annual grant/award levels for the executive directors are set out in the table below and have been applied to awards made from August
2008 to date.
Face value of grants/awards as a percentage of base salary
Executive share options Performance shares
Michael Roney 150% 112.5%
Brian May 140% 105%
Patrick Larmon 125% 94%
To the extent that the performance conditions have been satisfied, grants of executive share options are normally exercisable between three and
10years after they have been made and awards of performance shares are normally exercisable between three and six years after they have been
made. A grant of executive share options or an award of performance shares lapses to the extent that the performance conditions are not satisfied
in accordance with the measures set out in the forthcoming sections at the end of the three year performance period.
Performance
The percentage of executive share options which vest is based solely on eps performance conditions, whereas for awards of performance shares
vesting is based on a combination of eps and TSR performance. Performance conditions in all cases are measured over a three year period and there
is no retesting. The Committee considers that both of these measures are appropriate benchmarks of the Company’s performance. This combination
provides an important balance of measures relevant to the Group’s business and market conditions as well as providing a common goal for the
executive directors, senior management and shareholders. Further details on these performance conditions are provided below.
Eps performance condition
Executive share options – LTIP Part A
Executive share options may vest based solely on the Company’s eps growth (adjusted to exclude items which do not reflect the Company’s underlying
financial performance) relative to UK inflation (RPI) over three years, based on the following sliding scale:
Face value of annual executive share options granted as a proportion of salary Total margin over UK inflation (RPI) after three years
First 150% of salary 9.3%
Next 75% of salary 12.5%
Next 75% of salary 19.1%
The Committee considers that the current performance condition remains appropriate after taking into consideration the recent levels of increase in
RPI, the current economic conditions, the performance of the business and the fact that a vested option has no value unless the share price increases.
They are, however, aware that should share options be retained within the new LTIP which will be proposed for shareholder approval in 2014, the
structure of the performance condition will be amended to reflect current best practice for such share plans. The Committee considers that over many
years vested executive share options have provided a high level of incentivisation for the management team to strive continually to improve the Group’s
operational performance and thereby increase the Company’s share price.
Performance shares – LTIP Part B
The extent to which half of the awards may vest is subject to a performance condition based on the Company’s eps growth (adjusted to exclude
items which do not reflect the Company’s underlying financial performance) relative to UK inflation (RPI) over three years, based on the following
slidingscale:
Total margin over UK inflation (RPI) after three years Proportion of performance share awards exercisable
Below 12.5% Nil
12.5% 25%
Between 12.5% and 33.1% Pro rata between 25%–100%
Over 33.1% 100%
The Committee considers that the current performance condition remains challenging given the recent levels of increase in RPI, the current economic
conditions and the performance of the business. The Committee considers that the eps performance condition for the vesting of performance shares
should be more stretching than for executive share options since on exercise of the award the value of the whole share is delivered to the participant
as opposed to executive share options where value only arises if the share price on exercise is greater than the option price.
TSR performance condition
Performance shares – LTIP Part B
The extent to which the other half of the performance share awards may vest is subject to the Company’s TSR performance relative to the TSR
performance of a specified group of companies (the ‘Comparator Group’). The process for identifying the Comparator Group is the same as that used
for setting executive remuneration as described under Executive directors’ remuneration on page 40. These performance share awards vest in full only
if the Company’s TSR performance is ranked at upper quartile or above within the Comparator Group and the following vesting schedule is applied:
TSR Proportion of performance share awards exercisable
Below median Nil
Median 25%
Median to upper quartile Pro rata between 25%–100%
Upper quartile 100%
DIRECTORS’ REMUNERATION REPORT CONTINUED

BUNZL PLC ANNUAL REPORT 2012 43
The performance condition relating to TSR for all awards under the LTIP Part B provides for the exclusion from the Comparator Group of those
companies that cease to be listed and the exclusion of those companies that have been subject to a recommended takeover offer and are therefore
in the process of delisting. Where the companies are excluded from the Comparator Group, the median/upper quartile rankings are recalculated using
the reduced number of companies in the Comparator Group. The applicable Comparator Group for the LTIP Part B awards in October 2012 are shown
below and will form the basis of the Comparator Group for the LTIP Part B awards in April 2013 subject to any variations as outlined above.
Aegis Group Hays Qinetiq Group
Aggreko IMI Reckitt Benckiser Group
Burberry Group Informa Rexam
Carnival Inmarsat Rotork
Chemring Group International Hotels Group Sabmiller
Cobham International Airlines Group SIG
Computacenter Intertek Group Smith & Nephew
Cookson Group Invensys Smiths Group
Croda International Johnson Matthey Spectris
Diageo Kingfisher Spirax-Sarco
Dixons Retail Lonmin Tate & Lyle
Easyjet Meggitt Tui Travel
Electrocomponents Melrose UBM
Experian Millennium & Copthorne Hotels Weir Group
G4S Mondi WPP
GKN Pearson
TSR is measured according to the return index calculated by Datastream and reviewed by New Bridge Street. It is measured on the basis that all
companies’ dividends are reinvested in the shares of those companies. The return is the percentage increase in each company’s index over the three
year performance period. The opening and closing indices for this calculation are respectively the average of the index numbers for the last month
preceding the performance period and for the last month of that performance period.
Vesting of LTIP grants/awards made in 2009
Executive share options – LTIP Part A
Grants of executive share options were made to the executive directors on 26 February 2009 and 27 August 2009 with the three year performance
periods being completed on 31 December 2011. The Committee subsequently assessed the relevant performance of the Company against the
performance conditions. Eps growth was 30.0% for the three years ended 31 December 2011 which compared to an increase in RPI of 12.4%
over the same period. Since the performance condition would have been satisfied if eps had grown by at least 21.7% over the period, all of the
options vested.
Performance shares – LTIP Part B
Awards of performance shares were made to the executive directors on 23 April 2009 and 2 October 2009 with the three year performance periods
being completed on 31 March 2012 and 30 September 2012 respectively. The Committee subsequently assessed the performance of the Company
against the relevant performance conditions. The extent to which half of the awards would vest was subject to a performance condition based on eps
growth relative to RPI. Eps growth was 30.0% for the three years ended 31 December 2011 compared to an increase in RPI of 12.5% over the same
period. A quarter of the award would have been exercisable if eps had grown by at least 25.0% over the period and the whole award would have been
exercisable if eps had grown by at least 45.6%. As a result of the Company’s actual growth in eps over the period, 43.4% of this part of the awards
vested (21.7% of the full awards).
The extent to which the other half of the awards vested was based on the Company’s TSR performance against the relevant Comparator Group. For
the April award, the Company ranked 22nd out of the remaining 40 companies in the Comparator Group of companies, resulting in no vesting for this
part of the award. For the October award, the Company ranked 11th out of the remaining 39 companies in the Comparator Group of companies, as a
result of which 94.2% of this part of the award vested (47.1% of the full award) for performance between median and upper quartile.
Accordingly 21.7% of the total performance shares awarded in April 2009 and 68.8% of the total performance shares awarded in October 2009
vested in April and October 2012 respectively.
Performance graph
Schedule 8 to the Large and Medium Sized Companies and Groups (Accounts and Reports) Regulations 2008 requires that the Company must
provide a graph comparing the TSR performance of a hypothetical holding of shares in the Company with a broad equity market index over a five
year period. The Company’s TSR performance against the FTSE Support Services Sector over a five year period commencing on 1 January 2008
is shown below.
70
80
90
100
110
120
130
140
150
160
170
FTSE Support Services
Bunzl
20122011201020092008
Source: Thomson Reuters datastream

44 BUNZL PLC ANNUAL REPORT 2012
LTIP – change of control
The rules of the LTIP provide that in the event of a change of control of the Company as a result of takeover, reconstruction or winding up of the
Company, the Committee has the discretion to allow grants of options/awards to become exercisable taking into consideration the period of time
which has elapsed since the date of the grant of option/award and the achievement of the relevant performance conditions at that date.
ALL EMPLOYEE SHARE SCHEMES
The executive directors are also eligible to participate in all employee share schemes which are designed to incentivise employees of the Group by
giving them opportunities to build a shareholding in the Company. The UK based executive directors may participate in an HM Revenue & Customs
(‘HMRC’) approved Sharesave Scheme and the US based executive director may participate in an IRS approved Employee Stock Purchase Plan (US)
(the ‘ESPP’). In addition employees in Australia, Canada, Germany and the Netherlands are eligible to participate in an International Sharesave Plan
and Irish employees can take part in the Irish Sharesave Plan.
Sharesave Scheme
The current Sharesave Scheme was approved by shareholders in 2011, is approved by HMRC and is open to all UK employees who have completed
at least three months of continuous service. It, like the Sharesave Scheme which preceded it, is linked to a contract for monthly savings of up to £250
per month over a period of either three or five years. Under the Sharesave Scheme options are granted to participating employees at a discount of up
to 20% of the market price prevailing on the day immediately preceding the date of invitation to apply for the option. Options are normally exercisable
either three or five years after they have been granted. Both Michael Roney and Brian May participate in the Sharesave Scheme.
ESPP
The current ESPP was also approved by shareholders in 2011 and, like its predecessor, provides an opportunity for employees in the US to purchase
the Company’s shares in the market at a 15% discount to the market price, up to an annual maximum of 10% of remuneration or US$25,000 worth
of shares, whichever is lower. The purchase of the shares is funded by after tax payroll deductions from the employee with the employing company
contributing the 15% discount. Shares held by Patrick Larmon under the ESPPs are included in his ordinary share interests set out in Note 19 to the
consolidated financial statements.
OPTIONS AND AWARDS OUTSTANDING
To satisfy the future exercise of options or awards of performance shares under the Group’s employee share schemes, ordinary shares are either
acquired in the market by the Trust or the Company issues new shares.
The Trust
The Trust is used to satisfy the vesting and exercise of awards of ordinary shares made under the DASBS and the LTIP Parts A and B. The number of
shares held in the Trust to satisfy outstanding awards is monitored by the Board. The Trust is funded by interest free loan facilities from the Company
enabling the Trust to facilitate the purchase of ordinary shares to satisfy the future vesting or exercise of options and awards under the DASBS and LTIP.
The loan is either repaid from the proceeds of the exercise of options or, in the case of ordinary shares acquired by the Trust to satisfy vesting and
exercise of awards under the DASBS and the LTIP Part B, the Company will subsequently waive the loan provided over the life of the awards. The Trust
currently waives dividends on the ordinary shares held by it. As at 31 December 2012, the Trust held 4,348,175 ordinary shares with a market value of
£43.9 million (31 December 2011: 5,230,867 ordinary shares; market value £46.2 million) being 1.2% of the Company’s issued ordinary share capital
(31 December 2011: 1.5%) (including treasury shares). While shares are held by the Trust, the trustee does not exercise any voting rights.
Details of the Company’s material equity share based payment arrangements are set out in Note 16 to the consolidated financial statements.
SHAREHOLDING GUIDELINES
In order to align further the interests of the executive directors and shareholders, the executive directors are required to build a significant personal
shareholding in the Company. A formal share ownership guideline is in place under which executive directors are expected to retain shareholdings
worth at least equal to their annual base salaries. A period of three years is allowed for executives who are promoted from within the Company to
achieve this shareholding with an additional two years permitted in the case of external appointments.
As at 31 December 2012, the value of the executive directors’ shareholdings as a percentage of salary were:
Actual share ownership as a percentage of salary at
31 December 2012 at the closing mid-market price
Michael Roney 373%
Brian May 227%
Patrick Larmon 190%
The interests of the executive directors, and their connected persons, in the ordinary shares of the Company at 31 December were:
2012 2011
Michael Roney 312,263 289,375
Brian May 105,240 105,240
Patrick Larmon 113,875 109,381
The interests of all of the directors in the ordinary shares of the Company are shown in Note 19 to the consolidated financial statements.
DIRECTORS’ REMUNERATION REPORT CONTINUED

BUNZL PLC ANNUAL REPORT 2012 45
PENSION BENEFITS
Purpose t provision of competitive post retirement benefits
Delivery t Bunzl Pension Plan (the ‘BPP’) for UK based executive directors, the Bunzl USA, Inc. Retirement Plan (the ‘US Plan’) and
Retirement Saving Benefit (the ‘RSB’) for US based executive directors and pension allowances and supplemental pension
arrangements
t monthly pension payment
Policy t all defined benefit pension plans in the Group have been closed since 2003 to new entrants who are offered a defined
contribution arrangement
t the current pension arrangements of the executive directors reflects their date and place of joining the Group
In the UK, Michael Roney receives a pension allowance of 30% of base salary. He has chosen to join the Defined Contribution Section of the BPP
and his contribution of 5% of base salary, up to the pensionable salary cap (notionally £129,600 for tax year 2011/2012 and £137,400 for tax year
2012/2013) is matched by the Company. During 2012 such contributions amounted to £6,773 (2011: £6,405) and this amount was deducted from
his pension allowance. The Company also provides lump sum life assurance cover of four times base salary.
Brian May, who joined the Group in the UK prior to the closure of the defined benefit sections of the BPP, is a member of the Bunzl Senior Pension
Section of the BPP. His pension accrues at the rate of 2.4% per annum up to two thirds of the pensionable salary cap, as described above. The
employee contribution rate is currently 9% of pensionable salary. The normal retirement date is 60 years of age but members can choose to take a
pension at any time after the age of 55 years without the employing company’s agreement, subject to a reduction as determined by the pension fund
trustee in conjunction with the pension fund actuary. This section of the BPP includes provision for spouses’ benefits on death in service or after
retirement. In the event of death in service a spouse’s pension equal to 60% of the member’s prospective pension at normal retirement age would be
payable. A spouse’s pension in the event of death after retirement is equal to 60% of the member’s full pension, irrespective of any decision to
exchange part of the benefit for a lump sum. In addition to benefits from the BPP, Brian May receives a pension allowance of 30% of base salary above
the pensionable salary cap which permits him to make provision, of his own choice, in respect of that part of his salary which exceeds the cap. The
Company also provides lump sum life assurance cover of four times base salary.
Patrick Larmon originally joined the US Plan, subject to IRS limits, which accrued at a rate of 1.67% per annum up to 50% of the five year average
pensionable salary less the primary social security benefit, with a normal retirement age of 65 years. Pensionable salary in the US Plan is capped at
US$140,000. On closure of the US Plan, Patrick Larmon chose to freeze his benefit and join a defined contribution plan, the RSB. Contributions to the
RSB are fully funded by the employer on a sliding scale that is age related. The contributions are a percentage of base salary (maximum 5%) which is
capped at US$200,000 per annum. The Company made contributions in respect of Patrick Larmon in 2012 of £6,289 (2011: £6,250). In addition
to the benefits described above, Patrick Larmon receives a supplementary pension through a defined benefit Senior Executive Retirement Agreement
(‘SERA’). Patrick Larmon’s SERA provides for a lifetime pension of US$100,000 per annum, payable upon retirement. In 2012 the Company paid
all necessary contributions, on actuarial advice, to the SERA which amounted to £74,030 (2011: £83,337). This decrease is attributable to a partial
year of service cost due to Patrick Larmon reaching the age of 60 when service accrual ceases. In 2007, the SERA arrangement was closed to new
entrants and existing members’ benefits were frozen. A new defined contribution SERA (‘DC SERA’) was put in place for Patrick Larmon. During
2012 contributions to the DC SERA amounted to £182,390 (2011: £181,250). Patrick Larmon also participates in the Bunzl USA, Inc Deferred
Savings (401k) Plan. The Company makes matching contributions to this Plan. During 2012 contributions for Patrick Larmon amounted to
£6,934 (2011: £6,891).
EXECUTIVE DIRECTORS’ SERVICE CONTRACTS
It is the Company’s policy that executive directors are normally employed on contracts that provide for 12 months’ notice from the Company and
six months’ notice from the executive. For Michael Roney and Brian May there is no predetermined compensation for termination of these contracts.
Patrick Larmon’s contract provides that on termination by the Company without cause he is entitled to receive payment of 12 months’ base salary plus
health insurance coverage, reduced by any interim earnings. There are no provisions for any of the directors for predetermined compensation in excess
of one year’s remuneration and benefits in-kind. The date of each service contract is noted in the table below.
Date of service contract
Michael Roney 1 September 2005
Brian May 9 December 2005
Patrick Larmon 1 January 2005
EXECUTIVE DIRECTORS’ EXTERNAL APPOINTMENTS
With the specific approval of the Board in each case, executive directors may accept external appointments as non-executive directors of other
companies and retain any related fees paid to them. Michael Roney served as a non-executive director of Johnson Matthey Plc throughout 2012
and retained fees of £65,500. Brian May served as a non-executive director of United Utilities Group PLC from 1 September 2012 and retained
fees of £19,467. Patrick Larmon does not hold any such appointments.

46 BUNZL PLC ANNUAL REPORT 2012
NON-EXECUTIVE DIRECTORS’ TERMS OF APPOINTMENT
The non-executive directors do not have service contracts with the Company but instead have letters of appointment. The date of appointment
and the most recent re-appointment and the length of service for each non-executive director are shown in the table below.
Date of appointment
Date of last
re-appointment at AGM
Length of service
as at 2013
Annual General Meeting
Ulrich Wolters* 1 July 2004 18 April 2012 8 years 9 months
Peter Johnson 1 January 2006 18 April 2012 7 years 3 months
David Sleath 1 September 2007 18 April 2012 5 years 7 months
Eugenia Ulasewicz 1 April 2011 18 April 2012 2 years
Jean-Charles Pauze 1 January 2013 n/a Up for election
Meinie Oldersma 1 April 2013 n/a Up for election
*Ulrich Wolters will retire from the Board at the conclusion of the 2013 AGM
On termination, at any time, a non-executive director is entitled to any accrued but unpaid director’s fees but not to any other compensation.
NON-EXECUTIVE DIRECTORS’ REMUNERATION POLICY
The current fee structure for the non-executive directors is shown below:
With effect
from January 2013
£
Fees paid in 2012
£
Basic fee 63,000 61,500
Supplements:
Senior Independent Director 16,000 16,000
Audit Committee Chairman 13,000 12,000
Remuneration Committee Chairman 13,000 12,000
The fees for the non-executive directors are considered annually and are determined in light of market practice and with reference to time commitment
and responsibilities associated with the roles.
Non-executive directors’ fees (including those of the Chairman) are determined within the overall aggregate annual limit of £1,000,000 authorised by
shareholders with reference to the Company’s Articles of Association. The Board as a whole considers the policy and structure for the non-executive
directors’ fees on the recommendation of the Chairman and the Chief Executive. The non-executive directors do not participate in discussions on their
specific levels of remuneration.
Non-executive directors receive no other pay or benefits (with the exception of reimbursement of expenses incurred in respect of their duties as
directors of the Company).
CHAIRMAN’S TERMS OF APPOINTMENT AND REMUNERATION
The Committee is responsible for determining the terms of engagement and fees payable to the Chairman. This process takes into account the breadth
of the role coupled with its associated levels of commitment and expertise.
Philip Rogerson has been a director of the Company since 1 January 2010 and has been Chairman of the Company from 1 April 2010. The terms of
his appointment provide that he holds the appointment for an initial term of three years unless terminated earlier by either party giving to the other not
less than three months’ written notice.
The terms of Philip Rogerson’s appointment provided for an annual fee of £300,000 in 2010 and 2011. The annual fee was increased to £310,000
with effect from January 2012 and will be reviewed again in February 2014. In common with the non-executive directors, Philip Rogerson does not
participate in the Company’s share schemes, bonus or long term incentive plans and is not a member of any Group pension plan.
COPIES OF SERVICE CONTRACTS AND TERMS OF APPOINTMENT
Copies of the executive directors’ service contracts and the details of the terms of appointment of each non-executive director and the Chairman
are available for inspection during normal business hours at the Company’s registered office and will also be available for inspection at the AGM
on 17April 2013.
DIRECTORS’ REMUNERATION REPORT CONTINUED

BUNZL PLC ANNUAL REPORT 2012 47
SUPPLEMENTARY INFORMATION ON DIRECTORS’ REMUNERATION
The following table gives details of each director’s remuneration for the financial year 2012.
Salary/fees
2012
£000
Annual
cash bonus
2012
£000
Pension
allowance
net of
pension
contributions
2012
£000
Benefits
2012
£000
Total
2012
£000
Deferred bonus
Total
2011
£000
2012
£000
2011
£000
Executive
Michael Roney 845.0 325.3 246.7 16.4 1,433.4 1,552.7 325.3 470.2
Brian May 468.0 180.2 99.8 16.4 764.4 830.7 180.2 259.9
Patrick Larmon 603.8 259.3 – 16.5 879.6 924.5 259.3 320.8
Non-executive
Philip Rogerson 310.0 – – – 310.0 300.0 – –
Ulrich Wolters 61.5 – – – 61.5 60.0 – –
Peter Johnson 89.5 – – – 89.5 83.3 – –
David Sleath 73.5 – – – 73.5 71.0 – –
Eugenia Ulasewicz 61.5 – – – 61.5 45.0 – –
2,512.8 764.8 346.5 49.3 3,673.4 3,867.2 764.8 1,050.9
Notes
a) The figures above represent remuneration earned as directors during the relevant financial year including, in the case of the executive directors,
the cash element of the bonus which is paid in the year following that in which it is earned. The deferred element of the bonus is shown above as
a cash amount. However this cash amount is conditionally awarded as shares as described on page 41. Shares relating to the 2011 deferred bonus
were awarded in 2012 as shown in the table on page 48 and the shares relating to the 2012 deferred bonus will be awarded in 2013.
b) The remuneration for Patrick Larmon is paid or determined in US dollars and has been translated at the average exchange rates for the year of
£1: US$1.59 in respect of 2012 and £1: US$1.60 in respect of 2011.
c) The pension allowance is the amount paid in cash during 2012. Further information relating to pensions is on page 45 and the table below which
shows increases in accrued benefits during the year for directors who are members of the Group’s defined benefit pension plans.
d) In addition to the remuneration paid to directors in 2011 shown above, Charles Banks, who retired as non-executive director during the year,
received remuneration of £29,600 in respect of the period 1 January 2011 to 31 May 2011.
Increases in pension benefits at 31 December 2012
Accrued
benefits
at 31.12.11
per annum
£
Accrued
benefits
at 31.12.12
per annum
£
Transfer value
of accrued
benefits
at 31.12.11
£
Change in
transfer value of
accrued benefits
during the year
£
Transfer
value of accrued
benefits
at 31.12.12
£
Brian May 47,549 53,698 965,897 126,591 1,104,679
Patrick Larmon* 16,856 16,028 143,998 21,182 165,180
*Excluding SERA entitlements
Notes
a) Of the additional benefits accrued since 1 January 2012, the increases attributable to factors other than inflation or foreign exchange translation
were £5,103 for Brian May and £nil for Patrick Larmon (whose benefits are frozen in this plan).
b) Pension accruals shown are the amounts accrued based on service with Bunzl plc or its subsidiaries.
c) The changes in the transfer values of accrued benefits have been calculated on the basis of actuarial advice in accordance with any relevant
actuarial legislation and, in the case of Brian May, are net of his contributions. The change in the transfer value of accrued benefits for Brian May
includes the effect of fluctuation in the transfer value due to factors beyond the control of the Company and the directors, such as changes in
market conditions.

48 BUNZL PLC ANNUAL REPORT 2012
Deferred share awards as at 31 December 2012
The following deferred share awards have been made to the directors. Further information relating to the deferred bonus is provided on pages 40 to 41.
Shares
held
at 1 January
2012
Shares
awarded
during 2012
Shares
vested
during 2012
Total number
of award
shares at
31 December
2012
Normal
vesting
date
Share
price
at grant
(p)
Market
price at
vesting
(p)
Monetary
value of
vested
award
£000
Michael Roney 41,217 – 41,217 – 01.03.12 581 972 401
29,724 – – 29,724 01.03.13 680.5 – –
43,215 – – 43,215 01.03.14 760 – –
–48,882 –48,88201.03.15962 – –
Brian May 22,603 – 22,603 – 01.03.12 581 972 220
16,300 – – 16,300 01.03.13 680.5 – –
23,728 – – 23,728 01.03.14 760 – –
– 27,018 – 27,018 01.03.15 962 – –
Patrick Larmon 29,672 – 29,672 – 01.03.12 581 972 288
23,268 – – 23,268 01.03.13 680.5 – –
28,372 – – 28,372 01.03.14 760 – –
– 33,349 – 33,349 01.03.15 962 – –
Notes
a) The deferred element of the 2012 annual bonus plan as shown on page 47 is not included in the table above as the appropriate number of shares
have not yet been awarded. No shares lapsed during the year.
b) Brian May’s awards are nil cost options with a three year exercise window commencing on the date of vesting.
DIRECTORS’ REMUNERATION REPORT CONTINUED

BUNZL PLC ANNUAL REPORT 2012 49
LTIP
The tables below show the number of executive share options and performance shares held by the executive directors under the LTIP. Details of the
relevant performance conditions and structure of the LTIP are set out on pages 42 to 43.
Executive share options – LTIP Part A
Options at
1 January
2012
Grant
date
Exercise
Price
(p)
Options
exercisable
between
Options at
31 December
2012
Michael Roney 180,530 01.11.05 565 01.11.08–31.10.15 –
78,643 06.03.06 648.5 06.03.09–05.03.16 –
78,500 01.09.06 652.5 01.09.09–31.08.16 –
83,000 01.03.07 659 01.03.10–28.02.17 –
79,500 31.08.07 684.5 31.08.10–30.08.17 –
81,000 28.02.08 721.5 28.02.11–27.02.18 –
83,000 29.08.08 700.5 29.08.11–28.08.18 –
103,500 26.02.09 564 26.02.12–25.02.19 –
99,500 27.08.09 585 27.08.12–26.08.19 99,500
89,500 25.02.10 676.5 25.02.13–24.02.20 89,500
81,000 03.09.10 746 03.09.13–02.09.20 81,000
85,500 03.03.11 724.5 03.03.14–02.03.21 85,500
76,500 02.09.11 812.5 02.09.14–01.09.21 76,500
– 01.03.12 962 01.03.15–28.02.22 66,000
– 31.08.12 1,116 31.08.15–30.08.22 57,000
Brian May 20,000 09.09.05 568 09.09.08–08.09.15 –
32,382 06.03.06 648.5 06.03.09–05.03.16 –
32,500 01.09.06 652.5 01.09.09–31.08.16 –
34,000 01.03.07 659 01.03.10–28.02.17 –
33,000 31.08.07 684.5 31.08.10–30.08.17 –
33,000 28.02.08 721.5 28.02.11–27.02.18 33,000
42,500 29.08.08 700.5 29.08.11–28.08.18 42,500
53,000 26.02.09 564 26.02.12–25.02.19 –
51,000 27.08.09 585 27.08.12–26.08.19 –
46,000 25.02.10 676.5 25.02.13–24.02.20 46,000
41,500 03.09.10 746 03.09.13–02.09.20 41,500
44,500 03.03.11 724.5 03.03.14–02.03.21 44,500
39,500 02.09.11 812.5 02.09.14–01.09.21 39,500
– 01.03.12 962 01.03.15–28.02.22 34,500
– 31.08.12 1,116 31.08.15–30.08.22 29,500
Patrick Larmon 48,411 09.09.05 568 09.09.08–08.09.15 –
38,458 06.03.06 648.5 06.03.09–05.03.16 –
43,000 01.09.06 652.5 01.09.09–31.08.16 43,000
47,000 01.03.07 659 01.03.10–28.02.17 47,000
45,000 31.08.07 684.5 31.08.10–30.08.17 45,000
44,500 28.02.08 721.5 28.02.11–27.02.18 44,500
45,500 29.08.08 700.5 29.08.11–28.08.18 45,500
56,500 26.02.09 564 26.02.12–25.02.19 56,500
54,500 27.08.09 585 27.08.12–26.08.19 54,500
48,500 25.02.10 676.5 25.02.13–24.02.20 48,500
44,000 03.09.10 746 03.09.13–02.09.20 44,000
46,500 03.03.11 724.5 03.03.14–02.03.21 46,500
41,500 02.09.11 812.5 02.09.14–01.09.21 41,500
– 01.03.12 962 01.03.15–28.02.22 36,000
– 31.08.12 1,116 31.08.15–30.08.22 34,000
Notes
a) Executive share options were exercised during 2012 by:
(i) Michael Roney on 1 March 2012 in respect of 180,530 ordinary shares at an exercise price of 565p, 78,643 ordinary shares at an exercise
price of 648.5p, 78,500 ordinary shares at an exercise price of 652.5p, 83,000 ordinary shares at an exercise price of 659p, 79,500 ordinary
shares atan exercise price of 684.5p, 81,000 ordinary shares at an exercise price of 721.5p and 83,000 ordinary shares at an exercise price
of 700.5p, at a market price of approximately 972p resulting in a gain of £2,156,577. In addition Michael Roney exercised share options on
1 October 2012 in respect of 103,500 ordinary shares at an exercise price of 564p at a market price of approximately 1,116p resulting in
a further gain of £571,320;
(ii) Brian May on 9 March 2012 in respect of 20,000 ordinary shares at an exercise price of 568p, 32,382 ordinary shares at an exercise price of
648.5p, 32,500 ordinary shares at an exercise price of 652.5p, 34,000 ordinary shares at an exercise price of 659p, 33,000 ordinary shares
at anexercise price of 684.5p and 5319 ordinary shares at an exercise price of 564p, at a market price of 991p resulting in a gain of £542,258.
In addition Brian May exercised share options on 28 September 2012 in respect of 47,681 ordinary shares at an exercise price of 564p and
51,000 ordinary shares at an exercise price of 585p at a market price of approximately 1,115p resulting in a further gain of £533,022; and
(iii) Patrick Larmon on 5 March 2012 in respect of 48,411 ordinary shares at an exercise price of 568p and 38,458 ordinary shares at an exercise
price of 648.5p at a market price of approximately 960p resulting in a gain of £309,568.
b) The mid-market price of a share on 31 December 2012 was 1,009p and the range during 2012 was 851.5p to 1,167p.
c) The performance conditions have been satisfied in relation to options granted prior to 2011 under the LTIP Part A.

50 BUNZL PLC ANNUAL REPORT 2012
Performance shares – LTIP Part B
Awards
(shares)
held at
1 January
2012
Conditional
shares
awarded
during
2012
Award
date
Market
price
per share
at award
(p)
Lapsed
awards
(shares)
during 2012
Exercised
awards
(shares)
during 2012
Market
price per
share at
exercise
(p)
Value at
exercise
£000
Awards
(shares)
held at
31 December
2012
Michael Roney 90,000 – 23.04.09 485.25 70,470 19,530 1021 199 –
69,500 – 02.10.09 628 21,685 47,815 1128 539 –
63,000 – 01.04.10 721 – – – –
63,000
60,000 – 08.10.10 759 – – – –
60,000
64,500 – 08.04.11 725 – – – –
64,500
59,000 – 11.10.11 787 – – – –
59,000
– 48,00005.04.12990.5––––
48,000
– 42,00008.10.121,137––––
42,000
Total 406,000 90,000 92,155 67,345 336,500
Brian May 46,000 – 23.04.09 485.25 36,018 9,982 1021 102 –
36,000 – 02.10.09 628 11,232 24,768 1062 263 –
32,500 – 01.04.10 721 – – – –
32,500
31,000 – 08.10.10 759 – – – –
31,000
33,500 – 08.04.11 725 – – – –
33,500
30,500 – 11.10.11 787 – – – –
30,500
–25,00005.04.12990.5––––
25,000
–22,00008.10.121,137––––
22,000
Total 209,500 47,000 47,250 34,750 174,500
Patrick Larmon 49,500 – 23.04.09 485.25 38,759 10,741 1021 110 –
38,500 – 02.10.09 628 12,013 26,487 1128 299 –
34,500 – 01.04.10 721 – – – –
34,500
32,500 – 08.10.10 759 – – – –
32,500
35,000 – 08.04.11 725 – – – –
35,000
32,000 – 11.10.11 787 – – – –
32,000
– 26,50005.04.12990.5––––
26,500
– 25,00008.10.121,137––––
25,000
Total 222,000 51,500 50,772 37,228 185,500
Note
a) The closing mid-market price of the Company’s shares as at the vesting dates on 23 April 2012 and 8 October 2012 were 1,016p and 1,128p
respectively.
All employees share scheme
Sharesave Scheme
The table below shows the number of share options granted to the executive directors under the Sharesave Scheme. Details of the Sharesave Scheme
are set out on page 44.
Options at
1 January
2012 Grant date
Exercise
price
(p)
Options
exercisable
between
Options at
31 December
2012
Michael Roney – 27 March 2012 770 01.05.17 – 31.10.17 1,948
Brian May 3,462 24 March 2009 452 01.05.14 – 31.10.14 3,462
Peter Johnson
Chairman of the Remuneration Committee
25 February 2013
DIRECTORS’ REMUNERATION REPORT CONTINUED

BUNZL PLC ANNUAL REPORT 2012 51
OTHER STATUTORY INFORMATION
ANNUAL GENERAL MEETING
The Annual General Meeting will be held at The Park Suite, The
Dorchester, Park Lane, London W1K 1QA on Wednesday 17 April 2013
at11.00 am. The Notice convening the Annual General Meeting is set
out in a separate letter from the Chairman to shareholders which explains
the items of business which are not of a routine nature.
DIVIDENDS
An interim dividend of 8.8p was paid on 2 January 2013 in respect of
2012 and the directors recommend a final dividend of 19.4p, making a
total for the year of 28.2p per share (2011: 26.35p). Dividend details are
given in Note 17 to the consolidated financial statements. Subject to
approval by the shareholders at the Annual General Meeting on 17 April
2013, the final dividend will be paid on 1 July 2013 to those shareholders
on the register at the close of business on 10 May 2013.
SHARE CAPITAL
The Company has a single class of share capital which is divided into
ordinary shares of 321∕7p each which rank pari passu in respect of
participation and voting rights. The shares are in registered form, are fully
paid up and are quoted on the London Stock Exchange. In addition, the
Company operates a Level 1 American Depositary Receipt programme
with the Bank of New York Mellon under which the Company’s shares
aretraded on the over the counter market in the form of American
Depositary Receipts.
Details of changes to the issued share capital during the year are set out
inNote 16 to the consolidated financial statements.
BUNZL GROUP GENERAL EMPLOYEE BENEFIT TRUST
Bunzl Employee Trustees Limited is trustee of the Bunzl Group General
Employee Benefit Trust (‘the EBT’) which holds shares in respect of
employee share options and awards that have not been exercised or
vested. The current position is that the EBT abstains from voting in
respectof these shares. The trustee has agreed to waive the right to
dividend payments on shares held within the EBT. Details of the shares
soheld are set out in Note 16 to the consolidated financial statements.
SUBSTANTIAL SHAREHOLDINGS
As at 31 December 2012 the directors had been notified by the following
shareholders that they were each interested in 3% or more of the issued
share capital of the Company.
Shareholder
Date of
notification
Number
of shares
% of issued
share capital
INVESCO plc 20.05.10 32,571,686 9.9
BlackRock, Inc. 23.03.11 16,491,628 5.0
Lloyds Banking Group plc 27.05.10 16,425,039 5.0
Newton Investment
Management Ltd 07.03.11 13,864,410 4.2
Cascade Investment, LLC 20.04.12 16,593,248 5.0
Legal & General Group Plc 12.11.09 13,069,891 4.0
As at 25 February 2013 no further notifications have been received since
the year end.
RIGHTS AND OBLIGATIONS ATTACHING TO SHARES
Subject to the provisions of the Companies Act 2006 and without
prejudice to any rights attached to any existing shares, the Company
mayresolve by ordinary resolution to issue shares with such rights and
restrictions as set out in such resolution or (if there is no such resolution
or so far as it does not make specific provision) as the Board may decide.
Subject to the provisions of the Companies Act 2006 and of any resolution
of the Company passed pursuant thereto and without prejudice to any
rights attached to existing shares, the Board is duly authorised to issue
and allot, grant options over or otherwise dispose of the Company’s shares
on such terms and conditions and at such times as it thinks fit. If at any
time the share capital of the Company is divided into different classes of
shares, the rights attached to any class may be varied or abrogated by
special resolution passed at a separate general meeting of such holders.
Subject to the rights attached to any existing shares, rights attached
toshares will be deemed to be varied by the reduction of capital paid
upon the shares and by the allotment of further shares ranking in
priorityin respect of dividend or capital or which confer on the holders
more favourable voting rights than the first-mentioned shares, but will
nototherwise be deemed to be varied by the creation or issue of
furthershares.
POWER TO ISSUE AND ALLOT SHARES
The directors are generally and unconditionally authorised under the
authorities granted at the 2012 Annual General Meeting to allot shares
orgrant rights to subscribe for or to convert any security into shares
oftheCompany up to i) a maximum nominal amount of £35.4 million;
andii)to allot ordinary shares or grant rights to subscribe for or convert
any securities into shares in connection with a rights issue to existing
shareholders in proportion (or as nearly as may be practicable) up to an
aggregate nominal amount equal to £70.9 million or as reduced by the
nominal value of any ordinary shares allotted under i) above. At the same
meeting authority was also granted to the directors to allot the Company’s
shares for cash, up to a maximum nominal amount of approximately
£5.7million, without regard to the pre-emption provisions of the
Companies Act 2006. No such shares were issued or allotted under
theseauthorities in 2012, nor is there any current intention to do so, other
than to satisfy share options under the Company’s share option schemes
and, if necessary, to satisfy the consideration payable for businesses to
be acquired. Ifthe directors do exercise the authority under ii) above the
directors intend to follow ABI recommendations concerning its use.
These authorities are valid until the conclusion of the forthcoming Annual
General Meeting. The directors propose to seek similar authorities at such
Annual General Meeting, save that in respect of the authority to allot shares
or grant rights to subscribe for or to convert any security into shares of the
Company the directors intend to limit such authority to i) above and the
authority to allot the Company’s shares for cash referred to above.
RESTRICTIONS ON TRANSFER OF SHARES
Dealings in the Company’s ordinary shares by its directors, persons
discharging managerial responsibilities, certain employees of the
Company and, in each case, their connected persons, are subject to
the Company’s dealing code which adopts the Model Code of the Listing
Rules published by the Financial Services Authority.
Certain restrictions, which are customary for a listed company, apply
to transfers of shares in the Company. The Board may refuse to register
an instrument of transfer of any share which is not a fully paid share and
of acertificated share at its discretion unless it is:
t lodged, duly stamped or duly certified, at the offices of the Company’s
registrar or such other place as the Board may specify and is
accompanied by the certificate for the shares to which it relates and
such other evidence as the Board may reasonably require to show
the right of the transferor to make the transfer;
t in respect of only one class of shares; and
t in favour of not more than four transferees.
Registration of a transfer of an uncertificated share may be refused in
the circumstances set out in the uncertificated securities rules, and
where, in the case of a transfer to joint holders, the number of joint holders
to whom the uncertificated share is to be transferred exceeds four.

52 BUNZL PLC ANNUAL REPORT 2012
OTHER STATUTORY INFORMATION CONTINUED
In addition, no instrument of transfer for certificated shares shall be
registered if the transferor has been served with a restriction notice
(asdefined in the Company’s Articles of Association (the ‘Articles’))
afterfailure to provide the Company with information concerning certain
interests in the Company’s shares required to be provided under the
Companies Act 2006, unless the transfer is shown to the Board to be
pursuant to an arm’s length sale. The Board has the power to procure
thatuncertifcated shares are converted into certificated shares and kept
in certificated form for as long as the Board requires.
The Company is not aware of any agreements between shareholders
that may result in any restriction of the transfer of shares or voting rights.
RESTRICTIONS ON VOTING RIGHTS
A member shall not be entitled to vote, unless the Board otherwise
decides, at any general meeting or class meeting in respect of any shares
held by them if any call or other sums payable remain unpaid. Currently,
all issued shares are fully paid. In addition, no member shall be entitled
tovote if he has been served with a restriction notice after failure to
provide the Company with information concerning certain interests in
theCompany’s shares required to be provided under the Companies
Act2006. Votes may be exercised in person or by proxy. The Articles
currently provide a deadline for submission of proxy forms of 48 hours
before the relevant meeting, 24 hours before a poll is taken if such poll
istaken more than 48 hours after it was demanded or during the meeting
at which the poll was demanded if the poll is not taken straight away but
istaken not more than 48 hours after it was demanded.
PURCHASE OF OWN SHARES
At the 2012 Annual General Meeting, shareholders gave the Company
authority to purchase a maximum of 33,080,000 ordinary shares. During
the year ended 31 December 2012 the Company did not purchase any
ofits own shares pursuant to this authority or the authority granted at
the2011 Annual General Meeting and no shares have been purchased
between 31 December 2012 and 25 February 2013. The total number
ofordinary shares currently held in treasury is 23,325,000. The Company
is therefore currently authorised to buy back 33,080,000 of its own
sharespursuant to the existing shareholders’ authority which is due to
expire at the conclusion of the forthcoming Annual General Meeting.
Thedirectors again propose to seek the equivalent authority at such
Annual General Meeting.
DIRECTORS
Directors may be elected by ordinary resolution at a duly convened
general meeting or appointed by the Board. Under the Articles, the
minimum number of directors shall be two and the maximum shall be 15.
In accordance with the Articles, each director is required to retire at the
Annual General Meeting held in the third calendar year in which he or she
was appointed or last appointed and any director who has held office with
the Company, other than employment or executive office, for a continuous
period of nine years or more at the date of the Annual General Meeting
issubject to annual re-appointment. The Board may also appoint a person
willing to act as a director during the year either to fill a vacancy or as an
additional director but so that the total number of directors shall not at any
time exceed 15. However such appointee shall only hold office until the
next Annual General Meeting of the Company.
In addition to any power to remove a director from office conferred by
company law, the Company may also by special resolution remove a
director from office before the expiration of his or her period of office
under the Articles.
The office of a director shall also be vacated pursuant to the Articles
if thedirector:
t resigns by giving notice to the Company or is asked to resign by all
ofthe other directors who are not less than three in number; or
t is or has been suffering from mental or physical ill health and the Board
resolves that his or her office be vacated; or
t is absent without permission from Board meetings for six consecutive
months and the Board resolves that his or her office be vacated; or
t becomes bankrupt or compounds with his or her creditors generally; or
t is prohibited by law from being a director; or
t ceases to be a director by virtue of any provisions of company law or is
removed from office pursuant to the Articles.
Jean-Charles Pauze and Meinie Oldersma were appointed to the Board
with effect from 1 January 2013 and 1 April 2013 respectively.
Biographical details of the directors are set out on page 32. All of the
directors with the exception of Jean-Charles Pauze and Meinie Oldersma
served throughout the year. Notwithstanding the retirement by rotation
provisions in the Articles, each of the directors will retire and offer
themselves for re-election at the forthcoming Annual General Meeting in
accordance with the UK Corporate Governance Code apart from Ulrich
Wolters who retires at the conclusion of the Annual General Meeting.
Directors’ interests in ordinary shares are shown in Note 19 to the
consolidated financial statements. None of the directors was materially
interested in any contract of significance with the Company or any of its
subsidiary undertakings during or at the end of 2012. Information relating
to the directors’ service agreements and their remuneration for the year
and details of the directors’ share options under the Company’s share
option schemes and awards under the Long Term Incentive Plan and
Deferred Annual Share Bonus Scheme are set out in the Directors’
remuneration report on pages 38 to 50.
POWERS OF THE DIRECTORS
Subject to the Articles, the Companies Act 2006 and any directions given
by the Company by special resolution, the business of the Company is
managed by the Board who may exercise all powers of the Company.
TheBoard may, by power of attorney or otherwise, appoint any person
orpersons to be the agent or agents of the Company for such purposes
and on such conditions as the Board determines.
DIRECTORS’ INDEMNITIES
As at the date of this report, indemnities are in force under which the
Company has agreed to indemnify the directors and the Company
Secretary, in addition to other senior executives who are directors of
subsidiaries of the Company, to the extent permitted by law and the
Articles in respect of all losses arising out of, or in connection with,
the execution of their powers, duties and responsibilities as a director
or officer of the Company or any of its subsidiaries.
AMENDMENT OF ARTICLES
Any amendments to the Articles may be made in accordance with the
provisions of the Companies Act 2006 by way of special resolution of
the Company’s shareholders.
BUNZL PLC ANNUAL REPORT 2012 53
ENVIRONMENTAL AND SOCIAL RESPONSIBILITY
The directors recognise that the Company is part of a wider community
and that it has a responsibility to act in a way that respects the
environment and social and community issues. Further information
relating to the Company’s approach to these matters is set out in the
Corporate responsibility report on pages 27 to 31.
EMPLOYMENT POLICIES
The employment policies of the Group have been developed to meet the
needs of its different business areas and the locations in which they
operate worldwide, embodying the principles of equal opportunity. The
Group has standards of business conduct with which it expects all its
employees to comply. Bunzl encourages involvement of its employees in
the performance of the business in which they are employed and aims to
achieve a sense of shared commitment. In addition to a regular magazine
and the Company’s intranet, which provide a variety of information on
activities and developments within the Group and incorporate half year
and annual financial reports, announcements are periodically circulated
togive details of corporate and staff matters together with a number of
subsidiary or business area publications dealing with activities in specific
parts of the Group.
It is the Group’s policy that disabled applicants should be considered for
employment and career development on the basis of their aptitudes and
abilities. Employees who become disabled during their working life will
beretained in employment wherever possible and given help with
rehabilitation and training.
SIGNIFICANT AGREEMENTS
The Company’s wholly owned subsidiary, Bunzl Finance plc, has a
number of bilateral loan facilities with a range of different counterparties,
all of which are guaranteed by the Company, are in substantially the same
form and are prepayable at the option of the lender in the event of a
change of control of the Company. Similar change of control provisions in
relation to the Company are included in the US dollar and sterling bonds
which have been entered into by Bunzl Finance plc and the Company
and are also guaranteed by the Company.
CONTRACTUAL ARRANGEMENTS
The Group has contractual arrangements with numerous third parties in
support of its business activities, none of which are considered individually
to be essential to its business and, accordingly, it has not been considered
necessary for an understanding of the development, performance or
position of the Group’s business to disclose information about any of those
third parties.
CREDITOR PAYMENT POLICY
Group operating companies do not follow any specific published code or
standard on payment practice but are instead responsible for agreeing the
payment terms when agreeing all other terms and conditions under which
business transactions with their suppliers are conducted. It is Group policy
that suppliers are made aware of these terms and that payments to
suppliers are made in accordance with them provided that suppliers also
comply with all other relevant terms and conditions. The number of days’
billings from the Company’s suppliers outstanding at the end of the year
was 30 (2011: 30).
DONATIONS
During 2012, amongst other worldwide charitable donations, the Group
contributed £225,000 to UK charities (2011: £220,000). No contributions
were made for political purposes.
EXTERNAL AUDITOR
Each of the directors at the date of approval of this report confirms that:
t so far as the director is aware, there is no relevant audit information
ofwhich the Company’s auditor is unaware; and
t the director has taken all steps that he or she ought to have taken
as adirector in order to make the director aware of any relevant audit
information and to establish that the Company’s auditor is aware of
thatinformation.
This confirmation is given and should be interpreted in accordance with
the provisions of section 418 of the Companies Act 2006.
Resolutions are to be proposed at the forthcoming Annual General
Meeting for the re-appointment of KPMG Audit Plc as auditor of the
Company at a rate of remuneration to be determined by the directors.
DIRECTORS’ REPORT
Pages 1 to 53 inclusive consist of a directors’ report that has been drawn
up and presented in accordance with, and in reliance upon, applicable
English company law and any liability of the directors in connection with
this report shall be subject to the limitations and restrictions provided by
such law.
Under the Companies Act 2006, a safe harbour limits the liability of
directors in respect of statements in and omissions from the directors’
report. Under English law, the directors would be liable to the Company,
but not to any third party, if the directors’ report contains errors as a result
of recklessness or knowing misstatement ordishonest concealment of a
material fact, but would not otherwise beliable.
On behalf of the Board
Paul Hussey
Secretary
25 February 2013

54 BUNZL PLC ANNUAL REPORT 2012
FOR THE YEAR ENDED 31 DECEMBER 2012
CONSOLIDATED INCOME STATEMENT
Notes
2012
£m
2011
£m
Revenue 35,359.2 5,109.5
Operating profit before intangible amortisation and acquisition related costs 3352.4 335.7
Intangible amortisation and acquisition related costs 3 (58.6) (56.4)
Operating profit 3293.8 279.3
Finance income 522.1 21.8
Finance cost 5(50.6) (51.4)
Disposal of business 4.0 (56.0)
Profit before income tax 269.3 193.7
Profit before income tax, intangible amortisation, acquisition related costs and disposal of business 323.9 306.1
Income tax 6(74.0) (69.9)
Profit for the year attributable to the Company’s equity holders 195.3 123.8
Earnings per share attributable to the Company’s equity holders
Basic 759.9p 38.2p
Diluted 759.5p 38.0p
The Accounting policies and Notes on pages 59 to 88 form part of these consolidated financial statements.

BUNZL PLC ANNUAL REPORT 2012 55
FOR THE YEAR ENDED 31 DECEMBER 2012
CONSOLIDATED STATEMENT OF COMPREHENSIVE INCOME
Notes
2012
£m
2011
£m
Profit for the year 195.3 123.8
Other comprehensive income
Actuarial loss on pension schemes 20 (13.5) (35.5)
Foreign currency translation differences for foreign operations (47.5) (10.7)
Gain/(loss) taken to equity as a result of designated effective net investment hedges 18.5 (9.5)
(Loss)/gain recognised in cash flow hedge reserve (0.4) 0.8
Movement from cash flow hedge reserve to income statement (1.0) 0.6
Income tax credit on other comprehensive income 6 3.7 11.0
Other comprehensive expense for the year (40.2) (43.3)
Total comprehensive income for the year attributable to the Company’s equity holders 155.1 80.5

56 BUNZL PLC ANNUAL REPORT 2012
AT 31 DECEMBER 2012
CONSOLIDATED BALANCE SHEET
Notes
2012
£m
2011
£m
Assets
Property, plant and equipment 8111.4 109.0
Intangible assets 91,322.9 1,256.8
Investment in associates –0.5
Derivative financial assets 8.2 18.4
Deferred tax assets 15 7.9 13.2
Total non-current assets 1,450.4 1,397.9
Inventories 10 587.6 528.6
Income tax receivable 0.3 0.6
Trade and other receivables 11 819.5 738.6
Derivative financial assets 2.2 1.5
Cash and deposits 23 81.2 74.2
Total current assets 1,490.8 1,343.5
Total assets 2,941.2 2,741.4
Equity
Share capital 16 114.2 113.8
Share premium 143.9 136.4
Translation reserve 7.3 37.3
Other reserves 9.7 10.8
Retained earnings 610.4 508.4
Total equity attributable to the Company’s equity holders 885.5 806.7
Liabilities
Interest bearing loans and borrowings 23 599.2 678.8
Retirement benefit obligations 20 75.5 74.3
Other payables 28.7 17.9
Derivative financial liabilities 1.2 2.3
Provisions 14 21.3 39.2
Deferred tax liabilities 15 120.1 126.7
Total non-current liabilities 846.0 939.2
Bank overdrafts 23 25.4 29.2
Interest bearing loans and borrowings 23 204.9 37.5
Income tax payable 53.5 44.9
Trade and other payables 12 906.9 874.4
Derivative financial liabilities 0.9 0.3
Provisions 14 18.1 9.2
Total current liabilities 1,209.7 995.5
Total liabilities 2,055.7 1,934.7
Total equity and liabilities 2,941.2 2,741.4
Approved by the Board of Directors of Bunzl plc (Company registration number 358948) on 25 February 2013 and signed on its behalf by
Michael Roney, Chief Executive and Brian May, Finance Director.

BUNZL PLC ANNUAL REPORT 2012 57
FOR THE YEAR ENDED 31 DECEMBER 2012
CONSOLIDATED STATEMENT OF CHANGES IN EQUITY
Other reserves Retained earnings
Share
capital
£m
Share
premium
£m
Translation
reserve
£m
Merger
£m
Capital
redemption
£m
Cash flow
hedge
£m
Own
shares
£m
Earnings
£m
Total
equity
£m
At 1 January 2012 113.8 136.4 37.3 2.5 8.6 (0.3) (213.8) 722.2 806.7
Profit for the year 195.3 195.3
Actuarial loss on pension schemes (13.5) (13.5)
Foreign currency translation differences for
foreign operations (47.5) (47.5)
Gain taken to equity as a result of designated
effective net investment hedges 18.5 18.5
Loss recognised in cash flow
hedge reserve (0.4) (0.4)
Movement from cash flow hedge reserve
to income statement (1.0) (1.0)
Income tax (charge)/credit on other
comprehensive income (1.0) 0.3 4.4 3.7
Total comprehensive income (30.0) (1.1) 186.2 155.1
2011 interim dividend (26.1) (26.1)
2011 final dividend (59.6) (59.6)
Issue of share capital 0.4 7.5 7.9
Employee trust shares (9.6) (9.6)
Share based payments 11.1 11.1
At 31 December 2012 114.2 143.9 7.3 2.5 8.6 (1.4) (223.4) 833.8 885.5
At 1 January 2011 113.3 133.9 57.5 2.5 8.6 (1.3) (199.5) 681.4 796.4
Profit for the year 123.8 123.8
Actuarial loss on pension schemes (35.5) (35.5)
Foreign currency translation differences for
foreign operations (10.7) (10.7)
Loss taken to equity as a result of designated
effective net investment hedges (9.5) (9.5)
Gain recognised in cash flow
hedge reserve 0.8 0.8
Movement from cash flow hedge reserve
to income statement 0.6 0.6
Income tax (charge)/credit on other
comprehensive income (0.4) 11.4 11.0
Total comprehensive income (20.2) 1.0 99.7 80.5
2010 interim dividend (16.6) (16.6)
2010 final dividend (52.3) (52.3)
Issue of share capital 0.5 2.5 3.0
Employee trust shares (14.3) (14.3)
Share based payments 10.0 10.0
At 31 December 2011 113.8 136.4 37.3 2.5 8.6 (0.3) (213.8) 722.2 806.7

58 BUNZL PLC ANNUAL REPORT 2012
FOR THE YEAR ENDED 31 DECEMBER 2012
CONSOLIDATED CASH FLOW STATEMENT
Notes
2012
£m
2011
£m
Cash flow from operating activities
Profit before income tax 269.3 193.7
Adjustments:
depreciation 23.0 25.4
intangible amortisation and acquisition related costs 58.6 56.4
share based payments 5.7 5.3
disposal of business (4.0) 56.0
Working capital movement (22.4) 31.4
Finance income (22.1) (21.8)
Finance cost 50.6 51.4
Provisions (6.4) 1.7
Pensions (7.8) (12.1)
Other 4.6 2.7
Cash generated from operations before acquisition related costs 349.1 390.1
Cash outflow from acquisition related costs 24 (20.2) (12.1)
Income tax paid (63.6) (63.4)
Cash inflow from operating activities 265.3 314.6
Cash flow from investing activities
Interest received 2.2 2.9
Purchase of property, plant and equipment (23.0) (22.6)
Sale of property, plant and equipment 2.8 1.7
Purchase of businesses 24 (234.5) (149.2)
Disposal of business –30.6
Cash outflow from investing activities (252.5) (136.6)
Cash flow from financing activities
Interest paid (32.8) (33.5)
Dividends paid (85.7) (68.9)
Increase/(decrease) in loans 123.8 (90.3)
Realised losses on foreign exchange contracts (0.9) (0.2)
Net purchase of employee shares (3.7) (12.6)
Cash inflow/(outflow) from financing activities 0.7 (205.5)
Exchange loss on cash and cash equivalents (2.7) (2.4)
Increase/(decrease) in cash and cash equivalents 10.8 (29.9)
Cash and cash equivalents at start of year 45.0 74.9
Increase/(decrease) in cash and cash equivalents 10.8 (29.9)
Cash and cash equivalents at end of year 23 55.8 45.0

BUNZL PLC ANNUAL REPORT 2012 59
NOTES
1 BASIS OF PREPARATION
The consolidated financial statements for the year ended 31 December 2012 have been approved by the directors and prepared in accordance with
EU endorsed International Financial Reporting Standards (‘IFRS’) and interpretations of the International Financial Reporting Interpretations Committee
(‘IFRIC’). The consolidated financial statements have been prepared on a going concern basis (as referred to in the Financial review on page 24)
andunder the historical cost convention with the exception of certain items which are measured at fair value as disclosed in the accounting policies
below. The Company has elected to prepare its parent company financial statements in accordance with UK Generally Accepted Accounting Practice
(‘UK GAAP’).
The accounting policies set out below have, unless otherwise stated, been applied to all periods presented in the consolidated financial statements.
2 ACCOUNTING POLICIES
a Basis of consolidation
(i) Subsidiaries
Subsidiaries are entities controlled by the Group. Control exists when the Group has the power, directly or indirectly, to govern the financial and
operating policies of an entity so as to obtain benefits from its activities. Subsidiaries are included in the consolidated financial statements from
the date that control commences until the date that control ceases.
The acquisition method of accounting is used to account for the acquisition of subsidiaries. Identifiable assets acquired and liabilities and contingent
liabilities assumed in abusiness combination are measured initially at fair value at the acquisition date. The consideration paid or payable in respect
ofacquisitions comprises amounts paid on completion, deferred consideration and payments which are contingent on the continued employment
offormer owners of businesses acquired. The excess of the consideration (excluding payments contingent on future employment) over the fair value
ofthe identifiable net assets acquired is recorded as goodwill. Payments that are contingent on future employment and transaction costs and expenses
such as professional fees are charged to the income statement.
(ii) Associates
Associates are entities over which the Group is in a position to exercise significant influence. Associates are accounted for using the equity method
and are recognised initially at cost. The consolidated financial statements include the Group’s share of the income and expenses of associates.
(iii) Transactions eliminated on consolidation
Intragroup balances and any unrealised gains and losses or income and expenses arising from intragroup transactions are eliminated in preparing
the consolidated financial statements.
b Foreign currency
Transactions in foreign currencies are recorded at the rate of exchange at the date of the transaction. Monetary assets and liabilities denominated
inforeign currencies at the balance sheet date are translated at the exchange rate prevailing at that date. Foreign exchange differences arising
ontranslation are recognised in the income statement, unless they qualify for cash flow or net investment hedge accounting treatment, in which
case the effective portion is recognised directly in a separate component of equity.
Assets and liabilities of foreign operations are translated at the exchange rate prevailing at the balance sheet date. Income and expenses of foreign
operations are translated at average exchange rates. All resulting exchange differences, including exchange differences arising from the translation
ofborrowings and other financial instruments designated as hedges of such investments, are recognised directly in a separate component of equity.
Differences that have arisen since 1 January 2004, the date of transition to IFRS, are presented as a separate component of equity.
c Financial instruments
Under International Accounting Standard (‘IAS’) 39 ‘Financial Instruments: Recognition and Measurement’, financial instruments are initially measured
at fair value with subsequent measurement depending upon the classification of the instrument. Other financial assets and liabilities are held at
amortised cost unless they are in a fair value hedging relationship. Derivative financial instruments are used to hedge exposures to foreign exchange
and interest rate risks.
(i) Fair value hedge
Where a derivative financial instrument is designated and qualifies as a hedge of a recognised asset or liability, all changes in the fair value of the
derivative are recognised immediately in the income statement. The carrying value of the hedged item is adjusted by the change in fair value that
is attributable to the risk being hedged with changes recognised in the income statement.
(ii) Cash flow hedge
Where a derivative that is designated and qualifies as a hedge is used to hedge forecast transactions, any effective portion of the change in fair value
isrecognised in equity. The gain or loss relating to any ineffective portion is recognised immediately in the income statement. Amounts accumulated
inequity are recycled to the income statement in the period when the hedged item affects profit or loss.
(iii) Hedge of a net investment in foreign operations
Foreign currency differences arising on the retranslation of a financial liability designated as a hedge of a net investment in foreign operations are
recognised directly in equity to the extent the hedge is effective. To the extent that the hedge is ineffective such differences are recognised in the
income statement.

NOTES CONTINUED
60 BUNZL PLC ANNUAL REPORT 2012
2 ACCOUNTING POLICIES CONTINUED
d Property, plant and equipment
Property, plant and equipment are stated at historical cost less accumulated depreciation and any impairment losses.
e Depreciation
Depreciation is provided on a straight line basis to write off cost less estimated residual value over the assets’ estimated remaining useful lives.
This is applied at the following annual rates:
Buildings 2% (or depreciated over life of lease if shorter than 50 years)
Plant and machinery 8%–33%
Fixtures, fittings and equipment 8%–33%
Freehold land Not depreciated
The assets’ residual values, useful lives and depreciation methods are reviewed, and adjusted if appropriate, at each balance sheet date.
f Intangible assets
(i) Goodwill
Acquisitions are accounted for using the acquisition method. As permitted by IFRS 1 ‘First-time Adoption of International Financial Reporting
Standards’, the Group has chosen to apply IFRS 3 ‘Business Combinations’ from 1 January 2004 and has elected not to restate previous business
combinations. For acquisitions made before 1 January 2004, goodwill represents the amount previously recorded under UK GAAP. For acquisitions
that occurred between 1 January 2004 and 31 December 2009, goodwill represents the cost of the business combination in excess of the fair value of
the identifiable assets, liabilities and contingent liabilities acquired. For acquisitions that have occurred on or after 1 January 2010, goodwill represents
the cost of the business combination (excluding payments contingent on future employment and acquisition related costs) in excess of the fair value of
the identifiable assets, liabilities and contingent liabilities acquired. Goodwill is allocated to cash generating units and is tested annually for impairment.
Negative goodwill arising on acquisition is recognised immediately in the income statement.
(ii) Other intangible assets
Intangible assets acquired in a business combination are recognised on acquisition and recorded at fair value. These principally relate to customer
relationships and are stated at cost less accumulated amortisation and any impairment losses. Amortisation is charged to the income statement on
astraight line basis over the estimated useful economic lives (which range from 10 to 19 years).
g Leases
Operating lease rentals and any incentives receivable are recognised in the income statement on a straight line basis over the term of the relevant
lease. Leases in which the Group assumes substantially all the risks and rewards of ownership of the leased assets are classified as finance leases.
Where land and buildings are held under leases, the accounting treatment of the land is considered separately from that of the buildings due to the
indefinite life of land.
h Impairment
The carrying amounts of the Group’s assets are reviewed annually to determine if there is any indication of impairment. If any such indication exists,
theassets’ recoverable amounts are estimated. The recoverable amounts of assets carried at amortised cost are calculated as the present value of
estimated future cash flows, discounted at appropriate pre-tax discount rates. The recoverable amounts of other assets are the greater of their fair value
less the costs to sell and the value in use. In assessing the value in use, the estimated future cash flows are discounted to their present values using
appropriate pre-tax discount rates. Impairment losses are recognised when the carrying amount of an asset or cash generating unit exceeds its
recoverable amount, with impairment losses being recognised in the income statement.
i Inventories
Inventories are valued at the lower of cost and net realisable value.
j Cash and cash equivalents
Cash and cash equivalents comprise cash balances, bank overdrafts and short term deposits with maturities of three months or less from the date the
deposit is made.
k Trade and other receivables
Trade and other receivables are stated at cost less any impairment losses. A provision for impairment is established when there is objective evidence
that the Group will not be able to collect all amounts due according to the original terms of the receivables or uncertainty as to whether the Group
willbe able to collect all such amounts.
l Trade and other payables
Trade and other payables are stated at cost.

BUNZL PLC ANNUAL REPORT 2012 61
2 ACCOUNTING POLICIES CONTINUED
m Income tax
Income tax in the income statement comprises current and deferred tax. Income tax is recognised in the income statement except when it relates
to items reflected in equity when it is recognised in equity.
Current tax reflects tax payable on taxable income for the year using rates enacted or substantively enacted at the balance sheet date and any
adjustments in respect of prior years.
Deferred tax is provided using the balance sheet liability method providing for temporary differences arising between tax bases and carrying amounts
in the consolidated financial statements. Deferred tax is measured at the tax rates that are expected to be applied to temporary differences when they
reverse, based on the laws that have been enacted or substantively enacted at the balance sheet date.
Deferred tax is not recognised for the following temporary differences: goodwill not deductible for tax purposes, the initial recognition of assets and
liabilities that affect neither accounting nor taxable profits and differences relating to investments in subsidiaries to the extent that they will probably not
reverse in the foreseeable future. Deferred tax assets are recognised to the extent that it is probable that future taxable profit will be available against
which any asset can be utilised.
n Revenue
The Group is engaged in the delivery of goods to customers. Revenue from a sale is recognised in the income statement upon delivery of the relevant
goods, which is the point in time at which the significant risks and rewards of ownership of the goods are transferred.
Revenue is valued at invoiced amount, excluding sales taxes, less estimated provisions for returns and trade discounts where relevant. Returns’
provisions and early settlement discounts are based on experience over an appropriate period whereas volume discounts are based on agreements
with customers.
Revenue is not recognised if there is significant uncertainty regarding recovery of the consideration due.
o Employee benefits
(i) Defined contribution pension schemes
Obligations for contributions to defined contribution pension schemes are charged as an expense to the income statement as incurred.
(ii) Defined benefit pension schemes
Pension liabilities are recognised in the consolidated balance sheet and represent the difference between the fair value of scheme assets and the
present value of scheme liabilities. Scheme liabilities are determined on an actuarial basis using the projected unit method and discounted using
the rate applicable to AA rated corporate bonds that have a similar maturity to the scheme liabilities.
Current service cost, past service cost/credit and gains and losses on any settlements and curtailments are credited or charged to the income
statement. Past service cost is recognised immediately to the extent benefits are already vested or is otherwise amortised on a straight line basis
overthe average period until the benefits are vested. The unwinding of the discount on scheme liabilities is recognised within finance cost and
the expected return on scheme assets generated during the year is included within finance income.
Actuarial gains and losses are recognised in full in the consolidated statement of comprehensive income.
p Investment in own shares
The cost of shares held either directly (treasury shares) or indirectly (employee benefit trust shares) is deducted from equity. Repurchased shares are
classified as treasury shares and are presented as a deduction from total equity. When treasury shares are sold or reissued subsequently, the amount
received is recognised as an increase in equity and the resulting surplus or deficit on the transaction is recognised in retained earnings.
q Share based payments
The Group operates equity settled share based compensation plans. Details of these plans are outlined in Note 16 and the Directors’ remuneration
report. The total expected expense is based on the fair value of options and other share based incentives on the grant date calculated using
a valuation model and is spread over the expected vesting period with a corresponding credit to equity.
r Provisions
Provisions are recognised in the balance sheet when the Group has a present legal or constructive obligation as a result of a past event and where it is
probable that an outflow of economic benefits will be required to settle the obligation. If the effect is material, provisions are determined by discounting
the expected future cash flows at a pre-tax rate that reflects current market assessments of the time value of money and, where appropriate, the risks
specific to the liability.
A provision for onerous contracts is recognised when the expected benefits to be derived by the Group from a contract are lower than the unavoidable
costs of meeting the Group’s obligations under the contract.
s Net debt
Net debt is defined as interest bearing loans and borrowings and the fair value of interest rate swaps on fixed interest rate borrowings, less cash
and cash equivalents.

NOTES CONTINUED
62 BUNZL PLC ANNUAL REPORT 2012
2 ACCOUNTING POLICIES CONTINUED
t Dividends
The interim dividend is recognised in the Consolidated statement of changes in equity in the period in which it is paid and the final dividend in the
period in which it is approved by shareholders at the Annual General Meeting.
CRITICAL ACCOUNTING JUDGEMENTS AND ESTIMATES
The following provides information on those policies that management considers critical because of the level of judgement and estimation required
which often involves assumptions regarding future events which can vary from what is anticipated. The directors review the judgements and estimates
on an ongoing basis with revisions to accounting estimates recognised in the period in which the estimates are revised and in any future periods
affected. The key sources of estimation uncertainty at the balance sheet date that have risk of causing material adjustment to the carrying amounts
ofassets and liabilities are set out below. The directors believe that the consolidated financial statements reflect appropriate judgements and estimates
and provide a true and fair view of the Group’s performance and financial position. Where appropriate and practicable, sensitivities are disclosed in
therelevant notes.
a Pension benefits
The cost of defined benefit pension schemes and the present value of the obligations relating thereto are determined using actuarial valuations
appropriate for each country where defined benefit pension schemes are provided. The actuarial valuations involve making assumptions about
discount rates, expected rates of return on assets, future salary increases, future pension increases and mortality rates. All assumptions are reviewed
at each reporting date. In determining the appropriate discount rates, management considers the interest rates of corporate bonds with an AA rating
inthe relevant country. Future salary increases and future pension increases are based on expected future inflation rates for each country. Mortality
rates are based on the relevant mortality tables for each country. Further details about the assumptions used are set out in Note 20.
b Intangible assets
IFRS 3 requires the identification of acquired intangible assets as part of a business combination. The methods used to value such intangible assets
require the use of estimates including forecast performance and customer attrition rates. Future results are impacted by the amortisation periods
adopted and changes to the estimated useful lives would result in different effects on the income statement.
Goodwill is tested annually for impairment. Tests for impairment are based on discounted cash flows and assumptions (including discount rates, timing
and growth prospects) which are inherently subjective. Further details about the assumptions used are set out in Note 9.
c Acquisitions
Acquisitions are accounted for using the acquisition method based on the fair value of the consideration paid. Assets and liabilities are measured
at fair value and the purchase price is allocated to assets and liabilities based on these fair values.
Determining the fair values of assets and liabilities acquired involves the use of significant estimates and assumptions (including discount rates, asset
lives and recoverability). Assets and liabilities are measured at fair value and the value of freehold properties is typically determined by qualified valuers
on an open market basis.
Management believes that estimates made in previous years have been materially accurate as any changes made in the allocation period following
acquisition to finalise provisional fair value adjustments made in the year of acquisition have not been material.
d Tax
The Group is subject to income taxes in a number of jurisdictions. Management is required to make judgements and estimates in determining
the provisions for income taxes and deferred tax assets and liabilities recognised in the consolidated financial statements. Tax benefits are recognised
to the extent that it is probable that sufficient taxable income will be available in the future against which temporary differences and unused tax losses
can be utilised.
NEW ACCOUNTING STANDARDS AND INTERPRETATIONS
The Group is currently assessing the impact of revisions to standards and interpretations or amendments that are not yet effective. The most significant
of these changes is considered to be IAS 19 (revised 2011) ‘Employee Benefits’ which is effective for the 2013 financial year and requires the
replacement of the expected return on assets and interest charge on pension scheme liabilities with a net financing cost based on the discount rate.
The impact of the change had it been effective in 2012 would have been to increase the net interest expense by approximately £5.5m, to reduce profit
before income tax by approximately £5.5m and reduce profit after tax by approximately £4.0m.
The Group does not consider that any other standards or interpretations issued by the International Accounting Standards Board (‘IASB’) but not
yet applicable will have a significant impact on the consolidated financial statements.

BUNZL PLC ANNUAL REPORT 2012 63
3 SEGMENT ANALYSIS
Year ended 31 December 2012
North
America
£m
Continental
Europe
£m
UK &
Ireland
£m
Rest of the
World
£m
Corporate
£m
Total
£m
Revenue 2,905.8 1,079.4 992.1 381.9 5,359.2
Operating profit/(loss) before intangible
amortisation and acquisition related costs 184.6 87.5 65.2 33.2 (18.1) 352.4
Intangible amortisation (8.1) (27.7) (6.5) (5.4) – (47.7)
Acquisition related costs (4.4) (3.5) (0.4) (2.6) – (10.9)
Operating profit/(loss) 172.1 56.3 58.3 25.2 (18.1) 293.8
Finance income 22.1
Finance cost (50.6)
Disposal of business 4.0
Profit before income tax 269.3
Profit before income tax, intangible amortisation,
acquisition related costs and disposal of business 323.9
Income tax (74.0)
Profit for the year 195.3
Capital expenditure 6.9 9.1 2.9 4.0 0.1 23.0
Depreciation 6.5 10.9 3.6 1.8 0.2 23.0
Year ended 31 December 2011
North
America
£m
Continental
Europe
£m
UK &
Ireland
£m
Rest of the
World
£m
Corporate
£m
Total
£m
Revenue 2,727.9 1,067.1 996.6 317.9 5,109.5
Operating profit/(loss) before intangible
amortisation and acquisition related costs 169.2 95.6 60.2 28.4 (17.7) 335.7
Intangible amortisation (6.9) (27.1) (7.8) (4.7) – (46.5)
Acquisition related costs (1.2) (5.2) (0.7) (2.8) – (9.9)
Operating profit/(loss) 161.1 63.3 51.7 20.9 (17.7) 279.3
Finance income 21.8
Finance cost (51.4)
Disposal of business (56.0)
Profit before income tax 193.7
Profit before income tax, intangible amortisation,
acquisition related costs and disposal of business 306.1
Income tax (69.9)
Profit for the year 123.8
Capital expenditure 7.6 8.2 4.7 1.8 0.3 22.6
Depreciation 6.3 11.2 6.1 1.6 0.2 25.4
Acquisition related costs for the year ended 31 December 2012 include transaction costs and expenses of £6.9m (2011: £4.6m) and net deferred
consideration payments of £4.0m (2011: £5.3m) relating to the continued employment of former owners of businesses acquired and earn outs.
The Group is managed through four business areas based on geographic regions which represent the reporting segments under IFRS 8 ‘Operating
Segments’. The revenue presented relates to external customers. Sales between the business areas are not material. Each of the business areas
supplies a range of products to customers operating primarily in the grocery, foodservice, cleaning & hygiene, safety, non-food retail and healthcare
market sectors. The performance of the four business areas is assessed by reference to operating profit before intangible amortisation and acquisition
related costs and this measure also represents the segment results for the purposes of reporting in accordance with IFRS 8. Debt and associated
interest is managed at a Group level and therefore has not been allocated across the business areas. In accordance with the provisions of IFRS 8,
theCompany’s chief operating decision maker is the Board of Directors.
Within each of the four business areas, there are a number of further segments based on geography and market sector. These segments have been
aggregated into the four business areas as shown above due to the similarity between them in terms of economic characteristics and also in respect
ofthe nature of the products and services, types of customer and the methods used to distribute these products and services.
There are no customers who account for more than 10% of Group revenue. Customer dependencies are regularly monitored.

NOTES CONTINUED
64 BUNZL PLC ANNUAL REPORT 2012
3 SEGMENT ANALYSIS CONTINUED
Revenue by market sector
2012
£m
2011
£m
Grocery 1,574.0 1,534.5
Foodservice 1,571.2 1,449.0
Cleaning & hygiene 724.3 731.2
Safety 455.7 400.1
Non-food retail 447.6 422.3
Healthcare 378.3 355.8
Other 208.1 216.6
5,359.2 5,109.5
The Other category covers a wide range of market sectors, none of which is sufficiently material to warrant separate disclosure.
At 31 December 2012
North
America
£m
Continental
Europe
£m
UK &
Ireland
£m
Rest of
the World
£m
Unallocated
£m
Total
£m
Segment assets 1,001.9 921.5 597.7 312.2 2,833.3
Unallocated assets 107.9 107.9
Total assets 1,001.9 921.5 597.7 312.2 107.9 2,941.2
Segment liabilities 363.8 240.1 256.3 83.6 943.8
Unallocated liabilities 1,111.9 1,111.9
Total liabilities 363.8 240.1 256.3 83.6 1,111.9 2,055.7
At 31 December 2011
North
America
£m
Continental
Europe
£m
UK &
Ireland
£m
Rest of the
World
£m
Unallocated
£m
Total
£m
Segment assets 818.6 949.4 600.2 256.5 2,624.7
Unallocated assets 116.7 116.7
Total assets 818.6 949.4 600.2 256.5 116.7 2,741.4
Segment liabilities 341.8 236.5 257.9 70.2 906.4
Unallocated liabilities 1,028.3 1,028.3
Total liabilities 341.8 236.5 257.9 70.2 1,028.3 1,934.7
Unallocated assets and liabilities include Corporate assets and liabilities, tax assets and liabilities, cash and deposits, borrowings, derivative assets
andliabilities and pension scheme assets and liabilities.

BUNZL PLC ANNUAL REPORT 2012 65
4 ANALYSIS OF OPERATING INCOME AND EXPENSES 2012
£m
2011
£m
Purchase of goods and changes in inventories 4,118.2 3,905.7
Employee costs (see Note 21) 494.7 486.9
Depreciation of property, plant and equipment 23.0 25.4
Amortisation of intangible fixed assets 47.7 46.5
Acquisition related costs 10.9 9.9
Profit on disposal of property, plant and equipment (0.2) (0.1)
Rentals payable under operating leases and subleases 83.8 83.0
Lease and sublease income (1.5) (1.3)
Other operating expenses 288.8 274.2
Net operating expenses 5,065.4 4,830.2
2012 2011
Auditor’s remuneration
UK
£m
Overseas
£m
Total
£m
UK
£m
Overseas
£m
Total
£m
Audit of these financial statements 0.3 – 0.3 0.3 – 0.3
Amounts receivable by the Company’s auditor and its
associates in respect of:
audit of financial statements of subsidiaries of the Company 0.3 1.3 1.6 0.3 1.3 1.6
audit related assurance services 0.1 – 0.1 0.1 – 0.1
taxation compliance services –0.10.1 –0.1 0.1
other tax advisory services 0.1 0.2 0.3 0.1 0.3 0.4
all other services –0.80.8 –0.5 0.5
Total remuneration 0.8 2.4 3.2 0.8 2.2 3.0
Management believes that given the Group’s auditor’s detailed knowledge of the Group’s operations, its structure and accounting policies and the
importance of carrying out tax services and detailed pre-acquisition due diligence, it is often appropriate for this additional work to be undertaken
bythe Group’s auditor rather than another firm of accountants. However other firms are also used by the Company to provide non-audit services
and it is the Company’s policy to assess the services required on a case by case basis to ensure that the best placed adviser is retained.
The Audit Committee, which consists entirely of independent non-executive directors, reviews and approves the level and type of non-audit work
whichthe auditor performs, including the fees paid for such work, to ensure that the auditor’s objectivity and independence are not compromised.
Further information is set out in the Audit Committee section of the Corporate governance report on pages 34 and 35.
5 FINANCE INCOME/(COST) 2012
£m
2011
£m
Interest on deposits 0.8 1.8
Interest income from foreign exchange contracts 1.8 1.0
Expected return on pension scheme assets 18.5 18.3
Other finance income 1.0 0.7
Finance income 22.1 21.8
Interest on loans and overdrafts (33.2) (32.6)
Interest expense from foreign exchange contracts (1.0) (1.4)
Interest charge on pension scheme liabilities (16.3) (16.4)
Fair value gain on US dollar bonds in a hedge relationship 5.7 5.9
Fair value loss on interest rate swaps in a hedge relationship (5.7) (5.9)
Foreign exchange loss on intercompany funding (8.7) (12.9)
Foreign exchange gain on external debt not in a hedge relationship 8.9 12.7
Other finance expense (0.3) (0.8)
Finance cost (50.6) (51.4)
The foreign exchange loss on intercompany funding arises as a result of foreign currency intercompany loans and deposits. This is substantially
matched by external debt to minimise this foreign currency exposure in the income statement.

NOTES CONTINUED
66 BUNZL PLC ANNUAL REPORT 2012
6 INCOME TAX 2012
£m
2011
£m
Current tax on profit
current year 84.9 82.5
prior years (8.6) (12.1)
double tax relief (0.1) (0.4)
76.2 70.0
Deferred tax on profit
current year (0.8) 2.5
prior years (1.4) (2.6)
(2.2) (0.1)
Income tax on profit 74.0 69.9
In assessing the underlying performance of the Group, management uses adjusted profit which excludes intangible amortisation, acquisition related
costs and the profit/loss on disposal of business. Similarly the tax effect of these items is excluded in monitoring the tax rate on the adjusted profit
of the Group which is shown in the table below:
2012
£m
2011
£m
Income tax on profit 74.0 69.9
Tax associated with intangible amortisation, acquisition related costs and disposal of business 15.7 14.3
Tax on adjusted profit 89.7 84.2
Profit before income tax 269.3 193.7
Intangible amortisation, acquisition related costs and disposal of business 54.6 112.4
Adjusted profit before income tax 323.9 306.1
Reported tax rate 27.5% 36.1%
Tax rate on adjusted profit 27.7% 27.5%
Tax on other comprehensive income and equity
Gross
2012
£m
Tax credit /
(charge)
2012
£m
Net
2012
£m
Gross
2011
£m
Tax credit /
(charge)
2011
£m
Net
2011
£m
Actuarial loss on pension schemes (13.5) 4.4 (9.1) (35.5) 11.4 (24.1)
Foreign currency translation differences for foreign operations (47.5) – (47.5) (10.7) – (10.7)
Gain/(loss) taken to equity as a result of designated effective
net investment hedges 18.5 (1.0) 17.5 (9.5) – (9.5)
(Loss)/gain recognised in cash flow hedge reserve (0.4) 0.1 (0.3) 0.8 (0.2) 0.6
Movement from cash flow hedge reserve to income statement (1.0) 0.2 (0.8) 0.6 (0.2) 0.4
Other comprehensive (expense)/income (43.9) 3.7 (40.2) (54.3) 11.0 (43.3)
Dividends (85.7) – (85.7) (68.9) – (68.9)
Issue of share capital 7. 9 – 7.9 3.0 – 3.0
Employee trust shares (9.6) – (9.6) (14.3) – (14.3)
Share based payments 5.7 5.4 11.1 5.3 4.7 10.0
Other comprehensive (expense)/income and equity (125.6) 9.1 (116.5) (129.2) 15.7 (113.5)

BUNZL PLC ANNUAL REPORT 2012 67
6 INCOME TAX CONTINUED
Factors affecting the tax charge for the year
The Group operates in many countries and is subject to income tax in many different jurisdictions. The expected tax rate is calculated as a weighted
average of the tax rates in the tax jurisdictions in which the Group operates. The adjustments to the tax charge at the weighted average rate to
determine the income tax on profit are as follows:
2012
£m
2011
£m
Profit before income tax 269.3 193.7
Tax charge at weighted average rate (2012: 31.6%; 2011: 35.3%) 85.2 68.4
Effects of:
(gain)/loss on disposal not (taxable)/deductible (1.0) 14.8
adjustment in respect of prior years (10.0) (14.7)
non-taxable and non-deductible items (1.3) (0.1)
other 1.1 1.5
Income tax on profit 74.0 69.9
Deferred tax in the income statement
2012
£m
2011
£m
Accelerated capital allowances 0.6 1.9
Pension liabilities 0.8 3.2
Intangible assets (11.2) (12.4)
Share based payments (0.1) (1.0)
Provisions (0.7) 6.4
Other 8.4 1.8
Deferred tax on profit (2.2) (0.1)
UK tax rate change
Following the enactment of legislation in the UK to reduce the corporation tax rate to 23% from 1 April 2013, the UK deferred tax balances were
reduced from 25% to 23%. This increased the tax expense for the year by £0.6m. The proposed future reduction in the UK tax rate to 21% will
be reflected in the consolidated financial statements when the relevant legislation is substantively enacted.
7 EARNINGS PER SHARE 2012
£m
2011
£m
Profit for the year 195.3 123.8
Adjustment 38.9 98.1
Adjusted profit* 234.2 221.9
Basic weighted average ordinary shares in issue (million) 326.1 324.0
Dilutive effect of employee share plans (million) 1.9 1.9
Diluted weighted average ordinary shares (million) 328.0 325.9
Basic earnings per share 59.9p 38.2p
Adjustment 11.9p 30.3p
Adjusted earnings per share* 71.8p 68.5p
Diluted basic earnings per share 59.5p 38.0p
Adjustment 11.9p 30.1p
Adjusted diluted earnings per share* 71.4p 68.1p
* Adjusted profit, adjusted earnings per share and adjusted diluted earnings per share exclude the charge for intangible amortisation, acquisition
relatedcosts and the respective associated tax and the profit/loss on disposal of business. The intangible amortisation and associated tax and the
profit/loss ondisposal of business are non-cash items which are not taken into account by management when assessing the underlying performance
of the business. Similarly, the acquisition related costs and associated tax do not relate to the underlying performance of the business. Accordingly,
such items are removed in calculating the adjusted earnings per share on which management assesses the performance of the Group.

NOTES CONTINUED
68 BUNZL PLC ANNUAL REPORT 2012
8 PROPERTY, PLANT AND EQUIPMENT
2012
Land and
buildings
£m
Plant and
machinery
£m
Fixtures,
fittings and
equipment
£m
Total
£m
Cost
Beginning of year 74.5 95.3 103.3 273.1
Acquisitions 3.5 4.0 0.6 8.1
Additions 2.0 8.9 12.1 23.0
Disposals (3.6) (5.5) (5.0) (14.1)
Currency translation (0.9) (3.8) (1.6) (6.3)
End of year 75.5 98.9 109.4 283.8
Depreciation
Beginning of year 24.1 63.5 76.5 164.1
Charge in year 2.7 8.2 12.1 23.0
Disposals (1.8) (5.1) (4.6) (11.5)
Currency translation 0.2 (2.1) (1.3) (3.2)
End of year 25.2 64.5 82.7 172.4
Net book value at 31 December 2012 50.3 34.4 26.7 111.4
2011
Land and
buildings
£m
Plant and
machinery
£m
Fixtures,
fittings and
equipment
£m
Total
£m
Cost
Beginning of year 74.7 102.8 95.9 273.4
Acquisitions 0.6 2.3 1.7 4.6
Disposal of business (1.2) (17.3) (2.5) (21.0)
Additions 1.6 10.3 10.7 22.6
Disposals (1.6) (2.7) (2.3) (6.6)
Currency translation 0.4 (0.1) (0.2) 0.1
End of year 74.5 95.3 103.3 273.1
Depreciation
Beginning of year 23.1 62.5 69.7 155.3
Charge in year 3.0 9.7 12.7 25.4
Disposal of business (1.0) (7.9) (3.2) (12.1)
Disposals (0.9) (2.0) (2.1) (5.0)
Currency translation (0.1) 1.2 (0.6) 0.5
End of year 24.1 63.5 76.5 164.1
Net book value at 31 December 2011 50.4 31.8 26.8 109.0
The net book value of property, plant and equipment includes assets held under finance leases and hire purchase contracts totalling £9.2m
(2011: £9.2m). Accumulated depreciation of these assets was £4.8m (2011: £4.4m). Future capital expenditure at 31 December 2012 consisted
of commitments not provided for of £0.7m (2011: £2.5m).

BUNZL PLC ANNUAL REPORT 2012 69
9 INTANGIBLE ASSETS
Goodwill
2012
£m
2011
£m
Beginning of year 784.6 789.0
Acquisitions 63.6 50.4
Disposal of business –(44.8)
Currency translation (25.9) (10.0)
End of year 822.3 784.6
Customer relationships
2012
£m
2011
£m
Cost
Beginning of year 707.9 661.0
Acquisitions 94.7 100.4
Disposal of business –(35.7)
Currency translation (26.3) (17.8)
End of year 776.3 707.9
Amortisation
Beginning of year 235.7 205.4
Charge in year 47.7 46.5
Disposal of business –(9.3)
Currency translation (7.7) (6.9)
End of year 275.7 235.7
Net book value at 31 December 500.6 472.2
Total net book value of intangible assets at 31 December 1,322.9 1,256.8
Both goodwill and customer relationships have been acquired as part of business combinations. Customer relationships are amortised over their
estimated useful lives which range from 10 to 19 years.
Impairment tests
The carrying amount of goodwill is allocated across cash generating units (‘CGUs’).
A description of the Group’s principal activities is set out in the Chief Executive’s review. There is no significant difference in the nature of activities
across different geographies. The identification of CGUs reflects the way in which the business is managed on a geographical basis. Given thesimilar
nature of the activities of each CGU, a consistent methodology is applied across the Group in assessing CGU recoverable amounts. The recoverable
amount is the higher of the value in use and the fair value less the costs to sell. The value in use is the present value of the cash flows expected to be
generated by the CGU over a projection period together with a terminal value. The projection period is the time period over which future cash flows are
predicted. The Group’s methodology is to use a projection period of five years being the maximum period over which detailed future cash flows for
each CGU are prepared. For periods after this five year period, the methodology applies a long term growth rate to derive a terminal value. Cash flow
expectations exclude any future cash flows that may arise from restructuring or other enhancements to the cash generating activities of the CGU and
reflect management’s expectations of the range of economic conditions that may exist over the projection period.
The value in use calculations are principally sensitive to revenue growth, including any significant changes to the customer base, achievability of future
margins and the discount rate used in the present value calculation. The information used for valuation purposes takes into consideration past
experience and the current economic environment with regard to customer attrition rates and additions to the customer base, the ability to introduce
price increases and new products and experience in controlling the underlying cost base. This provides a long term growth rate which is consistent
with thegeographic segments in which the Group operates and management’s assessment of future operating performance and market share
movements. The growth rate has been calculated based principally on current inflation rates of the relevant economies.
At 31 December 2012 North America, France Hygiene and UK Hospitality carried a significant amount of goodwill in comparison with the total value of
the Group’s goodwill. At 31 December 2012 the carrying value of goodwill in respect of North America was £224.8m (2011: £191.7m), France Hygiene
was £80.2m (2011: £82.2m) and UK Hospitality was £62.5m (2011: £60.1m). At 31 December 2012 the aggregate amount of goodwill attributable to
the Group’s CGUs, excluding North America, France Hygiene and UK Hospitality, was £454.8m (2011: £450.6m). The remaining goodwill relates to
CGUs which are not individually significant.
For North America, France Hygiene and UK Hospitality the weighted average growth rate used in 2012 was 2.5% (2011: 2.5%). A discount rate
of 8% (2011: 7%) has been applied to the value in use calculations representing a pre-tax rate reflecting market assessments of the time value of
money at the balance sheet date. Similar assumptions have been applied to the other CGUs but where appropriate the directors have considered
alternative market risk assumptions to reflect the specific conditions arising in individual countries (with discount rates ranging from 8%–20%).

NOTES CONTINUED
70 BUNZL PLC ANNUAL REPORT 2012
9 INTANGIBLE ASSETS CONTINUED
Sensitivity to changes in key assumptions
Impairment testing is dependent on management’s estimates and judgements, particularly as they relate to the forecasting of future cash flows,
thediscount rates selected and expected long term growth rates. A key assumption on which value in use calculations are dependent relates to
revenue growth including the impact of changes to the underlying customer base. This assumption is sensitive to customer attrition and the rate
atwhich new customer relationships are introduced and established.
Based on past experience and taking into account current market conditions, management has concluded that it is reasonable to assume that there
will be no material deterioration in the customer base over the projection period which will significantly impact future cash flows and that no reasonably
possible change in key assumptions would result in impairment in any of the Group’s CGUs. Should such a change occur, this would represent a
triggering event to indicate that an impairment review may be necessary. In accordance with IAS 36 ‘Impairment of Assets’, a full impairment review
would then be undertaken on the relevant assets within the CGU. Any such changes are monitored through normal monthly procedures.
10 INVENTORIES 2012
£m
2011
£m
Goods for resale 587.6 528.6
£5.3m was written off inventories during the year (2011: £4.0m) due to obsolescence or damage. The inventories provision at 31 December 2012 was
£49.5m (2011: £52.8m).
11 TRADE AND OTHER RECEIVABLES 2012
£m
2011
£m
Trade receivables 667.4 609.8
Prepayments and other receivables 152.1 128.8
819.5 738.6
The ageing of trade receivables at 31 December was:
Gross
2012
£m
Provision
2012
£m
Gross
2011
£m
Provision
2011
£m
Current 517.5 2.1 480.4 3.7
0–30 days overdue 129.9 0.2 110.4 0.3
31–90 days overdue 24.4 2.1 23.7 0.7
Over 90 days overdue 9.7 9.7 9.1 9.1
681.5 14.1 623.6 13.8
The movement in the provision for doubtful debts in respect of trade receivables during the year was as follows:
2012
£m
2011
£m
Beginning of year 13.8 15.6
Acquisitions 0.3 1.4
Disposal of business –(1.2)
Charge 2.4 1.6
Utilised and unused (1.9) (3.8)
Currency translation (0.5) 0.2
End of year 14.1 13.8
12 TRADE AND OTHER PAYABLES – CURRENT 2012
£m
2011
£m
Trade payables 648.1 642.7
Other tax and social security contributions 22.2 20.3
Other payables 101.6 98.1
Accruals and deferred income 135.0 113.3
906.9 874.4

BUNZL PLC ANNUAL REPORT 2012 71
13 RISK MANAGEMENT AND FINANCIAL INSTRUMENTS
Capital management
The Group’s policy is to maintain a strong capital base so as to maintain investor, creditor and market confidence and to sustain future development
ofthe business. The Group monitors the return on average operating capital employed and the return on invested capital as well as the level of total
shareholders’ equity and the amount of dividends paid to ordinary shareholders. For the year ended 31 December 2012, the return on average
operating capital employed was 56.4% (2011: 57.4%), the return on invested capital was 17.9% (2011: 17.3%), the level of total shareholders’
equityat31 December 2012 was £885.5m (2011: £806.7m) and the amount of dividends paid in the year ended 31 December 2012 was £85.7m
(2011: £68.9m).
The Group funds its operations through a mixture of shareholders’ equity and bank and capital market borrowings. All of the borrowings are managed
by a central treasury function and funds raised are lent onward to operating subsidiaries as required. The overall objective is to manage the funding to
ensure the Group has a portfolio of competitively priced borrowing facilities to meet the demands of the business over time and, in order to do so, the
Group arranges a mixture of borrowings from different sources with a variety of maturity dates.
The Group’s businesses provide a high and consistent level of cash generation which helps fund future development and growth. The Group seeks to
maintain an appropriate balance between the higher returns that might be possible with higher levels of borrowings and the advantages and security
afforded by a sound capital position.
There were no changes to the Group’s approach to capital management during the year and the Group is not subject to any externally imposed
capitalrequirements.
Treasury policies and controls
The Group has a centralised treasury department to control external borrowings and manage liquidity, interest rate and foreign currency risks. Treasury
policies have been approved by the Board and cover the nature of the exposure to be hedged, the types of financial instruments that may be employed
and the criteria for investing and borrowing cash. The Group uses derivatives to manage its foreign currency and interest rate risks arising from
underlying business activities. No transactions of a speculative nature are undertaken. The treasury department is subject to periodic independent
review by the internal audit department. Underlying policy assumptions and activities are periodically reviewed by the executive directors and the
Board. Controls over exposure changes and transaction authenticity are in place.
Hedge accounting
The Group designates derivatives which qualify as hedges for accounting purposes as either (a) a hedge of the fair value of a recognised asset
or liability; (b) a hedge of the cash flow risk resulting from changes in interest rates or foreign exchange rates; or (c) a hedge of a net investment
in a foreign operation. The accounting treatment for hedges is set out in the financial instruments accounting policy in Note 2.
The Group tests the effectiveness of hedges on a prospective and retrospective basis to ensure compliance with IAS 39. Methods for testing
effectiveness include dollar offset, critical terms and regression analysis.
Liquidity risk
Liquidity risk is the risk that the Group will not be able to meet its financial obligations as they fall due. The Group continually monitors net debt
and forecast cash flows to ensure that sufficient facilities are in place to meet the Group’s requirements in the short, medium and long term and, in
order to do so, arranges borrowings from a variety of sources. Additionally, compliance with debt covenants is monitored. During 2012 all covenants
have been complied with.
The Group has substantial borrowing facilities available to it comprising multi-currency credit facilities from the Group’s banks and US dollar and
sterlingbonds. During the year an issue of fixed interest rate US dollar bonds was agreed for a total value of US$350.0m of which US$110.0m was
drawn down inDecember 2012 and US$240.0m is due to be drawn by the Group in April 2013. The latter amount is included in a contractual cash
flow table as an inflow within one year and as an outflow after more than five years. At 31 December 2012 the total bonds outstanding were £618.9m
(2011: £585.1m) with maturities ranging from 2013 to 2023. During the year the Group also refinanced or agreed new banking facilities totalling
£150.7m. The Group’s committed bank facilities mature between 2013 and 2017. At 31 December 2012 the available committed bank facilities
totalled £758.5m (2011: £730.8m) of which £169.2m (2011: £109.3m) was drawn down.
The undrawn committed bank facilities available at 31 December are as follows:
2012
£m
2011
£m
Expiring within one year 50.1 157.5
Expiring after one year but within two years 80.0 53.2
Expiring after two years 459.2 410.8
589.3 621.5
In addition the Group maintains overdraft and uncommitted facilities to provide short term flexibility. At 31 December 2012 loans totalling £0.8m were
secured by fixed charges on property (2011: £4.0m).

NOTES CONTINUED
72 BUNZL PLC ANNUAL REPORT 2012
13 RISK MANAGEMENT AND FINANCIAL INSTRUMENTS CONTINUED
The contractual maturity profile of the Group’s financial assets and liabilities at 31 December is set out in the tables below. The amounts disclosed
are the contractual undiscounted cash flows and therefore include interest cash flows (forecast using LIBOR interest rates at 31 December in the
case offloating rate financial assets and liabilities). Derivative assets and liabilities have been included within the tables since they predominantly relate
to derivatives which are used to manage the interest cash flows on the Group’s debt. Bank loans have been drawn under committed facilities and
can berefinanced on maturity from these same facilities. Accordingly they have been aged based on the maturity dates of the underlying facilities.
The tables below also compare the fair value and carrying amounts for financial assets and liabilities:
Contractual cash inflows/(outflows)
2012
Fair value
£m
Carrying
amount
£m
Total
contractual
cash flows
£m
Within one
year
£m
After
one year
but within
two years
£m
After
two years
but within
five years
£m
After
more than
five years
£m
Financial assets:
Cash and deposits 81.2 81.2 81.2 81.2 – – –
Loans and receivables
Trade receivables 667.4 667.4 667.4 667.4 – – –
Derivative financial instruments
Interest rate swaps 10.2 10.2 11.8 5.2 2.2 4.1 0.3
758.8 758.8 760.4 753.8 2.2 4.1 0.3
Financial liabilities:
Financial liabilities at amortised cost
Bank loans (175.7) (175.7) (180.4) (56.7) (1.6) (122.1) –
US dollar and sterling bonds (528.9) (472.2) (659.4) 117.6 (62.8) (278.3) (435.9)
Bank overdrafts (25.4) (25.4) (25.4) (25.4) – – –
Other interest bearing loans and borrowings (0.3) (0.3) (0.3) – – (0.3) –
Finance lease creditors (0.6) (0.6) (0.6) (0.3) (0.1) (0.2) –
Trade payables (648.1) (648.1) (648.1) (648.1) – – –
Other current payables (111.1) (111.1) (111.1) (111.1) – – –
Non-current payables (26.4) (26.4) (26.4) – (26.4) – –
Financial liabilities at fair value
US dollar bonds (146.4) (146.7) (148.6) (148.6) – – –
Derivative financial instruments
Cross currency interest rate swaps (7.3) (7.3) (7.3) (0.6) (3.7) (3.0) –
Foreign exchange contracts for
cash flow hedging (0.8) (0.8) (0.8) (0.8) – – –
Foreign exchange contracts for net
investment hedging (2.7) (2.7) (2.7) (2.7) – – –
(1,673.7) (1,617.3) (1,811.1) (876.7) (94.6) (403.9) (435.9)

BUNZL PLC ANNUAL REPORT 2012 73
13 RISK MANAGEMENT AND FINANCIAL INSTRUMENTS CONTINUED
Contractual cash inflows/(outflows)
2011
Fair value
£m
Carrying
amount
£m
Total
contractual
cash flows
£m
Within one
year
£m
After
one year
but within
two years
£m
After
two years
but within
five years
£m
After
more than
five years
£m
Financial assets:
Cash and deposits 74.2 74.2 74.2 74.2 – – –
Loans and receivables
Trade receivables 609.8 609.8 609.8 609.8 – – –
Derivative financial instruments
Interest rate swaps 18.4 18.4 20.6 8.4 5.3 6.0 0.9
Foreign exchange contracts for cash
flow hedging 1.0 1.0 1.0 1.0 – – –
Foreign exchange contracts not in
a hedge relationship 0.1 0.1 0.1 0.1 – – –
703.5 703.5 705.7 693.5 5.3 6.0 0.9
Financial liabilities:
Financial liabilities at amortised cost
Bank loans (124.3) (124.4) (128.8) (37.8) (47.9) (43.0) (0.1)
US dollar and sterling bonds (478.1) (425.2) (574.1) (27.2) (27.2) (243.7) (276.0)
Bank overdrafts (29.2) (29.2) (29.2) (29.2) – – –
Other interest bearing loans and borrowings (0.4) (0.4) (0.4) – – (0.4) –
Finance lease creditors (0.5) (0.5) (0.5) (0.2) (0.1) (0.2) –
Trade payables (642.7) (642.7) (642.7) (642.7) – – –
Other current payables (110.5) (110.5) (110.5) (110.5) – – –
Non-current payables (15.2) (15.2) (15.2) – (15.2) – –
Financial liabilities at fair value
US dollar bonds (158.0) (159.9) (164.1) (7.9) (156.2) – –
Derivative financial instruments
Cross currency interest rate swaps (7.1) (7.1) (6.2) (0.5) (0.5) (5.2) –
Foreign exchange contracts for net
investment hedging (1.1) (1.1) (1.1) (1.1) – – –
(1,567.1) (1,516.2) (1,672.8) (857.1) (247.1) (292.5) (276.1)
All financial assets and liabilities stated at fair value in the tables above have carrying amounts where the fair value component is a level two fair
valuemeasurement. Level two fair value measurements use inputs other than quoted prices that are observable for the relevant asset or liability,
eitherdirectly or indirectly. The US dollar bonds, included within financial assets and liabilities stated at fair value, have a carrying amount of
£146.7m (2011: £159.9m) which includes a fair value measurement related to the risk being hedged. The tables above also disclose the fair value
of these bonds including all other components of £146.4m (2011: £158.0m).
Fair value gains and losses on interest rate caps impact the income statement immediately while all other financial assets and liabilities stated at fair
value are in hedging relationships.

NOTES CONTINUED
74 BUNZL PLC ANNUAL REPORT 2012
13 RISK MANAGEMENT AND FINANCIAL INSTRUMENTS CONTINUED
Interest rate risk
The Group is funded by a mixture of fixed and floating rate debt. In addition, interest rate swaps and interest rate caps are used to manage the
interest rate risk profile. At 31 December 2012 fixed rate debt of £472.2m (2011: £425.2m) related to fixed rate US dollar and sterling bonds stated
at amortised cost with maturities ranging from 2014 to 2023.
At 31 December 2012 floating rate debt comprised £174.3m of floating rate bank loans (2011: £109.3m) and £146.7m of fixed rate US dollar bonds
which have been swapped to floating rates using interest rate swaps (2011: £159.9m). Bank loans are drawn for various periods of up to three
monthsat interest rates linked to LIBOR. The interest rate swaps reprice every three or six months. These interest rate swaps are in fair value hedge
relationships with the market risk of the US dollar bonds. These hedges were effective during the year and have therefore had no net impact on the
income statement.
The interest rate risk on the floating rate debt is managed using interest rate options. Borrowings with a notional principal of £162.6m were capped
at 31 December 2012 (2011: £266.7m). Hedge accounting is not applied to the interest rate caps since the majority of their value is related to time
value. The strike rates of these options are based on LIBOR repricing every three months.
After taking account of hedge relationships, a change of 1% in the interest rate forward curves on 31 December would have increased/(decreased)
profit before tax and equity for the year by the amounts shown below as a result of changes in the fair values of derivative assets and liabilities at
that date:
Impact on profit before tax Impact on equity
+1%
£m
–1%
£m
+1%
£m
–1%
£m
2012 0.1 0.2 0.1 0.2
2011 (0.1) 0.3 (0.1) 0.3
Foreign currency risk
The principal underlying currencies of the Group’s earnings are sterling, US dollars and euros. The Group does not hedge the impact of exchange rate
movements arising on translation of earnings into sterling at average exchange rates.
The following significant exchange rates applied during the year:
Average rate Closing rate
2012 2011 2012 2011
US dollar 1.59 1.60 1.63 1.55
Euro 1.23 1.15 1.23 1.20
For the year ended 31 December 2012, a movement of one cent in the US dollar and euro average exchange rates would have changed profit before
tax by £0.8m and £0.3m respectively and profit before tax, intangible amortisation, acquisition related costs and disposal of business by £0.9m and
£0.5m respectively.
The majority of the Group’s transactions are carried out in the respective functional currencies of the Group’s operations and so transaction exposures
are usually relatively limited. Where they do occur the Group’s policy is to hedge significant exposures of firm commitments for a period of up to one
year as soon as they are committed using forward foreign exchange contracts and these are designated as cash flow hedges. However, the economic
impact of foreign exchange on the value of uncommitted future purchases and sales is not hedged. As a result, sudden and significant movements in
foreign exchange rates can impact profit margins where there is a delay in passing on to customers the resulting price increases. For the year ended
31December 2012 all foreign exchange cash flow hedges were effective with a loss of £0.8m recognised in equity (2011: gain of £1.0m) which will
affectthe income statement during2013.
The majority of the Group’s borrowings are effectively denominated in sterling, US dollars and euros, aligning them to the respective functional
currencies of its operating profit before depreciation, intangible amortisation and acquisition related costs (‘EBITDA’). This currency profile is achieved
using short term foreign exchange contracts, long term cross currency interest rate swaps and foreign currency debt. This currency composition
minimises the impact of foreign exchange rates on the ratio of net debt to EBITDA.
Cross currency interest rate swaps in a cash flow hedge relationship were effective during the year, with a loss of £1.1m (2011: loss of £1.4m) being
recognised in equity which will affect the income statement from 2014 to 2015.

BUNZL PLC ANNUAL REPORT 2012 75
13 RISK MANAGEMENT AND FINANCIAL INSTRUMENTS CONTINUED
The currency profile of the Group’s net debt at 31 December is set out in the table below:
2012
£m
2011
£m
Sterling 198.7 179.6
US dollar 365.3 305.1
Euro 114.4 135.5
Other 59.7 32.7
738.1 652.9
If a 10% strengthening or weakening of sterling had taken place on 31 December it would have increased/(decreased) profit before tax and equity for
the year by the amounts shown below. The impact of this translation is much greater on equity than it is on profit before tax since equity is translated
using the closing exchange rates and profit before tax is translated using the average exchange rates for the year. As a result the value of equity is more
sensitive than the value of profit before tax to a movement in exchange rates on 31 December and the resulting movement in profit before tax is due
solely to the translation effect on monetary items. This analysis assumes that all other variables, and in particular interest rates, remain constant.
Impact on profit before tax Impact on equity
+10%
£m
–10%
£m
+10%
£m
–10%
£m
2012 0.5 (0.7) (47.0) 57.6
2011 0.4 (0.5) (56.2) 68.7
Credit risk
Credit risk is the risk of loss in relation to a financial asset due to non-payment by the counterparty. The Group’s objective is to reduce its exposure
tocounterparty default by restricting the type of counterparty it deals with and by employing an appropriate policy in relation to the collection of
financial assets.
The Group’s principal financial assets are cash and deposits, derivative financial instruments and trade and other receivables which represent
the Group’s maximum exposure to credit risk in relation to financial assets. The maximum exposure to credit risk for cash and deposits (Note 23),
derivative financial instruments (see above) and trade and other receivables (Note 11) is their carrying amount.
Dealings are restricted to those banks with the relevant combination of geographic presence and suitable credit rating. The Group continually monitors
the credit ratings of its counterparties and the credit exposure to each counterparty.
For trade and other receivables, the amounts represented in the balance sheet are net of allowances for doubtful receivables, estimated by the Group’s
management based on prior experience and their assessment of the current economic environment. Note 11 sets out an analysis of trade and other
receivables and the provision for doubtful debts in respect of trade receivables.
At the balance sheet date there were no significant concentrations of credit risk.
14 PROVISIONS 2012
£m
2011
£m
Current 18.1 9.2
Non-current 21.3 39.2
39.4 48.4
Properties
2012
£m
Claims
2012
£m
Total
2012
£m
Properties
2011
£m
Claims
2011
£m
Total
2011
£m
Beginning of year 19.2 29.2 48.4 21.6 22.5 44.1
Charge 1.1 4.8 5.9 1.0 6.7 7.7
Acquisitions 0.6 1.7 2.3 0.6 3.1 3.7
Disposal of business –(4.0)(4.0)(0.6) 4.5 3.9
Utilised or released (3.7) (8.6) (12.3) (3.4) (7.1) (10.5)
Currency translation (0.1) (0.8) (0.9) –(0.5)
(0.5)
End of year 17.1 22.3 39.4 19.2 29.2 48.4
The properties provision includes vacant properties where amounts are held against liabilities for onerous lease commitments, repairs and
dilapidations. These provisions cover the relevant periods of the lease agreements, up to the earliest possible termination date, which typically
extend from one to 10 years.

NOTES CONTINUED
76 BUNZL PLC ANNUAL REPORT 2012
14 PROVISIONS CONTINUED
The Group has provisions for expected legal, environmental and other claims based on management’s best estimate at the balance sheet date of the
probable loss likely to be incurred. It expects that these amounts, which are based on detailed plans or other known factors and take account of past
experience for similar items, will be settled within the next one to five years.
The Group is a defendant in a number of legal proceedings incidental to its operations. While any litigation has an element of uncertainty, management
does not expect that the outcome of such proceedings, either individually or in the aggregate, will have a material adverse effect on the Group’s
financial condition or results of operations.
15 DEFERRED TAX
2012 2011
Asset
£m
Liability
£m
Net
£m
Asset
£m
Liability
£m
Net
£m
Accelerated capital allowances 1.8 (7.7) (5.9) 1.7 (8.2) (6.5)
Pension liabilities 25.3 – 25.3 23.4 – 23.4
Intangible assets –(143.6)(143.6) –(144.3)
(144.3)
Share based payments 8.6 – 8.6 8.4 – 8.4
Provisions 10.3 (1.2) 9.1 7.7 (1. 3) 6.4
Inventories 8.0 (14.2) (6.2) 8.7 (15.6) (6.9)
Other 8.6 (8.1) 0.5 10.7 (4.7) 6.0
Deferred tax asset/(liability) 62.6 (174.8) (112.2) 60.6 (174.1) (113.5)
Set-off of tax (54.7) 54.7 – (47.4) 47.4 –
Net deferred tax asset/(liability) 7.9 (120.1) (112.2) 13.2 (126.7) (113.5)
Except as noted below, deferred tax is calculated in full on temporary differences under the liability method using the tax rate of the country
of operation.
The Company is able to control the dividend policy of its subsidiaries and, therefore, the timing of the remittance of the undistributed earnings of
overseas subsidiaries. In general, the Company has determined either that such earnings will not be distributed in the foreseeable future or, where
there are plans to remit those earnings, no tax liability is expected to arise. Deferred tax of £2.5m (2011: £1.9m) has been recognised in the exceptional
case where distribution of earnings is both planned and expected to result in a tax liability.
Deferred tax assets in respect of temporary differences have only been recognised in respect of tax losses and other temporary differences where
it is probable that these assets will be realised. No deferred tax asset has been recognised in respect of unutilised tax losses of £5.3m (2011: £5.3m).
The unutilised tax losses may be carried forward indefinitely.
No deferred tax has been recognised in respect of unutilised capital losses of £96.1m (2011: £95.8m) as it is not considered probable that there will
be suitable future taxable profits against which they can be utilised.
The movement on the net deferred tax liability is shown below:
2012
£m
2011
£m
Beginning of year 113.5 109.5
Acquisitions 14.0 22.3
Disposal of business –(3.4)
Credit to income statement (2.2) (0.1)
Recognised in other comprehensive income and equity (5.7) (14.2)
Reclassification to current tax (3.9) –
Currency translation (3.5) (0.6)
End of year 112.2 113.5

BUNZL PLC ANNUAL REPORT 2012 77
16 SHARE CAPITAL AND SHARE BASED PAYMENTS 2012
£m
2011
£m
Issued and fully paid ordinary shares of 321⁄7p each 114.2 113.8
Number ordinary shares in issue and fully paid
Beginning of year 353,975,080 352,520,158
Issued – scrip dividend –925,544
– option exercises 1,445,554 529,378
End of year 355,420,634 353,975,080
The Company operates the following share plans for the benefit of employees of the Company and its subsidiaries relating to the acquisition of shares
inthe Company. Further details of the share plans operated by the Company are set out in the Directors’ remuneration report.
Sharesave Scheme (2011)
The Sharesave Scheme (2011), approved by shareholders at the 2011 Annual General Meeting, is approved by HM Revenue & Customs in the UK
andis open to all UK employees, including UK based executive directors, who have completed at least three months of continuous service. It is
linkedto a contract for monthly savings of up to £250 per month over a period of either three or five years. Under the Sharesave Scheme (2011)
options are granted to participating employees at a discount of up to 20% of the market price prevailing shortly before the invitation to apply for the
option. Options are normally exercisable either three or five years after they have been granted.
The Sharesave Scheme (2011) replaced the Sharesave Scheme (2001) which was approved by shareholders at the 2001 Annual General Meeting.
TheSharesave Scheme (2001) operates on a similar basis to the Sharesave Scheme (2011). Although there are a number of options outstanding
under the Sharesave Scheme (2001), no further options have been granted under this Scheme since it expired in May 2011.
International Sharesave Plan
The International Sharesave Plan was introduced following the approval of the Sharesave Scheme (2001) by shareholders and was extended following
the approval of the Sharesave Scheme (2011). The plan operates on a similar basis to both the Sharesave Scheme (2001) and the Sharesave Scheme
(2011) as described above except that it is linked to a contract for monthly savings of approximately £250 per month (or equivalent in other currencies)
over a period of three years.
Irish Sharesave Plan
The Irish Sharesave Plan was also introduced following the approval of the Sharesave Scheme (2001) by shareholders and was extended following the
approval of the Sharesave Scheme (2011). It is approved by the Irish Revenue Commissioners and operates on a similar basis to both the Sharesave
Scheme (2001) and the Sharesave Scheme (2011) as described above except that it is linked to a contract for monthly savings of the euro equivalent
ofapproximately £250 per month over a period of three years.
1994 Executive Share Option Scheme (‘1994 Scheme’)
The 1994 Scheme was approved by shareholders at the 1994 Annual General Meeting. No further options have been granted under the 1994 Scheme
since it expired in May 2004. A performance condition, based on the Company’s adjusted earnings per share growth relative to UK RPI inflation over
three years, had to be satisfied before options would normally be exercisable. All such performance conditions relating to options granted under the
1994 Scheme have been satisfied.
Long Term Incentive Plan (‘LTIP’)
The LTIP was approved by shareholders at the 2004 Annual General Meeting and replaced the 1994 Scheme. The LTIP is divided into two parts.
Part A allows the Board to grant share options. In normal circumstances options granted are only exercisable if the relevant performance condition has
been satisfied. Share options granted to date have a performance condition attached based on the Company’s adjusted earnings per share growth
relative to UK RPI inflation over three years.
Part B of the LTIP allows the Board to award performance shares which is a conditional right to receive shares in the Company for nil consideration.
Aperformance share award will normally vest (i.e. become exercisable) on the third anniversary of its grant to the extent that the applicable
performance condition has been satisfied. Theextent to which performance share awards granted vest is normally partly subject to the Company’s
total shareholder return performance and partly subject to the Company’s adjusted earnings per share growth relative to UK RPI inflation over
threeyears.

NOTES CONTINUED
78 BUNZL PLC ANNUAL REPORT 2012
16 SHARE CAPITAL AND SHARE BASED PAYMENTS CONTINUED
Investment in own shares
The Company holds a number of its ordinary shares in an employee benefit trust. The principal purpose of this trust is to hold shares in the Company
for subsequent transfer to certain senior employees and executive directors relating to options granted and awards made in respect of market purchase
shares under the 1994 Scheme, the LTIP and the Deferred Annual Share Bonus Scheme (‘DASBS’). Details of such plans are set out above and in
theDirectors’ remuneration report. The assets, liabilities and expenditure of the trust have been incorporated in the consolidated financial statements.
Finance costs and administration charges are included in the income statement on an accruals basis. At 31 December 2012 the trust held 4,348,175
(2011: 5,230,867) shares, upon which dividends have been waived, with an aggregate nominal value of £1.4m (2011: £1.7m) and market value of
£43.9m (2011: £46.2m). At 31 December 2012, 23,325,000 (2011: 23,325,000) shares with an aggregate nominal value of £7.5m (2011: £7.5m)
andmarket value of £235.3m (2011: £206.2m) were held in treasury.
IFRS 2 disclosures
Options granted during the year have been valued using a stochastic model. The fair value per option granted during the year and the assumptions
used inthe calculations are as follows:
2012 2011
Grant date 01.03.12–08.10.12 03.03.11–11.10.11
Share price at grant date (£) 9.73–11.28 7.0 3 –7.91
Exercise price (£) nil–11.16 nil–8.13
Options granted during the year (shares) 3,985,922 4,247,408
Vesting period (years) 3–5 3–5
Expected volatility (%) 19–23 21–24
Option life (years) 3–10 3–10
Expected life (years) 3.0–6.7 3.0–6.5
Risk free rate of return (%) 0.2–1.2 0.9–2.9
Expected dividends expressed as a dividend yield (%) 2.4–2.7 3.1–3.3
Fair value per option (£) 0.94–4.88 0.62–3.08
The expected volatility is based on historical volatility over the last three to seven years. The expected life is the average expected period to exercise.
Therisk free rate of return is the yield on zero coupon UK government bonds of a term consistent with the assumed option life.
The weighted average share price for options exercised by employees of the Company and its subsidiaries during the year was £10.30 (2011: £7.95).
The total charge for the year relating to share based payments was £5.7m (2011: £5.3m). After tax the total charge was £3.3m (2011: £3.1m).
Details of share options and awards which have been granted and exercised, those which have lapsed during 2012 and those outstanding and
available to exercise at 31 December 2012, in each case in respect of all options and awards, whether over new issue or market purchase shares,
under the Sharesave Scheme (2001), Sharesave Scheme (2011), International Sharesave Plan, 1994 Scheme and LTIP Part A and Part B are set
out in the following table:
Options
outstanding Grants/awards Exercises Lapses*
Options
outstanding
Options
available
to exercise
at 01.01.12 2012 2012 2012 at 31.12.12 31.12.12
Number Number Price (p) Number Price (p) Number Number Price (p) Number
Sharesave Scheme (2001) 976,082 – – 333,477 452-580 100,854 541,751 452-580 5,474
Sharesave Scheme (2011) – 249,262 770 45 770 17,111 232,106 770 3,389
International Sharesave Plan 116,311 74,144 770 61,306 452 4,086 125,063 542-770 –
Irish Sharesave Plan 28,451 17,141 770 20,776 452 5,554 19,262 542-770 –
1994 Scheme 320,500 – – 252,500 372-461 – 68,000 446-452 68,000
LTIP Part A 15,118,314 3,067,509 962-1,116 5,113,633 429-813 263,308 12,808,882 429-1,116 3,711,723
LTIP Part B 2,081,121 577,866 nil 258,925 nil 378,815 2,021,247 nil 33,551
18,640,779 3,985,922 6,040,662 769,728 15,816,311 3,822,137
*Share option lapses relate to those which have either been forfeited or have expired during the year.

BUNZL PLC ANNUAL REPORT 2012 79
16 SHARE CAPITAL AND SHARE BASED PAYMENTS CONTINUED Weighted
average
fair value
of options
granted (£)
Weighted
average
remaining
contractual
life (years)
Sharesave Scheme 1.24 2.55
International Sharesave Plan 1.18 2.25
Irish Sharesave Plan 1.18 2.25
LTIP Part A 1.05 2.64
LTIP Part B 4.40 2.49
The outstanding options and awards are exercis able at various dates up to September 2022.
17 DIVIDENDS 2012
£m
2011
£m
2010 interim 23.2
2010 final 52.3
2011 interim 26.1
2011 final 59.6
Total 85.7 75.5
Total dividends per share for the year to which they relate are:
Per share
2012 2011
Interim 8.80p 8.05p
Final 19.40p 18.30p
Total 28.20p 26.35p
The 2012 interim dividend of 8.80p per share was paid on 2 January 2013 and comprised £28.8m of cash. The 2012 final dividend of 19.40p per
share will be paid on 1 July 2013 to shareholders on the register at the close of business on 10 May 2013.
18 CONTINGENT LIABILITIES 2012
£m
2011
£m
Bank guarantees 0.2 0.2
19 DIRECTORS’ ORDINARY SHARE INTERESTS
The interests of the directors, and their connected persons, in the share capital of the Company at 31 December were:
2012 2011
Philip Rogerson 10,000 10,000
Michael Roney 312,263 289,375
Ulrich Wolters 5,000 5,000
Patrick Larmon 113,875 109,381
Peter Johnson 6,630 6,630
Brian May 105,240 105,240
David Sleath 4,000 4,000
Eugenia Ulasewicz 4,000 4,000
561,008 533,626
Details of directors’ options over ordinary shares and awards made under the 1994 Scheme, the LTIP and DASBS are set out in the Directors’
remuneration report. Since 31 December 2012 Patrick Larmon has acquired interests in 803 ordinary shares as a result of his election to participate
in the dividend reinvestment plan in respect of the interim dividend which was paid on 2 January 2013 and he has also acquired an interest in 381
ordinary shares pursuant to the Company’s US Stock Purchase Plan. No other changes to the directors’ ordinary share interests shown in this note
and the Directors’ remuneration report have taken place between 31 December 2012 and 25 February 2013.

NOTES CONTINUED
80 BUNZL PLC ANNUAL REPORT 2012
20 PENSIONS
The Group operates both defined benefit and defined contribution pension schemes. The funds of the principal schemes are administered
by trustees and are held independently from the Group. Pension costs of defined benefit schemes are assessed in accordance with the advice
of independent professionally qualified actuaries. Full triennial actuarial valuations were carried out on the UK defined benefit schemes in April 2012
and annual actuarial valuations are performed on the principal US defined benefit schemes. The valuation of the UK defined benefit schemes has
been updated to 31 December 2012 by the Group’s actuaries. Contributions to all schemes are determined in line with actuarial advice and local
conditions and practices. Scheme assets for the purpose of IAS 19 are stated at their bid value.
The amounts included in the consolidated financial statements in respect of the Group were:
Amounts included in net operating expenses
2012
£m
2011
£m
Defined contribution schemes 12.9 9.9
Defined benefit schemes
current service cost 5.4 5.5
Total operating charge 18.3 15.4
Amounts included in finance (income)/cost
Expected return on scheme assets (18.5) (18.3)
Interest charge on scheme liabilities 16.3 16.4
Net financial return (2.2) (1.9)
Total charge 16.1 13.5
Amounts recognised in the statement of comprehensive income
2012
£m
2011
£m
Actual return less expected return on scheme assets 15.3 (12.6)
Experience gain on scheme liabilities 4.7 0.4
Impact of changes in assumptions relating to the present value of scheme liabilities (33.5) (23.3)
Actuarial loss on pension schemes (13.5) (35.5)
The cumulative amount of actuarial losses arising since 1 January 2004 recognised in the statement of comprehensive income at 31 December 2012
was £116.4m (2011: £102.9m).

BUNZL PLC ANNUAL REPORT 2012 81
20 PENSIONS CONTINUED
The principal assumptions used by the independent qualified actuaries for the purposes of IAS 19 were:
Europe 2012 2011
Longevity at age 65 for current pensioners (years) 22.5 21.1
Longevity at age 65 for future pensioners (years) 24.2 23.0
US
Longevity at age 65 for current and future pensioners (years) 20.2 20.1
Europe US
2012 2011 2010 2012 2011 2010
Rate of increase in salaries 3.7% 3.8% 4.2% 3.0% 3.0% 3.0%
Rate of increase in pensions 2.9% 3.0% 3.4% –––
Discount rate 4.5% 4.7% 5.4% 4.1% 5.1% 5.7%
Inflation rate 2.2% 2.3% 2.8% 2.5% 2.5% 2.5%
The assumptions used by the actuaries are the best estimates chosen from a range of possible actuarial assumptions which, due to the timescales
covered, may not necessarily be borne out in practice.
To develop the expected long term rate of return on assets assumption, the Group considers the current level of expected returns on risk free
investments (primarily government bonds), the historical level of the risk premium associated with the other asset classes in which the portfolio
is invested and the expectations for the future returns of each asset class. The expected return for each asset class is then weighted based on the
actual asset allocation to develop the expected long term rate of return on assets assumption for the portfolio. The market value of scheme assets
and the present value of pensions obligations were:
Europe US Total
2012 2012 2012
Long term
rate of return†
Value
£m
Long term
rate of return
Value
£m
Value
£m
Equities 7.6% 123.1 8.1% 45.4 168.5
Bonds 4.6% 96.3 4.7% 32.1 128.4
Other 5.2% 3.1 7.6% 3.8 6.9
Blended rate of return on scheme assets 6.3% 7.1%
Total market value of scheme assets 222.5 81.3 303.8
Present value of funded obligations (244.9) (117.4) (362.3)
Present value of unfunded obligations (6.1) (11.0) (17.1)
Present value of funded and unfunded obligations (251.0) (128.4) (379.4)
Unrecognised past service cost –0.1
0.1
Deficit (28.5) (47.0) (75.5)
Deferred tax 7.1 1 8. 2 25.3
Net deficit (21.4) (28.8) (50.2)
†Long term rate of return for Europe is based on the weighted average across all European defined benefit pension schemes.

NOTES CONTINUED
82 BUNZL PLC ANNUAL REPORT 2012
20 PENSIONS CONTINUED
Europe US Total
2011 2011 2011
Long term
rate of return†
Value
£m
Long term
rate of return
Value
£m
Value
£m
Equities 7.6% 136.5 8.2% 40.4 176.9
Bonds 4.4% 60.1 5.1% 30.5 90.6
Other 6.6% 0.9 8.0% 3.9 4.8
Blended rate of return on scheme assets 6.7% 7.5%
Total market value of scheme assets 197.5 74.8 272.3
Present value of funded obligations (229.6) (102.3) (331.9)
Present value of unfunded obligations (4.3) (10.5) (14.8)
Present value of funded and unfunded obligations (233.9) (112.8) (346.7)
Unrecognised past service cost – 0.1 0.1
Deficit (36.4) (37.9) (74.3)
Deferred tax 9.4 14.0 23.4
Net deficit (27.0) (23.9) (50.9)
†Long term rate of return for Europe is based on the weighted average across all European defined benefit pension schemes.
Five year summary
2012
£m
2011
£m
2010
£m
2009
£m
2008
£m
Total market value of scheme assets 303.8 272.3 258.0 223.1 202.3
Present value of funded and unfunded obligations (379.4) (346.7) (310.5) (283.1) (253.0)
Unrecognised past service cost 0.1 0.1 0.2 0.2 0.3
Pension schemes’ minimum funding liabilities (5.5)
Deficit (75.5) (74.3) (52.3) (59.8) (55.9)
Experience adjustments arising on scheme liabilities (4.7) 0.4 1.2 1.2 2.2
Movement in deficit
2012
£m
2011
£m
Beginning of year (74.3) (52.3)
Current service cost (5.4) (5.5)
Contributions 13.2 17.2
Net financial return 2.2 1.9
Actuarial loss (13.5) (35.5)
Curtailment gain –0.4
Currency translation 2.3 (0.5)
End of year (75.5) (74.3)

BUNZL PLC ANNUAL REPORT 2012 83
20 PENSIONS CONTINUED
Changes in the present value of defined benefit obligations
2012
£m
2011
£m
Beginning of year 346.7 310.5
Current service cost 5.4 5.5
Interest charge on scheme liabilities 16.3 16.4
Contributions by employees 0.8 1.0
Actuarial loss 28.8 22.9
Benefits paid (12.0) (10.5)
Curtailment gain –(0.4)
Currency translation (6.6) 1.3
End of year 379.4 346.7
Changes in the fair value of scheme assets £m £m
Beginning of year 272.3 258.0
Expected return on scheme assets 18.5 18.3
Actuarial gain/(loss) 15.3 (12.6)
Contributions by employer 13.2 17.2
Contributions by employees 0.8 1.0
Benefits paid (12.0) (10.5)
Currency translation (4.3) 0.9
End of year 303.8 272.3
The calculation of expected return on scheme assets is determined with reference to market expectations in conjunction with the relevant
scheme’s actuaries.
The actual return on scheme assets was £33.8m (2011: £5.7m).
The Group expects to pay approximately £13.5m in contributions to the defined benefit pension schemes in the year ending 31 December 2013.
21 DIRECTORS AND EMPLOYEES
Average number of employees 2012 2011
North America 3,687 3,519
Continental Europe 3,447 3,406
UK & Ireland 3,314 3,934
Rest of the World 1,241 1,047
11,689 11,906
Corporate 49 50
11,738 11,956
Employee costs
2012
£m
2011
£m
Wages and salaries 418.0 413.6
Social security costs 52.7 52.6
Share based payments 5.7 5.3
Pension costs 18.3 15.4
494.7 486.9

NOTES CONTINUED
84 BUNZL PLC ANNUAL REPORT 2012
21 DIRECTORS AND EMPLOYEES CONTINUED
Key management remuneration
2012
£m
2011
£m
Salaries and short term employee benefits 5.2 5.7
Share based payments 1.4 1.9
Post employment benefits 1.0 1.0
7.6 8.6
The Group considers key management personnel as defined in IAS 24 ‘Related Party Disclosures’ to be the directors of the Company and those
members of the Executive Committee and the Managing Directors of the major geographic regions who are not directors of the Company. The amounts
disclosed are calculated on the same bases as those used to determine the relevant amounts disclosed in the Directors’ remuneration report.
Directors’ emoluments
2012
£m
2011
£m
Non-executive directors 0.6 0.6
Executive directors:
remuneration excluding performance related elements 2.3 2.3
annual cash bonus 0.8 1.0
3.7 3.9
More detailed information concerning directors’ emoluments and long term incentives is set out in the Directors’ remuneration report. The aggregate
amount of gains made by directors on the exercise of share options during the year was £4.1m (2011: £0.2m). The aggregate market value of
performance share awards exercised by directors under long term incentive schemes during the year was £1.5m (2011: £0.9m). The aggregate
market value of shares exercised by directors under the DASBS was £0.9m (2011: £0.6m).
22 LEASE COMMITMENTS
The Group leases certain property, plant and equipment under non-cancellable operating lease agreements. These leases have varying terms
and renewal rights. At 31 December the total future minimum lease payments under non-cancellable operating leases for each of the following
periodswere:
Land &
buildings
2012
£m
Other
2012
£m
Land &
buildings
2011
£m
Other
2011
£m
Within one year 53.0 21.1 51.2 20.1
Between one and five years 149.8 32.2 150.9 31.7
After five years 66.3 1.0 72.6 0.8
269.1 54.3 274.7 52.6
Total of future minimum sublease income under non-cancellable subleases (0.3) – (0.9) –

BUNZL PLC ANNUAL REPORT 2012 85
23 CASH AND CASH EQUIVALENTS AND NET DEBT 2012
£m
2011
£m
Cash at bank and in hand 77.0 63.6
Short term deposits repayable in less than three months 4.2 10.6
Cash and deposits 81.2 74.2
Bank overdrafts (25.4) (29.2)
Cash and cash equivalents 55.8 45.0
Current liabilities (204.9) (37.5)
Non-current liabilities (599.2) (678.8)
Derivative assets – fair value of interest rate swaps on fixed interest rate borrowings 10.2 18.4
Interest bearing loans and borrowings (793.9) (697.9)
Net debt (738.1) (652.9)
Movement in net debt
2012
£m
2011
£m
Beginning of year (652.9) (716.8)
Net cash (outflow)/inflow (109.4) 63.0
Realised losses on foreign exchange contracts (0.9) (0.2)
Currency translation 25.1 1.1
End of year (738.1) (652.9)
24 ACQUISITIONS
2012
The principal acquisitions made or agreed to be made in the year ended 31 December 2012 were CDW Merchants, the redistribution business of
Star Services International, FoodHandler, Zahav, Service Paper, Distrimondo, Indigo Concept Packaging, Atlas Health Care, McCordick Glove & Safety,
Destiny Packaging, Vicsa Safety, Vicsa Brasil and Schwarz Paper Company.
CDW Merchants, a business principally engaged in the sale of retail gift packaging and visual merchandising solutions and products to the specialty
retail and online retailing sectors throughout the US, was acquired on 21 February 2012. The Star Services International redistribution business,
which is principally engaged in the supply of foodservice disposable products to wholesalers and redistributors throughout Queensland, Australia, was
acquired on 27April2012. FoodHandler, a leading supplier of a variety of disposable gloves and other foodhandling products to the foodservice sector
throughout the US, was acquired on 30 April 2012. Zahav, a leading distributor of packaging supplies to the foodservice sector throughout Israel was
acquired on 30 April 2012. Service Paper, a business principally engaged in the distribution of disposable supplies to the grocery, foodservice, food
processor and industrial packaging sectors throughout the Pacific Northwest in the US, was acquired on 11 June 2012. Distrimondo, a business
principally engaged in the distribution of foodservice disposables and cleaning and hygiene products throughout Switzerland, was acquired on 29 June
2012. Indigo Concept Packaging, a business based in the UK and principally engaged in the sale of quality retail packaging products, was acquired on
3 October 2012. AtlasHealth Care, a business principally engaged in the supply of medical consumables to the healthcare sector in South Australia,
was acquired on31 October 2012. McCordick Glove & Safety, a distributor of gloves and other personal protection equipment to a variety of industrial
and retail customers as well as to redistributors, was acquired on 14 December 2012. Destiny Packaging, a leading distributor of flexible packaging
supplies to fruit and vegetable growers in the US, was acquired on 20 December 2012. Vicsa Safety, a business specialising in the sourcing and sale
of a variety ofpersonal protection equipment throughout Chile, Peru, Argentina, Colombia and Mexico, was acquired on 21 December 2012. Schwarz
Paper Company, a business based in Chicago and principally engaged in the provision of consumables and supply chain solutions for the non-food
retail and grocery sectors, was acquired on 28 December 2012.
The Company also entered into an agreement to acquire Vicsa Brasil on 21 December 2012 which distributes personal protection equipment
throughout Brazil. Following clearance from the Brazilian Competition Authority, the acquisition was completed on 19 February 2013.
Acquisitions have been accounted for under the acquisition method of accounting, involving the purchase of the acquiree’s share capital or, as the case
may be, the relevant assets of the businesses acquired. Part of the Group’s strategy is to grow through acquisition. The Group has developed a process
to assist with the identification of the fair values of the assets acquired and liabilities assumed, including the separate identification of intangible assets
in accordance with IFRS 3 ‘Business Combinations’. This formal process is applied to each acquisition and involves an assessment of the assets
acquired and liabilities assumed with assistance provided by external valuation specialists where appropriate. Until this assessment is complete, the
allocation period remains open up to a maximum of 12 months from the relevant acquisition date. At 31 December 2012 the allocation period for all
acquisitions completed since 1 January 2012 remained open and accordingly the fair values presented are provisional.

NOTES CONTINUED
86 BUNZL PLC ANNUAL REPORT 2012
24 ACQUISITIONS CONTINUED
Adjustments are made to the assets acquired and liabilities assumed during the allocation period to the extent that further information and knowledge
come to light that more accurately reflect conditions at the acquisition date. To date the adjustments made have impacted assets acquired to
reflectmore accurately the estimated realisable or settlement value. Similarly adjustments have been made to acquired liabilities to record onerous
commitments or other commitments existing at the acquisition date but not recognised by the acquiree. Adjustments have also been made to reflect
the associated tax effects.
The consideration paid or payable in respect of acquisitions comprises amounts paid or agreed to be paid on completion, deferred consideration
andpayments which are contingent on the continued employment of former owners of businesses acquired. IFRS 3 requires that any such payments
that are contingent on future employment are charged to the income statement. All other consideration has been allocated against the identified
netassets, with the balance recorded as goodwill. Transaction costs and expenses such as professional fees are charged to the income statement.
Theacquisitions provide opportunities for further development of the Group’s activities and create enhanced returns. Such opportunities and the
workforces inherent in each of the acquired businesses do not translate to separately identifiable intangible assets but do represent much of the
assessed value that supports the recognised goodwill.
A summary of the effect of acquisitions completed in 2012 is detailed below:
Book value at
acquisition
£m
Provisional
fair value
adjustments
£m
Fair value
of assets
acquired
£m
Intangible assets 94.7 94.7
Property, plant and equipment 9.3 (1.2) 8.1
Inventories 81.0 (1.2) 79.8
Trade and other receivables 72.0 (0.2) 71.8
Trade and other payables (54.3) (5.1) (59.4)
Net bank overdrafts (21.8) (21.8)
Provisions for liabilities and charges (2.3) (2.3)
Tax and deferred tax (0.2) (14.2) (14.4)
86.0 70.5 156.5
Goodwill 63.6
Consideration 220.1
Satisfied by:
cash consideration 206.0
deferred consideration 13.1
other consideration 1.0
220.1
Contingent payments to former owners 16.3
Net bank overdrafts acquired 21.8
Transaction costs and expenses 6.9
Total expected spend in respect of current year completed acquisitions 265.1
Committed spend in respect of current year acquisitions not completed 7. 2
Total committed spend in respect of current year acquisitions 272.3
The net cash outflow in the year in respect of acquisitions comprised:
Cash consideration 206.0
Net bank overdrafts acquired 21.8
Deferred consideration in respect of prior year acquisitions 6.7
Net cash outflow in respect of acquisitions 234.5
Acquisition related costs 20.2
Total cash outflow in respect of acquisitions 254.7
Acquisitions made in the year ended 31 December 2012 contributed £111.3m to the Group’s revenue and £8.7m to the Group’s operating profit
before intangible amortisation and acquisition related costs.
The estimated contributions of businesses acquired or agreed to be acquired to the results of the Group, as if the acquisitions had been made at
the beginning of the year, are as follows:
£m
Revenue 518.4
Operating profit before intangible amortisation and acquisition related costs 36.1

BUNZL PLC ANNUAL REPORT 2012 87
24 ACQUISITIONS CONTINUED
2011
The principal acquisitions made in the year ended 31 December 2011 were Omega, Cannon Consumables, Hospitality Depot, King Espana,
SIG Safety and Workwear, Netpak, D-Care, Majestic, Ideal and Danny.
Omega, a business principally engaged in the supply of catering equipment and disposables to contract caterers, hotels and other foodservice
customers in New South Wales, Australia, was acquired on 4 March 2011. Cannon Consumables, a business principally engaged in the supply of
cleaning and hygiene consumable products, was acquired on 31 March 2011. Hospitality Depot, a business principally engaged in the distribution
ofcatering equipment and supplies to hotels, restaurants and caterers as well as to aged care facilities and education establishments in New South
Wales, Australia, was acquired on 6 May 2011. King Espana, a leading distributor of foodservice disposables and cleaning and hygiene supplies to the
catering and cleaning sectors in Spain, was acquired on 26 May 2011. SIG Safety and Workwear, a leading distributor of personal protection equipment
and workwear to a variety of market sectors throughout the UK, was acquired on 31 May 2011. Netpak, a business principally engaged in the supply of
packaging supplies and equipment to a variety of sectors throughout Canada, was acquired with effect from 1 July 2011. D-Care, a business principally
engaged in the distribution of medical disposable products to hospitals and other healthcare customers throughout the Netherlands, was acquired
on2September 2011. Majestic and its associated companies, which supply personal protection equipment and safety products to customers in
theBenelux, Germany and the US, was acquired on 23 September 2011. Ideal, a leading supplier of cleaning and hygiene consumable products to
facilities management companies, contract cleaners and other customers in the industrial, healthcare and education sectors in Brazil, was acquired
on22 September 2011. Danny, a leading supplier of personal protection equipment throughout Brazil, specialising in the sourcing and sale of gloves
and safety glasses for a variety of industrial uses including the automotive, consumer goods, food processing, petrochemical and mining sectors,
wasacquired on 3 November 2011.
A summary of the effect of acquisitions completed in 2011 is detailed below:
Book value at
acquisition
£m
Fair value
adjustments
£m
Fair value
of assets
acquired
£m
Intangible assets 100.4 100.4
Property, plant and equipment 5.4 (0.8) 4.6
Inventories 34.2 (6.8) 27.4
Trade and other receivables 32.6 (1.2) 31.4
Trade and other payables (19.4) (2.4) (21.8)
Net cash 3.0 3.0
Provisions for liabilities and charges (3.7) (3.7)
Tax and deferred tax (1.4) (22.7) (24.1)
54.4 62.8 117.2
Goodwill 50.4
Consideration 167.6
Satisfied by:
cash consideration 144.8
deferred consideration 22.8
167.6
Contingent payments to former owners 15.7
Net cash acquired (3.0)
Transaction costs and expenses 4.6
Total expected spend in respect of current year acquisitions 184.9
The net cash outflow in the year in respect of acquisitions comprised:
Cash consideration 144.8
Net cash acquired (3.0)
Deferred consideration in respect of prior year acquisitions 7.4
Net cash outflow in respect of acquisitions 149.2
Acquisition related costs 12.1
Total cash outflow in respect of acquisitions 161.3
Acquisitions made in the year ended 31 December 2011 contributed £89.6m to the Group’s revenue and £9.4m to the Group’s operating profit before
intangible amortisation and acquisition related costs.
The estimated contributions of acquired businesses to the results of the Group, as if the acquisitions had been made at the beginning of the year, are
as follows:
£m
Revenue 204.3
Operating profit before intangible amortisation and acquisition related costs 24.2

NOTES CONTINUED
88 BUNZL PLC ANNUAL REPORT 2012
25 RELATED PARTY DISCLOSURES
The Group has identified the directors of the Company, the Group pension schemes and its key management as related parties for the purpose
of IAS 24 ‘Related Party Disclosures’. Details of the relevant relationships with these related parties are disclosed in the Directors’ remuneration
report, Note 20 and Note 21 respectively.
26 PRINCIPAL SUBSIDIARY UNDERTAKINGS Country of incorporation
Bunzl Australasia Ltd Australia
Bunzl Finance plc* England & Wales
Bunzl Holding Danmark A/S Denmark
Bunzl Holding GmbH Germany
Bunzl Holdings France SNC France
Bunzl Outsourcing Services BV Netherlands
Bunzl UK Ltd England & Wales
Bunzl USA Holdings LLC USA
*Direct subsidiary undertaking of Bunzl plc.
The companies named above are the principal subsidiary undertakings of Bunzl plc at 31 December 2012, which are wholly owned, and are included
in the consolidated financial statements of the Group. The investments in these companies, as shown above, relate to ordinary shares or common
stock. The principal country in which each company operates is the country of incorporation. The principal activities of the Group are reviewed in the
Chief Executive’s review. A full list of the Group’s subsidiary undertakings will be annexed to the next annual return filed at CompaniesHouse.

BUNZL PLC ANNUAL REPORT 2012 89
AT 31 DECEMBER 2012
COMPANY BALANCE SHEET
Notes
2012
£m
2011
£m
Fixed assets
Tangible fixed assets 30.6 0.8
Investments 4654.6 677.9
655.2 678.7
Current assets
Debtors 5398.0 263.4
Cash at bank and in hand 0.5 –
398.5 263.4
Current liabilities
Creditors: amounts falling due within one year 6 (109.0) (107.2)
Net current assets 289.5 156.2
Total assets less current liabilities 944.7 834.9
Provisions 7(2.7) (8.7)
Net assets 942.0 826.2
Capital and reserves
Called up share capital 8114.2 113.8
Share premium account 9143.9 136.4
Other reserves 95.6 5.6
Capital redemption reserve 98.6 8.6
Profit and loss account 9669.7 561.8
Shareholders’ funds 942.0 826.2
Approved by the Board of Directors of Bunzl plc (Company registration number 358948) on 25 February 2013 and signed on its behalf by
Michael Roney, Chief Executive and Brian May, Finance Director.
The Accounting policies and Notes on pages 90 to 96 form part of these financial statements.

90 BUNZL PLC ANNUAL REPORT 2012
NOTES TO THE COMPANY FINANCIAL STATEMENTS
1 BASIS OF PREPARATION
The financial statements of Bunzl plc (‘the Company’) have been prepared on a going concern basis and under the historical cost convention
and have been prepared in accordance with the Companies Act 2006 and UK GAAP. Under section 408 of the Companies Act 2006, the
Company isexempt from the requirement to present its own profit and loss account.
The following accounting policies have been applied consistently in dealing with items which are considered material in relation to the Company
financial statements.
2 ACCOUNTING POLICIES
a Investments in subsidiary undertakings
Investments in subsidiary undertakings are held at cost less any provision for impairment.
b Investment in own shares
The cost of shares held either directly (treasury shares) or indirectly (employee benefit trust shares) is deducted from equity. Repurchased shares are
classified as treasury shares and are presented as a deduction from total equity. When treasury shares are subsequently sold or reissued, the amount
received is recognised as an increase in equity and the resulting surplus or deficit on the transaction is recognised in retained earnings.
c Share based payments
The Company operates equity settled share based compensation plans for which the total expected expense is based on the fair value of options
andother share based incentives on the grant date, calculated using a valuation model, and is spread over the expected vesting period with a
corresponding credit to equity. The amount recognised as an expense is adjusted to reflect the number of options that are expected to vest. Details
ofthe relevant plans are outlined in Note 16 to the consolidated financial statements. Where the Company grants options over its own shares to the
employees of its subsidiaries these awards are accounted for by the Company as an additional investment in the relevant subsidiary equivalent to the
equity settled share based payment charge recognised in the consolidated financial statements with the corresponding credit recognised directly in
equity. Any payment made by the subsidiaries in respect of these arrangements is treated as a return of this investment. These costs are determined
inaccordance with Financial Reporting Standard (‘FRS’) 20 ‘Share-based Payment’.
d Tangible fixed assets
Until 31 December 1999 land and buildings were revalued periodically. As permitted under FRS 15 ‘Tangible Fixed Assets’, the valuations of land and
buildings have not been and will not be updated. All other tangible fixed assets are included at historical cost, less accumulated depreciation. The profit
or loss on sale of tangible fixed assets is calculated by reference to the carrying values of the assets. The carrying values of tangible fixed assets are
periodically reviewed for impairment when events or changes in circumstances indicate that the carrying values may not be recoverable.
e Depreciation
Depreciation is provided on a straight line basis to write off cost less estimated residual value over the assets’ estimated remaining useful lives. This is
applied at the following annual rates:
Buildings 2% (or depreciated over life of lease if shorter than 50 years)
Fixtures, fittings and equipment 10%–33%
The assets’ residual values, useful lives and depreciation methods are reviewed, and adjusted if appropriate, at each balance sheet date.
f Leases
Operating lease rentals and any incentives receivable are recognised in the income statement on a straight line basis over the term of the relevant
lease. Leases in which the Company assumes substantially all the risks and rewards of ownership of the leased assets are classified as finance leases.
Where land and buildings are held under leases, the accounting treatment of the land is considered separately from that of the buildings due to the
indefinite life of land.

BUNZL PLC ANNUAL REPORT 2012 91
2 ACCOUNTING POLICIES CONTINUED
g Tax
The charge for tax is based on the profit or loss for the year and takes into account tax deferred due to timing differences between the treatment
of certain items for tax and accounting purposes. Deferred tax is recognised in respect of all timing differences between the treatment of certain items
for tax and accounting purposes which have arisen but not reversed by the balance sheet date, except as otherwise required by FRS19 ‘Deferred Tax’.
h Pensions
The Company participates in a Group UK defined benefit scheme providing benefits based on final pensionable pay. As the Company is unable
to identify its share of scheme assets and liabilities on a consistent and reasonable basis, the Company treats contributions to the defined benefit
scheme as if they were contributions to a defined contribution scheme in accordance with the exemptions permitted by FRS 17 ‘Retirement Benefits’.
As a result the amount charged to the profit and loss account represents the contributions payable to the scheme in respect of the relevant
accountingperiod.
i Financial guarantee contracts
Where the Company enters into financial guarantee contracts to guarantee the indebtedness of other companies within the Group, the Company
considers these to be insurance arrangements and accounts for them as such. In this respect, the Company treats the guarantee contract as
a contingent liability until such time as it becomes probable that the Company will be required to make a payment under the guarantee.
j Dividends
The interim dividend is included in the financial statements in the period in which it is paid and the final dividend in the period in which it is approved
by shareholders at the Annual General Meeting.
3 TANGIBLE FIXED ASSETS
Short
leasehold
£m
Fixtures,
fittings and
equipment
£m
Total
£m
Cost
Beginning and end of year 0.5 2.8 3.3
Depreciation
Beginning of year 0.4 2.1 2.5
Charge in year 0.1 0.1 0.2
End of year 0.5 2.2 2.7
Net book value at 31 December 2012 – 0.6 0.6
Net book value at 31 December 2011 0.1 0.7 0.8

92 BUNZL PLC ANNUAL REPORT 2012
NOTES TO THE COMPANY FINANCIAL STATEMENTS CONTINUED
4 INVESTMENTS HELD AS FIXED ASSETS Investments in
subsidiary
undertakings
£m
Cost
Beginning of year 723.5
Additions 4.6
Capital repayment (27.9)
End of year 700.2
Impairment provisions
Beginning and end of year 45.6
Net book value at 31 December 2012 654.6
Net book value at 31 December 2011 677.9
The principal companies in which the Company’s interest at 31 December 2012 is more than 20% are as follows:
Country of incorporation
Bunzl Australasia Ltd Australia
Bunzl Finance plc* England & Wales
Bunzl Holding Danmark A/S Denmark
Bunzl Holding GmbH Germany
Bunzl Holdings France SNC France
Bunzl Outsourcing Services BV Netherlands
Bunzl UK Ltd England & Wales
Bunzl USA Holdings LLC USA
*Direct subsidiary undertaking of Bunzl plc.
5 DEBTORS 2012
£m
2011
£m
Amounts owed by subsidiary undertakings 390.0 256.2
Prepayments and other debtors 1.4 1.5
Corporation tax 6.1 5.0
Deferred tax 0.5 0.7
398.0 263.4

BUNZL PLC ANNUAL REPORT 2012 93
6 CREDITORS: AMOUNTS FALLING DUE WITHIN ONE YEAR 2012
£m
2011
£m
Trade creditors 0.3 0.4
Amounts owed to subsidiary undertakings 100.7 100.4
Other tax and social security contributions 1.4 0.6
Accruals and deferred income 6.6 5.8
109.0 107.2
7 PROVISIONS 2012
£m
2011
£m
Beginning of year 8.7 4.6
Charge –5.2
Utilised or released (6.0) (1.1)
End of year 2.7 8.7
The provisions relate to properties, where amounts are held against liabilities for onerous lease commitments, repairs and dilapidations, and
otherclaims.
8 SHARE CAPITAL AND SHARE BASED PAYMENTS 2012
£m
2011
£m
Issued and fully paid ordinary shares of 321⁄7p each 114.2 113.8
Number of ordinary shares in issue and fully paid
Beginning of year 353,975,080 352,520,158
Issued – scrip dividend –925,544
– option exercises 1,445,554 529,378
End of year 355,420,634 353,975,080
The Company operates a number of share plans, for the benefit of employees of the Company and its subsidiaries relating to the acquisition of shares
in the Company, which are described in Note 16 to the consolidated financial statements.

94 BUNZL PLC ANNUAL REPORT 2012
NOTES TO THE COMPANY FINANCIAL STATEMENTS CONTINUED
8 SHARE CAPITAL AND SHARE BASED PAYMENTS CONTINUED
FRS 20 disclosures
Options granted to employees of the Company during the year have been valued using a stochastic model. The fair value per option granted during the
year and the assumptions used inthe calculations are as follows:
2012 2011
Grant date 01.03.12– 08.10.12 03.03.11–11.10.11
Share price at grant date (£) 9.73–11.28 7. 3 0 –7. 91
Exercise price (£) nil–11.6 nil–8.13
Options granted during the year (shares) 632,328 767,380
Vesting period (years) 3–5 3–5
Expected volatility (%) 19–23 21–24
Option life (years) 3–10 3–10
Expected life (years) 3.0–6.2 3.0–6.3
Risk free rate of return (%) 0.2–1.2 0.9–2.9
Expected dividends expressed as a dividend yield (%) 2.4–2.7 3.0–3.2
Fair value per option (£) 0.94–4.88 0.66–3.08
The expected volatility is based on historical volatility over the last three to seven years. The expected life is the average expected period to exercise.
Therisk free rate of return is the yield on zero coupon UK government bonds of a term consistent with the assumed option life.
The weighted average share price for options exercised by employees of the Company during the year was £10.17 (2011: £7.99). The total Company
charge for the year relating to share based payments was £1.1m (2011: £0.7m).
Details of share options and awards to employees of the Company which have been granted and exercised, those which have lapsed during 2012 and
those outstanding and available to exercise at 31 December 2012, in each case in respect of all options and awards, whether over new issue or market
purchase shares, under the Sharesave Scheme (2001), Sharesave Scheme (2011), 1994 Executive Share Option Scheme and Long Term Incentive Plan
Part A and Part B are set out in the following table:
Options
outstanding Grants/awards Exercises Lapses*
Options
outstanding
Options
available
to exercise
at 01.01.12 2012 2012 2012 at 31.12.12 31.12.12
Number Number Price (p) Number Price (p) Number Number Price (p) Number
Sharesave Scheme (2001) 52,495 – – 14,376 452-529 2,294 35,825 452-580 –
Sharesave Scheme (2011) – 10,940 770 – – 1,168 9,772 770 –
1994 Scheme 2,000 – – 2,000 446 – – – –
LTIP Part A 2,702,891† 396,450 962-1,116 1,370,296 429-722 65,000 1,664,045 568-1,116 400,595
LTIP Part B 958,878 224,938 nil 115,083 nil 188,779 879,954 nil 24,264
3,716,264 632,328 1,501,755 257,241 2,589,596 424,859
*Share option lapses relate to those which have either been forfeited or have expired during the year.
† Excludes 22,500 options previously granted to an individual whose employment was transferred from the Company during 2012 to another wholly-
owned subsidiary of the Company.
Weighted
average
fair value
of options
granted (£)
Weighted
average
remaining
contractual
life (years)
Sharesave Scheme 1.26 2.81
LTIP Part A 1.01 2.46
LTIP Part B 4.40 2.50
The outstanding options and awards are exercis able at various dates up to September 2022.

BUNZL PLC ANNUAL REPORT 2012 95
9 CAPITAL AND RESERVES
Share
capital
£m
Share premium
account
£m
Other
reserves
£m
Capital
redemption
reserve
£m
Profit and loss account
Total
£m
Own
shares
£m
Retained
earnings
£m
At 1 January 2012 113.8 136.4 5.6 8.6 (213.8) 775.6 826.2
Issue of share capital 0.4 7.5 7.9
Employee trust shares (9.6) (9.6)
Share based payments 5.7 5.7
Profit for the year 197.5 197.5
2011 interim dividend (26.1) (26.1)
2011 final dividend (59.6) (59.6)
At 31 December 2012 114.2 143.9 5.6 8.6 (223.4) 893.1 942.0
As permitted by section 408 of the Companies Act 2006, the profit and loss account of the Company has not been separately presented in these
financial statements.
Included within own shares are ordinary shares of the Company held by the Group in an employee benefit trust. The principal purpose of this
trust is to hold shares in the Company for subsequent transfer to certain senior employees and executive directors relating to options granted
and awards made in respect of market purchase shares under the Long Term Incentive Plan, the Deferred Annual Share Bonus Scheme and
the 1994 Executive Share Option Scheme. Details of such plans are set out in Note 16 to the consolidated financial statements and the Directors’
remuneration report. The assets, liabilities and expenditure of the trust have been incorporated in the consolidated financial statements. Finance
costs and administration charges are included in the income statement on an accruals basis. At 31 December 2012 the trust held 4,348,175
(2011:5,230,867) shares, upon which dividends have been waived, with an aggregate nominal value of £1.4m (2011: £1.7m) and market value
of £43.9m (2011: £46.2m). At 31 December 2012, 23,325,000 (2011: 23,325,000) shares with an aggregate nominal value of £7.5m (2011: £7.5m)
and market value of £235.3m (2011: £206.2m) were held in treasury.

96 BUNZL PLC ANNUAL REPORT 2012
NOTES TO THE COMPANY FINANCIAL STATEMENTS CONTINUED
10 RECONCILIATION OF MOVEMENT IN SHAREHOLDERS’ FUNDS 2012 2011
£m £m
Profit/(loss) for the year 197.5 (98.5)
Dividends (85.7) (68.9)
111.8 (167.4)
Issue of share capital 7. 9 3.0
Employee trust shares (9.6) (14.3)
Share based payments 5.7 5.3
Net increase in shareholders’ funds 115.8 (173.4)
Opening shareholders’ funds 826.2 999.6
Closing shareholders’ funds 942.0 826.2
The Company had no recognised gains or losses in the year ended 31 December 2012 or the year ended 31 December 2011 other than its
loss for the relevant year.
11 CONTINGENT LIABILITIES
Borrowings by subsidiary undertakings totalling £778.2m (2011: £676.1m) which are included in the Group’s borrowings have been guaranteed by
theCompany.
12 DIRECTORS’ REMUNERATION
The remuneration of the directors of the Company is disclosed in Note 21 to the consolidated financial statements and the Directors’
remunerationreport.
13 EMPLOYEE NUMBERS AND COSTS
The average number of persons employed by the Company (including directors) during the year was 41 (2011: 42).
The aggregate employee costs relating to these persons were:
2012 2011
£m £m
Wages and salaries 7.6 7. 2
Social security costs 1.0 1.2
Share based payments 1.1 0.7
Pension costs 0.9 0.8
10.6 9.9
14 RELATED PARTY DISCLOSURES
The Company has identified the directors of the Company, the UK pension scheme and its key management as related parties for the purpose
of FRS 8 ‘Related Party Disclosures’. Details of the relevant relationships with these related parties are disclosed in the Directors’ remuneration
report, Note 20 of the consolidated financial statements and Note 21 of the consolidated financial statements respectively.

BUNZL PLC ANNUAL REPORT 2012 97
STATEMENT OF DIRECTORS’ RESPONSIBILITIES
The directors are responsible for preparing the Group and parent
company financial statements in accordance with applicable law
and regulations.
Company law requires the directors to prepare Group and parent
company financial statements for each financial year. Under that law
the directors are required to prepare the Group financial statements in
accordance with IFRS as adopted by the EU and applicable law and have
elected to prepare the parent company financial statements in accordance
with UK GAAP and applicable law.
Under company law the directors must not approve the financial
statements unless they are satisfied that they give a true and fair view
of the state of affairs of the Group and parent company and of their profit
or loss for that period.
In preparing both the Group and parent company financial statements,
the directors are required to:
t TFMFDUTVJUBCMFBDDPVOUJOHQPMJDJFTBOEUIFOBQQMZUIFNDPOTJTUFOUMZ
t NBLFKVEHFNFOUTBOEFTUJNBUFTUIBUBSFSFBTPOBCMFBOEQSVEFOU
t GPSUIF(SPVQmOBODJBMTUBUFNFOUTTUBUFXIFUIFSUIFZIBWFCFFO
prepared in accordance with IFRS as adopted by the EU;
t GPSUIFQBSFOUDPNQBOZmOBODJBMTUBUFNFOUTTUBUFXIFUIFS
applicable UK GAAP has been followed, subject to any material
departures disclosed and explained in the parent company financial
statements; and
t QSFQBSFUIFmOBODJBMTUBUFNFOUTPOUIFHPJOHDPODFSOCBTJTVOMFTT
it is inappropriate to presume that the Group and the parent company
will continue in business.
The directors are responsible for keeping adequate accounting
records that are sufficient to show and explain the parent company’s
transactions and disclose with reasonable accuracy at any time the
financial position of the parent company and enable them to ensure that
its financial statements comply with the Companies Act 2006. They have
general responsibility for taking such steps as are reasonably open to
them to safeguard the assets of the Group and to prevent and detect fraud
and other irregularities.
Under applicable law and regulations, the directors are also responsible
for preparing a directors’ report, Directors’ remuneration report and
Corporate governance statement that comply with that law and
thoseregulations.
The directors are responsible for the maintenance and integrity of the
corporate and financial information included on the Company’s website.
Legislation in the UK governing the preparation and dissemination of
financial statements may differ from legislation in other jurisdictions.
The Annual Report and financial statements comply with the Disclosure
and Transparency Rules of the United Kingdom’s Financial Services
Authority in respect of the requirement to produce an annual
financial report.
We confirm on behalf of the Board that to the best of our knowledge:
t UIF(SPVQBOEQBSFOUDPNQBOZmOBODJBMTUBUFNFOUTIBWFCFFO
prepared in accordance with the applicable set of accounting
standards and give a true and fair view of the assets, liabilities, financial
position and profit or loss of the Company and the undertakings
included in the consolidation taken as a whole; and
t UIF"OOVBM3FQPSUBOEmOBODJBMTUBUFNFOUTJODMVEFBGBJSSFWJFXPG
the development and performance of the business and the position
of the Company and the undertakings included in the consolidation
taken as a whole, together with a description of the principal risks
and uncertainties that they face.
On behalf of the Board
Michael Roney Brian May
Chief Executive Finance Director
25 February 2013

98 BUNZL PLC ANNUAL REPORT 2012
INDEPENDENT AUDITOR’S REPORT TO THE MEMBERS OF BUNZL PLC
We have audited the financial statements of Bunzl plc for the year ended
31 December 2012 which comprise the consolidated income statement,
the consolidated statement of comprehensive income, the Group and
parent company balance sheets, the consolidated cash flow statement,
the consolidated statement of changes in equity and related notes. The
financial reporting framework that has been applied in the preparation
ofthe Group financial statements is applicable law and International
Financial Reporting Standards (IFRS) as adopted by the EU. The
financialreporting framework that has been applied in the preparation
ofthe parent company financial statements is applicable law and UK
Accounting Standards (UK Generally Accepted Accounting Practice).
This report is made solely to the Company’s members, as a body,
in accordance with Chapter 3 of Part 16 of the Companies Act 2006.
Ouraudit work has been undertaken so that we might state to the
Company’s members those matters we are required to state to them
inanauditor’s report and for no other purpose. To the fullest extent
permitted by law, we do not accept or assume responsibility to anyone
other than the Company and the Company’s members, as a body, for
ouraudit work, for this report, or for the opinions we have formed.
RESPECTIVE RESPONSIBILITIES OF DIRECTORS AND AUDITORS
As explained more fully in the Statement of directors’ responsibilities set
out on page 97, the directors are responsible for the preparation of the
financial statements and for being satisfied that they give a true and fair
view. Our responsibility is to audit, and express an opinion on, the financial
statements in accordance with applicable law and International Standards
on Auditing (UK and Ireland). Those standards require us to comply with
the Auditing Practices Board’s (APB’s) Ethical Standards for Auditors.
SCOPE OF THE AUDIT OF THE FINANCIAL STATEMENTS
A description of the scope of an audit of financial statements is provided
on the APB’s website at www.frc.org.uk/apb/scope/private.cfm.
OPINION ON FINANCIAL STATEMENTS
In our opinion:
t UIFmOBODJBMTUBUFNFOUTHJWFBUSVFBOEGBJSWJFXPGUIFTUBUFPGUIF
Group’s and of the parent company’s affairs at 31 December 2012
and of the Group’s profit for the year then ended;
t UIF(SPVQmOBODJBMTUBUFNFOUTIBWFCFFOQSPQFSMZQSFQBSFEJO
accordance with IFRS as adopted by the EU;
t UIFQBSFOUDPNQBOZmOBODJBMTUBUFNFOUTIBWFCFFOQSPQFSMZQSFQBSFE
in accordance with UK Generally Accepted Accounting Practice; and
t UIFmOBODJBMTUBUFNFOUTIBWFCFFOQSFQBSFEJOBDDPSEBODFXJUIUIF
requirements of the Companies Act 2006 and, as regards the Group
financial statements, Article 4 of the IAS Regulation.
OPINION ON OTHER MATTERS PRESCRIBED BY THE COMPANIES
ACT 2006
In our opinion:
t UIFQBSUPGUIF%JSFDUPSTSFNVOFSBUJPOSFQPSUUPCFBVEJUFEIBTCFFO
properly prepared in accordance with the Companies Act 2006; and
t UIFJOGPSNBUJPOHJWFOJOUIFEJSFDUPSTSFQPSUGPSUIFmOBODJBMZFBSGPS
which the financial statements are prepared is consistent with the
financial statements.
MATTERS ON WHICH WE ARE REQUIRED TO REPORT
BY EXCEPTION
We have nothing to report in respect of the following:
Under the Companies Act 2006 we are required to report to you if,
in our opinion:
t BEFRVBUFBDDPVOUJOHSFDPSETIBWFOPUCFFOLFQUCZUIFQBSFOU
company or returns adequate for our audit have not been received
from branches not visited by us; or
t UIFQBSFOUDPNQBOZmOBODJBMTUBUFNFOUTBOEUIFQBSUPGUIF%JSFDUPST
remuneration report to be audited are not in agreement with the
accounting records and returns; or
t DFSUBJOEJTDMPTVSFTPGEJSFDUPSTSFNVOFSBUJPOTQFDJmFECZMBXBSF
not made; or
t XFIBWFOPUSFDFJWFEBMMUIFJOGPSNBUJPOBOEFYQMBOBUJPOTXFSFRVJSF
for our audit.
Under the Listing Rules we are required to review:
t UIFEJSFDUPSTTUBUFNFOUTFUPVUPOQBHFJOSFMBUJPOUPHPJOHDPODFSO
t UIFQBSUPGUIF$PSQPSBUFHPWFSOBODFTUBUFNFOUPOQBHFTUP
relating to the Company’s compliance with the nine provisions of the
UK Corporate Governance Code specified for our review; and
t DFSUBJOFMFNFOUTPGUIF%JSFDUPSTSFNVOFSBUJPOSFQPSU
Michael Maloney (Senior Statutory Auditor)
for and on behalf of KPMG Audit Plc, Statutory Auditor
Chartered Accountants
15 Canada Square, London
25 February 2013

BUNZL PLC ANNUAL REPORT 2012 99
FIVE YEAR REVIEW
2012 2011 2010 2009 2008
£m £m £m £m £m
Revenue 5,359.2 5,109.5 4,829.6 4,648.7 4,177.3
Operating profit before intangible amortisation and acquisition related
costs 352.4 335.7 306.7 295.7 280.5
Intangible amortisation and acquisition related costs (58.6) (56.4) (51.0) (41.8) (36.0)
Operating profit 293.8 279.3 255.7 253.9 244.5
Finance income 22.1 21.8 20.3 16.8 27.6
Finance cost (50.6) (51.4) (50.8) (54.7) (65.2)
Disposal of business 4.0 (56.0) – – –
Profit before income tax 269.3 193.7 225.2 216.0 206.9
Profit before income tax, intangible amortisation, acquisition related
costs and disposal of business 323.9 306.1 276.2 257.8 242.9
Income tax (74.0) (69.9) (66.2) (67.1) (64.7)
Profit for the year 195.3 123.8 159.0 148.9 142.2
Basic earnings per share 59.9p 38.2p 49.1p 46.4p 44.5p
Adjusted earnings per share 71.8p 68.5p 60.6p 55.9p 52.7p

100BUNZL PLC ANNUAL REPORT 2012
SHAREHOLDER INFORMATION
FINANCIAL CALENDAR 2013
Annual General Meeting 17 April
Results for the half year to 30 June 2013 27 August
2014
Results for the year to 31 December 2013 February
Annual Report circulated March
Dividend payments are normally made on these dates:
Ordinary shares (final) 1 July
Ordinary shares (interim) 2 January
ANALYSIS OF ORDINARY SHAREHOLDERS
At 31 December 2012 the Company had 5,429 (2011: 5,603)
shareholders who held 355.4 million (2011: 354.0 million) ordinary
shares (including treasury shares) between them, analysed as follows:
Size of holding
Number of
shareholders
% of issued
share capital
0 – 10,000 4,818 2
10,001 – 100,000 357 3
100,001 – 500,000 164 11
500,001 – 1,000,000 41 8
1,000,001 and over 49 76
5,429 100
REGISTRAR
Computershare Investor Services PLC
The Pavilions
Bridgwater Road
Bristol BS99 6ZZ
Telephone 0870 889 3257
Fax 0870 703 6101
Website www.computershare.com
INVESTOR CENTRE
Shareholders can manage their shareholding online at
www.investorcentre.co.uk. The Investor Centre is our Registrar’s
easytouse website, available 24 hours a day, 7 days a week,
wherethefollowing services are available:
tDIBOHFPGBEESFTT
tWJFXTIBSFCBMBODFJOGPSNBUJPO
tKPJOUIFEJWJEFOESFJOWFTUNFOUQMBOBOE
tWJFXEJWJEFOEQBZNFOUBOEUBYJOGPSNBUJPO
In order to register for the Investor Centre, shareholders will need their
shareholder reference number which can be found on either their share
certificate or dividend tax voucher.
DIVIDEND PAYMENT BY BACS
Shareholders can have their dividends paid directly into their bank
orbuilding society account using the Bankers’ Automated Clearing Service
(‘BACS’). This means that dividends will be in the account onthesameday
the dividend payment is made. Shareholders will receive their tax vouchers
by post. To use this method of payment please contact our Registrar on
0870 889 3257 or visit the Investor Centre website. Please note that this
option will not override any existing dividend scheme mandate, which
would need to be revoked in writing.
DIVIDEND REINVESTMENT PLAN
The Company operates a dividend reinvestment plan which allows
shareholders to use the whole of their cash dividend to buy additional
shares in the Company, thereby increasing their shareholding.
Shareholders can apply to join the plan online in the Investor Centre
or can contact the Company’s registrar to request the terms and
conditions of the plan and a printed mandate form.
GLOBAL PAYMENTS SERVICE
Shareholders may if they wish have their dividend payments paid directly
into their bank account in certain foreign currencies. Please contact the
Company’s Registrar on 0870 889 3257 to request further information
about the currencies for which this service is available.
SHARE DEALING
Bunzl plc shares can be traded through most banks and
stockbrokers.The Company’s Registrar also offers an internet
andtelephonedealing service. Further details can be found at
www.computershare.com/dealing/uk or by telephoning 0870 703 0084.
SHAREGIFT
Sometimes shareholders have only a small holding of shares which may
be uneconomical to sell. Shareholders who wish to donate these shares
tocharity can do so through ShareGift, an independent charity share
donation scheme (registered charity no. 1052686). Further information
about ShareGift may be obtained from ShareGift on 020 7930 3737
oratwww.sharegift.org.
SHAREHOLDER SECURITY
Shareholders are advised to be cautious about any unsolicited
financialadvice, offers to buy shares at a discount or offers of free
company reports. More detailed information about this can be
foundatwww.fsa.gov.uk in the Consumer Information section. Details
ofanyshare dealing facilities that the Company endorses will be included
in Company mailings.
AUDITOR
KPMG Audit Plc
STOCKBROKERS
J.P. Morgan Cazenove
Citigroup
COMPANY SECRETARY
Paul Hussey
REGISTERED OFFICE
York House
45 Seymour Street
London W1H 7JT
Telephone 020 7725 5000
Fax 020 7725 5001
Website www.bunzl.com
Registered in England no. 358948
FORWARD-LOOKING STATEMENTS
The Annual Report contains certain statements about the future outlook
for the Group. Although the Company believes that the expectations are
based on reasonable assumptions, any statements about future outlook
may be influenced by factors that could cause actual outcomes and
results to be materially different.

The paper used in the report is Amadeus 50 Silk containing 50%
recycled content, all of which is de-inked post-consumer waste,
and 50% virgin fibre. All of the pulp is bleached using an elemental
chlorine free process (ECF). Printed in the UK by Pureprint using their
® and ® environmental printing technology and
vegetable inks were used throughout. Pureprint is a CarbonNeutral®
company. Both manufacturing mill and the printer are registered to
the Environmental Management System ISO14001 and are Forest
Stewardship Council® (FSC) chain-of-custody certified.
Designed and produced by

York House
45 Seymour Street
London W1H 7JT
www.bunzl.com
