Printmgr File BENCHMARK 14/19 Ar 2014 E
User Manual: BENCHMARK 14/19
Open the PDF directly: View PDF ![]() .
.
Page Count: 208 [warning: Documents this large are best viewed by clicking the View PDF Link!]

ROYAL BANK OF CANADA ANNUAL REPORT 2014

RBC IS A
GLOBAL LEADER
Royal Bank of Canada is the largest bank in Canada, and the
12th largest bank in the world, based on market capitalization.
Our approximately 78,000 employees serve over 16 million
personal, business and corporate clients across a diversified
mix of businesses in 40 countries.
Our values define who we are:
Service – Excellent service to clients and each other
Teamwork – Working together to succeed
Responsibility – Personal responsibility for high performance
Diversity – Diversity for growth and innovation
Integrity – Trust through integrity in everything we do
CONTENTS
We Have A Focused
Strategy 1
We Create Long-term Value 2
We Have Five Key Strengths
That Drive Our Success 3
We Deliver Stability &
Opportunity Through
Diversification 4
We Make Communities
Stronger 5
Message from Dave McKay 6
Message from Katie Taylor 9
Management’s Discussion
and Analysis 10
Enhanced Disclosure Task Force
Recommendations Index 107
Reports and Consolidated
Financial Statements 108
Ten-Year Statistical Review 197
Glossary 199
Directors and
Executive Officers 202
Principal Subsidiaries 203
Shareholder Information 204
For more information, please visit: rbc.com
To view our online annual report, please visit:
rbc.com/ar2014

WE HAVE A
FOCUSED STRATEGY
Our client focus, diversified business model and commitment to our
long-term strategic priorities have been fundamental to our growth and
success in the past, and will allow us to continue to create value in the future.
STRATEGIC GOALS
In Canada, to be the
undisputed leader in
financial services
Globally, to be a leading
provider of capital
markets, investor and
wealth management
solutions
In targeted markets, to
be a leading provider of
select financial services
complementary to our
core strengths
2014 KEY HIGHLIGHTS
䊳Gained market share across key
businesses and client segments
䊳Delivered solid volume growth
(loans and deposits)
䊳Launched new products to meet
clients’ evolving needs
䊳Continued to lead the Canadian
league tables
䊳Recognized as Canada’s most
valuable brand
䊳Expanded international distribution
of our U.S. and global asset
management business
䊳Deepened offering and capabilities in
key markets to win new clients and
mandates and to grow market share
䊳Strategically added top talent
within capital markets and wealth
management in the U.S. and
internationally
䊳Continued to optimize Caribbean
banking operations for efficiency
and profitability
䊳Strengthened our cross-border
banking business in the U.S.
2015 STRATEGIC PRIORITIES
1. Extend lead in Canada through largest distribution network and increased efficiency
2. Deepen presence in the U.S., U.K./Europe and key international hubs by expanding capabilities, offering and distribution
3. Lead change with differentiated experiences to help clients achieve their goals
4. Pursue balanced growth opportunities and disciplined use of capital to create value for the long term
5. Maintain robust risk management staying within our risk appetite across our diversified business model
Royal Bank of Canada: Annual Report 2014 1
WE CREATE
LONG-TERM VALUE
We delivered record earnings and strong returns to shareholders. In 2014, we
grew earnings by 8%, increased our quarterly dividend by 12% compared to
last year, delivered strong return on equity (ROE) of 19% and maintained a
robust capital ratio of 9.9%.
Financial Performance Metric
MEDIUM-TERM OBJECTIVE
(3 TO 5-YEAR)
2014
RESULTS ACHIEVED
Diluted EPS Growth 7%+ 9.3% ✓
Return on Equity 18%+ 19.0% ✓
Capital Ratios (CET1) Strong 9.9% ✓
Dividend Payout Ratio 40%–50% 47% ✓
Strong
Earnings
Profitable
Growth
Financial
Strength
Delivered Returns
to Shareholders
NET INCOME
(C$ BILLION)
RETURN ON EQUITY
(ROE)
COMMON EQUITY TIER 1 (CET1)
CAPITAL RATIO
DIVIDENDS DECLARED
PER SHARE
$9.0
$7.5
$8.3
1412 13
12 13 14
19.0%
19.6% 19.7%
9.9%
8.9% 9.6%
1412 13
(pro forma)
$1.01
04
$2.84
Annualized
dividend
increase of:
12% – 1 yr
11% – 10 yr CAGR
14
Over the past decade, we’ve delivered a strong annualized total shareholder return (TSR) of 14%, second highest among our global peer
group. Our strong TSR has been underpinned by consistent financial performance and low earnings volatility.
Total Shareholder Return1ONE-YEAR THREE-YEAR FIVE-YEAR TEN-YEAR
RBC 19% 23% 12% 14%
Global Peer Average 11% 19% 8% 5%
1. Compounded annually, as at October 31, 2014. The peer group average excludes RBC; for more information on the list of 19 financial institutions in the peer group, refer to the Financial
performance section of our 2014 Management’s Discussion and Analysis.
2 Royal Bank of Canada: Annual Report 2014

WE HAVE FIVE
KEY STRENGTHS THAT
DRIVE OUR SUCCESS
Our key strengths underpin past performance and provide a strong foundation
for future growth. These strengths enable us to successfully deliver on our
strategy.
DIVERSIFIED
BUSINESS MODEL
SIZE & SCALE IN
CANADA WITH
GLOBAL REACH
CLIENT
FOCUS
EMPLOYEES, BRAND
& REPUTATION
FINANCIAL STRENGTH &
PRUDENT RISK MANAGEMENT
@ Named Bank of the Year
for Canada1
@ Best-in-class client
service, wealth planning
and trust offerings2
@ Received Best Banking
awards for financial
planning, advice and
channel excellence3
@ Recognized as a global
leader among investment
banks in expertise and skill4
@ Diversified by
business, geography
and client segment
@ 37% of revenue from
outside Canada
@ Largest bank in Canada by
market capitalization5
• 5th in North America
• 12th globally
@ 40 countries
@ ~78,000 employees
@ ~16 million clients
@ 4.5+ million active online
& mobile clients
@ ~1,400 branches
@ Consistent earnings and
dividend growth
@ Strong capital position
and credit ratings
@ Prudent risk management
built on a culture of doing
what’s right
@ Named one of the Best Workplaces in
Canada6 for the 6th consecutive year
while attracting talented employees
globally
@ Canada’s most valuable
brand and 16th most
valuable bank brand
globally7
@ One of the World’s
Most Admired
Companies8
1. The Banker. 5. Bloomberg as at Oct. 31, 2014.
2. Private Banker International. 6. The Great Place to Work®Institute.
3. Ipsos – Best Banking Awards. 7. Brand Finance.
4. The Economist. 8. Fortune.
Royal Bank of Canada: Annual Report 2014 3

WE DELIVER
STABILITY & OPPORTUNITY
THROUGH DIVERSIFICATION
We serve our clients through a number of business lines across many geographies.
We’re confident we have the right mix to deepen client relationships, benefit from growth
opportunities and support consistent performance over the long term. Our diversified
business model positions us well to deliver superior returns and earnings stability through
the business cycle.
23%
CAPITAL MARKETS
12%
WEALTH MANAGEMENT
5%
INVESTOR &
TREASURY SERVICES
1. By client assets – Scorpio Partnership’s 2014
Global Private Banking Benchmark.
2. Pensions & Investments and Towers Watson 2014
Global Asset Manager Ranking Report.
3. By assets – Investment Funds Institute of Canada
(IFIC) as at September, 2014.
4. By assets and advisors – Company data.
5. Company data.
6. By AUA.
7. Global Investor.
8. Thomson Reuters by fees.
9. The Economist.
10. Euromoney.
11. Retail Banker International.
2014
EARNINGS
$9.0B
9%
INSURANCE
@ Among the fastest-growing insurance
organizations in Canada5
@ One of the largest Canadian bank-
owned insurance organizations
@ Top 10 global custodian6
@ Best overall global custodian7
@ Top 5 global wealth manager1 and
top 50 global asset manager2
•
Among the fastest-growing asset
managers in the world2
•
#1 in Canada in mutual funds3
•
Top 10 full-service brokerage firm
in the U.S.4
@ Top 10 global investment bank8
•
#1 in Canada
@ Recognized as the Most Trusted
Investment Bank in the World9
@ Named Best Investment Bank in
Canada across Equity, Debt and
M&A for the 7th consecutive year10
51%
PERSONAL &
COMMERCIAL BANKING
@ #1 or #2 market share in
all Canadian banking retail
product categories
@ Largest distribution network
in Canada
@ Recognized as the Global Retail
Bank of the Year11
@ First bank globally to provide a
cloud-based mobile payment
solution offering clients a choice
of paying with credit or debit, and
the first in North America to offer
the flexibility to pay a friend
through Facebook Messenger
* Amounts exclude Corporate Support
For more awards, please visit: rbc.com/aboutus/awards
4 Royal Bank of Canada: Annual Report 2014

WE MAKE
COMMUNITIES
STRONGER
We contributed more than $100 million this year to causes that will have a positive and
lasting social, economic and environmental impact for generations to come. We are actively
involved with charitable organizations around the world and we support our employees in
their volunteering efforts.
RBC KIDS PLEDGE:
$100 MILLION.
5 YEARS.
We believe kids are our future: for our economic prosperity,
the health of the planet and the hope for our communities.
The RBC Kids Pledge is a commitment to
improve the well-being of at least 1 million
kids and youth. We believe kids need and
deserve our complete commitment so they
can be healthy in mind, body and spirit.
This pledge consolidates our support for a
diverse range of arts, sports, wellness,
education and employment programs to
help kids reach their full potential.
When you believe in kids, they can do
anything.
Employees laced up their running shoes to take
part in RBC Run/Race for the Kids events globally to
help raise funds for local children’s charities.
$50 MILLION.
10 YEARS.
RBC BLUE
WATER PROJECT®:
We help provide access to drinkable, swimmable, fishable water
now and for future generations.
The RBC Blue Water Project is our global
charitable commitment that is dedicated
to protecting fresh water and promoting
responsible water use. This year, RBC
Blue Water Project Leadership and
Community Action Grants provided
funding for protection and preservation
programs.
On RBC Blue Water Day, more than 20,000 employees
rolled up their sleeves and participated in over 700
‘clean up,’ ‘plant some green’ and ‘cultivate awareness’
makeover events to help protect water.
WE ALSO INVEST IN A WIDE RANGE OF EDUCATION, HEALTH, ARTS & CULTURE,
ENVIRONMENT AND SPORTS PROGRAMS AND ORGANIZATIONS
For more information, please visit: RBC Corporate Responsibility Review at rbc.com/community-sustainability
Royal Bank of Canada: Annual Report 2014 5

MESSAGE FROM
DAVE MCKAY
Dave McKay
President and Chief Executive Officer
Dear fellow shareholders,
Let me begin this letter by saying that I’m
honoured to serve as your President and
Chief Executive Officer. I started my career
at RBC more than 25 years ago as a summer
student. As I worked in different
businesses, functions and locations over
the years, I was always impressed by the
calibre of people who work here. Today, I’m
privileged to lead this tremendous team
with a shared commitment to building on
RBC’s proud history of more than 150 years.
Six years after the financial crisis it feels
like the global economy has begun to turn a
corner. The Canadian and U.S. economies
continued to improve throughout the year.
While the central banks of both countries
maintained historically low interest rates,
we saw lower unemployment, higher
consumer spending and improved housing
market activity – all signals of healthy
economic activity. The U.S. Federal Reserve
ended its asset purchase program in
October, further proof that the U.S.
economy is back on track. While growth in
Europe was slow, the U.K. continued to be a
good news story in the region. Across the
banking industry, regulation continued to
be a key theme.
Delivering record financial results in
2014 for our shareholders
Against this backdrop, I’m pleased to report
that 2014 was a record year for RBC. We
continued to extend our leadership position
in Canada and build our businesses in
select global markets. We earned $9 billion,
up 8 per cent from last year, reflecting
record results in all of our business
segments.
With these results, we achieved all of our
financial objectives. We earned $6.00 per
share (diluted EPS) with a return on equity
of 19 per cent, and we ended the year with
a strong Common Equity Tier 1 capital
ratio of 9.9 per cent.
These financial objectives measure
progress toward our medium-term
objective of maximizing Total Shareholder
Returns (TSR). We delivered compound
annual TSR of 23 per cent and 12 per cent
over the three- and five-year periods.
During 2014, our one-year TSR was 19 per
cent. We raised our dividend twice during
2014 for a combined increase of 12 per
cent while repurchasing shares, and we
renewed our share buyback program for
2015.
Building on our strengths to grow our
businesses
Looking ahead, we understand the drivers
of growth will be different from those in
the past decade, and I feel confident RBC
can adapt to changes and capitalize on
new opportunities including the shift in
demographics, the emergence of new
technologies and the changing needs and
preferences of our clients.
We know the pace of consumer borrowing
in Canada will continue to moderate
following many years of strong credit
growth, and that the shift to savings and
investing will accelerate. In fact,
investments are forecast to grow three
I am enormously proud of
what we’ve achieved
together and incredibly
excited for the
opportunities that lie
ahead
times faster than credit over the next
decade. RBC is extremely well positioned to
serve our clients as we are the largest
mutual fund provider in our home market,
selling almost twice as many mutual funds
as our nearest bank competitor. We also
have the largest full-service wealth
management business with leading market
share for high-net-worth individuals in
Canada, and we have the most mobile and
branch-based investment and financial
planners to serve our clients. We are also
among the fastest-growing insurance
organizations in Canada.
As the market leader in business financial
services in Canada, we see opportunity
from the growing demand for credit from
businesses, especially as improvements in
the U.S. economy help foster greater
confidence to spur investing. Additionally,
with over 45 per cent of businesses
expected to change ownership in the next
five to 10 years, we are well placed to help
business owners plan for succession and
with the transition itself – by finding a
buyer, financing the transaction and
managing their new wealth.
6 Royal Bank of Canada: Annual Report 2014

ANNOUNCED 37% TOTAL
INCREASE TO QUARTERLY
DIVIDENDS OVER 3 YEARS
There is no question our home market is a
competitive banking environment and
pressure from continued low interest rates
will remain a headwind for our business
next year. Within this context, we are
committed to improving on our industry
leading efficiency ratio and deepening
client relationships through cross-sell, a
proven capability for RBC. Overall, I believe
we can continue to extend our lead in
Canada to deliver profitable growth.
Globally, we have the right strategies to
build leadership in select businesses and
markets where our strengths can help us
win.
We have a strong presence in the U.S., an
advantage given the expected growth in the
American economy. In our Capital Markets
business, the U.S. now accounts for more
than 50 per cent of revenue, reflecting
strong client acquisition over the past
number of years, and we are focused on
building deeper relationships with those
clients. Our U.S. Wealth Management
business is the seventh-largest full-service
brokerage by assets and we are broadening
our product offering. Over the last few years
we’ve also added global fixed income and
equity capabilities to our asset
management business in that market,
which continues to grow.
In the U.K. and Europe, we are building our
presence, adding expertise across wealth
management, asset management and
capital markets, and benefitting from RBC’s
brand and reputation. Given the challenging
economic environment, we are taking a
prudent approach to building our
capabilities as we know the recovery will
take some time. I am encouraged by our
progress in these markets and expect it to
continue. In Capital Markets, we are
increasingly winning corporate and
investment banking mandates. We are
among the fastest growing asset
managers with strong momentum outside
of Canada. With its reputation for service
excellence, our Investor & Treasury
Services business is also well positioned
for expansion in the global investment
industry.
Across all of our businesses advance-
ments in technology are changing client
expectations, transforming business
models and redefining the competitive
landscape. Meanwhile, the regulatory
environment for banks will continue to
evolve. Our financial strength gives us the
flexibility to effectively manage regulatory
changes while investing in our
businesses. We have digitized and
simplified processes to lower costs and
deliver a faster, better client experience,
and are investing in our technology and
innovation to shape the future with new
products and services. For example, this
year we launched a new system that
automates many of the steps in
processing a new mortgage to deliver
faster service, and we are a leader in
emerging payment solutions.
Looking ahead, we will maintain our
balanced and disciplined approach to
capital deployment. Our first priority will
remain investing in our existing
businesses to generate strong returns.
Second, we remain committed to returning
capital to shareholders through dividend
increases and share buybacks. And lastly,
we will consider targeted acquisitions that
fit our strategy and risk appetite, and
deliver strong returns for our shareholders
over the long term.
Bringing the best of RBC to our clients
United by our vision of always earning the
right to be our clients’ first choice, we put
customers at the centre of everything that
we do.
Whether it’s helping them buy their first
home, start their own business, travel
worry-free, pay for their children’s
education or prepare for a comfortable
retirement, we enable more than 16 million
clients in achieving their goals. At the end
of 2014, we funded $231 billion in
mortgages and lines of credit for
homeowners in Canada and $5 billion in
small business loans for Canadian
entrepreneurs. We grew the assets
entrusted to us by investors around the
world by 13 per cent this year.
We loaned nearly $110 billion to medium
and large companies around the world to
help them build their businesses, and
ensured our institutional clients could make
informed decisions by providing top-ranked
research and investment solutions in key
international markets.
Royal Bank of Canada: Annual Report 2014 7

NAMED BANK OF
THE YEAR FOR CANADA1
Creating opportunities for our
employees
Our employees’ passion for helping
clients succeed is second to none. They
represent our brand with pride. I’m
particularly proud of how much our
employees care about doing what’s right.
Our people, culture and brand are a true
differentiator wherever we do business.
We enable success by fostering an
environment of respect and inclusion
where everyone can contribute and
achieve their potential. The diversity of
our workforce brings different
perspectives and abilities and plays a
central role in serving our clients and
driving productivity, innovation and
growth.
Making a positive difference in
communities
One of the things that defines RBC is the
positive social, economic and environ-
mental impact we make in communities.
In 2014, we invested more than
$100 million in community efforts, shared
our expertise and provided nearly
2,500 RBC Employee Volunteer grants.
We’re on track to improve the well-being
of at least one million kids and youth
through our multi-year, $100-million RBC
Kids Pledge. A key element of that
commitment is the RBC Run/Race for the
Kids, which took place in seven cities
around the world, and this year more than
8,000 employees, their families and
friends ran with us in support of local
children’s charities. Our employees are
also tremendous supporters of the RBC
Blue Water Project, our commitment to
protecting fresh water for generations to
come.
Thank you
Thank you to our clients who choose to
place their trust in us, and to our
employees who work so hard to help them
succeed.
I’d like to acknowledge and thank Gordon
Nixon, who retired as CEO this year, for his
leadership of a truly world-class
organization, and for leaving the company
with the strength and depth to build for
the future. And finally, I’d like to express
my gratitude to the Board of Directors for
their continued insight and counsel.
And to you, our shareholders, we are
committed to delivering high-quality
growth, industry-leading returns and long-
term value. I am enormously proud of
what RBC has achieved and incredibly
excited for the opportunities that lie
ahead.
David McKay
President and Chief Executive Officer
We serve more than
25% of active
Canadian digital
banking clients2
We have more than
30% share of all
mutual funds
sold by banks in
Canada – other banks
have less than 20%3
Awarded Best Fund
Group Overall4
Named Most Trusted
Investment Bank in
the World5
1. The Banker.
2. Finalta Digital and Multichannel
Banking Benchmark 2014 Study –
Big 5 Canadian banks.
3. Investment Funds Institute of Canada,
September 2014.
4. 2014 Lipper Canada Fund Awards.
5. The Economist.
8 Royal Bank of Canada: Annual Report 2014

MESSAGE FROM
KATIE TAYLOR
Katie Taylor, Chair of the Board
Dear fellow shareholders,
It is an honour to take on the role of Chair,
more than a decade after first joining RBC’s
Board of Directors in 2001.
Over the years the Board has overseen
RBC’s continued growth resulting from its
successful focus on cultivating broad and
deep client relationships, investing in
people and contributing to the economic
prosperity and betterment of communities
where it does business.
In 2014 the Board continued to engage with
the outstanding management team at RBC.
Our oversight is directed at guiding their
business decisions to deliver value to
shareholders over the long term.
RBC has the right strategy to drive
growth and create value
As strategic advisors to management, the
Board must prudently balance strategic
opportunities with risk discipline. Today’s
approach to shareholder value creation
must build agility to benefit from oppor-
tunities to allow RBC to thrive in tomorrow’s
changing environment. To that end, the
Board and management actively discuss
how RBC is positioned to grow as external
factors such as technology, regulation and
changing client demographics shape the
financial services industry.
The Board is focused on ensuring that RBC
has both the right strategy to drive
continued success and the competitive
strengths and capabilities to deliver on its
priorities. We assess the amount and type
of risk RBC will accept in pursuit of its
business objectives, and monitor the
organization’s systems and processes to
manage those risks. We work closely with
management on how best to enhance the
bank’s strong capital position and create
value by investing in organic growth,
funding dividend increases, repurchasing
shares or making strategic acquisitions.
RBC has the right team in place to
benefit from future opportunities
Succession planning, including the
selection and appointment of the senior
management team, is a fundamental
responsibility of the Board. We review the
depth and diversity of succession pools
for key leadership roles, and we monitor
the progress of succession candidates.
This year Dave McKay succeeded Gordon
Nixon as President and CEO, and there
were a number of other important
appointments at the Group Executive
level. The skills and experience of our
senior leaders are essential to achieving
sustainable growth over the long term.
The Board is confident that under Dave
McKay’s leadership, RBC will continue to
build on its past successes. His
distinguished 26-year career at RBC
includes international experience in
corporate banking and senior roles in
retail banking and risk management. His
outstanding dedication to clients, focus
on innovation, commitment to employees
and track record of performance will serve
RBC well as it continues to grow.
As the bank grows and its leadership team
transitions, we remain committed to
enhancing the diversity of experience,
perspectives and skill sets represented on
the Board. We are pleased to welcome
Dave McKay and Jacynthe Côté to the
Board, and to announce that Toos
Daruvala will join as a Director in January
2015. With a longstanding career at Rio
Tinto Alcan, most recently as President
and Chief Executive Officer, Ms. Côté
brings extensive experience in interna-
tional business. Mr. Daruvala, currently a
Director and Senior Partner at McKinsey &
Company, brings more than 30 years of
experience in advising financial institutions
on matters ranging from banking and risk
management practices to corporate strategy
and organizational effectiveness.
As we welcome these three new Directors,
we say farewell to one. Over his 13-year
tenure as CEO, Gordon Nixon added
tremendous value in earnings, returns and
client focus. Under his guidance, RBC has
taken its place among the most-respected
financial institutions globally.
RBC is committed to driving growth,
which is essential to its continued
success
The Board of Directors recognizes that RBC
succeeds when its stakeholders –
shareholders, employees, clients and
communities – succeed. As one of the
largest financial institutions in the world,
RBC sets high standards as a top employer
and leading corporate citizen. United by
strong corporate values, the Board of
Directors, management and employees
worldwide share the vision of always
earning the right to be our clients’ first
choice.
In 2014, RBC delivered significant value to
stakeholders as it continued to grow and
deliver on its strategic goals. I want to thank
my fellow Board members for their valuable
advice. The Board would like to extend its
sincere thanks to the management team at
RBC and the company’s dedicated
employees who serve and focus on clients
– each and every day.
Kathleen Taylor
Chair of the Board
For more information on our governance policies, visit: rbc.com/governance
Royal Bank of Canada: Annual Report 2014 9

MANAGEMENT’S
DISCUSSION AND
ANALYSIS
Management’s Discussion and Analysis (MD&A) is provided to enable a reader to assess our results of operations and financial condition for the fiscal year ended
October 31, 2014, compared to the preceding two years. This MD&A should be read in conjunction with our 2014 Annual Consolidated Financial Statements and related
notes and is dated December 2, 2014. All amounts are in Canadian dollars, unless otherwise specified, and are based on financial statements prepared in accordance with
International Financial Reporting Standards (IFRS) as issued by the International Accounting Standards Board (IASB), unless otherwise noted.
Additional information about us, including our 2014 Annual Information Form, is available free of charge on our website at rbc.com/investorrelations, on the Canadian
Securities Administrators’ website at sedar.com and on the EDGAR section of the United States (U.S.) Securities and Exchange Commission’s (SEC) website at sec.gov.
Table of contents
Caution regarding forward-looking statements 10
Overview and outlook 11
Selected financial and other highlights 11
About Royal Bank of Canada 12
Vision and strategic goals 12
Economic and market review and outlook 12
Defining and measuring success through Total
Shareholder Returns 13
Key corporate events of 2014 14
Financial performance 14
Overview 14
Business segment results 18
Results by business segment 18
How we measure and report our business segments 19
Key performance and non-GAAP measures 19
Personal & Commercial Banking 23
Wealth Management 28
Insurance 31
Investor & Treasury Services 34
Capital Markets 35
Corporate Support 39
Quarterly financial information 39
Fourth quarter 2014 performance 39
Quarterly results and trend analysis 40
Results by geographic segment 42
Financial condition 43
Condensed balance sheets 43
Off-balance sheet arrangements 43
Risk management 46
Overview 46
Top and emerging risks 46
Enterprise risk management 47
Credit risk 52
Market risk 63
Liquidity and funding risk 68
Insurance risk 78
Regulatory compliance risk 78
Operational risk 79
Strategic risk 80
Reputation risk 80
Legal and regulatory environment risk 80
Competitive risk 82
Systemic risk 82
Overview of other risks 82
Capital management 85
Additional financial information 94
Exposures to selected financial instruments 94
Accounting and control matters 95
Critical accounting policies and estimates 95
Controls and procedures 99
Related party transactions 99
Supplementary information 100
See our Glossary for definitions of terms used throughout this document
Caution regarding forward-looking statements
From time to time, we make written or oral forward-looking statements within the meaning of certain securities laws, including the “safe harbour” provisions of the United States
Private Securities Litigation Reform Act of 1995 and any applicable Canadian securities legislation. We may make forward-looking statements in this 2014 Annual Report, in
other filings with Canadian regulators or the SEC, in other reports to shareholders and in other communications. Forward-looking statements in this document include, but are
not limited to, statements relating to our financial performance objectives, vision and strategic goals, the economic and market review and outlook for Canadian, U.S., European
and global economies, the regulatory environment in which we operate, the outlook and priorities for each of our business segments, and the risk environment including our
liquidity and funding risk. The forward-looking information contained in this document is presented for the purpose of assisting the holders of our securities and financial
analysts in understanding our financial position and results of operations as at and for the periods ended on the dates presented and our financial performance objectives,
vision and strategic goals, and may not be appropriate for other purposes. Forward-looking statements are typically identified by words such as “believe”, “expect”, “foresee”,
“forecast”, “anticipate”, “intend”, “estimate”, “goal”, “plan” and “project” and similar expressions of future or conditional verbs such as “will”, “may”, “should”, “could” or
“would”.
By their very nature, forward-looking statements require us to make assumptions and are subject to inherent risks and uncertainties, which give rise to the possibility that
our predictions, forecasts, projections, expectations or conclusions will not prove to be accurate, that our assumptions may not be correct and that our financial performance
objectives, vision and strategic goals will not be achieved. We caution readers not to place undue reliance on these statements as a number of risk factors could cause our
actual results to differ materially from the expectations expressed in such forward-looking statements. These factors – many of which are beyond our control and the effects of
which can be difficult to predict – include: credit, market, liquidity and funding, insurance, regulatory compliance, operational, strategic, reputation, legal and regulatory
environment, competitive and systemic risks and other risks discussed in the Risk management and Overview of other risks sections; anti-money laundering, growth in
wholesale credit, the high levels of Canadian household debt; cybersecurity; the business and economic conditions in Canada, the U.S. and certain other countries in which we
operate; the effects of changes in government fiscal, monetary and other policies; tax risk and transparency; our ability to attract and retain employees; the accuracy and
completeness of information concerning our clients and counterparties; the development and integration of our distribution networks; model, information technology,
information management, social media, environmental and third party and outsourcing risk.
We caution that the foregoing list of risk factors is not exhaustive and other factors could also adversely affect our results. When relying on our forward-looking statements
to make decisions with respect to us, investors and others should carefully consider the foregoing factors and other uncertainties and potential events. Material economic
assumptions underlying the forward looking statements contained in this 2014 Annual Report are set out in the Overview and outlook section and for each business segment
under the heading Outlook and priorities. Except as required by law, we do not undertake to update any forward-looking statement, whether written or oral, that may be made
from time to time by us or on our behalf.
Additional information about these and other factors can be found in the Risk management and Overview of other risks sections.
Information contained in or otherwise accessible through the websites mentioned does not form part of this report. All references in this report to websites are inactive textual references and
are for your information only.
10 Royal Bank of Canada: Annual Report 2014 Management’s Discussion and Analysis

Overview and outlook
Selected financial and other highlights Table 1
(Millions of Canadian dollars, except per share, number of and percentage amounts) 2014 2013 (1) 2012 (1)
2014 vs. 2013
Increase (decrease)
Continuing operations
Total revenue $ 34,108 $ 30,682 $ 29,147 $ 3,426 11.2%
Provision for credit losses (PCL) 1,164 1,237 1,299 (73) (5.9)%
Insurance policyholder benefits, claims and
acquisition expense (PBCAE) 3,573 2,784 3,621 789 28.3%
Non-interest expense 17,661 16,214 14,641 1,447 8.9%
Net income before income taxes 11,710 10,447 9,586 1,263 12.1%
Net income from continuing operations 9,004 8,342 7,558 662 7.9%
Net loss from discontinued operations – – (51) – 0.0%
Net income $ 9,004 $ 8,342 $ 7,507 $ 662 7.9%
Segments – net income from continuing operations
Personal & Commercial Banking $ 4,475 $ 4,380 $ 4,056 $ 95 2.2%
Wealth Management 1,083 886 753 197 22.2%
Insurance 781 595 713 186 31.3%
Investor & Treasury Services 441 339 102 102 30.1%
Capital Markets 2,055 1,700 1,576 355 20.9%
Corporate Support 169 442 358 (273) (61.8)%
Net income from continuing operations $ 9,004 $ 8,342 $ 7,558 $ 662 7.9%
Selected information
Earnings per share (EPS) – basic $ 6.03 $ 5.53 $ 4.96 $ 0.50 9.0%
– diluted 6.00 5.49 4.91 0.51 9.3%
Return on common equity (ROE) (2), (3) 19.0% 19.7% 19.6% n.m. (70) bps
Selected information from continuing operations
EPS – basic $ 6.03 $ 5.53 $ 4.99 $ 0.50 9.0%
–diluted 6.00 5.49 4.94 0.51 9.3%
ROE (2), (3) 19.0%19.7% 19.7% n.m. (70) bps
PCL on impaired loans as a % of average net loans and
acceptances 0.27%0.31% 0.35% n.m. (4) bps
Gross impaired loans (GIL) as a % of loans and acceptances 0.44%0.52% 0.58% n.m. (8) bps
Capital ratios and multiples (4)
Common Equity Tier 1 (CET1) ratio (4) 9.9%9.6% n.a. n.m. 30 bps
Tier 1 capital ratio (4) 11.4%11.7% 13.1% n.m. (30) bps
Total capital ratio (4) 13.4%14.0% 15.1% n.m. (60) bps
Assets-to-capital multiple (4) 17.0X 16.6X 16.7X n.m. 40 bps
Selected balance sheet and other information
Total assets $ 940,550 $ 859,745 $ 823,954 $ 80,805 9.4%
Securities 199,148 182,710 161,602 16,438 9.0%
Loans (net of allowance for loan losses) 435,229 408,850 378,241 26,379 6.5%
Derivative related assets 87,402 74,822 91,293 12,580 16.8%
Deposits 614,100 563,079 512,244 51,021 9.1%
Common equity 48,615 43,064 38,346 5,551 12.9%
Average common equity (2) 45,700 40,600 36,500 5,100 12.6%
Total capital risk-weighted assets 372,050 318,981 280,609 53,069 16.6%
Assets under management (AUM) 457,000 391,100 343,000 65,900 16.8%
Assets under administration (AUA) (5) 4,647,000 4,050,900 3,653,300 596,100 14.7%
Common share information
Shares outstanding (000s) – average basic 1,442,553 1,443,735 1,442,167 (1,182) (0.1)%
– average diluted 1,452,003 1,466,529 1,468,287 (14,526) (1.0)%
– end of period 1,442,233 1,441,056 1,445,303 1,177 0.1%
Dividends declared per common share $ 2.84 $ 2.53 $ 2.28 $ 0.31 12.3%
Dividend yield (6) 3.8%4.0% 4.5% n.m. (20) bps
Common share price (RY on TSX) $ 80.01 $ 70.02 $ 56.94 $ 9.99 14.3%
Market capitalization (TSX) 115,393 100,903 82,296 14,490 14.4%
Business information from continuing operations (number of)
Employees (full-time equivalent) (FTE) 73,498 74,247 74,377 (749) (1.0)%
Bank branches 1,366 1,372 1,361 (6) (0.4)%
Automated teller machines (ATMs) 4,929 4,973 5,065 (44) (0.9)%
Period average US$ equivalent of C$1.00 (7) $ 0.914 $ 0.977 $ 0.997 $ (0.063) (6.4)%
Period-end US$ equivalent of C$1.00 $ 0.887 $ 0.959 $ 1.001 $ (0.072) (7.5)%
(1) Comparative amounts prior to November 1, 2013 have been restated for the adoption of new accounting standards. For further details, refer to Note 2 of our 2014 Annual Consolidated
Financial Statements.
(2) Average amounts are calculated using methods intended to approximate the average of the daily balances for the period. This includes ROE and Average common equity. For further details,
refer to the Key performance and non-GAAP measures section.
(3) These measures may not have a standardized meaning under generally accepted accounting principles (GAAP) and may not be comparable to similar measures disclosed by other financial
institutions. For further details, refer to the Key performance and non-GAAP measures section.
(4) Effective the first quarter of 2013, we calculate capital ratios and Assets-to-capital multiple using the Basel III framework. Capital ratios presented above are on an “all-in” basis. Capital ratios
and Assets-to-capital multiple in 2012 were calculated using the Basel II framework. Basel III and Basel II are not directly comparable. The CET1 ratio is a regulatory measure under the Basel
III framework and is not applicable (n.a.) for 2012. For further details, refer to the Capital management section.
(5) Includes $31.2 billion (2013 – $32.6 billion, 2012 – $38.4 billion) of securitized mortgages and credit card loans.
(6) Defined as dividends per common share divided by the average of the high and low share price in the relevant period.
(7) Average amounts are calculated using month-end spot rates for the period.
n.m. not meaningful
Management’s Discussion and Analysis Royal Bank of Canada: Annual Report 2014 11

About Royal Bank of Canada
Royal Bank of Canada (RY on TSX and NYSE) is Canada’s largest bank, and one of the largest banks in the world, based on market capitalization.
We are one of North America’s leading diversified financial services companies, and provide personal and commercial banking, wealth
management services, insurance, investor services and capital markets products and services on a global basis. We employ approximately
78,000 full- and part-time employees who serve more than 16 million personal, business, public sector and institutional clients through offices
in Canada, the U.S. and 38 other countries. For more information, please visit rbc.com.
Our business segments are described below.
Personal & Commercial Banking operates in Canada, the Caribbean and the U.S., and comprises our personal and business banking
operations, as well as our auto financing and retail investment businesses.
Wealth Management serves affluent, high net worth and ultra-high net worth clients from our offices in key financial centres mainly in
Canada, the U.S., the U.K., Channel Islands, continental Europe, and Asia with a comprehensive suite of investment, trust, banking, credit and
other wealth management solutions. We also provide asset management products and services directly to institutional and also to individual
clients through our distribution channels and third-party distributors.
Insurance provides a wide range of life, health, home, auto, travel, wealth and reinsurance products and solutions. We offer insurance
products and services through our proprietary distribution channels, comprised of the field sales force which includes retail insurance branches,
our field sales representatives, call centres and online, as well as through independent insurance advisors and affinity relationships in Canada.
Outside Canada, we operate in reinsurance markets globally.
Investor & Treasury Services serves the needs of institutional investing clients by providing asset servicing, custodial, advisory, financing
and other services to safeguard assets, maximize liquidity and manage risk in multiple jurisdictions around the world. We also provide short-
term funding and liquidity management for RBC.
Capital Markets provides public and private companies, institutional investors, governments and central banks with a wide range of
products and services. In North America, we offer a full suite of products and services which include corporate and investment banking, equity
and debt origination and distribution, and structuring and trading. Outside North America, we offer a diversified set of capabilities in our key
sectors of expertise such as energy, mining and infrastructure and we are now expanding into industrial, consumer and health care in Europe.
Our business segments are supported by Corporate Support, which consists of Technology & Operations and Functions. Technology &
Operations provides the technological and operational foundation required to effectively deliver products and services to our clients, while
Functions includes our finance, human resources, risk management, internal audit and other functional groups.
The following chart presents our business segments and respective lines of business:
ROYAL BANK OF CANADA
Personal &
Commercial Banking
Wealth
Management Insurance Investor & Treasury
Services
Capital
Markets
OCanadian Banking
OCaribbean &
U.S. Banking
OCanadian Wealth
Management
OU.S. & International
Wealth
Management
OGlobal Asset
Management
OCanadian
Insurance
OInternational
Insurance
OCorporate and
Investment
Banking
OGlobal Markets
OOther
Corporate Support
OTechnology & Operations OFunctions
Vision and strategic goals
Our business strategies and actions are guided by our vision of “Always earning the right to be our clients’ first choice.” Our three strategic
goals are:
• In Canada, to be the undisputed leader in financial services;
• Globally, to be a leading provider of capital markets, investor and wealth management solutions; and
• In targeted markets, to be a leading provider of select financial services complementary to our core strengths.
For our progress in 2014 against our business strategies and strategic goals, refer to the Business segment results section.
Economic and market review and outlook – data as at December 2, 2014
The predictions and forecasts in this section are based on information and assumptions from sources we consider reliable. If this information or
these assumptions are not accurate, actual economic outcomes may differ materially from the outlook presented in this section. For details on
risk factors from general business and economic conditions that may affect our business and financial results, refer to the Overview of other risks
section.
Canada
The Canadian economy is expected to grow at an estimated rate of 2.5% during calendar 2014, slightly below our estimate of 2.6% as at
December 4, 2013. Growth in the economy continues to be driven by solid consumer spending and strength in the labour market on employment
gains as the unemployment rate fell to its lowest level since November 2008 at 6.5% in October 2014. Housing market activity remained firm
through the year, despite the dampening impact of poor weather conditions early in 2014. Weakening commodity prices, lower expectations of
interest rate increases by the Bank of Canada (BoC) and a strengthening of the U.S. dollar compared to most world currencies due to an improving
U.S. economy and anticipated U.S. interest rate increases are key factors in the Canadian dollar depreciating against the U.S. dollar during 2014.
Interest rates remained low as the persistence of excess capacity in the economy led the BoC to maintain its overnight rate at 1% in October 2014.
12 Royal Bank of Canada: Annual Report 2014 Management’s Discussion and Analysis

In calendar 2015, we expect the Canadian economy to grow at an estimated rate of 2.7%, driven by an improvement in net exports, increase
in business investment, and steady, albeit slowing consumer spending growth. We expect growth in the housing market to ease to more
sustainable levels in 2015 as market interest rates move higher and household debt accumulation slows. As the economy strengthens and
inflation holds around the BoC’s target level of 2% on a sustained basis, we expect the BoC to begin to raise its overnight rate from the current
1% in the middle of calendar 2015.
U.S.
We expect the U.S. economy to grow at an estimated rate of 2.3% during calendar 2014, which is below our estimate of 2.7% as at December 4,
2013. Strengthening consumption and firming business investment continue to drive the economy, with weaker net exports and the impact of
poor weather early in the year limiting growth. Growth in consumer spending was driven by improvements in the labour market as the
unemployment rate fell to 5.8% in October 2014 which is the lowest level since July 2008. As a result of improving labour market conditions and
a general strengthening in the economy, the Federal Reserve (Fed) reduced its monthly asset purchases throughout 2014 and ended the program
in October 2014, although it has maintained interest rates at historically low levels.
In calendar 2015, we expect the U.S. economy to grow at a rate of 3.3%, as both household and business spending accelerate given
expected gains in household wealth and the recent momentum in the labour market. Housing market activity is expected to improve given the
easing in lending standards and the decline in long-term mortgage rates. As labour markets and core inflation levels approach target levels, we
expect the Fed to begin to raise its key interest rate from the current funds target range of 0.0% to 0.25% starting in the middle of calendar 2015.
Europe
The Euro area economy is expected to grow marginally at an estimated rate of 0.7% during calendar 2014, below our estimate of 1.0% as at
December 4, 2013. The harmonized inflation level continues to remain below the European Central Bank’s (ECB) desired range, and averaged
0.5% from January through October 2014. Labour markets remain weak and the unemployment rate has stayed elevated at 11.5% in October
2014. To support the recovery, the ECB is taking steps to provide stimulus to the Euro area economy through an asset purchase program which
will run a minimum of two years, and has reduced its key interest rate twice during the calendar year, by 10 basis points (bps) each time, to the
current 0.05%. The ECB is also encouraging liquidity and business investment in the Euro area by introducing negative deposit rates in order to
stimulate lending by European banks.
We expect the Euro area economy to grow at a rate of 1.0% during calendar 2015, as the ECB’s stimulus measures take hold, and expect the
ECB to hold its key interest rate at the current level for the foreseeable future.
Financial markets
Equity markets in Canada, the U.S. and major European economies generally exhibited capital appreciation through most of fiscal 2014
supported by highly accommodative monetary policy, before concerns related to recent geopolitical uncertainty, the Ebola outbreak in Africa,
and expectations for recessionary conditions in Europe led to some volatility towards the end of our fiscal year. Yields on long-term government
bonds in Canada, the U.S. and major European economies have continued to decline over the year and remain near historically low levels. Credit
spreads remained relatively stable through most of fiscal 2014, but widened significantly in the last two months of fiscal 2014. Commodity
prices declined in the second half of calendar 2014. Oil prices, in particular, decreased sharply towards the end of our fiscal year due to a
combination of increased global supply and weak demand prospects.
Regulatory environment
We continue to monitor and prepare for regulatory developments in a manner that seeks to ensure compliance with new requirements while
mitigating any adverse business or economic impacts, including those with the potential to negatively impact our products or services. Such
impacts could result from new or amended regulations and the expectations of those who enforce them. Significant developments include
regulations enacted under the U.S. Dodd-Frank Wall Street Reform and Consumer Protection Act, such as restrictions on banking entities
engaging in proprietary trading and having certain relationships with hedge and private equity funds (the Volcker Rule); the Fed’s enhanced
prudential standards for Bank Holding Companies and Foreign Banking Organizations; changes to capital and liquidity rules under the Basel
Committee on Banking Supervision’s global standards (Basel III); over-the-counter (OTC) derivatives reforms; and the recently announced
voluntary commitments by MasterCard Canada and Visa Canada to reduce merchant credit card fees in Canada.
For a discussion on risk factors resulting from these and other regulatory developments which may affect our business and financial results,
refer to the Risk management – Top and emerging risks section. For further details on our framework and activities to manage risks, refer to the
Risk management and Capital management sections.
Defining and measuring success through Total Shareholder Returns
Our focus is to maximize total shareholder returns (TSR) through the achievement of top tier performance over the medium term (3-5 years) which
we believe reflects a longer term view of strong and consistent financial performance.
Maximizing TSR is aligned with our three strategic goals discussed earlier and we believe represents the most appropriate measure of
shareholder value creation. TSR is a concept used to compare the performance of our common shares over a period of time, reflecting share price
appreciation and dividends paid to common shareholders. The absolute size of the TSR will vary depending on market conditions, and the
relative position reflects the market’s perception of our overall performance relative to our peers over a period of time.
Financial performance objectives are used to measure progress against our medium-term TSR objectives. We review and revise these
financial performance objectives as economic, market and regulatory environments change. By focusing on our medium-term objectives in our
decision-making, we believe we will be well positioned to provide sustainable earnings growth and solid returns to our common shareholders.
Management’s Discussion and Analysis Royal Bank of Canada: Annual Report 2014 13

We achieved all our performance objectives in 2014. The following table provides a summary of our performance against our financial
performance objectives in 2014:
Financial performance objectives Table 2
2014 results Achieved
Diluted EPS growth of 7% + 9.3% ✓
ROE of 18% + 19.0% ✓
Strong capital ratios (CET1) (1) 9.9% ✓
Dividend payout ratio 40% – 50% 47% ✓
(1) For further details on the CET1 ratio, refer to the Capital management section.
For 2015, our financial performance objectives will remain unchanged.
We compare our TSR to that of a global peer group approved by our Board of Directors and consisting of the following 19 financial institutions:
• Canadian financial institutions: Bank of Montreal, Canadian Imperial Bank of Commerce, Manulife Financial Corporation, National Bank of
Canada, Power Financial Corporation, The Bank of Nova Scotia, and the Toronto-Dominion Bank.
• U.S. banks: Bank of America Corporation, JPMorgan Chase & Co., The Bank of New York Mellon Corporation, U.S. Bancorp, and Wells
Fargo & Company.
• International banks: Banco Bilbao Vizcaya Argentaria Group, Barclays PLC, BNP Paribas, Credit Suisse Group AG, Deutsche Bank Group,
National Australia Bank, and Westpac Banking Corporation.
Medium-term objectives – three and five year TSR vs. peer group average Table 3
Three year TSR (1) Five year TSR (1)
Royal Bank of Canada 23% 12%
2nd quartile 2nd quartile
Peer group average (excluding RBC) (2) 19% 8%
(1) The three and the five year average annual TSR are calculated based on our common share price appreciation plus reinvested dividends for the period October 31, 2011 to October 31, 2014
and October 31, 2009 to October 31, 2014 respectively, based on information as disclosed by Bloomberg L.P.
As a result of changes in the financial services industry over the past several years, and considering our performance and strategy, we recently
completed a re-evaluation of our peer group with the goal of ensuring that we include only those institutions in the global financial services
industry that are most relevant to us as competitors. Our Canadian peer group remains unchanged and we have revised our peer group of U.S.
and International banks. Our new peer group will be effective in 2015, and will include:
• Canadian financial institutions: Bank of Montreal, Canadian Imperial Bank of Commerce, Manulife Financial Corporation, National Bank of
Canada, Power Financial Corporation, The Bank of Nova Scotia, and the Toronto-Dominion Bank.
• U.S. banks: JPMorgan Chase & Co., and Wells Fargo & Company.
• International banks: Westpac Banking Corporation.
Common share and dividend information Table 4
For the year ended October 31 2014 2013 2012 2011 2010
Common share price (RY on TSX) – close, end of period $ 80.01 $ 70.02 $ 56.94 $ 48.62 $ 54.39
Dividends paid per share 2.76 2.46 2.22 2.04 2.00
Increase (decrease) in share price 14.3% 23.0% 17.1% (10.6)% (0.7)%
Total shareholder return 19.0% 28.0% 22.0% (6.7)% 2.9%
Key corporate events of 2014
Jamaican banking operations
On June 27, 2014, we completed the sale of RBC Royal Bank (Jamaica) Limited and RBTT Securities Jamaica Limited (collectively, RBC Jamaica) to
Sagicor Group Jamaica Limited, as announced on January 29, 2014. As a result of the transaction, we recorded a total loss on disposal of $100
million (before- and after-tax), including a loss of $60 million in the first quarter of 2014 and a further loss of $40 million in the third quarter of
2014, which includes foreign currency translation related to the closing of the sale. For further details, refer to Note 11 of our 2014 Annual
Consolidated Financial Statements.
Financial performance
On November 1, 2013, we adopted amendments to IAS 19 Employee benefits, as well as adopted IFRS 10 Consolidated Financial Statements and
IFRS 11 Joint Arrangements. The financial information presented in this document reflects the effects of these standards on our comparative
financial information presented for the year ended or as at October 31, 2013 and October 31, 2012. For further details, refer to Note 2 of our
2014 Annual Consolidated Financial Statements.
Overview
2014 vs. 2013
Net income of $9,004 million was up $662 million or 8% from a year ago. Diluted earnings per share (EPS) of $6.00 was up $0.51 and return on
common equity (ROE) of 19.0% was down 70 bps from 19.7% last year. Our Common Equity Tier 1 (CET1) ratio was 9.9%.
Our results reflected solid volume growth across most of our Canadian Banking businesses, higher earnings from growth in average
fee-based client assets in Wealth Management, and higher earnings in Capital Markets primarily reflecting strong equity markets, our continued
focus on origination and lending, and increased activity from client-focused strategies. The impact of foreign exchange translation also
contributed to the increase. These factors were partially offset by higher costs in support of business growth, a loss of $100 million (before- and
after-tax) related to the sale of RBC Jamaica, and higher litigation provisions and related legal costs in Capital Markets. In addition, our results
14 Royal Bank of Canada: Annual Report 2014 Management’s Discussion and Analysis

last year included a charge of $160 million ($118 million after-tax) as a result of new tax legislation in Canada, which affects the policyholders’
tax treatment of certain individual life insurance policies, as well as net favourable income tax adjustments of $214 million in Corporate Support.
For further details on our results and CET1 ratio, refer to the Business segment results and Capital management sections, respectively.
2013 vs. 2012
In 2013, net income of $8,342 million was up $835 million or 11% from 2012. Diluted EPS of $5.49 was up $0.58 and ROE of 19.7% was up
10 bps.
Our results reflected strong earnings growth across most of our business segments. Favourable income tax adjustments in 2013 of
$214 million related to prior years, lower provision for credit losses (PCL) reflecting improved credit quality, and continuing benefits from our
efficiency management activities also contributed to the increase. These factors were partially offset by lower trading revenue in Capital Markets
and a charge of $160 million ($118 million after-tax) in Insurance as a result of new tax legislation in Canada. In addition, our 2012 results were
impacted by net favourable adjustments of $60 million after-tax including a release of $128 million of tax uncertainty provisions and interest
income of $72 million ($53 million after-tax) related to a refund of taxes paid due to the settlement of several tax matters with the Canada
Revenue Agency (CRA), an adjustment related to a change in estimate of mortgage prepayment interest of $125 million ($92 million after-tax),
and a loss of $224 million ($213 million after-tax) related to the acquisition of the remaining 50% stake of RBC Dexia Investor Services Limited
(RBC Dexia).
Estimated impact of foreign currency translation on our consolidated financial results
Our foreign currency-denominated results are impacted by exchange rate fluctuations. Revenue, PCL, insurance policyholder benefits, claims and
acquisition expense (PBCAE), non-interest expense and net income denominated in foreign currency are translated at the average rate of
exchange for the year.
The following table reflects the estimated impact of foreign exchange translation on key income statement items:
Table 5
(Millions of Canadian dollars, except per share amounts) 2014 vs. 2013 2013 vs. 2012
Increase (decrease):
Total revenue $ 818 $ 213
PCL 93
PBCAE 75 8
Non-interest expense 510 110
Net income 121 53
Impact on EPS from continuing operations:
Basic $ .08 $ .04
Diluted .08 .04
The relevant average exchange rates that impact our business are shown in the following table:
Table 6
(Average foreign currency equivalent of C$1.00) (1) 2014 2013 2012
U.S. dollar 0.914 0.977 0.997
British pound 0.551 0.626 0.630
Euro 0.680 0.740 0.771
(1) Average amounts are calculated using month-end spot rates for the period.
Total revenue
Table 7
(Millions of Canadian dollars) 2014 2013 2012
Interest income $ 22,019 $ 21,148 $ 20,769
Interest expense 7,903 7,899 8,330
Net interest income $ 14,116 $ 13,249 $ 12,439
Net interest margin (on average earning assets) (1) 1.86% 1.88% 1.97%
Investments (2) $ 7,355 $ 6,408 $ 5,084
Insurance (3) 4,957 3,911 4,897
Trading 742 867 1,305
Banking (4) 4,090 3,909 3,399
Underwriting and other advisory 1,809 1,569 1,434
Other (5) 1,039 769 589
Non-interest income $ 19,992 $ 17,433 $ 16,708
Total revenue $ 34,108 $ 30,682 $ 29,147
(1) Net interest margin (on average earning assets) is calculated as net interest income divided by average earning assets.
(2) Includes securities brokerage commissions, investment management and custodial fees, and mutual fund revenue.
(3) Includes premiums and investment and fee income. Investment income includes the change in fair value of investments backing
policyholder liabilities and is largely offset in PBCAE.
(4) Includes service charges, foreign exchange revenue other than trading, card service revenue and credit fees.
(5) Includes other non-interest income, net gain (loss) on available-for-sale (AFS) securities and share of profit in associates.
2014 vs. 2013
Total revenue increased $3,426 million or 11% from last year. The impact of foreign exchange translation this year increased our total revenue by
$818 million.
Management’s Discussion and Analysis Royal Bank of Canada: Annual Report 2014 15

Net interest income increased $867 million or 7%, mainly due to solid volume growth of 5% across most of our businesses in Canadian
Banking and higher trading-related net interest income in Capital Markets. Higher lending activity in Capital Markets also contributed to the
increase. For further details on the change in net interest income, refer to the Supplementary information section.
Net interest margin was down 2 bps compared to last year largely due to the continuing low interest rate environment and competitive
pressures. For further details on net interest margin, refer to the Supplementary information section.
Investments revenue increased $947 million or 15%, mainly due to higher revenue from growth in average fee-based client assets in Wealth
Management resulting from capital appreciation and strong net sales. Higher mutual fund distribution fees also contributed to the increase.
Insurance revenue increased $1,046 million or 27%, mainly due to the change in fair value of investments backing our policyholder
liabilities resulting from a decrease in long-term interest rates, largely offset in PBCAE. Business growth in our European life and U.K. annuity
products also contributed to the increase.
Banking revenue increased $181 million or 5%, mainly due to the impact of foreign exchange translation, higher credit card balances and
transaction volumes, and higher service fee revenue. These factors were partially offset by lower loan syndication activity compared to the strong
levels last year.
Underwriting and other advisory revenue increased $240 million or 15%, mainly due to strong growth in equity origination reflecting
increased issuance activity, and higher mergers and acquisitions (M&A) activity reflecting increased mandates.
Other revenue increased $270 million or 35%, mainly due to favourable cumulative accounting adjustments in Personal & Commercial
Banking, and gains on credit default swaps used to economically hedge our corporate loan portfolio in Capital Markets compared to losses
last year.
2013 vs. 2012
Total revenue increased $1,535 million or 5% as compared to 2012, mainly due to solid volume growth across all businesses in Canadian
Banking, higher revenue from growth in average fee-based client assets across all businesses in Wealth Management, and incremental
revenue related to our additional 50% ownership of Investor Services. The inclusion of our acquisition of Ally Canada, strong growth in our
lending portfolio in Capital Markets, and in our loan syndication business primarily in the U.S., and higher debt origination reflecting solid
issuance activity also contributed to the increase. These factors were partially offset by a change in fair value of investments backing our
policyholder liabilities resulting from an increase in long-term interest rates, largely offset in PBCAE, lower fixed income trading revenue, and
spread compression. In addition, 2012 was favourably impacted by a mortgage prepayment interest adjustment of $125 million resulting from
a change in methodology with respect to the timing of recognition of mortgage prepayment interest.
Additional trading information
Table 8
(Millions of Canadian dollars) 2014 2013 2012
Total trading revenue
Net interest income $ 2,029 $ 1,661 $ 1,532
Non-interest income 742 867 1,305
Total trading revenue $ 2,771 $ 2,528 $ 2,837
Total trading revenue by product
Interest rate and credit $ 1,560 $ 1,611 $ 1,932
Equities 814 594 516
Foreign exchange and commodities 397 323 389
Total trading revenue $ 2,771 $ 2,528 $ 2,837
Trading revenue (teb) by product
Interest rate and credit $ 1,560 $ 1,611 $ 1,932
Equities 1,305 972 945
Foreign exchange and commodities 397 323 389
Total trading revenue (teb) $ 3,262 $ 2,906 $ 3,266
Trading revenue (teb) by product – Capital Markets
Interest rate and credit $ 1,293 $ 1,350 $ 1,584
Equities 1,244 942 925
Foreign exchange and commodities 333 286 323
Total Capital Markets trading revenue (teb) $ 2,870 $ 2,578 $ 2,832
2014 vs. 2013
Total trading revenue of $2,771 million, which comprises trading-related revenue recorded in Net interest income and Non-interest income, was
up $243 million, or 10%, mainly due to higher equity trading revenue reflecting strong market conditions and higher commodities trading
revenue. These factors were partially offset by lower fixed income trading revenue largely driven by the unfavourable impact of the
implementation of valuation adjustments related to funding costs on uncollateralized OTC derivatives (FVA), and the exiting of certain proprietary
trading strategies to comply with the Volcker Rule.
2013 vs. 2012
Total trading revenue of $2,528 million, which comprises trading-related revenue recorded in Net interest income and Non-interest income, was
down $309 million, or 11%, mainly due to lower fixed income trading revenue, largely in Europe, as a result of challenging market conditions.
16 Royal Bank of Canada: Annual Report 2014 Management’s Discussion and Analysis

Provision for credit losses
2014 vs. 2013
Total PCL decreased $73 million or 6% from a year ago, mainly due to lower provisions in Capital Markets and Wealth Management, partially
offset by higher provisions in Personal & Commercial Banking, primarily in Caribbean Banking.
2013 vs. 2012
Total PCL decreased $62 million or 5% as compared to 2012, mainly reflecting improved credit quality in our Personal & Commercial banking,
partially offset by higher provisions in Capital Markets and Wealth Management.
For further details on PCL, refer to the Credit quality performance section.
Insurance policyholder benefits, claims and acquisition expense
2014 vs. 2013
PBCAE increased $789 million or 28% from a year ago, mainly due to the change in fair value of investments backing our policyholder liabilities,
which was largely offset in revenue, and the impact of foreign exchange translation. These factors were partially offset by lower net claims costs.
In addition, our PBCAE last year included the unfavourable impact of the charge of $160 million related to new tax legislation in Canada, which
affects the policyholders’ tax treatment of certain individual life insurance policies, and a favourable impact from interest and asset related
activities on the Canadian life business.
2013 vs. 2012
PBCAE decreased $837 million or 23% as compared to 2012, mainly due to the change in fair value of investments backing our policyholder
liabilities, which was largely offset in insurance revenue. Favourable actuarial adjustments reflecting management actions and assumption
changes also contributed to the decrease. These factors were partially offset by the charge related to new tax legislation in Canada.
Non-interest expense
Table 9
(Millions of Canadian dollars) 2014 2013 2012
Salaries $ 4,834 $ 4,604 $ 4,089
Variable compensation 4,388 3,924 3,638
Benefits and retention compensation 1,561 1,464 1,216
Share-based compensation 248 256 139
Human resources $ 11,031 $ 10,248 $ 9,082
Equipment 1,147 1,081 913
Occupancy 1,330 1,235 1,130
Communications 779 728 748
Professional fees 763 753 666
Outsourced item processing 246 250 254
Amortization of other intangibles 666 566 494
Impairment of other intangibles 810 –
Impairment of investments in joint ventures and associates –20 168
Other 1,691 1,323 1,186
Non-interest expense $ 17,661 $ 16,214 $ 14,641
Efficiency ratio (1) 51.8% 52.8% 50.2%
(1) Efficiency ratio is calculated as non-interest expense divided by total revenue.
2014 vs. 2013
Non-interest expense increased $1,447 million or 9%, primarily due to the impact of foreign exchange translation of $510 million, higher costs in
support of business growth, and higher variable compensation driven by higher revenue in Wealth Management and higher results in Capital
Markets. Increased litigation provisions and related legal costs in Capital Markets, and the loss of $100 million related to the sale of RBC Jamaica
also contributed to the increase. These factors were partly offset by continuing benefits from our efficiency management activities.
Efficiency ratio of 51.8% decreased 100 bps from 52.8% last year, mainly due to continuing benefits from our efficiency management
activities.
2013 vs. 2012
Non-interest expense increased $1,573 million or 11% as compared to 2012, primarily reflecting incremental costs related to our additional 50%
ownership of Investor Services and higher variable compensation mainly driven by higher revenue in Wealth Management. The inclusion of our
acquisition of Ally Canada, higher costs in support of business growth, and higher litigation provisions and related legal costs in Capital Markets
also contributed to the increase. These factors were partially offset by continued benefits from our ongoing focus on efficiency management
activities, and lower variable compensation in Capital Markets reflecting a lower compensation to revenue ratio. In addition, non-interest
expense was unfavourably impacted in 2012 by an impairment loss and other costs of $188 million related to the acquisition of the remaining
50% stake of RBC Dexia.
Management’s Discussion and Analysis Royal Bank of Canada: Annual Report 2014 17

Income and other taxes
Table 10
(Millions of Canadian dollars, except percentage amounts) 2014 2013 2012
Income taxes $ 2,706 $ 2,105 $ 2,028
Other taxes
Goods and services sales taxes $ 395 $ 370 $ 343
Payroll taxes 529 497 430
Capital taxes 86 85 79
Property taxes 106 119 120
Insurance premium taxes 51 50 50
Business taxes 825 16
$ 1,175 $ 1,146 $ 1,038
Total income and other taxes $ 3,881 $ 3,251 $ 3,066
Net income before income taxes $ 11,710 $ 10,447 $ 9,586
Canadian statutory income tax rate (1) 26.3% 26.2% 26.4%
Lower average tax rate applicable to subsidiaries (2.3) (1.8) (3.1)
Goodwill impairment 0.0 0.0 0.4
Tax-exempt income from securities (3.3) (2.8) (3.4)
Tax rate change 0.0 0.0 0.0
Effect of previously unrecognized tax loss, tax credit or
temporary differences (0.1) (0.5) (0.1)
Other 2.5 (1.0) 1.0
Effective income tax rate 23.1% 20.1% 21.2%
Effective total tax rate (2) 30.1% 28.0% 28.9%
(1) Blended Federal and Provincial statutory income tax rate.
(2) Total income and other taxes as a percentage of net income before income taxes and other taxes.
2014 vs. 2013
Income tax expense increased $601 million or 29% from last year, mainly due to higher earnings before income tax. The effective income tax rate
of 23.1% increased 300 bps as last year included net favourable tax adjustments, including $214 million of income tax adjustments related to
prior years.
Other taxes increased $29 million or 3%, mainly due to higher payroll taxes and sales taxes which were partially offset by lower business
taxes and property taxes. In addition to the income and other taxes reported in our Consolidated Statements of Income, we recorded income tax
recoveries of $643 million (2013 – $231 million) in shareholders’ equity, primarily reflecting foreign currency translation losses from hedging
activities.
2013 vs. 2012
Income tax expense increased $77 million or 4% from 2012, mainly due to higher earnings before income taxes. The effective income tax rate of
20.1% decreased 110 bps from 21.2% in 2012, mainly due to favourable income tax adjustments in 2013 related to prior years.
Other taxes increased $108 million or 10% from 2012, mainly due to higher payroll taxes and sales taxes.
Business segment results
Results by business segment Table 11
2014 2013 2012
(Millions of Canadian dollars,
except percentage amounts)
Personal &
Commercial
Banking
Wealth
Management Insurance
Investor &
Treasury
Services
Capital
Markets (1)
Corporate
Support (1) Total Total Total
Net interest income $ 9,743 $ 469 $ – $ 732 $ 3,485 $ (313) $ 14,116 $ 13,249 $ 12,439
Non-interest income 3,987 5,844 4,964 1,152 3,881 164 19,992 17,433 16,708
Total revenue $ 13,730 $ 6,313 $ 4,964 $ 1,884 $ 7,366 $ (149) $ 34,108 $ 30,682 $ 29,147
PCL 1,103 19 – – 44 (2) 1,164 1,237 1,299
PBCAE – – 3,573 – – – 3,573 2,784 3,621
Non-interest expense 6,563 4,800 579 1,286 4,344 89 17,661 16,214 14,641
Net income before
income taxes $ 6,064 $ 1,494 $ 812 $ 598 $ 2,978 $ (236) $ 11,710 $ 10,447 $ 9,586
Income tax 1,589 411 31 157 923 (405) 2,706 2,105 2,028
Net income from continuing
operations $ 4,475 $ 1,083 $ 781 $ 441 $ 2,055 $ 169 $ 9,004 $ 8,342 $ 7,558
Loss from discontinued
operations –––––– –– (51)
Net income $ 4,475 $ 1,083 $ 781 $ 441 $ 2,055 $ 169 $ 9,004 $ 8,342 $ 7,507
ROE (2) from continuing
operations 29.0% 19.2% 49.7% 19.8% 14.1% n.m. 19.0% 19.7% 19.7%
ROE (2) 19.0% 19.7% 19.6%
Average assets $ 368,800 $ 25,800 $ 12,000 $ 94,200 $ 392,300 $ 13,400 $ 906,500 $ 852,000 $ 803,000
(1) Net interest income, total revenue and net income before income taxes are presented in Capital Markets on a taxable equivalent basis (teb). The teb adjustment is eliminated in the Corporate
Support segment. For a further discussion, refer to the How we measure and report our business segments section.
(2) This measure may not have a standardized meaning under GAAP and may not be comparable to similar measures disclosed by other financial institutions. For further details, refer to the Key
performance and non-GAAP measures section.
n.m. not meaningful
18 Royal Bank of Canada: Annual Report 2014 Management’s Discussion and Analysis

How we measure and report our business segments
Our management reporting framework is intended to measure the performance of each business segment as if it were a stand-alone business
and reflects the way that the business segment is managed. This approach is intended to ensure that our business segments’ results include all
applicable revenue and expenses associated with the conduct of their business and depicts how management views those results. The following
highlights the key aspects of how our business segments are managed and reported:
• Personal & Commercial Banking reported results include securitized Canadian residential mortgage and credit card loans and related
amounts for income and provisions for credit losses on impaired loans.
• Wealth Management reported results also include disclosure in U.S. dollars as we review and manage the results of certain businesses
largely in this currency.
• Capital Markets results are reported on a taxable equivalent basis (teb), which grosses up net interest income from certain tax-advantaged
sources (Canadian taxable corporate dividends) to their effective taxable equivalent value with a corresponding offset recorded in the
provision for income taxes. We record the elimination of the teb adjustments in Corporate Support. We believe these adjustments are useful
and reflect how Capital Markets manages its business, since it enhances the comparability of revenue and related ratios across taxable
revenue and our principal tax-advantaged source of revenue. The use of teb adjustments and measures may not be comparable to similar
GAAP measures or similarly adjusted amounts disclosed by other financial institutions.
• Corporate Support results include all enterprise-level activities that are undertaken for the benefit of the organization that are not allocated
to our five business segments, including residual asset/liability management results, impact from income tax adjustments, net charges
associated with unattributed capital and PCL on loans not yet identified as impaired.
Key methodologies
The following outlines the key methodologies and assumptions used in our management reporting framework. These are periodically reviewed by
management to ensure they remain valid.
Expense allocation
To ensure that our business segments’ results include expenses associated with the conduct of their business, we allocate costs incurred or
services provided by Technology & Operations and Functions, which are directly undertaken or provided on the business segments’ behalf. For
other costs not directly attributable to our business segments, including overhead costs and other indirect expenses, we use our management
reporting framework for allocating these costs to each business segment in a manner that is intended to reflect the underlying benefits.
Capital attribution
Our framework also determines the attribution of capital to our business segments in a manner that is intended to consistently measure and
align economic costs with the underlying benefits and risks associated with the activities of each business segment. The amount of capital
assigned to each business segment is referred to as attributed capital. Unattributed capital and associated net charges are reported in Corporate
Support. For further information, refer to the Capital management section.
Funds transfer pricing
A funds transfer pricing methodology is used to allocate interest income and expense by product to each business segment. This allocation
considers the interest rate risk, liquidity and funding risk and regulatory requirements of each of our business segments. We base transfer pricing
on external market costs and each business segment fully absorbs the costs of running its business. Our business segments may retain certain
interest rate exposures subject to management approval that would be expected in the normal course of operations.
Provisions for credit losses (PCL)
PCL are recorded to recognize estimated losses on impaired loans, as well as losses that have been incurred but are not yet identified in our
loans portfolio. This portfolio includes on-balance sheet exposures, such as loans and acceptances, and off-balance sheet items such as letters
of credit, guarantees and unfunded commitments. PCL on impaired loans are included in the results of each business segment to fully reflect the
appropriate expenses related to the conduct of each business segment. PCL on loans not yet identified as impaired are included in Corporate
Support, as Group Risk Management effectively controls this through its monitoring and oversight of various lending portfolios throughout the
enterprise. For details on our accounting policy on Allowance for credit losses, refer to Note 2 of our 2014 Annual Consolidated Financial
Statements.
Key performance and non-GAAP measures
Performance measures
The following discussion describes the key performance measures we use in evaluating our operating results.
Return on common equity (ROE)
We measure and evaluate the performance of our consolidated operations and each business segment using a number of financial metrics such
as net income and ROE. We use ROE, at both the consolidated and business segment levels, as a measure of return on total capital invested in
our business. Management views the business segment ROE measure as a useful measure for supporting investment and resource allocation
decisions because it adjusts for certain items that may affect comparability between business segments and certain competitors.
Our consolidated ROE calculation is based on net income available to common shareholders divided by total average common equity for the
period. Business segment ROE calculations are based on net income available to common shareholders divided by average attributed capital for
the period. For each segment, average attributed capital includes the capital required to underpin various risks as described in the Capital
Management section and amounts invested in goodwill and intangibles.
The attribution of capital and risk capital involves the use of assumptions, judgments and methodologies that are regularly reviewed and
revised by management as necessary. Changes to such assumptions, judgments and methodologies can have a material effect on the segment
ROE information that we report. Other companies that disclose information on similar attributions and related return measures may use different
assumptions, judgments and methodologies.
Management’s Discussion and Analysis Royal Bank of Canada: Annual Report 2014 19

The following table provides a summary of our ROE calculations:
Calculation of ROE Table 12
2014 2013 2012
(Millions of Canadian dollars, except
percentage amounts)
Personal &
Commercial
Banking
Wealth
Management Insurance
Investor &
Treasury
Services
Capital
Markets
Corporate
Support Total Total Total
Net income available to common
shareholders from continuing
operations $ 4,405 $ 1,057 $ 773 $ 429 $ 1,990 $ 43 $ 8,697 $ 7,991 $ 7,203
Loss to common shareholders from
discontinued operations –– (51)
Net income available to common
shareholders $ 4,405 $ 1,057 $ 773 $ 429 $ 1,990 $ 43 $ 8,697 $ 7,991 $ 7,152
Average common equity from
continuing operations (1),(2) $ 15,200 $ 5,500 $ 1,550 $ 2,150 $ 14,100 $ 7,200 $ 45,700 $ 40,600 $ 36,100
Average common equity from
discontinued operations (1) –– 400
Total average common equity (1),(2) $ 15,200 $ 5,500 $ 1,550 $ 2,150 $ 14,100 $ 7,200 $ 45,700 $ 40,600 $ 36,500
ROE (3) 29.0% 19.2% 49.7% 19.8% 14.1% n.m. 19.0% 19.7% 19.6%
(1) Average common equity represent rounded figures.
(2) The amounts for the segments are referred to as attributed capital.
(3) ROE is based on actual balances of average common equity before rounding.
n.m. not meaningful
Embedded value for Insurance operations
Embedded value is a measure of shareholder value embedded in the balance sheet of our Insurance segment, excluding any value from future
new sales. We use the change in embedded value between reporting periods as a measure of the value created by the insurance operations
during the period.
We define embedded value as the value of equity held in our Insurance segment and the value of in-force business (existing policies). The
value of in-force business is calculated as the present value of future expected earnings on in-force business less the present value of capital
required to support in-force business. We use discount rates that are consistent with those used by other insurance companies. Required capital
uses the capital frameworks in the jurisdictions in which we operate.
Key drivers affecting the change in embedded value from period to period are new sales, investment performance, claims and policyholder
experience, change in actuarial assumptions, changes in foreign exchange rates and changes in shareholder equity arising from transfers in
capital.
Embedded value does not have a standardized meaning under GAAP and may not be directly comparable to similar measures disclosed by
other companies. Given that this measure is specifically used for our Insurance segment and involves the use of discount rates to present value
the future expected earnings and capital required for the in-force business, reconciliation to financial statements information is not applicable.
Non-GAAP measures
We believe that certain non-GAAP measures described below are more reflective of our ongoing operating results, and provide readers with a
better understanding of management’s perspective on our performance. These measures enhance the comparability of our financial performance
for the year ended October 31, 2014 with results from last year as well as, in the case of economic profit, measure relative contribution to
shareholder value. Non-GAAP measures do not have a standardized meaning under GAAP and may not be comparable to similar measures
disclosed by other financial institutions.
The following discussion describes the non-GAAP measures we use in evaluating our operating results.
Economic profit
Economic profit is net income excluding the after-tax effect of amortization of other intangibles less a capital charge for use of attributed capital.
It measures the return generated by our businesses in excess of our cost of capital, thus enabling users to identify relative contributions to
shareholder value.
The capital charge includes a charge for common equity and preferred shares. In 2014, we revised our cost of equity to 9.0% from 8.5% in
2013, largely as a result of higher long-term interest rates.
20 Royal Bank of Canada: Annual Report 2014 Management’s Discussion and Analysis

The following table provides a summary of our Economic profit on a continuing basis:
Economic profit from continuing operations Table 13
2014
(Millions of Canadian dollars)
Personal &
Commercial
Banking
Wealth
Management Insurance
Investor &
Treasury
Services
Capital
Markets
Corporate
Support Total
Net income from continuing operations $ 4,475 $ 1,083 $ 781 $ 441 $ 2,055 $ 169 $ 9,004
add: Non-controlling interests 1 (1) – (1) – (93) (94)
After-tax effect of amortization
of other intangibles 27 73 – 21 1 1 123
Intangibles writedown –6––2–8
Adjusted net income $ 4,503 $ 1,161 $ 781 $ 461 $ 2,058 $ 77 $ 9,041
less: Capital charge 1,439 521 147 205 1,333 696 4,341
Economic profit (loss) from
continuing operations $ 3,064 $ 640 $ 634 $ 256 $ 725 $ (619) $ 4,700
2013 2012
(Millions of Canadian dollars)
Personal &
Commercial
Banking
Wealth
Management Insurance
Investor &
Treasury
Services
Capital
Markets
Corporate
Support Total Total
Net income from continuing operations $ 4,380 $ 886 $ 595 $ 339 $ 1,700 $ 442 $ 8,342 $ 7,558
add: Non-controlling interests (4) – – (1) – (93) (98) (97)
After-tax effect of amortization
of other intangibles 26 67 – 21 1 2 117 112
Goodwill and intangibles writedown – – – ––––168
Adjusted net income $ 4,402 $ 953 $ 595 $ 359 $ 1,701 $ 351 $ 8,361 $ 7,741
less: Capital charge 1,285 492 129 180 1,053 563 3,702 3,681
Economic profit (loss) from
continuing operations $ 3,117 $ 461 $ 466 $ 179 $ 648 $ (212) $ 4,659 $ 4,060
Results excluding specified items
Our results were impacted by the following specified items:
• For the year ended October 31, 2014, in our Personal & Commercial Banking segment:
– A total loss of $100 million (before- and after-tax) related to the sale of RBC Jamaica, comprised of a loss of $60 million (before- and
after-tax) in the first quarter of 2014, and a further loss of $40 million (before- and after-tax) in the third quarter of 2014 which includes
foreign currency translation related to the closing of the sale of RBC Jamaica; and
– A provision of $40 million ($32 million after-tax) related to post-employment benefits and restructuring charges in the Caribbean.
• For the year ended October 31, 2013:
– A charge of $160 million ($118 million after-tax) as a result of new tax legislation in Canada, which affects the policyholders’ tax
treatment of certain individual life insurance policies in our Insurance segment; and
– A restructuring charge of $44 million ($31 million after-tax) related to the integration of Investor Services, primarily in Europe, in our
Investor & Treasury Services segment.
• For the year ended October 31, 2012:
– A loss of $224 million ($213 million after-tax) related to our acquisition of the remaining 50% stake in RBC Dexia in our Investor &
Treasury Services segment.
Management’s Discussion and Analysis Royal Bank of Canada: Annual Report 2014 21

The following tables provide calculations of our segment results and measures excluding these specified items:
Personal & Commercial Banking Table 14
2014
Items excluded
(Millions of Canadian dollars, except percentage amounts) As reported
Total loss on sale
of RBC
Jamaica (1)
Provision for
post-employment
benefits and
restructuring
charges Adjusted
Total revenue $ 13,730 $ – $ – $ 13,730
PCL 1,103 – – 1,103
Non-interest expense 6,563 (100) (40) 6,423
Net income before taxes 6,064 100 40 6,204
Net income $ 4,475 $ 100 $ 32 $ 4,607
Selected balances and other information
Non-interest expense $ 6,563 $ (100) $ (40) $ 6,423
Total revenue 13,730 13,730
Efficiency ratio 47.8% 46.8%
Revenue growth rate 5.5% 5.5%
Non-interest expense growth rate 6.4% 4.2%
Operating leverage (0.9%) 1.3%
(1) Total loss is comprised of a loss of $60 million (before- and after-tax) recorded in Q1 2014, and a further loss of $40 million (before- and after-tax) which includes foreign currency translation
recorded in Q3 2014.
Insurance Table 15
2013
(Millions of Canadian dollars, except percentage amounts) As reported
Charge related to
certain individual life
insurance policies Adjusted
Total revenue $ 3,928 $ – $ 3,928
PBCAE 2,784 (160) 2,624
Non-interest expense 551 – 551
Net income before income taxes 593 160 753
Net income $ 595 $ 118 $ 713
Selected balance and other information
Net income available to common shareholders $ 586 $ 118 $ 704
Average common equity 1,400 1,400
ROE (1) 41.4% 49.8%
(1) Based on actual balances before rounding.
Investor & Treasury Services Table 16
2013 2012
(Millions of Canadian dollars, except percentage amounts) As reported
Restructuring
charge (1) Adjusted As reported
Loss related to the
acquisition of the
remaining 50%
stake of RBC Dexia (2) Adjusted
Total revenue $ 1,804 $ – $ 1,804 $ 905 $ 36 $ 941
Non-interest expense 1,348 (44) 1,304 701 (188) 513
Net income before income taxes 456 44 500 204 224 428
Net income $ 339 $ 31 $ 370 $ 102 $ 213 $ 315
Selected balances and other information
Net income available to common
shareholders $ 326 $ 31 $ 357 $ 90 $ 213 $ 303
Average common equity 2,000 2,000 1,700 1,700
ROE (3) 16.5% 18.1% 5.3% 17.9%
(1) Related to the integration of Investor Services.
(2) Consisted of an impairment loss of $168 million (before- and after-tax), comprised of a write-down of investments in joint ventures, other costs relating to the acquisition of $20 million
($19 million after-tax), and a loss of $36 million ($26 million after-tax), which was our proportionate share of the loss recorded by RBC Dexia from the securities exchange with Dexia Group
and trading losses on the sale of a majority of the securities received in the exchange.
(3) Based on actual balances before rounding.
22 Royal Bank of Canada: Annual Report 2014 Management’s Discussion and Analysis

Personal & Commercial Banking
Personal & Commercial Banking is comprised of our personal and business banking operations, and our auto financing and retail investment
businesses, including our online discount brokerage channel, and operates through two businesses: Canadian Banking, and Caribbean & U.S.
Banking. We provide services to more than 13 million individual, business and institutional clients across Canada, the Caribbean and the U.S. In
Canada, we provide a broad suite of financial products and services through our extensive branch, automated teller machine (ATM), online,
mobile and telephone banking networks, as well as through a large number of proprietary sales professionals. In the Caribbean, we offer a broad
range of financial products and services to individuals and business clients, and public institutions in various markets. In the U.S., we serve the
cross-border banking needs of Canadian clients within the U.S. through online channels, as well as the banking product needs of our U.S. wealth
management clients.
Our banking-related operations compete in the Canadian financial services industry, which consists of other Schedule I banks, independent
trust companies, foreign banks, credit unions, caisses populaires, and auto financing companies. We maintain top (#1 or #2) rankings in market
share in this competitive environment for all retail and business financial product categories, and have the largest branch network, the most
ATMs and the largest mobile sales network across Canada. In the Caribbean, our competition includes banks, trust companies and investment
management companies serving retail and corporate customers and public institutions. We continue to be the second largest bank as measured
by assets in the English Caribbean, with 93 branches in 18 countries and territories. In the U.S., we compete primarily with other Canadian
banking institutions with operations in the U.S.
Economic and market review
We continued to see solid volume growth across most of our Canadian banking businesses, reflecting solid economic performance in Canada
and the continuing low interest rate environment which has driven solid, although slowing, credit industry growth compared to last year. Stable
credit loss rates in our business and consumer products reflect improving unemployment rates in Canada. Our businesses continued to be
impacted by competitive pressures and certain regulatory measures aimed at slowing the pace of borrowing. In the Caribbean, unfavourable
economic conditions continued to negatively impact our results through higher PCL, lower loan volumes, and spread compression.
Highlights
• We were the first financial institution in Canada to deliver a mobile app for businesses on all major platforms including Android, BlackBerry,
iOS, and Windows Phone 8.
• We partnered with BestBuy and Future Shop to offer online rewards points redemption access to over 90,000 items.
• Our mutual funds distribution through our branch network exceeded $110 billion in assets under administration, an increase of 17%.
• In the Caribbean, we continued to focus on quality asset and revenue growth while reducing our structural costs despite continued
challenging market conditions.
• We completed the sale of RBC Jamaica to Sagicor Group Jamaica Limited in June 2014.
• As a result of our successes in most of our businesses, we received external recognition as an industry leader and were named:
– “Best Global Retail Bank” by Retail Banker International.
– “Best Trade Finance Bank 2014 in Canada” by Global Finance Magazine for the second consecutive year.
– “Best Private Banking Services in Canada, the Caribbean, Cayman Islands and Jersey 2014” by Euromoney Magazine.
Outlook and priorities
Financial conditions in Canada are expected to remain favourable, driven by continued improvement in the Canadian economy, supportive credit
conditions, and continuing low interest rates. We expect continued solid volume growth across most of our products, but anticipate increased
pricing pressures and industry competition resulting from the slowing credit industry. We are adapting to these market trends by focusing on
higher growth segments.
On November 4, 2014, MasterCard Canada and Visa Canada announced voluntary commitments to reduce merchant credit card fees to an
average effective rate of 1.5% for the next five years, effective April 30, 2015. As a result of these commitments, the Minister of Finance signaled
the government’s intention to not regulate credit card interchange rates at this time. While we continue to assess the potential impact of this
announcement on our operations, we do not expect it to have a significant impact on our Canadian Banking results.
In the Caribbean, challenging market conditions and slow economic growth continue to constrain our outlook. We expect net interest
margins to remain challenged by spread compression. However, we expect to drive more efficiency through expense reduction as we continue to
leverage our common operating model across our Caribbean platforms.
For further details on the legal and regulatory environment, refer to the Risk management – Legal and regulatory environment risk section.
For further details on our general economic review and outlook, refer to the Economic and market review and outlook section.
Key strategic priorities for 2015
In Canada, our priorities are to continue to:
• Leverage our sales capabilities, strategic partnerships and innovative distribution channels to help broaden our client base.
• Provide a superior client experience through relevant and tailored advice in order to achieve industry-leading volume growth.
• Extend and strengthen our capabilities to differentiate us in the emerging payments markets.
• Enhance our channel capabilities particularly in the digital and mobile platforms.
• Automate and digitize our business processes to improve the customer experience and maintain our industry-leading efficiency.
In the Caribbean and the U.S., we are focused on:
• Strengthening our operations by focusing on quality asset growth in key markets, optimizing our cost structure, improving our credit and
operational risk practices and enhancing our leadership and talent capabilities.
• Strengthening the cross-border business in the U.S. and continuing to assess the market and our strategic business development options.
Management’s Discussion and Analysis Royal Bank of Canada: Annual Report 2014 23

Personal & Commercial Banking Table 17
(Millions of Canadian dollars, except number of and percentage amounts and as otherwise noted) 2014 2013 2012
Net interest income $ 9,743 $ 9,434 $ 9,059
Non-interest income 3,987 3,585 3,379
Total revenue 13,730 13,019 12,438
PCL 1,103 995 1,165
Non-interest expense 6,563 6,168 5,822
Net income before income taxes 6,064 5,856 5,451
Net income $ 4,475 $ 4,380 $ 4,056
Revenue by business
Canadian Banking $ 12,869 $ 12,220 $ 11,614
Caribbean & U.S. Banking 861 799 824
Key ratios
ROE 29.0% 30.5% 31.2%
NIM (1) 2.77% 2.78% 2.86%
Efficiency ratio (2) 47.8% 47.4% 46.8%
Efficiency ratio adjusted (2), (3) 46.8% n.a. n.a.
Operating leverage (0.9)% (1.3)% n.a.
Operating leverage adjusted (3) 1.3% n.a. n.a.
Selected average balance sheet information
Total assets $ 368,800 $ 355,300 $ 330,700
Total earning assets (4) 351,300 338,700 316,200
Loans and acceptances (4) 351,600 337,800 315,400
Deposits 278,800 262,200 243,900
Attributed capital 15,200 14,050 12,700
Other information
AUA (5) $ 214,200 $ 192,200 $ 179,200
AUM 4,000 3,400 3,100
Number of employees (FTE) 36,174 38,011 38,244
Effective income tax rate 26.2% 25.2% 25.6%
Credit information
Gross impaired loans as a % of average net loans and acceptances 0.54% 0.55% 0.58%
PCL on impaired loans as a % of average net loans and acceptances 0.31% 0.30% 0.37%
Estimated impact of U.S. dollar and Trinidad & Tobago dollar (TTD) translation on key income
statement items
(Millions of Canadian dollars, except percentage amounts) 2014 vs 2013
Increase (decrease):
Total revenue $46
Non-interest expense 39
Net income (1)
Percentage change in average US$ equivalent of C$1.00 (6)%
Percentage change in average TTD equivalent of C$1.00 (7)%
(1) NIM is calculated as Net interest income divided by Average total earning assets.
(2) Efficiency ratio is calculated as Non-interest expense divided by Total revenue.
(3) Measures have been adjusted by excluding the loss related to the sale of RBC Jamaica and the provision related to post-employment benefits and restructuring charges in the Caribbean, and
are non-GAAP measures. For further details, refer to the Key performance and non-GAAP measures section.
(4) Average total earning assets and average loans and acceptances include average securitized residential mortgages and credit card loans for the year of $54.5 billion and $8.0 billion,
respectively (2013 – $53.9 billion and $7.2 billion; 2012 – $44.9 billion and $7.3 billion).
(5) AUA includes securitized residential mortgages and credit card loans as at October 31, 2014 of $23.2 billion and $8.0 billion respectively (October 31, 2013 – $25.4 billion and $7.2 billion;
October 31, 2011 – $31.0 billion and $7.4 billion).
n.a. not applicable
Financial performance
2014 vs. 2013
Net income increased $95 million or 2% compared to last year. Excluding the loss of $100 million (before- and after-tax) related to the sale of
RBC Jamaica, and a provision of $40 million ($32 million after-tax) related to post-employment benefits and restructuring charges in the
Caribbean, net income of $4,607 million was up $227 million or 5%, largely reflecting solid volume growth and strong fee-based revenue growth
across most of our businesses in Canada, and the full integration of Ally Canada. These factors were partially offset by higher PCL largely in the
Caribbean.
Total revenue increased $711 million or 5% from last year, mainly due to solid volume growth of 5% across most of our Canadian
businesses, and strong fee-based revenue growth primarily attributable to higher mutual fund distribution fees and card services revenue.
Net interest margin was relatively stable compared to last year.
PCL increased $108 million, with the PCL ratio increasing 1 bp, largely reflecting an additional provision of $50 million related to our
impaired residential mortgages portfolio in the Caribbean, as well as higher provisions in our Canadian small business portfolio. For further
details, refer to the Credit quality performance section.
Non-interest expense increased $395 million or 6%. Excluding the specified items noted above, non-interest expense was up $255 million
or 4%, mostly due to higher staff and marketing costs in support of business growth, the impact of foreign exchange translation, and higher
litigation provisions. These factors were partially offset by continuing benefits from our efficiency management activities and benefits from the
full integration of Ally Canada.
Average loans and acceptances increased $14 billion or 4%, mainly due to growth in Canada, primarily in residential mortgages, business
loans, and personal loans. Average deposits increased $17 billion or 6%, reflecting solid growth in both personal and business deposits.
24 Royal Bank of Canada: Annual Report 2014 Management’s Discussion and Analysis

2013 vs. 2012
Net income was up $324 million or 8% from 2012, reflecting solid volume growth across all our businesses in Canada, improved credit quality in
our Canadian and Caribbean portfolios, and the inclusion of our acquisition of Ally Canada. These factors were partially offset by spread
compression, and a provision related to post-employment benefits and restructuring charges in the Caribbean of $40 million ($31 million after-
tax). In addition, our results in 2012 were favourably impacted by a mortgage prepayment interest adjustment of $125 million ($92 million after-
tax) resulting from a change in methodology with respect to the timing of recognition of mortgage prepayment interest.
Average loans and acceptances increased $22 billion or 7% from 2012, mainly due to growth in Canadian home equity products, personal
loans, and business loans. Average deposits increased $18 billion or 8% from 2012, reflecting solid growth in both business and personal
deposits.
Results excluding the specified items noted above are non-GAAP measures. For further details, including a reconciliation, refer to the Key
performance and non-GAAP measures section.
In Canada, we operate through three business lines: Personal Financial Services, Business Financial Services and Cards and Payments
Solutions. The following provides a discussion of our consolidated Canadian Banking results.
Canadian Banking financial highlights Table 18
(Millions of Canadian dollars, except number of and percentage
amounts and as otherwise noted) 2014 2013 2012
Net interest income $ 9,168 $ 8,875 $ 8,484
Non-interest income 3,701 3,345 3,130
Total revenue 12,869 12,220 11,614
PCL 928 908 1,015
Non-interest expense 5,687 5,464 5,163
Net income before income taxes 6,254 5,848 5,436
Net income $ 4,642 $ 4,352 $ 4,045
Revenue by business
Personal Financial Services $ 7,285 $ 6,948 $ 6,591
Business Financial Services 3,135 2,990 2,894
Cards and Payment Solutions 2,449 2,282 2,129
Key ratios
ROE 37.0% 37.5% 38.9%
NIM (1) 2.71% 2.72% 2.78%
Efficiency ratio (2) 44.2% 44.7% 44.5%
Operating leverage 1.2% (0.6%) n.a.
Selected average balance sheet information
Total assets $ 350,400 $ 338,000 $ 314,600
Total earning assets (3) 337,900 326,400 305,100
Loans and acceptances (3) 343,900 330,400 307,900
Deposits 263,600 248,100 230,300
Attributed capital 12,400 11,400 10,200
Other information
AUA (4) 205,200 183,600 171,100
Number of employees (FTE) 31,442 31,970 31,800
Effective income tax rate 25.8% 25.6% 25.6%
Credit information
Gross impaired loans as a % of average net loans and
acceptances 0.33% 0.36% 0.37%
PCL on impaired loans as a % of average net loans and
acceptances 0.27% 0.27% 0.33%
(1) NIM is calculated as Net interest income divided by Average total earning assets.
(2) Efficiency ratio is calculated as Non-interest expense divided by Total revenue.
(3) Average total earning assets and average loans and acceptances include average securitized residential mortgages and credit card
loans for the year of $54.5 billion and $8.0 billion, respectively (2013 – $53.9 billion and $7.2 billion; 2012 – $44.9 billion and
$7.3 billion).
(4) AUA includes securitized residential mortgages and credit card loans as at October 31, 2014 of $23.2 billion and $8.0 billion
respectively (October 31, 2013 – $25.4 billion and $7.2 billion; October 31, 2012 – $31.0 billion and $7.4 billion).
n.a. not applicable
Financial performance
2014 vs. 2013
Net income increased $290 million or 7%, compared to last year, reflecting solid volume growth across most businesses, strong fee-based
revenue growth, and the full integration of Ally Canada.
Total revenue increased $649 million or 5% from last year, largely due to solid volume growth of 5% across most businesses, and strong
fee-based revenue growth primarily attributable to higher mutual fund distribution fees and card services revenue.
Net interest margin was relatively stable compared to last year.
PCL increased $20 million, with the PCL ratio flat, mainly due to higher provisions in our small business portfolio.
Non-interest expense increased $223 million or 4%, due to higher staff and marketing costs in support of business growth, and higher
litigation provisions. These factors were partially offset by continuing benefits from our efficiency management activities and benefits from the
full integration of Ally Canada.
Average loans and acceptances increased $14 billion or 4%, mainly due to growth in residential mortgages, business loans and personal
loans. Average deposits increased $16 billion or 6%, primarily reflecting growth in both personal and business deposits.
Management’s Discussion and Analysis Royal Bank of Canada: Annual Report 2014 25
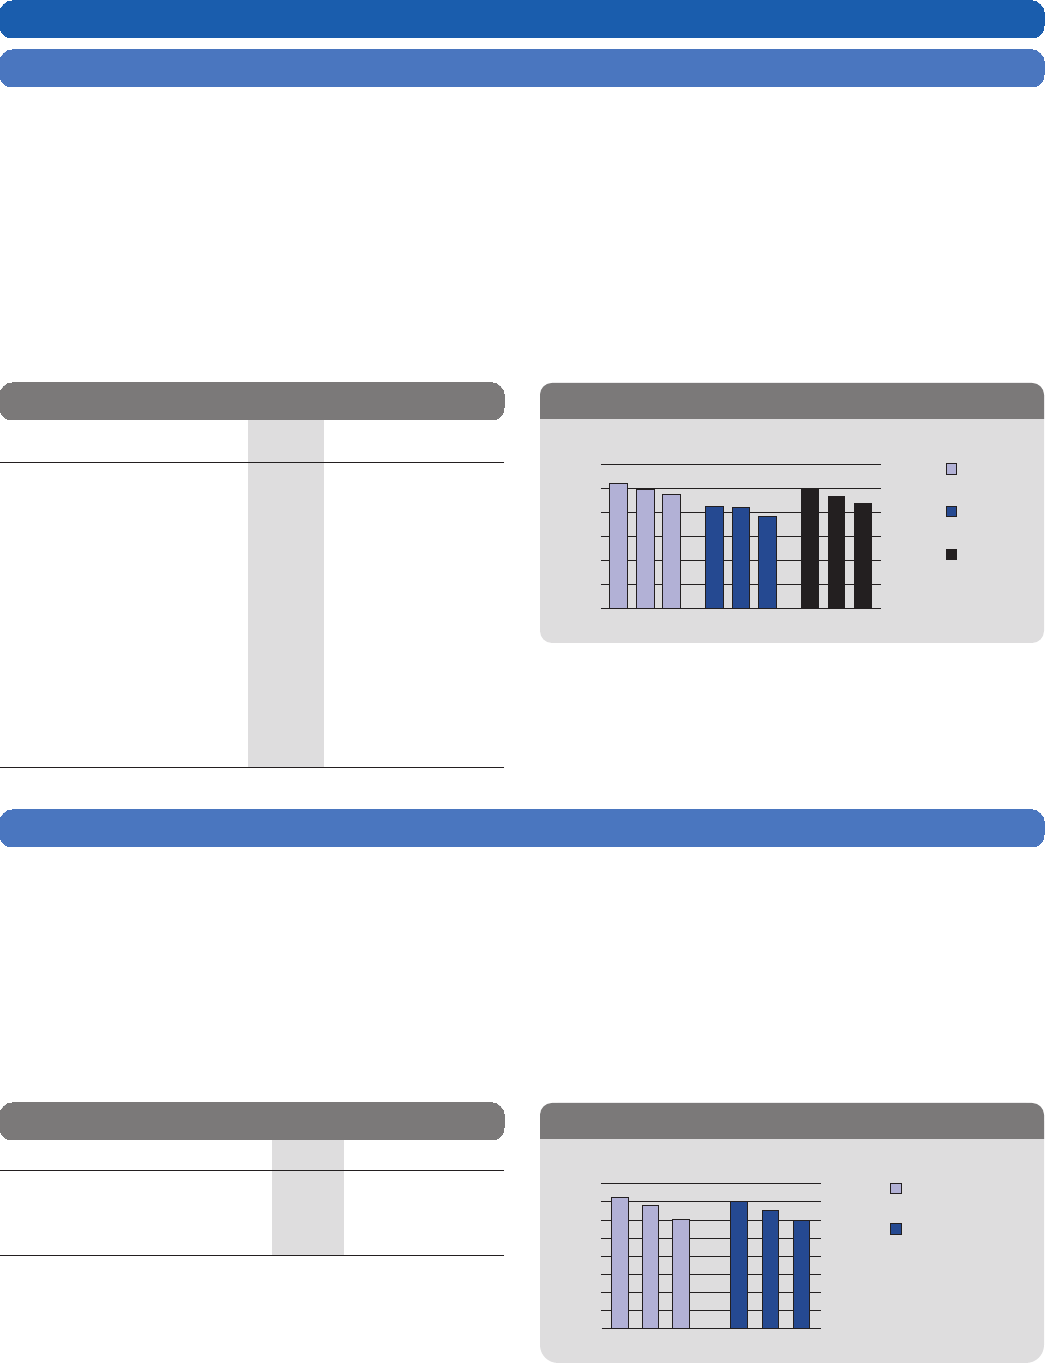
2013 vs. 2012
Net income increased $307 million or 8% from 2012, reflecting solid volume growth across all businesses, improved credit quality, and the
inclusion of our acquisition of Ally Canada. These factors were partially offset by higher costs in support of business growth and spread
compression.
Business line review
Personal Financial Services
Personal Financial Services focuses on meeting the needs of our individual Canadian clients at every stage of their lives through a wide range of
financing and investment products and services, including home equity financing, personal lending, deposit accounts, Canadian private
banking, indirect lending (including auto financing), mutual funds and self-directed brokerage accounts, and Guaranteed Investment Certificates
(GICs). We rank #1 or #2 in market share for most personal banking products in Canada and our retail banking network is the largest in Canada
with 1,272 branches and 4,620 ATMs.
Financial performance
Total revenue increased $337 million or 5% compared to last year, reflecting solid volume growth across most businesses, and higher mutual
fund distribution fees.
Average residential mortgages increased 4% compared to 2013, resulting from solid housing market activity supported by the continuing
low interest rate environment. Average personal loans grew 2% from last year largely due to growth in indirect lending. Average personal
deposits grew 7% from last year, reflecting the acquisition of new clients as well as the continued use of savings and other deposits products by
existing clients.
Selected highlights Table 19
(Millions of Canadian dollars,
except number of) 2014 2013 2012
Total revenue $ 7,285 $ 6,948 $ 6,591
Other information (average)
Residential mortgages 186,700 178,700 170,400
Personal loans 85,200 83,600 76,300
Personal deposits 100,000 93,700 87,300
Personal GICs 65,100 63,100 59,100
Branch mutual fund
balances (1) 111,600 95,300 82,300
AUA – Self-directed
brokerage (1) 60,500 53,300 48,900
Number of:
New deposit accounts opened
(thousands) 1,514 1,285 1,204
Branches 1,272 1,255 1,239
ATM 4,620 4,622 4,724
(1) Represents year-end spot balances.
Personal
loans
Residential
mortgages
Personal
deposits
0
36,000
72,000
108,000
216,000
180,000
144,000
0
20,000
40,000
60,000
120,000
100,000
80,000
Average residential mortgages, personal loans and deposits
(Millions of Canadian dollars)
2014 2013 2012 2014 2013 2012 2014 2013 2012
Business Financial Services
Business Financial Services offers a wide range of lending, leasing, deposit, investment, foreign exchange, cash management, auto dealer
financing (floorplan), and trade products and services to small, medium-sized and commercial businesses and agriculture and agribusiness
clients across Canada. Our business banking network has the largest team of relationship managers and specialists in the industry. Our strong
commitment to our clients has resulted in our leading market share in business loans and deposits.
Financial performance
Total revenue increased $145 million or 5% compared to last year, primarily due to strong volume growth in business deposits and business
loans, and a favourable cumulative accounting adjustment related to deferred loan fees in our business lending portfolio. These factors were
partially offset by spread compression from competitive pressures.
Average loans and acceptances increased 6% and average business deposits were up 8%, in a very competitive environment, due to
increased activity from existing and new clients.
Selected highlights Table 20
(Millions of Canadian dollars) 2014 2013 2012
Total revenue $ 3,135 $ 2,990 $ 2,894
Other information (average)
Business loans and acceptances 57,900 54,500 48,300
Business deposits (1) 98,500 91,300 83,900
(1) Includes GIC balances.
Business deposits
Business loans and
acceptances
0
8,000
16,000
24,000
32,000
40,000
64,000
56,000
0
14,000
28,000
42,000
70,000
56,000
112,000
98,000
84,000
2014 20122013 2014 20122013
Average business loans and acceptances and business deposits
(Millions of Canadian dollars)
48,000
26 Royal Bank of Canada: Annual Report 2014 Management’s Discussion and Analysis
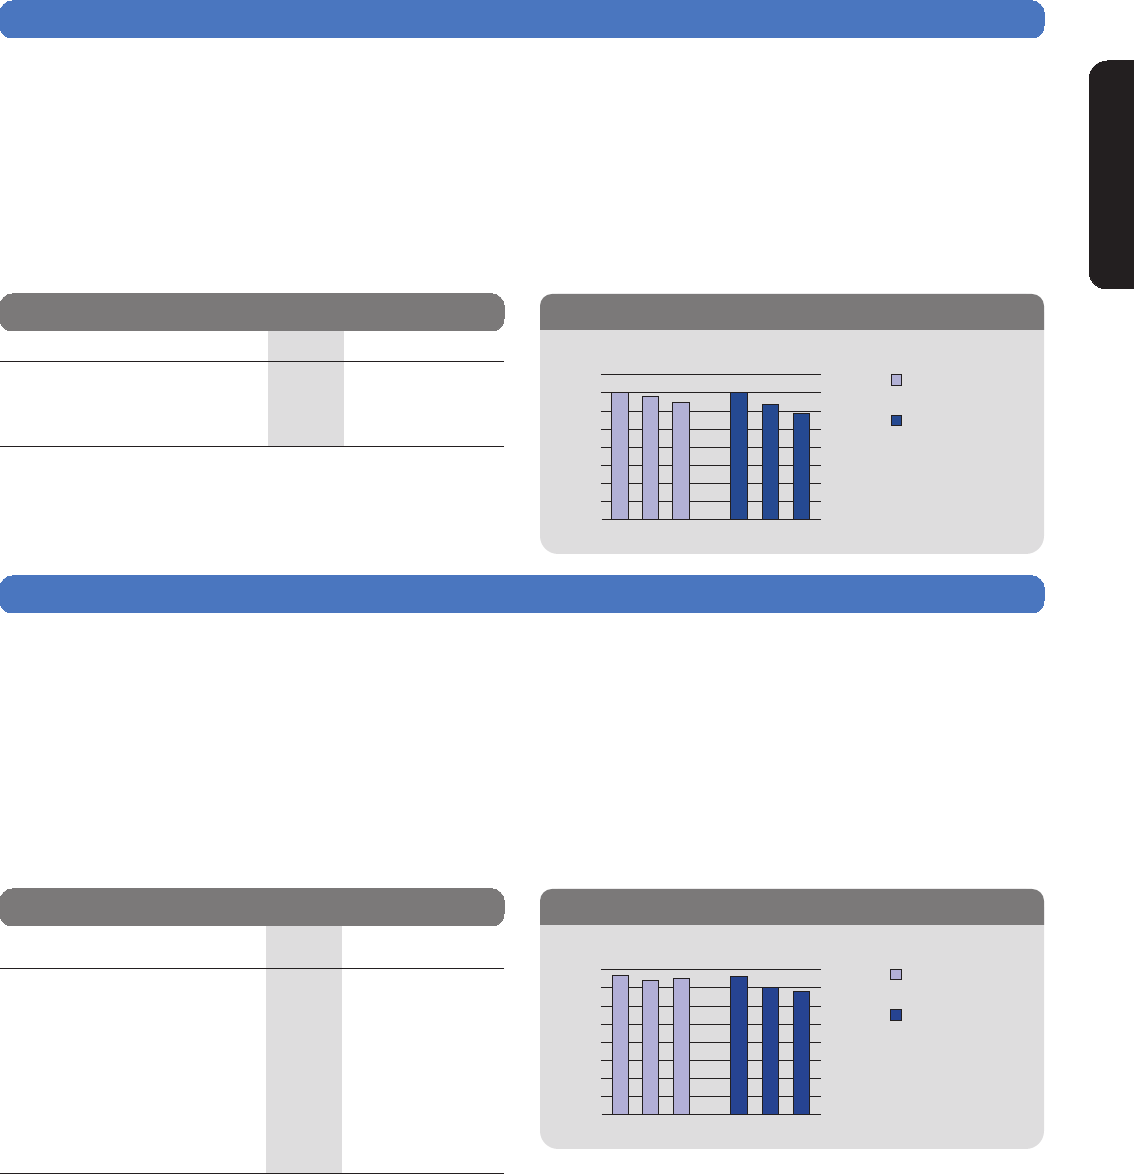
Card and Payment Solutions
Cards and Payment Solutions provides a wide array of convenient credit cards with loyalty and reward benefits, and payment products and
solutions within Canada. We have over 6.7 million credit card accounts and have approximately 23% market share of Canada’s credit card
purchase volume.
In addition, this business line includes our 50% interest in Moneris Solutions, Inc., our merchant card processing joint venture with the
Bank of Montreal. Moneris processes approximately $195 billion in annual credit and debit card transaction volumes.
Financial performance
Total revenue increased $167 million or 7%, compared to last year, driven by improved spreads, higher balances and higher credit card trans-
action volumes.
Average credit card balances increased 4% and net purchase volumes increased 10% due to higher active accounts driven by strength in
new account acquisitions.
Selected highlights Table 21
(Millions of Canadian dollars) 2014 2013 2012
Total revenue $ 2,449 $ 2,282 $ 2,129
Other information
Average credit card balances 14,100 13,600 12,900
Net purchase volumes 84,200 76,200 70,500 Net purchase
volumes
Average credit
card balances
0
4,000
2,000
8,000
16,000
10,000
12,000
14,000
6,000
0
24,000
12,000
48,000
36,000
96,000
84,000
72,000
60,000
2014 20122013 2014 20122013
Average credit card balances and net purchase volumes
(Millions of Canadian dollars)
Caribbean & U.S. Banking
Our Caribbean banking business offers a comprehensive suite of banking products and services, as well as international financing and trade
promotion services through extensive branch, ATM, online and mobile banking networks.
Our U.S. cross-border banking business serves the needs of our Canadian clients within the U.S. through online and mobile channels, and
offers a broad range of financial products and services to individual and business clients across all 50 states. As well, we serve the banking
product needs of our U.S. wealth management clients.
Financial performance
Total revenue increased $62 million or 8% from last year, primarily due to the impact of foreign exchange translation, and the implementation of
full-service pricing in the Caribbean.
Average loans and acceptances increased $300 million or 4%, primarily due to the impact of foreign exchange translation and strong loan
growth in the U.S. client base. Average deposits increased $1 billion or 8%, mostly due to increased liquidity in the Caribbean leading to higher
savings and current account balances, and the impact of foreign exchange translation.
Selected highlights Table 22
(Millions of Canadian dollars, except number of
and percentage amounts) 2014 2013 2012
Total revenue $ 861 $ 799 $ 824
Other information
Net interest margin 4.30% 4.56% 5.19%
Average loans and acceptances 7,700 7,400 7,500
Average deposits 15,200 14,100 13,600
AUA 9,000 8,600 8,100
AUM 4,000 3,400 3,100
Number of:
Branches 93 116 121
ATM 309 351 341
Deposits
Loans and
acceptances
0
1,000
2,000
4,000
5,000
6,000
7,000
3,000
8,000
0
2,000
4,000
6,000
8,000
10,000
12,000
14,000
16,000
2014 20122013 2014 20122013
Average loans and deposits (Millions of Canadian dollars)
Management’s Discussion and Analysis Royal Bank of Canada: Annual Report 2014 27

Wealth Management
Wealth Management comprises Canadian Wealth Management, U.S. & International Wealth Management and Global Asset Management (GAM).
Wealth Management serves individual and institutional clients in target markets around the world. From our offices in key financial centres
mainly in Canada, the U.S., the U.K., Channel Islands, continental Europe, and Asia, Wealth Management offers a comprehensive suite of
investment, trust, banking, credit and other wealth management solutions to affluent, high net worth (HNW), and ultra-high net worth (UHNW)
clients. Our asset management group, Global Asset Management, which includes BlueBay Asset Management (BlueBay), is an established
global leader in investment management services, providing investment strategies and fund solutions directly to institutional investors and also
to individual clients through our distribution channels and third-party distributors.
Economic and market review
Solid economic performance in Canada and the U.S., as well as strong growth in capital markets throughout most of fiscal 2014, drove higher
growth in our average fee-based client assets through capital appreciation and net sales. The Euro area economy grew marginally, leading the
ECB to implement policy measures aimed at restoring investor confidence and stimulating lending in the region. In addition, the continuing
global low interest rate environment resulted in continued spread compression and money market fee waivers.
Highlights
• Capital appreciation and strong net sales continued to drive client assets higher surpassing $1.1 trillion this year.
• In Canada, our full service private wealth business is the industry leader. We continued to extend our leadership amongst HNW clients by
focusing on delivering comprehensive value to our clients, leveraging our expertise around business owners, succession and wealth
planning.
• In the U.S., we are among the top 10 full service brokerage firms in terms of assets and number of advisors, and we continued to focus on
improving advisor productivity.
• Outside Canada and the U.S., we have focused on select markets with growth potential where we are well positioned to succeed, while at
the same time enhancing our product offering and operating environment.
• We continued to grow and invest in our high-performing asset management business and maintained a leading market share of 14.5% of
the Canadian mutual fund asset management industry. We have increased BlueBay’s distribution footprint with institutional clients and
expanded our international distribution capabilities to U.S. and international institutional clients and professional buyers. We also
enhanced our capabilities by acquiring differentiated global equities investment capabilities.
• The strength of our global capabilities and commitment to deliver integrated global wealth management advice, solutions and services to
HNW and UHNW clients helped us earn significant industry awards. We were ranked or named:
–5
th largest global wealth manager by client assets (Scorpio Partnership’s 2014 Global Private Banking KPI Benchmark)
– Outstanding Wealth Manager – Customer Relationship Service and Engagement (Private Banker International)
– Best Fund Group Overall and Best Bond Funds Group (Lipper Awards)
– A top 50 Global Asset Manager (Pensions & Investments / Towers Watson)
– Best Bank-owned Brokerage Firm in Canada (International Executive Brokerage Report Card)
– Trust Company of the Year (Society of Trust and Estate Practitioners)
Outlook and priorities
Economic and market conditions are expected to continue improving, particularly in Canada and the U.S., and we anticipate further growth in
average fee-based client assets. We have also recently realigned our International Wealth Management business to allow us to continue focusing
our strategic priorities around evolving markets and competition, and the changing needs of our clients. For further details on our general
economic review and outlook, refer to the Economic and market review and outlook section.
Key strategic priorities for 2015
• Bring the best of RBC to our clients by leveraging the RBC enterprise brand, capabilities and competitive strengths.
• Leverage and grow our high performing asset management business globally.
• Focus growth on the HNW and UHNW client segments in our priority markets.
• Focus on serving our international cross-border clients well from our targeted markets by realigning certain international businesses for
sustainable growth and profitable scale.
28 Royal Bank of Canada: Annual Report 2014 Management’s Discussion and Analysis

Wealth Management Table 23
(Millions of Canadian dollars, except number of and percentage amounts and as otherwise noted) 2014 2013 2012
Net interest income $ 469 $ 396 $ 393
Non-interest income
Fee-based revenue 4,185 3,463 2,964
Transactional and other revenue 1,659 1,628 1,478
Total revenue 6,313 5,487 4,835
PCL 19 51 (1)
Non-interest expense 4,800 4,219 3,809
Net income before income taxes 1,494 1,217 1,027
Net income $ 1,083 $ 886 $ 753
Revenue by business
Canadian Wealth Management $ 2,186 $ 1,889 $ 1,741
U.S. & International Wealth Management 2,430 2,225 1,977
U.S. & International Wealth Management (US$ millions) 2,221 2,174 1,973
Global Asset Management (1) 1,697 1,373 1,117
Key ratios
ROE 19.2% 15.8% 13.9%
Pre-tax margin (2) 23.7% 22.2% 21.2%
Selected average balance sheet information
Total assets $ 25,800 $ 21,600 $ 20,900
Loans and acceptances 15,700 12,100 9,900
Deposits 36,200 31,900 29,200
Attributed capital 5,500 5,400 5,150
Other information
Revenue per advisor (000s) (3) $ 983 $ 862 $ 793
AUA (4) 717,500 639,200 577,800
AUM (4) 452,300 387,200 339,600
Average AUA 690,500 609,500 554,800
Average AUM 427,800 367,600 322,500
Number of employees (FTE) 12,919 12,462 12,139
Number of advisors (5) 4,402 4,366 4,388
Estimated impact of U.S. dollar, British pound and Euro translation on key income
statement items
(Millions of Canadian dollars, except percentage amounts) 2014 vs. 2013
Increase (decrease):
Total revenue $ 212
Non-interest expense 180
Net income 21
Percentage change in average US$ equivalent of C$1.00 (6)%
Percentage change in average British pound equivalent of C$1.00 (12)%
Percentage change in average Euro equivalent of C$1.00 (8)%
(1) Effective the first quarter of 2014, BlueBay results are no longer reported on a one-month lag. As a result, 2014 included thirteen months of results from BlueBay.
(2) Pre-tax margin is defined as net income before income taxes divided by Total revenue.
(3) Represents investment advisors and financial consultants of our Canadian and U.S. full-service wealth businesses.
(4) Represents year-end spot balances.
(5) Represents client-facing advisors across all our wealth management businesses.
2014 vs. 2013
Net income increased $197 million or 22% from a year ago, mainly due to higher earnings from growth in average fee-based client assets,
primarily in our Global Asset Management and Canadian Wealth Management businesses.
Total revenue increased $826 million or 15%, mainly due to higher revenue from growth in average fee-based client assets resulting from
capital appreciation and strong net sales, and the impact of foreign exchange translation.
PCL decreased $32 million mainly due to lower provisions on a few accounts. For further details, refer to the Credit quality performance
section.
Non-interest expense increased $581 million or 14%, mainly due to higher variable compensation driven by higher revenue, the impact of
foreign exchange translation, and higher staff levels and infrastructure investments in support of business growth.
2013 vs. 2012
Net income increased $133 million or 18% from 2012, mainly due to higher earnings from growth in average fee-based client assets resulting
from net sales and capital appreciation and higher transaction volumes reflecting improved market conditions. These factors were partially offset
by higher PCL.
Management’s Discussion and Analysis Royal Bank of Canada: Annual Report 2014 29
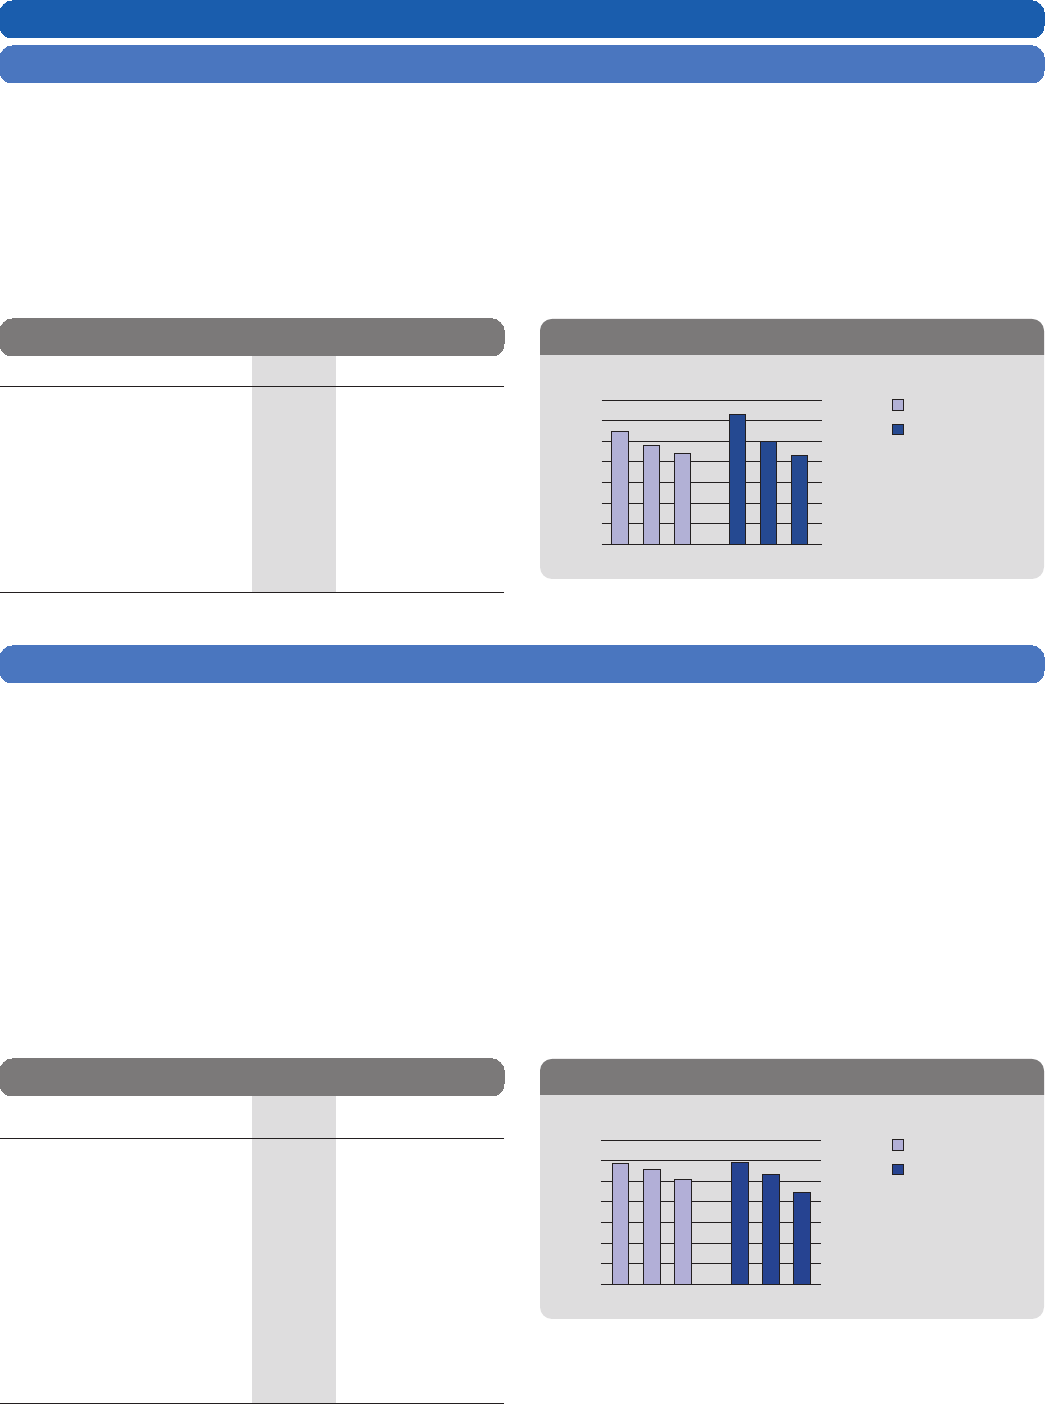
Business line review
Canadian Wealth Management
Canadian Wealth Management includes our full-service Canadian wealth advisory business, which is the largest in Canada as measured by AUA,
with over 1,600 investment advisors providing comprehensive advice-based financial solutions to affluent, HNW and UHNW clients. Additionally,
we provide discretionary investment management and estate and trust services to our clients through approximately 60 investment counsellors
and 95 trust professionals in locations across Canada.
We compete with domestic banks and trust companies, investment counselling firms, bank-owned full service brokerages and boutique
brokerages, mutual fund companies and global private banks. In Canada, bank-owned wealth managers continue to be the major players.
Financial performance
Revenue increased $297 million or 16% from a year ago, mainly due to higher revenue from a 14% increase in AUA reflecting capital appreciation
and net sales.
Selected highlights Table 24
(Millions of Canadian dollars) 2014 2013 2012
Total revenue $ 2,186 $ 1,889 $ 1,741
Other information
Total loans and acceptances (1) 3,000 2,500 2,300
Total deposits (1) 15,300 13,400 11,900
AUA 285,100 251,400 230,400
AUM 55,400 43,600 36,100
Average AUA 272,900 239,100 222,100
Average AUM 50,400 40,000 34,400
Total assets under fee-based
programs 166,700 139,400 120,700
(1) Represents an average amount, which is calculated using methods intended to
approximate the average of the daily balances for the period.
AUM
AUA
2014 2013 2012 2014 2012
0
50,000
100,000
150,000
200,000
250,000
0
8,000
16,000
24,000
32,000
56,000
48,000
300,000
40,000
350,000
Average AUA and AUM (1) (Millions of Canadian dollars)
2013
(1) Represents average balances, which are more representative of the impact client
balances have upon our revenue.
U.S. & International Wealth Management
U.S. Wealth Management includes our private client group, which is the 8th largest full-service wealth advisory firm in the U.S., as measured by
number of advisors, with over 1,800 financial advisors. Additionally, our correspondent and advisor services businesses deliver clearing and
execution services for small to mid-sized independent broker-dealers and registered investment advisor firms. In the U.S., we operate in a
fragmented and extremely competitive industry. There are approximately 4,300 registered broker-dealers in the U.S., comprising independent,
regional and global players.
We have recently realigned our International Wealth Management business to focus on serving our international cross-border clients well
from our targeted markets for sustainable growth and profitable scale. International Wealth Management includes Wealth Management –
International (formerly Wealth Management – British Isles & Caribbean and also includes the international businesses in Canada and the U.S.),
and Wealth Management – Emerging markets. We provide customized and integrated trust, banking, credit, and investment solutions to HNW
and UHNW clients and corporate clients with over 1,500 employees located in 17 countries around the world. Competitors to our International
Wealth Management business comprise global wealth managers, traditional offshore private banks, domestic wealth managers and U.S.
investment-led private client operations.
Financial performance
Revenue increased $205 million or 9% from a year ago. In U.S. dollars, revenue increased $47 million or 2%, mainly due to higher revenue from
a 6% increase in AUA reflecting capital appreciation and net sales, partially offset by the change in fair value of our U.S. share-based
compensation plan, largely offset in non-interest expense.
Selected highlights Table 25
(Millions of Canadian dollars, except otherwise
noted) 2014 2013 2012
Total revenue $ 2,430 $ 2,225 $ 1,977
Other information (Millions of U.S.
dollars)
Total revenue 2,221 2,174 1,973
Total loans, guarantees and
letters of credit (1) 14,500 12,100 10,200
Total deposits (1) 19,100 18,000 17,200
AUA 383,700 371,900 347,800
AUM 41,100 35,600 31,300
Average AUA 382,000 361,800 331,700
Average AUM 38,400 34,700 29,000
Total assets under fee-based
programs (2) 94,500 83,200 71,700
(1) Represents an average amount, which is calculated using methods intended to
approximate the average of the daily balances for the period.
(2) Represents amounts related to our U.S. wealth management businesses.
AUM
AUA
2014 2013 2012 2014 2013 2012
0
65,000
130,000
195,000
260,000
455,000
0
6,500
13,000
19,500
26,000
45,500
39,000
32,500
325,000
390,000
Average AUA and AUM (1) (Millions of U.S. dollars)
(1) Represents average balances, which are more representative of the impact client
balances have upon our revenue.
30 Royal Bank of Canada: Annual Report 2014 Management’s Discussion and Analysis

Global Asset Management
Global Asset Management provides global investment management services and solutions for individual and institutional investors in Canada,
the U.S., the U.K., Europe and emerging markets. We provide a broad range of investment management services through mutual, pooled and
hedge funds, fee-based accounts and separately managed portfolios. We distribute our investment solutions through a broad network of bank
branches, our self-directed and full-service wealth advisory businesses, independent third party advisors and private bank, and directly to
individual clients. We also provide investment solutions directly to institutional clients, including pension plans, endowments and foundations.
We are the largest retail fund company in Canada as well as a leading institutional asset manager. We face competition in Canada from
major banks, insurance companies, asset management organizations and boutique firms. The Canadian fund management industry is large and
mature, but still a relatively fragmented industry.
In the U.S., our asset management business offers investment management solutions and services primarily to institutional investors and
competes with independent asset management firms, as well as those that are part of national and international banks, insurance companies
and boutique asset managers.
Internationally, through our leading global capabilities of BlueBay and RBC Global Asset Management, we offer investment management
solutions for institutions and, through private banks including RBC Wealth Management, to HNW and UHNW investors. We face competition from
asset managers that are part of international banks as well as national, regional and boutique asset managers in the geographies where we
serve clients.
Financial performance
Revenue increased $324 million or 24% from a year ago, mainly due to higher revenue from a 14% increase in AUM reflecting capital
appreciation and strong net sales, the impact of foreign exchange translation, and an additional month of revenue from BlueBay.
Selected highlights Table 26
2014 2013 2012
0
50,000
100,000
150,000
200,000
350,000
250,000
300,000
Average AUM (1) (Millions of Canadian dollars)
(Millions of Canadian dollars) 2014 2013 2012
Total revenue (1) $ 1,697 $ 1,373 $ 1,117
Other information
Canadian net long-term mutual
fund sales 10,982 8,064 7,906
Canadian net money
market mutual fund
(redemptions) sales (1,229) (1,348) (1,981)
AUM 350,600 306,500 272,200
Average AUM 335,300 292,100 259,100
(1) Effective the first quarter of 2014, BlueBay results are no longer reported on a one-
month lag. As a result, 2014 included thirteen months of results from BlueBay. (1) Represents average balances, which are more
representative of the impact client balances have
upon our revenue.
Insurance
Insurance comprises our operations in Canada and globally and operates under two business lines: Canadian Insurance and International
Insurance, providing a wide range of life, health, home, auto, travel, wealth and reinsurance products and solutions. In Canada, we offer our
products and services through our proprietary distribution channels, comprised of the field sales force which includes retail insurance branches,
our field sales representatives, call centres and online, as well as through independent insurance advisors and affinity relationships. Outside
Canada, we operate in reinsurance markets globally offering life, accident and annuity reinsurance products. Our competitive environment is
discussed below in each business.
Economic and market review
While the global insurance industry has shown signs of stabilization, we continued to experience pressure from systemic factors such as
persistently low interest rates, uncertain global market conditions, a slowdown in consumer lending, and changes in the regulatory environment
including the Ontario government’s mandated auto rate reduction strategy which continue to impact the insurance marketplace. Although these
factors have negatively impacted our businesses, product and pricing actions taken in recent years, a migration to lower cost proprietary
distribution channels, conservative investment practices and diversified product lines have continued to mitigate this challenging environment.
Highlights
• We introduced tools, training and technology including simplified processes and improved applications to create a best-in-class sales force
to capture increased market share in the Canadian insurance marketplace.
• For the 3rd consecutive quarter, RBC Insurance continues to be the fastest growing group insurance provider in Canada.
• Annual travel insurance plan solutions were launched in the branch network and to our credit card clients, including optional Trip
Cancellation insurance.
• We made pricing and product enhancements in individual disability insurance including a new unique program for established
professionals.
• The U.K. longevity risk transfer market continued to be robust as pension plan sponsors and annuity writers continued to pursue de-risking
solutions. The market has seen growth in new entrants as well as various risk transfer options. We have been active in the U.K. market since
2008 and continue to selectively add annuity reinsurance contracts at a measured pace.
Outlook and priorities
We expect continued business growth as a result of the product and pricing actions taken during the last few years, including increasing volumes
through our growing proprietary channels and the execution of efficiency management initiatives, which we anticipate will assist in mitigating
economic and regulatory challenges. For further details, refer to the Economic and market review and outlook section.
Management’s Discussion and Analysis Royal Bank of Canada: Annual Report 2014 31

Key strategic priorities for 2015
• Deepen client relationships by continuing to provide our customers with a comprehensive suite of insurance products and services based
on their unique family needs.
• Continue to improve our proprietary channels distribution efficiency through implementation of performance management processes, a
proactive sales culture and enhanced cross-selling initiatives.
• Continue to simplify the way we do business by streamlining all business processes to ensure that clients find it easy to do business with
us, while diligently managing our expenses.
• Pursue select international opportunities, within our risk appetite, with the aim of continuing to grow our core reinsurance business.
Insurance Table 27
(Millions of Canadian dollars, except percentage amounts and as otherwise noted) 2014 2013 2012
Non-interest income
Net earned premiums $ 3,742 $ 3,674 $ 3,705
Investment income (1) 938 (17) 929
Fee income 284 271 263
Total revenue 4,964 3,928 4,897
Insurance policyholder benefits and claims (1) 3,194 2,326 3,055
Insurance policyholder acquisition expense 379 458 566
Non-interest expense 579 551 518
Net income before income taxes 812 593 758
Net income $ 781 $ 595 $ 713
Revenue by business
Canadian Insurance $ 2,911 $ 1,962 $ 2,992
International Insurance 2,053 1,966 1,905
Key ratios
ROE 49.7% 41.4% 46.7%
Selected average balance sheet information
Total assets $ 12,000 $ 11,900 $ 11,500
Attributed capital 1,550 1,400 1,500
Other information
Premiums and deposits (2) $ 5,164 $ 4,924 $ 4,849
Canadian Insurance 2,419 2,344 2,362
International Insurance 2,745 2,580 2,487
Insurance claims and policy benefit liabilities 8,564 8,034 $ 7,921
Fair value changes on investments backing policyholder liabilities (1) 439 (491) 410
Embedded value (3) 6,239 6,302 5,861
AUM 700 500 300
Number of employees (FTE) 3,126 2,965 2,744
Estimated impact of U.S. dollar and British pound translation on key income statement items
(Millions of Canadian dollars, except percentage amounts) 2014 vs. 2013
Increase (decrease):
Total revenue $74
PBCAE 75
Non-interest expense –
Net income (2)
Percentage change in average US$ equivalent of C$1.00 (6)%
Percentage change in average British pound equivalent of C$1.00 (12)%
(1) Investment income can experience volatility arising from fluctuation of fair value through profit or loss (FVTPL) assets. The investments which support actuarial liabilities are predominantly
fixed income assets designated as at FVTPL. Consequently changes in the fair values of these assets are recorded in investment income in the consolidated statement of income and are
largely offset by changes in the fair value of the actuarial liabilities, the impact of which is reflected in insurance policyholder benefits and claims.
(2) Premiums and deposits include premiums on risk-based insurance and annuity products, and individual and group segregated fund deposits, consistent with insurance industry practices.
(3) Embedded value is defined as the sum of value of equity held in our Insurance segment and the value of in-force business (existing policies). For further details, refer to the Key performance
and non-GAAP measures section.
Financial performance
2014 vs. 2013
Net income increased $186 million or 31%. Excluding the charge last year of $160 million ($118 million after-tax) as a result of new tax legis-
lation in Canada, which affects the policyholders’ tax treatment of certain individual life insurance policies, net income increased $68 million, or
10%, mainly due to lower net claims costs, business growth in our European life and U.K. annuity products, and favourable actuarial adjustments
reflecting management actions and assumption changes. Our results last year also included a favourable impact from interest and asset related
activities on the Canadian life business.
Total revenue increased $1,036 million or 26%, mainly due to the change in fair value of investments backing our policyholder liabilities
resulting from a decrease in long-term interest rates, largely offset in PBCAE. Business growth in our European life and U.K. annuity products, and
the impact of foreign exchange translation also contributed to the increase.
PBCAE increased $789 million or 28%, mainly due to the change in fair value of investments backing our policyholder liabilities, which was
largely offset in revenue, and the impact of foreign exchange translation. These factors were partially offset by lower net claims costs. In addition,
our PBCAE last year included the unfavourable impact of the charge related to new tax legislation in Canada as noted above and a favourable
impact from interest and asset related activities on the Canadian life business.
Non-interest expense increased $28 million or 5%, mainly due to higher costs in support of business growth, partially offset by continuing
benefits from our efficiency management activities.
32 Royal Bank of Canada: Annual Report 2014 Management’s Discussion and Analysis

Premiums and deposits were up $240 million or 5%, reflecting growth in both International and Canadian Insurance.
Embedded value decreased $63 million, as the impact of the transfer of capital from our insurance businesses through dividend payments
was mostly offset by growth from operations and the favourable change in discount rates. For further details, refer to the Key performance and
non-GAAP measures section.
2013 vs. 2012
Net income decreased $118 million or 17% from 2012, mainly due to a charge of $160 million ($118 million after-tax) as a result of new tax
legislation in Canada. Excluding this charge, net income of $713 million was relatively flat compared to 2012 as favourable actuarial adjust-
ments reflecting management actions and assumption changes and the continuing benefit from our efficiency management activities were
mostly offset by higher net claims costs.
Results excluding the specified item noted above are non-GAAP measures. For further details, including a reconciliation, refer to the Key
performance and non-GAAP measures section.
Business line review
Canadian Insurance
We offer life, health, property and casualty insurance products as well as wealth accumulation solutions, to individual and group clients across
Canada. Our life and health portfolio includes universal life, term life, critical illness, disability, long-term care insurance and group benefits. We
offer a wide range of property and casualty products including home, auto and travel insurance. Our travel products include out of province/
country medical coverage, trip cancellation insurance and interruption insurance.
In Canada, we compete against over 200 insurance companies, with the majority of the organizations specializing in either life and health,
or property and casualty products. We hold a leading market position in disability insurance products, have a significant presence in life and
travel products, and have a growing presence in the home, auto and wealth markets.
Financial performance
Total revenue increased $949 million or 48% from last year, mainly due to the change in fair value of investments backing our policyholder
liabilities resulting from the decrease in long-term interest rate, largely offset in PBCAE.
Premiums and deposits increased $75 million or 3% reflecting growth in our life, health, wealth accumulation, home and auto product lines,
partially offset by the impact of the sale of the travel agency insurance business in the previous year.
Selected highlights Table 28
2014 2013 2012
0
500
1,500
1,000
2,000
3,000
2,500
Premiums and deposits (Millions of Canadian dollars)
(Millions of Canadian dollars) 2014 2013 2012
Total revenue $ 2,911 $ 1,962 $ 2,992
Other information
Premiums and deposits
Life and health 1,266 1,245 1,280
Property and casualty 951 942 965
Annuity and segregated fund
deposits 202 157 117
Fair value changes on
investments backing
policyholder liabilities 490 (510) 408
International Insurance
International Insurance is primarily comprised of our reinsurance businesses which insure risks of other insurance and reinsurance companies.
We offer life and health, accident and annuity reinsurance products.
The global reinsurance market is dominated by a few large players, with significant presence in the U.S., U.K. and Euro area. The reinsurance
industry is competitive but barriers to entry remain high.
Financial performance
Total revenue increased $87 million or 4%, mainly due to business growth in our European life and U.K. annuity products and the impact of
foreign currency translation. These factors were partially offset by the change in fair value of investments backing our policyholder liabilities,
largely offset in PBCAE.
Management’s Discussion and Analysis Royal Bank of Canada: Annual Report 2014 33

Premiums and deposits increased $165 million, or 6% driven by volume growth in both U.K. annuity and European life products.
Selected highlights Table 29
2014 2013 2012
0
500
1,500
1,000
2,000
3,000
2,500
Premiums and deposits (Millions of Canadian dollars)
(Millions of Canadian dollars) 2014 2013 2012
Total revenue $ 2,053 $ 1,966 $ 1,905
Other information
Premiums and deposits
Life and health 2,128 2,069 1,980
Property and casualty 650 56
Annuity 611 461 451
Investor & Treasury Services
Investor & Treasury Services is a specialist provider of asset servicing, custody, payments, treasury services, and transaction banking for
financial institutions and other institutional investors worldwide. We deliver custodial, advisory, financing and other services to safeguard client
assets, maximize liquidity, and manage risk across multiple jurisdictions. We also provide short-term funding and liquidity management for RBC.
We are a top 10 global custodian by assets under administration with a network of 18 offices across North America, Europe, the Middle East and
Asia-Pacific. While we compete against the world’s largest global custodians, we remain a specialist provider and our transaction banking
business competes primarily with major Canadian banks.
Economic and market review
The highly competitive environment in the global custody industry continued to exert downward pressure on margins in 2014. Continued
uncertainty relating to the timing of a recovery in the Euro area economy and the corresponding low to negative interest rate environment
reduced deposit rates, leading to spread compression. In Canada and the U.S., investor confidence improved, driving higher transaction volumes
and growth in custodial fees. Increased regulation across the industry continued to impact our custody business, resulting in higher compliance
and technology costs.
Highlights
• We maintained our leading market position in Canada by focusing on new client wins and deepening relationships with existing clients.
• We continued to evolve our service offering by investing in technology to provide enhanced solutions and we restructured our coverage
teams to better serve our key client segments.
• We achieved improved earnings and extracted further expense savings with the continuation of our efficiency management program.
• We delivered strong growth in client deposits in support of RBC growth objectives.
• As a result of our successes, we received external recognition and were named:
– Best Custodian Overall (Global Investor) and Fund Administrator of the Year (GlobalCustody.net Survey);
– Real Estate Fund Administrator of the Year (Custody Risk European Awards).
Outlook and priorities
In 2015 we will mark the transition to ‘business-as-usual operations’ following extensive integration efforts since the formation of the Investor &
Treasury Services segment two years ago. Having achieved significant cost savings as well as revenue growth, our focus in 2015 will be to
leverage our leading market position in Canada and our offshore capabilities in Luxembourg and Ireland to increase sales revenue. While we
expect the asset servicing environment to remain challenging in the near-term largely due to competitive margin pressures and the continuing
low interest rate environment, we believe we are well-positioned to compete in the continuously changing operating environment. For further
details on our general economic review and outlook, refer to the Economic and market review and outlook section.
Key strategic priorities for 2015
• Maintain our leadership position in Canada by continuing to invest in technology solutions that enhance the overall client experience.
• Evolve our global operating and client servicing model to improve efficiencies by leveraging the strength of our leading offshore service
offering in Luxembourg and Ireland for our global client base.
• Continue to support RBC growth strategies through the expertise of our liquidity management team.
• Leverage our enterprise-wide relationships to access new business and broaden client opportunities.
34 Royal Bank of Canada: Annual Report 2014 Management’s Discussion and Analysis

Investor & Treasury Services Table 30
(Millions of Canadian dollars, except percentage amounts and as otherwise noted) 2014 2013 2012
Net interest income $ 732 $ 671 $ 612
Non-interest income 1,152 1,133 293
Total revenue 1,884 1,804 905
Non-interest expense 1,286 1,348 701
Net income before income taxes 598 456 204
Net income $ 441 $ 339 $ 102
Key Ratios
ROE 19.8% 16.5% 5.3%
ROE adjusted (1) n.a. 18.1% 17.9%
Selected average balance sheet information
Total assets $ 94,200 $ 83,100 $ 66,900
Deposits 112,100 104,300 92,900
Client deposits 42,700 36,100 14,100
Wholesale funding deposits 69,400 68,200 78,800
Attributed capital 2,150 2,000 1,700
Other Information
AUA 3,702,800 3,208,800 2,886,900
Average AUA 3,463,000 3,052,600 2,781,800
Number of employees (FTE) 4,963 5,208 6,084
Estimated impact of U.S. dollar, British pound and Euro translation on key income statement
items
(Millions of Canadian dollars, except percentage amounts) 2014 vs. 2013
Increase (decrease):
Total revenue $69
Non-interest expense 57
Net income 7
Percentage change in average US$ equivalent of C$1.00 (6)%
Percentage change in average British pound equivalent of C$1.00 (12)%
Percentage change in average Euro equivalent of C$1.00 (8)%
(1) Measures have been adjusted by excluding a restructuring charge related to the integration of Investor Services and the acquisition of the remaining 50% stake of RBC Dexia, and are non-
GAAP measures. For further details, refer to the Key performance and non-GAAP measures section.
n.a. not applicable
Financial performance
2014 vs. 2013
Net income increased $102 million or 30% from last year. Excluding a restructuring charge last year of $44 million ($31 million after-tax) related
to the integration of Investor Services, net income increased $71 million or 19%, largely due to continuing benefits from our efficiency
management activities and higher earnings from growth in client deposits.
Total revenue increased $80 million or 4% from last year, mainly reflecting the impact of foreign exchange translation, higher net interest
income resulting from growth in client deposits, and higher funding and liquidity revenue as a result of tightening credit spreads. These factors
were partially offset by a decrease in custodial fees and lower foreign exchange transaction volumes in Investor Services.
Non-interest expense decreased $62 million or 5% from last year. Excluding the restructuring charge last year noted above, non-interest
expense decreased $18 million or 1%, primarily reflecting continuing benefits from our efficiency management activities, largely offset by the
impact of foreign exchange translation.
2013 vs. 2012
Net income was up $237 million from 2012. Excluding the restructuring charge in 2013 noted above and a loss of $224 million ($213 million
after-tax) in 2012 related to the acquisition of the remaining 50% stake of RBC Dexia, net income increased $55 million or 17%, largely due to
continuing benefits from our efficiency management activities and incremental earnings related to our additional 50% ownership of Investor
Services. Higher custodial fees and increased foreign exchange in Investor Services also contributed to the increase. These factors were partially
offset by lower funding and liquidity results and higher infrastructure costs.
Results excluding the specified items noted above are non-GAAP measures. For further details, including a reconciliation, refer to the Key
performance and non-GAAP measures section.
Capital Markets
Capital Markets provides public and private companies, institutional investors, governments and central banks globally with a wide range of
capital markets products and services across our two main business lines, Corporate and Investment Banking and Global Markets. Our legacy
portfolio is grouped under Other.
In North America, we offer a full suite of products and services which include corporate and investment banking, equity and debt origination
and distribution, and structuring and trading. Outside North America, we have a select presence in the U.K. and Europe, and Asia-Pacific, where
we offer a diversified set of capabilities in our key sectors of expertise such as energy, mining and infrastructure and we are now expanding into
industrial, consumer and healthcare in Europe.
In Canada, we compete mainly with Canadian banks where we are the premier global investment bank and market leader with a strategic
presence in all lines of capital markets businesses. In the U.S., we have full industry sector coverage and investment banking product range and
compete with large U.S. and global investment banks as well as smaller regional firms. In the U.K. and Europe, we compete in our key sectors of
Management’s Discussion and Analysis Royal Bank of Canada: Annual Report 2014 35
expertise with global and regional investment banks. In Asia-Pacific, we compete with global and regional investment banks in select products,
consisting of our fixed income distribution and currencies trading in Asia and our corporate and investment banking in Australia.
Economic and market review
The capital market environments in the U.S. and Canada were strong during 2014 partly reflecting solid economic growth in both countries and
ongoing favourable monetary policies, while growth in European economies and markets improved marginally during 2014. However recent
geopolitical uncertainties and expectations for recessionary conditions in Europe led to some volatility towards the end of our fiscal year.
Strong client activity reflecting economic growth particularly in the U.S. and Canada, and the low interest rate environment led to strong
issuance activity throughout most of the year, with our corporate and investment banking businesses continuing to perform well, as we
continued to focus our efforts on origination and increased activity from client-focused strategies. Equity trading businesses were strong during
the year, driven by economic growth in the U.S., Canada and U.K. Fixed income trading businesses strengthened in Europe and the U.S. reflecting
improved market conditions driven by stable credit spreads when compared to volatile credit spreads experienced in 2013.
Highlights
• We continued to focus on growing our corporate and investment banking businesses, particularly in the U.S. and Europe, while rebalancing
our global markets businesses by leveraging our investments that were made in prior years, allocating capital from trading to corporate and
investment banking businesses and managing risks by narrowing the focus of our trading products.
• In Canada, we maintained our market leadership by deepening our existing client relationships, gaining new clients by leveraging our strong
cross border capabilities and improving collaboration with Wealth Management to drive operational efficiencies, and offering a full suite of
global capabilities. We continued to win significant mandates including acting as global coordinators and joint bookrunner on a
US$3 billion bought deal financing for Barrick Gold Corporation, and acting as joint bookrunner on Encana Corporation’s $2.6 billion bought
secondary offering of PrairieSky Royalty Ltd.
• In the U.S., we continued to leverage our key strategic investments made in recent years to expand our corporate and investment banking
businesses. We successfully positioned our lending relationships as we continued to focus on origination and increased activity from client-
focused strategies, and our trading businesses took advantage of improved market conditions, particularly in the fixed income credit, equity
and municipal markets. We continued growing our businesses and won several significant mandates including acting as joint bookrunner
and sole swap arranger in a US$1 billion debt offering for AT&T.
• In the U.K. and Europe, we continued to expand our corporate and investment banking businesses. We won new mandates including acting
as sole financial advisor to the Irish government-owned utility Bord Gáis Eireann on its sale of Bord Gáis Energy for €1.1 billion.
• In Asia, we continued to focus on our fixed income trading distribution and foreign exchange trading capabilities, while in Australia, we
continued to selectively grow our corporate and investment banking business in mining, energy and infrastructure. We won new mandates
including acting as joint bookrunner in a US$3.25 billion debt offering for Westpac Banking Corporation.
• As a result of our successes in each of our regions, we received external recognition as an industry leader and were named or ranked:
– Best Investment Bank in Canada by Euromoney Magazine for the seventh consecutive year.
– The 10th largest investment bank globally and in the U.S. by fees for the first nine months of 2014 (Dealogic).
– The most trusted investment bank in the world and ranked second globally in terms of expertise and skills by the Economist.
– The 14th largest financial advisor to M&A deals globally by value for the first nine months of 2014 (Dealogic), up from 18th for the same
period last year.
Outlook and priorities
We expect continuing improvement in economic and market environments in 2015. We have positioned our business through strategic
investments in our U.S. and U.K. corporate and investment banking businesses in recent years to take advantage of these improved economic
conditions. As a result, we anticipate growth in our corporate and investment banking businesses reflecting our continued focus on lending and
client focused activities. However, we expect that growth in our net lending revenue will be impacted by increased competition and narrower
spreads. Overall we anticipate slight growth in our fixed income, currencies and commodities businesses reflecting improving market conditions.
We continue to work towards compliance with Volcker Rule restrictions in the U.S. on banking entities engaging in proprietary trading and
having certain relationships with hedge and private equity funds by July 2015. As a result, we have exited certain proprietary trading strategies
and believe that our remaining strategies are permitted under the Volcker Rule as we expect to conduct these in accordance with certain
exemptions from the regulation (e.g. activities found to be conducted solely outside the U.S.) We do not expect these changes to have a material
effect on our results in our global markets businesses. Further growth in our businesses will be dependent on continued growth in the global
economy, impacts associated with other regulatory reforms, and implications associated with heightened concerns from regulators related to
leveraged finance activities.
For further details, refer to our Risk management – Top and emerging risks section. For further details on our general economic outlook, refer
to the Economic and market review and outlook section.
Key strategic priorities for 2015
• Maintain our leadership position in Canada by focusing on long-term client relationships, leveraging our global capabilities, and continuing
to improve collaboration with Wealth Management.
• Expand and strengthen client relationships in the U.S. by building on our momentum through expanded origination, advisory and
distribution activity, and driving cross-selling through our diversified loan book.
• Build on our core strengths in Europe and Asia in both Corporate and Investment Banking and Global Markets by continuing to grow and
deepen client relationships.
• Optimize capital use to earn high risk-adjusted returns by maintaining both a balanced approach between investment banking and trading
revenues and a disciplined approach to managing the risk and costs of our business.
• Manage through the significant changes in the regulatory environment.
36 Royal Bank of Canada: Annual Report 2014 Management’s Discussion and Analysis
Capital Markets financial highlights Table 31
(Millions of Canadian dollars, except percentage amounts and as otherwise noted) 2014 2013 2012
Net interest income (1) $ 3,485 $ 2,872 $ 2,559
Non-interest income 3,881 3,708 3,629
Total revenue (1) 7,366 6,580 6,188
PCL 44 188 135
Non-interest expense 4,344 3,856 3,752
Net income before income taxes 2,978 2,536 2,301
Net income $ 2,055 $ 1,700 $ 1,576
Revenue by business
Corporate and Investment Banking $ 3,437 $ 3,014 $ 2,533
Global Markets 3,930 3,492 3,635
Other (1) 74 20
Key ratios
ROE 14.1% 14.1% 13.4%
Selected average balance sheet information
Total assets $ 392,300 $ 368,300 $ 349,200
Trading securities 103,800 100,800 90,400
Loans and acceptances 64,800 54,700 47,000
Deposits 47,600 38,400 33,700
Attributed capital 14,100 11,500 11,150
Other information
Number of employees (FTE) 3,927 3,729 3,658
Credit information
Gross impaired loans as a % of average net loans and acceptances 0.08% 0.42% 0.83%
PCL on impaired loans as a % of average net loans and acceptances 0.07% 0.34% 0.29%
Estimated impact of U.S. dollar, British pound and Euro translation on key income statement
items
(Millions of Canadian dollars, except percentage amounts) 2014 vs. 2013
Increase (decrease):
Total revenue $ 421
Non-interest expense 227
Net income 121
Percentage change in average US$ equivalent of C$1.00 (6)%
Percentage change in average British pound equivalent of C$1.00 (12)%
Percentage change in average Euro equivalent of C$1.00 (8)%
(1) The teb adjustment for 2014 was $492 million (2013 – $380 million, 2012 – $431 million). For further discussion, refer to the How we measure and report our business segments section.
2014 2013 2012
0
Europe
U.S.
Canada
Asia and other
Revenue by region
(Millions of Canadian dollars)
2,500
5,000
7,500
Financial performance
2014 vs. 2013
Net income increased $355 million or 21%, reflecting growth across most businesses, largely driven by strong equity markets, our continued
focus on origination and lending, and increased activity from client-focused strategies. Lower PCL also contributed to the increase. These factors
were partially offset by higher litigation provisions and related legal costs.
Total revenue increased $786 million or 12%, largely due to higher equity trading revenue reflecting strong market conditions, the impact of
foreign exchange translation, strong growth in most of our investment banking businesses and higher lending revenue. These factors were
partially offset by lower fixed income trading revenue largely driven by the unfavourable impact of the implementation of valuation adjustments
related to funding costs on uncollateralized OTC derivatives, and the exiting of certain proprietary trading strategies to comply with the Volcker
Rule. In addition, our revenue last year was favourably impacted by the disposition of our London Metal Exchange shares.
PCL decreased $144 million or 77%, as last year included higher provisions on a few accounts. For further details, refer to the Credit quality
performance section.
Non-interest expense increased $488 million or 13%, mainly due to the impact of foreign exchange translation, higher litigation provisions
and related legal costs, and higher variable compensation on improved results.
2013 vs. 2012
Net income increased $124 million or 8% from 2012, primarily due to strong growth in our corporate and investment banking businesses mainly
driven by higher lending, loan syndication and debt origination mainly in the U.S., and lower variable compensation. These factors were partially
Management’s Discussion and Analysis Royal Bank of Canada: Annual Report 2014 37
offset by lower revenue in our fixed income trading businesses largely in Europe, as a result of challenging market conditions in 2013, higher
litigation provisions and related legal costs, and higher PCL.
Business line review
Corporate and Investment Banking
Corporate and Investment Banking comprises our corporate lending, loan syndications, debt and equity origination, M&A advisory services,
private equity, research, client securitization and the global credit businesses. For debt and equity origination, revenue is allocated between
Corporate and Investment Banking and Global Markets based on the contribution of each group in accordance with an established agreement.
Financial performance
Corporate and Investment Banking revenue of $3,437 million increased $423 million or 14%, as compared to last year.
Investment banking revenue increased $162 million or 10%, mainly driven by strong growth in equity origination reflecting increased
issuance activity mainly in Canada and the U.S. Higher distributions on private equity investments and higher M&A activity reflecting increased
mandates primarily in the U.S. also contributed to the increase. These factors were partially offset by lower loan syndication activity mainly in the
U.S. compared to the strong levels last year.
Lending and other revenue increased $261 million or 18%, mainly due to strong growth in our lending portfolio.
Selected highlights Table 32
(Millions of Canadian dollars) 2014 2013 2012
Total revenue (1) $ 3,437 $ 3,014 $ 2,533
Breakdown of revenue (1)
Investment banking 1,736 1,574 1,338
Lending and other (2) 1,701 1,440 1,195
Other information
Average assets 49,500 40,000 33,800
Average loans and acceptances 42,530 34,350 27,875
(1) The teb adjustment for 2014 was $13 million (2013 – $2 million, 2012 – $10 million).
For further discussion, refer to the How we measure and report our business segments
section.
(2) Comprises our corporate lending, client securitization, and global credit businesses.
2014 2013 2012
0
800
1,600
4,000
2,400
Investment banking
Lending and other
3,200
Breakdown of total revenue (Millions of Canadian dollars)
Global Markets
Global Markets comprises our fixed income, foreign exchange, equity sales and trading, repos and secured financing and commodities
businesses.
Financial performance
Total revenue of $3,930 million increased $438 million or 13% as compared to last year.
Revenue in our Fixed income, currencies and commodities business decreased $33 million or 2%. The unfavourable impact of the
implementation of the FVA noted above, and the exiting of certain proprietary trading strategies to comply with the Volcker Rule, were largely
offset by higher fixed income trading revenue reflecting strong market conditions as compared to the challenging market conditions last year,
and higher commodities trading revenue.
Revenue in our Equities business increased $254 million or 26%, primarily due to strong equity markets and our continued focus on equity
origination and increased activity from client-focused strategies.
Revenue in our Repo and secured financing business increased $217 million or 32%, mainly due to higher trading revenue reflecting
increased client activity.
Selected highlights Table 33
(Millions of Canadian dollars) 2014 2013 2012
Total revenue (1) $ 3,930 $ 3,492 $ 3,635
Breakdown of revenue (1)
Fixed income, currencies and
commodities 1,801 1,834 2,052
Equities 1,243 989 927
Repo and secured financing (2) 886 669 656
Other information
Average assets 369,200 351,100 311,700
(1) The teb adjustment for 2014 was $470 million (2013 – $378 million, 2012 – $421
million). For further discussion, refer to the How we measure and report our business
segments section.
(2) Comprises our secured funding businesses for internal businesses and external clients.
2014 2013 2012
0
4,000
Global equities
Fixed income, currencies
and commodities
Repo and secured financing
Breakdown of total revenue (Millions of Canadian dollars)
1,000
3,000
2,000
38 Royal Bank of Canada: Annual Report 2014 Management’s Discussion and Analysis

Other
Other comprises our legacy portfolio which consists of our bank-owned life insurance (BOLI) stable value products, U.S. commercial mortgage-
backed securities, U.S. auction rate securities (ARS), and structured rates in Asia. In recent years, in order to optimize our capital employed to
improve our risk-adjusted returns and reduce our liquidity risk on various products, we have significantly reduced several of our legacy portfolios.
Our legacy portfolios decreased by 20% as compared to last year.
Financial performance
Revenue decreased $75 million as compared to last year, mainly due to gains taken on certain legacy portfolios in 2013.
Corporate Support
Corporate Support comprises Technology & Operations which provide the technological and operational foundation required to effectively
deliver products and services to our clients, and Functions which includes our finance, human resources, risk management, internal audit and
other functional groups. Reported results for Corporate Support mainly reflect certain activities related to monitoring and oversight of enterprise
activities which are not allocated to business segments. Corporate Support also includes our Corporate Treasury function. For further details,
refer to the How we measure and report our business segments section.
Corporate Support Table 34
(Millions of Canadian dollars, except number of) 2014 2013 2012
Net interest income (loss) (1) $ (313) $ (124) $ (184)
Non-interest income (loss) 164 (12) 68
Total revenue (1) (149) (136) (116)
PCL (2) 3–
Non-interest expense 89 72 39
Net income (loss) before income taxes (1) (236) (211) (155)
Income taxes (recoveries) (1) (405) (653) (513)
Net income (2) $ 169 $ 442 $ 358
Other information
Number of employees (FTE) 12,388 11,871 11,508
(1) Teb adjusted.
(2) Net income reflects income attributable to both shareholders and Non-Controlling Interests (NCI). Net income attributable to NCI for the year ended October 31, 2014 was $93 million
(October 31, 2013 – $93 million; October 31, 2012 – $92 million).
Due to the nature of activities and consolidated adjustments reported in this segment, we believe that a comparative period analysis is not
relevant. The following identifies material items affecting the reported results in each period.
Net interest income (loss) and income taxes (recoveries) in each period in Corporate Support include the deduction of the teb adjustments
related to the gross-up of income from Canadian taxable corporate dividends recorded in Capital Markets. The amount deducted from net
interest income (loss) was offset by an equivalent increase in income taxes (recoveries). The teb amount for the year ended October 31, 2014
was $492 million as compared to $380 million last year and $431 million for the year ended October 31, 2012. For further discussion, refer to
the How we measure and report our business segments section.
In addition to the teb impacts noted above, the following identifies the other material items affecting the reported results in each period.
2014
Net income was $169 million largely reflecting asset/liability management activities and gains on private equity investments mainly related to
the sale of a legacy portfolio, partially offset by net unfavourable tax adjustments.
2013
Net income was $442 million largely reflecting net favourable tax adjustments, including $214 million of income tax adjustments related to
previous years, and asset/liability management activities.
2012
Net income was $358 million largely reflecting the settlement of several tax matters with the CRA which resulted in the release of $128 million of
tax uncertainty provisions and interest income of $72 million ($53 million after-tax) related to a refund of taxes paid and asset/liability
management activities.
Quarterly financial information
Fourth quarter 2014 performance
Q4 2014 vs. Q4 2013
Fourth quarter net income of $2,333 million, was up $232 million or 11% from last year. Diluted EPS of $1.57 was up $0.18 and ROE of 19.0%
was up 20 bps. Our fourth quarter earnings reflected higher earnings from growth in average fee-based client assets in Wealth Management, and
higher earnings in Canadian Banking reflecting strong fee-based revenue growth and solid volume growth of 5%. Lower net claims costs and
business growth in European Life and U.K. annuity products in Insurance also contributed to the increase. These factors were partially offset by
lower trading results in Capital Markets. Our fourth quarter results last year were impacted by a charge of $160 million ($118 million after-tax) as
Management’s Discussion and Analysis Royal Bank of Canada: Annual Report 2014 39

a result of new tax legislation in Canada, which affects the policyholders’ tax treatment of certain individual life insurance policies, which was
largely offset by net favourable income tax adjustments including a $124 million income tax adjustment related to prior years.
Total revenue increased $463 million or 6%, mainly due to higher revenue from growth in average fee-based client assets in Wealth
Management, strong fee-based revenue growth primarily attributable to higher mutual fund distribution fees and card services revenue, solid
volume growth of 5% across most of our Canadian Banking businesses, and favourable net cumulative accounting adjustments in the current
quarter of $55 million ($40 million after-tax) in Canadian Banking. Higher corporate and investment banking revenue mainly reflecting increased
investment banking activity and strong growth in lending in Capital Markets, as well as a change in the fair value of investments backing our
policyholder liabilities in Insurance, largely offset in PBCAE, also contributed to the increase. These factors were partly offset by lower trading
revenue which included the unfavourable impact of the implementation of FVA on uncollateralized OTC derivatives and the exiting of certain
proprietary trading strategies during the quarter to comply with the Volcker Rule.
Total PCL increased $11 million from last year, mainly reflecting an additional provision of $50 million related to our impaired residential
mortgages portfolio in the Caribbean, and a provision on a single account in Capital Markets. These factors were partly offset by lower provisions
in our Canadian personal lending portfolio. In addition, our PCL last year included provisions on a few accounts in Wealth Management. The PCL
ratio of 31 bps decreased 1 bp from last year.
PBCAE decreased $126 million or 14%, as last year was impacted by the charge related to new tax legislation in Canada noted above. A
favourable claims adjustment in our life retrocession business also contributed to the decrease. These factors were partially offset by the change
in fair value of investments backing our policyholder liabilities, which was largely offset in revenue.
Non-interest expense increased $189 million or 5%, primarily reflecting higher costs in support of business growth, higher variable
compensation in Wealth Management driven by higher revenue, and increased marketing costs. These factors were partially offset by continuing
benefits from our efficiency management activities.
Q4 2014 vs. Q3 2014
Net income of $2,333 million decreased $45 million, or 2% compared to the prior quarter, as solid revenue growth in our retail businesses
including higher earnings from average fee-based client assets in Wealth Management, and the favourable net cumulative accounting adjust-
ments noted above and fee-based revenue growth in Canadian Banking were more than offset by lower trading results reflecting challenging
market conditions compared to strong levels last quarter, the implementation of FVA, and the exiting of certain proprietary trading strategies
noted above. Lower results in most investment banking businesses compared to strong levels last quarter, and restructuring costs related to our
U.S. and International Wealth Management businesses also contributed to the decrease. Our prior quarter results were impacted by a loss of
$40 million (before- and after-tax) related to the closing of the sale of RBC Jamaica.
Quarterly results and trend analysis
Our quarterly results are impacted by a number of trends and recurring factors, which include seasonality of certain businesses, general
economic and market conditions, and fluctuations in the Canadian dollar relative to other foreign currencies. The following table summarizes our
results for the last eight quarters (the period):
Quarterly results (1), (2) Table 35
2014 2013
(Millions of Canadian dollars, except per share and percentage amounts) Q4 Q3 Q2 Q1 Q4 Q3 Q2 Q1
Net interest income $ 3,560 $ 3,647 $ 3,449 $ 3,460 $ 3,351 $ 3,392 $ 3,222 $ 3,284
Non-interest income 4,822 5,343 4,827 5,000 4,568 3,784 4,501 4,580
Total revenue $ 8,382 $ 8,990 $ 8,276 $ 8,460 $ 7,919 $ 7,176 $ 7,723 $ 7,864
PCL 345 283 244 292 334 267 287 349
PBCAE 752 1,009 830 982 878 263 938 705
Non-interest expense 4,340 4,602 4,332 4,387 4,151 3,999 4,015 4,049
Net income before income taxes $ 2,945 $ 3,096 $ 2,870 $ 2,799 $ 2,556 $ 2,647 $ 2,483 $ 2,761
Income taxes 612 718 669 707 455 362 574 714
Net income $ 2,333 $ 2,378 $ 2,201 $ 2,092 $ 2,101 $ 2,285 $ 1,909 $ 2,047
EPS – basic $ 1.57 $ 1.59 $ 1.47 $ 1.39 $ 1.40 $ 1.52 $ 1.26 $ 1.35
– diluted 1.57 1.59 1.47 1.38 1.39 1.51 1.25 1.34
Segments – net income (loss)
Personal & Commercial Banking $ 1,151 $ 1,138 $ 1,115 $ 1,071 $ 1,070 $ 1,167 $ 1,039 $ 1,104
Wealth Management 285 285 278 235 202 233 222 229
Insurance 256 214 154 157 107 160 164 164
Investor & Treasury Services 113 110 112 106 91 104 65 79
Capital Markets 402 641 507 505 469 386 383 462
Corporate Support 126 (10) 35 18 162 235 36 9
Net income – total $ 2,333 $ 2,378 $ 2,201 $ 2,092 $ 2,101 $ 2,285 $ 1,909 $ 2,047
Effective income tax rate 20.8% 23.2% 23.3% 25.3% 17.8% 13.7% 23.1% 25.9%
Period average US$ equivalent of C$1.00 $ 0.900 $ 0.925 $ 0.907 $ 0.926 $ 0.960 $ 0.963 $ 0.982 $ 1.005
(1) Fluctuations in the Canadian dollar relative to other foreign currencies have affected our consolidated results over the period.
(2) Comparative amounts have been revised from those previously presented.
Seasonality
Seasonal factors impact our results in most quarters. The first quarter is seasonally stronger for our capital markets businesses. The second
quarter has fewer days than the other quarters, which generally results in a decrease in net interest income and certain expense items. The third
quarter results for Investor Services are generally favourably impacted by higher securities lending as a result of the European dividend season.
The third and fourth quarters include the summer months during which market activity generally tends to slow, negatively impacting the results
of our capital markets, brokerage and investment management businesses.
40 Royal Bank of Canada: Annual Report 2014 Management’s Discussion and Analysis

Notable items affecting our consolidated results
• In the third quarter of 2014, our results included a loss of $40 million (before- and after-tax) which includes foreign currency translation
related to the closing of the sale of RBC Jamaica.
• In the first quarter of 2014, our results included a loss of $60 million (before- and after-tax) related to the announced sale of RBC Jamaica,
as well as a provision of $40 million ($32 million after-tax) related to post-employment benefits and restructuring charges in the Caribbean.
• In the fourth quarter of 2013, our results included a charge of $160 million ($118 million after-tax) as a result of new tax legislation in
Canada, which affects the policyholders’ tax treatment of certain individual life insurance policies, as well as net favourable income tax
adjustments including a $124 million income tax adjustment related to prior years.
• In the third quarter of 2013, our results included net favourable income tax adjustments including a $90 million income tax adjustment
related to 2012.
• In the second quarter of 2013, our results included a restructuring charge of $44 million ($31 million after-tax) related to the integration of
Investor Services, primarily in Europe.
Trend analysis
Economic conditions in Canada and the U.S. have continued to improve over the period, driven mostly by solid consumer spending supported by
strengthening labour markets, along with firm housing market activity. Capital markets in both countries have generally strengthened since
2013, despite the recent conclusion of the Fed’s monthly asset purchase program. Global equity indices experienced volatility throughout the
period resulting from geopolitical uncertainty and the possibility of Euro area recession. For further details, refer to the Economic and market
review and outlook section.
Earnings have generally trended upwards over the period, driven by solid volume growth in our Canadian Banking businesses and higher
earnings from growth in average-fee based client assets reflecting capital appreciation and strong net sales in Wealth Management. Capital
Markets results have generally trended upwards since the third quarter of 2013, and were negatively impacted in the fourth quarter of 2014 by
the implementation of FVA on uncollateralized OTC derivatives, and the exiting of certain proprietary trading strategies to comply with the
Volcker Rule. Results in our Insurance segment have continued to fluctuate over the period, largely due to the timing of new U.K. annuity
contracts, claims costs, and actuarial adjustments, and have generally trended upwards since the fourth quarter of 2013. Insurance results in the
fourth quarter of 2013 were impacted by an unfavourable charge resulting from new tax legislation in Canada as noted above. Investor &
Treasury Services results have generally trended upwards due to benefits from our efficiency management activities and improved business
performance, and have generally been stable over the past four quarters.
Revenue generally trended upwards over the period, mostly due to solid volume growth in our Canadian Banking businesses, and higher
revenue from growth in average fee-based client assets in Wealth Management. Trading revenue has generally trended upwards since the third
quarter of 2013, and was unfavourably impacted in the fourth quarter of 2014 by the implementation of FVA and the exiting of certain proprietary
trading strategies as noted above. Net interest income has trended upwards over the period, largely due to solid volume growth across our
Canadian Banking businesses.
Despite increased lending, strong asset quality has resulted in PCL remaining relatively stable over the period. The fourth quarter of 2014
included an additional provision in Personal & Commercial Banking related to our impaired residential mortgages portfolio in the Caribbean,
while Wealth Management had provisions in the last two quarters of 2013 and the first quarter of 2014 related to a few accounts. PCL in Capital
Markets has fluctuated over the period, with provisions in the first two quarters of 2013 and the last quarter of 2014 mainly related to a few
accounts.
PBCAE has fluctuated quarterly as it includes the changes to the fair value of investments backing our policyholder liabilities, which is
largely offset in revenue. PBCAE has also been impacted by volume growth in our Insurance businesses as well as actuarial liability adjustments
and generally lower claims costs. PBCAE in the fourth quarter of 2013 included a charge as a result of new tax legislation in Canada as noted
above.
While we continue to focus on efficiency management activities, non-interest expense has generally trended upwards over the period largely
in support of business growth. The first quarter of 2014 was impacted by the loss related to the sale of RBC Jamaica and a provision in the
Caribbean as noted above, while the third quarter of 2014 was impacted by foreign currency translation related to the closing of the sale of RBC
Jamaica, also noted above.
Our effective income tax rate has fluctuated over the period, mostly due to varying levels of income being reported in jurisdictions with
different tax rates, as well as fluctuating levels of income from tax-advantaged sources such as Canadian taxable corporate dividends. Our
effective income tax rate has also been impacted by various favourable tax adjustments as noted above.
Management’s Discussion and Analysis Royal Bank of Canada: Annual Report 2014 41
Results by geographic segment (1)
For geographic reporting, our segments are grouped into Canada, U.S. and Other International. Transactions are primarily recorded in the location
that best reflects the risk due to negative changes in economic conditions and prospects for growth due to positive economic changes. The
following table summarizes our financial results by geographic region.
Table 36
2014 2013 (2) 2012 (2)
(Millions of Canadian dollars) Canada U.S.
Other
International Total Canada U.S.
Other
International Total Canada U.S.
Other
International Total
Continuing operations
Net interest income $ 11,121 $ 1,896 $ 1,099 $ 14,116 $ 10,956 $ 1,603 $ 690 $ 13,249 $ 10,391 $ 1,308 $ 740 $ 12,439
Non-interest income 10,495 4,256 5,241 19,992 8,606 3,835 4,992 17,433 9,059 3,569 4,080 16,708
Total revenue $ 21,616 $ 6,152 $ 6,340 $ 34,108 $ 19,562 $ 5,438 $ 5,682 $ 30,682 $ 19,450 $ 4,877 $ 4,820 $ 29,147
PCL 922 52 190 1,164 892 78 267 1,237 1,018 90 191 1,299
PBCAE 2,188 1 1,384 3,573 1,425 10 1,349 2,784 2,315 21 1,285 3,621
Non-interest expense 9,650 4,222 3,789 17,661 9,210 3,681 3,323 16,214 8,586 3,406 2,649 14,641
Income taxes 1,983 672 51 2,706 1,709 396 - 2,105 1,527 521 (20) 2,028
Net income from continuing
operations $ 6,873 $ 1,205 $ 926 $ 9,004 $ 6,326 $ 1,273 $ 743 $ 8,342 $ 6,004 $ 839 $ 715 $ 7,558
Net loss from discontinued
operations –– – – – – – – (51) – (51)
Net income $ 6,873 $ 1,205 $ 926 $ 9,004 $ 6,326 $ 1,273 $ 743 $ 8,342 $ 6,004 $ 788 $ 715 $ 7,507
(1) For further details, refer to Note 30 of our 2014 Annual Consolidated Financial Statements.
(2) Amounts have been revised from those previously presented.
2014 vs. 2013
Net income in Canada was up $547 million or 9% from last year, mainly due to solid volume growth across most of our businesses in Canadian
Banking, and higher earnings from growth in average fee-based client assets resulting from capital appreciation and strong net sales in Wealth
Management. Strong fee-based revenue growth primarily attributable to higher mutual fund distribution fees and card services revenue in
Canadian Banking also contributed to the increase. These factors were partially offset by higher costs in support of business growth including
higher staff and marketing costs, and the unfavourable impact of the implementation of the FVA. In addition, results last year benefited from net
favourable tax adjustments. Our results last year were also unfavourably impacted by a charge of $160 million ($118 million after-tax) as a result
of new tax legislation in Canada, which affects the policyholders’ tax treatment of certain individual life insurance policies.
U.S. net income decreased $68 million or 5% from last year, as last year benefited from favourable income tax adjustments, including $214
million related to prior years. Strong growth in our lending portfolio, strong equity markets and our continued focus on equity origination and
increased activity from client-focused strategies were partly offset by higher litigation provisions and related legal costs in Capital Markets.
Other International net income was up $183 million or 25% from the previous year, largely due to lower PCL in Capital Markets, higher
trading revenue in Europe, and higher lending in Capital Markets. These factors were partially offset by a loss of $100 million (before- and after-
tax) related to the sale of RBC Jamaica, and a provision of $40 million ($32 million after-tax) related to post-employment benefits and
restructuring charges in the Caribbean. In addition, last year was unfavourably impacted by a restructuring charge of $44 million related to the
integration of Investor Services, primarily in Europe.
2013 vs. 2012
Net income in Canada was up $322 million or 5% compared to 2012, mainly due to solid volume growth across all businesses in Canadian
Banking. Higher earnings from growth in average fee-based client assets in Wealth Management, strong growth in our corporate and investment
banking businesses driven by higher lending, M&A and loan syndication activity, improved credit quality in our Canadian Banking portfolio, and
the contribution of our acquisition of Ally Canada also contributed to the increase. These factors were partially offset by spread compression and
a charge of $160 million ($118 million after-tax) in Insurance as a result of new tax legislation in Canada. In addition, the 2012 results were
favourably impacted by a settlement of several tax matters with the CRA which resulted in the release of $128 million of tax uncertainty provi-
sions and interest income of $72 million ($53 million after-tax) and a favourable adjustment related to a change in estimate of mortgage
prepayment interest of $125 million ($92 million after-tax). Our results in 2012 were also unfavourably impacted by an impairment loss related
to the acquisition of the remaining 50% stake of RBC Dexia of which $105 million (before- and after-tax) was recorded in our Canadian
operations.
U.S. net income increased $485 million or 62% compared to 2012, largely due to favourable income tax adjustments of $214 million
related to prior years. Strong growth in our corporate and investment banking businesses mainly driven by higher loan syndication and higher
lending, and higher earnings from growth in average fee-based client assets and higher transaction volumes in Wealth Management also
contributed to the increase. These factors were partially offset by higher variable compensation in Wealth Management and Capital Markets.
Other International net income was up $28 million or 4% compared to 2012, largely due to strong growth in our corporate and investment
banking businesses. Improved business performance in Investor Services including higher revenue and continuing benefits from our efficiency
management activities, lower variable compensation in Capital Markets, and higher earnings from growth in average fee-based client assets and
higher transaction volumes in Wealth Management also contributed to the increase. In addition, the 2012 results were unfavourably impacted by
the impairment loss related to our acquisition of RBC Dexia as noted above of which $63 million (before- and after-tax) was recorded in our Other
International operations, and our proportionate share of the loss on the securities exchange and trading losses recorded by RBC Dexia. These
factors were partially offset by lower trading revenue largely in Europe, higher PCL in Wealth Management and Capital Markets, and a provision
related to post-employment benefits and restructuring charges in the Caribbean of $40 million ($31 million after-tax).
42 Royal Bank of Canada: Annual Report 2014 Management’s Discussion and Analysis

Financial condition
Condensed balance sheets (1) Table 37
As at October 31 (Millions of Canadian dollars) 2014 2013 2012
Assets
Cash and due from banks $ 17,421 $ 15,550 $ 12,428
Interest-bearing deposits with banks 8,399 9,039 10,246
Securities 199,148 182,710 161,602
Assets purchased under reverse repurchase agreements and securities borrowed 135,580 117,517 112,257
Loans
Retail 334,987 320,627 300,288
Wholesale 102,236 90,182 79,949
Allowance for loan losses (1,994) (1,959) (1,996)
Segregated fund net assets 675 513 383
Other – Derivatives 87,402 74,822 91,293
– Other 56,696 50,744 57,504
Total assets $ 940,550 $ 859,745 $ 823,954
Liabilities
Deposits $ 614,100 $ 563,079 $ 512,244
Segregated fund liabilities 675 513 383
Other – Derivatives 88,982 76,745 96,761
– Other 174,431 162,505 162,030
Subordinated debentures 7,859 7,443 7,615
Total liabilities 886,047 810,285 779,033
Equity attributable to shareholders 52,690 47,665 43,160
Non-controlling interests 1,813 1,795 1,761
Total equity 54,503 49,460 44,921
Total liabilities and equity $ 940,550 $ 859,745 $ 823,954
(1) Foreign currency-denominated assets and liabilities are translated to Canadian dollars.
Our consolidated balance sheet was impacted by foreign exchange translation which increased our total assets and our total liabilities and
equity by approximately $21 billion compared to last year due to the weaker Canadian dollar.
2014 vs. 2013
Total assets were up $81 billion or 9% from last year.
Interest-bearing deposits with banks decreased by $1 billion or 7%, largely reflecting lower deposits with central banks.
Securities were up $16 billion or 9% compared to last year, primarily due to the impact of foreign exchange translation, increased equity
trading positions in support of business activity, and an increase in corporate debt securities largely reflecting our management of liquidity and
funding risk.
Assets purchased under reverse repurchase agreements (reverse repos) and securities borrowed increased $18 billion or 15%, mainly
attributable to increased client activity, and the impact of foreign exchange translation.
Loans were up $26 billion or 6%, predominantly due to volume growth in residential mortgages and growth in wholesale loans. The impact
of foreign exchange translation also contributed to the increase.
Derivative assets were up $13 billion or 17%, mainly attributable to increased fair values on interest rate swaps, cross currency interest rate
swaps, foreign exchange forward contracts, and equity contracts, partially offset by increased financial netting.
Other assets were up $6 billion or 12%, partially reflecting an increase in customers’ liability under acceptances and the impact of foreign
exchange translation.
Total liabilities were up $76 billion or 9% from last year.
Deposits increased $51 billion or 9%, mainly reflecting higher business deposits, largely due to increased client activity and our issuances
of fixed term notes and covered bonds to satisfy funding requirements. The impact of foreign exchange translation and demand for our high-yield
savings accounts and other product offerings in our retail business also contributed to the increase.
Derivative liabilities were up $12 billion or 16%, primarily attributable to increased fair values on interest rate swaps, cross currency interest
rate swaps, foreign exchange forward contracts, and equity contracts, partially offset by increased financial netting.
Other liabilities increased $12 billion or 7%, mainly resulting from the impact of foreign exchange translation, an increase in bankers’
acceptances due to increased client activity, higher cash collateral requirements, and higher obligations related to securities sold short.
Total equity increased $5 billion or 10%, largely reflecting earnings, net of dividends.
Off-balance sheet arrangements
In the normal course of business, we engage in a variety of financial transactions that, for accounting purposes, are not recorded on our
Consolidated Balance Sheets. Off-balance sheet transactions are generally undertaken for risk, capital and funding management purposes which
benefit us and our clients. These include transactions with structured entities and may also include the issuance of guarantees. These trans-
actions give rise to, among other risks, varying degrees of market, credit, liquidity and funding risk, which are discussed in the Risk management
section.
We use structured entities to securitize our financial assets as well as assist our clients in securitizing their financial assets. These entities
are not operating entities, typically have no employees, and may or may not be recorded on our Consolidated Balance Sheets.
Management’s Discussion and Analysis Royal Bank of Canada: Annual Report 2014 43

Securitizations of our financial assets
We periodically securitize our credit card receivables, residential and commercial mortgage loans and bond participation certificates primarily to
diversify our funding sources, enhance our liquidity position and for capital purposes. We also securitize residential and commercial mortgage
loans for sales and trading activities. Securitization can be used as a cost-effective fund raising technique compared to the relative cost of
issuing unsecured wholesale debt.
The majority of our securitization activities are recorded on our Consolidated Balance Sheets. We securitize our credit card receivables, on a
revolving basis, through a consolidated structured entity. We securitize single and multiple-family residential mortgages through the National
Housing Act Mortgage-Backed Securities (NHA MBS) program, which are not derecognized from our Consolidated Balance Sheets. For details of
these activities, refer to Note 6 and Note 7 of our 2014 Annual Consolidated Financial Statements.
We periodically securitize residential mortgage loans for the Canadian social housing program through the NHA MBS program which are
derecognized from our Consolidated Balance Sheets when sold to third party investors. During 2014, we securitized $158 million of residential
mortgage loans for the Canadian social housing program (2013 – $nil).
We also periodically securitize commercial mortgages by selling them in collateral pools, which meet certain diversification, leverage and
debt coverage criteria, to structured entities, one of which is sponsored by us. Securitized commercial mortgage loans are derecognized from our
Consolidated Balance Sheets as we have transferred substantially all of the risk and rewards of ownership of the securitized assets. Our
continuing involvement with the transferred assets is limited to servicing the underlying commercial mortgages sold to our sponsored structured
entity. As at October 31, 2014, there were $1.3 billion of commercial mortgages outstanding related to these securitization activities (October
31, 2013 – $1.3 billion). During 2014, we securitized $173 million of commercial mortgages which were sold to our sponsored entity (2013 –
$nil).
In prior years, we participated in bond securitization activities where we purchased government, government related and corporate bonds
and repackaged those bonds in participation certificates, which were sold to third party investors. Securitized bond participation certificates are
derecognized from our Consolidated Balance Sheets as we have transferred substantially all of the risk and rewards of ownership of the securi-
tized assets. Our continuing involvement with the transferred assets is limited to servicing the underlying bonds. As at October 31, 2014, there
were $482 million of bond participation certificates outstanding related to these prior period securitization activities (October 31, 2013 – $624
million). We did not securitize bond participation certifications during 2014 or 2013.
Involvement with unconsolidated structured entities
In the normal course of business, we engage in a variety of financial transactions with structured entities to support our customers’ financing and
investing needs, including securitization of client financial assets, creation of investment products, and other types of structured financing.
We have the ability to use credit mitigation tools such as third party guarantees, credit default swaps, and collateral to mitigate risks
assumed through securitization and re-securitization exposures. The process in place to monitor the credit quality of our securitization and re-
securitization exposures involves, among other things, reviewing the performance data of the underlying assets. We affirm our ratings each
quarter and formally confirm or assign a new rating at least annually. For further details on our activities to manage risks, refer to the Risk
management section.
Below is a description of our involvement in certain significant unconsolidated structured entities. For a complete discussion of our interests
in consolidated and unconsolidated structured entities, refer to Note 7 to our 2014 Annual Consolidated Financial Statements.
RBC-administered multi-seller conduits
We administer multi-seller conduits which are used primarily for the securitization of our clients’ financial assets. We are involved in these
conduit markets because our clients value these transactions. Our clients primarily use multi-seller conduits to diversify their financing sources
and to reduce funding costs by leveraging the value of high-quality collateral. The conduits offer us a favourable revenue stream, risk-adjusted
return and cross-selling opportunities.
We provide services such as transaction structuring, administration, backstop liquidity facilities and partial credit enhancements to the
multi-seller conduits. Fee revenue for all such services amounted to $168 million during the year (2013 – $153 million). We do not maintain any
ownership or retained interests in these multi-seller conduits and have no rights to, or control of, their assets.
Our total commitment to the conduits in the form of backstop liquidity and credit enhancement facilities is shown below. The total
committed amount of these facilities exceeds the total amount of the maximum assets that may have to be purchased by the conduits under the
purchase agreements. As a result, the maximum exposure to loss attributable to our backstop liquidity and credit enhancement facilities is less
than the total committed amounts of these facilities.
Liquidity and credit enhancement facilities Table 38
2014 2013
As at October 31 (Millions of Canadian dollars)
Notional of
committed
amounts (1)
Allocable
notional
amounts
Outstanding
loans
Maximum
exposure
to loss (3)
Notional of
committed
amounts (1)
Allocable
notional
amounts
Outstanding
loans (2)
Maximum
exposure
to loss (3)
Backstop liquidity facilities $ 31,019 $ 27,340 $ 864 $ 28,204 $ 31,675 $ 27,875 $ 896 $ 28,771
Credit enhancement facilities 2,928 2,815 – 2,815 2,889 2,785 – 2,785
Total $ 33,947 $ 30,155 $ 864 $ 31,019 $ 34,564 $ 30,660 $ 896 $ 31,556
(1) Based on total committed financing limit.
(2) Net of allowance for loan losses and write-offs.
(3) Not presented in the table above are derivative assets with a fair value of $nil (2013 – $44 million) which are a component of our total maximum exposure to loss from our interests in the
multi-seller conduits. Refer to Note 7 of our 2014 Annual Consolidated Financial Statements for more details.
As at October 31, 2014, the notional amount of backstop liquidity facilities we provide decreased by $656 million or 2.1% from last year. Total
loans extended to the multi-seller conduits under the backstop liquidity facilities decreased by $32 million from last year primarily due to
principal repayments. The partial credit enhancement facilities we provide increased by $39 million from last year. The decrease in the amount of
backstop liquidity facilities provided to the multi-seller conduits compared to last year primarily reflects a decrease in the outstanding securi-
tized assets of the multi-seller conduits. The increase in the amount of credit enhancement facilities provided to the multi-seller conduits
compared to last year primarily reflects a fluctuation in exchange rates.
44 Royal Bank of Canada: Annual Report 2014 Management’s Discussion and Analysis

Maximum exposure to loss by client type Table 39
2014 2013
As at October 31 (Millions) (US$) (C$) Total (C$) (US$) (C$) Total (C$)
Outstanding securitized assets
Credit cards $ 5,768 $ 510 $ 7,011 $ 6,096 $ 510 $ 6,866
Auto loans and leases 8,154 1,793 10,983 8,643 2,252 11,264
Student loans 2,536 – 2,858 3,374 – 3,518
Trade receivables 2,094 112 2,472 2,688 56 2,859
Asset-backed securities 767 – 864 859 – 896
Equipment receivables 1,301 – 1,466 1,649 – 1,720
Electricity market receivables –– – – 173 173
Dealer floor plan receivables 1,053 771 1,958 765 740 1,538
Fleet finance receivables 436 377 869 313 265 592
Insurance premiums 127 – 144 87 – 90
Corporate loan receivables –– –75 – 78
Residential mortgages – 1,275 1,275 – 1,530 1,530
Transportation finance 857 153 1,119 415 – 432
Total $ 23,093 $ 4,991 $ 31,019 $ 24,964 $ 5,526 $ 31,556
Canadian equivalent $ 26,028 $ 4,991 $ 31,019 $ 26,030 $ 5,526 $ 31,556
Our overall exposure decreased 1.7% compared to last year reflecting a decrease in the outstanding securitized assets of the multi-seller conduits.
Correspondingly, total assets of the multi-seller conduits decreased by $647 million or 2.1% over last year, primarily due to decrease in the
Student loans, Trade receivables, Auto loans and leases, Residential mortgages, Equipment and Electricity market receivables asset classes, which
was partially offset by increases in the Transportation finance, Dealer floor plan and Fleet finance receivables and Credit cards asset classes. 100%
of multi-seller conduits assets were internally rated A or above, compared to 99.5% last year. All transactions funded by the unconsolidated multi-
seller conduits are internally rated using a rating system which is largely consistent with that of the external rating agencies.
Multiple independent debt rating agencies review all of the transactions in the multi-seller conduits. Transactions financed in the U.S. multi-
seller conduits are reviewed by Moody’s Investors Service (Moody’s), Standard & Poor’s (S&P) and Fitch Ratings (Fitch). Transactions in the
Canadian multi-seller conduits are also reviewed by Dominion Bond Rating Services (DBRS). Each applicable rating agency also reviews ongoing
transaction performance on a monthly basis and may publish reports detailing portfolio and program information related to the conduits.
As at October 31, 2014, the total asset-backed commercial paper (ABCP) issued by the conduits amounted to $19.8 billion, an increase of
$1.0 billion or 5.6% from last year. The increase in the amount of ABCP issued by the multi-seller conduits compared to last year is primarily due
to exchange rate fluctuations. The rating agencies that rate the ABCP rated 73% (October 31, 2013 – 75%) of the total amount issued within the
top ratings category and the remaining amount in the second highest ratings category.
We sometimes purchase ABCP issued by the multi-seller conduits in our capacity as a placement agent in order to facilitate overall program
liquidity. As at October 31, 2014, the fair value of our inventory was $42 million, an increase of $28 million from last year. The fluctuations in
inventory held reflect normal trading activity. This inventory is classified as Securities – Trading on our Consolidated Balance Sheets.
Structured finance
We invest in ARS of trusts which fund their long-term investments in student loans by issuing short-term senior and subordinated notes. Our
maximum exposure to loss in these ARS trusts as at October 31, 2014 was $913 million (2013 – $870 million). The increase in our maximum
exposure to loss is primarily related to exchange rate differences. As at October 31, 2014, approximately 89.8% of these investments were AAA
rated. Interest income from the ARS investments, which is reported in Net-interest income was $7.2 million during the year
(2013 – $12.6 million).
We also provide liquidity facilities to certain municipal bond Tender Option Bond (TOB) trusts in which we have an interest but do not
consolidate because the residual certificates issued by the TOB trusts are held by third parties. As at October 31, 2014, our maximum exposure
to loss from these unconsolidated municipal bond TOB trusts was $749 million (2013 – $572 million). The increase in our maximum exposure to
loss relative to last year is primarily related to new TOB trusts and an increase in our TOB funding limits. Fee revenue from provision of liquidity
facilities to these entities reported in Non-interest income was $2.8 million during the year (2013 – $3.6 million).
During this fiscal year, we entered the collateralized loan obligation market as a senior warehouse lender and structuring and placement
agent. We now provide senior warehouse financing to discrete unaffiliated structured entities that are established by third parties to acquire
loans and issue a term collateralized loan obligation transaction. A portion of the proceeds from the sale of the term collateralized loan obliga-
tions certificates is used to fully repay the senior warehouse financing that we provide. As at October 31, 2014 all such loans made during the
year have been repaid.
Investment funds
We enter into fee-based equity derivative transactions with third parties including mutual funds, unit investment trusts and other investment
funds. These transactions provide their investors with the desired exposure to the reference funds, and we economically hedge our exposure
from these derivatives by investing in those third party managed reference funds. Our maximum exposure as at October 31, 2014, which is
primarily related to our investments in such reference funds, was $3.4 billion (October 31, 2013 – $2.7 billion). The increase in our maximum
exposure compared to last year is primarily due to exchange rate differences and positive performance of the reference funds.
Beginning in the first quarter of 2013, we also provide liquidity facilities to certain third party investment funds. The funds issue unsecured
variable-rate preferred shares and invest in portfolios of tax exempt bonds. As at October 31, 2014, our maximum exposure to these funds was
$641 million (October 31, 2013 – $594 million). The increase in our maximum exposure compared to last year is primarily due to exchange rate
differences.
Management’s Discussion and Analysis Royal Bank of Canada: Annual Report 2014 45

Third-party securitization vehicles
We hold interests in certain unconsolidated third-party securitization vehicles, which are structured entities. We, as well as other financial
institutions, are obligated to provide funding to these entities up to our maximum commitment level and are exposed to credit losses on the
underlying assets after various credit enhancements. As at October 31, 2014, our maximum exposure to loss in these entities was $2.4 billion
(October 31, 2013 – $2.2 billion). The increase in our maximum exposure compared to last year reflects additional securitized assets and
exchange rate fluctuations. Interest and non-interest income earned in respect of these investments was $20 million (2013 – $26 million).
Guarantees, retail and commercial commitments
We provide guarantees and commitments to our clients that expose us to liquidity and funding risks. Our maximum potential amount of future
payments in relation to our commitments and guarantee products as at October 31, 2014 amounted to $258 billion compared to $232 billion
last year. The increase compared to last year relates primarily to business growth and the impact of foreign currency translation in other
commitments. Refer to Liquidity and funding risk and Note 26 to our 2014 Annual Consolidated Financial Statements for details regarding our
guarantees and commitments.
Risk management
Overview
The ability to manage risk well is a core competency at RBC, and is supported by strong risk conduct and an effective risk management approach.
RBC defines risk as the potential for loss or an undesirable outcome with respect to volatility of actual earnings in relation to expected earnings,
capital adequacy or liquidity. The organization design and governance processes of Group Risk Management (GRM) assures independence from
the businesses it supports. Our ability to manage these risks is supported by both strong risk conduct and an effective risk management
approach.
We manage our risks by seeking to ensure that business activities and transactions provide an appropriate balance of return for the risks
assumed and remain within our Risk Appetite, which is collectively managed throughout RBC, through adherence to our Enterprise Risk Appetite
Framework. Our major risk categories include credit, market, liquidity and funding, insurance, regulatory compliance, operational, strategic,
reputation, legal and regulatory environment, competitive, and systemic risk. In order to avoid excessive concentration of risks, we strive to
diversify our business lines, products and industries.
Mission statement
Build shareholder value through leadership in the strategic management of risk.
Objectives
The key objectives of GRM are to:
• Provide independent and objective oversight of the management of significant risks arising from the bank’s businesses and operations;
• Maintain an effective enterprise-wide risk management process through working in partnership with all areas of RBC;
• Ensure the continuous improvement in risk management processes, tools and practices; and
• Promote strong risk conduct.
Risk priorities:
• Risk Appetite – Articulates what risks we are prepared to undertake
• Risk Conduct – Defines how we should operate;
• Risk Governance and Controls – Focus on the maintenance of effective enterprise-wide risk management processes
• Support enterprise, segment and business strategies by maintaining strong partnerships, balancing risk and reward, and striving to achieve
a shared responsibility for risk compliance within our businesses
• Risk Infrastructure (People, operating plan and systems) – Deliver efficient and scalable risk and compliance infrastructure comprised of
highly competent professionals supported by appropriate training/development, tools and technology; and
• Managing regulatory environment and relationships – Comply with regulatory requirements and expectations, and maintaining strong
regulatory standards.
Accomplishments:
• Our risk profile remained within the Risk Appetite throughout the year.
• Maintained strong credit quality ratios.
• Stress testing capabilities significantly enhanced.
• Operational risk events impacting earnings remained low.
• Ensured sound management of regulatory compliance risk.
Top and emerging risks
Our view of risks is not static. An important component of our enterprise risk management approach is to ensure that top risks which are evolving
or emerging risks are appropriately identified, managed, and incorporated into existing enterprise risk management assessment, measurement,
monitoring and escalation processes.
These practices ensure management is forward-looking in its assessment of risks to the organization. Identification of top and emerging
risks occurs in the course of businesses developing and pursuing approved strategies and as part of the execution of risk oversight
responsibilities by GRM, Finance, Corporate Treasury, Global Compliance and other control functions.
Risk oversight activities which can lead to identification of new, evolving or emerging risks include control mechanisms (e.g. approval of
new products, transactions, projects or initiatives), business strategy development, stress testing, portfolio level measurement, monitoring and
reporting activities, and the ongoing assessment of industry and regulatory developments.
Details of the top and emerging risks we are facing are discussed below.
46 Royal Bank of Canada: Annual Report 2014 Management’s Discussion and Analysis

Anti-Money Laundering (AML)
We are subject to a highly complex and dynamic set of anti-money laundering, anti-terrorist financing, and anti-bribery and anti-corruption
(collectively, AML) laws, regulations and expectations across the multiple jurisdictions in which we operate. These requirements are of critical
importance to members of the international financial community, law enforcement agencies and regulatory bodies. The regulatory landscape for
AML practices remains in a state of rapid change in response to globalization, proliferation of technologies to conduct financial transactions, and
new and changing money laundering and terrorist financing strategies. The scope of AML activities continues to expand with evolving criminal
activities, such as tax evasion, human trafficking, bribery, and corruption. Money laundering, terrorist financing, and, increasingly, bribery and
corruption pose significant potential risks for RBC. Our reputation is at risk with regulators, clients and other stakeholders in the event of AML
related incidence, particularly in light of the current regulatory environment. The regulatory tolerance for major AML Program failures is low as
demonstrated by recent penalties and enforcement actions.
We continuously enhance our transaction monitoring, client identification and client risk assessment processes and practices to prevent or
detect activities that might pose risk to our systems and networks. Internally, annual AML training is mandatory for all applicable employees
including senior management and the Board of Directors.
Growth in wholesale credit
Our wholesale loan growth has been strong in recent years, largely driven by Capital Markets. Loan growth in the U.S. has been strong given our
strategy of expanding and strengthening client relationships in that market along with strong demand. Growth has been across various sectors
with strong growth in commercial real estate and leveraged financing. To manage risks associated with this increase we focus on diversification,
driven by limits on single name, country and industry exposures across all businesses, portfolios and transactions. We continue to adhere to
strict lending standards as we grow our wholesale credit portfolio. We also stress test our portfolio to assist in evaluating the potential impact of
severe economic conditions.
High levels of Canadian household debt
Canadian household debt remains elevated as persistently low interest rates continue to fuel strong home sales, supporting home prices and
limiting moderation in mortgage credit growth. The risks surrounding elevated credit balances largely stem from households’ continued ability to
manage existing debt repayments when interest rates rise and a greater share of disposable income is needed to make payments. Additional risk
stems from the potential for high household debt to amplify the impact of an external shock to the Canadian economy. The combination of
increasing unemployment, rising interest rates, and a downturn in real estate markets would pose a risk to the credit quality of our retail lending
portfolio. We actively manage our lending portfolios and stress test them against various scenarios. Our stress testing shows that the vast
majority of our mortgage clients have sufficient capacity to absorb interest rate increases in the ranges currently forecasted. For further
discussion relating to our retail portfolio, refer to the Credit risk section.
Cybersecurity
The bank leverages advancements in technology to support our business model and enhance the experience of our clients on a global basis. As
a result, we are exposed to risks related to cybersecurity and the increasing sophistication of cyber-attacks in the marketplace. Attacks in the
industry are often focused on compromising sensitive data for inappropriate use or disrupting business operations. Such an attack could
compromise our confidential information as well as that of our clients and third parties with whom we interact and may result in negative
consequences, including remediation costs, loss of revenue, additional regulatory scrutiny, litigation and reputational damage. We are
committed to protecting our bank through ongoing and growing investments in our cyber defense technologies, rigorous processes and controls,
and investments in our team of cyber defense professionals. Our investments are positioned to manage the risks we face today and position the
bank for the evolving threat landscape.
Enterprise risk management
Our Enterprise Risk Management Framework provides an overview of our enterprise-wide programs for identifying, assessing, measuring,
controlling, monitoring and reporting on the significant risks that face the organization.
Risk conduct
Our risk conduct is a shared set of behavioural norms that sustain our core values, protect our clients, safeguard our shareholders’ value, and
support market integrity and stability from undue risk. Risk conduct defines how we should operate, in order to instill the mindset of undertaking
risk and “doing what’s right” in a manner that is consistent with our values and Code of Conduct.
There are four key components that we rely on to ensure strong and effective risk conduct at RBC:
• Tone at the top and middle management;
• Accountability, which is shared across all businesses and employees;
• Incentives, which are closely linked to our Risk Profile relative to our Risk Appetite, and to our financial, strategic, risk and operational
goals; and
• Effective challenge, which promotes constructive discussion of different points of view on the level of risk undertaken.
We also have a strong ethical culture of integrity and compliance grounded in our Code of Conduct. The Code of Conduct broadly addresses a
variety of ethical and legal concerns that our employees face on a daily basis. Our Code of Conduct is supported by a number of global and
regional compliance frameworks, policies, training programs, online tools, job aids, new employee orientation materials, and the direction of
senior management.
Management’s Discussion and Analysis Royal Bank of Canada: Annual Report 2014 47
Risk Appetite
Our Risk Appetite is the amount and type of risk we are able and willing to accept in the pursuit of our business objectives. Our approach to
articulating Risk Appetite is focused around three key concepts:
• The amount of “Earnings at Risk” that is determined to be acceptable over an economic cycle, using an expected loss lens;
• The amount of “Capital at Risk” that is determined to be acceptable under stress, using an unexpected loss lens; and
• Ensuring adequate liquidity throughout times of stress.
Our Risk Appetite Framework has four major components as follows:
1.Define our Risk Capacity by identifying regulatory constraints that restrict our ability to accept risk.
2. Establish and regularly confirm our Risk Appetite, comprised of Drivers that are the business objectives which include risks we must accept
to generate desired financial returns, and Self-Imposed Constraints that limit or otherwise influence the amount of risk undertaken. Our
Self-Imposed Constraints include:
• Maintaining stability of earnings;
• Avoiding excessive concentrations of risk;
• Maintaining low exposure to stress events;
• Ensuring sound management of regulatory compliance risk and operational risk;
• Ensuring sound management of liquidity and funding risk;
• Ensuring capital adequacy by maintaining capital ratios in excess of rating agency and regulatory expectations;
• Maintaining strong credit ratings; and
• Maintaining a Risk Profile that is in the top half of our peer group.
3. Set Risk Limits and Tolerances to ensure that risk-taking activities are within Risk Appetite.
4. Regularly measure and evaluate our Risk Profile, representing the risks we are exposed to, relative to our Risk Appetite, and ensure
appropriate action is taken prior to Risk Profile surpassing Risk Appetite.
The Enterprise Risk Appetite Framework is structured in such a way that it can be applied at the enterprise, business segment, business unit,
and legal entity levels. Risk Appetite is integrated into our business strategies and capital plan. We also ensure that the business strategy aligns
with the enterprise and business segment level Risk Appetite.
One aspect of our Enterprise Risk Appetite Framework is the concept of Risk Posture which is used within the enterprise and business
segment strategic planning processes to identify potential pressure points on our Risk Profile or Risk Appetite that can result from a proposed
strategy. Risk Posture is an expression of the impact of strategic priorities on our Risk Profile over a one year timeframe, using a scale of
conservative, neutral or expansionary.
Risk management principles
The following principles guide our enterprise-wide management of risk:
1. Effective balancing of risk and reward by aligning business strategy with Risk Appetite, avoiding excessive concentration of risk through
diversification, pricing appropriately for risk, mitigating risk through preventive and detective controls and transferring risk to third parties.
2. Shared responsibility for risk management as business segments are responsible for active management of their risks, with direction and
oversight provided by GRM and other corporate functions groups.
3. Business decisions are based on an understanding of risk as we perform rigorous assessment of risks in relationships, products, trans-
actions and other business activities.
4. Avoid activities that are not consistent with our values, Code of Conduct or policies, which contributes to the protection of our reputation.
5. Proper focus on clients reduces our risks by knowing our clients and ensuring that all products and transactions are suitable for, and
understood by our clients.
6. Use of judgment and common sense in order to manage risk throughout the organization.
48 Royal Bank of Canada: Annual Report 2014 Management’s Discussion and Analysis

Risk governance
The Board of Directors and senior management utilize the Three Lines of Defence Governance Model to ensure that risks in achieving our
strategic objectives are appropriately and adequately managed.
Risk Owners Independent Assurance
BOARD OF DIRECTORS
Business and support
functions embedded in
the business
Accountable for:
Identification
Assessment
Mitigation
Risk Oversight
Establish risk
management practices
and provide risk
guidance
Provide oversight of the
effectiveness of First
Line risk management
practices
Monitor and independently
reports on the level of risk
against established
appetite
Primarily provided by
internal audit
Independent
assurance to
management and the
Board of Directors on
the effectiveness of
risk management
practices
First Line of Defence Second Line of Defence Third Line of Defence
Group Executive & Group Risk Committee
and Senior Management Risk Committees
Risk Committee
Corporate Governance &
Public Policy Committee
Human Resources
Committee
Audit Committee
Monitoring and
Reporting of risk
relative to approved
policies and appetite
The Board of Directors establishes the tone at the top, approves our Risk Appetite, provides oversight and carries out its risk management
mandate primarily through its committees which include the Risk Committee, the Audit Committee, the Corporate Governance & Public Policy
Committee and the Human Resources Committee.
The purpose of the Risk Committee is to oversee our risk management program. The Risk Committee’s oversight role is designed to ensure
that the risk management function is adequately independent from the businesses whose activities it reviews, and that the policies, procedures
and controls used by management are sufficient to keep risks within our Risk Appetite.
The Audit Committee also has a risk oversight role through its responsibilities to review our internal controls and the control environment,
and to ensure that policies related to capital management and adequacy are in place and effective. The Audit Committee regularly reviews
reporting on legal and regulatory compliance risks including significant litigation issues and regulatory compliance matters.
In addition, the following board committees have specific reputation risk oversight responsibilities:
• Corporate Governance & Public Policy Committee – Monitors the effectiveness of our corporate governance, reviews policies and programs,
reviews our efforts to understand and meet changing public values and expectations, and identifies, assesses and advises management on
public affairs issues related to our image and reputation.
• Human Resources Committee – This committee, along with the Risk Committee, is jointly responsible for our Code of Conduct, and actively
oversees the design and operation of our compensation system.
The Group Executive (GE) is comprised of our senior management team and is led by the President & Chief Executive Officer (CEO) and includes
the Chief Risk Officer (CRO) and Chief Administrative Officer & Chief Financial Officer (CAO & CFO). The GE is responsible for our strategy and its
execution and establishing the “tone at the top”. The GE actively shapes and recommends our Risk Appetite for approval by the Board of
Directors. The GE’s risk oversight role is executed primarily through the mandate of the Group Risk Committee (GRC). The GRC with the assistance
of its supporting senior management risk committees is responsible for ensuring that our overall Risk Profile is consistent with our strategic
objectives and remains within our Risk Appetite and there are ongoing, appropriate and effective risk management processes.
Employees at all levels of the organization are responsible for managing the day-to-day risks that arise in the context of their mandate.
The First Line of Defence is provided by the employees across the businesses as well as support functions embedded in the businesses that are
responsible for providing products and services, and for the execution of activities. The First Line of Defence has ownership and accountability
for:
• Risk identification, assessment, mitigation, monitoring and reporting in accordance with established enterprise risk policies and Risk
Appetite;
• Ensuring appropriate and adequate capabilities to manage risks relevant to the businesses; and
• Alignment of business and operational strategies with our strong Risk Conduct and Risk Appetite.
Management’s Discussion and Analysis Royal Bank of Canada: Annual Report 2014 49
The Second Line of Defence is provided by areas with independent oversight accountabilities residing in functions such as GRM, Global
Compliance, and other areas within our Control and Group Functions (such as Corporate Treasury, Law, Human Resources, Finance, Technology
and Operations, Corporate Taxation and Enterprise Strategy Group). The Second Line of Defence:
• Establishes the enterprise level risk management frameworks and policies, and provides risk guidance;
• Provides oversight of the effectiveness of first line risk management practices; and
• Monitors and independently reports on the level of risk relative to established appetite.
GRM, under the direction of the CRO, is responsible for the oversight of a number of significant risks we face. GRM also provides oversight of
Strategic Risk through the CRO and the Group Executive, who have responsibility for ensuring business Risk Appetite and strategies align with
Enterprise Risk Appetite. Global Compliance is responsible for our policies and processes designed to mitigate and manage regulatory
compliance risk. In addition to GRM and Global Compliance, other Control and Group Functions have designated roles supporting our enterprise-
wide risk management program.
The Third Line of Defence is primarily provided by internal audit, and provides independent assurance to senior management and the Board of
Directors on the effectiveness of risk management policies, processes and practices in all areas of our organization.
Risk measurement
Our ability to measure risks is a key component of our enterprise-wide risk and capital management processes. Certain measurement
methodologies are common to a number of risk types, while others only apply to a single risk type. While quantitative risk measurement is
important, we also place reliance on qualitative factors. Our measurement models and techniques are continually subject to independent
assessment for appropriateness and reliability. For those risk types that are difficult to quantify, we place greater emphasis on qualitative risk
factors and assessment of activities to gauge the overall level of risk to ensure that they are within our Risk Appetite.
Quantifying expected loss
Expected loss is used to assess earnings at risk and is a representation of losses that are statistically expected to occur in the normal course of
business in a given period of time. For credit risk, the key parameters used to measure our exposure to expected loss are probability of default,
loss given default, and exposure at default. For market risk, a statistical technique known as Value-at-Risk (VaR) is used to measure losses under
normal market conditions.
Quantifying unexpected loss
Unexpected loss is used to assess capital at risk and is a statistical estimate of the amount by which actual losses can exceed expected loss over
a specified time horizon, measured at a specified level of confidence. We hold capital to withstand these unexpected losses, should they occur.
For further details, refer to the Capital management section.
Stress testing
Stress testing examines potential impacts arising from exceptional but plausible adverse events, and is an important component of our risk
management framework. Stress testing results are used in:
• Monitoring our Risk Profile relative to Risk Appetite in terms of earnings and capital at risk;
• Setting limits;
• Identifying key risks to and potential shifts in our capital levels and financial position;
• Enhancing our understanding of available mitigating actions in response to adverse events; and
• Assessing the adequacy of our target capital levels.
Our enterprise-wide stress tests evaluate key balance sheet, income statement, leverage, and capital impacts arising from risk exposures and
changes in earnings. The results are used by our senior management risk committees, the GRC, and the Board of Directors to understand our
performance drivers under stress, and review stressed capital and leverage ratios against regulatory thresholds and internal targets. The results
are also incorporated into our Internal Capital Adequacy Assessment Process (ICAAP) and Capital Plan analyses.
We annually evaluate a number of enterprise-wide stress scenarios over a multi-year horizon, featuring a range of severities. Our Board of
Directors reviews the recommended scenarios, and GRM leads the scenario assessment process. Results from across the organization are
integrated to develop an enterprise-wide view of the impacts, with input from subject matter experts in GRM, Corporate Treasury, Finance, and
Economics. Recent scenarios evaluated include global recessions, local Canadian recessions, energy price shocks, and natural catastrophe
events. Our 2014 enterprise-wide stress test results are within our Board approved Risk Appetite.
Ongoing stress testing and scenario analyses within specific risk types such as market risk, liquidity risk, structural interest rate risk, retail
and wholesale credit risk, operational risk, and insurance risk supplement and support our enterprise-wide analyses. Results from these risk-
specific programs are used in a variety of decision-making processes including risk limit setting, portfolio composition evaluation, and business
strategy implementation. For further details on some of these programs, refer to the Market risk and Liquidity and funding risk sections.
In addition to ongoing enterprise-wide and risk specific stress testing programs, we also utilize ad-hoc and reverse stress testing to deepen
our knowledge of the risks we face. Ad-hoc stress tests are one-off analyses used to investigate developing conditions or stress a particular
portfolio in more depth. Reverse stress tests, starting with a severe outcome and aiming to identify scenarios that might lead to that outcome,
are used in risk identification and understanding of risk/return boundaries.
We also participate in a number of regulator-required stress test exercises at both the consolidated and subsidiary levels.
Back-testing
We back-test credit risk parameters (i.e. Probability of default, Loss given default, and Usage given default) on a quarterly basis to ensure the
parameters remain appropriate for use in regulatory and economic capital calculations. Back-testing is performed by comparing the realized
values to the parameter estimates that were in use at the beginning of the period.
50 Royal Bank of Canada: Annual Report 2014 Management’s Discussion and Analysis

Validation of measurement models
We widely use models for many purposes, including valuation of financial products and the measurement and management of different types of
risk. Models are subject to validation by qualified employees that are sufficiently independent of the model design and development, or by
approved external parties. Model validation is a comprehensive independent review of a model that evaluates the applicability of the model’s
logic, its assumptions and theoretical underpinnings, the appropriateness of input data sources, the interpretation of the model results, and the
strategic use of the model outputs. By reviewing and evaluating a model’s assumptions and limitations, initial and ongoing model validation
helps ensure the model incorporates current market developments and industry trends. Our model validation process is designed to ensure that
all material underlying model risk factors are identified and successfully mitigated.
Risk control
Our enterprise-wide risk management approach is supported by a comprehensive set of risk controls. The controls are anchored by our Enter-
prise Risk Management and Risk-Specific Frameworks. These frameworks lay the foundation for the development and communication of policies,
establishment of formal risk review and approval processes, and the establishment of delegated authorities and limits. The implementation of
robust risk controls enables the optimization of risk and return on both a portfolio and a transactional basis.
Our risk management frameworks and policies are organized into the following five levels:
Level 1: Enterprise Risk Management Framework provides an overview of our enterprise-wide program for identifying, assessing, measuring,
controlling, monitoring and reporting on the significant risks we face. This framework is underpinned by our Risk Appetite Framework and Risk
Conduct Framework.
Level 2: Risk-Specific Frameworks elaborate on each specific risk type and the mechanisms for identifying, measuring, monitoring and reporting
of our principal risks; key policies; and roles and responsibilities.
Level 3: Enterprise Risk Policies articulate minimum requirements, within which businesses and employees must operate.
Level 4: “Multi-risk” Enterprise Risk Policies govern activities such as product risk review and approval, stress testing, risk limits, risk approval
authorities and model risk management.
Level 5: Business Segments and Corporate Support – Specific Policies and Procedures are established to manage the risks that are unique to
their operations.
Risk review and approval processes
Risk review and approval processes are established by GRM based on the nature, size, and complexity of the risk involved. In general, the risk
review and approval process involves a formal review and approval by an individual, group or committee that is independent from the originator.
The approval responsibilities are governed by delegated authorities based on the following categories: transactions, structured credit, projects
and initiatives, and new products and services.
Authorities and limits
The Risk Committee of the Board of Directors delegates credit, market, and insurance risk authorities to the President & CEO and the CRO. The
delegated authorities allow these officers to approve single name, geographic (country and region) and industry sector exposures within defined
parameters to manage concentration risk, establish underwriting and inventory limits for trading and investment banking activities and set
market risk tolerances.
The Board of Directors also delegates liquidity risk authorities to the President & CEO, CAO & CFO, and CRO. These limits act as a key risk
control designed to ensure that reliable and cost-effective sources of cash or its equivalent are available to satisfy our current and prospective
commitments.
Reporting
Enterprise and business segment level risk monitoring and reporting are critical components of our enterprise risk management program and
support the ability of senior management and the Board of Directors to effectively perform their risk management and oversight responsibilities.
On a quarterly basis, we provide to senior management and the Board of Directors the Enterprise Risk Report which includes a comprehensive
review of our Risk Profile relative to our Risk Appetite and focuses on the range of risks we face along with an analysis of the related issues and
trends. In addition to our regular risk monitoring, other risk specific presentations are provided to and discussed with senior management and
the Board of Directors on top and emerging risk issues or significant changes in our level of risk.
Risk Pyramid
We use a pyramid to identify and categorize our principal risks. The Risk Pyramid drives internal consistency of risk terminology and language,
and is used to identify and assess risk in new and existing businesses, products or initiatives, acquisitions and alliances. Principal risk types are
organized vertically from the top of the pyramid to its base according to the relative degree of control and influence we consider to have over
each risk type. The Risk Pyramid is reviewed regularly to ensure that all key risks are reflected and ranked appropriately.
The base of the pyramid – The risk categories along the base of the Risk Pyramid are those over which we have the greatest level of control and
influence. These are credit, market, liquidity and funding, insurance and regulatory compliance risks. Operational risk, while still viewed as one
of the risks over which we have the greatest level of control and influence, is ranked higher on the pyramid than the other highly controllable
risks. This ranking acknowledges the level of controllability associated with people, systems and external events.
Management’s Discussion and Analysis Royal Bank of Canada: Annual Report 2014 51

The top of the pyramid – Systemic risk is placed at the top of the Risk Pyramid, and is generally considered the least controllable type of risk
arising from the business environment impacting us. However, we have in place measures for mitigating the impacts of systemic risk such as
stress testing programs and diversification. We are diversified across various business models, funding sources, products and geographies.
Legal and regulatory environment and competitive risks, which can be viewed as somewhat controllable, can be influenced through our role as a
corporate entity, and as an active participant in the Canadian and global financial services industry.
SYSTEMIC
COMPETITIVE
REPUTATION
LEGAL &
REGULATORY
ENVIRONMENT
STRATEGIC
OPERATIONAL
CREDIT MARKET LIQUIDITY
& FUNDING INSURANCE REGULATORY
COMPLIANCE
LESS
Control & Influence
MORE
The shaded text along with the tables specifically marked with an asterisk(*) in the following sections of the MD&A represent our disclosures
on credit, market and liquidity and funding risks in accordance with IFRS 7, Financial Instruments: Disclosures, and include discussion on how
we measure our risks and the objectives, policies and methodologies for managing these risks. Therefore, these shaded text and tables
represent an integral part of our 2014 Annual Consolidated Financial Statements.
Credit risk
Credit risk is the risk of loss associated with an obligor’s potential inability or unwillingness to fulfill its contractual obligations. Credit risk
may arise directly from the risk of default of a primary obligor (e.g. issuer, debtor, counterparty, borrower or policyholder), or indirectly from a
secondary obligor (e.g. guarantor or reinsurer). Credit risk includes counterparty credit risk from both trading and non-trading activities.
The failure to effectively manage credit risk across all our products, services and activities can have a direct, immediate and material impact
on our earnings and reputation.
We balance our risk and return by:
• Ensuring credit quality is not compromised for growth;
• Diversifying credit risks in transactions, relationships and portfolios;
• Using our credit risk rating and scoring systems or other approved credit risk assessment or rating methodologies, policies and tools;
• Pricing appropriately for the credit risk taken;
• Applying consistent credit risk exposure measurements;
• Mitigating credit risk through preventive and detective controls;
• Transferring credit risk to third parties, where appropriate, through approved credit risk mitigation techniques, including hedging
activities and insurance coverage; and
• Ongoing credit risk monitoring and administration.
Risk measurement – Credit risk
We quantify credit risk, at both the individual obligor and portfolio levels, to manage expected credit losses and minimize unexpected losses
in order to limit earnings volatility.
We employ different risk measurement processes for our wholesale and retail credit portfolios. The wholesale portfolio comprises
businesses, sovereigns, public sector entities, banks and other financial institutions, and certain individuals and small businesses that are
managed on an individual client basis. The retail portfolio is comprised of residential mortgages, personal, credit card, and small business
loans, which are managed on a pooled basis. Credit risk rating systems are designed to assess and quantify the risk inherent in credit
activities in an accurate and consistent manner.
In measuring credit risk and setting regulatory capital, two principal approaches are available: Internal Ratings Based Approach (IRB)
and Standardized Approach. Most of our credit risk exposure is measured under the IRB.
Economic capital, which is our internal quantification of risks, is used extensively for performance measurement, limit setting and
internal capital adequacy.
52 Royal Bank of Canada: Annual Report 2014 Management’s Discussion and Analysis

The key parameters that form the basis of our credit risk measures for both regulatory and economic capital are:
• Probability of default (PD): An estimated percentage that represents the likelihood of default within a given time period of an obligor for
a specific rating grade or for a particular pool of exposure.
• Exposure at default (EAD): An amount expected to be owed by an obligor at the time of default.
• Loss given default (LGD): An estimated percentage of EAD that is not expected to be recovered during the collections and recovery
process.
These parameters are determined based on historical experience from internal credit risk rating systems in accordance with supervisory
standards, and are independently validated and updated on a regular basis.
Under the Standardized Approach, used primarily for Investor Services and our Caribbean and U.S. banking operations, risk-weights
prescribed by the Office of the Superintendent of Financial Institutions (OSFI) are used to calculate risk-weighted assets (RWA) for credit risk
exposure.
Wholesale credit risk
The wholesale credit risk rating system is designed to measure the credit risk inherent in our wholesale lending activities.
Each obligor is assigned a borrower risk rating (BRR), reflecting an assessment of the credit quality of the obligor. Each BRR has a PD
assigned to it. The BRR differentiates the riskiness of obligors and represents our evaluation of the obligor’s ability and willingness to meet its
contractual obligations on time over a three year time horizon. The assignment of BRRs is based on the evaluation of the obligor’s business
risk and financial risk and is based on fundamental credit analysis. The determination of the PD associated with each BRR relies primarily on
internal default history since the late 1990s augmented where necessary with reference to external data. PD estimates are designed to be a
conservative reflection of our experience across the economic cycle including periods of stress or economic downturn.
Our rating system is largely consistent with that of external rating agencies. The following table aligns the relative rankings of our
22-grade internal risk ratings with the ratings used by external rating agencies.
Internal ratings map* Table 40
Ratings BRR
Standard & Poor’s
(S&P)
Moody’s Investors
Service (Moody’s) Description
1 1+ AAA Aaa
Investment Grade
2 1H AA+ Aa1
3 1M AA Aa2
4 1L AA- Aa3
5 2+H A+ A1
6 2+M A A2
7 2+L A- A3
8 2H BBB+ Baa1
9 2M BBB Baa2
10 2L BBB- Baa3
11 2-H BB+ Ba1
Non-investment Grade
12 2-M BB Ba2
13 2-L BB- Ba3
14 3+H B+ B1
15 3+M B B2
16 3+L B- B3
17 3H CCC+ Caa1
18 3M CCC Caa2
19 3L CCC- Caa3
20 4 CC Ca
21 5 D C Impaired
22 6 Bankruptcy Bankruptcy
* This table represents an integral part of our 2014 Annual Consolidated Financial Statements.
Each credit facility is assigned an LGD rate. LGD rates are largely driven by factors that will impact the extent of any losses in the event the
obligor defaults including seniority of debt, collateral security, and the industry sector in which the obligor operates. Estimated LGD rates
draw primarily on internal loss experience since the late 1990s. Where we have limited internal loss data we also look to external data to
inform the estimation. LGD rates are estimated to reflect conditions that might be expected to prevail in a period of an economic downturn,
with additional conservatism added to reflect data limitations and judgments made in the estimation process.
EAD is estimated based on the current exposure to the obligor and the possible future changes in that exposure driven by factors such
as the nature of the credit commitment and the type of obligor. As with LGD, rates are estimated to reflect downturn conditions, with added
conservatism to reflect data and modeling uncertainty. Estimates are based on internal data dating back to the late 1990s.
Estimates of PD, LGD, and EAD are updated, and then validated and back-tested by an independent team within the bank, on an annual
basis. In addition, quarterly monitoring and back-testing is performed by the estimation team. These ratings and risk measurements are used
in the determination of our expected losses as well as economic and regulatory capital, setting of risk limits, portfolio management and
product pricing.
Counterparty credit risk
Counterparty credit risk is the risk that a party with whom the bank has entered into a financial or non-financial contract will fail to fulfill its
contractual agreement and default on the obligation. It is measured not only by its current value, but also by how this value can move as market
conditions change. Counterparty credit risk usually occurs in trading-related derivative and repo-style transactions.
Management’s Discussion and Analysis Royal Bank of Canada: Annual Report 2014 53

Derivative transactions include financial (e.g. forwards, futures, swaps, and options) and non-financial derivatives (e.g. precious metal and
commodities). For further details on our derivative instruments and credit risk mitigation, refer to Note 8 of our 2014 Annual Consolidated
Financial Statements.
Retail credit risk
Credit scoring is the primary risk rating system for assessing obligor and transaction risk for retail exposures. Credit scores along with
decision strategies are employed in the acquisition of new clients (acquisition) and management of existing clients (behavioural).
Criteria used to pool exposures for risk quantification include behavioural score, product type (mortgages, credit cards, lines of credit
and instalment loans), collateral type (chattel, liquid assets and real estate), loan-to-value, and the delinquency status (performing,
delinquent and default) of the exposure. Regular monitoring and periodic adjustments and alignments are conducted to ensure that this
process provides for a meaningful differentiation of risk. Migration between the pools is considered when assessing credit quality.
The pools are also assessed based on credit risk parameters (PD and EAD) which consider borrower and transaction characteristics,
including behavioural credit score, product type and delinquency status. LGD is reviewed and re-estimated on an annual basis under the
Basel III IRB. The estimation is based on transaction specific factors, including product, loan-to-value and collateral types. LGD is determined
based on over 10 years of historical economic losses with the highest degree of granularity and sufficient margin of conservatism. Parameters
are validated and back-tested by an independent team within the bank.
The following table maps PD bands to various risk levels:
Internal ratings map* Table 41
PD bands Description
0.000% – 1.718% Low risk
1.719% – 6.430% Medium risk
6.431% – 99.99% High risk
100% Impaired/Default
* This table represents an integral part of our 2014 Annual Consolidated Financial Statements.
Risk control – Credit risk
The Board of Directors and its committees, the GE, the GRC and other senior management risk committees work together to ensure a Credit
Risk Management Framework and supporting policies, processes and procedures exist to manage credit risk and approve related credit risk
limits. Reports are distributed to the Board of Directors, the GRC, and senior executives to keep them informed of our Risk Profile, including
trending information and significant credit risk issues and shifts in exposures to ensure appropriate actions can be taken where necessary.
Our enterprise-wide credit risk policies set out the minimum requirements for the management of credit risk in a variety of borrower, transac-
tional and portfolio management contexts.
Credit policies are an integral component of our Credit Risk Management Framework and set out the minimum requirements for the
management of credit risk as follows:
Credit risk assessment
• Mandatory use of credit risk rating and scoring systems.
• Consistent credit risk assessment criteria.
• Standard content requirements in credit application documents.
Credit risk concentration
We define credit concentration risk as the risk arising from an over-concentration on single names, industry sectors, countries or credit
products within the portfolio. Concentration risk results from large exposure to similar risks that are positively correlated such that their
ability to meet contractual obligations could be similarly affected by changes in economic, political or other conditions. We manage credit
exposures to promote alignment to the Bank’s risk appetite, to maintain our target business mix and to ensure that there is no undue risk
concentration. Credit concentration limits are reviewed and approved by the Risk Committee.
Credit risk mitigation
Structuring of transactions
• Specific credit policies and procedures set out the requirements for structuring transactions. Risk mitigants include the use of
guarantees, seniority, loan-to-value requirements and covenants. Product-specific guidelines set out appropriate product structuring as
well as client and guarantor criteria.
Collateral
• We often require obligors to pledge collateral as security when we advance credit. The extent of risk mitigation provided by collateral
depends on the amount, type and quality of the collateral taken. Specific requirements relating to collateral valuation and management
are documented in our credit risk management policies.
Credit derivatives
• Used as a tool to mitigate industry sector concentration and single-name exposure. For a more detailed description of the types of credit
derivatives we enter into and how we manage related credit risk, refer to Note 8 of our 2014 Annual Consolidated Financial Statements.
54 Royal Bank of Canada: Annual Report 2014 Management’s Discussion and Analysis

Loan forbearance
In our overall management of borrower relationships, economic or legal reasons may necessitate forbearance to certain clients with respect to
the original terms and conditions of their loans. We strive to identify borrowers in financial difficulty early and modify their loan terms in order
to maximize collection and to avoid foreclosure, repossession, or other legal remedies. In these circumstances, a borrower may be granted
concessions that would not otherwise be considered. We have specialized groups and formalized policies that direct the management of
delinquent or defaulted borrowers. Examples of such concessions to retail borrowers may include rate reduction, principal forgiveness, and
term extensions. Concessions to wholesale borrowers may include restructuring the agreements, modifying the original terms of the
agreement and/or relaxation of covenants. For both retail and wholesale loans, the appropriate remediation techniques are based on the
individual borrower’s situation, the Bank’s policy and the customer’s willingness and capacity to meet the new arrangement. When a loan is
restructured, the recorded investment in the loan is reduced as of the date of restructuring to the amount of the net cash flows receivable
under the modified terms, discounted at the effective interest rate inherent in the loan (prior to restructuring). During 2014, the amount of
loans restructured was not material.
Product approval
• Proposals for credit products and services are comprehensively reviewed and approved under a risk assessment framework.
Credit portfolio management
• Limits are used to manage concentration risk and to ensure our portfolio is well-diversified and remains within our Risk Appetite. Limits
are reviewed on a regular basis taking into account the business, economic, financial and regulatory environments.
• Our credit limits are established at the following levels: single name limits (notional and economic capital), underwriting risk limits,
geographic (country and region) limits (notional and economic capital), industry sector limits (notional and economic capital), and
product and portfolio limits, where deemed necessary.
Gross credit risk exposure
Gross credit risk exposure is calculated based on the definitions provided under the Basel III framework. Under this method, risk exposure is
calculated before taking into account any collateral and is inclusive of an estimate of potential future changes to that credit exposure. Gross
credit risk is categorized into lending-related and other, and trading-related.
Lending-related and other includes:
• Loans and acceptances outstanding, undrawn commitments, and other exposures including contingent liabilities such as letters of
credit and guarantees, Available-for-sale (AFS) debt securities and deposits with financial institutions. Undrawn commitments represent
an estimate of the contractual amount that may be drawn upon at the time of default of an obligor.
Trading-related credit includes:
• Repo-style transactions which include repurchase and reverse repurchase agreements and securities lending and borrowing trans-
actions. For repo-style transactions, gross exposure represents the amount at which securities were initially financed, before taking into
account collateral.
• Derivative amount which represents the credit equivalent amount, which is defined by OSFI as the replacement cost plus an amount for
potential future credit exposure.
Management’s Discussion and Analysis Royal Bank of Canada: Annual Report 2014 55

Gross credit risk exposure by portfolio and sector* Table 42
As at
October 31
2014
October 31
2013
Lending-related and other Trading-related Lending-related and other Trading-related
Loans and acceptances Loans and acceptances
(Millions of
Canadian dollars) Outstanding
Undrawn
commitments Other (1)
Repo-style
transactions Derivatives (2)
Total
exposure (3) Outstanding
Undrawn
commitments Other (1)
Repo-style
transactions Derivatives (2)
Total
exposure (3)
Residential mortgages $ 219,257 $ – $ 197 $ – $ – $ 219,454 $ 209,238 $ – $ – $ – $ – $ 209,238
Personal 96,021 83,965 154 – – 180,140 92,859 77,463 32 – – 170,354
Credit cards 14,924 21,689 – – – 36,613 14,142 20,347 – – – 34,489
Small business (4) 4,785 4,631 9 – – 9,425 4,388 4,043 41 – – 8,472
Retail $ 334,987 $ 110,285 $ 360 $ – $ – $ 445,632 $ 320,627 $ 101,853 $ 73 $ – $ – $ 422,553
Business (4)
Agriculture $ 5,694 $ 1,079 $ 55 $ – $ 51 $ 6,879 $ 5,441 $ 630 $ 51 $ – $ 30 $ 6,152
Automotive 6,209 4,880 299 – 697 12,085 6,167 3,602 255 – 451 10,475
Consumer goods 7,172 6,189 547 – 281 14,189 6,230 5,786 509 – 142 12,667
Energy 9,615 22,161 3,353 – 1,578 36,707 8,906 19,843 3,140 – 2,047 33,936
Non-bank financial services 5,688 9,775 13,414 160,514 23,290 212,681 4,903 8,529 13,374 134,290 18,368 179,464
Forest products 979 452 108 – 18 1,557 893 434 104 – 15 1,446
Industrial products 4,665 4,753 441 – 462 10,321 4,038 3,656 384 – 266 8,344
Mining & metals 1,320 2,870 876 – 174 5,240 1,074 2,648 807 – 158 4,687
Real estate & related 30,387 7,791 1,699 22 286 40,185 24,413 5,461 1,487 7 295 31,663
Technology & media 4,822 8,705 511 2 955 14,995 4,006 6,883 500 3 620 12,012
Transportation &
environment 5,432 3,624 1,702 – 810 11,568 5,593 3,032 1,574 – 564 10,763
Other 25,886 13,345 8,379 3,490 13,800 64,900 22,755 9,989 9,060 2,202 14,537 58,543
Sovereign (4) 4,628 5,303 47,798 25,863 8,170 91,762 4,396 5,527 34,789 27,193 8,319 80,224
Bank (4) 1,201 710 73,365 94,824 22,724 192,824 1,320 270 67,007 87,953 21,243 177,793
Wholesale $ 113,698 $ 91,637 $ 152,547 $ 284,715 $ 73,296 $ 715,893 $ 100,135 $ 76,290 $ 133,041 $ 251,648 $ 67,055 $ 628,169
Total exposure $ 448,685 $ 201,922 $ 152,907 $ 284,715 $ 73,296 $ 1,161,525 $ 420,762 $ 178,143 $ 133,114 $ 251,648 $ 67,055 $ 1,050,722
* This table represents an integral part of our 2014 Annual Consolidated Financial Statements.
(1) Includes credit equivalent amounts for contingent liabilities such as letters of credit and guarantees, outstanding amounts for AFS debt securities, deposits with financial institutions and
other assets.
(2) Credit equivalent amount after factoring in master netting agreements.
(3) Gross credit risk exposure is before allowance for loan losses. Exposure under Basel III asset classes of qualifying revolving retail and other retail are largely included within Personal and
Credit cards, while home equity lines of credit are included in Personal.
(4) Refer to Note 5 of our 2014 Annual Consolidated Financial Statements for the definition of these terms.
2014 vs. 2013
Total gross credit risk exposure increased $111 billion or 11% from last year, largely reflecting an increase in repo-style transactions and growth
in loans and acceptances.
Retail exposure increased $23 billion or 5%, primarily due to volume growth in Canadian residential mortgages and personal loans
reflecting the ongoing low interest rate environment.
Wholesale exposure increased $88 billion or 14%, largely driven by an increase in repo-style transactions due to higher client activity,
higher loans and acceptances reflecting growth across various industry sectors, particularly in Real estate & related, and an increase in Other
exposure related to letters of credit and guarantees, and AFS securities. The impact of foreign exchange translation also contributed to the
increase. Wholesale loan utilization was 37%, unchanged from last year.
Gross credit risk exposure by geography* (1) Table 43
As at
October 31
2014
October 31
2013
Lending-related and other Trading-related Lending-related and other Trading-related
Loans and acceptances Loans and acceptances
(Millions of
Canadian dollars) Outstanding
Undrawn
commitments Other
Repo-style
transactions Derivatives
Total
exposure Outstanding
Undrawn
commitments Other
Repo-style
transactions Derivatives
Total
exposure
Canada $ 390,221 $ 142,841 $ 63,060 $ 56,308 $ 21,649 $ 674,079 $ 373,714 $ 129,632 $ 58,048 $ 55,394 $ 23,619 $ 640,407
U.S. 28,325 43,270 23,487 150,549 12,536 258,167 23,177 35,633 20,811 120,482 11,829 211,932
Europe 15,348 13,091 47,904 52,501 34,222 163,066 11,471 10,200 39,111 55,928 27,215 143,925
Other International 14,791 2,720 18,456 25,357 4,889 66,213 12,400 2,678 15,144 19,844 4,392 54,458
Total Exposure $ 448,685 $ 201,922 $ 152,907 $ 284,715 $ 73,296 $ 1,161,525 $ 420,762 $ 178,143 $ 133,114 $ 251,648 $ 67,055 $ 1,050,722
* This table represents an integral part of our 2014 Annual Consolidated Financial Statements.
(1) Geographic profile is primarily based on country of residence of the borrower.
2014 vs. 2013
The geographic mix of our gross credit risk exposure to Canada, U.S., Europe, and Other International ended the year at 58%, 22%, 14%, and
6%, respectively (2013 – 61%, 20%, 14%, and 5%, respectively). Shifts in our geographic mix were largely related to repo-style transactions.
56 Royal Bank of Canada: Annual Report 2014 Management’s Discussion and Analysis

Loans and acceptances outstanding and undrawn commitments* (1), (2) Table 44
As at
October 31
2014
October 31
2013(4)
(Millions of Canadian dollars) Low risk
Medium
risk High risk Impaired Total Low risk
Medium
risk High risk Impaired Total
Retail (3)
Residential mortgages $ 206,699 $ 9,452 $ 2,428 $ 678 $ 219,257 $ 195,578 $ 10,561 $ 2,408 $ 691 $ 209,238
Personal 158,530 17,309 3,847 300 179,986 150,701 15,240 4,018 363 170,322
Credit cards 29,900 5,403 1,310 – 36,613 28,359 4,981 1,149 – 34,489
Small business 6,542 1,519 1,308 47 9,416 5,908 1,439 1,047 37 8,431
$ 401,671 $ 33,683 $ 8,893 $ 1,025 $ 445,272 $ 380,546 $ 32,221 $ 8,622 $ 1,091 $ 422,480
As at
October 31
2014
October 31
2013
(Millions of Canadian dollars)
Investment
grade
Non-investment
grade Impaired Total
Investment
grade
Non-investment
grade Impaired Total
Wholesale (5)
Business $ 82,714 $ 109,829 $ 950 $ 193,493 $ 73,865 $ 89,940 $ 1,107 $164,912
Sovereign 9,476 455 – 9,931 9,582 341 – 9,923
Bank 1,440 469 2 1,911 1,387 200 3 1,590
Total $ 93,630 $ 110,753 $ 952 $ 205,335 $ 84,834 $ 90,481 $ 1,110 $176,425
* This table represents an integral part of our 2014 Annual Consolidated Financial Statements.
(1) This table represents our retail and wholesale loans and acceptances outstanding and undrawn commitments by portfolio and risk category. For a qualitative description of the credit risk
assessment process, refer to the Risk measurement – Credit risk section.
(2) This amount is before allowance for impaired loans.
(3) Includes undrawn commitments of $nil, $84.0 billion, $21.7 billion, and $4.6 billion for Residential mortgages, Personal, Credit cards and Small business, respectively.
(4) Comparative amounts have been restated to align with changes in our parameter estimation methodology and risk band classification during 2014.
(5) Includes undrawn commitments of $85.6 billion, $5.3 billion, and $0.7 billion for Business, Sovereign and Bank, respectively.
2014 vs. 2013
There were no significant shifts in the overall distribution of our exposure across the various credit quality categories compared to last year.
European exposure Table 45
As at
October 31
2014
October 31
2013
Loans and acceptances Other
(Millions of Canadian dollars) Outstanding
Undrawn
commitments (1) Securities (2)
Letters of
credit and
guarantees
Repo-style
transactions Derivatives
Total
European
exposure
Total
European
exposure
Gross exposure to Europe $ 15,348 $ 13,091 $ 22,916 $ 24,988 $ 52,501 $ 34,222 $ 163,066 $ 143,925
Less: Collateral held
against repo-style
transactions – – – – 51,386 – 51,386 54,416
Potential future
credit exposure
add-on amount – – – – – 22,403 22,403 18,827
Undrawn
commitments – 13,091 – 24,988 – – 38,079 27,719
Gross drawn exposure to
Europe $ 15,348 $ – $ 22,916 $ – $ 1,115 $ 11,819 $ 51,198 $ 42,963
Less: Collateral applied
against derivatives – – – – – 8,249 8,249 6,306
Add: Trading securities – – 15,471 – – – 15,471 13,816
Net exposure to Europe (3) $ 15,348 $ – $ 38,387 $ – $ 1,115 $ 3,570 $ 58,420 $ 50,473
(1) Comprised of undrawn commitments of $10.6 billion to corporate entities, $2.1 billion to financial entities and $0.4 billion to sovereign entities. On a country basis, exposure is comprised of
$5.2 billion to the U.K., $2.3 billion to Germany, $2.1 billion to France, $509 million to Ireland, $343 million to Spain, $1 million to Italy, with the remaining $2.6 billion related to Other
Europe. Of the undrawn commitments, over 77% are to investment grade entities.
(2) Securities include $15.5 billion of trading securities (2013 – $13.8 billion), $11.9 billion of deposits (2013 – $13.8 billion) and $11 billion of AFS securities (2013 – $7.8 billion).
(3) Excludes $2.8 billion (2013 – $1 billion) of exposures to supranational agencies and $0.7 billion (2013 – $2.4 billion) of exposures to trade credit reinsurance.
Our gross credit risk exposure is calculated based on the definitions provided under the Basel III framework whereby risk exposure is calculated
before taking into account any collateral and inclusive of an estimate of potential future changes to that credit exposure. On that basis, our total
European exposure as at October 31, 2014 was $163 billion. Our gross drawn exposure to Europe was $51 billion, after taking into account
Management’s Discussion and Analysis Royal Bank of Canada: Annual Report 2014 57

collateral held against repo-style transactions of $51 billion, letters of credit and guarantees, and undrawn commitments for loans of $38 billion
and potential future credit exposure to derivatives of $23 billion. Our net exposure to Europe was $58 billion, after taking into account $8 billion
of collateral, primarily in cash, we hold against derivatives and the addition of trading securities of $15 billion held in our trading book. Our net
exposure to Europe also reflected $0.4 billion of mitigation through credit default swaps, which are largely used to hedge single name exposures
and market risk.
Net European exposure by country (1) Table 46
As at
October 31
2014
October 31
2013
(Millions of Canadian dollars)
Loans
outstanding Securities
Repo-style
transactions Derivatives Total Total
U.K. $ 9,428 $ 12,486 $ 874 $ 1,245 $ 24,033 $ 17,515
Germany 914 8,602 36 620 10,172 8,270
France 569 3,176 50 489 4,284 3,856
Total U.K., Germany, France $ 10,911 $ 24,264 $ 960 $ 2,354 $ 38,489 $ 29,641
Greece $–$ –$ –$–$–$–
Ireland 619 104 8 152 883 174
Italy 26 67 – 57 150 325
Portugal 9–––96
Spain 350 105 – 21 476 491
Total Peripheral (2) $ 1,004 $ 276 $ 8 $ 230 $ 1,518 $ 996
Luxembourg $ 524 $ 1,136 $ 2 $ 247 $ 1,909 $ 5,666
Netherlands 882 2,893 20 465 4,260 2,861
Norway 369 2,613 – 29 3,011 2,925
Sweden 13 2,658 60 – 2,731 2,831
Switzerland 502 2,890 54 111 3,557 3,094
Other 1,143 1,657 11 134 2,945 2,459
Total Other Europe $ 3,433 $ 13,847 $ 147 $ 986 $ 18,413 $ 19,836
Total exposure to Europe $ 15,348 $ 38,387 $ 1,115 $ 3,570 $ 58,420 $ 50,473
(1) Geographic profile is based on country of risk, which reflects our assessment of the geographic risk associated with a given exposure. Typically, this is the residence of the borrower.
(2) Gross credit risk exposure to peripheral Europe is comprised of Greece $nil (2013 – $nil), Ireland $2.5 billion (2013 – $1.5 billion), Italy $0.2 billion (2013 – $0.3 billion), Portugal $nil (2013
– $0.1 billion), and Spain $0.9 billion (2013 – $0.9 billion).
2014 vs. 2013
Net credit risk exposure to Europe increased $8 billion from last year, largely driven by increased exposure in the U.K., Germany and Netherlands,
partially offset by a decrease in Luxembourg. Our net exposure to peripheral Europe, which includes Greece, Ireland, Italy, Portugal and Spain,
remained minimal with total outstanding exposure increasing $0.5 billion during the year to $1.5 billion as at October 31, 2014, largely due to an
increase in Ireland.
Our exposure was predominantly investment grade. Our net exposure to larger European countries, including the U.K., Germany and France,
was primarily related to our capital markets, wealth management and investor services businesses, particularly in fixed income, treasury
services, derivatives, and corporate and individual lending. These are predominantly client-driven businesses where we transact with a range of
European financial institutions, corporations and individuals. In addition, we engage in primary dealer activities in the U.K., where we participate
in auctions of government debt and act as a market maker and provide liquidity to clients. Exposures to other European countries are largely
related to securities which include trading securities, deposits, and AFS securities.
Our trading securities are related to both client market making activities and our funding and liquidity management needs. All of our trading
securities are marked-to-market on a daily basis. Deposits are primarily related to deposits with central banks or financial institutions and also
included deposits related to our wealth management business in the Channel Islands. AFS securities are largely comprised of Organization of
Economic Co-operation and Development government and corporate debt. Our European corporate loan book is run on a global basis and the
underwriting standards for this loan book reflect the same approach to the use of our balance sheet as we have applied in both Canada and the
U.S. We had a PCL recovery on this portfolio of $1 million this year. The gross impaired loans ratio of this loan book was 0.12%, down from
0.69% last year.
Net European exposure by client type Table 47
As at
October 31
2014
October 31
2013
(Millions of Canadian dollars) U.K. Germany France
Total
U.K.,
Germany,
France Greece Ireland Italy Portugal Spain
Total
Peripheral
Other
Europe
Total
Europe
Total
Europe
Financials $ 4,928 $ 6,948 $ 1,385 $ 13,261 $ – $ 92 $ 59 $ – $ 97 $ 248 $ 11,132 $ 24,641 $ 21,593
Sovereign 10,028 1,776 2,137 13,941 – 14 6 – 10 30 3,556 17,527 16,205
Corporate 9,077 1,448 762 11,287 – 777 85 9 369 1,240 3,725 16,252 12,675
Total $ 24,033 $ 10,172 $ 4,284 $ 38,489 $ – $ 883 $ 150 $ 9 $ 476 $ 1,518 $ 18,413 $58,420 $ 50,473
58 Royal Bank of Canada: Annual Report 2014 Management’s Discussion and Analysis

2014 vs. 2013
Our net exposure to Corporate increased by $4 billion due to increases in the U.K. and Germany. The increase in Financials of $3 billion was
largely in Germany and the U.K.
Residential mortgages and home equity lines of credit (insured vs. uninsured)
Residential mortgages and home equity lines of credit are secured by residential properties. The following table presents a breakdown by
geographic region:
Residential mortgages and home equity lines of credit Table 48
As at October 31, 2014
Residential mortgages (1)
Home equity
lines of credit
(Millions of Canadian dollars, except percentage
amounts) Insured (2) Uninsured Total Total
Region (3)
Canada
Atlantic provinces $ 6,411 55% $ 5,169 45% $ 11,580 $ 2,068
Quebec 13,006 50 13,248 50 26,254 4,163
Ontario 35,354 40 51,974 60 87,328 17,104
Prairie provinces 25,813 53 22,826 47 48,639 10,310
B.C. and territories 15,585 38 25,887 62 41,472 9,768
Total Canada (4) $ 96,169 45% $ 119,104 55% $ 215,273 $ 43,413
U.S. 4 1 535 99 539 332
Other International 13 – 3,081 100 3,094 2,691
Total International $ 17 –% $ 3,616 100% $ 3,633 $ 3,023
Total $ 96,186 44% $ 122,720 56% $ 218,906 $ 46,436
Total – October 31, 2013 $ 96,624 46% $ 111,822 54% $ 208,446 $ 45,494
(1) The residential mortgages amounts exclude our third party mortgage-backed securities (MBS) of $351 million (2013 – $792 million).
(2) Insured residential mortgages are mortgages whereby our exposure to default is mitigated by insurance through the Canada Mortgage and Housing
Corporation (CMHC) or other private mortgage default insurers.
(3) Region is based upon address of the property mortgaged. The Atlantic provinces are comprised of Newfoundland and Labrador, Prince Edward Island,
Nova Scotia and New Brunswick, the Prairie provinces are comprised of Manitoba, Saskatchewan and Alberta, and B.C. and territories are comprised of
British Columbia, Nunavut, Northwest Territories and Yukon.
(4) Total Canada residential mortgages balance of $215 billion consolidated is comprised of $192 billion of residential mortgages and $5 billion of
mortgages with commercial clients of which $3.4 billion are insured mortgages, both in Canadian Banking, and $18 billion of securitized residential
mortgages in Capital Markets.
Home equity lines of credit are uninsured and reported within the personal loan category. As at October 31, 2014, home equity lines of credit in
Canadian Banking were $43 billion (2013 – $43 billion). Approximately 97% of these home equity lines of credit (2013 – 97%) are secured by a
first lien on real estate, and less than 8% (2013 – 8%) of these clients pay the scheduled interest payment only.
Residential mortgages portfolio by amortization period
The following table provides a summary of the percentage of residential mortgages that fall within the remaining amortization periods based
upon current customer payment amounts, which incorporate payments larger than the minimum contractual amount and/or higher frequency of
payments:
Residential mortgages portfolio by amortization period Table 49
As at
October 31
2014
October 31
2013
Canada
U.S. and Other
International Total Total
Amortization period
≤25 years 71% 91% 72% 68%
>25 years ≤30 years 23 9 22 22
>30 years ≤35 years 5–5 8
>35 years 1–1 2
Total 100% 100% 100% 100%
Management’s Discussion and Analysis Royal Bank of Canada: Annual Report 2014 59

Average loan-to-value (LTV) ratio for newly originated and acquired uninsured residential mortgages and homeline products
The following table provides a summary of our average LTV ratio for newly originated and acquired uninsured residential mortgages and homeline
products by geographic region:
Average LTV ratio Table 50
2014 2013
Uninsured Uninsured
Residential
mortgages (1)
Homeline
products (2)
Residential
mortgages (1)
Homeline
products (2)
Region (3)
Atlantic provinces 74% 74% 73% 74%
Quebec 71 73 71 73
Ontario 71 71 71 71
Prairie provinces 74 73 73 73
B.C. and territories 69 67 69 67
U.S. 71 n.m. 69 n.m.
Other International 85 n.m. 83 n.m.
Average of newly originated and acquired for the
year (4), (5) 72% 71% 71% 71%
Total Canadian Banking residential mortgages portfolio 55% 55% 56% 56%
(1) Residential mortgages excludes residential mortgages within the homeline products.
(2) Homeline products are comprised of both residential mortgages and home equity lines of credit.
(3) Region is based upon address of the property mortgaged. The Atlantic provinces are comprised of Newfoundland and Labrador, Prince Edward Island,
Nova Scotia and New Brunswick, the Prairie provinces are comprised of Manitoba, Saskatchewan and Alberta, and B.C. and territories are comprised of
British Columbia, Nunavut, Northwest Territories and Yukon.
(4) The average LTV ratio for newly originated and acquired uninsured residential mortgages and homeline products is calculated on a weighted basis by
mortgage amounts at origination.
(5) For newly originated mortgages and homeline products, LTV is calculated based on the total facility amount for the residential mortgage and homeline
product divided by the value of the related residential property.
n.m. not meaningful
While the above table provides the LTV ratios for the current year originations, the LTV ratio on our outstanding balances of the entire Canadian
Banking uninsured residential mortgages, including homeline products is 55% as at October 31, 2014 (2013 – 56%). This calculation is
weighted by mortgage balances and adjusted for property values base on the Teranet – National Bank National Composite House Price Index.
We employ a risk-based approach to property valuation. Property valuation methods include automated valuation models (AVM) and
appraisals. An AVM is a tool that estimates the value of a property by reference to market data including sales of comparable properties and
price trends specific to the Metropolitan Statistical Area in which the property being valued is located. Using a risk-based approach, we also
employ appraisals which can include drive-by or full on-site appraisals.
We continue to actively manage our entire mortgage portfolio and perform stress testing, based on a combination of increasing
unemployment, rising interest rates, and a downturn in real estate markets. Our stress test results indicate the vast majority of our residential
mortgage and homeline clients have sufficient capacity to continue making payments in the event of a shock to one of the above noted
parameters.
60 Royal Bank of Canada: Annual Report 2014 Management’s Discussion and Analysis

Credit quality performance
Provision for (recovery of) credit losses Table 51
(Millions of Canadian dollars, except percentage amounts) 2014 2013
Personal & Commercial Banking $ 1,103 $ 995
Wealth Management 19 51
Capital Markets 44 188
Corporate Support and Other (1) (2) 3
Total PCL $ 1,164 $ 1,237
Canada (2)
Residential mortgages $27$27
Personal 393 391
Credit cards 345 346
Small business 44 32
Retail 809 796
Wholesale 123 149
PCL on impaired loans 932 945
U.S. (2)
Retail $2$3
Wholesale 40 32
PCL on impaired loans 42 35
Other International (2)
Retail $ 121 $86
Wholesale 69 171
PCL on impaired loans 190 257
Total PCL $ 1,164 $ 1,237
PCL ratio (3)
Total PCL ratio 0.27% 0.31%
Personal & Commercial Banking 0.31 0.30
Canadian Banking 0.27 0.27
Caribbean Banking 2.44 1.24
Wealth Management 0.12 0.42
Capital Markets 0.07 0.34
(1) PCL in Corporate Support and Other primarily comprised of PCL for loans not yet identified as impaired. For further information, refer
to the How we measure and report our business segments section.
(2) Geographic information is based on residence of borrower.
(3) PCL on impaired loans as a % of average net loans and acceptances.
2014 vs. 2013
Total PCL decreased $73 million, or 6%, from a year ago. The PCL ratio of 27 bps, decreased 4 bps.
PCL in Personal & Commercial Banking increased $108 million or 11%, and the PCL ratio of 31 bps, increased 1 bp, mainly reflecting higher
provisions in our Caribbean portfolio including an additional provision of $50 million in our impaired residential mortgages portfolio, and higher
provisions in our small business portfolio in Canada.
PCL in Wealth Management decreased $32 million, mainly due to lower provisions on a few accounts.
PCL in Capital Markets decreased $144 million, as the PCL last year included higher provisions on a few accounts in the technology & media
sector in Other International.
Management’s Discussion and Analysis Royal Bank of Canada: Annual Report 2014 61

Gross impaired loans (GIL) Table 52
(Millions of Canadian dollars, except percentage amounts) 2014 2013
Personal & Commercial Banking $ 1,913 $ 1,872
Wealth Management 11 96
Capital Markets 50 229
Investor & Treasury Services 23
Corporate Support and Other 11
Total GIL $ 1,977 $ 2,201
Canada (1)
Retail $ 659 $ 729
Wholesale 487 526
GIL 1,146 1,255
U.S. (1)
Retail $13$14
Wholesale 18 98
GIL 31 112
Other International (1)
Retail $ 353 $ 348
Wholesale 447 486
GIL 800 834
Total GIL $ 1,977 $ 2,201
Impaired loans, beginning balance $ 2,201 $ 2,250
Classified as impaired during the year (new impaired) (2) 1,317 1,769
Net repayments (2) (228) (265)
Amounts written off (1,329) (1,471)
Other (2), (3) 16 (82)
Impaired loans, balance at end of year $ 1,977 $ 2,201
GIL ratio (4)
Total GIL ratio 0.44% 0.52%
Personal & Commercial Banking 0.54 0.55
Canadian Banking 0.33 0.36
Caribbean Banking 11.05 9.91
Wealth Management 0.07 0.79
Capital Markets 0.08 0.42
(1) Geographic information is based on residence of borrower.
(2) Certain GIL movements for Canadian Banking retail and wholesale portfolios are generally allocated to New Impaired, as Return to
performing status, Repayments, Sold, and Exchange and other movements amounts are not reasonably determinable. Certain GIL
movements for Caribbean Banking retail and wholesale portfolios are generally allocated to Exchange and other movements, as
Return to performing status, Repayments, and Sold amounts are not reasonably determinable.
(3) Includes Return to performing status during the year, Recoveries of loans and advances previously written off, Sold, and Exchange
and other movements.
(4) GIL as a % of loans and acceptances.
2014 vs. 2013
Total GIL decreased $224 million or 10% from a year ago. The GIL ratio of 44 bps, decreased 8 bps.
GIL in Personal & Commercial Banking increased $41 million or 2%, mainly due to higher impaired loans in our Caribbean portfolios,
partially offset by lower impaired loans in our Canadian residential mortgages portfolio. The GIL ratio of 54 bps, decreased 1 bp from last year.
GIL in Wealth Management decreased $85 million, mainly due to write-offs and repayments related to a few accounts.
GIL in Capital Markets decreased $179 million, primarily due to lower impaired loans in our technology & media, transportation &
environment, and financing products sectors, largely reflecting repayments, write-offs and sales.
Allowance for credit losses (ACL) Table 53
(Millions of Canadian dollars) 2014 2013
Allowance for impaired loans
Personal & Commercial Banking $ 602 $ 486
Wealth Management 10 53
Capital Markets 18 58
Investor & Treasury Services 22
Total allowance for impaired loans 632 599
Canada (1)
Retail $ 143 $ 149
Wholesale 160 170
Allowance for impaired loans 303 319
U.S. (1)
Retail $1$2
Wholesale 16 19
Allowance for impaired loans 17 21
Other International (1)
Retail $ 172 $ 146
Wholesale 140 113
Allowance for impaired loans 312 259
Total allowance for impaired loans 632 599
Allowance for loans not yet identified as impaired 1,453 1,451
Total ACL $ 2,085 $ 2,050
(1) Geographic information is based on residence of borrower.
62 Royal Bank of Canada: Annual Report 2014 Management’s Discussion and Analysis

2014 vs. 2013
Total ACL increased $35 million or 2% from a year ago, mainly related to higher ACL in our Caribbean portfolio, partially offset by lower ACL in
Wealth Management and Capital Markets.
Market risk
Market risk is defined to be the impact of market prices upon the financial condition of the firm. This includes potential gains or losses due to
changes in market determined variables such as interest rates, credit spreads, equity prices, commodity prices, foreign exchange rates and
implied volatilities.
The measures of financial condition impacted by market risk, and ways in which market risk manifests itself, are as follows:
1. Positions whose revaluation gains and losses are reported in Revenue, which includes:
a) Changes in the fair value of instruments classified or designated as at fair value through profit and loss (FVTPL),
b) Impairment on available-for-sale (AFS) securities, and
c) Hedge ineffectiveness.
2. CET1 capital, which includes:
a) All of the above, plus
b) Changes in the fair value of AFS securities where revaluation gains and losses are reported as other comprehensive income,
c) Changes in the Canadian dollar value of investments in foreign subsidiaries, net of hedges, due to foreign exchange translation,
and
d) Remeasurements of employee benefit plans.
3. CET1 Ratio, which includes:
a) All of the above, plus
b) Changes in risk-weighted assets (RWA) resulting from changes in traded market risk factors, and
c) Changes in the Canadian dollar value of RWA due to foreign exchange translation.
4. The economic value of the bank, which includes:
a) Points 1 and 2 above, plus
b) Changes in the value of other non-trading positions whose value is a function of market risk factors.
Market risk controls – FVTPL positions
As an element of the Enterprise Risk Appetite Framework, the Board of Directors approves the overall market risk constraints for RBC. GRM
creates and manages the control structure for FVTPL positions that ensures that business is conducted consistent with Board requirements.
The Market and Trading Credit Risk function within GRM is responsible for creating and managing the controls and governance procedures
that ensure that risk taken is consistent with risk appetite constraints set by the Board. These controls include limits on:
(1) Market risk positions;
(2) Probabilistic measures of potential loss such as Value-at-Risk and Stressed Value-at-Risk defined below, and;
(3) Scenario based stress tests which utilize both actual historical market scenarios such as the global financial crisis of 2008 and
hypothetical scenarios designed to be more forward looking. These stress tests apply severe and long duration stresses to market
variables.
Market Risk Positions – are measures of potential loss due to changes in market variables.
Value-at-Risk (VaR) – is a statistical measure of potential loss for a financial portfolio computed at a given level of confidence and over a
defined holding period. We measure VaR at the 99th percentile confidence level for price movements over a 1 day holding period using
historic simulation of the last two years of equally weighted historic market data. These calculations are updated daily with current risk
positions with the exception of CVA and certain other positions which are updated weekly.
Stressed Value-at-Risk (SVaR) – is calculated in an identical manner as VaR with the exception that it is computed using a fixed historical
one year period of extreme volatility and its inverse rather than the most recent two year history. The stress period used is the interval from
September 2008 through August 2009. Stressed VaR is calculated weekly for all portfolios.
VaR and SVaR are statistical estimates based on historical market data and should be interpreted with knowledge of their limitations –
which include the following:
• VaR and SVaR will not be predictive of future losses if the realized market movements differ significantly from the periods used to
compute them.
• VaR and SVaR project potential losses over a one day holding period and do not project potential losses for risk positions held over
longer time periods.
• VaR and SVaR are measured using positions at close of business and do not include the impact of trading activity over the course of a
day.
We validate our VaR and SVaR measures through a variety of means – including subjecting the models to vetting and validation by a group
independent of the model developers and by back-testing the VaR against daily marked-to-market revenue to identify and examine events
in which actual outcomes in trading revenue exceed the VaR projections.
Stress Tests – Our market risk stress testing program is used to identify and control risk due to large changes in market prices and rates.
We conduct stress testing daily on positions that are marked-to-market. The stress tests simulate both historical and hypothetical events
which are severe and long term in duration. Historical scenarios are taken from actual market events over the last 30 years and range in
duration up to 90 days. Examples include the equity market crash of 1987 and the global financial crisis of 2008. Hypothetical scenarios
are designed to be forward looking at potential future market stresses, and are designed to be severe but plausible. We are constantly
evaluating and refining these scenarios as market conditions change. Stress results are calculated assuming an instantaneous revaluation
of our positions with no management action.
These measures are computed on all positions that are FVTPL for financial reporting purposes, with the exception of those in a designated
hedging relationship and those in our insurance businesses.
Management’s Discussion and Analysis Royal Bank of Canada: Annual Report 2014 63
Market risk measures – FVTPL positions
VaR and SVaR
The following table presents our Market risk VaR and Market risk SVaR figures for 2014 and 2013.
Market Risk VaR* Table 54
2014 2013
As at
Oct. 31
For the year ended October 31 As at
Oct. 31
For the year ended October 31
(Millions of Canadian dollars) Average High Low Average High Low
Equity $9$10$17$4$8$9$19$5
Foreign exchange 32515 471
Commodities 23723 352
Interest rate 24 27 36 18 38 41 51 36
Credit specific (1) 8 9 11 6 10 10 12 7
Diversification (2) (18) (21) (30) (15) (23) (23) (31) (16)
Market risk VaR $ 28 $ 30 $ 39 $ 19 $41$44$51$38
Market risk SVaR $ 83 $ 92 $ 121 $ 69 $ 117 $ 95 $ 123 $ 73
* This table represents an integral part of our 2014 Annual Consolidated Financial Statements.
(1) General credit spread risk is measured under interest rate VaR while credit specific risk captures issuer-specific credit spread volatility.
(2) Market risk VaR is less than the sum of the individual risk factor VaR results due to portfolio diversification.
2014 vs. 2013
Average market risk VaR of $30 million was down $14 million compared to last year, mainly driven by lower risk positions in MBS portfolios and
the roll forward of the historical time period used to calculate VaR.
Average SVaR of $92 million decreased $3 million compared to last year, largely due to lower risk positions in certain MBS portfolios. The
decrease was also a result of the adoption of the provisions of IFRS 9 Financial Instruments (IFRS 9) in which changes in the fair value of non-
derivative liabilities attributable to changes in our credit risk are no longer reported in revenue and were therefore excluded from our VaR model
as of May 1, 2014. The decrease was partially offset by higher risk in fixed income positions whose price behaviour was particularly volatile in
the historical period used to calculate SVaR when compared to more recent history, and the impact of foreign exchange translation on foreign-
denominated portfolios.
The following chart graphically displays a bar chart of our daily trading profit and loss and a line chart of our daily Market risk VaR for the current
year. We incurred net trading losses on eleven days in the year totalling $46 million, as compared to seven days of losses totalling $14 million in
2013, with none of the losses exceeding VaR.
Daily Trading Revenue Market Risk VaR
Nov 1, 2013
Jan 31, 2014
Apr 30, 2014
Jul 31, 2014
Oct 31, 2014
-50
-40
-30
-20
-10
10
30
40
20
0
60
50
Trading Revenue and VaR (Millions of Canadian dollars)
64 Royal Bank of Canada: Annual Report 2014 Management’s Discussion and Analysis
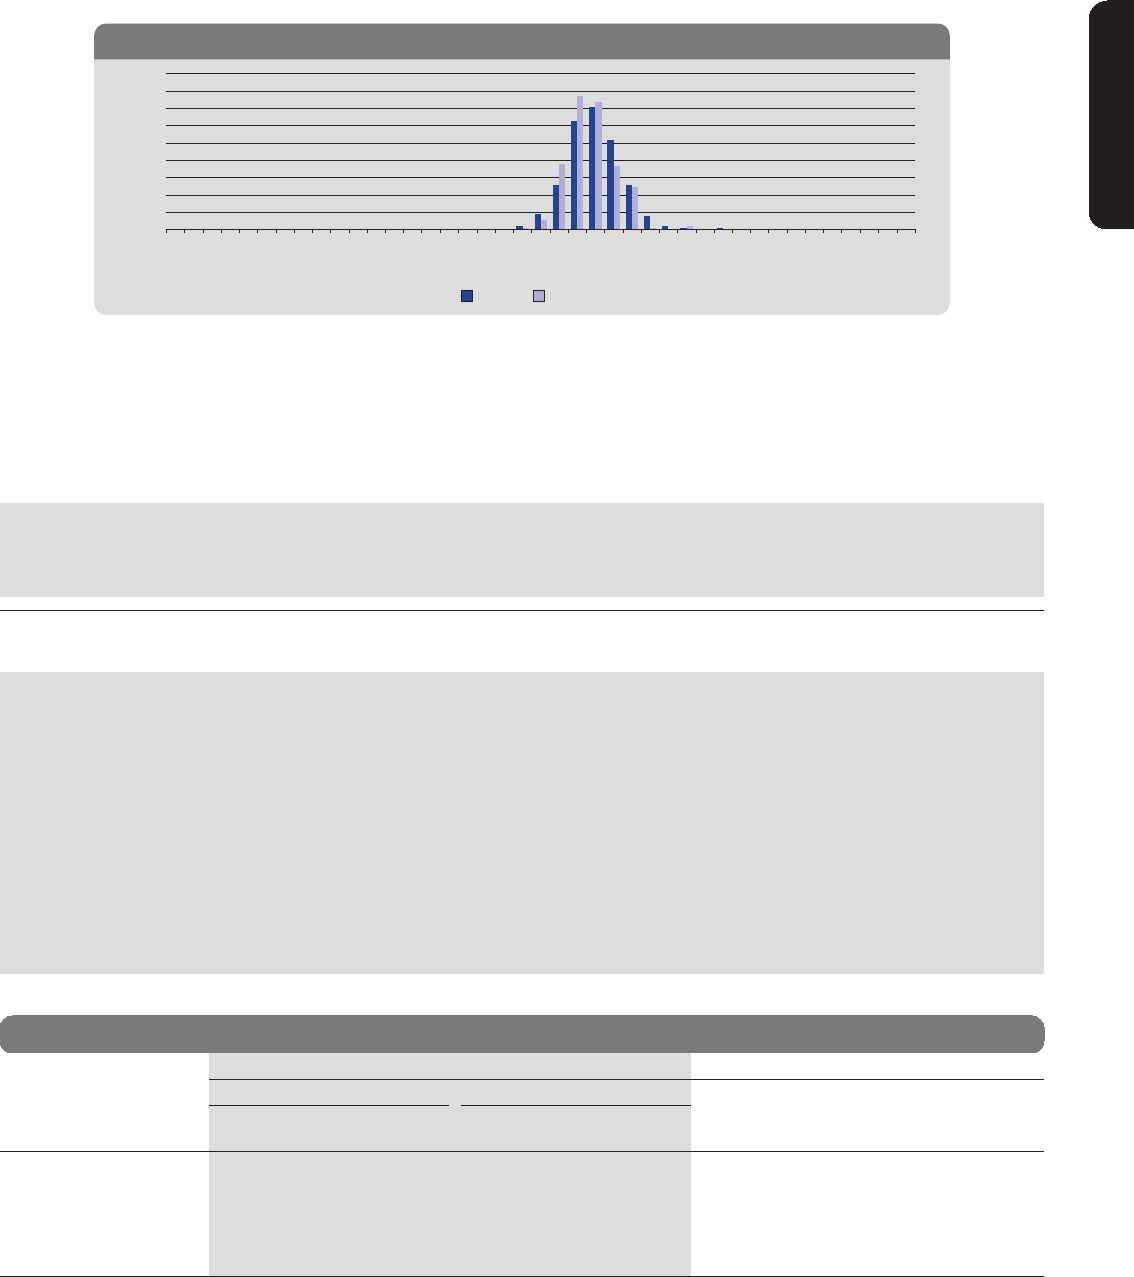
The following chart displays the distribution of daily trading profit and loss in 2014. The largest daily reported loss of $11 million on October 13,
2014 was primarily driven by certain proprietary trading strategies. The largest reported profit was $50 million with an average daily profit of
$12 million.
< -100
-90
-80
-70
-60
-50
-40
-30
-20
-10
0
10
20
30
40
50
60
70
80
90
> 100
Frequency in Number of Days
Daily net trading revenue (Millions of Canadian dollars), excluding VIEs
0
20
10
40
30
90
80
70
60
50
Trading Revenue for the year ended October 31, 2014 (teb)
2014 2013
Market risk measures for other FVTPL positions – Assets and liabilities of RBC Insurance
We offer a range of insurance products to clients and hold investments to meet the future obligations to policyholders. The investments which
support actuarial liabilities are predominantly fixed income assets designated as at FVTPL. Consequently changes in the fair values of these
assets are recorded in investment income in the consolidated statements of income and are largely offset by changes in the fair value of the
actuarial liabilities, the impact of which is reflected in insurance policyholder benefits and claims. As at October 31, 2014, we had liabilities in
respect to insurance obligations of $8.6 billion and trading securities of $6.8 billion in support of the liabilities.
Market risk controls – Structural Interest Rate Risk (SIRR) Positions (1)
The asset/liability mismatch of positions not marked-to-market is referred to as SIRR and is subject to a separate set of limits and controls.
The Board of Directors approves the overall risk appetite for SIRR, and Asset Liability Committee (ALCO) along with GRM provide oversight for
this risk through risk policies, limits, and operating standards. In addition, interest rate risk reports are reviewed regularly by GRM, ALCO, the
Group Risk Committee, the Risk Committee of the Board and the Board of Directors.
(1) SIRR positions include impact of derivatives in hedge accounting relationships and AFS securities used for interest rate risk management.
Structural Interest Rate Risk measurement
SIRR measures include the impact of interest rate changes to both one year’s net interest income and the instantaneous impact to economic
value of equity. These measures are reported on a weekly basis and are subject to limits and controls set by ALCO and GRM.
We further supplement our assessment by measuring interest rate risk for a range of dynamic and static market scenarios. Dynamic
scenarios simulate our interest income in response to various combinations of business and market factors. Business factors include
assumptions about future pricing strategies and volume and mix of new business, whereas market factors include assumed changes in
interest rate levels and changes in the shape of the yield curve. Static scenarios supplement dynamic scenarios and are employed for
assessing the risks to the value of equity and net interest income.
As part of our monitoring process, the effectiveness of our interest rate risk mitigation activity is assessed on value and earnings bases,
and model assumptions are validated against actual client behavior.
Market risk measures – Structural Interest Rate Positions
The following table provides the potential before-tax impact of an immediate and sustained 100 bps and 200 bps increase or decrease in interest
rates on net interest income and economic value of equity of our non-trading portfolio, assuming that no further hedging is undertaken. These
measures are based upon assumptions made by senior management and validated by empirical research. All interest rate risk measures are based
upon interest rate exposures at a specific time and continuously change as a result of business activities and our risk management actions.
Over the course of 2014, our interest rate risk exposure was within our target level.
Market risk measures – Non-trading banking activities* Table 55
2014 2013 2012
Economic value of equity risk Net interest income risk (2) Economic
value of
equity risk
Net interest
income risk (2)
Economic
value of
equity risk
Net interest
income risk (2)(Millions of Canadian dollars)
Canadian
dollar impact
U.S. dollar
impact (1) Total
Canadian
dollar impact
U.S. dollar
impact (1) Total
Before-tax impact of:
100bps increase in rates $ (910) $ (6) $ (916) $ 402 $ 12 $ 414 $ (540) $ 391 $ (497) $ 397
100bps decrease in rates 755 (1) 754 (346) (2) (348) 446 (303) 405 (322)
Before-tax impact of:
200bps increase in rates (1,893) (17) (1,910) 736 27 763 (1,160) 758 (1,005) 842
200bps decrease in rates 1,264 (5) 1,259 (431) (3) (434) 799 (398) 651 (370)
* This table represents an integral part of our 2014 Annual Consolidated Financial Statements.
(1) Represents the impact on the non-trading portfolios held in our U.S. banking operations.
(2) Represents the 12-month Net interest income exposure to an instantaneous and sustained shift in interest rates.
Management’s Discussion and Analysis Royal Bank of Canada: Annual Report 2014 65

Market risk measures for other material non-trading portfolios
Available for Sale (AFS) Securities
We held $46 billion of securities classified as AFS as at October 31, 2014, compared to $38 billion as at October 31, 2013. We hold debt
securities designated as AFS primarily as investments and to manage interest rate risk in our non-trading banking activity. Certain legacy debt
portfolios are also classified as AFS. As at October 31, 2014, our portfolio of AFS securities exposes us to interest rate risk of a pre-tax loss of
$6.9 million as measured by the change in the value of the securities for a one basis point parallel increase in yields. The portfolio also exposes
us to credit spread risk of a pre-tax loss of $11.2 million, as measured by the change in value for a one basis point widening of credit spreads.
Changes in the value of these securities are reported in other comprehensive income. Our available-for-sale securities also include equity
exposures of $1.7 billion as at October 31, 2014, which is unchanged compared to last year.
Derivatives in hedge accounting relationships
Derivative assets in a designated hedge accounting relationship of $2.0 billion as at October 31, 2014 were unchanged from last year, and
derivative liabilities of $837 million as at October 31, 2014 were down from $931 million last year. We use interest rate swaps to manage our
structural interest rate risk, as described above. To the extent these swaps are considered effective hedges, changes in their fair value are
recognized in other comprehensive income. The interest rate risk for the designated cash flow hedges, measured as the change in the value of
the derivatives for a one basis point parallel increase in yields, was $3.6 million as of October 31, 2014.
We also use interest rate swaps to hedge changes in the fair value of certain fixed-rate instruments. Changes in fair value of the interest rate
swaps and the hedged instruments that are related to interest rate movements are reflected in income.
We also use foreign exchange derivatives to manage our exposure to equity investments in subsidiaries that are denominated in foreign
currencies, particularly the U.S. dollar and British pound. Changes in the fair value of these hedges and the cumulative translation adjustment
related to our structural foreign exchange risk are reported in other comprehensive income.
Non-trading foreign exchange rate risk
Foreign exchange rate risk is the potential adverse impact on earnings and economic value due to changes in foreign currency rates. Our
revenue, expenses and income denominated in currencies other than the Canadian dollar are subject to fluctuations as a result of changes in
the value of the average Canadian dollar relative to the average value of those currencies. Our most significant exposure is to the U.S. dollar
due to our level of operations in the U.S., and other activities conducted in U.S. dollars. Other significant exposures are to the British pound
and the Euro due to our activities conducted internationally in these currencies. A strengthening or weakening of the Canadian dollar
compared to the U.S. dollar, British pound and the Euro could reduce or increase, as applicable, the translated value of our foreign currency
denominated revenue, expenses and earnings and could have a significant effect on the results of our operations. We are also exposed to
foreign exchange rate risk arising from our investments in foreign operations. For un-hedged equity investments, when the Canadian dollar
appreciates against other currencies, the unrealized translation losses on net foreign investments decreases our shareholders’ equity
through the other components of equity and decreases the translated value of the RWA of the foreign currency-denominated operations. The
reverse is true when the Canadian dollar depreciates against other currencies. Consequently, we consider these impacts in selecting an
appropriate level of our investments in foreign operations to be hedged.
Our overall trading and non-trading market risk objectives, policies and methodologies have not changed significantly from 2013.
66 Royal Bank of Canada: Annual Report 2014 Management’s Discussion and Analysis

Linkage of market risk to selected balance sheet items
The following table provides the linkages between selected balance sheet items with positions included in our trading market risk and non-
trading market risk disclosures, which illustrates how we manage market risk for our assets and liabilities through different risk measures.
Linkage of market risk to selected balance sheet items Table 56
As at October 31, 2014
Market risk measure
(Millions of Canadian dollars)
Balance sheet
amount Traded risk (1)
Non-traded
risk (2)
Non-traded risk
primary risk sensitivity
Assets subject to market risk
Cash and due from banks (3) $ 17,421 $ 10,840 $ 6,581 Interest rate
Interest-bearing deposits with banks (4) 8,399 5,642 2,757 Interest rate
Securities
Trading (5) 151,380 144,607 6,773 Interest rate, credit spread
Available-for-sale (6) 47,768 – 47,768 Interest rate, credit spread, equity
Assets purchased under reverse repurchase
agreements and securities borrowed (7) 135,580 135,444 136 Interest rate
Loans
Retail (8) 334,987 16,614 318,373 Interest rate
Wholesale (9) 102,236 427 101,809 Interest rate
Allowance for loan losses (1,994) – (1,994) Interest rate
Segregated fund net assets (10) 675 – 675 Interest rate
Derivatives 87,402 83,981 3,421 Interest rate, foreign exchange
Other assets (11) 49,878 14,098 35,780 Interest rate
Assets not subject to market risk (12) 6,818
Total assets $ 940,550 $ 411,653 $ 522,079
Liabilities subject to market risk
Deposits (13) $ 614,100 $ 116,348 $ 497,752 Interest rate
Segregated fund liabilities (14) 675 – 675 Interest rate
Other
Obligations related to securities sold short 50,345 50,345 –
Obligations related to assets sold under repurchase
agreements and securities loaned (15) 64,331 64,210 121 Interest rate
Derivatives 88,982 87,145 1,837 Interest rate, foreign exchange
Other liabilities (16) 51,190 14,756 36,434 Interest rate
Subordinated debentures 7,859 – 7,859 Interest rate
Liabilities not subject to market risk (17) 8,565
Total liabilities $ 886,047 $ 332,804 $ 544,678
Total equity $ 54,503
Total liabilities and equity $ 940,550
(1) Traded risk includes FVTPL positions whose revaluation gains and losses are reported in revenue. Market risk measures of VaR, SVaR and Stress testing are used as risk controls for traded
risk.
(2) Non-traded risk includes positions used in the management of the SIRR and other non-trading portfolios. Other material non-trading portfolios include positions from our Insurance business
and AFS securities not included in SIRR.
The following footnotes provide additional information on the Non-traded risk amounts:
(3) Cash and due from banks includes $5,494 million included in SIRR. An additional $1,087 million is included in other risk controls.
(4) Interest-bearing deposits with banks of $2,757 million are included in SIRR.
(5) Trading securities include $6,761 million in securities used in the management of the SIRR of RBC Insurance, which is not included in our disclosed SIRR measure.
(6) Available-for-sale securities of $44,403 million are included in SIRR. An additional $3,365 million are held by our insurance businesses that do not contribute to our disclosed SIRR measures
and certain legacy assets.
(7) Assets purchased under reverse repurchase agreements include $136 million reflected in SIRR.
(8) Retail loans include $318,376 million reflected in SIRR.
(9) Wholesale loans include $100,646 million reflected in SIRR. An additional $1,163 million is used in the management of the SIRR of RBC Insurance.
(10) Investments for the account of segregated fund holders are included in the management of the SIRR of RBC Insurance.
(11) Other assets include $33,309 million reflected in SIRR. An additional $2,471 million is used in the management of the SIRR of RBC Insurance.
(12) Other assets include $6,818 million of physical and other assets that are not subject to market risk.
(13) Deposits include $497,747 million reflected in SIRR. An additional $5 million is used in the management of the SIRR of RBC Insurance.
(14) Insurance and investment contracts for the account of segregated fund holders are included in the management of the SIRR of RBC Insurance.
(15) Obligations related to assets sold under repurchase agreements include $121 million reflected in SIRR.
(16) Other liabilities include $9,324 million used in the management of the SIRR of RBC Insurance, and $27,110 million contribute to our SIRR measure.
(17) Other liabilities include $8,565 million of payroll related and other liabilities that are not subject to market risk.
Management’s Discussion and Analysis Royal Bank of Canada: Annual Report 2014 67

As at October 31, 2013
Market risk measure
(Millions of Canadian dollars)
Balance sheet
amount Traded risk (1)
Non-traded
risk (2)
Non-traded risk
primary risk sensitivity
Assets subject to market risk
Cash and due from banks (3) $ 15,550 $ 8,202 $ 7,348 Interest rate
Interest-bearing deposits with banks (4) 9,039 2,833 6,206 Interest rate
Securities
Trading (5) 144,023 137,718 6,305 Interest rate, credit spread
Available-for-sale (6) 38,687 – 38,687 Interest rate, credit spread, equity
Assets purchased under reverse repurchase agreements
and securities borrowed (7) 117,517 116,703 814 Interest rate
Loans
Retail (8) 320,627 16,168 304,459 Interest rate
Wholesale (9) 90,182 387 89,795 Interest rate
Allowance for loan losses (1,959) – (1,959) Interest rate
Segregated fund net assets (10) 513 – 513 Interest rate
Derivatives 74,822 71,678 3,144 Interest rate, foreign exchange
Other assets (11) 43,999 12,631 31,368 Interest rate
Assets not subject to market risk (12) 6,745
Total assets $ 859,745 $ 366,320 $ 486,680
Liabilities subject to market risk
Deposits (13) $ 563,079 $ 105,313 $ 457,766 Interest rate
Segregated fund liabilities (14) 513 – 513 Interest rate
Other
Obligations related to securities sold short 47,128 47,128 –
Obligations related to assets sold under repurchase
agreements and securities loaned (15) 60,416 60,147 269 Interest rate
Derivatives 76,745 75,368 1,377 Interest rate, foreign exchange
Other liabilities (16) 46,265 12,962 33,303 Interest rate
Subordinated debentures 7,443 – 7,443 Interest rate
Liabilities not subject to market risk (17) 8,696
Total liabilities $ 810,285 $ 300,918 $ 500,671
Total equity $ 49,460
Total liabilities and equity $ 859,745
(1) Traded risk includes FVTPL positions whose revaluation gains and losses are reported in revenue. Market risk measures of VaR, SVaR and Stress testing are used as risk controls for traded
risk.
(2) Non-traded risk includes positions used in the management of the SIRR and other non-trading portfolios. Other material non-trading portfolios include positions from our Insurance business
and AFS securities not included in SIRR.
The following footnotes provide additional information on the Non-traded risk amounts:
(3) Cash and due from banks includes $6,396 million included in SIRR. An additional $952 million is included in other risk controls.
(4) Interest-bearing deposits with banks of $6,206 million are included in SIRR.
(5) Trading securities include $5,863 million in securities used in the management of the SIRR of RBC Insurance, which is not included in our disclosed SIRR measure.
(6) Available-for-sale securities of $34,307 million are included in SIRR. An additional $4,380 million are held by our insurance businesses that do not contribute to our SIRR measures and
certain legacy assets.
(7) Assets purchased under reverse repurchase agreements include $814 million reflected in SIRR.
(8) Retail loans include $304,459 million reflected in SIRR.
(9) Wholesale loans include $88,765 million reflected in SIRR. An additional $1,030 million is used in the management of the SIRR of RBC Insurance.
(10) Investments for the account of segregated fund holders are included in the management of the SIRR of RBC Insurance.
(11) Other assets include $28,756 million reflected in SIRR. An additional $2,612 million is used in the management of the SIRR of RBC Insurance.
(12) Other assets include $6,745 million of physical and other assets that are not subject to market risk.
(13) Deposits include $457,766 million reflected in SIRR.
(14) Insurance and investment contracts for the account of segregated fund holders are included in the management of the SIRR of RBC Insurance.
(15) Obligations related to assets sold under repurchase agreements include $269 million reflected in SIRR.
(16) Other liabilities include $8,735 million used in the management of the SIRR of RBC Insurance, and $24,568 million contribute to our SIRR measure.
(17) Other liabilities include $8,696 million of payroll related and other liabilities that are not subject to market risk.
Liquidity and funding risk
Liquidity and funding risk (liquidity risk) is the risk that we may be unable to generate or obtain sufficient cash or its equivalent in a timely
and cost-effective manner to meet our commitments as they come due. The nature of banking services inherently exposes us to various types
of liquidity risk. The most common sources of liquidity risk arise from mismatches in the timing and value of cash inflows and outflows, both
from on- and off-balance sheet exposures.
Our liquidity position is structured to satisfy our current and prospective commitments in normal business conditions, and in
conjunction with our capital position, to maintain safety and soundness in times of stress. To achieve these goals, we operate under a
comprehensive Liquidity Management Framework and employ key liquidity risk mitigation strategies that include the maintenance of:
• An appropriate balance between the level of exposure allowed under our risk appetite given the potential impact of extreme but
plausible events and the cost of its mitigation;
• Broad funding access, including preserving and promoting a reliable base of core client deposits, ongoing access to diversified sources
of wholesale funding and demonstrated capacities to monetize specific asset classes;
• A comprehensive enterprise-wide liquidity contingency plan that is supported by unencumbered marketable securities; and
• Appropriate and transparent liquidity transfer pricing and cost allocation.
68 Royal Bank of Canada: Annual Report 2014 Management’s Discussion and Analysis

Our liquidity management policies, practices and processes reinforce these risk mitigation strategies. In managing liquidity risk, we favour a
centralized management approach to the extent possible given the various considerations outlined in this section.
Our liquidity risk objectives, policies and methodologies have not changed materially from 2013. However, certain limits and risk practices
have been modified as a result of market conditions and to align with local regulatory developments and to position ourselves for the
prospective Basel III regulatory liquidity standards. We continue to maintain liquidity and funding that is appropriate for the execution of our
strategy. Liquidity risk remains well within our risk appetite.
Regulatory environment
We continue to monitor and, as appropriate, modify our risk policies, practices and processes to align with regulatory developments and to
position ourselves for prospective regulatory reforms, such as the Basel III regulatory liquidity standards established by the BCBS and supported
by OSFI and other jurisdictions. The BCBS liquidity standards include minimum requirements for two regulatory measures, the Liquidity Coverage
Ratio (LCR) and Net Stable Funding Ratio (NSFR). In January 2013, the BCBS released its final rules for LCR, with phased timelines for compliance,
starting with a minimum of 60% coverage in 2015 and increasing by 10% annually to 100% in 2019. In January 2014, the BCBS released its final
paper on “Liquidity coverage ratio disclosure standards”. Banks are expected to comply with the BCBS LCR disclosure standards beginning in the
first full fiscal quarter of calendar 2015 (Q2 for Canadian banks). In October 2014, the BCBS issued the final standard for NSFR and banks are
required to meet the minimum standard by January 1, 2018. Disclosure standards for the NSFR are currently being developed by the BCBS and a
consultative document is expected to be released by the end of the year.
In May 2014, OSFI issued the final version of the “Liquidity Adequacy Requirements (LAR) Guideline”. The objective of this guideline is to
describe the methodologies supporting a series of liquidity metrics that will be used by OSFI to assess the liquidity adequacy of an institution.
The LAR guideline converts the BCBS liquidity requirements (including the LCR and NSFR liquidity metrics together with monitoring tools) into
OSFI guidance as well as formalizing use of the OSFI-designed Net Cumulative Cash Flow (NCCF) as a supervisory tool. The LAR guideline contains
modified assumptions and parameters for NCCF which OSFI originally introduced in 2010. Of note in the LAR guideline is that, while the LCR
implementation date of January 2015 is consistent with the BCBS requirement, there will be no phase-in period as the minimum LCR requirement
for Canadian institutions at that date will be 100% compared to the minimum 60% coverage as prescribed by the BCBS. Implementation of the
formal version of NCCF and other liquidity monitoring tools will also be January 2015. Intraday monitoring tools will be implemented by 2017. In
July 2014, OSFI issued its guideline setting out the public disclosure requirements regarding the LCR for D-SIBs which is consistent with the
international standards established by the BCBS final rules published earlier this year. We prepare a NCCF report for OSFI on a monthly basis and
are submitting monthly LCR and quarterly NSFR results to OSFI as well as Quantitative Impact Study reports on LCR and NSFR for OSFI and BCBS
twice a year.
In August 2014, the Government of Canada’s Department of Finance released its bail-in consultation paper “Taxpayer Protection and Bank
Recapitalization Regime”. Bail-in regimes are being implemented in a number of jurisdictions following the 2008 financial crisis in an effort to
limit taxpayer exposure to potential losses of a failing institution and ensure the institution’s shareholders and creditors remain responsible for
bearing such losses. The proposed regime applies only to D-SIBs and focuses on a specific range of liabilities and excludes deposits. For further
details, refer to the Legal and regulatory environment risk section.
Risk measurement
To monitor and control risk within appropriate tolerances, limits are set on various metrics reflecting a range of time horizons and severity of
stress conditions. Risk methodologies and underlying assumptions are periodically reviewed and validated to ensure alignment with our
operating environment, expected economic and market conditions, rating agency preferences, regulatory requirements and accepted
practices. Liquidity risk is measured using contractual maturity dates for some assets and liabilities (e.g., wholesale lending and funding) and
effective maturity for others. In the effective maturity approach, the liquidity value of assets and liabilities is determined based on observed
behavioural or market-based patterns unrelated to contractual maturity. For example, effective maturity may be shorter than contractual
maturity if the demonstrated behaviour of the asset suggests that it can be monetized before maturity. Effective maturity for a liability may be
longer than contractual maturity if the demonstrated behaviour of the liability suggests that it will be extended or rolled over at maturity.
Specific examples include government bonds for assets as they can be quickly and reliably monetized and relationship-based deposits for
liabilities where a significant portion is typically assigned core value although contractual maturity dates may be quite short or even legally
characterized as available on demand (conversely, demand loans display attributes of longer term assets and are treated accordingly from an
effective maturity perspective). Internally derived assumptions consider all relevant material and available data, information and methods of
quantifying liquidity risk. We measure and manage our liquidity position from three risk perspectives as follows:
Structural (longer-term) liquidity risk
We use cash capital and other structural metrics, which focus on mismatches in effective maturity between all assets and liabilities, to
measure and control balance sheet risk and to assist in the determination of our term funding strategy. Stressed conditions are considered,
including a protracted loss of access to longer term unsecured wholesale deposits that fund illiquid assets.
Tactical (shorter-term) liquidity risk
We apply net cash flow limits in Canadian dollar and foreign currencies for key short-term time horizons (overnight to nine weeks) under
various stages of stress and assign a risk-adjusted limit to our aggregate pledging exposure and individual limits by types of pledging activ-
ities to measure our shorter-term liquidity exposures. Net cash flow positions are derived from application of internally generated risk
assumptions and parameters to known and anticipated cash flows for all material unencumbered assets, liabilities and off-balance sheet
activities. Pledged assets are not considered a source of available liquidity. We also control this risk by adhering to group-wide and unit-
specific prescribed regulatory standards.
Management’s Discussion and Analysis Royal Bank of Canada: Annual Report 2014 69

Contingency liquidity risk
Contingency liquidity risk management assesses the impact of and our intended responses to sudden stressful events. Our liquidity
contingency plan, maintained and administered by Corporate Treasury, guides our actions and responses to liquidity crises. The Liquidity
Crisis Team, consisting of senior representatives with relevant subject matter expertise from key business segments and Corporate Support,
contributes to the development of stress tests and funding plans and meets regularly to assess our liquidity status, conduct stress tests and
review liquidity contingency preparedness.
Our stress tests, which include elements of scenario and sensitivity analyses, are based on models that measure our potential exposure
to global, country-specific and RBC-specific events (or combinations thereof) and consider both historical and hypothetical events over a
nine-week period consistent with our internal tactical liquidity risk measure and our view of the most critical time span for such events.
Different levels of severity are considered for each type of crisis with some scenarios reflecting multiple notch downgrades to our credit
ratings. Key tests are run monthly, while others are run quarterly. The frequency of review is determined by considering a combination of
likelihood and impact.
In a particularly acute short-term crisis or if a crisis was to extend over a number of months, actions would be taken to supplement liquidity
available from our earmarked contingency asset pool by limiting cash and collateral outflows and by accessing new sources of liquidity and
funding; for example, through sales of liquid assets and securitization and, in extraordinary circumstances, sales of core assets. As well, in light
of our current credit ratings and well-developed market relationships and access, it is expected that even under extreme but plausible scenarios,
we would continue to be able to access wholesale funding markets, albeit possibly at reduced overall capacity, higher costs and for shorter
average maturities.
While we also have potential access to various normal course and emergency central bank lending facilities in Canada, the U.S. and Europe,
such facilities are not considered a source of funding in our contingency planning for scenarios identified as extreme but plausible.
After reviewing test results, the liquidity contingency plan and other liquidity risk management practices and limits may be modified
accordingly. The risk of more prolonged crises is addressed through measures of structural liquidity risk that assume stress conditions.
Our liquid assets consist primarily of a diversified pool of highly rated and liquid marketable securities and include segregated portfolios (in
both Canadian and U.S. dollars) of contingency liquidity assets to address potential on- and off-balance sheet liquidity exposures (such as
deposit erosion, loan drawdowns and higher collateral demands), that have been sized through models we have developed or by the scenario
analyses and stress tests we conduct periodically. These portfolios are subject to minimum asset quality levels and, as appropriate, other strict
eligibility guidelines (e.g., maturity, diversification and eligibility for central bank advances) to maximize ready access to cash in emergencies.
Examples of assets held in these portfolios include U.S. and Canadian federal government treasury bills and bonds, U.S. Agency bonds, U.S. and
Canadian government guaranteed and sponsored entity bonds, other highly rated foreign sovereign bonds and their guaranteed debt, suprana-
tional bonds and Canadian provincial bonds. Our total pool of unencumbered liquid assets, whether held specifically for contingency liquidity
purposes or for investment or trading activities, would be available during times of crisis as sources of liquidity, either via outright sale or to
obtain secured funding.
Risk Profile
As at October 31, 2014, relationship-based deposits, which are the primary source of funding for retail loans and mortgages, were $394 billion or
54% of our total funding (October 31, 2013 – $359 billion or 54%). Funding for highly liquid assets during the year consisted primarily of a range
of shorter-term wholesale funding that reflects the purpose and expected monetization period of these assets. This wholesale funding comprised
unsecured short-term liabilities of $74 billion and secured (repos and short sales) liabilities of $126 billion, and represented 10% and 17% of
total funding as at October 31, 2014, respectively (October 31, 2013 – $67 billion and $111 billion or 10% and 17% of total funding,
respectively). Long-term wholesale funding is mostly used to fund less liquid wholesale assets. Additional quantitative information is provided in
the following Funding section.
As at October 31, 2014, we held earmarked contingency liquidity assets of $12 billion, of which $7 billion was in U.S. currency and
$5 billion was in Canadian currency (October 31, 2013 – $12 billion of which $7 billion was in U.S. currency and $5 billion was in Canadian
currency). During the year ended October 31, 2014, we held on average $12 billion, of which $7 billion was in U.S. currency and $5 billion was in
Canadian currency (October 31, 2013 – $10 billion of which $5 billion was in U.S. currency and $5 billion was in Canadian currency). We also
held a derivatives pledging liquid asset buffer of US$4 billion as at October 31, 2014 to mitigate the volatility of our net pledging requirements
for derivatives trading (October 31, 2013 – US$4 billion). This buffer averaged US$4 billion during the year ended October 31, 2014 (October 31,
2013 – US$2 billion).
As recommended by the EDTF, the following tables provide summaries of our liquidity reserve and asset encumbrance. Unencumbered assets
represent, for the most part, a ready source of funding that can be accessed quickly, when required. In the Liquidity reserve table, available
liquid assets consist of on-balance sheet cash and securities holdings as well as securities received as collateral from securities financing
(reverse repos and off-balance sheet collateral swaps) and derivative transactions and constitute the preferred source for quickly accessing
liquidity. The other component of our liquidity reserve consists primarily of uncommitted and undrawn central bank credit facilities that could be
accessed under exceptional circumstances provided certain pre-conditions could be met and where advances could be supported by eligible
assets (e.g. certain unencumbered loans) not included in the liquid assets category. The Asset encumbrance table provides a comprehensive
view of the assets available to the Bank, not just the liquidity reserve, and identifies assets already pledged as well as those available for use as
collateral (including unencumbered assets from the Liquidity reserve table) for secured funding purposes. Less liquid assets such as mortgages
and credit card receivables can in part be monetised although requiring more lead times relative to liquid assets. As at October 31, 2014, our
assets available as collateral comprised 66% of our total liquid assets. For the purpose of constructing the following tables, encumbered assets
include: (i) bank-owned liquid assets that are either pledged as collateral (e.g., repo financing and derivative pledging) or not freely available
due to regulatory or internal policy requirements (e.g., earmarked to satisfy mandatory reserve or local capital adequacy requirements and to
maintain continuous access to payment and settlement systems); (ii) securities received as collateral from securities financing and derivative
transactions which have either been re-hypothecated where permissible (e.g., to obtain financing through repos or to cover securities sold short)
or have no liquidity value since re-hypothecation is prohibited; and (iii) illiquid assets that have been securitized and sold into the market or that
have been pledged as collateral in support of structured term funding vehicles. We do not include encumbered assets as a source of available
liquidity in measuring liquidity risk. Unencumbered assets are the difference between total and encumbered assets from both on- and off-
balance sheet sources.
70 Royal Bank of Canada: Annual Report 2014 Management’s Discussion and Analysis

Liquidity reserve (1) Table 57
As at October 31, 2014
(Millions of Canadian dollars)
Bank-owned
liquid assets
Securities
received as
collateral from
securities
financing and
derivative
transactions
Total liquid
assets
Encumbered
liquid assets
Unencumbered
liquid assets
Cash and holding at central banks $ 18,656 $ – $ 18,656 $ 1,054 $ 17,602
Deposits in other banks available overnight 3,855 – 3,855 333 3,522
Securities issued or guaranteed by sovereigns, central
banks or multilateral development banks (2), (3) 204,409 16,626 221,035 104,335 116,700
Other (2) 112,878 21,346 134,224 59,345 74,879
Liquidity assets eligible at central banks
(not included above) (4) 62 – 62 – 62
Undrawn credit lines granted by central banks (5) 8,372 – 8,372 – 8,372
Other assets eligible as collateral for discount (6) 125,627 – 125,627 – 125,627
Other liquid assets (7) 11,887 – 11,887 11,887 –
Total liquid assets $ 485,746 $ 37,972 $ 523,718 $ 176,954 $ 346,764
As at October 31, 2013 (8)
(Millions of Canadian dollars)
Bank-owned
liquid assets
Securities
received as
collateral from
securities
financing and
derivative
transactions
Total liquid
assets
Encumbered
liquid assets
Unencumbered
liquid assets
Cash and holding at central banks $ 12,711 $ – $ 12,711 $ 980 $ 11,731
Deposits in other banks available overnight 3,767 – 3,767 287 3,480
Securities issued or guaranteed by sovereigns, central
banks or multilateral development banks (2), (3) 202,007 15,470 217,477 103,446 114,031
Other (2) 83,008 20,509 103,517 51,921 51,596
Liquidity assets eligible at central banks
(not included above) (4) 60 – 60 – 60
Undrawn credit lines granted by central banks (5) 6,345 – 6,345 – 6,345
Other assets eligible as collateral for discount (6) 123,778 – 123,778 – 123,778
Other liquid assets (7) 11,678 – 11,678 11,678 –
Total liquid assets $ 443,354 $ 35,979 $ 479,333 $ 168,312 $ 311,021
As at
(Millions of Canadian dollars)
October 31
2014
October 31
2013 (8)
Royal Bank of Canada $ 221,007 $ 198,989
Foreign branches 47,570 37,619
Subsidiaries 78,187 74,413
Total unencumbered liquid assets $ 346,764 $ 311,021
(1) Information is provided from an enterprise-wide perspective and amounts shown are based on face value. In managing liquidity risk, we consider legal, regulatory, tax and other constraints
that may impede transferability of liquidity among RBC units.
(2) The Bank-owned liquid assets amount includes securities owned outright by the bank or acquired via on-balance sheet securities finance transactions.
(3) Includes liquid securities issued by provincial governments and U.S. government sponsored entities working under U.S. Federal government’s conservatorship (e.g. Federal National Mortgage
Association and Federal Home Loan Mortgage Corporation).
(4) Includes Auction Rate Securities.
(5) Includes loans that qualify as eligible collateral for the discount window facility available to us at the Federal Reserve Bank of New York. Amounts are face value and would be subject to
collateral margin requirements applied by the Federal Reserve Bank to determine collateral value/borrowing capacity. Access to the discount window borrowing program is conditional on
meeting requirements set by the Federal Reserve Bank and borrowings are typically expected to be infrequent and due to uncommon occurrences requiring temporary accommodation.
(6) Represents our unencumbered Canadian dollar non-mortgage loan book (at face value) that could, subject to satisfying conditions precedent to borrowing and application of prescribed
collateral margin requirements, be pledged to the Bank of Canada for advances under its Emergency Lending Assistance (ELA) program. ELA and other central bank facilities are not
considered sources of available liquidity in our normal liquidity risk profile but could in extraordinary circumstances, where normal market liquidity is seriously impaired, allow us and other
banks to monetize assets eligible as central bank collateral to meet requirements and mitigate further market liquidity disruption.
(7) Represents pledges related to OTC and exchange traded derivative transactions.
(8) Amounts have been revised from those previously presented.
2014 vs. 2013
Total liquid assets increased $44 billion or 9%, largely attributable to client financing through reverse repo and changes to client reverse repo
collateral mix, while trading inventories grew from a combination of asset growth and valuations, and liquid asset buffers expanded.
Management’s Discussion and Analysis Royal Bank of Canada: Annual Report 2014 71

Asset encumbrance (1) Table 58
As at
October 31
2014
October 31
2013 (6)
Encumbered Unencumbered Encumbered Unencumbered
(Millions of Canadian dollars)
Pledged as
collateral Other (2)
Available as
collateral (3) Other (4) Total (5)
Pledged as
collateral Other (2)
Available as
collateral (3) Other (4) Total (5)
Cash and due from banks $ 243 $ 1,054 $ 15,839 $ 285 $ 17,421 $ 204 $ 980 $ 14,082 $ 284 $ 15,550
Interest-bearing deposits with banks 90 – 8,309 – 8,399 83 – 8,956 – 9,039
Securities
Trading 64,467 – 85,698 1,215 151,380 54,923 – 88,012 1,088 144,023
Available-for-sale 7,781 57 37,802 2,128 47,768 7,496 48 31,016 127 38,687
Assets purchased under reverse
repurchase agreements and
securities borrowed 111,056 – 68,044 8,432 187,532 104,878 – 53,779 3,925 162,582
Loans
Retail
Mortgage securities 37,441 – 29,042 – 66,483 44,229 – 19,190 – 63,419
Mortgage loans 26,589 – – 126,185 152,774 22,750 – – 123,069 145,819
Non-mortgage loans 8,915 – 97,223 9,592 115,730 8,174 – 94,365 8,850 111,389
Wholesale – – 36,777 65,459 102,236 – – 35,758 54,424 90,182
Allowance for loan losses – – – (1,994) (1,994) – – – (1,959) (1,959)
Segregated fund net assets – – – 675 675 – – – 513 513
Other – Derivatives – – – 87,402 87,402 – – – 74,822 74,822
– Others (7) 11,887 – – 44,809 56,696 11,678 – – 39,066 50,744
Total assets $ 268,469 $ 1,111 $ 378,734 $344,188 $992,502 $ 254,415 $ 1,028 $ 345,158 $304,209 $904,810
(1) Information is provided from an enterprise-wide perspective and amounts shown are based on face value. In managing liquidity risk, we consider legal, regulatory, tax and other constraints
that may impede transferability of liquidity among RBC units.
(2) Includes assets restricted from use to generate secured funding due to legal or other constraints.
(3) Includes loans that could be used to collateralize central bank advances. Our unencumbered Canadian dollar non-mortgage loan book (at face value) could, subject to satisfying conditions
precedent to borrowing and application of prescribed collateral margin requirements, be pledged to the Bank of Canada for advances under its ELA program. We also lodge loans that qualify
as eligible collateral for the discount window facility available to us at the Federal Reserve Bank of New York. ELA and other central bank facilities are not considered sources of available
liquidity in our normal liquidity risk profile but could in extraordinary circumstances, where normal market liquidity is seriously disrupted, allow us and other banks to monetize assets eligible
as central bank collateral to meet requirements and mitigate market liquidity dislocations.
(4) Other unencumbered assets are not subject to any restrictions on their use to secure funding or as collateral but would not be considered readily available since they may not be acceptable
at central banks or other for other lending programs.
(5) Includes bank-owned liquid assets and securities received as collateral from off-balance sheet securities financing and derivative transactions.
(6) Amounts have been revised from those previously presented.
(7) The Pledged as collateral amounts relate to OTC and exchange traded derivative transactions.
Other sources of liquidity that could be available to mitigate stressed conditions include: (i) our unused wholesale funding capacity, which is
regularly assessed using an established methodology that is periodically reviewed and, as necessary, revised, and (ii) central bank borrowing
facilities if, in extraordinary circumstances, market sources were not sufficient to allow us to monetize our assets available as collateral to meet
our requirements (e.g., Bank of Canada, Federal Reserve Bank, Bank of England, and Bank of France).
Risk control
The Board of Directors annually approves delegation of liquidity risk authorities to senior management. The Risk Committee of the Board
annually approves the Liquidity Management Framework and the Pledging Policy and is responsible for its oversight. The Board of Directors,
the Risk Committee, GRC and ALCO review, on a regular basis, reporting on our enterprise-wide liquidity position and status. The GRC, the
Policy Review Committee (PRC) and/or ALCO also review liquidity documents prepared for the Board of Directors or its committees. The PRC
and ALCO annually approve the Liquidity Management Framework’s key supporting documents and provide strategic direction and primary
management oversight to Corporate Treasury, GRM, other functions and business platforms in the area of liquidity risk management. To
maximize funding and operational efficiencies, we monitor and manage our liquidity position on a consolidated basis and for key units taking
into account market, legal, regulatory, tax, operational and any other applicable restrictions that may impede transferability of liquidity
between RBC units. This includes analyzing our ability to lend or borrow funds between branches and subsidiaries, and converting funds
between currencies. The outcome of this analysis is considered in liquidity metrics and our Recovery Plan.
Policies
Our principal liquidity policies define risk tolerance parameters. They authorize senior management committees, Corporate Treasury or GRM
to approve more detailed policies and limits that govern management, measurement and reporting requirements for specific businesses and
products.
Authorities and limits
Limits for our structural liquidity risk positions are approved at least annually and monitored regularly. Net cash flow limits are approved at
least annually. Depending on the significance of each reporting entity, net cash flow limits are monitored daily or weekly by major currency,
branches, subsidiaries and geographic locations. Any potential exceptions to established limits are reported immediately to Corporate
Treasury and GRM, who provide or arrange for approval where appropriate after reviewing remedial action plans.
The liquidity factors for cash flow assets and liabilities under varying conditions are reviewed periodically by Corporate Treasury, GRM
and the business segments to determine if they remain valid or changes to assumptions and limits are required. Through this process, we
ensure that a close link is maintained between the management of liquidity risk, market liquidity risk and credit risk, including GRM approval
of credit lines between entities. In response to our experience during periods of market volatility over the past six years, we have modified the
liquidity treatment of certain asset classes to reflect changes in market liquidity. Where required, limits are reduced in consideration of the
results of stress tests.
72 Royal Bank of Canada: Annual Report 2014 Management’s Discussion and Analysis

Funding
Funding strategy
Core funding, comprising capital, longer-term wholesale liabilities and a diversified pool of personal and, to a lesser extent, commercial and
institutional deposits, is the foundation of our structural liquidity position.
Deposit profile
During 2014, we continued to focus on building our core deposit base. Our relationship-based deposits, including our personal deposit franchise
and our commercial and institutional client groups, maintain balances with relatively low volatility profiles and constitute our principal source of
reliable funding. Reflecting deposit insurance and at times, exclusive relationships with us, these balances represent a highly stable source of
core deposits in most circumstances as they are typically less reactive to market developments than those from transactional lenders and
investors. Core deposits consist of our own statistically derived liquidity adjusted estimates of the highly stable portions of our relationship-
based balances (demand, notice and fixed-term) together with wholesale funds maturing beyond one year and as at October 31, 2014
represented 69% of our total deposits (2013 – 70%). Over the past year, core deposit balances have increased by 10%, generally keeping pace
with the growth in our total deposits. Core deposit growth was driven predominantly by growth in relationship-based deposits and to a lesser
extent by issuance of longer-term wholesale funding. For further details on the gross dollar amounts of our relationship-based deposits and our
wholesale funding maturity schedule, refer to the Risk profile section and the following Composition of wholesale funding table, respectively.
Long-term debt issuance
During 2014, we continued to experience more favourable unsecured wholesale funding access and pricing compared to many of our global
peers. As demonstrated in the following table, we also continued to expand our unsecured long-term funding base by selectively issuing, either
directly or through our subsidiaries, $24 billion of term funding in various currencies and markets. Total unsecured long-term funding
outstanding increased by $12 billion.
We use residential mortgage and credit card and auto receivable-backed securitization programs as alternative sources of funding and for
liquidity and asset/liability management purposes. Our total secured long-term funding includes outstanding MBS sold, covered bonds that
are collateralized with residential mortgages, and credit card and auto receivables.
Compared to 2013, our outstanding MBS sold decreased $7 billion while our covered bonds and credit card and auto receivables
increased $5 billion and $1 billion, respectively.
For further details, refer to the Off-balance sheet arrangements section.
Long-term funding sources* Table 59
As at
(Millions of Canadian dollars)
October 31
2014
October 31
2013
Unsecured long-term funding $ 82,033 $ 69,903
Secured long-term funding 57,996 59,285
Commercial mortgage-backed securities sold 1,330 1,304
Subordinated debentures 7,832 7,408
$ 149,191 $ 137,900
* This table represents an integral part of our 2014 Annual Consolidated Financial Statements.
Our wholesale funding activities are well-diversified by geography, investor segment, instrument, currency, structure and maturity. We maintain
an ongoing presence in different funding markets, which allows us to continuously monitor market developments and trends, identify oppor-
tunities and risks, and take appropriate and timely actions. We operate longer-term debt issuance registered programs. The following table
summarizes these programs with their authorized limits by geography.
Programs by geography Table 60
Canada U.S. Europe/Asia
• Canadian Shelf – $15 billion • SEC Registered – US$25 billion
• SEC Registered Covered Bonds –
US$12 billion
• European Debt Issuance Program –
US$40 billion
• Covered Bond Program –
Euro 23 billion
• Japanese Issuance Programs –
JPY 1 trillion
Management’s Discussion and Analysis Royal Bank of Canada: Annual Report 2014 73

We also raise long-term funding using Canadian Deposit Notes, Canadian NHA MBS, Canada Mortgage Bonds, credit card receivable-backed
securities, Kangaroo Bonds (issued in the Australian domestic market by foreign firms) and Yankee Certificates of Deposit (issued in the U.S.
domestic market by foreign firms). We continuously evaluate expansion into new markets and untapped investor segments against relative
issuance costs since diversification expands our wholesale funding flexibility and minimizes funding concentration and dependency, and
generally reduces financing costs. As presented in the following charts, our current long-term debt profile is well diversified by currency as well
as by type of long-term funding products. Maintaining competitive credit ratings is also critical to cost-effective funding.
Long-term debt – funding mix by currency of issuance
($128.3 billion as at October 31, 2014)
Other
5%
Euro
7%
Canadian dollar
43%
U.S. dollar
45%
Long-term debt – funding mix by product
($128.3 billion as at October 31, 2014)
Unsecured
funding
55%
MBS/CMB
(1)
18%
Covered
bonds
20%
Cards and auto
securitization
7%
(1) Mortgage-backed securities and Canada Mortgage Bonds
The following table provides our composition of wholesale funding and represents our enhanced disclosure in response to EDTF
recommendations.
Composition of wholesale funding (1) Table 61
As at October 31, 2014
(Millions of Canadian dollars)
Less than 1
month
1to3
months
3to6
months
6to12
months
Less than
1 year
sub-total
1 year
to 2
years
2 years
and
greater Total
Deposits from banks (2) $ 3,034 $ 277 $ 11 $ 19 $ 3,341 $ – $ – $ 3,341
Certificates of deposit and commercial paper 859 4,411 10,880 12,873 29,023 2,746 – 31,769
Asset-backed commercial paper (3) 518 1,320 1,835 4,114 7,787 – – 7,787
Senior unsecured medium-term notes (4) 592 4,573 3,341 3,970 12,476 16,809 38,254 67,539
Senior unsecured structured notes (5) 336 578 458 1,058 2,430 597 4,729 7,756
Mortgage securitization 58 699 950 1,435 3,142 3,751 16,395 23,288
Covered bonds/asset-backed securities (6) 761 22 2,391 2,635 5,809 6,934 20,246 32,989
Subordinated liabilities 200 – – 1,500 1,700 1,500 4,632 7,832
Other (7) 3,203 51 596 1,111 4,961 42 3,963 8,966
Total $ 9,561 $ 11,931 $ 20,462 $ 28,715 $ 70,669 $ 32,379 $ 88,219 $ 191,267
Of which:
– Secured $ 4,455 $ 2,041 $ 5,176 $ 8,184 $ 19,856 $ 10,685 $ 36,641 $ 67,182
– Unsecured 5,106 9,890 15,286 20,531 50,813 21,694 51,578 124,085
As at October 31, 2013
(Millions of Canadian dollars)
Less than 1
month
1to3
months
3to6
months
6to12
months
Less than
1 year
sub-total
1 year
to 2
years
2 years
and
greater Total
Deposits from banks (2) $ 1,820 $ 164 $ 10 $ 354 $ 2,348 $ $ – $ 2,348
Certificates of deposit and commercial paper 549 3,350 17,122 9,969 30,990 2,088 624 33,702
Asset-backed commercial paper (3) – 626 1,586 1,717 3,929 – – 3,929
Senior unsecured medium-term notes (4) – 2,333 3,162 4,608 10,103 9,771 35,670 55,544
Senior unsecured structured notes (5) 274 283 565 808 1,930 828 3,131 5,889
Mortgage securitization 758 2,477 4,078 2,040 9,353 2,845 18,251 30,449
Covered bonds/asset-backed securities (6) 54 94 132 213 493 6,007 21,761 28,261
Subordinated liabilities 1,000 – – 600 1,600 1,700 4,121 7,421
Other (7) 4,401 55 163 1,148 5,767 – 3,390 9,157
Total $ 8,856 $ 9,382 $ 26,818 $ 21,457 $ 66,513 $ 23,239 $ 86,948 $ 176,700
Of which:
– Secured $ 5,040 $ 3,197 $ 5,796 $ 3,970 $ 18,003 $ 8,852 $ 40,011 $ 66,866
– Unsecured 3,816 6,185 21,022 17,487 48,510 14,387 46,937 109,834
(1) Excludes bankers’ acceptances.
(2) Only includes deposits raised by treasury. Excludes deposits associated with services we provide to these banks (e.g., custody, cash management).
(3) Only includes consolidated liabilities, including our collateralized commercial paper program.
(4) Includes deposit notes.
(5) Includes notes where the payout is tied to movements in foreign exchange, commodities and equities.
(6) Includes credit card, auto and mortgages.
(7) Includes tender option bonds (secured) of $3,118 million (October 31, 2013 – $4,227 million), bearer deposit notes (unsecured) of $2,215 million (October 31, 2013 – $1,540 million) and
other long-term structured deposits (unsecured) of $3,633 million (October 31, 2013 – $3,390 million).
74 Royal Bank of Canada: Annual Report 2014 Management’s Discussion and Analysis

Contractual maturities of financial assets, financial liabilities and off-balance sheet items
The following tables provide remaining contractual maturity profiles of all our assets, liabilities, and off-balance sheet items at their carrying
value (i.e. amortized cost or fair value) at the balance sheet date and have been enhanced in response to EDTF recommendations. Off-balance
sheet items are allocated based on the expiry date of the contract.
Details of contractual maturities and commitments to extend funds are a source of information for the management of liquidity risk. Among
other purposes, these details form a basis for modeling a behavioural balance sheet with effective maturities to calculate liquidity risk measures.
For further details, refer to the Risk measurement section.
Contractual maturities of financial assets, financial liabilities and off-balance sheet items Table 62
As at October 31, 2014
(Millions of Canadian dollars)
Less than
1 month
1to3
months
3to6
months
6to9
months
9to12
months
1 year
to 2 years
2 years
to 5 years
5 years
and greater
With no
specific
maturity Total
Assets
Cash and deposits with
banks $ 22,871 $ 218 $ – $ – $ – $ – $ – $ – $ 2,731 $ 25,820
Securities
Trading (1) 94,025 13 65 55 48 229 558 5,236 51,151 151,380
Available-for-sale 4,450 3,739 2,528 433 1,113 3,417 18,307 11,959 1,822 47,768
Assets purchased under
reverse repurchase
agreements and securities
borrowed 54,860 24,728 28,241 8,261 10,361 2,142 – – 6,987 135,580
Loans (net of allowance for
loan losses) 19,260 10,776 7,490 14,961 16,081 73,788 176,063 29,787 87,023 435,229
Other
Customers’ liability under
acceptances 6,218 2,013 399 433 2,393 – 6 – – 11,462
Derivatives 4,145 7,275 3,483 2,673 1,909 8,507 21,331 38,071 8 87,402
Other financial assets 18,729 672 585 169 106 245 281 828 828 22,443
Total financial assets $ 224,558 $ 49,434 $ 42,791 $ 26,985 $ 32,011 $ 88,328 $ 216,546 $ 85,881 $ 150,550 $ 917,084
Other non-financial assets 1,847 779 679 409 52 589 1,637 2,302 15,172 23,466
Total assets $ 226,405 $ 50,213 $ 43,470 $ 27,394 $ 32,063 $ 88,917 $ 218,183 $ 88,183 $ 165,722 $ 940,550
Liabilities and equity
Deposits (2)
Unsecured borrowing $ 31,190 $ 22,626 $ 27,372 $ 18,602 $ 21,581 $ 39,693 $ 49,523 $ 9,727 $ 310,045 $ 530,359
Secured borrowing 561 2,715 2,950 5,331 4,786 9,753 21,099 10,135 – 57,330
Covered bonds 748 – 2,558 – – 4,908 14,556 3,641 – 26,411
Other
Acceptances 6,218 2,013 399 433 2,393 – 6 – – 11,462
Obligations related to
securities sold short 50,345 ––––– – – –50,345
Obligations related to
assets sold under
repurchase agreements
and securities loaned 58,208 1,252 1,306 1,051 574 – – – 1,940 64,331
Derivatives 3,745 6,997 3,845 3,351 2,042 10,345 22,295 36,359 3 88,982
Other financial liabilities 18,094 1,121 492 170 298 309 530 4,033 357 25,404
Subordinated debentures 200––––– –7,659 – 7,859
Total financial liabilities $ 169,309 $ 36,724 $ 38,922 $ 28,938 $ 31,674 $ 65,008 $ 108,009 $ 71,554 $ 312,345 $ 862,483
Other non-financial
liabilities 1,454 2,970 674 57 78 917 2,456 7,956 7,002 23,564
Equity –––––– – –54,503 54,503
Total liabilities and equity $ 170,763 $ 39,694 $ 39,596 $ 28,995 $ 31,752 $ 65,925 $ 110,465 $ 79,510 $ 373,850 $ 940,550
Off-balance sheet items
Financial guarantees $ 646 $ 2,391 $ 2,289 $ 1,982 $ 2,970 $ 1,325 $ 5,292 $ 254 $ 59 $ 17,208
Lease commitments 58 114 167 165 161 634 1,220 1,291 – 3,810
Commitments to extend
credit 1,660 6,352 7,329 6,806 8,513 19,768 108,250 11,539 2,299 172,516
Other commitments 127 420 575 879 2,578 289 984 263 62,319 68,434
Total off-balance sheet
items $ 2,491 $ 9,277 $ 10,360 $ 9,832 $ 14,222 $ 22,016 $ 115,746 $ 13,347 $ 64,677 $ 261,968
(1) Trading debt securities classified as fair value through profit or loss have been included in the less than 1 month category as there is no expectation to hold these assets to their contractual
maturity.
(2) A major portion of relationship-based deposits are repayable on demand or at short notice on a contractual basis while, in practice, these customer balances form a core base, as explained
in the preceding Deposit profile section, for our operations and liquidity needs.
Management’s Discussion and Analysis Royal Bank of Canada: Annual Report 2014 75

As at October 31, 2013
(Millions of Canadian dollars)
Less than
1 month
1to3
months
3to6
months
6to9
months
9to12
months
1 year
to 2 years
2 years
to 5 years
5 years
and greater
With no
specific
maturity Total
Assets
Cash and deposits with banks $ 12,989 $ – $ – $ – $ – $ – $ – $ – $ 11,600 $ 24,589
Securities
Trading (1) 93,407 40 19 40 38 249 534 4,507 45,189 144,023
Available-for-sale 3,420 4,641 1,268 796 1,116 2,452 10,021 13,140 1,833 38,687
Assets purchased under
reverse repurchase
agreements and securities
borrowed (2) 59,226 10,653 18,506 6,268 10,207 1,543 – – 11,114 117,517
Loans (net of allowance for
loan losses) (2) 14,489 9,689 6,136 10,459 19,614 45,686 181,766 30,918 90,093 408,850
Other
Customers’ liability under
acceptances 5,224 1,621 470 254 2,384 – – – – 9,953
Derivatives 2,349 5,028 2,338 2,353 1,627 6,284 21,056 33,786 1 74,822
Other financial assets 16,082 847 754 114 122 270 447 639 575 19,850
Total financial assets $ 207,186 $ 32,519 $ 29,491 $ 20,284 $ 35,108 $ 56,484 $ 213,824 $ 82,990 $ 160,405 $ 838,291
Other non-financial assets 1,273 453 311 147 741 406 1,341 2,227 14,555 21,454
Total assets $ 208,459 $ 32,972 $ 29,802 $ 20,431 $ 35,849 $ 56,890 $ 215,165 $ 85,217 $ 174,960 $ 859,745
Liabilities and equity
Deposits (3)
Unsecured borrowing (2) $ 22,556 $ 16,258 $ 27,847 $ 11,422 $ 14,107 $ 52,027 $ 46,194 $ 10,830 $ 281,237 $ 482,478
Secured borrowing (2) 812 3,800 6,685 3,656 4,265 7,190 21,667 11,218 – 59,293
Covered bonds – – – – – 3,226 14,612 3,470 – 21,308
Other
Acceptances 5,224 1,621 470 254 2,384 – – – – 9,953
Obligations related to
securities sold short 47,128 – – – – – – – – 47,128
Obligations related to
assets sold under
repurchase agreements
and securities loaned 53,389 1,991 1,308 877 290 1,500 – – 1,061 60,416
Derivatives 3,021 5,233 2,569 2,536 2,312 11,365 17,739 31,970 – 76,745
Other financial liabilities (2) 17,123 875 692 268 344 383 662 3,969 123 24,439
Subordinated debentures – – – – – 217 – 7,226 – 7,443
Total financial liabilities $ 149,253 $ 29,778 $ 39,571 $ 19,013 $ 23,702 $ 75,908 $ 100,874 $ 68,683 $ 282,421 $ 789,203
Other non-financial
liabilities (2) 1,606 2,834 686 114 135 1,085 1,692 7,349 5,581 21,082
Equity – – – – – – – – 49,460 49,460
Total liabilities and equity $ 150,859 $ 32,612 $ 40,257 $ 19,127 $ 23,837 $ 76,993 $ 102,566 $ 76,032 $ 337,462 $ 859,745
Off-balance sheet items
Financial guarantees $ 392 $ 1,341 $ 2,336 $ 1,938 $ 2,985 $ 2,295 $ 4,113 $ 141 $ 51 $ 15,592
Lease commitments 62 122 181 179 173 662 1,389 1,346 – 4,114
Commitments to extend credit 3,757 6,843 4,780 6,488 7,320 18,031 91,288 13,615 1,044 153,166
Other commitments 156 405 444 799 2,292 371 585 169 57,749 62,970
Total off-balance sheet items $ 4,367 $ 8,711 $ 7,741 $ 9,404 $ 12,770 $ 21,359 $ 97,375 $ 15,271 $ 58,844 $ 235,842
(1) Trading debt securities classified as fair value through profit or loss have been included in the less than 1 month category as there is no expectation to hold these assets to their contractual
maturity.
(2) Amounts have been revised from those previously presented.
(3) A major portion of relationship-based deposits are repayable on demand or at short notice on a contractual basis while, in practice, these customer balances form a core base, as explained
in the preceding Deposit profile section, for our operations and liquidity needs.
Contractual maturities of financial liabilities and off-balance sheet items – undiscounted basis
The following tables provide remaining contractual maturity analysis of our financial liabilities and off-balance sheet items. The amounts
disclosed in the following table are the contractual undiscounted cash flows of all financial liabilities (i.e. par value or amount payable upon
maturity). The amounts do not reconcile directly with those in our consolidated balance sheets as the table only incorporates cash flows
relating to payments on maturity of the instrument and do not recognize premiums, discounts or mark-to-market adjustments recognized in
the instruments’ carrying value as at the balance sheet date. Financial liabilities are based upon the earliest period in which they are required
to be paid. For off-balance sheet items, the undiscounted cash flows potentially payable under financial guarantees and commitments to
extend credit are classified on the basis of the earliest date they can be called.
76 Royal Bank of Canada: Annual Report 2014 Management’s Discussion and Analysis

Contractual maturities of financial liabilities and off-balance sheet items – undiscounted basis * Table 63
As at October 31, 2014
(Millions of Canadian dollars)
On
demand
Within
1 year
1 year
to 2 years
2 years
to 5 years
5 years
and
greater Total
Financial liabilities
Deposits (1) $ 289,204 $ 161,953 $ 54,385 $ 84,609 $ 22,967 $ 613,118
Other
Acceptances – 11,456 – 6 – 11,462
Obligations related to securities sold short – 50,345 – – – 50,345
Obligations related to assets sold under repurchase
agreements and securities loaned 1,941 62,391 – – – 64,332
Other liabilities 358 20,174 309 530 4,013 25,384
Subordinated debentures – 200 – – 7,632 7,832
291,503 306,519 54,694 85,145 34,612 772,473
Off-balance sheet items
Financial guarantees (2) 5,883 11,206 111 7 1 17,208
Operating leases – 665 634 1,220 1,291 3,810
Commitments to extend credit (2) 137,696 34,819 1 – – 172,516
143,579 46,690 746 1,227 1,292 193,534
Total financial liabilities and off-balance sheet items $ 435,082 $ 353,209 $ 55,440 $ 86,372 $ 35,904 $ 966,007
As at October 31, 2013
(Millions of Canadian dollars)
On
demand
Within
1 year
1 year
to 2 years
2 years
to 5 years
5 years
and
greater Total
Financial liabilities
Deposits (1),(3) $ 264,287 $ 128,206 $ 62,267 $ 81,738 $ 25,534 $ 562,032
Other
Acceptances (3) – 9,953 – – – 9,953
Obligations related to securities sold short – 47,128 – – – 47,128
Obligations related to assets sold under repurchase
agreements and securities loaned 1,061 57,855 1,500 – – 60,416
Other liabilities (3) 123 19,277 350 678 4,095 24,523
Subordinated debentures – – 200 – 7,208 7,408
265,471 262,419 64,317 82,416 36,837 711,460
Off-balance sheet items
Financial guarantees (2) 5,850 9,550 178 14 – 15,592
Operating leases – 717 662 1,389 1,346 4,114
Commitments to extend credit (2) 117,753 35,413 – – – 153,166
123,603 45,680 840 1,403 1,346 172,872
Total financial liabilities and off-balance sheet items $ 389,074 $ 308,099 $ 65,157 $ 83,819 $ 38,183 $ 884,332
* This table represents an integral part of our 2014 Annual Consolidated Financial Statements.
(1) A major portion of relationship-based deposits are repayable on demand or at short notice on a contractual basis while, in practice, these customer balances form a core base, as explained
in the preceding Deposit profile section, for our operations and liquidity needs.
(2) We believe that it is highly unlikely that all or substantially all of these guarantees and commitments will be drawn or settled within one year, and contracts may expire without being drawn or
settled. The management of the liquidity risk associated with potential extensions of funds is outlined in the preceding Risk measurement section.
(3) Amounts have been revised from those previously presented.
Credit ratings
Our ability to access unsecured funding markets and to engage in certain collateralized business activities on a cost-effective basis are primarily
dependent upon maintaining competitive credit ratings. Credit ratings and outlooks provided by rating agencies reflect their views and are based
on their methodologies. Ratings are subject to change from time to time, based on a number of factors including, but not limited to, our financial
strength, competitive position and liquidity and other factors not completely within our control.
On January 24, 2014, Fitch Ratings affirmed our ratings with a stable outlook along with the other six largest Canadian banks.
On June 11, 2014, Moody’s affirmed our long-term ratings and revised our outlook to negative from stable along with the other six largest
Canadian banks. The outlook revisions are linked to Moody’s view that risks for the Canadian banks’ senior debt holders and uninsured
depositors have shifted to the downside as a result of previously announced plans by the Canadian government to implement a bail-in regime for
domestic systemically important banks and the accelerating global trends towards reducing the public cost of future bank resolutions through
such burden-sharing.
On July 7, 2014, DBRS affirmed our ratings with a stable outlook along with the other five largest Canadian banks.
On December 2, 2014, Standard & Poor’s (S&P) affirmed our ratings with a negative outlook. On August 8, 2014, S&P revised our outlook
to negative from stable along with the other five largest Canadian banks to reflect the possible impact of a bail-in policy proposal from the
Canadian federal government, which was released on August 1, 2014.
For further details on the proposed bail-in regime, refer to the Legal and regulatory environment risk section.
Management’s Discussion and Analysis Royal Bank of Canada: Annual Report 2014 77

The following table presents our major credit ratings(1) and outlooks as at December 2, 2014:
Credit ratings Table 64
As at December 2, 2014 (2)
Short-term debt Senior long-term debt Outlook
Moody’s P-1 Aa3 negative (3)
Standard & Poor’s A-1+ AA- negative (4)
Fitch Ratings F1+ AA stable
Dominion Bond Rating Services R-1(high) AA stable
(1) Credit ratings are not recommendations to purchase, sell or hold a financial obligation inasmuch as they do not
comment on market price or suitability for a particular investor. Ratings are determined by the rating agencies based
on criteria established from time to time by them, and are subject to revision or withdrawal at any time by the rating
organization.
(2) On August 19, 2014, Kroll Bond Rating Agency affirmed our senior long-term and short-term debt and deposit ratings
of AA and K1+, respectively, with a stable outlook. These ratings were unsolicited and we did not participate in the
rating process.
(3) On June 11, 2014, Moody’s revised our outlook to negative from stable for our supported senior debt and uninsured
deposit ratings.
(4) On August 8, 2014, Standard & Poor’s revised our outlook to negative from stable, reflecting the possible impact of a
bail-in policy proposal from the Canadian federal government.
Additional contractual obligations for rating downgrades
A lowering of our credit rating may have potentially adverse consequences for our funding capacity or access to the capital markets, may also
affect our ability, and the cost, to enter into normal course derivative or hedging transactions and may require us to post additional collateral
under certain contracts. However, we estimate, based on periodic reviews of ratings triggers embedded in our existing businesses and of our
funding capacity sensitivity, that a minor downgrade would not significantly influence our liability composition, funding access, collateral usage
and associated costs. The following table presents the additional collateral obligations required at the reporting date in the event of a one-, two-
or three-notch downgrade to our credit ratings. These additional collateral obligations are incremental requirements for each successive
downgrade and do not represent the cumulative impact of multiple downgrades. The amounts reported change periodically as a result of several
factors, including the transfer of trading activity to centrally cleared financial market infrastructures and exchanges, the expiration of transactions
with downgrade triggers, the imposition of internal limitations on new agreements to exclude downgrade triggers, as well as normal course mark
to market of positions with collateralized counterparties moving from a negative to a positive position. There is no outstanding senior debt
issued in the market that contains rating triggers which would lead to early prepayment of principal.
Additional contractual obligations for rating downgrades Table 65
As at
October 31
2014
October 31
2013
(Millions of Canadian dollars)
One-notch
downgrade
Two-notch
downgrade
Three-notch
downgrade
One-notch
downgrade
Two-notch
downgrade
Three-notch
downgrade
Contractual derivatives funding or margin requirements $ 518 $ 143 $ 790 $ 616 $ 171 $ 762
Other contractual funding or margin requirements (1) 396 62 – 490 187 95
(1) Includes GICs issued by our municipal markets business out of New York and London.
Insurance risk
Insurance risk refers to the potential financial loss that may arise where the amount, timing and/or frequency of benefit payments under
insurance and reinsurance contracts are different than expected. Insurance risk does not include other risks covered by other parts of our risk
management framework (e.g., credit, market, and operational risk) where those risks are ancillary to, or accompany the risk transfer.
We have implemented an Insurance Risk Framework that provides an overview of our program for identifying, assessing, managing, and
reporting on the insurance risks that face the organization. Key processes and tools have been developed to support and enhance risk
management, including: Own Risk and Solvency Assessment (ORSA), insurance risk appetite, Comprehensive Identification and Assessment of
Risk (CIAR), insurance risk delegated authorities and risk limits, model risk management, stress testing, experience studies, actuarial liabilities,
and reinsurance. Insurance risk policies and procedures have also been established to define the requirements for managing product, pricing,
underwriting, and claims management risk.
Regulatory compliance risk
Regulatory compliance risk is the risk of potential non-conformance with laws, rules, regulations, prescribed practices, contracts or ethical
standards in any jurisdiction in which we operate. Issues regarding compliance with laws and regulations can arise in a number of areas in a
large complex financial institution such as RBC, and are often the result of inadequate or failed internal processes, people or systems.
Laws and regulations are in place to protect the financial and other interests of our clients, investors and the public. As a large scale global
financial institution, we are subject to numerous laws and to extensive and evolving regulation by governmental agencies, supervisory author-
ities and self-regulatory organizations in Canada, the U.S., Europe and other jurisdictions in which we operate. In recent years such regulation
has become increasingly extensive and complex. In addition, the enforcement of regulatory matters has intensified. Recent resolution of such
matters involving other global financial institutions have involved the payment of substantial penalties, agreements with respect to future
operation of their business, actions with respect to relevant personnel and guilty pleas with respect to criminal charges.
78 Royal Bank of Canada: Annual Report 2014 Management’s Discussion and Analysis

Operating in this increasingly complex regulatory environment and intense regulatory enforcement environment, we are and have been
subject to a variety of legal proceedings, including civil claims and lawsuits, regulatory examinations, investigations, audits and requests for
information by various governmental regulatory agencies and law enforcement authorities in various jurisdictions, and we anticipate that our
ongoing business activities will give rise to such matters in the future. Changes to laws, including tax laws, regulations or regulatory policies, as
well as the changes in how they are interpreted, implemented or enforced, could adversely affect us, for example by lowering barriers to entry in
the businesses in which we operate, increasing our costs of compliance or limiting our activities and ability to execute our strategic plans.
Further, there is no assurance that we always will be or will be deemed to be in compliance with laws, regulations or regulatory policies.
Accordingly, it is possible that we could receive a judicial or regulatory judgment or decision that results in fines, damages, penalties, and other
costs or injunctions, convictions or loss of licenses or registrations that would damage our reputation and negatively impact our earnings. In
addition, we are subject to litigation arising in the ordinary course of our business and the adverse resolution of any litigation could have a
significant adverse effect on our results or could give rise to significant reputational damage, which in turn could impact our future business
prospects. Global compliance has developed a Regulatory Compliance Management Framework consistent with regulatory expectations from
OSFI and other regulators. The framework is designed to manage and mitigate the regulatory compliance risks associated with failing to comply
with, or adapt to, current and changing laws and regulations in the jurisdictions in which we operate. Regulatory compliance risk has been
further defined as risks associated with money laundering, bribery, privacy, market conduct, consumer protection, and business conduct.
Specific compliance policies, procedures, and supporting frameworks have been developed to support the minimum requirements for the
prudent management of regulatory compliance risk. Within the framework there are five elements that form a cycle by which all regulatory
compliance risk management programs are developed, implemented and maintained. The first element is intended to ensure our regulatory
compliance programs evolve alongside our business activities and operations. The second element is intended to ensure regulatory compliance
risks are identified and assessed appropriately so regulatory compliance programs are designed in a manner to most effectively meet regulatory
requirements. The third element relates to the design and implementation of specific controls. The fourth element is intended to ensure
appropriate monitoring and oversight of the effectiveness of the controls. Lastly, the fifth element is intended to ensure the timely escalation and
resolution of issues, and clear and transparent reporting. This is a critical step in enabling senior management and the Board of Directors to
effectively perform their management and oversight responsibilities.
Operational risk
Operational risk is the risk of loss or harm resulting from inadequate or failed internal processes, people and systems or from external events.
Operational risk is embedded in all our activities, including the practices and controls used to manage other risks. Failure to manage
operational risk can result in direct or indirect financial loss, reputational impact, regulatory censure, or failure in the management of other risks
such as credit or market risk.
Three Lines of Defence
Operational risk follows our established Three Lines of Defence governance model. This model encompasses the organizational roles and
responsibilities for a coordinated enterprise-wide approach for the management of operational risk. For further details, refer to the Risk
management – Enterprise risk management section.
Operational Risk Framework
We have put in place an Operational Risk Framework which is founded on the principles of our Enterprise Risk Management Framework and sets
out the processes to identify, assess and monitor operational risk. The processes are established through the following core programs:
• Internal events – Internal events are specific instances where operational risk leads to or could have led to an unintended, identifiable
impact. The internal events program provides a structured and consistent approach for collecting and analyzing internal event data to
facilitate the analysis of the operational risk events affecting RBC. This program enables learnings based on “what has happened to us” and
supports the articulation of the operational risk appetite.
• External events – External events are operational risk events that affect institutions other than RBC. External event monitoring and analysis
is critical to gain awareness of operational risk experience within the industry and to identify emerging industry trends.
• Business Environment and Internal Control Factors (BEICF) Assessments – BEICF Assessments are conducted to improve business decision-
making by gaining awareness of the key risks and the strengths and vulnerabilities of internal controls. Key BEICF Assessment processes
include: Risk and Control Assessments conducted at both enterprise and business levels; and Change Initiatives and New/Amended
Product Assessments conducted to ensure understanding of the risk and reward trade-off for business initiatives (e.g., new products,
acquisitions, changes in business processes, implementation of new technology, etc.).
• Scenario analysis – Scenario analysis is a structured and disciplined process for making reasonable assessments of infrequent, yet
plausible, severe operational risk events. Understanding how vulnerable RBC is to such “tail risks” identifies mitigating actions and informs
the determination of related operational risk thresholds as part of the articulation of operational risk appetite.
• BEICF monitoring – BEICF monitoring is conducted on an ongoing basis through Key Risk Indicators (KRIs) and other assurance/monitoring
programs (e.g., Business Unit monitoring, Centres of Governance monitoring, audit results, etc.).
Conclusions from the operational risk programs are used to inform the overall level of exposure to operational risk, which defines our operational
risk profile. The profile includes significant operational risk exposures, potential new and emerging exposures and trends, and overall
conclusions on the control environment and risk outlook. We proactively identify and investigate corporate insurance opportunities to mitigate
and reduce potential future impacts of operational risk.
We consider risk/reward decisions in striking the balance between accepting potential losses versus incurring costs of mitigation, the
expression of which is in the form of our operational risk appetite. Our operational risk appetite is established at the board level and cascaded
throughout each of our business segments.
Management reports have been implemented at various levels of RBC in order to support proactive management of operational risk and
transparency of risk exposures. Reports are provided on a regular basis and provide detail on the main drivers of the risk status and trend for
each of our business segments and RBC overall. In addition, changes to the operational risk profile that are not aligned to our business strategy
or operational risk appetite are identified and discussed.
Operational risk capital
We currently use the Standardized Approach to calculate operational risk capital requirements and the allocation of capital amongst our
business units. We are in the process of attaining accreditation towards the Basel II Advanced Measurement Approach (AMA) as the approved
Management’s Discussion and Analysis Royal Bank of Canada: Annual Report 2014 79

regulatory capital methodology. Output from capital modeling will provide further transparency around the materiality of key risks by quantifying
the expected losses and unexpected losses.
Operational risk loss events
During 2014, we did not experience any material operational risk loss event. For further details on our contingencies, including litigation, refer to
Notes 26 and 27 of our 2014 Annual Consolidated Financial Statements.
Strategic risk
Strategic risk is the risk that the enterprise or particular business areas will make inappropriate strategic choices, or will be unable to success-
fully implement selected strategies or related plans and decisions. Business strategy is the major driver of our risk profile and consequently the
strategic choices we make in terms of business mix determine how our risk profile changes.
Responsibility for selecting and successfully implementing business strategies is mandated to the individual heads of the businesses.
Oversight of strategic risk is the responsibility of the heads of the business segments, the Enterprise Strategy Office, GE, and the Board of
Directors. Management of strategic risk is supported by the Enterprise Strategy Group as per the Enterprise Strategic Planning Policy.
For details on the key strategic priorities for our business segments, refer to the Business segment results section.
Reputation risk
Reputation risk is the risk that an activity undertaken by an organization or its representatives will impair its image in the community or lower
public confidence in it, resulting in the loss of business, legal action or increased regulatory oversight.
Reputation risk can arise from a number of events and primarily occurs in connection with credit risk, regulatory, legal and operational risks
and failure to maintain strong risk conduct. Operational failures and non-compliance with laws and regulations can have a significant reputa-
tional impact on us.
We have put in place a Reputation Risk Framework which provides an overview of our approach to the management of this risk. It focuses on
our organizational responsibilities, and controls in place to mitigate reputation risks.
The following principles guide our management of reputation risk:
• We must operate with integrity at all times in order to sustain a strong and positive reputation.
• Protecting our reputation is the responsibility of all our employees, including senior management, and extends to all members of the
Board of Directors.
Legal and regulatory environment risk
Certain regulatory reforms will impact the way in which we operate, both in Canada and abroad, and the full impact of some of these reforms on
our business will not be known until final rules are implemented and market practices have developed in response. We continue to respond to
these and other developments and are working to minimize any potential adverse business or economic impact. The following regulatory reforms
have potential to increase our operational, compliance, and technology costs and adversely affect our profitability.
Basel Committee on Banking Supervision global standards for capital and liquidity reform (Basel III)
The Basel Committee’s standards for capital and liquidity (commonly referred to as “Basel III”) establish minimum requirements for common
equity, increased capital requirements for counterparty credit exposures, a new global leverage ratio and measures to promote the build up of
capital that can be drawn down in periods of stress. Banks around the world continue to adopt these new standards in accordance with domestic
implementation.
In January 2013, the BCBS released final rules for the short-term liquidity standard, the LCR, with implementation commencing in 2015.
Subsequently in October 2014, the BCBS released final rules for the long-term liquidity standard, the NSFR, with implementation commencing in
2018. For further details on how our business may be impacted, refer to the Liquidity and funding risk section.
In January 2014, the BCBS released final rules for the global leverage requirement, which takes effect as a 3% minimum supplemental
capital requirement on January 1, 2018. For further details on how our business may be impacted, refer to the Capital management section.
During the year, U.S. regulators approved final rules to apply a U.S. based supplemental leverage requirement and LCR requirement to large
banking organizations operating in the U.S. We anticipate subsequent rules will be introduced to apply U.S.-specific LCR and leverage require-
ments to our U.S. Intermediate Holding Company and U.S. branch network (see below for further details).
Basel III requirements are being implemented in the European Union through a revised Capital Requirements Directive (CRD IV) and
accompanying Capital Requirements Regulation (CRR), both of which became effective January 1, 2014 and are to be phased-in gradually
through 2019. CRD IV/CRR also introduces improvements to the transparency of activities of banks and investment funds in different countries,
adds a host of governance standards (including standards for executive compensation and bonuses, board oversight of risk and board diversity),
and implements a common reporting framework for regulatory reporting. These changes may also result in higher capital requirements for our
European subsidiaries.
Dodd-Frank – Volcker Rule
On December 10, 2013 U.S. authorities finalized section 619 of the Dodd-Frank Act relating to broad prohibitions and restrictions on proprietary
trading and certain banking entity relationships with hedge funds and private equity funds (the “Volcker Rule”). The final Volcker Rule extended
the general compliance deadline to July 21, 2015 and provided some flexibility for foreign institutions as it relates to activities conducted outside
the U.S. The Rule impacts our global activities as its reach extends to the Bank and each of its subsidiaries and affiliates (subject to certain
exceptions). The majority of our trading businesses will continue to be permissible under the Rule and we are in the process of building the
requisite monitoring program and reporting metrics to demonstrate compliance. We have exited or are in the process of exiting certain activities
that cannot be restructured to comply with the Rule. For a limited number of business activities, we are continuing discussions with regulators
and others in the industry in order to assess the best means of restructuring those activities to comply with the Rule. The combined impact of
these changes is not expected to materially affect our overall results.
80 Royal Bank of Canada: Annual Report 2014 Management’s Discussion and Analysis

Dodd-Frank – Enhanced Supervision of Foreign Banking Organizations
On February 18, 2014, the U.S. Federal Reserve finalized their new oversight regime for non-U.S. banks with subsidiaries, affiliates and branches
operating in the U.S. (the “Enhanced Prudential Standards for Bank Holding Companies and Foreign Banking Organizations”), pursuant to
section 165 of the Dodd-Frank Act. The rule is intended to address the perceived systemic risk that large foreign banks could pose to the U.S.
financial markets. As a foreign banking organization with more than US$50 billion in U.S. non- branch assets, RBC is required to establish a
separately capitalized U.S. Intermediate Holding Company (the IHC), into which all of our U.S. legal entities must be placed and for which certain
U.S.-based requirements will apply. The IHC will be subject to Federal Reserve oversight comparable to U.S. bank holding companies. As a result,
changes to our existing practices will be required to provide the governance and infrastructure needed to support these U.S.-specific require-
ments in areas of financial reporting, capital and liquidity, risk management, and stress testing. In addition, there will be limitations on capital
distributions from the IHC to RBC, and such distributions will be subject to supervisory approval. The requirements will be phased in between
2015 and 2018, with RBC needing to form its IHC by July 1, 2016. An implementation plan outlining our approach for meeting these requirements
including forming the IHC must be filed with the Federal Reserve by January 1, 2015. The Federal Reserve has stated that it plans to issue, at a
later date, separate rules to apply early remediation requirements and limits on exposures to single counterparties. The final rule also deferred
application of U.S.-based leverage requirements, which differ from the Basel III leverage ratio, to January 1, 2018. RBC will incur costs to comply
with these additional U.S. based financial reporting, risk management and governance requirements (both initially and on an ongoing basis) and
we may have less flexibility in our capital and liquidity structures which historically have been managed on a global (vs. regional) basis. These
impacts are not expected to materially affect our financial performance or overall results.
Canadian bail-in regime
On August 1, 2014, the Government of Canada proposed a “bail-in” regime for the six D-SIBs. Bail-in regimes are being implemented in a number
of jurisdictions following the 2008 financial crisis in an effort to limit taxpayer exposure to potential losses of a failing institution and ensure the
institution’s shareholders and creditors remain responsible for bearing such losses. The proposed regime would grant the Government of Canada
the power to permanently cancel an institution’s existing common shares and/or convert an institution’s long-term senior debt into common
shares. Either power would only be exercisable once the institution was no longer viable and full conversion of the institution’s non-viable
contingent capital (NVCC) instruments into common shares had already occurred. Deposits (including those insured by the Canada Deposit
Insurance Corporation), shorter-term unsecured wholesale debt, and derivatives would not be subject to conversion or cancellation. Higher Loss
Absorbency requirements would also apply to ensure affected banks maintain sufficient capital to absorb the proposed conversions. The
proposed changes could adversely impact our cost of funding.
Total loss-absorbing capacity (TLAC)
On November 10, 2014, the Financial Stability Board (FSB) proposed minimum common international standards related to the TLAC of global
systemic banks. The standards are intended to address the sufficiency of global systemically important banks’ (G-SIBs) capital to absorb losses
in a resolution, in a manner that minimizes impact on financial stability and ensures continuity of critical economic functions. To date, RBC and
the other Canadian banks have not been designated as G-SIBs. It is uncertain how these proposed standards will be integrated into Canada’s
bail-in regime as discussed above, which also remains to be finalized.
Over-the-counter (OTC) derivatives reform
Reforms in the OTC derivatives markets continue on a global basis, with the governments of the G20 nations proceeding with plans to transform
the capital regimes, national regulatory frameworks and infrastructures in which we and other market participants operate. We, along with other
Canadian banks, will experience changes in our wholesale banking business, some of which will impact our client- and trading-related
derivatives revenues in Capital Markets. As part of this, we have implemented a compliance framework to adhere to new requirements in Canada
(including new trade reporting rules effective October 31, 2014), the U.S., Europe, Asia-Pacific, and Australia.
In September 2013, the BCBS and the International Organization of Securities Commissions (IOSCO) released joint guidelines that include a
requirement for non-exempt financial entities to exchange initial and variation margin (i.e. margin held as collateral to protect against potential
counterparty default). Throughout 2014, European, Japanese, and U.S. regulators proposed domestic rules based on these guidelines. Effective
December 1, 2015, RBC expects it will be required to comply with these guidelines and will work with national authorities to prepare for
compliance as Canadian rules are developed.
On December 31, 2012, RBC registered as a swaps dealer in the U.S. pursuant to U.S. Commodity Futures Trading Commission (CFTC)
requirements. To avoid the imposition of duplicative prudential requirements (and mitigate some of the expected compliance and operating
costs), we are continuing to work with Canadian and U.S. authorities to encourage reliance on the Canadian framework.
In Europe, OTC regulation is being phased in since the European Market Infrastructure Rules (EMIR) came into force in March 2013. EMIR
requires firms to clear certain OTC standardized derivative contracts through central counterparties, establish risk mitigation controls for OTC
derivatives transactions that cannot be cleared, and report both cleared and non-cleared contracts to trade repositories. The review of Markets in
Financial Instruments Directive (MiFID II) (in effect January 2017) is another key initiative seeking to achieve greater trade transparency,
enhanced investor protection and more oversight of OTC derivatives and fixed income products, primarily through the introduction of new types
of regulated trading platforms and increased governance over certain trading activities.
The payments system in Canada
The Federal government is continuing to review a number of aspects of the Canadian payments system, in areas such as governance, mobile
payments, debit and credit cards, and the overall regulatory framework.
On November 4, 2014, MasterCard Canada and Visa Canada announced voluntary commitments to reduce merchant credit card fees to an
average effective rate of 1.5% for the next five years, effective April 30, 2015. As a result of these commitments, the Minister of Finance signalled
the government’s intention to not regulate credit card interchange rates at this time. However, the government also indicated it may implement
amendments to the voluntary Code of Conduct for the Credit and Debit Card Industry in Canada in the near future. We will continue to assess the
impact as further details are made available. We believe that we are well positioned to make any adjustments required in response to these
commitments and will continue to support our personal and business clients with competitive credit card products.
These and other potential changes could have implications for RBC from a technological, systems, operational and regulatory perspective.
While the government’s review is still at an early stage, risks associated with the implementation of these reforms could include implications to
our revenue and business strategy through potential measures such as enhanced disclosure requirements, and the introduction of some form of
dispute resolution mechanism for merchants. We continue to provide input into the government’s consultations in this area, arguing for fair and
consistent regulation of all participants in the payments system to protect safety and soundness while promoting innovation.
Management’s Discussion and Analysis Royal Bank of Canada: Annual Report 2014 81

Consumer protection
On September 19, 2014, the Supreme Court of Canada rendered its judgment in the 2003 Quebec class action lawsuit, Marcotte v. Bank of
Montreal. The Court specifically found that certain provisions of Quebec’s Consumer Protection Act apply to credit cards issued by federally-
chartered banks. The Supreme Court agreed with the banks that foreign currency conversion fees cardholders pay when they transact in other
currencies are not “credit charges”, and therefore not subject to certain restrictions imposed by the Consumer Protection Act, but ruled that the
disclosure requirements of the legislation do apply. Accordingly, five banks and one credit union must reimburse and pay punitive damages to
credit cardholders for failing to properly disclose these fees. Neither Royal Bank of Canada nor any of the three other banks named in the lawsuit
are required to pay any damages or reimbursement given that, at all relevant times, the conversion fee was disclosed in accordance with the
applicable legislative provisions. The Supreme Court decision is important in that it narrows the circumstances in which exclusive federal
jurisdiction over banking renders provincial/territorial legislation inoperative, opening the door further for the activities of RBC and other
federally-regulated institutions to be subject to both federal and provincial/territorial legislation.
The Supreme Court decision may also influence the work being undertaken by the Federal government in the area of consumer protection
more generally. In December 2013 the government began consulting on the development of a principles-based federal consumer protection
framework focused on setting standards for the protection of consumers and we participated in that Department of Finance consultation.
Foreign Account Tax Compliance Act (FATCA)
The U.S. Foreign Account Tax Compliance Act (FATCA) came into effect on July 1, 2014 and generally requires non-U.S. financial institutions to
provide information to the U.S. Internal Revenue Service (IRS) about U.S. persons and financial accounts in which they have an interest in order
to identify persons who may be evading U.S. taxes through the use of foreign accounts. On February 5, 2014, the Canadian government
concluded an intergovernmental agreement (IGA) with the U.S. government providing some relief to Canadian financial institutions and their
clients. Under the terms of the IGA, Canadian financial institutions will report information directly to CRA rather than directly to the IRS. The CRA
will then exchange the information with the IRS through provisions in the existing Canada-U.S. Tax Convention. The IGA also generally eliminates
the requirement for Canadian financial institutions to withhold and remit to the IRS a 30% tax on U.S.-source payments paid or credited to
individual account holders who fail to provide information requested to determine their U.S. status. Instead, the accounts for those individuals
will be treated as U.S. reportable accounts and included in the reporting to the tax authorities.
Regulatory reform in the U.K.and elsewhere in Europe
The regulatory framework in the U.K. and elsewhere in Europe continues to undergo significant reform and reorganization. The U.K. Financial
Services (Banking Reform) Act was finalized in December 2013 and regulators continue to adopt regulations to implement the new legislation.
Key changes focus on heightened requirements for governance, consumer protection, and bank executive remuneration. The approved persons
regime applies more stringent oversight, certification, and disclosure requirements to those performing senior management functions at a
subject bank. U.K. authorities are also consulting on a new remuneration code for the U.K. that sets out new rules on remuneration to strengthen
the alignment between long-term risk and reward in the banking sector. European authorities have also published guidelines aimed at ensuring
a consistent approach for complaints handling across the European Union.
In July 2014, U.K. legislation confirmed that our U.K. entities will be exempt from the requirement to separate our retail banking and
investment banking activities by virtue of meeting the prescribed de minimis threshold for applicability.
Competitive risk
The competition for clients among financial services companies in the markets in which we operate is intense. Client loyalty and retention can be
influenced by a number of factors, including new technology used or services offered by our competitors, relative service levels, relative prices,
product and service attributes, our reputation, actions taken by our competitors, and adherence with competition and anti-trust laws. Other
companies, such as insurance companies and non-financial companies, are increasingly offering services traditionally provided by banks. For
example, our payments business is facing intense competition from emerging non-traditional competitors. This competition could also reduce
net interest income, fee revenue and adversely affect our results.
Systemic risk
Systemic risk is the risk that the financial system as a whole, or a major part of it – either in an individual country, a region, or globally – is put in
real and immediate danger of collapse or serious damage with the likelihood of material damage to the real economy, and that this will result in
financial, reputation or other risks for RBC.
Systemic risk is considered to be the least controllable risk facing RBC. Our ability to mitigate this risk when undertaking business activities is
limited, other than through collaborative mechanisms between key industry participants, and, as appropriate, the public sector, to reduce the
frequency and impact of these risks. The two most significant measures in mitigating the impact of systemic risk are diversification and stress testing.
Our diversified business portfolios, products, activities and funding sources help mitigate the potential impacts from systemic risk. We also
mitigate systemic risk by establishing risk limits to ensure our portfolio is well diversified, concentration risk is reduced and remains within our
Risk Appetite.
Stress testing involves consideration of the simultaneous movements in a number of risk factors. It is used to ensure our business strat-
egies and capital planning are robust by measuring the potential impacts of credit, market, liquidity and funding and operational risks on us,
under adverse economic conditions. Our enterprise-wide stress testing program utilizes stress scenarios featuring a range of severities based on
plausible adverse economic and financial market events. These stress scenarios are evaluated across the organization, and results are
integrated to develop an enterprise-wide view of the impacts on our financial results and capital requirements. For further details on our stress
testing, refer the Risk management – Enterprise risk management section.
Overview of other risks
In addition to the risks described in the Risk management section, there are other risk factors, described below, which may adversely affect our
businesses and financial results. The following discussion is not exhaustive as other factors could also adversely affect our results.
Business and economic conditions
Our earnings are significantly affected by the general business and economic conditions in the geographic regions in which we operate. These
conditions include consumer saving and spending habits as well as consumer borrowing and repayment patterns, business investment,
government spending, exchange rates, sovereign debt risks, the level of activity and volatility of the capital markets, strength of the economy
and inflation. For example, an economic downturn may result in high unemployment and lower family income, corporate earnings, business
82 Royal Bank of Canada: Annual Report 2014 Management’s Discussion and Analysis
investment and consumer spending, and could adversely affect the demand for our loan and other products and result in higher provisions for
credit losses. Given the importance of our Canadian operations, an economic downturn in Canada or in the U.S. impacting Canada would largely
affect our personal and business lending activities in our Canadian banking businesses, including cards, and could significantly impact our
results of operations.
Our earnings are also sensitive to changes in interest rates. A continuing low interest rate environment in Canada, the U.S. and globally
would result in net interest income being unfavourably impacted by spread compression largely in Personal & Commercial Banking and Wealth
Management. While an increase in interest rates would benefit our businesses that are currently impacted by spread compression, a significant
increase in interest rates could also adversely impact household balance sheets. This could result in credit deterioration which might negatively
impact our financial results, particularly in some of our personal and commercial banking and Wealth Management businesses.
Capital Markets and Investor & Treasury Services would be negatively impacted if global capital markets deteriorate resulting in lower
average fee-based client assets and transaction volumes and trading volatility. In Wealth Management, weaker market conditions would lead to
lower average fee-based client assets and transaction volumes. Worsening of financial and credit market conditions may adversely affect our
ability to access capital markets on favourable terms and could negatively affect our liquidity, resulting in increased funding costs and lower
transaction volumes in Capital Markets and Investor & Treasury Services. For further details on economic and market factors which may impact
our financial performance, refer to the Wealth Management, Investor & Treasury Services and Capital Markets sections.
Government fiscal, monetary and other policies
Our businesses and earnings are affected by the fiscal, monetary or other policies that are adopted by the Bank of Canada and various other
Canadian regulatory authorities, the Board of Governors of the Federal Reserve System in the U.S. and other U.S. government authorities, as well
as those adopted by international regulatory authorities and agencies in jurisdictions in which we operate. Such policies can also adversely
affect our clients and counterparties in Canada, the U.S. and internationally, which may increase the risk of default by such clients and counter-
parties.
Tax risk and transparency
Tax risk refers to the risk of loss related to unexpected tax liabilities. The tax laws and systems that are applicable to RBC are complex and wide
ranging. As a result, we ensure that any decisions or actions related to tax always reflect our assessment of the long-term costs and risks
involved, including their impact on our relationship with clients, shareholders, and regulators, and our reputation.
Our approach to tax is governed by our Taxation Policy and Risk Management Framework, and reflects the fundamentals of our Risk
Pyramid. Oversight of our tax policy and the management of tax risk is the responsibility of the CAO & CFO and the Senior Vice President,
Taxation. We report our tax position to the Audit Committee on a regular basis and discuss our tax strategy with the Audit and Risk Committees
as well as with GE.
Our tax strategy is designed to ensure transparency and support our business strategy, and is aligned with our corporate vision and values.
We seek to maximize shareholder value by ensuring that our businesses are structured in a tax efficient manner while considering reputational
risk by being in compliance with all laws and regulations. Our framework seeks to ensure that we:
• Act with integrity and in a straightforward, open and honest manner in all tax matters;
• Ensure tax strategy is aligned with our business strategy supporting only bona fide transactions with a business purpose and economic
substance;
• Ensure our full compliance and full disclosure to tax authorities of our statutory obligations; and
• Endeavor to work with the tax authorities to build positive long-term relationships and where disputes occur, address them
constructively.
With respect to assessing the needs of our clients, we consider a number of factors including the purposes of the transaction. We ensure that we
only support bona fide client transactions with a business purpose and economic substance. Should we become aware of client transactions
that are aimed at evading their tax obligations, we will not proceed with the transaction.
Given that we have offices in 40 countries worldwide, complex tax legislation and accounting principles can often result in differing legal
interpretations between the respective tax authorities we deal with and ourselves. Should this occur, we are committed to an open and trans-
parent dialogue with the tax authorities to ensure a quick assessment and prompt resolution of the issue. Failure to adequately manage tax risk
and resolve issues with tax authorities could adversely impact our results and/or significantly impact our reputation.
Tax Contribution
In 2014, total income and other tax expense to various levels of governments totalled $3.2 billion (2013 – $3 billion; 2012 – $2.9 billion). In
Canada, total income and other tax expense for the year ended October 31, 2014 to various levels of government totalled $2.2 billion (2013 –
$2.6 billion; 2012 – $2 billion).
2014 2013 2012
0
Payroll taxes
Goods and services
sales taxes
Income taxes
Capital taxes
Property taxes
Insurance premium taxes
Business taxes
1,750
875
2,625
3,500
Income and other tax expense – by category
(Millions of Canadian dollars)
2014 2013 2012
0
Other International
U.S.
Canada
Income and other tax expense – by geography
(Millions of Canadian dollars)
1,750
875
2,625
3,500
For further details on income and other tax expense, refer to the Financial performance section.
Management’s Discussion and Analysis Royal Bank of Canada: Annual Report 2014 83
Ability to attract and to retain employees
Competition for qualified employees is intense within the financial services industry and from non-financial industries looking to recruit.
Although our goal is to attract and retain qualified employees, there is no assurance that we will be able to do so.
Accuracy and completeness of information on clients and counterparties
When deciding to extend credit or enter into other transactions with clients and counterparties, we may rely on information provided by or on
behalf of clients and counterparties, including audited financial statements and other financial information. We may also rely on representations
of clients and counterparties as to the completeness and accuracy of that information. Our financial results could be adversely impacted if the
financial statements and other financial information relating to clients and counterparties on whom we rely do not comply with GAAP or are
materially misleading.
Development and integration of our distribution networks
We regularly explore opportunities to expand our distribution networks, either through acquisitions or organically by adding, for example, new
bank branches, insurance offices, online savings accounts and ATMs in high-growth, receptive markets. However, if we are not able to develop or
integrate these distribution networks effectively, our results of operations and financial condition may be negatively affected.
Model risk
The use of models plays an important role in many of our business activities. We use a variety of models for many purposes, including the
valuation of financial products, risk measurement and management of different types of risk. Model risk is the risk of error in the design,
development, implementation or subsequent use of models. We have established an enterprise-wide Model Risk Management Framework,
including principles, policies and procedures, roles and responsibilities to manage model risk. One of the key factors in the framework to
mitigate model risk is independent validation.
Information technology risk
We use information technology for business operations and the enablement of strategic business goals and objectives. Information technology
risk is the risk to our business associated with the use, ownership, operation, involvement, influence and adoption of information technology
within the enterprise. It consists of information technology related events that could potentially have an adverse impact on our business. Such
events could result in business interruption, service disruptions, theft of intellectual property and confidential information, additional regulatory
scrutiny, litigation and reputational damage. To manage our information technology risk, we have established an enterprise-wide Information
Technology Risk Management Framework.
Information management risk
Information management risk is the risk of loss or harm resulting from the failure to manage information appropriately throughout its lifecycle.
Exposure to this risk exists when information is acquired or created, processed, used, shared, accessed, retained or disposed. With respect to
personal information, the failure to manage information appropriately can result in the misuse of personal information or privacy breaches. With
respect to client information, the inability to process information accurately and on a timely basis can result in service disruptions. With respect
to corporate and proprietary information, the mismanagement of information can result in the disclosure of confidential information, the
unavailability of information when it is required and the reliance on inaccurate information for decision-making purposes. Such events could
lead to legal and regulatory consequences, reputational damage and financial loss.
Social media risk
The scale and profile of social media has grown to present a number of risks. These risks include brand and reputational damage, information
leaks, non-compliance with regulatory requirements and governance risk. To manage the risks associated with social media, we have
implemented an enterprise-wide policy as well as business unit policies on the usage of external social media, which sets out the requirements
for the business and corporate use of social media and is part of our larger Social Media Governance Framework.
Environmental risk
Environmental risk is the risk of loss to financial, operational or reputational value resulting from the impact of environmental issues. It arises
from the business activities and operations of both us and our clients. For example, the environmental issues associated with our clients’
purchase and sale of contaminated property or development of large-scale projects may give rise to credit, regulatory and reputation risk.
Operational and legal risks may arise from environmental issues at our branches, offices or data processing centres.
Corporate Sustainability (CS) sets enterprise-wide policy requirements for the identification, assessment, control, monitoring and reporting
of environmental risk. Oversight is provided by GE and the Corporate Governance and Public Policy Committee (CG&PPC) of the Board of
Directors. Business segments and corporate functions are responsible for incorporating environmental risk management requirements and
controls within their operations. The CS Group also provides advisory services and support to business segments on the management of specific
environmental risks in business transactions.
Periodically, we verify that our environmental risk management policies and processes are operating as intended. On an annual basis, and
more frequently as required, environmental risk management activities, issues, and trends are reported to GE and to the CG&PPC of the Board of
Directors. Failure to adequately manage environmental risk could adversely impact our results and/or significantly impact our reputation.
We report on the full extent of environmental management annually in the Corporate Responsibility Report and Public Accountability
Statements.
Third party and outsourcing risk
Failing to effectively manage our service providers may expose RBC to service disruptions, regulatory action, financial loss, litigation or reputa-
tional damage. Third party and outsourcing risk has received increased oversight from regulators and attention from the media. We formalized
and standardized our expectations of our suppliers with a principles-based Supplier Code of Conduct to ensure their behaviour aligns with our
standards in the following key areas: business integrity, responsible business practices, responsible treatment of individuals, and the
environment.
Other factors
Other factors that may affect actual results include changes in government trade policy, changes in accounting standards, including their effect
on our accounting policies, estimates and judgements, currency and interest rate movements in Canada, the U.S., and other jurisdictions in
which we operate, changes to our credit ratings, the timely and successful development of new products and services, our ability to cross-sell
more products to customers, technological changes, effective design, implementation and execution of processes and their associated controls,
84 Royal Bank of Canada: Annual Report 2014 Management’s Discussion and Analysis
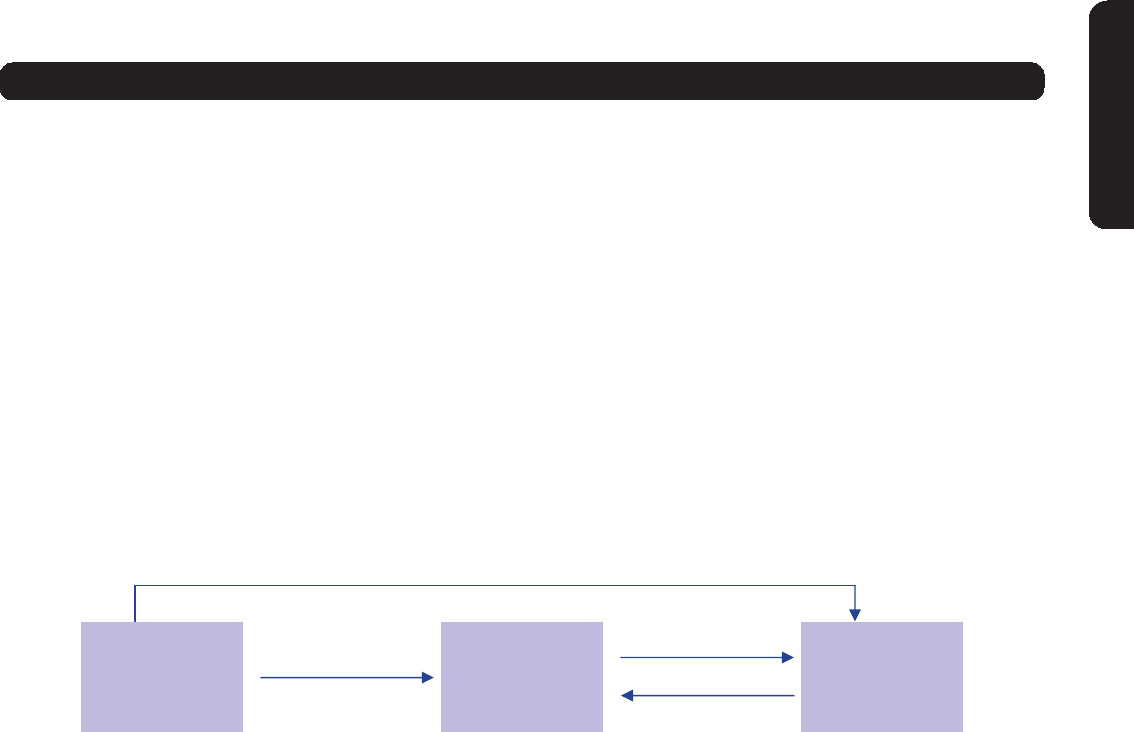
fraud by internal and external parties, the possible impact on our business from disease or illness that affects local, national or global
economies, disruptions to public infrastructure, including transportation, communication, power and water, international conflicts and other
political developments including those relating to the war on terrorism, and our success in anticipating and managing the associated risks.
We caution that the foregoing discussion of risk factors, many of which are beyond our control, is not exhaustive and other factors could
also affect our results.
Capital management
We actively manage our capital to maintain strong capital ratios and high ratings while providing strong returns to our shareholders. In addition
to the regulatory requirements, we consider the expectations of credit rating agencies, depositors and shareholders, as well as our business
plans, stress tests, peer comparisons and our internal capital ratio targets. Our goal is to optimize our capital usage and structure, and provide
support for our business segments and clients and better returns for our shareholders, while protecting depositors and senior creditors.
Capital management framework
Our capital management framework provides the policies and processes for defining, measuring, raising and investing all types of capital in a
coordinated and consistent manner. It includes the overall approach of capital management, including guiding principles as well as roles and
responsibilities relating to capital adequacy and transactions, dividends, solo capital and management of risk-weighted assets and gross-
adjusted assets or total exposures. We manage and monitor capital from several perspectives, including regulatory capital, economic capital and
subsidiary capital.
Our capital planning is a dynamic process which involves various teams including Finance, Corporate Treasury, GRM, Economics and our
businesses, and covers internal capital ratio targets, potential capital transactions as well as projected dividend payouts and share repurchases.
The integral parts of our capital planning comprise our business operating plans, Enterprise-wide stress testing and Internal Capital Adequacy
Assessment Process (ICAAP), along with the considerations of regulatory capital requirements and accounting changes, internal capital
requirements, rating agency metrics and solo capital.
Our capital plan is established on an annual basis and is aligned with the management actions included in the annual business operating
plan, which includes forecast growth in assets and earnings taking into account our business strategies, projected market and economic
environment and peer positioning. This includes incorporating potential capital transactions based on our projected internal capital generation,
business forecasts, market conditions and other developments, such as accounting and regulatory changes that may impact capital require-
ments. All of the components in the capital plan are monitored throughout the year and are revised as deemed appropriate.
Total capital requirements
Capital available and target
capital ratios
Capital impacts of
severe but plausible
scenarios
Enterprise-wide
Stress Testing ICAAP
Capital Plan and
Business
Operating Plan
Capital impacts of severe but plausible scenarios
Our Enterprise-wide stress testing and ICAAP provide key inputs for capital planning, including setting the appropriate internal capital ratio
targets. The stress scenarios are evaluated across the organization, and results are integrated to develop an enterprise-wide view of financial
impacts and capital requirements, which in turn facilitate the planning of mitigating actions to absorb exceptional adverse events. ICAAP is an
OSFI mandated annual process to assess capital adequacy and requirements to cover all material risks, with a cushion to cover severe but
plausible contingencies. In accordance with the OSFI guideline, the major components of our ICAAP process include comprehensive risk
assessment, stress testing, capital assessment and planning (both economic and regulatory capital), board and senior management oversight,
monitoring and reporting and internal control review.
Our internal capital targets are established to maintain robust capital positions in excess of OSFI’s Basel III “all-in” regulatory targets, which
include minimum capital requirements plus a capital conservation buffer that can absorb losses during periods of stress. The “all-in” method-
ology includes all regulatory adjustments that will be required by 2019, while retaining the phase-out rules for non-qualifying capital
instruments, as per OSFI’s Basel III Capital Adequacy Requirements (CAR) guideline. The stress test results of our Enterprise-wide stress testing
and ICAAP are incorporated into the OSFI capital conservation buffer, with a view to ensuring the bank has adequate capital to underpin risks
and absorb losses under all plausible stress scenarios given our risk profile and appetite. In addition, we include a discretionary cushion on top
of the OSFI regulatory targets to maintain capital strength for forthcoming regulatory and accounting changes, peer comparatives, rating agencies
sensitivities and solo capital level.
The Board of Directors is responsible for ultimate oversight of capital management, including the annual review and approval of the Capital
Plan. ALCO and GE share responsibility for capital management and receive regular reports detailing our compliance with established limits and
guidelines. The Risk Committee annually approves the Capital Management Framework. The Audit and Risk Committees jointly approve the ICAAP
process. The Audit Committee is also responsible for the ongoing review of internal controls over capital management.
Basel III
Our regulatory capital requirements are determined on a Basel III “all-in” basis as per OSFI guidelines. The top corporate entity to which Basel III
applies at the consolidated level is Royal Bank of Canada.
Under Basel III, banks select from among alternative approaches to calculate their minimum regulatory capital required to underpin credit,
market and operational risks.
We adopted the Basel III IRB approach to calculate credit risk capital for consolidated regulatory reporting purposes. While the majority of
our credit risk exposures are reported under the Basel III IRB approach for regulatory capital purposes, certain portfolios considered non-material
from a consolidated perspective continue to use the Basel III Standardized approach for credit risk (for example, our Caribbean banking
operations). For consolidated regulatory reporting of operational risk capital, we continue to use the Standardized approach. For consolidated
regulatory reporting of market risk capital, we use both Internal Models-based and Standardized approaches.
Management’s Discussion and Analysis Royal Bank of Canada: Annual Report 2014 85

In December 2010, the BCBS issued “Basel III: A global regulatory framework for more resilient banks and banking systems”, which outlines
the capital and liquidity requirements for global banks, with the objective of promoting financial stability and is intended to ensure sustainable
economic growth. The BCBS sets out the Basel III transitional requirements for Common Equity Tier 1 (CET1), Tier 1 and Total capital ratios at 4%,
5.5% and 8%, respectively for 2014, which will be fully phased-in to 7%, 8.5% and 10.5%, respectively (including minimums plus capital
conservation buffer of 2.5%) by January 1, 2019. The BCBS also released the NVCC requirements in January 2011 with an effort to ensure the loss
absorbency of regulatory capital instruments at the point of non-viability. In August 2011, OSFI issued an advisory outlining the NVCC principles
and requirements, including a full and permanent conversion of non-common capital instruments into common shares upon a trigger event,
effective the first quarter of 2013.
OSFI expects Canadian banks to currently meet the “all-in” targets (minimum ratios plus the capital conservation buffer – January 1, 2019
BCBS requirements) for CET1 ratio, and Tier 1 and Total capital. Effective January 1, 2014, the CVA capital charge is phased in over a five-year
period beginning 2014 and ending December 31st, 2018 to ensure an implementation similar to that in other countries. In accordance with the
guidance, there are two possible options to phase in the CVA capital charge. Under the option selected by RBC, option 1, CVA increased RWA for
purposes of calculating CET1, Tier 1 and Total Capital ratios, and was phased-in using 57%, 65% and 77% phase-in multiples respectively for
2014. The multiples will vary by year, reaching 100% by the end of 2018. The 2015 CET1, Tier 1 and Total Capital ratios phase-in multiples will be
64%, 71% and 77%, respectively.
In January 2014, the BCBS released its final paper on “Basel III leverage ratio framework and disclosure requirement”, which requires banks
to disclose the leverage ratio and its components, effective the first fiscal quarter of 2015. The leverage ratio is defined as the capital measure
divided by the exposure measure. The capital measure is currently defined as Tier 1 capital and the exposure measure is the sum of (a) on-
balance sheet exposures; (b) derivative exposures; (c) securities financing transaction (SFT) exposures and (d) off-balance sheet items. The
minimum leverage ratio is 3%. On October 30, 2014, OSFI issued its final “Leverage Requirements (LR) Guideline”, which replaces the existing
OSFI assets-to-capital multiple (ACM) with the Basel leverage ratio beginning in Q1 2015.
OSFI released the list of six Canadian banks, including RBC, which are designated as D-SIBs in March 2013, for which an additional 1% risk
weighted capital surcharge will be required commencing January 1, 2016. In July 2013, BCBS published a revised document on “Global
systemically important banks (G-SIB): updated assessment methodology and the higher loss absorbency requirement”. BCBS requires all banks
with a Basel III leverage ratio total exposure exceeding EUR 200 billion as well as those designated as G-SIBs in the previous year to publish the
twelve indicators used in the assessment methodology, with the goal of enhancing the transparency of the relative scale of banks’ potential
global systemic importance and data quality. Per OSFI advisory “Global systemically important banks – Public disclosure requirements” issued
in March 2014, Canadian banks, including RBC, that meet the BCBS size threshold and are not designated as G-SIBs in the previous year will be
required to disclose in the report to shareholders the twelve indicators only (not the full template) for financial year ends 2013 and 2014, no later
than the first quarter of 2015. For subsequent year ends, disclosure should be made as part of a bank’s annual report to shareholders.
The following table provides a summary of OSFI regulatory target ratios under Basel III.
Basel III – OSFI regulatory target Table 66
Basel III
Capital Ratios
OSFI regulatory target requirements for large banks under Basel III RBC capital
ratios as at
October 31,
2014
Meet or
exceed
OSFI
regulatory
target
ratios
Minimum Capital
Conservation
Buffer
Minimum
including
Capital
Conservation
Buffer
D-SIBs
Surcharge (1)
Minimum
including Capital
Conservation
Buffer and D-SIBs
surcharge (1)
Common Equity Tier 1 (%) > 4.5% 2.5% > 7.0% 1.0% > 8.0% 9.9% ✓
Tier 1 capital (%) > 6.0% 2.5% > 8.5% 1.0% > 9.5% 11.4% ✓
Total capital (%) > 8.0% 2.5% > 10.5% 1.0% > 11.5% 13.4% ✓
(1) The D-SIBs surcharge will be applicable to risk weighted capital commencing January 1, 2016.
The following table provides details on our regulatory capital, RWA and capital ratios. Our capital position remained strong during the year and
our capital ratios remain well above OSFI regulatory targets.
86 Royal Bank of Canada: Annual Report 2014 Management’s Discussion and Analysis

Regulatory capital, RWA and capital ratios
Regulatory capital, risk-weighted assets (RWA) and capital ratios Table 67
As at
(Millions of Canadian dollars, except percentage and multiple amounts)
October 31
2014
October 31
2013
Capital (1)
CET1 capital $ 36,406 $ 30,541
Tier 1 capital 42,202 37,196
Total capital 50,020 44,716
RWA used in calculation of capital ratios (1), (2)
CET1 capital RWA $ 368,594 $ 318,981
Tier 1 capital RWA 369,976 318,981
Total capital RWA 372,050 318,981
Total capital RWA consisting of: (1)
Credit risk $ 286,327 $ 232,641
Market risk 38,460 42,184
Operational risk 47,263 44,156
Total capital risk-weighted assets $ 372,050 $ 318,981
Capital ratios and multiples (1), (3)
CET1 ratio 9.9% 9.6%
Tier 1 capital ratio 11.4% 11.7%
Total capital ratio 13.4% 14.0%
Assets-to-capital multiple (4) 17.0X 16.6X
Gross-adjusted assets (GAA) (billions) (4) $ 885.0 $ 807.0
(1) Capital, RWA and capital ratios and multiples are calculated using OSFI CAR based on the Basel III framework.
(2) Effective Q3, 2014 different scalars were applied to the CVA included in the risk weighted asset calculation applicable to each of the
three tiers of capital. In Q3 and Q4, 2014, the CVA scalars 57%, 65% and 77% were applied to CET 1, Tier 1 and Total Capital
respectively. The CVA scalars will change to 64%, 71% and 77% in fiscal 2015.
(3) To enhance comparability among other global financial institutions, the following are our transitional capital ratios. The transitional
CET1, Tier 1 and Total capital ratios as at October 31, 2014 were 11.8%, 11.8% and 13.8% respectively. Transitional is defined as
capital calculated according to the current year’s phase-in of regulatory adjustments and phase-out of non-qualifying capital
instruments.
(4) Assets-to-capital multiple and GAA are also calculated on a transitional basis.
Basel III regulatory capital and capital ratios
Under Basel III, regulatory capital consists of CET1, Additional Tier 1 and Tier 2 capital.
CET1 capital comprises the highest quality of capital. Regulatory adjustments under Basel III include full deductions of certain items and
additional capital components that are subject to threshold deductions.
Tier 1 capital comprises predominantly CET1 and Additional Tier 1 items including non-cumulative preferred shares. Tier 2 capital includes
subordinated debentures that meet certain criteria, certain loan loss allowances and non-controlling interests in subsidiaries’ Tier 2 instruments.
Total capital is defined as the sum of Tier 1 and Tier 2 capital. Preferred shares and subordinated debentures issued after January 1, 2013 require
NVCC features to be included into regulatory capital. For further details on NVCC, refer to the Legal and regulatory environment risk section.
Regulatory capital ratios are calculated by dividing CET1, Tier 1 and Total capital by their respective RWA. OSFI requires Canadian banks to
maintain an ACM (which is calculated by dividing Gross-Adjusted Assets (GAA) by Total capital calculated on a Basel III transitional basis) at or
below a maximum level prescribed by OSFI. All items that are deducted from capital are excluded from total assets. As required by OSFI, we will
transition to the Basel III leverage ratio which replaces the existing ACM commencing in the first quarter of 2015.
Management’s Discussion and Analysis Royal Bank of Canada: Annual Report 2014 87
The following chart provides a summary of the major components of CET1, Additional Tier 1 and Tier 2 capital.
Tier 1 Capital
Common Equity Tier 1 (CET1) Additional Tier 1 Capital
Common shares
Retained earnings
Other components of equity
Goodwill and other intangibles
Deferred tax assets on loss
carryforwards
Defined benefit pension funds assets
Non-significant investments in CET1
instruments of Financial Institutions(2)
Preferred shares
Non-controlling interests in subsidiaries
Tier 1 instruments
Significant investments in insurance
subsidiaries and CET1 instruments in
other Financial Institutions
Mortgage servicing rights
Deferred tax assets relating to
temporary differences
Total Capital
Tier 2 Capital
Subordinated debentures
Certain loan loss allowances
Non-controlling interests in subsidiaries
Tier 2 instruments
Deductions
Threshold
Deductions(1)
+
Higher quality
capital
Lower quality
capital
+
Non-significant investments in Tier 2
instruments of Financial Institutions(2)
Non-significant investments in Tier 1
instruments of Financial Institutions(2)
Significant investments in other Financial
Institutions and insurance subsidiaries
Tier 2 instruments
Significant investments in other Financial
Institutions and insurance subsidiaries
Tier 1 instruments
(1) First level: The amount by which each of the items exceeds a 10% threshold of CET1 capital (after all deductions but before threshold deductions) will be deducted from CET1
capital. Second level: The aggregate amount of the three items not deducted from the first level above and in excess of 15% of CET1 capital after regulatory adjustments will be
deducted from capital, and the remaining balance not deducted will be risk-weighted at 250%.
(2) Non-significant investments are subject to certain CAR criteria that drive the amount eligible for deduction.
Regulatory Capital Table 68
All-in basis
(Millions of Canadian dollars) 2014 2013
CET1 capital: instruments and reserves and regulatory adjustments
Directly issued qualifying common share capital (and equivalent for non-
joint stock companies) plus related stock surplus $ 14,684 $ 14,607
Retained earnings 31,442 28,124
Accumulated other comprehensive income (and other reserves) 2,418 1,207
Directly issued capital subject to phase out from CET1 (only applicable to
non-joint stock companies) ––
Common share capital issued by subsidiaries and held by third parties
(amount allowed in group CET1) 12 11
Regulatory adjustments applied to CET1 under Basel III (12,150) (13,408)
Common Equity Tier 1 capital (CET1) $ 36,406 $ 30,541
Additional Tier 1 capital: instruments and regulatory adjustments
Directly issued qualifying Additional Tier 1 instruments plus related stock
surplus 1,000 –
Directly issued capital instruments to phase out from Additional Tier 1 4,794 6,652
Additional Tier 1 instruments issued by subsidiaries and held by third
parties (amount allowed in group AT1) 23
Regulatory adjustments applied to Additional Tier 1 under Basel III ––
Additional Tier 1 capital (AT1) 5,796 6,655
Tier 1 capital (T1 = CET1 + AT1) $ 42,202 $ 37,196
Tier 2 capital: instruments and provisions and regulatory adjustments
Directly issued qualifying Tier 2 instruments plus related stock surplus 2,010 –
Directly issued capital instruments subject to phase out from Tier 2 5,595 7,234
Tier 2 instruments issued by subsidiaries and held by third parties (amount
allowed in group Tier 2) 31 24
Collective allowance 182 262
Other ––
Regulatory adjustments applied to Tier 2 under Basel III ––
Tier 2 capital (T2) $ 7,818 $ 7,520
Total capital (TC = T1 + T2) $ 50,020 $ 44,716
88 Royal Bank of Canada: Annual Report 2014 Management’s Discussion and Analysis

2014 vs. 2013
Continuity of CET1 ratio (Basel III)
October 31, 2013 (1) Internal
capital
generation (2)
CVA
phase-in
OtherAmendments
to IAS 19R
Employee
Benefits
RWA
increase
Threshold
deductions
Risk
parameters
update
October 31, 2014 (1)
9.6%
144 bps 15 bps (53) bps
(38) bps
(30) bps
(9) bps 2 bps 9.9%
(1) Represents round figures.
(2) Internal capital generation of $4.6 billion represents Net income available to shareholders less common and preferred shares
dividends.
Our CET 1 ratio was 9.9% as at October 31, 2014, up 30 bps from October 31, 2013, mainly due to internal capital generation and lower
threshold deductions. These factors were partially offset by higher RWA reflecting business growth, an update to our risk parameters and CVA
capital charge implementation. The impact from the adoption of the amendments to IAS 19 Employee Benefits and net impact of foreign
exchange translation also decreased our CET1 ratio.
Our Tier 1 capital ratio of 11.4% was down 30 bps, mainly due to the net redemption of Additional Tier 1 instruments, higher RWA reflecting
business growth, an update to our risk parameters and CVA capital charge implementation, along with the impact from the adoption of the
amendments to IAS 19 Employee Benefits and net impact of foreign exchange translation. These factors were partially offset by internal capital
generation, lower threshold deductions, and a decrease in the phase-out of non-qualifying capital.
Our Total capital ratio of 13.4% was down 60 bps, driven by the factors noted above in respect of our Tier 1 ratio, partially offset by net
issuance of subordinated debentures.
As at October 31, 2014, our ACM (on a transitional basis) was 17.0X as compared to ACM as at October 31, 2013 of 16.6X. The increase was
mainly due to higher GAA due to business growth, net redemption of Additional Tier 1 instruments, phase-in of capital deductions, the impact
from the adoption of the amendments to IAS 19 Employee Benefits and the impact of foreign exchange translation. These factors were partially
offset by internal capital generation, a decrease in the phase-out of non-qualifying capital, and net issuance of subordinated debentures.
Management’s Discussion and Analysis Royal Bank of Canada: Annual Report 2014 89

Basel III RWA
OSFI requires banks to meet minimum risk-based capital requirements for exposures to credit risk, operational risk, and, where they have
significant trading activity, market risk. RWA is calculated for each of these risk types and added together to determine total RWA. In addition,
OSFI requires the minimum risk-based capital to be no less than 90% of the capital requirements as calculated under the Basel I standards. If the
capital requirement is less than 90%, a transitional adjustment to RWA must be applied as prescribed by OSFI CAR guidelines.
Total capital risk-weighted assets Table 69
2014 2013
As at October 31 (Millions of Canadian dollars, except
percentage amounts) Exposure (1)
Average
of risk
weights (2)
Risk-weighted assets
Standardized
approach
Advanced
approach Other Total Total
Credit risk
Lending-related and other
Residential mortgages $ 191,905 6% $ 1,048 $ 9,525 $ – $ 10,573 $ 8,490
Other retail 229,594 21% 4,775 44,201 – 48,976 48,418
Business 231,982 55% 17,594 109,354 – 126,948 101,780
Sovereign 58,453 13% 2,538 5,145 – 7,683 3,910
Bank 81,477 9% 2,543 4,536 – 7,079 5,409
Total lending-related and other $ 793,411 25% $ 28,498 $ 172,761 $ – $ 201,259 $ 168,007
Trading-related
Repo-style transactions $ 284,715 2% $ 24 $ 4,864 $ 24 $ 4,912 $ 2,662
Derivatives – including CVA – CET1
phase-in adjustment 73,296 37% 1,447 15,116 10,312 26,875 16,489
Total trading-related $ 358,011 9% $ 1,471 $ 19,980 $ 10,336 $ 31,787 $ 19,151
Total lending-related and other and
trading-related $ 1,151,422 20% $ 29,969 $ 192,741 $ 10,336 $ 233,046 $ 187,158
Bank book equities 2,035 100% – 2,025 – 2,025 1,712
Securitization exposures 39,936 15% 342 5,488 – 5,830 6,789
Regulatory scaling factor n.a. n.a. n.a. 11,938 – 11,938 9,813
Other assets 43,764 69% n.a. n.a. 30,032 30,032 27,169
Total credit risk $ 1,237,157 23% $ 30,311 $ 212,192 $ 40,368 $ 282,871 $ 232,641
Market risk
Interest rate $ 2,211 $ 4,115 $ – $ 6,326 $ 3,361
Equity 178 1,443 – 1,621 3,330
Foreign exchange 1,224 50 – 1,274 1,661
Commodities 2,025 5 – 2,030 990
Specific risk 11,640 3,340 – 14,980 21,948
Incremental risk charge – 12,229 – 12,229 10,894
Total market risk $ 17,278 $ 21,182 $ – $ 38,460 $ 42,184
Operational risk $ 47,263 n.a. n.a. $ 47,263 $ 44,156
CET1 capital risk-weighted assets (3) $ 94,852 233,374 40,368 $ 368,594 $ 318,981
Additional CVA adjustment, prescribed by
OSFI, for Tier 1 capital – – 1,382 1,382 –
Tier 1 capital risk-weighted assets (3) $ 94,852 233,374 41,750 $ 369,976 $ 318,981
Additional CVA adjustment, prescribed by
OSFI, for Total capital – – 2,074 2,074 –
Total capital risk-weighted assets (3) $ 1,237,157 $ 94,852 $ 233,374 $ 43,824 $ 372,050 $ 318,981
(1) Total exposure represents exposure at default which is the expected gross exposure upon the default of an obligor. This amount is before any allowance against impaired loans or partial
write-offs and does not reflect the impact of credit risk mitigation and collateral held.
(2) Represents the average of counterparty risk weights within a particular category.
(3) Effective Q3, 2014 different scalars were applied to the CVA included in the risk weighted asset calculation applicable to each of the three tiers of capital. In Q3 and Q4, 2014, the CVA scalars
57%, 65% and 77% were applied to CET 1, Tier 1 and Total Capital respectively. The CVA scalars will change to 64%, 71% and 77% in fiscal 2015.
2014 vs. 2013
During the year, CET1 RWA was up $50 billion, mainly reflecting business growth, an update to our retail and corporate and business lending risk
parameters, the CVA capital charge implementation, and the impact of foreign exchange translation.
90 Royal Bank of Canada: Annual Report 2014 Management’s Discussion and Analysis

Selected capital management activity
The following table provides our selected capital management activity for the year ended October 31, 2014.
Selected capital management activity Table 70
2014
(Millions of Canadian dollars, except number of shares)
Issuance or
redemption date Number of
shares (000s) Amount
Tier 1 capital
Common shares issued
Stock options exercised (1) 2,723 $ 150
Purchased for cancellation (1,546) (16)
Issuance of preferred shares Series AK (2) February 24, 2014 2,421 61
Issuance of preferred shares Series AZ (2), (3), (4) January 30, 2014 20,000 500
Issuance of preferred shares Series BB (2), (3), (4) June 3, 2014 20,000 500
Redemption of preferred shares Series AN February 24, 2014 (9,000) (225)
Redemption of preferred shares Series AP February 24, 2014 (11,000) (275)
Redemption of preferred shares Series AR February 24, 2014 (14,000) (350)
Redemption of preferred shares Series AT August 24, 2014 (11,000) (275)
Redemption of preferred shares Series AV August 24, 2014 (16,000) (400)
Redemption of TruCS 2013 (2) December 31, 2013 (900)
Tier 2 capital
Issuance of July 17, 2024 subordinated debentures (2), (4) July 17, 2014 1,000
Issuance of September 29, 2026 subordinated
debentures (2), (4) September 29, 2014 1,000
Redemption of June 18, 2103 subordinated debentures (2) June 18, 2014 (600)
Redemption of November 4, 2018 subordinated
debentures (2) November 4, 2013 (1,000)
(1) Amounts include cash received for stock options exercised during the period and the fair value adjustments to stock options.
(2) For further details, refer to Notes 19, 20 and 21 of our 2014 Annual Consolidated Financial Statements.
(3) Based on gross amount.
(4) NVCC capital instruments.
Dividends
Our common share dividend policy reflects our earnings outlook, payout ratio objective and the need to maintain adequate levels of capital to
fund business opportunities. In 2014, our dividend payout ratio was 47%, which met our dividend payout ratio target of 40% to 50%. Common
share dividends paid during the year were $4.1 billion.
Selected share data (1) Table 71
2014 2013 2012
(Millions of Canadian dollars, except
number of shares)
Number of
shares
(000s) Amount
Dividends
declared
per share
Number of
shares
(000s) Amount
Dividends
declared
per share
Number of
shares
(000s) Amount
Dividends
declared
per share
Common shares outstanding 1,442,233 $14,511 $ 2.84 1,441,056 $ 14,377 $ 2.53 1,445,303 $ 14,323 $ 2.28
First preferred shares outstanding
Non-cumulative Series W (2) 12,000 300 1.23 12,000 300 1.23 12,000 300 1.23
Non-cumulative Series AA 12,000 300 1.11 12,000 300 1.11 12,000 300 1.11
Non-cumulative Series AB 12,000 300 1.18 12,000 300 1.18 12,000 300 1.18
Non-cumulative Series AC 8,000 200 1.15 8,000 200 1.15 8,000 200 1.15
Non-cumulative Series AD 10,000 250 1.13 10,000 250 1.13 10,000 250 1.13
Non-cumulative Series AE 10,000 250 1.13 10,000 250 1.13 10,000 250 1.13
Non-cumulative Series AF 8,000 200 1.11 8,000 200 1.11 8,000 200 1.11
Non-cumulative Series AG 10,000 250 1.13 10,000 250 1.13 10,000 250 1.13
Non-cumulative Series AH –– – – – 0.86 8,500 213 1.41
Non-cumulative Series AJ (3) 13,579 339 0.97 16,000 400 1.25 16,000 400 1.25
Non-cumulative Series AK (3) 2,421 61 0.53 –– – –– –
Non-cumulative Series AL (3) 12,000 300 1.15 12,000 300 1.40 12,000 300 1.40
Non-cumulative Series AN (3) – – 0.39 9,000 225 1.56 9,000 225 1.56
Non-cumulative Series AP (3) – – 0.39 11,000 275 1.56 11,000 275 1.56
Non-cumulative Series AR (3) – – 0.39 14,000 350 1.56 14,000 350 1.56
Non-cumulative Series AT (3) – – 1.17 11,000 275 1.56 11,000 275 1.56
Non-cumulative Series AV (3) – – 1.17 16,000 400 1.56 16,000 400 1.56
Non-cumulative Series AX (3) 13,000 325 1.53 13,000 325 1.53 13,000 325 1.53
Non-cumulative Series AZ (3), (4) 20,000 500 0.50 –– – –– –
Non-cumulative Series BB (3), (4) 20,000 500 0.46 –– – –– –
Treasury shares – preferred 1– 47 1 42 1
Treasury shares – common 892 71 666 41 543 30
Stock options
Outstanding 8,579 10,604 12,304
Exercisable 4,987 5,711 6,544
Dividends
Common 4,097 3,651 3,291
Preferred 213 253 258
(1) For further details about our capital management activity, refer to Note 21 of our Annual Consolidated Financial Statements.
(2) Effective February 24, 2010, we have the right to convert into common shares at our option, subject to certain restrictions.
(3) Dividend rate will reset every five years.
(4) NVCC capital instruments.
Management’s Discussion and Analysis Royal Bank of Canada: Annual Report 2014 91

On October 27, 2014, we announced that the TSX approved our normal course issuer bid (NCIB) to purchase up to 12 million of our common
shares, commencing on November 1, 2014 and which may continue until October 31, 2015. Purchases may be made through the TSX, the NYSE
and other designated exchanges and published markets in both Canada and the U.S. The price paid for any repurchased shares will be the
prevailing market price at the time of acquisition. We determine the amount and timing of the purchase under the NCIB, subject to prior
consultation with OSFI. As at December 2, 2014, we have not purchased any shares under the 2015 NCIB.
Our previous NCIB commenced on November 1, 2013 and expired on October 31, 2014. Over the term of the previous bid, we purchased
1.5 million of our common shares. The total cost of the shares repurchased was $113 million, comprised of a book value of $16 million, with an
additional $97 million premium paid on repurchase.
On November 14, 2014, all $200 million outstanding 10% subordinated debentures matured. The maturity proceeds plus accrued interest
were paid to the noteholders on the maturity date.
On November 24, 2014, we redeemed all outstanding Non-cumulative 5-Year Rate Reset First Preferred Shares Series AX. The redemption
was financed out of general corporate funds.
As at November 28, 2014, the number of outstanding common shares and stock options was 1,442,238,852 and 8,573,404, respectively.
As at November 28, 2014, the number of Treasury shares – preferred and Treasury shares – common was (67,007) and (442,349), respectively.
NVCC provisions require the conversion of our capital instruments into a variable number of common shares in the event that OSFI deems
the Bank to be non-viable or a federal or provincial government in Canada publicly announces that the Bank has accepted or agreed to accept a
capital injection. If a NVCC trigger event were to occur, our NVCC capital instruments preferred shares Series AZ, preferred shares Series BB,
subordinated debentures due on July 17, 2024 and subordinated debentures due on September 29, 2026 would be converted into RBC common
shares pursuant to an automatic conversion formula with a conversion price based on the greater of: (i) a floor price of $5.00, and (ii) the current
market price of our common shares at the time of the trigger event (10-day weighted average). Based on a floor price of $5.00 and including an
estimate for accrued dividends and interest, these NVCC capital instruments would convert into a maximum of 812 million RBC common shares,
on aggregate, which would represent a dilution impact of 36.01% based on the number of RBC common shares outstanding as at October 31,
2014.
Attributed capital
Our methodology for allocating capital to our business segments is based on the higher of fully diversified economic capital and the Basel III
regulatory capital requirements. Risk-based capital attribution provides a uniform base for performance measurement among business
segments, which compares to our overall corporate return objective and facilitates management decisions in resource allocation in conjunction
with other factors.
Attributed capital is calculated and attributed on a wider array of risks compared to Basel III regulatory capital requirements, which are
calibrated predominantly to target credit, market (trading) and operational risk measures. Economic capital is our internal quantification of risks
associated with business activities which is the capital required to remain solvent under extreme market conditions, reflecting our objective to
maintain strong credit ratings. Economic capital is calculated based on credit, market (trading and non-trading), operational, business and fixed
asset, and insurance risks, along with capital attribution for goodwill and other intangibles. The common risks between the two frameworks are
aligned to reflect increased regulatory requirements.
• Business risk is the risk of loss or harm due to variances in volumes, prices and costs caused by competitive forces, regulatory changes,
reputation and strategic risks.
• Fixed asset risk is defined as the risk that the value of fixed assets will be less than their book value at a future date.
For further discussion on Credit, Market, Operational and Insurance risks, refer to the Risk management section.
Attributed capital is also used to assess the adequacy of our capital base. Our policy is to maintain a level of available capital, defined as
common equity and other capital instruments with equity-like loss absorption features such as preferred shares that exceed Economic capital
with a comfortable cushion.
The calculation and attribution of capital involves a number of assumptions and judgments by management which are monitored to ensure
that the economic capital framework remains comprehensive and consistent. The models are benchmarked to leading industry practices via
participation in surveys, reviews of methodologies and ongoing interaction with external risk management industry professionals.
The following outlines our attributed capital.
Attributed capital Table 72
(Millions of Canadian dollars) 2014 2013
Credit risk $ 13,800 $ 11,800
Market risk (trading and non-trading) 3,900 3,300
Operational risk 4,300 4,050
Business and fixed asset risk 2,750 2,650
Insurance risk 500 500
Goodwill and other intangibles 11,350 10,750
Regulatory capital allocation 4,150 3,400
Attributed capital $ 40,750 $ 36,450
Under attribution of capital (1) 4,950 4,150
Average common equity $ 45,700 $ 40,600
(1) Comparative amount has been restated to reflect the adoption of the amendments to IAS 19 Employee benefits.
92 Royal Bank of Canada: Annual Report 2014 Management’s Discussion and Analysis
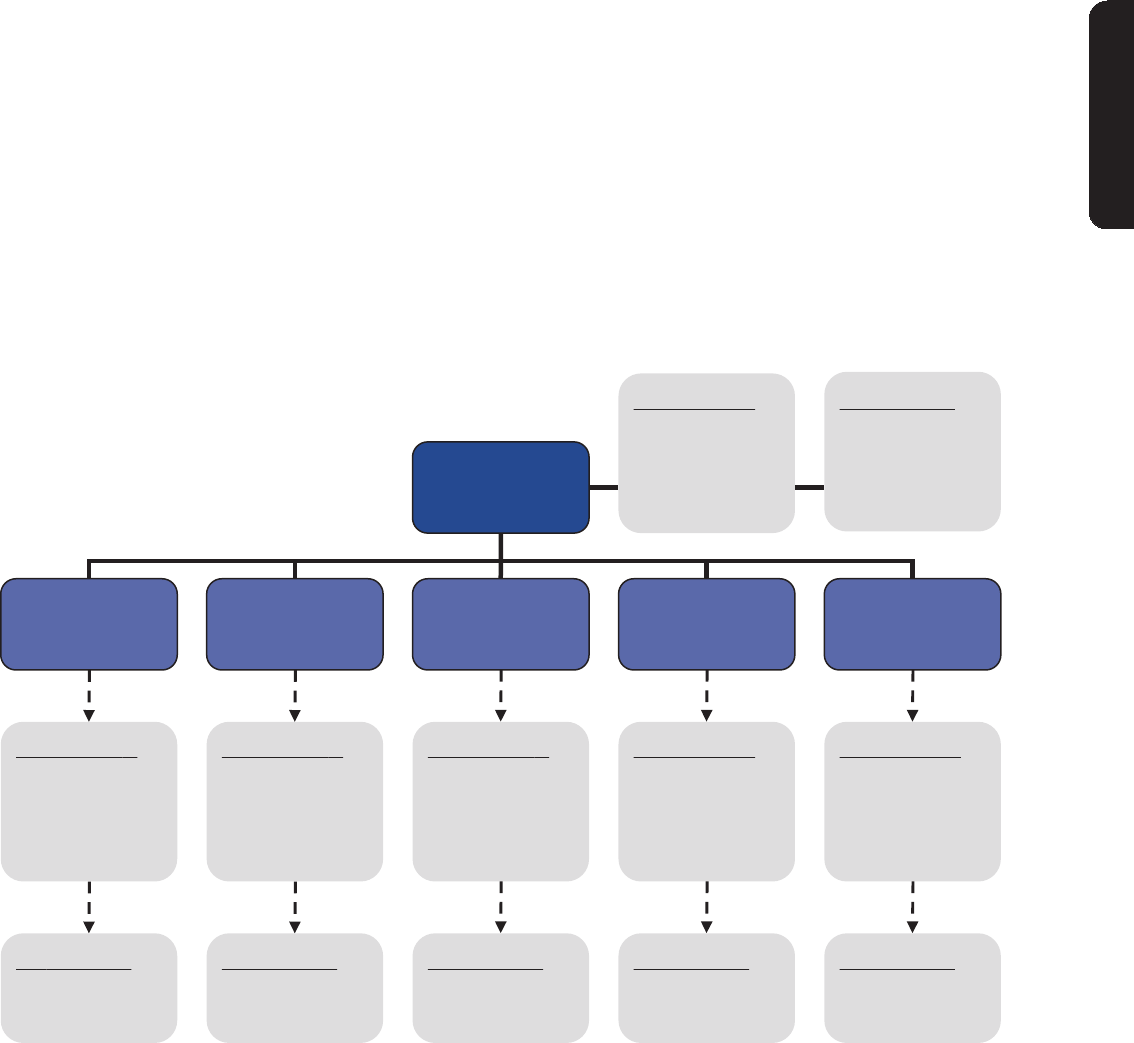
2014 vs. 2013
Attributed capital increased $4.3 billion largely due to an increase in Credit risk reflecting business growth, an update to our risk parameters, and
the impact of foreign exchange translation. Market risk increased mainly due to an increase in non-trading interest rate risk and the introduction
of structural foreign exchange risks in the first quarter of 2014. Operational and business risks increased due to higher gross revenue. Goodwill
and other intangibles risk increased mainly as a result of the impact of foreign exchange translation.
We remain well capitalized with current levels of available capital exceeding the attributed capital required to underpin all of our material
risks. For further details on the additional capital, refer to table 66 which provides a summary of OSFI regulatory target ratios.
Attributed capital in the context of our business activities
In carrying out our business activities, we are exposed to a range of risks. The following chart provides a high level view of risks within our
business segments, which includes credit, market and operational risks. We have used attributed capital to illustrate the relative size of the risks
in each of our businesses. The attributed capital distribution reflects the diversified nature of our business activities. RWA represents our
exposure to credit, market and operational risk for regulatory capital requirement.
Within Personal & Commercial Banking, credit risk is the most significant risk, largely related to our personal financial services, business
financial services and cards businesses. The primary risks within Wealth Management, which provides services to institutional and individual
clients, are operational risk and credit risk. Risks within our Insurance operations are primarily related to insurance risk in our life, health, home
and auto businesses followed by market risk and operational risk. The largest risk within Investor & Treasury Services is credit risk, followed by
market risk and operational risk. The most significant risk within Capital Markets is credit risk, followed by market risk. For additional information
on the risks highlighted below, refer to the Risk management section.
Royal Bank of
Canada
Personal &
Commercial
Banking
Wealth
Management Insurance Investor &
Treasury Services Capital Markets
Attributed capital
(1)
Credit 44%
Market
(2)
3
Operational 11
Goodwill and other
intangibles 31
Other
(5)
11
Attributed capital
(1)
Credit 6%
Market
(2)
2
Operational 14
Goodwill and other
intangibles 71
Other
(5)
7
Attributed capital
(1)
Credit 13%
Market
(2)
21
Operational 13
Goodwill and other
intangibles 9
Other
(5)
44
Attributed capital
(1)
Credit 30%
Market
(2)
9
Operational 9
Goodwill and other
intangibles 25
Other
(3)
27
Attributed capital
(1)
Credit 27%
Market
(2)
21
Operational 13
Goodwill and other
intangibles 25
Other
(5)
14
Attributed capital
(1)
Credit 41%
Market
(2)
18
Operational 8
Goodwill and other
intangibles 7
Other
(5)
26
RWA
(C$ millions) (4)
Credit $118,901
Market 119
Operational 20,719
RWA
(C$ millions) (4)
Credit $13,512
Market 869
Operational 8,658
RWA
(C$ millions) (6)
Credit $7,286
Market 14
Operational 1
RWA
(C$ millions) (4)
Credit $12,083
Market 7,667
Operational 3,507
RWA
(C$ millions) (4)
Credit $124,850
Market 29,522
Operational 13,542
RWA
(C$ millions) (4)
Credit $282,871
Market 38,460
Operational 47,263
(1) Attributed capital: An estimate of the amount of equity capital required to underpin risks. It is calculated by estimating the level of capital that is necessary to support our various business,
given their risks, consistent with our desired solvency standard and credit ratings.
(2) Market risk attributed capital: An estimate of the amount of equity capital required to underpin trading market risk and interest rate risk.
(3) Other – RBC: Includes (a) an estimate of the amount of equity capital required to underpin risks associated with business, fixed assets and insurance risks; (b) a regulatory capital adjustment
since attributed capital is determined at the higher of regulatory or economic capital; and (c) unattributed capital reported representing common equity in excess of common equity attributed
to our business segments which is reported in the Corporate Support segment only.
(4) RWA amount above represents RWA for CET1.
(5) Other – Business segments: Includes (a) An estimate of the amount of equity capital required to underpin risks associated with business, fixed assets and insurance risks; and (b) a
regulatory capital adjustment since attributed capital is determined at the business segment level as the greater of regulatory or economic capital.
(6) Insurance RWA amount above represents our investments in the insurance subsidiaries capitalized at the regulatory prescribed rate as required under Basel CAR filing.
Subsidiary capital
Our capital management framework includes the management of our subsidiaries capital. We invest capital across the enterprise to meet local
regulators’ capital adequacy requirements and maximize returns to our shareholders. We invest in our subsidiaries as appropriate during the
year. We set guidelines for defining capital investments in our subsidiaries and manage the relationship between capital invested in subsidiaries
and our consolidated capital base to ensure that we can access capital recognized in our consolidated regulatory capital measurements.
Management’s Discussion and Analysis Royal Bank of Canada: Annual Report 2014 93
Each of our subsidiaries has responsibility for maintaining its compliance with local regulatory capital adequacy requirements, which may
include restrictions on the transfer of assets in the form of cash, dividends, loans or advances. Concurrently, Corporate Treasury provides
centralized oversight and consolidated capital management across all subsidiary entities.
Other considerations affecting capital
Capital treatment for equity investments in other entities is determined by a combination of accounting and regulatory guidelines based on the
size or nature of the investment. Three broad approaches apply as follows:
• Consolidation: entities which we control are consolidated on our Consolidated Balance Sheets.
• Deduction: certain holdings are deducted in full from our regulatory capital. These include all unconsolidated “substantial investments,” as
defined by the Bank Act (Canada) in the capital of financial institutions, as well as all investments in insurance subsidiaries.
• Risk weighting: unconsolidated equity investments that are not deducted from capital are risk weighted at a prescribed rate for determi-
nation of capital charges.
Regulatory capital approach for securitization exposures
For our securitization exposures, we use an internal assessment approach (IAA) for exposures related to our ABCP business, and for other
securitization exposures we use a combination of approaches including a ratings-based approach and the standardized approach.
While our IAA rating methodologies are based in large part on criteria that are published by External Credit Assessment Institutions (ECAIs)
such as S&P and therefore are similar to the methodologies used by these institutions, they are not identical. Our ratings process includes a
comparison of the available credit enhancement in a securitization structure to a stressed level of projected losses. The stress level used is
determined by the desired risk profile of the transaction. As a result, we stress the cash flows of a given transaction at a higher level in order to
achieve a higher rating. Conversely, transactions that only pass lower stress levels achieve lower ratings.
Most of the other securitization exposures (non-ABCP) carry external ratings and we use the lower of our own rating or the lowest external
rating for determining the proper capital allocation for these positions. We periodically compare our own ratings to ECAIs ratings to ensure that
the ratings provided by ECAIs are reasonable.
GRM has responsibility for providing risk assessments for capital purposes in respect of all our banking book exposures. GRM is
independent of the business originating the securitization exposures and performs its own analysis, sometimes in conjunction with but always
independent of the applicable business. GRM has developed asset class specific criteria guidelines which provide the rating methodologies for
each asset class. The guidelines are reviewed periodically and are subject to the ratings replication process mandated by Pillar I of the Basel
rules.
Additional financial information
Exposures to selected financial instruments
Exposure to U.S. subprime and Alt-A through RMBS, CDOs and mortgages Table 73
2014 2013
As at October 31 (Millions of Canadian dollars)
Subprime
RMBS
Alt-A
RMBS
CDOs
that may
contain
subprime
or Alt-A Total
Subprime
RMBS
Alt-A
RMBS
CDOs
that may
contain
subprime
or Alt-A Total
Fair value of securities $ 157 $ 188 $ – $ 345 $ 205 $ 221 $ 15 $ 441
Fair value of securities by rating
AAA $1$–$– $8$8$–
AA 19 4 – 36 19 –
A66 3 – 16 25 –
BBB 25 – – 51 11 –
Below BBB- 46 181 – 94 158 15
Total $ 157 $ 188 $ – $ 345 $ 205 $ 221 $ 15 $ 441
Fair value of securities by vintage
2003 (or before) $–$23$– $1$25$–
2004 419 – 443 –
2005 58 67 – 94 63 15
2006 73 68 – 38 64 –
2007 and later 22 11 – 68 26 –
Total $ 157 $ 188 $ – $ 345 $ 205 $ 221 $ 15 $ 441
Amortized cost of subprime/Alt-A mortgages (whole loans) $ 10 $ 41 $ – $ 51 $7$26$–$33
Total subprime and Alt-A exposures $ 167 $ 229 $ – $ 396 $ 212 $ 247 $ 15 $ 474
Sensitivities of fair value of securities to changes in assumptions:
100bps increase in credit spread $ (4) $ (8)
100bps increase in interest rates (1) (18)
20% increase in default rates (2) (2)
25% decrease in prepayment rates (2) 6
Certain activities and transactions we enter into expose us to the risk of default of U.S. subprime and Alt-A residential mortgages. Our exposures
to U.S. subprime and Alt-A residential mortgages of $396 million represented less than 0.1% of our total assets as at October 31, 2014,
compared to $474 million or 0.1% last year. The decrease of $78 million was primarily due to the sale of securities.
94 Royal Bank of Canada: Annual Report 2014 Management’s Discussion and Analysis

2014 vs. 2013
Our total holdings of RMBS noted in the table above may be exposed to U.S. subprime risk. As at October 31, 2014, our U.S. subprime RMBS
exposure of $157 million decreased $48 million or 23% from last year, primarily due to the sale of certain securities. Of this exposure, $86
million or 55% of our related holdings were rated A and above, an increase of $26 million from last year due to the purchase of certain securities.
As at October 31, 2014, U.S. subprime RMBS holdings rated AAA comprised 1% of our total U.S. subprime RMBS holdings compared with
4% last year, primarily due to the sale of certain securities. As at October 31, 2014, our exposure to U.S. subprime loans of $10 million increased
$3 million, largely reflecting the purchase of certain securities.
Of our total portfolio of RMBS, holdings with a fair value of $188 million may be exposed to U.S. Alt-A risk. U.S. Alt-A exposures, decreased
$33 million from last year, with approximately 42% issued during 2006 and onwards, which compares to 41% last year. As at October 31, 2014,
our exposure to U.S. Alt-A loans of $41 million increased $15 million from last year due to the purchase of certain securities.
Of our total portfolio of CDOs, we have no holdings that are exposed to U.S. subprime or Alt-A risk. As at October 31, 2014, the fair value of
our corporate CDOs, which were predominantly comprised of $812 million of corporate collateralized loan obligations, decreased $600 million
from last year mainly due to the redemption of certain securities.
Off-balance sheet arrangements
For details on our off-balance sheet arrangements including multi-seller conduits, structured investment vehicles and other variable interest
entities as at October 31, 2014, refer to the Off-balance sheet arrangements section.
Leveraged finance
Leveraged lending involves the provision of debt financing to borrowers where proceeds are generally used to finance equity buyouts, mergers
and acquisitions, business recapitalizations, and include bridge facilities that meet certain leverage criteria. We revised our definition during the
year as we previously defined leveraged finance as primarily being related with a financial sponsor-related entity. This definition is subject to
refinement moving forward. As at October 31, 2014, our total commitments, including funded and unfunded amounts, were $16.4 billion.
Commercial mortgage-backed securities
The fair value of our total direct holdings of commercial mortgage-backed securities was $115 million as at October 31, 2014.
Assets and liabilities measured at fair value
Our financial instruments carried at fair value are classified as Level 1, 2, or 3, in accordance with the fair value hierarchy set out in IFRS 13 Fair
Value Measurement. For further details on the fair value of our financial instruments and transfers between levels of the fair value hierarchy, refer
to Note 3 of our 2014 Annual Consolidated Financial Statements.
The following table presents the total fair value of each major class of financial assets and financial liabilities measured at fair value and the
percentage of the fair value of each class categorized as Level 1, 2, or 3 as at October 31, 2014.
Assets and liabilities measured at fair value Table 74
As at October 31, 2014
(Millions of Canadian dollars, except percentage amounts) Fair value (1) Level 1 (1) Level 2 (1) Level 3 (1) Total
Financial assets
Securities at FVTPL $ 151,380 43% 56% 1% 100%
Available-for-sale 45,995 17 74 9 100
Assets purchased under reverse
repurchase agreements and securities
borrowed 85,292 0 100 0 100
Loans – Wholesale 3,615 0 87 13 100
Derivatives 144,470 2 97 1 100
Financial liabilities
Deposits $ 79,439 0% 99% 1% 100%
Obligations related to securities
sold short 50,345 65 35 0 100
Obligations related to assets sold under
repurchase agreements and securities
loaned 58,411 0 100 0 100
Derivatives 145,964 2 97 1 100
(1) The derivative assets and liabilities presented in the table above do not reflect the impact of netting.
Accounting and control matters
Critical accounting policies and estimates
Application of critical accounting policies and estimates
Our significant accounting policies are described in Note 2 to our 2014 Annual Consolidated Financial Statements. Certain of these policies, as
well as estimates made by management in applying such policies, are recognized as critical because they require us to make particularly
subjective or complex judgments about matters that are inherently uncertain and because of the likelihood that significantly different amounts
could be reported under different conditions or using different assumptions. Our critical accounting policies and estimates relate to the fair value
of financial instruments, allowance for credit losses, goodwill and other intangible assets, employee benefits, consolidation, derecognition of
financial assets, and income taxes. Our critical accounting policies and estimates have been reviewed and approved by our Audit Committee, in
consultation with management, as part of their review and approval of our significant accounting policies, estimates and judgments.
Management’s Discussion and Analysis Royal Bank of Canada: Annual Report 2014 95
Fair value of financial instruments
The fair value of a financial instrument is the price that would be received to sell an asset or paid to transfer a liability in an orderly transaction
between market participants at the measurement date. We determine fair value by incorporating all factors that market participants would
consider in setting a price, including commonly accepted valuation approaches.
The Board of Directors provides oversight on valuation of financial instruments, primarily through the Audit Committee and Risk Committee.
The Audit Committee reviews the presentation and disclosure of financial instruments that are measured at fair value, while the Risk Committee
assesses adequacy of governance structures and control processes for these instruments.
We have established policies, procedures and controls for valuation methodologies and techniques to ensure fair value is reasonably
estimated. Major valuation processes and controls include, but are not limited to, profit and loss decomposition, independent price verification
(IPV) and model validation standards. These control processes are managed by either Finance or Group Risk Management and are independent
of the relevant businesses and their trading functions. Profit and loss decomposition is a process to explain the fair value changes of certain
positions and is performed daily for trading portfolios. All fair value instruments are subject to IPV, a process whereby trading function valuations
are verified against external market prices and other relevant market data. Market data sources include traded prices, brokers and price vendors.
Other valuation techniques are used when a price or quote is not available. Some valuation processes use valuation models to determine fair
value. We have a systematic and consistent approach to control model use. Valuation models are approved for use within our model risk
management framework. The framework addresses, among other things, model development standards, validation processes and procedures,
and approval authorities. One significant model control is the validation process. The purpose of model validation is to ensure that a model is
suitable for its intended use and to set limitations for its use. All models are re-validated regularly.
Other controls include the use of a documented third-party pricing source list. The third-party pricing source list gives priority to those
services and prices having the highest and most consistent accuracy. The level of accuracy is determined over time by comparing third-party
price values to traders’ or system values, to other pricing service values and, when available, to actual trade data.
In determining fair value, a hierarchy is used which prioritizes the inputs to valuation techniques. The fair value hierarchy gives the highest
priority to unadjusted quoted prices in active markets for identical assets or liabilities (Level 1) and the lowest priority to unobservable inputs
(Level 3). Determination of fair value based on this hierarchy requires the use of observable market data whenever available. Level 1 inputs are
unadjusted quoted prices in active markets for identical assets or liabilities that we have the ability to access at the measurement date. Level 2
inputs include quoted prices for similar assets or liabilities in active markets, quoted prices for identical or similar assets or liabilities in markets
that are not active, and model inputs that are either observable, or can be corroborated by observable market data for substantially the full term
of the assets or liabilities. Level 3 inputs are one or more inputs that are unobservable and significant to the fair value of the asset or liability.
Unobservable inputs are used to measure fair value to the extent that observable inputs are not available at the measurement date. The
availability of inputs for valuation may affect the selection of valuation techniques. The classification of a financial instrument in the hierarchy for
disclosure purposes is based upon the lowest level of input that is significant to the measurement of fair value.
Where observable prices or inputs are not available, management judgment is required to determine fair values by assessing other relevant
sources of information such as historical data, proxy information from similar transactions, and through extrapolation and interpolation
techniques. For instruments not traded in an active market, fair value is determined using a valuation technique that maximizes the use of
observable market inputs to the extent available. For more complex or illiquid instruments, significant judgment is required in the determination
of the model used, the selection of model inputs, and in some cases the application of valuation adjustments to the model value or quoted price
for inactively traded financial instruments, as the selection of model inputs may be subjective and the inputs may be unobservable.
Unobservable inputs are inherently uncertain as there is little or no market data available from which to determine the level at which an arm’s
length transaction would occur under normal business circumstances. Appropriate parameter uncertainty and market risk valuation adjustments
for such inputs and other model risk valuation adjustments are assessed in all such instances.
We record valuation adjustments to appropriately reflect counterparty credit quality of our derivative portfolio, differences between the
overnight index swap (OIS) curve and London Interbank Offered Rates (LIBOR) for collateralized derivatives, funding valuation adjustments (FVA)
for uncollateralized and under-collateralized over-the-counter (OTC) derivatives, unrealized gains or losses at inception of the transaction, bid-
offer spreads and unobservable parameters. These adjustments may be subjective as they require significant judgment in the input selection,
such as probability of default and recovery rate, and are intended to arrive at fair value that is determined based on assumptions that market
participants would use in pricing the financial instrument. The realized price for a transaction may be different from its recorded value that is
previously estimated using management judgment, and may therefore impact unrealized gains and losses recognized in Non-interest income –
Trading revenue or Other.
Valuation adjustments are recorded for the credit risk of our derivative portfolios in order to arrive at their fair values. Credit valuation
adjustments (CVA) take into account our counterparties’ creditworthiness, the current and potential future mark-to-market of the transactions,
and the effects of credit mitigants such as master netting and collateral agreements. CVA amounts are derived from estimates of exposure at
default, probability of default, recovery rates on a counterparty basis, and market and credit factor correlations. Exposure at default is the
amounts of expected derivative related assets and liabilities at the time of default, estimated through modeling using underlying risk factors.
Probability of default and recovery rate are generally implied from the market prices for credit protection and credit ratings of the counterparty.
Correlation is the statistical measure of how credit and market factors may move in relation to one another. Correlation is estimated using
historical data and market data where available. CVA is calculated daily and changes are recorded in Non-interest income – Trading revenue.
In the determination of fair value of collateralized OTC derivatives using the OIS curve, our valuation approach accounts for the difference
between certain OIS rates and LIBOR for derivatives valuation as valuation adjustments.
FVA are also calculated to incorporate cost and benefit of funding in the valuation of uncollateralized and under-collateralized OTC
derivatives. Future expected cash flows of these derivatives are discounted to reflect the cost and benefit of funding the derivatives by using a
funding curve, implied volatilities and correlations as inputs.
Where required, a valuation adjustment is made to reflect the unrealized gain or loss at inception of a financial instrument contract where
the fair value of that financial instrument is not obtained from a quoted market price or cannot be evidenced by other observable market
transactions based on a valuation technique incorporating observable market data.
A bid-offer valuation adjustment is required when a financial instrument is valued at the mid-market price, instead of the bid or offer price
for asset or liability positions, respectively. The valuation adjustment takes into account the spread from the mid-market to either the bid or offer
price.
Some valuation models require parameter calibration from such factors as market observed option prices. The calibration of parameters
may be sensitive to factors such as the choice of instruments or optimization methodology. A valuation adjustment is also estimated to mitigate
the uncertainties of parameter calibration.
96 Royal Bank of Canada: Annual Report 2014 Management’s Discussion and Analysis

We classify our financial instruments measured at fair value on a recurring basis into three levels based on the transparency of the inputs
used to measure the fair values of the instruments. As at October 31, 2014, Level 2 instruments, whose fair values are based on observable
inputs, include $355 billion of financial assets (2013 – $296 billion) and $296 billion of financial liabilities (2013 – $234 billion). These
amounts represent 81% of our total financial assets at fair value (2013 – 79%) and 89% of our total financial liabilities at fair value (2013 – 85%
respectively. Level 3 instruments, whose valuations include significant unobservable inputs, include $6 billion of financial assets (2013 –
$8 billion) and $2 billion of financial liabilities (2013 - $8 billion), representing 1% of our total financial assets at fair value (2013 – 2% and 1%
of our total financial liabilities at fair value (2013 – 3%), respectively.
At each reporting date or more frequently when conditions warrant, we evaluate our AFS securities to determine whether there is any
objective evidence of impairment, such as a significant or prolonged decline in the fair value of the security below its cost or when an adverse
effect on future cash flows from the security can be reliably estimated. When assessing impairment for debt instruments we primarily considered
counterparty ratings and security-specific factors, including collateral, external ratings, subordination and other market factors. For complex debt
instruments including U.S. non-agency MBS, ABS and other structured products, we also use cash flow projection models which incorporate
actual and projected cash flows for each security using a number of assumptions and inputs that are based on security specific factors. The
inputs and assumptions used such as default, prepayment and recovery rates are based on updated market data. For U.S. non-agency MBS,
recovery rates are largely dependent upon forecasted property prices which were assessed at the municipal level, provided by a third-party
vendor. In addition, we also consider the transaction structure and credit enhancement for the structured securities. If the result indicates that
we will not be able to recover the entire principal and interest amount, we do a further review of the security in order to assess whether a loss
would ultimately be realized. As equity securities do not have contractual cash flows, they are assessed differently than debt securities. In
assessing whether there is any objective evidence that suggests that the security is impaired we consider factors which include the length of
time and extent the fair value has been below the cost and the financial condition and near term prospects of the issuer. We also consider the
estimated recoverable value and the period of recovery. We conduct further analysis for securities where the fair value had been below cost for
greater than twelve months. If an AFS security is impaired, the cumulative unrealized losses previously recognized in Other components of equity
are recognized directly in income under Non-interest income. As at October 31, 2014, our gross unrealized losses on AFS securities were
$181 million (2013 – $293 million). Refer to Note 3 to our 2014 Annual Consolidated Financial Statements for more information.
Allowance for credit losses
We maintain allowance for credit losses relating to on-balance sheet exposures, such as loans and acceptances, and off-balance sheet items
such as letters of credit, guarantees and unfunded commitments, at levels that management considers appropriate to cover credit related losses
incurred as at the balance sheet date.
Allowances are determined individually for loans that are individually significant, and collectively for loans that are not individually
significant and loans which are significant but for which there is no objective evidence of impairment, using current and historical credit
information in both quantitative and qualitative assessments. For further information on allowance for credit losses, refer to Note 5 to our 2014
Annual Consolidated Financial Statements.
Individually assessed loans
Loans which are individually significant are assessed individually for objective indicators of impairment. A loan is considered impaired when
management determines that it will not be able to collect all amounts due according to the original contractual terms or the equivalent value.
Credit exposures of individually significant loans are evaluated based on factors including the borrower’s overall financial condition,
resources and payment record, and where applicable, the realizable value of any collateral. If there is evidence of impairment leading to an
impairment loss, then the amount of the loss is recognized in income and is determined as the difference between the carrying amount of the
loan, including accrued interest, and the estimated recoverable amount. The estimated recoverable amount is measured as the present value of
expected future cash flows discounted at the loan’s original effective interest rate, including cash flows that may result from the realization of
collateral less costs of disposal.
Collectively assessed loans
Loans which are not individually significant, or which are individually assessed and not determined to be impaired, are collectively assessed for
impairment. For the purposes of a collective evaluation of impairment, loans are grouped on the basis of similar risk characteristics, taking into
account loan type, industry, geographic location, collateral type, past due status and other relevant factors.
The collective impairment allowance is determined by reviewing factors including: (i) historical loss experience, which takes into
consideration historical probabilities of default, loss given default and exposure at default, in portfolios of similar credit risk characteristics, and
(ii) management’s judgment on the level of impairment losses based on historical experience relative to the actual level as reported at the
balance sheet date, taking into consideration the current portfolio credit quality trends, business and economic and credit conditions, the impact
of policy and process changes, and other supporting factors. Future cash flows for a group of loans are collectively evaluated for impairment on
the basis of the contractual cash flows of the loans in the group and historical loss experience for loans with credit risk characteristics similar to
those in the group. Historical loss experience is adjusted based on current observable data to reflect the effects of current conditions that did not
affect the period on which the historical loss experience is based and to remove the effects of conditions in the historical period that do not
currently exist. The methodology and assumptions used for estimating future cash flows are reviewed regularly to reduce any differences
between loss estimates and actual loss experience.
Write-off of loans
Loans and the related impairment allowance for credit losses are written off, either partially or in full, when there is no realistic prospect of
recovery. Where loans are secured, they are generally written off after receipt of any proceeds from the realization of the collateral. In
circumstances where the net realizable value of any collateral has been determined and there is no reasonable expectation of further recovery,
write off may be earlier. For credit cards, the balances and related allowance for credit losses are written off when payment is 180 days in arrears.
Personal loans are generally written off at 150 days past due.
Total allowance for credit losses
Based on the procedures discussed above, management believes that the total allowance for credit losses of $2,085 million is adequate to
absorb estimated credit losses incurred in the lending portfolio as at October 31, 2014 (2013 – $2,050 million). This amount includes
$91 million (2013 – $91 million) classified in Provisions under Other Liabilities on our Consolidated Balance Sheets, which relates to off-balance
sheet and other items.
Management’s Discussion and Analysis Royal Bank of Canada: Annual Report 2014 97
Goodwill and other intangible assets
We allocate goodwill to groups of cash-generating units (CGU). Goodwill is not amortized and is tested for impairment on an annual basis, or
more frequently if there are objective indications of impairment. We test for impairment by comparing the recoverable amount of a CGU with its
carrying amount. A CGU’s recoverable amount is the higher of its fair value less cost of disposal and its value in use. The carrying amount of a
CGU comprises the carrying amount of assets, liabilities, and goodwill allocated to the CGU. When the carrying value of a CGU exceeds its
recoverable amount, the impairment loss is allocated first to reduce the carrying amount of any goodwill allocated to the CGU and then to the
other assets of the CGU proportionally based on the carrying amount of each asset. Any impairment charge is recognized in income in the period
it is identified. Subsequent reversals of goodwill impairment are prohibited.
We estimate the value in use and fair value less costs of disposal of our CGUs primarily using a discounted cash flow method which
incorporates each CGU’s internal forecasts of revenues and expenses. Significant management judgment is applied in the determination of
expected future cash flows (uncertainty in timing and amount), discount rates (based on CGU-specific risks) and terminal growth rates.
CGU-specific risks include country risk, business/operational risk, geographic risk (including political risk, devaluation risk and government
regulation), currency risk and price risk (including product pricing risk and inflation). If the forecast earnings and other assumptions in future
periods deviate significantly from the current amounts used in our impairment testing, the value of our goodwill could become impaired.
Other intangible assets with a finite life are amortized on a straight-line basis over their estimated useful lives as follows: computer software
– 3 to 10 years and customer relationships – 10 to 20 years. They are tested for impairment when there is an indication that an asset may be
impaired. An impairment test is performed by comparing the carrying amount of the intangible asset to its recoverable amount. Where it is not
possible to estimate the recoverable amount of an individual asset, we estimate the recoverable amount of the CGU to which the asset belongs.
If the recoverable amount of the asset (or CGU) is less than its carrying amount, the carrying amount of the intangible asset is written down to its
recoverable amount as an impairment loss. An impairment loss recognized previously is reversed if there is a change in the estimates used to
determine the recoverable amount of the asset (or CGU) since the last impairment loss recognized. Significant judgment is applied in estimating
the useful lives and recoverable amounts of our intangible assets and assessing whether certain events or circumstances constitute objective
evidence of impairment. We do not have any intangible assets with indefinite lives.
As at October 31, 2014, we had $8.6 billion of goodwill (2013 – $8.3 billion) and $2.8 billion of other intangible assets (2013 –
$2.8 billion). For further details, refer to Notes 2 and 10 to our 2014 Annual Consolidated Financial Statements.
Employee benefits
We sponsor a number of benefit programs for eligible employees, including registered pension plans, supplemental pension plans, health,
dental, disability and life insurance plans.
The calculation of defined benefit expenses and obligations depends on various assumptions such as discount rates, healthcare cost trend
rates, projected salary increases, retirement age, and mortality and termination rates. The discount rate assumption is determined using spot
rates from a derived Aa corporate bond yield curve for our Canadian pension and other post-employment plans, and spot rates from an Aa
corporate bond yield curve for our International pension and other post-employment plans. All other assumptions are determined by
management, applying significant judgment, and are reviewed by the actuaries. Actual experience that differs from the actuarial assumptions
will affect the amounts of benefit obligations and remeasurements that we recognize. The weighted average assumptions used and the
sensitivity of key assumptions are presented in Note 17 to our 2014 Annual Consolidated Financial Statements.
Consolidation
Subsidiaries are those entities, including structured entities, over which we have control. We control an entity when we are exposed, or have
rights, to variable returns from our involvement with the entity and have the ability to affect those returns through our power over the investee.
We have power over an entity when we have existing rights that give us the current ability to direct the activities that most significantly affect the
entity’s returns (relevant activities). Power may be determined on the basis of voting rights or, in the case of structured entities, other contractual
arrangements.
We are not deemed to control an entity when we exercise power over an entity in an agency capacity. In determining whether we are acting
as an agent, we consider the overall relationship between us, the investee and other parties to the arrangement with respect to the following
factors: (i) the scope of our decision making power; (ii) the rights held by other parties; (iii) the remuneration to which we are entitled; and
(iv) our exposure to variability of returns.
The determination of control is based on the current facts and circumstances and is continuously assessed. In some circumstances,
different factors and conditions may indicate that various parties control an entity depending on whether those factors and conditions are
assessed in isolation or in totality. Significant judgment is applied in assessing the relevant factors and conditions in totality when determining
whether we control an entity. Specifically, judgment is applied in assessing whether we have substantive decision making rights over the
relevant activities and whether we are exercising our power as a principal or an agent.
We consolidate all subsidiaries from the date control is transferred to us, and cease consolidation when an entity is no longer controlled by
us. Our consolidation conclusions affect the classification and amount of assets, liabilities, revenues and expenses reported in our Consolidated
Financial Statements.
Non-controlling interests in subsidiaries that we consolidate are shown on our Consolidated Balance Sheets as a separate component of
equity which is distinct from our shareholders’ equity. The net income attributable to non-controlling interests is separately disclosed in our
Consolidated Statements of Income.
For further details, refer to Off-balance sheet arrangements and Note 7 to our Annual Consolidated Financial Statements.
Derecognition of financial assets
We periodically enter into transactions in which we transfer financial assets such as loans or packaged mortgage-backed securities (MBS) to
structured entities or trusts that issue securities to investors. We derecognized the assets when our contractual rights to the cash flows from the
assets have expired, when we retain the rights to receive the cash flows but assume an obligation to pay those cash flows to a third party subject
to certain pass-through requirements, or when we transfer our contractual rights to receive the cash flows and substantially all of the risks and
rewards of the assets have been transferred. When we retain substantially all of the risks and rewards of the transferred assets, the transferred
assets are not derecognized from our Consolidated Balance Sheets and are accounted for as secured financing transactions. When we neither
retain nor transfer substantially all risks and rewards of ownership of the assets, we derecognize the assets if control over the assets is
relinquished. If we retain control over the transferred assets, we continue to recognize the transferred assets to the extent of our continuing
involvement. Management’s judgment is applied in determining whether we have transferred or retained substantially all risk and rewards of
ownership of the transferred financial asset.
98 Royal Bank of Canada: Annual Report 2014 Management’s Discussion and Analysis

The majority of assets transferred under repurchase agreements, securities lending agreements, and in our Canadian residential mortgage
securitization transactions do not qualify for derecognition; as a result, we continue to record the associated transferred assets on our
Consolidated Balance Sheets and no gains or losses are recognized for these securitization activities. Otherwise, a gain or loss is recognized on
securitization by comparing the carrying amount of the transferred asset with its fair value at the date of the transfer. As at October 31, 2014, the
carrying and fair values of the transferred assets that do not qualify for derecognition were $101 billion and $101 billion, respectively (2013 –
$104 billion and $103 billion), and the carrying and fair values of the associated liabilities totalled $101 billion and $102 billion, respectively
(2013 – $103 billion and $104 billion). For further information on derecognition of financial assets, refer to Note 6 to our 2014 Annual
Consolidated Financial Statements.
Income Taxes
We are subject to income tax laws in various jurisdictions where we operate, and the complex tax laws are potentially subject to different
interpretations by us and the relevant taxation authority. Management’s judgment is applied in the interpretation of the relevant tax laws and in
the estimation of the provision for current and deferred income taxes, including the expected timing and amount of the realization. A deferred tax
asset or liability is determined for each temporary difference based on the tax rates that are expected to be in effect in the period that the asset is
realized or the liability is settled. Where the temporary differences will not reverse in the foreseeable future, no deferred tax amount is recog-
nized.
On a quarterly basis, we review whether it is probable that the benefits associated with our deferred tax assets will be realized, using both
positive and negative evidence. Refer to Note 24 to our 2014 Annual Consolidated Financial Statements for further information.
Changes in accounting policies and disclosure
We have adopted several new and amended IFRS standards effective November 1, 2013. These new and amended standards include IFRS 10
Consolidated Financial Statements, IFRS 11 Joint Arrangements, IFRS 12 Disclosure of Interests in Other Entities, IAS 27 Separate Financial
Statements, IAS 28 Investments in Associates and Joint Ventures, IFRS 13 Fair Value Measurement, IAS 19 Employee Benefits, IFRS 7
Disclosure – Offsetting Financial Assets and Financial Liabilities, and the own credit provisions of IFRS 9 Financial Instruments. Refer to Note 2 to
our 2014 Annual Consolidated Financial Statements for details of these changes.
Future changes in accounting policies and disclosure
Effective November 1, 2014, we will adopt amendments to IAS 32 Financial Instruments:Presentation and IFRS Interpretations Committee
Interpretation 21 Levies. Refer to Note 2 to our 2014 Annual Consolidated Financial Statements for details of the new standards. The adoption of
these new or amended standards is not expected to have a material impact on our consolidated financial statements.
Controls and procedures
Disclosure controls and procedures
Our disclosure controls and procedures are designed to provide reasonable assurance that information required to be disclosed by us in reports
filed or submitted under Canadian and U.S. securities laws is recorded, processed, summarized and reported within the time periods specified
under those laws and include controls and procedures that are designed to ensure that information is accumulated and communicated to
management, including the President and Chief Executive Officer, and the Chief Administrative Officer and Chief Financial Officer, to allow timely
decisions regarding required disclosure.
As of October 31, 2014, management evaluated, under the supervision of and with the participation of the President and Chief Executive
Officer and the Chief Administrative Officer and Chief Financial Officer, the effectiveness of our disclosure controls and procedures as defined
under rules adopted by the United States Securities and Exchange Commission. Based on that evaluation, the President and Chief Executive
Officer and the Chief Administrative Officer and Chief Financial Officer concluded that our disclosure controls and procedures were effective as of
October 31, 2014.
Internal control over financial reporting
Management is responsible for establishing and maintaining adequate internal control over financial reporting. Internal control over financial
reporting is designed to provide reasonable assurance regarding the reliability of financial reporting and the preparation of financial statements
for external purposes in accordance with GAAP. However, because of its inherent limitations, internal control over financial reporting may not
prevent or detect misstatements on a timely basis. See Management’s Report on Internal Control over Financial Reporting and the Report of
Independent Registered Public Accounting Firm.
No changes were made in our internal control over financial reporting during the year ended October 31, 2014, that have materially
affected, or are reasonably likely to materially affect, our internal control over financial reporting.
Related party transactions
In the ordinary course of business, we provide normal banking services, operational services, and enter into other transactions with associated
and other related corporations, including our joint venture entities, on terms similar to those offered to non-related parties. We grant loans to
directors, officers and other employees at rates normally accorded to preferred clients. In addition, we offer deferred share and other plans to
non-employee directors, executives and certain other key employees. For further information, refer to Notes 12 and 28 of our 2014 Annual
Consolidated Financial Statements.
Management’s Discussion and Analysis Royal Bank of Canada: Annual Report 2014 99

Supplementary information
Net interest income on average assets and liabilities Table 75
Average balances Interest Average rate
(Millions of Canadian dollars, except for percentage
amounts)
2014 2013 2012 (1) 2014 2013 2012 (1) 2014 2013 2012 (1)
Assets
Deposits with other banks (2)
Canada $ 1,692 $ 1,355 $ 1,104 $61$57$303.61% 4.21% 2.72%
U.S. 540 426 899 1480.19 0.94 0.89
Other International 5,227 7,370 3,496 14 13 16 0.27 0.18 0.46
7,459 9,151 5,499 76 74 54 1.02% 0.81% 0.98%
Securities
Trading 149,920 137,064 122,573 3,322 3,113 3,027 2.22 2.27 2.47
Available-for-sale 43,047 37,809 36,838 671 666 811 1.56 1.76 2.20
192,967 174,873 159,411 3,993 3,779 3,838 2.07 2.16 2.41
Asset purchased under reverse
repurchase agreements and
securities borrowed 136,857 123,766 103,042 971 941 937 0.71 0.76 0.91
Loans (2), (3)
Canada
Retail 314,159 301,887 292,899 12,245 12,077 11,961 3.90 4.00 4.08
Wholesale 54,681 50,248 37,204 2,721 2,486 2,180 4.98 4.95 5.86
368,840 352,135 330,103 14,966 14,563 14,141 4.06 4.14 4.28
U.S. 28,402 22,691 18,802 888 776 702 3.13 3.42 3.73
Other International 25,067 21,129 14,251 1,125 1,015 1,097 4.49 4.80 7.70
422,309 395,955 363,156 16,979 16,354 15,940 4.02 4.13 4.39
Total interest-earning assets 759,592 703,745 631,108 22,019 21,148 20,769 2.90 3.01 3.29
Non-interest-bearing deposits with
other banks 13,495 11,511 9,322 ——— ———
Customers’ liability under acceptances 10,725 9,663 8,617 ——— ———
Other assets (2) 122,688 127,081 153,953 ——— ———
Total assets $ 906,500 $ 852,000 $ 803,000 $ 22,019 $ 21,148 $ 20,769 2.43% 2.48% 2.59%
Liabilities and shareholders’ equity
Deposits (2), (4)
Canada 415,509 375,864 349,053 5,416 5,242 5,368 1.30% 1.39% 1.54%
U.S. 50,459 43,076 39,255 158 169 209 0.31 0.39 0.53
Other International 54,267 48,953 38,113 299 283 471 0.55 0.58 1.24
520,235 467,893 426,421 5,873 5,694 6,048 1.13 1.22 1.42
Obligations related to securities sold
short 50,548 48,979 43,080 1,494 1,579 1,584 2.96 3.22 3.68
Obligations related to assets sold
under repurchase agreements and
securities loaned 68,594 70,881 55,369 278 279 327 0.41 0.39 0.59
Subordinated debentures 6,632 8,216 8,156 246 336 360 3.71 4.09 4.41
Other interest-bearing liabilities 251 484 429 12 11 11 4.78 2.27 2.56
Total interest-bearing liabilities 646,260 596,453 533,455 7,903 7,899 8,330 1.22 1.32 1.56
Non-interest-bearing deposits 72,867 69,823 64,179 ——— ———
Acceptances 10,725 9,663 8,617 ——— ———
Other liabilities (2) 124,643 129,118 154,108 ——— ———
Total liabilities $ 854,495 $ 805,057 $ 760,359 $ 7,903 $ 7,899 $ 8,330 0.92% 0.98% 1.10%
Equity 52,005 46,943 42,641 —n.a. n.a. n.a. n.a. n.a.
Total liabilities and shareholders’
equity $ 906,500 $ 852,000 $ 803,000 $ 7,903 $ 7,899 $ 8,330 0.87% 0.93% 1.04%
Net interest income and margin $ 906,500 $ 852,000 $ 803,000 $ 14,116 $ 13,249 $ 12,439 1.56% 1.56% 1.55%
Net interest income and margin
(average earning assets)
Canada $ 497,436 $ 471,448 $ 441,562 $ 11,121 $ 10,956 $ 10,357 2.24% 2.32% 2.35%
U.S. 135,876 116,016 87,845 1,896 1,603 1,308 1.40 1.38 1.49
Other International 126,280 116,281 101,701 1,099 690 774 0.87 0.59 0.76
Total $ 759,592 $ 703,745 $ 631,108 $ 14,116 $ 13,249 $ 12,439 1.86% 1.88% 1.97%
(1) On a continuing operations basis.
(2) In 2012, we reclassified cash collateral for 2012 and 2011 paid from Interest bearing deposits with banks and Loans-wholesale to Other assets and cash collateral received from Deposits to
Other liabilities.
(3) Interest income includes loan fees of $516 million (2013 – $509 million; 2012 – $467 million).
(4) Deposits include savings deposits with average balances of $133 billion (2013 – $124 billion; 2012 – $109 billion), interest expense of $.7 billion (2013 – $.7 billion; 2012 – $.6 billion) and
average rates of .5% (2013 – .6%; 2012 – .6%). Deposits also include term deposits with average balances of $302 billion (2013 – $273 billion; 2012 – $264 billion), interest expense of
$4.4 billion (2013 – $4.3 billion; 2012 – $4.6 billion) and average rates of 1.47% (2013 – 1.57%; 2012 – 1.74%).
100 Royal Bank of Canada: Annual Report 2014 Management’s Discussion and Analysis

Change in net interest income Table 76
2014 vs. 2013 2013 vs. 2012 (1)
Increase (decrease)
due to changes in
Increase (decrease)
due to changes in
(Millions of Canadian dollars)
Average
volume (2)
Average
rate (2) Net change
Average
volume (2)
Average
rate (2) Net change
Assets
Deposits with other banks (3)
Canada (4) $ 14 (10) 4 72027
U.S. (4) 1 (4) (3) (4) – (4)
Other international (4) (4) 5 1 18 (21) (3)
Securities
Trading 292 (83) 209 358 (272) 86
Available-for-sale 92 (87) 5 21 (166) (145)
Asset purchased under reverse repurchase agreements
and securities borrowed 100 (70) 30 188 (184) 4
Loans (3)
Canada
Retail 491 (323) 168 367 (251) 116
Wholesale 219 16 235 764 (458) 306
U.S. 195 (83) 112 145 (71) 74
Other international 189 (79) 110 529 (611) (82)
Total interest income $ 1,589 $ (718) $ 871 $ 2,393 $ (2,014) $ 379
Liabilities
Deposits (3)
Canada 553 (379) 174 412 (538) (126)
U.S. 29 (40) (11) 20 (60) (40)
Other international 31 (15) 16 134 (322) (188)
Obligations related to securities sold short 51 (136) (85) 217 (222) (5)
Obligations related to assets sold under repurchase
agreements and securities loaned (9) 8 (1) 92 (140) (48)
Subordinated debentures (65) (25) (90) 3 (27) (24)
Other interest-bearing liabilities (5) 6 1 1 (1) -
Total interest expense $ 585 $ (581) $ 4 $ 879 $ (1,310) $ (431)
Net interest income $ 1,004 $ (137) $ 867 $ 1,514 $ (704) $ 810
(1) On a continuing operations basis.
(2) Volume/rate variance is allocated on the percentage relationships of changes in balances and changes in rates to the total net change in net interest income.
(3) In 2012, we reclassified cash collateral for 2012 and 2011 paid from Interest bearing deposits with banks and Loans-wholesale to Other assets and cash collateral received from Deposits to
Other liabilities.
(4) Geographic classification for selected assets and liabilities is based on the domicile of the booking point of the subject assets and liabilities.
Loans and acceptances by geography Table 77
IFRS
Canadian
GAAP
As at October 31 (Millions of Canadian dollars) 2014 2013 2012 (1) 2011 (1) 2010 (1)
Canada
Residential mortgages $ 215,624 $ 206,134 $ 195,552 $ 185,620 $ 124,064
Personal 86,984 85,701 80,000 75,668 69,291
Credit cards 14,650 13,902 13,422 12,723 9,704
Small business 4,785 4,388 2,503 2,481 2,712
Retail 322,043 310,125 291,477 276,492 205,771
Business 63,925 58,959 51,212 45,186 45,217
Sovereign 3,840 3,807 3,751 3,304 2,785
Bank 413 823 390 747 808
Wholesale $ 68,178 $ 63,589 $ 55,353 $ 49,237 $ 48,810
$ 390,221 $ 373,714 $ 346,830 $ 325,729 $ 254,581
U.S.
Retail 4,686 3,734 3,138 3,101 4,230
Wholesale 23,639 19,443 17,081 11,094 7,584
28,325 23,177 20,219 14,195 11,814
Other International
Retail 8,258 6,768 5,673 5,152 4,936
Wholesale 21,881 17,103 16,900 12,110 11,084
30,139 23,871 22,573 17,262 16,020
Total loans and acceptances $ 448,685 $ 420,762 $ 389,622 $ 357,186 $ 282,415
Total allowance for loan losses (1,994) (1,959) (1,996) (1,967) (2,038)
Total loans and acceptances, net of allowance for loan losses $ 446,691 $ 418,803 $ 387,626 $ 355,219 $ 280,377
(1) On a continuing operations basis.
Management’s Discussion and Analysis Royal Bank of Canada: Annual Report 2014 101

Loans and acceptances by portfolio and sector Table 78
IFRS
Canadian
GAAP
As at October 31 (Millions of Canadian dollars) 2014 2013 2012 (1) 2011 (1) 2010 (1)
Residential mortgages $ 219,257 $ 209,238 $ 198,324 $ 188,406 $ 126,790
Personal 96,021 92,859 85,800 80,921 75,519
Credit cards 14,924 14,142 13,661 12,937 9,916
Small business 4,785 4,388 2,503 2,481 2,712
Retail $ 334,987 $ 320,627 $ 300,288 $ 284,745 $ 214,937
Business
Agriculture 5,694 5,441 5,202 4,880 4,705
Automotive 6,209 6,167 3,585 3,025 3,228
Consumer goods 7,172 6,230 5,432 5,341 5,202
Energy 9,615 8,906 8,802 6,394 5,869
Non-bank financial services 5,688 4,903 3,895 2,007 4,593
Forest products 979 893 811 698 726
Industrial products 4,665 4,038 3,938 3,381 3,143
Mining & metals 1,320 1,074 965 1,122 587
Real estate & related 30,387 24,413 20,650 15,569 12,651
Technology & media 4,822 4,006 4,203 2,712 2,257
Transportation & environment 5,432 5,593 5,221 4,927 3,546
Other (2) 25,886 22,755 21,447 17,011 15,290
Sovereign 4,628 4,396 4,193 4,050 3,765
Bank 1,201 1,320 990 1,324 1,916
Wholesale $ 113,698 $ 100,135 $ 89,334 $ 72,441 $ 67,478
Total loans and acceptances $ 448,685 $ 420,762 $ 389,622 $ 357,186 $ 282,415
Total allowance for loan losses (1,994) (1,959) (1,996) (1,967) (2,038)
Total loans and acceptances, net of allowance for loan losses $ 446,691 $ 418,803 $ 387,626 $ 355,219 $ 280,377
(1) On a continuing operations basis.
(2) Other in 2014 related to financing products, $3.7 billion; health, $4.0 billion; holding and investments, $6.9 billion; other services, $8.3 billion; and other, $3.0 billion.
102 Royal Bank of Canada: Annual Report 2014 Management’s Discussion and Analysis

Impaired loans by portfolio and geography Table 79
IFRS
Canadian
GAAP
As at October 31 (Millions of Canadian dollars, except for percentage amounts) 2014 2013 2012 (1) 2011 (1) 2010 (1)
Residential mortgages $ 678 $ 691 $ 674 $ 719 $ 691
Personal 300 363 273 289 278
Small business 47 37 33 40 49
Retail 1,025 1,091 980 1,048 1,018
Business
Agriculture $40$ 43 $ 52 $ 75 $ 74
Automotive 12 12 17 38 97
Consumer goods 108 101 83 91 91
Energy 614 2 33 104
Non-bank financial services 31 5 13 28
Forest products 25 26 30 27 49
Industrial products 48 54 88 38 102
Mining & metals 9224 8
Real estate & related 314 367 353 464 560
Technology & media 38 117 251 47 68
Transportation & environment 32 98 73 105 52
Other (2) 315 272 312 311 385
Sovereign –––– 9
Bank 23 2 33 34
Wholesale 952 1,110 1,270 1,279 1,661
Total impaired loans (3) $ 1,977 $ 2,201 $ 2,250 $ 2,327 $ 2,679
Canada
Residential mortgages $ 388 $ 464 $ 475 $ 567 $ 544
Personal 224 229 206 188 174
Small business 47 36 34 40 49
Retail 659 729 715 795 767
Business
Agriculture 36 38 44 62 71
Automotive 11 91130 87
Consumer goods 70 58 34 48 53
Energy 414 – 25 65
Non-bank financial services 1131 1
Forest products 6812 7 11
Industrial products 41 40 34 26 99
Mining & metals 9222 4
Real estate & related 171 169 153 164 177
Technology & media 37 86 238 43 55
Transportation & environment 11 21 22 12 42
Other 90 80 88 93 106
Sovereign –––– –
Bank –––– –
Wholesale 487 526 641 513 771
Total $ 1,146 $ 1,255 $ 1,356 $ 1,308 $ 1,538
U.S.
Retail $13$14$ 7$ 6$ –
Wholesale 18 98 162 116 364
Total $31$ 112 $ 169 $ 122 $ 364
Other International
Retail $ 353 $ 348 $ 258 $ 247 $ 251
Wholesale 447 486 467 650 526
Total $ 800 $ 834 $ 725 $ 897 $ 777
Total impaired loans $ 1,977 $ 2,201 $ 2,250 $ 2,327 $ 2,679
Allowance against impaired loans (632) (599) (636) (605) (721)
Net impaired loans $ 1,345 $ 1,602 $ 1,614 $ 1,722 $ 1,958
Gross impaired loans as a % of loans and acceptances
Residential mortgages 0.31% 0.33% 0.34% 0.38% 0.54%
Personal 0.31% 0.39% 0.32% 0.36% 0.37%
Small business 0.98% 0.83% 1.32% 1.61% 1.81%
Retail 0.31% 0.34% 0.33% 0.37% 0.47%
Wholesale 0.84% 1.11% 1.42% 1.77% 2.46%
Total 0.44% 0.52% 0.58% 0.65% 0.95%
Allowance against impaired loans as a % of gross impaired loans 31.98% 27.22% 28.33% 26.00% 26.91%
(1) On a continuing operations basis.
(2) Other in 2014 is related to health, $18 million; holding and investments, $132 million; other services, $99 million; and other, $66 million.
(3) Past due loans greater than 90 days not included in impaired loans were $316 million in 2014 (2013 – $346 million; 2012 – $393 million; 2011 – $525 million; 2010 – $180 million).
Management’s Discussion and Analysis Royal Bank of Canada: Annual Report 2014 103

Provision for credit losses by portfolio and geography Table 80
IFRS
Canadian
GAAP
(Millions of Canadian dollars, except for percentage amounts) 2014 2013 2012 (1) 2011 (1) 2010 (1)
Residential mortgages $94$41$ 67$42$25
Personal 441 458 445 438 457
Credit cards 353 354 394 448 399
Small business 44 32 43 35 45
Retail $ 932 $ 885 $ 949 $ 963 $ 926
Business
Agriculture $3$4$ 8$7$18
Automotive 23 (2) (4) 15
Consumer goods 27 17 27 14 29
Energy 27 (6) (11) (20) (6)
Non-bank financial services –10 1 (11) (34)
Forest products 74553
Industrial products 14 21 32 3 (6)
Mining & metals 21 – – (1)
Real estate & related 58 62 82 66 184
Technology & media 14 157 102 (3) 5
Transportation & environment 235 47 29 10
Other (2) 76 44 61 82 76
Sovereign –––––
Bank ––––15
Wholesale $ 232 $ 352 $ 352 $ 168 $ 308
Total provision for credit losses on impaired loans $ 1,164 $ 1,237 $ 1,301 $ 1,131 $ 1,234
Canada
Residential mortgages $27$27$ 34$25$ 7
Personal 393 391 413 408 444
Credit cards 345 346 391 448 399
Small business 44 32 43 35 45
Retail $ 809 $ 796 $ 881 $ 916 $ 895
Business
Agriculture 448718
Automotive 33 (2) (3) 15
Consumer goods 25 16 13 13 17
Energy (5) (6) (11) (9) 3
Non-bank financial services –– 1 – (1)
Forest products 13543
Industrial products 14 14 12 3 (4)
Mining & metals 21–12
Real estate & related 34 37 43 31 35
Technology & media 14 50 98 6 (6)
Transportation & environment 3210510
Other 28 25 30 44 30
Sovereign –––––
Bank –––––
Wholesale $ 123 $ 149 $ 207 $ 102 $ 122
Total $ 932 $ 945 $ 1,088 $ 1,018 $ 1,017
U.S.
Retail 2344–
Wholesale 40 32 29 (19) 62
$42$ 35 $ 33 $ (15) $ 62
Other International
Retail 121 86 64 43 31
Wholesale 69 171 116 85 124
$ 190 $ 257 $ 180 $ 128 $ 155
Total provision for credit losses on impaired loans $ 1,164 $ 1,237 $ 1,301 $ 1,131 $ 1,234
Total provision for credit losses on non-impaired loans – – (2) 2 6
Total provision for credit losses $ 1,164 $ 1,237 $ 1,299 $ 1,133 $ 1,240
Provision for credit losses as a % of average net loans and
acceptances 0.27% 0.31% 0.35% 0.33% 0.40%
(1) On a continuing operations basis.
(2) Other in 2014 is related to financing products, $3 million; holding and investments, $29 million; other services, $18 million; and other, $26 million.
104 Royal Bank of Canada: Annual Report 2014 Management’s Discussion and Analysis

Allowance for credit losses by portfolio and geography Table 81
IFRS
Canadian
GAAP
(Millions of Canadian dollars, except percentage amounts) 2014 2013 2012 (1),(2) 2011 (1) 2010 (1)
Allowance at beginning of year $ 2,050 $ 2,087 $ 2,056 $ 2,966 $ 2,264
Allowance at beginning of year – discontinued operations – – – (854) –
Provision for credit losses 1,164 1,237 1,299 1,133 1,240
Write-offs by portfolio
Residential mortgages (30) (24) (32) (16) (11)
Personal (565) (498) (499) (515) (538)
Credit cards (466) (466) (496) (545) (463)
Small business (47) (35) (50) (45) (56)
Retail $ (1,108) $ (1,023) $ (1,077) $ (1,121) $ (1,068)
Business $ (221) $ (448) $ (288) $ (226) $ (478)
Sovereign –– – (9) –
Bank –– (32) – –
Wholesale $ (221) $ (448) $ (320) $ (235) $ (478)
Total write-offs by portfolio $ (1,329) $ (1,471) $ (1,397) $ (1,356) $ (1,546)
Recoveries by portfolio
Residential mortgages $2$2$1$1$1
Personal 106 96 83 79 79
Credit cards 114 112 102 97 63
Small business 998 77
Retail $ 231 $ 219 $ 194 $ 184 $ 150
Business $32$51$39$60$51
Sovereign ––– ––
Bank ––– ––
Wholesale $32$51$39$60$51
Total recoveries by portfolio $ 263 $ 270 $ 233 $ 244 $ 201
Net write-offs $ (1,066) $ (1,201) $ (1,164) $ (1,112) $ (1,345)
Adjustments (3) (63) (73) (104) (75) (33)
Total allowance for credit losses at end of year $ 2,085 $ 2,050 $ 2,087 $ 2,058 $ 2,126
Allowance against impaired loans
Canada
Residential mortgages $31$36$41$47$47
Personal 93 97 89 88 88
Small business 19 16 12 15 18
Retail $ 143 $ 149 $ 142 $ 150 $ 153
Business
Agriculture $6$6$9$13$14
Automotive 44 7 15 27
Consumer goods 22 15 14 17 20
Energy –11 310
Non-bank financial services ––– –1
Forest products 346 34
Industrial products 18 15 10 12 36
Mining & metals 111 11
Real estate & related 48 42 45 47 36
Technology & media 17 46 107 20 12
Transportation & environment 568 56
Other 36 30 31 43 40
Sovereign ––– ––
Bank ––– ––
Wholesale $ 160 $ 170 $ 239 $ 179 $ 207
$ 303 $ 319 $ 381 $ 329 $ 360
U.S.
Retail $1$2$1$1$–
Wholesale 16 19 38 25 85
$17$21$39$26$85
Other International
Retail $ 172 $ 146 $ 96 $ 80 $ 83
Wholesale 140 113 120 170 193
$ 312 $ 259 $ 216 $ 250 $ 276
Total allowance against impaired loans $ 632 $ 599 $ 636 $ 605 $ 721
Allowance against non-impaired loans
Residential mortgages $78$48$48$41$26
Personal 400 405 392 412 480
Credit cards 385 385 403 415 365
Small business 45 45 60 60 60
Retail $ 908 $ 883 $ 903 $ 928 $ 931
Wholesale $ 454 $ 477 $ 457 $ 434 $ 386
Off-balance sheet and other items $ 91 $91$91$91$88
Total allowance against non-impaired loans $ 1,453 $ 1,451 $ 1,451 $ 1,453 $ 1,405
Total allowance for credit losses $ 2,085 $ 2,050 $ 2,087 $ 2,058 $ 2,126
Key ratios
Allowance for credit losses as a % of loans and acceptances 0.46% 0.49% 0.54% 0.57% 0.75%
Net write-offs as a % of average net loans and acceptances 0.25% 0.27% 0.31% 0.33% 0.49%
(1) On a continuing operations basis.
(2) Opening allowance for credit losses as at November 1, 2011 has been restated due to the implementation of amendments to IFRS 11.
(3) Under IFRS, other adjustments include $87 million of unwind of discount and $(24) million of changes in exchange rate (2013 – $86 million and $(13) million; 2012 – $110 million and
$(6) million). For further details, refer to Note 5 of our 2014 Annual Consolidated Financial Statements.
Management’s Discussion and Analysis Royal Bank of Canada: Annual Report 2014 105

Credit quality information by Canadian province Table 82
IFRS
Canadian
GAAP
(Millions of Canadian dollars) 2014 2013 2012 (1) 2011 (1) 2010 (1)
Loans and acceptances
Atlantic provinces (2) $ 22,130 $ 21,263 $ 19,953 $ 18,481 $ 14,558
Quebec 50,748 48,060 42,920 38,776 33,093
Ontario 159,817 152,258 141,566 141,230 103,179
Prairie provinces (3) 88,538 84,015 77,187 68,468 54,843
B.C. and territories (4) 68,988 68,118 65,204 58,774 48,908
Total loans and acceptances in Canada $ 390,221 $ 373,714 $ 346,830 $ 325,729 $ 254,581
Gross impaired loans
Atlantic provinces (2) $81$83$67$66$72
Quebec 205 177 180 135 162
Ontario 391 424 502 398 598
Prairie provinces (3) 258 330 338 404 429
B.C. and territories (4) 211 241 269 305 277
Total gross impaired loans in Canada $ 1,146 $ 1,255 $ 1,356 $ 1,308 $ 1,538
Provision for credit losses on impaired loans
Atlantic provinces (2) $51$50$62$54$50
Quebec 92 78 96 63 85
Ontario 588 605 704 686 659
Prairie provinces (3) 111 113 120 107 146
B.C. and territories (4) 90 99 106 108 77
Total provision for credit losses on impaired loans in Canada $ 932 $ 945 $ 1,088 $ 1,018 $ 1,017
(1) On a continuing operations basis.
(2) Comprises Newfoundland and Labrador, Prince Edward Island, Nova Scotia and New Brunswick.
(3) Comprises Manitoba, Saskatchewan and Alberta.
(4) Comprises British Columbia, Nunavut, Northwest Territories and Yukon.
106 Royal Bank of Canada: Annual Report 2014 Management’s Discussion and Analysis

EDTF recommendations index
On October 29, 2012, the Enhanced Disclosure Task Force (EDTF), established by the Financial Stability Board, issued its report Enhancing the
Risk Disclosures of Banks, which included 32 recommendations aimed at achieving transparent, high-quality risk disclosures. As a result, our
enhanced disclosures have been provided in our 2014 Annual Report and Supplementary Financial Information package (SFI).
The following index summarizes our disclosure by EDTF recommendation:
Location of
disclosure
Type of Risk Recommendation Disclosure
Annual
Report
page
SFI
page
General
1 Table of contents for EDTF risk disclosure 107 1
2 Define risk terminology and measures 47-52
199-201
–
3 Top and emerging risks 46-47 –
4 New regulatory ratios 69,85-86 –
Risk governance, risk
management and
business model
5 Risk management organization 47-52 –
6 Risk culture 49-50 –
7 Risk in the context of our business activities 93 –
8 Stress testing 50,63 –
Capital adequacy and
risk-weighted assets
(RWA)
9 Minimum Basel III capital ratios and Domestic systemically
important bank surcharge
86 –
10 Composition of capital and reconciliation of the accounting
balance sheet to the regulatory balance sheet
– 21-24
11 Flow statement of the movements in regulatory capital – 25
12 Capital strategic planning 85-86 –
13 RWA by business segments – 28
14 Analysis of capital requirement, and related measurement
model information
52-55 26-27
15 RWA credit risk and related risk measurements – 40-42
16 Movement of risk-weighted assets by risk type – 28
17 Basel back-testing 50,53 40
Liquidity 18 Quantitative and qualitative analysis of our liquidity reserve 70-71 –
Funding
19 Encumbered and unencumbered assets by balance sheet
category, and contractual obligations for rating downgrades
72
78
–
20 Maturity analysis of consolidated total assets, liabilities and
off-balance sheet commitments analyzed by remaining
contractual maturity at the balance sheet date
75-76 –
21 Sources of funding and funding strategy 73-74 –
Market risk
22 Relationship between the market risk measures for trading
and non-trading portfolios and the balance sheet
67-68 –
23 Decomposition of market risk factors 63-65 –
24 Market risk validation and back-testing 63 –
25 Primary risk management techniques beyond reported risk
measures and parameters
63-64 –
Credit risk
26 Bank’s credit risk profile
Quantitative summary of aggregate credit risk exposures that
reconciles to the balance sheet
52-63
146-148
100-106
29-42
38
27 Policies for identifying impaired loans 55,97
125
–
28 Reconciliation of the opening and closing balances of
impaired loans and impairment allowances during the year
62 31,35
29 Quantification of gross notional exposure for OTC derivatives
or exchange-traded derivatives
53-54 44
30 Credit risk mitigation, including collateral held for all sources
of credit risk
54 39
Other
31 Other risk types 78-85 –
32 Publicly known risk events 80
185
–
Management’s Discussion and Analysis Royal Bank of Canada: Annual Report 2014 107

REPORTS AND CONSOLIDATED FINANCIAL STATEMENTS
109 Reports
109 Management’s responsibility for financial reporting
109 Report of Independent Registered Public Accounting
Firm
110 Management’s Report on Internal Control over
Financial Reporting
111 Report of Independent Registered Public Accounting
Firm
112 Consolidated Financial Statements
112 Consolidated Balance Sheets
113 Consolidated Statements of Income
114 Consolidated Statements of Comprehensive Income
115 Consolidated Statements of Changes in Equity
116 Consolidated Statements of Cash Flows
117 Notes to Consolidated Financial Statements
117 Note 1 General information
117 Note 2 Summary of significant accounting policies,
estimates and judgments
131 Note 3 Fair value of financial instruments
143 Note 4 Securities
146 Note 5 Loans
149 Note 6 Derecognition of financial assets
149 Note 7 Structured entities
153 Note 8 Derivative financial instruments and
hedging activities
159 Note 9 Premises and equipment
160 Note 10 Goodwill and other intangible assets
162 Note 11 Significant dispositions
163 Note 12 Joint ventures and associated companies
163 Note 13 Other assets
164 Note 14 Deposits
165 Note 15 Insurance
167 Note 16 Segregated funds
168 Note 17 Employee benefits – Pension and other
post-employment benefits
172 Note 18 Other liabilities
173 Note 19 Subordinated debentures
173 Note 20 Trust capital securities
175 Note 21 Equity
177 Note 22 Share-based compensation
179 Note 23 Income and expenses from selected
financial instruments
180 Note 24 Income taxes
182 Note 25 Earnings per share
182 Note 26 Guarantees, commitments, pledged assets
and contingencies
185 Note 27 Litigation
186 Note 28 Contractual repricing and maturity
schedule
186 Note 29 Related party transactions
187 Note 30 Results by business segment
190 Note 31 Nature and extent of risks arising from
financial instruments
191 Note 32 Capital management
192 Note 33 Offsetting of financial assets and financial
liabilities
194 Note 34 Recovery and settlement of on-balance
sheet assets and liabilities
195 Note 35 Parent company information
196 Note 36 Subsequent events
108 Royal Bank of Canada: Annual Report 2014 Consolidated Financial Statements

Management’s responsibility for financial reporting
The accompanying consolidated financial statements of Royal Bank of Canada were prepared by management, which is responsible for the
integrity and fairness of the information presented, including the many amounts that must of necessity be based on estimates and judgments.
These consolidated financial statements were prepared in accordance with the Bank Act (Canada) and International Financial Reporting
Standards as issued by the International Accounting Standards Board. Financial information appearing throughout our Management’s
Discussion and Analysis is consistent with these consolidated financial statements.
Our internal controls are designed to provide reasonable assurance that transactions are authorized, assets are safeguarded and proper
records are maintained. These controls include quality standards in hiring and training of employees, policies and procedures manuals, a
corporate code of conduct and accountability for performance within appropriate and well-defined areas of responsibility.
The system of internal controls is further supported by a compliance function, which is designed to ensure that we and our employees
comply with securities legislation and conflict of interest rules, and by an internal audit staff, which conducts periodic audits of all aspects of
our operations.
The Board of Directors oversees management’s responsibilities for financial reporting through an Audit Committee, which is composed
entirely of independent directors. This Committee reviews our consolidated financial statements and recommends them to the Board for
approval. Other key responsibilities of the Audit Committee include reviewing our existing internal control procedures and planned revisions to
those procedures, and advising the directors on auditing matters and financial reporting issues. Our Chief Compliance Officer and Chief Internal
Auditor have full and unrestricted access to the Audit Committee.
The Office of the Superintendent of Financial Institutions Canada (OSFI) examines and inquires into our business and affairs as deemed
necessary to determine whether the provisions of the Bank Act are being complied with, and that we are in sound financial condition. In carrying
out its mandate, OSFI strives to protect the rights and interests of our depositors and creditors.
Deloitte LLP, Independent Registered Public Accounting Firm appointed by our shareholders upon the recommendation of the Audit
Committee and Board, have performed an independent audit of the consolidated financial statements and their report follows. The auditors have
full and unrestricted access to the Audit Committee to discuss their audit and related findings.
David I. McKay
President and Chief Executive Officer
Janice R. Fukakusa
Chief Administrative Officer and Chief Financial Officer
Toronto, December 2, 2014
Report of Independent Registered Public Accounting Firm
To the Shareholders of Royal Bank of Canada
We have audited the accompanying consolidated financial statements of Royal Bank of Canada and subsidiaries (the “Bank”), which comprise
the consolidated balance sheets as at October 31, 2014 and October 31, 2013, and the consolidated statements of income, statements of
comprehensive income, statements of changes in equity, and statements of cash flows for each of the years in the three-year period ended
October 31, 2014, and a summary of significant accounting policies and other explanatory information.
Management’s Responsibility for the Consolidated Financial Statements
Management is responsible for the preparation and fair presentation of these consolidated financial statements in accordance with International
Financial Reporting Standards as issued by the International Accounting Standards Board, and for such internal control as management
determines is necessary to enable the preparation of consolidated financial statements that are free from material misstatement, whether due to
fraud or error.
Auditor’s Responsibility
Our responsibility is to express an opinion on these consolidated financial statements based on our audits. We conducted our audits in
accordance with Canadian generally accepted auditing standards and the standards of the Public Company Accounting Oversight Board (United
States). Those standards require that we comply with ethical requirements and plan and perform the audit to obtain reasonable assurance about
whether the consolidated financial statements are free from material misstatement.
An audit involves performing procedures to obtain audit evidence about the amounts and disclosures in the consolidated financial
statements. The procedures selected depend on the auditor’s judgment, including the assessment of the risks of material misstatement of the
consolidated financial statements, whether due to fraud or error. In making those risk assessments, the auditor considers internal control
relevant to the entity’s preparation and fair presentation of the consolidated financial statements in order to design audit procedures that are
appropriate in the circumstances. An audit also includes evaluating the appropriateness of accounting policies used and the reasonableness
of accounting estimates made by management, as well as evaluating the overall presentation of the consolidated financial statements.
We believe that the audit evidence we have obtained in our audits is sufficient and appropriate to provide a basis for our audit opinion.
Consolidated Financial Statements Royal Bank of Canada: Annual Report 2014 109

Opinion
In our opinion, the consolidated financial statements present fairly, in all material respects, the balance sheets of Royal Bank of Canada and
subsidiaries as at October 31, 2014 and October 31, 2013, and their financial performance and cash flows for each of the years in the three-year
period ended October 31, 2014 in accordance with International Financial Reporting Standards as issued by the International Accounting
Standards Board.
Other Matter
We have also audited, in accordance with the standards of the Public Company Accounting Oversight Board (United States), the Bank’s internal
control over financial reporting as of October 31, 2014 based on the criteria established in Internal Control – Integrated Framework (2013) issued
by the Committee of Sponsoring Organizations of the Treadway Commission and our report dated December 2, 2014 expressed an unqualified
opinion on the Bank’s internal control over financial reporting.
Deloitte LLP
Chartered Professional Accountants, Chartered Accountants
Licensed Public Accountants
Toronto, Canada
December 2, 2014
Management’s Report on Internal Control over Financial Reporting
Management of Royal Bank of Canada is responsible for establishing and maintaining adequate internal control over financial reporting. Internal
control over financial reporting is a process designed by, or under the supervision of, the President and Chief Executive Officer and the Chief
Administrative Officer and Chief Financial Officer and effected by the Board of Directors, management and other personnel to provide reasonable
assurance regarding the reliability of financial reporting and the preparation of financial statements for external purposes in accordance with
generally accepted accounting principles. It includes those policies and procedures that:
• Pertain to the maintenance of records that, in reasonable detail, accurately and fairly reflect the transactions related to and dispositions of
our assets;
• Provide reasonable assurance that transactions are recorded as necessary to permit preparation of financial statements in accordance with
generally accepted accounting principles, and our receipts and expenditures are made only in accordance with authorizations of our
management and directors; and
• Provide reasonable assurance regarding prevention or timely detection of unauthorized acquisition, use, or disposition of our assets that
could have a material effect on our financial statements.
Due to its inherent limitations, internal control over financial reporting may not prevent or detect misstatements on a timely basis. Also, projec-
tions of any evaluation of the effectiveness of internal control over financial reporting to future periods are subject to the risk that the controls
may become inadequate because of changes in conditions, or that the degree of compliance with the policies or procedures may deteriorate.
Management evaluated, under the supervision of and with the participation of the President and Chief Executive Officer and the Chief
Administrative Officer and Chief Financial Officer, the effectiveness of our internal control over financial reporting as of October 31, 2014, based
on the criteria set forth in Internal Control – Integrated Framework (2013) issued by the Committee of Sponsoring Organizations of the Treadway
Commission. Based on that evaluation, management concluded that, as of October 31, 2014, internal control over financial reporting was
effective based on the criteria established in the Internal Control – Integrated Framework (2013). Also, based on the results of our evaluation,
management concluded that there were no material weaknesses that have been identified in internal control over financial reporting as of
October 31, 2014.
Our internal control over financial reporting as of October 31, 2014 has been audited by Deloitte LLP, Independent Registered Public
Accounting Firm, who also audited our Consolidated Financial Statements for the year ended October 31, 2014, as stated in the Report of
Independent Registered Public Accounting Firm, which report expressed an unqualified opinion on the effectiveness of our internal control
over financial reporting.
David I. McKay
President and Chief Executive Officer
Janice R. Fukakusa
Chief Administrative Officer and Chief Financial Officer
Toronto, December 2, 2014
110 Royal Bank of Canada: Annual Report 2014 Consolidated Financial Statements

Report of Independent Registered Public Accounting Firm
To the Shareholders of Royal Bank of Canada
We have audited the internal control over financial reporting of Royal Bank of Canada and subsidiaries (the “Bank”) as of October 31, 2014,
based on the criteria established in Internal Control – Integrated Framework (2013) issued by the Committee of Sponsoring Organizations of the
Treadway Commission. The Bank’s management is responsible for maintaining effective internal control over financial reporting and for its
assessment of the effectiveness of internal control over financial reporting, included in the accompanying Management’s Report on Internal
Control over Financial Reporting. Our responsibility is to express an opinion on the Bank’s internal control over financial reporting based on our
audit.
We conducted our audit in accordance with the standards of the Public Company Accounting Oversight Board (United States). Those
standards require that we plan and perform the audit to obtain reasonable assurance about whether effective internal control over financial
reporting was maintained in all material respects. Our audit included obtaining an understanding of internal control over financial reporting,
assessing the risk that a material weakness exists, testing and evaluating the design and operating effectiveness of internal control based on
the assessed risk, and performing such other procedures as we considered necessary in the circumstances. We believe that our audit provides
a reasonable basis for our opinion.
A company’s internal control over financial reporting is a process designed by, or under the supervision of, the company’s principal
executive and principal financial officers, or persons performing similar functions, and effected by the company’s board of directors,
management, and other personnel to provide reasonable assurance regarding the reliability of financial reporting and the preparation of
financial statements for external purposes in accordance with International Financial Reporting Standards as issued by the International
Accounting Standards Board. A company’s internal control over financial reporting includes those policies and procedures that (1) pertain to the
maintenance of records that, in reasonable detail, accurately and fairly reflect the transactions and dispositions of the assets of the company;
(2) provide reasonable assurance that transactions are recorded as necessary to permit preparation of financial statements in accordance with
International Financial Reporting Standards as issued by the International Accounting Standards Board, and that receipts and expenditures of
the company are being made only in accordance with authorizations of management and directors of the company; and (3) provide reasonable
assurance regarding prevention or timely detection of unauthorized acquisition, use, or disposition of the company’s assets that could have a
material effect on the financial statements.
Because of the inherent limitations of internal control over financial reporting, including the possibility of collusion or improper
management override of controls, material misstatements due to error or fraud may not be prevented or detected on a timely basis. Also,
projections of any evaluation of the effectiveness of the internal control over financial reporting to future periods are subject to the risk that
the controls may become inadequate because of changes in conditions, or that the degree of compliance with the policies or procedures may
deteriorate.
In our opinion, the Bank maintained, in all material respects, effective internal control over financial reporting as of October 31, 2014,
based on the criteria established in Internal Control – Integrated Framework (2013) issued by the Committee of Sponsoring Organizations of
the Treadway Commission.
We have also audited, in accordance with Canadian generally accepted auditing standards and the standards of the Public Company
Accounting Oversight Board (United States), the consolidated financial statements as of and for the year ended October 31, 2014 of the Bank
and our report dated December 2, 2014 expressed an unqualified opinion on those consolidated financial statements.
Deloitte LLP
Chartered Professional Accountants, Chartered Accountants
Licensed Public Accountants Toronto, Canada
December 2, 2014
Consolidated Financial Statements Royal Bank of Canada: Annual Report 2014 111

Consolidated Balance Sheets
As at
(Millions of Canadian dollars)
October 31
2014
October 31
2013
Assets
Cash and due from banks $ 17,421 $ 15,550
Interest-bearing deposits with banks 8,399 9,039
Securities (Note 4)
Trading 151,380 144,023
Available-for-sale 47,768 38,687
199,148 182,710
Assets purchased under reverse repurchase agreements and securities borrowed 135,580 117,517
Loans (Note 5)
Retail 334,987 320,627
Wholesale 102,236 90,182
437,223 410,809
Allowance for loan losses (Note 5) (1,994) (1,959)
435,229 408,850
Segregated fund net assets (Note 16) 675 513
Other
Customers’ liability under acceptances 11,462 9,953
Derivatives (Note 8) 87,402 74,822
Premises and equipment, net (Note 9) 2,684 2,636
Goodwill (Note 10) 8,647 8,332
Other intangibles (Note 10) 2,775 2,777
Investments in joint ventures and associates (Note 12) 295 247
Employee benefit assets (Note 17) 138 161
Other assets (Note 13) 30,695 26,638
144,098 125,566
Total assets $ 940,550 $ 859,745
Liabilities and equity
Deposits (Note 14)
Personal $ 209,217 $ 194,943
Business and government 386,660 354,593
Bank 18,223 13,543
614,100 563,079
Segregated fund net liabilities (Note 16) 675 513
Other
Acceptances 11,462 9,953
Obligations related to securities sold short 50,345 47,128
Obligations related to assets sold under repurchase agreements and securities loaned 64,331 60,416
Derivatives (Note 8) 88,982 76,745
Insurance claims and policy benefit liabilities (Note 15) 8,564 8,034
Employee benefit liabilities (Note 17) 2,420 2,027
Other liabilities (Note 18) 37,309 34,947
263,413 239,250
Subordinated debentures (Note 19) 7,859 7,443
Total liabilities 886,047 810,285
Equity attributable to shareholders (Note 21)
Preferred shares 4,075 4,600
Common shares (shares issued – 1,442,232,886 and 1,441,055,616) 14,511 14,377
Treasury shares – preferred (shares held – (1,207) and (46,641)) –1
– common (shares held – (891,733) and (666,366)) 71 41
Retained earnings 31,615 27,438
Other components of equity 2,418 1,208
52,690 47,665
Non-controlling interests (Note 21) 1,813 1,795
Total equity 54,503 49,460
Total liabilities and equity $ 940,550 $ 859,745
The accompanying notes are an integral part of these Consolidated Financial Statements. Comparative amounts have been restated. Refer to
Note 2.
David I. McKay Victor L. Young
President and Chief Executive Officer Director
112 Royal Bank of Canada: Annual Report 2014 Consolidated Financial Statements

Consolidated Statements of Income
For the year ended
(Millions of Canadian dollars, except per share amounts)
October 31
2014
October 31
2013
October 31
2012
Interest income
Loans $ 16,979 $ 16,354 $ 15,940
Securities 3,993 3,779 3,838
Assets purchased under reverse repurchase agreements and securities borrowed 971 941 937
Deposits and other 76 74 54
22,019 21,148 20,769
Interest expense
Deposits and other 5,873 5,694 6,048
Other liabilities 1,784 1,869 1,922
Subordinated debentures 246 336 360
7,903 7,899 8,330
Net interest income 14,116 13,249 12,439
Non-interest income
Insurance premiums, investment and fee income (Note 15) 4,957 3,911 4,897
Trading revenue 742 867 1,305
Investment management and custodial fees 3,355 2,870 2,006
Mutual fund revenue 2,621 2,201 1,896
Securities brokerage commissions 1,379 1,337 1,182
Service charges 1,494 1,437 1,376
Underwriting and other advisory fees 1,809 1,569 1,434
Foreign exchange revenue, other than trading 827 748 586
Card service revenue 689 632 588
Credit fees 1,080 1,092 849
Net gain on available-for-sale securities (Note 4) 192 188 148
Share of profit in joint ventures and associates (Note 12) 162 159 163
Other 685 422 278
19,992 17,433 16,708
Total revenue 34,108 30,682 29,147
Provision for credit losses (Note 5) 1,164 1,237 1,299
Insurance policyholder benefits, claims and acquisition expense (Note 15) 3,573 2,784 3,621
Non-interest expense
Human resources (Note 17 and 22) 11,031 10,248 9,082
Equipment 1,147 1,081 913
Occupancy 1,330 1,235 1,130
Communications 779 728 748
Professional fees 763 753 666
Outsourced item processing 246 250 254
Amortization of other intangibles (Note 10) 666 566 494
Impairment of other intangibles (Note 10 and 11) 810 –
Impairment of investments in joint ventures and associates (Note 12) –20 168
Other 1,691 1,323 1,186
17,661 16,214 14,641
Income before income taxes from continuing operations 11,710 10,447 9,586
Income taxes (Note 24) 2,706 2,105 2,028
Net income from continuing operations 9,004 8,342 7,558
Net loss from discontinued operations (Note 11) –– (51)
Net income $ 9,004 $ 8,342 $ 7,507
Net income attributable to:
Shareholders $ 8,910 $ 8,244 $ 7,410
Non-controlling interests 94 98 97
$ 9,004 $ 8,342 $ 7,507
Basic earnings per share (in dollars) (Note 25) $ 6.03 $ 5.53 $ 4.96
Basic earnings per share from continuing operations (in dollars) 6.03 5.53 4.99
Basic loss per share from discontinued operations (in dollars) –– (0.03)
Diluted earnings per share (in dollars) (Note 25) 6.00 5.49 4.91
Diluted earnings per share from continuing operations (in dollars) 6.00 5.49 4.94
Diluted loss per share from discontinued operations (in dollars) –– (0.03)
Dividends per common share (in dollars) 2.84 2.53 2.28
The accompanying notes are an integral part of these Consolidated Financial Statements. Comparative amounts have been restated. Refer to
Note 2.
Consolidated Financial Statements Royal Bank of Canada: Annual Report 2014 113

Consolidated Statements of Comprehensive Income
For the year ended
(Millions of Canadian dollars)
October 31
2014
October 31
2013
October 31
2012
Net income $ 9,004 $ 8,342 $ 7,507
Other comprehensive income (loss), net of taxes (Note 24)
Items that will be reclassified subsequently to income:
Net change in unrealized gains (losses) on available-for-sale securities
Net unrealized gains on available-for-sale securities 143 15 193
Reclassification of net gains on available-for-sale securities to income (58) (87) (33)
85 (72) 160
Foreign currency translation adjustments
Unrealized foreign currency translation gains 2,743 1,402 114
Net foreign currency translation losses from hedging activities (1,585) (912) –
Reclassification of losses on foreign currency translation to income 44 1 170
Reclassification of losses (gains) on net investment hedging activities to income 3(1) (159)
1,205 490 125
Net change in cash flow hedges
Net (losses) gains on derivatives designated as cash flow hedges (108) (11) 32
Reclassification of losses (gains) on derivatives designated as cash flow hedges to income 28 (30) 25
(80) (41) 57
Items that will not be reclassified subsequently to income:
Remeasurements of employee benefit plans (236) 319 (779)
Net fair value change due to credit risk on financial liabilities designated as at fair value through
profit or loss (59) ––
(295) 319 (779)
Total other comprehensive income (loss), net of taxes 915 696 (437)
Total comprehensive income $ 9,919 $ 9,038 $ 7,070
Total comprehensive income attributable to:
Shareholders $ 9,825 $ 8,940 $ 6,972
Non-controlling interests 94 98 98
$ 9,919 $ 9,038 $ 7,070
The accompanying notes are an integral part of these Consolidated Financial Statements. Comparative amounts have been restated. Refer to
Note 2.
114 Royal Bank of Canada: Annual Report 2014 Consolidated Financial Statements

Consolidated Statements of Changes in Equity
Other components of equity
(Millions of Canadian dollars)
Preferred
shares
Common
shares
Treasury
shares –
preferred
Treasury
shares –
common
Retained
earnings
Available-
for-sale
securities
Foreign
currency
translation
Cash
flow
hedges
Total other
components
of equity
Equity
attributable to
shareholders
Non-controlling
interests
Total
equity
Balance at November 1, 2011 $ 4,813 $14,010 $ – $ 8 $20,084 $ 259 $ 71 $ 160 $ 490 $ 39,405 $ 1,758 $41,163
Changes in equity
Issues of share capital – 313 – – – – – – – 313 – 313
Sales of treasury shares – – 98 5,186 – – – – – 5,284 – 5,284
Purchases of treasury shares – – (97) (5,164) – – – – – (5,261) – (5,261)
Share-based compensation awards – – – – (9) – – – – (9) – (9)
Dividends on common shares – – – – (3,291) – – – – (3,291) – (3,291)
Dividends on preferred shares and other – – – – (258) – – – – (258) (92) (350)
Other – – – – 5 – – – – 5 (3) 2
Net income – – – – 7,410 – – – – 7,410 97 7,507
Total other comprehensive income (loss), net of taxes – – – – (779) 160 125 56 341 (438) 1 (437)
Balance at October 31, 2012 $ 4,813 $14,323 $ 1 $ 30 $23,162 $ 419 $ 196 $ 216 $ 831 $ 43,160 $ 1,761 $44,921
Changes in equity
Issues of share capital – 121 – – – – – – – 121 – 121
Common shares purchased for cancellation – (67) – – (341) – – – – (408) – (408)
Preferred shares redeemed (213) – – – (9) – – – – (222) – (222)
Sales of treasury shares – – 127 4,453 – – – – – 4,580 – 4,580
Purchases of treasury shares – – (127) (4,442) – – – – – (4,569) – (4,569)
Share-based compensation awards – – – – (7) – – – – (7) – (7)
Dividends on common shares – – – – (3,651) – – – – (3,651) – (3,651)
Dividends on preferred shares and other – – – – (253) – – – – (253) (94) (347)
Other – – – – (26) – – – – (26) 30 4
Net income – – – – 8,244 – – – – 8,244 98 8,342
Total other comprehensive income (loss), net of taxes – – – – 319 (72) 490 (41) 377 696 – 696
Balance at October 31, 2013 $ 4,600 $14,377 $ 1 $ 41 $27,438 $ 347 $ 686 $ 175 $ 1,208 $ 47,665 $ 1,795 $49,460
Changes in equity
Issues of share capital 1,000 150 – – (14) – – – – 1,136 – 1,136
Common shares purchased for cancellation – (16) – – (97) – – – – (113) – (113)
Preferred shares redeemed (1,525) – – – – – – – – (1,525) – (1,525)
Sales of treasury shares – – 124 5,333 – – – – – 5,457 – 5,457
Purchases of treasury shares – – (125) (5,303) – – – – – (5,428) – (5,428)
Share-based compensation awards – – – – (9) – – – – (9) – (9)
Dividends on common shares – – – – (4,097) – – – – (4,097) – (4,097)
Dividends on preferred shares and other – – – – (213) – – – – (213) (94) (307)
Other – – – – (8) – – – – (8) 18 10
Net income – – – – 8,910 – – – – 8,910 94 9,004
Total other comprehensive income (loss), net of taxes – – – – (295) 85 1,205 (80) 1,210 915 – 915
Balance at October 31, 2014 $ 4,075 $14,511 $ – $ 71 $31,615 $ 432 $ 1,891 $ 95 $ 2,418 $ 52,690 $ 1,813 $54,503
The accompanying notes are an integral part of these Consolidated Financial Statements. Comparative amounts have been restated. Refer to Note 2.
Consolidated Financial Statements Royal Bank of Canada: Annual Report 2014 115

Consolidated Statements of Cash Flows
For the year ended
(Millions of Canadian dollars)
October 31
2014
October 31
2013
October 31
2012
Cash flows from operating activities
Net income $ 9,004 $ 8,342 $ 7,507
Adjustments for non-cash items and others
Provision for credit losses 1,164 1,237 1,416
Depreciation 499 445 412
Deferred income taxes (207) (72) (204)
Amortization and Impairment of other intangibles 674 576 514
Impairment of investments in joint ventures and associates –20 168
Loss (Gain) on sale of premises and equipment 14 (24) 25
Gain on available-for-sale securities (228) (217) (222)
Loss (Gain) on disposition of business 95 (17) –
Impairment of available-for-sale securities 25 26 55
Share of profit in joint ventures and associates (162) (159) (162)
Net gain on sales of joint ventures and associates (62) ––
Adjustments for net changes in operating assets and liabilities
Insurance claims and policy benefit liabilities 530 113 802
Net change in accrued interest receivable and payable 187 (467) (177)
Current income taxes (206) 354 (815)
Derivative assets (12,580) 16,475 8,180
Derivative liabilities 12,237 (20,017) (3,679)
Trading securities (7,253) (23,038) 6,850
Loans, net of securitizations (27,096) (20,175) (29,320)
Assets purchased under reverse repurchase agreements and securities borrowed (18,063) (5,260) (25,179)
Deposits 52,339 41,857 18,103
Obligations related to assets sold under repurchase agreements and securities loaned 3,915 (3,616) 16,162
Obligations related to securities sold short 3,233 6,372 (3,484)
Brokers and dealers receivable and payable (638) 536 537
Other (2,247) 3,794 864
Net cash from (used in) operating activities 15,174 7,085 (1,647)
Cash flows from investing activities
Change in interest-bearing deposits with banks 640 1,207 1,585
Proceeds from sale of available-for-sale securities 8,795 6,476 9,779
Proceeds from maturity of available-for-sale securities 38,950 37,099 45,991
Purchases of available-for-sale securities (54,208) (41,057) (54,782)
Proceeds from maturity of held-to-maturity securities 285 401 190
Purchases of held-to-maturity securities (1,625) (284) (242)
Net acquisitions of premises and equipment and other intangibles (1,227) (932) (1,320)
Proceeds from dispositions 173 17 2,677
Cash used in acquisitions –(2,537) (628)
Net cash (used in) from investing activities (8,217) 390 3,250
Cash flows from financing activities
Redemption of trust capital securities (900) ––
Issue of subordinated debentures 2,000 2,046 –
Repayment of subordinated debentures (1,600) (2,000) (1,006)
Issue of common shares 150 121 126
Common shares purchased for cancellation (113) (408) –
Issue of preferred shares 1,000 ––
Redemption of preferred shares (1,525) (222) –
Sales of treasury shares 5,457 4,580 5,284
Purchase of treasury shares (5,428) (4,569) (5,261)
Dividends paid (4,211) (3,810) (3,272)
Issuance costs (14) ––
Dividends/distributions paid to non-controlling interests (94) (94) (92)
Change in short-term borrowings of subsidiaries (6) (93) 21
Net cash used in financing activities (5,284) (4,449) (4,200)
Effect of exchange rate changes on cash and due from banks 198 96 1
Net change in cash and due from banks 1,871 3,122 (2,596)
Cash resources at beginning of period (1), (2) 15,550 12,428 15,024
Cash and due from banks at end of period (1) $ 17,421 $ 15,550 $ 12,428
Cash flows from operating activities include:
Amount of interest paid $ 7,186 $ 7,223 $ 7,839
Amount of interest received 20,552 19,348 19,691
Amount of dividend received 1,702 1,478 1,316
Amount of income taxes paid 2,315 1,479 2,884
(1) We are required to maintain balances with central banks and other regulatory authorities. The total balances were $2.0 billion as at October 31, 2014 (October 31, 2013 – $2.6 billion;
October 31, 2012 – $2.1 billion; November 1, 2011 – $2.0 billion).
(2) For the year ended October 31, 2012, cash resources at the beginning of the period include cash and due from banks of $12,308 million and cash and due from banks included in assets of
discontinued operations of $2,716 million.
The accompanying notes are an integral part of these Consolidated Financial Statements. Comparative amounts have been restated. Refer to
Note 2.
116 Royal Bank of Canada: Annual Report 2014 Consolidated Financial Statements

Note 1 General information
Royal Bank of Canada and its subsidiaries (the Bank) provide diversified financial services including personal and commercial banking, wealth
management, insurance, investor services and capital markets products and services on a global basis. Refer to Note 30 for further details on our
business segments.
The parent bank, Royal Bank of Canada, is a Schedule I Bank under the Bank Act (Canada) incorporated and domiciled in Canada. Our
corporate headquarters are located at Royal Bank Plaza, 200 Bay Street, Toronto, Ontario, Canada and our head office is located at 1 Place Ville-
Marie, Montreal, Quebec, Canada. Our common shares are listed on the Toronto Stock Exchange and New York Stock Exchange with the ticker
symbol RY.
These Consolidated Financial Statements are prepared in compliance with International Financial Reporting Standards (IFRS) as issued by
the International Accounting Standards Board (IASB). Unless otherwise stated, monetary amounts are stated in Canadian dollars. Tabular
information is stated in millions of dollars, except per share amounts and percentages. These Consolidated Financial Statements also comply
with Subsection 308 of the Bank Act (Canada), which states that, except as otherwise specified by the Office of the Superintendent of Financial
Institutions (OSFI), our Consolidated Financial Statements are to be prepared in accordance with IFRS. The accounting policies outlined in Note 2
have been consistently applied to all periods presented.
On December 2, 2014, the Board of Directors authorized the Consolidated Financial Statements for issue.
Note 2 Summary of significant accounting policies, estimates and judgments
The significant accounting policies used in the preparation of these Consolidated Financial Statements, including the accounting requirements
prescribed by OSFI, are summarized below. These accounting policies conform, in all material respects, to IFRS.
General
Use of estimates and assumptions
In preparing our Consolidated Financial Statements, management is required to make subjective estimates and assumptions that affect the
reported amount of assets, liabilities, net income and related disclosures. Estimates made by management are based on historical experience
and other assumptions that are believed to be reasonable. Key sources of estimation uncertainty include: securities impairment, determination
of fair value of financial instruments, the allowance for credit losses, derecognition of financial assets, insurance claims and policy benefit
liabilities, pensions and other post-employment benefits, income taxes, carrying value of goodwill and other intangible assets, litigation
provisions, and deferred revenue under the credit card customer loyalty reward program. Accordingly, actual results may differ from these and
other estimates thereby impacting our future Consolidated Financial Statements. Refer to the relevant accounting policies in this Note for details
on our use of estimates and assumptions.
Significant judgments
In preparation of these Consolidated Financial Statements, management is required to make significant judgments that affect the carrying
amounts of certain assets and liabilities, and the reported amounts of revenues and expenses recorded during the period. Significant judgments
have been made in the following areas and discussed as noted in the Consolidated Financial Statements:
Consolidation of structured
entities
Note 2 – page 117
Note 7 – page 149
Fair value of financial
instruments
Note 2 – page 122
Note 3 – page 131
Allowance for credit losses Note 2 – page 125
Note 5 – page 146
Employee benefits Note 2 – page 127
Note 17 – page 168
Goodwill and other intangibles Note 2 – page 128
Note 10 – page 160
Note 11 – page 162
Securities impairment Note 2 – page 121
Note 4 – page 143
Application of the effective interest
method
Note 2 – page 123
Derecognition of financial assets Note 2 – page 125
Note 6 – page 149
Income taxes Note 2 – page 127
Note 24 – page 180
Provisions Note 2 – page 129
Note 26 – page 182
Note 27 – page 185
Basis of consolidation
Our Consolidated Financial Statements include the assets and liabilities and results of operations of the parent company, Royal Bank of Canada,
and its subsidiaries including certain structured entities, after elimination of intercompany transactions, balances, revenues and expenses.
Consolidation
Subsidiaries are those entities, including structured entities, over which we have control. We control an entity when we are exposed, or have
rights, to variable returns from our involvement with the entity and have the ability to affect those returns through our power over the investee.
We have power over an entity when we have existing rights that give us the current ability to direct the activities that most significantly affect the
entity’s returns (relevant activities). Power may be determined on the basis of voting rights or, in the case of structured entities, other contractual
arrangements.
We are not deemed to control an entity when we exercise power over an entity in an agency capacity. In determining whether we are acting
as an agent, we consider the overall relationship between us, the investee and other parties to the arrangement with respect to the following
factors: (i) the scope of our decision making power; (ii) the rights held by other parties; (iii) the remuneration to which we are entitled; and
(iv) our exposure to variability of returns.
The determination of control is based on the current facts and circumstances and is continuously assessed. In some circumstances,
different factors and conditions may indicate that various parties control an entity depending on whether those factors and conditions are
assessed in isolation or in totality. Significant judgment is applied in assessing the relevant factors and conditions in totality when determining
whether we control an entity. Specifically, judgment is applied in assessing whether we have substantive decision making rights over the
relevant activities and whether we are exercising our power as a principal or an agent.
Consolidated Financial Statements Royal Bank of Canada: Annual Report 2014 117

Note 2 Summary of significant accounting policies, estimates and judgments (continued)
We consolidate all subsidiaries from the date control is transferred to us, and cease consolidation when an entity is no longer controlled by
us. Our consolidation conclusions affect the classification and amount of assets, liabilities, revenues and expenses reported in our Consolidated
Financial Statements.
Non-controlling interests in subsidiaries that we consolidate are shown on our Consolidated Balance Sheets as a separate component of
equity which is distinct from our shareholders’ equity. The net income attributable to non-controlling interests is separately disclosed in our
Consolidated Statements of Income.
Investments in associates and joint ventures
Our investments in associated corporations and limited partnerships over which we have significant influence are accounted for using the equity
method. The equity method is also applied to our interests in joint ventures over which we have joint control. Under the equity method of
accounting, investments are initially recorded at cost, and the carrying amount is increased or decreased to recognize our share of the investee’s
net profit or loss, including net profit or loss recognized in other comprehensive income (OCI), subsequent to the date of acquisition.
Non-current assets held for sale and discontinued operations
Non-current assets (and disposal groups) are classified as held for sale if their carrying amounts will be recovered principally through a sale
transaction rather than through continuing use. This condition is satisfied when the asset is available for immediate sale in its present condition,
management is committed to the sale, and it is highly probable to occur within one year. Non-current assets (and disposal groups) classified as
held for sale are measured at the lower of their previous carrying amount and fair value less costs to sell and are presented separately from other
assets on our Consolidated Balance Sheets.
A disposal group is classified as a discontinued operation if it meets the following conditions: (i) it is a component that can be
distinguished operationally and financially from the rest of our operations, and (ii) it represents either a separate major line of business or is part
of a single co-ordinated plan to dispose of a separate major line of business or geographical area of operations. Disposal groups classified as
discontinued operations are presented separately from our continuing operations in our Consolidated Statements of Income.
During the third quarter in 2011, we announced the sale of substantially all of our U.S. regional retail banking operations and completed
this sale in the second quarter of 2012. Our U.S. regional retail banking operations are reflected as discontinued operations on our Consolidated
Financial Statements for all periods presented.
Changes in accounting policies
During the first quarter, we adopted the following new accounting standards (in order of significance).
IAS 19 Employee Benefits (IAS 19)
The amendments to IAS 19 change the accounting for pension and other post-employment benefits, specifically with respect to actuarial gains
and losses, past service costs, interest expense and return on plan assets. The amended standard eliminates the deferral and amortization of
actuarial gains and losses in net income, instead requiring the immediate recognition of actuarial gains and losses in OCI. Past service costs are
immediately recognized in the period in which a plan amendment occurs. Net interest, calculated by applying the discount rate to the Net
defined benefit liability or asset, replaces the Interest cost and Expected return on plan assets components of Defined benefit pension expense.
The amendments also introduce a number of interim and annual disclosure requirements for defined benefit plans.
We retrospectively adopted the amendments on November 1, 2013. Under the amended standard, we recognize the present value of our
defined benefit obligation under each of our defined benefit plans, less the fair value of the plan’s assets, as a liability reported in Employee
benefit liabilities on our Consolidated Balance Sheets. For plans where there is a net defined benefit asset, the amount is reported as an asset in
Employee benefit assets. New annual disclosures have been provided in Note 17.
IFRS 10 Consolidated Financial Statements (IFRS 10)
IFRS 10 replaces the consolidation requirements in IAS 27 Consolidated and Separate Financial Statements (IAS 27) and SIC-12 Consolidation –
Special Purpose Entities (SIC-12) and provides a single consolidation model applicable to all types of entities. IFRS 10 is based on the existing
principle that an entity should consolidate all other entities that it controls.
Under IAS 27 and SIC-12, control was based on having a majority of the voting interests or, for special purpose entities, an overall
assessment of the purpose and design of the entity, our decision making rights, and our exposure to the majority of the risks and rewards of
ownership. Under IFRS 10, control is based on three conditions, which must all be satisfied: (i) decision making power over the relevant
activities, (ii) exposure to variable returns, and (iii) a link between decision making power and returns. IFRS 10 introduces a substantial amount
of application guidance that expands on new and existing principles related to the determination of control. It places a greater emphasis on
decision making power by making it a required condition for control, removes the bright lines for assessing exposure to risks and rewards, and
introduces new considerations related to our role as a principal or an agent in entities over which we have decision making power. The
determination of control is based on the current facts and circumstances and is to be continuously assessed.
We retrospectively adopted IFRS 10 on November 1, 2013. On adoption, RBC Capital Trust II was deconsolidated as our involvement does
not expose us to variable returns. See Note 20 for further details on our innovative capital instruments.
IFRS 11 Joint Arrangements (IFRS 11)
IFRS 11 requires a party to a joint arrangement to determine the type of joint arrangement in which it is involved by assessing its rights and
obligations arising from the arrangement. IFRS 11 requires a joint operator to recognize and measure the assets and liabilities in relation to its
interest in the arrangement, and a joint venturer to apply the equity method of accounting. We retrospectively adopted IFRS 11 on November 1,
2013. The adoption resulted in a change to our method of accounting for joint ventures from proportionate consolidation to the equity method.
IFRS 12 Disclosure of Interest in Other Entities (IFRS 12)
IFRS 12 provides enhanced guidance on the annual disclosure requirements of a reporting entity’s interests in other entities. The standard
requires an entity to disclose information that helps users to evaluate (i) the nature of, and risks associated with, a reporting entity’s interests in
subsidiaries, joint arrangements, associates and unconsolidated structured entities (off-balance sheet structures); and (ii) the effect of those
interests on the entity’s financial position, financial performance and cash flows. We adopted IFRS 12 on November 1, 2013. Our annual
disclosures in Notes 7 and 12 have been updated to reflect the requirements of IFRS 12.
118 Royal Bank of Canada: Annual Report 2014 Consolidated Financial Statements

IAS 27 Separate Financial Statements (IAS 27) and IAS 28 Investments in Associates and Joint Ventures (IAS 28)
As a consequence of the new IFRS standards IFRS 10, IFRS 11 and IFRS 12, the IASB issued amended and retitled IAS 27 and IAS 28. We
retrospectively adopted these new requirements on November 1, 2013. The adoption did not impact the Consolidated Financial Statements.
IFRS 13 Fair Value Measurement (IFRS 13)
IFRS 13 provides a revised definition of fair value and sets out a framework for measuring fair value in a single standard. IFRS 13 also requires
more comprehensive disclosure requirements on fair value measurement. The measurement and disclosure requirements of IFRS 13 apply when
another standard requires or permits the item to be measured at fair value with limited exceptions. We prospectively adopted IFRS 13 on
November 1, 2013. The adoption did not have a material impact on the Consolidated Financial Statements. New annual disclosures have been
provided in Notes 3, 10 and 17.
IFRS 7 Financial Instruments – Disclosure (IFRS 7)
The amendments to IFRS 7 require expanded disclosures to enable users to assess the effect of offsetting arrangements on an entity’s financial
position. The amendments require entities to disclose both gross and net amounts associated with master netting agreements and similar
arrangements, including the effects of financial collateral, whether or not they are presented net on the balance sheet. We adopted the
amendments to IFRS 7 on November 1, 2013. New annual disclosures have been provided in Note 33.
The tables below present the impact of the above standards adopted during the first quarter on our Consolidated Balance Sheets as at
October 31, 2013, October 31, 2012 and November 1, 2011 and Consolidated Statements of Income for the years ended October 31, 2013
and 2012.
As at and for the year ended October 31, 2013
Adjustments
(Millions of Canadian dollars, except per share amounts) Published IAS 19 IFRS 10 IFRS 11
Total
impact Restated
Consolidated Balance Sheet
Cash and due from banks $ 15,870 $ – $ – $ (320) $ (320) $ 15,550
Interest-bearing deposits with banks 9,061 – – (22) (22) 9,039
Securities – Trading and Available-for-sale 182,718 – 1 (9) (8) 182,710
Loans – Wholesale (1) 89,998 – 3 181 184 90,182
Other – Investment in joint ventures and associates 112 – – 135 135 247
Other – Employee benefit assets 1,084 (923) – – (923) 161
Other – Other lines impacted by accounting changes (2) 40,503 292 – (412) (120) 40,383
Lines not impacted by accounting changes 521,473 – – – – 521,473
Total assets 860,819 (631) 4 (447) (1,074) 859,745
Deposits – Business and government (1) 353,723 – 903 (33) 870 354,593
Other – Employee benefit liabilities 1,759 268 – – 268 2,027
Other – Other liabilities (1) 35,384 (24) 1 (414) (437) 34,947
Trust capital securities 900 – (900) – (900) –
Retained earnings 28,314 (876) – – (876) 27,438
Other components of equity 1,207 1 – – 1 1,208
Lines not impacted by accounting changes 439,532 – – – – 439,532
Total liabilities and equity $ 860,819 $ (631) $ 4 $ (447) $ (1,074) $ 859,745
Consolidated Statement of Income
Net income $ 8,429 $ (87) $ – $ – $ (87) $ 8,342
Basic earnings per share (in dollars) 5.60 (0.07) – – (0.07) 5.53
Diluted earnings per share (in dollars) 5.54 (0.05) – – (0.05) 5.49
Consolidated Financial Statements Royal Bank of Canada: Annual Report 2014 119

Note 2 Summary of significant accounting policies, estimates and judgments (continued)
As at and for the year ended October 31, 2012
Adjustments
(Millions of Canadian dollars, except per share amounts) Published IAS 19 IFRS 10 IFRS 11
Total
impact Restated
Consolidated Balance Sheet
Cash and due from banks $ 12,617 $ – $ – $ (189) $ (189) $ 12,428
Interest-bearing deposits with banks 10,255 – – (9) (9) 10,246
Securities – Trading and Available-for-sale 161,611 – 1 (10) (9) 161,602
Loans – Wholesale (1) 79,953 – 3 (7) (4) 79,949
Other – Investment in joint ventures and associates 125 – – 452 452 577
Other – Employee benefit assets 1,049 (920) – – (920) 129
Other – Other lines impacted by accounting changes (2) 47,881 367 – (834) (467) 47,414
Lines not impacted by accounting changes 511,609 – – – – 511,609
Total assets 825,100 (553) 4 (597) (1,146) 823,954
Deposits – Business and government (1) 315,457 – 903 (21) 882 316,339
Other – Employee benefit liabilities 1,729 589 – – 589 2,318
Other – Other liabilities (1) 38,228 (35) 1 (576) (610) 37,618
Trust capital securities 900 – (900) – (900) –
Retained earnings 24,270 (1,108) – – (1,108) 23,162
Other components of equity 830 1 – – 1 831
Lines not impacted by accounting changes 443,686 – – – – 443,686
Total liabilities and equity $ 825,100 $ (553) $ 4 $ (597) $ (1,146) $ 823,954
Consolidated Statement of Income
Net income $ 7,539 $ (32) $ – $ – $ (32) $ 7,507
Basic earnings per share (in dollars) 4.98 (0.02) – – (0.02) 4.96
Diluted earnings per share (in dollars) 4.93 (0.02) – – (0.02) 4.91
As at November 1, 2011
Adjustments
(Millions of Canadian dollars, except per share amounts) Published IAS 19 IFRS 10 IFRS 11
Total
impact Restated
Consolidated Balance Sheet
Cash and due from banks $ 12,428 $ – $ – $ (120) $ (120) $ 12,308
Interest-bearing deposits with banks 6,460 – – (3,133) (3,133) 3,327
Securities – Trading and Available-for-sale 167,022 – 7 (4,577) (4,570) 162,452
Loans – Wholesale (1) 64,752 – 3 (849) (846) 63,906
Other – Investment in joint ventures and associates 142 – – 1,652 1,652 1,794
Other – Employee benefit assets 311 (144) – (12) (156) 155
Other – Other lines impacted by accounting changes (2) 40,182 97 – (3,872) (3,775) 36,407
Lines not impacted by accounting changes 502,536 – – – – 502,536
Total assets 793,833 (47) 10 (10,911) (10,948) 782,885
Deposits – Business and government (1) 299,956 – 903 (15,424) (14,521) 285,435
Other – Employee benefit liabilities 1,639 263 – (8) 255 1,894
Other – Other liabilities (1) 36,796 (13) 1 4,521 4,509 41,305
Trust capital securities 894 – (894) – (894) –
Retained earnings 20,381 (297) – – (297) 20,084
Other components of equity 490 – – – – 490
Lines not impacted by accounting changes 433,677 – – – – 433,677
Total liabilities and equity $ 793,833 $ (47) $ 10 $ (10,911) $ (10,948) $ 782,885
(1) Amounts have been restated from those originally published to reflect classification changes made in the current period.
(2) Includes Premises and equipment, Goodwill, Other intangibles and Other assets.
During the second quarter, we adopted the following new accounting standard.
Own credit provisions of IFRS 9 Financial Instruments (IFRS 9)
The own credit provisions of IFRS 9 change the accounting for financial liabilities designated as at fair value through profit or loss (FVTPL).
Previously under International Accounting Standard (IAS) 39 Financial Instruments: Recognition and Measurement (IAS 39), all fair value changes
in financial liabilities designated as at FVTPL were recognized in net income. Under IFRS 9, the changes in the fair value of these liabilities
attributable to our own credit are recognized in OCI rather than income. Amounts recognized in OCI will not be reclassified subsequently to net
income.
We prospectively adopted the own credit provisions of IFRS 9 with an initial application date of November 1, 2013. Fair value changes in our
financial liabilities designated as at FVTPL attributable to changes in our own credit risk are now recorded in OCI. The remaining fair value
changes continue to be recorded in Trading revenue or Non-interest income - Other. We did not restate our quarterly or annual results for periods
prior to February 1, 2014 as the amounts were not significant. Amounts recognized in the Statement of Income in the first quarter were recorded
in OCI in the second quarter.
120 Royal Bank of Canada: Annual Report 2014 Consolidated Financial Statements

The table below presents the impact of adopting the above standard on our Consolidated Statement of Income and Consolidated Statement
of Comprehensive Income for the year ended October 31, 2014. Results as reported under the own credit provisions of IFRS 9 are compared to
the pro-forma results had we continued to apply IAS 39. The adoption did not impact our Consolidated Balance Sheet.
For the year ended October 31, 2014
(Millions of Canadian dollars, except per share amounts)
Pro-forma
(IAS 39) Impact
As
reported
(IFRS 9)
Consolidated Statement of Income
Non-interest income – Trading revenue $ 672 $ 70 $ 742
Non-interest income – Other 674 11 685
Non-interest expense – Human resources (1) 11,008 23 11,031
Net income 8,962 42 9,004
Basic earnings per share (in dollars) 6.00 0.03 6.03
Diluted earnings per share (in dollars) 5.97 0.03 6.00
Consolidated Statement of Comprehensive Income
Total other comprehensive income, net of taxes $ 974 $ (59) $ 915
(1) Adjustments related to variable compensation arrangements.
Financial instruments – Recognition and measurement
Securities
Securities are classified at inception, based on management’s intention, as at FVTPL, available-for-sale (AFS) or held-to-maturity. Certain debt
securities with fixed or determinable payments and which are not quoted in an active market may be classified as loans and receivables.
Trading securities include securities purchased for sale in the near term which are classified as at FVTPL by nature and securities designated
as at FVTPL under the fair value option. Obligations to deliver trading securities sold but not yet purchased are recorded as liabilities and carried
at fair value. Realized and unrealized gains and losses on these securities are recorded as Trading revenue in Non-interest income. Dividends
and interest income accruing on Trading securities are recorded in Interest income. Interest and dividends accrued on interest-bearing and equity
securities sold short are recorded in Interest expense.
AFS securities include: (i) securities which may be sold to meet liquidity needs, in response to or in anticipation of changes in interest rates
and resulting prepayment risk, changes in foreign currency risk, changes in funding sources or terms, and (ii) loan substitute securities which are
client financings that have been structured as after-tax investments rather than conventional loans in order to provide the clients with a
borrowing rate advantage. AFS securities are measured at fair value. Unrealized gains and losses arising from changes in fair value are included
in Other components of equity. Changes in foreign exchange rates for AFS equity securities are recognized in Other components of equity, while
changes in foreign exchange rates for AFS debt securities are recognized in Foreign exchange revenue, other than trading in Non-interest income.
When the security is sold, the cumulative gain or loss recorded in Other components of equity is included as Net gain (loss) on AFS securities in
Non-interest income. Purchase premiums or discounts on AFS debt securities are amortized over the life of the security using the effective
interest method and are recognized in Net interest income.
At each reporting date, and more frequently when conditions warrant, we evaluate our AFS securities to determine whether there is any
objective evidence of impairment. Such evidence includes: for debt instruments, when an adverse effect on future cash flows from the asset or
group of assets can be reliably estimated; for equity securities, when there is a significant or prolonged decline in the fair value of the investment
below its cost.
When assessing impairment for debt instruments we primarily consider counterparty ratings and security-specific factors, including
subordination, external ratings, and the value of any collateral held, for which there may not be a readily accessible market. Significant judgment
is required in assessing impairment as management is required to consider all available evidence in determining whether objective evidence of
impairment exists and whether the principal and interest on the AFS debt security can be fully recovered. For complex debt instruments we use
cash flow projection models which incorporate actual and projected cash flows for each security based on security specific factors using a
number of assumptions and inputs that involve management judgment, such as default, prepayment and recovery rates. Due to the subjective
nature of choosing these inputs and assumptions, the actual amount of the future cash flows and their timing may differ from the estimates used
by management and consequently may cause a different conclusion as to the recognition of impairment or measurement of impairment loss.
In assessing whether there is any objective evidence that suggests that equity securities are impaired, we consider factors which include
the length of time and extent the fair value has been below cost, along with management’s assessment of the financial condition, business and
other risks of the issuer. Management weighs all these factors to determine the impairment but to the extent that management judgment may
differ from the actual experience of the timing and amount of the recovery of the fair value, the estimate for impairment could change from period
to period based upon future events that may or may not occur, the conclusion for the impairment of the equity securities may differ.
If an AFS security is impaired, the cumulative unrealized loss previously recognized in Other components of equity is removed from equity
and recognized in Net gain (loss) on AFS securities under Non-interest income. This amount is determined as the difference between the cost/
amortized cost and current fair value of the security less any impairment loss previously recognized. Subsequent to impairment, further declines
in fair value are recorded in Non-interest income, while increases in fair value are recognized in Other components of equity until sold. For AFS
debt securities, reversal of previously recognized impairment losses is recognized in our Consolidated Statements of Income if the recovery is
objectively related to a specific event occurring after recognition of the impairment loss.
Held-to-maturity securities are debt securities where we have the intention and the ability to hold the investment until its maturity date.
These securities are initially recorded at fair value and are subsequently measured at amortized cost using the effective interest method, less any
impairment losses which we assess using the same impairment model as for loans. Interest income and amortization of premiums and discounts
on debt securities are recorded in Net interest income. For held-to-maturity securities, reversal of previously recognized impairment losses is
recognized in our Consolidated Statements of Income if the recovery is objectively related to a specific event occurring after the recognition of
the impairment loss. Reversals of impairment losses on held-to-maturity securities are recorded to a maximum of what the amortized cost of the
investment would have been before the original impairment charge. We hold an insignificant amount of held-to-maturity securities. All held-to-
maturity securities have been included with AFS securities on our Consolidated Balance Sheets.
Consolidated Financial Statements Royal Bank of Canada: Annual Report 2014 121

Note 2 Summary of significant accounting policies, estimates and judgments (continued)
We account for all of our securities using settlement date accounting and changes in fair value between the trade date and settlement date
are reflected in income for securities classified or designated as at FVTPL, and changes in the fair value of AFS securities between the trade and
settlement dates are recorded in OCI except for changes in foreign exchange rates on debt securities, which are recorded in Non-interest income.
Fair value option
A financial instrument can be designated as at FVTPL (the fair value option) on its initial recognition even if the financial instrument was not
acquired or incurred principally for the purpose of selling or repurchasing it in the near term. An instrument that is designated as at FVTPL by way
of this fair value option must have a reliably measurable fair value and satisfy one of the following criteria: (i) it eliminates or significantly
reduces a measurement or recognition inconsistency that would otherwise arise from measuring assets or liabilities, or recognizing gains and
losses on them on a different basis (an accounting mismatch); (ii) it belongs to a group of financial assets or financial liabilities or both that are
managed, evaluated, and reported to key management personnel on a fair value basis in accordance with our risk management strategy, and we
can demonstrate that significant financial risks are eliminated or significantly reduced; or (iii) there is an embedded derivative in the financial or
non-financial host contract and the derivative is not closely related to the host contract. These instruments cannot be reclassified out of the
FVTPL category while they are held or issued.
Financial assets designated as at FVTPL are recorded at fair value and any unrealized gain or loss arising due to changes in fair value is
included in Trading revenue or Non-interest income – Other. Financial liabilities designated as at FVTPL are recorded at fair value and fair value
changes attributable to changes in our own credit risk are recorded in OCI. The remaining fair value changes are recorded in Trading revenue or
Non-interest income – Other. Upon initial recognition, if we determine that presenting the effects of own credit risk changes in OCI would create
or enlarge an accounting mismatch in net income, the full fair value change in our debt designated as at FVTPL is recognized in net income.
To determine the fair value adjustments on our debt designated as at FVTPL, we calculate the present value of the instruments based on the
contractual cash flows over the term of the arrangement by using our effective funding rate at the beginning and end of the period with the
change in present value recorded in OCI, Trading revenue or Non-interest income – Other as appropriate.
Determination of fair value
The fair value of a financial instrument is the price that would be received to sell an asset or paid to transfer a liability in an orderly transaction
between market participants at the measurement date. We determine fair value by incorporating all factors that market participants would
consider in setting a price, including commonly accepted valuation approaches.
The Board of Directors provides oversight on valuation of financial instruments, primarily through the Audit Committee and Risk Committee.
The Audit Committee reviews the presentation and disclosure of financial instruments that are measured at fair value, while the Risk Committee
assesses adequacy of governance structures and control processes for valuation of these instruments.
We have established policies, procedures and controls for valuation methodologies and techniques to ensure fair value is reasonably
estimated. Major valuation processes and controls include, but are not limited to, profit and loss decomposition, independent price verification
(IPV) and model validation standards. These control processes are managed by either Finance or Group Risk Management and are independent
of the relevant businesses and their trading functions. Profit and loss decomposition is a process to explain the fair value changes of certain
positions and is performed daily for trading portfolios. All fair value instruments are subject to IPV, a process whereby trading function valuations
are verified against external market prices and other relevant market data. Market data sources include traded prices, brokers and price vendors.
We give priority to those third-party pricing services and prices having the highest and most consistent accuracy. The level of accuracy is
determined over time by comparing third-party price values to traders’ or system values, to other pricing service values and, when available, to
actual trade data. Other valuation techniques are used when a price or quote is not available. Some valuation processes use models to
determine fair value. We have a systematic and consistent approach to control model use. Valuation models are approved for use within our
model risk management framework. The framework addresses, among other things, model development standards, validation processes and
procedures, and approval authorities. Model validation ensures that a model is suitable for its intended use and sets parameters for its use. All
models are revalidated regularly.
We record valuation adjustments to appropriately reflect counterparty credit quality of our derivative portfolio, differences between the
overnight index swap (OIS) curve and London Interbank Offered Rates (LIBOR) for collateralized derivatives, funding valuation adjustments (FVA)
for uncollateralized and under-collateralized over-the-counter (OTC) derivatives, unrealized gains or losses at inception of the transaction, bid-
offer spreads and unobservable parameters. These adjustments may be subjective as they require significant judgment in the input selection,
such as probability of default and recovery rate, and are intended to arrive at fair value that is determined based on assumptions that market
participants would use in pricing the financial instrument. The realized price for a transaction may be different from its recorded value that is
previously estimated using management judgment, and may therefore impact unrealized gains and losses recognized in Non-interest income –
Trading revenue or Other.
Valuation adjustments are recorded for the credit risk of our derivative portfolios in order to arrive at their fair values. Credit valuation
adjustments (CVA) take into account our counterparties’ creditworthiness, the current and potential future mark-to-market of the transactions,
and the effects of credit mitigants such as master netting and collateral agreements. CVA amounts are derived from estimates of exposure at
default, probability of default, recovery rates on a counterparty basis, and market and credit factor correlations. Exposure at default is the
amounts of expected derivative related assets and liabilities at the time of default, estimated through modeling using underlying risk factors.
Probability of default and recovery rate are generally implied from the market prices for credit protection and credit ratings of the counterparty.
Correlation is the statistical measure of how credit and market factors may move in relation to one another. Correlation is estimated using
historical data and market data where available. CVA is calculated daily and changes are recorded in Non-interest income – Trading revenue.
In the determination of fair value of collateralized OTC derivatives using the OIS curve, our valuation approach accounts for the difference
between certain OIS rates and LIBOR for derivatives valuation as valuation adjustments.
FVA are also calculated to incorporate cost and benefit of funding in the valuation of uncollateralized and under-collateralized OTC
derivatives. Future expected cash flows of these derivatives are discounted to reflect the cost and benefit of funding the derivatives by using a
funding curve, implied volatilities and correlations as inputs.
Where required, a valuation adjustment is made to reflect the unrealized gain or loss at inception of a financial instrument contract where
the fair value of that financial instrument is not obtained from a quoted market price or cannot be evidenced by other observable market
transactions based on a valuation technique incorporating observable market data.
A bid-offer valuation adjustment is required when a financial instrument is valued at the mid-market price, instead of the bid or offer price
for asset or liability positions, respectively. The valuation adjustment takes into account the spread from the mid to either the bid or offer price.
122 Royal Bank of Canada: Annual Report 2014 Consolidated Financial Statements

Some valuation models require parameter calibration from such factors as market observed option prices. The calibration of parameters
may be sensitive to factors such as the choice of instruments or optimization methodology. A valuation adjustment is also estimated to mitigate
the uncertainties of parameter calibration.
In determining fair value, a hierarchy is used which prioritizes the inputs to valuation techniques. The fair value hierarchy gives the highest
priority to unadjusted quoted prices in active markets for identical assets or liabilities (Level 1) and the lowest priority to unobservable inputs
(Level 3). Determination of fair value based on this hierarchy requires the use of observable market data whenever available. Level 1 inputs are
unadjusted quoted prices in active markets for identical assets or liabilities that we have the ability to access at the measurement date. Level 2
inputs include quoted prices for similar assets or liabilities in active markets, quoted prices for identical or similar assets or liabilities in markets
that are not active, and model inputs that are either observable, or can be corroborated by observable market data for substantially the full term
of the assets or liabilities. Level 3 inputs are one or more inputs that are unobservable and significant to the fair value of the asset or liability.
Unobservable inputs are used to measure fair value to the extent that observable inputs are not available at the measurement date. The
availability of inputs for valuation may affect the selection of valuation techniques. The classification of a financial instrument in the hierarchy for
disclosure purposes is based upon the lowest level of input that is significant to the measurement of fair value.
Where observable prices or inputs are not available, management judgment is required to determine fair values by assessing other relevant
sources of information such as historical data, proxy information from similar transactions, and through extrapolation and interpolation
techniques. For more complex or illiquid instruments, significant judgment is required in the determination of the model used, the selection of
model inputs, and in some cases the application of valuation adjustments to the model value or quoted price for inactively traded financial
instruments, as the selection of model inputs may be subjective and the inputs may be unobservable. Unobservable inputs are inherently
uncertain as there is little or no market data available from which to determine the level at which the transaction would occur under normal
business circumstances. Appropriate parameter uncertainty and market risk valuation adjustments for such inputs and other model risk
valuation adjustments are assessed in all such instances.
Interest
Interest is recognized in Interest income and Interest expense in the Consolidated Statements of Income for all interest bearing financial
instruments using the effective interest method. The effective interest rate is the rate that discounts estimated future cash flows over the
expected life of the financial asset or liability to the net carrying amount upon initial recognition. Significant judgment is applied in determining
the effective interest rate due to uncertainty in the timing and amounts of future cash flows.
Transaction costs
Transaction costs are expensed as incurred for financial instruments classified or designated as at FVTPL. For other financial instruments,
transaction costs are capitalized on initial recognition. For financial assets and financial liabilities measured at amortized cost, capitalized
transaction costs are amortized through Net income over the estimated life of the instrument using the effective interest method. For AFS
financial assets measured at fair value that do not have fixed or determinable payments and no fixed maturity, capitalized transaction costs are
recognized in Net income when the asset is derecognized or becomes impaired.
Offsetting financial assets and financial liabilities
Financial assets and financial liabilities are offset on the balance sheet when there exists both a legally enforceable right to offset the recognized
amounts and an intention to settle on a net basis, or realize the asset and settle the liability simultaneously.
Assets purchased under reverse repurchase agreements and sold under repurchase agreements
We purchase securities under agreements to resell (reverse repurchase agreement) and take possession of these securities. Reverse repurchase
agreements are treated as collateralized lending transactions whereby we monitor the market value of the securities purchased and additional
collateral is obtained when appropriate. We have the right to liquidate the collateral held in the event of counterparty default. We also sell
securities under agreements to repurchase (repurchase agreements), which are treated as collateralized borrowing transactions. The securities
received under reverse repurchase agreements and securities delivered under repurchase agreements are not recognized on, or derecognized
from, our Consolidated Balance Sheets, respectively, unless the risks and rewards of ownership are obtained or relinquished.
Reverse repurchase agreements and repurchase agreements are carried on our Consolidated Balance Sheets at the amounts at which the
securities were initially acquired or sold, except when they are designated as at FVTPL and are recorded at fair value. Interest earned on reverse
repurchase agreements is included in Interest income, and interest incurred on repurchase agreements is included in Interest expense in our
Consolidated Statements of Income. Changes in fair value for reverse repurchase agreements and repurchase agreements designated as at FVTPL
are included in Trading revenue or Other in Non–interest income.
Derivatives
Derivatives are primarily used in sales and trading activities. Derivatives are also used to manage our exposure to interest, currency, credit and
other market risks. The most frequently used derivative products are interest rate swaps, interest rate futures, forward rate agreements, interest
rate options, foreign exchange forward contracts, cross currency swaps, foreign currency futures, foreign currency options, equity swaps and
credit derivatives. All derivative instruments are recorded on our Consolidated Balance Sheets at fair value, including those derivatives that are
embedded in financial or non-financial contracts and are not closely related to the host contracts.
When derivatives are embedded in other financial instruments or host contracts, such combinations are known as hybrid instruments with
the effect that some of the cash flows of a hybrid instrument vary in a way similar to a stand-alone derivative. If the host contract is not carried at
fair value with changes in fair value reported in our Consolidated Statements of Income, the embedded derivative is generally required to be
separated from the host contract and accounted for separately as at FVTPL if the economic characteristics and risks of the embedded derivative
are not closely related to those of the host contract. All embedded derivatives are presented on a combined basis with the host contracts
although they are separated for measurement purposes when conditions requiring separation are met.
When derivatives are used in sales and trading activities, the realized and unrealized gains and losses on these derivatives are recognized
in Trading revenue in Non-interest income. Derivatives with positive fair values are reported as Derivative assets and derivatives with negative
fair values are reported as Derivative liabilities. In accordance with our policy for offsetting financial assets and financial liabilities, the net fair
value of certain derivative assets and liabilities are reported as an asset or liability, as appropriate. Valuation adjustments are included in the fair
value of Derivative assets and Derivative liabilities. Premiums paid and premiums received are shown in Derivative assets and Derivative
liabilities, respectively.
When derivatives are used to manage our own exposures, we determine for each derivative whether hedge accounting can be applied, as
discussed in the Hedge accounting section below.
Consolidated Financial Statements Royal Bank of Canada: Annual Report 2014 123

Note 2 Summary of significant accounting policies, estimates and judgments (continued)
Hedge accounting
We use derivatives and non-derivatives in our hedging strategies to manage our exposure to interest rate, currency, credit and other market risks.
Where hedge accounting can be applied, a hedge relationship is designated and documented at inception to detail the particular risk
management objective and strategy for undertaking the hedge transaction. The documentation identifies the specific asset, liability or antici-
pated cash flows being hedged, the risk that is being hedged, the type of hedging instrument used and how effectiveness will be assessed. We
assess, both at the inception of the hedge and on an ongoing basis, whether the hedging instruments have been ‘highly effective’ in offsetting
changes in the fair value or cash flows of the hedged items. A hedge is regarded as highly effective only if the following criteria are met: (i) at
inception of the hedge and throughout its life, the hedge is expected to be highly effective in achieving offsetting changes in fair value or cash
flows attributable to the hedged risk, and (ii) actual results of the hedge are within a pre-determined range. In the case of hedging a forecast
transaction, the transaction must have a high probability of occurring and must present an exposure to variations in cash flows that could
ultimately affect the reported net profit or loss. Hedge accounting is discontinued when it is determined that the hedging instrument is no longer
effective as a hedge, the hedging instrument is terminated or sold, upon the sale or early termination of the hedged item, or when the forecast
transaction is no longer deemed highly probable. Refer to Note 8 for the fair value of derivatives and non-derivative instruments categorized by
their hedging relationships, as well as derivatives that are not designated in hedging relationships.
Fair value hedges
In a fair value hedging relationship, the carrying value of the hedged item is adjusted for changes in fair value attributable to the hedged risk and
recognized in Non-interest income. Changes in fair value of the hedged item, to the extent that the hedging relationship is effective, are offset by
changes in the fair value of the hedging derivative, which are also recognized in Non-interest income. When hedge accounting is discontinued,
the carrying value of the hedged item is no longer adjusted and the cumulative fair value adjustments to the carrying value of the hedged items
are amortized to Net income over the remaining life of the hedged items.
We predominantly use interest rate swaps to hedge our exposure to changes in a fixed interest rate instrument’s fair value caused by
changes in interest rates.
Cash flow hedges
In a cash flow hedging relationship, the effective portion of the change in the fair value of the hedging derivative, net of taxes, is recognized in
OCI while the ineffective portion is recognized in Non-interest income. When hedge accounting is discontinued, the cumulative amounts
previously recognized in Other components of equity are reclassified to Net interest income during the periods when the variability in the cash
flows of the hedged item affects Net interest income. Unrealized gains and losses on derivatives are reclassified immediately to Net income
when the hedged item is sold or terminated early, or when the forecast transaction is no longer expected to occur.
We predominantly use interest rate swaps to hedge the variability in cash flows related to a variable-rate asset or liability.
Net investment hedges
In hedging a foreign currency exposure of a net investment in a foreign operation, the effective portion of foreign exchange gains and losses on
the hedging instruments, net of applicable taxes, is recognized in OCI and the ineffective portion is recognized in Non-interest income. The
amounts, or a portion thereof, previously recognized in Other components of equity are recognized in Net income on the disposal, or partial
disposal, of the foreign operation.
We use foreign exchange contracts and foreign currency-denominated liabilities to manage our foreign currency exposures to net invest-
ments in foreign operations having a functional currency other than the Canadian dollar.
Loans
Loans are non-derivative financial assets with fixed or determinable payments that are not quoted in an active market and which are not
classified as AFS. Loans are initially recognized at fair value. When loans are issued at a market rate, fair value is represented by the cash
advanced to the borrowers. Loans are subsequently measured at amortized cost using the effective interest method less impairment, unless we
intend to sell them in the near future upon origination or they have been designated as at FVTPL, in which case they are carried at fair value.
We assess at each balance sheet date whether there is objective evidence that the loans are impaired. Evidence of impairment may include
indications that the borrower is experiencing significant financial difficulty, probability of bankruptcy or other financial reorganization, as well as
a measurable decrease in the estimated future cash flows evidenced by the adverse changes in the payments status of the borrower or economic
conditions that correlate with defaults. Whenever a payment is 90 days past due, loans other than credit card balances and loans guaranteed or
insured by a Canadian government (Federal or Provincial) or a Canadian government agency (collectively, Canadian government) are classified as
impaired unless they are fully secured and collection efforts are reasonably expected to result in repayment of debt within 180 days of the loans
becoming past due. Loans guaranteed by a Canadian government are classified as impaired when the loan is contractually 365 days in arrears.
Credit card balances are written off when a payment is 180 days in arrears.
Assets acquired to satisfy loan commitments are recorded at their fair value less costs to sell. Fair value is determined based on either
current market value where available or discounted cash flows. Any excess of the carrying value of the loan over the fair value of the assets
acquired is recognized by a charge to Provision for credit losses.
Interest on loans is recognized in Interest income – Loans using the effective interest method. The estimated future cash flows used in this
calculation include those determined by the contractual term of the asset, all fees that are considered to be integral to the effective interest rate,
transaction costs and all other premium or discounts. Fees that relate to activities such as originating, restructuring or renegotiating loans are
deferred and recognized as Interest income over the expected term of such loans using the effective interest method. Where there is a
reasonable expectation that a loan will result, commitment and standby fees are also recognized as interest income over the expected term of
the resulting loans using the effective interest method. Otherwise, such fees are recorded as other liabilities and amortized into Non-interest
income over the commitment or standby period. Prepayment fees on mortgage loans are not included as part of the effective interest rate at
origination as the amounts are not reliably measurable. If prepayment fees are received on a renewal of a mortgage loan, the fee is included as
part of the effective interest rate, and if not renewed, the prepayment fee is recognized in interest income at the prepayment date.
124 Royal Bank of Canada: Annual Report 2014 Consolidated Financial Statements

Allowance for credit losses
An allowance for credit losses is established if there is objective evidence that we will be unable to collect all amounts due on our loans portfolio
according to the original contractual terms or the equivalent value. This portfolio includes on-balance sheet exposures, such as loans and
acceptances, and off-balance sheet items such as letters of credit, guarantees and unfunded commitments.
The allowance for credit losses is increased by the impairment losses recognized and decreased by the amount of write-offs, net of
recoveries. The allowance for credit losses for on-balance sheet items is included as a reduction to assets, and the allowance for credit losses
relating to off-balance sheet items is included in Provisions under Other Liabilities.
We assess whether objective evidence of impairment exists individually for loans that are individually significant and collectively for loans
that are not individually significant. If we determine that no objective evidence of impairment exists for an individually assessed loan, whether
significant or not, the loan is included in a group of loans with similar credit risk characteristics and collectively assessed for impairment. Loans
that are individually assessed for impairment and for which an impairment loss is recognized are not included in a collective assessment of
impairment.
Allowance for credit losses represent management’s best estimates of losses incurred in our loan portfolio at the balance sheet date.
Management’s judgment is required in making assumptions and estimations when calculating allowances on both individually and collectively
assessed loans. The underlying assumptions and estimates used for both individually and collectively assessed loans can change from period to
period and may significantly affect our results of operations.
Individually assessed loans
Loans which are individually significant are assessed individually for objective indicators of impairment. A loan is considered impaired when
management determines that it will not be able to collect all amounts due according to the original contractual terms or the equivalent value.
Credit exposures of individually significant loans are evaluated based on factors including the borrower’s overall financial condition,
resources and payment record, and where applicable, the realizable value of any collateral. If there is evidence of impairment leading to an
impairment loss, then the amount of the loss is determined as the difference between the carrying amount of the loan, including accrued
interest, and the estimated recoverable amount. The estimated recoverable amount is measured as the present value of expected future cash
flows discounted at the loan’s original effective interest rate, including cash flows that may result from the realization of collateral less costs to
sell. Individually-assessed impairment losses reduce the carrying amount of the loan through the use of an allowance account and the amount of
the loss is recognized in Provision for credit losses in our Consolidated Statements of Income. Following impairment, interest income is
recognized on the unwinding of the discount from the initial recognition of impairment.
Significant judgment is required in assessing evidence of impairment and estimation of the amount and timing of future cash flows when
determining the impairment loss. When assessing objective evidence of impairment we primarily consider specific factors such as the financial
condition of the borrower, borrower’s default or delinquency in interest or principal payments, local economic conditions and other observable
data. In determining the estimated recoverable amount we consider discounted expected future cash flows at the effective interest rate using a
number of assumptions and inputs. Management judgment is involved when choosing these inputs and assumptions used such as the expected
amount of the loan that will not be recovered and the cost of time delays in collecting principal and/or interest, and when estimating the value of
any collateral held for which there may not be a readily accessible market. Changes in the amount expected to be recovered would have a direct
impact on the Provision for credit losses and may result in a change in the Allowance for credit losses
Collectively assessed loans
Loans which are not individually significant, or which are individually assessed and not determined to be impaired, are collectively assessed for
impairment. For the purposes of a collective evaluation of impairment, loans are grouped on the basis of similar risk characteristics, taking into
account loan type, industry, geographic location, collateral type, past due status and other relevant factors.
The collective impairment allowance is determined by reviewing factors including: (i) historical loss experience, which takes into
consideration historical probabilities of default, loss given default and exposure at default, in portfolios of similar credit risk characteristics, and
(ii) management’s judgment on the level of impairment losses based on historical experience relative to the actual level as reported at the
balance sheet date, taking into consideration the current portfolio credit quality trends, business and economic and credit conditions, the impact
of policy and process changes, and other supporting factors. Future cash flows for a group of loans are collectively evaluated for impairment on
the basis of the contractual cash flows of the loans in the group and historical loss experience for loans with credit risk characteristics similar to
those in the group. Historical loss experience is adjusted based on current observable data to reflect the effects of current conditions that did not
affect the period on which the historical loss experience is based and to remove the effects of conditions in the historical period that do not
currently exist. The methodology and assumptions used for estimating future cash flows are reviewed regularly to reduce any differences
between loss estimates and actual loss experience. Collectively-assessed impairment losses reduce the carrying amount of the aggregated loan
position through an allowance account and the amount of the loss is recognized in Provision for credit losses. Following impairment, interest
income is recognized on the unwinding of the discount from the initial recognition of impairment.
The methodology and assumptions used to calculate collective impairment allowances are subject to uncertainty, in part because it is not
practicable to identify losses on an individual loan basis due to the large number of individually insignificant loans in the portfolio. Significant
judgment is required in assessing historical loss experience, the loss identification period and its relationship to current portfolios including
delinquency, and loan balances; and current business, economic and credit conditions including industry specific performance, unemployment
and country risks. Changes in these assumptions would have a direct impact on the Provision for credit losses and may result in changes in the
related Allowance for credit losses.
Write-off of loans
Loans and the related impairment allowance for credit losses are written off, either partially or in full, when there is no realistic prospect of
recovery. Where loans are secured, they are generally written off after receipt of any proceeds from the realization of the collateral. In
circumstances where the net realizable value of any collateral has been determined and there is no reasonable expectation of further recovery,
write off may be earlier. For credit cards, the balances and related allowance for credit losses are written off when payment is 180 days in arrears.
Personal loans are generally written off at 150 days past due.
Derecognition of financial assets
Our various securitization activities generally consist of the transfer of financial assets such as loans or packaged mortgage-backed securities
(MBS) to independent structured entities or trusts that issue securities to investors.
Consolidated Financial Statements Royal Bank of Canada: Annual Report 2014 125

Note 2 Summary of significant accounting policies, estimates and judgments (continued)
Financial assets are derecognized from our Consolidated Balance Sheets when our contractual rights to the cash flows from the assets have
expired, when we retain the rights to receive the cash flows of the assets but assume an obligation to pay those cash flows to a third party
subject to certain pass-through requirements or when we transfer our contractual rights to receive the cash flows and substantially all of the risk
and rewards of the assets have been transferred. When we retain substantially all of the risks and rewards of the transferred assets, the trans-
ferred assets are not derecognized from our Consolidated Balance Sheets and are accounted for as secured financing transactions. When we
neither retain nor transfer substantially all risks and rewards of ownership of the assets, we derecognize the assets if control over the assets is
relinquished. If we retain control over the transferred assets, we continue to recognize the transferred assets to the extent of our continuing
involvement.
Management’s judgment is applied in determining whether the contractual rights to the cash flows from the transferred assets have expired
or whether we retain the rights to receive cash flows on the assets but assume an obligation to pay for those cash flows. We derecognize
transferred financial assets if we transfer substantially all the risk and rewards of the ownership in the assets. When assessing whether we have
transferred substantially all of the risk and rewards of the transferred assets, management considers the entity exposure before and after the
transfer with the variability in the amount and timing of the net cash flows of the transferred assets. In transfers that we retain the servicing
rights, management has applied judgment in assessing the benefits of servicing against market expectations. When the benefits of servicing are
greater than fair market value, a servicing asset is recognized in Other assets in our Consolidated Balance Sheets. When the benefits of servicing
are less than fair market value, a servicing liability is recognized in Other liabilities in our Consolidated Balance Sheets.
Derecognition of financial liabilities
We derecognize a financial liability from our Consolidated Balance Sheets when our obligation specified in the contract expires, or is discharged
or cancelled. We recognize the difference between the carrying amount of a financial liability transferred and the consideration paid in our
Consolidated Statements of Income.
Guarantees
Financial guarantee contracts are contracts that contingently require us to make specified payments (in cash, other assets, our own shares or
provision of services) to reimburse the holder for a loss it incurs because a specified debtor fails to make payment when due in accordance with
the original or modified terms of a debt instrument. Liabilities are recognized on our Consolidated Balance Sheets at the inception of a guarantee
for the fair value of the obligation undertaken in issuing the guarantee. Financial guarantees are subsequently remeasured at the higher of (i) the
amount initially recognized and (ii) our best estimate of the present value of the expenditure required to settle the present obligation at the end
of the reporting period.
If the financial guarantee contract meets the definition of a derivative, it is measured at fair value at each balance sheet date and reported
under Derivatives on our Consolidated Balance Sheets.
Insurance and segregated funds
Premiums from long-duration contracts, primarily life insurance, are recognized when due in Non-interest income – Insurance premiums,
investment and fee income. Premiums from short-duration contracts, primarily property and casualty, and fees for administrative services are
recognized in Insurance premiums, investment and fee income over the related contract period. Unearned premiums of the short-duration
contracts, representing the unexpired portion of premiums, are reported in Other liabilities. Investments made by our insurance operations are
classified as AFS or loans and receivables, except for investments supporting the policy benefit liabilities on life and health insurance contracts
and a portion of property and casualty contracts. These are designated as at FVTPL with changes in fair value reported in Insurance premiums,
investment and fee income.
Insurance claims and policy benefit liabilities represent current claims and estimates for future insurance policy benefits. Liabilities for life
insurance contracts are determined using the Canadian Asset Liability Method (CALM), which incorporates assumptions for mortality, morbidity,
policy lapses and surrenders, investment yields, policy dividends, operating and policy maintenance expenses, and provisions for adverse
deviation. These assumptions are reviewed at least annually and updated in response to actual experience and market conditions. Liabilities for
property and casualty insurance represent estimated provisions for reported and unreported claims. Liabilities for life and property and casualty
insurance are included in Insurance claims and policy benefit liabilities. Changes in Insurance claims and policy benefit liabilities are included in
the Insurance policyholder benefits, claims and acquisition expense in our Consolidated Statements of Income in the period in which the
estimates change.
Premiums ceded for reinsurance and reinsurance recoveries on policyholder benefits and claims incurred are reported in income and
expense as appropriate. Reinsurance recoverables, which relate to paid benefits and unpaid claims, are included in Other assets.
Acquisition costs for new insurance business consist of commissions, premium taxes, certain underwriting costs and other costs that vary
with the acquisition of new business. Deferred acquisition costs for life insurance products are implicitly recognized in Insurance claims and
policy benefit liabilities by CALM. For property and casualty insurance, these costs are classified as Other assets and amortized over the
policy term.
Segregated funds are lines of business in which we issue an insurance contract where the benefit amount is directly linked to the market
value of the investments held in the underlying fund. The contractual arrangement is such that the underlying segregated fund assets are
registered in our name but the segregated fund policyholders bear the risks and rewards of the funds’ investment performance. Liabilities for
these contracts are calculated based on contractual obligations using actuarial assumptions and are at least equivalent to the surrender or
transfer value calculated by reference to the value of the relevant underlying funds or indices. Segregated funds’ assets and liabilities are
separately presented on our Consolidated Balance Sheets. As the segregated fund policyholders bear the risks and rewards of the funds’
performance, investment income earned by the segregated funds and expenses incurred by the segregated funds are offset and are not
separately presented in our Consolidated Statements of Income. Fee income we earn from segregated funds includes management fees,
mortality, policy administration and surrender charges, and these fees are recorded in Non-interest income – Insurance premiums, investment
and fee income. We provide minimum death benefit and maturity value guarantees on segregated funds. The liability associated with these
minimum guarantees is recorded in Insurance claims and policy benefit liabilities.
Liability adequacy tests are performed for all insurance contract portfolios at each balance sheet date to ensure the adequacy of insurance
contract liabilities. Current best estimates of future contractual cash flows, claims handling and administration costs, and investment returns
from the assets backing the liabilities are taken into account in the tests. When the test results indicate that there is a deficiency in liabilities, the
deficiency is charged immediately to our Consolidated Statements of Income by writing down the deferred acquisition costs in Other assets
and/or increasing Insurance claims and policy benefit liabilities.
126 Royal Bank of Canada: Annual Report 2014 Consolidated Financial Statements

Employee benefits – Pensions and other post-employment benefits
Our defined benefit pension expense, which is included in Non-interest expense – Human resources, consists of the cost of employee pension
benefits for the current year’s service, net interest on the net defined benefit liability (asset), past service cost and gains or losses on settlement.
Remeasurements of the net defined benefit liability, which comprise actuarial gains and losses and return on plan assets (excluding amounts
included in net interest on the net defined benefit liability), are recognized immediately in OCI in the period in which they occur. Actuarial gains
and losses comprise experience adjustments (the effects of differences between the previous actuarial assumptions and what has actually
occurred), as well as the effects of changes in actuarial assumptions. Past service cost is the change in the present value of the defined benefit
obligation resulting from a plan amendment or curtailment and is charged immediately to income.
For each defined benefit plan, we recognize the present value of our defined benefit obligations less the fair value of the plan assets, as a
defined benefit liability reported in Employee benefit liabilities on our Consolidated Balance Sheets. For plans where there is a net defined
benefit asset, the amount is reported as an asset in Employee benefit assets on our Consolidated Balance sheets.
The calculation of defined benefit expenses and obligations requires significant judgment as the recognition is dependent on discount rates
and various actuarial assumptions such as healthcare cost trend rates, projected salary increases, retirement age, and mortality and termination
rates. Due to the long-term nature of these plans, such estimates and assumptions are subject to inherent risks and uncertainties. For our
pension and other post-employment plans, the discount rate is determined by reference to market yields on high quality corporate bonds. Since
the discount rate is based on currently available yields, and involves management’s assessment of market liquidity, it is only a proxy for future
yields. Actuarial assumptions, set in accordance with current practices in the respective countries of our plans, may differ from actual experience
as country specific statistics is only an estimate for future employee behaviour. These assumptions are determined by management and are
reviewed by actuaries at least annually. Changes to any of the above assumptions may affect the amounts of benefits obligations, expenses and
remeasurements that we recognize.
Our contributions to defined contribution plans are expensed when employees have rendered services in exchange for such contributions.
Defined contribution plan expense is included in Non-interest expense – Human resources.
Share–based compensation
We offer share-based compensation plans to certain key employees and to our non-employee directors.
To account for stock options granted to employees, compensation expense is recognized over the applicable vesting period with a
corresponding increase in equity. Fair value is determined by using option valuation models, which take into account the exercise price of the
option, the current share price, the risk free interest rate, the expected volatility of the share price over the life of the option and other relevant
factors. When the options are exercised, the exercise price proceeds together with the amount initially recorded in equity are credited to common
shares. Our other compensation plans include performance deferred share plans and deferred share unit plans for key employees (the Plans).
The obligations for the Plans are accrued over their vesting periods. The Plans are settled in cash.
For cash-settled awards, our accrued obligations are adjusted to their fair value at each balance sheet date. For share-settled awards, our
accrued obligations are based on the fair value of our common shares at the date of grant. Changes in our obligations, net of related hedges, are
recorded as Non-interest expense – Human resources in our Consolidated Statements of Income with a corresponding increase in Other
liabilities for cash-settled awards and in Retained earnings for share-settled awards.
The compensation cost attributable to options and awards granted to employees who are eligible to retire or will become eligible to retire
during the vesting period, is recognized immediately if the employee is eligible to retire on the grant date or over the period between the grant
date and the date the employee becomes eligible to retire.
Our contributions to the employee savings and share ownership plans are expensed as incurred.
Income taxes
Income tax comprises current tax and deferred tax and is recognized in our Consolidated Statements of Income except to the extent that it relates
to items recognized directly in equity, in which case it is recognized in equity.
Current income tax payable on profits is recognized as an expense based on the applicable tax laws in each jurisdiction in the period in
which profits arise, calculated using tax rates enacted or substantively enacted by the balance sheet date. Deferred tax is recognized on
temporary differences between the carrying amounts of assets and liabilities for accounting purposes compared with tax purposes. A deferred
income tax asset or liability is determined for each temporary difference, except for earnings related to our subsidiaries, branches, associates
and interests in joint ventures where the temporary differences will not reverse in the foreseeable future and we have the ability to control the
timing of reversal. Deferred tax assets and liabilities are determined based on the tax rates that are expected to be in effect in the period that the
asset is realized or the liability is settled, based on tax rates and tax laws that have been enacted or substantively enacted at the balance sheet
date. Current tax assets and liabilities are offset when they are levied by the same taxation authority on either the same taxable entity or different
taxable entities within the same tax reporting group (which intends to settle on a net basis), and when there is a legal right to offset. Deferred tax
assets and liabilities are offset when the same conditions are satisfied. Our Consolidated Statements of Income include items that are non-
taxable or non-deductible for income tax purposes and, accordingly, this causes the income tax provision to be different from what it would be if
based on statutory rates.
Deferred income taxes accumulated as a result of temporary differences and tax loss carryfowards are included in Other assets and Other
liabilities. On a quarterly basis, we review our deferred income tax assets to determine whether it is probable that the benefits associated with
these assets will be realized; this review involves evaluating both positive and negative evidence.
We are subject to income tax laws in various jurisdictions where we operate, and the complex tax laws are potentially subject to different
interpretations by us and the relevant taxation authorities. Significant judgment is required in the interpretation of the relevant tax laws, and the
determination of our tax provision which includes our best estimate of tax positions that are under audit or appeal by relevant taxation
authorities. We perform a review on a quarterly basis to incorporate our best assessment based on information available, but additional liability
and income tax expense could result based on decisions made by the relevant tax authorities.
The determination of our deferred tax asset or liability also requires significant management judgment as the recognition is dependant on
our projection of future taxable profits and tax rates that are expected to be in effect in the period the asset is realized or the liability is settled.
Any changes in our projection will result in changes in deferred tax assets or liabilities on our Consolidated Balance Sheets, and also deferred tax
expense in our Consolidated Statements of Income.
Consolidated Financial Statements Royal Bank of Canada: Annual Report 2014 127

Note 2 Summary of significant accounting policies, estimates and judgments (continued)
Business combinations, goodwill and other intangibles
All business combinations are accounted for using the acquisition method. Non-controlling interests, if any, are recognized at their proportionate
share of the fair value of identifiable assets and liabilities, unless otherwise indicated. Identifiable intangible assets are recognized separately
from goodwill and included in Other intangibles. Goodwill represents the excess of the price paid for the business acquired over the fair value of
the net identifiable assets acquired on the date of acquisition.
Goodwill
Goodwill is allocated to cash-generating units or groups of cash-generating units (CGU) for the purpose of impairment testing, which is
undertaken at the lowest level at which goodwill is monitored for internal management purposes. Impairment testing is performed annually as at
August 1, or more frequently if there are objective indicators of impairment, by comparing the recoverable amount of a CGU with its carrying
amount. The recoverable amount of a CGU is the higher of its value in use and its fair value less costs of disposal. Value in use is the present
value of the expected future cash flows from a CGU. Fair value less costs of disposal is the amount obtainable from the sale of a CGU in an
orderly transaction between market participants, less disposal costs. The fair value of a CGU is estimated using valuation techniques such as a
discounted cash flow method, adjusted to reflect the considerations of a prospective third-party buyer. External evidence such as binding sale
agreements or recent transactions for similar businesses within the same industry is considered to the extent that it is available.
Significant judgment is involved in estimating the model inputs used to determine the recoverable amount of our CGU, in particular future
cash flows, discount rates and terminal growth rates, due to the uncertainty in the timing and amount of cash flows and the forward-looking
nature of these inputs. Future cash flows are based on financial plans agreed by management which are estimated based on forecast results,
business initiatives, planned capital investments and returns to shareholders. Discount rates are based on the bank-wide cost of capital,
adjusted for CGU-specific risks and currency exposure as reflected by differences in expected inflation. Bank-wide cost of capital is based on the
Capital Asset Pricing Model. CGU-specific risks include country risk, business/operational risk, geographic risk (including political risk,
devaluation risk, and government regulation), currency risk, and price risk (including product pricing risk and inflation). Terminal growth rates
reflect the expected long-term gross domestic product growth and inflation for the countries within which the CGU operates. Changes in these
assumptions may impact the amount of impairment loss recognized in Non-interest expense.
The carrying amount of a CGU includes the carrying amount of assets, liabilities and goodwill allocated to the CGU. If the recoverable
amount is less than the carrying value, the impairment loss is allocated first to reduce the carrying amount of any goodwill allocated to the CGU
and then to the other non-financial assets of the CGU proportionately based on the carrying amount of each asset. Any impairment loss is
charged to income in the period in which the impairment is identified. Goodwill is stated at cost less accumulated impairment losses.
Subsequent reversals of goodwill impairment are prohibited.
Upon disposal of a portion of a CGU, the carrying amount of goodwill relating to the portion of the CGU sold is included in the determination
of gains or losses on disposal. The carrying amount is determined based on the relative fair value of the disposed portion to the total CGU.
Other intangibles
Intangible assets represent identifiable non-monetary assets and are acquired either separately or through a business combination, or generated
internally. Intangible assets acquired through a business combination are recognized separately from goodwill when they are separable or arise
from contractual or other legal rights, and their fair value can be measured reliably. The cost of a separately acquired intangible asset includes its
purchase price and directly attributable costs of preparing the asset for its intended use. In respect of internally generated intangible assets, cost
includes all directly attributable costs necessary to create, produce, and prepare the asset to be capable of operating in the manner intended by
management. Research and development costs that are not eligible for capitalization are expensed. After initial recognition, an intangible asset
is carried at its cost less any accumulated amortization and accumulated impairment losses, if any. Intangible assets with a finite-life are
amortized on a straight-line basis over their estimated useful lives as follows: computer software – 3 to 10 years; and customer relationships –
10 to 20 years. We do not have any intangible assets with indefinite lives.
Intangible assets are assessed for indicators of impairment at each reporting period. If there is an indication that an intangible asset may be
impaired, an impairment test is performed by comparing the carrying amount of the intangible asset to its recoverable amount. Where it is not
possible to estimate the recoverable amount of an individual asset, we estimate the recoverable amount of the CGU to which the asset belongs.
If the recoverable amount of the asset (or CGU) is less than its carrying amount, the carrying amount of the intangible asset is written down to its
recoverable amount as an impairment loss.
An impairment loss recognized previously is reversed if there is a change in the estimates used to determine the recoverable amount of the
asset (or CGU) since the last impairment loss was recognized. If an impairment loss is subsequently reversed, the carrying amount of the asset
(or CGU) is revised to the lower of its recoverable amount and the carrying amount that would have been determined (net of amortization) had
there been no prior impairment.
Due to the subjective nature of these estimates, significant judgment is required in determining the useful lives and recoverable amounts of
our intangible assets, and assessing whether certain events or circumstances constitute objective evidence of impairment. Estimates of the
recoverable amounts of our intangible assets rely on certain key inputs, including future cash flows and discount rates. Future cash flows are
based on sales projections and allocated costs which are estimated based on forecast results and business initiatives. Discount rates are based
on the bank-wide cost of capital, adjusted for asset-specific risks. Changes in these assumptions may impact the amount of impairment loss
recognized in Non-interest expense.
Other
Translation of foreign currencies
Monetary assets and liabilities denominated in foreign currencies, are translated into Canadian dollars at rates prevailing at the balance sheet
date. Foreign exchange gains and losses resulting from the translation and settlement of these items are recognized in Non-interest income in
the Consolidated Statements of Income.
Non-monetary assets and liabilities that are measured at historical cost are translated into Canadian dollars at historical rates. Non-
monetary financial assets classified as AFS securities, such as equity instruments, that are measured at fair value are translated into Canadian
dollars at rates prevailing at the balance sheet date, and the resulting foreign exchange gains and losses are recorded in Other components of
equity until the asset is sold or becomes impaired.
Assets and liabilities of our foreign operations with functional currencies other than Canadian dollars are translated into Canadian dollars at
rates prevailing at the balance sheet date, and income and expenses of these foreign operations are translated at average rates of exchange for
the reporting period.
128 Royal Bank of Canada: Annual Report 2014 Consolidated Financial Statements

Unrealized gains or losses arising as a result of the translation of our foreign operations along with the effective portion of related hedges
are reported in Other components of equity on an after-tax basis. Upon disposal or partial disposal of a foreign operation, an appropriate portion
of the accumulated net translation gains or losses is included in Non-interest income.
Premises and equipment
Premises and equipment includes land, buildings, leasehold improvements, computer equipment, furniture, fixtures and other equipment, and
are stated at cost less accumulated depreciation and accumulated impairment losses. Cost comprises the purchase price, any costs directly
attributable to bringing the asset to the location and condition necessary for its intended use, and the initial estimate of any disposal costs.
Depreciation is recorded principally on a straight–line basis over the estimated useful lives of the assets, which are 25 to 50 years for buildings,
3 to 10 years for computer equipment, and 7 to 10 years for furniture, fixtures and other equipment. The amortization period for leasehold
improvements is the lesser of the useful life of the leasehold improvements or the lease term plus the first renewal period, if reasonably assured
of renewal, up to a maximum of 10 years. Land is not depreciated. Gains and losses on disposal are recorded in Non–interest income.
Premises and equipment are assessed for indicators of impairment at each reporting period. If there is an indication that an asset may be
impaired, an impairment test is performed by comparing the asset’s carrying amount to its recoverable amount. Where it is not possible to
estimate the recoverable amount of an individual asset, we estimate the recoverable amount of the CGU to which the asset belongs and test for
impairment at the CGU level. An impairment charge is recorded to the extent the recoverable amount of an asset (or CGU), which is the higher of
value in use and fair value less costs of disposal, is less than its carrying amount. Value in use is the present value of the future cash flows
expected to be derived from the asset (or CGU). Fair value less costs of disposal is the amount obtainable from the sale of the asset (or CGU) in
an orderly transaction between market participants, less costs of disposal.
After the recognition of impairment, the depreciation charge is adjusted in future periods to reflect the asset’s revised carrying amount. If an
impairment is later reversed, the carrying amount of the asset is revised to the lower of the asset’s recoverable amount and the carrying amount
that would have been determined (net of depreciation) had there been no prior impairment loss. The depreciation charge in future periods is
adjusted to reflect the revised carrying amount.
Provisions
Provisions are liabilities of uncertain timing or amount and are recognized when we have a present legal or constructive obligation as a result of a
past event, it is probable that an outflow of resources will be required to settle the obligation, and a reliable estimate can be made of the amount
of the obligation. Provisions are measured as the best estimate of the consideration required to settle the present obligation at the reporting
date. Significant judgment is required in determining whether a present obligation exists and in estimating the probability, timing and amount of
any outflows. We record provisions related to litigation, asset retirement obligations, and the allowance for off-balance sheet and other items.
Provisions are recorded under Other liabilities on our Consolidated Balance Sheets.
We are required to estimate the results of ongoing legal proceedings, expenses to be incurred to dispose of capital assets, and credit losses
on undrawn commitments and guarantees. The forward-looking nature of these estimates requires us to use a significant amount of judgment in
projecting the timing and amount of future cash flows. We record our provisions on the basis of all available information at the end of the
reporting period and make adjustments on a quarterly basis to reflect current expectations. Should actual results differ from our expectations, we
may incur expenses in excess of the provisions recognized.
When some or all of the economic benefits required to settle a provision are expected to be recovered from a third party, such as an insurer,
a separate asset is recognized if it is virtually certain that reimbursement will be received.
Commissions and fees
Portfolio management and other management advisory and service fees are recognized based on the applicable service contracts. Fees related
to provision of services including asset management, wealth management, financial planning and custody services that cover a specified service
period, are recognized over the period in which the service is provided. Fees such as underwriting fees and brokerage fees that are related to the
provision of specific transaction type services are recognized when the service has been completed.
Dividend income
Dividend income is recognized when the right to receive payment is established. This is the ex-dividend date for listed equity securities, and
usually the date when shareholders have approved the dividend for unlisted equity securities.
Leasing
A lease is an agreement whereby the lessor conveys to the lessee the right to use an asset for an agreed upon period of time in return for a
payment or series of payments. A finance lease is a lease that transfers substantially all the risks and rewards incidental to ownership of the
leased asset to the lessee, where title may or may not eventually be transferred. An operating lease is a lease other than a finance lease.
Operating leases
When we are the lessee in an operating lease, we record rental payments on a straight-line basis over the lease term in Non-interest expense.
Finance leases
When we are the lessee in a finance lease, we initially record both the leased asset and the related lease obligation in Premises and equipment,
Other intangibles and Other liabilities on our Consolidated Balance Sheets at an amount equal to the fair value of the leased asset or, if lower,
the present value of the minimum lease payments, each determined at the date of inception of the lease. Initial direct costs directly attributed to
the lease are recognized as an asset under the finance lease.
Earnings per share
Earnings per share is computed by dividing Net income available to common shareholders by the weighted average number of common shares
outstanding for the period. Net income available to common shareholders is determined after deducting dividend entitlements of preferred
shareholders, any gain (loss) on redemption of preferred shares net of related income taxes and the net income attributable to non-controlling
interests.
Diluted earnings per share reflects the potential dilution that could occur if additional common shares are assumed to be issued under
securities or contracts that entitle their holders to obtain common shares in the future, to the extent such entitlement is not subject to
unresolved contingencies. For contracts that may be settled in cash or in common shares at our option, diluted earnings per share is calculated
based on the assumption that such contracts will be settled in shares. Income and expenses associated with these types of contracts are
Consolidated Financial Statements Royal Bank of Canada: Annual Report 2014 129

Note 2 Summary of significant accounting policies, estimates and judgments (continued)
excluded from the Net income available to common shareholders, and the additional number of shares that would be issued is included in the
diluted earnings per share calculation. These contracts include our convertible Preferred Shares and Trust Capital Securities. For stock options
whose exercise price is less than the average market price of our common shares, they are assumed to be exercised and the proceeds are used
to repurchase common shares at the average market price for the period. The incremental number of common shares issued under stock options
and repurchased from proceeds is included in the calculation of diluted earnings per share.
Share capital
We classify a financial instrument that we issue as a financial asset, financial liability or an equity instrument in accordance with the substance
of the contractual arrangement.
Our common shares held by us are classified as treasury shares in equity and accounted for at weighted average cost. Upon the sale of
treasury shares, the difference between the sale proceeds and the cost of the shares is recognized in Retained earnings. Financial instruments
issued by us are classified as equity instruments when there is no contractual obligation to transfer cash or other financial assets. Incremental
costs directly attributable to the issue of equity instruments are included in equity as a deduction from the proceeds, net of tax. Financial
instruments that will be settled by a variable number of our common shares upon their conversion by the holders as well as the related accrued
distributions are classified as liabilities on our Consolidated Balance Sheets. Dividends and yield distributions on these instruments are
classified as Interest expense in our Consolidated Statements of Income.
Future changes in accounting policy and disclosure
We are currently assessing the impact of adopting the following standards on our consolidated financial statements:
IAS 32 Financial Instruments: Presentation (IAS 32)
In December 2011, the IASB issued amendments to IAS 32 which clarify the existing requirements for offsetting financial assets and financial
liabilities. The amendments will be effective for us on November 1, 2014. The adoption of these amendments is not expected to have a material
impact on our consolidated financial statements.
IFRS Interpretations Committee Interpretation 21 Levies (IFRIC 21)
In May 2013, the IASB issued IFRIC 21 which provides guidance on when to recognize a liability to pay a levy that is accounted for in accordance
with IAS 37 Provisions, Contingent Liabilities and Contingent Assets. It also addresses the accounting for a liability to pay a levy whose timing
and amount is certain. The Interpretation clarifies that the obligating event that gives rise to a liability to pay a levy is the activity described in the
relevant legislation that triggers the payment of the levy. IFRIC 21 will be effective for us on November 1, 2014. The adoption of this interpretation
is not expected to have a material impact on our consolidated financial statements.
IFRS 15 Revenue from Contracts with Customers (IFRS 15)
In May 2014, the IASB issued IFRS 15 which establishes principles for reporting about the nature, amount, timing and uncertainty of revenue and
cash flows arising from an entity’s contracts with customers. The standard provides a single, principles based five-step model for revenue
recognition to be applied to all contracts with customers. IFRS 15 will be effective for us on November 1, 2017.
IFRS 9 Financial Instruments
In July 2014, the IASB issued the complete version of IFRS 9, first issued in November 2009, which brings together the classification and
measurement, impairment and hedge accounting phases of the IASB’s project to replace IAS 39.
IFRS 9 introduces a principles-based approach to the classification of financial assets based on an entity’s business model and the nature
of the cash flows of the asset. All financial assets, including hybrid contracts, are measured as at FVTPL, fair value through OCI or amortized cost.
For financial liabilities, IFRS 9 includes the requirements for classification and measurement previously included in IAS 39.
IFRS 9 also introduces an expected loss impairment model for all financial assets not as at FVTPL. The model has three stages: (1) on initial
recognition, 12-month expected credit losses are recognized in profit or loss and a loss allowance is established; (2) if credit risk increases
significantly and the resulting credit risk is not considered to be low, full lifetime expected credit losses are recognized; and (3) when a financial
asset is considered credit-impaired, interest revenue is calculated based on the carrying amount of the asset, net of the loss allowance, rather
than its gross carrying amount.
Finally, IFRS 9 introduces a new hedge accounting model that aligns the accounting for hedge relationships more closely with an entity’s
risk management activities.
We adopted the own credit provisions of IFRS 9 in the second quarter of this year. The remaining sections of IFRS 9 will be effective for us no
later than November 1, 2018.
130 Royal Bank of Canada: Annual Report 2014 Consolidated Financial Statements

Note 3 Fair value of financial instruments
Carrying value and fair value of selected financial instruments
The following tables provide a comparison of the carrying and fair values for each classification of financial instruments.
As at October 31, 2014
Carrying value and fair value Carrying value Fair value
(Millions of Canadian dollars)
Financial
instruments
classified
as at FVTPL
Financial
instruments
designated
as at FVTPL
Available-
for-sale
instruments
measured at
fair value
Financial
instruments
measured at
amortized cost
Financial
instruments
measured at
amortized cost
Total carrying
amount
Total
fair value
Financial assets
Securities
Trading $ 141,217 $ 10,163 $ – $ – $ – $ 151,380 $ 151,380
Available-for-sale (1) – – 46,009 1,759 1,762 47,768 47,771
Total Securities 141,217 10,163 46,009 1,759 1,762 199,148 199,151
Assets purchased under reverse repurchase agreements
and securities borrowed – 85,292 — 50,288 50,288 135,580 135,580
Loans
Retail – – – 333,763 335,178 333,763 335,178
Wholesale 1,337 2,278 – 97,851 97,758 101,466 101,373
1,337 2,278 – 431,614 432,936 435,229 436,551
Other
Derivatives 87,402 – – – – 87,402 87,402
Other assets – 930 – 32,975 32,975 33,905 33,905
Financial liabilities
Deposits
Personal $ 112 $ 13,289 $ 195,816 $ 195,964 $ 209,217 $ 209,365
Business and government (2) – 59,446 327,214 328,328 386,660 387,774
Bank (3) – 6,592 11,631 11,636 18,223 18,228
112 79,327 534,661 535,928 614,100 615,367
Other
Obligations related to securities sold short 50,345 – – – 50,345 50,345
Obligations related to assets sold under repurchase
agreements and securities loaned – 58,411 5,920 5,921 64,331 64,332
Derivatives 88,982 – – – 88,982 88,982
Other liabilities 20 30 36,816 36,762 36,866 36,812
Subordinated debentures – 106 7,753 7,712 7,859 7,818
As at October 31, 2013
Carrying value and fair value Carrying value Fair value
(Millions of Canadian dollars)
Financial
instruments
classified
as at FVTPL
Financial
instruments
designated
as at FVTPL
Available-
for-sale
instruments
measured at
fair value
Financial
instruments
measured at
amortized cost
Financial
instruments
measured at
amortized cost
Total carrying
amount
Total
fair value
Financial assets
Securities
Trading $ 135,346 $ 8,677 $ – $ – $ – $ 144,023 $ 144,023
Available-for-sale (1) – – 38,286 401 401 38,687 38,687
Total Securities 135,346 8,677 38,286 401 401 182,710 182,710
Assets purchased under reverse repurchase agreements
and securities borrowed – 82,023 – 35,494 35,494 117,517 117,517
Loans
Retail – – – 319,447 317,635 319,447 317,635
Wholesale 614 964 – 87,825 87,848 89,403 89,426
614 964 – 407,272 405,483 408,850 407,061
Other
Derivatives 74,822 – – – – 74,822 74,822
Other assets – 983 – 28,820 28,820 29,803 29,803
Financial liabilities
Deposits
Personal $ 69 $ 9,069 $ 185,805 $ 185,989 $ 194,943 $ 195,127
Business and government (2) – 56,037 298,556 299,442 354,593 355,479
Bank (3) – 1,932 11,611 11,611 13,543 13,543
69 67,038 495,972 497,042 563,079 564,149
Other
Obligations related to securities sold short 47,128 – – – 47,128 47,128
Obligations related to assets sold under repurchase
agreements and securities loaned – 53,948 6,468 6,468 60,416 60,416
Derivatives 76,745 – – – 76,745 76,745
Other liabilities (2) 42 34,352 34,352 34,392 34,392
Subordinated debentures – 109 7,334 7,285 7,443 7,394
(1) Available-for-sale securities include held-to-maturity securities that are recorded at amortized cost.
(2) Business and government includes deposits from regulated deposit-taking institutions other than regulated banks.
(3) Bank refers to regulated banks.
Consolidated Financial Statements Royal Bank of Canada: Annual Report 2014 131

Note 3 Fair value of financial instruments (continued)
The following tables present information on loans and receivables designated as at FVTPL, the maximum exposure to credit risk, the extent to
which the risk is mitigated by credit derivatives and similar instruments, and changes in the fair value of these assets. For our loans and
receivables designated as at FVTPL, we measure the change in fair value attributable to changes in credit risk as the difference between the total
change in the fair value of the instrument during the period and the change in fair value calculated using the appropriate risk-free yield curves.
Loans and receivables designated as at fair value through profit or loss
As at October 31, 2014
(Millions of Canadian dollars)
Carrying
amount of
loans and
receivables
designated
as at FVTPL
Maximum
exposure to
credit risk
Extent to
which credit
derivatives
or similar
instruments
mitigate
credit risk
Changes in
fair value for
the year
attributable
to changes in
credit risk for
positions
still held
Cumulative
change in
fair value
attributable
to changes in
credit risk for
positions
still held (1)
Changes in
fair value
of credit
derivatives
or similar
instruments
for the year
Cumulative
change
in fair value
of credit
derivatives
or similar
instruments (1)
Interest-bearing deposits with banks $ 5,603 $ 5,603 $ – $ – $ – $ – $ –
Assets purchased under reverse
repurchase agreements and
securities borrowed 85,292 85,292 – – – – –
Loans – Wholesale 2,278 2,278 242 4 5 – –
Other Assets 326 326 – – – – –
$ 93,499 $ 93,499 $ 242 $ 4 $ 5 $ – $ –
As at October 31, 2013
(Millions of Canadian dollars)
Carrying
amount of
loans and
receivables
designated
as at FVTPL
Maximum
exposure to
credit risk
Extent to
which credit
derivatives
or similar
instruments
mitigate
credit risk
Changes in
fair value for
the year
attributable
to changes in
credit risk for
positions
still held
Cumulative
change in
fair value
attributable
to changes in
credit risk for
positions
still held (1)
Changes in
fair value
of credit
derivatives
or similar
instruments
for the year
Cumulative
change
in fair value
of credit
derivatives or
similar
instruments (1)
Interest-bearing deposits with banks $ 2,424 $ 2,424 $ – $ – $ – $ – $ –
Assets purchased under reverse
repurchase agreements and
securities borrowed 82,023 82,023 – – – – –
Loans – Wholesale 964 964 224 3 1 – –
Other assets 463 463 – – – – –
$ 85,874 $ 85,874 $ 224 $ 3 $ 1 $ – $ –
(1) The cumulative change is measured from the initial recognition of the credit derivative or similar instruments.
The following tables present the changes in the fair value of our financial liabilities designated as at FVTPL as well as their contractual maturity
and carrying amounts. For our financial liabilities designated as at FVTPL, we measure the change in fair value attributable to changes in credit
risk as the difference between the total change in the fair value of the instrument during the period and the change in the fair value attributable
to changes in market conditions such as changes in benchmark interest rate or foreign exchange rate.
Liabilities designated as at fair value through profit or loss
As at October 31, 2014
(Millions of Canadian dollars)
Contractual
maturity
amount
Carrying
Value
Difference
between
carrying value
and contractual
maturity amount
Changes in fair
value for the year
ended attributable
to changes in
credit risk included
in net income for
positions still held
Changes in fair value
for the year ended
attributable to
changes in credit
risk included in other
comprehensive income
for positions still held
Cumulative change
in fair value
attributable to
changes in credit
risk for positions
still held (1)
Term deposits
Personal $ 12,964 $ 13,289 $ 325 $ – $ 13 $ 19
Business and government (2) 59,139 59,446 307 – 61 58
Bank (3) 6,592 6,592 – – – –
78,695 79,327 632 – 74 77
Obligations related to assets sold
under repurchase agreements
and securities loaned 58,413 58,411 (2) – – –
Other liabilities 30 30 – – – –
Subordinated debentures 101 106 5 – 3 (3)
$ 137,239 $ 137,874 $ 635 $ – $ 77 $ 74
132 Royal Bank of Canada: Annual Report 2014 Consolidated Financial Statements

As at October 31, 2013
(Millions of Canadian dollars)
Contractual
maturity
amount
Carrying
value
Difference
between
carrying value
and contractual
maturity amount
Changes in fair
value for the year
ended attributable
to changes in
credit risk included
in net income for
positions still held
Changes in fair value
for the year ended
attributable to
changes in credit risk
included in other
comprehensive income
for positions still held
Cumulative change
in fair value
attributable to
changes in credit
risk for positions
still held (1)
Term deposits
Personal $ 8,963 $ 9,069 $ 106 $ (20) n.a. $ 6
Business and government (2) 56,216 56,037 (179) 36 n.a. (3)
Bank (3) 1,932 1,932 – – n.a. –
67,111 67,038 (73) 16 n.a. 3
Obligations related to assets sold
under repurchase agreements
and securities loaned 53,952 53,948 (4) – n.a. –
Other liabilities 42 42 – – n.a. –
Subordinated debentures 106 109 3 6 n.a. (6)
$ 121,211 $ 121,137 $ (74) $ 22 n.a. $ (3)
(1) The cumulative change is measured from the initial recognition of the liabilities designated as at FVTPL. For the year ended October 31, 2014, $4 million of fair value losses previously
included in OCI were realized for financial liabilities derecognized during the year.
(2) Business and government includes deposits from regulated deposit-taking institutions other than regulated banks.
(3) Bank refers to regulated banks.
n.a. not applicable.
Consolidated Financial Statements Royal Bank of Canada: Annual Report 2014 133

Note 3 Fair value of financial instruments (continued)
Fair value of assets and liabilities measured on a recurring basis and classified using the fair value hierarchy
The following tables present the financial instruments that are measured at fair value on a recurring basis and classified by the fair value
hierarchy.
As at
October 31, 2014 October 31, 2013
Fair value
measurements using Total
gross fair
value
Netting
adjustments
Assets/
liabilities
at fair
value
Fair value
measurements using Total
gross fair
value
Netting
adjustments
Assets/
liabilities
at fair
value
(Millions of Canadian dollars) Level 1 Level 2 Level 3 Level 1 Level 2 Level 3
Financial assets
Interest bearing deposits with banks $ – $ 5,603 $ – $ 5,603 $ $ 5,603 $ – $ 2,424 $ – $ 2,424 $ $ 2,424
Securities
Trading
Canadian government debt (1)
Federal 8,288 5,855 – 14,143 14,143 11,978 6,976 – 18,954 18,954
Provincial and municipal – 11,371 – 11,371 11,371 – 12,146 – 12,146 12,146
U.S. state, municipal and
agencies debt (1) 1,838 27,628 6 29,472 29,472 5,480 23,980 22 29,482 29,482
Other OECD government debt (2) 7,334 7,991 – 15,325 15,325 2,815 8,101 370 11,286 11,286
Mortgage-backed securities (1) – 964 4 968 968 – 802 28 830 830
Asset-backed securities
CDOs (3) – 37 74 111 111 – – 31 31 31
Non-CDO securities – 889 364 1,253 1,253 – 1,084 260 1,344 1,344
Corporate debt and other debt 15 27,422 149 27,586 27,586 – 24,346 415 24,761 24,761
Equities 47,396 3,589 166 51,151 51,151 41,874 3,132 183 45,189 45,189
64,871 85,746 763 151,380 151,380 62,147 80,567 1,309 144,023 144,023
Available-for-sale (4)
Canadian government debt (1)
Federal 429 11,540 – 11,969 11,969 153 9,690 – 9,843 9,843
Provincial and municipal – 799 – 799 799 – 667 – 667 667
U.S. state, municipal and
agencies debt (1) 29 4,839 1,389 6,257 6,257 26 4,238 2,014 6,278 6,278
Other OECD government debt 6,979 7,303 11 14,293 14,293 5,463 5,434 – 10,897 10,897
Mortgage-backed securities (1) – 138 – 138 138 – 139 – 139 139
Asset-backed securities
CDOs – 857 24 881 881 – 1,294 103 1,397 1,397
Non-CDO securities – 381 182 563 563 – 283 180 463 463
Corporate debt and other debt – 7,714 1,573 9,287 9,287 – 5,096 1,673 6,769 6,769
Equities 140 514 1,028 1,682 1,682 137 585 969 1,691 1,691
Loan substitute securities 102 24 – 126 126 103 24 – 127 127
7,679 34,109 4,207 45,995 45,995 5,882 27,450 4,939 38,271 38,271
Assets purchased under reverse
repurchase agreements and
securities borrowed – 85,292 – 85,292 85,292 – 82,023 – 82,023 82,023
Loans – 3,154 461 3,615 3,615 – 1,164 414 1,578 1,578
Other
Derivatives
Interest rate contracts 13 102,176 339 102,528 102,528 22 78,517 333 78,872 78,872
Foreign exchange contracts – 33,761 48 33,809 33,809 – 20,709 76 20,785 20,785
Credit derivatives – 244 10 254 254 – 193 32 225 225
Other contracts 3,238 4,839 560 8,637 8,637 2,558 3,219 858 6,635 6,635
Valuation adjustments (5) – (702) (56) (758) (758) (2) (398) (105) (505) (505)
Total gross derivatives 3,251 140,318 901 144,470 144,470 2,578 102,240 1,194 106,012 106,012
Netting adjustments (57,068) (57,068) (31,190) (31,190)
Total derivatives 87,402 74,822
Other assets 604 326 – 930 930 520 452 11 983 983
$ 76,405 $ 354,548 $ 6,332 $ 437,285 $ (57,068) $ 380,217 $ 71,127 $ 296,320 $ 7,867 $ 375,314 $ (31,190) $ 344,124
Financial Liabilities
Deposits
Personal $ – $ 12,904 $ 497 $ 13,401 $ $ 13,401 $ – $ 8,095 $ 1,043 $ 9,138 $ $ 9,138
Business and government – 59,376 70 59,446 59,446 – 52,104 3,933 56,037 56,037
Bank – 6,592 – 6,592 6,592 – 1,932 – 1,932 1,932
Other
Obligations related to securities
sold short 32,857 17,484 4 50,345 50,345 31,832 15,280 16 47,128 47,128
Obligations related to assets sold
under repurchase agreements
and securities loaned – 58,411 – 58,411 58,411 – 53,948 – 53,948 53,948
Derivatives
Interest rate contracts 9 96,752 709 97,470 97,470 9 74,113 791 74,913 74,913
Foreign exchange contracts – 35,664 39 35,703 35,703 – 22,715 193 22,908 22,908
Credit derivatives – 327 15 342 342 – 295 37 332 332
Other contracts 2,886 8,537 1,062 12,485 12,485 2,379 5,979 1,727 10,085 10,085
Valuation adjustments (5) – (65) 29 (36) (36) n.a. n.a. n.a. n.a. n.a.
Total gross derivatives 2,895 141,215 1,854 145,964 145,964 2,388 103,102 2,748 108,238 108,238
Netting adjustments (56,982) (56,982) (31,493) (31,493)
Total derivatives 88,982 76,745
Other liabilities –302050 50 – 37 3 40 40
Subordinated debentures – 106 – 106 106 – – 109 109 109
$ 35,752 $ 296,118 $ 2,445 $ 334,315 $ (56,982) $ 277,333 $ 34,220 $ 234,498 $ 7,852 $ 276,570 $ (31,493) $ 245,077
(1) As at October 31, 2014, residential and commercial mortgage-backed securities (MBS) included in all fair value levels of Trading securities were $6,564 million and $81 million (October 31,
2013 – $4,934 million and $93 million), respectively, and in all fair value levels of AFS securities, $6,956 million and $34 million (October 31, 2013 – $3,105 and $35 million), respectively.
(2) OECD stands for Organisation for Economic Co-operation and Development.
(3) CDOs stand for Collateralized Debt Obligations.
(4) Excludes $14 million and $1,759 million of AFS and held-to-maturity securities (October 31, 2013 – $15 million and $401 million), respectively, that are carried at cost.
(5) IFRS 13 requirements are applied on a prospective basis and the standard permits an exception, through an accounting policy choice, to measure the fair value of a portfolio of financial
instruments on a net open risk position basis when certain criteria are met. We have elected to use this policy choice to determine fair value of certain portfolios of financial instruments,
primarily derivatives, on a net exposure to market or credit risk. The valuation adjustment amounts in this table include those determined on a portfolio basis.
n.a. not applicable.
134 Royal Bank of Canada: Annual Report 2014 Consolidated Financial Statements

The following describes how fair values are determined, what inputs are used and where they are classified in the fair value hierarchy table
above, for our significant assets and liabilities that are measured at fair value on a recurring basis:
Government bonds (Canadian, U.S. and other OECD governments)
Government bonds are included in Canadian government debt, U.S. state, municipal and agencies debt, Other OECD government debt and
Obligations related to securities sold short in the fair value hierarchy table. The fair values of government issued or guaranteed debt securities in
active markets are determined by reference to recent transaction prices, broker quotes, or third-party vendor prices and are classified as Level 1
in the fair value hierarchy. The fair values of securities that are not traded in active markets are based on either security prices, or valuation
techniques using implied yields and risk spreads derived from prices of actively traded and similar government securities. Securities with
observable prices or rate inputs as compared to transaction prices, dealer quotes or vendor prices are classified as Level 2 in the hierarchy.
Securities where inputs are unobservable are classified as Level 3 in the hierarchy.
Corporate and U.S. municipal bonds
The fair values of corporate and U.S. municipal bonds, which are included in Corporate debt and other debt, U.S. state, municipal and agencies
debt and Obligations related to securities sold short in the fair value hierarchy table, are determined using either recently executed transaction
prices, broker quotes, pricing services, or in certain instances discounted cash flow method using rate inputs such as benchmark yields
(Canadian Dealer Offered Rate, LIBOR and other similar reference rates) and risk spreads of comparable securities. Securities with observable
prices or rate inputs as compared to transaction prices, dealer quotes or vendor prices are classified as Level 2 in the hierarchy. Securities where
inputs are unobservable are classified as Level 3 in the hierarchy.
Asset-backed securities and Mortgage-backed securities
Asset-backed securities (ABS) and MBS are included in Asset-backed securities, Mortgage-backed securities, Canadian government debt, U.S.
state, municipal and agencies debt, and Obligations related to securities sold short in the fair value hierarchy table. ABS are primarily
collateralized debt obligations (CDO). Inputs for valuation of MBS and CDO are, when available, traded prices, dealer or lead manager quotes,
broker quotes and vendor prices of the identical securities. When prices of the identical securities are not readily available, we use industry
standard models with inputs such as discount margins, yields, default, prepayment and loss severity rates that are implied from transaction
prices, dealer quotes or vendor prices of comparable instruments. Where security prices and inputs are observable, ABS and MBS are classified
as Level 2 in the hierarchy. Otherwise, they are classified as Level 3 in the hierarchy.
Auction rate securities
Auction rate securities (ARS) are included in U.S. state, municipal and agencies debt, and Asset-backed securities in the fair value hierarchy
table. The valuation of ARS involves discounting forecasted cash flows from the underlying student loan collateral and incorporating multiple
inputs such as default, prepayment, deferment and redemption rates, and credit spreads. These inputs are unobservable, and therefore, ARS are
classified as Level 3 in the hierarchy. All relevant data must be assessed and significant judgment is required to determine the appropriate
valuation inputs.
Equities
Equities and Obligations related to securities sold short in the fair value hierarchy table consist of listed and unlisted common shares, private
equities and hedge funds with certain redemption restrictions. The fair values of common shares are based on quoted prices in active markets,
where available, and are classified as Level 1 in the hierarchy. Where quoted prices in active markets are not readily available, fair value is
determined based on quoted market prices for similar securities or through valuation techniques, including multiples of earnings and discounted
cash flow method with forecasted cash flows and discount rate as inputs. Private equities are classified as Level 3 in the hierarchy as their inputs
are not observable. Hedge funds are valued using Net Asset Values (NAV). If we can redeem a hedge fund at NAV prior to the next quarter end,
the fund is classified as Level 2 in the hierarchy. Otherwise, it is classified as Level 3 in the hierarchy.
Derivatives
The fair values of exchange-traded derivatives, such as interest rate and equity options and futures, are based on quoted market prices and are
classified as Level 1 in the fair value hierarchy. OTC derivatives primarily consist of interest rate and cross currency swaps, interest rate options,
foreign exchange forward contracts and options, and commodity options and swaps. The exchange-traded or OTC interest rate, foreign exchange
and equity derivatives are included in Interest rate contracts, Foreign exchange contracts and Other contracts, respectively, in the fair value
hierarchy table. The fair values of OTC derivatives are determined using valuation models when quoted market prices or third-party consensus
pricing information are not available. The valuation models, such as discounted cash flow method or Black-Scholes option model, incorporate
observable or unobservable inputs for interest and foreign exchange rates, equity and commodity prices (including indices), credit spreads,
corresponding market volatility levels, and other market-based pricing factors. As previously discussed, other adjustments to fair value include
bid-offer, CVA, FVA, OIS, parameter and model uncertainties, and unrealized gain or loss at inception of a transaction. A derivative instrument is
classified as Level 2 in the hierarchy if observable market inputs are available or the unobservable inputs are not significant to the fair value.
Otherwise, it is classified as Level 3 in the hierarchy.
Securities borrowed or purchased under resale agreements and securities lent or sold under repurchase agreements
In the fair value hierarchy table, these instruments are included in Assets purchased under reverse repurchase agreements and securities
borrowed, and Obligations related to assets sold under repurchase agreements and securities loaned. Fair value for these contracts is calculated
using valuation techniques such as discounted cash flow method using interest rate curves as inputs. They are classified as Level 2 instruments
in the hierarchy as the inputs are observable.
Deposits
A majority of our deposits are measured at amortized cost but we designated certain deposits as at FVTPL. These FVTPL deposits are composed of
deposits taken, the issuance of certificate of deposits and promissory notes, interest rate and equity linked notes, and are included in Deposits
in the fair value hierarchy table. The fair values for these instruments are determined using discounted cash flow method and derivative option
valuation models. The inputs to the valuation models include benchmark yield curves, credit spreads, interest rates, interest rate and equity
volatility, dividends and correlation, where applicable. They are classified as Level 2 or 3 instruments in the hierarchy, depending on the
significance of the unobservable credit spreads, volatility, dividend and correlation rates.
Consolidated Financial Statements Royal Bank of Canada: Annual Report 2014 135
Note 3 Fair value of financial instruments (continued)
Quantitative information about fair value measurements using significant unobservable inputs (Level 3 Instruments)
The following table presents fair values of our significant Level 3 financial instruments, valuation techniques used to determine their fair values,
ranges and weighted averages of unobservable inputs.
As at October 31, 2014 (Millions of Canadian dollars, except for prices, percentages and ratios)
Fair value
Significant
unobservable
inputs (1)
Range of input values (2), (3), (4)
Products
Reporting line in the fair value
hierarchy table Assets Liabilities
Valuation
techniques Low High
Weighted
average / Inputs
distribution (5)
Non-derivative financial instruments
Asset-backed securities Price-based Prices $ 53.70 $ 90.50 $ 75.92
Asset-backed securities $ 478 Discounted cash flows Discount margins 0.70% 9.48% 5.09%
Yields 2.84% 5.36% 3.52%
Default rates 1.00% 5.00% 2.00%
Prepayment rates 15.00% 30.00% 20.00%
Loss severity rates 30.00% 70.00% 50.00%
Auction rate securities Discounted cash flows Discount margins 1.32% 4.63% 2.26%
U.S. state, municipal and
agencies debt 979
Default rates
Prepayment rates
9.00%
4.00%
10.00%
8.00%
9.80%
4.76%
Asset-backed securities 166 Recovery rates 40.00% 97.50% 93.51%
Corporate debt Price-based Prices $ 2.50 $ 119.52 $ 97.86
Corporate debt and other debt 100 Discounted cash flows Yields 2.75% 7.50% 3.84%
Loans 461 Capitalization rates 6.43% 9.47% 7.95%
Obligations related to
securities sold short 4
Liquidity discounts (6) 10.00% 10.00% 10.00%
Government debt and municipal bonds Price-based Prices $ 67.38 $ 100.00 $ 96.24
U.S. state, municipal and
agencies debt 416
Discounted cash flows Yields 0.17% 30.15% 3.06%
Other OECD government debt 11
Corporate debt and other debt 1,616
Bank funding and deposits Discounted cash flows Interest rate (IR)–IR correlations 19.00% 67.00% Even
Deposits 70 Foreign exchange (FX)–FX
correlations 68.00% 68.00% Even
FX–IR correlations 29.00% 56.00% Even
Private equities, hedge fund
investments and related equity
derivatives
Market comparable EV/EBITDA multiples 4.00 X 10.80 X 8.73 X
Equities 1,194 Price-based P/E multiples 8.79 X 15.70 X 11.79 X
Derivative-related assets 11 Discounted cash flows EV/Rev multiples 0.45 X 7.50 X 4.97 X
Derivative-related liabilities 434 Liquidity discounts (6) –% 50.00% 26.92%
Discount rate 12.00% 17.00% 14.78%
Net Asset Values /Prices (7) n.a. n.a. n.a.
Derivative financial instruments
Interest rate derivatives and interest-
rate-linked structured notes (8)
Discounted cash flows Interest rates 2.96% 2.98% Even
Derivative-related assets 348 Option pricing model CPI swap rates 1.73% 2.30% Even
Derivative-related liabilities 732 IR–IR correlations 19.00% 67.00% Even
FX–IR correlations 29.00% 56.00% Even
FX-FX correlations 68.00% 68.00% Even
IR volatilities 26.28% 28.28% Even
Equity derivatives and equity-linked
structured notes (8)
Discounted cash flows Dividend yields 0.04% 18.11% Lower
Derivative-related assets 442 Option pricing model Equity (EQ)-EQ correlations 0.50% 97.20% Middle
Deposits 497 EQ-FX correlations (72.80)% 53.20% Middle
Derivative-related liabilities 529 EQ volatilities 1.00% 172.00% Lower
Other (9)
Mortgage-backed securities 4
Corporate debt and other debt 6
Derivative-related assets 100
Derivative-related liabilities 159
Other Liabilities 20
Total $ 6,332 $ 2,445
(1) The acronyms stand for the following: (i) Enterprise Value (EV); (ii) Earnings Before Interest, Taxes, Depreciation and Amortization (EBITDA); (iii) Price / Earnings (P/E); (iv) Revenue (Rev); and
(v) Consumer Price Index (CPI).
(2) Comparative information relating to periods before November 1, 2013 is not required by IFRS 13.
(3) The low and high input values represent the actual highest and lowest level inputs used to value a group of financial instruments in a particular product category. These input ranges do not
reflect the level of input uncertainty, but are affected by the different underlying instruments within the product category. The input ranges will therefore vary from period to period based on
the characteristics of the underlying instruments held at each balance sheet date. Where provided, the weighted average of the input values is calculated based on the relative fair values of
the instruments within the product category. The weighted averages for derivatives are not presented in the table as they would not provide a comparable metric; instead, distribution of
significant unobservable inputs within the range for each product category is indicated in the table.
(4) Price-based inputs are significant for certain debt securities, and are based on external benchmarks, comparable proxy instruments or pre-quarter-end trade data. For these instruments, the
price input is expressed in dollars for each $100 par value. For example, with an input price of $105, an instrument is valued at a premium over its par value.
(5) The level of aggregation and diversity within each derivative instrument category may result in certain ranges of inputs being wide and unevenly distributed across the range. In the table, we
indicated whether the majority of the inputs are concentrated toward the upper, middle, or lower end of the range, or evenly distributed throughout the range.
(6) Fair value of securities with liquidity discount inputs totalled $211 million.
(7) NAV of a hedge fund is total fair value of assets less liabilities divided by the number of fund units. The NAVs of the funds and the corresponding equity derivatives referenced to NAVs are not
considered observable as we cannot redeem certain of these hedge funds at NAV prior to the next quarter end. Private equities are valued based on NAV or valuation techniques. The range
for NAV per unit or price per share has not been disclosed for the hedge funds or private equities due to the dispersion of prices given the diverse nature of the investments.
(8) The structured notes contain embedded equity or interest rate derivatives with unobservable inputs that are similar to those of the equity or interest rate derivatives.
(9) Other primarily includes certain insignificant instruments such as commodity derivatives, foreign exchange derivatives, credit derivatives and bank-owned life insurance.
n.a. not applicable
136 Royal Bank of Canada: Annual Report 2014 Consolidated Financial Statements

Sensitivity to unobservable inputs and interrelationships between unobservable inputs
Yield, credit spreads/discount margins
A financial instrument’s yield is the interest rate used to discount future cash flows in a valuation model. An increase in the yield, in isolation,
would result in a decrease in a fair value measurement and vice versa. A credit spread/discount margin is the difference between a debt
instrument’s yield and a benchmark instrument’s yield. Benchmark instruments have high credit quality ratings, similar maturities and are often
government bonds. The credit spread/discount margin therefore represents the discount rate used to present value future cash flows of an asset
to reflect the market return required for uncertainty in the estimated cash flows. The credit spread/discount margin for an instrument forms part
of the yield used in a discounted cash flow method. Generally, an increase in the credit spread or discount margin will result in a decrease in fair
value, and vice versa.
Funding spread
Funding spreads are credit spreads specific to our funding or deposit rates. A decrease in funding spreads, on its own, will increase fair value of
our liabilities, and vice versa.
Default rates
A default rate is the rate at which borrowers fail to make scheduled loan payments. A decreasing default rate will typically increase the fair value
of the loan, and vice versa. This effect will be significantly more pronounced for a non-government guaranteed loan than a government
guaranteed loan.
Prepayment rates
A prepayment rate is the rate at which a loan will be repaid in advance of its expected amortization schedule. Prepayments change the future
cash flows of a loan. An increase in the prepayment rate in isolation will result in an increase in fair value when the loan interest rate is lower
than the then current reinvestment rate, and a decrease in the prepayment rate in isolation will result in a decrease in fair value when the loan
interest rate is lower than the then current reinvestment rate. Prepayment rates are generally negatively correlated with interest rates.
Recovery and loss severity rates
A recovery rate is an estimation of the amount that can be collected in a loan default scenario. The recovery rate is the percentage of the
recovered amount divided by the loan balance due. The inverse concept of recovery is loss severity. Loss severity is an estimation of the loan
amount not collected when a loan defaults. The loss severity rate is the percentage of the loss amount divided by the loan balance due.
Generally, an increase in the recovery rate or a decrease in the loss severity rate will increase the loan fair value, and vice versa.
Capitalization rates
A capitalization rate is a rate of return on a real estate property investment calculated by dividing a property’s income by the property’s value. A
lower capitalization rate increases the property value, and vice versa.
Volatility rates
Volatility measures the potential variability of future prices and is often measured as the standard deviation of price movements. Volatility is an
input to option pricing models used to value derivatives and issued structured notes. Volatility is used in valuing equity, interest rate, commodity
and foreign exchange options. A higher volatility rate means that the underlying price or rate movements are more likely to occur. Higher volatility
rates may increase or decrease an option’s fair value depending on the option’s terms. The determination of volatility rates is dependent on
various factors, including but not limited to, the underlying’s market price, the strike price and maturity.
Dividend yields
A dividend yield is the underlying equity’s expected dividends expressed as an annual percentage of its price. Dividend yield is used as an input
for forward equity price and option models. Higher dividend yields will decrease the forward price, and vice versa. A higher dividend yield will
increase or decrease an option’s value, depending on the option’s terms.
Correlation rates
Correlation is the linear relationship between the movements in two different variables. Correlation is an input to the valuation of derivative
contracts and issued structured notes when an instrument’s payout is determined by correlated variables. When variables are positively corre-
lated, an increase in one variable will result in an increase in the other variable. When variables are negatively correlated, an increase in one
variable will result in a decrease in the other variable. The referenced variables can be within a single asset class or market (equity, interest rate,
commodities, credit and foreign exchange) or between variables in different asset classes (equity to foreign exchange, or interest rate to foreign
exchange). Changes in correlation will either increase or decrease a financial instrument’s fair value depending on the terms of its contractual
payout.
Interest rates
An interest rate is the percentage amount charged on a principal or notional amount. Increasing interest rates will decrease the discounted cash
flow value of a financial instrument, and vice versa.
Consumer Price Index swap rates
A Consumer Price Index (CPI) swap rate is expressed as a percentage of an increase in the average price of a basket of consumer goods and
services, such as transportation, food and medical care. An increase in the CPI swap rate will cause inflation swap payments to be larger, and
vice versa.
Consolidated Financial Statements Royal Bank of Canada: Annual Report 2014 137

Note 3 Fair value of financial instruments (continued)
EV/EBITDA multiples, P/E multiples, EV/Rev multiples, and liquidity discounts
Private equity valuation inputs include Enterprise Value / Earnings Before Interest, Taxes, Depreciation and Amortization (EV/EBITDA) multiples,
Price / Earnings (P/E) multiples and Enterprise Value / Revenue (Ev/Rev) multiples. These are used to calculate either enterprise value or share
value of a company based on a multiple of earnings or revenue estimates. Higher multiples equate to higher fair values for all multiple types, and
vice versa. A liquidity discount may be applied when few or no transactions exist to support the valuations.
Interrelationships between unobservable inputs
Unobservable inputs of ARS, including the above discount margin, default rate, prepayment rate, recovery and loss severity rates, may not be
independent of each other. The discount margin of ARS can be affected by a change in default rate, prepayment rate, or recovery and loss
severity rates. Discount margins will generally decrease when default rates decline or when recovery rates increase. Prepayments may cause fair
value to either increase or decrease.
Changes in fair value measurement for instruments measured on a recurring basis and categorized in Level 3
The following tables present the changes in fair value measurements on a recurring basis for instruments included in Level 3 of the fair value
hierarchy.
For the year ended October 31, 2014
(Millions of Canadian dollars)
Fair value
November 1,
2013
Total
realized/
unrealized
gains (losses)
included in
earnings
Total
unrealized
gains (losses)
included in
other
comprehensive
income (1)
Purchases
of assets/
issuances of
liabilities
Sales of
assets/
settlements
of liabilities
and
other (2)
Transfers
into
Level 3
Transfers
out of
Level 3
Fair value
October 31,
2014
Changes in
unrealized gains
(losses) included
in earnings for
assets and
liabilities for the
year ended
October 31, 2014
for positions
still held
Assets
Securities
Trading
U.S. state, municipal and
agencies debt $ 22 $ – $ 2 $ 47 $ (61) $ 5 $ (9) $ 6 $ 1
Other OECD government debt 370 – (4) – – – (366) – –
Mortgage-backed securities 28 (3) 2 90 (83) 1 (31) 4 –
Asset-backed securities
CDOs 31 15 (9) 130 (85) 7 (15) 74 2
Non-CDO securities 260 (2) 20 2,083 (1,984) 16 (29) 364 (5)
Corporate debt and other debt 415 (2) 27 263 (487) 20 (87) 149 –
Equities 183 1 14 84 (77) 22 (61) 166 –
1,309 9 52 2,697 (2,777) 71 (598) 763 (2)
Available-for-sale
U.S. state, municipal and
agencies debt 2,014 – 240 – (856) – (9) 1,389 n.a.
Other OECD government debt – – – 1 10 – – 11 n.a.
Asset-backed securities
CDOs 103 – 9 – (36) 24 (76) 24 n.a.
Non-CDO securities 180 (4) 23 – (17) – – 182 n.a.
Corporate debt and other debt 1,673 – 130 1,760 (1,921) – (69) 1,573 n.a.
Equities 969 120 120 47 (228) – – 1,028 n.a.
4,939 116 522 1,808 (3,048) 24 (154) 4,207 n.a.
Loans – Wholesale 414 3 32 31 (19) – – 461 (22)
Other
Net derivative balances (3)
Interest rate contracts (458) (100) (2) 31 (13) 94 78 (370) (108)
Foreign exchange contracts (117) (28) 3 3 – 2 146 9 (18)
Credit derivatives (5) (31) (2) – 33 – – (5) (5)
Other contracts (869) 43 (54) (103) 93 (169) 557 (502) 20
Valuation adjustments (105) 15 (1) – (73) – 79 (85) 4
Other assets 11 – – – – – (11) – –
$ 5,119 $ 27 $ 550 $ 4,467 $ (5,804) $ 22 $ 97 $ 4,478 $ (131)
Liabilities
Deposits
Personal $ (1,043) $ 11 $ (54) $ (560) $ 184 $ (299) $ 1,264 $ (497) $ 20
Business and government (3,933) (184) (180) (1,551) 265 – 5,513 (70) (7)
Other
Obligations related to securities
sold short (16) 1 (1) (198) 202 – 8 (4) –
Other liabilities (3) 29 – – (50) – 4 (20) (22)
Subordinated debentures (109) – (3) – – – 112 – –
$ (5,104) $ (143) $ (238) $ (2,309) $ 601 $ (299) $ 6,901 $ (591) $ (9)
138 Royal Bank of Canada: Annual Report 2014 Consolidated Financial Statements

For the year ended October 31, 2013
(Millions of Canadian dollars)
Fair value
November 1,
2012
Total
realized/
unrealized
gains (losses)
included in
earnings
Total
unrealized
gains (losses)
included in
other
comprehensive
income (1)
Purchases
of assets/
issuances of
liabilities
Sales of
assets/
settlements
of liabilities
and
other (2)
Transfers
into
Level 3
Transfers
out of
Level 3
Fair value
October 31,
2013
Changes in
unrealized gains
(losses) included
in earnings for
assets and
liabilities for the
year ended
October 31, 2013
for positions
still held
Assets
Securities
Trading
U.S. state, municipal and
agencies debt $ 99 $ 2 $ 2 $ 414 $ (525) $ 34 $ (4) $ 22 $ –
Other OECD government debt 375 (1) 6 633 (237) – (406) 370 –
Mortgage-backed securities 55 7 2 50 (64) 21 (43) 28 1
Asset-backed securities
CDOs 59 10 1 16 (48) – (7) 31 8
Non-CDO securities 23 (2) 7 4,608 (4,376) 70 (70) 260 (2)
Corporate debt and other debt 397 19 10 634 (655) 96 (86) 415 1
Equities 302 (16) 8 107 (224) 7 (1) 183 (29)
1,310 19 36 6,462 (6,129) 228 (617) 1,309 (21)
Available-for-sale
U.S. state, municipal and
agencies debt 1,906 – 88 417 (406) 9 – 2,014 n.a.
Other OECD government debt – – – – – – – – n.a.
Asset-backed securities
CDOs 1,996 – 67 – (542) 12 (1,430) 103 n.a.
Non-CDO securities 645 4 36 – (505) – – 180 n.a.
Corporate debt and other debt 1,446 (12) 80 1,281 (1,172) 50 – 1,673 n.a.
Equities 948 65 51 27 (122) – – 969 n.a.
6,941 57 322 1,725 (2,747) 71 (1,430) 4,939 n.a.
Loans – Wholesale 403 8 22 288 (307) – – 414 –
Other
Net derivative balances (3)
Interest rate contracts (487) 70 (3) 32 (70) (4) 4 (458) 95
Foreign exchange contracts (198) 46 21 19 (9) 13 (9) (117) 56
Credit derivatives (22) (21) – – 38 – – (5) (8)
Other contracts (1,052) (193) (33) 153 101 (79) 234 (869) 13
Valuation adjustments (282) 160 – (6) 26 (2) (1) (105) 124
Other assets 14 (3) – – – – – 11 1
$ 6,627 $ 143 $ 365 $ 8,673 $ (9,097) $ 227 $ (1,819) $ 5,119 $ 260
Liabilities
Deposits
Personal $ (6,840) $ (737) $ (102) $ (6,133) $ 7,213 $ (69) $ 5,625 $ (1,043) $ (34)
Business and government (2,519) (11) (95) (1,738) 165 – 265 (3,933) (120)
Other
Obligations related to securities
sold short (8) 10 – (96) 79 (8) 7 (16) –
Other liabilities (101) 98 (3) – 3 – – (3) 98
Subordinated debentures (122) (6) 19 – – – – (109) (6)
$ (9,590) $ (646) $ (181) $ (7,967) $ 7,460 $ (77) $ 5,897 $ (5,104) $ (62)
(1) These amounts include the foreign currency translation gains or losses arising on consolidation of foreign subsidiaries relating to the Level 3 instruments, where applicable. The unrealized
gains included in OCI on AFS securities were $152 million for the year ended October 31, 2014 (October 31, 2013 – gains of $79 million), excluding the translation gains or losses arising on
consolidation.
(2) Other includes amortization of premiums or discounts recognized in net income.
(3) Net derivatives as at October 31, 2014 included derivative assets of $901 million (October 31, 2013 – $1,194 million) and derivative liabilities of $1,854 million (October 31, 2013 – $2,748
million).
n.a. not applicable
Total gains or losses of Level 3 instruments recognized in earnings (1)
For the year ended October 31, 2014
Total realized/unrealized gains
(losses) included in earnings
Changes in unrealized
gains (losses) included in earnings for
assets and liabilities for the year
ended October 31, 2014 for positions
still held
(Millions of Canadian dollars) Assets Liabilities Total Assets Liabilities Total
Non-interest income
Insurance premiums, investment and fee income $ 1$–$1$ –$ –$–
Trading revenue 686 (882) (196) 136 (208) (72)
Net gain on available-for-sale securities 115 – 115 – – –
Credit fees and Other (3) (33) (36) 11 (79) (68)
$ 799 $ (915) $ (116) $ 147 $ (287) $ (140)
(1) Comparative information relating to periods before November 1, 2013 is not required by IFRS 13.
Consolidated Financial Statements Royal Bank of Canada: Annual Report 2014 139

Note 3 Fair value of financial instruments (continued)
Transfers between fair value hierarchy levels for instruments carried at fair value on a recurring basis
Transfers between Level 1 and Level 2, and transfers in and out of Level 3 are assumed to occur at the end of the period. For an asset or a liability
that transfers into Level 3 during the period, the entire change in fair value for the period is excluded from the Total realized/unrealized gains
(losses) included in earnings column of the above reconciliation, whereas for transfers out of Level 3 during the period, the entire change in fair
value for the period is included in the same column of the above reconciliation.
Transfers between Level 1 and Level 2 are dependent on whether fair value is obtained on the basis of quoted market prices in active
markets (Level 1) as opposed to fair value estimated using observable inputs in a discounted cash flow method (Level 2). For the year ended
October 31, 2014, $1,905 million of certain government bonds reported in Trading and Available-for-sale U.S. state, municipal and agencies
debt, and $1,027 million included in Obligations related to securities sold short were transferred from Level 1 to the corresponding Level 2
balances. During the year ended October 31, 2013, $1,105 million of certain government bonds reported in Trading U.S. state, municipal and
agencies debt, and $1,308 million included in Obligations related to securities sold short were transferred from Level 1 to the corresponding
Level 2 balances, and certain government bonds of $122 million reported in Trading Canadian government debt – Federal were transferred from
Level 2 to the corresponding Level 1 balances.
During the year ended October 31, 2014, significant transfers out of Level 3 included: (i) Other OECD government debt of $366 million, due
to improved price transparency; (ii) net Interest rate contracts of $112 million, due to the increase in observability of swap rates; (iii) net Foreign
exchange contracts of $149 million, due to shorter maturities; (iv) net Other contracts of $515 million, mainly due to the increase in observability
of pricing in the underlying investments; (v) Personal deposits of $1,071 million and $185 million, as the unobservable inputs did not
significantly affect their fair values, and the equity volatility became observable, respectively; (vii) Business and government deposits of
$5,032 million, as the funding spread became observable; and (viii) Business and government deposits of $462 million, as yields became
observable. Significant transfer in to Level 3 includes Personal deposits of $139 million, as the equity volatility became unobservable.
During the year ended October 31, 2013, significant transfers out of Level 3 included: (i) Other OECD government debt of $406 million, due
to increased market activity; (ii) CDOs of $1,437 million, as a result of increased price transparency evidenced by trade data, dealer data or
multiple vendor quotes; (iii) certain net derivative balances, with a majority of the transfers related to derivatives for which pricing became
observable as maturity dates became shorter due to the passage of time; (iv) Personal deposits of $5,535 million, transferred out of Level 3, as
unobservable inputs did not significantly affect fair value measurement of these instruments.
Positive and negative fair value movement of Level 3 financial instruments from using reasonably possible alternative assumptions
A financial instrument is classified as Level 3 in the fair value hierarchy if one or more of its unobservable inputs may significantly affect the
measurement of its fair value. In preparing the financial statements, appropriate levels for these unobservable input parameters are chosen so
that they are consistent with prevailing market evidence or management judgment. Due to the unobservable nature of the prices or rates, there
may be uncertainty about valuation of these Level 3 financial instruments.
The following table summarizes the impact to fair values of Level 3 financial instruments using reasonably possible alternative assump-
tions. This sensitivity disclosure is intended to illustrate the potential impact of the relative uncertainty in the fair value of Level 3 financial
instruments. In reporting the sensitivities below, we have considered offsetting balances in instances when: (i) the move in valuation factor
caused an offsetting positive and negative fair value movement, (ii) both offsetting instruments are in Level 3, and (iii) when exposures are
managed and reported on a net basis. With respect to overall sensitivity, it is unlikely in practice that all reasonably possible alternative
assumptions would be simultaneously realized.
140 Royal Bank of Canada: Annual Report 2014 Consolidated Financial Statements

As at
October 31, 2014 October 31, 2013
(Millions of Canadian dollars) Level 3 fair value
Positive fair value
movement from
using reasonably
possible
alternatives
Negative fair value
movement from
using reasonably
possible
alternatives Level 3 fair value
Positive fair value
movement from
using reasonably
possible
alternatives
Negative fair value
movement from
using reasonably
possible
alternatives
Securities
Trading
U.S. state, municipal and agencies debt $6$ –$ –$ 22 $ – $ (1)
Other OECD government debt –– –370 – –
Mortgage-backed securities 4 1 (1) 28 1 (2)
Asset-backed securities 438 10 (14) 291 3 (3)
Corporate debt and other debt 149 2 (2) 415 42 (32)
Equities 166 – – 183 – –
Available-for-sale
U.S. state, municipal and agencies debt 1,389 23 (57) 2,014 20 (64)
Other OECD government debt 11 – – –– –
Asset-backed securities 206 12 (18) 283 9 (16)
Corporate debt and other debt 1,573 12 (10) 1,673 9 (10)
Equities 1,028 92 (23) 969 24 (20)
Loans 461 12 (11) 414 3 (3)
Derivatives 901 23 (21) 1,194 84 (85)
Other assets – – – 11 – –
$ 6,332 $ 187 $ (157) $ 7,867 $ 195 $ (236)
Deposits (567) 14 (14) (4,976) 60 (39)
Derivatives (1,854) 38 (59) (2,748) 77 (100)
Other, securities sold short, other liabilities
and subordinated debentures (24) – – (128) 1 –
$ (2,445) $ 52 $ (73) $ (7,852) $ 138 $ (139)
Sensitivity results
As at October 31, 2014, the effects of applying other reasonably possible alternative assumptions to the Level 3 asset positions would be an
increase of $187 million and a reduction of $157 million in fair value, of which $139 million and $98 million would be recorded in Other
components of equity, respectively. The effects of applying these assumptions to the Level 3 liability positions would result in a decrease of
$52 million and an increase of $73 million in fair value.
Level 3 valuation inputs and approaches to developing reasonably possible alternative assumptions
The following is a summary of the unobservable inputs of the Level 3 instruments and our approaches to develop reasonably possible alternative
assumptions used to determine sensitivity.
Financial assets or liabilities Sensitivity methodology
Asset-backed securities,
corporate debt, government
debt and municipal bonds
Sensitivities are determined based on adjusting, plus or minus one standard deviation, the bid-offer spreads
or input prices if a sufficient number of prices is received, or using high and low vendor prices as reasonably
possible alternative assumptions.
Auction Rate Securities Sensitivity of ARS is determined by decreasing the discount margin between 12% and 15% and increasing the
discount margin between 19% and 38%, depending on the specific reasonable range of fair value uncertainty
for each particular financial instrument’s market. Changes to the discount margin reflect historic monthly
movements in the student loan asset-backed securities market.
Private equities, hedge fund
investments and related
equity derivatives
Sensitivity of direct private equity investments is determined by (i) adjusting the discount rate by 2% when
discounted cash flow method is used to determine fair value, (ii) adjusting the price multiples based on the
range of multiples of comparable companies when price-based models are used, or (iii) using an alternative
valuation approach. NAVs of the private equity funds, hedge funds and related equity derivatives are provided
by the fund managers, and as a result, there are no other reasonably possible alternative assumptions for
these investments.
Interest rate derivatives Sensitivities of interest rate and cross currency swaps are derived using plus or minus one standard deviation
of these inputs, and an amount based on model and parameter uncertainty, where applicable.
Equity derivatives Sensitivity of the Level 3 position will be determined by shifting the unobservable model inputs by plus or
minus one standard deviation of the pricing service market data including volatility, dividends or correlations,
as applicable.
Bank funding and deposits Sensitivities of deposits are calculated by shifting the funding curve by plus or minus certain basis points.
Structured notes Sensitivities for interest-rate-linked and equity-linked structured notes are derived by adjusting inputs by plus
or minus one standard deviation, and for other deposits, by estimating a reasonable move in the funding curve
by plus or minus certain basis points.
Municipal guaranteed
investment certificates
Sensitivity is calculated using plus or minus one standard deviation of the funding curve bid-offer spread.
Consolidated Financial Statements Royal Bank of Canada: Annual Report 2014 141

Note 3 Fair value of financial instruments (continued)
Fair value for financial instruments that are carried at amortized cost and classified using the fair value hierarchy
The following table presents fair values of financial instruments that are carried at amortized cost and classified by the fair value hierarchy.
As at October 31, 2014 (1)
Fair value always
approximates
carrying value (2)
Fair value may not approximate carrying value
Fair value measurements using
Total
Total
Fair value
(Millions of Canadian dollars) Level 1 Level 2 Level 3
Held-to-maturity securities (3) $ – $ 5 $ 1,522 $ 235 $ 1,762 $ 1,762
Assets purchased under reverse repurchase agreements and
securities borrowed 29,198 – 21,090 – 21,090 50,288
Loans
Retail 65,766 – 265,038 4,374 269,412 335,178
Wholesale 5,603 – 88,940 3,215 92,155 97,758
71,369 – 353,978 7,589 361,567 432,936
Other assets 28,224 – 4,546 205 4,751 32,975
128,791 5 381,136 8,029 389,170 517,961
Deposits
Personal 139,209 – 55,924 831 56,755 195,964
Business and government 176,555 – 150,827 946 151,773 328,328
Bank 9,659 – 1,915 62 1,977 11,636
325,423 – 208,666 1,839 210,505 535,928
Obligations related to assets sold under repurchase
agreements and securities loaned 5,419 – 502 – 502 5,921
Other liabilities 27,280 – 5,699 3,783 9,482 36,762
Subordinated debentures – – 7,657 55 7,712 7,712
$ 358,122 $ – $ 222,524 $ 5,677 $ 228,201 $ 586,323
(1) Comparative information relating to periods before November 1, 2013 is not required by IFRS 13.
(2) Certain financial instruments have not been assigned to a level as the carrying amount always approximates their fair values due to the short-term nature (instruments that are receivable or
payable on demand, or with original maturity of three months or less) and insignificant credit risk.
(3) Included in Securities – Available-for-sale on our Consolidated Balance Sheets
Fair values of financial assets and liabilities carried at amortized cost and disclosed in the table above are determined using the following
valuation techniques and inputs.
Held-to-maturity securities
Fair values of Canadian Federal and OECD government bonds, and corporate bonds are based on quoted prices. Fair values of certain Non-OECD
government bonds are based on vendor prices or the discounted cash flow method with yield curves of other countries’ government bonds as
inputs.
Assets purchased under reverse repurchase agreements and securities borrowed, and Obligations related to assets sold under repurchase
agreements and securities loaned
Valuation methods used for the long-term instruments are described in the Fair value of assets and liabilities measured on a recurring basis and
classified using the fair value hierarchy section of this note. The carrying values of short-term instruments generally approximate their fair values.
Loans – Retail
Retail loans include residential mortgages, personal and small business loans and credit cards. For residential mortgages, and personal and
small business loans, we segregate the portfolio based on certain attributes such as product type, contractual interest rate, term to maturity and
credit scores, if applicable. Fair values of these loans are determined by the discounted cash flow method using applicable inputs such as
prevailing interest rates, contractual and posted client rates, client discounts, credit spreads, prepayment rates and loan-to-value ratio. Fair
values of credit card receivables are also calculated based on a discounted cash flow method with portfolio yields, charge off and monthly
payment rates as inputs. The carrying values of short-term and variable rate loans generally approximate their fair values.
Loans – Wholesale
Wholesale loans include Business, Bank and Sovereign loans. Where market prices are available, loans are valued based on market prices.
Otherwise, fair value is determined by the discounted cash flow method using the following inputs: market interest rates and market based
spreads of assets with similar credit ratings and terms to maturity, expected default frequency implied from credit default swap prices, if
available, and relevant pricing information such as contractual rate, origination and maturity dates, redemption price, coupon payment
frequency and date convention.
Deposits
Deposits are composed of demand, notice, and term deposits which include senior deposit notes we have issued to provide us with long-term
funding. Fair values of term deposits are determined by one of several valuation techniques: (i) for term deposits and similar instruments, we
segregate the portfolio based on term to maturity. Fair values of these instruments are determined by the discounted cash flow method using
inputs such as client rates for new sales of the corresponding terms; and (ii) for senior deposit notes, we use actual traded prices, vendor prices
or the discounted cash flow method using a market interest rate curve and our funding spreads as inputs. The carrying values of short-term term
deposits, and demand and notice deposits generally approximate their fair values.
Other assets and Other liabilities
Other assets and Other liabilities include receivables and payables relating to certain commodities and option premiums. Fair values of the
commodity receivables and payables are calculated by the discounted cash flow method using applicable inputs such as market interest rates,
counterparties’ credit spreads, our funding spreads, commodity forward prices and spot prices. The option premium receivables and payables
are valued by the discounted cash flow models using market interest rates as inputs.
142 Royal Bank of Canada: Annual Report 2014 Consolidated Financial Statements

Subordinated debentures
Fair values of Subordinated debentures are based on recent transaction prices.
Note 4 Securities
Carrying value of securities
The following table presents the financial instruments that we held at the end of the period, measured at carrying value:
As at October 31, 2014
Term to maturity (1)
(Millions of Canadian dollars)
Within
3 months
3 months
to 1 year
1 year to
5 years
5 years to
10 years
Over
10 years
With no
specific
maturity Total
Trading (2)
Canadian government debt $ 3,050 $ 6,651 $ 7,594 $ 2,232 $ 5,987 $ – $ 25,514
U.S. state, municipal and agencies debt 3,272 6,811 7,109 5,678 6,602 – 29,472
Other OECD government debt 1,637 3,205 6,223 1,594 2,666 – 15,325
Mortgage-backed securities (3) – 1 86 246 635 – 968
Asset-backed securities (3) 56 66 307 321 614 – 1,364
Corporate debt and other debt (3)
Bankers’ acceptances 754 8 – – – – 762
Certificates of deposit 17 342 574 30 17 – 980
Other (4) 470 5,501 13,086 2,998 3,789 – 25,844
Equities – – – – – 51,151 51,151
9,256 22,585 34,979 13,099 20,310 51,151 151,380
Available-for-sale (2)
Canadian government debt
Federal
Amortized cost 626 615 8,195 2,197 – – 11,633
Fair value 627 619 8,356 2,367 – – 11,969
Yield (5) 1.8% 2.8% 2.2% 3.3% – – 2.4%
Provincial and municipal
Amortized cost – – 644 130 18 – 792
Fair value – – 648 131 20 – 799
Yield (5) – – 2.4% 2.9% 4.9% – 2.5%
U.S. state, municipal and agencies debt
Amortized cost 108 385 80 213 5,544 – 6,330
Fair value 108 383 81 213 5,472 – 6,257
Yield (5) 0.0% 8.5% 0.7% 0.4% 0.7% – 1.1%
Other OECD government debt
Amortized cost 5,663 2,138 6,357 117 – – 14,275
Fair value 5,663 2,139 6,374 117 – – 14,293
Yield (5) 0.1% 0.2% 0.9% 0.4% – – 0.5%
Mortgage-backed securities
Amortized cost – – – 17 116 – 133
Fair value – – – 17 121 – 138
Yield (5) – – – 3.0% 1.8% – 2.0%
Asset-backed securities
Amortized cost – – 381 833 277 – 1,491
Fair value – – 387 849 208 – 1,444
Yield (5) – – 0.6% 0.5% 1.0% – 0.6%
Corporate debt and other debt
Amortized cost 1,625 822 5,820 727 255 – 9,249
Fair value 1,628 823 5,840 739 257 – 9,287
Yield (5) 1.1% 2.0% 1.6% 2.0% 4.2% – 1.7%
Equities
Cost – – – – – 1,333 1,333
Fair value – – – – – 1,696 1,696
Loan substitute securities
Cost – – – – – 124 124
Fair value – – – – – 126 126
Yield (5) – – – – – 3.9% 3.9%
Amortized cost 8,022 3,960 21,477 4,234 6,210 1,457 45,360
Fair value 8,026 3,964 21,686 4,433 6,078 1,822 46,009
Held-to-maturity (2)
Amortized cost 163 110 38 1,448 – – 1,759
Fair value 163 110 40 1,449 – – 1,762
Total carrying value of securities (2) $ 17,445 $ 26,659 $ 56,703 $ 18,980 $ 26,388 $ 52,973 $ 199,148
Consolidated Financial Statements Royal Bank of Canada: Annual Report 2014 143

Note 4 Securities (continued)
As at October 31, 2013
Term to maturity (1)
(Millions of Canadian dollars)
Within
3 months
3 months
to 1 year
1 year to
5 years
5 years to
10 years
Over
10 years
With no
specific
maturity Total
Trading (2)
Canadian government debt $ 3,341 $ 8,872 $ 8,245 $ 4,204 $ 6,438 $ – $ 31,100
U.S. state, municipal and agencies debt 2,415 9,852 8,655 3,376 5,184 – 29,482
Other OECD government debt 1,181 2,041 6,281 709 1,074 – 11,286
Mortgage-backed securities (3) 2 6 46 136 640 – 830
Asset-backed securities (3) 90 38 351 206 690 – 1,375
Corporate debt and other debt (3)
Bankers’ acceptances 678 – – – – – 678
Certificates of deposit 22 493 1,042 19 12 – 1,588
Other (4) 1,319 2,114 12,289 3,115 3,658 – 22,495
Equities – – – – – 45,189 45,189
9,048 23,416 36,909 11,765 17,696 45,189 144,023
Available-for-sale (2)
Canadian government debt
Federal
Amortized cost 852 533 4,927 3,189 4 – 9,505
Fair value 853 540 5,007 3,439 4 – 9,843
Yield (5) 2.6% 2.7% 2.1% 3.6% 4.8% – 2.7%
Provincial and municipal
Amortized cost 250 175 181 40 19 – 665
Fair value 250 175 182 40 20 – 667
Yield (5) 1.4% 1.4% 2.5% 4.3% 4.9% – 2.0%
U.S. state, municipal and agencies debt
Amortized cost 158 68 521 534 5,141 – 6,422
Fair value 157 68 522 533 4,998 – 6,278
Yield (5) 0.4% 0.1% 2.5% 0.4% 0.7% – 0.8%
Other OECD government debt
Amortized cost 5,263 1,306 2,913 1,405 – – 10,887
Fair value 5,262 1,311 2,917 1,407 – – 10,897
Yield (5) 0.1% 0.7% 0.7% 0.4% – – 0.4%
Mortgage-backed securities
Amortized cost – – – 25 105 – 130
Fair value – – – 26 113 – 139
Yield (5) – – – 3.5% 2.5% – 2.7%
Asset-backed securities
Amortized cost 8 – 279 1,193 408 – 1,888
Fair value 5 – 291 1,237 327 – 1,860
Yield (5) 2.6% – 1.0% 0.5% 1.1% – 0.7%
Corporate debt and other debt
Amortized cost 1,387 939 3,475 615 333 – 6,749
Fair value 1,394 945 3,478 619 333 – 6,769
Yield (5) 1.3% 1.8% 1.7% 2.8% 4.5% – 1.9%
Equities
Cost – – – – – 1,407 1,407
Fair value – – – – – 1,706 1,706
Loan substitute securities
Cost – – – – – 125 125
Fair value – – – – – 127 127
Yield (5) – – – – – 4.0% 4.0%
Amortized cost 7,918 3,021 12,296 7,001 6,010 1,532 37,778
Fair value 7,921 3,039 12,397 7,301 5,795 1,833 38,286
Held-to-maturity (2)
Amortized cost 140 141 76 44 – – 401
Fair value 140 141 76 44 – – 401
Total carrying value of securities (2) $ 17,109 $ 26,596 $ 49,382 $ 19,110 $ 23,491 $ 47,022 $182,710
(1) Actual maturities may differ from contractual maturities shown above since borrowers may have the right to prepay obligations with or without prepayment penalties.
(2) Trading securities and AFS securities are recorded at fair value. Held-to-maturity securities are recorded at amortized cost.
(3) Includes CDOs which are presented as Asset-backed securities – CDOs in the table entitled Fair value of assets and liabilities measured on a recurring basis and classified using the fair value
hierarchy in Note 3.
(4) Primarily composed of corporate debt, supra-national debt, and commercial paper.
(5) The weighted average yield is derived using the contractual interest rate and the carrying value at the end of the year for the respective securities.
144 Royal Bank of Canada: Annual Report 2014 Consolidated Financial Statements

Unrealized gains and losses on available-for-sale securities (1), (2)
As at
October 31, 2014 October 31, 2013
(Millions of Canadian dollars)
Cost/
Amortized
cost
Gross
unrealized
gains
Gross
unrealized
losses
Fair
value
Cost/
Amortized
cost
Gross
unrealized
gains
Gross
unrealized
losses
Fair
value
Canadian government debt
Federal $ 11,633 $ 338 $ (2) $ 11,969 $ 9,505 $ 340 $ (2) $ 9,843
Provincial and municipal 792 8 (1) 799 665 3 (1) 667
U.S. state, municipal and agencies
debt (3) 6,330 9 (82) 6,257 6,422 9 (153) 6,278
Other OECD government debt 14,275 19 (1) 14,293 10,887 14 (4) 10,897
Mortgage-backed securities 133 5 – 138 130 10 (1) 139
Asset-backed securities
CDOs 857 26 (2) 881 1,343 58 (4) 1,397
Non-CDO securities 634 5 (76) 563 545 3 (85) 463
Corporate debt and other debt 9,249 49 (11) 9,287 6,749 49 (29) 6,769
Equities 1,333 369 (6) 1,696 1,407 312 (13) 1,706
Loan substitute securities 124 2 – 126 125 3 (1) 127
$ 45,360 $ 830 $ (181) $ 46,009 $ 37,778 $ 801 $ (293) $ 38,286
(1) Excludes $1,759 million held-to-maturity securities as at October 31, 2014 (October 31, 2013 – $401 million) that are carried at cost.
(2) The majority of the MBS are residential. Cost/Amortized cost, gross unrealized gains, gross unrealized losses and fair value related to commercial MBS are $33 million, $1 million, $nil, and
$34 million, respectively as at October 31, 2014 (October 31, 2013 – $34 million, $1 million, $nil, and $35 million).
(3) Includes securities issued by U.S. non-agencies backed by government insured assets, and MBS and ABS issued by U.S. government agencies.
AFS securities are assessed for objective evidence of impairment at each reporting date and more frequently when conditions warrant. Our
impairment review is primarily based on the factors described in Note 2. Depending on the nature of the securities under review, we apply
specific methodologies to assess whether the cost/amortized cost of the security would be recovered. As at October 31, 2014, our gross
unrealized losses on AFS securities were $181 million (October 31, 2013 – $293 million). Management believes that there is no objective
evidence of impairment on our AFS securities that are in an unrealized loss position as at October 31, 2014.
Held-to-maturity securities
Held-to-maturity securities stated at amortized cost are subject to periodic impairment review and are classified as impaired when, in
management’s opinion, there is no longer reasonable assurance of the timely collection of the full amount of principal and interest. The
impairment review of held-to-maturity securities is primarily based on the impairment model for loans. Management believes that there is no
objective evidence of impairment on our held-to-maturity securities as at October 31, 2014.
Net gain and loss on available-for-sale securities (1)
For the year ended
(Millions of Canadian dollars)
October 31
2014
October 31
2013
October 31
2012
Realized gains $ 232 $ 231 $ 242
Realized losses (15) (17) (46)
Impairment losses (25) (26) (48)
$ 192 $ 188 $ 148
(1) The following related to our insurance operations are excluded from Net gain (loss) on AFS securities and included in Insurance premiums, investment and fee income on the Consolidated
Statements of Income: Realized gains for the year ended October 31, 2014 were $12 million (October 31, 2013 – $3 million; October 31, 2012 – $9 million). Realized losses for the year
ended October 31, 2014 were $1 million (October 31, 2013 – $nil, October 31, 2012 – $nil). There were no impairment losses related to our insurance operations for the years ended
October 31, 2014, October 31, 2013 and October 31, 2012.
During the year ended October 31, 2014, $192 million of net gains were recognized in Non-interest income as compared to $188 million in the
prior year. The current year reflects net realized gains of $217 million mainly comprised of distributions from and gains on sale of certain
Equities, redemption and restructurings of certain Asset-backed securities and the sale of Canadian government debt. Partially offsetting the net
realized gains are $25 million of impairment losses primarily on certain Equities. This compares to net realized gains for the year ended
October 31, 2013 of $214 million which was partially offset by $26 million of impairment losses.
Reclassification of financial Instruments
The following table provides information regarding certain securities that we reclassified in prior reporting periods:
Financial instruments reclassified in prior periods
As at
October 31
2014
October 31
2013
(Millions of Canadian dollars)
Total carrying value
and fair value
Total carrying value
and fair value
Financial assets – FVTPL reclassified to available-for-sale (1)
CDOs $ 751 $ 1,154
Mortgage-backed securities 44 59
$ 795 $ 1,213
(1) On October 1, 2011 and November 1, 2011, we reclassified $1,872 million and $255 million, respectively, of certain CDOs and U.S. non-agency MBS from classified as at FVTPL to AFS.
Consolidated Financial Statements Royal Bank of Canada: Annual Report 2014 145

Note 4 Securities (continued)
For the year ended
October 31, 2014 October 31, 2013 October 31, 2012
(Millions of Canadian dollars)
Change in fair value
during the period (1)
Interest income/ gains
(losses) recognized
in net income
during the period
Change in fair value
during the period (1)
Interest income/gains
(losses) recognized
in net income
during the period
Change in fair value
during the period (1)
Interest income/ gains
(losses) recognized
in net income
during the period
FVTPL reclassified to available-for-sale
CDOs $ (29) $ 58 $ (5) $ 59 $ 60 $ 76
Mortgage-backed securities (2) 4 –828
$ (31) $ 62 $ (5) $ 67 $ 62 $ 84
(1) This change represents the fair value gains or losses that would have been recognized in profit or loss had the assets not been reclassified.
Note 5 Loans
As at
October 31, 2014 October 31, 2013
(Millions of Canadian dollars) Canada
United
States
Other
International Total Canada
United
States
Other
International Total
Retail (1)
Residential mortgages $ 215,624 $ 539 $ 3,094 $ 219,257 $ 206,134 $ 378 $ 2,726 $ 209,238
Personal 86,984 4,082 4,955 96,021 85,701 3,306 3,852 92,859
Credit cards 14,650 65 209 14,924 13,902 50 190 14,142
Small business (2) 4,785 – – 4,785 4,388 – – 4,388
$ 322,043 $ 4,686 $ 8,258 $ 334,987 $ 310,125 $ 3,734 $ 6,768 $ 320,627
Wholesale (1)
Business (3) 54,656 23,544 20,250 98,450 51,122 19,395 16,009 86,526
Bank (4) 413 30 758 1,201 823 28 469 1,320
Sovereign (5) 1,797 – 788 2,585 1,747 – 589 2,336
$ 56,866 $ 23,574 $ 21,796 $ 102,236 $ 53,692 $ 19,423 $ 17,067 $ 90,182
Total loans $ 378,909 $ 28,260 $ 30,054 $ 437,223 $ 363,817 $ 23,157 $ 23,835 $ 410,809
Allowance for loan losses (1,466) (100) (428) (1,994) (1,482) (105) (372) (1,959)
Total loans net of allowance for loan losses $ 377,443 $ 28,160 $ 29,626 $ 435,229 $ 362,335 $ 23,052 $ 23,463 $ 408,850
(1) Geographic information is based on residence of borrower.
(2) Includes small business exposure managed on a pooled basis.
(3) Includes small business exposure managed on an individual client basis.
(4) Bank refers primarily to regulated deposit-taking institutions and securities firms.
(5) Sovereign refers to all central governments and agencies, central banks, as well as other qualifying public sector entities and multilateral development banks.
Loans maturity and rate sensitivity
As at October 31, 2014
Maturity term (1) Rate sensitivity
(Millions of Canadian dollars)
Under
1 year (2)
1to5
years
Over
5 years Total Floating
Fixed
Rate
Non-rate-
sensitive Total
Retail $ 184,647 $ 140,785 $ 9,555 $ 334,987 $ 121,451 $ 208,956 $ 4,580 $ 334,987
Wholesale 83,263 15,526 3,447 102,236 43,808 57,284 1,144 102,236
Total loans $ 267,910 $ 156,311 $ 13,002 $ 437,223 $ 165,259 $ 266,240 $ 5,724 $ 437,223
Allowance for loan losses (1,994) (1,994)
Total loans net of allowance for loan losses $ 435,229 $ 435,229
As at October 31, 2013
Maturity term (1) Rate sensitivity
(Millions of Canadian dollars)
Under
1 year (2)
1to5
years
Over
5 years Total Floating
Fixed
Rate
Non-rate-
sensitive Total
Retail $ 175,673 $ 133,501 $ 11,453 $ 320,627 $ 125,836 $ 189,628 $ 5,163 $ 320,627
Wholesale 73,050 12,010 5,122 90,182 47,061 41,611 1,510 90,182
Total loans $ 248,723 $ 145,511 $ 16,575 $ 410,809 $ 172,897 $ 231,239 $ 6,673 $ 410,809
Allowance for loan losses (1,959) (1,959)
Total loans net of allowance for loan losses $ 408,850 $ 408,850
(1) Generally, based on the earlier of contractual repricing or maturity date.
(2) Includes variable rate loans that can be repriced at the clients’ discretion without penalty.
146 Royal Bank of Canada: Annual Report 2014 Consolidated Financial Statements

Allowance for credit losses
For the year ended October 31, 2014
(Millions of Canadian dollars)
Balance at
beginning
of period
Provision
for credit
losses Write-offs Recoveries
Unwind of
discount
Exchange
rate
changes/
other
Balance
at end
of period
Retail
Residential mortgages $ 151 $ 95 $ (30) $ 2 $ (26) $ 48 $ 240
Personal 583 444 (565) 106 (23) (10) 535
Credit cards 385 353 (466) 114 – (1) 385
Small business 61 44 (47) 9 (2) (1) 64
1,180 936 (1,108) 231 (51) 36 1,224
Wholesale
Business 777 228 (221) 32 (36) (12) 768
Bank (1) 2– – – – –2
779 228 (221) 32 (36) (12) 770
Total allowance for loan losses 1,959 1,164 (1,329) 263 (87) 24 1,994
Allowance for off-balance sheet and other
items (2) 91 – – – – – 91
Total allowance for credit losses $ 2,050 $ 1,164 $ (1,329) $ 263 $ (87) $ 24 $ 2,085
Individually assessed 240 160 (188) 16 (24) 10 214
Collectively assessed 1,810 1,004 (1,141) 247 (63) 14 1,871
Total allowance for credit losses $ 2,050 $ 1,164 $ (1,329) $ 263 $ (87) $ 24 $ 2,085
For the year ended October 31, 2013
(Millions of Canadian dollars)
Balance at
beginning
of period
Provision
for credit
losses Write-offs Recoveries
Unwind of
discount
Exchange
rate
changes/
other
Balance
at end
of period
Retail
Residential mortgages $ 124 $ 41 $ (24) $ 2 $ (24) $ 32 $ 151
Personal 543 455 (498) 96 (17) 4 583
Credit cards 403 354 (466) 112 – (18) 385
Small business 72 32 (35) 9 (2) (15) 61
1,142 882 (1,023) 219 (43) 3 1,180
Wholesale
Business 852 355 (448) 51 (43) 10 777
Bank (1) 2– – – – –2
854 355 (448) 51 (43) 10 779
Total allowance for loan losses 1,996 1,237 (1,471) 270 (86) 13 1,959
Allowance for off-balance sheet and other
items (2) 91 – – – – – 91
Total allowance for credit losses $ 2,087 $ 1,237 $ (1,471) $ 270 $ (86) $ 13 $ 2,050
Individually assessed 298 287 (346) 31 (28) (2) 240
Collectively assessed 1,789 950 (1,125) 239 (58) 15 1,810
Total allowance for credit losses $ 2,087 $ 1,237 $ (1,471) $ 270 $ (86) $ 13 $ 2,050
Consolidated Financial Statements Royal Bank of Canada: Annual Report 2014 147

Note 5 Loans (continued)
For the year ended October 31, 2012
(Millions of Canadian dollars)
Balance at
beginning
of period
Provision
for credit
losses Write-offs Recoveries
Unwind of
discount
Exchange
rate
changes/
other
Balance
at end
of period
Retail
Residential mortgages $ 112 $ 64 $ (32) $ 1 $ (34) $ 13 $ 124
Personal 557 437 (499) 83 (23) (12) 543
Credit cards 415 403 (496) 102 – (21) 403
Small business 75 43 (50) 8 (2) (2) 72
1,159 947 (1,077) 194 (59) (22) 1,142
Wholesale
Business 773 352 (288) 39 (51) 27 852
Bank (1) 33 – (32) – – 1 2
806 352 (320) 39 (51) 28 854
Total allowance for loan losses 1,965 1,299 (1,397) 233 (110) 6 1,996
Allowance for off-balance sheet and other
items (2) 91 – – – – – 91
Total allowance for credit losses $ 2,056 $ 1,299 $ (1,397) $ 233 $ (110) $ 6 $ 2,087
Individually assessed 252 244 (202) 19 (26) 11 298
Collectively assessed 1,804 1,055 (1,195) 214 (84) (5) 1,789
Total allowance for credit losses $ 2,056 $ 1,299 $ (1,397) $ 233 $ (110) $ 6 $ 2,087
(1) Bank refers primarily to regulated deposit-taking institutions and securities firms.
(2) The allowance for off-balance sheet and other items is reported separately in Other liabilities – Provisions.
Net interest income after provision for credit losses
For the year ended
(Millions of Canadian dollars)
October 31
2014
October 31
2013
October 31
2012
Net interest income $ 14,116 $ 13,249 $ 12,439
Provision for credit losses 1,164 1,237 1,299
Net interest income after provision for credit losses $ 12,952 $ 12,012 $ 11,140
Loans past due but not impaired
As at
October 31,2014 October 31,2013
(Millions of Canadian dollars) 1 to 29 days 30 to 89 days
90 days
and greater Total 1 to 29 days 30 to 89 days
90 days
and greater Total
Retail $ 3,055 $ 1,284 $ 316 $ 4,655 $ 2,953 $ 1,358 $ 329 $ 4,640
Wholesale 431 322 – 753 624 303 17 944
$ 3,486 $ 1,606 $ 316 $ 5,408 $ 3,577 $ 1,661 $ 346 $ 5,584
Gross carrying value of loans individually determined to be impaired (1)
As at
(Millions of Canadian dollars)
October 31
2014
October 31
2013
Retail $– 71
Wholesale
Business 631 815
Bank (2) 23
$ 633 $ 889
(1) Average balance of gross individually assessed impaired loans for the year ended October 31, 2014 was $690 million (October 31, 2013 – $887 million).
(2) Bank refers primarily to regulated deposit-taking institutions and securities firms.
148 Royal Bank of Canada: Annual Report 2014 Consolidated Financial Statements

Note 6 Derecognition of financial assets
We enter into transactions in which we transfer financial assets such as loans or securities to structured entities or other third parties. The
transferred financial assets are derecognized from our Consolidated Balance Sheets when we transfer substantially all of the risks and rewards of
ownership of the financial assets. When we are exposed to substantially all of the risks and rewards of the assets, or when we have neither
transferred nor retained substantially all of the risks and rewards but retain control of the financial assets, we continue to recognize the financial
assets on our Consolidated Balance Sheets and a liability is recognized for the cash proceeds received.
The majority of assets transferred under repurchase agreements, securities lending agreements, and in our Canadian residential mortgage
securitization transactions do not qualify for derecognition.
Transferred financial assets not derecognized
Securitization of Canadian residential mortgage loans
We securitize insured Canadian residential mortgage loans through the creation of MBS pools under the National Housing Act MBS (NHA MBS)
program. All loans securitized under the NHA MBS program are required to be insured by the Canadian Mortgage Housing Corporation (CMHC) or
a third-party insurer. We require the borrower to pay the insurance for mortgages in which the loan amount is greater than 80% of the original
appraised value of the property (loan-to-value (LTV) ratio). For residential mortgage loans securitized under this program with an LTV ratio less
than 80%, we are required to insure the mortgages at our own expense. Under the NHA-MBS program, we are responsible for making all
payments due on our issued MBS, regardless of whether we collect the necessary funds from the mortgagor or the insurer. When the borrower
defaults on the mortgage payment, we submit a claim to the insurer if the amount recovered from the collection or foreclosure process is lower
than the sum of the principal balance, accrued interest and collection costs on the outstanding loan. The insurance claim process is managed by
the insurance provider in accordance with the insurer’s policies and covers the entire unpaid loan balance plus generally up to 12 months of
interest, selling costs and other eligible expenses. If an insurance claim is denied, a loss is recognized in Provision for credit losses in our
Consolidated Statements of Income. The amount recorded as a loss is not significant to our Consolidated Financial Statements and no significant
losses were incurred due to legal action arising from a mortgage default during 2014 and 2013.
We sell the NHA MBS pools primarily to a government-sponsored structured entity under the Canada Mortgage Bond (CMB) program. The
entity periodically issues CMBs, which are guaranteed by the government, and sells them to third-party investors. Proceeds of the CMB issuances
are used by the entity to purchase the NHA MBS pools from eligible NHA MBS issuers who participate in the issuance of a particular CMB series.
Our continuing involvement includes servicing the underlying residential mortgage loans we have securitized, either ourselves or through a third-
party servicer. We also act as counterparty in interest rate swap agreements where we pay the entity the interest due to CMB investors and
receive the interest on the underlying MBS and reinvested assets. As part of the swap, we are also required to maintain a principal reinvestment
account for principal payments received on the underlying mortgage loans to meet the repayment obligation upon maturity of the CMB. We
reinvest the collected principal payments in permitted investments as outlined in the swap agreement.
We have determined that all of the NHA MBS program loans transferred to the entity do not qualify for derecognition as we have not
transferred substantially all of the risks and rewards of ownership. As a result, these transferred MBS continue to be classified as residential
mortgage loans and recognized on our Consolidated Balance Sheets. The cash received for these transferred MBS is treated as a secured
borrowing and a corresponding liability recorded in Deposits – Business and government on our Consolidated Balance Sheets.
Securities sold under repurchase agreements and securities loaned
We also enter into transactions such as repurchase agreements and securities lending agreements where we transfer assets under agreements
to repurchase them on a future day and retain substantially all of the credit, price, interest rate and foreign exchange risks and rewards
associated with the assets. These transferred assets remain on our Consolidated Balance Sheets and are accounted for as collateralized
borrowing transactions.
The following table provides information on the carrying amount and fair value of the transferred assets that did not qualify for derecognition,
and their associated liabilities.
As at
October 31, 2014 October 31, 2013
(Millions of Canadian dollars)
Canadian
residential
mortgage
loans (1), (2)
Securities
sold under
repurchase
agreements (3)
Securities
loaned (3) Total
Canadian
residential
mortgage
loans (1) (2)
Securities
sold under
repurchase
agreements (3)
Securities
loaned (3) Total
Carrying amount of transferred
assets that do not qualify
derecognition $ 36,972 $ 60,279 $ 4,052 $101,303 $ 43,092 $ 55,715 $ 4,701 $103,508
Carrying amount of associated
liabilities 36,941 60,279 4,052 101,272 43,019 55,715 4,701 103,435
Fair value of transferred assets $ 37,010 $ 60,279 $ 4,052 $101,341 $ 42,921 $ 55,715 $ 4,701 $103,337
Fair value of associated liabilities 37,769 60,279 4,052 102,100 43,418 55,715 4,701 103,834
Fair value of net position $ (759) $ – $ – $ (759) $ (497) $ – $ – $ (497)
(1) Includes Canadian residential mortgages loans transferred primarily to Canada Housing Trust at the initial securitization and other permitted investments used for funding requirements after
the initial securitization.
(2) CMB investors have legal recourse only to the transferred assets, and do not have recourse to our general assets.
(3) Does not include over-collateralization of assets pledged.
Note 7 Structured entities
In the normal course of business, we engage in a variety of financial transactions with structured entities to support our financing and investing
needs as well as those of our customers. A structured entity is an entity in which voting or similar rights are not the dominant factor in deciding
control. Structured entities are generally created to achieve a narrow and well defined objective with restrictions around their ongoing activities.
We consolidate a structured entity when we control the entity in accordance with our accounting policy described in Note 2. In other cases, we
may sponsor or have an interest in such an entity but not consolidate it.
Consolidated Financial Statements Royal Bank of Canada: Annual Report 2014 149

Note 7 Structured entities (continued)
Consolidated structured entities
We consolidate the following structured entities, whose assets and liabilities are recorded on our Consolidated Balance Sheets. Third-party
investors in these structured entities generally have recourse only to the assets of the related entity and do not have recourse to our general
assets unless we breach our contractual obligations to those entities. In the ordinary course of business, the assets of each consolidated
structured entity can generally only be used to settle the obligations of that entity.
Credit card securitization vehicle
We securitize a portion of our credit card receivables through a structured entity on a revolving basis. The entity is financed through the issuance
of senior and subordinated notes collateralized by the underlying credit card receivables. The senior notes are issued to third-party investors and
the subordinated notes are retained by us. The third-party investors have recourse only to the transferred assets.
We continue to service the credit card receivables sold and perform an administrative role for the entity. We also provide first-loss
protection through our ownership of all the subordinated notes issued by the entity and our interest in the excess spread (residual net interest
income after all trust expenses) which is subordinated to the obligations to the senior noteholders. Additionally, we may own some senior notes
as investments or for market-making activities; we retain a cash reserve account of the entity from time to time; we provide subordinated loans to
the entity to pay upfront expenses; and we act as counterparty to interest rate and cross currency swap agreements which hedge the entity’s
interest rate and currency risk exposure.
We consolidate the structured entity because we have decision making power over the timing and size of future issuances and other
relevant activities which were predetermined by us at inception. We also obtain significant funding benefits and are exposed to the majority of
the residual ownership risks through the credit support provided. As at October 31, 2014, $8.5 billion of notes issued by our credit card securiti-
zation vehicle were included in Deposits on our Consolidated Balance Sheets (October 31, 2013 – $7.0 billion).
Auto loan securitization vehicles
We obtained control of certain auto loan securitization vehicles as a result of the acquisition of the Canadian auto finance and deposit business
of Ally Financial Inc. completed in 2013. These vehicles issued senior and subordinated notes collateralized by auto loan receivables originated
and transferred to the entities by Ally Financial Inc. We continue to provide credit enhancement to the outstanding notes through
overcollateralization, cash reserve accounts and our interest in the excess spread, which is subordinated to the noteholders. We also act as
swap counterparty for one entity’s interest rate swap agreements which hedge its interest rate risk exposure. The third-party investors have
recourse only to the transferred assets.
We consolidate these vehicles because we have the decision making power over the relevant activities and are exposed to the majority of
the residual ownership risks. As at October 31, 2014, there were $407 million of deposits outstanding related to these structures (October 31,
2013 – $944 million).
Collateralized commercial paper vehicle
We established a funding vehicle that provides loans to us and finances those loans by issuing commercial paper to third-party investors. The
structured entity’s commercial paper carries an equivalent credit rating to RBC because we are obligated to advance funds to the entity in the
event there are insufficient funds from other sources to settle maturing commercial paper. We pledge collateral to secure the loans and are
exposed to the market and credits risks of the pledged securities. We administer the entity and earn an administration fee for providing these
services.
We consolidate the structured entity because we have decision making power over the relevant activities, are the sole borrower from the
structure, and are exposed to a majority of the residual ownership risks through the credit support provided. As at October 31, 2014, $7.8 billion
of commercial paper was included in Deposits on our Consolidated Balance Sheets (October 31, 2013 – $3.9 billion).
Innovative capital vehicles
RBC Capital Trust was created to issue innovative capital instruments, the proceeds from which were used to purchase mortgages from RBC. We
consolidate the trust as, through our roles as trustee, administrative agent and equity investor, we have the decision making power over the
relevant activities of the trust and are exposed to variability from the performance of the underlying mortgages. Refer to Note 20 for further
details on our innovative capital instruments.
Covered bonds
RBC Covered Bond Guarantor Limited Partnership (Guarantor LP) was created to issue guarantees of covered bonds that we issue. We periodi-
cally transfer mortgages to Guarantor LP to support funding activities and asset coverage requirements under our covered bond program. The
covered bonds guaranteed by Guarantor LP are direct, unsecured and unconditional obligations of RBC; therefore, investors have a claim against
the Bank which will continue if the covered bonds are not paid by the Bank and the mortgage assets in Guarantor LP are insufficient to satisfy the
obligations owing on the covered bonds.
We consolidate Guarantor LP as, through our roles as trustee, administrative agent and equity investor, we have the decision making power
over the relevant activities of Guarantor LP and are exposed to variability from the performance of the underlying mortgages. As at October 31,
2014, the total amount of mortgages transferred and outstanding was $38.3 billion (October 31, 2013 – $37.1 billion) and $26.4 billion of
covered bonds were recorded as Deposits on our Consolidated Balance Sheets (October 31, 2013 – $21.3 billion).
ARS TOB programs
We sold ARS into Tender Option Bond (TOB) trusts, where each program consists of a credit enhancement (CE) trust and a TOB trust. Each ARS
sold to the TOB program is supported by a letter of credit and liquidity facility issued by us, which requires us to extend funding if there are any
losses on the ARS. The CE trust certificate is deposited into a TOB trust which provides the financing of the purchase of the underlying security
through the issuance of floating-rate certificates to short-term investors and a residual certificate to a single third-party investor. Both the CE and
the TOB trusts are structured entities. We are the remarketing agent for the floating-rate certificates and we provide liquidity facilities to each of
the ARS TOB programs to purchase any floating-rate certificates that have been tendered but not successfully remarketed. We receive market-
based fees for acting as the remarketing agent and providing the letters of credit and liquidity facilities.
150 Royal Bank of Canada: Annual Report 2014 Consolidated Financial Statements

We consolidate these ARS TOB programs as we have decision making power over the relevant activities of the CE trust and are exposed to
the variability from the performance of the underlying ARS through our provision of the credit enhancement and the liquidity facility. As at
October 31, 2014, $67 million of ARS were included in AFS securities related to consolidated TOB structures (October 31, 2013 – $683 million)
and a corresponding $69 million of floating rate certificates were included in Deposits on our Consolidated Balance Sheets (October 31, 2013 -
$744 million).
Municipal bond TOB programs
We utilize the TOB funding vehicle to finance taxable and tax-exempt municipal bonds within our Capital Markets segment. The structure of
municipal bond TOB programs that we are involved with is similar to the structure of the ARS TOB programs described above. However, in certain
municipal bond TOB programs, we also purchase residual certificates issued by these TOB vehicles which expose us to credit risk of the
underlying bonds as well as interest rate risk of the structure.
We consolidate programs in which we are the holder of the residual certificate as we have decision making power over the relevant activ-
ities, including the selection of the underlying municipal bonds and the ability to terminate the structure, and are exposed to variability from the
performance of the underlying municipal bonds. As at October 31, 2014, $3.3 billion of municipal bonds were included in AFS Securities related
to consolidated TOB structures (October 31, 2013 – $3.7 billion) and a corresponding $3.3 billion of floating rate certificates were included in
Deposits on our Consolidated Balance Sheets (October 31, 2013 - $3.7 billion).
Non-RBC managed Investment funds
We enter into certain fee-based equity derivative transactions where our investments in the reference funds are held by an intermediate limited
partnership entity (intermediate entity) in which we hold a substantial majority of the equity interests. We consolidate the intermediate entity
because we have the decision making power to direct all the activities of the entity and are exposed to a majority of the risks and rewards
through our equity investments. As at October 31, 2014, $277 million of Trading securities representing our investments in the reference funds
were recorded on our Consolidated Balance Sheets (October 31, 2013 – $300 million).
RBC managed investment funds
We are sponsors and investment managers of mutual and pooled funds which gives us the ability to direct the investment decisions of the funds.
We consolidate those mutual and pooled funds in which our interests, which include direct investment in seed capital plus management or
performance fees, indicate that we are acting as a principal. As at October 31, 2014, $499 million of Trading securities held in the consolidated
funds (October 31, 2013 – $295 million) and $189 million of Other liabilities representing the fund units held by third parties (October 31,
2013 – $26 million) were recorded on our Consolidated Balance Sheets.
Unconsolidated structured entities
We have interests in certain structured entities that we do not consolidate but have recorded assets and liabilities on our Consolidated Balance
Sheets related to our transactions and involvement with these entities.
The following table presents the assets and liabilities recorded on our Consolidated Balance Sheets and our maximum exposure to loss
related to our interests in unconsolidated structured entities. It also presents the size of each class of unconsolidated structured entity, as
measured by the total assets of the entities in which RBC has an interest.
As at October 31, 2014
(Millions of Canadian dollars)
Multi-seller
conduits (1)
Structured
finance
Non-RBC
managed
investment
funds
RBC
managed
investment
funds
Third-party
securitization
vehicles
Trading
portfolio
investments Other Total
On-balance sheet assets
Securities $ 42 $ – $ 3,343 $ 151 $ 1 $ 3,345 $ 718 $ 7,600
Loans 864 – – – 1,463 – – 2,327
Derivatives –3––––811
Other assets – 913 1 220 – – 286 1,420
$ 906 $ 916 $ 3,344 371 $ 1,464 $ 3,345 $ 1,012 $ 11,358
On-balance sheet liabilities
Derivatives $ 85$ –$ –$ –$ 2$ –$ –$ 87
Other liabilities – – 5 – – – 260 265
$ 85$ –$ 5$ –$ 2$ –$ 260$ 352
Maximum exposure to loss (2) $ 31,019 $ 2,158 $ 4,005 $ 203 $ 2,397 $ 3,345 $ 873 $ 44,000
Total assets of unconsolidated
structured entities $ 30,428 $ 13,118 $ 621,938 $ 272,852 $ 27,095 $ 875,438 $ 64,963 $1,905,832
Consolidated Financial Statements Royal Bank of Canada: Annual Report 2014 151

Note 7 Structured entities (continued)
As at October 31, 2013
(Millions of Canadian dollars)
Multi-seller
conduits (1)
Structured
finance
Non-RBC
managed
investment
funds
RBC
managed
investment
funds
Third-party
securitization
vehicles
Trading
portfolio
investments Other Total
On-balance sheet assets
Securities $ 14 $ – $ 2,629 $ 143 $ – $ 3,494 $ 761 $ 7,041
Loans 896 – – – 1,454 – 3 2,353
Derivatives 44 20 ––––973
Other assets – 870 1 200 – – 350 1,421
$ 954 $ 890 $ 2,630 $ 343 $ 1,454 $ 3,494 $ 1,123 $ 10,888
On-balance sheet liabilities
Deposits $ – $ – $ – $ – $ – $ – $ 903 $ 903
Derivatives 11 – – – 2 – – 13
Other liabilities – – 1 – – – 333 334
$ 11 $ – $ 1 $ – $ 2 $ – $ 1,236 $ 1,250
Maximum exposure to loss (2) $ 31,600 $ 1,969 $ 3,294 $ 182 $ 2,187 $ 3,494 $ 1,059 $ 43,785
Total assets of unconsolidated
structured entities $ 31,075 $ 22,733 $ 810,866 $ 238,348 $ 40,183 $ 736,756 $ 58,102 $1,938,063
(1) Total assets of unconsolidated structured entities represent the maximum assets that may have to be purchased by the conduits under purchase commitments outstanding. Of the purchase
commitments outstanding, the conduits have purchased financial assets totalling $19.8 billion as at October 31, 2014 (October 31, 2013 - $18.8 billion).
(2) The maximum exposure to loss resulting from our interests in these entities consists mostly of investments, loans, fair value of derivatives, liquidity and credit enhancement facilities. The
maximum exposure to loss of the multi-seller conduits is higher than the on-balance sheet assets primarily by the notional amounts of the backstop liquidity and credit enhancement
facilities. Refer to Note 26.
Below is a description of our involvement with each significant class of unconsolidated structured entity.
Multi-seller conduits
We administer five multi-seller asset-backed commercial paper (ABCP) conduit programs (multi-seller conduits) – two in Canada and three in the
U.S. These conduits primarily purchase financial assets from clients and finance those purchases by issuing ABCP.
We do not maintain any ownership or retained interests in the multi-seller conduits that we administer and have no rights to, or control of,
their assets. As the administrative agent, we earn a residual fee for providing services such as coordinating funding activities, transaction
structuring, documentation, execution and monitoring of transactions. The ABCP issued by each multi-seller conduit is in the conduit’s own
name with recourse to the financial assets owned by each multi-seller conduit, and is non-recourse to us except through our participation in
liquidity and/or credit enhancement facilities. We may purchase ABCP issued by our multi-seller conduits from time to time in our capacity as
placement agent in order to facilitate the overall program liquidity.
We provide transaction-specific and program-wide liquidity facilities to the multi-seller conduits. In addition, we provide program-wide
credit enhancement to the multi-seller conduits which obligate us to purchase assets or advance funds in the event the multi-seller conduit does
not otherwise have funds from other sources, such as from the liquidity facilities, to settle maturing ABCP. In some cases, we or another third
party may provide transaction-specific credit enhancement which can take various forms. We receive market-based fees for providing these
liquidity and credit facilities.
For certain transactions, we act as counterparty to foreign exchange rate forward contracts and interest rate swaps to facilitate our clients’
securitization of fixed rate and/or foreign currency denominated assets through the conduits. These derivatives expose us to foreign exchange
and interest rate risks that are centrally managed by our foreign exchange trading and swap desks, respectively, and credit risk on the underlying
assets that is mitigated by the credit enhancement described below.
Each transaction is structured with transaction-specific first loss protection provided by the third-party seller. This enhancement can take
various forms, including but not limited to overcollateralization, excess spread, subordinated classes of financial assets, guarantees or letters
of credit. The amount of this enhancement varies but is generally sized to cover a multiple of loss experience.
An unrelated third party (expected loss investor) absorbs credit losses, up to a maximum contractual amount, that may occur in the future
on the assets in the multi-seller conduits before the multi-seller conduits’ debt holders and us. In return for assuming this multi-seller conduit
first-loss position, each multi-seller conduit pays the expected loss investor a return commensurate with its risk position. The expected loss
investor has substantive power to direct the majority of the activities which significantly impact the conduit’s economic performance, including
initial selection and approval of the asset purchase commitments and liquidity facilities, approval of renewal and amendment of these
transactions and facilities, sale or transfer of assets, ongoing monitoring of asset performance, mitigation of credit losses, and management of
the ABCP liabilities.
We do not consolidate these multi-seller conduits as we do not have the decision-making power to direct the relevant activities noted
above.
Structured finance
We purchased U.S. ARS from certain trusts (U.S. ARS Trusts) which fund their long-term investments in student loans by issuing short-term senior
and subordinated notes. We are subject to losses on these U.S. ARS Trusts if defaults are experienced on the underlying student loans; however,
in the majority of these structures, the principal and accrued interest on the student loans is guaranteed by U.S. government agencies. We act as
auction agent for some of these entities but have no legal obligation to purchase the notes issued by these entities in the auction process. We do
not consolidate these U.S. ARS Trusts as we do not have decision making power over the investing and financing activities of the Trusts, which
are the activities that most significantly affect the performance of the Trusts.
Additionally, we invest in certain municipal bond TOB programs that we do not consolidate. These programs are similar to those
consolidated municipal bond TOB programs described above; however, the residual certificates are held by third-parties and we do not provide
credit enhancement of the underlying assets. We only provide liquidity facilities on the floating-rate certificates which may be drawn if
certificates are tendered but not able to be remarketed. We do not have decision making power over the relevant activities of the programs;
therefore, we do not consolidate these programs. The assets transferred into these programs are derecognized from our Consolidated Balance
Sheets.
152 Royal Bank of Canada: Annual Report 2014 Consolidated Financial Statements

Non-RBC managed investment funds
We enter into fee-based equity derivative transactions with third parties including mutual funds, unit investment trusts and other investment
funds. These transactions provide their investors with the desired exposure to a reference fund, and we economically hedge our exposure to
these derivatives by investing in those reference funds. We also act as custodian or administrator for several funds. We do not consolidate those
reference funds that are managed by third parties as we do not have power to direct their investing activities.
We provide liquidity facilities to certain third-party investment funds. The funds issued unsecured variable-rate preferred shares and invest
in portfolios of tax-exempt municipal bonds. Undrawn liquidity commitments expose us to liquidity risk of the preferred shares and drawn
commitments expose us to the credit risk of the underlying municipal bonds. We do not consolidate these third-party managed funds as we do
not have power to direct their investing activities.
RBC managed investment funds
We are sponsors and investment managers of mutual and pooled funds which gives us the ability to direct the investment decisions of the funds.
We do not consolidate those mutual and pooled funds in which our interests indicate that we are exercising our decision making power as an
agent of the other unit holders.
Third-party securitization vehicles
We hold interests in securitization vehicles that provide funding to certain third-parties on whose behalf the entities were created. The activities
of these entities are limited to the purchase and sale of specified assets from the sponsor and the issuance of asset-backed notes collateralized
by those assets. The underlying assets are typically receivables, including auto loans and leases. We, as well as other financial institutions, are
obligated to provide funding up to our maximum commitment level and are exposed to credit losses on the underlying assets after various credit
enhancements. Enhancement can take various forms, including but not limited to overcollateralization, excess spread, subordinated classes of
financial assets, guarantees or letters of credit. The amount of this enhancement varies but is generally sized to cover a multiple of loss
experience. We do not consolidate these entities as we do not have decision making power over the relevant activities, including the investing
and financing activities.
Trading portfolio investments
We also invest in the securities issued by structured entities, including government-sponsored entities, as part of our trading activities. We did
not create and are not the sponsor of these entities and our involvement is limited to that of a passive investor. These investments do not carry
a funding commitment; therefore our maximum exposure to loss is limited to our investment. We do not consolidate these entities as we do not
have any decision making power over their activities.
Other
Other structured entities include credit investment products and tax credit funds.
We use structured entities to generally transform credit derivatives into cash instruments, to distribute credit risk and to create customized
credit products to meet investors’ specific requirements. We enter into derivative contracts, including credit derivatives, to purchase protection
from these entities (credit protection) and convert various risk factors such as yield, currency or credit risk of underlying assets to meet the needs
of the investors. We act as sole arranger and swap provider for certain entities and, in some cases, fulfill other administrative functions for the
entities. We do not consolidate these credit investment product entities as we do not have decision making power over the relevant activities,
which include selection of the collateral and reference portfolio, and are not exposed to a majority of the benefits or risks of the entities.
We created certain funds to pass through tax credits received from underlying low-income housing or historic rehabilitation real estate
projects to third parties (tax credit funds). We are sponsors of the tax credit funds as a result of our responsibility to manage the funds, arrange
the financing, and perform the administrative duties of these tax credit funds. We do not consolidate the tax credit funds as the investors in
these funds have the decision making power to select the underlying investments and are exposed to the majority of the residual ownership and
tax risks of the funds.
Sponsored entities
We are a sponsor of certain structured entities in which we have interests but do not consolidate. In determining whether we are a sponsor of a
structured entity, we consider both qualitative and quantitative factors, including the purpose and nature of the entity, our initial and continuing
involvement and whether we hold subordinated interests in the entity. We are considered to be the sponsor of certain credit investment
products, tax credit entities, RBC-managed mutual funds and a commercial mortgage securitization vehicle. During the year end October 31,
2014, we transferred commercial mortgages with a carrying amount of $173 million (October 31, 2013 – $nil) to a sponsored securitization
vehicle in which we did not have an interest as at the end of the reporting period.
Financial support provided to structured entities
During the years ended October 31, 2014, 2013 and 2012, we have not provided any financial or non-financial support to any consolidated or
unconsolidated structured entities when we were not contractually obligated to do so. Furthermore, we have no intention to provide such support
in the future.
Note 8 Derivative financial instruments and hedging activities
Derivative instruments are categorized as either financial or non-financial derivatives. Financial derivatives are financial contracts whose value
is derived from an underlying interest rate, foreign exchange rate, credit risk, and equity or equity index. Non-financial derivatives are contracts
whose value is derived from a precious metal, commodity instrument or index. Notional amount of derivatives represents the contract amount
used as a reference point to calculate payments. Notional amounts are generally not exchanged by counterparties, and do not reflect our
exposure at default.
Consolidated Financial Statements Royal Bank of Canada: Annual Report 2014 153

Note 8 Derivative financial instruments and hedging activities (continued)
Financial derivatives
Forwards and futures
Forward contracts are effectively non-standardized agreements that are transacted between counterparties in the over-the-counter market,
whereas futures are standardized contracts with respect to amounts and settlement dates, and are traded on regular futures exchanges.
Examples of forwards and futures are described below:
Interest rate forwards (forward rate agreements) and futures are contractual obligations to buy or sell an interest-rate sensitive financial
instrument on a predetermined future date at a specified price.
Foreign exchange forwards and futures are contractual obligations to exchange one currency for another at a specified price for settlement
at a predetermined future date.
Equity forwards and futures are contractual obligations to buy or sell at a fixed value (the specified price) of an equity index, a basket of
stocks or a single stock at a predetermined future date.
Swaps
Swaps are over-the-counter contracts in which two counterparties exchange a series of cash flows based on agreed upon rates to a notional
amount. Examples of swap agreements are described below.
Interest rate swaps are agreements where two counterparties exchange a series of payments based on different interest rates applied to
a notional amount in a single currency. Cross currency swaps involve the exchange of fixed payments in one currency for the receipt of fixed
payments in another currency. Cross currency interest rate swaps involve the exchange of both interest and notional amounts in two different
currencies.
Equity swaps are contracts in which one counterparty agrees to pay or receive from the other cash flows based on changes in the value of
an equity index, a basket of stocks or a single stock.
Options
Options are contractual agreements under which the seller (writer) grants the purchaser the right, but not the obligation, either to buy (call
option) or sell (put option), a security, exchange rate, interest rate, or other financial instrument or commodity at a predetermined price, at or by
a specified future date. The seller (writer) of an option can also settle the contract by paying the cash settlement value of the purchaser’s right.
The seller (writer) receives a premium from the purchaser for this right. The various option agreements that we enter into include but are not
limited to interest rate options, foreign currency options, equity options and index options.
Credit derivatives
Credit derivatives are over-the-counter contracts that transfer credit risk related to an underlying financial instrument (referenced asset) from one
counterparty to another. Examples of credit derivatives are described below.
Credit default swaps provide protection against the decline in value of the referenced asset as a result of specified credit events such as
default or bankruptcy. They are similar in structure to an option, whereby the purchaser pays a premium to the seller of the credit default swap in
return for payment contingent on a credit event affecting the referenced asset.
Credit default baskets are similar to credit default swaps except that the underlying referenced financial instrument is a group of assets
instead of a single asset.
Total return swaps are contracts where one counterparty agrees to pay or receive from the other cash flows based on changes in the value
of the referenced asset.
Other derivative products
Certain warrants and loan commitments that meet the definition of derivative are also included as derivative instruments.
Non-financial derivatives
We also transact in non-financial derivative products including precious metal and commodity derivative contracts in both the over-the-counter
and exchange markets.
Derivatives issued for trading purposes
Most of our derivative transactions relate to sales and trading activities. Sales activities include the structuring and marketing of derivative
products to clients to enable them to transfer, modify or reduce current or expected risks. Trading involves market-making, positioning and
arbitrage activities. Market-making involves quoting bid and offer prices to other market participants with the intention of generating revenue
based on spread and volume. Positioning involves managing market risk positions with the expectation of profiting from favourable movements
in prices, rates or indices. Arbitrage activities involve identifying and profiting from price differentials between markets and products.
Derivatives issued for other-than-trading purposes
We also use derivatives for purposes other than trading, primarily for hedging, in conjunction with the management of interest rate, credit, equity
and foreign exchange risk related to our funding, lending, investment activities and asset/liability management.
Interest rate swaps are used to manage our exposure to interest rate risk by modifying the repricing or maturity characteristics of existing
and/or forecasted assets and liabilities, including funding and investment activities. Purchased options are used to hedge redeemable deposits
and other options embedded in consumer products. We manage our exposure to foreign currency risk with cross currency swaps and foreign
exchange forward contracts. We predominantly use credit derivatives to manage our credit exposures. We mitigate industry sector concentrations
and single-name exposures related to our credit portfolio by purchasing credit derivatives to transfer credit risk to third parties.
Certain derivatives and cash instruments are specifically designated and qualify for hedge accounting. We apply hedge accounting to
minimize volatility in earnings and capital caused by changes in interest rates or foreign exchange rates. Interest rate and currency fluctuations
will either cause assets and liabilities to appreciate or depreciate in market value or cause variability in forecasted cash flows. When a hedging
relationship is effective, gains, losses, revenue and expenses of the hedging instrument will offset the gains, losses, revenue and expenses of
the hedged item. We largely assess and measure the effectiveness of a hedging relationship based on the change in fair value of the derivative
hedging instrument relative to the change in fair value of the hedged item. When cash instruments are designated as hedges of currency risks,
only changes in their value due to currency risk are included in the assessment and measurement of hedge effectiveness.
154 Royal Bank of Canada: Annual Report 2014 Consolidated Financial Statements

From time to time, we also enter into derivative transactions to economically hedge certain exposures that do not otherwise qualify for
hedge accounting, or where hedge accounting is not considered economically feasible to implement. In such circumstances, changes in fair
value are reflected in Non-interest income.
After-tax unrealized gains relating to de-designated hedges of $44 million (before-tax unrealized gains of $60 million) included in Other
components of equity as at October 31, 2014, are expected to be reclassified to Net interest income within the next 12 months.
The following table presents the fair values of the derivative and non-derivative instruments categorized by their hedging relationships, as
well as derivatives that are not designated in hedging relationships.
Derivatives and non-derivative instruments
As at
October 31, 2014 October 31, 2013
Designated as hedging
instruments in
hedging relationships
Designated as hedging
instruments in
hedging relationships
(Millions of Canadian dollars)
Cash
flow
hedges
Fair
value
hedges
Net
investment
hedges
Not designated
in a hedging
relationship
Cash
flow
hedges
Fair value
hedges
Net
investment
hedges
Not designated
in a hedging
relationship
Assets
Derivative instruments $ 504 $ 1,392 $ 87 $ 85,419 $ 555 $ 1,461 $ 32 $ 72,774
Liabilities
Derivative instruments 511 121 205 88,145 460 376 95 75,814
Non-derivative instruments – – 20,949 – – – 17,499 –
Results of hedge activities recorded in Net income and Other comprehensive income
For the year ended
October 31, 2014 October 31, 2013 October 31, 2012
(Millions of Canadian dollars)
Net gains
(losses) included
in Non-interest
income
Net gains
(losses) included
in Net interest
income
After-tax
unrealized
gains (losses)
included in OCI
Net gains
(losses) included
in Non-interest
income
Net gains
(losses) included
in Net interest
income
After-tax
unrealized
gains (losses)
included in OCI
Net gains
(losses) included
in Non-interest
income
Net gains
(losses) included
in Net interest
income
After-tax
unrealized
gains (losses)
included in OCI
Fair value hedges
Gains (losses) on hedging
instruments $ 216 $ n.a. $ n.a. $ (551) $ n.a. $ n.a. $ (66) $ n.a. $ n.a.
(Losses) gains on hedged
items attributable to
the hedged risk (329) n.a. n.a. 459 n.a. n.a. (15) n.a. n.a.
Ineffective portion (1) (113) n.a. n.a. (92) n.a. n.a. (81) n.a. n.a.
Cash flow hedges
Ineffective portion (13) n.a. n.a. (13) n.a. n.a. (4) n.a. n.a.
Effective portion n.a. n.a. (108) n.a. n.a. (11) n.a. n.a. 32
Reclassified to income
during the period (2) n.a. (38) n.a. n.a. 40 n.a. n.a. (35) n.a.
Net investment hedges
Ineffective portion 1 n.a. n.a. 1 n.a. n.a. 1 n.a. n.a.
Foreign currency gains
(losses) n.a. n.a. 2,743 n.a. n.a. 1,402 n.a. n.a. 114
(Losses) gains from
hedges n.a. n.a. (1,585) n.a. n.a. (912) n.a. n.a. –
$ (125) $ (38) $ 1,050 $ (104) $ 40 $ 479 $ (84) $ (35) $ 146
(1) Includes losses of $109 million (2013 – $82 million; 2012 – $76 million) that are excluded from the assessment of hedge effectiveness. These amounts are recorded in Non-interest income
and are offset by other economic hedges.
(2) After-tax losses of $28 million were reclassified from Other components of equity to income during the year ended October 31, 2014 (October 31, 2013 – gains of $30 million; October 31,
2012 – losses of $25 million).
n.a. not applicable
Consolidated Financial Statements Royal Bank of Canada: Annual Report 2014 155

Note 8 Derivative financial instruments and hedging activities (continued)
Notional amount of derivatives by term to maturity (absolute amounts)
As at October 31, 2014
Term to maturity
(Millions of Canadian dollars) Within 1 year 1 to 5 years Over 5 years (1) Total Trading
Other than
Trading
Over-the-counter contracts
Interest rate contracts
Forward rate agreements $ 324,707 $ 47,227 $ – $ 371,934 $ 371,934 $ –
Swaps 1,626,852 3,301,834 1,852,349 6,781,035 6,579,940 201,095
Options purchased 98,085 101,493 23,930 223,508 223,508 –
Options written 97,259 104,445 32,258 233,962 233,962 –
Foreign exchange contracts
Forward contracts 1,019,102 30,832 1,094 1,051,028 1,018,520 32,508
Cross currency swaps 7,371 15,102 20,415 42,888 42,156 732
Cross currency interest rate swaps 148,340 424,982 218,011 791,333 763,764 27,569
Options purchased 27,159 12,665 4,058 43,882 43,882 –
Options written 28,287 12,220 4,475 44,982 44,982 –
Credit derivatives (2) 1,702 16,188 8,124 26,014 24,707 1,307
Other contracts (3) 62,652 58,982 20,685 142,319 140,168 2,151
Exchange-traded contracts
Interest rate contracts
Futures – long positions 14,429 16,614 47 31,090 31,090 –
Futures – short positions 52,345 19,373 1 71,719 71,719 –
Options purchased 21,303 5,229 – 26,532 26,532 –
Options written 4,322 – – 4,322 4,322 –
Foreign exchange contracts
Futures – long positions 960 – – 960 960 –
Futures – short positions 1,167 – – 1,167 1,167 –
Other contracts (3) 132,399 33,755 420 166,574 166,571 3
$ 3,668,441 $ 4,200,941 $ 2,185,867 $10,055,249 $ 9,789,884 $ 265,365
As at October 31, 2013
Term to maturity
(Millions of Canadian dollars) Within 1 year 1 to 5 years Over 5 years (1) Total Trading
Other than
Trading
Over-the-counter contracts
Interest rate contracts
Forward rate agreements $ 364,918 $ 93,570 $ – $ 458,488 $ 458,488 $ –
Swaps 1,218,382 2,718,313 1,369,003 5,305,698 5,095,519 210,179
Options purchased 59,272 83,085 27,178 169,535 169,337 198
Options written 59,921 81,222 33,000 174,143 174,112 31
Foreign exchange contracts
Forward contracts 887,156 30,991 1,079 919,226 858,547 60,679
Cross currency swaps 6,054 14,420 13,796 34,270 34,270 –
Cross currency interest rate swaps 131,805 308,927 144,779 585,511 555,841 29,670
Options purchased 19,217 10,917 4,732 34,866 34,866 –
Options written 19,737 11,729 4,682 36,148 36,148 –
Credit derivatives (2) 1,650 11,498 8,961 22,109 20,704 1,405
Other contracts (3) 57,593 42,101 20,647 120,341 120,336 5
Exchange-traded contracts
Interest rate contracts
Futures – long positions 10,332 6,809 – 17,141 17,103 38
Futures – short positions 20,727 13,952 – 34,679 34,604 75
Options purchased 13,831 3,557 – 17,388 17,388 –
Options written 11,371 1,277 – 12,648 12,648 –
Foreign exchange contracts
Futures – long positions 6,092 9,646 102 15,840 15,840 –
Futures – short positions 11,381 12,617 – 23,998 23,998 –
Other contracts (3) 140,471 29,786 387 170,644 170,641 3
$ 3,039,910 $ 3,484,417 $ 1,628,346 $ 8,152,673 $ 7,850,390 $ 302,283
(1) Includes contracts maturing in over 10 years with a notional value of $668 billion (October 31, 2013 – $501 billion). The related gross positive replacement cost is $39 billion (October 31,
2013 – $25 billion).
(2) Credit derivatives include credit default swaps, total return swaps and credit default baskets, including credit derivatives given guarantee treatment for OSFI regulatory reporting purposes.
Credit derivatives with a notional value of $1.3 billion (October 31, 2013 – $1.4 billion) are economic hedges. Trading credit derivatives comprise protection purchased of $13.3 billion
(October 31, 2013 – $11.0 billion) and protection sold of $11.4 billion (October 31, 2013 – $9.7 billion).
(3) Other contracts include precious metal, commodity, stable value and equity derivative contracts.
156 Royal Bank of Canada: Annual Report 2014 Consolidated Financial Statements

The following tables indicate the periods when the cash flows are expected to occur and when they are expected to affect profit or loss for cash
flow hedges:
As at October 31, 2014
(Millions of Canadian dollars) Within 1 year 1 to 2 years 2 to 3 years 3 to 5 years Over 5 years Total
Cash inflows from assets $ 268 $ 287 $ 243 $ 325 $ 85 $ 1,208
Cash outflows from liabilities (540) (446) (384) (269) (87) (1,726)
Net cash flows $ (272) $ (159) $ (141) $ 56 $ (2) $ (518)
As at October 31, 2013
(Millions of Canadian dollars) Within 1 year 1 to 2 years 2 to 3 years 3 to 5 years Over 5 years Total
Cash inflows from assets $ 267 $ 232 $ 218 $ 314 $ 321 $ 1,352
Cash outflows from liabilities (533) (531) (495) (602) (122) (2,283)
Net cash flows $ (266) $ (299) $ (277) $ (288) $ 199 $ (931)
Fair value of derivative instruments
As at
October 31, 2014 October 31, 2013
Average fair value
for year ended (1) Year end fair value
Average fair value
for year ended (1) Year end fair value
(Millions of Canadian dollars) Positive Negative Positive Negative Positive Negative Positive Negative
Held or issued for trading purposes
Interest rate contracts
Forward rate agreements $ 258 $ 206 $ 347 $ 357 $ 505 $ 347 $ 348 $ 262
Swaps 78,884 75,195 95,960 91,386 80,490 78,156 73,164 69,897
Options purchased 3,671 – 4,123 – 2,792 – 3,253 –
Options written – 4,509 – 5,101 – 3,619 – 3,966
82,813 79,910 100,430 96,844 83,787 82,122 76,765 74,125
Foreign exchange contracts
Forward contracts 8,416 8,741 12,155 11,752 9,229 9,381 6,774 7,629
Cross currency swaps 1,732 1,155 1,788 1,506 1,505 1,053 1,432 944
Cross currency interest rate swaps 10,433 14,261 16,034 19,165 9,692 16,333 9,308 12,058
Options purchased 1,645 – 2,621 – 1,900 – 2,234 –
Options written – 1,349 – 2,222 – 1,704 – 1,744
22,226 25,506 32,598 34,645 22,326 28,471 19,748 22,375
Credit derivatives (2) 225 281 254 301 229 254 225 276
Other contracts (3) 7,052 10,662 8,525 12,373 5,203 8,275 6,635 10,085
112,316 116,359 141,807 144,163 111,545 119,122 103,373 106,861
Held or issued for other than trading purposes
Interest rate contracts
Swaps 2,098 626 2,106 787
Options purchased –– 1–
Options written –– –1
2,098 626 2,107 788
Foreign exchange contracts
Forward contracts 326 259 194 194
Cross currency swaps –45 ––
Cross currency interest rate swaps 885 754 843 339
Options purchased –– ––
Options written –– ––
1,211 1,058 1,037 533
Credit derivatives (2) –41 –56
Other contracts (3) 112 112 ––
3,421 1,837 3,144 1,377
Total gross fair values before netting 145,228 146,000 106,517 108,238
Valuation adjustments determined on a pooled
basis (4) (758) (36) (505) n.a.
Impact of netting agreements that qualify for
balance sheet offset (57,068) (56,982) (31,190) (31,493)
87,402 88,982 74,822 76,745
Impact of netting agreements that do not qualify for
balance sheet offset (5) (60,546) (60,546) (51,653) (51,653)
$ 26,856 $ 28,436 $ 23,169 $ 25,092
(1) Average fair value amounts are calculated based on monthly balances.
(2) Credit derivatives include credit default swaps, total return swaps and credit default baskets, including credit derivatives given guarantee treatment for OSFI regulatory reporting purposes.
(3) Other contracts include precious metal, commodity, stable value and equity derivative contracts.
(4) IFRS 13 requirements are applied on a prospective basis and the standard permits an exception, through an accounting policy choice, to measure the fair value of a portfolio of financial
instruments on a net open risk position basis when certain criteria are met. We have elected to use this policy choice to determine the fair value of certain portfolios of financial instruments,
primarily derivatives, on a net exposure to market or credit risk. The valuation adjustment amounts in this table include those determined on a portfolio basis.
(5) Additional impact of offsetting credit exposures on contracts that do not qualify for balance sheet offset.
n.a. not applicable
Consolidated Financial Statements Royal Bank of Canada: Annual Report 2014 157

Note 8 Derivative financial instruments and hedging activities (continued)
Fair value of derivative instruments by term to maturity
As at
October 31, 2014 October 31, 2013
(Millions of Canadian dollars)
Less than
1 year
1to
5 years
Over
5 years Total
Less than
1 year
1to
5 years
Over
5 years Total
Derivative assets $ 19,485 $ 29,838 $38,079 $ 87,402 $ 13,695 $ 27,340 $ 33,787 $ 74,822
Derivative liabilities 19,980 32,640 36,362 88,982 15,672 29,104 31,969 76,745
Derivative-related credit risk
Credit risk from derivative transactions is generated by the potential for the counterparty to default on its contractual obligations when one or
more transactions have a positive market value to us. Therefore, derivative-related credit risk is represented by the positive fair value of the
instrument and is normally a small fraction of the contract’s notional amount.
We subject our derivative-related credit risk to the same credit approval, limit and monitoring standards that we use for managing other
transactions that create credit exposure. This includes evaluating the creditworthiness of counterparties, and managing the size, diversification
and maturity structure of the portfolio. Credit utilization for all products is compared with established limits on a continual basis and is subject to
a standard exception reporting process. We utilize a single internal rating system for all credit risk exposure. In most cases, these internal ratings
approximate the external risk ratings of public rating agencies.
Netting is a technique that can reduce credit exposure from derivatives and is generally facilitated through the use of master netting
agreements. A master netting agreement provides for a single net settlement of all financial instruments covered by the agreement in the event
of default. However, credit risk is reduced only to the extent that our financial obligations to the same counterparty can be set off against
obligations of the counterparty to us. We maximize the use of master netting agreements to reduce derivative-related credit exposure. Our overall
exposure to credit risk that is reduced through master netting agreements may change substantially following the reporting date as the exposure
is affected by each transaction subject to the agreement as well as by changes in underlying market rates. Measurement of our credit exposure
arising out of derivative transactions is reduced to reflect the effects of netting in cases where the enforceability of that netting is supported by
appropriate legal analysis as documented in our trading credit risk policies.
The use of collateral is another significant credit mitigation technique for managing derivative-related counterparty credit risk. Mark-to-
market provisions in our agreements with some counterparties, typically in the form of a Credit Support Annex, provide us with the right to
request that the counterparty pay down or collateralize the current market value of its derivatives positions when the value passes a specified
threshold amount.
Replacement cost represents the total fair value of all outstanding contracts in a gain position after factoring in the master netting
agreements. The credit equivalent amount is defined as the sum of the replacement cost plus an add-on amount for potential future credit
exposure as defined by OSFI. The risk-weighted amount is determined by applying the standard OSFI defined measures of counterparty risk to
the credit equivalent amount.
Derivative-related credit risk
As at
October 31, 2014 (1) October 31, 2013 (1)
(Millions of Canadian dollars)
Replacement
cost
Credit
equivalent
amount (2)
Risk-weighted
equivalent (3)
Replacement
cost
Credit
equivalent
amount (2)
Risk-weighted
equivalent (3)
Over-the-counter contracts
Interest rate contracts
Forward rate agreements $ 183 $ 276 $ 70 $94$278$48
Swaps 12,455 22,308 4,660 13,133 20,914 5,465
Options purchased 355 665 386 399 634 363
Foreign exchange contracts
Forward contracts 5,731 11,049 3,201 2,463 6,891 2,232
Swaps 3,190 6,576 2,516 2,500 6,262 1,946
Options purchased 225 443 201 259 444 221
Credit derivatives (4) 178 2,053 1,136 106 1,480 719
Other contracts (5) 1,780 6,670 3,996 1,864 6,838 3,519
Exchange traded contracts 3,530 10,358 207 2,867 11,186 224
$ 27,627 $ 60,398 $ 16,373 $ 23,685 $ 54,927 $ 14,737
(1) The amounts presented are net of master netting agreements in accordance with Basel III.
(2) The total credit equivalent amount includes collateral applied of $11.4 billion (October 31, 2013 – $9.6 billion).
(3) The risk-weighted balances are calculated in accordance with Basel III.
(4) Credit derivatives include credit default swaps, total return swaps and credit default baskets, and exclude credit derivatives issued for other-than-trading purposes related to bought
protection.
(5) Other contracts include precious metal, commodity, stable value, and equity derivatives contracts.
158 Royal Bank of Canada: Annual Report 2014 Consolidated Financial Statements

Replacement cost of derivative instruments by risk rating and by counterparty type
As at October 31, 2014
Risk rating (1) Counterparty type (2)
(Millions of Canadian dollars) AAA, AA A BBB
BB or
lower Total Banks
OECD
governments Other Total
Gross positive replacement cost $ 25,765 $ 98,566 $ 13,995 $ 6,915 $ 145,241 $ 52,986 12,427 $ 79,828 $ 145,241
Impact of master netting
agreements 19,279 88,911 8,154 1,270 117,614 44,372 7,743 65,499 117,614
Replacement cost (after netting
agreements) $ 6,486 $ 9,655 $ 5,841 $ 5,645 $ 27,627 $ 8,614 $ 4,684 $ 14,329 $ 27,627
As at October 31, 2013
Risk rating (1) Counterparty type (2)
(Millions of Canadian dollars) AAA, AA A BBB
BB or
lower Total Banks
OECD
governments Other Total
Gross positive replacement cost $ 20,610 $ 68,471 $ 11,604 $ 5,844 $ 106,529 $ 48,730 $ 10,634 $ 47,165 $ 106,529
Impact of master netting
agreements 14,345 60,780 6,829 890 82,844 37,070 6,734 39,040 82,844
Replacement cost (after netting
agreements) $ 6,265 $ 7,691 $ 4,775 $ 4,954 $ 23,685 $ 11,660 $ 3,900 $ 8,125 $ 23,685
(1) Our internal risk ratings for major counterparty types approximate those of public ratings agencies. Ratings of AAA, AA, A and BBB represent investment grade ratings and ratings of BB or
lower represent non-investment grade ratings.
(2) Counterparty type is defined in accordance with the capital adequacy requirements of OSFI.
Note 9 Premises and equipment
(Millions of Canadian dollars) Land Buildings
Computer
equipment
Furniture,
fixtures
and other
equipment
Leasehold
improvements
Work in
process Total
Cost
Balance at October 31, 2013 $ 134 $ 1,358 $ 1,516 $ 1,434 $ 2,040 $ 113 $ 6,595
Additions (1) – 14 108 74 54 279 529
Acquisitions through business combinations –––– –––
Transfers from work in process 1 17 43 34 90 (185) –
Disposals (2) (1) (412) (303) (67) (1) (786)
Foreign exchange translation 2 8 27 14 34 2 87
Other 2 (49) (4) (5) 41 – (15)
Balance at October 31, 2014 $ 137 $ 1,347 $ 1,278 $ 1,248 $ 2,192 $ 208 $ 6,410
Accumulated depreciation
Balance at October 31, 2013 $ – $ 499 $ 1,155 $ 1,015 $ 1,290 $ – $ 3,959
Depreciation – 50 181 101 167 – 499
Disposals – (1) (412) (282) (61) – (756)
Foreign exchange translation – 3 21 9 20 – 53
Other – (52) (20) (4) 47 – (29)
Balance at October 31, 2014 $ – $ 499 $ 925 $ 839 $ 1,463 $ – $ 3,726
Net carrying amount at October 31, 2014 $ 137 $ 848 $ 353 $ 409 $ 729 $ 208 $ 2,684
Consolidated Financial Statements Royal Bank of Canada: Annual Report 2014 159

Note 9 Premises and equipment (continued)
(Millions of Canadian dollars) Land Buildings
Computer
equipment
Furniture,
fixtures
and other
equipment
Leasehold
improvements
Work in
process Total
Cost
Balance at October 31, 2012 $ 128 $ 1,274 $ 1,430 $ 1,369 $ 1,864 $ 199 $ 6,264
Additions (1) 3 12 107 40 40 234 436
Acquisitions through business combinations – – 1 21 – – 22
Transfers from work in process 2 44 31 52 155 (284) –
Disposals (1) (3) (59) (56) (6) (3) (128)
Foreign exchange translation 2 6 13 7 16 2 46
Other – 25 (7) 1 (29) (35) (45)
Balance at October 31, 2013 $ 134 $ 1,358 $ 1,516 $ 1,434 $ 2,040 $ 113 $ 6,595
Accumulated depreciation
Balance at October 31, 2012 $ – $ 455 $ 1,048 $ 950 $ 1,147 $ – $ 3,600
Depreciation – 42 171 92 140 – 445
Disposals – (2) (56) (48) (5) – (111)
Foreign exchange translation – 2 9 4 8 – 23
Other – 2 (17) 17 – – 2
Balance at October 31, 2013 $ – $ 499 $ 1,155 $ 1,015 $ 1,290 $ – $ 3,959
Net carrying amount at October 31, 2013 $ 134 $ 859 $ 361 $ 419 $ 750 $ 113 $ 2,636
(1) At October 31, 2014, we had total contractual commitments of $216 million to acquire premises and equipment (October 31, 2013 – $122 million; October 31, 2012 – $222 million).
Note 10 Goodwill and other intangible assets
Goodwill
The following table presents changes in the carrying amount of goodwill by CGU for the years ended October 31, 2014 and 2013.
(Millions of Canadian dollars)
Canadian
Banking
Caribbean
Banking
Canadian
Wealth
Management
Global Asset
Management
U.S. Wealth
Management
International
Wealth
Management Insurance
Investor &
Treasury
Services
Capital
Markets Total
At October 31, 2012 $ 1,929 $ 1,446 $ 543 $ 1,889 $ 517 $ 127 $ 118 $ 52 $ 837 $ 7,458
Acquisitions 598––––––9611705
Currency translations – 58 5 48 22 5 – 1 30 169
At October 31, 2013 $ 2,527 $ 1,504 $ 548 $ 1,937 $ 539 $ 132 $ 118 $ 149 $ 878 $ 8,332
Dispositions – (51) – – – – – – – (51)
Currency translations – 140 10 105 43 9 – – 59 366
At October 31, 2014 $ 2,527 $ 1,593 $ 558 $ 2,042 $ 582 $ 141 $ 118 $ 149 $ 937 $ 8,647
We perform our annual impairment test by comparing the carrying amount of each CGU to its recoverable amount. The recoverable amount of a
CGU is represented by its value in use, except in circumstances where the carrying amount of a CGU exceeds its value in use. In such cases, we
determine the CGU’s fair value less costs of disposal and its recoverable amount is the greater of its value in use and fair value less costs of
disposal. Our annual impairment test is performed as at August 1.
In our 2014 annual impairment test, the recoverable amounts of our Caribbean Banking and International Wealth Management CGUs were
based on fair value less costs of disposal (2013 annual impairment test – Caribbean Banking CGU). In 2014 and 2013, the recoverable amounts
of all other CGUs tested were based on value in use.
Value in use
We calculate value in use using a five-year discounted cash flow method. Future cash flows are based on financial plans agreed by management
for a five-year period, estimated based on forecast results, business initiatives, capital required to support future cash flows and returns to
shareholders. Key drivers of future cash flows include net interest margins and average interest-earning assets. The values assigned to these
drivers over the forecast period are based on past experience, external and internal economic forecasts, and management’s expectations of the
impact of economic conditions on our financial results. Beyond the initial five-year period, cash flows are assumed to increase at a constant rate
using a nominal long-term growth rate (terminal growth rate). Terminal growth rates are based on the current market assessment of gross
domestic product and inflation for the countries within which the CGU operates. The discount rates used to determine the present value of each
CGU’s projected future cash flows are based on the bank-wide cost of capital, adjusted for the risks to which each CGU is exposed. CGU-specific
risks include: country risk, business/operational risk, geographic risk (including political risk, devaluation risk, and government regulation),
currency risk, and price risk (including product pricing risk and inflation).
The estimation of value in use involves significant judgment in the determination of inputs to the discounted cash flow model and is most
sensitive to changes in future cash flows, discount rates and terminal growth rates applied to cash flows beyond the forecast period. These
160 Royal Bank of Canada: Annual Report 2014 Consolidated Financial Statements

key inputs and assumptions used to determine the recoverable amount of each CGU using value in use were tested for sensitivity by applying a
reasonably possible change to those assumptions. The post-tax discount rates were increased by 1%, terminal growth rates were decreased by
1%, and future cash flows were reduced by 10%. As at August 1, 2014, no change in an individual key input or assumption, as described, would
result in a CGU’s carrying amount exceeding its recoverable amount based on value in use.
The terminal growth rates and pre-tax discount rates used in our discounted cash flow models are summarized below.
As at
August 1, 2014 August 1, 2013
Discount
rate (1)
Terminal
growth
rate
Discount
rate (1)
Terminal
growth
rate
Group of cash generating units
Canadian Banking 10.6% 3.0% 10.6% 3.0%
Caribbean Banking 13.0 4.2 12.9 4.2
Canadian Wealth Management 11.9 3.0 11.9 3.0
Global Asset Management 11.6 3.0 11.8 3.0
U.S. Wealth Management 15.7 3.0 15.9 3.0
International Wealth Management 10.3 3.0 11.8 3.0
Insurance 10.1 3.0 10.2 3.0
Investor & Treasury Services 12.8 3.0 12.5 3.0
Capital Markets 15.9 3.0 15.6 3.0
(1) Pre-tax discount rates are determined implicitly based on post-tax discount rates.
Fair value less costs of disposal – Caribbean Banking
For our Caribbean Banking CGU, we calculated fair value less costs of disposal using a discounted cash flow method that projects future cash
flows over a 5-year period. Cash flows are based on management forecasts, adjusted to approximate the considerations of a prospective third-
party buyer. Cash flows beyond the initial 5-year period are assumed to increase at a constant rate using a nominal long-term growth rate. Future
cash flows, terminal growth rates, and discount rates are based on the same factors noted above. This fair value measurement is categorized as
level 3 in the fair value hierarchy as certain significant inputs are not observable.
The estimation of fair value less costs of disposal involves significant judgment in the determination of inputs to the discounted cash flow
model and is most sensitive to changes in future cash flows, discount rates and terminal growth rates applied to cash flows beyond the forecast
period. These key inputs and assumptions were tested for sensitivity by applying a reasonably possible change to those assumptions. The post-
tax discount rates were increased by 1%, terminal growth rates were decreased by 1%, and future cash flows were reduced by 10%. As at
August 1, 2014, the recoverable amount, based on fair value less costs of disposal, was 120% of its carrying amount. No reasonably possible
change in an individual key input or assumption, as described, would result in a CGU’s carrying amount exceeding its recoverable amount based
on fair value less costs of disposal.
Fair value less costs of disposal – International Wealth Management
For our International Wealth Management CGU, we calculated fair value less costs of disposal using a multiples-based approach. Each business
within the CGU was valued using either a Price-to-assets-under-administration (P/AUA) or Price-to-revenue (P/Rev) multiple, as appropriate, to
reflect the considerations of a prospective third-party buyer. For the applicable businesses, we applied a P/AUA multiple of 2.5% to AUA as at
August 1, 2014 and a P/Rev multiple of 2.5x to revenue for the 12 months preceding the testing date. These multiples represent our best
estimate from a range of reasonably possible inputs based on precedent transactions for comparable businesses. This fair value measurement
is categorized as level 3 in the fair value hierarchy as certain significant inputs are not observable.
The estimation of fair value less costs of disposal involves significant judgment in the determination of the appropriate valuation approach
and inputs and is most sensitive to changes in the P/AUA and P/Rev multiples. If the multiples used were each reduced to the low end of the
range of reasonably possible inputs considered, the recoverable amount of the CGU based on fair value less costs of disposal would still exceed
its carrying amount.
Other intangible assets
The following table presents the carrying amount of our other intangible assets:
As at October 31, 2014
(Millions of Canadian dollars)
Internally
generated
software
Other
software
Core
deposit
intangibles
Customer
list and
relationships
In process
software Total
Gross carrying amount
Balance at October 31, 2013 $ 2,554 $ 1,128 $ 157 $ 1,509 $ 711 $ 6,059
Additions 48 57 – – 545 650
Transfers 750 22 – – (772) –
Dispositions (4) (2) (3) – – (9)
Impairment losses – – – (8) – (8)
Currency translations 32 15 14 48 8 117
Other changes 22 (34) – (38) (5) (55)
Balance at October 31, 2014 $ 3,402 $ 1,186 $ 168 $ 1,511 $ 487 $ 6,754
Accumulated amortization
Balance at October 31, 2013 $ (1,815) $ (811) $ (117) $ (539) $ – $ (3,282)
Amortization charge for the year (460) (60) (22) (124) – (666)
Dispositions 41 – – – 5
Impairment losses –– – – – –
Currency translations (22) (13) (12) (22) – (69)
Other changes – (5) – 38 – 33
Balance at October 31, 2014 $ (2,293) $ (888) $ (151) $ (647) $ – $ (3,979)
Net balance, at October 31, 2014 $ 1,109 $ 298 $ 17 $ 864 $ 487 $ 2,775
Consolidated Financial Statements Royal Bank of Canada: Annual Report 2014 161

Note 10 Goodwill and other intangible assets (continued)
As at October 31, 2013
(Millions of Canadian dollars)
Internally
generated
software
Other
software
Core
deposit
intangibles
Customer
list and
relationships
In process
software Total
Gross carrying amount
Balance at October 31, 2012 $ 2,206 $ 976 $ 150 $ 1,365 $ 650 $ 5,347
Additions 30 63 – 120 581 794
Transfers 400 122 – – (522) –
Dispositions (2) (2) – – – (4)
Impairment losses (7) (4) – – (2) (13)
Currency translations 15 9 7 25 2 58
Other changes (88) (36) – (1) 2 (123)
Balance at October 31, 2013 $ 2,554 $ 1,128 $ 157 $ 1,509 $ 711 $ 6,059
Accumulated amortization
Balance at October 31, 2012 $ (1,442) $ (730) $ (90) $ (413) $ – $ (2,675)
Amortization charge for the year (361) (66) (22) (117) – (566)
Dispositions 1 1 – – – 2
Impairment losses 3 – – – – 3
Currency translations (9) (7) (5) (11) – (32)
Other changes (7) (9) – 2 – (14)
Balance at October 31, 2013 $ (1,815) $ (811) $ (117) $ (539) $ – $ (3,282)
Net balance, at October 31, 2013 $ 739 $ 317 $ 40 $ 970 $ 711 $ 2,777
Note 11 Significant dispositions
Personal & Commercial Banking
Caribbean Banking
On June 27, 2014, we completed the sale of RBC Royal Bank (Jamaica) Limited and RBTT Securities Jamaica Limited (collectively, RBC Jamaica) to
Sagicor Group Jamaica Limited, as announced on January 29, 2014. As a result of the transaction, we recorded a total loss on disposal of $100
million (before and after-tax), including a loss of $60 million in the first quarter and $40 million primarily relating to foreign currency translation
losses reclassified from Other components of equity in the third quarter of 2014. The loss on disposal has been included in Non-Interest expense
– Other.
U.S. Banking
On March 2, 2012, we completed the sale of our U.S. regional retail banking operations to the PNC Financial Services Group, Inc. (PNC)
announced on June 20, 2011. As a result of the transaction, we recorded a total loss on sale of $294 million after-tax, including an estimated
loss of $304 million in 2011 and a reduction to loss on sale of $10 million in 2012. The loss on disposal was recorded in Net loss from
discontinued operations.
The results of the operations sold to PNC and certain of our U.S. regional banking assets have been presented in our Consolidated Financial
Statements as discontinued operations for all periods presented. Select financial information is set out in the tables below.
Total discontinued operations – Statements of Income
For the year ended
(Millions of Canadian dollars)
October 31
2014
October 31
2013
October 31
2012
Net interest income $–$ – $ 200
Non-interest income ––68
Total Revenue – – 268
Provision for credit losses –– 117
Non-interest expense –– 258
Net loss before income taxes – – (107)
Net loss – – (61)
Gain on sale ––10
Net loss from discontinued operations
U.S. regional retail banking operations sold to PNC –– (36)
Other U.S. regional banking assets –– (15)
Total $–$ – $ (51)
162 Royal Bank of Canada: Annual Report 2014 Consolidated Financial Statements

Total discontinued operations – Statements of Cash Flows
For the year ended
(Millions of Canadian dollars)
October 31
2014
October 31
2013
October 31
2012
Net cash used in operating activities $–$ – $ (6,727)
Net cash from investing activities –– 4,054
Net cash used in financing activities –– (24)
Effect of exchange rate changes on cash and due from banks –– (19)
Net change in cash and due from banks –– (2,716)
Cash and due from banks at beginning of year –– 2,716
Cash and due from banks at end of year $–$–$–
Note 12 Joint ventures and associated companies
The following table summarizes the carrying value of our interests in joint ventures and associated companies accounted for under the equity
method as well as our share of the income of those entities.
Joint ventures Associated companies
As at and for the year ended
(Millions of Canadian dollars)
October 31
2014
October 31
2013
October 31
2012
October 31
2014
October 31
2013
October 31
2012
Carrying amount $ 180 $ 135 $ 452 $ 115 $ 112 $ 125
Share of:
Net income (1) 131 133 139 31 26 24
Other comprehensive income 5525 –––
$ 136 $ 138 $ 164 $31$26$24
(1) Net income for the year ended October 31, 2012 reflects our share of the income of RBC Dexia up to July 27, 2012, the date we completed our acquisition of the remaining 50% interest that
we did not already own.
We do not have any joint ventures or associated companies that are individually material to our financial results. Previously, our principal joint
ventures included a 50% interest in RBC Dexia. In the third quarter of 2012, we completed the acquisition of RBC Dexia and as a result, it is no
longer a joint venture.
During the year ended October 31, 2014, we recognized no impairment losses in respect of our interests in associated companies
(October 31, 2013 – $20 million; October 31, 2012 – none) and $62 million of gains on sales of associated companies (October 31, 2013 –
none; October 31, 2012 – none). During the year ended October 31, 2012, we recognized an impairment loss of $168 million related to our
interest in our previous joint venture, RBC Dexia.
Note 13 Other assets
As at
(Millions of Canadian dollars)
October 31
2014
October 31
2013
Cash collateral and margin deposits $ 12,481 $ 11,689
Accounts receivable and prepaids 3,773 3,563
Receivable from brokers, dealers and clients 2,354 1,474
Insurance-related assets
Collateral loans 1,121 1,273
Policy loans 113 132
Reinsurance assets 512 422
Other 400 355
Deferred income tax asset 2,382 2,141
Accrued interest receivable 1,554 1,789
Taxes receivable 1,620 1,252
Precious metals 223 173
Other 4,162 2,375
$ 30,695 $ 26,638
Consolidated Financial Statements Royal Bank of Canada: Annual Report 2014 163
Note 14 Deposits
The following table details our deposit liabilities:
As at
October 31, 2014 October 31, 2013
(Millions of Canadian dollars) Demand (1) Notice (2) Term (3) Total Demand (1) Notice (2) Term (3) Total
Personal $ 120,444 $ 17,793 $ 70,980 $ 209,217 $ 111,566 $ 15,732 $ 67,645 $ 194,943
Business and government 162,988 3,038 220,634 386,660 146,985 1,209 206,399 354,593
Bank 5,771 11 12,441 18,223 5,734 11 7,798 13,543
$ 289,203 $ 20,842 $ 304,055 $ 614,100 $ 264,285 $ 16,952 $ 281,842 $ 563,079
Non-interest-bearing (4)
Canada $ 65,774 $ 3,478 $ - $ 69,252 $ 60,201 $ 3,282 $ - $ 63,483
United States 1,777 15 - 1,792 1,444 7 - 1,451
Europe (5) 3,314 1 - 3,315 3,810 1 - 3,811
Other International 5,057 279 - 5,336 4,684 315 - 4,999
Interest-bearing (4)
Canada 175,172 10,895 241,902 427,969 158,743 9,604 223,409 391,756
United States 3,497 2,144 45,359 51,000 3,488 202 42,863 46,553
Europe (5) 31,118 418 9,282 40,818 28,985 45 7,992 37,022
Other International 3,494 3,612 7,512 14,618 2,930 3,496 7,578 14,004
$ 289,203 $ 20,842 $ 304,055 $ 614,100 $ 264,285 $ 16,952 $ 281,842 $ 563,079
(1) Deposits payable on demand include all deposits for which we do not have the right to notice of withdrawal. These deposits include both savings and chequing accounts.
(2) Deposits payable after notice include all deposits for which we can legally require notice of withdrawal. These deposits are primarily savings accounts.
(3) Term deposits include deposits payable on a fixed date. These deposits include term deposits, guaranteed investment certificates and similar instruments. As at October 31, 2014, the
balance of term deposits also include senior deposit notes we have issued to provide long-term funding of $150 billion (October 31, 2013 – $134 billion).
(4) The geographical splits of the deposits are based on the point of origin of the deposits and where the revenue is recognized. As at October 31, 2014, deposits denominated in U.S. dollars,
Sterling, Euro and other foreign currencies were $183 billion, $11 billion, $23 billion and $22 billion, respectively (October 31, 2013 – $152 billion, $8 billion, $20 billion and $21 billion).
(5) Europe includes the United Kingdom, Switzerland and the Channel Islands.
The following table presents the contractual maturities of our term deposit liabilities.
As at
(Millions of Canadian dollars)
October 31
2014
October 31
2013
Within 1 year:
less than 3 months $ 57,840 $ 43,426
3 to 6 months 32,880 34,532
6 to 12 months 50,300 33,450
1 to 2 years 54,354 62,443
2 to 3 years 31,559 34,519
3 to 4 years 28,946 22,358
4 to 5 years 24,673 25,596
Over 5 years 23,503 25,518
$ 304,055 $ 281,842
Aggregate amount of term deposits in denominations of $100,000 or more $ 270,000 $ 247,000
The following table presents the average deposit balances and average rates of interest.
For the year ended
October 31, 2014 October 31, 2013 October 31, 2012
(Millions of Canadian dollars, except for percentage amounts)
Average
balances
Average
rates
Average
balances
Average
rates
Average
balances
Average
rates
Canada $ 477,316 1.13% $ 435,842 1.20% $ 403,610 1.33%
United States 52,058 0.30 44,512 0.38 41,617 0.50
Europe (1) 43,429 0.21 38,791 0.27 33,394 0.62
Other International 20,299 1.03 18,571 0.95 11,979 2.20
$ 593,102 0.99% $ 537,716 1.06% $ 490,600 1.23%
(1) Europe includes the United Kingdom, Switzerland and the Channel Islands.
164 Royal Bank of Canada: Annual Report 2014 Consolidated Financial Statements

Note 15 Insurance
Risk management
Insurance risk is the risk of fluctuations in the timing, frequency or severity of insured events, relative to our expectations at the time of
underwriting. We do not have a high degree of concentration risk due to our geographic diversity and business mix. Concentration risk is not a
major concern for the life and health insurance business as it does not have a material level of regional specific characteristics like those
exhibited in the property and casualty insurance business. Exposure to concentrations of insurance risks for the property and casualty business
is primarily mitigated through a robust Insurance Risk Framework including prudent underwriting practices and diversification by product
offerings and geographical areas. Reinsurance is also used for all insurance businesses to lower our risk profile and limit the liability on a single
claim. We manage underwriting and pricing risk through the use of underwriting guidelines which detail the class, nature and type of business
that may be accepted, pricing policies by product line and centralized control of policy wordings. The risk that claims are handled or paid
inappropriately is mitigated using a range of IT system controls and manual processes conducted by experienced staff. These, together with a
range of detailed policies and procedures, ensure that all claims are handled in a timely, appropriate and accurate manner.
Reinsurance
In the ordinary course of business, our insurance operations reinsure risks to other insurance and reinsurance companies in order to lower our
risk profile, limit loss exposure to large risks, and provide additional capacity for future growth. These ceding reinsurance arrangements do not
relieve our insurance subsidiaries from their direct obligations to the insureds. We evaluate the financial condition of the reinsurers and monitor
our concentrations of credit risks to minimize our exposure to losses from reinsurer insolvency. Reinsurance amounts (ceded premiums)
included in Non-interest income are shown in the table below.
Net premiums and claims
For the year ended
(Millions of Canadian dollars)
October 31
2014
October 31
2013
October 31
2012
Gross premiums $ 4,962 $ 4,785 $ 4,739
Premiums ceded to reinsurers (1,220) (1,111) (1,034)
Net premiums $ 3,742 $ 3,674 $ 3,705
Gross claims and benefits $ 3,692 $ 2,768 $ 3,472
Reinsurers’ share of claims and benefits (498) (442) (417)
Net claims $ 3,194 $ 2,326 $ 3,055
Insurance claims and policy benefit liabilities
All actuarial assumptions are set in conjunction with Canadian Institute of Actuaries Standards of Practice and OSFI requirements. The
assumptions that have the greatest effect on the measurement of insurance liabilities, the processes used to determine them and the
assumptions used as at October 31, 2014 are as follows:
Life insurance
Mortality and morbidity – Mortality estimates are based on standard industry and national mortality tables, adjusted where appropriate to reflect
our own experience. Morbidity assumptions are made with respect to the rates of claim incidence and claim termination for health insurance
policies and are based on a combination of industry and our own experience.
Future investment yield – Assumptions are based on the current yield rate, a reinvestment assumption and an allowance for future credit losses
for each line of business, and are developed using interest rate scenario testing, including prescribed scenarios for determination of minimum
liabilities as set out in the actuarial standards.
Policyholder behaviour – Under certain policies, the policyholder has a contractual right to change benefits and premiums, as well as convert
policies to permanent forms of insurance. All policyholders have the right to terminate their policies through lapse. Lapses represent the
termination of policies due to non-payment of premiums. Lapse assumptions are primarily based on our recent experience adjusted for emerging
industry experience where applicable.
Non-life insurance
Assumptions related to unpaid claims concern the patterns of development of claims from inception to ultimate settlement. The reserving
assumptions, based on historical paid/incurred development patterns adjusted for changes in products, claims processes and legislative trends,
result in a collective loss ratio when compared with earned premium.
Consolidated Financial Statements Royal Bank of Canada: Annual Report 2014 165

Note 15 Insurance (continued)
The portfolio assumptions that have the greatest effect on the net liabilities included in our Consolidated Balance Sheets are listed below:
Significant insurance assumptions
As at
October 31
2014
October 31
2013
Life Insurance
Canadian Insurance
Mortality rates (1) 0.12% 0.12%
Morbidity rates (2) 1.82 1.99
Reinvestment yield (3) 3.15 3.15
Lapse rates (4) 0.50 0.50
International Insurance
Mortality rates (1) 0.43 0.46
Reinvestment yield (3) 2.19 2.29
Non-life Insurance
Expected loss ratio (5), (6) 60.16 62.14
(1) Average annual death rate for the largest portfolio of insured policies.
(2) Average net settlement rate for the individual and group disability insurance portfolio.
(3) Ultimate reinvestment rate of the insurance operations.
(4) Ultimate policy termination rate (lapse rate) for the largest permanent life insurance portfolio that relies on higher termination rate to maintain its profitability (lapse-supported policies).
(5) Ratio of incurred claim losses and claim expenses to Net premiums of the property and casualty business, measuring the profitability or loss experience on our total book of business.
(6) Amounts have been revised from those previously reported.
The following table summarizes our gross and reinsurers’ share of insurance liabilities at the end of the year.
Insurance claims and policy benefit liabilities
As at
October 31, 2014 October 31, 2013
(Millions of Canadian dollars) Gross Ceded Net Gross Ceded Net
Life insurance policyholder liabilities
Life, health and annuity $ 7,555 $ 390 $ 7,165 $ 7,029 $ 300 $ 6,729
Investment contracts (1) 5–5 1–1
$ 7,560 $ 390 $ 7,170 $ 7,030 $ 300 $ 6,730
Non-life insurance policyholder liabilities
Unearned premium provision (1) $ 419 $ – $ 419 $ 410 $ – $ 410
Unpaid claims provision 1,010 29 981 1,005 21 984
$ 1,429 $ 29 $ 1,400 $ 1,415 $ 21 $ 1,394
$ 8,989 $ 419 $ 8,570 $ 8,445 $ 321 $ 8,124
(1) Insurance claims and policy benefit liabilities include Investment contracts and Unearned premium provision, both of which are reported in Other liabilities on the Consolidated Balance
Sheets.
Reconciliation of life insurance policyholder liabilities
October 31, 2014 October 31, 2013
(Millions of Canadian dollars) Gross Ceded Net Gross Ceded Net
Balances, beginning of the year $ 7,030 $ 300 $ 6,730 $ 6,989 $ 206 $ 6,783
New and in-force policies 621 90 531 (67) 94 (161)
Changes in assumption and methodology (95) – (95) 108 – 108
Net change in investment contracts 4–4 –––
Balances, end of the year $ 7,560 $ 390 $ 7,170 $ 7,030 $ 300 $ 6,730
Reconciliation of non-life insurance policyholder liabilities
October 31, 2014 October 31, 2013
(Millions of Canadian dollars) Gross Ceded Net Gross Ceded Net
Balances, beginning of the year $ 1,415 $ 21 $ 1,394 $ 1,354 $ 27 $ 1,327
Changes in unearned premiums provision
Written premiums 942 91 851 980 32 948
Less: Net premiums earned (933) (91) (842) (990) (32) (958)
Changes in unpaid claims provision and adjustment expenses
Incurred claims 595 38 557 652 33 619
Less: Claims paid (590) (30) (560) (581) (39) (542)
Balances, end of the year $ 1,429 $ 29 $ 1,400 $ 1,415 $ 21 $ 1,394
166 Royal Bank of Canada: Annual Report 2014 Consolidated Financial Statements

The net increase in Insurance claims and policy benefit liabilities over the prior year was comprised of the net increase in life and health,
reinsurance and property and casualty liabilities attributable to business growth and market movements on assets backing life and health
liabilities. During the year, we reviewed all key actuarial methods and assumptions which are used in determining the policy benefit liabilities
resulting in a $102 million net decrease to insurance liabilities comprised of: (i) a decrease of $37 million for assumption updates due to net
favourable interest rate and equity market changes; (ii) a decrease of $36 million due to liability impacts of significant business projects; (iii) a
decrease of $21 million due to valuation system and data changes; and (iv) a decrease of $8 million arising from insurance risk related
assumption updates largely due to mortality, morbidity, maintenance, property and casualty margin for adverse deviation and expense
assumptions. Changes in Insurance claims and policy benefit liabilities are included in Insurance policyholder benefits, claims and acquisition
expenses in our Consolidated Statements of Income in the period in which the estimates changed.
Sensitivity analysis
The following table presents the sensitivity of the level of insurance policyholder liabilities disclosed in this note to reasonably possible changes
in the actuarial assumptions used to calculate them. The percentage change in variable is applied to a range of existing actuarial modelling
assumptions to derive the possible impact on net income. The disclosure is not intended to explain the impact of a percentage change in the
insurance assets and liabilities disclosed above. The analyses are performed where a single assumption is changed while holding other
assumptions constant, which is unlikely to occur in practice.
Sensitivity
Net income impact for year ended
(Millions of Canadian dollars, except for percentage amounts)
Change in
variable
October 31
2014
October 31
2013
Increase in market interest rates (1) 1% $1$27
Decrease in market interest rates (1) 1(3) (35)
Increase in equity market values 10 68
Decrease in equity market values 10 (3) (2)
Increase in maintenance expenses 5 (25) (30)
Life Insurance
Adverse change in annuitant mortality rates 2 (72) (53)
Adverse change in assurance mortality rates 2 (47) (46)
Adverse change in morbidity rates 5 (156) (191)
Adverse change in lapse 10 (192) (170)
Non-life Insurance
Increase in expected loss ratio 5 (10) (11)
(1) Sensitivities for market interest rates have been calculated by increasing or decreasing 100 basis points at all points on the yield curve, with changes persisting for one year. In the prior year
we also included a corresponding impact of 15 basis points on the ultimate reinvestment rate that is no longer required due to actuarial changes in the determination of the ultimate
reinvestment rate implemented in the current period.
Note 16 Segregated funds
We offer certain individual variable insurance contracts that allow policyholders to invest in segregated funds. The investment returns on these
funds are passed directly to the policyholders. Amounts invested are at the policyholders’ risk, except where the policyholders have selected
options providing maturity and death benefit guarantees. A liability for the guarantees is recorded in Insurance claims and policy benefit
liabilities.
Segregated funds net assets are recorded at fair value. All of our segregated funds net assets are categorized as Level 1 in the fair value
hierarchy. The fair value of the segregated funds liabilities is equal to the fair value of the segregated funds net assets. Segregated funds net
assets and segregated funds liabilities are presented on separate lines on the Consolidated Balance Sheets. The following tables present the
composition of net assets and the changes in net assets for the year.
Segregated funds net assets
As at
(Millions of Canadian dollars)
October 31
2014
October 31
2013
Cash $1$6
Investment in mutual funds 675 509
Other liabilities, net (1) (2)
$ 675 $ 513
Changes in net assets
For the year ended
(Millions of Canadian dollars)
October 31
2014
October 31
2013
Net assets, beginning of year $ 513 $ 383
Additions (deductions):
Deposits from policyholders 239 188
Net realized and unrealized gains 52 45
Interest and dividend 19 13
Payment to policyholders (132) (105)
Management and administrative fees (16) (11)
Net assets, end of year $ 675 $ 513
Consolidated Financial Statements Royal Bank of Canada: Annual Report 2014 167

Note 17 Employee benefits - Pension and other post-employment benefits
Plan characteristics
We sponsor a number of programs that provide pension and post-employment benefits to eligible employees. The pension plans are
administered by separate trustees that are legally segregated from the Bank. The majority of beneficiaries of the pension plans are located in
Canada and other beneficiaries of the pension plans are primarily located in the United States, the United Kingdom and the Caribbean. The
pension arrangements including investment, plan benefits and funding decisions are governed by local pension committees, trustees (U.K.), or
management. Significant plan changes require the approval of the Board of Directors.
Our defined benefit pension plans provide pension benefits based on years of service, contributions and average earnings at retirement.
Our principal defined benefit pension plans are closed to new members. New employees are generally eligible to join defined contribution
pension plans. The specific features of these plans vary by location. We also provide supplemental non-registered (non-qualified) pension plans
for certain executives and senior management that are typically unfunded or partially funded.
Our defined contribution pension plans provide pension benefits based on accumulated employee and company contributions. The
company contributions are based on a percentage of an employee’s annual earnings and a portion of the company contribution is dependent on
the amount being contributed by the employee and their years of service.
Our primary other post-employment benefit plans provide health, dental, disability and life insurance coverage and cover a number of
current and retired employees who are mainly located in Canada. These plans are unfunded unless required by legislation.
We measure our benefit obligations and pension assets as at October 31 each year. All plans are valued using the projected unit-credit
method. We fund our registered defined benefit pension plans in accordance with actuarially determined amounts required to satisfy employee
benefit obligations under current pension regulations. For our primary pension plan, the most recent funding actuarial valuation was completed
on January 1, 2014, and the next valuation will be completed on January 1, 2015.
For the year ended October 31, 2014, total company contributions to our pension plans (defined benefit and defined contribution plans)
and other post-employment benefit plans were $537 million and $63 million (October 31, 2013 – $389 million and $55 million), respectively.
For 2015, total contributions to our pension plans and other post-employment benefit plans are expected to be $363 million and $70 million,
respectively.
Risks
By their design, the defined benefit pension plans expose the Bank to risks such as investment performance, reductions in discount rates used
to value the obligations, increased longevity of plan members, future inflation levels impacting future salary increases as well as future increases
in healthcare costs. By closing our principal defined benefit pension plans and migrating to defined contribution pension plans, the volatility
associated with future service costs will reduce over time.
The following table presents the financial position related to all of our material pension and other post-employment benefit plans worldwide,
including executive retirement arrangements.
As at
October 31, 2014 October 31, 2013
(Millions of Canadian dollars)
Defined benefit
pension plans
Other post-
employment
benefit
plans
Defined benefit
pension plans
Other post-
employment
benefit
plans
Canada
Fair value of plan assets $ 10,419 $ 4 $ 9,454 $ 3
Present value of defined benefit obligation 10,767 1,754 9,519 1,636
Net deficit $ (348) $ (1,750) $ (65) $ (1,633)
International
Fair value of plan assets $ 932 $ – $ 812 $ –
Present value of defined benefit obligation 1,038 78 894 86
Net deficit $ (106) $ (78) $ (82) $ (86)
Total
Fair value of plan assets $ 11,351 $ 4 $ 10,266 $ 3
Present value of defined benefit obligation 11,805 1,832 10,413 1,722
Total net deficit $ (454) $ (1,828) $ (147) $ (1,719)
Amounts recognized in our Consolidated Balance Sheets
Employee benefit assets $ 138 $ – $ 161 $ –
Employee benefit liabilities (592) (1,828) (308) (1,719)
Total net deficit $ (454) $ (1,828) $ (147) $ (1,719)
168 Royal Bank of Canada: Annual Report 2014 Consolidated Financial Statements
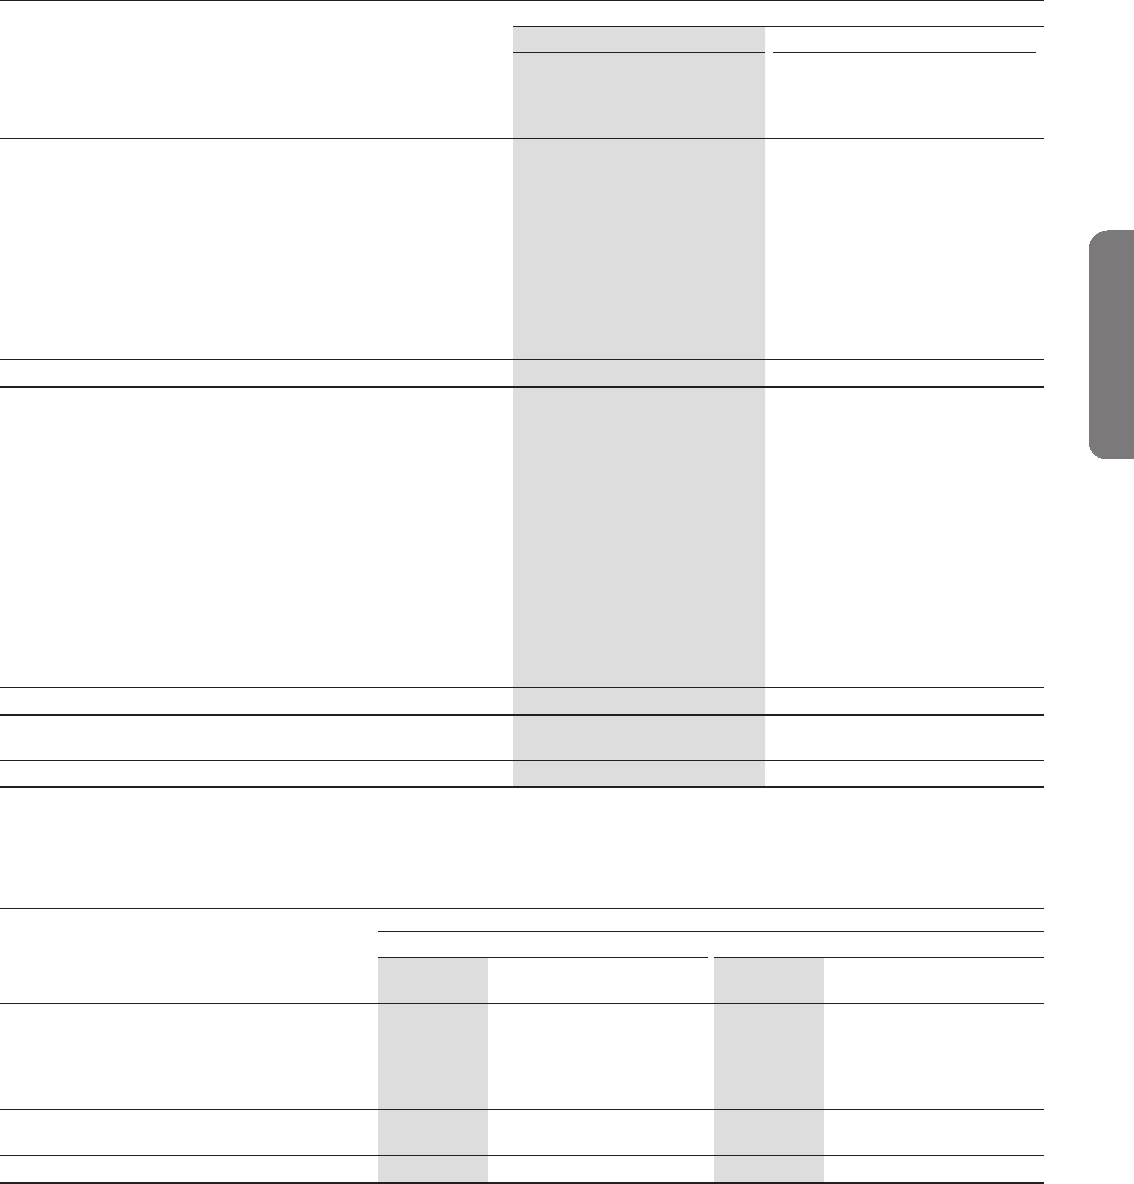
The following table presents an analysis of the movement in the financial position related to all of our material pension and other post-
employment benefit plans worldwide, including executive retirement arrangements.
As at or for the year ended
October 31, 2014 October 31, 2013
(Millions of Canadian dollars)
Defined benefit
pension plans (1)
Other post-
employment
benefit
plans
Defined benefit
pension plans (1)
Other post-
employment
benefit
plans
Change in fair value of plan assets
Opening fair value of plan assets $ 10,266 $ 3 $ 9,348 $ 1
Interest income 472 – 408 –
Remeasurements
Return on plan assets (excluding interest income) 647 – 601 –
Change in foreign currency exchange rate 60 – 32 –
Contributions – Employer 400 63 272 55
Contributions – Plan participant 52 13 52 12
Payments (456) (75) (430) (65)
Payments – amount paid of any settlements (78) – (4) –
Other (12) – (13) –
Closing fair value of plan assets $ 11,351 $ 4 $ 10,266 $ 3
Change in present value of benefit obligation
Opening benefit obligation $ 10,413 $ 1,722 $ 9,857 $ 1,682
Current service costs 315 31 298 28
Past service costs 97 – (2) (2)
Interest expense 486 80 438 73
Remeasurements
Actuarial (gains) losses from demographic assumptions 76 (58) 382 51
Actuarial (gains) losses from financial assumptions 830 119 (265) (65)
Actuarial losses from experience adjustments 67 49 4
Change in foreign currency exchange rate 67 6 38 4
Contributions – Plan participant 52 13 52 12
Payments (456) (75) (430) (65)
Payments – amount paid of any settlements (78) – (4) –
Business combinations/Disposals – (11) ––
Other (3) (2) ––
Closing benefit obligation $ 11,805 $ 1,832 $ 10,413 $ 1,722
Unfunded obligation $ 28 $ 1,670 $ 27 $ 1,557
Wholly or partly funded obligation 11,777 162 10,386 165
Total benefit obligation $ 11,805 $ 1,832 $ 10,413 $ 1,722
(1) For pension plans with funding deficits, the benefit obligations and fair value of plan assets as at October 31, 2014 were $10,180 million and $9,587 million, respectively (October 31,
2013 – $8,996 million and $8,688 million, respectively).
Pension and other post-employment benefit expense
The following table presents the composition of our pension and other post-employment benefit expense.
For the year ended
Pension plans Other post-employment benefit plans
(Millions of Canadian dollars)
October 31
2014
October 31
2013
October 31
2012
October 31
2014
October 31
2013
October 31
2012
Current service costs $ 315 $ 298 $ 221 $31$28$25
Past service costs 97 (2) 1 –(2) (4)
Net interest expense (income) 14 30 (4) 80 73 79
Remeasurements of other long term benefits ––– 9(5) 2
Administrative expense 13 11 11 –––
Defined benefit pension expense $ 439 $ 337 $ 229 $ 120 $ 94 $ 102
Defined contribution pension expense 137 117 91 –––
Total benefit expense $ 576 $ 454 $ 320 $ 120 $ 94 $ 102
Total service costs for the year ended October 31, 2014 totalled $307 million (October 31, 2013 – $284 million; October 31, 2012
– $212 million) for pension plans in Canada and $105 million (October 31, 2013 – $12 million; October 31, 2012 – $10 million) for International
plans. Net interest expense for the year ended October 31, 2014 totalled $10 million (October 31, 2013 – $26 million; October 31, 2012 – net
interest income of $8 million) for pension plans in Canada and $4 million (October 31, 2013 – $4 million; October 31, 2012 – $4 million) for
International plans.
Consolidated Financial Statements Royal Bank of Canada: Annual Report 2014 169

Note 17 Employee benefits - Pension and other post-employment benefits (continued)
Remeasurements of employee benefit plans
The following table presents the composition of our remeasurements recorded in OCI.
For the year ended
Defined benefit pension plans Other post-employment benefit plans
(Millions of Canadian dollars)
October 31
2014
October 31
2013
October 31
2012
October 31
2014
October 31
2013
October 31
2012
Actuarial (gains) losses:
Changes in demographic assumptions $76$ 382 $ (1) $ (54) $ 53 $ (65)
Changes in financial assumptions 830 (265) 1,159 113 (62) 190
Experience adjustments 649 8 –4 (2)
Return on plan assets (excluding interest based on
discount rate) (647) (601) (231) –––
$ 265 $ (435) $ 935 $59$ (5) $ 123
Total remeasurements recorded in OCI for the year ended October 31, 2014 were loss of $238 million (October 31, 2013 – gain of $424 million;
October 31, 2012 – loss of $871 million) for pension plans in Canada and loss of $27 million (October 31, 2013 – gain of $11 million;
October 31, 2012 – loss of $64 million) for International plans.
Investment policy and strategies
Defined benefit pension plan assets are invested prudently in order to meet our longer term pension obligations. The pension plan’s investment
strategy is to hold a diversified mix of investments by asset class and geographic location, in order to reduce investment-specific risk to the
funded status while maximizing the expected returns to meet pension obligations. Investment of the plan’s assets is conducted with careful
consideration of the pension obligation’s exposure to interest rates, credit spreads and inflation which are key risk factors impacting the
obligation. The asset mix policy is therefore consistent with an asset/liability framework. Factors taken into consideration in developing our
asset mix include but are not limited to the following:
(i) the nature of the underlying benefit obligations, including the duration and term profile of the liabilities;
(ii) the member demographics, including expectations for normal retirements, terminations, and deaths;
(iii) the financial position of the pension plans;
(iv) the diversification benefits obtained by the inclusion of multiple asset classes; and
(v) expected asset returns, including asset and liability volatility and correlations.
To implement our asset mix policy, we may invest in equity securities, debt securities, alternative investments and derivative instruments. Our
holdings in certain investments, including common shares, emerging market equity and debt, debt securities rated lower than BBB and
residential and commercial mortgages, cannot exceed a defined percentage of the market value of our defined benefit pension plan assets. We
may use derivative instruments as either a synthetic investment to more efficiently replicate the performance of an underlying security, or as a
hedge against financial risks associated with the underlying portfolio. To manage our credit risk exposure, counterparties of our derivative
instruments are required to meet minimum credit ratings and enter into collateral agreements.
Our defined benefit pension plan assets are primarily comprised of equity and debt securities. Our equity securities generally have unadjusted
quoted market prices in an active market (Level 1) and our debt securities generally have quoted market prices for similar assets in an active
market (Level 2). Alternative investments and other includes cash, hedge funds, and private fund investments including infrastructure, real
estate leases, private equity and derivative financial instruments. In the case of private fund investments, no quoted market prices are usually
available (Level 2 or Level 3). These fund assets are either valued by an independent valuator or priced using observable market inputs.
During the year, investment changes and risk factor diversification continued in support of our efforts to reduce variability in the funded status.
As a result, equity risk was reduced through redeployment of equity investments into a diverse mix of quality alternative investments with low
correlation to equity markets, including investments in hedge funds, infrastructure, private equity and real estate. In addition, an increasing
allocation to debt securities is used to reduce asset liability duration mismatch and hence variability of the plan’s funded status due to interest
rate changes. Longer maturity debt securities, given their price sensitivity to movements in interest rates, are considered to be a good economic
hedge to risk associated with the plan’s liabilities, which are discounted using predominately long maturity bond interest rates as inputs. We
expect to continue to move towards a higher weighting of debt securities as market conditions permit, to further reduce risk of variability in the
funded status.
Asset allocation of defined benefit pension plans (1)
As at
October 31, 2014 October 31, 2013
(Millions of Canadian dollars, except percentages) Fair value
Percentage
of total
plan assets
Quoted
in active
market (2) Fair value
Percentage
of total
plan assets
Quoted
in active
market (2)
Equity securities
Domestic $ 1,623 14% 100% $ 1,354 13% 100%
Foreign 2,530 22 100 2,625 25 100
Debt securities
Domestic government bonds 2,199 19 – 2,377 23 –
Foreign government bonds 530 5 – 495 5 –
Corporate and other bonds 2,097 19 – 1,601 16 –
Alternative investments and other 2,372 21 11 1,814 18 15
$ 11,351 100% 39% $ 10,266 100% 41%
(1) The asset allocation is based on the underlying investments held directly and indirectly through the funds as this is how we manage our investment policy and strategies.
(2) If our assessment of quoted in an active market was based on the direct investments, 45% of our total plan assets would be classified as quoted in an active market (October 31,
2013 –48%).
170 Royal Bank of Canada: Annual Report 2014 Consolidated Financial Statements

The allocation to equity securities of our pension plan in Canada is 38% (October 31, 2013 – 40%) and that of our International plan is 18%
(October 31, 2013 – 24%). The allocation to debt securities of our pension plan in Canada is 41% (October 31, 2013 – 42%) and that of our
International plan is 58% (October 31, 2013 – 62%). The allocation to alternative investments and other in our pension plan in Canada is 21%
(October 31, 2013 –18%) and that of our International plan is 24% (October 31, 2013 – 14%).
As at October 31, 2014, the plan assets include 1 million (October 31, 2013 – 1 million) of our common shares with a fair value of
$107 million (October 31, 2013 – $84 million) and $39 million (October 31, 2013 – $13 million) of our debt securities. For the year ended
October 31, 2014, dividends received on our common shares held in the plan assets were $4 million (October 31, 2013 – $3 million).
Maturity profile
The following table presents the maturity profile of our defined benefit pension plan obligation.
As at
(Millions of Canadian dollars, except participants and years) October 31, 2014
Canada International Total
Number of plan participants 75,250 10,084 85,334
Actual benefit payments 2014 $ 405 $ 51 $ 456
Benefits expected to be paid 2015 488 40 528
Benefits expected to be paid 2016 512 41 553
Benefits expected to be paid 2017 537 39 576
Benefits expected to be paid 2018 560 40 600
Benefits expected to be paid 2019 581 43 624
Benefits expected to be paid 2020-2024 3,192 263 3,455
Weighted average duration of defined benefit payments 15.2 years 19.8 years 15.5 years
Significant assumptions
Our methodologies to determine significant assumptions used in calculating the defined benefit pension and other post-employment benefit
expense are as follows:
Discount rate
For the Canadian pension and other post-employment benefit plans, all future expected benefit payments at each measurement date are
discounted at spot rates from a derived Aa corporate bond yield curve. The derived curve is based on observed rates for Aa corporate bonds with
maturities less than six years and a projected Aa corporate curve based on spreads between observed Aa corporate bonds and Aa provincial
bonds for periods greater than six years. For the International pension and other post-employment benefit plans, all future expected benefit
payments at each measurement date are discounted at spot rates from an Aa corporate bond yield curve. Spot rates beyond 30 years are set to
equal the 30-year spot rate. The discount rate is the equivalent single rate that produces the same discounted value as that determined using
the entire discount curve. This valuation methodology does not rely on assumptions regarding reinvestment returns.
Rate of increase in future compensation
The assumptions for increases in future compensation are developed separately for each plan, where relevant. Each assumption is set based on
the price inflation assumption and compensation policies in each market, as well as relevant local statutory and plan-specific requirements.
Healthcare cost trend rates
Healthcare cost calculations are based on both short and long term trend assumptions established based on the plan’s recent trend experience
as well as on market expectations.
As at
Defined benefit pension plans Other post-employment benefit plans
October 31
2014
October 31
2013
October 31
2012
October 31
2014
October 31
2013
October 31
2012
Weighted average assumptions to determine benefit
obligation
Discount rate 4.10% 4.60% 4.40% 4.20% 4.70% 4.50%
Rate of increase in future compensation 3.30% 3.30% 3.30% n.a. n.a. n.a.
Healthcare cost trend rates
– Medical (1) n.a. n.a. n.a. 3.50% 3.80% 3.90%
– Dental n.a. n.a. n.a. 4.00% 4.00% 4.00%
(1) For our other post-employment benefit plans, the assumed medical healthcare cost trend rates used to measure the expected cost of benefits were 3.50% for the next year decreasing to an
ultimate rate of 2.50% in 2030.
n.a. not applicable
Consolidated Financial Statements Royal Bank of Canada: Annual Report 2014 171

Note 17 Employee benefits - Pension and other post-employment benefits (continued)
Mortality assumptions
Mortality assumptions are significant in measuring our obligations under the defined benefit pension plans. These assumptions have been set
based on country specific statistics. Future longevity improvements have been considered and included where appropriate. The following table
summarizes the mortality assumptions used for major plans.
As at
October 31, 2014 October 31, 2013
Life expectancy at 65 for a member currently at Life expectancy at 65 for a member currently at
Age 65 Age 45 Age 65 Age 45
(In years) Male Female Male Female Male Female Male Female
Country
Canada 23.0 23.5 24.0 24.5 22.4 23.2 23.5 24.1
United States 20.6 22.9 21.1 23.4 20.5 22.8 21.0 23.3
United Kingdom 23.9 25.2 26.1 27.6 23.8 25.1 26.0 27.5
Sensitivity analysis
Assumptions adopted can have a significant effect on the obligations for defined benefit pension and other post-employment benefit plans. The
increase (decrease) in obligation in the following table has been determined assuming all other assumptions are held constant. In practice, this
is unlikely to occur, as changes in some of the assumptions may be correlated. The following table presents the sensitivity analysis of key
assumptions for 2014:
(Millions of Canadian dollars)
Defined benefit
pension plans –
Increase
(decrease) in
obligation
Other post-
employment
benefit
plans – Increase
(decrease) in
obligation
Discount rate
Impact of 50bps increase in discount rate $ (864) $ (125)
Impact of 50bps decrease in discount rate 960 140
Rate of increase in future compensation
Impact of 50bps increase in rate of increase in future compensation 65 n.a.
Impact of 50bps decrease in rate of increase in future compensation (66) n.a.
Mortality rate
Impact of an increase in longevity by one additional year 265 46
Healthcare cost trend rate
Impact of 100bps increase in healthcare cost trend rate n.a. 131
Impact of 100bps decrease in healthcare cost trend rate n.a. (112)
n.a. not applicable
Note 18 Other liabilities
As at
(Millions of Canadian dollars)
October 31
2014
October 31
2013
Cash collateral $ 10,500 $ 8,855
Accounts payable and accrued expenses 2,386 2,917
Payroll and related compensation 6,582 5,911
Payable to brokers, dealers and clients 2,063 1,821
Negotiable instruments 2,416 2,172
Accrued interest payable 1,748 1,796
Deferred income 1,937 1,783
Taxes payable 1,691 1,480
Precious metals certificates 572 677
Dividends payable 1,127 1,027
Insurance related liabilities 617 566
Deferred income taxes 204 170
Provisions 500 271
Other 4,966 5,501
$ 37,309 $ 34,947
172 Royal Bank of Canada: Annual Report 2014 Consolidated Financial Statements

Note 19 Subordinated debentures
The debentures are unsecured obligations and are subordinated in right of payment to the claims of depositors and certain other creditors. All
redemptions, cancellations and exchanges of subordinated debentures are subject to the consent and approval of OSFI. All subordinated
debentures are redeemable at our option. The amounts presented below include the impact of fair value hedging for interest rate risk and are net
of our holdings in these securities which have not been cancelled and are still outstanding.
(Millions of Canadian dollars, except percentage and foreign currency)
Interest
rate
Denominated in
foreign currency
(millions)
As at
Maturity
Earliest par value
redemption date
October 31
2014
October 31
2013
November 14, 2014 (1) 10.00% $ 200 $ 217
November 4, 2018 November 4, 2013 (2) 5.45% (3) –1,000
June 15, 2020 June 15, 2015 4.35% (4) 1,491 1,508
November 2, 2020 November 2, 2015 3.18% (5) 1,483 1,488
June 8, 2023 9.30% 110 110
July 17, 2024 (6) July 17, 2019 3.04% (7) 1,002 –
December 6, 2024 December 6, 2019 2.99% (8) 1,992 1,947
September 29, 2026 (6) September 29, 2021 3.45% (9) 1,009 –
November 1, 2027 November 1, 2022 4.75% TT$300 53 49
June 26, 2037 June 26, 2017 2.86% JPY 10,000 106 109
October 1, 2083 Any interest payment date (10) 224 224
June 29, 2085 Any interest payment date (11) US$174 196 181
June 18, 2103 June 18, 2009 (12) 5.95% (13) –615
$ 7,866 $ 7,448
Deferred financing costs (7) (5)
$ 7,859 $ 7,443
The terms and conditions of the debentures are as follows:
(1) All $200 million outstanding 10.00% subordinated debentures matured on November 14, 2014.
(2) All $1 billion outstanding subordinated debentures were redeemed on November 4, 2013 for 100% of their principal amount plus accrued interest to the redemption date.
(3) Interest at stated interest rate until earliest par value redemption date, and thereafter at a rate of 1.00% above the 90-day Bankers’ Acceptance rate.
(4) Interest at stated interest rate until earliest par value redemption date, and thereafter at a rate of 1.41% above the 90-day Bankers’ Acceptance rate.
(5) Interest at stated interest rate until earliest par value redemption date, and thereafter at a rate of 1.21% above the 90-day Bankers’ Acceptance rate.
(6) The notes include non-viability contingency capital (NVCC) provisions, necessary for the notes to qualify as Tier 2 regulatory capital under Basel III. NVCC provisions require the conversion of
the instrument into a variable number of common shares in the event that OSFI deems the Bank non-viable or a federal or provincial government in Canada publicly announces that the Bank
has accepted or agreed to accept a capital injection. In such an event, each note is convertible into common shares pursuant to an automatic conversion formula with a multiplier of 1.5 and a
conversion price based on the greater of: (i) a floor price of $5.00 and (ii) the current market price of our common shares based on the volume weighted average trading price of our common
shares on the Toronto Stock Exchange. The number of shares issued is determined by dividing the par value of the note (including accrued and unpaid interest on such note) by the
conversion price and then times the multiplier.
(7) Interest at stated interest rate until earliest par value redemption date, and thereafter at a rate of 1.08% above the 90-day Bankers’ Acceptance rate.
(8) Interest at stated interest rate until earliest par value redemption date, and thereafter at a rate of 1.10% above the 90-day Bankers’ Acceptance rate.
(9) Interest at stated interest rate until earliest par value redemption date, and thereafter at a rate of 1.12% above the 90-day Bankers’ Acceptance rate.
(10) Interest at a rate of 40 basis points above the 30-day Bankers’ Acceptance rate.
(11) Interest at a rate of 25 basis points above the U.S. dollar 3-month LIMEAN. In the event of a reduction of the annual dividend we declare on our common shares, the interest payable on the
debentures is reduced pro rata to the dividend reduction and the interest reduction is payable with the proceeds from the sale of newly issued common shares.
(12) All $600 million outstanding subordinated debentures were redeemed on June 18, 2014 for 100% of their principal amount plus accrued interest to the redemption date.
(13) Interest at stated rate until earliest par value redemption date and every 5 years thereafter at a rate of 1.72% above the 5-year Government of Canada yield.
Maturity schedule
The aggregate maturities of subordinated debentures, based on the maturity dates under the terms of issue, are as follows:
(Millions of Canadian dollars)
October 31
2014
Within 1 year $ 200
5 to 10 years 4,086
Thereafter 3,580
$ 7,866
Note 20 Trust capital securities
We issued innovative capital instruments, RBC Trust Capital Securities (RBC TruCS), through two structured entities: RBC Capital Trust (Trust) and
RBC Capital Trust II (Trust II). Trust II was wound up in 2014 after the redemption of the RBC TruCS Series 2013 (RBC TruCS 2013) on
December 31, 2013.
The Trust has issued non-voting RBC TruCS Series 2010, 2011, 2015 and 2008-1 (RBC TruCS 2010, 2011, 2015 and 2008-1). RBC TruCS
2010 and 2011 were redeemed in 2010 and 2011, respectively.
The holders of RBC TruCS 2015 and 2008-1 do not have any conversion rights or any other redemption rights. As a result, upon
consolidation of the Trust, RBC TruCS 2015 and 2008-1 are classified as Non-controlling interests. Holders of RBC TruCS 2015 and 2008-1 are
eligible to receive semi-annual non-cumulative fixed cash distributions until December 31, 2015 and June 30, 2018, respectively, and a floating-
rate cash distribution thereafter.
No cash distributions will be payable by the Trust on RBC TruCS if we fail to declare regular dividends (i) on our preferred shares, or (ii) on
our common shares if no preferred shares are then outstanding. In this case, the net distributable funds of the Trust will be distributed to us as
holders of residual interest in the Trust. Should the Trust fail to pay the semi-annual distributions in full, we will not declare dividends of any kind
on any of our preferred or common shares for a specified period of time.
Consolidated Financial Statements Royal Bank of Canada: Annual Report 2014 173

Note 20 Trust capital securities (continued)
The table below presents the significant terms and conditions of RBC TruCS.
Significant terms and conditions of RBC Trust Capital Securities
As at
Earliest
redemption date Conversion date October 31
2014
Principal
amount
October 31
2013
Principal
amount
(Millions of Canadian dollars, except for
percentage amounts) Issuance date Distribution dates
Annual
yield
At the option of the
issuer
At the option
of the holder
RBC Capital Trust (1),(2),(3),(4),(5),(6),(7)
Included in Non-controlling interests
1,200,000 Trust Capital Securities
– Series 2015 October 28, 2005 June 30, December 31 4.87% (8) December 31, 2010 n.a. $ 1,200 $ 1,200
500,000 Trust Capital Securities
– Series 2008-1 April 28, 2008 June 30, December 31 6.82% (8) June 30, 2013 n.a. 500 500
RBC Capital Trust II (2),(3),(4),(5),(6),(7),(9)
Included in Deposits
900,000 Trust Capital Securities
– Series 2013 (10) July 23, 2003 June 30, December 31 5.812% December 31, 2008 Any time $—$ 900
The significant terms and conditions of the RBC TruCS are as follows:
(1) Subject to the approval of OSFI, the Trust may, on the earliest redemption date specified above, and on any distribution date thereafter, redeem in whole (but not in part) the RBC TruCS
2008-1 and 2015, without the consent of the holders.
(2) Subject to the approval of OSFI, upon occurrence of a special event as defined, prior to the earliest redemption date specified above, the trusts may redeem in whole (but not in part) the RBC
TruCS 2008-1, 2013 or 2015 without the consent of the holders.
(3) Issuer Redemption Price: The RBC TruCS 2008-1 may be redeemed for cash equivalent to (i) the Early Redemption Price if the redemption occurs prior to June 30, 2018 or (ii) the Redemption
Price if the redemption occurs on or after June 30, 2018. The RBC TruCS 2013 and 2015 may be redeemed for cash equivalent to (i) the Early Redemption Price if the redemption occurs prior
to December 31, 2013 and 2015, respectively, or (ii) the Redemption Price if the redemption occurs on or after December 31, 2013 and 2015, respectively. Redemption Price refers to an
amount equal to $1,000 plus the unpaid distributions to the redemption date. Early Redemption Price refers to an amount equal to the greater of (i) the Redemption Price and (ii) the price
calculated to provide an annual yield, equal to the yield on a Government of Canada bond issued on the redemption date with a maturity date of June 30, 2018, plus 77 basis points, for RBC
TruCS 2008-1, and a maturity date of December 31, 2013 and 2015, plus 23 basis points and 19.5 basis points, for RBC TruCS 2013 and 2015, respectively.
(4) Automatic Exchange Event: Without the consent of the holders, each RBC TruCS 2008-1, 2013 and 2015 will be exchanged automatically for 40 of our non-cumulative redeemable First
Preferred Shares Series Al, T and Z, respectively, upon occurrence of any one of the following events: (i) proceedings are commenced for our winding-up; (ii) OSFI takes control of us; (iii) we
have Tier 1 capital ratio of less than 5% or Total capital ratio of less than 8%; or (iv) OSFI has directed us to increase our capital or provide additional liquidity and we elect such automatic
exchange or we fail to comply with such direction. The First Preferred Shares Series AI, T and Z pay semi-annual non-cumulative cash dividends and Series T is convertible at the option of the
holder into a variable number of common shares.
(5) From time to time, we purchase some of the innovative capital instruments and hold them temporarily. As at October 31, 2014, we held $9 million of RBC TruCS 2015 (October 31, 2013 –
$nil) and $3 million of the RBC TruCS 2008-1 (October 31, 2013 – $nil) as treasury holdings which were deducted from regulatory capital.
(6) Regulatory capital: In accordance with OSFI Capital Adequacy Requirements, effective January 2013, RBC TruCS no longer qualify as additional Tier 1 capital due to their lack of non-viability
contingent capital terms and conditions. As such, outstanding RBC TruCS are being phased out of regulatory capital in accordance with OSFI guidelines.
(7) Holder Exchange Right: Holders of RBC TruCS 2013 may, at any time, exchange all or part of their holdings for 40 non-cumulative redeemable First Preferred Shares Series U, for each RBC
TruCS 2013 held. The First Preferred Shares Series U pay semi-annual non-cumulative cash dividends as and when declared by our Board of Directors and are convertible at the option of the
holder into a variable number of common shares. Holders of RBC TruCS 2008-1 and RBC TruCS 2015 do not have similar exchange rights.
(8) The non-cumulative cash distribution on the RBC TruCS 2015 will be 4.87% paid semi-annually until December 31, 2015, and at one half of the sum of 180-day Bankers’ Acceptance rate plus
1.5%, thereafter. The non-cumulative cash distribution on the RBC TruCS 2008-1 will be 6.82% paid semi-annually until June 30, 2018, and at one half of the sum of 180-day Bankers’
Acceptance rate plus 3.5% thereafter.
(9) Subject to the approval of OSFI, Trust II may, in whole or in part, on the redemption date specified above, and on any distribution date thereafter, redeem any outstanding RBC TruCS 2013
without the consent of the holders.
(10) On December 31, 2013, Trust II redeemed all $900 million principal amount of RBC TruCS 2013 for cash at a redemption price of $1,000 per unit.
n.a. not applicable
174 Royal Bank of Canada: Annual Report 2014 Consolidated Financial Statements

Note 21 Equity
Share capital
Authorized share capital
Preferred – An unlimited number of First Preferred Shares and Second Preferred Shares without nominal or par value, issuable in series; the
aggregate consideration for which all the First Preferred Shares and all the Second Preferred Shares that may be issued may not exceed
$20 billion and $5 billion, respectively.
Common – An unlimited number of shares without nominal or par value may be issued.
Outstanding share capital
The following table details our common and preferred shares outstanding.
As at
October 31, 2014 October 31, 2013
(Millions of Canadian dollars, except the
number of shares and dividends per share)
Number of
shares
(thousands) Amount
Dividends
declared
per share
Number of
shares
(thousands) Amount
Dividends
declared
per share
Preferred shares
First preferred (1)
Non-cumulative, fixed rate
Series W 12,000 $ 300 $ 1.23 12,000 $ 300 $ 1.23
Series AA 12,000 300 1.11 12,000 300 1.11
Series AB 12,000 300 1.18 12,000 300 1.18
Series AC 8,000 200 1.15 8,000 200 1.15
Series AD 10,000 250 1.13 10,000 250 1.13
Series AE 10,000 250 1.13 10,000 250 1.13
Series AF 8,000 200 1.11 8,000 200 1.11
Series AG 10,000 250 1.13 10,000 250 1.13
Series AH (2) ––– – – 0.86
Non-cumulative, 5-Year Rate Reset
Series AJ (3) 13,579 339 0.97 16,000 400 1.25
Series AL 12,000 300 1.15 12,000 300 1.40
Series AN (4) – – 0.39 9,000 225 1.56
Series AP (4) – – 0.39 11,000 275 1.56
Series AR (4) – – 0.39 14,000 350 1.56
Series AT (5) – – 1.17 11,000 275 1.56
Series AV (5) – – 1.17 16,000 400 1.56
Series AX (6) 13,000 325 1.53 13,000 325 1.53
Series AZ 20,000 500 0.50 –––
Series BB 20,000 500 0.46 –––
Non-cumulative, floating rate
Series AK (3) 2,421 61 0.53 –––
$ 4,075 $ 4,600
Common shares
Balance at beginning of year 1,441,056 $14,377 1,445,303 $ 14,323
Issued under the stock option plan (7) 2,723 150 2,528 121
Purchased for cancellation (8) (1,546) (16) (6,775) (67)
Balance at end of year 1,442,233 $14,511 $ 2.84 1,441,056 $ 14,377 $ 2.53
Treasury shares – Preferred shares
Balance at beginning of year 47 $ 1 42 $ 1
Sales 4,919 124 4,892 127
Purchases (4,965) (125) (4,887) (127)
Balance at end of year 1$ – 47 $ 1
Treasury shares – Common shares
Balance at beginning of year 666 $ 41 543 $ 30
Sales 70,684 5,333 71,361 4,453
Purchases (70,458) (5,303) (71,238) (4,442)
Balance at end of year 892 $ 71 666 $ 41
(1) First Preferred Shares Series were issued at $25 per share.
(2) On July 2, 2013, we redeemed all 8.5 million of issued and outstanding Non-Cumulative First Preferred Shares Series AH for cash at a redemption price of $26 per share plus declared
dividends. This amount is comprised of the $25 per share original issue price plus a $1 per share redemption premium.
(3) On February 24, 2014, we issued 2.4 million Non-Cumulative Floating Rate First Preferred Shares, Series AK, totalling $61 million through a holder option, one-for-one conversion of some of
our Non-Cumulative 5-Year Rate Reset First Preferred Shares, Series AJ.
(4) On February 24, 2014, we redeemed all issued and outstanding Non-Cumulative 5-Year Rate Reset First Preferred Shares, Series AN (9 million shares), Series AP (11 million shares), and
Series AR (14 million shares) for cash at a redemption price of $25 per share.
(5) On August 24, 2014, we redeemed all issued and outstanding Non-Cumulative 5-Year Rate Reset First Preferred Shares, Series AT (11 million shares) and Series AV (16 million shares) for
cash at a redemption price of $25 per share.
(6) On November 24, 2014, we redeemed all 13 million of issued and outstanding Non-Cumulative 5-year Rate Reset First Preferred Shares Series AX for cash at a redemption price of $25 per
share.
(7) Includes fair value adjustments to stock options of $16 million (2013 – $14 million).
(8) During the year ended October 31, 2014, we purchased for cancellation common shares at an average cost of $72.64 per share (October 31, 2013 – $60.34 per share) with a book value of
$10.03 per share (October 31, 2013 – $9.94 per share).
Consolidated Financial Statements Royal Bank of Canada: Annual Report 2014 175

Note 21 Equity (continued)
As at October 31, 2014
Initial
Period
Annual Yield Premium
Current
Dividend
per share (1)
Earliest
redemption
date (2) Issue Date
Redemption
price (2),(3)
Preferred shares
First preferred
Non-cumulative, fixed rate
Series W (4) 4.90% $ .306250 February 24, 2010 January 31, 2005 $ 25.00
Series AA 4.45% .278125 May 24, 2011 April 4, 2006 25.25
Series AB 4.70% .293750 August 24, 2011 July 20, 2006 25.25
Series AC 4.60% .287500 November 24, 2011 November 1, 2006 25.50
Series AD 4.50% .281250 February 24, 2012 December 13, 2006 25.50
Series AE 4.50% .281250 February 24, 2012 January 19, 2007 25.50
Series AF 4.45% .278125 May 24, 2012 March 14, 2007 25.50
Series AG 4.50% .281250 May 24, 2012 April 26, 2007 25.50
Non-cumulative, 5-Year Rate Reset (5)
Series AJ 5.00% 1.93% .220000 February 24, 2014 September 16, 2008 25.00
Series AL 5.60% 2.67% .266250 February 24, 2014 November 3, 2008 25.00
Series AX 6.10% 4.13% .381250 November 24, 2014 April 29, 2009 25.00
Series AZ (6) 4.00% 2.21% .250000 May 24, 2019 January 30, 2014 25.00
Series BB (6) 3.90% 2.26% .243750 August 24, 2019 June 3, 2014 25.00
Non-cumulative, floating rate
Series AK (7) 1.93% .180786 February 24, 2019 February 24, 2014 25.00
(1) Non-cumulative preferential dividends of each Series are payable quarterly, as and when declared by the Board of Directors, on or about the 24th day of February, May, August and November.
(2) The redemption price represents the price as at October 31, 2014 or the contractual redemption price, whichever is applicable. Subject to the consent of OSFI and the requirements of the
Bank Act (Canada), we may, on or after the dates specified above, redeem First Preferred Shares. Unless otherwise noted, shares may be redeemed for cash at a price per share of $25 if
redeemed on the earliest redemption date and on the same date every fifth year thereafter. In the case of Series W, AA, AB, AC, AD, AE, AF and AG, these may be redeemed for cash at a price
per share of $26 if redeemed during the 12 months commencing on the earliest redemption date and decreasing by $0.25 each 12-month period thereafter to a price per share of $25 if
redeemed four years from the earliest redemption date or thereafter.
(3) Subject to the consent of OSFI and the requirements of the Bank Act (Canada), we may purchase the First Preferred Shares of each Series for cancellation at the lowest price or prices at which,
in the opinion of the Board of Directors, such shares are obtainable.
(4) Subject to the approval of the Toronto Stock Exchange, we may, on or after February 24, 2010, convert First Preferred Shares Series W into our common shares. First Preferred Shares Series W
may be converted into that number of common shares determined by dividing the current redemption price by the greater of $2.50 and 95% of the weighted average trading price of common
shares at such time.
(5) The dividend rate will reset on the earliest redemption date and every fifth year thereafter at a rate equal to the 5-year Government of Canada bond yield plus the premium indicated. The
holders have the option to convert their shares into non-cumulative floating rate First Preferred Shares subject to certain conditions on the earliest redemption date and every fifth year
thereafter at a rate equal to the three-month Government of Canada Treasury Bill rate plus the premium indicated.
(6) The preferred shares include non-viability contingency capital (NVCC) provisions, necessary for the shares to qualify as Tier 1 regulatory capital under Basel III. NVCC provisions require the
conversion of the instrument into a variable number of common shares in the event that OSFI deems the Bank non-viable or a federal or provincial government in Canada publicly announces
that the Bank has accepted or agreed to accept a capital injection. In such an event, each preferred share is convertible into common shares pursuant to an automatic conversion formula
with a conversion price based on the greater of: (i) a floor price of $5.00 and (ii) the current market price of our common shares based on the volume weighted average trading price of our
common shares on the Toronto Stock Exchange. The number of shares issued is determined by dividing the preferred share value ($25.00 plus declared and unpaid dividends) by the
conversion price.
(7) The dividend rate is equal to the three-month Government of Canada Treasury Bill rate plus the premium indicated. The holders have the option to convert their shares into non-cumulative
First Preferred Shares, Series AJ subject to certain conditions on February 24, 2019 and every fifth year thereafter.
Restrictions on the payment of dividends
We are prohibited by the Bank Act (Canada) from declaring any dividends on our preferred or common shares when we are, or would be placed as
a result of the declaration, in contravention of the capital adequacy and liquidity regulations or any regulatory directives issued under the Act. We
may not pay dividends on our common shares at any time unless all dividends to which preferred shareholders are then entitled have been
declared and paid or set apart for payment. We have agreed that if the Trust fails to pay any required distribution on the trust capital securities in
full, we will not declare dividends of any kind on any of our preferred or common shares. Refer to Note 20.
Currently, these limitations do not restrict the payment of dividends on our preferred or common shares.
Dividend reinvestment plan
Our dividend reinvestment plan (DRIP) provides common and preferred shareholders with a means to receive additional common shares rather
than cash dividends. The plan is only open to shareholders residing in Canada or the United States. The requirements of our DRIP are satisfied
through either open market share purchases or shares issued from treasury. During 2014 and 2013, the requirements of our DRIP were satisfied
through open market share purchases.
Shares available for future issuances
As at October 31, 2014, 43.7 million common shares are available for future issue relating to our DRIP and potential exercise of stock options
outstanding. In addition, we may issue up to 38.9 million common shares from treasury under the RBC Umbrella Savings and Securities Purchase
Plan that was approved by shareholders on February 26, 2009.
176 Royal Bank of Canada: Annual Report 2014 Consolidated Financial Statements

Non-controlling interests
As at
(Millions of Canadian dollars)
October 31
2014
October 31
2013
RBC Trust Capital Securities (1)
Series 2015 $ 1,211 $ 1,220
Series 2008-1 508 511
Other 94 64
$ 1,813 $ 1,795
(1) As at October 31, 2014, RBC TruCS Series 2015 includes $20 million of accrued interest (October 31, 2013 – $20 million), net of $9 million of treasury holdings (October 31, 2013 – $nil).
Series 2008-1 includes $11 million of accrued interest (October 31, 2013 – $11 million), net of $3 million of treasury holdings (October 31, 2013 – $nil).
Note 22 Share-based compensation
Stock option plans
We have stock option plans for certain key employees. Under the plans, options are periodically granted to purchase common shares. The
exercise price for each grant is determined as the higher of the volume-weighted average of the trading prices per board lot (100 shares) of our
common shares on the Toronto Stock Exchange (i) on the day preceding the day of grant; and (ii) the five consecutive trading days immediately
preceding the day of grant. The options vest over a four-year period for employees, and are exercisable for a period not exceeding 10 years from
the grant date.
The compensation expense recorded for the year ended October 31, 2014, in respect of the stock option plans was $7 million (October 31,
2013 – $7 million; October 31, 2012 – $7 million). The compensation expense related to non-vested options was $4 million at October 31, 2014
(October 31, 2013 – $5 million; October 31, 2012 – $7 million), to be recognized over the weighted average period of 1.4 years (October 31,
2013 – 1.1 years; October 31, 2012 – 1.5 years).
Analysis of the movement in the number and weighted average exercise price of options is set out below:
A summary of our stock option activity and related information
October 31, 2014 October 31, 2013 October 31, 2012
(Canadian dollars per share except share amounts)
Number
of options
(thousands)
Weighted
average
exercise price
Number
of options
(thousands)
Weighted
average
exercise price
Number
of options
(thousands)
Weighted
average
exercise price
Outstanding at beginning of year 10,604 $ 50.39 12,304 $ 48.12 14,413 $ 45.06
Granted 705 69.17 906 58.65 1,161 48.93
Exercised (1),(2) (2,723) 49.03 (2,528) 42.22 (3,174) 34.36
Forfeited in the year (7) 52.92 (78) 53.27 (96) 52.37
Outstanding at end of year 8,579 $ 52.36 10,604 $ 50.39 12,304 $ 48.12
Exercisable at end of year 4,987 $ 49.60 5,711 $ 47.80 6,544 $ 45.43
Available for grant 11,443 12,140 12,968
(1) Cash received for options exercised during the year was $133 million (October 31, 2013 – $107 million; October 31, 2012 – $109 million) and the weighted average share price at the date of
exercise was $74.27 (October 31, 2013 – $63.17; October 31, 2012 – $54.48).
(2) New shares were issued for all stock options exercised in 2014, 2013 and 2012. See Note 21.
Options outstanding as at October 31, 2014 by range of exercise price:
Options outstanding Options exercisable
(Canadian dollars per share except share amounts)
Number
outstanding
(thousands)
Weighted
average
exercise price (1)
Weighted
average
remaining
contractual life
Number
exercisable
(thousands)
Weighted
average
exercise price (1)
$31.70 - $35.37 1,031 $ 35.35 4.09 1,031 $ 35.35
$44.13 - $48.93 1,448 47.86 5.75 322 44.13
$50.55 - $52.94 2,323 52.66 5.02 1,452 52.70
$54.99 - $57.90 2,182 55.08 4.33 2,182 55.08
$58.65 - $69.17 1,595 63.30 8.55 – –
8,579 $ 52.36 5.51 4,987 $ 49.60
(1) The weighted average exercise prices have been revised to reflect the conversion of foreign currency-denominated options at the exchange rate as of October 31, 2014.
The weighted average fair value of options granted during the year ended October 31, 2014 was estimated at $7.19 (October 31, 2013 – $5.33;
October 31, 2012 – $4.42). This was determined by applying the Black-Scholes model on the date of grant, taking into account the specific
terms and conditions under which the options are granted, such as the vesting period and expected share price volatility estimated by
considering both historic average share price volatility and implied volatility derived from traded options over our common shares of similar
maturity to those of the employee options. The following assumptions were used to determine the fair value of options granted:
Consolidated Financial Statements Royal Bank of Canada: Annual Report 2014 177

Note 22 Share-based compensation (continued)
Weighted average assumptions
For the year ended
(Canadian dollars per share except percentages)
October 31
2014
October 31
2013
October 31
2012
Share price at grant date $ 68.75 $ 58.65 $ 48.19
Risk-free interest rate 1.95% 1.38% 1.38%
Expected dividend yield 3.94% 4.19% 3.93%
Expected share price volatility 18% 18% 18%
Expected life of option 6 years 6 years 6 years
Employee savings and share ownership plans
We offer many employees an opportunity to own our common shares through savings and share ownership plans. Under these plans, the
employees can generally contribute between 1% and 10% of their annual salary or benefit base for commissioned based employees. For each
contribution between 1% and 6%, we will match 50% of the employee contributions in our common shares. For the RBC Dominion Securities
Savings Plan, our maximum annual contribution is $4,500 per employee. For the RBC U.K. Share Incentive Plan, our maximum annual
contribution is £1,500 per employee. For the year ended October 31, 2014, we contributed $85 million (October 31, 2013 – $77 million;
October 31, 2012 – $75 million), under the terms of these plans, towards the purchase of our common shares. As at October 31, 2014, an
aggregate of 38 million common shares were held under these plans (October 31, 2013 – 38 million common shares; October 31, 2012 –
37 million common shares).
Deferred share and other plans
We offer deferred share unit plans to executives, non-employee directors and to certain key employees. Under these plans, the executives or
directors may choose to receive all or a percentage of their annual variable short-term incentive bonus or directors’ fee in the form of deferred
share units (DSUs). The executives or directors must elect to participate in the plan prior to the beginning of the year. DSUs earn dividend
equivalents in the form of additional DSUs at the same rate as dividends on common shares. The participant is not allowed to convert the DSUs
until retirement, permanent disability or termination of employment/directorship. The cash value of the DSUs is equivalent to the market value of
common shares when conversion takes place.
We have a deferred bonus plan for certain key employees within Capital Markets. The deferred bonus is invested as RBC share units and a
specified percentage vests on each of the three anniversary dates following the grant date. Each vested amount is paid in cash and is based on
the original number of RBC share units plus accumulated dividends valued using the average closing price of RBC common shares during the five
trading days immediately preceding the vesting date.
We offer performance deferred share award plans to certain key employees, all of which vest at the end of three years. Upon vesting, the
award is paid in cash and is based on the original number of RBC share units granted plus accumulated dividends valued using the average
closing price of RBC common shares during the five trading days immediately preceding the vesting date. A portion of the award under certain
plans can be increased or decreased up to 25%, depending on our total shareholder return compared to a defined peer group of global financial
institutions. We previously offered deferred compensation to certain employees in the form of common shares that were held in trust and
accumulated dividends during the three year vesting period.
We maintain a non-qualified deferred compensation plan for key employees in the United States under an arrangement called the RBC U.S.
Wealth Accumulation Plan. This plan allows eligible employees to defer a portion of their annual income and allocate the deferrals among
various fund choices, which include a share unit fund that tracks the value of our common shares. Certain deferrals may also be eligible for
matching contributions, all of which are allocated to the RBC share unit fund.
Our liabilities for the awards granted under the deferred share and other plans are measured at fair value, determined based on the quoted
market price of our common shares. The following tables present our obligations under the deferred share and other plans, and the related
compensation expenses (recoveries) recognized for the year.
Obligation under deferred share and other plans
October 31, 2014 October 31, 2013 October 31, 2012
Units granted
during the year
Units
outstanding
at the end
of the year
Units granted
during the year
Units
Outstanding
at the end
of the year
Units granted
during the year
Units
outstanding
at the end
of the year
(Millions of Canadian dollars
except units and per unit
amounts)
Number
granted
(thousands)
Weighted
average
fair value
Carrying
amount
Number
granted
(thousands)
Weighted
average
fair value
Carrying
amount
Number
granted
(thousands)
Weighted
average
fair value
Carrying
amount
Deferred share unit plans 315 $ 71.57 $ 333 265 $ 60.83 $ 307 302 $ 59.60 $ 229
Deferred bonus plan 5,339 78.97 1,585 5,215 69.45 1,517 8,917 56.72 1,494
Performance deferred
share award plans 2,181 68.09 503 2,337 58.62 440 2,570 49.03 307
RBC U.S. Wealth
Accumulation Plan 69 74.68 343 374 61.23 301 458 51.91 253
Other share-based plans 845 70.32 118 809 60.47 76 437 51.34 45
8,749 $ 75.12 $ 2,882 9,000 $ 65.23 $ 2,641 12,684 $ 54.87 $ 2,328
178 Royal Bank of Canada: Annual Report 2014 Consolidated Financial Statements
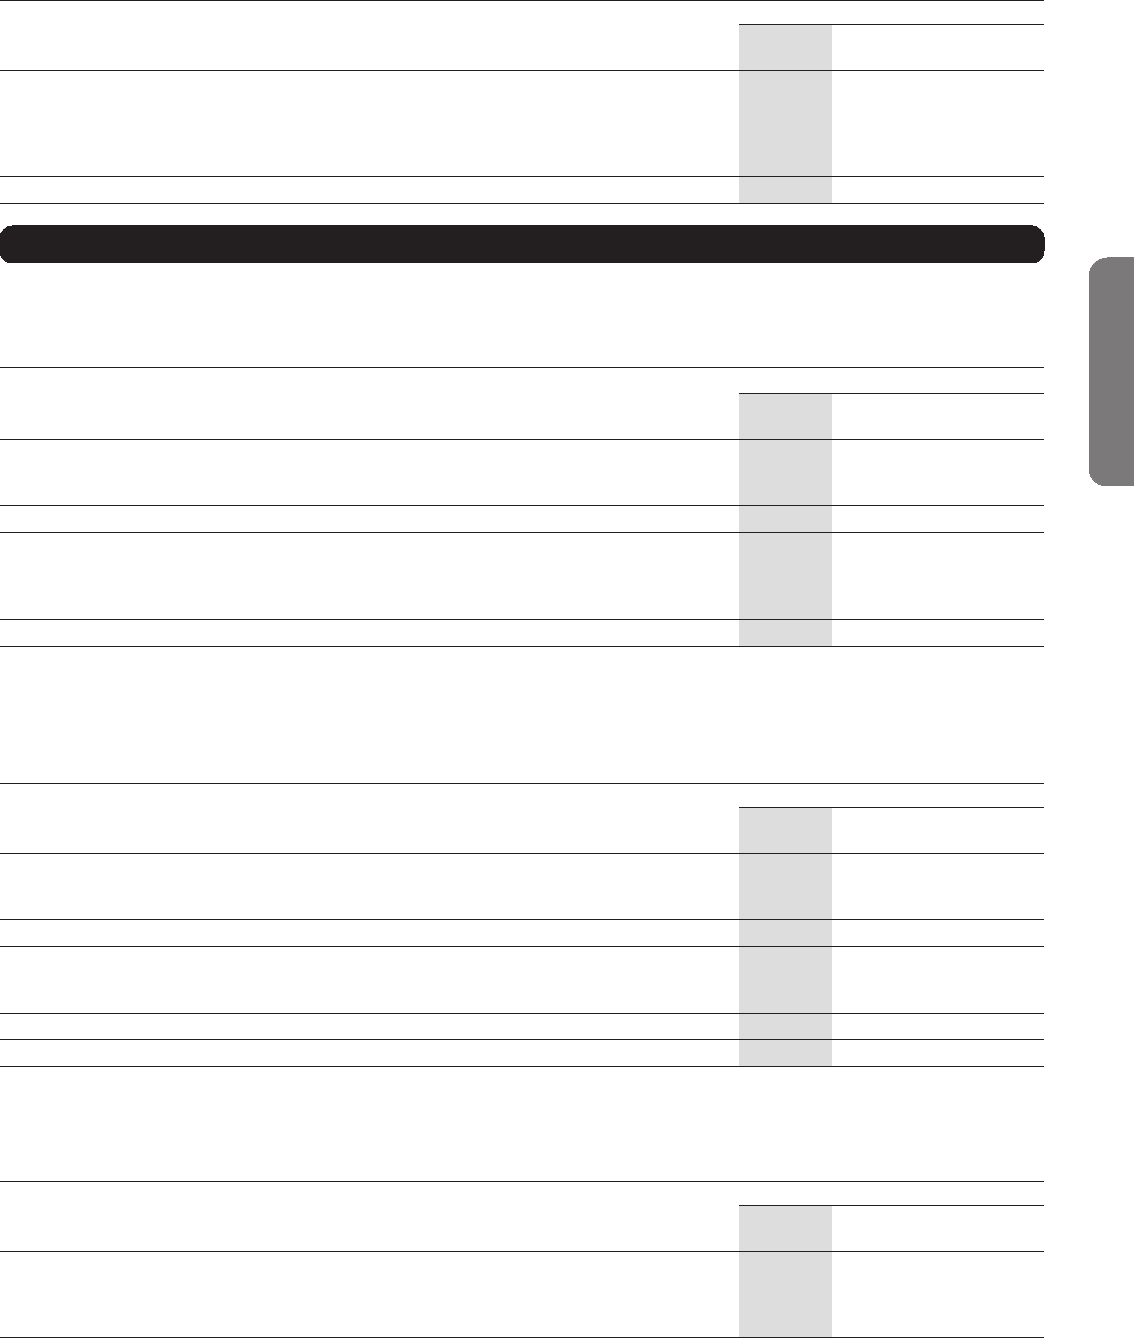
Compensation expenses recognized under deferred share and other plans
For the year ended
(Millions of Canadian dollars)
October 31
2014
October 31
2013
October 31
2012
Deferred share unit plans $61$53$29
Deferred bonus plan 121 284 185
Performance deferred share award plans 243 249 151
RBC U.S. Wealth Accumulation Plan 147 211 136
Other share-based plans 65 46 29
$ 637 $ 843 $ 530
Note 23 Income and expenses from selected financial instruments
Gains and losses arising from financial instruments held at FVTPL, except for those supporting our insurance operations, are reported in Non-
interest income. Related interest and dividend income are reported in Net interest income.
Net gains (losses) from financial instruments held at fair value through profit or loss (1)
For the year ended
(Millions of Canadian dollars)
October 31
2014
October 31
2013
October 31
2012
Net gains (losses)
Classified as at fair value through profit or loss (2) $ 922 $ 875 $ 1,217
Designated as at fair value through profit or loss (3) (132) (30) (54)
$ 790 $ 845 $ 1,163
By product line
Interest rate and credit $ 603 $ 593 $ 805
Equities (190) (55) (8)
Foreign exchange and commodities 377 307 366
$ 790 $ 845 $ 1,163
(1) The following related to our insurance operations are excluded from Non-interest income and included in Insurance premiums, investment and fee income in the Consolidated Statements of
Income: Net gains (losses) from financial instruments designated as at FVTPL were $515 million (October 31, 2013 – $(496) million; October 31, 2012 – $439 million).
(2) Excludes derivatives designated in a hedging relationship. Refer to Note 8 for net gains (losses) on these derivatives.
(3) For the year ended October 31, 2014, $414 million of net fair value losses on financial liabilities designated as at FVTPL, other than those attributable to changes in our own credit risk, were
included in Non-interest income.
Net interest income from financial instruments (1)
For the year ended
(Millions of Canadian dollars)
October 31
2014
October 31
2013
October 31
2012
Interest income
Financial instruments held as at fair value through profit or loss $ 4,246 $ 3,959 $ 4,955
Other categories of financial instruments (2) 17,773 17,189 15,814
22,019 21,148 20,769
Interest expense
Financial instruments held as at fair value through profit or loss $ 2,198 $ 2,260 $ 3,029
Other categories of financial instruments 5,705 5,639 5,301
7,903 7,899 8,330
Net interest income $ 14,116 $ 13,249 $ 12,439
(1) The following related to our insurance operations are excluded from Net-interest income and included in Insurance premiums, investment and fee income in the Consolidated Statements of
Income: Interest income of $435 million (October 31, 2013 – $470 million; October 31, 2012 – $466 million), Interest expense of $nil million (October 31, 2013 – $nil million; October 31,
2012 – $nil million).
(2) Refer to Note 5 for interest income accrued on impaired financial assets.
Income from other categories of financial instruments (1), (2)
For the year ended
(Millions of Canadian dollars)
October 31
2014
October 31
2013
October 31
2012
Net gains (losses) arising from financial instruments measured at amortized cost (3) $ (7) $ – $ (4)
Net fee income which does not form an integral part of the effective interest rate of financial assets
and liabilities 4,190 3,869 3,378
Net fee income arising from trust and other fiduciary activities 9,138 7,990 6,595
(1) Refer to Note 4 for net gains (losses) on AFS securities.
(2) Refer to Note 4 for impairment losses on AFS and held-to-maturity securities, and Note 5 for impairment losses on loans.
(3) Financial instruments measured at amortized cost include held-to-maturity securities, loans and financial liabilities measured at amortized cost.
Consolidated Financial Statements Royal Bank of Canada: Annual Report 2014 179

Note 24 Income taxes
The components of tax expense are as follows:
For the year ended
(Millions of Canadian dollars)
October 31
2014
October 31
2013
October 31
2012
Income taxes (recoveries) in Consolidated Statements of Income
Current tax
Tax expense for current year $ 2,858 $ 2,516 $ 2,166
Adjustments for prior years (64) (289) (184)
Recoveries arising from previously unrecognized tax loss, tax credit or temporary difference of a
prior period (4) (2) –
2,790 2,225 1,982
Deferred tax
Origination and reversal of temporary difference (156) (100) (107)
Effects of changes in tax rates (3) (1) 2
Adjustments for prior years 74 (5) 167
Recoveries arising from previously unrecognized tax loss, tax credit or temporary difference of a
prior period (3) (46) (16)
Write-down 432 –
(84) (120) 46
2,706 2,105 2,028
Income taxes in Consolidated Statements of Comprehensive Income and Changes in Equity
Other comprehensive income
Net unrealized gains on available-for-sale securities 70 372
Reclassification of gains on available-for-sale securities to income (12) (20) (2)
Unrealized foreign currency translation gains 521
Foreign currency translation (losses) gains from hedging activities (561) (322) 39
Reclassification of (gains) losses on net investment hedging activities 1– (59)
Net unrealized (losses) gains on derivatives designated as cash flow hedges (39) (4) 11
Reclassification of (gains) losses on derivatives designated as cash flow hedges to income 10 (11) 10
Remeasurement of employee benefit plans (88) 121 (279)
Net fair value change due to credit risk on financial liabilities designed as at fair value through
profit and loss (22) ––
Issuance costs (7) ––
(643) (231) (207)
Total income taxes $ 2,063 $ 1,874 $ 1,821
Our effective tax rate changed from 20.1% for 2013 to 23.1% for 2014, principally due to a net favourable tax adjustment of $214 million related
to prior years recorded in 2013, which is presented in Other in the table below.
The following is an analysis of the differences between the income tax expense reflected in the Consolidated Statements of Income and the
amounts calculated at the Canadian statutory rate.
Reconciliation to statutory tax rate
For the year ended
(Millions of Canadian dollars, except for percentage amounts) October 31, 2014 October 31, 2013 October 31, 2012
Income taxes at Canadian statutory tax rate $ 3,080 26.3% $ 2,737 26.2% $ 2,531 26.4%
(Decrease) increase in income taxes resulting from
Lower average tax rate applicable to subsidiaries (272) (2.3) (190) (1.8) (299) (3.1)
Goodwill Impairment –– – – 37 0.4
Tax-exempt income from securities (386) (3.3) (294) (2.8) (330) (3.4)
Tax rate change (3) – (1) – 2 –
Effect of previously unrecognized tax loss, tax credit or temporary differences (7) (0.1) (48) (0.5) (16) (0.1)
Other 294 2.5 (99) (1.0) 103 1.0
Income taxes reported in Consolidated Statements of Income / effective tax rate $ 2,706 23.1% $ 2,105 20.1% $ 2,028 21.2%
Deferred tax assets and liabilities result from tax loss carryforwards and temporary differences between the tax basis of assets and liabilities and
their carrying amounts on our Consolidated Balance Sheets.
180 Royal Bank of Canada: Annual Report 2014 Consolidated Financial Statements

Significant components of deferred tax assets and liabilities
As at October 31, 2014
(Millions of Canadian dollars)
Net Asset
November 1,
2013
Change
through
equity
Change
through profit
or loss
Exchange rate
differences
Acquisitions/
disposals Other
Net Asset
October 31,
2014
Net deferred tax asset/(liability)
Allowance for credit losses $ 413 $ – $ (37) $ – $ – $ – $ 376
Deferred compensation 1,290 – 151 72 – – 1,513
Business realignment charges 6– 3 – –– 9
Tax loss carryforwards 62 – (19) 1 – – 44
Deferred income 42 – 78 – – – 120
Available-for-sale securities 102 (49) (19) (4) – – 30
Premises and equipment (227) – (99) 4 – – (322)
Deferred expense (80) 7 (25) – – – (98)
Pension and post-employment related 492 88 (16) 2 – – 566
Intangibles (279) – 5 (8) – – (282)
Other 150 – 62 10 – – 222
$ 1,971 $ 46 $ 84 $ 77 $ – $ – $ 2,178
Comprising
Deferred tax assets $ 2,141 $ 2,382
Deferred tax liabilities (170) (204)
$ 1,971 $ 2,178
As at October 31, 2013
(Millions of Canadian dollars)
Net Asset
November 1,
2012
Change
through
equity
Change
through profit
or loss
Exchange rate
differences
Acquisitions/
disposals Other
Net Asset
October 31,
2013
Net deferred tax asset/(liability)
Allowance for credit losses $ 418 $ – $ (55) $ (1) $ 58 $ (7) $ 413
Deferred compensation 988 – 270 33 – (1) 1,290
Business realignment charges 39 – (33) – – – 6
Tax loss carryforwards 72 1 (13) – – 2 62
Deferred income 97 – 2 – (57) – 42
Available-for-sale securities 140 (1) (39) 2 – – 102
Premises and equipment (150) – (83) 1 – 5 (227)
Deferred expense (81) – 1 – – – (80)
Pension and post-employment related 555 (121) 53 5 – – 492
Intangibles (230) – (15) (7) (31) 4 (279)
Other 80 1 32 1 31 5 150
$ 1,928 $ (120) $ 120 $ 34 $ 1 $ 8 $ 1,971
Comprising
Deferred tax assets $ 2,071 $ 2,141
Deferred tax liabilities (143) (170)
$ 1,928 $ 1,971
The tax loss carryforwards amount of deferred tax assets was related to losses in our Luxembourg, U.K., U.S., Caribbean and Japanese
operations. Deferred tax assets of $44 million (October 31, 2013 – $62 million) were recognized at October 31, 2014 in respect of tax losses
incurred in current or preceding years which recognition is dependent on the projection of future taxable profits. Management’s forecasts
support the assumption that it is probable that the results of future operations will generate sufficient taxable income to utilize the deferred tax
assets. The forecasts rely on continued liquidity and capital support to our business operations, including tax planning strategies implemented
in relation to such support.
As at October 31, 2014, unused tax losses, tax credits and deductible temporary differences of $532 million, $267 million and $7 million
(October 31, 2013 – $514 million, $183 million and $nil) available to be offset against potential tax adjustments or future taxable income were
not recognized as deferred tax assets. This amount includes unused tax losses of $167 million (October 31, 2013 – $168 million) which expire in
two to four years, and $365 million (October 31, 2013 – $346 million) which expire after four years. There are $6 million of tax credits (October
31, 2013 – $nil) that will expire in two to four years, and $261 million (October 31, 2013 – $183 million) that will expire after four years. In
addition, there are deductible temporary differences of $7 million (October 31, 2013 – $nil) that will expire after four years.
The amount of temporary differences associated with investments in subsidiaries, branches and associates and interests in joint ventures
for which deferred tax liabilities have not been recognized in the parent bank is $9.0 billion as at October 31, 2014 (October 31, 2013 –
$7.7 billion).
Consolidated Financial Statements Royal Bank of Canada: Annual Report 2014 181

Note 25 Earnings per share
For the year ended
(Millions of Canadian dollars, except share and per share amounts)
October 31
2014
October 31
2013
October 31
2012
Basic earnings per share
Net Income $ 9,004 $ 8,342 $ 7,507
Net loss from discontinued operations –– (51)
Net income from continuing operations 9,004 8,342 7,558
Preferred share dividends (213) (253) (258)
Net income attributable to non-controlling interest (94) (98) (97)
Net income available to common shareholders from continuing operations 8,697 7,991 7,203
Weighted average number of common shares (in thousands) 1,442,553 1,443,735 1,442,167
Basic earnings (loss) per share
Continuing operations (in dollars) $ 6.03 $ 5.53 $ 4.99
Discontinued operations (in dollars) –– (0.03)
$ 6.03 $ 5.53 $ 4.96
Diluted earnings per share
Net income available to common shareholders from continuing operations $ 8,697 $ 7,991 $ 7,203
Dilutive impact of exchangeable shares 21 53 53
Net income from continuing operations available to common shareholders including dilutive
impact of exchangeable shares 8,718 8,044 7,256
Net loss from discontinued operations available to common shareholders –– (51)
Weighted average number of common shares (in thousands) 1,442,553 1,443,735 1,442,167
Stock options (1) 2,938 2,320 1,626
Issuable under other share-based compensation plans –74 433
Exchangeable shares (2) 6,512 20,400 24,061
Average number of diluted common shares (in thousands) 1,452,003 1,466,529 1,468,287
Diluted earnings (loss) per share
Continuing operations (in dollars) $ 6.00 $ 5.49 $ 4.94
Discontinued operations (in dollars) –– (0.03)
$ 6.00 $ 5.49 $ 4.91
(1) The dilutive effect of stock options was calculated using the treasury stock method. When the exercise price of options outstanding is greater than the average market price of our common
shares, the options are excluded from the calculation of diluted earnings per share. The following amounts were excluded from the calculation of diluted earnings per share: for the years
ended October 31, 2014 and 2013 – no outstanding options were excluded from the calculation of diluted earnings per share; for the year ended October 31, 2012 – an average of 3,992,229
outstanding options with an average exercise price of $55.05.
(2) Includes exchangeable preferred shares and trust capital securities.
Note 26 Guarantees, commitments, pledged assets and contingencies
Guarantees and commitments
We utilize guarantees and other off-balance sheet credit instruments to meet the financing needs of our clients.
The table below summarizes our maximum exposure to credit losses related to our guarantees and commitments provided to third parties.
The maximum exposure to credit risk relating to a guarantee is the maximum risk of loss if there was a total default by the guaranteed parties,
without consideration of possible recoveries under recourse provisions, insurance policies or from collateral held or pledged. The maximum
exposure to credit risk relating to a loan commitment is the full amount of the commitment. In both cases, the maximum risk exposure is
significantly greater than the amount recognized as a liability in our Consolidated Balance Sheets.
Maximum exposure to credit losses
As at
(Millions of Canadian dollars)
October 31
2014
October 31
2013
Financial guarantees
Financial standby letters of credit $ 17,208 $ 15,592
Commitments to extend credit
Backstop liquidity facilities 31,467 32,142
Credit enhancements 3,246 3,181
Documentary and commercial letters of credit 180 139
Other commitments to extend credit 137,623 117,704
Other commitments
Securities lending indemnifications 62,319 57,749
Performance guarantees 6,115 5,221
182 Royal Bank of Canada: Annual Report 2014 Consolidated Financial Statements

Our credit review process, our policy for requiring collateral security, and the types of collateral security held are generally the same for
guarantees and commitments as for loans. Our clients generally have the right to request settlement of, or draw on, our guarantees and
commitments within one year. However, certain guarantees can only be drawn if specified conditions are met. These conditions, along with
collateral requirements, are described below. We believe that it is highly unlikely that all or substantially all of the guarantees and commitments
will be drawn or settled within one year, and contracts may expire without being drawn or settled.
Financial guarantees
Financial standby letters of credit
Financial standby letters of credit represent irrevocable assurances that we will make payments in the event that a client cannot meet its
obligations to the third party. For certain guarantees, the guaranteed party can request payment from us even though the client has not defaulted
on its obligations. The term of these guarantees can range up to eight years.
Our policy for requiring collateral security with respect to these instruments and the types of collateral security held is generally the same as
for loans. When collateral security is taken, it is determined on an account-by-account basis according to the risk of the borrower and the
specifics of the transaction. Collateral security may include cash, securities and other assets pledged.
Commitments to extend credit
Backstop liquidity facilities
Backstop liquidity facilities are provided to asset-backed commercial paper conduit programs administered by us and third parties, as an
alternative source of financing in the event that such programs are unable to access commercial paper markets, or in limited circumstances,
when predetermined performance measures of the financial assets owned by these programs are not met. The average remaining term of these
liquidity facilities is approximately three years.
Backstop liquidity facilities are also provided to non-asset backed programs such as variable rate demand notes issued by third parties.
These standby facilities provide liquidity support to the issuer to buy the notes if the issuer is unable to remarket the notes, as long as the
instrument and/or the issuer maintain the investment grade rating.
The terms of the backstop liquidity facilities do not require us to advance money to these programs in the event of bankruptcy or insolvency
events and generally do not require us to purchase non-performing or defaulted assets.
Credit enhancements
We provide partial credit enhancement to multi-seller programs administered by us to protect commercial paper investors in the event that the
collection on the underlying assets, the transaction-specific credit enhancement or the liquidity proves to be insufficient to pay for maturing
commercial paper. Each of the asset pools is structured to achieve a high investment-grade credit profile through credit enhancements from us
and other third parties related to each transaction. The average remaining term of these credit facilities is approximately three years.
Documentary and commercial letters of credit
Documentary and commercial letters of credit, which are written undertakings by us on behalf of a client authorizing a third party to draw drafts
on us up to a stipulated amount under specific terms and conditions, are collateralized by the underlying shipment of goods to which they relate.
Other commitments to extend credit
Commitments to extend credit represent unused portions of authorizations to extend credit in the form of loans, bankers’ acceptances or letters
of credit.
Other commitments
Securities lending indemnifications
In securities lending transactions, we act as an agent for the owner of a security, who agrees to lend the security to a borrower for a fee, under the
terms of a pre-arranged contract. The borrower must fully collateralize the security loaned at all times. As part of this custodial business, an
indemnification may be provided to securities lending customers to ensure that the fair value of securities loaned will be returned in the event
that the borrower fails to return the borrowed securities and the collateral held is insufficient to cover the fair value of those securities. These
indemnifications normally terminate without being drawn upon. The term of these indemnifications varies, as the securities loaned are recallable
on demand. Collateral held for our securities lending transactions typically includes cash or securities that are issued or guaranteed by the
Canadian government, U.S. government or other OECD countries.
Performance guarantees
Performance guarantees represent irrevocable assurances that we will make payments to third-party beneficiaries in the event that a client fails
to perform under a specified non-financial contractual obligation. Such obligations typically include works and service contracts, performance
bonds, and warranties related to international trade. The term of these guarantees can range up to eight years.
Our policy for requiring collateral security with respect to these instruments and the types of collateral security held is generally the same as
for loans. When collateral security is taken, it is determined on an account-by-account basis according to the risk of the borrower and the
specifics of the transaction. Collateral security may include cash, securities and other assets pledged.
Indemnifications
In the normal course of our operations, we provide indemnifications which are often standard contractual terms to counterparties in transactions
such as purchase and sale contracts, fiduciary, agency, licensing, custodial and service agreements, director/officer contracts and leasing
transactions. These indemnification agreements may require us to compensate the counterparties for costs incurred as a result of changes in
laws and regulations (including tax legislation) or as a result of litigation claims or statutory sanctions that may be suffered by the counterparty
as a consequence of the transaction. The terms of these indemnification agreements will vary based on the contract. The nature of the
indemnification agreements prevents us from making a reasonable estimate of the maximum potential amount we could be required to pay to
counterparties. Historically, we have not made any significant payments under such indemnifications.
Uncommitted amounts
Uncommitted amounts represent undrawn credit facilities for which we have the ability to unilaterally withdraw the credit extended to the
borrower. These include both retail and commercial commitments. As at October 31, 2014, the total balance of uncommitted amounts was
$195 billion (October 31, 2013 – $183 billion).
Consolidated Financial Statements Royal Bank of Canada: Annual Report 2014 183
Note 26 Guarantees, commitments, pledged assets and contingencies (continued)
Pledged assets and collateral
In the ordinary course of business, we pledge assets and enter in collateral agreements with terms and conditions that are usual and customary
to our regular lending, borrowing and trading activities recorded on our Consolidated Balance Sheets. The following are examples of our general
terms and conditions on pledged assets and collateral:
• The risks and rewards of the pledged assets reside with the pledgor.
• The pledged asset is returned to the pledgor when the necessary conditions have been satisfied.
• The right of the pledgee to sell or re-pledge the asset is dependent on the specific agreement under which the collateral is pledged.
• If there is no default, the pledgee must return the comparable asset to the pledgor upon satisfaction of the obligation.
We are also required to provide intraday pledges to the Bank of Canada when we use the Large Value Transfer System (LVTS), which is a real-time
electronic wire transfer system that continuously processes all Canadian dollar large-value or time-critical payments throughout the day. The
pledged assets earmarked for LVTS activities are normally released back to us at the end of the settlement cycle each day. Therefore, the pledged
assets amount is not included in the table below. For the year ended October 31, 2014, we had on average $3.1 billion of assets pledged
intraday to the Bank of Canada on a daily basis (October 31, 2013 – $3.0 billion). There are infrequent occasions where we are required to take
an overnight advance from the Bank of Canada to cover a settlement requirement, in which case an equivalent value of the pledged assets would
be used to secure the advance. There were no overnight advances taken on October 31, 2014 and October 31, 2013.
Details of assets pledged against liabilities and collateral assets held or re-pledged are shown in the following tables:
As at
(Millions of Canadian dollars)
October 31
2014
October 31
2013 (1)
Sources of pledged assets and collateral
Bank assets
Cash and due from banks $ 243 $ 204
Interest-bearing deposits with banks 90 83
Loans 72,191 74,138
Securities 59,476 50,527
Other assets 11,887 11,678
$ 143,887 $ 136,630
Client assets
Collateral received and available for sale or re-pledging 189,229 164,397
Less: not sold or re-pledged (67,747) (49,612)
121,482 114,785
265,369 251,415
Uses of pledged assets and collateral
Securities lent $ 21,550 $ 19,535
Securities borrowed 25,150 27,951
Obligations related to securities sold short 50,345 47,128
Obligations related to securities lent or sold under repurchase agreements 61,184 56,580
Securitization 45,089 49,899
Covered bonds 26,589 22,750
Derivative transactions 17,068 14,363
Foreign governments and central banks 2,167 1,928
Clearing systems, payment systems and depositories 4,947 3,672
Other 11,280 7,609
$ 265,369 $ 251,415
(1) Certain amounts have been revised from those previously reported.
Lease commitments
Finance lease commitments
We lease computer equipment from third parties under finance lease arrangements. The leases have various terms, escalation and renewal
rights. The future minimum lease payments under the finance leases are as follows:
As at
October 31, 2014 October 31, 2013
(Millions of Canadian dollars)
Total
future
minimum
lease
payments
Future
interest
charges
Present
value of
finance lease
commitments
Total
future
minimum
lease
payments
Future
interest
charges
Present
value of
finance lease
commitments
Future minimum lease payments
No later than one year $ 59 $ (6) $ 53 $ 69 $ (8) $ 61
Later than one year and no later than five years 51 (6) 45 86 (10) 76
$ 110 $ (12) $ 98 $ 155 $ (18) $ 137
The net carrying amount of computer equipment held under finance lease as at October 31, 2014 was $113 million (October 31, 2013 – $153
million).
184 Royal Bank of Canada: Annual Report 2014 Consolidated Financial Statements

Operating lease commitments
We are obligated under a number of non-cancellable operating leases for premises and equipment. These leases have various terms, escalation
and renewal rights. The minimum future lease payments under non-cancellable operating leases are as follows.
As at
October 31, 2014 October 31, 2013
(Millions of Canadian dollars)
Land and
buildings Equipment
Land and
buildings Equipment
Future minimum lease payments
No later than one year $ 536 $ 134 $ 586 $ 138
Later than one year and no later than five years 1,663 200 1,752 314
Later than five years 1,294 – 1,349 –
3,493 334 3,687 452
Less: Future minimum sublease payments to be received (17) – (25) –
Net future minimum lease payments $ 3,476 $ 334 $ 3,662 $ 452
Note 27 Litigation
We are a large global institution that is subject to many different complex legal and regulatory requirements that continue to evolve. As a result,
Royal Bank of Canada and its subsidiaries are and have been subject to a variety of legal proceedings, including civil claims and lawsuits,
regulatory examinations, investigations, audits and requests for information by various governmental regulatory agencies and law enforcement
authorities in various jurisdictions. Some of these matters may involve novel legal theories and interpretations and may be advanced under
criminal as well as civil statutes, and some proceedings could result in the imposition of civil, regulatory enforcement or criminal penalties.
Management reviews the status of all proceedings on an ongoing basis and will exercise its judgment in resolving them in such manner as
management believes to be in the Bank’s best interest. This is an area of significant judgment and uncertainty and the extent of our financial and
other exposure to these proceedings could be material to our results of operations in any particular period. The following is a description of our
significant legal proceedings.
LIBOR inquiries and litigation
Various regulators and competition and enforcement authorities around the world, including in Canada, the United Kingdom, and the U.S., are
conducting investigations related to certain past submissions made by panel banks in connection with the setting of the U.S. dollar London
interbank offered rate (LIBOR). As Royal Bank of Canada is a member of certain LIBOR panels, including the U.S. dollar LIBOR panel, we have
been the subject of regulatory demands for information and are cooperating with those investigations. In addition, Royal Bank of Canada and
other U.S. dollar panel banks have been named as defendants in private lawsuits filed in the U.S. with respect to the setting of LIBOR, including a
number of class action lawsuits which have been consolidated before the U.S. District Court for the Southern District of New York (the Court). The
complaints in those actions assert claims against us and other panel banks under various U.S. laws including U.S. antitrust laws, the U.S.
Commodity Exchange Act (CEA), and state law. The Court has issued three detailed rulings on various motions in the consolidated cases, on
March 29, 2013, August 23, 2013 and June 23, 2014, which have collectively narrowed the scope of claims against us and the other panel bank
defendants. A procedural aspect of these rulings is currently on appeal to the U.S. Supreme Court which may cause the scope of the claims
against us to change. Based on the facts currently known, it is not possible at this time for us to predict the resolution of these regulatory
investigations or private lawsuits, including the timing and potential impact on Royal Bank of Canada.
CFTC litigation
Royal Bank of Canada is a defendant in a civil lawsuit brought by the Commodity Futures Trading Commission (CFTC) in the U.S. The lawsuit
alleges that certain inter-affiliate transactions were improper wash trades and effected in a non competitive manner. At this time, management
does not believe that the ultimate resolution of this matter will have a material adverse effect on our consolidated financial position or results of
operations.
Wisconsin school districts litigation
Royal Bank of Canada is a defendant in a lawsuit relating to our role in transactions involving investments made by a number of Wisconsin
school districts in certain collateralized debt obligations. These transactions were also the subject of a regulatory investigation. Despite reaching
a settlement with the Securities and Exchange Commission in September 2011, which was paid to the school districts through a Fair Fund, the
lawsuit is continuing. Based on the facts currently known, it is not possible at this time to predict the ultimate outcome of this proceeding or the
timing of its resolution; however, management believes the ultimate resolution of this proceeding will not have a material adverse effect on our
consolidated financial position or results of operations.
Rural/Metro litigation
On October 10, 2014, the Delaware Court of Chancery in a class action brought by former shareholders of Rural/Metro Corporation held Royal
Bank of Canada liable in the amount of US$75.8 million, plus interest, for aiding and abetting a breach of fiduciary duty by three Rural/Metro
directors. Plaintiffs’ attorneys’ fee application is pending and must be resolved before a final judgment will be entered. Management believes
that the ultimate resolution of this proceeding, including any possible appeal, will not have a material adverse effect on our consolidated
financial position or results of operations.
Other matters
We are a defendant in a number of other actions alleging that certain of our practices and actions were improper. The lawsuits involve a variety of
complex issues and the timing of their resolution is varied and uncertain. Management believes that we will ultimately be successful in resolving
these lawsuits, to the extent that we are able to assess them, without material financial impact to the Bank. This is, however, an area of
significant judgment and the potential liability resulting from these lawsuits could be material to our results of operations in any particular
period.
Various other legal proceedings are pending that challenge certain of our other practices or actions. We consider that the aggregate liability,
to the extent that we are able to assess it, resulting from these other proceedings will not be material to our consolidated financial position or
results of operations.
Consolidated Financial Statements Royal Bank of Canada: Annual Report 2014 185

Note 28 Contractual repricing and maturity schedule
The following table details our exposure to interest rate risk. The carrying amounts of financial assets and financial liabilities are reported below
based on the earlier of their contractual repricing date or maturity date.
The following table does not incorporate management’s expectation of future events where expected repricing or maturity dates differ
significantly from the contractual dates. We incorporate these assumptions in the management of interest rate risk exposure. These assumptions
include expected repricing of trading instruments and certain loans and deposits. Taking into account these assumptions on the consolidated
contractual repricing and maturity schedule at October 31, 2014, would result in a change in the under-one-year gap from $11.4 billion to
$75.6 billion.
As at October 31, 2014
(Millions of Canadian dollars)
Immediately
interest
rate-sensitive
Under 3
months
3to6
months
6to12
months 1 to 5 years
Over
5 years
Non-rate-
sensitive Total
Assets
Cash and deposits with banks $ 10,912 $ 8,638 $ 1 $ – $ – $ – $ 6,269 $ 25,820
Trading securities 105 27,518 9,181 8,408 23,001 32,464 50,703 151,380
Available-for-sale securities – 23,387 2,414 1,465 14,264 4,416 1,822 47,768
Assets purchased under reverse
repurchase agreements and
securities borrowed 1,004 115,025 15,933 3,618 – – – 135,580
Loans (net of allowance for loan
losses) 165,259 65,121 12,339 25,191 156,311 7,278 3,730 435,229
Derivatives 87,402 – – – – – – 87,402
Segregated fund net assets – – – – – – 675 675
Other assets 33 12,428 1 – – 113 44,121 56,696
$ 264,715 $ 252,117 $ 39,869 $ 38,682 $ 193,576 $ 44,271 $ 107,320 $ 940,550
Liabilities
Deposits $ 236,376 $ 119,539 $ 18,251 $ 37,724 101,572 $ 20,943 $ 79,695 $ 614,100
Obligations related to assets sold
under repurchase agreements
and securities loaned 592 61,308 806 1,625 – – – 64,331
Obligations related to securities
sold short 450 938 1,790 824 10,392 14,633 21,318 50,345
Derivatives 88,982 – – – – – – 88,982
Segregated fund net liabilities – – – – – – 675 675
Other liabilities 71 10,605 31 61 1,720 6,710 40,557 59,755
Subordinated debentures – 620 – 1,491 2,591 3,157 – 7,859
Non-controlling interests – – – – 1,719 – 94 1,813
Shareholders’ equity – 825 – 1,050 2,200 – 48,615 52,690
$ 326,471 $ 193,835 $ 20,878 $ 42,775 $ 120,194 $ 45,443 $ 190,954 $ 940,550
Total gap $ (61,756) $ 58,282 $ 18,991 $ (4,093) $ 73,382 $ (1,172) $ (83,634) $ –
Canadian dollar $ (39,220) $ 11,370 $ 4,683 $ (1,898) $ 97,840 $ (6,936) $ (65,948) $ (109)
Foreign currency (22,536) 46,912 14,308 (2,195) (24,458) 5,764 (17,686) 109
Total gap $ (61,756) $ 58,282 $ 18,991 $ (4,093) $ 73,382 $ (1,172) $ (83,634) $ –
Note 29 Related party transactions
Related parties
Related parties include associated companies, post-employment benefit plans for the benefit of our employees, key management personnel, the
Board of Directors (Directors), close family members of key management personnel and Directors, and entities which are, directly or indirectly,
controlled by, jointly controlled by or significantly influenced by key management personnel, Directors or their close family members.
Key management personnel and Directors
Key management personnel are defined as those persons having authority and responsibility for planning, directing and controlling our
activities, directly or indirectly. They include the senior members of our organization called the Group Executive. The Group Executive is
comprised of the President and Chief Executive Officer and individuals that report directly to him, including the Chief Administrative Officer and
Chief Financial Officer, Chief Human Resources Officer, Chief Risk Officer, and heads of our business units. The Directors do not plan, direct, or
control the activities of the entity; they oversee the management of the business and provide stewardship.
186 Royal Bank of Canada: Annual Report 2014 Consolidated Financial Statements
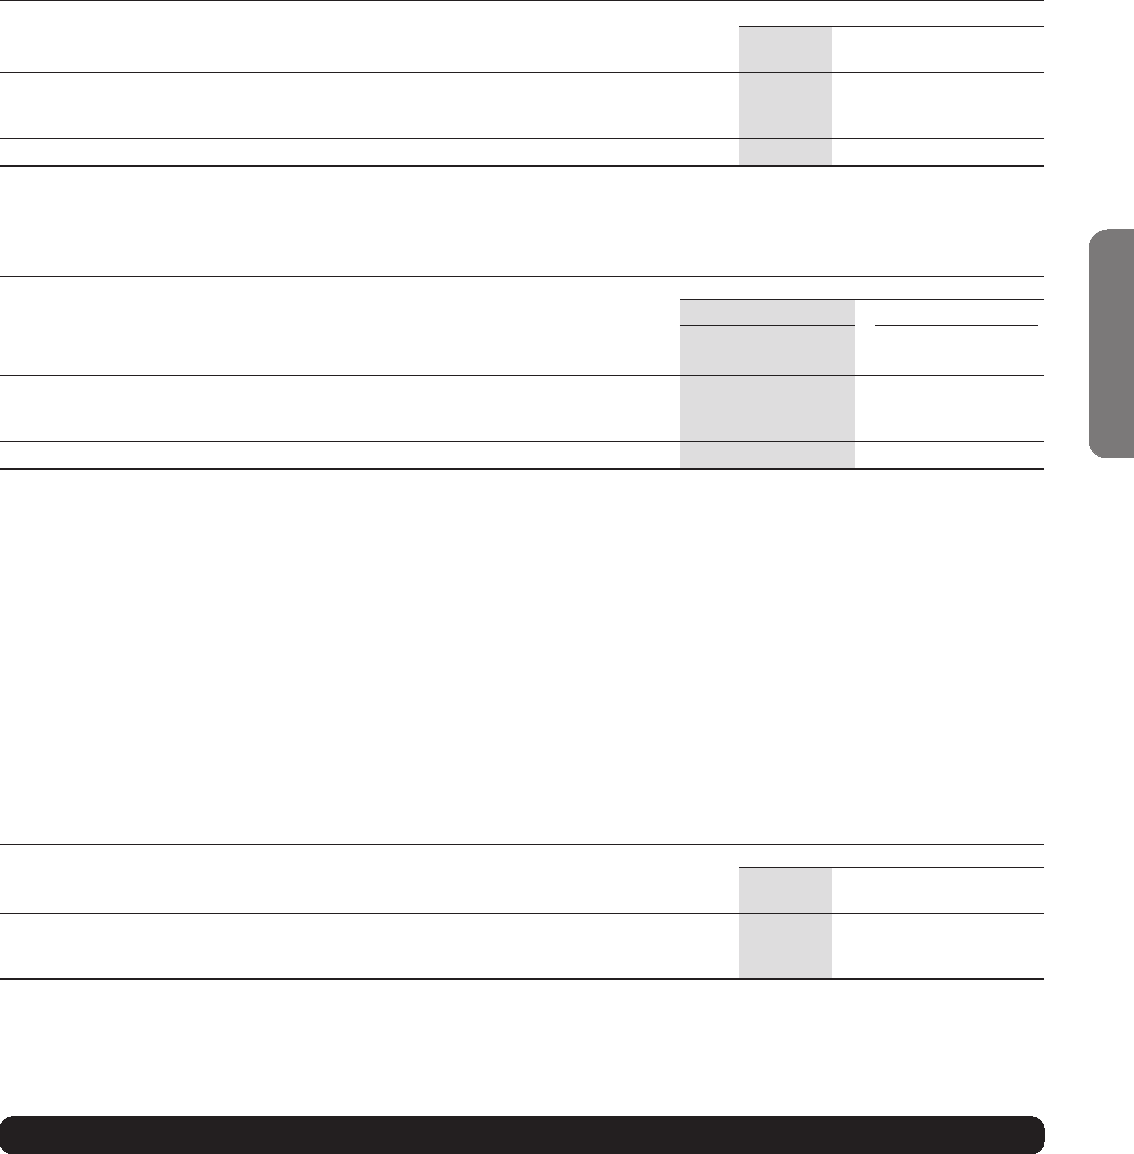
Compensation of key management personnel and Directors
The following tables present the compensation paid, shareholdings and options held by key management personnel and Directors.
For the year ended
(Millions of Canadian dollars)
October 31
2014 (1)
October 31
2013
October 31
2012
Salaries and other short-term employee benefits (2) $22$23$21
Post-employment benefits 732
Share-based payments 26 30 25
$55$56$48
(1) During the year, certain executives who were members of the Bank’s Group Executive as at October 31, 2013 have left the Bank and therefore, are no longer part of key management
personnel. Compensation for the year ended October 31, 2014, attributable to the former executives, including current year benefits and share based payments relating to awards granted in
prior years was $60 million.
(2) Includes the portion of the annual variable short-term incentive bonus that certain executives elected to receive in the form of DSUs. Refer to Note 22 for further details.
Stock options, stock awards and shares held by key management personnel, Directors and their close family members
As at
October 31, 2014 (1) October 31, 2013
(Millions of Canadian dollars, except number of shares)
No. of units
held Value
No. of units
held Value
Stock options 2,472,134 $ 66 4,566,316 $ 84
Other non-option stock based awards 1,447,763 116 2,467,532 173
RBC common shares 686,674 55 1,485,843 104
4,606,571 $ 237 8,519,691 $ 361
(1) During the year, certain executives who were members of the Bank’s Group Executive as at October 31, 2013 have left the Bank and therefore, are no longer part of key management
personnel. Total stock options, stock awards and shares held by these executives upon their departure were 3,459,347 units with a value of $194 million.
Transactions, arrangements and agreements involving key management personnel, Directors and their close family members
In the normal course of business, we provide certain banking services to key management personnel, Directors, and their close family members.
These transactions were made on substantially the same terms, including interest rates and security, as for comparable transactions with
persons of a similar standing and did not involve more than the normal risk of repayment or present other unfavourable features.
As at October 31, 2014, total loans to key management personnel, Directors and their close family members were $7 million (October 31,
2013 – $6 million). No guarantees, pledges or commitments have been given to key management personnel, Directors or their close family
members.
Joint ventures and associates
In the normal course of business, we provide certain banking and financial services to our joint ventures and associates, including loans, interest
and non-interest bearing deposits. These transactions meet the definition of related party transactions and were made on substantially the same
terms as for comparable transactions with third-party counterparties.
As at October 31, 2014, loans to joint ventures and associates were $57 million (October 31, 2013 – $48 million) and deposits from
joint ventures and associates were $14 million (October 31, 2013 – $12 million).
Other transactions, arrangements or agreements involving joint ventures or associates
As at or for the year ended
(Millions of Canadian dollars)
October 31
2014
October 31
2013
October 31
2012
Commitments and other contingencies $ 315 $ 240 $ 349
Other fees received for services rendered 45 47 84
Other fees paid for services received 185 191 245
Restricted net assets
Certain of our subsidiaries and joint ventures are subject to regulatory requirements of the jurisdictions in which they operate. When these
subsidiaries and joint ventures are subject to such requirements, they may be restricted from transferring to us, our share of their assets in the
form of cash dividends, loans or advances. At October 31, 2014, restricted net assets of these subsidiaries and joint ventures were $16.0 billion
(October 31, 2013 – $16.2 billion).
Note 30 Results by business segment
Composition of business segments
For management purposes, based on the products and services offered, we are organized into five business segments: Personal & Commercial
Banking, Wealth Management, Insurance, Investor & Treasury Services and Capital Markets.
Personal & Commercial Banking is comprised of our personal and business banking operations, auto financing and retail investment
businesses and operates through four business lines: Personal Financial Services, Business Financial Services and Cards and Payment Solutions
(Canadian Banking), and Caribbean & U.S. Banking. In Canada we provide a broad suite of financial products and services to our individual and
business clients through our extensive branch, automated teller machines, online and telephone banking networks, as well as through a large
number of proprietary sales professionals. In the Caribbean we offer a broad range of financial products and services to individuals, business
clients and public institutions in their respective markets. In the United States, we serve the cross-border banking needs of Canadian clients
within the United States, as well as the banking needs of our U.S. wealth management clients.
Wealth Management is comprised of Canadian Wealth Management, U.S. & International Wealth Management and Global Asset
Management. We serve affluent, high net worth and ultra high net worth clients in Canada, the United States, the United Kingdom, Europe, Asia,
Consolidated Financial Statements Royal Bank of Canada: Annual Report 2014 187

Note 30 Results by business segment (continued)
and emerging markets with a comprehensive suite of investment, trust, banking, credit and other wealth management solutions. We also provide
asset management products and services directly to institutional and individual clients as well as through RBC distribution channels and third-
party distributors.
Insurance is comprised of our insurance operations in Canada and globally and operates under two business lines: Canadian Insurance and
International Insurance, providing a wide range of life, health, property and casualty, and reinsurance products and solutions. In Canada, we
offer our products and services through our proprietary distribution channels, comprised of the field sales force which includes retail insurance
branches, our field sales representatives, call centers and online network, as well as through independent insurance advisors and affinity
relationships. Outside North America, we operate in reinsurance markets globally.
Investor & Treasury Services offers global custody, fund and pension administration, as well as an integrated suite of products to
institutional investors worldwide. We also provide cash management, correspondent banking and trade finance services to financial institutions
globally and funding and liquidity management for RBC as well as other select institutions.
Capital Markets is comprised of a majority of our global wholesale banking businesses providing public and private companies,
institutional investors, governments and central banks with a wide range of products and services across our two main business lines, Global
Markets and Corporate and Investment Banking. In North America, we offer a full suite of products and services which include corporate and
investment banking, equity and debt origination and distribution, and structuring and trading. Outside North America, we have a select presence
in the U.K., Europe, and Asia Pacific, where we offer a diversified set of capabilities in our key sectors of expertise such as energy, mining and
infrastructure.
All other enterprise level activities that are not allocated to these five business segments, such as enterprise funding, securitizations, net
charges associated with unattributed capital, and consolidation adjustments, including the elimination of the Taxable equivalent basis (Teb)
gross-up amounts, are included in Corporate Support. Teb adjustments gross up Net interest income from certain tax-advantaged sources
(Canadian taxable corporate dividends) to their effective tax equivalent value with the corresponding offset recorded in the provision for income
taxes. Management believes that these adjustments are necessary for Capital Markets to reflect how it is managed. The use of the Teb
adjustments enhances the comparability of revenue across our taxable and tax-advantaged sources. Our use of Teb adjustments may not be
comparable to similarly adjusted amounts at other financial institutions. The Teb adjustment for the year ended October 31, 2014 was
$492 million (October 31, 2013 – $380 million, October 31, 2012 – $431 million).
Geographic segments
For geographic reporting, our segments are grouped into Canada, United States and Other International. Transactions are primarily recorded in
the location that best reflects the risk due to negative changes in economic conditions and prospects for growth due to positive economic
changes. This location frequently corresponds with the location of the legal entity through which the business is conducted and the location of
our clients. Transactions are recorded in the local currency and are subject to foreign exchange rate fluctuations with respect to the movement in
the Canadian dollar.
Management reporting framework
Our management reporting framework is intended to measure the performance of each business segment as if it were a stand–alone business
and reflects the way our business segments are managed. This approach is intended to ensure that our business segments’ results reflect all
relevant revenue and expenses associated with the conduct of their businesses. Management regularly monitors these segments’ results for
the purpose of making decisions about resource allocation and performance assessment. These items do not impact our consolidated results.
The expenses in each business segment may include costs or services directly incurred or provided on their behalf at the enterprise level.
For other costs not directly attributable to one of our business segments, we use a management reporting framework that uses assumptions,
estimates and methodologies for allocating overhead costs and indirect expenses to our business segments and that assists in the attribution
of capital and the transfer pricing of funds to our business segments in a manner that fairly and consistently measures and aligns the economic
costs with the underlying benefits and risks of that specific business segment. Activities and business conducted between our business
segments are generally at market rates. All other enterprise level activities that are not allocated to our five business segments are reported
under Corporate Support.
Our assumptions and methodologies used in our management reporting framework are periodically reviewed by management to ensure that
they remain valid. The capital attribution methodologies involve a number of assumptions and estimates that are revised periodically.
188 Royal Bank of Canada: Annual Report 2014 Consolidated Financial Statements

For the year ended October 31, 2014
(Millions of Canadian dollars)
Personal &
Commercial
Banking
Wealth
Management Insurance
Investor &
Treasury
Services
Capital
Markets (1)
Corporate
Support (1) Total Canada
United
States
Other
International
Net interest income (2), (3) $ 9,743 $ 469 $ – $ 732 $ 3,485 $ (313) $ 14,116 $ 11,121 $ 1,896 $ 1,099
Non-interest income 3,987 5,844 4,964 1,152 3,881 164 19,992 10,495 4,256 5,241
Total revenue 13,730 6,313 4,964 1,884 7,366 (149) 34,108 21,616 6,152 6,340
Provision for credit losses 1,103 19 – – 44 (2) 1,164 922 52 190
Insurance policyholder
benefits, claims and
acquisition expense – – 3,573 – – – 3,573 2,188 1 1,384
Non-interest expense 6,563 4,800 579 1,286 4,344 89 17,661 9,650 4,222 3,789
Net income (loss) before
income taxes 6,064 1,494 812 598 2,978 (236) 11,710 8,856 1,877 977
Income taxes (recoveries) 1,589 411 31 157 923 (405) 2,706 1,983 672 51
Net income from
continuing operations 4,475 1,083 781 441 2,055 169 9,004 6,873 1,205 926
Net income from
discontinued
operations ––––––––– –
Net income $ 4,475 $ 1,083 $ 781 $ 441 $ 2,055 $ 169 $ 9,004 $ 6,873 $ 1,205 $ 926
Non-interest expense
includes:
Depreciation and
amortization $ 339 $ 147 $ 16 $ 58 $ 28 $ 577 $ 1,165 $ 971 $ 39 $ 155
Impairment of other
intangibles –6– – 2– 8 2 6 –
Restructuring
provisions 20 16 – – – – 36 – 16 20
Total assets $377,051 $ 27,084 $12,930 $ 103,822 $ 400,314 $ 19,349 $ 940,550 $ 496,055 $ 215,985 $ 228,510
Total assets include:
Additions to property,
plant, equipment
and intangibles $ 318 $ 105 $ 16 $ 30 $ 147 $ 563 $ 1,179 $ 924 $ 154 $ 101
Total liabilities $376,154 $ 27,022 $12,988 $ 103,798 $ 400,114 $(34,029) $ 886,047 $ 441,535 $ 216,052 $ 228,460
For the year ended October 31, 2013
(Millions of Canadian dollars)
Personal &
Commercial
Banking
Wealth
Management Insurance
Investor &
Treasury
Services
Capital
Markets (1)
Corporate
Support (1) Total Canada
United
States
Other
International
Net interest income (2), (3) $ 9,434 $ 396 $ – $ 671 $ 2,872 $ (124) $ 13,249 $ 10,956 $ 1,603 $ 690
Non-interest income 3,585 5,091 3,928 1,133 3,708 (12) 17,433 8,606 3,835 4,992
Total revenue 13,019 5,487 3,928 1,804 6,580 (136) 30,682 19,562 5,438 5,682
Provision for credit losses 995 51 – – 188 3 1,237 892 78 267
Insurance policyholder
benefits, claims and
acquisition expense – – 2,784 – – – 2,784 1,425 10 1,349
Non-interest expense 6,168 4,219 551 1,348 3,856 72 16,214 9,210 3,681 3,323
Net income (loss) before
income taxes 5,856 1,217 593 456 2,536 (211) 10,447 8,035 1,669 743
Income taxes (recoveries) 1,476 331 (2) 117 836 (653) 2,105 1,709 396 –
Net income from
continuing operations 4,380 886 595 339 1,700 442 8,342 6,326 1,273 743
Net income from
discontinued
operations – – – – – – – – – –
Net income $ 4,380 $ 886 $ 595 $ 339 $ 1,700 $ 442 $ 8,342 $ 6,326 $ 1,273 $ 743
Non-interest expense
includes:
Depreciation and
amortization $ 281 $ 135 $ 13 $ 56 $ 25 $ 501 $ 1,011 $ 838 $ 36 $ 137
Impairment of other
intangibles 1 – – 5 – 4 10 10 – –
Restructuring
provisions 21 – – 44 – – 65 9 – 56
Total assets $363,894 $ 23,361 $12,275 $ 90,621 $ 358,036 $ 11,558 $ 859,745 $ 494,306 $ 181,703 $ 183,736
Total assets include:
Additions to property,
plant, equipment
and intangibles $ 468 $ 90 $ 13 $ 35 $ 107 $ 517 $ 1,230 $ 966 $ 132 $ 132
Total liabilities $362,892 $ 23,306 $12,325 $ 90,793 $ 357,872 $(36,903) $ 810,285 $ 444,781 $ 181,815 $ 183,689
Consolidated Financial Statements Royal Bank of Canada: Annual Report 2014 189
Note 30 Results by business segment (continued)
For the year ended October 31, 2012
(Millions of Canadian dollars)
Personal &
Commercial
Banking
Wealth
Management Insurance
Investor &
Treasury
Services
Capital
Markets (1)
Corporate
Support (1) Total Canada
United
States
Other
International
Net interest income (2), (3) $ 9,059 $ 393 $ – $ 612 $ 2,559 $ (184) $ 12,439 $ 10,391 $ 1,308 $ 740
Non-interest income 3,379 4,442 4,897 293 3,629 68 16,708 9,059 3,569 4,080
Total revenue 12,438 4,835 4,897 905 6,188 (116) 29,147 19,450 4,877 4,820
Provision for credit losses 1,165 (1) – – 135 – 1,299 1,018 90 191
Insurance policyholder benefits,
claims and acquisition expense – – 3,621 – – – 3,621 2,315 21 1,285
Non-interest expense 5,822 3,809 518 701 3,752 39 14,641 8,586 3,406 2,649
Net income (loss) before income
taxes 5,451 1,027 758 204 2,301 (155) 9,586 7,531 1,360 695
Income taxes (recoveries) 1,395 274 45 102 725 (513) 2,028 1,527 521 (20)
Net income from continuing
operations 4,056 753 713 102 1,576 358 7,558 6,004 839 715
Net income from discontinued
operations – – – – – – (51) – (51) –
Net income $ 4,056 $ 753 $ 713 $ 102 $ 1,576 $ 358 $ 7,507 $ 6,004 $ 788 $ 715
Non-interest expense includes:
Depreciation and amortization $ 253 $ 136 $ 14 $ 15 $ 27 $ 452 $ 897 $ 723 $ 38 $ 136
Impairment of other intangibles – – – – – –––– –
Restructuring provisions – – – – – –––– –
Total assets $342,514 $ 21,993 $ 12,322 $ 77,255 $ 355,153 $ 14,717 $ 823,954 $ 457,386 $ 173,179 $ 193,389
Total assets include:
Additions to property, plant,
equipment and intangibles $ 240 $ 133 $ 11 $ 304 $ 128 $ 877 $ 1,693 $ 1,069 $ 145 $ 479
Total liabilities $341,368 $ 21,979 $ 12,372 $ 77,276 $ 355,030 $(28,992) $ 779,033 $ 412,406 $ 173,308 $ 193,319
(1) Taxable equivalent basis (Teb).
(2) Inter-segment revenue and share of profits in associates are not material.
(3) Interest revenue is reported net of interest expense as management relies primarily on net interest income as a performance measure.
Revenue by business line
For the year ended
(Millions of Canadian dollars)
October 31
2014
October 31
2013
October 31
2012
Personal Financial Services $ 7,285 $ 6,948 $ 6,591
Business Financial Services 3,135 2,990 2,894
Cards and Payment Solutions 2,449 2,282 2,129
Caribbean & U.S. Banking 861 799 824
Canadian Wealth Management 2,186 1,889 1,741
U.S. & International Wealth Management 2,430 2,225 1,977
Global Asset Management 1,697 1,373 1,117
Insurance 4,964 3,928 4,897
Investor & Treasury services 1,884 1,804 905
Corporate and Investment Banking 3,437 3,014 2,533
Global Markets 3,930 3,492 3,635
Other Capital Markets (1) 74 20
Corporate Support (149) (136) (116)
$ 34,108 $ 30,682 $ 29,147
Note 31 Nature and extent of risks arising from financial instruments
We are exposed to credit, market and liquidity and funding risks as a result of holding financial instruments. Our risk measurement and
objectives, policies and methodologies for managing these risks are disclosed in the shaded text along with those tables specifically marked
with an asterisk (*) on pages 52 to 77 of the Management’s Discussion and Analysis. These shaded text and tables are an integral part of these
Consolidated Financial Statements.
Concentrations of credit risk exist if a number of our clients are engaged in similar activities, are located in the same geographic region or
have comparable economic characteristics such that their ability to meet contractual obligations would be similarly affected by changes in
economic, political or other conditions.
190 Royal Bank of Canada: Annual Report 2014 Consolidated Financial Statements

Concentrations of credit risk indicate the relative sensitivity of our performance to developments affecting a particular industry or
geographic location. The amounts of credit exposure associated with certain of our on- and off-balance sheet financial instruments are
summarized in the following table.
As at October 31, 2014
(Millions of Canadian dollars, except percentage amounts) Canada %
United
States % Europe %
Other
International % Total
On-balance sheet assets other than
derivatives (1) $ 422,498 72% $ 79,140 14% $ 46,596 8% $ 36,031 6% $ 584,265
Derivatives before master netting
agreement (2), (3) 12,825 9 23,039 16 102,368 70 7,009 5 145,241
$ 435,323 60% $ 102,179 14% $ 148,964 20% $ 43,040 6% $ 729,506
Off-balance sheet credit instruments (4)
Committed and uncommitted (5) $ 224,849 62% $ 102,253 28% $ 28,312 8% $ 7,876 2% $ 363,290
Other 44,808 52 24,569 29 11,189 13 5,076 6 85,642
$ 269,657 60% $ 126,822 28% $ 39,501 9% $ 12,952 3% $ 448,932
As at October 31, 2013 (6)
(Millions of Canadian dollars, except percentage amounts) Canada %
United
States % Europe %
Other
International % Total
On-balance sheet assets other than
derivatives (1) $ 401,206 74% $ 62,739 12% $ 42,935 8% $ 31,399 6% $ 538,279
Derivatives before master netting
agreement (2), (3) 10,842 10 18,249 17 71,085 67 6,353 6 106,529
$ 412,048 64% $ 80,988 12% $ 114,020 18% $ 37,752 6% $ 644,808
Off-balance sheet credit instruments (4)
Committed and uncommitted (5) $ 213,602 64% $ 86,834 26% $ 24,020 7% $ 8,242 3% $ 332,698
Other 43,173 55 20,840 27 11,361 14 3,188 4 78,562
$ 256,775 62% $ 107,674 26% $ 35,381 9% $ 11,430 3% $ 411,260
(1) Includes assets purchased under reverse repurchase agreements and securities borrowed, loans and customers’ liability under acceptances. The largest concentrations in Canada are
Ontario at 46% (October 31, 2013 – 45%), the Prairies at 21% (October 31, 2013 – 21%), British Columbia and the territories at 16% (October 31, 2013 – 17%) and Quebec at 12%
(October 31, 2013 – 12%). No industry accounts for more than 33% (October 31, 2013 – 31%) of total on-balance sheet credit instruments.
(2) The largest concentration of credit exposure by counterparty type is banks at 36% (October 31, 2013 – 46%).
(3) Excludes credit derivatives classified as other than trading.
(4) Represents financial instruments with contractual amounts representing credit risk.
(5) Retail and wholesale commitments comprise 38% (October 31, 2013 – 39%) and 62% (October 31, 2013 – 61%), respectively, of our total commitments. The largest sector concentrations
in the wholesale portfolio relate to Energy at 18% (October 31, 2013 – 18%), Financing products at 14% (October 31, 2013 – 16%), Non-bank financial services at 9% (October 31, 2013 –
10%), Real estate and related at 9% (October 31, 2013 – 9%), and Technology and media at 7% (October 31, 2013 – 6%).
(6) Certain amounts have been revised from results previously reported.
Note 32 Capital management
Regulatory capital and capital ratios
OSFI formally establishes risk-based capital targets for deposit-taking institutions in Canada. We are required to calculate our capital ratios and
Assets-to-capital multiple using the Basel III framework. Under Basel III, regulatory capital includes Common Equity Tier 1 (CET1), Tier 1 and Tier 2
capital. CET1 capital mainly consists of common shares, retained earnings and other components of equity. Regulatory adjustments under Basel
III include full deductions of intangibles (excluding mortgage servicing rights), certain deferred tax assets, defined benefit pension fund assets
and liabilities, and non-significant investments in banking, financial and insurance entities. Tier 1 capital comprises predominantly CET1, with
additional items that consist of capital instruments such as certain preferred shares, and certain non-controlling interests in subsidiaries. Tier2
capital includes subordinated debentures that meet certain criteria and certain loan loss allowances. Total Capital is the sum of CET1, additional
Tier 1 capital and Tier 2 capital. Regulatory capital ratios are calculated by dividing CET1, Tier 1 and Total capital by risk-weighted assets. The
Assets-to-capital multiple is calculated by dividing gross adjusted assets by Total capital. During 2014 and 2013, we have complied with all
capital requirements imposed by OSFI.
Consolidated Financial Statements Royal Bank of Canada: Annual Report 2014 191

Note 32 Capital management (continued)
As at
(Millions of Canadian dollars, except percentage and multiple amounts)
October 31
2014
October 31
2013
Capital
Common Equity Tier 1 capital $ 36,406 $ 30,541
Tier 1 capital 42,202 37,196
Total capital 50,020 44,716
Risk-weighted assets used in calculation of capital ratios (1), (2)
Common Equity Tier 1 capital ratio 368,594 318,981
Tier 1 capital ratio 369,976 318,981
Total capital ratio 372,050 318,981
Total capital risk-weighted assets (1)
Credit risk $ 286,327 $ 232,641
Market risk 38,460 42,184
Operational risk 47,263 44,156
$ 372,050 $ 318,981
Capital ratios and multiples (1)
Common Equity Tier 1 capital ratio 9.9% 9.6%
Tier 1 capital ratio 11.4% 11.7%
Total capital ratio 13.4% 14.0%
Assets-to-capital multiple (3) 17.0X 16.6X
(1) Capital, risk-weighted assets and capital ratios and multiples are calculated using OSFI Capital Adequacy Requirements based on the Basel III framework.
(2) Effective third quarter, the credit valuation adjustment to our risk-weighted asset calculation implemented in the first quarter, must reflect different percentages for each tier of capital. This
change reflects a phase-in of credit valuation adjustments ending in the fourth quarter of 2018. During this phase-in period, risk-weighted assets for CET1, Tier 1 capital and Total capital
ratios will be subject to different annual credit valuation adjustment percentages.
(3) Gross adjusted assets as at October 31, 2014 were $885 billion (October 31, 2013 – $807 billion).
Note 33 Offsetting financial assets and financial liabilities
Offsetting within our balance sheet may be achieved where financial assets and liabilities are subject to master netting arrangements that
provide the currently enforceable right of offset and where there is an intention to settle on a net basis, or realize the assets and liabilities
simultaneously. For derivative contracts and repurchase and reverse repurchase arrangements, this is generally achieved when there is a market
mechanism for settlement (e.g. central counterparty exchange, or clearing house) which provides daily net settlement of cash flows arising from
these contracts. Margin receivables and margin payables are generally offset as they settle simultaneously through a market settlement
mechanism. These are generally classified as Other assets or Other liabilities.
Amounts that do not qualify for offsetting include master netting arrangements that only permit outstanding transactions with the same
counterparty to be offset in an event of default or occurrence of other predetermined events. Such master netting arrangements include the ISDA
Master Agreement or derivative exchange or clearing counterparty agreements for derivative contracts, global master repurchase agreement and
global master securities lending agreements for repurchase, reverse repurchase and other similar secured lending and borrowing arrangements.
The amount of the financial collateral received or pledged subject to master netting arrangement or similar agreements but not qualified for
offsetting refers to the collateral received or pledged to cover the net exposure between counterparties by enabling the collateral to be realized in
an event of default or the occurrence of other predetermined events. Certain amounts of collateral are restricted from being sold or re-pledged
unless there is an event of default or the occurrence of other predetermined events.
The table below provides the amount of financial instruments that have been offset on the Consolidated Balance Sheet and the amounts
that do not qualify for offsetting but are subject to enforceable master netting arrangements or similar agreements. The amounts presented are
not intended to represent our actual exposure to credit risk.
Financial assets subject to offsetting, enforceable master netting arrangements and similar agreements
As at October 31, 2014
Amounts subject to offsetting and enforceable netting arrangements
Amounts subject to master
netting arrangements or
similar agreements but do
not qualify on offsetting on
the balance sheet (1)
Gross amounts
of financial
assets before
balance sheet
offsetting
Amounts of
financial
liabilities
offset on the
balance sheet
Net amount of
financial assets
presented on
the balance
sheet
Impact of
master
netting
agreements
Financial
collateral
received (2)
Net
amount
Amounts not
subject to
enforceable
netting
arrangements
Total amount
recognized
on the
balance sheet
Assets purchased under reverse
repurchase agreements and securities
borrowed $ 149,348 $ 14,038 $ 135,310 $ 56 $ 134,985 $ 269 $ 270 $ 135,580
Derivative assets (3) 136,230 57,068 79,162 60,546 8,993 9,623 8,240 87,402
Other financial assets 1,264 1,240 24 – – 24 – 24
$ 286,842 $ 72,346 $ 214,496 $ 60,602 $ 143,978 $ 9,916 $ 8,510 $ 223,006
192 Royal Bank of Canada: Annual Report 2014 Consolidated Financial Statements

As at October 31, 2013
Amounts subject to offsetting and enforceable netting arrangements
Amounts subject to master
netting arrangements or
similar agreements but do
not qualify on offsetting on
the balance sheet (1)
Gross
amounts of
financial
assets before
balance sheet
offsetting
Amounts of
financial
liabilities
offset on the
balance sheet
Net amount of
financial assets
presented on
the balance
sheet
Impact of
master
netting
agreements
Financial
collateral
received (2)
Net
amount
Amounts not
subject to
enforceable
netting
arrangements
Total amount
recognized
on the
balance sheet
Assets purchased under reverse
repurchase agreements and securities
borrowed $ 127,549 $ 11,156 $ 116,393 $ 41 $ 116,013 $ 339 $ 1,124 $ 117,517
Derivative assets (3) 98,878 31,190 67,688 51,653 8,459 7,576 7,134 74,822
Other financial assets 1,302 1,290 12 – – 12 – 12
$ 227,729 $ 43,636 $ 184,093 $ 51,694 $ 124,472 $ 7,927 $ 8,258 $ 192,351
(1) Financial collateral is reflected at fair value. The amount of financial instruments and financial collateral disclosed is limited to the net balance sheet exposure, and any over-collateralization
is excluded from the table.
(2) Includes cash collateral of $8,687 million (October 31, 2013 – $6,027 million) and non-cash collaterals of $135 billion (October 31, 2013 – $118 billion).
(3) Includes cash margin of $1,326 million (October 31, 2013 – $988 million) which offset against the derivative balance on the balance sheet.
Financial liabilities subject to offsetting, enforceable master netting arrangements and similar agreements
As at October 31, 2014
Amounts subject to offsetting and enforceable netting arrangements
Amounts subject to master
netting arrangements or
similar agreements but do
not qualify on offsetting on
the balance sheet (1)
Gross amounts
of financial
liabilities
before balance
sheet offsetting
Amounts of
financial
assets offset
on the
balance sheet
Net amount of
financial
liabilities
presented on the
balance sheet
Impact of
master
netting
agreements
Financial
collateral
pledged (2)
Net
amount
Amounts not
subject to
enforceable
netting
arrangements
Total amount
recognized
on the
balance sheet
Obligations related to assets sold
under repurchase agreements and
securities loaned $ 78,029 $ 14,038 $ 63,991 $ 56 $ 63,790 $ 145 $ 340 $ 64,331
Derivative liabilities (3) 135,662 56,982 78,680 60,546 9,184 8,950 10,302 88,982
Other financial liabilities 1,381 1,326 55 – – 55 – 55
$ 215,072 $ 72,346 $ 142,726 $ 60,602 $ 72,974 $ 9,150 $ 10,642 $ 153,368
As at October 31, 2013
Amounts subject to offsetting and enforceable netting arrangements
Amounts subject to master
netting arrangements or
similar agreements but do
not qualify on offsetting on
the balance sheet (1)
Gross amounts
of financial
liabilities
before balance
sheet offsetting
Amounts of
financial
assets offset
on the
balance sheet
Net amount of
financial liabilities
presented on the
balance sheet
Impact of
master
netting
agreements
Financial
collateral
pledged (2)
Net
amount
Amounts not
subject to
enforceable
netting
arrangements
Total amount
recognized
on the
balance sheet
Obligations related to assets sold under
repurchase agreements and securities
loaned $ 70,306 $ 11,155 $ 59,151 $ 41 $ 59,024 $ 86 $ 1,265 $ 60,416
Derivative liabilities (3) 99,122 31,493 67,629 51,653 8,040 7,936 9,116 76,745
Other financial liabilities 989 988 1 – – 1 – 1
$ 170,417 $ 43,636 $ 126,781 $ 51,694 $ 67,064 $ 8,023 $ 10,381 $ 137,162
(1) Financial collateral is reflected at fair value. The amount of financial instruments and financial collateral disclosed is limited to the net balance sheet exposure, and any over-collateralization
is excluded from the table.
(2) Includes cash collateral of $6,709 million (October 31, 2013 – $6,281 million) and non-cash collateral of $66 billion (October 31, 2013 – $61 billion).
(3) Includes cash margin of $1,240 million (October 31, 2013 – $1,290 million) which offset against the derivative balance on the balance sheet.
Consolidated Financial Statements Royal Bank of Canada: Annual Report 2014 193

Note 34 Recovery and settlement of on-balance sheet assets and liabilities
The table below presents an analysis of assets and liabilities recorded on our Consolidated Balance Sheets by amounts to be recovered or
settled within one year and after one year, as at the balance sheet date, based on contractual maturities and certain other assumptions outlined
in the footnotes below. As warranted, we manage the liquidity risk of various products based on historical behavioural patterns that are often not
aligned with contractual maturities. Amounts to be recovered or settled within one year, as presented below, may not be reflective of
management’s long-term view of the liquidity profile of certain balance sheet categories.
As at
October 31, 2014 October 31, 2013 (1)
(Millions of Canadian dollars)
Within one
year
After one
year Total
Within one
year
After one
year Total
Assets
Cash and due from banks (2) $ 16,649 $ 772 $ 17,421 $ 13,665 $ 1,885 $ 15,550
Interest-bearing deposits with banks 7,494 905 8,399 5,732 3,307 9,039
Securities
Trading securities (3) 141,399 9,981 151,380 135,484 8,539 144,023
Available-for-sale securities 12,318 35,450 47,768 11,388 27,299 38,687
Assets purchased under reverse repurchase agreements
and securities borrowed 126,451 9,129 135,580 104,860 12,657 117,517
Loans
Retail 52,196 282,791 334,987 43,338 277,289 320,627
Wholesale 38,290 63,946 102,236 36,710 53,472 90,182
Allowance for loan losses (1,994) (1,959)
Segregated fund net assets – 675 675 – 513 513
Other
Customers’ liability under acceptances 11,456 6 11,462 9,953 – 9,953
Derivatives (3) 19,485 67,917 87,402 13,695 61,127 74,822
Premises and equipment, net – 2,684 2,684 3 2,633 2,636
Goodwill – 8,647 8,647 – 8,332 8,332
Other intangibles – 2,775 2,775 – 2,777 2,777
Investments in joint ventures and associates – 295 295 – 247 247
Employee benefit assets – 138 138 – 161 161
Other assets 24,414 6,281 30,695 21,039 5,599 26,638
$ 450,152 $ 492,392 $ 940,550 $ 395,867 $ 465,837 $ 859,745
Liabilities
Deposits (4) $ 451,065 $ 163,035 $ 614,100 $ 392,645 $ 170,434 $ 563,079
Segregated fund net liabilities – 675 675 – 513 513
Other
Acceptances 11,456 6 11,462 9,953 – 9,953
Obligations related to securities sold short 46,125 4,220 50,345 44,231 2,897 47,128
Obligations related to assets sold under repurchase
agreements and securities loaned 62,391 1,940 64,331 57,855 2,561 60,416
Derivatives (3) 19,980 69,002 88,982 15,671 61,074 76,745
Insurance claims and policy benefit liabilities 135 8,429 8,564 338 7,696 8,034
Employee benefit liabilities – 2,420 2,420 – 2,027 2,027
Other liabilities 25,228 12,081 37,309 24,204 10,743 34,947
Subordinated debentures 200 7,659 7,859 – 7,443 7,443
$ 616,580 $ 269,467 $ 886,047 $ 544,897 $ 265,388 $ 810,285
(1) Certain amounts have been revised from those previously reported.
(2) Cash and due from banks are assumed to be recovered within one year, except for cash balances not available for use by the bank.
(3) Trading securities classified as at FVTPL and trading derivatives not designated in hedging relationships are presented as within one year as this best represents in most instances the short-
term nature of our trading activities. Non-trading derivatives designated in hedging relationships are presented according to the recovery or settlement of the related hedged item.
(4) Demand deposits of $289 billion (October 31, 2013 – $264 billion) are presented as within one year due to their being repayable on demand or at short notice on a contractual basis. In
practice, these deposits relate to a broad range of individuals and customer-types which form a stable base for our operations and liquidity needs.
194 Royal Bank of Canada: Annual Report 2014 Consolidated Financial Statements
Note 35 Parent company information
The following table presents information regarding the legal entity of Royal Bank of Canada with its subsidiaries presented on an equity
accounted basis.
Condensed Balance Sheets
As at
(Millions of Canadian dollars)
October 31
2014
October 31
2013
Assets
Cash and due from banks $ 7,333 $ 3,561
Interest-bearing deposits with banks 5,788 2,707
Securities 111,159 100,574
Investments in bank subsidiaries and associated corporations 20,240 24,302
Investments in other subsidiaries and associated corporations 53,131 42,298
Assets purchased under reverse repurchase agreements 17,075 14,578
Loans, net of allowances for loan losses 407,440 384,906
Net balances due from bank subsidiaries 10,466 –
Other assets 120,052 105,219
$ 752,684 $ 678,145
Liabilities and shareholders’ equity
Deposits $ 497,053 $ 455,625
Net balances due to bank subsidiaries –4,892
Net balances due to other subsidiaries 56,146 35,899
Other liabilities 138,989 126,670
692,188 623,086
Subordinated debentures 7,806 7,394
Shareholders’ equity 52,690 47,665
$ 752,684 $ 678,145
Condensed Statements of Income
For the year ended
(Millions of Canadian dollars)
October 31
2014
October 31
2013
October 31
2012
Interest income (1) $ 18,415 $ 18,573 $ 18,842
Interest expense 5,882 5,795 6,914
Net interest income 12,533 12,778 11,928
Non-interest income (2) 6,007 4,626 1,737
Total revenue 18,540 17,404 13,665
Provision for credit losses 1,010 1,147 1,139
Non-interest expense 7,801 7,304 6,974
Income before income taxes 9,729 8,953 5,552
Income taxes 2,283 1,537 1,423
Net income before equity in undistributed income of subsidiaries 7,446 7,416 4,129
Equity in undistributed income of subsidiaries 1,558 926 3,378
Net income $ 9,004 $ 8,342 $ 7,507
(1) Includes dividend income from investments in subsidiaries and associated corporations of $10 million (2013 – $1,313 million; 2012 – $1,292 million).
(2) Includes gain from associated corporations of $7 million (2013 – loss of $9 million; 2012 – gain of $2 million).
Consolidated Financial Statements Royal Bank of Canada: Annual Report 2014 195

Note 35 Parent company information (continued)
Condensed Statements of Cash Flows
For the year ended
(Millions of Canadian dollars)
October 31
2014
October 31
2013
October 31
2012
Cash flows from operating activities
Net income $ 9,004 $ 8,342 $ 7,507
Adjustments to determine net cash from operating activities:
Change in undistributed earnings of subsidiaries (1,558) (926) (3,378)
Change in deposits 41,428 31,183 9,772
Change in loans, net of loan securitizations (22,865) (18,927) (29,324)
Change in trading securities (4,193) (19,048) 9,440
Change in obligations related to assets sold under repurchase agreements and securities loaned (2,712) 1,730 (229)
Change in assets purchased under reverse repurchase agreements and securities borrowed (2,497) (3,668) (2,164)
Change in obligations related to securities sold short (1,305) 388 (2,713)
Other operating activities, net 182 (8,210) (2,571)
Net cash from (used in) operating activities 15,484 (9,136) (13,660)
Cash flows from investing activities
Change in interest-bearing deposits with banks (3,081) (1,548) 400
Proceeds from sale of available-for-sale securities 1,225 1,641 3,991
Proceeds from maturity of available-for-sale securities 28,875 28,056 28,994
Purchases of available-for-sale securities (36,165) (26,392) (29,307)
Net acquisitions of premises and equipment and other intangibles (803) (754) (867)
Change in cash invested in subsidiaries (2,409) (7,323) 163
Change in net funding provided to subsidiaries 4,889 20,164 10,158
Proceeds from sale of an associate 70 ––
Net cash (used in) from investing activities (7,399) 13,844 13,532
Cash flows from financing activities
Issue of subordinated debentures 2,000 2,046 –
Repayment of subordinated debentures (1,600) (2,000) (1,006)
Issue of preferred shares 1,000 ––
Issuance costs (14) ––
Redemption of preferred shares for cancellation (1,525) (222) –
Issue of common shares 150 121 126
Redemption of common shares for cancellation (113) (408) –
Dividends paid (4,211) (3,810) (3,272)
Net cash used in financing activities (4,313) (4,273) (4,152)
Net change in cash and due from banks 3,772 435 (4,280)
Cash and due from banks at beginning of year 3,561 3,126 7,406
Cash and due from banks at end of year $ 7,333 $ 3,561 $ 3,126
Supplemental disclosure of cash flow information
Amount of interest paid in year $ 5,814 $ 5,943 $ 7,372
Amount of interest received in year 18,582 17,281 17,502
Amount of dividends received in year 10 1,313 1,302
Amount of income taxes paid in year 1,286 265 1,951
Note 36 Subsequent events
On November 14, 2014, all $200 million outstanding 10% subordinated debentures matured. The maturity proceeds plus accrued interest were
paid to the noteholders on the maturity date.
On November 24, 2014, we redeemed all 13 million of issued and outstanding Non-Cumulative 5-Year Rate Reset First Preferred Shares,
Series AX for cash at a redemption price of $25 per share.
196 Royal Bank of Canada: Annual Report 2014 Consolidated Financial Statements

Ten-year statistical review
Condensed Balance Sheet
IFRS CGAAP
(Millions of Canadian dollars) 2014 (1) 2013 (1) 2012 (1) 2011 2011 2010 2009 2008 2007 2006 2005
Assets
Cash and due from banks $ 17,421 $ 15,550 $ 12,428 $ 12,428 $ 13,247 $ 8,440 $ 7,584 $ 11,086 $ 4,226 $ 4,401 $ 5,001
Interest-bearing deposits
with banks 8,399 9,039 10,246 6,460 12,181 13,254 8,919 20,041 11,881 10,502 5,237
Securities 199,148 182,710 161,602 167,022 179,558 183,519 177,298 171,134 178,255 184,869 160,495
Assets purchased under
reverse repurchase
agreements and
securities borrowed 135,580 117,517 112,257 84,947 84,947 72,698 41,580 44,818 64,313 59,378 42,973
Loans net of allowance 435,229 408,850 378,241 347,530 296,284 273,006 258,395 289,540 237,936 208,530 190,416
Other 144,773 126,079 149,180 175,446 165,485 175,289 161,213 187,240 103,735 69,100 65,399
Total Assets $ 940,550 $ 859,745 $ 823,954 $ 793,833 $ 751,702 $ 726,206 $ 654,989 $ 723,859 $ 600,346 $ 536,780 $ 469,521
Liabilities
Deposits $ 614,100 $ 563,079 $ 512,244 $ 479,102 $ 444,181 $ 414,561 $ 378,457 $ 438,575 $ 365,205 $ 343,523 $ 306,860
Other 264,088 239,763 259,174 263,625 256,124 263,030 229,699 242,744 201,404 160,575 131,003
Subordinated debentures 7,859 7,443 7,615 8,749 7,749 6,681 6,461 8,131 6,235 7,103 8,167
Trust capital securities –– – 894 – 727 1,395 1,400 1,400 1,383 1,400
Preferred shares liabilities –––– ––––300298300
Non-controlling interest in
subsidiaries –n.a. n.a. n.a. 1,941 2,256 2,071 2,371 1,483 1,775 1,944
Total Liabilities 886,047 810,285 779,033 752,370 709,995 687,255 618,083 693,221 576,027 514,657 449,674
Equity attributable to
shareholders 52,690 47,665 43,160 39,702 41,707 38,951 36,906 30,638 24,319 22,123 19,847
Non-controlling interest 1,813 1,795 1,761 1,761 n.a. n.a. n.a. n.a. n.a. n.a. n.a.
Total equity 54,503 49,460 44,921 41,463 41,707 38,951 36,906 30,638 24,319 22,123 19,847
Total liabilities and equity $ 940,550 $ 859,745 $ 823,954 $ 793,833 $ 751,702 $ 726,206 $ 654,989 $ 723,859 $ 600,346 $ 536,780 $ 469,521
Condensed Income Statement
IFRS CGAAP
(Millions of Canadian dollars) 2014 2013 2012 2011 2011 2010 2009 2008 2007 2006 2005
Net interest income $ 14,116 $ 13,249 $ 12,439 $ 11,357 $ 10,600 $ 10,338 $ 10,705 $ 9,054 $ 7,700 $ 6,796 $ 6,793
Non-interest income 19,992 17,433 16,708 16,281 16,830 15,744 15,736 12,528 14,762 13,481 12,391
Total revenue 34,108 30,682 29,147 27,638 27,430 26,082 26,441 21,582 22,462 20,637 19,184
Provision for credit losses
(PCL) 1,164 1,237 1,299 1,133 975 1,240 2,167 1,595 791 429 455
Insurance policyholder
benefits, claims and
acquisition expense 3,573 2,784 3,621 3,358 3,360 3,546 3,042 1,631 2,173 2,509 2,625
Non-interest expense (NIE) 17,661 16,214 14,641 14,167 14,453 13,469 13,436 12,351 12,473 11,495 11,402
Non-controlling interest n.a. n.a. n.a. n.a. 104 99 100 81 141 44 (13)
Net income from
continuing operations 9,004 8,342 7,558 6,970 6,650 5,732 5,681 4,555 5,492 4,757 3,437
Net loss from discontinued
operations –– (51) (526) (1,798) (509) (1,823) – – (29) (50)
Net income 9,004 8,342 7,507 6,444 4,852 5,223 3,858 4,555 5,492 4,728 3,387
(1) Current and two preceding periods reflect changes in accounting standards and presentation changes as disclosed in Note 2 of our Annual Consolidated Financial Statements.
Ten-year statistical review Royal Bank of Canada: Annual Report 2014 197

Other Statistics – reported
(Millions of Canadian dollars,
except percentages and per
share amounts)
IFRS CGAAP
2014 (1) 2013 (1) 2012 (1) 2011 2011 2010 2009 2008 2007 2006 2005
PROFITABILITY MEASURES (2)
Earnings per shares (EPS)
– basic $ 6.03 $ 5.53 $ 4.96 $ 4.25 $ 3.21 $ 3.49 $ 2.59 $ 3.41 $ 4.24 $ 3.65 $ 2.61
– diluted $ 6.00 $ 5.49 $ 4.91 $ 4.19 $ 3.19 $ 3.46 $ 2.57 $ 3.38 $ 4.19 $ 3.59 $ 2.57
Return on common equity
(ROE) 19.0% 19.7% 19.6% 18.7% 12.9% 14.9% 11.9% 18.1% 24.7% 23.5% 18.0%
Return on risk-weighted
assets (RWA) 2.52% 2.67% 2.70% 2.44% 1.87% 2.03% 1.50% 1.78% 2.23% 2.21% 1.77%
Efficiency ratio (3) 51.8% 52.8% 50.2% 51.3% 52.7% 51.6% 50.8% 57.2% 55.5% 55.7% 59.2%
KEY RATIOS
PCL on impaired loans as
a % of Average net
loans and acceptances 0.27% 0.31% 0.35% 0.33% 0.34% 0.45% 0.72% 0.53% 0.33% 0.23% 0.21%
Net interest margin (total
average assets) 1.56% 1.56% 1.55% 1.52% 1.49% 1.59% 1.64% 1.39% 1.33% 1.35% 1.53%
Non-interest income as a
% of total revenue 58.6% 56.8% 57.3% 58.9% 61.4% 60.4% 59.5% 58.0% 65.7% 67.1% 64.6%
SHARE INFORMATION (2)
Common shares
outstanding (000s) –
end of period 1,442,233 1,441,056 1,445,303 1,438,376 1,438,376 1,424,922 1,417,610 1,341,260 1,276,260 1,280,890 1,293,502
Dividends declared per
common share $ 2.84 $ 2.53 $ 2.28 $ 2.08 $ 2.08 $ 2.00 $ 2.00 $ 2.00 $ 1.82 $ 1.44 $ 1.18
Dividend yield 3.8% 4.0% 4.5% 3.9% 3.9% 3.6% 4.8% 4.2% 3.3% 3.1% 3.2%
Dividend payout ratio (3) 47% 46% 46% 45% 47% 52% 52% 59% 43% 40% 45%
Book value per share $ 33.69 $ 29.87 $ 26.52 $ 24.25 $ 25.65 $ 23.99 $ 22.67 $ 20.90 $ 17.49 $ 16.52 $ 14.89
Common share price (RY
on TSX) – close, end of
period $ 80.01 $ 70.02 $ 56.94 $ 48.62 $ 48.62 $ 54.39 $ 54.80 $ 46.84 $ 56.04 $ 49.80 $ 41.67
Market capitalization
(TSX) 115,393 100,903 82,296 69,934 69,934 77,502 77,685 62,825 71,522 63,788 53,894
Market price to book value 2.38 2.34 2.15 2.00 1.90 2.27 2.42 2.24 3.20 3.01 2.80
CAPITAL MEASURES -
CONSOLIDATED (4)
Common Equity Tier 1
capital ratio 9.9% 9.6% n.a. n.a. n.a. n.a. n.a. n.a. n.a. n.a. n.a.
Tier 1 capital ratio 11.4% 11.7% 13.1% n.a. 13.3% 13.0% 13.0% 9.0% 9.4% 9.6% 9.6%
Total capital ratio 13.4% 14.0% 15.1% n.a. 15.3% 14.4% 14.2% 11.0% 11.5% 11.9% 13.1%
Assets-to-capital multiple 17.0X 16.6X 16.7X n.a. 16.1X 16.5X 16.3X 20.1X 20.0X 19.7X 17.6X
(1) Current and two preceding periods reflect changes in accounting standards and presentation changes as disclosed in Note 2 of our Annual Consolidated Financial Statements.
(2) On April 6, 2006, we paid a stock dividend of one common share on each of our issued and outstanding common shares. The effect was the same as two-for-one split of our common shares.
All common share and per share information have been adjusted retroactively for the stock dividend.
(3) Ratios for 2009-2012 represent continuing operations.
(4) Effective 2013 we calculate the capital ratios and multiples using the Basel III (all-in basis) framework unless otherwise stated. 2008-2012 capital ratios and multiples were calculated using
the Basel II framework. 2004-2007 capital ratios and 2005-2007 asset-to-capital multiples were calculated using the Basel I framework. Capital ratios and multiples prior to 2011 were
determined under Canadian GAAP.
198 Royal Bank of Canada: Annual Report 2014 Ten-year statistical review

Glossary
Acceptances
A bill of exchange or negotiable instrument
drawn by the borrower for payment at maturity
and accepted by a bank. The acceptance
constitutes a guarantee of payment by the bank
and can be traded in the money market. The
bank earns a “stamping fee” for providing this
guarantee.
Allowance for credit losses
The amount deemed adequate by management
to absorb identified credit losses as well as
losses that have been incurred but are not yet
identifiable as at the balance sheet date. This
allowance is established to cover the lending
portfolio including loans, acceptances,
guarantees, letters of credit, and unfunded
commitments. The allowance is increased by
the provision for credit losses, which is charged
to income and decreased by the amount of
write-offs, net of recoveries in the period.
Alt-A assets
A term used in the U.S. to describe assets
(mainly mortgages) with a borrower risk profile
between the prime and subprime catego-
rizations. Categorization of assets as Alt-A (as
opposed to prime) varies, such as limited
verification or documentation of borrowers’
income or a limited credit history.
Asset-backed securities (ABS)
Securities created through the securitization of
a pool of assets, for example auto loans or
credit card loans.
Assets-to-capital multiple (ACM)
Total assets plus specified off-balance sheet
items, as defined by OSFI, divided by total
regulatory capital on a transitional basis. ACM
will be replaced in 2015 by the Basel III
Leverage Ratio.
Assets under administration (AUA)
Assets administered by us, which are benefi-
cially owned by clients, as at October 31,
unless otherwise noted. Services provided in
respect of assets under administration are of
an administrative nature, including
safekeeping, collecting investment income,
settling purchase and sale transactions, and
record keeping.
Assets under management (AUM)
Assets managed by us, which are beneficially
owned by clients, as at October 31, unless
otherwise noted. Services provided in respect
of assets under management include the
selection of investments and the provision of
investment advice. We have assets under
management that are also administered by us
and included in assets under administration.
Auction rate securities (ARS)
Securities issued through structured entities
that hold long-term assets funded with long-
term debt. In the U.S., these securities are
issued by sponsors such as municipalities,
student loan authorities or other sponsors
through bank-managed auctions.
Average earning assets
Average earning assets include interest-bearing
deposits with other banks including certain
components of cash and due from banks,
securities, assets purchased under reverse
repurchase agreements and securities
borrowed, loans, and excludes segregated fund
net assets and other assets. The averages are
based on the daily balances for the period.
Bank-owned life insurance contracts (BOLI)
Our legacy portfolio includes BOLI where we
provided banks with BOLI stable value
agreements (“wraps”), which insure the life
insurance policy’s cash surrender value from
market fluctuations on the underlying
investments, thereby allowing us to guarantee
a minimum tax-exempt return to the counter-
party. These wraps allow us to account for the
underlying assets on an accrual basis instead
of a mark-to-market basis.
Basis point (bp)
One one-hundredth of a percentage point
(.01%).
Collateral
Assets pledged as security for a loan or other
obligation. Collateral can take many forms,
such as cash, highly rated securities, property,
inventory, equipment and receivables.
Collateralized debt obligation (CDO)
Securities with multiple tranches that are
issued by structured entities and collateralized
by debt obligations including bonds and loans.
Each tranche offers a varying degree of risk and
return so as to meet investor demand.
Commercial mortgage-backed securities
(CMBS)
Securities created through the securitization of
commercial mortgages.
Commitments to extend credit
Unutilized amount of credit facilities available
to clients either in the form of loans, bankers’
acceptances and other on-balance sheet
financing, or through off-balance sheet
products such as guarantees and letters of
credit.
Common Equity Tier 1 (CET1) capital
A regulatory Basel III capital measure
comprised mainly of common shareholders’
equity less regulatory deductions and
adjustments for goodwill and intangibles,
defined benefit pension fund assets, shortfall
in allowances and other specified items.
Common Equity Tier 1 capital ratio
A risk-based capital measure calculated as
CET1 capital divided by risk-weighted assets.
Covered bonds
Full recourse on-balance sheet obligations
issued by banks and credit institutions that are
also fully collateralized by assets over which
investors enjoy a priority claim in the event of
an issuer’s insolvency.
Credit default swaps (CDS)
A derivative contract that provides the
purchaser with a one-time payment should the
referenced entity/entities default (or a similar
triggering event occur).
Derivative
A contract between two parties, which requires
little or no initial investment and where
payments between the parties are dependent
upon the movements in price of an underlying
instrument, index or financial rate. Examples of
derivatives include swaps, options, forward
rate agreements and futures. The notional
amount of the derivative is the contract amount
used as a reference point to calculate the
payments to be exchanged between the two
parties, and the notional amount itself is
generally not exchanged by the parties.
Dividend payout ratio
Common dividends as a percentage of net
income available to common shareholders.
Earnings per share (EPS), basic
Calculated as net income available to common
shareholders divided by the average number of
shares outstanding.
Glossary Royal Bank of Canada: Annual Report 2014 199
Earnings per share (EPS), diluted
Calculated as net income available to common
shareholders divided by the average number of
shares outstanding adjusted for the dilutive
effects of stock options and other convertible
securities.
Economic capital
An estimate of the amount of equity capital
required to underpin risks. It is calculated by
estimating the level of capital that is necessary
to support our various businesses, given their
risks, consistent with our desired solvency
standard and credit ratings. The identified risks
for which we calculate Economic Capital are
credit, market (trading and non-trading),
operational, business, fixed asset, and
insurance. Additionally, Economic Capital
includes goodwill and intangibles, and allows
for diversification benefits across risks and
business segments.
Fair value
Fair value of a financial instrument is the price
that would be received to sell an asset or paid
to transfer a liability in an orderly transaction
between market participants at the
measurement date.
Funding Valuation Adjustment
Funding valuation adjustments are calculated
to incorporate cost and benefit of funding in the
valuation of uncollateralized and under-
collateralized OTC derivatives. Future expected
cash flows of these derivatives are discounted
to reflect the cost and benefit of funding the
derivatives by using a funding curve, implied
volatilities and correlations as inputs.
Gross-adjusted assets (GAA)
GAA are used in the calculation of the Assets-
to-capital multiple. They represent our total
assets including specified off-balance sheet
items and net of prescribed deductions. Off
balance sheet items for this calculation are
direct credit substitutes, including letters of
credit and guarantees, transaction-related
contingencies, trade-related contingencies and
sale and repurchase agreements.
Guarantees and standby letters of credit
These primarily represent irrevocable
assurances that a bank will make payments in
the event that its client cannot meet its
financial obligations to third parties. Certain
other guarantees, such as bid and performance
bonds, represent non-financial undertakings.
Hedge
A risk management technique used to mitigate
exposure from market, interest rate or foreign
currency exchange risk arising from normal
banking operations. The elimination or
reduction of such exposure is accomplished by
establishing offsetting positions. For example,
assets denominated in foreign currencies can
be offset with liabilities in the same currencies
or through the use of foreign exchange hedging
instruments such as futures, options or foreign
exchange contracts.
Hedge funds
A type of investment fund, marketed to
accredited high net worth investors, that is
subject to limited regulation and restrictions on
its investments compared to retail mutual
funds, and that often utilize aggressive
strategies such as selling short, leverage,
program trading, swaps, arbitrage and
derivatives.
Home equity products
This is comprised of residential mortgages and
secured personal loans whereby the borrower
pledges real estate as collateral.
International Financial Reporting Standards
(IFRS)
IFRS are principles-based standards, inter-
pretations and the framework adopted by the
International Accounting Standards Board.
Impaired loans
Loans are classified as impaired when there
has been a deterioration of credit quality to the
extent that management no longer has
reasonable assurance of timely collection of the
full amount of principal and interest in
accordance with the contractual terms of the
loan agreement. Credit card balances are not
classified as impaired as they are directly
written off after payments are 180 days past
due.
Leverage Ratio
A Basel III regulatory measure, the ratio divides
Tier 1 capital by the sum of total assets plus
specified off-balance sheet items.
Loan-to-value (LTV) ratio
Calculated based on the total facility amount
for the residential mortgage and homeline
product divided by the value of the related
residential property.
Master netting agreement
An agreement between us and a counterparty
designed to reduce the credit risk of multiple
derivative transactions through the creation of
a legal right of offset of exposure in the event of
a default.
Net interest income
The difference between what is earned on
assets such as loans and securities and what is
paid on liabilities such as deposits and
subordinated debentures.
Net interest margin (average assets)
Net interest income as a percentage of total
average assets.
Net interest margin (on average earning
assets)
Calculated as net interest income divided by
average earning assets.
Normal course issuer bid (NCIB)
A program for the repurchase of our own shares
for cancellation through a stock exchange that
is subject to the various rules of the relevant
stock exchange and securities commission.
Notional amount
The contract amount used as a reference point
to calculate payments for derivatives.
Off-balance sheet financial instruments
A variety of arrangements offered to clients,
which include credit derivatives, written put
options, backstop liquidity facilities, stable
value products, financial standby letters of
credit, performance guarantees, credit
enhancements, mortgage loans sold with
recourse, commitments to extend credit,
securities lending, documentary and
commercial letters of credit, note issuances
and revolving underwriting facilities, securities
lending indemnifications and indemnifications.
Office of the Superintendent of Financial
Institutions Canada (OSFI)
The primary regulator of federally chartered
financial institutions and federally
administered pension plans in Canada. OSFI’s
mission is to safeguard policyholders,
depositors and pension plan members from
undue loss.
200 Royal Bank of Canada: Annual Report 2014 Glossary

Operating leverage
The difference between our revenue growth rate
and non-interest expense growth rate.
Options
A contract or a provision of a contract that gives
one party (the option holder) the right, but not
the obligation, to perform a specified trans-
action with another party (the option issuer or
option writer) according to specified terms.
Primary dealer
A formal designation provided to a bank or
securities broker-dealer permitted to trade
directly with a country’s central bank. Primary
dealers participate in open market operations,
act as market-makers of government debt and
provide market information and analysis to
assist with monetary policy.
Provision for credit losses (PCL)
The amount charged to income necessary to
bring the allowance for credit losses to a level
determined appropriate by management. This
includes both specific and general provisions.
Repurchase agreements
These involve the sale of securities for cash and
the simultaneous repurchase of the securities
for value at a later date. These transactions
normally do not constitute economic sales and
therefore are treated as collateralized financing
transactions.
Residential mortgage-backed securities
(RMBS)
Securities created through the securitization of
residential mortgage loans.
Return on common equity (ROE)
Net income available to common shareholders,
expressed as a percentage of average common
equity.
Reverse repurchase agreements
These involve the purchase of securities for
cash and the simultaneous sale of the
securities for value at a later date. These
transactions normally do not constitute
economic sales and therefore are treated as
collateralized financing transactions.
Risk-weighted assets (RWA)
Assets adjusted by a regulatory risk-weight
factor to reflect the riskiness of on and off-
balance sheet exposures. Certain assets are
not risk-weighted, but deducted from capital.
The calculation is defined by guidelines issued
by OSFI. For more details, refer to the Capital
management section.
Securities lending
Transactions in which the owner of a security
agrees to lend it under the terms of a
prearranged contract to a borrower for a fee.
The borrower must collateralize the security
loan at all times. An intermediary such as a
bank often acts as agent for the owner of the
security. There are two types of securities
lending arrangements: lending with and
without credit or market risk indemnification. In
securities lending without indemnification, the
bank bears no risk of loss. For transactions in
which the bank provides an indemnification, it
bears the risk of loss if the borrower defaults
and the value of the collateral declines
concurrently.
Securities sold short
A transaction in which the seller sells securities
and then borrows the securities in order to
deliver them to the purchaser upon settlement.
At a later date, the seller buys identical
securities in the market to replace the
borrowed securities.
Securitization
The process by which various financial assets
are packaged into newly issued securities
backed by these assets.
Structured entities
A structured entity is an entity in which voting
or similar rights are not the dominant factor in
deciding who controls the entity, such as when
the activities that significantly affect the
entity’s returns are directed by means of
contractual arrangements. Structured entities
often have restricted activities, narrow and well
defined objectives, insufficient equity to
finance their activities, and financing in the
form of multiple contractually-linked instru-
ments.
Standardized Approach
Risk weights prescribed by OSFI are used to
calculate risk-weighted assets for the credit risk
exposures. Credit assessments by OSFI-
recognized external credit rating agencies of
S&P, Moody’s, Fitch and DBRS are used to risk-
weight our Sovereign and Bank exposures
based on the standards and guidelines issued
by OSFI. For our Business and Retail exposures,
we use the standard risk weights prescribed by
OSFI.
Structured investment vehicle
Managed investment vehicle that holds mainly
highly rated asset-backed securities and funds
itself using the short-term commercial paper
market as well as the medium-term note (MTN)
market.
Subprime loans
Subprime lending is the practice of making
loans to borrowers who do not qualify for the
best market interest rates because of their
deficient credit history. Subprime lending
carries more risk for lenders due to the
combination of higher interest rates for the
borrowers, poorer credit histories, and adverse
financial situations usually associated with
subprime applicants.
Taxable equivalent basis (teb)
Income from certain specified tax advantaged
sources is increased to a level that would make
it comparable to income from taxable sources.
There is an offsetting adjustment in the tax
provision, thereby generating the same after-
tax net income.
Tier 1 capital
Tier 1 capital comprises predominantly of CET1
capital, with additional Tier 1 items such as
preferred shares, innovative instruments and
non-controlling interests in subsidiaries Tier 1
instruments.
Tier 2 capital
Tier 2 capital consists mainly of subordinated
debentures that meet certain criteria, certain
loan loss allowances and non-controlling
interests in subsidiaries’ Tier 2 instruments.
Total capital and total capital ratio
Total capital is defined as the total of Tier 1 and
Tier 2 capital. The total capital ratio is calcu-
lated by dividing total capital by risk-weighted
assets.
Tranche
A security class created whereby the risks and
returns associated with a pool of assets are
packaged into several classes of securities
offering different risk and return profiles from
those of the underlying asset pool. Tranches
are typically rated by ratings agencies, and
reflect both the credit quality of underlying
collateral as well as the level of protection
based on the tranches’ relative subordination.
Trust Capital Securities (RBC TruCS)
Transferable trust units issued by structured
entities RBC Capital Trust or RBC Capital Trust II
for the purpose of raising innovative Tier 1
capital.
Value-at-Risk (VaR)
A generally accepted risk-measurement
concept that uses statistical models based on
historical information to estimate within a given
level of confidence the maximum loss in market
value we would experience in our trading
portfolio from an adverse one-day movement in
market rates and prices.
Glossary Royal Bank of Canada: Annual Report 2014 201

Directors and executive officers
Directors (1)
W. Geoffrey Beattie (2001)
Toronto, Ontario
Chief Executive Officer
Generation Capital
Jacynthe Côté (2014)
Montreal, Quebec
Corporate Director
David F. Denison, O.C., FCPA,
FCA (2012)
Toronto, Ontario
Corporate Director
Richard L. George, O.C. (2012)
Calgary, Alberta
Partner, Novo Investment Group
Timothy J. Hearn (2006)
Calgary, Alberta
Chairman
Hearn & Associates
Alice D. Laberge (2005)
Vancouver, British Columbia
Corporate Director
Michael H. McCain (2005)
Toronto, Ontario
President and Chief
Executive Officer
Maple Leaf Foods Inc.
David I. McKay (2014)
Toronto, Ontario
President and Chief
Executive Officer
Royal Bank of Canada
Heather Munroe-Blum,
O.C., O.Q., Ph.D., FRSC (2011)
Montreal, Quebec
Professor of Medicine and
Principal Emerita
McGill University
J. Pedro Reinhard (2000)
Key Biscayne, Florida
President
Reinhard & Associates
Thomas A. Renyi (2013)
New Harbor, Maine
Corporate Director
Edward Sonshine, O.Ont., Q.C.
(2008)
Toronto, Ontario
Chief Executive Officer
RioCan Real Estate
Investment Trust
Kathleen P. Taylor (2001)
Toronto, Ontario
Chair of the Board
Royal Bank of Canada
Bridget A. van Kralingen (2011)
New York, New York
Senior Vice President
IBM Global Business Services
IBM Corporation
Victor L. Young, O.C. (1991)
St. John’s, Newfoundland
and Labrador
Corporate Director
The date appearing after the name of each director indicates the year in which the individual became a director.
(1) On December 2, 2014, the Board of Directors appointed Toos N. Daruvala as a director, to take effect on January 1, 2015. Mr. Daruvala is a Director and Senior Partner of McKinsey & Company
based in New York City, U.S.A.
Group Executive
Janice R. Fukakusa, FCPA, FCA
Chief Administrative Officer and
Chief Financial Officer
Zabeen Hirji
Chief Human Resources Officer
Mark Hughes
Chief Risk Officer
M. George Lewis, FCPA, FCA,
CFA
Group Head, Wealth
Management and Insurance
A. Douglas McGregor
Group Head, Capital Markets
and Investor & Treasury Services
David I. McKay
President and
Chief Executive Officer
Bruce Ross
Group Head, Technology &
Operations
Jennifer Tory
Group Head, Personal &
Commercial Banking
202 Royal Bank of Canada: Annual Report 2014 Directors and executive officers

Principal subsidiaries
Principal subsidiaries (1) Principal office address (2)
Carrying value of
voting shares owned
by the Bank (3)
Royal Bank Holding Inc. Toronto, Ontario, Canada $ 40,630
Royal Mutual Funds Inc. Toronto, Ontario, Canada
RBC Insurance Holdings Inc. Mississauga, Ontario, Canada
RBC General Insurance Company Mississauga, Ontario, Canada
RBC Insurance Company of Canada Mississauga, Ontario, Canada
RBC Life Insurance Company Mississauga, Ontario, Canada
RBC Direct Investing Inc. Toronto, Ontario, Canada
RBC Phillips, Hager & North Investment Counsel Inc. Toronto, Ontario, Canada
R.B.C. Holdings (Bahamas) Limited Nassau, New Providence, Bahamas
RBC Caribbean Investments Limited George Town, Grand Cayman, Cayman Islands
Royal Bank of Canada Insurance Company Ltd. St. Michael, Barbados
Investment Holdings (Cayman) Limited George Town, Grand Cayman, Cayman Islands
RBC (Barbados) Funding Ltd. St. Michael, Barbados
RBC Capital Markets Arbitrage S.A. Luxembourg, Luxembourg
Capital Funding Alberta Limited Calgary, Alberta, Canada
RBC Global Asset Management Inc. Toronto, Ontario, Canada
RBC Investor Services Trust Toronto, Ontario, Canada
RBC Investor Services Bank S.A. Esch-sur-Alzette, Luxembourg
RBC (Barbados) Trading Bank Corporation St. James, Barbados
RBC USA Holdco Corporation (2) New York, New York, U.S. 11,305
RBC Capital Markets, LLC (2) New York, New York, U.S.
RBC Global Asset Management (U.S.) Inc. Minneapolis, Minnesota, U.S.
RBC Dominion Securities Limited Toronto, Ontario, Canada 6,499
RBC Dominion Securities Inc. Toronto, Ontario, Canada
RBC Holdings (Barbados) Ltd. St. Michael, Barbados 2,910
RBC Financial (Caribbean) Limited Port of Spain, Trinidad and Tobago
RBC Finance S.à r.l./B.V. (2) Amsterdam, Netherlands 2,816
RBC Holdings (Luxembourg) S.A R.L. Luxembourg, Luxembourg
RBC Holdings (Channel Islands) Limited Jersey, Channel Islands
Royal Bank of Canada (Channel Islands) Limited Guernsey, Channel Islands
BlueBay Asset Management (Services) Ltd London, England 1,962
RBC Europe Limited London, England 1,648
RBC Capital Trust Toronto, Ontario, Canada 1,783
Royal Bank Mortgage Corporation Toronto, Ontario, Canada 1,085
The Royal Trust Company Montreal, Quebec, Canada 531
RBC Bank (Georgia), National Association (2) Atlanta, Georgia, U.S. 272
RBC Covered Bond Guarantor Limited Partnership Toronto, Ontario, Canada 269
RBC Luxembourg (Suisse) Holdings S.A R.L. Luxembourg, Luxembourg 167
Royal Bank of Canada (Suisse) SA Geneva, Switzerland
Royal Trust Corporation of Canada Toronto, Ontario, Canada 150
(1) The Bank directly or indirectly controls each subsidiary.
(2) Each subsidiary is incorporated or organized under the law of the state or country in which the principal office is situated, except for RBC USA Holdco Corporation which is incorporated under
the laws of the State of Delaware, U.S., RBC Capital Markets, LLC, which is organized under the laws of the State of Minnesota, U.S. RBC Finance S.à r.l. / B.V. is a company incorporated in the
Netherlands with its official seat in Amsterdam, the Netherlands, and place of effective management, central administration, and principal establishment in Luxembourg, Grand Duchy of
Luxembourg. RBC Bank (Georgia), National Association is a national banking association organized under the laws of the U.S. with its main office in Atlanta, Georgia and management offices
in Raleigh, North Carolina.
(3) The carrying value (in millions of dollars) of voting shares is stated as the Bank’s equity in such investments.
Principal subsidiaries Royal Bank of Canada: Annual Report 2014 203

Shareholder Information
Corporate headquarters
Street address:
Royal Bank of Canada
200 Bay Street
Toronto, Ontario M5J 2J5
Canada
Tel: 1-888-212-5533
Fax: 416-955-7800
Mailing address:
P.O. Box 1
Royal Bank Plaza
Toronto, Ontario M5J 2J5
Canada
website: rbc.com
Transfer Agent and Registrar
Main Agent:
Computershare Trust Company of
Canada
1500 University Street
Suite 700
Montreal, Quebec H3A 3S8
Canada
Tel: 1-866-586-7635 (Canada and
the U.S.) or 514-982-7555
(International)
Fax: 514-982-7580
website: computershare.com\rbc
Co-Transfer Agent (U.S.):
Computershare Trust
Company, N.A.
250 Royall Street
Canton, Massachusetts 02021
U.S.A.
Co-Transfer Agent (U.K.):
Computershare Investor
Services PLC
Securities Services – Registrars
P.O. Box 82, The Pavilions,
Bridgwater Road,
Bristol BS99 6ZZ
U.K.
Stock exchange listings
(Symbol: RY)
Common shares are listed on:
Canada – Toronto Stock
Exchange (TSX)
U.S. – New York Stock Exchange
(NYSE)
Switzerland – Swiss Exchange
(SIX)
All preferred shares are listed on
the TSX.
Valuation day price
For capital gains purposes, the
Valuation Day (December 22,
1971) cost base for our common
shares is $7.38 per share. This
amount has been adjusted to
reflect the two-for-one share split
of March 1981 and the two-for-
one share split of February 1990.
The one-for-one share dividends
paid in October 2000 and April
2006 did not affect the Valuation
Day value for our common
shares.
Shareholder contacts
For dividend information, change
in share registration or address,
lost stock certificates, tax forms,
estate transfers or dividend
reinvestment, please contact:
Computershare Trust Company of
Canada
100 University Avenue, 8th Floor
Toronto, Ontario M5J 2Y1
Canada
Tel: 1-866-586-7635 (Canada and
the U.S.) or 514-982-7555
(International)
Fax: 1-888-453-0330 (Canada and
the U.S.) or 416-263-9394
(International)
email: service@computershare.com
For other shareholder inquiries,
please contact:
Shareholder Relations
Royal Bank of Canada
200 Bay Street
9th Floor, South Tower
Toronto, Ontario M5J 2J5
Canada
Tel: 416-955-7806
Fax: 416-974-3535
Financial analysts, portfolio
managers, institutional
investors
For financial information inquiries,
please contact:
Investor Relations
Royal Bank of Canada
200 Bay Street
4th Floor, North Tower
Toronto, Ontario M5J 2W7
Canada
Tel: 416-955-7802
Fax: 416-955-7800
or visit our website at
rbc.com/investorrelations
Direct deposit service
Shareholders in Canada and the
U.S. may have their RBC common
share dividends deposited directly
to their bank account by electronic
funds transfer. To arrange for this
service, please contact our
Transfer Agent and Registrar,
Computershare Trust Company of
Canada.
Eligible dividend designation
For purposes of the enhanced
dividend tax credit rules
contained in the Income Tax Act
(Canada) and any corresponding
provincial and territorial tax
legislation, all dividends (and
deemed dividends) paid by us to
Canadian residents on our
common and preferred shares
after December 31, 2005, are
designated as “eligible
dividends.”
Unless stated
otherwise, all dividends (and
deemed dividends) paid by us
hereafter are designated as
“eligible dividends” for the
purposes of such rules.
Common share repurchases
We are engaged in a Normal
Course Issuer Bid (NCIB). During
the one-year period commencing
November 1, 2014, we may
repurchase for cancellation, up to
12 million common shares in the
open market at market prices. We
determine the amount and timing
of the purchases under the NCIB,
subject to prior consultation with
the Office of the Superintendent
of Financial Institutions Canada
(OSFI).
A copy of our Notice of Intention
to file a NCIB may be obtained,
without charge, by contacting our
Corporate Secretary at our
Toronto mailing address.
2015 Quarterly earnings release
dates
First quarter February 25
Second quarter May 28
Third quarter August 26
Fourth quarter December 2
2015 Annual Meeting
The Annual Meeting of Common
Shareholders will be held on
Friday, April 10, 2015 in Toronto,
Ontario, Canada.
Dividend dates for 2015
Subject to approval by the Board of Directors
Ex-dividend
dates
Record
dates
Payment
dates
Common and preferred
shares series W, AA, AB,
AC, AD, AE, AF, AG, AJ,
AK, AL, AZ and BB
January 22
April 21
July 23
October 22
January 26
April 23
July 27
October 26
February 24
May 22
August 24
November 24
Governance
A summary of the significant ways in which corporate governance
practices followed by RBC differ from corporate governance practices
required to be followed by U.S. domestic companies under the New
York Stock Exchange listing standards is available on our website at
rbc.com/governance.
Information contained in or otherwise accessible through the websites mentioned in this report to shareholders does not form a part of this report. All references to websites are
inactive textual references and are for your information only.
Trademarks used in this report include the LION & GLOBE Symbol, ROYAL BANK OF CANADA, RBC, RBC BLUE WATER PROJECT, RBC CAPITAL TRUST, RBC GLOBAL ASSET MANAGEMENT,
RBC INSURANCE, RBC TSNs, RBC TruCS and RBC WEALTH MANAGEMENT which are trademarks of Royal Bank of Canada used by Royal Bank of Canada and/or by its subsidiaries under
license. All other trademarks mentioned in this report, which are not the property of Royal Bank of Canada, are owned by their respective holders.
204 Royal Bank of Canada: Annual Report 2014 Shareholder information

Thanks to our employees who chose the cover for this annual report. More than 7,000 employees from
around the world voted, and many took the time to share their comments and pride in RBC.
ALWAYS EARNING
THE RIGHT TO
BE OUR CLIENTS’
FIRST CHOICE
rbc.com/ar2014 81104 (12/2014)
