Automobile Parts Ar4 Wg3 Chapter5
User Manual: Automobile Parts
Open the PDF directly: View PDF ![]() .
.
Page Count: 64

5
Transport and its infrastructure
Coordinating Lead Authors:
Suzana Kahn Ribeiro (Brazil), Shigeki Kobayashi (Japan)
Lead Authors:
Michel Beuthe (Belgium), Jorge Gasca (Mexico), David Greene (USA), David S. Lee (UK), Yasunori Muromachi (Japan),
Peter J. Newton (UK), Steven Plotkin (USA), Daniel Sperling (USA), Ron Wit (The Netherlands), Peter J. Zhou (Zimbabwe)
Contributing Authors:
Hiroshi Hata (Japan), Ralph Sims (New Zealand), Kjell Olav Skjolsvik (Norway)
Review Editors:
Ranjan Bose (India), Haroon Kheshgi (USA)
This chapter should be cited as:
Kahn Ribeiro, S., S. Kobayashi, M. Beuthe, J. Gasca, D. Greene, D. S. Lee, Y. Muromachi, P. J. Newton, S. Plotkin, D. Sperling, R. Wit,
P. J. Zhou, 2007: Transport and its infrastructure. In Climate Change 2007: Mitigation. Contribution of Working Group III to the Fourth
Assessment Report of the Intergovernmental Panel on Climate Change [B. Metz, O.R. Davidson, P.R. Bosch, R. Dave, L.A. Meyer (eds)],
Cambridge University Press, Cambridge, United Kingdom and New York, NY, USA.

324
Transport and its infrastructure Chapter 5
Table of Contents
Executive Summary ................................................... 325
5.1 Introduction ..................................................... 328
5.2 Current status and future trends ................ 328
5.2.1 Transport today .................................................. 328
5.2.2 Transport in the future ....................................... 330
5.3 Mitigation technologies and strategies ...... 335
5.3.1 Road transport ................................................... 336
5.3.2 Rail ...................................................................... 351
5.3.3 Aviation ............................................................... 352
5.3.4 Shipping ............................................................ 356
5.4 Mitigation potential ....................................... 357
5.4.1 Available worldwide studies ............................... 357
5.4.2 Estimate of world mitigation costs and
potentials in 2030 .............................................. 359
5.5 Policies and measures ..................................... 366
5.5.1 Surface transport ............................................... 366
5.5.2 Aviation and shipping ......................................... 375
5.5.3 Non-climate policies ........................................... 378
5.5.4 Co-benefits and ancillary benefits ...................... 378
5.5.5 Sustainable Development impacts of mitigation
options and considerations on the link of
adaptation with mitigation. ................................ 379
5.6 Key uncertainties and gaps in
knowledge .......................................................... 380
References ..................................................................... 380

325
Chapter 5 Transport and its infrastructure
EXECUTIVE SUMMARY
Transport activity, a key component of economic
development and human welfare, is increasing around the world
as economies grow. For most policymakers, the most pressing
problems associated with this increasing transport activity
are trafc fatalities and injuries, congestion, air pollution and
petroleum dependence. These problems are especially acute in
the most rapidly growing economies of the developing world.
Mitigating greenhouse gas (GHG) emissions can take its place
among these other transport priorities by emphasizing synergies
and co-benets (high agreement, much evidence).
Transport predominantly relies on a single fossil resource,
petroleum that supplies 95% of the total energy used by world
transport. In 2004, transport was responsible for 23% of world
energy-related GHG emissions with about three quarters
coming from road vehicles. Over the past decade, transport’s
GHG emissions have increased at a faster rate than any other
energy using sector (high agreement, much evidence).
Transport activity will continue to increase in the future as
economic growth fuels transport demand and the availability
of transport drives development, by facilitating specialization
and trade. The majority of the world’s population still does not
have access to personal vehicles and many do not have access
to any form of motorized transport. However, this situation is
rapidly changing.
Freight transport has been growing even more rapidly than
passenger transport and is expected to continue to do so in the
future. Urban freight movements are predominantly by truck,
while international freight is dominated by ocean shipping.
The modal distribution of intercity freight varies greatly
across regions. For example, in the United States, all modes
participate substantially, while in Europe, trucking has a higher
market share (in tkm1), compared to rail (high agreement, much
evidence).
Transport activity is expected to grow robustly over the next
several decades. Unless there is a major shift away from current
patterns of energy use, world transport energy use is projected
to increase at the rate of about 2% per year, with the highest
rates of growth in the emerging economies, and total transport
energy use and carbon emissions is projected to be about 80%
higher than current levels by 2030 (medium agreement, medium
evidence).
There is an ongoing debate about whether the world is
nearing a peak in conventional oil production that will require a
signicant and rapid transition to alternative energy resources.
There is no shortage of alternative energy sources, including
oil sands, shale oil, coal-to-liquids, biofuels, electricity and
hydrogen. Among these alternatives, unconventional fossil
carbon resources would produce less expensive fuels most
compatible with the existing transport infrastructure, but lead
to increased carbon emissions (medium agreement, medium
evidence).
In 2004, the transport sector produced 6.3 GtCO2 emissions
(23% of world energy-related CO2 emissions) and its growth rate
is highest among the end-user sectors. Road transport currently
accounts for 74% of total transport CO2 emissions. The share
of non-OECD countries is 36% now and will increase rapidly
to 46% by 2030 if current trends continue (high agreement,
much evidence). The transport sector also contributes small
amounts of CH4 and N2O emissions from fuel combustion
and F-gases (uorinated gases) from vehicle air conditioning.
CH4 emissions are between 0.1–0.3% of total transport GHG
emissions, N2O between 2.0 and 2.8% (based on US, Japan and
EU data only). Worldwide emissions of F-gases (CFC-12+HFC-
134a+HCFC-22) in 2003 were 0.3–0.6 GtCO2-eq, about 5–10%
of total transport CO2 emissions (medium agreement, limited
evidence).
When assessing mitigation options it is important to consider
their lifecycle GHG impacts. This is especially true for choices
among alternative fuels but also applies to a lesser degree to
the manufacturing processes and materials composition of
advanced technologies. Electricity and hydrogen can offer
the opportunity to ‘de-carbonise’ the transport energy system
although the actual full cycle carbon reduction depends upon
the way electricity and hydrogen are produced. Assessment
of mitigation potential in the transport sector through the year
2030 is uncertain because the potential depends on:
• World oil supply and its impact on fuel prices and the
economic viability of alternative transport fuels;
• R&D outcomes in several areas, especially biomass fuel
production technology and its sustainability in massive
scale, as well as battery longevity, cost and specic energy.
Another problem for a credible assessment is the limited
number and scope of available studies of mitigation potential
and cost.
Improving energy efciency offers an excellent opportunity
for transport GHG mitigation through 2030. Carbon emissions
from ‘new’ light-duty road vehicles could be reduced by up
to 50% by 2030 compared to currently produced models,
assuming continued technological advances and strong
policies to ensure that technologies are applied to increasing
fuel economy rather than spent on increased horsepower and
vehicle mass. Material substitution and advanced design could
reduce the weight of light-duty vehicles by 20–30%. Since the
TAR (Third Assessment Report), energy efciency of road
vehicles has improved by the market success of cleaner direct-
injection turbocharged (TDI) diesels and the continued market
penetration of numerous incremental efciency technologies.
1 ton-km, “ton” refers to metric ton, unless otherwise stated.

326
Transport and its infrastructure Chapter 5
Hybrid vehicles have also played a role, though their market
penetration is currently small. Reductions in drag coefcients
of 20–50% seem achievable for heavy intercity trucks,
with consequent reductions in fuel use of 10–20%. Hybrid
technology is applicable to trucks and buses that operate in
urban environments, and the diesel engine’s efciency may be
improved by 10% or more. Prospects for mitigation are strongly
dependent on the advancement of transport technologies.
There are also important opportunities to increase the
operating efciencies of transport vehicles. Road vehicle
efciency might be improved by 5–20% through strategies
such as eco-driving styles, increased load factors, improved
maintenance, in-vehicle technological aids, more efcient
replacement tyres, reduced idling and better trafc management
and route choice (medium agreement, medium evidence).
The total mitigation potential in 2030 of the energy efciency
options applied to light duty vehicles would be around 0.7–0.8
GtCO2-eq in 2030 at costs <100 US$/tCO2. Data is not sufcient
to provide a similar estimate for heavy-duty vehicles. The use
of current and advanced biofuels would give an additional
reduction potential of another 600–1500 MtCO2-eq in 2030 at
costs <25 US$/tCO2 (low agreement, limited evidence).
Although rail transport is one of the most energy efcient
modes today, substantial opportunities for further efciency
improvements remain. Reduced aerodynamic drag, lower train
weight, regenerative breaking and higher efciency propulsion
systems can make signicant reductions in rail energy use.
Shipping, also one of the least energy intensive modes, still has
some potential for increased energy efciency. Studies assessing
both technical and operational approaches have concluded that
energy efciency opportunities of a few percent to up to 40%
are possible (medium agreement, medium evidence).
Passenger jet aircraft produced today are 70% more fuel
efcient than the equivalent aircraft produced 40 years ago and
continued improvement is expected. A 20% improvement over
1997 aircraft efciency is likely by 2015 and possibly 40 to 50%
improvement is anticipated by 2050. Still greater efciency
gains will depend on the potential of novel designs such as the
blended wing body, or propulsion systems such as the unducted
turbofan. For 2030 the estimated mitigation potential is 150
MtCO2 at carbon prices less than 50 US$/tCO2 and 280 MtCO2
at carbon prices less than 100 US$/tCO2 (medium agreement,
medium evidence). However, without policy intervention,
projected annual improvements in aircraft fuel efciency of
the order of 1–2%, will be surpassed by annual trafc growth
of around 5% each year, leading to an annual increase of CO2
emissions of 3–4% per year (high agreement, much evidence).
Biofuels have the potential to replace a substantial part
but not all petroleum use by transport. A recent IEA analysis
estimates that biofuels’ share of transport fuel could increase
to about 10% in 2030. The economic potential in 2030 from
biofuel application is estimated at 600–1500 MtCO2-eq/yr at a
cost of <25 US$/tCO2-eq. The introduction of exfuel vehicles
able to use any mixture of gasoline2 and ethanol rejuvenated
the market for ethanol as a motor fuel in Brazil by protecting
motorists from wide swings in the price of either fuel. The
global potential for biofuels will depend on the success of
technologies to utilise cellulose biomass (medium agreement,
medium evidence).
Providing public transports systems and their related
infrastructure and promoting non-motorised transport can
contribute to GHG mitigation. However, local conditions
determine how much transport can be shifted to less energy
intensive modes. Occupancy rates and primary energy sources of
the transport mode further determine the mitigation impact. The
energy requirements for urban transport are strongly inuenced
by the density and spatial structure of the built environment, as
well as by location, extent and nature of transport infrastructure.
If the share of buses in passenger transport in typical Latin
American cities would increase by 5–10%, then CO2 emissions
could go down by 4–9% at costs of the order of 60–70 US$/
tCO2 (low agreement, limited evidence).
The few worldwide assessments of transport’s GHG
mitigation potential completed since the TAR indicate that
signicant reductions in the expected 80% increase in transport
GHG emission by 2030 will require both major advances in
technology and implementation via strong, comprehensive
policies (medium agreement, limited evidence).
The mitigation potential by 2030 for the transport sector is
estimated to be about 1600–2550 MtCO2 for a carbon price less
than 100 US$/tCO2. This is only a partial assessment, based
on biofuel use throughout the transport sector and efciency
improvements in light-duty vehicles and aircraft and does
not cover the potential for heavy-duty vehicles, rail transport,
shipping, and modal split change and public transport promotion
and is therefore an underestimation. Much of this potential
appears to be located in OECD North America and Europe.
This potential is measured as the further reduction in CO2
emissions from a Reference scenario, which already assumes
a substantial use of biofuels and signicant improvements in
fuel efciency based on a continuation of current trends. This
estimate of mitigation costs and potentials is highly uncertain.
There remains a critical need for comprehensive and consistent
assessments of the worldwide potential to mitigate transport’s
GHG emissions (low agreement, limited evidence).
While transport demand certainly responds to price signals,
the demand for vehicles, vehicle travel and fuel use are
signicantly price inelastic. As a result, large increases in prices
or taxes are required to make major changes in GHG emissions.
2 US term for petrol.

327
Chapter 5 Transport and its infrastructure
Many countries do heavily tax motor fuels and have lower rates
of fuel consumption and vehicle use than countries with low
fuel taxes (high agreement, much evidence).
Fuel economy regulations have been effective in slowing the
growth of GHG emissions, but so far growth of transport activity
has overwhelmed their impact. They have been adopted by most
developed economies as well as key developing economies,
though in widely varying form, from uniform, mandatory
corporate average standards, to graduated standards by vehicle
weight class or size, to voluntary industry-wide standards. The
overall effectiveness of standards can be signicantly enhanced
if combined with scal incentives and consumer information
(medium agreement, medium evidence).
A wide array of transport demand management (TDM)
strategies have been employed in different circumstances
around the world, primarily to manage trafc congestion and
reduce air pollution. TDMs can be effective in reducing private
vehicle travel if rigorously implemented and supported (high
agreement, low evidence).
In order to reduce emissions from air and marine transport
resulting from the combustion of bunker fuels, new policy
frameworks need to be developed. However ICAO endorsed
the concept of an open, international emission trading system
for the air transport sector, implemented through a voluntary
scheme, or incorporation of international aviation into existing
emission trading systems. Environmentally differentiated port
dues are being used in a few places. Other policies to affect
shipping emissions would be the inclusion of international
shipping in international emissions trading schemes, fuel taxes
and regulatory instruments (high agreement, much evidence).
Since currently available mitigation options will probably
not be enough to prevent growth in transport’s emissions,
technology research and development is essential in order to
create the potential for future, signicant reductions in transport
GHG emissions. This holds, amongst others, for hydrogen
fuel cell, advanced biofuel conversion and improved batteries
for electric and hybrid vehicles (high agreement, medium
evidence).
The best choice of policy options will vary across regions.
Not only levels of economic development, but the nature of
economic activity, geography, population density and culture all
inuence the effectiveness and desirability of policies affecting
modal choices, infrastructure investments and transport demand
management measures (high agreement, much evidence).

328
Transport and its infrastructure Chapter 5
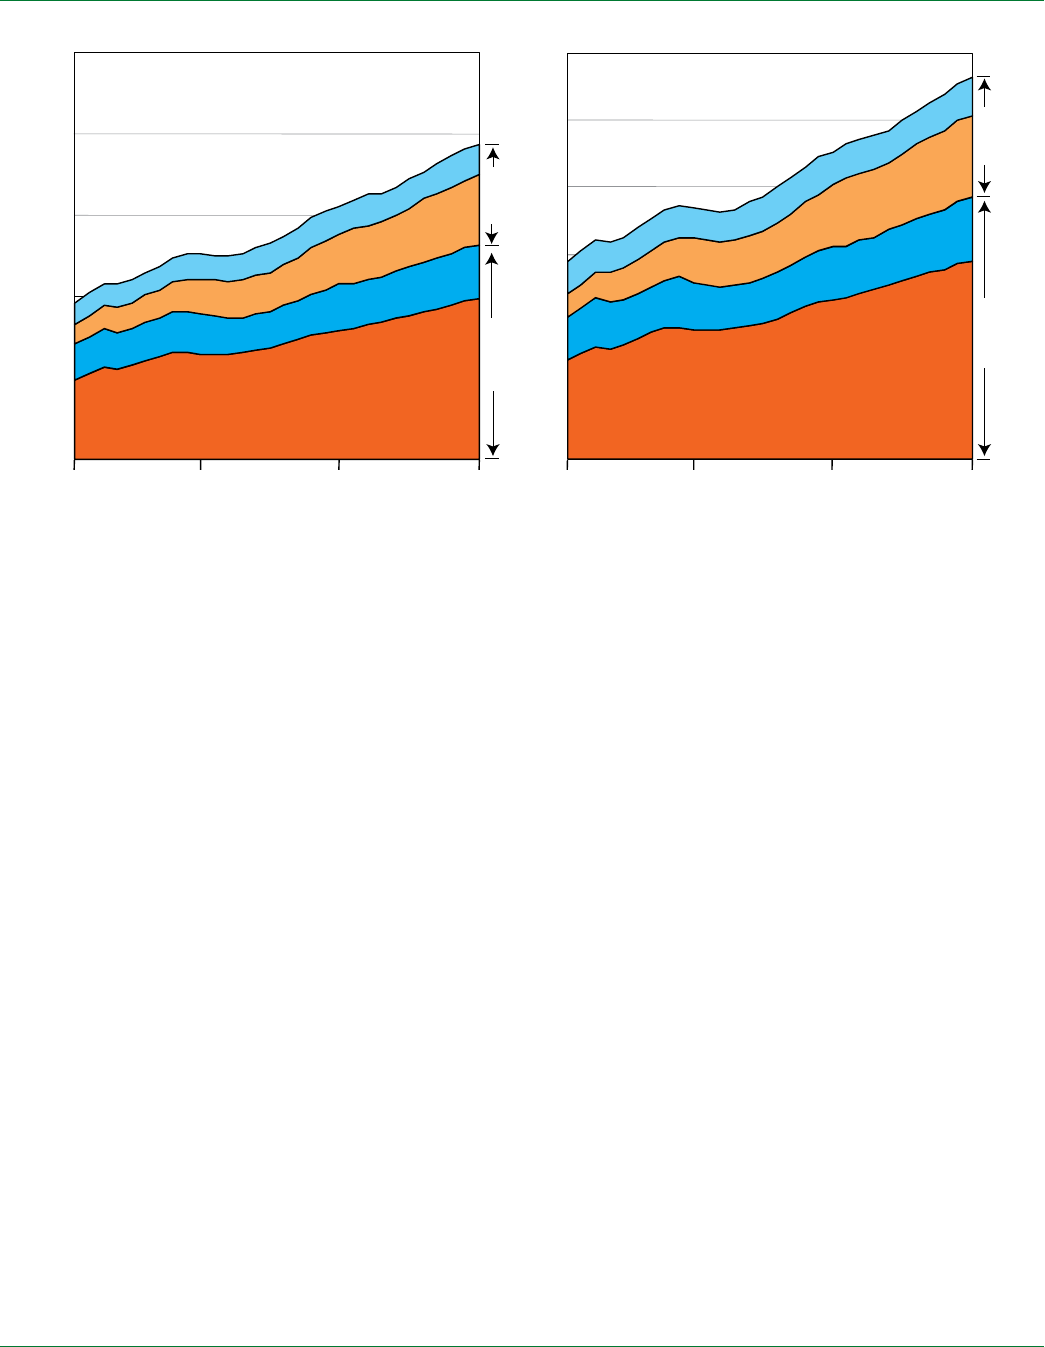
oil-based fuels, is that the CO2 emissions from the different
transport sub-sectors are approximately proportional to their
energy use (Figure 5.1).
Economic development and transport are inextricably linked.
Development increases transport demand, while availability of
transport stimulates even more development by allowing trade
and economic specialization. Industrialization and growing
specialization have created the need for large shipments of
goods and materials over substantial distances; accelerating
globalization has greatly increased these ows.
Urbanization has been extremely rapid in the past century.
About 75% of people in the industrialized world and 40% in
the developing world now live in urban areas. Also, cities have
grown larger, with 19 cities now having a population over 10
million. A parallel trend has been the decentralization of cities –
they have spread out faster than they have grown in population,
with rapid growth in suburban areas and the rise of ‘edge cities’
in the outer suburbs. This decentralization has created both
a growing demand for travel and an urban pattern that is not
easily served by public transport. The result has been a rapid
increase in personal vehicles – not only cars but also 2-wheelers
– and a declining share of transit. Further, the lower-density
development and the greater distances needed to access jobs
and services have seen the decline of walking and bicycling as
a share of total travel (WBCSD, 2002).
Another crucial aspect of our transport system is that much
of the world is not yet motorized because of low incomes.
The majority of the world’s population does not have access
to personal vehicles, and many do not even have access to
motorized public transport services of any sort. Thirty-three
percent of China’s population and 75% of Ethiopia’s still did not
have access to all-weather transport (e.g., with roads passable
3 Although congestion and air pollution are also found in developed countries, they are exacerbated by developing country conditions.
4 The primary source for the ‘current status’ part of this discussion is WBCSD (World Business Council for Sustainable Development) Mobility 2001 (2002), prepared by Mas-
sachusetts Institute of Technology and Charles River Associates Incorporated.
5 83 EJ in 2004 (IEA, 2006b).
Mode Energy use
(EJ)
Share
(%)
Light-duty vehicles (LDVs) 34.2 44.5
2-wheelers 1.2 1.6
Heavy freight trucks 12.48 16.2
Medium freight trucks 6.77 8.8
Buses 4.76 6.2
Rail 1.19 1.5
Air 8.95 11.6
Shipping 7.32 9.5
Total 76.87 100
Source: WBCSD, 2004b.
5.1 Introduction
Mobility is an essential human need. Human survival and
societal interaction depend on the ability to move people and
goods. Efcient mobility systems are essential facilitators of
economic development. Cities could not exist and global trade
could not occur without systems to transport people and goods
cheaply and efciently (WBCSD, 2002).
Since motorized transport relies on oil for virtually all its
fuel and accounts for almost half of world oil consumption, the
transport sector faces a challenging future, given its dependence
on oil. In this chapter, existing and future options and potentials
to reduce greenhouse gases (GHG) are assessed.
GHG emission reduction will be only one of several key
issues in transport during the coming decades and will not
be the foremost issue in many areas. In developing countries
especially, increasing demand for private vehicles is outpacing
the supply of transport infrastructure – including both road
networks and public transit networks. The result is growing
congestion and air pollution,3 and a rise in trafc fatalities.
Further, the predominant reliance on private vehicles for
passenger travel is creating substantial societal strains as
economically disadvantaged populations are left out of the rapid
growth in mobility. In many countries, concerns about transport
will likely focus on the local trafc, pollution, safety and equity
effects. The global warming issue in transport will have to be
addressed in the context of the broader goal of sustainable
development.
5.2 Current status4 and future trends
5.2.1 Transport today
The transport sector plays a crucial and growing role in
world energy use and emissions of GHGs. In 2004, transport
energy use amounted to 26% of total world energy use and
the transport sector was responsible for about 23% of world
energy-related GHG emissions (IEA, 2006b). The 1990–2002
growth rate of energy consumption in the transport sector was
highest among all the end-use sectors. Of a total of 77 EJ5
of total transport energy use, road vehicles account for more
than three-quarters, with light-duty vehicles and freight trucks
having the lion’s share (see Table 5.1). Virtually all (95%) of
transport energy comes from oil-based fuels, largely diesel
(23.6 EJ, or about 31% of total energy) and gasoline (36.4 EJ,
47%). One consequence of this dependence, coupled with the
only moderate differences in carbon content of the various
Table 5.1: World transport energy use in 2000, by mode
329
Chapter 5 Transport and its infrastructure
the US new Light-duty Vehicle (LDV) eet fuel economy in
2005 would have been 24% higher had the eet remained at
the weight and performance distribution it had in 1987. Instead,
over that time period, it became 27% heavier and 30% faster
in 0–60 mph (0–97 km/h) time, and achieved 5% poorer fuel
economy (Heavenrich, 2005). In other words, if power and size
had been held constant during this period, the fuel consumption
rates of light-duty vehicles would have dropped more than 1%
per year.
Worldwide travel studies have shown that the average
time budget for travel is roughly constant worldwide, with
the relative speed of travel determining distances travelled
yearly (Schafer, 2000). As incomes have risen, travellers have
shifted to faster – and more energy-intensive – modes, from
walking and bicycling to public transport to automobiles and,
for longer trips, to aircraft. And as income and travel have
risen, the percentage of trips made by automobiles has risen.
Automobile travel now accounts for 15–30% of total trips in the
developing world, but 50% in Western Europe and 90% in the
United States. The world auto eet has grown with exceptional
rapidity – between 1950 and 1997, the eet increased from
about 50 million vehicles to 580 million vehicles, ve times
faster than the growth in population. In China, for example,
vehicle sales (not including scooters, motorcycles and locally
manufactured rural vehicles) have increased from 2.4 million
in 2001 to 5.6 million in 20057 and further to 7.2 million in
2006.8 2-wheeled scooters and motorcycles have also played
an important role in the developing world and in warmer parts
of Europe, with a current world eet of a few hundred million
most of the year). Walking more than 10 km/day6 each way to
farms, schools and clinics is not unusual in rural areas of the
developing world, particularly sub-Saharan Africa, but also in
parts of Asia and Latin America. Commuting by public transport
is very costly for the urban poor, taking, for example, 14% of
the income of the poor in Manila compared with 7% of the
income of the non-poor (World Bank, 1996). If and when these
areas develop and their population’s incomes rise, the prospects
for a vast expansion of motorization and increase in fossil fuel
use and GHG emissions is very real. And these prospects are
exacerbated by the evidence that the most attractive form of
transport for most people as their incomes rise is the motorized
personal vehicle, which is seen as a status symbol as well
as being faster, exible, convenient and more comfortable
than public transport. Further aggravating the energy and
environmental concerns of the expansion of motorization is the
large-scale importation of used vehicles into the developing
world. Although increased access to activities and services will
contribute greatly to living standards, a critical goal will be to
improve access while reducing the adverse consequences of
motorization, including GHG emissions.
Another factor that has accelerated the increase in transport
energy use and carbon emissions is the gradual growth in the
size, weight and power of passenger vehicles, especially in
the industrialized world. Although the efciency of vehicle
technology has improved steadily over time, much of the benet
of these improvements have gone towards increased power and
size at the expense of improved fuel efciency. For example,
the US Environmental Protection Agency has concluded that
6 6.21 miles/day.
7 Automotive News Data Center: http://www.autonews.com/apps/pbcs.dll/search?Category=DATACENTER01archive.
8 China Association of Automobile Manufacturers 2007.1.17: http://60.195.249.78/caam/caam.web/Detail.asp?id=359#
0
500
1000
1500
2000
2500
1971 19801990 20001971 19801990 2000
0
2
4
6
Mtoe Gt CO2
Non-
OECD
Non-
OECDOECD
OECD
Road
Non-Road
Road
Non-Road
Road
Non-Road
Road
Non-Road
5.1
Figure 5.1: Energy consumption and CO2 emission in the transport sector
Source: IEA, 2006c,d

330
Transport and its infrastructure Chapter 5
vehicles (WBSCD, 2002). Non-motorized transport continues
to dominate the developing world. Even in Latin America and
Europe, walking accounts for 20–40% of all trips in many cities
(WBCSD, 2002). Bicycles continue to play a major role in much
of Asia and scattered cities elsewhere, including Amsterdam
and Copenhagen.
Public transport plays a crucial role in urban areas. Buses,
though declining in importance against private cars in the
industrialized world (EC, 2005; Japanese Statistical Bureau,
2006; US Bureau of Transportation Statistics, 2005) and some
emerging economies, are increasing their role elsewhere,
serving up to 45% of trips in some areas. Paratransit – primarily
minibus jitneys run by private operators – has been rapidly
taking market share from the formal public-sector bus systems
in many areas, now accounting for 35% of trips in South Africa,
40% in Caracas and Bogota and up to 65% in Manila and other
southeast Asian cities (WBCSD, 2002). Heavy rail transit
systems are generally found only in the largest, densest cities of
the industrialized world and a few of the upper-tier developing
world cities.
Intercity and international travel is growing rapidly, driven
by growing international investments and reduced trade
restrictions, increases in international migration and rising
incomes that fuel a desire for increased recreational travel. In
the United States, intercity travel already accounts for about
one-fth of total travel and is dominated by auto and air.
European and Japanese intercity travel combines auto and air
travel with fast rail travel. In the developing world, on the other
hand, intercity travel is dominated by bus and conventional rail
travel, though air travel is growing rapidly in some areas – 12%
per year in China, for example. Worldwide passenger air travel
is growing 5% annually – a faster rate of growth than any other
travel mode (WBCSD, 2002).
Industrialization and globalization have also stimulated freight
transport, which now consumes 35% of all transport energy,
or 27 exajoules (out of 77 total) (WBCSD, 2004b). Freight
transport is considerably more conscious of energy efciency
considerations than passenger travel because of pressure on
shippers to cut costs, however this can be offset by pressure
to increase speeds and reliability and provide smaller ‘just-in-
time’ shipments. The result has been that, although the energy-
efciency of specic modes has been increasing, there has been
an ongoing movement to the faster and more energy-intensive
modes. Consequently, rail and domestic waterways’ shares of
total freight movement have been declining, while highway’s
share has been increasing and air freight, though it remains a
small share, has been growing rapidly. Some breakdowns:
• Urban freight is dominated by trucks of all sizes.
• Regional freight is dominated by large trucks, with bulk
commodities carried by rail and pipelines and some water
transport.
• National or continental freight is carried by a combination
of large trucks on higher speed roads, rail and ship.
• International freight is dominated by ocean shipping. The
bulk of international freight is carried aboard extremely
large ships carrying bulk dry cargo (e.g., iron ore), container
freight or fuel and chemicals (tankers).
• There is considerable variation in freight transport around
the world, depending on geography, available infrastructure
and economic development. The United States’ freight
transport system, which has the highest total trafc in the
world, is one in which all modes participate substantially.
Russia’s freight system, in contrast, is dominated by rail and
pipelines, whereas Europe’s freight systems are dominated
by trucking with a market share of 72% (tkm) in EU-25
countries, while rail’s market share is just 16.4% despite its
extensive network.9 China’s freight system uses rail as its
largest carrier, with substantial contributions from trucks
and shipping (EC, 2005).
Global estimates of direct GHG emissions of the transport
sector are based on fuel use. The contribution of transport to
total GHG emissions was about 23%, with emissions of CO2
and N2O amounting to about 6300–6400 MtCO2-eq in 2004.
Transport sector CO2 emissions have increased by around 27%
since 1990 (IEA, 2006d). For sub-sectors such as aviation and
marine transport, estimates based on more detailed information
are available. Estimates of global aviation CO2 emissions using
a consistent inventory methodology have recently been made by
Lee et al. (2005). These showed an increase by approximately
a factor of 1.5 from 331 MtCO2/yr in 1990 to 480 MtCO2/yr in
2000. For seagoing shipping, fuel usage has previously been
derived from energy statistics (e.g., Olivier et al., 1996; Corbett
et al., 1999; Endresen et al., 2003). More recently, efforts have
been committed to constructing inventories using activity-
based statistics on shipping movements (Corbett and Köhler,
2003; Eyring et al., 2005a). This has resulted in a substantial
discrepancy. Estimated CO2 emissions vary accordingly. This
has prompted debate over inventory methodologies in the
literature (Endresen et al., 2004; Corbett and Köhler, 2004). It is
noteworthy that the NOx emissions estimates also vary strongly
between the different studies (Eyring et al., 2005a).
5.2.2 Transport in the future
There seems little doubt that, short of worldwide economic
collapse, transport activity will continue to grow at a rapid pace
for the foreseeable future. However, the shape of that demand
and the means by which it will be satised depend on several
factors.
First, it is not clear whether oil can continue to be the
dominant feedstock of transport. There is an on-going debate
about the date when conventional oil production will peak, with
many arguing that this will occur within the next few decades
9 This rather small share is the result of priority given to passenger transport and market fragmentation between rival national rail systems.

331
Chapter 5 Transport and its infrastructure
(though others, including some of the major multinational
oil companies, strongly oppose this view). Transport can be
fuelled by multiple alternative sources, beginning with liquid
fuels from unconventional oil (very heavy oil, oil sands and
oil shale), natural gas or coal, or biomass. Other alternatives
include gaseous fuels such as natural gas or hydrogen and
electricity, with both hydrogen and electricity capable of being
produced from a variety of feedstocks. However, all of these
alternatives are costly, and several – especially liquids from
fossil resources – can increase GHG emissions signicantly
without carbon sequestration.
Box 5.1: Non-CO2 climate impacts
When considering the mitigation potential for the transport sector, it is important to understand the effects that it has
on climate change. Whilst the principal GHG emitted is CO2, other pollutants and effects may be important and control/
mitigation of these may have either technological or operational trade-offs.
Individual sectors have not been studied in great detail, with the exception of aviation. Whilst surface vehicular transport
has a large fraction of global emissions of CO2, its radiative forcing (RF) impact is little studied. Vehicle emissions of NOx,
VOCs and CO contribute to the formation of tropospheric O3, a powerful GHG; moreover, black carbon and organic carbon
may affect RF from this sector. Shipping has a variety of associated emissions, similar in many respects to surface vehicular
transport. One of shipping’s particular features is the observed formation of low-level clouds (‘ship-tracks’), which has a
negative RF effect. The potential coverage of these clouds and its associated RF is poorly studied, but one study estimates a
negative forcing of 0.110 W/m2 (Capaldo et al., 1999), which is potentially much larger than its positive forcing from CO2 and
it is possible that the overall forcing from shipping may be negative, although this requires more study. However, a distinction
should be drawn between RF and an actual climate effect in terms of global temperature change or sea-level rise; the latter
being much more complicated to estimate.
Non-CO2 emissions (CH4 and N2O) from road transport in major Annex I parties are listed in UNFCC GHG inventory data.
The refrigerant banks and emission trend of F-gases (CFC-12 + HFC-134a) from air-conditioning are reported in the recent
IPCC special report on Safeguarding the Ozone Layer and the Global Climate System (IPCC, 2005). Since a rapid switch
from CFC-12 to HFC-134a, which has a much lower GWP index, is taking place, the total amount of F-gases is increasing
due to the increase in vehicles with air-conditioning, but total emission in CO2-eq is decreasing and forecasted to continue
to decrease. Using the recent ADEME data (2006) on F-gas emissions, the shares of emissions from transport sectors for
CO2, CH4, N2O and F-gases (CFC-12 + HFC-134a+HCFC-22) are:
CO2
(%)
CH4
(%)
N2O
(%)
F-gas
(%)
USA 88.4 0.2 2.0 8.9
Japan 96.0 0.1 2.5 1.4
EU 95.3 0.3 2.8 1.7
Worldwide F-gas emissions in 2003 were reported to be 610 MtCO2-eq in IPCC (2005), but more recent ADEME data
(ADEME, 2006) was about 310 Mt CO2-eq (CFC-12 207, HFC-134a 89, HCFC-22 10 MtCO2-eq), which is about 5% of total
transport CO2 emission. It can be seen that non-CO2 emissions from the transport sector are considerably smaller than the
CO2 emissions. Also, air-conditioning uses significant quantities of energy, with consequent CO2 emissions from the fuel
used to supply this energy. Although this depends strongly on the climate conditions, it is reported to be 2.5–7.5% of vehicle
energy consumption (IPCC, 2005).
Aviation has a larger impact on radiative forcing than that from its CO2 forcing alone. This was estimated for 1992 and a range
of 2050 scenarios by IPCC (1999) and updated for 2000 by Sausen et al. (2005) using more recent scientific knowledge and
data. Aviation emissions impact radiative forcing in positive (warming) and negative (cooling) ways as follows: CO2 (+25.3
mW/m2); O3 production from NOx emissions (+21.9 mW/m2); ambient CH4 reduction as a result of NOx emissions (–10.4 mW/
m2); H2O (+2.0 mW/m2); sulphate particles (–3.5 mW/m/2); soot particles (+2.5 mW/m2); contrails (+10.0 mW/m2); cirrus cloud
enhancement (10–80 mW/m2). These effects result in a total aviation radiative forcing for 2000 of 47.8 mW/m2, excluding
cirrus cloud enhancement, for which no best estimate could be made, as was the case for IPCC (1999). Forster et al. (2007)
assumed that aviation radiative forcing (0.048 W/m2 in 2000, which excludes cirrus) to have grown by no more that 10%
between 2000 and 2005. Forster et al. (2007) estimate a total net anthropogenic radiative forcing in 2005 of 1.6 W/m2 (range
0.6–2.4 W/m2). Aviation therefore accounts for around 3% of the anthropogenic radiative forcing in 2005 (range 2–8%). This
90% confidence range is skewed towards lower percentages and does not account for uncertainty in the aviation forcings.
332
Transport and its infrastructure Chapter 5
Second, the growth rate and shape of economic development,
the primary driver of transport demand, is uncertain. If China
and India as well as other Asian countries continue to rapidly
industrialize, and if Latin America and Africa full much of
their economic potential, transport demand will grow with
extreme rapidity over the next several decades. Even in the
most conservative economic scenarios though, considerable
growth in travel is likely.
Third, transport technology has been evolving rapidly. The
energy efciency of the different modes, vehicle technologies,
and fuels, as well as their cost and desirability, will be strongly
affected by technology developments in the future. For example,
although hybrid electric drive trains have made a strong early
showing in the Japanese and US markets, their ultimate degree
of market penetration will depend strongly on further cost
reductions. Other near-term options include the migration of
light-duty diesel from Europe to other regions. Longer term
opportunities requiring more advanced technology include new
biomass fuels beyond those made from sugar cane in Brazil and
corn in the USA, fuel cells running on hydrogen and battery-
powered electric vehicles.
Fourth, as incomes in the developing nations grow, transport
infrastructure will grow rapidly. Current trends point towards
growing dependence on private cars, but other alternatives
exist (as demonstrated by cities such as Curitiba and Bogota
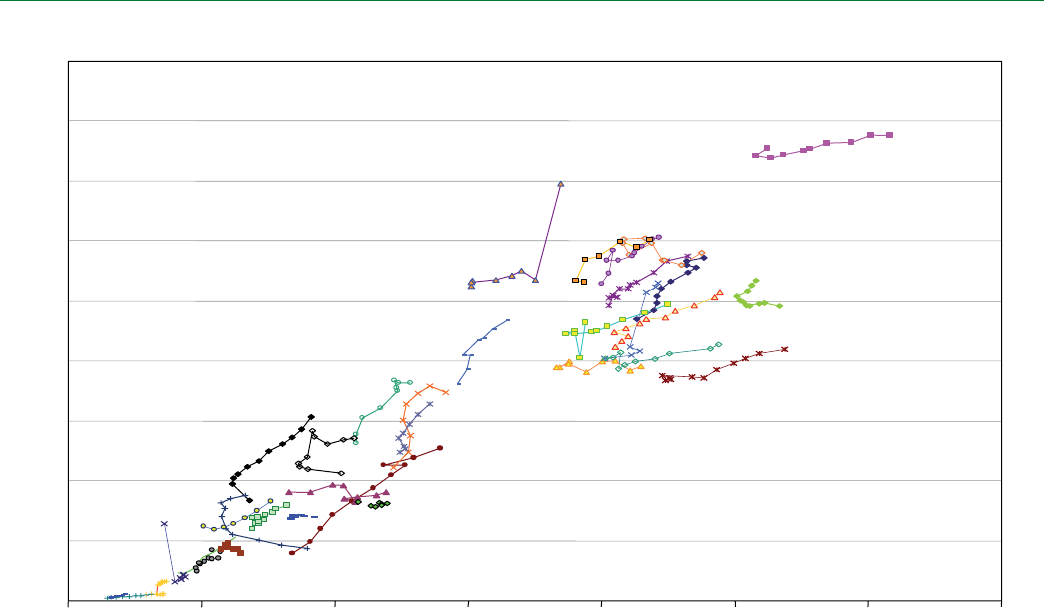
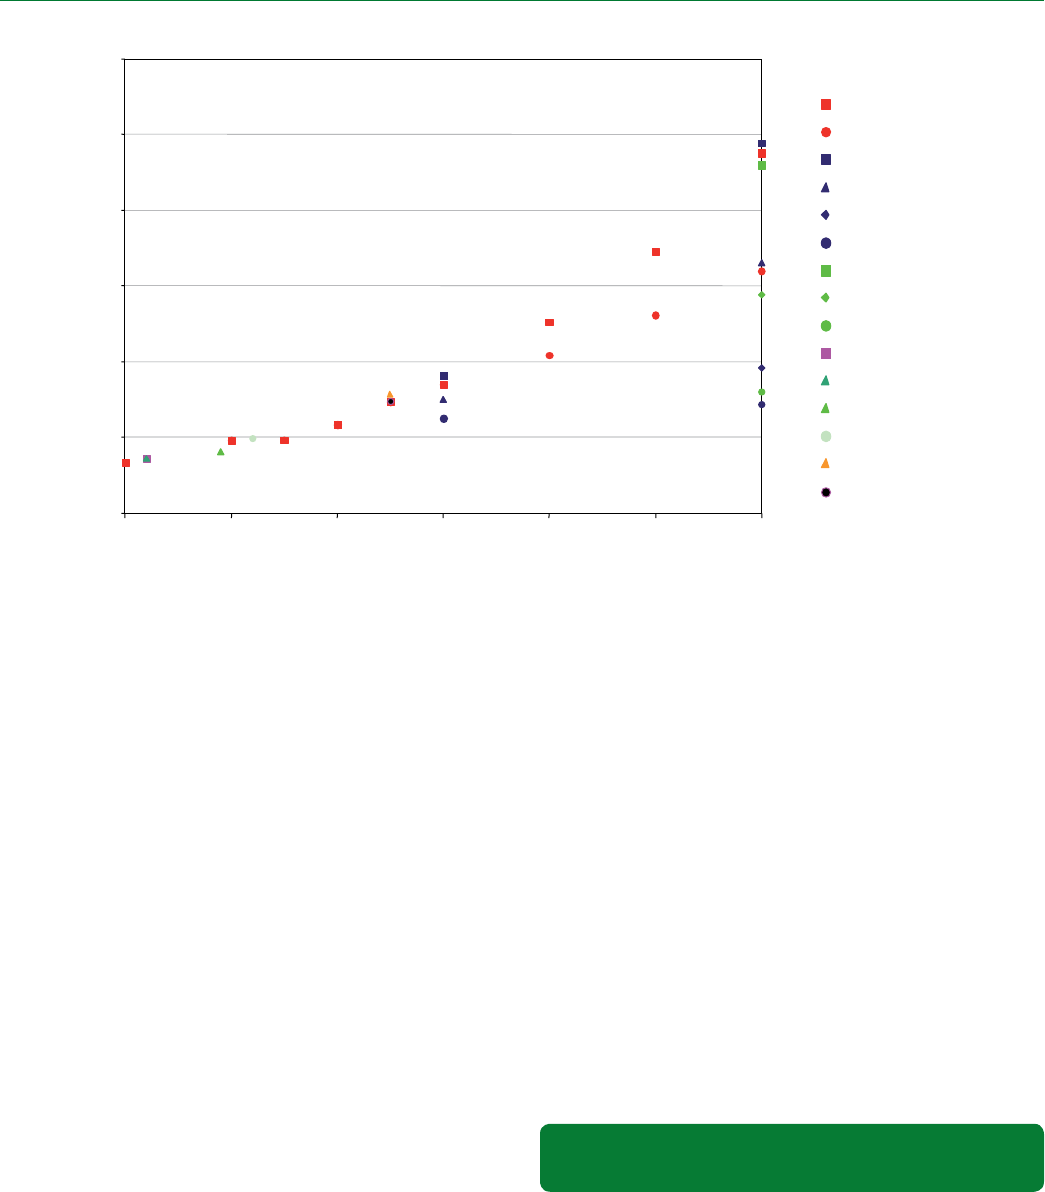
with their rapid bus transit systems). Also, as seen in Figure
5.2, the intensity of car ownership varies widely around the
world even when differences in income are accounted for, so
different countries have made very different choices as they
have developed. The future choices made by both governments
and travellers will have huge implications for future transport
energy demand and CO2 emissions in these countries.
Most projections of transport energy consumption and GHG
emissions have developed Reference Cases that try to imagine
what the future would look like if governments essentially
continued their existing policies without adapting to new
conditions. These Reference Cases establish a baseline against
which changes caused by new policies and measures can be
measured, and illustrate the types of problems and issues that
will face governments in the future.
Two widely cited projections of world transport energy use
are the Reference Cases in the ongoing world energy forecasts
of the United States Energy Information Administration,
‘International Energy Outlook 2005’ (EIA, 2005) and the
International Energy Agency, World Energy Outlook 2004
(IEA, 2004a). A recent study by the World Business Council on
Japan
USA
Germany
France
Korea
China
India
0
100
200
300
400
500
600
700
800
900
05000 10000 15000 20000 25000 30000 35000
UK
Canada
Mexico
Belgium
Denmark
Italy
Netherlands
Spain
Sweden
Switzerland
Australia
Portugal
Greece
Turkey
Russia
Czech
Hungary
Poland
Brazil
Argentina
Peru
Malaysia
Philippines
Saudi Arabia
South Africa
New Zealand
GDP per Capita (US$)
Vehicle Ownership/ 1000 Persons
5.2
Figure 5.2: Vehicle ownership as a function of per capita income
Note: plotted years vary by country depending on data availability.
Data source: World Bank, 2004.
333
Chapter 5 Transport and its infrastructure
Sustainable Development, ‘Mobility 2030’, also developed a
projection of world transport energy use. Because the WBCSD
forecast was undertaken by IEA personnel (WBCSD, 2004b),
the WEO 2004 and Mobility 2030 forecasts are quite similar. The
WEO 2006 (IEA, 2006b) includes higher oil price assumptions
than previously. Its projections therefore tend to be somewhat
lower than the two other studies.
The three forecasts all assume that world oil supplies will be
sufcient to accommodate the large projected increases in oil
demand, and that world economies continue to grow without
signicant disruptions. With this caveat, all three forecast robust
growth in world transport energy use over the next few decades,
at a rate of around 2% per year. This means that transport
energy use in 2030 will be about 80% higher than in 2002 (see
Figure 5.3). Almost all of this new consumption is expected to
be in petroleum fuels, which the forecasts project will remain
between 93% and slightly over 95% of transport fuel use over
the period. As a result, CO2 emissions will essentially grow in
lockstep with energy consumption (see Figure 5.4).
Another important conclusion is that there will be a
signicant regional shift in transport energy consumption, with
the emerging economies gaining signicantly in share (Figure
5.3). EIA’s International Energy Outlook 2005, as well as the
IEA, projects a robust 3.6% per year growth rate for these
economies, while the IEA’s more recent WEO 2006 projects
transport demand growth of 3.2%. In China, the number of cars
has been growing at a rate of 20% per year, and personal travel
has increased by a factor of ve over the past 20 years. At its
projected 6% rate of growth, China’s transport energy use would
nearly quadruple between 2002 and 2025, from 4.3 EJ in 2002
to 16.4 EJ in 2025. China’s neighbour India’s transport energy
is projected to grow at 4.7% per year during this period and
countries such as Thailand, Indonesia, Malaysia and Singapore
will see growth rates above 3% per year. Similarly, the Middle
East, Africa and Central and South America will see transport
energy growth rates at or near 3% per year. The net effect is
that the emerging economies’ share of world transport energy
use would grow in the EIA forecasts from 31% in 2002 to 43%
in 2025. In 2004, the transport sector produced 6.2 GtCO2
emissions (23% of world energy-related CO2 emissions). The
share of Non-OECD countries is 36% now and will increase
rapidly to 46% by 2030 if current trends continue.
In contrast, transport energy use in the mature market
economies is projected to grow more slowly. EIA forecasts
1.2% per year and IEA forecasts 1.3% per year for the OECD
nations. EIA projects transport energy in the United States to
grow at 1.7% per year, with moderate population and travel
growth and only modest improvement in efciency. Western
Europe’s transport energy is projected to grow at a much slower
0.4% per year, because of slower population growth, high fuel
taxes and signicant improvements in efciency. IEA projects
a considerably higher 1.4% per year for OECD Europe. Japan,
with an aging population, high taxes and low birth rates, is
projected to grow at only 0.2% per year. These rates would lead
to 2002–2025 increases of 46%, 10% and 5%, for the USA,
Western Europe and Japan, respectively. These economies’
share of world transport energy would decline from 62% in
2002 to 51% in 2025.
The sectors propelling worldwide transport energy growth
are primarily light-duty vehicles, freight trucks and air travel.
The Mobility 2030 study projects that these three sectors will
be responsible for 38, 27 and 23%, respectively, of the total 100
EJ growth in transport energy that it foresees in the 2000–2050
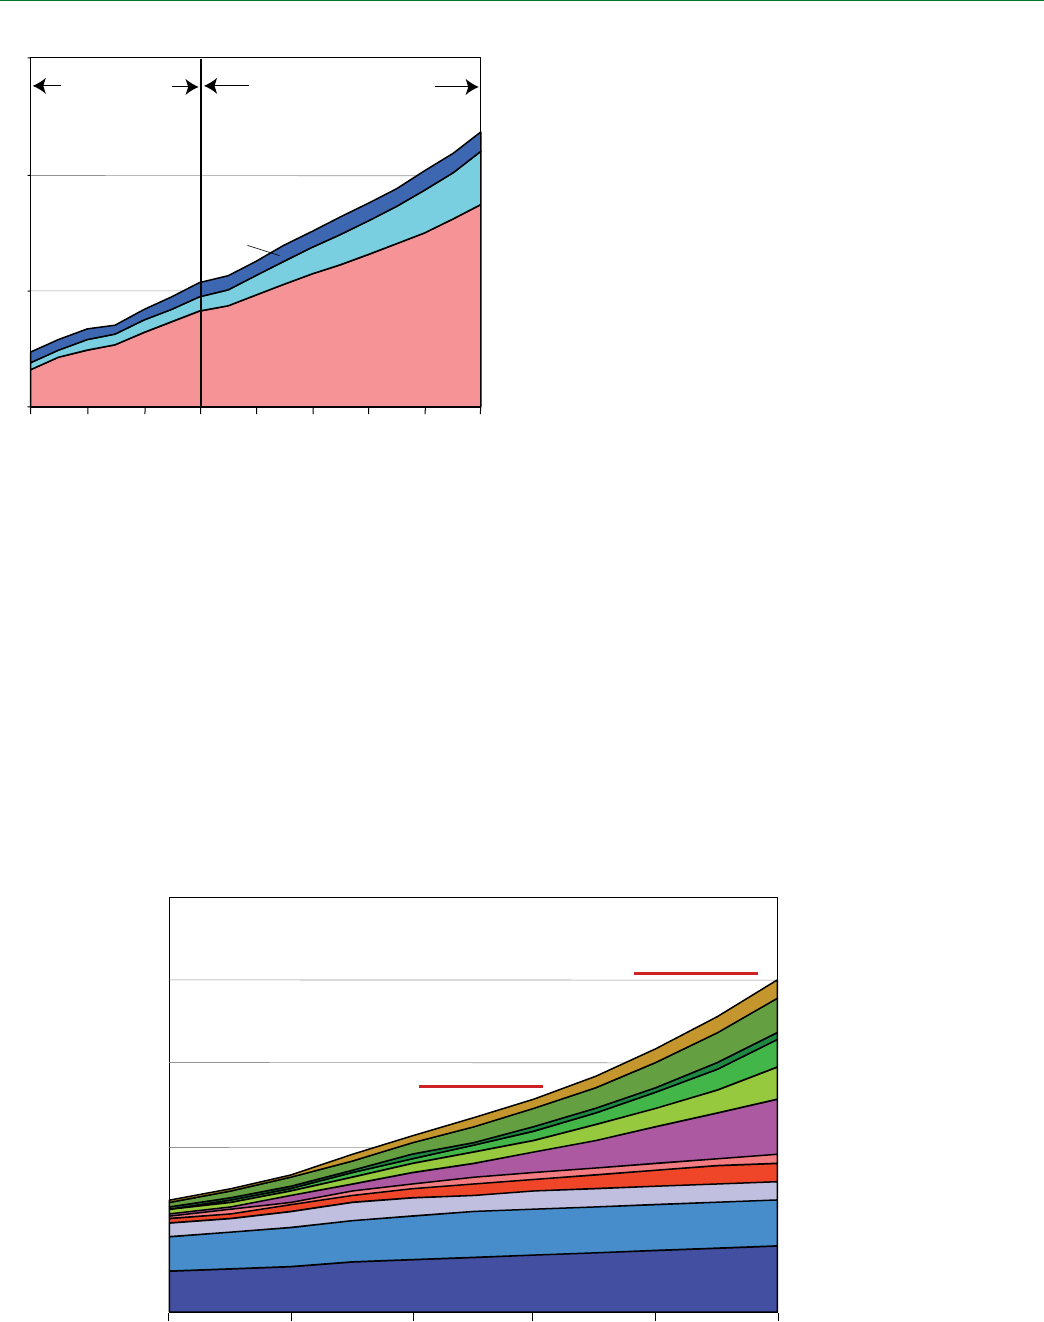
period. The WBCSD/SMP reference case projection indicates
that the number of LDVs will grow to about 1.3 billion by 2030
and to just over 2 billion by 2050, which is almost three times
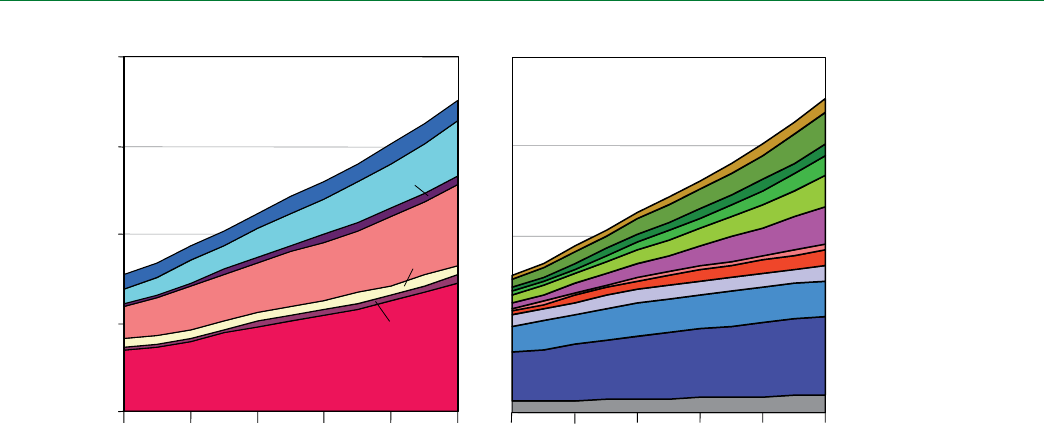
Africa
Latin America
Middle East
India
Other Asia
China
Eastern Europe
EECCA
OECD Pacific
OECD Europe
OECD N. America
Bunker fuel
200020102020 203020402050
EJ
0
50
100
150
200
200020102020203020402050
Water
Air
Rail
Freight trucks
Buses
2-3 wheelers
LDVs
Figure 5.3: Projection of transport energy consumption by region and mode
Source: WBCSD, 2004a.
334
Transport and its infrastructure Chapter 5
higher than the present level (Figure 5.5). Nearly all of this
increase will be in the developing world.
Aviation
Civil aviation is one of the world’s fastest growing transport
means. ICAO (2006) analysis shows that aviation scheduled
trafc (revenue passenger-km, RPK) has grown at an average
annual rate of 3.8% between 2001 and 2005 despite the downturn
from the terrorist attacks and SARS (Severe Acute Respiratory
Syndrome) during this period, and is currently growing at 5.9%
per year. These gures disguise regional differences in growth
rate: for example, Europe-Asia/Pacic trafc grew at 12.2%
and North American domestic trafc grew at 2.6% per year in
2005. ICAO’s outlook for the future forecasts a passenger trafc
demand growth of 4.3% per year to 2020. Industry forecasts
offer similar prospects for growth: the Airbus Global Market
Forecast (Airbus, 2004) and Boeing Current Market Outlook
(Boeing, 2006) suggest passenger trafc growth trends of 5.3%
and 4.9% respectively, and freight trends at 5.9% and 6.1%
respectively over the next 20 or 25 years. In summary, these
forecasts and others predict a global average annual passenger
trafc growth of around 5% – passenger trafc doubling in 15
years – with freight trafc growing at a faster rate that passenger
trafc, although from a smaller base.
The primary energy source for civil aviation is kerosene.
Trends in energy use from aviation growth have been modelled
using the Aero2K model, using unconstrained demand growth
forecasts from Airbus and UK Department of Trade and Industry.
The model results suggest that by 2025 trafc will increase
by a factor of 2.6 from 2002, resulting in global aviation fuel
consumption increasing by a factor of 2.1 (QinetiQ, 2004).
Aero2k model results suggest that aviation emissions were
approximately 492 MtCO2 and 2.06 MtNOx in 2002 and will
increase to 1029 and 3.31 Mt respectively by 2025.
Several organizations have constructed scenarios of aviation
emissions to 2050 (Figure 5.6), including:
• IPCC (1999) under various technology and GDP assumptions
(IS92a, e and c). Emissions were most strongly affected by
5.4
0
5
10
15
1970 1980 1990 2000 2010 2020 20302040 2050
historical data
(IEA) estimated data (WBCSD)
Air
Sea
Road
Gt CO
2
Figure 5.4: Historical and projected CO2 emission from transport by modes,
1970–2050
Source: IEA, 2005; WBCSD, 2004b.
Africa
Latin America
Middle East
India
Other Asia
China
Eastern Europe
EECCA
OECD Pacific
OECD Europe
OECD N. America
0
0.5
1.0
1.5
2.0
2.5
20002010 20202030 2040 2050
x3
x2
Billions
Figure 5.5: Total stock of light-duty vehicles by region
Source: WBCSD, 2004a.
335
Chapter 5 Transport and its infrastructure
the GDP assumptions, with technology assumptions having
only a second order effect;
• CONSAVE 2050, a European project has produced further
2050 scenarios (Berghof et al., 2005). Three of the four
CONSAVE scenarios are claimed to be broadly consistent
with IPCC SRES scenarios A1, A2 and B1. The results were
not greatly different from those of IPCC (1999);
• Owen and Lee (2005) projected aviation emissions for
years 2005 through to 2020 by using ICAO-FESG forecast
statistics of RPK (FESG, 2003) and a scenario methodology
applied thereafter according to A1 and B2 GDP assumptions
similarly to IPCC (1999).
The three estimates of civil aviation CO2 emissions in 2050
from IPCC (1999) show an increase by factors of 2.3, 4.0 and
6.4 over 1992; CONSAVE (Berghof et al., 2005) four scenarios
indicate increases of factors of 1.5, 1.9, 3.4 and 5.0 over 2002
emissions (QinetiQ, 2004); and FAST A1 and B2 results (Owen
and Lee, 2006) indicate increases by factors of 3.3 and 5.0 over
2000 emissions.
Shipping
Around 90% of global merchandise is transported by sea.
For many countries sea transport represents the most important
mode of transport for trade. For example, for Brazil, Chile
and Peru over 95% of exports in volume terms (nearly 75% in
value terms) are seaborne. Economic growth and the increased
integration in the world economy of countries from far-east and
southeast Asia is contributing to the increase of international
marine transport. Developments in China are now considered to
be one of the most important stimulus to growth for the tanker,
chemical, bulk and container trades (OECD, 2004b).
World seaborne trade in ton-miles recorded another
consecutive annual increase in 2005, after growing by 5.1%.
Crude oil and oil products dominate the demand for shipping
services in terms of ton-miles (40% in 2005) (UN, 2006),
indicating that demand growth will continue in the future.
During 2005, the world merchant eet expanded by 7.2%. The
eets of oil tankers and dry bulk carriers, which together make
up 72.9% of the total world eet, increased by 5.4%. There was
a 13.3% increase in the container ship eet, whose share of total
eet is 12%.
Eyring et al. (2005a) provided a set of carbon emission
projections out to 2050 (Eyring et al., 2005b) based upon four
trafc demand scenarios corresponding to SRES A1, A2, B1,
B2 (GDP) and four technology scenarios which are summarized
below in Table 5.2.
The resultant range of potential emissions is shown in Figure
5.7.
5.3 Mitigation technologies and
strategies
Many technologies and strategies are at hand to reduce the
growth or even, eventually, reverse transport GHG emissions.
Most of the technology options discussed here were mentioned
in the TAR. The most promising strategy for the near term is
incremental improvements in current vehicle technologies.
Advanced technologies that provide great promise include
greater use of electric-drive technologies, including hybrid-
0
500
1000
1500
2000
2500
3000
FAST-A1
FAST-B2
CONSAVE ULS
CONSAVE RPP
CONSAVE FW
CONSAVE DtE
IPCCFe1
IPCCFc1
IPCCFa1
ANCAT/EC2
NASA 1992
NASA 1999
AERO2K
NASA 2015
ANCAT/EC2 2015
1990
2000 2010 2020 2030 2040 2050
Mt CO2/yr
2,442
2,377
2,302
1,727
1,306
1,262
1,041
907
860
749
625
783
739
735
584
482
492
480
404
359
331
1,597
1,654
1,440
955
800
719
Figure 5.6: Comparison of global CO2 emissions of civil aviation, 1990–2050

336
Transport and its infrastructure Chapter 5
electric power trains, fuel cells and battery electric vehicles. The
use of alternative fuels such as natural gas, biofuels, electricity
and hydrogen, in combination with improved conventional and
advanced technologies; provide the potential for even larger
reductions.
Even with all these improved technologies and fuels, it
is expected that petroleum will retain its dominant share of
transport energy use and that transport GHG emissions will
continue to increase into the foreseeable future. Only with sharp
changes in economic growth, major behavioural shifts, and/or
major policy intervention would transport GHG emissions
decrease substantially.
5.3.1 Road transport
GHG emissions associated with vehicles can be reduced by
four types of measures:
1. Reducing the loads (weight, rolling and air resistance and
accessory loads) on the vehicle, thus reducing the work
needed to operate it;
2. Increasing the efciency of converting the fuel energy to
work, by improving drive train efciency and recapturing
energy losses;
3. Changing to a less carbon-intensive fuel; and
4. Reducing emissions of non-CO2 GHGs from vehicle exhaust
and climate controls.
The loads on the vehicle consist of the force needed to
accelerate the vehicle, to overcome inertia; vehicle weight when
climbing slopes; the rolling resistance of the tyres; aerodynamic
forces; and accessory loads. In urban stop-and-go driving,
aerodynamic forces play little role, but rolling resistance and
especially inertial forces are critical. In steady highway driving,
aerodynamic forces dominate, because these forces increase
with the square of velocity; aerodynamic forces at 90 km/h10
are four times the forces at 45 km/h. Reducing inertial loads
is accomplished by reducing vehicle weight, with improved
design and greater use of lightweight materials. Reducing tyre
losses is accomplished by improving tyre design and materials,
to reduce the tyres’ rolling resistance coefcient, as well as
by maintaining proper tyre pressure; weight reduction also
contributes, because tyre losses are a linear function of vehicle
weight. And reducing aerodynamic forces is accomplished by
changing the shape of the vehicle, smoothing vehicle surfaces,
reducing the vehicle’s cross-section, controlling airow under
the vehicle and other measures. Measures to reduce the heating
and cooling needs of the passengers, for example by changing
window glass to reect incoming solar radiation, are included
in the group of measures.
Increasing the efciency with which the chemical energy
in the fuel is transformed into work, to move the vehicle and
provide comfort and other services to passengers, will also
reduce GHG emissions. This includes measures to improve
engine efciency and the efciency of the rest of the drive
train and accessories, including air conditioning and heating.
The range of measures here is quite great; for example,
engine efciency can be improved by three different kinds
of measures, increasing thermodynamic efciency, reducing
frictional losses and reducing pumping losses (these losses
are the energy needed to pump air and fuel into the cylinders
and push out the exhaust) and each kind of measure can be
addressed by a great number of design, material and technology
changes. Improvements in transmissions can reduce losses in
the transmission itself and help engines to operate in their most
Table 5.2: Summary of shipping technology scenarios
Technology scenario 1 (TS1) –
‘Clean scenario’
Technology scenario 2 (TS2) –
‘Medium scenario’
Technology scenario 3 (TS3) –
‘IMO compliant scenario’
Technology scenario 4 (TS4) –
‘BAU’
Low S content fuel (1%/0.5%),
aggressive NOx reductions
Relatively low S content fuel
(1.8%/1.2%), moderate NOx
reduction
High S content fuel (2%/2%),
NOx reductions according to IMO
stringency only
High S content fuel (2%/2%),
NOx reductions according to IMO
stringency only
Fleet = 75% diesel, 25%
alternative plant
Fleet = 75% diesel, 25%
alternative plant
Fleet = 75% diesel, 25%
alternative plant
Fleet = 100% diesel
Note: The fuel S percentages refer to values assumed in (2020/2050).
Source: Eyring et al. 2005b.
0
100
200
300
400
500
600
1950 1970 1990 2010 2030 2050
Mt C
D1TS1
D1TS2
D1TS3
D1TS4
D2TS1
D2TS2
D2TS3
D2TS4
D3TS1
D3TS2
D3TS3
D3TS4
D4TS1
D4TS2
D4TS3
D4TS4
Figure 5.7: Historical and projected CO2 emissions of seagoing shipping, 1990-
2050
Note: See Table 5.2 for the explanation of the scenarios.
Source: adapted from Eyring et al., 2005a,b.
10 1 km/h = 0.621 mph

337
Chapter 5 Transport and its infrastructure
efcient modes. Also, some of the energy used to overcome
inertia and accelerate the vehicle – normally lost when the
vehicle is slowed, to aerodynamic forces and rolling resistance
as well to the mechanical brakes (as heat) – may be recaptured
as electrical energy if regenerative braking is available (see the
discussion of hybrid electric drive trains).
The use of different liquid fuels, in blends with gasoline and
diesel or as ‘neat fuels’ require minimal or no changes to the
vehicle, while a variety of gaseous fuels and electricity would
require major changes. Alternative liquid fuels include ethanol,
biodiesel and methanol, and synthetic gasoline and diesel
made from natural gas, coal, or other feedstocks. Gaseous
fuels include natural gas, propane, dimethyl ether (a diesel
substitute) and hydrogen. Each fuel can be made from multiple
sources, with a wide range of GHG emission consequences.
In evaluating the effects of different fuels on GHG emissions,
it is crucial to consider GHG emissions associated with fuel
production and distribution in addition to vehicle tailpipe
emissions (see the section on well-to-wheels analysis). For
example, the consumption of hydrogen produces no emissions
aside from water directly from the vehicle, but GHG emissions
from hydrogen production can be quite high if the hydrogen is
produced from fossil fuels (unless the carbon dioxide from the
hydrogen production is sequestered).
The sections that follow discuss a number of technology,
design and fuel measures to reduce GHG emissions from
vehicles.
5.3.1.1 Reducing vehicle loads
Lightweight materials
A 10% weight reduction from a total vehicle weight can
improve fuel economy by 4–8%, depending on changes in
vehicle size and whether or not the engine is downsized. There
are several ways to reduce vehicle weight; including switching
to high strength steels (HSS), replacing steel by lighter materials
such as Al, Mg and plastics, evolution of lighter design concepts
and forming technologies. The amount of lighter materials in
vehicles has been progressively increasing over time, although
not always resulting in weight reductions and better fuel
economy if they are used to increase the size or performance of
the vehicle. In fact, the average weight of a vehicle in the USA
and Japan has increased by 10–20% in the last 10 years (JAMA,
2002; Haight, 2003), partly due to increased concern for safety
and customers’ desire for greater comfort.
Steel is still the main material used in vehicles, currently
averaging 70% of kerb weight. Aluminium usage has grown
to roughly 100 kg per average passenger car, mainly in the
engine, drive train and chassis in the form of castings and
forgings. Aluminium is twice as strong as an equal weight of
steel, allowing the designer to provide strong, yet lightweight
structures. Aluminium use in body structures is limited, but
there are a few commercial vehicles with all Al bodies (e.g.,
Audi’s A2 and A8). Where more than 200 kg of Al is used and
secondary weight reductions are gained by down-sizing the
engine and suspension – more than 11–13% weight reduction
can be achieved. Ford’s P2000 concept car11 has demonstrated
that up to 300 kg of Al can be used in a 900 kg vehicle.
Magnesium has a density of 1.7–1.8 g/cc12, about 1/4 that
of steel, while attaining a similar (volumetric) strength. Major
hurdles for automobile application of magnesium are its high
cost and performances issues such as low creep strength and
contact corrosion susceptibility. At present, the use of magnesium
in vehicle is limited to only 0.1–0.3% of the whole weight.
However, its usage in North American-built family vehicles
has been expanding by 10 to 14% annually in recent years.
Aluminium has grown at 4–6%; plastics by 1–1.8%; and high
strength steels by 3.5–4%. Since the amount of energy required
to produce Mg and also Al is large compared with steel, LCA
analysis is important in evaluating these materials’ potential for
CO2 emission reduction (Helms and Lambrecht, 2006). Also,
the extent of recycling is an important issue for these metals.
The use of plastics in vehicles has increased to about 8%
of total vehicle weight, which corresponds to 100-120 kg per
vehicle. The growth rate of plastics content has been decreasing
in recent years however, probably due to concerns about
recycling, given that most of the plastic goes to the automobile
shredder residue (ASR) at the end of vehicle life. Fibre-
reinforced plastic (FRP) is now widely used in aviation, but its
application to automobiles is limited due to its high cost and
long processing time. However, its weight reduction potential is
very high, maybe as much as 60%. Examples of FRP structures
manufactured using RTM (resin transfer method) technology
are wheel housings or entire oor assemblies. For a compact-
size car, this would make it possible to reduce the weight; of a
oor assembly (including wheel housings) by 60%, or 22 kg per
car compared to a steel oor assembly. Research examples of
plastics use in the chassis are leaf or coil springs manufactured
from bre composite plastic. Weight reduction potentials of up
to 63% have been achieved in demonstrators using glass and/or
carbon bre structures (Friedricht, 2002).
Aside from the effect of the growing use of non-steel
materials, the reduction in the average weight of steel in a
car is driven by the growing shift from conventional steels to
high strength steels (HSS). There are various types of HSS,
from relatively low strength grade (around 400 MPa) such as
solution-hardened and precipitation-hardened HSS to very
high strength grade (980–1400 MPa) such as TRIP steel and
tempered martensitic HSS. At present, the average usage per
vehicle of HSS is 160 kg (11% of whole weight) in the USA
11 SAE International (Society of Automotive Engineers): The aluminum angle, automotive engineering on-line, http://www.sae.org/automag/metals/10.htm.
12 Specific gravity 1738

338
Transport and its infrastructure Chapter 5
and 75 kg (7%) in Japan. In the latest Mercedes A-class vehicle,
HSS comprises 67% of body structure weight. The international
ULSAB-AVC project (Ultra Light Steel Auto Body – Advanced
Vehicle Concept) investigated intensive use of HSS, including
advanced HSS, and demonstrated that using HSS as much as
possible can reduce vehicle weight by 214 kg (–19%) and 472
kg (–32%) for small and medium passenger cars respectively.
In this concept, the total usage of HSS in body and closures
structures is 280–330 kg, of which over 80% is advanced HSS
(Nippon Steel, 2002).
Since heavy-duty vehicles such as articulated trucks are
much heavier than passenger vehicles, their weight reduction
potential is much larger. It is possible to reduce the weight
of tractor and trailer combination by more than 3000 kg by
replacing steel with aluminium (EAA, 2001).
Aerodynamics improvement
Improvements have been made in the aerodynamic
performance of vehicles over the past decade, but substantial
additional improvements are possible. Improvement in
aerodynamic performance offers important gains for vehicles
operating at higher speeds, e.g., long-distance trucks and light-
duty vehicles operating outside congested urban areas. For
example a 10% reduction in the coefcient of drag (CD) of
a medium sized passenger car would yield only about a 1%
reduction in average vehicle forces on the US city cycle (with
31.4 km/h average speed), whereas the same drag reduction
on the US highway cycle, with average speed of 77.2 km/h,
would yield about a 4% reduction in average forces.13 These
reductions in vehicle forces translate reasonably well into similar
reductions in fuel consumption for most vehicles, but variations
in engine efciency with vehicle force may negate some of the
benet from drag reduction unless engine power and gearing
are adjusted to take full advantage of the reduction.
For light-duty vehicles, styling and functional requirements
(especially for light-duty trucks) may limit the scope of
improvement. However, some vehicles introduced within the
past ve years demonstrate that improvement potential still
remains for the eet. The Lexus 430, a conservatively styled
sedan, attains a CD (coefcient of aerodynamic drag) of 0.26
versus a eet average of over 0.3 for the US passenger car eet.
Other eet-leading examples are:
• Toyota Prius, Mercedes E-class sedans, 0.26
• Volkswagen Passat, Mercedes C240, BMW 320i, 0.27
For light trucks, General Motors’ 2005 truck eet has
reduced average CD by 5–7% by sealing unnecessary holes in
the front of the vehicles, lowering their air dams, smoothing
their undersides and so forth (SAE International, 2004).
The current generation of heavy-duty trucks in the United
States has average CDs ranging from 0.55 for tractor-trailers
to 0.65 for tractor-tandem trailers. These trucks generally have
spoilers at the top of their cabs to reduce air drag, but substantial
further improvements are available. CD reductions of about
0.15, or 25% or so (worth about 12% reduced fuel consumption
at a steady 65 mph14), can be obtained with a package of base
aps (simple at plates mounted on the edges of the back end
of a trailer) and side skirts (McCallen et al., 2004). The US
Department of Energy’s 2012 research goals for heavy-duty
trucks (USDOE, 2000)15 include a 20% reduction (from a 2002
baseline, with CD of 0.625) in aerodynamic drag for a ‘class 8’
tractor-trailer combination.16 CD reductions of 50% and higher,
coupled with potential benets in safety (from better braking
and roll and stability control), may be possible with pneumatic
(air blowing) devices (Englar, 2001). A complete package of
aerodynamic improvements for a heavy-duty truck, including
pneumatic blowing, might save about 15–20% of fuel for trucks
operating primarily on uncongested highways, at a cost of about
5000 US$ in the near-term, with substantial cost reductions
possible over time (Vyas et al., 2002).
The importance of aerodynamic forces at higher speeds
implies that reduction of vehicle highway cruising speeds
can save fuel and some nations have used speed limits as fuel
conservation measures, e.g., the US during the period following
the 1973 oil embargo. US tests on nine vehicles with model
years from 1988 to 1997 demonstrated an average 17.1% fuel
economy loss in driving at 70 mph compared to 55 mph (ORNL,
2006). Recent tests on six contemporary vehicles, including two
hybrids, showed similar results – the average fuel economy loss
was 26.5% in driving at 80 mph compared to 60 mph, and 27.2%
in driving at 70 mph compared to 50 mph (Duoba et al., 2005).
Mobil Air Conditioning (MAC) systems
MAC systems contribute to GHG emissions in two ways
by direct emissions from leakage of refrigerant and indirect
emissions from fuel consumption. Since 1990 signicant
progress has been made in limiting refrigerant emissions due to
the implementation of the Montreal Protocol. The rapid switch
from CFC-12 (GWP 8100) to HFC-134a (GWP 1300) has led to
the decrease in the CO2-eq emissions from about 850 MtCO2-
eq in 1990 to 609 MtCO2-eq in 2003, despite the continued
growth of the MAC system eet (IPCC, 2005).
Refrigerant emissions can be decreased by using new
refrigerants with a much lower GWP, such as HFC-152a or CO2,
restricting refrigerant sales to certied service professionals and
better servicing and disposal practices. Although the feasibility
of CO2 refrigerant has been demonstrated, a number of technical
hurdles have still to be overcome.
13 The precise value would depend on the value of the initial CD as well as other aspects of the car’s design.
14 1 mph = 1.6 km/h
15 Http://www.eere.energy.gov/vehiclesandfuels/about/partnerships/21centurytruck/21ct_goals.shtml.
16 These are heavy-duty highway trucks with separate trailers, but less than 5 axles – the standard long-haul truck in the U.S.

339
Chapter 5 Transport and its infrastructure
Since the energy consumption for MAC is estimated to be
2.5–7.5% of total vehicle energy consumption, a number of
solutions have to be developed in order to limit the energy
consumption of MAC, such as improvements of the design
of MAC systems, including the control system and airow
management.
5.3.1.2 Improving drive train efciency
Advanced Direct Injection Gasoline / Diesel Engines and
transmissions.
New engine and transmission technologies have entered the
light-duty vehicle eets of Europe, the USA and Japan, and
could yield substantial reductions in carbon emissions if more
widely used.
Direct injection diesel engines yielding about 35% greater
fuel economy than conventional gasoline engines are being
used in about half the light-duty vehicles being sold in European
markets, but are little used in Japan and the USA (European taxes
on diesel fuel generally are substantially lower than on gasoline,
which boosts diesel share). Euro 4 emission standards were
enforced in 2005, with Euro 5 (still undened) to follow around
2009–2010. These standards, plus Tier 2 standards in the USA,
will challenge diesel NOx controls, adding cost and possibly
reducing fuel efciency somewhat. Euro 4/Tier 2 compliant
diesels for light-duty vehicles, obtaining 30% better fuel
efciency than conventional gasoline engines, may cost about
2000–3000 US$ more than gasoline engines (EEA, 2003).
Improvements to gasoline engines include direct injection.
Mercedes’ M271 turbocharged direct injection engine is
estimated to attain 18% reduced fuel consumption, part of which
is due to intake valve control and other engine technologies
(SAE International, 2003a); cylinder shutoff during low load
conditions (Honda Odyssey V6, Chrysler Hemi, GM V8s)
(SAE International, 2003a) and improved valve timing and lift
controls.
Transmissions are also being substantially improved.
Mercedes, GM, Ford, Chrysler, Volkswagen and Audi are
introducing advanced 6 and 7 speed automatics in their luxury
vehicles, with strong estimated fuel economy improvements
ranging from 4–8% over a 4-speed automatic for the Ford/GM 6-
speed to a claimed 13% over a manual, plus faster acceleration,
for the VW/Audi BorgWarner 6-speed (SAE International,
2003b). If they follow the traditional path for such technology,
these transmissions will eventually be rolled into the eet. Also,
continuously variable transmissions (CVTs), which previously
had been limited to low power drive trains, are gradually rising
in their power-handling capabilities and are moving into large
vehicles.
The best diesel engines currently used in heavy-duty trucks
are very efcient, achieving peak efciencies in the 45–46%
range (USDOE, 2000). Although recent advances in engine and
drive train technology for heavy-duty trucks have focused on
emissions reductions, current research programmes in the US
Department of Energy are aiming at 10–20% improvements in
engine efciency within ten years (USDOE, 2000), with further
improvements of up to 25% foreseen if signicant departures
from the traditional diesel engine platform can be achieved.
Engines and drive trains can also be made more efcient by
turning off the engine while idling and drawing energy from
other sources. The potential for reducing idling emissions in
heavy-duty trucks is signicant. In the USA, a nationwide
survey found that, on average, a long-haul truck consumed
about 1,600 gallons, or 6,100 litres, per year from idling during
driver rest periods. A variety of behavioural and technological
practices could be pursued to save fuel. A technological x is to
switch to grid connections or use onboard auxiliary power units
during idling (Lutsey et al., 2004).
Despite the continued tightening of emissions standards for
both light-duty vehicles and freight trucks, there are remaining
concerns about the gap between tested emissions and on-
road emissions, particularly for diesel engines. Current EU
emissions testing uses test cycles that are considerably gentler
than seen in actual driving, allowing manufacturers to design
drive trains so that they pass emissions tests but ‘achieve better
fuel efciency or other performance enhancement at the cost of
higher emissions during operation on the road (ECMT, 2006).’
Other concerns involve excessive threshold limits demanded of
onboard diagnostics systems, aftermarket mechanical changes
(replacement of computer chips, disconnection of exhaust gas
recirculation systems) and failure to maintain required uid
levels in Selective Catalytic Reduction systems (ECMT, 2006).
Similar concerns in the USA led to the phase-in between 2000
and 2004 of a more aggressive driving cycle (the US06 cycle)
to emission tests for LDVs; however, the emission limits tied to
this cycle were not updated when new Tier 2 emission standards
were promulgated, so concerns about onroad emissions,
especially for diesels, will apply to the USA as well.
Hybrid drive trains
Hybrid-electric drive trains combine a fuel-driven power
source, such as a conventional internal combustion engine
(ICE) with an electric drive train – electric motor/generator and
battery (or ultracapacitor) - in various combinations.17 In current
hybrids, the battery is recharged only by regenerative braking
and engine charging, without external charging from the grid.
‘Plug-in hybrids,’ which would obtain part of their energy from
the electric grid, can be an option but require a larger battery
and perhaps a larger motor. Hybrids save energy by:
17 A hybrid drive train could use an alternative to an electric drive train, for example a hydraulic storage and power delivery system. The U.S. Environmental Protection Agency has
designed such a system.

340
Transport and its infrastructure Chapter 5
• Shutting the engine down when the vehicle is stopped (and
possibly during braking or coasting);
• Recovering braking losses by using the electric motor to
brake and using the electricity generated to recharge the
battery;
• Using the motor to boost power during acceleration,
allowing engine downsizing and improving average engine
efciency;
• Using the motor instead of the engine at low load (in some
congurations), eliminating engine operation during its
lowest efciency mode;
• Allowing the use of a more efcient cycle than the standard
Otto cycle (in some hybrids);
• Shifting power steering and other accessories to (more
efcient) electric operation.
Since the 1998 introduction of the Toyota Prius hybrid in
the Japanese market, hybrid electric drive train technology has
advanced substantially, expanding its markets, developing in
alternative forms that offer different combinations of costs and
benets and improving component technologies and system
designs. Hybrids now range from simple belt-drive alternator-
starter systems offering perhaps 7 or 8% fuel economy benet
under US driving conditions to ‘full hybrids’ such as the Prius
offering perhaps 40–50% fuel economy benets18 (the Prius
itself more than doubles the fuel economy average – on the
US test – of the combined 2004 US model year compact and
medium size classes, although some portion of this gain is due
to additional efciency measures). Also, hybrids may improve
fuel efciency by substantially more than this in congested
urban driving conditions, so might be particularly useful for
urban taxis and other vehicles making frequent stops. Hybrid
sales have expanded rapidly: in the United States, sales were
about 7,800 in 2000 and have risen rapidly, to 207,000 in
200519; worldwide hybrid sales were about 541,000 in 2005
(IEA Hybrid Website, 2006).
Improvements made to the Prius since its introduction
demonstrate how hybrid technology is developing. For
example, the power density of Prius’s nickel metal hydride
batteries has improved from 600 W/kg1 in 1998 to 1250 W/kg1
in 2004 - a 108% improvement. Similarly, the batteries’ specic
energy has increased 37% during the same period (EEA, 2003).
Higher voltage in the 2004 Prius allows higher motor power
with reduced electrical losses and a new braking-by-wire
system maximizes recapture of braking energy. The 1998 Prius
compact sedan attained 42 mpg on the US CAFE cycle, with
0–60 mph acceleration time of 14.5 seconds; the 2004 version
is larger (medium size) but attains 55 mpg and a 0–60 of 10.5
seconds. Prius-type hybrid systems will add about 4,000 US$ to
the price of a medium sized sedan (EEA, 2003), but continued
cost reduction and development efforts should gradually reduce
costs.
Hybridization can yield benets in addition to directly
improving fuel efciency, including (depending on the design)
enhanced performance (with reduced fuel efciency benets in
some designs), less expensive 4-wheel drive systems, provision
of electric power for off-vehicle use (e.g., GM Silverado hybrid),
and ease of introducing more efcient transmissions such as
automated manuals (using the motor to reduce shift shock).
Hybrid drive trains’ strong benets in congested stop-and-go
travel mesh well with some heavier-duty applications, including
urban buses and urban delivery vehicles. An initial generation
of hybrid buses in New York City obtained about a 10%
improvement in fuel economy as well as improved acceleration
capacity and substantially reduced emissions (Foyt, 2005).
More recently, a different design achieved a 45% fuel economy
increase in NYC operation (not including summer, where the
increase should be lower) (Chandler et al., 2006). Fedex has
claimed a 57% fuel economy improvement for its E700 diesel
hybrid delivery vehicles (Green Car Congress, 2004).
Hybrid applications extend to two and three-wheelers, as
well, because these often operate in crowded urban areas in stop-
and-go operation. Honda has developed a 50 cc hybrid scooter
prototype that offers about a one-third reduction in fuel use and
GHG emissions compared to similar 50 cc scooters (Honda,
2004). However, sales of two and three-wheeled vehicles in
most markets are extremely price sensitive, so the extent of any
potential market for hybrid technology may be quite limited.
Plug-in hybrids, or PHEVs, are a merging of hybrid
electric and battery electric. PHEVs get some of their energy
from the electricity grid. Plug-in hybrid technology could be
useful for both light-duty vehicles and for a variety of medium
duty vehicles, including urban buses and delivery vehicles.
Substantial market success of PHEV technology is, however,
likely to depend strongly on further battery development, in
particular on reducing battery cost and specic energy and
increasing battery lifetimes.
PHEVs’ potential to reduce oil use is clear – they can use
electricity to ‘fuel’ a substantial portion of miles driven. The
US Electric Power Research Institute (EPRI, 2001) estimates
that 30 km hybrids (those that have the capability to operate up
to 30 km solely on electricity from the battery) can substitute
electricity for gasoline for approximately 30–40% of miles
driven in the USA. With larger batteries and motors, the vehicles
could replace even more mileage. However, their potential to
reduce GHG emissions more than that achieved by current
hybrids depends on their sources of electricity. For regions that
rely on relatively low-carbon electricity for off-peak power,
e.g., natural gas combined cycle power, GHG reductions over
the PHEV’s lifecycle will be substantial; in contrast, PHEVs in
areas that rely on coal-red power could have increased lifecycle
18 Precise values are somewhat controversial because of disagreements about the fuel economy impact of other fuel-saving measures on the vehicles.
19 Based on sales data from http://electricdrive.org/index.php?tg=articles&topics=7 and J.D. Power.
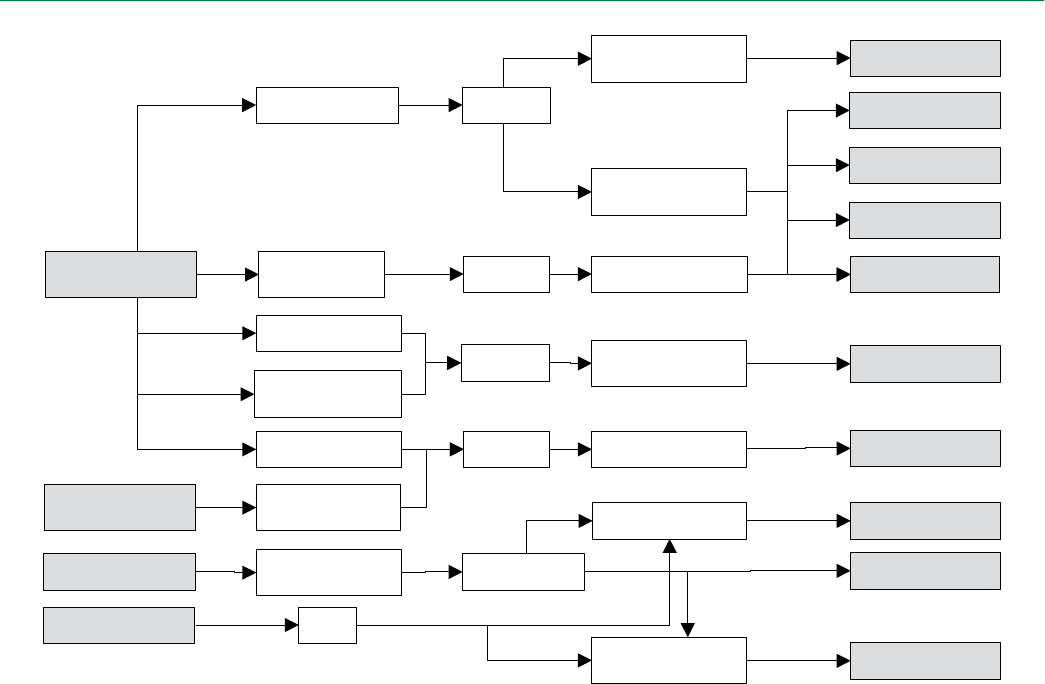
341
Chapter 5 Transport and its infrastructure
carbon emissions. In the long-term, movement to a low-carbon
electricity sector could allow PHEVs to play a major role in
reducing transport sector GHG emissions.
5.3.1.3 Alternative fuels
Biofuels
The term biofuels describes fuel produced from biomass. A
variety of techniques can be used to convert a variety of CO2
neutral biomass feedstocks into a variety of fuels. These fuels
include carbon-containing liquids such as ethanol, methanol,
biodiesel, di-methyl esters (DME) and Fischer-Tropsch liquids,
as well as carbon-free hydrogen. Figure 5.8 shows some
main routes to produce biofuels: extraction of vegetable oils,
fermentation of sugars to alcohol, gasication and chemical
synthetic diesel, biodiesel and bio oil. In addition, there are more
experimental processes, such as photobiological processes that
produce hydrogen directly.
Biofuels can be used either ‘pure’ or as a blend with other
automotive fuels. There is a large interest in developing biofuel
technologies, not only to reduce GHG emission but more so
to decrease the enormous transport sector dependence on
imported oil. There are two biofuels currently used in the world
for transport purposes – ethanol and biodiesel.
Ethanol is currently made primarily by the fermentation of
sugars produced by plants such as sugar cane, sugar beet and
corn. Ethanol is used in large quantities in Brazil where it is
made from sugar cane, in the USA where it is made from corn,
but only in very small quantities elsewhere.
Ethanol is blended with gasoline at concentrations of 5–10%
on a volume basis in North America and Europe. In Brazil
ethanol is used either in its pure form replacing gasoline, or
as a blend with gasoline at a concentration of 20–25%. The
production of ethanol fuelled cars in Brazil achieved 96%
market share in 1985, but sharply declining shortly thereafter
to near zero. Ethanol vehicle sales declined because ethanol
producers shifted to sugar production and consumers lost
condence in reliable ethanol supply. A 25% blend of ethanol
has continued to be used. With the subsequent introduction of
exfuel cars (see Box 5.2), ethanol fuel sales have increased.
However, the sugar cane experience in Brazil will be difcult
to replicate elsewhere. Land is plentiful, the sugar industry is
highly efcient, the crop residues (bagasse) are abundant and
easily used for process energy, and a strong integrated R&D
capability has been developed in cane growing and processing.
In various parts of Asia and Africa, biofuels are receiving
increasing attention and there is some experience with ethanol-
Lignocellulosic
biomass
Gasification Syngas
Anaerobic
digestion
Hydrothermal
liquefaction
Sugar/starch
crops
Milling and
hydrolysis
Processing or
Extraction
Water gas shift
+ separation
Hydro treating
and refining
Catalysed
synthesis
Biogas
Bio oil
Sugar
Vegetable oil
Flash pyrolysis
Hydrolysis
Oil plants
Purification
Fermentation
Esterification
Hydrogen
Methanol
DME
FT Diesel
Methane
Diesel (CxHy)
Ethanol
Biodiesel (esters)
Bio oil
Animal fat
Hydro treating
and refining Diesel (CxHy)
Oil
Figure 5.8: Overview of conversion routes from crops to biofuels
Source: Adapted from Hamelinck and Faaij, 2006.

342
Transport and its infrastructure Chapter 5
gasoline blending of up to 20%. Ethanol is being produced
from sugar cane in Africa and from corn in small amounts in
Asia. Biodiesel production is being considered from Jatropha
(a drought resistant crop) that can be produced in most parts of
Africa (Yamba and Matsika, 2004). It is estimated that with 10%
ethanol-gasoline blending and 20% biodiesel-diesel blending
in southern Africa, a reduction of 2.5 MtCO2 and 9.4 MtCO2
respectively per annum can be realized. Malaysian palm oil and
US soybean oils are currently being used as biodiesel transport
fuel in limited quantities and other oilseed crops are being
considered elsewhere.
For the future, the conversion of ligno-cellulosic sources
into biofuels is the most attractive biomass option. Ligno-
cellulosic sources are grasses and woody material. These
include crop residues, such as wheat and rice straw, and corn
stalks and leaves, as well as dedicated energy crops. Cellulosic
crops are attractive because they have much higher yields per
hectare than sugar and starch crops, they may be grown in areas
unsuitable for grains and other food/feed crops and thus do not
compete with food, and the energy use is far less, resulting in
much greater GHG reductions than with corn and most food
crops (IEA, 2006a).
A few small experimental cellulosic conversion plants
were being built in the USA in 2006 to convert crop residues
(e.g., wheat straw) into ethanol, but considerably more R&D
investment is needed to make these processes commercial.
These investments are beginning to be made. In 2006 BP
announced it was committing 1 billion US$ to develop new
biofuels, with special emphasis on bio-butanol, a liquid that can
be easily blended with gasoline. Other large energy companies
were also starting to invest substantial sums in biofuels R&D
in 2006, along with the US Department of Energy, to increase
plant yields, develop plants that are better matched with
process conversion technologies and to improve the conversion
processes. The energy companies in particular are seeking
biofuels other than ethanol that would be more compatible with
the existing petroleum distribution system.22
Biodiesel is less promising in terms of cost and production
potential than cellulosic fuels but is receiving increasing
attention. Bioesters are produced by a chemical reaction
between vegetable or animal oil and alcohol, such as ethanol
or methanol. Their properties are similar to those of diesel oil,
allowing blending of bioesters with diesel or the use of 100%
bioesters in diesel engines, and they are all called biodiesel.
Blends of 20% biodiesel with 80% petroleum diesel (B20) can
generally be used in unmodied diesel engines.23
Diesel fuel can also be produced through thermochemical
hydrocracking of vegetable oil and animal fats. This technology
has reached the demonstration stage. In Finland and Brazil24
a commercial production project is under way. The advantage
of the hydrocracked biodiesel is its stability and compatibility
with conventional diesel (Koyama et al., 2006).
20 http://www.eere.energy.gov/afdc/afv/eth_vehicles.html, http://en.wikipedia.org/wiki/Flexible-fuel_vehicle.
21 http://www.epa.gov/smartway/growandgo/documents/factsheet-e85.htm.
22 http://www.greencarcongress.com/2006/06/bp_and_dupont_t.html.
23 http://www.eere.energy.gov/afdc/altfuel/biodiesel.html.
Box 5.2 Flexfuel vehicle (FFV)20
Particularly in Brazil where there is large ethanol availability as an automotive fuel there has been a substantial increase
in sales of flexfuel vehicles (FFV). Flexfuel vehicle sales in Brazil represent about 81% (Nov. 2006) of the market share of
light-duty vehicles. The use of FFVs facilitates the introduction of new fuels. The incremental vehicle cost is small, about
100 US$.
The FFVs were developed with systems that allow the use of one or more liquid fuels, stored in the same tank. This system is
applied to OTTO cycle engines and enables the vehicles to run on gasoline, ethanol or both in a mixture, according to the fuel
availability. The combustion control is done through an electronic device, which identifies the fuel being used and then the
engine control system makes the suitable adjustments allowing the running of the engine in the most adequate condition.
One of the greatest advantages of FFVs is their flexibility to choose their fuel depending mainly on price. The disadvantage
is that the engine cannot be optimized for the attributes of a single fuel, resulting in foregone efficiency and higher pollutant
emissions (though the latter problem can be largely addressed with sophisticated sensors and computer controls, as it is in
the USA).
In the USA21, the number of FFVs is close to 6 million and some US manufacturers are planning to expand their sales.
However, unlike in the Brazilian experience, ethanol has not been widely available at fuel stations (other than as a 10% blend)
and thus the vehicles rarely fuel with ethanol. Their popularity in the USA is due to special fuel economy credits available to
the manufacturer.
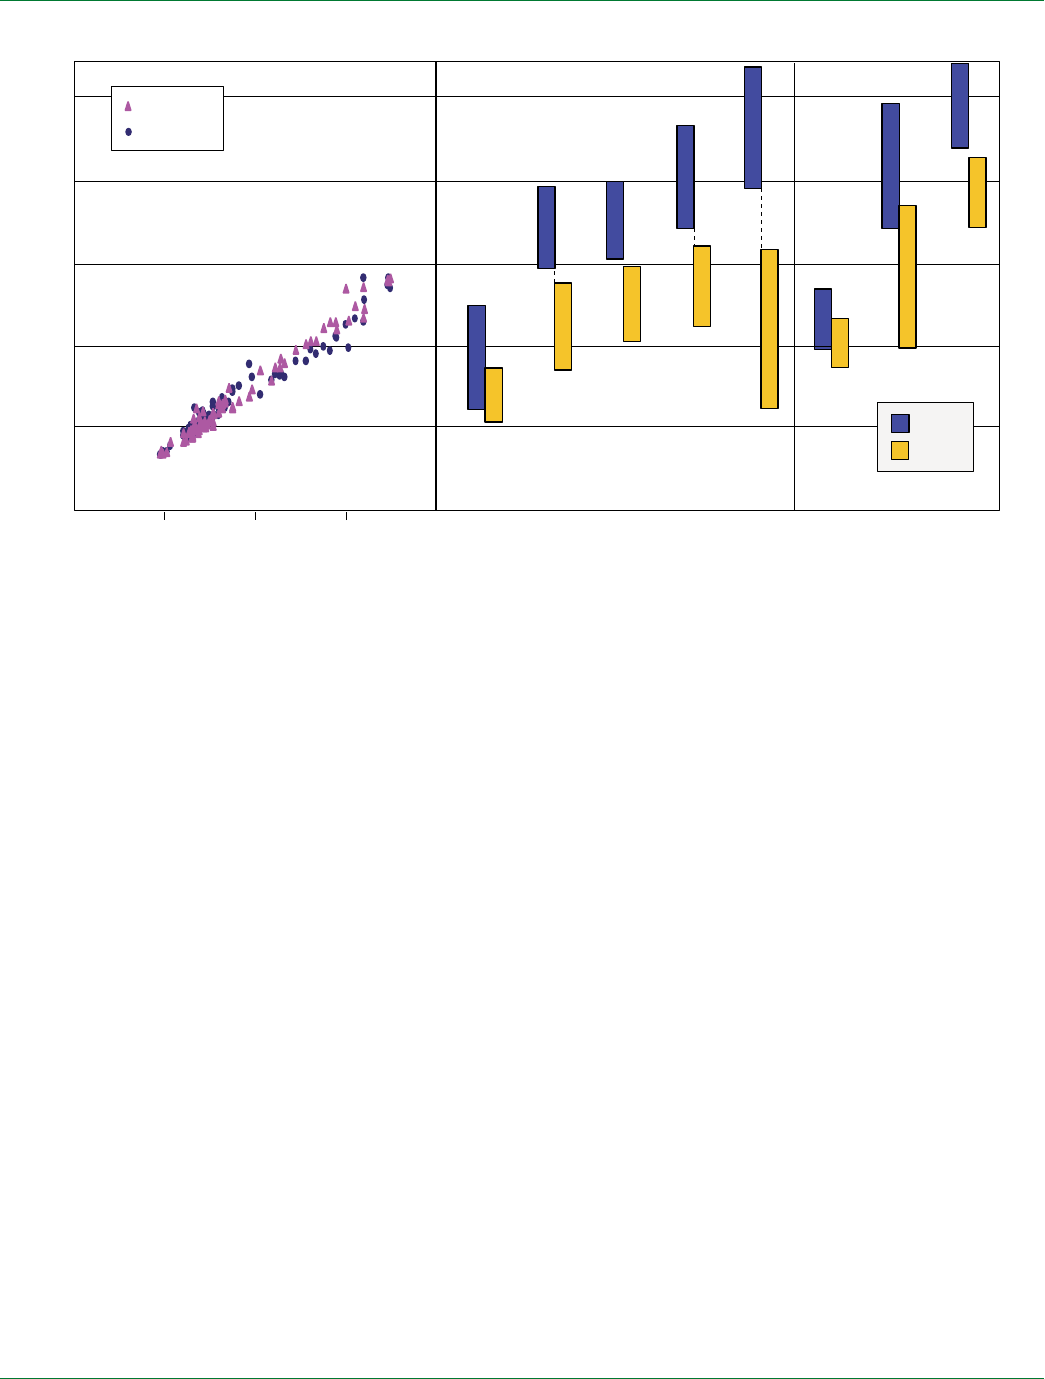
343
Chapter 5 Transport and its infrastructure
A large drawback of biodiesel fuels is the very high cost of
feedstocks. If waste oils are used the cost can be competitive,
but the quantity of waste oils is miniscule compared to transport
energy consumption. If crops are used, the feedstock costs are
generally far higher than for sugar, starch or cellulosic materials.
These costs are unlikely to drop since they are the same highly
developed crops used for foods and food processing. Indeed,
if diverted to energy use, the oil feedstock costs are likely
to increase still further, creating a direct conict with food
production. The least expensive oil feedstock at present is palm
oil. Research is ongoing into new ways of producing oils. The
promising feedstock seems to be algae, but cost and scale issues
are still uncertain.
For 2030 IEA (2006a) reports mitigation potentials for
bioethanol between 500–1200 MtCO2, with possibly up to 100–
300 MtCO2 of that for ligno-cellulosic ethanol (or some other
bio-liquid). The long-term potential for ligno-cellulosic fuels
beyond 2030 is even greater. For biodiesel, it reports mitigation
potential between 100–300 MtCO2.
The GHG reduction potential of biofuels, especially with
cellulosic materials, is very large but uncertain. IEA estimated
the total mitigation potential of biofuels in the transport sector
in 2050 to range from 1800 to 2300 MtCO2 at 25 US$/tCO2-
eq. based on scenarios with a respective replacement of 13 and
25% of transport energy demand by biofuels (IEA, 2006a). The
reduction uncertainty is huge because of uncertainties related to
costs and GHG impacts.
Only in Brazil is biofuel competitive with oil at 50 US$ per
barrel or less. All others cost more. As indicated in Figure 5.9,
biofuel production costs are expected to drop considerably,
especially with cellulosic feedstocks. But even if the processing
costs are reduced, the scale issue is problematic. These facilities
have large economies of scale. However, there are large
diseconomies of scale in feedstock production (Sperling, 1985).
The cost of transporting bulky feedstock materials to a central
point increases exponentially, and it is difcult assembling large
amount of contiguous land to serve single large processing
facilities.
Another uncertainty is the well-to-wheel reduction in GHGs
by these various biofuels. The calculations are very complex
because of uncertainties in how to allocate GHG emissions
across the various products likely to be produced in the bio-
renery facilities, how to handle the effects of alternative uses
of land, and so on, and the large variations in how the crops
are grown and harvested, as well as the uncertain efciencies
and design congurations of future process technologies and
24 Brasil Energy, No.397-July/August (2006), 40:“H-Bio, The Clean Diesel”.
0
0.2
0.4
0.6
0.8
1.0
040 80
20 60
Average crude oil price, US$/bbl
Ethanol Biodiesel
sugar cane
maize
beet
wheat
cellulosic
vegetable oil
animal fat
Fisher-Tropsch
synthesis
2005
2030
Diesel
US $/l
Gasoline
Figure 5.9: Comparison of cost for various biofuels with those for gasoline and diesel
Source: IEA, 2006b.
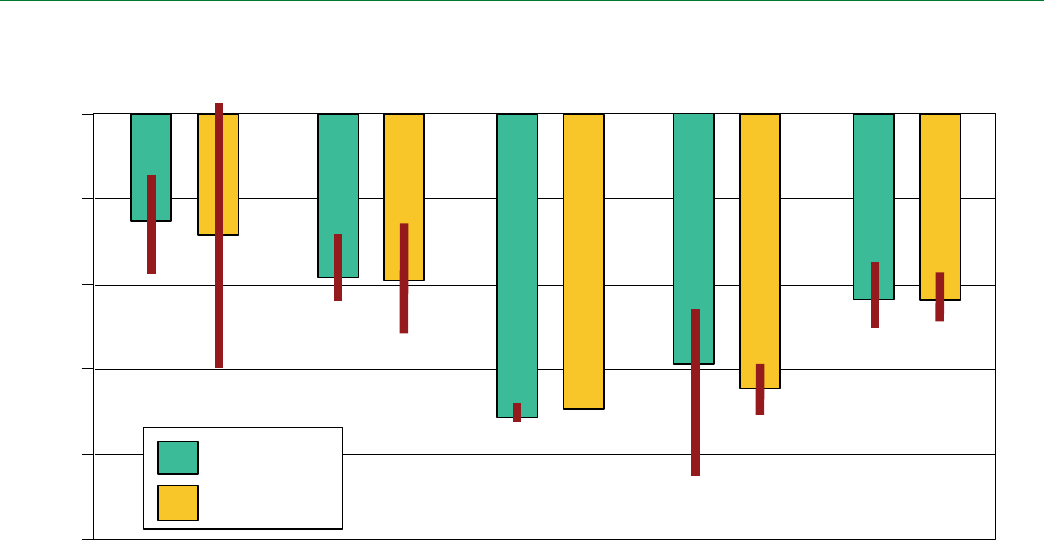
344
Transport and its infrastructure Chapter 5
bio-engineering plant materials. Typical examples are shown
in Figure 5.10.
Ethanol from sugar cane, as produced in Brazil, provides
signicant reductions in GHG emissions compared to gasoline
and diesel fuel on a ‘well-to-wheels’ basis. These large
reductions result from the relatively energy efcient nature of
sugar cane production, the use of bagasse (the cellulosic stalks
and leaves) as process energy and the highly advanced state
of Brazilian sugar farming and processing. Ongoing research
over the years has improved crop yields, farming practices
and process technologies. In some facilities the bagasse is
being used to cogenerate electricity which is sold back to the
electricity grid.
In contrast, the GHG benets of ethanol made from corn are
minor (Ribeiro & Yones-Ibrahim, 2001). Lifecycle estimates
range from a net loss to gains of about 30%, relative to gasoline
made from conventional oil. Farrell et al. (2006) evaluates the
many studies and concludes that on average the reductions are
probably about 13% compared to gasoline from conventional
oil. The corn-ethanol benets are minimal because corn farming
and processing are energy intensive.
Biofuels might play an important role in addressing GHG
emissions in the transport sector, depending on their production
pathway (Figure 5.10). In the years to come, some biofuels may
become economically competitive, as the result of increased
biomass yields, developments of plants that are better suited
to energy production, improved cellulosic conversion processes
and even entirely new energy crops and conversion processes.
In most cases, it will require entirely new businesses and
industries. The example of ethanol in Brazil is a model. The
question is the extent to which this model can be replicated
elsewhere with other energy crops and production processes.
The biofuel potential is limited by:
• The amount of available agricultural land (and in case of
competing uses for that land) for traditional and dedicated
energy crops;
• The quantity of economically recoverable agricultural and
silvicultural waste streams;
• The availability of proven and cost-effective conversion
technology.
Another barrier to increasing the potential is that the
production of biofuels on a massive scale may require
deforestation and the release of soil carbon as mentioned in
Chapter 8.4. Another important point on biofuels is a view from
the cost-effectiveness among the sectors. When comparing
the use of biofuel in the transport sector with its use in power
stations, the latter is more favourable from a cost-effectiveness
point of view (ECMT, 2007).
Natural Gas (CNG / LNG / GTL)
Natural gas, which is mainly methane (CH4), can be used
directly in vehicles or converted into more compact fuels. It
may be stored in compressed (CNG) or liqueed (LNG) form
Ethanol from
sugar beet,
EU
Ethanol from
sugar cane,
Brazil
Ethanol from
cellulosic
feedstock, IEA
Biodiesel
from rapeseed,
EU
0
-25
-50
-75
-100
-125
Ethanol from
grain,
US/EU
IEA (2004)
EUCAR (2006)
5.10
%
Figure 5.10: Reduction of well-to-wheels GHG emissions compared to conventionally fuelled vehicles
Note: bars indicate range of estimates.
Source: IEA, 2004c; EUCAR/CONCAWE/JRC, 2006.

345
Chapter 5 Transport and its infrastructure
on the vehicle. Also, natural gas may be converted in large
petrochemical plants into petroleum-like fuels (the process is
known as GTL, or gas-to-liquid). The use of natural gas as a
feedstock for hydrogen is described in the hydrogen section.
CNG and LNG combustion characteristics are appropriate
for spark ignition engines. Their high octane rating, about
120, allows a higher compression ratio than is possible using
gasoline, which can increase engine efciency. This requires
that the vehicle be dedicated to CNG or LNG, however. Many
current vehicles using CNG are converted from gasoline
vehicles or manufactured as bifuel vehicles, with two fuel
tanks. Bifuel vehicles cannot take full advantage of CNG’s high
octane ratio.
CNG has been popular in polluted cities because of its good
emission characteristics. However, in modern vehicles with
exhaust gas after-treatment devices, the non-CO2 emissions
from gasoline engines are similar to CNG, and consequently
CNG loses its emission advantages in term of local pollutants;
however it produces less CO2. Important constraints on its use
are the need for a separate refuelling infrastructure system
and higher vehicle costs – because CNG is stored under high
pressure in larger and heavier fuel tanks.
Gas-to-liquids (GTL) processes can produce a range of
liquid transport fuels using Fischer-Tropsch or other conversion
technologies. The main GTL fuel produced will be synthetic
sulphur-free diesel fuel, although other fuels can also be
produced. GTL processes may be a major source of liquid fuels
if conventional oil production cannot keep up with growing
demand, but the current processes are relatively inefcient:
61–65% (EUCAR/CONCAWE/JRC, 2006) and would lead
to increased GHG emissions unless the CO2 generated is
sequestered.
DME can be made from natural gas, but it can also be
produced by gasifying biomass, coal or even waste. It can be
stored in liquid form at 5–10 bar pressure at normal temperature.
This pressure is considerably lower than that required to store
natural gas on board vehicles (200 bar). A major advantage of
DME is its high cetane rating, which means that self-ignition
will be easier. The high cetane rating makes DME suitable for
use in efcient diesel engines.
DME is still at the experimental stage and it is still too
early to say whether it will be commercially viable. During
experiments, DME has been shown to produce lower emissions
of hydrocarbons, nitric oxides and carbon monoxide than diesel
and zero emissions of soot (Kajitani et al., 2005). There is no
current developed distribution network for DME, although
it has similarities to LPG and can use a similar distribution
system. DME has a potential to reduce GHG emissions since it
has a lower carbon intensity (15 tC/TJ) than petroleum products
(18.9–20.2 tC/TJ) (IPCC, 1996).
Hydrogen / Fuel Cells
During the last decade, fuel cell vehicles (FCVs) have attracted
growing attention and have made signicant technological
progress. Drivers for development of FCVs are global warming
(FCVs fuelled by hydrogen have zero CO2 emission and high
efciency), air quality (zero tailpipe emissions), and energy
security (hydrogen will be produced from a wide range of
sources), and the potential to provide new desirable customer
attributes (low noise, new designs).
There are several types of FCVs; direct-drive and hybrid
power train architectures fuelled by pure hydrogen, methanol
and hydrocarbons (gasoline, naphtha). FCVs with liquid fuels
have advantages in terms of fuel storage and infrastructure, but
they need on-board fuel reformers (fuel processors), which leads
to lower vehicle efciency (30–50% loss), longer start-up time,
slower response and higher cost. Because of these disadvantages
and rapid progress on direct hydrogen systems, nearly all auto
manufacturers are now focused on the pure hydrogen FCV.
Signicant technological progress has been made since TAR
including: improved fuel cell durability, cold start (sub-freezing)
operation, increased range of operation, and dramatically reduced
costs (although FCV drive train costs remain at least an order of
magnitude greater than internal combustion engine (ICE) drive
train costs) (Murakami and Uchibori, 2006).
In addition, many demonstration projects have been
initiated since TAR25. Since 2000, members of the California
Fuel Cell Partnership have placed 87 light-duty FCVs and 5
FC buses in California, which have travelled over 590,000 km
on California’s roads and highways. In 2002–2003, Japanese
automakers began leasing FCVs in Japan and the USA, now
totalling 17 vehicles. In 2004, US DOE started government/
industry partnership ‘learning demonstrations’ for testing,
demonstrating and validating hydrogen fuel cell vehicles and
infrastructure and vehicle/infrastructure interfaces for complete
system solutions. In Europe, there are several partnerships for
FCV demonstration such as CUTE (Clean Urban Transport
for Europe), CEP (Clean Energy Partnership) and ECTOS
(Ecological City Transport System), using more than 30 buses
and 20 passenger cars.
The recent US (NRC/NAE, 2004) and EU (JRC/IPTS, 2004)
analyses conclude:
Although the potential of FCVs for reducing GHG emissions
is very high there are currently many barriers to be overcome
before that potential can be realized in a commercial market.
These are:
• To develop durable, safe, and environmentally desirable fuel
cell systems and hydrogen storage systems and reduce the
25 See the report of JHFC, Current status of overseas FCV demonstration, http://www.jhfc.jp/j/data/data/h17/11_h17seminar_e.pdf.
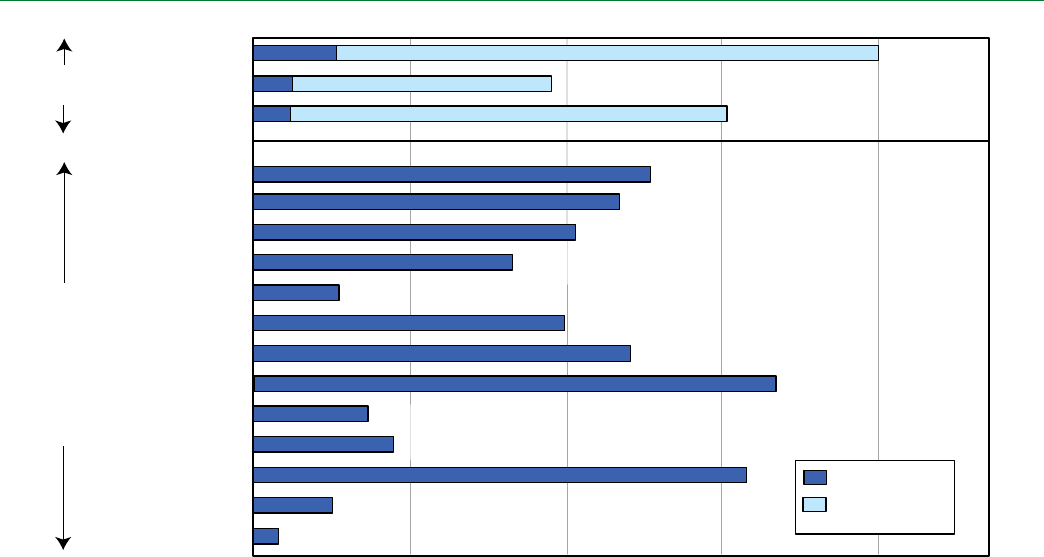
346
Transport and its infrastructure Chapter 5
cost of fuel cell and storage components to be competitive
with today’s ICEs;
• To develop the infrastructure to provide hydrogen for the
light-duty vehicle user;
• To sharply reduce the costs of hydrogen production from
renewable energy sources over a time frame of decades.
Or to capture and store (‘sequester’) the carbon dioxide
byproduct of hydrogen production from fossil fuels.
Public acceptance must also be secured in order to create
demand for this technology. The IEA echoes these points
while also noting that deployment of large-scale hydrogen
infrastructure at this point would be premature, as some of
the key technical issues that are still being worked on, such as
fuel cell operating conditions and hydrogen on-board storage
options, may have a considerable impact on the choice of
hydrogen production, distribution and refuelling (IEA, 2005).
The GHG impact of FCVs depends on the hydrogen
production path and the technical efciency achieved by vehicles
and H2 production technology. At the present technology level
with FCV tank-to-wheel efciency of about 50% and where
hydrogen can be produced from natural gas at 60% efciency,
well-to-wheel (WTW) CO2 emissions can be reduced by 50–
60% compared to current conventional gasoline vehicles. In the
future, those efciencies will increase and the potential of WTW
CO2 reduction can be increased to nearly 70%. If hydrogen is
derived from water by electrolysis using electricity produced
using renewable energy such as solar and wind, or nuclear
energy, the entire system from fuel production to end-use in
the vehicle has the potential to be a truly ‘zero emissions’. The
same is almost true for hydrogen derived from fossil sources
where as much as 90% of the CO2 produced during hydrogen
manufacture is captured and stored (see Figure 5.11).
FCV costs are expected to be much higher than conventional
ICE vehicles, at least in the years immediately following their
introduction and H2 costs may exceed gasoline costs. Costs for
both the vehicles and fuel will almost certainly fall over time
with larger-scale production and the effects of learning, but the
long-term costs are highly uncertain. Figure 5.11 shows both
well-to-wheels emissions estimates for several FCV pathways
and their competing conventional pathways, as well as cost
estimates for some of the hydrogen pathways.
Although fuel cells have been the primary focus of
research on potential hydrogen use in the transport sector,
some automakers envision hydrogen ICEs as a useful bridge
technology for introducing hydrogen into the sector and have
built prototype vehicles using hydrogen. Mazda has started
to lease bi-fuel (hydrogen or gasoline) vehicles using rotary
engines and BMW has also converted a 7-series sedan to bi-fuel
operation using liqueed hydrogen (Kiesgen et al., 2006) and
is going to lease them in 2007. Available research implies that a
direct injected turbocharged hydrogen engine could potentially
achieve efciency greater than a DI diesel (Wimmer et al.,
Gasoline
Gasoline-HV
Diesel
Gasoline
Fuel Cell Vehicles ICE
Naphtha
LPG
LNG
LNG with CCS
NG-LiqH2
Metha
Coal
Coal with CCS
Coke Oven Gas
Electricity
Electricity-Nuclear
Electricity-Wind/PV
Well-to-Wheel CO2 emission (ICE gasoline=1)
($23.8-89.1/GJ)
($7.3-8.3/GJ)
($8.5-10.2/GJ)
($5.9-8.0/GJ)
($6.4-8.6/GJ)
($19.2-39.2/GJ)
00.5 1.0
Well-to-Tank
Tank-to-Wheel
Figure 5.11: Well-to-wheel CO2 emission for major pathways of hydrogen with some estimates of hydrogen production cost (numbers in parentheses)
Source: Toyota/Mizuho, 2004; NRC/NAE, 2004.

347
Chapter 5 Transport and its infrastructure
2005), although research and development challenges remain,
including advanced sealing technology to insure against leakage
with high pressure injection.
Electric vehicles
Fuel cell and hybrid vehicles gain their energy from
chemical fuels, converting them into electricity onboard. Pure
electric vehicles operating today are either powered from
off-board electricity delivered through a conductive contact
– usually buses with overhead wires or trains with electried
‘third rails’ – or by electricity acquired from the grid and stored
on-board in batteries. Future all-electric vehicles might use
inductive charging to acquire electricity, or use ultracapacitors
or ywheels in combination with batteries to store electricity
on board.
The electric vehicles are driven by electric motors with high
efciencies of more than 90%, but their short driving range and
short battery life have limited the market penetration. Even
a limited driving range of 300 km requires a large volume of
batteries weighing more than 400 kg (JHFC, 2006). Although
the potential of CO2 reduction strongly depends on the power
mix, well-to-wheels CO2 emission can be reduced by more than
50% compared to conventional gasoline-ICE (JHFC, 2006).
Vehicle electrication requires a more powerful, sophisticated
and reliable energy-storage component than lead-acid batteries.
These storage components will be used to start the car and also
operate powerful by-wire control systems, store regenerative
braking energy and to operate the powerful motor drives needed
for hybrid or electric vehicles. Nickel metal hydride (NiMH)
batteries currently dominate the power-assist hybrid market
and Li ion batteries dominate the portable battery business.
Both are being aggressively developed for broader automotive
applications. The energy density has been increased to 170 Wh
kg–1 and 500 Wh L–1 for small-size commercial Li ion batteries
(Sanyo, 2005) and 130 Wh kg–1 and 310 Wh L–1 for large-size
EV batteries (Yuasa, 2000). While NiMH has been able to
maintain hybrid vehicle high-volume business, Li ion batteries
are starting to capture niche market applications (e.g., the idle-
stop model of Toyota’s Vitz). The major hurdle left for Li ion
batteries is their high cost.
Ultracapacitors offer long life and high power but low energy
density and high current cost. Prospects for cost reduction
and energy enhancement and the possibility of coupling the
capacitor with the battery are attracting the attention of energy
storage developers and automotive power technologists alike.
The energy density of ultracapacitors has increased to 15–20
Wh kg–1 (Power System, 2005), compared with 40–60 Wh kg–1
for Ni-MH batteries. The cost of these advanced capacitors is
in the range of several 10s of dollars/Wh, about one order of
magnitude higher than Li batteries.
5.3.1.4 Well-to-wheels analysis of technical mitigation
options
Life cycle analysis (LCA) is the most systematic and
comprehensive method for the assessment of the environmental
impacts of transport technologies. However, non-availability,
uncertainty or variability of data limit its application. One
key difculty is deciding where to draw the boundary for the
analysis; another is treating the byproducts of fuel production
systems and their GHG emission credits. Also in some cases,
LCA data varies strongly across regions
For automobiles, the life-cycle chain can be divided into the
fuel cycle (extraction of crude oil, fuel processing, fuel transport
and fuel use during operation of vehicle) and vehicle cycle
(material production, vehicle manufacturing and disposal at
the end-of-life). For a typical internal combustion engine (ICE)
vehicle, 70–90% of energy consumption and GHG emissions
take place during the fuel cycle, depending on vehicle efciency,
driving mode and lifetime driving distance (Toyota, 2004).
Recent studies of the Well-to-wheels CO2 emissions of
conventional and alternative fuels and vehicle propulsion
concepts include a GM/ANL (2005) analysis for North
America, EU-CAR/CONCAWE/JRC (2006) for Europe and
Toyota/Mizuho (2004) for Japan. Some results are shown in
Fig. 5.12. Some of the differences, as apparent from Figure
5.12 for ICE-gasoline and ICE-D (diesel) reect difference in
the oil producing regions and regional differences in gasoline
and diesel fuel requirements and processing equipment in
reneries.
The Well-to-wheel CO2 emissions shown in Fig. 5.12 are
for three groups of vehicle/fuel combinations – ICE/fossil fuel,
ICE/biofuel and FCV. The full well-to-wheels CO2 emissions
depend on not only the drive train efciency (TTW: tank-to-
wheel) but also the emissions during the fuel processing (WTT:
well-to-tank). ICE-CNG (compressed natural gas) has 15–25%
lower emissions than ICE-G (Gasoline) because natural gas
is a lower-carbon fuel and ICE-D (Diesel) has 16–24% lower
emissions due to the high efciency of the diesel engine. The
results for hybrids vary among the analyses due to different
assumptions of vehicle efciency and different driving cycles.
Although Toyota’s analysis is based on Prius, and using
Japanese 10–15 driving cycle, the potential for CO2 reduction
is 20–30% in general.
Table 5.3 summarizes the results and provides an overview
of implementation barriers. The lifecycle emissions of ICE
vehicles using biofuels and fuel cell vehicles are extremely
dependent on the fuel pathways. For ICE-Biofuel, the CO2
reduction potential is very large (30–90%), though world
potential is limited by high production costs for several biomass
pathways and land availability. The GHG reduction potential
for the natural gas-sourced hydrogen FCV is moderate, but
lifecycle emissions can be dramatically reduced by using CCS
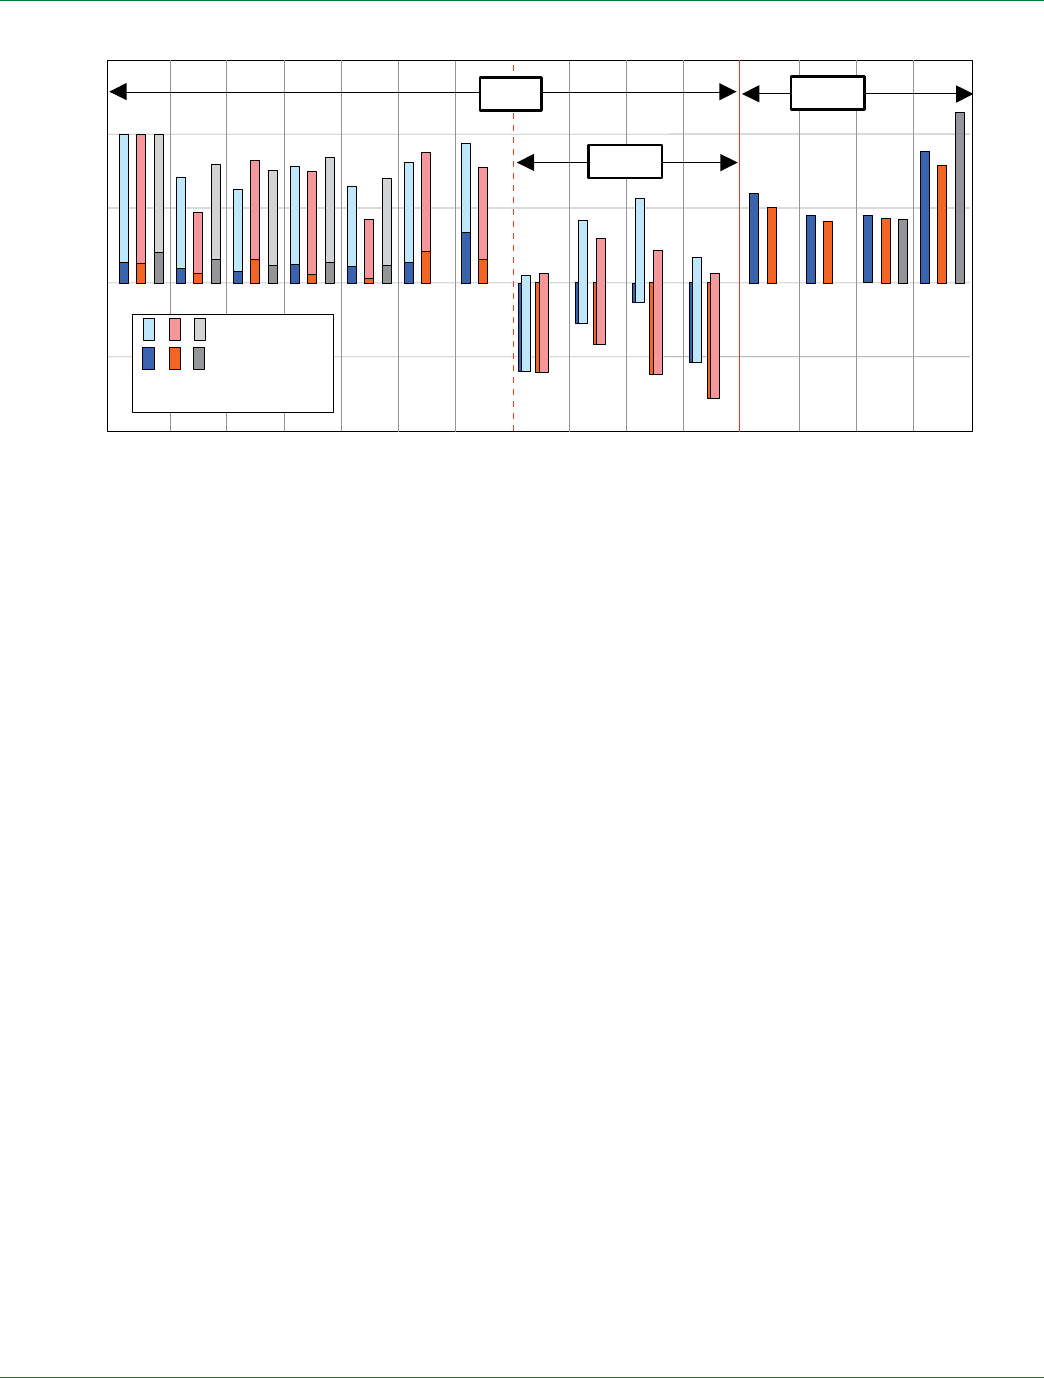
348
Transport and its infrastructure Chapter 5
(carbon capture and storage) technology during H2 production
(FCEV-H2ccs in Table 5.3). Using renewable energy such as C-
neutral biomass as a feedstock or clean electricity as an energy
source (FCEV-RE-H2) also will yield very low emissions.
5.3.1.5 Road transport: mode shifts
Personal motor vehicles consume much more energy and
emit far more GHGs per passenger-km than other surface
passenger modes. And the number of cars (and light trucks)
continues to increase virtually everywhere in the world. Growth
in GHG emissions can be reduced by restraining the growth in
personal vehicle ownership. Such a strategy can, however, only
be successful if high levels of mobility and accessibility can be
provided by alternative means.
In general, collective modes of transport use less energy and
generate less GHGs than private cars. Walking and biking emit
even less. There is important worldwide mitigation potential if
public and non-motorised transport trip share loss is reversed.
The challenge is to improve public transport systems in order to
preserve or augment the market share of low-emitting modes. If
public transport gets more passengers, it is possible to increase
the frequency of departures, which in turn may attract new
passengers (Akerman and Hojer, 2006).
The USA is somewhat of an anomaly, though. In the USA,
passenger travel by cars generates about the same GHG
emissions as bus and air travel on a passenger-km basis (ORNL
Transportation Energy Databook; ORNL, 2006). That is mostly
because buses have low load factors in the USA. Thus, in
the USA, a bus-based strategy or policy will not necessarily
lower GHG emissions. Shifting passengers to bus is not simply
a matter of lling empty seats. To attract more passengers,
it is necessary to enhance transit service. That means more
buses operating more frequently – which means more GHG
emissions. It is even worse than that, because transit service is
already offered where ridership26 demand is greatest. Adding
more service means targeting less dense corridors or adding
more service on an existing route. There are good reasons to
promote transit use in the USA, but energy use and GHGs are
not among them.
Virtually everywhere else in the world, though, transit is used
more intensively and therefore has a GHG advantage relative
to cars. Table 5.4 shows the broad average GHG emissions
from different vehicles and transport modes in a developing
country context. GHG emissions per passenger-km are lowest
for transit vehicles and two-wheelers. It also highlights the fact
that combining alternative fuels with public transport modes
can reduce emissions even further.
It is difcult to generalize, though, because of substantial
differences across nations and regions. The types of buses,
occupancy factors, and even topography and weather can
affect emissions. For example, buses in India and China tend
26 The number of passengers using a specific form of public transport.
Tank-to-Wheel
Well-to-Tank
EU
Japan
US
CO2 Emission( ICE-gasoline=1 )
0
0.5
1.0
-0.5
Gasoline
Gasoline-HV
CNG
Diesel
Diesel-HV
Diesel-FTD
Diesel-DME
Diesel-BTL
Diesel-BD
Etha(Sugar)
Etha(Wood)
GH
2
(NG-off)
GH
2
(NG-on)
LH
2
GH
2
(Elec)
ICE FCV
BioFuel
Figure 5.12: Comparison of three studies on Well-to-wheels CO2 emission analyses
Note: See text for an explanation of the legend. All the results are normalized by the value of ICE-G (gasoline).
Source: EUCAR/CONCAWE/JRC, 2006; GM/ANL, 2005; Toyota/Mizuho, 2004.

349
Chapter 5 Transport and its infrastructure
to be more fuel-efcient than those in the industrialized world,
primarily because they have considerably smaller engines and
lack air conditioning (Sperling and Salon, 2002).
Public transport
In addition to reducing transport emissions, public transport
is considered favourably from a socially sustainable point of
view because it gives higher mobility to people who do not
have access to car. It is also attractive from an economically
sustainable perspective since public transport provides more
capacity at less marginal cost. It is less expensive to provide
additional capacity by expanding bus service than building new
roads or bridges. The expansion of public transport in the form
of large capacity buses, light rail transit and metro or suburban
rail can be feasible mitigation options for the transport sector.
The development of new rail services can be an effective
measure for diverting car users to carbon-efcient mode
while providing existing public transport users with upgraded
service. However, a major hurdle is higher capital and possibly
operating cost of the project. Rail is attractive and effective
at generating high ridership in very dense cities. During the
1990s, less capital-intensive public transport projects such as
light rail transit (LRT) were planned and constructed in Europe,
North America and Japan. The LRT systems were successful in
some regions, including a number of French cities where land
use and transport planning is often well integrated (Hylen and
Pharoah, 2002), but less so in other cities especially in the USA
(Richmond, 2001; Mackett and Edwards, 1998), where more
attention has been paid to this recently.
Around the world, the concept of bus rapid transit (BRT)
is gaining much attention as a substitute for LRT and as an
enhancement of conventional bus service. BRT is not new.
Plans and studies for various BRT type alternatives have been
prepared since the 1930s and a major BRT system was installed
in Curitiba, Brazil in the 1970s (Levinson et al., 2002). But
only since about 2000 has the successful Brazilian experience
gained serious attention from cities elsewhere.
BRT is ‘a mass transit system using exclusive right of way
lanes that mimic the rapidity and performance of metro systems,
but utilizes bus technology rather than rail vehicle technology’
(Wright, 2004). BRT systems can be seen as enhanced bus service
and an intermediate mode between conventional bus service
and heavy rail systems. BRT includes features such as exclusive
right of way lanes, rapid boarding and alighting, free transfers
between routes and preboard fare collection and fare verication,
as well as enclosed stations that are safe and comfortable, clear
route maps, signage and real-time information displays, modal
integration at stations and terminals, clean vehicle technologies
and excellence in marketing and customer service. To be most
effective, BRT systems (like other transport initiatives) should
be part of a comprehensive strategy that includes increasing
vehicle and fuel taxes, strict land-use controls, limits and higher
fees on parking, and integrating transit systems into a broader
package of mobility for all types of travellers (IEA, 2002b).
Most BRT systems today are being delivered in the range of
1–15 million US$/km, depending upon the capacity requirements
and complexity of the project. By contrast, elevated rail systems
and underground metro systems can cost from 50 million US$
Table 5.3: Reduction of Well-to-wheels GHG emissions for various drive train/fuel combinations
Drive train/Fuel GHG reduction
(%)
Barriers
ICE Fossil fuel Gasoline (2010) 12-16
Diesel 16-24 Emissions (NOx, PM)
CNG 15-25 Infrastructure, storage
G-HEV 20-52 Cost, battery
D-HEV 29-57 Cost
Biofuel Ethanol-Cereal 30-65 Cost, availability (biomass, land), competition with food
Ethanol-Sugar 79-87
Biodiesel 47-78
Advanced biofuel
(cellulosic ethanol)
70-95 Technology, cost, environmental impact, competition with
usage of other sectors
H2H2-ICE 6-16 H2 storage, cost
Cost, infrastructure, deregulation
FCV FCEV 43-59
FCEV+H2ccs 78-86 Technology (stack, storage), cost, durability
FCEV+RE-H289-99
Source: EUCAR/CONCAWE/JRC, 2006, GM/ANL, 2005 and Toyota/Mizuho (2004).

350
Transport and its infrastructure Chapter 5
to over 200 million US$/km (Wright, 2004). BRT systems now
operate in several cities throughout North America, Europe,
Latin America, Australia, New Zealand and Asia. The largest
and most successful systems to date are in Latin America in
Bogotá, Curitiba and Mexico City (Karekezi et al., 2003).
Analysing the Bogotá Clean Development Mechanism
project gives an insight into the cost and potential of
implementing BRT in large cities. The CDM project shows the
potential of moving about 20% of the city population per day
on the BRT that mainly constitutes putting up dedicated bus
lanes (130 km), articulated buses (1200) and 500 other large
buses operating on feeder routes. The project is supported by an
integrated fare system, centralized coordinated eet control and
improved bus management27. Using the investment costs, an
assumed operation and maintenance of 20–50%28 of investment
costs per year, fuel costs of 40 to 60 US$ per barrel in 2030 and
a discount rate of 4%, a BRT lifespan of 30 years, the cost of
implementing BRT in the city of Bogotá was estimated to range
from 7.6 US$/tCO2 to 15.84 US$/tCO2 depending on the price
of fuel and operation and maintenance (Table 5.5). Comparing
with results of Winkelman (2006), BRT cost estimates ranged
from 14-66 US$/tCO2 depending on the BRT package involved
(Table 5.6). The potential for CO2 reduction for the city of
Bogotá was determined to average 247,000 tCO2 per annum or
7.4 million tCO2 over a 30 year lifespan of the project.
Non-motorized transport (NMT)
The prospect for the reduction in CO2 emissions by
switching from cars to non-motorized transport (NMT) such as
walking and cycling is dependent on local conditions. In the
Netherlands, where 47% of trips are made by NMT, the NMT
plays a substantial role up to distances of 7.5 km and walking
up to 2.5 km (Rietveld, 2001). As more than 30% of trips made
in cars in Europe cover distances of less than 3 km and 50% are
less than 5 km (EC, 1999), NMT can possibly reduce car use
in terms of trips and, to a lesser extent, in terms of kilometres.
While the trend has been away from NMT, there is considerable
potential to revive interest in NMT. In the Netherlands, with
strong policies and cultural commitment, the modal share of
bicycle and walking for accessing trains from home is about 35
to 40% and 25% respectively (Rietveld, 2001).
Walking and cycling are highly sensitive to the local built
environment (ECMT, 2004a; Lee and Mouden, 2006). In
Denmark, where the modal share of cycling is 18%, urban
planners seek to enhance walking and cycling by shortening
journey distances and providing better cycling infrastructure
(Dill and Carr 2003, Page, 2005). In the UK where over 60%
of people live within a 15 minute bicycle ride of a station,
NMT could be increased by offering convenient, secure bicycle
parking at stations and improved bicycle carriage on trains
(ECMT, 2004a).
Safety is an important concern. NMT users have a much
higher risk per trip of being involved in an accident than those
using cars, especially in developing countries where most
NMT users cannot afford to own a car (Mohan and Tiwari,
1999). Safety can be improved through trafc engineering and
campaigns to educate drivers. An important co-benet of NMT,
27 http://cdm.unfccc.int/Projects/DB/DNV-CUK1159192623.07/view.html.
28 O & M costs are expected to be high as the measure involves high demand for management and implementation beyond putting up the infrastructure.
Table 5.4: GHG Emissions from vehicles and transport modes in developing
countries
Load factor
(average occu-
pancy)
CO2-eq emissions
per passenger-km
(full energy cycle)
Car (gasoline) 2.5 130-170
Car (diesel) 2.5 85-120
Car (natural gas) 2.5 100-135
Car (electric)a) 2.0 30-100
Scooter (two-stroke) 1.5 60-90
Scooter (four-stroke) 1.5 40-60
Minibus (gasoline) 12.0 50-70
Minibus (diesel) 12.0 40-60
Bus (diesel) 40.0 20-30
Bus (natural gas) 40.0 25-35
Bus (hydrogen fuel
cell)b)
40.0 15-25
Rail Transitc) 75% full 20-50
Note: All numbers in this table are estimates and approximations and are best
treated as illustrative.
a) Ranges are due largely to varying mixes of carbon and non-carbon energy
sources (ranging from about 20–80% coal), and also the assumption that the
battery electric vehicle will tend to be somewhat smaller than conventional cars.
b) Hydrogen is assumed to be made from natural gas.
c) Assumes heavy urban rail technology (‘Metro’) powered by electricity gener-
ated from a mix of coal, natural gas and hydropower, with high passenger use
(75% of seats filled on average).
Source: Sperling and Salon, 2002.
O & Ma)
(%)
Fuel price per
barrel
(US$)
Cost
(US$/tCO2)
20 40 11.22
20 60 7.60
50 40 12.20
50 60 15.84
Note: Assuming 20% of the urban population uses the BRT each day.
a) Operation and maintenance (O & M) costs are expected to be high as the
measure involves high demand for management and implementation beyond
putting up the infrastructure.
Source: estimate based on Bogata CDM Project (footnote 27)
Table 5.5: Cost and potential estimated for BRT in Bogota

351
Chapter 5 Transport and its infrastructure
gaining increasing attention in many countries, is public health
(National Academies studies in the USA; Pucher, 2004).
In Bogotá, in 1998, 70% of the private car trips were under
3 km. This percentage is lower today thanks to the bike and
pedestrian facilities. The design of streets was so hostile to
bicycle travel that by 1998 bicycle trips accounted for less than
1% of total trips. After some 250 km of new bicycle facilities were
constructed by 2001 ridership had increased to 4% of total trips.
In most of Africa and in much of southern Asia, bicyclists and
other non-motorised and animal traction vehicles are generally
tolerated on the roadways by authorities. Non-motorised goods
transport is often important for intermodal goods transport. A
special form of rickshaw is used in Bangladesh, the bicycle
van, which has basically the same design as a rickshaw (Hook,
2003).
Mitigation potential of modal shifts for passenger
transport
Rapid motorization in the developing world is beginning to
have a large effect on global GHG emissions. But motorization
can evolve in quite different ways at very different rates. The
amount of GHG emissions can be considerably reduced by
offering strong public transport, integrating transit with efcient
land use, enhancing walking and cycling, encouraging minicars
and electric two-wheelers and providing incentives for efcient
vehicles and low-GHG fuels. Few studies have analyzed the
potential effect of multiple strategies in developing nations,
partly because of a severe lack of reliable data and the very
large differences in vehicle mix and travel patterns among
varying areas.
Wright and Fulton (2005) estimated that a 5% increase in
BRT mode share against a 1% mode share decrease of private
automobiles, taxis and walking, plus a 2% share decrease of
mini-buses can reduce CO2 emissions by 4% at an estimated
cost of 66 US$/tCO2 in typical Latin American cities. A 5%
or 4% increase in walking or cycling mode share in the same
scenario analysis can also reduce CO2 emissions by 7% or
4% at an estimated cost of 17 or 15 US$/tCO2, respectively
(Table5.6). Although the assumptions of a single infrastructure
unit cost and its constant impact on modal share in the analysis
might be too simple, even shifting relatively small percentages
of mode share to public transport or NMT can be worthwhile,
because of a 1% reduction in mode share of private automobiles
represents over 1 MtCO2 through the 20-year project period.
Figure 5.13 shows the GHG transport emission results,
normalized to year 2000 emissions, of four scenario analyses
of developing nations and cities (Sperling and Salon, 2002).
For three of the four cases, the ‘high’ scenarios are ‘business-
as-usual’ scenarios assuming extrapolation of observable
and emerging trends with an essentially passive government
presence in transport policy. The exception is Shanghai, which
is growing and changing so rapidly that ‘business-as-usual’ has
little meaning. In this case the high scenario assumes both rapid
motorization and rapid population increases, with the execution
of planned investments in highway infrastructure while at the
same time efforts to shift to public transport falter (Zhou and
Sperling, 2001).
5.3.1.6 Improving driving practices (eco-driving)
Fuel consumption of vehicles can be reduced through
changes in driving practices. Fuel-efcient driving practices,
with conventional combustion vehicles, include smoother
deceleration and acceleration, keeping engine revolutions low,
shutting off the engine when idling, reducing maximum speeds
and maintaining proper tyre pressure (IEA, 2001). Results from
studies conducted in Europe and the USA suggested possible
improvement of 5–20% in fuel economy from eco-driving
training. The mitigation costs of CO2 by eco-driving training
were mostly estimated to be negative (ECMT/IEA, 2005).
Eco-driving training can be attained with formal training
programmes or on-board technology aids. It applies to drivers
of all types of vehicles, from minicars to heavy-duty trucks.
The major challenge is how to motivate drivers to participate in
the programme, and how to make drivers maintain an efcient
driving style long after participating (IEA, 2001). In the
Netherlands, eco-driving training is provided as part of driving
school curricula (ECMT/IEA, 2005).
5.3.2 Rail
Railway transport is widely used in many countries. In
Europe and Japan, electricity is a major energy source for rail,
while diesel is a major source in North America. Coal is also still
used in some developing countries. Rail’s main roles are high
speed passenger transport between large (remote) cities, high
density commuter transport in the city and freight transport over
long distances. Railway transport competes with other transport
modes, such as air, ship, trucks and private vehicles. Major
Transport measure
GHG reduc-
tion potential
(%)
Cost per
tCO2
(US$)
BRT mode share increases from
0-5%
3.9 66
BRT mode share increases from
0-10%
8.6 59
Walking share increases from
20-25%
6.9 17
Bike share increases from 0-5% 3.9 15
Bike mode share increases from
1-10%
8.4 14
Package (BRT, pedestrian up-
grades, cycleways)
25.1 30
Source: Wright and Fulton, 2005.
Table 5.6: CO2 reduction potential and cost per tCO2 reduced using public transit
policies in typical Latin American cities

352
Transport and its infrastructure Chapter 5
R&D goals for railway transport are higher speeds, improved
comfort, cost reductions, better safety and better punctuality.
Many energy efciency technologies for railways are discussed
in the web site of the International Union of Railways.29 R&D
programmes aimed at CO2 reduction include:
Reducing aerodynamic resistance
For high speed trains such as the Japanese Shinkansen,
French TGV and German ICE, aerodynamic resistance
dominates vehicle loads. It is important to reduce this resistance
to reduce energy consumption and CO2 emissions. Aerodynamic
resistance is determined by the shape of the train. Therefore,
research has been carried out to nd the optimum shape by
using computer simulation and wind tunnel testing. The latest
series 700 Shinkansen train has reduced aerodynamic resistance
by 31% compared with the rst generation Shinkansen.
Reducing train weight
Reduction of train weight is an effective way to reduce
energy consumption and CO2 emission. Aluminium car bodies,
lightweight bogies and lighter propulsion equipments are
proven weight reduction measures.
Regenerative braking
Regenerative brakes have been used in railways for three
decades, but with limited applications. For current systems, the
electric energy generated by braking is used through a catenary
for powering other trains, reducing energy consumption and
CO2 emissions. However, regenerative braking energy cannot
be effectively used when there is no train running near a braking
train. Recently research in energy storage device onboard or
trackside is progressing in several countries. Lithium ion
batteries, ultracapacitors and ywheels are candidates for such
energy storage devices.
Higher efciency propulsion system
Recent research on rail propulsion has focused on
superconducting on-board transformers and permanent magnet
synchronous traction motors.
Apart from the above technologies mainly for electric trains,
there are several promising technologies for diesel swichers,
including common rail injection system and hybridization/on-
board use of braking energy in diesel-electric vehicles (see the
web site of the International Union of Railways),
5.3.3 Aviation
Fuel efciency is a major consideration for aircraft operators
as fuel currently represents around 20% of total operating costs
for modern aircraft (2005 data, according to ICAO estimates30
for the scheduled airlines of Contracting States). Both aircraft
and engine manufacturers pursue technological developments
to reduce fuel consumption to a practical minimum. There
are no fuel efciency certication standards for civil aviation.
ICAO31 has discussed the question of whether such a standard
would be desirable, but has been unable to develop any form
of parameter from the information available that correlates
sufciently well with the aircraft/engine performance and is
therefore unable to dene a fuel efciency parameter that might
be used for a standard at this time. ‘Point’ certication could
drive manufacturers to comply with the regulatory requirement,
possibly at the expense of fuel consumption for other operational
conditions and missions. Market pressures therefore determine
fuel efciency and CO2 emissions.
29 Energy Efficiency Technologies for Railways: http://www.railway-energy.org/tfee/index.php.
30 ICAO Estimates for the scheduled airlines of Contracting States, 2005.
31 Doc. 9836, CAEP/6, 2004.
0
5
10
Low scenario
High scenario
Delhi Shanghai Chile S. Africa
Index: 2000 emissions = 1
Figure 5.13: Projections for transport GHG emissions in 2020 for some cities of
developing countries
Notes: Components of the Low 2020 scenario:
Delhi (Bose and Sperling, 2001): Completion of planned busways and rail transit,
land-use planning for high density development around railway stations, network
of dedicated bus lanes, promotion of bicycle use, including purchase subsidies
and special lanes, promotion of car sharing, major push for more natural gas use
in vehicles, economic re-straints on personal vehicles.
Shanghai (Zhou and Sperling, 2001): Emphasis on rapid rail system growth, high
density development at railway sta-tions, bicycle promotion with new bike lanes
and parking at transit stations, auto industry focus on minicars and farm cars
rather than larger vehicles, incentives for use of high tech in minicars – electric,
hybrid, fuel cell drive trains, promotion of car sharing.
Chile (O’Ryan et al., 2002): Overall focus on stronger use of market-based
policy to insure that vehicle users pay the full costs of driving, internalizing
costs of pollution and congestion, parking surcharges and restrictions, vehicle
fees, and road usage fees, improvements in bus and rail systems, encourage-
ment of minicars, with lenient usage and parking rules and strong commitment
to alternative fuels, especially natural gas. By 2020, all taxis and 10% of other
light and medium vehicles will use natural gas; all new buses will use hydrogen,
improvements in bus and rail sys-tems.
South Africa (Prozzi et al., 2002): Land-use policies towards more efficient
growth patterns, strong push to improve public transport, including use of bus-
ways in dense corridors, provision of new and better buses, strong government
oversight of the minibus jitney industry, incentives to moderate private car use,
coal-based synfuels shifts to imported natural gas as a feedstock
Source: Sperling and Salon, 2002.

353
Chapter 5 Transport and its infrastructure
Technology developments
Aviation’s dependence on fossil fuels, likely to continue
for the foreseeable future, drives a continuing trend of fuel
efciency improvement through aerodynamic improvements,
weight reductions and engine fuel efcient developments.
New technology is developed not only to be introduced into
new engines, but also, where possible, to be incorporated into
engines in current production. Fuel efciency improvements
also confer greater range capability and extend the operability
of aircraft. Evolutionary developments of engine and airframe
technology have resulted in a positive trend of fuel efciency
improvements since the passenger jet aircraft entered service,
but more radical technologies are now being explored to
continue this trend.
Engine developments
Engine developments require a balancing of the emissions
produced to both satisfy operational need (fuel efciency) and
regulatory need (NOx, CO, smoke and HC). This emissions
performance balance must also reect the need to deliver
safety, reliability, cost and noise performance for the industry.
Developments that reduce weight, reduce aerodynamic drag
or improve the operation of the aircraft can offer all-round
benets. Emissions – and noise – regulatory compliance
hinders the quest for improved fuel efciency, and is often
most difcult for those engines having the highest pressure
ratios (PR). Higher PRs increase the temperature of the air
used for combustion in the engine, exacerbating the NOx
emissions challenge. Increasing an engine’s pressure ratio is
one of the options engine manufacturers use to improve engine
efciency. Higher pressure ratios are likely to be a continuing
trend in engine development, possibly requiring revolutionary
NOx control techniques to maintain compliance with NOx
certication standards.
A further consideration is the need to balance not only
emissions trade-offs, but the inevitable trade-off between
emissions and noise performance from the engine and aircraft.
For example, the engine may be optimised for minimum NOx
emissions, at which design point the engine will burn more fuel
than it might otherwise have done. A similar design compromise
may reduce noise and such performance optimisation must be
conducted against engine operability requirements described in
Box 5.3.
Aircraft developments
Fuel efciency improvements are available through
improvements to the airframe, as well as the engine. Most
modern civil jet aircraft have low-mounted swept wings and
are powered by two or four turbofan engines mounted beneath
the wings. Such subsonic aircraft are about 70% more fuel
efcient per passenger-km than 40 years ago. The majority
of this gain has been achieved through engine improvements
and the remainder from airframe design improvements. A 20%
improvement in fuel efciency of individual aircraft types is
projected by 2015 and a 40–50% improvement by 2050 relative
to equivalent aircraft produced today (IPCC, 1999). The
current aircraft conguration is highly evolved, but has scope
for further improvement. Technological developments have
to be demonstrated to offer proven benets before they will
be adopted in the aviation industry, and this coupled with the
overriding safety requirements and a product lifetime that has
60% of aircraft in service at 30 years age (ICAO, 2003) results
in slower change than might be seen in other transport forms.
For the near term, lightweight composite materials for the
majority of the aircraft structure are beginning to appear and
promise signicant weight reductions and fuel burn benets.
The use of composites, for example in the Boeing 787 aircraft
Box 5.3 Constraints on aviation technology development
Technology developments in civil aviation are brought to the marketplace only after rigorous airworthiness and safety testing.
The engineering and safety standards that apply, along with exacting weight minimisation, reliability and maintainability
requirements, impose constraints to technology development and diffusion that do not necessarily apply to the same degree
for other transport modes. Some of these certification requirements for engines are as follows:
• Altitude relight to 30000ft – the engine must be capable of relighting under severe adverse conditions
• Engine starting capability between –50°C–+50°C
• Ice, hail and water ingestion
• Fan blade off test – blade to be contained and engine to run down to idle
• ETOPS (extended range operations) clearance – demonstrable engine reliability to allow single engine flight for up to 240
minutes for twin-engine aircraft
In addition, the need to comply with stringent engine emissions and aircraft noise standards, to offer products that allow
aircraft to remain commercially viable for three decades or more and to meet the most stringent safety requirements impose
significant costs for developments. Moreover, a level of engineering excellence beyond that demanded for other vehicles is
the norm. It is under these exacting conditions that improvements are delivered thus affect the rate at which improvements
can be offered.

354
Transport and its infrastructure Chapter 5
(that has yet to enter service), could reduce fuel consumption
by 20% below that of the aircraft the B787 will replace32. Other
developments, such as the use of winglets, the use of fuselage
airow control devices and weight reductions have been studied
by aircraft manufacturers and can reduce fuel consumption by
around 7%33. But these can have limited practical applicability
– for example, the additional fuel burn imposed by the weight
of winglets can negate any fuel efciency advantage for short
haul operations.
Longer term, some studies suggest that a new aircraft
conguration might be necessary to realise a step change in
aircraft fuel efciency. Alternative aircraft concepts such as
blended wing bodies or high aspect ratio/low sweep conguration
aircraft designs might accomplish major fuel savings for some
operations. The blended wing body (ying wing) is not a new
concept and in theory holds the prospect of signicant fuel
burn reductions: estimates suggest 20–30% compared with
an equivalent sized conventional aircraft carrying the same
payload (GbD, 2001; Leifsson and Mason, 2005). The benets
of this tailless design result from the minimised skin friction
drag, as the tail surfaces and some engine/fuselage integration
can be eliminated. Its development for the future will depend
on a viable market case and will incur signicant design,
development and production costs.
Laminar ow technology (reduced airframe drag through
control of the boundary layer) is likely to provide additional
aerodynamic efciency potential for the airframe, especially
for long-range aircraft. This technology extends the smooth
boundary layer of undisturbed airow over more of the
aerodynamic structure, in some cases requiring articial means
to promote laminar ow beyond its natural extent by suction
of the disturbed ow through the aerodynamic surface. Such
systems have been the subject of research work in recent times,
but are still far from a ightworthy application. Long-term
technical and economic viability have yet to be proven, despite
studies suggesting that fuel burn could be reduced by between
10 and 20% for suitable missions (Braslow, 1999).
In 2001 the Greener by Design (GbD) technology subgroup
of the Royal Aeronautical Society considered a range of
possible future technologies for the long-term development of
the aviation industry and their possible environmental benets
(GbD, 2001). It offered a view of the fuel burn reduction benets
that some advanced concepts might offer. Concepts considered
included alternative aircraft congurations such as the blended
wing body and the laminar ying wing, and the use of an
unducted fan (open rotor) power plant. The study concluded
that these two aircraft concepts could offer signicant fuel
burn reduction potential compared with a conventional aircraft
design carrying an equivalent payload. Other studies (Leifsson
and Mason, 2005) have suggested similar results. Table 5.7
summarises, from the GbD results, the theoretical fuel savings
of these future designs relative to a baseline conventional swept
wing aircraft for a 12,500 km design range, with the percentage
fuel burn requirements for the mission.
Further reduction in both NOx and CO2 emission could be
achieved by advances in airframe and propulsion systems which
reduce fuel burn. In propulsion, the open rotor offers signicant
reductions in fuel burn over the turbofan engines used typically
on current passenger jets. However, aircraft speed is reduced
below typical jet aircraft speeds as a consequence of propeller
tip speed limits and therefore this technology may be more
suitable for short- and medium-haul operations where speed
may be less important. The global average ight length in
2005 was 1239 km (ICAO, 2006) and many ights are over
shorter distances than this average. However, rotor noise from
such devices would need to be controlled within acceptable
(regulatory) limits.
In summary, airframe and engine technology developments,
weight reduction through increased used of advanced structural
composites, and drag reduction, particularly through the
application of laminar ow control, hold the promise of
further aviation fuel burn reductions over the long term. Such
developments will only be accepted by the aviation industry
should they offer an advantage over existing products and meet
demanding safety and reliability criteria.
Alternative fuels for aviation
Kerosene is the primary fuel for civil aviation, but alternative
fuels have been examined. These are summarised in Box 5.4.
32 http://www.boeing.bom/commercial/787family/specs.
33 NASA, www.nasa.gov/centers/dryden/about/Organisations/Technology/Facts?
Table 5.7: Weight breakdown for four kerosene-fuelled configurations with the same payload and range
Configuration Empty weight (t) Payload (t) Fuel (t) Max TOW (t)
Baseline 236 86 178 (100%) 500
BWB 207 86 137 (77%) 430
Laminar Flying Wing (LFW) 226 86 83 (47%) 395
LFW with UDF 219 86 72 (40%) 377
Source: GbD, 2001.

355
Chapter 5 Transport and its infrastructure
A
potential non-carbon fuel is hydrogen and there have been
several studies on its use in aviation. An EC study (Airbus, 2004)
developed a conceptual basis for applicability, safety, and the
full environmental compatibility for a transition from kerosene
to hydrogen for aviation. The study concluded that conventional
aircraft designs could be modied to accommodate the larger
tank sizes necessary for hydrogen fuels. However, the increased
drag due to the increased fuselage volume would increase the
energy consumption of the aircraft by between 9% and 14%. The
weight of the aircraft structure might increase by around 23% as
a result, and the maximum take-off weight would vary between
+4.4% to –14.8% dependent on aircraft size, conguration and
mission. The hydrogen production process would produce CO2
unless renewable energy was used and the lack of hydrogen
production and delivery infrastructure would be a major obstacle.
The primary environmental benet from the use of hydrogen
fuel would be the prevention of CO2 emissions during aircraft
operation. But hydrogen fuelled aircraft would produce around
2.6 times more water vapour than the use of kerosene and water
vapour is a GHG. The earliest implementation of this technology
was suggested as between 15–20 years, provided that research
work was pursued at an appropriate level. The operating cost of
hydrogen-powered aircraft remains unattractive under today’s
economic conditions.
The introduction of biofuels could mitigate some of
aviation’s carbon emissions, if biofuels can be developed to
meet the demanding specications of the aviation industry,
although both the costs of such fuels and the emissions from
their production process are uncertain at this time.
Aviation potential practices
The operational system for aviation is principally governed
by air trafc management constraints. If aircraft were to operate
for minimum fuel use (and CO2 emissions), the following
constraints would be modied: taxi-time would be minimized;
aircraft would y at their optimum cruising altitude (for load
and mission distance); aircraft would y minimum distance
between departure and destination (i.e., great circle distances)
but modied to take account of prevailing winds; no holding/
stacking would be applied.
Another type of operational system/mitigation potential is
to consider the total climate impact of aviation. Such studies
are in their infancy but were the subject of a major European
project ‘TRADE-OFF’. In this project different methods were
devised to minimize the total radiative forcing impact of
aviation; in practice this implies varying the cruise altitudes
as O3 formation, contrails (and presumably cirrus cloud
enhancement) are all sensitive to this parameter. For example,
Fichter et al. (2005) found in a parametric study that contrail
coverage could be reduced by approximately 45% by ying
the global eet 6,000 feet lower, but at a fuel penalty of 6%
compared with a base case. Williams et al. (2003) also found
that regional contrail coverage was reduced by ying lower with
a penalty on fuel usage. By ying lower, NOx emissions tend
to increase also, but the removal rate of NOx is more efcient
at lower altitudes: this, compounded with a lower radiative
efciency of O3 at lower altitudes meant that ying lower could
also imply lower O3 forcing (Grewe et al., 2002). Impacts on
cirrus cloud enhancement cannot currently be modelled in the
same way, since current estimates of aviation effects on cirrus
are rudimentary and based upon statistical analyses of air trafc
and satellite data of cloud coverage (Stordal et al., 2005) rather
than modelling. However, as Fichter et al. (2005) note, to a rst
order, one might expect aviation-induced cirrus cloud to scale
with contrails. The overall ‘trade-offs’ are complex to analyse
since CO2 forcing is long lasting, being an integral over time.
Moreover, the uncertainties on some aviation forcings (notably
contrail and cirrus) are still high, such that the overall radiative
forcing consequences of changing cruise altitudes need to be
considered as a time-integrated scenario, which has not yet been
done. However, if contrails prove to be worth avoiding, then
such drastic action of reducing all aircraft cruising altitudes
need not be done, as pointed out by Mannstein et al. (2005),
since contrails can be easily avoided – in principle – by
relatively small changes in ight level, due to the shallowness
of ice supersaturation layers. However, this more nely tuned
operational change would not necessarily apply to O3 formation
as the magnitude is a continuous process rather than the case of
contrails that are either short-lived or persistent. Further intensive
research of the impacts is required to determine whether such
operational measures can be environmentally benecial.
Box 5.4 Alternative fuels for aviation
The applicability of alternative and renewable fuels for civil aviation has been examined by many countries, for both the
environmental benefit that might be produced and to address energy security issues. One study, The Potential for Renewable
Energy Sources in Aviation (PRESAV, 2003) concluded that biodiesel, Fischer-Tropsch synthetic kerosene liquefied hydrogen
(H2) could be suitable for aviation application. Fuel cost would be an issue as in comparative terms, in 2003, conventional
aviation kerosene cost 4.6 US$/GJ whereas the cost of biodiesel, FT kerosene and H2 would be in the respective ranges of
33.5–52.6 US$, 8–31.7 US$, 21.5–53.8 US$/GJ. In the and elsewhere, synthetic kerosene production is being studied the
engine company Pratt and Whitney noted in a presentation (Biddle, 2006) that synthetic kerosene could be ‘economically
viable when crude prices reach (up to) 59 US$/barrel’. However, any alternative fuel for commercial aircraft will need to be
compatible with aviation kerosene (to obviate the need for tank and system flushing on re-fuelling) and meet a comprehensive
performance and safety specification.

356
Transport and its infrastructure Chapter 5
ATM (Air Trafc Management) environmental benets
The goal of RVSM (Reduced Vertical Separation Minimum)
is to reduce the vertical separation above ight level (FL) 290
from the current 610 m (2000 ft) minimum to 305 m (1000 ft)
minimum. This will allow aircraft to safely y more optimum
proles, gain fuel savings and increase airspace capacity. The
process of safely changing this separation standard requires a
study to assess the actual performance of airspace users under
the current separation (610 m) and potential performance
under the new standard (305 m). In 1988, the ICAO Review
of General Concept of Separation Panel (RGCSP) completed
this study and concluded that safe implementation of the 305 m
separation standard was technically feasible.
A Eurocontrol study (Jelinek et al., 2002) tested the
hypothesis that the implementation of RVSM would lead to
reduced aviation emissions and fuel burn, since the use of
RVSM offers the possibility to optimise ight proles more
readily than in the pre-existing ATC (Air Trafc Control)
regime. RVSM introduces six additional ight levels between
FL290 and FL410 for all States involved in the EUR RVSM
programme. The study analysed the effect from three days
of actual trafc just before implementation of RVSM in the
European ATC region, with three trafc days immediately after
implementation of RVSM. It concluded that a clear trend of
increasing environmental benet was shown. Total fuel burn,
equating to CO2 and H2O emissions, was reduced by between
1.6–2.3% per year for airlines operating in the European RVSM
area. This annual saving in fuel burn translates to around
310,000 tonnes annually, for the year 2003.
Lower ight speeds
Speed comes at a cost in terms of fuel burn, although modern
jet aircraft are designed to y at optimum speeds and altitudes
to maximise the efciencies of their design. Flying slower
would be a possibility, but a different engine would be required
in order to maximise the efciencies from such operation. The
propfan – this being a conventional gas turbine powering a
highly efcient rotating propeller system, as an open rotor or
unducted fan – is already an established technology and was
developed during the late 1980s in response to a signicant
increase in fuel cost at the time. The scimitar shaped blades
are designed to minimise aerodynamic problems associated
with high blade speeds, although one problem created is the
noise generated by such devices. The fuel efciency gains
from unducted fans, which essentially function as ultra high
bypass ratio turbofans, are signicant and require the adoption
of lower aircraft speeds in order to minimise the helical mach
number at the rotating blade tip. Typically the maximum cruise
speed would be less than 400 miles per hour, compared with
550 mph34 for conventional jet aircraft. In the event the aero
acoustic problem associated with propfans could be overcome,
such aircraft might be suitable for short-haul operations where
speed has less importance. But there would be the need to
inuence passenger choice: propeller driven aircraft are often
perceived as old fashioned and dangerous and many passengers
are reluctant to use such aircraft.
5.3.4 Shipping
In the past few years, the International Maritime Organization
(IMO) has started research and discussions on the mitigation
of GHG emissions by the shipping industry. The potential of
technical measures to reduce CO2 emissions was estimated at
5–30% in new ships and 4–20% in old ships. These reductions
could be achieved by applying current energy-saving
technologies vis-à-vis hydrodynamics (hull and propeller) and
machinery on new and existing ships (Marintek, 2000).
The vast majority of marine propulsion and auxiliary plants
onboard ocean-going ships are diesel engines. In terms of the
maximum installed engine output of all civilian ships above 100
gross tonnes (GT), 96% of this energy is produced by diesel
power. These engines typically have service lives of 30 years or
more. It will therefore be a long time before technical measures
can be implemented in the eet on any signicant scale. This
implies that operational emission abatement measures on
existing ships, such as speed reduction, load optimization,
maintenance, eet planning, etc., should play an important role
if policy is to be effective before 2020.
Marintek (2000) estimates the short-term potential of
operational measures at 1–40%. These CO2 reductions could
in particular be achieved by eet optimization and routing
and speed reduction. A general quantication of the potential
is uncertain, because ship utilization varies across different
segments of shipping and the operational aspects of shipping
are not well dened.
The long-term reduction potential, assuming implementation
of technical or operational measures, was estimated for the
major fuel consuming segments35 of the world eet as specic
case studies. The result of this analysis was that the estimated
CO2 emission reduction potential of the world eet would be
17.6% in 2010 and 28.2% in 2020. Even though this potential
is signicant, it was noted that this would not be sufcient to
compensate for the effects of projected eet growth (Marintek,
2000). Speed reduction was found to offer the greatest potential
for reduction, followed by implementation of new and improved
technology. Speed reduction is probably only economically
feasible if policy incentives, such as CO2 trading or emissions
charges are introduced.
A signicant shift from a primarily diesel-only eet to a
eet that uses alternative fuels and energy sources cannot be
expected until 2020, as most of the promising alternative
34 1 mph = 1.6 km/h
35 In fact four segments covering 80% of the fuel consumption were assessed: tank, bulk, container and general cargo ships.

357
Chapter 5 Transport and its infrastructure
techniques are not yet tested to an extent that they can compete
with diesel engines (Eyring et al., 2005b). Furthermore, the
availability of alternative fuels is currently limited and time
is needed to establish the infrastructure for alternative fuels.
For these reasons, in the short term switching to alternative
fuels provides a limited potential in general, but a signicant
potential for segments where a switch from diesel to natural gas
is possible (Skjølsvik, 2005). Switching from diesel to natural
gas has a 20% CO2 reduction potential and is being pursued
as a measure in Norway for inland ferries and offshore supply
vessels operating on the Norwegian Continental Shelf. The main
obstacle to the increased utilization of natural gas is the access
to LNG (Liqueed Natural Gas) and the technology’s level of
costs compared to traditional ship solutions based on traditional
fuel (Skjølsvik, 2005). A co-benet of a switch from diesel to
natural gas is that it also reduces emissions of SOx and NOx that
contribute to local air pollution in the vicinity of ports.
For the long-term (2050), the economical CO2 reduction
potential might be large. One potential option is a combination
of solar panels and sails. The use of large sails for super tankers
is currently being tested in Germany and looks promising
and may even be a cost-effective measure in the short term
in case oil prices continue to soar. The use of large sails does
not require eet turnover but can be added to existing vessels
(retrot). The introduction of hydrogen-propelled ships and the
use of fuel cell power at least for the auxiliary engines seem to
be a possibility as well. For larger vessels capable and reliable
fuel-cell-based ship propulsion systems are still a long way
into the future, but might be possible in 2050 (Eyring et al.,
2005b). Altmann et al. (2004) concluded that fuel cells offer
the potential for signicant environmental improvements both
in air quality and climate protection. Local pollutant emissions
and GHG emissions can be eliminated almost entirely over the
full life cycle using renewable primary energies. The direct use
of natural gas in high temperature fuel cells employed in large
ships and the use of natural gas derived hydrogen in fuel cells
installed in small ships allows for a GHG emission reduction
of 20–40%.
5.4 Mitigation potential
As discussed earlier, under ‘business-as-usual’ conditions
with assumed adequate supplies of petroleum, GHG emissions
from transport are expected to grow steadily during the next few
decades, yielding about an 80% increase from 2002–2030 or
2.1% per year. This growth will not be evenly distributed; IEA
projections of annual CO2 growth rates for 2002–2030 range
from 1.3% for the OECD nations to 3.6% for the developing
countries. The potential for reducing this growth will vary
widely across countries and regions, as will the appropriate
policies and measures that can accomplish such reduction.
Analyses of the potential for reducing GHG emissions in the
transport sector are largely limited to national or sub-national
studies or to examinations of technologies at the vehicle level,
for example well-to-wheel analyses of alternative fuels and drive
trains for light-duty vehicles. The TAR presented the results of
several studies for the years 2010 and 2020 (Table 3.16 of the
TAR), with virtually all limited to single countries or to the
EU or OECD. Many of these studies indicated that substantial
reductions in transport GHG emissions could be achieved at
negative or minimal costs, although these results generally used
optimistic assumptions about future technology costs and/or
did not consider trade-offs between vehicle efciency and other
(valued) vehicle characteristics. Studies undertaken since the
TAR have tended to reach conclusions generally in agreement
with these earlier studies, though recent studies have focused
more on transitions to hydrogen used in fuel cell vehicles.
This section will discuss some available studies and
provide estimates of GHG emissions reduction potential and
costs/tonne of carbon emissions reduced for a limited set of
mitigation measures. These estimates do not properly reect
the wide range of measures available, many of which would
likely be undertaken primarily to achieve goals other than GHG
reduction (or saving energy), for example to provide mobility
to the poor, reduce air pollution and trafc reduce congestion.
The estimates do not include:
• Measures to reduce shipping emissions;
• Changes in urban structure that would reduce travel demand
and enhance the use of mass transit, walking and bicycling;
• Transport demand management measures, including parking
‘cash out’, road pricing, inner city entry charges, etc.
5.4.1 Available worldwide studies
Two recent studies – the International Energy Agency’s
World Energy Outlook (IEA, 2004a) and the World Business
Council on Sustainable Development’s Mobility 2030 (WBCSD,
2004a) – examined worldwide mitigation potential but were
limited in scope. The IEA study focused on a few relatively
modest measures and the WBCSD examined the impact of
specied technology penetrations on the road vehicle sector
(the study sponsors are primarily oil companies and automobile
manufacturers) without regard to either cost or the policies
needed to achieve such results. In addition, IEA has developed
a simple worldwide scenario for light-duty vehicles that also
explores radical reductions in GHG emissions.
World Energy Outlook postulates an ‘Alternative scenario’ to
their Reference scenario projection described earlier, in which
vehicle fuel efciency is improved, there are increased sales of
alternative-fuel vehicles and the fuels themselves and demand
side measures reduce transport demand and encourage a switch
to alternative and less energy intensive transport modes. Some
specic examples of technology changes and policy measures
are:
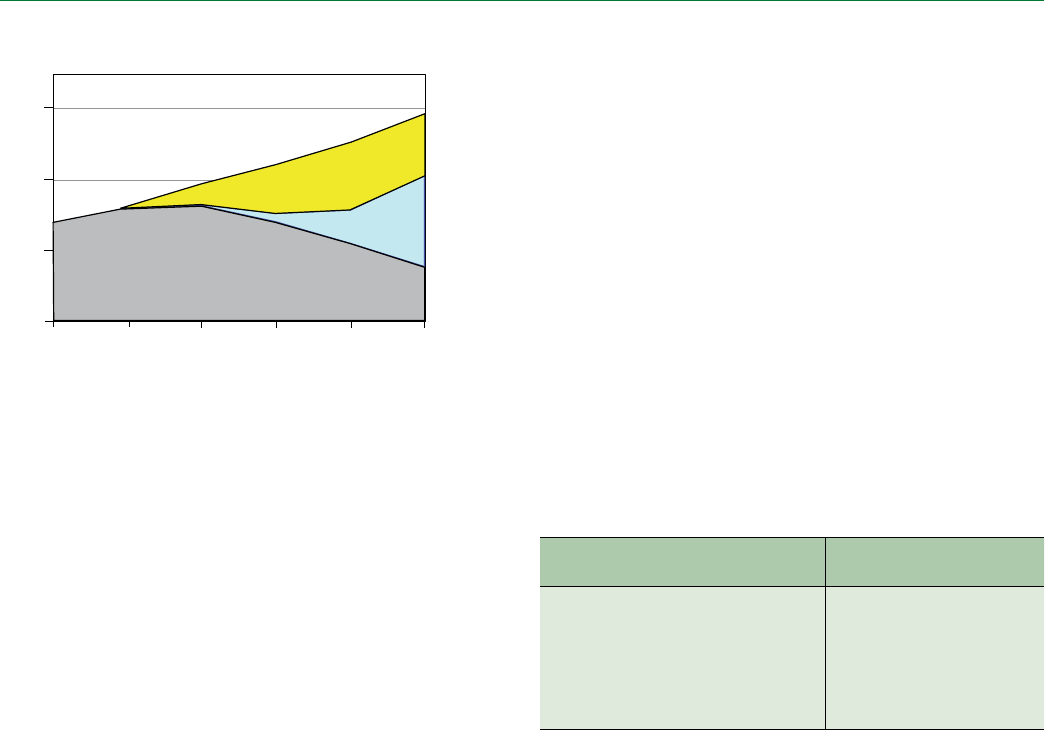
358
Transport and its infrastructure Chapter 5
• In the United States and Canada, vehicle fuel efciency is
nearly 20% better in 2030 than in the Reference scenario
and hybrid and fuel-cell powered vehicles make up 15% of
the stock of light-duty vehicles in 2030;
• Average fuel efciency in the developing countries and
transition economies are 10–15% higher than in the
Reference scenarios;
• Measures to slow trafc growth and move to more efcient
modes reduce road trafc by 5% in the European Union and
6% in Japan. Similarly, road freight is reduced by 8% in the
EU and 10% in Japan.
The net reductions in transport energy consumption and
CO2 emissions in 2030 are 315 Mtoe, or 9.6% and 997 MtC, or
11.4%, respectively compared to the Reference scenario. This
represents a 2002–2030 reduction in the annual growth rate
of energy consumption from 2.1-1.3% per year, a signicant
accomplishment but one which still allows transport energy to
grow by 57% during the period. CO2 emissions grow a bit less
because of the shift to fuels with less carbon intensity, primarily
natural gas and biofuels.
IEA has also produced a technology brief that examines a
simple scenario for reducing world GHG emissions from the
transport sector (IEA, 2004b). The scenario includes a range
of short-term actions, coupled with the development and
deployment of fuel-cell vehicles and a low-carbon hydrogen fuel
infrastructure. For the long-term actions, deployment of fuel-cell
vehicles would aim for a 10% share of light-duty vehicle sales
by 2030 and 100% by 2050, with a 75% per-vehicle reduction
in GHG emissions by 2050 compared to gasoline vehicles. The
short-term measures for light-duty vehicles are:
• Improvements in fuel economy of gasoline and diesel
vehicles, ranging from 15% (in comparison to the IEA
reference case) by 2020 to 35% by 2050;
• Growing penetration of hybrid vehicles, to 50% of sales by
2040;
• Widespread introduction of biofuels, with 50% lower well-
to-wheels GHG emissions per km than gasoline, with a 25%
penetration by 2050;
• Reduced travel demand, compared to the reference case, of
20% by 2050.
Figure 5.14 shows the light-duty vehicle GHG emissions
results of the scenario. The penetration of fuel cell vehicles
by itself brings emissions back to their 2000-levels by 2050.
Coupled with the nearer-term measures, GHG emissions peak
in 2020 and retreat to half of their 2000-level by 2050.
The Mobility 2030 study examined a scenario postulating
very large increases in the penetration of fuel efcient
technologies into road vehicles, coupled with improvements in
vehicle use, assuming different time frames for industrialized
and developing nations.
The technologies and their fuel consumption and carbon
emissions savings referenced to current gasoline ICEs were:
Technology Carbon reduced/vehicle
(%)
1. Diesels 18
2. Hybridization 30 (36 for diesel hybrids)
3. Biofuels 20-80
4. Fuel cells with fossil hydrogen 45
5. Carbon-neutral hydrogen 100
Figure 5.15 shows the effect of a scenario postulating the
market penetration of all of the technologies as well as an
assumed change in consumer preferences for larger vehicles
and improved trafc ows. The scenario assumes that diesels
make up 45% of light-duty vehicles and medium trucks by
2030; that half of all sales in these vehicle classes are hybrids,
also by 2030; that one-third of all motor vehicle liquid fuels
are biofuels (mostly advanced) by 2050; that half of LDV
and medium truck vehicle sales are fuel cells by 2050, with
the hydrogen beginning as fossil-based but gradually moving
to 80% carbon neutral by 2050; that better trafc ow and
other efciency measures reduce GHG emissions by 10%; and
that the underlying efciency of light-duty vehicles improves
by 0.6% per year due to steady improvements (e.g., better
aerodynamics and tyres) and to reduced consumer preference
for size and power. In this scenario, GHG emissions return to
their 2000-level by 2050.
Mobility 2030’s authors make it quite clear that for this ‘mixed’
scenario to be even remotely possible will require overcoming
many major obstacles. The introduction and widespread use of
hydrogen fuel cell vehicles for example requires huge reductions
in the costs of fuel cells; breakthroughs in on-board hydrogen
storage; major advances in hydrogen production; overcoming
the built-in advantages of the current gasoline and diesel fuel
infrastructure; demonstration and commercialization of carbon
2000 2010 2020 2030 2040 2050
2
4
6
0
Remaining GHG emissions
Short-term
measures
FC with Low-
GHG-emission-H2
Well-to-Wheels GHG emissions,
Gt CO2-eq
Figure 5.14: Two possible scenarios for GHG reductions in Light-duty vehicles
Source: IEA, 2004b.
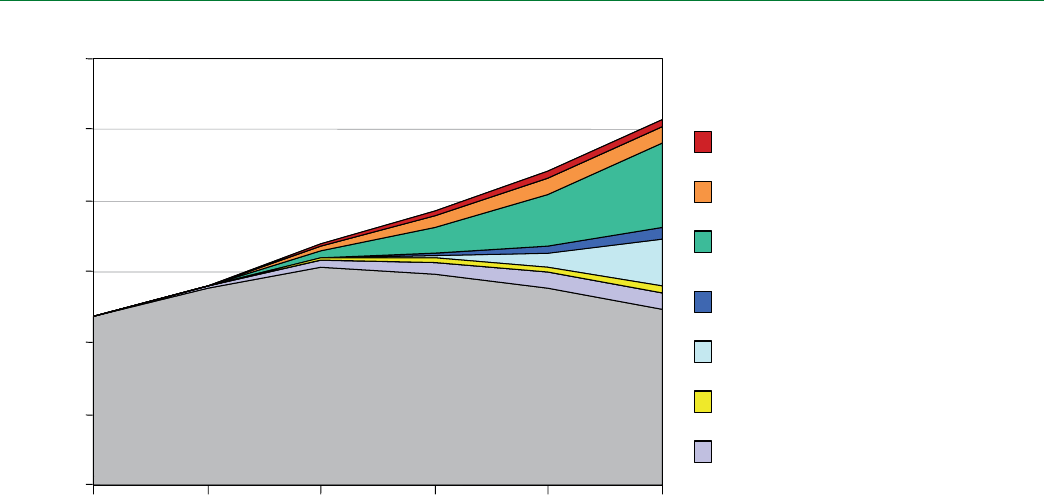
359
Chapter 5 Transport and its infrastructure
sequestration technologies for fossil fuel hydrogen production
(at least if GHG emission goals are to be reached); and a host of
other R&D, engineering and policy successes.
Table 5.8 summarizes technical potentials for various
mitigation options for the transport sector. As mentioned above,
there are few studies dealing with worldwide analysis. In most
of these studies, potentials are evaluated based on top-down
scenario analysis. For combinations of specic power train
technologies and fuels, well-to-wheels analyses are used to
examine the various supply pathways. Technical potentials for
operating practices, policies and behaviours are more difcult
to isolate from economic and market potential and are usually
derived from case studies or modelling analyses. Uncertainty
is a key factor at all stages of assessment, from technology
performance and cost to market acceptance.
5.4.2 Estimate of world mitigation costs and
potentials in 2030
By extrapolating from recent analyses from the IEA and
others an estimate can be given of the cost and potential
for reducing transport CO2 emissions. This section covers
improving the efciency of light-duty vehicles and aircraft,
and the substitution of conventional fossil fuels by biofuels
throughout the transport sector (though primarily in road
vehicles). As noted above, these estimates do not represent the
full range of options available to reduce GHG emissions in the
transport sector.
5.4.2.1 Light-duty Vehicles
The following estimate of the overall GHG emissions
reduction potential and costs for improving the efciency of
the world’s light-duty vehicle eet (thus reducing carbon
emissions), is based on the IEA Reference Case, as documented
in a spreadsheet model developed by the IEA for the Mobility
2030 project (WBSCD, 2004b). The cost estimates for total
mitigation potential are provided in terms of ‘societal’ costs
of reductions in GHG emissions, measured in US$/tonne of
carbon (tC) or carbon dioxide (CO2); the costs are the net of
higher vehicle costs minus discounted lifetime fuel savings.
Fuel savings benets are measured in terms of the untaxed cost
of the fuels at the retail level, and future savings are discounted
at a low societal rate of 4% per year. These costs are not the
same as those that would be faced by consumers, who would
face the full taxed costs of fuel, would almost certainly use a
higher discount rate, and might value only a few years of fuel
savings. Also, they do not include the consumer costs of forgoing
further increases in vehicle performance and weight. Over the
past few decades, increasing acceleration performance and
vehicle weight have stied increases in fuel economy for light-
duty vehicles and these trends must be stopped if substantial
progress is to be made in eet efciency. Because consumers
value factors such as vehicle performance, stopping these trends
will have a perceived cost – but there is little information about
its magnitude.
The potential improvements in light-duty fuel economy
assumed in the analysis, and the costs of these improvements,
are based on the scenarios in the MIT study summarised in Box
5.5. The efciency improvements as mentioned in this study are
1 - Diesels (LDVs)
2 - Hybrids (LDVs + MDTs)
3 - Biofuels
80% low GHG sources
4 - Fuel Cells
fossil hydrogen
5 - Fuel Cells
80% low-GHG H2
6 - Mix shifting
10% fuel efficiency improvement
7 - 10% vehicle travel reduction
all road vehicles
0
2
4
6
8
10
12
2000 2010 2020 2030 2040 2050
Gt CO2-eq
Remaining GHG emissions
Figure 5.15: The effect of a scenario postulating the market penetration of all technologies
Source: WBCSD, 2004a.

360
Transport and its infrastructure Chapter 5
Table 5.8: Summary table of CO2 mitigation potentials in transport sector taken from several studies
Study Mitigation measure/policy Region CO2 reduction (%) CO2 reduction (Mt)
2010 2020 2030 2050 2010 2020 2030 2050
IEA 2004a Alternative scenario World
OECD
Developing countries
Transition economies
2.2
2
2.8
2.3
6.8
6.9
6.8
6.2
11.4
11.5
11.4
11.2
133
77
49
8
505
308
170
27
997
557
381
59
IEA 2001 Improving Tech for Fuel
Economy
Diesel
OECD 30 40
5-15
IEA 2002a All scenarios included
All scenarios included
All scenarios included
NA
Western Europe
Japan
6.6
6.6
8.3
14.4
15.6
16.1
148
76
28
358
209
61
IEA 2004d Improving fuel economy
Biofuels
FCV with hydrogen refuelling
COMBINING THESE THREE
World 18
12
7
30
IEA 2004b Reduction in fuel use per km
Blend of biofuels
Reduction in growth of LDV
travel
using hydrogen in vehicle
World 15
5
5
0
25
8
10
3
35
13
20
75
ACEEE 2001 A-scenario
B-scenario
C-scenario
USA 9.9
11.8
13.2
26.3
30.6
33.4
132
158
176
418
488
532
(2035)
MIT 2004 Baseline
Medium HEV
Composite
USA 3.4
5.2
14.9
16.8
29.9
44.4
Combined policies 3-6 14-24 32-50
Greene and
Schafer
2003
Efficiency standards
Light-duty vehicles
Heavy trucks
Commercial aircraft
USA (2015)
6
2
1
18
3
2
Replacement & alternative fuels
Low-carbon replacement fuels
Hydrogen fuel (all LDV fuel)
2
1
7
4
Pricing policies
Low-carbon fuel subsidy
Carbon pricing
Variabilization
2
3
6
6
6
9
Behavioural
Land use & infrastructure
System efficiency
Climate change education
Fuel economy information
3
0
1
1
5
1
2
1
Total 22 48
WEC 2004 New technologies World 30 46
WBCSD
2004b
Road transport
Diesels (LDVs)
Hybrids (LDVs and MDTs)
Biofuels-80% low GHG sources
Fuel Cells-fossil hydrogen
Fuel Cells-80% low-GHG
hydrogen
Mix shifting 10% FE improve-
ment
10% Vehicle travel reduction-
all vehicles
World
0.9
2.4
5.7
5.9
5.9
6.7
9.4
2.1
6.1
15.6
16.7
17.2
18.8
22.8
1.8
6.1
29.5
32.7
45.3
47.3
51.9
61
161
386
400
400
451
639
160
474
1207
1293
1333
1455
1765
181
623
3030
3364
4650
4864
5335

361
Chapter 5 Transport and its infrastructure
discounted somewhat to take into account the period in which
the full benets can be achieved. Further, eet penetration of the
technology advances are assumed to be delayed by 5 years in
developing nations; however, because developing nation eets
are growing rapidly, higher efciency vehicles, once introduced,
may become a large fraction of the total eet in these nations
within a relatively short time. The technology assumptions for
two ‘efciency scenarios’ are as follows (Table 5.9a).
The high efciency and medium efciency scenarios achieve
the following improvements in efciency for the new light-duty
vehicle eet (Table 5.9b):
Table 5.10 shows the light-duty vehicle fuel consumption and
(vehicle only) CO2 emissions for the Reference scenario and the
High and medium efciency scenarios. In the Reference case,
LDV fuel consumption increases by nearly 60% by 2030; the
High Efciency Case cuts this increase to 26% and the Medium
efciency scenario cuts it to 42%. For the OECD nations, the
Reference Case projects only a 22% increase by 2030, primarily
because of moderate growth in travel demand, with the High
efciency scenario actually reducing fuel consumption in this
group of nations by 9% and the Medium efciency scenario
reducing growth to only 6%. This regional decrease (or modest
increase) in fuel use is overwhelmed by the rapid growth in
the world’s total eet size and overall travel demand and the
slower uptake of efciency technologies in the developing
nations. Because no change in the use of biofuels was assumed
in this analysis, the CO2 emissions in the scenarios essentially
track the energy consumption paths discussed above. Figure
5.16 shows the GHG emissions path for the three scenarios,
resulting in a mitigation potential of about 800 (High) and 400
(Medium) MtCO2 in 2030.
Table 5.11 shows the cost of the reductions in GHG emissions
in US$/tCO2 for those reductions obtained by the 2030 new
vehicle eet over its lifetime, assuming oil prices of 30 US$, 40
US$, 50 US$ and 60 US$/bbl over the vehicles’ lifetime.36 Note
that the costs in Table 5.11 do not apply to the carbon reductions
achieved in that year by the entire LDV eet (from Table
Box 5.5 Fuel economy benefits of multiple efficiency technologies
Several studies have examined the fuel economy benefits of simultaneously applying multiple efficiency technologies to
light-duty vehicles. However, most of these are difficult to compare because they examine various types of vehicles, on
different driving cycles, using different technology assumptions, for different time frames. The Massachusetts Institute of
Technology has developed such an assessment for 2020 (MIT, 2000) with documentation of basic assumptions though
with few details about the specific technologies that achieve these values, for a medium size passenger car driving over
the official US Environmental Protection Agency driving cycle (Heywood et al., 2003). There are two levels of technology
improvement – ‘baseline’ and ‘advanced,’ with the latter level of improvement further subdivided into conventional and
hybrid drive trains.
Some of the key features of the 2020 vehicles are:
• Vehicle mass is reduced by 15% (baseline) and 22% (advanced) by a combination of greater use of high strength steel,
aluminium and plastics coupled with advanced design;
• Tyre rolling resistance coefficient is reduced from the current .009 to .008 (baseline) and .006 (advanced);
• Drag coefficient is reduced to 0.27 (baseline) and 0.22 (advanced). The baseline level is at the level of the best current
vehicles, while the advanced level should be readily obtainable for the best vehicles in 2020, but seems quite ambitious
for a fleet average;
• Indicated engine efficiency increases to 41% in both baseline and advanced versions. This level of efficiency would likely
require direct injection, full valve control (and possibly camless valves) and advanced engine combustion strategies.
The combined effects of applying this full range of technologies are quite dramatic (Table 5.9). From current test values
of 30.6 mpg (7.69 litres/100 km) as a 2001 reference, baseline 2020 gasoline vehicles obtain 43.2 mpg (5.44 L/100 km),
advanced gasoline vehicles 49.2 mpg (4.78 L/100 km) and gasoline hybrids 70.7 mpg (3.33 L/100 km); advanced diesels
obtain 58.1 mpg (4.05 L/100 km) and diesel hybrids 82.5 mpg (2.85 L/100 km) (note that on-road values will be at least 15%
lower). In comparison, Ricardo Consulting Engineers (Owen and Gordon, 2002) estimate the potential for achieving 92 g/km
CO2 emissions, equivalent to 68.6 mpg (3.43 L/100 km), for an advanced diesel hybrid medium size car ‘without’ substantive
non-drive train improvements. This is probably a bit more optimistic than the MIT analysis when accounting for the additional
effects of reduced vehicle mass, tyre rolling resistance and aerodynamic drag coefficient.
These values should be placed in context. First, the advanced vehicles represent ‘leading edge’ vehicles which must then be
introduced more widely into the new vehicle fleet over a number of years and may take several years (if ever) to represent an
‘average’ vehicle. Second, the estimated fuel economy values are attainable only if trends towards ever-increasing vehicle
performance are stifled; this may be difficult to achieve.

362
Transport and its infrastructure Chapter 5
5.10), because those reductions are associated with successive
waves of high efciency vehicles entering the eet during the
approximately 15 year period before (and including) 2030.
The Table 5.11 results show that the ‘social cost of carbon
reduction’ for light-duty vehicles varies dramatically across
regions and with fuel prices (since the cost is the net of
technology costs minus the value of fuel savings). The results
are also quite different for the High and Medium efciency
scenarios, primarily because the estimated technology costs
begin to rise more steeply at higher efciency levels, raising
the average cost/tonne of CO2 in the High efciency scenario.
For the High efciency scenario, CO2 reduction costs are very
high for the OECD countries aside from North America, even at
60 US$/bbl oil prices, reecting the ambitious (and expensive)
increases in that scenario, the relatively high efciencies of
those regions’ eets in the Reference Case, and the relatively
low km/vehicle/year driven outside North America; on the
other hand, the costs of the moderate increases in the Medium
efciency scenario are low to negative for all regions, reecting
the availability of moderate cost technologies capable of raising
average vehicle efciencies up to 30–40% or so.
The values in Table 5.11 are sensitive to several important
assumptions:
• Technology costs: the costs assumed here appear to be
considerably higher than those assumed in WEO 2006 (IEA,
2006a).
• Discount rates: the analysis assumes a low social discount
rate of 4% in keeping with the purpose of the analysis. As
noted, vehicle purchasers would undoubtedly use higher
rates and would value fuel savings at retail fuel prices rather
than the untaxed values used here; they might also only
value a few years of fuel savings rather than the lifetime
savings assumed here. WEO 2006 on the other hand, used
a zero discount rate, substantially reducing the net cost of
carbon reduction.
• Vehicle km travelled (vkt): this analysis used the IEA/
WBCSD spreadsheet’s assumption of constant vkt over
time and applied these values to new cars. Actual driving
patterns will depend on the balance of increasing road
infrastructure and rapidly increasing eet size in developing
nations. Unless infrastructure keeps pace with growing eet
size, which will be difcult, the assumption of constant vkt/
vehicle may prove accurate or even optimistic.
• Efciency gains assumed in the Reference scenario: the
Reference scenario assumed signicant gains in most areas
(aside from North America), which makes the Efciency
scenarios more expensive.
Table 5.12 shows the economic potential for reducing CO2
emissions in the 2030 eet of new LDVs as a function of
world oil price.37 The values show that much of the economic
potential is available at a net savings, ‘if consumer preference
for power and other efciency-robbing vehicle attributes is
ignored’. Even at 30 US$/bbl oil prices, over half of the total
36 Note, however, that these results do not take into account changes in travel demand that would occur with changing fuel price and changes in Reference case vehicle efficiency
levels. At higher oil prices, the Reference case would likely have less travel and higher vehicle efficiency; this would, in turn, reduce the oil savings and GHG reductions ob-
tained by the Efficiency case and would likely raise the costs/tonne C from the values shown here.
Table 5.9a: Fuel economy and cost assumptions for cost and potentials analysis
Medium size car MPG
(L/100 km)
Incr from Ref
(%)
Cost
(%)
DCost
(US$)a)
2001 reference 30.6 (7.69) 0 100 0
2030 baseline 43.2 (5.55) 41 105 1,000
2030 advanced 49.2 (4.78) 61 113 2,600
2030 hybrid 70.7 (3.33) 131 123 4,600
2030 diesel 58.1 (4.05) 90 119 3,800
2030 diesel hybrid 82.5 (2.85) 170 128 5,600
a) Cost differential based on a reference 20,000 US$ vehicle. See Box 5.5 for the definitions of the vehicle types.
Source: adapted from MIT (2000), as explained in the text.
Region % improvement from 2001 levels, high/medium
2015 2020 2025 2030
North America 30/15 45/25 70/32 80/40
Europe 30/25 40/30 55/35 70/40
Emerging Asia/Pacific 30/25 40/30 65/35 75/40
Rest of world 0/12+ 30/20+ 45/25+ 60/30+
Table 5.9b: Efficiency improvements new light-duty vehicle fleet

363
Chapter 5 Transport and its infrastructure
(<100 US$/tCO2) potential is available at a net savings over the
vehicle lifetime; at 40 US$/bbl, over 90% of the 718 Mt total
potential is available at a net savings.
The regional detail, not shown in Table 5.12, is illuminating.
In the High Efciency scenario, of 793 Mt of total potential,
445 Mt are in OECD North America and are available at a net
savings at 40 US$/bbl oil (and at less than 20 US$/tCO2 at 30
US$/bbl oil). The next highest regional potential is in OECD
Europe at 104 Mt, but this potential is more expensive: at 30
US$/bbl oil. Only 56 Mt is available below 100 US$/tCO2, and
becomes available at below 100 US$/tCO2 only at 60 US$/bbl
37 These results do not take account of the effect higher oil prices would have on LDV efficiency in the Reference Scenario. This efficiency level would be expected to be a strong
function of oil price, that is, it would be higher for higher prices. Consequently, the technology cost of improving vehicle efficiency further would also be higher – reducing the
economic potential.
CO2 emissions
(Mt)
Energy use
(EJ)
2000 2030
2000
2030
Reference High Medium Reference High Medium
OECD North America 1226 1623 1178 1392 17.7 23.4 17.0 20.0
OECD Europe 488 535 431 479 7.0 7.5 6.0 6.7
OECD Pacific 220 219 176 197 3.2 3.2 2.6 2.9
EECCA 84 229 188 209 1.2 3.3 2.7 3.0
Eastern Europe 49 82 68 74 0.7 1.2 1.0 1.0
China 46 303 267 287 0.7 4.4 3.8 4.1
Other Asia 54 174 148 160 0.8 2.5 2.1 2.3
India 22 103 87 95 0.3 1.5 1.2 1.4
Middle East 27 67 57 62 0.4 1.0 0.8 0.9
Latin America 110 294 251 273 1.6 4.2 3.6 3.9
Africa 53 167 152 162 0.8 2.4 2.2 2.3
Total 2379 3797 3004 3390 34.2 54.4 43.1 48.6
Note: EECCA = countries of EasternEurope, the Caucasus and Central Asia.
Table 5.10: Regional and worldwide Light-duty vehicle CO2 emissions (vehicle only) and fuel consumption, efficiency and reference cases
Table 5.11: Cost of CO2 reduction in new 2030 LDVs
CO2 reduction cost (US$/tCO2)
High efficiency case Medium efficiency case
30 US$/bbl
0.39 US$/L
40 US$/bbl
0.45 US$/L
50 US$/bbl
0.51 US$/L
60 US$/bbl
0.60 US$/L
30 US$/bbl
0.39 US$/L
40 US$/bbl
0.45 US$/L
50 US$/bbl
0.51 US$/L
60 US$/bbl
0.60 US$/L
OECD North
America
5 -16 -37 -68 -72 -93 -114 -146
OECD Europe 131 110 89 58 14 -7 -28 -60
OECD Pacific 231 210 189 157 -14 -36 -57 -88
EECCA 81 60 39 8 -54 -76 -97 -128
Eastern Europe 181 160 139 107 -18 -39 -60 -92
China 23 2 -19 -51 -23 -44 -65 -97
Other Asia 19 -2 -23 -55 -23 -44 -65 -96
India 62 41 20 -12 9 -12 -33 -65
Middle East -15 -36 -57 -89 -49 -70 -91 -122
Latin America -6 -27 -48 -79 -42 -63 -84 -116
Africa 10 -12 -33 -64 -33 -54 -75 -106
Note: EECCA = countries of EasternEurope, the Caucasus and Central Asia.
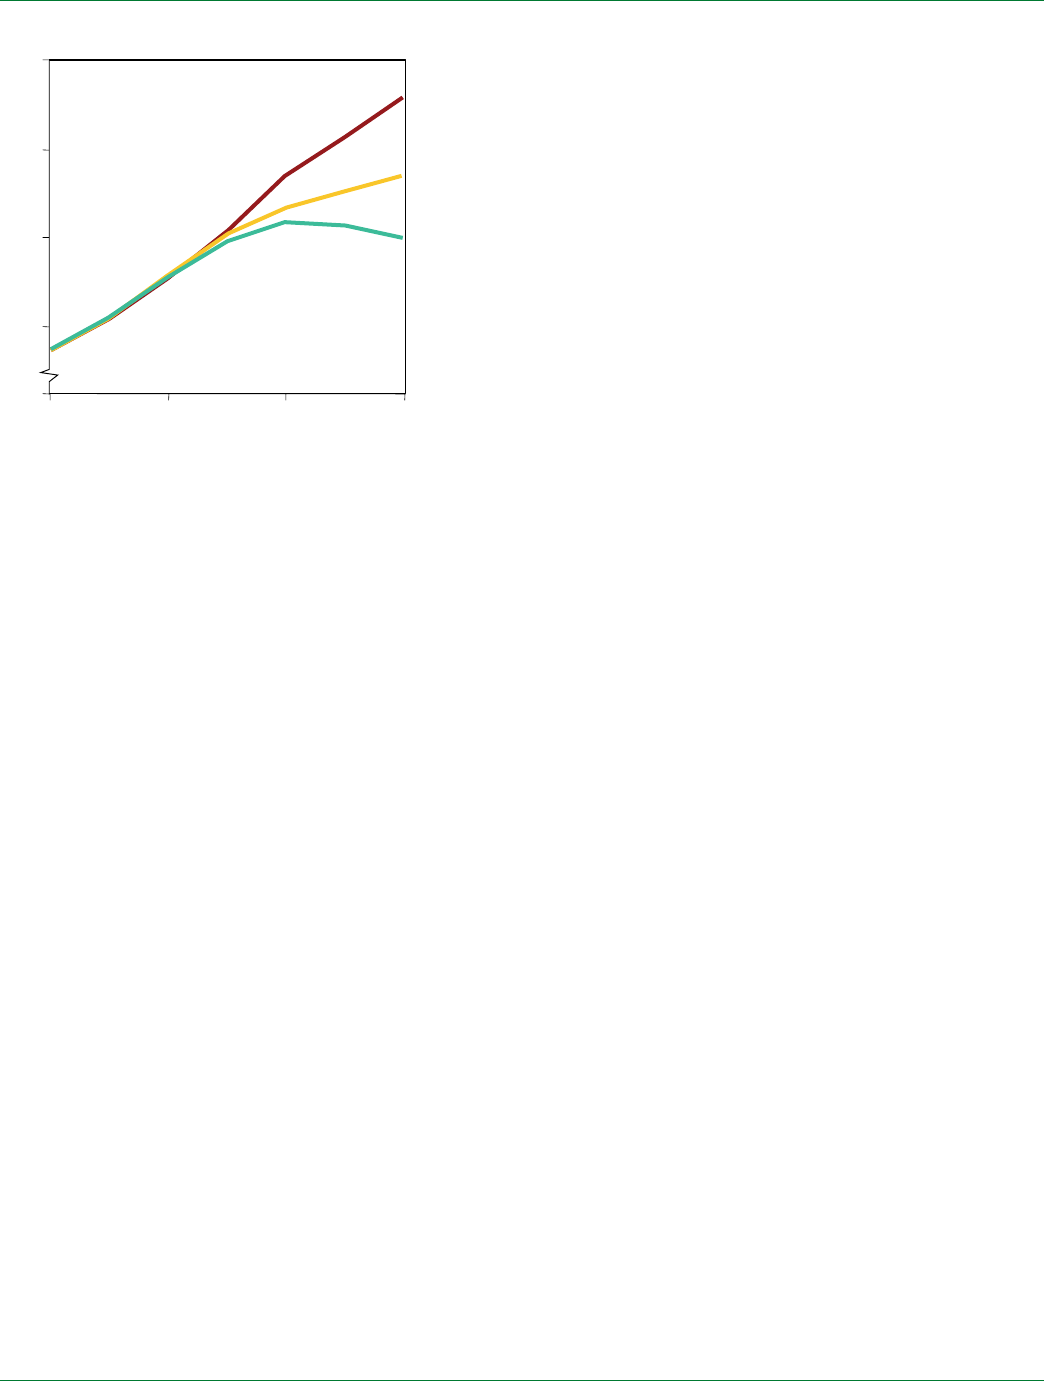
364
Transport and its infrastructure Chapter 5
oil. China has the next highest total emissions (2030 Reference
case emissions of 303 Mt) but only a moderate potential of 36
Mt. This potential is fully available at a net savings only if oil is
50 US$/bbl or higher – perhaps not surprising because China has
ambitious fuel economy standards embedded in the Reference
Case and has relatively low driving rates, which make further
improvements more difcult and expensive.
5.4.2.2 Aircraft
QinetiQ (UK)38 analysed the fuel consumption and CO2
trends for a simple global aviation growth scenario to provide
an indicative view on the extent that technology and other
developments might mitigate aviation emissions. The ICAO
trafc forecast (ICAO/FESG, 2003) dened trafc growth to
2030 from which a future eet composition was developed,
using a range of current and future aircraft types where their
introduction could be assumed, as well as representative aircraft
types based on seat capacity. Fuel burn and emissions were
calculated using known emissions performance and projections
for future aircraft where necessary.
The analysis assumed a range of technology options as
follows:
• Case 1 assumed no technology change from 2002 to 2030;
using the extrapolated trafc forecast from ICAO FESG
– this case shows only the effects of trafc growth on
emissions.
• Case 2 – as Case 1, but assumes all new aircraft deliveries
after 2005 would be ‘best available technology at a 2005
(BAT)’ performance standard, and with specic new aircraft
(A380, A350, B787) delivered from 2008.
• Case 3 – as Case 1, but with assumed annual eet fuel
efciency improvements as per ‘Greene’ and DTI (IPCC
1999, Chapter 9, Table 9.15). This assumes a eet efciency
improvement trend of 1.3% per year to 2010, assumed then
to decline to 1.0% per year to 2020 and 0.5% per year
thereafter. This is the reference case.
• Case 4 – as Case 3, plus the assumption that a 50 US$/tCO2
cost will produce a further 0.5% fuel efciency improvement
per annum from 2005, as suggested by the cost-potential
estimates of Wit et al., (2002), that assume technologies
such as winglets, fuselage skin treatments (riblets) and
further weight reductions and engine developments will be
introduced by airlines.
• Case 5 – as Case 3, plus the assumption of 100 US$/tCO2
cost, producing a 1.0% fuel efciency improvement per
annum from 2005 (Wit et al., 2002), again inuencing the
introduction of additional technologies as above.
The results of this analysis are summarised in Table 5.13.
Case 2 is a simple representation of planned industry
developments and shows their effect to 2030, ignoring further
technology developments. This is an articial case, as on-going
efciency improvements would occur as a matter of course,
but it shows that these planned eet developments alone
might save 14% of the CO2 that the ‘no technology change’
of Case 1 would have produced. Case 3 should be regarded as
the ‘base case’ from which benets are measured, as this case
reects an agreed fuel efciency trend assumed for some of the
calculations produced in the IPCC Special Report (1999). This
results in a further 11% reduction in CO2 by 2030 compared
with Case 2. Cases 4 and 5 assume that a carbon cost will drive
additional technology developments from 2005 – no additional
demand effect has been assumed. These show further CO2
reduction of 11.8% and 22.2% compared with ‘base case’ 3
over the same period from technologies that are assumed to be
more attractive than hitherto. However, even the most ambitious
scenario suggests that CO2 production will increase by almost
100% from the base year. The cost potentials for Cases 4 and
5 are based on one study and further studies may rene these
results. There is limited literature in the public domain on
costs of mitigation technologies. The effects of more advanced
technology developments, such as the blended wing body, are
not modelled here, as these developments are assumed to take
place after 2030.
The analysis suggests that aviation emissions will continue
to grow as a result of continued demand for civil aviation.
Assuming the historical fuel efciency trend produced by
industry developments will continue (albeit at a declining
level), carbon emissions will also grow, but at a lower rate than
trafc. Carbon pricing could effect further emissions reductions
if the aviation industry introduces further technology measures
in response.
38 http://www.dti.gov.uk/files/file35675.pdf
2.5
3.0
3.5
4.0
20002010 20202030
High
Efficiency
Medium
Efficiency
Reference
Gt CO2
Figure 5.16: Light-duty vehicle CO2 emissions for three scenarios

365
Chapter 5 Transport and its infrastructure
5.4.2.3 Biofuels
IEA has projected the potential worldwide increased use of
biofuels in the transport sector assuming successful technology
development and policy measures reducing barriers to biomass
deployment and providing economic incentives.
IEA’s World Energy Outlook 2006 (IEA, 2006b) develops
an Alternative policy scenario that adds 55 Mtoe biofuels
above baseline levels of 92 Mtoe by 2030, which increases the
biofuels share of total transport fuel demand from 3 to 5%. In
this scenario, all of the biofuels are produced by conventional
technology, that is ethanol from starch and sugar crops and
biodiesel from oil crops. Assuming an average CO2 reduction
from gasoline use of 25%,39 this would reduce transport CO2
emissions by 36 Mt.
Furthermore, according to the Beyond the Alternative
policy scenario (BAPS), which assumed more energy savings
and emission reductions through a set of technological
breakthroughs, biofuels use in road transport would double
compared to the Alternative policy scenario.
A second IEA report, Energy Technology Perspectives 2006
(IEA, 2006a), evaluates a series of more ambitious scenarios
that yield biomass displacement of 13–25% of transport
energy demand by 2050, compared to Baseline levels of 3%
displacement. Two scenarios, called Accelerated Technology
(ACT) Map and TECH Plus, assume economic incentives
equivalent to 25 US$/tCO2, increased support for research and
development, demonstration, and deployment programmes, and
policy instruments to overcome commercialization barriers.
Both scenarios have optimistic assumptions about the success
of efforts to reduce fuel production costs, increase crop yields,
and so forth. In the ACT Map scenario, transport biofuels
production reaches 480 Mtoe in 2050, accounting for 13%
of total transport demand; in TECH Plus, biofuels represents
25% of transport energy demand by 2050. These displacements
yield CO2 reductions (below the Baseline levels) of 1800
MtCO2 in Map and 2300 MtCO2 in TECH Plus, with the major
World oil
price
(US$/bbl)
Region Economic potential (MtCO2)
Cost ranges (US$/tCO2)
<100 <0 0-20 20-50 50-100
30 OECD
EIT
Other
World
523
49
146
718
253
28
88
369
270
0
30
300
0
0
20
20
0
21
8
29
40 OECD
EIT
Other
World
523
49
146
718
523
28
118
669
0
0
20
20
0
0
8
8
0
21
0
21
50 OECD
EIT
Other
World
571
49
146
766
523
28
138
689
0
0
8
8
0
21
0
21
48
0
0
48
60 OECD
EIT
Other
World
571
49
146
766
523
28
146
697
0
21
0
21
0
0
0
0
48
0
0
48
Table 5.12: Economic potential of LDV mitigation technologies as a function of world oil price, for new vehicles in 2030
Aviation technology 2002 CO2
(Mt)
2030 CO2
(Mt)
Ratio
(2030/2002)
Case 1 (no technological change) 489.29 1,609.74 3.29
Case 2 (BAT new aircrafts) 489.29 1,395.06 2.85
Case 3 (base) 489.29 1,247.02 (100%) 2.55
Case 4 (50 US$/tCO2-eq) 489.29 1,100.15 (88%) 2.25
Case 5 (100 US$/tCO2-eq) 489.29 969.96 (78%) 1.98
39 IEA cites the following estimates for biofuels CO2 reduction when used as a replacement fuel: Corn in the U.S., –13%; ethanol in Europe, –30%; ethanol in Brazil, –90%; sugar
beets to ethanol in Europe, –40 to –60%; rapeseed-derived biodiesel in Europe, –40 to –60%.
Table 5.13: Summaries of CO2 mitigation potential analysis in aviation

366
Transport and its infrastructure Chapter 5
contributors being biodiesel from Fischer Tropsch conversion
and ethanol from both sugar crops and cellulosic feedstocks;
biodiesel from vegetable oil and ethanol from grains represent
somewhat lower shares.
Although the report does not provide quantitative estimates
of CO2 reduction in 2030, it presents qualitative information
(Table 3.5 of the IEA report) that implies that 2030-levels of
biodiesel from vegetable oil and ethanol from grain and sugar
crops are similar to 2050-levels, but biodiesel from Fischer
Tropsch conversion, a major source in 2050, plays little role in
2030 and cellulosic ethanol is also signicantly lower in 2030
than in 2050. The implied 2030 potential from the two scenarios
appears to be about 600–1500 MtCO2.
5.4.2.4 Totals
The estimates discussed above can be summarized as
follows:
Light-duty vehicles:
718–766 MtCO2 at carbon prices less than 100 US$/tCO2
689–718 MtCO2 at carbon prices less than 50 US$/tCO2
669–718 MtCO2 at carbon prices less than 20 US$/tCO2
369–697 MtCO2 at carbon prices less than 0 US$/tCO2
Aircraft:
150 MtCO2 at carbon prices less than 50 US$/tCO2
280 MtCO2 at carbon prices less than 100 US$/tCO2
Biofuels:
600–1500 MtCO2 at carbon prices less than 25 US$/tCO2
Although presumably the potential for biofuels penetration
would be higher above the cited 25 US$/tCO2 carbon price,
the total potential for a carbon price of 100 US$/tCO2 for the
three mitigation sources is about 1600–2550 MtCO2. Much of
this potential appears to be located in OECD North America
and Europe. Note, however, that the potential is measured as
the ‘further’ reduction in CO2 emissions from the Reference
scenario, which assumes that substantial amounts of biofuels
will be produced in Brazil and elsewhere and signicant
improvements in fuel efciency will occur in China and in other
industrializing nations without further policy measures.
5.5 Policies and measures
This section provides policies and measures for the transport
sector, considering experiences of countries and regions in
achieving both energy savings (and hence GHG reduction) and
sustainable transport systems. An overall policy consideration
at the national level and international levels is presented in
Chapter 13.3
The policies and measures that have been considered in this
section that are commonly applied for the sector and can be
effective are:
• Land use and transport planning;
• Taxation and pricing;
• Regulatory and operational instruments (e.g., trafc
management, control and information);
• Fuel economy standards – road transport;
• Transport demand management;
• Non-climate policies inuencing GHG emissions;
• Co-benets and ancillary benets.
This section discusses climate policies related to GHG from
international aviation and shipping separately, reecting the
international coordination that is required for effective reduction
strategies in these sectors. Both sectors are subject to a global
legal framework and mitigation policies applied on a unilateral
basis may reduce its environmental effectiveness due to evasion
(Wit et al., 2004).
5.5.1 Surface transport
A wide array of policies and strategies has been employed
in different circumstances around the world to restrain vehicle
usage, manage trafc congestion and reduce energy use, GHGs,
and air pollution. There tends to be considerable overlap among
these policies and strategies, often with synergistic effects.
The recent history almost everywhere in the world has been
increasing travel, bigger vehicles, decreasing land-use densities
and sprawling cities. But some cities are far less dependent
on motor vehicles and far denser than others, even at the
same incomes. The potential exists to greatly reduce transport
energy use and GHG emissions by shaping the design of cities,
restraining motorization and altering the attributes of vehicles
and fuels. Indeed, slowing the growth in vehicle use through
land-use planning and through policies that restrain increases in
vehicle use would be an important accomplishment. Planning
and policy to restrain vehicles and densify land use not only
lead to reduced GHG emissions, but also reduced pollution,
trafc congestion, oil use, and infrastructure expenditures and
are generally consistent with social equity goals as well.
5.5.1.1 Land use and transport planning
Energy use for urban transport is determined by a number of
factors, including the location of employment and residential
locations. In recent decades, most cities have been increasing
their dependence on the automobile and decreasing dependence
on public transport. In some cases increasing motorization
is the result of deliberate planning – what became known as
‘predict and provide’ (The Royal Commission on Transport
and the Environment, 1994; Goodwin, 1999). This planning
and programming process played a central role in developed
countries during the second half of the 20th century. In many
developing countries, the process of motorization and road
building is less organized, but is generally following the same
motorization path, often at an accelerated rate.
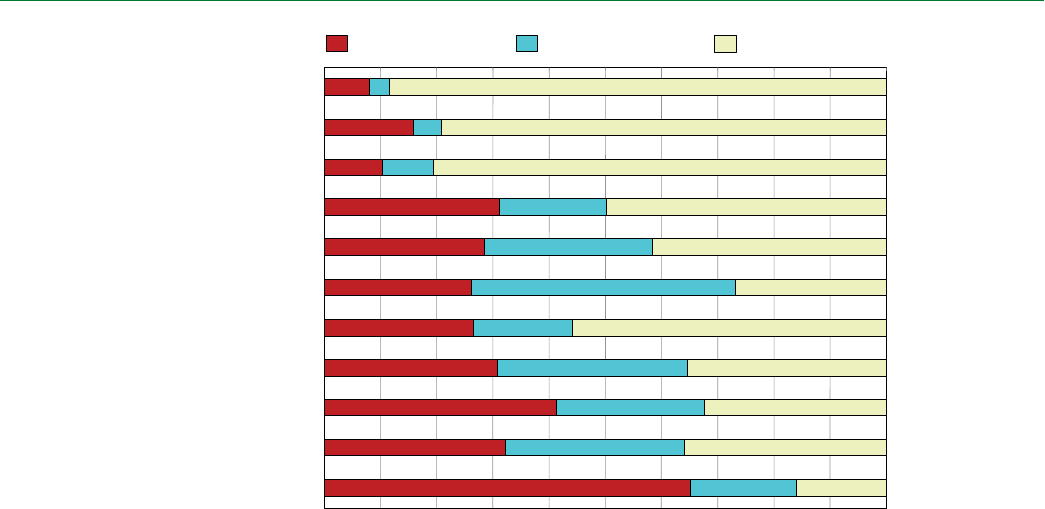
367
Chapter 5 Transport and its infrastructure
Income plays a central role in explaining motorization.
But cities of similar wealth often have very different rates of
motorizsation. Mode shares vary dramatically across cities, even
within single countries. The share of trips by walking, cycling
and public transport is 50% or higher in most Asian, African and
Latin American cities, and even in Japan and Western Europe
(Figure 5.17). Coordination of land use and transport planning
is key to maintaining these high mode shares.
Kenworthy and Laube (1999) pointed out that high urban
densities are associated with lower levels of car ownership
and car use and higher levels of transit use. These densities
are decreasing almost everywhere. Perhaps the most important
strategy and highest priority to slow motorization is to strengthen
local institutions, particularly in urban areas (Sperling and
Salon, 2002).
Some Asian cities with strong governments, especially Hong
Kong, Singapore and Shanghai are actively and effectively
pursuing strategies to slow motorization by providing high
quality public transport and coordinating land use and transport
planning (Cullinane, 2002; Willoughby, 2001; Cameron et al.,
2004; Sperling and Salon, 2002).
There are many other examples of successfully integrated
land use and transport planning, including Stockholm and
Portland, Oregon (USA) (Abbott, 2002; Lundqvist, 2003). They
mostly couple mixed-use and compact land use development
with better public transport access to minimize auto dependence.
The effectiveness of these initiatives in reducing sprawl is the
subject of debate, especially in the USA (Song and Knaap, 2004;
Gordon and Richardson, 1997; Ewing, 1997). There are several
arguments that the settlement pattern is largely determined,
so changes in land use are marginal, or that travel behaviour
may be more susceptible to policy interventions than land-use
preferences (Richardson and Bae, 2004). Ewing and Cervero
(2001) found that typical elasticity of vehicle-km travelled with
respect to local density is –0.05, while Pickrell (1999) noted
that reduction in auto use become signicant only at densities
of 4000 people or more per square kilometre – densities rarely
observed in US suburbs, but often reached elsewhere (Newman
and Kenworthy, 1999). Coordinated transport and land-use
methods might have greater benets in the developing world
where dense mixed land use prevails and car ownership rate
is low. Curitiba is a prime example of coordinated citywide
transport and land-use planning (Gilat and Sussman, 2003;
Cervero, 1998).
The effectiveness of policies in shifting passengers from cars
to buses and rails is uncertain. The literature on elasticity with
respect to other prices (cross price elasticity) is not abundant
and likely to vary according to the context (Hensher, 2001).
The Transport Research Laboratory guide showed several
cross price elasticity estimates with considerable variance
in preceding studies (TRL, 2004). Goodwin (1992) gave an
average cross elasticity of public transport demand with respect
to petrol prices of +0.34. Jong and Gunn (2001) also gave an
average cross elasticity of public transport trips with respect to
fuel price and car time of +0.33 and +0.27 in the short term and
+0.07 and +0.15 in the long term.
The literature on mode shifts from cars to new rail services
is also limited. A monitoring study of Manchester indicated that
about 11% of the passengers on the new light rail would have
02040 6080100%
U.S.A.
A
ustralia/New Zealand
Canada
Western Europe
High Income Asia
Eastern Europe
Middle East
Latin America
Africa
Low Income Asia
China
non motorised motorised public motorised private
Figure 5.17: Modal split for the cities represented in the Millennium Cities Database for Sustainable Transport by region
Source: Kenworthy & Laube, 2002.

368
Transport and its infrastructure Chapter 5
otherwise used their cars for their trips (Mackett and Edwards,
1998), while a Japanese study of four domestic rails and
monorails showed that 10–30% of passengers on these modes
were diverted from car mode. The majority of the passengers
were transferred from alternative bus and rail routes (Japanese
Ministry of Land, Infrastructure and Transport and Institute
of Highway Economics, 2004). The Transport Research
Laboratory guide (2004) contained international evidence of
diversion rates from car to new urban rail ranging from 5–30%.
These diversion rates are partly related to car mode share, in
the sense that car share is so high in the USA and Australia
that ridership on new rail systems is more likely to come from
cars in those countries (Booz Allen & Hamilton 1999, cited in
Transport Research Laboratory, 2004). It is also known that
patronage of metros for cities in the developing world has been
drawn almost exclusively from existing public transport users
or through generation effects (Fouracre et al., 2003).
The literature suggests that in general, single policies
or initiatives tend to have a rather modest effect on the
motorization process. The key to restraining motorization is to
cluster a number of initiatives and policies, including improved
transit service, improved facilities for NMT (Non-motorized
transport) and market and regulatory instruments to restrain car
ownership and use (Sperling and Salon, 2002). Various pricing
and regulatory instruments are addressed below.
Investment appraisal is an important issue in transport
planning and policy. The most widely applied appraisal
technique in transport is cost benet analysis (CBA) (Nijkamp
et al., 2003). In CBA, the cost of CO2 emissions can be indirectly
included in the vehicle operating cost or directly counted at an
estimated price, but some form of robustness testing is useful
in the latter case. Alternatively, the amount of CO2 emissions is
listed on an appraisal summary table of Multi-Criteria Analysis
(MCA) as a part of non-monetized benets and costs (Mackie
and Nellthorp, 2001; Grant-Muller et al., 2001; Forkenbrock
and Weisbrod, 2001; Japanese Study Group on Road Investment
Evaluation, 2000). To the extent that the cost of CO2 emissions
has a relatively important weight in these assessments,
investments in unnecessarily carbon-intensive projects might
be avoided. Strategic CBA can further make transport planning
and policy carbon-efcient by extending CBA to cover multi-
modal investment alternatives, while Strategic Environmental
Assessment (SEA) can accomplish it by including multi-sector
elements. (ECMT, 2000; ECMT, 2004b).
5.5.1.2 Taxation and pricing
Transport pricing refers to the collection of measures used
to alter market prices by inuencing the purchase or use of a
vehicle. Typically measures applied to road transport are fuel
pricing and taxation, vehicle license/registration fees, annual
circulation taxes, tolls and road charges and parking charges.
Table 5.14 presents an overview of examples of taxes and
pricing measures that have been applied in some developing
and developed countries.
Pricing, taxes and charges, apart from raising revenue for
governments, are expected to inuence travel demand and
hence fuel demand and it is on this basis that GHG reduction
can be realized.
Transport pricing can offer important gains in social welfare.
For the UK, France and Germany together, (OECD, 2003)
estimates net welfare gains to society of optimal charges (set
at the marginal social cost level) at over 20 billion €/yr (22.6
US$/yr).
Instrument Developing countries/EIT Developed countries
Tax incentives to promote use of natural gas Pakistan, Argentina, Colombia, Russia Italy, Germany, Australia, Ireland, Canada, UK,
Belgium
Incentives to promote natural gas vehicles Malaysia, Egypt Belgium, UK, USA, Australia, Ireland
Annual road tax differentiated by vintage Singapore and India (fixed span and scrap-
ping)
Germany
Emission trading Chile
Congestion pricing including Area Licens-
ing Scheme; vehicle registration fees; annual
circulation tax
Chile, Singapore Norway, Belgium
Vehicle taxes based on emissions-tax deduc-
tions on cleaner cars e.g., battery operated or
alternative fuel vehicles
South Korea Austria, Britain, Belgium, Germany, Japan,
The Netherlands, Sweden
Carbon tax by size of engine Zimbabwe
Cross subsidization of cleaner fuels (ethanol
blending by gasoline tax - through imposition
of lower surcharge or excise duty exemption)
India
Source: Adapted from Pandey and Bhardwaj, 2000; Gupta, 1999 and European Natural Gas Vehicle Association, 2002.
Table 5.14: Taxes and pricing in the transport sector in developing and developed countries
Source: Adapted from Pandey and Bhardwaj, 2000; Gupta, 1999 and European Natural Gas Vehicle Association, 2002.

369
Chapter 5 Transport and its infrastructure
Although the focus here is on transport pricing options to
limit CO2 emissions, it should be recognized that many projects
and policies with that effect are not focused on GHG emissions
but rather on other objectives. A pricing policy may well aim
simultaneously at reducing local pollution and GHG emissions,
accidents, noise and congestion, as well as generating State
revenue for enlarging of social welfare and/or infrastructure
construction and maintenance. Every benet with respect to
these objectives may then be assessed simultaneously through
CBA or MCA; they may be called co-benets. Governments
can take these co-benets into account when considering the
introduction of transport pricing such as for fuel. This is all the
more important since a project could be not worth realising if
only one particular benet is considered, whereas it could very
well be proved benecial when adding all the co-benets.
Taxes
Empirically, throughout the last 30 years, regions with
relatively low fuel prices have low fuel economy (USA,
Canada, Australia) and regions where relatively high fuel prices
apply (due to fuel taxes) have better car fuel economy (Japan
and European countries). For example, fuel taxes are about 8
times higher in the UK than in the USA, resulting in fuel prices
that are about three times higher. UK vehicles are about twice
as fuel-efcient; mileage travelled is about 20% lower and
vehicle ownership is lower as well. This also results in lower
average per capita fuel expenditures. Clearly, automobile use
is sensitive to cost differences in the long run (VTPI, 2005).
In theory, long run impact of increases in fuel prices on fuel
consumption are likely to be about 2 to 3 times greater than
short run impact (VTPI, 2005). Based on the price elasticities
(Goodwin et al., 2004) judged to be the best dened results
for developed countries, if the real price of fuel rises by 10%
and stays at that level, the volume of fuel consumed by road
vehicles will fall by about 2.5% within a year, building up to a
reduction of over 6% in the longer run (about 5 years or so), as
shown in Table 5.15.
An important reason why a fuel or CO2 tax would have
limited effects is that price elasticities tend to be substantially
smaller than the income elasticities of demand. In the long run
the income elasticity of demand is a factor 1.5–3 higher than
the price elasticity of total transport demand (Goodwin et al.,
2004). In developing countries, where incomes are lower, the
demand response to price changes may be signicantly more
elastic.
Recent evidence suggests that the effect of CO2 taxes and
high fuel prices may be having a shrinking effect in the more
car-dependent societies. While the evidence is solid that price
elasticities indicated in Table 5.15 and used by Goodwin were
indeed around –0.25 (i.e., 2.5% reduction in fuel for every 10%
increase in price), in earlier years, new evidence indicates a
quite different story. Small and Van Dender (2007) found that
price elasticities in the USA dropped to about –0.11 in the late
1990s, and Hughes et al. (2006) found that they dropped even
further in 2001–2006, to about –0.04. The explanation seems
to be that people in the USA have become so dependent on
their vehicles that they have little choice but to adapt to higher
prices. One might argue that these are short term elasticities, but
the erratic nature of gasoline prices in the USA (and the world)
result in drivers never exhibiting long-term behavior. Prices
drop before they seriously consider changing work or home
locations or even buying more efcient vehicles. If oil prices
continue to cycle up and down, as many expect, drivers may
continue to cling to their current behaviors. If so, CO2 taxes
would have small and shrinking effects in the USA and other
countries where cars are most common.
Box 5.6 Examples of pricing policies for heavy-duty vehicles
Switzerland: In January 2001, trucks of maximum 35 tonnes weight were allowed on Swiss territory (previously 28 tonnes)
and a tax of 1.00 cent/tkm (for the vehicle middle emission category) was imposed on trucks above 3.5 tonnes on all
roads. It replaced a previous fixed tax on heavy-duty vehicles. The tax is raised electronically. Since 2005, the tax is higher
at 1.60 cent/tkm, but 40 tonnes trucks are allowed. Over the period 2001–2003, it was estimated that it contributed to an
11.9% decrease in vehicle-km and a 3.5% decrease in tonnes-km of domestic traffic. The tax led to an improved carriers’
productivity and it is anticipated that, for that reason, emissions of CO2 and NOx would decrease over the period 2001–2007
by 6–8%. On the other hand transit traffic, which amounts to 10% of total traffic, was also affected in a similar way by the
new tax regime, so that the number of HDL has been decreasing at a rate of about 2–3% per year, while, at the same time,
increasing in terms of tonnes-km (ARE, 2004b; 2006). A part of the revenues are used to finance improvements to the rail
network.
Germany: A new toll system was introduced in January 2005 for all trucks with a maximum weight of 12 tonnes and above.
This so-called LKW-MAUT tax is levied on superhighways on the base of the distance driven; its cost varies between 9
and 14 Eurocents according to the number of axles and the emission category of the truck. Payments are made via a GPS
system, at manual payment terminals or by Internet. The receipts will be used to improve the transport networks of Germany.
The system introduction appears successful, but it is too early to assess its impacts.

370
Transport and its infrastructure Chapter 5
As an alternative to fuel taxes, registration and circulation
taxes can be used to incentivise the purchase (directly) and
manufacturing (indirectly) of fuel-efcient cars. This could be
done through a revenue neutral fee system, where fuel-efcient
cars receive a rebate and guzzler cars are faced with an extra
fee. There is evidence that incentives given through registration
taxes are more effective than incentives given through annual
circulation taxes (Annema et al., 2001). Buyers of new cars
do not expect to be able to pass on increased registration taxes
when selling the vehicle. Due to refunds on registration taxes
for cars that were relatively fuel efcient compared to similar
sized cars, the percentage of cars sold in the two most fuel
efcient classes increased from 0.3%–3.2% (cars over 20%
more fuel efcient than average) and from 9.5%–16.1% (for
cars between 10 and 20% more fuel efcient than average) in
the Netherlands (ADAC, 2005). After the abolishment of the
refunds, shares decreased again. COWI (2002) modelled the
impact on fuel efciency of reforming current registration
and circulation taxes so they would depend fully on the CO2
emissions of new cars. Calculated reduction percentages varied
from 3.3–8.5% for 9 European countries, depending on their
current tax bases.
Niederberger (2005) outlines a voluntary agreement with
the Swiss government under which the oil industry took
responsibility for GHG emissions from the road transport
sector, which they supply with fuel. As of 1 October 2005,
Swiss oil importers voluntarily contribute the equivalent of
about 5 cents per gallon (approx. 80 million US$ annually)
into a climate protection fund that is invested via a non-prot
(non-governmental) foundation into climate mitigation projects
domestically and abroad (via the emerging carbon market
mechanisms of the Kyoto Protocol). Cost savings (compared
with an incentive tax) are huge and the private sector is in charge
of investing the funds effectively. A similar system in the USA
could generate 9 billion US$ in funds annually to incentivize
clean alternative fuels and energy efcient vehicles, which could
lower US dependency on foreign fuel sources. This policy is
also credible from a sustainable development perspective than
the alternative CO2 tax, since the high CO2 tax would have led
to large-scale shifts in tank tourism – and bookkeeping GHG
reductions for Switzerland – although the real reductions would
have been less than half of the total effect and neighbouring
countries would have been left with the excess emissions.
Licensing and parking charges
The most renowned area licensing and parking charges
scheme has been applied in Singapore with effective reduction
in total vehicular trafc and hence energy (petroleum) demand
(Fwa, 2002). The area licensing scheme in Singapore resulted
in 1.043 GJ per day energy savings with private vehicular trafc
reducing by 75% (Fwa, 2002).
Unfortunately there is currently a lack of data on potential
GHG savings associated with policy, institutional and scal
reforms/measures with respect to transport particularly in other
developing countries. General estimates of reduction in use of
private vehicle operators resulting from fuel pricing and taxing
are 15–20% (World Bank, 2002; Martin et al., 1995).
Table 5.15: Impact of a permanent increase in real fuel prices by 10%
Short run/within 1
year
(%)
Long run/5 years
(%)
Traffic volume -1 -3
Fuel consumption -2.5 -6
Vehicle fuel ef-
ficiency
-1.5 -4
Vehicle ownership Less than -1 -2.5
Source: Goodwin et al. 2004.
Tax/pricing measure Potential energy/GHG savings or transport
improvements
Reference
Optimal road pricing based on congestion
charging (London, UK)
20% reduction in CO2 emissions as a result of
18% reduction in traffic
Transport for London (2005)
Congestion pricing of the Namsan Tunnels
(Seoul, South Korea)
34% reduction of peak passenger traffic
volume. Traffic flow from 20 to 30 km/hr.
World Bank (2002)
Fuel pricing and taxation 15-20% for vehicle operators. Martin et al. (1995)
Area Licensing Scheme (Singapore) 1.043 GJ/day energy savings.
Vehicular traffic reduced by 50%. Private traffic
reduced by 75%.
Travel speed increased 20 to 33 km/hr.
Fwa (2002)
Urban gasoline tax (Canada) 1.4 Mton by 2010
2.6 Mton by 2020
Transportation in Canada; www.tc.gc.
ca/pol/en/Report/anre1999/tc9905be.htm
Congestion charge trial in Stockholm (2005-
2006)
13% reduction of CO2http://www.stockholmsforsoket.se/
templates/page.aspx?id=2453
Table 5.16: Potential energy and GHG savings from pricing, taxes and charges for road transport

371
Chapter 5 Transport and its infrastructure
5.5.1.3 Regulatory and operational measures
Although pricing and scal instruments are obvious tools for
government policy, they are often not very effective, as reected
by the potential reduction in fuel savings (IEA, 2003). Potential
effective (and cost-effective) non-scal measures that can be
effective in an oil crisis are regulatory measures such as:
• Lower speed limits on motorways;
• High occupancy vehicle requirements for certain roads and
networks;
• Vehicle maintenance requirements;
• Odd/even number plate and other driving restrictions;
• Providing information on CO2 emission performances of
vehicles (labelling);
• Establishing carbon standards for fuels;
• Direct trafc restrictions (e.g., no entry into business
district);
• Free/expanded urban public transport;
• Encouraging alternatives to travel (e.g., greater telecommuting);
• Emergency switching from road to rail freight;
• Reducing congestion through removal of night-time/
weekend driving bans for freight.
IEA (2003) indicates that such measures could contribute to
signicant oil savings. This is a typical case where a portfolio
of measures is applied together and they would work well with
adequate systems of monitoring and enforcement.
For the measures to be implemented effectively considerable
preparatory work is necessary and Table 5.17 shows examples
of what could be done to ensure the measures proposed above
can be effective in oil savings.
The combined effect of these regulatory measures used to
target light-duty vehicles (in addition to blending non-petroleum
fuels with gasoline and diesel) is estimated to be a reduction of
15% of daily fuel consumption.
In OECD countries vehicles consume 10–20% more fuel
per km than indicated by their rated efciency. It is estimated
that 5–10% reduction in fuel consumption can be achieved
by stronger inspection and vehicle maintenance programmes,
adoption of on board technologies, more widespread driver
training and better enforcement and control of vehicle speeds.
Box 5.7 Policies to promote biofuels
Policies to promote biofuels are prominent in national emissions abatement strategies. Since benefits of biofuels for CO2
mitigation mainly come from the well-to-tank part, incentives for biofuels are more effective climate policies if they are tied
to the whole well-to-wheels CO2 efficiencies. Thus preferential tax rates, subsi-dies and quotas for fuel blending should
be calibrated to the benefits in terms of net CO2 savings over the whole well-to-wheel cycle associated with each fuel.
Development of an index of CO2 savings by fuel type would be useful and if agreed internationally could help to liberalise
markets for new fuels. Indexing incentives would also help to avoid discrimination between feedstocks. Subsidies that
support production of specific crops risk being counterproductive to emission policies in the long run (ECMT, 2007). In order
to avoid negative effects of biofuel production on sustainable development (e.g. biodiversity impacts), additional conditions
could be tied to incentives for biofuels.
The following incentives for biofuels are implemented or in the policy pipeline (Hamelinck, et al. 2005):
Brazil was one of the first countries to implement policies to stimulate biofuel consumption. Currently, flexible fuel vehicles
are eligible for federal value-added tax reductions ranging from 15–28%. In addition, all gasoline should meet a legal alcohol
content requirement of 20–24%.
Motivated by the biofuels directive in the European Union, the EU member states have implemented a variety of policies.
Most of the member states have implemented an excise duty relief. Austria, Spain, Sweden, the Netherlands and the
UK have implemented an obligation or intend to implement an obligation in the coming years. Sweden and Austria also
implemented a CO2 tax.
The American Jobs creation act of 2004 provides tax incentives for alcohol and biodiesel fuels. The credits have been set at
0.5–1 US$/gallon (about 0.11–0.21 >/litre). Some 39 states have developed additional policy programmes or mechanisms to
support the increase use of biofuel. The types of measures range from tax exemptions on resources required to manufacturing
or distributing biofuels (e.g. labour, buildings); have obligatory targets for governmental fleets and provide tax exemptions
or subsidies when purchasing more flexible vehicles. One estimate is that total subsidies in the US for biofuels were 5.1–6.8
billion US$ in 2006, about half in the form of fuel excise tax reductions, and another substantial amount for growing corn
used for ethanol.
New blending mandates have also appeared in China, Canada, Colombia, Malaysia and Thailand. Four provinces in China
added dates for blending in major cities, bringing to nine the number of provinces with blending mandates (REN21, 2006).

372
Transport and its infrastructure Chapter 5
Vehicle travel demand can be reduced by 10–15% by
aggressively combining infrastructure improvements, intelligent
transport technologies and systems (e.g., better routing systems
and congestion reduction), information systems and better
transit systems in addition to road pricing.
Another regulatory approach, under consideration in
California as part of its 2006 Global Warming Solutions Act, is
carbon-based fuel standards. Fuel suppliers would be required
to reduce the carbon content of their fuels according to a
tightening schedule. For instance, gasoline from conventional
oil would be rated at 1.0, ethanol from corn and natural gas at
0.8, electricity for vehicles at 0.6 and so on. The fuel suppliers
would be allowed to trade and bank credits and car makers would
be required to produce vehicles at an amount that corresponds
to the planned sales of alternative fuels. Reductions of 5% or
more in transport fuel GHGs by 2020 are envisioned, with
much greater reductions in later years.
5.5.1.4 Fuel economy standards – road transport
Most industrialized nations now impose fuel economy
requirements (or their equivalent in CO2 emissions requirements)
on new light-duty vehicles (Plotkin, 2004; An and Sauer, 2004).
The rst standards were imposed by the United States in 1975,
requiring 27.5 mpg (8.55 L/100 km) corporate eet averages
for new passenger cars and 20.7 mpg (11.36 L/100 km) for
light trucks (based on tests instituted by the US Environmental
Protection Agency, using the ‘CAFE’ driving cycle) by 1985.
The passenger car standard remains unchanged, whereas the
light truck standard has recently been increased to 22.2 mpg
(10.6 L/100 km) for the 2007 model year and to 23.5 mpg (10.0
L/100 km) in model year 2010.40 Additional standards (some
voluntary) include:
• European Union: a 2008 eet wide requirement41 of 140
gCO2/km, about 41 mpg (5.74 L/100 km) of gasoline
equivalent, using the New European Driving Cycle
(NEDC), based on a Voluntary Agreement between the
EU and the European manufacturers, with the Korean and
Japanese manufacturers following in 2009. Recent slowing
of the rate of efciency improvement has raised doubts that
the manufacturers will achieve the 2008 and 2009 targets
(Kageson, 2005).
• Japan: a 2010 target of about 35.5 mpg (6.6 L/100 km) for
new gasoline passenger vehicles, using the Japan 10/15
driving cycle based on weight-class standards.
• China: weight-class standards that are applied to each new
vehicle using the NEDC driving cycle, with target years
of 2005 and 2008. At the historical mix of vehicles, the
standards are equivalent to eet targets of about 30.4 mpg
(7.7 L/100 km) by 2005 and 32.5 mpg (7.2 L/100 km) by
2008 (An and Sauer, 2004).
• Australia: a 2010 target for new vehicles of 18% reduction
in average fuel consumption relative to the 2002 passenger
car eet, corresponding to 6.8 L/100 km, or 34.6 mpg. (DfT,
2003), based on a voluntary agreement between industry
and government.
• The State of California has established GHG emission
standards for new light-duty vehicles designed to reduce
per-vehicle emissions by 22% in 2012 and 30% by 2016.
Several US states have decided to adopt these standards, as
well. At the time of writing, US industry and the federal
government were ghting these standards in the courts.
The NEDC and Japan 10/15 driving cycles are slower than
the US CAFE cycle and, for most vehicles (though probably
not for hybrids), will yield lower measured fuel economy levels
than the CAFE cycle for the same vehicles. Consequently, if
they reach their targets, the EU, Japanese and Chinese eets
are likely to achieve fuel economies higher than implied by the
values above if measured on the US test. A suggested correction
factor (for the undiscounted test results) is 1.13 for the EU and
China and 1.35 for Japan (An and Sauer, 2004), though these
are likely to be at the high end of the possible range of values
Table 5.17: Preparations required to implement some regulatory measures
Measure to be
implemented
Preparatory work
Speed limitsa) Install electronic speed limit system
Change the law
•
•
Carpool days System of finding rides
Car parks
High occupancy car lanes
•
•
•
Energy efficient car and
driving choice from home
On board efficient indicator systems
Driver training
Information on efficient car
purchases
•
•
•
Telecommuting days Telecommuting programmes and
protocols
Practice
•
•
Clean car choice Public awareness of car
consumption
Labeling based on CO2
performance
•
•
Car free days Biking/walking/transit facilities
Home/job commuting reduced
•
•
a) The Swedish road administration has calculated the effect of regulatory
measures on speed. Exceeding speed limits on the Swedish road network gives
an extra CO2 emission of 0.7Mt on an annual basis (compared to total emissions
of 20 Mt). A large part of this can be tackled using speed cameras and in the
future intelligent speed adaptation in vehicles. Besides this, reduction of speed
limits (by 10 km/h except for the least densely populated areas where there is no
alternative to the private car) could result in a similar amount of CO2 reduction.
Source: Adapted from IEA, 2003.
40 In 2011, manufacturers must comply with a reformed system where required CAFE levels depend on the manufacturer’s fleet mix based on vehicle “footprint,” or track width
wheelbase (NHTSA CAFE website, 2006).
41 There are no specific corporate requirements for the entire new light-duty vehicle fleet.
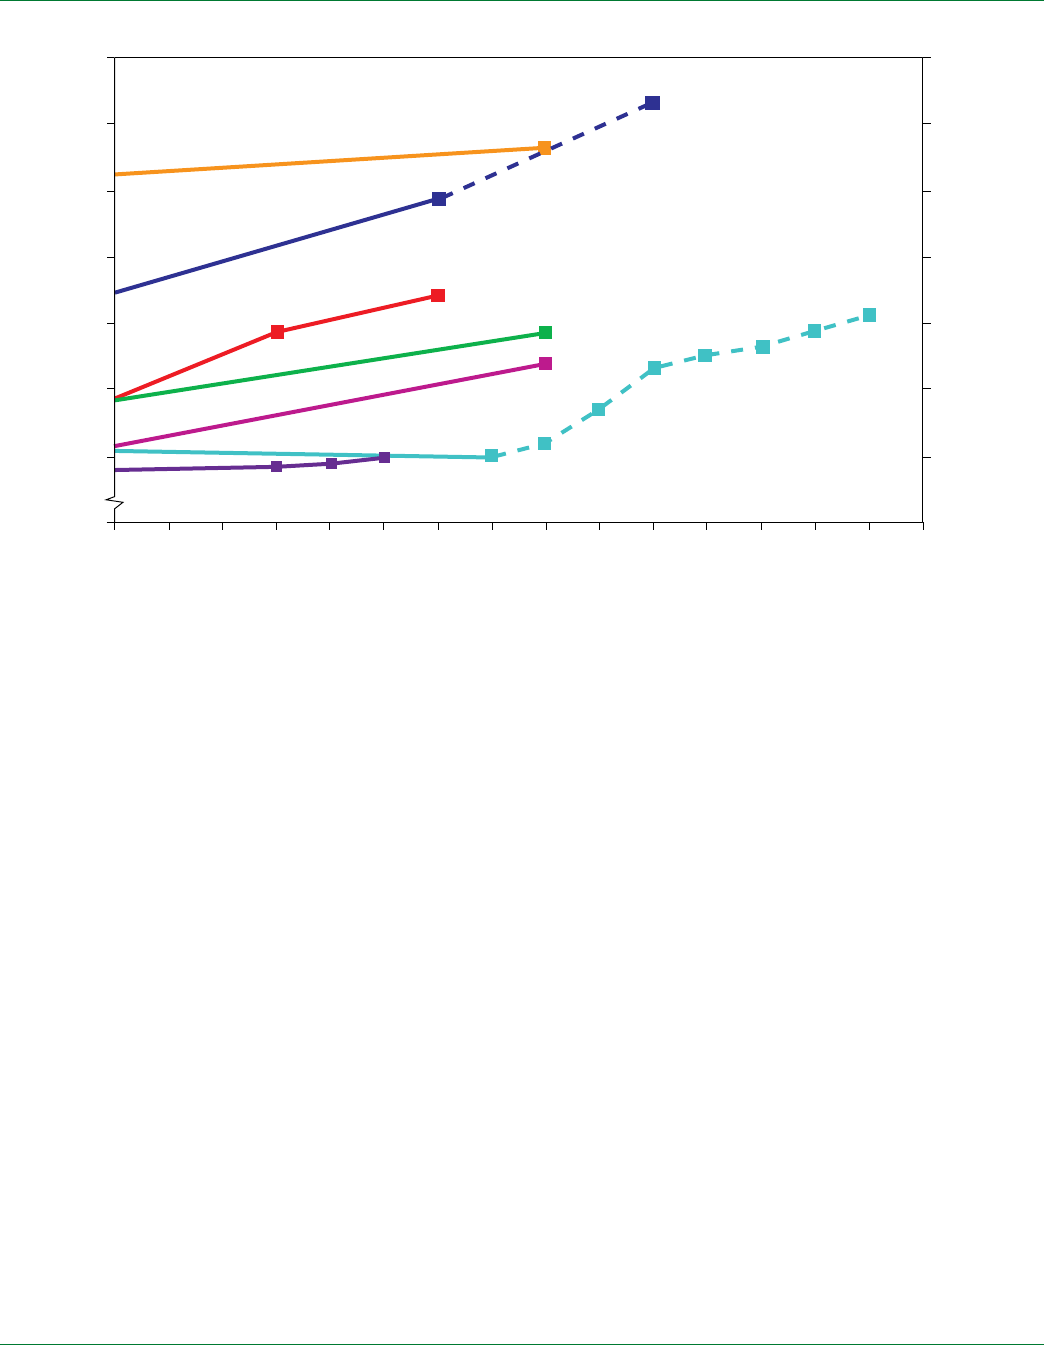
373
Chapter 5 Transport and its infrastructure
for such factors.42 Figure 5.18 shows the ‘corrected’ comparison
of standards.
Recent studies of the costs and fuel savings potential of
technology improvements indicate considerable opportunity to
achieve further eet fuel economy gains from more stringent
standards. For example, the US National Research Council
(NRC, 2002) estimates that US light-duty vehicle fuel economy
can be increased by 25–33% within 15 years with existing
technologies that cost less than the value of fuel saved. A study
by Ricardo Consulting Engineers for the UK Department for
Transport (Owen and Gordon, 2002) develops a step-wise
series of improvements in a baseline diesel passenger car that
yields a 38% reduction in CO2 emissions (a 61% increase in fuel
economy), to 92 g/km, by 2013 using parallel hybrid technology
at an incremental cost of 2300–3,100 £ (4200–5700 US$) with
a 15,300 £ (28,000 US$) baseline vehicle. Even where fuel
savings will outweigh the cost of new technologies, however,
the market will not necessarily adopt these technologies by
itself (or achieve the maximum fuel economy benets from the
technologies even if they are adopted). Two crucial deterrents
are, rst, that the buyers of new vehicles tend to consider only
the rst three years or so of fuel savings (NRC, 2002; Annema
et al., 2001), and second, that vehicle buyers will take some
of the benets of the technologies in higher power and greater
size rather than in improved fuel economy. Further, potential
benets for consumers over the vehicle’s lifetime are generally
small, while risks for producers are high (Greene, 2005). Also,
neither the purchasers of new vehicles nor their manufacturers
will take into account the climate effects of the vehicles.
Strong criticisms have been raised about fuel economy
standards, particularly concerning claimed adverse safety
implications of weight reductions supposedly demanded by
higher standards and increased driving caused by the lower fuel
costs (per mile or km) associated with higher fuel economy.
The safety debate is complex and not easily summarized.
Although there is no doubt that adding weight to a vehicle
improves its safety in some types of crashes, it does so at the
expense of other vehicles; further, heavy light trucks have
been shown to be no safer, and in some cases less safe than
lighter passenger cars, primarily because of their high rollover
risk (Ross et al., 2006). The US National Highway Trafc
Safety Administration (NHTSA) has claimed that eet wide
weight reductions ‘reduce’ eet safety (Kahane, 2003), but this
conclusion is strongly disputed (DRI, 2004; NRC, 2002). An
important concern with the NHTSA analysis is that it does not
Japan
EU
China
Australia
Canada California
25
30
35
40
45
50
55 4.3
4.7
5.2
5.9
6.7
7.8
9.4
20022004 2006 2008 2010 2012 2014 2016
miles / gallon liter / 100 km
US
Figure 5.18: Fuel economy and GHG emission standards
Note: all the fuel economy targets represent test values based on artificial driving cycles. The standards in the EU and Australia are based on voluntary agreements.
In most cases, actual on-road fuel economy values will be lower; for example, the US publishes fuel economy estimates for individual LDVs that are about 15% lower
than the test val-ues and even these values appear to be optimistic. Miles/gallon is per US gallon.
42 These values are derived by simulating US vehicles running on the CAFE, NEDC, and Japan 10.15 cycles and comparing their estimated fuel economies. Because car manu-
facturers design their vehicles to do well on the cycles on which they will be tested, the US vehicles are likely to do a bit worse on the NEDC and Japan 10.15 cycles than they
would have had they been designed for those cycles. This will somewhat exaggerate the estimated differences between the cycles in their effects on fuel economy.

374
Transport and its infrastructure Chapter 5
separate the effects of vehicle weight and size. In any case, other
factors, e.g., overall vehicle design and safety equipment, driver
characteristics, road design, speed limits and alcohol regulation
and enforcement play a more signicant role in vehicle safety
than does average weight.
Some have argued that increases in driving associated
with reduced fuel cost per mile will nullify the benets of
fuel economy regulations. Increased driving ‘is’ likely, but it
will be modest and decline with higher income and increased
motorization. Recent data implies that a driving ‘rebound’
would reduce the GHG reduction (and reduce oil consumption)
benets from higher standards by about 10% in the United
States (Small and Van Dender, 2007) but more than this in less
wealthy and less motorized countries.
In deciding to institute a new fuel economy standard,
governments should consider the following:
• Basing stringency decisions on existing standards elsewhere
requires careful consideration of differences between the
home market and compared markets in fuel quality and
availability; fuel economy testing methods; types and
sizes of vehicles sold; road conditions that may affect
the robustness of key technologies; and conditions that
may affect the availability of technologies, for example,
availability of sophisticated repair facilities.
• There are a number of different approaches to selecting
stringency levels for new standards. Japan selected its
weight class standards by examining ‘top runners’ –
exemplary vehicles in each weight class that could serve as
viable targets for future eet wide improvements. Another
approach is to examine the costs and fuel saving effects
of packages of available technologies on several typical
vehicles, applying the results to the new vehicle eet (NRC,
2002). Other analyses have derived cost curves (percent
increase in fuel economy compared with technology cost)
for available technology and applied these to corporate or
national eets (Plotkin et al., 2002). These approaches are
not technology-forcing, since they focus on technologies
that have already entered the eet in mass-market form.
More ambitious standards could demand the introduction
of emerging technologies. Selection of the appropriate level
of stringency depends, of course, on national goals and
concerns. Further, the selection of enforcement deadlines
should account for limitations on the speed with which
vehicle manufacturers can redesign multiple models and
introduce the new models on a schedule that avoids severe
economic disruption.
• The structure of the standard is as important as its level of
stringency. Basing target fuel economy on vehicle weight
(Japan, China) or engine size (Taiwan, South Korea) will
tend to even out the degree of difculty the standards impose
on competing automakers, but will reduce the potential fuel
economy gains that can be expected (because weight-based
standards eliminate weight reduction and engine-size-based
standards eliminate engine downsizing as viable means of
achieving the standards). Basing the standard on vehicle
wheelbase times track width may provide safety benets by
providing a positive incentive to maintain or increase these
attributes. Using a uniform standard for all vehicles or for
large classes of vehicles (as in the US) is simple and easy to
explain, but creates quite different challenges on different
manufacturers depending on the market segments they
focus on.
• Allowing trading of fuel economy ‘credits’ among different
vehicles or vehicle categories in an automaker’s eet, or
even among competing automakers, will reduce the overall
cost of standards without reducing the total societal benets,
but may incur political costs from accusations of allowing
companies or individuals to ‘buy their way out’ of efciency
requirements.
• Alternatives (or additions) to standards are worth
investigating. For example, ‘feebates’, which award cash
rebates to new vehicles whose fuel economy is above a
designated level (often the eet average) and charge a fee
to vehicles with lower fuel economy, may be an effective
market-based measure to increase eet fuel economy. An
important advantage of feebates is that they provide a
‘continuous’ incentive to improve fuel economy, because
an automaker can always gain a market advantage by
introducing vehicles that are more efcient than the current
average.
5.5.1.5 Transport Demand Management
Transport Demand Management (TDM) is a formal
designation for programmes in many countries that improve
performance of roads by reducing trafc volumes (Litman,
2003). There are many potential TDM strategies in these
programmes with a variety of impacts. Some improve transport
diversity (the travel options available to users). Others provide
incentives for users to reduce driving, changing the frequency,
mode, destination, route or timing of their travel. Some reduce
the need for physical travel through mobility substitutes or
more efcient land use. Some involve policy reforms to correct
current distortions in transport planning practices. TDM is
particularly appropriate in developing country cities, because
of its low costs, multiple benets and potential to redirect the
motorization process. In many cases, effective TDM during
early stages of development can avoid problems that would
result if communities become too automobile dependent. This
can help support a developing country’s economic, social and
environmental objectives (Gwilliam et al., 2004).
The set of strategies to be implemented will vary depending
on each country’s demographic, geographic and political
conditions. TDM strategies can have cumulative and synergetic
impacts, so it is important to evaluate a set of TDM programmes
as a package, rather than as an individual programme. Effective
strategies usually include a combination of positive incentives
to use alternative modes (‘carrots’ or ‘sweeteners’) and negative
incentives to discourage driving (‘sticks’ or ‘levellers’). Recent

375
Chapter 5 Transport and its infrastructure
literature gives a comprehensive overview of these programmes
with several case studies (May et al., 2003; Litman, 2003;
WCTRS and IPTS, 2004). Some major strategies such as
pricing and land-use planning are addressed above. Below is a
selective review of additional TDM strategies with signicant
potential to reduce vehicle travel and GHGs.
Employer travel reduction strategies gained prominence
from a late 1980s regulation in southern California that required
employers with 100 or more employees to adopt incentives and
rules to reduce the number of car trips by employees commuting
to work (Giuliano et al., 1993). The State of Washington in the
USA kept a state law requiring travel plans in its most urban
areas for employers with 100 or more staff. The law reduced
the percentage of employees in the targeted organizations who
drove to work from 72–68% and affected about 12% of all trips
made in the area. In the Netherlands, the reduction in single
occupant commute trips from a travel plan averaged 5–15%.
In the UK, in very broad terms, the average effectiveness of
UK travel plans might be 6% in trips by drive alone to work
and 0.74% in the total vehicle-km travelled to work by car. The
overall effectiveness was critically dependent on both individual
effectiveness and levels of plan take-up (Rye, 2002).
Parking supply for employees is so expensive that employers
naturally have an incentive to reduce parking demand. The
literature found the price elasticity of parking demand for
commuting at –0.31 to –0.58 (Deuker et al., 1998) and –0.3
(Veca and Kuzmyak, 2005) based on a non-zero initial parking
price. The State of California enacted legislation that required
employers with 50 or more persons who provided parking
subsidies to offer employees the option to choose cash in
lieu of a leased parking space, in a so-called parking cash-out
programme. In eight case studies of employers who complied
with the cash-out programme, the solo driver share fell from
76% before cashing out to 63% after cashing out, leading to
the reduction in vehicle-km for commuting by 12%. If all the
commuters who park free in easily cashed-out parking spaces
were offered the cash option in the USA, it would reduce
vehicle-km travelled per year by 6.3 billion (Shoup, 1997).
Reducing car travel or CO2 emissions by substituting
telecommuting for actual commuting has often been cited in
the literature, but the empirical results are limited. In the USA,
a micro-scale study estimated that 1.5% of the total workforce
telecommuted on any day, eliminating at most 1% of total
household vehicle-km travelled (Mokhtarian, 1998), while
a macro-scale study suggested that telecommuting reduced
annual vehicle-km by 0–2% (Choo et al., 2005).
Reduction of CO2 emissions by hard measures, such as car
restraint, often faces public opposition even when the proposed
measures prove effective. Soft measures, such as a provision of
information and use of communication strategies and educational
techniques (OECD, 2004a) can be used for supporting the
promotion of hard measures. Soft measures can also be directly
helpful in encouraging a change in personal behaviour leading
to an efcient driving style and reduction in the use of the car
(Jones, 2004). Well organized soft measures were found to be
effective for reducing car travel while maintaining a low cost.
Following travel awareness campaigns in the UK, the concept
of Individualized marketing, a programme based on a targeted,
personalized, customized marketing approach, was developed
and applied in several cities for reducing the use of the car. The
programme reduced car trips by 14% in an Australian city, 12%
in a German city and 13% in a Swedish city. The Travel Blending
technique was a similar programme based on four special kits
for giving travel-feedback to the participants. This programme
reduced vehicle-km travelled by 11% in an Australian city.
The monitoring study after the programme implementation in
Australian cities also showed that the reduction in car travel
was maintained (Brog et al., 2004; Taylor and Ampt, 2003).
Japanese cases of travel-feedback programmes supported the
effectiveness of soft measures for reducing car travel. The
summary of the travel-feedback programmes in residential
areas, workplaces and schools indicated that car use was reduced
by 12% and CO2 emissions by 19%. It also implied that the
travel-feedback programmes with a behavioural plan requiring
a participant to make a plan for a change showed better results
than programmes without one (Fujii and Taniguchi, 2005).
5.5.2 Aviation and shipping
In order to reduce emissions from air and marine transport
resulting from the combustion of bunker fuels, new policy
frameworks need to be developed. Both the ICAO and IMO
have studied options for limiting GHG emissions. However,
neither has as yet been able to devise a suitable framework for
implementing effective mitigation policies.
5.5.2.1 Aviation
IPCC (1999), ICAO/FESG (2004a,b), Wit et al. (2002 and
2005), Cames and Deuber (2004), Arthur Andersen (2001)
and others have examined potential economic instruments for
mitigating climate effects from aviation.
At the global level no support exists for the introduction of
kerosene taxes. The ICAO policy on exemption of aviation fuel
from taxation has been called into question mainly in European
states that impose taxes on fuel used by other transport modes
and other sources of GHGs. A study by Resource Analysis
(1999) shows that introducing a charge or tax on aviation
fuel at a ‘regional’ level for international ights would give
rise to considerable distortions in competition and may need
amendment of bilateral air service agreements. In addition, the
effectiveness of a kerosene tax imposed on a regional scale
would be reduced as airlines could take ‘untaxed’ fuel onboard
into the taxed area (the so-called tankering effect).
Wit and Dings (2002) analyzed the economic and
environmental impacts of en-route emission charges for all

376
Transport and its infrastructure Chapter 5
ights in European airspace. Using a scenario-based approach
and an assumed charge level of 50 US$/tCO2, the study found a
cut in forecast aviation CO2 emissions in EU airspace of about
11 Mt (9%) in 2010. This result would accrue partly (50%)
from technical and operational measures by airlines and partly
from reduced air transport demand. The study found also that
an en-route emission charge in European airspace designed in
a non-discriminative manner would have no signicant impact
on competition between European and non-European carriers.
In a study prepared for CAEP/6, the Forecasting and
Economic Analysis Support Group (ICAO/FESG, 2004a)
considered the potential economic and environmental impacts
of various charges and emission trading schemes. For the
period 1998–2010, the effects of a global CO2 charge with a
levy equivalent to 0.02 US$/kg to 0.50 US$/kg jet fuel show
a reduction in global CO2 emissions of 1–18%. This effect is
mainly caused by demand effects (75%). The AERO modelling
system was used to conduct the analyses (Pulles, 2002).
As part of the analysis of open emission trading systems for
CAEP/6, an impact assessment was made of different emission
trading systems identied in ICF et al. (2004). The ICAO/FESG
report (2004b) showed that under a Cap-and-Trade system for
aviation, total air transport demand will be reduced by about
1% compared to a base case scenario (FESG2010). In this
calculation, a 2010 target of 95% of the 1990-level was assumed
for aviation on routes from and to Annex-I countries and the
more developed non-Annex-I countries such as China, Hong
Kong, Thailand, Singapore, Korea and Brazil. Furthermore a
permit price of 20 US$/tCO2 was assumed. Given the relative
high abatement costs in the aviation sector, this scenario would
imply that the aviation sector would buy permits from other
sectors for about 3.3 billion US$.
In view of the difculty of reaching global consensus on
mitigation policies to reduce GHG emissions from international
aviation, the European Commission decided to prepare climate
policies for aviation. On 20 December 2006 the European
Commission presented a legislative proposal that brings aviation
emissions into the existing EU Emissions Trading Scheme (EU
ETS). The proposed directive will cover emissions from ights
within the EU from 2011 and all ights to and from EU airports
from 2012. Both EU and foreign aircraft operators would be
covered. The environmental impact of the proposal may be
signicant because aviation emissions, which are currently
growing rapidly, will be capped at their average level in 2004–
2006. By 2020 it is estimated by model analysis that a total of
183 MtCO2 will be reduced per year on the ights covered,
a 46% reduction compared with business-as-usual. However,
aviation reduces the bulk of this amount through purchasing
allowances from other sectors and through additional supply
of Joint Implementation and Clean Development Mechanism
credits. In 2020 aviation reduces its own emissions by 3%
below business-as-usual (EC, 2006).
If emission trading or emission charges were applied to
the aviation sector in isolation, the two instruments would in
principle be equivalent in terms of cost-effectiveness. However,
combining the reduction target for aviation with the emission
trading scheme of other sectors increases overall economic
efciency by allowing the same amount of reductions to be
made at a lower overall cost to society. Therefore, if aviation
were to achieve the same environmental goal under emission
trading and emission charges, the economic costs for the sector
and for the economy as a whole would be lower if this was done
under an emission trading scheme including other sectors rather
than under a charging system for aviation only.
Alternative policy instruments that may be considered are
voluntary measures or fuel taxation for domestic ights. Fuel
for domestic ights, which are less vulnerable to economic
distortions, is already taxed in countries such as the USA,
Japan, India and the Netherlands. In parallel to the introduction
of economic instruments such as emission trading, governments
could improve air trafc management.
Policies to address the full climate impact of aviation
A major difculty in developing a mitigation policy for the
climate impacts of aviation is how to cover non-CO2 climate
impacts, such as the emission of nitrogen oxides (NOx) and the
formation of condensation trails and cirrus clouds (see also Box
5.1 in section 5.2). IPCC (1999) estimated these effects to be
about 2 to 4 times greater than those of CO2 alone, even without
considering the potential impact of cirrus cloud enhancement.
This means that the perceived environmental effectiveness of
any mitigation policy will depend on the extent to which these
non-CO2 climate effects are also taken into account.
Different approaches may be considered to account for non-
CO2 climate impacts from aviation (Wit et al., 2005). A rst
possible approach is where initially only CO2 from aviation is
included in for example an emission trading system, but anking
instruments are implemented in parallel such as differentiation
of airport charges according to NOx emissions.
Another possible approach is, in case of emission trading
for aviation, a requirement to surrender a number of emission
permits corresponding to its CO2 emissions multiplied by a
precautionary average factor reecting the climate impacts
of non-CO2 impacts. It should be emphasised that the metric
that is a suitable candidate for incorporating the non-CO2
climate impacts of aviation in a single metric that can be used
as a multiplier requires further development, being fairly
theoretical at present. The feasibility of arriving at operational
methodologies for addressing the full climate impact of aviation
depends not only on improving scientic understanding of
non-CO2 impacts, but also on the potential for measuring or
calculating these impacts on individual ights.

377
Chapter 5 Transport and its infrastructure
5.5.2.2 Shipping
CO2 emission indexing scheme
The International Maritime Organisation (IMO), a specialized
UN agency, has adopted a strategy with regard to policies and
measures, focusing mainly on further development of a CO2
emission indexing scheme for ships and further evaluation of
technical, operational and market-based solutions.
The basic idea behind a CO2 emission index is that it describes
the CO2 efciency (i.e., the fuel efciency) of a ship, i.e., the
CO2 emission per tonne cargo per nautical mile. This index
could, in the future, assess both the technical features (e.g., hull
design) and operational features of the ship (e.g., speed).
In June 2005, at the 53rd session of the Marine Environment
Protection Committee of IMO (IMO, 2005), interim guidelines
for voluntary ship CO2 emission indexing for use in trials were
approved. The Interim Guidelines should be used to establish a
common approach for trials on voluntary CO2 emission indexing,
which enable shipowners to evaluate the performance of their
eet with regard to CO2 emissions. The indexing scheme will
also provide useful information on a ship’s performance with
regard to fuel efciency and may thus be used for benchmarking
purposes. The interim guidelines will later be updated, taking
into account experience from new trials as reported by industry,
organisations and administrations.
A number of hurdles have to be overcome before such a
system could become operational. The main bottleneck appears
to be that there is major variation in the fuel efciency of similar
ships, which is not yet well understood (Wit et al., 2004). This
is illustrated by research by the German delegation of IMO’s
Working Group on GHG emission reduction (IMO, 2004),
in which the specic energy efciency (i.e., a CO2 emission
index) was calculated for a range of container ships, taking
into account engine design factors rather than operational data.
The results of this study show that there is considerable scatter
in the specic engine efciency of the ships investigated,
which could not be properly explained by the deadweight
of the ships, year of build, ship speed and several other ship
design characteristics. The paper therefore concludes that the
design of any CO2 indexing scheme and its differentiation
according to ship type and characteristics, requires in-depth
investigation. Before such a system can be used in an incentive
scheme, the reasons for the data scatter need to be understood.
This is a prerequisite for reliable prediction of the economic,
competitive and environmental effects of any incentive based
on this method.
Voluntary use and reporting results of CO2 emission
indexing may not directly result in GHG emission reductions,
although it may well raise awareness and trigger certain initial
moves towards ‘self regulation’. It might also be a rst step
in the process of designing and implementing some of the
other policy options. Reporting of the results of CO2 emission
indexing could thus generate a signicant impetus to the
further development and implementation of this index, since
it would lead to widespread experience with the CO2 indexing
methodology, including reporting procedure and monitoring,
for shipping companies as well as for administrations of states.
In the longer term, in order to be more effective, governments
may consider using CO2 indexing via the following paths:
1. The indexing of ship operational performance is introduced
as a voluntary measure and over time developed and adopted
as a standard;
2. Based on the experience with the standard, it will act as
a new functional requirement when new buildings are
ordered, hence over time the operational index will affect
the requirements from ship owners related to the energy
efciency of new ships;
3. Differentiation of en route emission charges or existing port
dues on the basis of a CO2 index performance;
4. To use the CO2 index of specic ship categories as a baseline
in a (voluntary) baseline-and-credit programme.
Economic instruments for international shipping
There are currently only a few cases of countries or ports
introducing economic instruments to create incentives to
reduce shipping emissions. Examples include environmentally
differentiated fairway dues in Sweden, the Green Award
scheme43 in place in 35 ports around the world, the Green
Shipping bonus in Hamburg and environmental differentiation
of tonnage tax in Norway. None of these incentives are based
on GHG emissions, but generally relate to fuel sulphur content,
engine emissions (mainly NOx), ship safety features and
management quality.
Harrison et al. (2004) explored the feasibility of a broad
range of market-based approaches to regulate atmospheric
emissions from seagoing ship in EU sea areas. The study
focused primarily on policies to reduce the air pollutants SO2
and NOx, but the approaches adopted may to a certain extent also
be applicable to other emissions, including CO2. According to
a follow-up study by Harrison et al. (2005) the main obstacles
to a programme of voluntary port dues differentiation are to
provide an adequate level of incentive, alleviating ports’
competitive concerns and reconciling differentiation with
specially negotiated charges. Swedish experience suggests
that when combined with a centrally determined mandatory
charging programme, these problems may be surmountable.
However, in many cases a voluntary system would not likely
be viable and other approaches to emissions reductions may
therefore be required.
An alternative economic instrument, such as a fuel tax is
vulnerable to evasion; that is ships may avoid the tax by taking
43 www.greenaward.org

378
Transport and its infrastructure Chapter 5
fuel on board outside the taxed area. Offshore bunker supply
is already common practice to avoid paying port fees or being
constrained by loading limits in ports. Thus even a global fuel
tax could be hard to implement to avoid evasion, as an authority
at the port state level would have to collect the tax (ECON,
2003). A CO2-based route charge or a (global) sectoral emission
trading scheme would overcome this problem if monitoring is
based on the carbon content of actual fuel consumption on a
single journey. As yet there is no international literature that
analyzes the latter two policy options. Governments may
therefore consider investigating the feasibility and effectiveness
of emission charges and emission trading as policy instruments
to reduce GHG emissions from international shipping.
5.5.3 Non-climate policies
Climate change is a minor factor in decision making and
policy in the transport sector in most countries. Policies and
measures are often primarily intended to achieve energy
security and/or sustainable development benets that include
improvements in air pollution, congestion, access to transport
facilities and recovery of expenditure on infrastructure
development. Achieving GHG reduction is therefore often
seen as a co-benet of policies and measures intended for
sustainable transport in the countries. On the other hand, there
are many transport policies that lead to an increase in GHG
emissions. Depending on their orientation, transport subsidies
can do both.
The impact of transport subsidies
Globally, transport subsidies are signicant in economic
terms. Van Beers and Van den Bergh (2001) estimated that
in the mid-1990s transport subsidies amounted to 225 billion
US$, or approximately 0.85% of the world GDP. They
estimated that transport subsidies affect over 40% of world
trade. In a competitive environment (not necessarily under full
competition), subsidies decrease the price of transport. This
results in the use of transport above its equilibrium value and
most of the time also results in higher emissions, although this
depends on the type of subsidy. Secondly, they decrease the
incentive to economise on fuel, either by driving efciently or
by buying a fuel-efcient vehicle.
A quantitative appraisal of the effect of subsidies on GHG
emissions is very complicated (Nash et al., 2002). Not only
have shifts between fuels and transport modes to be taken into
account, but the relation between transport and the production
structure also needs to be analysed. As a result, reliable
quantitative assessments are almost non-existent (OECD,
2004a). Qualitative appraisals are less problematic. Transport
subsidies that denitely raise the level of GHG emissions include
subsidies on fossil transport fuels, subsidies on commuting and
subsidies on infrastructure investments.
Many, mostly oil producing, countries provide their
inhabitants with transport fuels below the world price. Some
countries spend more than 4% of their GDP on transport fuel
subsidies (Esfahani, 2001). Many European countries and Japan
have special scal arrangements for commuting expenses. In
most of these countries, taxpayers can deduct real expenses or
a xed sum from their income (Bach, 2003). By reducing the
incentive to move closer to work, these tax schemes enhance
transport use and emissions.
Not all transport subsidies result in higher emissions
of GHGs. Some subsidies stimulate the use of climate-
friendly fuels. In many countries, excise duty exemptions on
compressed natural or petroleum gas and on biofuels exist (e.g.,
Riedy, 2003). If these subsidies result in a change in the fuel
mix, without resulting in more transport movements, they may
actually decrease emissions of GHGs.
The most heavily subsidised form of transport is probably
public transport, notably suburban and regional passenger
rail services. In the USA, fares only cover 25% of the costs,
in Europe 50% (Brueckner, 2004). Although public transport
generally emits fewer GHGs per passenger-km, the net effect
of these subsidies has not been quantied. It depends on the
balance between increased GHG emissions due to higher
demand (due to lower ‘subsidised’ fares) and substitution of
relatively less efcient transport modes.
5.5.4 Co-benefits and ancillary benefits
The literature uses the term ancillary benets when focusing
primarily on one policy area, and recognizing there may be
benets with regard to other policy objectives. One speaks
of co-benets when looking from an integrated perspective.
This section focuses on co-benets and ancillary benets of
transport policies. Chapter 11.6 provides a general discussion
of the benets and linkages related to air pollution policies.
As mentioned above, several different benets can result
from one particular policy. In the eld of transport, local air
pollutants and GHGs have a common source in motorized
trafc, which may also induce congestion, noise and accidents.
Addressing these problems simultaneously, if possible, offers
the potential of large cost reductions, as well as reductions of
health and ecosystems risks. A recent review of costs of road
transport emissions, and particularly of particulates PM2.5,
for European countries strongly supports that view (HEATCO,
2006). Tackling these problems would also contribute to more
effective planning of transport, land use and environmental
policy (UN, 2002; Stead et al., 2004). This suggests that it
would be worthwhile to direct some research towards the
linkages between these effects.
Model studies indicate a potential saving of up to 40%
of European air pollution control costs if the changes in the
energy systems that are necessary for compliance with the
Kyoto protocol were simultaneously implemented (Syri et
al., 2001). For China, the costs of a 5–10% CO2 reduction

379
Chapter 5 Transport and its infrastructure
would be compensated by increased health benets from the
accompanying reduction in particulate matter (Aunan et al.,
1998). McKinley et al. (2003) analyzed several integrated
environmental strategies for Mexico City. They conclude
that measures to improve the efciency of transport are the
key to joint local/global air pollution control in Mexico City.
The three measures in this category that were analyzed, taxi
eet renovation, metro expansion and hybrid buses, all have
monetized public health benets that are larger than their costs
when the appropriate time horizon is considered.
A simulation of freight trafc over the Belgian network
indicated that a policy of internalizing the marginal social costs
caused by freight transport types would induce a change in the
modal shares of trucking, rail and inland waterways transport.
Trucking would decrease by 26% and the congestion cost it
created by 44%. It was estimated that the total cost of pollution
and GHG emissions (together) would decrease by 15.4%, the
losses from accidents diminish by 24%, the cost of noise by
20% and wear and tear by 27%. At the same time, the total
energy consumption by the three modes would decrease by
21% (Beuthe et al., 2002).
Other examples of worthwhile policies can be given. The
policy of increasing trucks’ weight and best practices awareness
in Sweden, UK and the Netherlands lead to a consolidation of
loads that resulted in economic benets as well as environmental
benets, including a decrease in CO2 emissions (MacKinnon,
2005; Leonardi and Baumgartner, 2004). Likewise, the Swiss
heavy vehicle fee policy also leads to better loaded vehicles and
a decrease of 7% in CO2 emissions (ARE, 2004a).
Obviously, promotion of non-motorized transport (NMT)
has the large and consistent co-benets of GHG reduction, air
quality and people health improvement (Mohan and Tiwari,
1999).
In the City of London a congestion charge was introduced
in February 2003, to reduce congestion. Simultaneous with
the introduction of the charge, investment in public transport
increased to provide a good alternative. The charge is a fee for
motorists driving into the central London area. It was introduced
in February 2003. Initially set at 5 £/day (Monday to Friday,
between 7 am and 6.30 pm), it was raised to 8 £ in July 2005.
The charge will be extended to a larger area in 2007. On a cost-
benet rating, the results of the charge are not altogether clear
(Prud’homme and Bocarejo, 2005, Mackie, 2005). However, it
contributed to a 30% decrease of the trafc by the chargeable
vehicles in the area and less congestion, to higher speed of
private vehicles (+20%) and buses (+7%), and to an increased
use of public transport, plus more walking and bicycling. The
charge has had substantial ancillary benets with respect to
air quality and climate policy. All the volume and substitution
effects in the charging zone has led to an estimated reductions
in CO2 emissions of 20%. Primary emissions of NOx and
PM10 fell by 16% after one year of introduction (Transport for
London, 2006). A variant of that scheme has been in operation
since 1975 in Singapore with similar results; Stockholm is
presently experimenting with such a system, Trondheim, Oslo
and Durham are other examples.
Under the Integrated Environmental Strategies Program
of the US EPA, analysis of public health and environmental
benets of integrated strategies for GHG mitigation and local
environmental improvement is supported and promoted in
developing countries. A mix of measures for Chile has been
proposed, aimed primarily at local air pollution abatement and
energy saving. Measures in the transport sector (CNG buses,
hybrid diesel-electric buses and taxi renovation) proved to
provide little ancillary benets in the eld of climate policy, see
Figure 5.19. Only congestion charges were expected to have
substantial ancillary benets for GHG reduction (Cifuentes et
al., 2001, Cifuentes & Jorquera, 2002).
While there are many synergies in emission controls for air
pollution and climate change, there are also trade-offs. Diesel
engines are generally more fuel-efcient than gasoline engines
and thus have lower CO2 emissions, but increase particle
emissions. Air quality driven measures, like obligatory particle
matter (PM) and NOx lters and in-engine measures, do not
result in higher fuel use if appropriate technologies are used,
like Selective Catalytic Reduction (SCR)- NOx catalyst.
5.5.5 Sustainable Development impacts of
mitigation options and considerations on the
link of adaptation with mitigation.
Within the transport sector there are ve mitigation options
with a clear link between sustainable development, adaptation
and mitigation. These areas are biofuels, energy efcient,
public transport, non-motorised transport and urban planning.
Implementing these options would generally have positive
social, environmental and economic side effects. The economic
Carbon credits
Cost of illness
health benefits
Total health
benefits
-20
0
20
40
60 % of direct transport benefits
AV ring
(bus toll:4US$)
AV ring
(toll:2US$)
Downtown
(toll:2US$)
Figure 5.19: Co-benefits from different mitigation measures in Santiago de Chile
Note: toll is applied for cars/busses to enter downtown area or inside the
Americo Vespucio ring around the city.
Source: Cifuentes and Jorquera, 2002.

380
Transport and its infrastructure Chapter 5
effects of using bio-energy and encouraging public transport
systems, however, need to be evaluated on a case-by-case basis.
For transport there are no obvious links between mitigation and
adaptation policies and the impact on GHG emissions due to
adaptation is expected to be negligible.
Mitigation and sustainable development is discussed from a
much wider perspective, including the other sectors, in Chapter
12, Section 12.2.4.
5.6 Key uncertainties and gaps in
knowledge
Key uncertainties in assessment of mitigation potential in
the transport sector through the year 2030 are:
• World oil supply and its impact on prices and alternative
transport fuels;
• R&D outcomes in several areas, especially biomass fuel
production technology and its sustainability if used on a
massive scale, and batteries. These outcomes will strongly
inuence the future costs and performance of a wide range
of transport technologies.
The degree to which the potential can be realized will crucially
depend on the priority that developed and developing countries
give to GHG emissions mitigation.
A key gap in knowledge is the lack of comprehensive and
consistent assessments of the worldwide potential and cost to
mitigate transport’s GHG emissions. There are also important
gaps in basic statistics and information on transport energy
consumption and GHG mitigation, especially in developing
countries.
REFERENCES
Abbot, C., 2002: Planning a Sustainable City: The Promise and Performance
of Portland’s Urban Growth Boundary. In Urban Sprawl, G.D. Squires
(ed.), The Urban Land Institute, pp. 207-235.
ACEEE, 2001: Technical Options for Improving the Fuel Economy of
U.S. Cars and Light Trucks by 2010-2015. DeCicco, J., F. An, and
M. Ross, American Council for an Energy-Efcient Economy, <www.
aceee.org/pubs/t012.htm> accessed 30/05/07.
ADAC, 2005: Study on the effectiveness of Directive 1999/94/EC relating
to the availability of consumer information on fuel economy and CO2
emissions in respect of the marketing of new passenger cars. München,
March 2003.
ADEME, 2006: Inventories of the worldwide eets of refrigerating and
air-conditioning equipment in order to determine refrigerant emissions:
the 1990 to 2003 updating, ADEME, Paris.
Airbus, 2004: Global Market Forecast 2004-2023. <http://www.airbus.
com/store/mm_repository/pdf/att00003033/media_object_file_
GMF2004_full_issue.pdf> accessed 30/05/07.
Akerman, J. and M. Hojer, 2006: How Much Transport Can the Climate
Stand? - Sweden on a Sustainable Path in 2050. Energy Policy, 34, pp.
1944-1957.
Altmann, M., M. Weinberger, and W. Weindorf, 2004: Life Cycle
Analysis results of fuel cell ships; Recommendations for improving
cost effectiveness and reducing environmental impacts. Contract no.
G3RD-CT-2002-00823 in the framework of the FCSHIP project of the
European Commission, Final report July 2004, 58 pp.
An, F. and A. Sauer, 2004: Comparison of Passenger Vehicle Fuel
Economy and Greenhouse Gas Emission Standards around the World.
Pew Center on Global Climate Change, Arlington, 33 pp.
Annema, J.A., E. Bakker, R. Haaijer, J. Perdok, and J. Rouwendal, 2001:
Stimuleren van verkoop van zuinige auto’s; De effecten van drie
prijsmaatregelen op de CO2-uitstoot van personenauto’s (summary in
English). RIVM, Bilthoven, The Netherlands, 49 pp.
ARE, 2004a: Die Schwerverkehrsabgabe der Schweiz. Bundesamt für
Raumentwicklung, Bern.
ARE, 2004b: Entwicklung des Strassengüterverkehrs nach Einführung
von LSVA und 34t-limite. Bundesamt für Raumentwicklung, Bern.
ARE, 2006: Equitable et efciente, la redevance sur le trac des poids
lourds liée aux prestations RPLP en Suisse. Ofce Fédéral du
Développement Territorial, Bern.
Arthur Andersen Consulting, 2001: Emission trading for aviation -
Workstream 3, key ndings and conclusions. Report prepared for the
International Air Transport Association (IATA).
Aunan, K., G. Patzay, H.A. Aaheim, and H.M. Seip, 1998: Health and
environmental benets from air pollution reduction in Hungary.
Science of the Total Environment, 212, pp. 245-268.
Bach, S., 2003: Entfernungspauschale: Kürzung gerechtfertigt. DIW
Wochenbericht 70(40), pp. 602-608.
Beers, C. van, and J.C.J.M. van den Bergh, 2001: Perseverance of perverse
subsidies and their impact on trade and environment. Ecological
Economics, 36, pp. 457-486.
Berghof, R., A. Schmitt, C. Eyers, K. Haag, J. Middel, M. Hepting, A.
Grübler, and R. Hancox, 2005: CONSAVE 2050 Constrained Scenarios
on Aviation and Emissions.
Beuthe, M., F. Degransart, J-F Geerts, and B. Jourquin, 2002: External
costs of the Belgian interurban freight trafc: a network analysis of
their internalisation. Transportation Research, D7, 4, pp. 285-301.
Biddle, T., 2006: Approval of a Fully Synthetic Fuel for Gas Turbine
Engines. TRB 23 Jan. 2006, <http://www.trbav030.org/pdf2006/265_
Biddle.pdf> accessed 30/05/07.
Boeing, 2006: Current Market Outlook 2006, <http://www.boeing.com/
commercial/cmo/pdf/CMO_06.pdf> accessed 30/05/07
Booz Allen & Hamilton, 1999: Effects of Public Transport System
Changes on Mode Switching and Road Trafc Levels. Transfund New
Zealand.
Bose, R., and D. Sperling, 2001: Transportation in Developing Countries:
Greenhouse Gas Scenarios for Delhi, India. Pew Center on Global
Climate Change, Arlington, 43 pp.
Braslow, A.L., 1999: A History of Suction-Type Laminar-Flow Control
with Emphasis on Flight Research, http://www.nasa.gov/centers/
dryden/pdf/88792main_Laminar.pdf
Brog, W., E. Erl, and N. Mense, 2004: Individualized Marketing: Changing
Travel Behavior for a Better Environment. In Communicating
Environmentally Sustainable Transport: The Role of Soft Measures.
OECD (ed.), pp. 83-97.
Brueckner, J.K., 2004: Transport Subsidies, System Choice, and Urban
Sprawl. Unpublished paper, Department of Economics, University of
Illinois at Urbana-Champaign, 26 pp.
Cameron, I., T.J. Lyons, and J.R. Kenworthy, 2004: Trends in Vehicle
Kilometres of Travel in World Cities, 1960-1990: Underlying Drives
and Policy Responses. Transport Policy, 11, pp. 287-298.
Cames, M. and O. Deuber, 2004: Emission trading in international aviation.
Oeko Institute V, Berlin, ISBN 3-934490-0.
Capaldo, K., J.J. Corbett, P. Kasibhatla, P.S. Fishbeck, and S.N. Pandis,
1999: Effects of ship emission on sulphur cycling and radiative climate
forcing over the ocean. Nature 400, pp. 743-746.
Cervero, R., 1998: The Transit Metropolis. Island Press, 464 pp.

381
Chapter 5 Transport and its infrastructure
Chandler, K., E. Eberts, and L. Eudy, 2006: New York City Transit Hybrid
and CNG Buses: Interim Evaluation Results. National Renewable
Energy Laboratory Technical Report NREL/TP-540-38843, January.
Choo, S., P.L. Mokhtarian, and I. Salomon, 2005: Does Telecommuting
Reduce Vehicle-Miles Traveled? An Aggregate Time Series for the
U.S. Transportation. 32, pp. 37-64.
Cifuentes, L. and H. Jorquera, 2002: IES Developments in Chile. October
2002, <http://www.epa.gov/ies/documents/chile/cifuentespres.pdf>
accessed 30/05/07.
Cifuentes, L., H. Jorquera, E. Sauma, and F. Soto, 2001: International
CO-Controls Analysis Program. Final Report, December 2001, the
Catholic University of Chile, 62pp.
Corbett, J.J. and H.W. Köhler, 2003: Updated emissions from ocean
shipping. Journal of Geophysical Research, 108(D20), 4650 pp.,
doi:10.1029/2003JD003751.
Corbett, J.J. and H.W. Köhler, 2004: Considering alternative input
parameters in an activity-based ship fuel consumption and emissions
model: Reply to comment by Øyvind Endresen et al. on ‘Updated
emissions from ocean shipping.’ Journal of Geophysical Research,
109, D23303, doi:10.1029/2004JD005030.
Corbett, J.J., P.S. Fischbeck, and S.N. Pandis, 1999: Global nitrogen
and sulfur inventories for oceangoing ships. Journal of Geophysical
Research, 104(3), pp. 3457-3470.
COWI, 2002: Fiscal measures to reduce CO2 emissions from new
passenger cars. Main report, EC, Brussel, 191 pp.
Cullinane, C., 2002: The Relationship between Car Ownership and Public
Transport Provision: A Case Study of Hong Kong. Transport Policy,
9, pp. 29-39.
Deuker, K.J., J.G. Strathman, and M.J. Bianco, 1998: Strategies to Attract
Auto Users to Public Transportation. TCRP Report 40, Transportation
Research Board, 105 pp.
DfT, 2003: Carbon to Hydrogen -Roadmap for Passenger Cars: Update of
the Study. Department for Transport, UK.
Dill, J. and T. Carr, 2003: Bicycle Commuting and Facilities in Major U.S.
Cities: If You Build Them, Commuters Will Use Them. Transportation
Research, 1828, pp. 116-123.
DRI, 2004: A Review of the Results in the 1997 Kahane, 2002 DRI, 2003
DRI, and 2003 Kahane. Reports on the Effects of Passenger Car and
Light Truck Weight and Size on Fatality Risk. R.M. Van Auken, and
J.W. Zellner, Dynamic Research Inc. DRI-TR-04-02, Torrance, CA.
Duoba, M., H. Lohse-Busch, and T. Bohn, 2005: Investigating Vehicle
Fuel Economy Robustness of Conventional and Hybrid Electric
Vehicles. EVS-21, January.
EAA, 2001: Moving up to aluminium -The future of road transport.
European Aluminium Association, Brussels, 19 pp.
EC, 1999: Cycling: The Way Ahead for Towns and Cities. European
Commission, Brussels, 61 pp.
EC, 2005: Energy and Transport in Figures 2005: Part 3: Transport.
European Commission, Directorate-General for Energy and Transport,
Brussels, Belgium.
EC, 2006: Impact assessment. Commission Staff Working Document
COM (2006) 818 nal, accompanying document to the Proposal for
the European Parlement and the Council Amending Directive 2003/87/
EC, Brussels.
ECMT, 2000: Strategic Environmental Assessment. OECD, European
Conference of Ministers of Transport, 91 pp.
ECMT, 2004a: National Policies to Promote Cycling. OECD, 91 pp.
ECMT, 2004b: Transport and Spatial Policies: The Role of Regulatory
and Fiscal Incentives. OECD, 180 pp.
ECMT, 2006: Reducing NOx Emissions on the Road; Ensuring Future
Exhausts Emission Limits Deliver Air Quality Standards, OECD, 50
pp.
ECMT, 2007: Cutting Transport CO2 Emissions - What Progress?, OECD,
264 pp.
ECMT/IEA, 2005: Making cars more fuel efcient; Technology for real
improvements on the road, Paris, 2005.
ECON, 2003: GHG Emissions from International Shipping and Aviation.
ECON Report no 38400, Oslo, Norway, ISBN 82-7645-577-8, 40 pp.
EEA, 2003: Europe’s Environment: The Third Assessment. Environmental
assessment report No 10. European Environment Agency,
Copenhagen.
EIA DOE, 2005: International Energy Outlook 2005, DOE/EIA-0484.
Energy Information Administration.
Endresen, Ø., E. Søgård, J.K. Sundet, S.B. Dalsøren, I.S.A. Isaksen,
T.F. Berglen, and G. Gravir, 2003: Emission from international sea
transportation and environmental impact. Journal of Geophysical
Research, 108, 4560 pp, doi:10.1029/2002JD002898.
Endresen, Ø., E. Sørgård, J. Bakke, and I.S.A. Isaksen, 2004: Substantiation
of a lower estimate for the bunker inventory: Comment on ‘Updated
emissions from ocean shipping’ by J.J. Corbett and H.W. Koehler.
Journal of Geophysical Research, 109, D23302, doi.
Englar, R.J., 2001: Advanced Aerodynamic Devices to Improve the
Performance, Economics, Handling and Safety of Heavy Vehicles.
SAE paper 2001-01-2072.
EPRI, 2001: Comparing the Benets and Impacts of Hybrid Electric
Vehicle Options. Report 1000349, Electric Power Research Institute,
Palo Alto, CA, July 2001.
Esfahani, H.S., 2001: A Political Economy Model of Resource Pricing
with Evidence from the Fuel Market. ERS Working paper 200134,
Economic Research Forum, Cairo, Egypt, 24 pp.
EUCAR/CONCAWE/JRC, 2006: Well-to-Wheels Analysis of Future
Automotive Fuels and Powertrains in the European Context. <http://
ies.jrc.ec.europa.eu/WTW> accessed 30/05/07.
European Natural Gas Vehicle Association, 2002: <www.engva.org>
accessed 30/05/07.
Ewing, R., 1997: Is Los Angeles-Style Sprawl Desirable? Journal of
American Planning Association, 63(1), pp. 96-126.
Ewing, R. and R. Cervero, 2001: Travel and the Built Environment: A
Synthesis. Transportation Research, 1780, pp. 87-113.
Eyring, V., H.W. Köhler, J. van Aardenne, and A. Lauer, 2005a: Emissions
from international shipping: 1. The last 50 years. Journal of Geophysical
Research, 110, D17305, doi: 10.1029/2004JD005619.
Eyring, V., H.W. Köhler, A. Lauer, and B. Lemper, 2005b: Emissions
from international shipping: 2. Impact of future technologies on
scenarios until 2050. Journal of Geophysical Research, 110, D17306,
doi:10.1029/2004JD005620.
Farrell, A.E., R.J. Plevin, B.T. Turner, A.D. Jones, M. O’Hare, and D.M.
Kammen, 2006: Ethanol can contribute to energy and environmental
goals. Science, 311, pp. 506-508.
FESG, 2003: Report of the FESG/CAEP-6 trafc and eet forecast
(forecasting sub-group of FESG). ICAO-CAEP FESG, Montreal.
Fichter, C., S. Marquart, R. Sausen and D.S. Lee, 2005: The impact of cruise
altitude on contrails and related radiative forcing. Meteorologische
Zeitschrift, 14(4), pp. 563-572.
Forkenbrock, D.J. and G.E. Weisbrod, 2001: Guidebook for Assessing
the Social and Economic Effects of Transportation Projects. NCHRP
Report 456, Transportation Research Board, 242 pp.
Forster, P., V. Ramaswamy, P. Artaxo, T. Berntsen, R. Betts, D.W. Fahey,
J. Haywood, J. Lean, D.C. Lowe, G. Myhre, J. Nganga, R. Prinn, G.
Raga, M. Schulz and R. Van Dorland, 2007: Changes in Atmospheric
Constituents and in Radiative Forcing. In: Climate Change 2007:
The Physical Science Basis. Contribution of Working Group I to the
Fourth Assessment Report of the Intergovernmental Panel on Climate
Change [Solomon, S., D. Qin, M. Manning, Z. Chen, M. Marquis,
K.B. Averyt, M.Tignor and H.L. Miller (eds.)]. Cambridge University
Press, Cambridge, United Kingdom and New York, NY, USA.
Fouracre, P., C. Dunkerley, and G. Gardner, 2003: Mass Rapid Transit
System for Cities in the Developing World. Transport Reviews, 23(3),
pp. 299-310.
Foyt, G., 2005: Demonstration and Evaluation of Hybrid Diesel-Electric
Transit Buses - Final Report. Connecticut Academy of Science and
Engineering report CT-170-1884-F-05-10, Hartford, CT, 33 pp.

382
Transport and its infrastructure Chapter 5
Friedricht, H.E., 2002: Leightbau und Werkstofnnovationen im
Fahrzeugbau. ATZ, 104(3), pp. 258-266.
Fujii, S. and A. Taniguchi, 2005: Travel Feedback Programs:
Communicative Mobility Management Measures for Changing Travel
Behavior. The Eastern Asia Society for Transportation Studies, 6, CD.
Fwa, T.F. 2002: Transportation Planning and Management for Sustainable
Development - Singapore’s Experience. Paper presented at a
Brainstorming Session on Non-Technology Options for Stimulating
Modal Shifts in City Transport Systems held in Nairobi, Kenya. STAP/
GEF, Washington D.C.
GbD, 2001: The Technology Challenge. Greener by Design, <http://www.
greenerbydesign.org.uk/> accessed 30/05/07.
Gilat, M. and J.M. Sussman, 2003: Coordinated Transportation and
Land Use Planning in the Developing World: Case of Mexico City.
Transportation Research, 1859, pp. 102-109.
Giuliano, G., K. Hwang, and M. Wachs, 1993: Employee Trip Reduction
in Southern California: First Year Results. Transportation Research,
27A(2), pp. 125-137.
GM/ANL, 2005: Well-to-Wheels Analysis of Advanced Fuel/Vehicle
Systems-A North American Study of Energy Use, Greenhouse
Gas Emissions, and Criteria Pollutant Emissions. <http://www.
transportation.anl.gov/pdfs/TA/339.pdf> accessed 30/05/07.
Goodwin, P., 1992: A Review of New Demand Elasticities with Special
Reference to Short and Long Run Effects of Price Changes. Journal of
Transport Economics and Policy, 26, pp. 139-154.
Goodwin, P., 1999: Transformation of Transport Policy in Great Britain.
Transportation Research, 33(7/8), pp. 655-669.
Goodwin, P., J. Dargay, and M. Hanly, 2004: Elasticities of Road Trafc
and Fuel Consumption With Respect to Price and Income: A Review.
Transport Reviews, 24(3), 275-292,
Gordon, P. and H.W. Richardson, 1997: Are Compact Cities a Desirable
Planning Goal? Journal of American Planning Association, 63(1), pp.
95-106.
Grant-Muller, S.M., P.J. Mackie, H. Nellthorp, and A.D. Pearman, 2001:
Economic Appraisal of European Transport Projects-the State of the
Art Revisited. Transport Reviews, 21(2), pp. 237-262.
Green Car Congress, 2004: [website] <http://www.greencarcongress.
com/2004/10/fedex_hybrid_up.html> accessed 30/05/07.
Greene, D.L. and A. Schafer, 2003: Reducing Greenhouse Gas Emissions
from U.S. Transportation. PEW Center, Arlington, 68 pp.
Greene, D.L., 2005: Improving the Nation’s Energy Security: Can Cars
and Trucks be Made More Fuel Efcient? Testimony to the U.S. House
of Representatives, Committee on Science, February.
Grewe, V., M. Dameris, C. Fichter, and D.S. Lee, 2002: Impact of
aircraft NOx emissions. Part 2: effects of lowering ight altitudes.
Meteorologische Zeitschrift, 11, pp. 197-205.
Gupta, S., 1999: Country environment review - India, policy measures
for sustainable development Manila: Asian Development Bank
[Discussion paper].
Gwilliam, K., K. Kojima, and T. Johnson, 2004: Reducing Air Pollution
from Urban Transport. The World Bank, 16 pp.
Haight, B., 2003: Advanced Technologies are opening doors for new
materials. Automotive Industries, April 2003.
Hamelinck, C.N., R. Janzic, A. Blake, R. van den Broek, 2005: Policy
Incentive Options for Liquid Biofuels Development in Ireland. SEI,
56 pp.
Hamelinck, C.N. and A.P.C. Faaij, 2006: Outlook for advanced biofuels.
Energy Policy, 34(17), 3268-3283.
Harrison, D., D. Radov and J. Patchett, 2004: Evaluation of the feasibility
of Alternative Market-Based Mechanisms to Promote Low-Emission
Shipping in European Sea Areas. NERA Economic Consulting,
London, UK, 106 pp.
Harrison, D., D. Radov, J. Patchett, P. Klevnas, A. Lenkoski, P. Reschke
and A. Foss, 2005: Economic instruments for reducing ship emissions
in the European Union. NERA Economic Consulting, London, UK,
117 pp.
HEATCO, 2006: Proposal for harmonised guidelines, Deliverable 5 to the
EU Commission. IER, Developing Harmonised European Approaches
for Transport Costing and Project assessment, Germany.
Heavenrich, R.M., 2005: Light-Duty Automotive Technology and Fuel
Economy Trends, 1975 Through 2005, U.S. Environmental Protection
Agency Report EPA-420-R-05-001, July.
Helms, H. and U. Lambrecht, 2006: The potential contribution of light-
weighting to reduce transport energy consumption. The International
Journal of Life Cycle Assessment. <http://dx.doi.org/10.1065/
lca2006.07.258>, 7 pp.
Hensher, D.A., 2001: Chapter 8 Modal Diversion. In Handbook of
Transport Systems and Trafc Control. Hensher, D.A. and K.J. Button,
(ed.), Pergamon, pp. 107-123.
Heywood, J. B., M. A. Weiss, A. Schafer, S. A. Bassene, and V. K.
Natarajan, 2003: The Performance of Future ICE and Fuel Cell
Powered Vehicles and Their Potential Fleet Impact. Massachusetts
Institute of Technology, Laboratory for Energy and the Environment,
MIT LFEE 2003-004 RP, December.
Honda, 2004: Honda Develops Hybrid Scooter Prototype. <http://world.
honda.com/news/2004/2040824_02.html> accessed 30/05/07.
Hook, W., 2003: Preserving and Expanding the Role of Non-motorised
Transport. GTZ, Eschborn, Germany, 35 pp.
Hughes, J.E., C.R. Knittel, and D. Sperling, 2006: Evidence of a Shift
in the Short-Run Price Elasticity of Gasoline Demand. Institute of
Transportation Studies, University of California, Davis UCD-ITS-RR-
06-16.
Hylen, B. and T. Pharoah, 2002: Making Tracks-Light Rail in England
and France. Swedish National Road and Transport Research Institute,
91 pp.
ICAO, 2003: CAEP FESG Report to CAEP/6 2003.
ICAO, 2006: Form A - ICAO Reporting form for Air Carrier Trafc.
ICAO/FESG, 2003: FESG CAEP-SG20031-IP/8 10/6/03. Steering Group
Meeting Report of the FESG/CAEP6 Trafc and Fleet Forecast
(Forecasting sub-group of FESG), Orlando SG meeting, June 2003.
ICAO/FESG, 2004a: Analysis of voluntary agreements and open emission
trading for the limitation of CO2 emissions from aviation with the
AERO modeling system Part I. Montreal, Canada, 57 pp.
ICAO/FESG, 2004b: Analysis of open emission trading systems for the
limitation of CO2 emissions from aviation with the AERO modeling
system. Montreal, Canada, 77 pp.
ICF, 2004: Designing a greenhouse gas emissions trading system for
international aviation, Study carried out for ICAO, London, UK
IEA Hybrid, 2006: International Energy Agency Implementing Agreement
on Hybrid and Electric Vehicles. <http://www.ieahev.org/evs_hevs_
count.html> accessed 30/05/07.
IEA, 2001: Saving Oil and Reducing CO2 Emissions in Transport.
International Energy Agency, OECD, 194 pp.
IEA, 2002a: Transportation Projections in OECD Regions - Detailed
report. International Energy Agency, 164 pp.
IEA, 2002b: Bus Systems for the Future: Achieving Sustainable Transport
Worldwide. International Energy Agency, 188 pp.
IEA, 2003: Transport Technologies and policies for energy security and
CO2 Reductions. Energy technology policy and collaboration papers,
International Energy Agency, ETPC paper no 02/2003.
IEA, 2004a: World Energy Outlook 2004. International Energy Agency,
570 pp.
IEA, 2004b: Energy Technologies for a Sustainable Future: Transport.
International Energy Agency, Technology Brief, 40 pp.
IEA, 2004c: Biofuels for Transport: An International Perspective.
International Energy Agency, Paris, 210 pp.
IEA, 2004d: Reducing Oil Consumption in Transport - Combining Three
Approaches. IEA/EET working paper by L. Fulton, International
Energy Agency, Paris, 24 pp.
IEA, 2005: Prospects for Hydrogen and Fuel Cells. International Energy
Agency, Paris, 253 pp.
IEA, 2006a: Energy Technology Perspectives 2006; Scenarios & Strategies
to 2050. International Energy Agency, Paris, 479 pp.

383
Chapter 5 Transport and its infrastructure
IEA, 2006b: World Energy Outlook 2006. International Energy Agency,
Paris, 596 pp.
IEA, 2006c: Energy Balances of Non-OECD countries, 2003-2004.
International Energy Agency, Paris, 468pp.
IEA, 2006d: CO2 Emissions from Fuel Combustion 1971-2004.
International Energy Agency, Paris, 548pp.
IMO, 2004: MEPC 51/INF.2, Statistical investigation of containership
design with regard to emission indexing. Submitted by Germany to
the 51ste of the Marine Environment Protection Committee of IMO.
IMO, 2005: MEPC 53/WP.11, Prevention of air pollution from ships.
Report of the Working Group, 21 July 2005.
IPCC, 1996: IPCC Guidelines for National Greenhouse Gas Inventories
- workbook. Intergovernmental Panel on Climate Change.
IPCC, 1999: Aviation and the Global Atmosphere [Penner, J.E., D.H.
Lister, D.J. Griggs, D.J. Dokken and M. McFarland (eds)]. Special
report of the Intergovernmental Panel on Climate Change (IPCC)
Working Groups I and III, Cambridge University Press, Cambridge.
IPCC, 2005: Safeguarding the Ozone Layer and the Global Climate
System. Special Report of the Intergovernmental Panel on Climate
Change (IPCC), Cambridge University Press, Cambridge, 478 pp.
JAMA, 2002: The Motor Industry of Japan 2002. Japan Automobile
Manufacturers Association.
Japanese Statistical Bureau, 2006: Historical Statistics of Japan. Chapter
12: Transport, Statistics Bureau, Tokyo.
Jelinek, F., S. Carlier, J. Smith, and A. Quesne, 2002: The EUR RVSM
implementation Project-Environmental Benet Analysis. Eurocontrol,
Brussels, Belgium, 77 pp.
JHFC, 2006: JHFC Well-to-Wheel Efciency Analysis Results. JARI,
Tsukuba, 114 pp.
JMLIT and IHE, 2004: The Impact Study of New Public Transport on
Road Trafc. IHE, Japanese Ministry of Land, Infrastructure and
Transport and Institute of Highway Economics, Japan, 169 pp.
Jones, P., 2004: Comments on the Roles of Soft measures in Achieving
EST. In Communicating Environmentally Sustainable Transport: The
Role of Soft Measures. OECD (ed.), pp. 63-66.
Jong, G.D. and H. Gunn, 2001: Recent Evidence on Car Cost and Time
Elasticities of Travel Demand in Europe. Journal of Transport
Economics and Policy, 35, pp. 137-160.
JRC/IPTS, 2004: Potential for Hydrogen as a Fuel for Transport in the
Long Term (2020-2030) -Full Background Report.
JSGRIE, 2000: Guidelines for the Evaluation of Road Investment Projects.
Japan Research Institute, Japanese Study Group on Road Investment
Evaluation, 188 pp.
Kageson, J., 2005: Reducing CO2 Emissions from New Cars, European
Federation for Transport and Environment.
Kahane, C.J., 2003: Relationships between Vehicle Size and Fatality Risk
in Model Year 1985-93 Passenger Cars and Light Trucks. Technical
Report No. DOT HS 808 570, National Highway Trafc Safety
Administration, Washington, D.C.
Kajitani, S., M. Takeda, A. Hoshimiya, S. Kobori, and M. Kato, 2005:
The Concept and Experimental Result of DME Engine Operated at
Stoichiometric Mixture. Presented at International Symposia on
Alcohol Fuels (September 26-28, 2005), see <http://www.eri.ucr.edu/
ISAFXVCD/ISAFXVPP/CnERDEOS.pdf> accessed 30/05/07.
Karekezi, S., L. Majoro, and T. Johnson, 2003: Climate Change Mitigation
in the Urban Transport Sector: Priorities for the World Bank. World
Bank, 53 pp.
Kenworthy, J.R. and F.B. Laube, 1999: Patterns of Automobile Dependence
in Cities: An International Overview of Key Physical and Economic
Dimensions with Some Implications for Urban Policy. Transportation
Research, 33A(7/8), pp. 691-723.
Kenworthy, J. and F. Laube, 2002: Urban transport patterns in a global
sample of cities & their linkages to transport infrastructure, land use,
economics & environment. World Transport Policy & Practice, 8(3),
pp. 5-19.
Kiesgen, G., M. Kluting, C. Bock, and H. Fischer, 2006: The New 12-
Cylinder Hydrogen Engine in the 7 Series: The H2 ICE Age Has
Begun. SAE Technical Paper 2006-01-0431.
Koyama, A., H. Iki, Y. Ikawa, M. Hirose, K. Tsurutani, and H. Hayashi,
2006: Proceedings of the JSAE Annual Congress, #20065913.
Lee, D.S., B. Owen, A. Graham, C. Fichter, L.L. Lim, and D. Dimitriu,
2005: International aviation emissions allocations - present day
and historical. Manchester Metropolitan University, Centre for Air
Transport and the Environment, Report CATE 2005-3(C)-2.
Lee, C. and A.V. Mouden, 2006: The 3Ds+R: Quantifying Land Use and
Urban Form Correlates of Walking. Transportation Research, 11D(3),
pp. 204-215.
Leifsson, L.T. and W.H. Mason, 2005: The Blended Wing Body Aircraft,
Virginia Polytechnic Institute and State University Blacksburg, VA,
<http://www.aoe.vt.edu/research/groups/bwb/papers/TheBWBAir-
craft.pdf> accessed 30/05/07.
Leonardi, J. and M. Baumgartner, 2004: CO2 efciency in road freight
transportation: Status quo, measures and potential. Transportation
Research, D9(6), pp. 451-464.
Levinson, H.S., S. Zimmerman, J. Clinger, and S.C. Rutherford, 2002:
Bus Rapid Transit: An overview. Journal of Public Transportation,
5(2), pp. 1-30.
Litman, T., 2003: The online TDM Encyclopedia: Mobility Management
Information Gateway. Transport Policy, 10, pp. 245-249.
Lundqvist, L., 2003: Multifunctional land use and mobility. In
Multifunctional Land Use, P. Nijkamp, C.A. Rodenburg and R. Vreeker
(ed.), Vrije Universiteit Amsterdam and Habiforum, pp. 37-40.
Lutsey, N., C.J. Brodrick, D. Sperling, and C. Oglesby, 2004: Heavy-
duty truck idling characteristics: Results from a national truck survey.
Transportation Research Record, 1880, pp. 29-38.
Mackett, R.L. and M. Edwards, 1998: The impact of new urban public
transport systems: Will the expectations be met? Transportation
Research, 32A(4), pp. 231-245.
Mackie, P. and J. Nellthorp, 2001: Chapter 10 Cost-benet analysis in
transport. In Handbook of Transport Systems and Trafc Control, D.A.
Hensher and K.J. Button, (eds.), Pergamon, pp. 143-174.
Mackie, P., 2005: The London congestion charge: a tentative economic
appraisal. A comment on the paper by Prud’homme and Bocajero,
Transport Policy, 12, pp. 288-290.
MacKinnon, A.C., 2005: The economic and environmental benets
of increasing maximum truck weight: the British experience.
Transportation Research, D10(1), pp. 79-95.
Mannstein, H., P. Spichtinger, and K. Gierens, 2005: A note on how to
avoid contrail cirrus. Transportation Research, 10D(5), 421-426.
Marintek, 2000: Study of greenhouse gas emissions from ships. Report
to the IMO, by Marintek, Det Norske Veritas, Econ, Carnegie Mellon
University.
Martin, D., D. Moon, S. Collings, and A. Lewis, 1995: Mechanisms
for improved energy efciency in transport. Overseas Development
Administration, London, UK.
May, A.D., A.F. Jopson, and B. Matthews, 2003: Research challenges in
urban transport policy. Transport Policy, 10, pp. 157-164.
McCallen, R.C., K. Salari, J. Ortega, L. DeChant, B. Hassan, C. Roy,
W.D. Pointer, F. Browand, M. Hammache, T.Y. Hsu, A. Leonard, M.
Rubel, P. Chatalain, R. Englar, J. Ross, D. Satran, J.T. Heineck, S.
Walker, D. Yaste, and B. Storms, 2004: DOE’s effort to reduce truck
aerodynamic drag-joint experiments and computations lead to smart
design. Lawrence Livermore National Laboratory paper UCRL-
CONF-204819, 34th AIAA Fluid Dynamics Conference and Exhibit,
Portland, OR, United States, June 22. <http://www.llnl.gov/tid/lof/
documents/pdf/308799.pdf> accessed 30/05/07
McKinley, G., Zuk, M., Hojer, M., Ávalos, M., González, I., Hernández,
M., Iniestra, R., Laguna, I., Martínez, M.A., Osnaya, P., Reynales,
L.M., Valdés, R., and J. Martínez, 2003: The local benets of global
air pollution control in Mexico City. Instituto Nacional de Ecologia,
Instituto Nacional de Salud Publica, Mexico.
MIT, 2000: On the road in 2020: A life-cycle analysis of new automobile
technologies. Massachusetts Institute of Technology, Energy
Laboratory Report #MIT EL 00-003, 153 pp.

384
Transport and its infrastructure Chapter 5
MIT, 2004: Coordinated policy measures for reducing the fuel
consumption of the U.S. light-duty vehicle eet. Bandivadekar, A.P.
and J.B. Heywood, Massachusetts Institute of Technology, Laboratory
for Energy and the Environment Report LFEE 2004-001, 76 pp.
Mohan, D. and D. Tiwari, 1999: Sustainable transport systems, linkages
between environmental issues. Public transport, non-motorised
transport and safety. Economic and Political Weekly, XXXIV(25),
June 19, 1580-1596.
Mokhtarian, P.L., 1998: A synthetic approach to estimating the impacts of
telecommuting on travel. Urban Studies, 35(2), pp. 215-241.
Murakami, Y. and K. Uchibori, 2006: Development of fuel cell vehicle
with next-generation fuel cell stack. SAE Paper 2006-01-0034.
Nash, C., P. Bickel, R. Friedrich, H. Link and L. Stewart, 2002: The
environmental impact of transport subsidies. Paper prepared for the
OECD Workshop on Environmentally Harmful Subsidies, Paris, 35
pp.
Newman, P. and J. Kenworthy, 1999: Sustainablity and cities: Overcoming
automobile dependence. Island Press, Washington, D. C. 442 pp.
NHTSA CAFE, 2006: Light truck fuel economy standards. <http://www.
nhtsa.dot.gov/portal/site/nhtsa/menuitem.43ac99aefa80569cdba046a0
/> accessed 30/05/07.
Niederberger, A., 2005: The Swiss climate penny: An innovative approach
to transport sector emissions. Transport Policy, 12(4), pp. 303-313.
Nijkamp, P., B. Ubbels, and E. Verhoef, 2003: Chapter 18. Transport
Investment Appraisal and the Environment. In Handbook of Transport
and the Environment, D.A. Hensher and K.J. Button, (eds.). Pergamon,
Amsterdam,pp. 333-355.
Nippon Steel, 2002: Advanced technology of Nippon Steel contributes to
ULSAB-AVC Program. Nippon Steel News, 295, September 2002.
NRC, 2002: Effectiveness and impact of Corporate Average Fuel Economy
(CAFE) Standards. National Research Council, National Academy
Press, Washington, D.C., 184 pp.
NRC/NAE, 2004: The Hydrogen Economy. National Academy Press,
Washington D.C. 240 pp.
O’Ryan, R., D. Sperling, M. Delucchi, and T. Turrentine, 2002:
Transportation in Developing Countries: Greenhouse Gas Scenarios
for Chile. Pew Center on Global Climate Change, Arlington, 56 pp.
OECD, 2003: Reforming transport taxes. Paris, 199 pp
OECD, 2004a: Synthesis report on environmentally harmful subsidies.
OECD publication SG/SD(2004)3/FINAL, Paris, France Priorities for
the World Bank. African Energy.
OECD, 2004b: Current international shipping market trends - community
maritime policy and legislative initiatives. OECD Workshop on
Maritime Transport, Paris.
Olivier, J.G.J., A.F. Bouwman, C.W.M. van der Maas, J.J.M. Berdowski,
C. Veldt, J.P.J. Bloos, A.J.H. Visschedijk, P.Y.J. Zandveld, and J.L.
Haverlag, 1996: Description of EDGAR Version 2.0: A set of global
emission inventories of greenhouse gases and ozone-depleting
substances for all anthropogenic and most natural sources on a per
country basis and on 1°x1° grid. RIVM, Bilthoven, The Netherlands,
171 pp.
ORNL (Oak Ridge National Laboratory), 2006: Transportation Energy
Data Book: Edition 25. Oak Ridge National Laboratory report ORNL-
6974, 332pp.
Owen, N. and R. Gordon, 2002: Carbon to hydrogen - roadmaps for
passenger cars: A study for the transport and the Department of Trade
and Industry. Ricardo Consulting Engineers, Ltd, November 2002,
RCEF.0124.31.9901, 174 pp.
Owen, B. and D.S. Lee, 2005: International aviation emissions - future
cases. Study on the allocation of emissions from international aviation
to the UK inventory - CPEG7. CATE-2005-3(C)-3, Centre for Air
Transport and the Environment, Manchester Metropolitan University.
Owen, B. and D.S. Lee, 2006: Allocation of international aviation emissions
from scheduled air trafc-Future cases, 2005 to 2050 (Report 3 of 3).
Manchester Metropolitan University, Centre for Air Transport and the
Environment, CATE-2006-3(C)-3A, Manchester, UK, 37 pp.
Page, M., 2005: Chapter 34. Non-motorized transport policy. In Handbook
of Transport Strategy, Policy and Institutions, D.A. Hensher and K.J.
Button, (eds.), Pergamon, pp. 581-596.
Pandey, R and G. Bhardwaj, 2000: Economic policy instruments for
controlling vehicular air pollution. New Delhi: National Institute of
Public Finance and Policy.
Pickrell, D., 1999: Transportation and land use. In Essays in Transportation
Economics and Policy, J. Gomez-Ibanez, W.B. Tye, and C. Winston
(eds.), Brookings, pp. 403-435.
Plotkin, S., D. Greene, and K.G. Duleep, 2002: Examining the potential
for voluntary fuel economy standards in the United States and Canada.
Argonne National Laboratory report ANL/ESD/02-5, October 2002.
Plotkin, S., 2004: Fuel economy initiatives: International comparisons. In
Encyclopedia of Energy, 2, 2004 Elsevier.
Power System, 2005: Press release 2005.6.27. Development of High
Power and High Energy Density Capacitor (in Japanese). <http://
www.powersystems.co.jp/newsrelease/20050627nscreleaser1-1.pdf>
accessed 30/05/07.
PRESAV, 2003: The potential for Renewable Energy Sources in aviation.
Imperial College, London, 78 pp.
Prozzi, J.P., C. Naude, and D. Sperling, 2002: Transportation in Developing
Countries: Greenhouse Gas Scenarios for South Africa. Pew Center on
Global Climate Change, Arlington, 52 pp.
Prud’homme, R. and J.P. Bocarejo, 2005: The London congestion charge:
a tentative economic appraisal. Transport Policy, 12, pp. 279-287.
Pucher, J., 2004: Chapter 8. Public Transportation. In The Geography of
Urban Transportation, S. Hanson and G. Giuliano (eds.), Guilford,
pp. 199-236.
Pulles, J.W., 2002: Aviation emissions and evaluation of reduction options/
AERO. Ministry of Transport, Public Works and Watermanagement,
Directorate-General of Civil Aviation, The Hague, The Netherlands.
QinetiQ, 2004: AERO2k Global Aviation Emissions Inventories for 2002
and 2025. QinetiQ Ltd, Hampshire, UK.
REN21. 2006: Renewables -Global Status Report- 2006 Update, REN21,
Paris, 35 pp.
Resource Analysis, MVA Limited, Dutch National Aerospace Laboratory
and International Institute of Air and Space Law, 1999: Analysis of the
taxation of aircraft fuel. Produced for European Commission, Delft,
The Netherlands.
Ribeiro, S.K. and P.S. Yones-Ibrahim, 2001: Global warming and transport
in Brazil - Ethanol alternative. International Journal of Vehicle Design
2001, 27(1/2/3/4), pp. 118-128.
Richardson, H.W. and C.H. Bae, 2004: Chapter 15. Transportation
and urban compactness. In Handbook of Transport Geography and
Spatial Systems, D.A. Hensher, K.J. Button, K.E. Haynes, and P.R.
Stopher (eds.), Pergamon, pp. 333-355.
Richmond, J., 2001: A whole-system approach to evaluating urban transit
investments. Transport Reviews, 21(2), pp. 141-179.
Riedy, C., 2003: Subsidies that encourage fossil fuel use in Australia.
Working paper CR2003/01, Institute for sustainable futures, Sydney,
Australia, 39 pp.
Rietveld, P., 2001: Chapter 19 Biking and Walking: the Position of Non-
motorized Transport Modes in Transport Systems. In Handbook of
Transport Systems and Trafc Control. D.A. Hensher and K.J. Button,
(eds.), Pergamon, pp. 299-319.
Ross, M., D. Patel, and T. Wenzel, 2006: Vehicle design and the physics of
trafc safety. Physics Today, January, pp. 49-54.
Rye, T., 2002: Travel Plans: Do They Work? Transport Policy, 9(4), pp.
287-298.
SAE International, 2003a: A powerful mix. Automotive Engineering
International, 111(5), pp. 50-56.
SAE International, 2003b: A different automatic. Automotive Engineering
International, 111(7), pp. 32-36.
SAE International, 2004: Trucks get aerodynamic touch. Automotive
Engineering International, 112(7), pp. 67-69.
Sanyo, 2005: On-line catalog, <http://www.sanyo.co.jp/energy/english/
product/lithiumion_2.html> accessed 30/05/07.

385
Chapter 5 Transport and its infrastructure
Sausen, R., I. Isaksen, V. Grewe, D. Hauglustaine, D.S. Lee, G. Myhre,
M.O. Köhler, G. Pitari, U. Schumann, F. Stordal and C. Zerefos,
2005: Aviation radiative forcing in 2000: an update on IPCC (1999).
Meteorologische Zeitschrift, 114, pp. 555-561.
Schafer, A., 2000: Regularities in Travel Demand: An International
Perspective. Journal of Transportation and Statistics, 3(3), pp. 1-31.
Shoup, D., 1997: Evaluating the effects of California’s parking cash-out
law: eight case studies. Transport Policy, 4(4), pp. 201-216.
Skjølsvik, K.O., 2005: Natural gas used as ship fuel; Norway heads the
development. In Navigare, February 2005, Oslo, Norway.
Small, K.A. and K. Van Dender, 2007: Fuel Efciency and Motor Vehicle
Travel: The Declining Rebound Effect. The Energy Journal, 28(1), pp.
25-51.
Song, Y. and G.J. Knaap, 2004: Measuring urban form: is Portland winning
the war on sprawl? Journal of American Planning Association, 70(2),
pp. 210-225.
Sperling, D., 1985: An analytical framework for siting and sizing biomass
fuel plants. Energy, 9, pp. 1033-1040.
Sperling, D. and D. Salon, 2002: Transportation in developing countries:
An overview of greenhouse gas reduction strategies. Pew Center on
Global Climate Change, Arlington, 40 pp.
Stead, D., H. Geerlings and E. Meijers, 2004: Policy integration in practice:
the integration of land use planning, transport and environmental
policy-making in Denmark, England and Germany. Delft University
Press, Delft.
Stordal, F., G. Myhre, E.J.G. Stordal, W.B. Rossow, D.S. Lee, D.W.
Arlander and T. Svenby, 2005: Is there a trend in cirrus cloud cover
due to aircraft trafc? Atmospheric Chemistry and Physics, 5, pp.
2155-2162.
Syri, S., M. Amann, P. Capros, L. Mantzos, J. Cofala, and Z. Klimont,
2001: Low-CO2 energy pathways and regional air pollution in Europe.
Energy Policy, 29, pp. 871-884.
Taylor, M.A.P. and E.S. Ampt, 2003: Travelling Smarter Down Under:
Policies for Voluntary Travel Behavior Change in Australia. Transport
Policy, 10, pp. 165-177.
The Royal Commission on Transport and the Environment, 1994:
Transport and the Environment. Oxford, 325 pp.
Toyota, 2004: Environmental & Social Report 2004.
<http://www.toyota.co.jp/en/environmental_rep/04/download/index.
html> accessed 30/05/07.
Toyota/Mizuho, 2004: Well-to-Wheel Analysis of Greenhouse Gas
Emissions of Automotive Fuels in the Japanese Context. Mizuho,
Tokyo, 122 pp.
Transport for London, 2005: Central London congestion charging,
Impacts monitoring; Third annual report. 162pp.
Transport for London, 2006: Central London congestion charging.
Fourth annual report, 215pp.
TRL, 2004: The Demand for Public Transport: A Practical Guide. Transport
Research Laboratory, TRL Report, 593, 237 pp.
U.S. Bureau of Transportation Statistics, 2005: Transportation Statistics
Annual Report. Bureau of Transportation Statistics, Washington, US,
351pp.
U.S. DOE, 2000: Technology Roadmap for the 21st Century Truck
Program. Department of Energy, 21CT-001, 196pp.
UN, 2002: Plan of implementation of the World Summit on Sustainable
Development. United Nations, New York.
UN, 2006: Review of Maritime Transport. United Nations, New York/
Geneva, 160pp.
Veca, E. and J.R. Kuzmyak, 2005: Traveler Response to Transport System
Changes: Chapter 13- Parking Pricing and Fees. TCRP Report 95,
Transportation Research Board, 62 pp.
VTPI (Victoria Transport Policy Institute), 2005: TDM Encyclopedia,
Transportation Elasticities, <http://www.vtpi.org/tdm/tdm11.htm>
accessed 30/05/07.
Vyas, A., C. Saricks, and F. Stodolsky, 2002: The Potential Effect of Future
Energy-Efciency and Emissions-Improving Technologies on Fuel
Consumption of Heavy Trucks. Argonne National Laboratory report
ANL/ESD/02-4, August.
WBCSD, 2002: Mobility 2001: World Mobility at the End of the Twentieth
Century, and its Sustainability. World Business Council for Sustainable
Development, <http://www.wbcsd.ch/> accessed 30/05/07.
WBCSD, 2004a: Mobility 2030: Meeting the Challenges to Sustainability.
<http://www.wbcsd.ch/> accessed 30/05/07.
WBSCD, 2004b: IEA/SMP Model Documentation and Reference
Projection. Fulton, L. and G. Eads, <http://www.wbcsd.org/web/
publications/mobility/smp-model-document.pdf> accessed 30/05/07
WCTRS and ITPS, 2004: Urban Transport and the Environment: An
International Perspective, World Conference on Transport Research
Society and Institute for Transport Policy Studies, Elsevier, 515 pp.
WEC, 2004: Energy End-Use Technologies for the 21st Century. WEC,
London, UK 128 pp.
Weiss, M.A., J.B. Heywood, E.M. Drake, A. Schafer, and F.F. AuYeung,
2000: On the Road in 2020: A Life-cycle Analysis of New Automobile
Technologies, MIT Energy Laboratory, <http://web.mit.edu/energylab/
www/> accessed 30/05/07.
Williams, V., R.B. Noland, and R. Toumi, 2003: Reducing the climate
change impacts of aviation by restricting cruise altitudes. Transportation
Research, D7, pp. 451-464.
Willoughby, C., 2001: Singapore’s Motorisation Policies: 1960-2000.
Transport Policy, 8, pp. 125-139.
Wimmer, A., T. Wallner, J. Ringler, and F. Gerbig, 2005: H2-Direct
Injection - A Highly Promising Combustion Concept. SAE Technical
Paper 2005-01-0108.
Winkelman, S., 2006: Transportation, the Clean Development Mechanism
and International Climate Policy. Center for Clean Air Policy, 8th
meeting of the Transportation Research Board. Washington D.C., 24
January 2006.
Wit, R.C.N. and J.M.W. Dings, 2002: Economic incentives to mitigate
greenhouse gas emissions from international aviation. CE Delft, Study
commissioned by the European Commission, Delft, The Netherlands,
200 pp.
Wit, R.C.N., B. Boon, A. van Velzen, M. Cames, O. Deuber, and D.S. Lee,
2005: Giving Wings to Emission Trading; Inclusion of Aviation under
the European Emission Trading System (ETS); Design and Impacts.
CE Delft, 245 pp.
Wit, R.C.N., B. Kampman, B. Boon, P.E. Meijer, J. Olivier, and D.S. Lee,
2004: Climate impacts from international aviation and shipping; State-
of-the-art on climatic impacts, allocation and mitigation policies. CE
Delft, The Netherlands, 104 pp.
World Bank, 1996: Sustainable Transport: Priorities for Policy Reform, A
World Bank Publication.
World Bank, 2002: Cities on the Move - A World Bank Urban Transport
Strategy Review. Private Sector Development and Infrastructure
Department, Washington, D.C, 206 pp.
World Bank, 2004: World Development Indicators CD-ROM, World
Bank, Washington, D.C.
Wright, L., 2004: Bus Rapid Transit Planning Guide. GTZ, Eschborn,
Germany, 225 pp.
Wright, L., L. Fulton, 2005: Climate Change Mitigation and Transport in
Developing Nations. Transport Reviews, 25(6), 691-717.
Yamba, F.D. and E. Matsika, 2004: Proceedings of the IPCC Expert
Meeting on Industrial Technology Development, Transfer and
Diffusion. Tokyo, Japan, 21-23 September 2004, pp. 278-288.
Yuasa, 2000: Press release 2000.4.20 - Development of high capacity Li
batteries with Mn type cathode (in Japanese). <http://www.gs-yuasa.
com/jp/news/ycj/topick/top20000420.html> ac-cessed 30/05/07.
Zhou, H. and D. Sperling, 2001: Transportation in Developing Countries:
Greenhouse Gas Scenarios for Shanghai. China, Pew Center on Global
Climate Change, Arlington, 43 pp.

