Behavioral Observation Research Interactive Software (BORIS) User Guide Boris
User Manual:
Open the PDF directly: View PDF ![]() .
.
Page Count: 69
- Follow BORIS
- Legal
- Install BORIS
- Launch BORIS
- Create a new project with BORIS
- Open an existing project with BORIS
- Observations
- Coding your media
- Exporting events data
- Playback menu
- Tools
- Coding map
- Analysis
- Preferences
- Various
- Acknowledgement
Contents
Follow BORIS 3
Legal 4
Install BORIS 4
Linux 4
Microsoft-Windows 4
Mac OS 4
VirtualBox virtual appliance 4
Launch BORIS 4
Create a new project with BORIS 5
Set an ethogram 6
Define the subjects 15
Define the Independent variables 16
Observations' tab 17
Converters' tab 17
Open an existing project with BORIS 18
Observations 19
Create a new observation 19
Observations list 27
Delete observations 31
Import observations from a project file 31
Coding your media 31
Media based coding 32
Live observations 32
Ethogram widget in the main window 33
Subjects widget in the main window 34
The media player widgets 35
The Events widget 36
Record an event 36
Fix unpaired state events 42
Frame-by-frame mode 42
Exporting events data 43
Export events 43
Export aggregated events 43
Export events for analysis with JWatcher 44
Export events as behavioral strings 44
Export events as Praat TextGrid 45
Extract sequences from media files 45
Export transitions matrix 46
Playback menu 46
Jump 46
Zoom 47
Tools 47
Geometric measurements 47
Coding pad 48
Converters for external data values 49
Transitions flow diagram 50
Re-encoding and resizing a video file 51
Project server 52
Coding map 52
The Behaviors coding map 52
The Modifiers coding map 56
Analysis 57
Time budget 57
Synthetic time budget 60
Plot events 60
Inter-rater reliability 62
Preferences 62
General preferences 63
FFmpeg framework 64
Frame-by-frame mode 65
Spectrogram 66
Plot colors 66
Various 67
Removing path of media files 67
Docking 67
Citing BORIS 68
Bug reports and features request 68
Acknowledgement 68
Valid keys for triggering behavior 68
Follow BORIS
BORIS web site: www.boris.unito.it
BORIS GitHub repository
BORIS twitter feed
BORIS YouTube channel
Legal
Copyright 2012-2018 Olivier Friard - Marco Gamba
BORIS is free software; you can redistribute it and/or modify it under the terms of the GNU General Public
License as published by the Free Software Foundation; either version 2, or any later version.
BORIS is distributed in the hope that it will be useful, but WITHOUT ANY WARRANTY; without even the
implied warranty of MERCHANTABILITY or FITNESS FOR A PARTICULAR PURPOSE. See the GNU
General Public License for more details.
Install BORIS
BORIS can be installed following instructions on the BORIS site at download page
Linux
BORIS is available only for 64-bit systems.
The VLC media player must be installed on your system.
You can also run BORIS from sources. See the Linux download page for details about the dependencies
to install.
Microsoft-Windows
BORIS is available for Windows in 32-bit and 64-bit versions. Check your OS before downloading.
Two versions are available: BORIS Setup and BORIS Portable
The BORIS Setup will install BORIS on your system (the default install path is located in your home
directory, you do not need administration rights to install BORIS).
The BORIS Portable will NOT install BORIS on your system but will run from a directory (find and launch
boris.exe). Use this version if you want to test a new version of BORIS for example.
Mac OS
BORIS is available for Mac OS only in 64-bit version (from >= 10.8)
VirtualBox virtual appliance
If you want to try BORIS without installing it you can download the VirtualBox virtual appliance from the
BORIS site. In this case you must first install the VirtualBox virtualizer from Oracle (released under GPL 2).
Launch BORIS
Start BORIS by clicking on its icon. For launching BORIS from sources see the BORIS web site. When
launching BORIS for the first time it may take some time to show up. Please be patient!
The main window of BORIS will show up. The toolbar with media player commands is disabled for now.
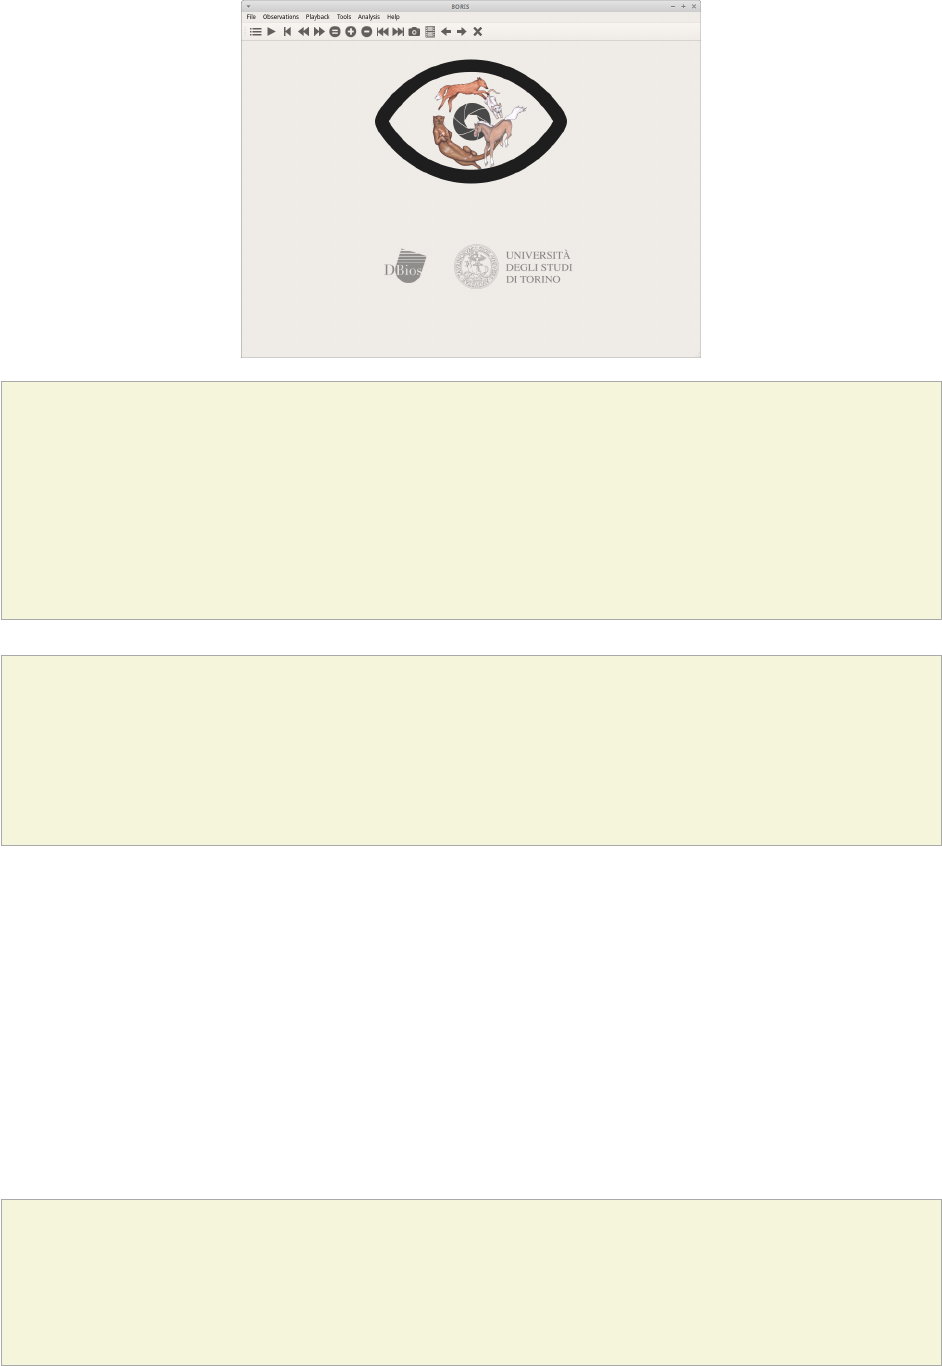
Warning
On Mac OS X 10.9 and above, launching can be stopped according to the Security & Privacy
settings of your computer. They can be changed opening System Preferences... > Security &
Privacy > General and selecting the option Anywhere in the frame Allow apps downloaded from.
Alternatively you can repeat the operation right-clicking on the BORIS icon and then clicking Open
in the following two dialog boxes.
Warning
On Microsoft-Windows, launching can be stopped by a `Security warning: The publisher
can not be verified. Are you sure you want to run this software?` Click the `Run` button to
launch BORIS.
At the first launch, BORIS will ask you to allow the automatically check for new version. Internet access is
required for this feature. If you choose Yes BORIS will check for new version about every 15 days. This
option can be changed on the Preferences window (See general preferences)
You can launch BORIS from command line by specifying the project file to open as the first argument.
Create a new project with BORIS
The BORIS project file is the container for all information related to the project. It contains the ethogram,
the independent variables, the subjects definition, the behaviors coding maps, the converters and
all observations data. The save menu option (File > Save project or Save project as ...) will save the
project in a path in your local file system. You can also activate the automatic backup feature (see
Preferences).
Note
It is VERY important to do regular backups of your project files to prevent the lost of data. Software
can be reinstalled but your data could quite possibly be lost for ever.
BORIS allows creating an unlimited number of projects but only one project can be opened at a time.
A video tutorial about creating a project is available at https://www.youtube.com/watch?v=I97Dny5hFOE
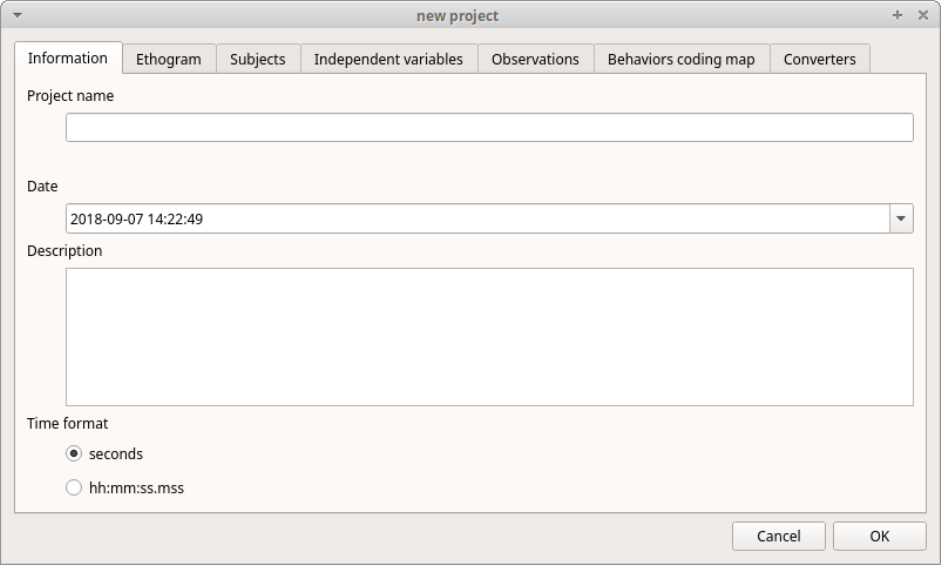
To create a new project, under the menu File , select New project. You can determine your project name
by writing in the Project name field in the Information tab. Once the project will be saved, the Project file
path will show the full path to your project file. Date will automatically set on the current date and time, but
you can alternatively set this info on your media date and time, or whatever you prefer. Description can
host all the relevant information about your project, can be also left empty. Time format can be
alternatively set to seconds or to hh:mm:ss.mss. This choice can be changed at anytime under File >
Preferences (for MAC users, BORIS > Preferences) > Default project time format.
Set an ethogram
See https://en.wikipedia.org/wiki/Ethogram for ethogram definition.
Switching to the Ethogram tab, you can alternatively:
• set your ethogram from scratch;
• import an existing ethogram from another BORIS project;
• import an ethogram from a JWatcher global definition file (.gdf).
•import an ethogram from a plain text file
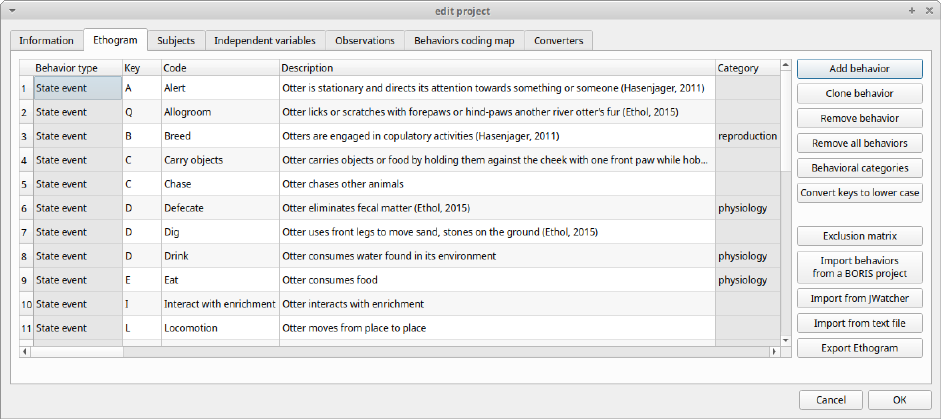
Set your ethogram from scratch
Clicking on the Add behavior button you can add a new row in the Ethogram table and behavior type will
be automatically set to Point event.
The cells with gray background can not be directly edited. You must double-click on them and then select
a value.
Behavior types
2 types of behaviors can be defined. Double-click on the cell and select the type of behavior:
•Point event behavior when the behavior has no duration. The behavior will be coded by pressing
the defined keyboard key (see below) or by clicking to the corresponding row in the Ethogram table.
•State event behavior when the behavior has a duration. The behavior start and stop will be coded
by pressing the defined keyboard key (see below) or by clicking to the corresponding row in the
Ethogram table. These behaviors must have a start event and a stop event.
You can switch between State event and Point event at your convenience with a double-click on the
Behavior type cell. You can also add a Coding map to either a State event (State event with coding
map) or a Point event (Point event with coding map; see the "Coding map" section for details).
An existing behavior can be duplicated using the Clone behavior button. Its code have then to be
changed. On a selected behavior, click on the Remove behavior button to remove. The Remove all
behaviors button will clear the Ethogram table. Both the above-mentioned operations must be confirmed
when prompted.
Behavioral codes (Code column) can be sorted alphabetically by checking the Alphabetical order
checkbox. Alternatively they can be sorted manually by using the Move up and Move down buttons.
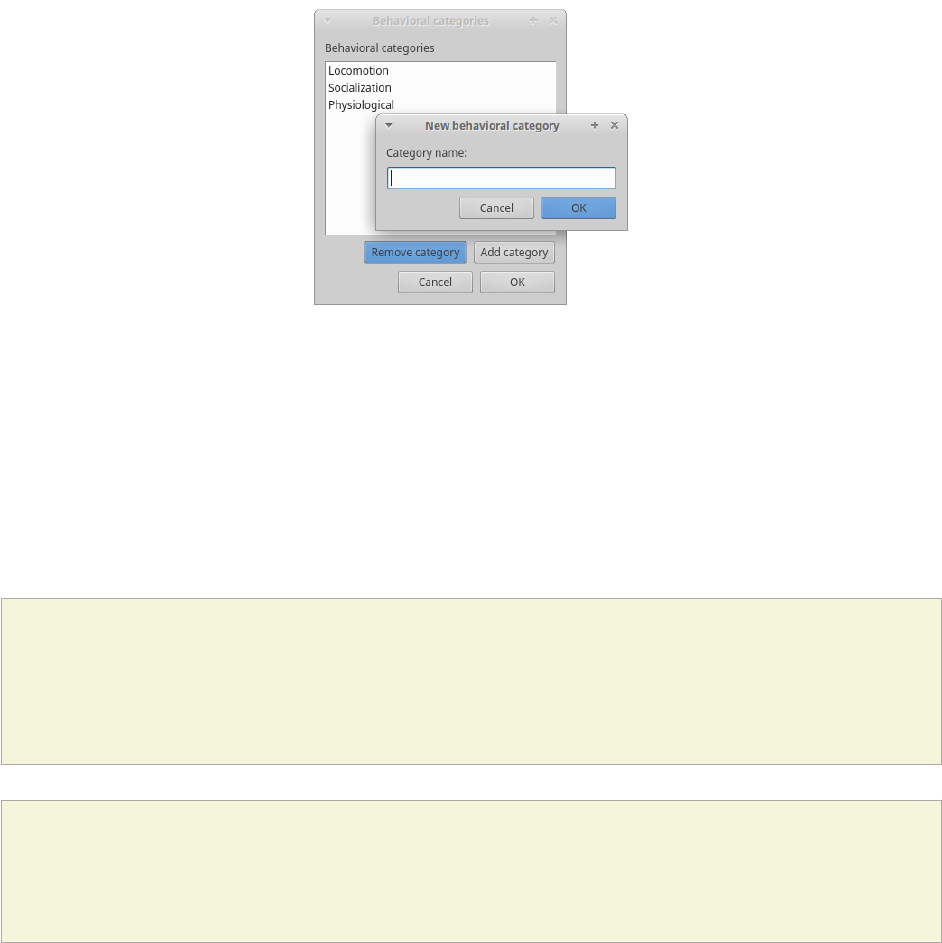
Categories of behaviors
Defining categories of behaviors can be usefull for the analysis of coded events (for example the time
budget analysis). Click the Behavioral categories button and add a the categories of behaviors.
Behaviors can then be included or not in a defined category.
Set keys and codes
For each behavior you have to set a keyboard key (Key column) that will be then used to code the
behavioral events. You can choose whether you want to set a unique key for each behavior or use the
same key for more than one behavior. In the case you set the same key for more than a behavior, BORIS
will pause your coding and ask which of the behavior you want to record. From version 7 the keys are
case-sensitive.
If your project was created with a previous version of BORIS (< v.7) you can use the Convert keys to
lower case to convert all keys to lower case otherwise you will have to code your observation using upper
case key.
Important
If you open a project file created with a version older than v.7 BORIS will ask you to convert the
upper case behavior and subject keys to lower case.
Important
Do not use the / and * keys! They are reserved for the frame-by-frame mode.
In the Code column, you have to add a unique code for each behavior. Duplicated codes are not accepted
and BORIS will warn in red about duplicates on the bottom left of the Ethogram tab. The code can be an
alphanumeric string (which must not include the pipe character | ).
The Category column allow you to include the behavior to a predefined category.
The Description of your behavior is optional. The Description column can be useful to add information
about a specific behavior, its characteristics (e.g. to standardise observation between different users) or to
refer to external information (e.g. reference to a previous ethogram).
The following three columns (Modifiers, Exclusion, Coding map) cannot be edited from the Ethogram
table.
Set the modifiers
Modifiers can be used to add attributes to a behavior. A single behavior can have two or more modifiers
attached (e.g. "play" may have "solitary" or "social" as modifiers). The use of modifiers can be convenient
to significantly reduce the number of keys and simplify the behavioral coding.
3 types of modifiers are available: Single selection, Multiple selection and Numeric. Single selection
modifiers allows the observer to select only one modifier in the list. Multiple selection allows to select
more modifiers from the list. Numeric allows to input a numeric data.
In BORIS modifiers can also be added in different modifier sets [e.g. "play, social" may have a modifier set
(#1) for "brothers" and another (#2) for "sisters"]. In the case of using sets of modifiers, you can select
one/more modifier for each set.
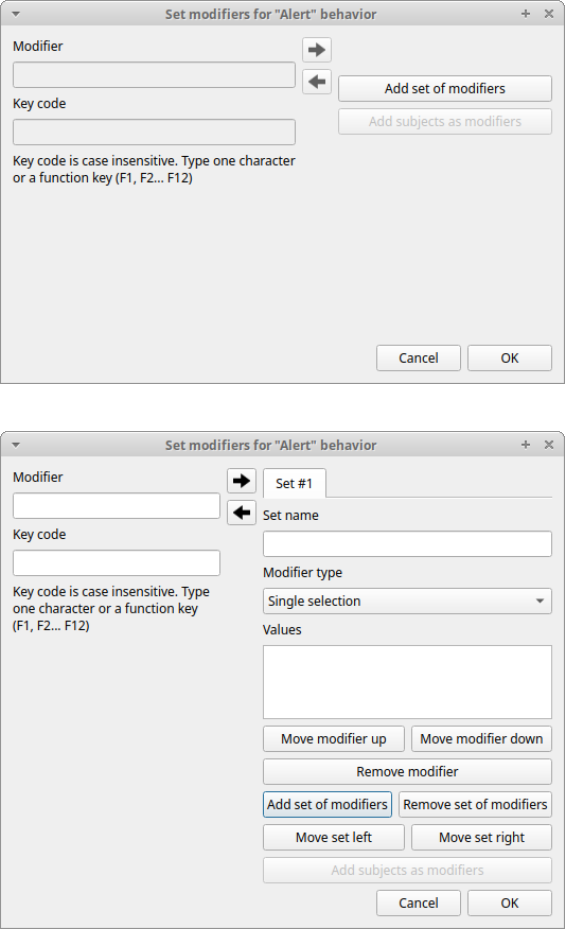
To add modifiers to a behavior, you need to double-click the Modifiers cell corresponding to the behavior
you want to add the modifiers to. The following window will show up:
Click the Add a set of modifiers button:
Set a name for the new modifiers set by typing it in the Set name edit box. Setting a modifiers' set name is
not mandatory.
Select the modifier type using the Modifier type combo box. You can choose between Single selection,
Multiple selection and Numeric
• the Single selection type will allow you to select only one modifier for the current behavior.
• the Multiple selection type will allow you to select one or more modifiers for the current behavior.
• the Numeric type will allow you to input a number. For example a distance of interaction.
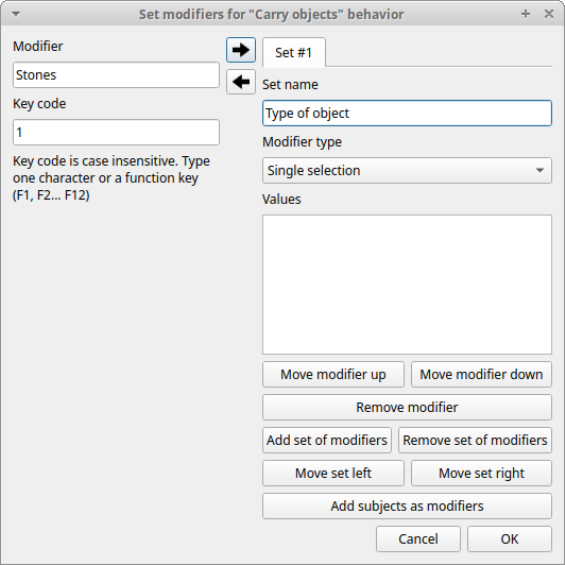
Within a set of modifiers, you can add a modifier by writing the modifier in the Modifier edit box. You can
choose a shortcut (one character - case sensitive) to this modifier (optional). Then press the right-arrow
button to add the new modifiers to the set.
To modify a modifier, select it and press the left-arrow button, edit the modifier and press the right-arrow
button.
A modifier can be removed by pressing the Remove modifier button.
After adding all modifiers the window will appear like this:
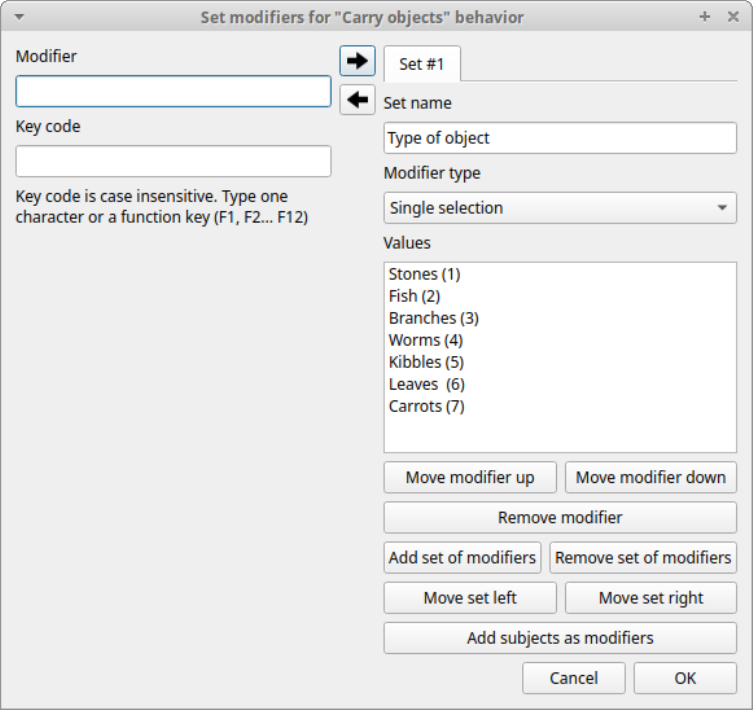
In case of Single selection or Multiple selection all defined subjects can be added as modifiers using the
Add subjects as modifiers button. This can help in case of coding the interactions between subjects for
example.
The modifier position into the modifiers' set can be manually set using the Move modifier up and Move
modifier down buttons.
You can add and/or remove sets using the buttons Add set of modifiers and Remove set of modifiers.
The position of a modifiers' set can be customized (using the Move set left and Move set right buttons)
Modifiers can not contain the following characters: (|),`~!
Example of a multiple selection modifiers set:
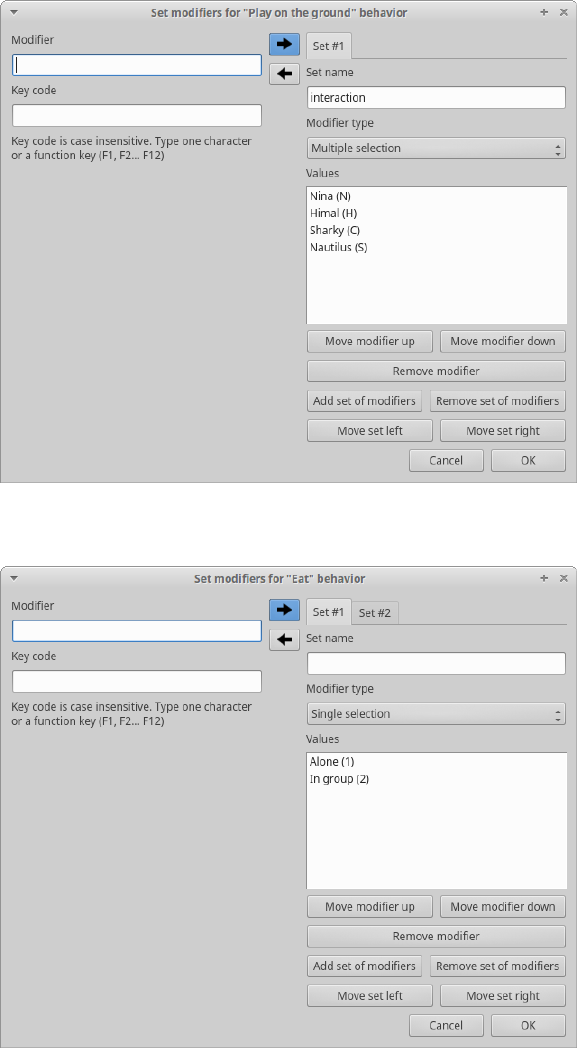
Many values can be selected together.
Example of 2 sets of modifiers:
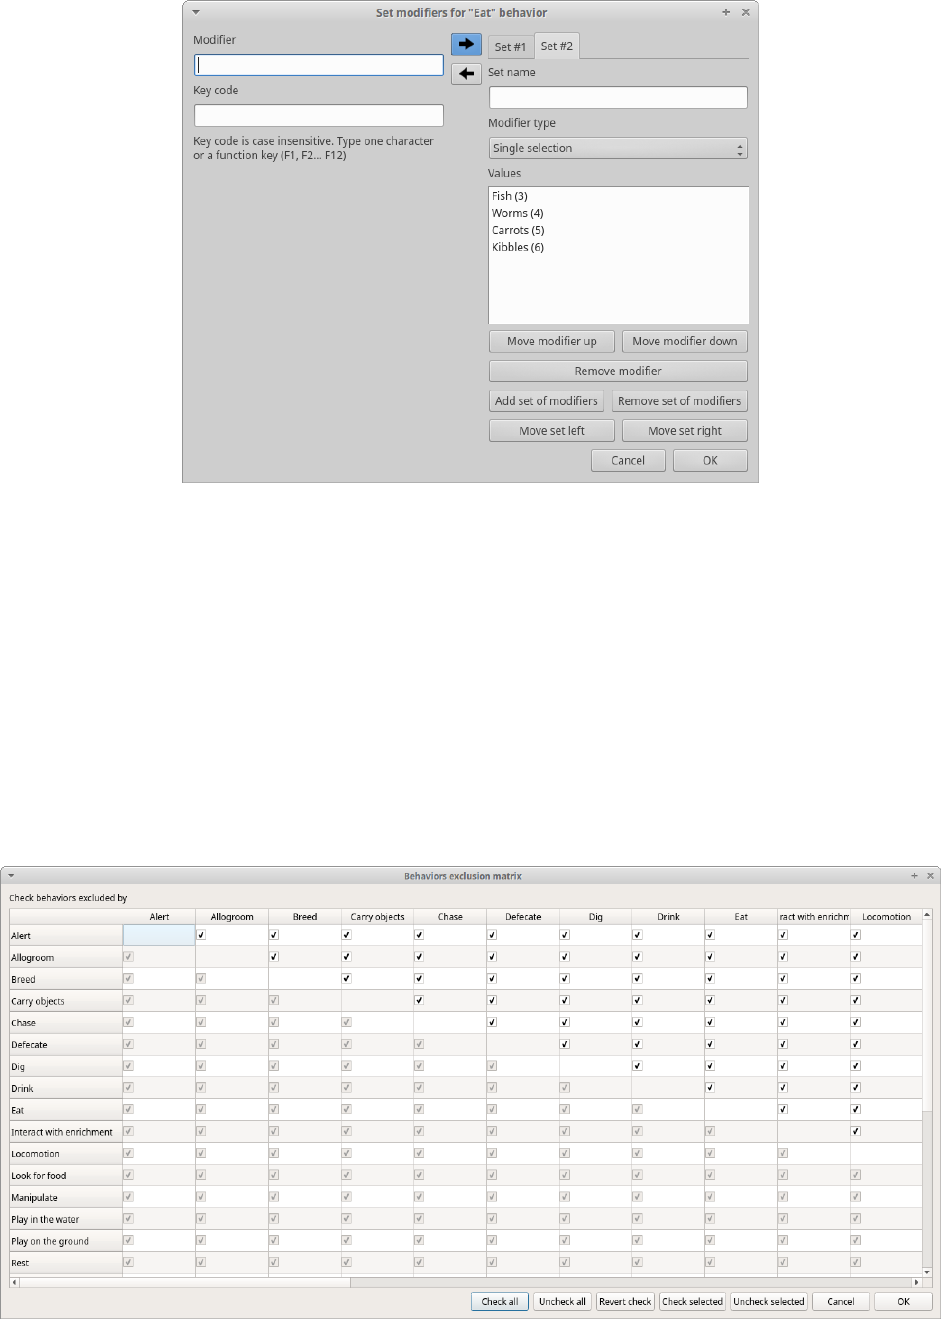
Click OK to save modifiers in the Ethogram table.
Set the exclusion matrix
The occurrence of an event (State or Point) can exclude the occurrence of a state event. This can be set
using the Behaviors exclusion matrix window, which can be opened clicking on the Exclusion matrix
button. BORIS will ask for including Point events or not and a new Exclusion matrix window will open.
Exclusive behavior may be selected by checking on the corresponding checkbox in the
automatically-generated matrix. We suggest to work on the Exclusion matrix when all the behaviors have
been added to your ethogram.
All behaviors can be excluded by a particular behavior by selecting the corresponding entire row (click on
the row header of the behavior) and by clicking on the Check selected button. You can also uncheck all
behaviors by selecting the Uncheck selected button.
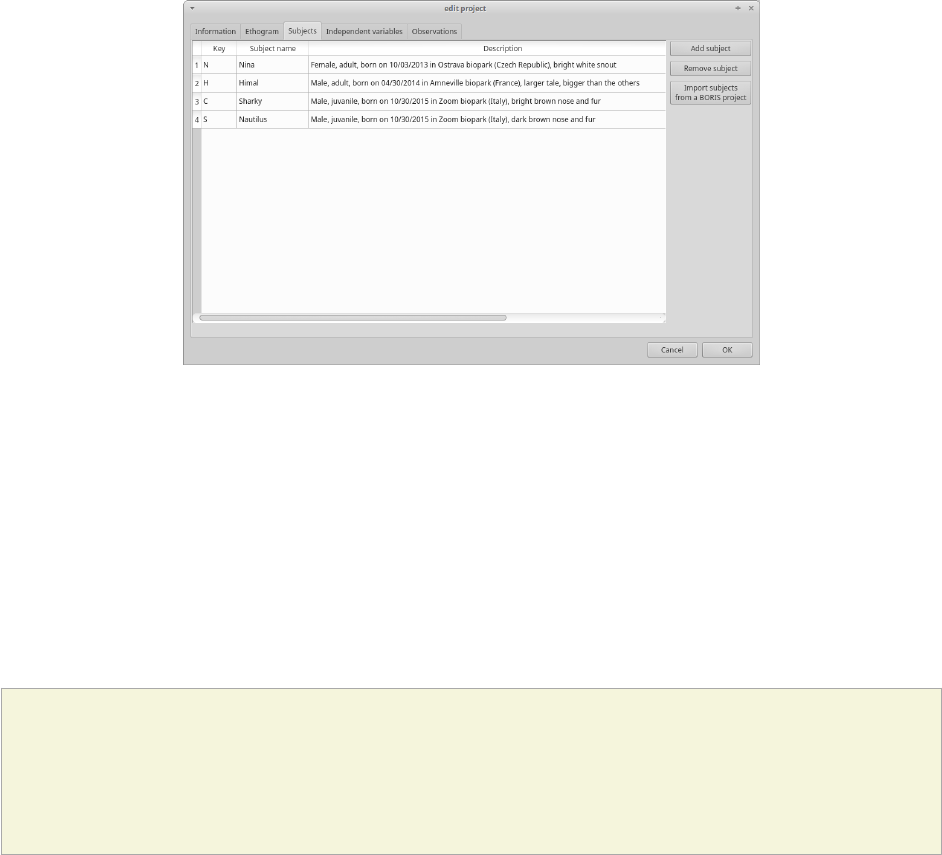
Example of an exclusion matrix:
For example in the previous figure, the Alert behavior will exclude the following behaviors: Allogroom,
Breed, Carry objects, Chase ...
During the observation, the excluding event will stop all the current excluded state events one millisecond
before the occurence of the event.
Import an ethogram from an existing project
Behaviors within an ethogram can be imported from an existing BORIS project (.boris) using the Import
behaviours from a BORIS project button. BORIS will ask to select a BORIS project file and whether
imported behaviors should replace or be appended to the Ethogram table. Imported behaviors will retain
all the previously defined behavior parameters (namely Behavior type, Key, Code, Description, Modifiers
and Exclusion information).
Import an ethogram from a JWatcher global definition file (.gdf)
Behaviors can be imported from a JWatcher global definition file (.gdf) using the Import from JWatcher
button. BORIS will ask to select a JWatcher file (.gdf) and whether imported behaviors should replace or
be appended to the Ethogram table. Behavior type and exclusion information for the behaviours imported
from JWatcher have to be redefined.
Import an ethogram from a plain text file
Behaviors can be imported from a plain text file using the Import from text file button. The fields must be
separated by TAB, comma (,) or semicolomn (;). All rows must contain the same number of fields.
The fields will be interpreted as:
• field #1: event type (point or state)
• field #2: key (case insensitive)
• field #3: code (must be unique)
• field #4: behavior category (empty if no category)
• field #5: description (optional)
All fields after the 5th will be ignored.
BORIS will ask to select a plain text file (by default: *.txt *.csv *.tsv) and whether imported behaviors
should replace or be appended to the Ethogram table. The missing information for the behaviours
imported from text file have to be redefined.
Export the ethogram
The entire ethogram can be exported in various formats (TSV, CSV, XLS, ODS, HTML). See File > Edit
project > Ethogram tab > Export ethogram
Define the subjects
BORIS allow coding behaviors for different subjects within a single observation. The Subject table allows
specifying subjects using a Key (e.g. the k on your keyboard), Subject name (e.g. "Kanzi"), Description
(e.g. male, born October 28 - 1980). In this case, pressing n will set "Nina" as the focal subject of the
behavioural coding. Pressing n again will deselect "Nina" and set to "no focal subject". The definition of
one or more subjects is not mandatory. Addition, removal and sorting of the subjects follows the same
logic of the Ethogram table (see Set your ethogram from scratch for info). The subjects can also be
imported from an existing BORIS project using the Import Subjects from a BORIS project.
From version 7 the keys are case-sensitive.
If your project was created with a previous version of BORIS (< v.7) you can use the Convert keys to
lower case to convert all keys to lower case otherwise you will have to code your observation using upper
case key.
Important
If you open a project file created with a version older than v.7 BORIS will ask you to convert the
upper case behavior and subject keys to lower case.
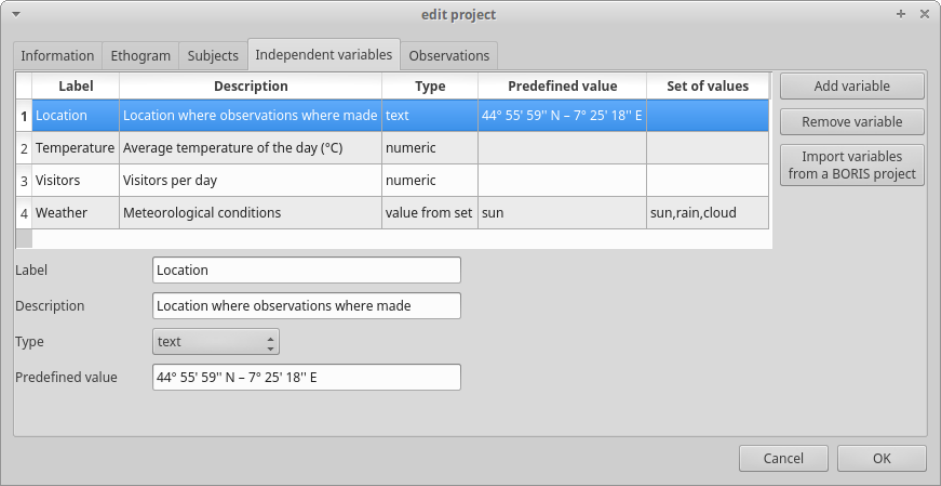
Define the Independent variables
BORIS allows adding information about the observation using Independent variables. This can be used
to specify factors that may influence the behaviors (e.g. group composition, temperature, weather
conditions) but will not change during a single observation within a project. Each independent variable can
be defined by a Label (e.g. weather), a Description (e.g. weather conditions), a Type (text, numeric,
value from set or timestamp).
The values of a set are defined in the Set of values column separating the available values with a comma
(,). Please note that the first value of the set will be selected by default. It should be useful to define a NA
value as first value of every set.
The values for the independent variables will be asked when creating a new observation. Addition,
removal and sorting of the independent variables follows the same logic of the Ethogram table (see Set
your ethogram from scratch for info). The independent variables can also be imported from an existing
BORIS project using the Import Variables from a BORIS project.
Example of independent variable defined as "set of values"
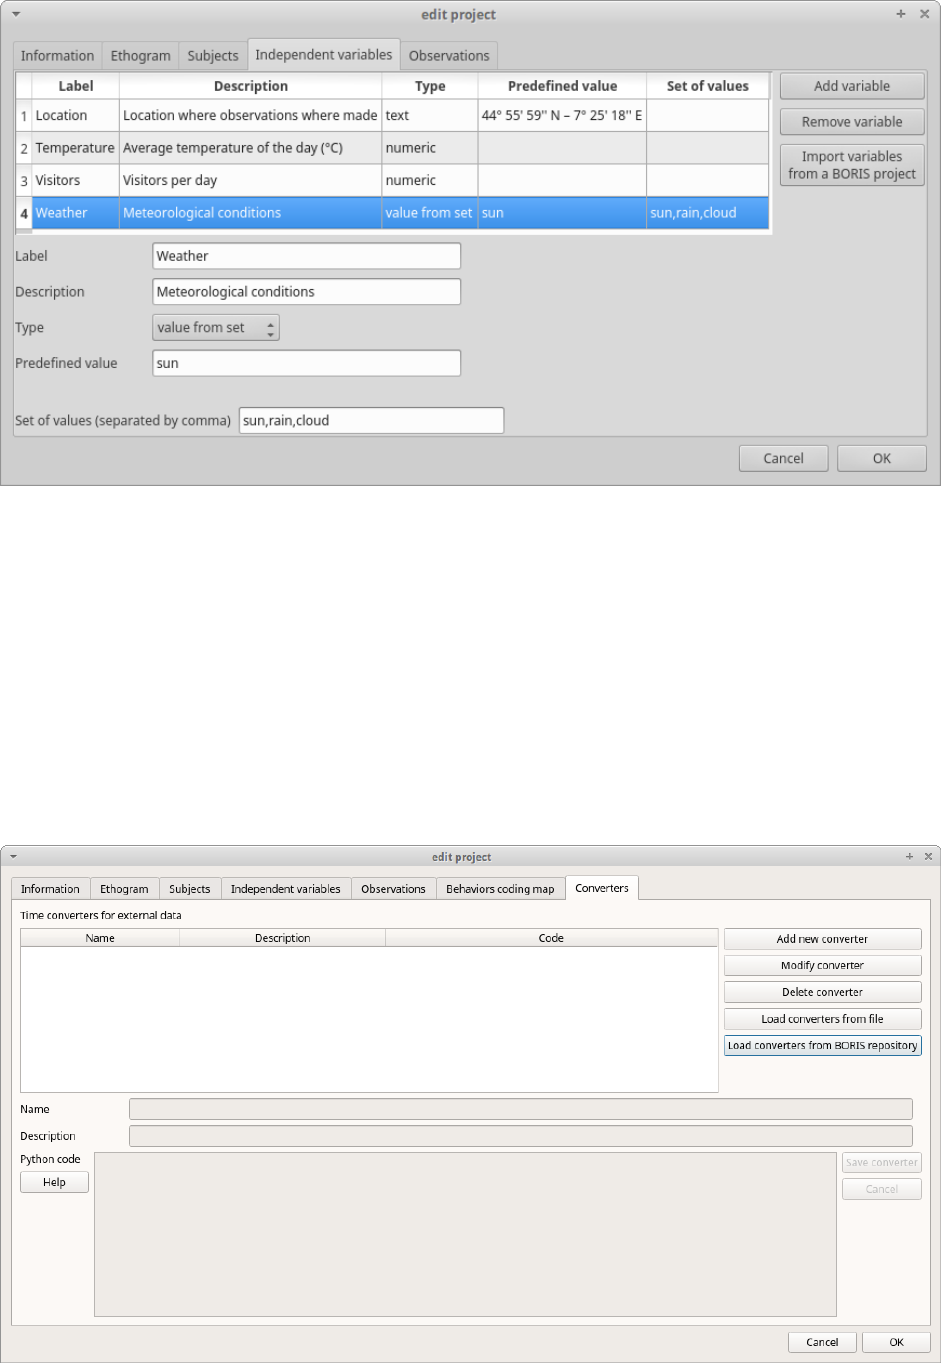
The predefined value must be contained in the set of value.
Observations' tab
The Observations table in BORIS shows information about all the previous observations within a project.
A selected "Observation" can be removed using the "Remove observation" button (you will be prompted
for confirmation). This operation cannot be undone and deleted observations cannot be recovered once
the project is saved. The Observations table shows four columns id Date Description Media.
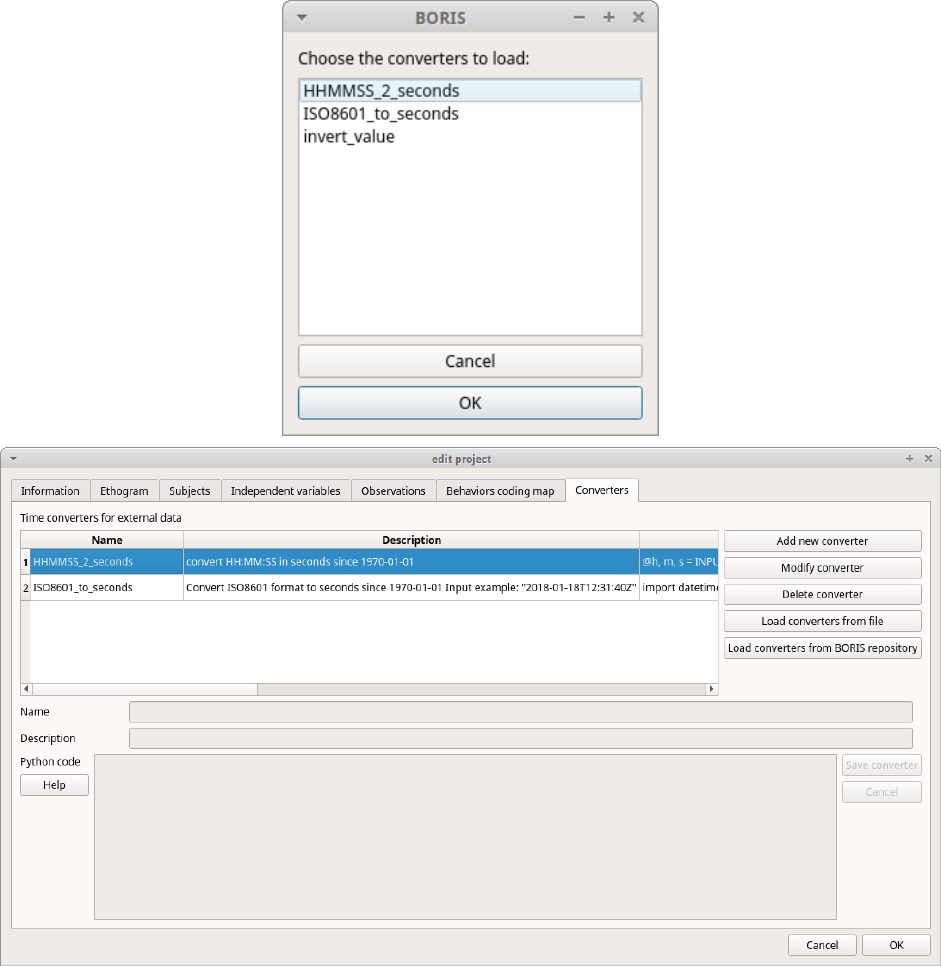
Converters' tab
Converters are used for plotting external data when the timestamp values are not expressed in seconds.
Converters can be written by the user, loaded from file or loaded from the repository of the BORIS web site
(http://www.boris.unito.it/static/converters.json).
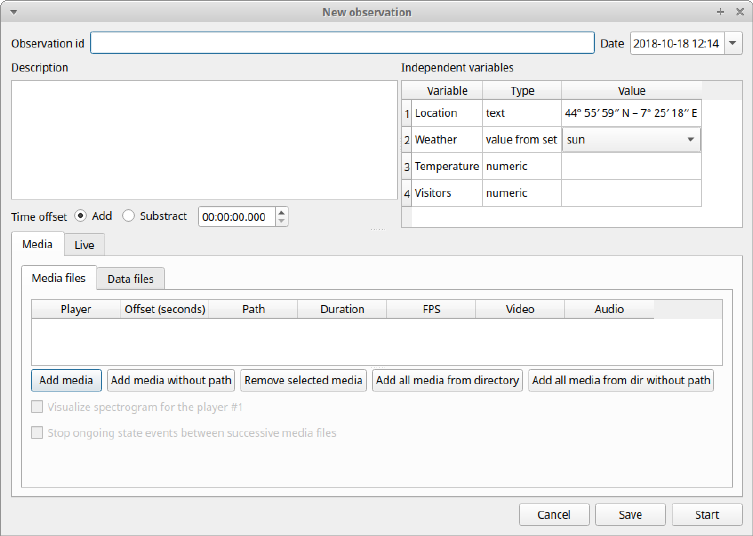
Load converters from BORIS web site
Click Load converters from BORIS repository and select the converters to be added to your project.
Writing a converter
See Converters for external data values
The converters loaded in your project can be then selected for converting timestamp (or other values) in
external data file (See converters)
Open an existing project with BORIS
IMPORTANT
Due to changes in modifiers format all the projects created with v. 4+ will not be suitable for
previous version of BORIS. The v. 4 will open projects created with previous version and convert
them. A copy of your old project will be kept.
To open an existing BORIS project, selct the menu File > Open project. A BORIS project file is a
container for all information related to a set of observations as the ethogram, the independent variables,
and the subjects. BORIS allows creating an unlimited number of projects but only one project can be
opened at a time.
Observations
Create a new observation
A video tutorial about making an observation is available at
https://www.youtube.com/watch?v=CKeBITCICXc
To create a new observation you must first Create a new project with BORIS or Open an existing project
with BORIS.
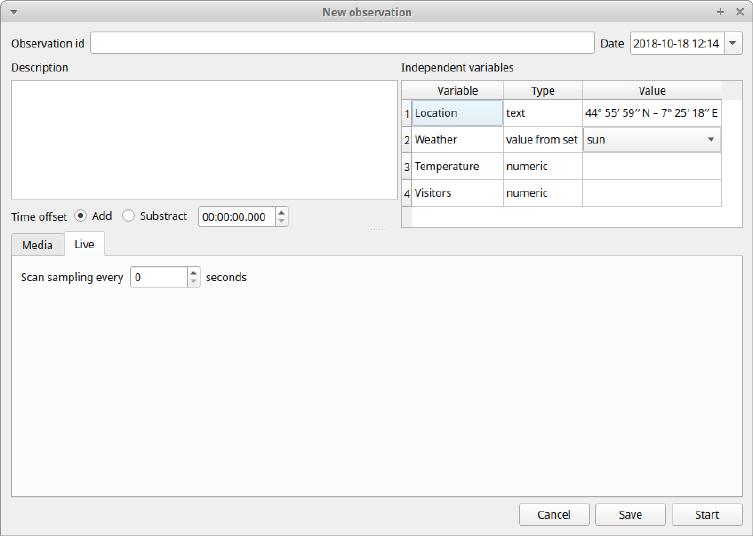
Clicking on Observations > New observation will show the New observation window.
This window allow adding various observation data:
• a mandatory Observation id (must be unique across all observations in the open project);
•Date, which will be automatically set on the current date and time, but you can alternatively set this
info on your media date and time, or whatever you prefer.
•Description, which can host all the relevant information about your observation, but can be also left
empty.
•Independent variables (e.g. to specify factors that may influence the behaviors but will not change
during the observation within a project). See the independent variables section for details.
•Time offset. BORIS allow specifying a time offset that can be added or subtracted from the media
timecode.
You must then indicate if you want to make an observation based on pre-recorded media (audio / video)
or a live observation.
Live observation
During the live observation BORIS will show you a timer that will be used for recording time for coded
events.
Choose the Live tab to make a live observation.
In the above tab you can select a time for Scan sampling observation. In this case the timer will stop at
every time offset you indicated and all the coded events will have the same time value.
Start the observation
Click the Start button to begin the live observation or Save to save it in the observations list.
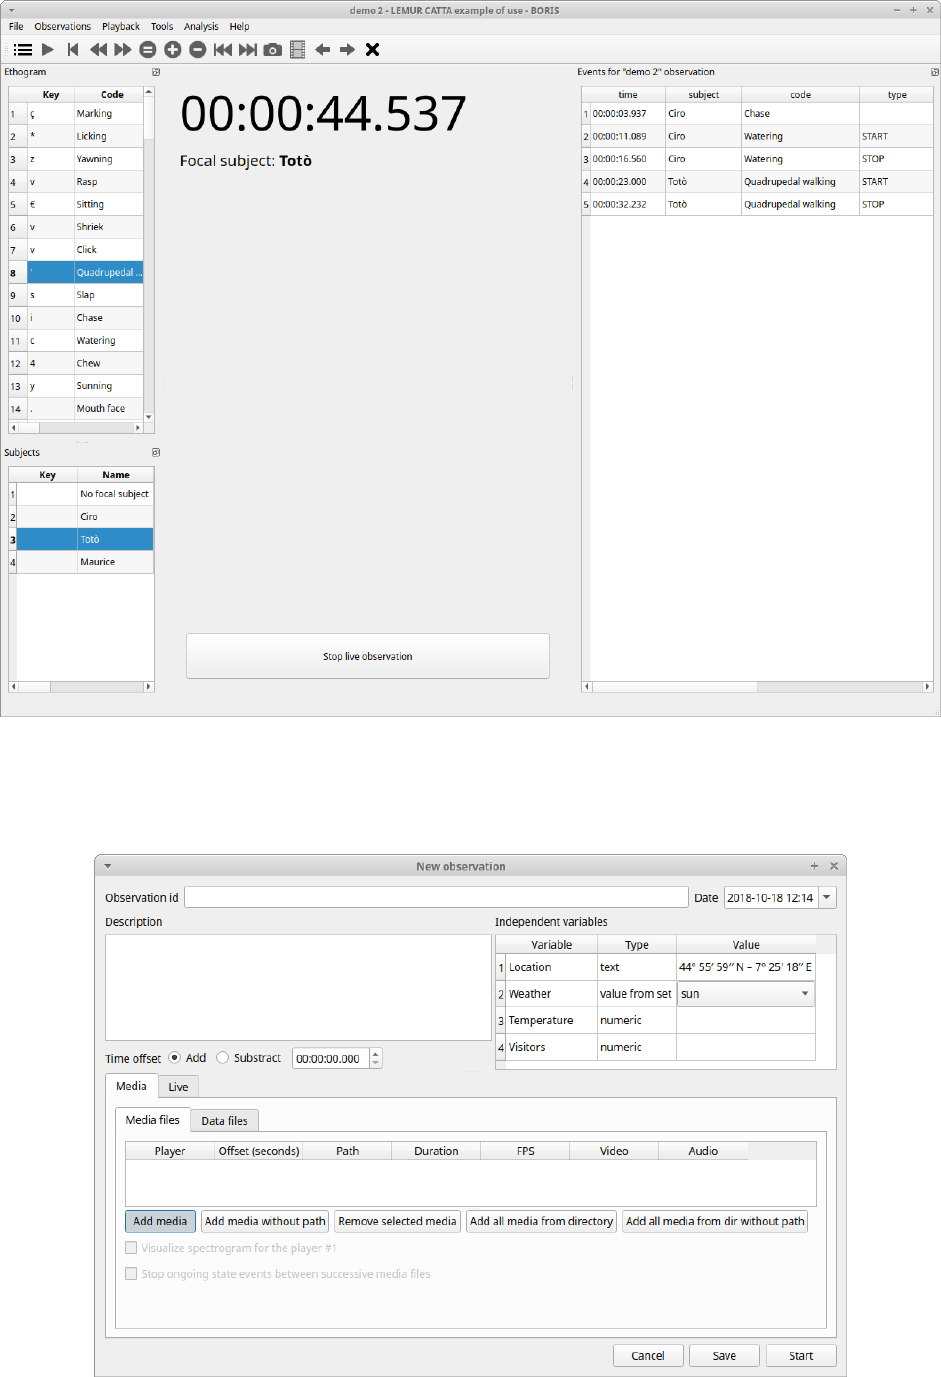
The main window during a live observation will look like this:
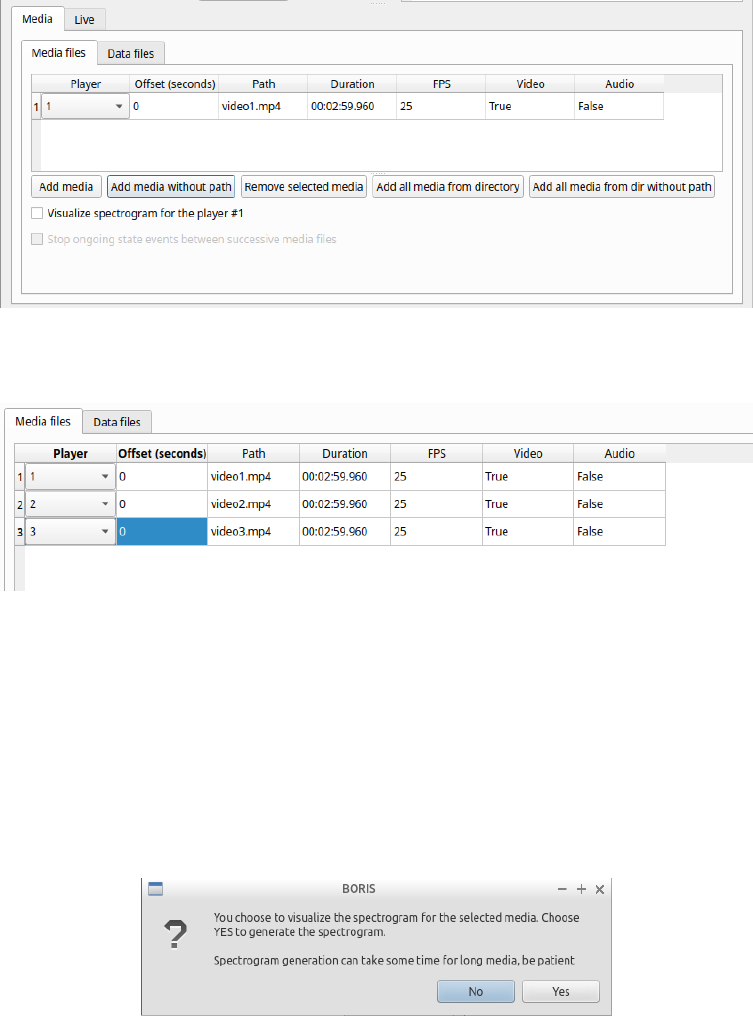
The Media tab contains 2 tabs: Media files and Data files.
Click the Media files tab and add one or more media files using the Add media or Add media without
path button. The Add media without path button allow you to not store the path of your media file(s) in
the BORIS project file. In this case the media file(s) must be in the same directory than the BORIS project
file to be found. This option is useful if you are working with various computers on the same project file(s).
If you want to remove the media file paths of an entire project see Removing path of media files.
The Add all media from directory and Add all media from dir without path allow to add all media files
found in a directory to the playlist.
Information about the selected media file will be extracted and displayed in the media list: media file path,
media duration, number of frames by second (FPS), the presence of a video stream, the presence of an
audio stream .
The dropdown list in the first column allow you to choose a player (for a maximum of 8). If you want to
observer more media files simultaneously you must use consecutive players (starting from 1). See
example below:
The Remove media button can be used to remove all the selected media files.
All the media types reported at http://www.videolan.org/vlc/features.html can be played in BORIS. The
media queued in the Media file paths will be played sequentially. This means that an event occurring at
time tx in the media file queued as second (e.g. second_video.mp4) in the playlist will be scored as
happening at time t1 + tx (where t1 is the duration of the first media file, e.g. first_video.mp4).
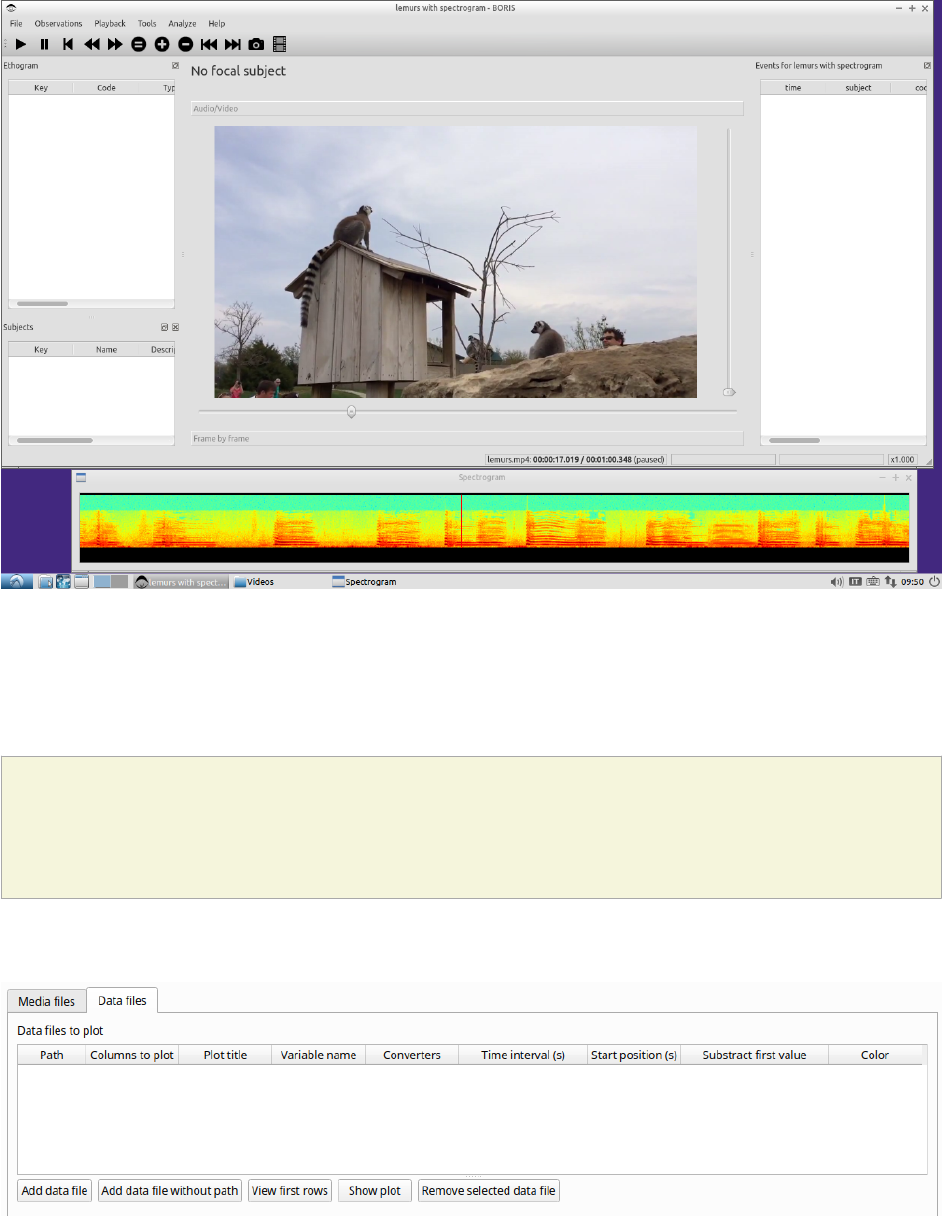
Spectrogram visualization
BORIS allow you to visualize the sound spectrogram during the media observation. Activate the Visualize
spectrogram check box. BORIS will ask you to generate the spectrograms for all media files loaded in the
first player.
The spectrogram visualization will be synchonized to the media position during the observation.
Close current behavior between videos
This option is disabled for now.
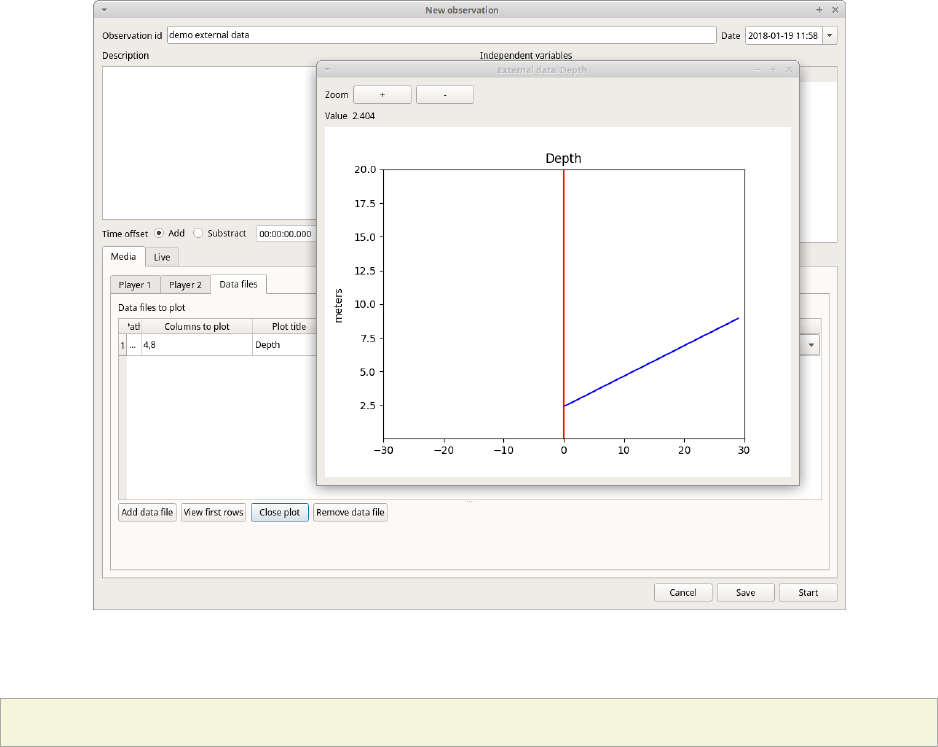
External data files
Warning
At this time only 2 external data can be plotted with your media file
You can select one or more external data files to be plotted synchronously with your media. Click the Data
files tab and use the Add data file button to select a data file.
The data files must be plain text files with at least 2 columns separated by comma or TAB. One column
must contain a timestamp that will be used to synchronize the plot with the media. The sampling rate can
be variable.
Example of a plain text data file with 5 columns separated by comma (,):
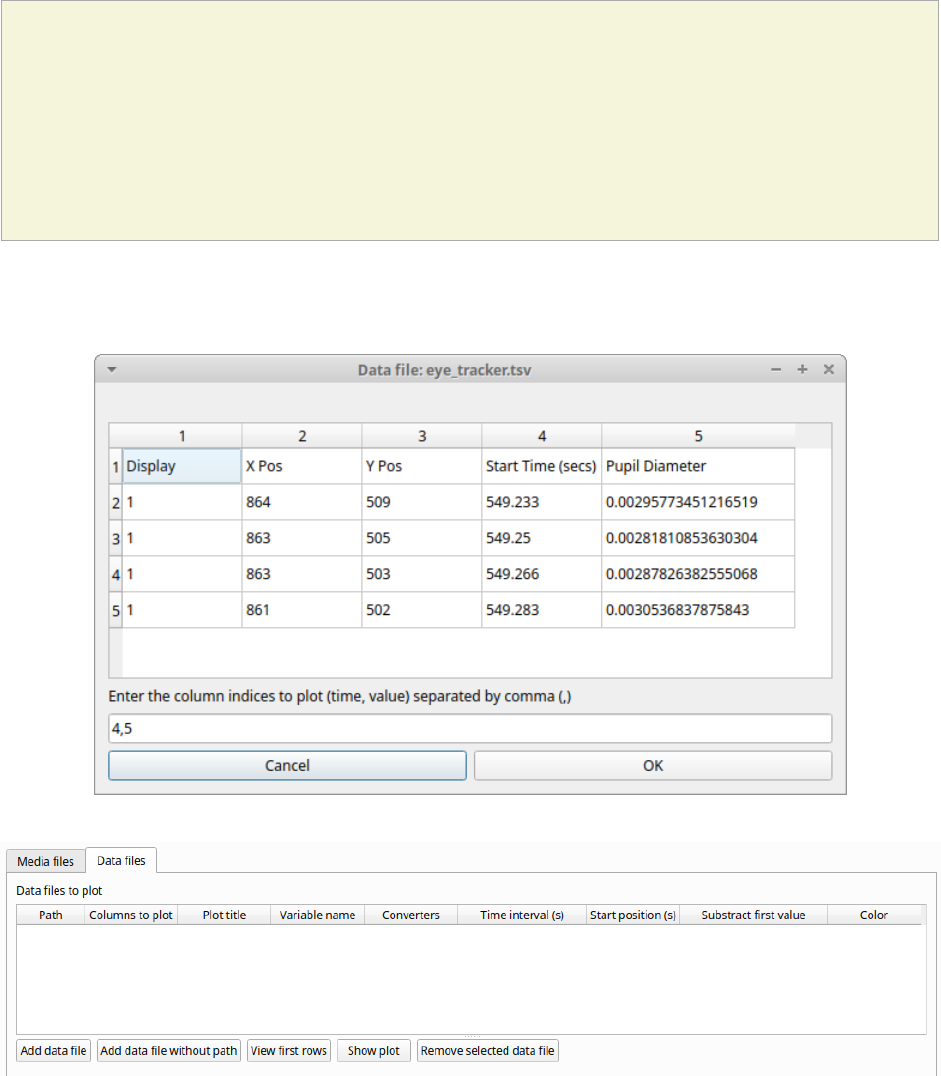
Display,X Pos,Y Pos,Start Time (secs),Pupil Diameter
1,864,509,549.233,0.00295773451216519
1,863,505,549.25,0.00281810853630304
1,863,503,549.266,0.00287826382555068
1,861,502,549.283,0.0030536837875843
1,858,501,549.3,0.00308083021081984
1,856,499,549.316,0.00306266942061484
1,854,499,549.333,0.00305776367895305
[...]
In the above example the 4th column contains the timestamp and the 5th the value to be plotted.
Input the index of the column containing the timestamp and the index of the column containing the value to
be plotted. The two indices must be separated by a comma (,). Click OK to close the window.
A new row will be added in the data files table.
You can modify/complete the following parameters by directly typing in the table cells:
• Columns to plot
• Plot title: the title of the plot
• Variable name
• Converters: Used if the timestamp is not expressed in seconds (see below for details)
• Time interval: The time interval that will be plotted (in seconds)
• Start position: the start position of data for synchronisation with the media (in seconds)
•Substract first value: if the timestamp does not start with a 0 value you can choose to substract the
first value to all timestamp values.
• Color: the color of the color
You can check if the data from file can be correctly plotted by using the Show plot button. If the data are
compatible you will see a plot otherwise you will obtain a message with an explanation.
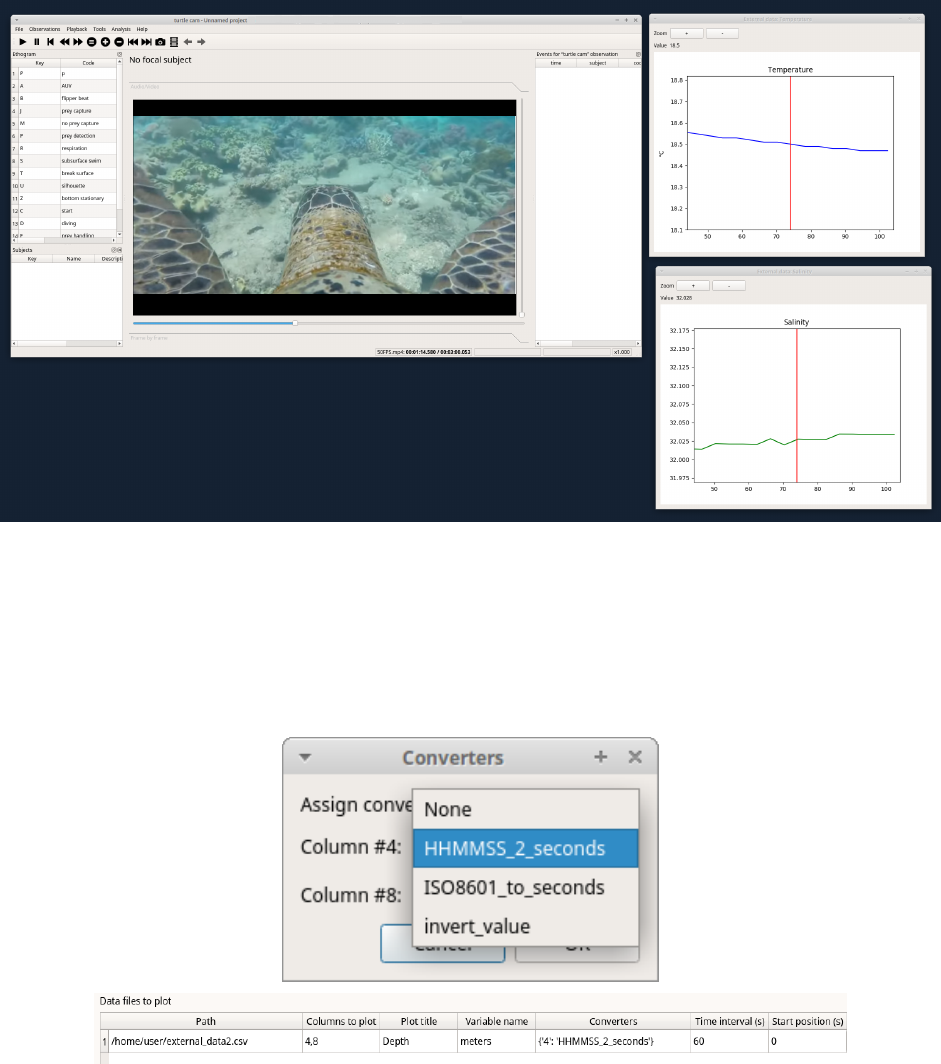
For now only 2 values can be plotted synchronously with your media file. The values can come from the
same file or from two different files.
During the observation tha values you have selected in external data files will be plotted synchronously
with your media file.
Converters
If the values in the timestamp column are not expessed in seconds (like 12.45) but in another format
(HH:MM:SS, MM:SS, ISO8601 2018-01-18T12:31:40Z ...) you must use a converter that will convert the
current format in seconds.
See the Converters' tab in the project configuration: converters tab
A double-click on the converters cell will allow you to select a converter for each column to be plotted
Use the Show plot button to verify if your external data can be plotted without problem. The Close plot
button will close the plot window.
Converters can also be used to convert values that are not time value.
Example of a converter for inverting value:
OUTPUT = - float(INPUT)
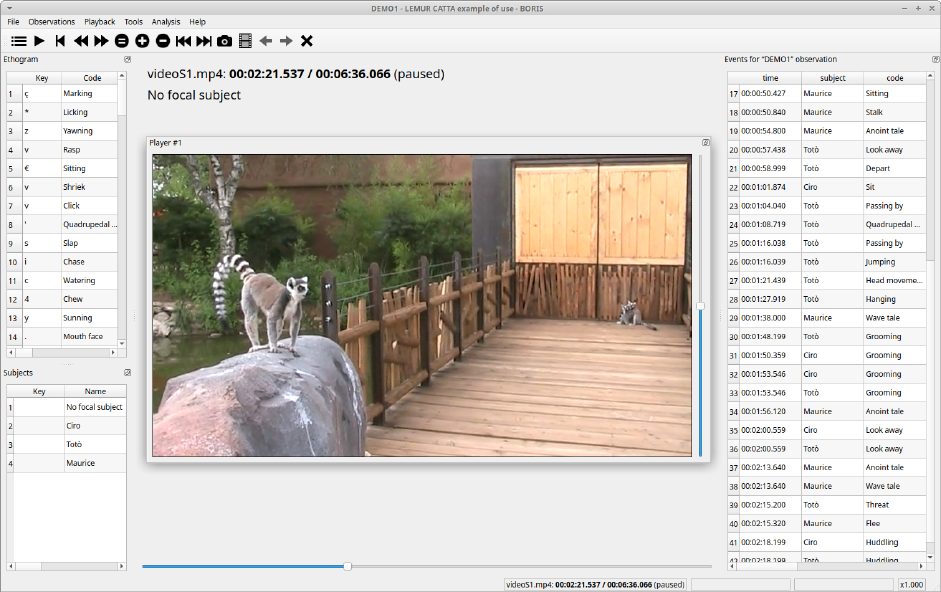
Start the observation
Click the Start button to start coding. The Observation window will be closed and you'll be transferred to
the main BORIS window. If you do not want to start the observation click the Save button. The observation
will be saved in the observations list.
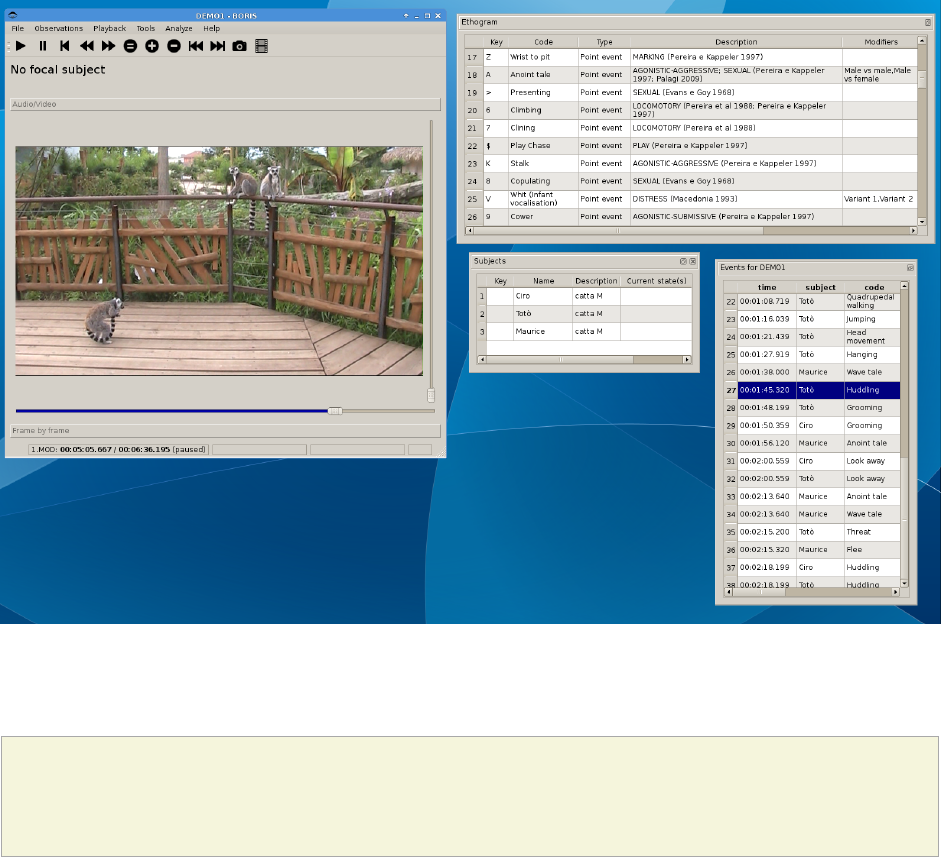
The main window during the observation of a single media file will look like this:
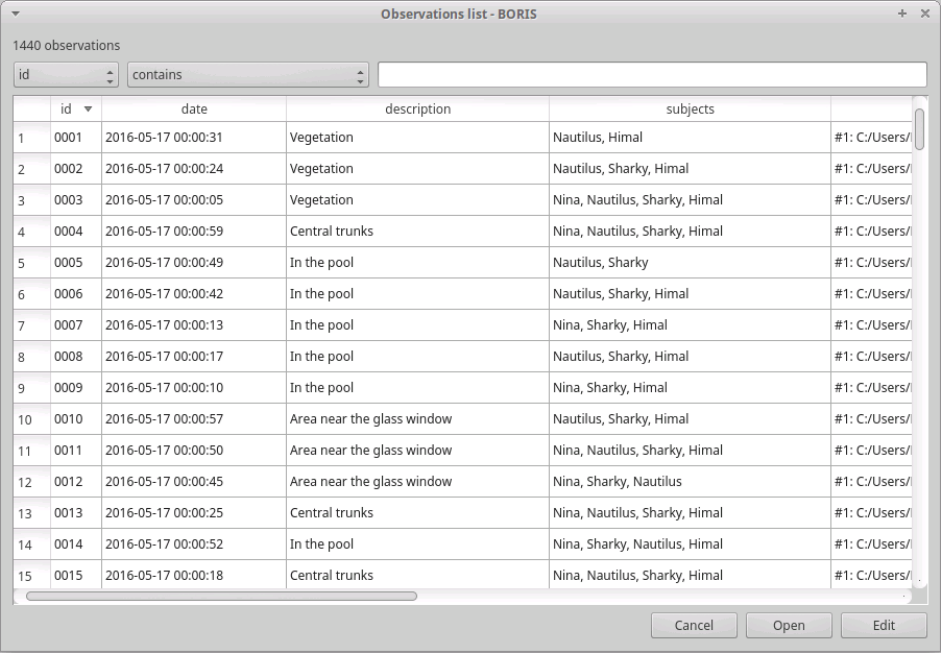
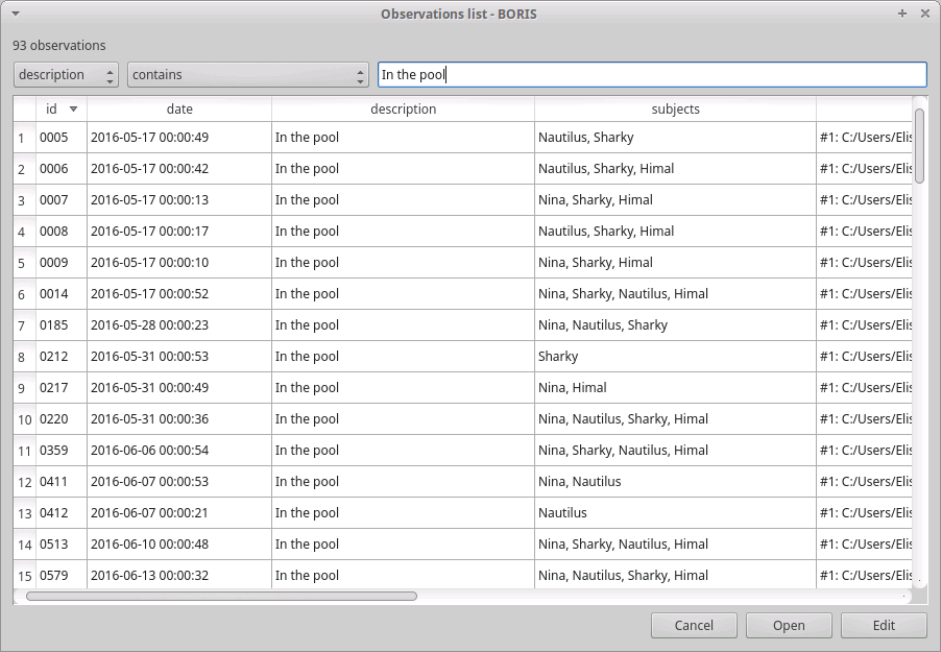
The observations list can be filtered selecting a field and a condition in the drop-list boxes.
In the following example observations are filtered: only observations with description containing the In
the pool subject are shown:
Observations can be filtered with Independent variables values.
The following example displays only the observations that do not contain "Sunny" in the Weather
independent variable :
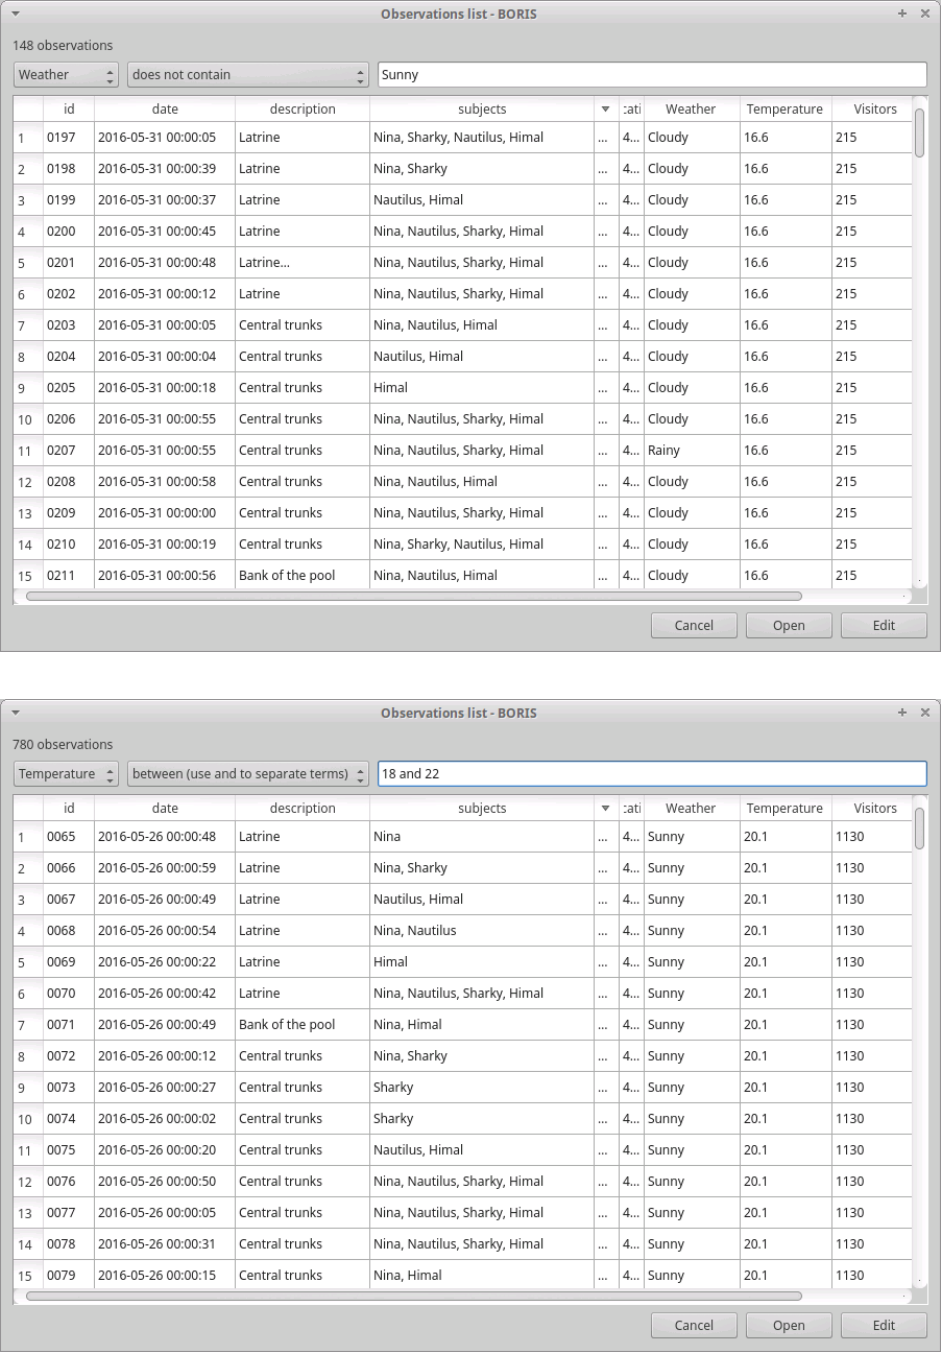
Observations with a value of Temperature independent variable between 18 and 22:
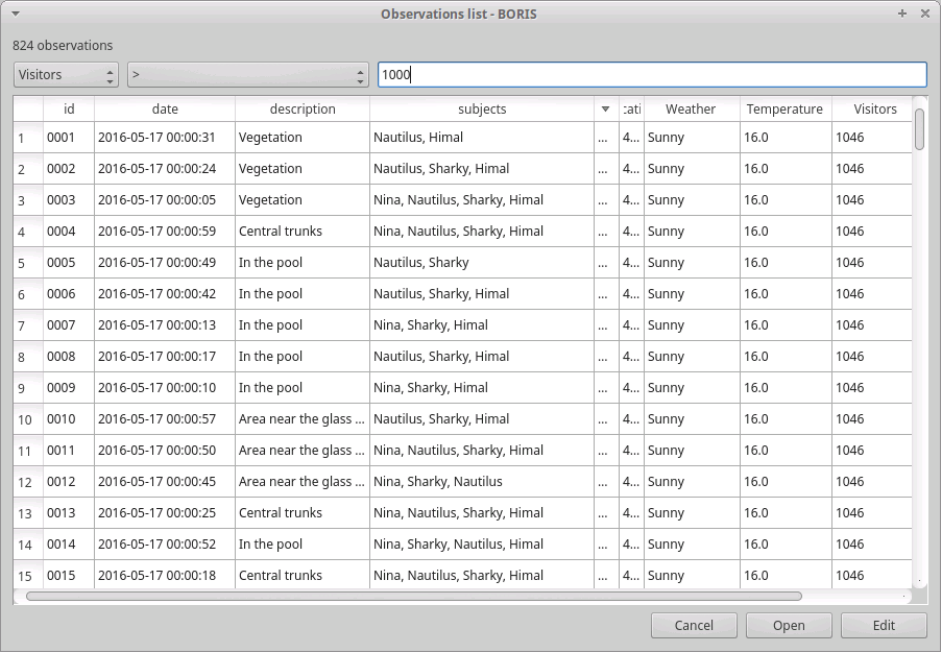
Observations with a value of Visitors independent variable greater than 1000:
Delete observations
The observations can be deleted from the project using the following procedure: File > Edit project >
Observation's tab
Select all observations to remove
Click the Remove selected observations button and confirm the deletion.
Please note that the deletion is irreversible.
Import observations from a project file
The Observations > Import observations option allows to import observations from a BORIS project file
into the current project. Choose the project file and then the observations to import. BORIS will check if
observations with same id are already existing in the current project. BORIS will also check if behaviors
and/or subjects used in the imported observations are not defined in the current project.
Coding your media
When looking at the BORIS main window, the window title bar shows the Observation id - Project name
- BORIS. The media (the first in the queue) will be loaded in the media player and paused.

Media based coding
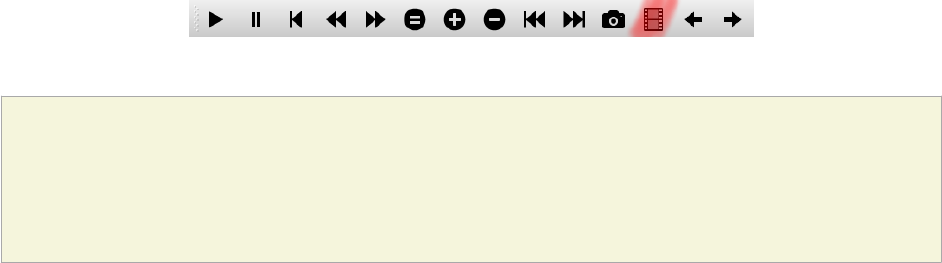
Media controls are available in the toolbar
Key to the symbols:
•List of observations
•Play (become Pause when media is played)
•Rewind reset your media at the beginning
•Fast backward jumps for n seconds backward in your media (See general preferences to set n)
•Fast forward jumps for n seconds forward in your media (See general preferences to set n)
•Set the playback at speed 1x
•Increase playback speed (See general preferences to set the step value)
•Decrease playback speed (See general preferences to set the step value)
•Jump to the previous media file
•Jump to the next media file
•Take a snapshot of current video or frame
•Switch between VLC and frame-by-frame modes
•Move on frame back (enabled in frame-by-frame mode)
•Move one frame forward (enabled in frame-by-frame mode)
•Close current observation
The media can be controlled by special keyboard keys:
•Page Up key: switch to the next media
•Page Down key: switch to the previous media
•Up arrow key: jump forward in the current media
•Down arrow key: jump backward in the current media
•ESC: switch between VLC and frame-by-frame mode
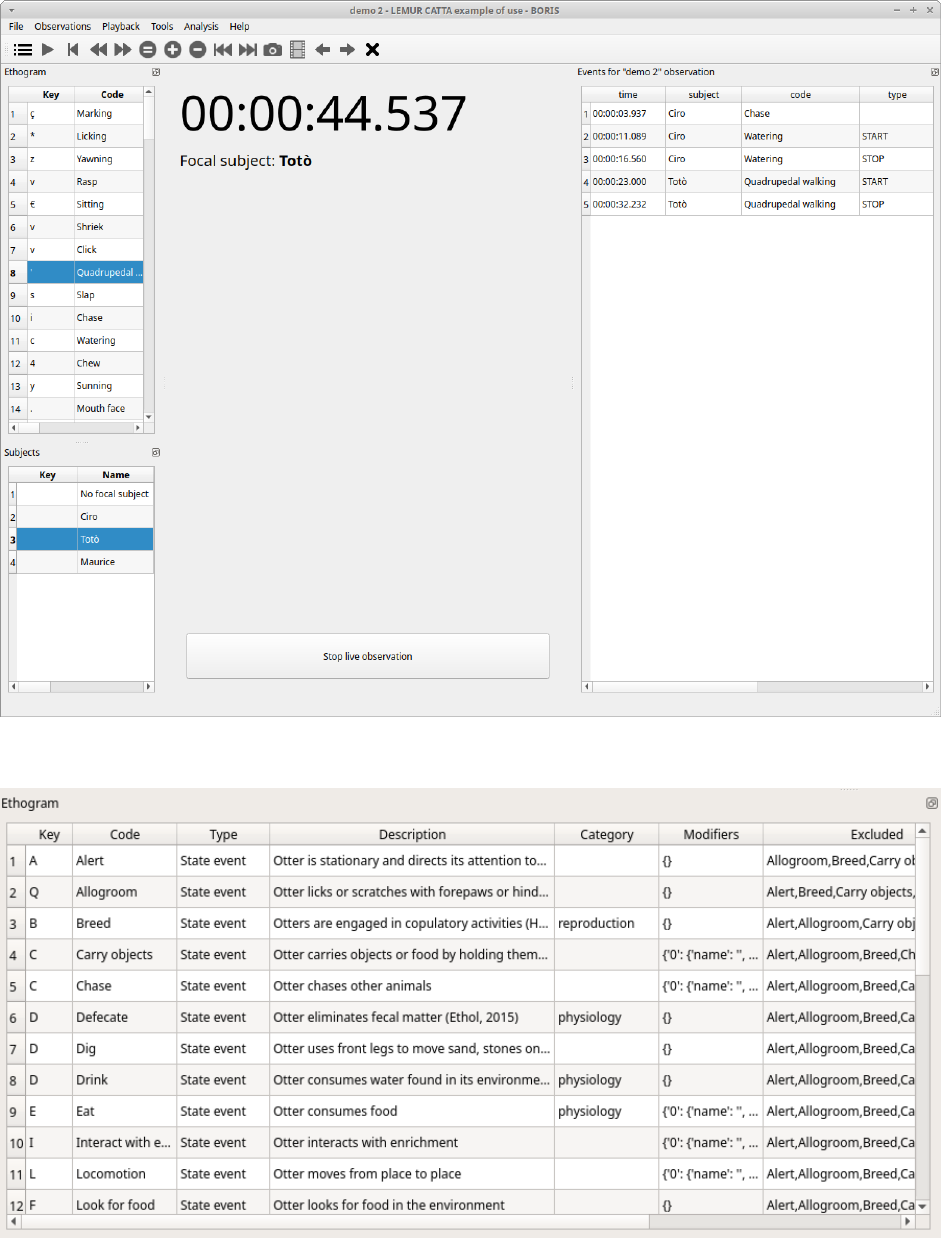
Live observations
During a live observation the media control toolbar is disabled.
Press the Start live observation button to start your observation. If some events are already coded
BORIS will ask you for deleting them.
A timer will be displayed. The events will be recorded in the events widget.
See the following screenshot.
Ethogram widget in the main window
The Ethogram widget provide the user with the list of behaviors defined in the Ethogram. It can be used
to record an event by double clicking on the corresponding row. The Key column indicates the keyboard
key assigned to each behavior (if any). Pressing a key will record the corresponding behavior (that will
appear in the Events widget).
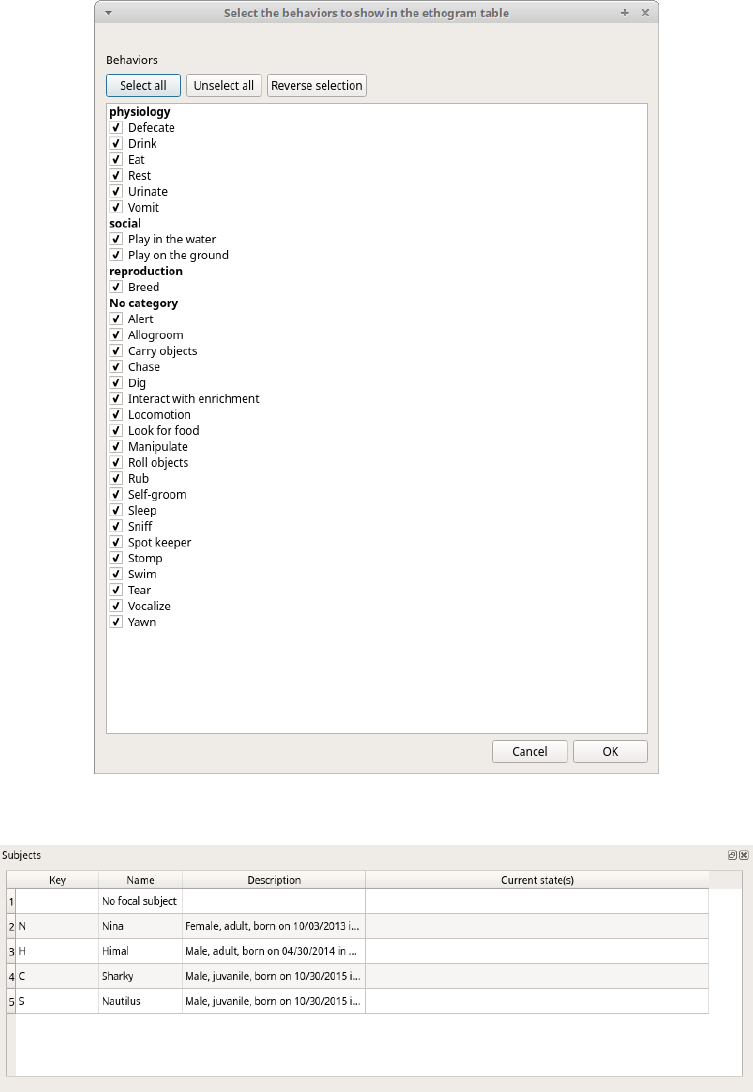
The behaviors shown in the ethogram widget can be filtered:
Right-click on ethogram widget > Filter behaviors
Check/Uncheck single behaviors or double-click on the behavioral category
Subjects widget in the main window
The Subjects widget provide the user with the list of subjects defined in the Subject tab in the Project
window. It can be used to add information about the focal subject on the recorded behaviors by double
clicking on the corresponding row. When a subject is selected his/her name appears above the media
player. The Key column indicates the keyboard key assigned to each subject (if any).
The subjects shown in the subjects widget can be filtered:
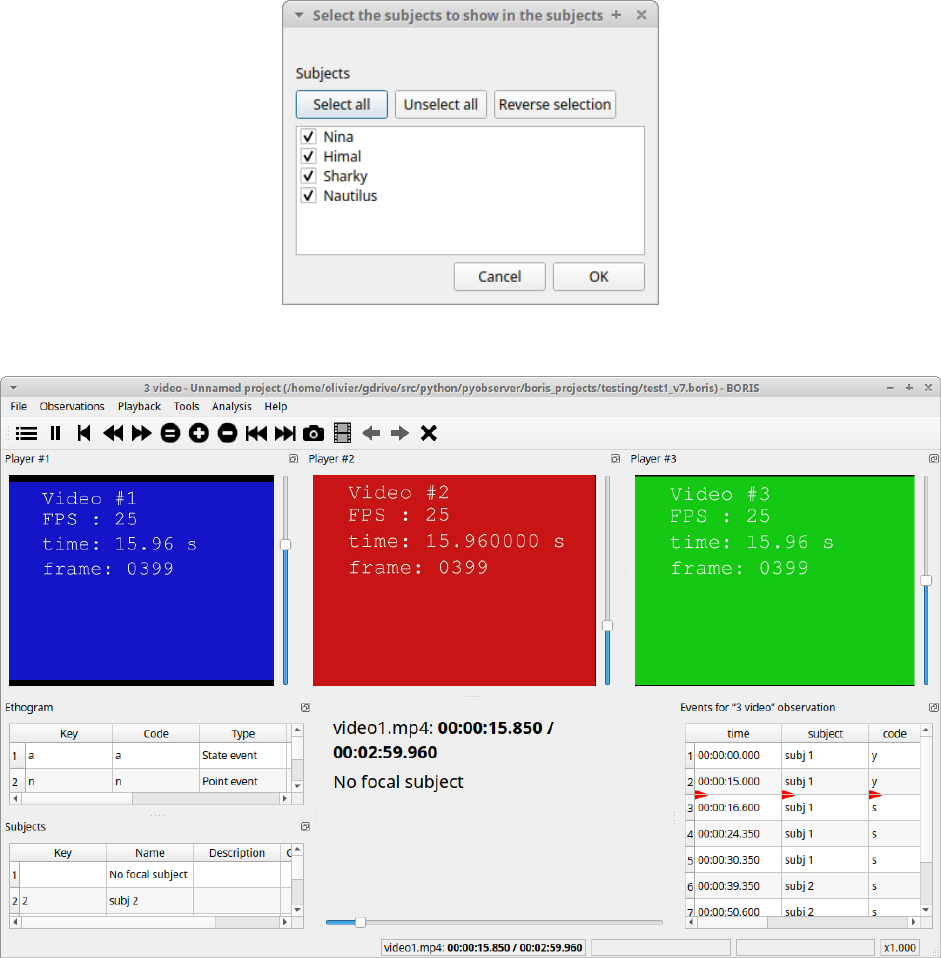
Right-click on subjects widget > Filter subjects
Check/Uncheck single subject
The media player widgets
The media position can be set using the horizontal slide bar. Each media player has its own audio volume
control (the vertical slide bar on the right side of the player).
The organization of the various widget can be customized:
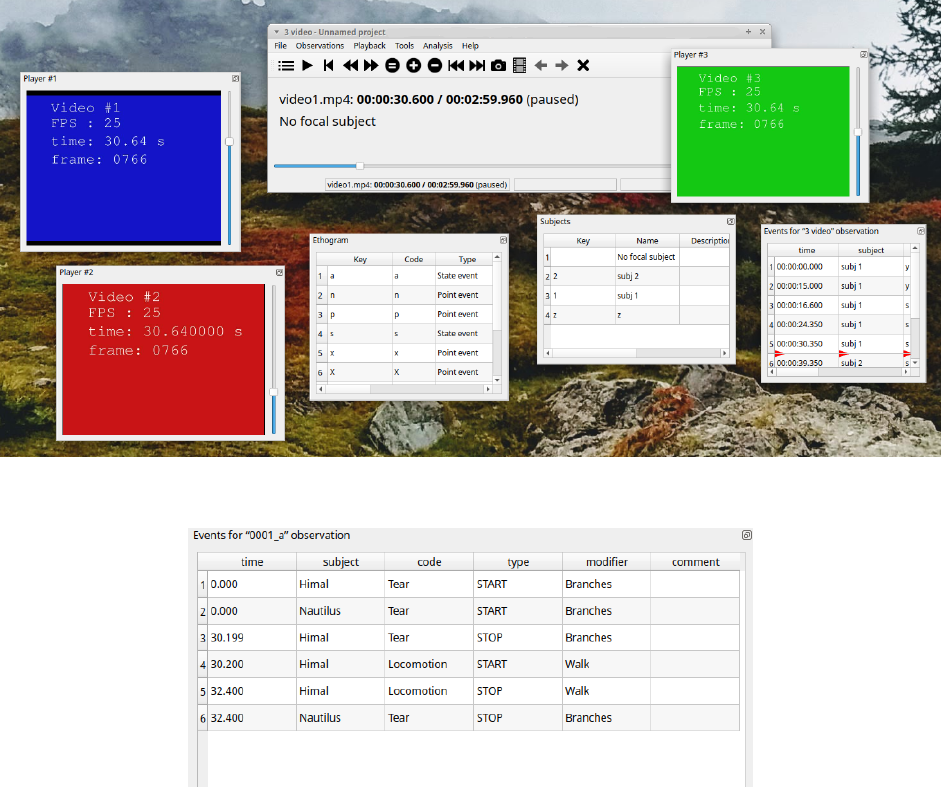
The Events widget
The Events widget shows all the recorded behaviors (events) with the following parameters (organized in
columns):
•time, the time at which the event occurred;
•subject, the focal subject (if any);
•code, the behavior code;
•type, in case of a state event indicates whether the time corresponds to the start or to the stop.
•modifier, indicates the modifier(s) that was(ere) selected (if any);
•comment, is an open field where the user can add notes.
A tracking cursor (red triangle) will show the current event. This cursor can be positioned above the current
event, see tracking cursor position option in Preferences window.
A double-click on a row will reposition the media player to the moment of the corresponding event. See
Time offset for media reposition in Preferences window to customize the time offset for media
repositioning.
Record an event
Once ready to begin your coding, you can start the media player using the Play button (or the Space bar).
The behaviors can be recorded using the keyboard with the predefined keys, by double-clicking the
corresponding row in the Ethogram table or by using the Coding pad (See coding pad).
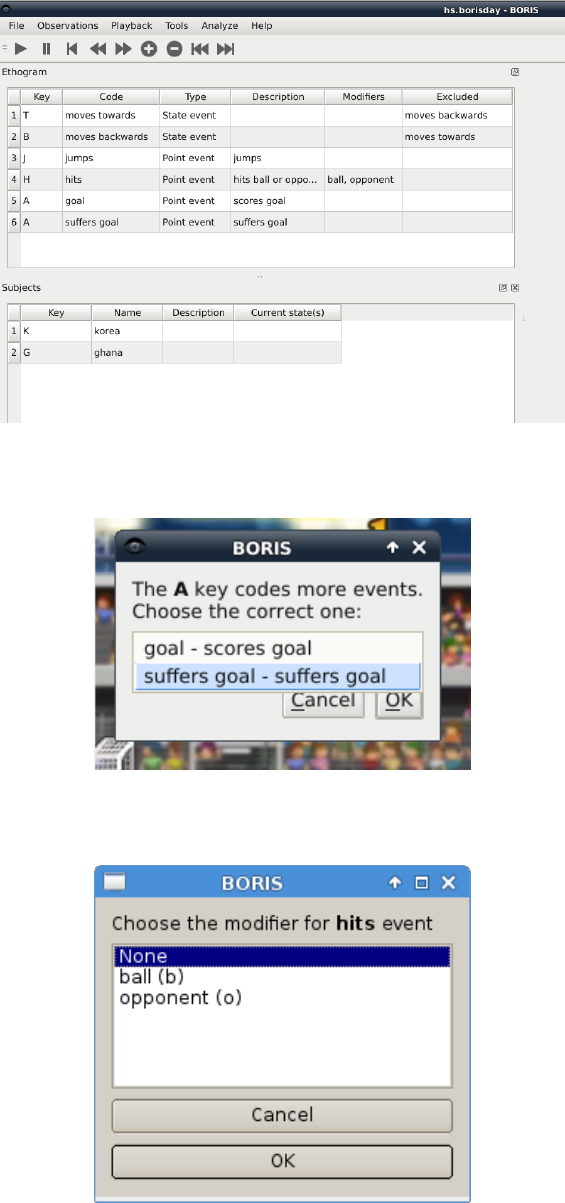
If the pressed key defines a single event, the corresponding event will be recorded in the Events table. In
the case you have specified the same key for two (or more) events (e.g. key A in the figure below), BORIS
will prompt you for the desired behavior.
In the case you have specified modifiers (one or more sets), BORIS will prompt you for the desired
modifier(s) if any (e.g. ball or opponent in the figure below). You can select the correct one using the
mouse or the keyboard ( b key or o key)
In the case your behavior type is a Point event with coding map or a State event with coding map, BORIS
will show the Coding map window and will allow selecting the desired area(s). In case you click a part of
the map in which two (or more) areas overlap, the corresponding codes will be recorded.
A recorded event can be edited (once selected) using the Observations > Edit event menu option. The
resulting Edit event parameters allows modifying every parameter (e.g. time, subject, code, modifiers, and
comment).
The Observations > Add event menu option allows adding a new event by specifying its time and the
other parameters.
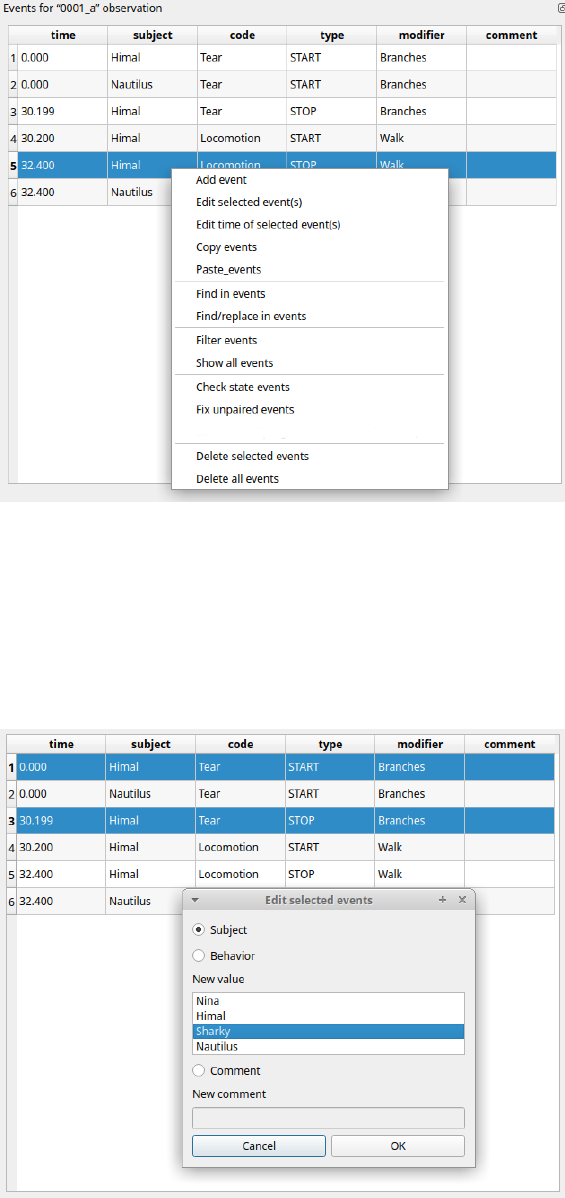
The Events widget context menu
Some functions are available in the Events widget context menu. Righ-click on the Events widget.
Add event
This option allows adding a new event by specifying its time and the other parameters.
Edit selected event(s)
This option allows to edit the selected event(s). When many events are selected you have to choose the
field to edit between Subject, Behavior and Comment. In this case the new value will apply to all
selected events.
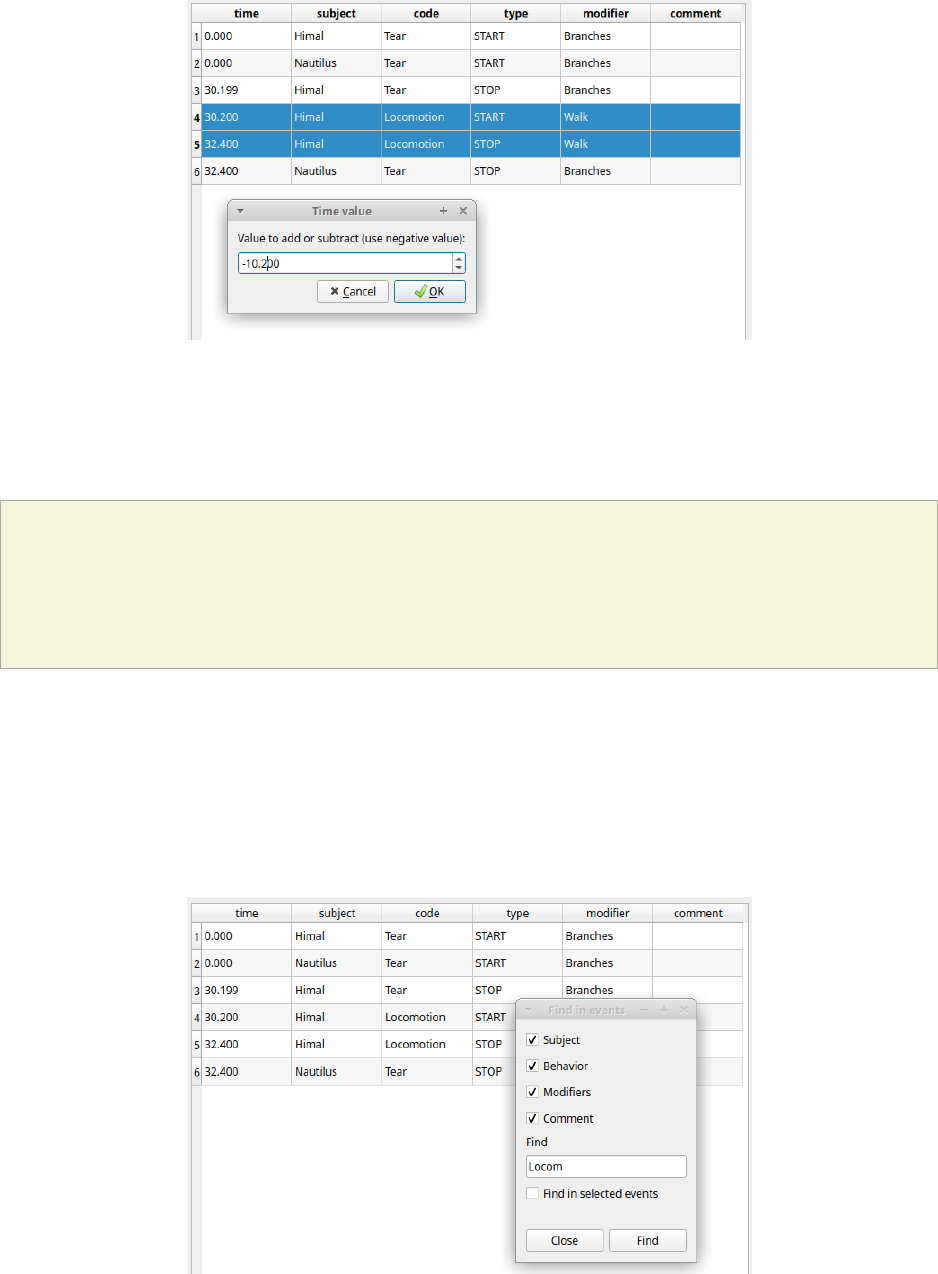
Edit time of selected event(s)
This option allows to add or subtract a time value (in seconds) to all selected events. For subtracting a
value use a negative value.
Copy events
This option allows to copy the selected events in the clipboard. The clipboard will contain the values of the
selected events (except the type field) separated by a <TAB> character.
Example of clipboard content:
0.0 Himal Tear Branches
0.0 Nautilus Tear Branches
30.199 Himal Tear Branches
30.2 Himal Locomotion Walk
32.4 Himal Locomotion Walk
32.4 Nautilus Tear Branches
Paste events
This option allows to paste the clipboard content into the events widget. The clipboard must respect the
format described in the previous section: 5 columns separated by <TAB> character.
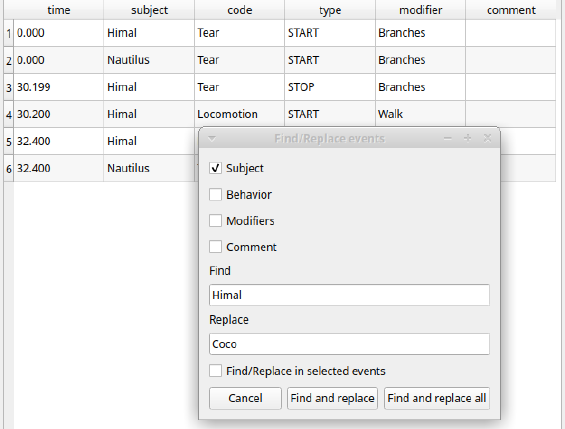
Find in events
This option allows to search for a string in the various field of events. Select the fields to be searched. The
find/replace operation can be restricted to the selected events.
Find/Replace in events
This option allows to search for a string and replace it by a new value in the various field of events. Select
the fields to be searched. The find operation can be restricted to the selected events.
Filter events
This option allows to filter the events by field value.
Show all events
This option reverts the previous one and allows to visualize all coded events
Check state events
This option allows to check if the state events are PAIRED, if they have a START and a STOP
occurences.
Delete selected events
This option allows to delete the selected events. This operation is irreversible!
Delete all events
This option allows to delete all then events in the current observation. This operation is irreversible!
Fix unpaired state events
You can use the "Fix unpaired events" function to fix the state events without a STOP event.
Observations > Fix unpaired events (keyboard shortcut: CTRL+U)
The program will ask for a time at which insert the STOP events for all unpaired state events
This function can be run on a set of selected observations (when no observation is open). In this case the
STOP events will be inserted at the end of observation.
Frame-by-frame mode
You can switch between the media player and the frame-by-frame mode using the dedicated button in the
toolbar:
In frame-by-frame mode the video will stop playing and the user will visualize the video frame by frame.
Warning
Please note that MTS video files should be re-encoded to be used in frame-by-frame mode.
Otherwise the extracted frames are not reliable.
You can move between frames by using the arrow keys in the toolbar (on the right) or by using keyboard
special keys:
For the both modes (media player and frame-by-frame mode)
•Page Up key: switch to the next media
•Page Down key: switch to the previous media
•Up arrow key: jump forward in the current media
•Down arrow key: jump backward in the current media
•ESC: switch between VLC and frame-by-frame mode
Only for the frame-by-frame mode
•Left arrow key: go to the previous frame
•Right arrow key: go to the next frame
If you have a numeric keypad you can use the following keys in alternative:
• The key / will allow you to view the previous frame
• The key * will allow you to view the next frame
To return in the media player mode press again the frame-by-frame button in the toolbar.
The frame can be resized before visualization. See the frame resizing option.
The frame viewer can be detached from the main window (See File > Preferences). In case on 2
simultaneous players the frame viewers will be automatically detached from the main window.
For every second of the media file the frames are extracted by BORIS with the embedded ffmpeg program
and are saved in the FFmpeg cache directory specified in the Preferences window.
Exporting events data
The coded events can be exported in various formats:
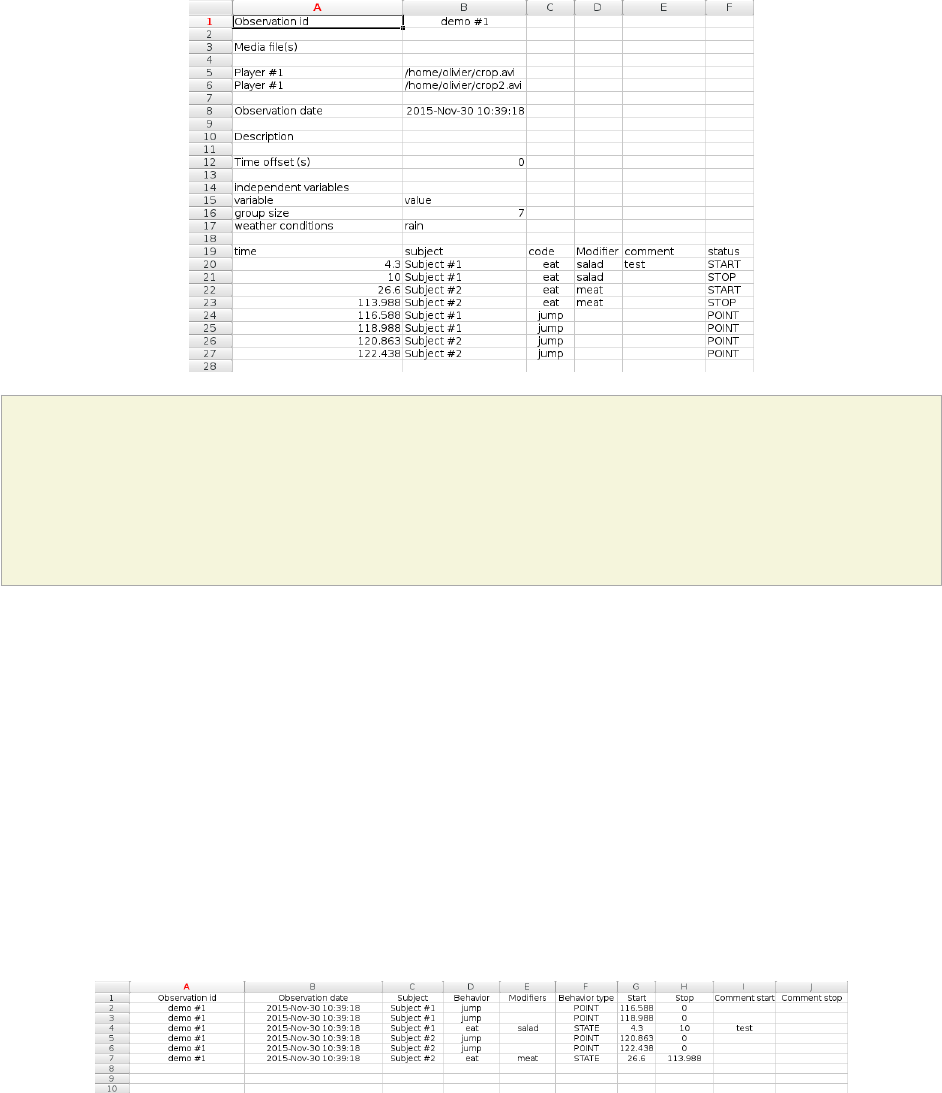
Export events
Observations > Export events
This function will export the events of selected observations in TSV, CSV, ODS, XLSX, XLS or HTML
formats. If many observations are selected BORIS will ask for a directory to save the various files. These
formats are suitable for further analysis.
Warning
Please note that for some formats (XLS - Excel 97) the name of the sheet will be based a modified
observation id in order to not contain forbidden characters (: / ? * [ or ]) and shortened to 31
characters.
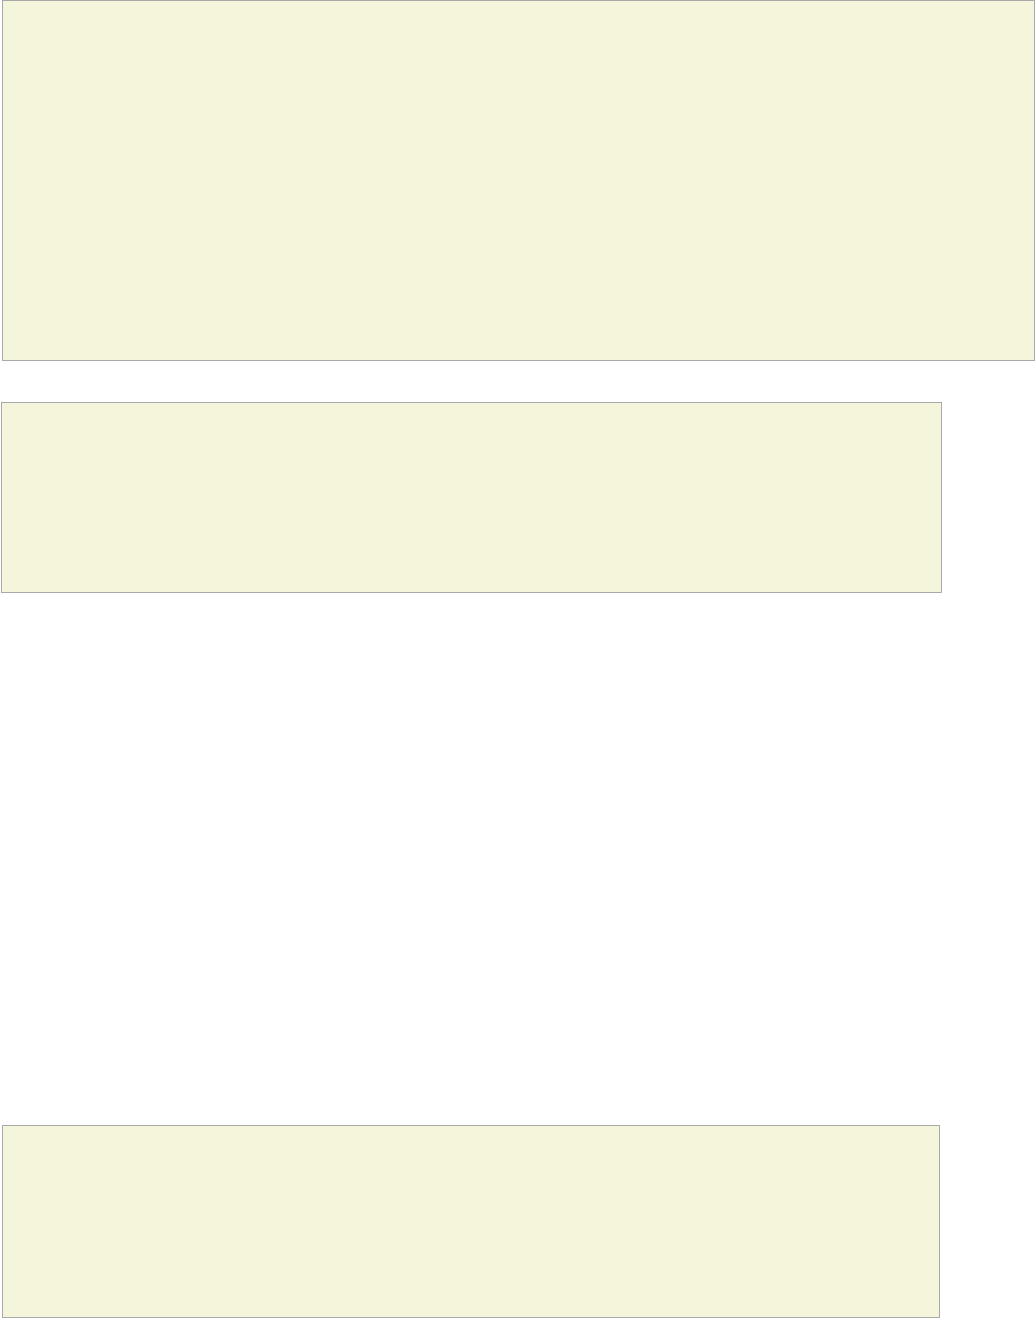
Export aggregated events
Observations > Export aggregated events
This function will export the events of the selected observations in the following formats:
•tabular format (TSV, CSV, XLSX, XLS, ODS, HTML)
•SQL format for populating a SQL database
•SDIS format for analysis with the GSEQ program available at http://www2.gsu.edu/~psyrab/gseq
If many observations are selected you can choose to group all results in one file. If you do not want to
group results BORIS will ask for a directory to save the various files.
The State events are paired and the duration is available.
Example of tabular export
Example of SQL export:
CREATE TABLE events (id INTEGER PRIMARY KEY ASC, observation TEXT,
date DATE, subject TEXT, behavior TEXT,
modifiers TEXT, event_type TEXT, start FLOAT,
stop FLOAT, comment_start TEXT,
comment_stop TEXT);
INSERT INTO events (observation, date, subject, behavior, modifiers,
event_type, start, stop, comment_start, comment_stop ) VALUES
("demo #1","2015-11-30 10:39:18","Subj #1","jump","","POINT",116.588,0,"",""),
("demo #1","2015-11-30 10:39:18","Subj #1","jump","","POINT",118.988,0,"",""),
("demo #1","2015-11-30 10:39:18","Subj #1","eat","salad","STATE",4.3,10.0,"vvv",""),
("demo #1","2015-11-30 10:39:18","Subj #2","jump","","POINT",120.863,0,"",""),
("demo #1","2015-11-30 10:39:18","Subj #2","jump","","POINT",122.438,0,"",""),
("demo #1","2015-11-30 10:39:18","Subj #2","eat","meat","STATE",26.6,113.988,"","");
Warning
Please note that for some formats (XLS - Excel 97) the name of the sheet will be based a modified
observation id in order to not contain forbidden characters (: / ? * [ or ]) and shortened to 31
characters.
Export events for analysis with JWatcher
JWatcher is a powerful tool for the quantitative analysis of behavior.
The events coded with BORIS can be exported to be analyzed with JWatcher.
Click Observations > Export events > for analysis with JWatcher to export the coded events.
BORIS will ask for selecting a directory. After this, for each combination of selected observation and
selected subject the following files will be created:
• the Focal Data File (.dat)
• the Focal Analysis Master File (.faf)
• the Focal Master File (.fmf)
These files can be used to analyze your observations with JWatcher.
Export events as behavioral strings
Behavioral strings can be used with the Behatrix program: Behatrix (formerly BSA)
Example:
# observation id: demo#1
# observation description:
# Media file name: video1.mp4, video2.mp4
Subject #1:
eat|jump|eat|jump
Subject #2:
eat|rest|jump|eat|jump
Export events as Praat TextGrid
Example:
File type = "ooTextFile"
Object class = "TextGrid"
xmin = 4.3
xmax = 113.988
tiers? <exists>
size = 2
item []:
item [1]:
class = "IntervalTier"
name = "Subject #1"
xmin = 4.3
xmax = 10.0
intervals: size = 1
intervals [1]:
xmin = 4.3
xmax = 10.0
text = "eat"
item [2]:
class = "IntervalTier"
name = "Subject #2"
xmin = 26.6
xmax = 113.988
intervals: size = 1
intervals [1]:
xmin = 26.6
xmax = 113.988
text = "eat"
Extract sequences from media files
Sequences of media file corresponding to coded events can be extracted from media files:
1. Click on Observations > Extract events from media files option.
2. Choose the observation(s).
3. Select the events to be extracted.
4. Select a destination directory that will contain the extracted sequences.
5. Select a time offset (in seconds, the default value is 0).
The time offset will be substracted from the starting time of event and added to the stopping time. All the
extracted sequences will be saved in the selected directory followind the file name format:
{observation id}_{player}_{subject}_{behavior}_{start time}-{stop time}
Export transitions matrix
3 transitions matrix outputs are available: The matrix of frequencies of transitions, the matrix of
frequencies of transition after each behavior and the matrix of number of transitions.
Matrix of frequencies of transitions
This matrix contains the frequencies of total transitions. The sum of all frequencies must be 1.
Example of frequencies of transitions matrix:
eat sleep walk
eat 0.0 0.286 0.143
sleep 0.143 0.0 0.143
walk 0.286 0.0 0.0
In this matrix you can see that the eat behavior precedes the sleep behavior with a frequency of 0.286 of
the total number of transitions.
Matrix of frequencies of transitions after behavior
This matrix contains the frequencies of transitions after each behavior. The sum of each row must be 1.
Example:
eat sleep walk
eat 0.0 0.667 0.333
sleep 0.5 0.0 0.5
walk 1.0 0.0 0.0
In this example you can see that sleep follows eat with a frequency of 0.667 and walk follows with a
frequency of 0.333.
Matrix of number of transitions
This matrix contains the number of transitions after each behavior.
Example:
eat sleep walk
eat 0 2 1
sleep 1 0 1
walk 2 0 0
Playback menu
Jump
Jump forward
Allow to jump forward in the current media file. See File > Preferences for setting the jump value.
Jump backward
Allow to jump backward in the current media file. See File > Preferences for setting the jump value.
Jump to specific time
Allow to go to a specific time in the current media file.
Zoom
Allow to zoom into the current video file. The available zoom values are: 1:2, 1:4, 2:1 and 1:1. Fit to
window adapts the zoom value to the current window size. In case of simultaneous playing you can set
different values of zoom in player #1 and player #2.
The Zoom option is not available in frame-by-frame mode.
The Zoom function is not working on Mac
Tools
Geometric measurements
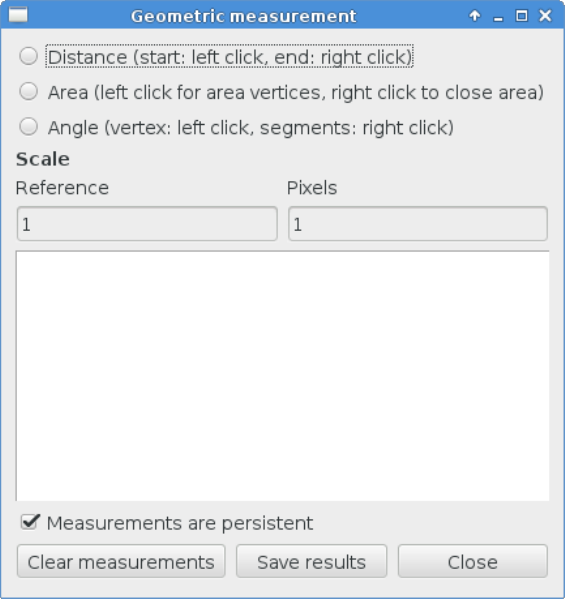
Geometric measurements can only be made in frame-by-frame mode. Distances, areas and angles can be
measured. Click on Tools > Geometric measurements to activate the measurements. The
Measurements window will be shown:
Setting the scale
For distance and area measurements you can set a scale in order to have results of measurements in a
real unit (like centimeters, meters etc). 1) measure a reference object (that have a known size) on the
frame (with the distance tool. See next chapter for details) and set the pixel distance in the Pixel text box.
2) Set the real size of the reference object in the Reference text box (must be a number without unit).
Distance measurements
Select the Distance radio button. Click the left mouse button on the frame bitmap to set the start of the
segment that will be measured. A blue circle with a cross will be drawn. Click the right mouse button to set
the end. A red circle with a cross will be drawn. The distance between the two selected points will be
available in the text area of the Measurements window.
Area measurements
Select the Area radio button. Click the left mouse button on the frame bitmap to set the area vertices. Blue
circles with a cross will be drawn. Click the right mouse button to close the area. The area of the drawn
polygon will be available in the text area of the Measurements window.
Angle measurements
Select the Angle radio button. Click the left mouse button on the frame bitmap to set the angle vertex. A
red circle with a cross will be drawn. Click the right mouse button to set the two segments. Blue circles with
a cross will be drawn. The angle between the two drawn segments will be available in the text area of the
Measurements window.
Persistent measurements
If the Measurements are persistent checkbox is checked the measurement schemes will be available on
all frames otherwise they will be deleted between frames.
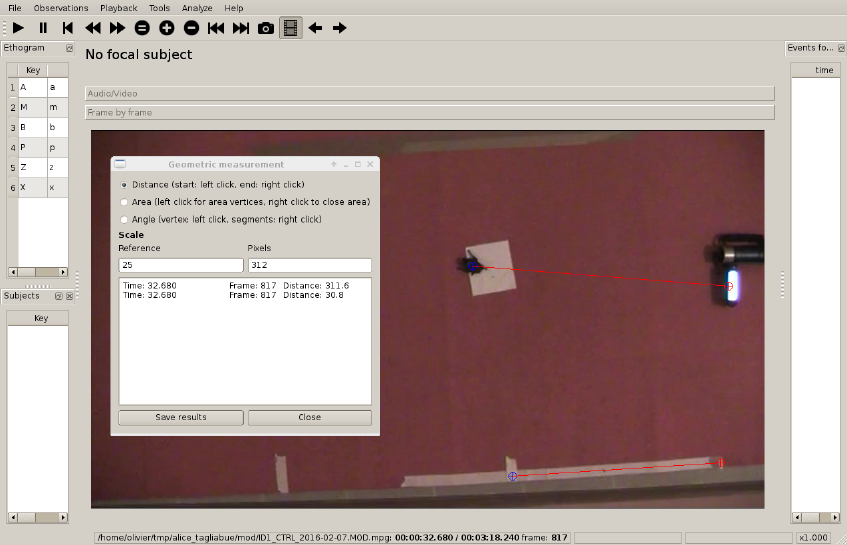
Coding pad
During observation a coding pad with the available behaviors can be displayed (Tools > Coding pad).
This Coding pad allows the user to code using a touch-screen or by clicking on the buttons. When the
Coding pad is displayed you can continue to code using the keyboard or the ethogram.
Converters for external data values
Converters can be written using the Python 3 programming language.
The INPUT variable will be loaded with the original value of the external data file (for example 01:22:32).
The OUPUT variable must contain the converted value in seconds (the dot must be used for decimal
separator).
Example of a converter for converting HH.MM:SS format in seconds:
h, m, s = INPUT.split(':')
OUTPUT = int(h) * 3600 + int(m) * 60 + int(s)
The Python function strptime() from the datetime module can be useful for converting time values:
https://docs.python.org/3/library/datetime.html#strftime-strptime-behavior
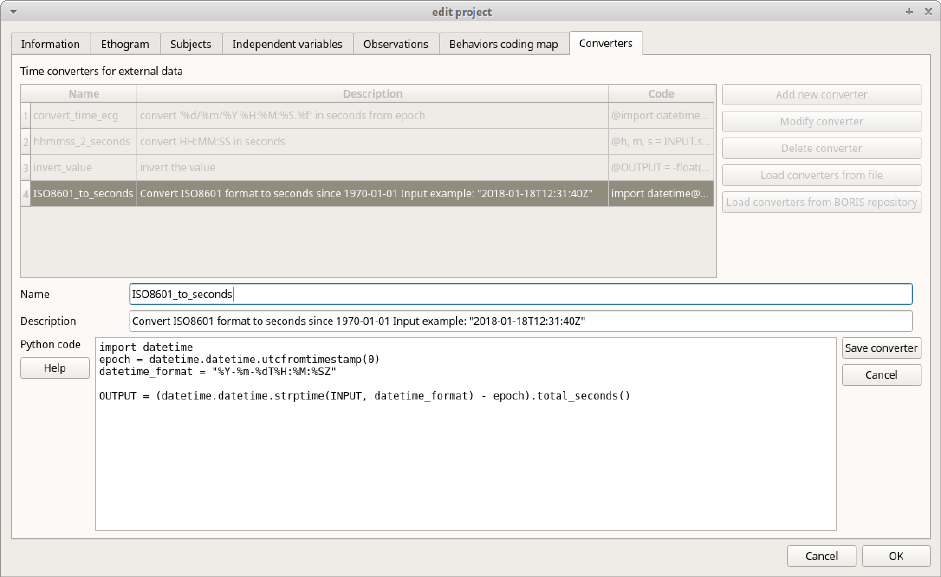
Example of a converter for converting ISO8601 format in seconds using the strptime() function:
import datetime
epoch = datetime.datetime.utcfromtimestamp(0)
datetime_format = "%Y-%m-%dT%H:%M:%SZ"
OUTPUT = (datetime.datetime.strptime(INPUT, datetime_format) - epoch).total_seconds()
File > Edit project > Converters tab
Transitions flow diagram
BORIS can generate DOT scripts and flow diagrams from the transitions matrices (See Observations >
Create transition matrix for obtaining the transitions matrices).
DOT script (Graphviz language)
Tools > Transitions flow diagram > Create transitions DOT script
Choose one ore more transitions matrix files and BORIS will create the relative DOT script file(s).
The DOT script files can then be used with Graphviz (Graph Visualization Software) or WebGraphviz
(Graphviz in the Browser) to generate flow diagram of transitions.
See DOT (graph description language) for details.
Flow diagram
If Graphviz (Graph Visualization Software) is installed on your system (and the dot program available in
the path) BORIS can generate flow diagram (PNG format) from a transitions matrix file.
Tools > Transitions flow diagram > Create transitions flow diagram
Choose one ore more transition matrix files and BORIS will create the relative flow diagram.
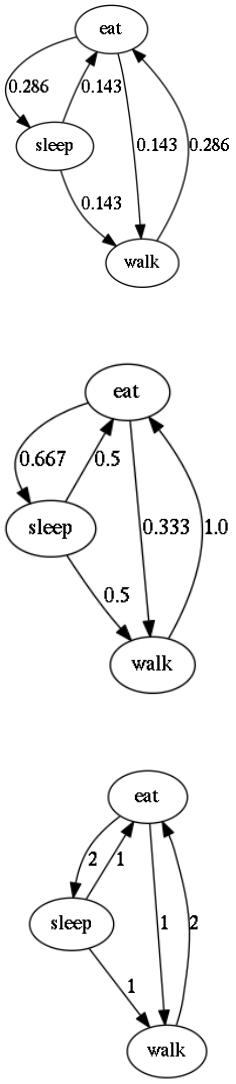
Flow diagram of frequencies of transitions
Flow diagram of frequencies of transitions after behavior
Flow diagram of number of transitions
Re-encoding and resizing a video file
BORIS can re-encode and resize your video files in order to reduce the size of the files and have a
smooth coding (specially with two video files playing together). The re-encoding and resizing operations
are done with the embedded ffmpeg program with high quality parameters (bitrate 2000k).
Select the files you want re-encode and resize and select the horizontal resolution in pixels (the default is
1024). The aspect ratio will be maintained.
You can continue to use BORIS during the re-encoding/resizing operation.
The re-encoded/resized video files are renamed by adding the re-encoded.avi extension to the original
files.
warning
The MTS video files should be re-encoded to be used in frame-by-frame mode. Otherwise the
extracted frames are not reliable.
Project server
This function allow you to communicate with the BORIS App by sending project and receiving
onservations made with the BORIS App. For details read the BORIS App user guide
Starting the project server
• Open your project
• Select File > Project server
A window will open and show you the URL of the server that should be used on the BORIS App. The
project server will serve the project for 30 minutes.
Stopping the project server
• Select File > Stop serving project
Coding map
A coding map is a bitmap image with user-defined clickable areas that will help to code for behaviors or
modifiers for a behavior.
2 types of coding maps are available:
• Behaviors coding map
• Modifiers coding map
The Behaviors coding map
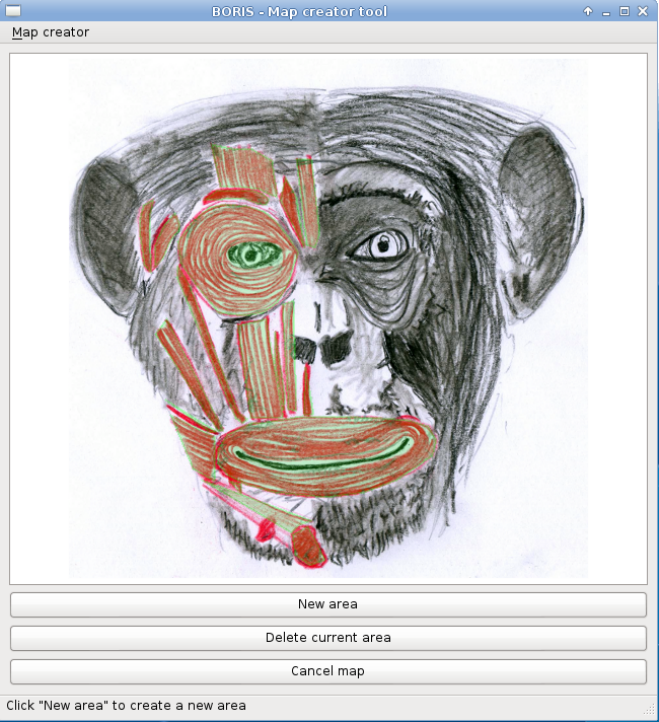
BORIS allows creating a Behaviors coding map using the Map creator tool (Tools > Create a coding
map > for behaviors).
A Behaviors coding map can be created only if you have defined behaviors in your ethogram.
Creating a Behaviors coding map
To create a new Behaviors coding map launch the Behaviors coding map creator
Tools > Create a coding map > for behaviors).
A new window will open
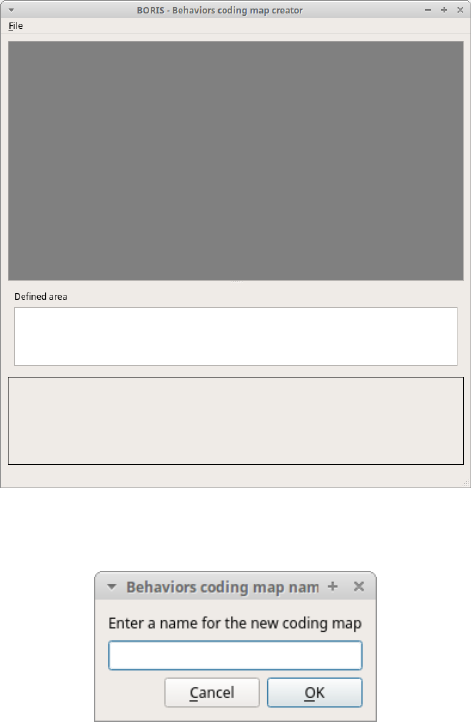
File > New behaviors coding map
Enter a name for the new Behaviors coding map
Loading a bitmap for a behaviors coding map
Click the Load bitmap button in the bottom of the window and select a bitmap image (PNG and JPEG
formats are accepted).
If the size of your bitmap image is bigger than 640 x 640 pixels BORIS will resize it to 640 x 640 pixels
keeping the aspect ratio and store the resized version in the coding map file.
The bitmap will be displayed
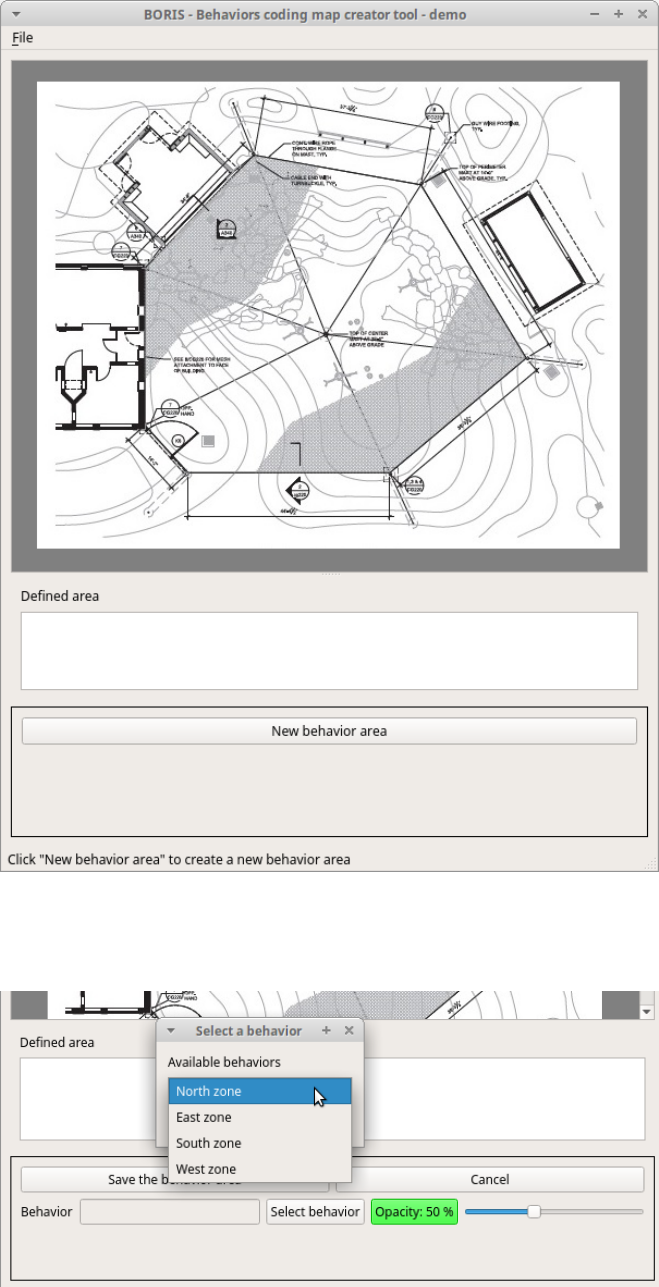
Adding areas corresponding the behaviors
Click the New behavior area button in the bottom of the window and select a behavior by clicking on the
Select behavior button.
The available behaviors are taken from the ethogram of the current project.

Click on the bitmap to define the vertex on the area that will code the selected behavior. Close the area by
clicking again on the first point.
The color of the new area can be changed using the Opacity button. The opacity can be changed (from 0
to 100%) using the slider.
Save the behavior area by clicking on the Save the behavior area button
The area will be added to the Defined area list
You can add more area and also add more than one area for a same behavior. Two or more areas can
overlap. In this case all corresponding behaviors will be triggered.
Add the Behaviors coding map to the current project
File > Add coding map to project
The coding map will be added to the current project
You can add a Behaviors coding map to the current project from a file containing the coding map:
(File > Edit project > Behaviors coding map > Add a behaviors coding map )
Saving the Behaviors coding map
Saving the Behaviors coding map will create a file containing the Behaviors coding map including the
bitmap image.
File > Save the current Behaviors coding map
The file containing the Behaviors coding map can be then reloaded in the Behaviors coding map
creator or added to a BORIS project (File > Edit project > Behaviors coding map > Add a behaviors
coding map )
The Modifiers coding map
BORIS allows creating a modifiers coding map using the Modifiers Map creator tool (Tools > Create a
coding map > for modifiers.) Clickable areas may correspond to specific modifiers that can be
meaningful for the behavioral coding. Facial expression is the case we thought to when developing this
function.
Creating a modifiers coding map
Loading a bitmap for a modifiers coding map
To create a new Modifiers coding map, launch the Modifiers Map creator tool (Tools > Create a
coding map > for modifiers). The BORIS main window will be replaced by the Modifiers Map creator
window. Click on Modifiers Map creator > New Modifiers map and enter a name for the new map in the
edit box. You have to load a bitmap image (JPEG or PNG) using the Load bitmap button. The loaded
image will be displayed.
If the size of your bitmap image is bigger than 640 x 640 pixels BORIS will resize it to 640 x 640 pixels
keeping the aspect ratio and store the resized version in the coding map file.
Adding areas corresponding to the modifiers
To create clickable areas on a coding map, you have to click on the New area button and enter an Area
code in the edit box. The new area can now be defined by clicking on the image. The drawing tool allows
defining a irregular polygon (a plane shape with straight sides, which does not have all sides equal and all
angles equal) by clicking to determine subsequent vertices. It can be convex or concave. Straight sides
must not cross each other. Once selected an area can be deleted using the Delete area button. When an
area is closed and its name has been defined in the Area code field, it can be saved by using the Save
area button. The areas can partially overlap each other. See the Using a Coding map section for more
details. Once all areas are added the entire map can be saved using the Save map option menu (Map
creator > Save map). The map is now saved in its own file (.boris_map) which is NOT part of the BORIS
project. A map can be edited at anytime by opening the map file from the Open map menu option (Map
creator > Open map).
Adding a modifiers coding map to your project
Creating a Coding map is not automatically adding the map to your project. The Coding map have to be
added to your project by selecting the corresponding Behavior type (Point event with coding map,
State event with coding map). BORIS will ask to select the file name containing the coding map
(.boris_map) and load the coding map in the project. The coding map name will appear in the Coding map
column and will be saved in the BORIS project file.
NOTE: If you later modify your coding map you must reload the new version in your BORIS project.
Analysis
Time budget
The Time budget analysis can be done by behavior (including or not the modifiers) or by category of
behaviors. Choose the option from the Analysis menu.
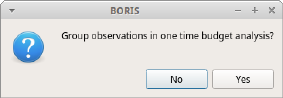
The Time budget analysis can be done on one or more observations. If you select more than one
observation you must then choose for a global time budget analysis that will contain all selected
observations or a time budget analysis for every single observation.
Choose Yes to group all observations in one time budget analysis
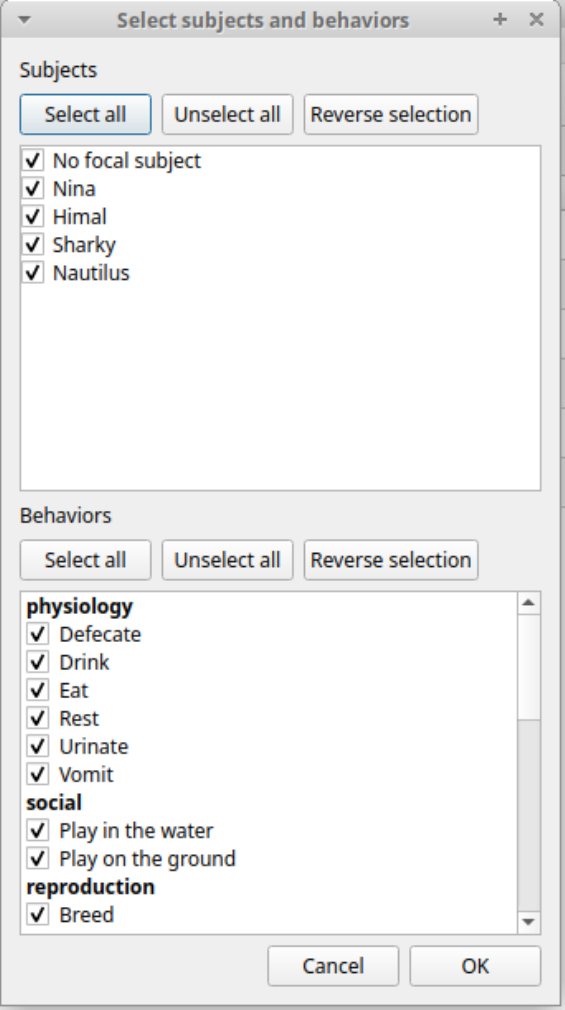
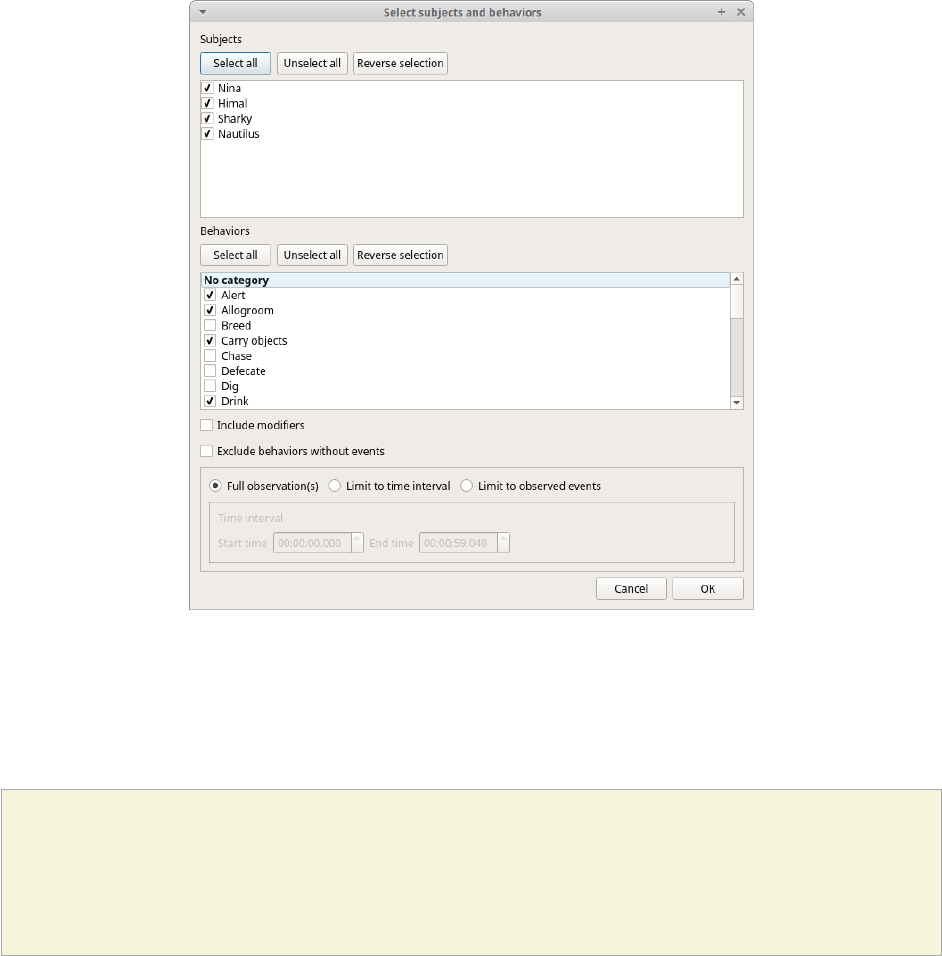
The Analysis > Time budget menu option shows the time budget for the events of the selected
observations. Select the subjects and behaviors you want to include in the time budget analysis:

All behaviors can be selected or unselected by clicking on the Category (bold).
You can choose to include or not the behavior modifiers in the Time budget analysis and to exclude
behaviors without coded events.
The Time budget analysis can be restricted to a part of the observation:
• Full observation(s): the analysis will be made on the full observation length.
• Limit to time interval: use the Start time and End time boxes to select starting time and ending time.
•Limit to observed events: the analysis will be made from the first observed event to the last observed
event.
The last dialog window will allow you to subtract the duration of one or more behaviors from the total
duration of the observation. This can help you if you have defined a "out-of-sight" code in your ethogram
for example:
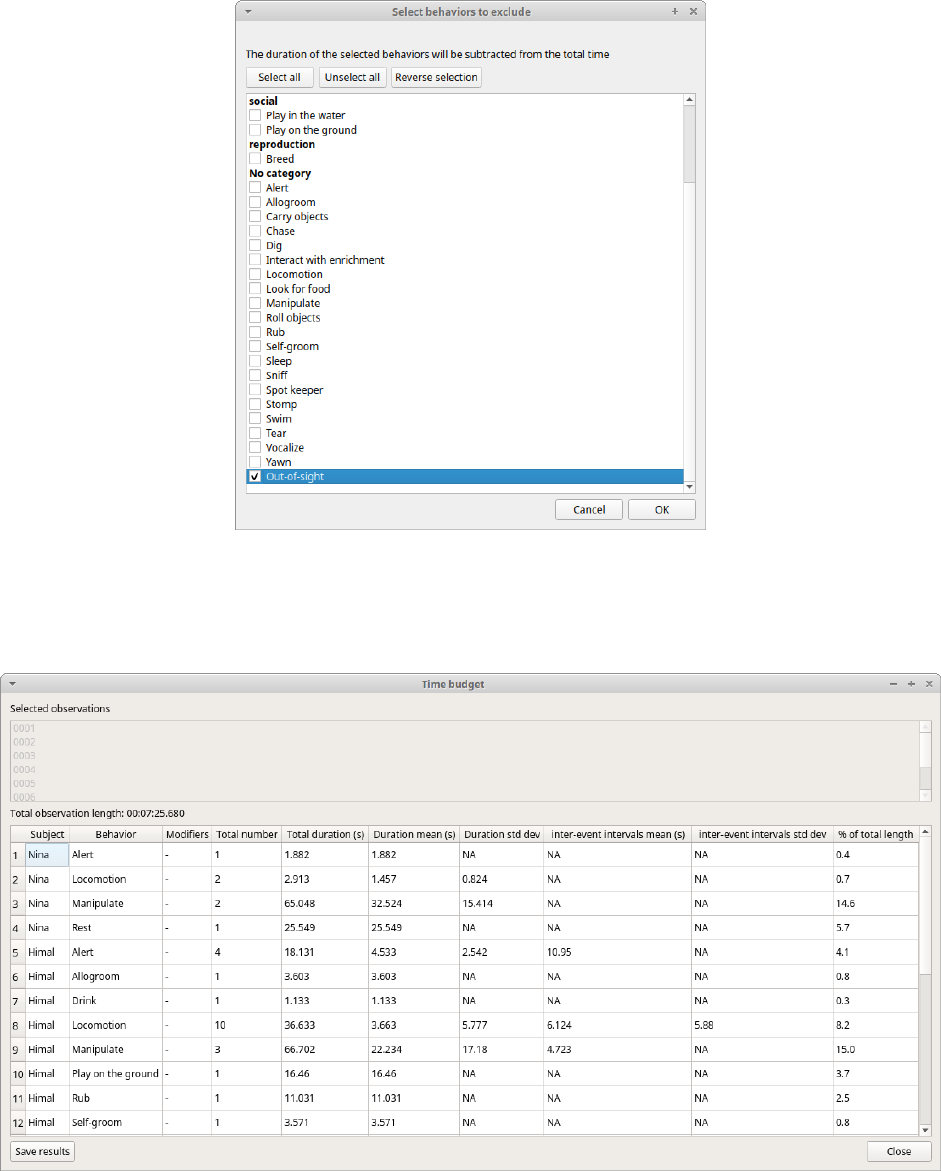
The results contain for each subject and behavior the total nuber of occurrences, the total duration (for
the behaviors defined as state events), The duration mean (for the behaviors defined as state events),
the standard deviation of duration, the inter-events intervals duration mean, th standard deviation
of the inter-events intervals duration and the percent of total duration of observation(s). All duration
times are expressed in seconds (s).
The time budget results can be saved in various formats for further analysis: * Plain text files: TSV, CSV
or HTML * Spreadsheets: Open Document (ODS), Microsoft Excel (XLSX) and Legacy Microsoft (XLS)
Note
If a STATE behavior has an odd number of coded events, BORIS will report "UNPAIRED" instead
of results"
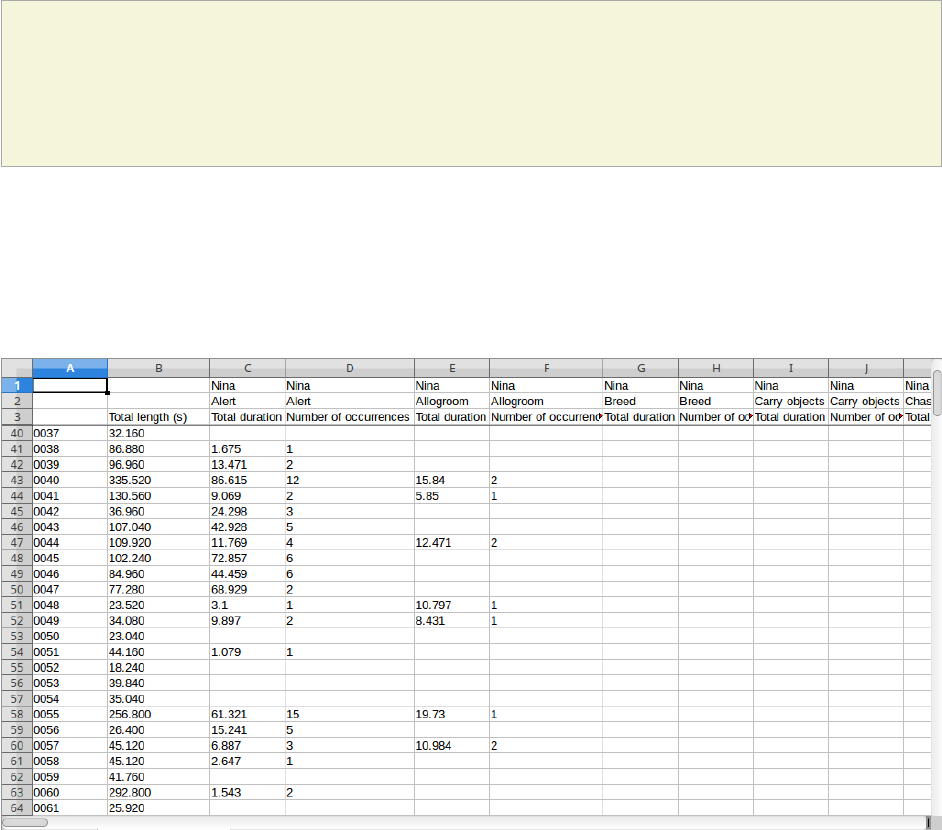
Synthetic time budget
The synthetic time budget is similar to time budget but with fewer parameters and a different organization
of results. Results of all selected observations are organized in columns on a single page. Two parameters
are provided for now: number of occurrences and total duration (for the behaviors defined as state
events)
All duration times are expressed in seconds (s).
The time budget results can be saved in various formats for further analysis: * Plain text files: TSV, CSV
or HTML * Spreadsheets: Open Document (ODS), Microsoft Excel (XLSX) and Legacy Microsoft (XLS)
Plot events
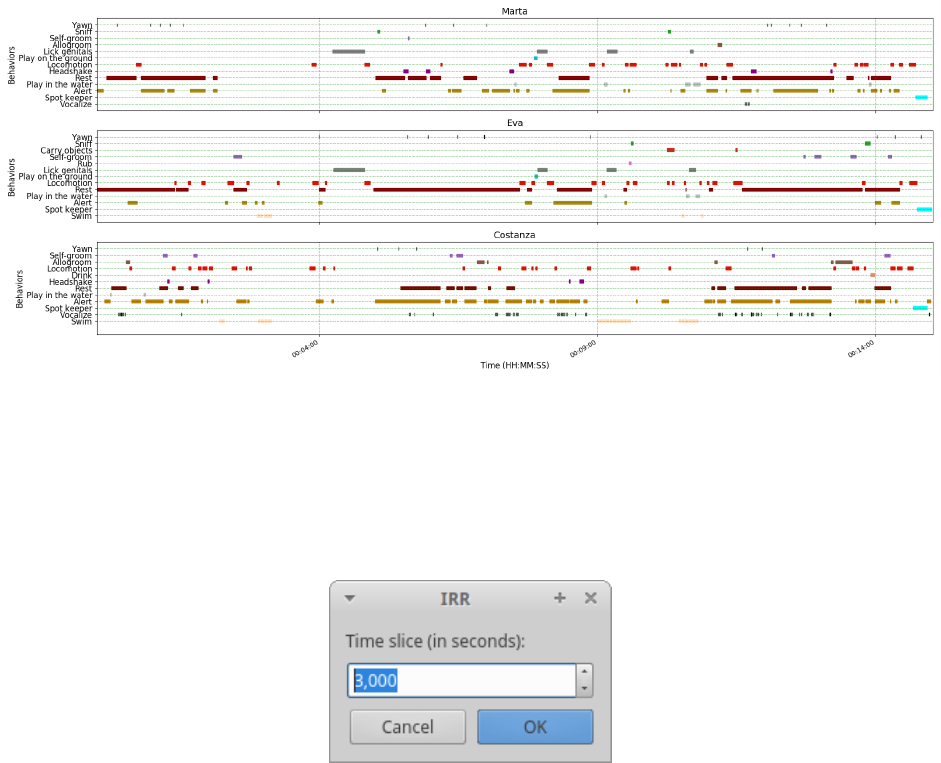
The coded events from many observations can be plotted along a time axis.
Analysis > Plot events
The subjects and behaviors you want to include in the plot can be selected in the following window:
You can choose to include or not the behavior modifiers (if any) and to exclude behaviors without coded
events.
The time interval can be selected (See time budget)
The plot can be exported in various formats like bitmap (PNG, JPG, TIFF) or vectorial graphic (SVG, PDF,
EPS, PS). The SVG format can be further edited with the Inkscape vector graphics editor.
Note
If a STATE behavior has an odd number of coded events, you will see this error message: "The
STATE behavior XXX is not paired"
This function creates one plot by subject on one figure.
The color of behaviors can be customized. See plot colors
Inter-rater reliability
The Cohen's kappa coefficient can be calculated (Analysis > Inter-rater reliability > Cohen's kappa).
Cohen's kappa on Wikipedia
After selecting 2 observations and a time window (in seconds) for the analysis (the default value is 10
seconds) the Cohen's kappa will be displayed in the results window.
Preferences
You can customize BORIS using the Preferences window (File > Preferences)
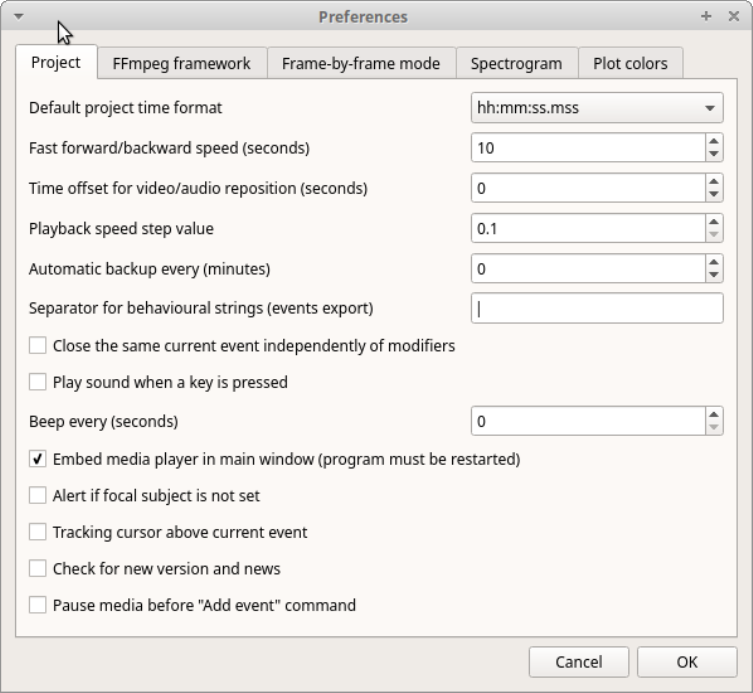
General preferences
Default project time format
This option allows the user to choose the format for displaying time in the project. Please note that
time is internally always saved in seconds with a precision of 3 decimal digits
Fast forward/backward speed (seconds)
This option allows the user to customize the amount of time for "jumping" forward or backward in
media.
Time offset for media reposition (seconds)
This value indicates the time offset for repositioning the media after double-click on a row event of the
Events table. 'for example -4 seconds indicates that after a double-click the media will be repositioned
4 seconds before the recorded event.'
Playback speed step value
This value indicate how much the speed will be increased or decreased after pressing the change
playback speed buttons.
Automatic backup every (minutes)
if set BORIS will save your project automatically every n minutes. 0 indicate no automatic backup.
Play sound when a key is pressed
Activate a sound signal after every keypress event
Alert if focal subject is not set
If this option is activated BORIS will show an alert box if no focal subject is selected
Tracking cursor above current event
Check this box to position the tracking cursor above the current event in events list table.
Check for new version
Check for new version on BORIS web site every 15 days (internet access required)
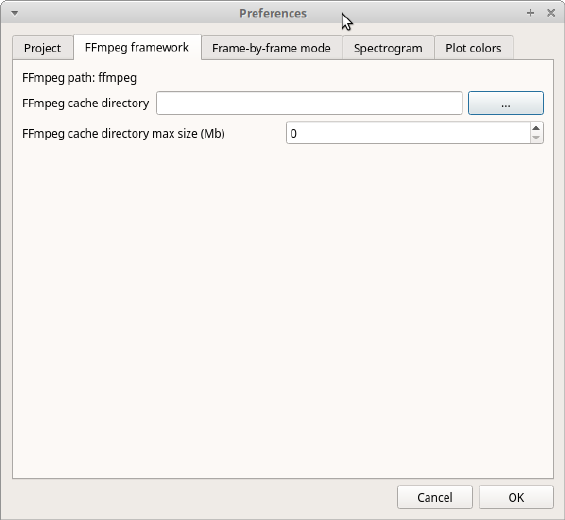
FFmpeg framework
The path for the ffmpeg executable program is displayed. The FFmpeg executable is now included with
BORIS in Windows and Mac OS versions.
FFmpeg cache directory
This indicates the directory that will be used as image cache for frame-by-frame mode and
spectrogram visualization. If you do not specify a path, BORIS will use the default temporary directory
of your system.
FFmpeg cache directory max size
Indicate a size limit (in Mb) for the image caching. 0 indicates no limit
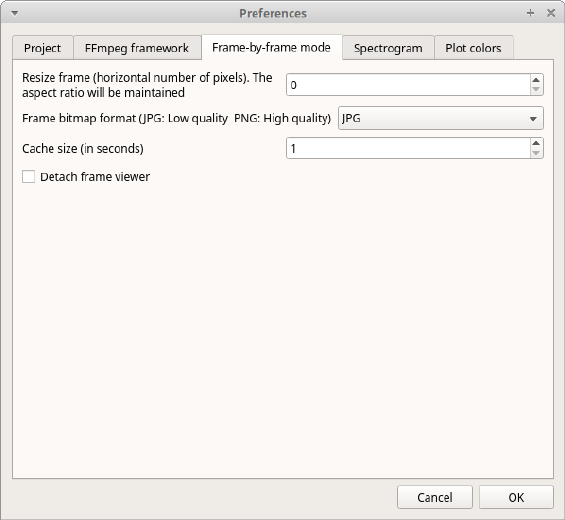
Frame-by-frame mode
Resize frame
In case of high resolution video (for example 4K 1920x1080) the extracted frames can be resized before
visualization to improve the speed. Select the width in pixel for the extracted frames. The aspect ratio will
be maintained. 0 will indicate no frame resizing.
Frame bitmap format
A bitmap format can be selected between JPG (JPEG low quality image) and PNG (Portable Network
Graphic - high quality image). The extracted frames will be saved in the directory defined in previous tab
(FFmpeg cache directory).
Cache size
In frame-by-frame mode the frames are extracted from the video with the ffmpeg program every second
by default.
This value can be increased to extract frames for a longer sequence and avoiding waiting for frames
extraction every second.
Note for high resolution video this operation can be long.
Detaching the frame viewer
The frame viewer can be detached from the main window. Please note that in case of two simultaneous
media files the frames viewers will be detached.
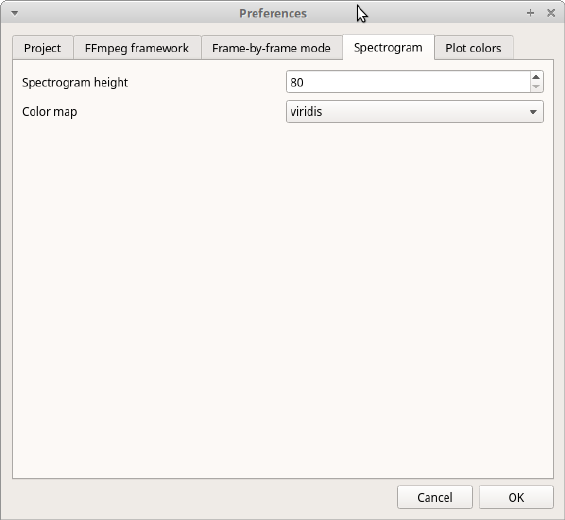
Spectrogram
Spectrogram height
Select the height of generated spectrogram (in pixels). You will need to restart the current observation to
apply changes.
Color map
Select the color map for displaying the generated spectrogram. See Matplotlib colormaps for details.
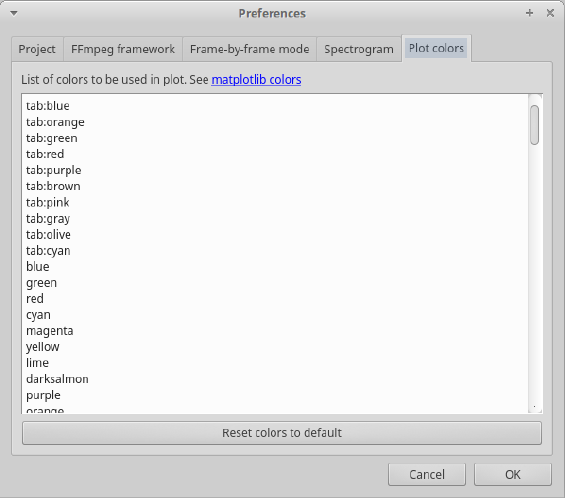
Plot colors
The color of behaviors in the plot events functions can be customized. The first color will be associated to
the first behavior in your ethogram, the second color to the second behavior and so on. Various color
formats can be used to specify a color: named color or hex RGB (like #0F0F0F). See
https://matplotlib.org/api/colors_api.html and https://matplotlib.org/examples/color/named_colors.html for
details
The reset colors to default button will reload the default colors.
Various
Removing path of media files
Using BORIS you can choose to store the full path of the media files into the file project (for example:
/home/user/Video/video_n1.mp4 or c:\Users\user\Documents\video1.avi).
If you want to move your project on a different computer or if you want to move your media files you may
want to do not store the full path. For this you can choose to add media files without the full path (See Add
media files section). You can also remove the full path of your media files from the all observations of the
current project (File > Remove path from media files. Please note that this operation is irreversible. After
remotion the full path of your media will be lost and will not be recoverable.
If you choose to do not store the full path of media files the media files must located in the same
directory than your BORIS project file.
Docking
All elements, including all the media players can be undocked from the main window and positioned
where you prefer (e.g. they can be on the same desktop over one or two screens).
Citing BORIS
If you have used BORIS for publications, please cite:
Olivier Friard and Marco Gamba. (2016) BORIS: a free, versatile open-source
event-logging software for video/audio coding and live observations.
Methods in Ecology and Evolution, 7(11), 1324-1330
DOI: 10.1111/2041-210X.12584
Bug reports and features request
Please send bug reports and features request using the BORIS GitHub repository
(https://github.com/olivierfriard/BORIS) or by e-mail in english, french or italian (see web site
http://www.boris.unito.it/pages/about.html).
In case of bug report please verify that you are using the last version of BORIS and indicate your
operating system, its version and the CPU architecture (32/64 bits). You may also include the BORIS
project that gave you an error. Any information you will provide will not be disclosed to any third party.
Acknowledgement
The authors would like to acknowledge Sergio Castellano, Valentina Matteucci and Laura Ozella for their
precious help.
Valid keys for triggering behavior
BORIS make difference between lower case and upper case characters
• keys from a to z
• keys from A to Z
• keys from 0 to 9
• function keys from F1 to F12
• à é è ù ì ç
• ! " £ $ % & / ( ) = ? ^ [ ] @ | § ° #
