Linking Bicycle/Pedestrian Facilities With Transit 96415 Case9
User Manual: 96415
Open the PDF directly: View PDF ![]() .
.
Page Count: 152 [warning: Documents this large are best viewed by clicking the View PDF Link!]
- Linking Bicycle/Pedestrian Facilities with Transit
- Table of Contents
- Executive Summary
- I. A Brief History of Transit Access in the U.S.
- II. Bicycle and Pedestrian Access to Transit in the U.S.
- III. Bike-on-Transit Programs
- IV. Transit Access Europe
- V. Bicycle-Transit Integration in Japan
- VI. Cost, Benefits, and Market Penetration
- VII. Recommendations
- Bibliography
- Selectioned Additional References
- Table of Contents
Publication No. FHWA-PD-93-012
Case
Study
No. 9
Linking
Bicycle/
Pedestrian
Facilities
with
Transit
National Bicycling
And Walking Study
U.S. Department
of Transportation
Federal Highway
Administration
National Bicycle and Walking Study
FHWA Case Study No. 9
Linking Bicycle/Pedestrian
Facilities with Transit
Enhancing Bicycle and Pedestrian Access to Transit
Submitted to:
Federal Highway Administration
400 Seventh Street, S.W.
Washington, DC 20590
October 1992
Table of Contents Page
Executive Summary ................................................................... 1
The Historical Context ................................................................... 2
Alternative Strategies for Transit Access......................................................... 2
Access System Costs, Energy Use, and Air Pollution ...................................... 3
Transit Markets and System Efficiency ........................................................... 4
I. A Brief History of Transit Access in the United States........................................... 15
Transit Access Prior to and During World War II.......................................... 15
Rise of the Automobile in the Aftermath of the War...................................... 16
Federal Government Recognizes the Need to Support Transit ....................... 16
Early Federal Support for Transit Access: Park-and-Ride Lots...................... 17
Neglect of Multimodal Transit Access in America ........................................ 18
Federal Funding Availability for Bicycle and Pedestrian
Facilities ................................................................. 18
II. Bicycle and Pedestrian Access to Transit in the United States................................ 21
Mode Shares for Access to Transit in U.S. Cities .......................................... 22
Bus Stop Shelters ................................................................. 26
Bicycle Parking Facilities at Transit.............................................................. 26
Vandalism: A Perplexing Problem ................................................................ 28
Fragmented Institutional Authority................................................................ 31
The Way to the Station or Bus Stop............................................................... 32
Florida ................................................................ 33
Charlotte ................................................................ 33
Los Angeles ................................................................ 34
Houston, Texas ................................................................ 34
San Diego ................................................................ 34
Santa Clara County ................................................................ 34
Sacramento ................................................................ 34
Use of GIS to Support Pedestrian Planning ................................................... 34
Including Pedestrian and Bicycle Factors
in Travel Demand Modeling ................................................................ 37
Marketing and Promotion of Bicycle and Pedestrian Access.......................... 39
III. Bike-on-Transit Programs ................................................................ 40
Bike-on-Rail Programs ................................................................ 40
The Historic Precedent ................................................................ 40
Bikes-on-Rail Programs in Uited States Today.............................................. 41
Permits ...................... ................................................................ 44
Time Restrictions ................................................................ 44
Rail Car Design Constraints ................................................................ 44
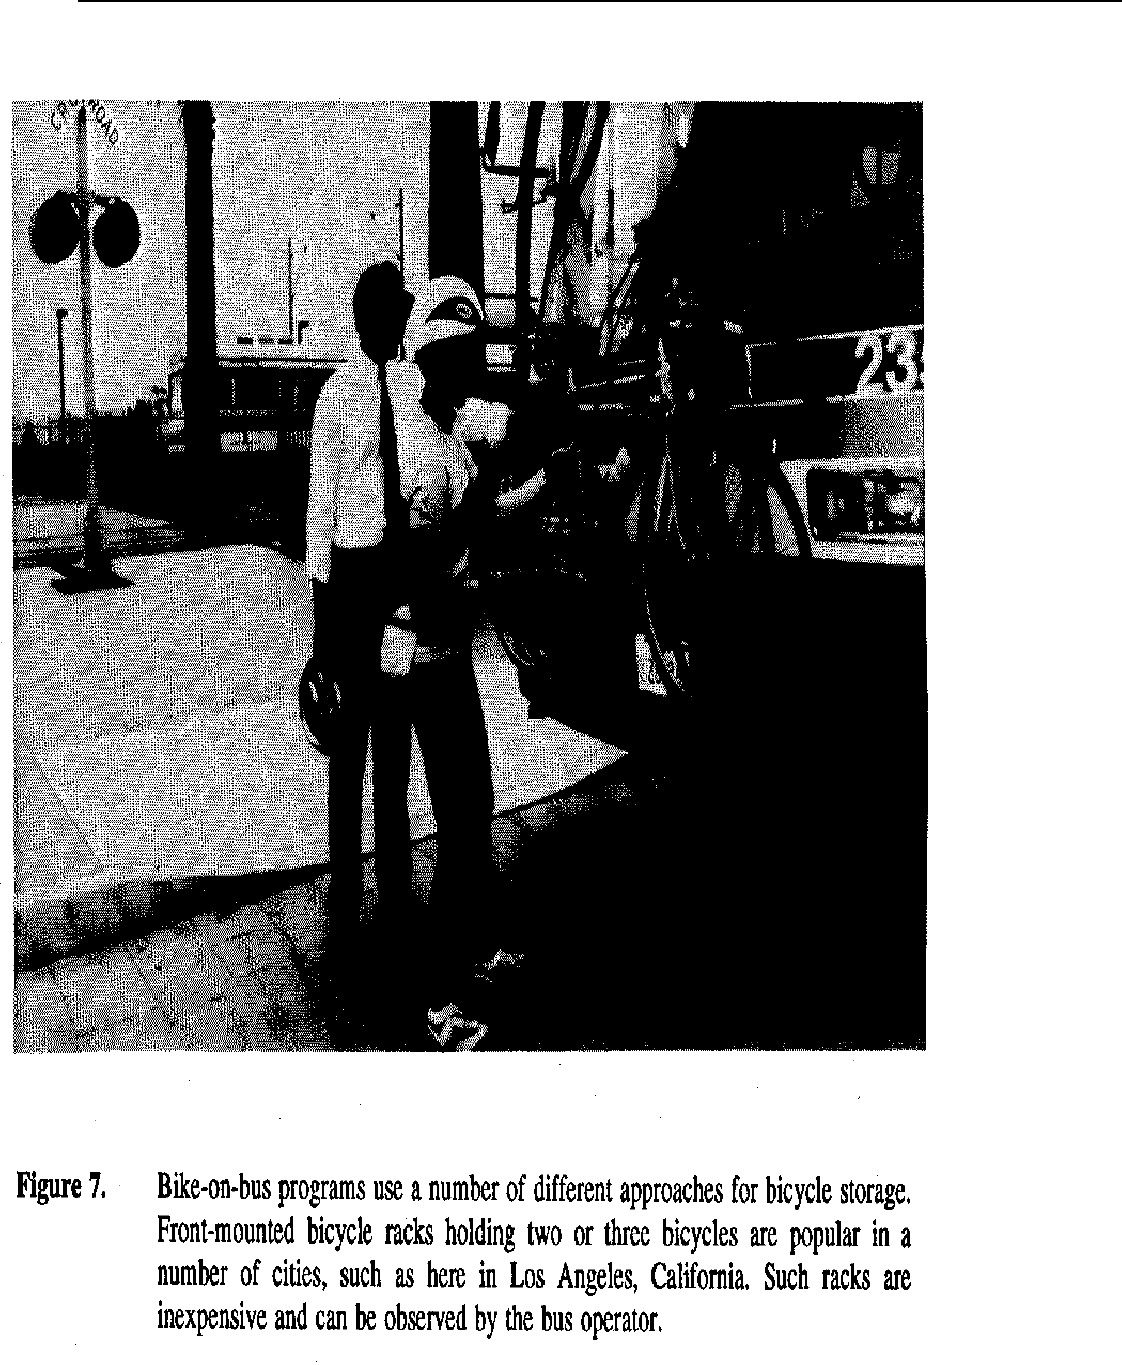
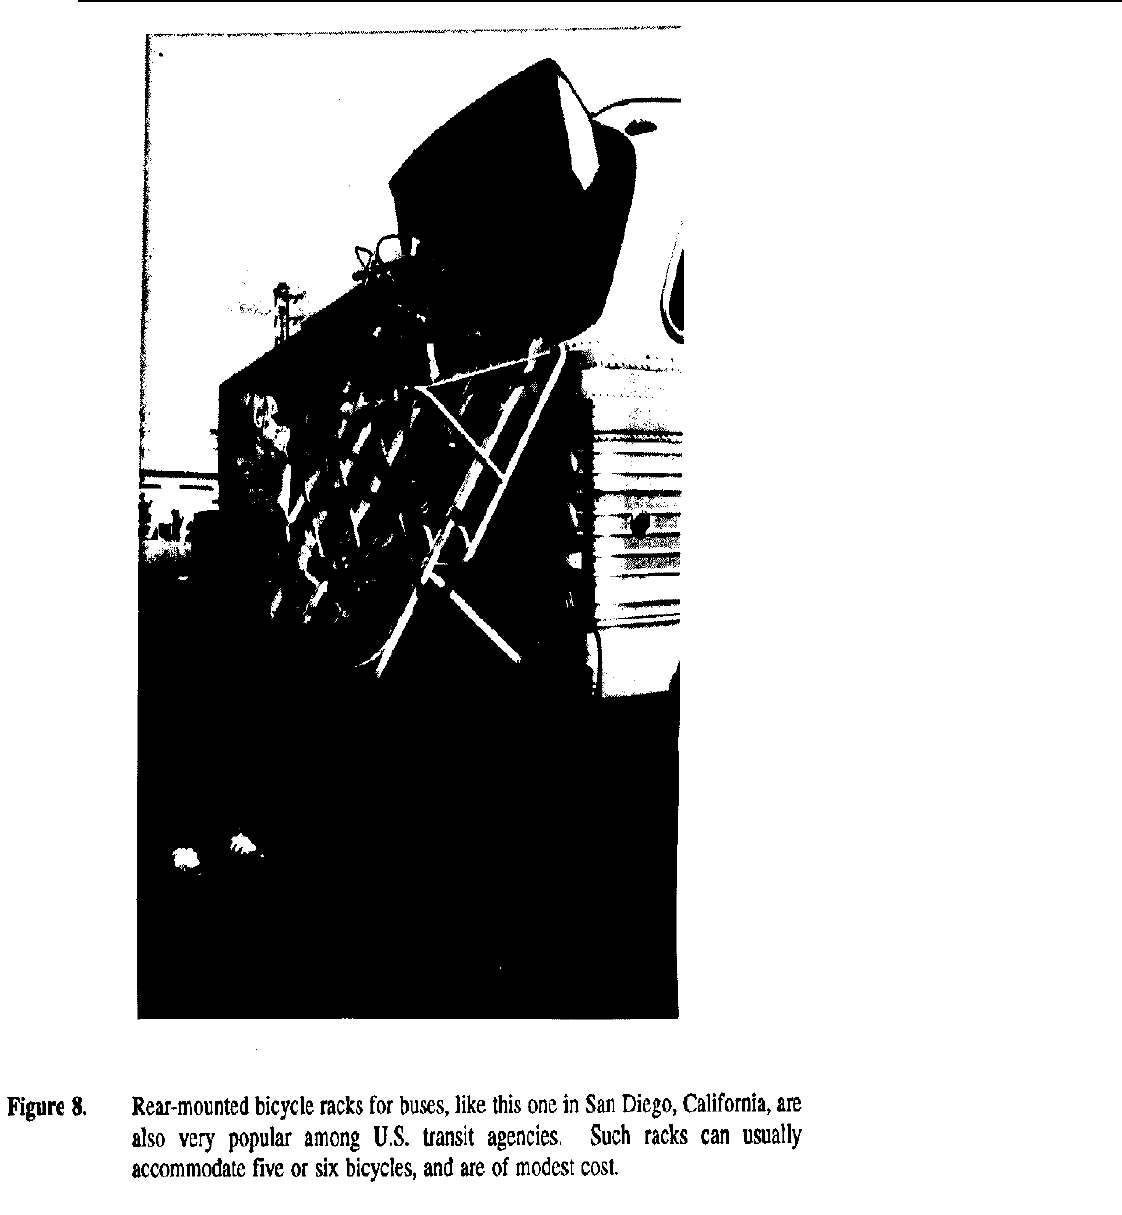
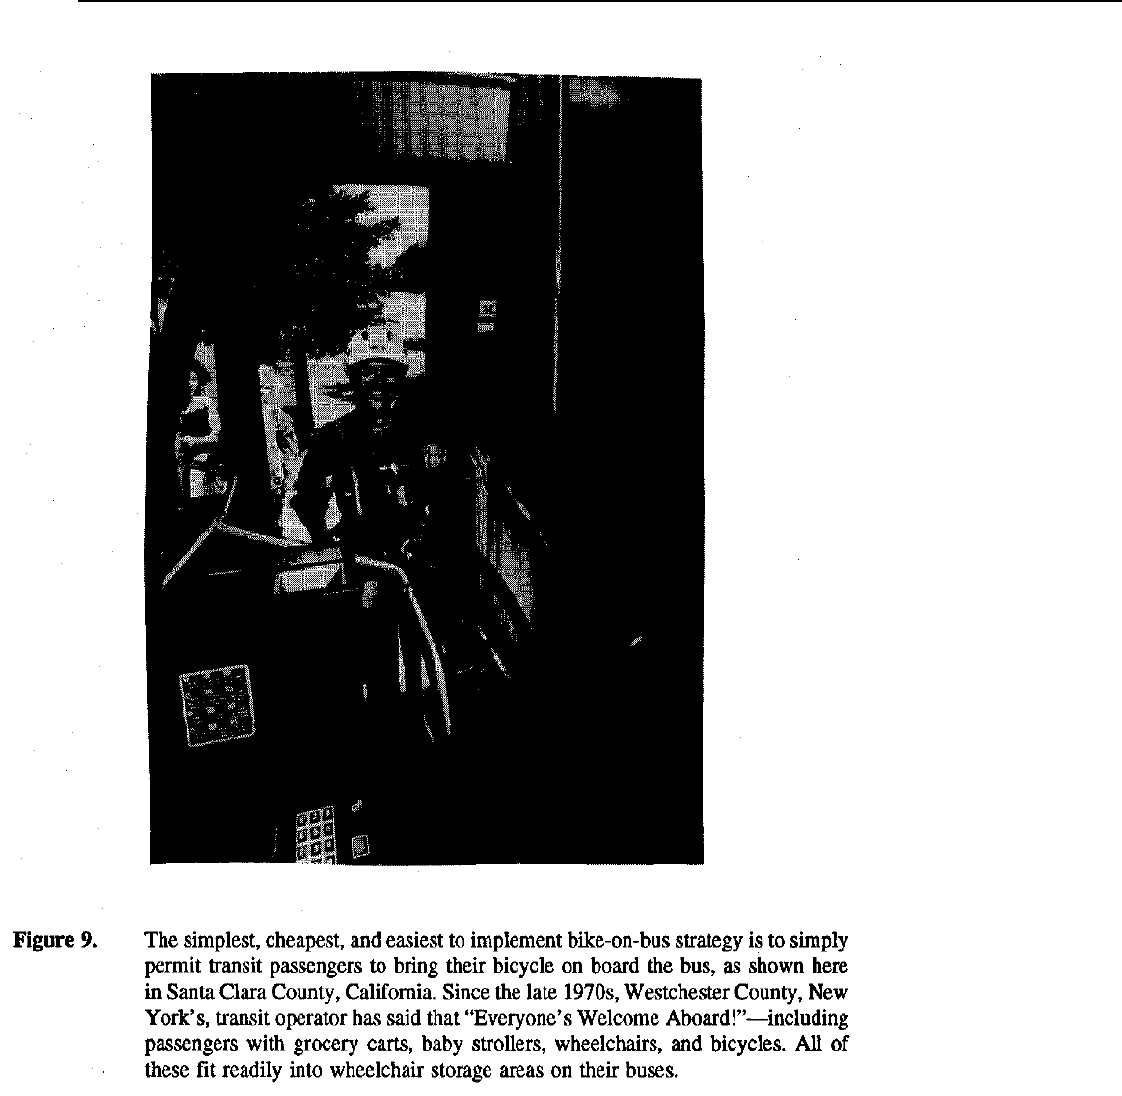
Bike-on-Bus Programs in U.S. Cities ............................................................ 45
Development of Bike-on-Bus Service .................................................... 45
IV. Transit Access in Europe ................................................................ 51
Introduction ................................................................ 51
Integration of Bicycles with Public Transport in the
Netherlands ................................................................ 52
Mode of Access to Rail Stations............................................................. 53
ii
Mode of Egress from Stations55
Parking at Rail Stations ................................................................ 55
Government Support for Bicycle-Transit Integration.............................. 58
Cost of Bicycle Parking Facilities .......................................................... 59
Bicycle and Pedestrian Access Conditions ............................................. 61
Bicycle Transit Integration in Denmark......................................................... 61
V. Bicycle-Transit Integration in Japan ................................................................ 68
Rapid Growth in Bicycle Access to Railways................................................ 68
Bicycle Parking Facility Characteristics ........................................................ 69
Changes in Bicycle Parking Industry in Japan........................................ 69
Average Facility Size ................................................................ 69
Average Occupancy of Bicycle Parking ................................................. 70
User Fees ................................................................ 70
Facility Types 70
Rent-a-Cycle Ports at Rail Stations................................................................ 71
Impacts of Bike-and-Ride Travel in Japan..................................................... 72
VI. Costs, Benefits, and Market Penetration.............................................................. 74
Impact on Transit Service Area and Penetration ............................................ 74
Access Trip Lengths ................................................................ 74
Network Patterns, Connectivity, and the Effects of Barriers .......................... 75
Effects of Service Area Size on Potential Transit Use.................................... 78
Bicycle-Transit Potential for Chicago Commuter Rail................................... 79
Bicycle Egress: Opportunity for Developing New Transit Markets................ 81
Bicycle/Pedestrian vs. Auto Access to Transit............................................... 82
Complementary Access Modes .............................................................. 82
Land Use Implications of Nonmotorized Vs. Auto Access ..................... 82
Capital and Operating Costs ................................................................ 83
Energy Use and Air Pollution Emissions................................................ 84
VII. Recommendations ................................................................ 89
Need for a Clearinghouse ................................................................ 89
Development of Guidelines for Nonmotorized Transit Access....................... 90
Selection of Bike-and-Ride Transit Locations ........................................ 90
Siting of Bicycle Parking Facilities ........................................................ 91
Equipment Selection ................................................................ 91
Bicycle Access Route Improvements ..................................................... 91
Bike-on-Transit Programs ................................................................ 93
Marketing and Promotion ................................................................ 94
Management and Operations95
Recommendations for Future Research and Pilot Projects ............................. 96
Conclusions ................................................................ 97
Bibliography ................................................................ 98
Selectioned Additional References ...............................................................102

FHWA Case Study No. 9
1
Executive Summary
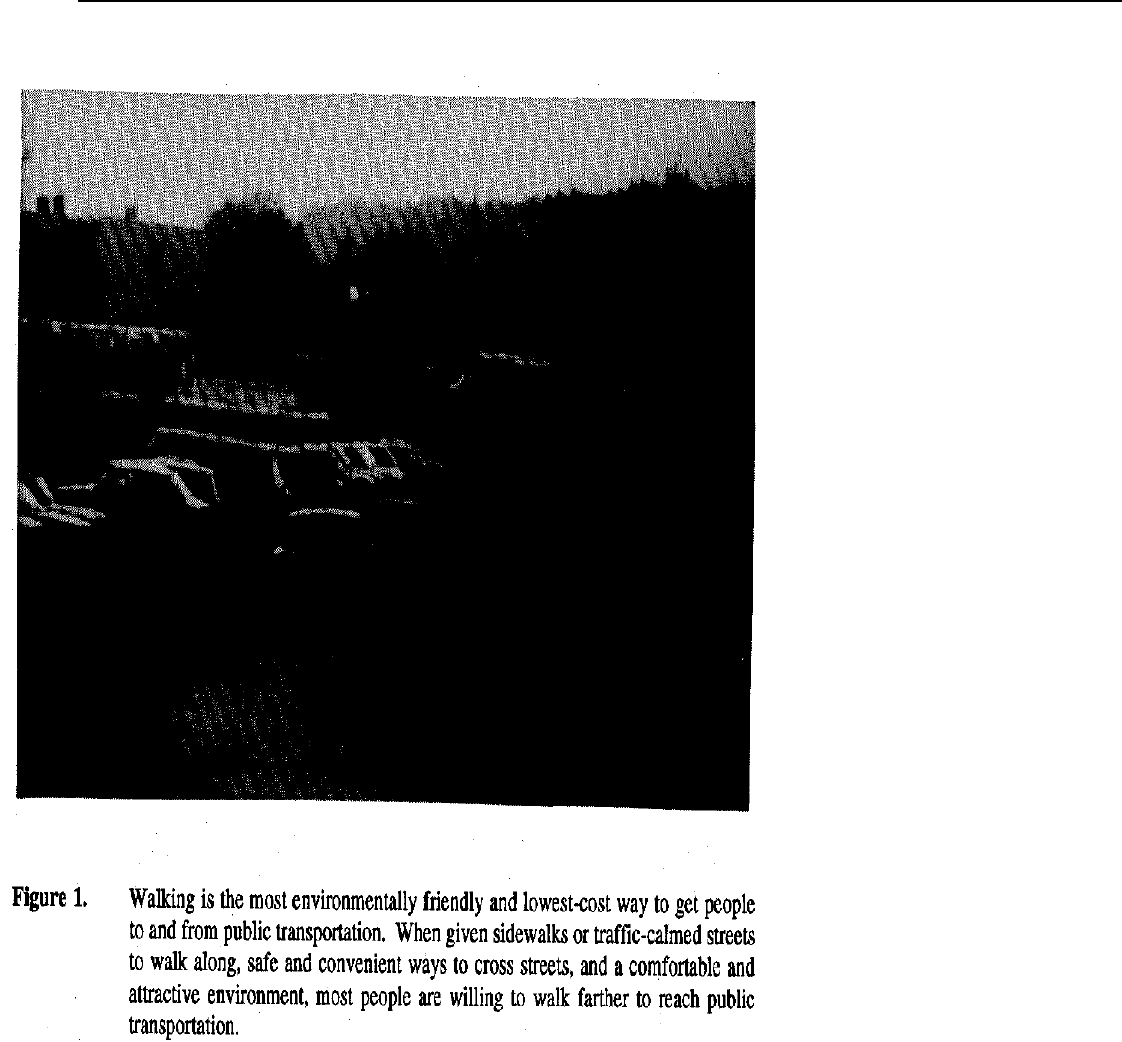
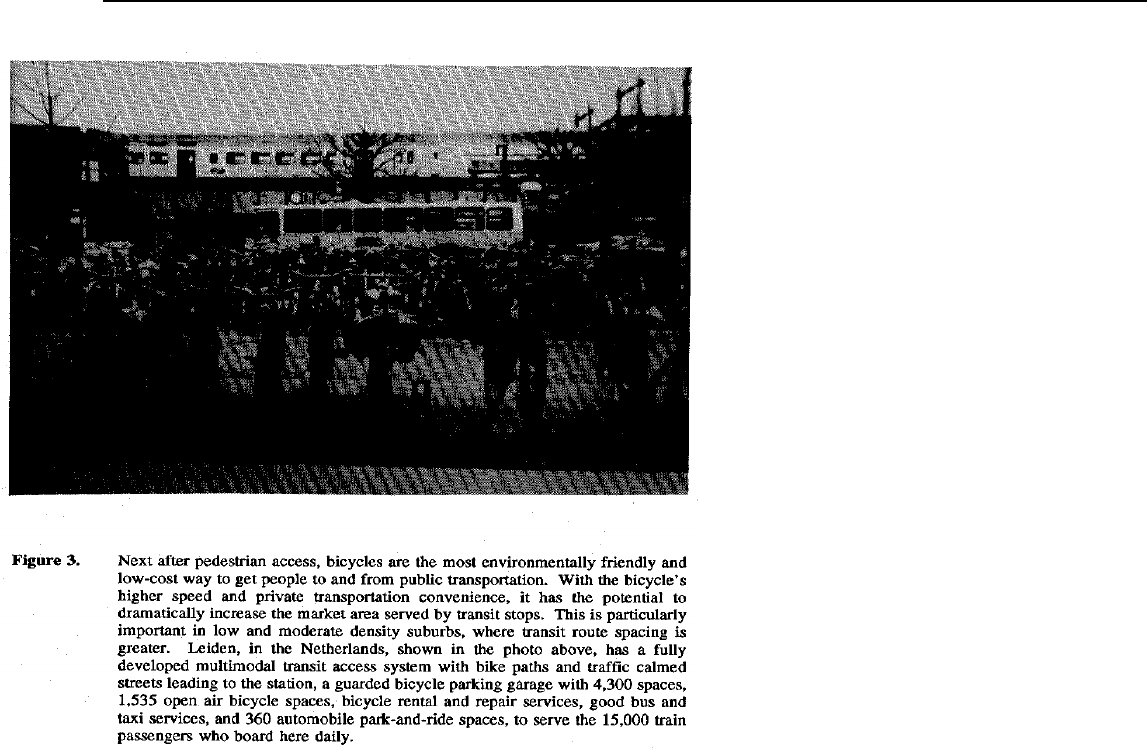
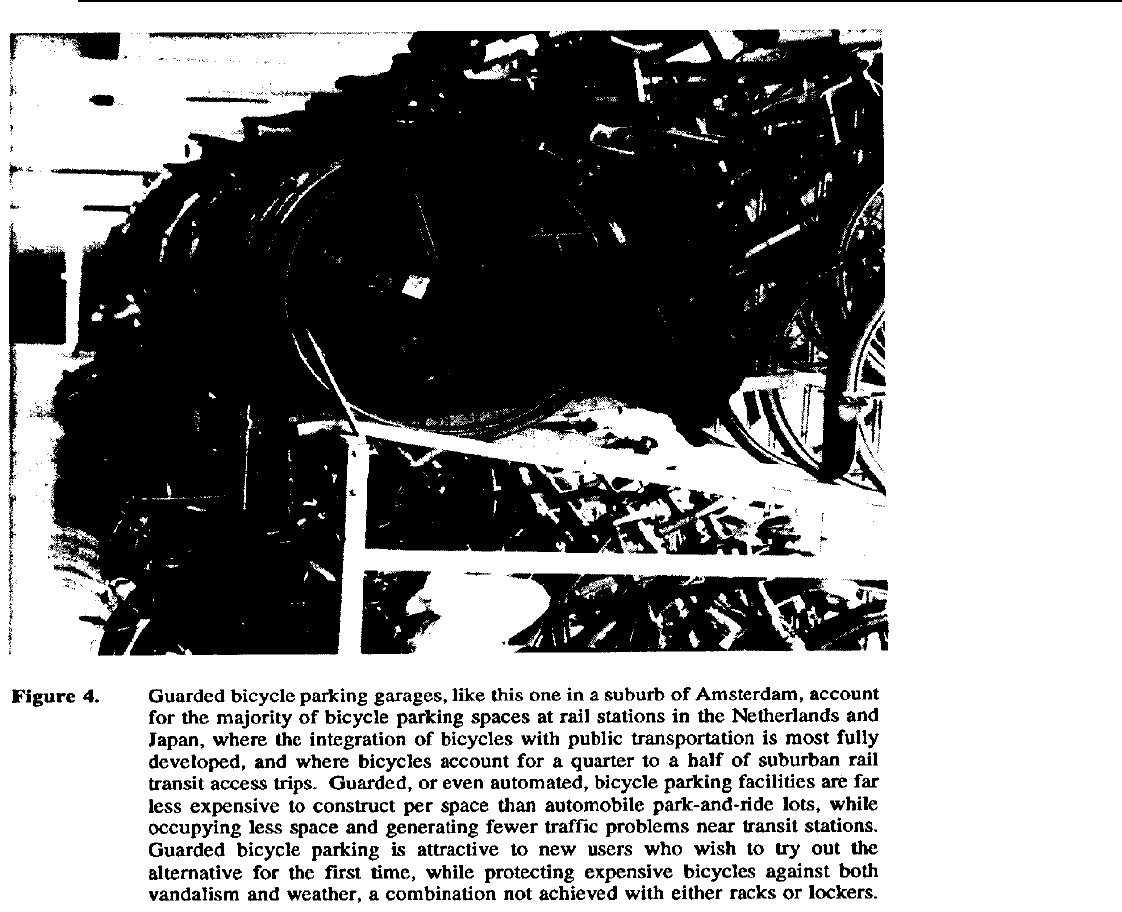
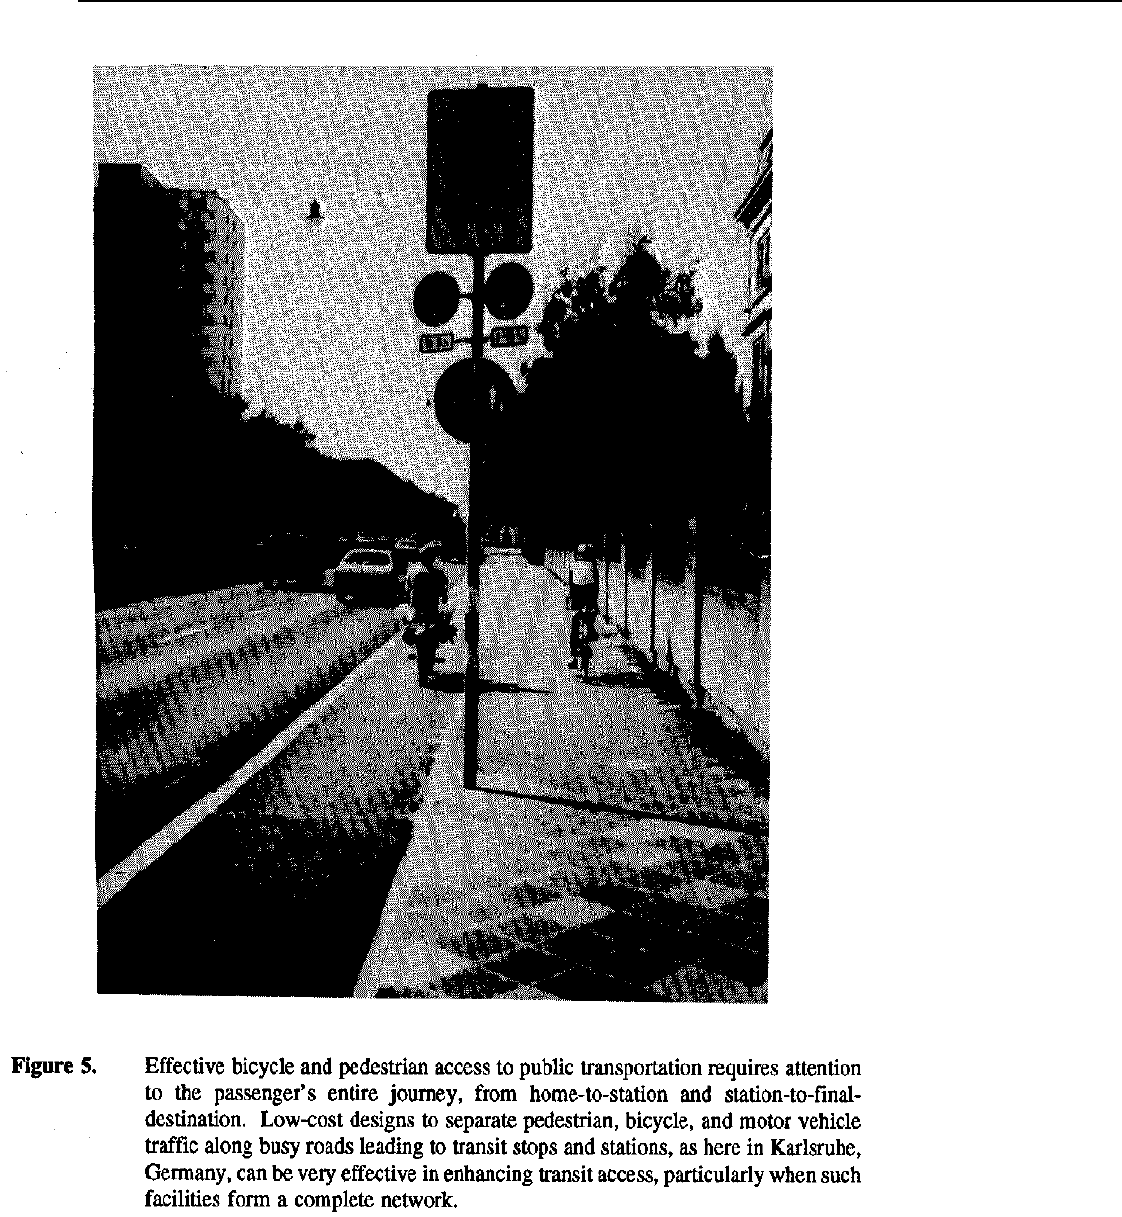
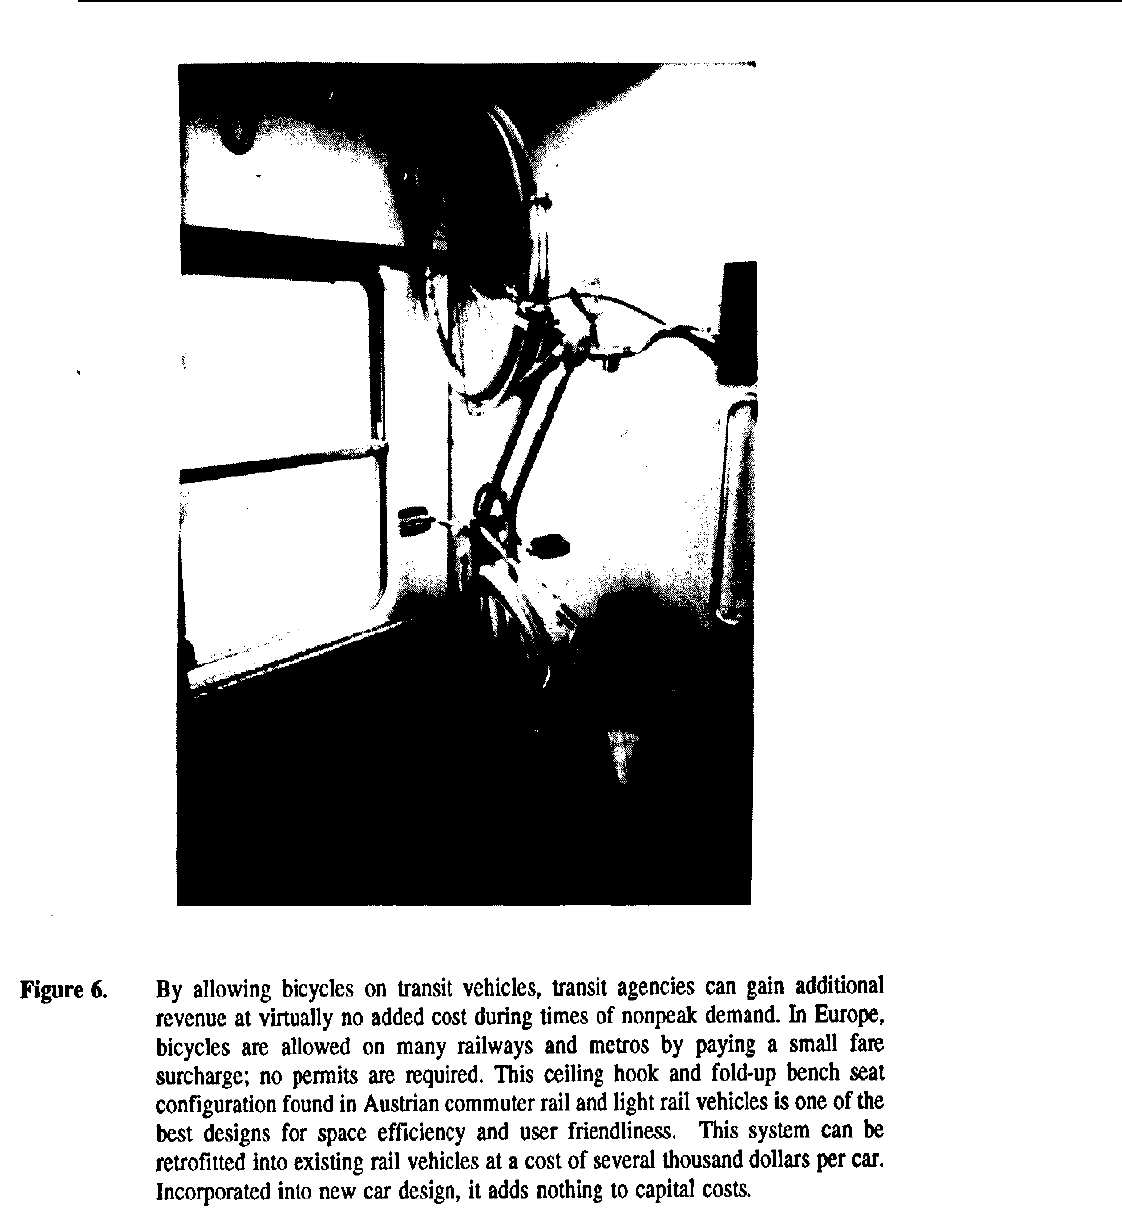
This report deals with how people get to and from public transportation by
bicycling or walking, a subject which has not been extensively studied in North
America. Intermodal research has attracted little attention in the modally organized
transportation agencies of the United States, except where large investments were at
stake, such as the construction of truck-rail, airport access, and park-and-ride facilities.
Pedestrian and bicycle access to transit has been taken for granted in many
communities, and frequently neglected in planning, design, and operations.
Pedestrian and bicycle planning and facilities development requires great
attention to small-scale, generally lower cost elements of the built environment.
Moreover, pedestrians and cyclists have been far less formally organized into
economic and political interest groups than automobile and transit interests. As a
result, the needs of pedestrians and cyclists have often been neglected in planning and
designing the built environment, including the development of new transit systems and
services.
However, without good pedestrian and bicycle access to transit, the only way
passengers can be attracted out of their cars is to provide extensive and expensive
parking at transit stations and stops. Indeed, this is the direction that many U.S. transit
agencies have taken, encouraged by Government funding programs which for decades
have favored park-and-ride lot construction over the provision of pedestrian and
bicycle facilities.
New flexibility in funding under the Intermodal Surface Transportation
Efficiency Act (ISTEA) of 1991 and the requirements of the 1990 Clean Air Act
Amendments offers new opportunities and strong encouragement for transportation
agencies to work together in improving pedestrian and bicycle access to transit. Action
in this area offers the potential of highly costeffective reductions in air pollution
emissions, increased transit ridership, alleviation of chronic capacity shortages at many
park-and-ride lots, and reduced traffic congestion near transit stations. A number of
transit agencies and local and State Governments have initiated efforts to improve
nonmotorized transit access, but many major problems and opportunities have not yet
been addressed. This report highlights some of these efforts and opportunities.

Linking Bicycle/Pedestrian Facilities with Transit
2
The Historical Context
Since the earliest days of public transportation, people have relied on their feet
to get to and from transit stops or stations. The urban environment of America early in
this century provided a hospitable environment for pedestrian access to transit. Within
that environment, public transportation rose to prominence as the shaper of growth and
predominant means of travel for all but short trips.
In the latter half of this century, however, America's urban patterns shifted to
radical new forms. Pedestrians and bicycles were thoroughly displaced as modem traffic
engineering widened roads to speed the movement of cars. Massive infrastructure
investment in highway transportation reshaped not only the streets, but also the
patterns of jobs, houses and shops. Faster speeds meant longer trips, expanded
separation of activities one from the other, and sprawl. More Americans began growing
up in places where it was neither safe nor convenient to walk, in a culture grounded in
automobile dependence.
All of these changes had a profound effect on public transportation, which
suffered itself from long-term disinvestment. In a spiral of decline, transit services in
mid-century lost ridership and cut services. By the 1960s, collapse was averted only
when the Government stepped in to reorganize the transit industry, offering subsidies in
recognition of transit's vital economic and community functions. As transit services
began expanding again into newer suburban areas organized around the automobile, the
share of access trips to transit by foot declined significantly. Transit agencies and State
and local Governments initiated a continuing steady expansion of parkand-ride lot
capacity at transit stops and stations. Today in many American suburbs and smaller
cities, more than half of access trips to transit are by automobile.
Alternative Strategies for Transit Access
In sharp contrast, bicycles and walking are the predominant means of access to
express public transportation services in Japan and much of Europe, where automobile
park-and-ride is far less developed. Differences in transportation policy and investment
strategy, urban design, and land use all account for this variation.
Japan and many European countries have invested heavily in bike-and-ride
facilities, providing many guarded bicycle parking garages at major rail stations, and
have adopted policies favoring bicycling and walking, with extensive use of traffic
calming techniques and provision of bicycle paths and lanes leading to stations.
Automobile park-and-ride facilities in Japan and Europe are far less extensive than in the
United States.
High rates of bicycle theft and vandalism pose a major barrier to bicycle-transit
integration in the United States. This can be overcome only by providing secure

FHWA Case Study No. 9
3
bicycle parking at transit stops and stations---lockers, unguarded shared check-rooms,
and guarded bicycle parking garages----as is found in Japan and much of Europe.
Bicycle-hostile street environments

Linking Bicycle/Pedestrian Facilities with Transit
4
near most U.S. transit stops and stations also pose a significant barrier to more
widespread use of bicycles for transit access. The majority of American cyclists are not
comfortable riding in fast or heavy traffic unless offered separate lanes or paths. A large,
but not well-connected, network of low-speed, low-volume, relatively bicycle-friendly
streets exist in most U.S. suburbs. However, without penetrator bicycle paths which
connect these to major transit stops, employment, and shopping centers, only a minority
of cyclists will consider it attractive to bike to transit.
Access System Costs, Energy Use, and Air Pollution
Although automobiles and bicycles are both potentially important modes for
transit access in low density areas, the costs of park-and-ride are far higher than bike-
and-ride. Typical construction and engineering costs for a park-and-ride lot are $3,500
to $5,000 per space for surface parking and $12,000 to $18,000 for structured parking,
compared to $50 to $500 per space for secure bicycle storage. Even automated bicycle
parking garages, like those found in Japan, are a fraction of the cost per space ($700-
$1,000) of simple automobile park-and-ride lots. Operating and maintenance costs are
also far lower for most bike-and-ride systems. Experience in Germany shows that the
needed operating subsidy per space for a several hundred space nonautomated guarded
bicycle parking garage is roughly comparable to typical operating and maintenance
costs for typical U.S. park-and-ride lots ($150-250 per space per year, while capital
costs are far lower.
Moreover, park-and-ride lots typically require 30 square meters (330 square
feet) of land per space, compared to 0.5 to 1.0 square meters (6 to 12 square feet)
needed for ground-level bicycle storage spaces. As a result, park-and-ride lots are often
constrained in size or location. Typically, they offer either inadequate capacity relative
to the potential demand or they must be sited in remote locations unsuited for pedestrian
access. In contrast, bicycle parking may be readily sited in congested areas around rail
stations and in traffic-sensitive residential areas.
From an energy use and pollution emissions standpoint, bike-and-ride travel is
far more cost-effective than further development of park-and-ride lots in most
communities. A study by the Chicago Area Transportation Study found that the
installation of secure bicycle parking at rail stations would reduce hydrocarbon
emissions at a public cost of $311 per ton, compared to $96,415 per ton for an express
park-and-ride service, $214,950 per ton for a feeder bus service, and $3,937 per ton for
a commuter rail carpool matching service. Similar differentials were found for carbon
monoxide reduction costs. Automobile park-and-ride trips involve cold start vehicle
operation, with associated pollution emission and fuel use rates several times higher
than the average for all automobile travel. In contrast, bicycle and pedestrian access
trips require no petroleum and have no emissions.
As Transportation Control Measures (TCMS) for air quality attainment, park-

FHWA Case Study No. 9
5
and-ride strategies frequently offer a very low payoff at a high cost, while
enhancements to pedestrian and bicycle access to transit offer a much higher payoff at
a far more modest cost. Switching short

Linking Bicycle/Pedestrian Facilities with Transit
6
auto access trips to bicycles can free up park-and-ride spaces for travelers living more
than 2 miles from the lot, improving the cost-effectiveness of the overall transit access
system.
Transit Markets and System Efficiency
The installation of secure bicycle parking at transit stops, combined with
targeted bicycle facility investments and selective traffic calmng near stations and major
stops and promotion of bike-and-ride travel, can be expected to increase suburban
transit use significantly in many communities. By giving people more choices about
how to get to and from transit, new riders can be drawn from those not now well
served by transit. In California, surveys show that 30 percent to 68 percent of bicycle
locker users at park-and-ride lots formerly drove alone to their destination before
switching to bike-and-ride. Across the United States, the potential for bicycle-transit
integration is large. About 100 million Americans own bicycles, and many of these
people live more than a quarter mile, but less than 2 miles from the nearest public
transportation route. Few of these people now use transit to get to work, in part because
of the lack of an inexpensive, convenient, safe, and fast transit access system suited to
trips of this distance. Further development of park-and-ride services may increase
transit market penetration somewhat in areas beyond walking distance of transit, but
only at a substantial cost. Bike-and-ride systems, however, offer the prospect not only
of lower access system costs, but of tapping market segments untouched by the existing
automobile-based transit access systems.
While park-and-ride enhances access to transit at the home end of the trip, it
does nothing to get people from transit to destinations beyond walking distance of
transit. Well developed bike-and-ride systems, on the other hand, can enable people to
use a bicycle to get from transit to workplaces and schools located outside the
immediate vicinity of transit stations. In the Silicon Valley of California, 40 percent of
bicycle locker users store their bicycle overnight in their locker and use it to get from
commuter rail stations to workplaces and schools not otherwise easily accessible from
transit. For U.S. transit services to retain or gain market share, they must be adapted to
the lower-density polycentric metropolitan land use patterns of late twentieth century
America. Bicycle access and egress are both important elements in making transit
services viable in such areas, where pedestrian access and egress are handicapped by
lowdensity development and frequently nonexistent pedestrian infrastructure.
Improved pedestrian and bicycle access to transit is not a panacea for the
problems transit agencies face in adapting to these new markets, but can be a major
element in improving suburban public transportation under conditions of economic
restraint. As a strategy for holding down transit costs while boosting transit ridership,
saving energy, reducing air pollution and traffic congestion, slowing global warming,
and preparing for future oil-supply interruptions and cost escalation, the improvement
of pedestrian and bicycle linkages to transit is among the most cost-effective

FHWA Case Study No. 9
7
approaches.
Linking Bicycle/Pedestrian Facilities with Transit
8
FHWA Case Study No. 9
9

Linking Bicycle/Pedestrian Facilities with Transit
10
FHWA Case Study No. 9
11
Linking Bicycle/Pedestrian Facilities with Transit
12

FHWA Case Study No. 9
13
Linking Bicycle/Pedestrian Facilities with Transit
14
FHWA Case Study No. 9
15

Linking Bicycle/Pedestrian Facilities with Transit
16
FHWA Case Study No. 9
17
Linking Bicycle/Pedestrian Facilities with Transit
18

FHWA Case Study No. 9
19
Linking Bicycle/Pedestrian Facilities with Transit
20
FHWA Case Study No. 9
21

Linking Bicycle/Pedestrian Facilities with Transit
22

FHWA Case Study No. 9
23
1. A Brief History of Transit Access in the
United States
Walking or riding a bicycle to access mass transit once played a predominant
role in American cities, only later eclipsed and virtually abandoned to automobile
commuting and auto access to transit stations. In recent years, a combination of factors
are focusing national attention on the inadequacies, inequities and high cost associated
with the unbalanced, auto-dominated transportation system that has developed in the
United States. Highway congestion, Federal mandates to restore healthy air quality,
concerns about energy consumption and a declining quality of urban life underscore
the need to bring greater modal balance and integration to the U.S. transport system.
Added to these factors is the challenge facing mass transit systems to provide
cost-effective and efficient service to the expanding low-density suburban
developments and to serve the increasing share of metropolitan area trips that are
suburb-to-suburb rather than suburb-todowntown. Legislators, transportation
professionals, planners, concerned citizens and others are taking a renewed interest in
the economic and environmental benefits that would result from improvements to
bicycle and pedestrian access to mass transit.
Transit Access Prior to and During World War II
In the late nineteenth and early twentieth centuries, compact American cities
began to expand outward along new railroad and electric trolley corridors. Walking
was virtually the only means of access to public transportation. Homes and businesses
in urban areas sought locations where transit service was within walking distance.
By the 1920s, however, development started to extend beyond easy walking
distance of transit stations. Automobile park-and-ride lots and bicycle racks appeared
at suburban commuter rail stations. . Cars were used more frequently to get to rail
stations, but commuting by auto to downtown had not yet become popular. Walking
remained the dominant means of transit access.
During World War II, gasoline rationing and scarce supplies of rubber and other
auto needs almost eliminated automobile access to rail stations; people walked or used
bicycles to get to the station. Bicycles were considered vital enough during the war to
merit rationing in 1942,

Linking Bicycle/Pedestrian Facilities with Transit
24

FHWA Case Study No. 9
25
with preference given to defense workers. In response to increased demand for bicycle
parking, a large number of bicycle racks were installed at stations.
Rise of the Automobile In the Aftermath of the War
A shift in commuting patterns toward the automobile and away from transit
began in the years following World War II and greatly accelerated in the decades
following. A combination of factors, including Government policies, rising persona)
income, increased automobile ownership and suburbanization played a crucial role in
this commute change. New U.S. Government programs ensured massive capital
investment in highways and suburban housing, and fostered the development of a web
of institutions at different Government levels to promote automobile-oriented
investments and policies.
At the end of World War II, the U.S. Government established major programs
to promote economic recovery. The 1944 Defense Highway Act was part of this
economic program and launched the Federal Government, in partnership with the
States, on a major highway construction program. Enactment in 1956 of the Highway
Trust Fund and Interstate Highway Defense System significantly expanded and
elevated the nation's highway building agenda.
Capital investment to modernize and expand public transportation systems and
inner city housing, on the other hand, was not forthcoming. In fact, streetcar lines in
cities across the country were converted to diesel bus operations. These conversions
were due not only to declining ridership in the face of rising auto ownership, but to
illegal collusion by major corporations in the automobile and petroleum industries. By
the time the corporations were found guilty of criminal conspiracy in Federal court,
they had succeeded in scrapping and replacing more than 100 electric rail transit
systems with diesel bus operations in cities across the United States.' Even in cities
where electric trolley lines were owned by local governments or local utilities,
competition from the automobile, changing land use patterns based around highways
and inadequate capital for maintenance and expansion led to service deterioration and
ridership loss.
Federal Government Recognizes the Need to Support Transit
In the early 1960s, with many American transit companies on the verge of
collapse, the Federal Government stepped in and established an emergency loan
program for transit capital needs. However, it was not until 1964, two decades after
passage of the first Defense Highway Act, that the Urban Mass Transportation Act was

Linking Bicycle/Pedestrian Facilities with Transit
26
enacted, providing Federal grants to transit agencies. Early Federal support for the
nation's mass transit systems, though highly insufficient to meet capital needs, helped
transit systems make necessary investments that led to service improvements.

FHWA Case Study No. 9
27
Federal mass transit legislation that followed over the years substantially
boosted and expanded Federal support for transit capital needs and operations, though
still falling far short of transit investment needs and far below levels of Federal funding
for highway construction and maintenance. Federal support of mass transit, in
partnership with State and local Governments, has been a crucial factor in reversing the
transit ridership losses of the 1950s and 1960s and putting transit ridership on an
upward trend.
Early Federal Support for Transit Access: Park-and-Ride Lots
The beginnings of Federal support for transit access are found in the Federal
Aid Highway Act of 1968, Section I 1, which funded a demonstration program for
automobile park- and-ride lot development. Local authorities had to provide 50 percent
match for the Federal funds and were required to set any parking fees for use of the
lots below the level needed to fully cover operating and maintenance costs of the
facilities. The Federal Aid Highway Act of 1970 moved park-and-ride out of the
demonstration phase by creating in Section 134, a program of Federal funding for park-
and-ride facilities, with 66 percent Federal share. The requirement that parking fees
remain below full market price was continued.
U.S. transit agencies used this new Federal program to make major investments
in parkand-ride facilities. The new transit access system addressed a clear need.
Expansion of transit route mileage had fallen far behind the expansion of urbanized land
area, leaving a large percent of the population beyond easy walking distance of bus or
rail transit lines. Park-and-ride lots were viewed as the only way to tap growing
suburban markets without providing expensive transit feeder services.
Bicycle parking and safe pedestrian and bicycle access routes were rarely, if
ever, incorporated into the park-and-ride facility designs. The potential of bicycle and
pedestrian access systems appears not to have been on the minds of American
transportation planners and transit system operators, in clear contrast to their Western
European and Japanese counterparts.
By the early 1980s, well over 1,000 park-and-ride lots had been created
throughout the United States, some with capacity for more than 1,000 vehicles. Many
suburban transit systems had become automobile-dependent, as the automobile became
the primary means of reaching many, if not most, suburban express bus and rail transit
services. Since then, park-and-ride lot construction has continued at a substantial pace,
and lots holding several thousand vehicles are increasingly common. However, the
high cost of parking construction, limitations on land area available near transit stations,

Linking Bicycle/Pedestrian Facilities with Transit
28
and opposition from residential neighborhoods near proposed parkand-ride lots
constrain parking capacity provision or expansion at many locations.

FHWA Case Study No. 9
29
Neglect of Multimodal Transit Access In America
Local and feeder buses play an important role in many American metropolitan
areas in extending access to express bus or rail transit. However, these feeder bus
services are constrained by the same factors that inhibit further development of line-
haul transit routes in the suburbs: low population densities and dispersed travel patterns.
The higher cost and higher subsidy required to provide such feeder services usually
result in less frequent service than desirable and/or sparse geographic coverage, leaving
much of the population outside their service area. In many suburban areas and small
cities, budget constraints prevent such services from being offered at all.
These limitations of feeder bus services and park-and-ride access make it
increasingly important to focus planning, design, and operating strategies for transit on
improved pedestrian and bicycle access. Until recently, little attention or spending has
been directed towards these more humble modes in American cities and suburbs. It is
not surprising, therefore, that such modes today play a much smaller role in U.S. transit
station access than only several decades ago. This neglect has not only failed to capture
a cost-effective opportunity to enhance transit's market area in the suburbs but also
missed an environmentally sound and economical means of improving the efficiency of
our transport system.
As the following chapters demonstrate, this situation is changing. Spurred by
environmental mandates and concerns, the need to relieve costly highway congestion
and the successful experience in Western European and Japanese cities, localities
throughout the United States, in conjunction with their transit agencies, are beginning to
implement policies and programs to encourage bicycling and walking and better
linkages between bicycling and walking and mass transit. Now in its early stages, the
effort to improve bicycle and pedestrian access to transit in the United States shows
clear signs of growth.
Federal Funding Availability for Bicycle and Pedestrian
Facilities
Federal support for bicycle parking facilities has been made available through
surface transportation reauthorization bills in recent years. Although Federal funding
was available for bike-and-ride facility development starting in the mid-1980s, few
transit agencies and local governments took advantage of the availability of such funds.
The Surface Transportation and Uniform Relocation Assistance Act of 1987
(STAA of 1987) amended Sec. 326 on Bicycle Facilities, made eligible for Federal

Linking Bicycle/Pedestrian Facilities with Transit
30
mass transit funding (under Sections 3, 9 and 18), at a 90 percent Federal match,
projects that provide access for bicycles to mass transportation facilities, including
shelters and parking facilities for bicycles in or around mass transportation facilities,
and racks or other equipment for transporting bicycles on mass transportation vehicles.

FHWA Case Study No. 9
31
Passage of the Intermodal Surface Transportation Efficiency Act of 1991
(ISTEA) also provides the opportunity for State and local Governments and transit
agencies to increase their investments in projects that provide bicycle or pedestrian links
to mass transit. For example, approximately $1 billion per year for 6 years is earmarked
for a Congestion Management and Air Quality Program (CMAQ), to be spent on
programs or projects that must or are likely to contribute to attainment of the national
air quality standards. Eligible projects for CMAQ funds include secure bicycle storage,
construction and reconstruction of paths and lanes for bicycle and pedestrian use, and
purchase of racks for use on transit vehicles. Bicycle and pedestrian improvements,
particularly those linked to mass transit, offer some of the most cost-effective
opportunities to improve air quality by eliminating cold starts and hot soaks of short
trips by automobile.
On February 20, 1992, the Federal Highway Administration issued interim
guidance on implementation of the CMAQ Program which encourages States and
metropolitan areas to invest in bicycle and pedestrian facilities and program activities.
While the program is aimed at areas in nonattainment of the clean air standards, all
States will receive at least $4 million annually.
Surface Transportation Program (STP) funds are also clearly eligible for use on
bicycle and pedestrian facility improvements. Moreover, some 70 percent of available
funding authorized by ISTEA can be "flexed" to other categories, such as the STP,
enabling it to be used for bicycle and pedestrian facilities.
Under ISTEA, for the first time, States are required to develop a long-range
bicycle and pedestrian plan, to include consideration of bicycles and pedestrians in their
long-range and annual transportation improvement plans (TIPs) and to appoint a bicycle
and pedestrian coordinator in their transportation department. Metropolitan areas are
subject to similar planning requirements. These requirements indicate the higher
priority Congress clearly intends State and local Governments to give to bicycle and
pedestrian projects.
The dedication of a much larger share of Federal transportation assistance to
metropolitan planning under ISTEA offers an important opportunity for improved
planning of transit access systems. This could include, for example, the development of
new regional inventories of sidewalks and bicycle facilities, based on Geographic
Information Systems (GIS) and the regional TIGER file, a computerized representation
of the entire street and road network prepared by the U.S. Bureau of the Census for the
1990 census and available for every jurisdiction in the U.S. GIS, which has only
recently become widely available, provides a framework for using these data to better
measure the pedestrian and bicycle friendliness of areas, and to identify gaps in
networks. When combined with tax assessor parcel files, GIS can also be used to

Linking Bicycle/Pedestrian Facilities with Transit
32
identify the proximity of housing and employment to transit stops and neighborhood
retail services, providing planners with better indicators of the market area of transit
stops by foot and bicycle, enabling better multimodal access system planning.

FHWA Case Study No. 9
33
Continued Federal funding of all transportation activities in many regions which
are in noncompliance with the Clean Air Act (CAA) standards will be dependent on the
local implementation of Transportation Control Measures (TCMs). Improving bicycle
and pedestrian access to transit can be an important and effective TCM, promising
significant reduction in emissions. To properly account for emission reductions from
pedestrian and bicycle programs, however, requires the use of models which separately
estimate running emissions, trip-based emissions (cold starts/hot soaks), and diurnal
emissions. It also requires travel demand models which estimate both work and
nonwork person travel, appropriately accounting for mode choice changes between
automobiles, transit, walking, and cycling. Federal metropolitan planning funds can be
used to improve the quality of regional air quality/transportation/land use models and
information systems to meet such needs.

Linking Bicycle/Pedestrian Facilities with Transit
34
II. Bicycle and Pedestrian Access to
Transit in the United States
"Bicycle-related matters are not yet accepted as a
legitimate part of the duties and functions of many
agencies and by many professionals. This needs to
change. The responsibility for bicycle considerations
should be fully vested in all appropriate agencies and
organizations concerned with transportation, education
and law enforcement." ----Florida Bicycle Sketch Plan,
1990
Over the past two decades there has been substantial growth in bicycling in
cities and States across America. Bicycling has become one of the most popular
recreational diversion for Americans of all ages and a means of transportation for
increasing numbers. A comparison of bicycle and automobile ownership for various
industrialized countries, shown in Table 1, however, shows that Americans remain far
more dependent on their cars and far less on bicycles than citizens of other
industrialized nations.
Table 1. Bicycles and Automobiles In Selected Countries (1985)
Country Bicycles Automobiles Bicycle:Auto
(millions) (millions) Ratio
Netherlands 11.0 4.9 2.2
Japan 60.0 30.7 2.0
West Germany 45.0 26.0 1.7
Argentina 4.5 3.4 1.3
Australia 6.8 7.1 1.0
United States 103.0 139.0 0.7
Increased interest in the United States by State and local transportation
professionals and planners in providing better bicycle and pedestrian facilities and
improving bicycle and pedestrian access to mass transit systems is evident in many
parts of the country. Planning studies and

FHWA Case Study No. 9
35
transportation demand management programs are beginning to include nonmotorized
links to mass transit and to examine the environmental benefits and potential gains in
transit ridership that would result from providing better intermodal connections.
Investment in bicycle lockers and racks at transit stations has increased but
remains inadequate and a key deterrent to increased bicycle access to transit. A
growing number of transit systems have implemented or are looking at bike-on-bus
and/or bike-on-mil policies, but many urban and suburban systems have yet to explore
bicycle-transit potential. While progress in improving bicycle facilities and bicycle
access to transit has occurred, observations in a 1980 U.S. Department of
Transportation report to Congress on bicycling and energy conservation remain
relevant:
"Many of the disincentives to increased bicycling are the result of the low
level of integration of bicycling into the U.S. transportation system. Three
root causes account for this situation: (1) lack of awareness and
understanding of bicycling concerns among transportation professionals; (2)
fragmentation of transportation planning and management, and (3) relatively
low level of funding commitment to support bicycling. Combined, these causes
produce a situation common in Federal, State and local transportation
agencies: bicycling is simply overlooked. "
Actions and policies put into place since that time are promising and indicate
that the country is beginning to understand and tap into the potential of nonmotorized
modes to bring greater efficiency, equity and environmental benefits to the U.S.
transportation system. Yet, the United States lags far behind Western European nations
and Japan and a real commitment of funding and policy from the highest levels of
Government on down is needed in the years ahead.
Mode Shares for Access to Transit In U.S. Cities
Studies that document the extent of transit access trips by nonmotorized modes
and examine the untapped potential to increase the nonmotorized share of trips have
been conducted by a number of transit authorities but are not yet common practice by
most transit agencies. The extent of nonmotorized access in many metropolitan areas
can only be inferred based on use of bicycle parking facilities at transit stations.
However, Tables 2 and 3 illustrate typical access modes shares for various selected
locations.
Studies have found motorized access-by automobile or bus-is the predominant

Linking Bicycle/Pedestrian Facilities with Transit
36
means of access to suburban rail transit stations, with park-and-ride or kiss-and-ride
(passenger is dropped off by automobile) constituting the vast majority of trips. This
comes as no surprise given the substantial investments in park-and-ride facilities that
have been made by transit agencies as a key strategy to entice commuters from the
suburbs to take public transit rather than drive to work.

FHWA Case Study No. 9
37
Table 2. Mode of Access to Four Northern Virginia Metrorail Stations (n=1,060)2
Mode.of Access to Metro Station
Metro Station Auto
Park-and- Auto
Ride Passenger Bus Walk Bicycle Other
Vienna 69.3 13.7 11.4 2.4 0.5 2.7
Dunn Loring 70.5 15.6 5.3 3.6 0.7 4.3
W. Falls Church 68.2 14.8 7.2 5.0 0.4 4.4
E. Falls Church 50.0 10.7 8.0 21.4 09.8
TOTAL 67.4 14.1 8.4 5.5 0.5 4.1
Table 3. Mode of Access to Various U.S. Rail and Bus Systems
Transit Access Mode Share (%)
Transit System Auto Bus LRT Walk Bike
Sacramento, CA Bus System 1.0 17.0 8.0 68.0 6.0
Sacramento, CA Light Rail 26.0 28.0 n/a 38.0 8.0
BART (1987) 32.7 17.1 48.1 1.0 1.1
Rail Transit
Columbus,OH (Bus) 28.3 n/a n/a 71.7 n/a n/a
SMART-Detroit (Bus) 30.1 n/a n/a 68.7 0.5 0.7
While this strategy has proven successful to a large extent, failure by
Government and transit agencies to also provide and seriously invest in bicycle
parking and improved pedestrian access to transit stations results in adverse
environmental and economic consequences. A large portion of parking spaces are
occupied by cars that have been driven very short distances-many 3 miles or less-trips
that are energy-inefficient and contribute disproportionate amounts of air pollution due
to the cold start phenomenon. The typical solution to overcrowded parking lots is to
expand parking, which is both expensive and land-consuming. Nonmotorized access
could eliminate many of these short automobile trips if proper investments were made
in bicycle parking and in bicycle and pedestrian paths from residential neighborhoods
to the transit stations.

Linking Bicycle/Pedestrian Facilities with Transit
38
NORTHERN VIRGINIA RAIL TRANSIT ACCESS
STUDY
A study of access to four Northern Virginia rail transit stations, conducted 1988
by the Metropolitan Washington Council of Governments, in cooperation with U.S.
DOT, FHWA and the Virginia Department of Highways and Transportation, found 81
percent of the Metrorail users accessed the stations by automobile.
Park-and-ride was the predominant mode of access, used by 67 percent of
Metrorail users at the four stations. Another 14 percent were either dropped off at the
Metrorail station or passengers in cars parked in the lot. Access by other means totaled:
8.4 percent by bus; 5.5 percent walked and 0.5 percent bicycled. Auto access was higher
than for Metrorail system-wide (40%) due largely to the means of selecting survey
households, which was based on vehicles parked in the four Metrorail parking lots.
The study found 66 percent of the available parking spaces at the four Metrorail
park- and-ride lots occupied by people living within 3 miles of the stations. The study
concluded that, "this is a misuse of this scarce resource. From a transportation system
perspective, these [automobile parking] spaces would be better used by long-distance
auto driver trips."
The main reasons cited by survey respondents who could be potential bike users
but are not, were: danger from auto traffic, lack of bike lanes, trails or bike storage and
insufficient security. Chief reasons for not walking by potential walkers were similar:
danger from auto traffic, no sidewalks and inadequate lighting.
Extrapolating the findings of survey respondents to the total 3,060 people who
live within 3 miles of the lots and drive to them in the peak hour, the study projected a
potential diversion of almost 1,300 auto drivers or 42 percent to bus and nonmotorized
modes.
Source: Metropolitan Washington Council of Governments, Metrorail Orange line
Bicycle/Pedestrian Access Study, Northern Virginia, October 1988.
Along with automobile access, walking is a key means of transit access.
Walking tends to be the predominant means of access to bus stops and, where residential
neighborhoods are located in close proximity to downtown or suburban rail stations (i.e.,
within easy walking distance), walking is an important or dominant means of access to
rail transit as well.
Mode of access can vary significantly by time of day and by location. For

FHWA Case Study No. 9
39
example, during the evening peak and off-peak hours in the San Francisco region,
bicycling constitutes a larger percent of BART access and egress trips than daily
average. Walking accounts for 80.6 percent of morning egress trips and 68.4 percent of
afternoon access trips, compared to a 48 percent daily average. Bicycle access to
BART is twice as high in the East Bay as in the West Bay or the region as a whole
(1.6% vs. .8%). Walking, on the other hand, makes up a larger

Linking Bicycle/Pedestrian Facilities with Transit
40
percent of total access trips in the West Bay than other areas or the region as a whole.
These regional differences reflect the various factors which influence the extent of
nonmotorized access to a station, such as the relative pedestrian and bicycle friendliness
of the area, availability of bicycle parking facilities, topography, and the pattern of land
use and overall urban design.
Wide variation is also seen in the means of access to the Metrorail transit
system in the Washington, D.C. metropolitan area by time of day and by station. A
1990 Metrorail passenger survey found walking to be the predominant means of
access, used by 61.4 percent of riders. The automobile is the second most prevalent
means of station access-auto driver, auto passenger and auto-drop-off is used by 17.8
percent of transit riders and only 0.2 percent of riders access Metrorail by bicycle. Yet,
in the AM peak period, bicycle access is higher than the daily average (.34% vs. .2%)
and is substantially higher at some stations: Braddock Road (1.8%); Clarendon (1.4%);
Dunn Loring (1.3%); Medical Center (2.0%); Takoma (1.2%); Virginia Square (1.3%)
and West Falls Church (1.2%). Walking access, like bicycle access, also varies
significantly by station.
A survey of 73 people who bicycle to Montgomery County, Maryland,
Metrorail stations found that bike-and-ride travelers are overwhelmingly male (86% in
this survey) and employed full-time or are full-time students. The typical individual
bicycling to Metro in Montgomery County arrives at the station between 6:30 and 8:30
AM (75%) and returns to the station to pick up his bicycle between 4:30 and 7:00 PM
(66%). Nearly three-fourths of these travelers are between 31 and 50 years old. Most
bicycle to the Metro station at least 4 days a week in the spring, summer, and fall.
Winter months reduce the use of bicycles to reach the station by half Four out of ten
travel 1/2 to 1 mile to reach the station, one-fourth travel 1-1.5 miles, and one out of 10
travel farther than 2.5 miles. Median bicycle access trip lengths for different stations
vary considerably, from 0.8 to 2.0 miles, reflecting differences in land use, the
friendliness of the bicycling environment, and topography. Roughly a fourth of those
surveyed use an automobile to reach the station if not bicycling, while half walk, and
the remainder use the bus. One out of 20 said they would not make the trip if not using
a bicycle. Only 7 percent use a bicycle primarily because they have no automobile
available.
When asked for their opinion about what bicycle improvements are most
needed, those surveyed ranked bicycle paths separated from vehicle traffic first,
followed closely by provision of additional and more secure bicycle parking, along with
more bicycle-compatible roadways and lower prices for secure bicycle parking.
Employer provision of showers was ranked lowest as a need, likely because those
bicycling to transit typically travel short enough distances to avoid extensive
perspiration. Indeed, 42 percent travel 5-9 minutes by bicycle to reach the station, 33
percent travel 10-14 minutes, and fewer than a quarter travel more than 15 minutes.
A number of studies, such as a mode split study conducted in Columbus, Ohio,

FHWA Case Study No. 9
41
have found that people's willingness to walk drops off rapidly with distances beyond 2
blocks or a quarter mile. The study notes that the steep drop-off in ridership leaves the
transit system with an "unrealistic mandate to provide stops within two blocks of homes
in the service area." Information provided by METRO Transit, a bus transit system in
Oklahoma City, similarly

Linking Bicycle/Pedestrian Facilities with Transit
42
indicates that most bus riders walk no more than 1/4 mile. Bicycle access to bus stops
would appear to hold significant potential to expand the transit market area in a cost-
effective manner.
An analysis of the 1977 National Personal Transportation Study, for example,
found that 13 percent of U.S. workers living within 1/4 mile of a transit stop use transit
to get to work, but this falls to 8 percent for those 1/4 to 1/2 mile from a stop, and to 4
percent for those living between 0.5 and 2.0 miles from a stop.3
Bus Stop Shelters
The vast majority of U.S. transit systems use buses only, and for these the
predominant means of access is by walking. Transit authorities have, therefore, paid a
fair amount of attention to providing sheltered stops on main bus routes, especially in
regions which experience extensive precipitation, extreme cold, or blazing heat and sun
for some months of the year. Most transit agencies have a policy threshold to determine
whether a shelter is warranted at a particular location. For example, in Charlotte, NC,
shelters are generally provided at stops that board 50 or more passengers per day.
A number of transit systems plan to significantly increase their budget for
shelters. MARTA in Atlanta is about to initiate a new program of bus stop shelters that
is expected to add at least 1,000 shelters over the next 2 years. The shelters will be
provided and maintained by companies who sell advertising to cover costs. Regional
Transit of Sacramento, CA is also considering an advertising/shelter program that
would greatly increase the number of bus stops with shelters. The Memphis Area
Transit Authority (MATA) will add approximately 500 new shelters over the next 5
years, supported by advertising revenues. Table 4 shows the extent and cost of bus stop
shelters in a number of cities.
Bicycle Parking Facilities at Transit
Cities and transit authorities across the country are beginning to recognize the
crucial role of secure bicycle parking at transit stations in promoting increased bicycle
access to transit. A number of the nation's commuter rail and rail transit systems are
investing in bicycle parking but many lack a more comprehensive strategy that looks at
the environment beyond the station. Frequently the quality of the parking provided is
inadequate, leaving most bicycles vulnerable to theft and vandalism. The majority of
suburban bus transit systems, which could expand service area and ridership through
bicycle-transit interface, appear to pay little, if any, attention to bicycle parking facilities
at bus stops.
There is wide variation in the use of bicycle racks and lockers between rail
stations and also between transit systems. A crucial factor appears to be the degree to

FHWA Case Study No. 9
43
which the environment leading to the station is bicycle-friendly and the quality of the
bicycle parking provided. In areas

Linking Bicycle/Pedestrian Facilities with Transit
44
Table 4. Passenger Shelters at Bus Stops
Number Average cost
per of Total % shelter
Transit System Sheltered Number of Sheltered
Stops Bus Stops
Central Ohio Transit 329 4,040 8.1 $6,600
Authority (COTA)
Charlotte, NC 70 350 2.0 $3,500
Memphis Area Transit 157 5,000 3.0
Authority (MATA)
Metro Transit, OK 72 750 10.0
Milwaukee County Transit, 760 6,260 12.1 $3,800
WI
MARTA, Atlanta, GA 138 20,000 0.6
Niagara Frontier Transit 272 4700 5.8 $4,000
Auth, NY
METRO, Houston, TX 1,000 10,000 10.0 $3,500
SMART, Detroit, MI 260 7,000 3.7 $3,000-8,000
Santa Clara County Transit, 10.0 $2,000-3,000
CA
Sacramento Regional Transit 85 3,855 2.0 $3,000-5,000
RTD, Boulder, CO 50 $4,500
where separate bicycle paths or bike lanes on streets have been implemented,
facilitating connection to rail or bus services, the ease and safety of access by bicycle is
greatly enhanced. Access to many stations is on streets where little or no thought has
been given to bicycle safety, curtailing the extent of bicycle access. The degree to
which a transit agency actively promotes its bicycle parking facilities, and more
broadly, promotes the environmental and social benefits of bicycle access vs. auto
access also impacts upon the use of bicycle lockers and racks.
In 1990, the commuter rail authority in Chicago, METRA, conducted a survey
of bicycles parked at METRA stations. A total of 809 bicycles were found to be parked
at the 88 METRA rail stations with bicycle parking. Of these, 564 were parked in
officially designated locations and another 245 at nondesignated locations (locked to
poles, trees, signs, etc.). As Table 5 indicates, there is significant variation in bicycle

FHWA Case Study No. 9
45
access among stations. Some 66 out of 88

Linking Bicycle/Pedestrian Facilities with Transit
46
stations had less than 10 bicycles parked at them and most of these, less than 5. Only 13
stations had more than 20 bicycles parked. Table 6 shows the characteristics of bicycle
parking at a sample of North American transit systems.
Table 5. Number of Bicycles Parked at METRA Stations, Chicago,
Illinois
No. of Bicycles Parked No. of Stations
30 or more bikes 8
20-29 bikes 5
10-19 bikes 13
5-9 bikes 22
Less than 5 bikes 40
Total 88 stations
Vandalism:A Perplexing Problem
Vandalism and abuse of bicycle racks and lockers are a problem experienced
not only in this country but other countries as well. The degree to which it occurs in the
United States varies between metropolitan areas and transit stations within a city. It has
caused some transit authorities to remove lockers at troublesome locations and
undoubtedly is a concern weighed by potential bicycle riders. It is important Chat
transit authorities work to minimize vandalism through the type of bicycle lockers and
racks they select and through the location and security provided for bicycle parking at
the station. Vandalized bicycle parking equipment is a dramatic advertisement of the
risks facing those who would contemplate parking their bicycle at a transit stop,
particularly for cyclists with bicycles costing many hundreds of dollars.
BART learned from its early mistake in installing cheap lockers made of
pressed board construction. The lockers proved to be poorly resistant to vandalism and
subject to malfunctions. Vandalism remains a vexing problem at various locations and
prompted BART to remove the lockers at the Richmond station. Locker break-ins

FHWA Case Study No. 9
47
average about two a month throughout the system and seem to come in clusters, with a
vandal targeting a particular station and hitting all the lockers there-although the bikes
are not necessarily stolen.

Linking Bicycle/Pedestrian Facilities with Transit
48
Table 6. Bicycle Parking at a Sample of North American Transit Systems
Transit System Number of Racks No. of Lockers Usage
BART, CA 1,368 600; 470 usable 352 lockers rented
Boulder, CO 50+ 38 (76 bike capacity)
CalTrain, CA 374 75%
COTA, Ohio 0 0
Charlotte, NC 15 2 (5 to be installed)
CTA, Chicago 0 0
SCRTD, Los Angles, CA installing racks and lockers at 50 stations
MBTA, Boston racks @ 20 stations 200-250 bikes/day
at some stations
Metro-Dade Transit, FL 325: user pays 40% rented
$70/year or $45/6 mos.
METRA, Chicago, EL 88 of 244 rail stations have bicycle parking
MARTA, Atlanta, GA posts or racks at all 29
stations
MATA, Memphis TN Planned for new trolley
line endpoints
MTA, Baltimore, MD removed from METRO stations; planned for MARC
commuter rail stations
METRO, Houston, TX I park&ride with 2 demand exceeds
racks; adding 2 more capacity
NFTA, Buffalo, NY 3 stations with racks Univ. station rack
get 50%
occupancy
NJ Transit at 39 stations at 5 stations
RT, Sacramento, CA racks at most stations 60 lockers at 10 LRT 90% occupied
stations; $15/6 mos.
San Diego, CA 800 at govt bldg., P&R
lots, LRT stations
Santa Clara Cty Transit, 10% of bus and LRT 75% rented
CA stops
SMART, Detroit, MI 1 @ park and ride lot
SEPTA, Philadelphia 30 removed due to
vandalism
WMATA, Washington 900 650 (about 64 broken); 286 lockers
DC $70/yr; $25/3 mos. rented; wait lists
at many stations
Toronto Transit, Canada at 32 stations (20 bike 0
spaces ea)

FHWA Case Study No. 9
49

Linking Bicycle/Pedestrian Facilities with Transit
50
Misuse of bicycle lockers has been a problem in many cities. In Washington,
DC, there have been problems with street vendors renting bicycle lockers to store their
supplies and equipment, frequently in neighborhoods where there are long wait lists for
bicycle lockers. In 1986, a homeless man lived in one of the BART 4-foot lockers at
the Lake Merritt station in Oakland, decorating it with magazine cut-outs. Although he
paid the $30/year rental fee, he was evicted after 6 months.
BARTS COMMITMENT TO BICYCLE PARKING
FACILITIES
Funding of bicycle parking by Bay Area Rapid Transit (BART) in the San
Francisco region dates back to 1972 when BART first started service. Twenty-four
coin-operated bicycle lockers were administered by a concessionaire. Vandalism,
however, led to change to a locker rental policy after four months. BART worked
with local bicycle groups to develop a locker installation program and took over
ownership and administration of the lockers from the concessionaire. Over the years,
BART has installed 600 lockers, of which 470 are currently in usable condition, with
352 rented. In addition, 1,368 bicycle racks have been installed at suburban and
urban rail stations. Lockers can be rented at a cost of $15 for a 3-month period or $30
per year, with a $25 deposit required.
Today, lockers at BART stations are almost at capacity and there are locker
waiting lists at certain stations such as the Union City Station. BART officials are
pushing to add capacity, contingent on obtaining additional funding through a Federal
Transit Administration grant for the next fiscal year. BART actively promotes its
bicycle parking facilities, in brochures and through electronic messages on station
destination signs.
Vandalism has resulted in other large and smaller transit systems removing
bicycle lockers, including SEPTA in the Philadelphia region; MARTA in Atlanta,
WMATA in Washington, DC, and the Milwaukee County Transit System in
Milwaukee. The Central Oklahoma Transportation and Parking Authority maintains 8
lockers but notes that vandalism of lockers and racks has occurred at various locations.
Guarded bicycle parking, as is commonly found in European and Japanese cities
and suburbs, offers the best solution to vandalism problems, particularly in crime-prone
areas. Even if formal guarded parking cannot be provided, vandalism can often be
reduced by locating bicycle parking in locations usually supervised by station
personnel, parking attendants, or small retail services near station entrances and making

FHWA Case Study No. 9
51
the surveillance of bicycle racks an explicit part of the responsibilities of such personnel
whenever possible. Station security can be enhanced while making transit more
attractive by strongly providing space for convenience retail kiosks in and near transit
stops. Such kiosks are barred by some transit systems in the United States, such as
WMATA in Washington, DC, due to concerns about littering in stations.

Linking Bicycle/Pedestrian Facilities with Transit
52
Fragmented Institutional Authority
While U.S. transit authorities have expended considerable planning and
engineering to meet pedestrian needs in station design, in many cases, little attention
has been devoted to either the pedestrian or bicycling environment to and from stations.
Poorly developed interjurisdictional and interagency cooperation often impedes
consideration of the door-to-door experience of using public transportation. It is not
unusual for several different agencies to maintain independent and poorly coordinated
control over the various facilities that are used by someone walking or cycling to and
from a single transit stop.
Unless these agencies agree to cooperate together in assessing, planning, and
enhancing nonmotorized transit access, major impediments to pedestrian and bicycle
access may persist or grow in severity with no notice from Government authorities.
Local and State Governments with authority to manage, maintain, and construct
pedestrian and bicycle facilities and roads need to cooperate with transit agencies and
interested citizens in developing action programs to reduce barriers to bicycle and
pedestrian access to transit.
METRO of Seattle, Washington, for example, is working to integrate
nonmotorized access to transit from the beginning in plans for new regional transit
services, rather than as an "add on" to already designed transit projects as frequently
occurs in many parts of the country. In December 1991, METRO published a
"Nonmotorized Access Study," a study conducted to assess the potential of and make
recommendations for incorporating bicycle and pedestrian access, with a focus on
bicycle access, into the system plan for Seattle's Regional Transit Project.' The'
Regional Transit Project examines two future rapid transit alternatives for the region-a
transitway alternative (bus and HOV facilities) and a rail system alternative (light rail).
The study notes:
"The potential 'commuter travelshed surrounding a transit line can be
increased by adding station and vehicle amenities to allow easier interface
between bicycles and the transit system."
Among the study's key findings are the following:
•Approximately I million people live within a 2-mile (desirable biking
distance) radius of the proposed rapid transit system
stations; a significant potential transit market;
•Agencies that have made improvements for bicycle access to stations
see substantial increases in bicycle ridership at those stations;

FHWA Case Study No. 9
53
•Transit vehicle [bus and rail] modificat ions and facility access
requirements can be accommodated at relatively modest capital
cost.

Linking Bicycle/Pedestrian Facilities with Transit
54
BICYCLING AND BICYCLE-TRANSIT LINKAGE IN LOS
ANGELES
Plagued by the nation's worst air pollution and by long hours of traffic
congestion, the Los Angeles region is making substantial investments in alternatives to
driving, such as light rail, commuter rail and bicycling. As part of this effort, the
Southern California Rapid Transit District (SCRTD), the major transit provider in Los
Angeles, is demonstrating a new commitment to bicycling and bicycle access to
transit.
As rail transit expands in the Los Angeles region, bicycling needs are being
considered and incorporated. SCRTD recently received funding for bicycle lockers and
racks at five stations with park-and-ride facilities on the Blue Line (the light rail line
linking Long Beach with downtown L.A.), serving a total of 120 bicycles. Fees for
locker rental will be $25 for 3 months, $45 for 6 months and $70 for one year.
A total of 36 lockers, serving 72 bicycles will be installed on the Green Line, a new
line due to open in several years. These lockers will be incorporated into the original
station designs and located close to the station entrances. The Gateway Center, which
will be constructed over the Red Line and where SCRTD will be moving its
headquarters, will also include bicycle lockers. The Gateway Center is being planned as
a model of pedestrian access and orientation, as well as a major multi-modal transfer
point between walkers, bicyclists, rail and bus transit users and auto drivers.
SCRTD will also select an experimental site at which coin-key lockers will be
provided. These coin-key lockers may reduce administrative costs and increase
revenues, but may also present problems in terms of cost of the coin-key mechanism,
maintenance and vandalism. They will be carefully evaluated to assess costs and
impacts. Class II bicycle racks will also be provided free of charge at the same stations,
with the thought that the lockers will serve bicycle commuters and the racks more casual
users. Since bicycle parking is being added to existing stations, it will be sited where
space allows. Preferred sites, however, are locations closer to the station entrances than
the park-and-ride lots.
The plans for secure bicycle parking at transit stations in the Los Angeles are part
of a comprehensive regional program of expanded bicycle paths and trails, better bicycle
and pedestrian access to transit, provisions in rail station design to accommodate
nonmotorized modes and bike-on-transit vehicle policies.
The Way to the Station or Bus Stop
A lack of attention to pedestrian and bicyclists needs beyond the bounds of the
transit station seems fairly common. The location of park-and-ride lots is often not

FHWA Case Study No. 9
55
amenable to nonmotorized access. One transit agency commented that all of their park-
and-ride lots are

Linking Bicycle/Pedestrian Facilities with Transit
56
located near freeways and/or shopping areas where residential housing is quite far away
and there are no bicycle paths or facilities located near the park-and-ride lots.
Some U.S. transit agencies and State and local Government transportation
departments, however, are showing a growing and promising awareness of the need to
focus on the larger environment that surrounds and leads to transit stations and bus
stops.
Florida. Florida has established itself through legislation and programs as one
of the nation's leading States in bicycle activities. Findings of the Governor's Bicycling
Activities Advisory Committee in 1980 led to implementation of several major
initiatives, including establishment of a State Bicycle Coordinator in Florida DOT and
development of a Bicycle Element in the State Transportation Plan.5 Building upon the
State's commitment to bicycling, a Bicycle Sketch Plan was developed in 1989 for the
Florida Department of Transportation under a grant from the Governor's Energy Office.
The Sketch Plan sets forth a framework for a comprehensive approach to the
development of bicycling in Florida and details the policies and programs that need to
be implemented by State and local Governments. The Plan notes the significant
potential of bicycling to help alleviate major urban and environmental problems facing
the State. The Plan estimates that oil savings in the range of 58,000-367,000 gallons of
gasoline/day could be realized if good bicycle programs were implemented in areas
covering Florida's 21 Metropolitan Planning Organizations (MPOs) and resulted in
modest increases in bicycling for transportation purposes.
Among the objectives identified as crucial to achieving a comprehensive
bicycle program, Objective 4, "Ensure the provision of support facilities to
accommodate and enhance bicycle use" is of particular relevance. Key programs listed
to achieve this objective include:
A. Local governments should amend their site-plan and zoning procedures to
require the routine provision of bicycle parking facilities;
B. The Florida DOT should prepare a manual detailing procedures for
selection and placement of bicycle parking;
C. Commercial establishments, especially malls and shopping centers, should
be encouraged to provide bicycle parking; and
D. Employers should be encouraged to consider providing showers at work
to accommodate bicycle commuters.
Charlotte. The city of Charlotte, North Carolina, began a project in 1981 to
encourage walking and bicycle access to bus transit along its heavily travelled Central
Avenue Corridor which contains seven intersections at Level of Service E or F in the

FHWA Case Study No. 9
57
peak hours. To help address bicycle access needs, 20 bicycle racks and three lockers
were installed at key bus stops. To maximize safe storage, bicycle racks were placed
near bus benches and shelters. Pedestrian access was improved by installing 114
pedestrian signals and 115 push-buttons at key

Linking Bicycle/Pedestrian Facilities with Transit
58
intersections and sidewalks were constructed with curb cuts to provide access for
children on bicycles and persons with disabilities.
Los Angeles. The Southern California Rapid Transit District (SCRTD) has
developed an interactive computer demonstration of the sidewalk "level of service"
(LOS) effects of pedestrian overcrowding.' This was used in a successful effort to n-
mitigate a plan by the Los Angeles Department of Transportation to take sidewalk
space away from a rail station area that will serve the intersection of the Red and Blue
rail transit lines. SCRTD has also commissioned a planning study of the Hill Street
Metro portals as a blueprint for directing Red Line rail transit passengers to significant
areas of downtown Los Angeles. The plan includes widening Hill Street sidewalks,
creating pedestrian short-cuts to key destinations, planting trees along Hill and
intersecting streets and a pedestrian walkway connecting the Museum of
Contemporary Art with the newly installed "Angel's Flight" cable railway (funicular).
Houston, Texas. METRO of Houston recently entered into a program to
implement sidewalks along major roads to provide access to their transit facilities. In
addition, METRO will be seeking in the 1993 legislative session authority to construct
bicycle paths and lanes, which METRO currently lacks authority to build.
Many of the new light rail transit (LRT) systems that have opened in recent
years in U.S. cities are attempting to integrate bicycles both at the station and in the
surrounding environment.
San Diego. The city of San Diego has added "destination plates" to its
bike routes----green and white signs that serve to direct bicyclists to LRT stations.
Plans are under way to plan for linkages between the new bicycle path and light mail
extension planned for the Mission Valley Corridor.
Santa Clara County. In Santa Clara County, CA, bikeways along the rail
right-of-way have been incorporated into the system. They are heavily used and very
successful. The new Tasman Corridor light rail extension will incorporate bikeways
into the project design.
Sacramento. All light rail stations in Sacramento, except one which is located
in a freeway right-of-way, provide at grade pedestrian and bicycle access. Some 17 of
the system's 28 stations are within three blocks of a city or county bikeway facility.
Linkages at most stations are via residential or connector streets with low traffic
volumes, presenting little or no problem for bicycle access. Four LRT stations are
located on pedestrian/transit malls.
Use of GIS to Support Pedestrian Planning
In Montgomery County, Maryland, a municipality of 750,000 people

FHWA Case Study No. 9
59
immediately north of Washington, DC, the County Government is undertaking new
initiatives to increase sidewalk construction and more fully incorporate the needs of
pedestrians into transportation planning. To support these efforts, the Montgomery
County Planning Department (MCPD) has developed

Linking Bicycle/Pedestrian Facilities with Transit
60
BOULDER, COLORADO: A PEDESTRIAN-FRIENDLY CITY
In 1991, Walking Magazine included Boulder, Colorado as one of America's
10 Most Walkable Cities. Magazine author, Dan Zevin noted in his article, "What
distinguishes a great walking city from your everyday Ameritropolis. In short, an
environment that makes it more compelling to stroll the sidewalks than to see it from
behind a steering wheel."
Boulder has worked hard to earn its pedestrian-friendly reputation. The
Transportation Master Plan for Boulder Valley, 1989, adopted by the Boulder City
Council, sets forth an ambitious goal to achieve a shift of 15 percent of all trips
currently made by single-occupant auto to other forms of transport such as bicycle,
walking and transit. The Pedestrian System Plan states, "The City and County shall
improve the status of pedestrians by increasing the convenience, comfort and safety
for pedestrians. " To this end, Boulder has made significant investments in sidewalks
and pedestrian pathways, hosted an annual International Pedestrian Conference for
the past 12 years; funded an Alternative Transportation Center and a Pedestrian
Systems Coordinator and taken other important steps to make Boulder a city where
people want to stroll rather than drive.
There are two heavily used pedestrian facilities in Boulder: the Boulder
Creek multi- use path which winds through the center of Boulder, parallel to Boulder
Creek for 4 miles, and the Downtown Pearl Street Pedestrian Mall, a gathering place
for shopper, strollers and entertainers.
Pedestrian needs are incorporated in the planning and design of transit
facilities. "In Boulder, the design of the transit station environment takes pedestrian
needs into consideration, as all bus riders are pedestrians waiting for transit," GO
Boulder notes. At the central transit station, a person can easily get schedule
information and bus passes/tokens and sit in a natural light, comfortable environment
while waiting for his/her bus. Sidewalk connections to transit are being explored as
part of the Neighborhood Transit Center concept, currently under study.
Maintenance of existing sidewalks, installation of handicap ramps and new
sidewalk construction is part of Boulder's "Sidewalk Program," to bring Boulder
sidewalks up to code in an efficient and effective manner. The program, estimated to
cost approximately $11 million over 7 years, will receive $600,000 in FY 1993 from
the Transportation Capital Improvement Program budget.
The City of Boulder's Alternative Transportation Center (known as GO
Boulder, for "Great Options" in transportation) has developed and begun to
implement an innovative comprehensive marketing program designed to change
citizen's mobility habits. The program seeks to both educate the public of their

FHWA Case Study No. 9
61
mobility choices and to encourage use of alternative modes of transport.

Linking Bicycle/Pedestrian Facilities with Transit
62
a computerized geographic information system (GIS) database on sidewalks.7 This
data flow is important to the County's efforts in growth management, master planning,
transportation analysis, and capital improvements planning.
Until the development of the Montgomery County sidewalk database, there was
only limited and fragmentary information available on where sidewalks existed and
where they were lacking across the County. A quick and low-cost comprehensive
survey, collected by two summer interns who spent 6 weeks driving on nearly every
road in the County, provided raw data for the inventory. These interns marked up
small-scale street maps with a dozen colors of ink to code each road segment for the
presence or absence of sidewalks on one or both sides of the street, sidewalk width
(under or over 3 feet), and the presence or absence of a buffer between street and
sidewalk (of under or over 3 feet). Open and closed section roads were also coded.
With these data, GIS software is now used to produce maps of roads by sidewalk status
at various scales of resolution, as well as sorted listings of street blocks by sidewalk
classification. The foundation of the database is the TIGER file used to enumerate
households in the 1990 U.S. Census, a low-cost product available from the Census
Bureau, which describes nearly all roads in the United States. Figure 11 shows an
example of a sidewalk map for one part of the County.
The inventory revealed that nearly 60 percent of the road links in the County
have no sidewalks and only 37 percent of road links have sidewalks on both sides of the
street, and that there is wide variation in the availability of sidewalks in different parts
of the County. This information should help explain some of the variation in walking
and walk-to-transit access between areas.
The database is being used to support a variety of MCPD work program
activities. A key application is to support administration of the County's Adequate
Public Facilities Ordinance through development of the Annual Growth Policy (AGP).
This is a regulatory system which limits the number of new subdivision approvals for
housing or employment based on the forecast level of traffic congestion in an area,
given transportation facilities that are fully funded in the County and State capital
improvement programs. Higher levels of traffic congestion are considered acceptable
in areas where people have more freedom to choose alternatives to the automobile.
A number of measures are used to ascertain the quality of alternative modes to
the automobile in the 23 policy areas used for AGP regulation. Since 1990, these
include the share of housing and employment within a quarter-mile of bus stops or one-
half-mile of rail stations, the frequency of bus and rail services, the share of trips made
by automobile drivers, the number of park-and-ride and secure bicycle parking spaces
at transit stops, and the ratios of sidewalk and bikeway length to street length. Transit
coverage and frequency account for much greater weight than access and use factors,
but all contribute to determining a weighted index of transit availability.

FHWA Case Study No. 9
63
To support this new measurement system, a preliminary sidewalk ratio was
calculated in 1990 by MCPD staff by coding to traffic zones a County street
maintenance inventory which

Linking Bicycle/Pedestrian Facilities with Transit
64
contained data on the presence or absence of sidewalks on many streets in the County.
These data had shortcomings which prevented them from being efficiently converted
into map data, but they provided an approximate measure of the sidewalk ratio. The
sidewalk inventory has replaced this earlier database to provide a much more accurate
measurement of the sidewalk ratio for the AGP.
Including Pedestrian and Bicycle Factors In Travel Demand
Modeling
The sidewalk ratio has been found to be a statistically significant factor in
explaining whether people walk to transit, drive to transit, or drive a car to work, and is
thus used in the transportation forecasting model that supports AGP traffic congestion
analysis. An AM peak hour work trip logit mode choice model used by the MCPD for
the past several years also incorporates an "Index of Pedestrian and Bicycle
Friendliness." This Index is a score independently assigned to all traffic zones in the
region based on the availability of sidewalks, bicycle paths, and bus stop shelters, the
extent of building set-backs from the street, and the heterogeneity of land use at a local
level.8 This Index was found to be highly statistically significant and explained much of
the variation in auto-transit mode choice not accounted for by another mode choice
model which focused solely on travel time and cost factors, ignoring transit access
conditions at the home and work-place trip ends.
A similar "Pedestrian Environment Factor (PEF)" is being used in
transportation modelling in Portland, Oregon, by the METRO planning agency. The
PEF was defined by local planners who scored each zone on a I to 3 scale for sidewalk
continuity, ease of street crossings, local street characteristics (grid vs. cul-de-sac), and
topography. These were summed up to indicate overall pedestrian environment
conditions, with scores ranging from 4 (poor) to 12 (good). The PEF proved to be a
significant factor in determining automobile ownership, which itself is a powerful factor
influencing transit ridership. It was found that in an area where walk trips can be more
easily made, the need for an automobile is less. The use of the PEF also improved the
ability of Portland's mode choice models to estimate walk and transit trips. Residential
and employment density and proximity factors, such as retail employment within I mile,
enter into Portland's models separate from the PEF and are also important indicators of
mode choice and automobile ownerships.9
In most U.S. cities, transportation models consider only travel time and cost of
competing modes, ignoring the quality of the pedestrian and cycling environment and
frequently treating the proximity of jobs and households to transit in at best crude
manner. This recent research and model development in Montgomery County and
Portland provides strong evidence that regional transportation models could improve
their forecasting methods by including more indicators of pedestrian and bicycle
friendliness. Such enhancement will likely be needed in many regions to evaluate air

FHWA Case Study No. 9
65
quality effects of transportation plans and programs.
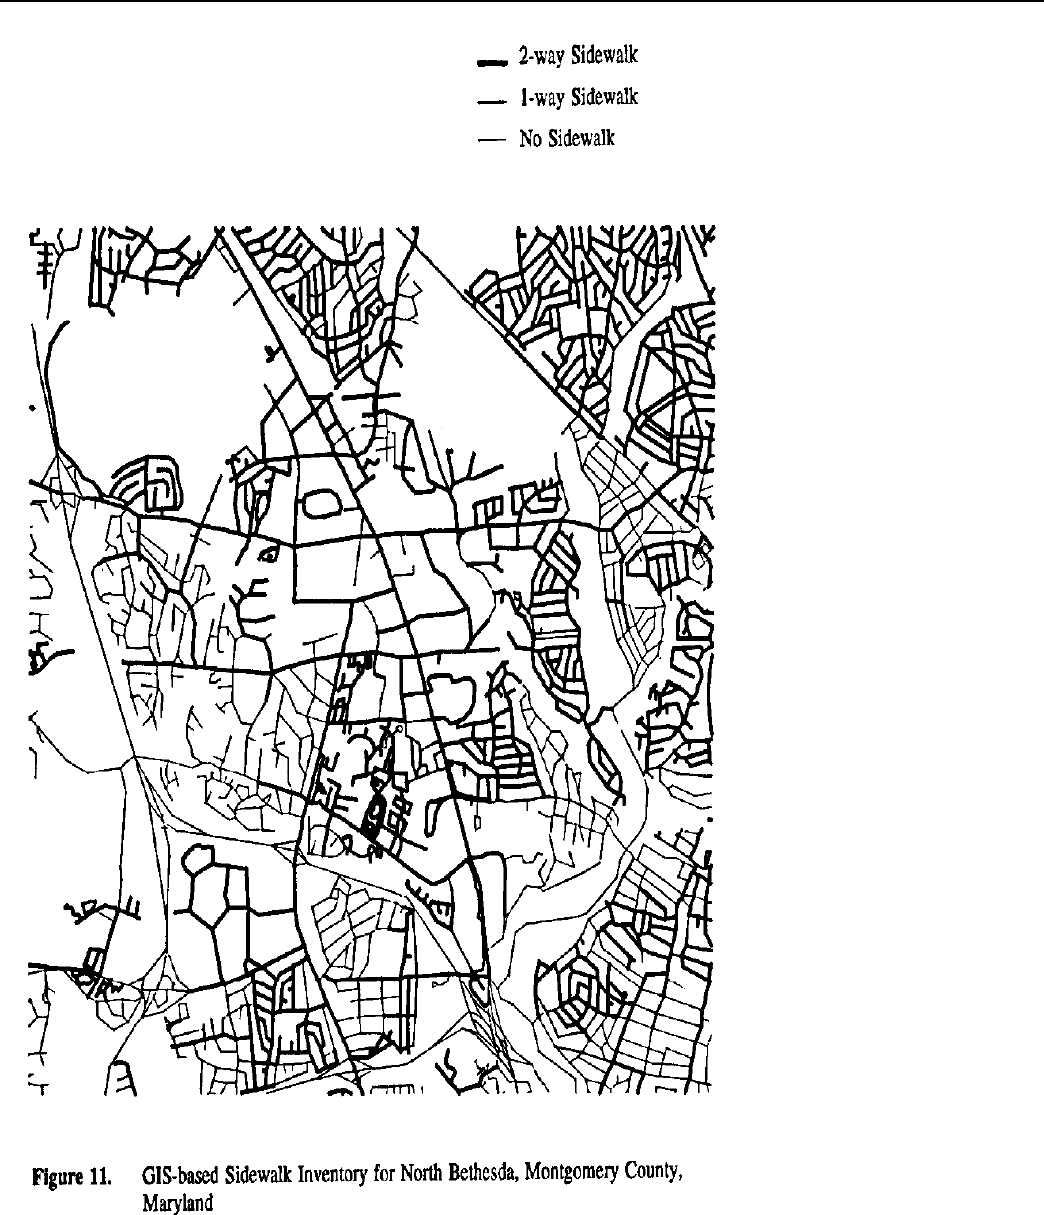
Linking Bicycle/Pedestrian Facilities with Transit
66

FHWA Case Study No. 9
67

Linking Bicycle/Pedestrian Facilities with Transit
68
With the more widespread adoption of GIS, detailed inventories of sidewalks
and street crossing conditions can be anticipated to come into wider use. Immediate
applications are possible in master plan development and in identifying key gaps in the
sidewalk network. Once coded, such data enable rapid production of sidewalk maps
and can support a variety of data analysis. The sidewalk inventory in Montgomery
County, for instance, has been used to help develop recommendations on where new
sidewalks are needed to connect affordable housing developments to nearby schools,
transit stops, and shopping centers. Future model development efforts are expected to
rely extensively on such data. Street address/intersection GIS-based georeferencing of
household and employer-based travel survey records, along with the use of real estate
parcel databases and TIGER-based inventories of bus stops and pedestrian/bicycle
systems will enable more effective analysis of the influence of pedestrian and bicycle
environmental quality and urban design on travel behavior.
Marketing and Promotion of Bicycle and Pedestrian Access
Some transit systems do an excellent job of promoting their bicycle parking
facilities or bike-on-rail and/or bike-on-bus programs, while other systems do little, if
anything, to promote nonmotorized access to transit.
The City of San Diego exemplifies a city that does an excellent job promoting
its bicycle and other alternative transportation programs. San Diego maintains a
separate phone line, 231- BIKE, that is widely publicized as a resource for information
on bicycling. The city provides free bicycle maps that indicate: city bicycle routes; bus
stops where bikes can be loaded and unloaded; location of bicycle lockers and bicycle
parking at park and ride lots and bike-on-bus routes. The San Diego trolley schedule
provides transit users with information on bicycle parking facilities and bike-on-rail
policies.
San Diego is also promoting bicycling with private employers in the region.
Commuter Computer, which operates the bicycle parking facilities in the San Diego
region, recently started a bike locker loan/purchase program under which lockers are
loaned to private companies for a 3-month trial period. After this time, the company
has the option to purchase the lockers at cost price (currently $942 for four bikes). To
date, lockers have been installed at 18 locations and Commuter Computer has received
payment at nine sites. Only two firms have requested that the lockers be removed
following the trial period.
By contrast, the Southeastern Pennsylvania Transportation Authority (SEPTA)
in the Philadelphia region, which initiated its bike-on-rail program in July 1991, does
not actively promote the program, leaving promotion thus far to be done by the Bicycle
Coalition of the Delaware Valley, a nonprofit citizen's coalition that worked closely
with SEPTA in developing its bike-on-rail program.

FHWA Case Study No. 9
69
Ill. Bike-on-Transit Programs
Bike-on-Rail Programs
A growing number of transit systems in U.S. cities allow bikes to be brought
on train___commuter, light rail and heavy rail transit services. In Europe, Japan and
Canada, bikeon-rail policies are more widespread, though still growing, and tend to be
structured in a manner that facilitates bike on rail use not only by regular commuters
but occasional bicycle riders and tourists as well. Bike-on-bus programs are also
spreading, especially in the United States.
The marriage of bicycles and transit, which forms an important part of the
increased use of bicycles for access and egress to suburban transit services, combines
many of the best features of each mode-using the bus or rail transit mode for the long
haul and the bicycle for distribution to and from dispersed destinations at both ends of
the trip.
Moreover, bike-on-rail services can provide high-quality metropolitan and
intercity mobility completely independent of petroleum-based transportation. In the
United States, as well as other oil-importing nations, these services contribute to efforts
to reduce dependence on imported sources of oil and to reduce the outflow of capital
from the country. The United States paid $51 billion for imported oil in 1991,
constituting 75 percent of the U.S. foreign trade deficit. And, these programs can play
an important role in urban strategies to meet Federal mandates to reduce air pollution.
The Historic Precedent
The original impetus for carrying bicycles on railroads came from railroad
companies in the late nineteenth century, which hoped to attract additional passengers.
These companies welcomed bicyclists and allowed them to bring their bicycles on
board at no cost. As bicycling became more popular, however, many rail operators
began to charge cyclists an extra fare for their vehicles, a policy that provoked strong
political opposition from bicyclists.
In February 1896, public pressure led to introduction and nearly unanimous
passage of legislation requiring railroads to carry bicycles free as personal baggage.
Following New York's example, similar legislation was introduced in other States. By
early 1897, the Passenger Committee of the Trunk Line Association, a railroad
management association, announced that

Linking Bicycle/Pedestrian Facilities with Transit
70
its member railroads would not charge for carrying bicycles. Free bike-on-rail policies
were subsequently enacted in Pennsylvania, New Jersey, Ohio, Michigan, Indiana and
parts of Illinois, California and Colorado.
Throughout the rest of the country, railroads and many streetcar lines offered
bike-on-rail services, but imposed a surcharge. The Market Street Railway Company
of San Francisco carried in 1897, an average of 1,800 bicycles per month on one route
alone, with up to 6 bicycles suspended from hooks at the front and rear of the trams.
The bicycles generated additional revenues of $180 per month without incurring any
increase in rail operating costs. In Pittsburgh, Pennsylvania, seats were removed from
one side of a number of trolley cars to accommodate bicycles inside. Bicycle hangers
were installed in the baggage cars of many commuter rail services in the 1890s.
However, as transit services moved towards collapse in the mid-part of this
century, bike-on-transit programs were abandoned, disappearing almost completely
until the 1980s.
Bikes-on-Rail Programs In the United States Today
The first American commuter rail system permitting bicycles in passenger
coaches in recent years was the Southern Pacific Railroad (SP), serving San Francisco
and San Jose. A 4_month demonstration project in 1982, sponsored by the California
Department of Transportation (Caltrans), allowed cyclists to secure their bicycles in the
aisles of the rail cars at no charge during nonpeak hours. No permit was required.
Southern Pacific's management, however, showed little enthusiasm for the project and
demanded payment of $73,000 by Caltrans to indemnify SP for potential accidents.
While there were no schedule delays, injuries or inconveniences to other passengers
during the 4-month demonstration, lack of publicity and a short program duration,
resulted in low bicycle use-only about 100 users a week. SP management's demand for
costly insurance payments----over $100 per bicycle trip----resulted in the program being
dropped.
At the time of the Caltrans demonstration project, only two other North
American rail systems had carried bicycles for more than I year: BART, the rail rapid
transit system in the San Francisco Bay Area and the Port Authority Trans-Hudson
(PATH) in New Jersey which started its bike-on-rail program in 1962. BART's
program enjoyed strong public support; by 1980, BART had issued more than 9,000
bike-on-rail permits. Community support and the excellent safety record of the
program prompted BART to relax restrictions on the bike-on-rail service and permits
were made available through the mail. By 1984, the number of permits had more than
tripled to 28,000; this had grown to 71,000 permits by 1992.
BART's success prompted other rail systems to institute bike-on-rail programs.

FHWA Case Study No. 9
71
Today, they exist on many commuter rail, heavy and light rail transit systems in cities
across the country and other transit agencies are planning bike-on-rail service. Table 7
provides information on some of these programs.
Table 7. North American Bike-on-Rail Programs
Rail System Permit Max. Time Restrictions
Number of Bikes/
Riders/Permits Train
METRO SYSTEMS
BART, San Yes-$3 7 (last car) nonpeak weekday; some reverse 7,445
July 90-June
Francisco commute; weekends 91;
71,000 permits issued
since 1974
SEPTA, Yes-$5 2/train last nonpeak weekday; weekends 167
permits
Philadelphia car)
MARTA, Atlanta .No no rule nonpeak weekday; weekends
( last car)
Metro-Dade, Miami, Yes-$5 4 last car) nonpeak weekday; weekends 2,000
permits
FL
WMATA, D.C. Yes-$15 (4 last car) weekday evenings; weekends 4,800
permits active;
9,000 since 1980
PATH, N.J. Yes-free 2/car nonpeak weekday; weekends;
midday with restrictions
Toronto Transit No Veh. op. nonpeak weekday; weekends
(metro/LRT) discretion
Montreal (rapid No 4 (last car) weekday evenings; weekends
transit)
MBTA (Red, Blue, Yes-$5 2/train (last nonpeak weekday; weekends;
Orange lines) car) some reverse commute
Boston
COMMUTER RAIL
Metro-North, NYC- Yes-$5 4 (north nonpeak weekday; weekends
CT cars)
MBTA, Boston Yes-$5 6/train nonpeak weekday; some reverse
max. commute; weekends

Linking Bicycle/Pedestrian Facilities with Transit
72
LIRR, New York Yes-$5 4/train (end nonpeak weekday; weekends;
cars) some summer restrictions
Caltrans, CA Starting up program
SEPTA, Yes-$5 2/train nonpeak weekday; weekends 167
permits (6/91-Philadelphia 12/91);
296 permits (1/92-
7/92)
MARC, Baltimore, Program under development
MD
NJ Transit, Atlantic Yes Conductor 220
since 1990
City line Discretion
TABLE 7: North America Bike-on-Rail Programs (Continued on next page)

FHWA Case Study No. 9
73
Rail System Permit Max. Time Restrictions
Number of Bikes/
Riders/Permits Train
LIGHT RAIL (LRT) SYSTEMS
San Diego Trolley, Yes-$3 2/car nonpeak weekday; weekends;
CA some Saturday restrictions
TRI-MET, Portland, Yes-$5 nonpeak weekday; weekends
OR
RT, Sacramento Yes-$5 2/car nonpeak weekday; weekends 1,439
permits issued
SCRTD, Blue Line, Yes-$6 2/car nonpeak weekday; weekends 400+
permits issued
L.A. in Ist
full year
Santa Clara County, No 4/car (pk bikes permitted at all times;
San Jose hr 2/car) 2 bikes/vehicle in rush hours;
4 bikes/vehicle in nonrush times
•At least five U.S. commuter railroads allow bikes-on-rail,
including: the Long Island Railroad (LIRR) (since 1983), Metro-North
Commuter Railroad between New York and its Connecticut suburbs
(since 1984), MBTA in Boston (since 1987), Caltrain and the Southeast
Pennsylvania Transportation Authority (SEPTA, since 1991).
SEPTA's bike-on-rail program followed a yearlong lobbying effort by
the Bicycle Coalition of the Delaware Valley. With SEPTA's new
program, the country's three largest commuter systems (LIRR,
MetroNorth and SEPTA) now all provide bike-on-rail service. While
Caltrain currently only permits folding bikes in a carrying case,
changes are in progress. A new operator will have taken over July 1,
1992, and a limited number of bicycles are now permitted on certain
runs. In Maryland, meetings are currently taking place between local
bicycle activists and the Mass Transit Administration to develop a bike-
on-rail program for the MARC commuter rail services in Maryland.
•At least 12 U.S. heavy rail and light rail transit systems have bike-on-
rail programs that generally operate only in the off-peak period. When
the Washington Metropolitan Area Transit Authority (WMATA) began
a bike-on-rail demonstration program in 198 1, following 5 years of
steady and patient lobbying by local bicycle activists, Washingtonian
Magazine awarded the program its "Best Idea of 1981." To date, 4,700
permits have been issued by WMATA.

Linking Bicycle/Pedestrian Facilities with Transit
74
New light rail systems that have opened in some U.S. cities in recent years are
integrating bicycles with their systems, providing bicycle parking at stations, and
permitting bikes-on-rail. These include LRT systems in Santa Clara County, San
Diego, Portland, Sacramento and Los Angeles. In mid-1992, Portland, Oregon,
initiated a more comprehensive bike-on-transit program, including bikes on the LRT,
regional buses and increased bicycle parking facilities at stations.

FHWA Case Study No. 9
75
Permits. Most U.S. transit authorities with bike-on-rail service require a cyclist
to obtain a valid permit. Costs for the permit generally range from $3-5 and are valid
for varying lengths of time: some systems, especially those with newer programs
require annual permit renewal while on other systems, permits may be valid from 3-5
years and on some, for an unlimited period. While the permit process provides a means
of assessing use of the system and ensures that bicyclists are familiar with the program
rules and regulations, permits severely constrain demand, generally excluding tourists
and potential occasional users. A few simple billboards or signs in transit vehicles and
near stations, as found in Europe, would provide an alternative means of
communicating rules of operation.
It is notable that not a single European bike-on-rail program requires a permit for
the carriage of bicycles. A large number of rail systems across Europe allow bicycles on
trains. Some offer this service for free, while others charge a fare supplement for the
bicycle. Eliminating permits allows them to attract a larger pool of users, generate
added revenues, and avoid the often considerable costs associated with permit
administration. Santa Clara County Transit, in California, is the first U.S. transit agency
to take a more European attitude towards the bicycle, allowing them on board without a
permit at no extra charge.
Time Restrictions. The U.S. bike-on-rail services are almost all restricted to
times outside the weekday peak hours. The exceptions are BART in San Francisco and
the MBTA commuter rail system in Boston, MA, which allow bicycles to be carried
during peak hours in the "reverse commute' direction only. Restrictions on most
systems prohibit bicycles on rail weekdays before 9:00 a.m. or 9:30 a.m. in the morning
(some allow bikes before 6:00 a.m.) and from 3:00 p.m. or 3:30-6:30 p.m. Weekend
policies vary, with some systems having no restrictions and some blocking out certain
hours when there is substantial shopping, work or recreational travel. Several European
bike-on-rail systems, including Oslo and Amsterdam, have no time restrictions on the
time when bicycles can be brought on board. Without any restrictions, cyclists, using
their own common sense, tend to naturally avoid bringing bicycles into rail cars during
crowded rush hours. Santa Clara County Transit again leads the United States in
adopting the most European attitude towards bike-on-rail, allowing two bicycles per car
in peak hours, and four per car in nonpeak hours.
Rail Car Design Constraints. Restrictions on the number of bikes permitted
on each rail transit system vary: some systems permit two bicycles/car and others
allow bicycles only on the last car of the train with a maximum of four bicycles/train.
In Santa Clara County, the bike-on-rail program is so popular that the number of bikes
far exceeds the limit. Passengers are expressing concerns about access problems
caused by bicycle overcrowding and efforts are under way to try to resolve this.
Rail transit system restrictions on the number of bicycles permitted are based in
part on rail car designs in this country, in which bicycle accommodation has not been a
consideration. On the MARTA system in Atlanta, and on other systems, cyclists hold

Linking Bicycle/Pedestrian Facilities with Transit
76
their bikes in a fold-up seat area near the backdoor of the rail car.

FHWA Case Study No. 9
77
In California, design of the new "California Car," mandated and funded by
Proposition 116, requires accommodation of a reasonable number of bicycles carried
on board by passengers for both intercity and commuter application. The California
Car is a bi-level car that superficially resembles Amtrak's Superliner, but with
significant design differences including bicycle storage on the lower level of the car.
The new rail car, which will be used on State -sponsored Amtrak and local commuter
rail services, is a promising new development in the United States. Its specifications
could be adapted by other rail agencies to enhance bicycle-rail linkage.
Bike-on-Bus Programs In U.S. Cities
At least 18 American transit systems have instituted bike-on-bus services, many
in the past 4 years. Bike-on-bus programs are functionally similar to bike-on-rail
programs but often operate in much lower density corridors than rail transport. By
expanding a bus line's access and egress service area, bike-on-bus programs can attract
many passengers who would not otherwise be able to use transit for their trip,
particularly to reach suburban destinations where transit coverage is often sparse.
There are three means of accommodating bicycles on buses--rear-mounted
racks, front- mounted racks, and allowing bikes inside the bus. Rear-mounted racks
were the earliest type of racks used by U.S. bus transit systems. While these continue to
be used by a number of transit systems, preferences appear to have shifted towards
front-mounted racks. At least three transit systems now use rear-mounted racks-San
Diego Transit, Humboldt Transit Authority in northern California, and Santa Cruz
Transit District. Two agencies that previously used rear-mounted racks-North County
Transit in northern San Diego County and Windham Regional Transit in Willimantic,
CT----have changed their policies; the former to front-mounted racks and the latter to a
policy that permits bikes inside the buses.
Development of Bike-on-Bus Service. The impetus for the first bike-on-bus
services, started in the 1970s in cities such as San Francisco, San Diego and Seattle, was
the lack of bicycle access to many major highway bridges. In the early 1970s, bicycle
activists in the San Francisco Bay area pressed local transportation officials for bicycle
shuttle services across the Oakland Bay Bridge which was closed to cyclists. AC
Transit, a local bus agency, removed half of the seats from a bus to make room for up
to 24 cyclists and their bicycles, initiating the "Pedal Hoppers", which offered limited
weekend services across the bridge.
California cyclists pressed ahead and won the attention of the State Legislature
which in 1974 required Caltrans to develop solutions to the problems of bicycle and
pedestrian access to State-owned toll bridges. Shuttle van services using bicycle trailers
were introduced by Caltrans at several locations, including the Oakland Bay Bridge and
the San Diego-Cordonado Bay Bridge. Although these services were popular and well

Linking Bicycle/Pedestrian Facilities with Transit
78
used, the costs were considered excessive.

FHWA Case Study No. 9
79
Seeking a cheaper way to provide bicycle access across the Coronado Bay
Bridge, Caltrans provided a demonstration grant to San Diego Transit to replace the
bike shuttle with a bike-on-bus service starting July 1, 1976. Rear-mounted bike racks
were put on three buses that operated on Route 9 over the Coronado Bridge. In 1977,
service was expanded to other routes serving the beach communities and two major
universities. The service began with a 10 cent fee that was later eliminated due to the
continual maintenance problems associated with the coin mechanisms. Today, 50 buses
operating on 3 routes are equipped to carry racks. There are 16 racks in daily service
with 3 spares available. The racks cost $1,250 each and the mounting brackets, which
are manufactured in-house, run $150/bus. New buses are specified to have the brackets
included. Table 8 shows the growth in level of use in this system, which by FY87 had
reached over 9,000 bike-on-bus riders a year.
Table 8: San Diego Transit: Average Daily Bike Rack Use FY 85-87
Weekday Use Saturday Use
Route FY85 FY86 FY87 FY85 FY86 FY 87
9 2 5 4 0 0 5
41 5 8 12.4 5 0 4
80 15 11 11.2 6 5 8.5
Total 22 24 28 11 5 17.5
In Seattle, limited access highway bridges across Lake Washington posed major
barriers to cyclists. Local bicycle activists pressured the city's transit agency and in
1978, Seattle Metro installed rear-mounted bicycle racks onto their buses that cross the
lake. A year later, front -mounted racks were substituted because of unconfirmed
reports that children were hitching rides on the rear racks.
The transit system in Santa Cruz, CA carries 400 bicycles a month on average.
In mid1992, they recently received a $45,000 grant from California's Proposition 116
and Clean Air Transportation Improvement funds to redesign their bicycle racks and
build new ones. Santa Cruz has had a few liability claims annually, involving minor
damage to bicycles.
Some transit systems, such as AC Transit in Oakland and SCRTD buses in Los
Angeles, have reported low usage of the bike racks. Implementation of bike-on-bus
service in Humboldt County, CA was troubled first by prolonged implementation and
then by rack functioning problems that raised liability insurance concerns. Humboldt's
experience provides a perspective on the unexpected difficulties encountered by rural

Linking Bicycle/Pedestrian Facilities with Transit
80
transit authority, which despite its difficulties, modified and continued its bike-on-bus
program (see box).

FHWA Case Study No. 9
81
Most U.S. bike-on-bus services do not require a permit, in contrast to most U.S.
bike-onrail services. While most U.S. transit systems accommodate bikes only on
designated routes, a few cities----such as Phoenix, AZ, Aspen, CO, and Sacramento,
CA-have no route restrictions and have opened their entire system to carrying bicycles.
The City of Phoenix began a 6-month bike-on-bus demonstration program from
MarchAugust 1991 to assess potential use of the service. Bicycle racks were mounted
on the front of buses operating on 3 routes, selected based on criteria developed in
coordination with the bicycle community. Two-thirds of the $15,000 program cost
came from a grant by the Arizona Department of Environmental Quality. During the
demonstration program, 5,500 bicycle trips were taken and ridership steadily increased.
At the end of the first month, 153 riders had used the service. By the end of the third
month (May), this jumped to 1,109 riders per month and by the end of the 6 months
there were 1,404 riders per month. Phoenix Transit reported no safety problems
associated with the new service. The service not only attracted increasing numbers of
bicyclists, but attracted to transit people who did not previously use the buses. A Bike
Rider Survey found that the vast majority (90%) of the bus riders used the bike racks
for commuting. An evaluation of the demonstration concluded:
"From the response received, it would not be a stretch to say that the
program was overwhelmingly popular among transit riders and
hailed as an excellent idea by bike riders. For bus patrons it is an
added option, for bike riders it is an opportunity and for public transit
it is another step toward reducing the number of vehicles travelling
on the road.
As a result of the successful demonstration, the Phoenix Transit bike-on-bus program
will be expanding system-wide in July 1992.
Although most transit agencies offering bike-on-bus services have relied on
various devices outside the bus, a few agencies have decided that added hardware is
unnecessary and allowed bicycles inside their buses. Westchester County Department
of Transportation (WCDOT), located near New York City, simply adopted a permissive
"welcome aboard" policy towards bicyclists and other potential users beginning in the
late 1970s. The space provided for wheelchair-bound passengers can be used by those
traveling with baby carriages, shopping carts, bulky packages, or bicycles. This policy
applies only to handicapped-accessible Advanced Design Buses, and only in nonpeak
periods. Wheelchair users are given priority over bicycles at all times. No problems
have been reported with the service.

Linking Bicycle/Pedestrian Facilities with Transit
82
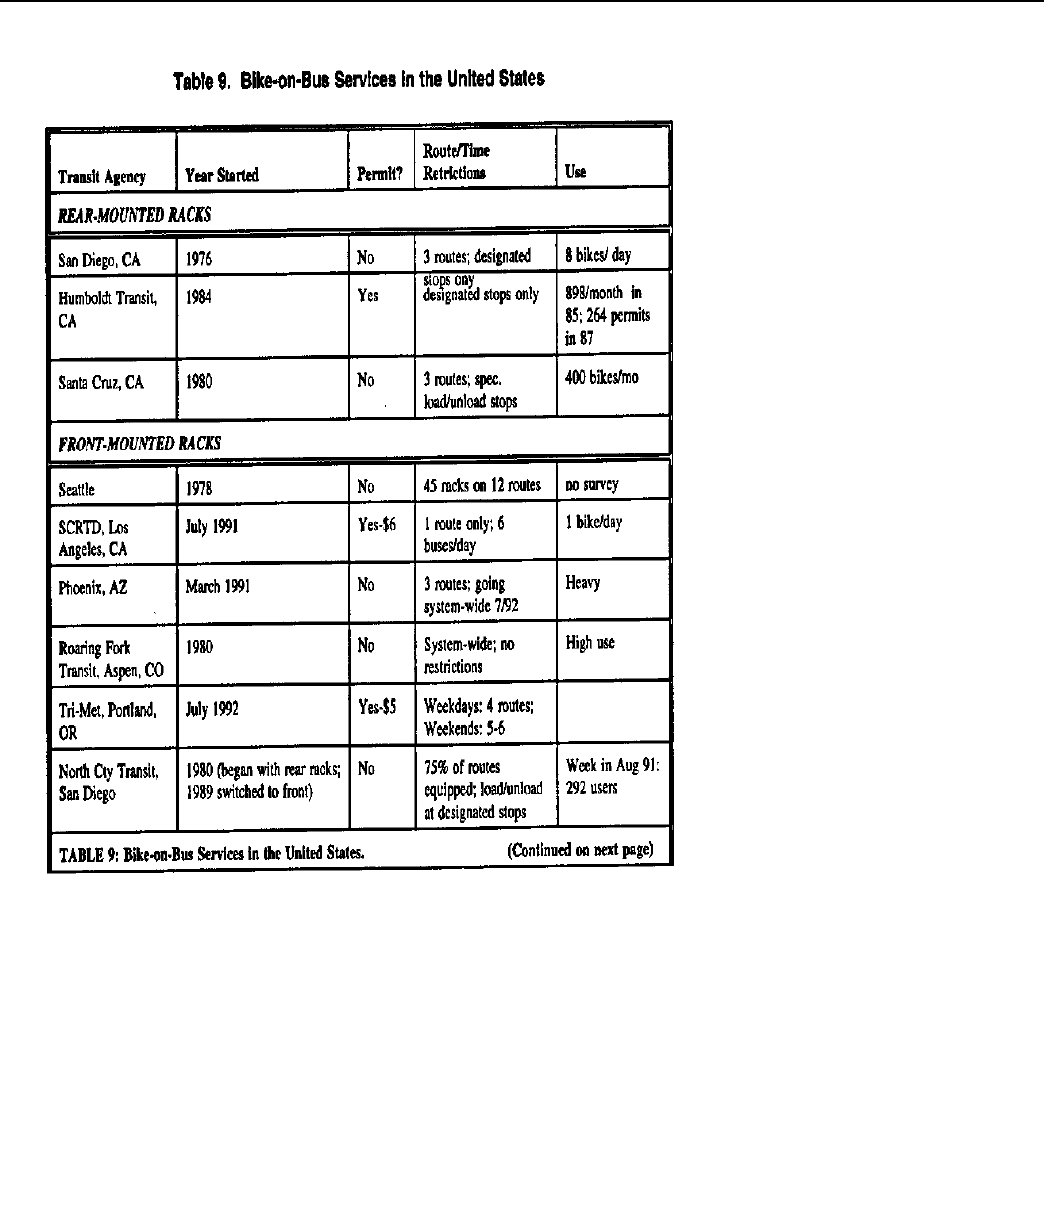
FHWA Case Study No. 9
83

Linking Bicycle/Pedestrian Facilities with Transit
84
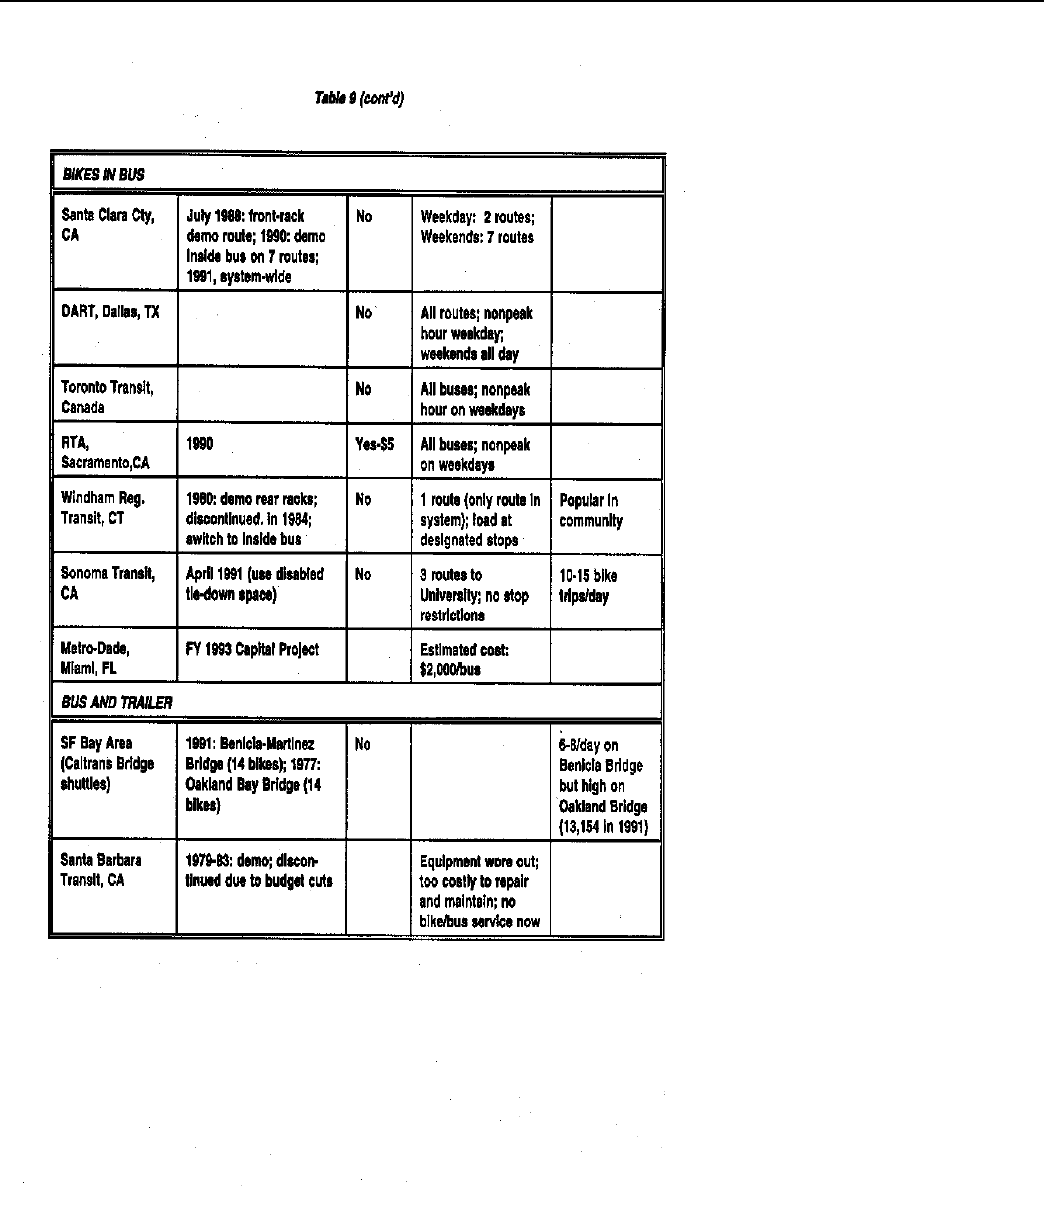
FHWA Case Study No. 9
85

Linking Bicycle/Pedestrian Facilities with Transit
86
HUMBOLDT COUNTY, CALIFORNIA:
OVERCOMING THE BUMPS TO KEEP BIKE-ON-BUS
SERVICE ROLLING
Bike-on-bus service for Humboldt County, CA was first conceived in July 1982
by the Humboldt Bay Bicycle Commuters Association (HBBCA), which wanted to use
funds provided by California's Bicycle Lane Account to benefit college students and
other residents of this northern rural region of the state. The letter writing and
newspaper campaign launched by HBBCA and the leadership of some of group
members were instrumental in getting HTA to adopt the bike-on-bus program. From
the start, there were problems: delays in obtaining the Sunshine U-Lock rear-mount
racks and discovery that the new Gillig Phantom coaches just ordered by the transit
agency did not easily accommodate the rear-mount racks. This required fabrication of
special mounts by a local manufacturer. The program was finally started in July, 1984,
and ridership in the first complete year of use --1985-averaged 898 bike users per
month.
Problems related to the racks and to users began to trouble the program. The
racks suffered from the effects of weather, diesel exhaust, vibration and wear and tear.
The spring -loaded "ball detent" pins which secure bicycles at the down tube were
prone to gumming up. The original design assumed use of a lock by riders and a hasp
was provided for this purpose. However, many riders ignored the feature and would
make the ball detent the only means of securing their bicycles. The bike-and-ride
brochure distributed to bike users failed to mention that the hasp had to be aligned with
its corresponding hole in the mounting clamp or else the ball detent would not engage,
allowing the pin to vibrate out and release the bike from the rack. The location of the
racks in the back of the bus was also a problem as it prevented the bus driver from
watching the loading/unloading process or from watching for potential bicycle theft at
bus stops.
By June 1986, six bicycles had officially disappeared from the HTA bike
racks----one was found beneath a car following the bus that had carried it. Fears of
liability caused some rethinking of the service. Rather than abandon the service, HTA
required bike users to sign a liability waiver and to pass a test at the transit agency
offices to demonstrate their knowledge of correct use of the racks. A $3 permit was
required. After the new permit system went into effect in mid-September 1986,
bike/bus ridership dropped 40 percent and in November, another 28%. A fare increase
in the winter of 1987 caused a further decline. The bike-on-bus service continued,
albeit at a much reduced level of use compared to 1985.

FHWA Case Study No. 9
87
The accommodation of bicycles on public transportation vehicles appears
likely to grow in the 1990s as efforts are made to expand transit markets in maturing
automobile-oriented areas in response to air quality and other concerns. New rail car
designs, improved bus bicycle racks, and GIS-based transit access planning and
analysis will likely aid this growth.

Linking Bicycle/Pedestrian Facilities with Transit
88
IV. Transit Access in Europe
Introduction
Bicycles and walking typically account for one-fourth to one-half of all person
trips in European cities, as well as for the vast majority of all public transportation
access trips, even in lower density suburban areas. This stands in sharp contrast to the
United States, where the share of person trips made by nonmotorized means fell in
recent decades to less than 10 percent, and where automobile park-and-ride accounts for
a major share of suburban transit access. There are many reasons for these differences,
including infrastructure investment and transport policies, urban design and land use
patterns, and commuter subsidies.
Compared to the land use patterns found in America, land development
throughout most of Europe is more clustered around public transportation nodes and
offers greater diversity of land uses within small neighborhoods. A larger share of jobs
and housing are located within walking distance of higher quality public transportation
in Europe. One can also find within these clusters of compact development the small-
scale retail services residents and workers need to meet most of their daily needs. An
extensive railway network links most major centers of development to each other with
frequent and rapid services. In larger centers, automobile parking supply is frequently
both limited and costly to users, particularly for long-term parking. Free workplace
parking, which is the norm in America, is far less commonplace in Europe.
Many European communities encourage walking and cycling through extensive
use of traffic calming to improve safety and comfort, complemented by a
comprehensive network of bicycle paths and lanes, secure bicycle parking at major
activity centers and transit stations, and extensive automobile restricted areas in town
and city centers.
Together, these factors of land use, urban design, infrastructure, and pricing
have been used by European public policy makers as powerful instruments for shaping
traveler mode choice. Despite high levels of automobile ownership, walking and
cycling remain the dominant mode for short trips, which themselves make up a
somewhat larger share of daily trip-making in European cities, compared to American
communities. For longer trips, both within and between metropolitan areas, railways
retain a significant share of the travel market in Europe, in sharp contrast to the United
States, where the automobile has become the predominant mode of travel for both short
and long trips.

FHWA Case Study No. 9
89
Europe's relatively well-developed bicycle and pedestrian transit access systems
are a crucial part of the overall mobility system, enabling many mom people to choose
public transportation over the automobile to meet their daily travel needs, particularly
for longer trips in metropolitan areas. This situation is one of the major reasons why, on
average, residents of European cities use 4.5 times less gasoline than residents of U.S.
cities.10
This report focuses particularly on the nonmotorized public transit access
systems of the Netherlands, Denmark, and some communities in Germany, which
provide prime examples of how best to integrate bicycles and public transportation for
mutual advantage. Many strategies used in these countries to enhance nonmotorized
transit access have not yet been applied in America and should be seriously considered
for pilot testing and evaluation.
Although it is beyond the scope of this report to provide greater detail and
analysis of the full international experience in integrating cycling with public
transportation, those interested in learning more from the experience of others may find
other examples worth emulation.11 Switzerland offers some of the best conditions for
carrying bicycles on transit vehicles. The Swiss railways (SBB) have included bicycles
in their marketing policy as the initial and final mode of transport, with a rail journey in
between. Bicycle parking facilities and bicycle rental services at rail stations are
becoming more widespread. At most stations, a variety of vehicle types can be rented,
including mountain bikes, racing bikes, and children's bikes. Bike-on transit programs
for regional trains are free of charge on weekends. On congested inter-city trains, SBB
requires that bicycles travel as checked baggage."
Other forms of inter-modal transportation should not be overlooked either. A
new type of "park-and-ride" system was recently introduced in Parma, Italy. Eleven
"park-and-ride" lots along the Parma ring road have been constructed, where motorists
can park their cars and continue their journey into the town center on a bicycle provided
by the local authorities. Extensive bicycle lanes and parking in the city have been
provided, and all main roads inside the. city, including one-way streets, are accessible to
cyclists in both directions. As a result of these measures, Parma has achieved a high
level of bicycle use, accounting for 27 percent of all commuter trips."
Integration of Bicycles with Public Transport In the Netherlands
Transportation planners, engineers, and policy makers interested in promoting
alternatives to the automobile can learn mom from the experience of the Netherlands
than nearly any other country in the world. This is particularly true in the area of
integrating bicycle and pedestrian

Linking Bicycle/Pedestrian Facilities with Transit
90

FHWA Case Study No. 9
91
modes with public transportation. As an April 1992 report of the Netherlands Railways
on its policy toward the bicycle notes, nationwide,
the bicycle is used as transport to the station for almost half of all
train journeys. On average, the bicycle is regarded as by far the
most important means of transport to the station."
Mode of Access to Rail Stations. Changes in transit access in the Netherlands
in recent decades are indicative of general trends in much of Northwestern Europe. In
1960, four out of 10 railway passengers in the Netherlands used buses or trams (LRT)
to get to their originating station, and these together constituted the predominant means
of access to railways. Walking accounted for about 36 percent of access to railway
stations, bicycles for 21 percent, and the automobile for about 7 percent. By 1978, the
share of access trips to rail stations in the Netherlands made by buses, trams, and metro
had been reduced by nearly one-half and the bicycle had become the most important
access mode to rail stations, accounting for 39 percent of all access trips. Pedestrian
access to rail stations showed a steady decline to about 24 percent15. Since 1978,
bicycles have continued to increase in importance as an access mode, gaining several
more points of market share, mostly at the expense of walking and bus/tram/metro
access, as growth has continued to shift a larger share of population and employment
to smaller cities and suburban centers, with some decrease in overall housing and
employment densities.
Although bicycle use in the Netherlands fell dramatically between 1950 and
the mid 1970s, bicycle and moped use for rail station access increased.* Many short
trips formerly made by bicycle were replaced by longer distance automobile or bike-
and-ride transit trips as people and jobs moved from cities to suburbs.
As Figure 12 shows, the prime distances from the station where bicycles are
used for access and egress are 2 to 4 km (1.25 to 2.5 miles). However, the average
distance traveled leaving destination stations by bicycle at the work or school end of
train trips is longer than the average distance traveled from home to the station.
The modal composition of station access trips has not changed uniformly.
Rather, walking continues to predominate in dense central areas, while the bicycle
predominates in moderate and lower density suburban communities. The proportion
of rail journeys originating in more recently developed moderate and lower density
areas has increased with suburbanization.
* Most data from the Netherlands combine bicycles and mopeds. Although mopeds were a
significant share of this combined total in 1960 (accounting for one-fourth to one-sixth of the
combined bike-moped total for station access trips), by 1978 mopeds accounted for only 3.4 percent
(out of 39 percent of access trips made by bike or moped) of station access journeys, according to
Dutch transportation officials. New mandatory helmet laws for moped riders and safety concerns

Linking Bicycle/Pedestrian Facilities with Transit
92
were the primary reasons for the shift from mopeds to nonmotorized bicycles. For the purposes of
ease of discussion in this report, this small share of moped trips mixed with bicycle trips is
otherwise neglected.
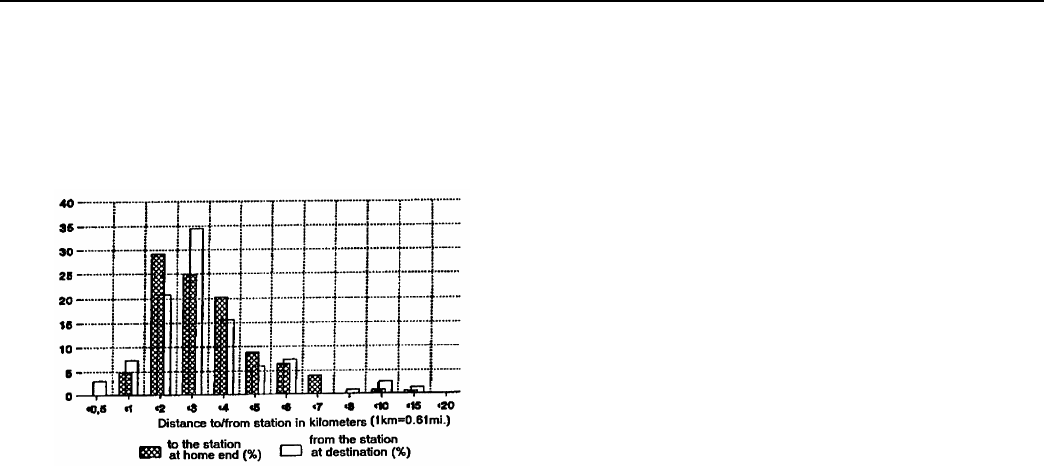
FHWA Case Study No. 9
93
Buses have retained a substantial access trip mode shares in the urban centers, but these centers now
account for a somewhat smaller share of population, employment, and transit trips. According to
oficials of the Dutch National Railways (NS), growth in passenger traffic on trains nationwide has
risen by 8 to 10 percent since the mid-1980s, while bike-and-ride travel has grown by some 15
percent in the same period.

Linking Bicycle/Pedestrian Facilities with Transit
94
Figure 12. Distribution of Bicycle Access Trips to/from Dutch Rail Stations by Access/Egress
Trip Length (Source: Beleidsplan FIETS MrAR, Dutch National Railway, Utrecht,
April 1992)
Table 10 shows the relative use of different access modes to Dutch railway stations in 1987,
including other public transport modes, which are themselves usually accessed by walking or
cycling. Bicycle access to railways typically accounts for roughly three times as large a number of
access trips as automobile driver and automobile passenger access combined.
Bicycles are most important for shorter distance trips on the railways, which typically
originate at local stations, where 44 percent of access is by bicycle. At such stations, average
population and employment densities are lower, as is the corresponding level of public
transportation services. Such local stations are also the places where there is the greatest use of
automobile park-and-ride for station access, although such trips account for only 13 percent of

FHWA Case Study No. 9
95
Table 10. Mode of Access to Dutch Railway Stations at Home End, 198716
Access Mode Stations In 4 Other Inter- Inter-Regional Local Stations
to Rail Stations Large Cities City Stations Stations
Walk 21 32 30 25
Bike/Moped 23 34 42 44
Bus/Tram/Metro 48 24 12 10
Auto Park & Ride 3511 13
Auto Kiss & Ride 4 4 4 5
Taxi 1 1 1 nil
Note: In this and other associated tables, the Dutch term "Agglo-regio stations" has been translated as
"Local Stations." These are stations serving principally short distance travel within metropolitan areas. Inter-
City stations serve a longer distance trip market at higher speeds than Inter-Regional stations. Minor
adjustments made to data from Dutch language report to ensure shares add to 100 percent.
access. Trips originating at the largest city stations rely more on public transport and walking for
access, since these are located in high density centers with very high levels of bus, tram, or metro
public transport services.
Mode of Egress from Stations. Walking is naturally the predominant mode used to get
from rail stations to destinations at the non home end of trips in the Netherlands and elsewhere.
However, the provision of a high-quality bicycle access system and secure bicycle parking at
stations has led roughly one out of 10 Dutch rail passengers to use a bicycle to get from the station
to workplaces or schools that are beyond easy walking distance of the station, as table 11 shows.
Usually, such passengers park a second bicycle overnight at the rail station for such purposes. This
is of greater importance in lower density suburban areas where bus, tram, and metro services are
less frequently available to serve destinations beyond walking distance of the railway station. Park-
and-ride, naturally, is completely unsuited to serve as an egress mode, as it would require the
considerable expense of parking a second car near the station.
Parking at Rail Stations. Every Dutch railway station has a place to park bicycles. In one
out of 10 urban-regional and around three quarters of all Intercity rail stations, supervised bicycle
parking garages are in operation, with a total of almost 100,000 places. Where there are not
guarded garages for bicycles, especially at urban-regional stations, there are bicycle lockers,
numbering some 10,000, which can be rented by the month or year. At virtually all stations where
there is no supervised parking for bicycles, covered racks are available, numbering 59,000 places on
urban-regional stations and 6,000 on Intercity stations. Finally, on urban-regional

Linking Bicycle/Pedestrian Facilities with Transit
96
Table 11. Mode of Egress from Dutch Rail Stations at Destination End, 1987
Egress Mode Stations In 4 Other Inter- Inter-Regional Local
at Destination Station Large Cities City Stations Stations Stations
Walk 39 41 43 38
Div 5 8 9 12
Bus/tram/Metro 38 36 35 26
Auto Park & Ride 0 0 0 0
Auto Kiss & Ride 8 8 6 11
Taxi 1 1 1 1
Note: In this and other associated tables, the Dutch term "Agglo-regio stations' has been translated as
"Local Stations." These are stations serving principally short distance travel within metropolitan areas.
Inter-City stations serve a longer distance trip market at higher speeds than Inter-Regional stations.
stations, there are a further I 1,000 bicycle racks and on Intercity stations 14,000. In total, therefore,
the NS provides almost 200,000 bicycle parking places. This does not count private bicycle parking
garage capacity or the thousands of additional bicycles parked informally near stations. For
example, according to NS officials, there are some 15,000 bicycles parked at the main mail station
in Utrecht, at four different guarded locations.
Figure 13 shows the distribution of parking spaces at Dutch rail stations by the volume of
station boardings. Stations with over 5,000 boardings per day have an average of 2,000 guarded
bicycle parking spaces, while stations with 2 to 5 thousand boardings a day offer on average nearly
800 guarded bicycle spaces. The mean and median capacity of guarded bicycle parking garages at
Dutch rail stations is about 1,000 bicycles. Fourteen stations can accommodate over 2,000 bicycles
in guarded spaces, 21 stations accommodate between 1,000 and 2,000 bicycles in their guarded
bicycle garages, 29 stations accommodate 500 to 1,000 bicycles in their garages, and only seven
guarded bicycle parking garages are smaller than 500 spaces, including two that have a capacity of
only 60 bicycles each.
Guarded bicycle parking spaces are relatively uncommon at stations with fewer than 1,500
boardings per day. At such stations, roofed bicycle parking is the most common form provided,
usually accommodating 300 to 800 bicycles, except for stations with fewer than 500 daily
boardings, where roofed bicycle parking capacities of 70 to 300 are typical, and usually
complemented with 10 to 50 bicycle lockers. Six stations offer more than 100 bicycle lockers and
no stations offer more than 190 lockers.
Guarded bicycle parking garages work with check tags, so that users can be assured that
someone else will not ride off on their bicycle. Repair services are available at every guarded
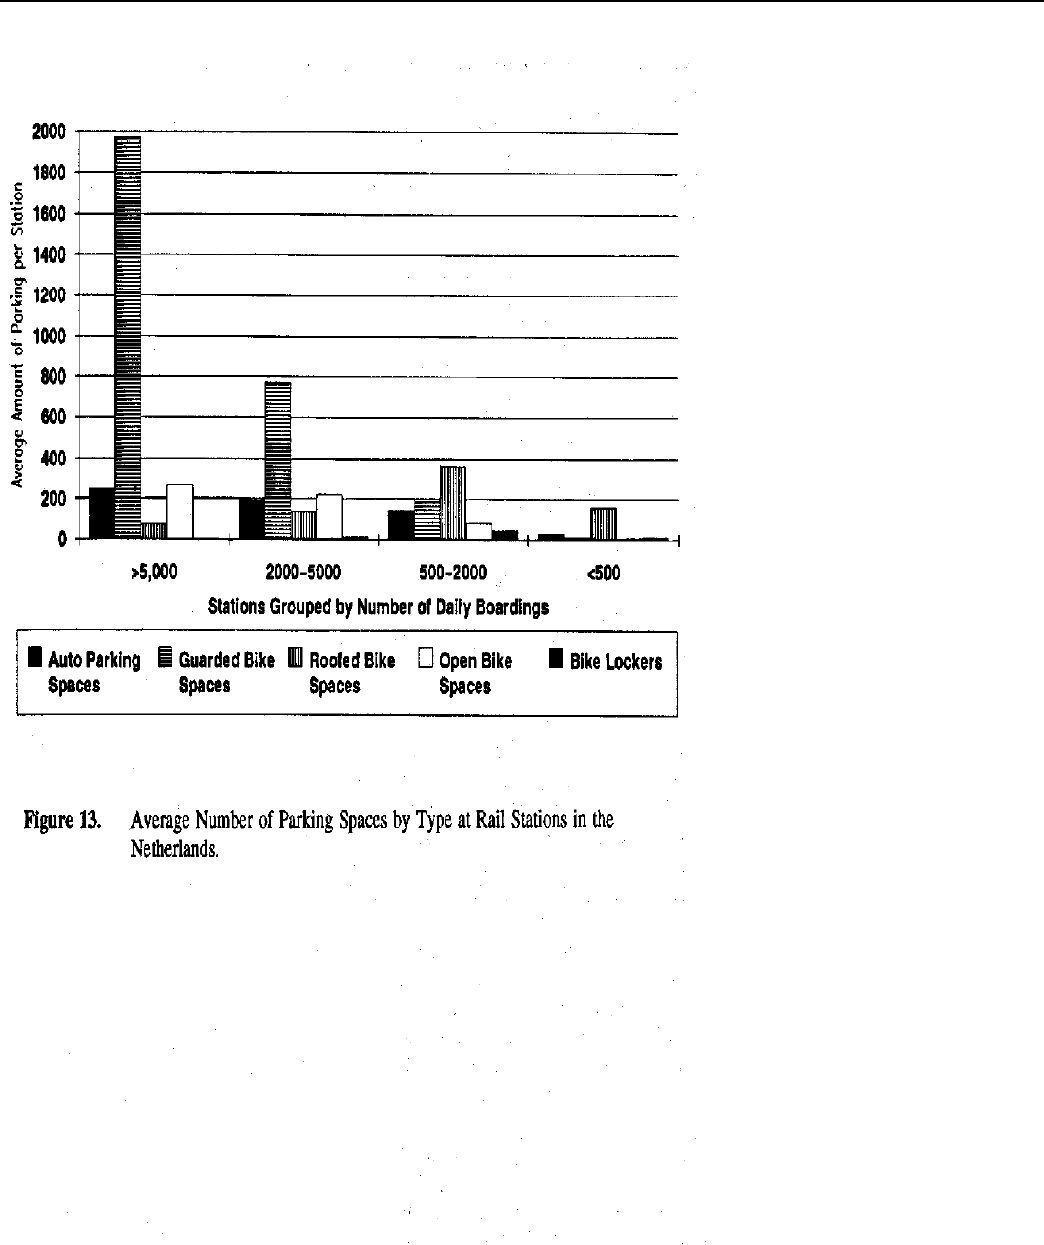
FHWA Case Study No. 9
97

Linking Bicycle/Pedestrian Facilities with Transit
98
bicycle parking garage, offering users the opportunity to have their bicycle kept well maintained
with a minimum of lost time. There are a number of private guarded bicycle parking facilities near
rail stations, although their number is decreasing, due to the significant Government subsidies
offered to public bicycle parking garages. Figures 2 and 3 illustrate typical Dutch bicycle parking
facilities at rail stations.
Increasingly, new guarded bicycle parking garages at Dutch rail stations are being located
under the stations to maintain close proximity to station entrances while reducing consumption of
valuable land near stations. NS has found that even expensive underground bicycle parking is more
than 10 times cheaper per space than automobile park-and-ride construction.
Bicycle rentals are also available at every bicycle parking garage, at a cost to users of
several dollars a day, providing out-of-town visitors an inexpensive and comfortable way to access
most destinations and supporting extensive recreation and tourism. Commuters holding a monthly
rail pass can also purchase a monthly bicycle rental ticket offering a deep discount.
Because automobile park-and-ride systems are the most expensive way to attract transit
ridership, NS has provided less than 25,000 automobile parking spaces across the Netherlands, a
figure barely one-fourth the number of guarded bicycle parking spaces. Since 1977, special park-
and-ride lots have been constructed at 42 stations across the Netherlands, providing about I 1,000
new automobile parking places. About three-fourths of these spaces are used on the average
workday. The median number of park-and-ride spaces at Dutch rail stations is 48 automobile
parking spaces, while the average is 102 spaces per station. Only four stations have more than 500
automobile parking spaces, while 17 stations offer 300 to 500 spaces, and 55 stations offer 100 to
300 spaces. At 91 other stations, motorists are offered between 25 and 100 parking spaces; 42
stations offer II to 25 spaces; the remaining 55 stations have 10 or fewer automobile parking spaces.
This reflects the official priority in station access modes adopted more than a decade ago by Dutch
authorities: pedestrians first, as they have the lowest access system cost; bicycles next, with parking
located as close to station platforms as possible, as they are a highly cost-effective and
environmentally sound means of access; and lowest priority to automobiles, as they require the
greatest capital investment, operating costs, and land area, while causing the greatest damage to the
environment.
Despite the extensive available bicycle parking, the growing use of both railways and
bicycles makes the parking supply inadequate, forcing many people to leave their bicycle locked to
fences and poles near stations. Bicycle theft, particularly from unguarded spaces, remains a major
problem, leading to growing use of high-strength bicycle locks by Dutch cyclists. Vandalism is less
of a problem than in many communities in the United States.
Government Support for Bicycle-Transit Integration. Dutch transport policy towards the
bicycle has undergone significant policy swings over the past several decades. Bicycle use declined
sharply in the 1950s and 1960s, thanks in part to the gradual displacement of bicycle traffic by
automobiles as a part of a pro-highway transport policy. However, after 1973, the national and local
Governments began to provide strong support for bicycle infrastructure,

FHWA Case Study No. 9
99
including bicycle parking at railways and paths to the stations. Federal spending for construction of
bicycle facilities increased by a factor of more than 16 times between 1975 and 1982, while funding
for highway development fell. Federal assistance for bicycle transportation in 1982 was equal to
more than 10 percent of the capital outlay for roadways. These expenditures, combined with strong
support for public transportation, mild restrictions on automobile use in central city areas, and a
culture supportive of cycling reversed the decline of bicycling in the late 1970s and 1980s, despite
growing automobile ownership and use. 17
Although local support for bicycle transportation has remained strong in many communities,
in the last half of the 1980s, the national Government shifted to a passive policy towards the bicycle,
with the absence of both new policy initiatives and significant funding. However, rising concerns
over global warming, traffic congestion, and the environment, combined with growing public
appeals to restrain car traffic in towns have begun to move national policies again towards favoring
bicycles. In 1990, the Dutch Ministry of Transport initiated a Dutch National Master Plan for the
Bicycle, which was adopted by the Parliament in June 1991. As part of this, spending for bicycle
transportation is being increased significantly at the national level, to over US $30 million per year
for bicycle infrastructure subsidies plus another US $6 million per year for bicycle-related research,
demonstration projects, and non-infrastructure activities. This is expected to leverage an additional
US $165 million per year in spending for bicycle infrastructure by local and provincial authorities
across the Netherlands.
Spending by the Dutch National Railways (NS) on bicycle parking at rail stations amounted
to US $1.8 million in 1988 and 1989, but fell to US $1.1 million in 1990. Spending in 1991-92,
however, has grown six-fold to US $7.1 million a year. Between 1991 and 1995, NS expects to
spend US $12.8 million expanding and upgrading guarded bicycle parking garages, and over US
$11 million on bicycle lockers and other types of parking facilities. By 1996, this will result in an
additional 13,500 covered bicycle racks and 5,000 lockers at stations to better meet demand.18 NS
also intends to test and evaluate both daily rental bicycle lockers and an automated bicycle parking
system of a carousel design, holding 88 bicycles, as is used in Japan.
Cost of Bicycle Parking Facilities. According to the Dutch National Railways, the typical
cost of providing a single guard for one of the Netherlands' 84 bicycle parking garages at a rail
station is about US $36,000 per year, including overhead. Each major station typically requires
three persons to staff it from 5:00 AM to 1:00 AM. Smaller stations are usually open from 6:00
a.m. to 9:00 p.m. and require only two staff persons per day. Parking attendants usually also rent,
repair, service, and sell bicycles, providing a full-service center for bicycle transportation. User
costs for parking at Dutch rail stations are about US $0.75 per day or US $75 per year, for either
guarded parking or individual lockers. Revenues from parking are reported to cover roughly 40
percent of the operating costs, and are augmented by income to the franchise operator from bicycle
repair and other services.19 Current cost and revenue data are not readily available for this report,
but in 1982, the cost of guarded bicycle parking garages in the Netherlands was about US $63 per
bicycle parking space. 20 A relatively new and relatively small (320 spaces) guarded bicycle
parking garage in Wunstorf, Germany, near Hannover, in

Linking Bicycle/Pedestrian Facilities with Transit
100
1991 had total operating costs of US $335 per space per year (see box). Table 12 gives a
breakdown by cost category.
Table 12. Cost of Operating "Bicycle Station" Guarded Garage In
Wunstorf, Germany
Government Share Contractor Share
Annual Monthly Cost Monthly Cost
cost US Percent US$ Percent US $
Cost Category $
Personnel (82.7%) $ 88,615
Bike Mechanic $ 18,000 0% $ 0 100% $1,500
2 Attendants $ 67,500 100% $ 5,625 0% $ 0
Part-time Assistants $ 1,882 100% $ 157 0% $ 0
Cleaning Staff $ 1,233 100% $ 116 0% $ 0
Facilities (4.6%) $ 4,974
Electricity, water $ 1,852 75% $ 116 25% $ 39
Telephone $ 112 100% $ 9 0% $ 0
Maintenance $ 2,057 100% $ 171 0% $ 0
Insurance $ 953 68% $ 54 32% $ 25
Equipment (3.3%) $ 3,478
Fare instruments $ 978 100% $ 82 0% $ 0
Office supplies $ 250 100% $ 21 0% $ 0
Rental Bike maintenance $ 2,250 0% $ 0 100% $ 188
Other Expenses (9.5%) $10,128
Advertising $ 625 100% $ 52 0% $ 0
Administration $ 5,753 100% $ 480 0% $ 0
Contingency $ 3,750 75% $ 234 25% $ 78
Total $107,195 $ 7,100 $ 1,830
Source: Heide Moeller and Thomas Dittert, Fahrradstation Wunstorf. Zur Notwendigkeit Eines Neuen
Betriebskonzeptes, Zweckverbands Grossmum Hannover, July 1991, Hannover, Germany, p. 14.

FHWA Case Study No. 9
101
Bicycle and Pedestrian Access Conditions. A key factor supporting the Netherland's
high level of bicycle and pedestrian access to public transport, and high overall levels of use of
public transport, bicycles, and walking, is the great attention that has been given by local
governments to making streets pedestrian and bicycle friendly. Especially within the past 20 years,
a major focus of local government traffic planners has been the introduction of more widespread
traffic calming measures in both residential and commercial areas, where automobile traffic has
been slowed down to give greater priority to pedestrians, bicycles, and traffic safety. In many
places where it has not been possible to slow down car traffic, bicycles and pedestrians have been
given their own separate right-of-way, with careful attention to the design of network intersections.
Many communities, following the excellent example of Delft, have developed well-
integrated comprehensive bicycle networks, with exclusive regional bicycle roads or paths on a
third- or half-mile grid within the denser urbanized area, and with a sub-regional and local grid of
bicycle-friendly streets, paths, and lanes on even tighter grids of a fifth to a tenth of a mile. At the
local grid level, this network is composed almost exclusively of woonerf-type streets, where cars are
allowed, but only at a speed of 5 mph. In such streets, pedestrians, cyclists, cars, playing children,
and chatting neighbors all share the same space, making a living street (woonerf. Combined with
the provision of neighborhood-level retail services within walking distance, this street pattern has
produced a very high level of walking and cycling for short trips of all kinds-shopping, access to
public transportation, and daily recreation-while reducing automobile dependency.
Across the Netherlands, the ratio of exclusive bicycle path length to total road length is
1:8.6, reflecting the degree to which bicycle facilities have been developed into more
comprehensive networks. 21 The network is of a far better quality in the western part of the
Netherlands than in the eastern part. Similar data for sidewalks and pedestrian infrastructure are not
readily available, but these are generally as good and extensive as anywhere else in the world.
Bicycle Transit Integration In Denmark
About 25 to 30 percent of passengers arriving at commuter rail stations in Denmark at the
home end use a bicycle to reach the station, as do about 2 to 5 percent of passengers departing
stations at their workplace end. With substantial housing and employment clustered in satellite
centers served by rail, a very large share of trip ends are within the 10-minute cycling distance of
rail stations shown in Figure 14.
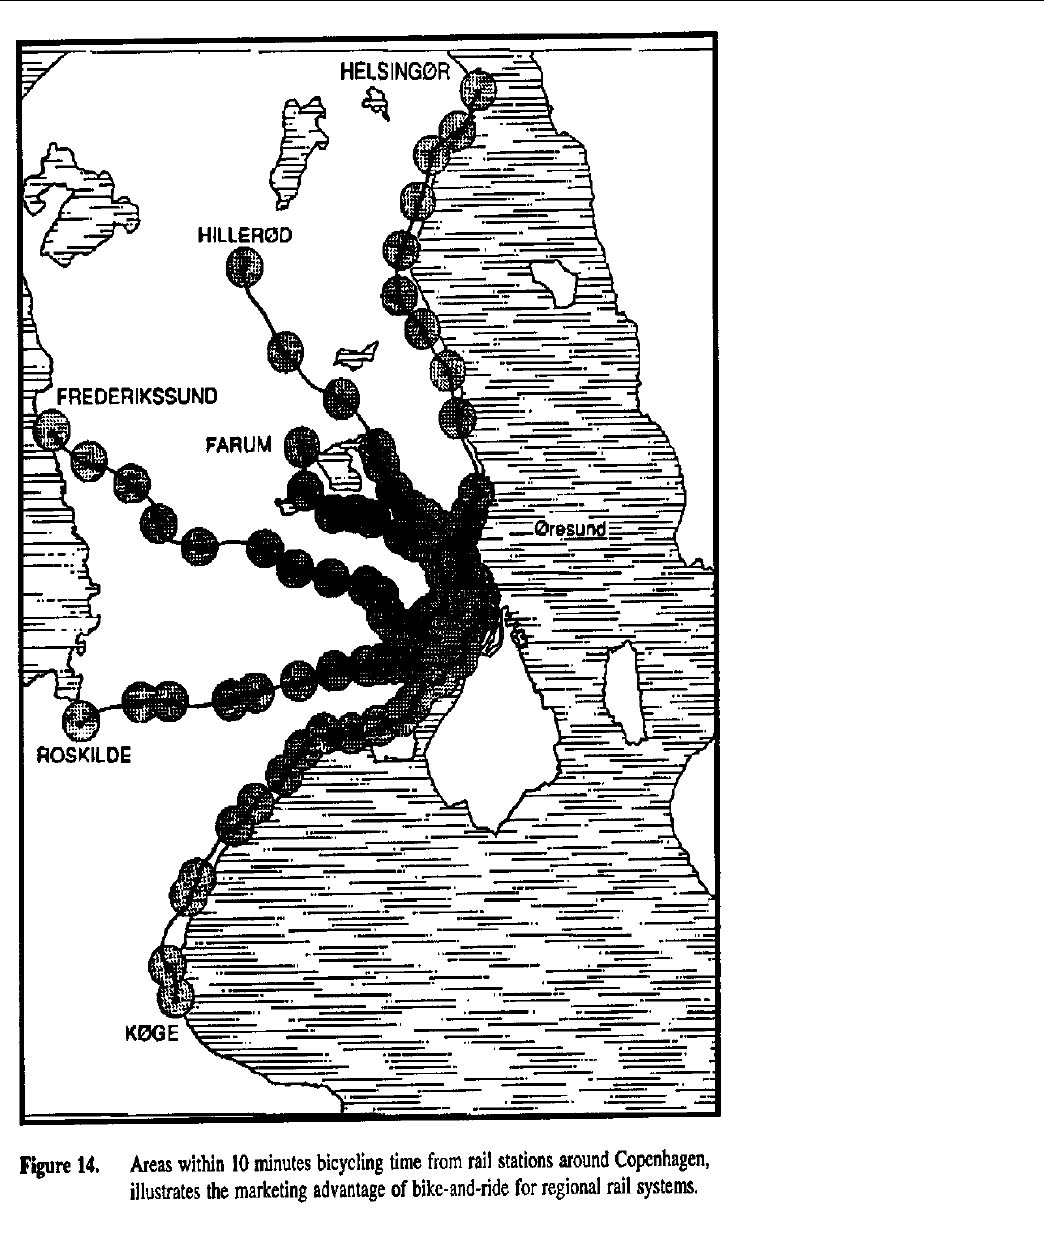
Linking Bicycle/Pedestrian Facilities with Transit
102

FHWA Case Study No. 9
103

Linking Bicycle/Pedestrian Facilities with Transit
104
ECONOMICS OF A GUARDED BICYCLE PARKING GARAGE IN GERMANY
Since July 1989, in Wunstorf, Germany, near Hannover, local authorities, working with a
private bicycle shop owner, have developed a "Bicycle Station," to provide 320 guarded bicycle
parking spaces at the railway station, along with bicycle rental and repair services.In the first 22
months of operations, the number of bicycles parked at the rail station increased four fold to about
160 each day, with growth continuing at a rate of 20 to 30 percent a year. Since the second year of
operation, some 60 to 90 bicycles were rented each month in the warmer months of the year,
mostly on weekends.
The facility and rental bicycles are in public ownership but operations are handled under a
private franchise contract. User fees for parking have been set at US $1.85 per week, $5.60 per
month, or $56 per year for those with a weekly, monthly, or yearly railway pass; without a railway
pass, parking fees are one-third higher. Single-use parking costs US $0.75 per day. The vast
majority of users buy monthly parking cards to obtain the discount they offer.
Bicycle parking fees comprise two-thirds to three-fourths of the revenues in any given
month, with bicycle repair work comprising most of the remainder, except in the warmer months,
when bicycle rentals, mostly for recreational use, provide up to a fifth of revenues. The franchise
operator is guaranteed minimum receipts by the local authorities of US $750 per month, but as of
May 1991, monthly revenues from the operation were US $1,650 and continuing to increase at a
steady pace, so this guarantee was not being exercised.
Total cost of the operation is about US $8,900 per month. The government provides a fixed
subsidy of about US $7,100 per month (or about US $22 per bicycle parking space) and the
franchise operator pays the remaining costs of about US $1,800. The franchise operator is
responsible for the cost of providing a bicycle mechanic, insurance and maintenance of rental
bicycles, and a portion of utilities and building insurance, while the government supports other costs
as a means of encouraging the use of transit and bicycles. With a continuation of the fixed contract
subsidy, the franchise operator was anticipated to achieve profitability in his activities at the "Bicycle
Station" by the end of 1991. A breakdown of the costs of operation are shown in Table 12.
The "Bicycle Station" is open 108.5 hours per week and is staffed by three people over the
course of a typical day. Labor costs comprise 83 percent of the costs of operations. A study which
examined the possibility of semi-automating the bicycle parking garage using a system found in
Japan and the Netherlands estimated that the full cost of conversion would be about US $121,000 to
provide a 168-bicycle capacity system, or $720 per unit capacity.

FHWA Case Study No. 9
105
A 1991 study by the Danish State Railways (DSB) of all of its stations found substantial
opportunities for expanding the use of bicycles for station access. The study found that most of the
problems at stations were connected with damaged bicycle racks, too few bicycle racks, a wish for
covered racks and for lockable parking spaces.22
Guarded bicycle parking facilities have been constructed recently at a number of the larger
stations, such as the Central Station and Osterport Station in Copenhagen, frequently holding
more than 1,000 bicycles each.23 These facilities are managed by private firms that operate the
facilities under contract to the railway. As in other countries, these usually offer bicycle repair and
rental services as well. At smaller stations, free covered or open air bicycle racks are found in great
number, sometimes complemented with special lock-up areas with a special key arrangement for
regular patrons, who can park their bicycles in a usually locked room which remains unguarded.
The typical cost of establishing new covered and locked bicycle racks is on the order of US $300 to
$500 per space.
According to DSB,
the solution to the bicycle parking problem is not just to establish more bicycle racks but
to establish more attractive bicycle parks where it is possible to place one's bicycle as close
to the platforms as possible, locked and under cover .. In recent years people have tended
to acquire bicycles that are so expensive and exclusive that they dare not park these
bicycles at stations. S-stations have a reputation for being the place where one's bicycle is
stolen. Some customers experience this several times a year. Therefore, quite a few
cyclists choose to have an old bicycle at the station at one end of the journey and another
category of otherwise dedicated cyclists choose not to use the bicycle at all as a daily
means of transport. It is the latter group which is especially interesting as a customer
group. In general an increase in the standard of bicycle parking facilities at stations will
thus encourage people to use better bicycles which will result in a general improvement in
the transport experience. This is true of both ends of the journey... Bicycle plus train
means increased revenues and equals a better business foundation.24
The Danish State Railways has adopted the following basic principles for making bicycle
parking attractive:25
1. The bicycle must be parked as close to the platform as possible.
2. It must be possible to place the bicycle in a locked area.
3. The rack must be user-friendly and easily accessible.
4. The bicycle must as far as possible be under cover from the weather.
5. The bicycle parking must be safe and secure.

Linking Bicycle/Pedestrian Facilities with Transit
106
SOLVING RAIL STATION BICYCLE PARKING PROBLEMS
IN HUNDIGE, DENMARK
Nearly 900 bicycles a day are parked at the Danish State Railways station at Hundige, where
nearly one out of five passengers bicycles to the station. The station has a large surrounding area
with scattered houses at relatively low density and a well-developed system of bicycle paths
crossing the railway on the same level as the platform entrances. While covered and uncovered
racks provide 738 spaces, this is a fourth less than the number of bicycles parked daily in the
station area. DSB plans a two-stage project to improve bicycle parking and has estimated the
economics of this as follows:
Finances Stage 1
1. Removal of half the present covered racks (240 spaces) $ 3,200
2. Establish new covered and locked racks (480 spaces) $230,000
Total investment stage I $230,000
Investment per space $ 475
Annual income from locked spaces assuming 100% use @ $4/month rental $22,970
Income from 55 completely new customers attracted by improved parking $26,315
Income from I 10 customers attracted from bus to bicycle for access $21,050
Total Increase in annual income $70,300
Return on investment in stage 1 30%
Finances Stage 2
3. Removal of remaining covered racks $3,200
4. Establishment of 240 new covered racks $153,100
Total investment in stage 2 $156,300
Investment per space $320
Income from 15 completely new customers $7,175
Income from 25 passengers diverted from bus to bicycle access $4,785
Total increase in annual income $11,960
Return on investment in stage 2 8%
Source: Danish State Railways, Action Plan to Improve Bicycle Parking at S-Train Stations,
August 1991, p. 10-11.
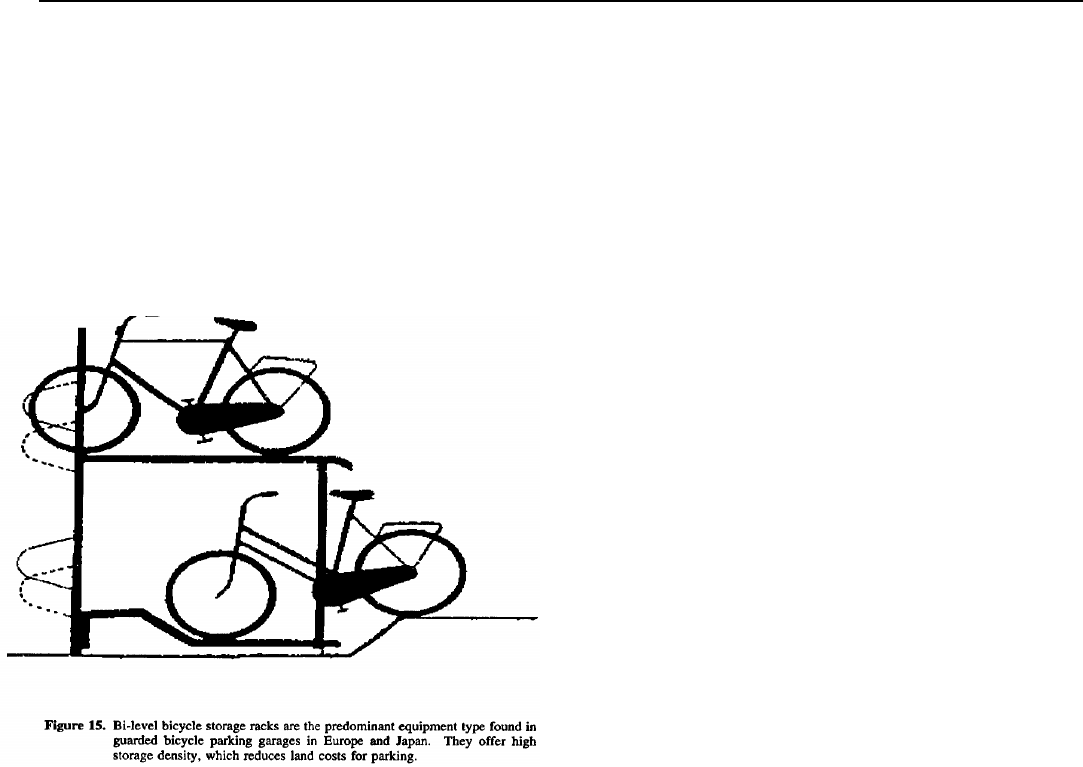
FHWA Case Study No. 9
107
DSB considers the ideal distance of bicycle parking from station platforms to be within 30
meters (100 feet), and considers any parking which is more than 60 meters (200 feet) from the
platform to be completely undesirable.
To develop more space-efficient and user-friendly bicycle parking systems, DSB has
established a bicycle parking laboratory to test a number of different bicycle racks and systems.
Two-tiered racks, as used in the Netherlands and Japan, are favored for areas where space is a
problem or where it is desirable to compress more bicycle parking capacity into the area immediately
close to the station platform. Such racks also generally ensure orderly parking.

Linking Bicycle/Pedestrian Facilities with Transit
108
DSB's action plan for bicycle parking focuses on a number of measures to improve bicycle
integration with the railways. These include-----
•improving access path conditions to the station for cyclists, including better lighting
on access roads to stations and in the bicycle parking areas, and ensuring
maintenance of vegetation in these areas,
•retrofitting bicycle wheel ramps along the edge of stairways to eliminate the need to
carry the bicycle when climbing or descending,
•establishing bicycle repair shops at stations, along with coin-operated tire pumps,
•improving directional signs leading to stations to show the location of the bicycle
parking facilities and nearest bicycle dealer/mechanic,
•preparing leaflets describing bicycle parking facilities at stations and their price, and
•promoting bike-on-train services by showing on the outside of rail cars which cars
are set up to accommodate bicycles and ensuring that cyclists can secure their
bicycles within rail cars, so the cyclist can leave their bicycle during their journey.

FHWA Case Study No. 9
109
V. Bicycle-Transit Integration In Japan
Even though Japan is now approaching the U.S. ratio of private car ownership, which
is the highest in the world, local governments have been successful in reducing motor
traffic in the nation's major cities by more than 10 percent over the past 3 years. More
and more people are now riding bicycles to suburban railway stations where they catch
trains to their jobs in the city.. The new environmental nuisance now being complained
about is the absolute mess created by bikes in front of the train stations. The regular
parking spaces are pitifully inadequate; desperate owners in a hurry to catch their
trains for downtown will leave their bike any place, and other comes along and throw
theirs on top, clogging pedestrian paths and creating a king-size chaos...
---- Institute of Transportation Engineers Journal, August 1978, Washington, DC.
Rapid Growth In Bicycle Access to Railways
In Japan, as in much of Europe, walking and bicycling account for a major share of trips in
cities and towns, despite rapid growth in the number of motor vehicles and suburbanization. Since
the early 1970s, the use of bicycles for access to public transportation has been growing at an
astounding rate across most of Japan, accompanying suburban growth.
As Table 13 shows, by 1987, there were nearly 3 million bicycles parked at Japanese rail
stations on typical November weekdays. Bicycle access to railways has gained market share at the
same time that bus and walk access has decreased.
Table 13: Growth In Use of Bicycles to Reach Japanese Rail Stations
Number of improperly Number of bicycles in Total bicycles parked
Year parked bicycles parking lots or garages at railway stations
1977 675,000 598,000 1,273,000
1979 852,000 929,000 1,781,000
1981 988,000 1,245,000 2,233,000
1983 864,000 1,430,000 2,294,000
1985 827,000 1,697,000 2,524,000
1987 799,000 2,089,000 2,888,000

Linking Bicycle/Pedestrian Facilities with Transit
110
The growth of bicycling for access to transit and other short trips in Japan has been
facilitated by compact development patterns, high costs associated with the use of automobiles,
well-developed transit networks, and substantial investments in pedestrian and bicycle facilities and
traffic-calming measures.26 Low rates of bicycle theft and crime made it possible for Japanese
bicyclists to leave their bicycles in any open area near station entrances without securing the
bicycle to a fixed object, relying on nothing more for theft prevention than a small metal lock that
prevents someone from wheeling the bike away casually. Seeking lower housing costs, more
people moved to distant lower density suburbs around major Japanese cities over the past two
decades, in many cases beyond easy walking distance of rail stations. With the environmental
movement in the early 1970s, attitudes towards the bicycle as a mode of transport for the poor
began to be replaced by new attitudes viewing it as appropriate for middle and upper middle class
mobility.
By the early 1970s, the demand for bicycle parking in station squares began to outstrip
designated capacity, leading to the "bicycle pollution problem," caused by thousands of disorderly
parked bicycles near station entrances. A model cities program for the development of bicycle
parking at rail stations was initiated in Japan in 1973 under the Act Concerning the Construction
and Improvement of Bikeways. Between 1974 and 1976, more than 22,000 bicycle parking spaces
were created under this program at 107 locations in 57 cities. However, this and other efforts to
develop new bicycle parking in the mid-1970s proved inadequate to meet burgeoning demand. The
number of bicycles parked at rail stations more than doubled between 1975 and 1977,
overwhelming both old and new bicycle storage facilities and occupying growing space in station
plazas.27
Bicycle Parking Facility Characteristics
Changes in Bicycle Parking Industry in Japan. Until 1978, the majority of official
bicycle parking facilities at rail stations in Japan was owned by private sector concerns. In that year,
the Japanese Ministry of Construction initiated a major program to expand bicycle parking supply at
stations. Bicycle parking capacity grew steadily from 598,000 spaces in 1977 to 1,333,400 in 1981
and 2,382,000 in 1987, and has continued similar growth since then. Municipal ownership of
bicycle parking facilities at stations now accounts for three-fourths of the parking supply, as Table
14 shows.
Average Facility Size. The average bicycle parking facility at a Japanese rail station holds
more than 275 bicycles. Facilities owned by noncommercial public corporations are on average the
largest, with over 600 spaces per facility. Privately owned facilities are the smallest on average, at
less than 125 spaces. In 1987, there were 55 bicycle parking garages holding more than 2,000
bicycles each, providing about 6 percent of total parking capacity. Another 380 facilities
accommodated 1,000 to 1,999 bicycles and these provided another 21 percent of total parking
capacity. A quarter of all parking capacity is in the 953 facilities that provide between 500 and 999
spaces, which make up a tenth of all facilities. Half of all facilities hold 100 to 499 bicycles and the
remaining third accommodate less than 99 bicycles.

FHWA Case Study No. 9
111
Table 14: Ownership of Japanese Bicycle Parking Facilities at Rail Stations, 1987
Number of Percent of Bicycle Parking Share of Bicycle
Type of Ownership Facilities Facilities Capacity Capacity
State, local, 4,639 53.7 1,707,641 71.7
community, etc.
Railway owner 515 6.0 112,096 4.7
Noncommercial 121 1.4 73,032 3.1
Public Corporation
Private Commercial 2,805 32.5 348,253 14.6
Large-scale shop 327 3.8 109,093 4.6
Other 22 2.6 33,071 1.4
Total 8,635 100.0 2,383,186 100.0
Source: Ryozo Tsutsumi, Safety Measurement and Parking System of Bicycle in Japan, Japan Bicycle
Promotion Institute, Tokyo, 1990.
Average Occupancy of Bicycle Parking. The occupancy level of all bicycle parking
facilities at Japanese rail stations was about 88 percent in 1987, with nearly 2.1 million users a day.
Occupancy rates were highest, at over 92 percent for parking facilities within 100 meters (330 feet)
of the station entrances, which accounted for 68 percent of the parking facilities. Occupancy rates
were observed to be lower at greater distances from the station and fell to less than 75 percent for
parking facilities more than 300 meters (1,100 feet) from station entrances.
User Fees. Nearly two-thirds of bike-and-ride users park their bicycles for free at Japanese
rail stations. One-sixth of users pay between 1,000 and 1,999 yen (US $8 to US $16) per month for
their parking, one-eighth pay between 2,000 and 2,999 yen (US $15 to US $32) per month, and the
remaining 7 percent pay other amounts. User fees are most common when higher quality parking is
offered close to the station entrance.
Facility Types. Table 15 shows the composition of bicycle parking facilities in Japan by
type. Half of all facilities are simple ground-level parking structures with a roof for weather
protection. These provide 30 percent of total capacity. Half of all capacity is provided in surface
parking lots without weather protection and these account for 43 percent of parking facilities. Two-
or three-story bicycle parking garages with ramps between levels and bi-level racks such as those
shown in Figure 15 account for 16 percent of total parking capacity, in 516 garages. In 1987, there
were 31 automated bicycle parking systems in place, with an average capacity of 636 spaces.
Underground bicycle parking facilities, with an average of 615 spaces each, are found

Linking Bicycle/Pedestrian Facilities with Transit
112
in 33 locations. Underground and automated bicycle facilities each account for about I percent of
total bicycle parking capacity at stations across Japan.
Table 15: Bicycle Parking at Rail Stations by Facility Type In Japan,
1987
Number Share of Bicycle Share of
Of Parking Parking Parking
Type of Structure Facilities Facilities Capacity Capacity
Ground-level with roof 4,237 49.1 716,184 30.1
Ground-level without 3,743 43.3 1,231,790 51.7
roof
Multi-story garage 516 6.0 380,440 16.0
Mechanical and 31 0.4 19,729 0.8
automated systems
Underground garages 33 0.4 20,305 0.9
Other 75 0.9 14,738 0.6
Total 8,635 100.0 2,383,186 100.0
Source: Ryozo Tsutsumi, op. cit.
The Japanese have developed a wider array of innovative bicycle storage systems than any
other country, spurred by high land costs to find space-efficient ways to accommodate more
bicycles close to station entrances. Even the most expensive fully computerized and automated
bicycle parking systems developed by the Japanese have capital costs of less than US $2,000 per
parking space. This compares favorably with the cost of constructing typical U.S. automobile park-
and-ride spaces, which typically amounts to $4,000 to $18,000 per parking space.28
Automated bicycle parking facilities in Japan include merry-go-round storage systems, dry-
cleaner type circulating racks, vertical rotating palate systems, multiple-layer suspension systems,
and several types using cranes or robots to lift bicycles into overhead storage areas that may be 60
feet or more in height.
Rent-a-Cycle Ports at Rail Stations
The Japanese have also developed extensive bicycle rental facilities at railway stations,
known as Rent-a-Cycle Ports. These employ fleets of identical minicycles, which are bicycles with

FHWA Case Study No. 9
113
20-inch wheels, a front basket for parcels, a built-in locking device, light, and bell. Seat

Linking Bicycle/Pedestrian Facilities with Transit
114
height is easily adjustable over a wide range, so that users of different stature can ride
comfortably. All vehicles are painted bright lime green for easy recognition and theft deterrence.
The largest bicycle rental operations are managed by the Japan Rent-a-Cycle Association, a
business consortium consisting of three bicycle parking companies, the manufacturer of the rental
bicycles, land leasing companies, bicycle parking facility manufacturers, and an insurance company.
Ownership of Rent-a-Cycle Ports is quite varied, from the Japan National Railways to a green tea
company.
Most customers contract for rental privileges on a monthly basis. They are then entitled to
take a bicycle whenever they wish from the Rent-a-Cycle Port, although it will often be a different
bicycle than they used before. There are several advantages to this type of operation:
⋅Storage density of bicycles can be greater than is possible in other bicycle parking,
since no room for access to a particular bicycle needs to be provided.
⋅A vertically movable floor technology for bicycle storage can be employed, with
access only on the ground level, since all bicycles are the same.
⋅The bicycles used by clients commuting in the peak direction can be rented, at least
in part, to clients involved in reverse commuting. Thus a higher level of vehicle
utilization over the course of the day can be achieved.
People who rent bicycles are given a magnetic card which they can use to take a bicycle
from the facility. The exit gates feature optical beams at chest height and wheelbase height
connected to an alarm for security. Users removing or returning bicycles run their magnetic card
through a card reader at the gate. They are notified at the gate by this device if their rental
agreement needs to be renewed.
Impacts of Bike-and-Ride Travel In Japan
As in Europe, access to public transportation in Japan has been undergoing a structural
change as a by-product of suburbanization. While in the early 1970s walking and collector buses
comprised the major elements of the access system to suburban rail stations, by the late 1970s the
bicycle had begun to penetrate the suburban rail access trip market on a footing nearly equal to or
exceeding that of collector buses. Although walking continues to be the almost sole means of
railway access in the central areas of Japan's major cities, bicycles account for roughly one- tenth or
more of station access trips in suburban areas. In the newer suburbs at the fringe of Japan's
metropolitan regions, where much growth is being experienced, bicycle access trips account for as
much as half of all station access trips while walking and bus access shares continue to fall.

FHWA Case Study No. 9
115
Limited automobile park-and-ride services have been developed at Japanese rail stations in
some distant suburbs and fringe areas, but congestion and land costs limit their usefulness in much
of Japan. Significant diversion of bicycle access trips to automobile park-and-ride would entail
large investments of capital and land, worsen air pollution and traffic problems near rail stations,
and increase the use of imported oil. Increased congestion would, in turn, impede feeder bus
services already suffering from traffic delay. Diversion of bicycle trips to collector buses would
similarly raise the cost of the metropolitan transportation system, requiring more peak capacity and
higher subsidies for bus operation. As rail transportation continues to grow in Japan, due to longer
trip lengths and increased suburbanization accompanied by rail service expansion, bicycles serve an
ever more important role in rail station access.
Bicycle access to rail stations has produced mixed, but generally positive effects on bus
services in Japanese suburbs. While urban rail services in Japan remain relatively viable financially,
bus operations have been increasingly unprofitable since the mid-1960s. Buses have lost riders to
the expanding rail networks and to increased competition with both the automobile and the bicycle.
Rising fuel and labor costs have affected bus services more than rail operations. Suburbanization
has reduced the concentration of travel demand in areas not served by rail. Increased automobile
use and accompanying traffic congestion have reduced travel speeds and productivity. In response
to these forces, the quality of bus services has declined while fares and subsidies have risen, causing
additional ridership loss.
Surveys in Japan show that deficiencies in bus service were the principal reason why many
people began using bicycles to get to rail stations. While the bicycle certainly accounts for some of
the bus ridership loss in Japanese urban areas, many Japanese transport planners believe that
bicycles have helped to alleviate overcrowding in the highly concentrated peak periods of demand.
Reduction of peak period bus ridership reduces the demand for additional vehicles and drivers that
would be employed only in the peaks with very high marginal costs. Since bicycles require no
operating subsidy and are socially beneficial in terms of pollution, energy use, and congestion, their
use as a peak period supplement to transportation system capacity appears to be highly desirable.29
The attitudes of Japanese bus transit managers towards the bicycle are quite mixed. Many
display open hostility to bicycle transportation, viewing it as a direct threat to their market position.
However, some bus transit managers perceive that the markets for bus and bicycle travel are
complementary rather than competitive, and feel that each mode should serve its function where it is
most effective. One Japanese transit manager has suggested that bus services should concentrate
more on rail access trips over 2 km (1.2 miles) length and station-to-station services between
parallel rail lines.
While the experience of Japan with bicycle-transit integration is not directly transferable to
the United States, there are many useful elements in this experience that could help transportation
planners, transit managers, and policy makers in diversifying transit access systems in America.

Linking Bicycle/Pedestrian Facilities with Transit
116
VI. Costs, Benefits, and Market Penetration
Impact on Transit Service Area and Penetration
The portions of a trip spent getting to and from public transportation are called the access"
and "egress" portions. Just as each transit trip possesses an access and egress portion, so each transit
station or route possesses an access and egress service area-the service area of a transit line being
the area from which its patronage is drawn or to which its passengers are traveling. It is common to
discuss a transit route's overall service area, but far less common to analyze the impact on service
area by mode of access or egress. Yet, the mode of access has a significant impact on the definition
of service area. Enhancing the potential for bicycle access to rail transit stations or bus stops can
play an important role in expanding a transit system's service area in a cost-effective and
environmentally sound manner.
Access Trip Lengths
In the United States, typically half of all pedestrian access trips to urban and suburban local
bus services are less than 0.09-0.12 miles (150-200 meters) in length. For commuter rail and rapid
transit stations outside downtown areas, median walking distances are significantly greater, but
rarely exceed 0.3 of a mile (480 meters).30
Automobile access can dramatically expand transit route service areas. Typical median
automobile driver trip lengths for public transit access range from 2.3-2.5 miles (3,750-4,100
meters). Auto passenger access trips, typically referred to in the United States as "kiss and ride," are
generally shorter than park-and-ride trips, with median lengths ranging between 1.3-1.6 miles
(2,075-2,640 meters). People will typically drive slightly longer distances to reach rail stations than
to reach express bus stops.
The median bicycle access trip length in Japan and Europe is typically about 1.1-1.4 miles
(1,700-2,200 meters). Information on characteristics of bicycle access trips to transit in the United
States is limited, but median bicycle access trip length to American transit services appear to be
significantly greater than this. A survey conducted in sprawling Phoenix, AZ as part of the
evaluation of the bike-on-bus demonstration, revealed that bus bike rack users were commuting an
average of 6.97 miles to access the bus. The survey also found that males, ages 16-66, were the
predominant users of the bus-bike racks. A survey of 145 bicycle locker users in San Diego

FHWA Case Study No. 9
117
found the average locker user at park-and-ride and San Diego trolley stops bikes 3.6 miles to the
locker, then travels another 11 miles by transit to reach his or her destination.
This reflects several factors-spread out low-density land development patterns in U.S.
suburbs, with greater transit line spacing, and differences in the demographic characteristics of
cyclists. In large part because the cycling environment is more hostile to bicycling in the United
States and Australia, compared to Japan and Europe, United States and Australian nonrecreational
cyclists tend overwhelmingly to be more adventuresome young and middle-aged males; in Japan
and Europe, nonrecreational cyclists more closely reflect the demographics of the general adult
population, including far mom women. Significant improvement of the cycling environment within
a 1- or 2-mile radius of transit stations, with separate bicycle paths, bike lanes, or traffic- calmed
streets, can be anticipated to reduce the average and median bicycle access travel distance and to
reshape the demographics of typical bike-and-ride travelers. Lower levels of bicycle use for
nonrecreational purposes by women in the United States may also be related to the higher levels of
rape and other violent crimes committed against women in the United States, compared to Europe
and Japan, as bicycles provide less personal security than automobiles against assault.
For all transit access modes, local factors play an important role in shaping transit route
service areas. Competition between adjacent stations and different transit routes have a major
impact on local access trip lengths. If travelers have two stations to choose from for transit access,
they will usually prefer the station closer to their ultimate destination, even if it is a bit farther access
distance. This typically results in off-centered egg-shaped station service areas, particularly for
automobile and bicycle access. Bicycle and pedestrian access trip lengths may also vary as a result
of local differences in topography, weather and access route conditions.
Table 16 shows the effects of various modes on access trip length distributions on effective
transit route service area. Both bicycles and automobiles offer substantial expansion of transit
access opportunities. Median bicycle access service areas are more than an order of magnitude
larger than median pedestrian service areas. There is significant overlap between automobile and
bicycle service areas. In many cases, 40 percent or more of auto access trips to transit are shorter
than typical median bicycle access distances. Clearly, there is substantial potential for bicycles to
substitute for autos in transit access.
Network Patterns, Connectivity, and the Effects of Barriers
It is important to consider network patterns and barriers when planning for pedestrian and
bicycle access to transit. As Figure 16 shows, barriers in orthogonal grid networks typically cause
pedestrians or cyclists to travel three times farther than the spacing, or mesh density, of the grid. In
diagonal networks with circumferential links, this detour factor is only twice the mesh density. In
the cul-de-sac street patterns commonplace in American suburbs, lack of network connectivity
frequently imposes a high detour penalty on pedestrian and bicycle trips, promoting greater
dependence on the automobile for access.
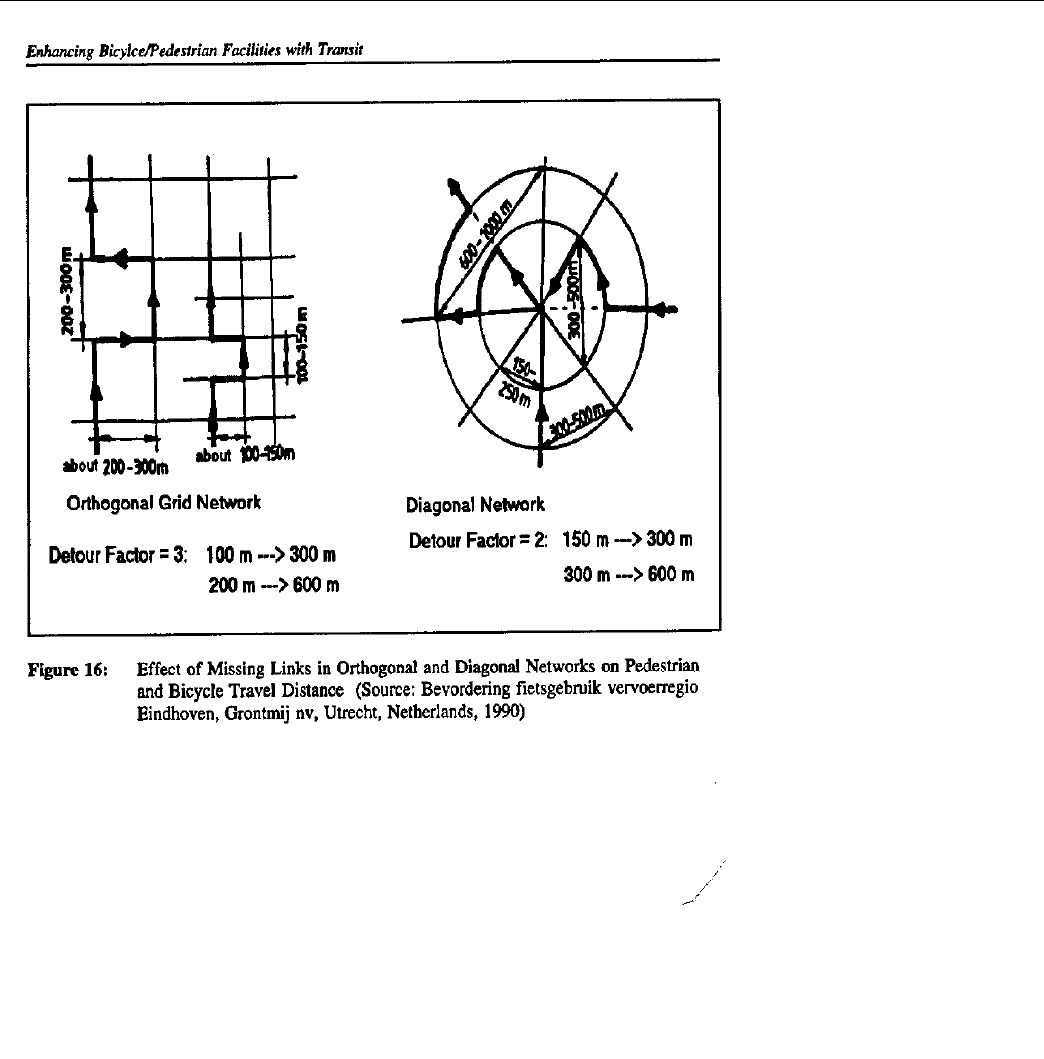
Linking Bicycle/Pedestrian Facilities with Transit
118

FHWA Case Study No. 9
119

Linking Bicycle/Pedestrian Facilities with Transit
120
Table 16. Transit Service Area Characteristics of Access Modes 31
Typical Access Trip Service Area (sq. km.)
Length (km)
Access To Transit 50% of 80% of Median Outer Bound
Mode Mode trips less trip less (50% of (80% of
than than market) market)
Walking Suburban 0.15 0.35 0.08 0.4
Local Bus
Suburban 0.15 0.43 0.07 0.5
Express Bus
Commuter/ 0.48 n.a. 0.72 n.a.
Rapid Rail
Automobile Suburban 3.75 10.0 44.2 314.2
Driver Express Bus
Commuter 4.10 9.8 52.8 301.7
Rail Stations
Automobile Suburban 2.08 5.9 13.6 109.4
Passenger Express Bus
Commuter 2.64 5.7 21.9 102.1
Rail Stations
Bicycle Rail Stations 1.70 3.1 9.1 30.2
(Japan)
Rail Stations 2.20 n.a. 15.2 n.a.
(Netherlands)
Rail Stations 2.40 n.a. 18.1 n.a.
(Illinois)
EXPRESS Bus 5.00 8.2 78.5 211.2
(San Diego)
A very effective strategy for promoting walking and cycling is the provision of shortcuts for
pedestrians and cyclists to overcome network barriers. Such shortcuts are needed to connect low-
speed, low-volume suburban residential streets into an effective network, which may dramatically
reduce the actual walking or cycling distance from homes to bus stops, stations, schools, and stores
at low cost. The addition of diagonal shortcuts for pedestrians and cyclists

FHWA Case Study No. 9
121
in the vicinity and direction of the stations has been found by the Dutch to be a very effective
strategy for expanding the area from which pedestrian and bicycle access trips are made, as these
shorten both trip distance and trip time for non-motorized access.
Accomplishing this requires taking advantage of opportunities as they arise, as in
redevelopment or through the subdivision process. However, in U.S. communities that were
designed for automobile dependence, creating such shortcuts to create network connectivity may at
times require the creation of special programs to purchase easements for pedestrian and bicycle
access at the edge of or through already subdivided residential and commercial land parcels.ss.
Effects of Service Area Size on Potential Transit Use
The overwhelming dependence of most Americans on the automobile, the dramatic drop in
the density of transit routes in American metropolitan areas since 1950, and the widespread neglect
of pedestrians in designing streets and communities together have sharply reduced the share of the
population enjoying easy pedestrian access to transit. By 1970, 42 percent of U.S. households with
incomes over $15,000 per year and 18 percent of low-income households lived farther than six
blocks from a transit route.
As Figure 16 shows, barriers in orthogonal grid networks typically cause pedestrians or
cyclists to travel three times farther than the spacing, or mesh density, of the grid.
Encouraging increased bicycle and pedestrian access to transit stations and stops offers a
cost-effective and environmentally sound means of expanding the transit market area and
diversifying the market segments to whom it is attractive. While park-and-ride facilities have
attracted many suburban riders to transit, they have, by definition, proven less useful to nondrivers
and proven more costly and land-consuming than would investment in nonmotorized means of
access.
Research by Patrick Moriarity, 32 working in Melbourne, Australia, examined the potential
effects of expanding the service area of fixed-rail systems by improving the access opportunities,
particularly for bicycles. Melbourne's central business district has lost population to surrounding
suburbs, similar to the trend in cities in other industrialized nations. Yet, Melbourne retained a 136-
mile light rail network, concentrated in the city's central area and an extensive commuter railroad
system, totaling 310 miles (500 route kilometers) throughout the metropolitan region. As
Melbourne's population became more dispersed and dependent on the automobile, rail ridership fell
and employment growth was strongest in the suburbs with only slow growth in the central core and
inner/middle rings. This is a situation common in U.S. cities.
Moriarity found that a doubling of the effective fixed-rail service area radius from 1 to 2
kilometers would increase the potential transit market from 6 percent of all people in the outer ring
to 33 percent; in the middle ring, a similar change in access radius would boost the potential transit
market from 65 percent to 87 percent of the population. By increasing the effective service

Linking Bicycle/Pedestrian Facilities with Transit
122
area radius of rail stations in Melbourne to 2 kilometers-through greater reliance on bicycle access--
-he estimated that over 33 percent of all trips in the metropolitan region could conceivably be made
by rail.
Beyond the findings of significant potential for substituting nonmotorized transportation for
auto trips, the study found that the combination of nonmotorized access with transit had important
energy conservation implications, stating that:
fuel savings resulting from the shift to fixed-rail are far more important than those
resulting from the direct shift of shorter car trips to walking and cycling. The most
important role of nonmotorized transport from the fuel-saving viewpoint is,
therefore, the ability to gain access to the fixed-rail system. 33
Moriarity's energy consumption analysis indicated that if all auto trips potentially served by
rail transit-with a maximum access/egress distance of 2 kilometers---were diverted to rail transit,
auto fuel consumption would decline 47 percent in the Melbourne region. While this theoretical
analysis ignores several important factors affecting modal choice, such as comparative travel time
and cost, physical ability to walk or cycle 2 kilometers and the need for some travelers to carry
baggage or passengers, the analysis points out the strong synergism between transit and supporting
access modes---that expanded transit service areas yield larger transit markets and can result in
energy savings previously not fully considered by most transportation and energy analysts.
Bicycle-Transit Potential for Chicago Commuter Rail
Research published in 1991 by Michael Erickson,34 previously with the Chicagoland
Bicycle Federation and now with the Division of Public Transportation', Illinois DOT, points to a
substantial latent demand for bicycle access to Metra, Chicago's commuter rail system.
Approximately 186 of 208 (89%) Metra stations have park-and-ride lots and at a usage rate of 84
percent, the entire system of 58,000 spaces is only I percent shy of parking deficiency. At least 85
of 109 stations (78%) specifically labeled as "parking deficient" are above 90 percent full (Knight
and Ghandi, 1989). Surveys of park-and-ride lot users at 41 stations found that almost 20 percent
cannot find parking in any given month, prompting some to taken an earlier train in order to obtain a
space and others to drive to a farther station.
Yet, many current park-and-ride patrons could be shifted to bike-and-ride if proper bicycle
infrastructure investments were made. For example, the Chicago Area Transportation Survey
(CATS) in 1988 found half of all park-and-ride rail users live less than 2 miles from the closest rail
station with available parking. Surveys undertaken by the Federal Highway Administration of
commuters in five urban areas (1980) and by the Northern Illinois Planning Commission 35 of
commuters asix Metra stations who hold monthly rail passes, indicate that many people who are
driving would rather use a bicycle for access if proper bicycle facilities were provided. Moreover,
surveys show that bicyclists access 12 Metra stations with park-and-

FHWA Case Study No. 9
123
ride lots, despite a lack of designated bicycle parking spaces. Another 23 stations have as many
bicyclists parked in nondesignated spaces as are parked in designated areas.
Erickson points out that Metra has financed ridership growth over the past 5 years with
heavy investment in new park-and-ride facilities, but that funding is becoming a problem,
threatening continued growth.36 Research suggests that most Metra parking spaces built in the
last few years at a cost of $14 million are now filled.37 Erickson notes that,
encouraging and facilitating people to bicycle to Metra stations, instead of driving
them to the auto, is the appropriate economic activity for mitigating parking
needs, congestion and air pollution.
Yet, only 85 of 217 Metra stations (39%) have bicycle parking and of the 109 rail stations
ranked "parking deficient," only 51----less than half-have bicycle parking.
Erickson projects mode shift goals toward which Metra might profitably commit itself,
shown in Table 17. In a 1- to 5-year period, a goal of 3,700 to 6,700 Metra commuters (5 to 9% of
auto access) could be reasonably shifted to bike-and-ride. The low end of the estimate (3,700) is
based on research by Ohm, who conservatively estimated that 10 percent of the less than 2 mile
trips to the station could be shifted to bicycle. The higher end of the short-term estimate (6,700) is
based on the number of passengers who would access Metra stations by bike if, as in some other
U.S. cities, 5 percent of all station access was by bicycle.
Table 17. Metra Access Modal Shift Goals: Reductions In VMT and Air Pollutants
#Shifted VMT Total Emission VMT Total
Emission automobile Reduction perReduction per Reduction per Reduction
per Time Horizon to bicycle day day (tons)* year (millions)year (tons)*
Short-term goal 5,763 23,052 38.0 2.977 5,226
Midterm goal 14,062 56,251 92.8 7.312 12,753
Long-term goal 37,800 182,952 301.9 36.590 41,496
Long-term Kiss- 2,700 14,904 24.6 2.980 3,380
n-ride diversion
* Total emissions include C02, HC, CO, NOx
In the long term, with promotion and training, high goals for shifting auto drivers to bicycles
could be achieved. The low end of the long-term estimate (33,750) represents bicycle access
averages in many cities of Europe and Japan, extrapolated to Metra passenger figures of 1989. The
likelihood, however, is that Metra will experience continued ridership growth over the next 20
years. If 50 percent growth were realized in 20 years, the number of auto drivers

Linking Bicycle/Pedestrian Facilities with Transit
124

FHWA Case Study No. 9
125
living less than 2 miles from the station--- 37,125 new bike-and-riders-would equal 33 percent of
auto station access or 18 percent of Metra's future ridership totals. Including kiss-and-riders, the
future potential bike-and-riders increases to 42,525.
Erickson's research notes that each automobile-to-bicycle mode shift results in a quick and
cheap increase in available parking at a rail station. The automobile commuter who now drives to
work can reduce his or her vehicle miles traveled (VMT) by becoming a Metra parkand-ride
passenger, due to the space made available by those who have shifted to bike-and-ride. Erickson
estimates that within 20 years, improved bike-and-ride access to Metra could reduce regional VMT
by nearly 40 million VMT per year and CO2 emissions by nearly 45,000 tons per year. This would
be accompanied by significant reductions in CO, hydrocarbons, and NOx, due to reduced vehicle
trip start, evaporative, and running emissions.
Bicycle Egress: Opportunity for Developing New Transit Markets
While greater use of bicycles to access transit stations increases the transit market area, the
use of bicycles for transit egress has the effect of multiplying the level of transit accessibility in
suburban areas, helping to overcome a notable limitation of automobile park-and-ride services. As
one American report noted:
With the automobile, access to stations at the end of the trip where the
automobile is available is possible from any location, but of course, once the
passenger transfers to the (transit) line, his automobile would no longer be
available for use at the other end of the trip, restricting possible destinations to
points reachable by either walking or other local transit. Since other local transit
is intensively provided only in (central city) areas, this limits possible destinations
considerably. " 38
This limitation is one reason public transportation accounts for such a small portion of
intrasuburban travel in the United States. Yet, the growth of suburban employment has made
suburb-to-suburb travel the fastest growing aspect of travel growth in U.S. metropolitan areas. The
promotion of bicycle egress (along with access), particularly near suburban employment clusters,
can help transit agencies attract more nonpeak direction riders, reducing directional imbalances in
transit passenger loads and increasing transit revenues without raising operating costs. Improved
bicycle egress systems can provide expanded employment opportunities for low income inner city
residents who are now often cut off from access to a large share of suburban employment.
Enhancing multi-modal access to low density suburban employment can help employers by
expanding the pool of workers who can fill lower wage jobs.
Bicycle egress from transit can be both practical and economical if secure bicycle parking
or rental bicycles are available at the destination transit stop or if bicycles are permitted aboard
transit vehicles. Where bicycles can be used for both transit access and egress, the effective service
area of a transit system expands dramatically for bicycle-transit users. Destinations

Linking Bicycle/Pedestrian Facilities with Transit
126
previously unreachable by transit become accessible; the use of more direct or faster transit routes
not directly serving either the travelers origin or destination in many cases becomes feasible. By
"sandwiching" a transit trip between two bicycle trips, the bicycle becomes a vehicle suited for a
greater variety of trips, both long and short. Similarly, public transportation becomes suitable and
competitive for many more trips, particularly in lower density suburban and rural areas, typically
more challenging and costly for transit to serve.
Indeed, Caltrans found in surveys in the early 1980s that 40 percent of those using bicycle
lockers at Southern Pacific commuter rail line stations in the Silicon Valley of California were
leaving their bicycles overnight in the lockers, and using bicycle egress to travel each morning from
the station to nearby employment and schools otherwise poorly served by transit.
Bicycle/Pedestrian vs. Auto Access to Transit
Complementary Access Modes. Bicycles, walking and automobiles are all well suited to
meeting the needs for improved access to suburban public transportation. Automobiles can quickly
traverse distances of many miles, carry passengers and offer comfort regardless of weather or
topography, but cars are a major source of air and water pollution and are expensive to own and
operate. Bicycles, by contrast, are cheap to own and operate, consume only renewable energy, emit
no pollution and are suitable for both access and egress distances of up to 3 or more miles. On the
other hand, bicycles expose the rider to the weather and require strenuous physical activity to
traverse hills. Bicycling can also pose real, but surmountable problems, in terms of the rider's
clothing and personal appearance at the workplace or trip-end. Walking shares many of the above-
mentioned attributes of bicycling, but is significantly more limited in terms of the distance the
average person is willing to walk to access public transportation.
Transit agencies and local governments can and do influences the relative use of bicycle,
walking and automobile access at individual transit stops by providing or failing to provide parking
for automobiles and bicycles and safe paths and access for bicycles and pedestrians. As with
automobiles, availability of parking infrastructure is required for bicycles if they are to function as
an access mode. If parking is only provided for automobiles, many potential bike and-ride trips will
be diverted to park-and-ride trips, while others will be diverted to automobile commuting.
Both European and Japanese transportation planners have recognized the complementary
roles of bicycle, pedestrian and auto access to transit and have sought to develop each where most
appropriate. In stark contrast to the United States, bicycles are given priority in the Japanese and
European transit access systems in most circumstances, for the benefit bicycles provide in less land
and energy consumption and lower capital costs are understood and appreciated.
Land Use Implications of Nonmotorized Vs. Auto Access. Park-and-ride lots typically
require 330 square feet (30.7 sq. meters) of land per parking space. By comparison, ground-level

FHWA Case Study No. 9
127
bicycle storage spaces require only 6-12 sq. feet (.6-1.1 sq. meters). The minimal space requirement
for bicycle parking allows it to be more easily sited in congested areas around rail stations and in
traffic-sensitive residential areas.
Too frequently, park-and-ride lots provide either inadequate parking capacity relative to the
demand for private vehicle access to a transit station or must be sited in remote locations unsuited
for access by foot. In the former case, potential transit ridership will be lost---most likely to auto
commuting-and in the latter case, many former pedestrian access trips to transit may be replaced by
park-and-ride trips, adding unnecessary vehicle travel and worsening transit access for households
without cars.
The development of expansive park-and-ride lots at suburban railway stations, moreover,
often compromises the potential for office, retail and high-density residential housing development
at these sites of high transit accessibility. By foregoing such possibilities for joint-development
projects, transit agencies often reduce their ability to capture revenue from land value increases
related to the improved transit accessibility and local governments lose significant potential real
estate and other tax revenues that would be generated by higher value uses of land near transit
stations. These amount to hidden costs of park-and-ride development related to rail transportation.
Thus, by maximizing the use of bicycle access, transit agencies and local governments can increase
revenue opportunities while reducing access system costs.
Because bicycle parking facilities can be developed at a small scale in residential
neighborhoods without generating significant noise, traffic congestion or other adverse
neighborhood impacts, they can supplement pedestrian access systems, rather than supplant them,
as park-and-ride services often do. In circumstances where park-and-ride facilities cannot be
developed due to insufficient or inappropriate land for the parking lots, small-scale bicycle parking
facilities could fill the gap, tapping new market areas not now served by transit systems.
I In many communities, park-and-ride lot construction proposals have been resisted by local
residents fearful of more traffic, the loss of open space, or opposed to loss of wetlands. Expanded
bicycle parking provides a sound alternative to the almost exclusive reliance on automobile park-
and-ride of the past.
Capital and Operating Costs. Park-and-ride lots vary widely in their costs. Although
some lots operate on a joint-use basis with suburban shopping centers, churches or other private
businesses, most have been constructed at considerable expense by transit agencies, local and State
Governments.
The typical construction cost of the simplest surface park-and-ride lots ranges between
$1,500 and $5,000 per space, excluding land acquisition, engineering, insurance and inspection.
Inclusion of these costs, other than land acquisition which varies widely by location, can more than
double this capital cost. If extensive cut-and-fill excavation and drainage structures for storm water
management are required, this can boost costs even more. Structured parking lots typically cost
$12,000 to $20,000 per space.

Linking Bicycle/Pedestrian Facilities with Transit
128
For example, a proposed expansion of the structured park-and-ride facility at the Shady
Grove Metro Station in Montgomery County, Maryland, is projected to cost about $18,000 per
space for 900 additional spaces. In the Chicago region, the 6,700 auto park-and-ride spaces planned
or under construction in 1990 for Metra were estimated to cost between $11-13 million or $1,641-
1,920 per space. Metra has estimated a 20-year need for 34,000 additional park-and- ride spaces,
which are projected to cost $125.8 million by the year 2010, excluding inflation, operation and
maintenance costs, or about $3,700 per space. In contrast, installed secure bicycle storage spaces,
except for fully automated or underground facilities-not yet found in U.S. cities-cost between $50-
500 each.
Maintenance and operating costs for bicycle vs. auto parking show a similar differential.
Annual maintenance and operating costs for an unattended auto park-and-ride amount for $150 or
more per space. In stark contrast, bicycle parking operating and maintenance costs range from a
few dollars to a high of $70 annually for parking garages (not found in the United States), based on
discussions with a number of U.S. and foreign transportation officials. Covered and guarded
bicycle parking at 80 rail stations in the Netherlands was reported in the early 1980s to cost about
$6.8 million per year or $64 per space, including all operating, maintenance and labor costs. This
figure also includes profits made by some bicycle garage operators.
Using these data, it is possible to view the comparative total costs of bicycle vs.
automobile parking over time. Even if one assumes that the life of bicycle parking facilities is half
that of auto park-and-ride lots, secure bicycle parking is still many times less expensive than auto
parking, even for fully guarded and covered bicycle parking.
Energy Use and Air Pollution Emissions. Park-and-ride lots usually result in some energy
savings and air pollution reductions by diverting auto commuters to transit for part of their trip, but
current analysis methods often overestimate these effects. According to several studies, 40-60
percent of park-and-ride transit users in the United States previously commuted to work as auto
drivers. When these automobile drivers substitute transit for part of their trip, they are reducing
their pollution emissions and fuel use somewhat.
The decrease in pollution emissions and fuel use is not proportionate to the reduction in
automobile trip length, however. The running emissions from motor vehicles typically make up less
than half of the total motor vehicle emissions in metropolitan areas. Evaporative emissions (related
to the number of motor vehicles), and trip-start related emissions (cold starts/hot soaks), together
typically account for the major share of motor vehicle emissions. 39
The emissions from short 1- to 2-mile automobile trips is nearly as great as the emissions
from typical 5- to 10-mile automobile commuter trips. A California Assembly Office of Research
paper noted that for a 7-mile trip, 90 percent of the emissions occur in the first mile. For a typical
trip of 5-20 miles, approximately 50 percent of the emissions come from the cold-start stage, which
occurs in the first minutes after the engine is started. This is because petroleum- fueled motor
vehicles usually combust their fuel much less efficiently when their engines are at cold, rather than at
warm operating temperatures. Each time after a petroleum-fueled motor

FHWA Case Study No. 9
129
vehicle is used, whether for I mile or for 10, the vehicle continues to give off hot soak emissions, as
gasoline remaining in the engine when the key is turned off evaporates from the engine.
As a recent report by the Environmental Defense Fund noted:
Because cold starts generate such a significant share of the pollution for most
trips, auto use reduction strategies should eventually given greater emphasis to
reducing the number of vehicle trips taken, rather than simply reducing total
miles travelled.
By switching longer automobile driver trips to park-and-ride, there may be significant
reductions in VMT but only small reductions in air pollution emissions-the reduction in running
emissions is small compared to the remaining cold start and hot soak emissions. On the other hand,
by shifting short automobile trips to the bicycle or walking, there may be an insignificant reduction
in VMT but a substantial reduction in emissions, through elimination of cold start and hot soak
emissions. These facts make park-and-ride lot expansion a relatively ineffective strategy for air
quality improvement, compared to strategies that reduce the number of motor vehicle trip starts,
such as enhanced pedestrian and bicycle access to transit.
However, many regional transportation/air quality modeling studies in the United States
have assumed that changes in mobile source emissions are all attributable to changes in the VMT
and operating speeds of roads, ignoring changes in the number of cold starts, hot soaks, and in trip
length. This error can result in substantial overestimation of emission reductions and cost-
effectiveness of park-and-ride lot development. This is important, as many States and regions are
planning to use substantial amounts of their Congestion Management and Air Quality (CMAQ)
funding under ISTEA for park-and-ride lot construction, with a primary air quality improvement
objective.
Transportation/air quality models in use are largely insensitive to both the supply and
demand for nonmotorized transportation, including walking and bicycling to transit. There has been
a lack of sensitivity in most transportation models to the factors influencing whether people will
make short nonmotorized trips or instead travel by automobile or transit. The nonmotorized modes
have simply not been represented in the analysis process. This has made it impossible for regional
planners to estimate how different land use, urban design, bicycle, and pedestrian policies could
affect air pollution emissions
In considering emissions reduction strategies, it is important to consider the potential for
diversion between modes and other changes in travel behavior as a result of new transportation
investments, services, and pricing changes. Typically, 25 to 45 percent of park-and-ride users
previously used transit to commute. Whereas, typically, 5 to 10 percent of transit riders boarding
vehicles at park-and-ride lots walk to the lot, 15 to 20 percent formerly walked directly to transit
routes before fringe parking was available.

Linking Bicycle/Pedestrian Facilities with Transit
130
Increased local auto use is often induced by new park-and-ride facilities, yet, few studies
have considered the effects of these induced auto trips in estimating energy and air pollution savings
associated with park-and-ride. In some cases, these induced emissions and adjustments for cold
starts and evaporative emissions may make park-and-ride system expansion a net new contributor to
emissions growth. Thus, such projects should undergo careful scrutiny and analysis in air quality
planning.
Finally, most evaluations of planned park-and-ride lots neglect the substantial indirect
energy costs associated with facility construction. A 1981 study by the North Central Texas
Council of Governments estimated the indirect energy consumption for creation of a 500-car
capacity park-and-ride lot as 20.7 billion BTUs, the equivalent of 166,400 gallons of gasoline
(630,000 liters). Maintenance costs were estimated to be 630 BTUs per square foot annually or an
added 1,160 gallons (4,400 liters). When considering net energy savings from park-and-ride lots,
this study found that, on average, it took 1 1/2 years to recover indirect energy costs from Dallas-
Fort Worth area lots (with 15 mpg average automobile fuel economy). In some cases, park-and-
ride lots needed to operate for 3 to 10 years before saving any energy, accounting for cold start fuel
economy and energy investment in lot construction. Moreover, as the fuel efficiency of cars
increases, the net energy savings from park-and-ride systems decreases. The Texas study found
that an increase in the fleet fuel economy from the assumed 15 mpg to 25 mpg (which is more
typical in the United States in the mid-1990s) would more than double the energy payback period
for a typical Texas park-and-ride lot.
Bicycle access to transit reduces fuel use and emissions proportionally more than it reduces
vehicle miles of travel, since cold starts, hot soaks, operating emissions and fuel use are all
eliminated when bike-and-ride trips substitute for automobile travel. Even at modest usage levels-
5 to 10 percent of modal share-bicycle access to and egress from bus and rail transit can make a
significant contribution to air pollution reduction. As Table 18 shows, for each park-and-ride
commuter diverted to bike-and-ride, an average of 150 gallons (550 liters) of gasoline per year can
be saved. A similar analysis shows that by diverting auto commuters to bike-andride, an average
of 400 gallons (1,500 liters) of gasoline may be saved for every new bike-and-ride commuter.
Although diversions shifted to bike-and-ride travel would likely result in some additional
home-based use of automobiles by other household members, reducing fuel savings somewhat, the
net energy savings would remain substantial. If only 0.5 percent of U.S. workers who now live 1/4
- 2 miles (400-3,200 meters) from a transit route and commute by auto could be attracted to bike-
and-ride travel, nationwide gasoline savings of approximately 20-50 million gallons (75150 liters)
per year could likely be achieved. The diversion of 10 percent of park-and-ride commuters to bike-
and-ride could result in gasoline savings of over 2.2 million gallons (8 million liters) per year
nationwide.
A shift of auto trips to walking trips also has substantial direct, beneficial impacts on air
quality, with auto emissions per trip reduced 100 percent. As with diversion of short auto trips to
bike-and-ride trips, diversion of short auto trips to walking produces a greater reduction in air

FHWA Case Study No. 9
131
pollutants per mile than if longer trips were diverted because of the disproportionate amount of
pollution produced by the cold start.
A 1980 study by the Chicago Area Transportation Study and the Illinois Department of
Transportation of newly installed bicycle racks at rail stations provides one of the few qualitative
evaluations of bike-and-ride effects on emissions. IDOT installed bicycle racks with a capacity of
457 bicycles at nine commuter rail stations near Chicago in July 1979 to help mitigate traffic on the
Edens Expressway. By August 1979, they recorded 222 additional bicycles parked in the new
racks. This was estimated to have reduced VMT by 1,739 per day, with a reduction of 1.99 tons of
hydrocarbons per year, and a reduction of 22.45 tons of CO per year. Evaluated along with other
emissions reduction strategies, bike-and-ride was found to be by far the most cost- effective means
of reducing hydrocarbon emissions at a cost of $311/ton reduced, as Table 19 shows.
As both a fuel conservation and air pollution emissions reduction strategy, promotion of
bike-and-ride service appears to be more cost-effective than almost any other politically feasible
transportation systems management strategy.
Table 18: Estimated Potential Energy Savings of U.S. Bike-and-Ride Development
Shift Park-and-Ride Shift Automobile
Commuter to Bike. Commuter to
and-Ride Bike-and-Ride
Average 2-way commute (or access) 4.0 miles 22 miles
distance
Fuel use rate (assume fleet fuel x .147 gallon/mile x .074 gallon/mile
economy of 17 mpg & cold start ________ _________
factor) .59 gallons/day 1.63 gallons/day
# workdays/yr x 250 days x 250 days
Potential Fuel savings/year for each 147 gallons/year 407 gallons/year
auto user

Linking Bicycle/Pedestrian Facilities with Transit
132
Table 19: Cost-Effectiveness of Various Strategies for Reducing
Hydrocarbon Emissions
Strategy Cost/ton of HC
avoided
Secure bicycle parking at rail $311
stations
Commuter rail carpool matching $3,979
Express Park-and-ride service $96,415
Feeder bus service to stations $214,959

FHWA Case Study No. 9
133
VII. Recommendations
A limited, but growing, number of U.S. transit agencies have taken actions to facilitate
improved bicycle and pedestrian access to public transportation. For the vast majority of U.S. cities
and transit agencies, however, the potential economic and environmental benefits of enhanced
bicycle and pedestrian access remains both untapped and unconsidered.
The new transportation direction embraced by the Intermodal Surface Transportation
Efficiency Act of 1991 (ISTEA), with its focus on intermodalism and enhanced efficiency of
existing transportation infrastructure, combined with the mandates of the Clean Air Act
Amendments of 1990 to reduce automobile-generated pollutants and growth in vehicle miles of
travel, will accelerate interest and investment by State and local Governments in bicycling and
walking and bicycle/pedestrian access to transit as sound alternatives to automobile commuting. In
a climate of scarce budget resources, improved nonmotorized transit access is seen by many as one
of the most cost-effective ways to improve air quality and manage traffic congestion.
As a means of encouraging and facilitating State and local Government investments in
bicycle/pedestrian access to transit, the Federal Government can play a needed and important role in
technology sharing and development of guidelines for nonmotorized access to transit.
Need for a Clearinghouse
Currently, there is no central location in the United States to which interested State or local
transportation planners, engineers, and transit agency staff can turn to obtain accurate and up-to-date
information on development and implementation of improved bicycle and pedestrian access to
transit. Information on the best types of bicycle lockers and racks, costs of various options,
experience of other cities in implementing bike-on-rail, bike-on-bus services and in creating more
pedestrian- and bicycle-friendly environments, and the successful experience of other countries,
must be gathered by each city, transit authority or State as best they can.
The establishment of a Nonmotorized Transit Access Clearinghouse would greatly facilitate
efforts of those interested in encouraging such intermodal connections and help ensure that future
efforts build on the past experience of others. Such a Clearinghouse could be housed within the
Department of Transportation or funded-at least initially-by a DOT grant to an existing private or
nonprofit organization knowledgeable about bicycle and pedestrian issues. A

Linking Bicycle/Pedestrian Facilities with Transit
134
clearinghouse could gather and disseminate information about nonmotorized transit access, prepare
case studies of successful experiences, and evaluate relevant pilot projects in the United States. If
established by DOT with a start-up grant, such a center could within several years become self-
sufficient through provision of contract technical assistance to transit agencies, municipalities, and
State Governments, including help in planning and evaluating alternative strategies for cost-
effective multi-modal transit access system development.
Development of Guidelines for Nonmotorized
Transit Access Development
Because there are relatively few U.S. transportation professionals who have received extensive
training in how to integrate the pedestrian and bicycle modes into policy, operations, or planning,
guidelines are needed to help ensure more effective progress in these areas. U.S. transportation
engineering and planning courses and textbooks should be revised to focus more attention on
intermodalism between motorized and nonmotorized modes, and U.S. universities should be
encouraged to carry out research in this area.
The following section provides comments and recommendations that might provide a basis for
development of more detailed planning guidelines on bicycle and pedestrian access to transit.
Further work is needed to fully develop such guidelines and make them available to cities, transit
agencies and others interested in implementing bicycle and pedestrian linkages to transit.
Selection of Bike-and-Ride Transit Locations. Virtually all passenger railroad stations should
offer secure bicycle parking, as a basic prerequisite to encouraging bike-and-ride connections.
Suburban stations have the greatest potential demand, particularly for access trip parking. For inner
city locations and suburban areas with substantial employment, secure overnight bicycle storage is
essential to enable bicycle egress from stations. At rural transit stations, bicycle racks and lockers
provide access to those without cars living nearby, particularly where other public transportation is
nonexistent.
The highest priority should be placed on developing bike-and-ride services in areas with the greatest
demand potential. For both rail and bus public transportation, demand will tend to be higher where:
⋅Many people live in a range of 1/2 - 3 miles from the transit boarding point and
where feeder bus service is less than frequent or unavailable at all;
⋅Express service or frequent local service is provided by transit from the station or
stop to destinations more than 5 miles distant;
⋅An attractive cycling environment is found in the area, with relatively flat terrain and
safe routes to the stop;

FHWA Case Study No. 9
135
⋅An inadequate supply of automobile parking is available at the station or stop;
⋅Major public transportation transfer points support frequent services to many
locations; and
⋅There is a substantial population favorably disposed towards bicycling.
Siting of Bicycle Parking Facilities. Bicycle parking facilities should be placed as close as
possible to the transit boarding point, but should not impede pedestrian flows or station operations.
Bicycle parking is best placed on both sides of rail stations where passengers board from outside
platforms rather than a central platform. This minimizes delay for bike-and-ride patrons and
reduces potential problems of bicycles being wheeled across bridges, subways or other track
crossings provided for pedestrian traffic. Where dual outside platforms are found and parking can
be provided only on one side of the station, it should be placed on the side most used by morning
commuters to minimize total perceived delay.
At bus stops, bicycle racks can often be placed adjacent to transit shelters on public right-
of-way. Parking lots at convenience or retail shops located close to the bus stops also offer good
locations for bicycle parking if the landowner is amenable.
Close proximity to the bus stop shelters or busy shops enhances the security of the parked
bicycles by placing them within easy view of other transit users or pedestrians. Good visibility of
bicycle parking facilities also serves to alert new transit patrons and potential cyclists to their
existence. Bicycle parking should be well lit at night to minimize vandalism and theft and enable
users to operate locks and keys easily. Protection for the bicycles from rain and snow is also most
desirable.
Equipment Selection. When it comes to selection of bicycle racks or lockers, the old adage
against being "penny wise and pound foolish" holds true. Investment in high quality racks and
lockers is well worth the extra expenditure that may be incurred, as experience has shown that lower
quality facilities are more subject to vandalism and theft and can undermine bicycle-transit program
goals by bringing about lower levels of use than would be the case with better quality parking
facilities. In locations with high crime rates, only secure bicycle lockers or guarded parking are
feasible; secure racks and coin-operated lockers are likely to be prone to vandalism. Several reports
are available that evaluate bicycle parking equipment. The Bicycle Parking Cookbook is a good
recent resource on bicycle parking siting and equipment. 40 Development of guarded bicycle parking
garages and bicycle check rooms at transit stations should be considered for higher potential
demand locations.
Bicycle Access Route Improvements. Although secure parking is the most important
element in the bicycle-transit access system, transit agencies and local governments seeking to
encourage bicycle-transit linkage should also evaluate access route conditions. Barriers and bicycle
safety hazards in the area of transit stops and stations should be identified and improvements made
where possible. Access route improvements should be concentrated in the

Linking Bicycle/Pedestrian Facilities with Transit
136
area within I mile or less of transit stops, where there is the greatest concentration of potential
bicycle travel demand. It is important to evaluate the connectivity of the bicycle and pedestrian
network, identifying missing links, and locations where it is hard to cross major streets, roads, or
other barriers. Where possible, opportunities to create bicycle/pedestrian exclusive shortcuts should
be explored, as these can form the most important elements in the transit access system, particularly
when they are in the immediate vicinity of stations or major Stops. 41
Often, minor improvements can make a major difference in the cycling environment. By
widening curb lanes to 14 feet (4.25 meters), for example, motor traffic can pass slower cyclists
with reduced conflict or threat. By narrowing motor vehicle lanes and creating parallel bicycle
lanes, additional legitimacy can be conferred for the cyclist's place on the road, although careful
attention must be given to pavement surface quality and maintenance, sight distances, driveways,
and intersection crossings to design a safe facility.
Implementation of traffic calming and neighborhood traffic management programs, which
keep through traffic off residential streets and reduce the speed of motor vehicles on minor streets,
can be a major aid to bicycle and pedestrian access. Such actions, when combined with the targeted
creation of pedestrian/bicycle shortcuts, can link together the low-speed, low-traffic volume streets
into an interconnected network for safe and comfortable nonmotorized travel. Such actions are often
undertaken as part of broader strategies to upgrade the quality of urban and suburban life. The
resulting enhanced bicycle and pedestrian access is but one element in a larger scheme of
progressive urban/suburban planning. Traffic calming should be considered not only for residential
streets, however. In Europe, Japan, and Australia, traffic calming is also being applied to larger
streets adjacent to transit stations and major retail and commercial centers. Designating these as
areas of pedestrian, bicycle, and transit priority can be an important step in creating or restoring a
balance of different modes in the overall urban travel environment. 42
Traffic control devices for bicycle and pedestrian crossing can be installed at relatively low
cost to make it easier to cross streets with high traffic volumes or speeds. Giving cyclists and
pedestrians a 10-second advance green phase, with motorized traffic held by a red stop signal, can
help nonmotorized travelers to secure their place in the roadway as they cross and proceed, reducing
safety problems. This is widely done in European cities.
Bicycle paths and lanes, when developed as part of a well-designed bicycle network, can aid
cyclists in areas of fast-moving traffic, often reducing the frequency of serious accidents.43 The City
of Delft, Netherlands, for example, created an extensive network of bicycle facilities, with a
subdistrict network of mostly shared (bicycle and automobile) traffic-calmed streets on a 100-150
meter (310-450 feet) grid, a district network of smaller bikeways and bikelanes at a 200-300 meter
(620-900 feet) grid, and a city network of higher capacity, segregated bikeways designed for longer
distance bicycle trips with a 400-600 meter (1,240-1,800 feet) grid. This led to a 20 percent
decrease in the likelihood of cyclist injury, while increasing overall cyclist mobility by 12 percent.'
In communities where bicycles are widely used and where appropriate provisions have been made
for the bicycle, accident rates for bicycles can be expected to be higher than for the automobile on a
per distance traveled basis, but proportionate to actual

FHWA Case Study No. 9
137
exposure time in the transportation system. In the Netherlands, for example, 26 percent of all
person trips are made by bicycle, 30 percent of all travel time is spent bicycling, and 22 percent of
traffic fatalities and 25 percent of recorded traffic injuries involve bicyclists.'
Planning of new bicycle paths in metropolitan areas should, wherever possible, link to major
transit stations and/or bus stops. The provision of signs along the bicycle path that direct cyclists to
proximate transit stations, as is done in San Diego, also serves to enhance the bicycle transit linkage.
Bike-on-Transit Programs. The greatest untapped potential for bike-on-bus service is in
low-density suburban and rural areas where transit serves only a small portion of all origins and
destinations. In these areas, bike-on-bus programs can significantly expand mobility for many
people who lack automobiles and for those who live too far from available bus stops. Bike-on-bus
programs can be a cost-effective means to overcome barriers to bicycle traffic, such as limited
access on bridges and tunnels, and can stimulate bicycle and transit use where they aid cyclists in
surmounting major topographic barriers such as long hill climbs.
Transit agencies and local governments should evaluate their services to identify the most
appropriate routes for initiation of bike-on-bus service. The successful experience of many U.S.
transit agencies with bike-on-bus services should allay concerns about service delays that the
bicycles might cause and potential liability problems. Moreover, the existing bike-on-bus services
provide a good basis of information to transit agencies considering bike-on-bus service on the pros
and cons of front-mounted vs. rear-mounted bike racks vs. the easiest and most cost effective
method: allowing bikes to be carried on board transit vehicles.
Bike-on-bus services should be considered for express bus routes travelling distances of
roughly 6 miles (10 kilometers) or more, especially where there are intermediate stops in low to
moderate density suburban areas and connecting bus service is infrequent. Unless there are
intermediate barriers to bicycle traffic, shorter routes will not offer a significant travel time
advantage to dual-mode travelers.
Bike-on-rail services should also be evaluated by transit agencies that do not yet provide
them. As with bike-on-bus programs, transit agencies considering such services can benefit from
the successful experience of many rail transit operators in cities across the country. It is
encouraging to see that most of the new light rail systems that have opened in recent years have
incorporated bike-on-rail services and are aware of the need for good bicycle parking facilities and
paths leading to the stations. The Santa Clara County Transit system offers perhaps the best U.S.
'example for other agencies, with its no-permit-required, bikes-welcome-aboard-at-all-times policy.
Additional rail ridership revenue can be gained through incorporating bike-on-rail services
at no cost by permitting bicycles aboard rail vehicles in the nonpeak direction during peak hours and
system-wide during nonpeak hours. New rail car purchases should require provision of bicycle and
hand luggage storage bays in rail cars to facilitate the growth of bike-on-

Linking Bicycle/Pedestrian Facilities with Transit
138
rail services. Design of the new "California Car," mandated by California's Proposition 116, to
accommodate bicycles is a promising development and similar requirements should be incorporated
into the design of all new commuter, light rail and intercity railcars.
Secure bicycle parking is a basic prerequisite to successful bike-on-transit services, whether
provided by the blessings of a low crime rate or the conscious provision of secure facilities. Such
parking should always be available along bike-bus routes and at railroad stations to serve passengers
who use a bicycle only for transit access.
Safety concerns of many transit managers about bike-on-transit service appear to be
unfounded, based on the positive experience in U.S. cities and abroad. Although American bikeon-
rail programs generally require users to obtain permits and take safety courses, the European
experience demonstrates that such measures are not needed to ensure safety. Such artificial barriers
merely inhibit the usefulness of bike-on-rail travel for infrequent users and out-of-town visitors.
Placement of signs in prominent locations in rail stations to notify potential bike-on-rail travelers of
safety rules and regulations can communicate the needed safety information and serve to maximize
use of the system.
If permits are required, efforts should be made to maximize the ease with which cyclists can
obtain the permits. Rather than requiring cyclists to go only to one central location to obtain the
permits, as is often the case, transit agencies should allow cyclists to obtain permits by mail (as
some transit agencies do) and have the permits available for sale at many or all stations on the
system, facilitating access for tourists and ocassional users.
Marketing and Promotion. The number of Americans that use a bicycle to access public
transportation is small compared to the potential that exists for such service. Bike-and-ride remains
a relatively new concept in the United States and will only achieve its full potential market
penetration with active promotion and marketing. The likelihood of program success is maximized
by concentrating initial improvements and promotion in locations where substantial potential
demand for bike-and-ride exists.
Information and marketing at railroad stations, park-and-ride lots, outside and inside transit
vehicles and in transit schedules is useful in diverting existing transit users to bicycle access. While
this may free up capacity in overcrowded park-and-ride lots, it will not attract many new riders to
transit that are not already transit users.
More effective strategies are needed to attract nontransit riding cyclists. These include:
marketing efforts through employers, ride-sharing coordinators, and transportation demand
management programs, advertising in community newspapers, distribution of leaflets in bicycle
shops and neighborhoods within the bicycle access service area of the transit stop or station and
other such means. Major new bicycle parking programs or facility openings can sometimes be
turned into community-level media events to attract attention of the local press and potential users.

FHWA Case Study No. 9
139
Marketing programs must be targeted to specific audiences for maximum impact. An
Australian report on bicycle-transit linkage discusses the characteristics of the most likely convert
to bike-and-ride services. This market profile is readily applicable in many American contexts.46
⋅The trip the individual is taking must be of some length, where fuel and other costs
become a factor;
⋅the trip may involve severe traffic congestion giving rise to unpredictable delays,
perceived dangers and considerable irritation;
⋅There are at least moderate parking problems or costs at the end of the trip;
⋅The family is, ideally, a single-car family living in an area with infrequent or not
easily accessible public transport, so there is pressure for the car to be available for
other household members;
⋅The individual lives more than a 6-7 minute walk from the transit stop or station but
no more than a 10-minute bicycle ride away;
⋅The individual already owns a bicycle and is disposed to cycling; and
⋅There are no steep hills or serious hazards that the individual would have to negotiate
going to and from the station.
Special offers should be tried for new bike-and-ride programs so people can try out the
system with little risk or expense for a short period of time. A 2-week trial lease, for example, for
bicycle lockers might be offered. Various giveaways can encourage mode change behavior and
sometimes attract media attention.
Management and Operations. The management of bicycle parking facilities at transit stops
varies widely. In some cities, the transit agency takes the lead; in others, local or State agencies are
responsible. Private businesses also play a role in cities in Japan and Europe and are beginning to
enter into this market in America. For example, in San Diego, Commuter Computer installs and
manages the city's bicycle parking facilities.
The tasks involved in managing bicycle storage facilities depend on the type of parking
provided. However, all types of operations must be concerned with maintenance and monitoring of
use. While most bicycle racks and lockers are designed for at least a 10-year life, without a
responsive maintenance program, minor equipment problems can lead to unused or nonfunctional
bicycle parking. The settling of locker pads can cause doors to stick or reduce the security of the
enclosure. Unattended drainage problems can cause premature rust-out of equipment. Vandalized
bicycle racks can indicate the need for parking relocation. Monitoring of use is

Linking Bicycle/Pedestrian Facilities with Transit
140
important to determine the adequacy of bicycle parking capacity and effectiveness of marketing
programs.
Many bicycle parking programs at U.S. transit agencies are run with centralized
administration. However, since parking facilities are dispersed, decentralization of some functions
could result in more convenient use and more responsive operations. This approach appears to have
worked well in Japan, Europe and Australia. In Melbourne, Australia, for example, station
attendants can rent lockers to local users, handle minor problems such as lost keys and quickly
report maintenance problems to the appropriate office. At locations where no transit staff are based,
the Australians are considering delegation of these functions to agents adjacent to the site.
Decentralization may make it much easier to attract new users who are dissatisfied with their
current mode of travel but who are not strongly enough committed to the idea of bike-andride to
pursue more elaborate procedures for obtaining a bicycle locker or permit. People are often more
inclined to talk to a local station agent or shopkeeper than they are to phone or write an impersonal
bureaucracy. The management and operation of bike-and-ride programs should seek to reduce
artificial barriers to change of behavior and decentralization of certain functions could be very
beneficial. Fundamentally, U.S. transit agencies need to cultivate a greater customer-service
orientation in their operations and system design, recognizing the need to offer services tailored to
the many different potential market niches than exist in metropolitan transportation.
Recommendations for Future Research and Pilot Projects
The integration of bicycles with public transport in the United States has been constrained
by many factors, including the lack of information, analysis and evaluation of linkage strategies.
Although advances have been made over the past decade, many potentially fruitful measures have
yet to be tried or adequately evaluated. Given the promise shown by experiences to date, both in the
United States and abroad, there is an immediate need for transit agencies, local and State
Governments and U.S. DOT to undertake additional research and pilot projects related to bicycle-
transit linkage.
It is important that State and locally sponsored pilot projects related to bicycle-transit
linkage include an evaluation to ensure that maximum learning occurs regardless of project success
or failure. Evaluation of the Phoenix bike-on-bus demonstration service showed demand and
acceptance of the new service far higher than anticipated and helped move the project to an
expanded system-wide service.
A general need for research and sharing of technology on transit access exists. Several
specific areas that could be most productive include:

FHWA Case Study No. 9
141
⋅Research and evaluation on factors affecting bike-and-ride demand in the United
States, particularly the impacts of local area crime rates, the price of bicycle parking,
different parking technologies and improvements in access to route conditions;
⋅Research and evaluation of marketing techniques for bike-and-ride promotion;
⋅Research and demonstration of guarded bicycle parking garages, bicycle check-
rooms, rental bicycle facilities, and bicycle transportation service centers at rail
stations near major suburban employment centers and near major tourist and
recreational activity centers;
⋅Research and evaluation of the effects of comprehensive bicycle-transit integration
action programs in metropolitan areas of different sizes, involving both rail and/or
bus services. Such programs would include major investments in bicycle parking
facilities at rail and bus stops, implementation at widespread stations, selected
improvements in station access conditions and multifaceted marketing programs
directed to various appropriate market segments; and
⋅Research and demonstration of enhanced transit access planning and analysis tools
that integrate Geographic Information Systems with conventional transportation
models.
Conclusions
Improved linkage of bicycles and pedestrians with public transit cannot alone alter the future
of American transit services. In all likelihood, it will contribute modestly to the growth or
stabilization of U.S. suburban public transport. However, as this report has shown, bicycle and
pedestrian linkages open up new opportunities for U.S. transit agencies at low cost in growing
markets that have until now been neglected or penetrated only by relying on the more expensive and
air pollution-intensive strategy of park-and-ride services.
The problems of urban and suburban congestion, air pollution and demands for cost
effective transportation services in the 1990's demand new approaches to transit development and
the application of low-cost, locally appropriate strategies to promote better coordination between
different transportation modes. Bicycle and pedestrian linkages to transit have an important role to
play in this larger context by helping to adapt transit to its modem nemesis, the suburb.

Linking Bicycle/Pedestrian Facilities with Transit
142
Bibliography
1. Robert Sell, Report on American Ground Transport, Subcommittee on Antitrust and
Monopoly, Senate Judiciary Committee, 26 February, 1974, pp. 28-32; Marty Jezer, The Dark
Ages: Life in the United States 1945-1960, South End Press, Boston, 1982, p. 140.
2. Metropolitan Washington Council of Governments, Metrorail Orange Line
Bicycle/Pedestrian Access Study, Northern Virginia, October 1988, Washington,
DC.
3. Michael Replogle, Bicycles and Public Transportation: New Links to Suburban Transit
Markets, The Bicycle Federation, Washington, DC, 1983, pp. 37-38; Arther B.
Sosslau, Home- to -Work Trips and Travel: Report 4, 1977, National Personal
Transportation Study, U.S. Federal Highway Administration, Washington, DC,
1980, Tables A-16, A-17, and pp. 19-20.
4. Parsons Brinckerhoff/Kaiser Engineers, Non-Motorized Access Study, Draft Final
Report, December 20, 1991, Seattle METRO, Seattle, Washington.
5. Florida State Transportation Plan: Bicycle Element, Florida Department of
Transportation, Tallahassee, FL, 1980.
6. Robin Plair and Karen Heit, "Utilization of a Pedestrian Simulator to Preserve and
Enhance a Sidewalk Space," presented at 12th Annual Pedestrian Conference,
Bethesda, MD, 1991.
7. Michael Replogle and Ivy Leung, Use of GIS to Support Computer Transportation
Modeling in Montgomery County, MD, U.S. Federal Highway Administration,
Washington, DC, 1991.
8. Michael Replogle, "Computer Transportation Models for Land Use Regulation and
Master Planning in Montgomery County, Maryland," Transportation Research
Record 1262, 1990, pp. 91-100.
9. Cambridge Systematics, Inc., Making the Land Use Transportation Air Quality
Connections: Volume 4: Model Modifications, I 000 Friends of Oregon, Portland,
Oregon,
August 1992 (Draft), pp. 3-21.

FHWA Case Study No. 9
143
10. Jeff Kenworthy and Peter W.G. Newman, "Learning from the Best and Worst:
Transportation and Land Use Lessons from Thirty-Two International Cities
with Implications for Gasoline Use and Emissions," Conference Proceedings
from Livable Cities for Florida's Future, May 1988, Governor's Energy
Office, Florida Department of Transportation, and City of Gainesville, pp. 27-
54. (reprinted from proceedings of the Eighth Annual Pedestrian Conference,
1987, City of Boulder, Colorado).
11. See, for example, Michael Replogle, Bicycles and Public Transportation: New Links
to Suburban Transit Markets, The Bicycle Federation, Washington, DC, 1983.
12. Tilman Bracher, Policy and Provision for Cyclists in Europe, Commission of the
European Communities, Brussels, Belgium, April 1989, p. XIV and pp. 43-44.
13. Tilman Bracher, 1989, op. cit., p. 71.
14. Netherlands National Railway (NS), Summary of Bicycle Policy Memorandum
(English translation provided by NS Marketing Department to author 14 May
1992), Utrecht, Netherlands, p. 1.
15. M. Replogle, Bicycles and Public Transportation, op. cit., pp. 12-14.
16. Data from Dutch language internal document, Netherlands National Railways, 1992.
17. M. Replogle, Bicycles and Public Transportation, op. cit., p. 75.
18. lbid, pp. 1-2, and Nederlandse Spoorwegen, "Deelbeleidsplan Infra fietsstalling,"
July 1991, pp. 10-12.
19. Interview of author with Keish Peters, Netherlands National Railways, March 30,
1992, Utrecht, Netherlands.
20. M. Replogle, Bicycles and Public Transportation, op. cit., p. 70.
21. Hirotaka Koike, "Current Issues and Problems of Bicycle Transport in Japan,"
Transportation Research Record No. 1294, Transportation Research Board,
Washington, DC, 1991, pp. 40-41.
22. Danish State Railways, S-Train Division, Action Plan to Improve Bicycle Parking at
S-Train Stations, Copenhagen, Denmark, August 1991.
23. Danish State Railways, Bicycle Parking Facilities and Bicycle Centers,
Copenhagen, Denmark, January 1990 (English summary of Cykelparkering og
cykelcentre -- et idekatalog).
24. lbid, p. 3.

Linking Bicycle/Pedestrian Facilities with Transit
144
25. DSB, Action Plan to Improve Bicycle Parking at S-Train Stations, 1991, p. 4.
26. For more information, see Michael Replogle, Bicycle and Pedestrian Policies and
Programs in Asia, Australia, and New Zealand, U.S. Federal Highway
Administration, National Walking and Bicycling Study, 1992 (forthcoming).
27. For more detailed information, see Michael Replogle, Bicycles and Public
Transportation, op.cit., pp. 51-66.
28. For more information on Japanese bicycle parking systems, see Michael Replogle,
Bicycles and Public Transportation, op. cit. pp. 55-63. Reprint of recent
marketing literature from Japanese parking manufacturers also available from
author upon request.
29. For a further discussion of the concept of peak-period supplements, see Richard
Oram, "Peak Period Supplements: The Contemporary Economics of Public
Transport," Progress in Planning, Vol. 12, part 2, Pergamon Press, 1979.
30. Jerome M. Lutin, Matthew Liotine, and Thomas Ash, "Empirical Models of Transit
Service Areas," Transportation Engineering Journal of ASCE, Vol. 107, No.
TE4, July 1981.
31. Sources: Jerome Lutin, 198 1, op. cit.; Boris S. Pushkarev and Jeffery Zupan, Public
Transportation and Land Use Policy, Indiana University Press, Bloomington,
Indiana, 1977, p.111; Japan Bicycle Promotion Institute, Tokyo (representing
rail stations in ten prefectures across Japan, 1980; Geert Teisman, Op De Fiets
Naar Het Station, Nederlandse Spoorewgen, Utrecht, 1980 (representing data
on 6 stations, 1978); Susan Pinsoff, Transportation Control Measure Analysis:
Bicycle Facilities, paper presented at Transportation Research Board Annual
Meeting, January 1982, Washington, DC; and Caltrans, data from 32 bike-and-
ride patrons at express bus and park-and-ride lots, San Diego, 1982.
32. Patrick Morarity, "Fuel Conservation and Modal Shift in Melbourne's Passenger
Transport," Australian Road Research, Vol. I 1, No. 1, March 198 1, pp. 44-50.
33. Ibid.
34. Michael J. Erickson, "Bicycle Commuting to Metra Stations: Potentials and Benefits,"
Chicagoland Bicycle Federation, June 1991.
35. Northeastern Illinois Planning Commission, "Bicycle Safety Planning Guide, " September
1975.
36. Jeffrey Ladd, "2,302 Added Parking Spaces Are Urged for Metra Stops,v4,31
Chicago Sun-Times, February 14, 1990.
37. Philip Pagaano, op. cit., 1990.

FHWA Case Study No. 9
145
38. Edward K. Morlok, Philip A. Viton, Palaniappan Sudalaimuthu, M. Suleiman
Hessami, Joseph Waldo, and Enrico Marelli, Self-Sustaining Public
Transportation Services: Vol. II, Technical Report, Department of Civil and
Urban Engineering, University of Pennsylvania, Philadelphia, PA 1979, pp. 2-
4.
39. Greig Harvey and Elizabeth Deakin, "Toward Improved Regional Transportation
Modeling Practice," prepared for National Association of Regional Councils,
Washington, DC, December 1992.
40. Ben Pugh, "A Bicycle Parking Cookbook," excerpted from 2010 Sacramento
City/County Bikeway Master Plan, California.
41. An excellent resource for conceptual thinking on this (which merits translation into
English), is Jan Wittenberg, de weg naar het station: ontwerp-ideeen voor
langzaam verkeersroutes (The Way to the Station), Technische Hogeschool
Delft (Technical University of Delft) and Nederlandsw Spoorwegen (Dutch
National Railway), Utrecht, 1980.
42. For more information on traffic calming, see Michael Replogle, Bicycle and
Pedestrian Policies and Programs in Asia, Australia, and New Zealand,
U.S.Federal Highway Administration, Washington, DC, 1992 (forthcoming).
43. Michael Replogle, Non-Motorized Vehicles in Asian Cities, World Bank Technical
Paper No. 162, Washington, DC, 1992, pp. 32-35.
44. Grotenhuis, Dirk Hten, "Safer Cycling in Delft After Realizing the Bicycle Plan,"
Proceedings of the Velo City '89 International Bicycle Conference,
Copenhagen, Denmark, August 1989, National Agency for Physical Planning,
Copenhagen, January 1990, pp. 196-199.
45. T. de Wit, "Standard for Design and Maintenance," Proceedings of Velo City 1987
Conference (op. cit.), p. 176, and Andre Pettinga, Grontmij Consultants, Utrecht
Netherlands, translated from Dutch language document, "The Netherland's
Traffic and Transport Policy and the Environment," 1991.
46. Loder and Bayly, Bicycle Storage at Transport Interchanges, The State Bicycle
Committee, Hawthorne, Victoria, Australia, June 1981. pp. 56-57.

Linking Bicycle/Pedestrian Facilities with Transit
146
Selected Additional References
"Bikes on Transit Demonstration Program," February 24, 1992, Proposal by the Bikes on Transit
Demonstration Task Force, TRIMET, Portland, Oregon.
"Florida Pedestrian System Plan," State Project No. 99000-1737, prepared by Applied Science
Associates, Inc. (Landover, MD) for Division of Planning, Florida DOT, 1989.
"1987 BART Passenger Profile Survey," Office of Research, Department of Planning, Budget,
and Research, BART, January 1988.
Michael Replogle, "Role of Bicycles in Public Transportation Access," Transportation Research
Record 959, Transportation Research Board, Washington, DC, 1984.
Loder & Bayly, Pty., Ltd. and Alan Parker Design, Provision of Bicycle Facilities at Railway
Stations, Report to Metropolitan Transit Authority, Melbourne, Australia, 1987.
