FHBO Cfs FY2012
User Manual: FHBO
Open the PDF directly: View PDF ![]() .
.
Page Count: 38

2012
FINANCIAL
REPORT
2012

Discussion of Financial Results (unaudited)
Selected Financial Data (unaudited)
Report of Independent Auditors
Consolidated Statements of Financial Position
Consolidated Statement of Activities
Consolidated Statements of Cash Flows
Notes to Financial Statements
1
7
8
9
10
11
12
CASE WESTERN RESERVE UNIVERSITY | 1
Case Western Reserve University continued to build on the solid
nancial resource base during scal year 2012 (“FY12”). The
University’s net operating activities were positive, working capital
initiatives successful, and philanthropic eorts reached new and
historic levels.
The FY12 nancial plan again centered on enhancing core operating
performance, increasing working capital resources, and growing
momentum throughout a comprehensive capital campaign. The
results were a $36 million or 4% operating margin, a $28 million
increase in working capital, and a new record for annual attainment
of $138 million. Capital expenditures continue to reect targeted
investments, supplemented by philanthropy. There are no current
plans for additional debt.
Below are additional comments related to the University’s operations
and nancial results.
FY12 FINANCIAL HIGHLIGHTS
Solid core operating performance
The University’s stewardship of resources produced net operating
income of $36 million, a 4% operating margin. A proactive nancial
management plan reected a balanced budget in FY12 with a
planned $2 million surplus. Actual results of a $6.4 million surplus
reect revenue diversity in a wide array of academic programs
attracting high quality students to a leading research university. Both
net operating activity and operating surpluses have been positive
in all of the last ve years, as well as outperforming annual budgets.
Management is committed to continuing sustainable operating
improvements.
Increased working capital resources
The University implemented several strategic initiatives to enhance
working capital. Working capital from operating, nancing, and
investing activities all increased in FY12, improving liquidity by
$28 million over FY11. This increase was during a period of two
extraordinary cash outlays to fund pension obligations and increased
interest rate swap collateral requirements totaling over $40 million.
Record-breaking capital campaign
The University benetted from the generous support of its donors.
During FY12, the University announced a capital campaign with a $1
billion goal. The attainment achieved in FY12 totaled $138 million,
an historic level and represents a 10% increase over the previous
record-setting year of FY11. The University received gifts from over
17,000 donors, totaling $92 million as reported on a cash basis.
Realized gifts and pledges of $62 million are reported in the nancial
statements on an accrual basis.
DISCUSSION
OF
FINANCIAL
RESULTS
2 | DISCUSSION OF FINANCIAL RESULTS
STATEMENT OF
OPERATIONS
The University manages its daily operations using a Statement
of Operations which is prepared on a modied cash basis and
presented by natural account class; it is unaudited. The Statement
of Operations measures and reports the management center-based
activities of the organization. It excludes non-operating transactions,
depreciation expense, diers in its treatment of capital, and excludes
most restricted funds transactions (e.g. restricted gift revenue).
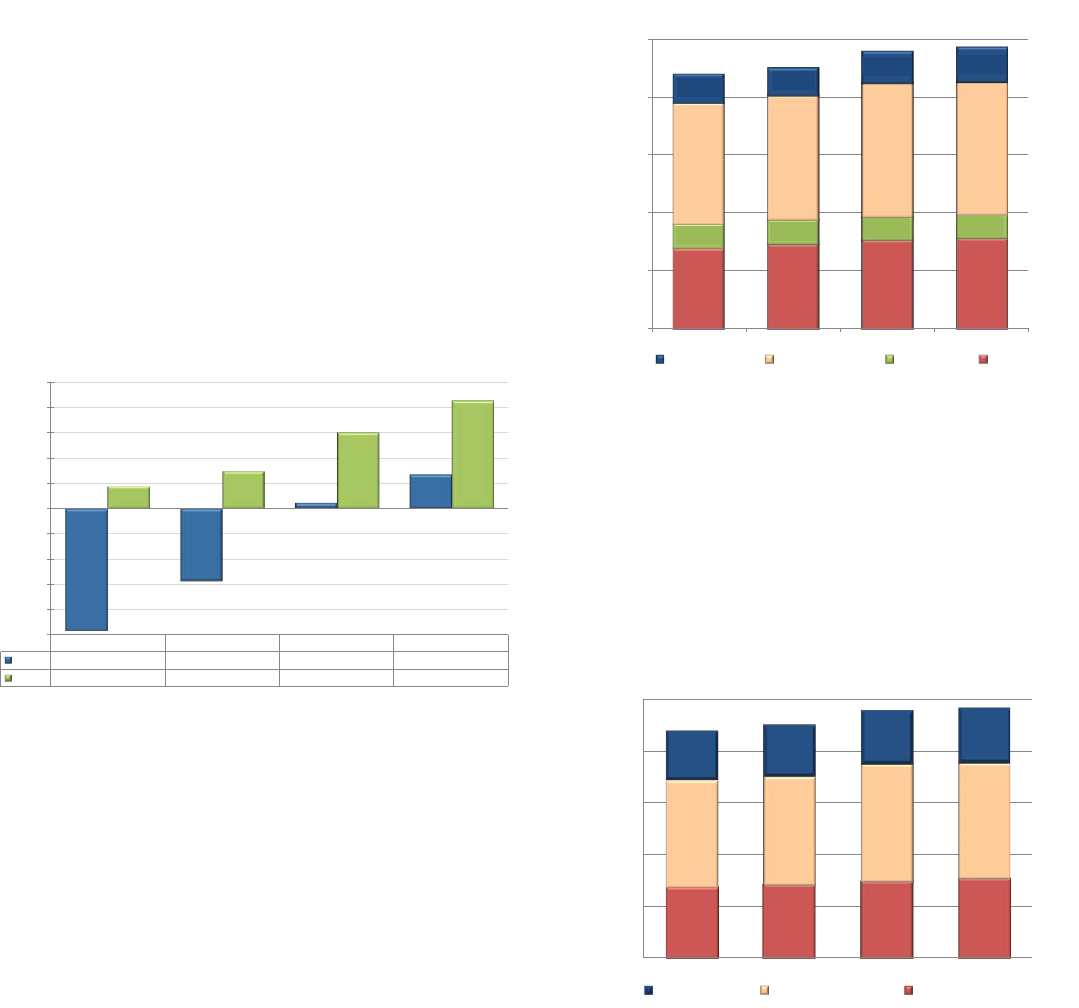
The University produced an operating surplus of $6.4 million in FY12,
compared to a budget of $2.0 million and a $4.5 million surplus in
FY11.
2009 2010 2011 2012
Budget (7,226) (4,278) 332 2,000
Actual 1,336 2,226 4,499 6,375
(7,500)
(6,000)
(4,500)
(3,000)
(1,500)
-
1,500
3,000
4,500
6,000
7,500
UNIVERSITY SURPLUS/(DEFICIT)
in thousands
The FY12 operating results were achieved without use of a Board-
designated contingency fund of $8.2 million which is retained for use
in subsequent years.
The operating surplus has increased in absolute dollars in each of
the last ve years. In addition, the surplus has exceeded plan in each
year as well.
MANAGEMENT CENTER OPERATING REVENUES
Operating revenues are classied in four categories: tuition,
endowment, research-related, and other. The University reported
$973 million in revenue, a $14 million or 1% increase from FY11.
All categories with the exception of research-related increased over
FY11. Research-related declined slightly due to the end of federal
stimulus funding made available through the American Recovery and
Reinvestment Act of 2009.
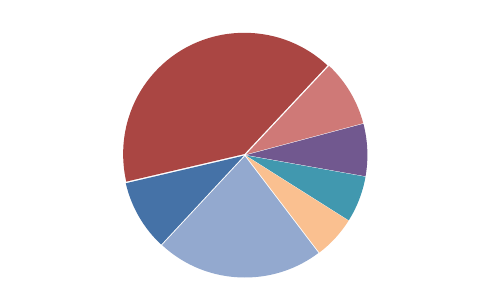
MANAGEMENT CENTER OPERATING EXPENSES
Operating expenses were $968 million, a $10 million or 1% increase
from FY11. Functional expenses are classied as salaries and
benets, other direct, and indirect expenses.
278,600 293,140 306,937 313,007
84,058 85,258 80,584 82,226
419,967 430,352 462,994 459,347
99,132 95,061
108,501 118,645
-
200,000
400,000
600,000
800,000
1,000,000
2009 2010 2011 2012
OPERATING REVENUE
(in thousands of dollars)
Other Revenue Research-related Endowment Tuition
Salaries and benets and indirect expenses increased due to
inationary increases, largely salary-related. Other direct expenses
of $447 million declined $7 million or 2% due to the related decline
in research activity mentioned previously, and due to operating
eciencies.
274,562 283,912 296,322 307,853
415,195 419,922 454,103 446,685
190,653 199,551
208,029 213,510
-
200,000
400,000
600,000
800,000
1,000,000
2009 2010 2011 2012
OPERATING EXPENSES
(in thousands of dollars)
Indirect Expense Other Direct Expense Salaries & Benefits
CASE WESTERN RESERVE UNIVERSITY | 3
CONSOLIDATED
STATEMENT OF
ACTIVITIES
The Statement of Activities includes consolidated results from
operating and non-operating activities of the University to produce
change in net assets. In FY12, operating activity contributed $36
million to net assets.
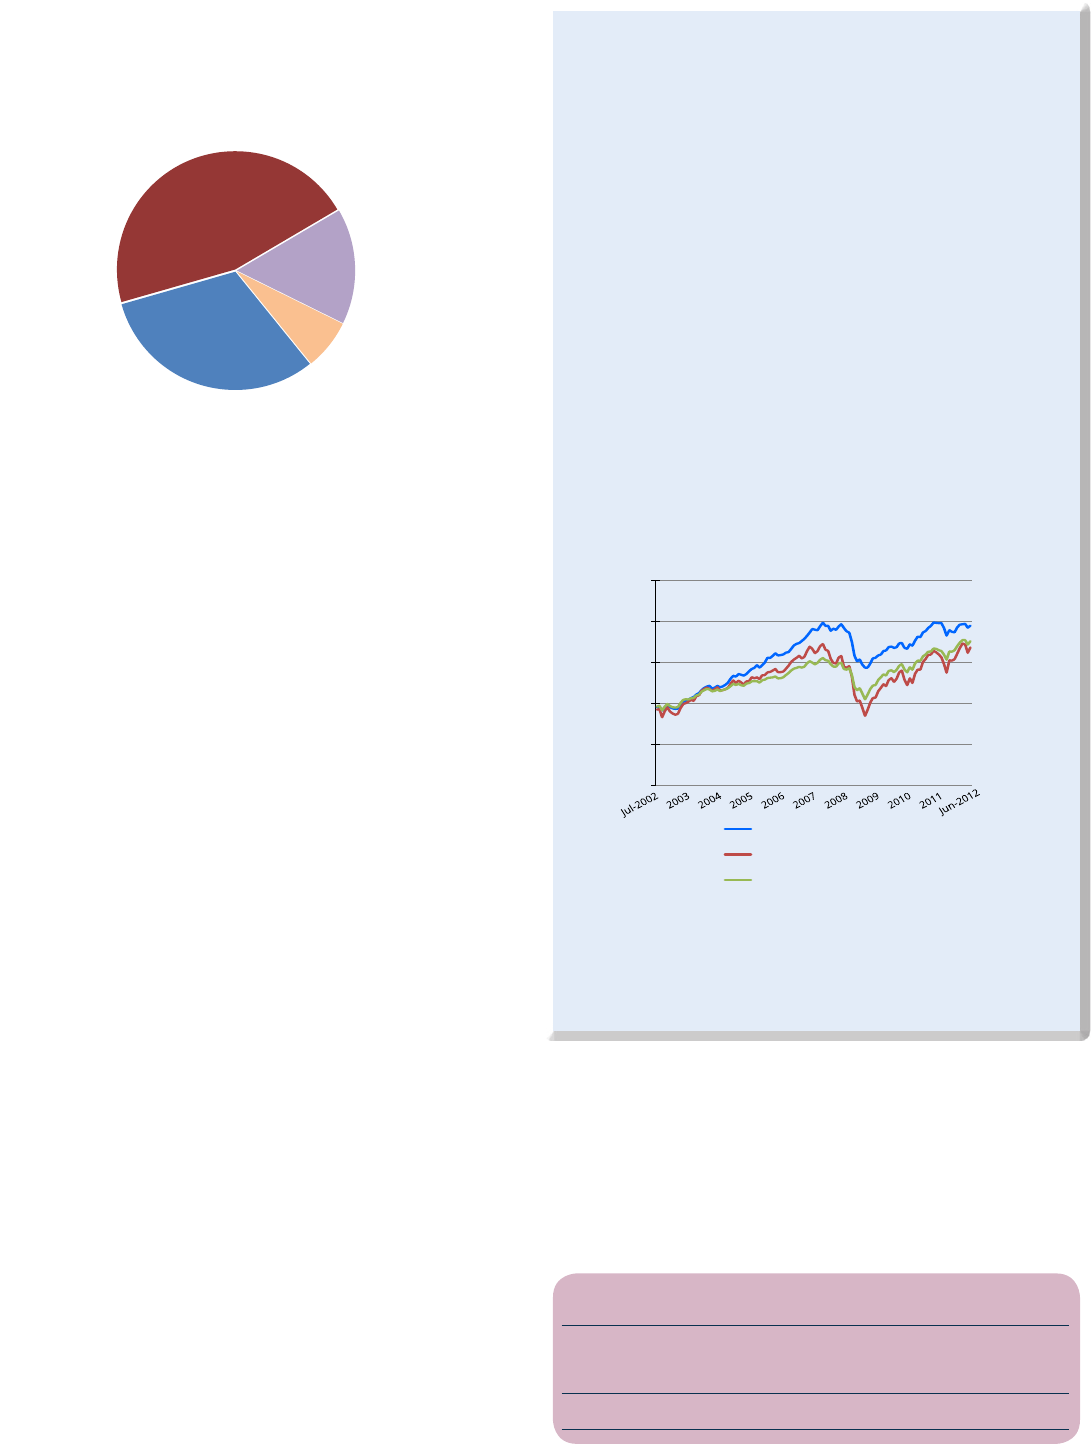
OPERATING REVENUES
Total operating revenues were $896 million, a $24 million or 3% drop
from FY11. The components of the University’s revenues are shown
below; additional detail of operating revenue follows.
Investment
Returns
9%
Grants and
Contracts
41%
Overhead
Recovery
9%
Gifts &
Pledges
7%
Other
6%
Auxiliaries
6%
Tuition
(net of
financial aid)
22%
Statement of Activities data
OPERATING REVENUES
$896 million
Tuition Income
Gross tuition income of $318 million, including fees and
undergraduate, graduate, summer, and professional tuition,
increased $8 million or 3% over FY11. Gross tuition income is oset
in part by nancial aid awarded; the nancial aid oset for FY12
was $118 million, resulting in net tuition of $200 million or 22% of
operating revenues.
The net tuition income of $200 million increased $12 million or 6%
over FY11, with increased revenues realized in graduate and summer
programs.
Investment Returns
Investment Returns included $61 million in returns distributed from
the long-term investment pool, $10 million in returns on operating
investments, and $13 million in distributions from funds held by
others (FHBO) for endowment spending. Investment returns in
operations, which represent 9% of operating revenue, totaled $84
million, a decrease of $21 million or 20% from FY11.
The majority of the decline was from returns on operating
investments, which were down $23 million from FY11. This decrease
was oset in part by a 6% or $1 million increase in returns from
FHBO and $1 million increase in long-term investment returns
distributed for operations.
Grants and contracts
Grant and contract revenue includes both awards for Case Western
Reserve University and also its aliates, most notably the Cleveland
Clinic Lerner College of Medicine (“CCLCM”).
Grants and contracts received for research and training purposes
of $364 million, including $98 million in CCLCM awards, decreased
$5 million or less than 2% from FY11. The total represents 41%
of University operating revenue. The decrease corresponds with
research operating expenses.
Overhead cost recovery
The facilities and administrative cost recovery applicable to federally
sponsored projects and all other sponsored activity was $80 million
in FY12 with no change from FY11. Overhead recovery constituted
9% of operating revenue.
Gifts & Pledges
Gifts & Pledges income of $62 million was down $16 million or 20%
from historic FY11 levels due to a number of one-time gifts being
realized in FY11. As compared to FY10, however, Gifts & Pledges
income, 7% of operating revenues, was up $7 million.
Other Revenue
Other revenue of $55 million, an increase of nearly $5 million or 9%
over FY11, constituted 6% of revenue. Other revenue was provided
by the State of Ohio appropriation, Organized activities, and Other
sources.
Auxiliaries
Auxiliary services income of $51 million, which was 6% of operating
revenues, increased $2 million or 3% over FY11. Auxiliary income
is categorized as either “Student,” which is largely Housing, Food,
and Health Services, totaling $40 million, or “Other,” including Rental
Properties and Parking, totaling $11 million for FY12.
4 | DISCUSSION OF FINANCIAL RESULTS
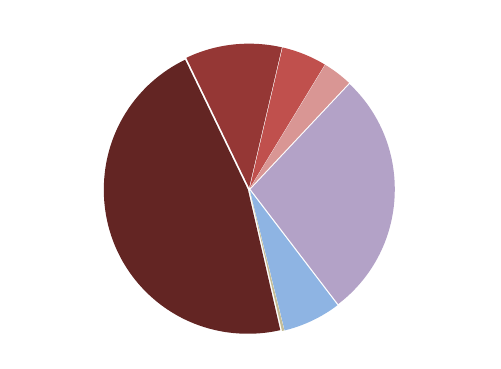
OPERATING EXPENSES
Total expenses of $860 million increased $6 million or less than1%
over FY11. The components of the University’s expenses are shown;
additional detail of operating expenses follows.
Instructional
31%
Sponsored
Research
Activity
46% Support
Services
16%
Auxiliaries
7%
Statement of Activities data
OPERATING EXPENSES
$860 million
Instructional costs of $270 million, which comprise 31% of
operating expenses, increased by $9 million or 3% over FY11.
Included in direct instructional costs are faculty and sta salaries and
benets, including a merit increase pool for faculty and sta of 2%
over FY11.
Sponsored Research Activity of $395 million, representing 46% of
operating expenses, increased by $372 thousand, less than 1% over
FY11. Sponsored Research Activity includes sponsored research and
training, other sponsored projects, and CCLCM research and training
expenses.
Support Services costs of $135 million, or 16% of operating
expenses, including Library, Student Services, and University
Services, increased $883 thousand or less than 1% over FY11.
Auxiliaries expenses of $59 million, which constitute 7% of
operating expenses, decreased by $3 million or 6% from FY11.
The reduction in expenses, when coupled with the 3% increase in
revenue, resulted in a net position of $5 million better than FY11 for
Auxiliaries.
NON-OPERATING ACTIVITIES
Non-operating activity decreased net assets $185 million due to
slightly negative investment returns and signicant pension plan
costs.
Long-term Investment Activities
Long-term investment activities realized $10 million in investment
gains and $18 million in interest and dividends on $1.5 billion in
investment assets. These gains were more than oset by expenses
of $10 million and a year-end mark to market adjustment of $34
million.
Other Non-Operating Activities
Other non-operating activities, including pension plan changes,
changes in liabilities due under life-income agreements, and loss on
disposal of plant assets, resulted in a $63 million loss in net assets.
Most signicant in this other non-operating activity was a $56 million
pension plan liability incurred from an historic 1.5% decline in the
pension plan discount rate.
CHANGE IN NET ASSETS
The combined net operating activity of $36 million and net non-
operating activity of -$185 million resulted in total net assets of
$1.825 billion, a decrease of $149 million or 8%.
THE UNIVERSITY’S ENDOWMENT
Case Western Reserve University manages its endowment of
generous donor contributions through employing active risk
management strategies designed to protect and grow portfolio
value in today’s world of volatile markets. Like the University itself,
the investment horizon is in essence perpetual, while investment,
liquidity, and spending distribution policies are grounded in
daily operational needs. These dual goals call for a balance of
aggressiveness and caution, diligence and diversication. The
pooled endowment (‘the pool”) asset allocation uses the risk
management tool of diversication, each category distinguished by
expected response to change in economic growth, ination, and
interest rates.
The overriding goal is to build a portfolio that does well on both
an absolute and a relative basis in a variety of economic and
inationary environments – an approach known as outcome-driven
investing. The success of this strategy can be seen in the value-
added monthly performance of $1,000 in the CWRU endowment
pool as compared to a S&P 500 and a 60% S&P500/40% Barclays
Aggregate bond index for a 10-year period ending June 30, 2012.
CHANGE IN NET ASSETS
(in millions) 2012 2011
Beginning net assets $ 1,973,541 $ 1,725,158
Increase/(decrease) in net assets (148,892) 248,383
Ending net assets $ 1,824,649 $ 1,973,541
In addition to the pool, the University benets from other endowed
assets, mostly trusts and deferred gifts. These funds held by others
are externally invested and managed. As of June 30, these other
assets helped bring the University’s total investments’ market value
to $1.60 billion.
$0
$500
$1,000
$1,500
$2,000
$2,500
VAMI
Growth of $1,000
CWRU Pooled Endowment
S&P 500 total return
60%/40% equity/bond index
CASE WESTERN RESERVE UNIVERSITY | 5
CONSOLIDATED
STATEMENTS OF
FINANCIAL POSITION
The University’s Statements of Financial Position reect total assets
of $2.645 billion, primarily a sizable cash and investment balance of
$1.736 billion, the cash portion of which increased liquidity over FY11.
ASSETS
Total cash and investments of $1.736 billion, including cash and cash
equivalents, operating investments, long-term investments, and funds
held by others, combined are 66% of University assets. Property,
plant, equipment and books represent an additional $731 million or
28% of assets. Total assets declined 3% or $95 million over FY11 due
to an investment mark-to-market adjustment at June 30, 2012.
Investments
held for long-
term purposes
46%
Funds held
in trust by
others
11%
Cash and cash
equivalents
5% Operating
investments, at
market
3%
Property, plant,
equipment,
and books
28%
Receivables
7%
TOTAL ASSETS
$2.645 billion
Statements of Financial Position data
Cash and Cash Equivalents
The University actively manages its working capital to maintain
targeted levels of working capital in highly liquid assets to meet daily
operating requirements. Working capital in excess of the liquidity
target is retained in operating investments producing a higher
investment return.
The University’s cash position at June 30 was $134 million, an
increase of $28 million or 26% over FY11. Cash equivalents include
all highly liquid investments with original purchase maturity of 90
days or less and appropriated endowment income which may be
spent on demand.
Operating Investments, at market
The University’s operations were supported by $87 million of
operational investments in addition to cash and cash equivalents.
These investments generally have a maturity of greater than 90 days
but may be liquidated on demand.
Operating investments were up 12% or $9 million over FY11 totals.
Receivables
Receivables include net accounts and loans receivable as well as
net pledges receivable. In total, the University has $172 million in
receivables, 6% of assets. Receivables were down $12 million or 7%
from FY11.
Investments held for long-term purposes
Long-term investments of $1.23 billion decreased $92 million or
7% from FY11. Because the majority of the University’s long-term
investments are endowments or similar funds, the Board of Trustees’
annually-designated endowment spending allocation had an impact
of approximately $70 million on long-term investments in FY12.
This endowment spending was only partially oset by investment
earnings of approximately $13 million, and was coupled with a mark-
to-market adjustment for unrealized gains of $34 million.
Funds Held By Others
Funds held in trust by others of $286 million decreased 4% or $12
million from FY11.
Property, Plant, Equipment, and Books
Property, plant, equipment, and library books, net of depreciation,
constitute 28% of the University’s assets, totaling $731 million for
FY12. Net plant assets decreased $15 million or 2% from FY11.

6 | DISCUSSION OF FINANCIAL RESULTS
LIABILITIES
Total liabilities increased over FY11 to $821 million, a $54 million or
7% increase from FY11 totals.
Retirement Plans
The University provides both dened benet and dened
contribution pension plans for its faculty and sta. The pension plan
discount rate for the dened benet plan decreased from 6.0% to
4.5% in FY12. This decrease caused the University’s accrued pension
liability position to increase by $41 million over FY11, to a total
accrued pension liability of $63 million in FY12.
Debt
Scheduled debt service payments made during FY12 decreased the
liability on notes and bonds payable by $10 million to $560 million.
While there is no current plan for new debt, the University’s Board
of Trustees authorized in 2008 an increase in its commercial paper
program to $90 million, of which $27 million has not yet been
drawn. It is anticipated this balance will be used for bridge nancing
for strategic capital projects, specically the new Tinkham Veale
University Center.
NET ASSETS
Total net assets of the University declined in FY12 by $149 million or
8% from FY11 to $1.825 billion.
Unrestricted Net Assets
Unrestricted net assets of $147 million decreased $69 million
from FY11. Net operating activity increased $11 million, while net
non-operating activity decreased $80 million, for a net change of
$69 million. Valuation adjustments for both pension liability and
investments account for the decrease.
Temporarily Restricted Net Assets
Temporarily restricted net assets decreased $89 million to $794
million. The University received $37 million of new temporarily
restricted gifts and pledges in FY12, which were oset by a year-end
market valuation adjustment of $31 million and $61 million in assets
released from restrictions.
Permanently Restricted Net Assets
Permanently restricted net assets increased $9 million to $884
million during FY12. The majority of the increase was due to the
receipt of $23 million in new gifts and pledges, which were partially
oset by $10 million in long-term investment activity losses and a
change in liabilities due under life-income agreements of $4 million.
PROSPECTIVE DISCUSSION
The University expects to continue to build on its solid nancial base
as reected in its budgeted surplus of $5 million for scal year 2013.
Strategic capital projects are supported through restricted gifts and
a new $1 billion dollar campaign through 2016 is well underway. The
incoming undergraduate class, the Class of 2016, is the largest and
most academically accomplished in the University’s history. Finally,
senior leadership is committed to continuous operating performance
improvements, thereby strengthening the University’s nancial
position through a disciplined and well-executed strategic plan.
John F. Sideras, CPA
Senior Vice President and Chief Financial Ocer

C A S E W E S T E R N R E S E R V E U N I V E R S I T Y | 7
SELECTED FINANCIAL DATA
unaudited
Fiscal Years Ended June 30
2012 2011 2010 2009
STATEMENT OF OPERATIONS HIGHLIGHTS
Tuition 313,007$ 306,937$ 293,140$ 278,600$
Endowment Revenue 82,226 80,584 85,258 84,058
Research-Related Revenue 459,347 462,994 362,495 419,967
Other Revenue 118,645 108,501 162,918 99,132
Total Revenue 973,225$ 959,016$ 903,811$ 881,757$
Salaries and Benefits 307,853 296,322 311,689 274,562
Other Direct Expense 446,685 454,103 392,145 415,195
Indirect Expenses 213,510 208,029 199,551 190,653
Total Expense 968,048$ 958,454$ 903,385$ 880,410$
Operating Margin 5,177$ 562$ 426$ 1,347$
Retained Surplus Use/(Contribution) 1,198 3,937 1,800 (11)
Surplus 6,375$ 4,499$ 2,226$ 1,336$
CONSOLIDATED STATEMENT OF ACTIVITIES HIGHLIGHTS
Tuition and Fees (net of student aid) 199,709$ 188,078$ 174,927$ 167,034$
Investment, FHBO, and operational returns 84,165 105,188 89,002 93,928
Grants and Contracts 364,197 369,007 349,475 360,395
Facilities and Administrative cost recovery 79,607 79,742 75,705 67,687
Gifts and Pledges 62,165 77,878 54,627 52,492
Other Revenue 55,205 50,424 43,784 52,786
Auxiliary Services 51,006 49,449 45,517 46,278
Total Operating Revenues 896,054$ 919,788$ 833,037$ 840,600$
Instructional Expenses 269,966 261,461 253,578 241,929
Sponsored Research Activity 395,327 394,955 375,141 378,006
Support Services 135,463 134,580 130,355 123,402
Auxiliary Services 58,975 62,414 58,781 59,090
Total Operating Expenses 859,731$ 853,410$ 817,855$ 802,427$
Net Operating Activity 36,323$ 66,378$ 15,182$ 38,173$
Long-term Investment Activities (60,933) 233,577 76,368 (368,987)
Other non-operating activity (124,282) (51,572) (76,241) (133,213)
Net Non-Operating activity (185,215)$ 182,005$ 127$ (502,200)$
Change in Net Assets (148,892)$ 248,383$ 15,309$ (464,027)$
CONSOLIDATED STATEMENTS OF FINANCIAL POSITION HIGHLIGHTS
Cash and cash equivalents 133,905$ 105,900$ 102,998$ 97,959$
Operating investments, at market 87,304 77,914 64,205
Receivables 171,807 183,870 148,607 158,630
Investments (held for long-term purposes)* 1,229,017 1,321,428 1,161,596 1,207,168
Funds held in trust by others 285,756 297,768 255,729 220,656
Property, plant, equipment, and books, net of depreciation 730,637 745,260 770,248 795,088
Prepaid expenses and other assets 6,979 8,424 9,258 16,314
Total Assets 2,645,405$ 2,740,564$ 2,512,641$ 2,495,815$
Total Liabilities 820,756$ 767,023$ 787,483$ 785,966$
Total Net Assets 1,824,649$ 1,973,541$ 1,725,158$ 1,709,849$
OTHER FINANCIAL INFORMATION
Total Investments (including FHBO) at year end 1,602,077$ 1,697,110$ 1,481,530$ 1,409,000$
Investments payout in support of operations 74,159 72,536 79,106 93,928
As a % of total expenses 8% 8% 9% 11%
Total gifts and pledges (attainment) 138,362$ 126,211$ 115,529$ 108,707$
Total gifts - cash basis 91,763 86,189 80,855 80,073
(in thousands of dollars)

8 | R E P O R T O F I N D E P E N D E N T A U D I T O R S
REPORT OF INDEPENDENT AUDITORS
Report of Independent Auditors
To the Board of Trustees
Case Western Reserve University:
In our opinion, the accompanying consolidated statement of financial position and the related
consolidated statements of activities and of cash flows present fairly, in all material respects, the
financial position of Case Western Reserve University (the “University”) as of June 30, 2012, and
the changes in their net assets and their cash flows for the year then ended in conformity with
accounting principles generally accepted in the United States of America. These financial
statements are the responsibility of the University’s management. Our responsibility is to express
an opinion on these financial statements based on our audit. The prior year summarized
comparative information has been derived from the University’s June 30, 2011 financial statements,
and in our report dated October 15, 2011, we expressed an unqualified opinion on those financial
statements. We conducted our audit of these statements in accordance with auditing standards
generally accepted in the United States of America. Those standards require that we plan and
perform the audit to obtain reasonable assurance about whether the financial statements are free of
material misstatement. An audit includes examining, on a test basis, evidence supporting the
amounts and disclosures in the financial statements, assessing the accounting principles used and
significant estimates made by management, and evaluating the overall financial statement
presentation. We believe that our audit provides a reasonable basis
for our opinion.
September 29, 2012
PricewaterhouseCoopers LLP, 200 Public Square, 18th Floor, Cleveland, OH 44114-2301
T: (216) 875 3000, F: (216) 566 7846, www.pwc.com/us

C A S E W E S T E R N R E S E R V E U N I V E R S I T Y | 9
CONSOLIDATED STATEMENTS OF FINANCIAL POSITION
In thousands of dollars
2012 2011
ASSETS
Cash and cash equivalents 133,905$ 105,900$
Operating investments, at market 87,304 77,914
Accounts and loans receivable, net 102,681 121,680
Pledges receivable, net 69,126 62,190
Prepaid expenses and other assets 6,979 8,424
Investments, held for long-term purposes 1,229,017 1,321,428
Funds held in trust by others 285,756 297,768
Property, plant, equipment and books, net 730,637 745,260
TOTAL ASSETS 2,645,405$ 2,740,564$
LIABILITIES AND NET ASSETS
LIABILITIES
Accounts payable and accrued expenses 66,376$ 57,834$
Deferred income and other liabilities 61,120 49,416
Annuities payable 41,454 40,623
Refundable advances 5,449 6,503
Accrued pension liability 63,291 22,582
Notes and bonds payable 559,978 570,179
Refundable federal student loans 23,088 19,886
TOTAL LIABILITIES 820,756$ 767,023$
NET ASSETS
Unrestricted 146,716$ 215,901$
Temporarily restricted 793,989 883,118
Permanently restricted 883,944 874,522
TOTAL NET ASSETS 1,824,649$ 1,973,541$
TOTAL LIABILITIES AND NET ASSETS 2,645,405$ 2,740,564$
The accompanying notes are an integral part of the consolidated financial statements.
For the year ended
June 30

10 | F I N A N C I A L S T A T E M E N T S
CONSOLIDATED STATEMENT OF ACTIVITIES
with summarized financial information for the year ended June 30, 2011
In thousands of dollars
Unrestricted
Temporarily
Restricted
Permanently
Restricted
2012 2011
OPERATING REVENUES
Student tuition and fees 317,861$ 317,861$ 309,499$
Less: Student aid (118,152) (118,152) (121,421)
199,709 199,709 188,078
Investment returns distributed for operations 60,366 304$ 163$ 60,833 59,934
FHBO returns distributed 13,326 13,326 12,602
Investment returns on operating investments 10,006 10,006 32,652
Grants and contracts 265,888 265,888 268,909
CCLCM grants and contracts 98,309 98,309 100,098
Gifts & pledges 2,539 36,959 22,667 62,165 77,878
State of Ohio appropriation 2,744 2,744 3,262
Facilities and administrative cost recovery 79,607 79,607 79,742
Organized activities 11,927 11,927 11,395
Other sources 39,895 639 40,534 35,789
Auxiliary services - students 39,858 39,858 38,742
Auxiliary services - other 11,148 11,148 10,707
Net assets released from restrictions 35,103 (36,745) 1,642 - -
TOTAL OPERATING REVENUES 870,425$ 518$ 25,111$ 896,054$ 919,788$
OPERATING EXPENSES
Instructional 269,966 269,966 261,461
Sponsored research and training 269,865 269,865 267,767
Other sponsored projects 27,153 27,153 27,090
CCLCM research and training 98,309 98,309 100,098
Libraries 22,279 22,279 22,122
Student services 22,780 22,780 21,886
University services 90,404 90,404 90,572
Auxiliary services - students 47,446 47,446 50,482
Auxiliary services - other 11,529 11,529 11,932
TOTAL OPERATING EXPENSES 859,731$ -$ -$ 859,731$ 853,410$
NET OPERATING ACTIVITY 10,694$ 518$ 25,111$ 36,323$ 66,378$
NON-OPERATING ACTIVITIES
Long-term investment activities
Investment (loss) income (20,004)$ 2,720$ 1,744$ (15,540)$ 71,590$
Net (depreciation) appreciation (2,148) (31,233) (12,012) (45,393) 161,987
Total long-term investment activities (22,152) (28,513) (10,268) (60,933) 233,577
Long-term investment income and gains distributed
for operations (60,366) (304) (163) (60,833) (59,934)
Change in liabilities due under life-income agreements (4,472) (4,472) (2,315)
Loss on disposal of plant assets (1,680) (1,680) (6)
Pension plan changes other than periodic benefit costs (55,655) (55,655) 10,390
Other non-operating activity (1,642) (1,642) 293
Net assets released from restrictions 61,616 (60,830) (786) - -
NET NON-OPERATING ACTIVITY (79,879)$ (89,647)$ (15,689)$ (185,215)$ 182,005$
CHANGE IN NET ASSETS (69,185)$ (89,129)$ 9,422$ (148,892)$ 248,383$
Beginning Net Assets 215,901 883,118 874,522 1,973,541 1,725,158
ENDING NET ASSETS 146,716$ 793,989$ 883,944$ 1,824,649$ 1,973,541$
The accompanying notes are an integral part of the consolidated financial statements.
June 30
For the year ended

C A S E W E S T E R N R E S E R V E U N I V E R S I T Y | 11
CONSOLIDATED STATEMENTS OF CASH FLOWS
In thousands of dollars
2012 2011
$ (148,892) $ 248,383
63,356 65,364
Amortization of bond issuance costs
98 128
Amortization of bond premiums
(755) (732)
1,044 1,452
34,371 (119,688)
(6,897) (96,276)
4,472 2,315
Gifts of property and equipment
(377) (495)
Receipt of contributed securities
(3,429) (3,731)
1,680 6
Contributions restricted for long-term investment
(20,729) (18,840)
Decrease (increase) in accounts and loans receivable, net
19,938 (24,769)
(6,936) (9,528)
Decrease in prepaid expenses and other assets
1,346 706
12,012 (42,039)
8,450 584
11,705 (3,923)
(1,055) (85)
40,709 (9,320)
NET CASH PROVIDED BY (USED FOR) OPERATING ACTIVITIES
$ 10,111 $ (10,488)
Student loans
$ 6,899 $ 6,274
(7,839) (7,240)
2,713,818 2,962,458
(2,654,842) (2,916,302)
1,005 2,126
(50,948) (41,912)
NET CASH PROVIDED BY INVESTING ACTIVITIES
$ 8,093 $ 5,404
$ 3,202 $ 2,976
20,729 18,840
Proceeds from short-term debt
15,000 -
Repayment of short-term debt
(15,000) -
(10,489) (9,839)
1,147 1,258
(4,788) (5,249)
NET CASH PROVIDED BY FINANCING ACTIVITIES
$ 9,801 $ 7,986
NET INCREASE IN CASH AND CASH EQUIVALENTS
$ 28,005 $ 2,902
105,900 102,998
CASH AND CASH EQUIVALENTS, END OF YEAR
$ 133,905 $ 105,900
SUPPLEMENTAL DATA:
Interest paid in cash
$ 16,968 $ 15,334
Noncash investing activities:
Contributions of securities and other noncash assets
3,806 4,226
Change in accounts payable for fixed assets
93 101
The accompanying notes are an integral part of the consolidated financial statements.
Increase (decrease) in accrued pension liability
Loss on disposal of plant assets
CASH FLOWS FROM OPERATING ACTIVITIES
Change in net assets
Adjustments to reconcile change in net assets to net cash provided by (used for) operating activities:
Depreciation
Net unrealized depreciation (appreciation) in the fair market value of investments
Realized gains on investments
Increase to annuities payable resulting from actuarial adjustments
Increase in capital appreciation notes
Increase in pledges receivable, net
Decrease (increase) in funds held in trust by others
Increase in accounts payable and accrued expenses
Increase (decrease) in deferred income and other liabilities
Decrease in refundable advances
Cash and cash equivalents, beginning of year
For the year ended
June 30
Repayment of notes and bonds payable
Increase to annuities payable resulting from new gifts
Decrease to annuities payable resulting from payments
Proceeds from the sale of plant assets
Purchases of property, plant, equipment and books
CASH FLOWS FROM FINANCING ACTIVITIES
Increase in federal advances for student loans
Contributions restricted for long-term investment
CASH FLOWS FROM INVESTING ACTIVITIES
Collected
Issued
Proceeds from the sale of investments
Purchase of investments

12 | N O T E S T O T H E F I N A N C I A L S T A T E M E N T S – i n t h o u s a n d s o f d o l l a r s
1. SUMMARY OF SIGNIFICANT ACCOUNTING POLICIES
Basis of Presentation
Case Western Reserve University (the “University”) is an Ohio not-
for-profit corporation that operates a private research university
in Cleveland, Ohio. The consolidated financial statements of the
University as of June 30, 2012, and for the year then ended, as
well as summarized information for the year ended June 30,
2011, have been prepared in accordance with accounting
principles generally accepted in the United States of America.
Accordingly, the accompanying consolidated financial statements
have been prepared on the accrual basis of accounting and
include the accounts of the University and all wholly-owned
subsidiaries.
The University wholly owns two subsidiaries. Triangle Residential
LP is a limited partnership formed in 2005 that owns and
operates two apartment buildings and a parking garage located
in the Ford-Euclid-Mayfield Road area. The University is the sole
limited partner. The general partner is Triangle Residential LLC,
also a wholly-owned subsidiary of the University, formed in 2005.
The University, through Triangle Residential LP, plans to operate
the properties pending finalization of plans to develop an arts,
entertainment and residential complex in the area. All material
transactions between the University and its subsidiaries have
been eliminated.
Net Asset Categories
Standards for external financial reporting by not-for-profit
organizations require that resources be classified for reporting
purposes into three net asset categories according to donor-
imposed restrictions:
UNRESTRICTED net assets are available for any purpose
consistent with the University’s mission. Unrestricted net assets
and related activity include the following:
All revenues traditionally classified as unrestricted resources
of the University, including tuition and fees, unrestricted gifts,
investment returns on unrestricted funds designated to
function as endowment, recovery of facility and administrative
costs from grants and contracts, and auxiliary services
revenues.
Revenues related to sponsored research and other sponsored
program agreements which are considered exchange
transactions.
Unrestricted funds functioning similar to endowment and
related investment returns.
Gifts with donor-imposed restrictions, if the restriction is
anticipated to be met within the current fiscal year of the
University.
Investments in plant assets.
All expenses of the University.
TEMPORARILY RESTRICTED net assets include investment
returns from endowments and gifts for which donor-imposed
restrictions have not been met. This restriction on temporarily
restricted endowment returns (income and realized and
unrealized gains and losses) is released when appropriations are
distributed for use and the funds have been spent. The category
also includes pledges receivable and life-income gifts for which
the ultimate purpose of the proceeds is not permanently
restricted.
PERMANENTLY RESTRICTED net assets include gifts, trusts and
pledges on which donors have imposed the restriction that the
corpus is maintained in perpetuity and only the investment
returns be made available for program operations. In the case of
trusts, gains and losses are added to the gift amount. Gifts
restricted by donors to provide loans to students are also
included in permanently restricted net assets.
Expirations of temporary restrictions on net assets are reported
as reclassifications between the applicable classes of net assets.
Donor required matching from University funds and donor
release or clarification of restrictions is also included in this
category.
The Financial Accounting Standards Board (“FASB”) issued
Accounting Standards Codification (“ASC”) 958, “Not for Profit
C A S E W E S T E R N R E S E R V E U N I V E R S I T Y | 13
Entities,” in August 2008. The standard provides guidance on the
net asset classification of donor restricted endowment funds for
a not-for-profit organization that is subject to an enacted version
of the Uniform Prudent Management of Institutional Funds Act
(“UPMIFA”) and expands disclosures about an organization's
endowment (both donor restricted and board designated funds).
The University’s Board of Trustees (“the Board”) has interpreted
UPMIFA as requiring the preservation of the original gift as of the
gift date of the donor restricted endowment funds absent explicit
donor stipulation to the contrary. As a result of this
interpretation, the University classifies as permanently restricted
net assets, (a) the original value of gifts donated to the permanent
endowment, (b) the original value of subsequent gifts to the
permanent endowment, and (c) accumulations to the permanent
endowment made in accordance with the direction of the
applicable donor gift instrument at the time the accumulation is
added to the fund. The remaining portion of the donor restricted
endowment fund that is not classified as permanently restricted
net assets is classified as temporarily restricted net assets until
those amounts are appropriated for expenditure by the
University in a manner consistent with the standard of prudence
prescribed by UPMIFA.
Contributions
Contributions, including unconditional pledges to give and
irrevocable trusts held by others with the University as the
beneficiary, are recognized as revenues in the period received or
promised. They are classified as unrestricted, temporarily
restricted, or permanently restricted net assets depending upon
the donor’s intent.
Contributions restricted for the acquisition of land, buildings and
equipment are reported as temporarily restricted revenues.
These contributions are reclassified to unrestricted net assets
when the assets are placed in service. Promises to give that are
subject to donor-imposed stipulations that the corpus be
maintained in perpetuity are recognized as increases in
permanently restricted net assets.
Conditional promises to give are not recognized until the
conditions on which they depend are substantially met. Gifts
whose restrictions are met in the same fiscal year in which they
are received are reported with unrestricted contribution
revenues. Contributions of assets other than cash are reported
at their estimated fair value at the date of gift. Contributions
scheduled to be received after one year are discounted using a
market rate (Note 3).
Grants and Contracts (Government and Private)
Revenues from government and private grants and contracts are
recognized as earned in accordance with the terms of the grant
or contract. Any government payment received before it has
been expended is recorded as a refundable advance. Projects
funded by government grants that incur expenses prior to
payment receipt are recorded as revenue with a corresponding
receivable.
Investment Returns on Operating Investments
Beginning in fiscal 2011, the University has invested excess
operating funds and certain board designated funds with the
University’s investment pool. The operating funds are invested
alongside other funds and receive a pro-rata portion of income,
expenses, gains, and losses of the pool.
Cash and Cash Equivalents
The University considers all highly liquid investments with an
original maturity of 90 days or less when purchased as cash and
cash equivalents, except those amounts managed by investment
managers as part of the investment pool that do not belong to
operations, or unspent bond proceeds, which are classified as
investments.
Operating Investments, at Market
Operating investments include all other current investments with
original maturities greater than three months that are used to
support operations. These investments include obligations of
triple A rated banks, various United States Government agencies,
and internal operating funds invested in the University’s
investment pool. Although the pool primarily invests in mid to
long term investments, the pool maintains a sufficient investment
mix that allows operating assets to be liquidated upon demand.
14 | N O T E S T O T H E F I N A N C I A L S T A T E M E N T S – i n t h o u s a n d s o f d o l l a r s
Investments
Investments are made within guidelines authorized by the Board.
Investments are initially recorded at cost at date of acquisition or
fair value at date of donation in the case of gifts. Ownership of
marketable securities is recognized as of the trade date.
Endowment returns are calculated net of internal and external
investment management expenses.
Investments are stated at fair value as defined by ASC 820, “Fair
Value Measurements and Disclosures.” Fair value is defined
under ASC 820 as the exchange price that would be received for
an asset or paid to transfer a liability, i.e., an exit price, in the
principal or most advantageous market for the asset or liability in
an orderly transaction between market participants on the
measurement date.
The fair value of all debt and equity securities with readily
determinable fair values are based on quotations obtained from
national securities exchanges. The alternative investments, which
are not readily marketable, are carried at estimated fair values as
provided by the investment managers. The University reviews
and evaluates the values provided by the investment managers
and agrees with the valuation methods and assumptions used in
determining the fair value of the alternative investments. Those
estimated fair values may differ significantly from the values that
would have been used had a ready market for these securities
existed. Realized gains and losses on investments are included in
investment income. Average cost is generally used to determine
gains or losses on securities sold. Unrealized changes in the fair
value of investments are shown as net unrealized appreciation or
depreciation.
The following describes the hierarchy of inputs used to measure
fair value and the primary valuation methodologies used by the
University for financial instruments measured at fair value on a
recurring basis (Note 6). The three levels of inputs are as follows:
Level 1 — Quoted unadjusted prices in active markets for
identical assets or liabilities. An active market is one in which
transactions occur with sufficient frequency and volume to
produce pricing information on an ongoing basis. Market price
data are generally obtained from exchange or dealer markets.
Level 2 — Pricing inputs other than Level 1 that are observable,
either directly or indirectly, such as quoted prices for similar
assets or liabilities; quoted prices in markets that are not active;
or other inputs that are observable or can be corroborated by
observable market data for substantially the same term of the
assets or liabilities. Inputs are obtained from various sources
including market participants, dealers and brokers.
Level 3 — Unobservable inputs that are supported by little or
no market activity and that are significant to the fair value of
the assets or liabilities.
Collections
The University’s collections of historically significant artifacts,
scientific specimens, and art objects are held for education,
research, scientific inquiry, and public exhibition. Their value is
not reflected in the University’s consolidated financial statements.
Funds Held in Trust by Others
Funds held in trust by others are assets held and administered by
outside trustees from which the University derives income or
residual interest. Funds held in trust by others are reported at
their fair value as of June 30, 2012 and 2011, which approximates
the present value of the future income flows from these funds.
Income received from funds held in trust by others is classified as
temporarily restricted net assets until those amounts are
appropriated for expenditure by the University. Income
appropriated within the same year is classified as unrestricted.
Unrealized changes in the fair value of investments are shown as
net unrealized appreciation or depreciation in permanently
restricted net assets.
Fixed Assets
When capital assets are sold or disposed, the carrying value of
such assets and any accumulated depreciation are removed from
the asset accounts. Any resulting gain or loss on disposal is
C A S E W E S T E R N R E S E R V E U N I V E R S I T Y | 15
recognized in the non-operating portion of the statement of
activities.
Expenditures for construction in progress are capitalized as
incurred and depreciated when placed into service. All
identifiable direct costs including other costs incurred to ready
the asset for its intended use are included in the cost of the
project. The University capitalizes interest on borrowings to
finance facilities, net of any investment income earned through
the temporary investment of project borrowings, during
construction until the project has been substantially completed.
Asset Retirement Obligations
The University accounts for asset retirement obligations in
accordance with ASC 410, “Asset Retirement Environmental
Obligations.” The University accrues for asset retirement
obligations in the period in which they are incurred if sufficient
information is available to reasonably estimate the fair value of
the obligation. Over time, the liability is accreted to its settlement
value. Upon settlement of the liability, the University will
recognize a gain or loss for any difference between the
settlement amount and liability recorded.
Allocation of Certain Expenses
The consolidated statement of activities presents expenses by
function. Some expenses — such as depreciation, amortization,
and expenses related to the operation of the physical plant — are
allocated by square footage. Interest expense is allocated to the
functions that derive the greatest benefit from the facilities
financed.
Retirement Plans
The University accounts for its defined benefit postretirement
plan in accordance with ASC 715 “Compensation - Retirement
Plans.” The University recognizes the overfunded or
underfunded status of a defined benefit postretirement plan as
an asset or liability in its consolidated statement of financial
position in the year in which the change occurs, with an offsetting
impact to unrestricted net assets.
Use of Estimates
Financial statements using accounting principles generally
accepted in the United States of America rely on estimates. At
June 30, management makes certain estimates and assumptions,
which affect assets and liabilities, disclosures of contingent assets
and liabilities, and reported revenues and expenses during the
period. Actual results may differ from these estimates.
Comparative Information
The consolidated statement of activities includes prior year
summarized comparative information in total, but not by net
asset category. Such information does not include enough detail
to constitute a presentation in conformity with accounting
principles generally accepted in the United States of America.
Accordingly, such information should be read in conjunction with
the University’s consolidated financial statements for the year
ending June 30, 2011, from which it was derived.
Income Taxes
The University is exempt from federal income tax to the extent
provided under section 501(c)(3) of the Internal Revenue Code.
The University is classified as an organization that is not a private
foundation under section 509(a) of the Internal Revenue Code
because it is described in sections 509(a)(l) and 170(b)(l)(A)(ii) and,
as such, gifts to the University qualify for deduction as charitable
contributions. The University is exempt from federal income tax,
however; it is required to pay federal income tax on unrelated
business income. The University did not have any material
income tax liabilities for the years ended June 30, 2012 and 2011.
ASC 740, “Income Taxes,” prescribes a recognition threshold and
measurement requirements for financial statement recognition
and measurement of a tax position taken or expected to be taken
in a tax return. In addition, ASC 740 provides guidance on
recognition, classification and disclosure requirements for
uncertain tax provisions. The University has no financial reporting
requirements associated with ASC 740 for the years ended June
30, 2012 and 2011.
Reclassifications
Certain amounts in the 2011 consolidated financial statements
have been reclassified to conform to the 2012 presentation.

16 | N O T E S T O T H E F I N A N C I A L S T A T E M E N T S – i n t h o u s a n d s o f d o l l a r s
2. ACCOUNTS AND LOANS RECEIVABLE
Accounts and loans receivable of the University at June 30, 2012
and 2011, in thousands of dollars, were as follows:
2012 2011
ACCOUNTS RECEIVABLE, NET
Grants, contracts and others 49,414$ 69,051$
Students 1,934 2,697
STUDENT LOANS, NET 51,333 49,932
ACCOUNTS AND LOANS RECEIVABLE, NET 102,681$ 121,680$
Allowances for doubtful accounts:
Accounts receivable 3,496$ 3,322$
Loans receivable 2,076$ 1,751$
Management regularly assesses the adequacy of the allowance
for doubtful accounts by performing ongoing evaluations of the
various components of the accounts receivable and student loan
portfolios, including such factors as the differing economic risks
associated with each category, the financial condition of specific
borrowers, the economic environment in which the borrowers
operate, the level of delinquent loans, and the past history of the
various borrowers and the University.
Factors also considered by management when performing its
assessment, in addition to general economic conditions and the
other factors described above, included, but were not limited to,
a detailed review of the aging of the various receivables and
loans, and a review of the default rate by loan category in
comparison to prior years. The level of the allowance is adjusted
based on the results of management’s analysis.
Management considers the allowance for doubtful accounts
losses to be prudent and reasonable. Furthermore, the
University’s allowance is general in nature and is available to
absorb losses from any loan category. Management believes that
the allowance for doubtful accounts at June 30, 2012 is adequate
to absorb credit losses inherent in the portfolio as of that date.
3. PLEDGES RECEIVABLE
Unconditional promises to give are included in the consolidated
financial statements as pledges receivable and revenue of the
appropriate net asset category. Multi-year pledges are recorded
after discounting to the present value of expected future cash
flows. Unconditional promises to give at June 30, 2012 and 2011,
are expected to be realized in the following periods:
2012 2011
In one year or less 11,173$ 9,327$
Between one year and five years 55,015 45,567
More than five years 13,805 18,521
79,993 73,415
Less: Discount (6,911) (7,584)
Less: Allowance (3,956) (3,641)
TOTAL PLEDGES RECEIVABLE, NET 69,126$ 62,190$
Management follows a similar approach as described in Note 2
for accounts and loans receivable in evaluating the adequacy of
the allowance for doubtful accounts for pledges receivable.
Management considers the allowance for doubtful accounts
losses to be prudent and reasonable. Management believes that
the allowance for doubtful accounts at June 30, 2012 is adequate
to absorb any uncollectible pledges as of that date.
Pledges receivable at June 30, 2012 and 2011, had the following
restrictions:
2012 2011
Department programs and activities 32,277$ 26,011$
Endowments for scholarships and
department programs and activities 18,270 17,337
Building construction 18,579 18,842
TOTAL PLEDGES RECEIVABLE, NET 69,126$ 62,190$
Pledges have been discounted at the market rate. Uncollectible
pledges totaling $4,042 (2012) and $2,314 (2011) were written off
against the allowance for uncollectible pledges.
The University had conditional pledge commitments totaling
$48,048 (2012) and $40,891 (2011).

C A S E W E S T E R N R E S E R V E U N I V E R S I T Y | 17
4. LONG TERM INVESTMENTS
The University holds long term investments for permanently
restricted endowment funds, donor restricted funds, annuity
assets, Board designated funds and excess operating assets that
are able to be invested in longer term investments. The
University invests through traditional investments as well as
operating an investment pool that works similar to a mutual fund
(see Note 5). The University’s long term investments at June 30,
2012 and 2011, were as follows:
2012 2011
Operating investments, at market 87,304$ 77,914$
Investments, held for long term
purposes 1,229,017 1,321,428
TOTAL INVESTMENTS 1,316,321$ 1,399,342$
2012 2011
Cash & cash equivalents 53,799$ 207,530$
Domestic stocks 68,117 56,716
International securities 36,444 41,686
Bonds
Government and municipal 28,503 13,816
Corporate 26,947 30,164
Mutual funds 183,080 186,435
Derivatives 11,217 1,150
Limited partnerships and other
Venture capital 78,331 77,945
Private equity 267,556 278,205
Hedge funds 412,188 359,101
Other 48,521 44,244
Equity real estate 101,618 102,350
TOTAL INVESTMENTS 1,316,321$ 1,399,342$
The investments were held for the following purposes:
2012 2011
Endowment 911,980$ 964,548$
Donor restricted funds 247,219 295,186
University investments 97,499 78,661
Annuities 51,450 52,673
Funds held for the benefit of others 7,856 7,971
Agency funds 317 303
TOTAL INVESTMENTS 1,316,321$ 1,399,342$

18 | N O T E S T O T H E F I N A N C I A L S T A T E M E N T S – i n t h o u s a n d s o f d o l l a r s
5. ENDOWMENT AND SIMILAR FUNDS
Endowment Funds
The purpose of endowment funds is to generate in perpetuity
operating revenue to support specific activities or for general
institutional use. Endowments represent only those net assets
that are under the control of the University. Gift annuities,
interests in funds held in trust by others and pledges
designated for the endowment but not yet received are not
considered components of the endowment.
The state of Ohio has enacted legislation that incorporates the
provisions outlined in the Uniform Prudent Management of
Institutional Funds Act (UPMIFA). UPMIFA stipulates that
unless directed otherwise in the gift instrument, donor-
restricted assets in an endowment fund are restricted assets
until appropriated for expenditure by the institution.
Accordingly, the following items are recorded as permanently
restricted net assets:
The original value of initial gifts donated to the permanent
endowment.
The original value of subsequent gifts to the permanent
endowment.
For those endowment funds with donor-specified
reinvestment provisions, accumulations to the permanent
endowment made in accordance with the gift instrument at
the time the accumulation is added to the fund.
The remaining portion of donor-restricted endowment funds
that are not classified in permanently restricted net assets is
classified as temporarily restricted net assets until those
amounts are appropriated and spent in accordance with the
endowment purpose by the University.
Similar Funds
The University has made the decision to co-invest and treat in
a similar fashion as endowment funds, certain funds that have
been purpose-restricted by donors. These funds were not
given to the University with the understanding that the gift
amount would be maintained in perpetuity; however, the
Board has moved to treat these funds in the same fashion as
an endowment fund. Accordingly, the Board, at its option, may
elect to change that treatment and spend these funds in
accordance with donor wishes without the constraints of the
University endowment spending formula. These funds follow
the same rules as above; however, no portion is permanently
restricted.
Temporarily Permanently
Unrestricted Restricted Restricted 2012 2011
Donor restricted endowment funds (20,079)$ 452,087$ 531,255$ 963,263$ 1,016,382$
Donor temporarily restricted funds - 260,630 - 260,630 283,637
TOTAL ENDOWMENT AND SIMILAR FUNDS (20,079)$ 712,717$ 531,255$ 1,223,893$ 1,300,019$
Total
Investment Pool
The Board’s interpretation of its fiduciary responsibilities for
endowment and similar funds is to preserve intergenerational
equity to the extent possible. This principle holds that future
beneficiaries should receive at least the same level of economic
support that the current generation enjoys. To that end,
investment goals are formulated to earn returns over the long-
term that equal or exceed the board-approved distribution rates
plus the impacts of inflation. The University’s endowment and
similar funds are invested in a broadly diversified portfolio
designed to produce long-term rates of return that sustain or
increase the real spending contribution from endowed and
similar assets and to mitigate downturns in a single sector.
Unless otherwise directed in the gift instrument, both
endowment and similar funds are pooled for efficient investment
purposes.
C A S E W E S T E R N R E S E R V E U N I V E R S I T Y | 19
Prior to 2012, a unit market value for the pool was used to
account for pooled transactions. The unit market value at June
30, 2011 was $41.68 (2011); however, beginning in fiscal year
2012, the pool is accounted for on a dollarized method of
accounting similar to a money market fund where each unit is
worth $1 and accounted for on a per endowment or account
basis. The total investment return for the pooled investments,
net of external manager fees, approximated -1.58% (2012) and
18.82% (2011).
Spending Policy
The Board has approved an endowment spending policy for
pooled investments based on a hybrid formula. The objective of
this two-pronged approach is to provide support for operations,
preserve intergenerational equity, and insulate programming
supported by endowment and similar funds from short-term
fluctuations in the investment markets. The two components are:
A constant growth component seeks to provide growth in
annual spending equal to the rate of academic inflation as
measured by the Higher Education Price Index.
A market value component based on 5% of the average of the
three previous calendar year-end market values.
Specific appropriation for expenditure of funds under the policy
occurs each spring when the Board approves the operating
budget for the following year. The fiscal 2012 pooled endowment
and similar funds spending allocation approximated 4.76% of
beginning market value totaling $63,769. For fiscal 2011, pooled
endowment and similar funds spending allocation was $2.015 per
unit totaling $63,846.
While the policy provides guidance for the level of spending
permitted (allocation), the actual spending will vary from the
spending allocation based on the timing of actual expenditures.
Funds are transferred from the investment pool to the
University’s operating account after they have been spent in
accordance with the endowment and similar funds requirements.
The physical movement of cash and investments between the
investment pool and operating accounts occurs on a periodic
basis as determined by the University and its process to maintain
the proper balance between liquidity and remaining invested.
For years where actual investment return exceeds actual
approved spending, the difference remains in temporarily
restricted net assets; years in which the actual endowment and
similar funds return is less than distributions under the policy, the
shortfall is covered by realized returns from prior years. The
fiscal 2012, pooled endowment and similar funds distribution was
funded from a combination of current year investment income
and prior year accumulated realized gains. For fiscal 2011,
pooled endowment and similar funds distribution was funded
from current year investment income.
In addition to the general distribution described above, the Board
has authorized a temporary supplemental distribution of
previously reinvested income and realized appreciation to
support certain development-related activities. This distribution,
which is slated to phase out by 2015, totaled $7,900 in both 2012
and 2011.

20 | N O T E S T O T H E F I N A N C I A L S T A T E M E N T S – i n t h o u s a n d s o f d o l l a r s
Changes in endowment and similar funds net assets for fiscal year 2012 are as follows:
Temporarily Permanently
Unrestricted Restricted Restricted 2012 2011
Endowment and similar funds
net assets, beginning of year (8,018)$ 797,937$ 510,100$ 1,300,019$ 1,154,155$
Investment income - 12,523 163 12,686 16,256
Realized and unrealized gains - (32,292) - (32,292) 182,702
TOTAL INVESTMENT RETURN - (19,769) 163 (19,606) 198,958
Contributions - 1,215 21,655 22,870 23,396
Current year withdrawals - (8,241) (663) (8,904) (6,532)
Current year expenditures - (70,486) - (70,486) (69,958)
Reclassification of deficits
in donor-designated funds (12,061) 12,061 - - -
ENDOWMENT AND SIMILAR FUNDS
NET ASSETS, END OF YEAR
Total
(20,079)$
712,717$
531,255$
1,300,019$
1,223,893$
Occasionally, the fair market value of assets associated with
individual donor-restricted endowment funds may fall below the
value of the original gift amounts. When deficits exist in donor-
restricted funds, they are classified as a reduction of unrestricted
net assets. Deficits of this nature reported in unrestricted net
assets were $20,079 (2012) and $8,018 (2011). These deficits
resulted from unfavorable market fluctuations that occurred after
the investment of recently established endowments, and
authorized appropriation that was deemed prudent.
Of the amount classified as temporarily restricted endowment
net assets, $452,087 (2012) and $514,300 (2011) represents the
portion of perpetual endowment funds subject to time and
purpose restrictions under Ohio’s enacted version of UPMIFA.

C A S E W E S T E R N R E S E R V E U N I V E R S I T Y | 21
6. FAIR VALUE MEASUREMENTS
Financial instruments carried at fair market value as of June 30, 2012 and 2011 by the ASC 820 valuation hierarchy are as follows:
June 30, 2012
Quoted Prices
in Active
Markets
Significant
Other
Observable
Inputs
Significant
Unobservable
Inputs
(Level 1) (Level 2) (Level 3) Total
INVESTMENTS
Cash & cash equivalents 46,979$ 6,820$ -$ 53,799$
Domestic stocks 27,238 11,355 29,524 68,117
International securities 10 25,026 11,408 36,444
Bonds
Government and municipal - 28,503 - 28,503
Corporate - 26,947 - 26,947
Mutual funds 174,413 8,435 232 183,080
Derivatives - 11,217 - 11,217
Limited partnerships and other
Venture capital - - 78,331 78,331
Private equity - - 267,556 267,556
Hedge funds - 79,309 332,879 412,188
Other 146 391 47,984 48,521
Equity real estate 213 - 101,405 101,618
TOTAL INVESTMENTS 248,999$ 198,003$ 869,319$ 1,316,321$
FUNDS HELD IN TRUST BY OTHERS - - 285,756$ 285,756$
PENSION PLAN ASSETS (Note 9)
Cash & cash equivalents 13,448$ -$ -$ 13,448$
Mutual funds 46,237 - - 46,237
Limited partnerships and Other
Hedge funds - 55,071 5,092 60,163
Other - - 383 383
Equity real estate - - 4,814 4,814
TOTAL PENSION PLAN ASSETS (Note 10) 59,686$ 55,071$ 10,289$ 125,046$
ASSETS AT FAIR VALUE 308,685$ 253,074$ 1,165,364$ 1,727,123$
Interest rate swaps payable -$ 34,038$ -$ 34,038$
LIABILITIES AT FAIR VALUE -$ 34,038$ -$ 34,038$

22 | N O T E S T O T H E F I N A N C I A L S T A T E M E N T S – i n t h o u s a n d s o f d o l l a r s
June 30, 2011
Quoted Prices
in Active
Markets
Significant
Other
Observable
Inputs
Significant
Unobservable
Inputs
(Level 1) (Level 2) (Level 3) Total
INVESTMENTS
Cash & cash equivalents 48,432$ 159,098$ -$ 207,530$
Domestic stocks 28,928 11,263 16,525 56,716
International securities 96 31,037 10,553 41,686
Bonds
Government and municipal 5 13,811 - 13,816
Corporate 4,956 25,208 - 30,164
Mutual funds 156,791 29,488 156 186,435
Derivatives - 1,150 - 1,150
Limited partnerships and other
Venture capital - - 77,945 77,945
Private equity - - 278,205 278,205
Hedge funds - 101,289 257,812 359,101
Other 146 74 44,024 44,244
Equity real estate 213 - 102,137 102,350
TOTAL INVESTMENTS 239,567$ 372,418$ 787,357$ 1,399,342$
FUNDS HELD IN TRUST BY OTHERS - - 297,768$ 297,768$
PENSION PLAN ASSETS (Note 9)
Cash & cash equivalents 1,759$ -$ -$ 1,759$
Mutual funds 42,619 - - 42,619
Limited partnerships and Other
Hedge funds - - 53,358 53,358
Other - - 2,215 2,215
Equity real estate - - 4,334 4,334
TOTAL PENSION PLAN ASSETS (Note 10) 44,378$ -$ 59,907$ 104,285$
ASSETS AT FAIR VALUE 283,945$ 372,418$ 1,145,032$ 1,801,395$
Interest rate swaps payable -$ 20,571$ -$ 20,571$
LIABILITIES AT FAIR VALUE -$ 20,571$ -$ 20,571$
Level 2 Investment Information
Investments included in Level 2 consist primarily of the
University’s ownership in assets through “fund of funds”
investments. In these types of arrangements, the University
invests in investment pools or mutual fund type arrangements
through banks, dealers, brokers and other intermediaries. While
the asset value of the direct investments in the pool or mutual
fund is not published, the underlying investments within those
funds are observable and obtained through the fund in which the
University invests.
Level 3 Investment Information
Investments included in Level 3 consist primarily of the
University's ownership in alternative investments (principally

C A S E W E S T E R N R E S E R V E U N I V E R S I T Y | 23
limited partnership interests in hedge funds, private equity, real
estate, real assets and other similar funds), beneficial interests in
funds held in trust by others, and portions of investments in the
pension assets. Level 3 investments are more difficult to value
due to the following:
The value of certain alternative investments represents the
ownership interest in the net asset value of the respective
partnership.
The fair values of the securities held by limited partnerships
that do not have readily determinable fair values are
determined by the general partner based on appraisals or
other estimates that require varying degrees of judgment.
If no public market exists for the investment securities, the fair
value is determined by the general partner taking into
consideration, among other things, the cost of the securities,
prices of recent significant placements of securities of the
same issuer, subsequent developments concerning the
companies to which the securities relate, or other estimates
requiring varying degrees of judgment. The University regularly
reviews, evaluates and performs significant due diligence
around these investments to ensure that the values provided
by the investment managers are appropriate measures of fair
value. The University agrees with the valuations and
assumptions used in determining the fair value of these
investments.
A roll forward of the consolidated statement of financial position
amounts for financial instruments classified by the University
within Level 3 of the fair value hierarchy is as follows:
Mutual Funds
& Domestic
Stocks
Int'l Securities
Venture
Capital
Private Equity Hedge Funds
Equity Real
Estate
Other &
Funds Held
by Others
Total
Beginning balance,
July 1, 2011
Realized gains (losses)
and investment
income
Unrealized gains (losses) 11,383 855 387 (12,058) 110 3,188 (15,401)
Purchases 7,355 - 13,668 36,078 127,000 11,897 8,776 204,774
Settlements (4,509) - (15,969) (52,571) (51,242) (17,129) (3,920) (145,340)
Transfers out of Level 3 - - - - (53,358) - -
ENDING BALANCE,
JUNE 30, 2012
(53,358)
311,170$
106,471$
344,007$
1,145,032$
4,291
1,792
661
25,792
(11,536)
(1,154)
-
2,300
17,902
16,681$
10,553$
77,945$
278,205$
106,219$
334,123$
1,165,364$
29,756$
11,408$
78,331$
267,556$
337,971$
The net realized and unrealized gains and losses in the table
above are included in the University’s consolidated statement of
activities in one of two financial statement lines: Investment (loss)
income or Net (depreciation) appreciation. In the case of pension
assets, net realized and unrealized gains and losses are
recognized in the financial statement line Pension plan changes
other than periodic benefit costs.
The pricing inputs and methods described above could produce
a fair value calculation that may not be indicative of net realizable
value or reflective of future fair values. Furthermore, while the
University believes its valuation methods are appropriate and
consistent with other market participants, the use of different
methodologies or assumptions to determine the fair value of
certain financial instruments could result in a different estimate
of fair value at the reporting date.
As a practical matter, the University is permitted under U.S.
generally accepted accounting principles (“US GAAP”) to estimate
the fair value of an investment at the measurement date using
the reported net asset value (“NAV”) without further adjustment
unless the entity expects to sell the investment at a value other

24 | N O T E S T O T H E F I N A N C I A L S T A T E M E N T S – i n t h o u s a n d s o f d o l l a r s
than NAV or if the NAV is not calculated in accordance with US
GAAP. The University’s investments in private equity, real estate
and certain hedge funds in the absolute return portfolio are fair
valued based on the most current NAV.
The University performs additional procedures including due
diligence reviews on its investments in investment companies and
other procedures with respect to the capital account or NAV
provided to ensure conformity with US GAAP. The University has
assessed factors including, but not limited to, managers’
compliance with Fair Value Measurement standard, price
transparency and valuation procedures in place, the ability to
redeem at NAV at the measurement date, and existence of
certain redemption restrictions at the measurement date.
The guidance also requires additional disclosures to enable users
of the financial statements to understand the nature and risk of
the University’s investments. Furthermore, investments which
can be redeemed at NAV by the University on the measurement
date or in the near term are classified as Level 2. Investments
which cannot be redeemed on the measurement date or in the
near term are classified as Level 3.
Category
Fair Value
Unfunded
Commitments
Redemption
Notice Period
Domestic Stocks (a) 39,898$ 45 - 90 days
International Securities (b) 35,887 30 - 90 days
Corporate Bonds (c) 15,808 30 days
Limited partnerships and other
Venture capital (d) 78,331 20,948$
Private equity (e) 267,556 68,003
Hedge funds (f) 352,708 - 30 - 90 days
Other (g) 47,984 33,494
Equity real estate (h) 101,405 53,297
TOTAL 939,577$ 175,742$
quarterly, annually
Redemption Frequency
monthly, quarterly
monthly
quarterly, annually
monthly, quarterly, annually
(a) Domestic stocks include equity securities domiciled in the
United States. Fund liquidity is daily, monthly, quarterly, semi-
annual, annual, and up to a maximum period of two years.
Approximately 53% of domestic equity exposure is accessible
within six months or less; with 26% accessible on a daily basis.
Approximately 14% of the net asset value in this class has a
lock up period of February 1, 2013.
(b) International securities include equity securities
domiciled in countries outside of the United States including
developed and emerging markets.
Approximately 48% of the net asset value can be accessed on
a daily basis after October of 2012, 16% can be accessed on a
quarterly basis, and the remaining balance over a period of 1-
3 years, most of which being accessible over the next 1-2
years.
(c) Corporate bonds include funds that invest in fixed income
securities in Fortune 500 companies. 1/3 of the fund may be
liquidated every 30 days.
(d) Venture capital includes several private equity funds that
invest primarily in technology, health care or clean technology
industries. While the portfolio is U.S. centric, there are small
allocations to companies in foreign markets. The funds
typically provide money and resources to entrepreneurs to
finance a start-up company or product, with the hope that the
company experiences exceptional growth and therefore
would produce a successful investment. The funds invest at
different stages of a company’s growth, some very early and
others at a later stage where the company may already
produce revenues. The valuations for these investments have
been estimated using the manager’s fair market values, which
have been vetted to make sure they meet the ASC 820
guidelines. These investments can never be redeemed with
the funds. As these investments age in duration, distributions
will be received from these funds as the underlying portfolio
companies are sold in the market. It is estimated that the
C A S E W E S T E R N R E S E R V E U N I V E R S I T Y | 25
underlying investments within the funds would be fully
liquidated over the next 7-12 years.
(e) Private equity includes several private equity funds that
invest across all industries. While the portfolio is U.S. centric,
there has been an increasingly larger allocation to companies
in foreign markets. The funds typically invest capital into
more mature companies for a minority or majority of
ownership and through operational and financial expertise,
generate a return of capital greater than the original amount
invested. The valuations for these investments have been
estimated using the manager’s fair market values, which have
been vetted to make sure they meet the ASC 820
guidelines. These investments can never be redeemed with
the funds. As these investments age in duration, distributions
will be received from these funds as the underlying portfolio
companies are sold in the market. It is estimated that the
underlying investments within the funds would be fully
liquidated over the next 7-12 years.
(f) Hedge funds includes hedge fund investments across a
multitude of strategies including long/short equity, long/short
commodity, global macro, multi-strategy, event-driven, credit,
fund of hedge funds, and emerging markets. The vast
majority of these investments are U.S. based, but some may
invest internationally. Investment managers may make
investment decisions based on top down macroeconomic
analysis or bottom up company or theme specific analysis;
managers may shift portfolios from net long to net short
positioning but on balance tend to carry a net long exposure
within their portfolios. The estimated fair values of the
investments are received on a monthly basis from the fund
administrators. Final valuations are typically received around
mid-month for most funds but in some instances funds will
report final valuations on a quarterly basis in accordance with
the reporting period specified in the fund legal
documents. Fund liquidity varies across the hedge fund
category from monthly, quarterly, annually, and up to a
maximum period of three years. Approximately 33% of the
net asset value in this class has a lock up period ranging from
three to fourteen months from June 30, 2012
(g) Other includes various direct private investments as well
as private funds that do not fall within the other categories
listed. Examples would include an Eastern Europe agriculture
fund, some private U.S. oil and gas partnerships and various
stakes in local private organizations. For the funds, the
valuations have been estimated using manager’s fair market
values, which have been vetted to make sure they meet the
ASC 820 guidelines. These investments can never be
redeemed with the funds. As these investments age in
duration, distributions will be received from these funds as
the underlying portfolio companies are sold in the market. It
is estimated that the underlying investments within the funds
would be fully liquidated over the next 7-10 years.
(h) Equity real estate includes private real estate funds that
invest primarily in the United States. Some of these private
partnerships also make investments internationally, primarily
in Europe, India and Brazil. The private funds make
investments in various real estate types, such as office,
industrial, retail and multi-family properties. The valuations
for these investments have been estimated using the
manager’s fair market values, which have been vetted to
make sure they meet the ASC 820 guidelines. These
investments can never be redeemed with the funds. As these
investments age in duration, distributions will be received
from these funds as the underlying properties are sold in the
market. It is estimated that the underlying investments within
the funds would be fully liquidated over the next 5-7 years.
Derivative Information
The use of financial derivative instruments is governed by the
University’s Investment Policy Statement, which is approved and
overseen by the Investment Committee of the Board of
Trustees. The University assumes many risks as a result of its
investment decisions and investment holdings. Many risks are
discussed in the Investment Policy Statement:
Manager risk – the risk that a manager underperforms similar
managers, benchmarks, or appropriate indices.
Benchmark risk – the risk of harm caused by constructing,
selecting, or managing to an inappropriate benchmark.
26 | N O T E S T O T H E F I N A N C I A L S T A T E M E N T S – i n t h o u s a n d s o f d o l l a r s
Peer risk – the risk that one’s peers generate better investment
performance, thereby boosting the relative size of their
endowments and enhancing their competitive advantage.
Market risk – the risk that the value of an investment will
decrease due to market moves.
Interest rate risk – the risk that an investment’s value will change
due to a change in the absolute level of interest rates, the
spread between two rates, the shape of the yield curve, or any
other interest rate relationship.
Concentration – the risk of being too concentrated in one
particular security, manager, strategy, sector or asset class, thus
being vulnerable to poor performance stemming from lack of
diversification.
Absolute return risk – the ability to generate positive absolute
returns, not just in favorable markets, but also in uncertain and
negative phases measured over a business cycle.
Currency risk – the risk that currency fluctuations or trends
reduce the value of investments in non-U.S. markets.
Commodity risk – refers to the uncertainties of future market
values and the size of future income caused by fluctuation in the
prices of commodities (energy, agricultural, precious and
industrial metals) due to demand/supply imbalances.
Leverage – the risk that significant volatility or losses will be
generated by the use of debt designed to magnify returns.
Counterparty risk – the risk that one party to a transaction does
not make complete or timely payment of margin, swap cash
flow, bond proceeds, or other similar payments.
Credit risk – the possibility that a bond issuer will default by
failing to pay interest or repay principal in a timely manner.
Tail risk – a form of portfolio risk that arises when the possibility
that an investment will move more than three standard
deviations from the mean is greater than what is shown by a
normal distribution.
Liquidity risk – the inability to sell or trade securities at fair
market value within a short period of time; also, the risk that
sufficient cash is not maintained, or cannot be accessed, to meet
short-term obligations.
Inflation risk – the risk that rising prices significantly erode the
effective purchasing power of the portfolio, as measured by the
University’s cost inflation.
Shortfall risk – the risk that investment returns will be lower than
expected, causing a failure to accomplish investment or financial
objectives.
The University seeks to mitigate these risks by using derivative
transactions. At the macro level of the investment portfolio,
derivative transactions also create cost-effective beta exposure
that may replace a fund or investment manager, add alpha,
support liquidity management, and reduce the impact of extreme
negative market conditions. The derivative instruments used
include futures, total return swaps, and over-the-counter options.
Futures: An Equity Index Future is a standardized obligation to
buy or sell a market index, at a certain date in the future
(settlement date), at a specified price (futures price). Equity Index
Futures are typically cash-settled. Trading Medium: Exchange A
single clearing house (e.g., Options Clearing Corporation, for the
Chicago Board Options Exchange) is the counterparty to both
parties involved in the contract. Futures trade a premium or
discount to the cash index level based on the following
theoretical formula: Futures Fair Value = Cash Index Value +
Expected Interest Income prior to contract expiry - Expected
Dividend Income prior to contract expiry – Expected Lending
Income prior to contract expiration. The value of a futures
contract converges to that of the underlying index at expiration.
The investor posts an initial margin and a maintenance margin
which represents a small portion of the overall notional value
(usually 12%-18% of the notional value). Collateral between the
counterparties is exchanged daily based on the mark to market
performance of the futures contract. Used to gain beta exposure
to an index on the long side and to hedge out beta exposure on
the short side. Used primarily as a manager replacement
strategy.
Total Return Swap (TRS): A TRS is a non-standardized agreement
whereby one party makes periodic cash payments based on a set
rate (e.g., LIBOR) while another party makes periodic cash
payments based on the total return of an underlying index. The
total return payer agrees to pay the total return of the underlying
index to the total return receiver. The total return receiver agrees
to receive future total return, and pay periodic payments to the
total return payer. Trading Medium: Over-The-Counter (OTC).

C A S E W E S T E R N R E S E R V E U N I V E R S I T Y | 27
Total Return Swaps offer synthetic exposure to beta returns while
avoiding the transaction and administrative costs of owning the
actual underlying equity shares. Subject to counterparty credit
risk; if collateral is posted between parties, counterparty credit
risk can be mitigated. Transacted via ISDA/CSA agreement
between counterparties. There is no initial or maintenance
margin posting. Collateral between the counterparties is
exchanged daily based on the mark to market performance of
the swap. Used to gain beta exposure to an index on the long
side and to hedge out beta exposure on the short side. The swap
resets on a periodic basis (monthly or quarterly), at which point
the LIBOR rate is reset and the gains/losses cash settled. A new
notional value reflecting the settled gains/losses is established at
this point. The next measurement begins with the new notional
value. There may be a breakup fee if the swap is terminated
earlier than its expiration date. Used primarily as a manager
replacement strategy.
Options: Options or Option structures are non-standardized
agreements whereby one party makes or receives one payment
at the time of initial transaction to/from a counterparty and may
make or receive a second payment to/from the counterparty at
the expiration date of the agreement based on an individual
option or a combination of individual options. Trading Medium:
Over-The-Counter (OTC). Transacted via ISDA/CSA agreement
between counterparties. Subject to counterparty credit risk; if
collateral is posted between parties, counterparty credit risk can
be mitigated. Options/Option structures allow investors to
customize the risk/return profile of existing portfolios. For
example: Investors who are underweight equities and have a
moderately positive outlook can obtain enhanced equity
exposure by capping returns with or without a leveraged payoff.
More bearish investors can opt for downside protection to
reduce risk. Collateral between the counterparties is exchanged
daily based on the mark to market performance of the Option or
Option Structure. At maturity the Option or Option structure is
cash settled. Prior to maturity, Options/Option structures may
trade above or below their intrinsic value due to various factors
such as time, volatility, interest rates, skew, delta, gamma etc. The
value eventually converges to intrinsic value at maturity. Used for
beta replacement strategies, alpha strategies or hedging
strategies.
The following table provides detailed information on the
derivatives included in the investment portfolio as of June 30 and
where they are located in the consolidated statements of
financial position.
Location Derivative Type
Notional
Amount
Level 1 Fair
Value
Level 2 Fair
Value
Level 3 Fair
Value
Investments
Total return swaps 107,264$ -$ 4,902$ -$
Options (over-the-counter) 26,363 - 5,864 -
Interest rate hedges 78,187 - 316 -
Yield curve hedges 145,471 - 135 -
TOTAL DERIVATIVES, 2012 -$ 11,217$ -$
Location Derivative Type
Notional
Amount
Level 1 Fair
Value
Level 2 Fair
Value
Level 3 Fair
Value
Investments
Total return swaps 32,230$ -$ (19)$ -$
Options (over-the-counter) 383,094 - 1,169 -
TOTAL DERIVATIVES, 2011 -$ 1,150$ -$
2012
2011

28 | N O T E S T O T H E F I N A N C I A L S T A T E M E N T S – i n t h o u s a n d s o f d o l l a r s
The following table provides detailed information on the effect
the derivatives had on the overall performance of the investment
portfolio which is reflected in the consolidated statement of
activities:
Location Derivative Type 2012 2011
Investment Income
Options (over the counter) (27,738)$ 48,254$
Futures contracts (10,255) 27,029
(37,993)$ 75,283$
Unrealized gains (losses)
Options (over the counter) (4,613)$ (1,133)$
Total return swaps (2,866) 230
(7,479)$ (903)$
EFFECT OF DERIVATIVES (45,472)$ 74,380$
7. PROPERTY, PLANT, EQUIPMENT, AND BOOKS
Property, plant, equipment and books are stated at cost, less
accumulated depreciation. Depreciation is computed on the
straight-line method over the estimated useful life of 40 years for
buildings, 5 to 12 years for equipment, and 10 years for books.
Components of property, plant, equipment and books are as
follows:
2012 2011
Land and land improvements 38,359$ 38,875$
Building and building improvements 1,137,051 1,129,256
Equipment and software 266,343 284,847
Library books 37,067 35,865
Construction-in-progress 27,818 7,898
1,506,638 1,496,741
Less: accumulated depreciation (776,001) (751,481)
TOTAL PROPERTY, PLANT, EQUIPMENT AND BOOKS, NET 730,637$ 745,260$
The above assets include $492,376 leased from the Ohio Higher
Education Facility Commission (OHEFC). The University may
purchase each of the leased assets for a nominal amount at the
end of the lease period. Therefore, these assets have been
capitalized and are included in the above listing. Also included in
the University’s consolidated financial statements is the obligation
for related bonds issued by the OHEFC.
Depreciation expense included in the Statement of Activities is
$63,356 (2012) and $65,364 (2011).

C A S E W E S T E R N R E S E R V E U N I V E R S I T Y | 29
8. NOTES AND BONDS PAYABLE
Notes and bonds payable are as follows:
Interest Rate Maturity 2012 2011
Series 1988 7.85 - 7.90% 2011-2013 12,334$ 17,821$
Series 1990 6.50 - 7.13% 2011-2020 11,650 11,650
Series 1994 6.00 - 6.25% 2014-2018 20,000 20,000
Series 1997 4.90 - 6.25% 2011-2014 5,105 6,525
Series 2001 Variable 2011-2022 12,200 12,615
Series 2002A Variable 2023-2031 64,875 64,875
Series 2004A 3.625 - 5.00% 2016-2034 75,670 75,670
Series 2006 3.75 - 5.25% 2012-2044 82,490 82,490
Series 2008A Variable 2030-2044 60,000 60,000
Series 2008B Variable 2030-2044 67,500 67,500
Series 2008C 4.00 - 5.00% 2014-2033 50,490 50,490
Series 1966 3.00 - 3.50% 2011-2016 535 665
Series 1971 3.00% 2011-2016 - 535
6.75% 2011-2018 467 543
4.12% 2011-2018 5,205 5,890
-n/a- 2011-2019 2,400 2,850
HUD Loan:
Part A 4.96% 2011-2041 12,082 12,268
Part B 5.33% 2011-2041 4,163 4,224
TOTAL LIABILITY 550,166 559,611
Unamortized Bond Premium
Series 2004A 1,703 1,860
Series 2006 6,487 6,909
Series 2008C 1,622 1,799
TOTAL UNAMORTIZED BOND PREMIUM 9,812$ 10,568$
TOTAL NOTES AND BONDS PAYABLE 559,978$ 570,179$
2030
.25 - .43%
63,000
63,000
Ohio Higher
Education Facility
Commission capital
lease:
Compass Group
USA, Inc.
Ohio Higher
Education Facility
Commission
revenue notes and
bonds:
Ohio Higher
Education Facility
Commission:
U.S. Government
housing bonds:
Ohio Higher
Education Facility
Commission
commercial paper:
The fair market value of the University’s notes and bonds payable
is approximately $578,290 (2012) and $575,020 (2011). These
values were estimated utilizing the discounted future cash
outflows at rates for similar debt.

30 | N O T E S T O T H E F I N A N C I A L S T A T E M E N T S – i n t h o u s a n d s o f d o l l a r s
The U.S government housing bonds are collateralized by
securities and pledges of net revenues from the University’s
student housing and dining facilities.
The Ohio Higher Education Facility Commission (OHEFC)
authorized a $63,000 tax-exempt commercial paper program in
February 2000 to provide construction funds for several
approved capital projects and to refinance earlier projects. In
November 2008, the OHEFC authorized a $27,000 expansion of
that program, to a total size of $90,000, to provide funding for
future projects. The University has issued no additional
commercial paper pursuant to the $27,000 of new authority, and
the amount outstanding under this program as of June 30 is
$63,000, with maturities not exceeding 270 days from the
issuance date. All commercial paper issued under the terms of
the program must mature no later than February 1, 2030. The
annualized interest cost and credit facility expense for this
program was 0.83% (2012) and 0.97% (2011).
The University has total revolving lines of credit in the amount of
$60,000 with two financial institutions of $30,000 each to finance
working capital. Both lines are subject to review and renewal
annually. There were no amounts outstanding at June 30, 2012.
In May 2008, the OHEFC series 2008 bonds were issued to
refinance the OHEFC series 2004B bonds. The amount
refinanced was $177,826. The variable portion of the debt is
supported by two lines of credit with financial institutions. The
unamortized balance of deferred financing fees is included in
prepaid expenses and other assets. The balance was $1,242
(2012) and $1,284 (2011).
Principal payment requirements for bonds, notes, and capital
lease obligations for the next five years and thereafter are as
follows:
Year
Scheduled
Principal
Payments
Outstanding
VRDO's
Total Maximum
Principal
Payments
2013 11,351$ 111,915$ 123,266$
2014 11,182 48,915 60,097
2015 11,755 48,915 60,670
2016 12,593 28,915 41,508
2017 13,434 28,915 42,349
Thereafter 489,851 (267,575) 222,276
TOTAL 550,166$ -$ 550,166$
The University has letter of credit agreements, standby bond
purchase agreements and a liquidity agreement with various
financial institutions to purchase the University’s variable rate
demand obligations (“VRDO’s”) and commercial paper if they
cannot be remarketed. Outstanding VRDO’s in the above table
represent amounts payable in the event that bonds are tendered
but not successfully remarketed.
Interest expense, including those amounts for interest rate swap
agreements (Note 12), was $21,090 (2012) and $22,812 (2011).
Certain borrowing agreements require that the University comply
with certain covenants. The University is in compliance with these
provisions as of June 30, 2012.

C A S E W E S T E R N R E S E R V E U N I V E R S I T Y | 31
9. RETIREMENT PLANS
The University has both defined benefit and defined contribution
pension plans for its employees. In accordance with provisions of
the Employee Retirement Income Security Act of 1974 (“ERISA”),
the University has established a trust to hold plan assets for its
defined benefit plan. The funded status of the University’s
defined benefit plan is as follows:
2012 2011
Benefit obligation at June 30 188,337$ 126,867$
Fair value of plan assets at June 30 125,046 104,285
FUNDED STATUS AT JUNE 30 (63,291)$ (22,582)$
Accumulated benefit obligation 186,742$ 125,983$
Benefit plan costs for the defined benefit plan are as follows:
2012 2011
Net periodic benefit cost 6,167$ 5,486$
Employer contributions 21,113 4,416
Benefits paid 3,681 5,192
Estimated benefits expected to be paid under the defined benefit
plan for the next five years are as follows:
Fiscal 2013 4,377$
Fiscal 2014 5,047$
Fiscal 2015 4,961$
Fiscal 2016 5,706$
Fiscal 2017 6,058$
Amounts expected to be paid between 2018 and 2022 total
$39,217. The University’s estimated employer contribution for
the defined benefit plan in fiscal 2013 will depend on the results
of the July 1, 2012 actuarial valuation and is estimated to be
$9,200.
Weighted-average assumptions used to determine the benefit
obligation and benefit plan costs are as follows:
2012 2011
BENEFIT OBLIGATION
Discount rate 4.50% 6.00%
Rate of compensation increase 4.25% 4.25%
Measurement date 6/30/12 6/30/11
Census date 7/1/11 7/1/10
NET PERIODIC BENEFIT COST
Discount rate 6.00% 6.25%
Expected return on plan assets 8.50% 8.50%
Rate of compensation increase 4.25% 4.25%
The expected long-term rate of return for the defined benefit
plan was estimated using market benchmarks for equities and
bonds applied to the plan's target asset allocation. The expected
return on equities was computed utilizing a valuation framework
that projected future returns based on current equity valuations
rather than historical returns. Management estimated the rate
by which the plan assets would outperform the market in the
future based on historical experience adjusted for changes in
asset allocation and expectations for overall lower future returns
on equities compared to past periods.
The investment objective for the defined benefit plan is to
maximize total return with tolerance for slightly above average
risk, in order to meet the obligations that the University has to its
plan beneficiaries. To accomplish this objective, the University
has established a broadly-diversified asset allocation strategy that
includes absolute return strategies (combination of fixed income
and equity securities) (50%), equity investments (30%), bonds and
cash (16%), and real estate (4%). The weightings of the
investments relative to each other in the total portfolio fluctuate
as market conditions vary; they are adjusted regularly to remain
within acceptable ranges.

32 | N O T E S T O T H E F I N A N C I A L S T A T E M E N T S – i n t h o u s a n d s o f d o l l a r s
The weighted-average asset allocation for the defined benefit
plan is as follows:
2012 2011
Equity securities 60.00% 63.00%
Fixed income securities 25.00% 31.00%
Real estate 4.00% 4.00%
Other 11.00% 2.00%
TOTAL ASSET ALLOCATION 100.00% 100.00%
The amounts recognized in the University’s consolidated
statements of financial position and in unrestricted net assets
related to the defined benefit plan are as follows:
2012 2011
STATEMENT OF FINANCIAL POSITION
NET LIABILITY (63,291)$ (22,582)$
UNRESTRICTED NET ASSETS
Prior service costs 160$ 398$
Actuarial losses 83,555 27,662
AMOUNT RECOGNIZED AS REDUCTION OF
UNRESTRICTED NET ASSETS
83,715$
28,060$
The estimated amortization of prior year service costs expected
in fiscal 2013 totals $160.
Components of the net periodic benefit cost and other changes
in plan assets that are recognized in the consolidated statement
of activities are as follows:
2012 2011
Change in actuarial losses 55,893$ (10,104)$
Amortization of prior service cost (238) (286)
55,655 (10,390)
Net periodic benefit cost 6,167 5,486
Employer contributions (21,113) (4,416)
40, 709$ (9,320)$
TOTAL (GAIN) LOSS RECOGNIZED,
UNRESTRICTED NET ASSETS
TOTAL (GAIN) LOSS RECOGNIZED,
STATEMENT OF ACTIVITIES
Benefit plan costs for the defined contribution plan are $19,499
(2012) and $18,833 (2011).
10. COMMITMENTS AND CONTINGENCIES
In its normal operations, the University is subject to various
claims and lawsuits. In management’s opinion, the resolution of
these contingencies will not have a significant adverse effect on
the University’s financial position, operations, or cash flows.
In April 2006, the Boards of University Hospitals Health System
and the University approved a new affiliation agreement between
the School of Medicine and University Hospitals of Cleveland
(“UHC”). This agreement significantly strengthened the historical
relationship between the entities through the creation of the
Case Medical Center, a virtual entity that encompasses certain
teaching, research and clinical activities of the School of Medicine
and UHC.
In May 2002, the University entered into an agreement with the
Cleveland Clinic Foundation (“CCF”) to form a new medical
education and research program, the Cleveland Clinic Lerner
College of Medicine (“CCLCM”). Beginning in 2004, research
grants from the National Institutes of Health to support work by
CCF-based investigators were awarded to and administered
through the University by CCLCM, which operates as an academic
unit of the School of Medicine. Expenditures for research
conducted under this joint agreement totaled $98,309 (2012) and
$100,098 (2011).
The University is self-insured for workers compensation and
employee and student medical coverage. Property is
commercially insured with an aggregate deductible of $700. The
University also carries general liability insurance with a deductible
of $100 per occurrence. The University believes its reserves for
self-insured risks and the deductible portion of insured risks are
sufficient.
The expected cost to complete construction in progress is
approximately $19,825.

C A S E W E S T E R N R E S E R V E U N I V E R S I T Y | 33
11. RELATED PARTY TRANSACTION
In 1998, the University entered into a thirty-year agreement with
the Medical Center Company (a cooperative utility company
formed by and serving institutions in the University Circle area) to
purchase chilled water and other utilities for several University
buildings. The amounts purchased were $21,998 (2012) and
$23,108 (2011). No obligation associated with this agreement is
recorded in the accompanying consolidated financial statements.
12. DERIVATIVES AND OTHER FINANCIAL INSTRUMENTS
The University uses floating-to-fixed interest rate swap
agreements of various durations to manage both its funding cost
and the interest rate risk associated with variable rate debt.
Under these swap agreements, the University pays a fixed rate
and receives from its counterparty a variable rate payment, each
calculated by reference to specified notional principal amounts
during the agreement period. Operations are charged the
variable rate interest on the corresponding bonds; the difference
between the fixed and variable interest amounts under the swap
agreements is recorded in non-operating revenues and expenses
as investment and other income.
The University follows accounting guidance that defines fair value,
establishes a framework for measuring fair value and expands
disclosure requirements about fair value measurements,
including derivatives. The University's interest rate swaps are
valued by an independent swap consultant that uses the mid-
market levels, as of the close of business, to value the
agreements. The valuations provided are derived from
proprietary models based upon well-recognized financial
principles and reasonable estimates about relevant future market
conditions and the University's credit worthiness. The
University's interest rate swap arrangements have inputs that can
generally be corroborated by market data and are classified as
Level 2 in the fair value hierarchy.
At June 30, 2012 the University has five interest rate swap
agreements. Net payments or receipts under the swap
agreements are recorded as adjustments to investment and
other income and the incremental expense is disclosed in the
table below. Under one agreement in effect at June 30, 2012, the
counterparty pays the University a variable interest rate equal to
the Securities Industry and Financial Markets Association (SIFMA)
index, and under four other agreements, the counterparty pays a
variable interest rate equal to a percentage of the one month
London Interbank Offered Rate (LIBOR).
The following table provides detailed information on the interest
rate swaps at June 30, 2012, with comparative fair values for June
30, 2011. The number of swaps is reported based on notional
amount. Information related to the interest rate swap
agreements to which the University is a party, including the
associated OHEFC borrowing, where applicable, and the liability
recognized in the consolidated statements of financial position in
deferred income and other liabilities are as follows:

34 | N O T E S T O T H E F I N A N C I A L S T A T E M E N T S – i n t h o u s a n d s o f d o l l a r s
Changes in the fair value of derivative instruments are recorded
in non-operating revenues and expenses as investment and
other income. The provisions of the swap agreements require
that on a weekly basis the University place into an escrow fund
collateral sufficient to limit the counter-party’s financial exposure
to the University to no more than $20,000. The University had
placed $17,796 (2012) and $2,472 (2011) into such a fund, which
is shown in Cash and cash equivalents on the consolidated
statements of financial position.
Interest expense recorded for the swap agreements in the non-
operating activities for the year ended June 30 was $6,161 in
2012 and $6,038 in 2011.
13. SUBSEQUENT EVENTS
The University has performed an evaluation of subsequent events
through September 29, 2012, the date on which the consolidated
financial statements were issued. As of the issuance of these
financial statements, the University has begun the underwriting
process to issue up to $30 million of State of Ohio Higher
Education Facility Revenue Refunding Bonds. The bond proceeds
will be placed into escrow to refund certain portions of certain
outstanding State of Ohio Higher Educational Facility Revenue
Bonds Series 2004A as well as portions of obligations under a
Master Lease and Sublease in the Ohio Higher Education Facility
Commission capital lease. All proceeds will be used for
refinancing and will not be used for additional spending or placed
on the statement of financial position. This issuance is expected
to be concluded in the 2nd quarter of Fiscal Year 2013.
Notional 2012 2011
Amount Interest Rate Commencement Termination Date Basis
12,200$ 4.34% Aug. 12, 2004 Oct.1, 2022 LIBOR (2,646)$ (1,507)$
15,000 4.43% Jun. 5, 2002 Jun. 5, 2022 LIBOR (4,321) (2,945)
15,000 3.60% Sept. 25, 2002 Sept. 25, 2022 LIBOR (3,254) (1,799)
35,000 3.81% Aug. 4, 2004 Aug. 1, 2034 LIBOR (11,795) (5,615)
100,000 3.37% Jan. 3, 2012 Jan. 1, 2017 SIFMA (12,022) -
100,000 3.37% Jan. 2, 2007 Jan. 1, 2012 SIFMA - (1,850)
100,000 3.37% Jan. 1, 2012 Jan. 1, 2017 SIFMA - (6,855)
TOTAL INTEREST RATE SWAP AGREEMENT LIABILITY (34,038)$ (20,571)$
Level 2 Fair Market Value


CASE_ THE VALUE OF RESEARCH 55
