Consumer Price Es Pacific Cities And U.S. City Average R09392S Consumerprice Summary Western
User Manual: R09392S
Open the PDF directly: View PDF ![]() .
.
Page Count: 1
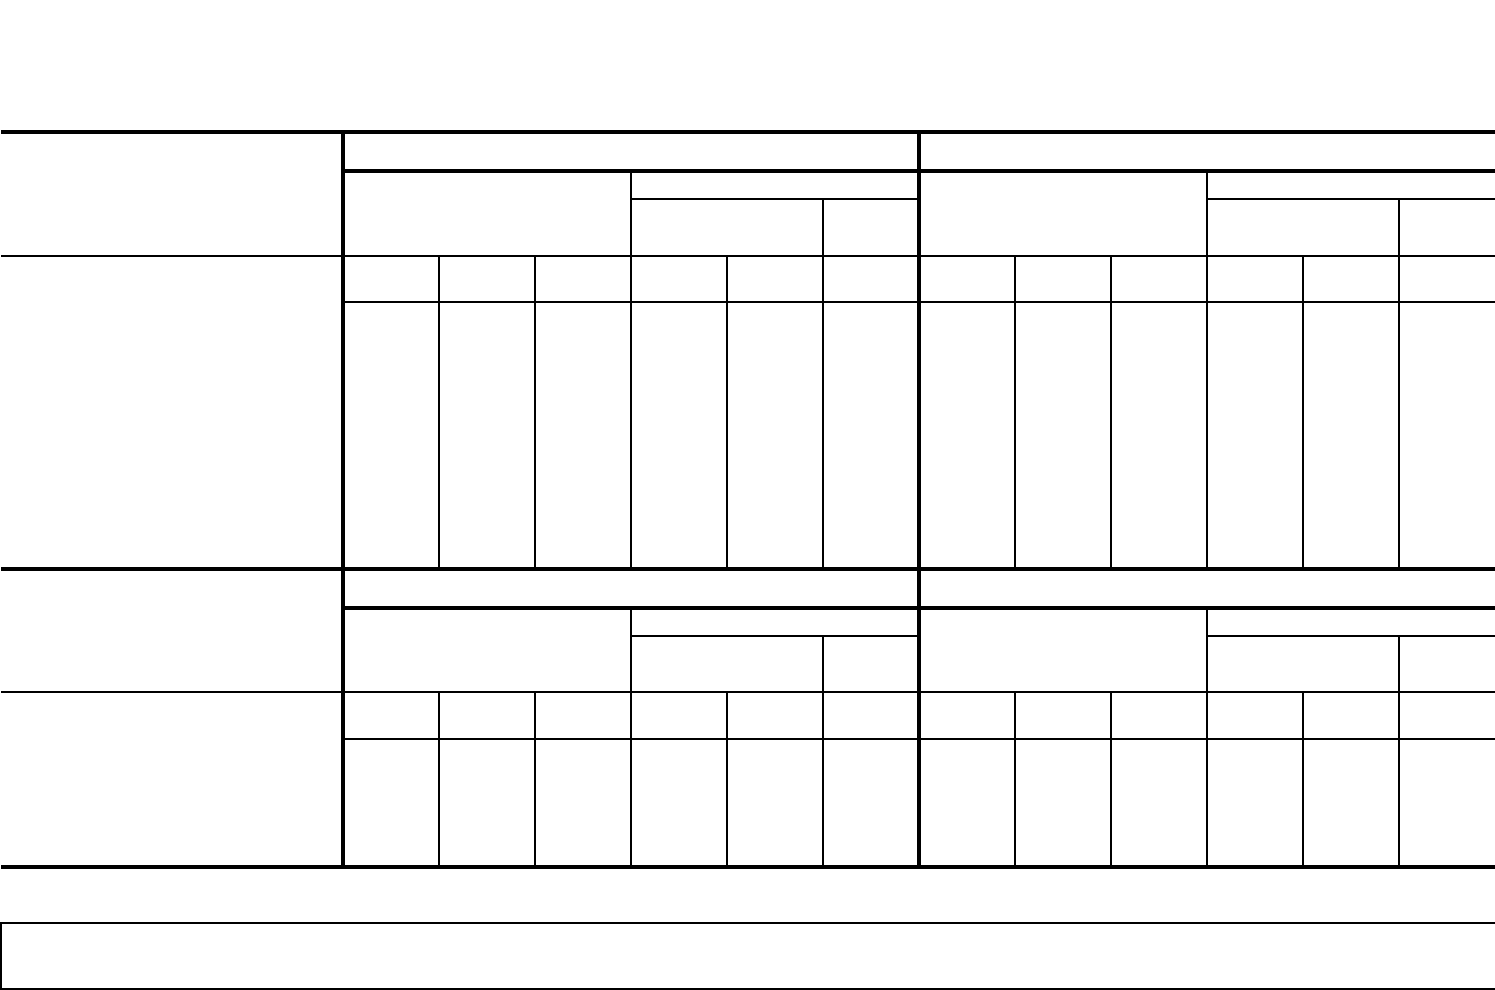
Percent Change Percent Change
MONTHLY DATA Indexes 1 Month Indexes 1 Month
ending ending
Jan Dec Jan Dec Jan Jan Jan Dec Jan Dec Jan Jan
2017 2017 2018 2017 2018 2018 2017 2017 2018 2017 2018 2018
U. S. City Average................................. 242.839 246.524 247.867 2.1 2.1 0.5 236.854 240.526 241.919 2.2 2.1 0.6
(1967=100)............................................ 727.439 738.477 742.499 - - - 705.517 716.454 720.604 - - -
Los Angeles-Long Beach-Anaheim …
…
252.373 259.220 261.235 3.6 3.5 0.8 242.735 249.854 251.785 3.7 3.7 0.8
(1967=100)............................................ 745.623 765.850 771.805 - - - 717.357 738.396 744.102 - - -
West ..................................................... 250.814 257.347 258.638 3.1 3.1 0.5 242.384 249.055 250.416 3.3 3.3 0.5
(Dec. 1977=100) ..................................
.
405.426 415.987 418.073 - - - 389.982 400.716 402.906 - - -
West – A*..............................................
.
257.949 265.009 266.498 3.4 3.3 0.6 247.442 254.682 256.300 3.6 3.6 0.6
(Dec. 1977=100) ..................................
.
420.622 432.135 434.563 - - - 400.561 412.281 414.900 - - -
West – B/C**(Dec. 1996=100)..............
.
146.469 149.920 150.564 2.7 2.8 0.4 145.963 149.595 150.288 2.9 3.0 0.5
Percent Change Percent Change
BI-MONTHLY DATA Indexes 2 Months Indexes 2 Months
ending ending
Dec Oct Dec Oct Dec Dec Dec Oct Dec Oct Dec Dec
2016 2017 2017 2017 2017 2017 2016 2017 2017 2017 2017 2017
San Francisco-Oakland-Hayward.........
.
269.483 277.570 277.414 2.7 2.9 -0.1 263.222 271.272 271.342 2.7 3.1 0.0
(1967=100)............................................ 828.464 853.328 852.847 - - - 801.534 826.046 826.260 - - -
Seattle-Tacoma-Bellevue...................... 256.821 264.653 265.850 3.0 3.5 0.5 252.286 261.218 262.485 3.4 4.0 0.5
(1967=100)............................................ 782.889 806.766 810.414 - - - 748.282 774.772 778.529 - - -
* A = greater than 2,500,000 population ** B/C = 2,500,000 population or less Dash (-) = Not Available
Release date February 14, 2018. The next monthly and bi-monthly releases are scheduled for March 13, 2018.
For questions, please contact us at BLSinfoSF@bls.gov or (415) 625-2270.
CONSUMER PRICE INDEXES PACIFIC CITIES AND U. S. CITY AVERAGE
January 2018
ALL ITEMS INDEXES
(1982-84=100 unless otherwise noted)
All Urban Consumers (CPI-U) Urban Wage Earners and Clerical Workers (CPI-W)
Year Year
ending ending
All Urban Consumers (CPI-U) Urban Wage Earners and Clerical Workers (CPI-W)
Year Year
ending ending
In January 2018, BLS introduced a new geographic area sample for the Consumer Price Index (CPI). Additional information on the geographic revision is
available at: www.bls.gov/cpi/georevision2018.htm.
