DHIS2 Implementation Guide En Part4
User Manual:
Open the PDF directly: View PDF ![]() .
.
Page Count: 4

Conceptual Design Principles All meta data can be added and modified
through the user interface
5
Chapter 2. Conceptual Design Principles
This chapter provides a introduction to some of the key conceptual design principles behind the DHIS 2 software.
Understanding and being aware of these principles will help the implementer to make better use of the software when
customising a local database. While this chapter introduces the principles, the following chapters will detail out how
these are reflected in the database design process.
The following conceptual design principles will be presented in this chapter:
• All meta data can be added and modified through the user interface
• A flexible data model supports different data sources to be integrated in one single data repository
• Data Input != Data Output
• Indicator-driven data analysis and reporting
• Maintain disaggregated facility-data in the database
• Support data analysis at any level in the health system
In the following section each principle is described in more detail.
2.1. All meta data can be added and modified through the user interface
The DHIS 2 application comes with a set of generic tools for data collection, validation, reporting and analysis, but
the contents of the database, e.g. what data to collect, where the data comes from, and on what format, will depend
on the context of use. This meta data need to be populated into the application before it can be used, and this can be
done through the user interface and requires no programming. This allows for more direct involvement of the domain
experts that understand the details of the HIS that the software will support.
The software separates the key meta data that describes the raw data being stored in the database, which is the critical
meta data that should not change much over time (to avoid corrupting the data), and the higher level meta like indicator
formulas, validation rules, and groups for aggregation as well as the various layouts for collection forms and reports,
which are not that critical and can be changed over time without interfering with the raw data. As this higher level
meta data can be added and modified over time without interfering with the raw data, a continuous customisation
process is supported. Typically new features are added over time as the local implementation team learn to master
more functionality, and the users are gradually pushing for more advanced data analysis and reporting outputs.
2.2. A flexible data model supports different data sources to be integrated
in one single data repository
The DHIS 2 design follows an integrated approach to HIS, and supports integration of many different data sources into
one single database, sometime referred to as an integrated data repository or a data warehouse.
The fact that DHIS 2 is a skeleton like tool without predefined forms or reports means that it can support a lot of
different aggregate data sources. There is nothing really that limits the use to the health domain either, although use in
other sectors are still very limited. As long as the data is collected by and orgunit, described as a data element (possibly
with some disaggregation categories), and can be represented by a predefined period frequency, it can be collected and
processed in DHIS 2. This flexibility makes DHIS 2 a powerful tool to set up integrated systems that bring together
collection tools, indicators, and reports from multiple health programs, departments or initiatives. Once the data is
defined and then collected or imported into a DHIS 2 database, it can be analysed in correlation to any other data in
the same database, no matter how and by whom it was collected. In addition to supporting integrated data analysis and
reporting, this integrated approach also helps to rationalise data collection and reduce duplication.
Conceptual Design Principles Data input != Data output
6
2.3. Data input != Data output
In DHIS 2 there are three dimensions that describe the aggregated data being collected and stored in the database;
the where - organisation unit, the what - data element, and the when - period. The organisation unit, data element and
period make up the three core dimensions that are needed to describe any data value in the DHIS 2, whether it is in a
data collection form, a chart, on a map, or in an aggregated summary report. When data is collected in an electronic
data entry form, sometimes through a mirror image of the paper forms used at facility level, each entry field in the
form can be described using these three dimensions. The form itself is just a tool to organise the data collection and
is not describing the individual data values being collected and stored in the database. Being able to describe each
data value independently through a Data Element definition (e.g. ‘Measles doses given <1 year’) provides important
flexibility when processing, validating, and analysing the data, and allows for comparison of data across collection
forms and health programs.
This design or data model approach separates DHIS from many of the traditional HIS software applications which treat
the data collection forms as the key unit of analysis. This is typical for systems tailored to vertical programs’ needs
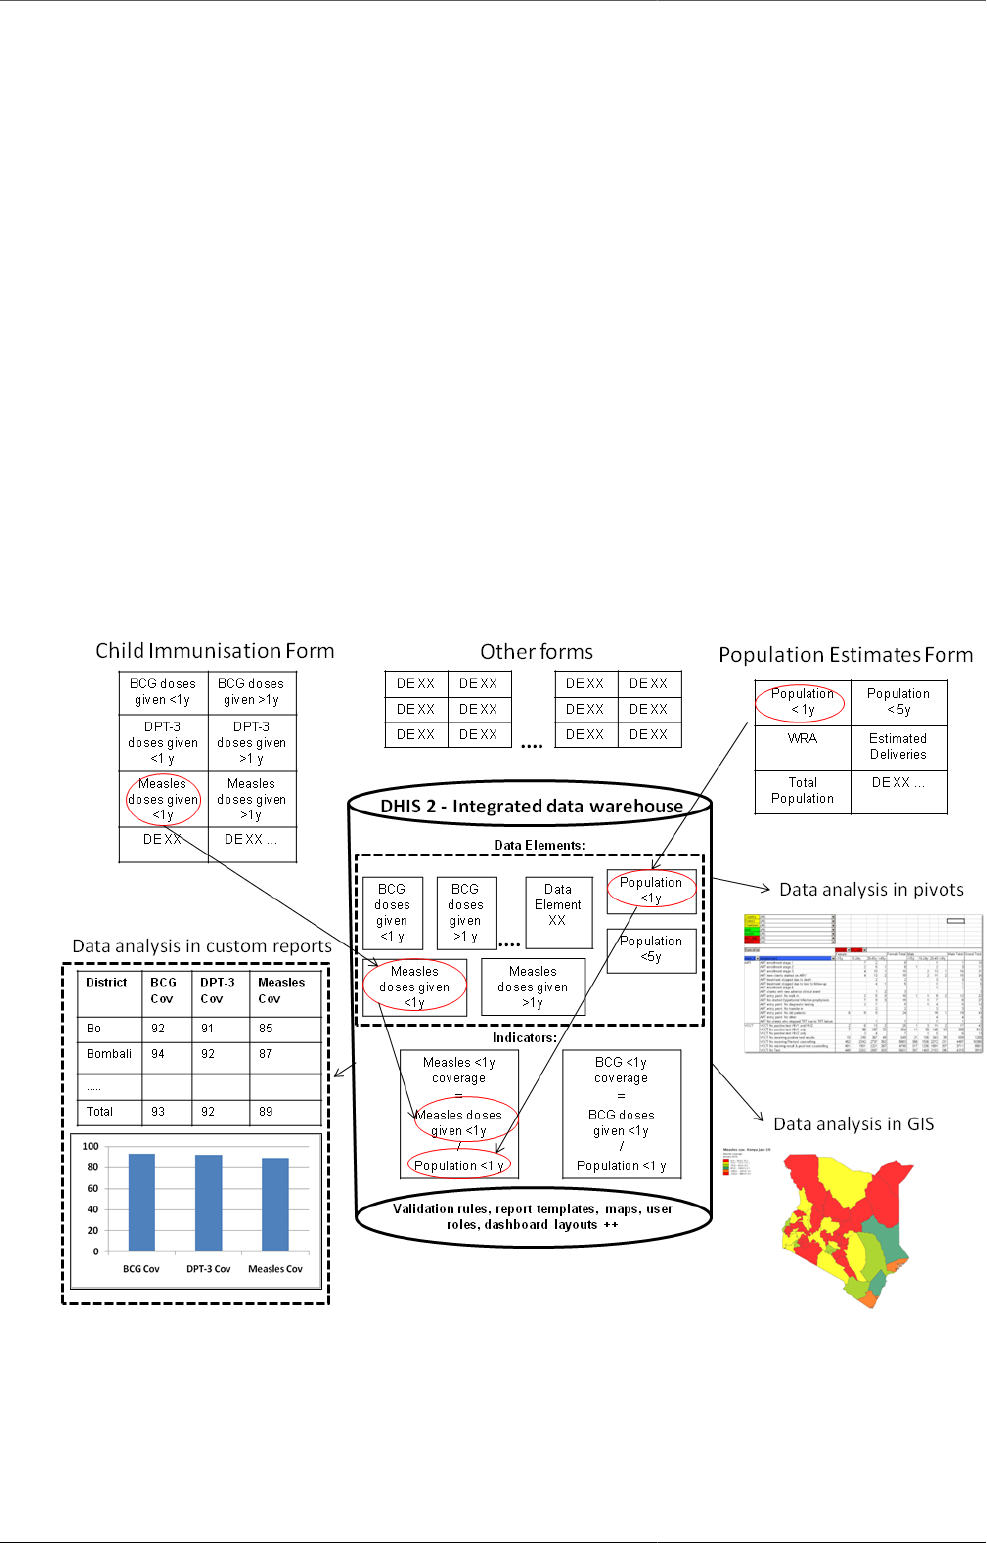
and the traditional conceptualisation of the collection form as also being the report or the analysis output. The figure
below illustrates how the more fine-grained DHIS design built around the concept of Data Elements is different and
how the input (data collection) is separated from the output (data analysis), supporting more flexible and varied data
analysis and dissemination. The data element ‘Measles doses given <1 y’ is collected as part of a Child Immunisation
collection form, but can be used individually to build up an Indicator (a formula) called ‘Measles coverage <1y’ where
it is combined with the data element called ‘Population <1y’, being collected through another collection form. This
calculated Indicator value can then be used in data analysis in various reporting tools in DHIS 2, e.g. custom designed
reports with charts, pivot tables, or on a map in the GIS module.
2.4. Indicator-driven data analysis and reporting
What is referred to as a Data Element above, the key dimension that describes what is being collected, is sometimes
referred to as an indicator in other settings. In DHIS 2 we distinguish between Data Elements which describe the the
Conceptual Design Principles Maintain disaggregated facility-data in the
database
7
raw data, e.g. the counts being collected, and Indicators, which are formula-based and describe calculated values, e.g.
coverage or incidence rates that are used for data analysis. Indicator values are not collected like the data (element)
values, but instead calculated by the application based on formulas defined by the users. These formulas are made up
of a factor (e.g. 1, 100, 100, 100 000), a numerator and a denominator, the two latter are both expressions based on
one or more data elements. E.g. the indicator "Measles coverage <1 year" is defined a formula with a factor 100, a
numerator ("Measles doses given to children under 1 year") and a denominator ("Target population under 1 year"). The
indicator "DPT1 to DPT3 drop out rate" is a formula of 100 % x ("DPT1 doses given"- "DPT3doses given") / ("DPT1
doses given"). These formulas can be added and edited through the user interface by a user with limited training, as
they are quite easy to set up and do not interfere with the data values stored in the database (so adding or modifying
an indicator is not a critical operation).
Indicators represent perhaps the most powerful data analysis feature of the DHIS 2, and all reporting tools support the
use of indicators, e.g. as displayed in the custom report in the figure above. Being able to use population data in the
denominator enables comparisons of health performance across geographical areas with different target populations,
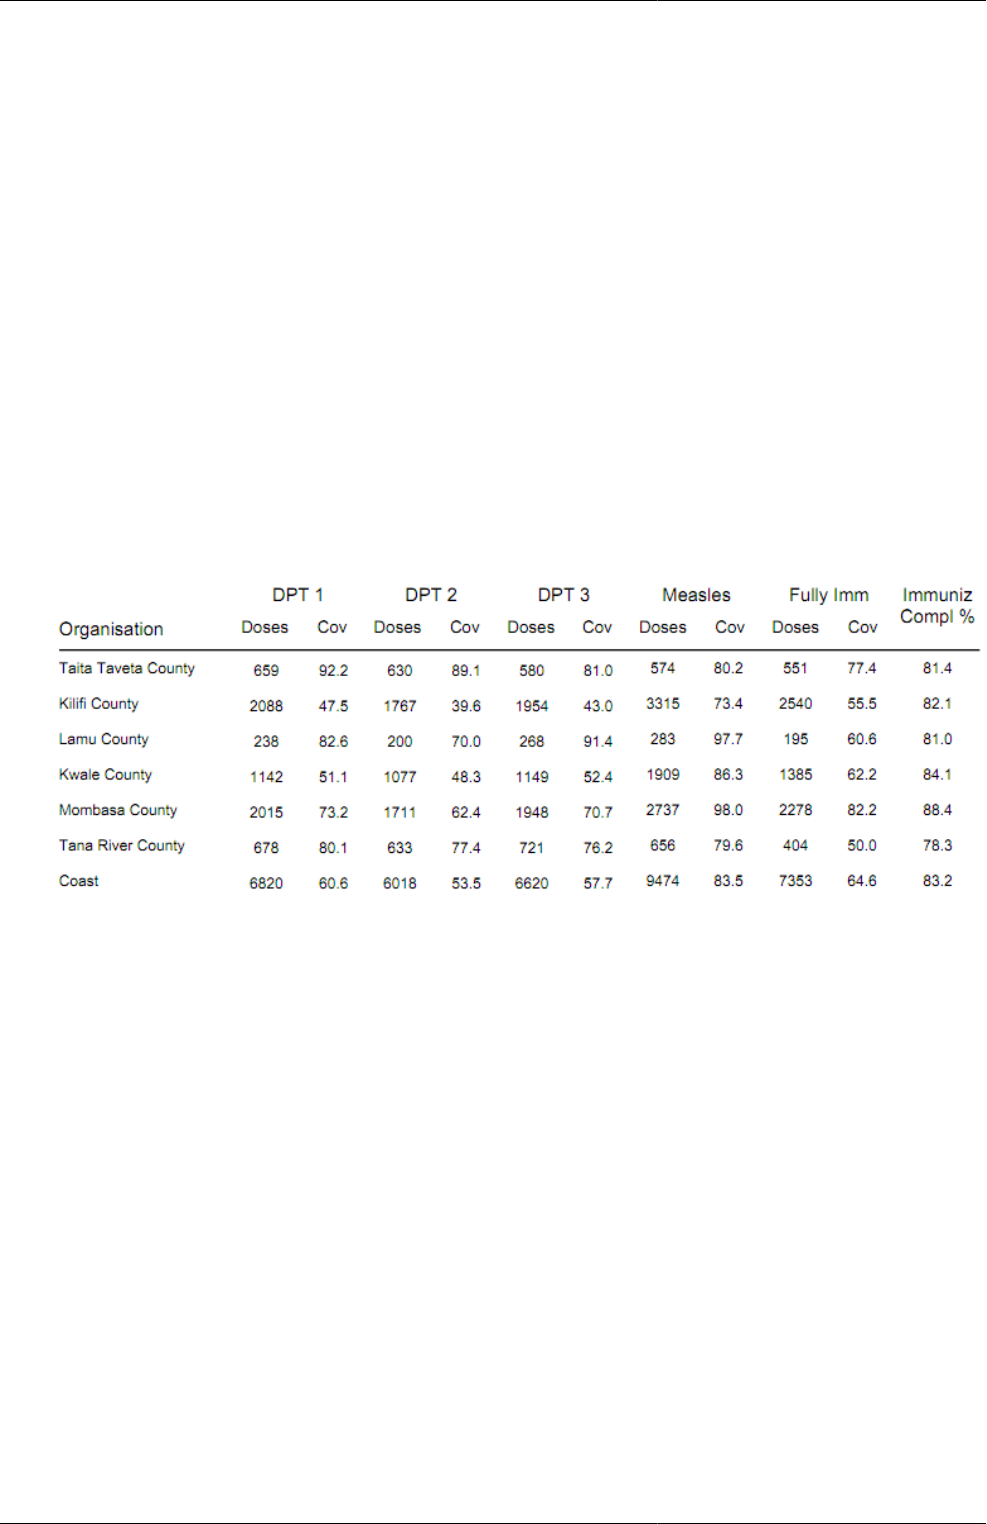
which is more useful than only looking at the raw numbers. The table below uses both the raw data values (Doses)
and indicator values (Cov) for the different vaccines. Comparing e.g. the two first orgunits in the list, Taita Taveta
County and Kilifi County, on DPT-1 immunisation, we can see that while the raw numbers (659 vs 2088) indicate
many more doses are given in Kilifi, the coverage rates (92.2 % vs 47.5 %) show that Taita Taveta are doing a better job
immunising their target population under 1 year. Looking at the final column (Immuniz. Compl. %) which indicates
the completeness of reporting of the immunisation form for the same period, we can see that the numbers are more
or less the same in the two counties we compared, which tells us that the coverage rates can be reasonably compared
across the two counties.
2.5. Maintain disaggregated facility-data in the database
When data is collected and stored in DHIS 2 it will remain disaggregated in the database with the same level of detail
as it was collected. This is a major advantage of having a database system for HIS as supposed to a paper-based or
even spreadsheet based system. The system is designed to store large amounts of data and always allow drill-downs
to the finest level of detail possible, which is only limited by how the data was collected or imported into the DHIS 2
database. In a perspective of a national HIS it is desired to keep the data disaggregated by health facility level, which
is often the lowest level in the orgunit hierarchy. This can be done even without computerising this level, through a
hybrid system of paper and computer. The data can be submitted from health facilities to e.g. district offices by paper
(e.g. on monthly summary forms for one specific facility), and then at the district office they enter all the facility data
into the DHIS 2 through the electronic data collection forms, one facility at a time. This will enable the districts health
management teams to perform facility-wise data analysis and to e.g. provide print-outs of feedback reports generated
by the DHIS 2, incl. facility comparisons, to the facility in-charges in their district.
2.6. Support data analysis at any level in the health system
While the name DHIS indicates a focus on the District, the application provides the same tools and functionality to all
levels in the health system. In all the reporting tools the users can select which orgunit or orgunit level to analyse and
the data displayed will be automatically aggregated up to the selected level. The DHIS 2 uses the orgunit hierarchy in

Conceptual Design Principles Support data analysis at any level in the
health system
8
aggregating data upwards and provides data by any orgunit in this hierarchy. Most of the reports are run in such a way
that the users will be prompted to select an orgunit and thereby enable reuse the same report layouts for all levels. Or of
desired, the report layouts can be tailored to any specific level in the health system if the needs differ between the levels.
In the GIS module the users can analyse data on e.g. the sub-national level and then by clicking on the map (on e.g.
a region or province) drill down to the next level, and continue like this all the way down to the source of the data
at facility level. Similar drill-down functionality is provided in the Excel Pivot Tables that are linked to the DHIS 2
database.
To speed up performance and reduce the response-time when providing aggregated data outputs, which may include
many calculations (e.g. adding together 8000 facilities), DHIS 2 pre-calculates all the possible aggregate values and
stores these in what is called a data mart. This data mart can be scheduled to run (re-built) at a given time interval,
e.g. every night.
