Frye Hearing Aid FP35
User Manual: Frye Hearing Aid FP35
Open the PDF directly: View PDF ![]() .
.
Page Count: 230 [warning: Documents this large are best viewed by clicking the View PDF Link!]

Hearing Aid Analyzer
Operator’s Manual
Ver. 5.01
©2009 Frye Electronics, Inc.
Ver. 5.01: 3/18/09 ; Revised December 2009
All rights reserved
FONIX® FP35

Table of Contents iii
Contents
Chapter 1: An Overview of the FP35
1.1 A Guide to Using this Manual..........................................................................2
1.2 Layout, Controls, & Safety .............................................................................2
1.2 .1 Lamps and LCD.................................................................................2
1.2.2 Front panel layout ...............................................................................3
1.2.3 Rear Panel Layout ...............................................................................4
1.2.4 Sound Chamber Connectors.....................................................................6
1.3 Accessories............................................................................................6
1.3.1 Standard Accessories............................................................................6
1.3.2 Real-Ear Option Accessories.....................................................................7
1.3.3 Optional accessories ............................................................................8
1.4 Optional Features for the FP35 .......................................................................12
1.5 Setup .................................................................................................14
1.6 Safety ................................................................................................14
1.7 Maintenance .........................................................................................16
1.7.1 Servicing the Instrument ........................................................................17
1.7.2 Cleaning the Instrument ........................................................................ 17
1.7.3 Warranty........................................................................................18
Chapter 2: General Operation
2.1 Operation of Keys.....................................................................................19
2.1.1 Using the Function Keys .........................................................................19
2.1.2 Using the Local Menus ..........................................................................21
2.1.3 Using the Help Menus...........................................................................23
2.1.4 Using the [EXIT] and [RESET] keys...............................................................23
2.2 Opening Screen ......................................................................................24
2.2.1 Entering the Opening Screen ...................................................................24
2.2.2 Opening Screen Display ........................................................................24
2.2.3 Switching Between Settings .....................................................................25
2.3 The Default Settings Menu ...........................................................................25
2.3.1 Customizing Your Instrument Default Settings ..................................................26
2.3.2 Switching between Easy and Advanced User Levels............................................26
2.3.3 Changing the use of [F1] in the Opening screen ................................................27
2.3.4 Setting the date and time .......................................................................27
2.3.5 Changing the external monitor colors ...........................................................27
2.3.6 Explaining the Settings in the Main Default Settings Menu .....................................28
2.3.7 Explaining the Settings in the Advanced Menu .................................................30
2.3.8 Explaining the Settings in the Resets Default Settings Menu ....................................33
2.4 Aid Types and Delay Times...........................................................................33
2.5 Source Types & Measurements .......................................................................34
2.5.1 Understanding Pure-Tone Signals ...............................................................35
2.5.1.1 Delay Settings............................................................................35

iv FONIX FP35 Hearing Aid Analyzer
2.5.1.2 Harmonic Distortion .....................................................................36
2.5.1.3 Noise Reduction .........................................................................36
2.5.1.4 Warble Rates ............................................................................37
2.5.1.5 Adjusting the Signal Skew................................................................37
2.5.1.6 Three-Frequency Averages ..............................................................38
2.5.2 Understanding Composite Signals ..............................................................38
2.5.2.1 Filter Type ...............................................................................39
2.5.2.2 Intermodulation Distortion . . . . . . . . . . . . . . . . . . . . . . . . . . . . . . . . . . . . . . . . . . . . . . . . . . . . . . . . . . . . . . 40
2.5.2.3 Noise Reduction .........................................................................43
2.5.3 Measuring RMS .................................................................................43
2.5.4 Measuring the RMS of the reference microphone . . . . . . . . . . . . . . . . . . . . . . . . . . . . . . . . . . . . . . . . . . . . . . . 45
2.5.5 Using the Earphone Jack ........................................................................46
2.5.6 Using Impulse Rejection ........................................................................47
2.5.7 Using an External Speaker or Sound Chamber ..................................................47
2.5.8 Measuring Telecoil ..............................................................................48
2.5.9 Changing the Microphone Selection ............................................................50
2.6 Printing ...............................................................................................50
2.6.1 Choosing the Printer............................................................................51
2.6.2 Adding a Label .................................................................................51
2.6.3 Changing the Thermal Paper ...................................................................52
2.6.4 Fixing Paper Jams ...............................................................................54
2.6.5 Minimizing Fading..............................................................................54
2.6.6. Using an External Printer .......................................................................54
2.7 Display & Data ........................................................................................54
2.7.1 Data Display ....................................................................................54
2.7.2 Curve ID Box ....................................................................................55
Chapter 3: Coupler Measurements
3.1 Coupler Multicurve Display ..........................................................................57
3.2 Leveling the Sound Chamber.........................................................................58
3.2.1 Leveling without the Reference Microphone (Standard) ........................................59
3.2.2 Leveling Using the Reference Microphone .....................................................60
3.2.3 Saving the Leveling Information ................................................................61
3.2.4 Changing the Leveling Source ...................................................................61
3.3 Hearing Aid Setup ....................................................................................62
3.3.1 Setting up a BTE ................................................................................62
3.3.2 Setting up an ITE ...............................................................................63
3.3.3 Setting up a Body Aid...........................................................................64
3.4 Frequency Responses ................................................................................64
3.4.1 Running a Test Curve ...........................................................................65
3.4.2 Running a Single Frequency Measurement .....................................................67
3.5 Distortion Measurements . . . . . . . . . . . . . . . . . . . . . . . . . . . . . . . . . . . . . . . . . . . . . . . . . . . . . . . . . . . . . . . . . . . . . . . . . . . . . 67
3.5.1 Measuring Harmonic Distortion .................................................................67
3.5.2 Measuring Intermodulation Distortion ..........................................................69
3.5.3 Performing an IM Distortion Sweep .............................................................70
3.5.4 Changing the Frequencies of an IM Distortion Sweep ...........................................71
3.5.5 Turning on/off Impulse Rejection ...............................................................72
3.5.6 Using the Reference Microphone ...............................................................72

Table of Contents v
3.6 CIC Option ...........................................................................................72
3.7 OES Option ...........................................................................................74
3.8 Advanced Testing.....................................................................................75
3.8.1 Testing Digital Hearing Aids .....................................................................75
3.8.2 Testing Directional Hearing Aids (FP35 with Real Ear option only) ..............................76
3.8.3 Testing with the Reference Microphone.........................................................78
3.8.4 Reversing the Microphones . . . . . . . . . . . . . . . . . . . . . . . . . . . . . . . . . . . . . . . . . . . . . . . . . . . . . . . . . . . . . . . . . . . . . 80
3.8.5 Splitting the Microphones.......................................................................80
3.8.6 Changing the Signal Filters ......................................................................81
3.8.7 Running a Three-Frequency Average ...........................................................82
3.8.8 Measuring the Telecoil Response ...............................................................83
3.8.9 Measuring with an External Signal ..............................................................85
3.9 Reference .............................................................................................87
3.9.1 Defining the Function Keys......................................................................87
3.9.2 Explaining the Menu Items......................................................................87
Chapter 4: Automated Test Sequences .................................................91
4.1 The ANSI Sequence ...................................................................................91
4.1.1 Viewing the ANSI ’96 Display ...................................................................92
4.1.2 Defining the Function Keys .....................................................................93
4.1.3 Leveling ........................................................................................94
4.1.4 Switching between ANSI 96 and ANSI 03 .......................................................94
4.1.5 Setting up for ANSI testing......................................................................94
4.1.6 Running an ANSI Test ...........................................................................96
4.1.7 Testing Digital Hearing Aids.....................................................................96
4.1.8 Understanding Menu Items.....................................................................97
4.2 IEC Testing ............................................................................................98
4.2.1 Viewing the IEC Display ........................................................................98
4.2.2 Defining the Function Keys ....................................................................100
4.2.3 Setting Up the Hearing Aid for Testing .........................................................100
4.2.4 Running an IEC Test............................................................................100
4.2.5 Defining the Menu Items ......................................................................101
4.3 JIS Testing ............................................................................................102
4.3.1 Viewing the JIS Display ........................................................................102
4.3.2 Defining the Function Keys ....................................................................104
4.3.3 Setting Up the Hearing Aid for Testing .........................................................104
4.3.4 Running the JIS Test ...........................................................................104
4.3.5 Defining the Menu Items.......................................................................104
4.4 ISI Testing ............................................................................................105
Chapter 5: Real-Ear Measurements ...................................................109
5.1 Introduction.........................................................................................109
5.1.1 Real-Ear Screens...............................................................................109
5.1.2 Navigation .....................................................................................109
5.2 Real-Ear Setup ......................................................................................110
5.2.1 General Setup .................................................................................110
5.2.2 Internal Speaker Setup (for Sound Field Use) .................................................111
5.2.3 External Speaker Setup........................................................................112

vi FONIX FP35 Hearing Aid Analyzer
5.2.4 Placing the Probe Tube ........................................................................113
5.2.5 Placing the Sound Field Speaker ..............................................................114
5.2.6 Leveling the Sound Field Speaker .............................................................114
5.2.7 Testing Digital Aids ............................................................................116
5.2.8 Testing Body Aids..............................................................................116
5.3 Audiogram Entry Screen—Creating A Target ........................................................117
5.3.1 Entering the Audiogram Screen................................................................117
5.3.2 Audiogram Display ............................................................................117
5.3.3 Entering Audiometric Information & Creating A Target ........................................118
5.3.4 Creating an NAL-NL1 Target....................................................................118
5.3.5 Modifying a Target.............................................................................120
5.3.6 Measuring the Real-Ear to Coupler Difference.................................................120
5.3.6.1 Analyzer Setup for RECD...............................................................120
5.3.6.2 Client Setup for RECD ..................................................................121
5.3.6.3 Taking the RECD Measurement.........................................................122
5.3.7 Measuring the Real-Ear to Dial Difference .....................................................122
5.3.8 Measuring the Unaided measurement ........................................................125
5.3.9 Starting a New Client ..........................................................................127
5.3.10 Defining the Menu Items .....................................................................128
5.4 Insertion Gain Testing ...............................................................................130
5.4.1 Measuring the Unaided Response.............................................................131
5.4.2 Measuring the Aided Response ...............................................................132
5.4.3 Automatic Testing..............................................................................134
5.4.4 Testing Directional Hearing Aids...............................................................134
5.4.5 Testing Open Fit Hearing Aids .................................................................137
5.5 The Real-Ear SPL Screen ............................................................................138
5.5.1 The SPL Display ...............................................................................139
5.5.2 Running an SPL Test ...........................................................................139
5.5.3 Important Notes on SPL Testing ...............................................................141
5.5.3.1 Speech-Weighting Effects on Pure tones ...............................................141
5.5.3.2 Target Formulas .......................................................................141
5.5.4 Important Notes on DSL Testing ...............................................................142
5.6 Live Speech Testing .................................................................................143
5.6.1 Using Speech as a Test Signal ..................................................................143
5.6.2 Measuring the occlusion effect.................................................................146
5.7 Miscellaneous Real-Ear Measurements..............................................................147
5.7.1 Measuring a Single Frequency Response ......................................................147
5.7.2 Measuring Harmonic Distortion................................................................147
5.7.3 Measuring Intermodulation Distortion.........................................................148
5.7.3.1 To perform a static IM distortion test ...................................................148
5.7.3.2 To perform an IM distortion sweep.....................................................150
5.7.3.3 To change the frequencies used in the sweep..........................................151
5.7.4 Using the Reference Microphone ..............................................................151
5.7.5 Viewing Target Data ............................................................................152
5.7.6 Measuring the Telecoil Response...............................................................153
5.8 Reference ...........................................................................................154

Table of Contents vii
5.8.1 Viewing the Real-Ear Screens..................................................................154
5.8.2 Defining the Menu Items.......................................................................156
5.9 CROS, and BICROS ..................................................................................160
5.9.1 Measuring the Head-Baffle Effect..............................................................161
5.9.2. Measuring the Overcoming of the Head-Baffle Effect ..........................................161
5.9.2.1 CROS ...................................................................................161
5.9.2.2 BI-CROS................................................................................162
5.9.3 Measuring Overall Insertion Gain .............................................................162
5.9.3.1 CROS ...................................................................................163
5.9.3.2 BI-CROS ................................................................................163
5.9.4 Measuring Insertion Loss to the “Good” Ear (CROS) ...........................................164
Chapter 6: 2-CC Targets ...............................................................165
6.1 Target Creation.......................................................................................166
6.2 The Coupler Target and Coupler EarSim Displays ...................................................167
6.2.1 Viewing the Coupler Target Screen.............................................................167
6.2.2 Viewing the Coupler EarSim Screen............................................................169
6.3 Measurements & Adjustments .......................................................................171
6.3.1 Taking Basic Measurements . . . . . . . . . . . . . . . . . . . . . . . . . . . . . . . . . . . . . . . . . . . . . . . . . . . . . . . . . . . . . . . . . . . . 171
6.3.2 Viewing Target Data ............................................................................172
6.3.3 Tying the Target to a Measurement Curve ......................................................173
6.4 Reference ............................................................................................173
Chapter 7: The Audiometer Option ....................................................179
7.1 Introduction .........................................................................................179
7.2 Equipment...........................................................................................179
7.3 Setup ................................................................................................179
7.3.1 Sound Field Speaker...........................................................................179
7.3.2 Insert Earphones ..............................................................................182
7.4 Taking Audiometric Measurements ..................................................................182
7.4.1 Measurements in HL ...........................................................................182
7.4.2 Measurements in SPL ..........................................................................182
7.4.3 Measurements in Gain.........................................................................183
7.5 Output Limitations ..................................................................................183
Chapter 8: Spectrum Analysis .........................................................185
8.1 Spectrum Analysis Measurements...................................................................185
8.2 Using the Spectrum Analysis Mode..................................................................185
8.3 Technical Details .....................................................................................186
Appendix A: Specifications ...........................................................189
Appendix B: Software Upgrades ......................................................193
Appendix C: Calibration ..............................................................199
Appendix D: Fitting Formula Tables ...................................................209
Appendix E: SPL Conversions .........................................................213
Appendix F: Digital Speech Technical Details ..........................................217
Index ................................................................................219

Chapter 1 1
An Overview of the FP35
Welcome to the FONIX FP35 Analyzer! The FONIX FP35 provides quick, accu-
rate information about how well a hearing aid works. It uses a graphical display
or numerical table to show how much amplification the aid provides, which fre-
quencies it amplifies, and how much distortion is creates.
The FP35 Hearing Aid Analyzer is a lightweight instrument notable for its ease
of use. It has an intuitive interface to lead novice users through the process
of hearing aid prescription and real-ear testing, but the interface is versatile
enough for experts to use without feeling limited.
You can reach the menus from any screen. To make finding what you are look-
ing for quick and easy, and to avoid confusion, the pop-up menu screens dis-
play only the choices relevant to the application currently in use. The FP35 also
offers pop-up help windows that guide you through the possible steps available
from the current screen.
The FP35 uses a backlit LCD with an adjustable contrast for its main display,
and it has a thermal printer built in so that you can print hard copies of gath-
ered data no matter where you are. The FP35 also has an external monitor
option that allows the simultaneous display of the built-in LCD and an external
monitor. Most computer monitors will work with this feature, although the FP35
display is only in two colors. There is also a parallel port on the back of all
FP35 analyzers, allowing the use of an external printer.
The FP35 features three different pure-tone tests. The normal sweep covers a
detailed range of frequencies; the fast sweep offers a continuous signal, updat-
ing as fast as once every three seconds; the short sweep is a quick test (under
two seconds) covering standard audiometric frequencies. You can view the
curves in either gain or sound pressure level.
Indications for use
The FONIX FP35 Hearing Aid Analyzer allows the user to test the characteris-
tics of a hearing aid using coupler and optional real-ear measurements. These
characteristics include: Frequency response, harmonic distortion, equivalent
input noise, and compression. Coupler measurements are performed inside
a sound chamber. Real-ear measurements are performed with a small probe
microphone inside the patient’s ear. This manual provides detailed instructions
on the measurement capabilities and user interface of the FONIX FP35.

2 FONIX FP35 Hearing Aid Analyzer
1.1 A Guide to Using this Manual
The FP35 is easy to use. You can begin testing right away, and, if you do happen
to get stuck, the pop-up help menus will guide you through what to do next. In
addition, this manual contains detailed instructions and information about all
the different testing capabilities and options that the FP35 gives you.
The FP35 Operator’s Manual follows a logical, sequential order and is meant to
be read in order. If you come across a section that contains information you are
already familiar with, skip to the next section.
Notations are consistent throughout the manual. Key names are contained in
brackets, for instance [START/STOP]. Selections and settings are written in all
capitals without brackets, such as PURETONE. Screen names are capitalized,
such as Coupler screen.
The up-down arrow keys are represented by these symbols: [p q]. The right-
left arrow keys are represented by these symbols: [t u].
1.2 Layout, Controls, & Safety
The basic layout of the FP35 analyzer and special information pertaining to
safety regulations are described in this section.
1.2 .1 Power LED and LCD display
The FP35 uses a 1/4 VGA LCD screen to display graphs and numerical data.
An optional external monitor connection is also available. The FP35 analyzer
is equipped with a screen saver that will turn off the display automatically if
the FP35 is not used for a period of ten minutes or some other length of time
specified by the user in the Default Settings Menu (see Section 2.3, The Default
Settings Menu). To activate the screen after the screen saver has turned it off,
press any key.
The FP35 has only one LED. It is above the [OPERATE] key (see Figure 1.2.1).
The LED can indicate several different things by its color and by how quickly it
flashes.
• Green (not flashing)—Normal operation
• Green fast flash (every second)—Screen saver mode
•Green slow flash (every three seconds)—Off, but the circuit continues to
receive power
• Red—Error condition; unit should not be used
• Red & Green alternating—Software upload mode
An Overview of the FP35 3
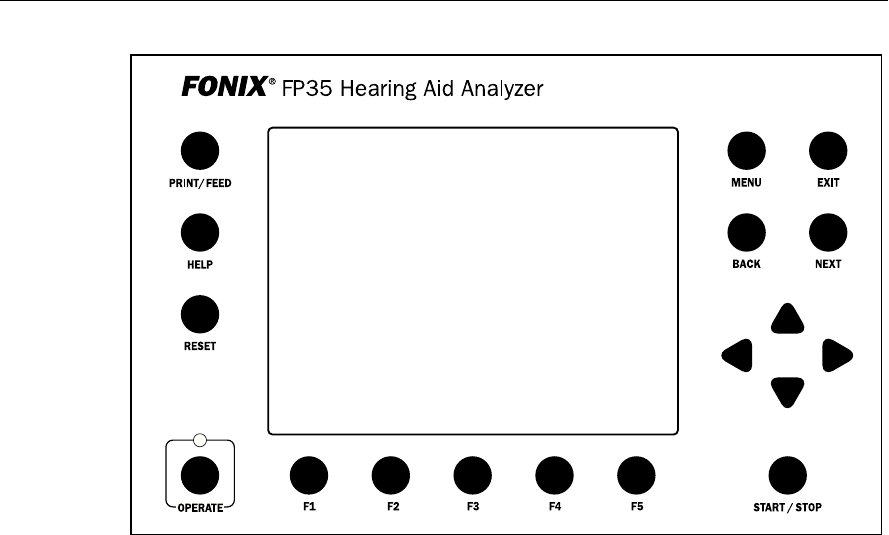
Figure 1.2.1—FP35 front panel
1.2.2 Front panel layout
The front panel of the FP35 analyzer consists of 5 function keys, 4 arrow keys,
and 9 other keys with varying operations. Together, these keys are used to con-
trol all the operations of the FP35 analyzer.
Function Keys:
There are five “function keys” located just below the FP35’s front panel, labeled
[F1] through [F5]. The function of these keys change from screen to screen,
according to the operation displayed. There are three basic uses of the function
keys:
•Tonavigatefromscreentoscreen
•Totoggleaselection
•Topop-upupaselectionmenu
For example, in the Opening Screen, pressing [F3] will take you into the Coupler
Multi-Curve screen where you can test an aid in the sound chamber.
Other Keys:
[MENU] Enters and exits the menu relevant to the current screen.
[EXIT] Exits the current screen, returning you to the a measurement
screen or the Opening Screen. Unlike the [RESET] key, press-
ing [EXIT] does not erase any data.

4 FONIX FP35 Hearing Aid Analyzer
[NEXT] [BACK] Moves back and forth between screens that are in a sequenc-
es. Examples include menus and the real-ear measurement
screens.
[p q] Moves the cursor up and down in a menu screen and in the
Audiogram Entry screen. Adjusts the level of the source ampli-
tude in a measurement screen.
[t u] Cycles through available menu choices, adjusts the frequency
selection in a single tone measurement, and adjusts the ampli-
tude levels in an audiogram in the Audiogram Entry screen.
[START/STOP] Starts or stops the current selected function.
[OPERATE] Powers up and down the analyzer. When powered down, the
LCD display is turned off and all data is cleared, but the main
power is not turned off. The green LED will flash once every 3
seconds.
[RESET] Interrupts any current running measurement and returns the
FP35 to the Opening Screen. [RESET] will not clear leveling or
calibration, but it will clear any data you have collected.
[HELP] Pops up a help window containing instructions for the current
screen.
[PRINT/FEED] Prints the current screen when you press and release this key.
Feeds the thermal paper when you press and hold this key.
Connector:
The FP35 main board was revised in late October 2008 (the “-09 revision”). This
added a new microphone connector on the front of the analyzer labeled “Mic”
for the integrated real-ear microphone. The coupler microphone (and the old
style real-ear microphone) is connected inside the sound chamber.
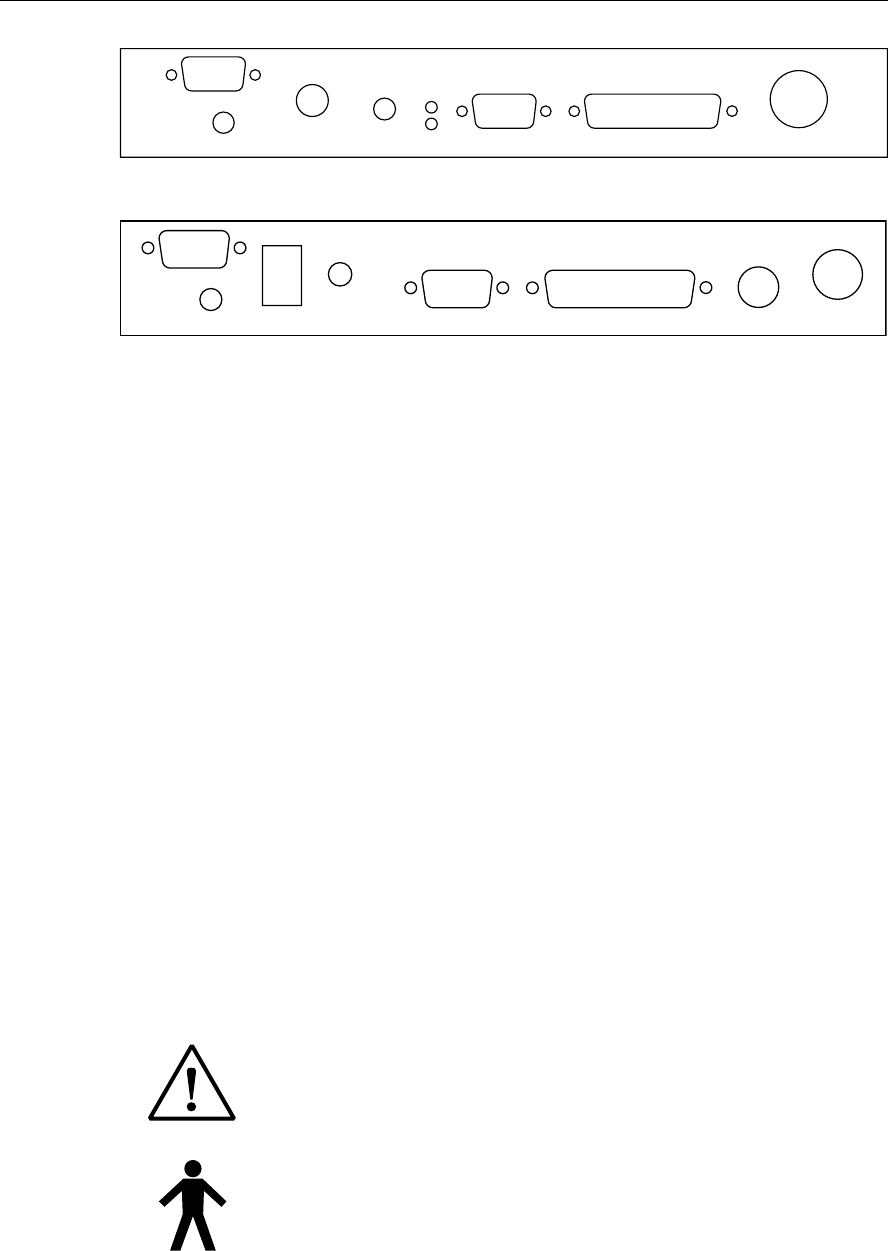
1.2.3 Rear Panel Layout
The rear panel layout contains most of the external connections for the FP35
analyzer. There have been three major versions of the FP35 rear panel. For the
sake of this manual, we will refer to them as the “original” rear panel, the “-08”
rear panel, and the “-09” rear panel.
VIDEO
EARPHONESPEAKERLINE IN CONTRAST RS232PRINTER POWER
Figure 1.2.3A—The newest rear-panel, manufactured starting in November 2008. This revision
added a “line-in” input as a 3.5mm jack.
An Overview of the FP35 5
VIDEO
EARPHONESPEAKER CONTRAST RS232 PRINTER POWER
Figure 1.2.3B—The “08” rear-panel, manufactured between February 2007 and October 2008.
VIDEO
EARPHONE SPEAKER
CONTRAST
RS232 PRINTER KEYBOARD POWER
Figure 1.2.3C—The “original” rear-panel, manufactured before February 2007.
Video Connects to an external monitor (optional).
Earphone Connects an insert earphone to the FP35 in order to perform
RECD or audiometric measurements. It can also be used to
connect a Telewand or telecoil board for telecoil measurements.
Speaker Connects an external sound field speaker or external sound
chamber to the FP35 analyzer. Can also be used to connect an
external telecoil board or Telewand (-08 or -09 rear panel only)
Contrast Changes the contrast of the LCD display.
RS232 Connects to a computer in order to run a computer program or
to upgrade your software.
Printer Connects the FP35 to an external printer.
Keyboard This connector has no function (original rear panel only)
Power Connects the FP35 to its power supply. We recommend that
you attach the power supply to the FP35 before plugging it
into the wall.
The following symbols can be found on the back and on the bottom of the FP35:
Meaning of Symbols
Read the accompanying documents. Please read this manual
before operating the FP35. A separate maintenance manual
exists for the FP35. If you wish to obtain a maintenance man-
ual please contact Frye Electronics, Inc., or your Frye represen-
tative.
For purposes of safety classification under IEC 60601-1, the
FP35 is class 1 equipment, Type B.
6 FONIX FP35 Hearing Aid Analyzer
This symbol indicates that Frye Electronics conforms to the
Medical Device Directive 93/42/EEC.
1.2.4 Sound Chamber Connectors
There are two jacks in the bottom part of the sound chamber. The small 3.5mm
jack is for the internal sound chamber. The larger multi-pronged jack is for the
coupler microphone or the M300 microphone set.
1.3 Accessories
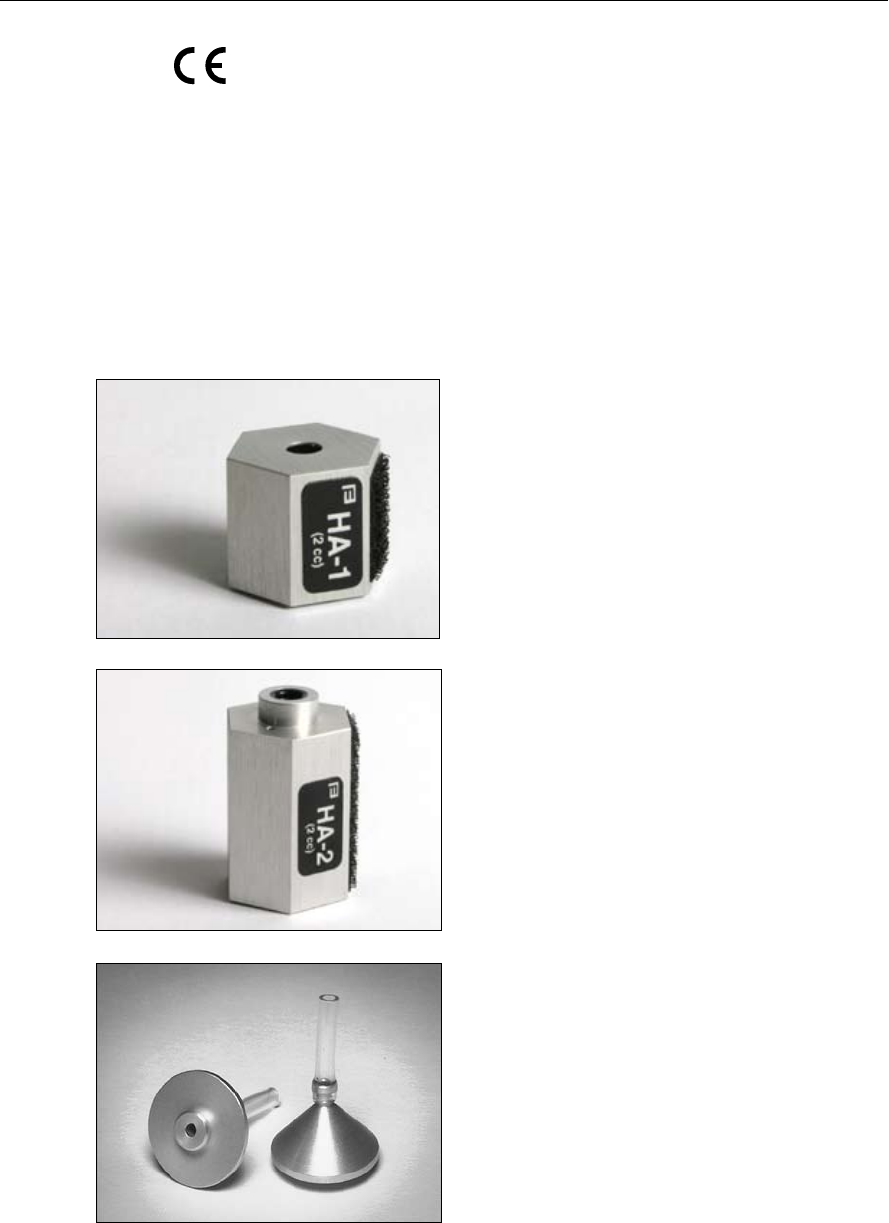
1.3.1 Standard Accessories
HA-1 2-cc Coupler
Dimensions per requirements of ANSI
S3.7 for testing in-the-ear hearing aids
HA-2 2-cc Coupler
Dimensions per requirements of ANSI
S3.7 for testing ear level, eyeglass and
body aids
0086
Ear-Level (BTE) Adapter
Snaps into the 1/4 in (6.35 mm) diam-
eter cavity in the HA-2 2-cc coupler.
Equipped with a 0.6 in (15 mm) length of
0.076 in (1.93 mm) ID tubing, the adapter
allows ANSI S3.22 specified connection
of an ear-level aid to the coupler.
An Overview of the FP35 7
Coupler Microphone
For performing coupler measurements.
Microphone Adapter
14 mm to 1-inch diameter microphone
size. Couples the coupler microphone to
a calibrator.
Other Standard Accessories
•StandardExternalPowerSupply
•RollofPrinterPaper
•Operator’sManual
•Fun-Tak
•RS232Cable
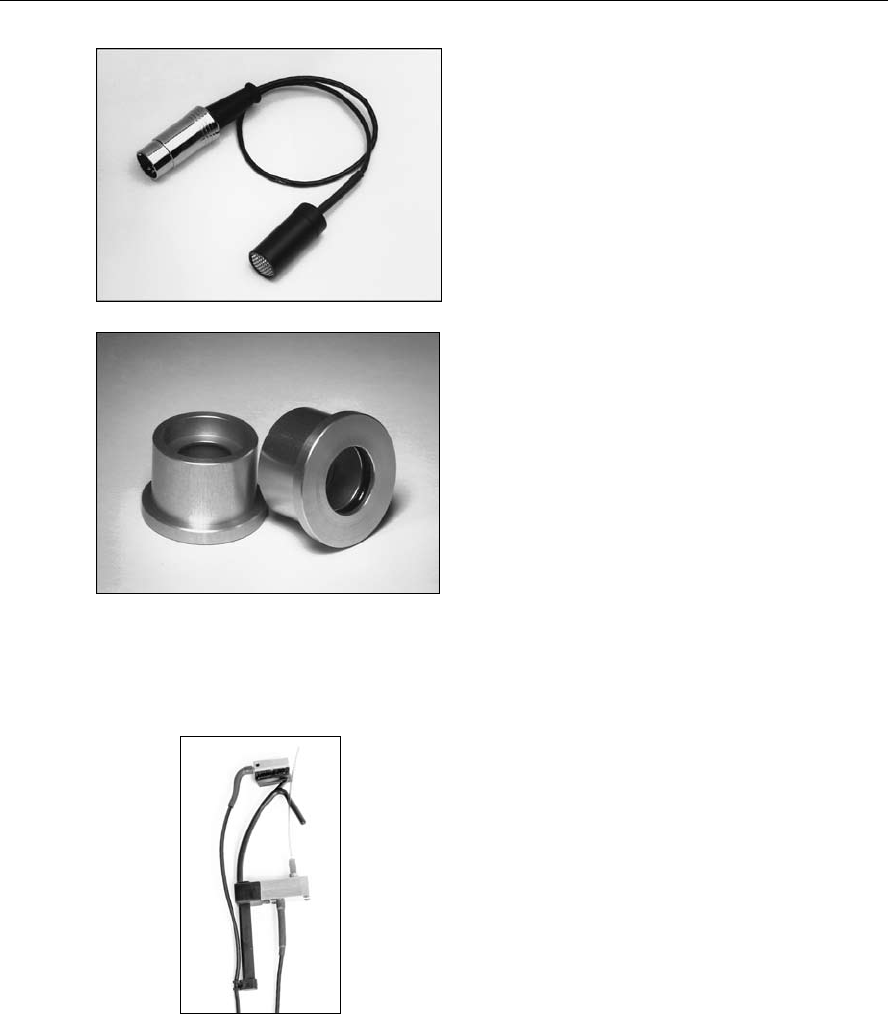
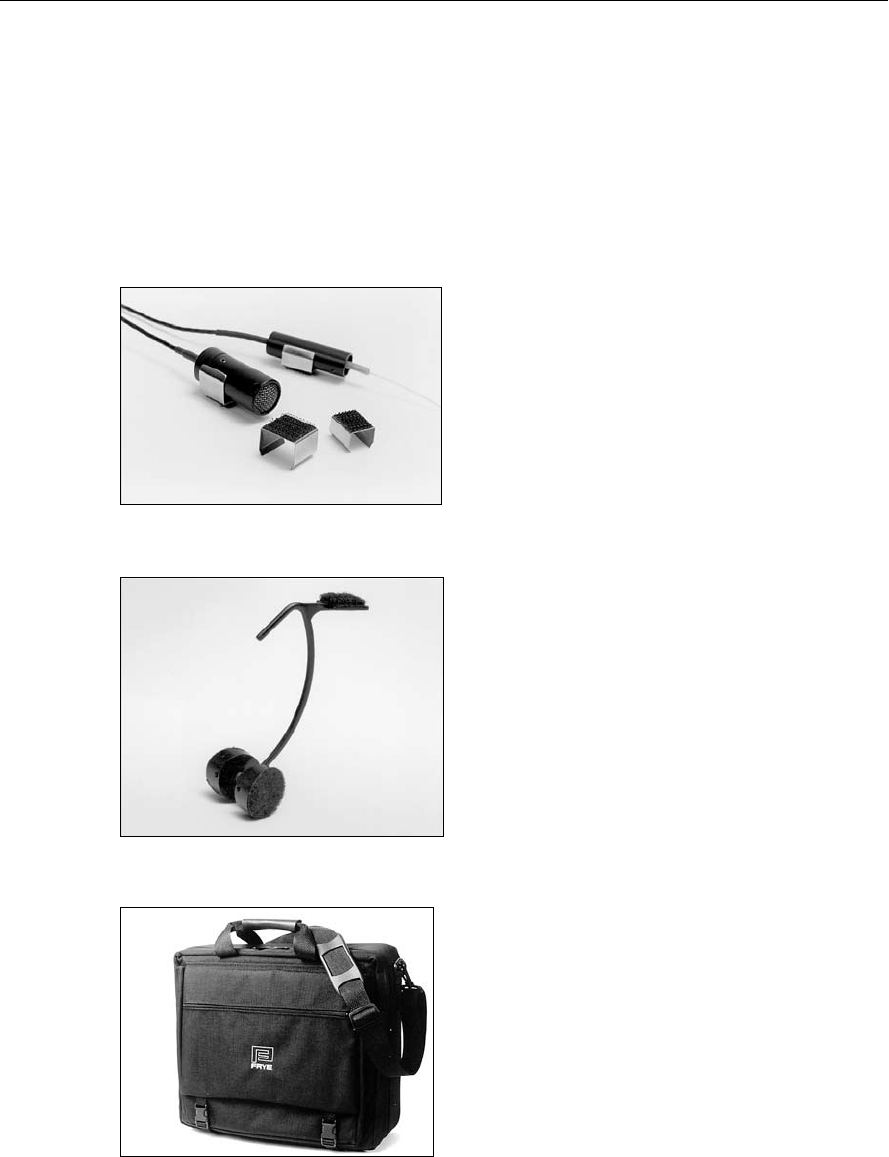
1.3.2 Real-Ear Option Accessories
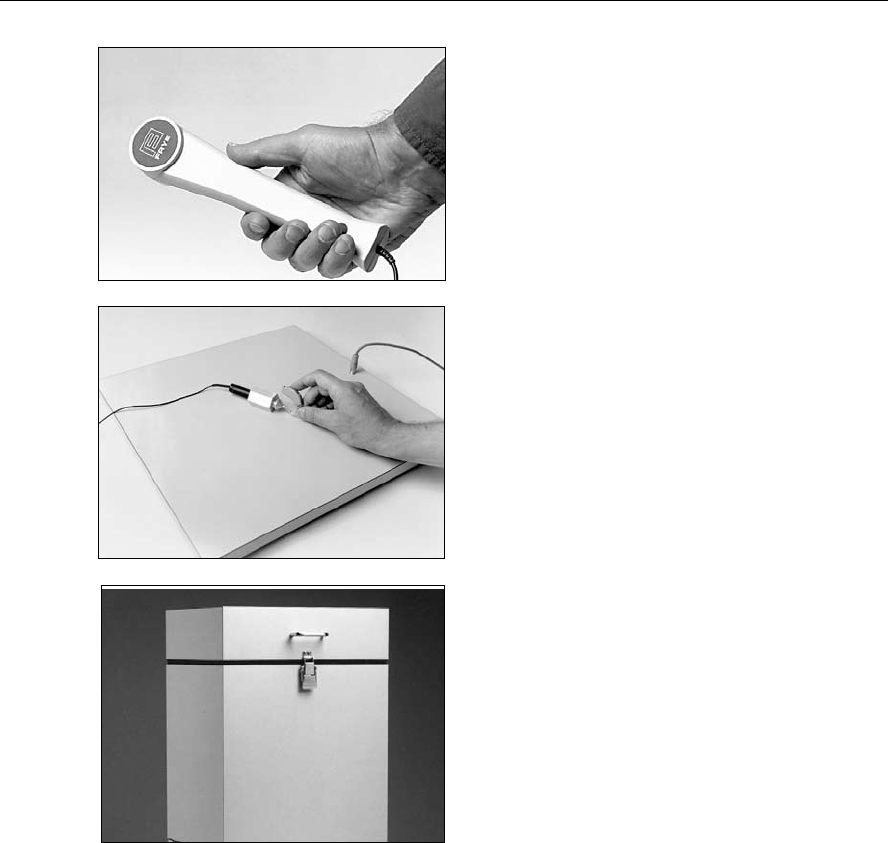
Probe Microphone
Integrated probe microphone with a 10 ft
(3 m) cable for real-ear measurements.
Other Real-Ear Option Accessories:
• Probe Calibration Adapter—Provides a means of coupling the probe
microphone to a calibrator.
• Extension Pole—This extra pole (6 1/2” long), lets you use two different
speaker heights when testing in the Real-ear Mode.
8 FONIX FP35 Hearing Aid Analyzer
•Probe Tubes—set of 25
•Felt Pen—Red, Dry-erase
•Rectangular reference microphone adapter—Couples the rectangular refer-
ence microphone to a calibrator.
1.3.3 Optional accessories
Mounting Sleeves
For securing microphones to the
earhook. Only used for M300 style
microphone set. The newer style
probe microphone with the integrated
earhook does not require these sleeves.
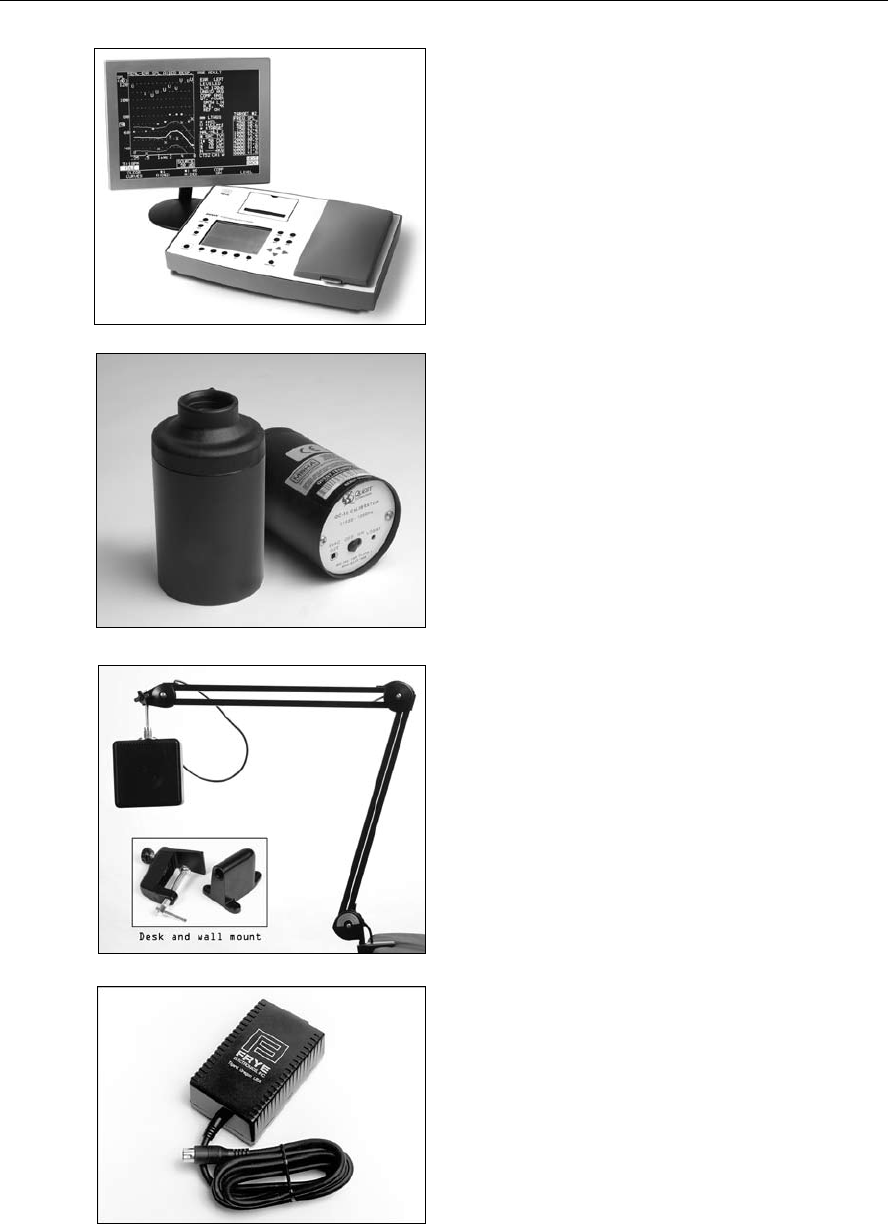
Wedge Style Earhook
Holds probe and reference micro-
phones during real-ear testing. Only
used for M300 style microphone set.
The newer style probe microphone
with integrated earhook does not
require this part.
Soft Carrying Case
An attractive, sturdy, soft carrying case
that holds the FP35 and accessories.
An Overview of the FP35 9
External Monitor Option
Used for the external display of the FP35
analyzer. Requires the external monitor
option.
Quest QC-10 Sound Level Calibrator
For calibration of microphone amplifier;
operates at 1000 Hz at a level of 114 dB
SPL.
Swing Arm Speaker
Gives you a wide range of speaker-
position angles and heights to work with
when testing in real ear.
Medical Grade External Power Supply
For the FP35 to qualify as a medical
grade unit, all connections must be with
medical grade equipment. This power
supply meets medical grade standards.
10 FONIX FP35 Hearing Aid Analyzer
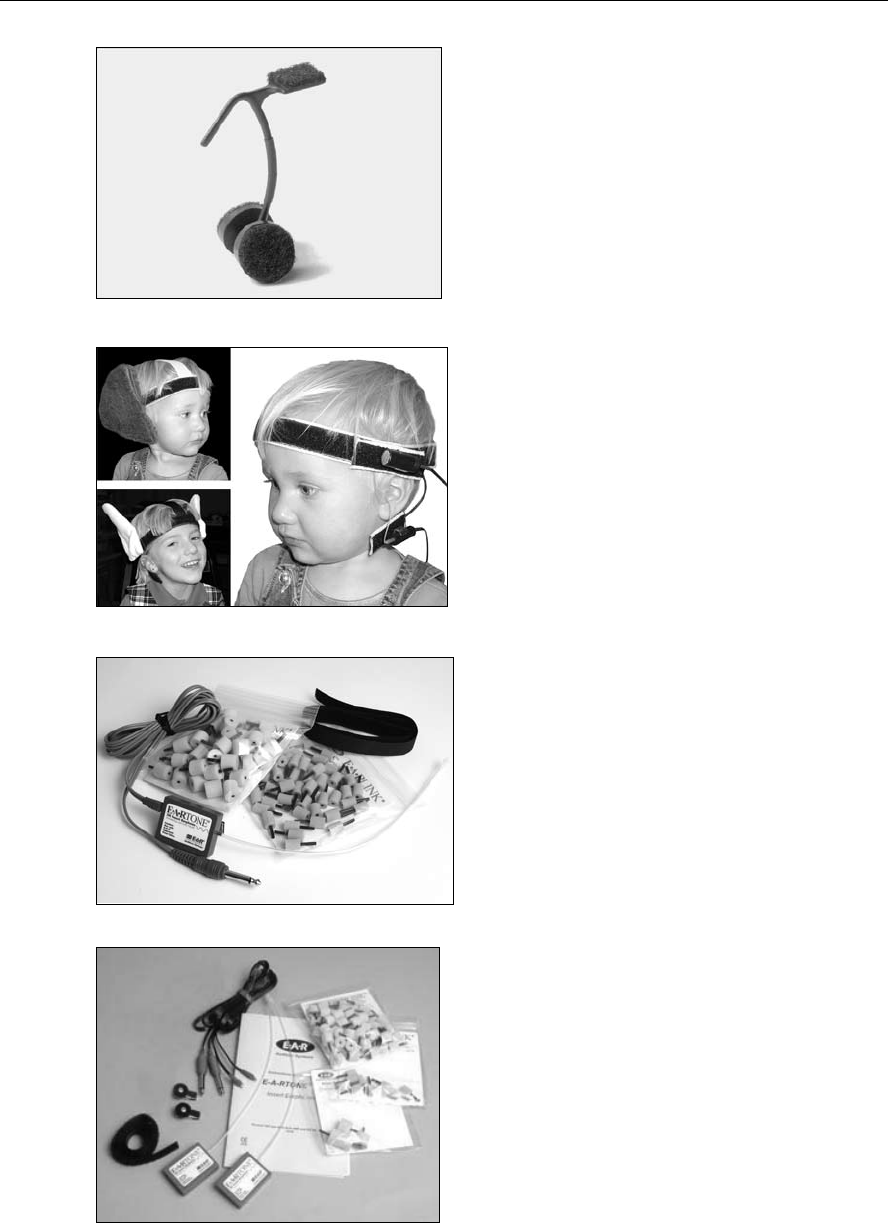
Child Size Wedge Style Earhook
Holds probe and reference microphones
during real-ear testing. Only used for
M300 style microphone set. The newer
style probe microphone with integrated
earhook does not require this part.
Infant Headband Package
Used for performing real-ear measure-
ments on infants and small children.
Includes infant, child, and adult head-
bands, six flexible ear hooks, and two
sets of “animal ears.”
Single Insert Earphone (RECD)
Consists of one ER3A earphone with a
phono plug, a 72-inch cable, an assort-
ment of ear tips, a calibration certificate,
and a lapel clip. This package is suitable
for performing an RECD measurement
with the FP35 analyzer. It can also be
used for performing audiometric mea-
surements with the Audiometer option.
Dual Insert Earphones
Pair of insert earphones with special con-
nector for performing audiometric mea-
surements. Can also be used for RECD
measurements.
An Overview of the FP35 11
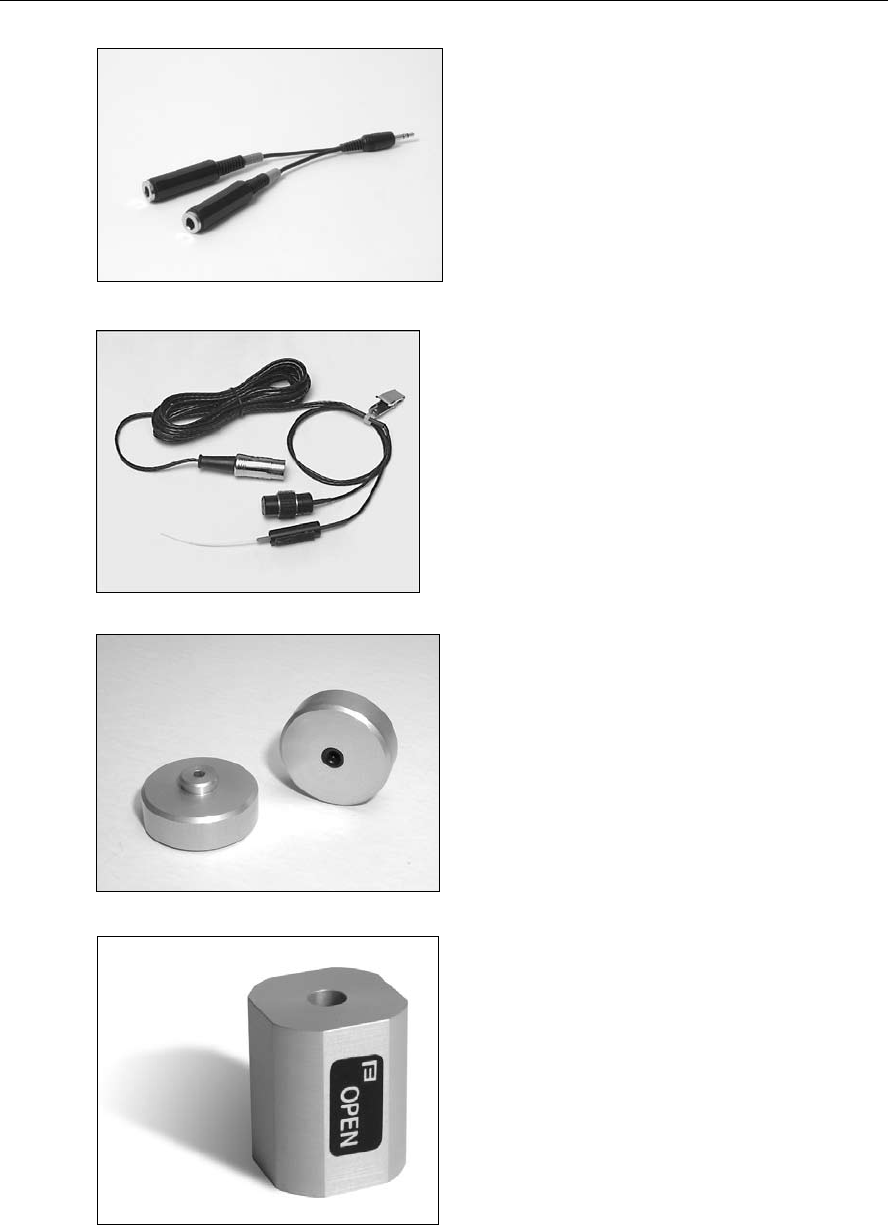
Dual Insert Earphones Y Cable
3.5 mm stereo phone plug to 1/4” phone
jack. Connects dual insert earphone to
FP35. Included with the Dual Insert
Earphone Option.
Earphone Calibration Adapter
Connects the Insert Earphone to the
HA-2 coupler. Included with the
Audiometer Option.
Two Microphone System
This two microphone setup can be
ordered for sound chamber-only FP35
analyzers in order to enable testing with
a reference microphone.
Open Fit Coupler
Non-standard coupler used for realistic
testing of open fit hearing aids.
12 FONIX FP35 Hearing Aid Analyzer
Telewand
Allows the measurement of telecoil per
ANSI S3.22-1996 and ANSI S3.22-2003.
Also allows real-ear telecoil measure-
ments.
Telecoil Board
Allows the measurement of telecoil in
sound chamber measurements.
Other Optional accessories
• Calibration Clip—Used to couple the old style probe and reference
microphones together for calibration purposes.
1.4 Optional Features for the FP35
Real-Ear Option
You can order the FP35 with the Real-Ear Option so that you can do tests on the
hearing aid while it is in the client’s ear. It is then possible to individualize the
fitting of a hearing aid—a necessary step since a coupler measurement can sel-
dom tell the operator exactly what sound is received by the client. Many factors
affect sound on its way to the eardrum. By measuring with a probe microphone,
you will know what is really happening in your client’s ear.
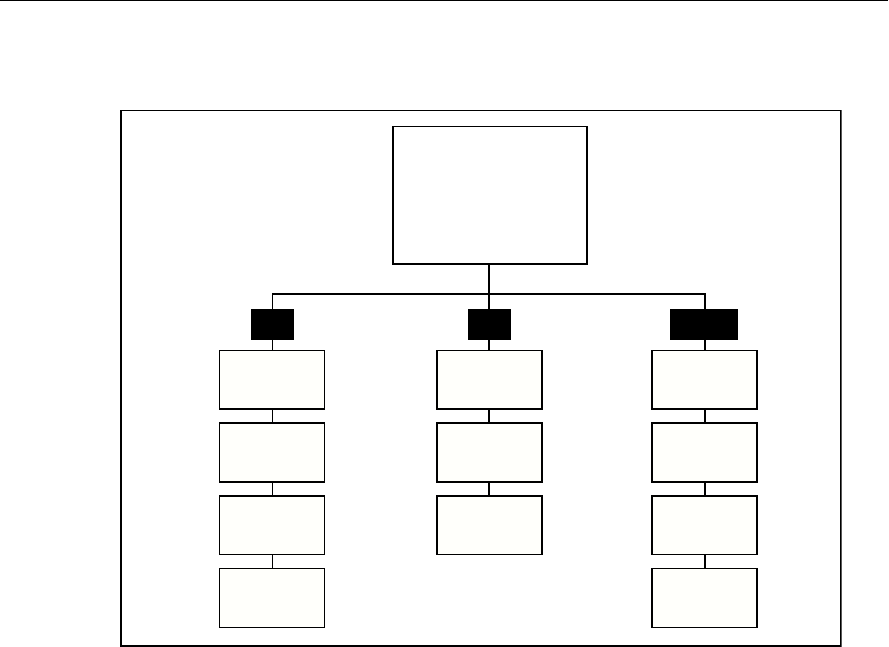
External Sound Chamber
Connect the FP35 analyzer to an external
sound chamber for better sound isolation
and positioning. Sound chamber models
6040 and 6050 can be used.

An Overview of the FP35 13
External Monitor Option
This hardware option allows the connection of the FP35 analyzer to an external
monitor. When connected, the FP35 displays on both its internal LCD monitor
and the connected external monitor. Although the display is always only in two
colors, most standard flat screen and VGA computer monitors can be used.
IEC
You can add the IEC (International Electrotechnical Commission) test sequence
to your FP35 analyzer. This automated sequence lets you test the performance
of hearing aids in accordance with the IEC 118-7 standard as amended in 1994.
JIS
An automated test sequence that follows the JIS standard, widely used in Japan.
ANSI
The ANSI 96 and ANSI 03 automated test sequences are available as an option
on your FP35. They provide you with the means to quickly and accurately test a
hearing aid in accordance with the ANSI S3.22 standard.
CIC Option
This option consists of a 0.4 cc CIC coupler and software correction factors. The
CIC correction factors are available in the Coupler Mode by selecting the CIC
coupler in the Coupler Menu.
Audiometer Option
This adds pure-tone air audiometric measurements to your FP35 hearing aid
analyzer. You can either take the measurements with insert earphones or with a
sound field speaker. See Chapter 9 for more details.
ISI
An automated test sequence conforming to the Indian ISI IS-10775-1984 standard.
Note: The FP35 is fully upgradeable. These options can be added to an existing
unit.
1.5 Setup
Unpack the instrument and all of the accessories, some of which can be found
in a card box. If you ordered the soft carry case as an optional accessory, it will
be shipped in a separate box.
Keep the shipping box for when you need to send the unit in to us for calibra-
tion, upgrade or repair.
Choose a location for your FP35 that is relatively free of ambient noise. Begin by
plugging in the power supply to the back panel. See Figure 1.2.3 for an illustra-

tion of the back panel. Measurements can be considered reliable only when per-
formed with the noise floor of the test environment 10 dB below the input level
of the test signal.
If you have ordered the Real-ear Option on your FP35, remove the integrated
probe microphone from its packing material and plug it into the front of the
analyzer after removing the warning sticker covering the mic port. This con-
nection can also be made when the analyzer is powered on, but make sure you
press the [RESET] button after plugging in the probe mic cable.
The FP35 will power up as soon as you plug the power cord into the wall. To
power it down again, either unplug it, or push the [OPERATE] key. Unplugging
the FP35 turns it completely off; pushing the [OPERATE] key powers the unit
down, but the internal circuit board continues to receive power.
Once you have power to the unit, you are ready to proceed.
1.6 Safety
Shipping
The following symbols are included on the electronic module shipping box:
Keep dry. The FP35 Hearing Aid Analyzer should not be
exposed to water or other fluids. Water or other fluids
could cause damage to the equipment.
60 º C
-20 º C
The shipping/storage temperature of the 7000 is -20 to 60
degrees Celsius (-4 to 140 degrees Fahrenheit)
%
85%
5%
The shipping/storage Humidity of the FP35 is 5 to 85 per-
cent relative humidity (non-condensing)
Probe Tubes
This symbol, included on the probe tube packaging, indicates
that probe tubes should be discarded after use in order to pre-
vent the possible spread of infection. They cannot be cleaned,
sterilized, or reused. Cutting the probe tube to a shorter length
will invalidate the probe microphone calibration.
14 FONIX FP35 Hearing Aid Analyzer

Safety Classification for IEC 60601-1
Type of protection against electric shock: Class I
Degree of protection against electric shock: Type B
Protection against harmful ingress of water: Ordinary
Mode of operation: Continuous
The FP35 does not require sterilization or disinfection.
Warning: This equipment is not suitable for use in the presence of flammable
anaesthetic mixture with air or with oxygen or nitrous oxide.
Warning: Connect only to the power supply packaged with the FP35. Using other
power supplies could lead to electric shock or other safety hazards.
Connection of peripheral equipment to the FP35
Compliance with IEC 60601-1-1 Safety requirements for medical electrical sys-
tems must be determined on a case-by-case basis.
All electrical equipment attached to the FP35, such as video monitors, computer
equipment, etc. must, at a minimum, meet one of the following conditions:
a. The equipment complies with IEC 60601-1
b. The equipment complies with relevant IEC and ISO safety standards and is
supplied from a medical grade isolation transformer.
c. The equipment complies with relevant IEC and ISO safety standards and is
kept at least 1.5 meters from the patient.
The allowable leakage currents of IEC 60601-1-1 must not be exceeded. IEC
60601-1-1 should be consulted when assembling such a system. Failure to follow
these instructions could cause interference with nearby medical equipment.
Electromagnetic compatibility
The FP35 complies with IEC 60601-1-2.
The FP35 generates and uses radio frequency energy. In some cases the FP35
could cause interference with radio or television reception. You can determine if
the FP35 is the source of such interference by turning the unit off and on.
If you are experiencing interference caused by the FP35, you may be able to cor-
rect it by one or more of the following measures:
1. Relocate or reorient the receiving antenna.
2. Increase the distance between the FP35 and the receiver.
3. Connect the FP35 to a different outlet than the receiver.
An Overview of the FP35 15

In some cases radio transmitting devices, such as cellular telephones, may cause
interference to the FP35. In this case try increasing the distance between the
transmitter and the FP35. Failure to follow these instructions could lead to inter-
ference with nearby medical equipment.
Disposal of the FP35 and accessories
The FP35 and some of its accessories contain lead. At the end of its useful life,
please recycle or dispose of the FP35 according to local regulations.
If you are located in the European Union, please report all safety-related con-
cerns to our authorized representative:
Siemens Hearing Instruments Ltd.
Alexandra House
Newton Road
Manor Royal
Crawley
West Sussex RH109TT
ENGLAND
Otherwise, please report all safety related concerns to the Frye factory:
Frye Electronics, Inc.
9826 SW Tigard St.
Tigard, OR 97223
Ph: (503) 620-2722 or (800) 547-8209
Fax: (503) 639-0128
email: support @frye.com
sales@frye.com
Frye Electronics, Inc. is a Registered Firm of British Standards
Institution, and we conform to the ISO 13485 standard.
1.7 Maintenance
We recommend checking the calibration of the FP35 analyzer once a year. See
Appendix C for details. Because of the configuration of the FP35, the micro-
phones should not go out of calibration. If you perform the checks described in
Appendix C and find that the microphones are in need of calibration, contact
your local service representative or Frye Electronics because this could be a sign
that further repairs to your system are needed.
When used in a hospital environment, where such test equipment is commonly
available, periodic current-leakage testing should be done on the power supply
while the FP35 is connected. Testing on a yearly basis is sufficient.
16 FONIX FP35 Hearing Aid Analyzer

1.7.1 Servicing the Instrument
Contact Frye Electronics, Inc., P.O. Box 23391, Tigard, Oregon 97281-3391 for
service. Our toll-free number is 1-800-547-8209. Our regular number is (503)
620-2722, or you may contact your local Frye representative. We are also avail-
able on the internet. Our e-mail address is: service@frye.com, and our web site
is www.frye.com.
Units may be returned to Frye Electronics, Inc., 9826 S.W. Tigard St., Tigard,
Oregon 97223. Please contact the company or your local Frye representative
first, since many problems can be fixed without returning the whole unit. If
something must be returned, a return authorization number (RMA) will be
issued to be attached to all returned materials.
When contacting the factory, please have the serial number of your instrument
on hand. Look for this number on the bottom of the instrument. It will also
be helpful for you to be able to tell us the software version installed on your
machine. Check the Opening Screen for this information.
1.7.2 Cleaning the Instrument
For your safety, disconnect the FP35 power supply from electric power while
cleaning.
Wipe the FP35 case with a slightly moist soft cloth. Use plain water or water
with mild dishwashing detergent. Wipe away any detergent with a clean, moist
cloth, then dry the FP35.
The LCD surface can be easily damaged, so wipe lightly and use a soft, water-
dampened cloth to clean it. Do not allow liquid to enter the LCD opening.
The microphones should be wiped with a dry cloth. Excess moisture may dam-
age the microphone.
The external power supply may be cleaned with a cloth dampened with clean-
ing alcohol. Clean the outside of the enclosure only.
Warning: Do not immerse the power supply in water or a safety hazard could
arise during use. This could cause an electric shock hazard.
Never allow fluid to enter:
• TheLiquidCrystalDisplay(LCD)
• Theelectronicsmodule
• Theelectricalconnectors
• Theexternalpowersupply
Solvents and abrasives will cause permanent damage to the FP35.
An Overview of the FP35 17

18 FONIX FP35 Hearing Aid Analyzer
1.7.3 Warranty
The FONIX FP35 and its accessories are guaranteed to be free of manufactur-
ing defects which would prevent the products from meeting the specifications
(given in Appendix A of this manual) for a period of one year from the date of
purchase.

Chapter 2 19
General Operation
This chapter describes the general operation of the FP35 analyzer, including
basic operation of the keys, screen navigation, default settings, source types, and
printing.
2.1 Operation of Keys
The general operation of the various keys on the FP35 analyzer is described in
this section. This includes a description of the function keys, the arrow keys,
and the Menu, Help, Reset, Exit, Level, Feed, Print, Stop, and Start keys.
2.1.1 Using the Function Keys
There are four basic uses of the function keys:
• Tonavigatefromscreentoscreen
• Totoggleaselection
• Topop-upupaselectionmenu
• Toperformanaction
A short description of the function of a key is always displayed above the key
on the bottom of the FP35 display.
Navigation
In the Opening screen, the function keys are used to navigate the various mea-
surement screens. See Figure 2.1.1A for a flowchart of the available screens on
the FP35 analyzer.
[F2] takes you to one of the real-ear screens: Audiogram Entry, Insertion Gain,
Unaided and Aided, or Real-Ear SPL. Once you are in one of these screens, you
can move to one of the other screens by using the [NEXT] and [BACK] keys.
Audiogram Entry is the default screen, but [F2] will always take you to the last
real-ear screen you entered. These screens are only available when the Real-Ear
Option is ordered.
[F3] takes you to one of the coupler multicurve screens: Coupler Multicurve,
Coupler Target, or Coupler EarSim. You can navigate between these screens
using the [NEXT] and [BACK] keys. Coupler Multicurve is the default screen,
but [F3] will always take you to the last coupler multicruve screen you entered.
Coupler Target and Coupler EarSim are only available with the Real-Ear Option.
[F4] and [F5] are used to take you to an automated test sequence screen. The
four available automated test sequences on the FP35 analyzer are: ANSI 96,
ACIC, IEC, JIS, and ISI. Only the automated test sequences that you have
ordered will be available.
20 FONIX FP35 Hearing Aid Analyzer
Note: To exit from any screen, press the [EXIT] key.
Audiogram
Entry
Real-Ear
SPL
Unaided
& Aided
Insertion
Gain
OPENING
SCREEN
Coupler
Multicurve
Coupler
Target
Coupler
EarSim
F2 F3 F4/F5
ANSI
IEC
JIS
ISI
Figure 2.1.1A—Flowchart of the FP35 screens
Toggle
Pressing a function key in a measurement screen will usually toggle a selection.
For instance, pressing [F2] in the Coupler Multicurve screen will toggle through
the various curves.
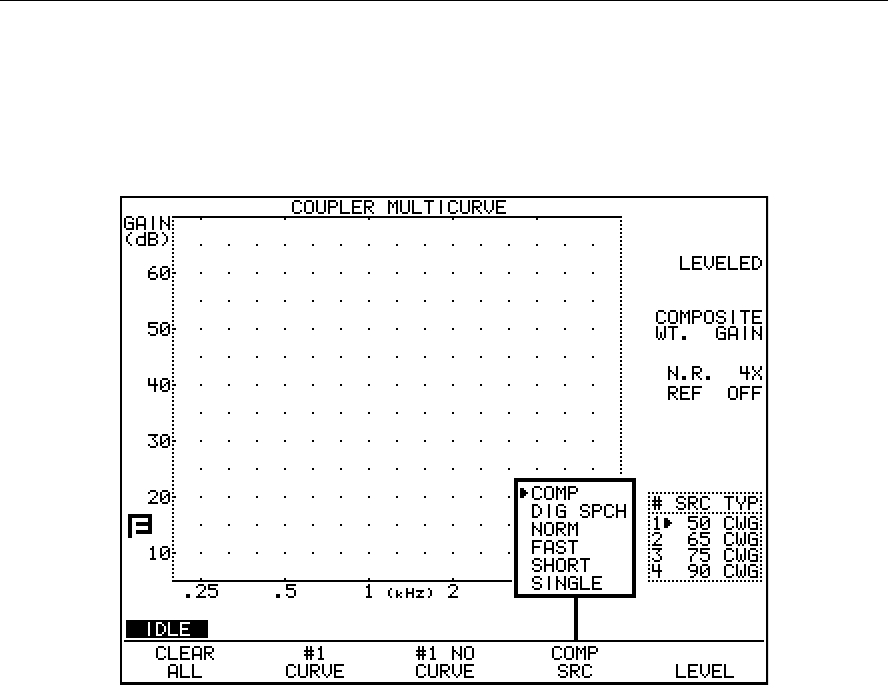
Pop-up Menu
In some cases, a particular function key will have several different available
settings. For example, in the Coupler Multicurve screen, [F4] selects the source
type for a frequency measurement. You can either push the function key repeat-
edly until the desired setting appears, or you can push and hold the key down
for half a second to pop up a function key balloon menu.
A function key balloon menu is a listing of all available selections for that key.
Choose the desired selection with [q p]. When satisfied, press [START/STOP]
or push and hold the function key for half a second again. Figure 2.1.1B shows
an example of a Function Key Balloon Menu.
General Operation 21
Action
Sometimes function keys perform an action. For instance, in most measurement
screens, [F5] levels the sound chamber. By looking at the label of the function
key, you should be able to determine the action of the function key.
Figure 2.1.1B—Function key balloon menu
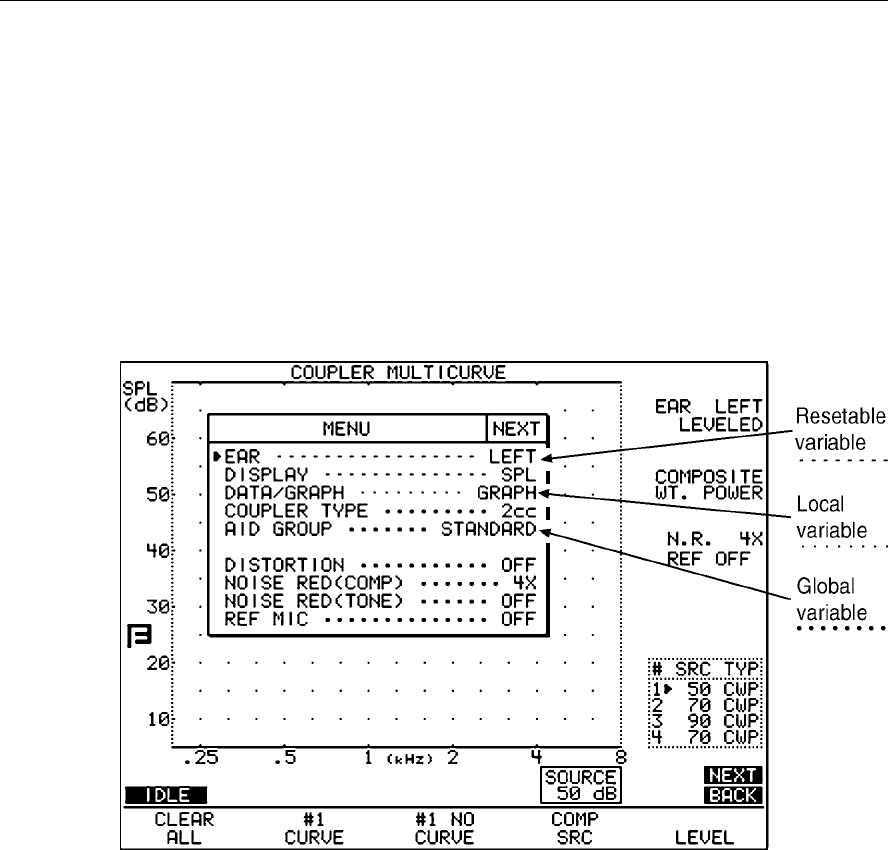
2.1.2 Using the Local Menus
Each screen contains a local menu that is displayed when you press the
[MENU] key. The local menu, overlaid on the current screen, contains only set-
tings that pertain to that screen. See Figure 2.1.2. For example, the local menu
of a real-ear measurement screen will contain a selection for OUTPUT LIMIT.
This setting does not pertain to coupler measurements, so you won’t find that
particular item in the local menu of a coupler screen.
In order for the FP35 to be highly configurable for the advanced user, yet easy to
operate for the user, we divided the local menus into several different sections.
In most cases these are: the menu, the advanced menu, and the custom menu.
When the [MENU] key is first pressed (in a screen other than the Opening
screen), the basic local menu is displayed. This basic menu contains the selec-
tions most important to the displayed screen. Advanced users can open the
advanced and custom menus by using the [NEXT] and [BACK] keys.
22 FONIX FP35 Hearing Aid Analyzer
There are three different types of menu items: local variables that are only
active within the current screen, global variables that are available in all screens
that use it, and resetable variables that change to a default value when [RESET]
is pressed or the unit is first turned on. Resetable variables can be local or
global. Most global and resetable variables are available in the Default Settings
menu. Local variables are not available in the Default Settings screen.
You can always tell what type a variable is by looking at the dash sequence next
to it in one of the menus. Local variables use a series of small dots. Global vari-
ables use a series of large dots. Resetable variables use a series of short dashes.
See Figure 2.1.2.
Figure 2.1.2—Local menu of the Coupler Multicurve screen
Details on the behavior of menu items:
Local variables are not available in the Default Settings menu. When the analyz-
er is first powered on, local variables are set to a factory defined default setting,
but they are not normally changed back to the default setting when [RESET] is
pressed. (There are some exceptions.)
When you change a resetable variable in the Default Settings menu, it will
impact that variable in all local menus where it is available. However, chang-
ing a resetable variable in a local menu will not change its value in the Default
Settings menu. When [RESET] is pressed, the local menu variable will revert
back to the value defined in the Default Settings menu.
General Operation 23
Changing a global variable will change its value in all screens where it is avail-
able, including the Default Settings menu.
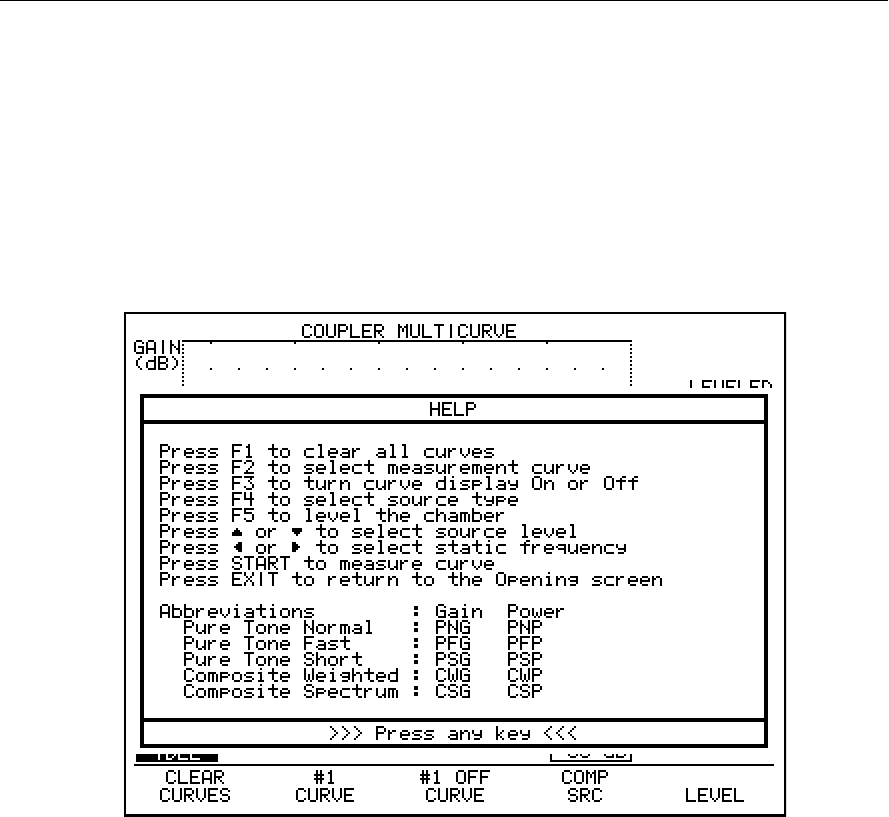
2.1.3 Using the Help Menus
Each screen of the FP35 analyzer contains a pop-up help feature to aid you if
you ever get stuck. If you find yourself uncertain of your next step, press the
[HELP] key. A pop-up window (Figure 2.1.3) will appear that lists the active
keys and explains what they will do from your current screen.
Figure 2.1.3—Pop-up Help Screen
2.1.4 Using the [EXIT] and [RESET] keys
The [EXIT] and [RESET] keys can be used to exit from any screen, menu, or
window.
The [RESET] key resets the analyzer and returns you to the Opening screen.
Caution: Many settings, measurements, and test conditions are erased or
returned to their default conditions with the push of this key. Use [EXIT]
instead of [RESET] to avoid the loss of data.
The [EXIT] key will close a pop-up window or local menu. When all such
windows and menus are closed, the [EXIT] key will exit you from the current
screen, leaving all settings, measurements, and test conditions as is.
24 FONIX FP35 Hearing Aid Analyzer
2.2 Opening Screen
The Opening Screen of the FP35 hearing aid analyzer is the starting point and
the returning point for all operations. To switch between coupler measurements,
real-ear measurements, and the automated test sequences, you always do it
through the Opening Screen. It is also the only screen from which the Default
Settings Menu is accessible.
2.2.1 Entering the Opening Screen
You can reach the Opening Screen by turning the FP35 on (plug it in or press
the [OPERATE] key if it is powered down), by pressing the [RESET] key, or by
repeatedly pressing [EXIT] from any other screen on the analyzer.
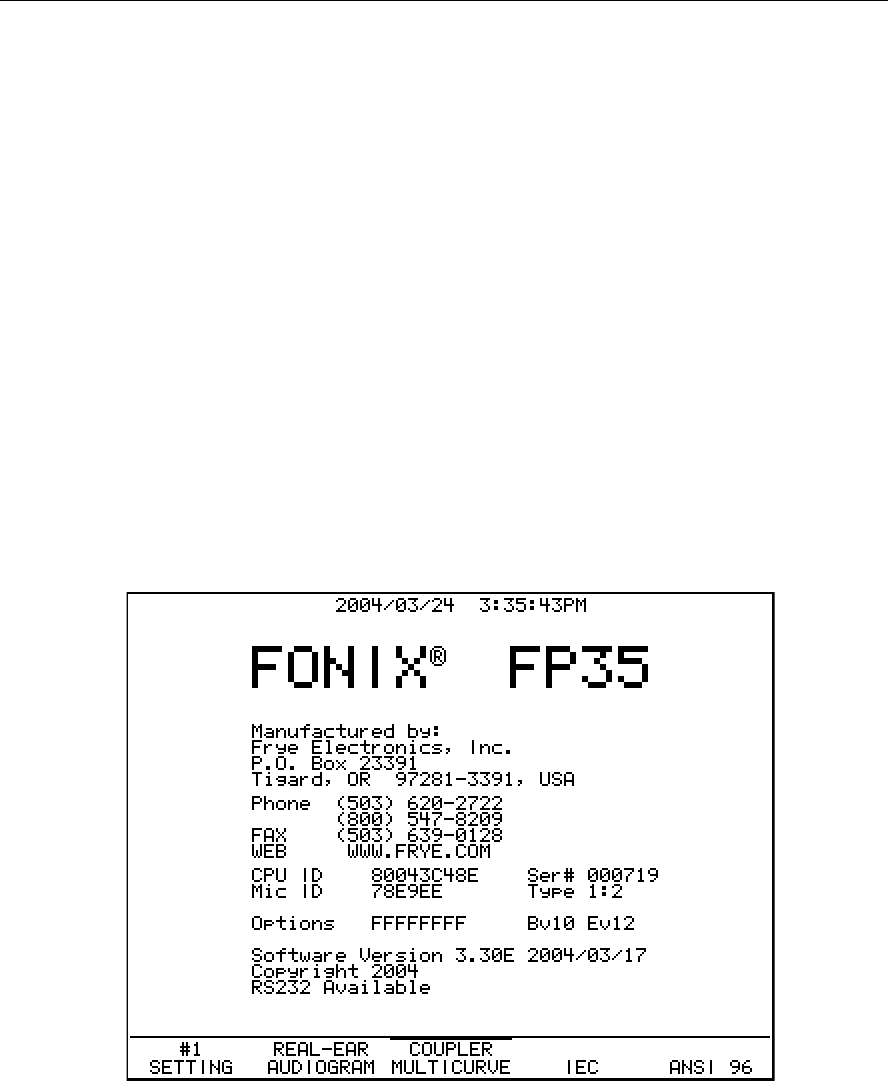
2.2.2 Opening Screen Display
The Opening Screen displays the Frye Electronics logo, the factory mailing (not
shipping) address, the factory phone number, the software version currently
being used by the FP35, the instrument’s ID number, the microphone’s ID num-
ber, and the option code. See Figure 2.2.2. A thick line above one of the func-
tion keys indicates that was the last screen exited.
Figure 2.2.2 –Opening Screen
General Operation 25
2.2.3 Switching Between Settings
The FP35 analyzer lets you save up to three different sets of default settings.
You may want to set up your analyzer in different ways for testing analog hear-
ing aids versus digital hearing aids. Or you may have multiple users, each with
his own default settings preferences. See Section 2.3.1 for details on saving
default settings setups.
[F1] in the Opening Screen is normally used for switching between different set-
ups. Push [F1] to switch between SETTING 1, SETTING 2, or SETTING 3. See
Section 2.3.2 for more information on how the [F1] key can be used.
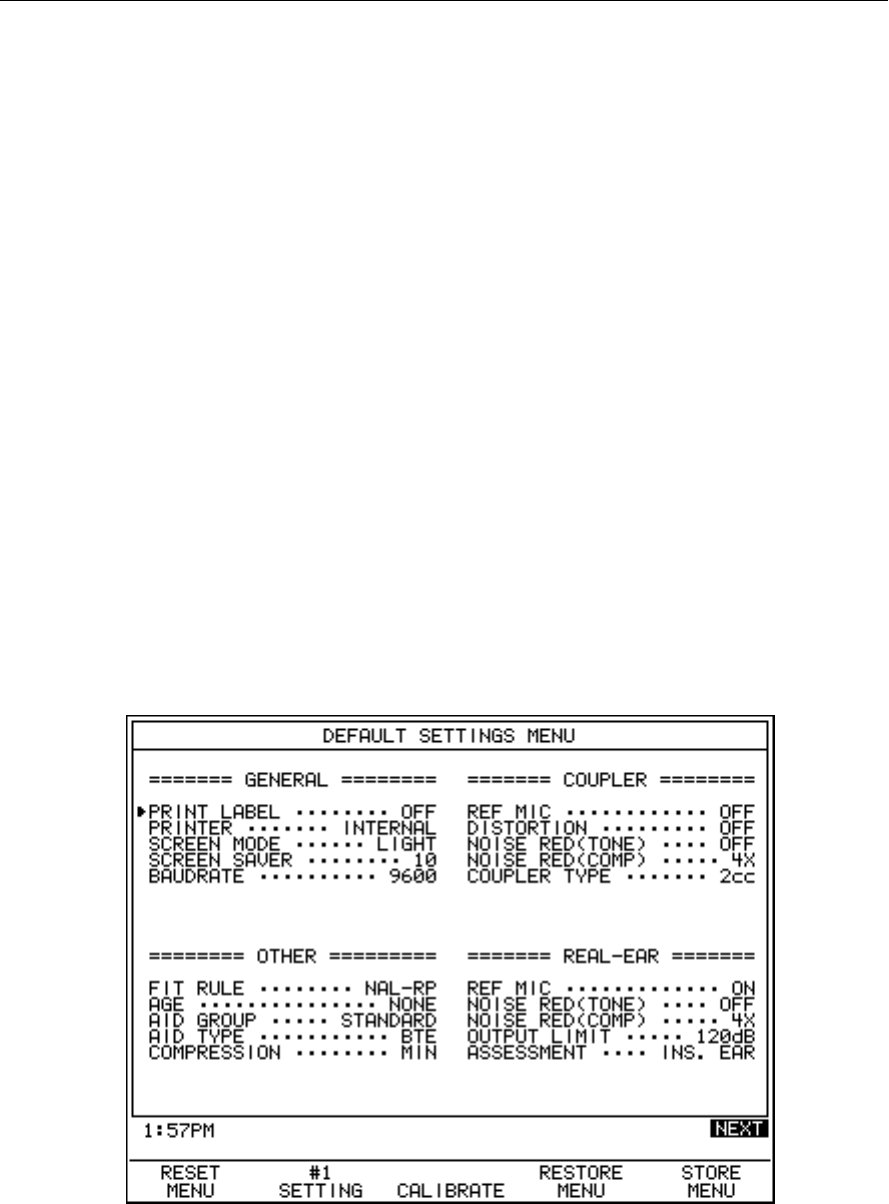
2.3 The Default Settings Menu
The Default Settings menu contains all the choices that you can adjust and save
as defaults. See Figure 2.3. This allows you to program your FP35 hearing aid
analyzer so that when you turn it on, your favorite settings are already selected.
A default setting can always be overridden by making an adjustment in a local
menu.
Just like the local menus, the Default Settings menu is divided into three parts—
the main menu, an advanced menu, and a resets menu. The main menu con-
tains basic settings that users will most likely want to adjust to fit their needs.
The advanced menu contains settings that advanced users may care to adjust.
The resets menu contains the default amplitudes and delay times for source sig-
nals.
Figure 2.3—Default Settings

26 FONIX FP35 Hearing Aid Analyzer
2.3.1 Customizing Your Instrument Default Settings
All of the settings available in the Main, Advanced, and Resets Default Settings
menus can be saved to the FP35 analyzer’s power-on default condition. In rec-
ognition that the FP35 might be used by several different users who prefer dif-
ferent default settings, three different sets of defaults can be stored to SETTING
1, SETTING 2, and SETTING 3, respectively.
To store the default settings:
1. Press [MENU] from the Opening screen to open the Default Settings menu.
2. Use [F2] to select the desired user number.
3. Set up the Default Settings menu as you like it. See Sections 2.3.5, 2.3.6 and
2.3.7 for an explanation of the different available settings.
4. Press [F5] to store the menu.
5. Press [START] to complete the action and store the new defaults. Pressing
any other key will cancel the action.
To change the setting number:
Use [F2] in the Default Settings menu to change the setting number. This
switches the FP35 to the default settings programmed with that setting number.
To save new default settings to this setting number, follow the instructions out-
lined above.
To quickly switch between the default setting programs without entering the
Default Settings menu, you can change the setting number in the Opening
screen using the [F1] key.
To reset default settings:
• Press[F1]toreturnallthesettingsintheDefaultSettingsmenutotheir
factory default condition.
• Press[F4]toreturnallthesettingstothedefaultconditionspecifiedfor
the selected setting number.
2.3.2 Switching between Easy and Advanced User Levels
The FP35 analyzer has “Easy” and “Advanced” user levels. When in Easy Mode,
the measurement screens have a cleaner look with less information about the
test conditions. The more advanced menu items have also been eliminated in
Easy Mode.
To switch between user modes:
1. Press [MENU] in the Opening screen to open the Default Settings menu.
2. Press [NEXT] to go to the Advanced Default Settings menu.
3. Use the [, ] keys to select USER LEVEL
4. Use [, ] to choose either EASY or ADVANCED.
5. Press [F5] and [START] to save the new setting as default.
6. Press [EXIT] to close the Default Settings menu and return to the Opening screen.

General Operation 27
2.3.3 Changing the use of [F1] in the Opening screen
By default, [F1] is used in the Opening screen to switch between default set-
tings (as described in Section 2.3.1). However, if you do not need different sets
of default settings, you can use it as a shortcut to any real-ear or coupler screen.
Unlike [F2] and [F3], whose functions change depending upon the last real-ear
or coupler multicurve screen you entered, the function of [F1] will remain con-
stant. This ability is only available if you have the Real-Ear Option.
To change the function of [F1] in the Opening screen:
1. Press [MENU] from the Opening screen to enter the Default Settings menu.
2. Press [NEXT] to enter the Advanced Default Settings menu.
3. Select the F1 KEY with [, ].
4. Use [, ] to select one of the following: USER SETTING, CP
MULTICURVE (Coupler Multicurve), CP TARGET (Coupler Target), CP
EARSIM (Coupler EarSim), AUDIOGRAM (Audiogram Entry), SPL (Real-Ear
SPL), GAIN (Real-Ear Aided & Unaided), and INS. GAIN (Real-Ear Insertion
Gain). The USER SETTING selection programs [F1] to choose between the
different user settings. Choosing one of the other options instead programs it
to be used as a shortcut key to a particular screen.
5. Press [EXIT] to return to the Opening screen.
2.3.4 Setting the date and time
The FP35 contains a lithium battery-powered clock chip to keep track of the
time and date.
To change the settings of the clock:
1. Press [MENU] from the Opening screen to enter the Default Settings menu.
2. Press [F3]—CALIBRATE
3. Press [F2]—SET TIME.
4. Use the [, ] keys to choose the time unit you would like to change. The
XM choice selects between AM, PM, and 24 hour format.
5. Use the [, ] keys to adjust the setting.
6. Press [EXIT] to leave the Time Setup Screen. Your changes will automati-
cally be stored.
2.3.5 Changing the external monitor colors
When the FP35 analyzer is connected to an external monitor, you can change
the colors it uses. Although most color computer monitors can be used with
the FP35 analyzer, only two colors can actually be displayed on the external
display: the foreground color and the background color. These colors can be
changed in the Main Default Settings screen with the VIDEO FOREGND and
VIDEO BACKGND settings. These settings are only available when the FP35
analyzer has the external monitor option hardware installed.

28 FONIX FP35 Hearing Aid Analyzer
The following 15 colors are available in each selection: BLACK, BLUE, GREEN,
CYAN, RED, MAGENTA, YELLOW, GRAY, L BLUE, L GREEN, L CYAN, L RED,
L MAGENTA, L YELLOW, WHITE. You cannot set both the VIDEO FOREGND
and VIDEO BACKGND selections to be the same color except for BLACK and
WHITE.
If BLACK is selected as both the FOREGND and the BACKGND colors, both
selections will change to DEFAULT display mode, which will follow the FP35
LCD display settings. That is, if the LCD display is set to LIGHT, both screens
will show black text on a white background. If the LCD display is set to DARK,
both screens will show white text on black background.
If WHITE is selected as both the FOREGND and the BACKGND colors, both
selections will change to INVERT display mode, which will invert the FP35 LCD
display settings. That is, if the LCD display is set to LIGHT, the external dis-
play will use white text on a black background, and if the LCD display is set to
DARK, the external display will use black text on a white background.
2.3.6 Explaining the Settings in the Main Default Settings Menu
When you first press [MENU] from the Opening screen, you will enter the Main
Default Settings menu, containing the most basic of the possible default set-
tings. Here is an explanation of the purpose of each of these settings:
General:
PRINT LABEL—Status of the printing label. Choose ON or OFF. See Section
2.6.2 for details.
PRINTER—Printer used for printouts. Choose INTERNAL to use the built-in
thermal printer. Choose EXTERNAL to use an attached laser or ink-jet printer.
SCREEN MODE—Background color of the LCD screen. Choose between LIGHT
and DARK.
SCREEN SAVER—Minutes of inactivity before the LCD display will go dark.
Choose from 10, 15, 30, 60, 90 and 120. A choice of OFF will deactivate the
screensaver.
VIDEO FOREGND—Color of the text on an externally connected monitor. This
setting is only available when the external monitor option is installed.
VIDEO BACKGND—Color of the background on an externally connected moni-
tor. This setting is only available when the external monitor option is installed.
BAUDRATE—The speed at which the FP35 communicates with a computer. The
choices are 9600, 19200 38400 and 57600.
Other:
FIT RULE—The fitting rule used for real-ear and target coupler measurements.
Choose from NAL-RP, POGO, BERGER, 1/3 GAIN, 1/2 GAIN, 2/3 GAIN, DSL
LIN, DSL WDRC, NAL-NL1 and DIRECT (direct entry). Available with Real-Ear
Option only.

General Operation 29
AGE—The age of the patient. This is used for creating real-ear and coupler tar-
gets. Available with Real-Ear Option only.
AID GROUP—Type of hearing aid being tested. Choose STANDARD, AGC or
ADAPTIVE (for adaptive AGC circuits). This selection sets the various delay
times used in pure-tone tests so that they are appropriate to the aid’s circuitry.
See Section 2.4 for more information on delay times.
AID TYPE—Style of hearing aid being tested, used for creating coupler targets.
Choose from BTE, ITE, ITC, CIC and NONE. Available with the Real-Ear Option
only.
COMPRESSION—Compression kneepoint, used for creating real-ear and coupler
targets. Selections are available in 1 dB steps, from MIN (the widest available
compression) to 69 dB SPL. Available with the Real-Ear Option only.
TARGET REF—Aided curve used to generate the real-ear target. In the real-ear
mode, the target is generated using the settings of one of the three available
aided measurement curves. Select a curve number to always use a particular
curve when generating the target. Choose AUTO to always use the current
selected curve when generating the target.
Coupler:
REF MIC—Status of the reference microphone during coupler measurements.
See Section 3.8.3 for more details.
DISTORTION—Type of distortion measured when performing a pure-tone mea-
surement. Choices are 2ND, 3RD and TOTAL (2ND and 3RD) or OFF.
NOISE RED (TONE)—The amount of noise reduction used for pure-tone coupler
measurements. See Section 2.5.1.3 for more information.
NOISE RED (COMP)—The amount of noise reduction used for Composite and
Digital Speech coupler measurements. See Section 2.5.2.3 for more information.
COUPLER TYPE—The type of coupler being used in making sound chamber
measurements. Selections of CIC and MZ turn on corresponding software cor-
rection factors (see Sections 3.6 and 3.7). A selection of 2CC labels the curve
with the coupler type but doesn’t use any software corrections. A selection of
NONE neither labels nor applies correction factors to the curve. This selection
is only available when the CIC or OES Options are ordered.
TELECOIL—Status of coupler telecoil measurements. OFF disables telecoil mea-
surements in the coupler measurement screen. TMFS EAR enables the use of a
connected Telewand in coupler measurements through the earphone jack. TMFS
SPKR enables the use of the Telewand through the speaker jack (new style, rear
panel only). TCOIL EAR enables the use of a connected external telecoil board
and/or Telewand for coupler measurements through the earphone jack. TCOIL
SPKR enables the telecoil measurements through the speaker jack (new style,
rear panel only). See Section 2.5.8 for more details.

30 FONIX FP35 Hearing Aid Analyzer
Real-Ear (only available with the Real-Ear Option)
REF MIC—Status of the reference microphone during real-ear measurements.
NOISE RED (TONE)—The amount of noise reduction used in pure-tone real-ear
measurements. See Section 2.5.1.3.
NOISE RED (COMP)—The amount of noise reduction used in Composite or
Digital Speech real-ear measurements. See Section 2.5.2.3 for more information.
OUTPUT LIMIT— The maximum dB SPL value that the analyzer will allow
when taking real-ear measurements. When this value is exceeded, the measure-
ment will automatically stop and the source will turn off in order to protect the
patient.
ASSESSMENT—The transducer used to take RECD/REDD and audiometric mea-
surements.
TELECOIL—Status of the real-ear telecoil measurements. OFF disables telecoil
measurements in the real-ear measurement screens. TMFS EAR enables the use
of a Telewand connected through the earphone jack. TMFS SPKR enables the
Telewand through the speaker jack (new rear panel only). There is no support
for the external telecoil board in real-ear measurements. See Section 2.5.8 for
more details.
VISIBLE SPEECH—Display used when the FP35 analyzer is in Spectrum
Analysis mode (requires Composite/Digital Speech Option). BARS displays a
set of vertical bars representing the maximum peaks of the measurements that
reach above the lower limits of the speech banana. AVERAGE displays a long
term average of the response using a peak decay method.
2.3.7 Explaining the Settings in the Advanced Menu
The Advanced Default Settings menu contains items that may be useful to some
advanced users. To reach it, press [MENU] from the Opening screen and then
push [NEXT]. The [BACK] key will return you to the Main Default Settings
menu.
General:
F1 KEY—Operation of the F1 quick key in the Opening screen. Choose from
USER SETTING, CP MULTICURVE (Coupler Multicurve), CP TARGET (Coupler
Target), CP EARSIM (Coupler EarSim), AUDIOGRAM (Audiogram Entry), SPL
(Real-Ear SPL), GAIN (Real-Ear Aided & Unaided) and INS. GAIN (Real-Ear
Insertion Gain). Available only with Real-Ear Option. See Section 2.3.2 for
details.
F2 KEY—Operation of the F2 key in the Opening screen. Choose from none
(no selection), AUDIOGRAM (Audiogram Entry), SPL (Real-Ear SPL), GAIN
(Real-Ear Aided & Unaided) and INS. GAIN (Real-Ear Insertion Gain). Available
only with Real-Ear Option.

General Operation 31
F3 KEY—Operation of the F3 key in the Opening screen. Choose from
MULTICURVE (Coupler Multicurve), TARGET (Coupler Target) and EARSIM
(Coupler EarSim). TARGET and EARSIM are only available with the Real-Ear
Option.
F4 & F5 KEY—Operation of the F4 and F5 keys in the Opening screen. These set-
tings will appear only if you have more than two automated test sequences on
your analyzer. These are the available choices: ANSI 96, IEC, JIS and ACIC (ANSI
96 with CIC correction factors).
USER LEVEL—User level affects screen layout and menu selections. Choose from
EASY and ADVANCED. See Section 2.3.2.
Resets:
AUTO-SCALE—Type of scaling used when taking measurements. Choosing ON
scales the graph to the selected curve. Choosing OFF scales the graph to the high-
est curve displayed.
REFERENCE STATUS—The status of the RMS measurement of the reference
microphone. A selection of RMS measures the overall RMS of the reference
microphone. A selection of FULL measures the overall RMS and the signal quality
of the reference microphone. A selection of NONE turns off these measurements.
See Section 2.5.4.
AVG FREQS— The frequencies used for averaging in pure-tone measurements.
The last frequency of the three-frequency pair is used as the selection. See Section
2.5.1.5 for a full list of the available frequencies.
EAR—The ear meant for the hearing aid being tested. Choose LEFT, RIGHT, or
NONE. The NONE selection doesn’t label the ear.
FREQ—The default frequency of the single tone measurement.
EQ INPUT NOISE—Type of equivalent input noise (EIS) included in the ANSI test.
NORMAL sets the EIN to use the entire 200-8000 Hz frequency band. A selection
of 5 KHz sets the frequency band to 200-5000 Hz (recommended), and a selection
of OFF skips the EIN entirely
Coupler:
DISPLAY—The type of display used in the Coupler Multicurve and Coupler Target
screens. Choose between GAIN and SPL.
RESET SRC—The default source used in the Coupler Multicurve and Coupler
Target screens.
LEVELING SOURCE—The amplitude used for leveling the sound chamber. This is
useful if you need to level with the chamber door open, and you don’t want to use
the loud default level of 90 dB SPL. Choose between 60 and 100 dB SPL.
LEVELING AUTO CLEAR—Behavior of sound chamber leveling. When set to ON,
currently displayed curves are automatically deleted when leveling the sound
chamber. When set to OFF, currently displayed curves are unaffected by leveling.

32 FONIX FP35 Hearing Aid Analyzer
OUTPUT LIMIT—The maximum dB SPL value that the analyzer will allow
when taking coupler measurements. When this value is exceeded, the measure-
ment will automatically stop and the source will turn off.
SPEAKER—Selected source device. Choose INTERNAL to present your signals
through the source connected to the internal speaker jack, EXTERNAL to pres-
ent your signals through the source connected to the external speaker jack, or
AUTO to use the internal jack for coupler tests and the external jack for real-ear
tests.
OUTPUT JACK— Status of the external source devices in the coupler screens.
SPEAKER enables only the speaker jack. MONO EAR enables only the left chan-
nel of the earphone jack. STEREO EAR enables both channels of the earphone
jack. ALL ON enables the speaker jack and both channels of the earphone jacks.
See Section 2.5.5 for details.
Real-Ear (only available with Real-Ear Option):
RESET SRC—The default source used in the real-ear measurement screens.
RESET SMOOTHING—Type of smoothing used for real-ear measurements.
Choose ON or LOG. Smoothing rounds off a curve, removing minor peaks.
DEFAULT UNAIDED—The type of unaided measurement used by default.
Choose from CUSTOM, which requires the unaided response to be measured
for each patient, AVG, which uses the KEMAR unaided response, and AUTO,
which sets the unaided response to custom in the insertion gain screens and
average in the SPL screen.
LEVELING AUTO CLEAR—Behavior of real-ear leveling. When set to ON, cur-
rently displayed curves are automatically deleted when leveling the sound field.
When set to OFF, currently displayed curves are unaffected by leveling.
SPEAKER—Selected source device. Choose INTERNAL to present your signals
through the source connected to the internal speaker jack, EXTERNAL to pres-
ent your signals through the source connected to the external speaker jack, or
AUTO to use the internal jack for coupler tests and the external jack for real-ear
tests.
OUTPUT JACK—Status of the external source devices in the real-ear screens.
SPEAKER enables only the speaker jack. MONO EAR enables only the left chan-
nel of the earphone jack. STEREO EAR enables both channels of the earphone
jack. ALL ON enables the speaker jack and both channels of the earphone jacks.
See Section 2.5.5 for details.
AUTO DURATION—Length of time used by the Real-Ear Auto Test. All settings
are in seconds. Available selections are: 0.5, 1.0, 2.0, 5.0, 10.0.
AUTO TEST—Status of the Real-ear Auto Test. See Section 5.4.3 for details.

General Operation 33
2.3.8 Explaining the Settings in the Resets Default Settings Menu
The Resets Default Settings lets you set up your own default source levels. To
reach it, press [MENU] from the Opening screen and then push [NEXT] twice.
Coupler:
CRV #1-4 SRC LEVEL: Set the default source level for curves 1-4 in the Coupler
Multicurve, Coupler Target and Coupler EarSim screens.
STD/AGC/ADAPT PREDELAY/SETTLE: Set the default delays for each aid type
and delay type displayed.
MIC PORT: Choose the microphone used for coupler measurements. Select
AUTO, INTERNAL, EXTERNAL or EXT LINE. See Section 2.5.9 for details.
EXTERNAL VOLUME: Adjust the volume of the external line-in input used in
the Coupler Multicurve, Coupler EarSim, and Coupler Target screens. Choices
range from -30 to +10 dB. A selection of DIRECT removes the ability to adjust
the volume on the FP35, but is recommended since such volume adjustments
are very crude and should be made on the external player when possible. See
Section 3.8.9 for more information.
Real-Ear:
CRV #1-4 SRC LEVEL: Set the default source levels for the AIDED 1, 2, 3 and
UNAIDED curves, respectively, in the real-ear measurement screens.
STD/AGC/ADAPT PREDELAY/SETTLE: Set the default delays for each aid type
and delay type displayed.
MIC PORT: Choose the microphone used for Real-ear measurements. Select
AUTO, INTERNAL, EXTERNAL or EXT LINE. See Section 2.5.9 for details.
EXTERNAL VOLUME: Adjust the volume of the external line-in input used in
the real-ear measurement screens. Choices range from -30 to +10 dB. A selec-
tion of DIRECT removes the ability to adjust the volume on the FP35, but is rec-
ommended since such volume adjustments are very crude and should be made
on the external player when possible. See Section 5.6.1 for more information.
2.4 Aid Types and Delay Times
The AID GROUP setting automatically changes the delays used in most mea-
surements. These delays give the hearing aid time to adjust to the test signal
before a measurement is taken. Without adequate delays built into the test, mea-
surements can be inaccurate.
When the AID GROUP is set to STANDARD, minimal delays are used with
each test. When the AID GROUP is set to AGC, the delay timings are increased.
The ADAPTIVE setting uses longer delays than the AGC. The AID GROUP set-
ting is available in the local menu of each measurement screen.

34 FONIX FP35 Hearing Aid Analyzer
When the USER LEVEL setting is set to ADVANCED (see Section 2.3.2), the
user can further fine tune the delays used in each test. There are three different
delay settings. They are located in the advanced menu of each screen (the USER
LEVEL setting must be set to ADVANCED).
• ThePREDELAY time is the amount of time the FP35 analyzer presents
the first tone in a test. The tests that the predelay setting affects are fre-
quency sweeps, FOG measurements in the automated test sequences, ref-
erence test gain measurements (automated test sequences), harmonic and
intermodulation distortion measurements, and equivalent input noise
measurements.
• TheSHORT SETTLE time is the amount of time each frequency in a
pure-tone sweep is presented before a measurement is made, and the
additional delay to the “on” time in a digital speech signal. It is also used
in intermodulation distortion sweeps.
• TheLONG SETTLE time is the amount of time each frequency in an
input/output sweep is presented before a measurement is made. It also
sets the delay between the individual frequencies of three-frequency
averages and distortion measurements.
The default delay times are as follows:
Standard PREDELAY: 100 ms
SHORT SETTLE: 0 ms
LONG SETTLE: 0 ms
AGC PREDELAY: 500 ms
SHORT SETTLE: 50 ms
LONG SETTLE: 100 ms
Adaptive PREDELAY: 3000 ms
SHORT SETTLE: 100 ms
LONG SETTLE: 250 ms
When you are testing an adaptive AGC aid, any test using the three frequency
average defined in AVG FREQS (full-on gain, reference test gain, distortion
measurement) is actually taken four times. In order to give the aid a chance to
settle, the first three measurements are discarded. The fourth measurement is
what appears on the screen as the final measurement.
2.5 Source Types & Measurements
The FP35 analyzer comes standard with the following pure-tone signals:
• NORM—A detailed frequency response curve that gives you information
on the amplification of 43 different frequencies between 200 and 8000 Hz.
• FAST—A continuous pure-tone sweep that updates as quickly as once a
second. It takes measurements at 16 different frequencies between 200
and 8000 Hz.

General Operation 35
• SHORT—A single pure-tone sweep of 10 different frequencies. It takes
about a second to complete.
• SINGLE—A single pure-tone frequency, or a continuous three frequency
average selected in the Advanced Menu.
• LONG—A frequency response curve that measures 64 different fre-
quencies, containing more information (and taking longer) than the
standard NORM sweep.
• COMP—A continuous real-time, speech-weighted signal made up of 79
different frequencies that update up to 5 times a second. The composite
signal gives you the advantage of seeing how an aid behaves to noise that
more closely simulates speech, and it lets you see immediately how the
aid responds to any change in the amplitude of the signal.
• DIG SPCH—A randomly interrupted composite signal designed to mimic
speech. This signal is for use with hearing aids with a “noise reduction”
or “speech enhancing” feature that lowers the gain of the aid in the pres-
ence of a continuous signal (such as the regular composite signal). See
Appendix F for more details.
2.5.1 Understanding Pure-Tone Signals
The different adjustments and measurements that you can make with pure-tone
signals are described in this section, including a discussion of the delay set-
tings, harmonic distortion, noise reduction, and warble rates.
2.5.1.1 Delay Settings
You can refine your pure-tone measurements by adjusting their delay times.
These adjustments are provided because some hearing aid circuits take a longer
time than others to adjust to changes in amplitude or frequency. If the measure-
ment is made too quickly, a testing artifact can result. If the measurement takes
too long, the test is longer than necessary.
In determining the length of time needed for a proper measurement, a good rule
is to use twice the published attack time of the hearing aid. If you are unsure
of the attack time, you can experiment with longer times and shorter times and
see if there is any difference in the test results. Linear aids can be tested very
quickly, so a delay of 20 msec is usually fine. Other aids are quite variable. See
Section 2.4 for a description of the available delay settings.
2.5.1.2 Harmonic Distortion
Harmonic distortion occurs when a hearing aid clips the peak of a pure-tone
input signal, resulting in artifacts at harmonics (integer multiples) of that input
signal. For example, if you present a 500 Hz tone to the hearing aid, distortion
artifacts could occur at 1000 Hz and 1500 Hz.
The harmonic distortion measurement is expressed as the percentage of the
power of these distortion artifacts to the power of the input signal. All hearing
aids will have some amount of distortion.

36 FONIX FP35 Hearing Aid Analyzer
Usually, the strongest artifacts occur at the second and third harmonics of the
frequency. With the FP35 analyzer, you can test the amount of distortion avail-
able in the second harmonics, the third harmonics, or both harmonics (consid-
ered “total harmonic distortion”).
In general, you should ignore the harmonic distortion measurement when the
amplitude of the response curve measurement at the second harmonic is more
than 12 dB greater than the amplitude at the first harmonic. This is called the
12 dB rule and is part of the ANSI S3.22 standard.
Historically, the harmonic distortion measurement has been taken only at sig-
nal levels below 90 dB SPL. This is because it was assumed that most hearing
aids went into saturation at that loud of a level, resulting in very high harmonic
distortion measurements. For this reason, we introduced a “90 dB harmonic dis-
tortion” rule on our analyzers that automatically turned off harmonic distortion
measurements with signals that are 90 dB SPL or higher. On the FP35 analyzer,
this was implemented as the DIST 90 DB RULE setting in the Custom menu of
the Coupler Multicurve and real-ear measurement screens. (The USER LEVEL
must be set to ADVANCED. See Section 2.3.2.) In recent years, however, hear-
ing aids have become more sophisticated and better able to handle loud signals,
making harmonic distortion a more useful measurement at 90 dB SPL. The
DIST 90 dB RULE is still available, but we have turned it OFF by default.
Definitions
• 2NDHarmonic:Energyofthesecondharmonicortwicethepresentedfre-
quency.
• 3RDHarmonic:Energyofthethirdharmonicorthreetimesthepresented
frequency.
• TOTAL:Combined2NDand3RDharmonicdistortion.
2.5.1.3 Noise Reduction
Noise reduction is used in noisy testing environments. Pure-tone noise reduc-
tion takes several measurements at each frequency and averages those measure-
ments together. Larger noise reduction numbers lead to smoother curves but
increase the amount of time it takes to complete a pure-tone sweep.
For example, if you select “4” as the pure-tone noise reduction setting, 172 mea-
surements (43 x 4) will be taken with every normal pure-tone sweep
2.5.1.4 Warble Rates
When you take pure-tone measurements in a sound field environment, it is use-
ful to warble the tones to reduce standing wave effects and create more accurate
measurements. (Warbling is not usually necessary in a sound chamber testing
environment.)

General Operation 37
The FP35 analyzer allows you to change the warbling rate of its pure-tone sig-
nals. You do this by altering the WARBLE SOURCE selection in the Custom
Menu of the Coupler Multicurve Screen and the Real-Ear Measurement Screens.
The USER LEVEL must be set to ADVANCED. See Section 2.3.2.
Some types of warbling can cause problems when used to test digital hearing
aids. This is because the digital processing delay of the aid conflicts with the
warbling timing. We have altered our SLOW warble signal to account for this
problem. This type of warbling is automatically selected during real-ear mea-
surements when the AID TYPE is set to ADAPTIVE in the local menu of the
measurement screen.
Here is an explanation of the available warble selections:
• FAST is usually used in real-ear measurements. In all screens except the
Audiogram Entry Screen, it warbles at a rate of 33 Hz. In the Audiogram
Entry Screen, it warbles at a rate of 20 Hz, ±5% deviation from the cen-
tral frequency.
• SLOWisusedfortestingdigitalhearingaidsandforaudiometricmea-
surements. It warbles at a rate of 6.25 Hz, ±5% deviation.
• OFFturnsoffallpure-tonewarblinginallmeasurements.
• AUTOmakesthefollowingwarblingselections:
- OFF for all sound chamber measurements and real-ear measurements
made with NORMAL or SHORT pure-tone sweeps.
- FAST for real-ear measurements made with either a FAST pure-tone
sweep or SINGLE pure-tone with an AID TYPE of STANDARD or AGC.
- SLOW for real-ear measurements made with either a FAST pure-tone
sweep or SINGLE pure-tone with an AID TYPE of ADAPTIVE.
2.5.1.5 Adjusting the Signal Skew
The SIGNAL SKEW selection, available in the Custom Menu of several mea-
surement screens, is the number of samples from when the source signal leaves
the speaker and when it is measured by the microphone. (The USER LEVEL
must be set to ADVANCED. See Section 2.3.2.)
The amount of time it takes for a sound signal to travel from the speaker,
through the hearing aid (or device being measured), and to the ear or coupler,
where it is measured by the FP35’s microphone, varies naturally depending
upon the distance of the FP35 microphone from the speaker and the amount of
digital processing delay inherent in the hearing aid. This time delay is normally
so small that it does not affect the quality of the hearing aid measurements.
However, some digital hearing aids have a signal processing delay significant
enough to make this amount of time more meaningful.

38 FONIX FP35 Hearing Aid Analyzer
A warbling pure-tone signal, in particular, is dependent upon the FP35’s abil-
ity to synchonize the source signal and the measurement processing. When the
hearing aid adds additional delay through its internal signal processing, it can
throw the FP35’s internal synchonization off. The SIGNAL SKEW menu item
lets you adjust for this delay by specifying the number of samples between the
source emitting the signal and the FP35 processing it. There are 39 uS (micro-
seconds) in each sample for 100 Hz-interval frequency. The SIGNAL SKEW
selection is applied to all source types, but it should only have an effect on
pure-tone measurements.
2.5.1.6 Three-Frequency Averages
Three-frequency averages are usually performed within an automated test
sequences. When the USER LEVEL is set to ADVANCED (see Section 2.3.2), you
can also perform them from within the Coupler Multicurve, Target Coupler, or
any of the real-ear measurement screens. The three frequencies that are used to
perform the average measurements are chosen in a menu selection and repre-
sented by the last frequency of the three-frequency average. Here is a complete
listing of the available averages.
• HFA1000,1600,2500
• SPA1250,2000,3150
• SPA1600,2500,4000
• SPA2000,3150,5000
• SPA800,1250,2000
• IEC500,1000,2000
Choose the three-frequency average that is closest to that recommended by the
manufacturer. When this average is unknown, choose the average that repre-
sents the frequency range that the aid amplifies the most. The default frequen-
cies are HFA 1000, 1600, 2500.
2.5.2 Understanding Composite Signals
There are two types of composite signals: Composite and Digital Speech. The
Composite signal is a continuous broadband signal containing 79 different fre-
quencies presented simultaneously. This signal is “speech weighted,” which
means that the lower frequencies have a higher emphasis than the higher fre-
quencies.
The Composite signal is both a faster and a more realistic signal than a pure-
tone sweep because there is no waiting for a progression of tones to complete,
and, like speech, a broad spectrum of frequencies is used simultaneously. The
Composite signal updates several times a second.
Digital Speech is an interrupted version of the Composite signal used for test-

General Operation 39
ing high end digital hearing aids. Many high end digital aids (though not all) use a
technology called “speech enhancement” or “noise reduction.” These aids respond
to any continuous signal as if it were noise, and lower the gain at the offending
frequencies. Unfortunately, these aids regard the Composite signal or pure-tone
sweeps as noise, making them difficult to test using traditional methods.
Digital Speech was developed as a way to test these high end hearing aids. Instead
of presenting a continuous signal, it presents an interrupted signal that the aid
regards as speech instead of noise.
2.5.2.1 Filter Type
Filters are the type of speech weighting applied to the test signals as they are pre-
sented to the hearing aid. By default, the FP35 analyzer automatically chooses the
appropriate speech weighting to use with a particular type of signal.
For instance, when you use a pure-tone signal, a flat weighting is used. That is,
every frequency of the pure-tone sweep has the same amplitude. When you use
the composite signal, the Frye ANSI speech weighting is used. That is, the low fre-
quencies have higher amplitudes than the higher frequencies.
The FP35 allows you to specifically choose the type of speech weighting you want
to use. You do this by altering the FILTER selection in the Advanced Menu of the
Coupler Multicurve Screen and the Real-Ear Measurement Screens. Here is an
explanation of the available filter selections:
• FLAT—No speech weighting used. All frequencies have the same amplitude.
• ANSI—The standard Frye composite signal weighting which starts 3 dB
down at 900 Hz and continues to roll off the high frequencies at a rate of 6
dB per octave.
• ICRA—The speech weighting taken from the CD of sounds developed by the
International Collegium of Rehabilitative Audiology.
• C-LTASS—The child long term average speech spectrum used by the
University of Western Ontario in their DSL fitting method.
• A-LTASS—The adult long term average speech spectrum used by the
University of Western Ontario in their DSL fitting method.
• ANSI-92—The speech weighting specified in the ANSI S3.22-1992 standard.
It is very similar to the ANSI weighting except that it contains a low fre-
quency filter at 200 Hz.
When AUTO is selected, the following filters are automatically applied:
Coupler Multicurve Screen:
• FLATwithpure-tonesignal
• ANSIwithComposite/DigitalSpeechsignal

40 FONIX FP35 Hearing Aid Analyzer
Real-Ear SPL Screen:
• FLATwithpure-tonesignalabove85dBSPL
• ANSIwithnon-DSLfittingrule(allothersignaltypes)
• A-LTASSwithDSLfittingruleforadults(allothersignaltypes)
• C-LTASS with DSL fitting rule for children (all other signal types)
Real-Ear Unaided & Aided Screen and Insertion Gain Screen:
• FLATwithnon-DSLfittingruleandpure-tonesignal
• ANSIwithnon-DSLfittingruleandComposite/DigitalSpeechsignal
• FLATwithDSLfittingruleandpure-tonesignalabove85dBSPL
• A-LTASSwithDSLfittingruleforadults(allothersignaltypes)
• C-LTASSwithDSLfittingruleforchildren(allothersignaltypes)
2.5.2.2 Intermodulation Distortion
IM distortion occurs when more than one frequency is present in the source sig-
nal and those frequencies combine to create new frequencies not actually pres-
ent in the source. It is visible as jagged peaks in the frequency response of the
hearing aid when a composite signal source is used.
The IM distortion test was developed as a more precise measurement of the
amount of IM distortion created by the hearing aid than can be obtained by just
eyeing the jagged peaks of a composite source response curve. It works by pre-
senting two different frequencies to the aid at the same time and measuring the
aid’s response to those frequencies. IM distortion occurs when the aid produces
components at frequencies other than the two input frequencies. These addi-
tional components usually occur at frequencies that are mathematically related
to the input frequencies (multiples of the sum and difference of the original fre-
quencies and their harmonics).
The two input frequencies are known as the “primary” and the “secondary” fre-
quencies. The primary frequency is controlled either by the user with the [ ]
keys, or by the analyzer when it is doing a sweep test. The secondary frequency
is always at a fixed distance from the primary frequency. You can select the
fixed distance between the primary and the secondary frequency in the mea-
surement screen menu.
Types of IM distortion tests
You can perform either a static IM distortion test or an IM distortion sweep. In
the static IM distortion test, the FP35 analyzer produces a signal consisting of
the primary and secondary frequencies, and shows the resulting response as
a composite type display. The measurement is updated in real-time until you
turn it off. You can change the primary frequency by using the [ ] keys. The
secondary frequency will also adjust as you change the primary. In this manner,
you can manually step through the different frequencies and see when the aid
produces IM distortion.

General Operation 41
In the IM distortion sweep test, the FP35 analyzer produces a sweep of the two
frequency combination. This is similar to a normal pure-tone frequency sweep,
but two frequencies are used at a time instead of one at a time. The FP35 ana-
lyzer measures the IM distortion by looking at frequencies that have a math-
ematical relationship to the primary frequencies. Any amplification at those fre-
quencies is considered IM distortion. The frequencies chosen are selected in the
DISTORTION menu selection. See the next section for details. The results are
displayed as a double wide line with a percentage scaling found on the right
side of the graph.
Harmonic Distortion measurement test
If desired, IM distortion tests can be performed with only one frequency instead
of two. This turns the test into a simple harmonic distortion test. The only dif-
ference between this type of harmonic distortion test and the standard harmonic
distortion test is that the results are displayed as a line on the graph instead of
bars, and more frequencies can be measured than in the standard harmonic dis-
tortion measurement. See Section 2.5.1.2 for more details on harmonic distor-
tion.
Range of available frequencies
The range of frequencies available for the IM distortion sweep is dependent
upon the IM FREQ DIFF and the DIST SWEEP END settings. When the USER
LEVEL is set to EASY, the IM FREQ DIFF setting is available in the Coupler
Multicurve Advanced Menu. When the USER LEVEL is set to ADVANCED, the
IM FREQ DIFF and DIST SWEEP END settings are available in the Coupler
Multicurve Custom menu. See Section 2.3.2 for information on the USER
LEVEL setting.
The FP35 analyzer can produce signals and take measurements at 100 Hz inter-
vals between 200 Hz and 8000 Hz. Both the primary and secondary frequencies
used in the IM distortion measurement must be within this range. Therefore,
the beginning of the range is always IM FREQ DIFF + 200 Hz. The ending of
the range is always 8000 – IM FREQ DIFF, or DIST SWEEP END, whichever is
lower.
Examples:
If the IM FREQ DIFF is 1000 Hz, the primary frequency will have a range of
1200 Hz to 8000 Hz. The secondary frequency will have a range of 200 Hz to
7000 Hz.
If the IM FREQ DIFF is 200 Hz, the primary frequency will have a range of 400
Hz to 7000 Hz. The secondary frequency will have a range of 200 Hz to 7800
Hz.
If the DIST SWEEP END is less than or equal to the first primary frequency,
only the primary frequency will be tested; there will be no IM distortion sweep.

42 FONIX FP35 Hearing Aid Analyzer
The range for the static IM distortion test is IM FREQ DIFF + 200 Hz through
8000 – IM FREQ DIFF. The DIST SWEEP END setting has no effect on the static
IM measurement.
Frequencies measured for IM distortion
When performing an IM distortion sweep, the FP35 analyzer looks at frequen-
cies with a mathematical relationship to the primary frequencies of the test to
determine IM distortion. You can select which frequencies are examined by
using the DISTORTION selection in the Coupler menu. Use 2ND or 3RD for a
faster test. Use TOTAL for a longer, more complete test.
Here’s the technical details of the frequencies examined for those of you who
are interested:
2ND: [F1 + F2] + [F1 – F2]_3RD: [(F1*2) + F2] + [(F1*2) – F2] + [(F2*2) – F1]
+ [(F2*2)+F1]_TOTAL: All frequencies excluding F1 and F2.
(F1 and F2 are the primary frequencies of the IM distortion sweep.)
Delays
Just like a pure-tone sweep, you can change the delays in the IM distortion sweep. The
PREDELAY time sets how long the first signal will be presented in a distortion sweep
before the measurement is made. The SHORT SETTLE time determines how long the
source is presented for the remaining sweep frequencies in the distortion sweep. See
Section 2.4 for more information. The USER LEVEL must be set to ADVANCED to
change these settings. See Section 2.3.2.
Distortion measurement noise
When measuring distortion, particularly IM distortion, it is important to under-
stand the contribution of noise in the measurement. The more distortion com-
ponents that are measured, the more that noise affects the results.
When distortion is being measured, it is usually desirable to find out how much
the hearing aid distorts the original signal. However, room noise also distorts the
signal. For example, for total IM distortion, a noise floor 20 dB below the source
will result in a 1% distortion contribution of noise to the test results. For this
reason, it is recommended that the IM distortion test be performed 30 dB above
the noise floor of the room. This will dramatically reduce the influence of room
noise in the IM distortion test.
Conversely, it is also important to be careful not to measure IM distortion with
too loud of a source level because you could risk creating distortion caused by
overdriving the hearing aid or the hearing aid analyzer.
You can reduce the affect of noise on the IM distortion test results by reducing
the number of frequencies that are measured in the test. Do this by measuring
the 2nd or the 3rd IM distortion instead of the total IM distortion. See Section
4.2.6.3.

General Operation 43
Impulse rejection
Impulse rejection can be used to reduce distortion caused by impulses in the
room noise. When noise reduction is used with IM distortion measurements, sev-
eral measurements are made to obtain the test results. When impulse rejection is
on, the FP35 analyzer looks at the peak response of each measurement. If the peak
of the last measurement plus the impulse rejection amount is more than the peak
of the current measurement, the current measurement will be rejected and taken
again. This can reduce the effect of room noise in the overall test results. Impulse
rejection applies to all measurements, not just intermodulation distortion.
Default Settings
When IM DIST is saved as the COUPLER or REAL-EAR RESET SRC in the
Advanced Default Settings Menu, the IM FREQ DIFF, DISTORTION SWEEP, and
DIST SWEEP END settings in the local menu will also be saved as default settings,
even though these settings are not available in any of the Default Settings Menus.
2.5.2.3 Noise Reduction
Composite noise reduction is a little different than pure-tone noise reduction (dis-
cussed in Section 2.5.1.3), even though both are used for noisy testing environ-
ments.
Noise reduction for a composite signal averages together several of the previous
measurements with the current measurement to produce the next curve. When
you start measuring with a composite signal, the noise reduction displayed on the
screen will show the number of curves averaged so far in the measurement. Thus,
when the composite signal is first turned on and only a few measurements have
been taken, the noise reduction will begin as a low number. This number will
increase as more measurements are taken, eventually reaching the target noise
reduction selected in the menu.
Larger noise reduction numbers lead to smoother curves but increase the amount
of time it takes the analyzer to update the composite display.
2.5.3 Measuring RMS
RMS (“root mean square”) is a measurement of the average energy of a response
curve. It comes from a mathematical formula in which the response at each fre-
quency is squared. The RMS is the square-root of the sum of all these squares.
RMS is normally used in all Composite and Digital Speech measurements for both
coupler and real-ear measurements. It is also used in pure-tone measurements
greater than 90 dB SPL in coupler mode, or greater than 85 dB SPL in real-ear
mode.
On the FP35 analyzer, the RMS analysis is normally done using an estimated RMS
(ERMS). In ERMS, the FP35 compensates for system response errors that, while
minimal, can amount to several dB SPL in some situations. Compensation for
these errors is done by passing the signal through an FFT (fast Fourier transform),
correcting the response, then converting the data back to RMS. This allows for
greater RMS accuracy as long as there is not a lot of noise in the signal.

44 FONIX FP35 Hearing Aid Analyzer
A problem with ERMS is that, in order for the measurement to be optimal, the
signal measured must be synchronized to the measurement system. When using
a source generated by the FP35, this will be the case. However, if the FP35 is in
Spectrum Mode, or if there is a lot of noise in the signal, part of the measure-
ment data may not be fully analyzed by the FFT, particularly if there is high
frequency noise that is outside the range of the FFT. Normally, the errors associ-
ated with the ERMS analysis method are less than the errors with the True RMS
(TRMS) method, but in specific cases, TRMS might be slightly more accurate.
True RMS (TRMS) does not compensate for system response errors. It can be
more accurate for measurements using external signal sources or measurements
in an extremely noisy test environment. It is also a much faster measurement
because it doesn’t use an FFT – using TRMS can speed up the measurement
by nearly 50%. TRMS does contain a frequency response correction at 1 kHz,
regardless of the selected frequency.
TRMS cannot be used with the probe microphone. This is because the probe
microphone of the FP35 analyzer does not have a flat response – to achieve an
accurate measurement, the analyzer must compensate for the response of the
microphone. As such, all RMS measurements made with the probe microphone
are always done as ERMS.
TRMS also cannot be used when the input speech filter is enabled.
Measurements made with the Composite and Digital Speech signals are usually
speech weighted. ERMS must be used for those measurements.
Corrected True RMS (CRMS) is True RMS with a correction in the frequency
response at the current selected frequency. CRMS can provide slightly more
accurate measurements when using the FP35 signal source, but potentially can
be less accurate if the dominant signal is not the source signal or there is no
source signal.
The accuracy difference between the different RMS analysis methods is normal-
ly +/- 3 dB, and typically less than 2 dB. By allowing different RMS methods
to be selected, the user can improve the accuracy for a particular measurement.
For best accuracy, the microphones should be custom calibrated.
The RMS analysis method can be set in the Custom menu of the real-ear mea-
surement screens and the Coupler Multicurve, Coupler Target and Coupler
EarSim screens. The USER LEVEL must be set to ADVANCED to change these
settings. See Section 2.3.2 for details.
To change the method:
1. Press [MENU] in one of the screens described above to enter a local menu.
2. Press [NEXT] twice to enter the Custom menu.
3. Use [, ] to select RMS ANALYSIS.
4. Use [, ] to choose the selection. The choices are: ERMS, TRMS, NONE,
AUTO.
The RMS analysis choices are described here:

General Operation 45
AUTO or ERMS:
• RMSOUTwillbemeasuredasERMSwithCompositeorDigitalSpeech
• ERMSwillbemeasuredwithreal-earpure-tonesatorabove85dBSPL.
• ERMSwillbemeasuredwithcouplerpure-tonesatorabove90dBSPL.
TRMS:
• RMSOUTwillbemeasuredasTRMSwithCompositeorDigitalSpeech.
• ERMSwillbemeasuredwithreal-earpure-tonesatorabove85dBSPL.
• ERMSwillbemeasuredwithcouplerpure-tonesatorabove90dBSPL
when the reference microphone is on.
• TRMSwillbemeasuredwithcouplerpure-tonesatorabove90dBSPL
when the reference microphone is off.
NONE:
• RMSOUTwillnotbemeasuredforCompositeorDigitalSpeech.
• ERMSwillbemeasuredwithreal-earpure-tonesatorabove85dBSPL.
• ERMSwillbemeasuredincouplerpure-tonesatorabove90dBSPL
when the reference microphone is on.
• CRMSwillbemeasuredincouplerpure-tonesatorabove90dBSPL
when the reference microphone is off.
2.5.4 Measuring the RMS of the reference microphone
The Advanced menus of the Coupler Multicurve, Coupler Target, Coupler
EarSim, and real-ear measurement screens contain the REFERENCE STATUS
menu item. This controls the RMS measurement of the reference microphone.
(The USER LEVEL must be set to ADVANCED to change these settings. See
Section 2.3.2 for details.) The following selections are available:
• NONE(default)—TheRMSofthereferencemicrophoneisnotmeasured.
• RMS—TheoverallRMSofthereferencemicrophonewillbedisplayed
when the reference microphone is on.
• FULL—ThereferencesignalqualityaswellastheoverallRMSwillbe
displayed when the reference microphone is on.
When set to RMS or FULL, the REF ON status display in the measurement
screen will be replaced with REF NNdB indicating the overall RMS of the refer-
ence microphone. If the microphones are reversed (see Section 3.8.4), it will be
displayed as “REV NNdB.” If the microphones are split (see Section 3.8.5), the
reference RMS information is not displayed.
When set to FILL, the reference signal quality will be displayed immediately
to the left of the “REF NNdB” status in a slightly smaller font. It will appear as
“nnREF NN dB.” If the quality value exceeds 99, a double exclamation “!!” will
be shown, indicating that the data is out of range.

46 FONIX FP35 Hearing Aid Analyzer
The signal quality information is obtained by determining the worst deviation
in dB from a perfect source signal. For instance, if the source measured by the
reference microphone is perfect (looks exactly as it looked when leveled), except
for a 3 dB error at 500 Hz, the reference quality will be “3.” Only the worst
error is indicated. In order to minimize the effect of noise and other problems
on the reference quality, only the frequencies between 260 Hz and 6000 Hz are
checked for quality.
Most of the chamber quality errors encountered will be the result of probe tube
errors. Doing a custom calibration of the probe microphone with the probe tube
that will be used with the measurement will improve this. It will not make the
response “perfect,” because minor changes in the probe tube placement can
result in minor variances in the readings. It is normal to have one to two dB
errors with the probe tube, even when it’s in the sound chamber. Sound field
errors may be even greater because of noise and reflections.
Note: When RMS ANALYSIS is set to NONE, the reference RMS and quality sig-
nal will not be measured. See Section 2.5.3 on the RMS analysis method.
2.5.5 Using the Earphone Jack
The earphone jack on the FP35 analyzer is normally used for RECD measure-
ments and telecoil measurements. However, it might also be used for special
purpose testing, such as a loop-back cable to test electrical (non-acoustic) opera-
tion, or a special user-supplied transducer, such as one that might be used to
test a cochlear implant. It is not used as an external speaker jack, which has its
own connector.
By default, the earphone jack on the back of the FP35 is disabled in all screens
except the Audiogram Entry screen when the telecoil is disabled. (See Section
2.5.8 for details on telecoil measurements.) This is to prevent confusion and to
make sure that if an external speaker is being used, it is plugged into the proper
speaker jack instead of the earphone jack.
You can choose to deliver the FP35 analyzer’s signal to:
• Onlythespeaker(thiscanbeinternalorexternal)
• Onlytheleftchanneloftheearphonejack
• Boththeleftandrightchannelsoftheearphonejack
• Bothchannelsoftheearphonejackandthespeakersimultaneously
To select the output device:
1. Set the USER LEVEL to ADVANCED in the Default Settings menu. See Section
2.3.3.
2. Press [MENU] in the measurement screen.
3. Press [NEXT] twice to enter the Custom menu.

General Operation 47
4. Select OUTPUT JACK using the [ ] keys.
5. Choose SPEAKER to enable only the speaker, MONO EAR to enable only the
left channel of the earphone jack, STEREO EAR to enable both channels of
the earphone jack, or ALL ON to enable both earphone jack channels and
the speaker.
6. Press [EXIT] to return to the measurement screen.
2.5.6 Using Impulse Rejection
Impulse rejection reduces the amount of noise measured in the testing environ-
ment by working together with the noise reduction setting. When the impulse
rejection is set, the FP35 looks for sudden increases in the signal equal to at
least as much as the set impulse rejection and lasting at least half as many
measurements as the set noise reduction. If an impulse is found meeting those
specifications, that measurement is ignored. For example, if the noise reduc-
tion setting is 8, and the impulse rejection is 12, the FP35 analyzer will look
for (and reject) impulses of at least 12 dB, lasting for up to 4 measurements.
This is useful for noisy testing environments. The USER LEVEL must be set to
ADVANCED in the Default Settings menu. See Section 2.3.3
2.5.7 Using an External Speaker or Sound Chamber
It is possible to use an external sound chamber for performing coupler measure-
ments, and an external sound field loudspeaker for performing real-ear measure-
ments.
In order to make the FP35 analyzer as portable and lightweight as possible, its
sound chamber necessarily had to be fairly small. We have compensated for its
size by making every effort to occlude exterior noise from entering the sound
chamber, and by recommending that the coupler be included in the chamber
during the leveling process. However, a large chamber will give better sound
isolation and make it easier to position hearing aids.
If you have the Real-Ear Option, you might also find it handy to use an exter-
nal sound field speaker for your measurements. The external speaker can be
mounted on a floor stand or a swing arm. A swing arm is especially convenient
because you can move the speaker around the patient when you switch ears,
rather than orient your patient to the speaker.
The external sound chamber and the external sound field speaker can both
use the external sound field speaker jack on the back panel of the FP35. If it
is desired to connect the external sound chamber and the external sound field
speaker at the same time, the internal speaker can be disconnected entirely, and
the internal speaker jack can be used to connect the external sound chamber. If
this is done, the external sound chamber will be treated as the “internal” speak-
er by the FP35 analyzer’s software.
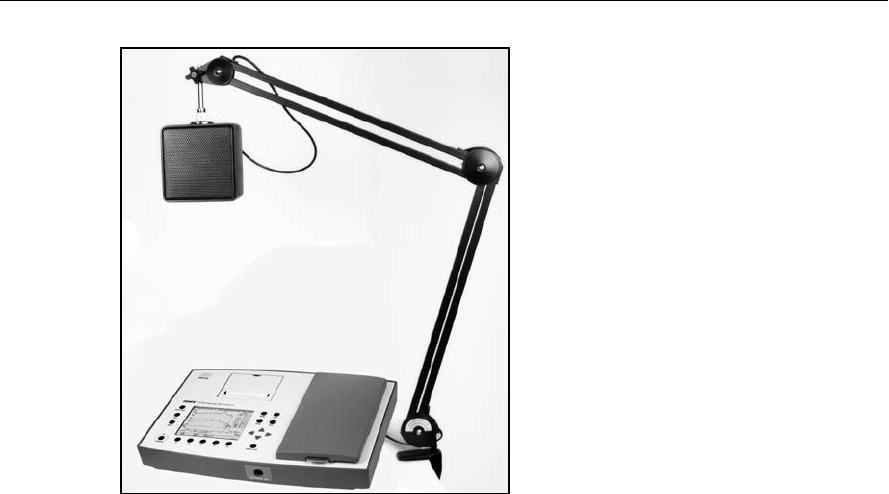
48 FONIX FP35 Hearing Aid Analyzer
Figure 2.5.7—External sound field speaker setup
To set up your FP35 software to use an external speaker:
1. Press [MENU] from the Opening screen to enter the Default Settings menu.
2. Press [NEXT] to enter the Advanced Default Settings menu.
3. Select SPEAKER under REAL-EAR and/or COUPLER with [, ] keys. Use
[, ] to make the selection. The SPEAKER selection under REAL-EAR
selects whether the INTERNAL or EXTERNAL speaker will be used for real-
ear measurements. The SPEAKER selection under COUPLER selects whether
the INTERNAL or EXTERNAL speaker will be used for coupler measure-
ments. The AUTO selection chooses the internal speaker for sound chamber
measurements and the external speaker for real-ear measurements.
4. Use [F5] to save the settings to permanent memory.
5. Press [EXIT] to return to the Opening screen.
You can also set the speaker selection by using the SPEAKER menu item in the
Advanced or Custom menu of most measurement screens. (Press [MENU] from
the measurement screen and press [NEXT] once or twice until the setting is
shown in the menu.)
2.5.8 Measuring Telecoil
The telecoil function of a hearing aid can be measured by using an external
telecoil board or by using a Telewand. These are both optional accessories that
can be plugged into the earphone jack.
In February 2007, a new rear panel was introduced on the FP35 analyzer. The
earphone jack connector was changed from 3.5 mm to 1⁄4 in to match the stan-
dard size of an insert earphone. The speaker jack was changed from a non-stan-

General Operation 49
dard modular plug to a 3.5 mm connector. If you have the new style rear panel,
you can use either the earphone jack or the speaker jack to connect the external
telecoil board or the Telewand device. You will need a 3.5 mm to 1/4 inch adapter
to use a 3.5 mm phone plug with the new rear panel.
1. Press [MENU] from the Opening Screen.
2. Use [, ] to select TELECOIL under COUPLER.
3. Use [, ] to choose one of the following settings:
• TMFSEARifyouwanttobeabletousetheTelewandintheearphonejack
in coupler mode.
• TCOILEARifyouwanttobeabletousetheTelewandor an external
telecoil board in the earphone jack in coupler mode.
• TMFSSPKRifyouwanttobeabletousetheTelewandinthespeakerjack
in coupler mode (new style rear panel only)
• TCOILSPKRifyouwanttobeabletousetheTelewandor an external
telecoil board in the speaker jack in coupler mode (new style rear panel
only)
• OFFifyouwanttodisabletelecoilmeasurementsincouplermode.
4. Use [, ] to select TELECOIL under REAL-EAR.
5. Use [, ] to choose one of the following settings:
• TMFSEARifyouwanttobeabletousetheTelewandintheearphonejack
in real-ear mode.
• TMFSSPKRifyouwanttobeabletousetheTelewandinthespeakerjack
in real-ear mode (new style rear panel only)
• OFFifyouwanttodisabletelecoilmeasurementsincouplermode.(an
external telecoil board cannot be used for real-ear measurements)
6. Press [EXIT] to return to the Opening Screen.
7. Enter the measurement screen you want to use to test telecoil and turn on the
telecoil test in that screen. For ANSI measurements, see Sections 4.1.5 and
4.1.6. For Coupler Multicurve measurements, see Section 3.8.7. For real-ear
measurements, see Section 5.7.6.
Testing Location
It is very important to pick a testing location that is free of magnetic disturbanes,
especially those caused by fluorescent lights and power lines. To do this:
1. Locate a wide range linear hearing aid with good low frequency response and
a telecoil switch.
2. Set the hearing aid to operate in the telecoil position and turn the gain control
up to its full-on position.
3. Connect the hearing aid to a coupler. Don’t insert the measurement micro-
phone.

50 FONIX FP35 Hearing Aid Analyzer
4. Walk around your possible testing location and listen for raspy humming
sounds from the hearing aid. This will be the aid responding to magnetic
fields in the room.
5. Pick a location that is as free of such sounds as possible. Rotate the aid in
all directions when looking for a good site.
2.5.9 Changing the Microphone Selection
In November 2008, the FP35 had a major revision (the “-09” main board) that
added an external microphone to the front of the analyzer. This connector is
for use with the new style probe microphone with the integrated ear hook. A
3.5mm jack labeled “Line-in” was also added for the use of external inputs from
a CD player.
By default, the external microphone is used for real-ear measurements and the
internal microphone (connected inside the sound chamber), is used for coupler
measurements. However, if you have a special circumstance, you can change
these selections.
If you would like to temporarily change the microphone input from the local
menu of the measurement screen, you must set the USER LEVEL of the ana-
lyzer to ADVANCED. See Section 2.3.2 for details. Once this is done, go to the
measurement screen and press [MENU], [NEXT], [NEXT]. This will take you to
the “Custom Menu” of the measurement screen. Change the MIC PORT setting.
These are the possible selections:
•AUTO:Usetheexternalmicrophoneportforreal-earmeasurementsifitis
available. Use the internal microphone port for coupler measurements if
it is available.
•INTERNAL:Usetheinternalmicrophoneportforallmeasurements.
•EXTERNAL:Usetheexternalmicrophoneportforallmeasurements.
•EXTLINE:Usethe“linein”jackonthebackoftheanalyzerasanexter-
nal measurement input. This is a special case used for devices such as
cochlear implants that are not measured with conventional hearing aid
measurement techniques.
If you would like to make one of these options more permanent as a default, you
can change this setting in the Default Settings Menu. From the Opening screen
of the analyzer, press [MENU], [NEXT], [NEXT] to enter the Resets Default
Setting Menu. The MIC PORT setting with the selections described above are
available in this screen.
2.6 Printing
The FP35 analyzer comes equipped with an internal thermal printer so that
the ability to print a hard copy of your results is always available. The thermal
printer prints a clear, easy-to-read image of the display. You can also hook up
an external printer to print your results on normal office paper. You can use
any external printer that supports HP PCL (Hewlett Packard Printer Computer
Language) version 3.0 and above.

General Operation 51
The general operation of the FP35 printer is easy:
• Press[PRINT/FEED]toprintanyscreen.
• Press[PRINT/FEED]againtostopprinting.(You can do this even if the
screen has blanked out!)
• Pressandholddownthe[PRINT/FEED]keytofeedthepaperforward.
2.6.1 Choosing the Printer
If you are in the middle of a test, and you want to switch between using the
internal and the external printer in the local screen without changing the
default printer:
1. Press [MENU] from any test screen.
2. Press [NEXT] to enter the Advanced Menu.
3. Select PRINTER with the [] key.
4. Select either INTERNAL or EXTERNAL with the [] key.
5. Press [EXIT] to return to the test screen.
If you want to change the default printer:
1. Press [MENU] from the Opening screen to open the Default Settings menu.
2. Select PRINTER using the [] key.
3. Choose either INTERNAL or EXTERNAL with the [] key.
4. Press [F5] to save the current selection as the default.
5. Press [EXIT] to return to the Opening Screen.
2.6.2 Adding a Label
A label with your printout allows you to record useful information about the
client and hearing aid to go along with the test results. See Figure 2.6.2. To view
the label set on your analyzer, press [MENU] from the Opening screen to enter
the Default Settings Menu, and then press [BACK]. This will display the label
that will be printed on your analyzer printout whenever labeling is turned on.
If you are in the middle of a test, and you want to add a label for a printout in
the local screen without changing the default setting:
1. Press [MENU] from any test screen.
2. Press [NEXT] to enter the Advanced Menu.
3. Select PRINT LABEL with the [] keys.
4. Select YES with the [] key.
5. Press [EXIT] to return to the test screen. Any printout in the current screen
will now include a label until you turn off the analyzer.
52 FONIX FP35 Hearing Aid Analyzer
Figure 2.6.2—Label generated with printed results
If you want to include a label on all printouts by default:
1. Press [MENU] from the Opening Screen to open the Default Settings Menu.
2. Select PRINT LABEL using the [] key.
3. Select YES with the [] key.
4. Press [F5] to save the current menu setup.
5. Press [EXIT] to return to the Opening Screen.
Note: With the RS232 Option, you can use a computer to store your own label and
graphic logo in the FP35. A program called “Set Label,” available in the “download”
section of our website www.frye.com, will help you change your analyzer’s label.
The internal printer of the FP35 uses high quality thermal paper. This section will
show you how to change the paper, fix any paper jams, and minimize the fading of
the thermal printout.
2.6.3 Changing the Thermal Paper
To change or refill the printer paper:
1. Remove the printer door by pulling up on the notch at its top.
2. Remove the empty spool or the roll of paper. You are likely to feel some resis-
tance as you pull it upward. If you are removing a full roll of paper, see Figure
2.6.3B.
3. Do not pull the paper backward out of the printer. Instead, cut or tear the end
off the spool of paper and pull it through the printer in the direction it is meant
to feed. Taking this step will help avoid unnecessary wear on the printer.
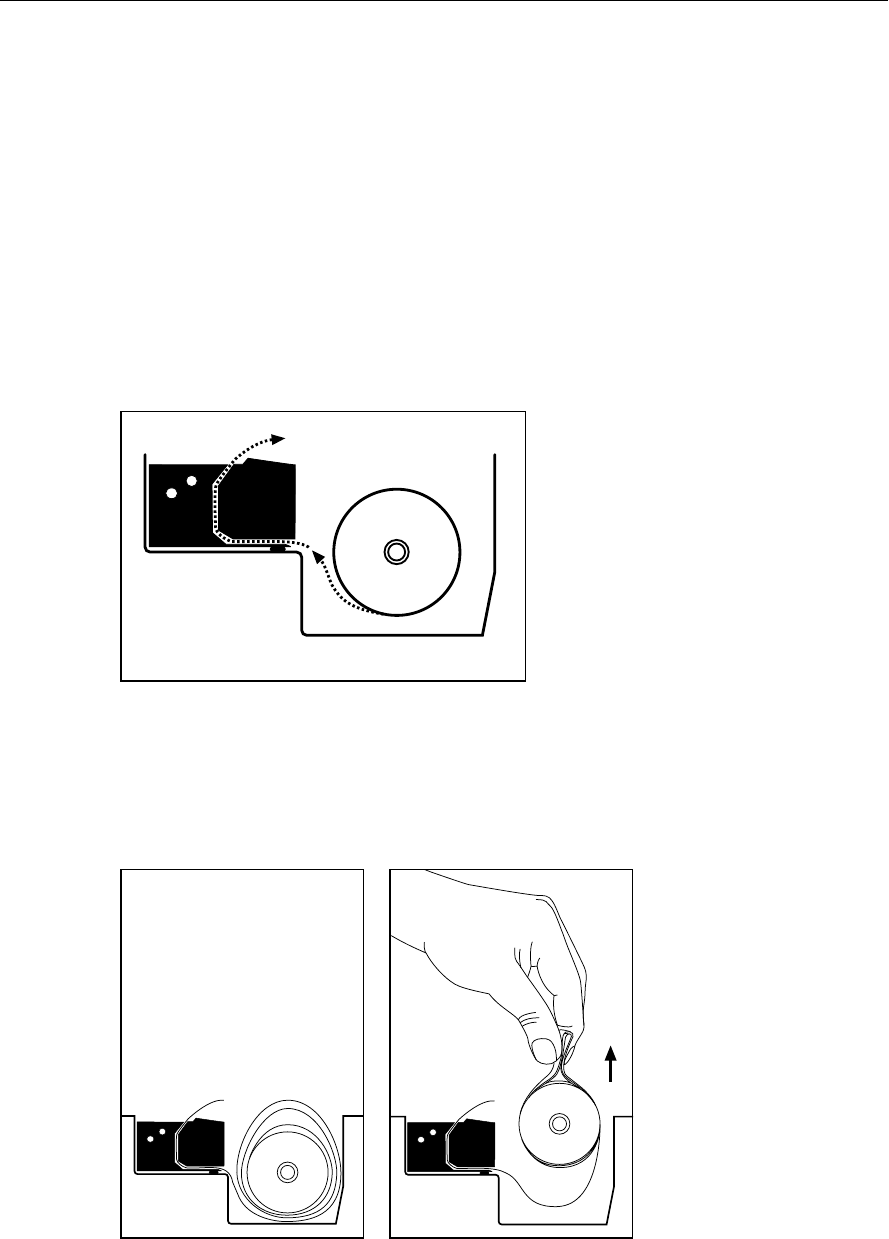
General Operation 53
4. Remove the plastic rod from the empty spool or the roll of paper.
5. Place a new roll of paper on the plastic rod.
6. Cut the paper into a point. This will make it easier to thread into the printer.
7. Thread the paper, shiny-side-down, into the slot at the lower, back of the
printer until it comes out the top.
Note: It is possible to feed the paper below the slot, in which case printing
will not work. After you have threaded the paper, press and hold [PRINT/
FEED] to make sure the paper feeds properly. See Figure 2.6.3A.
8. Set the plastic rod (with the paper roll still on it) into the slots in the printer
cavity, and replace the printer door, so that the paper feeds through the
opening.
Side view of printer showing paper path
paper tape
Figure 2.6.3A—Paper path for FP35
Note: If the roll of paper is full, it can be difficult to grip. Loosen some of the
paper, pinch it into a fold, and use the fold to pull the paper and spool out of
the cavity, as in Figure 2.6.3B
Figure 2.6.3B—Removing a full roll of paper

54 FONIX FP35 Hearing Aid Analyzer
2.6.4 Fixing Paper Jams
If you do not get a response from pressing the [PRINT/FEED] key, check for a
paper jam. In the event of a paper jam, manually pull paper through the printer
6–12 inches and try again.
2.6.5 Minimizing Fading
Although the paper used in the FONIX FP35 is a good quality thermal paper,
any thermal printing can eventually fade over time. To minimize fading, store
print-outs away from the light in a cool, dry place. Do not store the strips in
plastic or put cellophane tape on them, and avoid fingerprints. If you want to be
absolutely certain that you will have data for many years, use a regular copier to
duplicate the printed results.
2.6.6. Using an External Printer
You can hook up an external printer to your FP35 analyzer to print your results
on normal office paper. This eliminates the problem of fading associated with
thermal printouts, and often makes it easier to store your results.
You can use any external printer that supports HP PCL (Hewlett Packard Printer
Computer Language) version 3.0 and above. We keep a list of printers that work
with our analyzers on our website: www.frye.com/products/analyzers/printerlist.
html.
To connect an external printer to the FP35 analyzer:
1. Unplug the FP35 analyzer and the external printer from any power source.
2. Connect a standard printer cable to the external printer.
3. Connect the other end of the cable to the connector on the back of the FP35
labeled “PRINTER.”
4. Plug the FP35 analyzer and the external printer into their respective power
sources.
5. Follow the directions found in Section 2.6.1 to select the external printer in
the FP35 software. You are now ready to use the external printer.
2.7 Display & Data
This section describes how to view individual response curves in terms of their
numerical data. It also describes the Curve ID box that is present in the real-ear
and coupler measurement screens.
2.7.1 Data Display
It’s often useful to look at the actual numerical data from a response curve.
There are two ways you can use the data display on the FP35—you can convert
a completed curve to a data table, or you can run a test and have the display
update in data format. Either way, the data tables give you detailed numerical
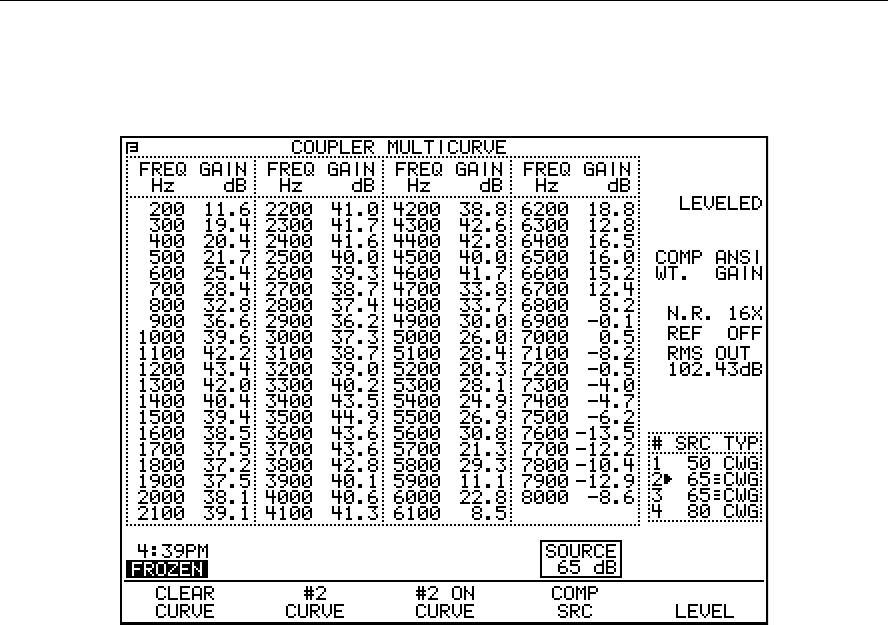
General Operation 55
information on the gain or output that the hearing aid provides. Figure 2.7.1
shows a printout of the data format.
Figure 2.7.1—Display of numerical test data
To use the data feature, select it as your DISPLAY in the menu:
1. Press [MENU].
2. Select DATA/GRAPH using the [, ] keys.
3. Set DATA using the [, ] keys.
4. Press [EXIT].
To see the numerical data of an existing curve, press [F2] to select desired curve.
To gather new information, press [START/STOP], and a new curve will be run,
updating the data table once the measurement is complete. If you are using the
composite or fast sweep signal, the information will continue to be refreshed
with each new measurement until you push [START/STOP] again.
When the LONG signal source is selected and a distortion measurement is
turned on, the data tabulation will not show the last four frequencies of the
sweep. The last frequency displayed is 6500 Hz. The last four sweep frequen-
cies 6700, 7100, 7500, and 8000 Hz will not be displayed.
2.7.2 Curve ID Box
The curve ID box provides you with much useful information about the curves.
It has three main columns: # (curve number), SRC (source), and TYP (type).

56 FONIX FP35 Hearing Aid Analyzer
Figure 2.7.2—Curve ID box
Number: This identifies the number of the relevant curve. The arrow to the
right of these numbers indicates the current selected curve.
Source: This identifies the amplitude of each curve.
Type: The curve type is a little more complicated; each curve is identified by
three letters.
First letter:
I = Intermodulation Distortion
C = Composite
P = Pure-tone
D = Digital Speech
Second letter:
For pure-tone:
N = Normal pure-tone
F = Fast pure-tone
S = Short pure-tone
For composite or digital speech:
W = Weighted composite
F = Flat weighted
S = Spectrum
Third letter:
P = SPL measurement
G = Gain measurement
% = Percent
Note: When you toggle back and forth between Gain and SPL in the menu, all
curves are converted to the new format, except for spectrum measurements made
with the reference microphone turned off.
Lastly, between the SRC and TYP columns, the FP35 uses symbols to describe the
display status of the curves.
≡ Curve is completely on the graph
• Curve is measured but turned off
↓ Curve is partially off the bottom of the graph
↑ Curve is partially off the top of the graph
Curve is on, but is out of view above the graph
Curve is on but is out of view below the graph
Curve is partially off the graph in both directions
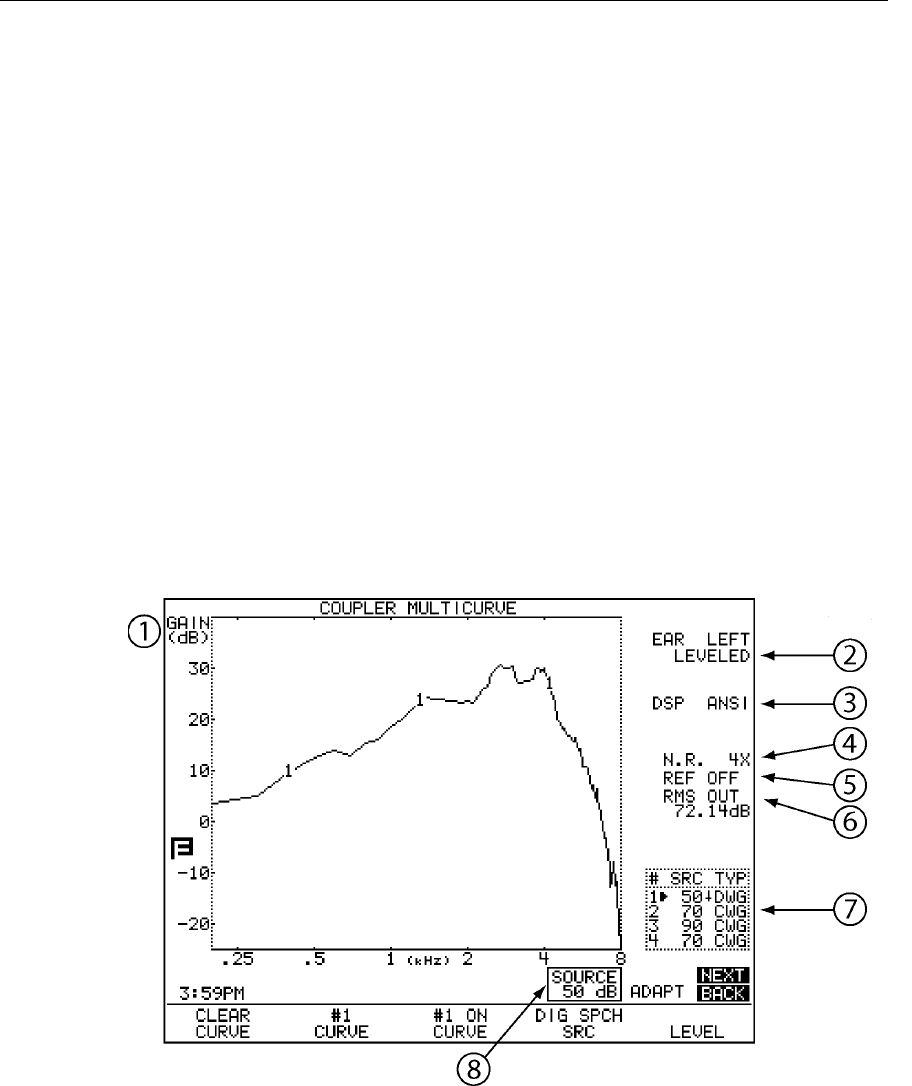
Chapter 3 57
Coupler Measurements
Coupler measurements are electro-acoustical tests performed using a coupler
acting as an artificial ear inside the sound chamber. This chapter describes how
to perform coupler measurements manually in the Coupler Multicurve screen.
For instructions on how to perform ANSI, IEC, or other automated test sequenc-
es, see Chapter 4, Automated Test Sequences.
In the Coupler Multicurve screen, you can perform up to four different coupler
frequency response measurements using a variety of puretone and broadband
signals (the Composite/Digital Speech Option is required for broadband signals).
Test results can be displayed in terms of either SPL (output) or Gain.
To enter the Coupler Multicurve screen, press [F3] from the Opening screen.
If this opens the Coupler Target or Coupler EarSim screen, use the [NEXT] or
[BACK] keys to go to the Coupler Multicurve screen.
3.1 Coupler Multicurve Display
Figure 3.1—Coupler Screen
Refer to Figure 3.1 for the following explanation of the graphical display:

58 FONIX FP35 Hearing Aid Analyzer
1. Type of display. This will be either dB SPL (coupler output) or dB Gain (cou-
pler gain). Select between the two in [MENU].
2. Displays leveling status of the sound chamber. See Section 3.2 for more
information.
3. Displays the signal and weighting types used with the selected curve.
4. N.R. = Noise reduction. Select this in [MENU].
5. Status of reference microphone. Select this in [MENU].
6. RMS/HFA data: If a composite signal is selected, the RMS OUT will be dis-
played here. Otherwise, the selected HFA or SPA will be displayed. Press
[MENU] to select HFA/SPA frequencies.
7. Curve ID box. See Section 2.7.2 for more information.
8. Source Signal Statistics Box. The information in the box is dependent upon
signal type.
• COMP,DIGSPCH—DisplaystheRMSsourceamplitude.
• NORM,FAST,SHORT,SINGLE—Displaysthesourceamplitude,frequen-
cy, distortion, and output/gain.
3.2 Leveling the Sound Chamber
Leveling is the process by which the response of the sound chamber is mea-
sured and computer-corrected so that a “flat” sound field is achieved. Usually
leveling is performed using only the coupler measurement microphone.
However, a reference microphone can also be used that theoretically will make
the leveling (and measurement) process more accurate. The reference micro-
phone is available when the Real-Ear option is included on the FP35 or the
M300 two microphone setup is specifically ordered with a sound chamber-
only analyzer. For most clinical situations, leveling with only the measurement
microphone (described in Section 3.2.1) is adequate.
There are three level states:
LEVELED—Indicates the leveling process was correct within 2 dB.
UNLEVELED—Indicates the leveling process was incorrect by at least 6 dB, or
that the system has not yet been leveled.
tBLANKu—If the display is blank where the words LEVELED or UNLEVELED
usually appear, the leveling process was correct between 2 dB and 6 dB. You
should attempt to level again. However, if repeated attempts fail to reach a lev-
eled status, you can consider this status “good enough.”
Note: Sections 3.2.1 and 3.2.2 describe how to level the sound chamber in the
Coupler Multicurve screen. These procedures also work in the Coupler Target
and automated test sequence screens.
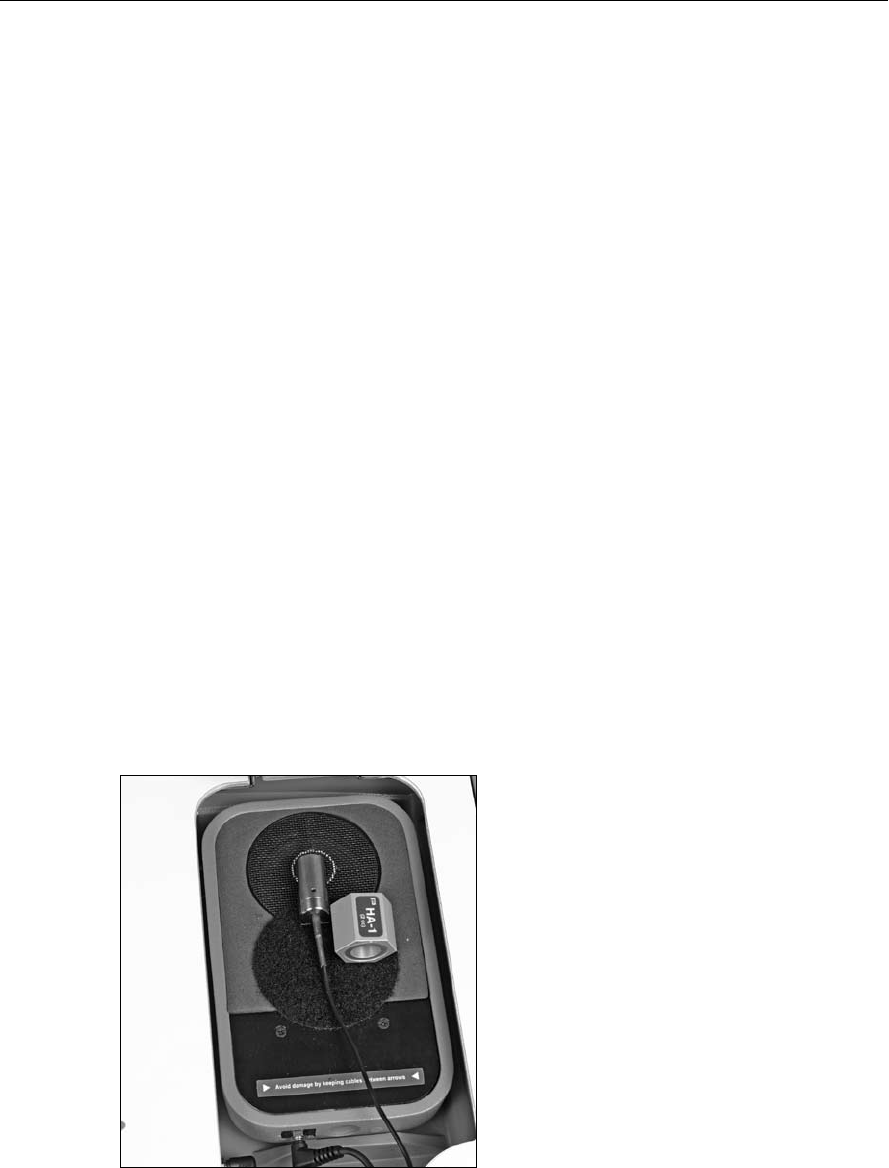
Coupler Measurements 59
3.2.1 Leveling without the Reference Microphone (Standard)
Leveling the sound chamber using only the measurement microphone is accu-
rate enough for most clinical tests.
1. Enter the Coupler Multicurve screen by pressing [F3] in the Opening screen.
2. Open the sound chamber and place the coupler microphone at the center of
the speaker cone in the sound chamber.
If the microphone cables are not positioned properly, the chamber lid can
pinch and eventually damage them. Avoid damage by placing the cables
between the arrows at the bottom of the speaker face. The foam on the
chamber lid is thicker and softer in this area, offering more protection.
3. Place the coupler that you will be using inside the chamber next to the cou-
pler microphone. This is necessary because of the small volume of the FP35
internal sound chamber, and measurement results, particularly in the high
frequencies, could be affected by the space the coupler takes up inside the
chamber. See Figure 3.2.1.
4. Close the sound chamber lid securely so that it latches in place.
5. Make sure the environment is as quiet as possible.
6. Press [F5], followed by [START/STOP], to level the sound chamber.
7. Follow the instructions in Section 3.2.3 to save the leveling, if desired.
Note: When testing, make sure the hearing aid microphone is located where
the grill of the measurement microphone was placed during the leveling pro-
cess (usually at the center of the speaker cone in the sound chamber). This will
increase accuracy through the low frequency range.
Figure 3.2.1—Normal leveling setup

60 FONIX FP35 Hearing Aid Analyzer
3.2.2 Leveling Using the Reference Microphone
If your analyzer has the M300 two microphone setup, you can level using the probe
microphone as a reference microphone. If you choose to do this type of leveling,
you will need to level every time the hearing aid set up changes significantly
(e.g. you begin to test a different style or model of aid). This method is more
exact than the general purpose leveling described in the previous section and
is performed at the factory. It is useful to note that for most practical purposes,
there is little difference between the results of these two methods of leveling.
1. Enter the Coupler Multicurve screen by pressing [F3] in the Opening screen.
2. Look in the middle of the right side of the screen. If it reads REF OFF, you
will need to turn on the reference microphone. To do this, press [MENU]
and use the arrow keys to turn the REF MIC selection ON, and press [EXIT]
to return to the Coupler Multicurve screen.
3. Set up the hearing aid that you are going to test. See Section 3.3 for details.
Make sure the hearing aid is off.
4. Place the hearing aid/microphone assembly in the sound chamber with the
hearing aid microphone at the reference point.
5. Attach a probe tube to the smaller reference (probe) microphone, and secure
the end of the probe tube with a bit of blue adhesive putty so that the tip is
right next to the microphone of the hearing aid.
6. Position the microphone cables between the arrows on the speaker face. The
Velcro on the coupler will help secure the assembly in place. See Figure
3.2.2.
7. Close and latch the chamber lid.
8. Make sure the environment is as quiet as possible.
9. Press [F5], followed by [START/STOP], to level the sound chamber.
10. Follow the instructions in Section 3.2.3 to save the leveling, if desired.
Figure 3.2.2—Leveling using the reference microphone

Coupler Measurements 61
3.2.3 Saving the Leveling Information
The FP35 can store leveling so that you do not need to re-level the sound cham-
ber every time you turn on the FP35 analyzer.
To store leveling:
1. Press [MENU] from the Opening screen to enter the Default Settings Menu.
2. Press [F3] to enter the Calibration Menu.
3. Use the [q, p] keys to move the cursor to the selection “Store Chamber
Leveling in EEROM”
4. Press [START/STOP]. The FP35 will confirm that you want to store the lev-
eling.
5. Press [START/STOP] again to proceed.
6. Press [EXIT] twice to return to the Opening Screen.
3.2.4 Changing the Leveling Source
By default, sound chamber leveling is performed at 90 dB SPL. (Real-ear level-
ing is performed at 70 dB SPL.) In special circumstances, you may want to
perform coupler measurements with the aid positioned in front of an upright
speaker. For instance, this is a technique often used to test directional hearing
aids.
A loud leveling source, such as the default 90 dB SPL, is more accurate than
softer leveling sources because there is less noise interference. However, the
loud leveling source also requires the speaker to be close to the microphone.
When you move the microphone away from the speaker, the leveling source will
often have to be lowered. So, when performing coupler measurements with an
upright speaker, it is often useful to turn the leveling source down.
To do this:
1. Press [MENU] from the Coupler Multicurve or Target Coupler screen to
enter the local menu.
2. Press [NEXT] to enter the Advanced menu. (If the USER LEVEL is set to
ADVANCED in the Default Settings menu, you will need to press [NEXT]
again to go to the Custom menu.)
3. Use [q, p] to select LEVELING SOURCE.
4. Use [t, u] to choose the desired level.
5. Press [EXIT] to return to the measurement screen.
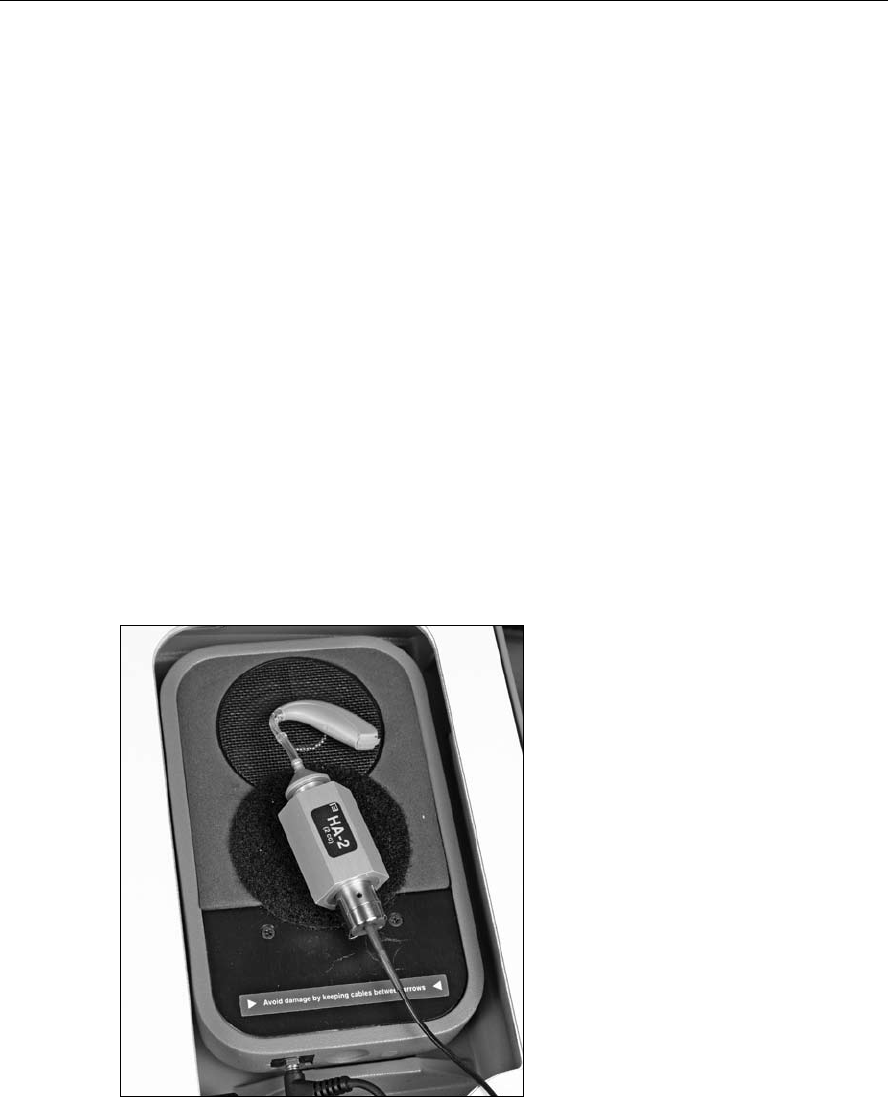
62 FONIX FP35 Hearing Aid Analyzer
3.3 Hearing Aid Setup
To set up the analyzer and the hearing aid for testing, you connect the hearing
aid to a coupler. The standard couplers of the FP35 analyzer are the HA-1 and
HA-2 couplers. These couplers contain 2 cc of space, simulating the amount
of space in a person’s ear canal. The procedure for connecting a hearing aid to
those couplers is described in this section.
Other available couplers include the MZ-series couplers (used in the OES and
JIS Options) and the CIC coupler.
3.3.1 Setting up a BTE
1. Adjust the tone and gain controls of the aid to the desired positions.
2. Insert the end of the earhook of the hearing aid into the plastic tubing of the
ear level adapter.
3. Insert the measurement microphone into the HA-2 coupler.
4. Snap the ear level adapter on to the end of the coupler.
5. Place the hearing aid/coupler assembly into the sound chamber so that the
microphone of the aid is directly over the center of the speaker. The Velcro
on the coupler will help secure the assembly in place. See Figure 3.3.1.
Figure 3.3.1—Setup for a BTE
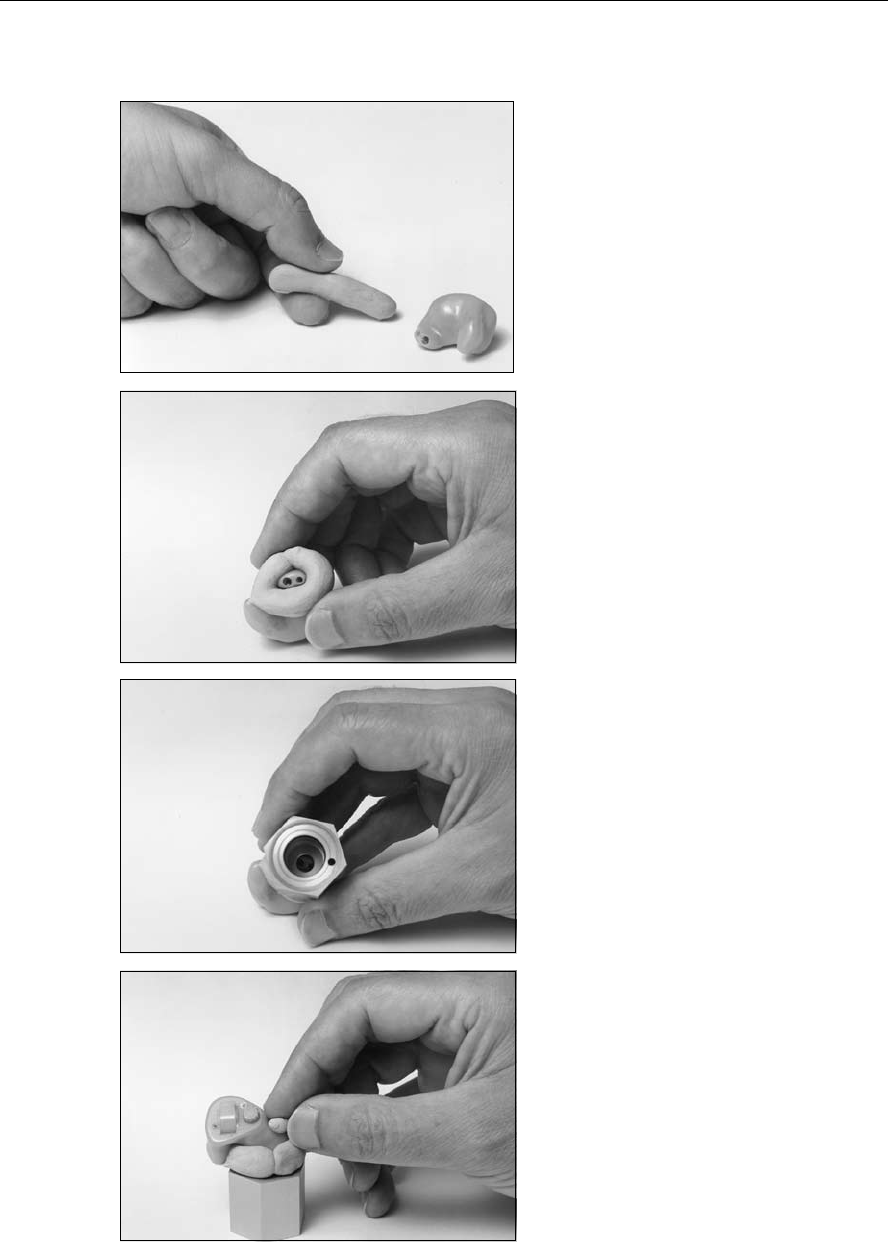
Coupler Measurements 63
3.3.2 Setting up an ITE
Roll the blue adhesive putty pro-
vided with each instrument into a
rod long enough to go around the
transmitting end of the aid (approx.
2 in or 5 cm). Modeling clay can
also be used, but it doesn’t work as
well.
Bend the blue adhesive putty rod
around the canal end of the aid,
making the resulting “donut” flush
with the end of the aid. (Some users
choose to seal the vent opening at
this end with a small amount of blue
adhesive putty. This is a good idea
if the vent does not go all the way
through the aid.)
With the measuring microphone
removed from the HA-1 coupler,
align the sound opening of the aid
with the small hole at the end of
the coupler. Look through the larg-
er hole at the other end to be sure
the sound opening of the aid is
clear of obstructions and correctly
placed.
Seal the outside opening of any
vent of the aid with a small kernel
of blue adhesive putty.
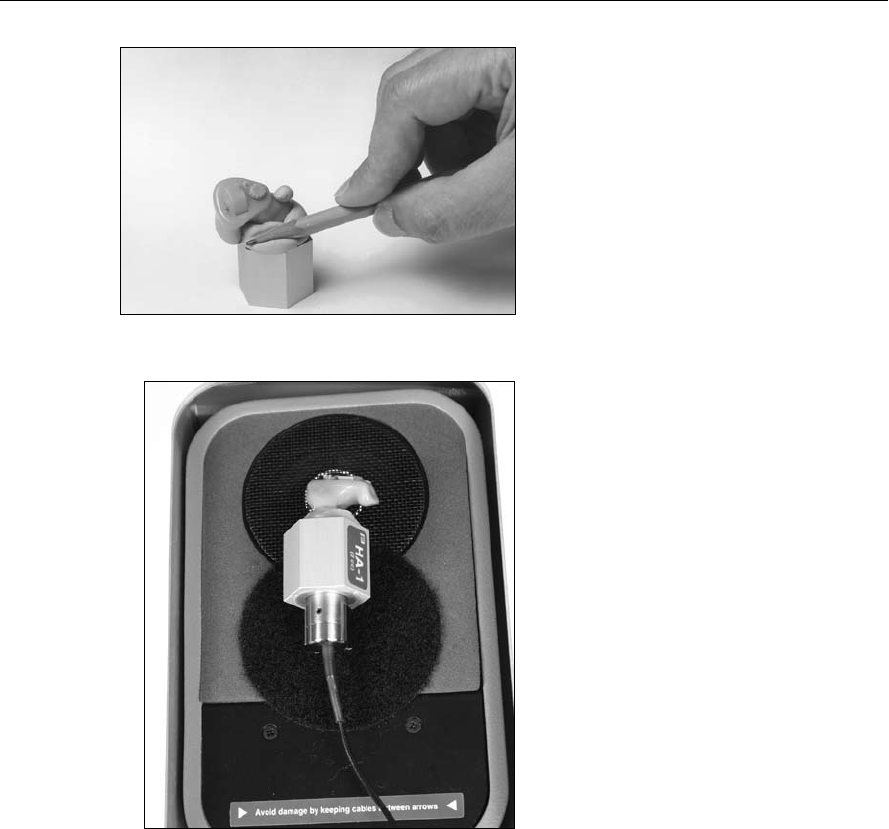
64 FONIX FP35 Hearing Aid Analyzer
Press down on the blue adhesive
putty with a pencil or your finger to
create an acoustic seal between the
aid and coupler.
You may want to double-check the
aid placement through the open
end of the coupler at this point.
Slowly insert the microphone into
the coupler. You may feel an initial
resistance when the mic reaches the
O-ring. Continue to push the micro-
phone until it stops.
Place the completed assembly over
the center of the speaker in the test
chamber. With ITEs, the position
of the aid can affect the frequency
response. Point the faceplate to the
right or left. Place the mic cable
between the arrows (secure it with a
bit of blue adhesive putty if neces-
sary). The Velcro on the coupler will
help hold the assembly in place. Be
consistent with your setup for repeat-
able results.
Set the hearing aid’s gain control to
the desired position, and adjust the
source level to the desired amplitude.
3.3.3 Setting up a Body Aid
Place the hearing aid into the sound chamber so that the microphone of the aid
is centered over the speaker. Adjust the tone and gain controls to the desired
positions. Insert the FP35 microphone into the HA-2 coupler and snap the
receiver onto the end of the coupler (you will not need the ear level adapter for
this setup). Place the coupler outside the sound chamber and close the lid if
possible.
Adjust the source level to the desired test drive amplitude.
3.4 Frequency Responses
In the Coupler Multicurve Mode of the FP35, you can perform the following
measurements: response curves, single-frequency measurements, harmonic dis-
tortion, and intermodulation distortion.
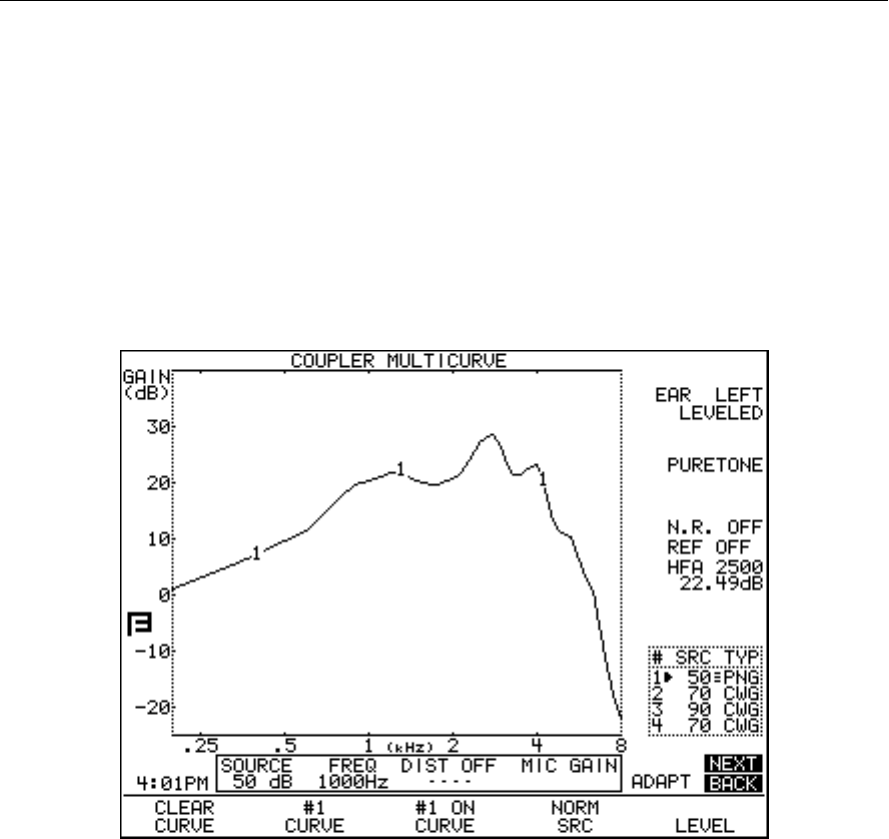
Coupler Measurements 65
3.4.1 Running a Test Curve
1. Enter the Coupler Multicurve screen by pressing [F3] from the Opening
screen. If the Coupler Target or Coupler EarSim screen is displayed when
you do this, instead of the Coupler Multicurve screen, use the [NEXT] key.
2. Press [MENU] from the Coupler Multicurve screen to make any necessary
selections. See Section 3.9 for details.
3. Level the sound chamber as described in Section 3.2, if necessary.
4. Set up the aid in the sound chamber as described in Section 3.3.
5. Use [F2] to select a curve number.
Figure 3.4.1A—Pure-tone measurement
6. Use [q, p] to adjust the source level to the desired amplitude.
7. Use [F4] to select the source type. See Section 2.5 for an explanation of the
available source types
8. Press [START/STOP] to initiate the frequency sweep. If you are using the
NORMAL, SHORT or LONG selections, the test will stop when the sweep is
complete. The COMP, DIG SPCH and FAST signals are continuous, making
it necessary to press [START/STOP] again when you want the signal to stop.
9. Use [t, u] to scroll back through the last four real-time measurements if
you used the COMP or DIG SPEECH signals.
10. Repeat steps 5-9 to take another measurement.
Figure 3.4.1A shows a completed normal pure-tone sweep.
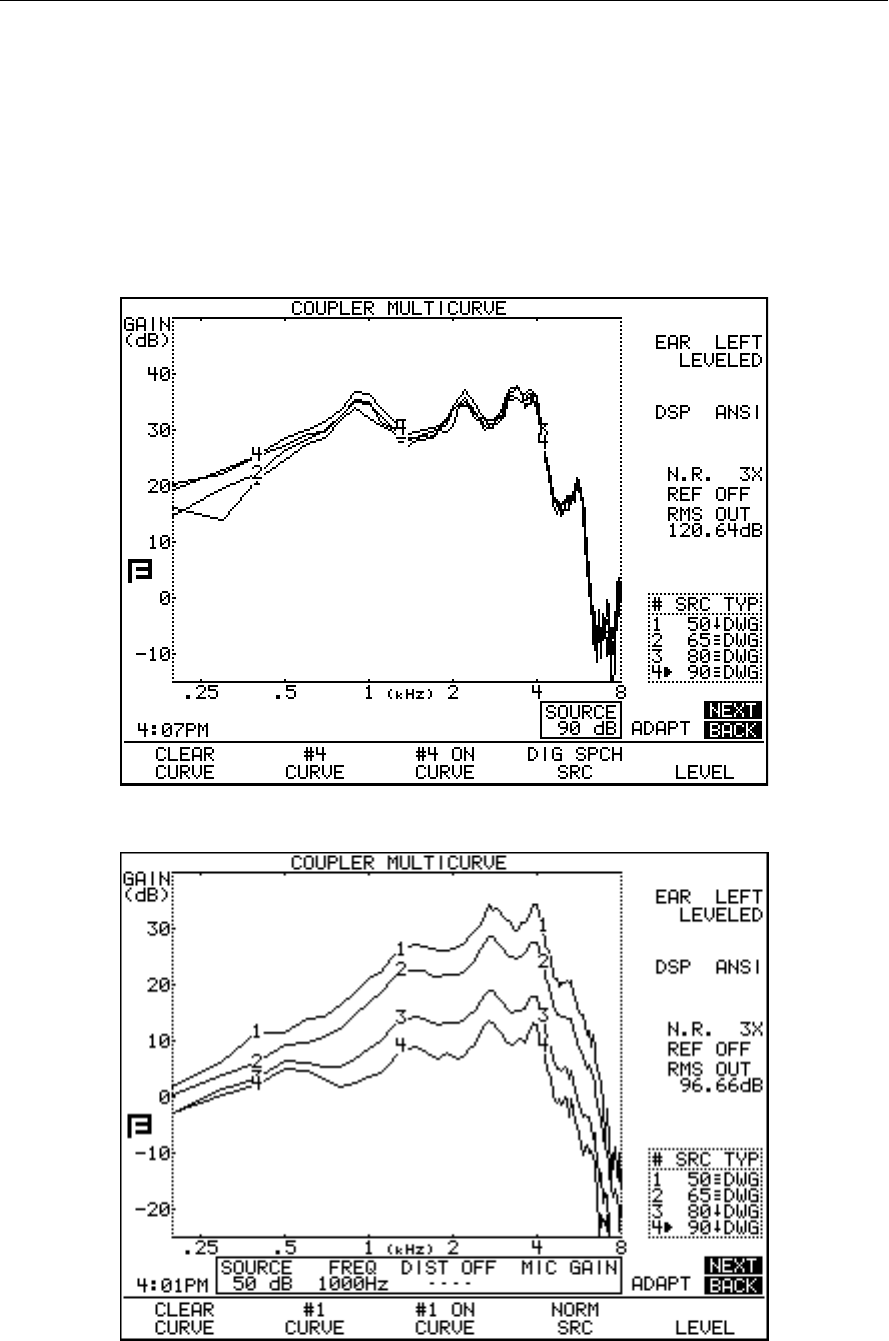
66 FONIX FP35 Hearing Aid Analyzer
Example
Following the instructions above, run 4 Gain curves using amplitudes 50, 60, 70
and 80 dB SPL. Use a signal source of NORM, COMP or DIG SPCH.
This scenario will provide you with a family of curves. Whenever the curves sit
on top of each other, the gain of the aid is the same for the amplitudes of those
curves. This indicates the aid is running linearly. If the curves provide progres-
sively less gain as the input rises, then the aid has some sort of compression cir-
cuit. Figures 3.4.1B and 3.4.1C show two examples of this scenario.
Figure 3.4.1B—This aid has very little compression between 50 dB and 90 dB.
Figure 3.4.1C—This aid shows a great deal of compression between 50 dB and 90 dB.
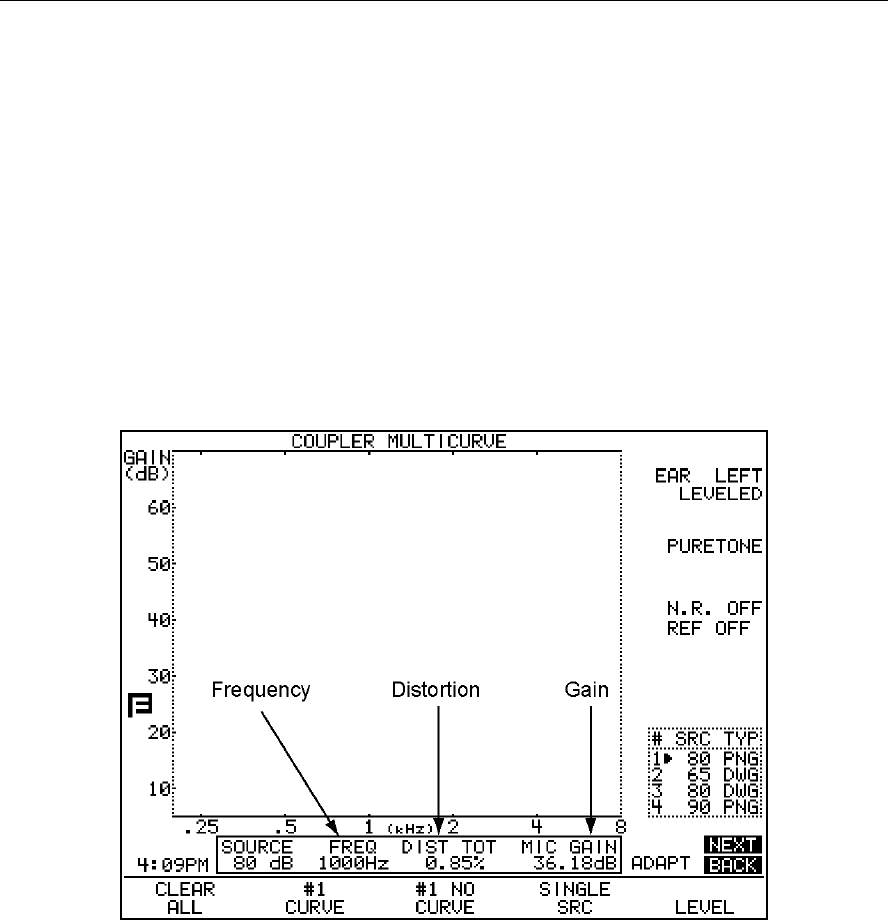
Coupler Measurements 67
3.4.2 Running a Single Frequency Measurement
At times, you may want to find out what the frequency response of the hearing
aid is to a single pure-tone signal.
1. Push [F4] and hold the key down for half a second until the Source
Selection box appears.
2. Use [q, p] to choose SINGLE.
3. Press [START] to make the selection and close the selection box.
4. Use [t, u] to select the frequency you want to use as the source signal. Use
[q, p] to select the amplitude.
5. Press [START] to start the measurement. When finished, press [START]
again to stop the signal.
Figure 3.4.2—Measuring a single frequency
3.5 Distortion Measurements
There are several different methods to measure distortion in a hearing aid. This
section describes how to measure harmonic distortion and intermodulation dis-
tortion.
3.5.1 Measuring Harmonic Distortion
Harmonic distortion is when the hearing aid returns energy at frequencies not
present in the source signal. The FP35 allows you test for this phenomenon very
easily. See Section 2.5.1.2 for more information on harmonic distortion.
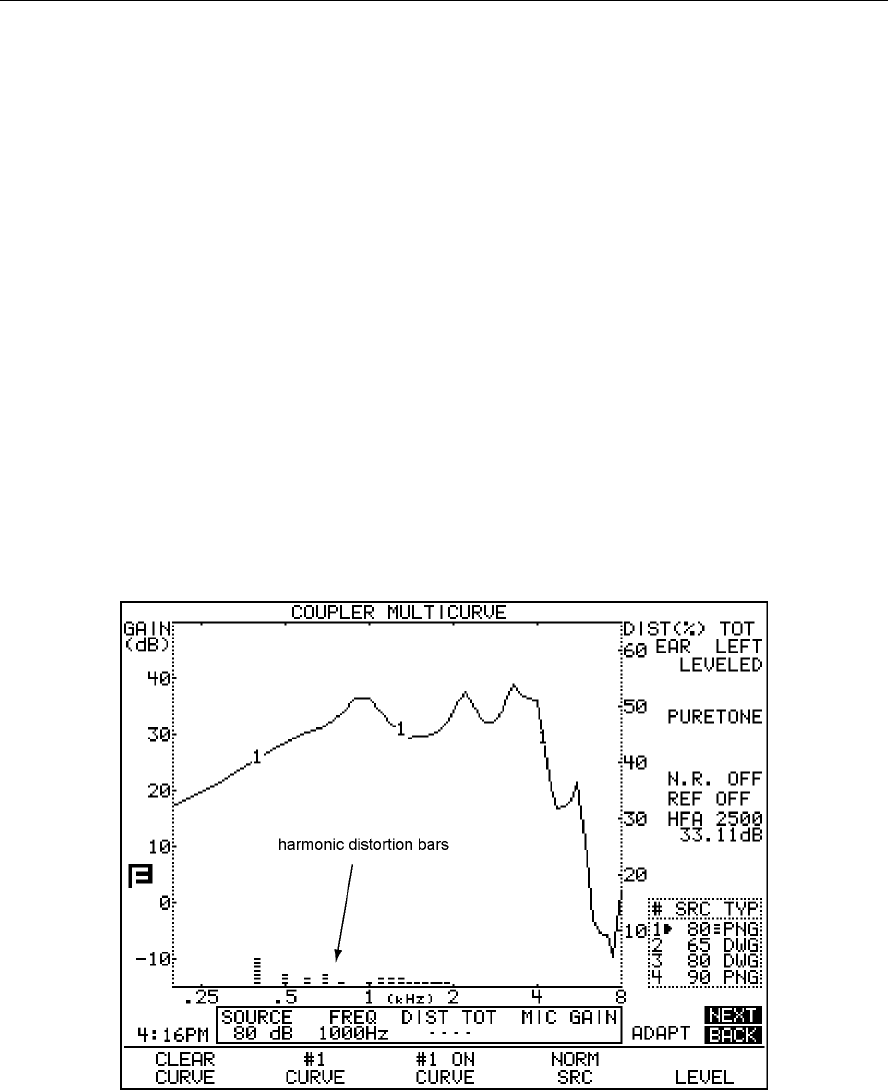
68 FONIX FP35 Hearing Aid Analyzer
1. Press [MENU].
2. Select DISTORTION using the [q, p] keys.
3. Select the distortion type desired by using the [t, u] keys.
4. Press [EXIT].
5. Press [F4] to select NORM.
6. Press [START/STOP] to run normal frequency sweep.
After running a normal sweep, the graph will have bars depicting the percentage
level of harmonic distortion at different frequencies. The scale for the harmonic
distortion measurements is given on the right vertical axis of the graph. See figure
3.5.1.
In the past, FONIX analyzers have not measured harmonic distortion when the
signal level was set to 90 dB SPL or higher. This is called the “90 dB harmonic
distortion rule.” Since hearing aids in recent years have become more sophisti-
cated and able to handle loud signals, we have turned this off this rule by default.
However, if you would like to use it, first set the USER LEVEL to ADVANCED in
the Default. See Section 2.3.2 for details. Then, go into the Custom Menu (press
[MENU], [NEXT], [NEXT]) and turn ON the DIST 90 dB RULE.
Figure 3.5.1—Measuring harmonic distortion
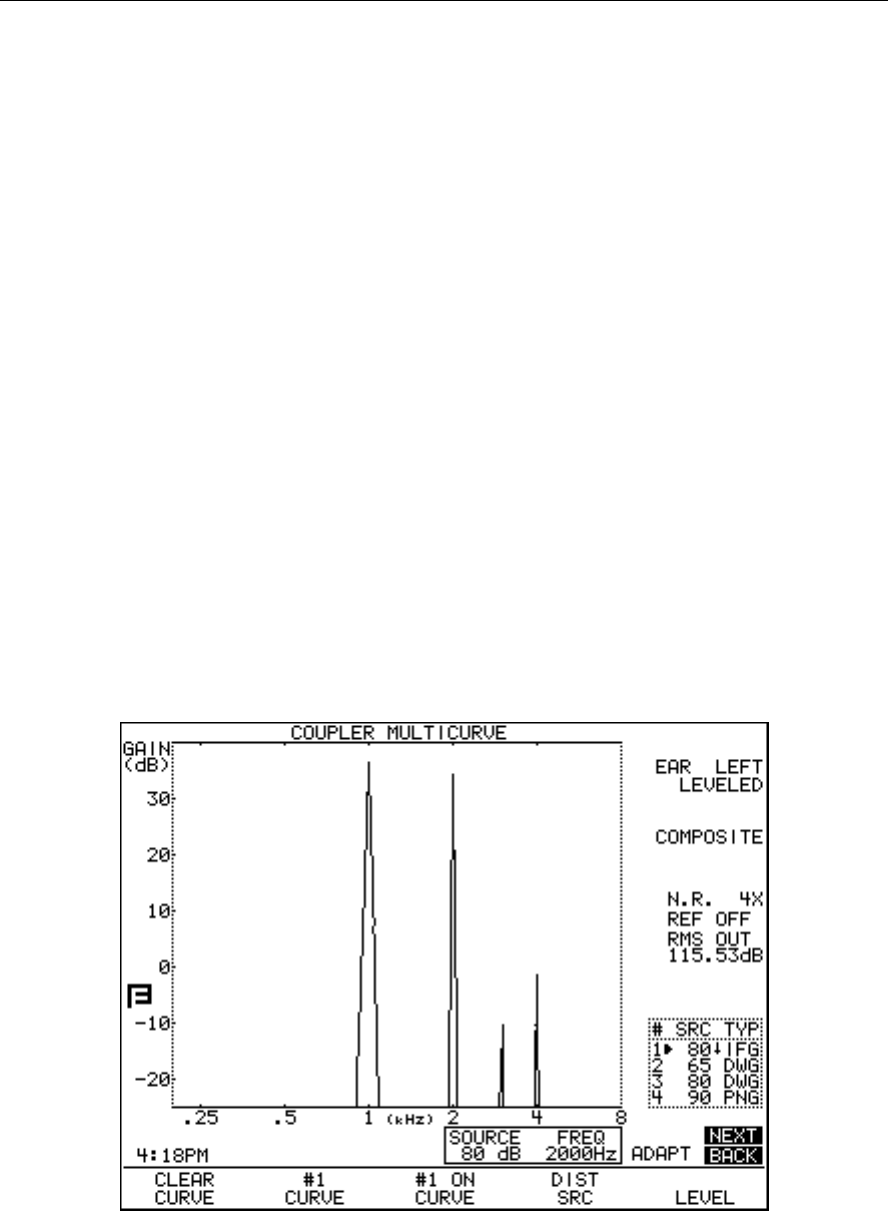
Coupler Measurements 69
3.5.2 Measuring Intermodulation Distortion
Intermodulation (IM) distortion occurs when more than one frequency is pres-
ent in the source signal and those frequencies combine to create new frequen-
cies not actually present in the source.
In the static IM distortion test, the FP35 analyzer produces a signal consisting
of the primary and secondary frequencies, and shows the resulting response as
a composite type display. The measurement is updated in real-time until you
turn it off. See Section 2.5.2.2 for more information on the FP35’s IM distortion
measurement.
1. Press [MENU] from the Coupler Multicurve screen to enter the local menu.
2. Make sure DISTORTION is set to OFF, and make sure the REF MIC is OFF. If
necessary, use the arrow keys to make these selections.
3. Press [NEXT] to enter the Advanced menu.
4. Select IM FREQ DIFF using [q, p].
5. Use [t, u] to select the fixed distance between the primary and second-
ary frequencies used in the measurement. You can choose from no distance
(HARM) to 4000 Hz.
6. Press [EXIT] to return to the Coupler Multicurve screen.
7. Press and hold down [F4]. This will pop up a list of the available selections,
including DIST.
8. Use [p,q] to select DIST.
Figure 3.5.2—Measuring intermodulation distortion
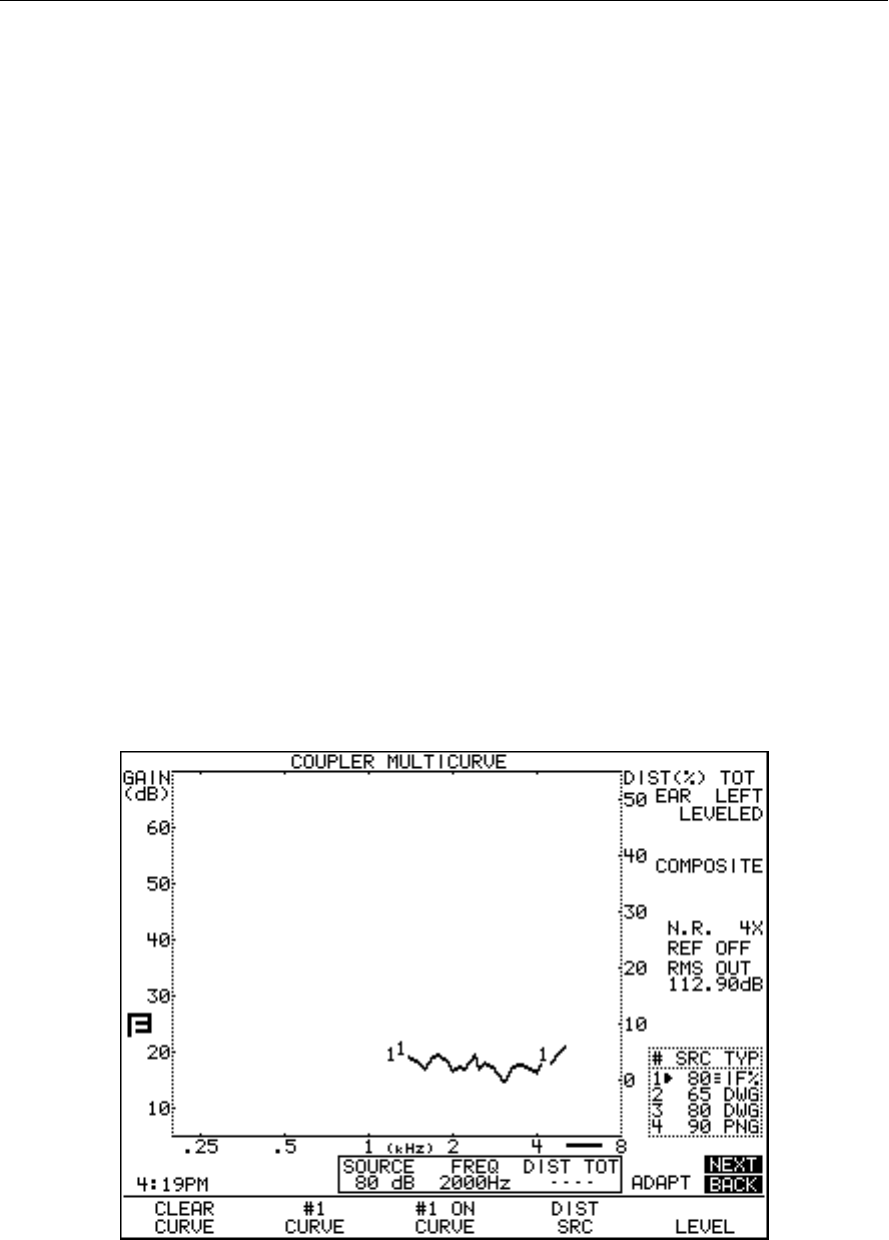
70 FONIX FP35 Hearing Aid Analyzer
9. Press [START/STOP] to make the selection.
10. Set up the aid in the sound chamber for testing as usual. Make sure to tightly
close the lid of the sound chamber.
11. Press [START/STOP] again to start the static IM distortion measurement. See
Figure 3.5.2.
12. Use [t, u] to change the primary frequency of the test. The secondary fre-
quency will also change, remaining a fixed distance (selected in Step 5) away
from the primary frequency.
13. Use [q, p] to change the RMS source of the test signals. Each signal will
have an amplitude 3 dB below the RMS source.
14. Press [START/STOP] to stop the measurement.
3.5.3 Performing an IM Distortion Sweep
In the IM distortion sweep test, the FP35 analyzer produces a sweep of the two
frequency combinations mentioned in the section above. This is similar to a nor-
mal pure-tone frequency sweep, but two frequencies are used at a time instead
of one at a time. The FP35 analyzer measures the IM distortion by looking at fre-
quencies that have a mathematical relationship to the primary frequencies. Any
amplitudes at those frequencies is considered IM distortion. The results are dis-
played as a double-wide line with a percentage scaling found on the right side of
the graph. See Section 2.5.2.2 for details.
1. Press [MENU] from the Coupler Multicurve screen to enter the local menu.
2. Use [q, p] to select DISTORTION.
Figure 3.5.3—IM distortion sweep

Coupler Measurements 71
3. Use [t, u] to select the harmonics where the IM distortion will be mea-
sured. You can select the 2nd distortion, the 3rd distortion, or TOTAL,
which is all frequencies except the primary and secondary frequencies.
4. Make sure the REF MIC is OFF. Use the arrow keys to make this selection, if
necessary.
5. Press [NEXT] to enter the Advanced menu.
6. Use [q, p] to select IM FREQ DIFF.
7. Use [t, u] to select the fixed distance between the primary and secondary
frequencies used in the measurement. You can choose between no distance
(HARM) to 4000 Hz.
8. Press [EXIT] to return to the Coupler Multicurve screen.
9. Use [q, p] to select the RMS source of the test. Each frequency will have
an amplitude 3 dB less than the RMS source.
10. Set up the aid for test in the sound chamber as usual. Make sure to close the
lid of the sound chamber tightly.
11. Press [START/STOP] to perform the IM distortion sweep. The percentage
scaling (DIST %) for the measurement is located on the right side of the
graph. Notice the thick line below the lower right corner of the graph. This
is an indication that the current selected measurement uses the right side
scaling. See Figure 3.5.3 for an example.
3.5.4 Changing the Frequencies of an IM Distortion Sweep
By default, the IM distortion sweep is performed at the frequencies used in the
NORMAL pure-tone sweep. This can be changed to perform the measurements
at fewer frequencies (for a faster test), and more frequencies (for a more com-
plete test). The USER LEVEL must be set to ADVANCED in the Default Settings
menu. See Section 2.3.2 for more details.
1. Press [MENU] from the Coupler Multicurve screen to enter the Coupler
Multicurve menu.
2. Press [NEXT] twice to enter the Custom Menu.
3. Use [ q, p] to select DISTORTION SWEEP.
4. Use [t, u] to make one of the following selections:
•NORM:Tomeasureat1/12octavefrequenciesclosestto100Hzintervals
(default test)
• FAST:Tomeasureat1/3octavefrequenciesclosestto100Hzintervals
(fastest test)
• FULL:Tomeasureatevery100Hzinterval(mostcompletetest)
5. Use the arrow keys to select DIST SWEEP END and choose the final fre-
quency in the IM distortion sweep.
6. Press [EXIT] to return to the Coupler Multicurve screen and follow the
directions in Section 3.5.3 to perform the IM distortion sweep.

72 FONIX FP35 Hearing Aid Analyzer
3.5.5 Turning on/off Impulse Rejection
Impulse rejection can be used to reduce distortion caused by impulses in the
room noise. When noise reduction is used with IM distortion measurements,
several measurements are made to obtain the test results. See Section 2.5.2.2 for
more details. To change the impulse rejection settings, the USER LEVEL must be
set to ADVANCED. See Section 2.3.2 for more details.
1. Press [MENU] in the Coupler Multicurve screen to enter the Coupler
Multicurve menu.
2. Use [q, p] to select NOISE REDUCTION.
3. Use [t, u] to set the level of noise reduction. This must be at least 2X.
4. Press [NEXT] twice to enter the Custom menu.
5. Use [q, p] to select IMPULSE REJ.
6. Use [t, u] to select the amount of impulse rejection you would like in the
IM distortion test. Lower values will make the FP35 analyzer reject more
measurements. Higher values will make the FP35 analyzer less sensitive.
7. Press [EXIT] to return to the Coupler Multicurve screen to make your IM
measurements. See Section 3.5.2 and 3.5.3.
Note: Impulse rejection applies to all measurements, not just IM distortion.
3.5.6 Using the Reference Microphone
If you are in a noisy testing environment, you might want to use the reference
microphone to create more accurate measurements. Remember that any noise
in the testing environment could be amplified by the device and show up as IM
distortion, even though the distortion is coming from the testing environment
and not from the aid itself.
When the reference microphone is turned on, you are no longer measuring
absolute distortion, but relative distortion. That is, you are measuring the differ-
ence between what the measurement microphone is reading inside the coupler
and what the reference microphone is reading outside of the coupler. If there
is noise in the test environment, you will likely see negative distortion values.
To remind you of the difference, the FP35 analyzer displays RLTV on the graph
scale instead of DIST when the reference microphone is turned on.
3.6 CIC Option
The CIC Option is a way of performing a coupler test of a CIC hearing aid which
more accurately reflects the real-ear performance of that aid than a regular 2-cc
coupler measurement. It is not a way to check the manufacturing specifications
of CIC hearing aids because those specifications are based upon 2-cc coupler
measurements.
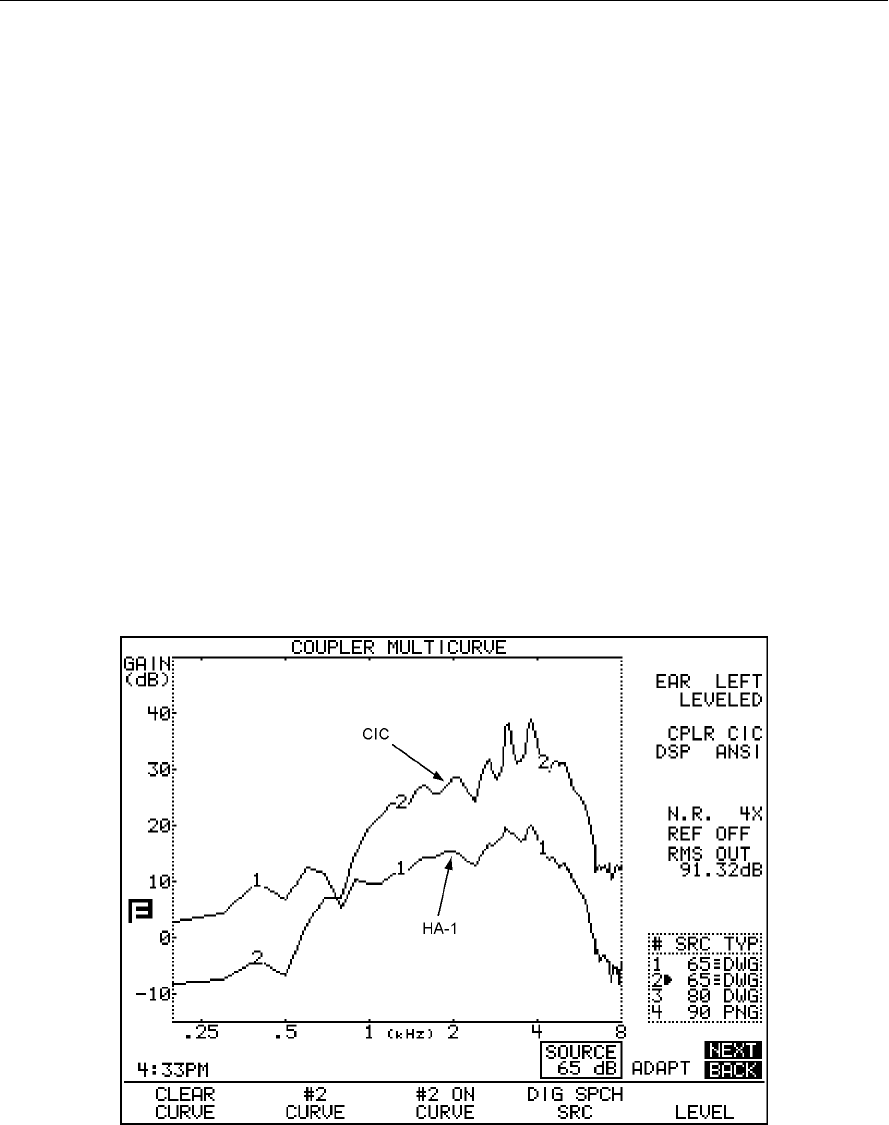
Coupler Measurements 73
The CIC Option consists of a CIC coupler and software correction factors. Both
need to be used in order to correctly perform the measurement.
To measure a CIC hearing aid:
1. Attach the CIC coupler to the CIC aid just as you would attach an HA-1 cou-
pler to the aid, and set the hearing aid up for testing as shown in Section
3.3.2.
2. Press [MENU] from the Coupler Multicurve screen.
3. Highlight COUPLER TYPE with the [q, p] keys.
4. Select CIC with the [t, u] keys.
5. Press [EXIT].
6. Select the desired source type with [F4].
7. Select the desired source amplitude with the [q, p] keys.
8. Press [START/STOP] to perform the measurement. You should see CPLR CIC
appear on the right column of the screen. If necessary, press [START/STOP]
to end measurement.
Figure 3.6 shows the difference between a CIC hearing aid tested with an HA-1
coupler, and the same aid tested with a CIC coupler and correction factors.
Figure 3.6— CURVE 1 uses 2-cc HA-1 coupler
CURVE 2 uses CIC coupler + correction factors

74 FONIX FP35 Hearing Aid Analyzer
3.7 OES Option
The Occluded Ear Simulator (OES) Option consists of software corrector fac-
tors and three special (MZ) couplers. Together, they allow you to obtain the
same data you would get with a standard ear simulator (IEC 711 or Zwislocki
coupler), providing the hearing aid or mold being tested is not vented. This
should give you a coupler measurement that more accurately reflects a real-ear
response of an occluded ear than a 2-cc coupler.
To use the OES Option:
1. Attach the MZ coupler to the aid. See Table 3.7 for details on choosing the
correct MZ coupler.
2. Set up the hearing aid for testing as described in Chapter 3.
3. Press [MENU] from the Coupler Multicurve screen.
4. Highlight COUPLER TYPE with the [q, p] keys.
Table 3.7—Which is the Correct MZ Coupler to use?
TYPE OF AID COUPLER COMMENT
ITE, ITC MZ-1
BTE, or EYEGLASS MZ-1 With custom earmold attached.
(NOTE: Vents must be plugged.)
MZ-2 Without custom earmold attached, when a 3 mm
horn earmold is planned, use with the Ear-Level
Hearing Aid Adaptor that normally snaps onto the
HA-2, 2-cc coupler.
MZ-3 Without custom earmold attached, when a con-
ventional (#13 tubing) earmold is planned, attach a
length of #13 tubing that corresponds to the length
of the sound channel of the wearer’s earmold.
BODY* MZ-2 With snap-on receivers, use the MZ-2 without the
Ear-Level Hearing Aid Adapter attached.
5. Select MZ with the [t, u] keys.
6. Press [EXIT].
7. Select the desired source type with [F4].
8. Select the desired source amplitude with the [q, p] keys.
9. Press [START/STOP] to perform the measurement. You should see CPLR MZ
appear on the right column of the screen. If necessary, press [START/STOP]
to end measurement.
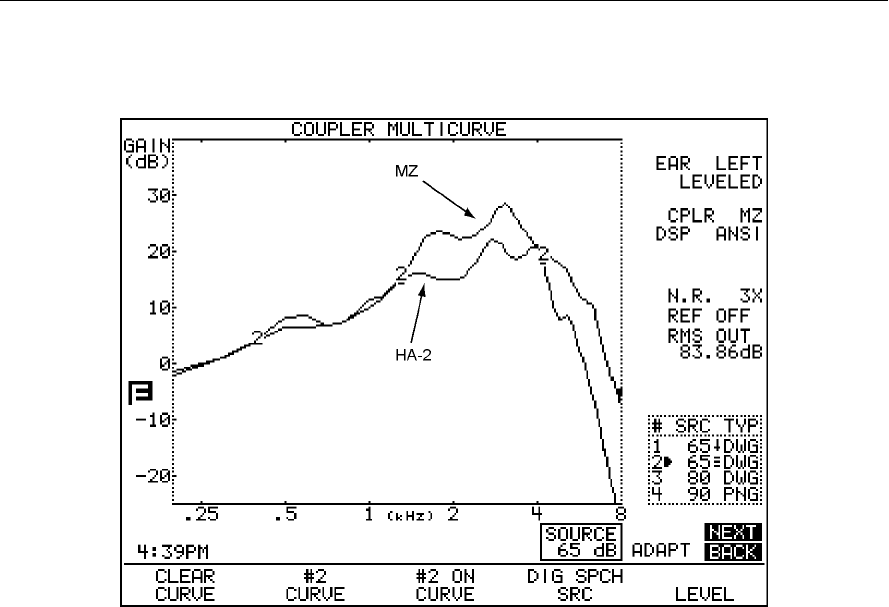
Coupler Measurements 75
See Figure 3.7 for a comparison of a BTE tested with an MZ coupler as opposed
to a 2-cc coupler.
Figure 3.7—Comparison of the responses with the MZ and HA-2 couplers
3.8 Advanced Testing
This section contains information of interest to the advanced user, including
instructions for testing digital and directional aids, and procedures for reversing
and splitting the measurement microphones.
3.8.1 Testing Digital Hearing Aids
The FP35 seamlessly incorporates the testing of digital hearing aids into its nor-
mal testing procedures.
Just follow the steps outlined in Section 3.4.1, choosing DIG SPCH in Step 7.
This digital speech signal source is an interrupted composite signal designed
to imitate the rhythms of speech. The aid will respond to the signal source as
it would respond to actual speech. See Appendix F for details about the digital
speech signal.
Confusion with Terminology
With the new testing technology of hearing aid analyzers combined with the
new technology of hearing aids, it’s easy to get terminology confused. Frye
Electronics has always used “noise reduction” to denote the averaging that
the analyzer makes when analyzing data, as described in Section 2.5.1.3 and
Section 2.5.2.3.
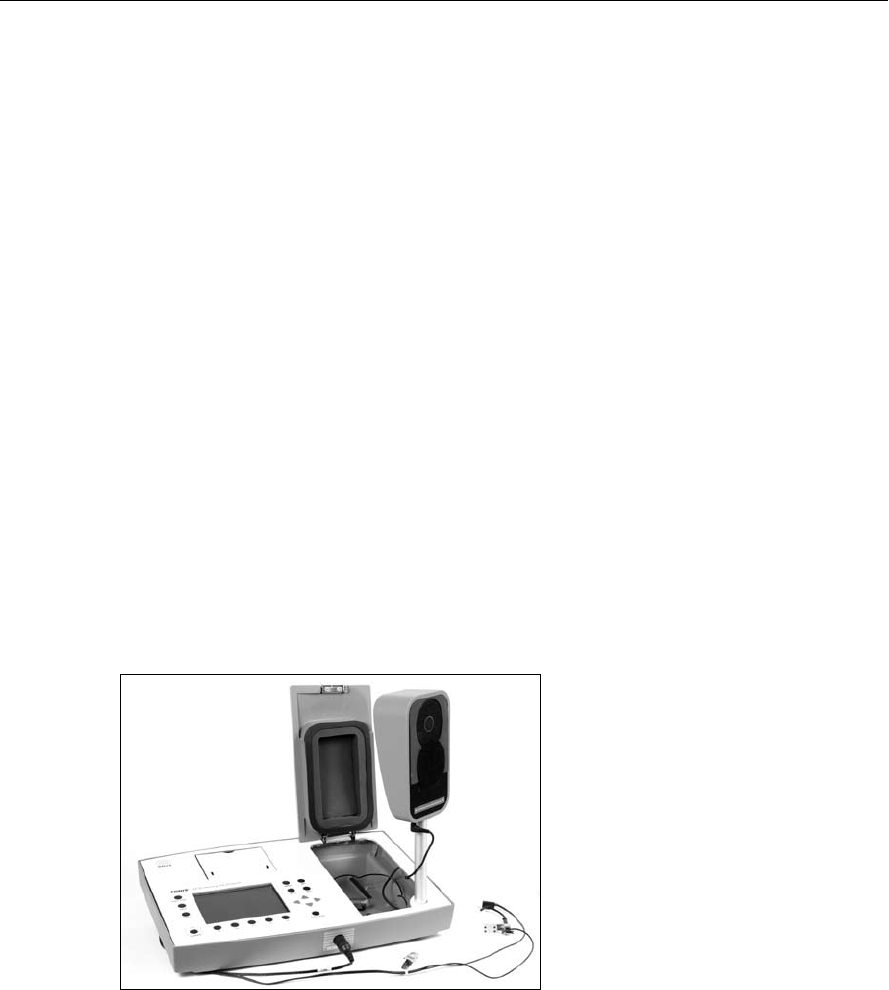
76 FONIX FP35 Hearing Aid Analyzer
Some high-end hearing aids have a function often referred to as “speech
enhancement” or “noise reduction.” This function listens for continuous signals
and lowers the gain of the hearing aid.
Just keep in mind that these are two separate applications of the phrase “noise
reduction” that mean two different things.
3.8.2 Testing Directional Hearing Aids (FP35 with Real Ear option only)
At the most basic level, the function of directional hearing aids is to amplify
sounds in front of the client while decreasing sounds behind the client, increas-
ing his ability to listen to speech in a noisy environment. Perfect tests of direc-
tionality can only be performed in an anechoic chamber, something usually
only available to hearing aid developers and researchers. However, you can use
the FP35 Analyzer to perform a basic check of directionality in order to verify
that the directional microphones are functioning properly.
To check directionality:
1. Take out the sound chamber speaker from its compartment.
2. Take out the extension pole located in the right side of the compartment,
and slide the wide end into the hole located on the bottom right corner of
the analyzer.
3. Install the speaker on the extension pole. See Figure 3.8.2A.
Figure 3.8.2A—Speaker on the extension pole
4. Enter the Coupler Multicurve screen.
5. Press [MENU] to open the local menu.
6. Use the arrow keys to make sure that DISPLAY is set to GAIN and REF MIC
is set to OFF.
7. Press [NEXT] to enter the Advanced menu.
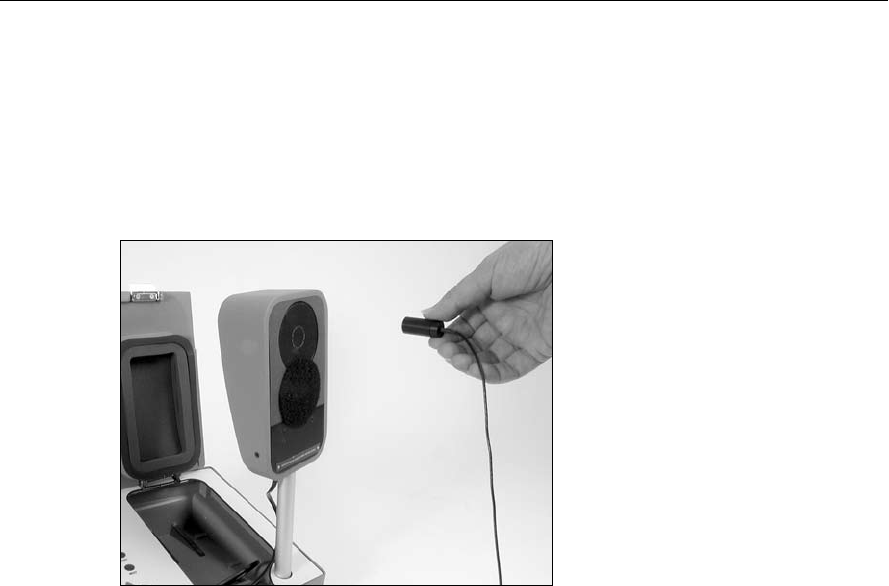
Coupler Measurements 77
8. Use the arrow keys to change LEVELING SOURCE to 70 dBSPL.
9. Press [EXIT] to close the local menu and return to the Coupler Multicurve
screen.
10. Hold the measurement microphone about six inches from the speaker, and
press [F5] to level it. See Figure 3.8.2B. Also see Section 3.2.4 for informa-
tion on changing the leveling source.
Figure 3.8.2B—Hold microphone six inches from the speaker
11. Attach the hearing aid to the appropriate coupler, and insert the measure-
ment microphone, as you would for normal coupler testing. See Section 3.3.
12. Use [F1] to select CRV 1.
13. Use [F4] to select the source type for the test. It is recommended to use
COMP or DIG SPCH, if available. Alternately, use the FAST pure-tone
sweep.
14. Use [q, p] to select the desired source level. It is recommended to use 65
dB SPL.
15. Hold the hearing aid, connected to the coupler and the microphone, six
inches in front of the speaker so that the hearing aid is pointed forward.
16. Press [START/STOP] to start the measurement. When it stabilizes, press
[START/STOP] to stop the measurement.
17. Press [F1] to select CRV 2.
18. Repeat Steps 9-10 to select the same source type and level as used for CRV1.
19. Press [START/STOP] to start the measurement. As it is running, slowing
rotate the hearing aid, maintaining the same distance from the sound field
speaker. The response of the aid should gradually diminish as the sound
field enters the directional aid’s “null” spot. When the response is at its min-
imum level, press [START/STOP] to stop the test.
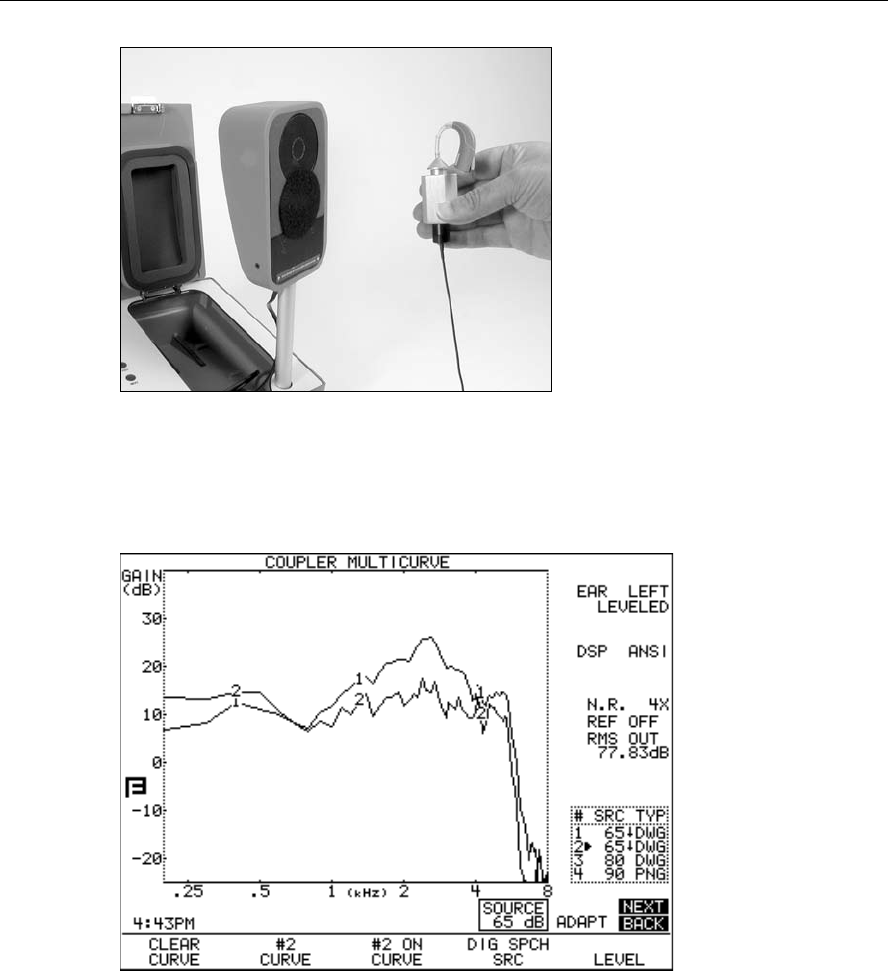
78 FONIX FP35 Hearing Aid Analyzer
Figure 3.8.2C—Make the measurement
20. Compare CRV 1 and CRV 2. See Figure 3.8.2D. If the hearing aid’s response
didn’t change when you rotated the aid in Step 15, it is a good indication
that the aid’s directional microphones are not working properly.
Figure 3.8.2D—Comparison of the directional response of the hearing aid at 0 °(CRV1) and
180 °(CRV2)
3.8.3 Testing with the Reference Microphone
If your FP35 has the M300 microphone, you have two microphones available
for taking measurements. The normal, recommended method for taking coupler
measurements involves the use of just the coupler microphone. The second
microphone, referred to in Coupler Multicurve Mode as the “reference” micro-
phone, is normally set to OFF in the menu settings. (In Real-Ear Mode, this
microphone is referred to as the “probe” microphone.)
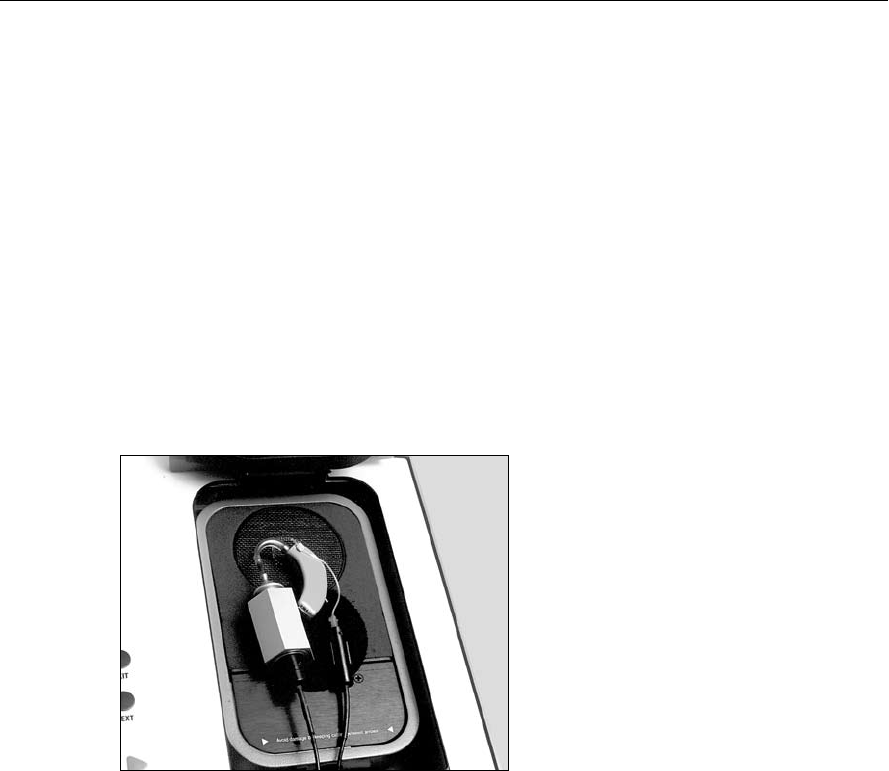
Coupler Measurements 79
However, the FP35 is a true dual microphone system. This means that, if
desired, you can take your coupler measurements using both the coupler micro-
phone and the reference microphone. In this method, the analyzer compares the
response of the aid from inside the coupler with the coupler microphone to the
response of the sound chamber next to the microphone’s receiver with the refer-
ence microphone.
This method of using both microphones is technically more exact than the
normal method of using a single microphone. However, we have found that for
most practical purposes, there is little difference between using one or both
microphones. In fact, if you forget that the reference microphone is on, you
might accidentally leave it outside of the test box during measurements, lead-
ing to wild results. For this reason, we recommend leaving the reference micro-
phone off, unless you are doing research or have some other clinical reason for
measuring with it.
Figure 3.8.3—Testing using the reference microphone
If you choose to use the reference microphone, you should use the leveling pro-
cedure described in Section 3.2.2.
1. Press [MENU]
2. Select REF MIC using the [q, p] keys.
3. Set REF MIC to ON using [t, u] keys.
4. Press [EXIT] to exit from menu.
5. Set up the aid as described in Section 3.3.
6. Place the tip of the probe microphone as close as possible to the hearing aid
microphone without touching it.
7. Test as usual.
Caution: If you set the reference microphone ON, you must use it to run tests. If
you do not, the instrument will return erroneous results.

80 FONIX FP35 Hearing Aid Analyzer
3.8.4 Reversing the Microphones
In normal operation, the coupler microphone functions as the “measurement”
microphone. It takes measurements and, if the reference microphone is on, com-
pares these measurements to the reference microphone.
It’s possible that you might encounter a situation where you want to perform
a measurement in the Coupler Multicurve screen, but the coupler microphone
is too large or somehow otherwise unsuitable for the particular function. If you
have the M300 two-microphone setup on your FP35, you can “reverse” the
microphones in Coupler Multicurve screen so that the probe microphone works
as the “measurement” microphone and the coupler microphone works as the
“reference” microphone. The USER LEVEL must be set to ADVANCED in the
Default Settings menu. See Section 2.3.2 for more details.
To reverse the microphones:
1. Press [MENU] from Coupler Multicurve screen.
2. Press [NEXT] twice to enter the Custom Menu.
3. Highlight MICROPHONES.
4. Use the [t, u] keys to select REVERSE.
5. Press [EXIT] to return to Coupler Multicurve Mode.
Once you have reversed the microphones by following the above procedure, the
coupler multicurve screen will be slightly altered. Instead of a display of REF
ON or REF OFF, the display will read MIC REV if the microphones are reversed
and the reference microphone is off, and REV ON if the microphones are
reversed and the reference microphone is on.
3.8.5 Splitting the Microphones
You can display the simultaneous results of both microphones using the split
microphone feature. This can be useful if you want to see what the reference
microphone is doing separately from the coupler microphone. The USER LEVEL
must be set to ADVANCED in the Default Settings menu. See Section 2.3.2 for
more details.
To split the microphones:
1. From Coupler Multicurve Mode, press [MENU].
2. Highlight REF MIC using the [q, p] keys.
3. Select ON using the [u] key.
4. Press [NEXT] twice to enter the Custom Menu.
5. Highlight MICROPHONES.
6. Select SPLIT using the [u] key.
7. Press [EXIT].
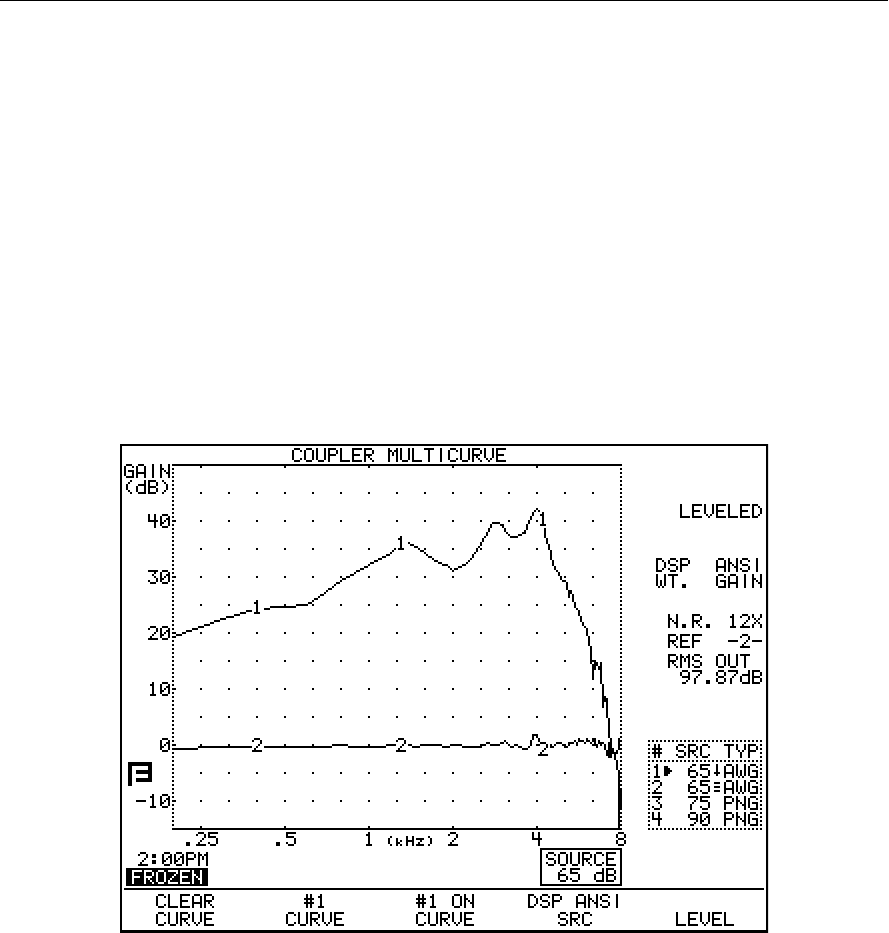
Coupler Measurements 81
8. Select the desired source type with [F4].
9. Select the desired source amplitude using the [q, p] arrow keys.
10. Press [START/STOP] to perform the measurement. If you’re using the
FAST pure-tone sweep or a composite type signal, press [START/STOP]
again to end the measurement.
You should see two graphs on your analyzer. The graph number selected with
[F2] will contain the measurement from the coupler microphone. The next
graph number will contain the measurement from the reference (probe) micro-
phone. So, if you have CRV 1 selected with [F2], CRV 1 will contain the coupler
microphone measurement and CRV 2 will contain the reference microphone
measurement. If you have selected CRV 4 with [F2], CRV 4 will contain the
coupler microphone measurement and CRV 1 will contain the reference (probe)
microphone measurement.
Figure 3.8.5—Curve 1 is the measurement microphone. Curve 2 is the reference microphone
3.8.6 Changing the Signal Filters
Filters are the type of speech weighting applied to the test signals as they are
presented to the hearing aid. By default, the FP35 analyzer automatically
chooses the appropriate speech weighting to use with a particular type of signal.
For instance, when you use a pure-tone signal, a flat weighting is used. That is,
every frequency of the pure-tone sweep has the same amplitude. When you use
the composite signal, the Frye ANSI speech weighting is used. That is, the low
frequencies have higher amplitudes than the higher frequencies.

82 FONIX FP35 Hearing Aid Analyzer
The FP35 analyzer allows you to specifically choose the type of speech weight-
ing you want to use. You do this by altering the FILTER selection in the
Advanced Menu of the Coupler Multicurve and Target Coupler screens and the
Real-Ear Measurement Screens. See Section 2.5.2.1 for more information.
To change the filter in the Coupler Multicurve or Target Coupler screen:
1. Press [MENU] from the measurement screen to enter the local menu.
2. Press [NEXT] to enter the Advanced menu.
3. Use [q, p] to select FILTER.
4. Use [t, u] to select the desired filter type. See Section 2.5.2.1 for an expla-
nation of the available selections.
5. Press [EXIT] to return to the measurement screen. The filter type you have
chosen will now be in effect.
3.8.7 Running a Three-Frequency Average
The ANSI and IEC automated test sequences call for running three frequency
average measurements. This can be done in the Coupler Multicurve screen
when the USER LEVEL is set to ADVANCED in the Default Settings menu. See
Section 2.3.2 for details.
To measure the three frequency average:
1. Select a signal type of NORM with [F4] in the Coupler Multicurve screen.
2. Check the bottom left corner of your screen. You should see one of three
messages: SINGLE, AVG or IDLE. If the message is SINGLE or IDLE, you will
have to put the FP35 in AVG Mode. To do this:
a. Press [MENU].
b. Press [NEXT].
c. Select AVG FREQS using [q, p].
d. Select the highest frequency of the three frequency average using [t, u].
See Section 2.5.1.6 for a complete listing of the available frequencies.
e. Select STATIC TONE using [q, p].
f. Select AVERAGE using [t, u].
g. Press [EXIT] to return to the Coupler Multicurve screen.
3. Look at the display. The FP35 will now be automatically performing the
three-frequency average measurement. Adjust the amplitude using the [q,
p] keys.
If you want to easily turn on and off the three-frequency average, press and hold
down the [F4] key to bring up the function key balloon menu. Use [q, p] to
select SINGLE and press [START/STOP] to complete the selection. Now use the
[START/STOP] key to turn on and off the single pure-tone signal.

Coupler Measurements 83
3.8.8 Measuring the Telecoil Response
Telecoil measurements can be performed in the Coupler Multicurve screen using
any source type available on the analyzer. During a telecoil measurement, a mag-
netic field is used that is supposed to simulate the magnetic field of a telephone
receiver. Two devices can be used to produce this field: an external telecoil board
or the Telewand.
FP35 software setup
Follow these instructions to configure the FP35 for telecoil measurements in the
Coupler Multicurve screen.
1. Follow the instructions found in Section 2.5.8 to set up the FP35 Default
Settings Menu for telecoil measurements.
2. Press F3 from the Opening Screen to enter the Coupler Multicurve screen.
3. Press [MENU] to open the local menu.
4. Use [q, p] to select TELECOIL and use [t, u] to choose ON.
5. Press [EXIT] to close the local menu. The source box at the bottom of the
measurement graph will now indicate TMFS.
6. Follow the instructions in the Telecoil Board Setup or Telewand Setup sec-
tions below, depending upon the device you are using for your telecoil mea-
surements.
Telecoil Board Setup
Follow these instructions for setting up the hearing aid and the FP35 analyzer for
telecoil measurements using an external telecoil board.
1. Plug the telecoil board into the earphone jack or the speaker jack (new style
rear panel only) on the back of the FP35 analyzer.
2. Attach the hearing aid to a coupler in the usual way and set the hearing aid
to telecoil mode.
3. Use [p] to select the desired mA/M strength for the telecoil test. This can
range from 1 to 100 mA/M.
4. Use [F4] to choose COMP, DIG SPCH or FAST for the signal type.
5. Press [START/STOP] to begin the measurement. This will show the output of
the telecoil response.
6. Orient the hearing aid at the center of the telecoil board for maximum output.
Normally this will be when the hearing aid is positioned vertically. See Figure
3.8.8A.
7. Press [START/STOP] to stop the measurement, or continue to test, as desired.
Adjust the source type with [F4] and the strength of the signal with [q, p].
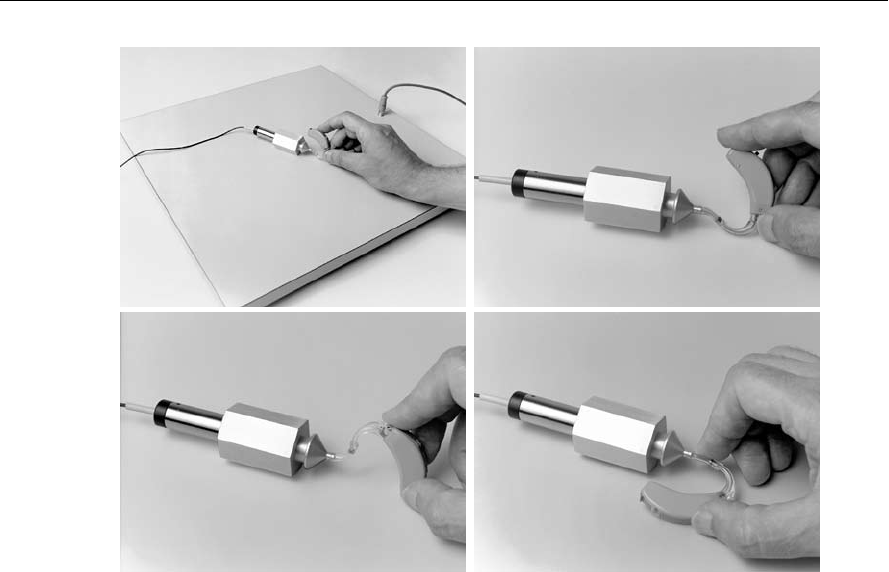
84 FONIX FP35 Hearing Aid Analyzer
Figure 3.8.8A—Orienting hearing aid for maximum output
Telewand Setup
Follow these instructions for setting up the hearing aid and the FP35 analyzer
for telecoil measurements using the Telewand.
1. Plug the Telewand into the earphone jack or the speaker jack (new style rear
panel only) on the back of the FP35 analyzer.
2. Attach the hearing aid to a coupler in the usual way and set the hearing aid
to telecoil mode.
3. Make sure the source box below the measurement graph in the Coupler
Multicurve screen is showing TMFS. This is the proper strength setting for
using the Telewand.
4. Use [F4] to choose COMP, DIG SPCH or FAST for the signal type.
5. Press [START/STOP] to begin the measurement. This will show the output
of the telecoil response.
6. Hold the Telewand next to the hearing aid as if you were holding a tele-
phone receiver to the hearing aid worn on the ear. That is, hold the
Telewand parallel to the body of a BTE or next to the faceplate of an ITE.
7. Position the hearing aid for maximum output. This will normally be when
the hearing aid is oriented vertically. See Figure 3.8.8B.
8. Test as desired. Make sure not to change the strength of the magnetic field
from the TMFS setting.
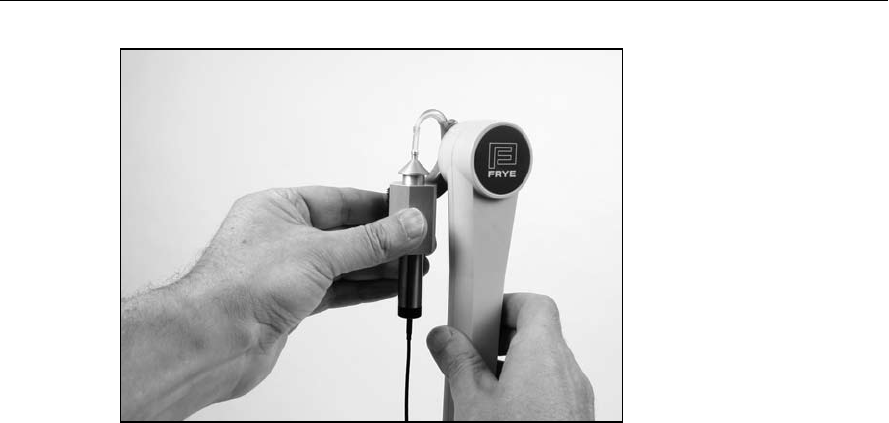
Coupler Measurements 85
Figure 3.8.8B—Using the Telewand
3.8.9 Measuring with an External Signal
Measurements with the FP35 analyzer are typically performed using the inter-
nal signals available in the analyzer, such as puretone sweeps, Composite or
the Digital Speech signal. However, you can also use an external signal from a
device such as a CD player or an MP3 player using the “line-in” 3.5 mm jack
on the back of the analyzer (available on instruments manufactured November
2008 or later).
You will need the Composite/Digital Speech Option to use this feature.
Connecting the External Source
Connect the FP35 to the external source by using the 3.5mm “line-in” jack on
the back of the analyzer. If your analyzer does not have this jack, then it was
probably manufactured previous to the addition of this feature. Existing analyz-
ers can be upgraded. Contact your FONIX distributor for details.
Setting up the FP35
To use an external source for coupler measurements:
1. Enter the Coupler Multicurve screen by pressing the [F3] key from the
Opening screen.
2. Use [F4] to set the source type to COMP.
3. Use the [q] key repeatedly until the source is OFF. This puts the analyzer in
“spectrum analysis mode.”
4. Press [START/STOP] to start the measurement.
5. Turn on the signal from the external player. The signal should now be play-
ing from the FP35 speaker.

86 FONIX FP35 Hearing Aid Analyzer
Calibrating the External Signal
We recommend that you calibrate the external signal for best measurement
results. Many CDs used by hearing health professionals contain a calibration
track as the first track of the CD. This is generally a puretone signal at a particu-
lar input level.
To calibrate the signal on the FP35:
1. Position the coupler microphone in the sound chamber at the reference
point (middle of the white circle).
2. Put the analyzer in spectrum analysis mode and play the calibration track
on the CD through the FP35 speaker using the setup described above. Make
sure to start a measurement by pressing the [START/STOP] key.
3. Adjust the volume control on the external player until the RMS OUT match-
es the desired level of the calibration tone. This level should be indicated in
the instruction materials of the CD.
Adjusting the FP35 External Volume
If your external player doesn’t have a volume control, there are some rough
adjustments that you can make on the analyzer, described below. However, we
recommend using the external player volume control when possible.
1. Press [MENU] from the Opening screen and then press [NEXT] and [NEXT].
This will enter the Resets Default Setting Menu.
2. Change the EXTERNAL VOLUME setting so that it is set to 0 dB using the
arrow keys.
3. Press [EXIT] to return to the Opening screen.
4. Press [F3] to enter the Coupler Multicurve screen.
5. Put the analyzer in spectrum analysis mode and play the calibration track
on the CD through the FP35 speaker using the setup described in the section
“Setting up the FP35” above. Make sure to press the [START/STOP] key to
start a measurement.
6. Use the [F5] key to adjust the volume of the external signal until the RMS
Out matches the desired level of the calibration tone. Available choices are:
+10, +5, 0, -5, -10, -15, -20, -25, -30 dB.

Coupler Measurements 87
3.9 Reference
This section contains specific information on the function of each of the function
keys, and the function of each available menu item.
The menu system in the Coupler Multicurve Mode has been divided into three
different screens: the Primary Menu, the Advanced Menu, and the Custom Menu.
The Primary Menu contains the most basic selections; things you may want to
change frequently. The Advanced Menu contains more advanced features that
you will only need to access occasionally. The Custom Menu is for advanced
users only – most people will probably not need to use it.
3.9.1 Defining the Function Keys
The following describes the function of each key in the Coupler Multicurve
screen.
[F1]—Clears curves. Pressing it once deletes the current curve. Pressing it again
will delete all curves.
[F2]—Cycles through the curve designations: 1, 2, 3, and 4.
[F3]—Turns the display of the selected curve ON and OFF. It doesn’t delete the
curves.
[F4]—Selects source type. Choose between NORM, SHORT, FAST, LONG, COMP,
DIG SPCH. The last two are available only if you have the Composite Option.
[F5]—Levels the sound chamber.
3.9.2 Explaining the Menu Items
This section describes the menu selections available in the Coupler Multicurve
screen. When the USER LEVEL is set to EASY in the Default Settings menu (see
Section 2.3.2 for details), fewer menu items are available. The items starred (*)
below are only available when the USER LEVEL is set to ADVANCED.
The menu system in the Coupler Multicurve screen has been divided into three
different screens: the Main menu, the Advanced menu, and the Custom menu.
Main Coupler Menu
Press [MENU] from the Coupler Screen to enter the Main Coupler menu. Here
are the selections:
EAR—Choose between LEFT, RIGHT, and NONE. The NONE selection will not
display the ear selection on the screen.
DISPLAY—The type of display used in the Coupler Multicurve and Coupler
Target screens. Choose between GAIN and SPL.
DATA/GRAPH—The type of display. Choose between a graphical display and a
numerical display.

88 FONIX FP35 Hearing Aid Analyzer
COUPLER TYPE—This setting will only be displayed if you have purchased
either the CIC or the OES options. It turns on the software correction factors
used with special couplers. If you have purchased the CIC Option, a coupler
type of CIC will be possible here. If you have purchased the OES Option, a cou-
pler type of MZ will be possible here. Also available: 2-cc. (Correction factors
are not used with this selection.)
AID GROUP—The type of hearing aid being tested. Select STANDARD, AGC,
or ADAPTIVE (for adaptive AGC circuits). This selection sets the various delay
times used in pure-tone tests so that they are appropriate to the aid’s circuitry.
See Section 2.4 for more information on delay times.
DISTORTION—Type of harmonic distortion measurement during a pure-tone
sweep. See Section 2.5.1.2 for more information.
NOISE RED (COMP)—Amount of noise reduction used for composite curve
measurements. See Section 2.5.2.3 for more information.
NOISE RED (TONE)—Amount of noise reduction used for pure-tone sweeps.
See Section 2.5.1.3 for more information.
REF MIC—Status of reference microphone. See Section 3.8.3 for more informa-
tion.
Advanced Menu
For more advanced control of your unit, press [NEXT] to go to the Advanced
Menu.
*AUTO-SCALE—The type of scaling used. ON scales the graph to the selected
curve. OFF scales the graph to the highest curve displayed.
*REFERENCE STATUS—The type of RMS measurement made with the refer-
ence microphone. The following selections are available: RMS displays the
overall RMS of the reference microphone, FULL displays the overall RMS and
the signal quality of the reference microphone, and NONE turns off the RMS
display of the reference microphone. See Section 2.5.4 for more information.
*AVG FREQ—The three frequencies used for averaging in pure-tone measure-
ments. Each set is represented on the screen by the highest frequency in the set.
See Section 2.5.1.6 for details.
*STATIC TONE—Status of the static pure-tone measurement. When a pure-tone
source is selected and a sweep isn’t running, measure the response and distor-
tion of a single frequency (SINGLE), the three frequency average chosen in AVG
FREQS (AVG), or no measurement (NONE).
FILTER—The type of speech weighting used on the signal sources. In most
cases, this should be set to AUTO. See Section 2.5.2.1 for more details.

Coupler Measurements 89
*SMOOTHING—Type of smoothing used. Smoothing rounds off the curve,
removing minor peaks. Usually only used for sound field measurements, this
should be off for normal coupler operation. Choose between OFF and LOG.
IM FREQ DIFF—The frequency difference of the two tones presented together
for the intermodulation distortion measurement. See Section 3.5.2.
*EXT SOURCE—The channel selected of the external source. The external source
(see Section 3.8.9) uses a dual channel connector. This means that the input signal
has potentially two different channels. This selection lets you choose which chan-
nel to use as the input signal. Choices are EXT CH1 and EXT CH2.
*PREDELAY TIME—The delay after the first tone is presented and before the
first measurement is taken in a pure-tone measurement. See Section 2.4 for
more information.
*SHORT SETTLE—The time delay between frequencies in a pure-tone sweep,
and the additional delay in a digital speech signal.
*LONG SETTLE—The time delay between frequencies in an input/output mea-
surement, a three-frequency average measurement, or a harmonic distortion
measurement.
PRINT LABEL—Status of the printing label.
PRINTER— Printer used for printouts. Choose INTERNAL to use the built-in
thermal printer. Choose EXTERNAL to use an attached laser or ink-jet printer.
Custom Menu
Press [NEXT] from the Advanced Menu to enter the Custom Menu.
*OUTPUT LIMIT—Level of output limiting, which shuts off the source when
the measured signal exceeds the limit set here. Choices are: OFF and 80-140 dB
SPL. This is usually used only for real-ear type measurements.
*WARBLE SOURCE—The warble rate in pure-tone signals. Warble is usually
used in sound field speaker measurements to reduce problems caused by stand-
ing waves. This is usually turned off for normal coupler measurements. See
Section 2.5.1.4 for more details.
*SIGNAL SKEW—The number of samples from when the signal source leaves
the speaker to when the FP35 analyzes it. See Section 2.5.1.5 for details.
SPEAKER—Selected speaker output. INTERNAL uses the internal speaker jack,
which is usually connected to the internal sound chamber. EXTERNAL uses the
external speaker jack, which can be connected to an external sound chamber.
AUTO uses the internal jack for sound chamber measurements and the external
jack for real-ear measurements.

90 FONIX FP35 Hearing Aid Analyzer
*MIC PORT—Choose the microphone used for Real-ear measurements. Select
AUTO, INTERNAL, EXTERNAL, or EXT LINE. See Section 2.5.9 for details.
*OUTPUT JACK—Select which external source devices are enabled in the cou-
pler screens. SPEAKER enables only the speaker jack. MONO EAR enables only
the left channel of the earphone jack. STEREO EAR enables both channels of
the earphone jack. ALL ON enables the speaker jack and both channels of the
earphone jacks. See Section 2.5.5 for details.
LEVELING SOURCE—The amplitude used for leveling the speaker. This is use-
ful if you need to level with the chamber door open, and you don’t want to use
the loud default level of 90 dB SPL. Choose between 60 and 100 dB SPL.
*IMPULSE REJ—Status of impulse rejection, which rejects noise in the testing
environment. See Section 2.5.6.
*DIST 90 dB RULE—Harmonic distortion measurements are generally made
only when the source of the test signal is below 90 dB SPL. To measure har-
monic distortion at 90 dB SPL or higher, turn this rule OFF.
*DISTORTION SWEEP—The frequencies used in the intermodulation distortion
measurement. NORM uses 1/12 octave frequencies to the nearest 100 Hz. FAST
uses 1/3 octave frequencies to the nearest 100 Hz. FULL uses every 100 Hz fre-
quencies available.
*DIST SWEEP END—The last frequency tested when performing an IM distor-
tion sweep. If the selected frequency is less than or equal to the first primary
frequency in the IM distortion sweep, only the primary frequency will be tested;
there will be no IM distortion sweep.
*MICROPHONES—Special operational selections for your microphones.
Choices are NORMAL, REVERSE, and SPLIT. See Sections 3.8.4 and 3.8.5 for
more details.
*SPECTRUM WINDOW—When performing spectrum analysis of random sig-
nals such as speech or room noise, leave this ON. If you would like to perform
a spectrum analysis of a “phase synchronous” signal, such as might be found in
one of our other instruments, turn this OFF. See Chapter 9 for more details.
*OUTPUT—Select which external source devices are enabled in the Coupler
Multicurve screen. The AUTO and SPEAKER selections enable only the speaker
jack. EARPHONE enables only the earphone jack. BOTH enables both the speak-
er and the earphone jacks. See Section 2.5.5 for details.
* only available when the USER LEVEL is set to ADVANCED in the Default
Settings menu. See Section 2.3.2 for details.

Chapter 4 91
Automated Test Sequences
There are several different automated test sequences available with the FP35
analyzer. One test sequence of your choice is included as a standard feature
when the FP35 is ordered. The other test sequences can be added as optional
features.
The available automated test sequence include: ANSI 96, ANSI 03, IEC, JIS,
and ISI.
4.1 The ANSI Sequence
The ANSI test sequence allows you to test hearing aids according to the ANSI
S3.22 standard. You can use the ANSI test to control the quality of the hearing
aids that you dispense. Compare the manufacturer’s specifications with your
own ANSI measurements of an aid. If they do not conform within expected tol-
erances, you can contact the manufacturer.
There are two versions of the ANSI S3.22 standard on the FP35 analyzer: ANSI
96 and ANSI 03. As of the printing of this manual, ANSI 96 is the current stan-
dard to which the FDA requires hearing aid manufacturers to label their hearing
aids. ANSI 03 will eventually replace this standard, but the date of the switch-
over is not yet known.
Here are the major differences in the two versions of the standard:
• WhenyousetupanAGCaidforanANSI03testsequence,youwillstart
with its compression controls set to minimum (with the compression
knee point set as high as possible). Just before the input/output measure-
ments, the test sequence will pause to allow you to set the compression
controls of the aid to maximum (with the compression knee point set as
low as possible). In ANSI 96, AGC aids are tested with their compression
controls set to maximum for all measurements.
• Whenyouadjustthegaincontrolofthehearingaidmidwaythroughthe
ANSI 03 automated test sequence, the measured reference test gain value
needs to be within 1.5 dB of the target value. In ANSI 96, the measured
value needs to be within 1 dB of the target value.
• TheEINformulainANSI03usesa50dBSPLinputinsteadofthe60dB
SPL input used in ANSI 96. With ANSI 96, any aid with a compression
knee point below 60 dB SPL showed artificially high EIN results. This
means that ANSI 03 EIN test results should be better (lower) for AGC
aids.
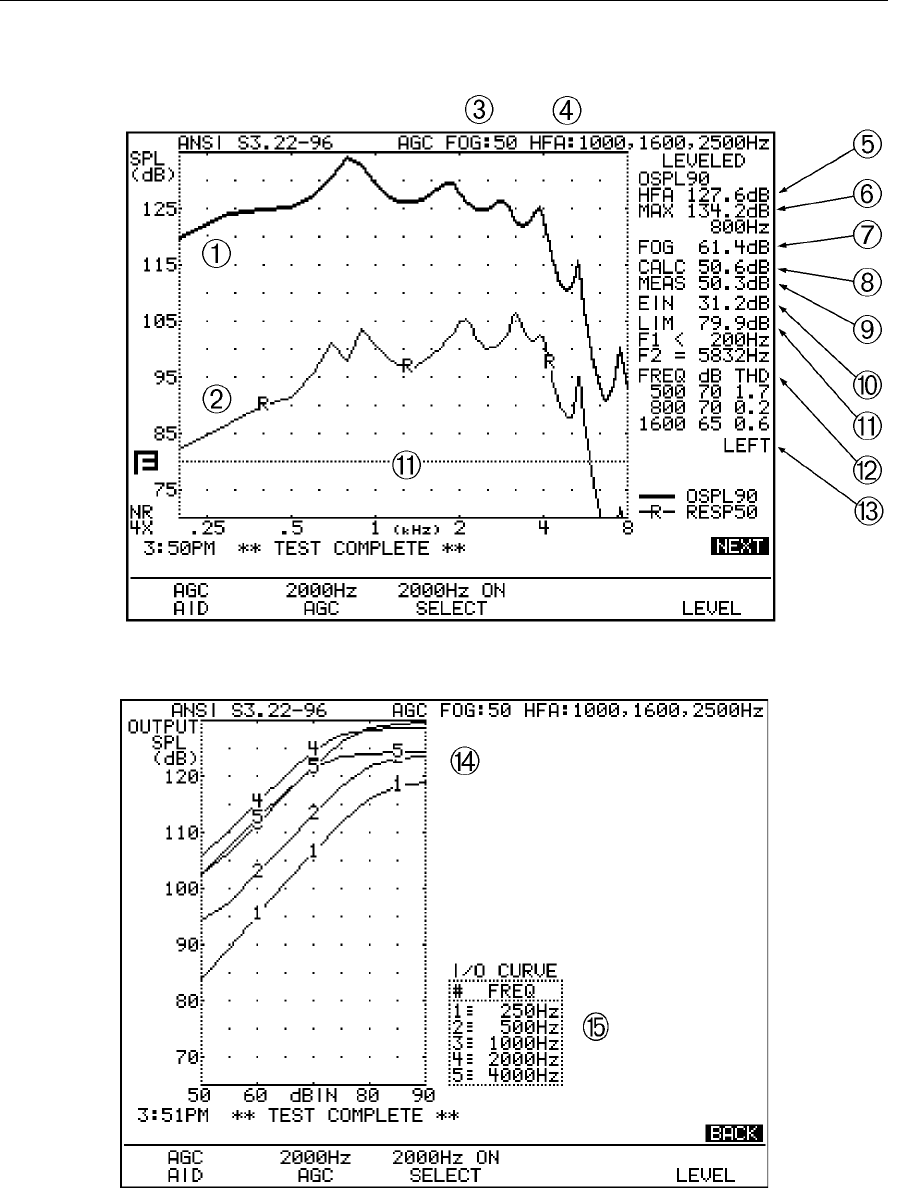
92 FONIX FP35 Hearing Aid Analyzer
4.1.1 Viewing the ANSI ’96 Display
Figure 4.1.1A—ANSI 96 test results, Frequency Response Screen
Figure 4.1.1B—ANSI 96 test, I/O Screen

Automated Test Sequences 93
Refer to Figure 4.1.1A and 4.1.1B for the following explanation of the graphical
display:
1. OSPL 90 curve: full-on gain frequency sweep taken at 90 dB SPL.
2. RESP 50 curve: reference test gain frequency sweep taken at 50 dB SPL.
3. FOG: amplitude of the full-on gain measurement.
4. HFA/SPA: three frequency average chosen in the MENU.
5. OSPL 90 HFA: three frequency average of the OSPL 90 curve.
6. MAX: amplitude and frequency of the maximum output of the aid.
7. FOG: full-on gain three frequency average taken at the amplitude of the
response curve.
8. CALC: target reference test gain.
9. MEAS: measured reference test gain.
10. EIN: equivalent input noise measurement.
11. LIM: The response limit level is determined by taking the three frequency
average of the RESP 50 curve and subtracting 20 dB.
F1 is where the RESP 50 curve crosses the response limit level on the way
up.
F2 is where the RESP 50 curve crosses the response limit level on the way
down.
12. TDH: total harmonic distortion measurements and the frequencies and
amplitudes at which they are taken.
13. Ear tested.
14. I/O curves: the input/output measurements taken of AGC aids. Only selected
frequencies are tested.
15. I/O curve selection box: the key to the I/O graph, listing which frequencies
go with which curve.
4.1.2 Defining the Function Keys
[F1]—Selects hearing aid type.
[F2]—Selects I/O frequency (only available with aid type of AGC or ADAPTIVE
AGC).
[F3]—Sets whether to test I/O frequency selected with F2.
[F5]—Starts the leveling procedure.

94 FONIX FP35 Hearing Aid Analyzer
4.1.3 Leveling
Before you run an ANSI test, you should make sure the sound chamber is lev-
eled. Even if the screen says that the chamber is leveled, it is a good idea to
periodically re-level it to account for any differences that might be affecting the
testing environment.
The ANSI standard requires that you do a special leveling that accounts for
everything that will be in the chamber during the test. If your unit has the
Real-Ear Option, you can level using the reference microphone as described in
Section 3.2.2. Otherwise, follow the procedure described in Section 3.2.1.
Note: For most clinical purposes, the standard leveling procedure (not using the
reference microphone) is adequate.
4.1.4 Switching between ANSI 96 and ANSI 03
To switch between ANSI 96 and ANSI 03, first enter the ANSI test screen
by using either [F4] or [F5] from the Opening screen: select the function key
labeled either ANSI 96 or ANSI 03. From the ANSI screen, push [MENU] to
open the local menu. Use [q, p] to select ANSI TEST and [t, u] to switch
between S3.22-1996 and S3.22-2003. After switching between the standards,
you must press [MENU] twice to update the local menu if you want to make
any further menu changes.
For instructions on changing the default ANSI test selection, see Section 2.3; the
ANSI TEST selection is available in the Advanced Default Settings screen.
4.1.5 Setting up for ANSI testing
The hearing aid controls must be set to conform with ANSI requirements for the
test results to be valid.
1. Set the controls on the aid (except for the compression controls) to give the
greatest possible output and gain.
2. Set the aid for the widest frequency response range.
3. For ANSI 96, set AGC aids to achieve the greatest possible compression or as
otherwise specified by the manufacturer. For ANSI 03, set the compression
controls to have minimum effect or as specified by the manufacturer.
4. If you are testing a digital hearing aid, put it in “test” mode if possible.
5. Set the gain control to full-on.
6. Set the aid up in the sound chamber as described in Section 3.3. If you lev-
eled with the reference microphone on, you can turn it off for measurement
purposes — just make sure to leave it in place in the sound chamber.
7. To measure the telecoil function, follow the instructions in Section 2.5.8
to enable telecoil measurements on the FP35. Then use [F4] in the ANSI
Screen to turn on the ANSI telecoil test.

Automated Test Sequences 95
Setting up a Linear Aid
For ANSI 96, use [F1] to select LINEAR 50 or LINEAR 60. Your selection should
be based upon manufacturer specifications. If the specifications are unavailable,
use:
•50 dB for aids with high gain and relatively low output.
•60 dB all other aids.
If you are unsure which to choose, press [EXIT] to return to the Main Screen
and [F3] to enter the Coupler Multicurve screen. Run a full-on SPL curve at 60
dB and at 90 dB. (See Section 3.4.1 for more information.) If there is less than a
4 dB difference at any frequency between 200 and 5000 Hz, use LINEAR 50 as
your aid type. Choose LINEAR 60 for all other aids.
In ANSI 03, the full-on gain measurement is always taken at 50 dB SPL, so this
selection is not available.
Setting up an AGC Aid
Use [F1] to select AGC or ADAPTIVE AGC.
When you run the ANSI sequence on an AGC aid, you may run up to five dif-
ferent input/output curves. The frequencies that you can choose from are 250,
500, 1000, 2000 and 4000 Hz. Choosing AGC or ADAPTIVE AGC with [F1] will
result in additional selections appearing above [F2] and [F3] that let you control
the input/output settings.
Push [F2] to toggle through the frequencies. Use [F3] to turn the input/output
curve for the current frequency on or off.
Press [NEXT] to see the ANSI I/O Screen. If you haven’t yet run an ANSI test,
the I/O curve selection box will show which curves you have selected to test.
In ANSI 03, you can choose whether or not you want to change the compres-
sion controls midway through the test. According to the ANSI standard, AGC
aids should be set to have minimum compression at the beginning of the test
and maximum compression for the AGC part of the test. However, if you don’t
want to adjust the compression controls during the test sequence, you can set
the analyzer to skip the pause it usually makes in the test sequence to allow you
to adjust the compression controls.
To do this:
1. Press [MENU] to open the local menu.
2. Make sure that ANSI TEST is set to S3.22-2003. If it isn’t, change the ANSI
TEST selection and press [MENU] twice to refresh the local menu.
3. Adjust the AGC SWITCHING selection. A choice of ON will include the
pause in the test sequence that will allow you to adjust the compression
controls. A choice of OFF will remove the pause from the test sequence.

96 FONIX FP35 Hearing Aid Analyzer
4.1.6 Running an ANSI Test
After making any necessary menu selections as described in Section 4.1.8, lev-
eling the sound chamber as described in Section 3.2, and setting up the aid as
described in Section 3.3, follow these instructions:
1. Press [START/STOP] to begin the test.
2. Usually the FP35 will pause during the measurement process in order to let
you adjust the gain of the hearing aid to the reference test position.
a. Lift the sound chamber lid and adjust the gain control of the aid until the
MEASURED gain matches TARGET gain.
b. Close the sound chamber lid when finished.
c. The MEASURED gain should be within 1 dB of the TARGET gain. (ANSI
03 only requires that you match the target within 1.5 dB.)
3. Press [START/STOP] to continue the test sequence. If you have enabled the
telecoil test, do the following. Otherwise, skip to step 4.
a. Wait for the analyzer to pause for you to set up the hearing aid for the
telecoil test.
b. Set the hearing aid to telecoil mode and position it for maximum output.
See Section 3.8.7 for instructions on how to determine this position.
c. Press [START/STOP] to run the telecoil measurement.
d. Wait for the analyzer to pause, set the hearing aid back into microphone
mode, and reposition the hearing aid in the test box.
e. Press [START/STOP] to continue the ANSI test sequence.
4. If you are measuring an ANSI test, push [START/STOP] to continue the
test. If you are measuring to ANSI 03 and have set the aid type to AGC or
ADAPTIVE, the analyzer will pause again after several measurements have
been taken. Adjust the AGC controls of the aid to have maximum effect (or
as specified by the manufacturer) and press [START/STOP] again to com-
plete the test sequence. The analyzer will not pause if the ANSI TEST is set
to S3.22-1996 or if AGC SWITCHING is OFF in the local menu. (See Section
4.1.5)
5. Press [NEXT] to view the ANSI I/O Screen for AGC aids.
6. Press [PRINT] for a hard copy of the results.
4.1.7 Testing Digital Hearing Aids
The ANSI S3.22 “labeling” standard for hearing aids was not designed with digi-
tal hearing aids in mind. In fact, most of the testing methods employed by ANSI
have been around since the 1970s. However, since ANSI is a standard, in order
to conform to that standard, it must use only the testing techniques outlined
in the standard. For this reason, the FP35 has no provisions for incorporating
composite or digital speech into the ANSI 96 or ANSI 03 test sequences.

Automated Test Sequences 97
In order to test digital hearing aids with “noise reduction” or “speech enhance-
ment” features to the ANSI 96 or ANSI 03 standards, put the aid in “test” mode
via its programming software and do the steps outlined in Section 4.1.6.
In order to get an accurate picture of the aid’s actual performance when it goes
home with your client, put the aid in the mode you will use for that client, and
perform response curve measurements in the coupler and in the real-ear mode
via the procedures described in Chapter 3 and Chapter 5 using the digital speech
(DIG SPCH) signal source.
4.1.8 Understanding Menu Items
There are two menus for the ANSI test screen. The first contains the most basic
items; things you may want to change frequently. The advanced menu contains
more advanced features that most users probably don’t need to access.
Main ANSI Menu
Press [MENU] from the ANSI test screen to enter the local menu. Here are the
selections:
ANSI TEST—ANSI standard selected for the test sequence. Choose between
S3.22-1996 and S3.22-2003. Once this selection is changed, you will need to
press [MENU] twice to update the local menu.
AGC SWITCHING—Choose whether or not to include a pause in the test
sequence that will allow you to adjust the compression controls of the AGC aid
from minimum to maximum. A selection of ON will include the pause. A selec-
tion of OFF will remove the pause. This setting is available only when ANSI
TEST is set to S3.22-2003. See Section 4.1.5.
EAR— Ear tested. Select LEFT, RIGHT, or NONE. When NONE is selected, the ear
will not be labeled on the ANSI results.
AVG FREQS—The three frequencies used in the ANSI three frequency aver-
ages. The last frequency of the three-frequency pair is used as the selection. See
Section 2.5.1.6 for a complete list of available frequencies.
EQ INPUT NOISE—The type of equivalent input noise measurement (EIN) made
with the ANSI test. NORMAL sets the EIN to use the entire 200 Hz - 8000 Hz fre-
quency band. A selection of 5KHz sets the frequency band to 200 Hz - 5000 Hz
(recommended), and a selection of OFF skips the EIN entirely.
NOISE RED—The amount of noise reduction used for the pure-tone measure-
ments. See Section 2.5.1.3.
REF MIC—The status of the reference microphone.

98 FONIX FP35 Hearing Aid Analyzer
Advanced ANSI Menu
Reach the following menu choices by pressing [NEXT] while the main menu is
open.
HDIST 12DB—Status of the harmonic distortion rule. The ANSI standard states
that when measuring harmonic distortion, if the amplitude of the response
curve at second harmonic of the distortion frequency is 12 dB greater than the
response curve at the distortion frequency, the harmonic distortion measure-
ment should be ignored. Choose ON to apply this rule. Choose OFF to ignore
this rule.
PREDELAY TIME—The delay after the first tone is presented and before the first
measurement is taken. See Section 2.4 for more information.
SHORT SETTLE—The time delay between the frequencies of a pure-tone sweep
and input/output curves.
LONG SETTLE—The time delay between the frequencies of a three frequency
average and distortion measurements.
IO PREDELAY TIME—The delay after the first tone is presented and before the
first measurement is taken in an input/output curve. This selection is only avail-
able when the aid type of the hearing aid is set to AGC or ADAPTIVE.
IO SETTLE—The delay after the second tone (and all subsequent tones) is
presented and before the measurement is taken in an input/output curve.
This selection is only available when the type of hearing aid is set to AGC or
ADAPTIVE.
PRINT LABEL— Status of the printing label. Choose ON or OFF.
PRINTER— Printer used for printouts. Choose INTERNAL to use the built-in
thermal printer. Choose EXTERNAL to use an attached laser or ink-jet printer.
4.2 IEC Testing
The IEC 118-7 standard was designed by the International Electrotechnical
Commission to assess hearing aids. The performance part of that standard can
be included as an automated sequence on your FP35.
Press [F4] from the Opening Screen of the FP35 analyzer.
4.2.1 Viewing the IEC Display
Refer to Figure 4.2.1A and Figure 4.2.1B for the following explanation of the
graphical display.
1. OSPL 90 curve: full-on gain frequency sweep taken at 90 dB SPL.
2. FOG: full-on gain curve taken at 50 or 60 dB SPL. Select with [F2].
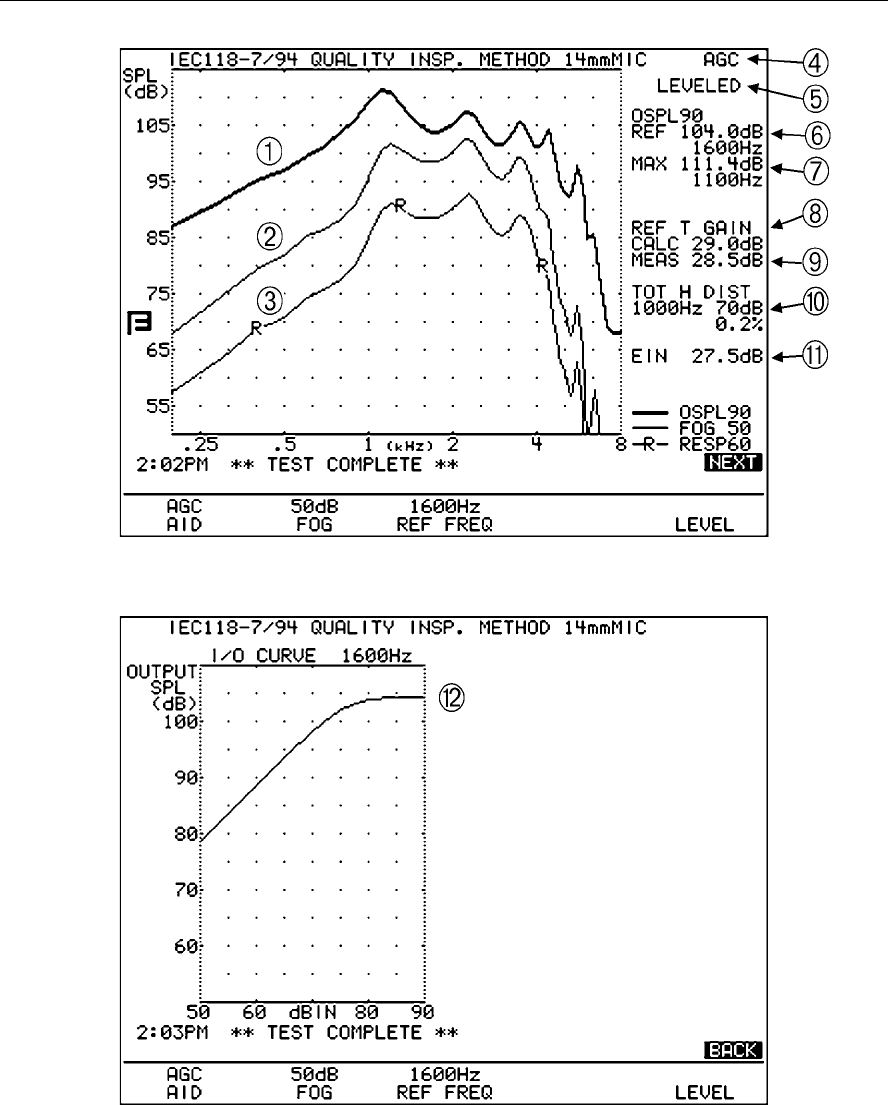
Automated Test Sequences 99
Figure 4.2.1A—IEC test results, Frequency Response Screen
Figure 4.2.1B—IEC test results, I/O Screen
3. RESP: reference test gain frequency sweep taken at 60 dB SPL.
4. Aid type. Select with [F1].

100 FONIX FP35 Hearing Aid Analyzer
5. Leveling status.
6. OSPL90 REF: frequency response of OSPL90 curve at reference frequency
(1600 or 2500 Hz). Select with [F3].
7. MAX: amplitude and frequency of the maximum output of the aid.
8. CALC: target reference test gain.
9. MEAS: measured reference test gain.
10. TOT H DIST: total harmonic distortion measured at frequency selected in
[MENU].
11. EIN: equivalent input noise measurement.
12. I/O CURVE: input/output curve at reference frequency (1600 or 2500 Hz).
Select with [F3].
4.2.2 Defining the Function Keys
[F1] Selects aid type: LINEAR, AGC or ADAPTIVE AGC.
[F2] Selects whether full-on gain curve will be run at 50 dB or at 60 dB.
[F3] Selects the reference test position to be 1600 Hz or 2500 Hz.
[F5] Levels the sound chamber.
4.2.3 Setting Up the Hearing Aid for Testing
1. Set the controls on the aid (except for compression controls) to give the
maximum output and gain.
2. Set the aid for the widest frequency response range.
3. Set AGC aids for maximum compression.
4. Make sure that the gain control of the aid is full on.
5. Set the aid up in the sound chamber as described in Chapter 3.
6. Press [F1] to select aid type.
7. Press [F2] to select between a full-on gain measurement at 50 dB or at 60 dB.
8. Press [F3] to select a reference frequency of 1600 Hz or 2500 Hz. Select 2500
Hz for high frequency emphasis aids.
4.2.4 Running an IEC Test
1. Level the sound chamber as described in Section 3.2, if needed.
2. Push the [START/STOP] key.
3. The FP35 will pause during the measurement process in order to let you
adjust the gain of the hearing aid to the reference test position.
a. Lift the sound chamber lid and adjust the gain control of the aid until the
MEASURED gain matches TARGET gain.

Automated Test Sequences 101
b. Close the sound chamber lid when finished.
c. The MEASURED gain should be within 1 dB of the TARGET gain.
4. Push [START/STOP] to complete the test.
5. Press [NEXT] to view the I/O Screen if the aid type was set to AGC or
Adaptive AGC.
6. Press [PRINT] for a hard copy of the results.
4.2.5 Defining the Menu Items
There are two menus for the IEC Screen. The first contains the most basic items;
things you may want to change frequently. The Advanced Menu contains more
advanced features that most users probably don’t need to access.
Main IEC Menu
Open the main IEC Menu by pressing [MENU] from the IEC Screen.
EQ INPUT NOISE—The type of equivalent input noise measurement (EIN) made
with the IEC test. NORMAL sets the EIN to use the entire 200 Hz - 8000 Hz fre-
quency band. A selection of 5KHz sets the frequency band to 200 Hz - 5000 Hz
(recommended), and a selection of OFF skips the EIN entirely.
DISTORTION FREQ—The frequency used to take the harmonic distortion test.
NOISE RED—The amount of noise reduction used for the pure-tone measure-
ments. See Section 2.5.1.3.
REF MIC—The status of the reference microphone.
Advanced IEC Menu
Reach the following menu choices by pressing [NEXT] while the IEC Menu is
open.
PREDELAY TIME—The delay after the first tone is presented and before the first
measurement is taken. See Section 2.4 for more information.
SHORT SETTLE—The time delay between the frequencies of pure-tone sweeps
and input/output curves.
LONG SETTLE—The time delay between the frequencies of three frequency aver-
ages and distortion measurements.
PRINT LABEL—Status of the printing label. Choose ON or OFF.
PRINTER—Printer used for printouts. Choose INTERNAL to use the built-in ther-
mal printer. Choose EXTERNAL to use an attached laser or ink-jet printer.

102 FONIX FP35 Hearing Aid Analyzer
4.3 JIS Testing
The JIS 2000 automated test sequence allows you to test hearing aids according
to the Japanese Instrument Standard.
To enter the JIS screen, look at the function key labels above [F4] and [F5] in
the Opening screen. If one of them reads “JIS,” press it to enter the screen.
Otherwise, press and hold down [F4] or [F5] until a function key balloon menu
appears. Use the arrow keys to select JIS, and press [START/STOP] to enter the
screen.
4.3.1 Viewing the JIS Display
Refer to Figure 4.3.1A and Figure 4.3.1B for the following explanation of the
graphical display.
1. OSPL 90 curve: full-on gain frequency sweep taken at 90 dB SPL.
2. FOG: full-on gain curve taken at 50 or 60 dB SPL. Select with [F2].
3. RESP: reference test gain frequency sweep taken at 60 dB SPL.
4. Aid type. Select with [F1].
5. CPLR: coupler typed used. Select in menu.
6. FOG: level with which the full-on gain curve was measured.
7. REF: reference frequency used.
8. Leveling status.
9. OSPL90 500: frequency response of OSPL90 curve at 500 Hz.
10. OSPL90 REF: frequency response of OSPL90 curve at reference frequency
(1600 or 2500 Hz). Select with [F3].
11. OSPL90 MAX: amplitude and frequency of the maximum output of the aid.
12. FOG CALC: target reference test gain.
13. FOG MEAS: measured reference test gain.
14. EIN: equivalent input noise measurement.
15. LIM: response limit level determined by taking the frequency response of
the RESP 50 (or 60) curve at the reference frequency and subtracting 15 dB.
F1: frequency at which the RESP 50 (or 60) curve crosses the response limit
level on the way up.
F2: frequency at which the RESP 50 (or 60) curve crosses the response limit
level on the way down.
16. TOT H DIST: total harmonic distortion measurements and the frequencies
and amplitudes at which they are taken.
17. I/O CURVE: input/output curve at reference frequency (1600 or 2500 Hz).
Select with [F3].
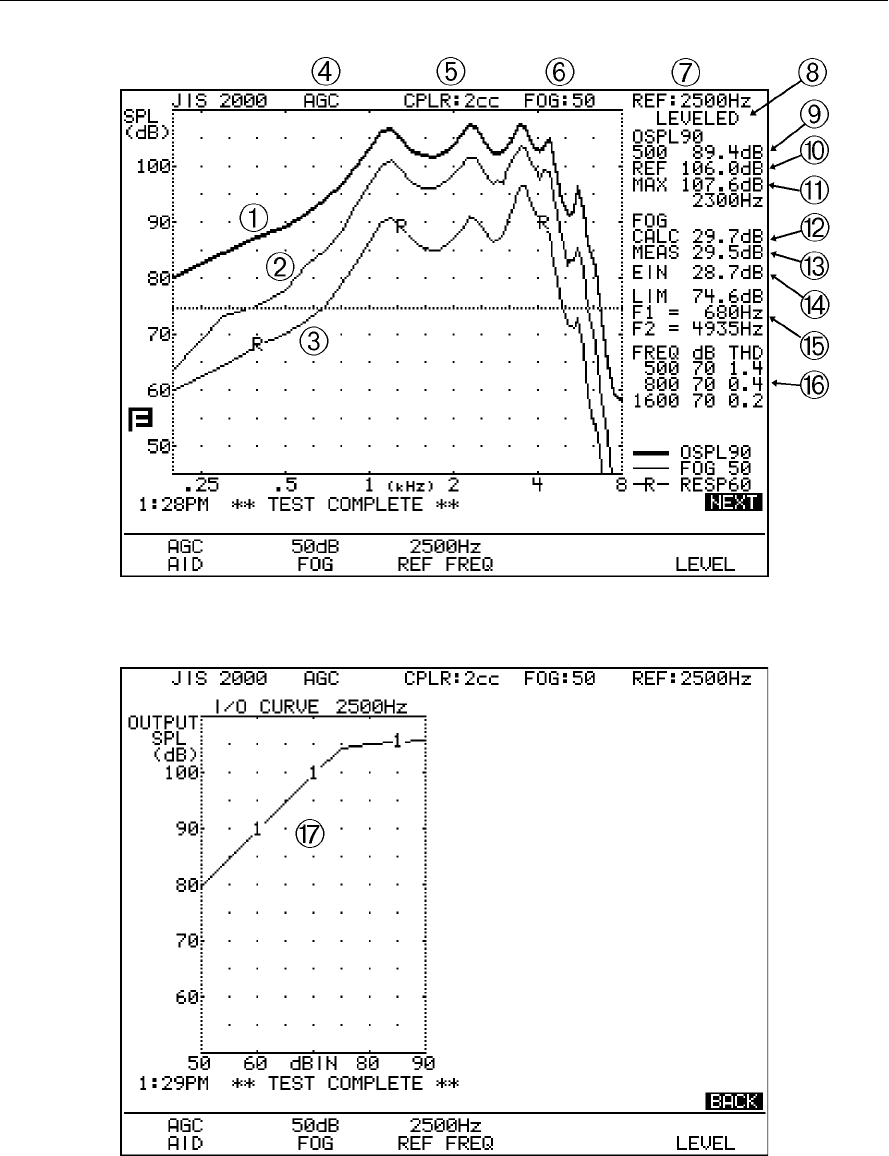
Automated Test Sequences 103
Figure 4.3.1A—JIS test results, Frequency Response Screen
Figure 4.3.1B—JIS test results, I/O Screen

104 FONIX FP35 Hearing Aid Analyzer
4.3.2 Defining the Function Keys
[F1] Selects aid type: LINEAR, AGC or ADAPTIVE AGC.
[F2] Selects whether the full-on gain curve will be run at 50 dB or at 60 dB.
[F3] Selects the reference test position to be 1600 Hz or 2500 Hz.
[F5] Levels the sound chamber.
4.3.3 Setting Up the Hearing Aid for Testing
1. Set the controls on the aid (except for compression controls) to give the maxi-
mum output and gain.
2. Set the aid for the widest frequency response range.
3. Set AGC aids for maximum compression.
4. Make sure that the gain control of the aid is full on.
5. Set the aid up in the sound chamber as described in Chapter 3.
6. Press [F1] to select aid type.
7. Press [F2] to select between a full-on gain measurement at 50 dB or at 60 dB.
8. Press [F3] to select a reference frequency of 1600 Hz or 2500 Hz. Select 2500
Hz for high frequency emphasis aids.
4.3.4 Running the JIS Test
1. Make sure the sound chamber is leveled. Follow the instructions found in
Section 3.3, if needed.
2. Push the [START/STOP] key.
3. The FP35 will pause during the measurement process in order to let you
adjust the gain of the hearing aid to the reference test position.
a. Lift the sound chamber lid and adjust the gain control of the aid until the
MEASURED gain matches TARGET gain.
b. Close the sound chamber lid when finished.
c. The MEASURED gain should be within 1 dB of the TARGET gain.
4. Push [START/STOP] to complete the test.
5. Press [NEXT] to view the I/O Screen.
6. Press [PRINT] for a hard copy of the results.
4.3.5 Defining the Menu Items
There are two menus for the IEC Screen. The first contains the most basic items;
things you may want to change frequently. The Advanced Menu contains more
advanced features that most users probably don’t need to access.

Automated Test Sequences 105
Main JIS Menu
Open the main JIS menu by pressing [MENU] from the JIS Screen.
COUPLER TYPE—Type of coupler used for the test sequence. Choose between
2cc, MZ, and CIC.
EQ INPUT NOISE—The type of equivalent input noise measurement (EIN) made
with the JIS test. NORMAL sets the EIN to use the entire 200 Hz - 8000 Hz fre-
quency band. A selection of 5KHz sets the frequency band to 200 Hz - 5000 Hz
(recommended), and a selection of OFF skips the EIN entirely.
NOISE RED— The amount of noise reduction used for the pure-tone measure-
ments. See Section 2.5.1.3.
REF MIC— The status of the reference microphone.
Advanced Menu
Reach the following menu choices by pressing [NEXT] while the JIS Menu is
open.
HDIST 12DB—Status of the harmonic distortion rule. The ANSI standard states
that when measuring harmonic distortion, if the amplitude of the response curve
at second harmonic of the distortion frequency is 12 dB greater than the response
curve at the distortion frequency, the harmonic distortion measurement should
be ignored. Choose ON to apply this rule. Choose OFF to ignore this rule.
PREDELAY TIME—The delay after the first tone is presented and before the first
measurement is taken. See Section 2.4 for more information.
SHORT SETTLE—The time delay between the frequencies of pure-tone sweeps
and input/output curves.
LONG SETTLE—The time delay between the frequencies of three frequency aver-
ages and distortion measurements.
PRINT LABEL— Status of the printing label. Choose ON or OFF.
PRINTER— Printer used for printouts. Choose INTERNAL to use the built-in
thermal printer. Choose EXTERNAL to use an attached laser or ink-jet printer.
4.4 ISI Testing
The ISI automated test sequence tests hearing aids to the ISI IS-10775-1984
standard. ISI is very similar to the IEC automated test sequence except that it
calculates the three-frequency HFA of the OSPL90 instead of the one-frequency
reference response, it tests the harmonic distortion at three different frequencies
instead of only one, and it provides an intermodulation distortion measurement
taken with tones at 1500 and 2500 Hz, referred to as the “difference frequency
distortion” (DF DIST).

106 FONIX FP35 Hearing Aid Analyzer
Because the FP35 does not support battery current drain measurements, if the
1.0 volt testing part of the ISI standard needs to be performed, the user will
need to attach an external 1.0 volt battery simulator (or a weak battery) to the
hearing aid and run the ISI test sequence again, marking the results as being
done at 1.0 volts.
To enter the ISI screen, look at the function key labels above [F4] and [F5] in
the Opening screen. If one of them reads “ISI,” press it to enter the screen.
Otherwise, press and hold down [F4] or [F5] until a function key balloon menu
appears. Use the arrow keys to select ISI, and press [START/STOP] to enter the
screen.
See Section 4.2 for instructions on running the IEC test sequence. ISI testing is
performed in the same manner.
Refer to Figure 4.4A and Figure 4.4B for the following explanation of the ISI test
results:
1. OSPL90: Response curve made at full-on gain at 90 dB SPL
2. FOG: Full-on gain response curve made at 50 or 60 dB SPL
3. RESP50: Response curve at 50 or 60 dB SPL at reference test gain
4. Aid type
5. Amplitude used to measure the full-on gain curve
6. Reference frequency
7. Leveling status
8. OSPL90 HFA: High frequency average of the OSPL90 curve
9. OSPL90 MAX: Maximum output of the OSPL90 curve and the frequency at
which it was measured
10. FOG: Reference frequency response made at full-on gain
11. HFA: High frequency average made at full-on gain
12. CALC: Calculated reference test gain
13. Equivalent input noise
14. LIM: Response limit
F1: Frequency at which the response curve first crosses the response limit.
F2: Frequency at which the response curve last crosses the response limit.
15. Total harmonic distortion
16. DF DIST: Difference frequency distortion, also known as intermodulation
distortion
17. I/0 curve
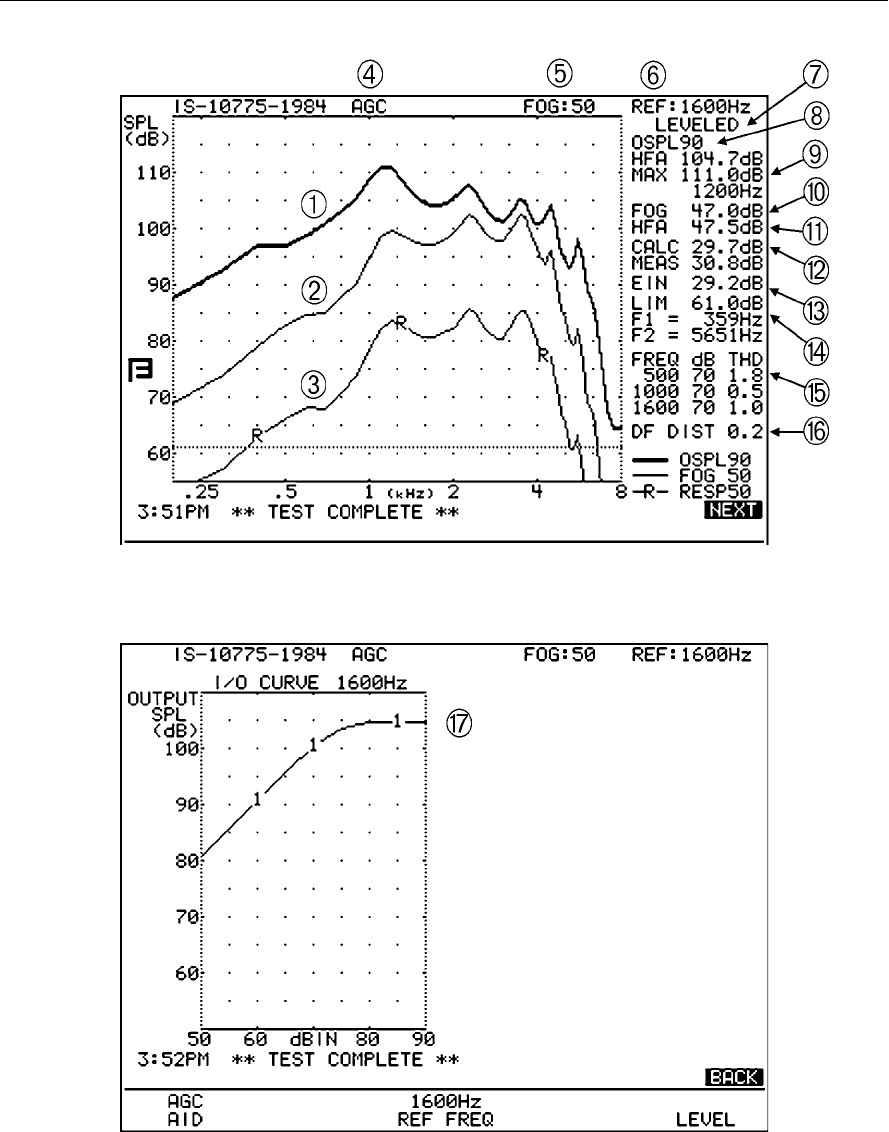
Automated Test Sequences 107
Figure 4.4A—ISI test sequence results
Figure 4.4B—ISI test sequence results

Chapter 5 109
Real-Ear Measurements
5.1 Introduction
When the Real-Ear Option is ordered with your FP35 analyzer, you can test
the hearing aid inside the patient’s ear using the probe microphone. When per-
formed correctly, this is the most accurate test available of the hearing aid’s per-
formance because it is measured using the patient’s own ear canal resonance.
In the real-ear measurement screens, you can input an audiogram, generate a
target, and take insertion gain and SPL measurements.
5.1.1 Real-Ear Screens
There are four different real-ear screens on the FP35 analyzer. One of these
screens is for creating a real-ear target: the Audiogram Entry Screen. The other
three screens are for performing real-ear measurements: the Unaided & Aided,
Insertion Gain, and SPL Screen—the insertion-gain technique for fitting hearing
aids has been separated into two separate screens to make it easy to distinguish
between gain curves and insertion gain curves.
Audiogram Entry—Enter your audiograms, choose your fitting rule, perform
RECD and REDD measurements, and generate a target in this screen.
Real-Ear SPL—View thresholds, UCLs, targets, and aided measurements in real-
ear SPL on one screen. This gives you a complete picture of the client’s hearing
range and where the aided responses are falling in that range.
Real-Ear Unaided & Aided—Measure and display your client’s unaided and
aided measurements. You can run up to three separate aided curves and display
them all on the same screen.
Insertion Gain—Measure and view your client’s unaided and insertion gain
measurements. Up to three insertion gain measurements can be displayed at one
time.
5.1.2 Navigation
To enter the Real-Ear Mode, press [F2] from the Opening Screen of the FP35.
This will open one of the Real-Ear Screens. To navigate through the four screens
of the Real-Ear Mode, press the [NEXT] and [BACK] keys. Continuously pressing
one of these keys will cycle you through the four choices, eventually bringing
you back to screen where you started. See Figure 5.1.2.
To leave the Real-Ear Mode, press [EXIT] at any time.
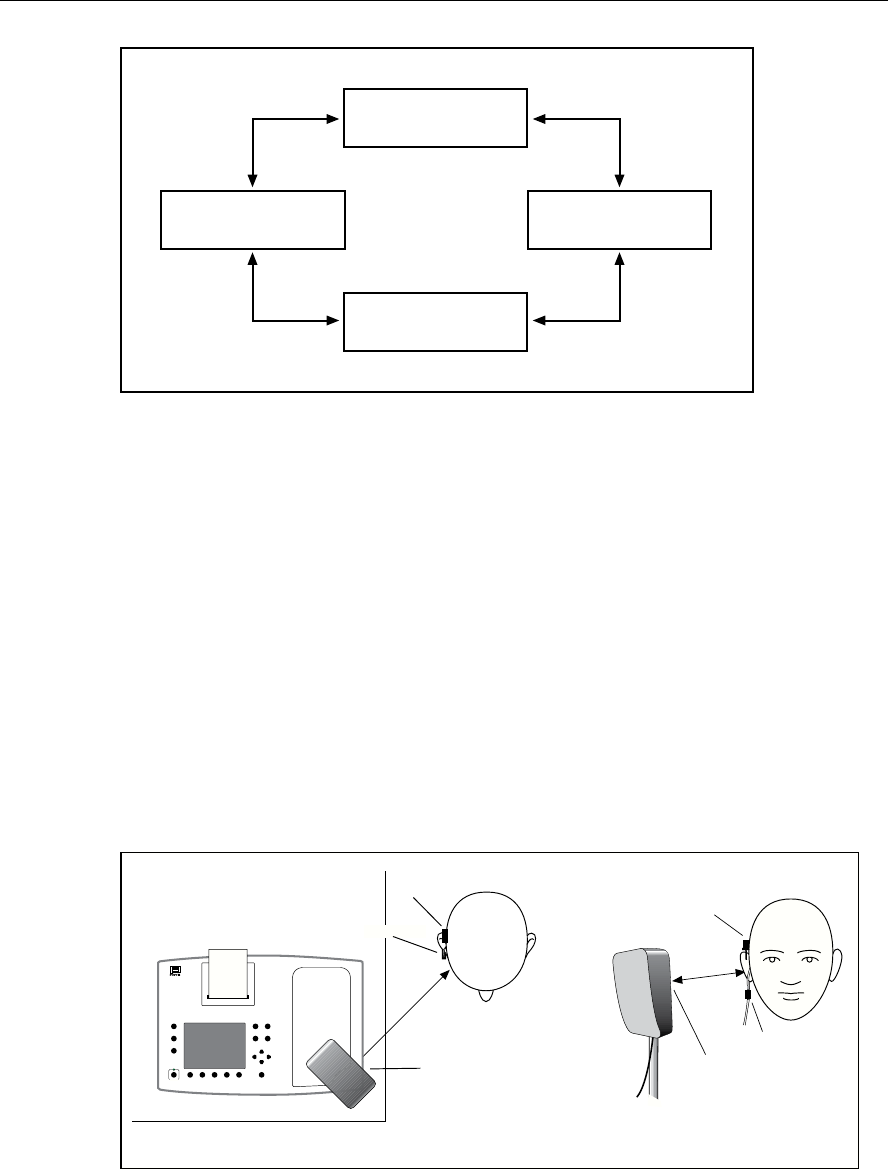
110 FONIX FP35 Hearing Aid Analyzer
Audiogram
Entry
Real-Ear SPL
Real Ear
Unaided & Aided
Insertion Gain
Figure 5.1.2—Real-ear navigation using next and back keys
5.2 Real-Ear Setup
If you are using the FP35 as a portable unit, you can easily convert the internal
sound chamber into a sound field speaker. If you are using the FP35 primarily
in an office or clinical setting, you may wish to set up an external speaker for
real-ear measurements.
5.2.1 General Setup
When testing, the loudspeaker should be about 12 inches (30 cm) from the
surface of the client’s head (near the temple) and pointing toward the ear to be
tested. We recommend an azimuth angle of 45 degrees (halfway between the
client’s nose and ear). The height of the loudspeaker should be level with, or a
little above, the ear. See Figure 5.2.1.
Top View
Speaker
(45 degrees)
12"
Reference Mic
Probe Mic
12"
Reference Mic
Probe Mic
Front View
Speaker
(45 degrees)
FONIX FP35 Hearing Aid Analyzer
Figure 5.2.1—Real-ear measurement setup
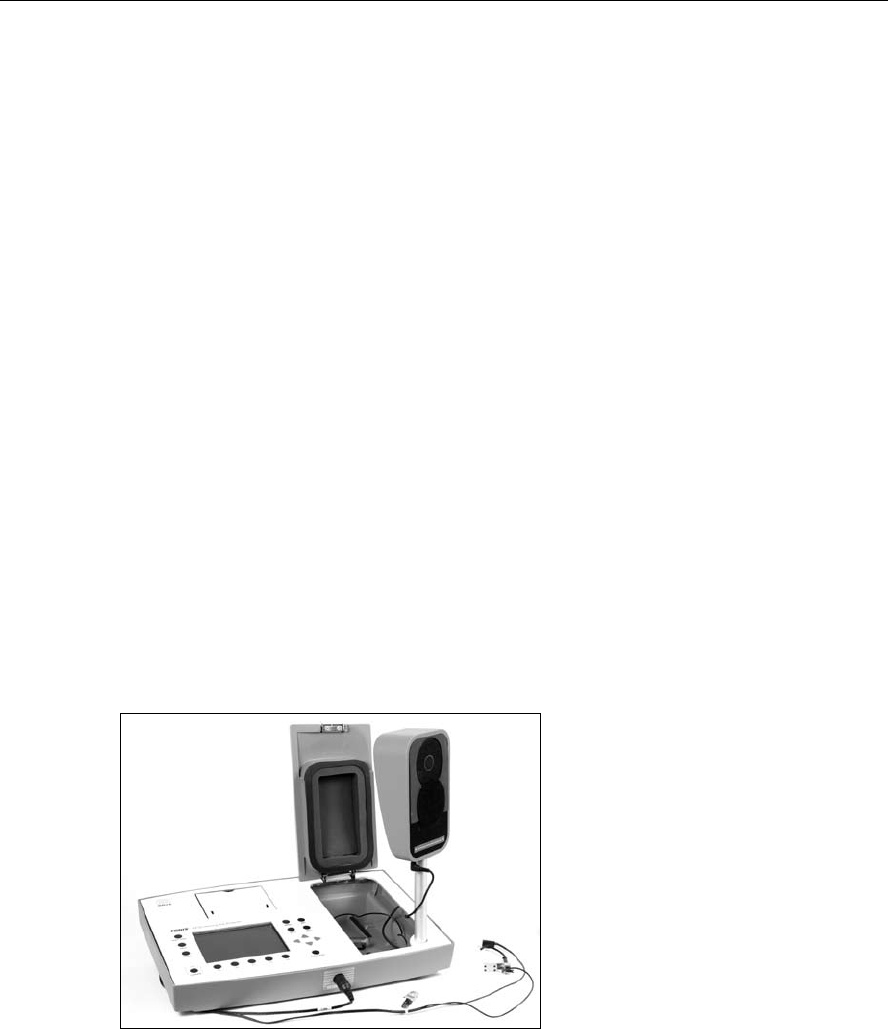
Real-Ear Measurements 111
Note: If you are using a 90 dB signal, the 12 inch distance is very important. If
the client is too far away, a message box will open, alerting you to move the cli-
ent closer. Don’t forget to relevel for the client’s new position.
5.2.2 Internal Speaker Setup (for Sound Field Use)
The technique for converting the FP35 analyzer’s internal sound chamber into
a sound field speaker to use for real-ear measurements is described in this sec-
tion.
Removing the speaker from the FP35 compartment
• Openthesoundchamberlid.Dothisbypressingdownonthemetallatch
at the front of the sound chamber lid.
• Liftthespeakeroutofthecompartment.
Installing the speaker on the extension pole
• Locatetheextensionpoleattherightsideofthecompartment.Remove
the pole and place the wide end in the hole at the bottom, right corner of
the sound chamber.
• Placethespeakeronthetaperedendofthepole.Ifthespeakerdoesnot
reach your client’s ear height, you may want to add the optional exten-
sion pole that raises the speaker by an additional 6.5 inches (16.5 cm).
• PositiontheFP35atoneedgeofatable.Thespeakercanberotatedso
that the correct angle for testing is easily achieved.
Figure 5.2.2—Internal sound field speaker setup
Replacing the speaker when the test is complete
• Removethespeakerfromthepole.
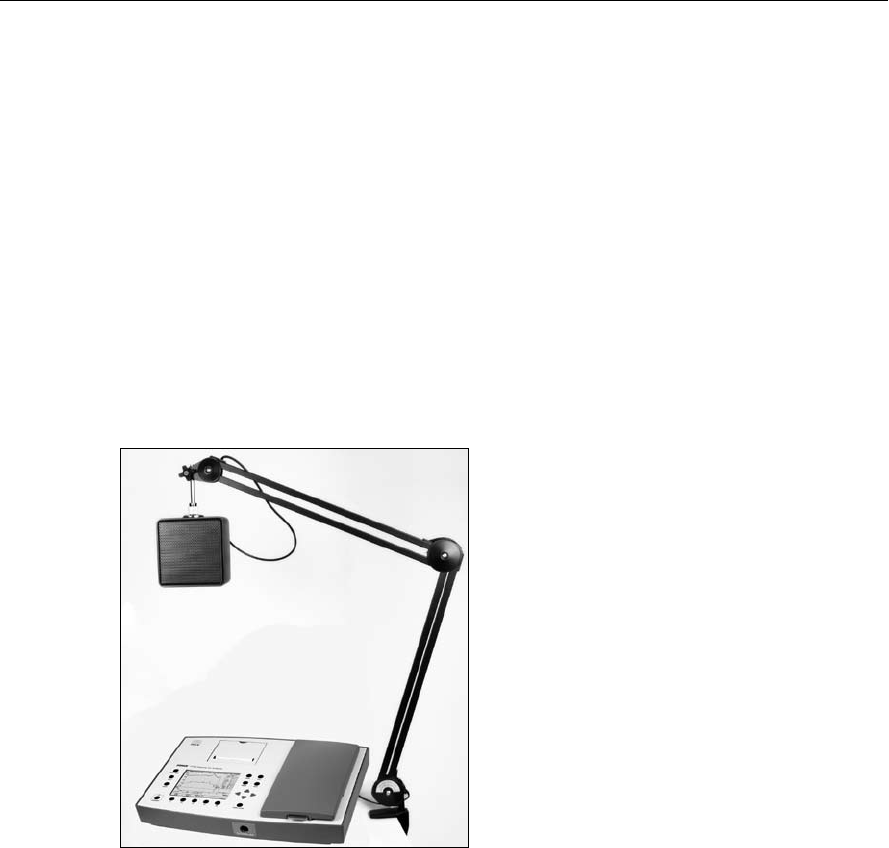
112 FONIX FP35 Hearing Aid Analyzer
• Liftthepoleoutofitsholeandreturnittotherightsideofthecompart-
ment. You must first slide one end of the pole into the notch toward the
front of the FP35 analyzer. The pole will then fit easily onto the ledge.
• Makesureallcablesinthecompartmentareputawaysotheywillnot
interfere with replacing the speaker.
• Setthespeakerbackinthecompartment.Asyoudothis,guidethespeaker
wire so it stays to the side of the speaker, not underneath it.
5.2.3 External Speaker Setup
If desired, you can use an external speaker to perform your real-ear measure-
ments. The external speaker can be mounted to a floor stand or to a swing arm.
A swing arm is especially nice because you can move the speaker around the
patient when you switch ears, rather than move your patient around the speaker.
Figure 5.2.3—External sound field speaker setup
To set up your FP35 software to use an external speaker:
1. Press [MENU] from the Opening screen to enter the Default Settings menu.
2. Press [NEXT] to enter the Advanced Default Settings menu.
3. Select SPEAKER under RESETS with [q,p] keys.
4. Set AUTO with [t,u]. All real-ear measurements will now be done with the
external speaker and all coupler measurements will be done with the internal
speaker.
5. Press [EXIT] to return to the Opening screen.
6. Press [F2] to enter Real-Ear Mode again.
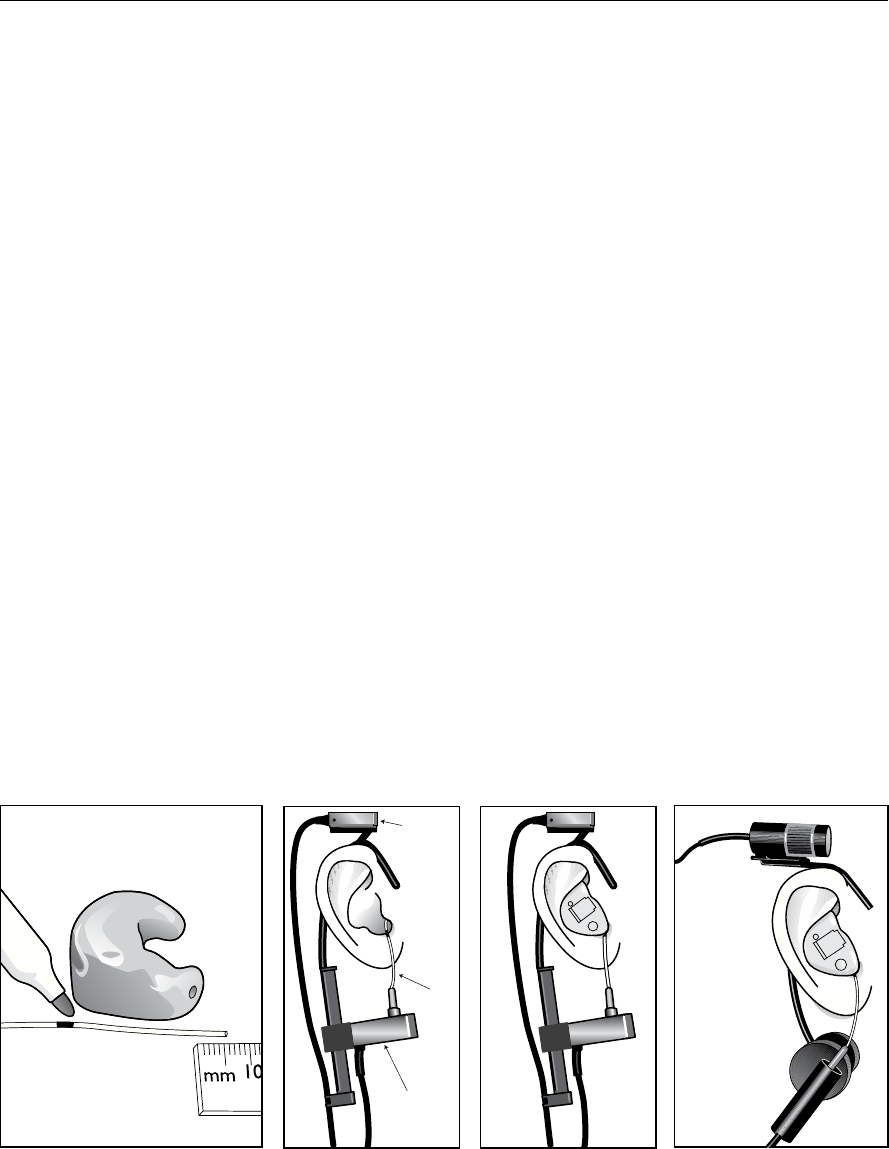
Real-Ear Measurements 113
5.2.4 Placing the Probe Tube
To ensure the proper insertion depth of the probe tube into the ear canal, the
following marking procedure is necessary. After some practice, the procedure is
easy.
1. Place an unattached probe tube on a flat surface along with the client’s
earmold or shell as shown in Figure 5.2.4A so that the tube rests along the
bottom of the canal part of the earmold, with the tube extending at least 5
mm past the canal opening.
2. Mark the probe tube with a marking pen where it meets the outside surface
of the earmold.
3. Attach the probe tube to the integrated probe microphone and place the
earhook of the microphone on the client’s ear.
4. Insert the probe tube into the client’s ear so that the mark is at the location
where the bottom of the outer surface of the earmold would be. See Figure
5.2.4B.
5. Insert the hearing aid making sure the mark on the probe tube remains
aligned with the outside of the aid. See Figures 5.2.4C.
Hints: To help keep the probe tube in place, position the tube so that it runs
through the tragal notch, resting against the lower edge of the tragus (Figure
5.2.4B) If necessary, adjust the integrated microphone for better positioning. If
desired, use surgical tape to hold the tube in position.
NOTE: Figures 5.2.4B and 5.2.4C contain pictures of the integrated probe micro-
phone. The probe microphone setup with the older style M300 separate probe
microphone set is shown in Figure 5.2.4D.
Reference
microphone
Probe
microphone
Probe
tube
Figure 5.2.4A Figure 5.2.4B Figure 5.2.4C Figure 5.2.4D
Mark the probe tube. Place the microphones. Insert the hearing aid. Real-ear setup using M300
separate microphone set.

114 FONIX FP35 Hearing Aid Analyzer
5.2.5 Placing the Sound Field Speaker
The placement of the sound field speaker can have a big influence on the accu-
racy and repeatability of your real-ear measurements. Research has shown that
a consistent placement of 45 degrees azimuth to the client produces the most
repeatable testing results. Some clinicians, however, prefer to use the more tra-
ditional 0 degrees azimuth to the client. See Figure 5.2.1 for a diagram of a cli-
ent being tested at 45 degrees azimuth.
In both instances, we recommend a distance of 12–15 inches from the speaker
to the client. A larger distance might make the FP35 analyzer unable to produce
a 90 dB SPL signal to the client. A smaller distance might place the client in an
unstable place in the field of the speaker.
You can specify which azimuth you are using for your real-ear measurements.
This will have an effect on:
1. Which average REUR is used in creating SPL and insertion gain targets
(when the measured REUR has not been taken).
2. DSL LIN and DSL WDRC targets.
3. NAL-NL1 targets.
To set the position of the speaker:
4. Press [MENU] in any real-ear measurement screen or in the Audiogram
Entry screen.
5. Use [q,p] to select SOUND FIELD.
6. Use [t,u] to select 0º or 45º.
7. Press [EXIT] to return to the real-ear screen.
Notes:
• Ifyoutookyouraudiometricmeasurementswithasoundfieldspeaker,it
is recommended that you use the same azimuth for the real-ear measure-
ments as you used in the audiometric assessment.
• Thespeakerpositionissetwhenthesoundfieldisleveled.Ifyouwant
to change the speaker position after leveling, you must re-level the sound
field speaker for the change to take effect.
• Thelevelingstatuswillreflecttheselectedsoundfieldspeakerazimuth.
By default, this is set to 45º.
5.2.6 Leveling the Sound Field Speaker
The leveling process measures the sound field at the client’s ear and accounts
for inconsistencies in the testing environment. It is essential for obtaining accu-
rate real-ear measurements. You must re-level the sound field for every client
and for every ear.

Real-Ear Measurements 115
The client must be in the same position for leveling and real-ear testing—you
can use either a 0º azimuth or a 45º azimuth for leveling, as long as it is consis-
tent with the speaker position used for the real-ear measurements.
Only the reference microphone is used during the leveling process. However,
to speed things up and ensure the client is in the same position during level-
ing and during the measurement process, it is recommended that you insert the
probe tube in the client’s ear for the leveling process. See Section 5.2.2 for more
details.
To level:
1. Place the integrated probe microphone on the client’s ear. See Figure 5.2.4B.
2. Insert the probe tube into the client’s ear, if desired. (The probe microphone
is not used during the leveling process.)
3. Position the sound field speaker 12–15 inches from the client’s head at a 0º
or 45º azimuth. (We recommend 45º azimuth in order to produce the most
repeatable results.)
4. Select the azimuth used in the SOUND FIELD setting in the real-ear menu.
See Section 5.2.5 for details.
5. Press [F5]—LEVEL in any of the real-ear measurement screens.
6. Press [START/STOP]. The instrument will now attempt to level the sound
field speaker.
These are the possible leveling status:
• LEVELED0ºorLEVELED45º—Thelevelingprocesswascorrectwithin2
dB. The azimuth used is indicated.
• UNLEVELED—Thelevelingprocesswasincorrectbyatleast6dB.You
should check the speaker, client, and reference microphone position and
try to level the instrument again. No azimuth is indicated for this status.
• 0ºor45º—Astatusshowingonlytheazimuthindicatesthattheleveling
process was correct somewhere between 2 dB and 6 dB. Just as with the
UNLEVELED status, you should check the speaker, client and reference
microphone position and try to level the instrument again. However, if
repeated attempts fail to reach a leveled status, you can consider this
stage “good enough.” Be aware that measurements when the instrument
is in the in-between stage will not be as accurate as measurements taken
when the sound field is leveled.
Note: The environment should be quiet during leveling. Noise can affect the lev-
eling results, though the FP35 does use measurement methods to minimize the
impact of external noise.
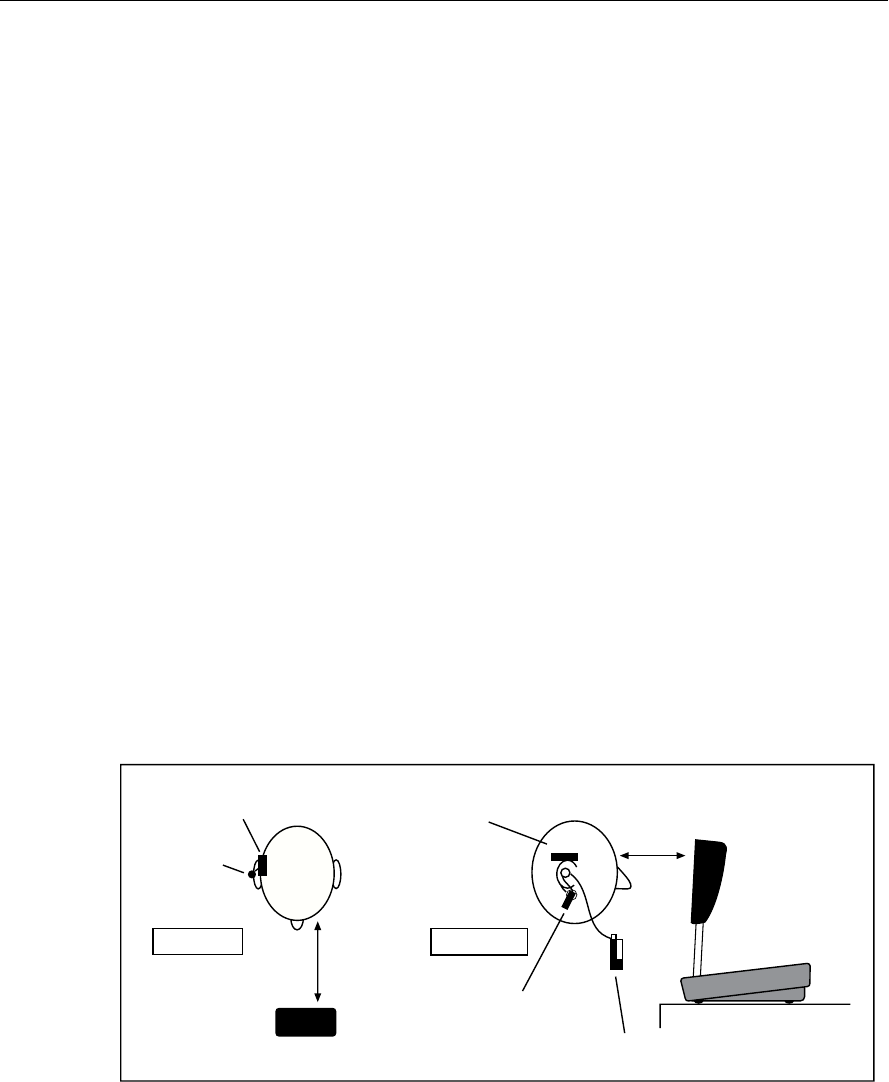
116 FONIX FP35 Hearing Aid Analyzer
5.2.7 Testing Digital Aids
The FP35 seamlessly incorporates the testing of digital hearing aids into its nor-
mal testing procedures.
If you have the Composite/Digital Speech Option, just follow the steps outlined
in Section 5.4.4 (Insertion Gain) or Section 5.5.2 (SPL), choosing a signal source
of DIG SPCH with [F4] in the Real-Ear Testing Screens. The Digital Speech
signal is an interrupted composite signal designed to imitate the rhythms of
speech. The aid will respond to Digital Speech as it would respond to actual
speech, without lowering the gain of the hearing aid. See Appendix F for more
details.
If you do not have the Composite Option, put the aid into “test” mode via its
programming software. You should also set the AID GROUP to ADAPTIVE. This
will automatically use the SLOW pure-tone warble, which has been adjusted for
the group delay of digital hearing aids.
1. Press [MENU] from a measurement screen.
2. Change AID GROUP to ADAPTIVE using the arrow keys.
3. Press [EXIT] to return to the measurement screen.
See Section 2.5.1.4 for details on pure-tone warbling.
5.2.8 Testing Body Aids
The setup below is recommended for Body aids. Follow normal insertion gain
measurement procedures.
REFERENCE MIC
PROBE MIC
TOP VIEW 12"
SPEAKER
REFERENCE MIC
SIDE VIEW
PROBE MIC
(ON EARHOOK)
BODY AID
(FACING FORWARD)
SPEAKER
(HEAD HIGH)
12"
Figure 5.2.8—Setting up a body aid for real-ear testing
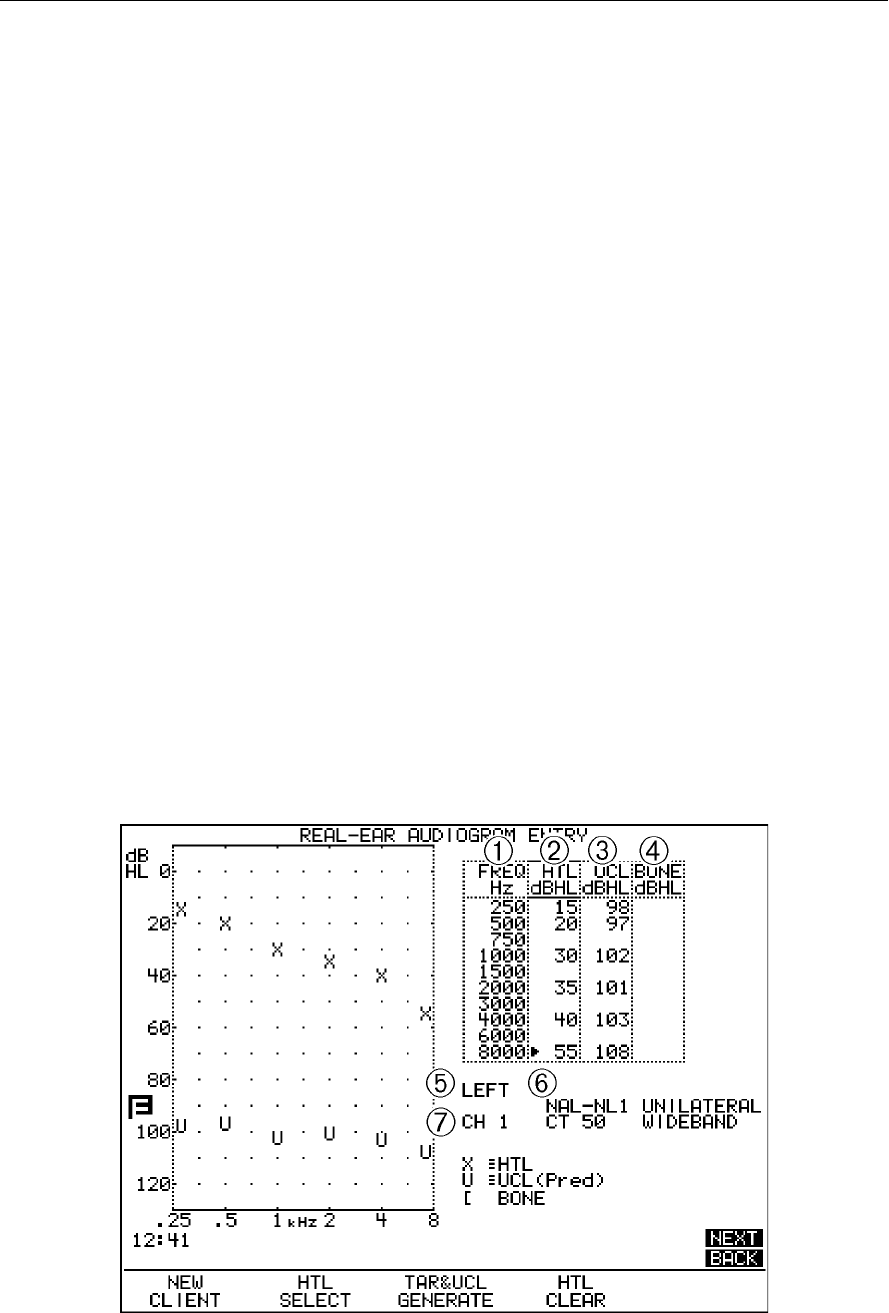
Real-Ear Measurements 117
5.3 Audiogram Entry Screen—Creating A Target
Creating a target for one or both ears is actually something you can do before
the client even enters the office. The first thing you have to do is enter the
audiogram.
5.3.1 Entering the Audiogram Screen
• Ifnecessary,press[F2]fromtheOpeningScreentoentertheRealEar
Mode.
• TheFP35willautomaticallybringyoutotheReal-EarScreenyouleftthe
last time you did a real-ear measurement.
• Ifnecessary,usethe[NEXT]or[BACK]keystoreachtheAudiogramEntry
Screen.
5.3.2 Audiogram Display
Please refer to Figures 5.3.2 for the following listing. Some fields are only visible
with certain selections.
1. Column denoting frequency of data.
2. Thresholds data.
3. Uncomfortable level data.
4. Bone data.
5. Selected ear and aid group.
6. Age of client, fitting rule, and type of loss.
7. Number of channels of the aid, compression threshold, and type of limiting
on the aid.
Figure 5.3.2—Display when editing audiometric data

118 FONIX FP35 Hearing Aid Analyzer
The display will change, depending upon the selection made with [F2]:
• AselectionofHTLorUCLdisplaystheaudiometricinformationindBHL.
• AselectionofTARGETdisplaysthetargetcurveindBinsertiongainordB
SPL.
• AselectionofRECDorREDDdisplaysthatdataindBgain.
5.3.3 Entering Audiometric Information & Creating A Target
Use the following instructions to create a non-NAL-NL1 target. See Section 5.3.4
for NAL-NL1 instructions. The following step-by-step instructions assume that
you are in the Audiogram Entry Screen.
1. Press [MENU] to enter the main local menu, and select the desired EAR and
ASSESSMENT.
2. Press [BACK] to enter the Target Menu, and select the desired FIT RULE and
AGE.
3. Press [EXIT] to return to the Audiogram Entry Screen.
4. Use [F2] to select HTL. A small arrow cursor will appear next to a frequency
in the HTL column of the data entry box.
5. Use the [q,p] keys to move the cursor through the frequencies. Use the
[t,u] to enter the client’s threshold levels in dB HL at each frequency.
6. If you have measured your client’s uncomfortable levels:
a. Press [F2] to select UCL.
b. Use the [q,p] keys to move the cursor through the frequencies.
c. Use the [t,u] to enter the client’s uncomfortable levels in dB HL at each
frequency.
7. Press [F3] to generate a target using your selected fitting rule. If you did not
enter any measured UCLs, predicted UCLs will also be generated.
8. Press [MENU] and change the selected EAR, if desired. Press [EXIT] to exit
the audiogram menu. If you entered the thresholds for the other ear, those
thresholds will automatically be copied to the current ear as a starting point.
The UCL and target values will not be copied.
9. Repeat steps 2-5 for the new ear, if desired.
Note: See Appendix E for information on how we predict the UCL values from
the threshold data.
5.3.4 Creating an NAL-NL1 Target
The NAL-NL1 fitting rule is more adjustable and slightly more complicated than
DSL and the traditional linear fitting rules. In addition to the client’s air conduc-
tion thresholds, it takes into consideration the client’s bone conduction thresh-
olds, whether the fitting is binaural or monaural, the number of channels of the

Real-Ear Measurements 119
hearing aid, and the type of limiting the aid has. The steps to creating an NAL-
NL1 target are very similar to creating a DSL or a linear target – NAL-NL1 just
requires a few more menu selections.
To create an NAL-NL1 target:
1. Press [MENU] in the Audiogram Entry screen and use the arrow keys to
select the following:
• EAR:Currentear
• ASSESSMENT:Typeoftransducerusedincreatingtheaudiogram
2. Press [BACK] to enter the Target menu. Use the arrow keys to select the fol-
lowing:
• FITRULE:NAL-NL1
• AGE:Ageoftheclient
• COMPRESSION:Thefirstcompressionkneepointofthehearingaid.
• CHANNELS:Thenumberofchannelsofthehearingaid.
• AIDLIMITING:Thetypeofoutputlimitingonthehearingaid.
• FITTYPE:Unilateralorbilateral
• REFERENCE:Levelingreference.Iflevelingisperformedwiththepatient
in the sound field, set this to HEAD SURFACE (recommended). If leveling
is performed by holding the reference microphone in front of the speaker,
set this to UNDISTURBED.
3. Press [EXIT] to return to the Audiogram Entry screen.
4. Press [F2] until HTL is selected. A small arrow cursor will appear next to a
frequency in the HTL column of the data entry box.
5. Use the [q,p] keys to move the cursor through the frequencies. Use the
[t,u] keys to enter the client’s threshold levels in dB HL at each frequency.
6. (Optional) Press [F2] and select BONE in order to enter the client’s bone
conduction thresholds. Use the arrow keys to enter the bone values in the
same manner as you entered the HTL values.
7. (Optional) Press [F2] to select UCL, and use the arrow keys to enter the cli-
ent’s UCL values in the same manner as you entered the HTL values.
8. (Optional) If you selected a FIT TYPE of “bilateral” in Step 1, you need to
enter audiometric data from both ears to generate a target.
9. Press [MENU] to enter the menu.
10. Change the EAR by using the arrow keys.
11. Press [EXIT] to return to the Audiogram Entry screen. The threshold values
for the first ear will be displayed on the screen as a starting point for the
entry of the new audiogram.

120 FONIX FP35 Hearing Aid Analyzer
12. Repeat Steps 3-4 to enter the audiogram for the new ear.
13. Press [F3] to generate the NAL-NL1 target. If you did not enter any measured
UCL values, predicted UCLs will also be generated.
5.3.5 Modifying a Target
If the target generated by the FP35 does not meet your client’s needs, you can
modify it so that it does. To modify the target:
1. Press [F2] until TARGET is selected. In the data entry box, the cursor will
now be in the TARG column.
2. Use the [q,p] keys to move the cursor through the frequencies.
3. Use the [t,u] keys to change the target values. The values will be adjusted
in 1 dB increments. Holding down the arrow key will change the numbers
more rapidly.
If you want to enter your own target values, use these same steps. In such a
case, it is unnecessary to generate the target. If you want to predict UCLs and
enter your own target values, choose DIRECT as your target fitting rule. Then
pushing [F3] will generate UCL values, but not IG values.
Note: You cannot modify DSL targets.
5.3.6 Measuring the Real-Ear to Coupler Difference
The real-ear to coupler difference (RECD) is the acoustical difference between
the response of an insert earphone in the ear versus in a 2-cc coupler. It
involves two measurements: a coupler measurement, and a real-ear measure-
ment. Both measurements are performed with an insert earphone.
The coupler part of the RECD is performed when you “calibrate” the insert
earphone used in the measurement. When this calibration is performed, the
coupler measurement is saved into the FP35 analyzer’s permanent memory.
See Appendix C for instructions on performing the calibration of the insert ear-
phone.
See Chapter 6: 2CC-Targets for information on performing coupler measure-
ments to a target.
5.3.6.1 Analyzer Setup for RECD
This section describes how to set up the analyzer to perform the real-ear portion
of the RECD.
1. Enter the Audiogram Entry Screen (See Section 5.3.1).
2. Press [MENU].
3. Select desired EAR, using [t] if necessary.
4. Select ASSESSMENT with [q,p] keys.
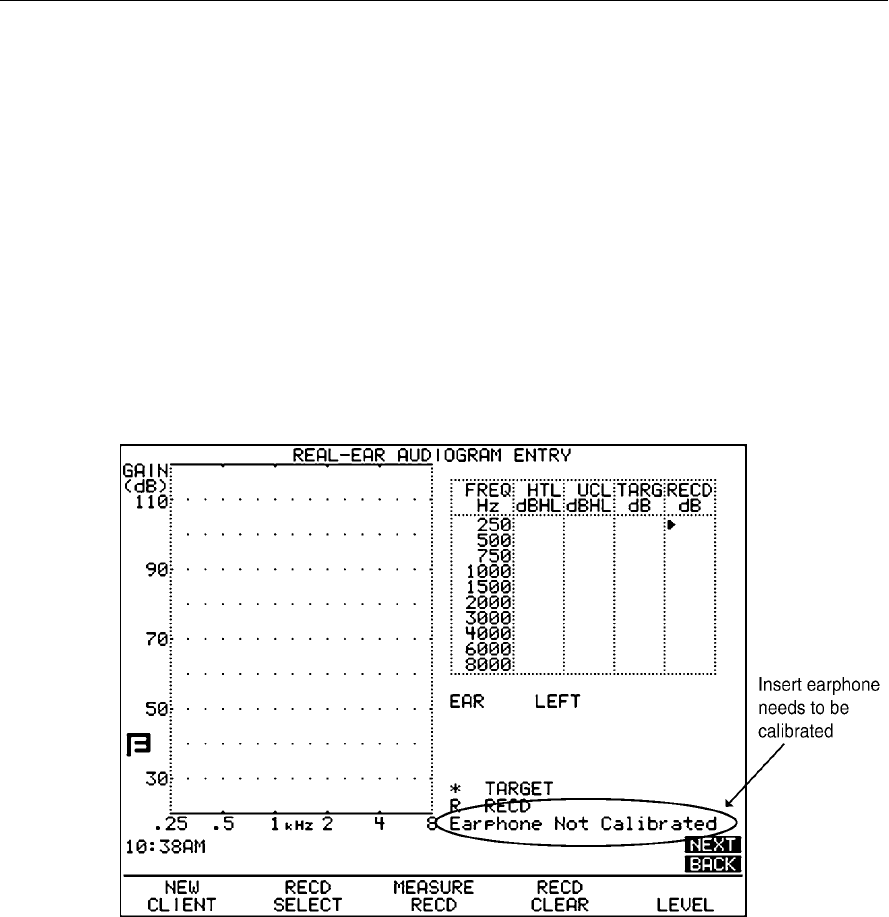
Real-Ear Measurements 121
5. Press [t,u] to select INS. EAR.
6. Press [EXIT] to return to Audiogram Entry Screen.
7. Press [F2] repeatedly until RECD (or REDD) is selected. You will see an addi-
tional column of average RECD information for the selected age appear on
the screen.
8. Make sure that SHOW RECD is displayed above [F5]. If it isn’t, press [F5] to
toggle the display.
9. Look at the bottom right corner of the LCD screen. If you see the message
“Earphone not calibrated,” you will need to follow the instructions found in
Appendix C for calibrating the insert earphones. See Figure 5.3.6.1.
10. Press [F3] to select MEASURE RECD.
11. Plug the insert earphone into the “earphone” jack in the back of the FP35.
Figure 5.3.6.1—This screen indicates that the coupler part of the RECD needs to be taken.
5.3.6.2 Client Setup for RECD
This section describes how to set up the client for the real-ear portion of the
RECD measurement.
1. Insert the probe microphone into your client’s ear. See Figure 5.3.6.2A.
2. Insert custom earmold or foam eartip coupled to the insert earphone into
your client’s ear. See Figure 5.3.6.2B.
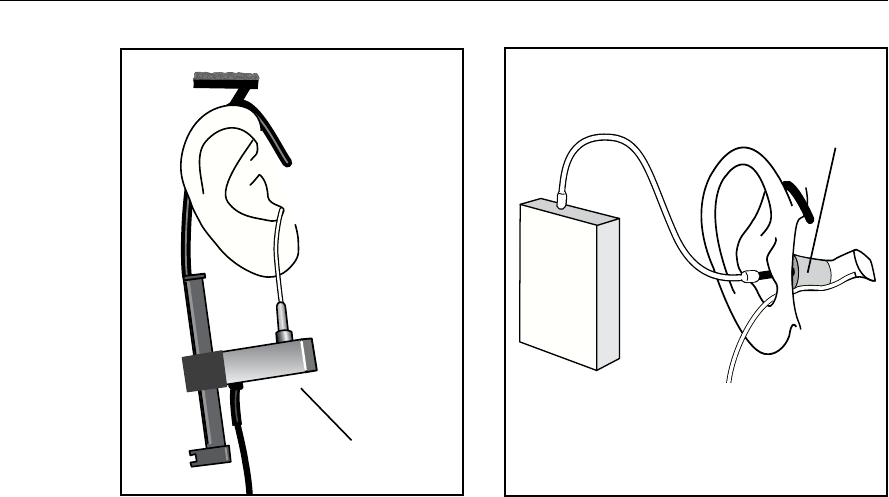
122 FONIX FP35 Hearing Aid Analyzer
Probe Mic
ER3
INSERT
EARPHONE
Foam plug or
custom earmold
To Probe Mic
Figure 5.3.6.2A—Insert probe microphone Figure 5.3.6.2B—Insert foam eartip connected
to insert microphone
5.3.6.3 Taking the RECD Measurement
If you’ve performed the steps described in Sections 5.3.6.1 and 5.3.6.2, you just
have to press [START/STOP] to take the RECD measurement. Results will be
displayed in graphical format in dB GAIN as well as numerical format in the
data table.
To erase the measured RECD, press [F4] and [START/STOP].
See Chapter 6: 2CC-Targets for information on performing coupler measure-
ments to a target.
5.3.7 Measuring the Real-Ear to Dial Difference
The real-ear to dial difference (REDD) is the difference between an audiometer‘s
output in dB HL and the unaided response of the client in dB SPL.
To take the REDD measurement on the FP35 analyzer, you perform a probe
microphone measurement using an insert earphone or the sound field speaker
as the transducer of the test. In other words, when you perform an RECD mea-
surement (using an insert earphone), or an REUR measurement (using the sound
field speaker), you get the REDD as an added bonus.
• WhenSPEAKERisselectedintheASSESSMENTfieldinthemenu,the
REUR and REDD are obtained simultaneously by taking a sound field
unaided measurement.
• WhenINSEARisselectedintheASSESSMENTfield,theRECDand
REDD are obtained simultaneously by taking an unaided measurement
using an insert earphone.

Real-Ear Measurements 123
Choose OUTPUT LIMITING carefully (see procedure below). You don’t
want to damage your client’s hearing or cause discomfort during test-
ing. To ensure safety and comfort, the FP35 system reacts automatically
when the OUTPUT LIMITING level is exceeded at the Probe Microphone.
When the level measured at the Probe Microphone exceeds the pre-set
limit, the words “PROBE OUTPUT LIMIT EXCEEDED” appear on the
screen, and program automatically stops.
The default setting for OUTPUT LIMITING is 120 dB SPL. You can set
the OUTPUT LIMITING to any level between 80 and 140 dB SPL in 5-dB
increments (see procedure below). In special cases, when you select 130
or 140 dB SPL, be aware that extra care is necessary with any output that
may exceed 132 dB SPL. Keep in mind that the sound pressure level at
the eardrum can be higher than that measured at the mid-ear canal
position, especially at high frequencies. For this reason, we recommend
extreme caution when using pure tones for real ear SSPL measurements.
Whenever the output limiting function has stopped the test signal, you
must turn down the hearing aid, lower the source SPL, or change the
output limit.
To view or change the OUTPUT LIMITING Setting:
1. Push [MENU].
2. Use the [p,q] keys to move the cursor next to OUTPUT LIM.
3. Use the [t,u] to select the desired limit.
4. Press [EXIT] to return to the testing screen.
WARNING

124 FONIX FP35 Hearing Aid Analyzer
SANITATION NOTICE
DO NOT REUSE PROBE TUBES.
Use a new probe tube for each ear to prevent the possible
spread of infection. Sterilization of probe tubes is not pos-
sible, and germicidal solutions can leave a residue inside
the tubing which can result in errors. Do not cut off any
portion of the tube.
DO NOT REUSE INSERT EARPHONE EARTIPS.
Insert earphone eartips are used primarily for perform-
ing RECD and audiometric measurements. Sterilization
of these eartips is not possible. When performing these
measurements, make sure to use a new ear tip for each
patient. You may spread infections if you reuse insert
earphone eartips.

Real-Ear Measurements 125
Follow the directions in Section 5.3.6 to obtain an REDD using an insert ear-
phone. Follow the directions in Section 5.3.8 to obtain an REDD using the
sound field speaker. After performing the measurements, press [F5] to toggle the
view to show REDD.
When TDH is the selection for the ASSESSMENT field, the REDD cannot be
measured automatically with the FP35 analyzer. Instead, the average values will
be used, or measured values can be entered manually.
To measure the REDD transform with the FP35 analyzer and a separate audiom-
eter (the Composite option is required):
1. Enter the Aided & Unaided measurement screen by using the [NEXT] and
[BACK] keys from the Audiogram Entry screen.
2. Press [MENU] and use the arrow keys to set the REF MIC to OFF. Use [EXIT]
to return to the measurement screen.
3. Use [F4] to set the source type to COMP. This will put the analyzer in spec-
trum analysis mode.
4. Use [q] repeatedly to turn the source OFF.
5. Insert the probe tube connected to the probe microphone into the client’s
ear, preferably within 4 mm of the eardrum. Use an otoscope for assistance.
We recommend using a bit of surgical tape to affix the probe tube in place at
the helix.
6. Place the TDH headphones on the client.
7. Press [START/STOP] to begin the spectrum analysis measurement.
8. Deliver 70 dB HL from the audiometer, and record the RMS OUT value as
measured by the FP35 analyzer for each audiometric frequency. This value
is the eardrum SPL.
9. Subtract 70 dB from each SPL value to get the custom REDD.
10. Press [START/STOP] to end the measurement when finished.
11. Use [NEXT] repeatedly to enter the Audiogram Entry screen.
12. Use [F2] repeatedly to select RECD or REDD. If RECD is shown, use [F5] to
select SHOW REDD. An REDD column will appear on the screen to the right
of the HTL, UCL, and TARG columns.
13. Use the arrow keys to enter the measured REDD values that you obtained in
step 9.
5.3.8 Measuring the Unaided measurement
If you used a sound field speaker to take your audiometric measurements, you
should use an REUR (real-ear unaided response) as the HL to SPL transform and
for the generation of targets.
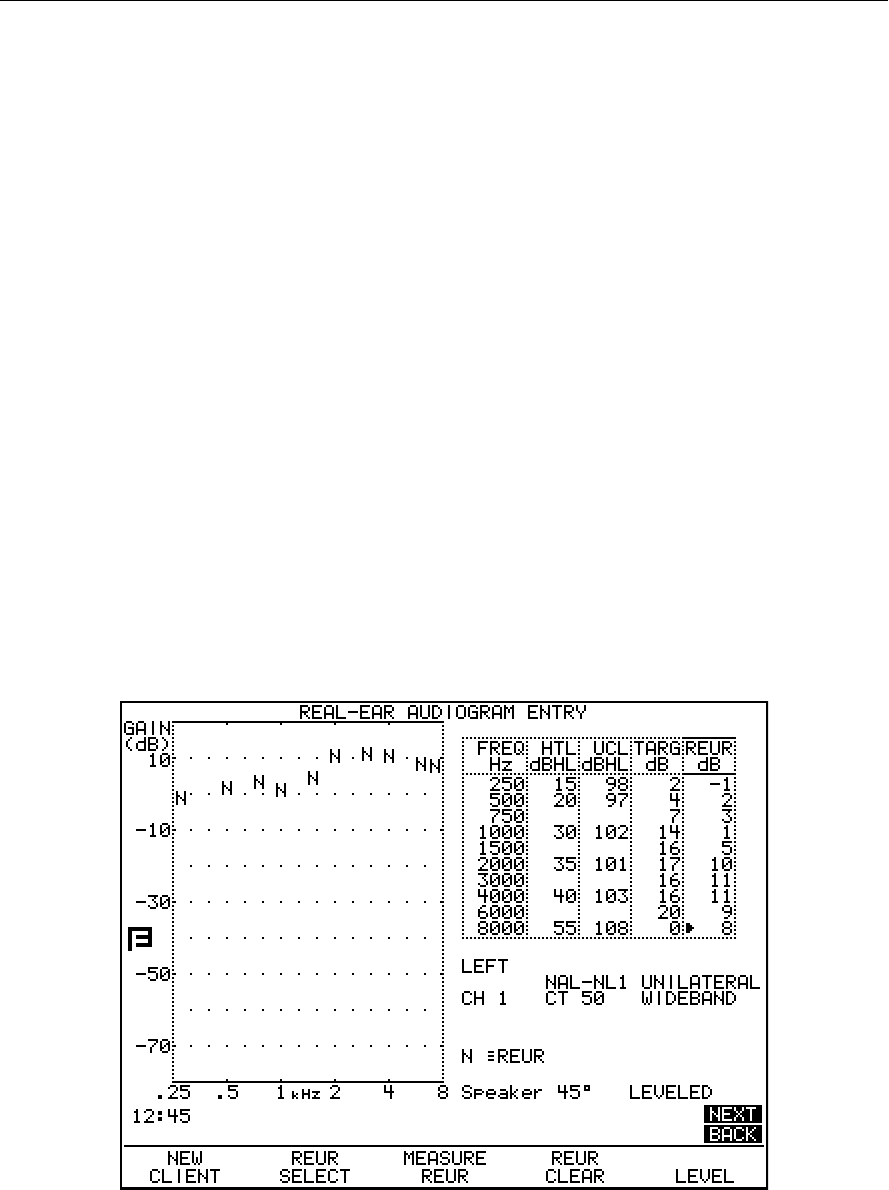
126 FONIX FP35 Hearing Aid Analyzer
If you measure the unaided response in the Audiogram Entry screen, the mea-
surement results will be copied into the Unaided and Aided screen for use with
insertion gain measurements. Likewise, any unaided measurement made in one
of the real-ear measurement screen will be copied into the Audiogram Entry
screen.
1. Press [MENU] in the Audiogram Entry Screen.
2. Select the desired EAR using the arrow keys.
3. Select SPEAKER in the ASSESSMENT field using the arrow keys.
4. Select the azimuth used (0º or 45º) when performing the audiometric assess-
ment in the SOUND FIELD entry by using the arrow keys. This will be the
azimuth you should use in your real-ear measurements.
5. Press [EXIT] to return to the Audiogram Entry Screen.
6. Press [F2] repeatedly until REUR is selected.
7. Set up the client for an unaided measurement with the reference micro-
phone on an earhook above the client’s ear and the probe tube inserted into
the ear. See Figure 5.2.4B. The speaker should be 12 inches from the client
at the selected azimuth.
8. Press [F5] to level the sound field speaker.
9. Press [START/STOP] to measure the unaided response. This unaided
response will be available for use and display in the Real-Ear Measurement
Screens. See Figure 5.3.8.
Figure 5.3.8—Unaided Measurement in the Audiogram Entry Screen

Real-Ear Measurements 127
5.3.9 Starting a New Client
When you have finished performing the real-ear (or target coupler) measure-
ments on the hearing aid and patient, pressing [F1] in the Audiogram Entry
screen will erase all measurements and restore settings in order to make setting
up for a new patient quick and easy.
In addition to all audiometric and real-ear measurements being erased, the
following menu items are reset when [F1] is pressed in the Audiogram Entry
screen. They are also set when the analyzer is powered on or when the [RESET]
key is pressed.
• CHANNELS–1(usedbyNAL-NL1only)
• AIDLIMITING–Wideband(usedbyNAL-NL1only)
• FITTYPE–Unilateral(usedbyNAL-NL1only)
• VENT–Tight(usedbyNAL-NL1TargetCoupleronly)
• TUBING–Libby#4(usedbyNAL-NL1TargetCoupleronly)
• SOUNDFIELD–45degrees
• TARGETREF–REF#2
• TABULATION–Target
• REFMETHOD–HEADSURFACE
The following menu items are set to their default values only when the analyzer
is first powered on. They aren’t reset when NEW CLIENT is pressed or when
[RESET] is pressed. Their default values can be changed in the Default Settings
menu. See Section 2.3.1. (The listed values are the factory defaults.)
• FITRULE–NAL-NL1
• AGE–Adult
• ASSESSMENT–Ins.Ear
• COMPRESSION–52dB(usedbyNAL-NL1andDSLonly)
• AIDTYPE–ITC
• AIDGROUP–Standard
• REFMIC–ON
• COUPLERTYPE–2cc(usedbyCouplermeasurementscreensonly)

128 FONIX FP35 Hearing Aid Analyzer
5.3.10 Defining the Menu Items
This section describes all the menu items in the Main and Advanced Audiogram
Entry menus.
Main Audiogram Entry menu
Press [MENU] from the Audiogram Entry screen to open the Audiogram Entry
menu. The following choices are available:
EAR—The ear tested. Select LEFT or RIGHT.
AID GROUP—Type of aid being tested. Choose STANDARD, AGC, or ADAPTIVE
(for adaptive AGC circuits). See Section 2.4 for more information.
ASSESSMENT—The transducer used in performing the audiometric measure-
ments. If you have the Audiometer Option, this will activate the selected trans-
ducer. (The FP35 cannot use the TDH transducer to make audiometric measure-
ments.)
SOUND FIELD—The sound field azimuth you are using with the real-ear mea-
surements. We recommend 45º for more repeatable results.
OUTPUT LIMIT—The maximum output of the hearing aid, as read by the probe
microphone, before the analyzer automatically shuts off its speaker. This limit
is designed to protect the hearing of your client from accidental overexposure to
noise while being tested.
NOISE RED (TONE)—The amount of noise reduction used when taking mea-
surements.
REF MIC (SPEAKER)—The status of the reference microphone when making
sound field measurements.
Target Menu
Press [BACK] from the Main Audiogram Entry menu to enter the Target menu.
FIT RULE—The fitting rule used to create the real-ear and coupler targets.
Selections are: NAL-NL1, NAL-RP, DSL WDRC, DSL LIN, POGO, BERGER, 1/3
GAIN, 1/2 GAIN, 2/3 GAIN and DIRECT. A selection of NAL-NL1 will add sev-
eral menu selections to the menu screen.
AGE—The age of the client. A selection of NONE sets the age to ADULT but
turns off the age display.
COMPRESSION—The type of wideband compression threshold the aid has.
This is selectable in increments of 1 dB, and it is only available with a fitting
rule selection of DSL WDRC or NAL-NL1.
CHANNELS—The number of channels the aid has. This is only available with a
fitting rule selection of NAL-NL1.

Real-Ear Measurements 129
AID LIMITING—The type of output limiting the aid has. If the aid has output
limiting, usually WIDEBAND should be selected. If the aid has output limiting,
and if the aid has more than one channel, this can be set to MULTICHAN. If the
aid doesn’t have limiting, set this to NONE. This selection is only available with a
fitting rule selection of NAL-NL1.
FIT TYPE—Type of fitting. Choose from UNILATERAL and BILATERAL. Bilateral
fittings require the audiograms of both ears to be entered.This is only available
with a fitting rule selection of NAL-NL1.
AID TYPE—Style of hearing aid. Choose from BTE, ITE, ITC, and CIC.
VENT—Type of venting on the hearing aid. Choose from OPEN, TIGHT, NO VENT,
1 mm, 2 mm and 3 mm. This selection is only available with a fitting rule selec-
tion of NAL-NL1.
TUBING—Type of tubing on the BTE hearing aid. Choose from LIBBY 4, LIBBY 3,
CFA #2 HORN, CFA #2 BORE, #13, 6C5, and 6C10. This selection is only avail-
able with a fitting rule selection of NAL-NL1 and an AID TYPE of BTE.
REFERENCE—Type of leveling used in the real-ear measurement. When HEAD
SURFACE is selected, leveling is performed with the patient within the sound
field and the reference microphone on top of the ear. When UNDISTURBED is
selected, leveling is performed by holding the reference microphone in front of the
sound field speaker. This selection is only available with a fitting rule selection of
NAL-NL1.
Advanced Audiogram Entry Menu
Press [NEXT] from the Main Audiogram Entry menu to enter the Advanced
Audiogram Entry menu.
SPEAKER—The sound field speaker selection. Choose to use the INTERNAL or an
EXTERNAL speaker.
WARBLE SOURCE—Type of pure-tone warbling used when taking measurements.
Choices are AUTO, FAST, SLOW, and OFF. It is recommended to set this to AUTO.
See Section 2.5.1.4 for more details on warbling options.
PROBE MIC (HL)—The status of the probe microphone (ON or OFF). This selec-
tion is only available if you have the Audiometer Option.
LEVELING SOURCE—The amplitude used for leveling the sound field speaker.
The default is 70 dB for real-ear measurements. See Section 3.2.4.
PRINT LABEL—The status of the printer label.
PRINTER—The printer selected. Choose between using an INTERNAL or an
EXTERNAL printer.
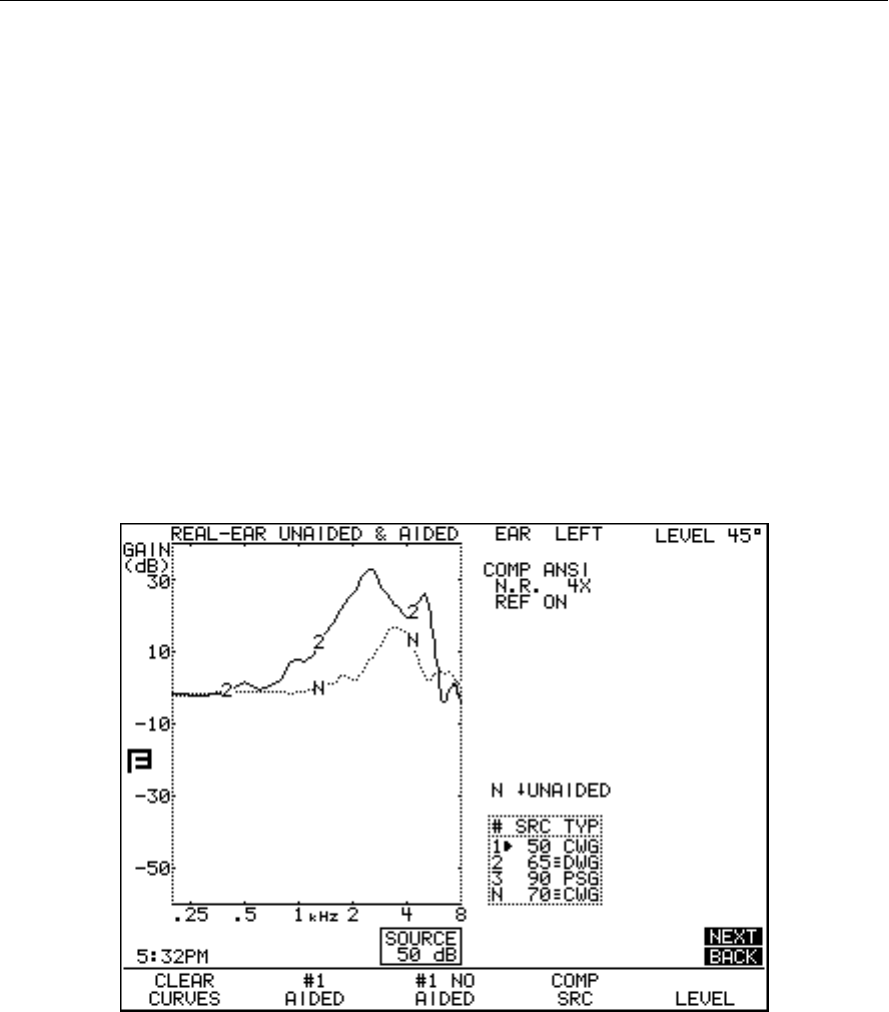
130 FONIX FP35 Hearing Aid Analyzer
5.4 Insertion Gain Testing
An insertion gain test measures how much gain the hearing aid is providing
over the client’s unaided response. This section assumes you have already gen-
erated a target curve (see Section 5.3.3 and 5.3.4) and are ready to test.
The Unaided & Aided Response screen and the Insertion Gain Screen are two
parts of the same insertion gain method of fitting hearing aids. The Unaided &
Aided Response Screen lets you measure and view aided gain measurements of
the hearing aid. See Figure 5.4A. The Insertion Gain screen displays the inser-
tion gain target and lets you measure and view insertion gain measurements of
the hearing aid. See Figure 5.4B. We divided insertion gain into two screens in
order to clearly distinguish between the aided gain and insertion gain curves.
Insertion gain is the difference between the client’s unaided response and his/
her aided response. In other words, insertion gain is the actual gain that the aid
is producing. Aided gain, in contrast, is the gain the aid is producing plus the
natural gain of the ear.
Figure 5.4A—Unaided and Aided Screen
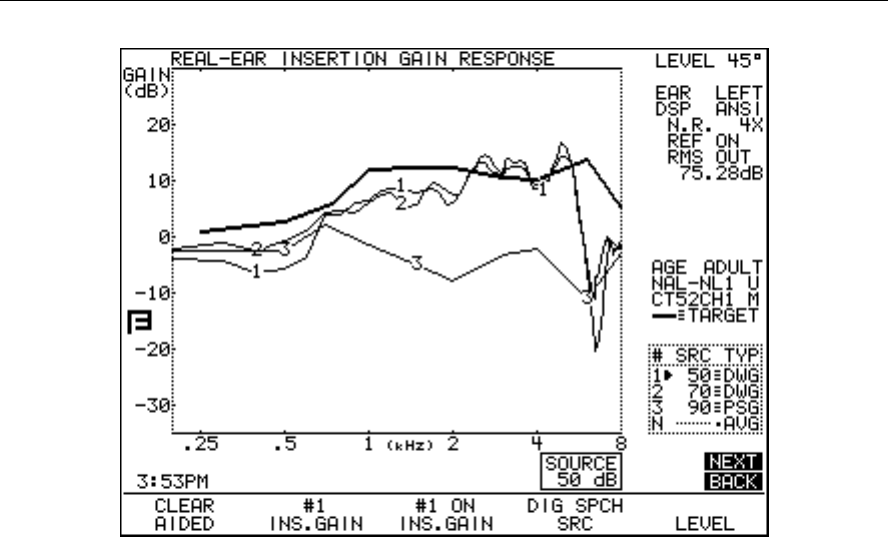
Real-Ear Measurements 131
Figure 5.4B—Insertion Gain Screen
5.4.1 Measuring the Unaided Response
The first step in taking an insertion gain measurement is to measure the unaid-
ed response. You can do this from either the Unaided & Aided Response Screen
or the Insertion Gain Screen.
If you are using the average unaided response, skip to the next section.
1. Place the probe tube in your client’s ear as described in Section 5.2.4. Level
the sound field speaker. See Section 5.2.6.
2. Press [MENU] and make any necessary menu selections. See Section 5.8.2
for a list of menu selections. Press [EXIT] to exit the menu.
3. Press [F4] to select the signal type. Use COMP if you have the Composite
Option. If not, use NORM.
4. Press [F2] to select CUSTOM UNAIDED.
5. Use the [q,p] keys to adjust the source amplitude to 65 or 70 dB SPL.
6. Have the client sit still in the same position they were in during leveling,
and press [START/STOP] to begin measuring the unaided response. If you
are using the composite signal, press [START/STOP] when satisfied with the
measurement.
7. The real-ear unaided response (REUR) will be displayed on the graph as a
dotted line marked with the letter N.
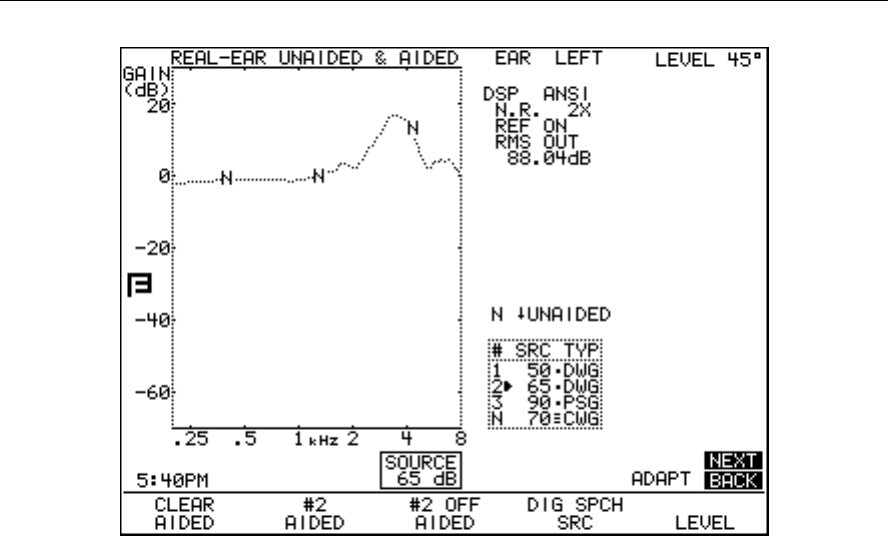
132 FONIX FP35 Hearing Aid Analyzer
Figure 5.4.1—Unaided response
8. If you used the composite signal for testing, use the [t,u]keys to show the
last four measurements taken while the signal source was running.
Note: To display the average unaided measurement, set UNAIDED to AVERAGE
in the menu. Then select AVG UNAIDED with [F2] and turn ON its display with
[F3].
5.4.2 Measuring the Aided Response
The second step in an insertion gain measurement is the aided response.
If you would like to view the measurement as an insertion gain curve and com-
pare it to an insertion gain target, take this measurement from the Insertion Gain
Screen. If you would prefer to view the aided gain, take this measurement from
the Unaided & Aided Response Screen.
Whenever you take a measurement in one of these screens, it will automatically
be converted and placed into the other screen.
To take an aided measurement:
1. Place the aid into the client’s ear taking care not to drag the probe tube fur-
ther into the ear canal. Once the aid is in the ear, the red mark on the probe
tube should be at the same position it was for the unaided test. See Figure
5.2.4C.
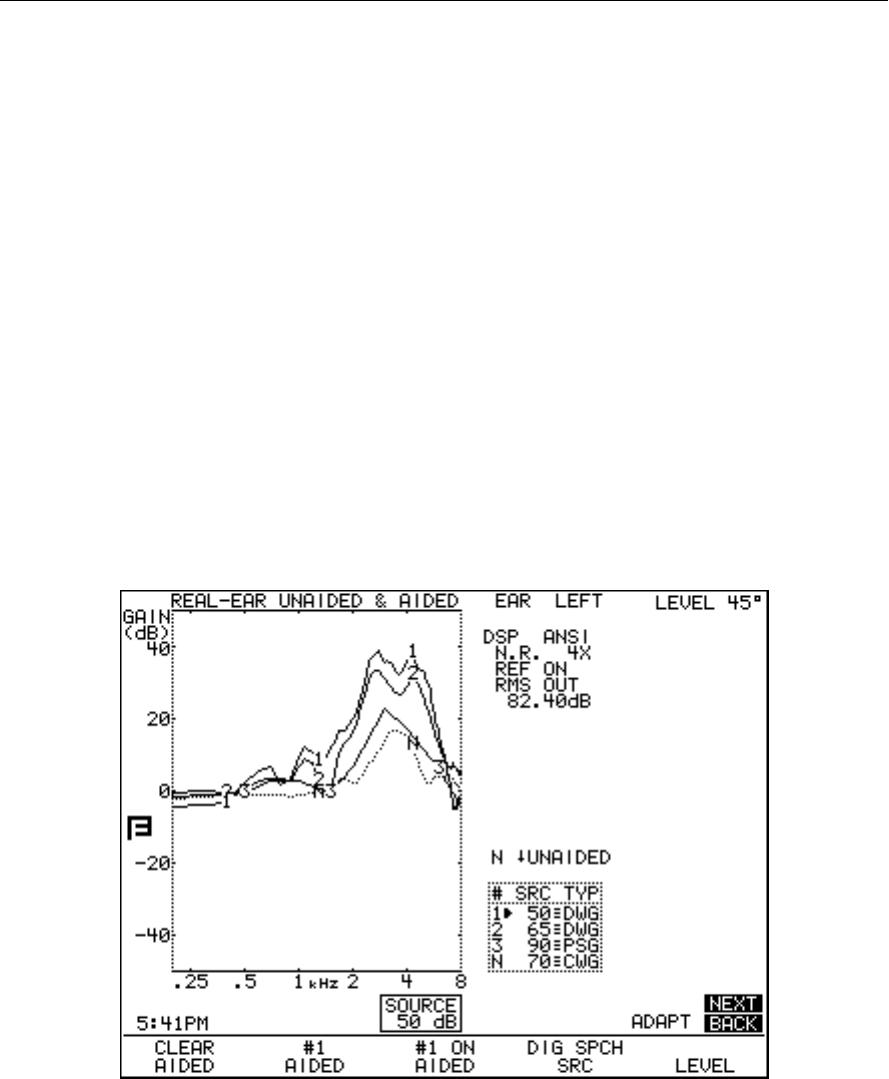
Real-Ear Measurements 133
2. Have the client set the aid’s gain control to the normal use level.
3. Press [F4] to select the source type.
4. Use the [q,p] keys to adjust the source amplitude to the desired level, usu-
ally the same level used for the unaided measurement.
5. Instruct the client to resume the position they were in for leveling and test-
ing. Tell them to sit very still while the signal is on.
6. Press [START/STOP] to introduce the signal. The aided response will appear
on the graph as a thin line labeled with a curve number.
Note: If you are using the COMP, DIG SPCH or FAST signal, you can change
the source amplitude during testing to see how the aid responds to such
changes.
7. Press [START/STOP] to end the measurement if you are using the COMP,
DIG SPCH or FAST signal.
8. If you used the COMP or DIG SPCH signal, use the [t,u]keys to view the
last four curves measured while the signal source was running. This should
help eliminate any momentary peaks in the response.
9. If desired, press [F2] to select a another curve number and repeat steps 3-8.
Figure 5.4.2A—Unaided and aided response

134 FONIX FP35 Hearing Aid Analyzer
Figure 5.4.2B—Insertion gain
5.4.3 Automatic Testing
The FP35 analyzer has the capability of performing automatic real-ear aided
measurements. This feature automatically tests the three aided measurements
automatically without needing user intervention between measurements. Auto
Test always measures AIDED 1, 2, and 3, in that order.
To enable auto test:
1. Press [MENU] in the real-ear measurement screen.
2. Use [q,p] to select AUTO TEST and set it to ON.
3. Press [EXIT] to close the menu.
4. Press [START/STOP]. The analyzer will automatically test AIDED 1, AIDED
2 and AIDED 3.
The Auto Test feature default can be set to ON. See Section 2.3 for details.
5.4.4 Testing Directional Hearing Aids
The Insertion Gain screen is a good place to perform a directionality test for
directional hearing aids. In an insertion gain measurement, the unaided curve
is subtracted from the aided curve in order to arrive at the insertion gain curve.
You can use this functionality in order to find out how much advantage the
directional microphones of the hearing aid are providing.

Real-Ear Measurements 135
To test directionality:
1. Place the probe tube in your client’s ear as described in Section 5.2.4, and
level the sound field speaker as described in Section 5.2.6. Although we
recommend a 45º azimuth for real-ear measurements, for this measurement
you should use a 0º azimuth, with the sound field speaker directly in front
of the patient.
2. Place the hearing aid in your client’s ear, making sure not to move the probe
tube.
3. Enter the Unaided & Aided Response screen. Use the [NEXT] and [BACK]
keys if necessary.
4. Press [MENU] to enter the real-ear menu. Make sure that CUSTOM is select-
ed for UNAIDED. Use the arrow keys to make the selection, if necessary.
Press [EXIT] to return to the real-ear measurement screen.
5. Press [F1] to clear all existing curves, if necessary.
6. Use [F2] to select AIDED #1.
7. Use [F4] to select the signal type. Use NORM, COMP or DIG SPCH.
8. Use [q,p] to select a signal source of 65 dB SPL.
9. Press [START/STOP] to take the measurement. If you’re using a COMP or
DIG SPCH signal, press [START/STOP] again to stop the signal once the
measurement has stabilized. This curve will be the “forward” measurement.
10. Turn your client around so that the back of his head is facing the speaker.
See Figure 5.4.4A. Alternately, if you are using an external speaker on a
swing arm, you can swing the speaker around in back of the client.
11. Use [F2] to select CUSTOM UNAIDED. Although this is an aided measure-
ment, the “unaided” measurement slot will give you a nice directional sub-
traction curve when the second measurement is completed.
12. Use [F4] to select the signal type used in the “forward” measurement.
13. Use [q,p] to select a signal source of 65 dB SPL.
14. Press [START/STOP] to take the measurement. If you’re using a COMP or
DIG SPCH signal, press [START/STOP] again to stop the signal once the
measurement has stabilized. This curve is the “reverse” measurement. See
Figure 5.4.4B.
15. Press [NEXT] to enter the Insertion Gain screen. The displayed measurement
curve is the difference between the “forward” and the “reverse” measure-
ments, or the amplification advantage provided by the directional micro-
phones of the hearing aid. See Figure 5.4.4C.
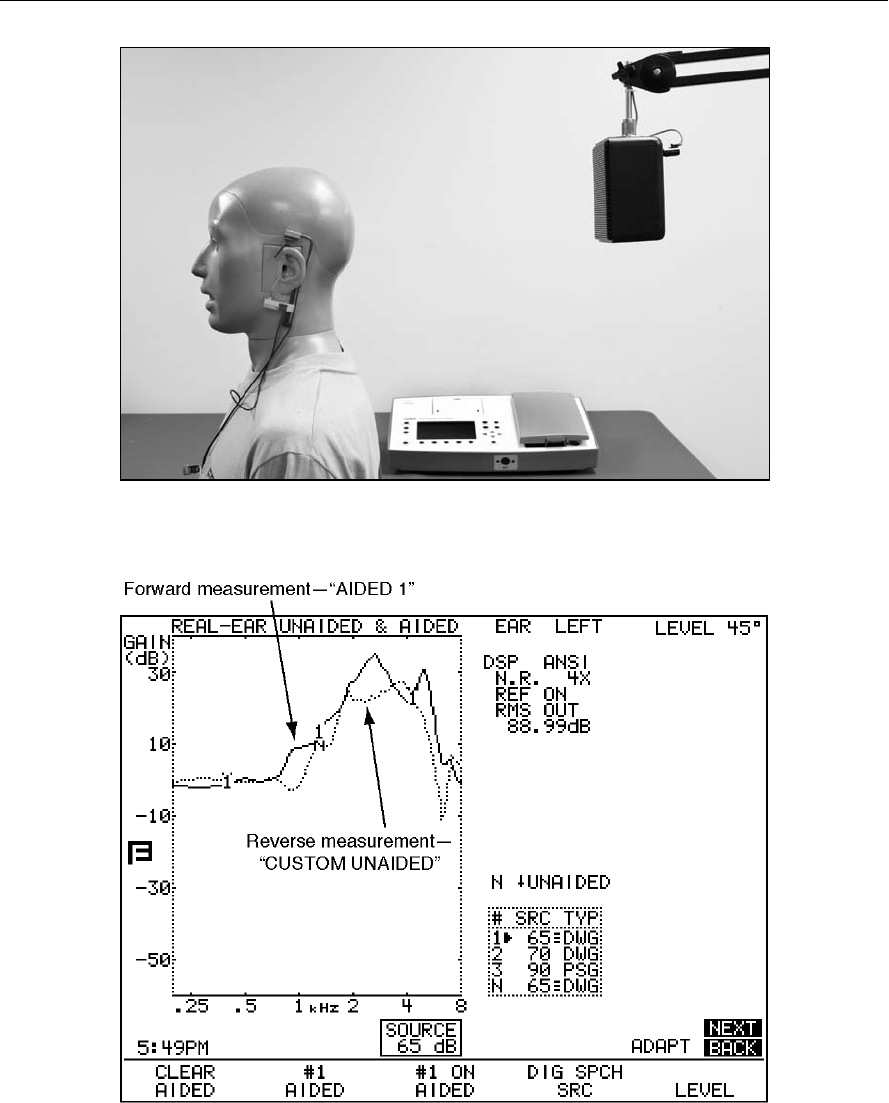
136 FONIX FP35 Hearing Aid Analyzer
Figure 5.4.4A—“Reverse” directional aid setup
Figure 5.4.4B—“Forward” and “reverse” directional aid measurements in the real-ear
unaided & unaided screen
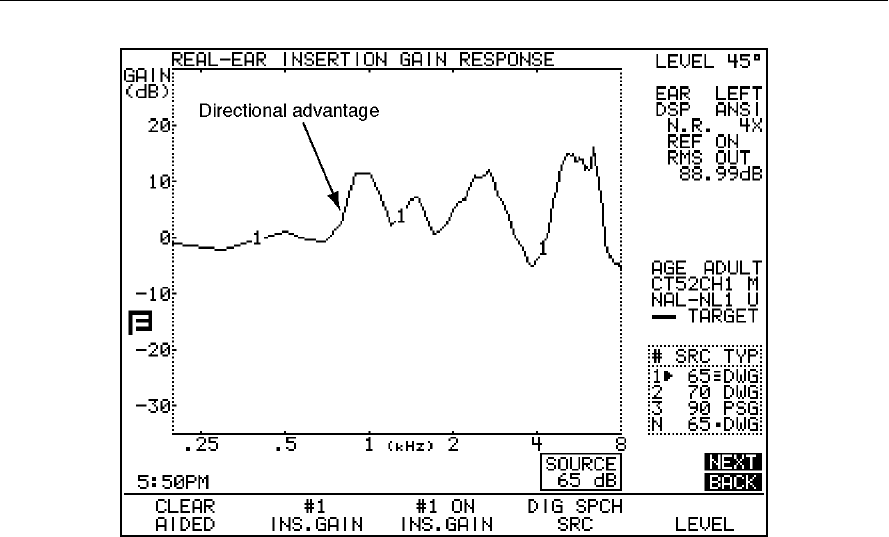
Real-Ear Measurements 137
Figure 5.4.4C—Amount of amplification advantage provided by the directional microphones
5.4.5 Testing Open Fit Hearing Aids
Open fit hearing aids have been known to interfere with the reference micro-
phone measurement outside the ear. To determine if a particular hearing aid is
interfering with the reference microphone, perform the following measurement
in any real-ear measurement screen. The feedback cancellation and other fea-
tures normally used by the patient should be enabled on the hearing aid.
1. Measure the aided response as described in Section 5.4.2.
• ThesoundfieldspeakershouldbeLEVELED.
• ThereferencemicrophonesettingshouldbeON.Thereferencemicro-
phone status is displayed in the column of data to the right of the graph
(REF ON or REF OFF).
• [F2]shouldbesettoAIDED1.
• Thesourceamplitudeshouldbesetto65dBSPL.Usetheup-downarrow
keys to adjust the source if necessary.
• [F4]shouldbesettoDIGSPCH.
2. Press [START/STOP] to start the measurement. Press [START/STOP] again
when the measurement has stabilized.
3. Use [F2] to select AIDED 2
4. Press [MENU] to open the local menu. Use the arrow keys to set the REF
MIC to OFF. Press [EXIT] to close the local menu.

138 FONIX FP35 Hearing Aid Analyzer
5. Measure the aided response as described in Section 5.4.2.
• Thesourceamplitudeshouldbesetto65dBSPL.Usetheup-downarrow
keys to adjust the source if necessary.
• [F4]shouldbesettoDIGSPCH.
6. Press [START/STOP] to start the measurement. Press [START/STOP] again
when the measurement has stabilized.
7. Look at the difference between AIDED 1 and AIDED 2.
If there is no more than 2 dB of difference between AIDED 1 and AIDED 2 at
any frequency, you can perform real-ear measurements using that particular
model of open ear hearing aid without adjusting the hearing aid analyzer. If the
two measurements are different by 3 dB or greater at any frequency, it is recom-
mended to disable the reference microphone when performing REMs using this
type of device. To disable the reference microphone, follow the instructions
found in Step 4 above.
When performing a real-ear measurement while the reference microphone is
disabled, it is particularly important to make sure the patient doesn’t move after
the sound field speaker has been leveled because the reference microphone will
not be able to compensate for any changes in the patient’s position.
5.5 The Real-Ear SPL Screen
The SPL screen permits the user to view all the major components of a client’s
hearing loss and hearing aid fitting on one screen in dB SPL. The hearing
thresholds and uncomfortable loudness levels, which are generally measured
in HL, are converted to SPL. The insertion gain target is also converted to SPL.
You can measure and display the unaided response and three aided responses,
in SPL, at three different source amplitude levels. Having all this information
in a common format provides a convenient way to view the hearing loss and
the amplification provided by the hearing aid without the confusion of different
frames of reference.
The factory default amplitudes used in this program are generally 50, 65 and 90
dB. (When DSL is the selected fitting rule, these default levels will vary.) The
user may choose other amplitude levels while conducting the tests. The idea is
to make sure that:
•Softsoundsareaudible(AIDED1).
•Moderatesoundsarecomfortable(AIDED2).
•Loudsoundsdonotexceedtheuser’suncomfortableloudnesslevel
(AIDED 3).
This technique is especially appropriate for non-linear hearing aids.
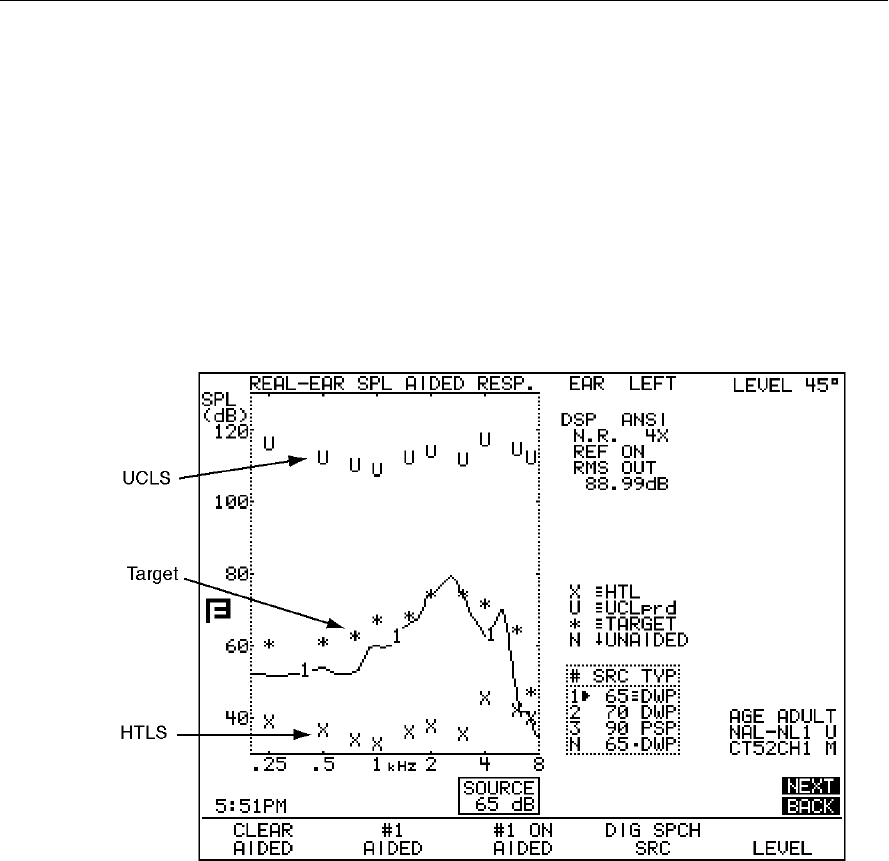
Real-Ear Measurements 139
5.5.1 The SPL Display
The information on the SPL screen is similar to the information in the other
real-ear measurement screens. However, in addition to the measurement curves
and the SPL-converted target, the SPL Screen also displays SPL-converted
thresholds and uncomfortable levels, allowing you to directly compare the mea-
surement curves to the audiometric information.
X denotes left thresholds
O denotes right thresholds
* denotes the target
U denotes the uncomfortable levels.
Figure 5.5.1—SPL display
5.5.2 Running an SPL Test
This section assumes you have already entered the client’s audiometric data in
the Audiogram Entry Screen, and that you have generated a target. See Section
5.3.3 and 5.3.4 for more details.
1. Place the probe tube into the client’s ear following the instructions provided
in Section 5.2.4.
2. Insert the aid into the client’s ear, being careful not to drag the probe tube
farther into the ear canal (See Figure 5.2.4C). Do not turn the aid on.
3. Instruct the client to remain still when the signal is on.
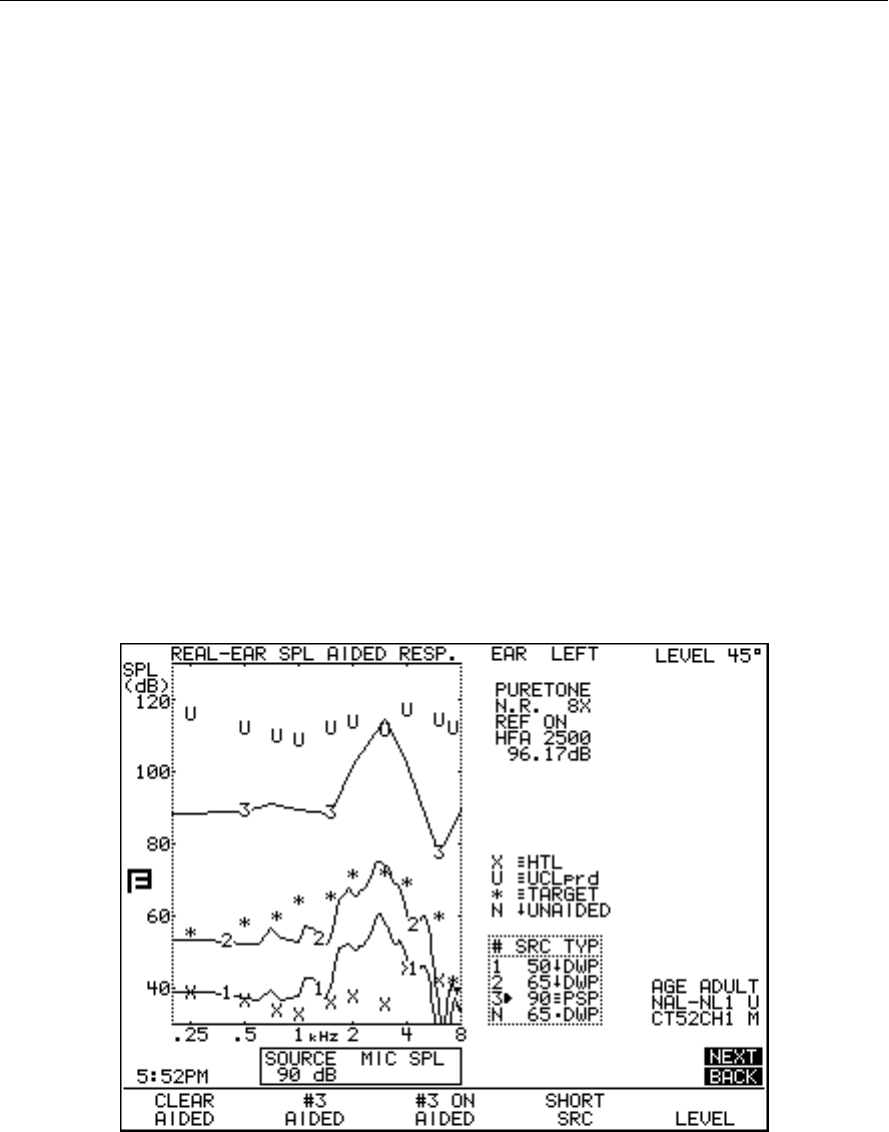
140 FONIX FP35 Hearing Aid Analyzer
4. Press [F5] to level.
5. Have the client turn the aid on and set the gain control to the normal use
level.
6. Use [F2] to select AIDED 1.
7. Use [F4] to select the source type for AIDED 1, and use the [q,p] keys to set
the source amplitude
8. If necessary, adjust noise reduction and output limiting with [MENU].
9. Have the client resume the position they were in during leveling, and
remind them to stay still while the signal is on.
10. Press [START/STOP] to test. If you are using the COMP, DIG SPCH or FAST
signal source, you will need to press [START/STOP] again to stop the signal.
11. Repeat steps 6 through 10 for AIDED 2 and AIDED 3.
In general, AIDED 1 is tested at low levels (50 dB SPL) to make sure soft sounds
are above the patient’s threshold values. AIDED 2 is tested at medium levels
(65-70 dB SPL) to make sure that the aid meets the target. AIDED 3 is tested at
loud levels (90 dB SPL) to make sure that loud sounds are beneath the patient’s
UCLs.
Note: See Section 5.4.5 for information on testing open fit hearing aids.
Figure 5.5.2—SPL display with measurements

Real-Ear Measurements 141
5.5.3 Important Notes on SPL Testing
This section contains somewhat technical details relating to the real-ear SPL
screen.
5.5.3.1 Speech-Weighting Effects on Pure tones
When the normal pure-tone or fast sweep of less than 85 dB is chosen as an SPL
source signal, it is always speech weighted. The corresponding target is also
speech weighted. The measurements and the target will therefore look different
from the target curves displayed in the Insertion Gain Mode.
5.5.3.2 Target Formulas
The target appearing in the SPL Screen normal changes according:
•AIDED2sourcetype
•AIDED2amplitude
•Averageorcustomunaidedresponse
When UNAIDED AVERAGE is chosen in [MENU], the target takes into consider-
ation the KEMAR average unaided response.
When UNAIDED CUSTOM is chosen in [MENU], the target takes into consid-
eration the measured unaided response. If the unaided response has not been
measured before an aided response is taken, the unaided selection automatically
reverts back to AVERAGE, and the target adjusted accordingly.
If no measurement for AIDED 2 has been taken, the target will adjust to the
amplitude and source type of AIDED 2 while you push the keys. If AIDED 2 has
been measured, the target will remain adjusted to the source type and amplitude
of the measured curve. Once you press [START/STOP] to take a new AIDED 2
measurement, the target will adjust to any new source type or amplitude select-
ed.
If you would like to tie the target to a curve other than AIDED 2:
1. Press [MENU] from the real-ear measurement screen.
2. Press [BACK] to enter the Target menu.
3. Use [q,p] to select TARGET REF.
4. Use [t,u] to select CURVE 1, CURVE 2, CURVE 3 or AUTO. The AUTO
selection always uses the current selected curve to generate the target.
5. Press [EXIT] to return to the measurement screen.
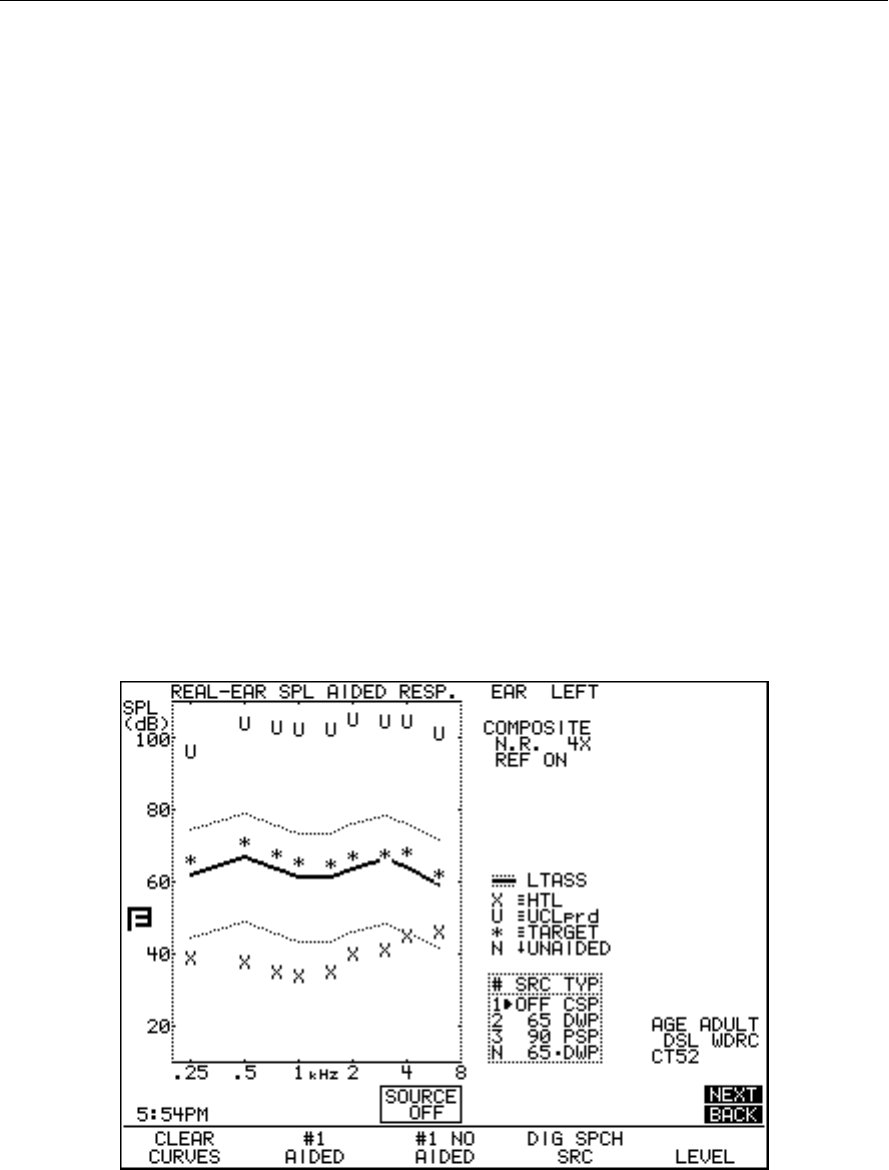
142 FONIX FP35 Hearing Aid Analyzer
5.5.4 Important Notes on DSL Testing
The DSL fitting method is slightly more complicated than the other fitting rules
available on the FP35 analyzer. For this reason, it is important to keep a few
things in mind when using DSL:
• DSLwasinitiallydevelopedforchildren.Forthisreason,itisimportantto
input the client’s age when generating a target for a child. If no age for the
client is set, the analyzer will assume that it is generating a target for an
adult. See Section 5.3.4 for instructions on how to generate a target.
• TheDSLWDRCtargetwillchangedependinguponthesourcelevelof
CRV 2. So, if you would like to see the DSL WDRC target for 80 dB SPL, for
example, set the amplitude of CRV 2 to 80 dB SPL. The DSL LIN target will
also adjust to the amplitude of CRV 2, but its adjustments will be linear.
• DSLdemandsaslightlydifferentspeechweightinginitsmeasurementsig-
nals than the speech weighting we usually use. When fitting an adult, DSL
requires the adult long-term average speech spectrum (A-LTASS) weighting.
When fitting a child, DSL requires the child long-term average speech spec-
trum (C-LTASS). The FP35 will automatically use these speech weightings
unless specifically directed otherwise. See Section 2.5.2.1 for more details.
• WhenDSLLINorDSLWDRCisthefittingmethod,theFP35willputthree
lines on the SPL Testing Screen, denoting the LTASS. Once a real-ear mea-
surement is taken, these lines will disappear. See Figure 5.5.4.
Figure 5.5.4—SPL Testing Screen with a DSL WDRC target and the LTASS speech banana.

Real-Ear Measurements 143
5.6 Live Speech Testing
The Spectrum Analysis mode lets you use the external signal of your choice with
your real-ear measurements. You can use sounds from a CD player, the patient’s
own voice, or the voice of a spouse or family member. This section describes
several different methods of using external signal in your real-ear measurements.
When you use live speech in the real-ear SPL screen, you can compare the hear-
ing aid’s response to the actual speech to the patient’s threshold and uncomfort-
able levels. This can be a great counseling tool for your patient.
5.6.1 Using Speech as a Test Signal
Visible Speech testing can be performed with a live voice signal or with a pre-
recorded stimulus from an external CD player or MP3 player. This is especially
useful if you have the spouse or family member of the client in the testing room.
You can use his/her voice as the test signal in order to educate both the client and
the spouse how close they need to be to each other in order for the hearing aid to
work effectively.
Visible Speech can be performed in any real-ear measurement screen, but this
section will focus on measurements in the Real-ear SPL screen.
To set up for Visible Speech:
1. Follow the instructions in Section 5.2.4 and 5.2.5 to set up the client and
hearing aid for real-ear measurements. The sound field speaker does not need
to be leveled for live speech testing.
2. Insert the patient’s hearing aid carefully and turn it on with the volume con-
trol at the normal user setting.
3. Follow the instructions in Section 5.3 to create a real-ear target, if desired.
4. Enter the Real-Ear SPL screen. See Section 5.1.2 for instructions.
5. Make sure that AIDED #1 is shown above F2. If necessary, use [F2] to change
the curve number. Visible Speech will not function when the UNAIDED curve
is selected.
6. Use [F4] to select COMP.
7. Press [q] repeatedly until the SOURCE is turned OFF. This is displayed in
the source box on the display above the F3 key.
8. Press [MENU] to open the local menu.
9. Use [q,p] to select VISIBLE SPEECH. The BARS selection will display a set
of vertical bars indicating the maximum and minimum response to the test.
The AVERAGE selection will display a second curve during the measurement,
indicating the average response over the time of the test using a peak decay
method.

144 FONIX FP35 Hearing Aid Analyzer
10. Use [q] to select NOISE RED (COMP) and [t,u] to select the amount of
averaging you would like to do when the measurements are performed.
Large noise reduction numbers will create a smoother curve that will update
more gradually with more averaging. If the noise reduction is turned to a
low number or OFF, the measurement curve will update more quickly with
less averaging.
11. Press [EXIT] to close the local menu.
To use an external CD/MP3 player
If your FP35 has been manufactured after October 2008, you can connect an
external CD player or MP3 player to the FP35 analyzer and play the signal
through the FP35 speaker using the 3.5mm “line-in” jack on the back of
the analyzer. If your analyzer does not have this jack, then it was probably
manufactured previous to the addition of this feature. Existing analyzers can be
upgraded. Contact your FONIX distributor for details.
When the FP35 is in spectrum analysis mode (as described in the “To set up for
Visible Speech” section above) and an external player is connected using the
line-in jack, then the FP35 will automatically play any input coming from the
external player.
To calibrate a pre-recorded signal
We recommend that you calibrate the external signal for best measurement
results. Many CDs used by hearing health professionals contain a calibration
track as the first track of the CD. This is generally a puretone signal at a
particular input level.
1. Set up the patient for real-ear measurements as described in the “To set up
for Visible Speech” section above.
2. Put the analyzer in spectrum analysis mode and play the calibration track
on the CD through the FP35 speaker. Make sure to start a measurement by
pressing the [START/STOP] key.
3. Adjust the volume control on the external player until the REF measurement
(located to the right of the measurement graph, above the RMS OUT
measurement) matches the desired level of the calibration tone. This level
should be indicated on the instruction materials of the CD.
To start measuring:
1. Press [START/STOP] to start the measurement.
2. Start your input signal:
a. If you are using a live voice, such as the patient’s spouse, have the person
speak to the patient from about 6 feet away (2 meters). It helps to have
something for them to read.
b. If you are using a pre-recorded signal, start the signal from the external
player.
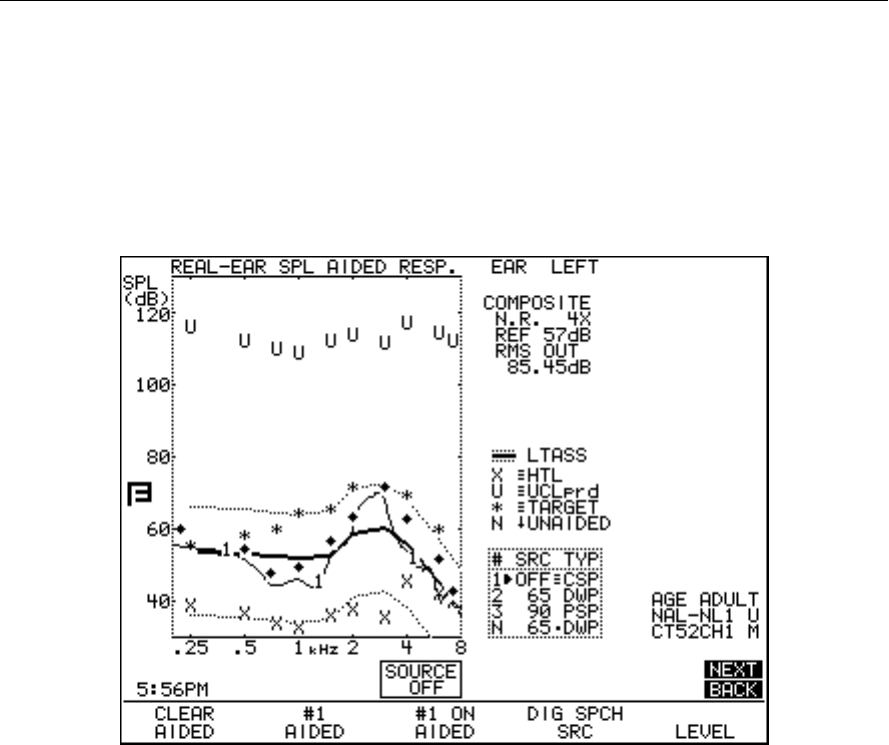
Real-Ear Measurements 145
3. Examine the measurement graph. The screen will display the hearing aid’s
response to the live voice or pre-recorded signal and how it relates to the
displayed speech banana. If you chose the BARS setting in step 8, you
will also see a succession of bars on the screen, indicating the maximum
peaks of the speech. If you chose the AVERAGE setting, you will see a sec-
ond curve composed of small diamonds indicating the long term average
response over the time of the test. See Figure 5.6.1.
Figure 5.6.1—Visible Speech Testing
4. Press [START/STOP] to stop the measurement. Show your patient and his
spouse how the hearing aid amplified the signal.
5. Press [F2] to select AIDED 2 and [START/STOP] to start a second measure-
ment. If using a live voice signal, instruct your patient’s spouse to stand 3
feet away (1 meter) and speak again.
6. Press [START/STOP] to stop the measurement. When used with a live voice
signal, this exercise can show how distance improved the gain of the fre-
quency response.
7. Experiment in this manner with different distances. This will help demon-
strate how close your patient and his spouse need to be to each other for
maximum speech intelligibility.
Notes
The target displayed in the Real Ear SPL screen when in spectrum analysis
mode assumes a 60 dB SPL input level.

146 FONIX FP35 Hearing Aid Analyzer
5.6.2 Measuring the occlusion effect
You can use the Aided & Unaided screen in order to measure the “occlusion
effect” of a hearing aid. By analyzing the spectrum of your patient’s own voice,
you can judge whether the occlusion effect will make the hearing aid uncom-
fortable, and you can measure an improvement (lessening) of the occlusion
effect after adjusting the vent opening.
To set up for measuring the occlusion effect:
1. Enter the Unaided & Aided screen. See Section 5.1.2 for instructions.
2. Follow the instructions in Section 5.2.4 to insert the probe tube into your
patient’s ear. There is no need to level the sound field speaker when measur-
ing the occlusion effect.
3. Insert the patient’s hearing aid, being careful not to move the probe tube.
The hearing aid can be turned on or off.
4. Use [F2] to select UNAIDED.
5. Use [F4] to select COMP.
6. Press [q] repeatedly until the SOURCE is turned OFF. This is displayed in
the source box on the display above the F3 key.
7. Press [MENU] to open the local menu, and use the arrow keys to change
NOISE RED (COMP) to 16X. This will increase the amount of averaging the
analyzer does when the measurements are performed.
To measure the occlusion effect:
1. Press [START/STOP] to start the measurement.
2. Instruct your client to sustain the vowel sound “eee.”
3. Press [START/STOP] while the “eee” is still sounding and the curve has sta-
bilized. The patient can now stop vocalizing.
4. Look at the gain in the low frequencies. If it seems high, you may consider
adjusting the vent to a more open condition in order to prevent occlusion-
effect discomfort.
5. Press [F2] to select AIDED 1. Make sure COMP is the selected source type
above F4, and the SOURCE is OFF. Use [F4] and [q] to make these selec-
tions, if necessary.
6. Press [START/STOP] to start a second measurement.
7. Ask your patient to sustain an “eee” sound again. Press [START/STOP] dur-
ing the vocalization when the measurement has stabilized. (You can then
tell your patient to stop.)

Real-Ear Measurements 147
8. Compare AIDED 1 to the “UNAIDED” measurement to see how your vent
adjustments have changed the response of the hearing aid.
9. Press [NEXT] to view the Insertion Gain screen. This will show you the
actual difference that your adjustments made—the first measurement is sub-
tracted from the second measurement.
5.7 Miscellaneous Real-Ear Measurements
The measurements and information described in this section can be performed
in the SPL screen, the Unaided and Aided screen, and the Insertion Gain screen.
5.7.1 Measuring a Single Frequency Response
It is sometimes useful to be able to determine the response of the hearing aid to
a single frequency and how that response changes as the frequency and ampli-
tude of the signal changes.
The USER LEVEL must be set to ADVANCED in the Default Settings menu. See
Section 2.3.2 for details.
To measure the single frequency response:
1. Hold down the [F4] key for half a second in any of the real-ear measurement
screen.
2. Use the [q,p] keys to select SINGLE.
3. Press [START/STOP] to make the selection.
4. Press [START/STOP] again to start the single frequency signal. It will be a
pure-tone warble.
5. Use [t,u] to change the frequency of the pure-tone warble.
6. Use [q,p] to change the amplitude of the pure-tone warble.
See Section 2.5.1.4 for information about changing the warble rate (or turning
off the warble) of the pure-tone signal.
5.7.2 Measuring Harmonic Distortion
Harmonic distortion is when the hearing aid returns energy at frequencies not
present in the source signal. The FP35 allows you test for this phenomenon very
easily. See Section 2.5.1.2 for more information on the harmonic distortion mea-
surement.
The USER LEVEL must be set to ADVANCED in the Default Settings menu. See
Section 2.3.2 for details.
1. Press [MENU] from any real-ear measurement screen.
2. Press [NEXT] to enter the Custom menu.
3. Select DISTORTION using the [q,p] keys.
4. Select the distortion type desired by using the [t,u]keys. See below for
definitions of distortion types.
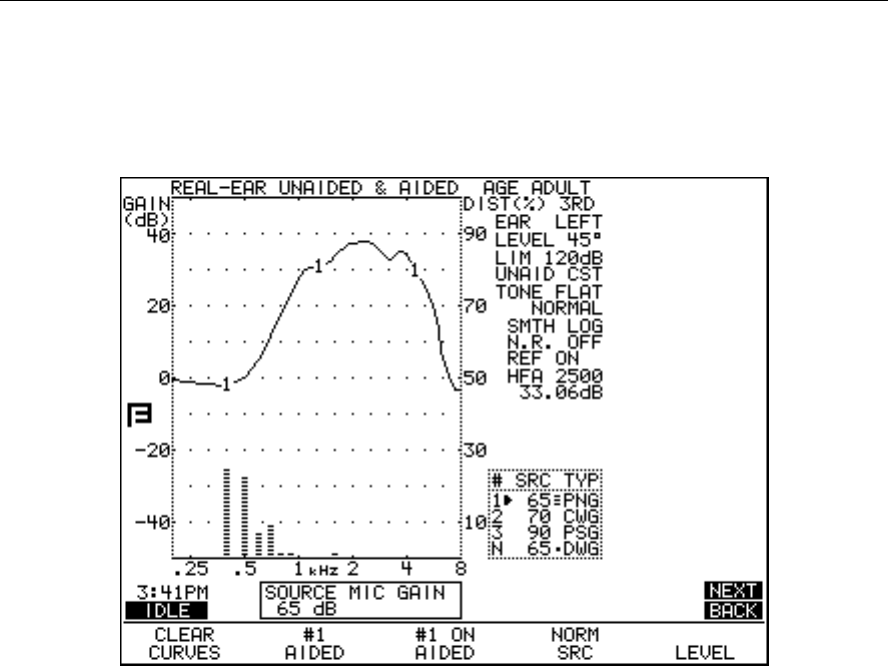
148 FONIX FP35 Hearing Aid Analyzer
5. Press [EXIT].
6. Press [F4] to select NORM.
7. Press [START/STOP] to run normal frequency sweep.
Figure 5.7.2—Measuring harmonic distortion
After running a normal sweep, the graph will have bars depicting the percentage
level of harmonic distortion at different frequencies. The scale for the harmonic
distortion measurements is given on the right vertical axis of the graph.
In the past, FONIX analyzers have not measured harmonic distortion when the
signal level was set to 90 dB SPL or higher. This is called the “90 dB harmonic
distortion rule.” Since hearing aids in recent years have become more sophis-
ticated and able to handle loud signals, we have turned this off this rule by
default. However, if you would like to use it, go into the Custom Menu (press
[MENU], [NEXT], [NEXT]) and turn ON the DIST 90 dB RULE.
5.7.3 Measuring Intermodulation Distortion
This section describes how to make various intermodulation distortion measure-
ments. See Section 2.5.2.2 for technical details on those measurements.
The USER LEVEL must be set to ADVANCED in the Default Settings menu. See
Section 2.3.2 for details.
5.7.3.1 To perform a static IM distortion test
1. Press [MENU] in the real-ear measurement screen to enter the real-ear
menu.
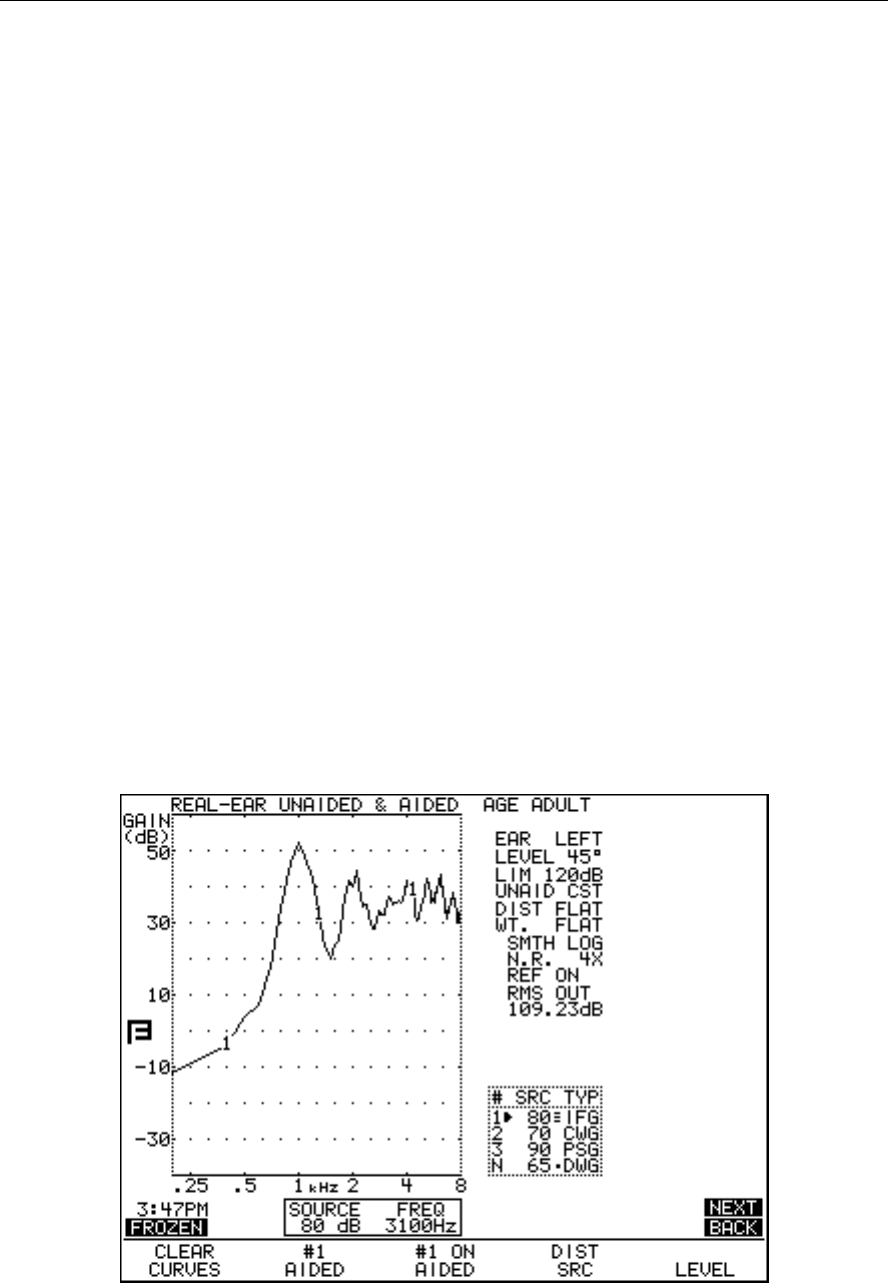
Real-Ear Measurements 149
2. Make sure the REF MIC is OFF. Use the arrow keys to make this selection, if
necessary.
3. Press [NEXT] twice to enter the Custom menu.
4. Make sure that DISTORTION is OFF. Use the arrow keys to make this selec-
tion if necessary.
5. Use [q,p] to select IM FREQ DIFF.
6. Use [t,u] to select the fixed distance between the primary and secondary
frequencies used in the measurement. You can choose from no distance
(HARM) to 4000 Hz.
7. Press [EXIT] to return to the real-ear measurement screen.
8. Press and hold down [F4]. This will pop up a list of the available selections,
including DIST.
9. Use [q,p] to select DIST.
10. Press [START/STOP] to make the selection.
11. Use [q,p] to select the RMS source of the test. Each frequency will have an
amplitude 3 dB less than the RMS source.
12. Set up the client, the aid, and the analyzer for real-ear testing. Make sure to
level the sound field speaker.
13. Press [START/STOP] to start the static IM distortion measurement. See
Figure 5.7.3.1.
14. Use [t,u] to change the primary frequency of the test. The secondary fre-
quency will also change, remaining a fixed distance (selected in Step 6)
away from the primary frequency.
15. Press [START/STOP] to stop the measurement.
Figure 5.7.3.1—Real-Ear static IM distortion test
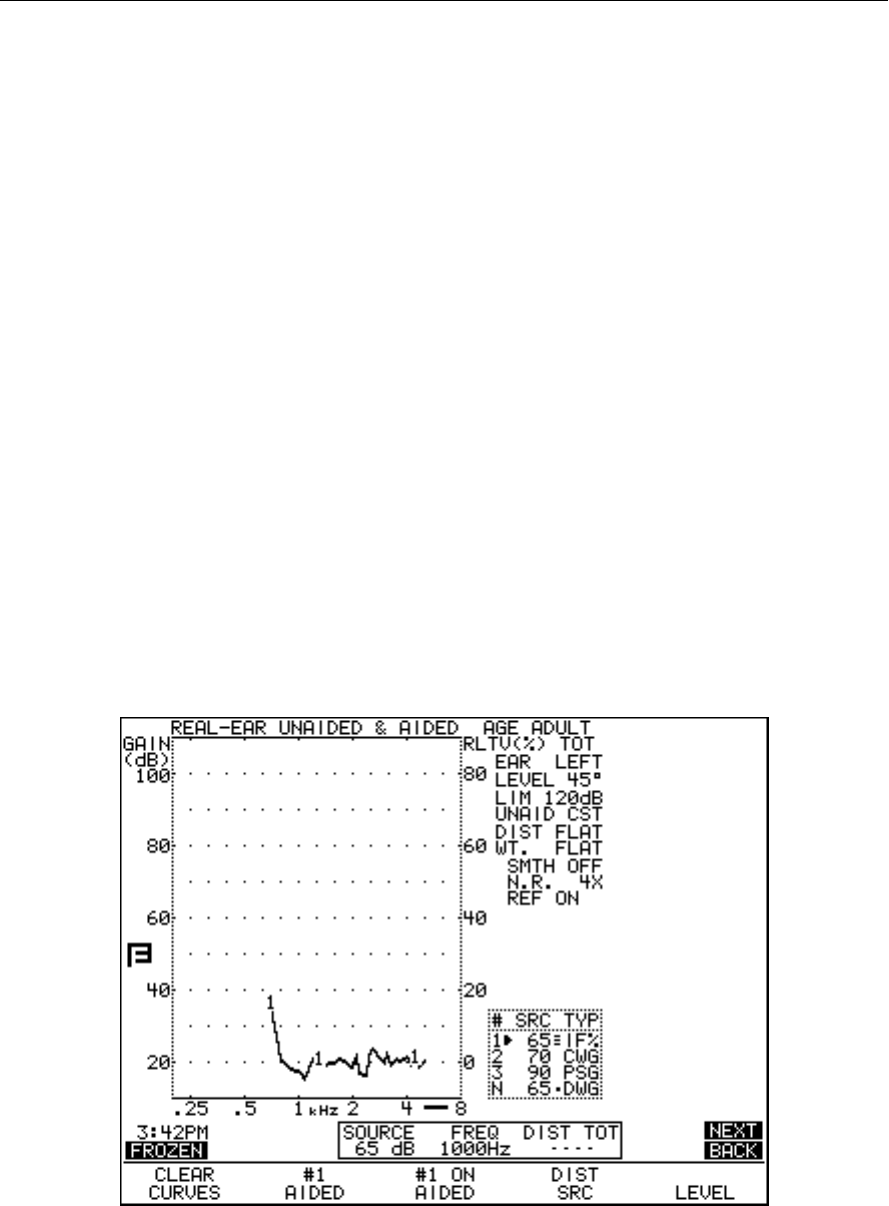
150 FONIX FP35 Hearing Aid Analyzer
5.7.3.2 To perform an IM distortion sweep
1. Press [MENU] in the real-ear measurement screen to enter the real-ear
menu.
2. Make sure the REF MIC is OFF. Use the arrow keys to make this selection, if
necessary.
3. Press [NEXT] twice to enter the Custom menu.
4. Select DISTORTION with [q,p].
5. Use [t,u] to select the harmonics where the IM distortion will be mea-
sured. You can select the 2nd distortion, the 3rd distortion or TOTAL, which
is all frequencies except the primary and secondary frequencies.
6. Use [q,p] to select IM FREQ DIFF.
7. Use [t,u] to select the fixed distance between the primary and secondary
frequencies used in the measurement. You can choose from no distance
(HARM) to 4000 Hz.
8. Press [EXIT] to return to the real-ear measurement screen.
9. Press and hold down [F4]. This will pop up a list of the available selections,
including DIST.
10. Use [q,p] to select DIST.
11. Press [START/STOP] to make the selection.
12. Use [q,p] to select the RMS source of the test. Each frequency will have an
amplitude 3 dB less than the RMS source.
Figure 5.7.3.2—Real-Ear IM distortion sweep

Real-Ear Measurements 151
13. Set up the client, the aid, and the analyzer for real-ear testing. Make sure to
level the sound field speaker.
14. Press [START/STOP] to start the IM distortion sweep. See Figure 5.7.3.2.
The measurement will stop when finished. The percentage scaling for the
measurement is located on the right side of the graph. Notice the thick line
below the lower right corner of the graph. This is an indication that the cur-
rent selected measurement uses the right side scaling.
5.7.3.3 To change the frequencies used in the sweep
By default, the IM distortion sweep is performed at the frequencies used in the
NORMAL pure-tone sweep. This can be changed to perform the measurements
at fewer frequencies (for a faster test), and more frequencies (for a more com-
plete test).
1. Press [MENU] from the real-ear measurement screen to enter the real-ear
menu.
2. Press [NEXT] twice to enter the Custom Menu.
3. Use [q,p] to select DISTORTION SWEEP.
4. Use [t,u] to make one of the following selections:
• NORM:Tomeasureat1/12octavefrequenciesclosestto100Hzintervals
(default test)
• FAST:Tomeasureat1/3octavefrequenciesclosestto100Hzintervals
(fastest test)
• FULL:Tomeasureatevery100Hzinterval(mostcompletetest)
5. Press [EXIT] to return to the real-ear measurement screen and follow the
directions in Section 5.7.3.2 to perform the IM distortion sweep.
5.7.4 Using the Reference Microphone
The microphone that sits on top of the client’s ear is always used for leveling
the sound field speaker. It can also be used in real-ear gain and insertion gain
measurements. When the reference microphone is turned on in the Unaided
and Aided measurement screen, or in the Insertion Gain screen, the analyzer
subtracts the reference microphone measurement, made just outside the client’s
ear, from the probe microphone measurement, made inside the client’s ear in
order to derive gain and insertion gain results.
When the reference microphone is turned off during these measurements, the
FP35 analyzer assumes that the sound field outside the client’s ear is absolutely
perfect, and just relies on the leveling information to achieve the gain (or inser-
tion gain) response. While this can lead to smoother response curves, the mea-
surement will not be quite as accurate. For most purposes, it is recommended to
perform gain and insertion gain measurements with the reference microphone
on. In a noisy testing environment, it might be advantageous to turn the refer-
ence microphone off in order to get a smoother response.
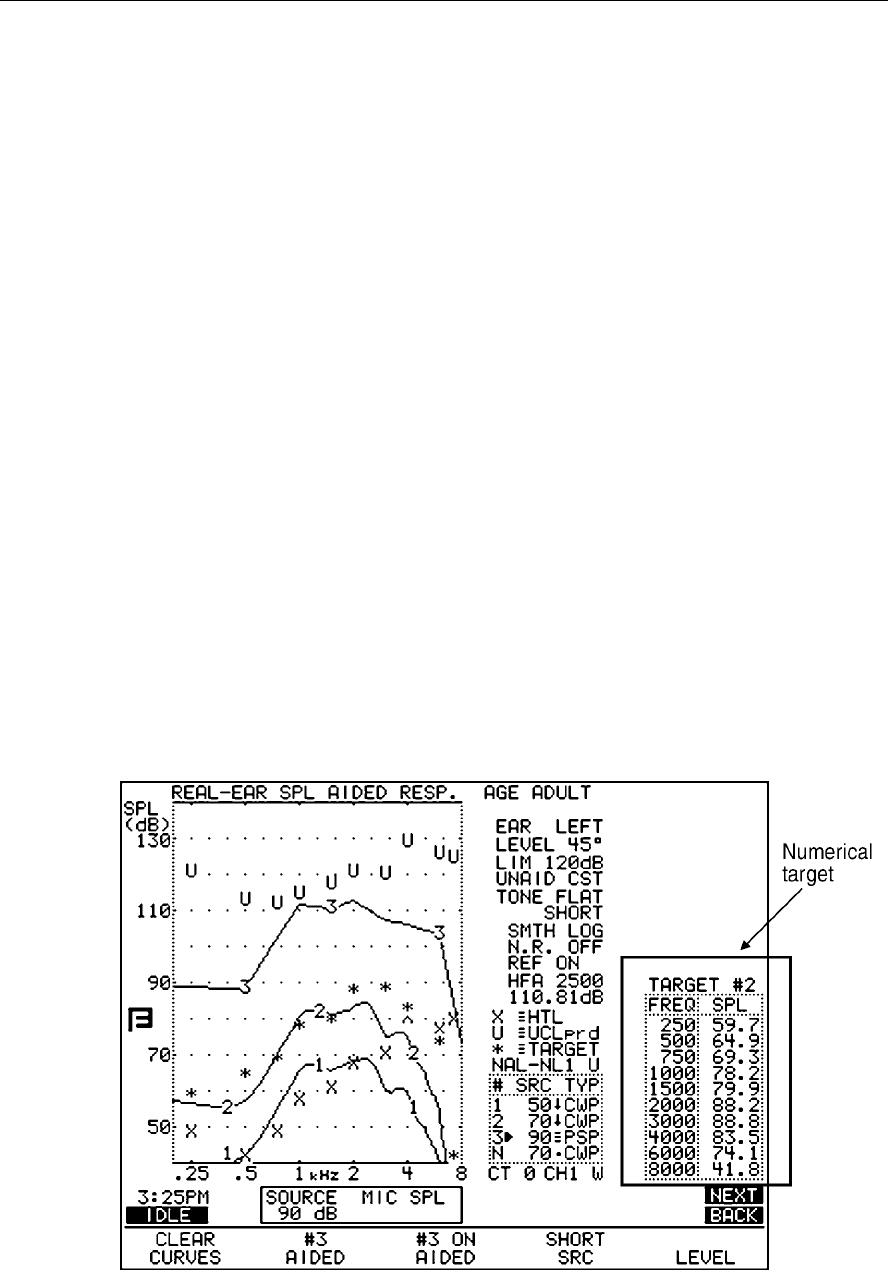
152 FONIX FP35 Hearing Aid Analyzer
To change the reference microphone status:
1. Press [MENU] in the real-ear measurement screen.
2. Use [q,p] to select REF MIC.
3. Use [t,u] to turn the reference microphone ON or OFF.
4. Press [EXIT] to return to the measurement screen.
5.7.5 Viewing Target Data
You can view the numerical data of your response curves with the DATA/
GRAPH selection in the main local menu of the real-ear measurement screen
and using [F2] to select the desired curve. However, if you want to view the
numerical data of the target curve itself, you must use the TABULATION field
in the Advanced real-ear menu. This will add a table to the right of the real-ear
measurement graph, displaying the target in numerical format.
The USER LEVEL must be set to ADVANCED in the Default Settings menu. See
Section 2.3.2 for details.
To view the target in numerical format:
1. Press [MENU] to enter the main real-ear menu.
2. Press [NEXT] to enter the Advanced real-ear menu.
3. Use [q,p] to select TABULATION.
4. Use [t,u] to select TARGET.
5. Use [EXIT] to return to the real-ear measurement screen. The target data will
now be displayed. See Figure 5.7.5.
Figure 5.7.5—Numerical display of target data

Real-Ear Measurements 153
5.7.6 Measuring the Telecoil Response
Telecoil measurements can be performed in the real-ear measurement screens
using any source type available on the analyzer. You must use the optional
Telewand to perform this measurement.
To test the telecoil function in a real-ear measurement:
1. Follow the instructions found in Section 2.5.8 to set up the FP35 Default
Settings Menu for telecoil measurements.
2. Press [F2] from the Opening Screen to enter the Real-ear mode and use
[NEXT] or [BACK] to enter one of the real-ear measurement screens.
3. Press [MENU] to open the local menu.
4. Use [q,p] to select TELECOIL and use [t,u] to choose ON.
5. Press [EXIT] to close the local menu. The source box at the bottom of the
measurement graph will now indicate TMFS.
6. Plug the Telewand into the earphone jack or the speaker jack (new style rear
panel only) on the back of the FP35 analyzer.
7. Set up the patient for real-ear measurements in the usual way. It is not nec-
essary to level the sound field speaker for this measurement.
8. Set the hearing aid to telecoil mode.
9. Use [F4] to choose the desired source type.
10. Instruct the patient to hold the Telewand next to his ear as if he were hold-
ing a telephone receiver next to his ear. See Figure 5.7.6A.
11. Press [START/STOP] to run the measurement and test as desired. See Figure
5.7.6B.
Figure 5.7.6A—Measuring telecoil response with the Telewand.
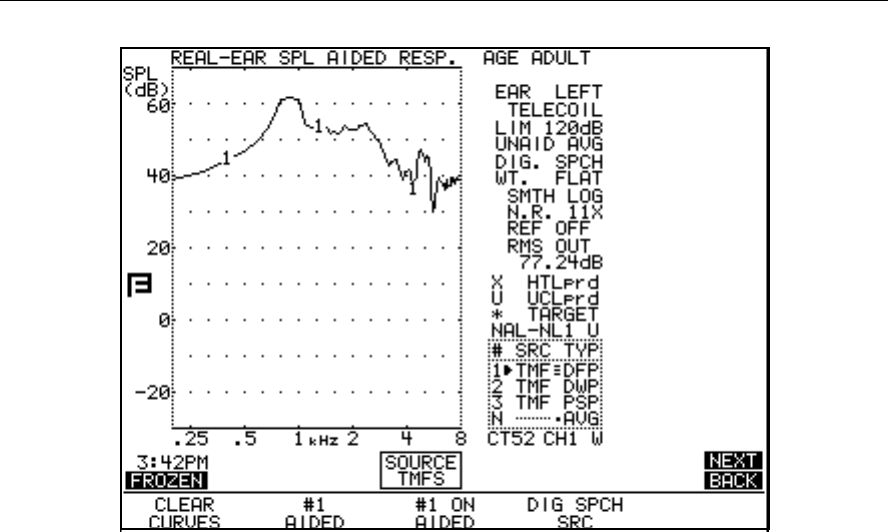
154 FONIX FP35 Hearing Aid Analyzer
Figure 5.7.6 B—Screenshot of Telewand test results
5.8 Reference
This section contains a description of the real-ear measurement displays and
definitions for each menu item available in the real-ear measurement screens.
5.8.1 Viewing the Real-Ear Screens
The display for each of the three Real-Ear Measurement Screens has similar
information.
Please refer to Figures 5.8.1A, 5.8.1B, and 5.8.1C for the following listing.
1. Ear tested. Select with [MENU].
2. Leveling status. See Section 5.2.6.
3. Signal type and weighting selected.
4. N.R is the noise reduction used for the selected curve.
5. Status of the reference microphone.
6. RMS/HFA/SPA: If a composite signal is selected, the RMS OUT will be dis-
played here. Otherwise, the selected HFA or SPA will be displayed.
7. Curve ID box. See Section 2.7.2 for more details.
8. The N curve is the unaided response curve.
9. Response curves labeled with identifying numbers.
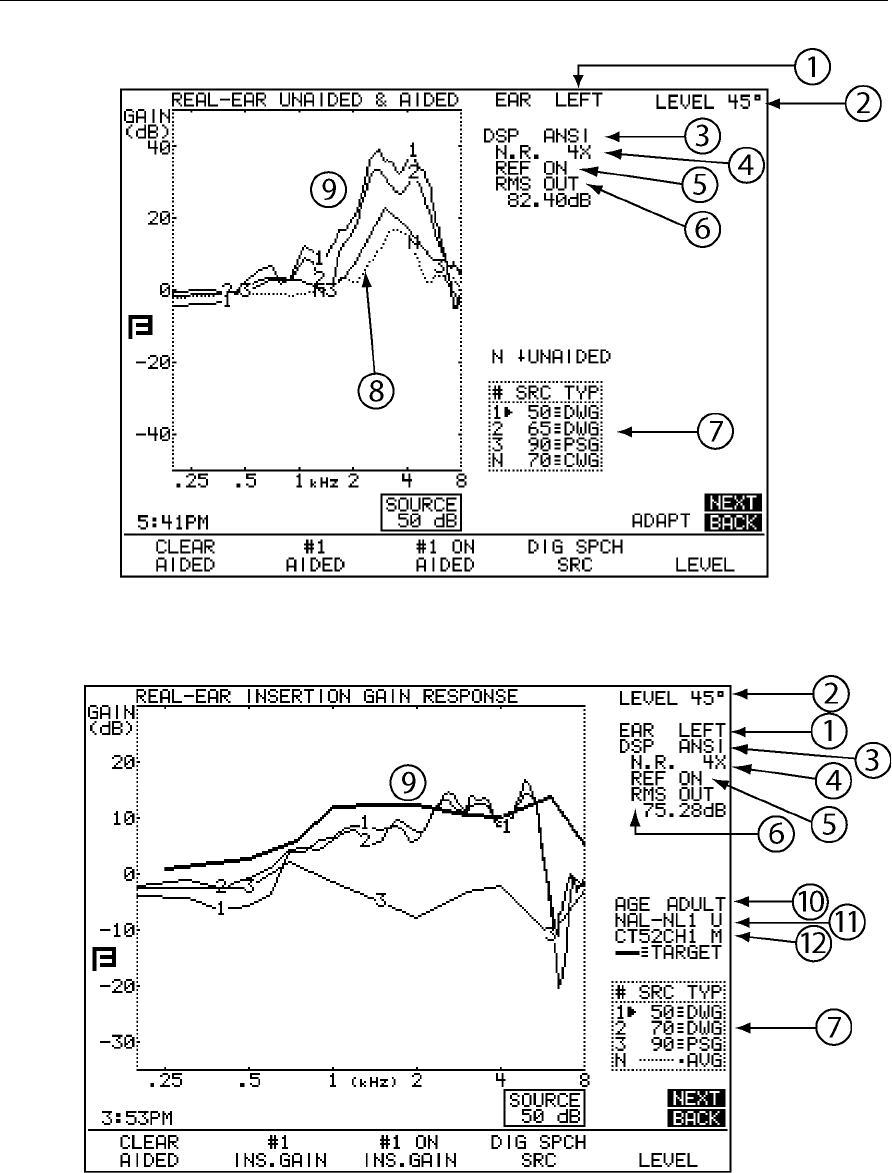
Real-Ear Measurements 155
Figure 5.8.1A—Unaided and Aided Screen.
Figure 5.8.1B—Insertion Gain Screen.
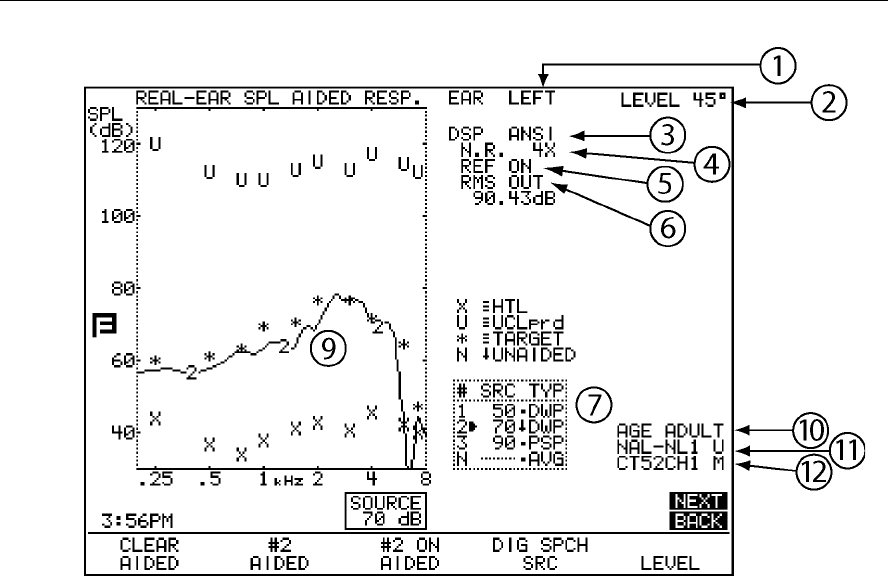
156 FONIX FP35 Hearing Aid Analyzer
Figure 5.8.1C—Real-ear measurement screen with NAL-NL1 fitting rule
The Real-ear SPL and Real-ear Insertion Gain screens also contain information
about the settings used to create the target: Not all settings are available with all
targets.
10. Age of patient
11. Fitting rule selected and the type of fitting. “U” indicates a unilateral fitting.
“B” indicates a bilateral fitting.
12. Compression threshold of the aid, number of channels of the aid, and the
type of output limiting. “W” indicates wideband limiting. “M” indicates
multi-channel limiting.
5.8.2 Defining the Menu Items
There are a number of menu settings that affect both measurements and tar-
gets. Some of these settings are only available when the USER LEVEL is set to
ADVANCED in the Default Settings menu. See Section 2.3.2 for details. These
menu items are marked with an asterisk (*).
Main Real-Ear Menu
To enter the menu, push [MENU] from any of the Real-Ear Measurement
screens. Use the arrow keys as you normally would to make selections.
EAR—The ear being tested. Select LEFT, RIGHT or NONE.

Real-Ear Measurements 157
DATA/GRAPH—The type of display. Choose between a graphical display and a
numerical display.
UNAIDED—The type of unaided response. Select AVG to use the average
unaided response, or select CUSTOM if you are going to measure your client’s
unaided response.
AID GROUP—The type of hearing aid being tested. Select STANDARD, AGC,
or ADAPTIVE (for adaptive AGC circuits). This selection sets the various delay
times used in pure-tone tests so that they are appropriate to the aid’s circuitry.
See Section 2.4 for more information on delay times.
SOUND FIELD—The sound field azimuth you are using with the real-ear mea-
surements. We recommend 45º for more repeatable results.
AUTO TEST—The status of the Auto Test. When enabled, the FP35 will auto-
matically measure AIDED 1, AIDED 2 and AIDED 3 without stopping for user
intervention. See Section 5.4.3 for details.
VISIBLE SPEECH—Display used when the FP35 analyzer is in Spectrum
Analysis mode (requires Composite/Digital Speech Option). BARS displays a
set of vertical bars representing the maximum peaks of the measurements that
reach above the lower limits of the speech banana. AVERAGE displays a long
term average of the response using a peak decay method.
OUTPUT LIMIT—Level of output limiting. Please review red warning page.
NOISE RED (TONE & COMP)—Select the amount of noise reduction suitable to
your environment. See Section 2.5.1.3 and 2.5.2.3 for more details.
REF MIC—The status of the reference microphone.
Target Menu
Press [BACK] from the Main Real-Ear menu to enter the Target menu.
FIT RULE—The fitting rule used to create the real-ear and coupler targets.
Selections are: NAL-NL1, NAL-RP, DSL WDRC, DSL LIN, POGO, BERGER, 1/3
GAIN, 1/2 GAIN, 2/3 GAIN and DIRECT. A selection of NAL-NL1 will add sev-
eral menu selections to the menu screen.
AGE—The age of the client. A selection of NONE sets the age to ADULT but
turns off the age display.
TARGET REF— The measurement curve that the target is based upon. Choose
from CURVE 1, CURVE 2 and CURVE 3, and AUTO. See Section 5.5.3.2.
COMPRESSION—The type of wideband compression threshold the aid has.
This is selectable in increments of 1 dB, and it is only available with a fitting
rule selection of DSL WDRC or NAL-NL1.
CHANNELS—The number of channels the aid has. This is only available with a
fitting rule selection of NAL-NL1.

158 FONIX FP35 Hearing Aid Analyzer
AID LIMITING—The type of output limiting the aid has. If the aid has output
limiting, usually WIDEBAND should be selected. If the aid has output limiting
and it has more than one channel, this can be set to MULTICHAN. If the aid
doesn’t have limiting, set this to NONE. This selection is only available with a
fitting rule selection of NAL-NL1.
FIT TYPE—Type of fitting Choose from UNILATERAL and BILATERAL. Bilateral
fittings require the audiograms of both ears to be entered.This is only available
with a fitting rule selection of NAL-NL1.
*REFERENCE—Type of leveling used in the real-ear measurement. When HEAD
SURFACE is selected, leveling is performed with the patient within the sound
field and the reference microphone on top of the ear. When UNDISTURBED is
selected, leveling is performed by holding the reference microphone in front of
the sound field speaker. This selection is only available with a fitting rule selec-
tion of NAL-NL1.
Advanced Real-Ear Menu
Press [NEXT] from the Main Real-Ear Menu to reach this screen.
*AUTO-SCALE—The type of scaling used. ON scales the graph to the selected
curve. OFF scales the graph to the highest curve displayed.
*TABULATION—Target data display on the right side of the real-ear measure-
ment screen. Choose TARGET or NONE. See Section 5.7.5 for details.
*REFERENCE STATUS—The type of RMS measurement made with the refer-
ence microphone. The following selections are available: RMS displays the
overall RMS of the reference microphone, FULL displays the overall RMS and
the signal quality of the reference microphone, and NONE turns off the RMS
display of the reference microphone. See Section 2.5.4 for more information.
*AVG FREQ—The three frequencies used for averaging in pure-tone measure-
ments. Each set is represented on the screen by the highest frequency in the set.
See Section 2.5.1.6 for details.
*STATIC TONE—Status of the static pure-tone measurement. When a pure-tone
source is selected and a sweep isn’t running, measure the response and distor-
tion of a single frequency (SINGLE), the three frequency average chosen in AVG
FREQS (AVG), or no measurement (NONE).
FILTER—The type of speech weighting used on the signal sources. In most
cases, this should be set to AUTO. See Section 2.5.2.1 for more details.
EXT SOURCE: The channel selected of the external source. The external source
(see Section 5.6.1) uses a dual channel connector. This means that the input sig-
nal has potentially two different channels. This selection lets you choose which
channel to use as the input signal. Choices are EXT CH1 and EXT CH2.
*SMOOTHING—Type of smoothing used. Smoothing rounds off the curve,
removing minor peaks.

Real-Ear Measurements 159
*SPEECH AVERAGE—Number of measurements used to obtain the Visible
Speech average curve: 2, 4, 8. 16, 32, 64, 127.
AUTO DURATION—The length of time used by the Auto Test. This can be set
in seconds: 0.5, 1.0, 2.0, 5.0 and 10.0.
*PREDELAY TIME—The delay after the first tone is presented and before the
first measurement is taken in a pure-tone measurement. See Section 2.4 for
more information.
*SHORT SETTLE—The time delay between frequencies in a pure-tone sweep,
and the additional delay in a digital speech measurement.
*LONG SETTLE—The time delay between frequencies in an input/output mea-
surement, a three-frequency average measurement, or a harmonic distortion
measurement.
PRINT LABEL—Status of the printing label.
PRINTER— Printer used for printouts. Choose INTERNAL to use the built-in
thermal printer. Choose EXTERNAL to use an attached laser or ink-jet printer.
Custom Menu
Press [NEXT] from the Advanced Menu to enter the Custom Menu.
*HIDE—The display of the non-measurement curves in the SPL screen. You can
selectively hide HTL, UCL and target values. SHOW ALL does not hide any of
these curves.
*WARBLE SOURCE—The warble rate in pure-tone signals. Warble is usually
used in sound field speaker measurements to reduce problems caused by stand-
ing waves. See Section 2.5.1.4 for more details.
*SIGNAL SKEW—The number of samples from when the speaker emits the
signal source to when the FP35 microphone reads and analyzes it. See Section
2.5.1.5 for details.
SPEAKER—The sound field speaker selection. Choose to use the FP35 analyz-
er’s INTERNAL speaker or an attached EXTERNAL speaker.
*OUTPUT JACK: The external source devices enabled in the measurement
screen. The AUTO and SPEAKER selections enable only the speaker jack.
MONO EAR enables the left channel of the earphone jack. STEREO EAR
enables both channels of the earphone jack. ALL ON enables all devices. See
Section 2.5.5 for details.
MIC PORT: Choose the microphone used for Real-ear measurements. Select
AUTO, INTERNAL, EXTERNAL or EXT LINE. See Section 2.5.9 for details.
*LEVELING SOURCE—The amplitude used for leveling the sound field speaker.
*IMPULSE REJ—Status of impulse rejection, which rejects noise in the testing
environment. See Section 2.5.6.

160 FONIX FP35 Hearing Aid Analyzer
*RMS ANALYSIS—The type of RMS analysis used for the measurements.
Choose AUTO (estimated RMS) or NONE. See Section 2.5.3 for details.
*DISTORTION—The type of harmonic distortion of a single tone or of a normal
sweep curve. Choices are 2ND, 3RD, TOTAL (2ND + 3RD) or OFF.
Note: Distortion is not normally measured in real-ear due to the noise levels in
the test environment being seen as distortion.
*DIST 90 dB RULE—Harmonic distortion measurements are generally made
only when the source of the test signal is below 90 dB SPL. To measure harmon-
ic distortion at 90 dB SPL or higher, turn this rule OFF.
*DISTORTION SWEEP—The frequencies used in the intermodulation distortion
measurement. NORM uses 1/12 octave frequencies to the nearest 100 Hz. FAST
uses 1/3 octave frequencies to the nearest 100 Hz. FULL uses every 100 Hz fre-
quency available.
*DIST SWEEP END— The last frequency tested when performing an IM distor-
tion sweep. If the selected frequency is less than or equal to the first primary
frequency in the IM distortion sweep, only the primary frequency will be tested;
there will be no IM distortion sweep.
*IM FREQ DIFF—The distance between the primary and secondary frequency
in the intermodulation distortion measurement. See Section 2.5.2.2 for more
details.
* These menu items are only available when the USER LEVEL is set to
ADVANCED mode. See Section 2.3.2 for details.
5.9 CROS, and BICROS
When using the FP35 probe with a CROS or BICROS aid, we suggest the follow-
ing setups and procedures.
Four Goals:
5.9.1 - Measuring the Head Baffle Effect
5.9.2 - Measuring the Overcoming of the Head Baffle Effect
5.9.3 - Measuring the Overall Insertion Gain
5.9.4 - Measuring the Insertion Loss to the “Good” Ear
Each of these measurements uses the insertion gain measurement technique,
taking advantage of the fact that the insertion gain is a difference curve between
two measured curves (usually the unaided and aided response). The techniques
assign the label of “unaided” to one measurement and a label of “aided” to
another measurement.
Take all measurements in the Insertion Gain Screen. For measurements labeled
“Unaided” (even if they aren’t unaided) follow the instructions in Section 5.4.2.
For measurements labeled “Aided” (even if they aren’t aided) follow the instruc-
tions in Section 5.4.4.
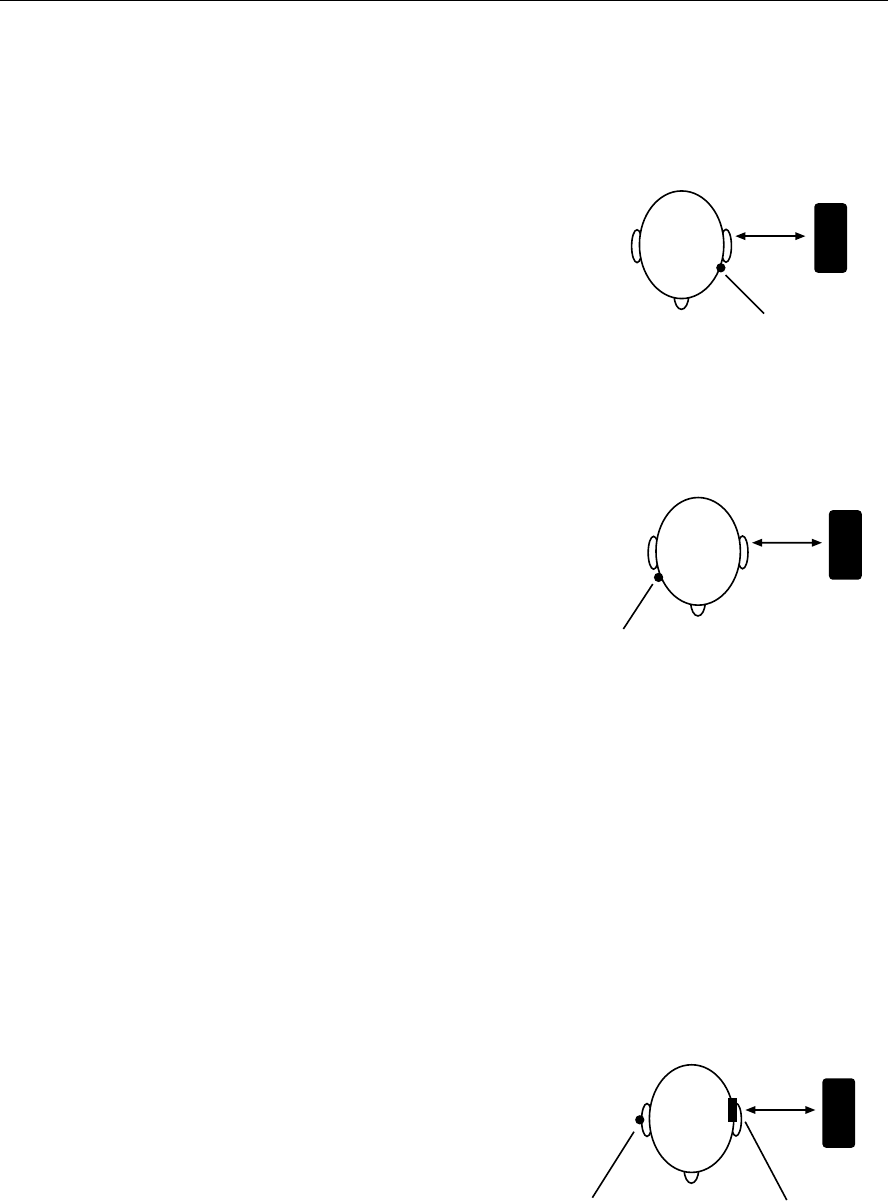
Real-Ear Measurements 161
5.9.1 Measuring the Head-Baffle Effect
The measurements described in this section are for both CROS and BI-CROS
hearing aids.
Unaided—Real-Ear response on “bad ear” side
Set up the FP35 analyzer as follows.
•SystemUNLEVELED
•ReferencemicrophoneOFF
•UnaidedCUSTOM
•Probemicrophoneoverthebadear,tube
jutting just slightly forward of pinna
•Loudspeakerat90º,12inchesfrombadear
Aided—Real-Ear response on “good” ear side
Same setup as above except:
•Probemicrophoneoverthegoodear
The difference curve, labeled “Insertion Gain”
on the screen, shows the attenuation of sound
arriving at the good ear from the bad ear side.
Since this measurement excludes the external
ear, differences across individuals should be minimal.
NOTE: Although the above two measurements call for the FP35 to be
UNLEVELED with the reference microphone OFF, the rest of the measurements
in this section call for the FP35 to be LEVELED with the reference microphone
ON.
5.9.2. Measuring the Overcoming of the Head-Baffle Effect
This section describes how to measure how well the hearing aid overcomes the
head-baffle effect. The methods are different for CROS hearing aids than they
are for BICROS hearing aids.
5.9.2.1 CROS
Unaided—Measurement of the “good” ear
canal (baffled by the head)
Set up the FP35 analyzer as follows.
•ReferencemicrophoneON
•SoundfieldLEVELED
•UnaidedCUSTOM
REFERENCE MIC
PROBE MIC
12"
GOOD
EAR
BAD
EAR
SPEAKER
12"
PROBE MIC
SPEAKER
GOOD
EAR
BAD
EAR
12"
PROBE MIC
SPEAKER
GOOD
EAR
BAD
EAR
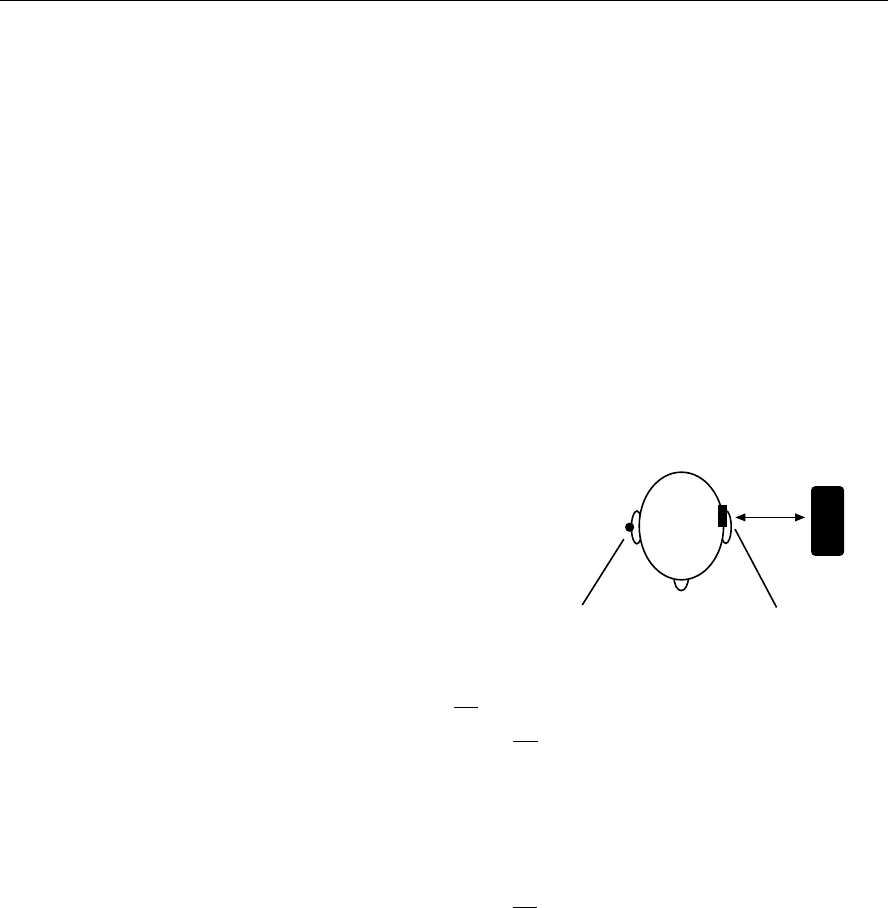
162 FONIX FP35 Hearing Aid Analyzer
•Referencemicrophoneoverthepinnaofthebadear
•Probemicrophoneinsidetheunoccludedearcanalofthegoodear
•Loudspeakerat90º,12inchesfromthebadear
Aided—Measurement of the “good” ear canal (baffle overcome by the aid)
Same setup as above, except:
•Aidinplaceinthegoodearandsettonormalusergain.
The difference curve, labeled “Insertion Gain” on the screen, shows the benefit
the aid gives for sound arriving from the “bad” side.
5.9.2.2 BI-CROS
Unaided—Measurement of the “better” ear canal (baffled by the head)
Set up the FP35 analyzer as follows.
•ReferencemicrophoneON
•SoundfieldLEVELED
•UnaidedsettoCUSTOM
•Referencemicrophoneoverthe
pinna of the “bad” ear
•Probemicrophoneinsidetheearcanalofthebetterear
•Hearingaidinthebetterear,on, set at use gain
•Transmitteronthebadsideturnedoff
•Loudspeakerat90º,12inchesfromthebadear
Aided—Measurement of the “better” ear canal (baffle overcome by the aid)
Same setup as above, except
•Transmitteronthebadsideturnedon
The difference curve, labeled “Insertion Gain” on the screen, shows the benefit
of adding the second microphone for sound arriving from the “bad” side.
5.9.3 Measuring Overall Insertion Gain
The methods for measuring the overall insertion gain of CROS and BICROS aids
are described in this section.
Since it has not been shown for CROS and BI-CROS instruments that a 45º
position of the loudspeaker improves the reliability of insertion gain measure-
ments, we recommend a 45º position of the loudspeaker only for monaural
instruments, and a 0º position for CROS and BI-CROS instruments.
REFERENCE MIC
PROBE MIC
12"
BETTER
EAR
BAD
EAR
SPEAKER
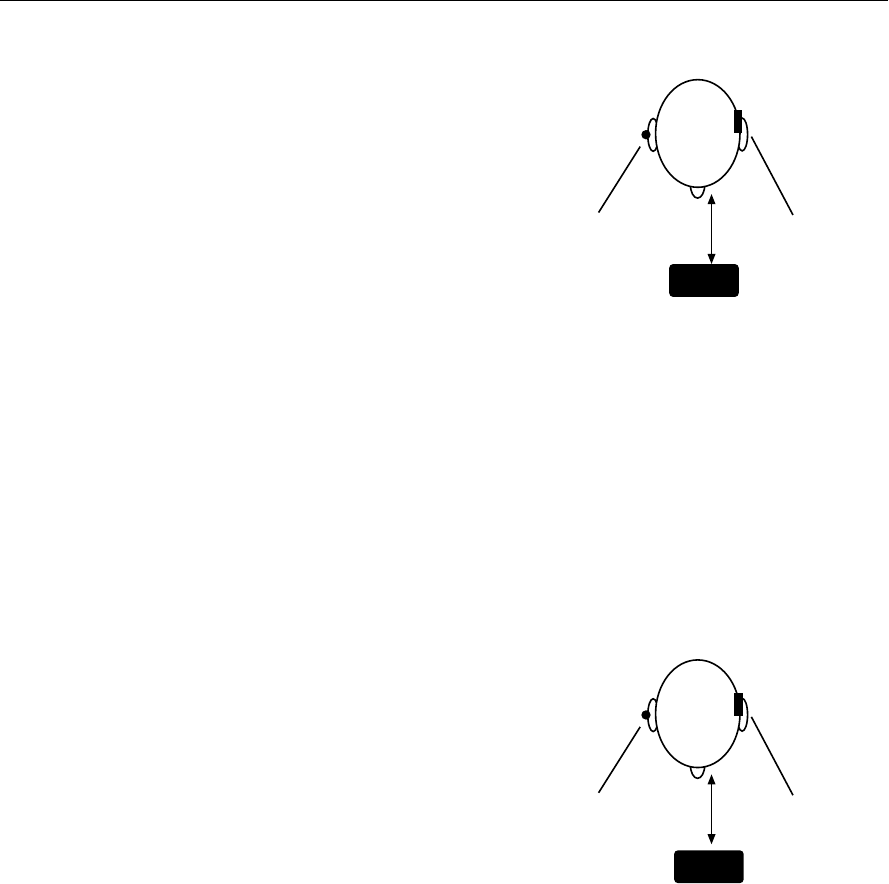
Real-Ear Measurements 163
5.9.3.1 CROS
Unaided—Measurement of the “good” ear
Set up the FP35 analyzer as follows.
•ReferencemicrophoneON
•SoundfieldLEVELED
•Referencemicrophoneoverthe
pinna of the bad ear
•Probemicrophoneinsidetheunoc-
cluded ear canal of the good ear
•Loudspeakerat0º,12inchesfromthebridgeofthenose
Aided—Measurement of the “good” ear
Same setup as above, except:
•Aidinplaceinthegoodearandsettousergain.
The difference curve, labeled “Insertion Gain” on the screen, shows the overall
benefit of inserting the hearing aid.
5.9.3.2 BI-CROS
Unaided—Measurement of the “better”
ear
Set up the FP35 analyzer as follows:
•ReferencemicrophoneON
•SoundfieldLEVELED
•UnaidedresponseCUSTOM
•Referencemicrophoneoverthe
pinna of the bad ear
•Probemicrophoneinsidetheun-
occluded ear canal of the better ear
•Loudspeakerat0º,12inchesfromthebridgeofthenose
Aided—Measurement of the “better” ear
Same setup as above, except…
•Completeaidinplaceinthebetterearandsetatusegain
•Bothtransmitterson
The difference curve, labeled “Insertion Gain” on the screen, shows the overall
benefit of inserting the hearing aid.
BETTER
EAR
REFERENCE MIC
PROBE MIC 12"
BAD
EAR
SPEAKER
REFERENCE MIC
PROBE MIC 12"
SPEAKER
GOOD
EAR
BAD
EAR
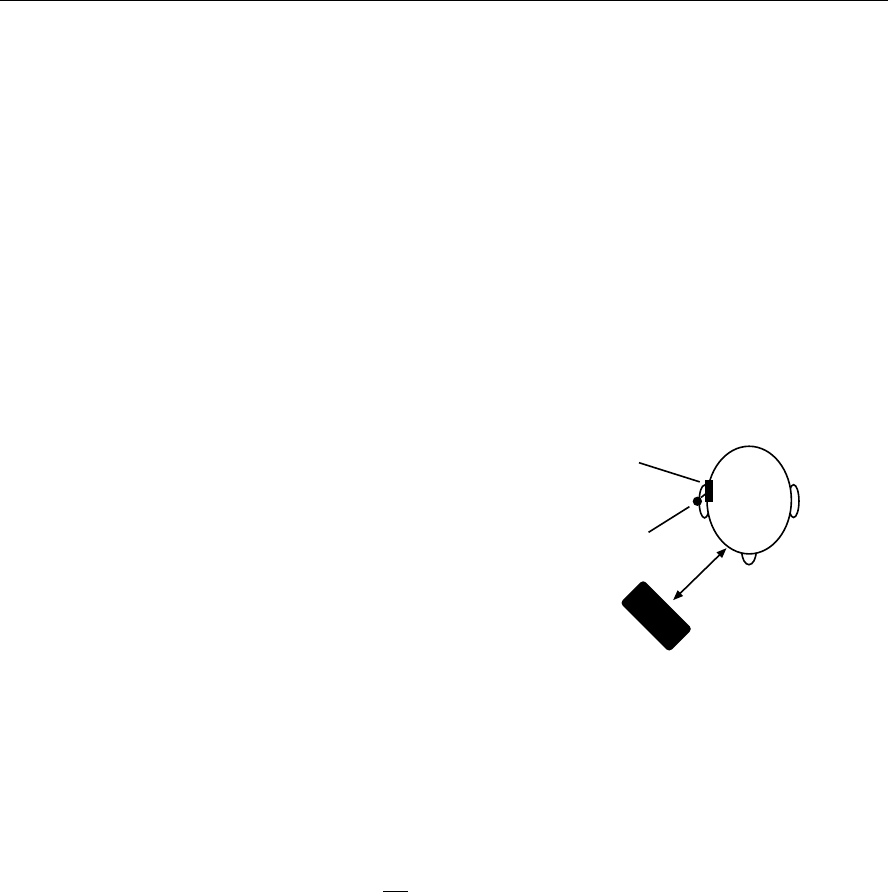
164 FONIX FP35 Hearing Aid Analyzer
5.9.4 Measuring Insertion Loss to the “Good” Ear (CROS)
The method for measuring insertion loss in the patient’s “good” ear is described
in this section. They are the same for CROS and BICROS hearing aids.
When a CROS aid has been prescribed to overcome a severe unilateral high-
frequency loss, you may want to ensure that inserting an open ear mold into the
good ear has not significantly attenuated the acoustic transmission to the good
ear.
Since this is a monaural measurement, a 45º position of the loudspeaker is rec-
ommended.
Unaided—Unoccluded Ear canal Response of the “good” ear
Set up the FP35 analyzer as follows.
•ReferencemicrophoneON
•SoundfieldLEVELED
•UnaidedCUSTOM
•Referencemicrophoneoverthe
pinna of the good ear
•Probemicrophoneinsidetheunoc-
cluded ear canal of the good ear
•Loudspeakerat45ºtowardthegood
ear, 12 inches from the surface of
the head
Aided—Occluded Response of the “good” ear.
Same setup as above, except
•Earmoldinplaceinthegoodear
•Hearingaidisturnedoff
The difference curve, labeled “Insertion Gain” on the screen, shows insertion
loss, if any, caused by inserting the earmold into the good ear.
REFERENCE MIC
PROBE MIC
12"
SPEAKER
GOOD
EAR
BA
D
EA
R

Chapter 6 165
2-CC Targets
The 2-cc target screens allow you to measure hearing aids using a coupler in a
sound chamber and compare them to a target. This type of testing is especially
useful when fitting a patient who is unable to sit still for a real-ear measure-
ment, such as an infant or a young child. There are two 2-cc Target screens
available: the Coupler Target screen, which converts real-ear targets into coupler
targets, and the Coupler EarSim screen, which converts coupler measurements
into simulated real-ear measurements. The FONIX real-ear option is required
to access these screens.
The Coupler Target screens convert real-ear targets into coupler targets so that
you can compare them to coupler measurements. Targets and measurements can
be displayed in either dB SPL or dB GAIN.
The Coupler EarSim screen uses the opposite approach, displaying actual real-
ear targets. When coupler measurements are taken, the response curves are
converted, using average or measured RECD transforms, into simulated real-ear
measurements, which can then be directly compared to the displayed real-ear
targets. Two displays are available: Insertion Gain and SPL. When the SPL dis-
play is selected, the patient’s HTL and UCL values are also displayed on the
screen. These HTL and UCL values are identical to the ones that would be dis-
played in the real-ear SPL screen.
The Coupler Multicurve (described in Chapter 3), Coupler Target, and Coupler
EarSim screens are all connected to each other by the [NEXT] and [BACK] keys,
similar to the way that the real-ear screens are connected to each other. Any
measurements taken in one screen are automatically converted to the other
screens, minimizing your measurement time.
Coupler
Multicurve
Coupler
Target
Coupler
EarSim

166 FONIX FP35 Hearing Aid Analyzer
The sections in this chapter will explain the following:
• 6.1:Targetcreation
• 6.2:Displays
• 6.3:Measurements
• 6.4:Reference
6.1 Target Creation
In order to create a target for use in the Coupler Target screen or the Coupler
EarSim screen, you must enter the Audiogram Entry screen, just as you would if
you were creating a normal real-ear target.
1. Enter the Audiogram Entry screen by pressing [F2] from the Opening screen
and using the [NEXT] and [BACK] keys if necessary.
2. Follow the instructions found in Section 5.3 to enter the patient’s audiogram
and to create a real-ear target.
3. Follow the instructions found in Section 5.3.6, if desired, to measure the
patient’s RECD.
4. Press [EXIT] to return to the Opening screen.
5. Press [F3] to enter one of the coupler multicurve screens. Use the [NEXT]
and [BACK] keys to enter the Coupler Target screen or the Coupler EarSim
screen.
6. Press [MENU] and [BACK] to enter the Target menu. Set the FIT RULE, AGE,
and AID TYPE in this menu using the arrow keys. If you select NAL-NL1 as
your FIT RULE, you will also have to set COMPRESSION, CHANNELS, AID
LIMITING, FIT TYPE, TUBING and VENT. See Section 5.3.4 for details.
7. Press [EXIT] to return to the measurement screen. You are now ready to per-
form the measurements and compare them to the displayed target.
The Coupler Target screen converts the real-ear target into a coupler target dis-
played in either dB GAIN or dB SPL. The Coupler EarSim screen displays real-
ear targets in either dB IG (insertion gain) or dB SPL. When the Coupler EarSim
display is set to dB SPL, the patient’s HTL and UCL values are also displayed.
To switch between the gain and SPL displays in each screen, use the [MENU]
key to open the local menu, and use the arrow keys to select GAIN or SPL in the
DISPLAY field. [EXIT] will close the local menu.
Targets are usually tied to the source type and source level of CRV 2. If you
would like to tie the target to a different curve, or to the currently selected
curve, change the TARGET REF setting in the Target menu. See Section 6.3.3.
If you have modified the actual numerical target values in the Audiogram Entry
screen, or entered your own target entirely, you will not be able to enter the
Target menu from the Coupler Target or Coupler EarSim screens. This is because

Target Coupler 167
those controls will have no effect on your custom target. To re-enable the target
controls, you must return to the Audiogram Entry screen and use the Generate
Target key (F3) to recreate an automatic target.
The NAL-NL1 targets in the Coupler Target screen have been slightly modified
from the original NAL-NL1 formula in order to better represent low gain pre-
scriptions. When the original NAL-NL1 formula calculates negative gain for a
coupler target, this gain is “clipped” to zero so that the final formula will never
prescribe negative gain for a patient. However, when measuring low gain hear-
ing aids, it is possible for a coupler measurement to show up as negative gain
while the corresponding real-ear measurement would show up as a slight posi-
tive gain. The FP35 instead clips the coupler gain at what would be the zero
gain of the real-ear insertion gain. This may produce some negative gain in the
Coupler Target screen. (The Coupler EarSim screen displays real-ear targets and
should not be affected.)
6.2 The Coupler Target and Coupler EarSim Displays
The Coupler Target screen converts the real-ear target into a coupler target and
displays it in either dB GAIN or dB SPL. The EarSim screen displays the real-ear
target in either dB insertion gain or dB SPL, converting any measurement taken
into simulated real-ear measurements.
Any measurement made in one of these screens will be automatically converted
into the other screen.
6.2.1 Viewing the Coupler Target Screen
The Coupler Target screen converts the real-ear target into a coupler target.
Coupler measurements can then be performed and compared directly to the
target. The only major difference between this screen and the basic Coupler
Multicurve screen (described in Chapter 3) is the addition of the coupler target.
To get the most accurate real-ear to coupler target conversions, measure the
patient’s unaided response in one of the real-ear measurement screens (Section
5.4.1) and the RECD in the Audiogram Entry screen (Section 5.3.6). When these
measurements are not taken, the FP35 substitutes average data. These averages
are sensitive to the selected age of the patient.
See Figure 6.2.1 for the following explanation of the dB GAIN display (the SPL
display is similar):
1. Type of display. This will be either dB SPL (coupler output) or dB Gain (cou-
pler gain).
2. Type of aid and the age of the patient.
3. Selected ear and leveling status of the sound chamber, including the real-ear
speaker angle that the coupler target is duplicating.
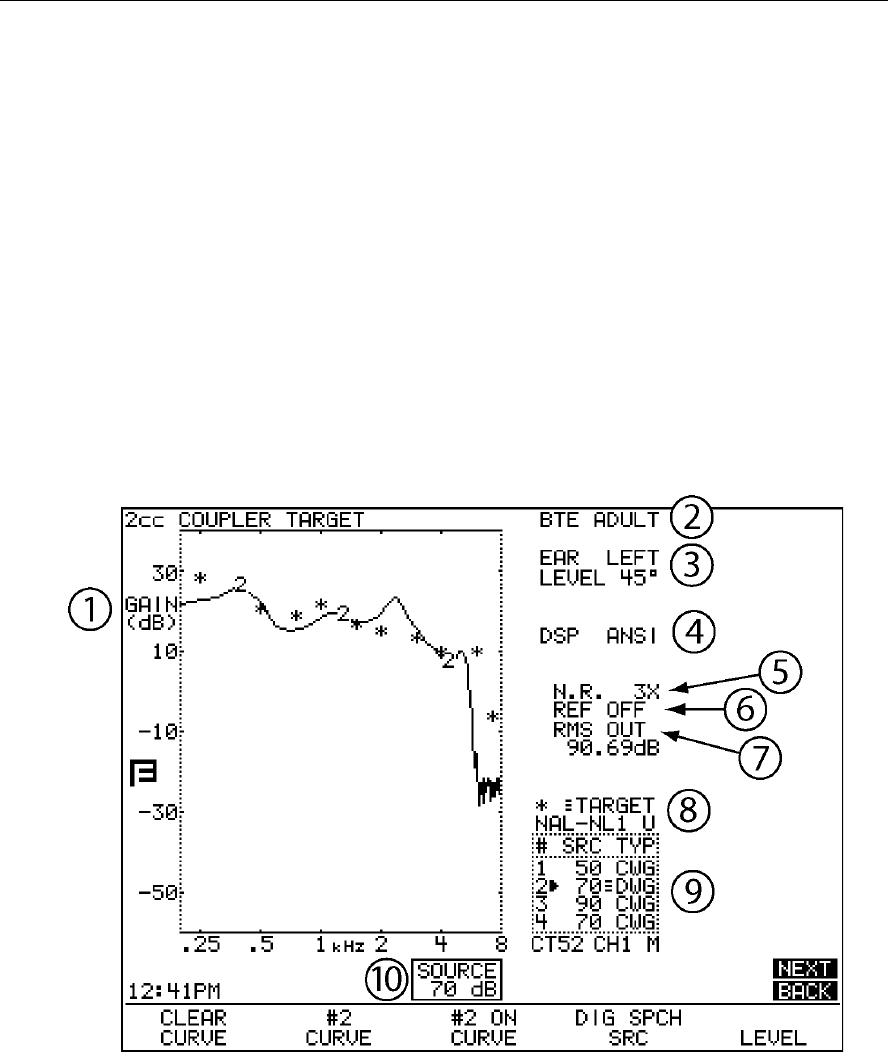
168 FONIX FP35 Hearing Aid Analyzer
4. The signal and weighting types used with the selected curve.
5. N.R. = Noise reduction.
6. Status of reference microphone.
7. RMS/HFA data: If a composite signal is selected, the RMS OUT will be dis-
played here. Otherwise, the selected HFA or SPA will be displayed. Press
[MENU] to select HFA/SPA frequencies.
8. Selected fitting rule.
9. Curve ID box. See Section 2.7.2 for more information.
10. Source Signal Statistics Box. The information in the box is dependent upon
signal type.
• COMP,DIGSPCH—DisplaystheRMSsourceamplitude.
• NORM,FAST,SHORT,LONG,SINGLE—Displaysthesourceamplitude,
frequency, distortion, and output/gain.
Fig 6.2.1—Target Coupler screen

Target Coupler 169
6.2.2 Viewing the Coupler EarSim Screen
The Coupler EarSim screen displays the actual real-ear target prescribed for the
patient. Targets are shown in either real-ear SPL or insertion gain. When SPL is
selected, the patient’s thresholds and uncomfortable levels are also displayed.
Any coupler measurements taken in this screen are converted into simulated
real-ear measurements using the average or measured real-ear unaided response.
To get the most accurate real-ear simulations possible, measure the patient’s
real-ear unaided response (REUR) in one of the real-ear measurement screens.
The measured REUR will be used to convert the coupler measurements into
simulated real-ear measurements. See Section 5.4.1 for instructions on perform-
ing the REUR measurement.
In the SPL display, the patient’s audiometric data (HTL and UCL values) are
displayed in dB SPL along with the target. To get the most accurate HL to SPL
transform of this data (and the most accurate real-ear target), measure the
patient’s RECD in the Audiogram Entry screen. See Section 5.3.6 for instruc-
tions.
When the REUR and RECD are not measured, the FP35 substitutes average data
to calculate the real-ear target and coupler measurement conversions. These
averages are sensitive to the selected age of the patient.
See Figure 6.2.2 for the following explanation of the Coupler EarSim screen
with the SPL display:
1. Type of display. This will be either dB SPL or dB I.G. (insertion gain).
2. U = uncomfortable levels, X = thresholds (right ear uses O), * = coupler
target
3. Coupler measurement curves converted into simulated real-ear
4. Type of aid and the age of the patient.
5. Ear selected.
6. Leveling status of the sound chamber, including the real-ear speaker angle
that the coupler target is duplicating.
7. Unaided—custom (measured) or average.
8. The signal and weighting types used with the selected curve.
9. N.R. = Noise reduction.
10. Status of reference microphone.
11. RMS/HFA data: If a composite signal is selected, the RMS OUT will be dis-
played here. Otherwise, the selected HFA or SPA will be displayed. Press
[MENU] to select HFA/SPA frequencies.
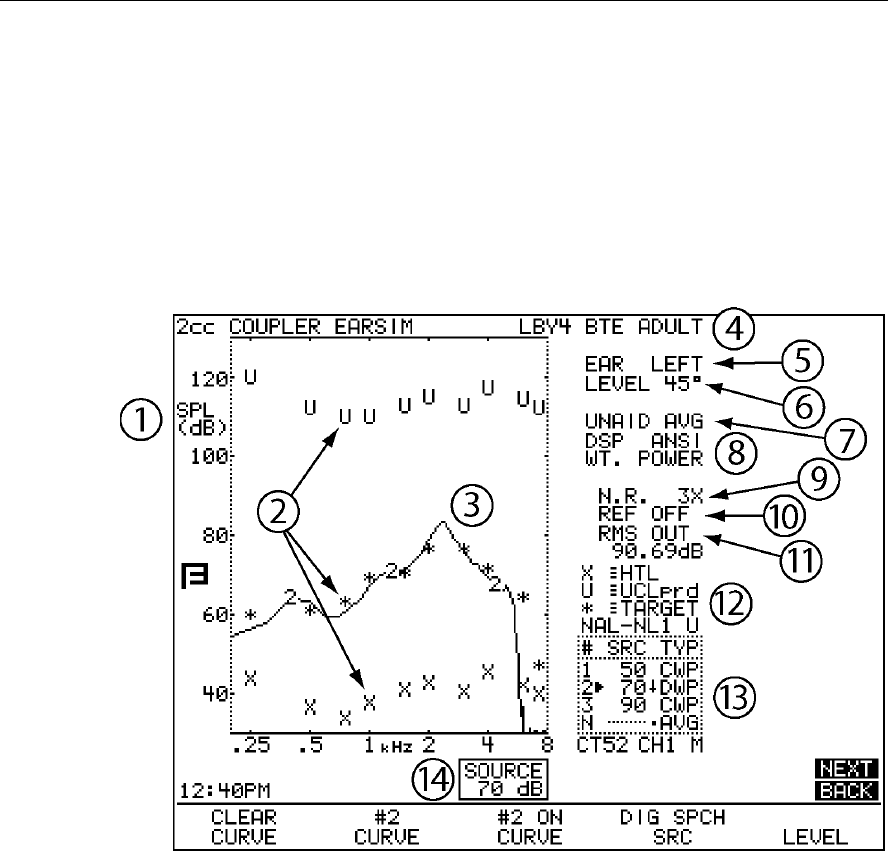
170 FONIX FP35 Hearing Aid Analyzer
12. Displays the selected fitting rule.
13. Curve ID box. See Section 2.7.2 for more information.
14. Source Signal Statistics Box. The information in the box is dependent upon
signal type.
• COMP,DIGSPCH—DisplaystheRMSsourceamplitude.
• NORM,FAST,SHORT,LONG,SINGLE—Displaysthesourceamplitude,
frequency, distortion and output/gain.
Fig 6.2.2—Coupler EarSim screen displayed with simulated insertion gain

Target Coupler 171
6.3 Measurements & Adjustments
Taking measurements in the Coupler Target and the Coupler EarSim screens is
just like taking measurements in the Coupler Multicurve screen. The only differ-
ence is the addition of the target (and possibly audiometric data) on the screen.
Any measurements taken in one of these screens will show up in the other
screens. For a detailed explanation of the measurements available in all coupler
measurement screens, see Chapter 3.
The Coupler Multicurve and Coupler Target screens will show identical mea-
surements. The Coupler EarSim screen converts these measurements into simu-
lated real-ear measurements, so their numerical values will be different than
those displayed in the other coupler screens.
6.3.1 Taking Basic Measurements
For your convenience, instructions for taking basic coupler measurements are
given here:
1. Enter the Coupler Target or Coupler EarSim screen by pressing [F3] from the
Opening screen and using the [NEXT] or [BACK] keys as necessary.
2. Press [MENU] from the measurement screen to make any necessary selec-
tions. See Section 6.4 for details.
3. Level the sound chamber as described in Section 3.2, if necessary.
4. Set up the aid in the sound chamber as described in Section 3.3.
5. Use [F2] to select a curve number.
You can measure 4 different curves in the FP35. By default, their source levels
are:
Curve 1: 50 dB
Curve 2: 65 dB
Curve 3: 75 dB
Curve 4: 90 dB
6. Use [p,q] to adjust the source level to the desired amplitude.
7. Use [F4] to select the source type.
8. Press [START/STOP] to initiate the frequency sweep. If you are using the
NORMAL, SHORT or LONG selections, the test will stop when the sweep is
complete. The COMP, DIG SPCH and FAST signals are continuous, making
it necessary to press [START/STOP] again when you want the signal to stop.
9. Use [t,u] to scroll back through the last four real-time measurements if you
used the COMP or DIG SPEECH signals.
10. Repeat steps 5-9 to take another measurement.
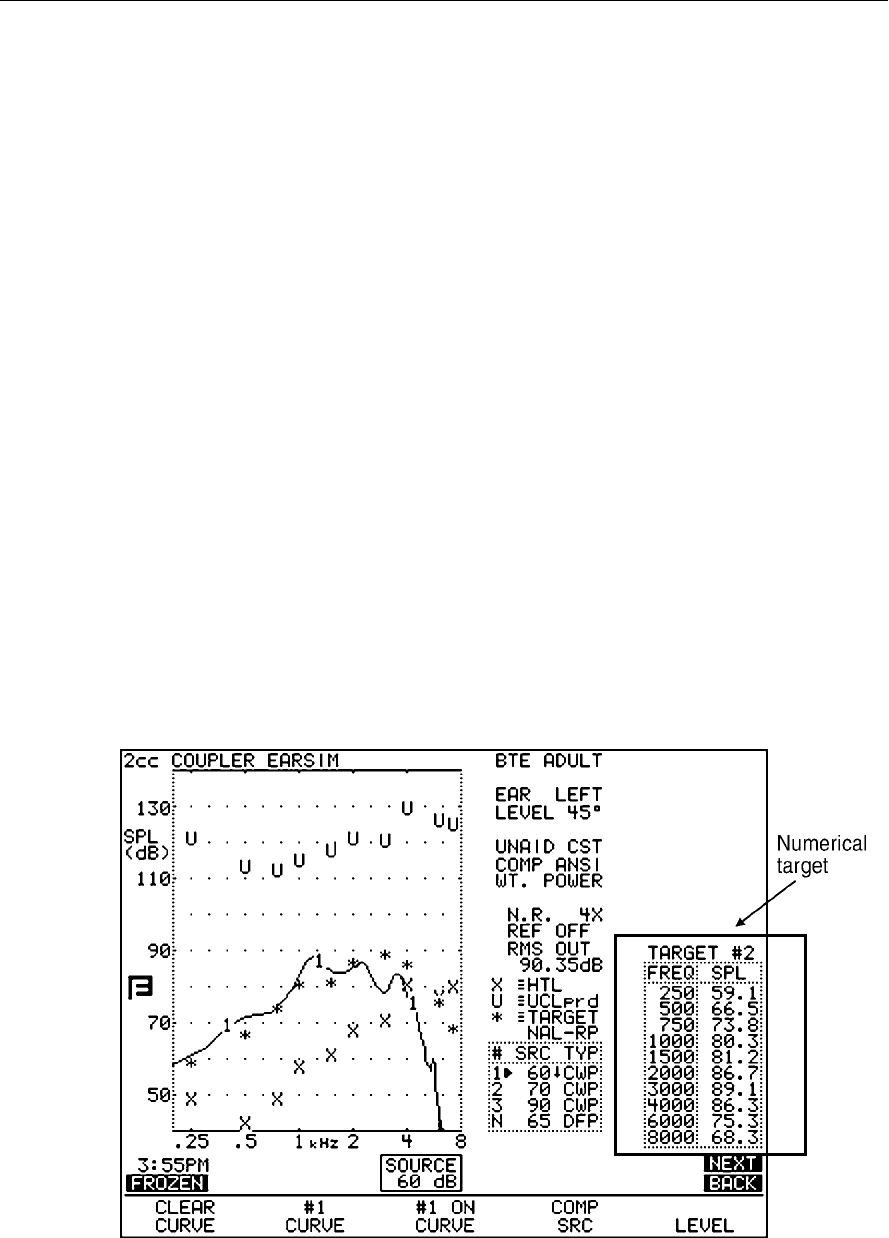
172 FONIX FP35 Hearing Aid Analyzer
6.3.2 Viewing Target Data
You can view the numerical data of your response curves with the DATA/
GRAPH selection in the main local menu of the Target Coupler screen and using
[F2] to select the desired curve. If you want to view the numerical data of the
target curve itself, you must use the TABULATION field in the Advanced Target
Coupler menu. The feature is only available when the USER LEVEL is set to
ADVANCED in the Default Settings menu. See Section 2.3.2 for details.
The tabulation feature will add a table to the right of the Target Coupler graph,
displaying the target in numerical format. Tabulation is only available when the
measurement data is displayed in graphical format. When numerical data for
the measured curve is displayed, there is not enough room for the target tabula-
tion box on the screen.
To view the target in numerical format:
1. Set the USER LEVEL to ADVANCED in the Default Settings menu. See
Section 2.3.2 for details.
2. Press [MENU] from the Coupler Target or Coupler EarSim screen to enter the
main menu.
3. Press [NEXT] to enter the Advanced menu.
4. Use [p,q] to select TABULATION.
5. Use [t,u] to select TARGET.
6. Use [EXIT] to return to the Target Coupler screen. The target data will now
be displayed. See Figure 6.3.2.
Figure 6.3.2—Numerical display of target data

Target Coupler 173
6.3.3 Tying the Target to a Measurement Curve
By default, the target is always “tied” to the second measurement curve. That
is, the source type and amplitude of that curve are used to create the target.
Whenever you change the source amplitude or type of that curve, the target will
alter as soon as you take a measurement.
If you would like to tie the target to a different measurement curve:
1. Press [MENU] from the Target Coupler screen to enter the local menu.
2. Press [BACK] to enter the Target menu.
3. Use [p,q] to select TARGET REF.
4. Use [t,u] to choose CURVE 1-4. A selection of AUTO will always tie the
target to the current selected curve.
6.4 Reference
The following is a description of the items available in the local menus of the
Coupler Target and Coupler EarSim screens. The items in bold reference cou-
pler targets specifically. Non-bold items are also available in the main Coupler
Multicurve screen.
Some of the menu items listed are not available when the USER LEVEL is set to
EASY in the Default Settings menu. These items are marked with an asterisk (*).
See Section 2.3.2 for details.
Target menu
Press [MENU] to enter the local menu from the Coupler Target or Coupler EarSim
screen. Press [BACK] from the main Target Coupler menu to enter the Target
menu. The items found in that menu are:
FIT RULE—Fitting rule used to create the coupler target. Select NAL-NL1,
NAL-RP, DSL WDRC, DSL LIN, POGO, BERGER, 1/3 GAIN, _ GAIN, 2/3 GAIN,
DIRECT. A selection of NAL-NL1 will add several menu selections to the menu
screen.
AGE—Age of the patient. Choose from NONE, 0-2 MN, 3-6 MN, 7-12 MN, 1-2
YR, 2-3 YR, 3-4 YR, 4-5 YR, u5 YR, ADULT. The NONE selection sets the age to
adult but does not display the age on the screen.
TARGET REF—The measurement curve that the target is based upon. Choose
from CURVE 1, CURVE 2, CURVE 3, CURVE 4 and AUTO. See Section 6.3.3 for
details.
COMPRESSION—The type of wideband compression threshold the aid has.
This is selectable in increments of 1 dB. This will only be available with a fit-
ting rule selection of DSL WDRC or NAL-NL1.

174 FONIX FP35 Hearing Aid Analyzer
CHANNELS—The number of channels the aid has. This is only available with a
fitting rule selection of NAL-NL1.
AID LIMITING—The type of output limiting the aid has. If the aid has output
limiting, usually WIDEBAND should be selected. If the aid has output limiting,
and if the aid has more than one channel, this can be set to MULTICHAN. If the
aid doesn’t have limiting, set this to NONE. This selection is only available with a
fitting rule selection of NAL-NL1.
FIT TYPE—Type of fitting. Choose BILATERAL or UNILATERAL. This is only
available with a fitting rule selection of NAL-NL1.TUBING. Note: If you select
BILATERAL, you must enter the audiogram for both ears in the Audiogram Entry
screen.
AID TYPE—Style of hearing aid. Choose from BTE, ITE, ITC, and CIC.
VENT—Type of venting on the hearing aid. Choose from OPEN, TIGHT, NO VENT,
1 mm, 2 mm and 3 mm. This selection is only available with a fitting rule selec-
tion of NAL-NL1.
TUBING—Type of tubing on the BTE hearing aid. Choose from LIBBY 4, LIBBY 3,
CFA #2 HORN, CFA #2 BORE, #13, 6C5 and 6C10. This selection is only avail-
able with a fitting rule selection of NAL-NL1 and an AID TYPE of BTE.
Main Menu
Press [MENU] from the Coupler Target or Coupler EarSim screen to reach the main
menu.
EAR—Ear assigned to the hearing aid. Choose LEFT or RIGHT.
DISPLAY—The type of display used in the Coupler Multicurve and Coupler Target
screens. Choose between GAIN and SPL.
DATA/GRAPH—The type of display. Choose between a graphical display and a
numerical display.
COUPLER TYPE—This setting will only be displayed if you have purchased either
the CIC or the OES options. It turns on the software correction factors used with
special couplers. If you have purchased the CIC Option, a coupler type of CIC will
be possible here. If you have purchased the OES Option, a coupler type of MZ will
be possible here. Also available: 2-cc. (Correction factors are not used with this
selection.)
AID GROUP—The type of hearing aid being tested. Select STANDARD, AGC or
ADAPTIVE (for adaptive AGC circuits). This selection sets the various delay times
used in pure-tone tests so that they are appropriate to the aid’s circuitry. See
Section 2.4 for more information on delay times.

Target Coupler 175
DISTORTION—Type of harmonic distortion measurement during a pure-tone
sweep. See Section 2.5.1.2 for more information.
NOISE RED (COMP)—Amount of noise reduction used for composite curve
measurements. See Section 2.5.2.3 for more information.
NOISE RED (TONE)—Amount of noise reduction used for pure-tone sweeps.
See Section 2.5.1.3 for more information.
REF MIC—Status of reference microphone. See Section 3.8.3 for more informa-
tion.
Advanced Menu
Press [NEXT] from the main menu to reach the Advanced menu.
*AUTO-SCALE—The type of scaling used. ON scales the graph to the selected
curve. OFF scales the graph to the highest curve displayed.
*TABULATION—Target data display on the right side of the Target Coupler
screen. Choose TARGET or NONE. See Section 6.2.4 for details.
*REFERENCE STATUS—The type of RMS measurement made with the refer-
ence microphone. The following selections are available: RMS displays the
overall RMS of the reference microphone, FULL displays the overall RMS and
the signal quality of the reference microphone, and NONE turns off the RMS
display of the reference microphone. See Section 2.5.4 for more information.
*AVG FREQ—The three frequencies used for averaging in pure-tone measure-
ments. Each set is represented on the screen by the highest frequency in the set.
See Section 2.5.1.5 for details.
*STATIC TONE—Status of the static pure-tone measurement. When a pure-tone
source is selected and a sweep isn’t running, measure the response and distor-
tion of a single frequency (SINGLE), the three frequency average chosen in AVG
FREQS (AVG), or no measurement (NONE).
FILTER—The type of speech weighting used on the signal sources. In most
cases, this should be set to AUTO. See Section 2.5.2.1 for more details.
*SMOOTHING—Type of smoothing used. Smoothing rounds off the curve, remov-
ing minor peaks. Usually only used for sound field measurements, this should be off
for normal coupler operation. Choose between OFF and LOG.
IM FREQ DIFF—The frequency difference of the two tones presented together for
the intermodulation distortion measurement. See Section 3.5.2.
*EXT SOURCE—The channel selected for the external source. The external source
(see Section 3.8.9) uses a dual channel connector. This means that the input signal
has potentially two different channels. This selection lets you choose which chan-
nel to use as the input signal. Choices are EXT CH1 and EXT CH2.

176 FONIX FP35 Hearing Aid Analyzer
*PREDELAY TIME—The delay after the first tone is presented and before the
first measurement is taken in a pure-tone measurement. See Section 2.4 for
more information.
*SHORT SETTLE—The time delay between frequencies in a pure-tone sweep,
and the additional delay in a digital speech signal.
*LONG SETTLE—The time delay between frequencies in an input/output mea-
surement, a three-frequency average measurement, or a harmonic distortion
measurement.
PRINT LABEL—Status of the printing label.
PRINTER— Printer used for printouts. Choose INTERNAL to use the built-in
thermal printer. Choose EXTERNAL to use an attached laser or ink-jet printer.
Custom Menu
Press [NEXT] from the Advanced Menu to enter the Custom Menu.
OUTPUT LIMIT—Level of output limiting, which shuts off the source when the
measured signal exceeds the limit set here. Choices are: OFF or 80-140 dB SPL.
This is usually used only for real-ear type measurements.
*WARBLE SOURCE—The warble rate in pure-tone signals. Warble is usually
used in sound field speaker measurements to reduce problems caused by stand-
ing waves. This is usually turned off for normal coupler measurements. See
Section 2.5.1.4 for more details.
*SIGNAL SKEW—The number of samples from when the signal source leaves
the speaker to when the FP35 analyzes it. See Section 2.5.1.5 for details.
SPEAKER—Speaker selection. INTERNAL selects the internal FP35 speaker.
EXTERNAL selects the external device (sound chamber or sound field speaker)
connected to the speaker jack. AUTO selects the internal speaker for sound
chamber measurements and the external speaker for real-ear measurements.
*MIC PORT—Choose the microphone used for Real-ear measurements. Select
AUTO, INTERNAL, EXTERNAL or EXT LINE. See Section 2.5.9 for details.
*OUTPUT JACK—Select which external source devices are enabled in the cou-
pler screens. SPEAKER enables only the speaker jack. MONO EAR enables only
the left channel of the earphone jack. STEREO EAR enables both channels of
the earphone jack. ALL ON enables the speaker jack and both channels of the
earphone jacks. See Section 2.5.5 for details.
LEVELING SOURCE—The amplitude used for leveling the speaker. This is use-
ful if you need to level with the chamber door open, and you don’t want to use
the loud default level of 90 dB SPL. Choose between 60 and 100 dB SPL.

Target Coupler 177
*MICROPHONES—Special operational selections for your microphones.
Choices are NORMAL, REVERSE and SPLIT. See Sections 3.8.4 and 3.8.5 for
more details.
*IMPULSE REJ—Status of impulse rejection, which rejects noise in the testing
environment. See Section 2.5.6.
*SPECTRUM WINDOW—When performing spectrum analysis of random sig-
nals such as speech or room noise, leave this ON. If you would like to perform
a spectrum analysis of a “phase synchronous” signal such as might be found in
one of our other instruments, turn this OFF. See Chapter 8 for more details.
*RMS ANALYSIS—Type of RMS measured. See Section 2.5.3.
*DIST 90 dB RULE—Harmonic distortion measurements are generally made
only when the source of the test signal is below 90 dB SPL. To measure har-
monic distortion at 90 dB SPL or higher, turn this rule OFF.
*DISTORTION SWEEP—The frequencies used in the intermodulation distortion
measurement. NORM uses 1/12 octave frequencies to the nearest 100 Hz. FAST
uses 1/3 octave frequencies to the nearest 100 Hz. FULL uses every 100 Hz fre-
quencies available.
*DIST SWEEP END—The last frequency tested when performing an IM distor-
tion sweep. If the selected frequency is less than or equal to the first primary
frequency in the IM distortion sweep, only the primary frequency will be tested;
there will be no IM distortion sweep.
* These menu items are only available when the USER LEVEL is set to
ADVANCED in the Default Settings menu. See Section 2.3.2 for details.

Chapter 7 179
The Audiometer Option
7.1 Introduction
The audiometer option on the FP35 turns your hearing aid analyzer into a type
5 screening audiometer. In other words, you can use the FP35 for doing pure-
tone air conduction screening using either insert earphones or sound field test-
ing. It is not intended for use as a clinical audiometer.
7.2 Equipment
The audiometric testing is performed using either a sound field speaker or one
or two insert earphones. If you use two earphones, you can set your client up
with two earphones and perform your measurements one ear at a time. If you
use one earphone, take the set of measurements for one ear, then switch the
earphone into the other ear and take the other set of measurements. TDH head-
phones are not supported on the FP35.
7.3 Setup
The following describes how to set up the FP35 for audiometric measurements.
If you are using the sound field speaker as the transducer, you must first level.
This is described in Section 7.3.1. The insert earphone setup is described in
Section 7.3.2.
7.3.1 Sound Field Speaker
There are two methods to leveling the sound field speaker for audiometric mea-
surements. The first method, called the head surface method, is identical to the
leveling method used for real-ear measurements – it is performed with the cli-
ent present and the reference microphone in position above the client’s ear. The
second method, called the free field method, is performed with the microphone
positioned in front of the sound field speaker without the presence of the client.
Head Surface Method
1. Set up your FP35 analyzer as you would for real-ear measurements with the
sound field speaker in place. See Section 9.2.
2. Situate your client with the sound field speaker at a 45º or 0º angle azimuth.
See Figure 7.3.1A. We recommend a testing distance of 12 inches from the
sound field speaker. You can test at longer distances but it will limit the
maximum output possible.
3. Enter the Audiometric Entry Screen by pressing [F2] and using the [NEXT]
and [BACK] keys as necessary.
4. Press [MENU].
5. Select EAR and choose the desired ear.
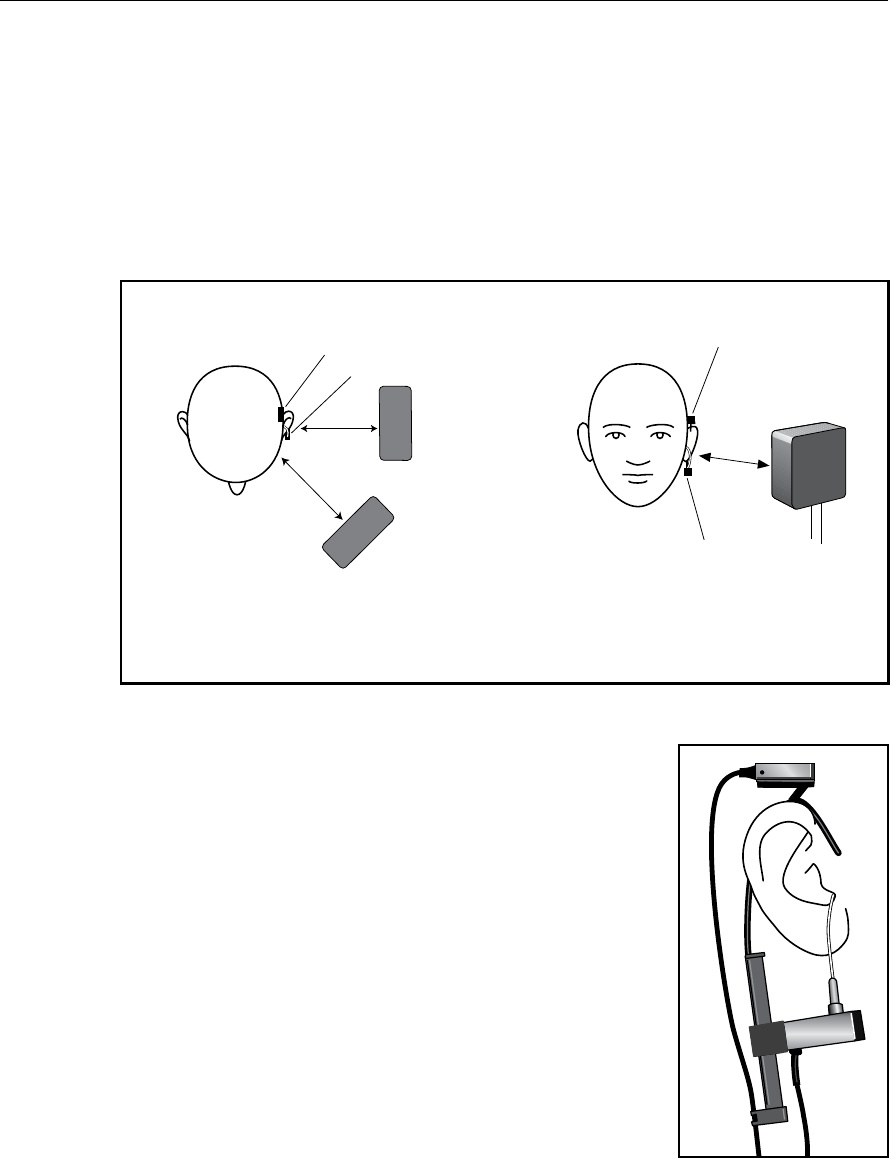
180 FONIX FP35 Hearing Aid Analyzer
6. Select ASSESSMENT and choose SPEAKER, using the arrow keys.
7. Select SOUND FIELD and use the arrow keys to choose 0º or 45º, depending
up on the azimuth used in the client setup.
8. Select REF MIC (SPEAKER) and choose OFF, using the arrow keys. (The ref-
erence microphone will automatically be used for the leveling process, but
you will probably not want to use it for the audiometric measurements.)
9. Press [EXIT].
12"
12"
Speaker
(45 degrees)
Speaker
(0 degrees)
Reference Mic
Probe Mic
12"
Top View Front View
Speaker
(45 or 0 degrees)
Reference Mic
Probe Mic
Figure 7.3.1A—Sound field speaker placement
10. Place the integrated probe microphone on the ear,
making sure the reference microphone is placed
above the ear. The probe microphone is not inserted
for this task. See Figure 7.3.1B.
11. Press [LEVEL] to level the sound field speaker.
12. Remove the reference microphone from the ear
if desired. (You may want to leave the reference
microphone in place if you will be performing real-
ear measurements.) Proceed to Section 7.4.
Free Field Method
1. Set up your sound field speaker as described in
Section 9.2.2 or Section 9.2.3.
2. Set up your testing environment to perform an
audiometric test. The client being tested and the
chair in which the client will be sitting should
not be present. All other items in the room,
Figure 7.3.1B—Reference
microphone placement
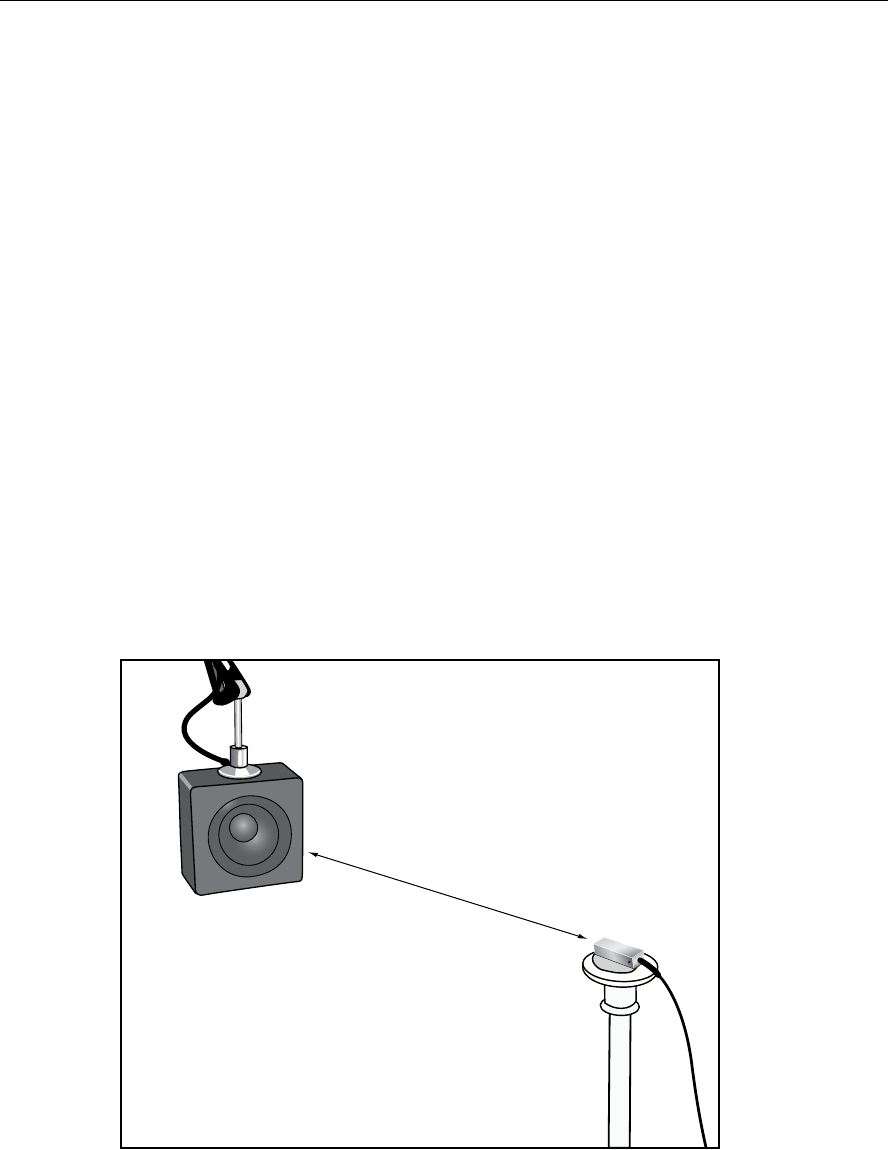
The Audiometer Option 181
including the clinician performing the test, should be at the location they
will be while the audiometric test is performed.
3. Remove the reference microphone from the integrated probe microphone
(the flat microphone on the top of the ear hook), and position it on a stand
1 meter from the sound field speaker at the height of a seated listener. See
Figure 7.3.1C.
4. Enter the Audiogram Entry screen by pressing [F2] in the Opening screen
and using [NEXT] and [BACK] as necessary.
5. Press [MENU].
6. Select EAR and choose the desired ear, using the arrow keys.
7. Select ASSESSMENT and choose SPEAKER, using the arrow keys.
8. Select SOUND FIELD and choose 0º, using the arrow keys.
9. Select REF MIC (SPEAKER) and choose OFF, using the arrow keys. (The ref-
erence microphone will automatically be used for the leveling process, but
you will probably not want to use it for the audiometric measurements.)
10. Press [EXIT].
11. Press [LEVEL] to level the sound field speaker.
12. Remove the stand and set the reference microphone aside. Proceed to
Section 7.4 to perform the audiometric measurements.
1 meter
Reference
Mic
Speaker and microphone
at height of seated listener
Figure 7.3.1C

182 FONIX FP35 Hearing Aid Analyzer
7.3.2 Insert Earphones
1. Plug in the insert earphone (or insert earphone set) into the “earphone” jack
on the back of your FP35 analyzer.
2. Insert the insert earphone (or insert earphone set) into your client’s ear(s).
3. Enter the Audiometric Entry Screen by pressing [F2] and using the [NEXT]
and [BACK] keys as necessary.
4. Press [MENU].
5. Select EAR and choose the desired ear with the arrow keys.
6. Select ASSESSMENT with [q,p].
7. Press [t,u] to select INS. EAR or TWO INS. EAR.
8. Press [EXIT].
7.4 Taking Audiometric Measurements
The procedures for measuring audiometric information is described in this sec-
tion. HTL and UCL measurements are described in Section 7.4.1. Sections 7.4.2
and 7.4.3 contain more advanced instruction for measuring HTL and UCL val-
ues in dB SPL and dB Gain.
7.4.1 Measurements in HL
1. If you want to take threshold measurements, select HTL with [F2]. If you
want to take loudness discomfort measurements, select UCL with [F2].
2. Using the [q,p] keys, select the desired frequency for testing. The selected
frequency will be highlighted in the data box and will also appear under
SOURCE below the HL graph.
3. Using the [t,u] keys, select the desired amplitude. The selected amplitude
will appear next to the selected frequency in the data box. It will also appear
under FREQ below the HL graph. See Section 7.5 for details on the output
limitations of the FP35.
4. Press [START/STOP] to present the tone. Hold the key down for as long as
you would like the tone to be presented. While the tone is being presented,
you will see an ACTIVE label in the lower left corner of the display.
7.4.2 Measurements in SPL
While you take the audiometric measurements, you can also get a probe micro-
phone measurement in dB SPL.
1. Press [MENU].
2. Press [NEXT] to enter the Advanced Menu.
3. Select PROBE MIC (HL) with [q] if necessary.
4. Choose ON with [t].
5. Press [EXIT].

The Audiometer Option 183
Set up the client for testing as described in Section 7.3, but also use the earhook
and insert a probe microphone in his or her ear. See Section 9.2.4 for more
details.
Now, follow the procedure described in the previous section. As you present
a tone, the output in dB SPL is displayed under MIC SPL at the bottom of the
screen.
7.4.3 Measurements in Gain
To obtain measurement in dB Gain while performing audiometric measure-
ments, follow the instructions in 7.4.2, but also turn REF MIC (SPEAKER) ON
in the Menu. This will display results in dB GAIN at the bottom of the screen
instead of the dB SPL.
7.5 Output Limitations
The minimum presentation level of the FP35 for both sound field speaker and
insert earphones is 10 dB HL.
The maximum output of the sound field speaker is determined by the distance
from the client to the speaker and the selected frequency. The maximum output
of the insert earphones depends upon the insert earphone used and the selected
frequency.
If you try to present a tone exceeding the minimum or the maximum output at
the selected frequency, an error message will pop up.

Chapter 8 185
Spectrum Analysis
The FONIX FP35 can be used as a sound spectrum analyzer in either the cou-
pler (test box) or Real-Ear Test Modes. External sounds are measured through the
microphones and displayed in an amplitude-vs-frequency format. See Section 5.6
for instructions on live speech testing.
8.1 Spectrum Analysis Measurements
Spectrum analysis measurements can be done in most measurement screens on
the FP35 analyzer using the composite, digital speech or fast pure-tone signals.
If you are using a fast pure-tone sweep to take the spectrum analysis, measure-
ments will only be taken at the frequencies normally measured by the fast sweep.
If you have the Composite Option, it is recommended that you use the composite
signal to take spectrum analysis measurements.
Once you have enter the desired measurement screen and selected your signal
source with [F4], use the [q] key to turn the source amplitude to OFF. Now press
[START/STOP] to begin spectrum analysis testing.
8.2 Using the Spectrum Analysis Mode
You should find the following suggested applications clinically helpful, interest-
ing and fun.
Ap p l i c A t i o n 1: m e A s u r i n g t h e o c c l u s i o n e f f e c t o f A h e A r i n g A i d .
This simple procedure will help you measure the occlusion effect of the hearing
aid on the wearer’s own voice. The spectrum analysis measurement will help you
judge the sometimes-uncomfortable feeling caused by the occlusion effect of a
hearing aid. You will be able to measure the effect and the improvements made
after venting adjustments have been made.
Suggested procedure:
1. Enter the REAL-EAR Mode.
2. Press [NEXT] or [BACK] until you enter the SPL Screen.
3. Use [F2] to select AIDED 1.
4. Choose COMP or FAST with [F4]. Press [q] repeatedly until the source is off.
5. Place the probe tube into the client’s ear (see Section 7.2.4).
6. Place the hearing aid in the client’s ear. The aid should be off.
7. Push the [START/STOP] key. Instruct the client to sustain the vowel sound
“eee.”

186 FONIX FP35 Hearing Aid Analyzer
8. While the “eee” is still sounding and once the curve on the screen has stabi-
lized, press [START/STOP] again. Note the total RMS Output in the ear canal
as indicated in the status box.
9. If the SPL seems high, you might modify the vent size. Then select AIDED 2
with [F2] and, if necessary, use [q] to turn off the source. Repeat steps 7 and
8. You should see a change in the RMS Output. Aided Curve 2 should be less
than Aided Curve 1.
10. If desired, press [PRINT/FEED] to print the results.
Note: You could also measure the effects with the hearing aid on.
Ap p l i c A t i o n 2: i n s e r t i o n g A i n m e A s u r e m e n t s u s i n g A n e x t e r n A l s o u n d s o u r c e .
For this procedure, you choose the external sound source. You may want to use
a tape or a CD player through a loudspeaker. Any sustained sound source will
work. Whether you use a cocktail noise tape or one of the new, environment CDs,
you should find your test results interesting, especially when testing nonlinear
signal processing hearing aids.
Suggested Procedure:
1. Prepare your sound source
2. Enter the IG Screen of the Real-ear Mode.
3. Do a typical UNAIDED and AIDED probe test using your external sound
source by taking measurements with the internal source of the FP35 off.
8.3 Technical Details
The FONIX analyzers use phase synchronous signal sources to generate sound.
This means that the sound has a predetermined repeatable source, which allows
FONIX analyzers to make accurate measurements and use time averaging to
improve the signal to noise measurement of the analyzer.
When you take spectrum measurements with the FP35, a sound source is not gen-
erated, and it is assumed that you will be measuring a non-repeating source such
as speech or room noise. In most cases, these measurement results are improved
with the use of a spectrum mode windowing filter. The windowing filter helps to
make the signal seem like it is synchronous to the analysis routines.
Unfortunately, using the windowing filter on a synchronous source signal will
result in mangling the results. You can see this by placing the FP35’s measure-
ment microphone in another analyzer’s chamber along side that analyzer’s own
microphone. The results will not look the same on the two analyzers. The way to
resolve this is to turn off the spectrum windowing filter. You can only do this in
Coupler Multicurve and Target Coupler screens.

Spectrum Analysis 187
Synopsis:
If you are doing a spectrum analysis of speech or room noise, leave the
Spectrum Window ON in the custom menu of the Coupler Multicurve or the
Target Coupler screen.
If you are doing a spectrum analysis of a phase synchronous signal such as the
source of a different analyzer, turn the Spectrum Window OFF in that menu.
Note: The SPECTRUM WINDOW setting is only available when the USER
LEVEL mode is set to ADVANCED in the Advanced Default Settings Menu. See
Section 2.3.2.

Appendix A 189
Specifications
Acoustical Outputs
Frequencies: 200-8000 Hz in 100 Hz intervals (user interface)
200-8000 Hz in 1 Hz intervals (RS232)
Frequency Accuracy 1%.
Amplitudes: 40-100 dB in 5 dB intervals coupler, 40-90 dB in 5 dB
intervals real-ear (user interface)
40-100 dB in 0.01 dB intervals coupler, 40-90 dB in
0.01 dB real-ear (RS232)
Accuracy: Coupler: ±2.5 dB from 300 to 5000 Hz, all others
±3.5 dB (after leveling)
Real-ear: ±3 dB, 200-8000 Hz (after leveling)
Distortion (at 70 dB SPL): Puretone: < 0.5%, 400-2500 Hz
Telecoil Outputs
Field Strength: TMFS, 1, 1.78, 3.16, 5.62, 10, 17.8, 31.6, 56.2,
100 mA/m (user interface)
0-180 mA/m in 0.01 mA/m specified intervals (RS232)
Accuracy: ± 2 dB
Digital Readout of Sound Pressure Level
Frequency Range: 200-8000 Hz
Amplitude Range: 0-150 dB SPL
Resolution 0.1 dB
Accuracy: Coupler measurements: ±2.0 dB
Probe measurements: ±2.0 dB
Reference measurements: ±2.0 dB
Equivalent Input Noise: < 50 dB RMS
Measurement Inputs
Probe Microphone: Crosstalk from reference microphone: < -80 dB
Crosstalk from coupler microphone: < -80 dB
Reference Microphone: Crosstalk from probe microphone: < -80 dB
Crosstalk from coupler microphone: < -80 dB

190 FONIX FP35 Hearing Aid Analyzer
Harmonic Distortion Analyzer
Type 2nd, 3rd, and 2nd + 3rd = Total
Resolution 0.1 percent
Available Tests
Automated test sequences: ANSI S3.22-1996, ANSI S3.22-2003,
IEC 60118-7:1994, JIS:2000, ISI
Additional Coupler Tests: Coupler Multicurve, Coupler Target, Coupler EarSim
Real-ear Test Screens: Audiogram Entry, Insertion Gain, Real-ear Unaided &
Aided, Real-ear SPL
Input Power
Voltage 90 - 250 VAC
Frequency 47 - 63 Hz
Power dissipation 27 watts typical with full operation.
23 watts when unit is in Standby.
Safety earth leakage current
Standard Unit 110VAC < 200 uA
Standard Unit 220VAC < 400uA
Medical Grade option < 100uA
Physical Dimensions
Size: 16 x 11 x 4.9 inches
Weight: 12 lbs (5.45 Kg) with softcase and all accessories (except
manual)
Printer, Internal
Type: Thermal
Paper width: 80 mm (+0, –1 mm)
Printer, External
Interface: Parallel
Language: HP PCL3
Internal Sound Chamber Dimensions
Test area 2.65” W x 5.25”L x 1.1” H
Speaker 2.5” cone

Specifications 191
Guarantee
The FONIX FP35 Portable Hearing Aid Analyzer and its accessories are guaraanteed
to be free from manufacturing defects which would prevent the products from meet-
ing these specifications for a period of one year from date of purchase.
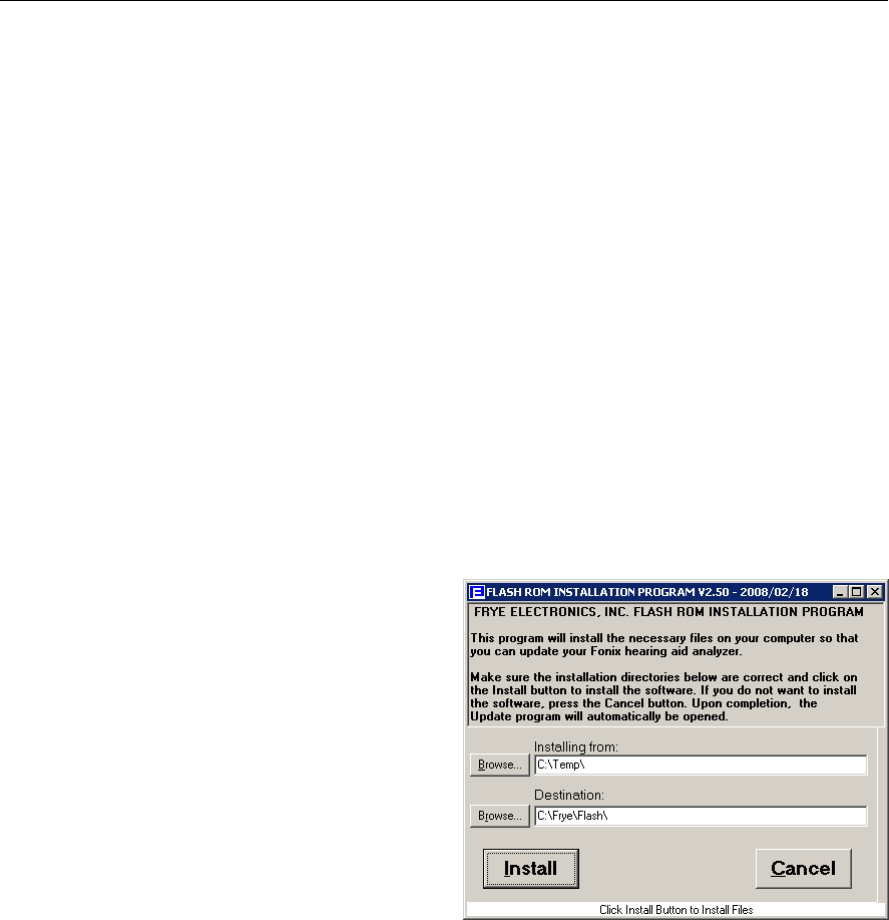
Appendix B 193
Software Upgrades
As new features and options become available on the FP35 analyzer, you may
need to upgrade your instrument. The FP35 analyzer is upgraded using com-
puter software.
It is recommended that you close any open programs on your computer before
executing the software upgrade. It is particularly important to close any other
programs that are Frye programs. It is also recommended that you disable your
screensaver.
Software upgrades are usually delivered via email in a .zip file. These instruc-
tions assume that you have unzipped this file. Ask your local computer techni-
cian for help, if needed.
B.1 Installing the Update Software
The software used to update your hearing aid analyzer needs to be installed on
a Windows computer that is connected to your analyzer.
1. Open setup.exe in the direc-
tory where you unzipped
your emailed software. This
will open the Flash ROM
Installation Program.
2. Click Install to begin the
installation. Do not alter the
installation directory unless
you are an expert computer
user.
3. Click OK to acknowledge
when the Installation is com-
plete. The Flash Rom Update
Program will automatically start.
B.2 Connecting the FP35 to the Computer
If you regularly use your computer to connect to your FONIX hearing aid ana-
lyzer (for instance, when using the NOAH Real-ear Module or WinCHAP), then
you can skip this section; your analyzer should already be connected to your
computer. Otherwise, you will need to establish a connection between your
hearing aid analyzer and your computer by using an RS232 or USB port.
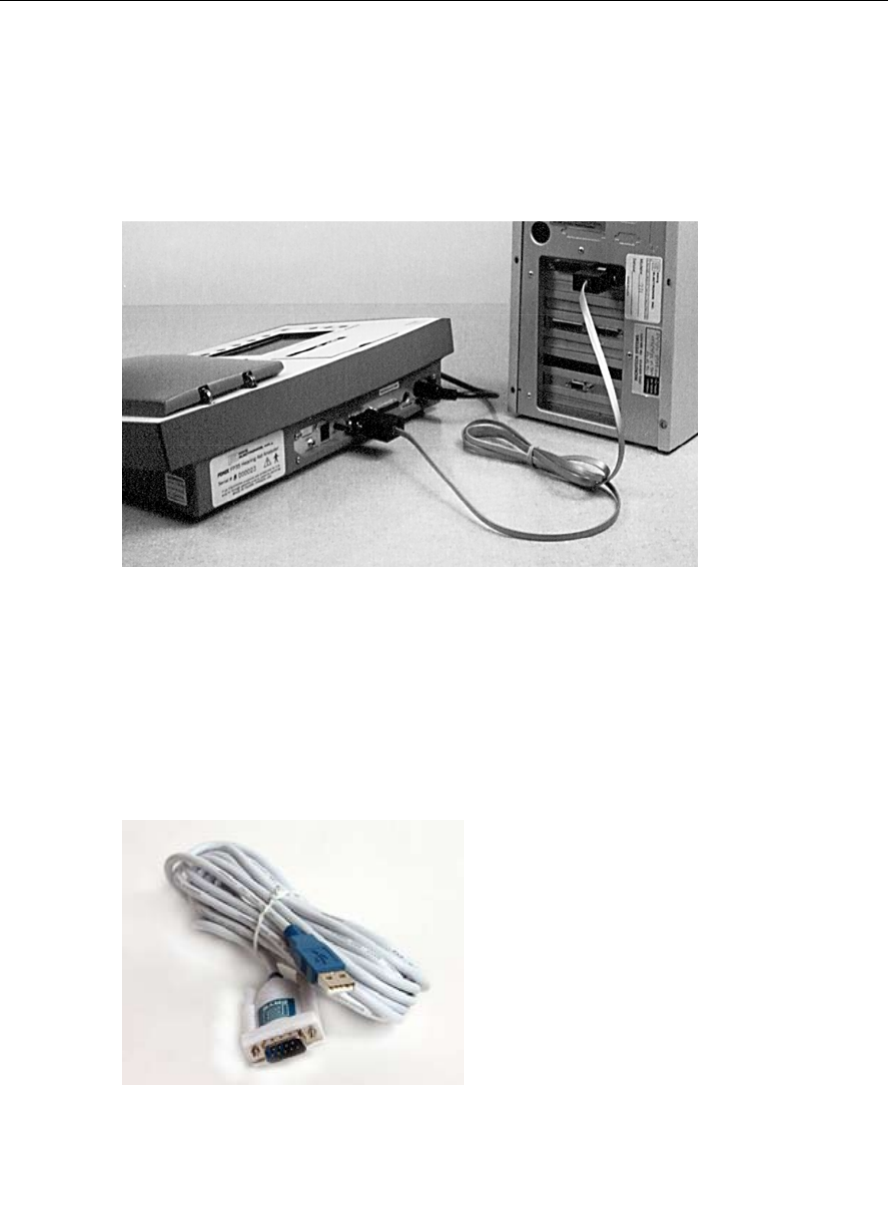
194 FONIX FP35 Hearing Aid Analyzer
RS232 Connector
The best way to connect your FONIX hearing aid analyzer to your computer
is to use an RS232 connector on your computer. This is normally a 9-pin male
connector. (Many hearing aid clinics regularly use this connector for their
HI-PRO box.) Use the 9-pin female connector on the back of your FONIX hear-
ing aid analyzer. A standard RS232 cable is used for this connection.
USB Serial Cable
All newer FONIX hearing aid analyzers are provided with a USB serial cable.
This cable comes with a driver installation disk and instructions. Make sure to
install this cable on your computer. (The hardware installation wizard for the
USB cable normally runs twice.)
Connect this cable to the 9-pin female connector labeled “RS232” on the back
of the FONIX analyzer.
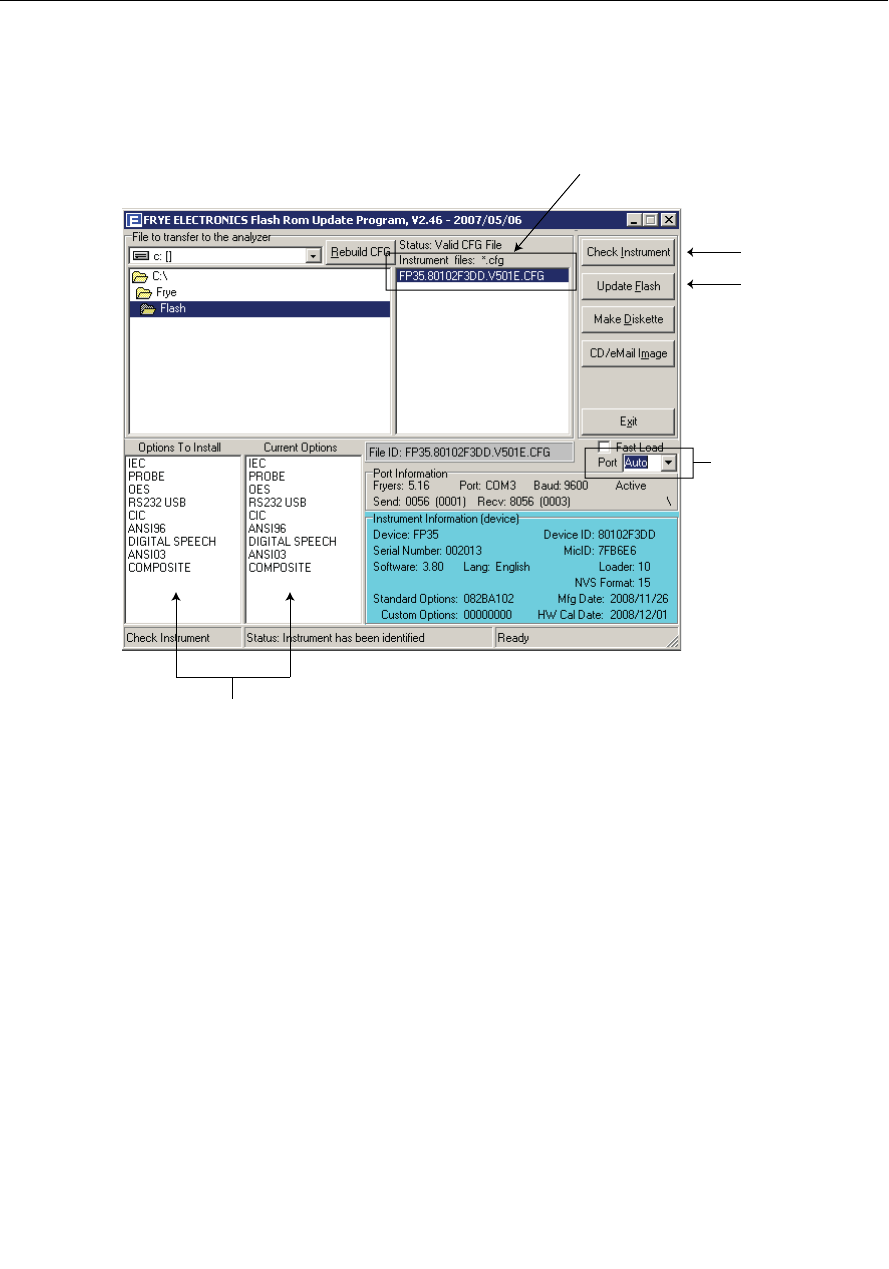
Software Upgrades 195
B.3 Updating the FONIX Analyzer
If the Flash Rom Update Program is not already open, open the file: C:\frye\
flash\update.exe.
Instrument les
Check Instrument
Check Options match
Perform Upgrade
COM port. selection
1. If necessary, click the Instrument File that matches the Instrument ID found
on the Opening Screen of your FONIX analyzer. In most cases, there will be
only one file and it will already be highlighted.
2. Click Update Flash to perform the flash ROM update. The computer will
then proceed to rewrite the flash memory on your FONIX analyzer. This
process may take about ten minutes. Do not use the computer for other
activities while this transfer is in process. Options will also be transferred
together with the new software upgrade.
3. Check that the Options to Install column matches the Current Options col-
umn. If these two columns don’t match, return to step 1 and repeat.
4. Click Exit to close the update program.
Troubleshooting the Update
• Ifyourcomputercrashesduringtheupgradeprocess,orifthetransferis
interrupted in any way, take the following steps:
a. Please be patient. Wait at least five minutes for the system to repair itself
(transfer may take up to ten minutes.)
b. Shut down the FP35 by unplugging it and then replugging it in.

196 FONIX FP35 Hearing Aid Analyzer
c. Reboot your computer.
d. Before attempting to upgrade the analyzer again, ensure that all programs
are closed, all screensavers and power management functions are turned
off, all desktop programs such as Office toolbar are closed, all programs
running in the Tray are closed.
• TheFlashROMUpdateprogramautomaticallydetectsthecommunications
port used in connecting to the FP35 analyzer. However, if you are having
trouble connecting, you might try specifying the COM port that the Update
program should use.
• WhenusingaUSBSerialcable,thecomputerturnstheUSBportintoa
COM port. In your Windows Device Manager, make sure the USB Cable is
using COM 1-9. If it is using a higher COM port, the installation will not
work. You may need to ask your local computer technician for help.
• Thelowerrightcornerofthescreendisplaysinstrumentinformation.If
you want to display information currently on the connected analyzer, click
Check Instrument.
• Sometimestheinstrumentconfigurationfilenamecanbedamaged.This
can happen if the package was copied through a computer system or pro-
gram that does not understand long file names. If the name does not look
right, or the Status says that the selected CFG file is not valid, try clicking
on the Rebuild CFG button just above and to the left of the software CFG file
selection. Normally that will correct a corrupted CFG file. If it does not, you
will need to obtain a replacement file from Frye Electronics.
B.4 Configuring the FP35 Analyzer
The following instructions may not be necessary every time an upgrade is per-
formed, but it may reduce user interface issues with menu settings.
1. Press [MENU] from the Opening Screen of the FP35.
2. Verify #1 SETTING is listed above the F2 key. Use F2 repeatedly to cycle
through options, if necessary.
3. Press [F1] and [START/STOP] to reset the default settings.
4. Press [F5] and [START/STOP] to save the configuration.
5. Press [F2] to select #2 SETTING.
6. Repeat steps 3-4.
7. Press [F2] to select #3 SETTING.
8. Repeat steps 3-4.
9. Press [F3] to go to the Calibration Screen.
10. Press [F2] to go to the Date/Time Screen. Use the arrow keys to adjust the
date and time as necessary.
11. Press [EXIT] three times to return to the Opening Screen of the analyzer.

Software Upgrades 197
12. Examine the Opening Screen below the copyright date for one of the follow-
ing two messages:
“Hardware not Calibrated”
“System not Calibrated”
13. Perform the following action:
• Ifneithermessageappears,thecalibrationiscomplete.
• If“HardwarenotCalibrated”appears,theanalyzerwillneedtobesent
back to the factory to perform this function.
• If“SystemnotCalibrated”appears,followtheinstructionsinAppendixC,
Section A: Calibrating the System.

Appendix C 199
Calibration
The FP35 provides you with a means to calibrate the system, the probe and coupler
microphones, and the insert earphone(s).
The system calibration of the FP35 should be done once a year, but the
microphones should be calibrated only when necessary. Even if you have
determined that the microphones are out of calibration, you should contact the
factory or your sales representative before calibrating the microphones. The
reason for taking this precaution is that the microphone calibration is stored in
the microphone connector rather than in the instrument. Because of this setup,
the microphones should not go out of calibration. If they do, it may indicate that
something more is wrong, and simply calibrating the microphones might not
correct the problem.
Note: For best accuracy, allow the FP35 to stabilize to room temperature before
performing a system calibration. The FP35 will stabilize to room temperature if
it is left on for 15 minutes. The current internal temperature is displayed in the
Calibration Screen.
A. Calibrating the System
To calibrate the system:
1. From the Default Settings Menu press [F3] to enter the Calibration Menu.
2. Use the [p,q] buttons to move the cursor next to “Calibrate System.”
3. Press [START/STOP]. The FP35 will confirm that you want to calibrate the
system.
4. Press [START/STOP] to begin the calibration (or press any other key to cancel).
The FP35 will ask you to wait while the system is calibrating. Once calibration
is complete, the FP35 will return to the Calibration Menu.
5. Select “Store Calibration in EEROM” in the menu.
6. Press [START/STOP] twice. The system calibration is now complete and stored.
B. Checking the Microphone Calibration
Do the following procedure to determine if the coupler and probe microphones are
out of calibration.
B.1 Coupler Microphone
For the coupler microphone, you will need a sound level calibrator such as the
Quest QC-10.
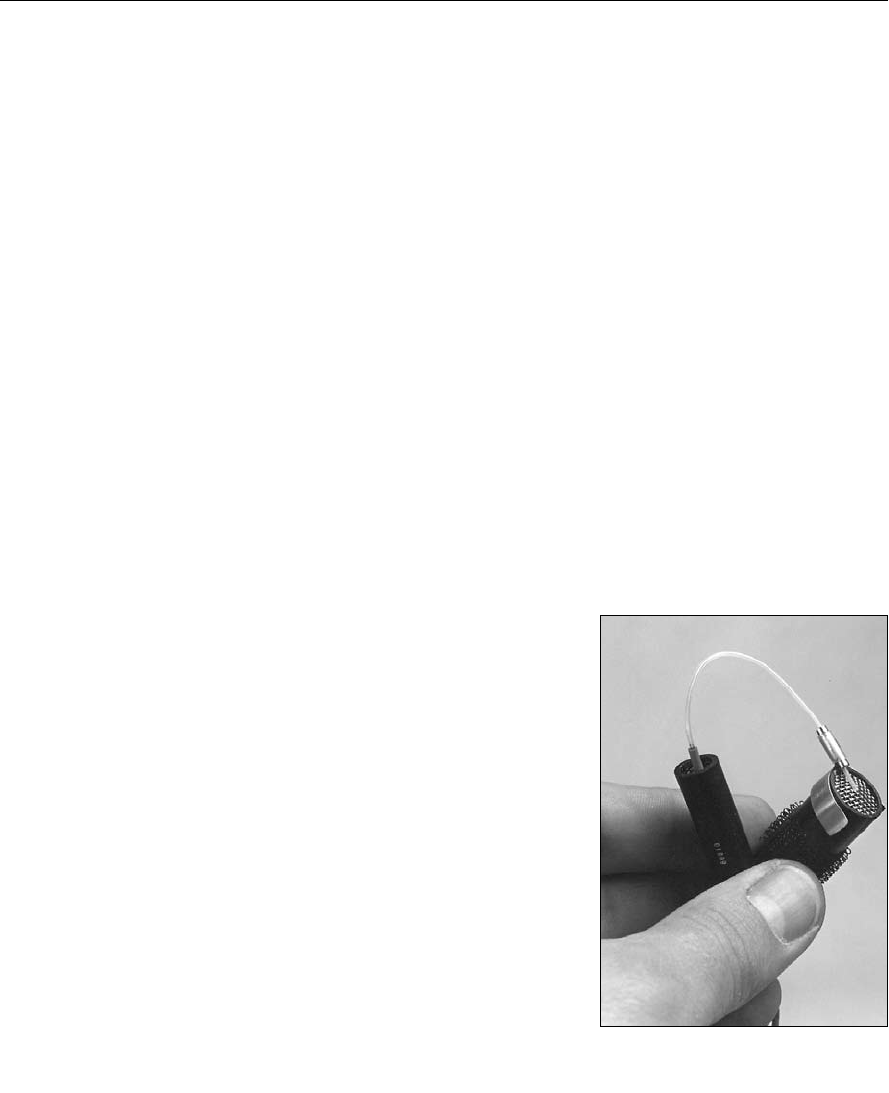
200 FONIX FP35 Hearing Aid Analyzer
1. Press [F3] to enter the Coupler Multicurve Mode from the Opening Screen.
2. Use [F4] to choose NORM.
3. Press [MENU].
4. Set REF MIC to OFF, if necessary, using the arrow keys
5. Press [NEXT] to enter the Advanced Menu. Set STATIC TONE to SINGLE.
6. Press [EXIT] to return to the Coupler Multicurve Screen.
7. Press [q] repeatedly until the single tone is turned off.
8. Use the microphone adapter supplied with the FP35 to fit the coupler micro-
phone into the calibrator, and turn the calibrator on.
9. Observe the output. If it matches the specified amplitude level of the cali-
brator within ±1 dB, the coupler microphone is not out of calibration.
Note: if you are using a calibrator that uses a signal with a frequency not divis-
ible by 100 Hz, you will need to check the calibration in the microphone cali-
bration screen.
B.2 Probe Microphone:
1. Press [F3] to enter the Coupler Multicurve Mode from the Opening Screen.
2. Press [MENU].
3. Use the arrow keys to set:
DISPLAY—GAIN
NOISE RED (TONE)—16X
REF MIC—ON
4. Press [EXIT] to return to the Coupler
Multicurve Screen.
5. Locate the calibration clip and fasten it to
the top edge of the coupler microphone.
6. Insert the probe tube through the tube
on the clip until the tip of the probe is at
the center of the coupler microphone grid
(Figure C-1).
7. Put both microphones into the sound cham-
ber and close the lid.
8. Set the source level to 70 dB or higher,
using the arrow keys.
9. Select NORM with [F4]
10. Push the [START/STOP] button.
11. Look at the response. This curve represents the difference between the
probe response and the reference response. The maximum deviation from
the zero line should be 5 dB.
Figure C-1—Attaching the probe to
the reference microphone

Calibration 201
12. If there is more than a 5 dB deviation from the zero line at any point along
the curve, the probe microphone is out of calibration.
C. Calibrating the Microphones
The FP35 microphones should be calibrated after the system calibration
described in Section A.
There are three possible microphones on the FP35 analyzer:
• Couplermicrophone
• Probemicrophone
• Referencemicrophone
There are several variations of these microphones that may be available,
depending upon when the analyzer was manufactured and whether or not it
includes the Real-ear Option.
FP35 analyzers that do not include the Real-ear Option will only have the cou-
pler microphone. This procedure for calibrating this microphone is described in
Section C.1.
FP35 analyzers with the Real-ear Option manufactured during or after
November 2008 will have an integrated probe microphone set in addition to
the coupler microphone. This consists of a probe microphone integrated into
the earhook and a rectangular reference microphone that attaches to the top of
the earhook. The procedure for calibrating the integrated probe microphone is
described in Section C.2. The procedure for calibrating the rectangular reference
microphone is described in Section C.3.
FP35 analyzers with the Real-ear Option manufactured before November 2008
will have a two microphone set consisting of a larger 14 mm coupler micro-
phone and a probe microphone. (The coupler microphone is used as a reference
microphone during real-ear measurements.) The procedure for calibrating the
coupler microphone is described in Section C.1. The procedure for calibration
the probe microphone is described in Section C.2.
To perform the microphone calibrations, you will need the following equipment,
depending on what type of microphones you are calibrating. The adapters come
standard with the analyzer. You can purchase additional adapters and a sound
calibrator from the factory. (Sound calibrators are special orders and may not be
immediately available for purchase.)
• SoundcalibratorsuchasaQC-10(allcalibrations)
• 14mm-to-1inchmicrophoneadapter(couplermicrophonecalibration)
• Probemicrophoneadapter(probemicrophonecalibration)
• Rectangularreferencemicrophoneadapter(rectangularreferencemicro-
phone on integrated probe microphone).
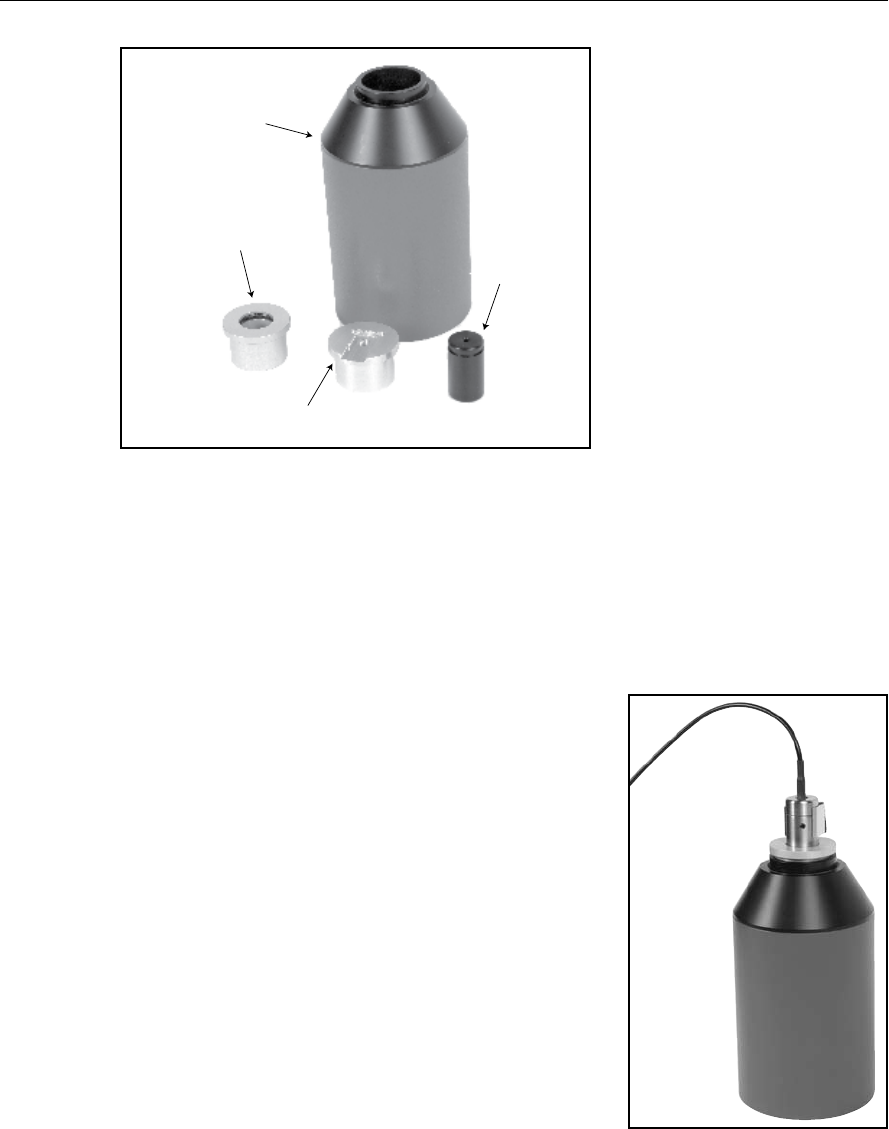
202 FONIX FP35 Hearing Aid Analyzer
Sound calibrator(QC-10)
14 mm-to-1 inch
microphone adapter
Rectangular reference
microphone adapter
Probe microphone
adapter
C.1 Calibrating the Coupler Microphone
This procedure describes how to calibrate the coupler microphone. (On FP35
analyzers manufactured before November 2008, the coupler microphone was
also used as a reference microphone during real-ear measurements.)
From the Opening Screen, press [MENU] and [F3] twice to enter the Microphone
Calibration Screen.
1. If you have an FP35 analyzer manufactured
after November 2008, select the port the
microphone is plugged into. The “internal
mic” is the connector located inside the
internal sound chamber. The “external mic”
is the connector located on the front of the
analyzer. This functionality is not available
if the external microphone port is not on the
analyzer. Normally the coupler microphone
is plugged into the internal port.
2. Use the arrow keys to select “Custom
Coupler Mic Cal.” This may be the only
selection available.
3. Attach the 14 mm-to-1 inch microphone
adaptor into the sound calibrator.
4. Insert the coupler microphone into the
adapter. See Figure C-3. Turn on the sound
calibrator.
Figure C-2: Microphone calibration
equipment
Figure C-3: Coupler microphone
inserted into sound calibrator.

Calibration 203
5. Press [START/STOP] to start the calibration.
6. Use the up/down arrow keys to adjust the “MEASURED dBSPL” until it
matches the output of the calibrator. Pressing the keys briefly will result in
0.1 dB changes. Holding the buttons down will result in 1 dB changes.
6. Once the “MEASURED dBSPL” matches the calibrator, press [EXIT] to return
to the Microphone Calibration Screen.
7. Press [F5] to store the calibration.
C.2 Calibrating the Probe Microphone
These instructions describe how to calibrate the probe microphone. There are
two models of probe microphone on the FP35 analyzer: the old style 1 cm diam-
eter microphone and the new style integrated microphone. The calibration pro-
cedure is the same.
From the Opening Screen, press [MENU] and [F3] twice to enter the Microphone
Calibration Screen.
1. If you have an FP35 analyzer manufactured after November 2008, select the
port the microphone is plugged into. The “internal mic” is the connector
located inside the internal sound chamber. The “external mic” is the connec-
tor located on the front of the analyzer. This functionality is not available
if the external microphone port is not on the analyzer. Normally the probe
microphone is plugged into the external port when it’s available.
2. Use the arrow keys to select “Custom Probe Mic Cal.”
3. Attach the 14 mm-to-1 inch microphone adaptor into the sound calibrator.
4. Attach a new probe tube to the probe microphone.
5. Thread the probe microphone through the edged side of the probe micro-
phone adapter so that the probe tube sticks out a coupler of millimeters
from the other side of the adapter. See Figure C-4A and C-4B.
6. Secure the probe tube in place by putting a dab of blue adhesive putty on
the edged end of the adapter.
7. Insert the probe microphone adapter with the attached probe microphone
into the calibrator.
8. Turn on the calibrator.
9. Press [START/STOP] to start the calibration.
10. Use the up/down arrow keys to adjust the “MEASURED dBSPL” until it
matches the output of the calibrator. Pressing the keys briefly will result in
0.1 dB changes. Holding the buttons down will result in 1 dB changes.
11. Once the “MEASURED dBSPL” matches the calibrator, press [EXIT] to return
to the Microphone Calibration Screen.
12. Press [F5] to store the calibration.
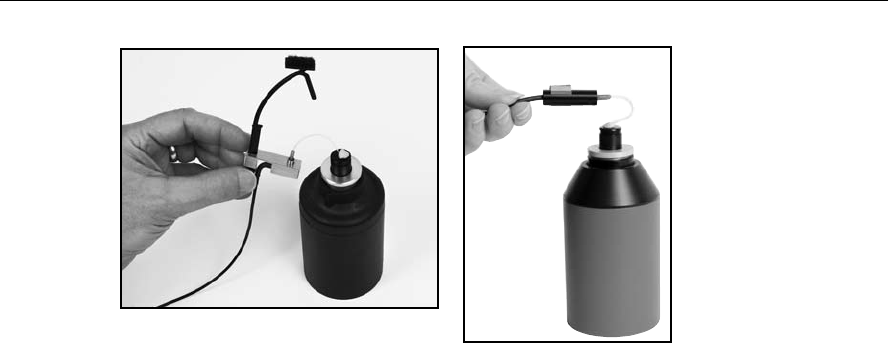
204 FONIX FP35 Hearing Aid Analyzer
C.3 Calibrating the Rectangular Reference Microphone
This procedure describes how to calibrate the rectangular reference microphone
that is part of the new-style integrated probe microphone set. This microphone
is not normally available on FP35 analyzers manufactured before November
2008.
From the Opening Screen, press [MENU] and [F3] twice to enter the Microphone
Calibration Screen.
1. Select the port the microphone is plugged into. The “internal mic” is the
connector located inside the internal sound chamber. The “external mic” is
the connector located on the front of the analyzer. Normally, the integrated
probe microphone is plugged into the external mic port.
2. Attach the rectangular reference microphone adaptor into the sound calibra-
tor.
3. Remove the reference microphone from the integrated ear hook and insert
it into the calibration adapter with the opening of the reference microphone
pointing into the calibrator. See Figure C-5A. You can use a rubber band to
hold the microphone onto the calibrator, if necessary. See Figure C-5B. Turn
on the sound calibrator.
4. Use the arrow keys to select “Custom Reference Mic Cal.”
5. Press [START/STOP] to start the calibration.
6. Use the up/down arrow keys to adjust the “MEASURED dBSPL” until it
matches the output of the calibrator. Pressing the keys briefly will result in
0.1 dB changes. Holding the buttons down will result in 1 dB changes.
7. Once the “MEASURED dBSPL” matches the calibrator, press [EXIT] to return
to the Microphone Calibration Screen.
8. Press [F5] to store the calibration.
Figure C-4A: Integrated probe
microphone inserted into sound
calibrator.
Figure C-4B: Old style probe microphone
inserted into the sound calibrator.
Calibration 205
D. Insert Earphone Calibration
Before you can perform RECD or audiometric measurements, it is necessary to
calibrate the insert earphone(s) that you will be using. The calibration for the
insert earphones is based on the ANSI S3.6-1996 specifications. There is no
need to specifically calibrate individual HL levels because the following calibra-
tion procedure provides a sufficiently stable reference.
D.1 RECD coupler setup
1. Insert the insert earphone into the “earphone” jack on the back of your ana-
lyzer.
2. Plug the other end of the insert earphone into the tubing of the ear level
adapter attached to an HA-2 coupler. See Figure C-6.
3. Insert coupler microphone into the HA-2 coupler. See Figure C-7.
4. From the Opening Screen, press [MENU] to enter Default Settings Menu.
5. Press [F3] to enter the Calibration Screen.
6. Press [F4] to enter the Earphone Calibration Screen.
Figure C-6—Insert earphone connected to Figure C-7—Coupler microphone inserted into
ear level adapter and HA-2 coupler HA-2 coupler
Figure C-5A: Rectangular reference micro-
phone inserted into sound calibrator
Figure C-5B: Using a rubber band to hold the
microphone in place on the calibrator
206 FONIX FP35 Hearing Aid Analyzer
D.2 RECD coupler measurement
1. Set up your insert earphone for calibration as described above.
2. Select “Cal Left (Single) Ins. Earphone (RECD)” with [p,q].
3. Press [START/STOP] twice to perform the calibration.
4. If you are using only one insert earphone for the RECD measurements, skip
to step 8. If you are using two insert earphones (one per ear), proceed to the
next step.
5. Set up the right insert earphone as described above.
6. Use [q] to select “Cal Right Ins. Earphone (RECD).”
7. Press [START/STOP] twice to perform the measurement.
8. Press [F5] to save the insert earphone calibration.
9. Press [EXIT] to exit Earphone Calibration Screen.
D.3 Audiometer calibration setup
1. Attach the earphone calibration adapter to the HA-2 coupler
2. Insert the insert earphone into the “earphone” jack on the back of your ana-
lyzer.
3. Plug the other end of the insert earphone into the earphone calibration
adapter. See Figure C-8.
4. Insert coupler microphone into the HA-2 coupler. See Figure C-9.
5. From the Opening Screen, press [MENU] to enter Default Settings Menu.
6. Press [F3] to enter the Calibration Screen.
7. Press [F4] to enter the Earphone Calibration Screen.
Figure C-8—Insert earphone connected to Figure C-9—Coupler microphone inserted into
earphone calibration adapter and coupler HA-2 coupler

Calibration 207
D.4 Calibrating the audiometer
1. Set up the left insert earphone for calibration as described above.
2. Select “Cal Left (Single) Ins. Earphone” using [p] if necessary.
3. Press [START/STOP] twice to perform the calibration.
4. If you’re only using one earphone, skip to step 8. Otherwise, proceed.
5. Set up the right insert earphone for calibration as described above.
6. Use [q] to select “Cal Right Ins. Earphone.”
7. Press [START/STOP] twice to perform the calibration.
8. Press [F5] to save the insert earphone calibration.
9. Press [EXIT] to exit Earphone Calibration Screen.
D.5 Erasing the insert earphone calibration
If you want to set the calibration to be electrically flat to allow you to use the
“earphone” jack for other devices, perform the following operation.
1. Press [F1] to erase the calibration.
2. Press [F5] to save this change.

Appendix D 209
Fitting Formula Tables
The conversions used by the FP35 to convert audiograms to target gain curves
are the following.
NAL-RP FITTING FORMULA CALCULATION
The insertion gains at each frequency are calculated according
to the following formulas:
Freq (Hz) Insertion Gain (dB)
250 X + .31 HTL - 17dB + S
500 X + .31 HTL - 8dB + S
750 X + .31 HTL - 3dB + S
1000 X + .31 HTL + 1dB + S
1500 X + .31 HTL + 1dB + S
2000 X + .31 HTL - 1dB + S
3000 X + .31 HTL - 2dB + S
4000 X + .31 HTL - 2dB + S
6000 X + .31 HTL - 2dB + S
8000 X + .31 HTL - 2dB + S
Where you calculate X and S (Slope correction values) as follows:
a. T = (HTL @ 500Hz) + (HTL @ 1000Hz) + (HTL @ 2000Hz)
b. If T is less than or equal to 180dB, then
X = .05 x T
If T is greater than 180dB, then
X = (.05 x 180dB) + (.116 x ( T - 180dB)
c. If the HTL at 2000 Hz is less than 95dB, S = 0
If the HTL at 2000 Hz is greater than or equal to 95dB, then
apply the following slope correction factors at each frequency
based on the 2000Hz measurement:
2000Hz 250 500 750 1000 1500 2k 3k 4k 6k 8k
HTL (dB)
95 4 3 1 0 -1 -2 -2 -2 -2 -2
100 6 4 2 0 -2 -3 -3 -3 -3 -3
105 8 5 2 0 -3 -5 -5 -5 -5 -5
110 11 7 3 0 -3 -6 -6 -6 -6 -6
115 13 8 4 0 -4 -8 -8 -8 -8 -8
120 15 9 4 0 -5 -9 -9 -9 -9 -9

210 FONIX FP35 Hearing Aid Analyzer
POGO
Prescription of Gain/Output (POGO) for Hearing Aids
by Geary A. McCandless, PhD,
& Poul Erik Lyregaard, MSc
Hearing Instruments vol 34 #1, 1983
Required insertion gain is calculated as follows:
Frequency (Hz) Insertion Gain (dB)
250 1/2 HTL - 10 dB
500 1/2 HTL - 5 dB
750* 1/2 HTL - 2.5 dB
1000 1/2 HTL
1500* 1/2 HTL
2000 1/2 HTL
3000 1/2 HTL
4000 1/2 HTL
6000* 1/2 HTL
8000* 1/2 HTL
Note: Frequencies preceded by an asterisk (*) are interpolated because the
article does not reference them.
BERGER
A Method of Hearing Aid Prescription
by Kenneth W. Berger, PhD, Eric N. Hagberg, M.A.,
& Robert L. Rane, PhD
Hearing Instruments July 1978
Required insertion gain is calculated as follows:
Frequency (Hz) Insertion Gain (dB)
250* 1/2 HTL
500 1/2 HTL
750* 1/2 HTL
1000 1/1.6 HTL
1500* 1/1.5 HTL
2000 1/1.5 HTL
3000 1/1.7 HTL
4000 1/2 HTL
6000* 1/2 HTL
8000* 1/2 HTL
Note: Frequencies preceded by an asterisk (*) are interpolated because the
article does not reference them.

Fitting Formula Tables 211
1/3, 1/2, 2/3 Gain
The 1/3-2/3 Insertion Gain Hearing Aid Selection Guide
by Robert Libby
Hearing Instruments vol 37 #3, 1986
Required insertion gain is calculated as follows:
FREQ. INS GAIN INS GAIN INS GAIN
(Hz) (dB) (dB) (dB)
(2/3 rule) (1/3 rule) (1/2 rule)
250 2/3 HTL - 5 dB 1/3 HTL - 5 dB 1/2 HTL -5 dB
500 2/3 HTL - 3 dB 1/3 HTL - 3 dB 1/2 HTL -3 dB
750* 2/3 HTL 1/3 HTL 1/2 HTL
1000 2/3 HTL 1/3 HTL 1/2 HTL
1500* 2/3 HTL 1/3 HTL 1/2 HTL
2000 2/3 HTL 1/3 HTL 1/2 HTL
3000 2/3 HTL 1/3 HTL 1/2 HTL
4000 2/3 HTL 1/3 HTL 1/2 HTL
6000 2/3 HTL - 5 dB 1/3 HTL - 5 dB 1/2 HTL -5 dB
8000* 2/3 HTL - 5 dB 1/3 HTL - 5 dB 1/2 HTL -5 dB
Note: Frequencies marked by an asterisk (*) are interpolated because the article
does not reference them.

Appendix E 213
SPL Conversions
The Target IG is converted to the Target SPL in the following steps.
1. Add the source level for aided curve 2.
2. Interpolate from 10 frequency to 80 frequency curve frame.
3. Add the AVG unaided ear response REUR in Table 1.
4. If aided 2 is composite, subtract 10.7 dB from each frequency.
5. If aided 2 is speech weighted, subtract the speech weighting in Table 2.
The complete formula is then:
Target SPL = Target IG + CRV2 source + AVG REUR
(If Aided2 is composite) - 10.7 dB - speech weighting.
(If Aided2 is speech tone) - speech weighting.
•ToconverttheHTLandUCLfromHLtoSPL:
Add the corrections in Table 3.
•TopredictUCL’s(HL)giventheHTL(HL):
Use Table 4 to convert from HTL to UCL.

214 FONIX FP35 Hearing Aid Analyzer
TABLE 1
Average Real-Ear Unaided Response (REUR) (Except for DSL and NAL-NL1)
FREQ GAIN FREQ GAIN FREQ GAIN FREQ GAIN
(Hz) dB (Hz) dB (Hz) dB (Hz) dB
2100 13.9 4100 12.7 6100 7.7
200 1.6 2200 14.7 4200 12.4 6200 7.5
300 2.1 2300 15.1 4300 12.2 6300 7.3
400 2.7 2400 15.0 4400 12.0 6400 7.2
500 2.9 2500 15.1 4500 11.9 6500 7.1
600 2.9 2600 15.0 4600 11.7 6600 6.9
700 3.1 2700 14.6 4700 11.6 6700 6.8
800 3.3 2800 14.1 4800 11.2 6800 6.6
900 3.6 2900 13.6 4900 10.7 6900 6.5
1000 3.4 3000 13.7 5000 10.3 7000 6.4
1100 3.1 3100 13.8 5100 9.9 7100 6.2
1200 3.6 3200 14.1 5200 9.5 7200 6.1
1300 4.2 3300 14.5 5300 9.2 7300 6.0
1400 4.4 3400 14.8 5400 8.9 7400 5.7
1500 5.6 3500 14.9 5500 8.7 7500 5.4
1600 7.0 3600 14.7 5600 8.5 7600 5.1
1700 8.1 3700 14.3 5700 8.3 7700 4.8
1800 9.3 3800 13.9 5800 8.2 7800 4.6
1900 10.9 3900 13.5 5900 8.0 7900 4.4
2000 12.6 4000 13.1 6000 7.8 8000 4.2
TABLE 2
Speech Weighting
FREQ FREQ FREQ FREQ
(Hz) dB (Hz) dB (Hz) dB (Hz) dB
2100 8.1 4100 13.4 6100 16.7
200 0.2 2200 8.4 4200 13.6 6200 16.9
300 0.5 2300 8.8 4300 13.8 6300 17.0
400 0.8 2400 9.1 4400 14.0 6400 17.1
500 1.2 2500 9.4 4500 14.1 6500 17.3
600 1.6 2600 9.7 4600 14.3 6600 17.4
700 2.1 2700 10.0 4700 14.5 6700 17.5
800 2.5 2800 10.3 4800 14.7 6800 17.6
900 3.0 2900 10.6 4900 14.9 6900 17.8
1000 3.5 3000 10.8 5000 15.0 7000 17.9
1100 4.0 3100 11.1 5100 15.2 7100 18.0
1200 4.4 3200 11.3 5200 15.4 7200 18.1
1300 4.9 3300 11.6 5300 15.5 7300 18.2
1400 5.3 3400 11.8 5400 15.7 7400 18.4
1500 5.8 3500 12.1 5500 15.8 7500 18.5
1600 6.2 3600 12.3 5600 16.0 7600 18.6
1700 6.6 3700 12.5 5700 16.1 7700 18.7
1800 7.0 3800 12.7 5800 16.3 7800 18.8
1900 7.4 3900 13.0 5900 16.4 7900 18.9
2000 7.7 4000 13.2 6000 16.6 8000 19.0

SPL Conversions 215
TABLE 3
HL to SPL (or SPL to HL) conversion table (Except for DSL and NAL-NL1)
from ANSI S3.6-1989 Table G.1
FREQ (Hz) dB
250 19.0
500 12.0
750 10.5
1000 9.0
1500 12.0
2000 15.0
3000 15.5
4000 13.0
6000 13.0
8000 14.0
TABLE 4
HTL(HL) to UCL(HL) (Except for DSL and NAL-NL1)
prediction table from Pascoe(1988) Table 4
HTL UCL HTL UCL
dBHL HL dBHL HL
0 97 65 114
5 99 70 115
10 99 75 117
15 98 80 120
20 97 85 120
25 101 90 124
30 102 95 130
35 101 100 127
40 103 105 133
45 105 110 134
50 107 115 137
55 108 120 140
60 110

Appendix F 217
Digital Speech Technical Details
The digital speech signal on the FP35 analyzer works by turning the compos-
ite signal on for a set period of time, taking a measurement, turning the signal
off for a random period of time, and turning the signal back on again. This
sequence is repeated until the user ends the test. Usually, either the ANSI S3.42
or the ICRA speech weighting is used to take the measurements.
The signal “on” time takes a minimum of 50 milliseconds. This includes the
time to turn the signal on, take the measurement, and turn the signal off.
Some aids may require an additional delay before the measurement is taken
to allow their circuits to settle. This additional delay time can be changed in
the SHORT SETTLE setting in the Advanced Menu of Real-Ear or Coupler. The
SHORT SETTLE is automatically adjusted according to the aid type selected.
The settle time is added to the 50 ms minimum measurement time.
The default settings are:
•STANDARD(linear):0ms
•AGC:50ms
•ADAPTIVE:100ms
The signal “off” time is random between 100 and 300 milliseconds. It is not
controllable by the user.
Digital Speech is usually used with the ANSI or ICRA speech spectra (see
Section 4.4.4 for a discussion on filters). There is a sizable difference between
these two filters. The ICRA rolls off the high frequencies of the composite signal
much more rapidly than the ANSI weighting. See Figure F-1 for a graphical rep-
resentation of the differences between the two weightings.
Since the speech weightings of the signals are different, the responses of hear-
ing aids to ANSI and ICRA will also be different. Figure F-2 shows an example
of a digital hearing aid being tested with the ANSI and the ICRA digital speech
signals.
218 FONIX FP35 Hearing Aid Analyzer
Figure F-1
Figure F-2

Index 219
Index
A
A-LTASS 39, 143
Accessories 6–11
Adapter
ear-level 6
earphone calibration 11
microphone 7
probe calibration 8
Adaptive 34
AGC 34, 97
AGC SWITCHING 99
Age 28, 130, 159, 177
Aided Response 132, 134
Aid Group 28, 88, 130, 159, 178
AID LIMITING 177
Aid Limiting 130, 160
AID TYPE 29, 131, 177
Aid Type 33
ANSI 39, 93, 98
ANSI 03 93, 96
ANSI 92 39
ANSI 96 96, 98, 100
ANSI TEST 96, 99
ASSESSMENT 30
Assessment 130, 182, 183, 184
Audiogram Entry Screen 3, 27, 30, 37, 111,
119
Audiometer Option 13, 130, 131, 181–185
Audiometric Entry Screen 181, 184
AUTO-SCALE 31
Auto-Scale 89, 160, 178
Averages
three-frequency 38, 68
AVG FREQ 89, 160, 179
AVG FREQS 31, 99
B
BACK 3, 19, 57, 111, 169
BAUDRATE 28
BICROS 162–167
Body Aid 64, 118
BTE 62, 76
Buttons. See Keys
C
C-LTASS 39, 40, 144
Calibration 199
Calibration clip 8
CE mark 5
CHANNELS 130, 160, 177
CIC
CIC Option 13, 74, 88, 178
correction factors 13, 31
Cleaning 17
COMP 34, 178
Composite Option 12, 57, 77
Composite signal 13, 34, 38
COMPRESSION 29, 130, 159, 177
Contrast 5
Couplers 29, 31, 75
CIC 13, 62
HA-1 6, 62, 63
HA-2 6, 62
MZ 62, 75, 76
Open Fit 11
Coupler measurements 13, 57–91, 169, 175
Coupler Multicurve 57, 64, 88, 169, 177
COUPLER TYPE 29, 88, 107, 178
CRMS 44
CROS 162–167
Curve ID Box 54, 55
D
Data 54
DATA/GRAPH 88, 153, 159, 175, 178
Date 27
Default Settings 22, 25, 129
DEFAULT UNAIDED 32
Default Values 129
Delay Settings 33, 35
Delay Times 33, 34, 159, 178
Digital Hearing Aids 39, 77, 98, 118
Digital Speech 12, 38, 213
Directional Hearing Aids 61, 78, 136
DISPLAY 31, 88, 178
Display 54
DISTORTION 29, 88, 161, 178
DISTORTION FREQ 103
Distortion Measurements 69
DISTORTION SWEEP 90, 152, 162, 180
DIST 90 dB RULE 90, 162, 180
DIST SWEEP END 90, 162, 180
DSL 121, 143
Note: The word in all capital letter refer to the menu that appear on screen.

220 FONIX FP35 Hearing Aid Analyzer
E
EAR 31, 99, 130, 159
Ear-Level Adapter 6
Earhook 8, 10
Earphone jack 4
EarSim 169, 171, 173
EQ INPUT NOISE 31, 99, 103, 107
ERMS 44
EXIT 3, 23
Extension Pole 8, 78, 113
External monitor 9, 13, 27
External Sound Source 188
External Speaker 47, 112, 114
F
F1-F5 Keys. See Function Keys
Factory, Frye 17
Fading Paper 53
FAST 34, 37
Felt Pen 8
FILTER 39, 84, 89, 160, 179
Filters, Signal 84
Filter Type 39
Fitting Formula Tables 205
FIT RULE 28, 130, 159, 177
FIT TYPE 131, 160, 177
FLAT 39
FM35 7
Free Field Method 182
FREQ 31
Frequency Responses 64
Front Panel 3
Function Keys 3, 19
F1-F5 keys described 30
in Coupler Multicurve 87
G
Gain 185
Global Variables 22
Group Delay 37
H
HA-1 6
HA-2 6
Harmonic Distortion 35, 41, 69, 148
HDIST 12DB 100, 107
Head-Baffle Effect 163, 164
Head Surface Method 181
HELP 4
Help Menu 23
HIDE 161
HL 184
I
ICRA 39
IEC 118-7 13, 100
IEC 601-1 5
IEC 60601 14
IMPULSE REJ 161
Impulse Rejection 43, 47, 73
IM Distortion Frequencies 73
IM Distortion Sweep 71
IM FREQ DIFF 151, 162
Insertion Gain 111, 131, 166
Insertion gain measurements 188
Insertion Gain Screen 132
Insertion Loss 167
Insert Earphones 184
Intermodulation Distortion 12, 40, 70, 149
IO PREDELAY TIME 100
IO SETTLE 100
ISI 14, 108
ITE 63
J
JIS 13, 104
K
Keyboard 5
L
Label 51
Leveling 58, 96
reference mic 60
saving 61
sound field speaker 116
standard 59
LEVELING AUTO CLEAR 31
LEVELING SOURCE 31, 131, 161
Leveling Source, changing 61
Line-in External Source 33, 86, 146
Live Speech Testing 144
Local Menus 21

Index 221
Local Variables 22
LONG SETTLE 89, 100, 104, 108, 161, 179
Long Settle time 33
LTASS 39
M
Maintenance 16
Medical Device Directive 5
MENU 3
Menu 20, 21, 23
MICROPHONES 90, 180
Microphones 7
reversing 82
splitting 83
Microphone Adapter 7
Monitor 9, 13, 27
MZ 62, 75, 76
N
NAL-NL1 121, 158
Navigation 19, 111
New Client 129
NEXT 3
NOISE RED 29, 88, 99, 103, 107, 130, 159, 178
Noise Reduction 36, 43
NORM 34, 35
O
Occlusion Effect 147, 187
OES Option 75
Opening Screen 17, 24
Open fit 139
OPERATE 4
OUTPUT 91
OUTPUT JACK 32
OUTPUT LIMIT 30, 31, 130, 159
Output Limitations 185
OUTPUT SELECT 161
P
Paper Jams 53
Pop-up Menu 20
Post. See Extension Pole
Power 5, 9
Predelay 33
PREDELAY TIME 89, 100, 103, 108, 161, 179
PRINT/FEED 4
PRINTER 28, 100, 104, 108, 131, 161
Printer 5, 50
Printing 50
PRINT LABEL 28, 100, 104, 108, 131, 161
PROBE MIC (HL) 131
Probe Tube 8, 115
Pure-Tone 35
R
Real-Ear Option 13
Real-Ear Screens 156
Real-Ear SPL 111
Real-Ear Unaided & Aided 111
Rear Panel 4
RECD 122
REDD 124
Reference 87
Reference Microphone 45, 60, 74, 81, 139, 152
REFERENCE STATUS 31, 45, 160
REF MIC 29, 88, 99, 103, 107, 159, 178
REF MIC (SPEAKER) 130, 182, 183
RESET 4, 22, 23, 129
Resetable Variables 22
RESET SMOOTHING 32
RESET SRC 31, 32
Reversing Microphones 82
RMS 43
RMS ANALYSIS 161
RS232 5
S
SCREEN MODE 28
SCREEN SAVER 28
Servicing 16
Setup 14, 181
body aid 64
BTE 62
hearing aid 62
ITE 63
real-ear 112
SHORT 34
SHORT SETTLE 89, 100, 103, 108, 161, 179
Short Settle time 33
Signal Processing Delay 37
SIGNAL SKEW 37, 161
Single Frequency 67
Single Frequency Response 148
SMOOTHING 160

222 FONIX FP35 Hearing Aid Analyzer
Sound Chamber 5, 12, 47
SOUND FIELD 130, 159, 182, 183
Sound Field Speaker 113, 116, 181
SPEAKER 32, 131, 161
Speaker Jack 5
Specifications 191
SPECTRUM WINDOW 90, 180
Spectrum Window 189
Speech-Weighting 142
SPL 184
Splitting Microphones 83
SPL Conversions 209
SPL screen 140
SPL Test 141
Standard 34
START/STOP 3
STATIC TONE 160
Swing Arm 9
T
TABULATION 153, 160, 176, 178
Target 119, 120
modifying 122
Target Coupler screen 169
Target Data 153, 175
Target Formulas 142
TARGET REF 143, 159, 176, 177
TELECOIL 29, 30
Telecoil
measurements 85
telecoil 96
board 12
measurements 154
Telewand 12
setup 86
Test Curve 65
Thermal Paper 52
Three-Frequency Averages 38, 68
Threshold Measurements 184
Time 27
Toggle 20
TRMS 44
TUBING 131, 178
U
UNAIDED 143, 159
Unaided 127
Unaided & Aided Response Screen 132
Unaided Response 133
Upgrades, Software 195
V
Variables 22
VENT 131, 177
VIDEO BACKGND 28
VIDEO FOREGND 28
Video Monitor 4
W
Warble Rates 36
WARBLE SOURCE 131, 161
Warranty 17
