Hands On Instructions
User Manual:
Open the PDF directly: View PDF ![]() .
.
Page Count: 101 [warning: Documents this large are best viewed by clicking the View PDF Link!]

OPENSHIFT HANDS-ON
@Microsoft
Développer et déployer une application Cloud-Native
Guillaume Estrem & Laurent Broudoux
AppDev Solution Architect
21 Février 2019
OPENSHIFT HANDS-ON ON AZURE
PAUSE
Lab 1
Lab 2
Lab 3
Lab 4
Lab 5
Lab 6
Lab 7
Lab 8
Getting Started
Deploying containers from an image
Deploying containers from sources
Monitoring application health
Distributed Tracing Configuration
Getting Application Metrics
Azure Service Broker
Continuous Delivery
2
LAB
GUIDE
13h00
14h30
16h00
14h45

OPENSHIFT CONCEPTS
OVERVIEW

OPENSHIFT HANDS-ON ON AZURE4
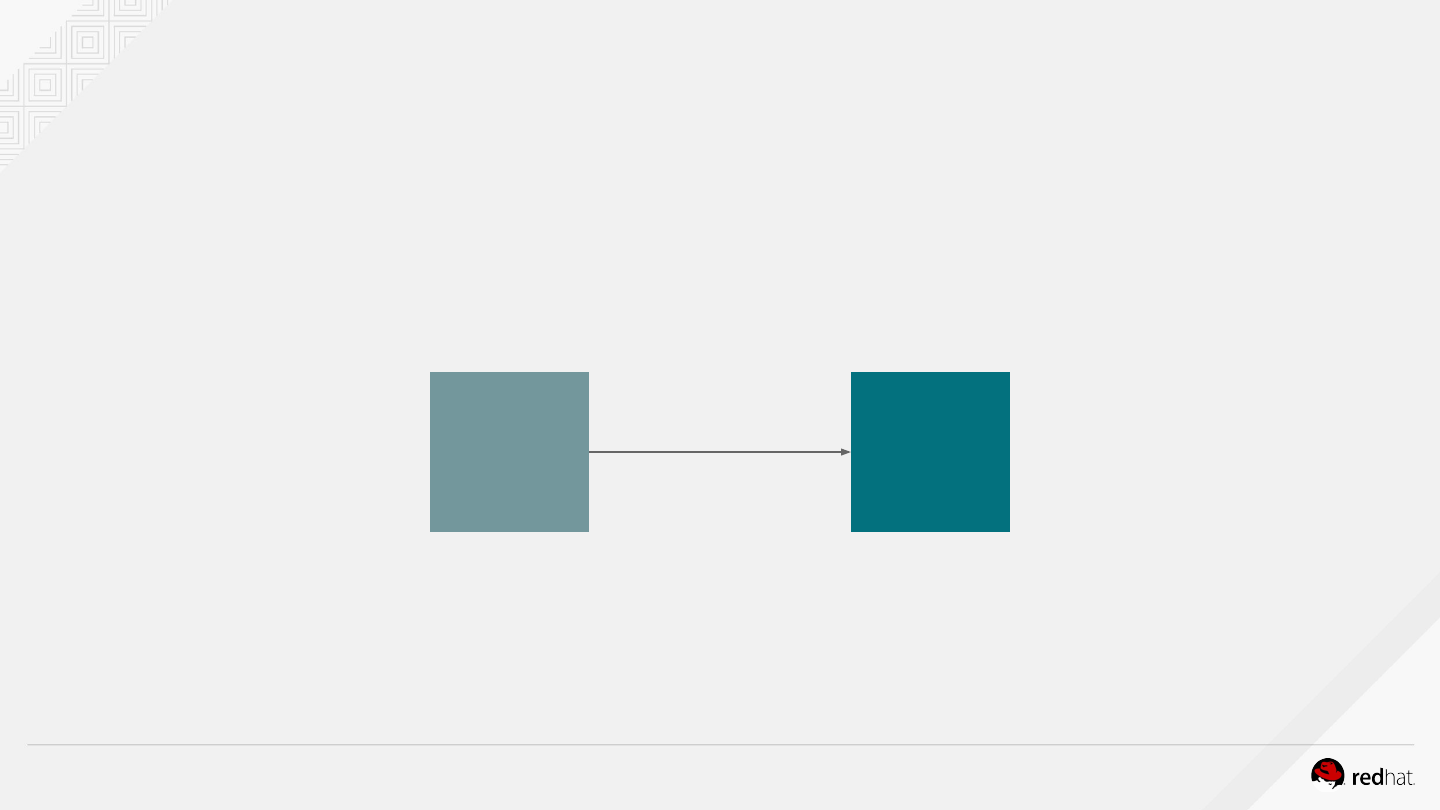
A container is the smallest compute unit
CONTAINER
OPENSHIFT HANDS-ON ON AZURE5
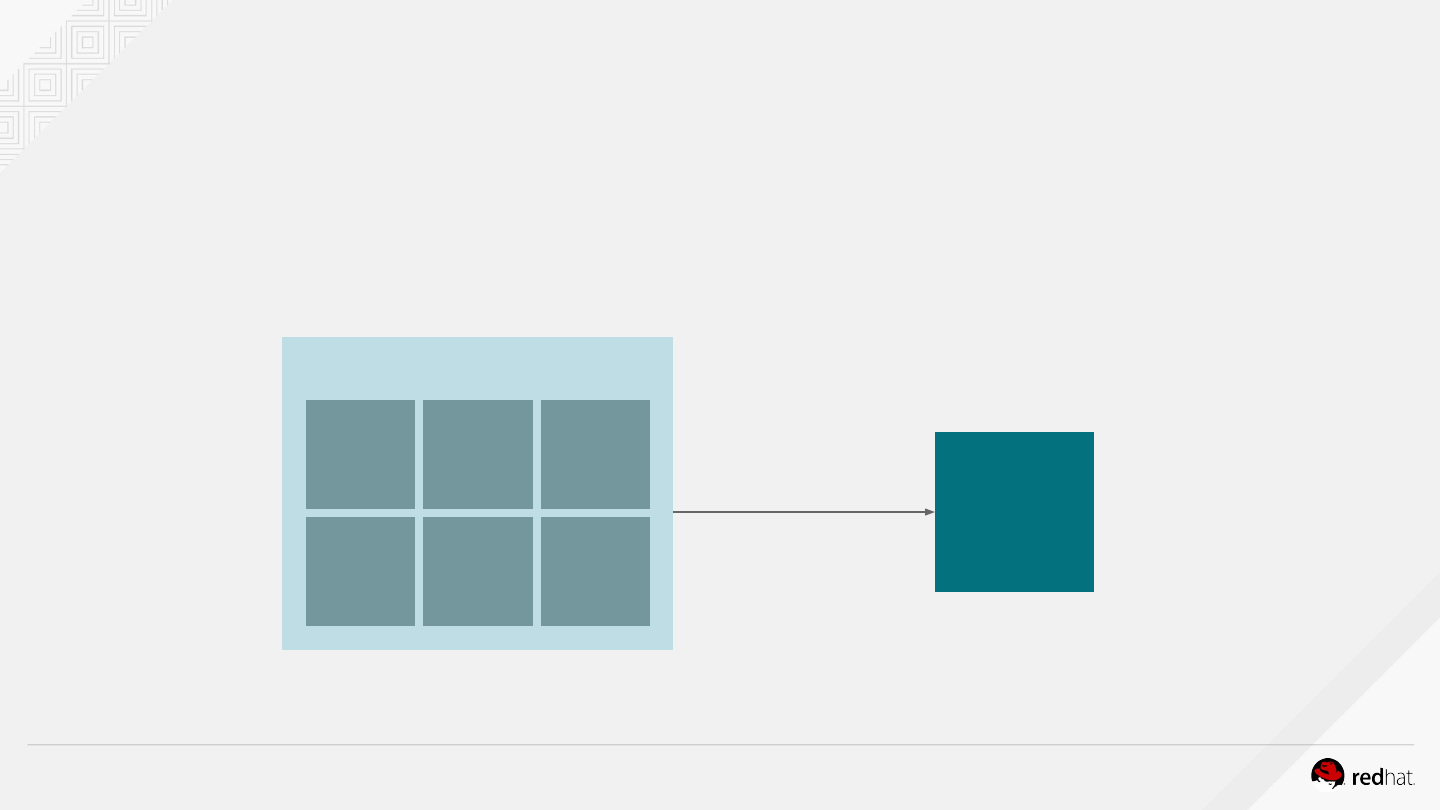
Containers are created from
container images
CONTAINER
CONTAINER
IMAGE
BINARY RUNTIME
OPENSHIFT HANDS-ON ON AZURE6
IMAGE REGISTRY
Container images are stored in
an image registry
CONTAINER
CONTAINER
IMAGE
CONTAINER
IMAGE
CONTAINER
IMAGE
CONTAINER
IMAGE
CONTAINER
IMAGE
CONTAINER
IMAGE

OPENSHIFT HANDS-ON ON AZURE
An image repository contains all versions of
an image in the image registry
7
IMAGE REGISTRY
frontend:latest
frontend:2.0
frontend:1.1
frontend:1.0
CONTAINER
IMAGE
mongo:latest
mongo:3.7
mongo:3.6
mongo:3.4
CONTAINER
IMAGE
myregistry/frontend myregistry/mongo

OPENSHIFT HANDS-ON ON AZURE
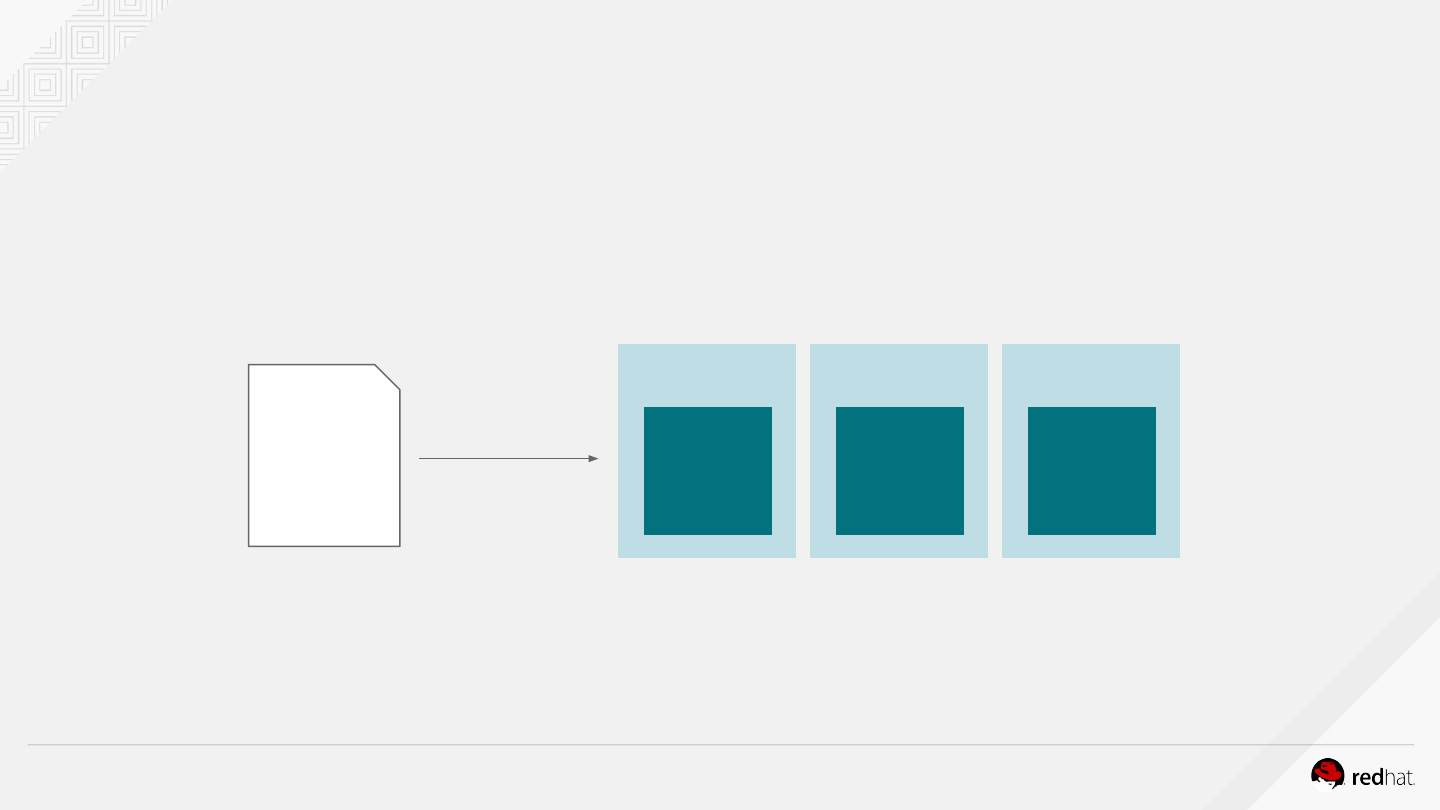
PODPOD
Containers are wrapped in pods which are
units of deployment and management
8
CONTAINER CONTAINER
CONTAINER
IP: 10.1.0.11 IP: 10.1.0.55
OPENSHIFT HANDS-ON ON AZURE
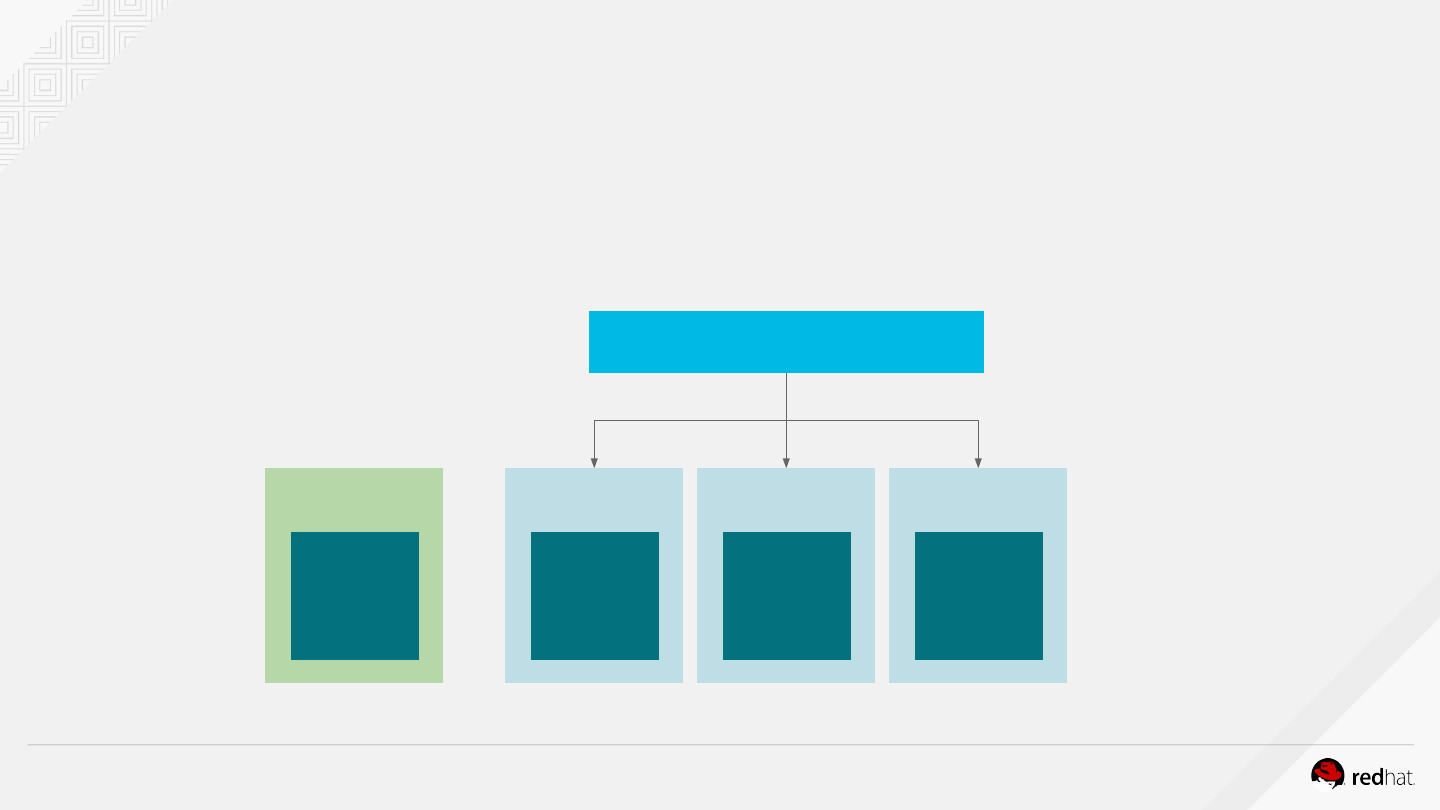
Pods configuration is defined
in a deployment
9
image name
replicas
labels
cpu
memory
storage
POD
CONTAINER
POD
CONTAINER
POD
CONTAINER
DEPLOYMENT
OPENSHIFT HANDS-ON ON AZURE
POD
Services provide internal load-balancing and
service discovery across pods
10
CONTAINER
POD
CONTAINER
POD
CONTAINER
BACKEND SERVICE
POD
CONTAINER
role: backend
role: backendrole: backendrole: backendrole: frontend

OPENSHIFT HANDS-ON ON AZURE
POD
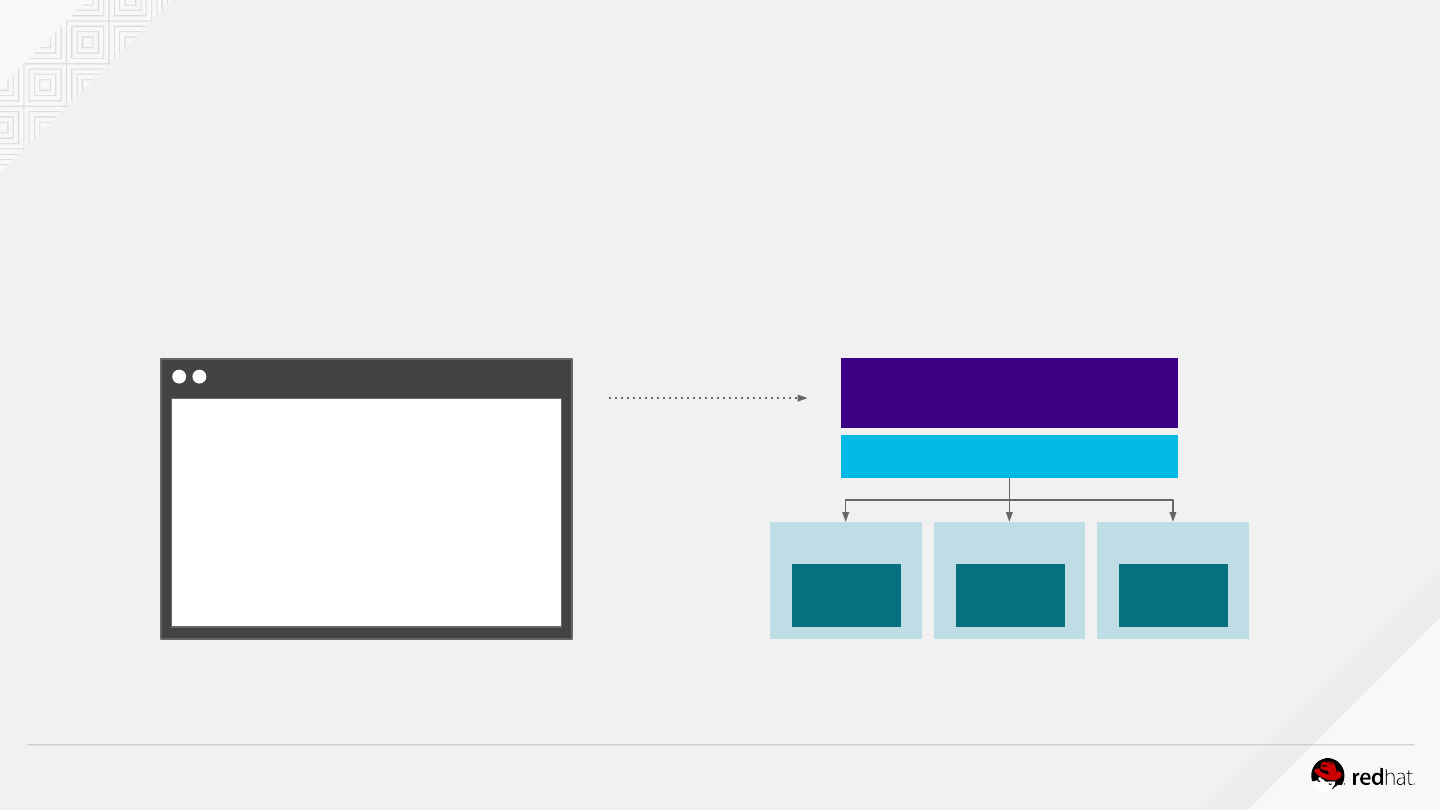
Apps can talk to each other via services
11
CONTAINER
POD
CONTAINER
POD
CONTAINER
BACKEND SERVICE
POD
CONTAINER
role: backend
role: backendrole: backendrole: backendrole: frontend
Invoke
Backend API
OPENSHIFT HANDS-ON ON AZURE
POD
Routes add services to the external load-balancer
and provide readable urls for the app
12
CONTAINER
POD
CONTAINER
POD
CONTAINER
BACKEND SERVICE
ROUTE
app-prod.mycompany.com
> curl http://app-prod.mycompany.com
OPENSHIFT HANDS-ON ON AZURE
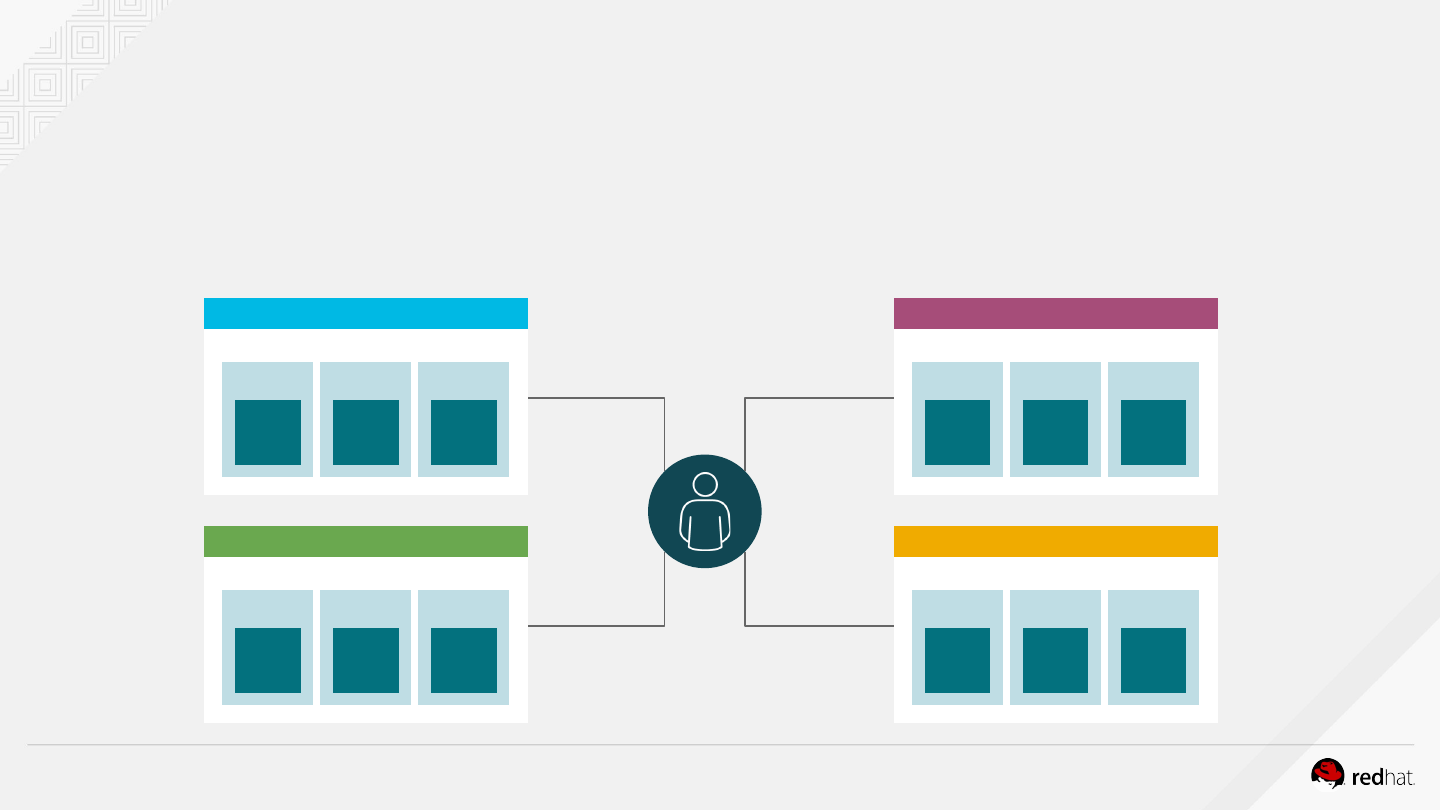
Projects isolate apps across
environments, teams, groups and
departments
13
POD
C
POD
C
POD
C
PAYMENT DEV
POD
C
POD
C
POD
C
PAYMENT PROD
POD
C
POD
C
POD
C
CATALOG
POD
C
POD
C
POD
C
INVENTORY
❌
❌❌

LAB 1
Getting started

OPENSHIFT HANDS-ON ON AZURE17
●Make sure you have a userId (userX). Each attendee has its own environment on
OpenShift Container Platform
●Fork the GitHub repo https://github.com/lbroudoux/ocp-on-azure-workshop into your
own GitHub and clone it in your home directory /home/userX/ on the bastion
●Open a terminal and login into Openshift with the following credentials
Before starting...
$ oc login https://masterdnscbmvtdzhvuqye.francecentral.cloudapp.azure.com/ -u userX -p
mypassword
Login successful.
You have access to the following projects and can switch between them with 'oc
project <projectname>':

APPLICATION ARCHITECTURE
OVERVIEW
OPENSHIFT HANDS-ON ON AZURE19
INVENTO
RY CATALOG
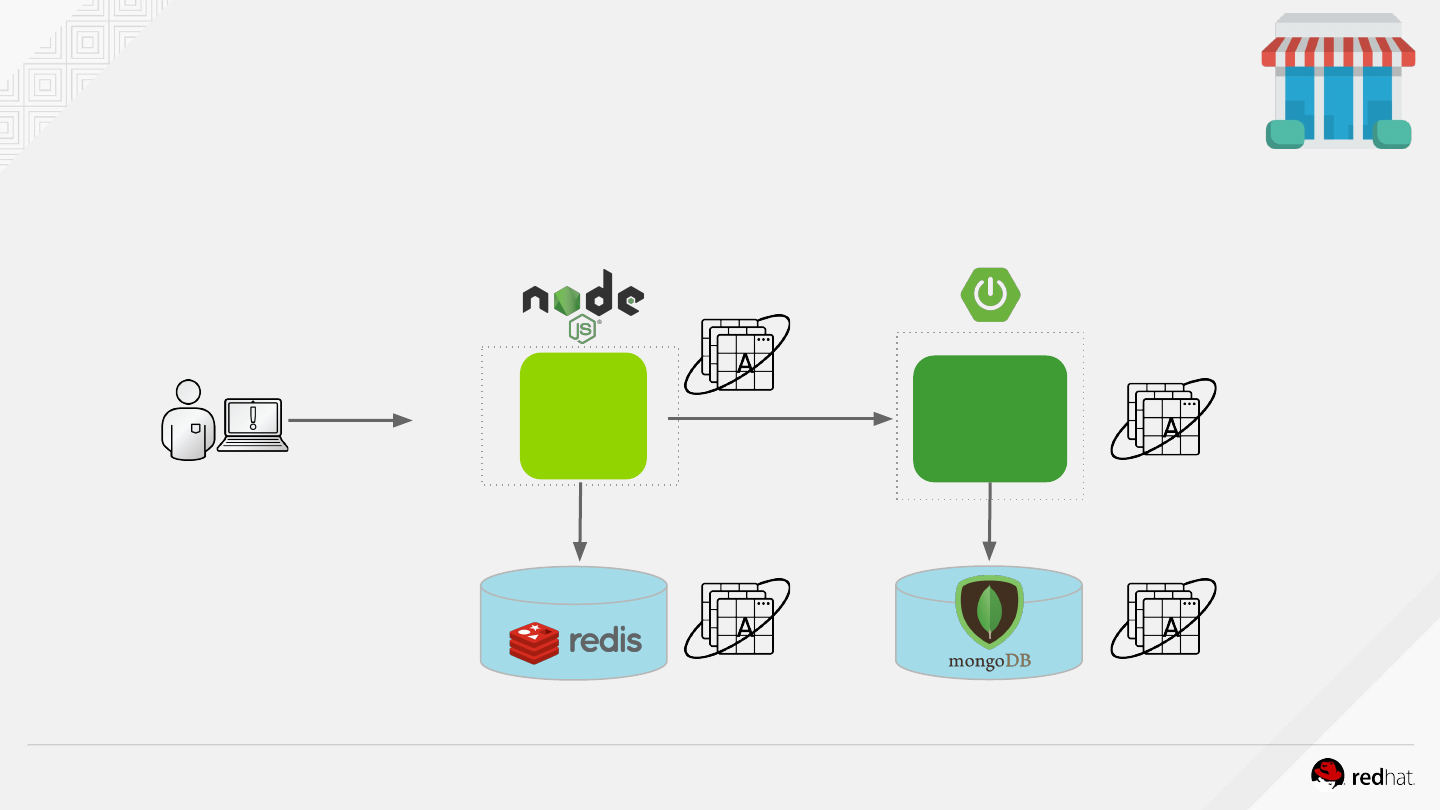
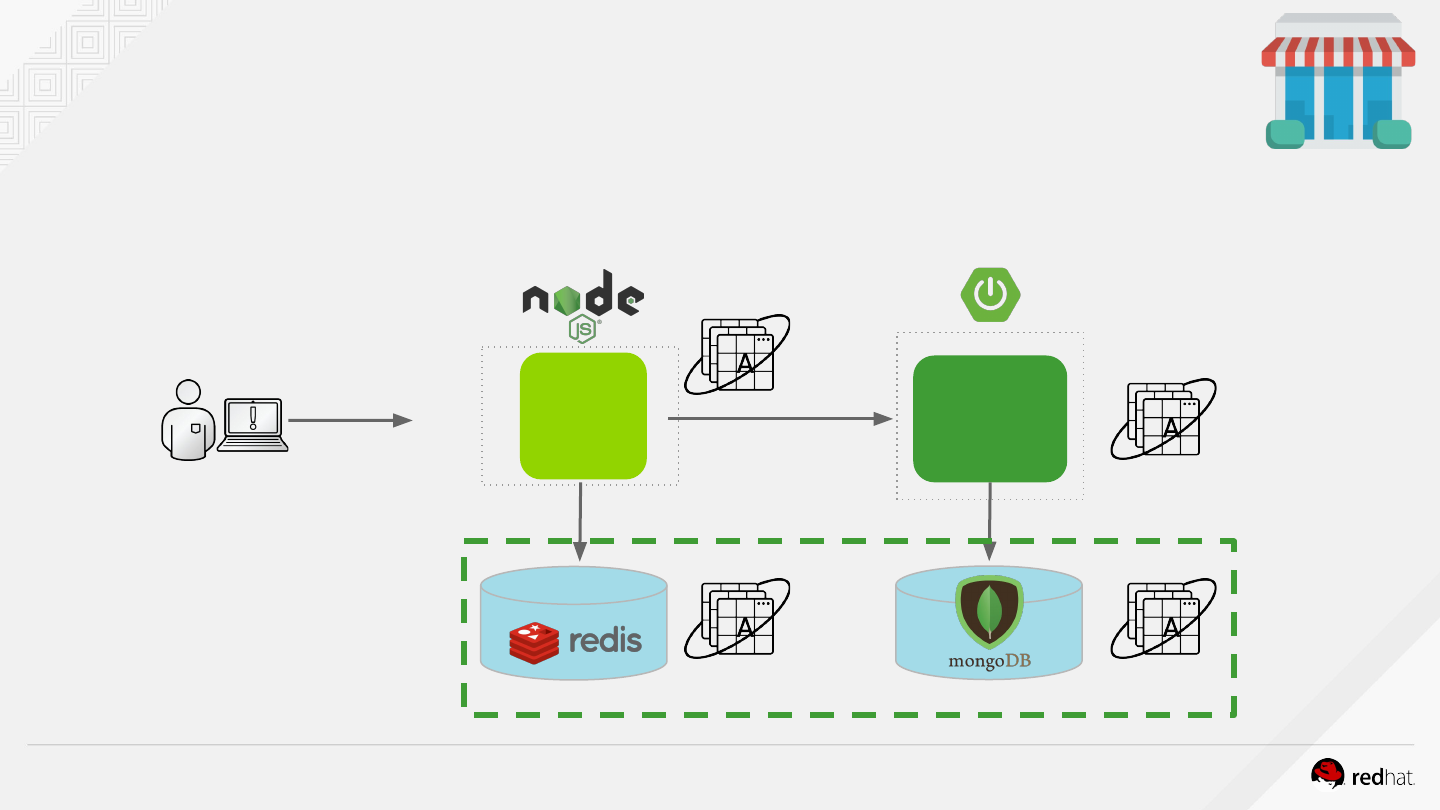
Grocery Store on OpenShift

LAB 2
Deploy containers from an image

OPENSHIFT HANDS-ON ON AZURE
Create your development environment
Let’s go the Web Console
●Via the web console :
https://masterdnscbmvtdzhvuqye.francecentral.cloudapp.azure.com
○Login with the same credentials
○Create a Project with the following informations
■Name : fruits-grocery-dev-userX
■Display Name: UserX - Fruits Grocery - Dev
OPENSHIFT HANDS-ON ON AZURE
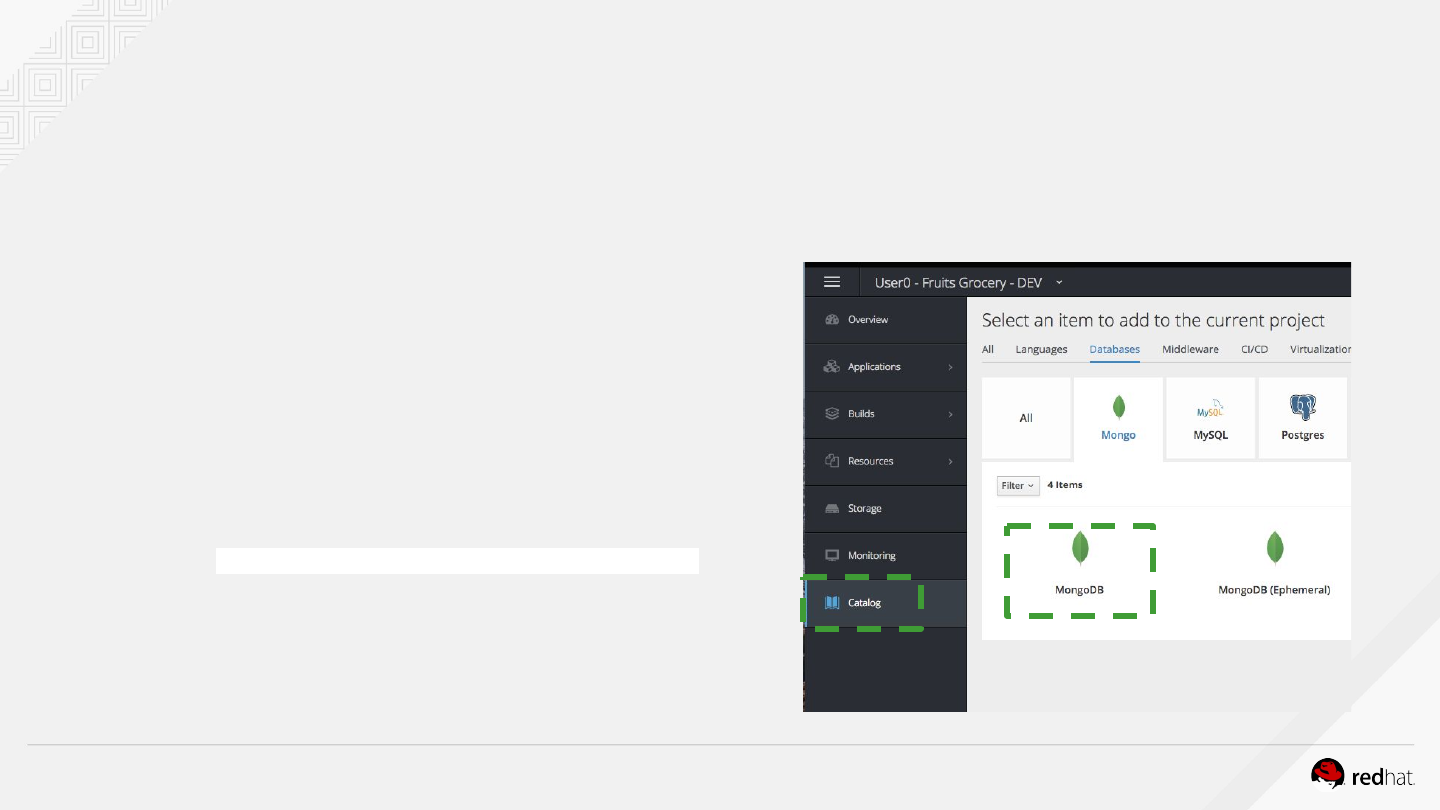
Deploy MongoDB database via the catalog
●Browse the service catalog and search for MongoDB
●Set MongoDb Database Name
○Name : fruitsdb
●Save and label the deployment config with the
command below
$ oc label dc/mongodb app=fruits-catalog
OPENSHIFT HANDS-ON ON AZURE
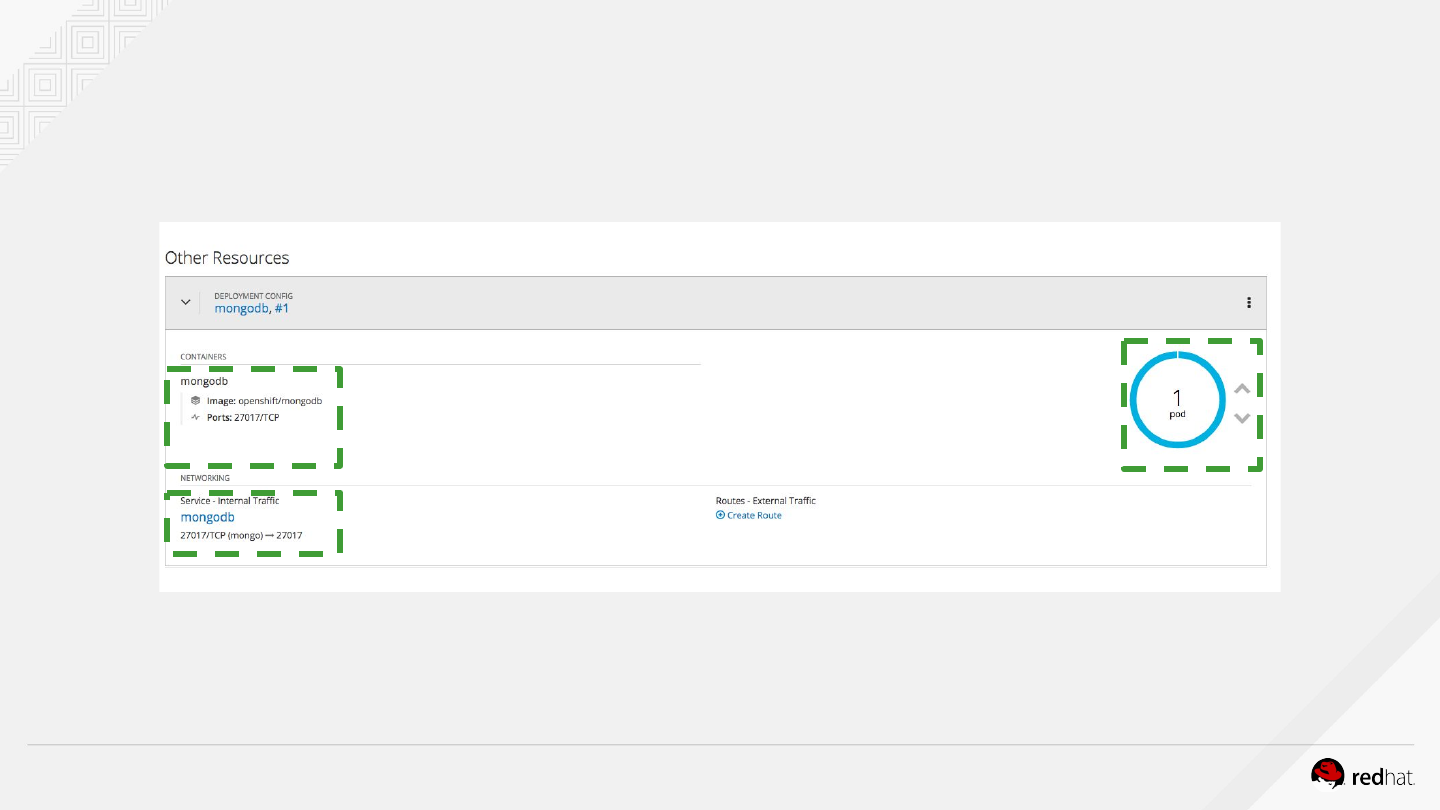
One Pod is running. Explore the objects created by OpenShift : image used, TCP port opened
and service created
Check MongoDB deployment

OPENSHIFT HANDS-ON ON AZURE
Deploy Redis via the CLI
Let’s do the deployment of Redis through the CLI rather than the Web console
$ oc new-app redis-persistent --name=redis -p DATABASE_SERVICE_NAME=redis -l app=fruits-inventory -n
fruits-grocery-dev-userX
Quick overview of the command line
●“redis-persistent” is the template we use from the catalog
●We specify also a label (app=fruits-inventory ) to select easily all resources
related to fruits-inventory in our environment
●DATABASE_SERVICE_NAME is the service to reach all pods related to Redis
OPENSHIFT HANDS-ON ON AZURE
Check Redis deployment
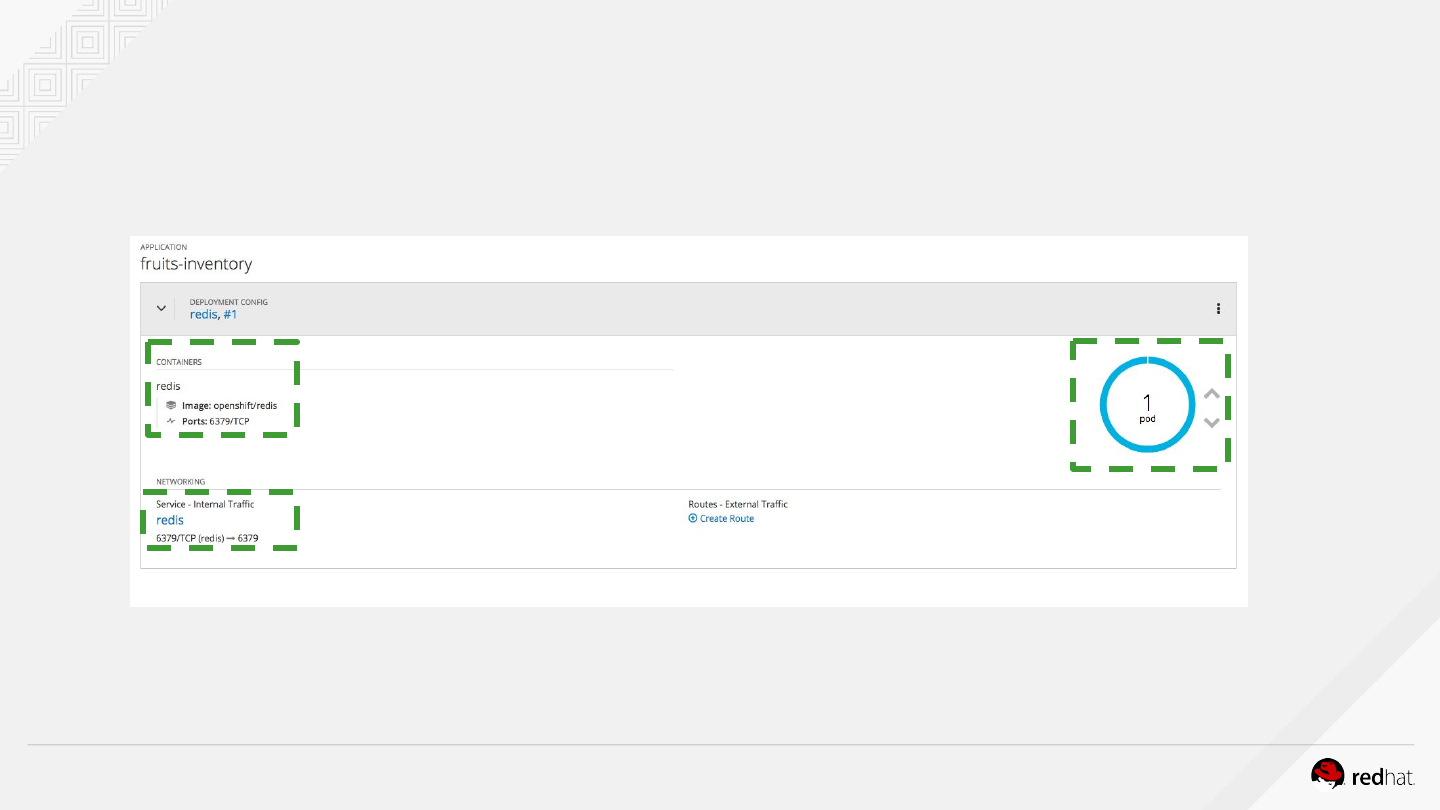
One Pod is running. Explore the objects created by OpenShift : image used, TCP port
opened and service created
OPENSHIFT HANDS-ON ON AZURE26
INVENTO
RY CATALOG
Grocery Store on OpenShift

LAB 3
Deploy containers from source
OPENSHIFT HANDS-ON ON AZURE
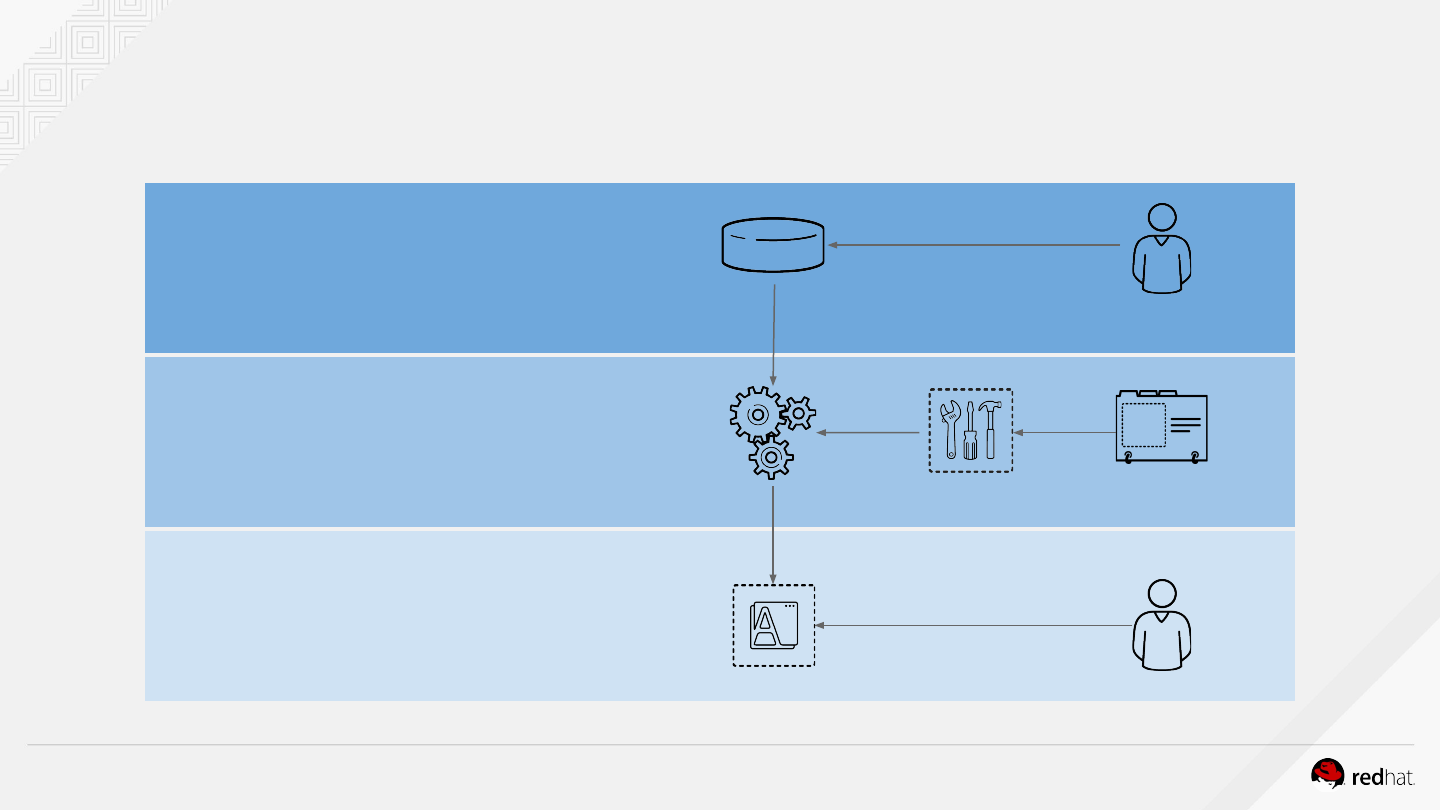
Deploy the fruits catalog with s2i strategy
Git
Repository
BUILD APP
(OpenShift) Developer
code
Source-to-Image
(S2I)
Builder
Image
Image
Registry
BUILD IMAGE
(OpenShift)
DEPLOY
(OpenShift)
deploy
Application
Container
OPENSHIFT HANDS-ON ON AZURE
Deploy the fruits catalog
Our application is developed with Spring Boot. A powerful Java framework to build next-gen
application and leverage Openshift capabilities.
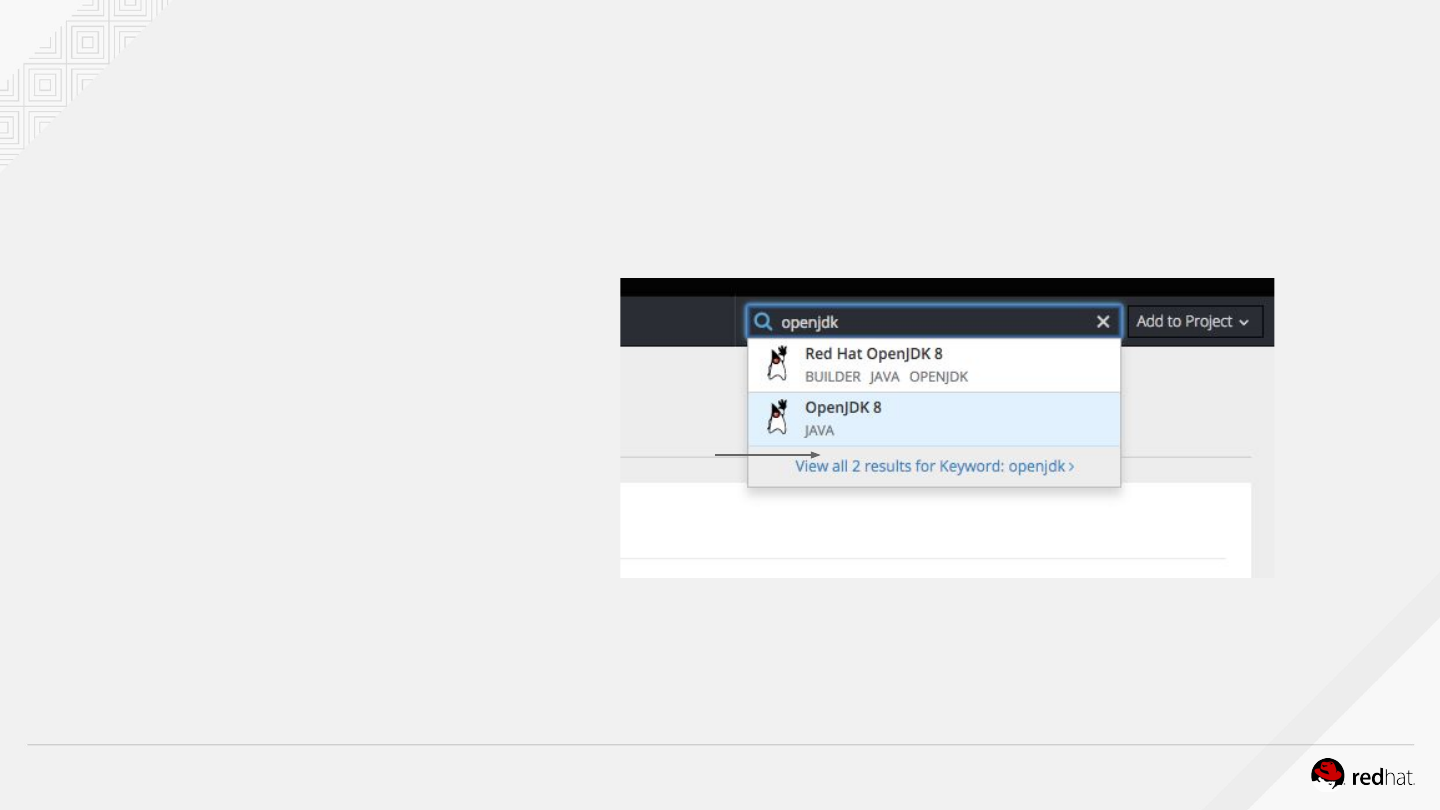
Let’s use the official Red Hat
OpenJDK 8 image Builder to
create our container Image
from the source code.
OPENSHIFT HANDS-ON ON AZURE
Deploy the fruits catalog
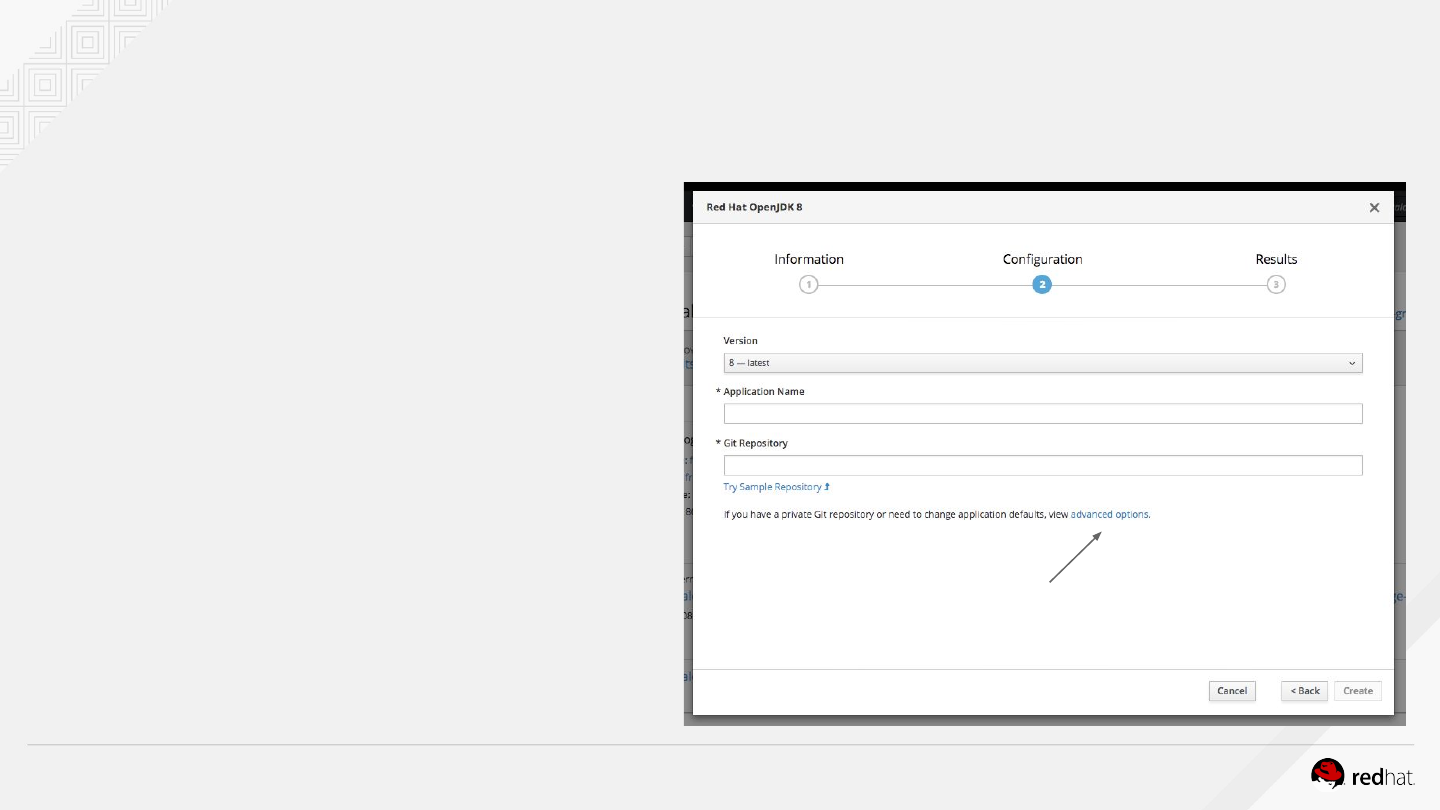
Let’s explore Advanced options to specify
environment variables and extras things!
OPENSHIFT HANDS-ON ON AZURE
Deploy the fruits catalog
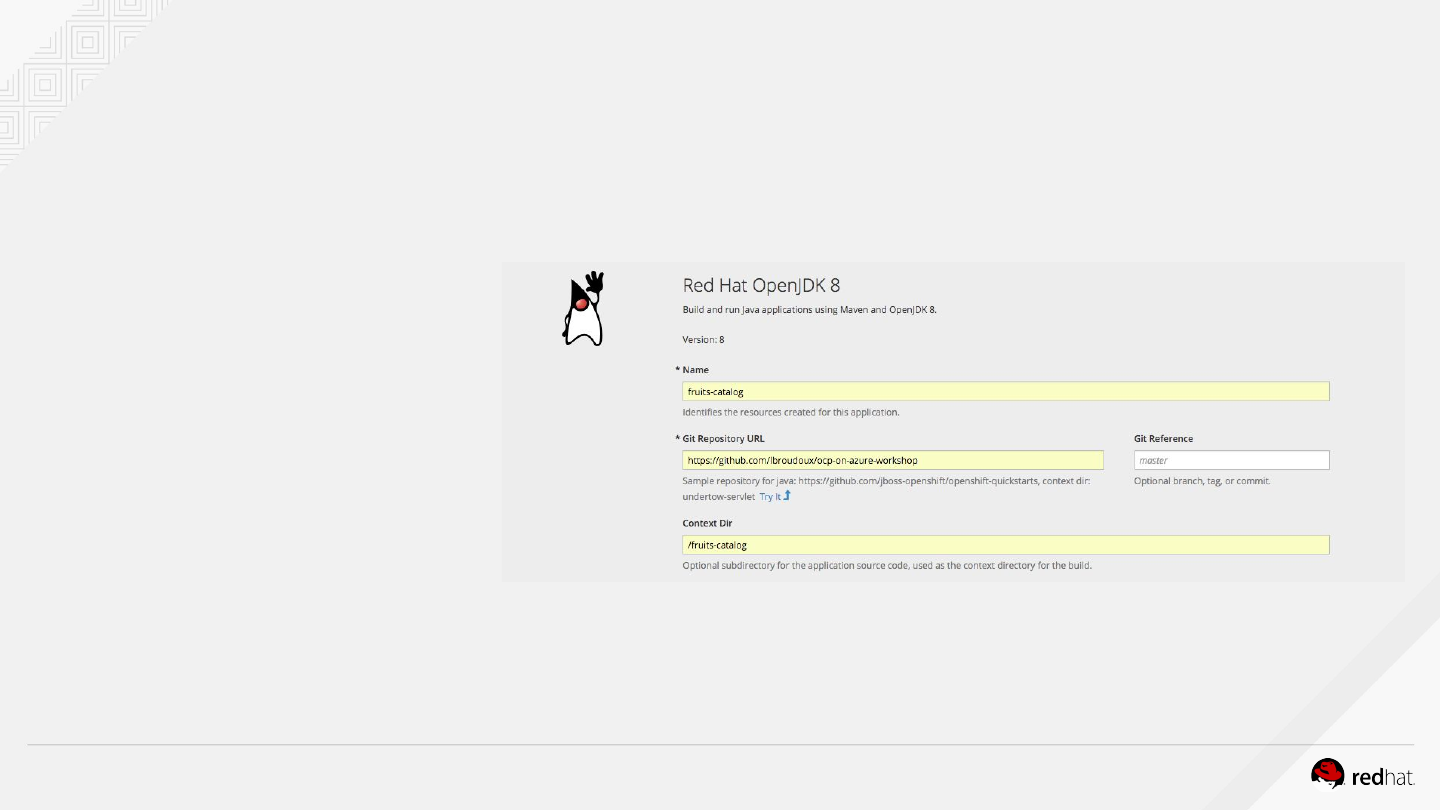
Complete source code informations to build the SpringBoot app in Openshift
●Name :
fruits-catalog
●Context Dir :
/fruits-catalog
●Your Git repo URL
OPENSHIFT HANDS-ON ON AZURE
Deploy the fruits catalog
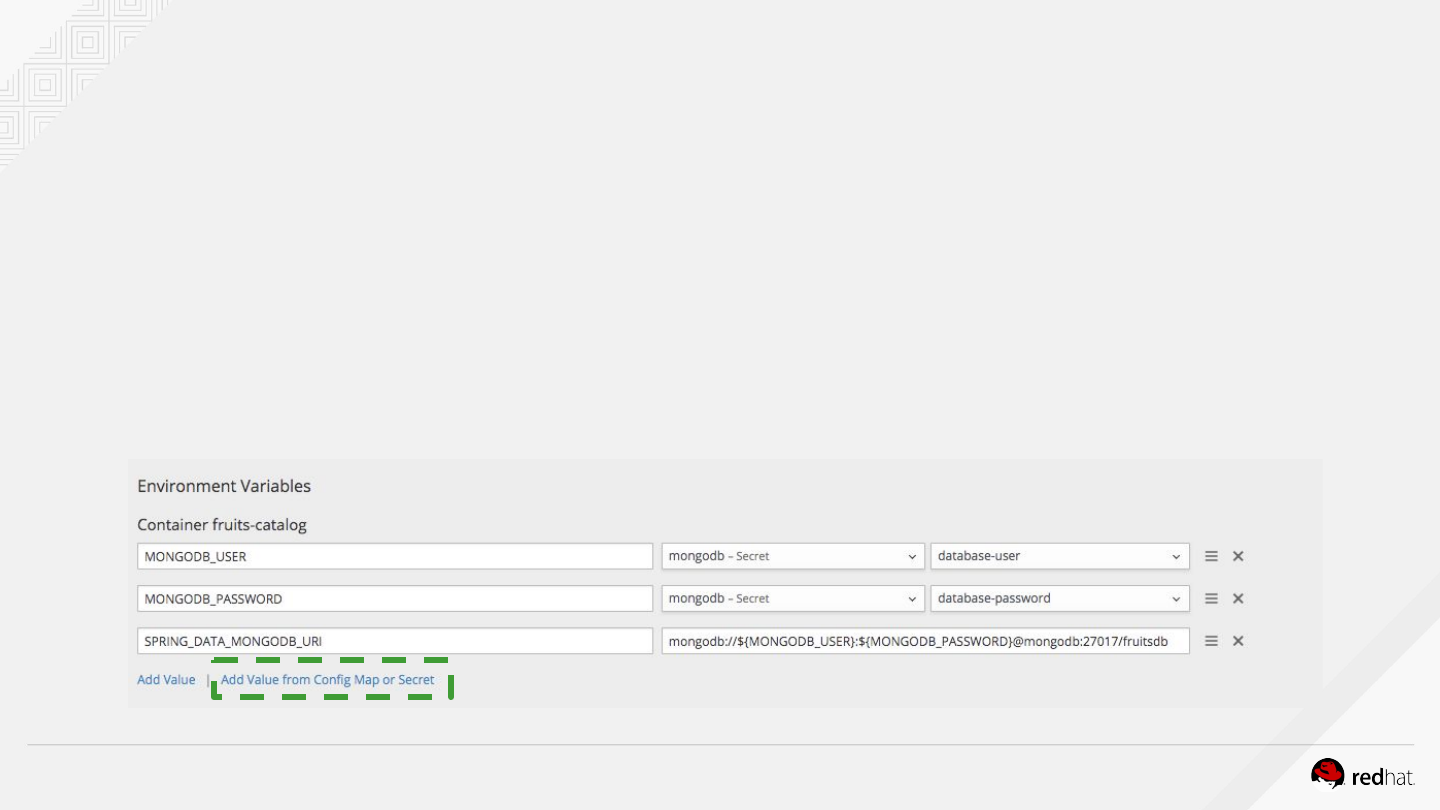
Set environment variables for database credentials and URI
●MONGODB_USER - pick the right secret
●MONGODB_PASSWORD - pick the right secret
●SPRING_DATA_MONGODB_URI :
mongodb://${MONGODB_USER}:${MONGODB_PASSWORD}@mongodb:27017/frui
tsdb
MongoDB credentials are located in a secret named mongodb
OPENSHIFT HANDS-ON ON AZURE
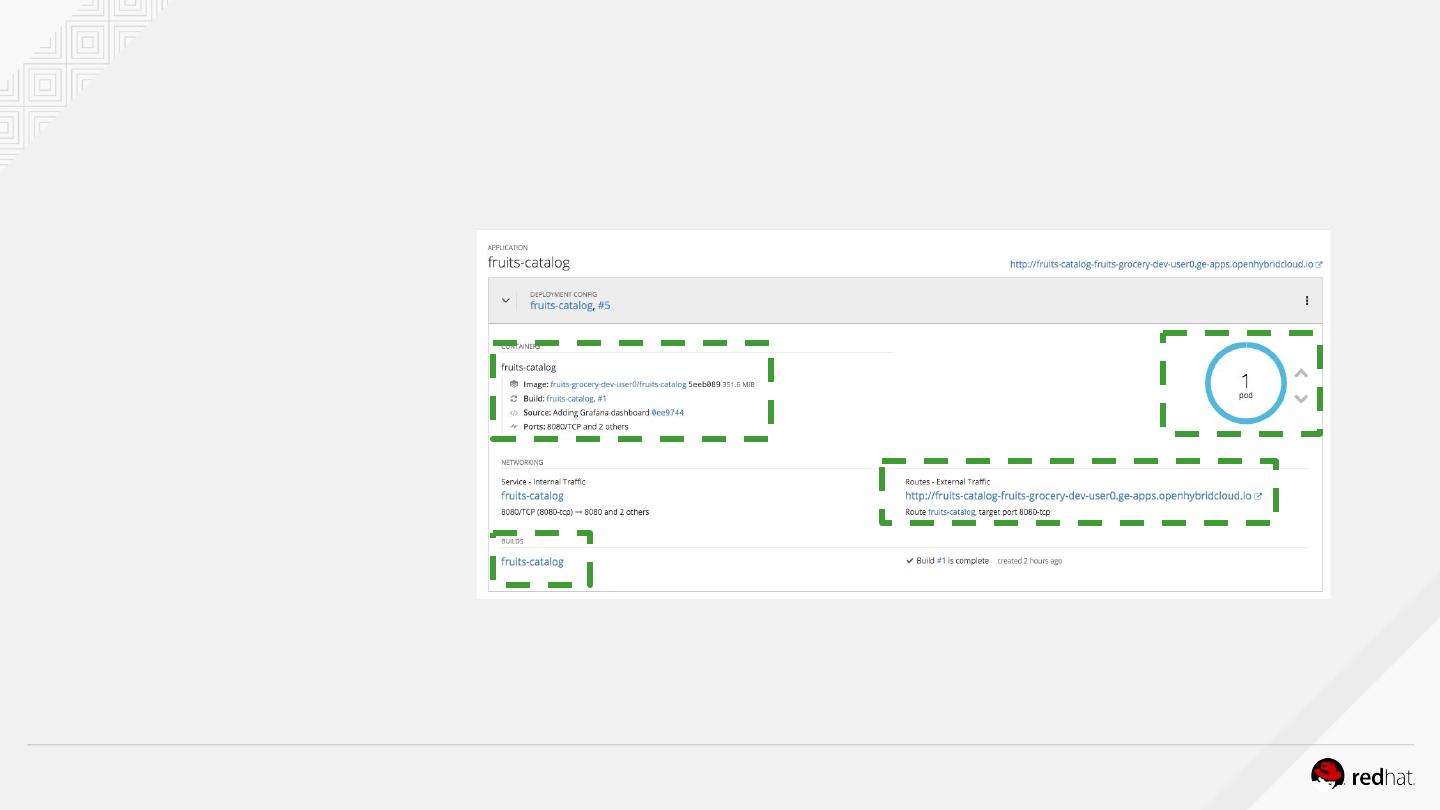
Click on the blue circle to explore the pod instance
Deploy the fruits catalog
Explore the application resources deployed
Container Image,
Build used, ports,
routes ...
OPENSHIFT HANDS-ON ON AZURE
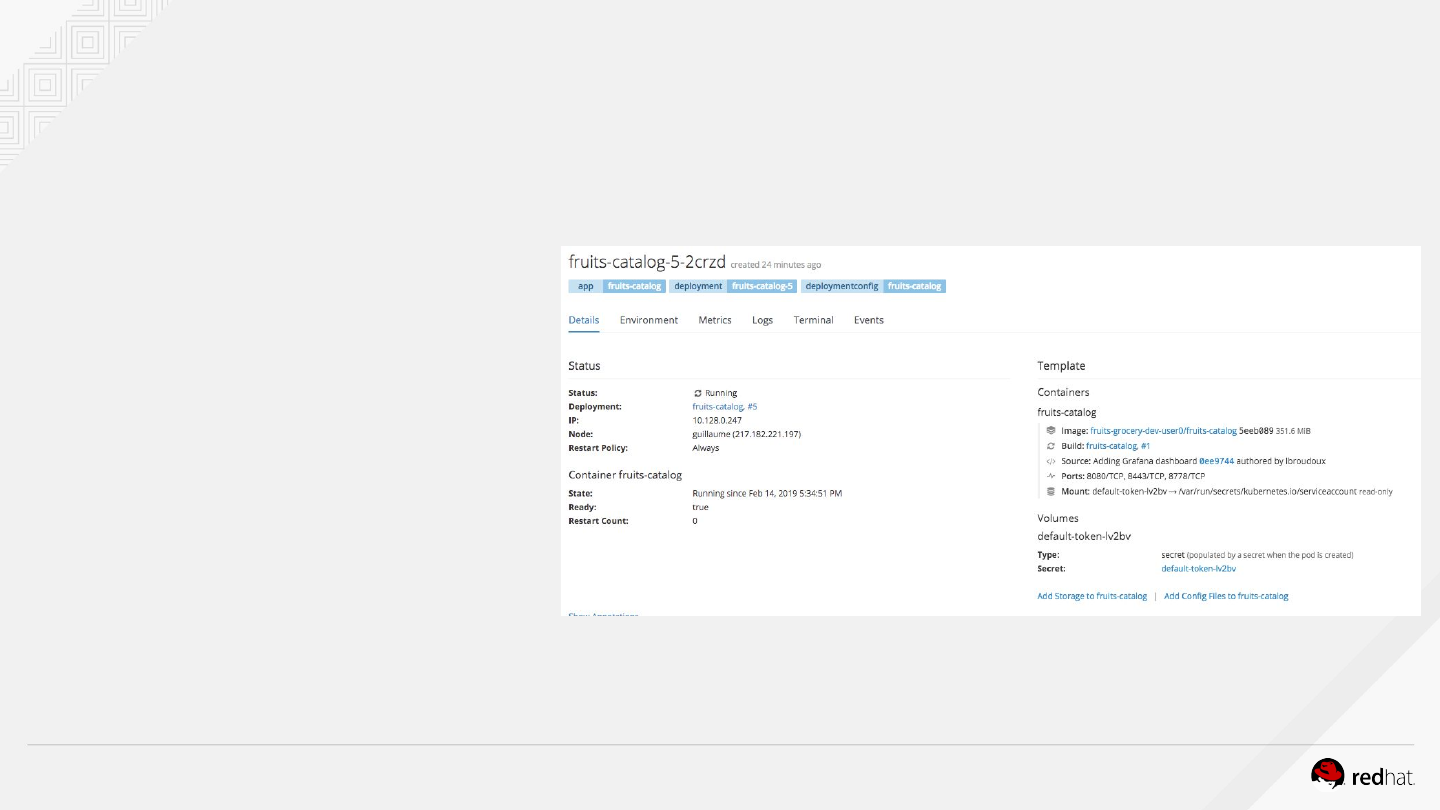
Deploy the fruits catalog
Explore the pod configuration
●Check Environment variables
●Access to the terminal
●Explore application logs
●Visualize metrics

OPENSHIFT HANDS-ON ON AZURE
Deploy the fruits catalog
Test the fruits catalog
Insert fruits in your catalog microservices via the fruits-catalog API
$ curl `oc get route/fruits-catalog -o template --template={{.spec.host}}`/api/fruits
-XPOST -H "Content-Type: application/json" -d '{"name":"Orange", "origin":"Spain"}'
$ curl `oc get route/fruits-catalog -o template --template={{.spec.host}}`/api/fruits
-XPOST -H "Content-Type: application/json" -d '{"name":"Apple", "origin":"France"}'
Get all fruits from the fruits-catalog
$ curl `oc get route/fruits-catalog -o template --template={{.spec.host}}`/api/fruits -v
OPENSHIFT HANDS-ON ON AZURE
Deploy the Fruits inventory
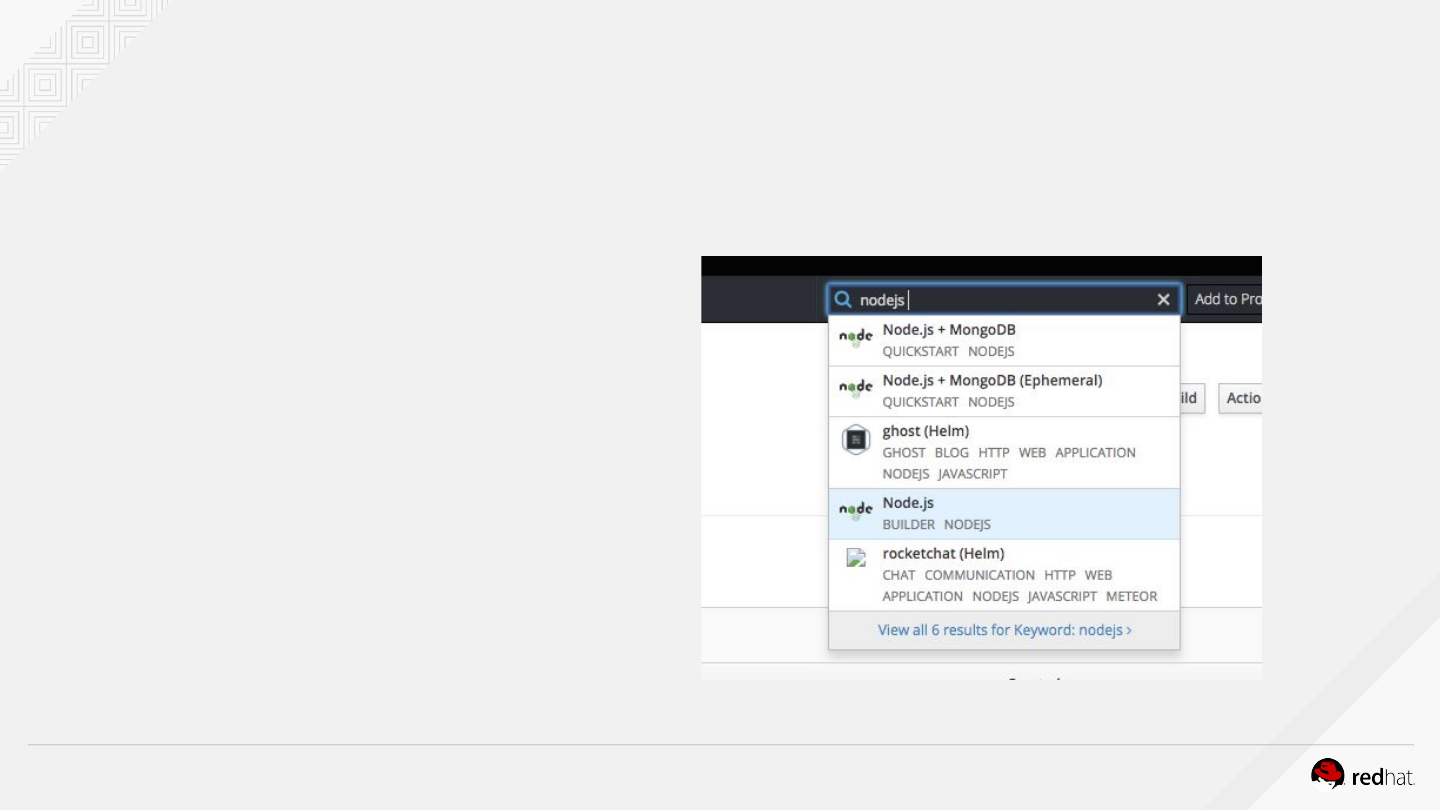
We use the same s2i strategy to build and deploy the app from source code
Choose the Node.JS image
builder from the catalog
OPENSHIFT HANDS-ON ON AZURE
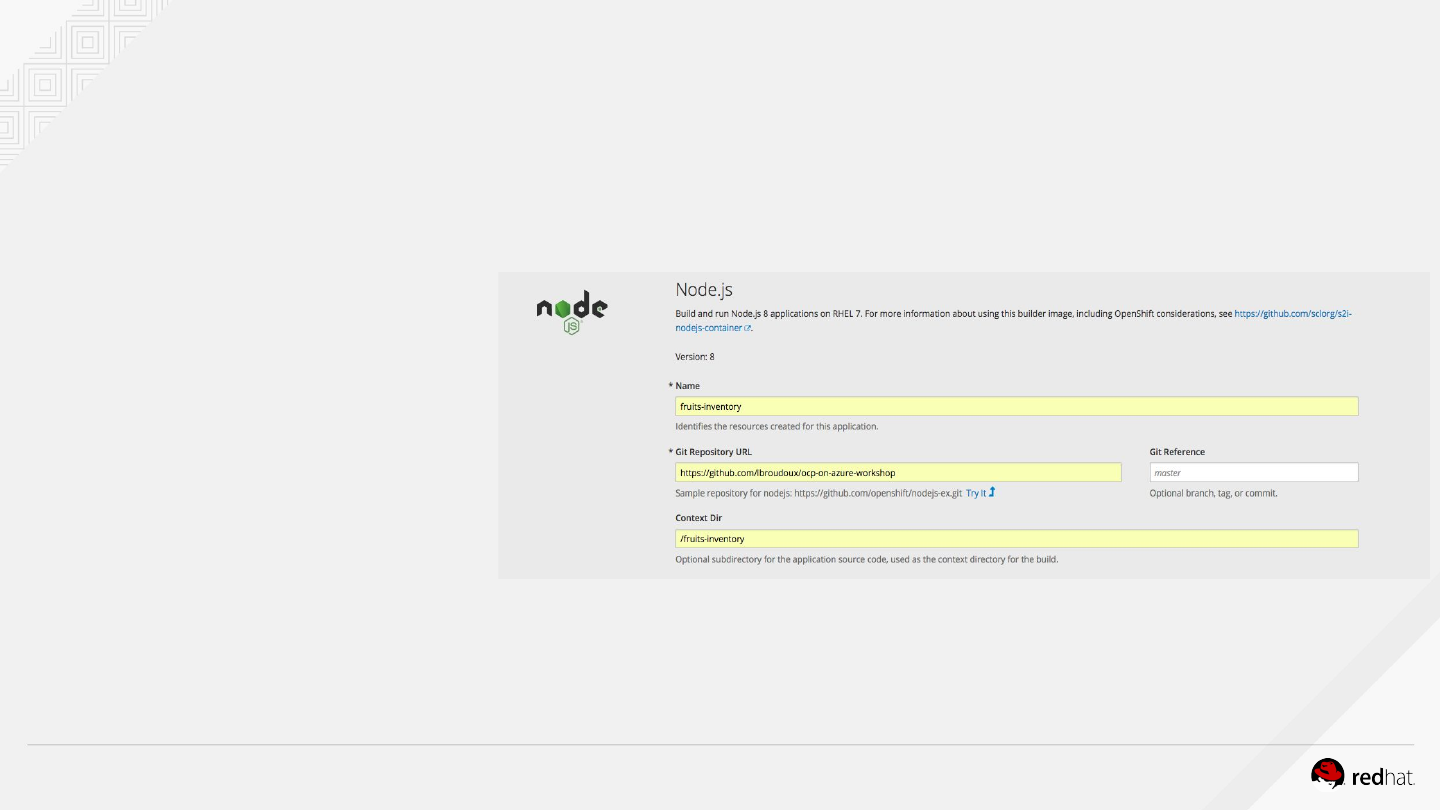
Deploy the Fruits inventory
●Name :
fruits-inventory
●Context Dir :
/fruits-inventory
●Your Git Repo URL
OPENSHIFT HANDS-ON ON AZURE
Deploy the Fruits inventory
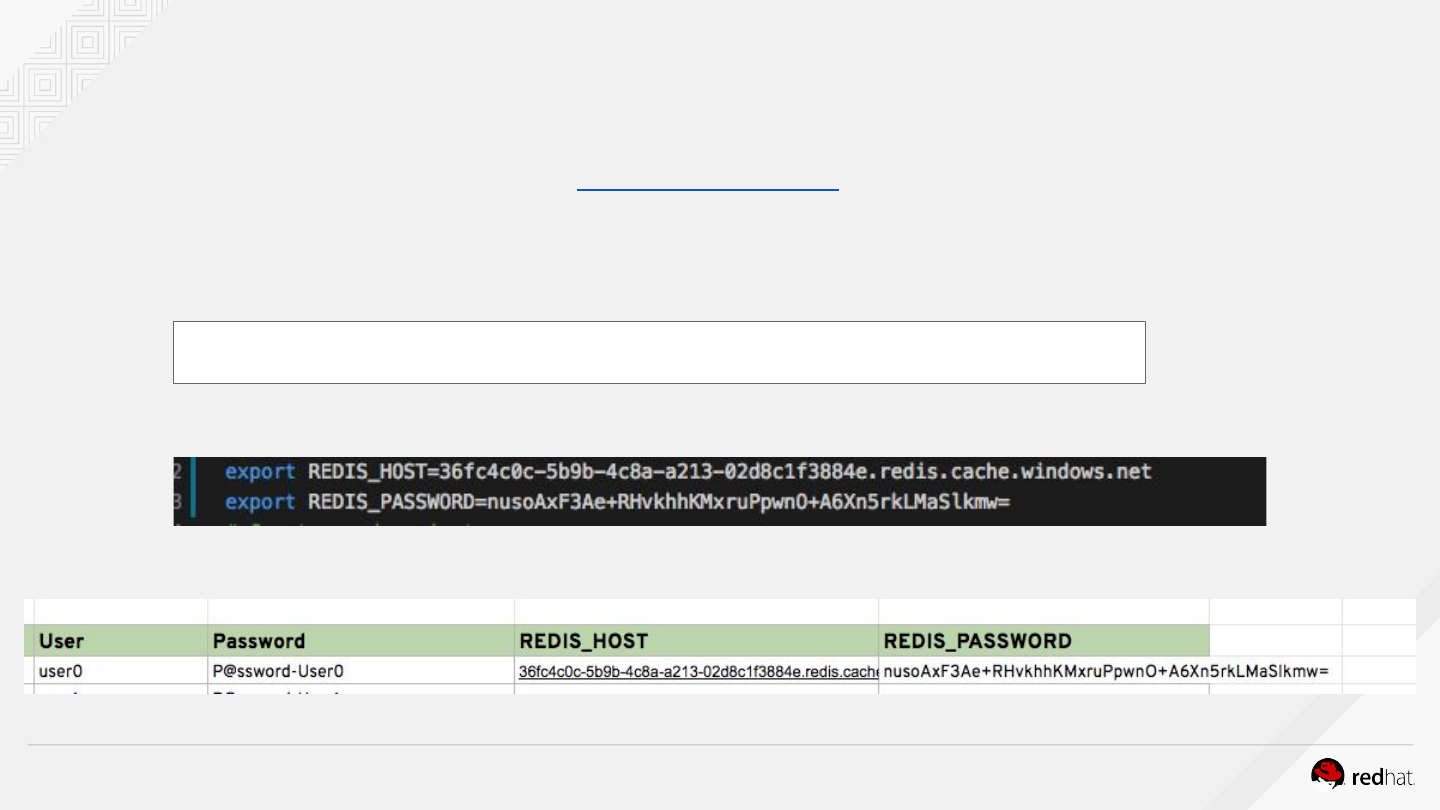
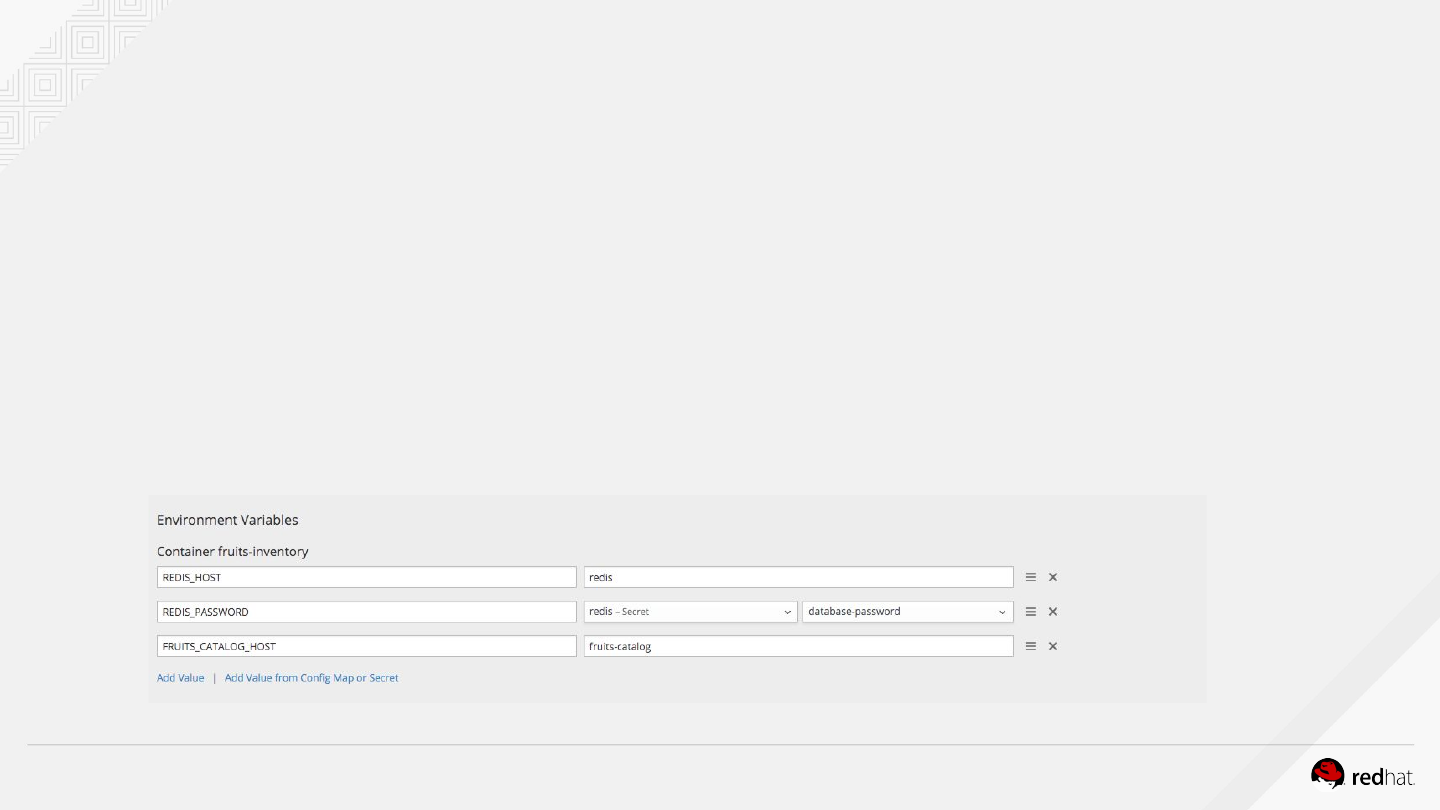
Set environment variables to access Redis Cache component already containerized
●REDIS_HOST - redis
●REDIS_PASSWORD - pick the right secret
●FRUITS_CATALOG_HOST - fruits-catalog
Set environment variables as described

OPENSHIFT HANDS-ON ON AZURE
Deploy the Fruits inventory
Check that the component works properly with Redis cache
Let’s get all fruits in the Grocery Store with their quantity
$ curl `oc get route/fruits-inventory -o template --template={{.spec.host}}`/api/fruits
[{"id":"5c641f4d18909600016320d0","name":"Orange","origin":"Spain","quantity":"1230"},{"id":"
5c64225818909600016320d1","name":"Apple","origin":"France","quantity":"356"}]
You can also explore the deployment and the pod resources

LAB 4
Monitoring application health

OPENSHIFT HANDS-ON ON AZURE41
●Review Health endpoints in services
●Add health probes to inventory-service
●Add health probes to shop-ui front-end
●Explore pod metrics
LAB 4: Monitoring Application Health
OPENSHIFT HANDS-ON ON AZURE42
HEALTH PROBES
CONTAINERCONTAINERCONTAINER
PROBE TYPES
Is it ready?
Is it alive?
PROBE CHECKS
HTTP
Shell Command
TCP Port

OPENSHIFT HANDS-ON ON AZURE43
Health probes
There are two type of health probes available in OpenShift: liveness probes and readiness probes.
Liveness probes are to know when to restart a container and readiness probes to know when a
Container is ready to start accepting traffic.
Health probes also provide crucial benefits when automating deployments with practices like
rolling updates in order to remove downtime during deployments. A readiness health probe would
signal OpenShift when to switch traffic from the old version of the container to the new version so
that the users don’t get affected during deployments.
OPENSHIFT HANDS-ON ON AZURE
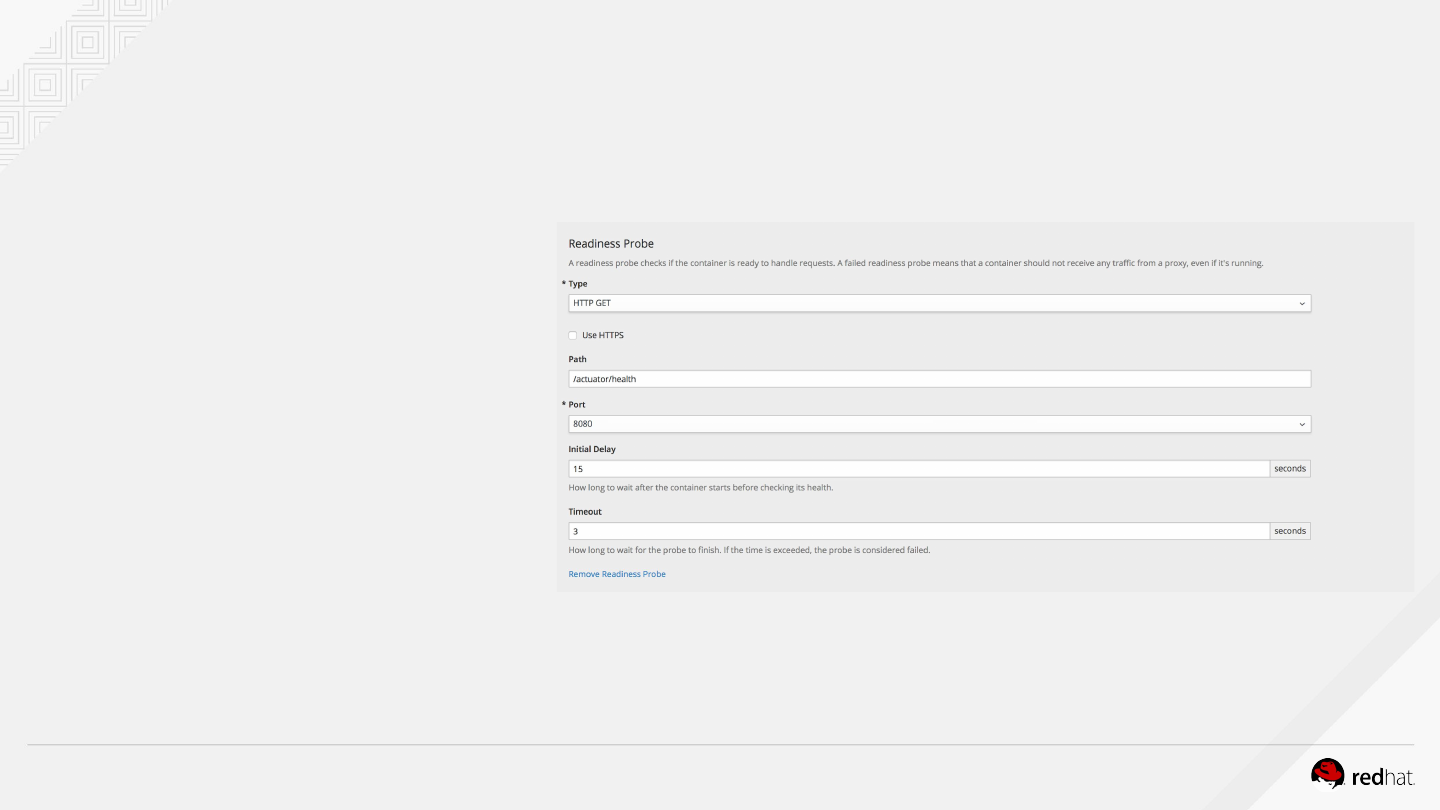
We use business and technical endpoints provided natively by the actuator Spring Boot
library. This library will be used in others labs ;)
Add Health check to fruits catalog
We can do it through the web console or the CLI
Set HTTP request to check
readiness. An endpoint is
already defined in the fruits
catalog.
OPENSHIFT HANDS-ON ON AZURE
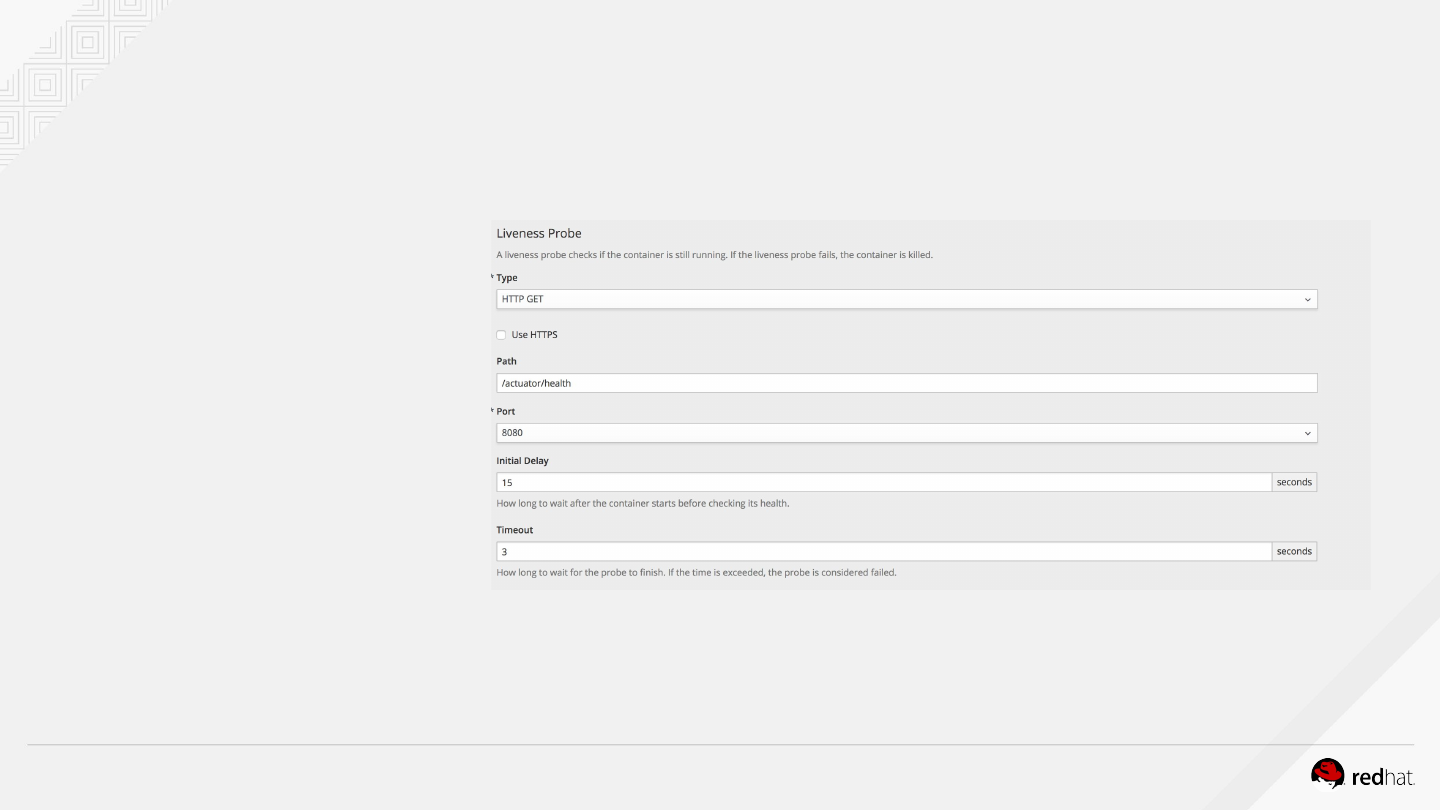
Add health check to Fruits catalog
Add the liveness probe
Is the app still running ?
We use the same
endpoint as the
readiness for this
example.
OPENSHIFT HANDS-ON ON AZURE46
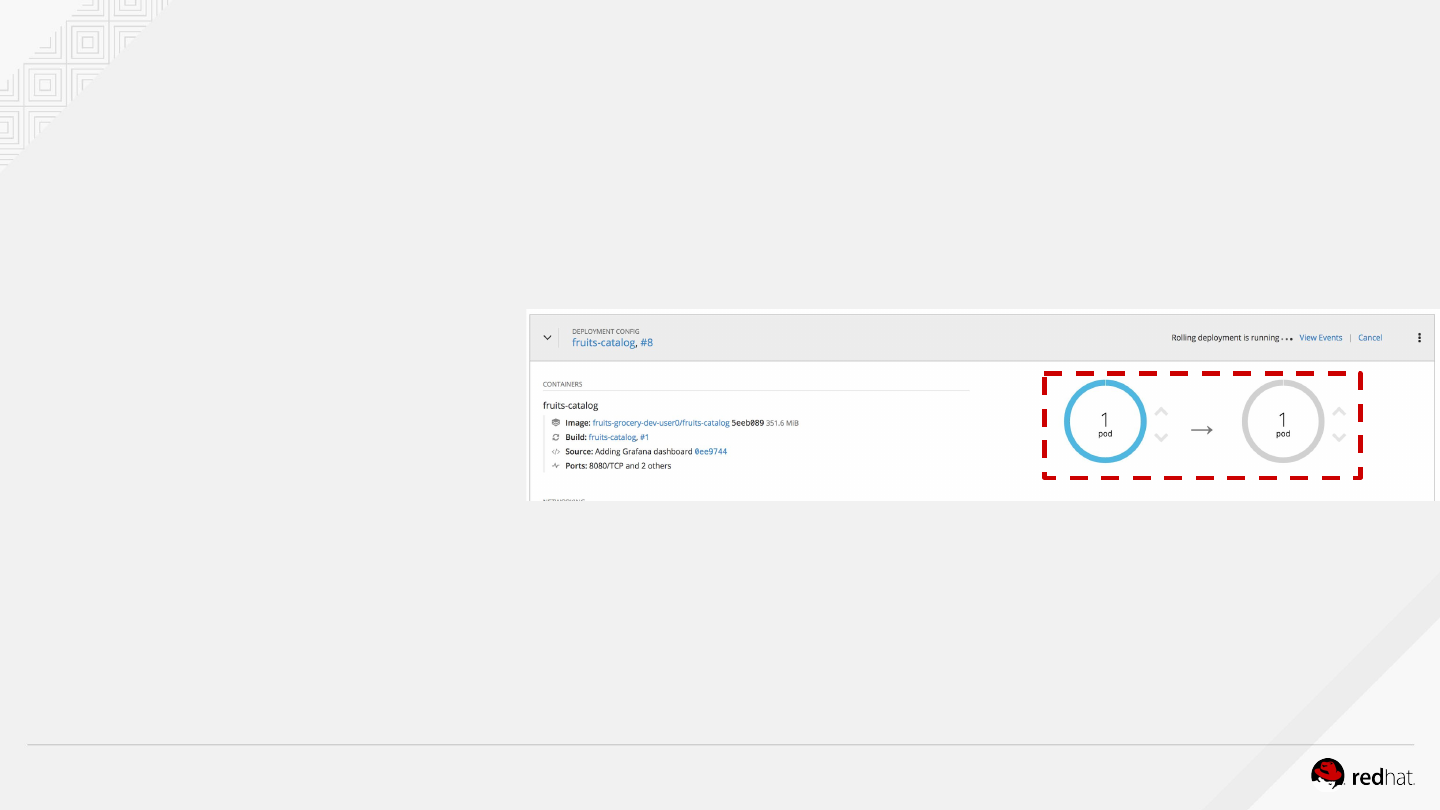
Save and check rolling upgrade strategy
Click Save and then click the
Overview button in the left
navigation.
You will notice that
fruits-catalog pod is
getting restarted and it stays
light blue for a while. This is a
sign that the pod(s) have not
yet passed their readiness
checks and it turns blue when
it’s ready!

OPENSHIFT HANDS-ON ON AZURE
Add health checks with the CLI
We set an HTTP Request for both health checks
$ oc set probe dc/fruits-inventory --liveness --get-url=http://:8080/api/health/liveness
--initial-delay-seconds=60 --period-seconds=30
$ oc set probe dc/fruits-inventory --readiness
--get-url=http://:8080/api/health/readiness
OPENSHIFT HANDS-ON ON AZURE48
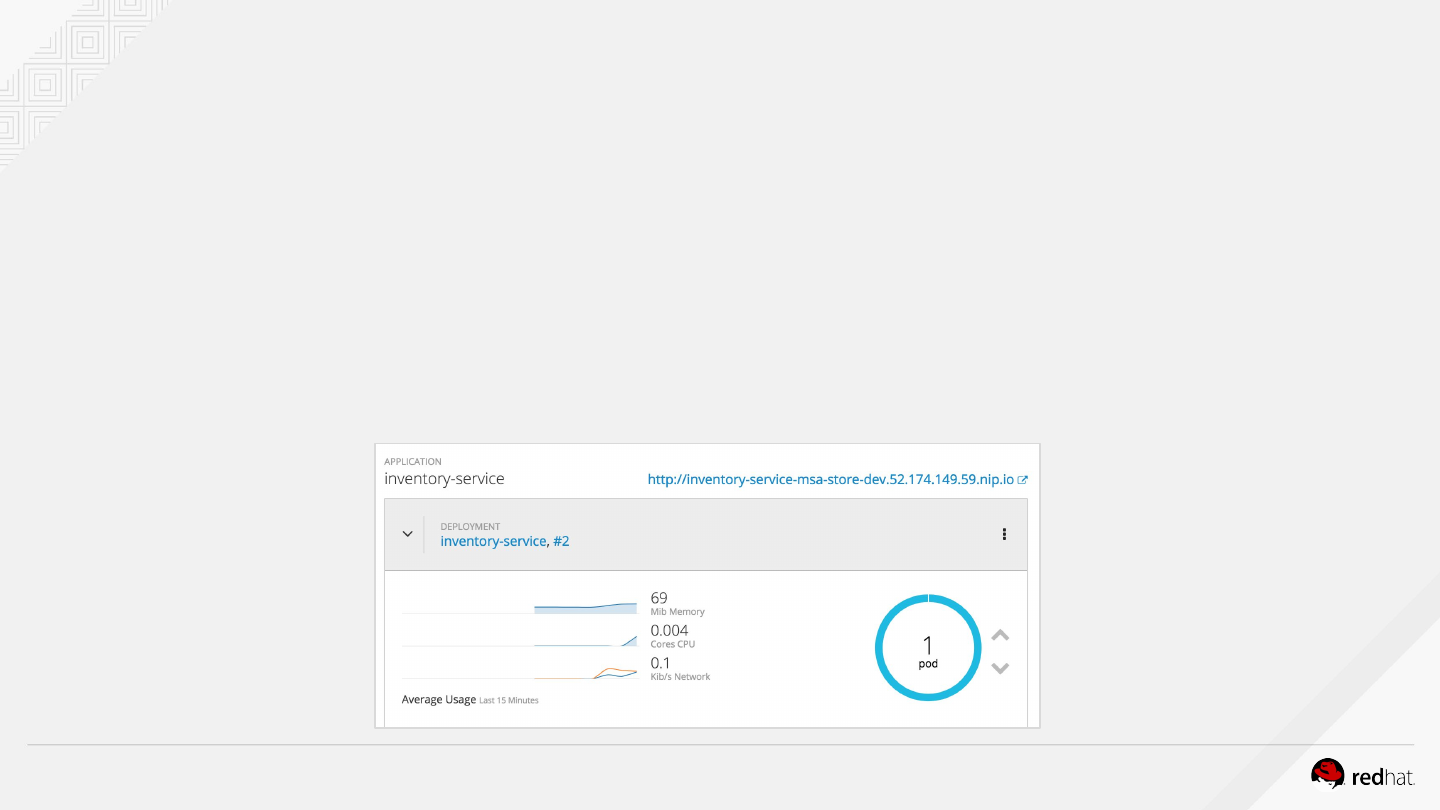
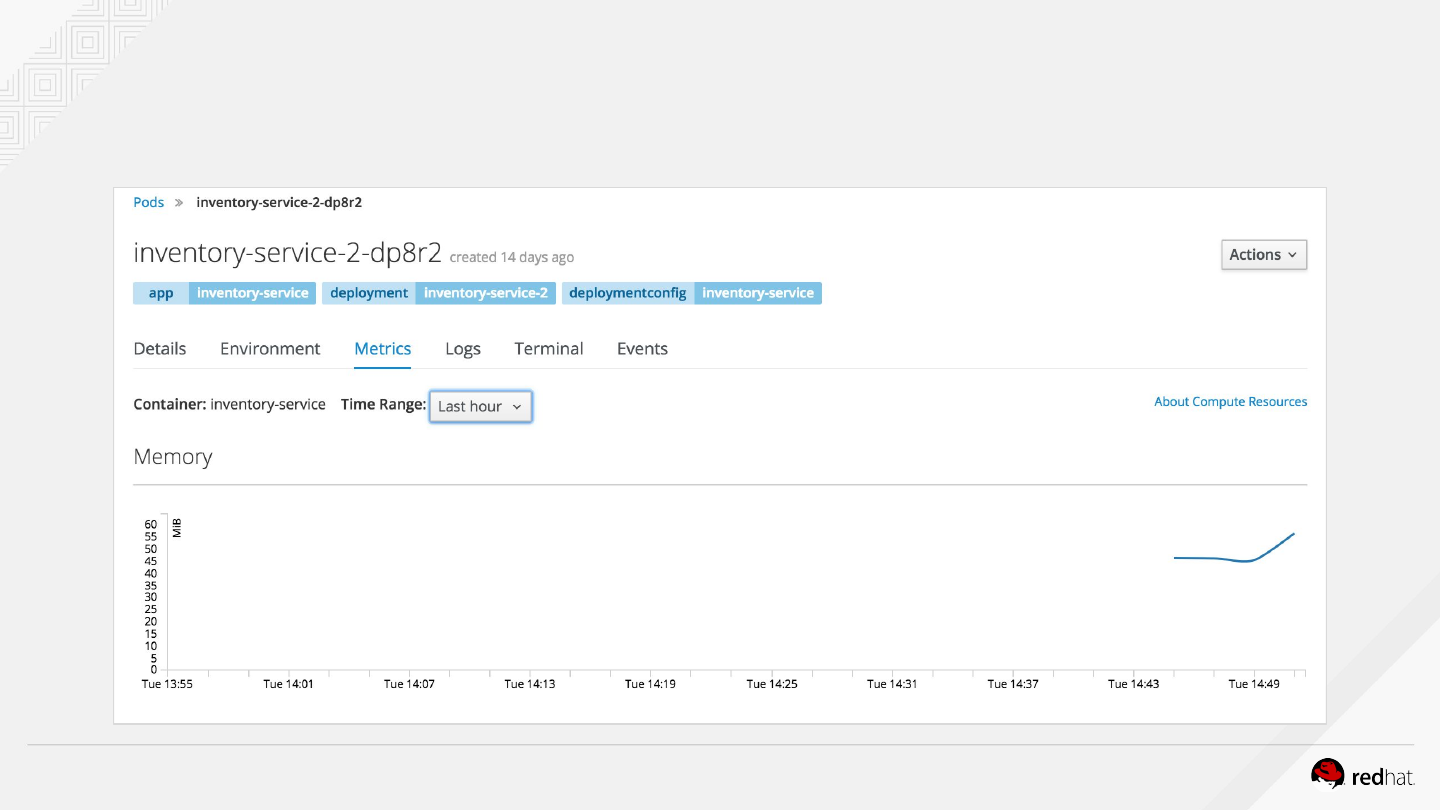
Monitoring pod metrics
Metrics are another important aspect of monitoring applications which is required in order to gain
visibility into how the application behaves and particularly in identifying issues.
OpenShift provides container metrics out-of-the-box and displays how much memory, cpu and
network each container has been consuming over time. In the project overview, you can see three
charts near each pod that shows the resource consumption by that pod.
OPENSHIFT HANDS-ON ON AZURE49
Monitoring pod metrics

LAB 5
Distributed tracing configuration

OPENSHIFT HANDS-ON ON AZURE51
●Externalize and manage application configuration
●Add Jaeger configuration to fruits-catalog
●Explore distributed traces
LAB 5: Distributed tracing configuration
OPENSHIFT HANDS-ON ON AZURE52
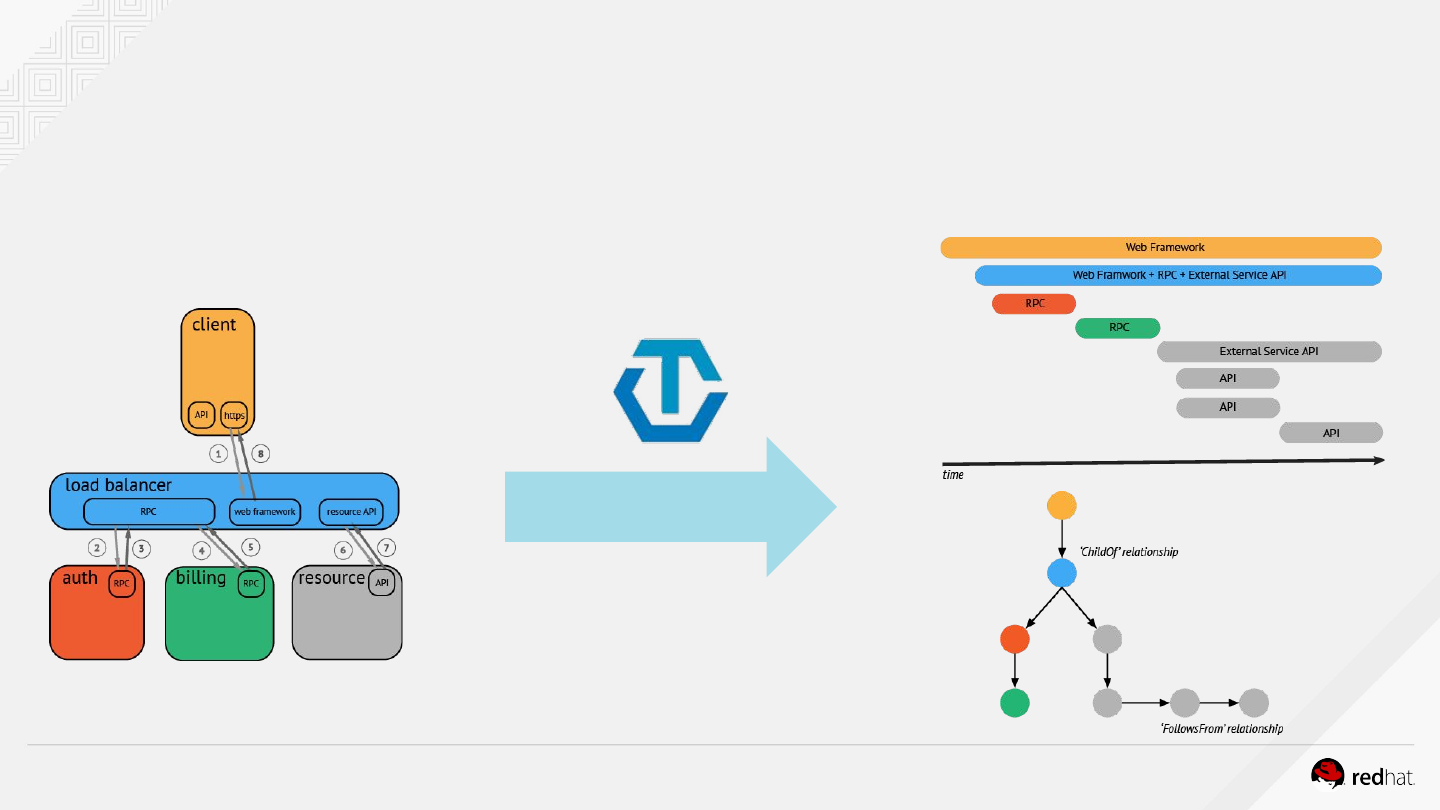
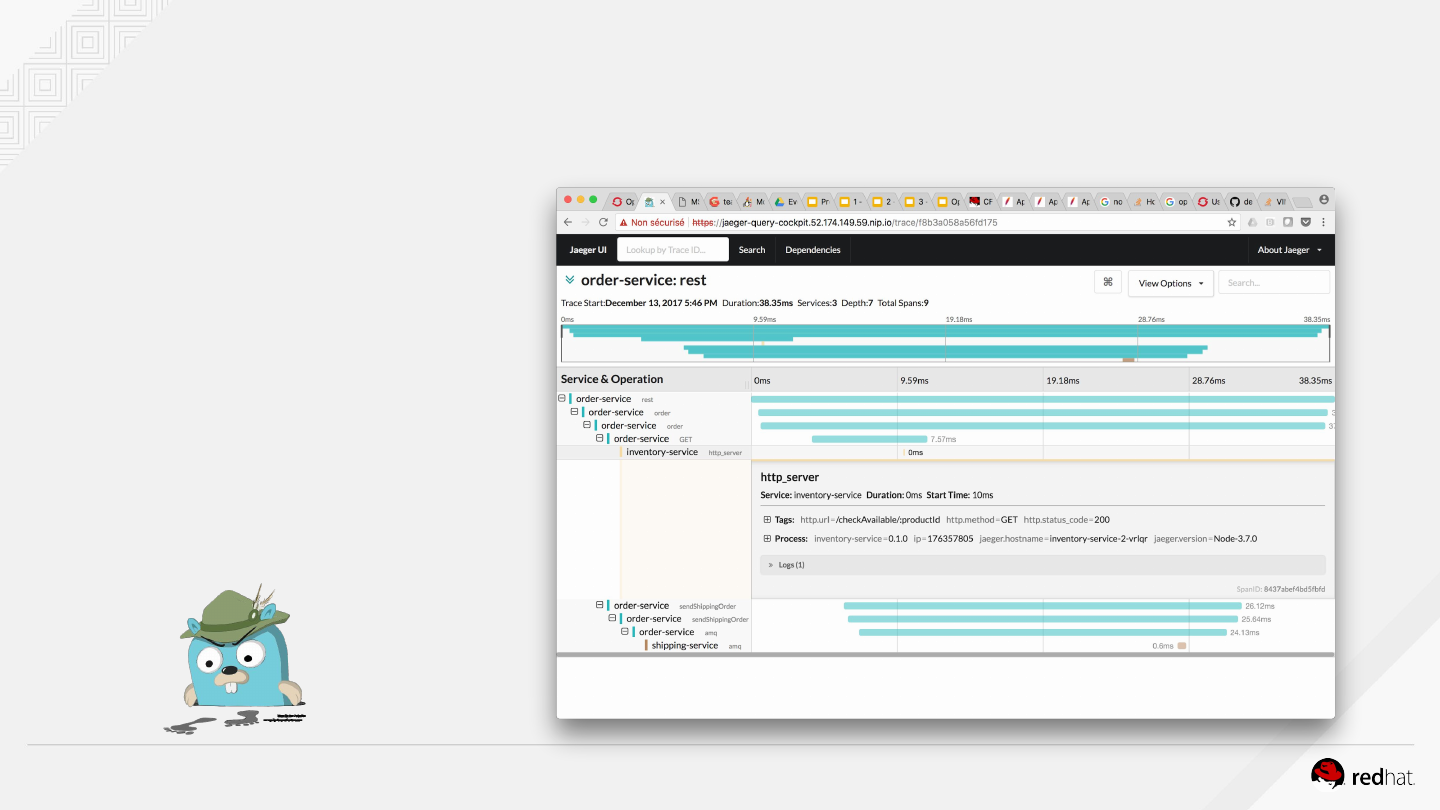
What is distributed tracing ?
Spans
Relationships
OpenTracing
instrumentation
OPENSHIFT HANDS-ON ON AZURE53
Distributed tracing
Jaeger is an OpenTracing
implementation and is available
in the Cockpit environment.

OPENSHIFT HANDS-ON ON AZURE
Before setting Jaeger in the fruits-catalog application, we have to add a specific role to the
current project to view particular objects, especially ConfigMap ...
$ oc policy add-role-to-user view -n $(oc project -q) -z default
Add Jaeger configuration to fruits-catalog

OPENSHIFT HANDS-ON ON AZURE55
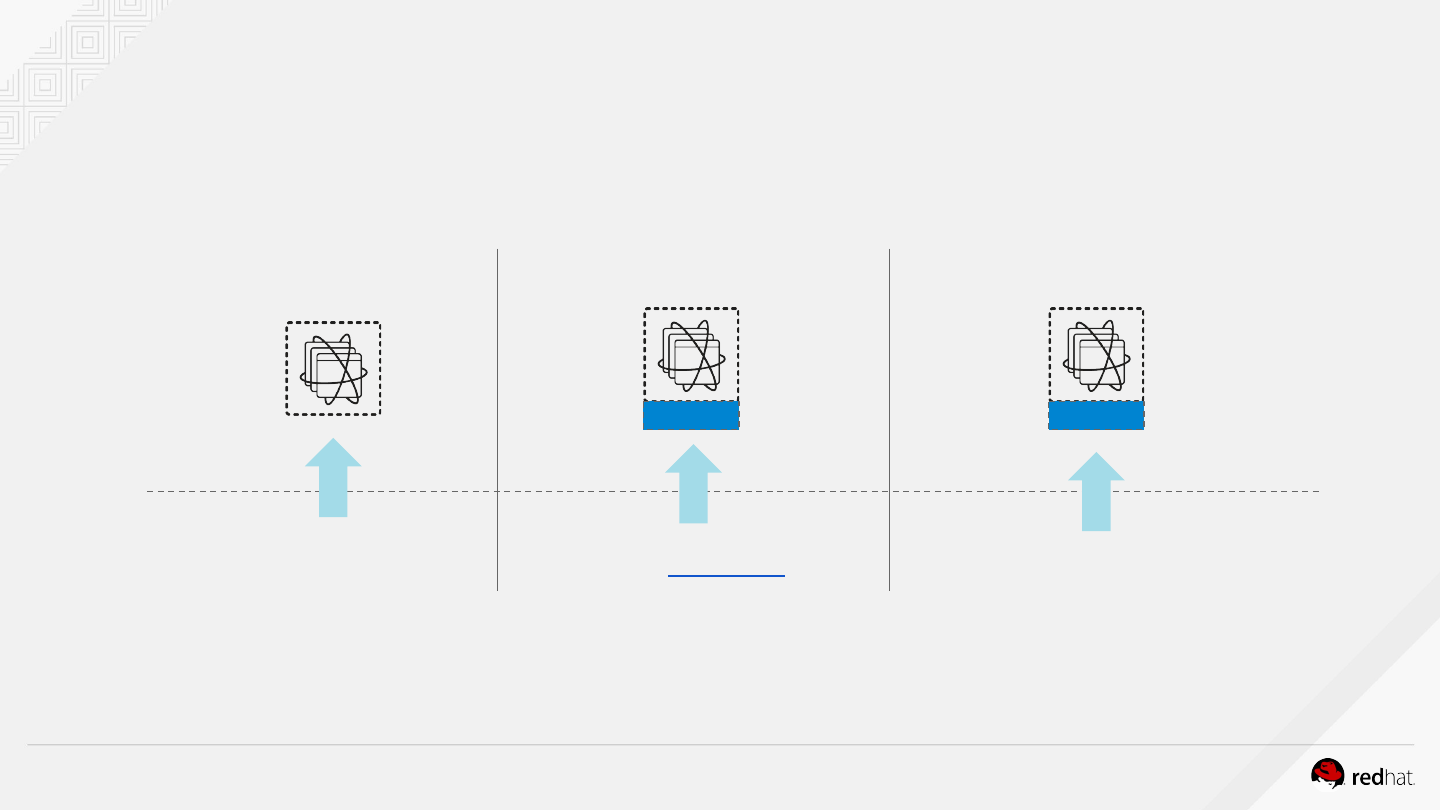
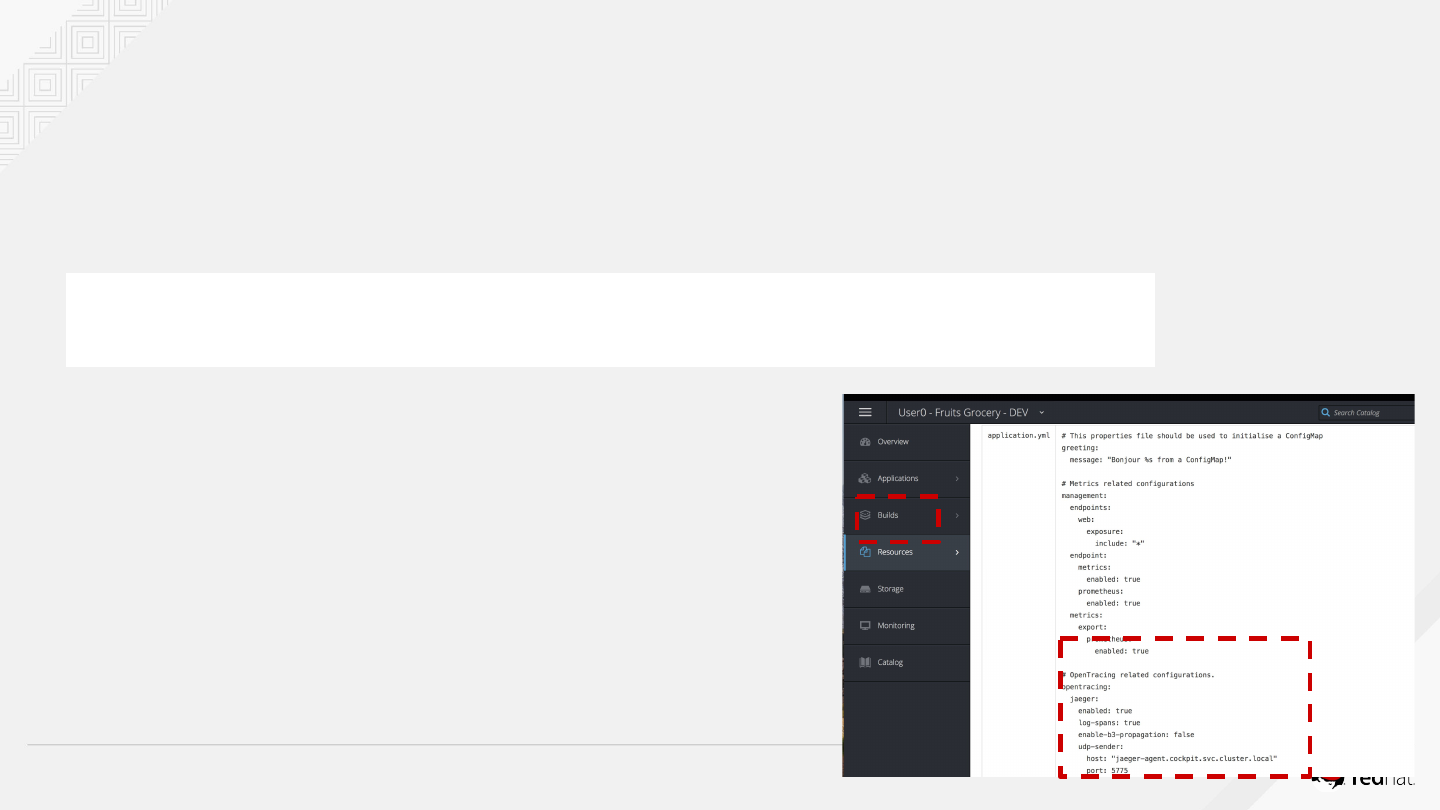
ConfigMap in OpenShift
●Config maps inject config data into containers
●Config maps can hold
○Properties (key-value pairs)
○Files (JSON, XML, etc)
●Containers see config maps as
○Files on the filesystem
○Environment variables
●Secrets are like config maps for sensitive data
○Credentials, certificates, SSH keys, etc
OPENSHIFT HANDS-ON ON AZURE56
Mounted on
filesystem
in read-only
Pod
Volume
Pod
Volume
Pod
RUNTIME
CONFIGURATION FOO=foo
BAR=bar
application.properties
com.svc=http://svc
…
…
mykey.p12
databasecredentials.properties
VARIABLES
D’ENVIRONNEMENT CONFIGMAPS SECRETS
Injected in
container
memory
De-cyphered
and mounted
on filesystem
in read-only
Configuration management
OPENSHIFT HANDS-ON ON AZURE57
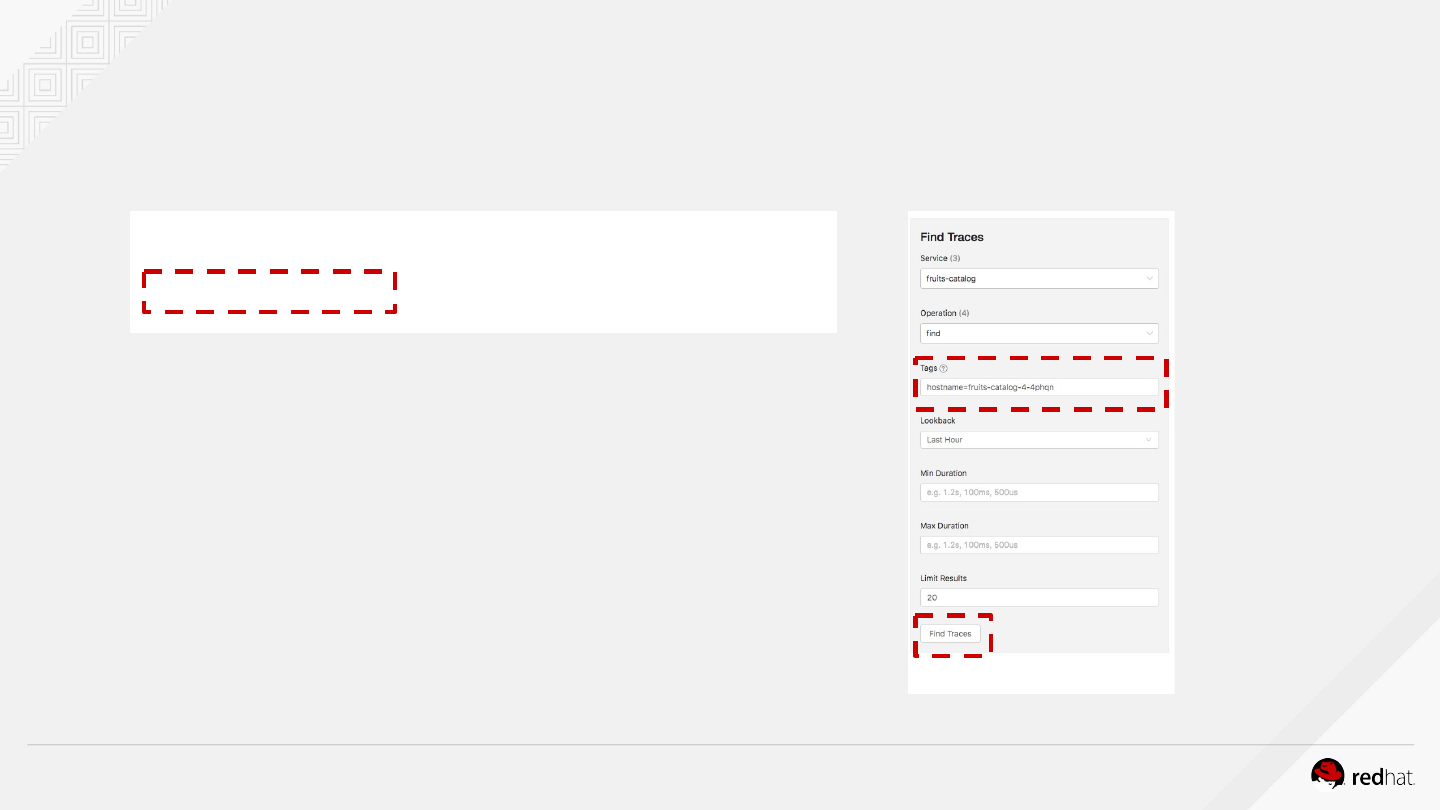
Add Jaeger configuration to fruits-catalog
Create a configMap with the CLI
Edit ConfigMap ( Actions > Edit Yaml ) created and
set Jaeger host as :
jaeger-agent.cockpit.svc.cluster.local
Click Add to Application
Now pod is redeploying
$ cd fruits-catalog
$ oc create configmap fruits-catalog-config --from-file=application.yml

OPENSHIFT HANDS-ON ON AZURE58
Add Jaeger host to fruits-inventory
$ oc set env dc/fruits-inventory JAEGER_HOST=jaeger-agent.cockpit.svc.cluster.local
A new deployment is created.
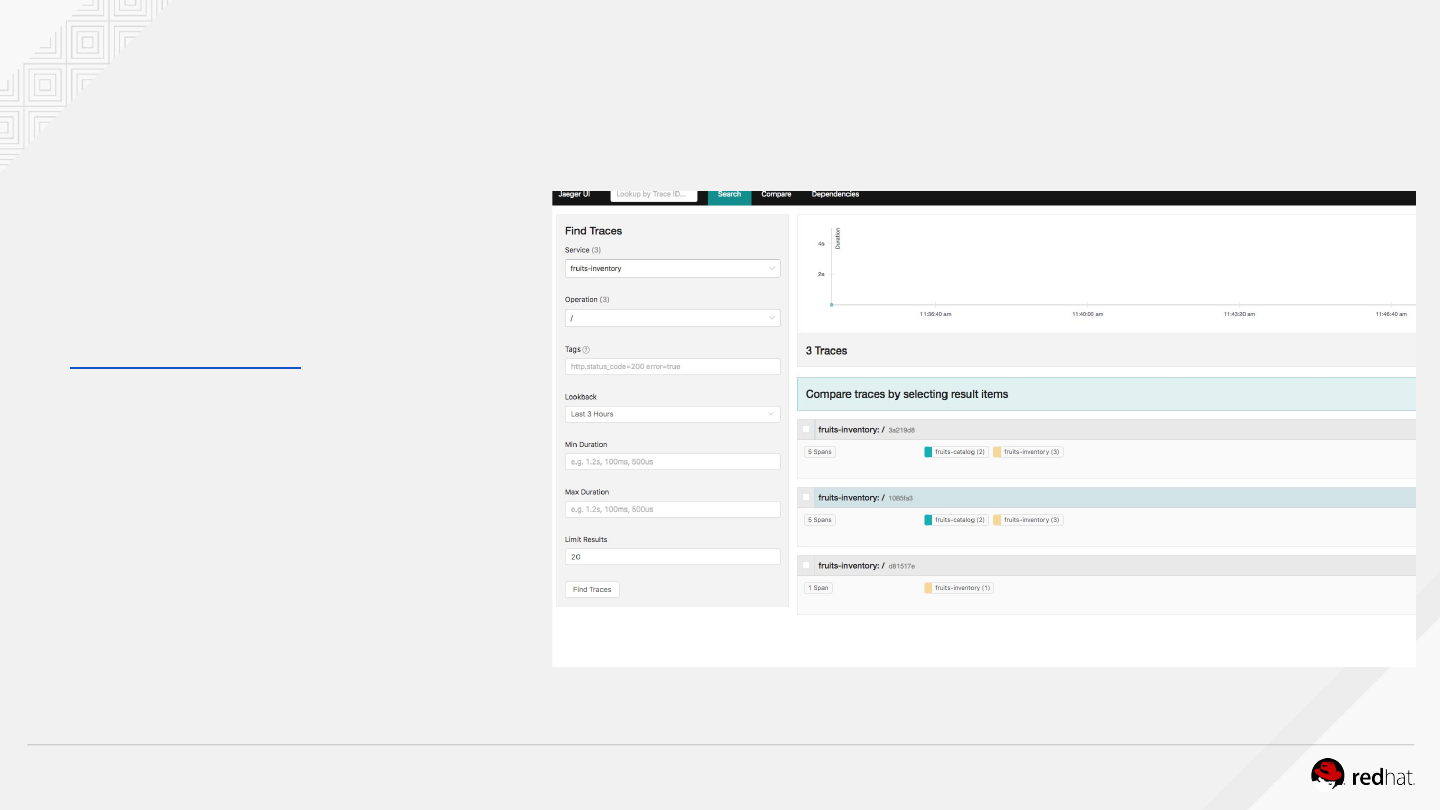
Get all fruits with their stock through the fruits-inventory API and jump to Jaeger to see
the detailed trace
$ curl `oc get route/fruits-catalog -o template --template={{.spec.host}}`/api/fruits -v
A Jaeger tracer is already set for all invocations in fruits-inventory.
We set the Jaeger host as environment variable
OPENSHIFT HANDS-ON ON AZURE
Filter the right Jaeger trace
As we use a mutual Jaeger, you need to filter on your pod fruits-catalog hostname
$ oc get pods -l app=fruits-catalog
NAME READY STATUS RESTARTS AGE
fruits-catalog-4-4phqn 1/1 Running 0 40m
Following filter criterias are :
●Services : fruits-inventory
●Operation: /
●Tags: hostname=fruits-catalog-4-4phqn
Click on Find Traces
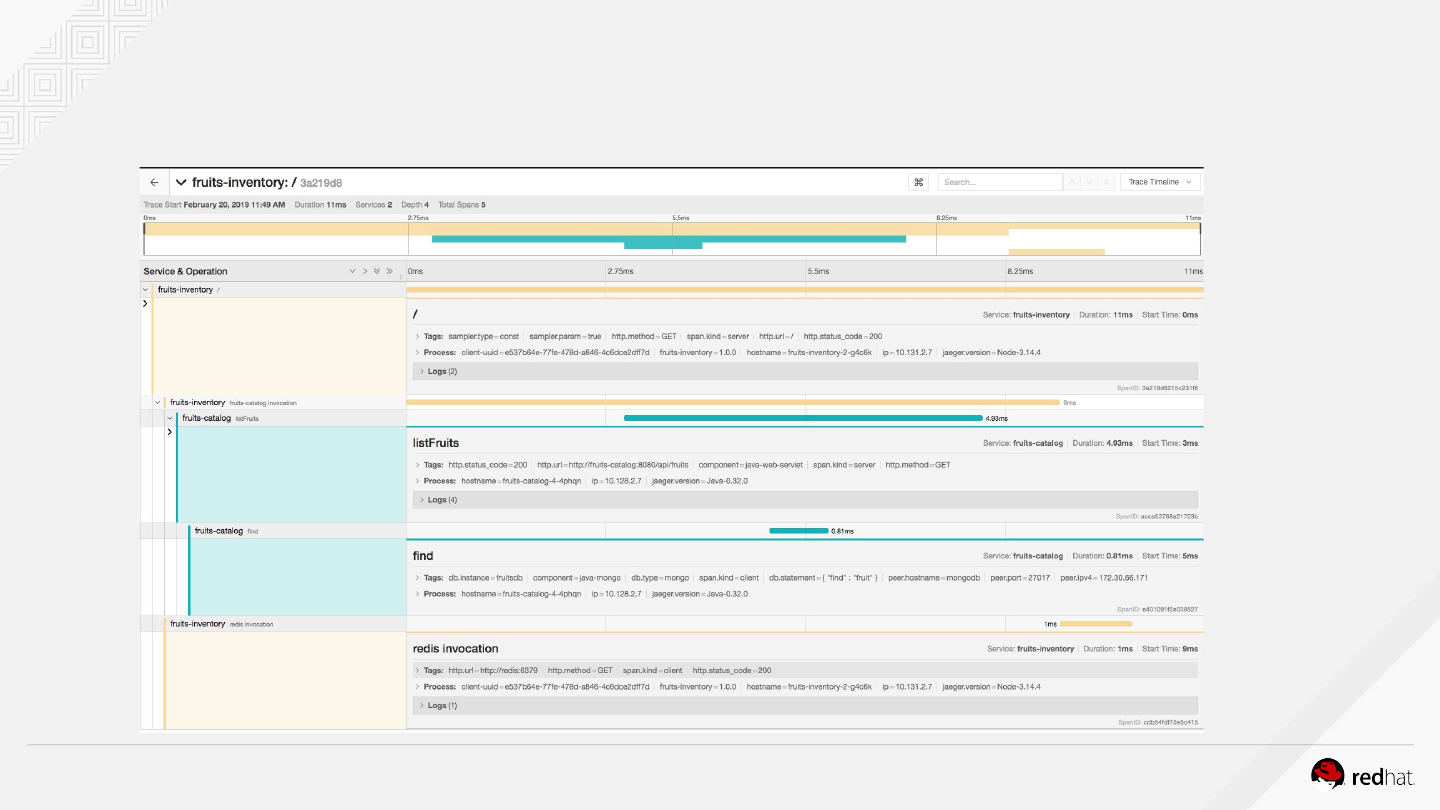
OPENSHIFT HANDS-ON ON AZURE
Explore the Jaeger trace

LAB 6
Getting application metrics

OPENSHIFT HANDS-ON ON AZURE63
●Update Prometheus configuration
●Add Prometheus datasource in Grafana
LAB 6: GETTING APPLICATION METRICS
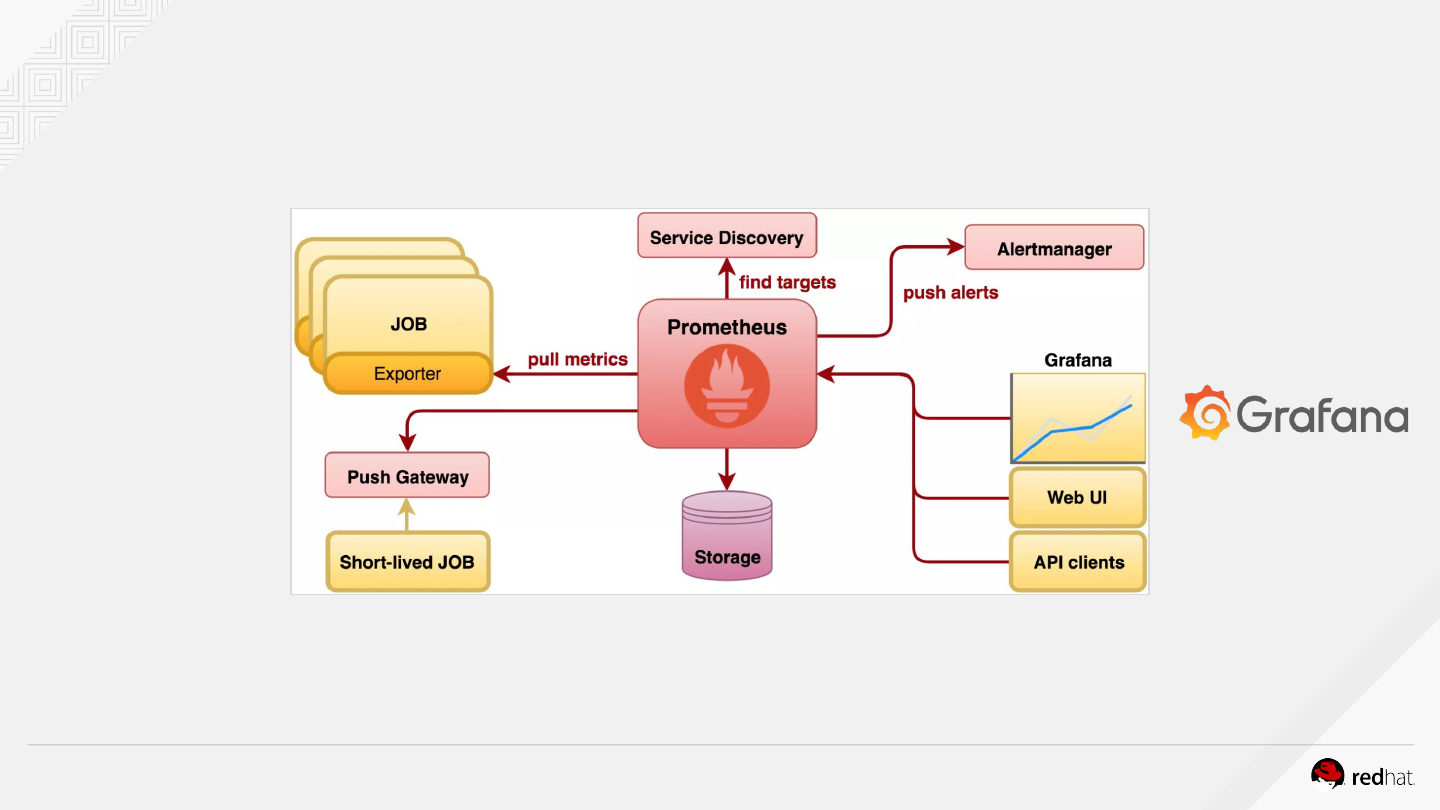
OPENSHIFT HANDS-ON ON AZURE64
Prometheus monitoring
OpenShift now provides Prometheus templates for automated deployment. One instance is
available into a cockpit project. A Grafana instance on same project.
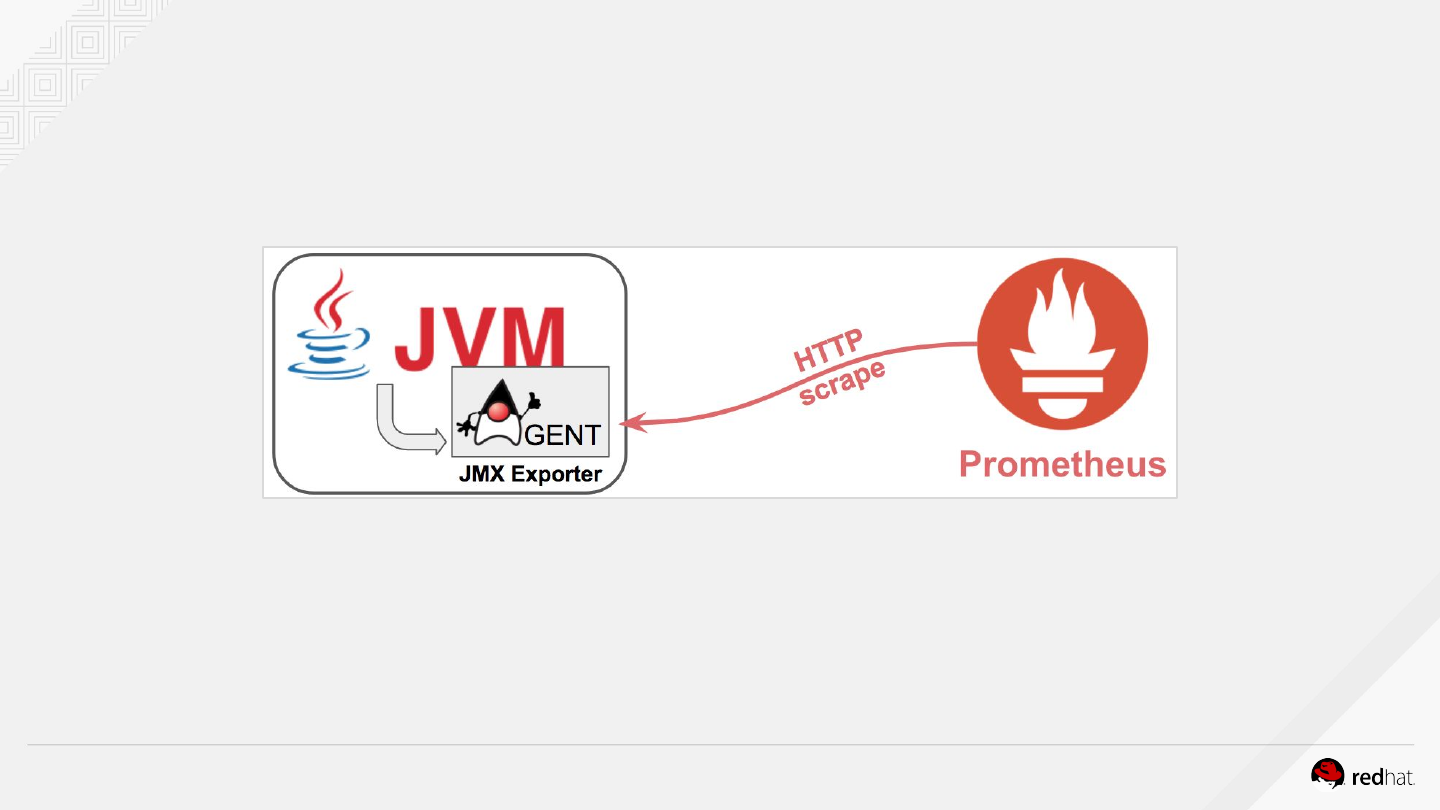
OPENSHIFT HANDS-ON ON AZURE65
Prometheus monitoring
For a quick run, we’ll use JMX Exporter Prometheus Agent that expose JMX metrics as Prometheus
endpoints. This is already configured into fruits-catalog thanks to actuator library.
A middleware Prometheus is added in fruits-inventory

OPENSHIFT HANDS-ON ON AZURE
Access to the pod terminal with oc rsh command
Check Prometheus metrics in deployed pods
$ oc rsh dc/fruits-catalog # Now logging in fruits-catalog pod
$ curl http://localhost:8080/actuator/prometheus
… # TYPE jvm_buffer_total_capacity_bytes gauge
jvm_buffer_total_capacity_bytes{id="direct",} 82807.0
jvm_buffer_total_capacity_bytes{id="mapped",} 0.0
…
$ curl http://localhost:8080/actuator/metrics # display metrics available
{"names":["jvm.memory.max","jvm.threads.states","process.files.max",
"jvm.gc.memory.promoted" ...

OPENSHIFT HANDS-ON ON AZURE
Go to Prometheus console : https://prometheus-cockpit.52.143.158.219.nip.io/ in the target menu
Nothing is sent by fruits-catalog and fruits-inventory Prometheus console !
Prometheus scraps by default /metrics endpoint on port 9900. Our 2 back-ends expose a different
Prometheus endpoint.
We need to annotate our application Kubernetes services to be discovered by Prometheus
Check Prometheus console now ...
$ oc annotate service/fruits-catalog prometheus.io/scrape=true
prometheus.io/path=/actuator/prometheus prometheus.io/port=8080
$ oc annotate service/fruits-inventory prometheus.io/scrape=true prometheus.io/port=8080
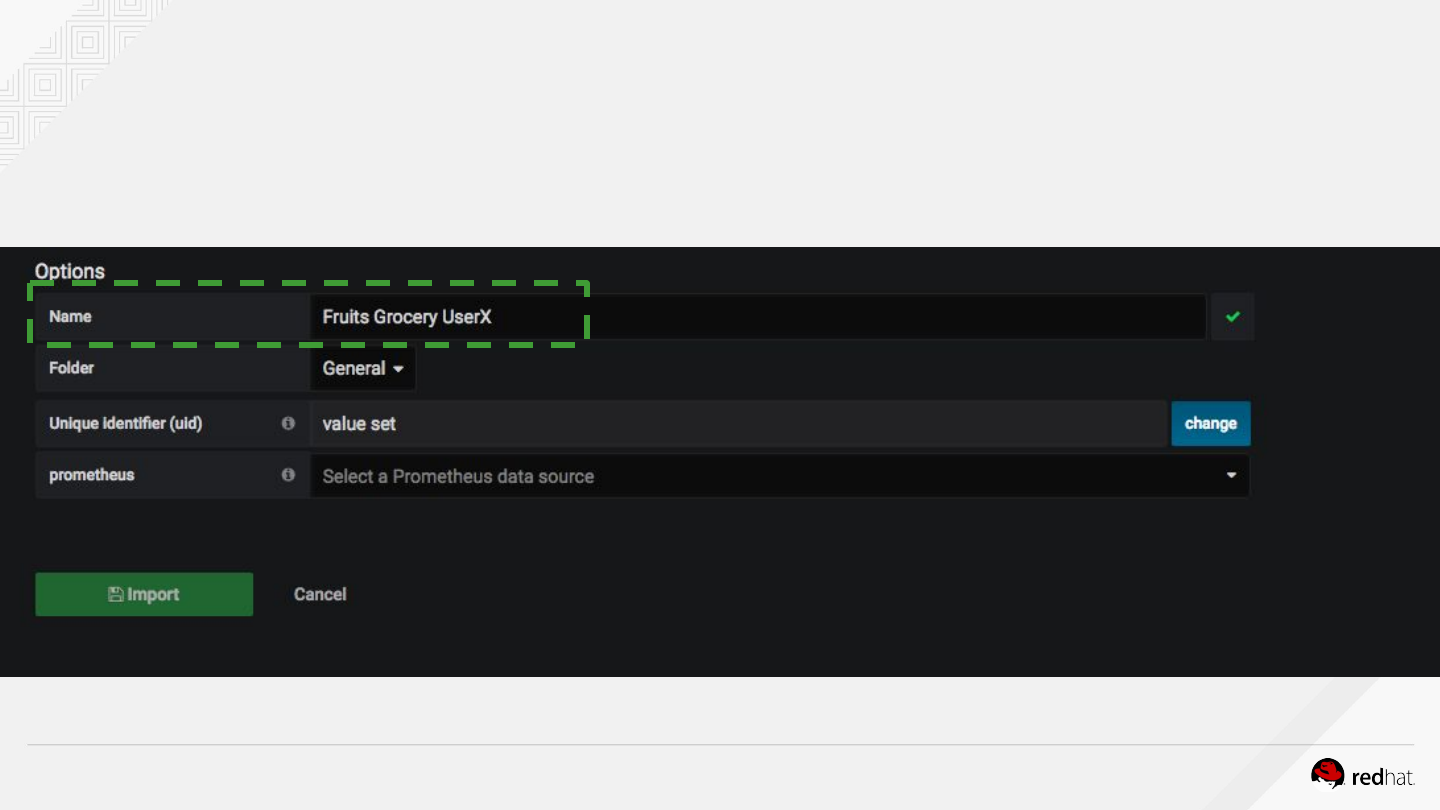
OPENSHIFT HANDS-ON ON AZURE
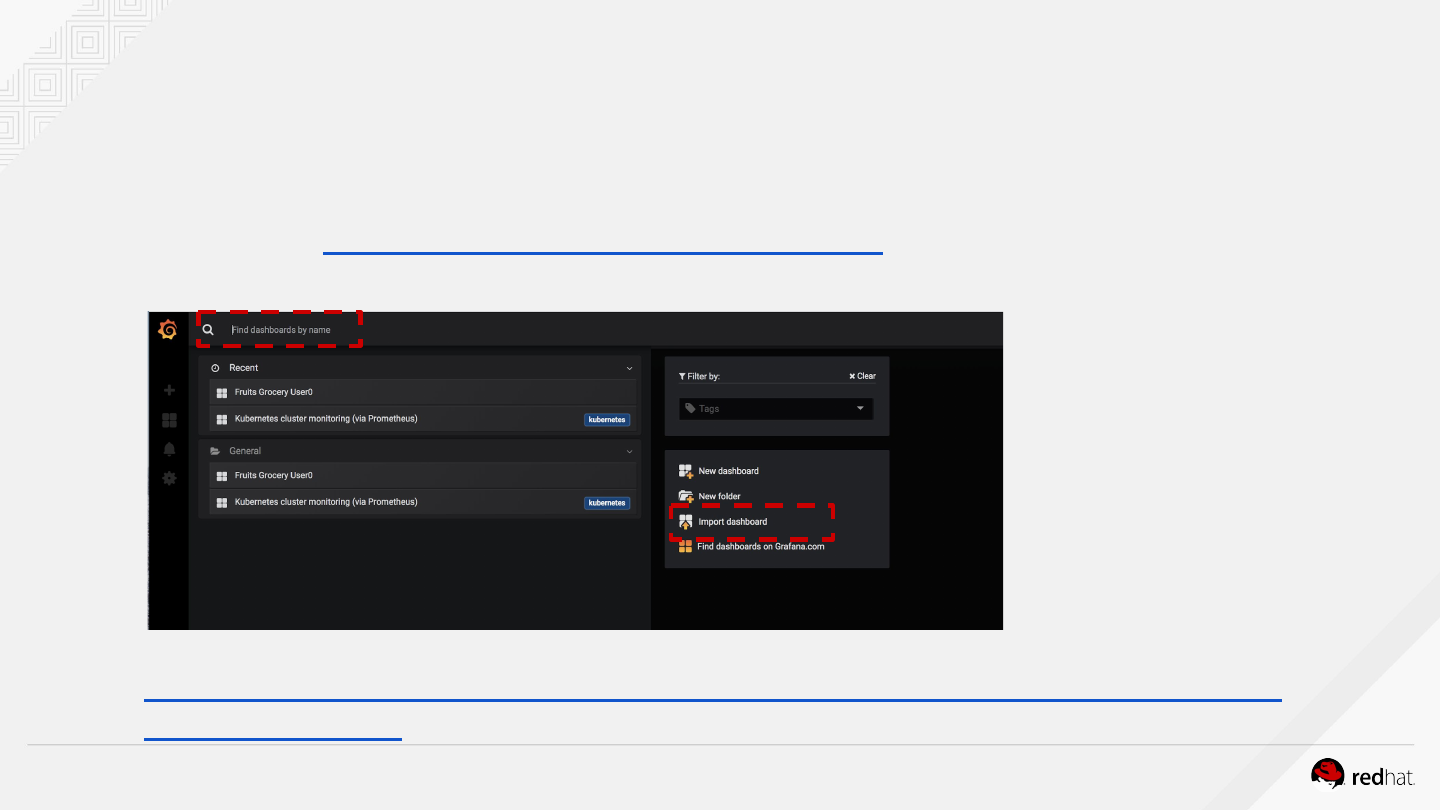
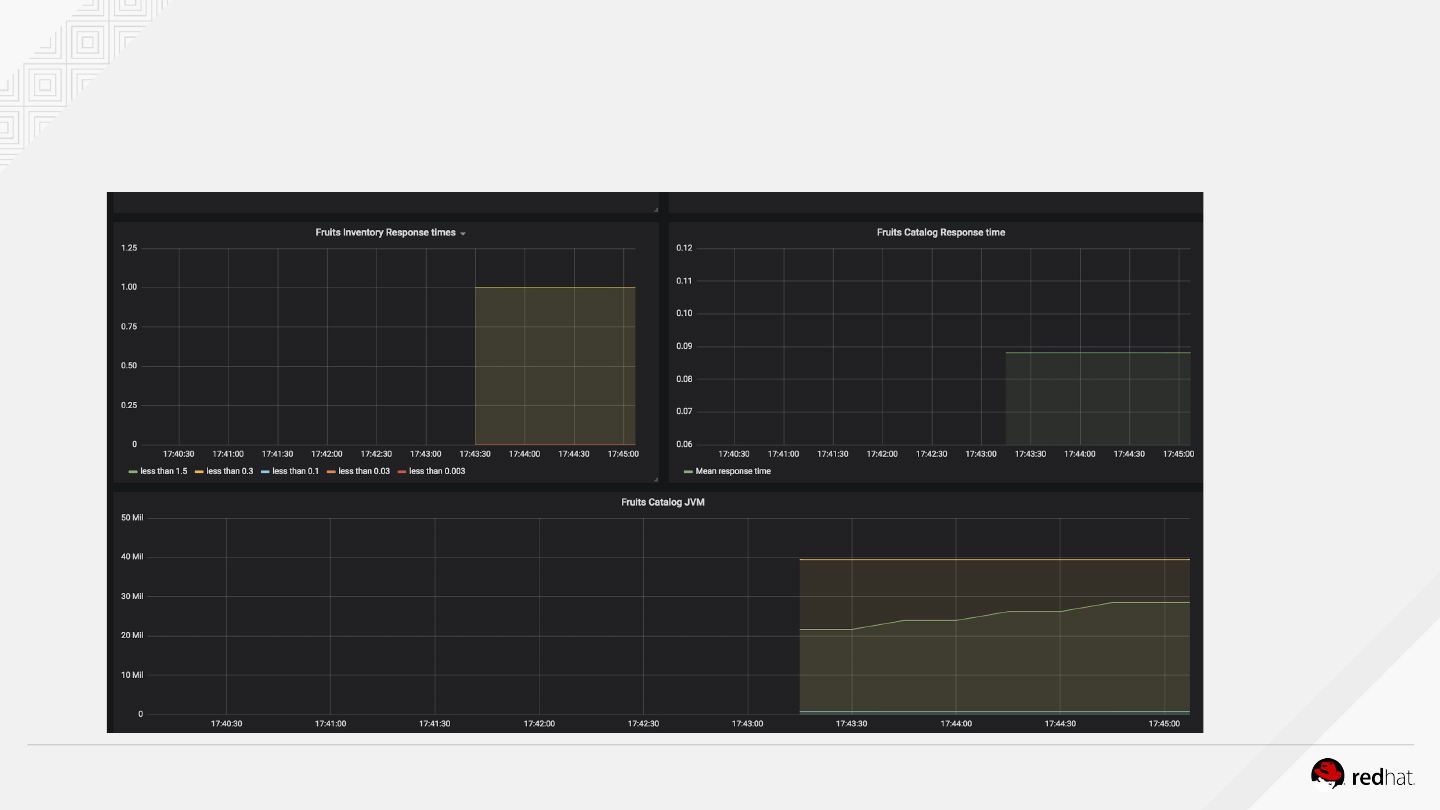
Change Dashboard name with your user ID
Import Grafana Dashboard
OPENSHIFT HANDS-ON ON AZURE70
Grafana Dashboard example

LAB 7
Azure Service Broker
OPENSHIFT TECHNICAL OVERVIEW72
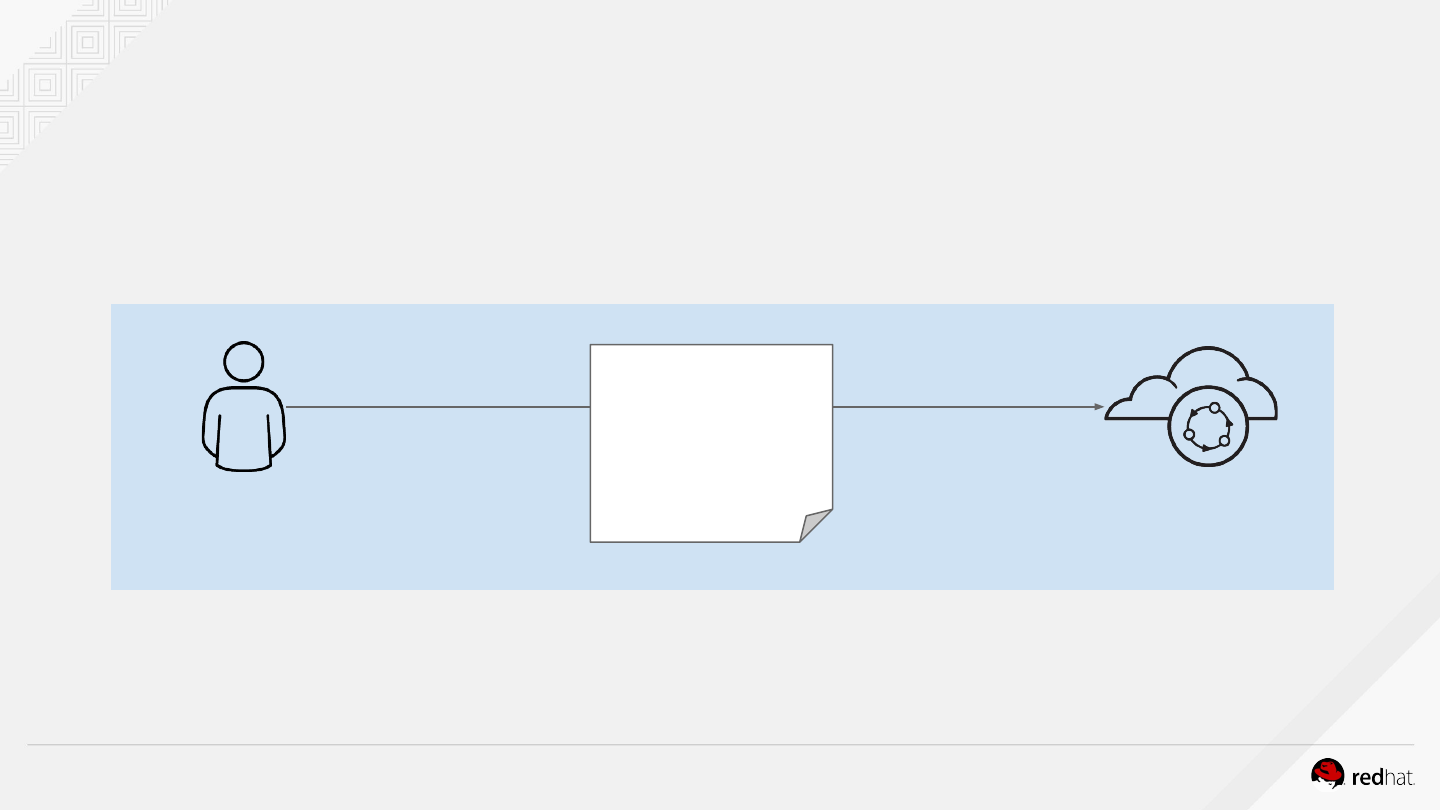
Why a service broker ?
SERVICE
CONSUMER
SERVICE
PROVIDER
☑ Open ticket
☑ Wait for allocation
☑ Receive credentials
☑ Add to app
☑ Deploy app
Manual, Time-consuming and Inconsistent
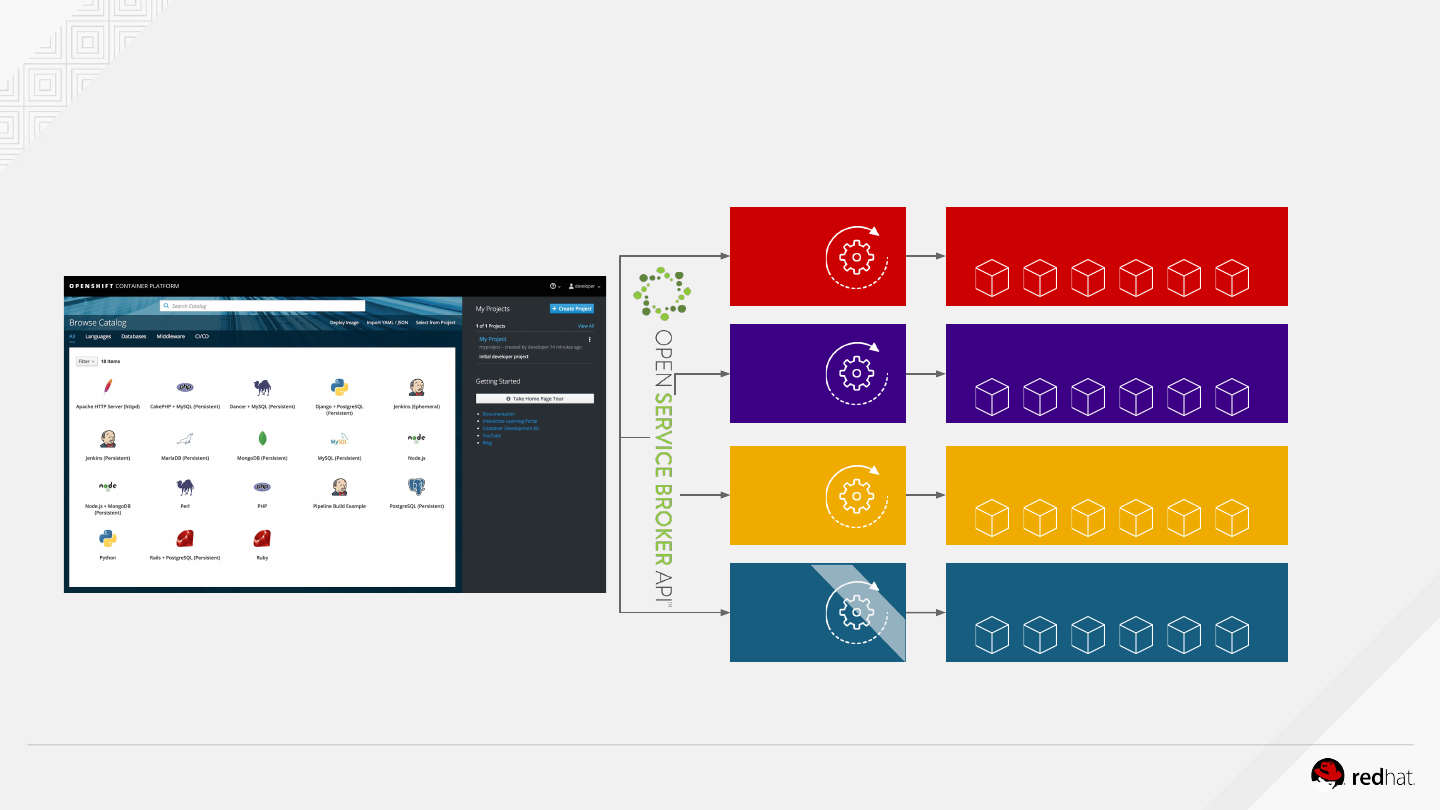
OPENSHIFT TECHNICAL OVERVIEW73
A multi-vendor project to
standardize how services
are consumed on
cloud-native platforms
across service providers
OPENSHIFT TECHNICAL OVERVIEW74
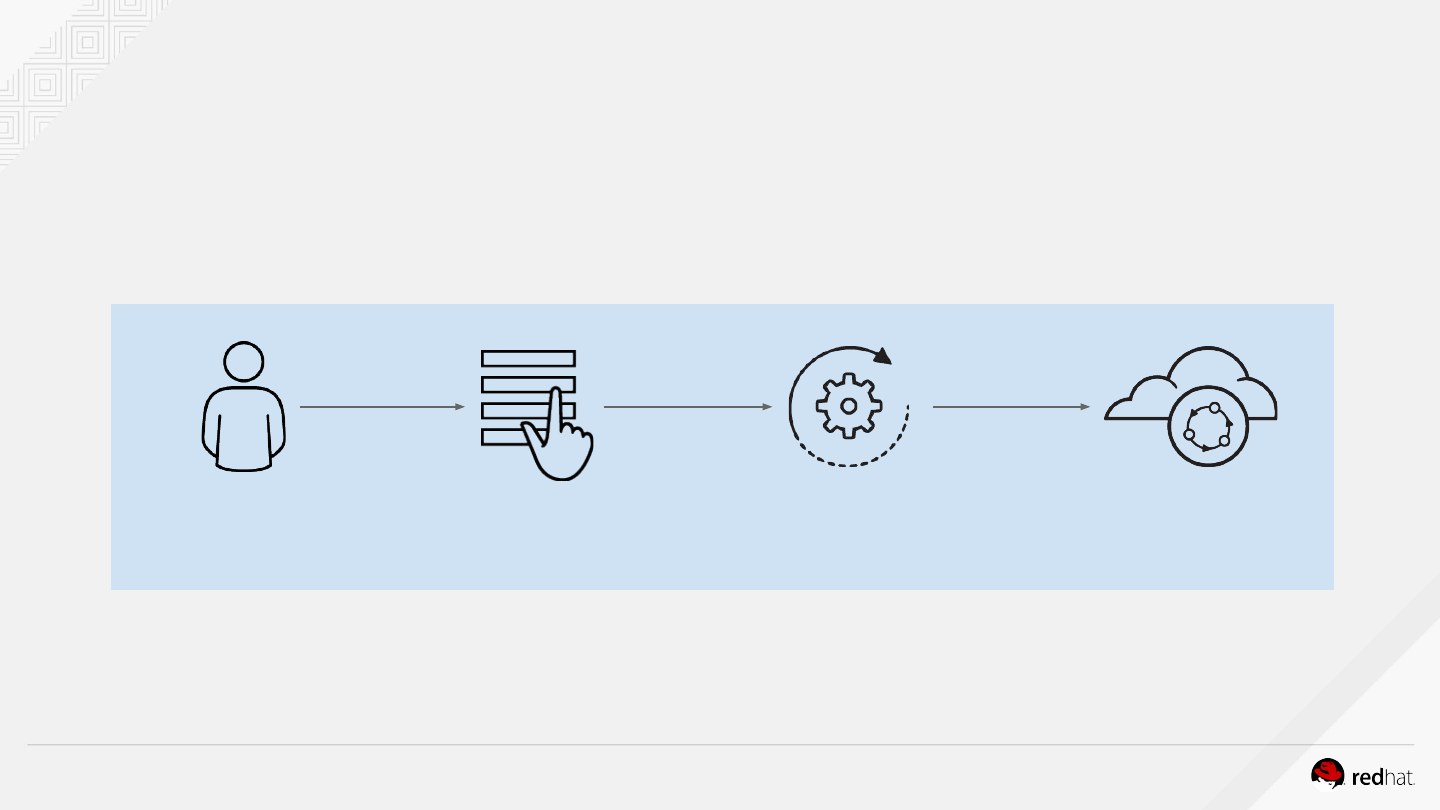
What is a service broker ?
SERVICE
CONSUMER
SERVICE
PROVIDER
SERVICE
CATALOG
SERVICE
BROKER
Automated, Standard and Consistent
OPENSHIFT TECHNICAL OVERVIEW75
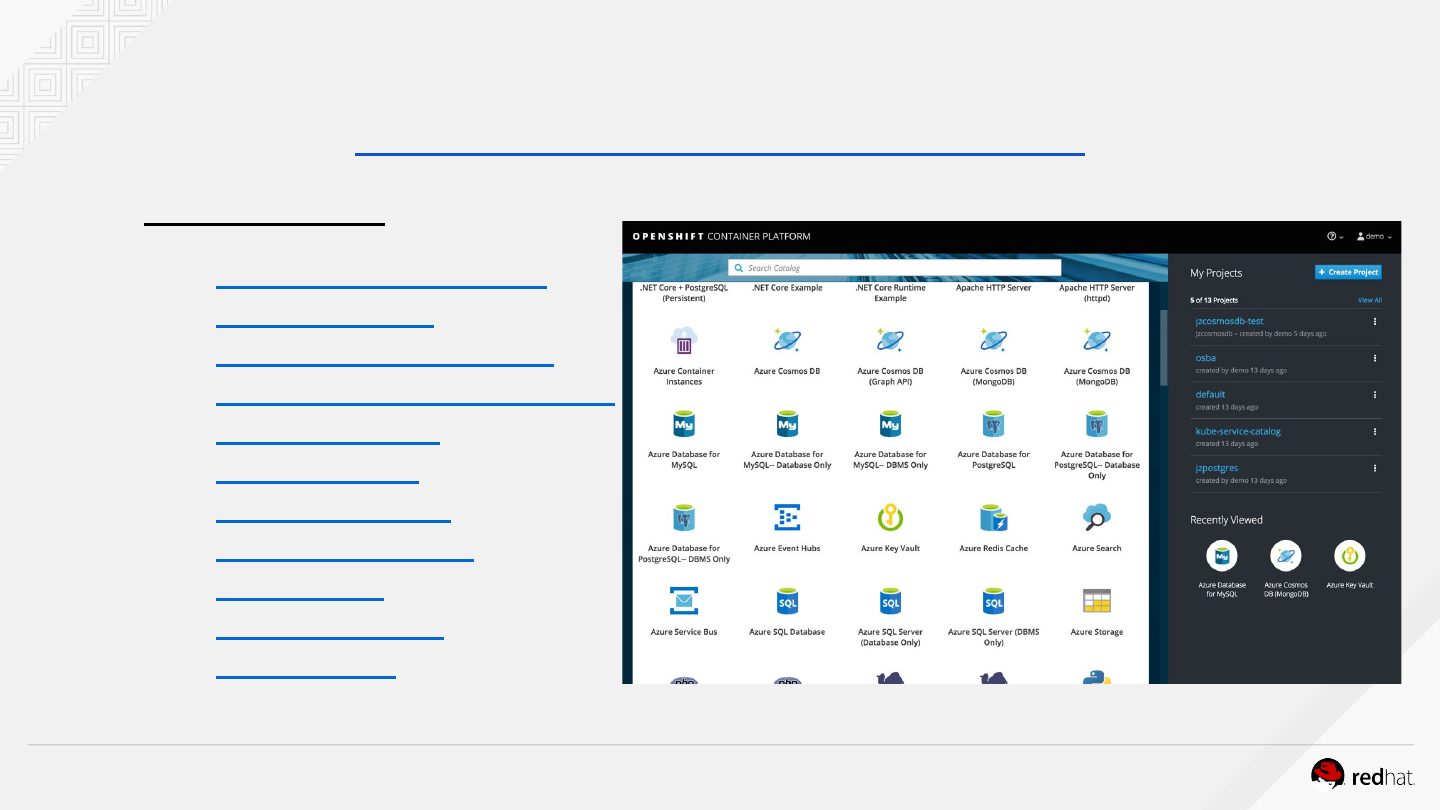
OpenShift service catalog
OPENSHIFT SERVICE CATALOG
OpenShift
Ansible
Broker
OpenShift
Template
Broker
AWS
Service
Broker
Other
Service
Brokers
ANSIBLE
OPENSHIFT
AWS
OTHER COMPATIBLE SERVICES
Ansible
Playbook
Bundles
OpenShift
Templates
AWS
Services
Other
Services
Azure
Service Broker
76
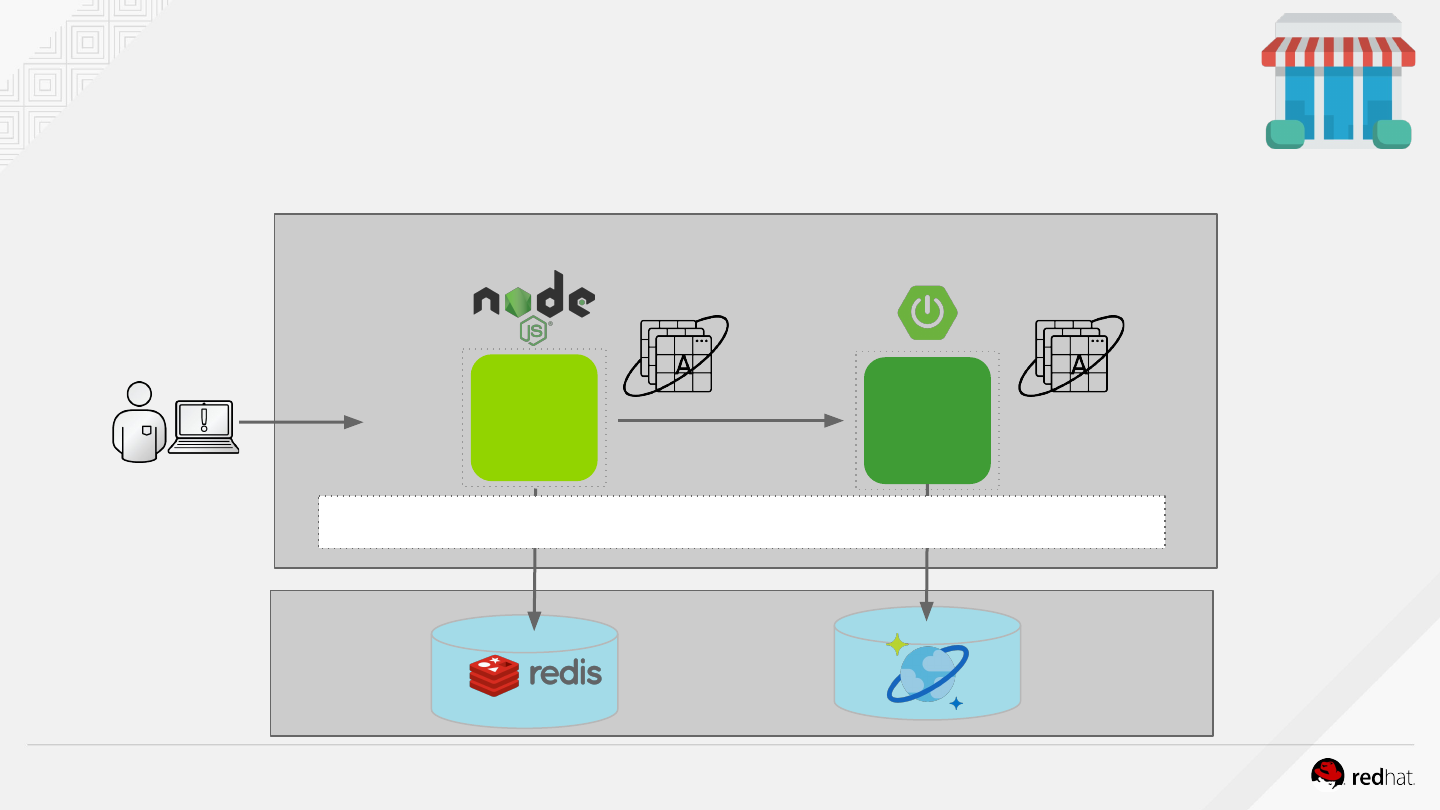
OPEN SERVICE BROKER AZURE
Supported services
●Azure Container Instances
●Azure CosmosDB
●Azure Database for MySQL
●Azure Database for PostgreSQL
●Azure Event Hubs
●Azure Key Vault
●Azure Redis Cache
●Azure SQL Database
●Azure Search
●Azure Service Bus
●Azure Storage
https://github.com/Azure/open-service-broker-azure
OPENSHIFT HANDS-ON ON AZURE77
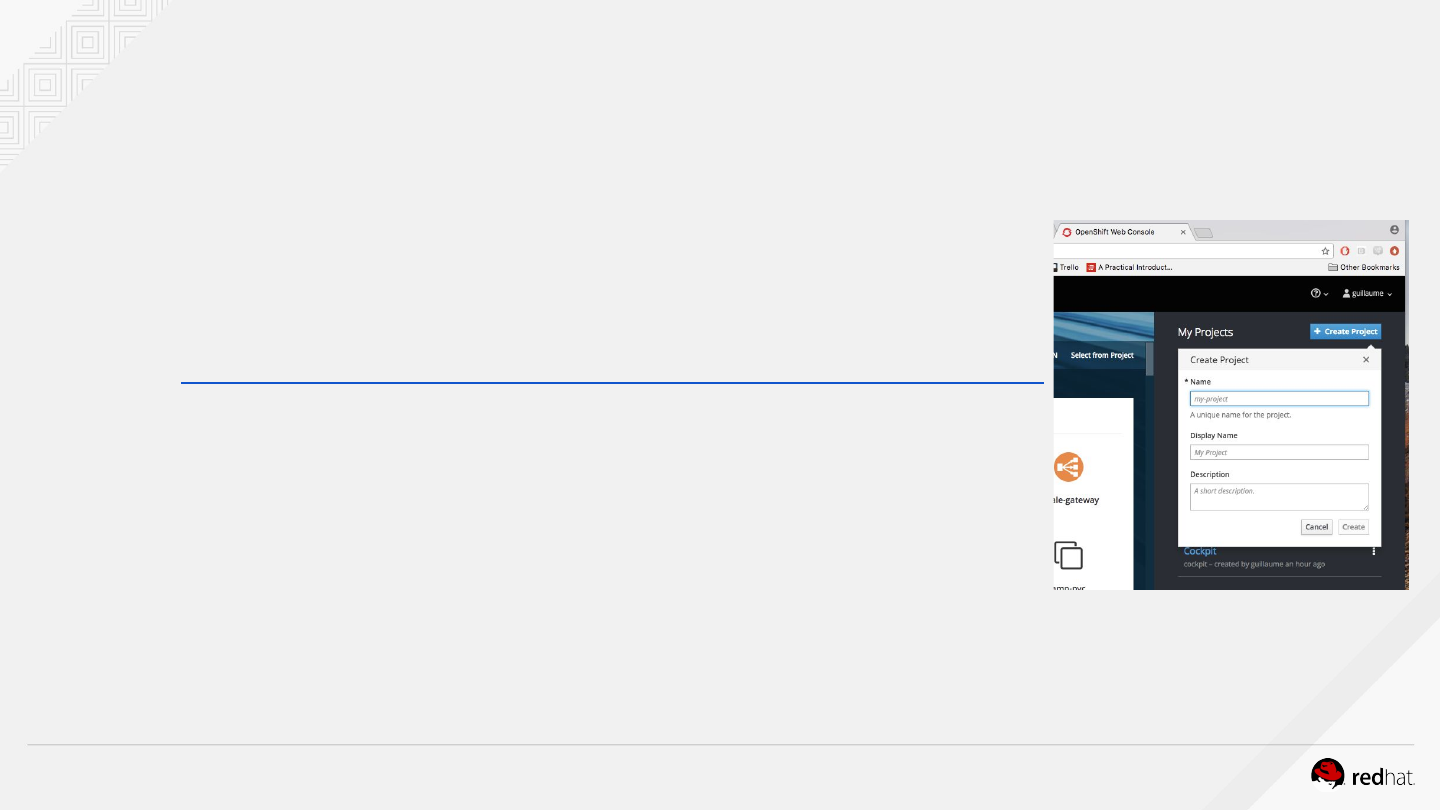
INVENTO
RY
CATALO
G
Grocery Store on OpenShift and Azure
Open Service Broker Azure
OpenShift
Azure
OPENSHIFT HANDS-ON ON AZURE
Create your production environment
Let’s go the Web Console
●Via the web console :
https://masterdnscbmvtdzhvuqye.francecentral.cloudapp.azure.com
○Login with the same credentials
○Create a Project with the following informations
■Name : fruits-grocery-prod-userX
■Display Name: UserX - Fruits Grocery - Prod
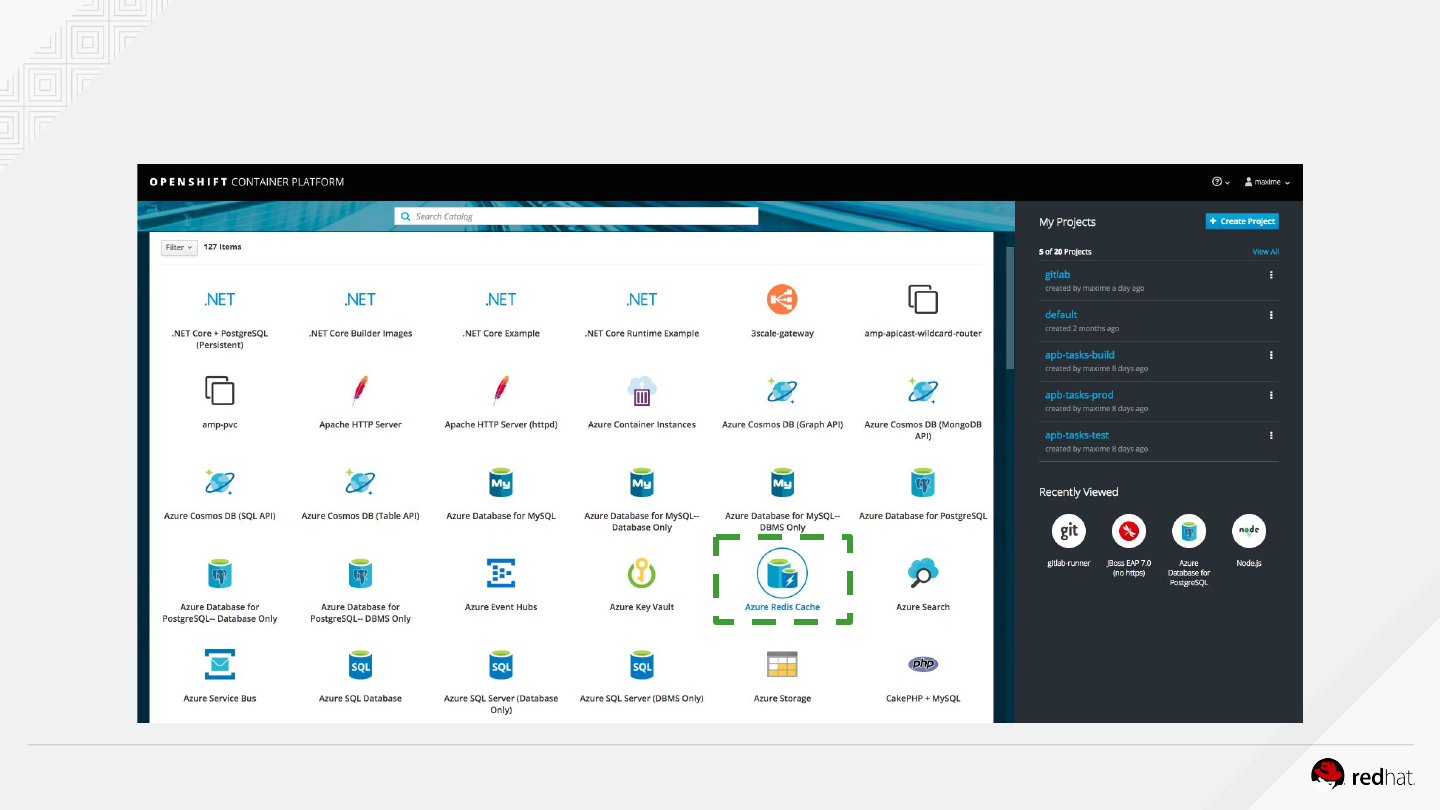
79
Deploy a Redis Cache instance with Open Service Broker Azure
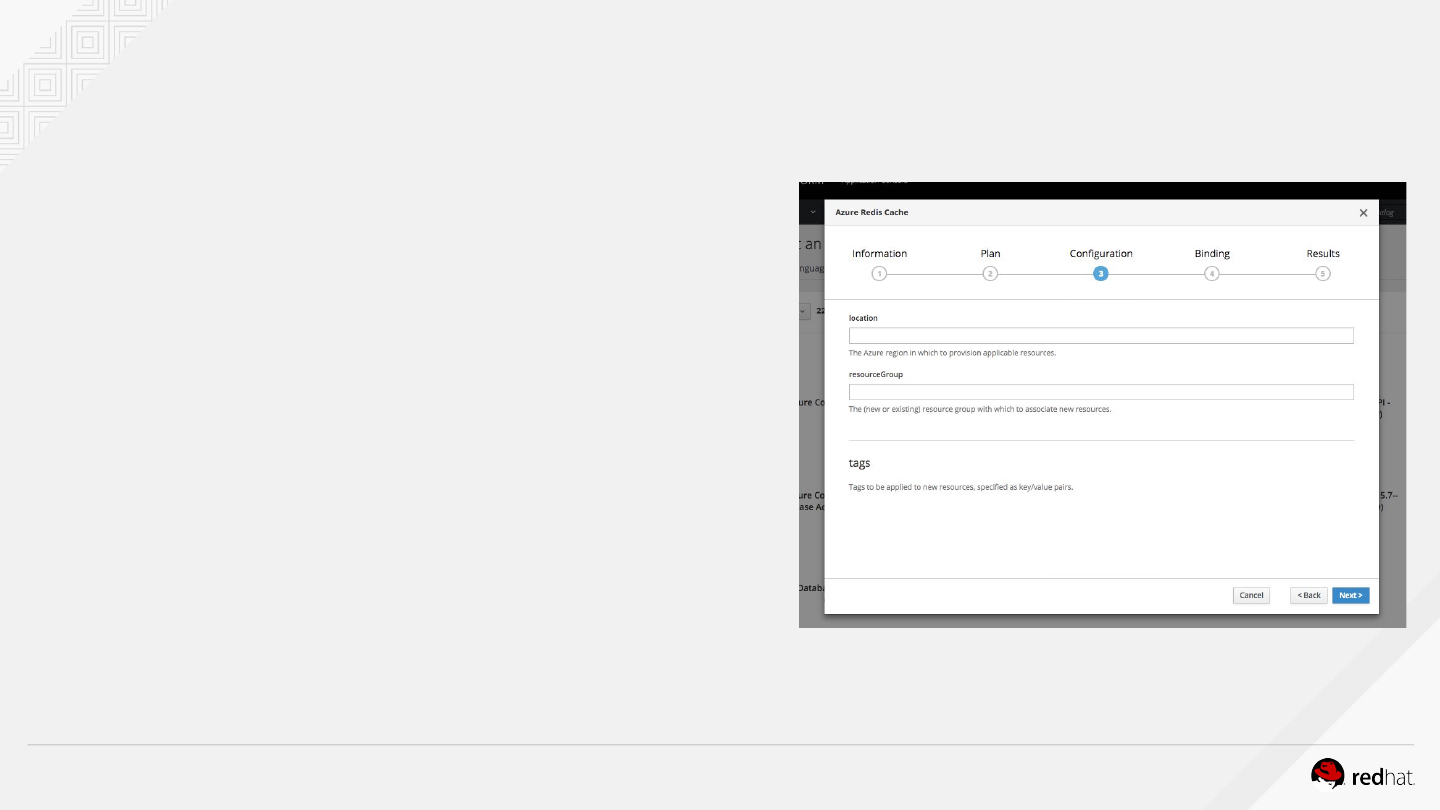
OPENSHIFT HANDS-ON ON AZURE
Deploy Redis Cache DB with OSBA
Complete the following settings
●Select a Plan
○Basic Tier
●Configuration
○location : eastus
○resourceGroup : osba
●Bindings
○Don’t bind to secrets. We will do it
Manually :)
OPENSHIFT HANDS-ON ON AZURE
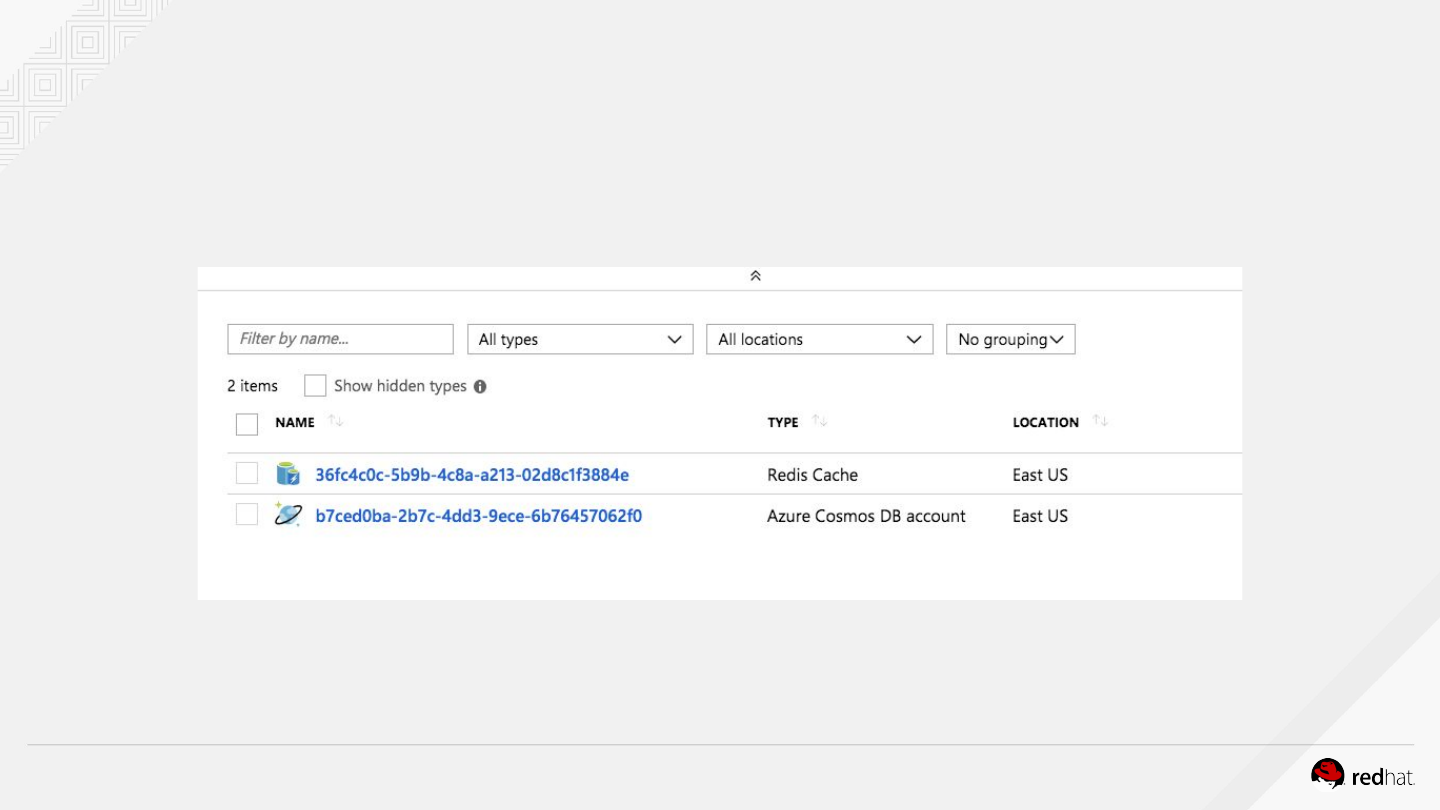
Let’s go to the backstage
A Redis Cache instance has been provisioned in Azure through the Azure Service Broker
82
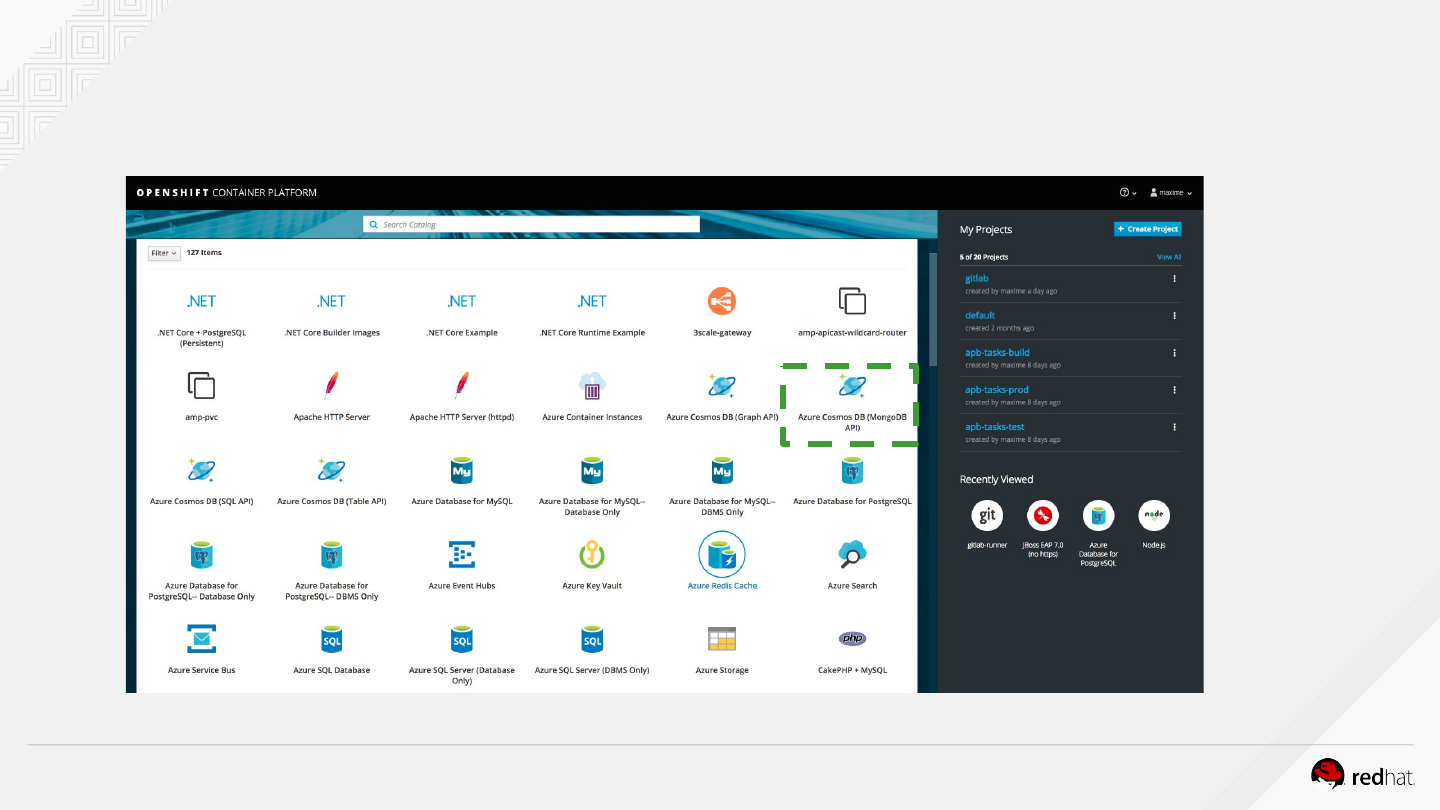
Deploy a Cosmo DB instance with OSBA

●defaultConsistencyLevel = Session
●allowedIPRanges = 0.0.0.0/0 . Then click Add and then click the X
●Location : eastus
●resourceGroup : osba
Binds:
●Add secrets bindings
●Service Broker will retrieve credentials CosmoDB instance from Azure
Deploy a Cosmo DB with OSBA
Complete the following settings
Configuration
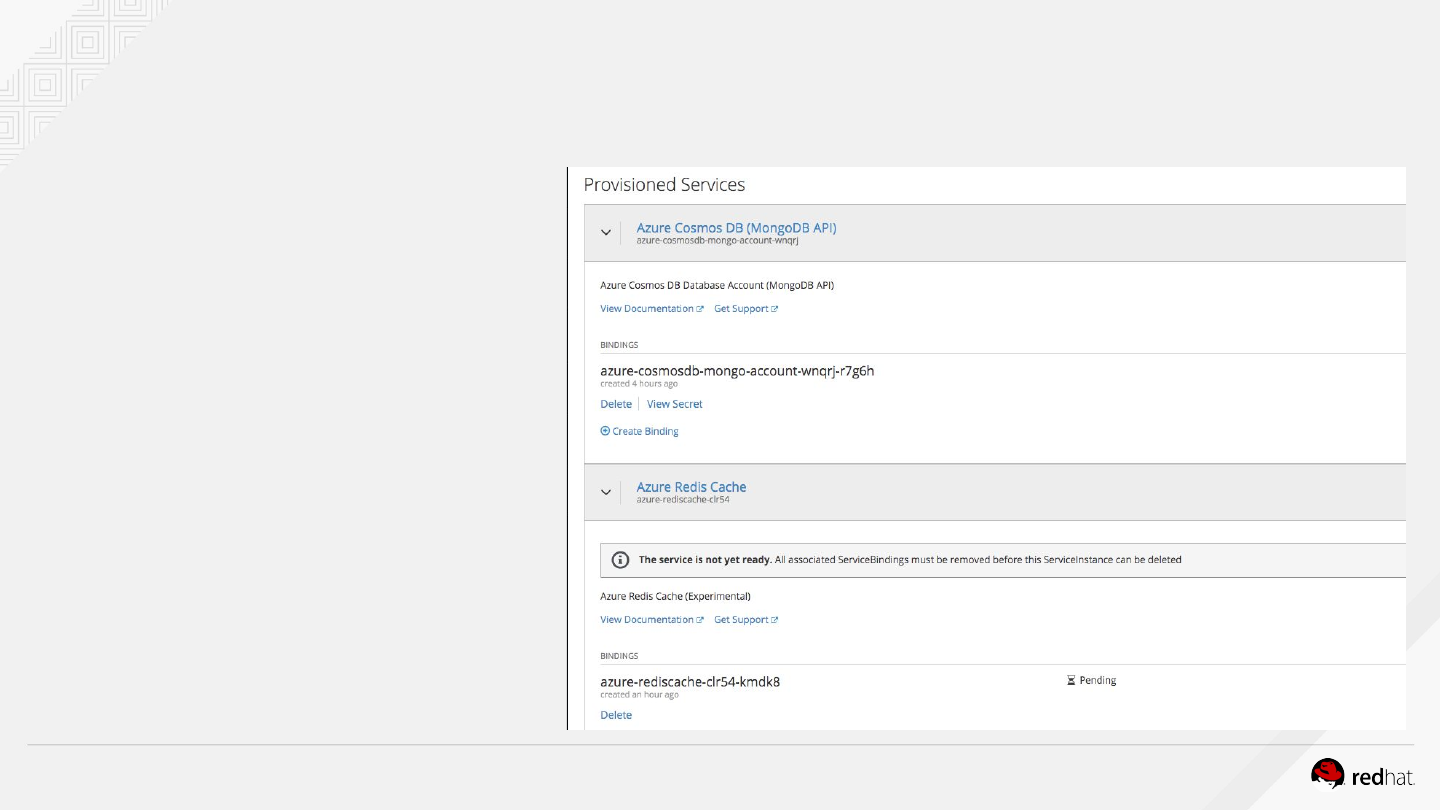
Our two services provisioned !
Redis and CosmoDB are
provisioned asynchronously in
Azure via the Open Service
Broker.
You can consume both services
through OpenShift via the
binding mechanism.
*Due to OSBA implementation
Redis stays in Pending status.

LAB 8
Continuous delivery

OPENSHIFT HANDS-ON ON AZURE
●Prepare a Production environment
●Explore the deployment configurations
●Promote images to production
●Create an OpenShift Jenkins Pipeline
●Add a Webhook to run the pipeline on every code change
●Change some code and review
86
LAB 8: Automating Deployments Using Tags and
Pipelines
OPENSHIFT HANDS-ON ON AZURE87
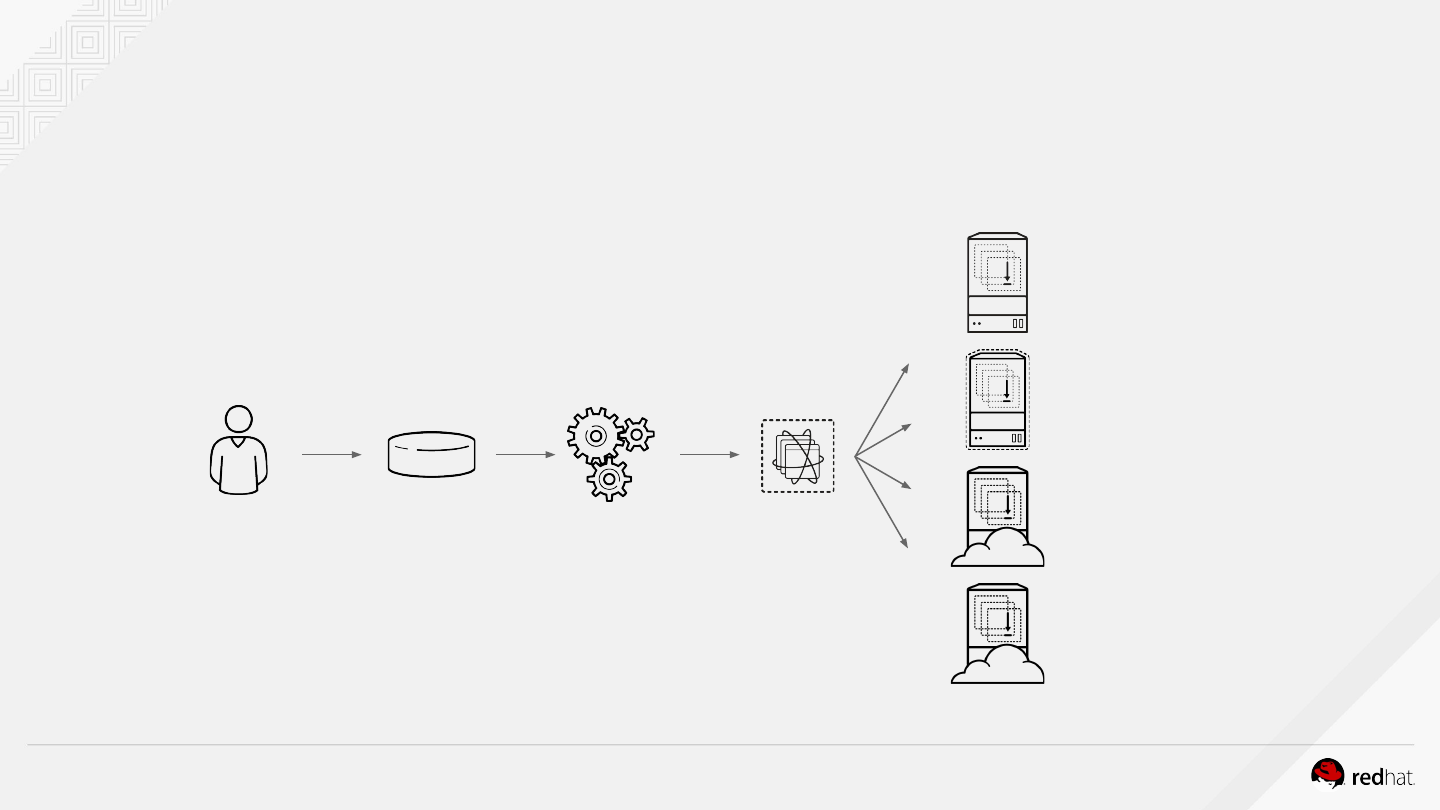
Deployment pipeline
source
repository
CI/CD
engine
dev container
physical
virtual
private cloud
public cloud
OPENSHIFT HANDS-ON ON AZURE88
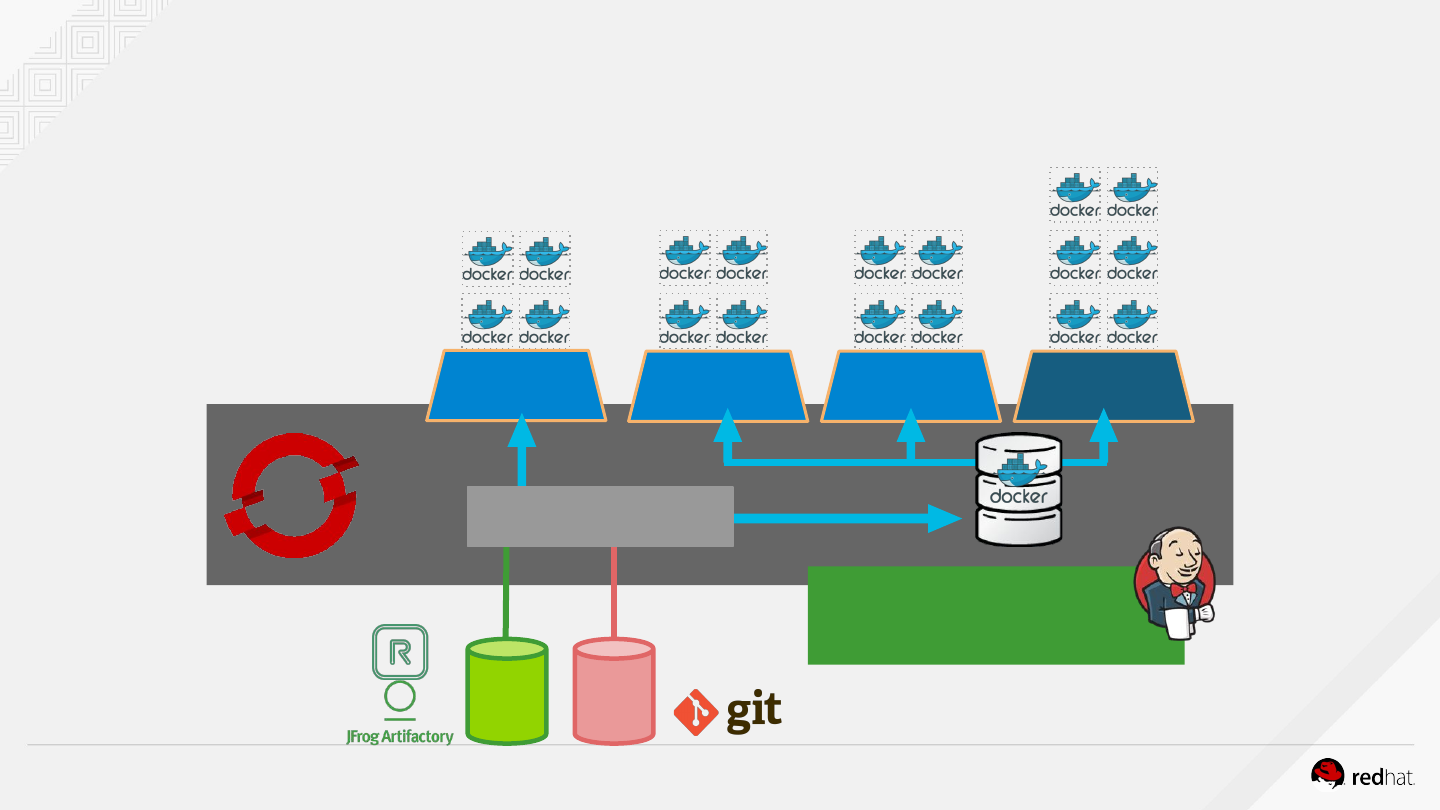
DEV INT QA PROD
Orchestrateur
Rolling Upgrades
Blue/Green Deployments
A/B Testing
Image build process
CI/CD with OpenShift

OPENSHIFT HANDS-ON ON AZURE89
●CI/CD workflow via Jenkins
●Pipelines are started, monitored,
and managed similar to other builds
●Auto-provisioning of Jenkins server
●On-demand Jenkins slaves
●Embedded Jenkinsfile or in Git repo
OpenShift Pipelines
pipeline {
agent {
label 'maven'
}
stages {
stage('build app') {
steps {
git url: 'https://git/app.git'
sh "mvn package"
}
}
stage('build image') {
steps {
script {
openshift.withCluster() {
openshift.startBuild("...")
}
}
}
}
}
}
OPENSHIFT HANDS-ON ON AZURE91
Prepare a Production environment
A wrap-up script has been prepared for you. It will contains all resources created previously in the
Development project.
$ ./prepare-prod.sh
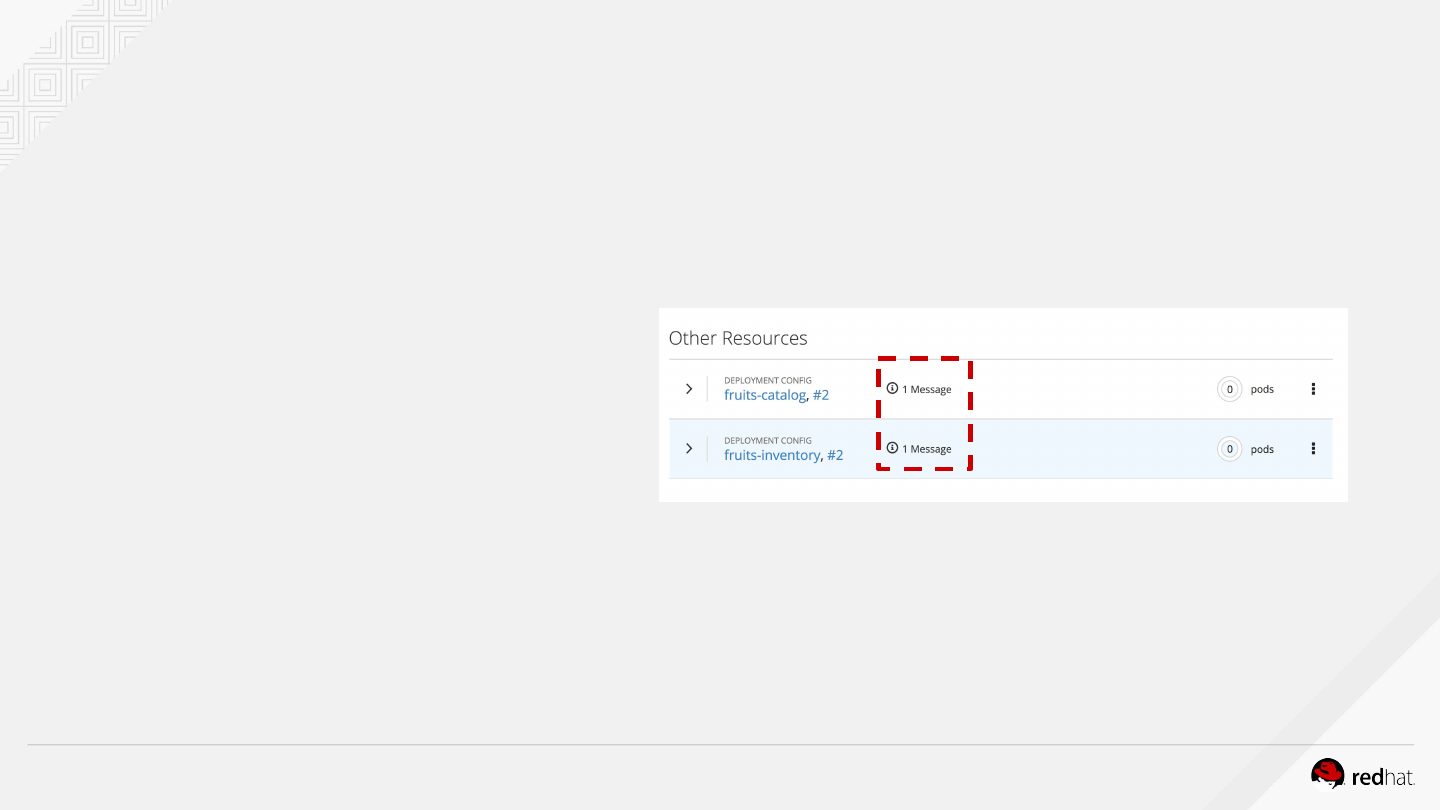
OPENSHIFT HANDS-ON ON AZURE92
Explore the deployment configurations
From overview on web console,
check the deployment
configuration All deployment are
cancelled.
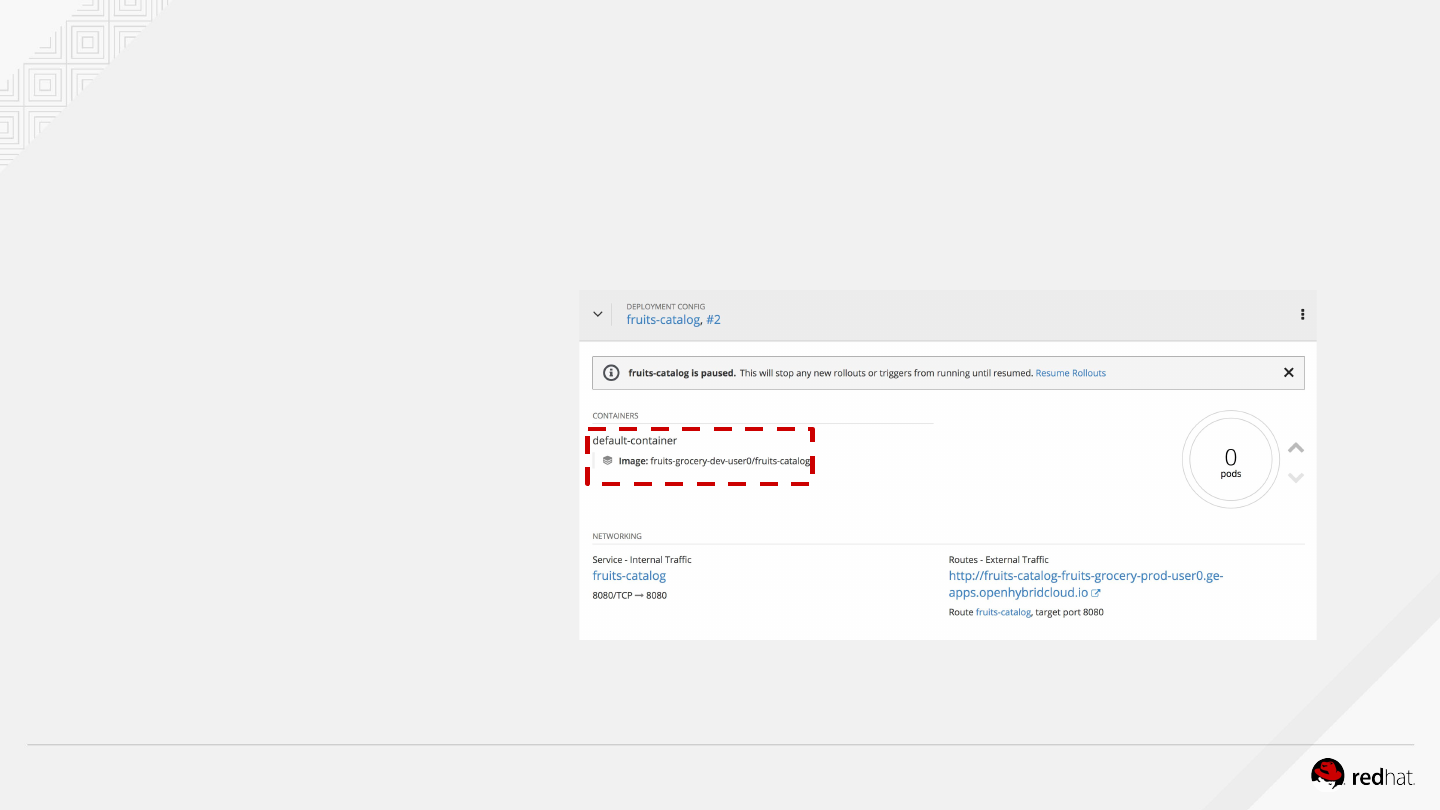
OPENSHIFT HANDS-ON ON AZURE93
Explore the deployment configurations
Clicking on a deployment
configuration, you should see that
there’s no automatic trigger
defined for deployment.
You shall also notice that the
image used for deployment is
coming from your development
project !
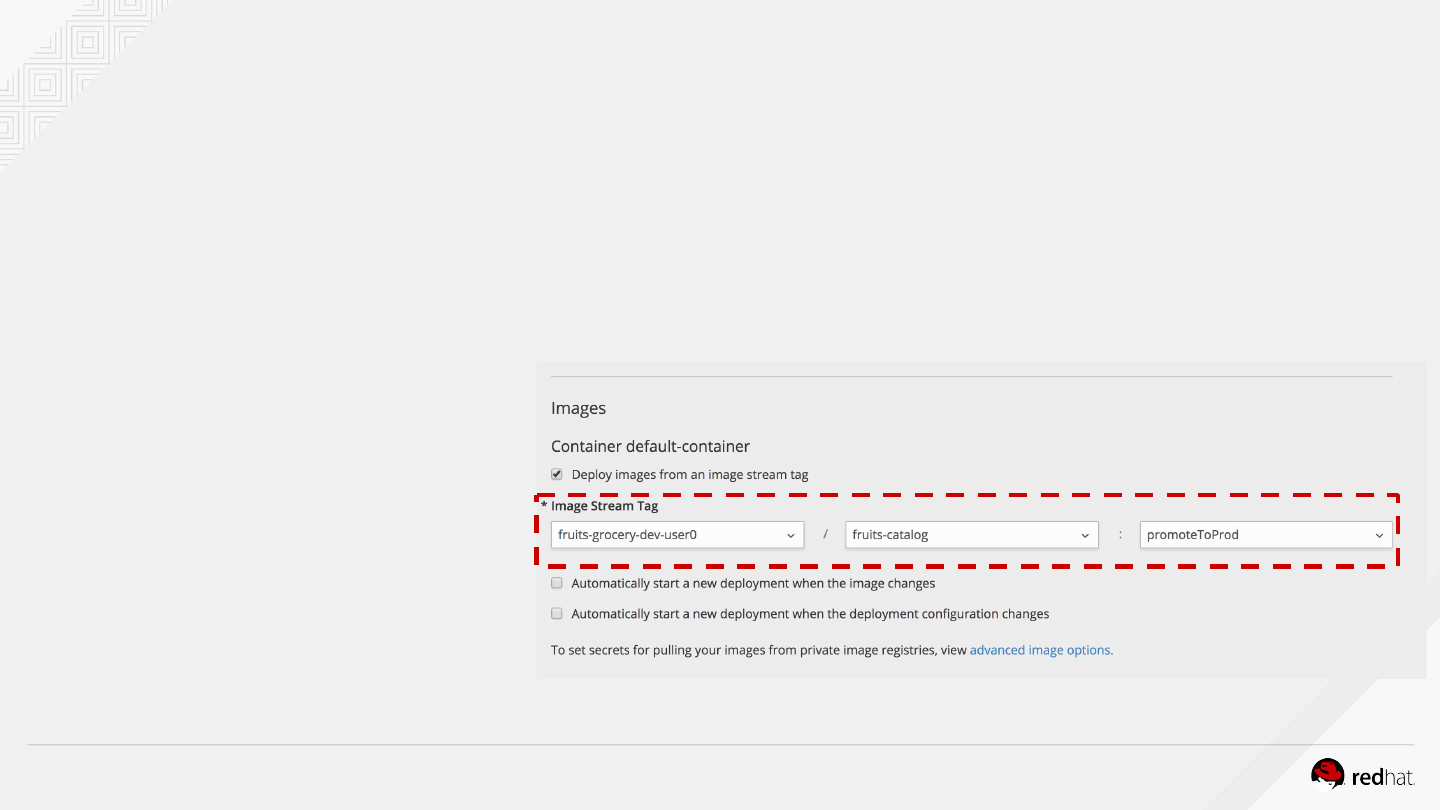
OPENSHIFT HANDS-ON ON AZURE94
Explore the deployment configurations
Access detailed configuration by
choosing Edit in Actions menu.
Check that the image referenced
into your dev project has the
:promoteToProd tag.
Because this tag does not exists,
deployment will fail !

OPENSHIFT HANDS-ON ON AZURE95
Promote images to production
$ . /home/userX/deploy-prod.sh
Tag fruits-grocery-dev-user0/fruits-catalog:promoteToProd set to
fruits-grocery-dev-user0/fruits-catalog@sha256:5eeb089a5df9aa55b4e80c581014a674c1e2f7e902c92a3f5c48e0df4155e95
7.
Tag fruits-grocery-dev-user0/fruits-inventory:promoteToProd set to
fruits-grocery-dev-user0/fruits-inventory@sha256:29a17627c330a5568f6a956ffddc5f7c3e17ab4839e22085899b7eb0328
9705a.
deploymentconfig "fruits-catalog" rolled out
deploymentconfig "fruits-inventory" rolled out
The wrap-up script can be used again here through a new command. The command will tag all
images from development streams and rollout all the deployments.
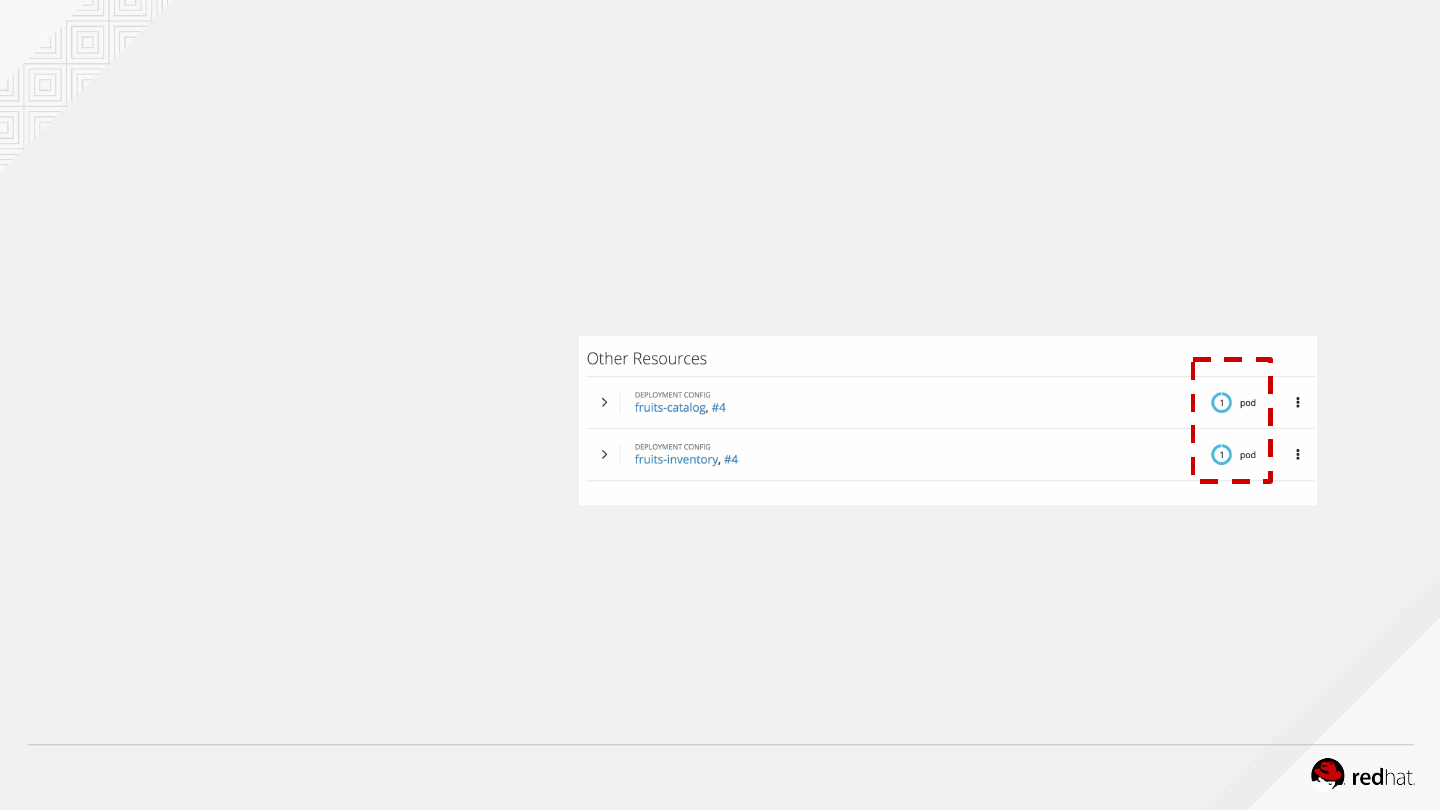
OPENSHIFT HANDS-ON ON AZURE96
Promote images to production
Check deployment are successful !
But wait … we have also created a
pipeline. Just go to your
development project.
OPENSHIFT HANDS-ON ON AZURE97
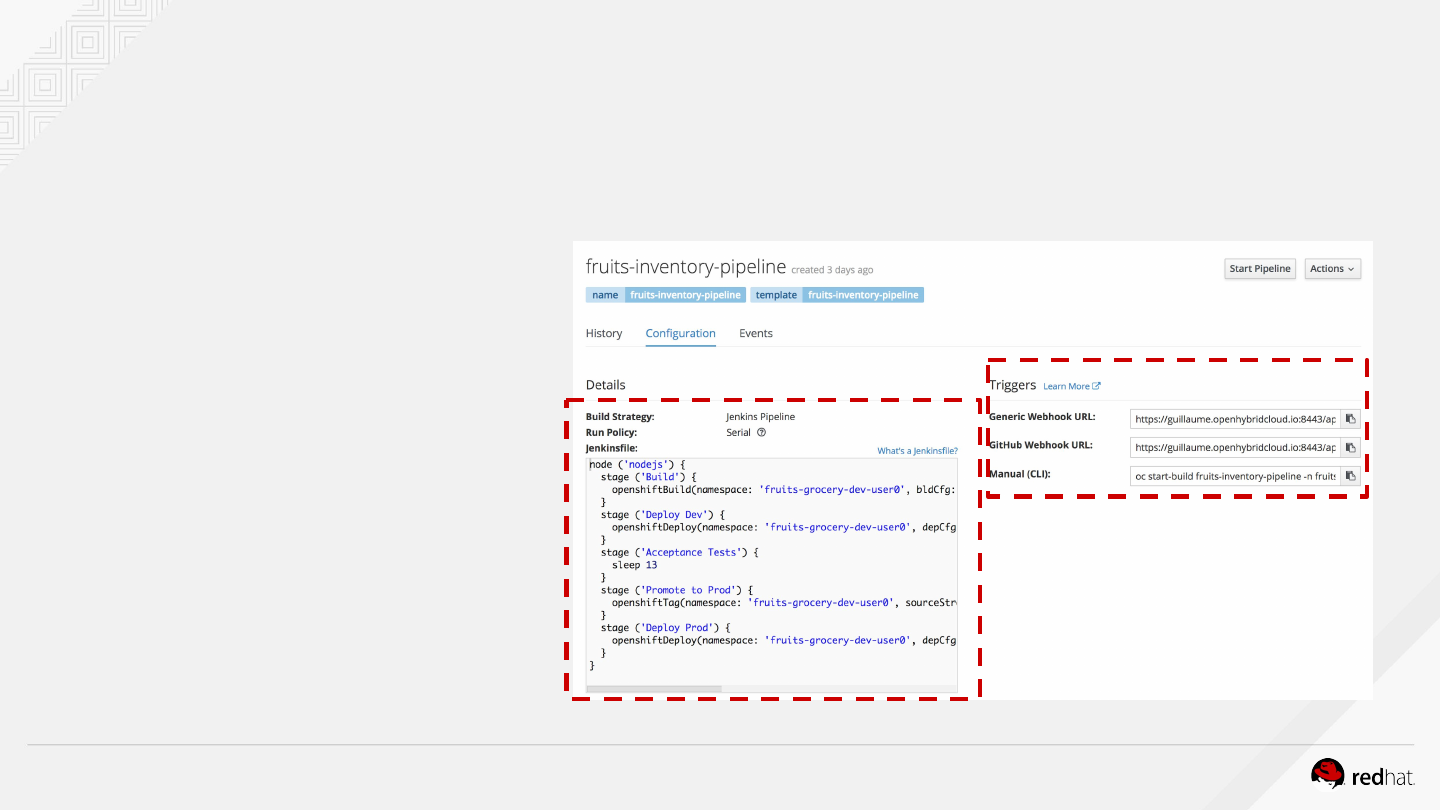
Create an OpenShift Jenkins Pipeline
In your development project within
the Builds section, Pipelines
subsection, check that
inventory-service-pipeline has
been created.
Triggers with webhooks provide a
full developer experience to
automate its deployment from a
local env to production
environment
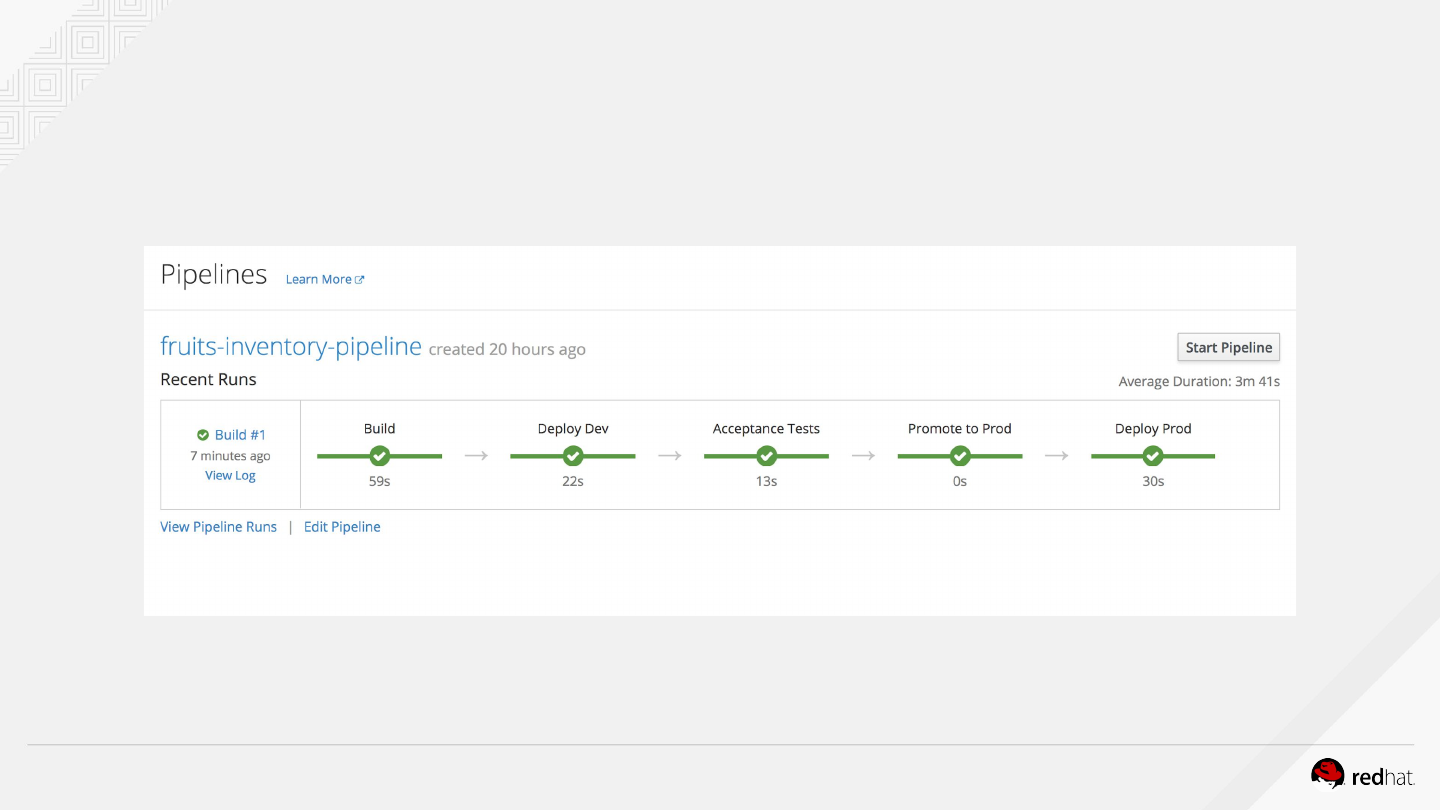
OPENSHIFT HANDS-ON ON AZURE
Check Jenkins pipeline job logs via the Jenkins console. Click on “View Log”
Start your Jenkins pipeline
We deploy the fruits-inventory application from Dev to Prod with complex tests ...

CONTAINERS & CLOUD-NATIVE ROADSHOW99
CONGRATULATIONS !
YOU’RE A CLOUD-NATIVE APPS
DEVELOPER.
OPENSHIFT HANDS-ON @ Société Générale100
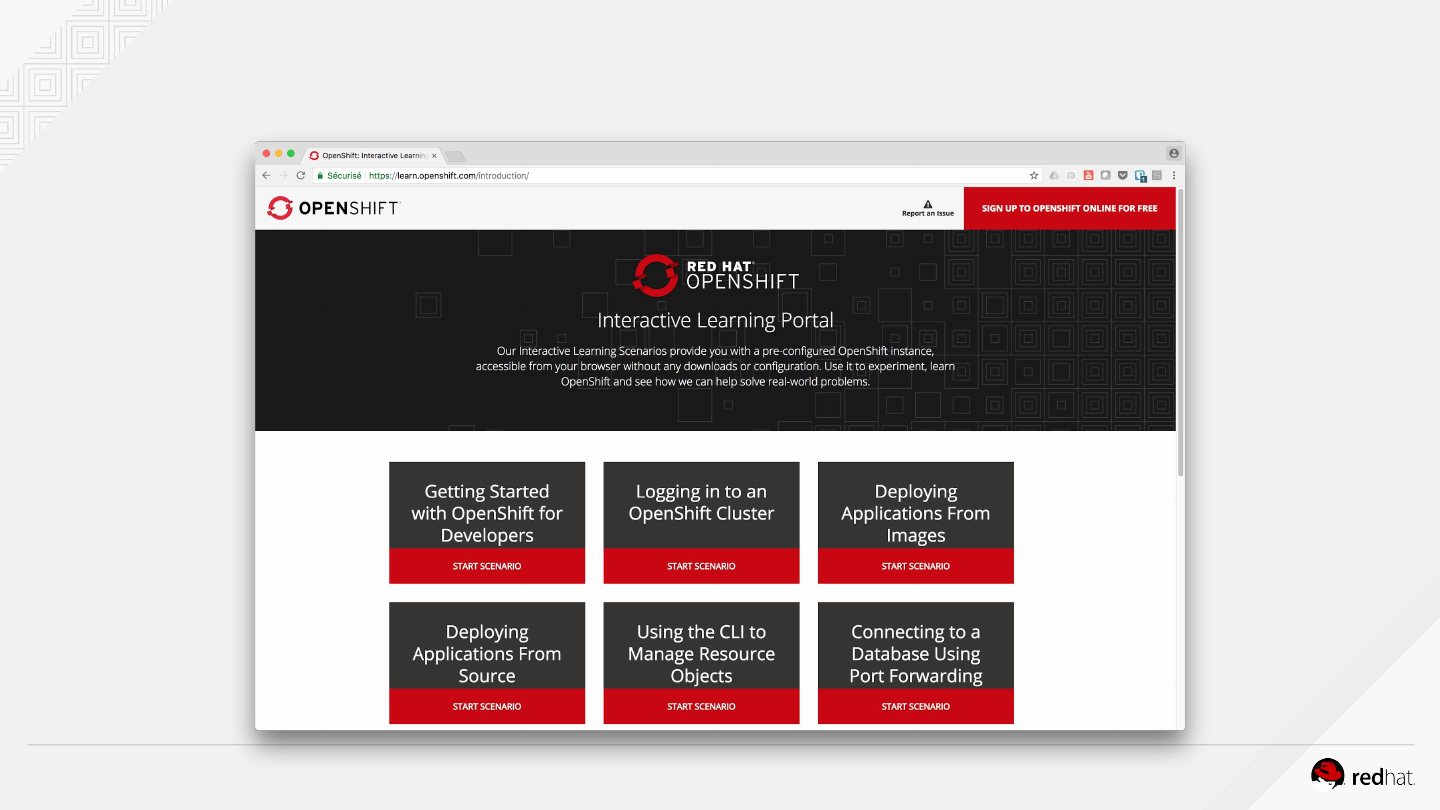
LEARN.OPENSHIFT.COM
THANK YOU
plus.google.com/+RedHat
linkedin.com/company/red-hat
youtube.com/user/RedHatVideos
facebook.com/redhatinc
twitter.com/RedHatNews


